Embed Size (px)
Citation preview

eScholarship provides open access, scholarly publishingservices to the University of California and delivers a dynamicresearch platform to scholars worldwide.
California Partners for AdvancedTransportation Technology
UC Berkeley
Title:Steady State Conditions on Automated Highways
Author:del Castillo, Jose M.Lovell, David J.Daganzo, Carlos F.
Publication Date:11-01-1995
Series:Working Papers
Permalink:http://escholarship.org/uc/item/6qv882hq
Keywords:Express highways--Automation, Highway capacity, Traffic flow
Copyright Information:All rights reserved unless otherwise indicated. Contact the author or original publisher for anynecessary permissions. eScholarship is not the copyright owner for deposited works. Learn moreat http://www.escholarship.org/help_copyright.html#reuse

�
Abstract:
Acknowledgements:
Steady State Conditions on Automated Highways
Jos�e M. del Castillo
David J. Lovell Carlos F. Daganzo
Escuela Superior de Ingenier��as Industriales
Universidad de Extremadura
06071 Badajoz, SPAIN
and
Institute of Transportation Studies
University of California, Berkeley
Berkeley, California 94720
November, 1995
Research supported by the PATH program, Institute of Transportation Studies, Uni-
versity of California, Berkeley, under MOU-165. Jos�e M. del Castillo would like to thank the Spanish Ministry of
Education and Science for the scholarship that has made this work possible.
This paper is concerned with technical investigations of tra�c operations on automated high-ways. Estimates are made of the steady-state capacity of such freeways, paying particular
attention to the e�ect of entry and exit maneuvers. The possibility of scheduling departingvehicles appropriately into platoons to minimize extraneous maneuvers is investigated. Charac-
teristics of urban areas likely to be candidates for automated freeways are discussed, and someshortcomings of automated freeways, vis-�a-vis conventional freeways, are pointed out. Finally,
some areas of future research needs are identi�ed.

CONTENTS
Contents
1 INTRODUCTION 1
2 CAPACITY ESTIMATION 3
3 SCENARIOS FOR AHS 13
4 STORAGE CAPACITY 15
5 CONCLUSIONS AND FUTURE RESEARCH 18
6 REFERENCES 20
A OFF-RAMP SPACING 21
i
1.1 BACKGROUND 1
1.2 PROBLEM IDENTIFICATION 1
1.3 RESEARCH NEEDS 2
2.1 PLATOONING ON THE AUTOMATED LANES 3
2.2 EFFECT OF THE EXIT MANUEVER ON THE CAPACITY 5
2.3 SCHEDULING VEHICLES INTO PLATOONS 9
2.4 THE EFFECT OF ENTERING VEHICLES 11
3.1 EXIT RAMP REQUIREMENTS 13
3.2 ABSORPTION ONTO LOCAL STREETS 14
4.1 JAM DENSITY 15
4.2 SHOCK WAVES 16
: : : : : : : : : : : : : : : : : : : : : : : : : : : : : : : : : : : :
: : : : : : : : : : : : : : : : : : : : : : : : : : : :
: : : : : : : : : : : : : : : : : : : : : : : : : : : : : : : : : :
: : : : : : : : : : : : : : : : :
: : : : : : : : : :
: : : : : : : : : : : : : : : : : : :
: : : : : : : : : : : : : : : : : : : :
: : : : : : : : : : : : : : : : : : : : : : : : : : :
: : : : : : : : : : : : : : : : : : : : :
: : : : : : : : : : : : : : : : : : : : : : : : : : : : : : : : : : : :
: : : : : : : : : : : : : : : : : : : : : : : : : : : : : : : : : : : :
1 INTRODUCTION
1 INTRODUCTION
1.1 BACKGROUND
1.2 PROBLEM IDENTIFICATION
1
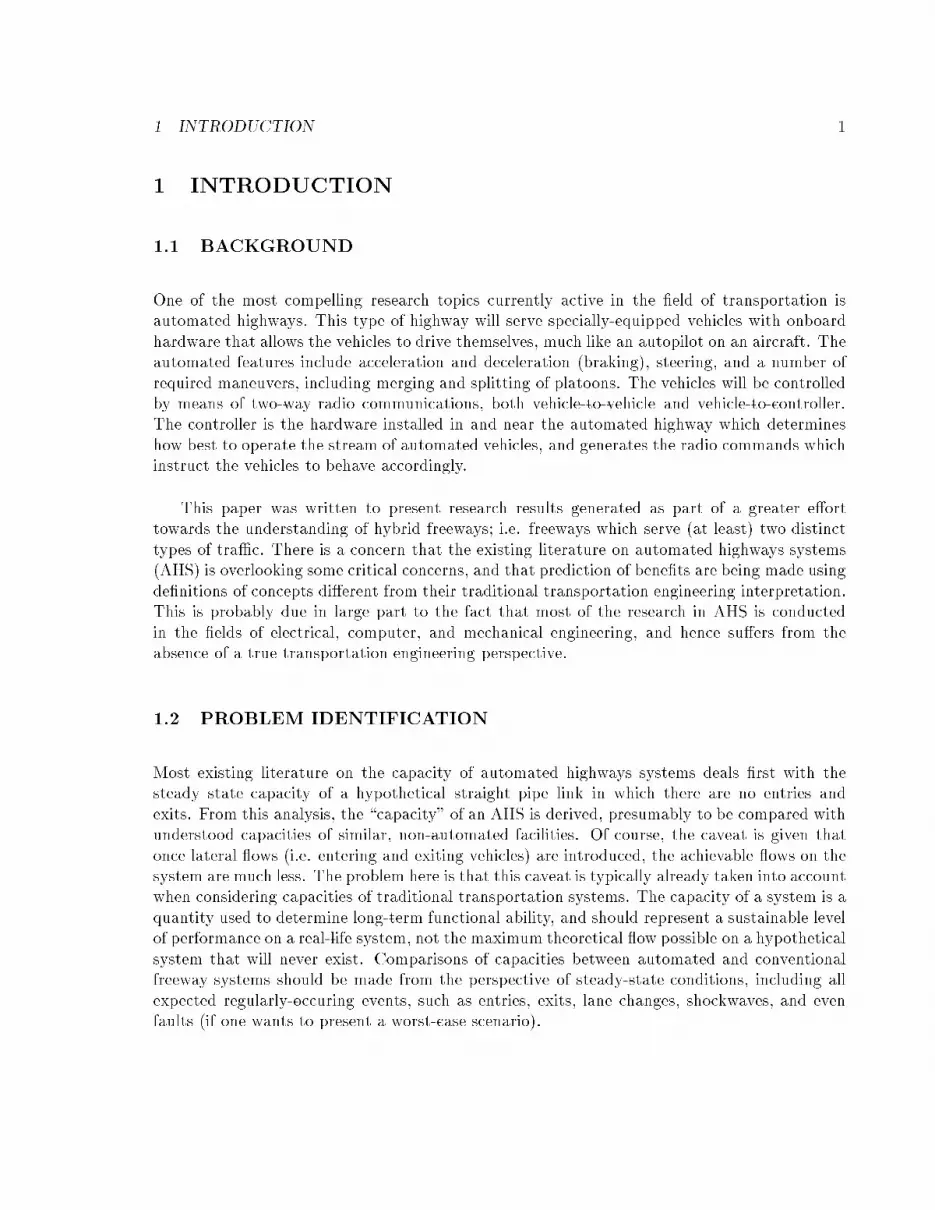
One of the most compelling research topics currently active in the �eld of transportation isautomated highways. This type of highway will serve specially-equipped vehicles with onboard
hardware that allows the vehicles to drive themselves, much like an autopilot on an aircraft. Theautomated features include acceleration and deceleration (braking), steering, and a number of
required maneuvers, including merging and splitting of platoons. The vehicles will be controlledby means of two-way radio communications, both vehicle-to-vehicle and vehicle-to-controller.The controller is the hardware installed in and near the automated highway which determines
how best to operate the stream of automated vehicles, and generates the radio commands whichinstruct the vehicles to behave accordingly.
This paper was written to present research results generated as part of a greater e�orttowards the understanding of hybrid freeways; i.e. freeways which serve (at least) two distinct
types of tra�c. There is a concern that the existing literature on automated highways systems(AHS) is overlooking some critical concerns, and that prediction of bene�ts are being made using
de�nitions of concepts di�erent from their traditional transportation engineering interpretation.This is probably due in large part to the fact that most of the research in AHS is conducted
in the �elds of electrical, computer, and mechanical engineering, and hence su�ers from theabsence of a true transportation engineering perspective.
Most existing literature on the capacity of automated highways systems deals �rst with thesteady state capacity of a hypothetical straight pipe link in which there are no entries and
exits. From this analysis, the \capacity" of an AHS is derived, presumably to be compared withunderstood capacities of similar, non-automated facilities. Of course, the caveat is given that
once lateral ows (i.e. entering and exiting vehicles) are introduced, the achievable ows on thesystem are much less. The problem here is that this caveat is typically already taken into accountwhen considering capacities of traditional transportation systems. The capacity of a system is a
quantity used to determine long-term functional ability, and should represent a sustainable levelof performance on a real-life system, not the maximum theoretical ow possible on a hypothetical
system that will never exist. Comparisons of capacities between automated and conventionalfreeway systems should be made from the perspective of steady-state conditions, including all
expected regularly-occuring events, such as entries, exits, lane changes, shockwaves, and evenfaults (if one wants to present a worst-case scenario).

1 INTRODUCTION
1.3 RESEARCH NEEDS
2
Existing literature on the capacity of automated highway systems focuses on the analysisof single subsections. It is assumed that if the operation of a single subsection, including entry
and exit gates, and manual and automatic lanes, can be controlled, then a working automatedfreeway system can be constructed simply by connecting a number of these subsections together.This logic is faulty, however, for the same reason that existing conventional freeways cannot be
studied in this manner. What often controls the ow of tra�c on many facilities is the abilityof the destination(s) to accommodate tra�c. For example, tra�c on a freeway that reaches its
terminus in a downtown area is restricted by the ability of the local city streets and parkingareas to absorb the incoming tra�c. No improvements to speed, ow, safety, or other conditions
on the freeway can increase the input ow of tra�c to the city center beyond the absorptioncapability of the terminus.
O�ramps prove to be a similar problem. It is not reasonable to suppose that all o�rampdestinations will always be able to unload their demand. We should recognize that there may be
a parameter such as the maximum absorption rate by local streets per unit mile of automatedfreeway that can be de�ned for various street systems or urban areas.
It is also not reasonable to suppose that there will always be su�cient real estate to buildtemporary storage for whatever queues may accumulate as a result of this. Thus, a thorough
study of the capacity of automated highway systems must incorporate parameters regarding thecapacity of the destination nodes. The fact that queues grow very quickly in reaction to veryfast shockwaves on automated lanes suggests that it may be wise to restrict their use to closed
loops bypassing congested termini that may generate such shocks.
There may be certain types of freeways, or certain possible locations of freeways, which are
better suited for automation than others. One example of such is a ring freeway, or beltway,due to the fact that there is no freeway terminus. Although the o�ramp capacity still needs
to be considered, these types of freeways typically serve areas of cities outside of the mostcongested inner area; hence the local street system and o�ramps typically have greater capability
of absorbing the incoming tra�c.
While this paper delves into the subject of capacities of automated lanes, there is considerably
more detail with which this can, and should, be studied. The main goal of this paper is togenerate an awareness of critical issues and potential pitfalls. Further research should be con-
ducted to de�ne in more detail exactly how the impementation-speci�c parameters of an AHSwill a�ect its capacity. Examples of such parameters include the nature of the freeway (linear,
beltway, etc.), what type of urban area is being served, the design of the entries and exits, theavailability of on- and o�-ramp capacity, etc.

�
�
�
b
p
v
L
L
L
2 CAPACITY ESTIMATION
2 CAPACITY ESTIMATION
2.1 PLATOONING ON THE AUTOMATED LANES
3
Other issues have come to mind while working on this current research, and although an-swers will not be provided here, a quick synopsis of the issues is given solely to activate interest
in them. The question of safety has been addressed to some extent, but there are still gaps in theknowledge, particularly with respect to real-world empirical testing of automated operations un-der high-risk conditions. Also, most theories on the control of automated vehicles are generated
under the assumption that the system is always fully functional. Some researchers have begunto study modes of failure of an AHS, but much more work is needed. Finally, once the conse-
quences of studying automated highway systems with a slightly less optimistic (and probablymore realistic) outlook are fully known, the question of economic viability must be addressed.
These systems represent a huge investment in research, testing, and ultimately, implementation.While one may argue that the �rst two categories are wise undertakings in that they will yield
side bene�ts (e.g. safer cars and better informed drivers), even if an AHS system is never built,the same cannot be said of implementation. In our view, an implementation decision requires
an unbiased awareness of all of the potential bene�ts and disbene�ts of these systems, not justby researchers and practitioners, but also by the general public.
The remainder of this report is dedicated to technical investigations of automated freeways.Section 2 deals with the steady-state capacity of automated highways. The platoon structurewill be investigated thoroughly, including speci�c requirements for merging and diverging tra�c
at exits and entries. The exit maneuver tends to have the greatest impact on the capacity, so itwill be examined in more detail, including the e�ect that limited exit ramp capacity may have
on the capacity of the system. Section 3 investigates how to determine if a particular urban areais a promising candidate for an AHS. Section 4 looks more closely into the issue of storage, an
important function that is widely recognized and observed on existing freeways (i.e. morningtra�c jams), but seems to have been neglected in studies of AHS to date. Finally, Section 5
o�ers some parting comments and insights.
Tra�c ow on the automated lanes is organized in platoons of closely spaced vehicles with alarge spacing between platoons. This tra�c concept is called \platooning". Figure 1 depicts
this concept. The variables that determine the capacity of the automated lane (AL) are:
the intraplatoon distance, or bumper-to-bumper distance between vehicles of the same
platoon, ;
the interplatoon distance, or distance between consecutive platoons, ;
the vehicle length, ;

Lp
Lv
Lb
�
�
�
�
min v b p
min
v b p
p v p
p v
2 CAPACITY ESTIMATION
V
N
S NL N L L ;
N
N=S V
CVN
NL N L L
L � V � ;
� �
4
the vehicle speed, ;
the platoon size, or number of vehicles per platoon, .
Figure 1: Scheme of platooning.
The minimum spacing between lead vehicles in consecutive platoons is then given by:
= + ( 1) + (1)
in units of meters, for example. Because there are vehicles within this spacing, the density of
tra�c is veh/m. If the velocity of the platoons is m/s, the hypothetical \capacity"of one uninterrupted automated lane, in vehicles per hour (veh/hr), is given by:
=3600
+ ( 1) +(2)
The above capacity formula has been used to support automated highways (see for exampleVaraiya, 1994). Very high capacity values are predicted, even with platoons of moderate length.
The increase of capacity is not the only justi�cation for the platooning concept. It is also claimedin the literature that platooning favors safety (e.g. Hitchcock, 1994). This claim is based on the
fact that the relative speed of collision between vehicles reaches a maximum for intermediatevalues of the distance between them, whereas it is small for both short and long distances.Hence, some researchers conclude that in case of a system breakdown, the risk for the drivers is
reduced by platooning.
Moreover, the interplatoon distance is a function of the speed. Godbole and Lygeros (1994)
assume that the interplatoon distance is a linear function of the speed:
= + (3)
where is the �xed minimum interplatoon distance, and is the rate at which this distance
increases with speed, in units of meters per meter per second, or simply, seconds. Such a distancebetween platoons is chosen so that if the preceding platoon applies maximum deceleration to

0
2000
4000
6000
8000
10000
12000
14000
capa
city
(ve
h/h)
0 6 12 18 24 30
N=15
N=10
N=5
speed (m/s)
N=7
N = Platoon Size
� �
L
L
p v
b
v
2 CAPACITY ESTIMATION
2.2 EFFECT OF THE EXIT MANUEVER ON THE CAPACITY
5
come to rest, the following platoon should be able to react without risk of collision. They take= 10 m and = 1 s. Figure 2 shows the capacity-speed curves for di�erent values of the
platoon size, when the interplatoon distance is given by (3), the capacity by (2), and = 1m,= 5 m. These simple calculations show that, in principle, very high ows may be achieved
on automated highways by means of platooning.
Figure 2: Capacity as a function of the speed.
The exit ramps of the automated lanes consist of a given number of exit gates connecting thoselanes to a transition lane placed between the automated and the manual lanes. Since there is no
need for a continuous transition lane, it can be designed to merge with the exit ramp from themanual lanes as shown in Figure 3, where AL and ML stand for automated and manual lanes,
respectively. For safety reasons, there must be a physical barrier between the transition and theautomated lanes which can be crossed only through the exit gates.
Since a safe execution of the exit manuever does not allow di�erent vehicles from the sameplatoon to exit through the same gates (Varaiya, 1994), a platoon should be split upstream ofthe exit gates if the number of exiting vehicles it contains exceeds the number of gates. This is
carried out by the split manuever, which decelerates the leader of the new platoon until it is ata safe distance from the preceding platoon. This process may need to be repeated more than

AL
ML
�
!
�
�
�
p
x
v b p x
x
x
nn N n
2 CAPACITY ESTIMATION
L
L
CVN
NL N L L E L
E L
L
n N
pN
n� �
6
Figure 3: Exit ramp with two exit gates.
once, until there are no more vehicles in any one platoon that desire to use the upcoming exit
than there are exit gates available. Thus, the additional interplatoon distance required by theexit manuever will depend on the number of exiting vehicles and the number of exit gates.
Figure 4 shows the time-space trajectories of several platoons as they pass the exit gates.
The �rst platoon did not have to be split because the number of exiting vehicles did not exceedthe number of exit gates. The second platoon was split and the trailing platoon created in this
manuever was decelerated until a new gap was created of length equal to the interplatoon orsafety distance . If this gap did not already exist in the tra�c stream, a backward-moving
shockwave would travel upstream, until such a point that this transient surge could be absorbed.For calculation of steady-state capacities, this space must be assumed to exist, and must be taken
into account. In the �gure, it has been assumed that the exiting vehicles are those in the rearpositions in the platoons, but this need not be the case. Finally, the exiting vehicles form a
platoon of their own once they pass through the exit gates. This platoon is called a `postplatoon'.
A direct consequence of the split manuever is the capacity reduction caused by the necessity
of accommodating the extra distance, , required by the splits. Thus, the capacity formulagiven by (2) needs to be rede�ned in the following manner:
=3600
+ ( 1) + + [ ](4)
where [ ] denotes expectation. The extra distance, , is a random variable, since the number
of exiting vehicles varies across platoons. Clearly, will depend on the composition of theplatoon; that is, on the destination of its vehicles. If we assume that a vehicle's destination
is not taken into account when granting or denying it access to any particular platoon, thenumber of exiting vehicles will follow a binomial distribution. Namely, the probability of �nding
exiting vehicles in a platoon of vehicles will be:
= (1 )

time
dist
ance
exitgate
Lp Lp
postplatoon
platoonLx
�
�
� �
� � �
� � � �
�
�
hX i
X X X X
X
�
!
2 CAPACITY ESTIMATION
2 3 4
=2
1
=1 =1 =2
0
=2
1
=2
0
3 4 5 6 7 8 2
1 2 2 4 6 81
x N p
N
n
n p p
N
n
n
N
n
n
N
n
n
N
n
n
N
n
nN
x p p
N
N
nn N n
�
E L p p p : : : N p L n p L � L
N� np p n p p n p
� n p N� p N� �
E L p p p p p p : : : L � L
� � p p p p : : :p ; N
p ; N
a b N n
sN
na b
7
Figure 4: Extra interplatoon distance required for the exit manuever.
where is the fraction of the upstream freeway ow desiring to use the exit in question. Withthe previous assumption, one can easily calculate the mean additional distance required for the
exit manuever. If there is only one exit gate,
[ ] = [ + 2 + 3 + + ( 1) ] = ( 1) =
From the mean of the binomial distribution:
= = + ( 1) = 1 + ( 1)
then
= ( 1) = 1 + = 1 + (1 ) (5)
If the exit ramp has two gates, the average exit distance is given by:
[ ] = [( + ) + 2( + ) + 3( + ) + ] =
Then
2 = + + + + +if is even
if is odd
Suppose we de�ne for any real numbers and and positive integers :
=

�
�
�
�
�
X ! X
X ! X�
h i �
h i �
� � �
� �
� � �
�
� �
� � � �
� �
2 CAPACITY ESTIMATION
NN
n
n N nN
n
n N
NN
n
n n N nN
n
nn
N
N
N N N
N
N N
N
N N
p
c
c
=0 =0
0 1 2
=0 0
0 1 2 3
0 1 2
0 2 4 6 81
0 2 41
1 2 0
0
2
0
0
2
a bN
na b s s s s : : : s
b aN
na b s
s s s s : : : s ; N
s s s : : : s ; N
a b b a s s s s s : : :s ; N
s ; N
a � b �
� p p p : : :p ;
p ;� � p
p
�N�
� �
C C
�L
VN
C
�
�
� �
: � :
�
q
q �C
8
Then from the binomial theorem,
( + ) = = = + + + +
In addition,
( ) = ( 1) = ( 1)
=+ + + if is even+ if is odd
Therefore,
1
2( + ) + ( ) = + + + + + +
if is even
if is odd
In particular, if we let = and = 1 - , then we arrive at the following:
1
21 + (1 2 ) = + + + +
if N is even
if N is odd= 2 +
Then, taking advantage of (5) and bearing in mind the expression for , one �nally gets:
=2
3
4+ (1 )
1
4(1 2 ) (6)
It is possible to express the capacity as follows:
1=
1+
3600(7)
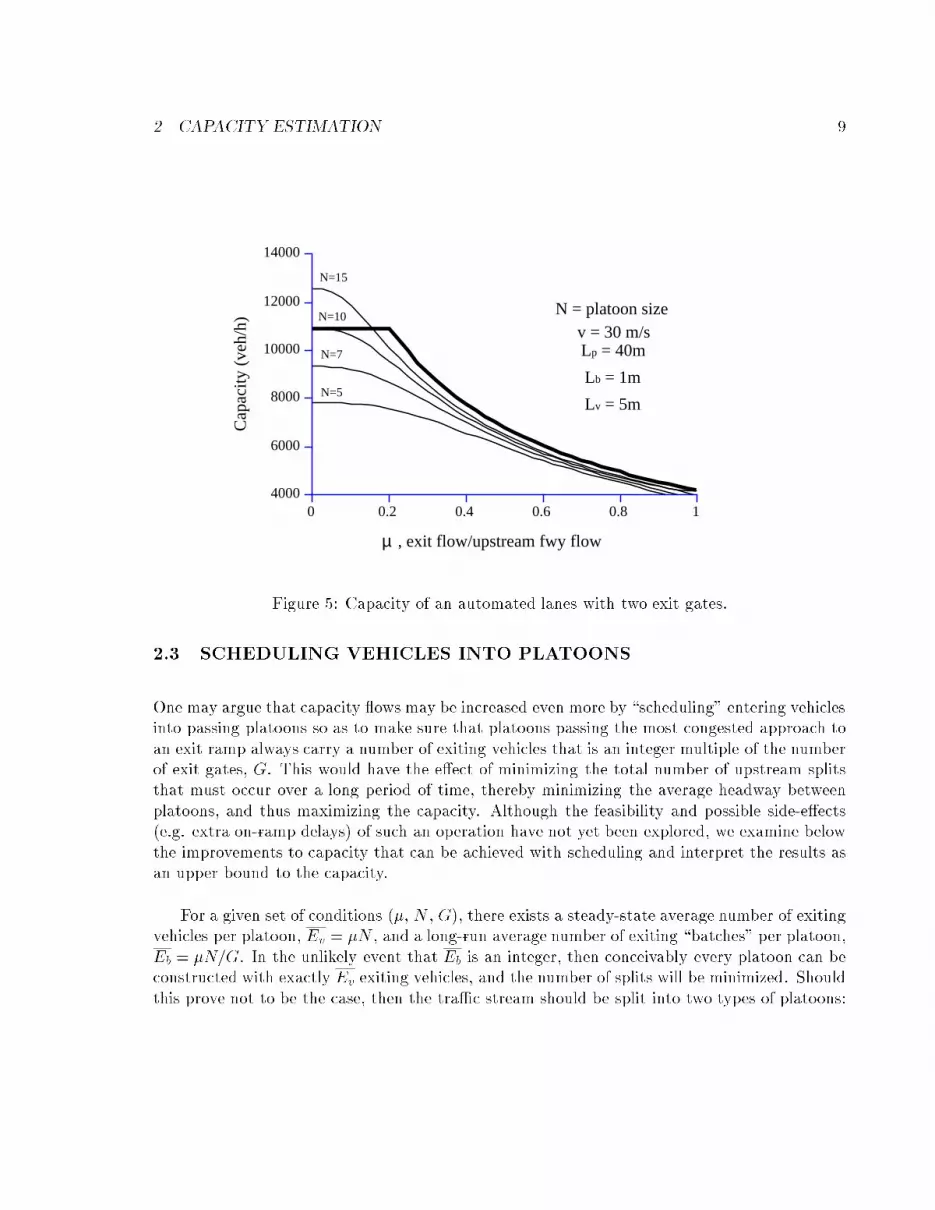
where is the nominal capacity given by (2) if the exit manuever does not demand any extrainterplatoon distance, and is given by (5), (6), or their generalization. Figure 5 depicts the
revised capacity as a function of the exit ow ratio , for di�erent values of the platoon sizeand assuming we have two exit gates. (Ignore for now the heavy line on the �gure; this will be
discussed shortly.) Thus, the capacity has been calculated by substituting for in (7). The�gure shows that very high values of the capacity can be obtained even for moderately high
values of the exit ow ratio. However, in the interval 0 1 0 4, the capacity decreasessigni�cantly with increasing . It should be said, on the other hand, that locations where
automated highways could be bene�cial would likely exhibit a low exit ow ratio (see Section 3).
If the freeway is operating at capacity, then the exit ow, , can be calculated from
=
This mean exit ow has been plotted in Figure 6, for two exit gates. The exit ow at capacity
depends weakly on the platoon size.
4000
6000
8000
10000
12000
14000
0
Cap
acity
(ve
h/h)
0.2 0.4 0.6
N=15
N=10
N=7
N=5
0.8
, exit flow/upstream fwy flow
1
N = platoon sizev = 30 m/sLp = 40m
Lb = 1m
Lv = 5m
µ
v
b b
v
G
� N G
E �N
E �N=G E
E
2 CAPACITY ESTIMATION
2.3 SCHEDULING VEHICLES INTO PLATOONS
9
Figure 5: Capacity of an automated lanes with two exit gates.
One may argue that capacity ows may be increased even more by \scheduling" entering vehiclesinto passing platoons so as to make sure that platoons passing the most congested approach to
an exit ramp always carry a number of exiting vehicles that is an integer multiple of the numberof exit gates, . This would have the e�ect of minimizing the total number of upstream splitsthat must occur over a long period of time, thereby minimizing the average headway between
platoons, and thus maximizing the capacity. Although the feasibility and possible side-e�ects(e.g. extra on-ramp delays) of such an operation have not yet been explored, we examine below
the improvements to capacity that can be achieved with scheduling and interpret the results asan upper bound to the capacity.
For a given set of conditions ( , , ), there exists a steady-state average number of exitingvehicles per platoon, = , and a long-run average number of exiting \batches" per platoon,
= . In the unlikely event that is an integer, then conceivably every platoon can beconstructed with exactly exiting vehicles, and the number of splits will be minimized. Should
this prove not to be the case, then the tra�c stream should be split into two types of platoons:

0
1000
2000
3000
4000
0 0.2
exit
flow
at c
apac
ity(v
eh/h
)
0.4 0.6 0.8
N=15
N=10
N=7
N=5
1
, exit flow/upstream fwy flowµ
N = platoon size
v = 30 m/sLp = 40m
Lb = 1m
Lv = 5m
b bE E
�
�
�
�
�
1 +
+
2
d�e d�e
+1
2
+
+ +
+
! 1
� �
� � � �
b b
b
b b b
Gb b
2 CAPACITY ESTIMATION
l m l m
l m� l m l m � �l m �
8<:
�l m � �l m �
l m l m
E E
f E
M f
MN� GM f E f E GM E f ;
�f E f E ; N�=G
;
Here the notation denotes rounding up to the next integer, while denotes rounding down to the
next integer. Clearly, = + 1.
Since the number of splits is a convex function of the number of exiting cars, the minimum average number
of splits is obtained by an average of the nearest integer neighbors to the (non-integer) average number of exiting
cars.
10
Figure 6: Maximum exit ow from an automated lane with two exit gates.
those carrying exiting batches, and those carrying exiting batches. Again, this
construction has the bene�t of minimizing the total number of platoon splits that needs to takeplace .
Let denote the fraction of platoons carrying exiting batches. In the long run, after
the passage of platoons, must satisfy the following:
= + (1 ) = + 1 (8)
since the number of vehicles wishing to exit must match the actual number exiting. Each platoon
requires one less split than the number of exiting batches it contains, unless the platoon containsno exiting batches, in which case no splits are required. Therefore, the average number of splits
per platoon is:
= 1 + (1 ) 1 if 1
0 otherwise(9)

0
+
2
2
l m
� �
�
�
� �
�
b
b
G
p
p
p
e
m e
p
p m
2 CAPACITY ESTIMATION
2.4 THE EFFECT OF ENTERING VEHICLES
fN�
GE ;
E f
� ;N�
G
� G N
: < N�=G <
�
�
L
L
L
v < v
L v v = a
a
L
L L
11
Rearranging (8) yields
= + 1 (10)
which is simply the fractional part of . Substituting this for in (9) and performing a littlealgebra, we �nd:
= max 0 1 (11)
An upper bound for the capacity is obtained by substituting this expression for the parameter
of (7). The heavy line in Figure 5 depicts this upper bound for the case = 2 and = 10.In this particular case, the upper bound seems to o�er a noticeable improvement in the range0 5 2.
Whether the system can/should be operated by \scheduling" vehicles into platoons is nota critical issue, however, because in the range of where such an operation would make a
di�erence, the capacity obtained without scheduling vehicles is already quite high. We thereforeignore the possibility of scheduling vehicles in what follows. This is reasonable, because the
values of that are likely to arise in scenarios conducive to automated highway systems shouldbe relatively low.
Unfortunately, the e�ect of the entering ows is more signi�cant and should not be ignored. Thisobservation, corroborated by the simulation experiments in Rao et. al. (1993) and Tsao et. al.
(1994), can be understood easily if we recognize that the platoon separation must be greaterthan that which would ensure a safe operation away from the ramps, . Figure 7 displays the
time-space trajectories for the gap in between two platoons into which a new platoon of vehiclesis to merge. We seek the gap width, , which will ensure that the merging vehicles are never
closer than a distance from the platoon they are not joining. (A similar �gure could beconstructed for a system designed to merge vehicles from the front.)
We can ignore the physical dimensions of the merging pre-platoon if it includes the samenumber of vehicles as those which had left the target platoon at the previous exit ramp. This
is reasonable because the tra�c ow is then restored to its level upstream of the \diamondinterchange" (periodic boundary condition).
A vehicle merging at speed , with a margin of safety (head to tail) of � meters will
fall behind the trailing end of the lead platoon by a maximum distance = ( ) 2 + �if the vehicle accelerates uniformly at a rate of m/s . It should be clear from Figure 7 that to
maintain a gap of size between the merging vehicles and the trailing platoon, the interplatoondistance upstream of the \diamond interchange" should be at least + .

time
dist
ance
onramp
Lm
Lp∆
L'p
ve
v
2
i
ii
�
�
� � � �
�
�
e
e
m m e
e
m m
m
2 CAPACITY ESTIMATION
a
v v
v v a
L L v v
a v v
L L
L N
� < : N �
� G
12
Figure 7: Gap necessary to merge new platoon between two existing platoons.
We note that for obvious reasons the design acceleration and the design speed di�erence
( ) should be those which would apply to the most underpowered vehicle allowed to use thesystem, and not to the average. If we take � = 5 m, ( ) = 5 m/s, and = 1 m/s , we �ndthat 17 m; this distance drops to 7 m for ( ) 2 m/s. Of course, a de�nite
choice for these parameters (�, , and ) cannot be made until a better experimentalunderstanding of the merging maneuver has been developed.
It seems reasonable to assume that the interplatoon distance would have to be increased bysomewhere between = 10 m and = 20 m in order to accommodate merges, which would
have a considerable e�ect on capacity. The e�ect can be quanti�ed by application of (7). Forexample, for = 20 m, a 20% reduction in capacity results for the data of Figure 5 if = 10
and 0 2. The fractional reductions are larger for smaller and larger and can approach30%.
Despite the downward corrections it would appear from Figure 5 that an AHS system couldstill pump tra�c on a single lane past a diamond interchange at rates upwards of 8000 veh/hr if
one can keep below 0.2 (for = 2). This is still better than two lanes of conventional freeway,although not as high as initially thought.
In the remainder of this paper we explore two other questions: ( ) where should an AHS be
installed to achieve maximum bene�t, and what would be the nature of said bene�ts? and ( )what are some of the implications of installing an AHS in a less-than-optimal location? Section

�
3 SCENARIOS FOR AHS
3 SCENARIOS FOR AHS
3.1 EXIT RAMP REQUIREMENTS
13
3 shows that AHS diamond interchanges must be widely separated. This increases and as aresult the exit ows of critical o�-ramps must be many times larger than those of conventional
ramps. Careful attention must thus be paid to the interface between the AHS system and theconventional system so as to make sure that the local street system can absorb the exit ows.It is concluded that AHS systems should not discharge tra�c into congested local streets (e.g.
near a Central Business District, CBD) because o�-ramp queues would grow into the AHS withrather undesirable e�ects (see Section 4). A possible AHS application would be to metropolitan
area beltways of wide diameter, as explained in Section 3. Section 4 explores the question ofstorage capacity of an AHS; it shows how by giving up the storage capacity of conventional
freeways, an AHS can �ll up with queues much more quickly, with the distinct possibility thatupstream onramps can become blocked.
In the previous section, it has been demonstrated that, theoretically, very high ows on the orderof 8000 veh/hr may be achieved on an automated lane. For some scenarios, the exit ow thatwould have to be accommodated to avoid mainline queues would also have to be considerably
greater than that typical of a manual lane; e.g. on the order of 2400 veh/hr if the exit owratio is 0.3. However, at a given point of the exit ramp, the control of the vehicle should be
transfered to the driver, meaning that the capacity of the exit ramp from the automated lanewill be the same as that of an exit ramp from a manual lane. Therefore, a capacity restriction
for the AHS may also arise beyond the exit gates from the ultimate necessity of manually drivingthe vehicles. The AHS exits should be designed so as to eliminate this potential bottleneck.
An exit ow of 2400 veh/hr is about three to four times the typical capacity of an exit rampfrom a manual lane. The only possible way to achieve such a high exit capacity is by splitting
the exit ow from the automated lane into several streams and feeding these into di�erent streetsor highways, as shown in Figure 8. The transition from automated to manual driving should be
carried out after the ows have been split. The additional construction cost of the exit rampsmay become an important part of the total cost of the AHS, and this should be recognizedin evaluation. In any case, the necessity of increasing the exit capacity of the automated lane
must be borne in mind when designing the AHS. We also recognize that even if the ramps areproperly designed, one still has to make sure that the local street system can absorb the ow.

AL
ML
0
0
�
�
�
3 SCENARIOS FOR AHS
3.2 ABSORPTION ONTO LOCAL STREETS
f
Q Q < fl l
fl
l
f
l
d
Qd=l
Qd=l
d Qd=l =f Q= fl
d =d Q= fl
14
Figure 8: Exit ramp design for enhanced exit capacity.
Next, we consider a (sub)urban AHS lane, theoretically able to carry the equivalent of fourfreeway lanes, that distributes tra�c to the local streets (e.g. during the morning commute near
a CBD). Clearly, such an AHS lane cannot be expected to achieve what a four-lane freewayis unable to do. In particular, we show below by means of simple calculations that neither a
freeway nor an AHS can alleviate freeway congestion inside urban areas.
A freeway (or AHS lane), located in a region that is able to absorb vehicles per hour per
linear meter of freeway, will be able to carry a ow of veh/hr if , where is the averagelength of a trip. This is a very important condition that bounds the capacity; i.e. there is no
incentive to build a facility that will carry more than vehicles per hour. For example, a 10km beltway for which would be expected to be on the order of 2.5 km, and ringing a CBD with
1 veh/hr-m, cannot serve more than 2500 veh/hr. Flows on the order of 10,000 veh/hr maybe possible on a longer (e.g. 40 km) ring road with longer average trip lengths (e.g. 10 km)but this would require o�-ramps able to serve 1000 veh/hr to be placed approximately every
kilometer.
Appendix A shows that AHS o�-ramps must be spaced at least = 5 km apart and will
have to carry substantial ows (approximately ). These ows can be handled as in Figure 8if is greater than what a single street can absorb. They will have to be spread over a
length = ( ) . The quantity ( ) represents the proportion of local streets that mustbe reached by ramps, and given the geometry of Figure 8, the ratio ( ) gives the
proportion of the AHS lane that must be overlapped by a service lane to handle exits. A similarproportion would be required to handle entries.
�
�
�j
p v b
p
p b v
4.1 JAM DENSITY
4 STORAGE CAPACITY
4 STORAGE CAPACITY
Q= fl << :
Q fl >>
f >> : f
f
l
KN
L NL N L;
L
� L L
N N
15
Thus, in order to save the construction cost of an extra auxiliary lane, we must require:
2 ( ) 1
An AHS lane with = 8000 veh/hr would require 16000 veh/hr. For an average trip
length of 10 km this would require 1 6; e.g. 10, which seems large, even in suburbanareas. (A two-lane o�-ramp ending in a tra�c signal may carry 1500 veh/hr onto an arterial
street; thus 10 means that there would have to be six such streets per kilometer.)
In view of these facts it seems that the best places for AHS are regions where is large
compared with 10 km; i.e. for interurban trips. This suggests strongly that AHS freewayscannot be a solution to the congestion problems in cities. The idea is further reinforced bythe results of the next section, which show that if an AHS lane is placed in a congested urban
location as a substitute for a traditional multi-lane freeway, the AHS is a�ected by congestionin a much less satisfactory way than the traditional freeway.
The previous sections have been devoted to the analysis of the capacity of the automated free-ways. However, nothing has been said about the vehicle storage capacity of such systems. This
term refers to the potential of the automated freeway to accommodate a given number of vehicleswhen the system breaks down; that is, when severe congestion occurs. We are not interested
in studying the possible causes of the onset of congestion but its consequences for the tra�c ow on an automated freeway. For this reason, we believe it is su�cient to focus on the storage
capacity of the system without needing the help of a dynamic model of tra�c ow. We thinkthis is a very important issue that has been surprisingly overlooked.
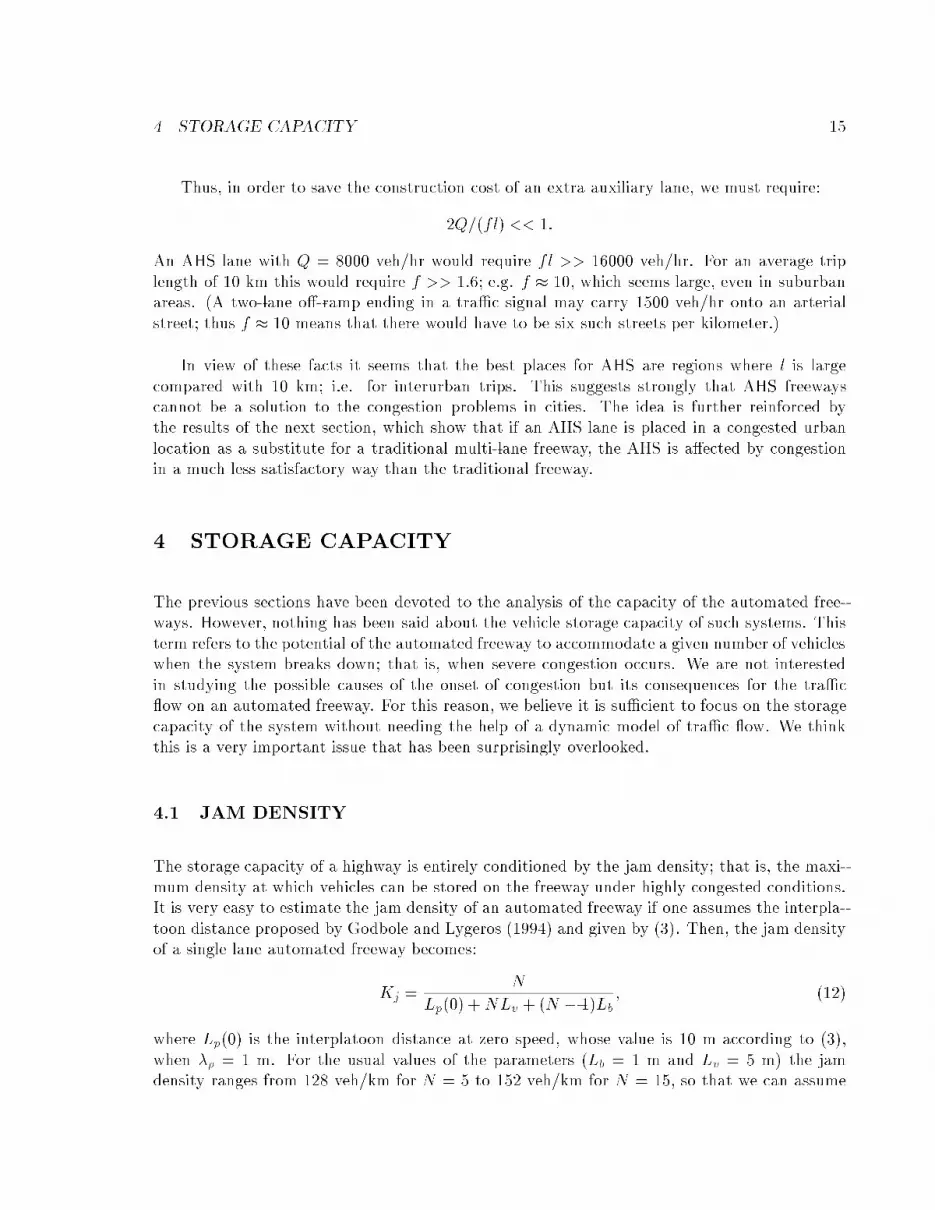
The storage capacity of a highway is entirely conditioned by the jam density; that is, the maxi-
mum density at which vehicles can be stored on the freeway under highly congested conditions.It is very easy to estimate the jam density of an automated freeway if one assumes the interpla-
toon distance proposed by Godbole and Lygeros (1994) and given by (3). Then, the jam densityof a single lane automated freeway becomes:
=(0) + + ( 1)
(12)
where (0) is the interplatoon distance at zero speed, whose value is 10 m according to (3),
when = 1 m. For the usual values of the parameters ( = 1 m and = 5 m) the jamdensity ranges from 128 veh/km for = 5 to 152 veh/km for = 15, so that we can assume

p
2
3
4
3
4
C
C
q k v
N L
k : ; :
4.2 SHOCK WAVES
4 STORAGE CAPACITY
Another meaningful comparison would be that of a newly built AHS lane vs. an equivalent 4-lane conventional
freeway.
The storage losses are more severe when one compares the AHS with a conventional freeway of the same
capacity. Obviously, the storage is cut by a factor of 4 in this case.
16
an average value of 140 veh/km. This value is of the same order as the jam density for aconventional freeway lane. In principle, it seems that the conversion of some of the lanes in a
conventional freeway to AHS useage would not make any di�erence in the ability of the facilityto store queued vehicles . However, this is incorrect for two reasons.
The �rst reason is the possible need of converting one or more of the original lanes into atransition lane. Although some of the arrangements proposed for automated freeways do notrequire a continuous transition lane, we believe that for urban freeways where o�- and on-ramps
have to be closely spaced, the transition sections will occupy a signi�cant length of the freeway.This will lead to the almost complete utilization of one of the original lanes. The resulting loss
of storage capacity has to be considered in the �nal design .
The second reason is the increase in capacity achieved by the automated freeway itself.
Obviously, this improvement should lead to much higher tra�c ows. Accordingly, if for somereason the tra�c ow collapses, the number of vehicles to store per unit time will be much
greater than that of a conventional lane. In other words, the resulting queue will grow muchmore rapidly and will become much longer. Figure 9 illustrates the e�ect of an incident of a
given duration for a four-lane freeway, assumed �rst to be a conventional freeway, and secondto have acquired automated vehicle capability. Both systems are assumed to be at capacity.
Before the construction of the automated lane, each lane carried a tra�c ow of veh/hr, soan incident of a given duration would create a queue of given length (shown for illustrationpurposes as three vehicles; the actual length is dependent on the actual duration of the incident
and other parameters). The automated lane can carry 4 veh/hr, meaning that the capacityof the freeway as a whole increases by 50%. In this condition, an incident creates a queue four
times longer on the automated lanes than on the manual lanes.
The reader familiar with tra�c engineering analysis will recognize the situation if s/he plots
the ow-versus-density (e.g. ( )) curve for the AHS lane and some typical data; e.g. = 30m/s, = 10, = 40 m, etc. See Figure 10 for an example of such a curve. While the exact
shape of the curve is not known, we know it must pass through the points 'O', 'C', and 'J'. Theslope of the dashed line connecting states 'C' and 'J' in the �gure is the velocity of growth of
the queue (also called the shockwave speed), which is on the order of -34 m/s, approximatelythe same magnitude as the prevailing tra�c speed. Although not shown in this �gure, similar
velocities will occur for transitions between any two queued states (i.e. with densities in therange (0 07 0 14) veh/m). Although the passage of such a fast shockwave should pose no
problem for a properly functioning AHS (it essentially requires a reaction time of at most one

BEFORE
AFTER
transition lane
2.4
0.07 0.14
capacity state, C
jam state, J
Flow (q)veh/s
Density (k)veh/m
30 m/s -34 m/s
O
4 STORAGE CAPACITY 17
Figure 9: E�ect of an incident before and after AHS implementation.
second from one platoon to the next) the same cannot be said if one or more of the a�ectedplatoons are experiencing internal communications problems.
Figure 10: Flow-versus-density curve for a typical automated highway lane.
Another point worth noting is that it would take as little as three minutes for a queue to
travel the 5 km distance between adjoining diamond interchanges, and that (in order to avoidgridlock e�ects; see Daganzo, 1995, for a discussion) it may be necessary to close many of
the on-ramps upstream of the bottleneck causing the queue, which would transfer much of thevehicle storage to the local street system. This illustrates the severe systemwide consequences
5 CONCLUSIONS AND FUTURE RESEARCH
5 CONCLUSIONS AND FUTURE RESEARCH 18
of local disturbances in an AHS. Further research into dynamic ramp control strategies to avoid,manage, and recover from disturbances should be given some priority.
This research has shown that estimates of AHS capacity that prevail in the existing literature areoptimistic, and are likely being used in comparison with understood capacities of conventional
freeways in an invalid manner. The entry and exit maneuvers have a distinct e�ect on steady-state capacity; however the AHS system still shows promise when compared to existing facilities,
particularly when a system for judiciously scheduling vehicles into platoons according to theirdestinations is considered.
A more troublesome capacity constraint exists at the interface with the local street system.This constraint is what causes a large proportion of existing congestion on conventional freeway
systems; improving the freeway system itself does nothing to solve the congestion problem.Existing conventional freeways have the ability to store many vehicles in queues during the rush
periods. While these queues are certainly frustrating to drivers, this is nonetheless an importantfunction of freeways, as these queues would be stored all over the local street system otherwise.Because of the reduction in e�ective lane-mileage available for storage under AHS, this critical
function of the freeways will be impaired.
Because of the above (and perhaps other) reasons, there may only be certain \boutique"
locations for which AHS implementation is a realistic solution to a congestion problem. Oneshould certainly avoid constructing AHS systems where downstream termini would be likely to
\back up" onto the AHS. Therefore, closed loop systems such as circumferential ring roads seemlikely candidates for this type of technology. There are very long freeways (such as Interstate 5
through the western United States) where no such termini exist (at least in rural areas); howeverthese freeways are rarely congested, so the bene�ts of AHS improvements would be slight.
The results presented in this paper are mainly intended to provide insights into some of theimportant issues surrounding automated highway systems and their implementation. Some of
the analysis could, and should, bene�t from a better understanding of the precise mechanismsand algorithms planned for an AHS. In addition, the results should be extended to include morecircumstances under which an AHS may operate, including a consideration of economic factors
and other possible designs.
Because this work is part of a greater research e�ort towards analyzing hybrid freeway
systems, there are other issues which have been identi�ed, but for which signi�cant results havenot yet been published. A brief description of some of the most important issues follows.

5 CONCLUSIONS AND FUTURE RESEARCH 19
Little research work has been published pertaining to the likely operation of an AHS underfaulty conditions, in which at least one vehicle ceases to function as expected. History is ripe
with examples of serious accidents as a result of supposedly foolproof technology gone awry,and there is no reason to think this phenomenon will not repeat itself with an AHS. A carefulunderstanding needs to be developed of the possible ways in which an AHS could fail, the
possible ways in which this failure could be detected, the possible ways in which the failurecould be mitigated, and the likely damages should this process fail.
We are aware that the current technology makes it possible to handle huge amounts ofinformation with extraordinary reliability. However, we are specially concerned about a problem
that has not been addressed in any previous work: the necessity of checking the condition of theautomated vehicles prior to their admission to the AHS. What the system cannot guarantee is
the absence of any mechanical or electrical failures of vehicles in platoons. Such failures mightlead to disasterous results under extreme (but not unexpected) operating conditions, such as
deceleration under the in uence of a shockwave.
One could imagine an implementation of an AHS where prior to admission to the automated
lanes, vehicles are required to pass a safety inspection station, to ensure that their steering, tires,brakes, etc. are all in working order, that the vehicle has su�cient fuel to reach its destination,
and so on. It may be possible to combine the functions of this safety inspection station with the\scheduling" system described in Section 2.3.
While simulation is a valid and (relatively) inexpensive method for testing potential AHS
situations, it is simply not capable of representing all possible conditions, particularly thosewhere very unlikely and dangerous incidents may occur. For this type of research, there is no
substitute for real-life empirical data. Of course, this data is expensive to gather, for determiningthe results of a collision (for example) requires that a collision be generated, and costly equipment
damaged in the process. This cost should pale in comparison, however, to the cost (bothmonetary and otherwise) of implementing a system whose behavior under adverse conditions is
not fully understood.
Finally, it is suspected that due to some of the reasons described above, and possibly others,
that the full costs of AHS have not yet been accurately predicted. There are also constraintson their implementation that have not yet been fully considered. These facts combined present
the need for a thorough economic study of the viability of these systems. The gains in capacitysuggested by an AHS may or may not justify its pursuit as a solution to problems of congestion.

6 REFERENCES
6 REFERENCES
Precursor Systems Analysis of Automated Highway Systems
Longitudinal Control of the Lead Car of a Platoon.
Investigations into Achievable Capacities and Stream
Stability with Coordinated Intelligent Vehicles.
Capacity of Automated Highway Systems: E�ect
of Platooning and Barriers.
Methods of Analysis of IVHS Safety.
The Nature of Freeway Gridlock and How to Prevent It.
20
Varaiya P. (1994) Dept. Electrical
Engineering and Computer Sciences, UC Berkeley and PATH.
Godbole D. N. and Lygeros J. (1994) IEEE
Transactions on Vehicular Technology, 43, 1125{1135.
Rao B.S.Y., Varaiya P. and Eska� F. (1993)
Transportation Research Record, 1048, 27{35.
Tsao H.S., Hall R.W. and Hongola B. (1994)
PATH Research Paper, 93-26.
Hitchcock A. (1994) PATH Research Report UCB-ITS-PPR-92-14, Institute of Transportation Studies, University of California, Berkeley.
Daganzo C.F. (1995) Research ReportUCB-ITS-RR-95-1, Institute of Transportation Studies, University of California, Berkeley.

AL
ML
150150
150 450 150 150 150 250X
TL
2
2
2
0
0 0
0
0
�
�
�
�
�
A OFF-RAMP SPACING
A OFF-RAMP SPACING
X
X X
v v v
a
sv v v v
a;
sv v
a
s v v
a : s X
21
This section is concerned with estimating the distance between o�-ramps. Figure 11 shows a
possible arrangement of the exit and entry ramps on an AHS. The distances are expressed inmeters. The abbreviations AL, TL, and ML stand for automated lane, transition lane, and
manual lane, respectively. The exit ramp should have a dedicated lane so that the exit ow doesnot interfere with the ow on the manual lanes. The entry to the automated lanes could bedone from the manual lanes to avoid the cost of an elevated structure. However, this may cause
a capacity reduction on the manual lanes due to the weaving ow. Varaiya (1994) suggests forsafety reasons a gate length and an intergate distance of 150 m. The distance between the last
entry gate to the AL and the entry gate from the TL to the ML should be about 250 m. This issu�cient to stop a vehicle with an initial velocity of 30 m/s and a constant deceleration of 2 m/s .
Such a braking distance is actually 225 m. On the transition from the ML to the AL, vehiclesmay be forced to come to rest before entering the AL. Thus, a distance of 2 225 = 450 m will
be required from the entry to the TL to that of the AL. This distance, denoted on Figure 11with an , is required to accommodate the grade required by the elevated structure of the exit
ramp. We can set 150 m. Then it is easy to see that the distance of 450+ meters allowsfor the regrouping of the platoon on the AL to �ll the gaps created by the exiting vehicles. Thisjoin manuever may be carried out by accelerating from to and decelerating back to the
vehicles upstream of the gaps with a constant acceleration and deceleration, . Then, the spacerequired by the manuever would be:
=( + )( )
whereas the distance travelled by those vehicles relative to the vehicles dowstream of the gaps
would be:
� =( )
Since � = 2 6 m is the gap left by two exiting vehicles, and taking = 32 m/s, = 30 m/s,we get = 0 33 m/s and = 372 m, considerably less than 450 + meters.
Figure 11: Exit and entry ramps of the automated lanes.

� > :
A OFF-RAMP SPACING 22
In conclusion, it seems that a realistic design of the exit and entry ramps with two gateswould require about 1800 m. Hence, it does not seem reasonable to locate ramps at distances
less than 3 km; then the mininum total length of each automated freeway section should beabout 5 km. A 50 km long beltway could accommodate up to ten sections, and the average triplength measured in number of ramps would be less than 5, which implies 0 2. Thus, even
in such a long beltway, the exit ow percentage would be rather high.


