Embed Size (px)
Citation preview
Diagnosis of meningioma by time-resolved fluorescencespectroscopy
Pramod V. Butte,University of Southern California, Department of Biomedical Engineering, Los Angeles, California90089 and Cedars-Sinai Medical Center, Biophotonic Research and Technology Development, LosAngeles, California 90048
Brian K. Pikul,Cedars-Sinai Medical Center, Maxine-Dunitz Neurosurgical Institute, Los Angeles, California 90048
Aviv Hever,Cedars-Sinai Medical Center, Department of Pathology, Los Angeles, California 90048
William H. Yong,Cedars-Sinai Medical Center, Department of Pathology, Los Angeles, California 90048 andUniversity of California at Los Angeles, David Geffen School of Medicine, Los Angeles, California90095
Keith L. Black, andCedars-Sinai Medical Center, Maxine-Dunitz Neurosurgical Institute, Los Angeles, California 90048
Laura MarcuCedars-Sinai Medical Center, Biophotonics Research and Technology Development, Los Angeles,California 90048
AbstractWe investigate the use of time-resolved laser-induced fluorescence spectroscopy (TR-LIFS) as anadjunctive tool for the intraoperative rapid evaluation of tumor specimens and delineation of tumorfrom surrounding normal tissue. Tissue autofluorescence is induced with a pulsed nitrogen laser (337nm, 1.2 ns) and the intensity decay profiles are recorded in the 370 to 500 nm spectral range with afast digitizer (0.2 ns resolution). Experiments are conducted on excised specimens (meningioma,dura mater, cerebral cortex) from 26 patients (97 sites). Spectral intensities and time-dependentparameters derived from the time-resolved spectra of each site are used for tissue characterization.A linear discriminant analysis algorithm is used for tissue classification. Our results reveal thatmeningioma is characterized by unique fluorescence characteristics that enable discrimination oftumor from normal tissue with high sensitivity (>89%) and specificity (100%). The accuracy ofclassification is found to increase (92.8% cases in the training set and 91.8% in the cross-validatedset correctly classified) when parameters from both the spectral and the time domain are used fordiscrimination. Our findings establish the feasibility of using TR-LIFS as a tool for the identificationof meningiomas and enables further development of real-time diagnostic tools for analyzing surgicaltissue specimens of meningioma or other brain tumors.
Keywordsmeningioma; fluorescence spectroscopy; optical diagnostic; brain tumor diagnostic
Address all correspondence to Laura Marcu, University of California at Davis, Department of Biomedical Engineering, Davis, California95616. [email protected].
NIH Public AccessAuthor ManuscriptJ Biomed Opt. Author manuscript; available in PMC 2010 November 15.
Published in final edited form as:J Biomed Opt. 2005 ; 10(6): 064026. doi:10.1117/1.2141624.
NIH
-PA Author Manuscript
NIH
-PA Author Manuscript
NIH
-PA Author Manuscript
1 IntroductionMeningiomas are slow growing lesions accounting for 15 to 20% of primary brain tumors.Surgical resection is the mainstay of treatment for meningiomas causing symptoms.1–3 Theextent of tumor resection directly correlates with prevention of recurrence. Intraoperativebiopsy specimens are routinely removed by the neurosurgeon from the main tumor mass andpossibly one to several dural margins. Neuropathologic evaluation for rapid intraoperativepreliminary diagnosis is often requested. The standard intraoperative tissue specimenneuropathologic evaluation has been the “frozen section.” This process of freezing the tissue,slicing the frozen specimen with a microtome, and staining/analysis can, at a minimum, take15 to 25 min. Multiple intraoperative “frozen section” specimen requests can lead to lengthyincreases in operative time, as well as a taxing increase in workload for the surgical pathologist.Certain intracranial characteristics of meningiomas, moreover, can increase the difficulty ofachieving a complete surgical resection. The “en plaque” variety and petroclival location ofmeningiomas are examples of meningiomas that often present difficulty in excising durainvolved with tumor. In addition, some meningiomas can invade the subjacent brainparenchyma, usually the cerebral cortex. Although conventional imaging techniques such asmagnetic resonance imaging (MRI) and computed tomography (CT) can guide the surgery,each tumor's intraoperative appearance dictates the ease with which a surgeon will accomplishcomplete tumor excision. Adjunctive instrumentation may provide additional benefit inachieving the goal of complete tumor resection. Time-resolved laser-induced fluorescencespectroscopy (TR-LIFS) represents a promising technique for identifying tumor in real timeand may become an intraoperative adjunct for neuropathologic analysis and completeness ofsurgical tumor resections.
Laser-induced fluorescence spectroscopy (LIFS) is a useful tool for characterization ofbiological tissues and offers potential for in vivo diagnosis of diseased tissues and theoptimization of therapeutic interventions.4 The presence of intrinsic fluorophores such asamino acids (tyrosine, tryptophan), structural proteins (elastin, collagen), and enzyme cofactors(nicotinamide adenine dinucleotide, flavins) in human tissue offer the potential to probebiochemical, morphological, and physiological changes occurring in diseased tissues. Thevarious alterations of these tissue fluorophores can be correlated by analyzing the changes ofthe relative contribution of each fluorescent constituent to the overall fluorescence emission.Either steady state4-7 or time-resolved8,9 fluorescence spectroscopy techniques can be used tomeasure or monitor these changes. Time-resolved measurement resolves fluorescence intensitydecay in terms of lifetimes, and thus provides additional information than is available from thesteady state measurement.10,11
Earlier work has demonstrated that LIFS of endogenous fluorophores (autofluorescence) canbe used as a tool for diagnosis of neoplasms.4,12–14 Several types of brain tumors have beeninvestigated, both in vivo and ex vivo, using this technique. These include studies ofglioblastoma4,6,7,9,13 astrocytoma,6 oligodendroglioma,6 and metastatic carcinoma.6 Forexample, combining fluorescence (excitation 337 nm) with diffuse reflectance spectroscopyat multiple excitation wavelengths6 or using microspectrofluorometric measurements at a fewexcitation wavelengths,13 it has been shown that brain tumors can be distinguished from normalbrain tissue with good sensitivity and specificity. Our group has also reported results on thetime-resolved fluorescence of glioblastoma.9,15 However, to the best of our knowledge, nostudy has investigated the fluorescence emission of meningiomas and the potential offluorescence spectroscopy for discrimination of meningiomas from the surrounding normaltissue.
Butte et al. Page 2
J Biomed Opt. Author manuscript; available in PMC 2010 November 15.
NIH
-PA Author Manuscript
NIH
-PA Author Manuscript
NIH
-PA Author Manuscript
In this study, we investigated the use of TR-LIFS technique as a diagnostic tool forintraoperative evaluation of meningioma tumor specimens (ex vivo) and delineation of tumorfrom surrounding normal tissue. Using an instrumental apparatus that enables simultaneousrecording of both time-integrated (spectra) and time-resolved fluorescence, this study intendsto (1) determine the spectrum- and time-dependent autofluorescence emission characteristicsof human samples of meningioma, dura mater, and normal cortex using an ultraviolet laser(337 nm) as an excitation light source; (2) identify the main autofluorescence features thatprovide means of discrimination between tumor and surrounding normal tissue; and (3)determine the effectiveness of the fluorescence spectroscopy for recognition of the diseasedtissue.
2 Methods2.1 Samples
The study was conducted on tissue specimens from patients undergoing brain tumor surgeryand histopathologically diagnosed as meningioma (total of 22 patients with various types ofmeningiomas: 8 transitional, 11 meningothelial, 1 psammo-matous, 2 microcystic) andadjacent normal dura (4 patients). Samples of normal gray matter were obtained from 4 patientsundergoing surgery for en-bloc resection of glioma brain tumor underlying cortex. The studywas carried out with approval of the Cedars-Sinai Institutional Review Board. After excision,the specimens were kept in a sealed container and transported from the operating room to thespectroscopy laboratory. The spectroscopic investigations were performed within 30 to 120min after excision. During the experimental procedure the samples were kept in a glass petridish and soaked using 1 to 2 drops of saline to avoid drying of the tissue. Multiple distinct sites(total: 97) on the tissue were selected for spectroscopic investigation. After the completion ofthe spectroscopic procedure, the selected sites were marked using a dye and fixed in 10%buffered formalin, and then sent for histopathological studies. From each sample, transverselyoriented sections (4 mm thick) were then cut from the marked areas. The tissues were embeddedin paraffin and stained with hematoxylin-eosin (H&E). The histological sections wereevaluated by light microscopy.
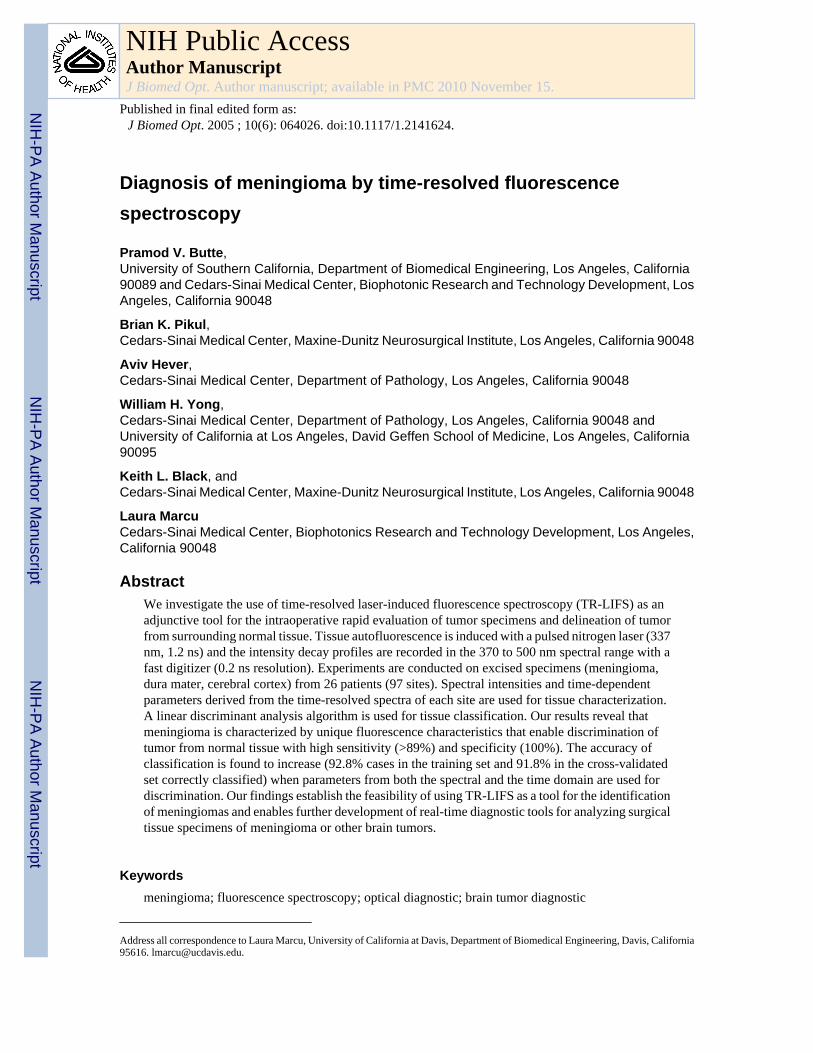
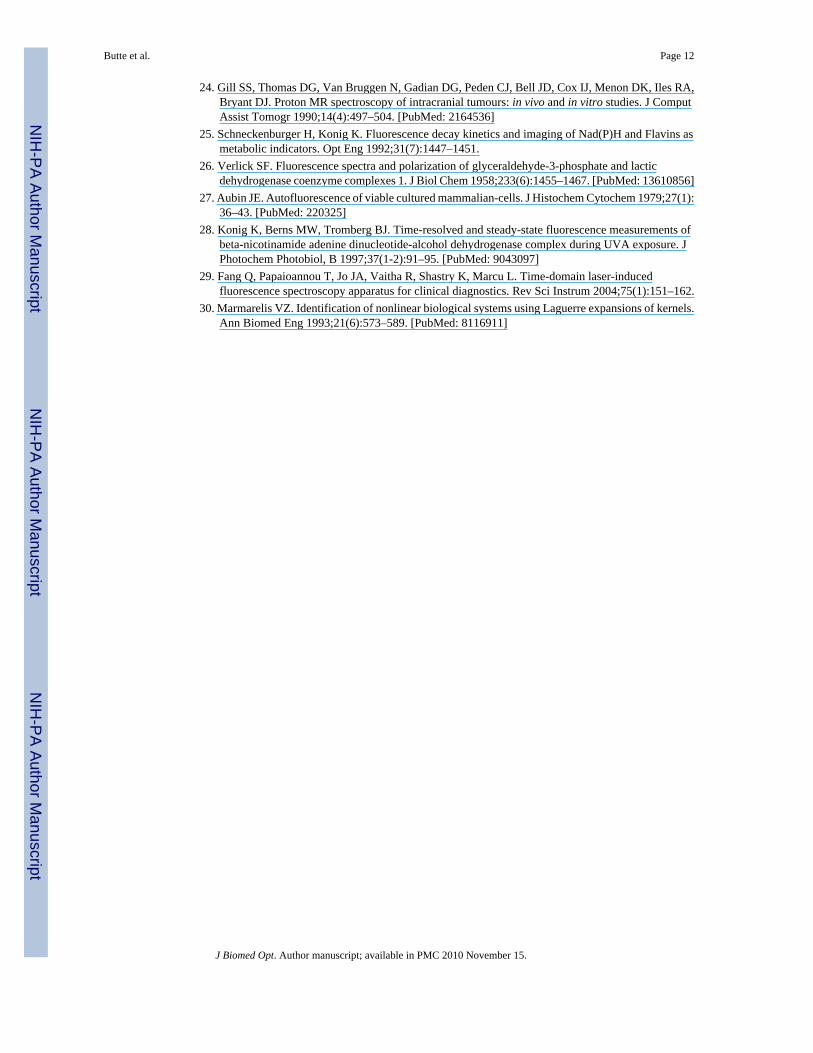
2.2 InstrumentationThe tissue samples were spectroscopically investigated with a prototype time-domain TR-LIFSapparatus (Fig. 1) similar to that used in previous studies.8,9 A pulsed nitrogen laser (EG&G,model 2100; 337 nm, 1.2 ns, 10 Hz) was used as excitation light source. The output of the lightsource was delivered to the tissue by a custom-made bifurcated probe, which consists of acentral excitation fiber (600 μm, numerical aperture 0.11) surrounded by a collection ring of14 fibers (200 μm, numerical aperture 0.22). The collection fibers are beveled at a 10° anglein order to improve light excitation-collection overlap for small tissue to probe distances.16
The pulse width measured at the tip of the fiber was 2.0 ns full width at half maximum. Thecollected fluorescence emission was focused into a scanning monochromator (ORIEL, model77200) using an F# matcher (ORIEL, model 77529), and detected by a gated multichannelplate photomultiplier tube (MCP-PMT; Hamamatsu, model R2024U, rise time: 0.3 ns) placedat the monochromator exit slit. The photomultiplier tube was gated using a high voltage gate(EG&G, ORTEC; 1 GHz). The photomultiplier output and the entire fluorescent pulse from asingle excitation laser pulse was directed to a digital oscilloscope (Tektronics, model TDS680C, sampling frequency: 5 Gsamples/s, bandwidth: 1 GHz) through a fast 1-GHzpreamplifier (EG&G, ORTEC model 9306). The gating of the PMT was achieved using anoptical switch triggered by laser pulse. To eliminate the scattering of the reflected excitationlaser by the sample, a 360-nm long-pass filter was placed at the entrance slit of themonochromator and a 345-nm long-pass filter was placed in front of the PMT. A personal
Butte et al. Page 3
J Biomed Opt. Author manuscript; available in PMC 2010 November 15.
NIH
-PA Author Manuscript
NIH
-PA Author Manuscript
NIH
-PA Author Manuscript
computer was used to control data acquisition, data transfer from oscilloscope, andmonochromator wavelength scanning.
2.3 Experimental ProcedureThe fiber optic probe was placed 3 mm above the tissue specimen to optimize the probe lightcollection efficiency, as previously reported.16 Time-resolved emission of each sample wasrecorded in the 370 to 500 nm spectral range and scanned at 5 nm intervals. Five consecutivemeasurements of the fluorescence pulse emission at 390 and 460 nm are performed to assessthe reproducibility of the fluorescence lifetime measurement. The energy output of the laser(at the tip of the fiber) for sample excitation was adjusted to 3.0 μJ/pulse.
2.4 Data Analysis2.4.1 Spectroscopic data processing—The conventional spectral emission or time-integrated fluorescence spectrum was computed from the measured fluorescence pulses byintegrating each pulse as a function of time for each investigated wavelength. The constructedfluorescence spectra was corrected for background noise and nonuniform instrumental systemresponse, and then normalized by dividing the fluorescence intensity at each emissionwavelength by the peak fluorescence intensity. The reconstructed spectrum was characterizedby discrete intensity values (Iλ) that describe the variation of fluorescence intensity as a functionof wavelength.
The time-resolved fluorescence spectrum or the fluorescence impulse response function (FIRF)was constructed by numerical deconvolution of the measured laser pulse from the measuredfluorescence pulse at each wavelength across the spectrum. The deconvolution was based onthe Laguerre expansion of kernels technique,8,17 using five Laguerre functions. Deconvolutionbased on this technique separates the computation of the FIRF from the modeling of thefluorescent system, and therefore facilitates an unconstrained interpretation of time-resolveddata from tissue. The dynamic of the fluorescence decay was characterized by two time-dependent parameters: the average lifetime τλ, estimated as the interpolated time at which theFIRF decays to 1/e of its maximum value, and the time-decay to 10%, τλ:10%, estimated as theinterpolated time at which the FIRF decays to 10% of the maximum value. All computationswere performed using the software package MATLAB® (Mathworks Inc.).
2.4.2 Statistical analysis—To compare the different tissue types based on theirfluorescence emission characteristics multiple spectroscopic parameters were derived from theresults: the ratio between the various fluorescence intensities (I440/I370, I450/I370, I460/I370,I470/I370, I480/I370, I390/I440, I460/I390), the time-dependent parameters near the peak observedat 390 nm (τ370, τ380, τ390, τ370:10, τ380:10, τ390:10), and the time-dependent parameters nearthe peak observed at 460 nm (τ460:10, τ 470:10, τ480:10). Statistical analysis was based on one-way analysis of variance (ANOVA) applied to these spectroscopic parameters. The level ofsignificance used was (P<0.05).
2.4.3 Classification—A stepwise linear discriminant analysis was employed to determinethe combination of predictor variables that accounts for most of the differences in the averageprofiles of the three tissue groups (meningioma, normal dura, and normal cortex), and togenerate a classification model (discriminant functions) for samples classification. Thediscriminant function analysis not only provides an effective means for classifyingspectroscopic data of unknown origin, but also is appropriate when the number of samples issmall. 18 The spectral intensities used as input for the discriminant analysis were chosen basedon the observed emission peaks at 390 and 460 nm of wavelength. To account for the breadthof emission, the intensity values around peak emission were also selected. This includesintensity values at 370 and 380 nm; and intensity values at 440, 450, 470, and 480 nm,
Butte et al. Page 4
J Biomed Opt. Author manuscript; available in PMC 2010 November 15.
NIH
-PA Author Manuscript
NIH
-PA Author Manuscript
NIH
-PA Author Manuscript
respectively. The second consideration while deriving the parameters from the spectra wasgiven to the fact that emission spectrum was normalized to the highest peak emission value.While the peak emission of meningioma and normal dura matter was at 390 nm, the peakemission of normal cortex was found at about 460 nm. This is likely to introduce errors whencomparing spectra normalized with two different values. To avoid such errors caused bydistinct normalization values and to compare the shapes of the spectrum independent ofnormalization values, we chose as parameters the ratios between normalized intensity atwavelengths close to peak emission and wavelengths at the two ends of the measured spectrum(Iλ/I370 and Iλ/I500). Another set of parameters derived from the spectral data were the intensityratios between the two observed peaks at 390 and 460 nm of wavelengths. Using the precedingcriterion, the spectral parameters chosen were as follows: I440/I370, I450/ I370, I460/ I370, I470/I370, I480/ I370, I390/ I370, I390/ I440, I390/ I460, I380/ I500, I390/ I500, I440/ I500, I450/ I500, I460/I500, I470/ I500, and I480/ I500 Temporal parameters used for the discriminant function analysiswere also selected from the wavelengths mentioned: τ370, τ380, τ390, τ440, τ460, τ480, τ450,τ 470, τ 500, τ 370:10%, τ 380:10%, τ 390:10%, τ 440:10%, τ 480:10%, τ 460:10%, τ 450:10%, τ 470:10%,and τ 500:10%.
The discriminant functions and classification accuracy were determined for three cases: (1)predictor variables selected from only spectral features, (2) predictor variables selected fromonly temporal features, and (3) predictor variables selected from both spectral and time-resolved features. The linear discriminant functions are a linear combination of the independentvariables (features), so that the function coefficients perform a linear transformation from theoriginal feature space into an optimal (lower-dimensional) space that provides maximumdiscrimination. A “leave-one-out” method was used to create the test/training set. This methodemploys all sets of spectroscopic data except one, as the training set, and then the excluded setis used as the test set.18 The process is repeated until all data sets are tested. Thus, the left outdata set is not a subset of the training set. This approach avoids splitting the available sampleset into training and test sets, while maintaining independence between them. The procedureutilizes all available samples more efficiently, and produces a conservative error estimate. Theclassification accuracy was determined by computing the specificity and sensitivity as follows:sensitivity=true positive predictions/ total positive cases; specificity=true negative predictions/total negative cases. The overall classification accuracy = total number of samples correctlyclassified/total number of samples. Linear discriminant analysis was performed with thesoftware package SPSS® (SPSS Inc.).
3 Results3.1 Histology
Tumors were classified using the World Health Organization (WHO) criteria.19 Of the total of97 sites that underwent spectroscopic analysis, 75 were histologically classified as a low-grademeningioma (WHO grade I), 17 as normal dura, and 5 as normal cortex. Most meningiomas,regardless of subtype, demonstrate some fibrous tissue component whether fibrosis, entrappeddura, or fibroblast-like meningioma tumor cells. The extent of extracellular fibrosis or sclerosisranged from approximately 5% of visualized surface area to approximately 80%. Mostmeningiomas had a few psammoma bodies focally. A few cases had no psammoma bodies.Two cases demonstrated numerous psammoma bodies. Normal dura samples demonstratedense fibrous tissue without evidence of tumor. The brain tissue demonstrates layered neuronsindicative of cerebral cortex also without evidence of tumor.
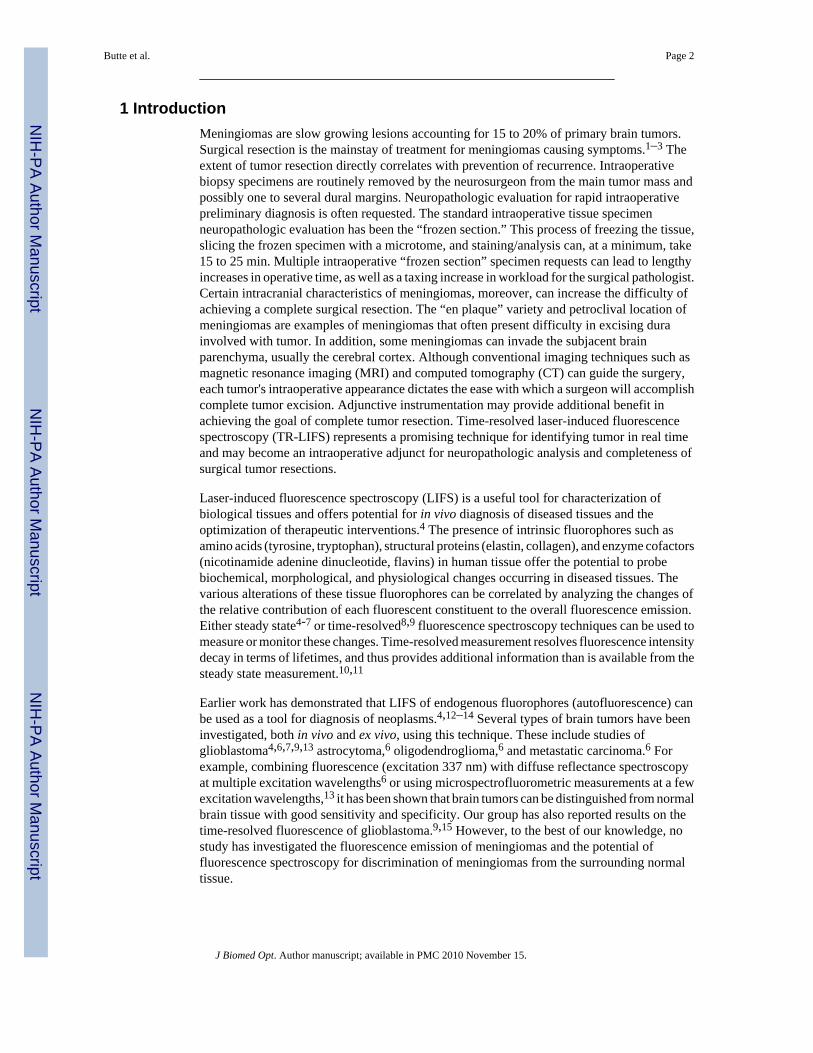
3.2 Time-Integrated and Time-Resolved Fluorescence3.2.1 Meningioma—The time-resolved fluorescence emission of meningioma samplesshowed a relatively narrow broadband emission characterized by a well-defined peak at a 385-
Butte et al. Page 5
J Biomed Opt. Author manuscript; available in PMC 2010 November 15.
NIH
-PA Author Manuscript
NIH
-PA Author Manuscript
NIH
-PA Author Manuscript
to 390-nm wavelength [Figs. 2(a) and 3] lasting for more than 15 ns. The fluorescence intensitydecay [Figs. 4(a) and 4(b)] was found wavelength-dependent with longer time-decay valuesin the region of peak fluorescence (τ390=2.04±0.72 ns; τ390:10%=8.0±1.84 ns) when comparedwith the red-shifted wavelengths (τ460=1.2±0.46 ns; τ460:10%= 5.1±1.8 ns).
3.2.2 Dura mater—Typical time-resolved emission spectrum of dura mater is depicted inFig. 2(b). The emission spectrum (Fig. 3) was characterized by a broad wavelength band withtwo peaks emission. The main peak is centered at about 385 to 390 nm, the second at about440 nm. The valley that modulates the spectrum of emission at about 415 nm indicateshemoglobin absorption.6 The fluorescence lifetime was found slightly longer in the region ofmain peak emission (τ390 =1.7±0.52ns) when compared with the red-shifted wavelengths(τ460=1.4±0.36 ns) [Fig. 4(a)]. However, no significant change of the time-dependentparameter, τλ:10% values as a function of wavelength was observed. These values were centeredat about 5.7 ns along the entire emission spectra [Fig. 4(b)].
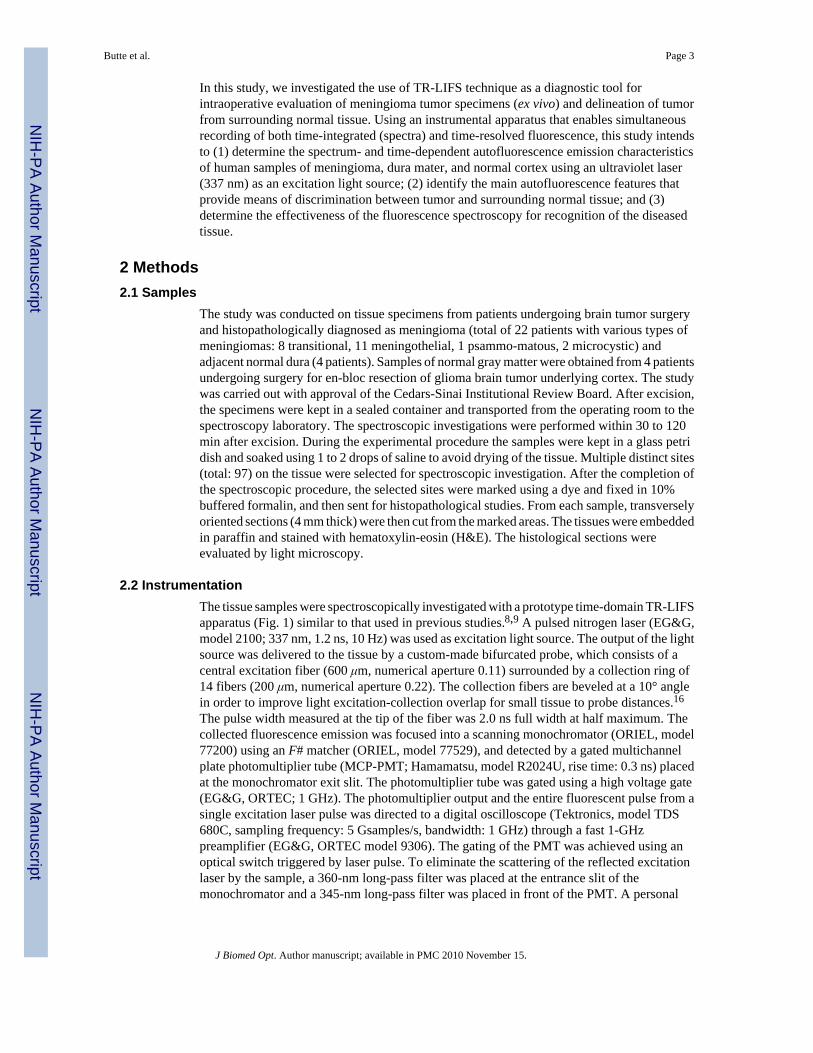
3.2.3 Cerebral cortex—The normal cortex was characterized by a broad fluorescenceemission spectrum (Fig. 3) with well-defined peak between 440 and 460 nm wavelength. Theattenuation of fluorescence intensity at about 415 nm corresponds to the hemoglobin absorptionband.5,6 Across the entire spectrum, the fluorescence emission was short lasting with anaverage lifetime [Fig. 4(a)] mainly below 1.5 ns (τ390=1.2±0.1 ns; τ460=1.0±0.07 ns) and adecay of the intensity to 10% of its maximum [Fig. 4(b)] in less than 4 ns (τ390:10%=3.8±0.6ns; τ460:10%= 2.6±0.2 ns).
3.2.4 Statistical analysis and tissues comparison—In the 385- to 390-nm wavelengthregion (Fig. 3) meningioma (I390/I460=2.5±1.5) and normal dura matter (I390/I460 =1.54±0.3)showed a strong intensity emission when compared with cortex (I390/I460=0.44±0.1). Withinthis wavelength range, meningioma (τ460:10=5.1±1.8) showed time-decay parameters valuessimilar with dura (τ460:10 =5.8± 1.85) but larger than cortex (τ460:10=2.65±0.59) [Fig. 4(a)].At wavelengths above 430 nm, meningioma exhibited significant lower fluorescence intensitywhen compared normal tissue, both dura and cortex (Fig. 3). Within this wavelength range,meningioma showed time-decay parameters values similar with dura [Fig. 4(a)] but larger thancortex. The lifetime reproducibility for the five consecutive measurements acquired at 390 nmwas within 1 to 11% of the mean value (median value 4.9%), whereas for 460 nm was within1.5 to 7% (median of 2.1%).
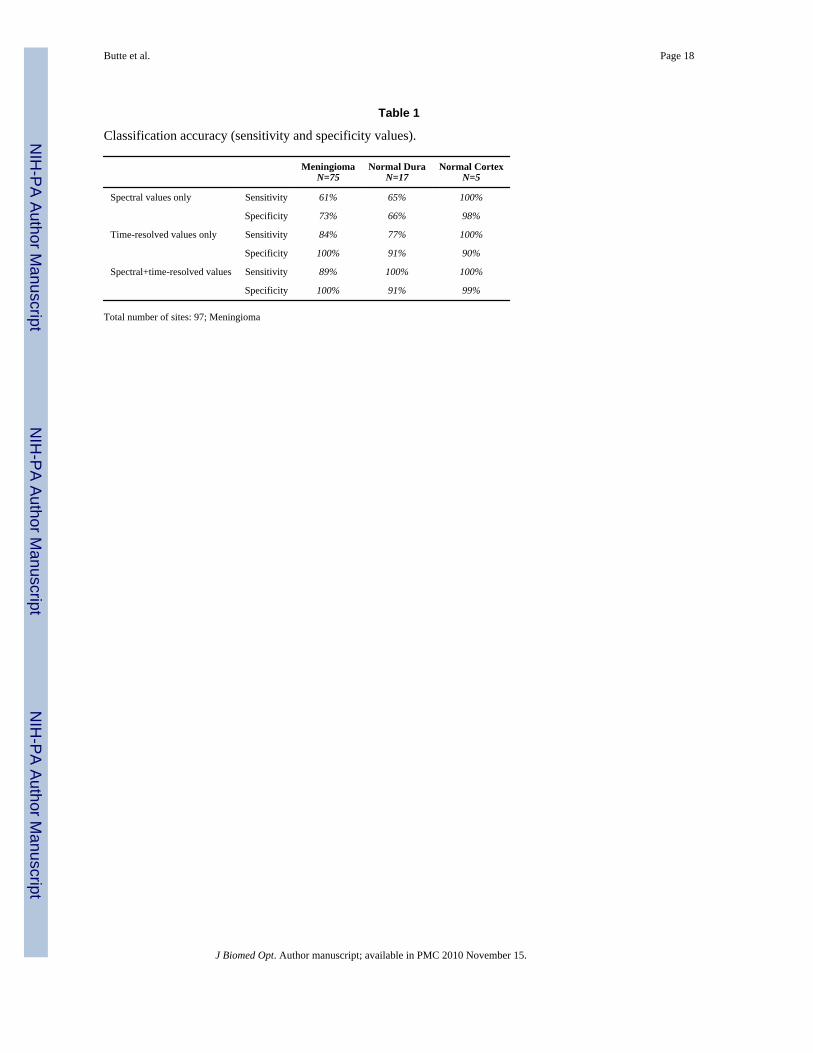
3.2.5 Discriminant analysis and classification—The classification accuracy(sensitivity and specificity values) for the discrimination of the meningioma from normal duraand cortex is summarized in Table 1. When only spectral parameters were used as input, thestepwise linear discriminant algorithm selected five parameters (I480/I370, I440/I370, I460/I370,I380/I370, I390/I460). When the classification was performed using only the temporal parametersas input, the discriminant algorithm selected three parameters (τ370:10%, τ500:10%, τ440). Whenboth spectral and temporal parameters were used for the analysis, eight significant parameterswere selected, I390/I460, I380/I370, I390/I370, and I480/I370 from the spectral domain andτ370:10%, τ370τ440:10%, and τ500:10% values from the temporal domain. Figure 5 depicts a 2-Dscatter-plot of two discriminant functions constructed using variables derived from bothspectral- and time-resolved domains. It can be observed that function 1 discriminates cortexfrom dura mater and meningioma, while function 2 enabled discrimination of meningiomafrom dura mater. In summary, parameters derived from either only spectral features or onlytemporal features provided means of discrimination between the three tissue groups. However,the overall accuracy of classification improved (91.8% cross-validated set; 92.8% training set)when both spectral and time-resolved features were used for discrimination. In contrast, theoverall classification accuracy was lower when either only spectral features (63.9% cross-
Butte et al. Page 6
J Biomed Opt. Author manuscript; available in PMC 2010 November 15.
NIH
-PA Author Manuscript
NIH
-PA Author Manuscript
NIH
-PA Author Manuscript
validated set; 67% training set) or only time-resolved features (83.5% cross-validated set;85.6% training set) were used as input predictor variables.
4 DiscussionThis study is the first to report the application of fluorescence spectroscopy, in particular time-resolved laser-induced fluorescence, to diagnosis of meningiomas. We examined the time-resolved fluorescence emission of meningioma and normal surrounding normal tissue (duramatter and cortex) on 337-nm excitation and determined that meningioma is characterized byunique fluorescence characteristics that allow discrimination of tumor from normal tissue withhigh sensitivity (>89%) and specificity (100%).
4.1 Time-Resolved Fluorescence Spectroscopy in Tissue CharacterizationIn this study, we employed a time-resolved fluorescence spectroscopy apparatus, enabling theacquisition of fluorescence temporal response across the emission spectrum of tissuespecimens, thus both steady state spectra and time-resolved intensity decay can be recoveredfrom a single measurement sequence. We found that combining spectroscopic parametersderived from both spectral and time domains, not only facilitates a better understanding of thekinetics of the biochemical and physiological processes occurring in meningiomas, dura mater,and cortex but also contributed to the improved accuracy of tissue recognition. Althoughnumerous research groups4,7,12,14 have shown that steady state fluorescence spectroscopytechniques alone are potential tools for diagnosis of tumors, including brain tumors, detectionof cancer using only spectral information is subject to several limitations. For example, therelatively broad emission brands of tissue fluorescent components may reduce the capabilityof this technique to resolve the spectrally overlapping components. Also, the presence ofendogenous chromophores (hemoglobin) or changes of excitation/collection geometry canstrongly influence the acquired spectral profile. The time-resolved measurement resolvesfluorescence intensity decay in terms of lifetimes and thus provides additional informationabout the underlying fluorescence dynamics. This property has intrinsic advantages, including(1) biomolecules with overlapping fluorescence emission spectra but with differentfluorescence decay times can be discriminated; (2) the measurements are sensitive to variousparameters of biological microenvironments (including pH and enzymatic activity); and (3)the measurement is independent of fluorescence emission intensity as long as the SNR iscommensurable, and consequently independent of the presence of the endogenouschromophores in tissue (hemoglobin) and excitation-collection geometry or optical assembly.8 These are important features for further in vivo studies and intraoperative diagnosis ofmeningiomas as well as other types of neoplasm.
4.2 Fluorescence Characteristics and Tissue RecognitionTwo wavelength ranges appeared important for developing diagnostic algorithm fordistinguishing meningioma from normal dura and cortex: 370 to 400 nm (the region of mainpeak emission for meningioma and dura) and 440 to 480 nm (the region of main peak emissionfor cortex). Note that the dominant narrowband blue-shifted peak emission is a hallmark formeningioma, but it is not always observed in healthy or diseased neuronal tissue includinggliomas.6,7,13,14 The application of multivariate statistical analysis has shown thatmeningioma, normal dura, and cortex tissues can be differentiated using a relatively limitednumber of predictor variables (16 in total) from these two spectral ranges. Parameters obtainedfrom both spectral (intensity values) and time-resolved emission contributed to the accuracyof tissue classification. The use of both sets of spectroscopic parameters, spectral and time-resolved, have improved the overall accuracy of meningioma detection (91.8%), compared tothe case when only spectral variables were employed (63.9%). Note that the temporal featuresalone used in discriminant function analysis demonstrate superior ability to classify the tissue
Butte et al. Page 7
J Biomed Opt. Author manuscript; available in PMC 2010 November 15.
NIH
-PA Author Manuscript
NIH
-PA Author Manuscript
NIH
-PA Author Manuscript

than spectral feature alone. Although in this study we used only a small dataset, these resultsindicate that the time-resolved fluorescence spectroscopy technique is robust enough to enablegood discrimination between the three types of tissue investigated in this study. Moreover, theuse of time-resolved information enhances the ability to discriminate tumor tissue from thesurrounding normal tissue. The classification accuracy may be further improved once thenumber of samples for dura and normal cortex in the training set increases.
4.3 Fluorescence of Meningioma, Dura, and Cortex: Interpretation in Terms of IntrinsicFluorescent Constituents
The fluorescence intensity time-decay characteristics were found both tissue- and wavelength-dependent. The fluorescence lifetimes τλ of meningioma and dura were longer when comparedto cortex and decreased significantly with the emission wavelength. These trends suggest thatat least two distinct fluorophores are likely to contribute to the fluorescence emission ofmeningioma and dura. In contrast, the fluorescence emission of normal cortex, characterizedby a short-lived emission with nearly constant lifetime values across the emission spectrum,most likely originated from a single fluorophore. Potential sources of fluorescence are outlinedin the following.
The fluorescence of connective tissue proteins, in particular collagens, is most likely todominate the fluorescence emission of dura and meningioma. Several types of collagen andtheir cross-links are known to absorb light above 300 nm and to exhibit a strong fluorescenceemission in 370-nm to 500-nm spectral range.5,8,20 This assumption is supported by ourhistopathological analysis, which identified fibrous tissue in both meningioma and durasamples. It is also in agreement with the biochemical and chromatographical analysis of thecomposition of meningioma and dura reported in other studies that demonstrated the presenceof high concentration of various types of collagen in these tissues.21 Our results also showedthat meningioma and dura were characterized by distinct fluorescence decay dynamic [e.g.,dura τλ :10%<meningioma τλ:10%, Fig. 4(b)], albeit having common spectroscopic features suchas an intense fluorescence emission in the 370- to 400-nm wavelengths range (peak at ∼390nm) with relatively long-lived fluorescence (τλ >1.5 ns). These differences suggest thatfluorescence of meningioma and dura have originated from distinct types of collagens and theircross-links.
For example, studies of fluorophores from collagen-rich fractions of human dura mater usingchromatography have demonstrated that two fluorophores are associated with durafluorescence emission.22 These are a “P” fluorophore (a pyridinium compound similar topyridinolines collagen cross-link, peaks excitation/emission: 335/385 nm) and an “M”fluorophore (an age-related fluorophore due to acceleration of collagen browning; peaksexcitation/emission: 370/440 nm). Our TR-LIFS measurement on dura mater tissuecorroborates with this early study by revealing two peaks emission, one at about 390 and theother at 440 nm. In addition, the change of the fluorescence decay dynamics as a function ofwavelength (decrease of τλ with wavelength, and a near constant τλ:10% across the spectrum),as observed in our study, not only confirm the presence of at least two fluorophores in duramatter, but also indicates that these fluorophores are characterized by distinct lifetimes. Ourresults also suggest that the valley that modulates the spectral emission may not be entirelydue to blood presence in tissue or fluorescence reabsorption, as initially assumed.
On the other hand, several immunocytochemical studies have demonstrated the presence inmeningioma of collagen I, collagen III, collagen IV, procollagens, laminins, and vimentine.21 Evidence has also shown that meningioma cells are derived closely from the leptomeningealarachnoid cells and are “fibrous response” of the leptomeninges to trauma, infection or otherpathologies such as tumor infiltration.21,23,24 The time-resolved spectra of meningiomas inour study, characterized by a relatively narrow-band blue-shifted emission [Fig. 2(a)], closely
Butte et al. Page 8
J Biomed Opt. Author manuscript; available in PMC 2010 November 15.
NIH
-PA Author Manuscript
NIH
-PA Author Manuscript
NIH
-PA Author Manuscript
resemble collagen type I (peak emission 380 nm) and collagen type III (peak 390 nm)fluorescence.5,8,20 Such trends indicate that these two types of collagen most likely dominatedthe fluorescence emission of meningioma at the blue-shifted wavelengths.
The short-lived (<1.5 ns) fluorescence emission (peak at about 460 nm) found for cortexcorresponds to the NAD(P)H fluorescence emission fluorescence. These features are inagreement with previous studies that have reported the spectral6,7,13,14 as well the lifetime9
fluorescence emission from cortex. Both forms of NAD(P)H, free in the cytoplasm [lowquantum yield of about 2% and lifetimes <1 ns (Refs. 25-27)] as well as bound in mitochondria[high quantum yield about fourfold higher than the free form and radiative lifetimes>1 ns (Refs.25-27)] are widely recognized as endogenous fluorophore involved in cellular metabolism,25,27,28 and probably have originated the fluorescence emission measured from cortex samples.Also, in the red-shifted spectral range, NAD(P)H fluorescence likely contributed to thefluorescence emission of dura mater and meningioma, as depicted by the short lifetimes valuesdetermined for these tissues at emission wavelengths above 440 nm.
Further investigations are required for a more complete understanding of the factors of intrinsicfluorophores causing differences in the fluorescence emission properties between meningiomadura, and cortex. Moreover, the metabolic properties of tissue may be different ex vivo versusin vivo, and these differences can be reflected in tissue fluorescence response.13 In vivo studieswill account for such differences and enable direct comparison with the current ex vivo studiesand better our understanding of how metabolic changes affect the fluorescence data. This study,however, indicated that time-resolved fluorescence spectroscopy represents a potentialpathway for nonintrusively gaining insights into the biochemical composition of these tissues.
4.4 Time-Resolved Fluorescence Spectroscopy Technology: Clinical PerspectiveNeurosurgeons often request frozen section intraoperative tissue specimen analysis from oneto many sites during a single surgery for tumor resection. This is generally the case with surgicalresection of meningiomas where one to several dural margins are often sent to theneuropathologist for intraoperative diagnosis beyond the initial tumor mass specimen. Rapididentification of neoplastic versus normal tissue using fluorescence-based diagnostics wouldbe a highly beneficial tool for both the surgical pathologist as well as the neurosurgeon.
Moreover, meningiomas are believed to arise from the “arachnoid cap” cells of the arachnoid,although they are intimately associated with the dura mater. Because of their histogenesis,meningiomas develop along any of the external surfaces of the brain as well as within theventricular system. Common sites of tumor include the convexity, the falx, and the skull baseof the anterior, middle, or posterior fossae. Meningiomas occurring “en plaque”, or located inanatomically challenging areas such as the petroclival region, present difficulties in achievingcomplete surgical resections. Thus, a fluorescence spectroscopy may also prove to be valuableintraoperative adjunct for improving completeness of resection in a setting where margins ofthe neoplastic tissue are indistinct.
In this study, we used the autofluorescent properties of tissue as a diagnostic tool. For a clinicalor intraoperative diagnostic of diseased tissue, such an approach has inherent advantages overthe use of exogenous fluorophores (molecular probes). The measurement of endogenousfluorescence does not require any systemic or local administration of an external imaging agent,thus problems associated to toxicity and pharmacodynamics/kinetics of the external agent arenot encountered. Because diagnosis based on autofluorescent properties of the tissue enablesa direct and safe evaluation of the TR-LIFS technique in patients, we have recently developeda clinically compatible TR-LIFS apparatus.29 Studies are currently being conducted at Cedars-Sinai Medical Center using this apparatus to intraoperatively record the fluorescence of braintumors including meningioma. These studies will also aid in developing efficient clinical
Butte et al. Page 9
J Biomed Opt. Author manuscript; available in PMC 2010 November 15.
NIH
-PA Author Manuscript
NIH
-PA Author Manuscript
NIH
-PA Author Manuscript
diagnostic procedures that include the detection of tumor margins. Studies have shown that the1/e optical penetration depth for 337-nm excitation wavelength ranges between 200 and 250μm depth in a variety of tissues including in brain tissue.13 Thus, using fiber optic probes withoptimal excitation-collection geometry, the presence of tumor at the margins can be detectedwith relatively high spatial accuracy.
In addition, the analytical methods employed in this study (Laguerre expansion of kernels andlinear discriminant analysis) facilitate near real-time data analysis. In a previous study, wedemonstrated the ability of the Laguerre expansion of kernels technique for fast (less than 35ms per wavelength) deconvolution of the fluorescence impulse function and analysis ofbiological systems.17 This method enables a direct recovery of the intrinsic properties of adynamic system from the experimental input-output data.30 The discriminant function analysis,also, has been explored for automated classification of 1H magnetic rotation spectroscopy(MRS) spectra from brain tumors.18 A fast real-time classification algorithm can be developedby assigning a discriminant score for different types of tissues. This discriminant score canthen be compared with the acquired fluorescence from the unknown tissue so as to classify thetissue in real time. The accuracy of classification by linear discriminant analysis can beincreased by continuously acquiring sample for training. Such a combination of analyticalmethods can aid the neurosurgeon with a realtime optical biopsy of tissue.
Furthermore, our current time-resolved fluorescence spectroscopic system has a potential tobe integrated with the current stereotactic-image-guided surgery apparatus; thus, it can providethe surgeon with the diagnostic map of the tissue in view. This particular feature would notonly enhance the surgeon's ability to ensure complete resection of various tumors, but mayalso help in future advances such as robotic surgery where the surgeon can access additionalinformation about the tumor beyond just the visual image.
5 ConclusionIn summary, accurate detection of neoplastic versus normal tissue and demarcation of tumorduring neurosurgical interventions play a crucial role in neuropathologic/neurosurgicalteamwork. The ability of the neuropathologist to quickly identify the nature of tissue specimensmay lead to shortened surgical time and potentially enable better decision making by thesurgical team secondary to rapid results from an “optical biopsy.” Our findings establish thefeasibility of using time-resolved fluorescence spectroscopy as a tool for the identification ofmeningiomas. Furthermore, time-resolved fluorescence spectroscopy represents a potentialtool to aid in a more complete resection of a tumor, which in turn can reduce the recurrencerate and improve survival in patients diagnosed with meningioma. Taking advantage of thetissue autofluorescence, the technique described in this paper facilitates a direct and rapidinvestigation of diseased tissue and enables further development of real-time diagnostic toolsfor guiding surgical resection of brain tumors. Moreover, this technique uses fiber optic probesthat enable remote investigations. These probes can be readily integrated into the existingsurgical neuronavigations systems, thus leading to improved diagnostic capabilities of suchsystems.
AcknowledgmentsThis work was supported in part by the Whitaker Foundation (RG-01-0346, PI: L. Marcu). The authors thank Dr.Qiyin Fang, Dr. Javier Jo, and Dr. Thanassis Papaioannou for help with experimental and analytical work.
References1. Whittle IR, Smith C, Navoo P, Collie D. Meningiomas. Lancet 2004;363(9420):1535–1543. [PubMed:
15135603]
Butte et al. Page 10
J Biomed Opt. Author manuscript; available in PMC 2010 November 15.
NIH
-PA Author Manuscript
NIH
-PA Author Manuscript
NIH
-PA Author Manuscript
2. Greenburg, MS. Handbook of Neurosurgery. Theime Publishing; New York: 2001. p. 4403. DeAngelis LM. Brain tumors. N Engl J Med 2001;344(2):114–123. [PubMed: 11150363]4. Wagnieres GA, Star WM, Wilson BC. In vivo fluorescence spectroscopy and imaging for oncological
applications. Photochem Photobiol 1998;68(5):603–632. [PubMed: 9825692]5. Richards-Kortum R, Sevick-Muraca E. Quantitative optical spectroscopy for tissue diagnosis. Annu
Rev Phys Chem 1996;47:555–606. [PubMed: 8930102]6. Lin WC, Toms SA, Motamedi M, Jansen ED, Mahadevan-Jansen A. Brain tumor demarcation using
optical spectroscopy; an in vitro study. J Biomed Opt 2000;5(2):214–220. [PubMed: 10938786]7. Lin WC, Toms SA, Johnson M, Jansen ED, Mahadevan-Jansen A. In vivo brain tumor demarcation
using optical spectroscopy. Photochem Photobiol 2001;73(4):396–402. [PubMed: 11332035]8. Marcu L, Fishbein MC, Maarek JM, Grundfest WS. Discrimination of human coronary artery
atherosclerotic lipid-rich lesions by time-resolved laser-induced fluorescence spectroscopy.Arterioscler Thromb Vasc Biol 2001;21(7):1244–1250. [PubMed: 11451759]
9. Marcu L, Javier JA, Butte P, Yong WH, Pikul B, Black KL, Thompson RC. Fluorescence lifetimespectroscopy of glioma multiforme. Photochem Photobiol 2004;80(1):98–103. [PubMed: 15339216]
10. Lakowicz, JR. Principles of Fluorescence Spectroscopy. 2nd. Kluwer Academic/Plenum; New York:1999.
11. Cubeddu R, Comelli D, D'Andrea C, Taroni P, Valentini G. Time-resolved fluorescence imaging inbiology and medicine. J Phys D 2002;35(9):R61–R76.
12. Poon WS, Schomacker KT, Deutsch TF, Martuza RL. Laser-induced fluorescence: experimentalintraoperative delineation of tumor resection margins. J Neurosurg 1992;76(4):679–686. [PubMed:1545262]
13. Croce AC, Fiorani S, Locatelli D, Nano R, Ceroni M, Tancioni F, Giombelli E, Benericetti E, BottiroliG. Diagnostic potential of autofluorescence for an assisted intraoperative delineation of glioblastomaresection margins. Photochem Photobiol 2003;77(3):309–318. [PubMed: 12685660]
14. Chung YG, Schwartz JA, Gardner CM, Sawaya RE, Jacques SL. Diagnostic potential of laser-inducedautofluorescence emission in brain tissue. J Korean Med Sci 1997;12(2):135–142. [PubMed:9170019]
15. Marcu L, Thompson RC, Garde S, Sedrak M, Black KL, Yong WH. Time-resolved fluorescencespectroscopy of human brain tumors. Proc SPIE 2002;4136:183–187.
16. Papaioannou T, Preyer NW, Fang Q, Brightwell A, Carnohan M, Cottone G, Ross R, Jones LR, MarcuL. Effects of fiberoptic probe design and probe-to-target distance on diffuse reflectancemeasurements of turbid media: an experimental and computational study at 337 nm. Appl Opt2004;43(14):2846–2860. [PubMed: 15143808]
17. Jo JA, Fang Q, Papaioannou T, Marcu L. Fast model-free deconvolution of fluorescence decay foranalysis of biological systems. J Biomed Opt 2003;9(4):743–752. [PubMed: 15250761]
18. Tate AR, Griffiths JR, Martinez-Perez I, Moreno A, Barba I, Cabanas ME, Watson D, Alonso J,Bartumeus F, Isamat F, Ferrer I, Vila F, Ferrer E, Capdevila A, Arus C. Towards a method forautomated classification of 1H MRS spectra from brain tumours. NMR Biomed 1998;11(4-5):177–191. [PubMed: 9719572]
19. Kleihues, P.; Cavenee, WK. Pathology and Genetics of Tumors of Nervous System. IARC Press;Lyon: 2000. World Health Organization classification of tumors.
20. Marcu, L.; Grundfest, WS.; Fishbein, MC. Time-resolved laser-induced fluorescence spectroscopyfor staging atherosclerotic lesions. In: Mycek, MA.; Pogue, B., editors. Handbook of BiomedicalFluorescence. Marcel Dekker; New York: 2003. p. 397-430.
21. Ng HK, Wong AT. Expression of epithelial and extracellular matrix protein markers in meningiomas.Histopathology 1993;22(2):113–125. [PubMed: 7681027]
22. Sell DR, Monnier VM. Isolation, purification and partial characterization of novel fluorophores fromaging human insoluble collagen-rich tissue. Connect Tissue Res 1989;19(1):77–92. [PubMed:2791558]
23. Nitta H, Yamashima T, Yamashita J, Kubota T. An ultrastructural and immunohistochemical studyof extracellular matrix in meningiomas. Histol Histopathol 1990;5(3):267–274. [PubMed: 2134380]
Butte et al. Page 11
J Biomed Opt. Author manuscript; available in PMC 2010 November 15.
NIH
-PA Author Manuscript
NIH
-PA Author Manuscript
NIH
-PA Author Manuscript
24. Gill SS, Thomas DG, Van Bruggen N, Gadian DG, Peden CJ, Bell JD, Cox IJ, Menon DK, Iles RA,Bryant DJ. Proton MR spectroscopy of intracranial tumours: in vivo and in vitro studies. J ComputAssist Tomogr 1990;14(4):497–504. [PubMed: 2164536]
25. Schneckenburger H, Konig K. Fluorescence decay kinetics and imaging of Nad(P)H and Flavins asmetabolic indicators. Opt Eng 1992;31(7):1447–1451.
26. Verlick SF. Fluorescence spectra and polarization of glyceraldehyde-3-phosphate and lacticdehydrogenase coenzyme complexes 1. J Biol Chem 1958;233(6):1455–1467. [PubMed: 13610856]
27. Aubin JE. Autofluorescence of viable cultured mammalian-cells. J Histochem Cytochem 1979;27(1):36–43. [PubMed: 220325]
28. Konig K, Berns MW, Tromberg BJ. Time-resolved and steady-state fluorescence measurements ofbeta-nicotinamide adenine dinucleotide-alcohol dehydrogenase complex during UVA exposure. JPhotochem Photobiol, B 1997;37(1-2):91–95. [PubMed: 9043097]
29. Fang Q, Papaioannou T, Jo JA, Vaitha R, Shastry K, Marcu L. Time-domain laser-inducedfluorescence spectroscopy apparatus for clinical diagnostics. Rev Sci Instrum 2004;75(1):151–162.
30. Marmarelis VZ. Identification of nonlinear biological systems using Laguerre expansions of kernels.Ann Biomed Eng 1993;21(6):573–589. [PubMed: 8116911]
Butte et al. Page 12
J Biomed Opt. Author manuscript; available in PMC 2010 November 15.
NIH
-PA Author Manuscript
NIH
-PA Author Manuscript
NIH
-PA Author Manuscript
Fig. 1.Schematic of the instrumental setup for time-resolved fluorescence spectroscopy. (GPIB:General Purpose Interface Bus).
Butte et al. Page 13
J Biomed Opt. Author manuscript; available in PMC 2010 November 15.
NIH
-PA Author Manuscript
NIH
-PA Author Manuscript
NIH
-PA Author Manuscript
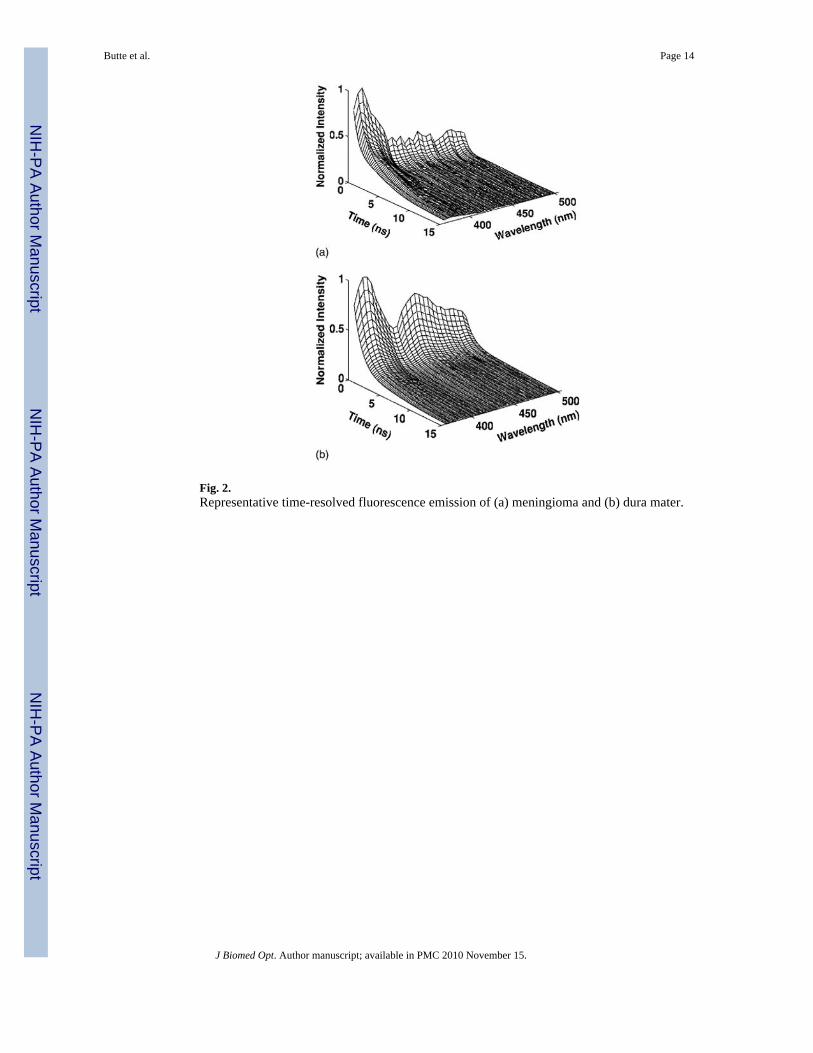
Fig. 2.Representative time-resolved fluorescence emission of (a) meningioma and (b) dura mater.
Butte et al. Page 14
J Biomed Opt. Author manuscript; available in PMC 2010 November 15.
NIH
-PA Author Manuscript
NIH
-PA Author Manuscript
NIH
-PA Author Manuscript
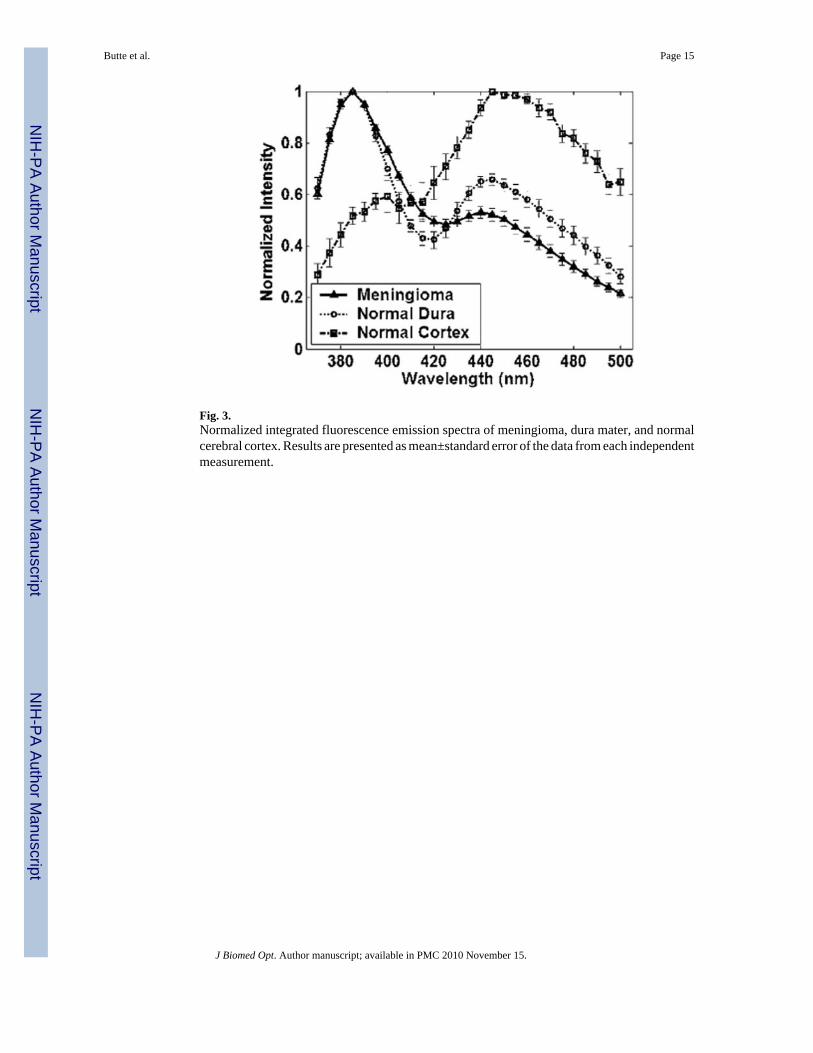
Fig. 3.Normalized integrated fluorescence emission spectra of meningioma, dura mater, and normalcerebral cortex. Results are presented as mean±standard error of the data from each independentmeasurement.
Butte et al. Page 15
J Biomed Opt. Author manuscript; available in PMC 2010 November 15.
NIH
-PA Author Manuscript
NIH
-PA Author Manuscript
NIH
-PA Author Manuscript
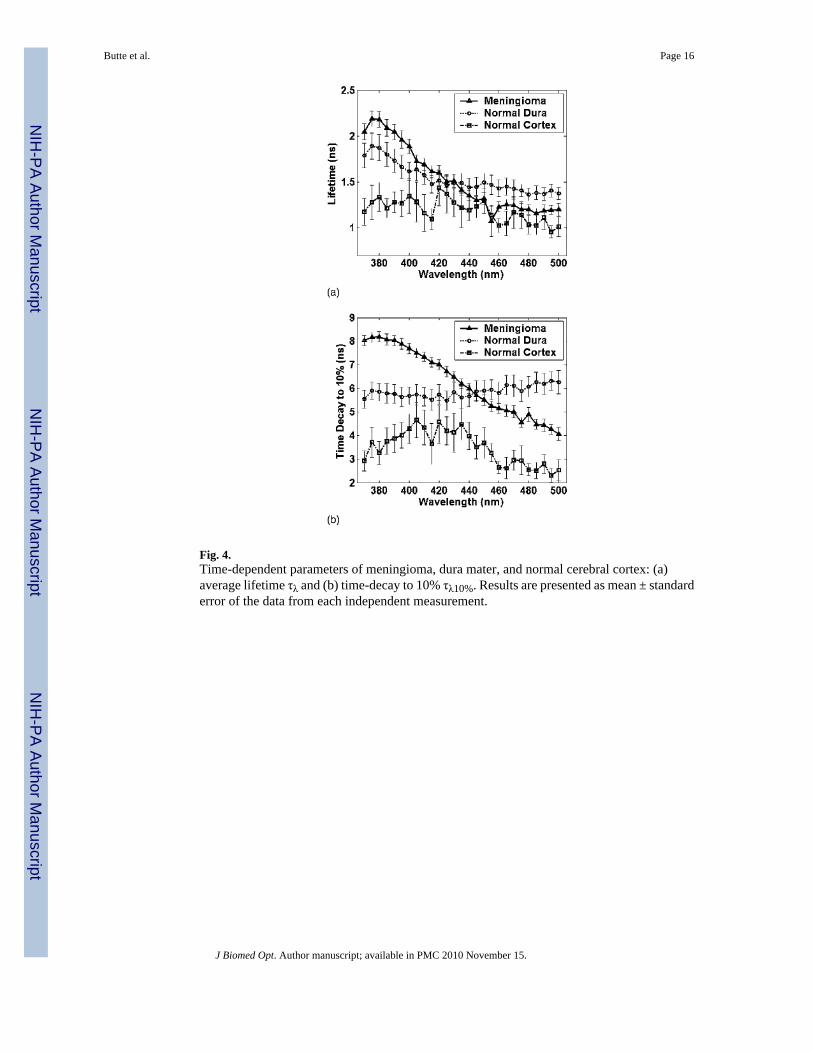
Fig. 4.Time-dependent parameters of meningioma, dura mater, and normal cerebral cortex: (a)average lifetime τλ and (b) time-decay to 10% τλ10%. Results are presented as mean ± standarderror of the data from each independent measurement.
Butte et al. Page 16
J Biomed Opt. Author manuscript; available in PMC 2010 November 15.
NIH
-PA Author Manuscript
NIH
-PA Author Manuscript
NIH
-PA Author Manuscript
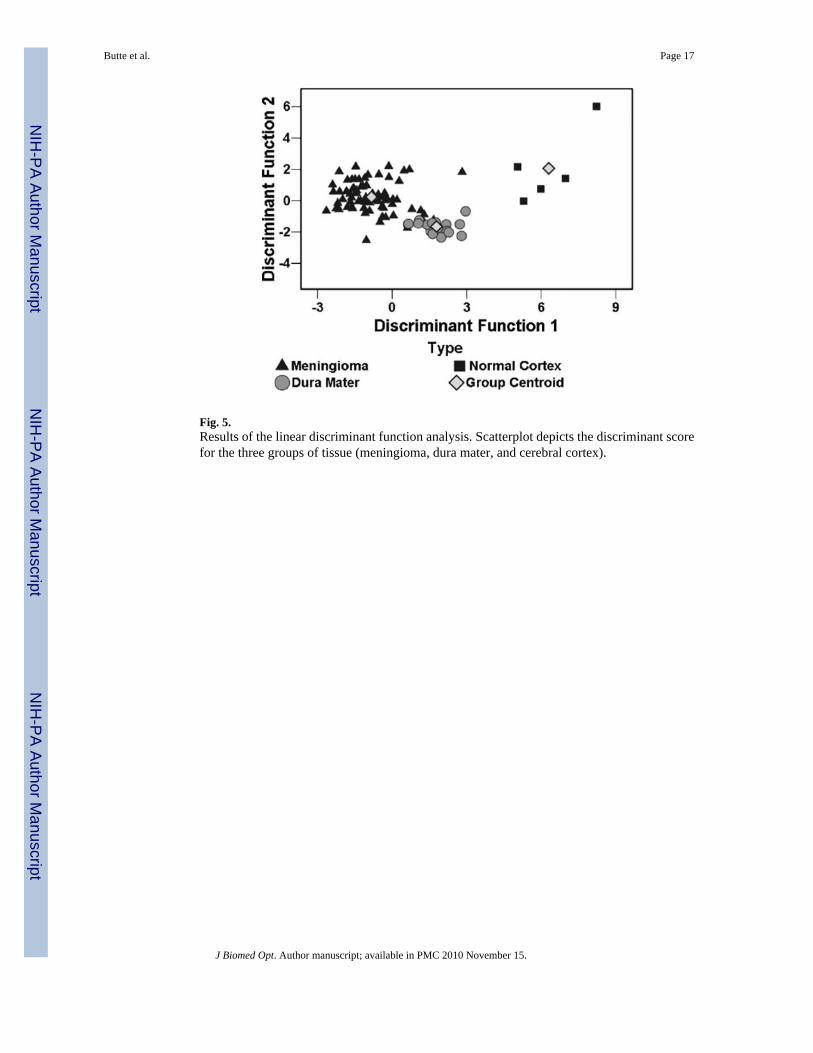
Fig. 5.Results of the linear discriminant function analysis. Scatterplot depicts the discriminant scorefor the three groups of tissue (meningioma, dura mater, and cerebral cortex).
Butte et al. Page 17
J Biomed Opt. Author manuscript; available in PMC 2010 November 15.
NIH
-PA Author Manuscript
NIH
-PA Author Manuscript
NIH
-PA Author Manuscript
NIH
-PA Author Manuscript
NIH
-PA Author Manuscript
NIH
-PA Author Manuscript
Butte et al. Page 18
Table 1
Classification accuracy (sensitivity and specificity values).
MeningiomaN=75
Normal DuraN=17
Normal CortexN=5
Spectral values only Sensitivity 61% 65% 100%
Specificity 73% 66% 98%
Time-resolved values only Sensitivity 84% 77% 100%
Specificity 100% 91% 90%
Spectral+time-resolved values Sensitivity 89% 100% 100%
Specificity 100% 91% 99%
Total number of sites: 97; Meningioma
J Biomed Opt. Author manuscript; available in PMC 2010 November 15.


![Time-Resolved Fluorescence Anisotropy of Bicyclo[1.1.1]pentane/Tolane-Based Molecular Rods Included in Tris( o -phenylenedioxy)cyclotriphosphazene (TPP)](https://img.dokumen.tips/doc/110x75/634bab57bb899b358c0a75fd/time-resolved-fluorescence-anisotropy-of-bicyclo111pentanetolane-based-molecular.jpg)


