Embed Size (px)
Citation preview
Published: March 14, 2011
r 2011 American Chemical Society 5109 dx.doi.org/10.1021/ja1113529 | J. Am. Chem. Soc. 2011, 133, 5109–5123
ARTICLE
pubs.acs.org/JACS
Photodynamics and Time-Resolved Fluorescence of Azobenzene inSolution: A Mixed Quantum-Classical Simulation
Teresa Cusati, Giovanni Granucci, and Maurizio Persico*
Dipartimento di Chimica e Chimica Industriale, Universit�a di Pisa, v. Risorgimento 35, I-56126 Pisa, Italy
bS Supporting Information
1. INTRODUCTION AND STATE OF THE ART
This paper presents a computational simulation of the nf π*photodynamics of trans- and cis-azobenzene (TAB and CAB,respectively), in vacuo and in three different solvents. Thephotoisomerization and the decay of the excited states ofazobenzene have been the object of many experimental1-27
and theoretical28-47 investigations, because of the basic ques-tions about the mechanism and because azobenzene has been usedas the photoactive unit in a wide variety of nanoscale devices andcompounds with photomodulable properties (see reviews48-54
and some recent applications55-68). The proposed applicationsuse light of the appropriate wavelength and polarization to powermolecular machines,48,50,54,60,67 control electrical switches,59
displace chemical equilibria,48,51 trigger enzymatic activity andpeptide folding,51,53 and change the properties of photorespon-sive materials of interest in optics,52,53,55,56,58,68 electronics,49
mechanical actuators,53,61,64-66 data storage,63 and other fields.In most of these examples, the (super)molecular structuressurrounding the azobenzene chromophore are modified becauseof its isomerization. The fact that azobenzene is able to isomerizein a variety of environments, some of which are very constrain-ing,42,43 is therefore crucial in such applications. Viscous solventsare typical media that may hinder large amplitude geometrychanges occurring in photochemical reactions, and some inter-esting experimental studies2,25 have investigated the effect ofviscosity on the photodynamics of azobenzene, as we do theore-tically in the present work.
The fundamental mechanistic questions concern the photo-reaction pathway and the competition between excited statedecay and isomerization, which determines the quantum yields.
In low viscosity solvents, by irradiation in the n f π* band(S1 state), the transf cis photoisomerization quantum yieldsΦtfc
range from 0.20 to 0.36.38 In the same conditions, by excitation tothe π f π* states (S2-S4) the Φtfc yield is smaller by about afactor of 2. A similar dependence on the wavelength is observedfor the reverse cisf trans photoconversion, but in generalΦcft
is larger than Φtfc: with low viscosity and n f π* irradiation,Φcft is in the range 0.40-0.69. The dependence of the quantumyields on the absorption band led to the postulation of twodifferent mechanisms for the photoisomerization:7-10 torsion ofthe NdNdouble bond for the nfπ* excitation andN-inversionfor theπfπ* one. This interpretation was supported by the firstcomputational attempt to characterize the excited potentialenergy surfaces (PES) of azobenzene, by Monti et al. in1982.28 Only in 1999 an ab initio study based on CASSCF andsecond order perturbation CI showed that the torsional mecha-nism is energetically preferable both in the S1 and in the S2 states,although the N-inversion might also be viable, at least for thenf π* cisf trans conversion.29 These findings have since thenbeen confirmed by more accurate and/or more extensive explo-rations of the PES.30-33,37,44,45 In particular, Ishikawa et al.30 pro-ducedmaps of the S0, S1, and S2 PES, as functions of the torsionaland inversional reaction coordinates, by CASSCF calculations.They also identified the S0-S1 conical intersection (CI) close tothe minimum of S1, that is, at a CNNC torsional angle of about90�. Diau31 found that the S0 and S1 surfaces also cross at atransoid (planar) geometry, along the symmetric NNC bending
Received: December 30, 2010
ABSTRACT: We have simulated the photodynamics of azobenzeneby means of the Surface Hopping method. We have considered boththe transf cis and the cisf trans processes, caused by excitation in thenf π* band (S1 state). To bring out the solvent effects on the excitedstate dynamics, we have run simulations in four different environ-ments: in vacuo, in n-hexane, in methanol, and in ethylene glycol. Oursimulations reproduce very well the measured quantum yields and thetime dependence of the intensity and anisotropy of the transientfluorescence. Both the photoisomerization and the S1 f S0 internalconversion require the torsion of the NdN double bond, but the N—C bond rotations and the NNC bending vibrations also play arole. In the transf cis photoconversion the NdN torsional motion and the excited state decay are delayed by increasing the solventviscosity, while the cisf trans processes are less affected. The analysis of the simulation results allows the experimental observationsto be explained in detail, and in particular the counterintuitive increase of the transf cis quantum yield with viscosity, as well as therelationship between the excited state dynamics and the solvent effects on the fluorescence lifetimes and depolarization.
5110 dx.doi.org/10.1021/ja1113529 |J. Am. Chem. Soc. 2011, 133, 5109–5123
Journal of the American Chemical Society ARTICLE
coordinate, that is, by opening both NNC angles. Orlandi and hisgroup33,44 determined the CIs with higher lying states andshowed that the S0-S1 CIs found by torsion and by symmetricinversion belong to the same crossing seam. Their CASSCF andCASPT2 calculations are probably the most accurate onesperformed on azobenzene to date.
The mere inspection of the PES cannot provide more than ahypothetical rationalization of the wavelength dependence of thequantum yields. To put the interpretation of such observationson firmer ground and describe the reaction mechanism, ourgroup performed a full set of single molecule simulations, for thetrans f cis and cis f trans photoconversions with n f π* andwith πf π* excitation.34,38We used the Surface Hopping (SH)approach,69 with PES and couplings computed on the fly by asemiempirical method with an ad hoc reparameterization.70 Thesimulation results were in rather good agreement with theexperimental quantum yields. We showed that, after π f π*excitation, the S2 state decays very fast (≈0.1 ps) to S1. Once onthe S1 surface, either by direct n f π* excitation or by internalconversion (IC) from S2, the dynamics follows essentially thetorsional mechanism, at least until the midpoint (CNNC≈ 90�)is reached. Near such a twisted geometry the minimum energypath in S1meets the S0-S1 crossing seam, and the conversion tothe ground state is very likely. By π f π* excitation andsubsequent decay to S1, the vibrational energy excess is largerthan in the case of direct n f π* excitation; in particular, thesymmetric NNC bending mode of TAB gets more excited. As aconsequence, the IC to the ground state takes place earlier, thatis, closer to the starting isomer geometry: this is why the πf π*quantum yields are lower than the nf π* ones. Our simulationstherefore explain the wavelength dependence of the quantumyields as due to shifting the balance between the competingprocesses of isomerization and internal conversion, within onebasic mechanism (torsion of the NdN double bond).
A wealth of data about the excited state dynamics wereobtained in the last 15 years through transient spectroscopytechniques. Here we shall focus on the n f π* photodynamics,which is the object of this paper. Time-resolved differentialabsorption12,13,15,23,24 and up-converted fluorescence21,25 mea-surements in low viscosity solvents show a biexponential decay ofthe S1 state: the more important component has lifetimes of0.15-0.6 ps, and the longer tail is in the range 0.6-3 ps. TheCAB photodynamics is also biexponential but faster, with shortlifetimes of 0.10-0.18 ps and long ones of 0.9-2 ps, obtained bytransient absorption.13,23 Recent resonant Raman measurementsby the Mathies group27 showed that the short time dynamics inthe S1 state of TAB is dominated by the NNC bending mode andthat of CAB by the CNNC torsion (in both cases also the NNand CN stretching modes play a role). On the basis of oursimulations34,38 we had predicted the possibility of observing theNNC bending vibration in TAB by resonant Raman spectros-copy, because this mode is excited in S1, where the equilibriumangle is much larger than in S0; and also, we had found a muchfaster CNNC torsion in CAB, such as to override the NNCbending motion. As to the S1 state lifetimes, our results wereconsistent with the fast component of both the trans- and the cis-azobenzene decays, but did not match the slow one. This partialdiscrepancy could be due to one or more approximationsinherent to our model: for instance, the slope of the S1 PEScould have been slightly overestimated, so as to accelerate thetorsional motion; or, the surface hopping algorithm might notreproduce adequately the real quantum wavepacket dynamics.
In a previous work,36 we compared the Surface Hopping resultswith those of Full Multiple Spawning (FMS)71 wavepacketdynamics. While the basic features of the mechanism and ofthe nonadiabatic dynamics were confirmed, some quantitativedifferences between the two treatments were apparent. Inparticular, the SH treatment in certain conditions overestimatesthe decay rates from upper to lower electronic states. In a laterpaper72 we have introduced in the SH algorithm a quantumdecoherence correction that improves the agreement with quan-tumwavepacket calculations andwill be used in the present work.
Probably the most important source of variance between ourprevious simulations34,38 and the transient spectroscopy mea-surements is that almost all the experiments were run in thecondensed phase, while we computed the single moleculedynamics. In fact, in the one case where lifetimes were measuredin a jet of azobenzene molecules,22 they were all found shorterthan 0.5 ps (πfπ* excitation, with time-resolved photoelectronspectroscopy as the probe technique). As we shall see more indetail in the next sections, the quantum yields and the lifetimesare strongly affected by the solvent viscosity. Chang et al.25
obtained an especially intriguing set of results by measuringthe decay of fluorescence intensity and anisotropy of TAB inn-hexane and ethylene glycol: the latter solvent not only slowsdown the decay of the S1 state but also suppresses almostcompletely the fluorescence depolarization. Solvent effects aretherefore quite important, and one cannot exclude that theywould alter substantially the reaction mechanism. Recent moleculardynamics simulations of the trans f cis photoisomerization byTiberio et al.,47 run with an empirical scheme for nonadiabatictransitions, suggest that a mixed torsion-inversionmechanism isespecially important in the condensed phase. However, in thesesimulations the reaction pathway only acquires a considerableN-inversional component after the molecule has reverted tothe ground state, as already found in our work on the isolatedmolecule.38On the other hand, the crucial events that determinethe quantum yield take place in the S1 state (namely, thecompetition between progress along the reaction coordinateand nonadiabatic decay). Moreover, the force field employed byTiberio et al.47 only allows for the opening of one NNC bondangle, while we have shown that the NNC bending motion issymmetric34 (see also Section 3 in this paper).
To clarify these matters we have run a set of simulations, ofboth the trans f cis and the cisf trans photoisomerizations, inthree solvents with different polarity and viscosity properties:n-hexane, methanol, and ethylene glycol. Details of the methodand of the PESs are given in the next section. In Section 3 weanalyze the simulation results, and in Section 4 we present thecomputed fluorescence transients, with spectral and anisotropydata to be compared with the experimental ones.
2. METHOD AND POTENTIAL ENERGY SURFACES
2.1. Semiempirical Potential Energy Surfaces. We rantrajectory Surface Hopping simulations of the trans f cis andthe cis f trans photodynamics, for the isolated azobenzenemolecule (as a reference to evaluate the solvent effects) and withthree solvents: n-hexane, methanol, and ethylene glycol (HEX,MeOH, and EG, respectively). The electronic energies and wavefunctions were computed on the fly by a semiempirical Config-uration Interaction method based on SCF orbitals with floatingoccupation numbers (FOMO-CI), suited to represent reactiveprocesses and excited states.70 The configuration space was a
5111 dx.doi.org/10.1021/ja1113529 |J. Am. Chem. Soc. 2011, 133, 5109–5123
Journal of the American Chemical Society ARTICLE
CAS with six electrons in four orbitals (two lone pairs of the Natoms, a π and a π* MOs), plus all single excitations from sevenoccupied to six virtual orbitals (in total 94 Slater determinants).All the calculations were run by means of a development versionof the MOPAC program,73 with extensive additions introducedby our group.The semiempirical parameters were optimized to yield accu-
rate PES. Our previous parametrization34 was revised, to takeinto account new ab initio results,32,33 and to improve thetorsional potential of the C—N bonds (details are given in aforthcoming paper74). In fact, a preliminary investigation of thenf π* transition of TAB showed that the rotation of the phenylgroups around the C—N bonds is quite important in determin-ing the transition dipole, which vanishes at the C2h equilibriumgeometry.41 The reparameterization strategy was similar in thetwo cases.34,74 From the available experimental and ab initio datawe selected a set of target values Vi
(t), mainly energies andgeometrical parameters pertaining to extrema of the PESs. Next,we defined a function S(P) of the semiempirical parameters P, asa sum of weighted squared differences between the semiempiri-cally computed values Vi
(s)(P) and the targets Vi(t). The function
S(P) was then minimized by varying the parameters, using thesimplex method combined with a form of simulated annealing.Only theN atom parameters were optimized, while for Cwe keptthose previously determined for the benzene molecule and for Hthe standard AM1, as in our previous work.34 We also added apotential term to improve the dependence of the PES on theNNC bond angles and on the NNCC dihedrals. All the details
required to reproduce our electronic structure calculations aregiven in the Supporting Information.The accuracy of the semiempirical PES is quite satisfactory,
thanks to the reparameterization. The computed vertical excita-tion energies of TAB and CAB are 2.83 and 2.89 eV, while theabsorption maxima in the vapor phase75 yield 2.82 and 2.92 eV,respectively. By comparison, the latest CASPT2 calculations44
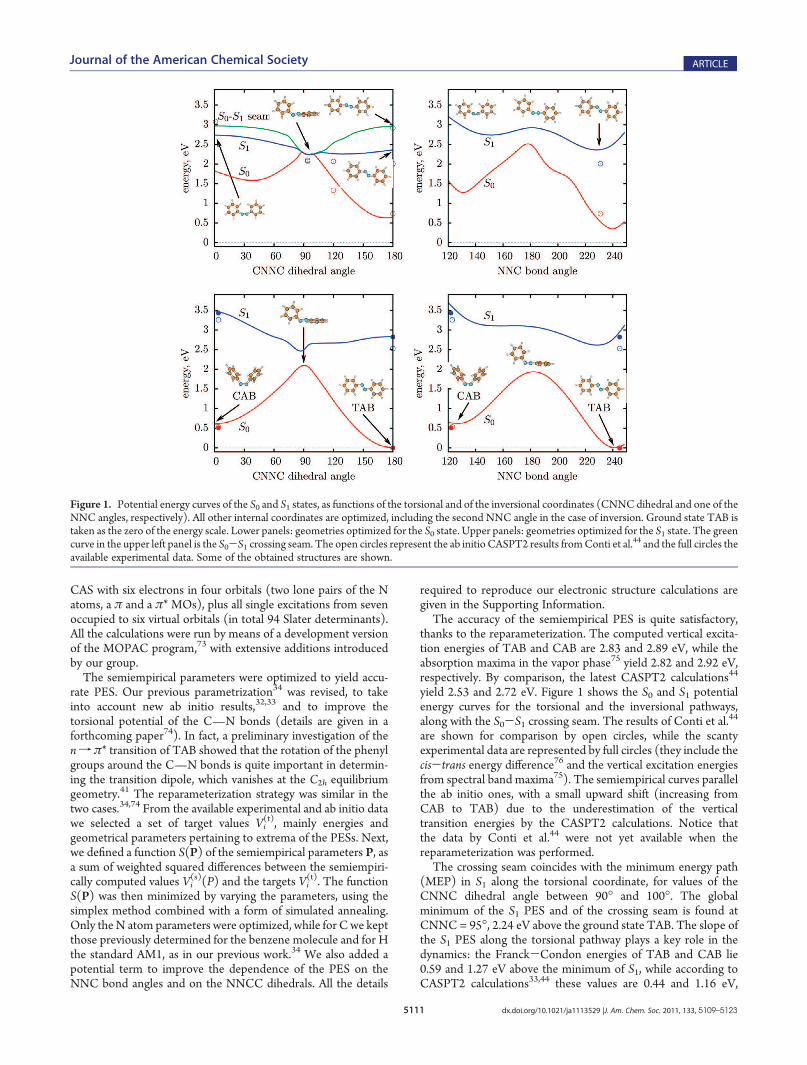
yield 2.53 and 2.72 eV. Figure 1 shows the S0 and S1 potentialenergy curves for the torsional and the inversional pathways,along with the S0-S1 crossing seam. The results of Conti et al.44
are shown for comparison by open circles, while the scantyexperimental data are represented by full circles (they include thecis-trans energy difference76 and the vertical excitation energiesfrom spectral band maxima75). The semiempirical curves parallelthe ab initio ones, with a small upward shift (increasing fromCAB to TAB) due to the underestimation of the verticaltransition energies by the CASPT2 calculations. Notice thatthe data by Conti et al.44 were not yet available when thereparameterization was performed.The crossing seam coincides with the minimum energy path
(MEP) in S1 along the torsional coordinate, for values of theCNNC dihedral angle between 90� and 100�. The globalminimum of the S1 PES and of the crossing seam is found atCNNC = 95�, 2.24 eV above the ground state TAB. The slope ofthe S1 PES along the torsional pathway plays a key role in thedynamics: the Franck-Condon energies of TAB and CAB lie0.59 and 1.27 eV above the minimum of S1, while according toCASPT2 calculations33,44 these values are 0.44 and 1.16 eV,
Figure 1. Potential energy curves of the S0 and S1 states, as functions of the torsional and of the inversional coordinates (CNNC dihedral and one of theNNC angles, respectively). All other internal coordinates are optimized, including the second NNC angle in the case of inversion. Ground state TAB istaken as the zero of the energy scale. Lower panels: geometries optimized for the S0 state. Upper panels: geometries optimized for the S1 state. The greencurve in the upper left panel is the S0-S1 crossing seam. The open circles represent the ab initio CASPT2 results fromConti et al.44 and the full circles theavailable experimental data. Some of the obtained structures are shown.
5112 dx.doi.org/10.1021/ja1113529 |J. Am. Chem. Soc. 2011, 133, 5109–5123
Journal of the American Chemical Society ARTICLE
respectively. The geometry optimization of TAB S1 with planar-ity constraints yields a stabilization of 0.47 eV with respect to theFranck-Condon point (0.52 eV according to CASPT2), withthe NNC angles opened to 132.3�. Outside the 90�-100� rangeof torsional angles the crossing seam is higher in energy than theS1 MEP. The geometry deformation needed to reach the seam,starting from the MEP, is mainly the symmetric opening of bothNNC angles. The inversional pathway in S1 features a low barrierat NNC = 180�, that lies below both the TAB and the CABFranck-Condon points. The phenyl group adjacent to theinverting N atom prefers a perpendicular conformation (90�rotation around the C—N bond) in the S0 transition state (TS),while in S1 it remains in the molecular plane.2.2. QM/MM Approach. The solvents have been represented
by the all atom OPLS force-field.77 In the case of EG we haveadopted the ad hoc modifications of OPLS, proposed by Konyet al.78 and by de Oliveira et al.79 to study the thermodynamicproperties of pure EG. Themolecularmechanics (MM) descriptionof the solvent and the quantum mechanical (QM) description ofazobenzene (at semiempirical level) are combined in a hybridQM/MM scheme with electrostatic embedding.80 The QM/MMcalculations have been run by linking MOPAC with the MMpackage TINKER.81 The QM/MM interactions are in the formof a Lennard-Jones potential between the MM and the QM atoms,plus electrostatic interactions that are added to the semiempiricalHamiltonian. The electrostatic potential to which the QM nucleiand electrons are subjected is generated by the MM atomiccharges. The latter had the standard OPLS values for HEXbut were rescaled by the factor 0.41 for MeOH and EG (thescaling was not applied to the interactions between MM atoms).The scaling factor and the Lennard-Jones parameters have beendetermined to reproduce the results of MP2 calculations on thedimers of azobenzene withmethane andmethanol, chosen as repre-sentatives of alkanes and alcohols.74 The methane-azobenzeneinteractions are very weak, with binding energies De = 0.042 and0.049 eV for TAB and CAB, respectively, at the semiempiricalQM/MM level. Methanol is hydrogen bound to both isomers, withDe=0.153 and 0.221 eV,which is less than themethanol-methanolinteraction (0.262 eV, according to OPLS).2.3. Initial Conditions. Each simulation consisted of about
600 trajectories, with initial conditions selected according to aBoltzmann distribution in the ground electronic state, weightedwith the S0 f S1 transition probability. We limited the initialexcitation to the nf π* band, by imposing a maximum of 3.4 eVto the transition energy, that is, the S1-S0 energy differenceΔEexc at the initial geometry. The Boltzmann distribution ofnuclear coordinates and momenta was obtained by running aBrownian trajectory.82 The sampling takes into account thegeometry dependent excitation probability, as described in aprevious paper,42 andmakes use of the last 50 ps of the trajectory.For the isolated molecule simulations, the starting point of theBrownian dynamics was the equilibrium geometry of eachisomer, while for the solvated azobenzene we applied thefollowing equilibration procedure.We first equilibrated the MM solvent alone, by running 2 ns of
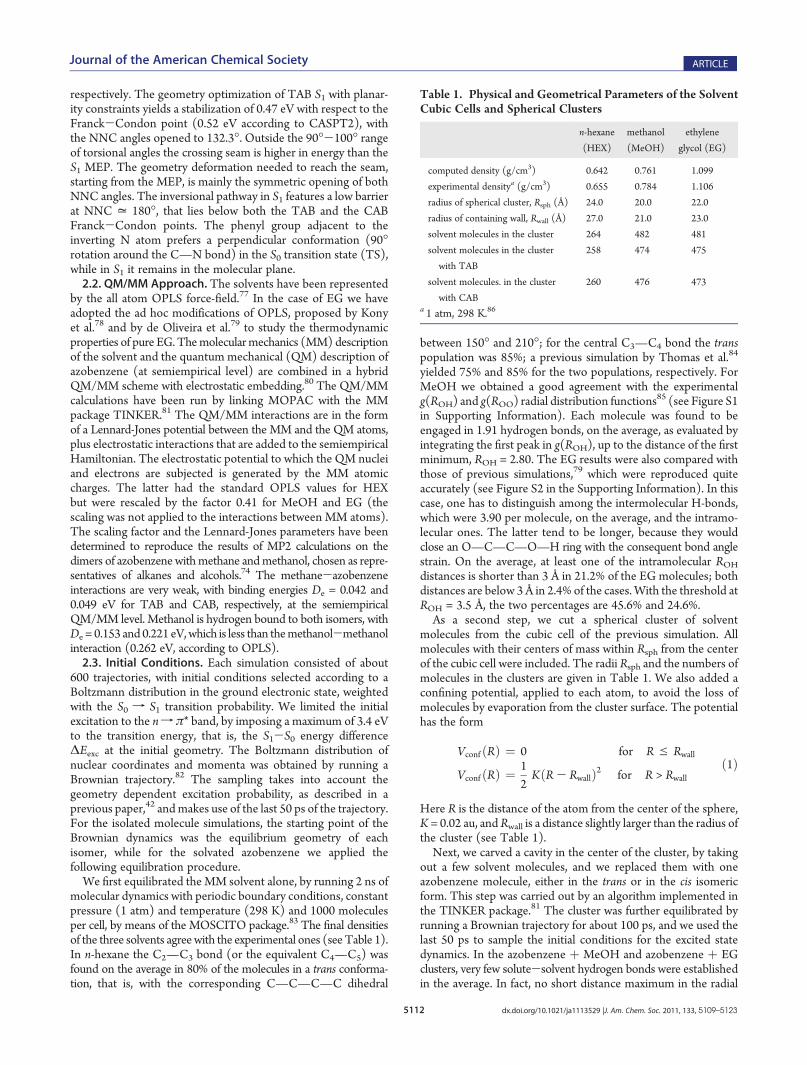
molecular dynamics with periodic boundary conditions, constantpressure (1 atm) and temperature (298 K) and 1000 moleculesper cell, by means of the MOSCITO package.83 The final densitiesof the three solvents agreewith the experimental ones (see Table 1).In n-hexane the C2—C3 bond (or the equivalent C4—C5) wasfound on the average in 80% of the molecules in a trans conforma-tion, that is, with the corresponding C—C—C—C dihedral
between 150� and 210�; for the central C3—C4 bond the transpopulation was 85%; a previous simulation by Thomas et al.84
yielded 75% and 85% for the two populations, respectively. ForMeOH we obtained a good agreement with the experimentalg(ROH) and g(ROO) radial distribution functions
85 (see Figure S1in Supporting Information). Each molecule was found to beengaged in 1.91 hydrogen bonds, on the average, as evaluated byintegrating the first peak in g(ROH), up to the distance of the firstminimum, ROH = 2.80. The EG results were also compared withthose of previous simulations,79 which were reproduced quiteaccurately (see Figure S2 in the Supporting Information). In thiscase, one has to distinguish among the intermolecular H-bonds,which were 3.90 per molecule, on the average, and the intramo-lecular ones. The latter tend to be longer, because they wouldclose an O—C—C—O—H ring with the consequent bond anglestrain. On the average, at least one of the intramolecular ROHdistances is shorter than 3 Å in 21.2% of the EG molecules; bothdistances are below 3Å in 2.4% of the cases.With the threshold atROH = 3.5 Å, the two percentages are 45.6% and 24.6%.As a second step, we cut a spherical cluster of solvent
molecules from the cubic cell of the previous simulation. Allmolecules with their centers of mass within Rsph from the centerof the cubic cell were included. The radii Rsph and the numbers ofmolecules in the clusters are given in Table 1. We also added aconfining potential, applied to each atom, to avoid the loss ofmolecules by evaporation from the cluster surface. The potentialhas the form
Vconf ðRÞ ¼ 0 for R e Rwall
Vconf ðRÞ ¼1
2KðR- RwallÞ
2 for R > Rwallð1Þ
Here R is the distance of the atom from the center of the sphere,K = 0.02 au, andRwall is a distance slightly larger than the radius ofthe cluster (see Table 1).Next, we carved a cavity in the center of the cluster, by taking
out a few solvent molecules, and we replaced them with oneazobenzene molecule, either in the trans or in the cis isomericform. This step was carried out by an algorithm implemented inthe TINKER package.81 The cluster was further equilibrated byrunning a Brownian trajectory for about 100 ps, and we used thelast 50 ps to sample the initial conditions for the excited statedynamics. In the azobenzene þ MeOH and azobenzene þ EGclusters, very few solute-solvent hydrogen bonds were establishedin the average. In fact, no short distance maximum in the radial
Table 1. Physical and Geometrical Parameters of the SolventCubic Cells and Spherical Clusters
n-hexane
(HEX)
methanol
(MeOH)
ethylene
glycol (EG)
computed density (g/cm3) 0.642 0.761 1.099
experimental densitya (g/cm3) 0.655 0.784 1.106
radius of spherical cluster, Rsph (Å) 24.0 20.0 22.0
radius of containing wall, Rwall (Å) 27.0 21.0 23.0
solvent molecules in the cluster 264 482 481
solvent molecules in the cluster
with TAB
258 474 475
solvent molecules. in the cluster
with CAB
260 476 473
a 1 atm, 298 K.86
5113 dx.doi.org/10.1021/ja1113529 |J. Am. Chem. Soc. 2011, 133, 5109–5123
Journal of the American Chemical Society ARTICLE
distribution function g(RNH) was observed. To be sure that thiswas not due to an incomplete equilibration, we ran 20 ps ofBrownian dynamics with a larger N 3 3 3H—O bond strength, byaltering the QM/MM parameters, until a small maximum ing(RNH) was obtained. However, by restoring the normal bondstrength, the maximum disappeared. This is due to the fact, alreadynoted, that the solvent-solvent H-bonds are stronger than thesolute-solvent ones.2.4. Nonadiabatic Dynamics. We applied the “fewest
switches” algorithm by Tully,69 modified with quantum deco-herence corrections.72 We used the time step Δt = 0.1 fs for theintegration of the trajectories (Beeman-Verlet method) and forthe propagation of the electronic wave functions.70 Five electro-nic states (S0-S4) were included in the dynamics, to allow forpossible transitions from S1 to the upper states. However, veryfew upward hops were observed.The conditions to stop a trajectory were chosen with two aims:
to obtain a final structure sufficiently close to the equilibriumgeometry of one of the two isomers and to be reasonably surethat no further isomerization events may occur, by hot groundstate processes and/or by reverting to the excited states. Thebackward cisf trans ground state process had been observed in aprevious simulation of TAB photoisomerization, with especiallyfavorable conditions: the azobenzene molecule was subjected toan external force with a destabilizing effect on CAB, and nosolvent effects were taken into account.42 The primary stoppingcondition is that the azobenzene molecule has reached theelectronic ground state. Next, the time elapsed from the excita-tion must be longer than a threshold tmin, to allow for a substantial,although not complete, intra- and intermolecular vibrationalenergy redistribution among the 66 modes of the azobenzenemolecule and from azobenzene to the solvent. On the basis of ourprevious experience42 and of the shorter times involved whenexciting CAB rather than TAB, we imposed tmin = 2.5 ps for atrajectory going from TAB to CAB, 1 ps for a trajectory startingfrom TAB and reverting to TAB, 1 ps for the CABf TAB case,and 1.5 ps for the CABfCAB one. As to the molecular geometry,the stop conditions require that both NNC angles are larger than150�, to be far from the TS for the N-inversion. Finally, theCNNC dihedral angle must be within (5� of either 180� or 0�,whereby the product is TAB or CAB, respectively.
3. QUANTUM YIELDS AND EXCITED STATE DYNAMICS
3.1. Quantum Yields. The quantum yield obtained by asimulation starting with the excitation of a given isomer is definedas the fraction of trajectories that are stopped near the equilib-rium geometry of the other isomer: these will be called the reactivetrajectories, and the others, unreactive. The computed quantumyields are in very good agreement with the experimental data (seeTable 2). In vacuo, the present results are quite close to ourprevious ones.34 They appear to be affected by the solventviscosity and much less by its polarity. We recall that theviscosities of n-hexane, methanol, and ethylene glycol at 298 Kare η = 0.30, 0.54, and 16.1 mPa 3 s, respectively.
86 In the lowviscosity solvents theΦtfc quantum yield is slightly lower than invacuo, whileΦcft is unaltered. With a higher viscosity, that is, inethylene glycol, we find a larger Φtfc and a smaller Φcft. Thisresult is not intuitive but is in agreement with the quantum yieldsmeasured in another viscous solvent,2 namely, glycerol at 298 K(η = 934mPa 3 s;
86 see again Table 2). Notice that at much higherviscosities (glycerol at 198 K) the Φtfc quantum yield drops to
0.23, more in line with the common expectation that a viscoussolvent would hamper any large amplitude internal motion and,particularly, the double bond torsion of ethene, imino, or azogroups with bulky substituents.2 A simulation of such extremeconditions is planned but faces a major problem as to theequilibration of the azobenzene plus solvent cluster.3.2. Internal Motions. To understand these trends, we must
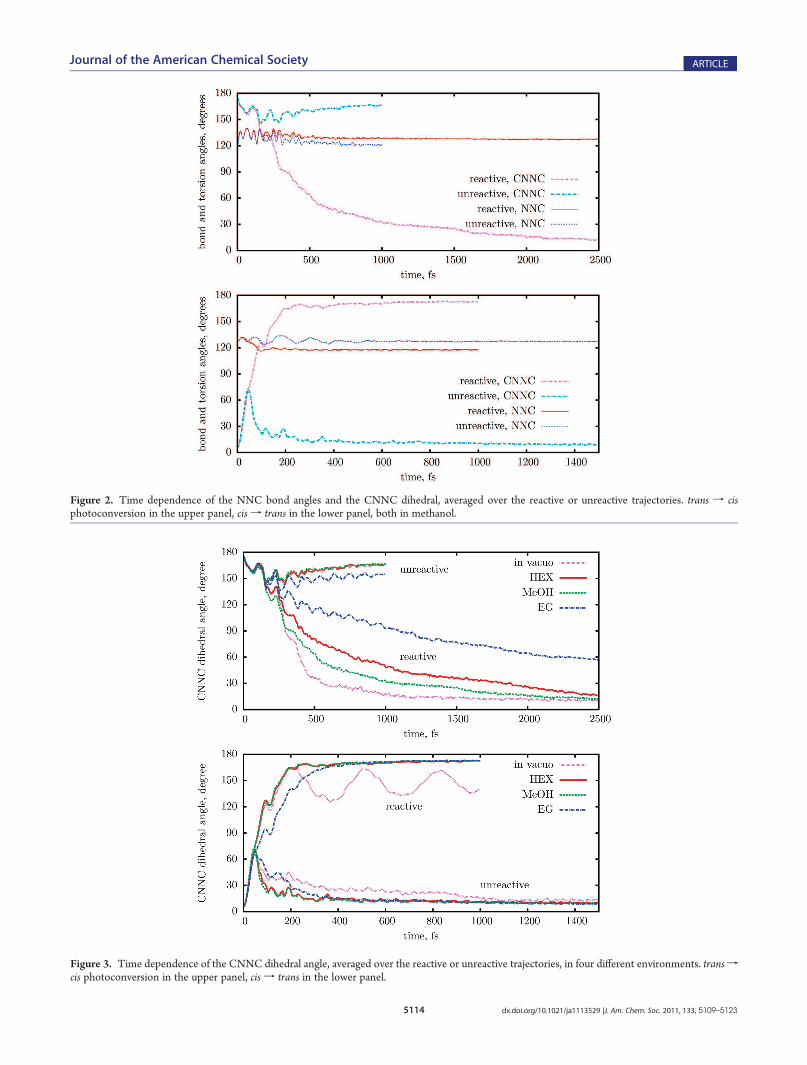
analyze the reaction mechanism. Figure 2 shows the averagesover all the reactive or unreactive trajectories of the mostimportant internal angles and dihedrals that determine themolecular structure, as functions of time. Figure 2 refers to themethanol solution, but essentially the same conclusions can bedrawn for the other environments (see Figures S3, S4, and S5 inthe Supporting Information). The NNC symmetric bendingmode is excited as a consequence of the n f π* transition,because the loss of one electron from the N lone pairs causes anopening of the NNC angles. In all the figures we show twoseparate averages, one for the larger and one for the smaller NNCangle. Nevertheless, the two averages almost coincide, that is, thebending motion is strictly symmetric and there is no hint of thesingle N-inversion that would lead to isomerization. Of course, ashort time after excitation the averages of NNC over reactive andunreactive trajectories start diverging, each one approaching therespective final equilibrium value in the ground state. Startingwith TAB, one can see several NNC oscillations with a frequencyof 155 cm-1, while the torsional motion and the deactivation ofCAB in methanol are so fast that only one coherent NNCoscillation can be observed. This is in agreement with theresonant Raman measurements by Stuart et al.,27 which detectthe NNC bending mode of TAB and the CNNC torsion of CABin ethanol solution. However, we find that the double bondtorsion is the most important geometrical change leading to theisomerization and/or to the excited state decay for both the transf cis and cisf trans processes, even in environments where it isslowed down.Figure 3 shows the time evolution of the averaged CNNC
dihedral angle. Before averaging, the angles are all reduced to the[0,180�] range by subtracting 360� and/or changing their sign;otherwise, the averages would be meaningless because of thesymmetry of the distributions with respect to 0 and 180�. Theinitial rate of change of CNNC is the same for all environments,and for both the reactive and unreactive trajectories, up to about150 fs when the starting isomer is TAB and up to 50 fs when it isCAB (see also the 30� torsion times in Table 3). After thesetimes, the CNNC angle for the unreactive trajectories goessharply back toward the initial value: as we shall see, this is theresult of nonadiabatic transitions to the ground state. The time
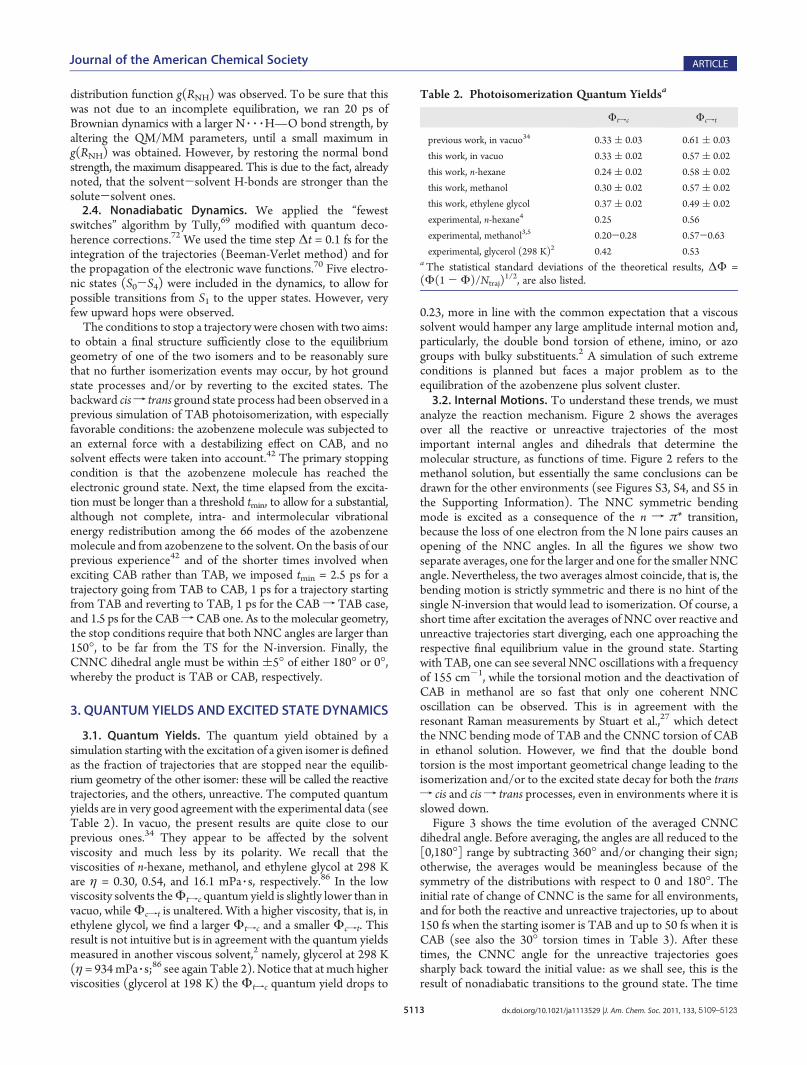
Table 2. Photoisomerization Quantum Yieldsa
Φtfc Φcft
previous work, in vacuo34 0.33 ( 0.03 0.61 ( 0.03
this work, in vacuo 0.33 ( 0.02 0.57 ( 0.02
this work, n-hexane 0.24 ( 0.02 0.58 ( 0.02
this work, methanol 0.30 ( 0.02 0.57 ( 0.02
this work, ethylene glycol 0.37 ( 0.02 0.49 ( 0.02
experimental, n-hexane4 0.25 0.56
experimental, methanol3,5 0.20-0.28 0.57-0.63
experimental, glycerol (298 K)2 0.42 0.53aThe statistical standard deviations of the theoretical results, ΔΦ =(Φ(1 - Φ)/Ntraj)
1/2, are also listed.
5114 dx.doi.org/10.1021/ja1113529 |J. Am. Chem. Soc. 2011, 133, 5109–5123
Journal of the American Chemical Society ARTICLE
Figure 2. Time dependence of the NNC bond angles and the CNNC dihedral, averaged over the reactive or unreactive trajectories. trans f cisphotoconversion in the upper panel, cis f trans in the lower panel, both in methanol.
Figure 3. Time dependence of the CNNC dihedral angle, averaged over the reactive or unreactive trajectories, in four different environments. transfcis photoconversion in the upper panel, cis f trans in the lower panel.
5115 dx.doi.org/10.1021/ja1113529 |J. Am. Chem. Soc. 2011, 133, 5109–5123
Journal of the American Chemical Society ARTICLE
dependence of CNNC appears to be modulated by the interac-tion with other skeletal modes; for TAB in ethylene glycol theoscillation with a period of 100 fs is particularly evident. Byinspecting the trajectories of TAB one by one, one finds thatCNNC remains confined for a while in the transoid region(roughly CNNC > 130�); then, in the reactive case, a fasttransition toward small CNNC angles takes place in 20-30 fs(see Figures S8 and S9 in the Supporting Information). Thismeans that the averages depicted in Figure 3 combine thecontributions of trajectories at transoid geometries with thosealready at cisoid geometries, the balance shifting gradually in timetoward the latter. The delay of the isomerization depends on theenvironment: it is fastest in vacuo and slowest in EG. Methanoland n-hexane yield similar results, but the latter, although lessviscous, has a slightly larger slowing effect: this is a clue that thelarge differences in the size and mass of the solvent molecules inthis case are more important than the intermolecular interactionsand solvent structure. In fact, Malhado et al. have recentlyemphasized the importance of solvent relaxation times (thatare related to molecular masses and sizes), in modeling aphotoisomerization in condensed phase.87 The slowing downcorrelated with the solvent properties is much more evident inthe transf cis process than in the cisf trans one, because on theCAB side the slope of the PES is larger and drives more forcefullythe motion along the torsional coordinate. In vacuo, the cis ftrans torsion acquires a sufficiently large momentum as to giveplace to oscillations around the TAB minimum, but in all thesolvents this motion is efficiently damped out (such oscillationsare centered around CNNC = 180�, but in our plot they rangefrom ∼130� to ∼160� because of the reduction to the interval[0,180�] applied when averaging CNNC).As expected for any considerable geometrical rearrangement,
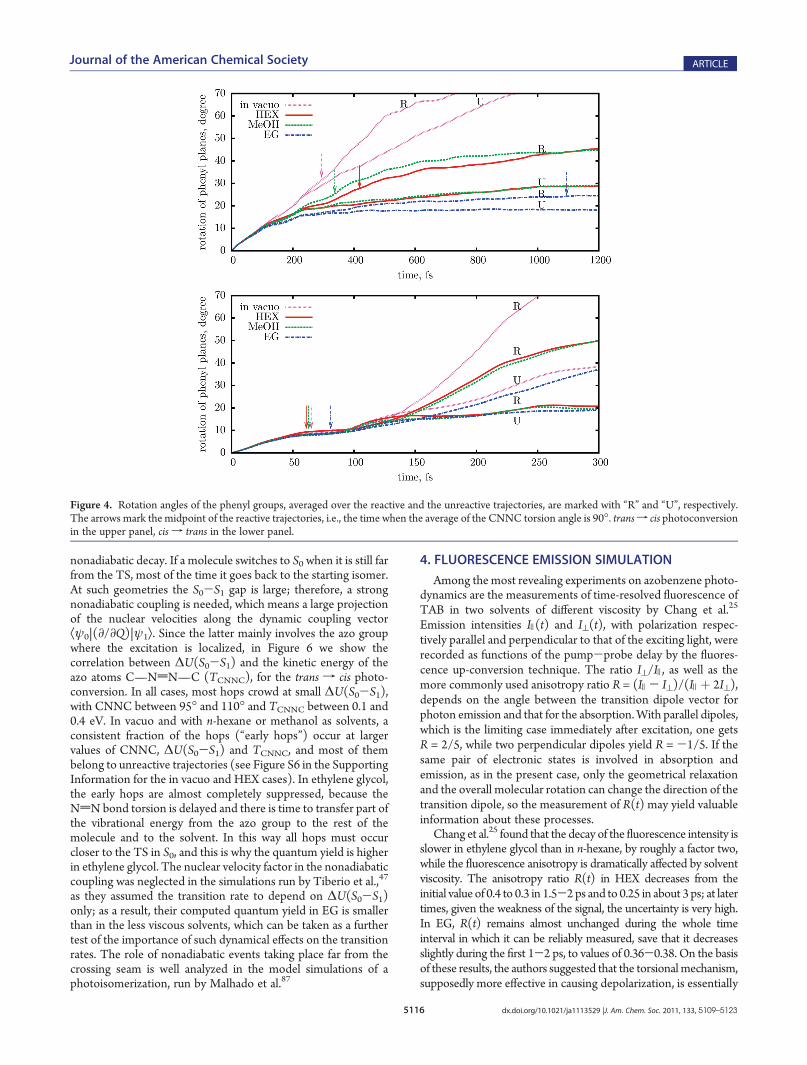
the double bond torsion is coordinated with other internalmotions, in order to minimize the overall displacement of atoms.This occurs in vacuo, due to inertial effects, and even more in thecondensed phase, because the surrounding molecules hinder anylarge amplitude motion. In azobenzene, the reorientation of eachphenyl group and of the inertial axes of the whole molecule isminimized by coordinating the NdN bond torsion with asimultaneous torsion of the N—C bonds. This behavior wasalready observed by Ootani et al., who performed a full simula-tion of the n f π* cis f trans and trans f cis photodynamicswith CASSCF/STO-3G PES for the isolated molecule and byB€ockmann et al., who ran a few trajectories starting from CAB88
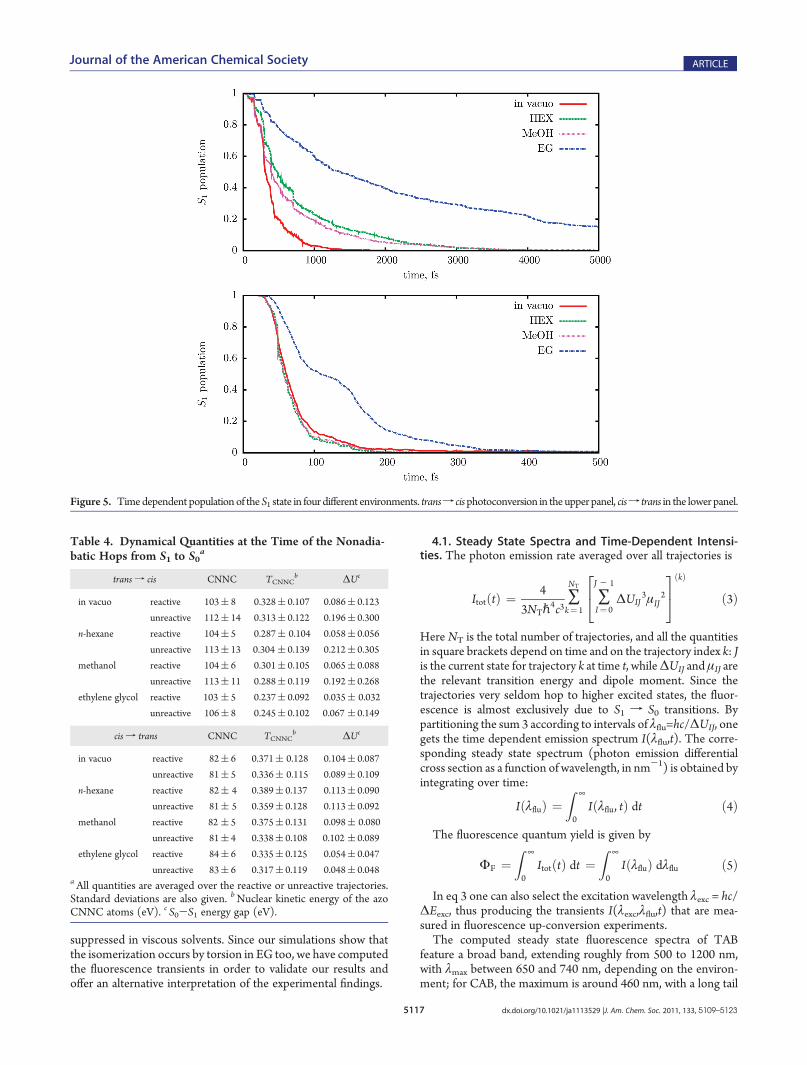
and from TAB89 in pure liquid azobenzene, with a QM/MMapproach based onDFT. Instead of flapping the phenyl rings, this“pedalling” motion modifies the orientation of the N—N axis.Thanks to this mechanism, the negative influence of the solventviscosity on the NdN torsion and on the quantum yields iseffectively reduced. In Figure 4 we show how the phenyl groupsreorient themselves in the four different media. We consider thevector VBi (i = 1,2) perpendicular to each phenyl ring, identified asthe principal axis of the six carbon atoms with the largest momentof inertia; then, for each trajectory, we compute the rotationunderwent by the phenyl ring as the angle Ri(t) between VBi(t)and the initial direction VBi(0). In Figure 4 we plot the averagesover all reactive or unreactive trajectories of (R1(t) þ R2(t))/2.The plots show that in solution the phenyl rings are less free toreorient themselves than in vacuo, and EG is the most constrainingsolvent of the three. This trend is quite apparent at long times, forboth isomers, but a comparison can also be made at someequivalent point along the reaction pathway. To this aim, we havemarked with arrows the midpoint of the pathway, that is, the timewhen the CNNC angle, averaged over the reactive trajectories, is90. ForCABexcitation, we hardly find a difference between the fourmedia at the midpoint of the pathway, which is reached very soon(60-80 fs), with little displacement of the phenyl rings. For TAB,at the same stage the rotation of the phenyl rings is smaller in EGthan in the other media, in spite of the much longer time elapsed.3.3. Excited State Decay. Figure 5 shows the time depen-
dence of the excited state population, that is, the fraction oftrajectories running on the S1 PES at a given time. The S1 decaycurves are characterized by an onset time τ0, during which almostno loss of population occurs; after τ0 they can be fitted by abiexponential form:
P1ðtÞ ¼ 1 for t e τ0
P1ðtÞ ¼ W1e-ðt - τ0Þ=τ1ð1-W1Þe-ðt - τ0Þ=τ2 for t g τ0
ð2Þ
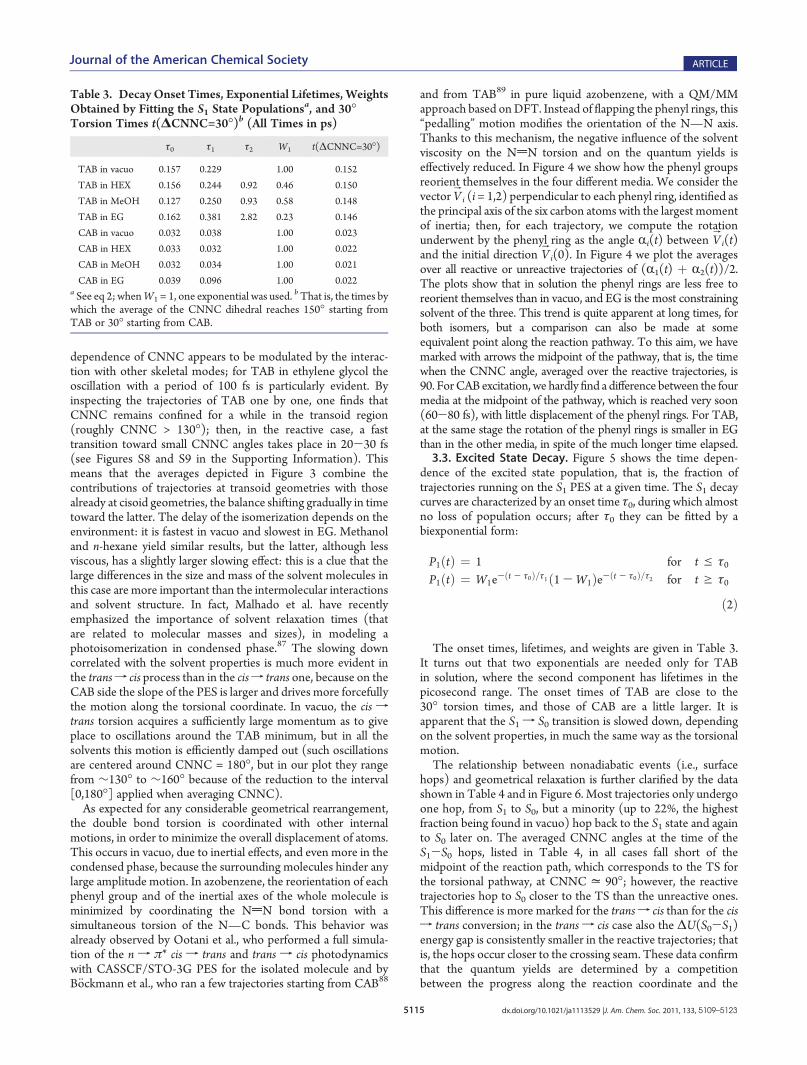
The onset times, lifetimes, and weights are given in Table 3.It turns out that two exponentials are needed only for TABin solution, where the second component has lifetimes in thepicosecond range. The onset times of TAB are close to the30� torsion times, and those of CAB are a little larger. It isapparent that the S1 f S0 transition is slowed down, dependingon the solvent properties, in much the same way as the torsionalmotion.The relationship between nonadiabatic events (i.e., surface
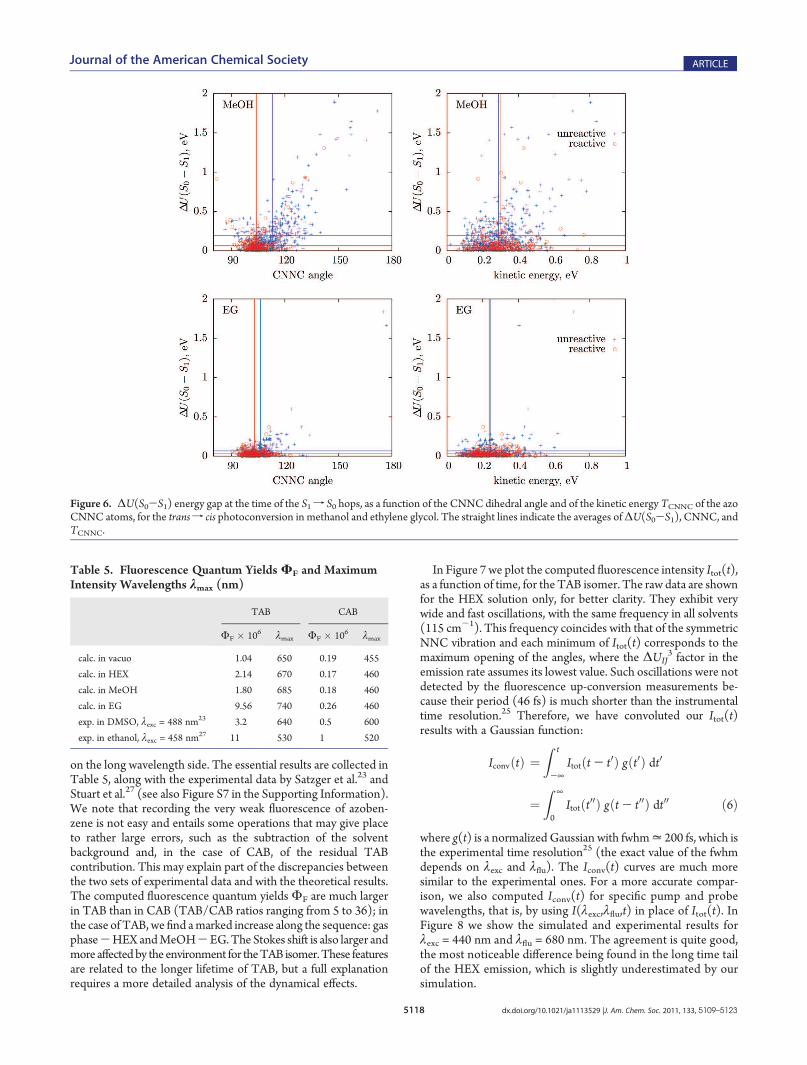
hops) and geometrical relaxation is further clarified by the datashown in Table 4 and in Figure 6. Most trajectories only undergoone hop, from S1 to S0, but a minority (up to 22%, the highestfraction being found in vacuo) hop back to the S1 state and againto S0 later on. The averaged CNNC angles at the time of theS1-S0 hops, listed in Table 4, in all cases fall short of themidpoint of the reaction path, which corresponds to the TS forthe torsional pathway, at CNNC = 90�; however, the reactivetrajectories hop to S0 closer to the TS than the unreactive ones.This difference is more marked for the transf cis than for the cisf trans conversion; in the transf cis case also the ΔU(S0-S1)energy gap is consistently smaller in the reactive trajectories; thatis, the hops occur closer to the crossing seam. These data confirmthat the quantum yields are determined by a competitionbetween the progress along the reaction coordinate and the
Table 3. Decay Onset Times, Exponential Lifetimes, WeightsObtained by Fitting the S1 State Populations
a, and 30�Torsion Times t(ΔCNNC=30�)b (All Times in ps)
τ0 τ1 τ2 W1 t(ΔCNNC=30�)
TAB in vacuo 0.157 0.229 1.00 0.152
TAB in HEX 0.156 0.244 0.92 0.46 0.150
TAB in MeOH 0.127 0.250 0.93 0.58 0.148
TAB in EG 0.162 0.381 2.82 0.23 0.146
CAB in vacuo 0.032 0.038 1.00 0.023
CAB in HEX 0.033 0.032 1.00 0.022
CAB in MeOH 0.032 0.034 1.00 0.021
CAB in EG 0.039 0.096 1.00 0.022a See eq 2; whenW1 = 1, one exponential was used.
bThat is, the times bywhich the average of the CNNC dihedral reaches 150� starting fromTAB or 30� starting from CAB.
5116 dx.doi.org/10.1021/ja1113529 |J. Am. Chem. Soc. 2011, 133, 5109–5123
Journal of the American Chemical Society ARTICLE
nonadiabatic decay. If a molecule switches to S0when it is still farfrom the TS, most of the time it goes back to the starting isomer.At such geometries the S0-S1 gap is large; therefore, a strongnonadiabatic coupling is needed, which means a large projectionof the nuclear velocities along the dynamic coupling vectorÆψ0|(∂/∂Q)|ψ1æ. Since the latter mainly involves the azo groupwhere the excitation is localized, in Figure 6 we show thecorrelation between ΔU(S0-S1) and the kinetic energy of theazo atoms C—NdN—C (TCNNC), for the trans f cis photo-conversion. In all cases, most hops crowd at small ΔU(S0-S1),with CNNC between 95� and 110� and TCNNC between 0.1 and0.4 eV. In vacuo and with n-hexane or methanol as solvents, aconsistent fraction of the hops (“early hops”) occur at largervalues of CNNC, ΔU(S0-S1) and TCNNC, and most of thembelong to unreactive trajectories (see Figure S6 in the SupportingInformation for the in vacuo and HEX cases). In ethylene glycol,the early hops are almost completely suppressed, because theNdN bond torsion is delayed and there is time to transfer part ofthe vibrational energy from the azo group to the rest of themolecule and to the solvent. In this way all hops must occurcloser to the TS in S0, and this is why the quantum yield is higherin ethylene glycol. The nuclear velocity factor in the nonadiabaticcoupling was neglected in the simulations run by Tiberio et al.,47
as they assumed the transition rate to depend on ΔU(S0-S1)only; as a result, their computed quantum yield in EG is smallerthan in the less viscous solvents, which can be taken as a furthertest of the importance of such dynamical effects on the transitionrates. The role of nonadiabatic events taking place far from thecrossing seam is well analyzed in the model simulations of aphotoisomerization, run by Malhado et al.87
4. FLUORESCENCE EMISSION SIMULATION
Among the most revealing experiments on azobenzene photo-dynamics are the measurements of time-resolved fluorescence ofTAB in two solvents of different viscosity by Chang et al.25
Emission intensities I )(t) and I^(t), with polarization respec-tively parallel and perpendicular to that of the exciting light, wererecorded as functions of the pump-probe delay by the fluores-cence up-conversion technique. The ratio I^/I ), as well as themore commonly used anisotropy ratio R = (I )- I^)/(I )þ 2I^),depends on the angle between the transition dipole vector forphoton emission and that for the absorption.With parallel dipoles,which is the limiting case immediately after excitation, one getsR = 2/5, while two perpendicular dipoles yield R = -1/5. If thesame pair of electronic states is involved in absorption andemission, as in the present case, only the geometrical relaxationand the overall molecular rotation can change the direction of thetransition dipole, so the measurement of R(t) may yield valuableinformation about these processes.
Chang et al.25 found that the decay of the fluorescence intensity isslower in ethylene glycol than in n-hexane, by roughly a factor two,while the fluorescence anisotropy is dramatically affected by solventviscosity. The anisotropy ratio R(t) in HEX decreases from theinitial value of 0.4 to 0.3 in 1.5-2 ps and to 0.25 in about 3 ps; at latertimes, given the weakness of the signal, the uncertainty is very high.In EG, R(t) remains almost unchanged during the whole timeinterval in which it can be reliably measured, save that it decreasesslightly during the first 1-2 ps, to values of 0.36-0.38. On the basisof these results, the authors suggested that the torsionalmechanism,supposedly more effective in causing depolarization, is essentially
Figure 4. Rotation angles of the phenyl groups, averaged over the reactive and the unreactive trajectories, are marked with “R” and “U”, respectively.The arrows mark the midpoint of the reactive trajectories, i.e., the time when the average of the CNNC torsion angle is 90�. transf cis photoconversionin the upper panel, cis f trans in the lower panel.
5117 dx.doi.org/10.1021/ja1113529 |J. Am. Chem. Soc. 2011, 133, 5109–5123
Journal of the American Chemical Society ARTICLE
suppressed in viscous solvents. Since our simulations show thatthe isomerization occurs by torsion in EG too, we have computedthe fluorescence transients in order to validate our results andoffer an alternative interpretation of the experimental findings.
4.1. Steady State Spectra and Time-Dependent Intensi-ties. The photon emission rate averaged over all trajectories is
ItotðtÞ ¼4
3NTp4c3∑NT
k¼ 1∑J - 1
I¼ 0ΔUIJ
3μIJ2
2
4
3
5
ðkÞ
ð3Þ
Here NT is the total number of trajectories, and all the quantitiesin square brackets depend on time and on the trajectory index k: Jis the current state for trajectory k at time t, whileΔUIJ and μIJ arethe relevant transition energy and dipole moment. Since thetrajectories very seldom hop to higher excited states, the fluor-escence is almost exclusively due to S1 f S0 transitions. Bypartitioning the sum 3 according to intervals of λflu=hc/ΔUIJ, onegets the time dependent emission spectrum I(λflu,t). The corre-sponding steady state spectrum (photon emission differentialcross section as a function of wavelength, in nm-1) is obtained byintegrating over time:
IðλfluÞ ¼
Z ¥
0Iðλflu, tÞ dt ð4Þ
The fluorescence quantum yield is given by
ΦF ¼
Z ¥
0ItotðtÞ dt ¼
Z ¥
0IðλfluÞ dλflu ð5Þ
In eq 3 one can also select the excitation wavelength λexc = hc/ΔEexc, thus producing the transients I(λexc,λflu,t) that are mea-sured in fluorescence up-conversion experiments.The computed steady state fluorescence spectra of TAB
feature a broad band, extending roughly from 500 to 1200 nm,with λmax between 650 and 740 nm, depending on the environ-ment; for CAB, the maximum is around 460 nm, with a long tail
Figure 5. Timedependent populationof theS1 state in four different environments. transf cisphotoconversion in theupper panel, cisf trans in the lower panel.
Table 4. Dynamical Quantities at the Time of the Nonadia-batic Hops from S1 to S0
a
trans f cis CNNC TCNNCb
ΔUc
in vacuo reactive 103( 8 0.328( 0.107 0.086( 0.123
unreactive 112( 14 0.313( 0.122 0.196( 0.300
n-hexane reactive 104( 5 0.287( 0.104 0.058( 0.056
unreactive 113( 13 0.304 ( 0.139 0.212( 0.305
methanol reactive 104( 6 0.301( 0.105 0.065( 0.088
unreactive 113( 11 0.288( 0.119 0.192( 0.268
ethylene glycol reactive 103 ( 5 0.237( 0.092 0.035( 0.032
unreactive 106( 8 0.245( 0.102 0.067 ( 0.149
cis f trans CNNC TCNNCb
ΔUc
in vacuo reactive 82( 6 0.371( 0.128 0.104( 0.087
unreactive 81( 5 0.336( 0.115 0.089( 0.109
n-hexane reactive 82( 4 0.389( 0.137 0.113( 0.090
unreactive 81( 5 0.359( 0.128 0.113( 0.092
methanol reactive 82 ( 5 0.375( 0.131 0.098( 0.080
unreactive 81( 4 0.338( 0.108 0.102 ( 0.089
ethylene glycol reactive 84( 6 0.335( 0.125 0.054( 0.047
unreactive 83( 6 0.317( 0.119 0.048( 0.048aAll quantities are averaged over the reactive or unreactive trajectories.Standard deviations are also given. bNuclear kinetic energy of the azoCNNC atoms (eV). c S0-S1 energy gap (eV).
5118 dx.doi.org/10.1021/ja1113529 |J. Am. Chem. Soc. 2011, 133, 5109–5123
Journal of the American Chemical Society ARTICLE
on the long wavelength side. The essential results are collected inTable 5, along with the experimental data by Satzger et al.23 andStuart et al.27 (see also Figure S7 in the Supporting Information).We note that recording the very weak fluorescence of azoben-zene is not easy and entails some operations that may give placeto rather large errors, such as the subtraction of the solventbackground and, in the case of CAB, of the residual TABcontribution. This may explain part of the discrepancies betweenthe two sets of experimental data and with the theoretical results.The computed fluorescence quantum yieldsΦF are much largerin TAB than in CAB (TAB/CAB ratios ranging from 5 to 36); inthe case of TAB, we find amarked increase along the sequence: gasphase-HEXandMeOH-EG.The Stokes shift is also larger andmore affectedby the environment for theTAB isomer.These featuresare related to the longer lifetime of TAB, but a full explanationrequires a more detailed analysis of the dynamical effects.
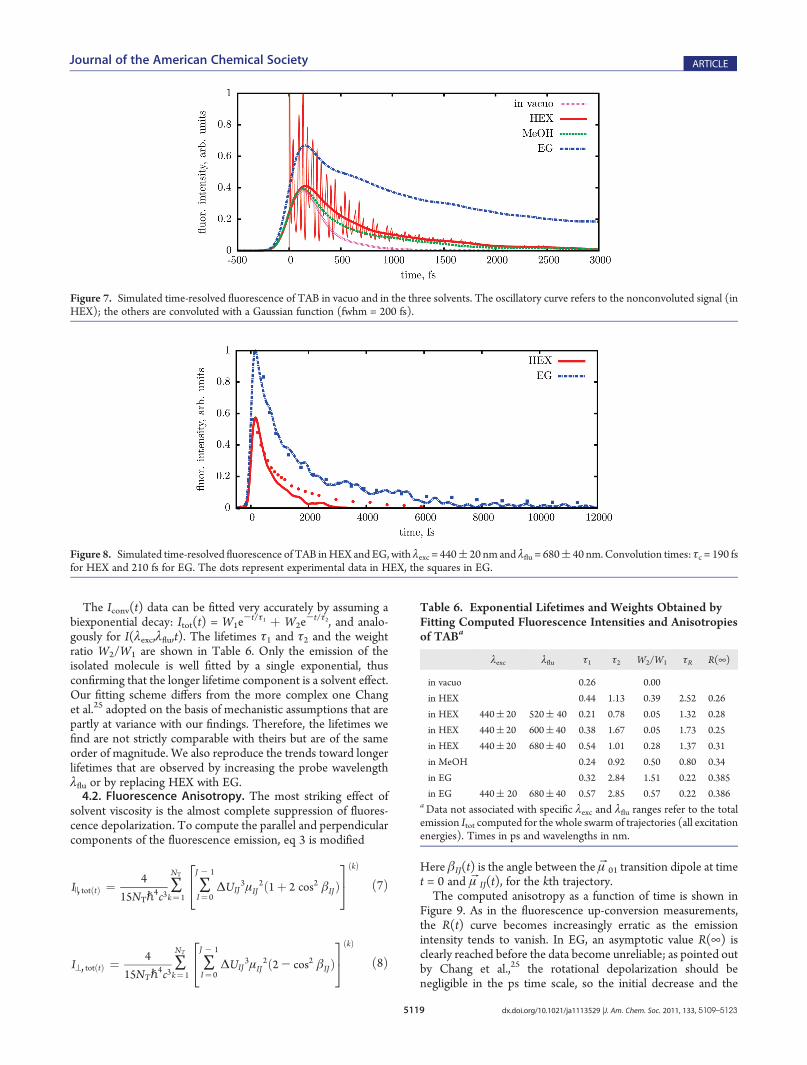
In Figure 7 we plot the computed fluorescence intensity Itot(t),as a function of time, for the TAB isomer. The raw data are shownfor the HEX solution only, for better clarity. They exhibit verywide and fast oscillations, with the same frequency in all solvents(115 cm-1). This frequency coincides with that of the symmetricNNC vibration and each minimum of Itot(t) corresponds to themaximum opening of the angles, where the ΔUIJ
3 factor in theemission rate assumes its lowest value. Such oscillations were notdetected by the fluorescence up-conversion measurements be-cause their period (46 fs) is much shorter than the instrumentaltime resolution.25 Therefore, we have convoluted our Itot(t)results with a Gaussian function:
IconvðtÞ ¼
Z t
-¥
Itotðt - t0Þ gðt0Þ dt0
¼
Z ¥
0Itotðt
00Þ gðt - t00Þ dt00 ð6Þ
where g(t) is a normalized Gaussian with fwhm= 200 fs, which isthe experimental time resolution25 (the exact value of the fwhmdepends on λexc and λflu). The Iconv(t) curves are much moresimilar to the experimental ones. For a more accurate compar-ison, we also computed Iconv(t) for specific pump and probewavelengths, that is, by using I(λexc,λflu,t) in place of Itot(t). InFigure 8 we show the simulated and experimental results forλexc = 440 nm and λflu = 680 nm. The agreement is quite good,the most noticeable difference being found in the long time tailof the HEX emission, which is slightly underestimated by oursimulation.
Figure 6. ΔU(S0-S1) energy gap at the time of the S1f S0 hops, as a function of the CNNC dihedral angle and of the kinetic energy TCNNC of the azoCNNC atoms, for the transf cis photoconversion in methanol and ethylene glycol. The straight lines indicate the averages ofΔU(S0-S1), CNNC, andTCNNC.
Table 5. Fluorescence Quantum Yields ΦF and MaximumIntensity Wavelengths λmax (nm)
TAB CAB
ΦF � 106 λmax ΦF � 106 λmax
calc. in vacuo 1.04 650 0.19 455
calc. in HEX 2.14 670 0.17 460
calc. in MeOH 1.80 685 0.18 460
calc. in EG 9.56 740 0.26 460
exp. in DMSO, λexc = 488 nm23 3.2 640 0.5 600
exp. in ethanol, λexc = 458 nm27 11 530 1 520
5119 dx.doi.org/10.1021/ja1113529 |J. Am. Chem. Soc. 2011, 133, 5109–5123
Journal of the American Chemical Society ARTICLE
The Iconv(t) data can be fitted very accurately by assuming abiexponential decay: Itot(t) = W1e
-t/τ1 þ W2e-t/τ2, and analo-
gously for I(λexc,λflu,t). The lifetimes τ1 and τ2 and the weightratio W2/W1 are shown in Table 6. Only the emission of theisolated molecule is well fitted by a single exponential, thusconfirming that the longer lifetime component is a solvent effect.Our fitting scheme differs from the more complex one Changet al.25 adopted on the basis of mechanistic assumptions that arepartly at variance with our findings. Therefore, the lifetimes wefind are not strictly comparable with theirs but are of the sameorder of magnitude. We also reproduce the trends toward longerlifetimes that are observed by increasing the probe wavelengthλflu or by replacing HEX with EG.4.2. Fluorescence Anisotropy. The most striking effect of
solvent viscosity is the almost complete suppression of fluores-cence depolarization. To compute the parallel and perpendicularcomponents of the fluorescence emission, eq 3 is modified
I ), totðtÞ ¼4
15NTp4c3∑NT
k¼ 1∑J - 1
I¼ 0ΔUIJ
3μIJ2ð1þ 2 cos2 βIJÞ
2
4
3
5
ðkÞ
ð7Þ
I^, totðtÞ ¼4
15NTp4c3∑NT
k¼ 1∑J - 1
I¼ 0ΔUIJ
3μIJ2ð2- cos2 βIJÞ
2
4
3
5
ðkÞ
ð8Þ
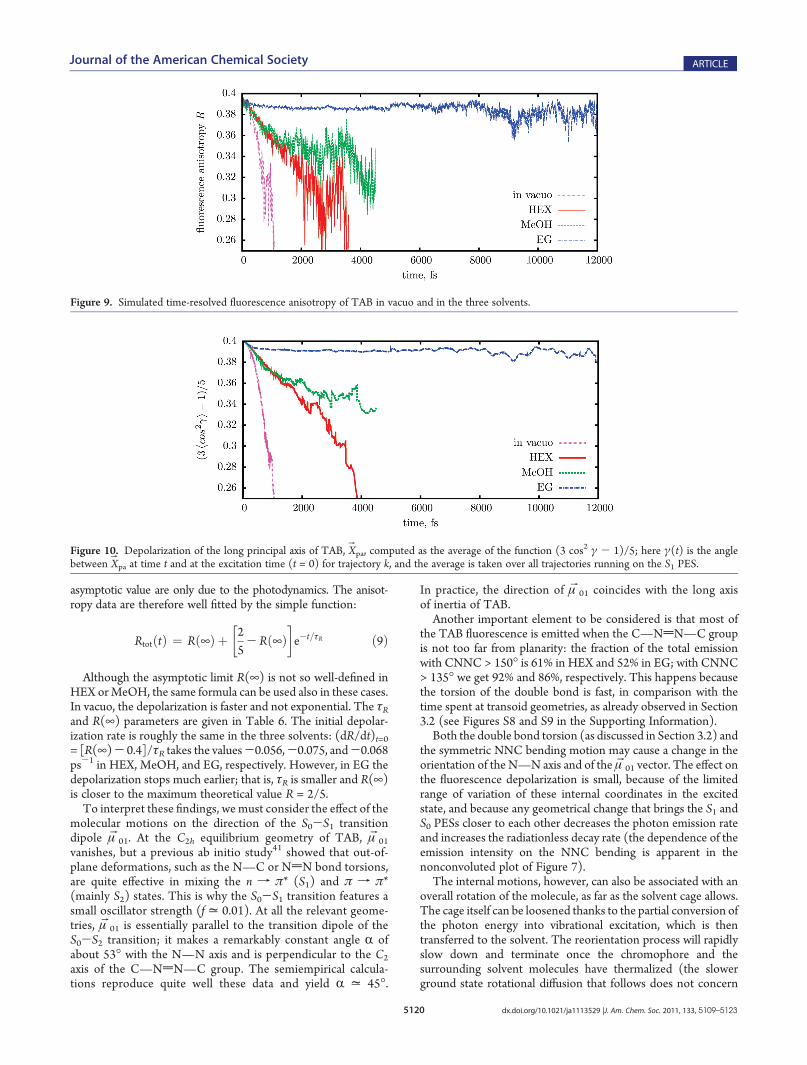
Here βIJ(t) is the angle between the μB01 transition dipole at timet = 0 and μBIJ(t), for the kth trajectory.The computed anisotropy as a function of time is shown in
Figure 9. As in the fluorescence up-conversion measurements,the R(t) curve becomes increasingly erratic as the emissionintensity tends to vanish. In EG, an asymptotic value R(¥) isclearly reached before the data become unreliable; as pointed outby Chang et al.,25 the rotational depolarization should benegligible in the ps time scale, so the initial decrease and the
Figure 7. Simulated time-resolved fluorescence of TAB in vacuo and in the three solvents. The oscillatory curve refers to the nonconvoluted signal (inHEX); the others are convoluted with a Gaussian function (fwhm = 200 fs).
Figure 8. Simulated time-resolved fluorescence of TAB inHEX and EG, with λexc = 440( 20 nm and λflu = 680( 40 nm.Convolution times: τc = 190 fsfor HEX and 210 fs for EG. The dots represent experimental data in HEX, the squares in EG.
Table 6. Exponential Lifetimes and Weights Obtained byFitting Computed Fluorescence Intensities and Anisotropiesof TABa
λexc λflu τ1 τ2 W2/W1 τR R(¥)
in vacuo 0.26 0.00
in HEX 0.44 1.13 0.39 2.52 0.26
in HEX 440( 20 520( 40 0.21 0.78 0.05 1.32 0.28
in HEX 440( 20 600( 40 0.38 1.67 0.05 1.73 0.25
in HEX 440( 20 680( 40 0.54 1.01 0.28 1.37 0.31
in MeOH 0.24 0.92 0.50 0.80 0.34
in EG 0.32 2.84 1.51 0.22 0.385
in EG 440( 20 680( 40 0.57 2.85 0.57 0.22 0.386aData not associated with specific λexc and λflu ranges refer to the totalemission Itot computed for the whole swarm of trajectories (all excitationenergies). Times in ps and wavelengths in nm.
5120 dx.doi.org/10.1021/ja1113529 |J. Am. Chem. Soc. 2011, 133, 5109–5123
Journal of the American Chemical Society ARTICLE
asymptotic value are only due to the photodynamics. The anisot-ropy data are therefore well fitted by the simple function:
RtotðtÞ ¼ Rð¥Þ þ2
5- Rð¥Þ
� �
e-t=τR ð9Þ
Although the asymptotic limit R(¥) is not so well-defined inHEX orMeOH, the same formula can be used also in these cases.In vacuo, the depolarization is faster and not exponential. The τRand R(¥) parameters are given in Table 6. The initial depolar-ization rate is roughly the same in the three solvents: (dR/dt)t=0= [R(¥)- 0.4]/τR takes the values-0.056,-0.075, and-0.068ps-1 in HEX, MeOH, and EG, respectively. However, in EG thedepolarization stops much earlier; that is, τR is smaller and R(¥)is closer to the maximum theoretical value R = 2/5.To interpret these findings, we must consider the effect of the
molecular motions on the direction of the S0-S1 transitiondipole μB01. At the C2h equilibrium geometry of TAB, μB01
vanishes, but a previous ab initio study41 showed that out-of-plane deformations, such as the N—C or NdN bond torsions,are quite effective in mixing the n f π* (S1) and π f π*(mainly S2) states. This is why the S0-S1 transition features asmall oscillator strength (f = 0.01). At all the relevant geome-tries, μB01 is essentially parallel to the transition dipole of theS0-S2 transition; it makes a remarkably constant angle R ofabout 53� with the N—N axis and is perpendicular to the C2
axis of the C—NdN—C group. The semiempirical calcula-tions reproduce quite well these data and yield R = 45�.
In practice, the direction of μB01 coincides with the long axisof inertia of TAB.Another important element to be considered is that most of
the TAB fluorescence is emitted when the C—NdN—C groupis not too far from planarity: the fraction of the total emissionwith CNNC > 150� is 61% in HEX and 52% in EG; with CNNC> 135� we get 92% and 86%, respectively. This happens becausethe torsion of the double bond is fast, in comparison with thetime spent at transoid geometries, as already observed in Section3.2 (see Figures S8 and S9 in the Supporting Information).Both the double bond torsion (as discussed in Section 3.2) and
the symmetric NNC bending motion may cause a change in theorientation of the N—N axis and of the μB01 vector. The effect onthe fluorescence depolarization is small, because of the limitedrange of variation of these internal coordinates in the excitedstate, and because any geometrical change that brings the S1 andS0 PESs closer to each other decreases the photon emission rateand increases the radiationless decay rate (the dependence of theemission intensity on the NNC bending is apparent in thenonconvoluted plot of Figure 7).The internal motions, however, can also be associated with an
overall rotation of the molecule, as far as the solvent cage allows.The cage itself can be loosened thanks to the partial conversion ofthe photon energy into vibrational excitation, which is thentransferred to the solvent. The reorientation process will rapidlyslow down and terminate once the chromophore and thesurrounding solvent molecules have thermalized (the slowerground state rotational diffusion that follows does not concern
Figure 9. Simulated time-resolved fluorescence anisotropy of TAB in vacuo and in the three solvents.
Figure 10. Depolarization of the long principal axis of TAB, XBpa, computed as the average of the function (3 cos2 γ - 1)/5; here γ(t) is the anglebetween XBpa at time t and at the excitation time (t = 0) for trajectory k, and the average is taken over all trajectories running on the S1 PES.
5121 dx.doi.org/10.1021/ja1113529 |J. Am. Chem. Soc. 2011, 133, 5109–5123
Journal of the American Chemical Society ARTICLE
us in this context). To monitor the effect on the reorientation ofthe transition dipole vector, which is roughly parallel to the longaxis of TAB, we considered the principal axis of inertia with thesmallest moment, XBpa. As a proxy of the β01 angle of eqs 7 and 8we took the change in the orientation of XBpa, that is, the angle γbetween XBpa(t) and its initial direction XBpa(0). By putting γinstead of β01 in eqs 7 and 8 and neglecting the weights U01
3μ012
in the averaging, the anisotropy ratio R is replaced by Rpa(t) =(3Æcos2 γæ- 1)/5. TheRpa(t) curves, shown in Figure 10, closelyparallel those of the fluorescence anisotropy R(t), apart from twodetails: they are less noisy, because they are much less affected bythe fast vibrations, and they have a smaller initial slope, ≈-0.02ps-1 instead of ≈-0.06 ps-1. The Rpa(t) functions remain lesssteep than R(t) for about 0.5 ps, so that at later times for eachsolvent Rpa is slightly larger than R. This difference is due to theinternal motions, which cause a fast but small depolarization,about the same in all environments. Themain difference betweenthe three solvents is due to the overall rotation of TAB, which isalmost absent in ethylene glycol.
5. CONCLUSIONS
We have performed a set of simulations of the photodynamicsof trans- and cis-azobenzene in different environments: in vacuo,in n-hexane, in methanol, and in ethylene glycol. The simulationprocedure was not calibrated versus empirical results; only thesemiempirical method by which we compute the PES and theelectronic wave functions has been reparameterized to fit the bestab initio, spectroscopic, and thermochemical data.
The simulations reproduced well the measured quantumyields for the trans f cis and cis f trans photoconversions,and in particular the increasing trend of Φtfc with solventviscosity. This feature is due to the intra- and intermolecularvibrational energy redistribution occurring in the S1 state, whichproceeds to a greater extent in viscous solvents where themolecule remains for much longer times at transoid geometries.With smaller vibrational energies the nonadiabatic transitions areless effective, and a larger fraction of molecules must approachthe crossing seam between S0 and S1 before they can decay to theground state. In this way, they get closer to the transition state forthe torsion around the NdN double bond, thus increasing theisomerization probability.
The reaction coordinate is essentially the NdN torsion forboth the trans f cis and cis f trans processes and in allenvironments. The torsion is assisted by simultaneous rotationsof the C—N bonds, such as to minimize the reorientation of thephenyl groups, especially (but not only) in the condensed phase.When the trans isomer absorbs a photon, the NNC symmetricbending vibration is excited, as already predicted by us on thebasis of simulations for the isolated molecule34 and detected byStuart et al. with resonant Raman scattering. However, the NNCbending does not lead to isomerization: in fact, it rather facilitatesthe excited state decay. The molecule remains at transoidgeometries during a time that falls in the picosecond range andincreases with solvent viscosity; then, a fast torsion takes place in20-30 fs, leading to a nonadiabatic transition to the ground stateand possibly to the isomerization. The cis isomer undergoes amuch prompter NdN torsion and faster nonadiabatic decay thanthe trans one, because of the steeper slope of the PES on the cisside. For the same reason, the excited state dynamics and thequantum yields are more influenced by the environment whenstarting from the trans isomer than from the cis one.
Chang et al.25measured quite different fluorescence transientsfor trans-azobenzene in n-hexane and in ethylene glycol. In themore viscous solvent the lifetimes are roughly twice as long as inthe former one. More strikingly, the fluorescence depolarizationis almost completely suppressed in ethylene glycol during at least10 ps, while it proceeds to a considerable extent in n-hexanewithin 2-3 ps. These differences led the authors to propose asolvent induced change in the reaction and decay mechanism.Our simulated time-dependent emission intensities and anisotro-pies agree very well with the experimental ones, but they can beinterpreted within the torsional mechanism, with a small contribu-tion of the NNC symmetric bending to the initial depolarization.The solvent effect on the depolarization is almost entirely ex-plained by the overall rotation of the chromophore, which is muchmore pronounced in the less viscous and associated solvent.
In all solvents, most of the fluorescence is emitted when trans-azobenzene is still at transoid geometries, that is before the fastNdN torsional motion that leads to the S0-S1 crossing seamand transition state region. As a consequence, it is difficult toobtain clues about the photoisomerization mechanism from thefluorescence transients, and the same holds for the resonantRaman spectra. At present, computational simulations with thenecessary validation against the experimental results seem to bethe best way to extend our knowledge to the crucial events of theazobenzene photodynamics, that is, the S1 f S0 nonadiabatictransition and the crossing of the transition state. Indirect cluescan be obtained from the dependence of the quantum yields onsolvent viscosity, about which more complete sets of data wouldbe welcome. To probe the crucial part of the dynamics it is notsufficient to improve the time resolution of the transient mea-surements, because there is no well-defined time delay at whichsuch events take place. Our suggestion is to rely on the selectivity(based on geometrical, electronic, or spectral properties) ofpump-and-probe methods such as time-resolved photoelectronspectroscopy or pulsed X-rays.
’ASSOCIATED CONTENT
bS Supporting Information. Semiempirical method andparameters and additional figures. This material is available freeof charge via the Internet at http://pubs.acs.org.
’AUTHOR INFORMATION
Corresponding [email protected]
’ACKNOWLEDGMENT
This work was supported by grants from the Italian MIUR(PRIN Project 2006030944) and of the University of Pisa. Agenerous allocation of computer time was provided throughTeraGrid resources by NCSA under Grant Number TG-CHE090047. We are grateful to Dr. Giacomo Prampolini forhis advice about MD simulations. This paper is dedicated to thememory of Alberto Marini.
’REFERENCES
(1) Zimmermann, G.; Chow, L.-Y.; Paik, U.-J. J. Am. Chem. Soc.1958, 80, 3528.
(2) Gegiou, D.; Muszkat, K. A.; Fischer, E. J. Am. Chem. Soc. 1968,90, 12.
5122 dx.doi.org/10.1021/ja1113529 |J. Am. Chem. Soc. 2011, 133, 5109–5123
Journal of the American Chemical Society ARTICLE
(3) Ronayette, J.; Arnaud, R.; Lebourgeois, P.; Lemaire, J. Can.J. Chem. 1974, 52, 1848.(4) Bortolus, P.; Monti, S. J. Phys. Chem. 1979, 83, 648.(5) Gauglitz, G.; Hubig, S. J. Photochem. 1985, 30, 121.(6) Siampiringue, N.; Guyot, G.; Monti, S.; Bortolus, P. J. Photochem.
1987, 37, 185.(7) Rau, H.; L€uddecke, E. J. Am. Chem. Soc. 1982, 104, 1616.(8) Rau, H. J. Photochem. 1984, 26, 221.(9) Rau, H.; Yu-Quan, S. J. Photochem. Photobiol., A 1988, 42, 321.(10) Rau, H. In Photochromism. Molecules and Systems; Durr, H.,
Bouas-Laurent, H., Eds.; Elsevier: Amsterdam, 1990; Chapter 4, p165.(11) Horspool, W. In The Chemistry of the Hydrazo, Azo and Azoxy
Groups; Patai, S., Ed.; Wiley: New York, 2000; Vol. 2.(12) Lednev, I. K.; Ye, T.-Q.; Hester, R. E.; Moore, J. N. J. Phys.
Chem. 1996, 100, 13338.(13) N€agele, T.; Hoche, R.; Zinth, W.; Wachtveitl, J. Chem. Phys.
Lett. 1997, 272, 489.(14) Hamm, P.; Ohline, S. M.; Zinth, W. J. Chem. Phys. 1997,
106, 519.(15) Lednev, I. K.; Ye, T.-Q.; Matousek, P.; Towrie, M.; Foggi, P.;
Neuwahl, F. V. R.; Umapathy, S.; Hester, R. E.; Moore, J. N. Chem. Phys.Lett. 1998, 290, 68.(16) Terazima, M.; Takezaki, M.; Yamaguchi, S.; Hirota, N. J. Chem.
Phys. 1998, 109, 603.(17) Tamai, N.; Miyasaka, H. Chem. Rev. 2000, 100, 1875.(18) Fujino, T.; Tahara, T. J. Phys. Chem. A 2000, 104, 4203.(19) Fujino, T.; Arzhantsev, S. Yu.; Tahara, T. J. Phys. Chem. A 2001,
105, 8123.(20) Fujino, T.; Arzhantsev, S. Yu.; Tahara, T. Bull. Chem. Soc. Jpn.
2002, 75, 1031.(21) Lu, Y.-C.; Chang, C.-W.; Diau, E. W.-G. J. Chin. Chem. Soc.
2002, 49, 693.(22) Schultz, T.; Quenneville, J.; Levine, B.; Toniolo, A.; Martínez,
T. J.; Lochbrunner, S.; Schmitt, M.; Schaffer, J. P.; Zgierski, M. Z.;Stolow, A. J. Am. Chem. Soc. 2003, 125, 8098.(23) Satzger, H.; Sp€orlein, S.; Root, C.; Wachtveitl, J.; Zinth, W.;
Gilch, P. Chem. Phys. Lett. 2003, 372, 216.(24) Satzger, H.; Root, C.; Braun, M. J. Phys. Chem. A 2004,
108, 6265.(25) Chang, C.-W.; Lu, Y.-C.; Wang, T.-T.; Diau, E. W.-G. J. Am.
Chem. Soc. 2004, 126, 10109.(26) Lu, Y.-C.; Diau, E. W.-G.; Rau, H. J. Phys. Chem. A 2005,
109, 2090.(27) Stuart, C. M.; Frontiera, R. R.; Mathies, R. A. J. Phys. Chem. A
2007, 111, 12072.(28) Monti, S.; Orlandi, G.; Palmieri, P. Chem. Phys. 1982, 71, 87.(29) Cattaneo, P.; Persico, M. Phys. Chem. Chem. Phys. 1999,
1, 4739.(30) Ishikawa, T.; Noro, T.; Shoda, T. J. Chem. Phys. 2001,
115, 7503.(31) Diau, E. W.-G. J. Phys. Chem. A 2004, 108, 950.(32) Gagliardi, L.; Orlandi, G.; Bernardi, F.; Cembran, A.; Garavelli,
M. Theor. Chem. Acc. 2004, 111, 363.(33) Cembran, A.; Bernardi, F.; Garavelli, M.; Gagliardi, L.; Orlandi,
G. J. Am. Chem. Soc. 2004, 126, 3234.(34) Ciminelli, C.; Granucci, G.; Persico, M. Chem.—Eur. J. 2004,
10, 2327.(35) Barada, D.; Itoh, M.; Yatagai, T. J. Appl. Phys. 2004, 96, 4204.(36) Toniolo, A.; Ciminelli, C.; Persico, M.; Martínez, T. J. J. Chem.
Phys. 2005, 123, 234308.(37) Crecca, C. R.; Roitberg, A. E. J. Phys. Chem. A 2006, 110, 8188.(38) Granucci, G.; Persico, M. Theor. Chem. Acc. 2007, 117, 1131.(39) Sauer, P.; Allen, R. E. J. Phys. Chem. A 2008, 112, 11142.(40) Yuan, S.; Dou, Y.; Wu, W.; Hu, Y.; Zhao, J. J. Phys. Chem. A
2008, 112, 13326.(41) Cusati, T.; Granucci, G.; Persico, M.; Spighi, G. J. Chem. Phys.
2008, 128, 194312.
(42) Creatini, L.; Cusati, T.; Granucci, G.; Persico, M. Chem. Phys.2008, 347, 492.
(43) Ciminelli, C.; Granucci, G.; Persico, M. Chem. Phys. 2008,349, 325.
(44) Conti, I.; Garavelli, M.; Orlandi, G. J. Am. Chem. Soc. 2008,130, 5216.
(45) Wang, L.; Wu, W.; Yi, C.; Wang, X. J. Mol. Graphics Modell.2009, 27, 792.
(46) Ootani, Y.; Satoh, K.; Nakayama, A.; Noro, T.; Taketsugu, T.J. Chem. Phys. 2009, 131, 194306.
(47) Tiberio, G.; Muccioli, L.; Berardi, R.; Zannoni, C. Chem-PhysChem 2010, 11, 1018.
(48) Asakawa, M.; Ashton, P. R.; Balzani, V.; Brown, C. L.; Credi, A.;Matthews, O. A.; Newton, S. P.; Raymo, F. M.; Shipway, A. N.; Spencer,N.; Quick, A.; Stoddart, J. F.; White, A. J. P.; Williams, D. J. Chem.—Eur.J. 1999, 5, 860.
(49) Shipway, A. N.; Willner, I. Acc. Chem. Res. 2001, 34, 421.(50) Ballardini, R.; Balzani, V.; Credi, A.; Gandolfi, M. T.; Venturi,
M. Acc. Chem. Res. 2001, 34, 445.(51) Dugave, C.; Demange, L. Chem. Rev. 2003, 103, 2475.(52) Cojocariu, C.; Rochon, P. Pure Appl. Chem. 2004, 76, 1479.(53) Yager, K. G.; Barrett, C. J. J. Photochem. Photobiol., A 2006,
182, 250.(54) Browne, W. R.; Feringa, B. L. Nat. Nanotechnol. 2006, 1, 25.(55) Camorani, P.; Fontana, M. P. Phys. Rev. E 2006, 73, 011703.(56) Vecchi, I.; Arcioni, A.; Bacchiocchi, C.; Tiberio, G.; Zanirato, P.;
Zannoni, C. J. Phys. Chem. B 2007, 111, 3355.(57) Ambrosio, A.; Camposino, A.; Maddalena, P.; Patan�e, S.;
Allegrini, M. J. Microsc. 2008, 229, 307.(58) Rais, D.; Zakrevskyy, Y.; Stumpe, J.; Ne�spøurek, S.; Sedl�akov�a,
Z. Opt. Mater. 2008, 30, 1335.(59) Ferri, V.; Elbing, M.; Pace, G.; Dickey, M. D.; Zharnikov, M.;
Samor, P.; Rampi, M. A. Angew. Chem., Int. Ed. 2008, 47, 4307.(60) Sasaki, T.; Tour, J. M. Org. Lett. 2008, 10, 897.(61) Yamada, M.; Kondo, M.; Mamiya, J.; Yu, Y.; Kinoshita, M.;
Barrett, C. J.; Ikeda, T. Angew. Chem., Int. Ed. 2008, 47, 4986.(62) Oki, K.; Nagasaka, Y. Colloids Surf., A 2009, 333, 182.(63) Savoini, M.; Biagioni, P.; Du�o, L.; Finazzi, M. Opt. Lett. 2009,
34, 761.(64) Domenici, V.; Ambro�zic, G.; �Copic, M.; Lebar, A.; Dreven�sek-
Olenik, I.; Umek, P.; Zalar, B.; Zupan�ci�c, B.; �Zigon, M. Polymer 2009,50, 4837.
(65) Devetak, M.; Zupan�ci�c, B.; Lebar, A.; Umek, P.; Zalar, B.;Domenici, V.; Ambro�zic, G.; �Zigon,M.; �Copic, M.; Dreven�sek-Olenik, I.Phys. Rev. E 2009, 80, 050701.
(66) Yoshino, T.; Kondo, M.; Mamiya, J.; Kinoshita, M.; Yu, Y.;Ikeda, T. Adv. Mater. 2010, 22, 1361.
(67) Basheer, M. C.; Oka, Y.; Mathews, M.; Tamaoki, N. Chem.—Eur. J. 2010, 16, 3489.
(68) Ji, M.; Li, Y.; White, T.; Urbas, A.; Li, Q. Chem. Commun. 2010,46, 3463.
(69) Tully, J. C. J. Chem. Phys. 1990, 93, 1061.(70) Granucci, G.; Persico, M.; Toniolo, A. J. Chem. Phys. 2001,
114, 10608.(71) Ben-Nun, M.; Martínez, T. J. Adv. Chem. Phys. 2002, 121, 439.(72) Granucci, G.; Persico, M. J. Chem. Phys. 2007, 126, 134114.(73) Stewart, J. J. P. MOPAC; Fujitsu Limited: Tokyo, Japan, 2002.(74) Cusati, T.; Granucci, G.; Martínez-N�u~nez, E.; Martini, F.;
Persico, M.; V�azquez, S. Manuscript in preparation.(75) Andersson, J.-Å.; Petterson, R.; Tegn�er, L. J. Photochem. 1982,
20, 17.(76) Adamson, A.W.;Wachter, R. J. Am. Chem. Soc. 1978, 100, 1298.(77) Jorgensen, W. L.; Tirado-Rives, J. J. Am. Chem. Soc. 1988,
110, 1657.(78) Kony, D.; Damm,W.; Stoll, S.; VanGunsteren, W. F. J. Comput.
Chem. 2002, 23, 1416.(79) de Oliveira, O. V.; Gomide Freitas, L. C. J. Mol. Struct.
THEOCHEM 2005, 728, 179.
5123 dx.doi.org/10.1021/ja1113529 |J. Am. Chem. Soc. 2011, 133, 5109–5123
Journal of the American Chemical Society ARTICLE
(80) Persico, M.; Granucci, G.; Inglese, S.; Laino, T.; Toniolo, A.J. Mol. Struct. THEOCHEM 2003, 621, 119.(81) Ponder, J. W. TINKER 4.1; Washington University School of
Medicine: St. Louis, MO: 2004. http://dasher.wustl.edu/tinker.(82) Cattaneo, P.; Granucci, G.; Persico, M. J. Phys. Chem. A 1999,
103, 3364.(83) Paschek, D.; Geiger, A.MOSCITO 3.9; Department of Physical
Chemistry, University of Dortmund: 2000.(84) Thomas, L. L.; Christakis, T. J.; Jorgensen, W. L. J. Phys. Chem.
B 2006, 110, 21198.(85) Yamaguchi, T.; Hidaka, K.; Soper, A. K. Mol. Phys. 1999,
97, 603.(86) Lide, D. R. CRC Handbook of Chemistry and Physics; 78th ed.;
CRC: Boca Raton, 1997.(87) Malhado, J. P.; Spezia, R.; Hynes, J. T. J. Phys. Chem. A
201110.1021/jp106096m.(88) B€ockmann, M.; Doltsinis, N. L.; Marx, D. Phys. Rev. E 2008,
78, 036101.(89) B€ockmann,M.; Doltsinis, N. L.; Marx, D. J. Phys. Chem. A 2010,
114, 745.
Photodynamics and time-resolved fluorescence of azobenzene in solution: amixed quantum-classical simulation.
Teresa Cusati, Giovanni Granucci and Maurizio Persico
Supporting Information.
Semiempirical method and parameters.We performed SCF-CI calculations with the FOMO-CI method.1,2 The orbitalenergy width was w = 0.1 a.u. The variable occupation concerned an activespace S of 13 MOs with 14 electrons. Within a subspace S ′ of 4 MOs with6 electrons we generated all the Slater determinants with Sz = 0, to whichwe added all the singly excited determinants of the active space S. The totalnumber of determinants in the CI was 94.
The basis for the parameterization was the AM1 hamiltonian,3 and the AM1standard parameters were kept for the H atoms. For the C atoms we usedthe parameters previously optimized for the excited states of benzene.4 Allthe parameters are given in Table S1. In order to limit the intrusion of MOslocalized on the phenyl rings in the active space, in the SCF procedure weused rather large values for the βs and βp parameters of C, i.e. -38 and -35 eV,respectively. In the CI calculations we used the optimized parameters listedin Table S1.
The adiabatic PES of all states were corrected with the same additive term:
Uadd(θ, α1, α2, φ1, φ2) = (1)
P1
[
cos(
πα1 − P2
π − P2
)
+ 1] [
cos(
πα2 − P2
π − P2
)
+ 1]
P3 + cos(2θ)
P3 + 1+
+ P4 (1 + cosα1) (1 + cosα2) (sin2φ1 + sin2φ2)
P5 − cosθ
P5 + 1
Here θ is the dihedral angle CNNC, α1 and α2 are the NNC bond angles, whileφ1 and φ2 are the torsion angles of the phenyl groups around the N-C bonds.The last two angles are defined through the average of the NNCC dihedralangles: for instance, φ1 = ( 6 NNC1C2 + 6 NNC1C6 − π)/2, where C1 is boundto a nitrogen atom, while C2 and C6 are bound to C1. φ2 is defined in thesame way, for the other phenyl group. The parameters PI are given in TableS2. The first term in the added potential Uadd was introduced to correct thetendency of AM1 and other NDDO methods to yield large equilibrium NNCbond angles and low inversion barriers. The second term was added to adjust
1
the torsional potential of the N-C bonds.
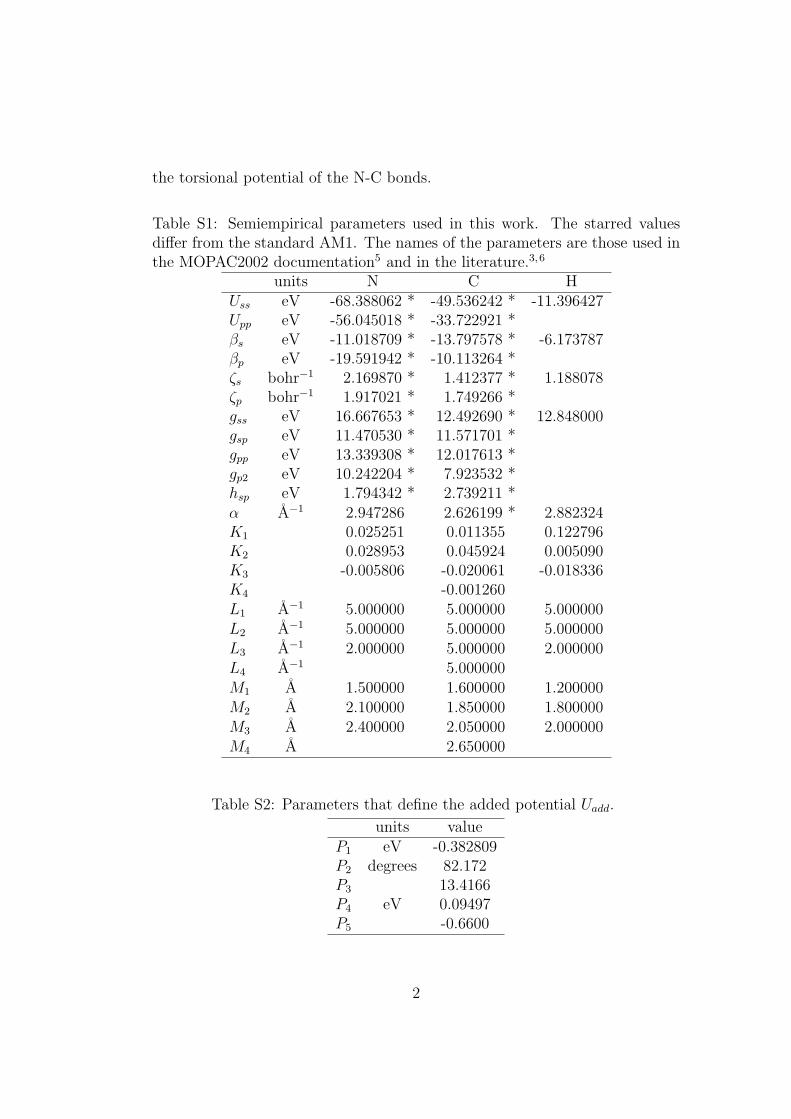
Table S1: Semiempirical parameters used in this work. The starred valuesdiffer from the standard AM1. The names of the parameters are those used inthe MOPAC2002 documentation5 and in the literature.3,6
units N C HUss eV -68.388062 * -49.536242 * -11.396427Upp eV -56.045018 * -33.722921 *βs eV -11.018709 * -13.797578 * -6.173787βp eV -19.591942 * -10.113264 *ζs bohr−1 2.169870 * 1.412377 * 1.188078ζp bohr−1 1.917021 * 1.749266 *gss eV 16.667653 * 12.492690 * 12.848000gsp eV 11.470530 * 11.571701 *gpp eV 13.339308 * 12.017613 *gp2 eV 10.242204 * 7.923532 *hsp eV 1.794342 * 2.739211 *α A−1 2.947286 2.626199 * 2.882324K1 0.025251 0.011355 0.122796K2 0.028953 0.045924 0.005090K3 -0.005806 -0.020061 -0.018336K4 -0.001260L1 A−1 5.000000 5.000000 5.000000L2 A−1 5.000000 5.000000 5.000000L3 A−1 2.000000 5.000000 2.000000L4 A−1 5.000000M1 A 1.500000 1.600000 1.200000M2 A 2.100000 1.850000 1.800000M3 A 2.400000 2.050000 2.000000M4 A 2.650000
Table S2: Parameters that define the added potential Uadd.
units valueP1 eV -0.382809P2 degrees 82.172P3 13.4166P4 eV 0.09497P5 -0.6600
2
References
[1] Granucci, G.; Toniolo, A. Chem. Phys. Lett. 2000, 325, 79.
[2] Granucci, G.; Persico, M.; Toniolo, A. J. Chem. Phys. 2001, 114, 10608.
[3] Dewar, M. J. S.; Zoebisch, E. G.; Healy, E. F.; Stewart, J. J. P. J. Am.
Chem. Soc. 1985, 107, 3902.
[4] A. Toniolo, private communication.
[5] Stewart, J. J. P. MOPAC 2002, Fujitsu Limited, Tokio, Japan.
[6] Stewart, J. J. P. J. Mol. Mod. 2007, 13, 1173.
3
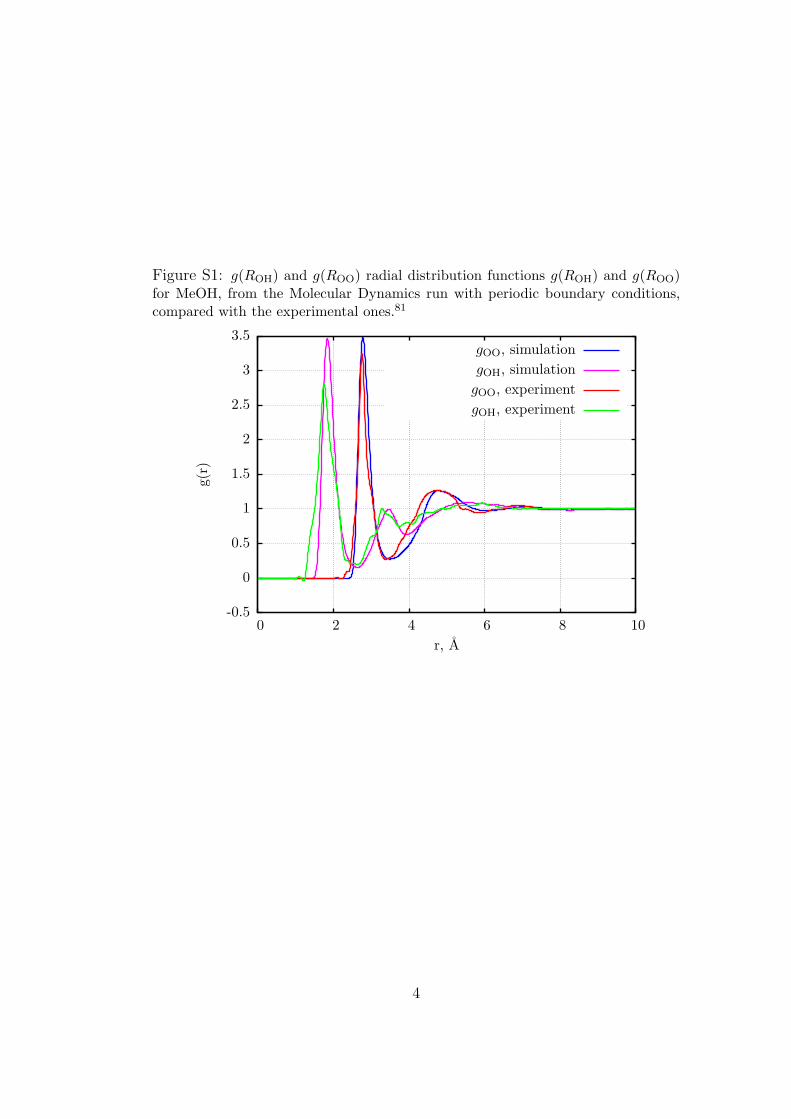
Figure S1: g(ROH) and g(ROO) radial distribution functions g(ROH) and g(ROO)for MeOH, from the Molecular Dynamics run with periodic boundary conditions,compared with the experimental ones.81
gOH, experiment
gOO, experiment
gOH, simulation
gOO, simulation
r, A
g(r)
1086420
3.5
3
2.5
2
1.5
1
0.5
0
-0.5
4
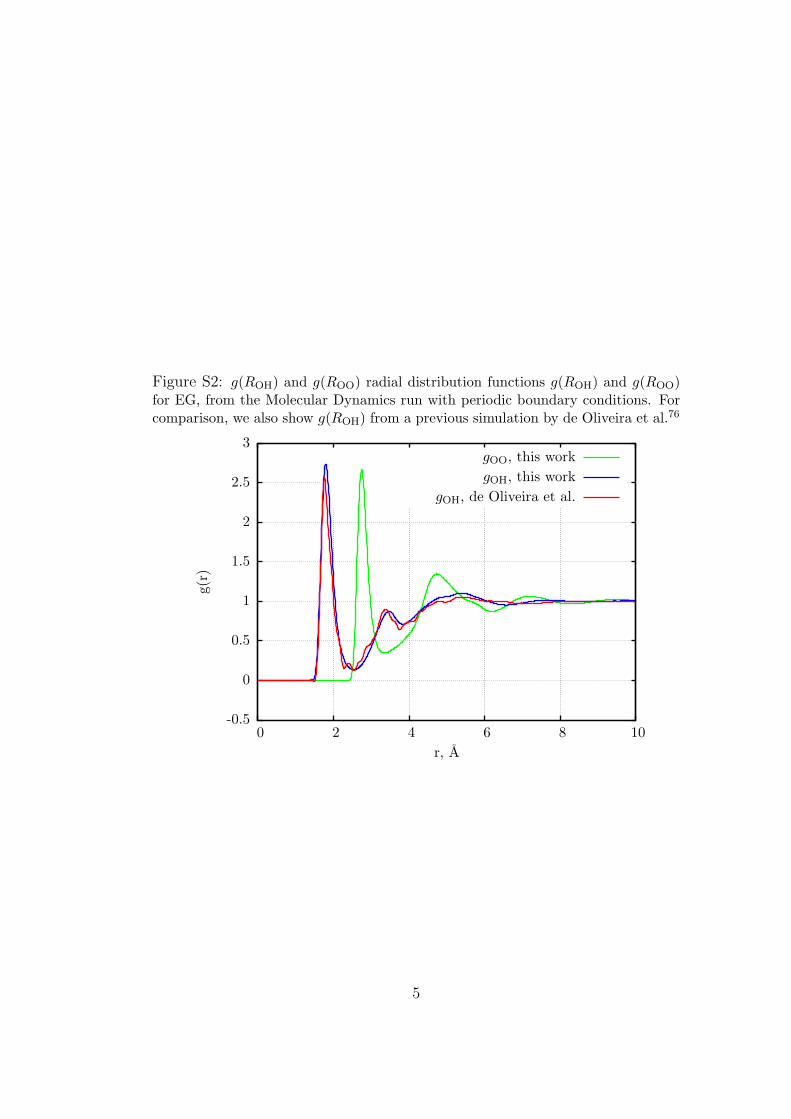
Figure S2: g(ROH) and g(ROO) radial distribution functions g(ROH) and g(ROO)for EG, from the Molecular Dynamics run with periodic boundary conditions. Forcomparison, we also show g(ROH) from a previous simulation by de Oliveira et al.76
gOH, de Oliveira et al.
gOH, this work
gOO, this work
r, A
g(r)
1086420
3
2.5
2
1.5
1
0.5
0
-0.5
5
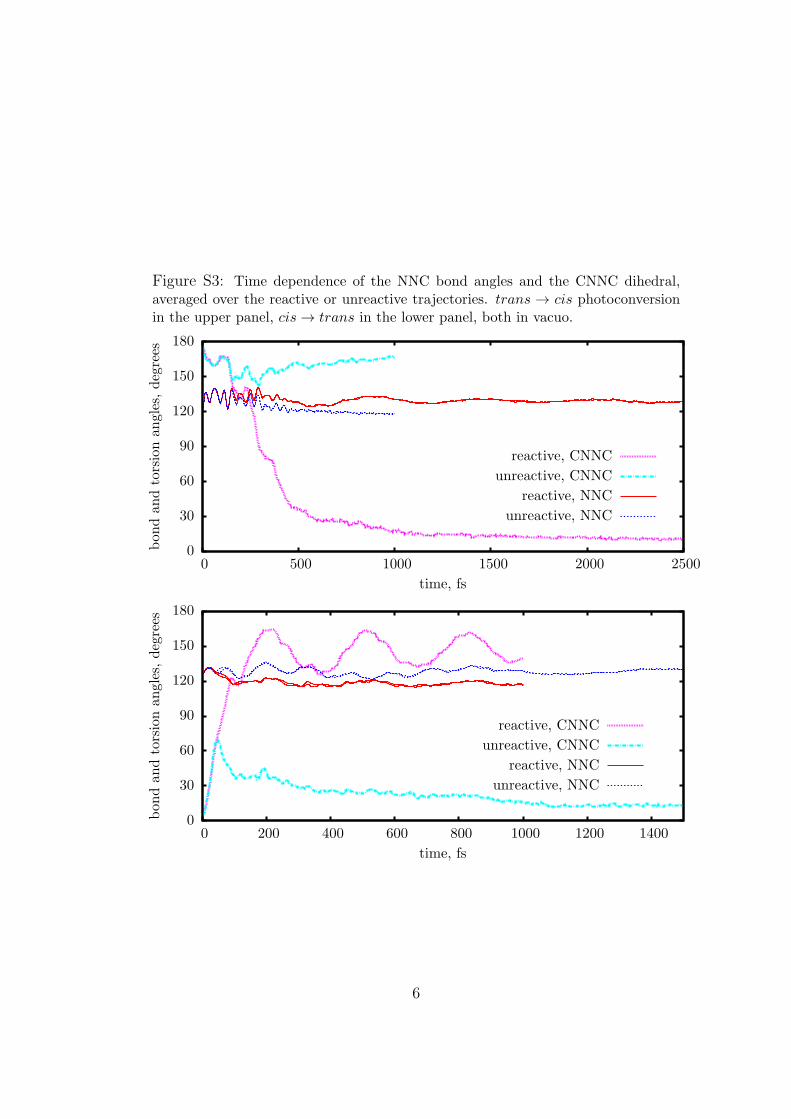
Figure S3: Time dependence of the NNC bond angles and the CNNC dihedral,averaged over the reactive or unreactive trajectories. trans → cis photoconversionin the upper panel, cis → trans in the lower panel, both in vacuo.
unreactive, NNC
reactive, NNC
unreactive, CNNC
reactive, CNNC
time, fs
bon
dan
dtorsionan
gles,degrees
25002000150010005000
180
150
120
90
60
30
0
unreactive, NNC
reactive, NNC
unreactive, CNNC
reactive, CNNC
time, fs
bon
dan
dtorsionan
gles,degrees
1400120010008006004002000
180
150
120
90
60
30
0
6
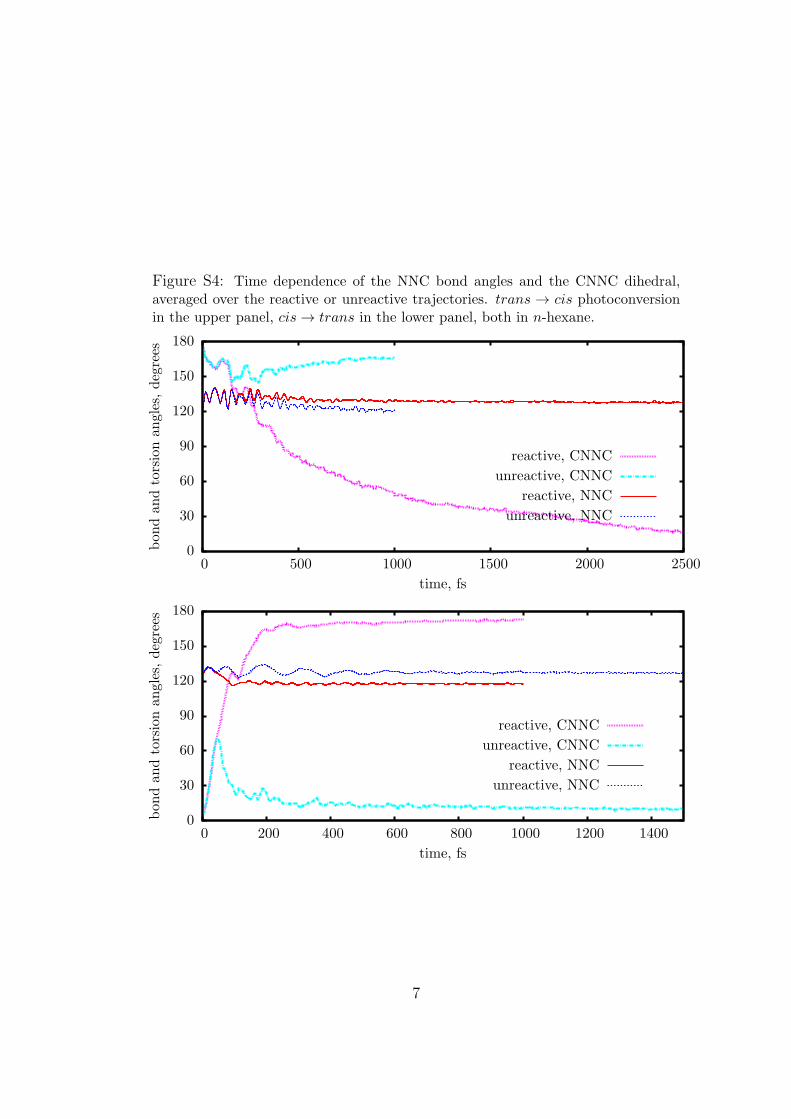
Figure S4: Time dependence of the NNC bond angles and the CNNC dihedral,averaged over the reactive or unreactive trajectories. trans → cis photoconversionin the upper panel, cis → trans in the lower panel, both in n-hexane.
unreactive, NNC
reactive, NNC
unreactive, CNNC
reactive, CNNC
time, fs
bon
dan
dtorsionan
gles,degrees
25002000150010005000
180
150
120
90
60
30
0
unreactive, NNC
reactive, NNC
unreactive, CNNC
reactive, CNNC
time, fs
bon
dan
dtorsionan
gles,degrees
1400120010008006004002000
180
150
120
90
60
30
0
7
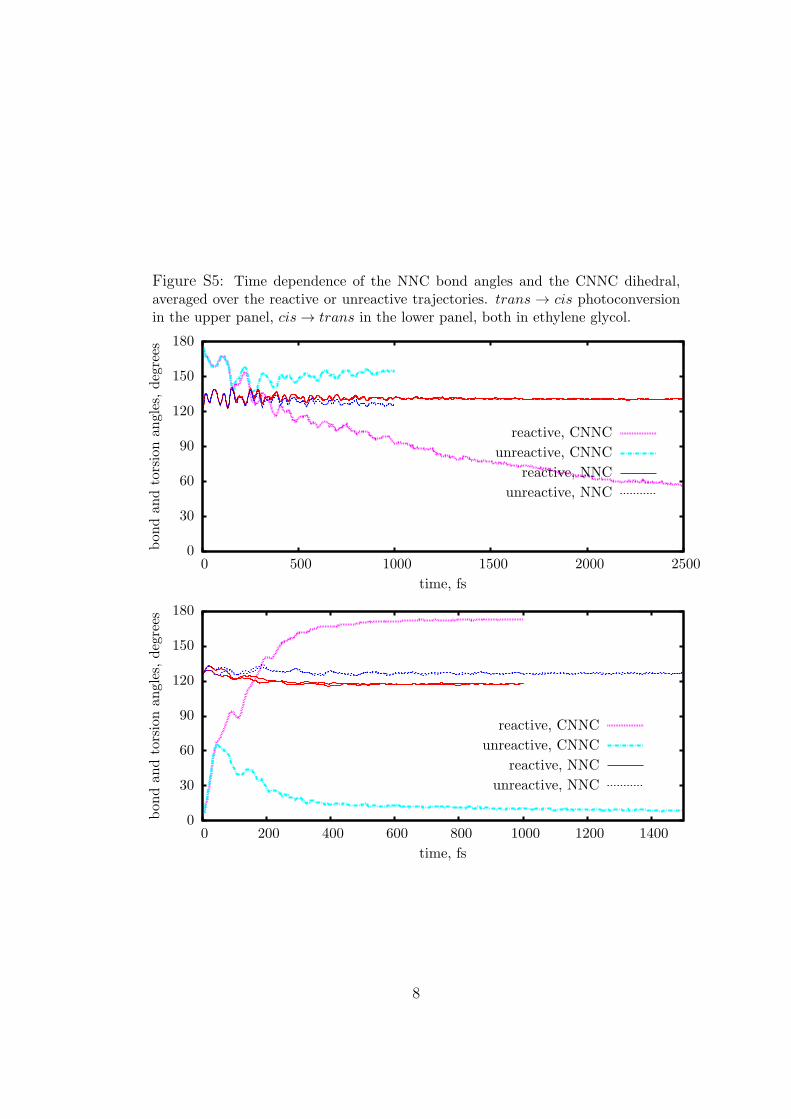
Figure S5: Time dependence of the NNC bond angles and the CNNC dihedral,averaged over the reactive or unreactive trajectories. trans → cis photoconversionin the upper panel, cis → trans in the lower panel, both in ethylene glycol.
unreactive, NNC
reactive, NNC
unreactive, CNNC
reactive, CNNC
time, fs
bon
dan
dtorsionan
gles,degrees
25002000150010005000
180
150
120
90
60
30
0
unreactive, NNC
reactive, NNC
unreactive, CNNC
reactive, CNNC
time, fs
bon
dan
dtorsionan
gles,degrees
1400120010008006004002000
180
150
120
90
60
30
0
8
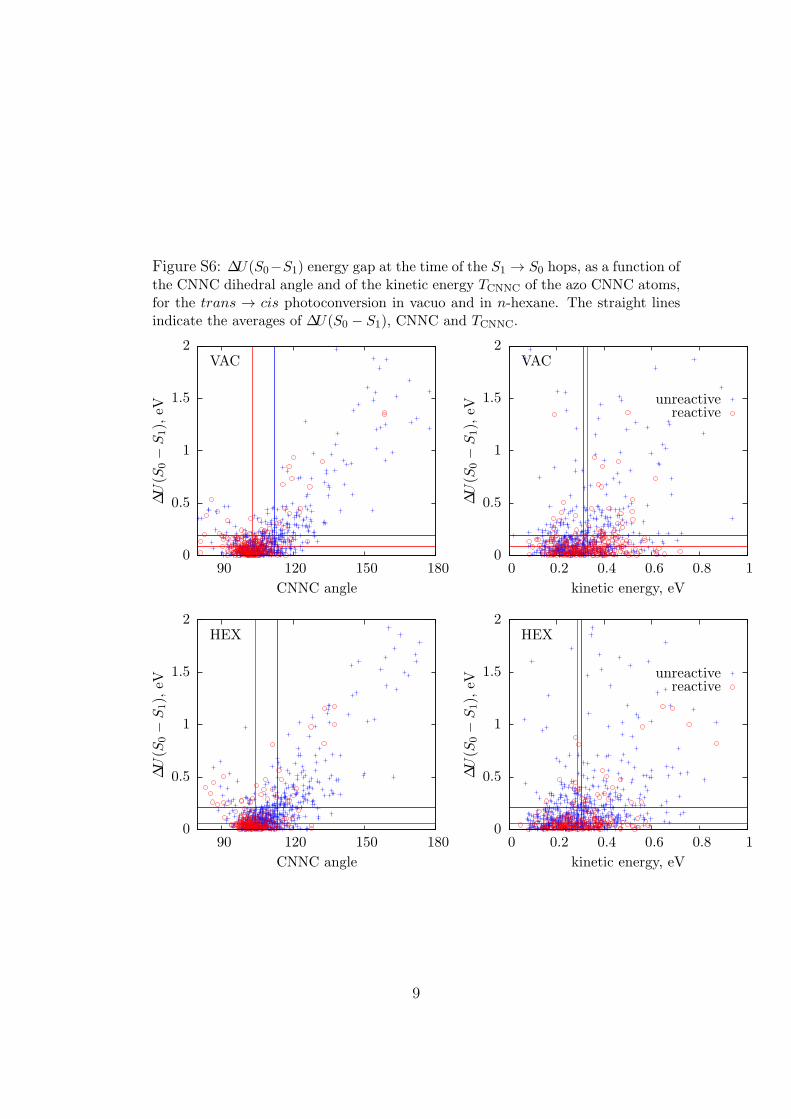
Figure S6: ∆U(S0−S1) energy gap at the time of the S1 → S0 hops, as a function ofthe CNNC dihedral angle and of the kinetic energy TCNNC of the azo CNNC atoms,for the trans → cis photoconversion in vacuo and in n-hexane. The straight linesindicate the averages of ∆U(S0 − S1), CNNC and TCNNC.
VAC
CNNC angle
∆U(S
0−S1),eV
18015012090
2
1.5
1
0.5
0
reactiveunreactive
VAC
kinetic energy, eV
∆U(S
0−
S1),eV
10.80.60.40.20
2
1.5
1
0.5
0
HEX
CNNC angle
∆U(S
0−S1),eV
18015012090
2
1.5
1
0.5
0
reactiveunreactive
HEX
kinetic energy, eV
∆U(S
0−
S1),eV
10.80.60.40.20
2
1.5
1
0.5
0
9
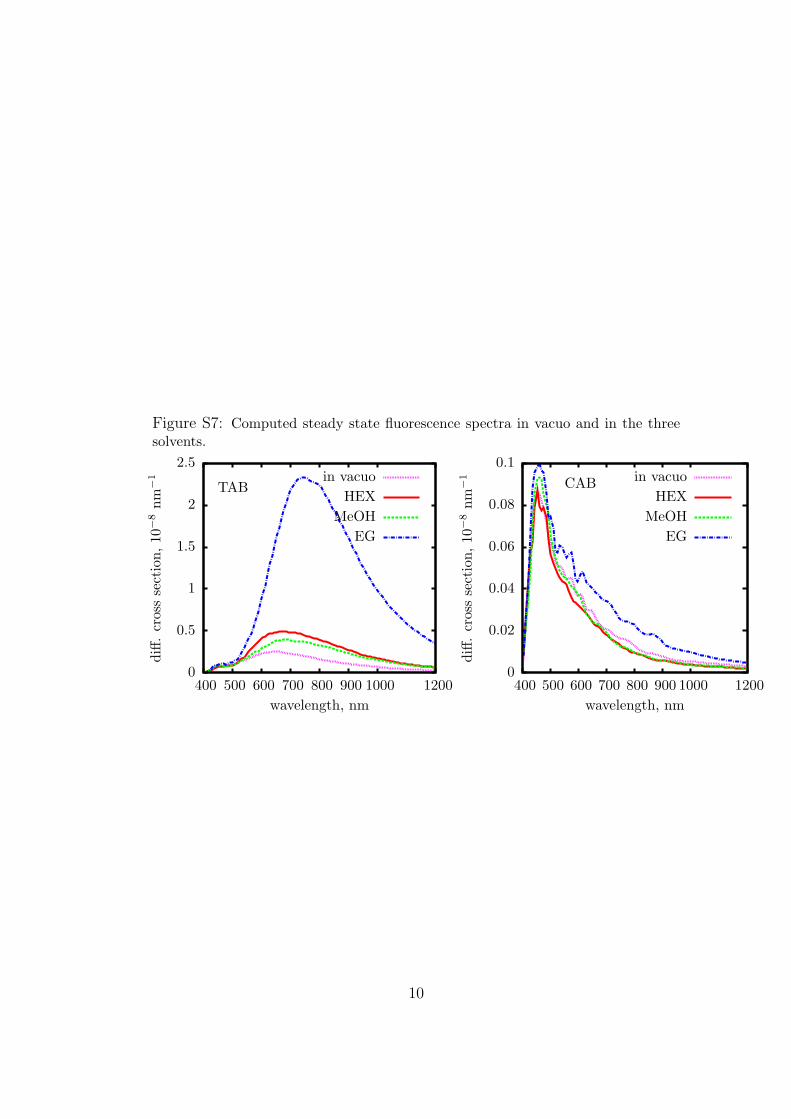
Figure S7: Computed steady state fluorescence spectra in vacuo and in the threesolvents.
EG
MeOH
HEX
in vacuoTAB
wavelength, nm
diff.crosssection,10
−8nm
−1
12001000900800700600500400
2.5
2
1.5
1
0.5
0
EG
MeOH
HEX
in vacuoCAB
wavelength, nm
diff.crosssection,10
−8nm
−1
12001000900800700600500400
0.1
0.08
0.06
0.04
0.02
0
10
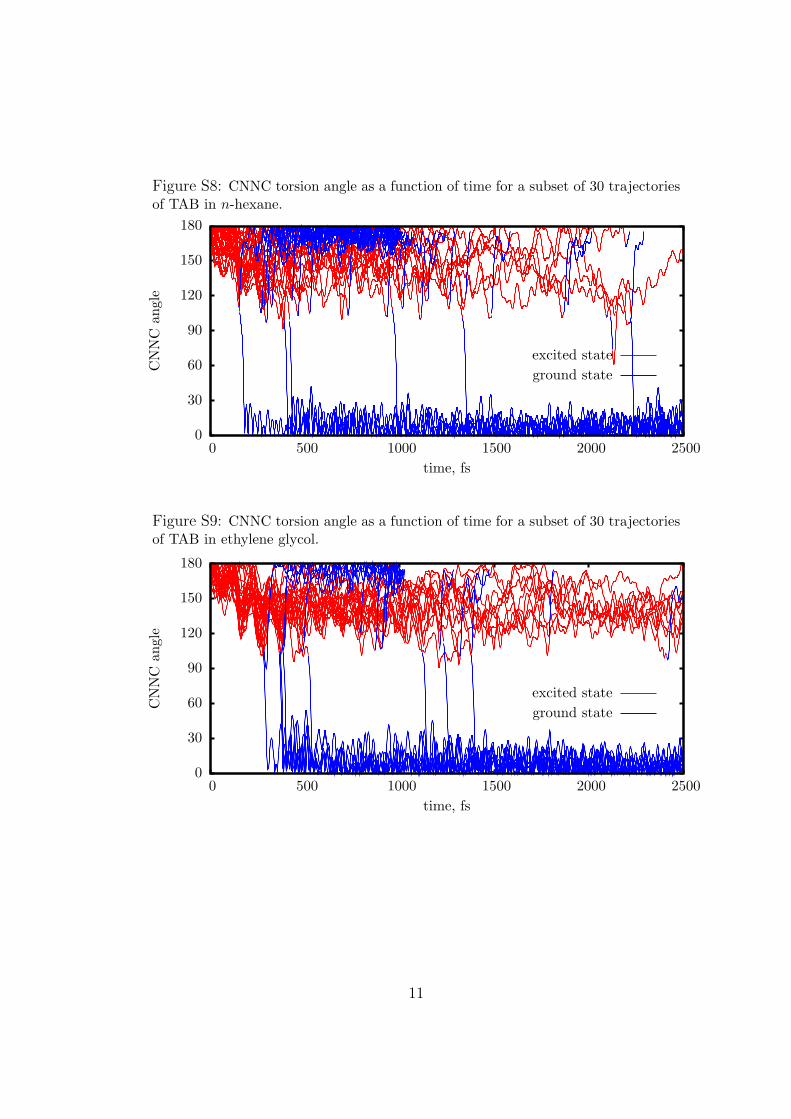
Figure S8: CNNC torsion angle as a function of time for a subset of 30 trajectoriesof TAB in n-hexane.
ground state
excited state
time, fs
CNNC
angle
25002000150010005000
180
150
120
90
60
30
0
Figure S9: CNNC torsion angle as a function of time for a subset of 30 trajectoriesof TAB in ethylene glycol.
ground state
excited state
time, fs
CNNC
angle
25002000150010005000
180
150
120
90
60
30
0
11


![Femtosecond velocity map imaging of concerted photodynamics in CF[sub 2]I[sub 2]](https://img.dokumen.tips/doc/110x75/6360dfeba514f501cd0c893c/femtosecond-velocity-map-imaging-of-concerted-photodynamics-in-cfsub-2isub-2.jpg)


