Embed Size (px)
Citation preview

Available online at www.sciencedirect.com
www.elsevier.com/locate/chemphys
Chemical Physics 341 (2007) 258–266
Slower processes of the ultrafast photo-isomerization of anazobenzene observed by IR spectroscopy
F.O. Koller, C. Sobotta, T.E. Schrader, T. Cordes, W.J. Schreier, A. Sieg, P. Gilch *
Department fur Physik, Ludwig-Maximilians-Universitat, Oettingenstr. 67, D-80538 Munchen, Germany
Received 31 January 2007; accepted 29 June 2007Available online 13 July 2007
Abstract
The photo-induced trans–cis isomerization of the azobenzene derivative 4-nitro-4 0-(dimethylamino)azobenzene in polar solution wasstudied by femtosecond UV/Vis and IR spectroscopy. The UV/Vis experiment reveals two excited state processes; the slower one (1 ps) isthe internal conversion to the ground state. The ensuing spectral changes point to vibrational cooling of the nascent cis product and therecovered trans isomer. Judging from the UV/Vis experiment this �5 ps process seems to terminate the isomerization. The internal con-version and the cooling also find their manifestation in the IR experiment. In addition slower spectral changes lasting until �50 ps aredetected. These slow IR responses are compared with the behavior of a non-isomerizing analogue, para-N,N-dimethyl-nitroaniline. Anorigin for this discrepancy is suggested and potential molecular processes causing the slow IR response are discussed.� 2007 Elsevier B.V. All rights reserved.
Keywords: Femtosecond spectroscopy; IR spectroscopy; Photochemistry; Isomerization; Vibrational cooling
1. Introduction
In very simple terms the following picture of an ultrafastphoto-isomerization in solution may be drawn (see e.g.Ref. [1]). After photo-excitation an isomerizable moleculeexperiences an altered electronic potential (see e.g. Ref.[2]). This potential can bring the nuclei of the molecule toregions in conformational space where the energy surfacesof ground and excited states come close to each other oreven touch. In these regions internal conversion to theground state takes place and will go along with a branchinginto the photo-product channel and the channel whichrecovers the starting material. After that branching excessenergy is re-distributed within the molecule (intramolecularvibrational relaxation) and transferred to the solvent sur-roundings (vibrational cooling). So the later stages ofphoto-isomerizations, i.e. those occurring after the returnto the ground state surface, should strongly resemble thoseseen in photochemically inert molecules.
0301-0104/$ - see front matter � 2007 Elsevier B.V. All rights reserved.
doi:10.1016/j.chemphys.2007.06.048
* Corresponding author. Fax: +49 89 2180 9202.E-mail address: [email protected] (P. Gilch).
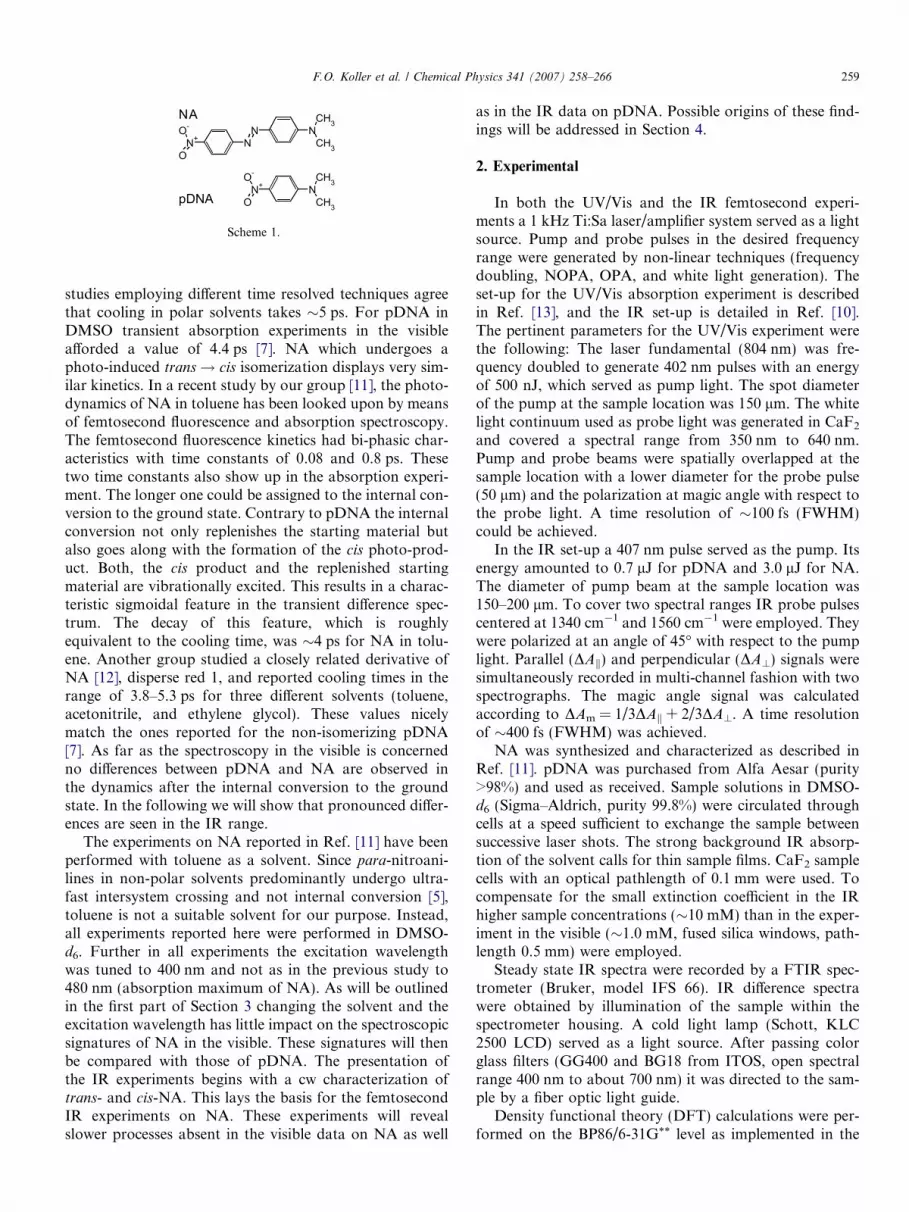
Here, we will put this assumption to an experimentaltest. We compare the femtosecond UV/Vis and IR signa-ture of a non-isomerizing and an isomerizing molecule.The molecules compared should bear as much similaritiesas possible. para-N,N-dimethyl-nitroaniline (pDNA, non-isomerizing) and 4-nitro-4 0-(dimethylamino)azobenzene(NA, isomerizing) are particularly suited (for their struc-tures see Scheme 1). Due to their dimethylamino- andnitro-substitution both aromatic molecules have a strongpush pull character. This results in charge transfer (CT)absorptions and concomitantly a positive solvatochromism(see Ref. [3] for NA and Ref. [4] for para-nitroanilines).Most importantly in the present context, both moleculesfeature similar (short) excited state lifetimes. Excitedpara-nitroanilines are known to undergo rapid internalconversion in polar solution [5–7]. For pDNA in DMSO(the solvent employed in the present study) a time constantfor the internal conversion of 0.85 ps has been reported [7].The process transfers electronic excitation energy ofaround 25,000 cm�1 to vibrational degrees of freedom.Therefore, this and related molecules have widely beenused to study vibrational cooling [7–10]. These various
CH3
CH3
N
ON+ N
NO-
CH3
CH3
O-
N+ NO
NA
pDNA
Scheme 1.
F.O. Koller et al. / Chemical Physics 341 (2007) 258–266 259
studies employing different time resolved techniques agreethat cooling in polar solvents takes �5 ps. For pDNA inDMSO transient absorption experiments in the visibleafforded a value of 4.4 ps [7]. NA which undergoes aphoto-induced trans! cis isomerization displays very sim-ilar kinetics. In a recent study by our group [11], the photo-dynamics of NA in toluene has been looked upon by meansof femtosecond fluorescence and absorption spectroscopy.The femtosecond fluorescence kinetics had bi-phasic char-acteristics with time constants of 0.08 and 0.8 ps. Thesetwo time constants also show up in the absorption experi-ment. The longer one could be assigned to the internal con-version to the ground state. Contrary to pDNA the internalconversion not only replenishes the starting material butalso goes along with the formation of the cis photo-prod-uct. Both, the cis product and the replenished startingmaterial are vibrationally excited. This results in a charac-teristic sigmoidal feature in the transient difference spec-trum. The decay of this feature, which is roughlyequivalent to the cooling time, was �4 ps for NA in tolu-ene. Another group studied a closely related derivative ofNA [12], disperse red 1, and reported cooling times in therange of 3.8–5.3 ps for three different solvents (toluene,acetonitrile, and ethylene glycol). These values nicelymatch the ones reported for the non-isomerizing pDNA[7]. As far as the spectroscopy in the visible is concernedno differences between pDNA and NA are observed inthe dynamics after the internal conversion to the groundstate. In the following we will show that pronounced differ-ences are seen in the IR range.
The experiments on NA reported in Ref. [11] have beenperformed with toluene as a solvent. Since para-nitroani-lines in non-polar solvents predominantly undergo ultra-fast intersystem crossing and not internal conversion [5],toluene is not a suitable solvent for our purpose. Instead,all experiments reported here were performed in DMSO-d6. Further in all experiments the excitation wavelengthwas tuned to 400 nm and not as in the previous study to480 nm (absorption maximum of NA). As will be outlinedin the first part of Section 3 changing the solvent and theexcitation wavelength has little impact on the spectroscopicsignatures of NA in the visible. These signatures will thenbe compared with those of pDNA. The presentation ofthe IR experiments begins with a cw characterization oftrans- and cis-NA. This lays the basis for the femtosecondIR experiments on NA. These experiments will revealslower processes absent in the visible data on NA as well
as in the IR data on pDNA. Possible origins of these find-ings will be addressed in Section 4.
2. Experimental
In both the UV/Vis and the IR femtosecond experi-ments a 1 kHz Ti:Sa laser/amplifier system served as a lightsource. Pump and probe pulses in the desired frequencyrange were generated by non-linear techniques (frequencydoubling, NOPA, OPA, and white light generation). Theset-up for the UV/Vis absorption experiment is describedin Ref. [13], and the IR set-up is detailed in Ref. [10].The pertinent parameters for the UV/Vis experiment werethe following: The laser fundamental (804 nm) was fre-quency doubled to generate 402 nm pulses with an energyof 500 nJ, which served as pump light. The spot diameterof the pump at the sample location was 150 lm. The whitelight continuum used as probe light was generated in CaF2
and covered a spectral range from 350 nm to 640 nm.Pump and probe beams were spatially overlapped at thesample location with a lower diameter for the probe pulse(50 lm) and the polarization at magic angle with respect tothe probe light. A time resolution of �100 fs (FWHM)could be achieved.
In the IR set-up a 407 nm pulse served as the pump. Itsenergy amounted to 0.7 lJ for pDNA and 3.0 lJ for NA.The diameter of pump beam at the sample location was150–200 lm. To cover two spectral ranges IR probe pulsescentered at 1340 cm�1 and 1560 cm�1 were employed. Theywere polarized at an angle of 45� with respect to the pumplight. Parallel (DAk) and perpendicular (DA?) signals weresimultaneously recorded in multi-channel fashion with twospectrographs. The magic angle signal was calculatedaccording to DAm = 1/3DAk + 2/3DA?. A time resolutionof �400 fs (FWHM) was achieved.
NA was synthesized and characterized as described inRef. [11]. pDNA was purchased from Alfa Aesar (purity>98%) and used as received. Sample solutions in DMSO-d6 (Sigma–Aldrich, purity 99.8%) were circulated throughcells at a speed sufficient to exchange the sample betweensuccessive laser shots. The strong background IR absorp-tion of the solvent calls for thin sample films. CaF2 samplecells with an optical pathlength of 0.1 mm were used. Tocompensate for the small extinction coefficient in the IRhigher sample concentrations (�10 mM) than in the exper-iment in the visible (�1.0 mM, fused silica windows, path-length 0.5 mm) were employed.
Steady state IR spectra were recorded by a FTIR spec-trometer (Bruker, model IFS 66). IR difference spectrawere obtained by illumination of the sample within thespectrometer housing. A cold light lamp (Schott, KLC2500 LCD) served as a light source. After passing colorglass filters (GG400 and BG18 from ITOS, open spectralrange 400 nm to about 700 nm) it was directed to the sam-ple by a fiber optic light guide.
Density functional theory (DFT) calculations were per-formed on the BP86/6-31G** level as implemented in the

260 F.O. Koller et al. / Chemical Physics 341 (2007) 258–266
Gaussian 98 program package [14]. After optimizing thestructures in the trans and cis conformations IR spectrawere calculated for each isomer using the same level of the-ory. The spectra displayed in Fig. 3c were obtained by con-voluting the intensity and frequency output of thecalculations with Gaussian line shapes using a constantwidth (FWHM) of 10 cm�1.
3. Experimental results
3.1. Visible transient absorption spectroscopy
The UV/Vis transient absorption behavior of NA inDMSO-d6 strongly resembles the one described earlier[11] for NA in toluene: Upon photo-excitation of NA inDMSO-d6 an instantaneous bleach in the vicinity of theground state absorption is observed (Fig. 1). On either sideof this bleach an induced absorption is found. Within some100 fs the induced absorption partially decays for shortwavelengths and increases for long wavelengths. (In thedata representation in Fig. 1 which focuses on slower pro-cesses this is difficult to discern. A detailed account of thespectral changes during the first 100 fs is given in Ref.
350 400 450 500 550 600Wavelength / nm
0
10
20
30
40
Del
ay T
ime
/ ps
-15 -10 -5 0 5Color Code for Absorbance Change / mOD
350 400 450 500 550 600
-10
0
10
20 0.18 ps 0.92 ps 8.4 ps infinite
Fit A
mpl
itude
/ a.
u.
Wavelength / nm
a
b
Fig. 1. Absorption changes of NA in DMSO-d6 induced by femtosecondexcitation at 400 nm. (a) gives an overview of the data. The spectra in (b)are derived from a global fit of the transient absorption data. Theyrepresent the spectral changes induced by the kinetic processes (decayassociated spectra).
[11].) Later on the induced absorption on either side andthe bleach decay with characteristic times of 1–10 ps to aconstant offset. Numerical values of the time constantsinvolved were retrieved by a global analysis employing amulti-exponential fit function with proper convolution.At least three exponentials and an offset are required toreproduce the temporal behavior. The time constantsdetermined were to be 0.18, 0.92, and 8.4 ps (errors forall constants are ±15%), the related values for NA in tolu-ene were 0.10, 0.80 and 4.0 ps, respectively [11]. The inspec-tion of the decay associated spectra resulting from the fit(Fig. 1b) yields interesting information: The 0.18 ps timeconstant marks the decay of the stimulated emission atabout 600 nm and of the excited state absorption fork < 550 nm. That process does not re-establish the groundstate as evidenced by the absence of a negative contributionaround 500 nm. The ground state recovers during the nextstage with a characteristic time of 0.92 ps. This is indicatedby the decaying excited state absorption (350–450 nm and>550 nm) and – more important – the negative signaturearound 500 nm. It coincides with the ground state spec-trum of NA and is thus due to ground state recovery.The 8.4 ps spectrum displays features which are equivalentto a spectral narrowing and blue shift. This is the behaviorexpected for vibrational cooling in the ground state [15].The spectral dynamics induced by cooling cannot beexactly represented by the exponential fitting procedureused here and the time constant of 8.4 ps should only beconsidered as an estimate of the cooling time. A betterway to retrieve this cooling time will be presented below.After this cooling period one observes an offset spectrumthat matches the feature of the trans–cis differencespectrum in toluene. A difference spectrum of NA inDMSO-d6 could not be recorded. The cis form of NA inpolar solvents is so short lived [3] that not enough cis iso-mer can be accumulated in a cw-experiment. In toluenethe lifetime is prolonged (�70 s [11]) and a steady statedifference spectrum is readily recorded. This differencespectrum bears all characteristics of the offset spectrumreported here. When accounting for the solvatochromicshift of the NA absorption when going from toluene toDMSO-d6 the agreement between the spectra becomesalmost quantitative. Thus, as already stated for NA in tol-uene it looks as if the cooling process on the <10 ps timescale terminates the formation of the cis–photo-productand the partial recovery of the initial trans-state.
As stated above the non-isomerizing molecule pDNAfeatures similar time constants. Our measurements (datanot shown) yield time constants of 0.4, 0.9, and 4.9 ps ingood agreement with the values reported elsewhere [7].The shortest time constant has been associated with a pro-cess in the excited state and the 0.9 ps component describesthe ground state recovery due to rapid internal conversion[7]. This internal conversion time is very close to that deter-mined for NA (0.92 ps). So in either case vibrationally hotground states are prepared one picosecond after photo-excitation. Cooling times deduced from the exponential

Table 1Compiled fitting parameters for the visible transient absorption data
Sample s1 s2 s3 sc sc,1 sc,2
NA 0.18 0.92 8.4 5.5 2.1 (0.44) 8.4 (0.56)pDNA 0.40 0.90 4.9 4.7 2.7 (0.48) 6.2 (0.52)
The time constants (all in units of picoseconds) si were determined byglobal fits. For NA the spectra associated with these time constants areplotted in Fig. 1b. The time constant sc represents the cooling time derivedfrom single exponential fits of data depicted in Fig. 2. The result of doubleexponential fits is also given (sc,1,2). The amplitude of each component isgiven in parenthesis.
-0.01
0.00
0.01
0.02
1100 1200 1300 1400 1500 1600-0.01
0.00
0.01
0.02
A / m
OD
cis - trans, exp. trans - cis, exp.
0.00
0.25
0.50
Abs
orba
nce
/ OD
NA in DMSOd6 trans-NA
cis - trans, theor. trans-NA, theor..
Wavenumber / cm-1
Inte
nsity
/ a.
u.
a
b
c
Fig. 3. Steady State IR spectra of NA. (a) IR spectrum of a solution ofNA dissolved in DMSO-d6 (thin gray line) displaying absorption bands of
F.O. Koller et al. / Chemical Physics 341 (2007) 258–266 261
fitting are also very similar. A better way to parameterizethis cooling is to monitor the change of the spectrum ofthe ground state with time. Hot ground states are charac-terized by broadened and red-shifted absorption spectra(see e.g. Refs. [7,15]). As these states cool, the spectraevolve towards their room temperature shape. This evolu-tion can for instance be described by plotting the meanwavelength of the absorption spectrum kmean versus time.To determine kmean the recorded transient difference spectraare transformed into absolute transient spectra. For thistransformation a scaled cw absorption spectrum is addedto the time dependent difference spectra. The scaling factoris derived from the ground state bleaching at time zero.This procedure is described in more detail in Ref. [10] albeitfor transient IR spectroscopy. It has been applied to theisomerizing NA and the non-isomerizing pDNA (Fig. 2).Almost identical relaxation behaviors of the normalizedshifts of the mean wavelengths kmean are observed. A singleexponential description yields relaxation times of 5.5 and4.7 ps for NA and pDNA, respectively. A bi-exponentialtreatment yields a somewhat better description, the result-ing parameters are compiled in Table 1. The relaxationtime of 4.7 ps for pDNA is in excellent agreement withthe value reported by Kovalenko et al. (4.38 ps) [7]. Theclose match of the cooling dynamics of pDNA and NA isin line with the expectation described in Section 1. Afterthe internal conversion to the ground state no differencesin the dynamics of isomerizing and non-isomerizing mole-cules are expected. We will now show that this does nothold true for IR observables.
3.2. IR spectroscopy
3.2.1. Steady state spectroscopy of NA
The steady state absorption and light induced differencespectra are depicted in Fig. 3. The spectral ranges covered
10 20 30 40 50 60 700.0
0.2
0.4
0.6
0.8
1.0
NA pDNA
Max
imum
pea
k sh
ift /
norm
.
Delay Time / ps
Fig. 2. Temporal evolution of the normalized mean absorption wave-length kmean,n(t) for pDNA (gray line) and NA (black line). Thenormalized wavelength is given by kmean,n(t) = (kmean(t) � kRT)/(kmean(t =0) � kRT), kRT being the mean absorption wavelength at roomtemperature.
the solvent and the solute and a spectrum of NA where the solventsignature was subtracted (black line). (b) IR absorption changes inducedby illumination of a solution of NA in toluene. The black line representsthe modulations observed in the photostationary state produced byshining light on a trans sample. The gray line stands for the changesdetected when starting with a photostationary cis/trans mixture aftercomplete trans recovery. The arrows indicate the spectral ranges coveredin the femtosecond IR experiments. Regions that are opaque due tosolvent absorptions are not shown. (c) Computed spectrum (BP86/6-31G**) of the trans-isomer (black line) and computed cis–trans differencespectrum (gray line).
in the time resolved measurements are marked by arrows.The most prominent IR resonances in these ranges are(the assignment follows work by Biswas and Umapathy[16]): aromatic C–C stretch vibrations at 1602, 1587,1517, and 1367 cm�1, a N@N stretch vibration of theazo-group at �1395 cm�1 (visible as a weak shoulder),the symmetric stretch of the nitro-group at 1339 cm�1
and a not yet assigned vibration at 1310 cm�1. Further-more at 1139 cm�1 there is the C–N stretch and C–C ringmode and finally at 1105 cm�1 another C–C ring mode.

262 F.O. Koller et al. / Chemical Physics 341 (2007) 258–266
The influence of steady state illumination on the IRspectrum was studied for NA in toluene since (see above)the cis-form is too short lived in DMSO-d6. Two kinds ofdifference spectra were recorded. Starting with a pure trans
sample the spectral changes caused by the formation of thephoto-stationary state were measured (thick black line inFig. 3b). Spectral changes with respect to the photo-sta-tionary state were obtained by turning the illuminationoff (thin gray line in Fig. 3b). That spectrum is – expectfor the sign – identical with the first difference spectrumindicating the reversibility of the photo process. The refor-mation of the initial trans isomer proceeds with a time con-stant of �70 s. This time constant matches the thermalcis! trans reaction time determined by UV/Vis spectros-copy [11]. This tells us that the photo-induced IR absorp-tion changes are due to the formation of the cis-isomer.The dominant effect of the cis formation is a reduction ofthe IR absorption. Only, for the 1515 cm�1 mode a clearsigmoidal difference signature indicative for a frequencyshift occurs. The major difference in the IR spectra of trans
and cis lies in the oscillator strength of the vibrational res-onance and not in their frequencies.
This observation is reproduced by DFT calculations(BP86/6-31 G**, Fig. 3c). For optimized structures oftrans-NA and cis-NA (depicted in Fig. 7) IR spectra havebeen calculated. The calculated trans spectrum reproducesthe general features of the experimental one. The strongestIR resonance is the symmetric NO2 stretch around1310 cm�1 in either spectrum. Further, the aromatic stretchvibrations around 1600 cm�1 or the C–N stretch at�1100 cm�1 are well accounted for by the calculation. InFig. 3c the calculated cis–trans difference spectrum isshown. In agreement with the experimental observationsat 1116 cm�1 and 1515 cm�1 the absorption of the cis-iso-mer exceeds the one of the trans isomer. The 1515 cm�1 res-onance in the trans form is due to a CH bending/CNstretch mode localized in the ring near the dimethylaminogroup. In the cis form the CN stretch character of thismode gains importance. The same kind of CN stretch con-tribution is responsible for an increased absorption of thecis-isomer around 1116 cm�1. The trans-isomer does notshow considerable intensity in this frequency range. Butapart from these exceptions the difference spectrum is dom-inated by signal reductions indicative of lower oscillatorstrengths in the cis isomer. From the measured spectrumthis lowering cannot be quantified since the photo-station-ary concentration of the cis isomer is unknown. The calcu-lations predict a reduction of the oscillator strength of�30% for the NO2 stretch vibration.
3.2.2. Femtosecond IR spectroscopy of NA
Femtosecond excitation of NA with 400 nm laser pulsesinduces pronounced spectral changes in the IR (for anoverview see Fig. 4). The common features of this responsemay be summarized as follows: At negative delay times, i.e.when the IR probe pulse precedes the visible pump pulse,absorption signals due to the perturbed free induction
decay [17–19] are present. This effect holds no informationon the photo-induced dynamics [18] and it will not be fur-ther examined. At time zero intense reductions of the IRabsorption of the IR resonances of trans-NA assignedabove are recorded. In addition, the time zero spectrumcontains positive signals (induced absorptions). Thesebroad absorption features are seen in the ranges of 1260–1310 cm�1 and 1530–1590 cm�1 and decay within �1 ps.
As these broad bands disappear new induced absorptionfeatures clinging to the low frequency wings of the bleachesemerge. With increasing delay time all these bands shift tohigher frequencies, thereby partially ‘‘eating up’’ the bleachsignals. The spectral shifts occur with a characteristic timeconstant of �10 ps. With exception of the weak 1312 cm�1
mode, shifts on that time scale are observed for all reso-nances covered. After roughly 40 ps the spectral positionsof the bands have settled. At even later times there is onlya change in their amplitudes.
We will highlight these slower changes taking the sym-metric NO2 stretch resonance at 1340 cm�1 as an example– but note that a similar behavior is found for the otherbands. The transient spectra symbolized by black and graylines in Fig. 4c describe the dynamics up to 20 ps alreadydiscussed above. Of the spectra recorded afterwards the50 ps spectrum is easy to assign since it comes close tothe steady state cis–trans difference spectrum in toluene(note that such a difference spectrum cannot be recordedin DMSO-d6, see above). Thus, this – in the IR – marksthe termination of the built-up of the final isomer distribu-tion. The fraction of the cis-isomer in this distribution isestimated to be �10%. This estimate is based on the bleachafter 50 ps in relation to the initial bleach. That ratioamounts to 7%. Taking into account that the isomerizationreduces the oscillator strength of the NO2 mode by 30%(see above) one arrives at the given yield. Clearly, that yieldis not yet settled after 20 ps since spectral changes occurthereafter. The 20 ps spectrum looks somewhat like ascaled up cis–trans-difference spectrum but there are somedeviations. The bleach spectrum of the NO2 mode at1340 cm�1 is sharper and shifted to higher frequencies at20 ps as compared to the steady state difference spectrum.Furthermore, there are weak induced absorption bandsat 1355 and 1320 cm�1 that are absent in the steady statedifference spectrum. So definitely, there are distinct spectralchanges in the IR occurring at delay times when the tran-sient absorption in the visible is already static.
This discrepancy becomes most evident when directlycomparing the two experiments. For that comparison theUV/Vis and IR time traces were normalized in the follow-ing fashion. Pedestal difference absorptions at t = 70 ps (atthat time the dynamics are terminated in either experiment)were subtracted to ensure that all time traces decay to thesame level. Further, the traces were normalized att = 0.25 ps for excited state dynamics or at t = 2.0 ps forthe ground state dynamics. At wavelengths/frequenciesthat predominately probe the electronically excited state(646 nm in UV/Vis, 1260 cm�1 in the IR, Fig. 5a) both

-30
-20
-10
0
10
Abso
rban
ce C
hang
e / m
OD
Wavenumber / cm-1
0.5 ps 5 ps 10 ps 20 ps 50 ps200 ps
1260 1280 1300 1320 1340 1360 1380
0
10
20
30
40
50
Del
ay T
ime
/ ps
-30 -20 -10 0 10
1500 1520 1540 1560 1580 1600 1620 1640
0
10
20
30
40
50
-10 -8 -6 -4 -2 0 2
Color Code for Absorbance Change / mOD
-10
-5
0
5
a b
c d
Fig. 4. Changes of the IR absorption upon optical excitation of NA in DMSO-d6 with femtosecond laser pulses centered at 400 nm. (a) and (b) Contourrepresentation. Negative (absorption bleach, blue coloring) and positive (induced absorption, green to red coloring) changes are observed. Note that thecolor codings in the two plots differ. (c) and (d) Difference absorption spectra at given delay times. (For interpretation of the references to color in thisfigure legend, the reader is referred to the web version of this article.)
0
-1.0
-0.5
0.0
Abso
rban
ce C
hang
e / a
.u.
Delay Time / ps
0.0
0.5
1.0
a
b
10 20 30 40 50 60
at 510 nm at 1339 cm-1
at 646 nm at 1260 cm-1
70
Fig. 5. Comparison of the UV/Vis (gray) and IR (black) transientsinduced by femtosecond optical excitation of NA in DMSO-d6. In (a) thedetection frequencies were chosen as to focus on the electronically excitedstate. In (b) emphasis is laid on ground state processes.
F.O. Koller et al. / Chemical Physics 341 (2007) 258–266 263
experiments feature similar kinetics: The signal aroundtime zero predominately decays with a time constant of�1 ps. This is due to the depletion of the excited state. In
the visible time trace a minor slower contribution causedby ground state cooling is also observed. A different pictureemerges when probing the ground state recovery (510 nmin the visible, 1339 cm�1 in the IR, Fig. 5b). The transientabsorption settles after �20 ps whereas in the IR the signalcontinues to evolve until �50 ps. So by means of IR spec-troscopy a slower process – most likely occurring in theelectronic ground state – can be observed which does notleave an imprint in the Vis spectroscopy. The question thatnow arises is whether this slower process is a unique pro-cess of the isomerizing NA or whether it is also presentin the dynamics of non-isomerizing pDNA. To address thisquestion we will compare the transient IR spectra ofpDNA with the above NA data.
3.2.3. Femtosecond IR spectroscopy of pDNA
In the pDNA measurements the same vibrational mode,namely the symmetric NO2 stretch, as above will befocused on. For pDNA in DMSO-d6 that mode is locatedat 1312 cm�1, i.e. at a slightly lower frequency as in NA.Upon femtosecond excitation at 400 nm one observes thebehavior detailed in Ref. [10] for the closely related mole-cule para-nitroaniline (Fig. 6a). Around time zero an
10 20 30 40 50 60 70-1.00
-0.75
-0.50
-0.25
0.00
Abso
rban
ce C
hang
e / a
.u.
Delay Time / ps
1342 cm-1
1339 cm-1
1336 cm-1
1315 cm-1
1312 cm-1
1310 cm-1
1240 1260 1280 1300 1320 1340Wavenumber / cm-1
0
10
20
30
40
Del
ay T
ime
/ ps
-2 -1 0 1
Color Code for Absorbance Change / mOD
a
b
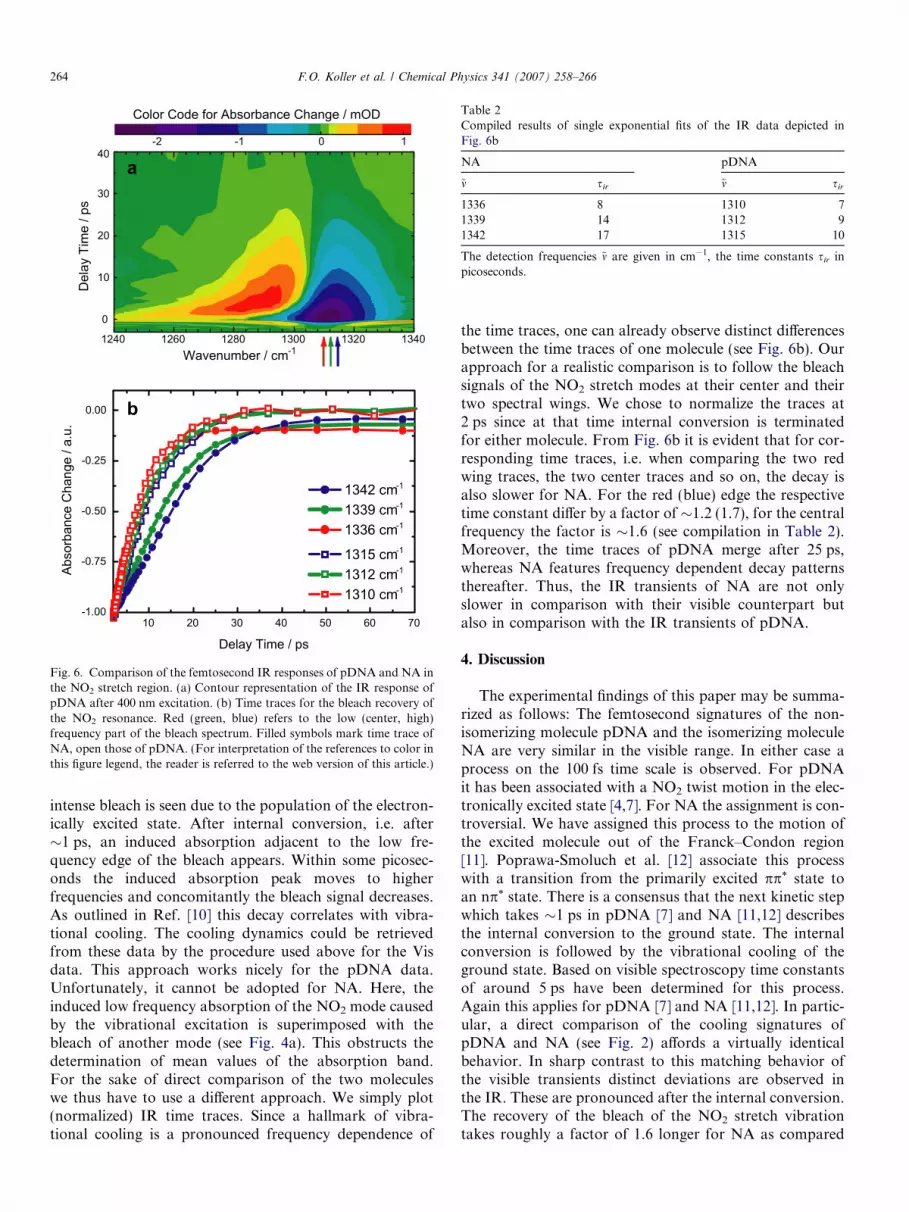
Fig. 6. Comparison of the femtosecond IR responses of pDNA and NA inthe NO2 stretch region. (a) Contour representation of the IR response ofpDNA after 400 nm excitation. (b) Time traces for the bleach recovery ofthe NO2 resonance. Red (green, blue) refers to the low (center, high)frequency part of the bleach spectrum. Filled symbols mark time trace ofNA, open those of pDNA. (For interpretation of the references to color inthis figure legend, the reader is referred to the web version of this article.)
Table 2Compiled results of single exponential fits of the IR data depicted inFig. 6b
NA pDNA
~m sir ~m sir
1336 8 1310 71339 14 1312 91342 17 1315 10
The detection frequencies ~m are given in cm�1, the time constants sir inpicoseconds.
264 F.O. Koller et al. / Chemical Physics 341 (2007) 258–266
intense bleach is seen due to the population of the electron-ically excited state. After internal conversion, i.e. after�1 ps, an induced absorption adjacent to the low fre-quency edge of the bleach appears. Within some picosec-onds the induced absorption peak moves to higherfrequencies and concomitantly the bleach signal decreases.As outlined in Ref. [10] this decay correlates with vibra-tional cooling. The cooling dynamics could be retrievedfrom these data by the procedure used above for the Visdata. This approach works nicely for the pDNA data.Unfortunately, it cannot be adopted for NA. Here, theinduced low frequency absorption of the NO2 mode causedby the vibrational excitation is superimposed with thebleach of another mode (see Fig. 4a). This obstructs thedetermination of mean values of the absorption band.For the sake of direct comparison of the two moleculeswe thus have to use a different approach. We simply plot(normalized) IR time traces. Since a hallmark of vibra-tional cooling is a pronounced frequency dependence of
the time traces, one can already observe distinct differencesbetween the time traces of one molecule (see Fig. 6b). Ourapproach for a realistic comparison is to follow the bleachsignals of the NO2 stretch modes at their center and theirtwo spectral wings. We chose to normalize the traces at2 ps since at that time internal conversion is terminatedfor either molecule. From Fig. 6b it is evident that for cor-responding time traces, i.e. when comparing the two redwing traces, the two center traces and so on, the decay isalso slower for NA. For the red (blue) edge the respectivetime constant differ by a factor of �1.2 (1.7), for the centralfrequency the factor is �1.6 (see compilation in Table 2).Moreover, the time traces of pDNA merge after 25 ps,whereas NA features frequency dependent decay patternsthereafter. Thus, the IR transients of NA are not onlyslower in comparison with their visible counterpart butalso in comparison with the IR transients of pDNA.
4. Discussion
The experimental findings of this paper may be summa-rized as follows: The femtosecond signatures of the non-isomerizing molecule pDNA and the isomerizing moleculeNA are very similar in the visible range. In either case aprocess on the 100 fs time scale is observed. For pDNAit has been associated with a NO2 twist motion in the elec-tronically excited state [4,7]. For NA the assignment is con-troversial. We have assigned this process to the motion ofthe excited molecule out of the Franck–Condon region[11]. Poprawa-Smoluch et al. [12] associate this processwith a transition from the primarily excited pp* state toan np* state. There is a consensus that the next kinetic stepwhich takes �1 ps in pDNA [7] and NA [11,12] describesthe internal conversion to the ground state. The internalconversion is followed by the vibrational cooling of theground state. Based on visible spectroscopy time constantsof around 5 ps have been determined for this process.Again this applies for pDNA [7] and NA [11,12]. In partic-ular, a direct comparison of the cooling signatures ofpDNA and NA (see Fig. 2) affords a virtually identicalbehavior. In sharp contrast to this matching behavior ofthe visible transients distinct deviations are observed inthe IR. These are pronounced after the internal conversion.The recovery of the bleach of the NO2 stretch vibrationtakes roughly a factor of 1.6 longer for NA as compared

trans
cis
100 fs
1 ps
cisoid
>10 pshn
Fig. 7. Schematic of the proposed model on the photo-isomerization ofNA. For simplicity cooling processes also taking place have been omitted.The depicted structures of trans and cis NA resulted from a DFTcalculation.
F.O. Koller et al. / Chemical Physics 341 (2007) 258–266 265
to pDNA. Further there are spectral changes with a smallamplitude with even longer characteristic times (Fig. 6b).
From these findings two questions arise. (i) Why do certainprocesses not leave a signature in the visible spectroscopy? (ii)What is the nature of these processes? Definitely whenaddressing these two questions we can focus on the nucleardegrees of freedoms of the NA molecule (and maybe its sol-vent surroundings) since the electronic excitation decays onmuch shorter time scales. Thus, we are looking for structuralchanges of NA in its electronic ground state that do not havean impact on its visible absorption spectrum.
(i) Spectroscopy textbooks (e.g. Ref. [20]) tell us that adisplacement Dm along a certain mode upon excitation(Franck–Condon active mode) is a prerequisite for aninfluence on the shape of visible absorption spectra. Forlarger molecules in solution with their structureless absorp-tion bands an assignment of the Franck–Condon activemodes based on the absorption spectrum is not feasible.However, a resonance Raman experiment can afford thosemodes [21,22]. A thorough analysis of the resonanceRaman spectrum of NA performed by Biswas and Umapa-thy [23] yielded in addition to a low frequency solvent con-tribution eight vibrational modes (out of 96) thatcontribute to the absorption spectrum of NA. These modesall lie in a range between 1100 and 1600 cm�1 whereby thesymmetric NO2 stretch mode shows the strongest contribu-tion. It is that very vibrational mode for which the slowkinetics in the IR experiments have a strong amplitude.One might now argue that the modulation of this stronglyFranck–Condon active mode should have an impact on thevisible absorption spectrum and therefore the slow processshould be present in the UV/Vis experiment. Yet, the slowprocess mainly effects the amplitude of the IR signal andonly to a minor extent its frequency xm (see Fig. 4). The res-onance Raman intensity and thereby the Franck–Condonfactor for a mode m is proportional to D2
mx2m [21,23]. If xm
is constant during a process a change in the amplitude ofan IR resonance need not modulate the electronic absorp-tion spectrum (provided that the displacement Dm remainsconstant too.) Thus, we are dealing with a process thatmodulates the IR absorption of a vibrational resonance,i.e. its oscillator strength, and not its eigen frequency.Indeed as the difference spectra in Fig. 3 demonstrate,strong structural changes like the trans! cis isomerizationaffect only the vibrational oscillator strength and not theresonance frequency of the NO2 stretch mode. In otherwords, this mode seems to ‘‘sense’’ structural changes viaits oscillator strength and not via its frequency. As this fre-quency (and that of other high frequency modes) remainsvirtually constant during the slow process, the visible spec-trum is not modulated by this process.
(ii) So what is the nature of this process? Two experi-mental observations might give a clue. First, the quantumyield of the isomerization is rather low (�10%). Second,the IR difference spectra after 20–30 ps resemble a scaledup cw cis–trans difference spectrum. Based on these obser-vations a preliminary model for the slow process is devel-
oped (cf. Fig. 7). Photo-excitation of the trans-isomerpromotes the molecule to an electronically excited state.There the altered potential generates forces which resultin a motion out of the Franck–Condon region towards atransition region to the ground state. We postulate thatthe structure the molecule adopts in the transition regionis closer to that of the cis-form than that of the trans-form.At the transition region a branching occurs. A minor frac-tion of molecules form the cis-isomer, the remainder takesa route which ultimately leads back to the trans-isomer.Along this route a shallow minimum exists in which somefraction of the population is intermediately trapped. Themolecules leave that shallow trap in the time scale of10 ps. As this process does not show up in the visible spec-troscopy the molecule experiences the barrier alongFranck–Condon-inactive modes. Along these modes thetrap structure is closer to that of the cis-isomer (cisoid inFig. 7) which is why a scaled up cw difference spectrum isobserved. When comparing the DFT structures of trans-and cis-NA (see Fig. 7) it becomes evident that distortionsof many internal degrees of freedom (vibrational modes)are necessary to re-transform the cis isomer into the trans
form. Several of them will be Franck–Condon inactiveand their evolution is only observed in the IR via anhar-monic couplings. In short, we attribute the slow processto dynamics in the ground state surface which is roughalong Franck–Condon-inactive modes.
5. Conclusions
In this study we have monitored an ultrafast photo-isomerization of an azo-dye by two femtosecond probingschemes, visible and IR spectroscopy. By visible spectros-copy signatures of expected processes as there are motionin or between excited states, internal conversion to the
266 F.O. Koller et al. / Chemical Physics 341 (2007) 258–266
ground state, and vibrational cooling are observed. Maybedue to a limited time resolution IR probing misses theexcited state motion occurring with a characteristic timeof �100 fs. The internal conversion takes about 1 ps andis seen by both techniques. The same applies to groundstate cooling which is terminated in roughly 10 ps. Toour surprise in the IR pronounced changes lasting until�50 ps are detected. These changes find no counterpartin the visible experiment. Presently, we associate thesechanges with smaller re-organizations that take the nascentazo-dye from the structure adopted immediately afterinternal conversion to the relaxed forms of the isomers. Itseems that these re-organizations mainly involve Franck–Condon silent modes. It would be of great interest to seewhether such a discrepancy between visible and IR observ-ables is observed for other isomerizing molecules too.
Acknowledgments
This work was supported by Deutsche Forschungsge-meinschaft through the DFG-Cluster of ExcellenceMunich-Centre for Advanced Photonics and through theSonderforschungsbereich (SFB) 533. T. Cordes is gratefulfor a scholarship donated by the Fonds der chemischenIndustrie. We thank W. Zinth for very helpful discussionand continuous support of this work.
References
[1] N. Tamai, H. Miyasaka, Chem. Rev. 100 (2000) 1875.
[2] E. Lenderink, K. Duppen, D.A. Wiersma, J. Phys. Chem. 99 (1995)8972.
[3] K. Gille, H. Knoll, K. Quitzsch, Int. J. Chem. Kinet. 31 (1999) 337.[4] V.M. Farztdinov, R. Schanz, S.A. Kovalenko, N.P. Ernsting, J. Phys.
Chem. A 104 (2000) 11486.[5] C.L. Thomsen, J. Thømsen, S.R. Keiding, J. Phys. Chem. A 102
(1998) 1062.[6] S.A. Kovalenko, R. Schanz, V.M. Farztdinov, H. Hennig, N.P.
Ernsting, Chem. Phys. Lett. 323 (2000) 312.[7] S.A. Kovalenko, S. Schanz, H. Hennig, N.P. Ernsting, J. Chem. Phys.
115 (2001) 3256.[8] V. Kozich, W. Werncke, J. Dreyer, K.W. Brzezinka, M. Rini, A.
Kummrow, T. Elsaesser, J. Chem. Phys. 117 (2002) 719.[9] Q. An, P. Gilch, Chem. Phys. Lett. 363 (2002) 397.
[10] T. Schrader, A. Sieg, F. Koller, W. Schreier, Q. An, W. Zinth, P.Gilch, Chem. Phys. Lett. 392 (2004) 358.
[11] B. Schmidt, C. Sobotta, S. Malkmus, S. Laimgruber, M. Braun, W.Zinth, P. Gilch, J. Phys. Chem. A 108 (2004) 4399.
[12] M. Poprawa-Smoluch, J. Baggerman, H. Zhang, H.P.A. Maas, L. DeCola, A.M. Brouwer, J. Phys. Chem. A 110 (2006) 11926.
[13] T. Cordes, D. Weinrich, S. Kempa, K. Riesselmann, S. Herre, C.Hoppmann, K. Ruck-Braun, W. Zinth, Chem. Phys. Lett. 428 (2006)167.
[14] M.J. Frisch et al. Gaussian 98, Revision A.7.[15] A. Seilmeier, W. Kaiser, in: W. Kaiser (Ed.), Topics in Applied
Physics, vol. 60, Elsevier, Amsterdam, 1993, p. 279 (Chapter 7).[16] N. Biswas, S. Umapathy, J. Phys. Chem. A 104 (2000) 2734.[17] C.H.B. Cruz, P.C. Becker, J.P. Gordon, R.L. Fork, C.V. Shank,
IEEE J. Quantum Electron. 24 (1988) 261.[18] P. Hamm, Chem. Phys. 200 (1995) 415.[19] K. Wynne, R.M. Hochstrasser, Chem. Phys. 193 (1995) 211.[20] J.M. Hollas, Modern Spectroscopy, fourth ed., Wiley, Chichester,
2003.[21] A.B. Myers, Chem. Rev. 96 (1996) 911.[22] A.B. Myers, Annu. Rev. Phys. Chem. 49 (1998) 267.[23] N. Biswas, S. Umapathy, J. Raman Spectrosc. 32 (2001) 471.


