Embed Size (px)
Citation preview
The Effect of Working Capital on Profitability in Computerand Electrical Equipment Industry
Accounting
Master's thesis
Ville Virkkala
2015
Department of AccountingAalto UniversitySchool of Business
Powered by TCPDF (www.tcpdf.org)
brought to you by COREView metadata, citation and similar papers at core.ac.uk
provided by Aaltodoc Publication Archive
Aalto University, P.O. BOX 11000, 00076 AALTO
www.aalto.fi
Abstract of master’s thesis
Author Ville Virkkala
Title of thesis The Effect of Working Capital on Profitability in Computer and Electrical
Equipment Industry
Degree Master of Science (Economics and Business Administration)
Degree programme Accounting
Thesis advisor Henry Jarva
Year of approval 2015 Number of pages 61 Language English
Abstract
Although working capital is one of the key issues in managing day-to-day operations, it has not
gained sufficient emphasis in financial literature until the late 1990s. Since then, efficient working
capital management has been highlighted more in both academic research and managerial
decision-making, thus raising acknowledgement of competitive advantage it can create. This master's thesis studies the impact of working capital on corporate profitability and
shareholder value in 1,683 publicly listed US computer and electrical equipment companies in 1990−2013. Using fixed effects regression methodology in a relatively homogenous sample of 16,481 observations, this thesis contributes to existing literature by presenting an in-depth analysis of working capital management in a specific industry.
Previous research mainly supports the theoretical assumption of a negative impact of working capital on profitability. However, unlike most prior papers solely assuming a linear effect of working capital on profitability, this thesis also addresses a quadratic relationship. The empirical results show a concave impact of cash conversion cycle on return on assets, which indicates that there exists an optimal level of working capital, resulting in a balance between risks and returns, hence maximizing profitability. Accordingly, deviations from the optimum reduce return on assets as a too low level of working capital increases the risk of illiquidity and distress costs, whereas too high level increases tied-up capital and thus opportunity costs.
By contrast, cash conversion cycle is found to have a negative impact on return on equity and stock return. Consistent with previous studies, this indicates that an in increase in the level of working capital reduces the company value for equity holders. In that way, investors prefer excess funds to be used in long-term investments or paid out as dividends.
The findings accentuate the contradiction of different benefits for the company itself and its shareholders regarding working capital management. Different time frames for different measures need also to be taken into account since profitability reflects the magnitude of current earnings, whereas market value shows the future expectations of shareholders. However, shareholders are also more interested in short-term returns, whereas holding a sufficient level of working capital may ensure long-term profitability. Consequently, the level of working capital maximizing return on assets does not necessarily lead to high stock returns and vice versa.
Above all, managers in computer and electrical equipment industry can increase returns and market value by paying more attention on effective working capital management and acknowledging the difference of benefits for the company and its shareholders. In any case, working capital is a particularly important topic in computer and electrical equipment industry due to the continuous development of technology and rapid changes in business environment. However, as this thesis is limited to one industry and country only, caution is needed when generalizing the results to different kinds of samples.
Keywords working capital, cash conversion cycle, profitability, performance
Aalto-yliopisto, PL 11000, 00076 AALTO
www.aalto.fi
Maisterin tutkinnon tutkielman tiivistelmä
Tekijä Ville Virkkala
Työn nimi Käyttöpääoman vaikutus kannattavuuteen tietokone- ja elektroniikkateollisuudessa
Tutkinto Kauppatieteiden maisteri
Koulutusohjelma Laskentatoimi
Työn ohjaaja Henry Jarva
Hyväksymisvuosi 2015 Sivumäärä 61 Kieli englanti
Tiivistelmä
Vaikka käyttöpääoma on yksi olennaisimpia lyhyen ajan päätöksentekoon vaikuttavia asioita, se
on jäänyt kirjallisuudessa vähälle huomiolle aina 1990-luvun lopulle asti. Siitä lähtien tehokasta
käyttöpääoman hallintaa on painotettu enemmän sekä akateemisessa tutkimuksessa että
yritysjohdon päätöksenteossa, jolloin myös sen mahdollistama kilpailuetu on noussut yleiseksi
puheenaiheeksi. Tämä maisterin tutkinnon tutkielma tarkastelee käyttöpääoman vaikutusta kannattavuuteen ja
osakekurssin tuottoon 1 683 listatussa yhdysvaltalaisessa tietokone- ja elektroniikkateollisuuden yrityksessä vuosina 1990−2013. Tutkielma laajentaa aiempaa tutkimusta tarjoamalla kattavan analyysin käyttöpääoman hallinnasta yksittäisellä toimialalla, ja melko homogeenisen 16 481 havainnon otoksen tutkimiseen käytetään metodologiana kiinteiden vaikutusten regressiota.
Aiempi tutkimus pääosin tukee teoreettista viitekehystä, jonka mukaan käyttöpääomalla on negatiivinen vaikutus kannattavuuteen. Toisaalta suurin osa aiemmista tutkimusartikkeleista on huomioinut pelkästään lineaarisen vaikutuksen, kun taas tässä tutkielmassa tarkastellaan myös toisen asteen yhteyttä. Empiiriset tulokset osoittavat käyttöpääomasyklillä olevan konkaavi vaikutus sijoitetun pääoman tuottoasteeseen, mikä tarkoittaa optimaalisen käyttöpääoman tason tasapainottavan riskit ja tuotot ja siten maksimoivan kannattavuuden. Vastaavasti poikkeamat optimitasosta heikentävät pääoman tuottoastetta, sillä liian alhainen käyttöpääoman määrä kasvattaa likviditeettivajeesta ja taloudellisesta ahdingosta johtuvia kustannuksia, kun taas liian korkea määrä kasvattaa sitoutunutta pääomaa ja siitä koituvia vaihtoehtoiskustannuksia.
Sen sijaan oman pääoman tuottoasteeseen ja osaketuottoon käyttöpääomasyklillä on negatiivinen vaikutus. Tämä tarkoittaa käyttöpääoman määrän kasvun vähentävän yrityksen arvoa sen osakkeenomistajille, kuten myös aiemmat tutkimukset osoittavat. Siten sijoittajat pitävät parempana vaihtoehtona ylimääräisen pääoman käyttöä investointeihin tai jakoa osinkoina.
Tulosten mukaan käyttöpääoman hallinnassa vallitsee ristiriita yrityksen itsensä ja sen omistajien etujen välillä. Eri tunnuslukujen erilainen ajallinen ulottuvuus on myös huomioitava, sillä kannattavuus kertoo päättyneen tilikauden tuloksen tason, kun taas markkina-arvo osoittaa sijoittajien tulevaisuuden odotuksia. Toisaalta sijoittajat ovat myös kiinnostuneempia lyhytaikaisista tuotoista, kun taas yritykselle itselleen riittävä käyttöpääoman määrä voi mahdollistaa pitkäaikaisen kannattavuuden. Tämän vuoksi kannattavuuden maksimoiva käyttöpääoman taso ei välttämätttä johda korkeaan osaketuottoon ja päinvastoin.
Kaiken kaikkiaan tietokone- ja elektroniikkateollisuuden yritysten johto voi lisätä tuottoa ja markkina-arvoa panostamalla enemmän tehokkaaseen käyttöpääoman hallintaan ja tunnistamalla yrityksen ja sen omistajien etujen väliset erot. Joka tapauksessa käyttöpääoma on erityisen tärkeä tekijä tietokone- ja elektroniikkateollisuudessa jatkuvan teknologian kehityksen ja nopeasti muuttuvan liiketoimintaympäristön vuoksi. Tämän tutkielman tuloksia yleistettäessä tulee kuitenkin muistaa, että tutkielman otos rajoittuu vain yhteen maahan ja toimialaan.
Avainsanat käyttöpääoma, käyttöpääomasykli, kannattavuus
Table of contents
1. INTRODUCTION ...................................................................................................................... 1
2. WORKING CAPITAL ................................................................................................................. 5
2.1. Defining working capital .................................................................................................. 5
2.2. Measuring working capital .............................................................................................. 7
2.3. Determinants of working capital management ............................................................ 11
3. PRIOR RESEARCH .................................................................................................................. 20
3.1. Measuring profitability .................................................................................................. 20
3.2. The relationship of working capital and performance .................................................. 21
3.3. Industry differences of working capital management .................................................. 29
3.4. Working capital in the computer industry .................................................................... 29
4. HYPOTHESES ......................................................................................................................... 34
5. DATA AND METHODOLOGY ................................................................................................. 37
5.1. Data ................................................................................................................................ 37
5.2. Descriptive statistics ...................................................................................................... 38
5.3. Methodology ................................................................................................................. 41
6. RESULTS ................................................................................................................................ 45
6.1. Study of correlations ..................................................................................................... 45
6.2. Regression analysis ........................................................................................................ 47
6.3. Sensitivity test................................................................................................................ 51
7. CONCLUSION ........................................................................................................................ 57
REFERENCES ............................................................................................................................. 62
APPENDICES.............................................................................................................................. 67
Appendix 1: List of SIC codes of companies used in the sample .......................................... 67
Appendix 2: List of COMPUSTAT items used in the sample ................................................. 67
Appendix 3: The effect of working capital components on return on equity ...................... 68
Appendix 4: The effect of working capital components on stock return ............................. 69
Appendix 5: Joint effect of working capital components on the dependent variables ....... 70
List of tables
Table 1. Expected signs for regressions ................................................................................... 36
Table 2. Descriptive statistics of the sample ............................................................................ 38
Table 3. Sample breakdown by CCC deciles ............................................................................. 39
Table 4. Sample breakdown by ROA deciles ............................................................................ 39
Table 5. Sample breakdown by year ........................................................................................ 40
Table 6. Correlation matrix ...................................................................................................... 46
Table 7. The effect of working capital on return on assets...................................................... 48
Table 8. The effect of cash conversion cycle on return on equity and stock return ............... 53
List of figures
Figure 1. Cash conversion cycle (Jose et al. 1996) ................................................................... 10
1
1. INTRODUCTION
Working capital is one of the most essential factors in short-term financial planning. Superior
working capital management can bring remarkable competitive advantage, but on the other
hand, inefficient working capital management can cause disastrous losses. In 2012, the
astonishing amount of 1.1 trillion dollars tied up in the working capital of US companies was
equivalent to 7 per cent of the US GDP, representing 25 per cent increase in the previous
three years and indicating that working capital efficiency has begun to deteriorate after the
improvements made during the financial crisis. (REL Consultancy 2013b). However,
although a significant part of decisions about financial management of a company is related to
short-term decisions, working capital has not been seen traditionally as an important issue in
the financial literature (Luo et al. 2009; Baños-Caballero et al. 2010; Ebben & Johnson 2011).
Instead, more emphasis has been put on other financial statement items, especially regarding
long-term financial planning and capital management (Chiou et al. 2006; Sagner 2011, 12).
As recent economic crises have increased the attention to reduce costs, improve profitability
and avoid financial distress by rationalizing operations, more efficient working capital
management has become a timely topic, raising more discussion in the 2000s (Autukaite &
Molay 2011; Hofmann et al. 2011, 5).
Regarding working capital categories, financial working capital (cash and securities) have
gained more attention than operational working capital (receivables and inventories).
However, there is also a considerable amount of funds tied up in the operational side of
working capital, as the mean operating working capital (receivables plus inventories) and net
operating working capital (receivables plus inventories less payables) in public US companies
accounted for 37.6 per cent and 27.7 per cent of total assets, respectively (Kieschnick et al.
2013). Although operational working capital represents a higher fraction of assets than
financial working capital, the latter has been accentuated more in the academic literature. On
the contrary, this thesis studies mainly the operational side of working capital.
The conservative view has been to consider working capital as a positive asset. It can be used
to boost sales by granting customers favorable credit terms, prevent inventory stock-outs by
keeping sufficient levels of safety stock and ensuring the reliability of deliveries by paying
suppliers on time. Greater amount of working capital also improves some financial indicators,
such as current ratio (Richards & Laughlin 1980). The sufficient level of cash is also
2
inevitable to be able to cope with day-to-day payments and to fulfill the assumption of going
concern – many companies have gone to default due to illiquidity although they have been in
principle profitable enough to succeed (Chiou et al. 2006).
However, working capital also has a negative side as its items are tied up in the balance sheet
and thus, they must be financed somehow and the opportunity cost of an alternative
investment object may be remarkable. Therefore, working capital is supposed to have an
adverse effect on profitability. This is supported by many studies conducted in the 2000s, that
way revoking the traditional view of working capital management (e.g. Deloof 2003;
Lazaridis & Tryfonidis 2006; Ebben & Johnson 2011). Thus, an optimal level of working
capital generates a balance between risk and efficiency. In addition, there are significant
variations between working capital management in different industries (Hawawini et al. 1986;
Weinraub & Visscher 1998; Filbeck & Krueger 2005).
The computer manufacturer Dell is an extreme example of efficient working capital
management. By minimizing accounts receivable and inventories and maximizing accounts
payable, the net operating working capital of Dell is negative (Kraemer et al. 2000; Hofmann
& Kotzab 2010; Lind et al. 2012). In fact, Dell has maintained a negative cash conversion
cycle since 1996 and it accounted for an astonishingly low cash conversion cycle of −22 days
in 2012 (REL Consultancy 2013b). This means that for Dell, working capital is a source
instead of a need for financing, enabling the company to gain interest income by investing
additional funds generated by the negative amount of net working capital. Thus, Dell adds its
value not only by earning a certain amount of income but also by operating business with
negative net working capital (Penman 2009).
Although several cross-sectional studies have examined the impact of working capital on
profitability, there have been very few in-depth analyses of a particular industry. By
conducting a research using a sample of publicly listed US companies in a specific industry,
the effect of other variables can be diminished, thus focusing on the main research question.
Furthermore, companies maintaining a negative net working capital have not been studied
much either. This thesis aims to fill the gap by examining the relationship between
operational working capital and profitability extensively in the computer and electrical
equipment industries. Unlike previous papers that have assumed a linear association of
working capital and profitability, this thesis also studies a quadratic relationship. In addition,
the effect of operational working capital on market value is briefly addressed to find out how
3
equity holders value working capital and whether it differs from the assessment accounting
measures show. A key motivation behind the choice of these industries is that since
technological improvements have a huge effect on computer companies, the value of time is
high, product life cycles are short and inventory loses its value quickly, resulting in the high
importance of effective working capital management in this industry (Kraemer et al. 2000).
As the example of Dell shows, it is possible to gain remarkable competitive advantage by
keeping net working capital and cash conversion cycle negative in the computer industry.
Electrical equipment industry is also taken in the sample to gain a more comprehensive view
of companies operating in these technological businesses and to include the major suppliers of
computer manufacturers. Computer industry can also be seen as a sub-group of electrical
equipment industry although these two industries are categorized differently in the Standard
Industry Classification (SIC) system. Using these two industries also give a more extended
view than the sole information and communications technology (ICT) sector. Overall, the
sample represents the fields of business where the impact of working capital on profitability is
one of the most significant ones among all industries. Based on aforementioned information,
the following research questions are addressed in this thesis:
1. How does working capital management affect the performance of computer and
electrical equipment companies?
2. Are there any particular factors affecting the relationship between working capital
and performance in computer and electrical equipment companies?
The findings of this thesis show that there is an inverted U-shaped impact of cash conversion
cycle on return on assets but linear negative impact on return on equity and stock return. This
evidence indicates that benefits regarding working capital management are different for the
company itself and for its shareholders. Compared with previous research, this thesis provides
new practical implications. Thus, in addition to more effective working capital management,
profitability and market value can be increased by successfully recognizing the contradiction
of different benefits for different stakeholders. Furthermore, investors can also gain additional
returns by acknowledging how different companies can create competitive advantage through
varying working capital management practices. However, the findings highlight the different
time frames of measures since profitability describes current earnings, whereas market value
shows shareholder’s future expectations but on the other hand, shareholders are also more
4
interested in short-term returns. Accordingly, the results emphasize the importance of paying
attention to working capital in computer and electrical equipment companies.
The remainder of this thesis is structured as follows: The second section defines working
capital, its key components and determinants of working capital practices. The third section
reviews prior literature examining the association of working capital and performance and
describes working capital management in computer industry. The fourth section expresses the
hypotheses, whereas the fifth section describes research data and methodology, including
descriptive statistics. The sixth section presents the empirical findings, expressing the results
of the statistical analysis. Finally, the seventh section presents practical implications and
concludes the study.
5
2. WORKING CAPITAL
This section defines working capital and its main metrics, followed by presenting the main
determinants of working capital management.
2.1. Defining working capital
Working capital or gross working capital equals current assets in the balance sheet (Sharma
2009, 26). Thus, it expresses the use of short-term funds to the operations of a company,
differentiated from long-term assets depicting investments financed with long-term liabilities
(Chiou et al. 2006). On the other side of the balance sheet, current liabilities express
obligations that must be paid within one year. To take into account the impact of short-term
liabilities, a common measure for basic working capital metrics is net working capital, which
is defined as current assets less current liabilities (Eljelly 2004; Hill et al. 2010). It expresses
the amount of working capital left if the company realized all its current assets and liabilities.
As the size of company obviously affects the amount of working capital, a usual practice is to
calculate working capital percentage by dividing net working capital by revenue, giving a
more comprehensive view of the working capital level. Net working capital can also be
divided by total assets to obtain the fraction of working capital in the balance sheet.
(1)
Since working capital contains both operational and financial items, it is important to
distinguish between operational and financial working capital. The operational working
capital expresses the assets tied on the day-to-day operations of a company. It needs to be
financed through either internal or external financing (Richards & Laughlin 1980). The main
items of operational working capital are accounts receivable, inventories and accounts
payable. Especially in business-to-business transactions, the majority of sales and purchases
are made in credit terms. Since accounting standards require revenue to be recognized and
costs incurred according to accrual basis instead of cash flow basis, this creates accounts
receivable for the seller and accounts payable for the buyer. As the purchase of materials or
finished goods usually occurs prior selling the goods to the customer, almost every company
handling physical goods hold inventories.
Cash and cash equivalents, for instance, are not considered as operating components of
working capital because they correspond to financial processes (Hill et al. 2010). In addition,
6
short-term liabilities belong to the financial side of working capital. Like operational working
capital items, cash can also be seen to have an opportunity cost, as it is an asset which could
be invested in more profitable objects as the interest rate of deposits is normally low (Chiou et
al. 2006). Shareholders also dislike idle cash and prefer it to be either invested profitably or
paid out as dividends. Consequently, increasing liquidity over the optimum level lowers
profitability and vice versa, creating a trade-off between liquidity and profitability (Eljelly
2004; Sharma 2009, 37−38).
Although all additional working capital items increase the direct or indirect cost of capital,
excess cash can be used in the future, whereas excess inventory bears the risk of obsolescence
and excess receivables the risk of customer default (Sagner 2011, 206). As the realization of
receivables results in cash inflow and the realization of payables in cash outflow, it is
essential to manage them concurrently with cash and other liquid assets (Sharma 2009, 97). In
any case, cash management is an essential part of day-to-day operations because a shortage of
cash may lead to failure to meet the company’s obligations (Sharma 2009, 27). Since this
thesis focuses primarily on operational working capital, the financial side of working capital
is not emphasized much. In fact, the term working capital is quite often used to stand for
operational working capital and that way it is also expressed several times later in this thesis
when there is no risk for confusion.
To measure net operational working capital, some studies have used the expression working
capital requirement (WCR), which equals accounts receivable plus inventories less accounts
payable, or in other words, net working capital less net liquid balance (Hawawini et al. 1986;
Chiou et al. 2006). This is a more accurate measure for operating efficiency as it omits the
finance-related side of working capital. Moreover, as cash conversion cycle measures the
amount of net operating working capital in days, working capital requirement equals the same
amount measured in a different unit (Hill et al. 2010).
(2)
Prior research has shown that the amount of working capital significantly differs between
industries (Hawawini et al. 1986; Weinraub & Visscher 1998). For instance, manufacturing
industries often hold significant amounts of inventories and extend longer periods of trade
credit, resulting in higher levels of working capital. As opposite, retailers dispose inventories
7
faster and get customer payments promptly, so the amount of working capital is lower.
Furthermore, service companies may not hold any inventories at all.
Nevertheless, the amounts of working capital items in the financial statement describe only
the situation of the balance sheet date, whereas levels of working capital may considerably
fluctuate during the fiscal year.
2.2. Measuring working capital
Traditionally, metrics such as current ratio and quick ratio have been the most common
measures for liquidity and working capital. They are relatively simple to be calculated, such
as current ratio represents the level of current assets compared with current liabilities.
Although most companies report them as a part of their key ratios, there are remarkable
weaknesses when using them. Particularly, current assets may include e.g. aged accounts
receivable to be written off or inventories having low liquidity. If the level of net working
capital is high, current ratio shows decent liquidity although the real situation is different as
profitability weakens due to longer turnover ratios. Quick ratio, also known as acid-test ratio,
expresses more liquid view of working capital by excluding inventories but likewise as
current ratio, it represents the situation of the balance sheet date, ignoring changes occurred
during the financial year. Therefore, current and quick ratios represent too static a view of
liquidity. (Richards & Laughlin 1980)
Turnover ratios, or also know as activity ratios, combine information from both balance sheet
and income statement, expressing more dynamic measures for liquidity than current and quick
ratios (Richards & Laughlin 1980). For each operational working capital item, a turnover ratio
expresses the amount of how many times either receivables, inventories or payables are
replaced during a year.
Accounts receivable turnover is defined as
(3a)
To find the exact value for accounts receivable turnover, cash sales should be deducted from
the numerator as they do not generate receivables. However, this deduction is impossible
without inside information on the company’s sales, so the normal practice is just to use net
sales in the formula (Sagner 2011, 9).
8
Inventory turnover is defined as
(3b)
For manufacturing companies, it is important to notice the different weight of raw materials,
work-in process and finished goods when assessing inventory turnover (Gentry et al. 1990).
Finally, accounts payable turnover is defined as
(3c)
The exact value of accounts payable turnover would require that open invoices regarding
investments in non-current assets are deducted from accounts payable. Because sufficient
information for this is not possible for an external analyst, total sum of accounts payable is
used, like when calculating aforementioned ratios.
Furthermore, average days outstanding ratios express the number of days the specific working
capital item is tied in the balance sheet. The number of days is calculated by dividing 365 by
the specific turnover ratio. Sometimes, 360 days is also used in to depict a financial year in a
formula.
Days sales outstanding (DSO) or the average collection period expresses the number of days
customers on average take to pay invoices, thus tying accounts receivable in the balance
sheet.
(4a)
Days inventory outstanding (DIO) or the average inventory period expresses the number of
days the company on average takes to generate revenue from the cumulative stock of raw
materials, work-in-progress and finished goods, thus tying inventories in the balance sheet.
(4b)
9
Days payables outstanding (DPO) or the average payment period expresses the number of
days the company on average takes to pay its vendors, creating liabilities in the balance sheet.
(4c)
Summing days sales outstanding and days inventory outstanding, operating cycle equals the
time span when operational working capital is tied up in the balance sheet (Richards &
Laughlin 1980). However, operating cycle omits the impact of current liabilities. Thus, when
subtracting days payables outstanding from the sum of days sales outstanding and days
inventory outstanding, we will get cash cycle, which was originally introduced by Gitman
(1974). Thus, cash cycle depicts an overall measure for working capital ratios, combining the
effect of all turnover ratios as optimizing only one component of cash cycle does not ensure
overall efficiency (Hager 1976). Later, the expression cash conversion cycle (CCC) has
become more frequent and it has turned into the most common unit to measure working
capital in the recent literature (Richards & Laughlin 1980). Besides, some studies have also
used the terms cash-to-cash cycle, C2C or cash gap to express the same measure as cash
conversion cycle.
By combining the turnover ratios of working capital items, cash conversion cycle expresses
the number of days between cash outlay and cash receipt when the tied working capital must
be financed somehow (Richards & Laughlin 1980). Shortening cash conversion cycle reduces
the amount of tied capital but increases the risk of stock-outs, lost sales and weakening of
credit rating (Jose et al. 1996). On the other hand, as lengthening cash conversion cycle
increases the need for external financing, it also increases the minimum liquidity requirement
which can be expressed as dividing the annual cash expenditures by the number of cash
conversion cycles in a year (Farris & Hutchison 2002).
Besides the accounting perspective, the importance of cash conversion cycle as a supply chain
measure has also increased, facilitating to achieve the lowest total cost through overall
management of all supply chain components (Farris & Hutchison 2002). To take ordering
times into account and express the components of CCC more thoroughly, DSO can be seen as
a part of the order-to-cash process, DIO as a part of the forecast-to-fulfill process and DPO as
a part of the purchase-to-pay process (Hofmann et al. 2011, 17−19).
10
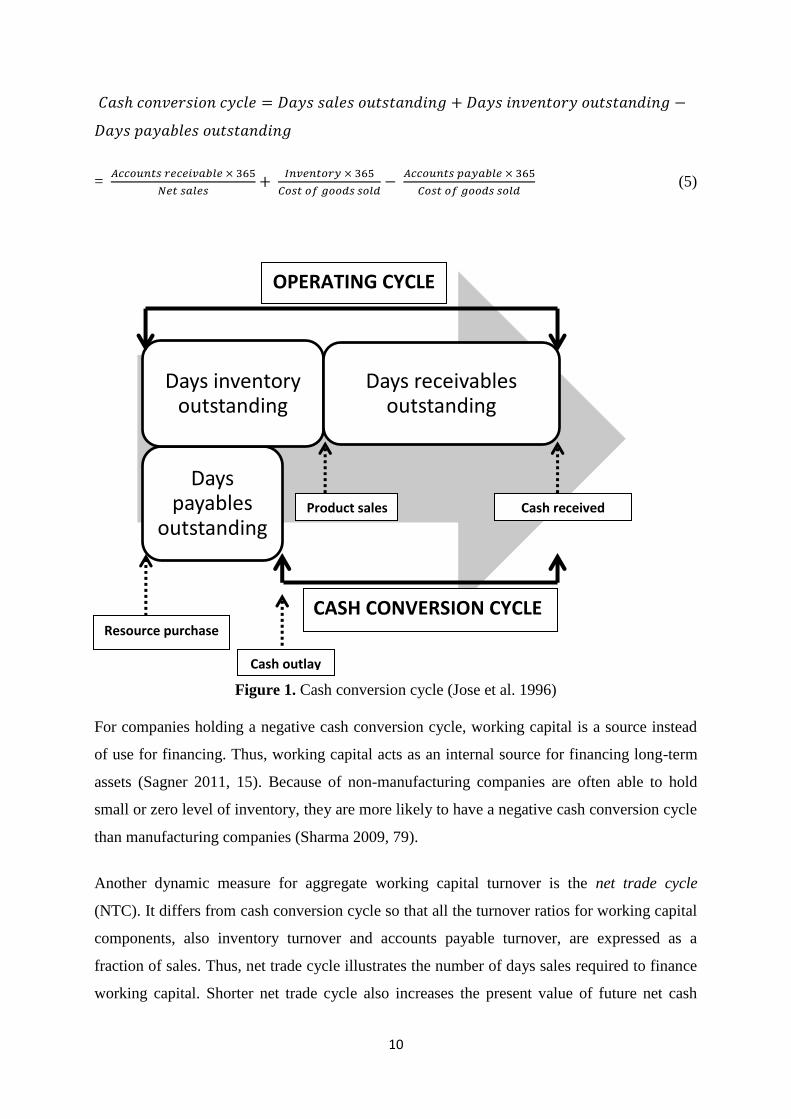
=
(5)
Figure 1. Cash conversion cycle (Jose et al. 1996)
For companies holding a negative cash conversion cycle, working capital is a source instead
of use for financing. Thus, working capital acts as an internal source for financing long-term
assets (Sagner 2011, 15). Because of non-manufacturing companies are often able to hold
small or zero level of inventory, they are more likely to have a negative cash conversion cycle
than manufacturing companies (Sharma 2009, 79).
Another dynamic measure for aggregate working capital turnover is the net trade cycle
(NTC). It differs from cash conversion cycle so that all the turnover ratios for working capital
components, also inventory turnover and accounts payable turnover, are expressed as a
fraction of sales. Thus, net trade cycle illustrates the number of days sales required to finance
working capital. Shorter net trade cycle also increases the present value of future net cash
Days payables
outstanding
Days inventory outstanding
Days receivables outstanding
OPERATING CYCLE
CASH CONVERSION CYCLE Resource purchase
Cash outlay
Product sales Cash received
11
flows generated by tied assets and hence, the shareholder value. (Shin & Soenen 1998) If cost
of goods sold is unknown, net sales is sometimes used as an alternative proxy measure for the
denominator of DIO and DPO to improve comparability between companies (Hofmann et al.
2011, 16).
The net trade cycle is calculated as
–
(6)
The weighted cash conversion cycle (WCCC) developed by Gentry et al. (1990) expresses
more detailed information about the working capital turnover, especially inventories. It differs
from cash conversion cycle as all the turnover ratios are weighted with the proportional
amount of funds tied up in the specific phase of the cycle and days inventory outstanding is
decomposed into ratios for raw materials, work-in-process and finished goods. However,
WCCC has been very rarely used in empirical studies since calculating weights requires more
in-depth data not available for external analysts.
The modified cash conversion cycle (mCCC) introduced by Talonpoika et al. (2013) takes
into account the effect of advance payments received since they do not belong to accounts
payable but they are an important source of financing in some industries due to the project
nature of the business, for instance. Therefore, if a company receives advance payments, they
practically have a significant effect on the level of working capital. Consequently, the mCCC
is calculated by deducting an additional component, days advance payments outstanding,
from the standard CCC. Nevertheless, modified cash conversion cycle recognizes only the
liabilities side of advance payments, omitting the effect of advance payments paid on the asset
side. In addition, calculating mCCC for large sample sizes is often irrelevant since financial
databases do not normally provide sufficient data regarding advance payments.
2.3. Determinants of working capital management
The traditional aspect has been to emphasize the positive sides of working capital (Sagner
2011, 13). In most cases, holding working capital is inevitable: granting trade credit results in
accounts receivable which is needed to generate sales, avoiding stock-outs requires holding
inventories and paying vendors on credit terms creates accounts payable. For instance, sales
can be boosted by creating a competitive advantage through loose credit terms policy and
12
service level can be improved to predict future demand by raising inventory levels proactively
(Jose et al. 1996). It is generally easier to stimulate sales by adjusting current assets e.g.
through more lenient credit terms than adjusting fixed assets through capacity change (Baños-
Caballero et al. 2010). In addition, decreasing working capital by delaying invoice payments
to vendors would cause interest expenses and even weaken the credit rating (Sharma 2009,
51; Sagner 2011, 52).
However, there has been more discussion about the drawbacks of working capital during a
couple of past decades. Working capital always causes costs – either direct or indirect – as
operating assets in the balance sheet do not provide earnings but they must be financed either
internally or externally. The components of working capital also create an opportunity cost as
the funds invested in working capital could be invested in more profitable objects (Sagner
2011, 13−14). Besides higher costs of capital, higher receivables level increases credit risk
and higher inventory level increases the possibility of abnormal waste and inventory
obsolescence. Neither are shareholders happy if funds are tied in the balance sheet without
generating adequate profit if the alternative would be paying them out as dividends (Sharma
2009, 26−27). Consequently, Kieschnick et al. (2013) found that an additional dollar invested
in working capital is worth for the shareholders less than an additional dollar held in cash.
When external analysts consider company financial statements, it is useful to notice that
longer cash conversion cycle and more volatile level of working capital increase the relative
magnitude of accruals and they are therefore negatively associated with the ability of
operating cash flow to measure company earnings and stock returns (Dechow 1994).
Furthermore, the level of corporate governance may also have some impact on the efficiency
of working capital management as Gill & Biger (2013) found that larger board size was
associated with shorter cash conversion cycle.
Declining working capital by reducing receivables and inventories as well as lengthening
purchase invoice payments is defined as aggressive working capital management (Jose et al.
1996). Thus, the opposite is named conservative working capital management. Aggressive
working capital management by maintaining a low level of working capital increases risks
and returns, while conservative working capital management results in lower risks but also
lower returns (Sharma 2009, 39−40; Baños-Caballero et al. 2012). According to Weinraub &
Visscher (1998), relatively aggressive management of working capital seems to be
13
compensated by relatively conservative management of current liabilities, resulting in a
balance in overall management of net working capital.
Both financial and operational aspects must be combined in order to manage working capital
effectively, especially when negotiating credit terms with customers and vendors. If this
teamwork is not successful, problems may occur if different functions have different
objectives related to working capital. (Sagner 2011, 207). That risk is particularly high in
bigger companies as administrative inefficiency may cause additional difficulties. For
instance, sales department may grant longer credit terms for a customer, resulting in higher
amount of accounts receivable and lower liquidity. This creates a trade-off between a top-line
and bottom-line strategy as a company needs to choose whether it largely pursues higher
revenue or lower cost of capital. Another administrative issue to be taken into account is that
it is not always possible to pay invoices as soon possible since it takes time from the receipt of
the invoice to the approval and the booking of the invoice (Hofmann et al. 2011, 27).
If much effort is not paid on working capital and liquidity management, it is often easier to
survive shortage of cash by delaying invoice payments than taking more loan (Petersen &
Rajan 1997; Howorth & Reber 2003; Farris & Hutchison 2003). This is often the case for
smaller companies which have less time and resources to concentrate on working capital
management (Peel et al. 2000; Howorth & Westhead 2003; Ebben & Johnson 2011). In turn,
smaller companies which put some effort on working capital management are likely to focus
on specific areas of working capital where they expect incremental profitability (Howorth &
Westhead 2003). In any case, efficient management of working capital is important also for
SMEs since they hold relatively high amounts of both current assets and current liabilities in
the balance sheet (Peel et al. 2000; García-Teruel & Martínez-Solano 2007). However, Ebben
& Johnson (2011) found unexpectedly that weakly performing SMEs improved working
capital management by reducing the level of receivables and inventories instead of increasing
the level of payables.
Trade credit is defined as a form of credit by paying a resource later than it has been
purchased. It is the most important source for short-term external financing in the US
companies (Petersen & Rajan 1997). Especially smaller companies use trade credit when no
market financing is available due to financial constraints (Niskanen & Niskanen 2006;
Anagnostopoulou 2012). Fluctuating cash flows also cause SMEs to be more dependent on
short-term financing (Peel et al. 2000). One reason for sellers offering trade credit as a source
14
of financing for their customers is that vendors have an advantage over banks in collecting
receivables and thus inferring the financial situation of their customers by examining the
occurrence of late payments (Emery 1984). This is the case especially when a seller has made
an irreversible investment in the customer relationship, as offering trade credit to the buyer is
worthwhile in order to ensure that the customer does not default and the investment lose its
value (Smith 1987). Besides, offering different payment terms for different customers is a
subtle way of price discrimination (Petersen & Rajan 1997; Niskanen & Niskanen 2000).
On the other hand, according to the financial explanation of trade credit, firms with a better
access to capital markets may grant trade credit to their customers with fewer possibilities of
bank financing in order to ensure a more confident long-term customer base (Emery 1984;
Niskanen & Niskanen 2006). This principle can also be applied the other way round: e.g. a
customer with more favourable payment terms may purchase materials and sell them to a
financially constrained key supplier which benefits from the buyer's lower cost of capital,
higher liquidity and quantity discounts, resulting in gains for both sides since the buyer with a
higher bargaining power secures the stability of its long-term supplier base (Hofmann et al.
2011, 57).
Trade credit terms are one of the main issues affecting the levels of payables and receivables.
Thus, the bargaining power allows larger companies to require shorter credit terms from their
customers and longer credit terms from their vendors. In addition, larger companies are often
offered longer payment terms due to their higher credit rating and thus, they obtain more trade
credit than smaller companies (Petersen & Rajan 1997; Niskanen & Niskanen 2006;
Anagnostopoulou 2012). Similarly, larger companies have more possibilities to pay late due
to their dominance over smaller suppliers (Peel et al. 2000). As a consequence, larger
companies should have relatively lower levels of net working capital. In addition, the
purchase lot size of larger companies is considerably higher compared with smaller
companies, resulting that larger companies have more chances to benefit from quantity
discounts and thus lower purchase prices (Eljelly 2004).
Nevertheless, Petersen & Rajan (1997) and Peel et al. (2000) found also that big companies
have larger proportional levels of receivables in addition to the larger proportion of payables.
Furthermore, since the negotiating power of customers is higher in competitive industries
compared with concentrated industries, customers are more likely to be granted longer trade
credit terms in competitive industries (Pike & Cheng 2001). Thus, industry concentration
15
reduces the average level of net operating working capital (Hill et al. 2010). Similarly, when a
company is dependent on a single major customer, it is likely to grant lenient credit terms to
hold on the customer (Petersen & Rajan 1997). On the contrary, risky customers exercising
insecure payment policy may be required prompt payment (Pike & Chang 2001).
Furthermore, Patatoukas (2012) found that firms with a more concentrated customer base
have lower levels of working capital, lower administrative costs and faster asset turnover,
resulting in higher profitability and higher stock returns.
The conventional view has been that growth companies have higher levels of receivables,
meaning that they may have gained growth with the help of granting lenient credit terms
(Petersen & Rajan 1997). In addition, rapidly growing companies need to put extensive
attention on managing liquidity risk in spite of profitability since their growth also requires
more liquid funds to finance the higher level of operational working capital (Sharma 2009,
39). This is consistent with the finding that despite revenue grows, the level of receivables
grows faster than revenue, indicating that companies have to tie up relatively higher amounts
of working capital to achieve their sales growth although effective working capital
management would be more flexible way of financing growth than long-term debt or equity
(REL Consultancy 2013b). What is more, suppliers may grant longer credit terms to growth
companies to establish a relationship to a customer that will buy in the future as well,
resulting in higher levels of payables for growth companies (Petersen & Rajan 1997; Hill et
al. 2010). On the contrary, growth companies can hold lower levels of receivables since
revenue grows even though they do not grant their customers long credit terms (Niskanen &
Niskanen 2000; Hill et al. 2010) state.
Seasonality of operations can be a major determinant for the level of working capital since a
peak period in sales results in higher levels of receivables, whereas higher levels of payables
and inventories are often required by additional purchases to enable an increase in sales
(Sharma 2009, 37). Accordingly, companies in non-cyclical sectors are more effective in
working capital management more effectively than their cyclical counterparts (REL
Consultancy 2013b). Macroeconomic business cycles also affect the possibilities to reduce
working capital: Enqvist et al. (2014) found that working capital management is more
important during economic downturns since it has more significant effect on profitability,
whereas Niskanen & Niskanen (2006) found that rising interest rates increase the amounts of
accounts payable and thus the use of trade credit. Since the supply of market financing is
16
lower during a slump, companies tend to tighten their working capital management (Chiou et
al. 2006). As a consequence, Pirttilä et al. (2014) found that cycle times of both receivables
and payables were longer during the financial crisis, implying the higher use of supplier
finance and lengthening the payment terms.
Granting early payment discounts is one way for the seller to speed up the collection period
(Baños-Caballero et al. 2010; Grosse-Ruyken et al. 2011). An example of payment terms
including a cash discount is expression 2/10, net 30, which indicates that paying within 10
days gives a discount of 2 per cent, whereas the invoice is due within 30 days otherwise. For
the buyer, forgoing cash discounts by paying on the due date instead of the discount date has a
high implicit cost, which may indicate difficulties in obtaining sufficient market financing if
the cash discount is not used (Smith 1987; Petersen & Rajan 1997; Niskanen & Niskanen
2006). Forgoing an early payment discount in the above example, for instance, and thus
paying on the due date would equal borrowing with an annual effective interest rate of 37 %
(Sharma 2009, 152). However, although cash discounts are widely discussed in the literature,
they are nowadays rarely used in practice (Sagner 2011, 103). A reason for this may be that
also sellers have recognized the high cost of cash discounts (Pike & Cheng 2001). Generally,
every purchase invoice including a possibility for the early payment discount should be
evaluated on an individual basis but a common practice is that companies take either all or
none of the early payment discounts they are offered (Sagner 2011, 136).
To finance short-term liquidity needs caused by the higher level of tied-up capital, weak
performance or some other reason, factoring is an option especially when the level of
receivables is high and there are not many alternatives to finance rapid growth (Hofmann et
al. 2011, 15). Factoring is selling receivables to a financial services provider called factor
which immediately pays the invoice price subtracted by a fee depending on e.g. receivable
age and debtor creditworthiness (Sharma 2009, 136). When the invoice is due, the factor
collects the money from the debtor. An advantage of using factoring is gaining a predictable
cash flow, whereas a disadvantage is the expensive fee charged by the factor. Strict collection
actions by the factor may also endanger important customer relations in incidents when a
more lenient collection approach would be desired (Sagner 2011, 108).
Moreover, although an overdue interest rate is often stated in the credit terms, many
companies virtually never collect overdue interest although the average collection period and
payment period are remarkably longer than the average credit terms (Pike & Cheng 2001). A
17
common practice for companies with a high bargaining power is also to take the early
payment discount even paying after the discount date (Smith 1987). Besides additional
administrative work, the main rationale for not to collect overdue interest is that companies
see bigger benefits in ensuring the customer relationship and future sales than in collecting
relatively small interest claims (Howorth & Reber 2003). This has a significant impact on the
level of receivables, since 89 per cent of respondents in a British survey stated that they pay
their own suppliers late (Peel et al. 2000). This, in turn, ties up receivables up in the supply
chain, transferring the costs of additional working capital to upstream suppliers which are
often smaller companies (Hofmann & Kotzab 2010).
In inventory management, an essential issue is the trade-off between service level and
inventory turnover. Holding some inventory is often necessary in order to handle timing
differences between supply and demand (Grosse-Ruyken et al. 2011). Nevertheless, too large
inventory level ties up capital, causes direct and indirect carrying costs and increases the risk
of obsolescence, whereas too low inventory level may cause stock-outs and lost sales (Sharma
2009, 163). Companies may also have other motives for high inventory levels, such as
preparing for rising prices. On the other hand, especially large companies may cover
themselves for price fluctuations also by trading with derivatives (Sagner 2011, 120).
Regarding different types of inventory, the overall optimization of raw materials, work-in-
process and finished goods inventories must be considered (Gentry et al. 1990). According to
Hager (1976), work-in-process inventory often has the most significant impact due to the
highest amount of cost incurred and the most crucial timing. Similarly, Farris & Hutchison
(2003) state that reducing inventory offers the highest return among working capital items
since inventory carrying costs include also other costs besides the cost of capital. Although
economic order quantity (EOQ) formula simplifies a lot when determining the trade-off
between carrying costs and ordering costs, it is a basis for many quantitative models used in
inventory management (Sagner 2011, 122−124). Above all, to find an optimal inventory level,
accurate demand forecasting is essential in order to prepare for peaks and bottoms in demand,
especially for frequently used products (Hofmann et al. 2011, 34).
Financially constrained companies tend to have lower levels of working capital, since more
aggressive working capital management and faster turnover ratios are more often
acknowledged in a difficult financial situation as more emphasis is put on the level of tied up
capital (Hill et al. 2010). On the other hand, too high a level of working capital may lead to
18
financial distress due to illiquidity (Chiou et al. 2006). Moreover, companies with lower
ability to internally generate cash have higher demand for trade credit, increasing the level of
accounts payable and decreasing the level of net working capital (Petersen & Rajan 1997).
Effective working capital management can thus generate additional free cash flow even
without revenue growth (REL Consultancy 2013b). However, invoice payments should not be
delayed too long, since lowered credit rating will increase the cost of capital and hinder the
ability to get loan in the future (Niskanen & Niskanen 2006).
Hofmann & Kotzab (2010) argue that the aggregate efficiency of working capital
management in a supply chain depends on the trade credit policy of a dominant firm who has
the lowest cost of capital and the best access to credit financing. As the payables turnover of
one company equals the receivables turnover of another company, the aggressive working
capital policy of the dominant firm maximizes short-term returns for the individual company
but also causes rising prices and more insecure supplier or customer base, making this kind of
practice a zero-sum-game (Hofmann et al. 2011, 20). Financial distress of a single important
supplier, for instance, might cause supplying failures throughout the whole value chain
(Grosse-Ruyken et al. 2011). Consequently, minimizing the net working capital of the whole
supply chain leads to higher long-term profitability, increasing the stability of the customer
and supplier base (Hofmann & Kotzab 2010). This is especially important for companies
creating customized products since they often need intensive collaboration and sustainable
commitment between supply chain partners in order to succeed in the long run (Grosse-
Ruyken et al. 2011). Correspondingly, Losbichler et al. (2008), found evidence that the
shortened overall cash conversion cycle in some industries was a result of a dominant
company in the supply chain optimizing its CCC at the expense of its suppliers or customers.
Above all, reducing the level of inventory is an efficient way of shortening cash conversing
cycle without squeezing the payment terms against customers suppliers.
As a whole, receivables, inventories and payables all affect each other. Therefore, the
individual components of working capital should be steered simultaneously instead of
separately (Hill et al. 2010). Moreover, identifying working capital management of the whole
supply chain is necessary since even if a company itself does not put attention into managing
its cash conversion cycle, it is still affected by the changes of the working capital practices of
its supply chain partners as suppliers shortening the receivables period and customers
lengthening the payables period directly weaken the CCC (Hutchison et al. 2007).

19
Particularly, the entire working capital management is not an individual subject but a major
element of the overall administration of a company (Sharma 2009, 31). In turn, it is important
to pay attention to both working capital and fixed assets, for instance, at the same time in
asset management (Marttonen et al. 2013). Therefore, working capital should be emphasized
sufficiently as a part of day-to-day operations.
20
3. PRIOR RESEARCH
This section reviews the past studies exploring the relationship between working capital and
profitability as well as industry-specific issues of working capital, especially practices in
computer industry. First, profitability is defined in order to analyze the effect of working
capital on profitability.
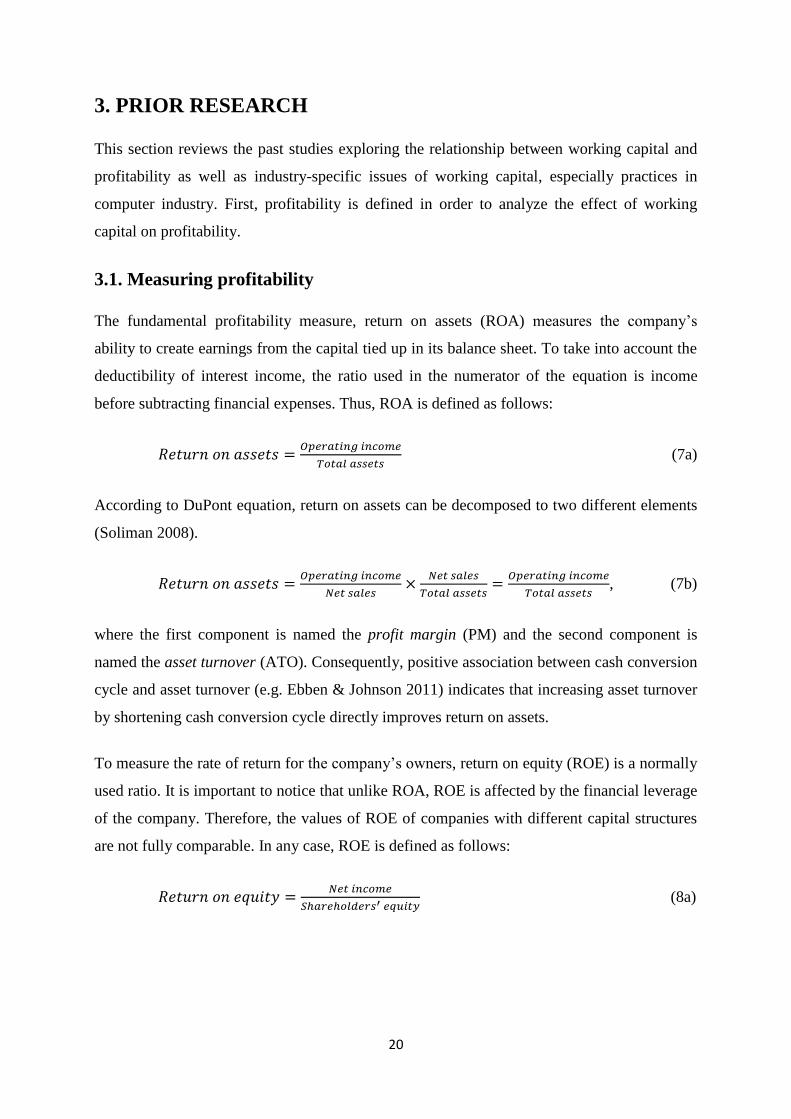
3.1. Measuring profitability
The fundamental profitability measure, return on assets (ROA) measures the company’s
ability to create earnings from the capital tied up in its balance sheet. To take into account the
deductibility of interest income, the ratio used in the numerator of the equation is income
before subtracting financial expenses. Thus, ROA is defined as follows:
(7a)
According to DuPont equation, return on assets can be decomposed to two different elements
(Soliman 2008).
, (7b)
where the first component is named the profit margin (PM) and the second component is
named the asset turnover (ATO). Consequently, positive association between cash conversion
cycle and asset turnover (e.g. Ebben & Johnson 2011) indicates that increasing asset turnover
by shortening cash conversion cycle directly improves return on assets.
To measure the rate of return for the company’s owners, return on equity (ROE) is a normally
used ratio. It is important to notice that unlike ROA, ROE is affected by the financial leverage
of the company. Therefore, the values of ROE of companies with different capital structures
are not fully comparable. In any case, ROE is defined as follows:
(8a)
21
Similarly, DuPont equation decomposes return on equity to three different elements (Soliman
2008).
, (8b)
where the first component is the net profit margin, the second component is the asset turnover
and the third component is the equity ratio.
Normally, ROA and ROE are expressed as a percentage. There is not an explicitly established
practice for the time span of the balance sheet values in the aforementioned equations. Some
studies use the value of the end of the fiscal period, whereas others use the beginning value.
Perhaps the most common method is to use the average of the beginning and the end values of
those since that way changes during the fiscal period are taken into consideration (Soliman
2008; Sharma 2009, 195).
Most prior working capital studies have used ROA and/or ROE as a measure for profitability.
On the other hand, some papers have used alternative metrics to express profitability. Deloof
(2003), Lazaridis & Tryfonidis (2006) and Gill et al. (2010) have, in turn, used gross
operating income, which equals gross margin divided by total assets less financial assets.
3.2. The relationship of working capital and performance
Since late 1990s, there have been many studies examining the relationship between working
capital and company performance. An interesting fact regarding the timing of the papers in
the 2000s is that the topic has been especially popular during years subsequent to the
economic downturn – both after the ICT collapse at the beginning of the millennium and the
financial crisis at the end of the decade. Most studies have examined listed companies in a
single country but there are also a few papers where data of SMEs or a sample of multiple
countries have been used.
A common methodology to measure the impact of working capital on profitability has been to
regress return on assets or some other profitability ratio on cash conversion cycle or net trade
cycle. Besides metrics for working capital, measures such as size, growth rate and debt ratio
have been used as control explanatory variables (e.g. Shin & Soenen 1998; Deloof 2003;
García-Teruel & Martínez-Solano 2007).
22
One of the pioneering papers on this topic has been the article by Jose et al. (1996) who used
a large sample representing the financial statements of listed US companies in 1974−1993.
Unlike many other studies, they used long run average values for each company to represent
variables rather than treating every company-year value as a specific observation. They found
that cash conversion cycle had a negative effect on return on assets and return on equity both
in cross-sectional sample and every industry-specific sample except construction but the level
of impact varied by industry. Moreover, comparing the regressions with and without
controlling for size, the results indicate that the negative impact of working capital level on
profitability is not dependent on company size although larger companies tend to have
generally shorter CCC and higher ROA.
Shin & Soenen (1998) were among the first ones who studied the impact working capital on
both profitability and stock returns. Like Jose et al. (1996), they used a large sample of US
companies covering 20 years and nearly 60,000 observations. Unlike many others, they used
net trade cycle to express working capital and operating income before depreciation as a
percentage of net sales and total assets to express profitability. Moreover, risk-adjusted stock
returns were measured by Jensen’s Alpha and Treynor index. The results showed a significant
negative impact of net trade cycle on both profitability and risk-adjusted stock returns.
Industry-specific results also indicated a negative effect of net trade cycle on stock returns in
all selected industries, the inverse relationship being the most significant in health services.
Wang (2002) explored the effect of liquidity and working capital management in both
profitability and market value in around 1,500 Japanese and 400 Taiwanese companies from
1985 through 1996. The results show a negative effect of cash conversion cycle on return on
assets, the negative coefficient being more significant for the sub-group of companies with a
higher market value measured by Tobin’s q ratio. Moreover, CCC is shorter for firms with
Tobin’s q higher than those with lower than 1, indicating a negative relationship between
CCC and corporate value. Regarding differences within the sample, the association of CCC
and ROA varies considerably between industries but not between Japanese and Taiwanese
companies in spite of the differences in the financial systems of those countries.
One of the most cited papers in this area has been the study by Deloof (2003) who examined
the association of cash conversion cycle and gross operating income in around 1,000 large
Belgian firms in 1992−1996. CCC, DSO and DIO had a significant negative impact on
profitability, suggesting that managers can improve performance by reducing the levels of
23
receivables and inventories. However, he found also a negative correlation between accounts
payable and gross operating income. This can be explained by weakly performing companies
paying their invoices late. Similarly, the negative impact of inventory on profitability can be
caused by an increase in inventory due to declining sales. Therefore, it cannot be ruled out
that the negative relationship between working capital and profitability is more or less a
consequence of profitability affecting working capital, not the other way round.
Eljelly (2004) was one of the first ones to study the impact of liquidity and working capital on
profitability in an emerging market. He used cash conversion cycle and current ratio as proxy
for liquidity and contribution margin percentage as a measure for profitability in quoted Saudi
companies in 1996−2000. His implication was that there is a significant negative association
of liquidity and profitability. Besides, he found that CCC is a more significant measure in
capital-intensive industries, whereas current ratio is more significant in labor-intensive
industries. Nonetheless, the results cannot be completely generalized as the sample size of the
study was less than 30 companies and the financial environment in Saudi Arabia differs to
some extent from many other countries.
Lazaridis & Tryfonidis (2006) studied the association of working capital and profitability in
131 Greek listed companies from 2001 through 2004. Besides cash conversion cycle, the
levels of accounts receivable, inventories and accounts payable had a negative impact on
gross operating income. Like Deloof (2003), they argue that releasing tied up working capital
increases profitability, whereas the negative effect of payables could be explained by less
profitable companies postponing their invoice payments. Consequently, they conclude that
keeping each operational working capital component at optimum level increases performance.
As prior working capital research had mainly focused on larger companies, García-Teruel &
Martínez-Solano (2007) contributed to the literature by studying the impact of working capital
management on profitability in nearly 9,000 Spanish SMEs during the period 1996−2002.
Consistent with the evidence from larger companies, they found that return on assets can be
improved by shortening cash conversion cycle. Similarly, receivables and inventories had a
negative impact on profitability but the influence of payables could not be confirmed since its
coefficient lost its significance when using first lags as instrumental variables.
Uyar (2009) investigated the relationship between cash conversion cycle and profitability in
166 listed Turkish companies in 2007, providing insights from a slightly different financial
24
environment than most other studies. Like previous papers, they found a negative correlation
between CCC and ROA as well as CCC and firm size. Regarding the individual components
of CCC, days inventory outstanding had the most remarkable effect. Besides, industry-
specific statistics showed that textile industry had the substantially longest CCC and DIO.
However, their results should be interpreted cautiously since the sample size was relatively
small and the time frame included only one fiscal year.
Unlike other studies, Gill et al. (2010) found a positive impact of cash conversion cycle on
gross margin in 88 publicly traded US manufacturing companies in the years 2005−2007. In
addition, receivables had a significant negative effect but payables and inventories did not
have any statistically significant effect significant on profitability. Thus, the main implication
was that profitability can be increased by reducing days receivables outstanding through
tightening customer trade credit policy. In any case, the small sample size and short time
frame should be taken into account when interpreting their results.
Ebben & Johnson (2011) studied the effect of working capital management on return on
invested capital and net balance position in around 1,700 small US firms from 2002 through
2004. Contrary to liquidity-profitability tradeoff (Eljelly 2004), they found evidence that
companies with shorter cash conversion cycle are both more liquid and more profitable,
requiring less invested capital. By classifying companies to different profitability quartiles,
they found that small firms appear to be reactive on their approach to cash conversion cycle as
weakly performing companies are more likely to decrease their CCC, while well performing
companies are likely to do the opposite. Moreover, decline in CCC was associated with higher
subsequent profitability and liquidity. These findings indicate the problems in small
companies as managers often do not have enough time for working capital management
which is accentuated only when performance and liquidity are weak.
Grosse-Ruyken et al. (2011) analyzed the effect of cash conversion cycle on return on capital
employed in a sample consisting of nearly 1,300 companies from, Canada, Germany, France,
England and the USA. Their results were in line with prior studies, finding that there is a
significant negative association of CCC and ROCE and it varies by industry. They also state
that squeezing suppliers and customers to accept strict payment terms only leads to short-term
success, whereas collaborative working capital management by targeting a balanced CCC for
the entire supply chain ensures sustainable relationships in the long term. Consequently, the
25
structure of the supply chain as a whole should be considered when determining the target
CCC for an individual company.
Anagnostopoulou (2012) contributed to the research by examining how working capital
management differs depending on the listing status of a company. By using a sample of
around 5,000 public and 65,000 private companies in the UK, unlisted firms were found to
have remarkably shorter cash conversion cycle and every one of its components than listed
ones and the determinants of CCC differ between those two groups. Moreover, the negative
effect of CCC on gross profit was more significant among private companies than public
ones. The findings are consistent with the rationale that private companies have more
constrained access to external financing, increasing the importance of efficient working
capital management. However, positive association of accounts payable and profitability in
unlisted companies was somewhat contradictory to previous papers, suggesting that less
profitable companies are offered stricter payment terms. In any case, besides a sample of UK
companies, similar results were also found when the analysis was extended for the rest of EU-
15 countries, implying that the differences in working capital management of public and
private firms are not country-dependent.
Baños-Caballero et al. (2012) studied working capital management in 1,000 Spanish SMEs in
the years 2002−2007 by using a little different methodology than other papers. Instead of
assuming a linear effect of working capital on profitability, they regressed operating
profitability on cash conversion cycle and its square, proposing a quadratic relationship
between these variables. There are consistent with the hypotheses since taking into account
both the advantages and disadvantages of holding working capital, the effect of working
capital on profitability is inversely U-shaped (concave) as there is an optimal level of working
capital at the inflection point of the regression function and working capital levels below and
above from the optimum reduce profitability. Accordingly, the relationship between working
capital and profitability is negative when the company has a high level of working capital but
positive when the level of working capital is low. The concave association of working capital
and profitability was also found when dividing the sample into sub-groups of specific
industries.
Enqvist et al. (2014) studied working capital management in different business cycles using a
sample of listed Finnish companies from 1990 through 2008. Using dummy and interaction
variables to express different states of economy, they found evidence that the negative effect
26
of cash conversion cycle on profitability is more significant during an economic downturn but
there is no significant effect during a boom. In addition, they found evidence consistent with
Deloof (2003) that besides accounts receivable and inventories, accounts payable also had a
negative impact on profitability, suggesting that less profitable firms wait longer to pay their
invoices.
In addition, there have also been a few papers examining the impact of working capital on
market values. Luo et al. (2009) studied the effect of change in cash conversion cycle on both
future return on assets and future stock returns in all retail, wholesale and manufacturing
firms in COMPUSTAT in 1980−2006. They found that a decrease in CCC increases both
future profitability compared with the industry median and future stock return compared with
the benchmark portfolio, the effect being more significant for more leveraged companies.
Regarding the individual components of CCC, payables turnover had a positive and inventory
turnover a negative effect on future performance and firm value but unlike other studies,
receivables turnover had a positive effect, suggesting a strategy for stimulating sales through
granting trade credit. Since additional analysis states that financial statement information
about more efficient working capital management increases excess share returns, the
implication of their results is that shareholders put some attention also to daily operations but
their interpretation of working capital management is not perfect.
Using the data of 200 listed Pakistani companies in 1998−2005, Nazir & Afza (2009) studied
the impact of aggressiveness of working capital management on both return on assets and
Tobin’s q ratio. The working capital investment policy was measured as a ratio of current
assets on total assets, where as the working capital financing policy was measured as a ratio
of current liabilities on total liabilities. The results indicate that conservative working capital
investment policy had a positive effect on both ROA and Tobin’s q but, on the other hand,
conservative working capital investment policy had a positive effect on only ROA, whereas it
had a negative effect on Tobin’s q. The positive impact of conservative working capital
management on profitability is contradictory to most previous papers. However, investors
value more companies that use a higher ratio of financing based on short-term liabilities
although that kind of approach in financing working capital results in lower profitability,
which is a sign that shareholders may have different interests than accounting measures show.
In any case, the nature of Pakistani economy as an emerging market needs to be taken into
account when comparing the results with developed economies.
27
Kieschnick et al. (2013) also examined the impact of working capital on shareholder wealth.
Using a US sample of public companies from the years 1990−2006, they found that the level
of net working capital has a negative impact on the benchmark adjusted stock return of the
company. Moreover, the results show that an incremental dollar invested in net operating
working capital is worth less for the shareholders than an incremental dollar held in cash and
an incremental dollar invested in credit for customers has a greater effect on shareholder value
than an incremental dollar invested in inventories. The rationale for this is that the risk
regarding receivables is if and when the invoice is paid whereas the risk regarding inventories
is whether the goods are sold at all. When observing the effect of different firm characteristics
on the relationship between working capital and shareholder wealth, an incremental dollar
invested in net operating working capital is worth less for shareholders when the company has
a high debt ratio and bankrupt risk and worth more when the company has financial
constraints and future sales growth.
Autukaite & Molay (2011) provided European evidence on the effect of working capital on
share price by using a sample of nearly 300 listed French companies from 2003 through 2009.
Consistent with Kieschnick et al. (2013), they found that an incremental euro invested in net
operating working capital has a negative impact on the share price and investors for French
companies value additional working capital even less than investors for US companies.
Besides, they found that an incremental euro invested in net operating working capital has a
lower value for shareholders than an incremental euro of cash. As both net working capital
and cash are valued less for investors in French companies than for investors in US ones, they
assume that the relatively low ratio of net working capital in the balance sheets of French
companies may be a possible explanation for the lower valuation.
Baños-Caballero et al. (2014) studied the impact of working capital on market performance in
around 250 listed UK firms for the period 2001−2007. Using similar methodology as in their
previous paper, they regressed market-to-book ratio against net trade cycle and its square.
Thus, their findings show a concave relationship between working capital and market value as
deviations from the optimum reduce market value, depicting a positive effect of net trade
cycle on market-to-book ratio with a low level of working capital and a negative effect with a
high level of working capital. Furthermore, they found that the optimal level of working
capital is lower for financially constrained companies than for unconstrained ones due to the
higher financing costs and more restricted capital access they suffer from.
28
Besides, there have been studies examining the relationship between working capital and
performance the other way round, thus studying the impact of profitability and other
determinants of working capital management by using a measure for working capital as a
dependent variable and profitability, among other ratios, as one of the independent variables
(Chiou et al. 2006; Baños-Caballero et al. 2010; Hill et al. 2010). What is more, those papers
address the gap pointed out by Deloof (2003), proposing that working capital may also be to
some extent affected by profitability instead of vice versa.
Chiou et al. (2006) examined the determinants of both working capital requirement and net
liquid balance, finding that changes in profitability, leverage and business cycle have a
negative effect on both WCR and NLB, whereas the change in company size is positively
associated with WCR but negatively with NLB. Their results are partially supported by Hill et
al. (2010) who found that net working capital requirement is positively affected by size,
operating cash flow and access to market financing, whereas lagged sales growth, sales
volatility and financial distress have a negative impact on WCR. Besides, Baños-Caballero et
al. (2010) stated Spanish SMEs have a target cash conversion cycle and they try to adjust their
current CCC towards the target relatively quickly because significant costs are incurred for
being far from the target CCC, possibly due to the high financial constraints that smaller
companies suffer from.
All in all, the frequency of papers examining the impact of working capital on performance
has been growing during the past two decades. Generally, the results are consistent with the
theoretical assumption that lower level of working capital tied up in the balance sheet results
in higher earnings in the income statement. Additionally, lower level of working capital has
also been found to be associated with higher stock returns. However, many studies have failed
to take into account the possibility that the association of working capital and profitability is
not necessarily linear since holding working capital has both its benefits and drawbacks.
Thus, there has also been found evidence that there is an optimal level of working capital and
deviations from the optimum either up- or downwards reduce profitability. Regarding factors
other than profitability influencing the level of net operational working capital, especially
size, operating cash flow and ability to obtain external financing have found to result in a
positive effect, whereas sales growth, financial constraints and economic downturn a negative
effect.
29
3.3. Industry differences of working capital management
Due to industry-specific characteristics of businesses, working capital management
significantly differs between industries (Hawawini et al. 1986; Weinraub & Visscher 1998). A
simple example is that retail companies have a faster inventory turnover than manufacturing
companies and very little receivables as the majority of sales are paid by cash. In addition, the
impact of working capital on profitability is more significant in companies with a lower ratio
of fixed assets (Marttonen et al. 2013). According to Hawawini et al. (1986), every industry
has a benchmark value for working capital requirement and it is difficult to significantly
differentiate from the norm since stricter credit terms would reduce market share, for instance.
Thus, differences in working capital management are more significant between industries than
within industries (Weinraub & Visscher 1998). An example of industry-specific practices is
that vendors typically determine the terms of payment according to industry standard (Sagner
2011, 110). On the other hand, Hill et al. (2010) state that industry averages should not be the
sole source of analysis since there are also many company-specific factors affecting working
capital management.
Weinraub & Visscher (1998) measured the aggressiveness of working capital industry-wide
by comparing current liabilities to total assets ratios in US companies in 1984−1993. They
found that aggressive and conservative working capital practices vary significantly between
industries and the between-industry differences remain relatively stable over time. Filbeck &
Krueger (2005) found consistent results by studying industry ratios of cash conversion
efficiency and days working capital published in CFO magazine’s annual Working Capital
Survey from 1996 through 2000. Their conclusion was that working capital ratios of industries
change over time but changes are consistent enough so that the working capital performance
ranking between industries stays stable over time. In turn, Farris & Hutchison (2003) found
that cash conversion cycles were generally shorter in 2001 than in 1986 but the level of
change remarkably differed between industries.
3.4. Working capital in the computer industry
Computer industry has been influenced by rapid technological improvements. Traditionally, it
had been dominated by IBM which developed the first platform, a technological standard to
which all the market participants had to adapt and to which various companies had to commit
for a long time due to platform-specific assets. However, since the early 1990s, radical
30
technological changes led to the reallocation of product segments and allowed many new
companies to begin to compete from the same customers. As a consequence, the industry
became highly competitive both horizontally and vertically as the use of personal computers
begun to grow dramatically and the leadership of a platform begun to be divided between
vertically different companies, such as Microsoft and Intel. (Bresnahan & Greenstein 1999)
The market structure and business characteristics have an essential impact on the working
capital management in computer industry as there seems to be no end for continuous
technological development. Therefore, the value of time is higher than in many other
industries as product life cycles are short, excess inventory loses its value quickly and most
advanced products can be sold at premium prices. (Kraemer et al. 2000). Consequently,
reliable demand forecasting and ability to adjust production flexibly to match demand can
create remarkable competitive advantage. Compared with many traditional manufacturing
businesses, the nature of ICT industry is also clearly more service-oriented, remarkably
affecting the working capital management (Pirttilä et al. 2014). Because of these reasons,
efficient working capital management is especially important in computer industry. However,
PC manufacturers have traditionally focused on minimizing distribution costs by producing
large lot sizes of standardized products, which, in turn, caused lost sales and inventory write-
offs because inflexible supply chain and long lead time scarcely matched the fluctuating
demand, not forgetting the adverse effect of excess working capital tied up in the balance
sheet (Johnson 2010).
Just-in-time (JIT) is a practice to minimize excess inventory costs and waste by having the
right parts in the right place at the right time. Just-in-time reduces the opportunity costs and
capital tied up but also creates larger risks regarding supplier failure, internal defects and
logistical problems which can cause remarkable losses because of unexpected delays (Sharma
2009, 170; Sagner 2011, 124). Dell is often mentioned as a textbook example of extremely
efficient working capital management as their just-in-time and build-to-order practices could
be described as a modern application of Toyota Production System and Lean manufacturing,
enabling the company to hold a negative cash conversion cycle (Kumar 2005; Luo et al. 2009;
Sagner 2011, 14). Since Dell mainly sells directly to its customers, without using resellers,
one link in the supply chain is removed, reducing lead times to minimum (Kumar 2005).
Overall, the differences in working capital practices within the computer industry are also
31
noteworthy depending on the branch since by contrast to computer manufacturers, software
companies barely hold any inventory at all (Lind et al. 2012).
Companies holding a strong position in a value network in the ICT industry are likely to rely
a lot on the use of external resources (Hallikas et al. 2008). This is the case also for Dell;
since most of the inventory it uses is not owned by the company itself but its suppliers having
warehouses near Dell's plants, the significant inventory risk is transferred to vendors (Kumar
& Craig 2007; Hofmann & Kotzab 2010; Lind et al. 2012). This requires close relationship
and comprehensive real-time information sharing between Dell and its suppliers, resulting
that Dell buys from less than 50 partners (Kumar 2005; Sagner 2011, 15). Because the
manufacturing of a customer order is normally started only after it has been paid, Dell is often
able to collect payments before it has to pay its customers (Kraemer et al. 2000; Kumar &
Craig 2007; Lind et al. 2012). As material prices have a declining trend in the computer
industry, Dell also benefits from lower procurement costs by purchasing components as late
as possible (Johnson 2010). These are the main explanations for Dell's negative cash
conversion cycle.
Not only the idea of just-in-time and build-to-order but also the execution of the practices
have made the business model of Dell so exceptional. The success of Dell has tempted other
computer manufacturers to develop their own build-to-order system but they have not been as
successful (Kraemer et al. 2000; Kumar 2005). Of course, the business model enabling a
negative cash conversion cycle is not possible for every company since Dell's vendor-
managed inventory and customer prompt payments requirements presume a high bargaining
power (Hofmann & Kotzab 2010; Lind et al. 2012). Although Dell's model may appear harsh
to suppliers, offering them accurate demand information and adjusting sales promotions
according to their inventory situation diminish the inventory risk transferred to vendors
(Grosse-Ruyken et al. 2011). Anyway, some examples of Dell's practices can be generally
benchmarked by other companies as well − outsourcing remarkable parts of production,
minimizing lead time and maintaining a superior real-time demand management system are
possible ways to improve working capital management in computer industry, for instance
(Kumar & Craig 2007).
In spite of its excellence in supply chain management and continual profits, Dell is not a
dominant company in the computer industry. The competitors of Dell also maintain strong
positions in the market through their own strengths, such as Sony being seen as a leader in
32
high-end computers and Apple being able to ask for a price premium for its products thanks to
the value of its exceptionally strong brand (Kumar & Craig 2007). In fact, Dell's competitive
advantage due to negative net working capital is no more unique since Apple has also attained
a negative amount of net operational working capital by holding a net trade cycle of −22 days
in 2012, which is nearly the same as Dell had (REL Consultancy 2013b). Another weakness
of the production system of Dell is that unlike individual consumers, large institutional
customers require computers to be distributed with a fixed configuration, price and schedule,
which causes Dell additional purchasing costs as it is required to buy particular components at
a specific time as opposed to its normally executed opportunistic procurement process
(Johnson 2010).
Farris & Hutchison (2003) found that both computer and electrical equipment industries were
among the best improvers regarding improving cash conversion cycle from 1986 through
2001. Among all industries, electronic equipment companies were the second-best improvers
by reducing their CCC of 48.1 days in 15 years and computer companies were the third-best
with a decrease of 46.8 days. This implies the importance of technological improvements,
successful supply chain management and the increased competition in those industries.
Lind et al. (2012) analyzed the association of cycle times and return on capital employed in
60 publicly traded ICT companies around the world in 2006−2010, especially focusing on
companies with a negative cash conversion cycle. The companies were divided into sub-
groups of nine different branches since there is a large variety of end products and users in the
ICT sector and the nature of business is somewhat different e.g. in component manufacturers
than in software developers. Totally, six companies of the entire sample maintained a
negative cash conversion cycle, including Apple, Dell and Lenovo, whose CCC differed
significantly from the other computer manufacturers. They state that by maintaining a
negative CCC, large companies with a high bargaining power can increase profitability at the
expense of their suppliers and customers. The analysis shows that companies with a negative
CCC are among the most profitable ones but a short CCC is not necessarily a requirement for
profitability since there are also highly profitable companies with a relatively long CCC,
exercising that way diverse tactics in their working capital management. Furthermore, they
found that particularly slow inventory turnover is associated with low profitability and
companies selling directly to consumers have faster receivables turnover and higher
profitability than companies operating in B2B markets. Generally, their findings are not fully
33
consistent with the negative relationship between CCC and profitability as high returns can be
achieved by holding a large level of working capital as well.
Above all, working capital accounts for a significant item in the balance sheet also in this
field of business as Weinraub & Visscher (1998) state that current assets accounted for 68.1
% and current liabilities for 30.0 % of total assets in computer industry. Moreover, Hill et al.
(2010) found that the average working capital requirement in computer industry was 21.4 %
of sales, whereas electrical equipment industry had a ratio of 29.4 % of sales. According to
annual US Working Capital Survey (REL Consultancy 2013b), the median net trade cycle was
29 days for computers and peripherals industry 73 days for electrical equipment industry,
whereas according to annual Europe Working Capital Survey (REL Consultancy 2013a), the
median net trade cycle was 51 days for computers and peripherals industry 92 days for
electrical equipment industry.
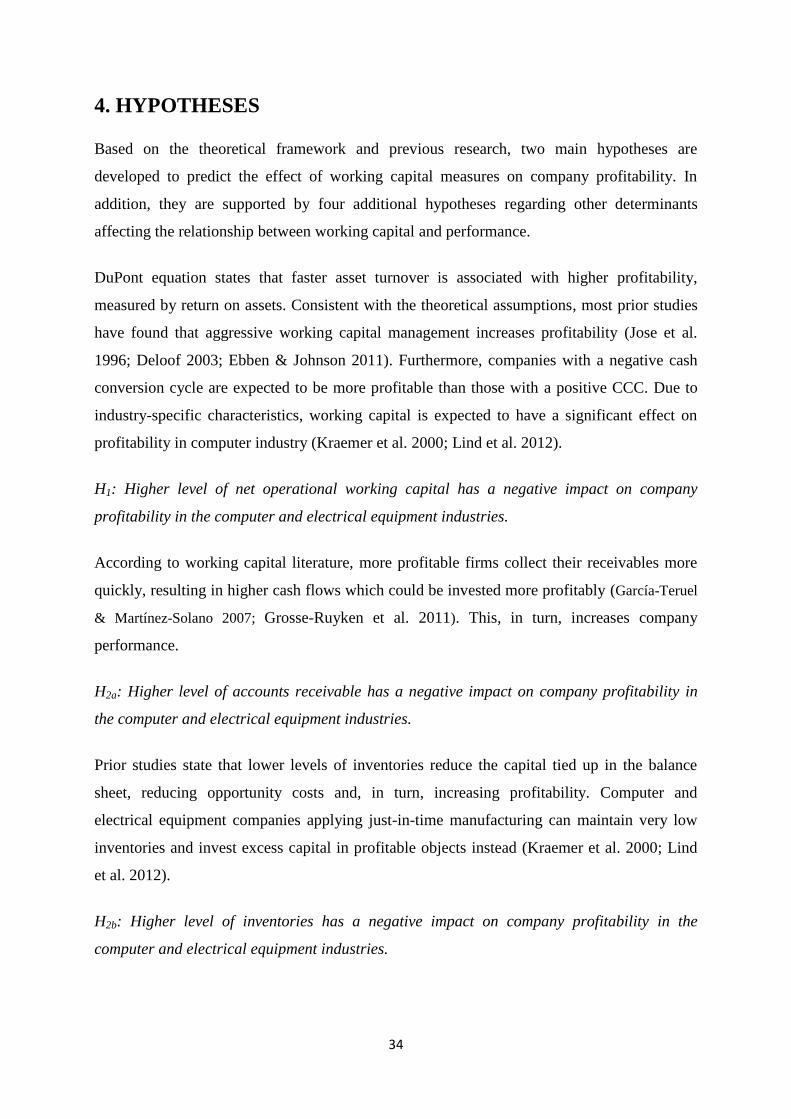
34
4. HYPOTHESES
Based on the theoretical framework and previous research, two main hypotheses are
developed to predict the effect of working capital measures on company profitability. In
addition, they are supported by four additional hypotheses regarding other determinants
affecting the relationship between working capital and performance.
DuPont equation states that faster asset turnover is associated with higher profitability,
measured by return on assets. Consistent with the theoretical assumptions, most prior studies
have found that aggressive working capital management increases profitability (Jose et al.
1996; Deloof 2003; Ebben & Johnson 2011). Furthermore, companies with a negative cash
conversion cycle are expected to be more profitable than those with a positive CCC. Due to
industry-specific characteristics, working capital is expected to have a significant effect on
profitability in computer industry (Kraemer et al. 2000; Lind et al. 2012).
H1: Higher level of net operational working capital has a negative impact on company
profitability in the computer and electrical equipment industries.
According to working capital literature, more profitable firms collect their receivables more
quickly, resulting in higher cash flows which could be invested more profitably (García-Teruel
& Martínez-Solano 2007; Grosse-Ruyken et al. 2011). This, in turn, increases company
performance.
H2a: Higher level of accounts receivable has a negative impact on company profitability in
the computer and electrical equipment industries.
Prior studies state that lower levels of inventories reduce the capital tied up in the balance
sheet, reducing opportunity costs and, in turn, increasing profitability. Computer and
electrical equipment companies applying just-in-time manufacturing can maintain very low
inventories and invest excess capital in profitable objects instead (Kraemer et al. 2000; Lind
et al. 2012).
H2b: Higher level of inventories has a negative impact on company profitability in the
computer and electrical equipment industries.
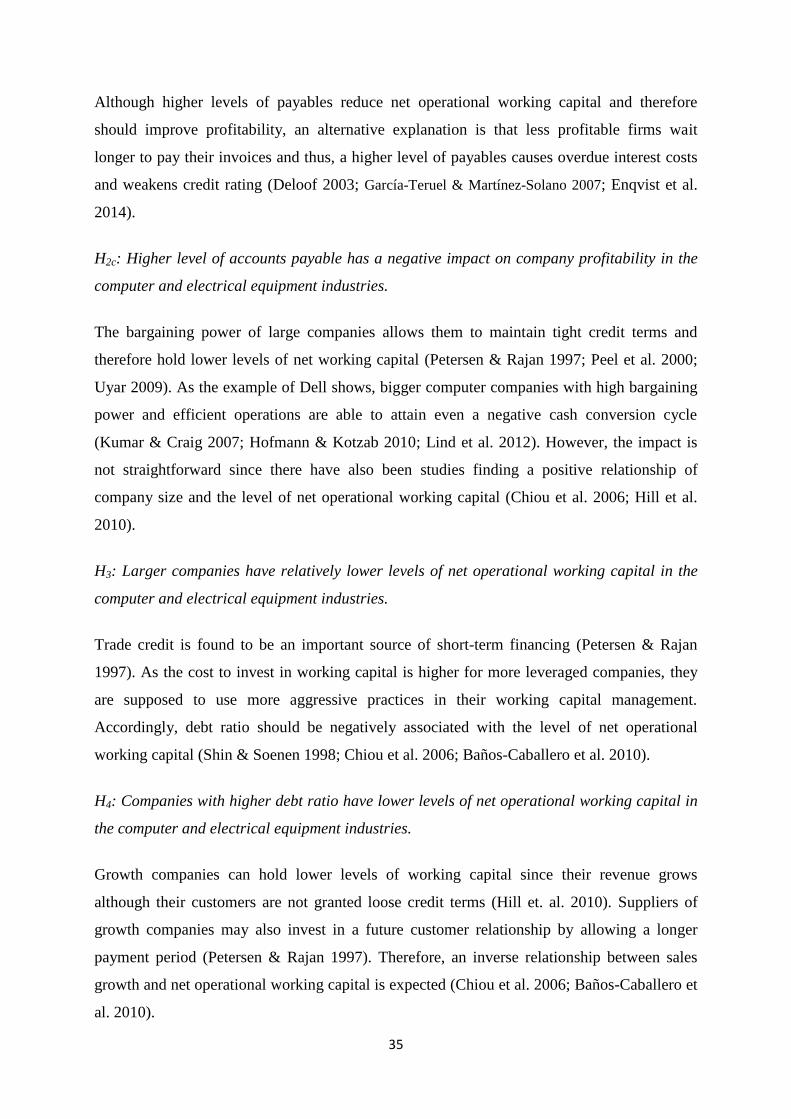
35
Although higher levels of payables reduce net operational working capital and therefore
should improve profitability, an alternative explanation is that less profitable firms wait
longer to pay their invoices and thus, a higher level of payables causes overdue interest costs
and weakens credit rating (Deloof 2003; García-Teruel & Martínez-Solano 2007; Enqvist et al.
2014).
H2c: Higher level of accounts payable has a negative impact on company profitability in the
computer and electrical equipment industries.
The bargaining power of large companies allows them to maintain tight credit terms and
therefore hold lower levels of net working capital (Petersen & Rajan 1997; Peel et al. 2000;
Uyar 2009). As the example of Dell shows, bigger computer companies with high bargaining
power and efficient operations are able to attain even a negative cash conversion cycle
(Kumar & Craig 2007; Hofmann & Kotzab 2010; Lind et al. 2012). However, the impact is
not straightforward since there have also been studies finding a positive relationship of
company size and the level of net operational working capital (Chiou et al. 2006; Hill et al.
2010).
H3: Larger companies have relatively lower levels of net operational working capital in the
computer and electrical equipment industries.
Trade credit is found to be an important source of short-term financing (Petersen & Rajan
1997). As the cost to invest in working capital is higher for more leveraged companies, they
are supposed to use more aggressive practices in their working capital management.
Accordingly, debt ratio should be negatively associated with the level of net operational
working capital (Shin & Soenen 1998; Chiou et al. 2006; Baños-Caballero et al. 2010).
H4: Companies with higher debt ratio have lower levels of net operational working capital in
the computer and electrical equipment industries.
Growth companies can hold lower levels of working capital since their revenue grows
although their customers are not granted loose credit terms (Hill et. al. 2010). Suppliers of
growth companies may also invest in a future customer relationship by allowing a longer
payment period (Petersen & Rajan 1997). Therefore, an inverse relationship between sales
growth and net operational working capital is expected (Chiou et al. 2006; Baños-Caballero et
al. 2010).
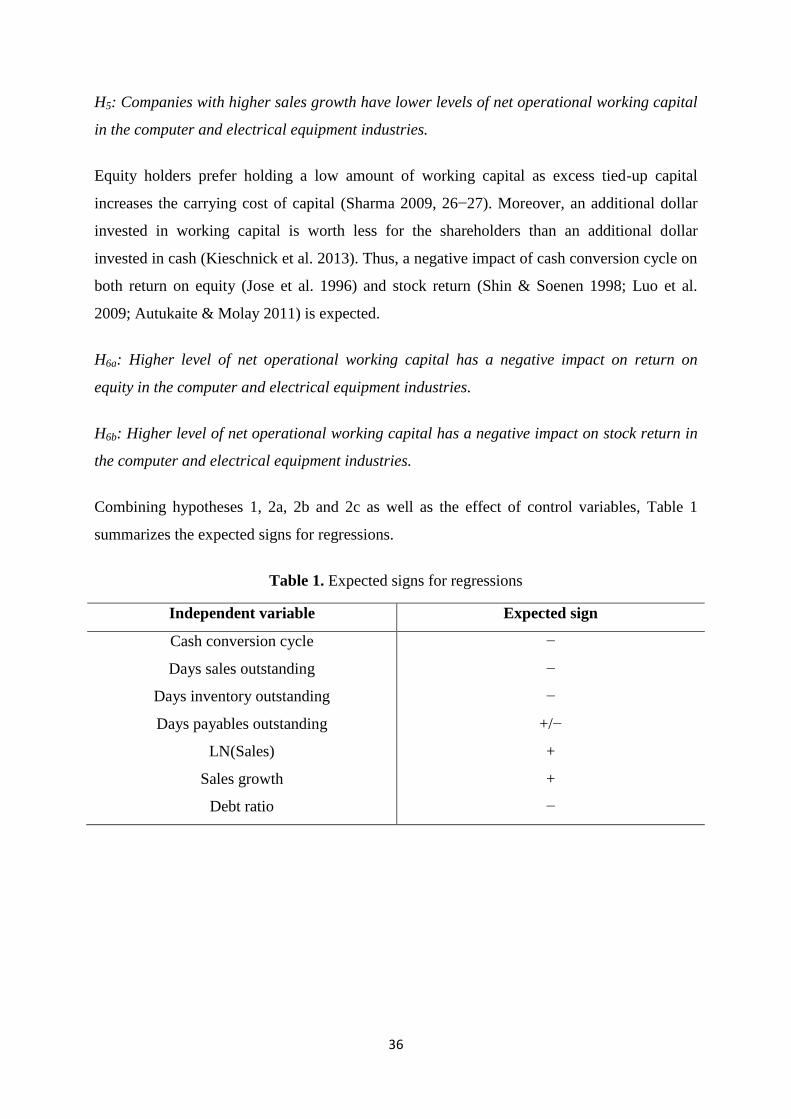
36
H5: Companies with higher sales growth have lower levels of net operational working capital
in the computer and electrical equipment industries.
Equity holders prefer holding a low amount of working capital as excess tied-up capital
increases the carrying cost of capital (Sharma 2009, 26−27). Moreover, an additional dollar
invested in working capital is worth less for the shareholders than an additional dollar
invested in cash (Kieschnick et al. 2013). Thus, a negative impact of cash conversion cycle on
both return on equity (Jose et al. 1996) and stock return (Shin & Soenen 1998; Luo et al.
2009; Autukaite & Molay 2011) is expected.
H6a: Higher level of net operational working capital has a negative impact on return on
equity in the computer and electrical equipment industries.
H6b: Higher level of net operational working capital has a negative impact on stock return in
the computer and electrical equipment industries.
Combining hypotheses 1, 2a, 2b and 2c as well as the effect of control variables, Table 1
summarizes the expected signs for regressions.
Table 1. Expected signs for regressions
Independent variable Expected sign
Cash conversion cycle −
Days sales outstanding −
Days inventory outstanding −
Days payables outstanding +/−
LN(Sales) +
Sales growth +
Debt ratio −
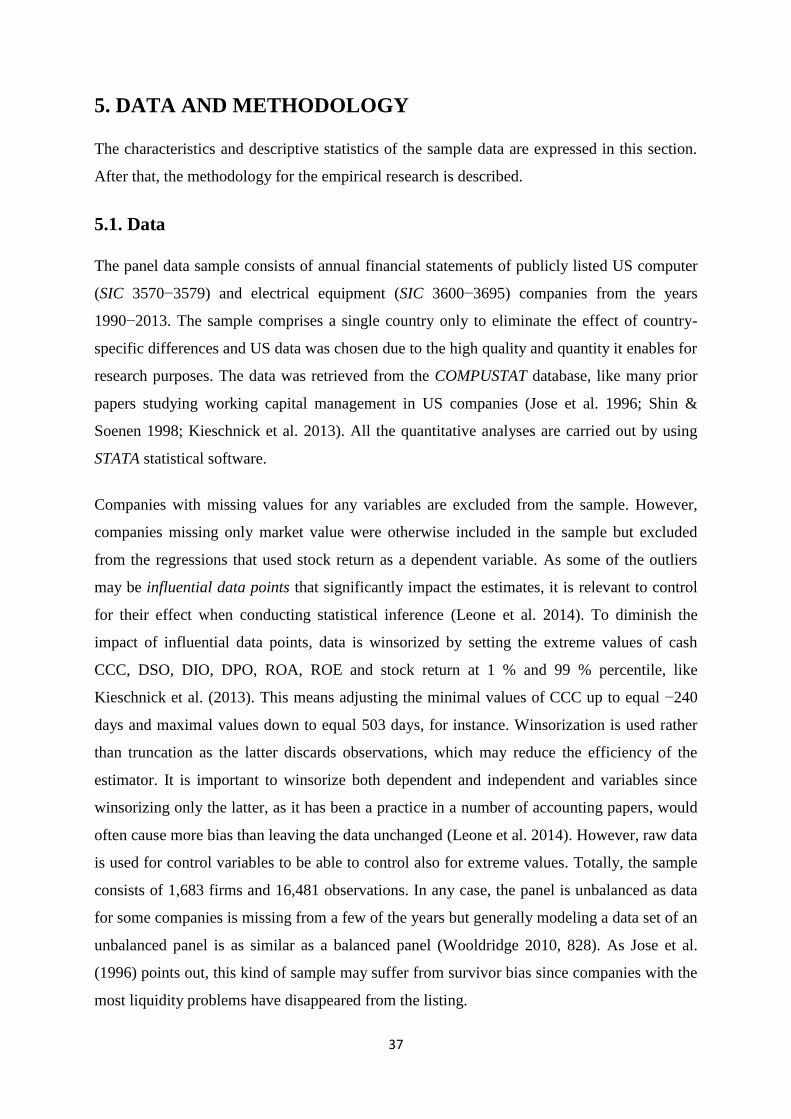
37
5. DATA AND METHODOLOGY
The characteristics and descriptive statistics of the sample data are expressed in this section.
After that, the methodology for the empirical research is described.
5.1. Data
The panel data sample consists of annual financial statements of publicly listed US computer
(SIC 3570−3579) and electrical equipment (SIC 3600−3695) companies from the years
1990−2013. The sample comprises a single country only to eliminate the effect of country-
specific differences and US data was chosen due to the high quality and quantity it enables for
research purposes. The data was retrieved from the COMPUSTAT database, like many prior
papers studying working capital management in US companies (Jose et al. 1996; Shin &
Soenen 1998; Kieschnick et al. 2013). All the quantitative analyses are carried out by using
STATA statistical software.
Companies with missing values for any variables are excluded from the sample. However,
companies missing only market value were otherwise included in the sample but excluded
from the regressions that used stock return as a dependent variable. As some of the outliers
may be influential data points that significantly impact the estimates, it is relevant to control
for their effect when conducting statistical inference (Leone et al. 2014). To diminish the
impact of influential data points, data is winsorized by setting the extreme values of cash
CCC, DSO, DIO, DPO, ROA, ROE and stock return at 1 % and 99 % percentile, like
Kieschnick et al. (2013). This means adjusting the minimal values of CCC up to equal −240
days and maximal values down to equal 503 days, for instance. Winsorization is used rather
than truncation as the latter discards observations, which may reduce the efficiency of the
estimator. It is important to winsorize both dependent and independent and variables since
winsorizing only the latter, as it has been a practice in a number of accounting papers, would
often cause more bias than leaving the data unchanged (Leone et al. 2014). However, raw data
is used for control variables to be able to control also for extreme values. Totally, the sample
consists of 1,683 firms and 16,481 observations. In any case, the panel is unbalanced as data
for some companies is missing from a few of the years but generally modeling a data set of an
unbalanced panel is as similar as a balanced panel (Wooldridge 2010, 828). As Jose et al.
(1996) points out, this kind of sample may suffer from survivor bias since companies with the
most liquidity problems have disappeared from the listing.
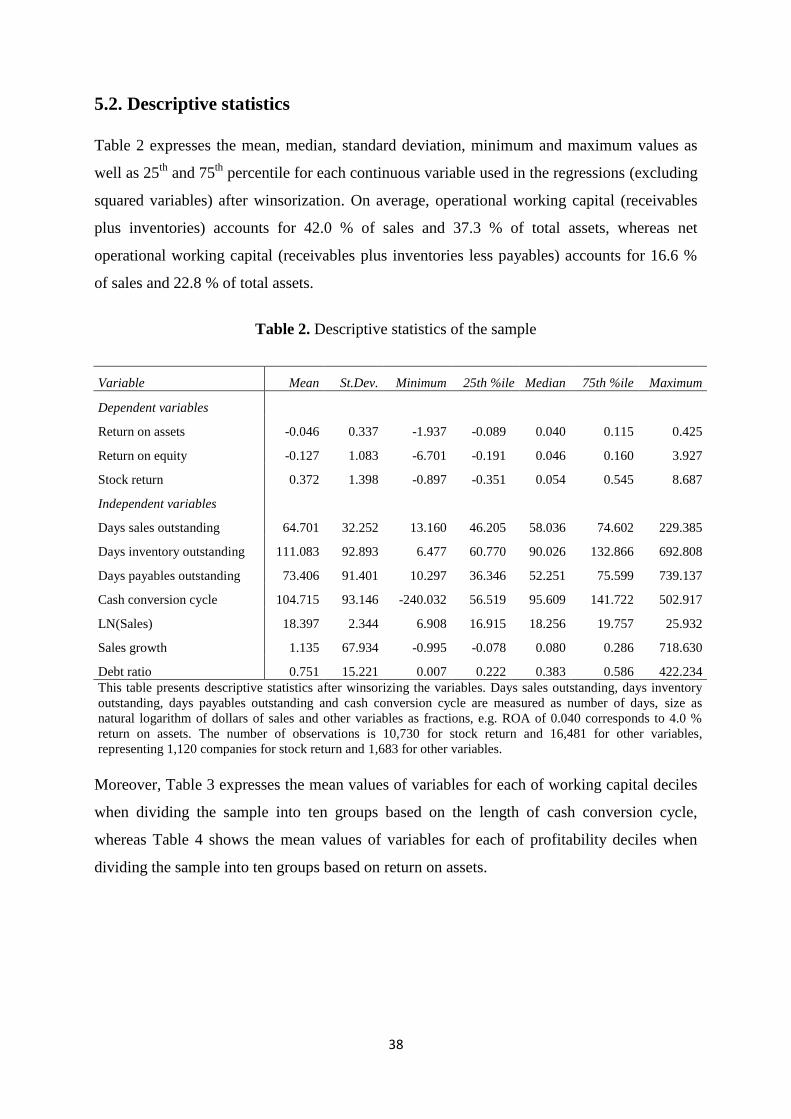
38
5.2. Descriptive statistics
Table 2 expresses the mean, median, standard deviation, minimum and maximum values as
well as 25th
and 75th
percentile for each continuous variable used in the regressions (excluding
squared variables) after winsorization. On average, operational working capital (receivables
plus inventories) accounts for 42.0 % of sales and 37.3 % of total assets, whereas net
operational working capital (receivables plus inventories less payables) accounts for 16.6 %
of sales and 22.8 % of total assets.
Table 2. Descriptive statistics of the sample
Variable Mean St.Dev. Minimum 25th %ile Median 75th %ile Maximum
Dependent variables
Return on assets -0.046 0.337 -1.937 -0.089 0.040 0.115 0.425
Return on equity -0.127 1.083 -6.701 -0.191 0.046 0.160 3.927
Stock return 0.372 1.398 -0.897 -0.351 0.054 0.545 8.687
Independent variables
Days sales outstanding 64.701 32.252 13.160 46.205 58.036 74.602 229.385
Days inventory outstanding 111.083 92.893 6.477 60.770 90.026 132.866 692.808
Days payables outstanding 73.406 91.401 10.297 36.346 52.251 75.599 739.137
Cash conversion cycle 104.715 93.146 -240.032 56.519 95.609 141.722 502.917
LN(Sales) 18.397 2.344 6.908 16.915 18.256 19.757 25.932
Sales growth 1.135 67.934 -0.995 -0.078 0.080 0.286 718.630
Debt ratio 0.751 15.221 0.007 0.222 0.383 0.586 422.234
This table presents descriptive statistics after winsorizing the variables. Days sales outstanding, days inventory
outstanding, days payables outstanding and cash conversion cycle are measured as number of days, size as
natural logarithm of dollars of sales and other variables as fractions, e.g. ROA of 0.040 corresponds to 4.0 %
return on assets. The number of observations is 10,730 for stock return and 16,481 for other variables,
representing 1,120 companies for stock return and 1,683 for other variables.
Moreover, Table 3 expresses the mean values of variables for each of working capital deciles
when dividing the sample into ten groups based on the length of cash conversion cycle,
whereas Table 4 shows the mean values of variables for each of profitability deciles when
dividing the sample into ten groups based on return on assets.
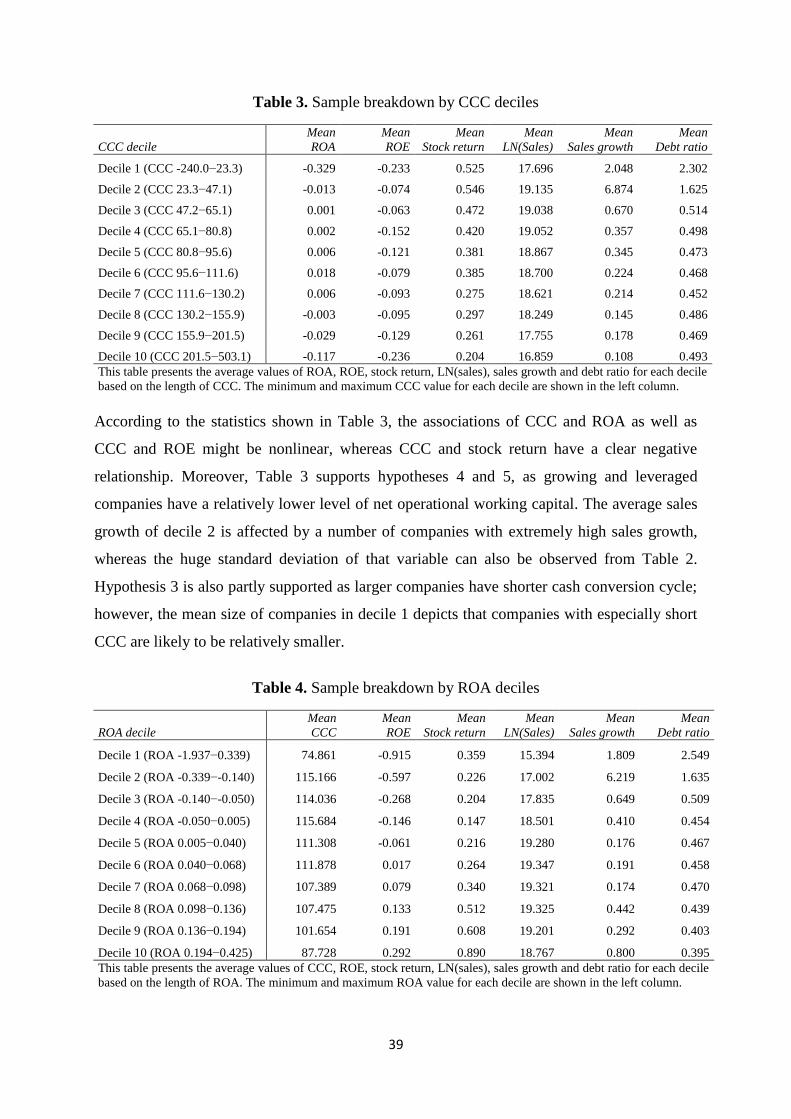
39
Table 3. Sample breakdown by CCC deciles
CCC decile
Mean
ROA
Mean
ROE
Mean
Stock return
Mean
LN(Sales)
Mean
Sales growth
Mean
Debt ratio
Decile 1 (CCC -240.0−23.3) -0.329 -0.233 0.525 17.696 2.048 2.302
Decile 2 (CCC 23.3−47.1) -0.013 -0.074 0.546 19.135 6.874 1.625
Decile 3 (CCC 47.2−65.1) 0.001 -0.063 0.472 19.038 0.670 0.514
Decile 4 (CCC 65.1−80.8) 0.002 -0.152 0.420 19.052 0.357 0.498
Decile 5 (CCC 80.8−95.6) 0.006 -0.121 0.381 18.867 0.345 0.473
Decile 6 (CCC 95.6−111.6) 0.018 -0.079 0.385 18.700 0.224 0.468
Decile 7 (CCC 111.6−130.2) 0.006 -0.093 0.275 18.621 0.214 0.452
Decile 8 (CCC 130.2−155.9) -0.003 -0.095 0.297 18.249 0.145 0.486
Decile 9 (CCC 155.9−201.5) -0.029 -0.129 0.261 17.755 0.178 0.469
Decile 10 (CCC 201.5−503.1) -0.117 -0.236 0.204 16.859 0.108 0.493
This table presents the average values of ROA, ROE, stock return, LN(sales), sales growth and debt ratio for each decile
based on the length of CCC. The minimum and maximum CCC value for each decile are shown in the left column.
According to the statistics shown in Table 3, the associations of CCC and ROA as well as
CCC and ROE might be nonlinear, whereas CCC and stock return have a clear negative
relationship. Moreover, Table 3 supports hypotheses 4 and 5, as growing and leveraged
companies have a relatively lower level of net operational working capital. The average sales
growth of decile 2 is affected by a number of companies with extremely high sales growth,
whereas the huge standard deviation of that variable can also be observed from Table 2.
Hypothesis 3 is also partly supported as larger companies have shorter cash conversion cycle;
however, the mean size of companies in decile 1 depicts that companies with especially short
CCC are likely to be relatively smaller.
Table 4. Sample breakdown by ROA deciles
ROA decile
Mean
CCC
Mean
ROE
Mean
Stock return
Mean
LN(Sales)
Mean
Sales growth
Mean
Debt ratio
Decile 1 (ROA -1.937−0.339) 74.861 -0.915 0.359 15.394 1.809 2.549
Decile 2 (ROA -0.339−-0.140) 115.166 -0.597 0.226 17.002 6.219 1.635
Decile 3 (ROA -0.140−-0.050) 114.036 -0.268 0.204 17.835 0.649 0.509
Decile 4 (ROA -0.050−0.005) 115.684 -0.146 0.147 18.501 0.410 0.454
Decile 5 (ROA 0.005−0.040) 111.308 -0.061 0.216 19.280 0.176 0.467
Decile 6 (ROA 0.040−0.068) 111.878 0.017 0.264 19.347 0.191 0.458
Decile 7 (ROA 0.068−0.098) 107.389 0.079 0.340 19.321 0.174 0.470
Decile 8 (ROA 0.098−0.136) 107.475 0.133 0.512 19.325 0.442 0.439
Decile 9 (ROA 0.136−0.194) 101.654 0.191 0.608 19.201 0.292 0.403
Decile 10 (ROA 0.194−0.425) 87.728 0.292 0.890 18.767 0.800 0.395
This table presents the average values of CCC, ROE, stock return, LN(sales), sales growth and debt ratio for each decile
based on the length of ROA. The minimum and maximum ROA value for each decile are shown in the left column.
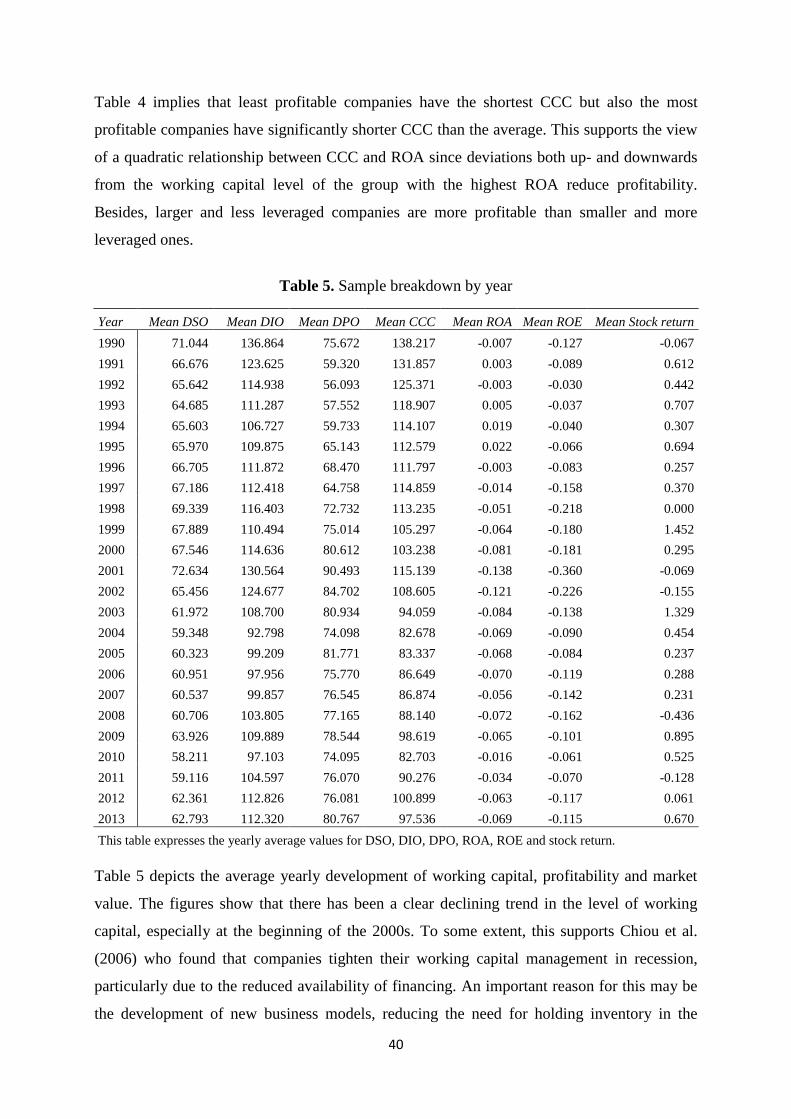
40
Table 4 implies that least profitable companies have the shortest CCC but also the most
profitable companies have significantly shorter CCC than the average. This supports the view
of a quadratic relationship between CCC and ROA since deviations both up- and downwards
from the working capital level of the group with the highest ROA reduce profitability.
Besides, larger and less leveraged companies are more profitable than smaller and more
leveraged ones.
Table 5. Sample breakdown by year
Year Mean DSO Mean DIO Mean DPO Mean CCC Mean ROA Mean ROE Mean Stock return
1990 71.044 136.864 75.672 138.217 -0.007 -0.127 -0.067
1991 66.676 123.625 59.320 131.857 0.003 -0.089 0.612
1992 65.642 114.938 56.093 125.371 -0.003 -0.030 0.442
1993 64.685 111.287 57.552 118.907 0.005 -0.037 0.707
1994 65.603 106.727 59.733 114.107 0.019 -0.040 0.307
1995 65.970 109.875 65.143 112.579 0.022 -0.066 0.694
1996 66.705 111.872 68.470 111.797 -0.003 -0.083 0.257
1997 67.186 112.418 64.758 114.859 -0.014 -0.158 0.370
1998 69.339 116.403 72.732 113.235 -0.051 -0.218 0.000
1999 67.889 110.494 75.014 105.297 -0.064 -0.180 1.452
2000 67.546 114.636 80.612 103.238 -0.081 -0.181 0.295
2001 72.634 130.564 90.493 115.139 -0.138 -0.360 -0.069
2002 65.456 124.677 84.702 108.605 -0.121 -0.226 -0.155
2003 61.972 108.700 80.934 94.059 -0.084 -0.138 1.329
2004 59.348 92.798 74.098 82.678 -0.069 -0.090 0.454
2005 60.323 99.209 81.771 83.337 -0.068 -0.084 0.237
2006 60.951 97.956 75.770 86.649 -0.070 -0.119 0.288
2007 60.537 99.857 76.545 86.874 -0.056 -0.142 0.231
2008 60.706 103.805 77.165 88.140 -0.072 -0.162 -0.436
2009 63.926 109.889 78.544 98.619 -0.065 -0.101 0.895
2010 58.211 97.103 74.095 82.703 -0.016 -0.061 0.525
2011 59.116 104.597 76.070 90.276 -0.034 -0.070 -0.128
2012 62.361 112.826 76.081 100.899 -0.063 -0.117 0.061
2013 62.793 112.320 80.767 97.536 -0.069 -0.115 0.670
This table expresses the yearly average values for DSO, DIO, DPO, ROA, ROE and stock return.
Table 5 depicts the average yearly development of working capital, profitability and market
value. The figures show that there has been a clear declining trend in the level of working
capital, especially at the beginning of the 2000s. To some extent, this supports Chiou et al.
(2006) who found that companies tighten their working capital management in recession,
particularly due to the reduced availability of financing. An important reason for this may be
the development of new business models, reducing the need for holding inventory in the
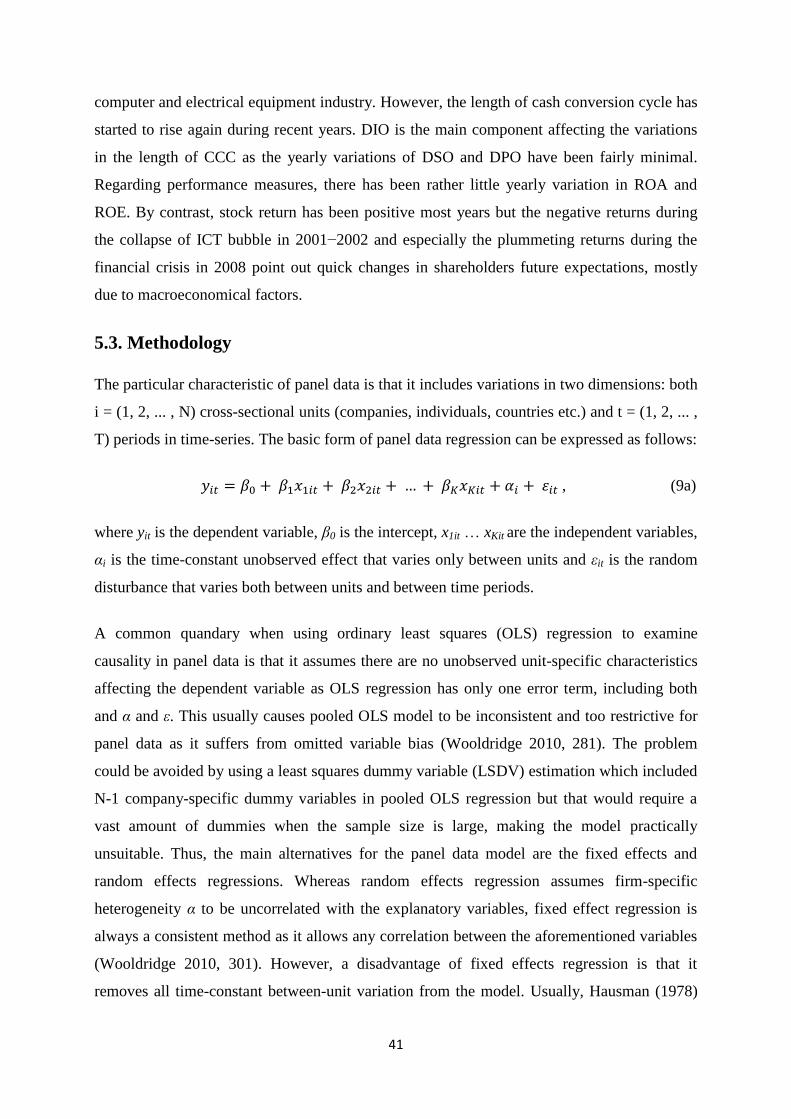
41
computer and electrical equipment industry. However, the length of cash conversion cycle has
started to rise again during recent years. DIO is the main component affecting the variations
in the length of CCC as the yearly variations of DSO and DPO have been fairly minimal.
Regarding performance measures, there has been rather little yearly variation in ROA and
ROE. By contrast, stock return has been positive most years but the negative returns during
the collapse of ICT bubble in 2001−2002 and especially the plummeting returns during the
financial crisis in 2008 point out quick changes in shareholders future expectations, mostly
due to macroeconomical factors.
5.3. Methodology
The particular characteristic of panel data is that it includes variations in two dimensions: both
i = (1, 2, ... , N) cross-sectional units (companies, individuals, countries etc.) and t = (1, 2, ... ,
T) periods in time-series. The basic form of panel data regression can be expressed as follows:
, (9a)
where yit is the dependent variable, β0 is the intercept, x1it … xKit are the independent variables,
αi is the time-constant unobserved effect that varies only between units and εit is the random
disturbance that varies both between units and between time periods.
A common quandary when using ordinary least squares (OLS) regression to examine
causality in panel data is that it assumes there are no unobserved unit-specific characteristics
affecting the dependent variable as OLS regression has only one error term, including both
and α and ε. This usually causes pooled OLS model to be inconsistent and too restrictive for
panel data as it suffers from omitted variable bias (Wooldridge 2010, 281). The problem
could be avoided by using a least squares dummy variable (LSDV) estimation which included
N-1 company-specific dummy variables in pooled OLS regression but that would require a
vast amount of dummies when the sample size is large, making the model practically
unsuitable. Thus, the main alternatives for the panel data model are the fixed effects and
random effects regressions. Whereas random effects regression assumes firm-specific
heterogeneity α to be uncorrelated with the explanatory variables, fixed effect regression is
always a consistent method as it allows any correlation between the aforementioned variables
(Wooldridge 2010, 301). However, a disadvantage of fixed effects regression is that it
removes all time-constant between-unit variation from the model. Usually, Hausman (1978)
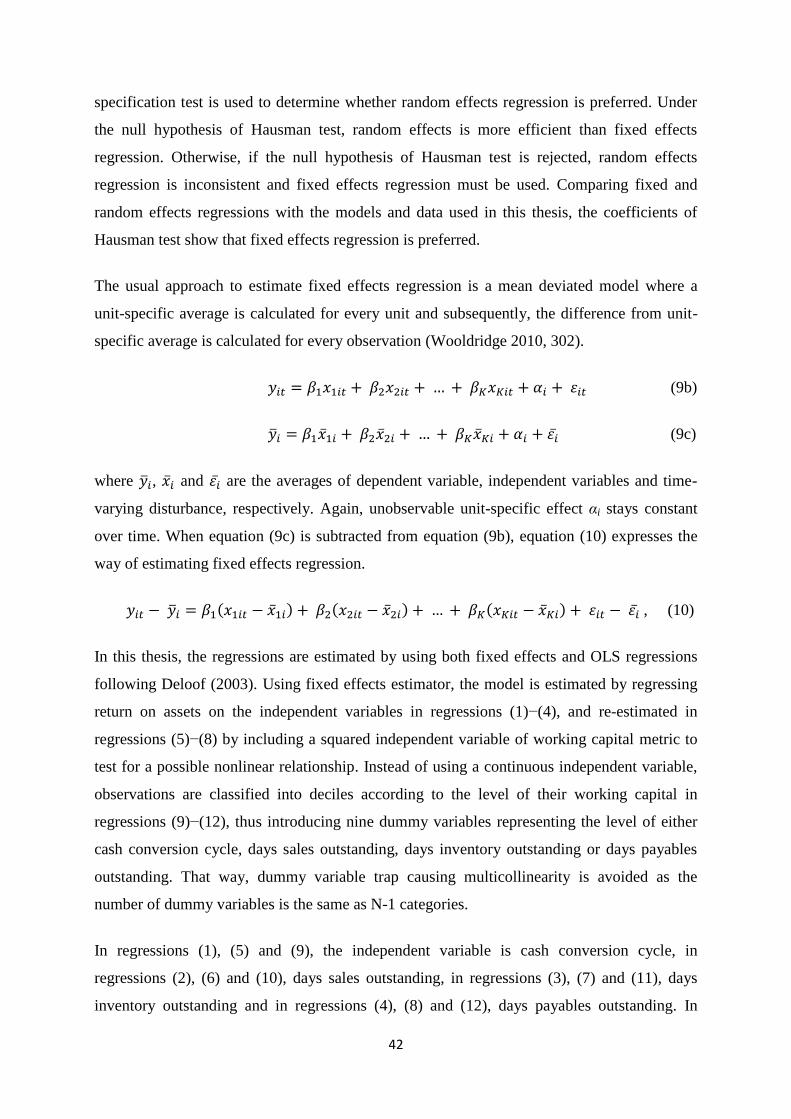
42
specification test is used to determine whether random effects regression is preferred. Under
the null hypothesis of Hausman test, random effects is more efficient than fixed effects
regression. Otherwise, if the null hypothesis of Hausman test is rejected, random effects
regression is inconsistent and fixed effects regression must be used. Comparing fixed and
random effects regressions with the models and data used in this thesis, the coefficients of
Hausman test show that fixed effects regression is preferred.
The usual approach to estimate fixed effects regression is a mean deviated model where a
unit-specific average is calculated for every unit and subsequently, the difference from unit-
specific average is calculated for every observation (Wooldridge 2010, 302).
(9b)
(9c)
where , and are the averages of dependent variable, independent variables and time-
varying disturbance, respectively. Again, unobservable unit-specific effect αi stays constant
over time. When equation (9c) is subtracted from equation (9b), equation (10) expresses the
way of estimating fixed effects regression.
, (10)
In this thesis, the regressions are estimated by using both fixed effects and OLS regressions
following Deloof (2003). Using fixed effects estimator, the model is estimated by regressing
return on assets on the independent variables in regressions (1)−(4), and re-estimated in
regressions (5)−(8) by including a squared independent variable of working capital metric to
test for a possible nonlinear relationship. Instead of using a continuous independent variable,
observations are classified into deciles according to the level of their working capital in
regressions (9)−(12), thus introducing nine dummy variables representing the level of either
cash conversion cycle, days sales outstanding, days inventory outstanding or days payables
outstanding. That way, dummy variable trap causing multicollinearity is avoided as the
number of dummy variables is the same as N-1 categories.
In regressions (1), (5) and (9), the independent variable is cash conversion cycle, in
regressions (2), (6) and (10), days sales outstanding, in regressions (3), (7) and (11), days
inventory outstanding and in regressions (4), (8) and (12), days payables outstanding. In
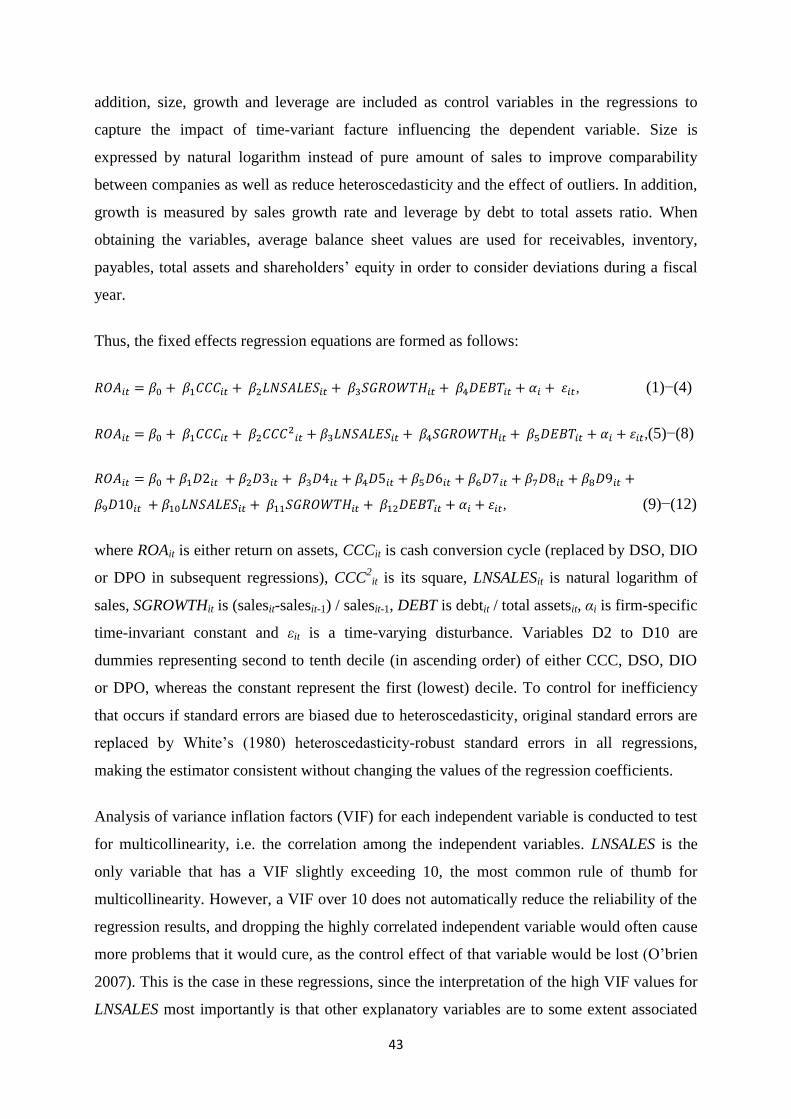
43
addition, size, growth and leverage are included as control variables in the regressions to
capture the impact of time-variant facture influencing the dependent variable. Size is
expressed by natural logarithm instead of pure amount of sales to improve comparability
between companies as well as reduce heteroscedasticity and the effect of outliers. In addition,
growth is measured by sales growth rate and leverage by debt to total assets ratio. When
obtaining the variables, average balance sheet values are used for receivables, inventory,
payables, total assets and shareholders’ equity in order to consider deviations during a fiscal
year.
Thus, the fixed effects regression equations are formed as follows:
, (1)−(4)
,(5)−(8)
, (9)−(12)
where ROAit is either return on assets, CCCit is cash conversion cycle (replaced by DSO, DIO
or DPO in subsequent regressions), CCC2
it is its square, LNSALESit is natural logarithm of
sales, SGROWTHit is (salesit-salesit-1) / salesit-1, DEBT is debtit / total assetsit, αi is firm-specific
time-invariant constant and εit is a time-varying disturbance. Variables D2 to D10 are
dummies representing second to tenth decile (in ascending order) of either CCC, DSO, DIO
or DPO, whereas the constant represent the first (lowest) decile. To control for inefficiency
that occurs if standard errors are biased due to heteroscedasticity, original standard errors are
replaced by White’s (1980) heteroscedasticity-robust standard errors in all regressions,
making the estimator consistent without changing the values of the regression coefficients.
Analysis of variance inflation factors (VIF) for each independent variable is conducted to test
for multicollinearity, i.e. the correlation among the independent variables. LNSALES is the
only variable that has a VIF slightly exceeding 10, the most common rule of thumb for
multicollinearity. However, a VIF over 10 does not automatically reduce the reliability of the
regression results, and dropping the highly correlated independent variable would often cause
more problems that it would cure, as the control effect of that variable would be lost (O’brien
2007). This is the case in these regressions, since the interpretation of the high VIF values for
LNSALES most importantly is that other explanatory variables are to some extent associated

44
with company size. Dropping LNSALES would therefore only cause the loss of controlling
firm size and its VIF value is only marginally over 10 anyway. In addition, the VIF values for
dummy variables should not be taken into account and fixed effects models often generate
large values VIF, too. Thus, multicollinearity among the independent variables is practically
not a problem in these regressions.
45
6. RESULTS
This section presents the empirical results of the study, first showing the correlations between
variables. Thereafter, the results of various regressions are analyzed, first addressing the effect
of working capital on profitability and then the sensitivity test regarding the effect of working
capital on value for equity holders.
6.1. Study of correlations
Table 6 depicts the correlation coefficients of all continuous variables used in the regressions.
Pearson’s correlations are shown below the main diagonal and Spearman’s rank correlations
above the main diagonal. Unlike the findings of many previous papers, CCC and ROA are
positively correlated. Although the higher level of receivables is usually associated with
higher revenue and the higher level of inventories can enable the higher service level, DSO
and DIO are both negatively correlated with ROA. Thus, the main working capital component
causing the negative relationship between CCC and ROA is DPO, as its correlation with ROA
is highly negative. As the direction of causality cannot be seen from correlations, this may
imply that less profitable companies take longer time to pay their purchase invoices as they
have fewer possibilities to obtain external financing. Furthermore, since the correlation
between CCC2 and ROA is negative, there is a possibility of a quadratic association of CCC
and ROA, meaning that the level of net operational working capital balances risks and returns
as up- and downward deviations from the optimum decrease profitability (Baños-Caballero et
al. 2012). On the other hand, CCC has a negative correlation with ROE and stock return,
denoting that an increase in the level of working capital reduces the value for equity holders
(Kieschnick et al. 2013) Moreover, the negative relationships of CCC with LN(Sales), sales
growth and debt ratio give support to hypotheses 3, 4 and 5.
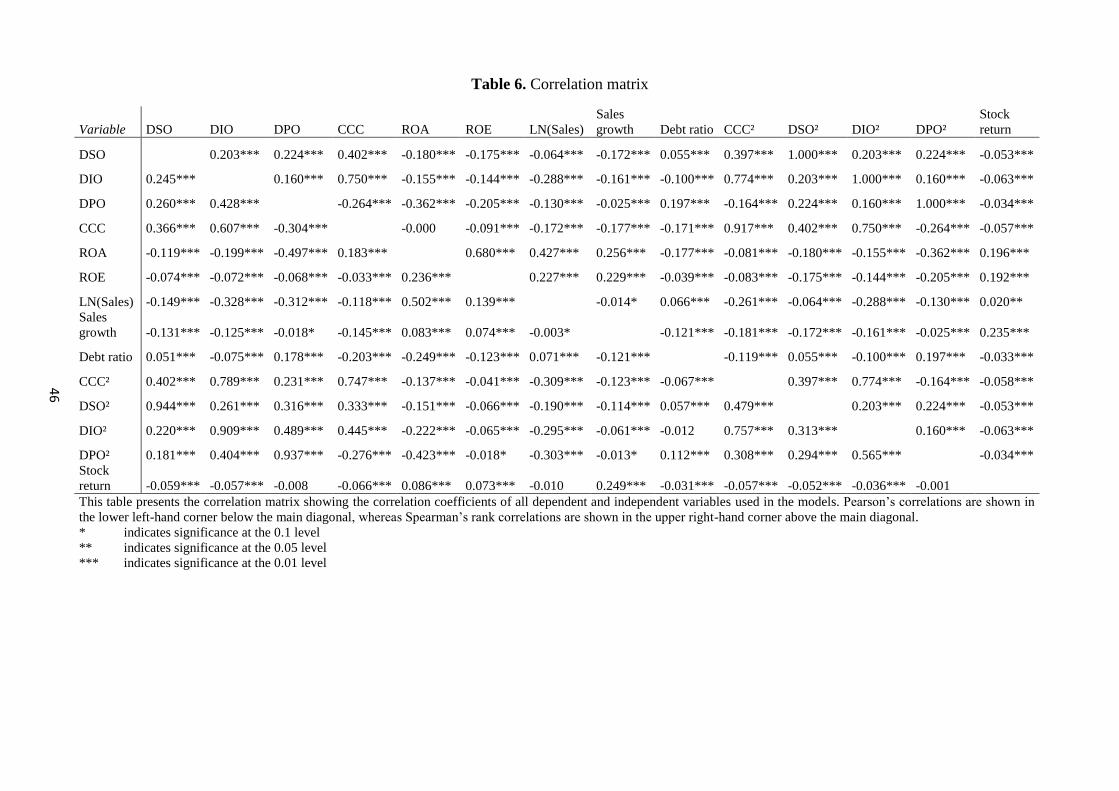
Table 6. Correlation matrix
Variable DSO DIO DPO CCC ROA ROE LN(Sales)
Sales
growth Debt ratio CCC² DSO² DIO² DPO²
Stock
return
DSO
0.203*** 0.224*** 0.402*** -0.180*** -0.175*** -0.064*** -0.172*** 0.055*** 0.397*** 1.000*** 0.203*** 0.224*** -0.053***
DIO 0.245***
0.160*** 0.750*** -0.155*** -0.144*** -0.288*** -0.161*** -0.100*** 0.774*** 0.203*** 1.000*** 0.160*** -0.063***
DPO 0.260*** 0.428***
-0.264*** -0.362*** -0.205*** -0.130*** -0.025*** 0.197*** -0.164*** 0.224*** 0.160*** 1.000*** -0.034***
CCC 0.366*** 0.607*** -0.304***
-0.000 -0.091*** -0.172*** -0.177*** -0.171*** 0.917*** 0.402*** 0.750*** -0.264*** -0.057***
ROA -0.119*** -0.199*** -0.497*** 0.183***
0.680*** 0.427*** 0.256*** -0.177*** -0.081*** -0.180*** -0.155*** -0.362*** 0.196***
ROE -0.074*** -0.072*** -0.068*** -0.033*** 0.236***
0.227*** 0.229*** -0.039*** -0.083*** -0.175*** -0.144*** -0.205*** 0.192***
LN(Sales) -0.149*** -0.328*** -0.312*** -0.118*** 0.502*** 0.139***
-0.014* 0.066*** -0.261*** -0.064*** -0.288*** -0.130*** 0.020**
Sales
growth -0.131*** -0.125*** -0.018* -0.145*** 0.083*** 0.074*** -0.003*
-0.121*** -0.181*** -0.172*** -0.161*** -0.025*** 0.235***
Debt ratio 0.051*** -0.075*** 0.178*** -0.203*** -0.249*** -0.123*** 0.071*** -0.121***
-0.119*** 0.055*** -0.100*** 0.197*** -0.033***
CCC² 0.402*** 0.789*** 0.231*** 0.747*** -0.137*** -0.041*** -0.309*** -0.123*** -0.067***
0.397*** 0.774*** -0.164*** -0.058***
DSO² 0.944*** 0.261*** 0.316*** 0.333*** -0.151*** -0.066*** -0.190*** -0.114*** 0.057*** 0.479***
0.203*** 0.224*** -0.053***
DIO² 0.220*** 0.909*** 0.489*** 0.445*** -0.222*** -0.065*** -0.295*** -0.061*** -0.012 0.757*** 0.313***
0.160*** -0.063***
DPO² 0.181*** 0.404*** 0.937*** -0.276*** -0.423*** -0.018* -0.303*** -0.013* 0.112*** 0.308*** 0.294*** 0.565***
-0.034***
Stock
return -0.059*** -0.057*** -0.008 -0.066*** 0.086*** 0.073*** -0.010 0.249*** -0.031*** -0.057*** -0.052*** -0.036*** -0.001
This table presents the correlation matrix showing the correlation coefficients of all dependent and independent variables used in the models. Pearson’s correlations are shown in
the lower left-hand corner below the main diagonal, whereas Spearman’s rank correlations are shown in the upper right-hand corner above the main diagonal.
*
**
***
indicates significance at the 0.1 level
indicates significance at the 0.05 level
indicates significance at the 0.01 level
46
47
6.2. Regression analysis
To find out the direction of the relationship, the causality of net operational working capital and
profitability is studied with regression analysis. Table 7 shows fixed effects regression coefficients
for the effect of working capital on return on assets. As the coefficient of CCC is positive in
regression (1), hypothesis 1 is not supported by the results. Instead, the negative coefficient of
CCC2 and positive coefficient of CCC in regression (5) express a quadratic effect of CCC on ROA,
pointing out that deviations of the optimal CCC either up- or downwards reduce profitability. Like
Baños-Caballero et al. (2012), the inversely U-shaped regression function shows that the effect of
working capital on profitability in computer and electrical equipment industry is positive with low
levels of working capital and negative with high levels of working capital. Regression (9) gives
additional evidence to support this interpretation as it shows low profitability for the deciles of low
and high CCC, whereas the highest profitability group is the decile 6. These findings illustrate that
both advantages and disadvantages of holding working capital need to be appropriately taken into
account in company’s operations in order to maximize performance.
The concave relationship is also consistent with the reactive approach to working capital
management found especially in the studies of small and medium-sized companies, as Ebben &
Johnson (2011) found that highly performing companies are likely to lengthen and weakly
performing companies shorten their CCC, while Baños-Caballero et al. (2010) concluded that
companies with higher or lower levels of working capital try to converge to their target CCC
relatively quickly. Regarding control variables, sales and sales growth have a positive effect and
debt ratio a negative effect on profitability, which is consistent with the expectations based on
previous studies. The value around 0.2 for the goodness of fit measure of R-squared indicates that
the independent variables explain around 20 % of the variation in the dependent variable, leaving 80
% of the variation to be explained by unobserved factors. The value is not especially high but
sufficient in comparison with earlier papers in this field. The within R2 reported here corresponds
the R2 used in OLS regressions, thus making the measures comparable. The value for F-test shows
also that the model as a whole is statistically significant.
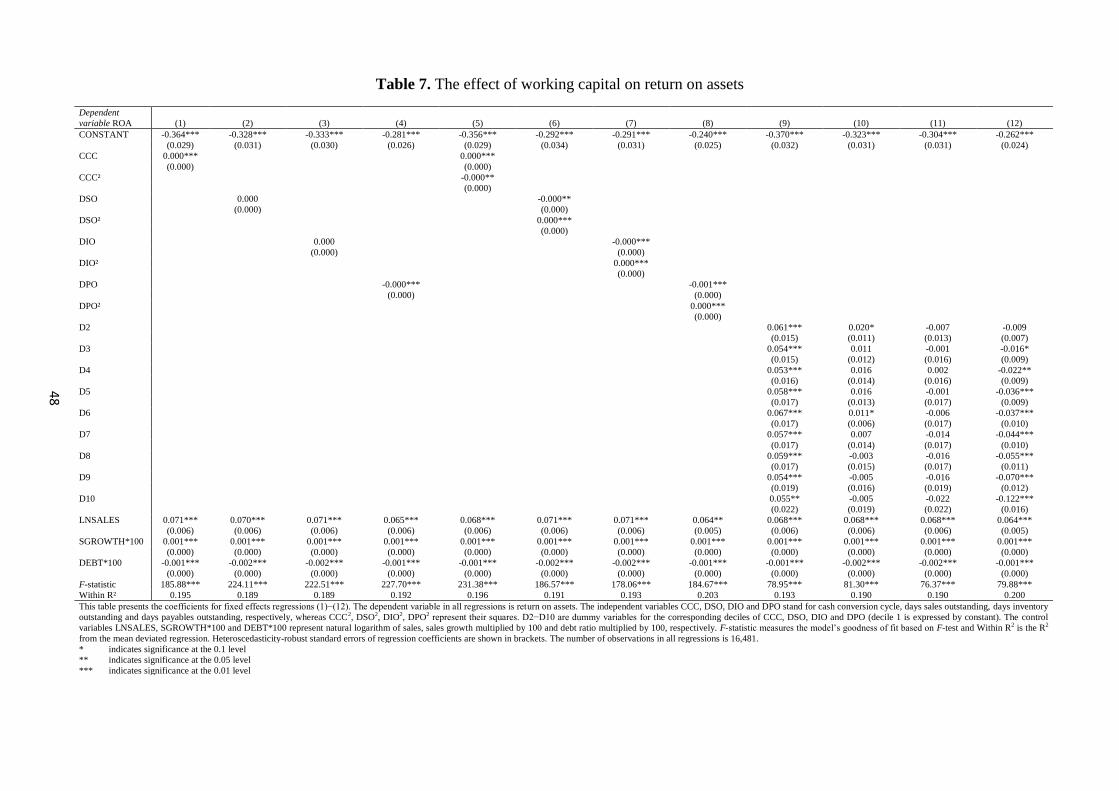
Table 7. The effect of working capital on return on assets
Dependent
variable ROA (1) (2) (3) (4) (5) (6) (7) (8) (9) (10) (11) (12)
CONSTANT -0.364*** -0.328*** -0.333*** -0.281*** -0.356*** -0.292*** -0.291*** -0.240*** -0.370*** -0.323*** -0.304*** -0.262***
(0.029) (0.031) (0.030) (0.026) (0.029) (0.034) (0.031) (0.025) (0.032) (0.031) (0.031) (0.024)
CCC 0.000***
0.000***
(0.000)
(0.000)
CCC²
-0.000**
(0.000)
DSO
0.000
-0.000**
(0.000)
(0.000)
DSO²
0.000***
(0.000)
DIO
0.000
-0.000***
(0.000)
(0.000)
DIO²
0.000***
(0.000)
DPO
-0.000***
-0.001***
(0.000)
(0.000)
DPO²
0.000***
(0.000)
D2
0.061*** 0.020* -0.007 -0.009
(0.015) (0.011) (0.013) (0.007)
D3
0.054*** 0.011 -0.001 -0.016*
(0.015) (0.012) (0.016) (0.009)
D4
0.053*** 0.016 0.002 -0.022**
(0.016) (0.014) (0.016) (0.009)
D5
0.058*** 0.016 -0.001 -0.036***
(0.017) (0.013) (0.017) (0.009)
D6
0.067*** 0.011* -0.006 -0.037***
(0.017) (0.006) (0.017) (0.010)
D7
0.057*** 0.007 -0.014 -0.044***
(0.017) (0.014) (0.017) (0.010)
D8
0.059*** -0.003 -0.016 -0.055***
(0.017) (0.015) (0.017) (0.011)
D9
0.054*** -0.005 -0.016 -0.070***
(0.019) (0.016) (0.019) (0.012)
D10
0.055** -0.005 -0.022 -0.122***
(0.022) (0.019) (0.022) (0.016)
LNSALES 0.071*** 0.070*** 0.071*** 0.065*** 0.068*** 0.071*** 0.071*** 0.064** 0.068*** 0.068*** 0.068*** 0.064***
(0.006) (0.006) (0.006) (0.006) (0.006) (0.006) (0.006) (0.005) (0.006) (0.006) (0.006) (0.005)
SGROWTH*100 0.001*** 0.001*** 0.001*** 0.001*** 0.001*** 0.001*** 0.001*** 0.001*** 0.001*** 0.001*** 0.001*** 0.001***
(0.000) (0.000) (0.000) (0.000) (0.000) (0.000) (0.000) (0.000) (0.000) (0.000) (0.000) (0.000)
DEBT*100 -0.001*** -0.002*** -0.002*** -0.001*** -0.001*** -0.002*** -0.002*** -0.001*** -0.001*** -0.002*** -0.002*** -0.001***
(0.000) (0.000) (0.000) (0.000) (0.000) (0.000) (0.000) (0.000) (0.000) (0.000) (0.000) (0.000)
F-statistic 185.88*** 224.11*** 222.51*** 227.70*** 231.38*** 186.57*** 178.06*** 184.67*** 78.95*** 81.30*** 76.37*** 79.88***
Within R² 0.195 0.189 0.189 0.192 0.196 0.191 0.193 0.203 0.193 0.190 0.190 0.200
This table presents the coefficients for fixed effects regressions (1)−(12). The dependent variable in all regressions is return on assets. The independent variables CCC, DSO, DIO and DPO stand for cash conversion cycle, days sales outstanding, days inventory
outstanding and days payables outstanding, respectively, whereas CCC2, DSO2, DIO2, DPO2 represent their squares. D2−D10 are dummy variables for the corresponding deciles of CCC, DSO, DIO and DPO (decile 1 is expressed by constant). The control
variables LNSALES, SGROWTH*100 and DEBT*100 represent natural logarithm of sales, sales growth multiplied by 100 and debt ratio multiplied by 100, respectively. F-statistic measures the model’s goodness of fit based on F-test and Within R2 is the R2
from the mean deviated regression. Heteroscedasticity-robust standard errors of regression coefficients are shown in brackets. The number of observations in all regressions is 16,481.
*
**
***
indicates significance at the 0.1 level
indicates significance at the 0.05 level
indicates significance at the 0.01 level
48
49
Although regressions (6) and (7) imply a quadratic relationship between DSO and ROA and
DIO and ROA, the results are not supported by decile-wise comparisons since regressions
(10) and (11) show a linear negative effect on ROA but their coefficients are not statistically
significant. The linear regressions (2) and (3) show a positive coefficient for DSO and DIO
but they are not significant either. Moreover, regressions (4) and (12) show a negative and
significant impact of DPO on ROA, implying that DPO is the main component affecting the
relationship between CCC and ROA, as it was in the correlation coefficients. The negative
impact of payables on profitability may indicate also reciprocal effect as less profitable
companies are likely to pay their invoices late, causing stricter credit terms, lost cash
discounts and excess interest costs (Deloof 2003; Lazaridis & Tryfonidis 2006). Thus,
hypothesis 2c is the only one that can be fully supported. Like Shin & Soenen (1998) state,
most remarkable benefits from reducing net working capital come from reducing the level of
assets rather than increasing the level of payables.
Consequently, the regression results for the separate regressions of the components of CCC
are not very robust, suggesting that the most comprehensive inference could be done when
analyzing the impact of CCC as a whole. Thus, the results of regressions including all the
working capitals components in the same model are presented in Appendix 5. However, the
high correlation among the independent variables prevents drawing comprehensive
conclusions based on those models but in any case, the results support those found in
regressions (1)−(12), the only difference being that the positive coefficient of DIO becomes
statistically significant. In practice, the findings also imply that companies should be
concerned with receivables, inventories and payables together in accordance with other day-
to-day operations to take advantage of successful working capital management.
Besides, the findings shed light on the conception that the level of working capital is a trade-
off concerning conservative working capital management by maintaining a high service level
and expensive carrying costs, contrary to aggressive working capital management by keeping
high risks and low carrying costs. Comparing with previous papers that have concluded a
negative impact of working capital on profitability, findings in this thesis take also into
account the need for holding an adequate level of working capital, which has often gained less
attention. Accordingly, it is important to be aware that short CCC itself does not guarantee
high profitability as the high risks of holding a low level of working capital can cause
additional costs such as lost sales, production cut-offs and lowered credit rating.
50
Although there are some very profitable companies holding a negative CCC, such as Dell or
Apple, a number of companies with a longer CCC have achieved as high ROA as well,
implying the diversity of successful working capital tactics as Lind et al. (2012) mentioned.
Similarly, besides aforementioned greatly performing companies, most companies with a
negative CCC have a low profitability since the median ROA for that subsample is negative (-
22.2 %). Hence, companies holding a negative CCC could be classified into two main
categories: there are a lot of weakly performing companies with a poor profitability due to
illiquidity and distress costs, whereas there are also a few highly profitable companies thanks
to their predominant bargaining power and effective operations. As the mean ROA for the
whole sample is negative (-4.6 %) but the median ROA is positive (4.0 %), the degree of
average loss a less profitable company reports is noteworthy. The high standard deviations of
ROA in decile 1 (0.632) as well as the whole sample (0.332) also support these inferences.
Generally, the optimal CCC based on the regression results does not guarantee a high ROA
either but it indicates the working capital level that most likely results in good performance by
balancing the strengths and weaknesses of holding working capital. Consequently, a CCC
which is neither too long nor too short maximizes profitability when other factors are held
constant.
However, it cannot be ruled out that profitability has a more significant impact on working
capital than the other way round. In the same way as found by Hill et al. (2010), financially
distressed companies need to exercise aggressive working capital management by tightening
their receivables policy and postponing invoice payments due to the reduced possibilities of
obtaining external financing. Regarding industry characteristics, this may be the case
especially for suppliers facing tight competition if they are required to implement just-in-time
production which, besides its benefits, increases the risks of production breakdowns, lost
customer relationships and illiquidity costs due to minimizing the level of working capital. On
the other hand, the bargaining power of large corporations may cause their suppliers to extend
longer credit periods and hold excessive amounts of inventory, causing additional carrying
costs of holding a high level of working capital. As Grosse-Ruyken et al. (2011) states, it is
beneficial to take into account the structure of the whole supply chain when determining the
target CCC. Another specialty in the computer and electrical equipment industry is the quick
technical development which can lead to either excess inventories if existing products lose
their demand due to new products penetrating the market or, in contrast, to lack of inventories
if production cannot respond to rapidly growing sales. Likewise, the risk of holding
51
delinquent receivables increases if the business environment changes quickly or if many
customers face financial constraints during an economic downturn. Hence, all aforementioned
cases may be determinants of quadratic impact of working capital on profitability.
Above all, it is important to keep in mind that other factors than working capital affect
company profitability as well. Those include both the control variables, size being the most
significant one, and factors unobserved in the model, explaining about 80 % of the variation
of profitability. As the sample in this thesis consists of one industry only, the effect of
unobserved between-industry variation is low but in any case, there is some unobserved
variation due to different sub-groups within computer and electrical equipment industry.
Nevertheless, varying working capital practices can result in substantial differences between
the overall performance of different companies. Taking into account the particular
characteristics of computer and electrical equipment industry, emphasizing working capital
management is especially important in the dynamic environment where characteristics of
business change, new products are developed and new innovations bring opportunities to
generate revenue relatively quickly.
6.3. Sensitivity test
Although working capital is found to have a quadratic impact on return on assets, it does not
necessarily mean that a similar impact would exist regarding the association of working
capital and the value for equity holders, especially since the correlation coefficients give a
sign that the effect on return on equity and stock return might differ from the one on return on
assets. Hence, the impact of net operational working capital on return on equity is addressed
to take into account the debt structure as well as the impact on shareholder value is studied to
test whether equity holders value working capital in a similar way as accounting measures
show. First, the impact of working capital on return on equity is studied like Jose et al. (1996)
in regressions (13)−(15). Furthermore, the impact of working capital on stock return is
examined in regressions (16)−(18). Except the different dependent variable, those equations
are identical to regressions (1), (5) and (9), using CCC and controls as independent variables
in fixed effects regressions.
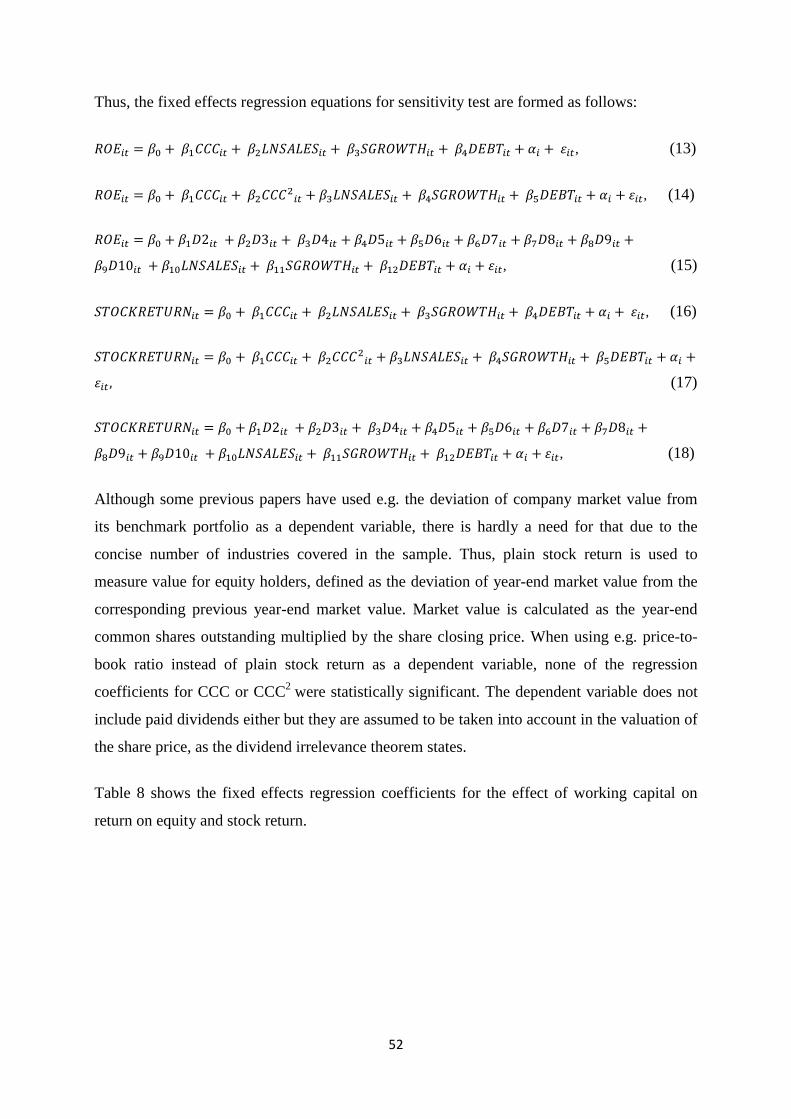
52
Thus, the fixed effects regression equations for sensitivity test are formed as follows:
, (13)
, (14)
, (15)
, (16)
(17)
, (18)
Although some previous papers have used e.g. the deviation of company market value from
its benchmark portfolio as a dependent variable, there is hardly a need for that due to the
concise number of industries covered in the sample. Thus, plain stock return is used to
measure value for equity holders, defined as the deviation of year-end market value from the
corresponding previous year-end market value. Market value is calculated as the year-end
common shares outstanding multiplied by the share closing price. When using e.g. price-to-
book ratio instead of plain stock return as a dependent variable, none of the regression
coefficients for CCC or CCC2
were statistically significant. The dependent variable does not
include paid dividends either but they are assumed to be taken into account in the valuation of
the share price, as the dividend irrelevance theorem states.
Table 8 shows the fixed effects regression coefficients for the effect of working capital on
return on equity and stock return.
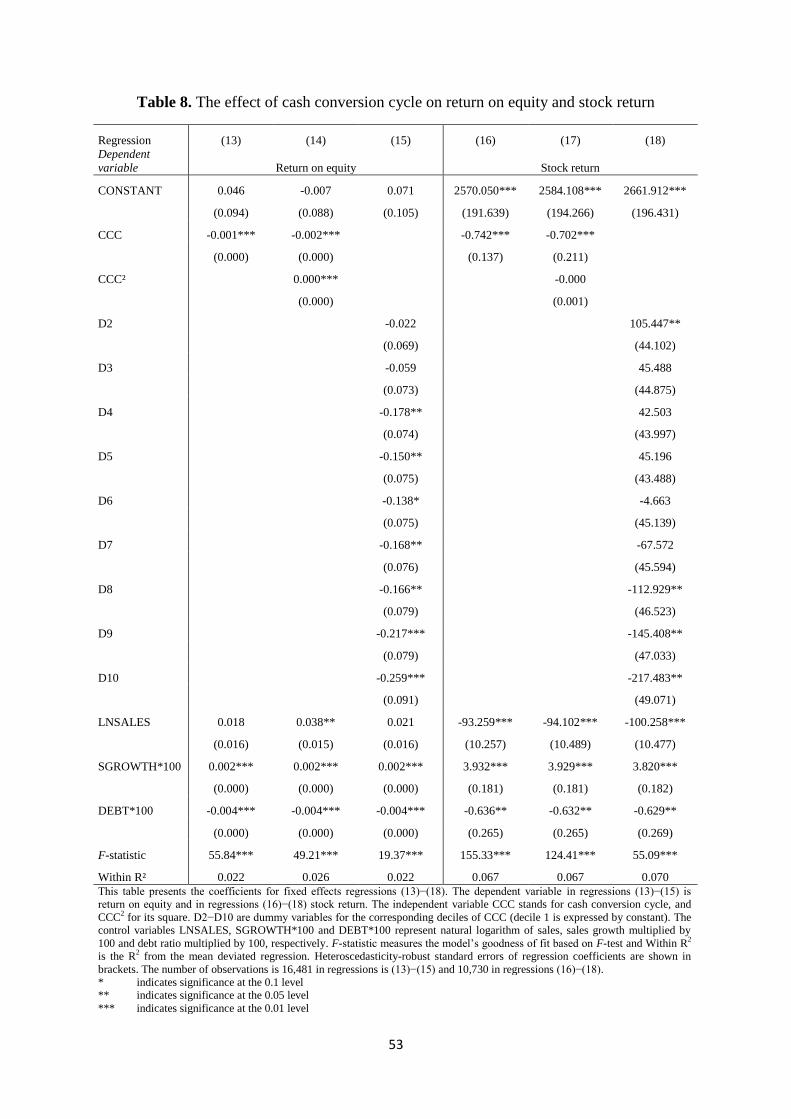
53
Table 8. The effect of cash conversion cycle on return on equity and stock return
Regression (13) (14) (15) (16) (17) (18)
Dependent
variable Return on equity Stock return
CONSTANT 0.046 -0.007 0.071 2570.050*** 2584.108*** 2661.912***
(0.094) (0.088) (0.105) (191.639) (194.266) (196.431)
CCC -0.001*** -0.002***
-0.742*** -0.702***
(0.000) (0.000)
(0.137) (0.211)
CCC²
0.000***
-0.000
(0.000)
(0.001)
D2
-0.022
105.447**
(0.069)
(44.102)
D3
-0.059
45.488
(0.073)
(44.875)
D4
-0.178**
42.503
(0.074)
(43.997)
D5
-0.150**
45.196
(0.075)
(43.488)
D6
-0.138*
-4.663
(0.075)
(45.139)
D7
-0.168**
-67.572
(0.076)
(45.594)
D8
-0.166**
-112.929**
(0.079)
(46.523)
D9
-0.217***
-145.408**
(0.079)
(47.033)
D10
-0.259***
-217.483**
(0.091)
(49.071)
LNSALES 0.018 0.038** 0.021 -93.259*** -94.102*** -100.258***
(0.016) (0.015) (0.016) (10.257) (10.489) (10.477)
SGROWTH*100 0.002*** 0.002*** 0.002*** 3.932*** 3.929*** 3.820***
(0.000) (0.000) (0.000) (0.181) (0.181) (0.182)
DEBT*100 -0.004*** -0.004*** -0.004*** -0.636** -0.632** -0.629**
(0.000) (0.000) (0.000) (0.265) (0.265) (0.269)
F-statistic 55.84*** 49.21*** 19.37*** 155.33*** 124.41*** 55.09***
Within R² 0.022 0.026 0.022 0.067 0.067 0.070
This table presents the coefficients for fixed effects regressions (13)−(18). The dependent variable in regressions (13)−(15) is
return on equity and in regressions (16)−(18) stock return. The independent variable CCC stands for cash conversion cycle, and
CCC2 for its square. D2−D10 are dummy variables for the corresponding deciles of CCC (decile 1 is expressed by constant). The
control variables LNSALES, SGROWTH*100 and DEBT*100 represent natural logarithm of sales, sales growth multiplied by
100 and debt ratio multiplied by 100, respectively. F-statistic measures the model’s goodness of fit based on F-test and Within R2
is the R2 from the mean deviated regression. Heteroscedasticity-robust standard errors of regression coefficients are shown in
brackets. The number of observations is 16,481 in regressions is (13)−(15) and 10,730 in regressions (16)−(18).
*
**
***
indicates significance at the 0.1 level
indicates significance at the 0.05 level
indicates significance at the 0.01 level
54
The coefficients of regressions (13) and (16) point out that cash conversion cycle has a linear
negative effect on both return on equity and stock return, thus supporting both hypotheses 6a
and 6b. The decile-wise comparisons in regressions (15) and (18) give additional support to
these results although all decile dummies are not statistically significant. Hence, there is a
contradiction of benefits to different sides as a CCC which is neither too long nor too short
results in high ROA and benefits the company as a whole, whereas minimizing CCC benefits
the equity holders the most. These findings in the computer and electrical equipment industry
are consistent with previous papers studying a cross-sectional sample, denoting that working
capital decreases shareholder value (Shin & Soenen 1998; Autukaite & Molay 2011;
Kieschnick et al. 2013). This implies that instead of holding idle working capital in the
balance sheet, shareholders prefer excess funds to be invested in profitable growth or paid out
as dividends.
Furthermore, the results point out also the different time frame of different stakeholders since
shareholders are more interested in short-term returns which can be achieved by holding a
minimal level of working capital, whereas holding an optimal level of working capital would
benefit the company as a whole in the long term by ensuring sufficient revenue growth and
service level. On the other hand, market value expresses shareholders’ future expectations,
implying that shareholders believe that current low level of working capital is more likely to
generate high free cash flow in the future. Theoretically, the negative association of working
capital and expected terminal value of the company would be apparent but it totally ignores
the future growth opportunities and changes in business prospects. In addition, besides putting
attention into plain financial performance, shareholders seem to also be at least to some extent
interested how effectively a company runs its day-to-day operations. This supports (Luo et al.
2009) who concluded that changes in working capital affect how investors value the company
but the market interpretation is not perfect.
However, the low value of R-squared needs to be taken into account when interpreting the
results since the majority of variation in the dependent variables is explained by factors that
are unobserved in this model. The variability between companies is also noteworthy, which
can be seen as the remarkable standard deviations of return on equity and stock return are
even higher than the one for return on assets. This implies a greater variation how
shareholders in different companies value working capital. Furthermore, regressions including
return on equity as a dependent variable and days sales outstanding, days inventory
55
outstanding and days payables outstanding as independent variables are reported in Appendix
3, whereas the same regressions including stock return as a dependent variable are reported in
Appendix 4. Generally, DSO and DIO have a negative impact on both dependent variables,
which is consistent with the findings in Table 7 as shareholders do not value working capital
very high. By contrast, DPO has a positive impact on return on equity but no significant effect
on stock return, which implies the relationship of high payables level and financial distress. In
addition, the results of regressions including all the working capitals components in the same
model are presented in Appendix 5 and the only difference found there is that DPO has a
positive effect also on stock return.
Regarding control variables, sales growth has positive and debt ratio negative impact on both
dependent variables. However, natural logarithm of sales has a significant positive effect on
return on equity only when assuming a quadratic effect, otherwise the coefficient is
insignificant. Instead, it has a significant negative effect on stock return, implying that
generally the market gives higher valuation to smaller companies. This is somewhat
contradictory to previous working capital papers but a possible explanation is that instead of
using plain stock return as a dependent variable, they have used excess stock return compared
with the benchmark portfolio.
The results imply that the characteristics of computer and electrical equipment industry are
even more meaningful when observing the effect of working capital management on
shareholder value than on profitability. One reason for this might be that profitability
measures, such as return on assets, express financial performance in the past, whereas market
value expresses how investors predict the company to generate cash flows and gain earnings
in the future. However, the expectations by shareholders in the area of technology are not
always accurate, as the collapse of several Internet-based companies in the early 2000s
showed. This may have affected the valuation of manufacturing companies in the computer
business as well, making shareholders more realistic and cautious regarding companies whose
share price is exceptionally high compared with earnings. Market value is also vulnerable to
economic shocks as investors’ expectations may change quickly, such as the strong decline of
stock prices in 2002 and 2008 has showed.
Since the effect of cash conversion cycle on stock return is strongly negative, shareholders
may expect a company to perform well in the future thanks to its efficient operations even
though its low level of working capital would currently cause low ROA. This is especially

56
important issue in an industry where excess working capital loses its value quickly due to
remarkably fast technical development, implying that companies with high levels of working
capital are likely to suffer from weakening profitability in the future if their business is not
able to fully respond to changes in the competitive environment.
57
7. CONCLUSION
By studying the association of working capital and profitability in computer and electrical
equipment industry, this thesis has contributed to prior research in several ways, bringing new
insights to working capital analysis. Previous papers in this field have found a linear negative
effect of working capital on profitability by using a cross-sectional sample, consistent with the
theoretical framework. By contrast, this thesis focuses on working capital management in a
less heterogeneous sample of 1,683 firms and 16,481 observations in only one industry, thus
reducing the effect of other variables. Unlike most studies solely assuming a linear association
of working capital on profitability, also a quadratic effect is studied in this thesis. Besides,
panel data methodology is used to control for company-specific heterogeneity by conducting
a fixed effect regression instead of a plain OLS, thus applying a consistent and less restrictive
estimator.
The results show that net operational working capital has an inverted U-shaped impact on
profitability in the computer and electrical equipment industries, implying that an increase in
the level of working capital affects company performance positively when the level of
working capital is low and negatively when the level is high. Thus, there exists an optimal
level of working capital, resulting in a balance between risks and returns. Regarding the
components of cash conversion cycle, accounts payable has a negative effect on profitability
but the effect of accounts receivable is not significant and the positive effect of inventories is
significant only when including all the working capital components in the same regression
model. This indicates that instead of increasing the level of current liabilities, reducing the
level of current assets is a more effective way of reducing the level of net working capital.
However, the levels of receivables and payables have stayed relatively constant during the
sample period, whereas yearly deviations of inventory level are remarkable, thus affecting the
length of cash conversion cycle. The effect of inventory is essential also because reducing
cash conversion cycle by reducing receivables or increasing payables results in higher level of
working capital for the corresponding supplier or customer, whereas reducing the level of
inventory enables more effective working capital management in a larger scale as it does not
have similar zero-sum-game impacts on the entire supply chain. Moreover, cash conversion
cycle has a linear negative effect on both return on equity and stock return, so an increase in
the level of working capital decreases value for equity holders.
58
The findings have several noteworthy practical implications. Hence, managers should pay
sufficient attention to effective working capital management not only during financial distress
but also generally when running day-to-day operations. Sufficient emphasis should be also
placed on the connection between short-term and long-term financial management. Although
some companies holding a negative cash conversion cycle are among the most profitable ones
in these industries, a low level of working capital is not a prerequisite for high performance as
the number of profitable companies holding a long CCC shows. In fact, most companies
holding a negative CCC have a negative ROA which implies that a low level of working
capital is associated with low profitability, consistent with the reactive approach of financially
distressed companies in managing working capital. Also, a high level of working capital is
associated with low profitability, whereas the working capital level maximizing ROA exists
between those two extremes. Accordingly, taking into account the impact of both profitability
and shareholder value is an important issue which has gained less attention both in academic
research and managerial discussions.
According to the empirical results, net operational working capital has a different effect on
shareholder value than on profitability, unlike most previous papers studying the effect of
working capital on both of aforementioned measures have concluded. However, the results
support Nazir & Afza (2009) who found that aggressive working capital financing policy had
a negative effect on profitability but a positive effect on shareholder value. Consequently, the
results emphasize different benefits for different parties, specifically the company itself and
its owners. Taking the benefits of a relatively long CCC may be a lucrative strategy for the
company but not for the shareholders who value tied-up capital less than cash, causing a
negative association of working capital and market value. The same holds also the other way
round as a short CCC may lead to high stock return but not necessarily favorable profitability.
This reflects future expectations as investors predict that companies having a low level of
working capital are more likely to generate high free cash flow in the future. However,
shareholders appreciate higher returns in the short term, whereas holding an adequate level of
working capital may ensure sales growth resulting in future profitability as well. Comparing
the differences of ROA and stock return, it is also important to keep in mind that market
values are more sensitive to macroeconomic factors as investors in general tend to overreact
to economic downturns, causing stock prices to significantly decline even though a company
itself would gain reasonable profit, whereas rapidly growing stock prices especially in a
booming market do not guarantee higher profitability.
59
Combining the effects of working capital on profitability and shareholder value, managers
should consider several factors in order to succeed in working capital management. Too low a
level of working capital increases the risks such as lost sales, production cut-offs and default
costs, whereas too high a level of working capital not only causes carrying costs and the risks
of delinquent receivables and obsolete inventory but also decreases market value.
Accordingly, the finding that a longer cash conversion cycle results in a lower value for
equity holders should also be taken into account in working capital management. Although
companies holding higher levels of working capital naturally need more external funds to
finance it, equity issues by them are less attractive for shareholders than equity issues by
companies holding lower levels of working capital, and issuing equity to finance short-term
assets would reduce ROE due to its expensive price compared with debt in any case.
Moreover, companies financing their high level of working capital with long-term debt need
also to take into account the risks regarding too high a debt ratio and additional costs caused
by rising interest rates. Finally, as REL Consultancy (2013b) states, the vast amount of idle
working capital offers numerous opportunities to increase operational efficiency and thus
shareholder wealth since working capital improvements achieved during the financial crisis
seem to be gone now. This can be also seen in this sample as the long-term declining trend in
the level of working capital has turned around during recent years since CCC has lengthened
in 2011−2013.
Investors should also acknowledge the contradiction between benefits for companies and their
shareholders. Hence, an advanced investor may gain additional returns by utilizing knowledge
about different objectives and strategies for working capital management, including industry-
specific and company-specific factors. As the market appreciates companies with a low level
of working capital, they can be considered as beneficial investments but however, they are not
necessarily profitable on a long-term basis, they have fewer possibilities to reduce their
invested capital and they also bear higher risks than those with a high level of working
capital. Furthermore, the impact of agency problems cannot be ruled out either as
management may have incentives to aim for high short-term share returns, which may lead to
holding less working than the level resulting in the highest profitability. Alternatively,
managers can also be more risk-averse than investors since their personal success is related to
the performance of the company and they cannot diversify their risk on capital markets the
same way as investors, which may result in holding excess working capital instead of
investing in long-time projects with a positive net present value. On the other hand,
60
companies with an optimal CCC and high ROA are generally more stable investments in the
long-run although their short-term stock returns may not be as high. Above all, when
choosing investments, careful company-specific analysis including the recognition of future
risks and opportunities is always required also regarding working capital management.
As hypothesis 1 expected a negative impact of net operational working capital on
profitability, it is not supported since cash conversion cycle was found to have a concave
effect on return on assets. Regarding hypotheses 2a, 2b and 2c that depict the individual
effects of the working capital components on profitability, only the negative association of
accounts payable and profitability can be confirmed, whereas accounts receivable has no
significant effect and inventory has a positive effect but it is significant only when including
all the working capital components in the same model. Hypotheses 3, 4 and 5 related to
control variables are supported, as companies with larger size, more leverage and higher sales
growth have lower levels of net operational working capital. Finally, hypotheses 6a and 6b are
confirmed since a higher level net operational working capital is worth less for equity holders
as it has negative impact on both return on equity and stock return.
However, there are certain limitations in the scope of this thesis. Even though this study
provides detailed information about the impact of working capital management on
profitability in one industry, giving an advantage over cross-sectional data, industry-wide
differences must be taken into account when comparing working capital practices in other
industries. In addition, electrical equipment companies consist of various sub-groups whose
differences cannot be fully controlled. Hence, one possibility for future research would be to
specify different typologies of companies by conducting a factor analysis. The low value of
R2 is also a concern which needs to be taken into account when inferring the relationship
between working capital and return on equity as well as stock return.
Most significantly, as Deloof (2003) points out, the relationship between working capital and
profitability can also be a consequence of the latter instead of vice versa, causing the
possibility of endogeneity problems. Using an instrumental variable is a common approach in
a situation where endogeneity bias causes the estimator to be inconsistent but finding a
convincing instrument is practically very difficult in this case (Wooldridge 2010, 94).
Suffering from survivor bias can neither be ruled out in this study as least profitable
companies are likely to drop out from the sample because they are delisted. On the other
61
hand, if companies once dropped out re-enter the sample, it may result in attrition bias, which
is a more complicated problem (Wooldridge 2010, 837).
There are also restrictions when generalizing the results to other countries or industries. If the
same analysis had been conducted in a more stable, more service-oriented or more capital-
intensive industry, the findings might be different. As the sample consists only of publicly
traded US companies, varying conditions for SMEs and companies based in other countries
could also bring different results. Thus, private companies have fewer possibilities for
external financing and companies from banking-oriented countries, such as most European
countries, operate in an environment where less financing is provided by capital markets.
Furthermore, if a similar study is replicated by using a European sample, the results may be
affected by the remarkably higher average level of working capital in European computer and
electrical equipment industry companies than in their US counterparts, not forgetting the
higher relative importance of trade credit in banking-oriented countries (REL Consultancy
2013a).
To gain further results on the effect of working capital on shareholder value, it would be
interesting to see how the change in cash conversion cycle affects subsequent return on assets
and stock return, using similar methodology as Luo et al. (2009). This way, it could be seen
whether excess working capital really reduces the ability to gain future earnings the way
shareholders expect. Moreover, to gain more comprehensive evidence about this issue, it
would also be important to analyze how changes in working capital have affected the
aggregate profitability and stock return in the long run. These questions are left open for
future research.
62
REFERENCES
Anagnostopoulou, S.C. 2012, "Working Capital Management and Firm Listing Status",
Multinational Finance Journal, vol. 16, no. 3, pp. 261−301.
Autukaite, R. & Molay, E. 2011, "Cash holdings, working capital and firm value: Evidence
from France", Working Paper, International Conference of the French Finance Association
(AFFI), Available at SSRN: http://ssrn.com/abstract=1836900 [Retrieved November 18,
2014].
Baños-Caballero, S., García-Teruel, P.J. & Martínez-Solano, P. 2010, "Working capital
management in SMEs", Accounting & Finance, vol. 50, no. 3, pp. 511−527.
Baños-Caballero, S., García-Teruel, P. & Martínez-Solano, P. 2012, "How does working
capital management affect the profitability of Spanish SMEs?", Small Business Economics,
vol. 39, no. 2, pp. 517−529.
Baños-Caballero, S., García-Teruel, P.J. & Martínez-Solano, P. 2014, "Working capital
management, corporate performance, and financial constraints", Journal of Business
Research, vol. 67, no. 3, pp. 332−338.
Bresnahan, T.F. & Greenstein, S. 1999, "Technological Competition and the Structure of the
Computer Industry", The Journal of Industrial Economics, vol. 47, no. 1, pp. 1−40.
Chiou, J., Cheng, L. & Wu, H. 2006, "The Determinants of Working Capital Management",
Journal of American Academy of Business, Cambridge, vol. 10, no. 1, pp. 149−155.
Dechow, P.M. 1994, "Accounting earnings and cash flows as measures of firm performance:
The role of accounting accruals", Journal of Accounting and Economics, vol. 18, no. 1, pp.
3−42.
Deloof, M. 2003, "Does Working Capital Management Affect Profitability of Belgian
Firms?", Journal of Business Finance & Accounting, vol. 30, no. 3−4, pp. 573−588.
Ebben, J.J. & Johnson, A.C. 2011, "Cash Conversion Cycle Management in Small Firms:
Relationships with Liquidity, Invested Capital, and Firm Performance", Journal of Small
Business & Entrepreneurship, vol. 24, no. 3, pp. 381−396.
Eljelly, A.M.A. 2004, "Liquidity-profitability tradeoff: an empirical investigation in an
emerging market", International Journal of Commerce & Management, vol. 14, no. 2, pp.
48−61.
Emery, G.W. 1984, "A Pure Financial Explanation for Trade Credit", Journal of Financial &
Quantitative Analysis, vol. 19, no. 3, pp. 271−285.
Enqvist, J., Graham, M. & Nikkinen, J. 2014, "The impact of working capital management on
firm profitability in different business cycles: Evidence from Finland", Research in
International Business and Finance, vol. 32, no. 1, pp. 36−49.
63
Farris, M.T. & Hutchison, P.D. 2002, "Cash-to-cash: the new supply chain management
metric", International Journal of Physical Distribution & Logistics Management, vol. 32, no.
4, pp. 288−298.
Farris, M.T. & Hutchison, P.D. 2003, "Measuring cash-to-cash performance", The
International Journal of Logistics Management, vol. 14, no. 2, pp. 83−92.
Filbeck, G. & Krueger, T.M. 2005, "An Analysis of Working Capital Management Results
Across Industries", Mid-American Journal of Business, vol. 20, no. 2, pp. 11−18.
García-Teruel, P.J. & Martínez-Solano, P. 2007, "Effects of working capital management on
SME
profitability", International Journal of Managerial Finance, vol. 3, no. 2, pp. 164−177.
Gentry, J.A., Vaidyanathan, R. & Lee, H.W. 1990, "A weighted cash conversion cycle", The
Journal of the Financial Management Association, vol. 19, no. 1, pp. 90−99.
Gill, A. & Biger, N. 2013, "The impact of corporate governance on working capital
management efficiency of American manufacturing firms", Managerial Finance, vol. 39, no.
2, pp. 116−132.
Gill, A., Biger, N. & Mathur, N. 2010, "The Relationship Between Working Capital
Management And Profitability: Evidence From The United States", Business and Economics
Journal, vol. 10, no. 1, pp. 1−9.
Gitman, L.J. 1974, "Estimating Corporate Liquidity Requirements: A Simplified Approach",
Financial Review, vol. 9, no. 1, pp. 79−88.
Grosse-Ruyken, P.T., Wagner, S.M. & Jonke, R. 2011, "What is the right cash conversion
cycle for your supply chain?", International Journal of Services and Operations Management,
vol. 10, no. 1, pp. 13−29.
Hager, H.C. 1976, "Cash management and the cash cycle", Management Accounting, vol. 57,
no. 9, pp. 19−21.
Hallikas, J., Varis, J., Sissonen, H. & Virolainen, V. 2008, "The evolution of the network
structure in the ICT sector", International Journal of Production Economics, vol. 115, no. 2,
pp. 296−304.
Hawawini, G., Viallet, C. & Vora, A. 1986, "Industry Influence on Corporate Working
Capital Decisions", Sloan Management Review, vol. 27, no. 4, pp. 15−24.
Hill, M.D., Kelly, G.W. & Highfield, M.J. 2010, "Net Operating Working Capital Behavior:
A First Look", Financial Management (Blackwell Publishing Limited), vol. 39, no. 2, pp.
783−805.
Hofmann, E. & Kotzab, H. 2010, "A Supply Chain-Oriented Approach of Working Capital
Management", Journal of Business Logistics, vol. 31, no. 2, pp. 305−330.
64
Hofmann, E., Maucher, D., Piesker, S. & Richter, P. 2011, Ways Out of the Working Capital
Trap: Empowering Self-Financing Growth Through Modern Supply Chain Management,
Springer-Verlag, Berlin.
Howorth, C. & Reber, B. 2003, "Habitual Late Payment of Trade Credit: An Empirical
Examination of UK Small Firms", Managerial & Decision Economics, vol. 24, no. 6, pp.
471−482.
Howorth, C. & Westhead, P. 2003, "The focus of working capital management in UK small
firms", Management Accounting Research, vol. 14, no. 2, pp. 94−111.
Hutchison, P.D., Farris, M.T. & Anders, S.B. 2007, "Cash-to-cash analysis and management",
CPA journal, vol. 77, no. 8, pp. 42−47.
Johnson, B. 2010, "Supply chain coordination and performance management with real options
based relationships", Multinational Finance Journal, vol. 14, no. 3/4, pp. 153−188.
Jose, M.L., Lancaster, C. & Stevens, J.L. 1996, "Corporate Returns and Cash Conversion
Cycles", Journal of Economics & Finance, vol. 20, no. 1, pp. 33−46.
Kieschnick, R., LaPlante, M. & Moussawi, R. 2013, "Working Capital Management and
Shareholders’ Wealth", Review of Finance, vol. 17, no. 5, pp. 1827−1852.
Kraemer, K.L., Dedrick, J. & Yamashiro, S. 2000, "Refining and Extending the Business
Model With Information Technology: Dell Computer Corporation", Information Society, vol.
16, no. 1, pp. 5−21.
Kumar, S. 2005, "An Exploratory Analysis of Competing Supply Chains in the Personal
Computer Industry", Supply Chain Forum: International Journal, vol. 6, no. 1, pp. 16−31.
Kumar, S. & Craig, S. 2007, "Dell, Inc.'s closed loop supply chain for computer assembly
plants", Information Knowledge Systems Management, vol. 6, no. 3, pp. 197−214.
Lazaridis, I. & Tryfonidis, D. 2006, "Relationship between Working Capital Management and
Profitability of Listed Companies in the Athens Stock Exchange", Journal of Financial
Management & Analysis, vol. 19, no. 1, pp. 26−35.
Leone, A.J., Minutti-Meza, M. & Wasley, C.E. 2014, "Influential observations and inference
in accounting research", Working Paper, Available at SSRN:
http://ssrn.com/abstract=2407967 [Retrieved May 13, 2015].
Lind, L., Pirttilä, M., Viskari, S., Schupp, F. & Kärri, T. 2012, "Competing with the negative
cycle time of working capital in ICT value network", 21th Annual IPSERA Conference, pp.
1−15.
Losbichler, H., Mahmoodi, F. & Rothboeck, M. 2008, "Creating Greater Shareholder Value
from Supply Chain Initiatives", Supply Chain Forum: International Journal, vol. 9, no. 1, pp.
82−91.
65
Luo, M.M., Lee, J.J. & Hwang, Y. 2009, "Cash Conversion Cycle, Firm Performance and
Stock Value", FMA International, [Online], . Available:
http://www.fma.org/Reno/Papers/CCC_performance_value_FMA.pdf [Retrieved November
23, 2014].
Marttonen, S., Viskari, S. & Kärri, T. 2013, "Appeasing company owners through effective
working capital management", International Journal of Managerial and Financial
Accounting, vol. 5, no. 1, pp. 64−78.
Nazir, M.S. & Afza, T. 2009, "Impact of aggressive working capital management policy on
firms’ profitability", The IUP Journal of Applied Finance, vol. 15, no. 8, pp. 19−30.
Niskanen, J. & Niskanen, M. 2000, "Accounts Receivable and Accounts Payable in Large
Finnish Firms’ Balance Sheets: What Determines Their Levels?", The Finnish Journal of
Business Economics, vol. 55, no. 4, pp. 489−503.
Niskanen, J. & Niskanen, M. 2006, "The Determinants of Corporate Trade Credit Policies in a
Bank-dominated Financial Environment: the Case of Finnish Small Firms", European
Financial Management, vol. 12, no. 1, pp. 81−102.
O’brien, R.M. 2007, "A caution regarding rules of thumb for variance inflation factors",
Quality & Quantity, vol. 41, no. 5, pp. 673−690.
Patatoukas, P.N. 2012, "Customer-Base Concentration: Implications for Firm Performance
and Capital Markets", The Accounting Review, vol. 87, no. 2, pp. 363−392.
Peel, M.J., Wilson, N. & Howorth, C. 2000, "Late Payment and Credit Management in the
Small Firm Sector: Some Empirical Evidence", International Small Business Journal, vol. 18,
no. 2, pp. 17−37.
Penman, S.H. 2009, "Accounting for Intangible Assets: There is Also an Income Statement",
Abacus, vol. 45, no. 3, pp. 358−371.
Petersen, M.A. & Rajan, R.G. 1997, "Trade credit: theories and evidence", The Review of
Financial Studies, vol. 10, no. 3, pp. 661−691.
Pike, R. & Nam, S.C. 2001, "Credit Management: An Examination of Policy Choices,
Practices and Late Payment in UK Companies", Journal of Business Finance & Accounting,
vol. 28, no. 7, pp. 1013−1042.
Pirttilä, M., Viskari, S., Lind, L. & Kärri, T. 2014, "Benchmarking working capital
management in the inter-organisational context", International Journal of Business Innovation
and Research, vol. 8, no. 2, pp. 119−136.
REL Consultancy 2013a, 2013 Europe Working Capital Survey. Available:
http://www.relconsultancy.com/working-capital/2013-Europe-Working-Capital-Survey.pdf
[Retrieved November 10, 2014].
66
REL Consultancy 2013b, 2013 US Working Capital Survey. Available:
http://www.relconsultancy.com/working-capital/2013-US-Working-Capital-Survey.pdf
[Retrieved November 10, 2014].
Richards, V.D. & Laughlin, E.J. 1980, "A Cash Conversion Cycle Approach to Liquidity
Analysis", Financial Management, vol. 9, no. 1, pp. 32−38.
Sagner, J. 2011, Essentials of Working Capital Management, Wiley, Hoboken, New Jersey.
Sharma, D. 2009, Working Capital Management: A Conceptual Approach, Himalaya
Publishing House, Mumbai.
Shin, H. & Soenen, L. 1998, "Efficiency of Working Capital Management and Corporate
Profitability", Financial Practice & Education, vol. 8, no. 2, pp. 37−45.
Smith, J.K. 1987, "Trade Credit and Informational Asymmetry", Journal of Finance, vol. 42,
no. 4, pp. 863−872.
Soliman, M.T. 2008, "The Use of DuPont Analysis by Market Participants", Accounting
Review, vol. 83, no. 3, pp. 823−853.
Talonpoika, A., Monto, S., Pirttilä, M. & Kärri, T. 2014, "Modifying the cash conversion
cycle: revealing concealed advance payments", International Journal of Productivity &
Performance Management, vol. 63, no. 3, pp. 341−353.
Uyar, A. 2009, "The Relationship of Cash Conversion Cycle with Firm Size and Profitability:
An Empirical Investigation in Turkey", International Research Journal of Finance &
Economics, , no. 24, pp. 186−193.
Wang, Y. 2002, "Liquidity management, operating performance, and corporate value:
evidence from Japan and Taiwan", Journal of Multinational Financial Management, vol. 12,
no. 2, pp. 159−169.
Weinraub, H.J. & Visscher, S. 1998, "Industry practice relating to aggressive conservative
working capital policies", Journal of Financial and Strategic Decisions, vol. 11, no. 2, pp.
39−46.
White, H. 1980, "A heteroskedasticity-consistent covariance matrix estimator and a direct test
for heteroskedasticity", Econometrica, vol. 48, no. 4, pp. 817−838.
Wooldridge, J.M. 2010, Econometric analysis of cross section and panel data, 2nd edition,
MIT press, Cambridge
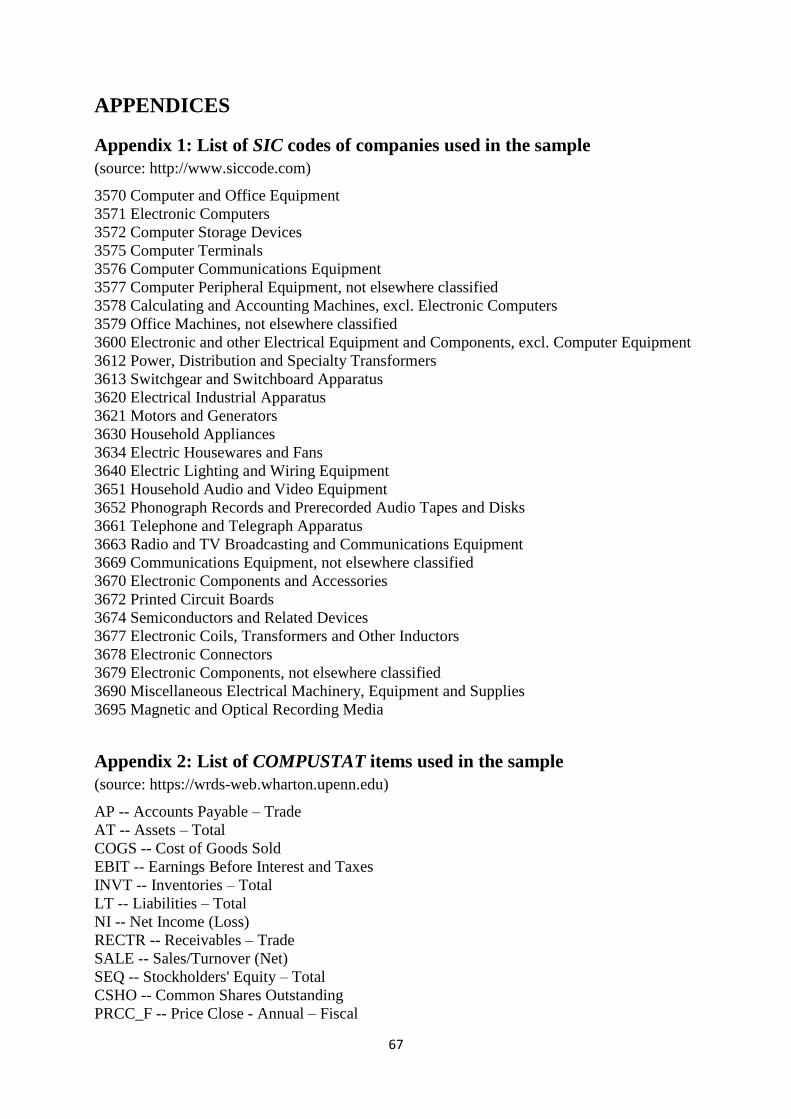
67
APPENDICES
Appendix 1: List of SIC codes of companies used in the sample
(source: http://www.siccode.com)
3570 Computer and Office Equipment
3571 Electronic Computers
3572 Computer Storage Devices
3575 Computer Terminals
3576 Computer Communications Equipment
3577 Computer Peripheral Equipment, not elsewhere classified
3578 Calculating and Accounting Machines, excl. Electronic Computers
3579 Office Machines, not elsewhere classified
3600 Electronic and other Electrical Equipment and Components, excl. Computer Equipment
3612 Power, Distribution and Specialty Transformers
3613 Switchgear and Switchboard Apparatus
3620 Electrical Industrial Apparatus
3621 Motors and Generators
3630 Household Appliances
3634 Electric Housewares and Fans
3640 Electric Lighting and Wiring Equipment
3651 Household Audio and Video Equipment
3652 Phonograph Records and Prerecorded Audio Tapes and Disks
3661 Telephone and Telegraph Apparatus
3663 Radio and TV Broadcasting and Communications Equipment
3669 Communications Equipment, not elsewhere classified
3670 Electronic Components and Accessories
3672 Printed Circuit Boards
3674 Semiconductors and Related Devices
3677 Electronic Coils, Transformers and Other Inductors
3678 Electronic Connectors
3679 Electronic Components, not elsewhere classified
3690 Miscellaneous Electrical Machinery, Equipment and Supplies
3695 Magnetic and Optical Recording Media
Appendix 2: List of COMPUSTAT items used in the sample
(source: https://wrds-web.wharton.upenn.edu)
AP -- Accounts Payable – Trade
AT -- Assets – Total
COGS -- Cost of Goods Sold
EBIT -- Earnings Before Interest and Taxes
INVT -- Inventories – Total
LT -- Liabilities – Total
NI -- Net Income (Loss)
RECTR -- Receivables – Trade
SALE -- Sales/Turnover (Net)
SEQ -- Stockholders' Equity – Total
CSHO -- Common Shares Outstanding
PRCC_F -- Price Close - Annual – Fiscal
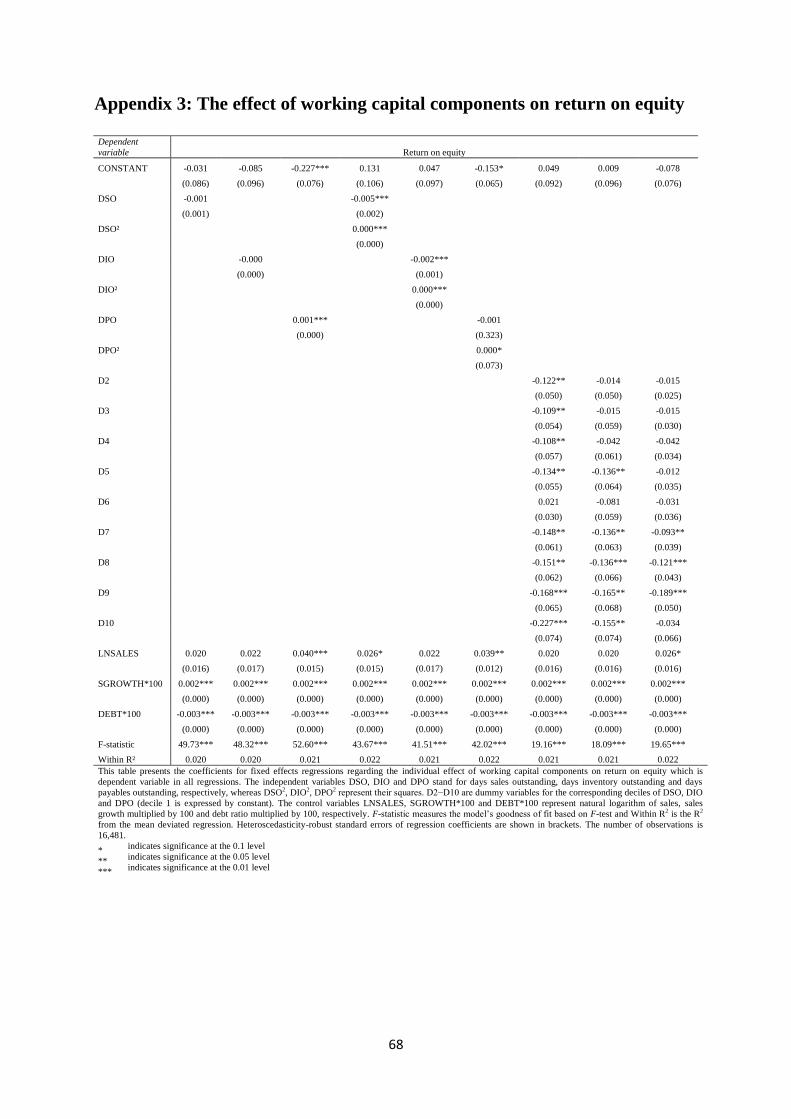
68
Appendix 3: The effect of working capital components on return on equity
Dependent
variable Return on equity
CONSTANT -0.031 -0.085 -0.227*** 0.131 0.047 -0.153* 0.049 0.009 -0.078
(0.086) (0.096) (0.076) (0.106) (0.097) (0.065) (0.092) (0.096) (0.076)
DSO -0.001
-0.005***
(0.001)
(0.002)
DSO²
0.000***
(0.000)
DIO
-0.000
-0.002***
(0.000)
(0.001)
DIO²
0.000***
(0.000)
DPO
0.001***
-0.001
(0.000)
(0.323)
DPO²
0.000*
(0.073)
D2
-0.122** -0.014 -0.015
(0.050) (0.050) (0.025)
D3
-0.109** -0.015 -0.015
(0.054) (0.059) (0.030)
D4
-0.108** -0.042 -0.042
(0.057) (0.061) (0.034)
D5
-0.134** -0.136** -0.012
(0.055) (0.064) (0.035)
D6
0.021 -0.081 -0.031
(0.030) (0.059) (0.036)
D7
-0.148** -0.136** -0.093**
(0.061) (0.063) (0.039)
D8
-0.151** -0.136*** -0.121***
(0.062) (0.066) (0.043)
D9
-0.168*** -0.165** -0.189***
(0.065) (0.068) (0.050)
D10
-0.227*** -0.155** -0.034
(0.074) (0.074) (0.066)
LNSALES 0.020 0.022 0.040*** 0.026* 0.022 0.039** 0.020 0.020 0.026*
(0.016) (0.017) (0.015) (0.015) (0.017) (0.012) (0.016) (0.016) (0.016)
SGROWTH*100 0.002*** 0.002*** 0.002*** 0.002*** 0.002*** 0.002*** 0.002*** 0.002*** 0.002***
(0.000) (0.000) (0.000) (0.000) (0.000) (0.000) (0.000) (0.000) (0.000)
DEBT*100 -0.003*** -0.003*** -0.003*** -0.003*** -0.003*** -0.003*** -0.003*** -0.003*** -0.003***
(0.000) (0.000) (0.000) (0.000) (0.000) (0.000) (0.000) (0.000) (0.000)
F-statistic 49.73*** 48.32*** 52.60*** 43.67*** 41.51*** 42.02*** 19.16*** 18.09*** 19.65***
Within R² 0.020 0.020 0.021 0.022 0.021 0.022 0.021 0.021 0.022
This table presents the coefficients for fixed effects regressions regarding the individual effect of working capital components on return on equity which is
dependent variable in all regressions. The independent variables DSO, DIO and DPO stand for days sales outstanding, days inventory outstanding and days
payables outstanding, respectively, whereas DSO2, DIO2, DPO2 represent their squares. D2−D10 are dummy variables for the corresponding deciles of DSO, DIO
and DPO (decile 1 is expressed by constant). The control variables LNSALES, SGROWTH*100 and DEBT*100 represent natural logarithm of sales, sales
growth multiplied by 100 and debt ratio multiplied by 100, respectively. F-statistic measures the model’s goodness of fit based on F-test and Within R2 is the R2
from the mean deviated regression. Heteroscedasticity-robust standard errors of regression coefficients are shown in brackets. The number of observations is
16,481.
*
**
***
indicates significance at the 0.1 level
indicates significance at the 0.05 level
indicates significance at the 0.01 level
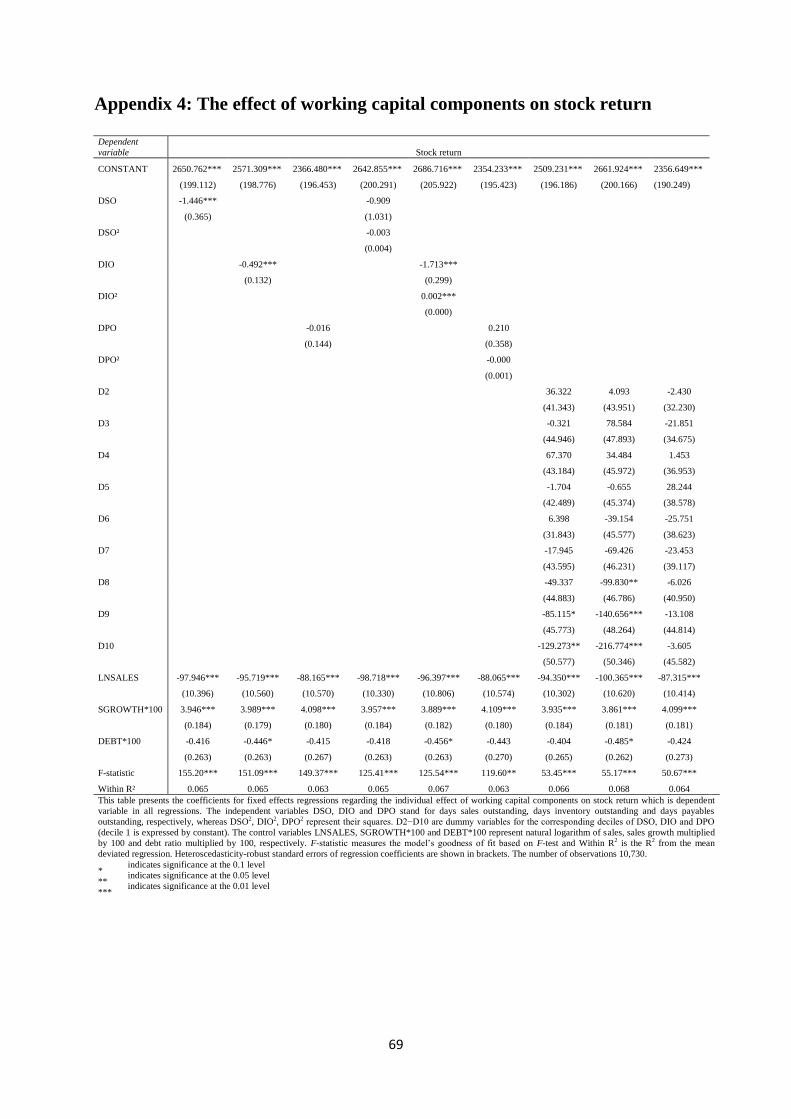
69
Appendix 4: The effect of working capital components on stock return
Dependent
variable Stock return
CONSTANT 2650.762*** 2571.309*** 2366.480*** 2642.855*** 2686.716*** 2354.233*** 2509.231*** 2661.924*** 2356.649***
(199.112) (198.776) (196.453) (200.291) (205.922) (195.423) (196.186) (200.166) (190.249)
DSO -1.446*** -0.909
(0.365) (1.031)
DSO² -0.003
(0.004)
DIO -0.492*** -1.713***
(0.132) (0.299)
DIO² 0.002***
(0.000)
DPO -0.016 0.210
(0.144) (0.358)
DPO² -0.000
(0.001)
D2 36.322 4.093 -2.430
(41.343) (43.951) (32.230)
D3 -0.321 78.584 -21.851
(44.946) (47.893) (34.675)
D4 67.370 34.484 1.453
(43.184) (45.972) (36.953)
D5 -1.704 -0.655 28.244
(42.489) (45.374) (38.578)
D6 6.398 -39.154 -25.751
(31.843) (45.577) (38.623)
D7 -17.945 -69.426 -23.453
(43.595) (46.231) (39.117)
D8 -49.337 -99.830** -6.026
(44.883) (46.786) (40.950)
D9 -85.115* -140.656*** -13.108
(45.773) (48.264) (44.814)
D10 -129.273** -216.774*** -3.605
(50.577) (50.346) (45.582)
LNSALES -97.946*** -95.719*** -88.165*** -98.718*** -96.397*** -88.065*** -94.350*** -100.365*** -87.315***
(10.396) (10.560) (10.570) (10.330) (10.806) (10.574) (10.302) (10.620) (10.414)
SGROWTH*100 3.946*** 3.989*** 4.098*** 3.957*** 3.889*** 4.109*** 3.935*** 3.861*** 4.099***
(0.184) (0.179) (0.180) (0.184) (0.182) (0.180) (0.184) (0.181) (0.181)
DEBT*100 -0.416 -0.446* -0.415 -0.418 -0.456* -0.443 -0.404 -0.485* -0.424
(0.263) (0.263) (0.267) (0.263) (0.263) (0.270) (0.265) (0.262) (0.273)
F-statistic 155.20*** 151.09*** 149.37*** 125.41*** 125.54*** 119.60** 53.45*** 55.17*** 50.67***
Within R² 0.065 0.065 0.063 0.065 0.067 0.063 0.066 0.068 0.064
This table presents the coefficients for fixed effects regressions regarding the individual effect of working capital components on stock return which is dependent
variable in all regressions. The independent variables DSO, DIO and DPO stand for days sales outstanding, days inventory outstanding and days payables
outstanding, respectively, whereas DSO2, DIO2, DPO2 represent their squares. D2−D10 are dummy variables for the corresponding deciles of DSO, DIO and DPO
(decile 1 is expressed by constant). The control variables LNSALES, SGROWTH*100 and DEBT*100 represent natural logarithm of sales, sales growth multiplied
by 100 and debt ratio multiplied by 100, respectively. F-statistic measures the model’s goodness of fit based on F-test and Within R2 is the R2 from the mean
deviated regression. Heteroscedasticity-robust standard errors of regression coefficients are shown in brackets. The number of observations 10,730.
*
**
***
indicates significance at the 0.1 level
indicates significance at the 0.05 level
indicates significance at the 0.01 level
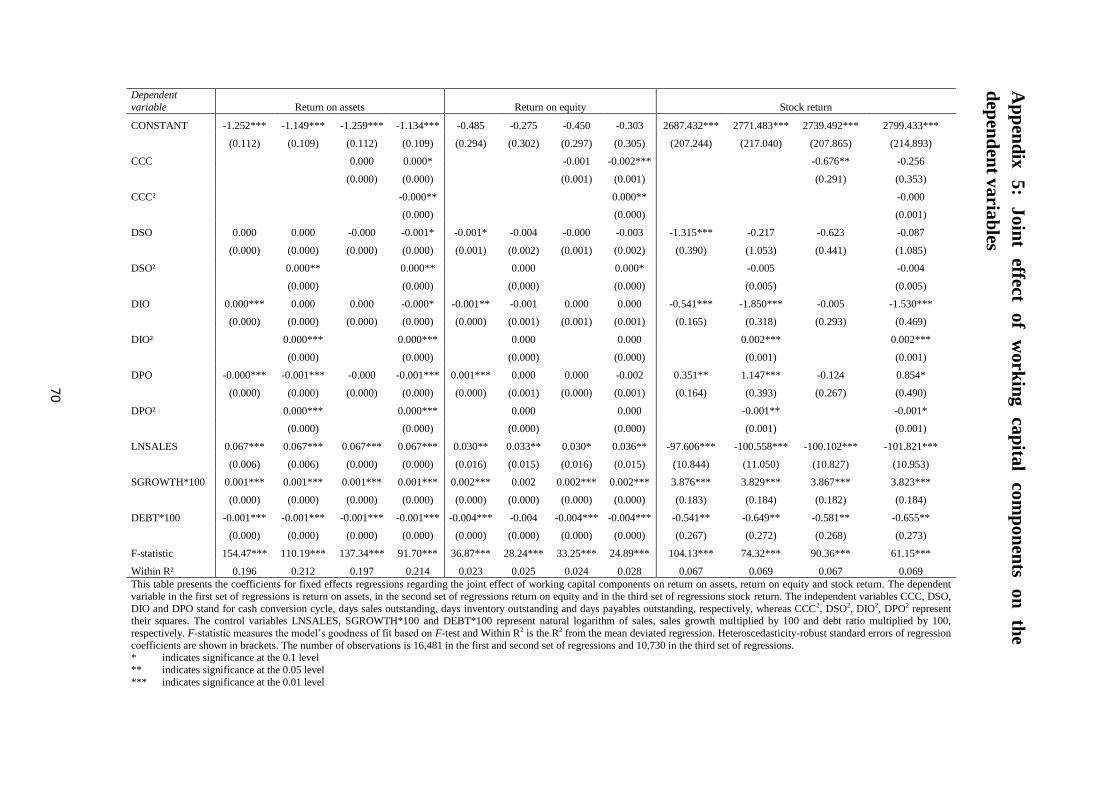
Dependent
variable Return on assets Return on equity Stock return
CONSTANT -1.252*** -1.149*** -1.259*** -1.134*** -0.485 -0.275 -0.450 -0.303 2687.432*** 2771.483*** 2739.492*** 2799.433***
(0.112) (0.109) (0.112) (0.109) (0.294) (0.302) (0.297) (0.305) (207.244) (217.040) (207.865) (214.893)
CCC
0.000 0.000*
-0.001 -0.002***
-0.676** -0.256
(0.000) (0.000)
(0.001) (0.001)
(0.291) (0.353)
CCC²
-0.000**
0.000**
-0.000
(0.000)
(0.000)
(0.001)
DSO 0.000 0.000 -0.000 -0.001* -0.001* -0.004 -0.000 -0.003 -1.315*** -0.217 -0.623 -0.087
(0.000) (0.000) (0.000) (0.000) (0.001) (0.002) (0.001) (0.002) (0.390) (1.053) (0.441) (1.085)
DSO²
0.000**
0.000**
0.000
0.000*
-0.005
-0.004
(0.000)
(0.000)
(0.000)
(0.000)
(0.005)
(0.005)
DIO 0.000*** 0.000 0.000 -0.000* -0.001** -0.001 0.000 0.000 -0.541*** -1.850*** -0.005 -1.530***
(0.000) (0.000) (0.000) (0.000) (0.000) (0.001) (0.001) (0.001) (0.165) (0.318) (0.293) (0.469)
DIO²
0.000***
0.000***
0.000
0.000
0.002***
0.002***
(0.000)
(0.000)
(0.000)
(0.000)
(0.001)
(0.001)
DPO -0.000*** -0.001*** -0.000 -0.001*** 0.001*** 0.000 0.000 -0.002 0.351** 1.147*** -0.124 0.854*
(0.000) (0.000) (0.000) (0.000) (0.000) (0.001) (0.000) (0.001) (0.164) (0.393) (0.267) (0.490)
DPO²
0.000***
0.000***
0.000
0.000
-0.001**
-0.001*
(0.000)
(0.000)
(0.000)
(0.000)
(0.001)
(0.001)
LNSALES 0.067*** 0.067*** 0.067*** 0.067*** 0.030** 0.033** 0.030* 0.036** -97.606*** -100.558*** -100.102*** -101.821***
(0.006) (0.006) (0.000) (0.000) (0.016) (0.015) (0.016) (0.015) (10.844) (11.050) (10.827) (10.953)
SGROWTH*100 0.001*** 0.001*** 0.001*** 0.001*** 0.002*** 0.002 0.002*** 0.002*** 3.876*** 3.829*** 3.867*** 3.823***
(0.000) (0.000) (0.000) (0.000) (0.000) (0.000) (0.000) (0.000) (0.183) (0.184) (0.182) (0.184)
DEBT*100 -0.001*** -0.001*** -0.001*** -0.001*** -0.004*** -0.004 -0.004*** -0.004*** -0.541** -0.649** -0.581** -0.655**
(0.000) (0.000) (0.000) (0.000) (0.000) (0.000) (0.000) (0.000) (0.267) (0.272) (0.268) (0.273)
F-statistic 154.47*** 110.19*** 137.34*** 91.70*** 36.87*** 28.24*** 33.25*** 24.89*** 104.13*** 74.32*** 90.36*** 61.15***
Within R² 0.196 0.212 0.197 0.214 0.023 0.025 0.024 0.028 0.067 0.069 0.067 0.069
This table presents the coefficients for fixed effects regressions regarding the joint effect of working capital components on return on assets, return on equity and stock return. The dependent
variable in the first set of regressions is return on assets, in the second set of regressions return on equity and in the third set of regressions stock return. The independent variables CCC, DSO,
DIO and DPO stand for cash conversion cycle, days sales outstanding, days inventory outstanding and days payables outstanding, respectively, whereas CCC2, DSO2, DIO2, DPO2 represent their squares. The control variables LNSALES, SGROWTH*100 and DEBT*100 represent natural logarithm of sales, sales growth multiplied by 100 and debt ratio multiplied by 100,
respectively. F-statistic measures the model’s goodness of fit based on F-test and Within R2 is the R2 from the mean deviated regression. Heteroscedasticity-robust standard errors of regression
coefficients are shown in brackets. The number of observations is 16,481 in the first and second set of regressions and 10,730 in the third set of regressions. *
**
***
indicates significance at the 0.1 level
indicates significance at the 0.05 level
indicates significance at the 0.01 level
70
Ap
pen
dix
5
: Jo
int
effect o
f w
ork
ing
cap
ital
com
pon
ents
on
th
e
dep
end
ent v
aria
bles