Embed Size (px)
Citation preview
1
CHAPTER I
RESEARCH BACKGROUND
I. INTRODUCTION
Management of Working capital has become crucial, given
the increasing pressure on operating cycles. Too much or
too low working capital may suffer firms, so an optimum
level of working capital is the key to maximize ensure
firm’s profitability. The management of working capital
refers to management of both current assets and current
liabilities (S.D. Talekar, 2005).
Statistically, about 97.5% of Vietnam's firms are small
and medium-sized enterprise (SME). The greatest weakness
and greatest impact to business operations of these
firms is capital. Vietnam Economy and businesses depend
heavily on bank credit. While the capital structure of
2
the banking system still has many risks, mainly use
short-term funds for medium and long term loans, or
deposits from customers for real estate projects, lead
to the deficiency of medium and long term capital for
the economy. On the other hand due to insufficiency of
capital, cost of capital in Viet Nam is still high
compared to other countries in Southeast Asia. Moreover,
in the period 2008-2011, Vietnam’s government still
prefer curbing inflation to stabilize macroeconomic, the
monetary policy will not be loosened in the short term,
plus the banking system is facing many difficulties so
the credit capital will be tightened more, stock market
and real estate stagnate for a long time will lead to
the fact that businesses would be more difficult to find
capital in the near future. Firms which hold less cash
will lack of capital to maintain operations while cannot
solving the problem of output and, increase the
inventory cost, this can cause bankruptcy for these
firms (Dr. Le Chi Hieu, 2012). According to Deloof, the
3
way that working capital is managed has a
significant impact on profitability of firms. Such
results indicate that firms may have a certain level of
working capital requirements which can maximize their
value.
The impact of Working capital management on firm’s
profitability can be analyzed in several ways, which
consisting of inventory management and accounts
receivables management. As the firm increase the level
of inventory it holds, the risk of running out inventory
is lessened, but the inventory expense are increase
(Krish Rangarajan, Krish Rangarajan; Anil Misra, 2005),
management and control the inventory effectively are the
important duties of the finance manager, inappropriate
decisions or inefficient procedures can add significant
costs, adversely impacting working capital (James
Sagner, 2014). Another component of working capital is
accounts payable. Delaying payments to suppliers allows
a firm to assess the quality of the products bought, and
4
can be an inexpensive and flexible source of financing
for the firm. On the other hand, delaying of such
payables can be expensive if a firm is offered a
discount for the early or instant payment (Deloof M,
2003). By the same token, uncollected accounts
receivables can lead to cash inflow problems for the
firm.
The firm also needs to take into account its cash
conversion cycle, which is the length of time between
the payment of account payables and the collection of
account receivables (Lorenzo Preve, Virginia Sarria-
Allende, 2010). Deloof found that the longer the time
lag, the larger the investment in working capital
(Deloof M, 2003). A long cash conversion cycle might
increase profitability because it leads to higher sales.
However, corporate profitability might decrease with the
cash conversion cycle, if the costs of higher investment
in working capital rise faster than the benefits of
holding more inventories or granting more trade credit
5
to customers. It recommends that managers of firm should
conduct some policy to reduce cash conversion cycle to
gain high firm’s value.
Key work: Working capital, firm’s profitability, SMEs,
Food and Beverage industry, AR, inventory, AP, CCC.
II. GLOBAL CONTEXT
SMEs are a multiform group of businesses which usually
running in the service, trade, agri-business, and
manufacturing sectors. SMEs take approximately for 95%
of total firms around the world (Arancha Gonzalez, 2014)
and it generates 35.3% of GDP on average. For instance,
in the European Union, SMEs occupied 99.8% of registered
firms and it provided 75 million jobs (67.4% of total
employment). In USA, SMEs contributed 29% of export
value. In Asia, especially in Japan, the number of
employees who work in SMEs occupies 81% of total
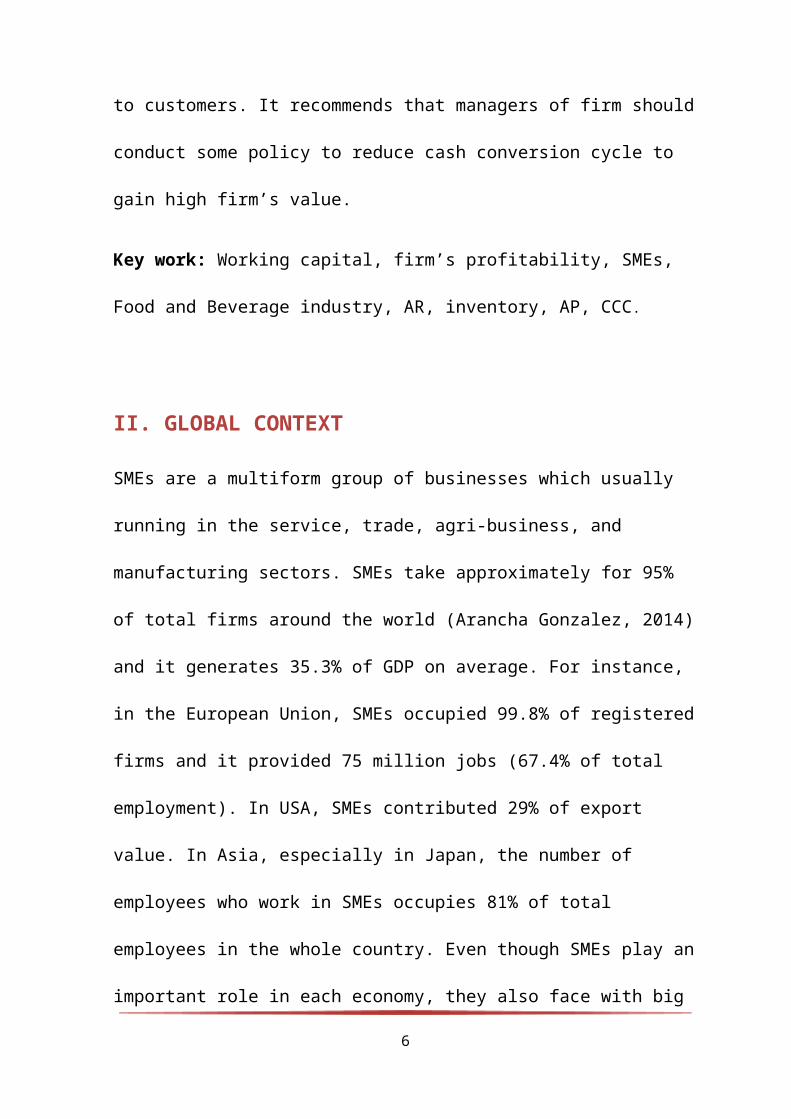
employees in the whole country. Even though SMEs play an
important role in each economy, they also face with big
6
barrier about approaching finance source which helps
them expand business scale.
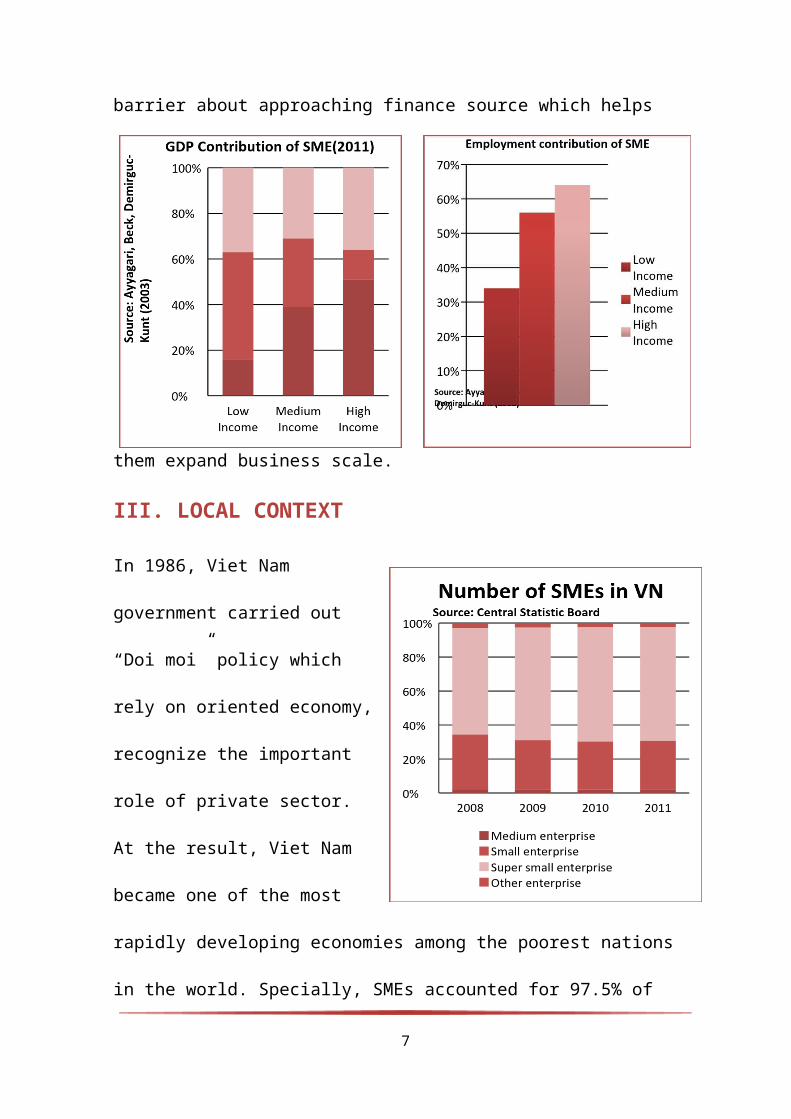
III. LOCAL CONTEXT
In 1986, Viet Nam
government carried out
“Doi moi” policy which
rely on oriented economy,
recognize the important
role of private sector.
At the result, Viet Nam
became one of the most
rapidly developing economies among the poorest nations
in the world. Specially, SMEs accounted for 97.5% of
7
total enterprise in Viet Nam (GSO, Number and Event
magazine 5/2013), it become a motivated factor to foster
economy by creating employment and contributing to gross
domestic product. Particularly, in 2011, SMEs area
created 40% GDP. Besides that, SMEs generate 1,000 new
jobs/ year (VINASME, 2014)
Besides above advantages, SMEs Viet Nam also faced with
difficult problems about liquidity and profitability.
According to the report about SMEs for 2011 – 2015, in
2010, SMEs’ income was 80.59 thousand billion VND (which
occupied 22.87% of the whole VN enterprises’ total net
operating income before tax). In 2012, the enterprises’
income sharply went down; it was 22.82 thousand billion
VND that took 7.26% of the whole VN enterprises’ total
net operating income before tax.
Ministry of Planning and Investment also expressed the
worrying about the increasing number of SMEs getting
loss. In 2010, SMEs suffering loss took 25.14% of total
enterprises; at the end of September 2013, this
8
percentage climbed up 65.8%. The percentage of
enterprise getting profit in 2010 and September 2013
were 64.12% and 34.12%, respectively.
Furthermore, in 2009 – 2011, bankruptcy situation took
place in SMEs. According CIEM (2011), 60% SMEs are
forced to cut down their full-time workforce. Total
number of full-time staff of 1,999 samples drop slightly
from 28,174 (2009) to 26,414 (2011), this is equivalent
to 6.2% in 2 years.
According to PhD. Nguyen Manh Quan – Director of
enterprise research and development institute (Inbus),
just 20% of total number of SMEs can live in rival
environment, while 60% of another are trying to survive
and 20% of 2,508 SMEs ,who are studied in 2009, went to
bankrupt in 2011. This percentage is higher than
percentage is observed in period 2007 – 2009.
Another problem exist in SMEs is lack of capital.
According to Cao Sĩ Kiêm (Director of VINASME), low
capital scale also cause disadvantage in access to
9
credit sources. Equity is too small, that leads to D/E
ratio are low. This limits the borrowing capital ability
of SMEs. Furthermore, SMEs often lack the collateral for
the loan amounts. Even in developed countries like USA,
Japan, banks are hesitating to give loans to SMEs
because the credit risk. In particularly, the percentage
of SMEs, whose chartered capital is lower than 7 billion
VND, is 80% and the percentage of SMEs that have demand
to loan from bank accounted for 90%. However, most of
SMEs had difficulties in mobilizing capital because of
lacking of competence to borrow money from banks or
approach international financial institutions.
IV. RATIONALE
According to Brigham and Houston (2003), about 60% of
financial manager’s time is spent for management of
working capital. Working capital management is
undoubtedly an important issue to firms, but in Viet
Nam, less firms use it effectively. For example, SMEs
use the equity as the major source of finance, the
10
equity ratio usually reaches at 90%. Furthermore,
because of difficulties in obtaining long-term loans,
SMEs are willing to use short-term loans to finance
long-term assets and investment; they also bear the high
cost of inventory and interest rate of bank loans (Kack
and Lindgren, 1999) and (Findings of Vuong Quan Hoang,
1998). These require a more detail research about the
application of working capital to SME firm's
profitability, especially in Viet Nam.
For reason above, the group investigates the
relationship between Working capital and firms’
profitability for SMEs in Viet Nam for the 2009-2011.
When selecting the period of time, group wants to study
the accuracy of problem (working capital affects SMEs’
profitability); therefore, group will focus on the
period from 2009 to 2011 in this research. The economic
crisis occurred from 2008, so the data might not reflect
suitably to the topic concepts.
V. RESEARCH QUESTIONS
11
To reach the purpose of this research, it is necessary
to answer: How does working capital affect SMEs'
profitability in 2009 – 2011 in VN?
VI. RESEARCH OBJECTIVES
In order to answer these questions, this study needs to
reach four objectives below:
● Providing the background of working capital, firm’s
profitability and SMEs.
● Offer a descriptive study about the effect of each
component of working capital
● Examining the relationship between working capital
and profitability
● Proposing conclusions and recommendations for
implications. (Evaluating and comparing the results in
Viet Nam context with some previous research)
12

CHAPTER II
LITERATURE REVIEW
I. WORKING CAPITAL
1.1 Definition
“The tradition definition of working capital shows how
much cash (or liquid assets) is available to satisfy the
short-term cash requirements imposed by current
liabilities”- Lorenzo A. Preve, Virginia Sarria-Allende
( 2010). Working capital is specified defined as stocks
of materials, fuels, semi-finished goods, finished
goods; cash and cash equivalent, payment such as rent,
salaries, interests, dividends, purchase of goods and
services; short-term loans, advances towards tax
payments (Arnold, 2008). Working capital is circular
changes of assets from one to other forms. For instance,
beginning with cash, changing to raw materials, shifting
13
to work in progress and finished goods, sales of product
and final ending with sales considered as cash (Weston
and Brigham, 1977). Firms use working capital and cash
inflows to finance materials needs for their operating
activities. When purchased materials have undergone a
manufacturing process and become finished goods, it is
time to get products sold to get money back. Money
earned from sales is used to pay liabilities, give
dividends to shareholders and reinvest. From here the
cycle starts over again (Pass & Hike, 2007).
Working capital is the difference between current assets
and current liabilities, and it may get the negative and
positive results. If the working capital is positive
which means the current assets are greater than
liabilities and this surplus can be used to fulfill
financial commitments and obligation to stockholders
with the aspect for the continuing growth in the future
(Lantz, 2008). On the other hand, the positive working
capital reflects the high level of capital tied up which
14
the capital does not generate any additions value and do
more good in new investment which could bring the
further return (Lantz, 2008). If the working capital is
negative which means firm does not have enough capital
for financing short-term debts and may goes to
bankruptcy.
1.2 Characteristics
According to Gauri Sankar – Senior Manager at Canara
Bank, there are two characteristics should be kept in
mind: short life span and swift transformation. Usually,
current assets have very short life span (within one
year or less than one year); the lifespan of current
assets bases on the time required in activities of
procurement, production process, sales and collection of
bills. The greater the time duration of activities is,
the longer life current assets gets. In addition,
working capital is swift transformation. Because of
short life span, current assets can easily shift to
other forms of asset such as cash, account receivables,
15
inventory for running business. These forms are
interrelated; therefore, a decision of one form may have
influence on other forms. To sum up, when analyzing
working capital, all of these forms must be brought in
account.
1.3 Working capital accounts
According to James S.Sagner, working capital account
consists of Cash accounts and short-term investments
which include in cash on hand or in bank accounts and
any short-term investments expected to be cash converted
within one year. Accounts receivable includes all credit
sales where the customer is expected to pay by a future
date specified on an invoice. Inventory usually is
combination of raw materials, work‐in‐process that
partially manufactured and assembled, and finished
goods. Accounts payables represent the amounts owed to
creditors for purchases. Other working capital accounts
like prepaid expenses and accrued expenses often appear
on balance sheets. Prepaid expenses are assets paid in
16
advance of expenses as incurred. Accrued expenses are
costs that have been incurred as of the date of a
balance sheet but not paid. The infrastructure of
working capital involves those activities that are
essential for managers to proceed. These include
international working capital, information and working
capital, and management of the working capital cycle.
1.4 Working Capital Measurement
In the past, working capital management was
compartmentalized (Sartoris and Hill, 1983). Sartoris
and Hill (1983) argued that there was a need for an
integrated approach, where all the three compartments
are combined. This led to the integration of the
management of inventories, account payables and account
receivables, called Working Capital Management (WCM),
these parts will now be discussed individually.
Companies often allow customers a specified number of
days to pay their invoices. The use of such credits
generates trade receivables, also known as account
17
receivables (Lorenzo Preve, Virginia Sarria-Allende,
2010). Giving these credit terms to customers are an
important way of securing sales (Berry and Jarvis, 2006)
.More specifically, goods or services delivered to
customers on credit will increase the receivables
balance, and payments subsequently received from
customers will decrease this balance (Lorenzo Preve,
Virginia Sarria-Allende , 2010). According to Berry and
Jarvis (2006), a firm sets up a policy for determining
the optimal amount of account receivables have to take
in account the following:
● The trade-off between the securing of sales and
profits and the amount of opportunity cost and
administrative costs of the increasing account
receivables.
● The level of risk the firm is prepared to take when
extending credit to a customer, because this customer
could default when payment is due.
● The investment in debt collection management.
18
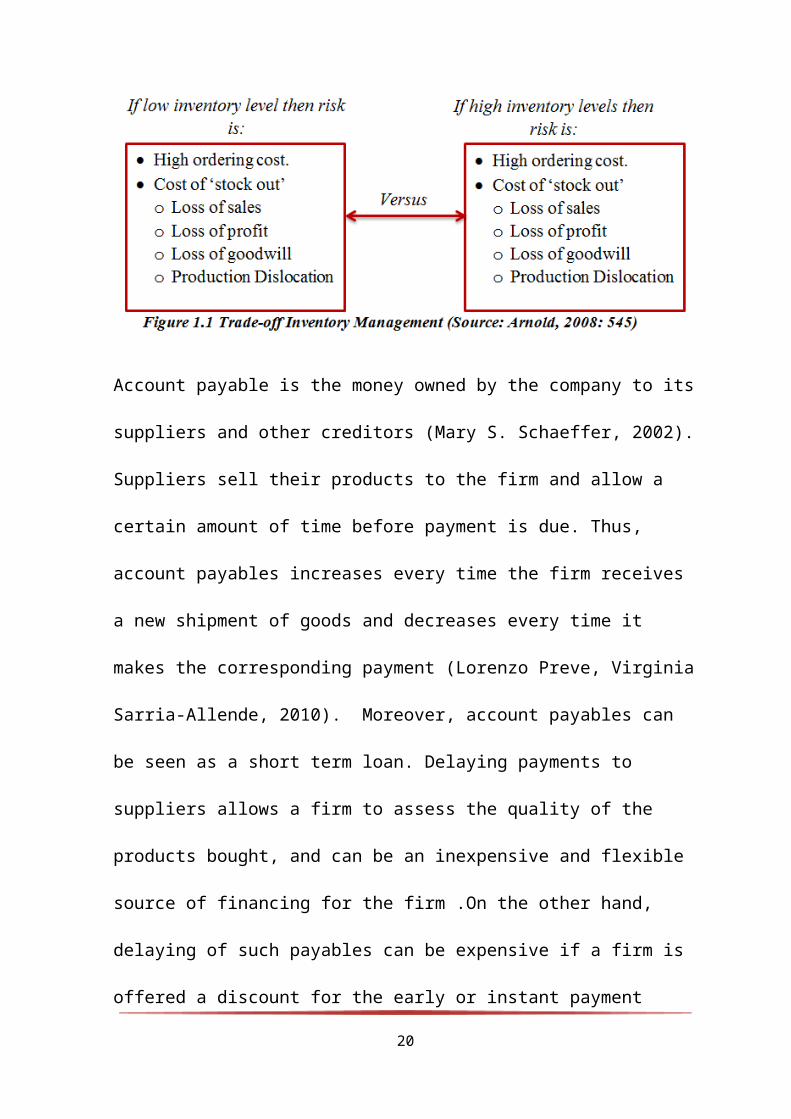
A firm’s inventory is the necessary investment that the
firm needs to make to ensure the normal operation of the
business and a certain level of customer service
(Lorenzo Preve, Virginia Sarria-Allende , 2010). The
goal of inventory management is to minimize the costs of
storing and financing goods while maintaining a level of
inventories that satisfies the amounts of sales of a
firm (Hampton and Wagner, 1989). Deloof (2003) argues
that with inventory management there is a trade-off
between sales and costs. As the firm increase the level
of inventory it holds, the risk of running out inventory
is lessened, but the inventory expense are increase
(Krish Rangarajan, Krish Rangarajan; Anil Misra, 2005).
In figure 1.1 the different trade-offs a firm faces, are
illustrated.
19
Account payable is the money owned by the company to its
suppliers and other creditors (Mary S. Schaeffer, 2002).
Suppliers sell their products to the firm and allow a
certain amount of time before payment is due. Thus,
account payables increases every time the firm receives
a new shipment of goods and decreases every time it
makes the corresponding payment (Lorenzo Preve, Virginia
Sarria-Allende, 2010). Moreover, account payables can
be seen as a short term loan. Delaying payments to
suppliers allows a firm to assess the quality of the
products bought, and can be an inexpensive and flexible
source of financing for the firm .On the other hand,
delaying of such payables can be expensive if a firm is
offered a discount for the early or instant payment
20
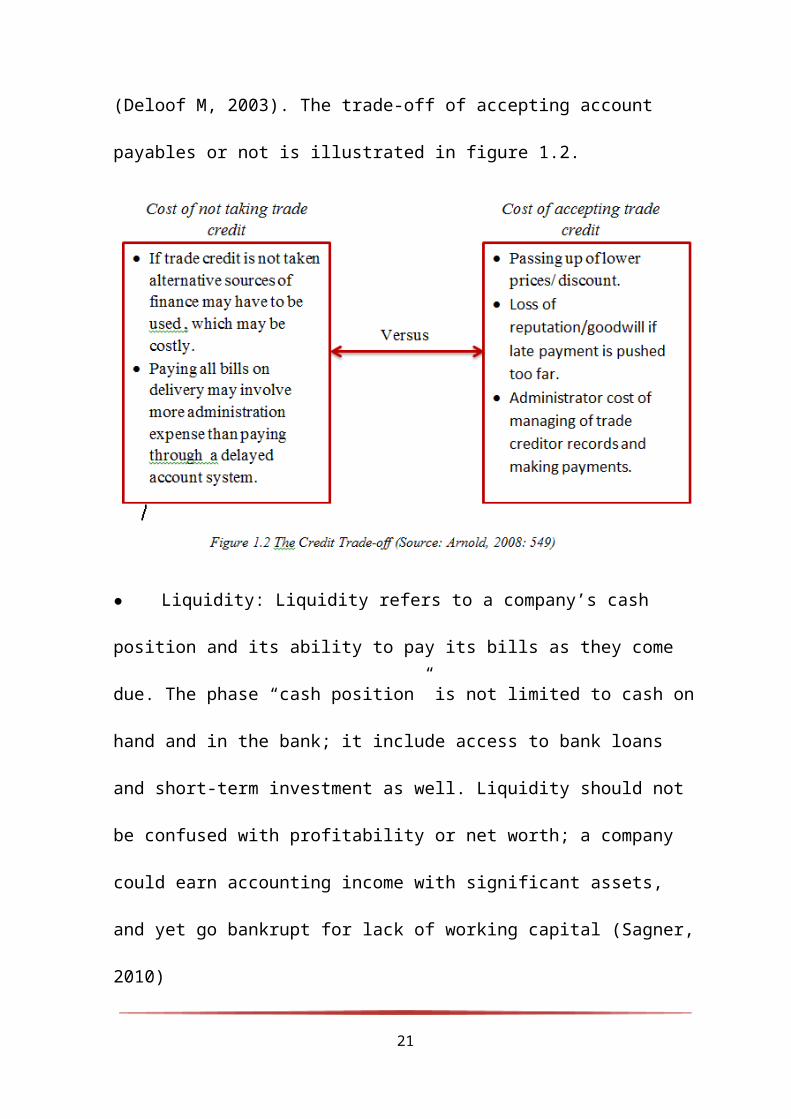
(Deloof M, 2003). The trade-off of accepting account
payables or not is illustrated in figure 1.2.
● Liquidity: Liquidity refers to a company’s cash
position and its ability to pay its bills as they come
due. The phase “cash position” is not limited to cash on
hand and in the bank; it include access to bank loans
and short-term investment as well. Liquidity should not
be confused with profitability or net worth; a company
could earn accounting income with significant assets,
and yet go bankrupt for lack of working capital (Sagner,
2010)
21

Current ratio
Quick ratio
Quick ratio is considered more useful because it
eliminates inventory in the numerator, on the theory
that this asset could be stale or not saleable accept at
bargain prices (Sagner, 2010).
● Activity Utilization: The activity utilization
ratio indicates how efficiently the business is using
its assets. The important working capital utilization
ratios are receivables turnover (and its complement,
average collection period) and inventory turnover (and
its complement, inventory turnover days) (Sagner, 2010).
II. PROFITABILITY AND LIQUIDITY
2.1 Relationship between working capital and
profitability
22
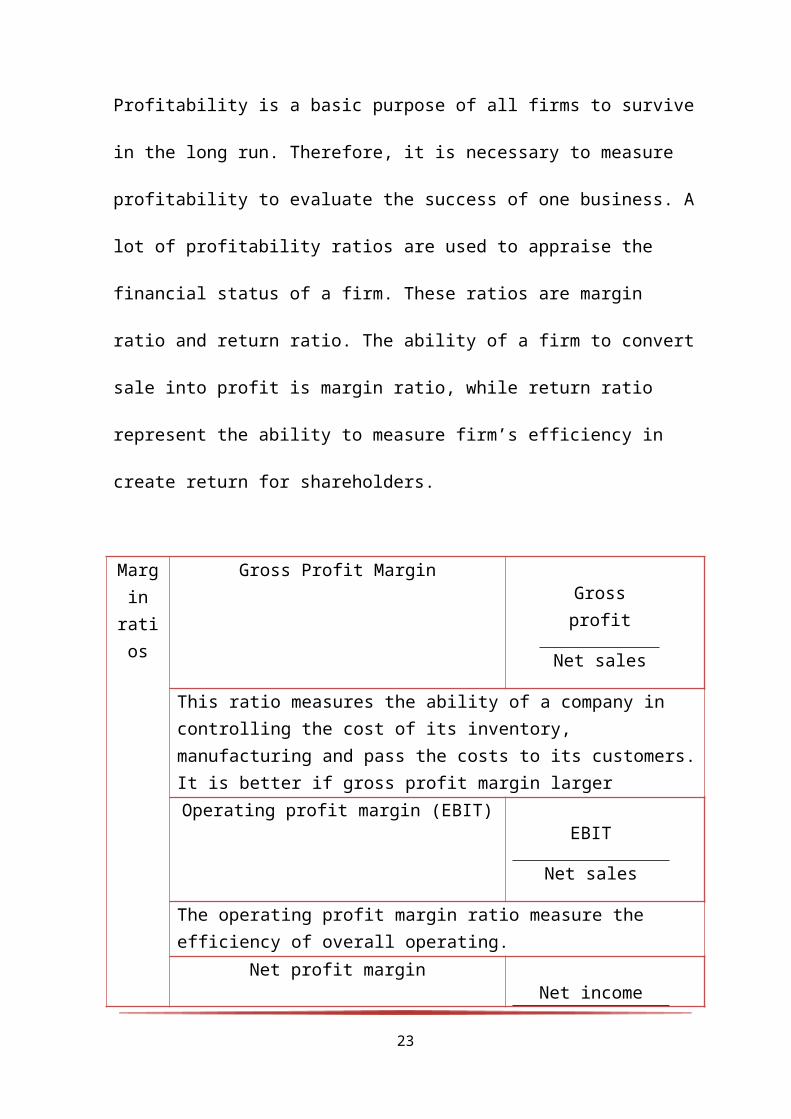
Profitability is a basic purpose of all firms to survive
in the long run. Therefore, it is necessary to measure
profitability to evaluate the success of one business. A
lot of profitability ratios are used to appraise the
financial status of a firm. These ratios are margin
ratio and return ratio. The ability of a firm to convert
sale into profit is margin ratio, while return ratio
represent the ability to measure firm’s efficiency in
create return for shareholders.
Margin
ratios
Gross Profit MarginGrossprofit
Net sales
This ratio measures the ability of a company in controlling the cost of its inventory, manufacturing and pass the costs to its customers.It is better if gross profit margin largerOperating profit margin (EBIT)
EBIT
Net sales
The operating profit margin ratio measure the efficiency of overall operating.
Net profit marginNet income
23
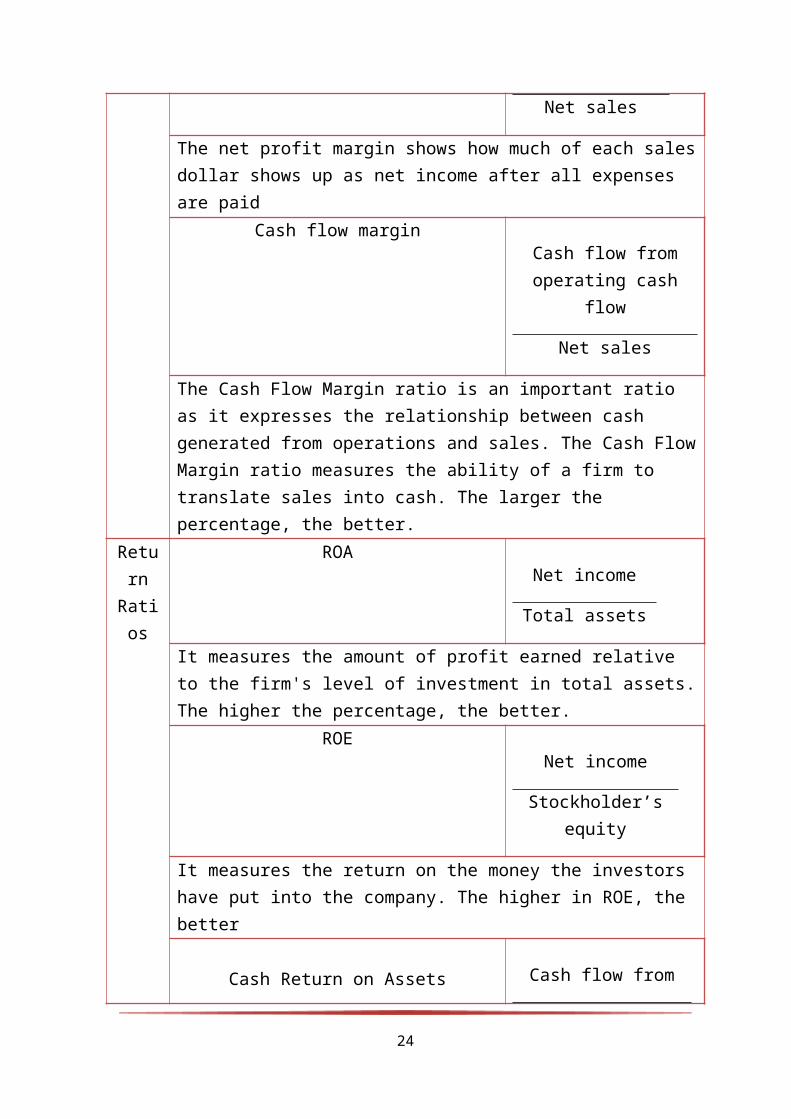
Net sales
The net profit margin shows how much of each salesdollar shows up as net income after all expenses are paid
Cash flow marginCash flow fromoperating cash
flow
Net sales
The Cash Flow Margin ratio is an important ratio as it expresses the relationship between cash generated from operations and sales. The Cash FlowMargin ratio measures the ability of a firm to translate sales into cash. The larger the percentage, the better.
Return
Ratios
ROANet income
Total assets
It measures the amount of profit earned relative to the firm's level of investment in total assets.The higher the percentage, the better.
ROENet income
Stockholder’sequity
It measures the return on the money the investors have put into the company. The higher in ROE, the better
Cash Return on Assets Cash flow from
24

operatingactivities
Total assets
Deloof (2003) conducts a study on Belgian Firms to exam
how the working capital management affects
profitability. At the result, he found that almost firms
invest a large amount of cash invested in working
capital. He recommends that by reducing the number of
day’s account receivable and inventories to reasonable
minimum, manager could improve corporate profitability.
The negative relation between profitability and accounts
payable suggest that companies wait longer to pay their
bills if they are less profitable.
2.2 Relationship between profitability and
liquidity
In a high level of trading activities, some investors
care about the liquidity of assets. The liquidity is the
ability to convert an asset to cash quickly. In
25
accounting, the liquidity reflects the ability of
current assets to match current liability.
According to Chandra (2001, p.72), a high liquidity
reflects the strength of financial. However, according
to some authors as Assaf Neto (2003, p.22), a high
liquidity can be as undesirable as a low because the
current assets are less profitable then the fixed
assets. That is because current assets generate
additional costs for maintenance, thus reducing the
profitability of the company.
According to Eljelly (2004), the virtual role of
managing working capital is maintaining its liquidity in
daily operation to meet its obligation. Therefore, every
firm attempt to optimize the profitability while
preserving the liquidity. Dilemma in liquidity
management is to achieve desired trade-off between
liquidity and profitability (Raheman et all, 2007). That
means the increasing in profits at the cost of liquidity
might lead to financial insolvency. Thus an effective
26
WCM needs to balance two core objectives of the firm.
Because, excessive liquidity don’t make any profits for
the firm and on the other hand, insufficient
liquidity might damage the firm’s goodwill,
deteriorate firm’s credit. That leads to the firm
might face to bankruptcy and insolvency problem.
Liquidity in itself, for the purpose of this research,
is measured in terms of current asset ratios, quick
ratio and operating cash flow.
III. REVIEW OF PREVIOUS STUDIES
3.1 Developed countries
America
Amarjit Gill, Nahum Biger, Neil Mathur (2010) conducted
the research to seek the relationship between working
capital management and profitability. They used the data
of 88 American firms listed on New York Stock Exchange
for a period from 2005 to 2007. The outcomes showed the
positive relationship between the CCC and profitability
estimated GOP. In addition, DSO and GOP have a negative
27
relationship which means firms can create profit by
keeping account receivables at an optimal level.
However, authors could not find the relationship of two
groups of factor firm size – gross operating profit
ratio and DPO – profitability.
Japanese
To study the relationship between working capital
management and firm’s profitability, Nobanee and Al
Hajjar (2009) investigated 2123 Japanese non-financial
firms listed in the Tokyo Stock Exchange for the period
from 1990 to 2004. The results suggest Japanese firms
concentrate on shortening the DPO, DSI and CC to
increase the profit. Authors also recommended
lengthening DPO is not solution because this could
impacts the firms’ credit reputation and profitability
in the long-term.
Thai
28
Kulkanya Napompech (2012) had figured out the
relationship between working capital and profitability
by sampling 255 companies listed on the Stock Exchange
of Thailand from 2007 through 2009. The results revealed
a negative relationship between GOP and DSI, DSO;
Thailand companies can increase the profitability by
shortening the CCC, DSI, and DSO. However, they cannot
increase firm’s profitability by lengthening the DPO.
3.2 Developing countries
Ghana
Examining the effect of working capital management on
firm’s performance for 125 non-listed Ghanaian firms
from 2004 to 2009 was carried out by Albert Amponsah
Addae and Michael Nyarko-Baasi (2013). The study found
that, profitability is negatively related to the length
of cash conversion cycle. This can be understood that
firms will be more profitable if they are able to
shorten the length of Cash conversion cycle. This
examination also indicates the negative relationship
29
between profitability and not only the CCC but also DSI,
DSO, and DPO.
Nigeria
Owolabi, Sunday Ajiao and Alu, Chituru Nkechinyere
(2012) pointed out the significant inverse relationship
between some working capital management factors measured
as DSO, DSI, DPO and profitability of manufacturing
firms. By implication, increases and decreases in any of
these variables affect the firm’s profits in an opposite
direction. Besides, the analysis showed that the size of
firm also influent its profitability such as the firms
increases in size, the ROA also goes up and vice versa.
Vietnam
Investigating relationship between Working capital
management and profitability, Tu and Nguyen (2014)
analyzed a panel data of 208 firms listed on both Ho Chi
Minh City Stock Exchange (HOSE) and Hanoi Stock Exchange
(HNX) in the period from 2006 to 2012. By using
30
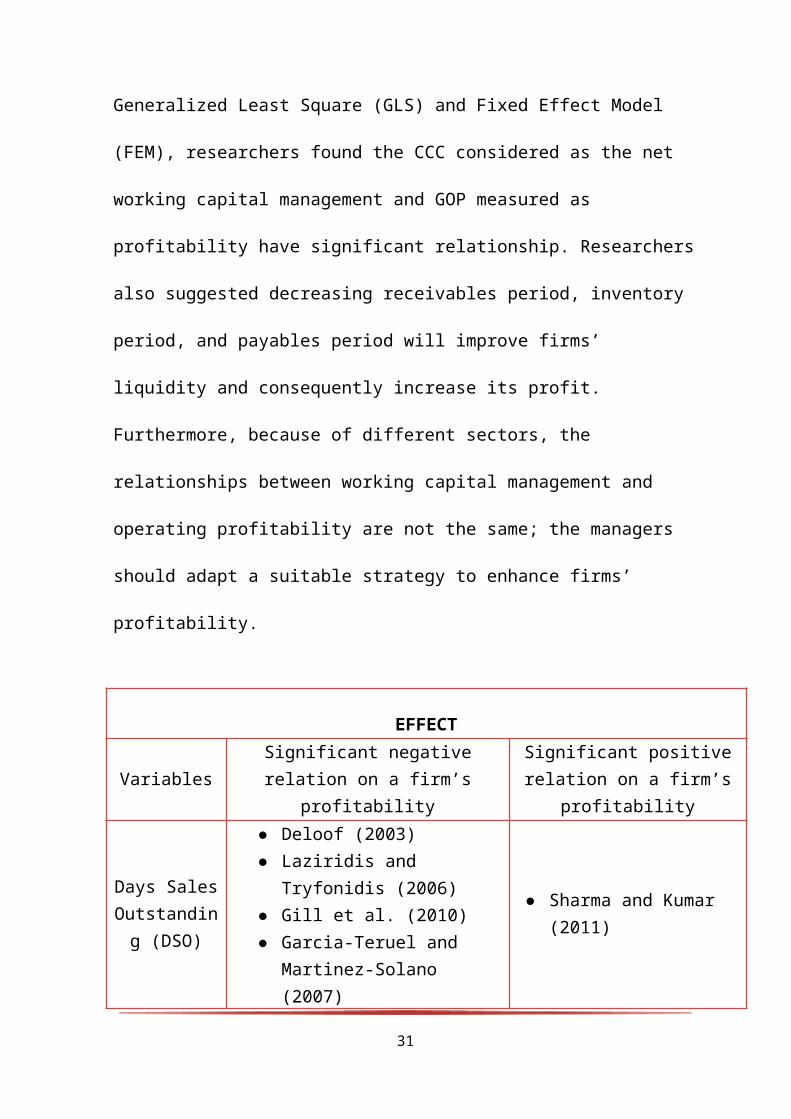
Generalized Least Square (GLS) and Fixed Effect Model
(FEM), researchers found the CCC considered as the net
working capital management and GOP measured as
profitability have significant relationship. Researchers
also suggested decreasing receivables period, inventory
period, and payables period will improve firms’
liquidity and consequently increase its profit.
Furthermore, because of different sectors, the
relationships between working capital management and
operating profitability are not the same; the managers
should adapt a suitable strategy to enhance firms’
profitability.
EFFECT
VariablesSignificant negativerelation on a firm’s
profitability
Significant positiverelation on a firm’s
profitability
Days SalesOutstanding (DSO)
● Deloof (2003)● Laziridis and
Tryfonidis (2006)● Gill et al. (2010)● Garcia-Teruel and
Martinez-Solano (2007)
● Sharma and Kumar (2011)
31
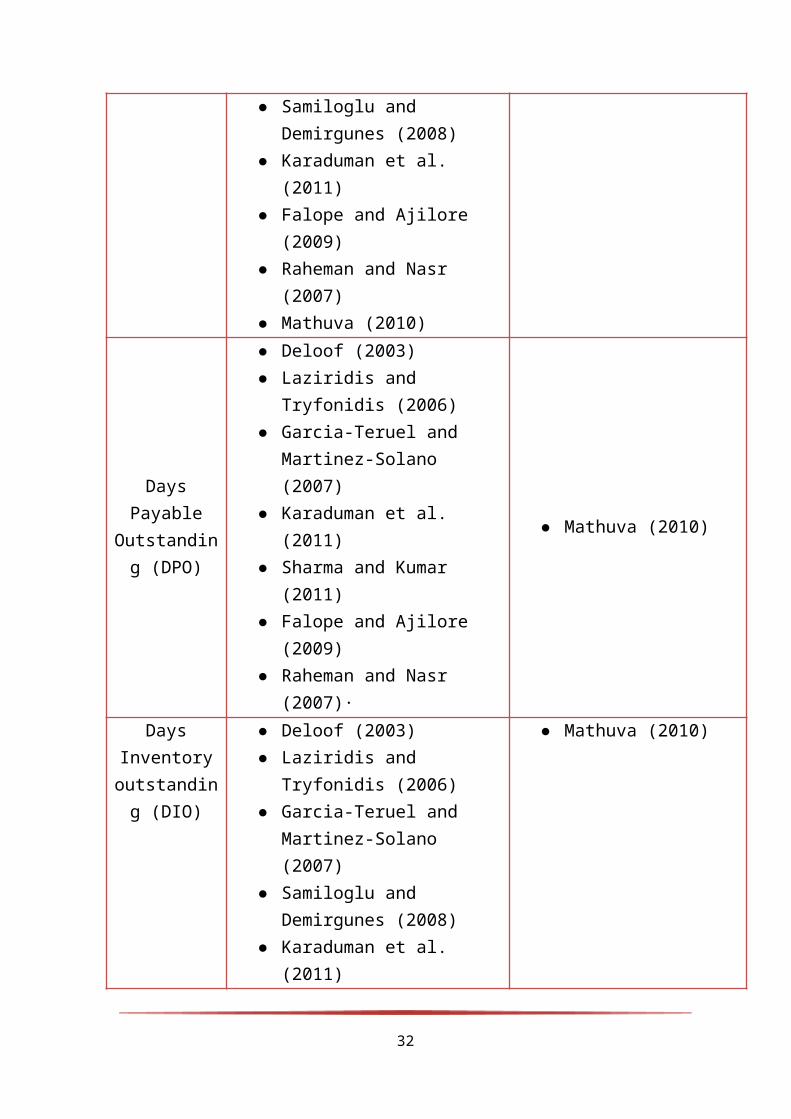
● Samiloglu and Demirgunes (2008)
● Karaduman et al. (2011)
● Falope and Ajilore (2009)
● Raheman and Nasr (2007)
● Mathuva (2010)
DaysPayable
Outstanding (DPO)
● Deloof (2003)● Laziridis and
Tryfonidis (2006)● Garcia-Teruel and
Martinez-Solano (2007)
● Karaduman et al. (2011)
● Sharma and Kumar (2011)
● Falope and Ajilore (2009)
● Raheman and Nasr (2007)·
● Mathuva (2010)
DaysInventoryoutstanding (DIO)
● Deloof (2003)● Laziridis and
Tryfonidis (2006)● Garcia-Teruel and
Martinez-Solano (2007)
● Samiloglu and Demirgunes (2008)
● Karaduman et al. (2011)
● Mathuva (2010)
32
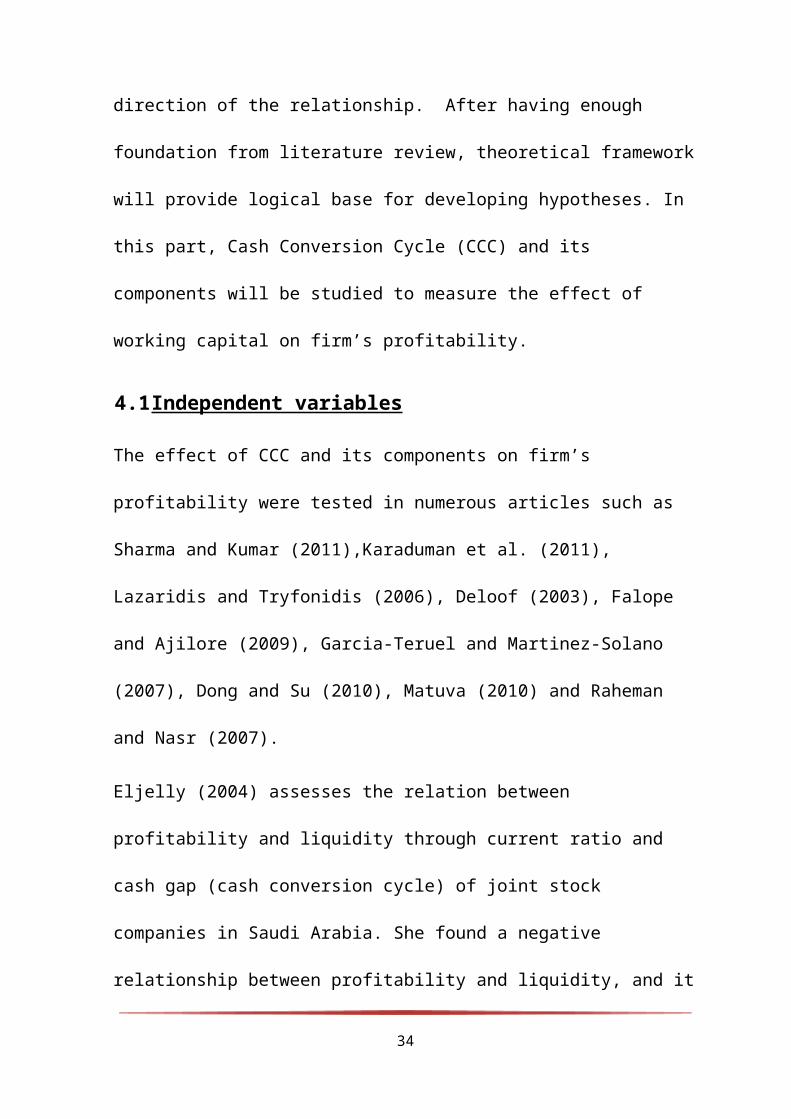
● Sharma and Kumar (2011)
● Falope and Ajilore (2009)
● Raheman and Nasr (2007)
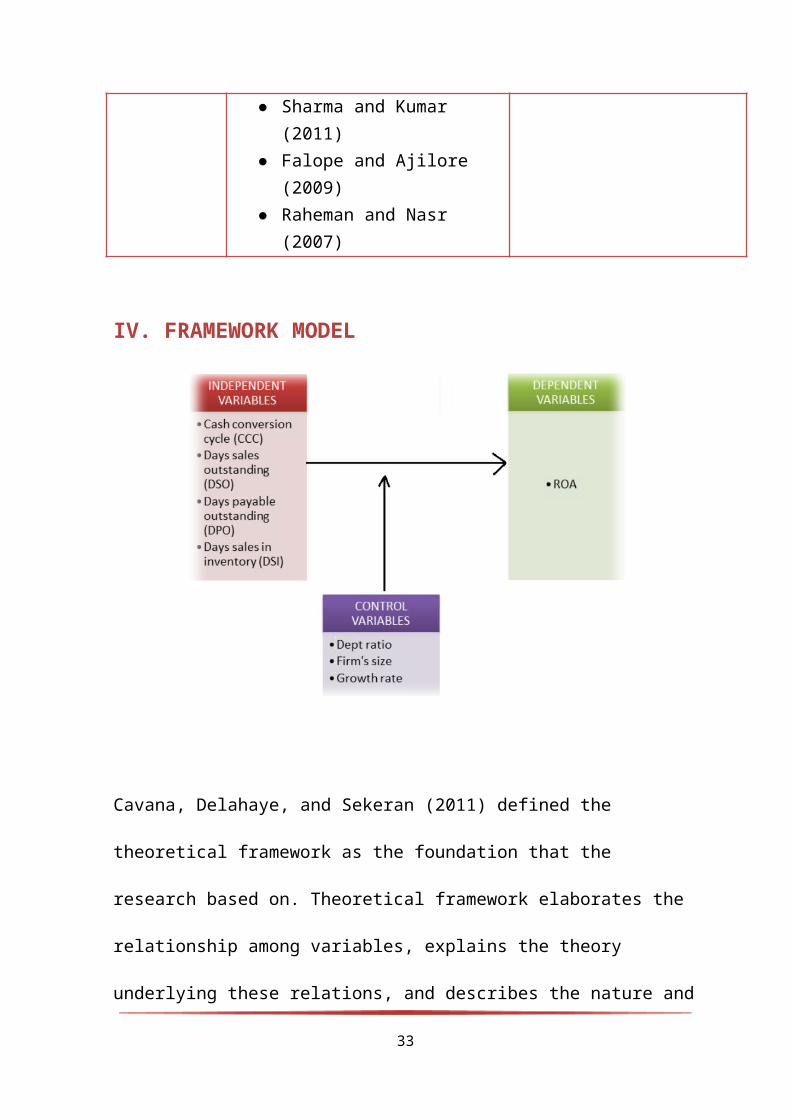
IV. FRAMEWORK MODEL
Cavana, Delahaye, and Sekeran (2011) defined the
theoretical framework as the foundation that the
research based on. Theoretical framework elaborates the
relationship among variables, explains the theory
underlying these relations, and describes the nature and
33
direction of the relationship. After having enough
foundation from literature review, theoretical framework
will provide logical base for developing hypotheses. In
this part, Cash Conversion Cycle (CCC) and its
components will be studied to measure the effect of
working capital on firm’s profitability.
4.1Independent variables
The effect of CCC and its components on firm’s
profitability were tested in numerous articles such as
Sharma and Kumar (2011),Karaduman et al. (2011),
Lazaridis and Tryfonidis (2006), Deloof (2003), Falope
and Ajilore (2009), Garcia-Teruel and Martinez-Solano
(2007), Dong and Su (2010), Matuva (2010) and Raheman
and Nasr (2007).
Eljelly (2004) assesses the relation between
profitability and liquidity through current ratio and
cash gap (cash conversion cycle) of joint stock
companies in Saudi Arabia. She found a negative
relationship between profitability and liquidity, and it
34
was found that CCC had a bigger impact over
profitability then current ratio. Also it was observed
that there was great variation among industries with
respect to the significant measure of liquidity.
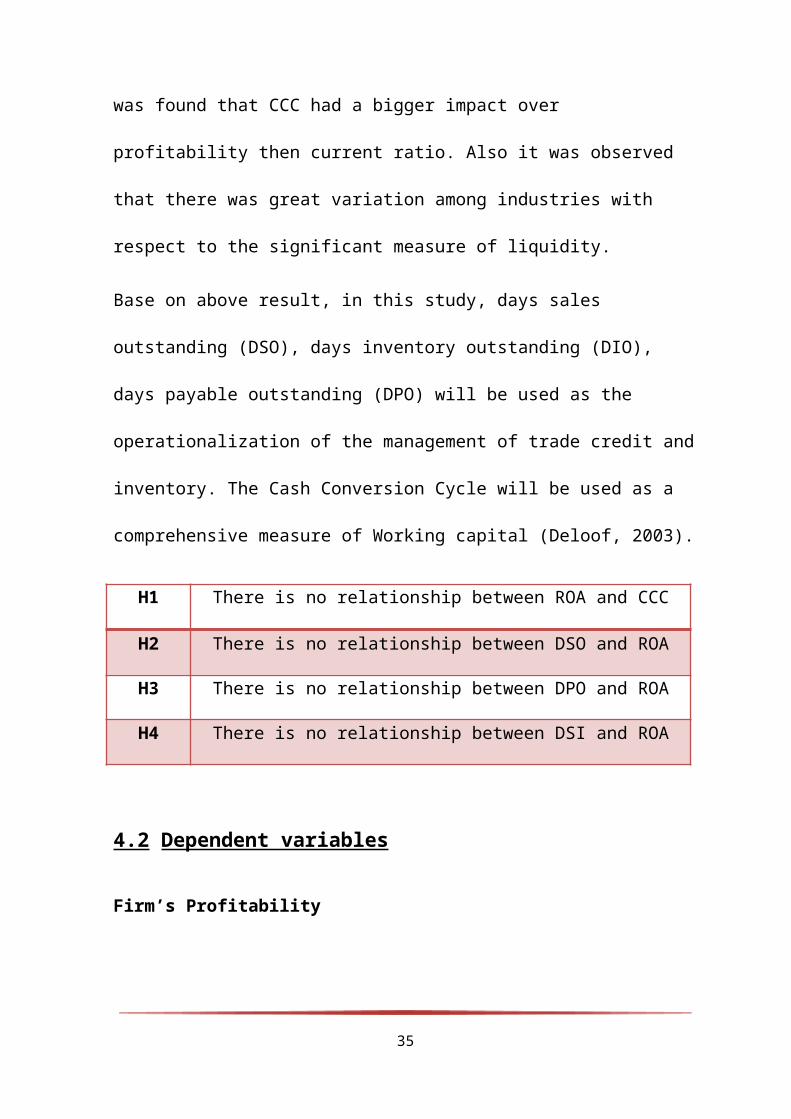
Base on above result, in this study, days sales
outstanding (DSO), days inventory outstanding (DIO),
days payable outstanding (DPO) will be used as the
operationalization of the management of trade credit and
inventory. The Cash Conversion Cycle will be used as a
comprehensive measure of Working capital (Deloof, 2003).
H1 There is no relationship between ROA and CCC
H2 There is no relationship between DSO and ROA
H3 There is no relationship between DPO and ROA
H4 There is no relationship between DSI and ROA
4.2 Dependent variables
Firm’s Profitability
35
There are many different measurements of firm
profitability among the researchers who studied the
relation between Working capital and firm’s
profitability. Return on Assets (ROA) is the simplest
measurement, which is measured by dividing net income
with total assets. ROA will be used to evaluate firm’s
profitability in this study, because the largest part of
Working Capital research uses ROA as the dependent
variable .It was used by Sharma and Kumar (2011), Falope
and Ajilore (2009), Wang (2002), Samiloglu and
Demirgunes (2008), Garcia-Teruel and Martinez-Solano
(2007), Nazir and Afza (2009) and Karaduman et al.
(2011). According to Padachi et al. (2006), ROA is a
good measure for firm’s profitability, because it
relates the profitability of a company with its assets.
4.3 Control variables
Debt
36
Leverage refers to the extent to which a firm relies on
debt. The more debt financing a firm uses in its capital
structure, the less profitability firm has .In this
study, debt ratio which is calculated by dividing total
debt with total assets will be used to measure leverage
that is used in the literature on the relationship
between firm profitability and Working Capital. It was
used in the studies of Raheman and Nasr (2007),
Samiloglu and Demirgunes (2008), Sharma and Kumar
(2011), Shin and Soenen (1998) Lazaridis and Tryfonidis
(2006) and Karaduman et al. (2011).
Firm’s Size
This control variable is operationalized by using the
natural logarithm of sales to determine the size of a
firm. It was used in the studies of Padachi et al.
(2010), Dong and Su (2010), Deloof (2003), Raheman and
Nasr (2007) and Karaduman et al. (2011). In this study
the natural logarithm of sales will also be used as a
measurement for size because of its effectiveness in
37
others studies and because this study is about analyzing
the effect of working capital on SME’s firms, so the
firm’s size is an important variable to discriminate the
effect of working capital between SME firms and larger
firms.
Growth
This control variable is calculated as follows: this
year’s sales minus previous year’s sales divided by
previous year’s sales. This control variable, like
firm’s size, is used in this study to better evaluate
the relation between Working capital and profitability
of SME firms, the growth rate of a firm can have
significant impact on its profitability, which have been
tested in many studies like Samiloglu and Demirgunes
(2008), Sharma and Kumar (2011), Shin and Soenen (1998),
Karaduman et al. (2011), Deloof (2003), Falope and
Ajilore (2009) and Zariyawati et al. (2009).
Fixed Financial Assets
38
The last control variable that will be used is the Fixed
Financial Asset ratio and is calculated by dividing
fixed financial assets with total assets. This control
variables is used in the studies of Deloof (2003),
Raheman and Nasr (2007) and Dong and Su (2010). Other
studies didn’t use this variable because of the possible
lack of data regarding fixed financial assets. According
to Lorenzo Preve and Virginia Sarria-Allende (2010) ,it
is crucial to notice that decisions regarding fixed
assets and long-term debt and equity are decisions over
how to set the appropriate level of working capital.
Therefore, this variable will also be used in this study
to better evaluate the working capital management.
Current Ratio
This variable and is calculated by dividing current
assets with current liabilities. It was used in the
studies of Zariyawati et al. (2009), Shin and Soenen
(1998) and Sharma and Kumar (2011). To enhance
39

robustness of this study this control variable will also
be used in the upcoming analyses.
CHAPTER III
METHODOLOGY
I. RESEARCH PHILOSOPHY
“Research philosophy is a term relates to the
development of knowledge and the nature of that
knowledge” (Saunders et al, 2012). Research philosophy
that researchers apply can be considered as assumptions
about the way we observe the world, which support to
build and reinforce specific research strategies and
methods. Base on the research’s topic and objectives,
the group adopts positivism. There are some important
40
components that positivist researchers concentrate on;
firstly, working with observed phenomena to make
credible data. Secondly, according to Remenyi el at
(1998), researchers are not considered as factor
impacting on the subject of research; therefore,
research ought to be carried out in a value – free way.
Moreover, positivist researchers use structured
methodology to collect quantified samples and test data.
1.1 Nature of research
The group adopts descriptive and explanatory study as
our nature of research. First of all, we present a
general view of the topic. Next, we will determine
working capital’s factors influencing on firms’
profitability. To find the relationship between
variables researchers analyze the data’s samples through
statistical test such as correlation, regression
(Saunders et al, 2012).
1.2 Research approaches
41
At very beginning, research must care the design of
research project, and group chooses the deduction. The
generalizability of deduction is describing phenomenon
from the general to specific which means basing on the
theoretical framework researcher will collect data and
do some statistical analyze to test the framework.
1.3 Research method
This study takes quantitative as research method because
researchers will subject the samples’ numerical data for
statistical analysis. Besides that, it is also
appropriate with characteristic with positivism and
deduction approach.
III. DATA ANALYSIS METHODS
3.1 Pearson’s correlation test
A correlation is a measure of the linear relationship
between variables (Field-2007 ). There are several ways
to evaluate sample data to find the association between
variables, if the variables have ordinal (ranked) data;
42
Spearman’s and Kendall’s analysis should be used.
Because the variables in this study contain interval
data and the measures are linear, so Pearson’s
correlation analysis will be the most suitable method to
evaluate the association of working capital and
profitability in this study. Pearson’s correlation
coefficient is a measure of the linear correlation
(dependence) between two variables X and Y, giving a
value ranging from −1 (indicating perfect negative
association) to 0 (no association) to +1 (perfect
positive association) (Kleinbaum, Kupper, Nizam,
Rosenberg-2007). The analysis will include the
correlation test between the dependent variable (GOP)
and others independent and control variables, to find
the nature of these variables ( positive or negative )
and which have the significant impact on firm’s
profitability (LeBlanc-2004).
3.2 Regression analysis
43
In the following part the regression analyses are used
to investigate the impact of working capital on SME
firm’s profitability in 2009-2011 periods. Numerous
regressions are held for this study, but four most
implicating regression models for each regression
equation are selected for the analysis, which are
CCC,DSO,DIO and DPO.
1. Heterokedasticity
In OLS analysis, it is assumed that the variance of
error is the same and not correlated with each other
(Gauss-Markov assumption). If the errors do not have
constant variance, it is call Heteroskedasticity.
Heteroskedasticity happens in panel data when there is a
change in variation in a short period. When using OLS
within presence of Heteroskedasticity, the standard
errors could be wrong, the OLS estimation will not have
the minimum variance among the set of unbiased
estimation. Therefore, the result could be misleading
(Introductory Econometrics for Finance - Chris Brooks,
44
Cambridge University Press, and May 22, 2008 - Business
& Economics) .In order to avoid heteroskedasticity, the
researcher will use Generalized Least Square (GLS) as an
alternative estimation method.
2. Autocorrelation.
Autocorrelation is the assumption that the errors are
uncorrelated with one another. The consequences of that
problem are similar to those of heteroskedasticity, the
standard error could be wrong and affects to the model
(Brooks 2008). In order to detect the autocorrelation ,
Durbin-Watson test is applied. If Durbin-Watson is near
2, there is a little evidence of autocorrelation. In the
case of Durbin-Watson 0 or 4, there is perfect
autocorrelation in the residual (Brooks 2008). In the
case of presence the dependence between two errors, to
deal with it, generalized least square (GLS) can be the
alternative method instead of using OLS. Under GLS, a
weighted sum of the square residuals is minimized
(Brooks 2008)
45

3. Hausman Tests for correlated random effect.
In panel data methodology, researchers have to
determine whether there is fixed effect (FEM) or
random effect (REM) in the models. When use FEM, we
assume the characteristic are unique to the company and
should be correlated with other individual
characteristic. If they do not correlate, FEM is not
suitable to apply and REM will be used instead. (Kohler,
Kreuter-2008). Hausman Test is applied when there is a
selection to choose which method is more appropriate
between FEM and REM. If the p-value is lower than 0.1,
we reject the null hypothesis of no correlation between
them, which means FEM is more suitable. Otherwise, if
null hypothesis is accepted, REM will be chosen instead.
4. Multicollinearity with Variance Inflation
Factor (VIF).
In multiple regression, the dependencies between the
response variable Y and the repressor’s X are expected
to be found. Multicollinearity exists when there are
46
strong dependencies among the regressors variable X.
Multicollinearity can have serious effects on the
estimates of the regression coefficients and on the
general applicability of the estimated model
(Montgomery, RungeIn-2011). In order to measure the
effect of multicollinearity, Variance Inflation Factor
(VIF) is calculated as follow:
VIF(Xh)
=1
1−Rh2 h=1,2,…,k
Where Rh2 is the R2value obtained for the regression
of , as dependent variable, on other X variables on
the original equation aimed at predicting Y. When the
VIF is greater than 5, there are some degree of
multicollinearity exists with respect to the
variables (Aczel and Sounderpandian - 2009). In another
way, when the VIF is lower than 5, there is no
multicollinearity. The results of VIF for each
regression are shown together with the regression
results.
3.3 Descriptive statistics
47
Descriptive statistics is the discipline of
quantitatively describing the main features of a
collection of information (Mann, Prem-1995) or the
quantitative description itself . The descriptive
statistics in this study will provide simple summaries
about the sample and about the observations that have
been made. The most common types of descriptive
statistic are measures of central tendency and measures
of variability (or dispersion) (Kleinbaum, Kupper,
Nizam, Rosenberg-2007).
The central tendency in a sample of data is the “average
value” of the variable being observed. (Kleinbaum,
Kupper, Nizam, Rosenberg-2007) .The three most
frequently encountered indices of central tendency are
the mode, the median, and the mean. The mode is used for
describing nominal data, the median for describing
ordinal data, and the mean for describing interval or
ratio data. As a quantitative measurement study, this
48
study uses an interval scale, so the mean will be the
best choice as a measurement of central tendency.
Measures of variability tell us the extent to which the
values of the measurements in the sample differ from one
another. (Kleinbaum, Kupper, Nizam, Rosenberg-2007) .
The three most often considered are the range, the
quartile deviation, and the standard deviation . The
range is the only appropriate index of variability for
nominal data, and the quartile deviation is the
appropriate index of variability for ordinal data. In
this study, standard deviation is generally the
preferred index because the study uses interval scale of
data.
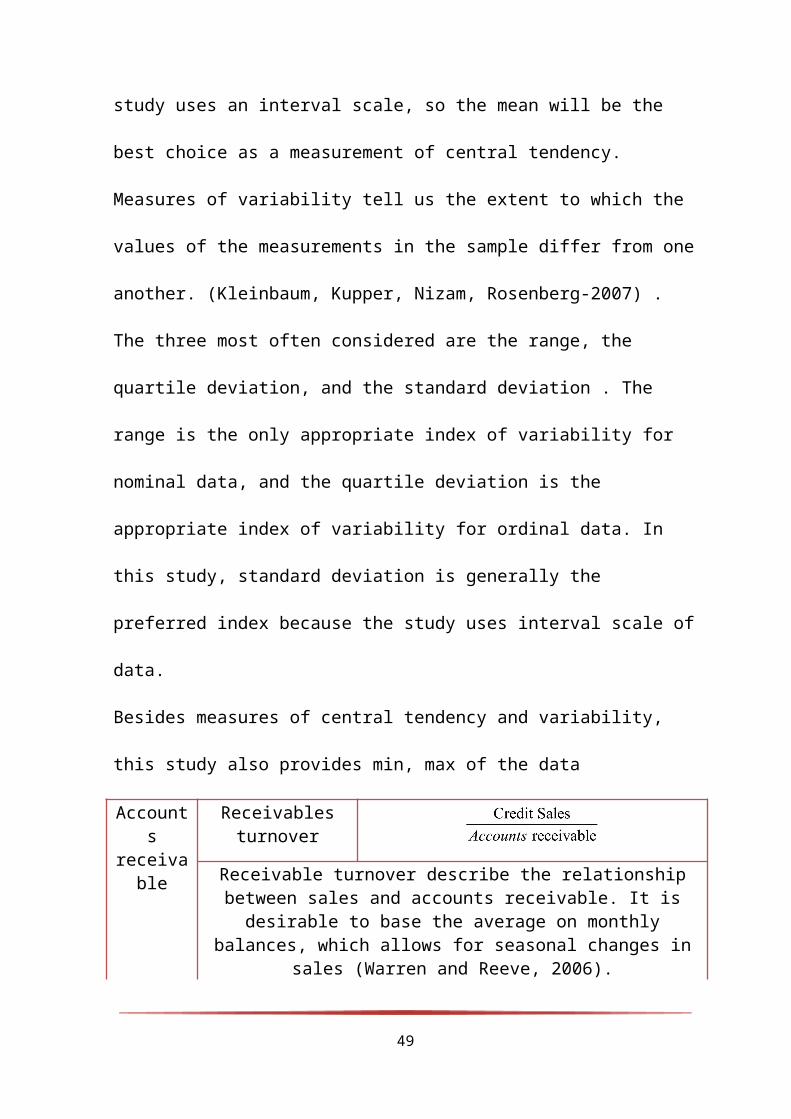
Besides measures of central tendency and variability,
this study also provides min, max of the data
Accounts
receivable
Receivablesturnover
Receivable turnover describe the relationshipbetween sales and accounts receivable. It is
desirable to base the average on monthlybalances, which allows for seasonal changes in
sales (Warren and Reeve, 2006).
49
Averagecollection
period (ACP)
Average collection period is an estimate of thelength of time (in days), the accounts
receivable have been outstanding (Sagne, 2010).
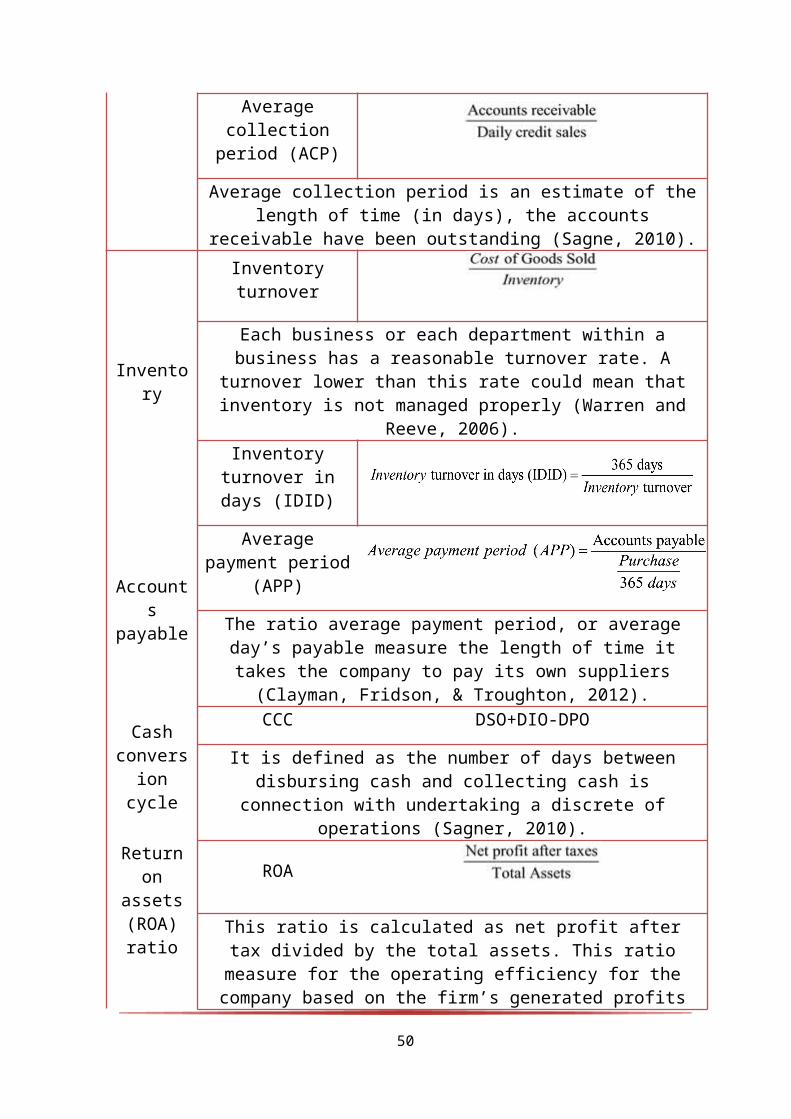
Inventory
Inventoryturnover
Each business or each department within abusiness has a reasonable turnover rate. A
turnover lower than this rate could mean thatinventory is not managed properly (Warren and
Reeve, 2006).Inventory
turnover indays (IDID)
Accounts
payable
Averagepayment period
(APP)
The ratio average payment period, or averageday’s payable measure the length of time ittakes the company to pay its own suppliers
(Clayman, Fridson, & Troughton, 2012).
Cashconversioncycle
CCC DSO+DIO-DPO
It is defined as the number of days betweendisbursing cash and collecting cash is
connection with undertaking a discrete ofoperations (Sagner, 2010).
Returnon
assets(ROA)ratio
ROA
This ratio is calculated as net profit aftertax divided by the total assets. This ratiomeasure for the operating efficiency for thecompany based on the firm’s generated profits
50
from its total assets (International Journal ofHumanities and Social Science, 2012).
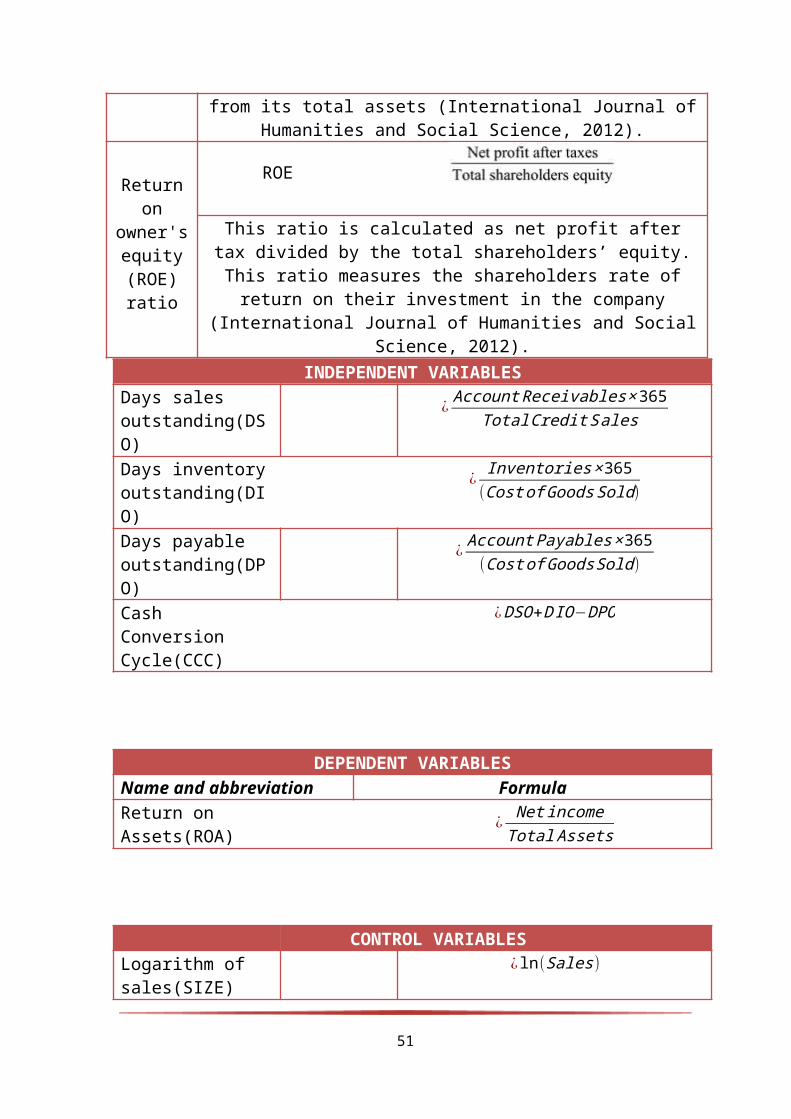
Returnon
owner'sequity(ROE)ratio
ROE
This ratio is calculated as net profit aftertax divided by the total shareholders’ equity.This ratio measures the shareholders rate ofreturn on their investment in the company
(International Journal of Humanities and SocialScience, 2012).
INDEPENDENT VARIABLESDays sales outstanding(DSO)
¿ AccountReceivables×365TotalCreditSales
Days inventoryoutstanding(DIO)
¿Inventories×365
(CostofGoodsSold)
Days payable outstanding(DPO)
¿ AccountPayables×365(CostofGoodsSold)
Cash Conversion Cycle(CCC)
¿DSO+DIO−DPO
DEPENDENT VARIABLESName and abbreviation FormulaReturn on Assets(ROA)
¿NetincomeTotalAssets
CONTROL VARIABLESLogarithm of sales(SIZE)
¿ln(Sales)
51
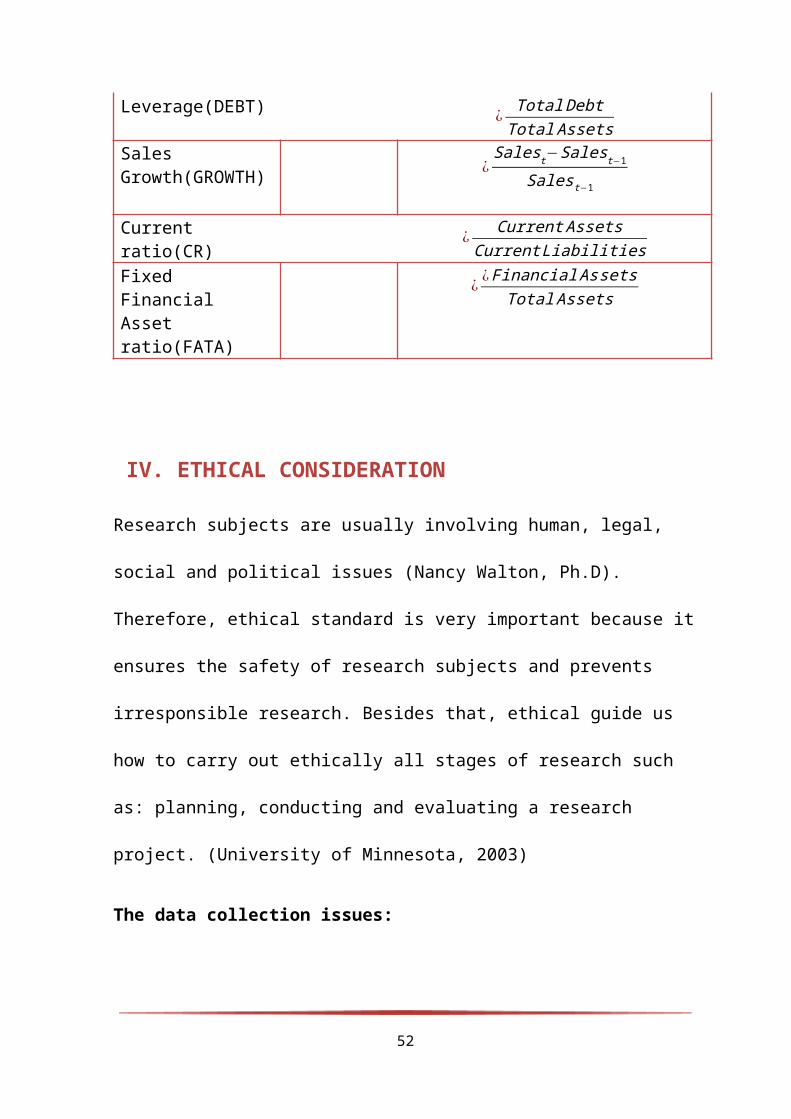
Leverage(DEBT) ¿TotalDebtTotalAssets
Sales Growth(GROWTH) ¿
Salest−Salest−1
Salest−1
Current ratio(CR)
¿CurrentAssets
CurrentLiabilitiesFixed Financial Asset ratio(FATA)
¿¿FinancialAssets
TotalAssets
IV. ETHICAL CONSIDERATION
Research subjects are usually involving human, legal,
social and political issues (Nancy Walton, Ph.D).
Therefore, ethical standard is very important because it
ensures the safety of research subjects and prevents
irresponsible research. Besides that, ethical guide us
how to carry out ethically all stages of research such
as: planning, conducting and evaluating a research
project. (University of Minnesota, 2003)
The data collection issues:
52
The source of financial data is acknowledged and
available in the public domain. The data is taken from
ranking board of the 500 SMEs in Viet Nam through the
period 2009 – 2011 and downloaded on the website
Fast500.vn. We ensure the data is correct with the
statistic of Fast500. In addition, we commit that all
data is used for study purpose, not for any commercial
aims.
The analysis and reporting process issues:
We ensure that the data will be analyzed and reported
honestly and there is no change to get better result.
The information and quote get their sources. The Harvard
style reference is followed as below.
V. LIMITATION OF THE RESEARCH PROJECT
Although 97% of Viet Nam firms are classified as SMEs,
the numbers of companies which have enough conditions to
see as SMEs according World Bank definition are.
Therefore, the result of our study can apply for Vietnam
53
List SMEs. Finally, due to the time and resources
limitation, we cannot update statistics from another
resources; this will effect on our outcome.
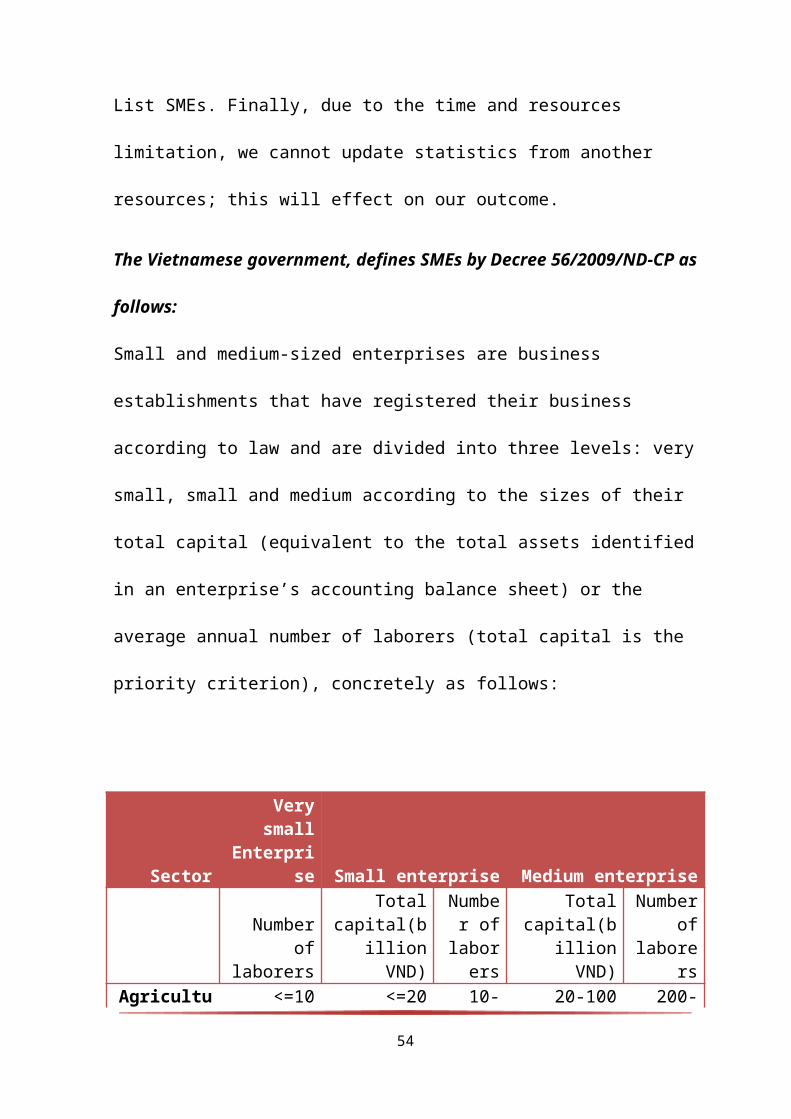
The Vietnamese government, defines SMEs by Decree 56/2009/ND-CP as
follows:
Small and medium-sized enterprises are business
establishments that have registered their business
according to law and are divided into three levels: very
small, small and medium according to the sizes of their
total capital (equivalent to the total assets identified
in an enterprise’s accounting balance sheet) or the
average annual number of laborers (total capital is the
priority criterion), concretely as follows:
Sector
Verysmall
Enterprise Small enterprise Medium enterprise
Numberof
laborers
Totalcapital(b
illionVND)
Number of
laborers
Totalcapital(b
illionVND)
Numberof
laborers
Agricultu <=10 <=20 10- 20-100 200-
54
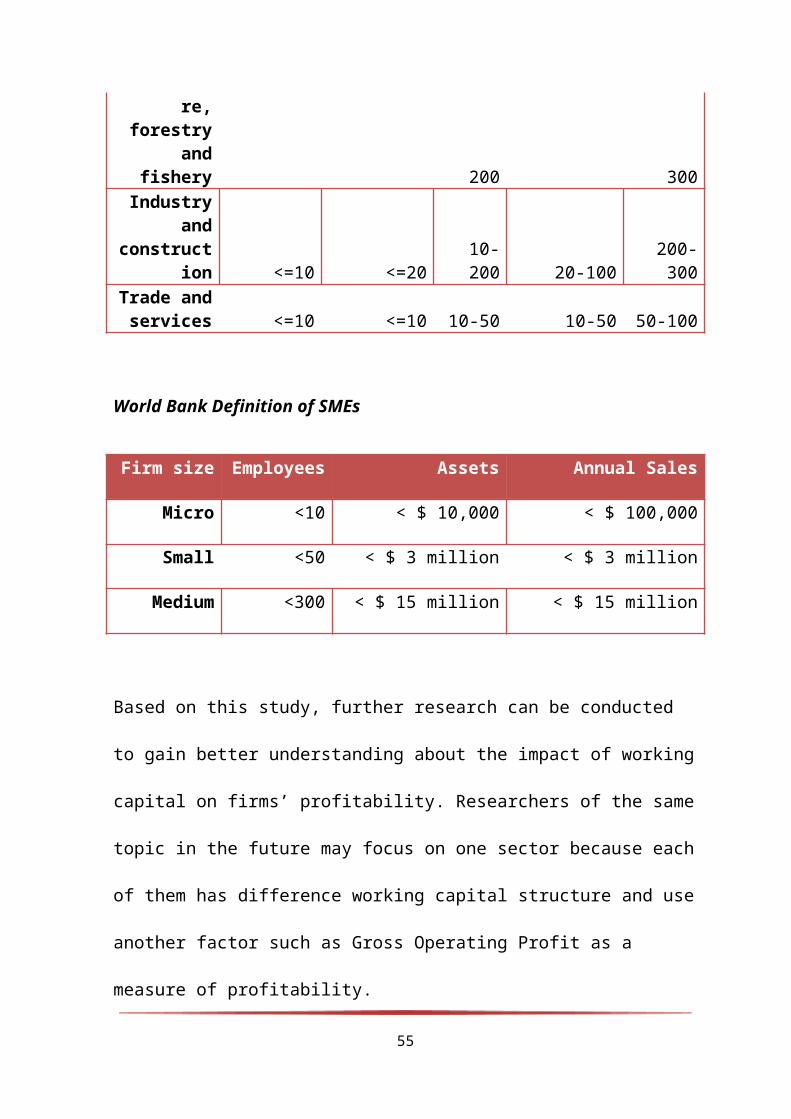
re,forestry
andfishery 200 300
Industryand
construction <=10 <=20
10-200 20-100
200-300
Trade andservices <=10 <=10 10-50 10-50 50-100
World Bank Definition of SMEs
Firm size Employees Assets Annual Sales
Micro <10 < $ 10,000 < $ 100,000
Small <50 < $ 3 million < $ 3 million
Medium <300 < $ 15 million < $ 15 million
Based on this study, further research can be conducted
to gain better understanding about the impact of working
capital on firms’ profitability. Researchers of the same
topic in the future may focus on one sector because each
of them has difference working capital structure and use
another factor such as Gross Operating Profit as a
measure of profitability.
55
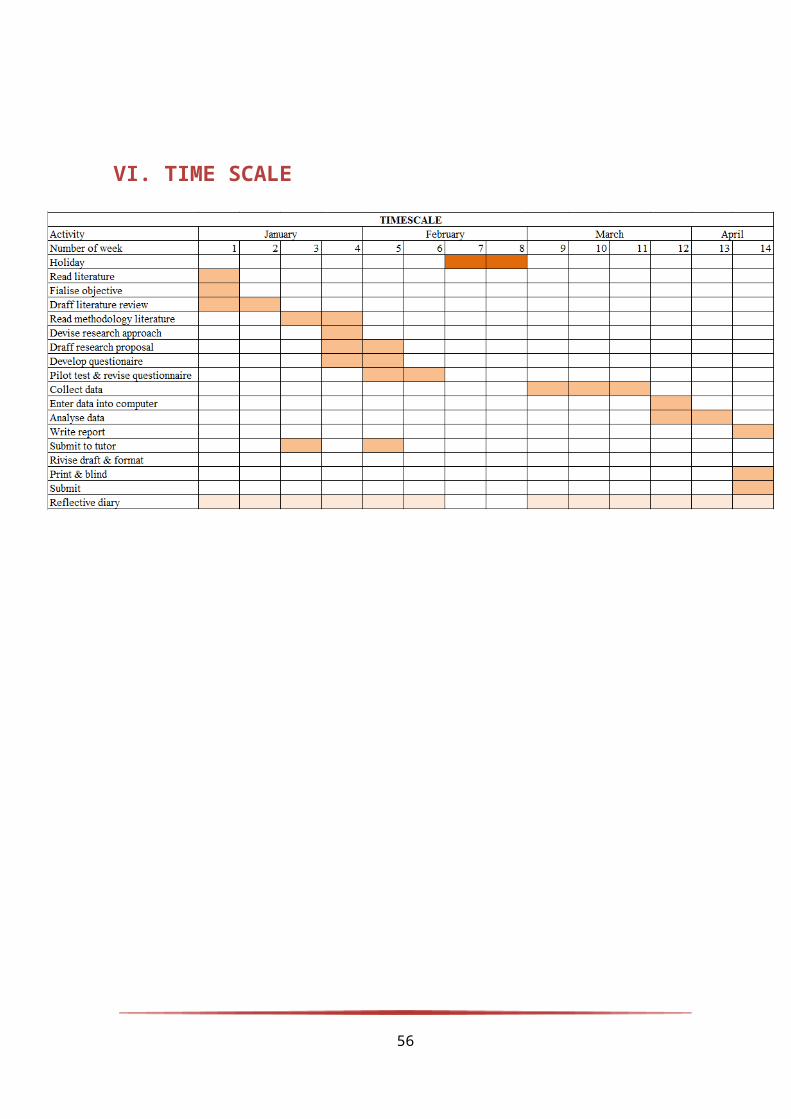
VI. TIME SCALE
56

http://www.researchethics.ca/what-is-research-ethics.htm
http://www.ahc.umn.edu/img/assets/26104/Research_Ethics.pdf
V. REFERENCES
Albert Amponsah Addae and Michael Nyarko-Baasi (2013).
Working Capital Management and Profitability: An empirical Investigation
57
in an Emerging Market. Research Journal of Finance and
Accounting.
Amarjit Gill, Nahum Biger, Neil Mathur (2010). The
Relationship between Working Capital Management and Profitability:
Evidence from the United States. Business and Economics Journal.
Berry, A. and Jarvis ,R. ,Accounting In A Business
Context. 4th edition .(2006)
Brigham, E. F., Houston, J. F., 2003, ‘Fundamentals of
Financial Management’, 10th Edition
Cihan Aktas- Director of Central Bank of the Republic of
Turkey, 2010.”The SMEs in the global world: Issue and Prospects”,
ADFIMI Development Forum 2010
CIEM, 2012. “Characteristics of the Vietnam business environment
evidence from a SME survey in 2011”, Central Institute for
economic management Office.
Cao Sĩ Kiêm (Director of VINASME),2013. “SMEs and support
solutions 2013”, Financial journal number 2-2013.
58
Deloof M, 2003. Does working capital management affect
profitability of Belgian firms? Journal of Business Finance
and Accounting
Dr. Le Chi Hieu, 2012. Economic crisis-Chance to improve
competitiveness of enterprises
Deloof, M. & Jeger, M. (1996). Trade Credit, Product
Quality, and Intragroup Trade: Some European Evidence.
Financial Management, 25(3), pp. 945-968.
Deloof, M. (2003). Does Working Capital Management
Affect Profitability of Belgian Firms?. Journal of
Business Finance & Accounting, 30(3) & (4), pp. 573 –
587.
Dong, H. P. & Su, J. (2010). The Relationship between
Working Capital Management and Profitability: A Vietnam
Case. International Research Journal of Finance and
Economics, 49. pp. 59-67.
Eljelly (2004). The Liquidity-Profitability Tradeoff: An
Empirical Investigation in an Emerging Market.
59
Falope, O. I. & Ajilore, O. T. (2009). Working Capital
Management and Corporate Profitability: Evidence from
Panel Data Analysis of Selected Quoted Companies in
Nigeria. Research Journal of Business Management, 3(3),
pp. 73-84.
Garcia-Teruel, J.P. & Martinez-Solano, P. (2007).
Effects of Working Capital on SME profitability.
International Journal of Managerial Finance, 3(2). pp.
164 –177.
Garcia-Teruel, J.P. & Martinez-Solano, P. (2010).
Determinants of Trade Credit: A Comparative Study of
European SMEs. International Small Business
Journal,28(3). pp. 215-233.
GSO, 2013.“Number and Event magazine 5/2013”, General
Statistics Office
James Sagner ,2014. “Working Capital Management – Application
and Cases” , p. 109.
60
Karaduman, H.A., Akbas, H.E., Caliskan, A.O. & Durer, S.
(2011). The Relationship between Working Capital Management and
Profitability: Evidence from an Emerging Market. International
Research Journal of Finance and Economics, 62(2011), pp.
61-67.
Kack, M and Lindgren, M. (1999), “The financing of private small
and medium size enterprises in Vietnam: A minor study, Department of
Business Studies”, Uppsala University, Sweden
Krish Rangarajan, Krish Rangarajan; Anil Misra , 2005.
“Working Capital Management”, p. 192.
Kulkanya Napompech (2012). Effects of Working Capital Management
on the Profitability of Thai Listed firms. Internal Journal of Trad,
Economics and Finance.
Lorenzo Preve, Virginia Sarria-Allende , 2010.”Working
Capital Management”,p. 67.
Lazaridis, I. & Tryfonidis, D. (2006). Relationship Between
Working Capital Management and Profitability of Listed Companies in the
61
Athens Stock Exchange. Journal of Financial Management and
Analysis, 19(1), pp. 26-35.
Mary S. Schaeffer , Essentials of Accounts Payable
(2002) , p. 2
Mathuva, D. M. (2010). The Influence of Working Capital
Management Components on Corporate Profitability: A Survey on Kenyan
Listed Firms. Research Journal of Business Management,
4(1), pp. 1 – 11.
Ministry Planning and Investment & Agency for enterprise
development, 2011. “SME White Paper 2011”,
http://www.economica.vn/
Nazir, M. S. & Afza, T. (2009). Working Capital Requirements
and the Determining Factors in Pakistan. ICFAI J Journal of
Applied Finance, 15(4), pp. 1109 – 1129.
Owolabi, Sunday Ajiao and Alu, Chituru Nkechinyere
(2012). Effective Working Capital Management and Profitability: A study
of Selected Quoted Manufacturing companies in Nigeria. Economics and
Financa Review.
62
Padachi, K. (2006). Trends in Working Capital Management and its
Impact on Firms’ Performance: An analysis of Mauritian small
manufacturing firms. International Review of Business
Research Papers, 2(2), pp. 45-58.
Padachi, K., Howorth, C., Narasimhan, M.S. & Durbarry,
R. (2010). Working Capital structure and Financing Pattern of
Mauritian SMEs. Oxford Business & Economics Conference
Program.
Raheman, A. & Nasr, M. (2007). Working Capital Management
and Profitability Case in Pakistani firms. ICFAI Journal of Applied
Finance, 54(3), pp. 279-300.
Samiloglu, F. & Demirgunes, K. (2008). The Effects of Working
Capital Management on Firm Profitability: Evidence from Turkey. The
international Journal of Applied Economics and Finance,
2(1), pp. 44 – 50.
Sartoris, W. & Hill, N. (1983). A Generalized Cash Flow
Approach to Short-Term Financial Decisions. Journal of Finance,
38, pp. 349 - 360.
63
Shin, H. & Soenen, L. (1998). Efficiency of Working Capital
Management and Corporate Profitability. Financial Practice and
Education (Now named Journal of Applied Finance) 8. pp.
37 - 45.
Soenen, L. A. (1993). Cash conversion cycle & corporate
profitability. Journal of Cash Management, 13(4), pp. 53-58
Thoa T.K. Tu and Uyen T.U. Nguyen (2014). Relationship
between Working Capital Management and Profitability – Empirical
evidence from Vietnamese listed firms.
S.D. Taleka, 2005. “Management Of Working Capital”, p. 56.
Vuong, Q. H., (1998), SMEs to play a large role in private sector,
Vietnam Investment Review
Wang, Y.J. (2002). Liquidity Management, Operating Performance,
and Corporate value: Evidence from Japan and Taiwan. Journal of
Multinational Financial Management. 12(2), pp. 159-169.
Zariyawati, M., M.N, A., Taufiq, H., & Sazali, A.
(2010). Determinants of Working Capital Management: Evidence from
Malaysia.
64
Introductory Statistics - Mann, Prem S.(1995). Applied
Regression Analysis and Other Multivariable Methods By
David Kleinbaum, Lawrence Kupper, Azhar Nizam, Eli
Rosenberg (2007)
Trochim, William M. K. "Descriptive statistics".
Research Methods Knowledge Base. (2006).
Psychology: A Journey By Dennis Coon, John Mitterer,
(2013), p. 595-596
Discovering Statistics Using SPSS for Windows By Andy P.
Field (2007)
Statistics: Concepts and Applications for Science By
David C. LeBlanc (2004)
Data Analysis Using Stata by Ulrich Kohler, Frauke
Kreuter (2008),p.245
65

Applied Statistics and Probability for Engineers By
Douglas C. Montgomery, George C. RungeIn (2011)
66