Embed Size (px)
Citation preview

AC605Profitability Analysis
mySAP Financials
Date
Training Center
Instructors
Education Website
Instructor HandbookCourse Version: 2005 Q2Course Duration: 5 Day(s)Material Number: 50071808Owner: Michael Janning (D034089)
An SAP Compass course - use it to learn, reference it for work

Copyright
Copyright © 2004 SAP AG. All rights reserved.
No part of this publication may be reproduced or transmitted in any form or for any purpose without theexpress permission of SAP AG. The information contained herein may be changed without prior notice.
Some software products marketed by SAP AG and its distributors contain proprietary softwarecomponents of other software vendors.
Trademarks
� Microsoft®, WINDOWS®, NT®, EXCEL®, Word®, PowerPoint® and SQL Server® areregistered trademarks of Microsoft Corporation.
� IBM®, DB2®, OS/2®, DB2/6000®, Parallel Sysplex®, MVS/ESA®, RS/6000®, AIX®, S/390®,AS/400®, OS/390®, and OS/400® are registered trademarks of IBM Corporation.
� ORACLE® is a registered trademark of ORACLE Corporation.� INFORMIX®-OnLine for SAP and INFORMIX® Dynamic ServerTM are registered trademarks
of Informix Software Incorporated.� UNIX®, X/Open®, OSF/1®, and Motif® are registered trademarks of the Open Group.� Citrix®, the Citrix logo, ICA®, Program Neighborhood®, MetaFrame®, WinFrame®,
VideoFrame®, MultiWin® and other Citrix product names referenced herein are trademarks ofCitrix Systems, Inc.
� HTML, DHTML, XML, XHTML are trademarks or registered trademarks of W3C®, World WideWeb Consortium, Massachusetts Institute of Technology.
� JAVA® is a registered trademark of Sun Microsystems, Inc.� JAVASCRIPT® is a registered trademark of Sun Microsystems, Inc., used under license for
technology invented and implemented by Netscape.� SAP, SAP Logo, R/2, RIVA, R/3, SAP ArchiveLink, SAP Business Workflow, WebFlow, SAP
EarlyWatch, BAPI, SAPPHIRE, Management Cockpit, mySAP.com Logo and mySAP.com aretrademarks or registered trademarks of SAP AG in Germany and in several other countries allover the world. All other products mentioned are trademarks or registered trademarks of theirrespective companies.
Disclaimer
THESE MATERIALS ARE PROVIDED BY SAP ON AN "AS IS" BASIS, AND SAP EXPRESSLYDISCLAIMS ANY AND ALL WARRANTIES, EXPRESS OR APPLIED, INCLUDING WITHOUTLIMITATION WARRANTIES OF MERCHANTABILITY AND FITNESS FOR A PARTICULARPURPOSE, WITH RESPECT TO THESE MATERIALS AND THE SERVICE, INFORMATION, TEXT,GRAPHICS, LINKS, OR ANY OTHER MATERIALS AND PRODUCTS CONTAINED HEREIN. INNO EVENT SHALL SAP BE LIABLE FOR ANY DIRECT, INDIRECT, SPECIAL, INCIDENTAL,CONSEQUENTIAL, OR PUNITIVE DAMAGES OF ANY KIND WHATSOEVER, INCLUDINGWITHOUT LIMITATION LOST REVENUES OR LOST PROFITS, WHICH MAY RESULT FROMTHE USE OF THESE MATERIALS OR INCLUDED SOFTWARE COMPONENTS.

About This HandbookThis handbook is intended to complement the instructor-led presentation of thiscourse, and serve as a source of reference. It is not suitable for self-study.
Typographic ConventionsAmerican English is the standard used in this handbook. The following typographicconventions are also used.
Type Style Description
Example text Words or characters that appear on the screen. Theseinclude field names, screen titles, pushbuttons as well asmenu names, paths, and options.
Also used for cross-references to other documentationboth internal (in this documentation) and external (inother locations, such as SAPNet).
Example text Emphasized words or phrases in body text, titles ofgraphics, and tables
EXAMPLE TEXT Names of elements in the system. These include reportnames, program names, transaction codes, table names,and individual key words of a programming language,when surrounded by body text, for example SELECTand INCLUDE.
Example text Screen output. This includes file and directory namesand their paths, messages, names of variables andparameters, and passages of the source text of a program.
Example text Exact user entry. These are words and characters thatyou enter in the system exactly as they appear in thedocumentation.
<Example text> Variable user entry. Pointed brackets indicate that youreplace these words and characters with appropriateentries.
04-02-2005 © 2004 SAP AG. All rights reserved. iii

About This Handbook AC605
Icons in Body TextThe following icons are used in this handbook.
Icon Meaning
For more information, tips, or background
Note or further explanation of previous point
Exception or caution
Procedures
Indicates that the item is displayed in the instructor�spresentation.
iv © 2004 SAP AG. All rights reserved. 04-02-2005

ContentsCourse Overview ...... . . . . . . . . . . . . . . . . . . . . . . . . . . . . . . . . . . . . . . . . . . . . . . . . . . . . . . . . . . . . . . . . . . . . . . . vii
Course Goals.. . . . . . . . . . . . . . . . . . . . . . . . . . . . . . . . . . . . . . . . . . . . . . . . . . . . . . . . . . . . . . . . . . . . . . . . . . . . . . . .viiCourse Objectives .. . . . . . . . . . . . . . . . . . . . . . . . . . . . . . . . . . . . . . . . . . . . . . . . . . . . . . . . . . . . . . . . . . . . . . . . . . ix
Unit 1: Profitability Management..... . . . . . . . . . . . . . . . . . . . . . . . . . . . . . . . . . . . . . . . . . . . . . . . . . . . . . . .1Overview of Profitability Management .. . . . . . . . . . . . . . . . . . . . . . . . . . . . . . . . . . . . . . . . . . . . . . . . . . . .3Profitability Analysis and Profit Center Accounting.. . . . . . . . . . . . . . . . . . . . . . . . . . . . . . . . . . . . 13Objects and Aspects in Profitability Management ... . . . . . . . . . . . . . . . . . . . . . . . . . . . . . . . . . . . 24
Unit 2: Structures..... . . . . . . . . . . . . . . . . . . . . . . . . . . . . . . . . . . . . . . . . . . . . . . . . . . . . . . . . . . . . . . . . . . . . . . . . 41Overview of Operating Concern .. . . . . . . . . . . . . . . . . . . . . . . . . . . . . . . . . . . . . . . . . . . . . . . . . . . . . . . . . 43Data Structures .. . . . . . . . . . . . . . . . . . . . . . . . . . . . . . . . . . . . . . . . . . . . . . . . . . . . . . . . . . . . . . . . . . . . . . . . . . . . 61
Unit 3: Master Data..... . . . . . . . . . . . . . . . . . . . . . . . . . . . . . . . . . . . . . . . . . . . . . . . . . . . . . . . . . . . . . . . . . . . . . . 89Introduction to Characteristic Derivation and Valuation... . . . . . . . . . . . . . . . . . . . . . . . . . . . . . 91Characteristic Derivation.. . . . . . . . . . . . . . . . . . . . . . . . . . . . . . . . . . . . . . . . . . . . . . . . . . . . . . . . . . . . . . . . . . 97Valuation .. . . . . . . . . . . . . . . . . . . . . . . . . . . . . . . . . . . . . . . . . . . . . . . . . . . . . . . . . . . . . . . . . . . . . . . . . . . . . . . . . . .120
Unit 4: Actual Data ..... . . . . . . . . . . . . . . . . . . . . . . . . . . . . . . . . . . . . . . . . . . . . . . . . . . . . . . . . . . . . . . . . . . . . .163Flow of Actual Data... . . . . . . . . . . . . . . . . . . . . . . . . . . . . . . . . . . . . . . . . . . . . . . . . . . . . . . . . . . . . . . . . . . . . .165Integration with Sales Order Management ... . . . . . . . . . . . . . . . . . . . . . . . . . . . . . . . . . . . . . . . . . .172Transfer of Overhead .. . . . . . . . . . . . . . . . . . . . . . . . . . . . . . . . . . . . . . . . . . . . . . . . . . . . . . . . . . . . . . . . . . . .202Direct Postings .. . . . . . . . . . . . . . . . . . . . . . . . . . . . . . . . . . . . . . . . . . . . . . . . . . . . . . . . . . . . . . . . . . . . . . . . . . . .242Value Flow from Cost Object CO ... . . . . . . . . . . . . . . . . . . . . . . . . . . . . . . . . . . . . . . . . . . . . . . . . . . . . .260
Unit 5: Planning..... . . . . . . . . . . . . . . . . . . . . . . . . . . . . . . . . . . . . . . . . . . . . . . . . . . . . . . . . . . . . . . . . . . . . . . . . .281The Profit Planning Process.. . . . . . . . . . . . . . . . . . . . . . . . . . . . . . . . . . . . . . . . . . . . . . . . . . . . . . . . . . . . .283Planning Methods .. . . . . . . . . . . . . . . . . . . . . . . . . . . . . . . . . . . . . . . . . . . . . . . . . . . . . . . . . . . . . . . . . . . . . . . .297
Unit 6: Information System...... . . . . . . . . . . . . . . . . . . . . . . . . . . . . . . . . . . . . . . . . . . . . . . . . . . . . . . . . . .363Overview of Financial Analytics.. . . . . . . . . . . . . . . . . . . . . . . . . . . . . . . . . . . . . . . . . . . . . . . . . . . . . . . . .365Creating Reports... . . . . . . . . . . . . . . . . . . . . . . . . . . . . . . . . . . . . . . . . . . . . . . . . . . . . . . . . . . . . . . . . . . . . . . . .386Financial Analytics in SAP BI .. . . . . . . . . . . . . . . . . . . . . . . . . . . . . . . . . . . . . . . . . . . . . . . . . . . . . . . . . . .461
04-02-2005 © 2004 SAP AG. All rights reserved. v

Contents AC605
Unit 7: Tools ..... . . . . . . . . . . . . . . . . . . . . . . . . . . . . . . . . . . . . . . . . . . . . . . . . . . . . . . . . . . . . . . . . . . . . . . . . . . . . .477Performance Tools... . . . . . . . . . . . . . . . . . . . . . . . . . . . . . . . . . . . . . . . . . . . . . . . . . . . . . . . . . . . . . . . . . . . . . .479Realignment and Customizing Monitors .. . . . . . . . . . . . . . . . . . . . . . . . . . . . . . . . . . . . . . . . . . . . . . .497
Appendix 1: Appendix ..... . . . . . . . . . . . . . . . . . . . . . . . . . . . . . . . . . . . . . . . . . . . . . . . . . . . . . . . . . . . . . .515
Index ..... . . . . . . . . . . . . . . . . . . . . . . . . . . . . . . . . . . . . . . . . . . . . . . . . . . . . . . . . . . . . . . . . . . . . . . . . . . . . . . . . . . . . . . .551
vi © 2004 SAP AG. All rights reserved. 04-02-2005

Course OverviewThis course describes the functions in profitability analysis and outlines how toimplement the component. It covers how to set up the structures of an operatingconcern and characteristic derivation and valuation. In addition, it explains how theflow of actual values from the SD, FI, and CO modules works. It also examines howto create planning layouts, reports, and report forms.
Target AudienceThis course is intended for the following audiences:
� Project team members from the Management Accounting Departments� Database administrators� Project team members from the Sales and Marketing Departments
Course PrerequisitesRequired Knowledge
� AC040 Business Proceses and Management Accounting� Basic knowledge and experience in cost accounting� Good working knowledge of the Microsoft Windows operating environment
Recommended Knowledge
� SAP01 - SAP Overview
Course Duration DetailsUnit 1:Profitability ManagementOverview of Profitability Management 30 MinutesProfitability Analysis and Profit Center Accounting 30 MinutesObjects and Aspects in Profitability Management 25 Minutes
Unit 2: StructuresOverview of Operating Concern 40 MinutesExercise 1: Operating Concerns 10 MinutesData Structures 50 MinutesExercise 2: Data Structures 15 Minutes
04-02-2005 © 2004 SAP AG. All rights reserved. vii

Course Overview AC605
Exercise 3: Data Structures of the OperatingConcern 15 Minutes
Unit 3: Master DataIntroduction to Characteristic Derivation andValuation 30 Minutes
Characteristic Derivation 40 MinutesExercise 4: Derivation 20 MinutesValuation 50 MinutesExercise 5: Valuation 10 Minutes
Unit 4: Actual DataFlow of Actual Data 30 MinutesIntegration with Sales Order Management 50 MinutesExercise 6: Sales Order Processing 15 MinutesExercise 7: Value Flows between Sales OrderManagement and CO-PA 15 Minutes
Transfer of Overhead 50 MinutesExercise 8: Cost Center Assessment 10 MinutesExercise 9: Internal Orders 15 MinutesExercise 10: Activity Allocation 10 MinutesDirect Postings 35 MinutesExercise 11: Direct Postings from FinancialAccounting 10 Minutes
Exercise 12: Direct Posting from FinancialAccounting/Operations 10 Minutes
Value Flow from Cost Object CO 30 Minutes
Unit 5: PlanningThe Profit Planning Process 30 MinutesPlanning Methods 50 MinutesExercise 13: Manual Planning Functions 15 MinutesExercise 14: Automatic Planning Functions 15 MinutesExercise 15: Integrated Planning Functions 15 Minutes
Unit 6: Information SystemOverview of Financial Analytics 30 MinutesExercise 16: Financial Analytics Overview 15 MinutesCreating Reports 50 MinutesExercise 17: Creating Reports 15 MinutesExercise 18: Report Components 15 MinutesExercise 19: Form Report 10 MinutesExercise 20: Line Item-Based Reports 10 MinutesFinancial Analytics in SAP BI 30 Minutes
viii © 2004 SAP AG. All rights reserved. 04-02-2005

AC605 Course Overview
Unit 7: ToolsPerformance Tools 45 MinutesExercise 21: Performance Tools 15 MinutesExercise 22: Summarization Levels 15 MinutesRealignment and Customizing Monitors 30 MinutesExercise 23: Realignment Concept 15 Minutes
Course GoalsThis course will prepare you to:
� Understand the functions in Profitability Analysis and obtain an insight on howto implement the component
� Explain Profitability Management in an SAP system� Work with CO-PA Structures and Master data� Identify the sources of actual values� Execute Planning� Use the Information system and work with the additional functions in CO-PA
Course ObjectivesAfter completing this course, you will be able to:
� Understand the functions in Profitability Analysis and obtain an insight on howto implement the component
� Set up the structures of an operating concern and examine characteristicderivation and valuation
� Explain how the integration betweenSales Order Management, FinancialAccounting and Management Accounting works
� Create planning layouts, reports, and report forms
SAP Software Component InformationThe information in this course pertains to the following SAP Software Componentsand releases:
Revised: December 2004 for mySAP ERP. You will only find minor changes, asfor example exercises and solutions have been corrected and a terminology updatehas been made. We only changed the terminology in the course book, but not in theinstructor handbook. You find the changes in terminology in the following table:
04-02-2005 © 2004 SAP AG. All rights reserved. ix

Course Overview AC605
old newR/3 system SAP systemcontrolling Management AccountingSD Sales Order ManagementFI Financial Accountingreporting analytics
SAP Contact(s)
Walldorf
N.A.
Subsidiaries
Andrea Anderson - SAP America
Peter Jones - SAP America
Revisions to Previous Instructor Guide
Created on: December 29, 1999
Revised: July, 2003 for release R/3 Enterprise
For Release R/3 Enterprise, you will find only minor changes in the course material.Exercises and solutions have been corrected and four new graphics have beenintegrated.
New graphic �Activity Allocation� in �Flow Data� because from Release R/3Enterprise it is possible to post the cost component split of a price to CO-PA.
New graphic �Variables in Planning� in �Planning� because you can use variables ineither planning levels or planning packages.
New graphic �Copy Plan: Transformation of Characteristics� in �Planning�, whichhighlights a new feature in the copy function.
New graphic �Planning sequence� in �Planning� so you can combine severalautomatic planning functions, such as copy and revaluation in one sequence.
In addition to these new graphics, nothing has changed in the course material.
Course Details
Duration
5 days
x © 2004 SAP AG. All rights reserved. 04-02-2005

AC605 Course Overview
The course has been extended to a standard 5-day course with Release 4.6. There are anumber of optional exercises, which can be used at your discretion.
The appendix contains a number of additional topics, which are not intended to be apart of the course content. Instead, these topics serve the purpose of explaining theconcepts that are not covered in the standard course materials but may come up duringthe course from more experienced participants.
Course Materials and Other Materials (Training Manual)
Normally, you should make use of the standard presentation material for the course.To convey difficult concepts, you can also make use of whiteboards, a flip chart, andan overhead projector.
� Participant handbook� SAP system� Knowledge warehouse� Whiteboards� Flip chart� Overhead projector
Country-Specific Chapters
None
Course Instructor Profiles
Level of Knowledge Required
In-depth knowledge of managerial accounting theory. Familiarity with the course,AC040. Basic knowledge of the sales order management module, such as pricing,sales, and billing, and the financial accounting module.
Should already have held CO courses. The course, AC410, is particularly helpful.Notice that AC605 should not be the first CO course that you are holding.
Recommended Preparatory Courses
AC040 Cost Management and Controlling
AC410 Cost Center Accounting
AC415 Overhead Orders
AC505 Product Cost Planning
AC510 Cost Object Controlling for Products
AC515 Cost Object Controlling for Sales Orders
04-02-2005 © 2004 SAP AG. All rights reserved. xi

Course Overview AC605
AC610 Profit Center Accounting
The level 2 courses in financial accounting and sales order management are alsorecommended. Extensive knowledge of the sales order management module, such aspricing, sales, and billing, is extremely advantageous.
Recommended Preparatory Online Help
WinHelp documentation for the CO-PA module.
CO-PA Implementation Guide.
IDES Demo Scripts for CO-PA.
Hints on Preparing This Course
To conduct this course successfully, it is a good idea to attend the above recommendedcourses and work through the course flow and exercises. Attend the course whenanother instructor holds it, and make sure to co-teach the course at least one timebefore venturing out on your own. CO-PA touches a lot of functions within andbeyond the CO application, which you will not immediately be familiar with. Topractice further, there are some excellent demo scripts in the IDES system.
Training System
Required Data
Refer to Example Data for the Instructor section.
User IDs and Password for Course Participants
User IDs: Create your own
Password: INIT
To create participant user IDs, use the transaction, ZUSR, and copy the user AC605-99(!). This user has been set up with a special authorization profile that prevents usersfrom maintaining the operating concern tables. If you decide to copy any other user,you must be aware that you will encounter major problems during class. This isbecause only one operating concern is available for each course and it should bemaintained only by you.
System Preparation
A CATT has been created to post a goods receipt of 10000 pieces to the stock for thematerial, P-100, in the storage location, 0002. This CATT should be automaticallyexecuted before class but you many want to check the balance on hand. If no stock isavailable, use:
Movement type: 501
xii © 2004 SAP AG. All rights reserved. 04-02-2005

AC605 Course Overview
Plant: 1000
Storage location: 0002
Material: P-100
Quantity: 1000
Logistics→Materials management→ Inventory management→ Goods movement→ Goods receipt→ Other
Master data, such as the customer numbers for each participant and for the course,is already available in the training system. The required transaction data also exists.The course instructor or participants during the course create some of the requiredtransaction data.
If you want to switch off the locking mechanism to maintain tables, use the transaction,SE38, to start the ZSENQOFF program. (The ZSENQON program switches thelocking mechanism back on again.) Switch ENQ to off.
Example ABAPs
None
Technical Hints
Because this course covers both the costing-based and account-based approacheswithin Profitability Analysis, there are points at which you can choose to demonstrateeither the costing-based or the account-based approach. As most customers usecosting-based CO-PA while using the account-based approach either additionally ornot at all, this course focuses on the costing-based approach. In fact, account-basedPA is less discussed in the presentation materials but there are a number of optionalexercises available, which work with account-based PA.
When examples in the system are used, you can assume that the examples arecosting-based. If the account-based approach is used, such as a report for theaccount-based approach is defined, it is explicitly stated.
Most customizing examples indicate customizing in CO-PA. The transaction code,ORKE, supports all the required configuration menu paths. The transaction code,SPRO, accesses the IMG in general. The menu paths to access the IMG will not berepeated in the following scripts.
Example Data
Data in the training systemOperating concern IDEAControlling area 1000
04-02-2005 © 2004 SAP AG. All rights reserved. xiii
Course Overview AC605
Company code 1000Sales organization 1000Distribution channel 10Plant 1000Storage location 0002, 0001Shipping point 1000Division 00Material P-100, P-101, P-102, P-103, M-01 to
M-20Customer 1000, T-CO05 A01 through T-CO05
A20 (participants)Order type OR, TA (Customer order)Order type 0450 (Internal order)Cost center 3200 (Assessment)Assessment cost element 691000Primary cost element VariousG/L account 113100Cost center 4120 (Activity allocation)Activity type 1412Currency UNIBusiness area 1000Plan version VariousCosting sheet ACT001
The transaction data for the Actual Data unit is generated using the above information.
Predefined planning layouts, report forms, and reports for the Planning andInformation System units are available in the IDES system. It is a good idea to defineyour own planning layouts, report forms, and reports during the course so that theparticipants get a better idea of how this is done. Course specific reports and layoutshave been created as samples.
This course teaches participants how to set up and use Profitability Analysis and howto adjust the system to company-specific requirements in the planning and informationsystem areas. It also introduces the interfaces for the flow of actual values.
xiv © 2004 SAP AG. All rights reserved. 04-02-2005

AC605 Course Overview
Course Structure and Flow
Units 1 through 3 introduce the Profitability Analysis application and ProfitabilityAnalysis customizing. The Actual Data, Planning, and Information System unitsprovide further information. Finally, unit 7 takes a closer look at additionalProfitability Analysis functions.
The following paragraphs provide a brief introduction to the important topics withineach unit:
The Profitability Management unit introduces participants to profitability accountingin the SAP system and highlights the differences between the CO-PA module andthe EC-PCA module. This is done by comparing the two modules in the light ofvarious criteria.
The Structures unit describes the individual structures in Profitability Analysis andteaches participants how to set up an operating concern within Customizing.
The Master Data unit introduces the concepts of characteristic derivation andvaluation. This unit explains how to customize characteristic derivation and set upthe valuation for costing-based Profitability Analysis.
The Actual Data unit manages the various sources of Profitability Analysis data, suchas billing documents, cost center, cost assessment, and order settlement.
The Planning unit demonstrates the planning methods supported in ProfitabilityAnalysis. Participants are given an overview of the planning functions for manualand automatic planning. Integrated planning within Profitability Analysis is outlinedextensively.
The Information System unit conveys elaborate information about the drill-downanalytics functions. Participants are additionally taught how to create their ownreports and report forms and to use the line item analytics function.
The Tools unit describes the various tools that have often proved essential for thesuccessful implementation of Profitability Analysis. The topics, Performance Tuningand Realignments, are discussed.
In addition, a lesson has been added to address the Workplace in context withProfitability Analysis. This lesson is optional and at your discretion. At the time ofpublishing, no system strategy for Workplaces was in place, so no demos have beenbuilt at this point.
You can easily make up time in the Information System unit by reducing the numberof exercises done. If you have been particularly quick, you can stretch the courseusing the numerous exercises provided. The Tools unit can also be handled either verybriefly or extensively and the exercises should also be seen as optional.
04-02-2005 © 2004 SAP AG. All rights reserved. xv

Course Overview AC605
Familiarize the participants with the organizational aspects of the course. Describe thecourse goals and the course content. Give participants the opportunity to introducethemselves to the group, say what relevant experience they have, and explain whatthey expect to gain from the course. Show the participants the overview diagram forthe course. It is designed to give an overview of the course flow. The main businessscenario is designed to introduce the example company, which will be used throughoutthe course. Further business scenarios add more information to the initial picture.
Should participants not be familiar with the role-based Easy Access menu, you maywant to explain some tips and tricks. You can have participants add a favorite for thetransactions, ORKE and SPRO, so they do not have to go through the menu pathevery time.
xvi © 2004 SAP AG. All rights reserved. 04-02-2005

Unit 11 Profitability Management
Describe the business purposes of Profitability Analysis and Profit Center Accountingin SAP system. Identify the information that can be obtained in ProfitabilityAnalysis and Profit Center Accounting. Clarify the aspect and scope of ProfitabilityManagement in SAP system.
Unit OverviewThis unit provides a general overview of the various methods used to analyze theprofits in an SAP system. The emphasis is on comparing and contrasting the CO-PAand EC-PCA. The EC-EIS, SIS, and Special Ledger are also capable of creating certainprofitability-oriented reports but are not suitable for classical profitability accounting.This unit also helps you to decide when to use the CO-PA and EC-PCA modules.
Unit ObjectivesAfter completing this unit, you will be able to:
� Understand the terminology and aim of profitability management� Identify the methods of profitability management� Explain the views of profitability management� Explain the purpose of profitability analysis and profit center accounting� Explain integration within accounting� Describe the flows in the actual values in profitability analysis and profit center
accounting� Identify the objects in profitability management� Identify the various aspects in profitability management
Unit ContentsLesson: Overview of Profitability Management .. . . . . . . . . . . . . . . . . . . . . . . . . . . . . . . . . . .3
04-02-2005 © 2004 SAP AG. All rights reserved. 1

Unit 1: Profitability Management AC605
Lesson: Profitability Analysis and Profit Center Accounting .. . . . . . . . . . . . . . . . . . 13Lesson: Objects and Aspects in Profitability Management... . . . . . . . . . . . . . . . . . . 24
Demonstration: Differences between CO-PA and EC-PCA.... . . . . . . . . . . . . 31
2 © 2004 SAP AG. All rights reserved. 04-02-2005

AC605 Lesson: Overview of Profitability Management
Lesson:2
Overview of Profitability ManagementLesson Duration: 30 Minutes
Lesson OverviewThis lesson explains the terminology and cost accounting methods used in profitabilitymanagement. It also helps you to identify the methods and the different views ofprofitability management.
Lesson ObjectivesAfter completing this lesson, you will be able to:
� Understand the terminology and aim of profitability management� Identify the methods of profitability management� Explain the views of profitability management
Describe to the participants, the terminology and cost accounting methods inprofitability management. Identify extensively, the methods of profitabilitymanagement and the views of profitability management. Examine the businesspurposes of Profitability Analysis and Profit Center Accounting in SAP system.
Business ExampleThe management of your company wants to implement a profitability accountingapplication in your SAP system. As a member of your project team, you are supposedto advise on the question of whether to implement CO-PA or EC-PCA. You then willbe responsible to implement the selected applications.
The corporation has legal entities in Germany, Italy, and the United States, and itrequires the ability to report sales and profitability both across the corporation ina corporate currency and within each of the legal entities in their local currencies.The sales managers, Sam Sales and Randy Revenue, require summarized salesperformance figures, such as revenue, discounts, and surcharges, both along as well asacross the lines of the sales structure, product lines, and customers of the company.They also require sales and marketing expenses along these lines. The companyPresident, Bob Big, wants all the month-end costs, such as freight and G and Aexpenses, accrued in Management Accounting but not in Finacial Accounting duringthe month. This is to enable bottom-line profitability to be estimated at any time.At the month-end, he wants the actual costs in Management Accounting allocatedrealistically across sales channels and responsibility areas. The accountant, Carrie
04-02-2005 © 2004 SAP AG. All rights reserved. 3

Unit 1: Profitability Management AC605
Cash, requires profitability reports at the month-end along the areas of responsibilityof the company, such as plants or departments. In addition, she wants to track capitalinvestments, such as assets, and report on certain financial key performance indicators.
As a result, both cross-company and company-specific reporting is required, inmultiple currencies. Multidimensional profit and loss reporting across elements of thesales force, product lines, customers, and other organizational units is required. Salesinformation, cost-of-sales information, contribution margins, production variances,and period cost information are required. The actual period costs (S, G, and A) are tobe allocated across organizational entities at the month-end. Reporting for CapitalInvestments and P and L accounts is required.
Definition and Aim of Profitability Management
The first task is to convey that CO-PA is a market-oriented Profitability Analysismodule and, for this reason, has the corresponding analytics functions. Theobjects considered in CO-PA, which represent market segments, also support thismarket-oriented view. The Module, EC-PCA, conversely, is designed for internalor company-oriented Profitability Analysis. Its purpose is to determine an internaloperating profit for the various corporate units. The reports in the module, EC-PCA,are capable of additionally displaying selected balance sheet items, as opposed to theCO-PA module, which displays only costs and revenues.
A further point, which needs clarifying, is the difference between the cost-of-salesaccounting approach and the period accounting approach. The period accountingapproach distinguishes between individual cost and revenue elements, such as materialcosts. The total costs for the period are compared with the total operating output forthe period. The output of products manufactured within the period but not yet sold,stock increases, are added to the sales revenues. The costs of the products producedin past periods but sold in this period, stock decreases, are taken away. Togetherwith additional capitalized internal activities and other revenues, this yields the totaloperating output for the period.
4 © 2004 SAP AG. All rights reserved. 04-02-2005

AC605 Lesson: Overview of Profitability Management
Figure 1: Terminology in Profitability Management
All terms on this graphic represent the key figures used in profitability accounting.The items highlighted in italics represent the values that can be analyzed inProfitability Analysis and also in profit center accounting. All others key figures canbe analyzed in profit center accounting.
04-02-2005 © 2004 SAP AG. All rights reserved. 5

Unit 1: Profitability Management AC605
Figure 2: Cost Accounting Methods
Profitability Reporting can be executed at various levels of detail. In a Distributionbusiness environment, the detailed product cost information is not required so a fullabsorption approach may be sufficient to analyze profitability.
In a standard, manufacturing, costing environment, the breakdown into fixed andvariable standards may be important when analyzing profitability.
To reflect the periodic actual cost, fixed and variable standard cost plus variance maybe added to analyze contribution margins.
Some companies prefer to analyze their contribution margin based on a periodicactual cost, which can be captured in the Material Ledger.
6 © 2004 SAP AG. All rights reserved. 04-02-2005

AC605 Lesson: Overview of Profitability Management
Figure 3: Unit Summary: Profitability Management (1)
Figure 4: Unit Summary: Profitability Management (2)
Methods of Profitability Management
In the cost-of-sales accounting approach, there is no differentiation according to costelements. Here, the sales revenues are compared with the manufacturing costs for theproducts sold, known as cost of sale. The manufacturing costs may include materialand personnel costs, which were incurred in previous periods. The costs that cannot
04-02-2005 © 2004 SAP AG. All rights reserved. 7

Unit 1: Profitability Management AC605
be directly assigned to the sale, such as sales and administration costs, are displayedseparately. The cost-of-sales procedure, for this reason, also indicates the whereaboutsin the company costs incurred.
Figure 5: Methods of Profitability Management
The two accounting methods used for generating profitability statements are thecost-of-sales method and the period accounting method. Applying either methodto a given set of business transactions under a given set of laws yields the samebottom-line result, profit, in concept. The difference is in how the overall profit andloss picture is presented.
Companies must choose to use one of these methods for generating their legal financialstatements. The choice is often determined by the country-specific legal requirements.
Cost-of-sales accounting
With this method, the emphasis is on matching the revenues for goods or servicesprovided, or both, such as the value that a company gains as a result of sales againstthe related expenses for the items for which the value is lost when products aretransferred out of the company. As a result, this accounting method displays the profitand loss information in a way optimized for conducting margin analyses, and as suchit is optimal for the sales, marketing, and product management areas.
Period accounting
8 © 2004 SAP AG. All rights reserved. 04-02-2005

AC605 Lesson: Overview of Profitability Management
With this method, the emphasis is on summarizing the activity and situational changeover a period of time for a given organizational unit. As a result, this accountingmethod presents the revenues and primary expenses that have been incurred duringa given period of time and the changes in stock value levels, work-in-process, andcapitalized activities. As such, it is optimal for the production and profit center areas.
Views of Profitability Management
It is also important to introduce the two types of profitability analysis in CO-PA.Costing-based profitability analysis uses the defined value fields, which represent thecost and revenue element groups. The advantage here is that these value fields allowuser-defined details in drill-down analytics. A further advantage is that the data canbe valuated using a product cost estimate. With the help of conditions, you can alsocalculate certain values, such as commissions for commercial representatives, to beincluded as estimated values in your analyses.
Account-based profitability analysis helps to ensure that Management Accountingand Financial Accounting are reconciled on the account level at all times. In theaccount-based approach, all costs and revenues are transferred simultaneously toFinancial Accounting and Profitability Analysis. The cost of sales, which is posted toProfitability Analysis when goods are issued, is of particular importance for CO-PA.
Figure 6: Views of Profitability Management
04-02-2005 © 2004 SAP AG. All rights reserved. 9

Unit 1: Profitability Management AC605
Sales Reporting
CO-PA allows you to analyze the profitability of specific market segments,structured according to products, customers, and summarizations of these and othercharacteristics as well as organizational units, such as company codes or businessareas. The aim is to provide your sales, marketing, product management and businessplanning departments with the market-oriented controlling information to support thedecision-making process.
Responsibility Reporting
You can use EC-PCA to analyze internal profit and loss for profit centers. This allowsyou to evaluate the different areas or units within your company. You can structure theprofit centers of your company according to region, such as branch offices and plants,or functions, such as production and sales, or products, such as product ranges anddivisions. Profit Center Accounting is a component of Enterprise Controlling.
10 © 2004 SAP AG. All rights reserved. 04-02-2005

AC605 Lesson: Overview of Profitability Management
Facilitated Discussion
Discussion QuestionsUse the following questions to engage the participants in the discussion.Feel free touse your own additional questions.
� Discuss the different methods of profitability management.
04-02-2005 © 2004 SAP AG. All rights reserved. 11

Unit 1: Profitability Management AC605
Lesson Summary
You should now be able to:� Understand the terminology and aim of profitability management� Identify the methods of profitability management� Explain the views of profitability management
12 © 2004 SAP AG. All rights reserved. 04-02-2005

AC605 Lesson: Profitability Analysis and Profit Center Accounting
Lesson:9
Profitability Analysis and Profit Center AccountingLesson Duration: 30 Minutes
Lesson OverviewThis lesson explains the concept of integration within accounting. It also describes theflows in the actual values in profitability analysis and profit center accounting.
Lesson ObjectivesAfter completing this lesson, you will be able to:
� Explain the purpose of profitability analysis and profit center accounting� Explain integration within accounting� Describe the flows in the actual values in profitability analysis and profit center
accounting
Outline the purpose of profitability analysis and profit center accounting to theparticipants. Examine the integration within accounting and the flows in the actualvalues in profitability analysis.
Business ExampleThe corporation has legal entities in Germany, Italy, and the United States, and itrequires the ability to report sales and profitability both across the corporation in acorporate currency and within each of the legal entities in their local currencies. Thesales managers, Sam Sales and Randy Revenue, require summarized sales performancefigures, such as revenue, discounts, and surcharges both along as well as across thelines of the sales structure, product lines, and customers of the company. They alsorequire sales and marketing expenses along these lines. The company President, BobBig, wants all the month-end costs, such as freight and G&A expenses, accrued inCO but not in FI during the month. This is to enable bottom line profitability to beestimated at any time. At the month-end, he wants the actual costs in CO allocatedrealistically across the sales channels and responsibility areas. The accountant, CarrieCash, requires profitability reports at the month-end along the areas of responsibilityof the company, such as plants or departments. In addition, she wants to track capitalinvestments, such as assets, and report on certain financial key performance indicators.
As a result, both cross-company and company-specific reporting is required inmultiple currencies. Multidimensional profit and loss reporting across elements of thesales force, product lines, customers, and other organizational units is required. Sales
04-02-2005 © 2004 SAP AG. All rights reserved. 13

Unit 1: Profitability Management AC605
information, cost-of-sales information, contribution margins, production variances,and period cost information are required. The actual period costs (S, G, & A) are tobe allocated across organizational entities at the month-end. Reporting for CapitalInvestments and P & L accounts is required.
For this purpose, you need to understand profitability analysis and profit centeraccounting.
Introduction to Profitability Analysis and Profit CenterAccounting
This topic is designed to help users decide in which cases it makes sense to usethe CO-PA module and when to use the EC-PCA module. It is very important thatparticipants are made aware of the fact that there are not always clear-cut criteria fordeciding when to use the CO-PA module. In addition, users must reach an individualdecision for their particular company based on the listed criteria. The aim is forparticipants to understand where SAP positions the Profitability Analysis module.
Figure 7: Typical Questions in Profitability Analysis
The best way to show the purpose of Profitability Management in the SAP systemis to think about some of the typical questions that can be answered, in this casewith Profitability Analysis.
14 © 2004 SAP AG. All rights reserved. 04-02-2005

AC605 Lesson: Profitability Analysis and Profit Center Accounting
Figure 8: Profitability Analysis by Market Segments
The business purpose of Profitability Analysis is to provide profitability-orientedperformance information on the market segments or sales channels of a companyto support corporate planning and decision-making, especially in the areas of salesand marketing.
The definitions of both market segments and performance figures are freely definable,allowing for maximum flexibility in market evaluation. The definition of a marketis configured in the system through the selection of characteristics that are to be thesubjects of analyses. Performance figures may either be profit and loss accountbalances or freely defined value fields.
Market segments are normally some combination of information regardingcustomers, products, and the selling organization. Performance figures are normallymeasurements of quantities, revenues, discounts, surcharges, product costs, margins,and period costs.
The results of Profitability Analysis can be analyzed with a multidimensionalreporting tool, which allows the dynamic sorting and rearranging of data to providemultiple perspectives within a single report.
04-02-2005 © 2004 SAP AG. All rights reserved. 15

Unit 1: Profitability Management AC605
Figure 9: Typical Questions in Profit Center Accounting
The best way to show the purpose of Profitability Management in the SAP system isto think about some of the typical questions which can be answered, in this case forprofit center accounting.
Figure 10: Responsibility Reporting
16 © 2004 SAP AG. All rights reserved. 04-02-2005

AC605 Lesson: Profitability Analysis and Profit Center Accounting
EC-PCA allows you to calculate the internal operating results for profit centers. Aprofit center represents an organizational subunit that operates independently on themarket and bears responsibility for its own costs and revenues. You organize yourorganization into profit centers by assigning the master data of each profit-relevantobject, such as materials, cost center, order, project, sales order, asset, cost object, andprofitability segment, to a profit center.
All the business transactions in the SAP system that are relevant for cost and profitsare updated in the profit centers in this hierarchy structure at the same time they areprocessed in the original component and organized according to cost and revenueelements. This transforms all the flows of goods and services within the company intoexchanges of goods and services between profit centers. This profit center structureapplies for both actual postings and profit center plan data.
You can also regard a profit center as an investment center. In addition to the flowsof goods and services, you can transfer the selected balance sheet line items, such asfixed assets, payables and receivables, material stocks, and work in process, to profitcenters on a periodic basis. This allows you to calculate key figures, such as profit onsales, return on investment, and cash flow.
Figure 11: Reporting
04-02-2005 © 2004 SAP AG. All rights reserved. 17

Unit 1: Profitability Management AC605
The method of determining period operating results in Profitability Analysis is basedon the assumption that the success of a company can be measured primarily onthe basis of its transactions with other companies. The aim is to supply the sales,marketing, product management, controlling, and corporate planning teams withdecision-support information.
This sales-oriented approach in CO-PA means that no contribution to the success ofthe organization is made until a sales transaction has been completed. As a result, theproducts sold are transferred to CO-PA in accordance with the cost-of-sales accountingmethod and provide the information about the sales revenue and sales deductions.
This net revenue is then compared with the cost of sales. The costs consist of thecost of goods manufactured of the products sold or the services rendered plus anyproduction variances known.
To complete your profitability data, you can also assign the overhead costs toprofitability segments in the course of your period-end closing activities.
Concept of Integration within Accounting
Value Flows and Reconciliation with Financial Accounting is a further decisivepoint. Individually defined value fields, which combine several cost and revenueelements, valuation with the help of a product cost estimate for materials, the use ofestimated costs or sales deductions, and reconciliation of costing-based ProfitabilityAnalysis with Financial Accounting are factors can prove very difficult, if notimpossible. Emphasize that the purpose of costing-based profitability analysis isnot to ensure that Profitability Analysis is reconciled with Financial Accounting.If this is required, account-based profitability analysis can be run in parallel withcosting-based profitability analysis. Because account-based profitability analysisdisplays cost and revenue elements and the values are posted at exactly the same timeas in Financial Accounting, comparison and reconciliation is much easier. In additionto this, the reconciliation ledger can be used to reconcile Financial Accounting andcost accounting.
18 © 2004 SAP AG. All rights reserved. 04-02-2005

AC605 Lesson: Profitability Analysis and Profit Center Accounting
Figure 12: The Concept of Integration within Accounting
The Management Accounting contains all the accounting functions required foreffective controlling. If an organization divides accounting into internal and externalviewpoints, Management Accounting>P represents internal accounting because itprovides information for managers, which means to the individuals who are inside anorganization and who are charged with directing and controlling its operations.
Management Accounting includes cost and revenue accounting and together withthe component, Profit Center Accounting, EC-PCA, it offers all the controllingopportunities without being limited to the legal structures used in FinancialAccounting.
Management Accounting is made up of multiple application components optimized forprocessing different approaches to managerial accounting. Management Accountinganswers the following typical questions by means of the appropriate component:
� What costs occur within our organization? (CO-OM)� What does producing a product or providing a service cost our organization?
(CO-PC)� In which market segments are we successful? (CO-PA)� How profitable are our individual organizational areas (Profit Centers)?
(EC-PCA)
04-02-2005 © 2004 SAP AG. All rights reserved. 19

Unit 1: Profitability Management AC605
Flows of Actual Values
Figure 13: Flows of Actual Values in Profitability Analysis
Actual Postings represent the most important source of information in CO-PA. Youcan transfer both sales orders and billing documents from the Sales and Distribution,SD, application component to CO-PA in real-time. In addition, an interface programis available to enable you to transfer external data to the SAP system. You can alsotransfer the costs from cost centers, orders, and projects as well as the costs andrevenues from direct postings, G/L account postings in FI, and the orders received inoperations, or settle the costs from CO to profitability segments.
In costing-based CO-PA, you can valuate the incoming sales orders or billingdocuments to automatically determine the anticipated sales deductions or costs. Youcan also revaluate your data periodically to adjust the initial, real-time valuation oradd the actual costs of goods manufactured.
20 © 2004 SAP AG. All rights reserved. 04-02-2005

AC605 Lesson: Profitability Analysis and Profit Center Accounting
Figure 14: Flows of Actual Values in Profit Center Accounting
Profit Center Accounting, EC-PCA, is a statistical accounting component. This meansthat it takes the transaction data posted in other components and represents it from aprofit-center-oriented point of view. The postings in EC-PCA are statistical postingsbecause the profit center is not itself an account assignment object in ManagementAccounting.
The integration of the SAP system makes it possible to post profit-relevant data toProfit Center Accounting automatically when the transaction is posted. The systemeither transfers the relevant items from the original postings or creates additionalpostings.
04-02-2005 © 2004 SAP AG. All rights reserved. 21

Unit 1: Profitability Management AC605
Facilitated Discussion
Discussion QuestionsUse the following questions to engage the participants in the discussion.Feel free touse your own additional questions.
� Discuss some typical questions that show the purpose of profitability analysisand profit center accounting.
22 © 2004 SAP AG. All rights reserved. 04-02-2005

AC605 Lesson: Profitability Analysis and Profit Center Accounting
Lesson Summary
You should now be able to:� Explain the purpose of profitability analysis and profit center accounting� Explain integration within accounting� Describe the flows in the actual values in profitability analysis and profit center
accounting
04-02-2005 © 2004 SAP AG. All rights reserved. 23

Unit 1: Profitability Management AC605
Lesson:18
Objects and Aspects in Profitability ManagementLesson Duration: 25 Minutes
Lesson OverviewThis lesson describes the objects and aspects in profitability management.
Lesson ObjectivesAfter completing this lesson, you will be able to:
� Identify the objects in profitability management� Identify the various aspects in profitability management
Inform the participants about the objects in profitability management. Ensure thatthey are aware of the parallel currencies. Explain extensively the various views inprofitability management.
Business ExampleThe management of your company wants to implement a profitability accountingapplication in the SAP system. As a member of the project team, you are supposedto advise on the question of whether to implement CO-PA or EC-PCA in the SAPsystem. You then will be responsible to implement the selected applications.
The corporation has legal entities in Germany, Italy, and the United States, and itrequires the ability to report sales and profitability both across the corporation ina corporate currency and within each of the legal entities in their local currencies.The sales managers, Sam Sales and Randy Revenue, require summarized salesperformance figures, such as revenue, discounts, and surcharges, both along as well asacross the lines of the sales structure, product lines, and customers of the company.They also require sales and marketing expenses along these lines. The companyPresident, Bob Big, wants all the month-end costs, such as freight and G and Aexpenses, accrued in Management Accounting but not in Financial Accounting duringthe month. This is to estimate bottom-line profitability at any time. At the month-end,he wants the actual costs in Management Accounting allocated realistically acrosssales channels and responsibility areas. The accountant, Carrie Cash, requiresprofitability reports at the month-end along the areas of responsibility of the company,such as plants or departments. In addition, she wants to track capital investments, suchas assets, and report on certain financial key performance indicators.
24 © 2004 SAP AG. All rights reserved. 04-02-2005

AC605 Lesson: Objects and Aspects in Profitability Management
As a result, both cross-company and company-specific reporting is required inmultiple currencies. Multidimensional profit and loss reporting across the elements ofthe sales force, product lines, customers, and other organizational units is required.Sales information, cost-of-sales information, contribution margins, productionvariances, and period cost information are required. Actual period costs (S, G, andA) are to be allocated across organizational entities at the month-end. Reporting forCapital Investments and P and L accounts is required.
For this purpose, you need to know about objects and aspects, such as organizationalstructure, currencies, and transfer prices.
Objects in Profitability Management
Figure 15: Objects in Profitability Management
Profitability segments are the market channels or strategic business units that are tobe analyzed in CO-PA. They may be combinations of product, customer, and salesstructure information, and may encompass company code, business area, and profitcenter information, or both.
Because reporting margins and other profitability figures along marketing lines, asdefined by these profitability segments, are the primary purpose of CO-PA, its designhas been optimized for producing profit and loss statements under the cost-of-salesaccounting format and philosophy.
04-02-2005 © 2004 SAP AG. All rights reserved. 25

Unit 1: Profitability Management AC605
Profit centers are areas of responsibility within a company for revenues and expenses,as well as certain assets and liabilities in some cases. All profit centers are arrangedinto a standard hierarchy representing the entire organization.
Because reporting performance information along responsibility-orientedorganizational lines, as defined by this profit center hierarchy, is the primary purposeof EC-PCA, its design has been optimized for producing profit and loss statementsunder the period accounting format and philosophy. Notice that the cost-of-salesaccounting in EC-PCA can also be undertaken with the aid of functional areas.
Aspects in Profitability Management
Familiarize participants with organizational units. Briefly explain where to defineindividual company units, such as the Management Accounting area. The mostimportant issue here is the operating concern. In addition, emphasize how the salesorganization and the plant are integrated in the corporate structure.
Currencies are a further central issue. Three currencies can be stored in EC-PCA.Three currencies are automatically stored in account-based Profitability Analysis. InRelease 4.0, the operating concern currency and the company code currency can bestored in parallel in costing-based Profitability Analysis. Emphasize that this leads toan increase in the data volume in CO-PA.
Finally, give a summary of the differences between CO-PA and EC-PCA. Explain thatParallel Valuation represents the concept of looking at profitability from an internaland external standpoint. The implication here is that from Release 4.5, Transfer Pricesand parallel valuation views can be reflected in CO-PA.
26 © 2004 SAP AG. All rights reserved. 04-02-2005

AC605 Lesson: Objects and Aspects in Profitability Management
Figure 16: Organizational Units and Master Data
The operating concern is the highest reporting level within CO-PA. It defines thelimit of the sales and marketing information that can be reported together from thismodule. One or more controlling areas are assigned to an operating concern whenorganizational structures are defined. In most cases, corporations have only a singleoperating concern, which is recommended for the sake of simplicity and convenienceif all controlling areas and company codes share the same fiscal calendar.
The controlling area is an organizational unit delimiting the independent costaccounting operations of the organization, such as cost center accounting, profit centeraccounting, and order accounting. Company codes are assigned to controlling areaswhen organizational structures are defined. To a large extent, a 1:1 relationship existsbetween the company code and the controlling area. Notice that a controlling areacan also incorporate several company codes to take cross-company cost allocationsinto account.
The company code is an independent accounting unit within a client. The legalrequirements of a balance sheet or a profit and loss statement are fulfilled on thecompany code level. Plants are assigned to company codes when organizationalstructures are defined.
The plant represents a production facility. It is the primary organizational unit inoperations and manufacturing.
04-02-2005 © 2004 SAP AG. All rights reserved. 27

Unit 1: Profitability Management AC605
Figure 17: Parallel Currencies in Profitability Management
In costing-based CO-PA, all amounts are stored in an operating concern currency,which is specified in operating concern attributes.
You can configure the attributes to store values in the local currency as well. This hasthe effect of doubling the stored transaction data.
Account-based CO-PA stores all transactions in three currencies, transaction currency,local currency, and controlling area currency.
Profit Center Accounting can store transactions in the transaction currency, localcurrency, and a special profit center accounting currency.
28 © 2004 SAP AG. All rights reserved. 04-02-2005

AC605 Lesson: Objects and Aspects in Profitability Management
Figure 18: Different Views of a Corporation
Different decision-makers in a company need different types of information.
For this reason, the ones responsible for the individual group companies requireprofitability data to be represented from the viewpoint of each company code and tomatch the income statement from external reporting.
For the group head office, the group as a whole is normally the most important view.This means that the basis for decision-making requires the group to be represented asa business unit to eliminate intercompany profits.
If company units, such as profit centers, are to be run as independent companies,profit center managers require the equivalent type of information. In such cases, salesbetween profit centers within a company are also taken into consideration.
04-02-2005 © 2004 SAP AG. All rights reserved. 29

Unit 1: Profitability Management AC605
Figure 19: Different Views in CO-PA
Profitability analysis must provide the appropriate information form the right basis fordecision making.
The individuals responsible for the group need to obtain a group result through thecompany results of the legally independent units. The same company results shouldalso allow profit center managers to arrive at a profit center result. This means theyshould be able to carry out profitability analysis using transfer prices.
30 © 2004 SAP AG. All rights reserved. 04-02-2005

AC605 Lesson: Objects and Aspects in Profitability Management
Figure 20: Transfer Prices in CO-PA
In Release 4.5, sales between profit centers can be shown in CO-PA. In Release 4.5,sales between profit centers can be shown in CO-PA.
When you customize CO-PA, you decide whether you want to store the profit centervaluation there.
Technically, the profit center valuation is updated in a separate ledger. This meansthe Ledger field is used in the CO-PA tables to distinguish the different valuationapproaches.
Demonstration: Differences between CO-PA and EC-PCA
PurposeTo demonstrate the differences between CO-PA and EC-PCA
System DataSystem:Client:User ID:Password:Set up instructions:1. Show a typical CO-PA report, such as the report, AC040. Do not spend too much
time on navigation and information but instead position this demonstration as apreview of what participants are aiming for.
04-02-2005 © 2004 SAP AG. All rights reserved. 31

Unit 1: Profitability Management AC605
Emphasize the multiple dimensions, full contribution margin results, and detailversus drill-down list.
Briefly demonstrate how to move through the report. The most important thing atthis stage is for the participants to realize what characteristics and value fields areand which information they can be used to access within Profitability Analysis.
Accounting→ Controlling→ Profitability analysis→ Information System→Execute Report: AC040
Accept the defaults: Year 2000, Version 100.
2. Show a typical cost-of-sales PCA report.
Accounting→ Controlling→ PCA→ Information Systems→ Reports→Interactive Reports→ Profit Center
Group: Plan/Act/Variance:
Period 1-12
Fiscal Year: 1999
Controlling Area: 1000PC
Group : H1000
P and L Accounts: OAS
Period 1 � 12
Version 0
3. Demonstrate how the participants access the various information sources in thetraining system (SAP system documentation, IMG documentation, and extendedhelp options).
Help→ R/3 library
32 © 2004 SAP AG. All rights reserved. 04-02-2005

AC605 Lesson: Objects and Aspects in Profitability Management
Facilitated Discussion
Discussion QuestionsUse the following questions to engage the participants in the discussion.Feel free touse your own additional questions.
� Different decision-makers in a company need different types of information.Explain that the requirement of profitability data varies with respect to thedifferent types of information.
04-02-2005 © 2004 SAP AG. All rights reserved. 33

Unit 1: Profitability Management AC605
Lesson Summary
You should now be able to:� Identify the objects in profitability management� Identify the various aspects in profitability management
34 © 2004 SAP AG. All rights reserved. 04-02-2005

AC605 Unit Summary
Unit SummaryYou should now be able to:� Understand the terminology and aim of profitability management� Identify the methods of profitability management� Explain the views of profitability management� Explain the purpose of profitability analysis and profit center accounting� Explain integration within accounting� Describe the flows in the actual values in profitability analysis and profit center
accounting� Identify the objects in profitability management� Identify the various aspects in profitability management
04-02-2005 © 2004 SAP AG. All rights reserved. 35

Unit Summary AC605
36 © 2004 SAP AG. All rights reserved. 04-02-2005

AC605 Test Your Knowledge
27Test Your Knowledge
1. The Full Absorption Costing accounting method can be analyzed only inprofitability analysis.Determine whether this statement is true or false.□ True□ False
2. The choice of one of the accounting methods is often determined by thecountry-specific legal requirements.Determine whether this statement is true or false.□ True□ False
3. The emphasis of the accounting method is onmatching the revenues for goods or services provided against the relatedexpenses for the items.Fill in the blanks to complete the sentence.
4. Briefly explain the view of responsibility reporting.
5. allows you to calculate the internal operating results forprofit centers.Fill in the blanks to complete the sentence.
6. CO includes cost and revenue accounting and together with the component,Profit Center Accounting (EC-PCA), it offers all the controllingopportunities without being limited to the legal structures used in
.Fill in the blanks to complete the sentence.
04-02-2005 © 2004 SAP AG. All rights reserved. 37

Test Your Knowledge AC605
7. Profit Center Accounting (EC-PCA) is a Financial Accounting component.Determine whether this statement is true or false.□ True□ False
8. What are profit centers?
9. Account-based CO-PA stores all transactions in three currencies, transactioncurrency, local currency, and currency.Fill in the blanks to complete the sentence.
38 © 2004 SAP AG. All rights reserved. 04-02-2005

AC605 Test Your Knowledge
29Answers
1. The Full Absorption Costing accounting method can be analyzed only inprofitability analysis.
Answer: False
The Full Absorption Costing accounting method can be analyzed in profitabilityanalysis as well as in profit center accounting.
2. The choice of one of the accounting methods is often determined by thecountry-specific legal requirements.
Answer: True
Companies must choose to use one of the accounting methods for generatingtheir legal financial statements. The choice is often determined by thecountry-specific legal requirements.
3. The emphasis of the cost-of-sales accounting method is on matching the revenuesfor goods or services provided against the related expenses for the items.
Answer: cost-of-sales
4. Briefly explain the view of responsibility reporting.
Answer: You can use EC-PCA to analyze internal profit and loss for profitcenters. This allows you to evaluate the different areas or units within yourcompany. You can structure the profit centers of your company according toregion (branch offices, plants), function (production, sales), or product (productranges, divisions).
5. EC-PCA allows you to calculate the internal operating results for profit centers.
Answer: EC-PCA
6. CO includes cost and revenue accounting and together with the component,Profit Center Accounting (EC-PCA), it offers all the controlling opportunitieswithout being limited to the legal structures used in Financial Accounting.
Answer: Financial Accounting
04-02-2005 © 2004 SAP AG. All rights reserved. 39

Test Your Knowledge AC605
7. Profit Center Accounting (EC-PCA) is a Financial Accounting component.
Answer: False
Profit Center Accounting (EC-PCA) is a statistical accounting component.
8. What are profit centers?
Answer: Profit centers are the areas of responsibility within a company forrevenues and expenses as well as certain assets and liabilities in some cases. Allprofit centers are arranged into a standard hierarchy representing the entireorganization.
9. Account-based CO-PA stores all transactions in three currencies, transactioncurrency, local currency, and controlling area currency.
Answer: controlling area
40 © 2004 SAP AG. All rights reserved. 04-02-2005

Unit 231 Structures
Explain to the participants how to create characteristics and value fields from differentfield sources and define the operating concern attributes. Demonstrate how to copycharacteristics and value fields into Data Structure Definition and generate theoperating concern environment. In addition, help them to identify and set nonsegmentlevel characteristics.
Unit OverviewThis unit introduces you to the organizational structures from a Profitability Analysisperspective. It helps you to know the data structures used within Profitability Analysis.It explains the CO-PA characteristics and value fields and the possibilities that thesystem offers to define these data structures.
Unit ObjectivesAfter completing this unit, you will be able to:
� Describe the various organizational units� Understand the basic concepts, characteristics and value fields, of an operating
concern� Define an operating concern and its attributes� Define data structures� Identify transaction data structures� Describe the CO-PA database structures and the operating concern templates
Unit ContentsLesson: Overview of Operating Concern .. . . . . . . . . . . . . . . . . . . . . . . . . . . . . . . . . . . . . . . . 43
Demonstration: Organizational Structures .. . . . . . . . . . . . . . . . . . . . . . . . . . . . . . . . . . 45Demonstration: Characteristics and Value Fields .. . . . . . . . . . . . . . . . . . . . . . . . . . 51Demonstration: Operating Concern and its Attributes ... . . . . . . . . . . . . . . . . . . . 55
04-02-2005 © 2004 SAP AG. All rights reserved. 41

Unit 2: Structures AC605
Exercise 1: Operating Concerns .. . . . . . . . . . . . . . . . . . . . . . . . . . . . . . . . . . . . . . . . . . . . . 57Lesson: Data Structures .. . . . . . . . . . . . . . . . . . . . . . . . . . . . . . . . . . . . . . . . . . . . . . . . . . . . . . . . . . . 61
Demonstration: Segment Level and Non-Segment Level Characteristics 68Demonstration: Operating Concern Templates.. . . . . . . . . . . . . . . . . . . . . . . . . . . . . 71Exercise 2: Data Structures .. . . . . . . . . . . . . . . . . . . . . . . . . . . . . . . . . . . . . . . . . . . . . . . . . . . 73Exercise 3: Data Structures of the Operating Concern... . . . . . . . . . . . . . . . . . . 77
42 © 2004 SAP AG. All rights reserved. 04-02-2005

AC605 Lesson: Overview of Operating Concern
Lesson:32
Overview of Operating ConcernLesson Duration: 40 Minutes
Lesson OverviewThis lesson describes the various organizational units. In addition, it covers theconcepts, characteristics, and value fields of an operating concern. It also definesan operating concern and its attributes.
Lesson ObjectivesAfter completing this lesson, you will be able to:
� Describe the various organizational units� Understand the basic concepts, characteristics and value fields, of an operating
concern� Define an operating concern and its attributes
In this lesson, explain to the participants, the various organizational units. Identify thebasic concepts, characteristics, and value fields of an operating concern. In addition,describe extensively, an operating concern and its attributes, to the participants.
Business ExampleThe management of your company wants to implement a profitability accountingapplication in the SAP system. As a member of the project team, you are supposedto advise on the question of whether to implement CO-PA or EC-PCA in the SAPsystem. You then will be responsible to implement the selected applications. Bothcross-company and company-specific reporting of contribution margins is requiredin multiple currencies. Multidimensional analysis of sales information, cost-of-salesinformation, production variances, and period cost information is required for thevarious market segments. Estimated costs are required for the actual costs posted onlyat the month-end. Actual period costs (S, G, and A) for the various organizationalentities are to be reflected at the month-end. Analytics by value category and byincome statement account is required.
For this purpose, you need to identify the operating concern, which represents a salesand marketing reporting unit for a corporation. You also need to understand theconcept of characteristics and value fields.
04-02-2005 © 2004 SAP AG. All rights reserved. 43

Unit 2: Structures AC605
Introduction to Organizational Units
Make the participants aware of the fact that only one user at a time can change thedata structures of an operating concern. Because the operating concern has to beregenerated each time a change is made, no changes should be made to the operatingconcern, IDEA. Instruct the participants that they can display the configuration butmust not make any changes. The user master records created for the course preventthe participants from having the authorization to change the operating concern.
This topic is designed to give the participants an overview of the organizationalunits and the significance of the operating concern. The business scenario emphasizesthat the company is an international company divided into various legal entities, andfor this reason, several different currencies are used. The various characteristics andvalue fields needed are indicated by the different analytics requirements.
First, explain the relationship between the various organizational units. In contrastwith other CO modules, the sales organization and the corresponding master data playan important role in CO-PA. Explain that several Management Accounting areas canbe grouped into one operating concern but in this case all Management Accountingareas must have the same fiscal year variant.
Figure 21: Organizational Units
44 © 2004 SAP AG. All rights reserved. 04-02-2005

AC605 Lesson: Overview of Operating Concern
The operating concern is the highest reporting level within CO-PA. It defines thelimit of sales and marketing information, which can be reported together from thismodule. One or more controlling areas are assigned to an operating concern whenorganizational structures are defined. In most cases, corporations have only a singleoperating concern, which is recommended for the sake of simplicity and convenienceif all controlling areas and company codes share the same fiscal calendar.
The controlling area is an organizational unit delimiting the independent costaccounting operations of the organization, such as cost center accounting, profitcenter accounting, and order accounting. Company codes are assigned to controllingareas when organizational structures are defined. Mostly, a 1:1 relationship existsbetween the company code and the controlling area. Notice that a controlling areacan also incorporate several company codes to take cross-company cost allocationsinto account.
The company code is an independent accounting unit within a client. The legalrequirements of a balance sheet or a profit and loss statement are fulfilled on thecompany code level. Plants are assigned to company codes when organizationalstructures are defined.
The plant represents a production center. It is the primary organizational unit inoperations and manufacturing.
Demonstration: Organizational Structures
PurposeTo demonstrate how to display the operating concern and assign the company codeand the controlling area
System DataSystem:Client:User ID:Password:Set up instructions:1. In structure maintenance, display the operating concern, IDEA.
IMG→ Enterprise structure→ Definition→ Controlling→ create OperatingConcern
2. Under �Assignment�, show how the company code, 1000, is assigned tothe controlling area, 1000, and the controlling area, 1000, is assigned to theoperating concern, IDEA.
04-02-2005 © 2004 SAP AG. All rights reserved. 45

Unit 2: Structures AC605
IMG→ Enterprise structure→ Assignment→ Controlling→ Company code� Assign controlling area
3. Inform the participants that the controlling area can only be assigned to anoperating concern after the operating concern has been generated.
4. Under �Assignment�, show how the plant, 1000, is assigned to the companycode,1000, and how the sales organization, 1000, is assigned to the companycode, 1000.
IMG→ Enterprise structure→ Assignment→ Logistics - General→ Assignplant to company code
IMG→ Enterprise structure→ Assignment→ Sales and Distribution→Assign sales organization to company code
5. As an alternative or supplemental demonstration, you may want to show thecustomizing monitor, a new tool as of Release 4.6. It shows a complete summaryof the organizational assignments for a particular operating concern.
COPA Configuration→ Tools→Analysis→ Check Customizing Settings:Overview of Organizational Structure
Basic Concepts: Characteristics and Value Fields
Explain that certain characteristics that are known as the fixed characteristics, areautomatically included in all operating concerns. There are also certain technicalfields, such as posting period, which are also automatically contained in the datastructures. Notice that in account-based profitability analysis, the cost element is afixed characteristic. The job of the user is to define any characteristics required butnot already available as fixed characteristics.
Value fields are created based on information requirements. They differ from onecompany to the next and only play a role in costing-based Profitability Analysis.Explain that value fields normally represent a group of cost or revenue elements. Thevarious accounts for discounts can be grouped into one value field. Value fields aredefined as either a quantity field or an amount field. Mention that the data structuresare valid across all the clients of a system.
46 © 2004 SAP AG. All rights reserved. 04-02-2005

AC605 Lesson: Overview of Operating Concern
Figure 22: Basic Concepts of CO-PA
Characteristics
� Answers the question: What do I want to report on?� Examples: Divisions, Regions, Products, Customers.
Characteristic Values
� Answers the question: What values can I have for these characteristics?� Examples: Region South; Region North.
Profitability Segments
� Answers the question: What is the technical definition of my sales channel?� Example: Combination of Region North, Product Prod1, Sales Rep Miller.
Value Fields
� Answers the question: What performance measures do I want to track andanalyze?
� Examples: Gross Sales, Surcharges, Discounts, Cost-of-Sales.
04-02-2005 © 2004 SAP AG. All rights reserved. 47

Unit 2: Structures AC605
Figure 23: Categories of Characteristics
Meaning of Characteristics
Characteristics are the analysis dimensions for CO-PA. They define what itemsor objects the user will be able to analyze. Several characteristics, such as salesorganization, customer, and product, are predefined automatically for every operatingconcern. These are known as fixed characteristics.
In addition to the fixed characteristics, up to 50 non-fixed non fixed characteristicscan be added to an operating concern.
Characteristic Maintenance in the Field Catalog: These non-fixed characteristicsmust be added to the field catalog before they can be used to define a new operatingconcern. The characteristics in the field catalog can be accessed in any client.
The field catalog originally contains some suggested characteristics which mightbe used in a new operating concern definition. There are two ways to add othercharacteristics to the field catalog:
� Choose an existing field from certain SAP tables, which must be five characterslong or less.
� Create a characteristic independently, which should begin with WW and befour to five characters total.
Each characteristic potentially has a check table behind it that carries the characteristicvalues, which are valid for CO-PA. This helps to validate the data flowing into CO-PA.When creating a new characteristic independently in the field catalog, you can choosewhether or not the system should generate a check table for it.
48 © 2004 SAP AG. All rights reserved. 04-02-2005

AC605 Lesson: Overview of Operating Concern
Figure 24: Categories of Characteristics in Detail
Characteristics can be categorized according to how and when they are defined:
� Copying characteristics from reference tables: You can use characteristicsthat already exist in other applications when you define your operating concerns.For example, you can copy the fields from the tables for the customer masterrecords, material master records, and sales documents. You can also copythe partner roles defined in the structure, PAPARTNER, in the Sales andDistribution, SD, application as characteristics in Profitability Analysis.
� Characteristics created from scratch: You can create ones that are onlyrequired in Profitability Analysis. To derive the values for these characteristics,you need to define your own derivation strategy.
� Predefined characteristics: In addition to the fixed characteristics, a numberof other predefined characteristics are available in the field catalog and can beadded to your operating concern, if required. These include the customer group,customer district, and country characteristics.
� Fixed characteristics: A number of fundamental characteristics areautomatically predefined in every operating concern. These include theproduct number, company code, billing type, business area, and sales ordercharacteristics.
04-02-2005 © 2004 SAP AG. All rights reserved. 49

Unit 2: Structures AC605
Figure 25: Categories of Value Fields
Meaning of Value Fields
� In costing-based Profitability Analysis, value fields store the base quantities andamounts for reporting. Value fields can either be highly summarized, such asrepresenting a summary of cost element balances, or highly detailed, such asrepresenting just one part of a single cost element balance.
� Normally, value fields are highly detailed with regard to sales performancefigures, such as types of revenues, discounts, and surcharges, and moresummarized for other items relating to period costs, such as types of periodexpenses. Unlike characteristics, there are no fixed value fields for a newoperating concern.
Value Field Maintenance in the Field Catalog
� All value fields must exist in the field catalog before they can be used to define anew operating concern. The value fields in the field catalog can be accessed inany client. The field catalog originally contains some suggested value fields,which might be used in a new operating concern. Value fields can also bedefined independently. These should begin with VV..., and should be four tofive characters in total.
� You do not need to create the value fields for calculated items, such as netsales and contribution margin. These items are normally calculated from thebase values stored in the value fields during the report execution progress, tominimize necessary data storage requirements.
50 © 2004 SAP AG. All rights reserved. 04-02-2005

AC605 Lesson: Overview of Operating Concern
Fixed Basic Key Figures (Account-Based CO-PA only)
� In account-based Profitability Analysis, all values are updated to accounts. Eachamount is stored in up to three different currencies under fixed basic key figures,which are accessed in reporting.
Figure 26: Value Fields With New Time Aggregation Rules
You can use value fields with the aggregation rules, AVG (average) and LAS (last)in CO-PA drill-down reports.
You define these value fields when you define the data structures for ProfitabilityAnalysis.
Demonstration: Characteristics and Value Fields
PurposeTo demonstrate the use of characteristics and value fields
System DataSystem:Client:User ID:Password:Set up instructions:
04-02-2005 © 2004 SAP AG. All rights reserved. 51

Unit 2: Structures AC605
1. Begin by displaying all characteristics and show the information behinda characteristic. For example: Customer Group. Highlight the type ofcharacteristic, origin, and explain the concept of a check table.
IMG→ Controlling→ Profitability Analysis→ Structures→ OperatingConcern→ Maintain characteristics: Customer Group
Display the fixed fields and explain that fixed fields are delivered by SAP. Showthe technical fields. Explain that they are related to report dimensions andtechnical identifiers, which are saved with each record.
2. Create two characteristics. Choose the first characteristic from the table, MARA(reference table), by selecting the field, �LABOR� (Laboratory or Office).Create the second characteristic as the user-defined characteristic, WWMGR,and name it �Regional Manager�. It has the data type, CHAR, and is a three-digitfield. Mention the corresponding check tables, T25**, and the fact that thesetables are created either automatically or manually. Save and Activate eachof the characteristics.
IMG→ Controlling→ Profitability Analysis→ Structures→ OperatingConcern→ Maintain characteristics: Change/Create
Explain some of the other options available when creating characteristics. Forexample, creating characteristics by referencing ANY data element.
3. Display the list of value fields. Explain that value fields come in two categories,quantity or currency, and can have various aggregation levels. Example:
Revenue: Each posting made to this field should be SUMMARIZED.
Number of Employees: Only the LAST posting for a given period should bereflected in CO-PA.
Balance on Hand: The AVERAGE number of items on hand should be reflectedin CO-PA.
Create a value field, VVSPE, and name it �Special Handling �.
Choose �summation� as the aggregation type and �Amount� as the value fieldcategory.
Save and Activate the value field.
In account-based PA, the account number serves as the counterpart to the valuefield. Acct-based PA does use the concept of a fixed basic key figure, which saysthat in addition to the sales quantity the system is delivered to store every valueposted to a cost/revenue element in three currencies.
52 © 2004 SAP AG. All rights reserved. 04-02-2005

AC605 Lesson: Overview of Operating Concern
IMG→ Controlling→ Profitability Analysis→ Structures→ OperatingConcern→ Maintain value fields
Defining an Operating Concern and its Attributes
Figure 27: Steps in Defining an Operating Concern
You define the structure of your operating concern when you set up your system.This is done by selecting the characteristics you want to use in the data structures ofthe operating concern.
In costing-based Profitability Analysis, you also need to select the value fields youwant to use.
The structure of an operating concern is valid in all clients.
04-02-2005 © 2004 SAP AG. All rights reserved. 53

Unit 2: Structures AC605
Figure 28: Defining Operating Concern and Attributes
The attributes are client-specific parameters of an operating concern. They havedifferent effects, depending on the type of Profitability Analysis you are working in.
Currency types
Operating concern currency- In costing-based Profitability Analysis, the actual datais always updated in the operating concern currency. You can change the operatingconcern currency as long as no data has been posted in the operating concern.
Company code currency- In addition to the operating concern currency, you have theoption of storing all data in the currency of the relevant company code. This makessense if your organization operates internationally and is concerned with exchangerates that change daily. It allows you to avoid differences due to different exchangerates and enables you to reconcile your CO-PA data directly with FI.
Profit center valuation In addition to storing data in these two currencies using thelegal company code, valuation view, you can also store data in both of these currenciesvaluated from the viewpoint of individual profit centers.
Fiscal year variant
The fiscal year variant determines the number of posting periods for each fiscal year.Because each controlling area assigned to the operating concern, and each companycode assigned to each of the controlling areas, can have its own fiscal year variant, thevariant you choose for the operating concern must agree with that for the other areas.
54 © 2004 SAP AG. All rights reserved. 04-02-2005

AC605 Lesson: Overview of Operating Concern
Demonstration: Operating Concern and its Attributes
PurposeTo demonstrate how to create an operating concern and define its attributes
System DataSystem:Client:User ID:Password:Set up instructions:1. Create an operating concern named T001. Maintain the attributes and mention
the fiscal year variant and the various currencies that can be displayed.
IMG→ Controlling→ Profitability Analysis→ Structures→ OperatingConcern→ Maintain operating concern
2. Create the data structures for the operating concern, T001. When you arechoosing characteristics, make sure you choose the characteristics you havecreated. Similarly, implement this for the value fields.
IMG→ Controlling→ Profitability Analysis→ Structures→ OperatingConcern→ Maintain operating concern
Change Operating Concern, IDEA, and add the above Characteristics and ValueFields:
LABOR
WWMGR
VVSPE
STDPR
3. Save, Activate, and Generate the operating concern, at minimum IDEA. Whenthis takes place, you may want to explain that no one can maintain the operatingconcern or make postings to any of its tables because data tables are beingrebuilt. Begin presenting the next graphics as your operating concern begins thegeneration process. Note that to get to the �Generate� step, you need to use thegreen arrow once. In addition, �Activate� normally �Saves� as well.
04-02-2005 © 2004 SAP AG. All rights reserved. 55

Unit 2: Structures AC605
56 © 2004 SAP AG. All rights reserved. 04-02-2005

AC605 Lesson: Overview of Operating Concern
41 Exercise 1: Operating ConcernsExercise Duration: 10 Minutes
Exercise ObjectivesAfter completing this exercise, you will be able to:� Describe the organizational structures relevant for Profitability Analysis� Summarize the types of Profitability Analysis in the SAP system
Business ExampleThe group has legal entities in Germany, Italy, and the United States. For this reason,it must be able to report sales and profitability both across the corporation in a groupcurrency and in each of the legal entity�s local currency. The sales managers requiresummarized sales performance figures, such as revenue, discounts, and surchargesboth along and across the lines of the sales structure, product lines, and customers.They also need to view sales and marketing costs along these lines. Describe theoptions available for the organizational structures for CO-PA.
Task 1:Based on the reporting requirements of your company, ensure that all the requiredorganizational units have been configured.
1. Which controlling areas are assigned to the operating concern, IDEA?
2. Which company codes are assigned to the controlling area, 1000?
3. What plants are assigned to the company code, 1000?
4. Which sales organizations are assigned to the company code, 1000?
Task 2:1. Read the online documentation regarding assigning the operating concern.
Task 3:1. Read the online documentation regarding the types of Profitability Analysis and
its applications for your company.
04-02-2005 © 2004 SAP AG. All rights reserved. 57

Unit 2: Structures AC605
Solution 1: Operating ConcernsTask 1:Based on the reporting requirements of your company, ensure that all the requiredorganizational units have been configured.
1. Which controlling areas are assigned to the operating concern, IDEA?
a) Use the following shortcut to display the IMG:
IMG = Tools→ Customizing→ IMG→ Execute Project→ SAP ReferenceIMG
Based on the reporting requirements of your company, ensure that all therequired organizational units have been configured.
Which controlling areas are assigned to the operating concern, IDEA?
IMG: Enterprise Structure→ Assignment→ Controlling→ AssignCompany Code to Controlling Area→ 1000, 2000, 2200, 5000, 6000,and so on
2. Which company codes are assigned to the controlling area, 1000?
a) Which company codes are assigned to the controlling area, 1000?
IMG: Enterprise Structure→ Assignment→ Controlling→ AssignCompany Code to Controlling Area
→ Select Controlling Area 1000
Double Click→ Assignment of Company Codes:
1000, 2000, 2100, 2300, 2400, 2500, and so on.
3. What plants are assigned to the company code, 1000?
a) Display the plant assignment to the company code, 1000:
IMG: Enterprise Structure→ Assignment→ Logistics - General→ AssignPlant to Company Code
1000 Hamburg, 1100 Berlin, 1200 Dresden, 1300 Frankfurt, and 1400Stuttgart.
Continued on next page
58 © 2004 SAP AG. All rights reserved. 04-02-2005

AC605 Lesson: Overview of Operating Concern
4. Which sales organizations are assigned to the company code, 1000?
a) Display the sales organizations assigned to the company code, 1000.
IMG: Enterprise Structure→ Assignment→ Sales and Distribution→Assign Sales Organization to Company Code
1000 Germany Frankfurt
1020 Germany Berlin
1030 Germany Hamburg, and so on
Task 2:1. Read the online documentation regarding assigning the operating concern.
a) Read the online documentation regarding assigning the operating concern.
Open the SAP Library and select the Financials submenu.
Choose CO and then Profitability Analysis (COPA). In the Structuressubmenu, select Operating Concern and then Assigning the OperatingConcern.
Task 3:1. Read the online documentation regarding the types of Profitability Analysis
and its applications for your company.
a) Read the online documentation regarding the types of Profitability Analysisand its applications for your company.
Open the SAP Library and select the Financials submenu.
Choose CO and thenProfitability Analysis (COPA). Select ProfitabilityAccounting Applications and then Accounting Applications
04-02-2005 © 2004 SAP AG. All rights reserved. 59

Unit 2: Structures AC605
Lesson Summary
You should now be able to:� Describe the various organizational units� Understand the basic concepts, characteristics and value fields, of an operating
concern� Define an operating concern and its attributes
60 © 2004 SAP AG. All rights reserved. 04-02-2005

AC605 Lesson: Data Structures
Lesson:45
Data StructuresLesson Duration: 50 Minutes
Lesson OverviewThis lesson defines data structures and identifies the transaction data structures. It alsocovers the CO-PA database structures and the operating concern templates.
Lesson ObjectivesAfter completing this lesson, you will be able to:
� Define data structures� Identify transaction data structures� Describe the CO-PA database structures and the operating concern templates
In this lesson, you must define the importance of data structures in an operatingconcern. You must identify for the participants, the transaction data structures. Youmust also describe the CO-PA database structures and the operating concern templates.
Business ExampleThe management of your company wants to implement a profitability accountingapplication in the SAP system. As a member of the project team of your company, youare supposed to advise on the question of whether to implement CO-PA or EC-PCA inthe SAP system. You will be responsible to implement the selected applications. Bothcross-company and company-specific reporting of contribution margins is required inmultiple currencies. The multidimensional analysis of sales information, cost-of-salesinformation, production variances, and period cost information is required for variousmarket segments. Estimated costs are required for the actual costs posted only at themonth-end. Actual period costs (S, G, and A) for various organizational entities are tobe reflected at the month-end. Reporting by value category and by income statementaccount is required. For this purpose, you need to understand the operating concern,data structures, and segment level and non segment level characteristics.
04-02-2005 © 2004 SAP AG. All rights reserved. 61

Unit 2: Structures AC605
Defining Data Structures
Explain to the participants that several steps are involved in defining an operatingconcern. First, the characteristics and value fields are defined as independent ofany operating concern. Operating concerns are then created on the basis of thesecharacteristics and value fields.
Figure 29: Operating Concern Data Structures
Defining Data Structures
To define data structures, copy the required characteristics and value fields to theoperating concern and save them.
Activating the Environment (up to 4.6B Generation)
After you have defined the attributes and data structures of an operating concern, youmust activate them and generate the operating environment.
This process generates all the tables, programs, and technical objects required tosupport the operating concern you have defined.
After you generate the operating concern and before you activate Profitability Analysisfor data entry, add the valid characteristic values to the check tables generated forthe new characteristics.
62 © 2004 SAP AG. All rights reserved. 04-02-2005

AC605 Lesson: Data Structures
Changing the Data Structures
You must reactivate the environment after you change the data structures of anoperating concern. For example, reactivate the environment after you add a newcharacteristic or a value field.
The regeneration process does not affect any existing transaction data. Notice thatit also does not automatically back-populate any new fields for existing transactiondata although this sometimes may be carried out using the CO-PA realignment orperiodic valuation functions.
The regeneration process will not affect any characteristic values that have alreadybeen entered in check tables for user-defined characteristics.
Transaction Data Structures
You may want to draw up a simple example of a sales order. It is important thatparticipants understand what a profitability segment is and how it is created. The firstthing to explain is that they get dynamically created by the system when a uniquecombination of characteristic values is posted to CO-PA:
Sales Order 1000:
Customer 1000 Product X:
Revenue 100,000 Tables: CE1, CE3,CE4
Product Y: Revenue 120,000 Tables:
CE1,CE3,CE4
Sales Order 2000:
Customer 1000 Product X:
Revenue 50,000 Tables: CE1, CE3
Content in CE4: Profit Segment 1
Customer 1000, Product X�
Content in CE3: Profit Segment 1
Revenue 150,000�
04-02-2005 © 2004 SAP AG. All rights reserved. 63

Unit 2: Structures AC605
Figure 30: CO-PA Transaction Data Structures (1)
Costing-based CO-PA stores its transaction data in its own data tables, which arecreated when activating and generating the operating concern. This means that its datawill never affect the execution speed of a report in another CO application.
Account-based CO-PA stores its transaction data in the transaction data tables forOverhead Cost Management. This means that its data will affect the execution speedof reports for other CO applications that share the same transaction data tables.
The definitions of profitability segments for both CO-PA sub modules are storedin the same table, CE4XXXX, where XXXX = operating concern. The systemalways accesses this segment definition table when posting the transaction data forcosting-based or account-based CO-PA.
Profitability segments, which represent the account assignment objects for profitabilityanalysis, are unique combinations of characteristic values that the system creates andnumbers automatically from the information in the originating transactions.
64 © 2004 SAP AG. All rights reserved. 04-02-2005

AC605 Lesson: Data Structures
Figure 31: CO-PA Transaction Data Structures (2)
The CE3... and CE4... tables work effectively together to store the summarizedtransaction information, both actual and plan, for costing-based Profitability Analysis.
The CO-PA drill-down reporting tool accesses the data in the CE3... and CE4... tables.Line item data and the information from the CE1... and CE2... tables can be accessedthrough line item display features.
04-02-2005 © 2004 SAP AG. All rights reserved. 65

Unit 2: Structures AC605
CO-PA Database Structures
Figure 32: CO-PA Database Structures
The data of CO-PA is divided into characteristics and value fields. The characteristicsare stored in the data division of the table, CE4xxxx. The key of the CE4xxxxbasically consists of the profitability segment number that is used as a join field for thetable, CE3xxxx. The key of the table, CE3xxxx, consists of the profitability segmentnumber and the posting-period and some other technical fields that are not listed. Thevalue fields are specified in the data division.
The table, CE4xxxx, represents the profitability segments, created based on thebusiness considerations that are defined when an operating concern is created. Thetable, CE3xxxx, contains the values posted to the profitability segments that areadditionally available broken down into the posting period.
Typical record lengths: CE4xxxx = 250 bytes, CE3xxxx = 2000 bytes.
Segment Level and Non-Segment Level Characteristics
You first have to name an operating concern and then define its attributes. Explain thevarious currency options and the period type, �Weeks�. This period type stores data inweeks and posting periods, which increases data volumes drastically. The setting isonly possible in costing-based Profitability Analysis. After the attributes are defined,you can define the data structures for the operating concern. This is done by choosing
66 © 2004 SAP AG. All rights reserved. 04-02-2005

AC605 Lesson: Data Structures
the required value fields and characteristics for the operating concern and then saving,activating, and generating the data structures. During the generation process, thesystem creates the tables, CE1XXXX, through CE8XXXX and check tables. Thetables from CE1 through CE4 are of particular significance for the market segments.It is important to mention that the data in costing-based profitability analysis is storedin separate tables, and the data for account-based profitability analysis is stored in thesame tables as the other CO modules.
CE4 contains only the characteristic values and profit segment numbers. CE3 isthe table access by drill-down analytics. It contains the profit segment number,certain technical characteristics, and the values for value fields. CE1 contains allcharacteristics and value fields as well as technical characteristics.
Figure 33: Segment-Level Characteristics
It is a good idea for performance reasons to keep the number of profitability segmentsto a minimum and, as a result, minimize the summary records required in CO-PA.This can be controlled through the selection of segment-level and non-segment-levelcharacteristics.
You can to configure the system so that certain characteristics are not used indefining profitability segments. The impact of this is that the values for thesenon-segment-level characteristics will appear on CO-PA line items but will not beavailable for reporting with the CO-PA drill-down reporting tool.
04-02-2005 © 2004 SAP AG. All rights reserved. 67

Unit 2: Structures AC605
For example, you need to have the originating sales order number on each CO-PA lineitem, CE1, which originated in sales order management but you do not need to alsohave a new summary record in CO-PA. CE3, for each new sales order. This wouldcreate as many summary records as line items.
You can customize the characteristics that are segment-level and the ones that arenon-segment-level and have different settings for costing-based and account-basedCO-PA. Certain fixed characteristics are non-segment-level by default but they canbe changed, if required.
SAP recommends that data be summarized on a higher level, something other thanthe customer or product level, for account-based CO-PA to minimize the number ofsummary records. This is because its transaction data is stored in the tables that areshared with other Management Accounting applications.
Demonstration: Segment Level and Non-Segment LevelCharacteristics
Purpose
To demonstrate the segment level and non segment level characteristics in ProfitabilityAnalysis
System DataSystem:Client:User ID:Password:Set up instructions:1. Display the segment level characteristics in Profitability Analysis and explain
the significance and impact of the settings. All the characteristics appear in thistable and you chose the characteristics should be �not used�, included as nonsegment level characteristics for either costing based or both costing based andaccount based. This table works somewhat backwards because you define herewhich characteristics should be non segment level. The example that is normallycited is the sales order number or sales order line number that you want to see atthe line item level but you probably will not want as a drill-down characteristic.
IMG → Controlling→ Profitability Analysis→ Structures → DefineOperating Concern→ Define segment level characteristics
68 © 2004 SAP AG. All rights reserved. 04-02-2005

AC605 Lesson: Data Structures
Operating Concern Templates
Operating Concern Templates are a new concept from Release 4.6. In prior releases,there was very little sample data or configuration set up in the client, 000, so to testCO-PA one had to begin a full blown configuration. Templates are a simple tool tocreate sample data to begin exploring some of the options available in CO-PA. Noticethat CO-PA is often a �phase II� project, and the implementation plan has to be �sold�to executive management � this demo tool is of great help. Quickstart takes the conceptone step further in highlighting the basic configuration steps to quickly create anoperating concern by either copying a template or using the steps and documentation.
Figure 34: Operating Concern Templates
CO-PA provides you with operating concern templates, predefined sample operatingconcerns, an environment in which to display the Customizing for these operatingconcern, make changes to the Customizing settings, and copy them.
S_AL: Template for Route Profitability.
S_GO: Cross Industry Template.
S_CP: Consumer Goods Industry Template.
Operating concern templates offer the following advantages:
04-02-2005 © 2004 SAP AG. All rights reserved. 69

Unit 2: Structures AC605
They enable you to gain an insight into Profitability Analysis as a demonstration,without your having to perform extensive Customizing. This means that you can usethe templates as a basis for quickly calling up reports.
They simplify Customizing in Profitability Analysis by allowing you to adapt, ifrequired, the Customizing for an operating concern template to suit your requirements,to copy its settings, and then to use the resulting operating concern productively.
Figure 35: Quickstart
Use SAP Operating Concern Templates.
This is where you can gain an initial overview of Profitability Analysis without theneed to have any specialist knowledge and without the need to have made any settingspreviously. Further, operating concerns that have already been preset are available,allowing Profitability Analysis to be quickly integrated into your productive system.To do this, you can customize these operating concern templates. At any time, youcan reset the templates to their original settings.
When you start the transaction for operating concern templates, the system loads thetemplate for the consumer goods industry.
The details view provides you with an overview of the delivered settings and of themodifications that you can make. By choosing Application examples, you can viewreports and planning layouts. The system fills them with example data to demonstratemore clearly how the application works. You can delete the example data later.
70 © 2004 SAP AG. All rights reserved. 04-02-2005

AC605 Lesson: Data Structures
If you want to implement an operating concern template as a template for yourProfitability Analysis, you first need to copy it using the copy function found underTools. This is also where you can choose to reset an operating concern templateback to its initial state.
Demonstration: Operating Concern Templates
PurposeTo demonstrate the use of operating concern templates
System DataSystem:Client:User ID:Password:Set up instructions:1. Show operating concern templates and the use of sample data.
CO-PA Configuration → Structures→ Define Operating Concern→Operating Concern Templates→ Use SAP Operating Concern Templates→Application Examples→ Prepare Application Examples: Create ExampleData .
2. Select a year: 1999.
This will generate sample data for reporting and planning. In addition, point outthe context sensitive help on the right Run a sample report.
Execute Application Examples→ Execute Profitability Report: SCPB0 .
3. Use the customer group, 01, and the year of your sample data.
4. To access a configuration activity, simply double-click one of the steps.
Note: It has been found several times after the system was upgraded,or new hot packages installed, that the sample operating concern hasto be reconfigured. If this situation is encountered, confirm to rebuildthe operating concern when prompted. Then, proceed with the abovedemonstration. You might also want to show the report, SCPB0, firstto demonstrate the fact that no data exists before you generate the datafor 1999.
04-02-2005 © 2004 SAP AG. All rights reserved. 71

Unit 2: Structures AC605
72 © 2004 SAP AG. All rights reserved. 04-02-2005

AC605 Lesson: Data Structures
53 Exercise 2: Data StructuresExercise Duration: 15 Minutes
Exercise ObjectivesAfter completing this exercise, you will be able to:� Understand the concepts of value fields and characteristics� Evaluate the different sources of characteristics� Explain the settings available for value fields
Business ExampleThe following requirements apply for the value fields and characteristics needed forprofitability reporting in your organization:
Your sales manager requires summarized sales performance figures, such as grossrevenue, discounts, and surcharges both along as well as across the lines of the salesstructure, product lines, and customers of the company. The sales manager also wantsto view sales and marketing costs along these lines.
Task 1:In the CO-PA settings menu, display all defined characteristics.
1. What is the table of origin for the Customer Class characteristic?
2. What is the check table for the Sales District characteristic?
Continued on next page
04-02-2005 © 2004 SAP AG. All rights reserved. 73

Unit 2: Structures AC605
Task 2:Based on your project requirements of the team, you determine that the followingcharacteristics and value fields are required for reporting. In the data structures of theoperating concern, determine which of the following items are value fields, non-fixedcharacteristics, fixed (delivered) characteristics, and technical fields:
Customer, Customer Group, Material Group, Controlling Area, Cost Element,Revenue, Customer Discount, Profit Center, Price Reduction, Sales Organization,Variable Production Costs, Sales District, Posting Date, Fiscal Year, and Numberof Employees.
Note: The overview list contains all user-defined characteristics, defaultcharacteristics, and the characteristics selected from the reference tables. Itdoes not include fixed characteristics or technical fields.
Assign the list of items in 2-2 to the following groups:
1. Which characteristics are non-fixed characteristics?
2. Which characteristics are fixed characteristics?
3. Which fields are technical fields?
4. Which fields are value fields?
5. What are the aggregation settings for the Number of Employees value field?Why may you decide to use this field?
6. Display the Strategic Business Unit characteristic. What type of characteristic isthe Strategic Business Unit?
74 © 2004 SAP AG. All rights reserved. 04-02-2005

AC605 Lesson: Data Structures
Solution 2: Data StructuresTask 1:In the CO-PA settings menu, display all defined characteristics.
1. What is the table of origin for the Customer Class characteristic?
a) IMG→ Controlling→ Profitability Analysis→ Structures→ DefineOperating Concern→ Maintain Characteristics
Select All Characteristics then choose Customer class→ Details KNA1
2. What is the check table for the Sales District characteristic?
a) Select: BZIRK and Details T171
Task 2:Based on your project requirements of the team, you determine that the followingcharacteristics and value fields are required for reporting. In the data structures of theoperating concern, determine which of the following items are value fields, non-fixedcharacteristics, fixed (delivered) characteristics, and technical fields:
Customer, Customer Group, Material Group, Controlling Area, Cost Element,Revenue, Customer Discount, Profit Center, Price Reduction, Sales Organization,Variable Production Costs, Sales District, Posting Date, Fiscal Year, and Numberof Employees.
Note: The overview list contains all user-defined characteristics, defaultcharacteristics, and the characteristics selected from the reference tables. Itdoes not include fixed characteristics or technical fields.
Assign the list of items in 2-2 to the following groups:
1. Which characteristics are non-fixed characteristics?
a) IMG→ Controlling→ Profitability Analysis→ Structures→ DefineOperating Concern→ Maintain Characteristics
Select Display All Characteristics and Choose Display
Customer Group, Material Group, and Sales District.
2. Which characteristics are fixed characteristics?
a) Extras→ Fixed Fields
Customer, Controlling Area, Profit Center, and Sales Organization.Continued on next page
04-02-2005 © 2004 SAP AG. All rights reserved. 75

Unit 2: Structures AC605
3. Which fields are technical fields?
a) Posting Date, Fiscal Year, and Cost Element
4. Which fields are value fields?
a) IMG→ Controlling→ Profitability Analysis→ Structures→ DefineOperating Concern→ Maintain Value Fields
Select All Value Fields and then Choose→ Display
Revenue, Customer Discount, Price Reduction, Variable Production Costs,Number of Employees
5. What are the aggregation settings for the Number of Employees value field?Why may you decide to use this field?
a) Select No. of Employees and Detail.
LAS (AVG and SUM also possible).
Period values are normally added together in the Information System andin Profitability Analysis (CO-PA) planning. This means the aggregationrule is SUM. The aggregation rules, Last value and Average, are usefulonly for representing statistical, non-cumulative values in value fields,when the most recent or average value is required instead of the sum.
6. Display the Strategic Business Unit characteristic. What type of characteristic isthe Strategic Business Unit?
a) IMG→ Controlling→ Profitability Analysis→ Structures→ DefineOperating Concern→ Maintain Characteristics
Select All Characteristics then Choose→ Display
Select the Strategic Business Unit, WWSBU, and Detail: 8-characteruser-defined field.
76 © 2004 SAP AG. All rights reserved. 04-02-2005

AC605 Lesson: Data Structures
57 Exercise 3: Data Structures of the OperatingConcernExercise Duration: 15 Minutes
Exercise ObjectivesAfter completing this exercise, you will be able to:� Determine the attributes of the operating concern� Add characteristics and value fields to the operating concern
Business ExampleYou need reports in both the group and company currency because your organizationconducts business in foreign countries.
Your sales manager and product manager ask you which data fields you specificallyrequire for reporting.
Task 1:Attributes of the Operating Concern
You have decided to use both company code and operating concern currencies incosting-based PA.
1. Display the currency settings for the operating concern, IDEA. What settingsare configured?
2. What is the fiscal year variant for IDEA?
Task 2:Data Structures of the Operating Concern
Your sales manager has asked you to check which of the following characteristics areactive for the operating concern:
Material Group, Customer, Postal Code
1. Which of these characteristics are selected for the operating concern?
2. Your product manager has requested that the following value fields be madeavailable in the operating concern:
Continued on next page
04-02-2005 © 2004 SAP AG. All rights reserved. 77

Unit 2: Structures AC605
Ordered Quantity, Scrap, Marketing Activities, and Annual Rebates
Which of these value fields are configured for the operating concern?
Task 3:1. Read the online documentation regarding Characteristics and Value fields.
Task 4:1. What is the status of the operating concern, IDEA? Why could this information
be important?
78 © 2004 SAP AG. All rights reserved. 04-02-2005

AC605 Lesson: Data Structures
Solution 3: Data Structures of the OperatingConcernTask 1:Attributes of the Operating Concern
You have decided to use both company code and operating concern currencies incosting-based PA.
1. Display the currency settings for the operating concern, IDEA. What settingsare configured?
a) You have decided to use both company code and operating concerncurrencies in costing-based PA.
Display the currency settings for the operating concern, IDEA. Whatsettings are configured?
IMG→ Controlling→ Profitability Analysis→ Structures→ DefineOperating Concern→Maintain Operating Concern: �Attributes� tab
Operating Concern Currency: EURO
Company Code Currency: Selected
Op Concern Crcy PrCtr Valuation: Selected
Comp. Code Crcy PrCtr Valuation: Selected
2. What is the fiscal year variant for IDEA?
a) What is the fiscal year variant for IDEA?
K4, Calendar Year + 4 special periods
Continued on next page
04-02-2005 © 2004 SAP AG. All rights reserved. 79

Unit 2: Structures AC605
Task 2:Data Structures of the Operating Concern
Your sales manager has asked you to check which of the following characteristics areactive for the operating concern:
Material Group, Customer, Postal Code
1. Which of these characteristics are selected for the operating concern?
a) Data Structures of the Operating Concern
Your sales manager has asked you to check which of the followingcharacteristics are active for the operating concern:
Material Group, Customer, and Postal Code
Which of these characteristics are selected for the operating concern?
IMG→ Controlling→ Profitability Analysis→ Structures→ DefineOperating Concern→ Maintain Operating Concern
Choose→ Display and select the Characteristics tab on the DataStructure tab (to see fixed characteristics, choose Extras→ DisplayFixed Fields).
Material Group, Customer (fixed characteristic)
2. Your product manager has requested that the following value fields be madeavailable in the operating concern:
Ordered Quantity, Scrap, Marketing Activities, and Annual Rebates
Which of these value fields are configured for the operating concern?
a) Your product manager has requested that the following value fields areavailable in the operating concern:
Ordered Quantity, Scrap, Marketing Activities, and Annual Rebates.
Which of these value fields are configured for the operating concern?
IMG→ Controlling→ Profitability Analysis→ Structures→ DefineOperating Concern→ Maintain Operating Concern
Choose Display and select the Value Fields tab on the Data Structure tab.
Ordered Quantity, Scrap, and Marketing Activities.
Continued on next page
80 © 2004 SAP AG. All rights reserved. 04-02-2005

AC605 Lesson: Data Structures
Task 3:1. Read the online documentation regarding Characteristics and Value fields.
a) Read the online documentation regarding Characteristics and Value fields.
Open the SAP Library and select the Financials submenu:
Choose CO and then Profitability Analysis (COPA). In the Structuressubmenu, select Operating Concern. Read the sections on Characteristicsand Value fields.
Task 4:1. What is the status of the operating concern, IDEA? Why could this information
be important?
a) What is the status of the operating concern, IDEA? Why could thisinformation be important?
IMG→ Controlling→ Profitability Analysis→ Structures→ DefineOperating Concern→Maintain Operating Concern: �Environment� tab
Status = Active
This means that the environment of the operating concern has beengenerated, all data tables are active, and attributes created. If any of thesteps, Save, Activate, or Generate have been left out, no postings can bemade to the tables of the operating concern. This would result in an error inany data transaction that affects the operating concern.
04-02-2005 © 2004 SAP AG. All rights reserved. 81

Unit 2: Structures AC605
Lesson Summary
You should now be able to:� Define data structures� Identify transaction data structures� Describe the CO-PA database structures and the operating concern templates
82 © 2004 SAP AG. All rights reserved. 04-02-2005

AC605 Unit Summary
Unit SummaryYou should now be able to:� Describe the various organizational units� Understand the basic concepts, characteristics and value fields, of an operating
concern� Define an operating concern and its attributes� Define data structures� Identify transaction data structures� Describe the CO-PA database structures and the operating concern templates
04-02-2005 © 2004 SAP AG. All rights reserved. 83

Unit Summary AC605
84 © 2004 SAP AG. All rights reserved. 04-02-2005

AC605 Test Your Knowledge
65Test Your Knowledge
1. Which of the following is the highest reporting level within CO-PA?Choose the correct answer(s).□ A Operating concern□ B Controlling area□ C Company code□ D Plant
2. The characteristics, such as �sales organization�, �customer�, �and product�,are predefined automatically for every operating concern and are known as
.Fill in the blanks to complete the sentence.
3. In costing-based Profitability Analysis, the actual data is always updated inthe company code currency.Determine whether this statement is true or false.□ True□ False
4. What must be done after you generate the operating concern, and before youactivate Profitability Analysis for data entry?
5. Costing-based CO-PA stores its transaction data in the transaction data tables forOverhead Cost Management.Determine whether this statement is true or false.□ True□ False
04-02-2005 © 2004 SAP AG. All rights reserved. 85

Test Your Knowledge AC605
6. State the advantages of operating concern templates.
86 © 2004 SAP AG. All rights reserved. 04-02-2005

AC605 Test Your Knowledge
67Answers
1. Which of the following is the highest reporting level within CO-PA?
Answer: A
Operating concern is the highest reporting level within CO-PA.
2. The characteristics, such as �sales organization�, �customer�, �and product�,are predefined automatically for every operating concern and are known asfixed characteristics.
Answer: fixed characteristics
3. In costing-based Profitability Analysis, the actual data is always updated inthe company code currency.
Answer: False
In costing-based Profitability Analysis, the actual data is always updated in theoperating concern currency.
4. What must be done after you generate the operating concern, and before youactivate Profitability Analysis for data entry?
Answer: After you generate the operating concern and before you activateProfitability Analysis for data entry, you need to add the valid characteristicvalues to the check tables generated for the new characteristics.
5. Costing-based CO-PA stores its transaction data in the transaction data tables forOverhead Cost Management.
Answer: False
Account-based CO-PA stores its transaction data in the transaction data tablesfor Overhead Cost Management.
04-02-2005 © 2004 SAP AG. All rights reserved. 87

Test Your Knowledge AC605
6. State the advantages of operating concern templates.
Answer: The advantages of operating concern templates are:
1. They enable you to gain an insight into Profitability Analysis without theneed to perform extensive Customizing.
2. They simplify Customizing in Profitability Analysis by allowing you toadapt, if required, the Customizing for an operating concern template tosuit your requirements, to copy its settings, and then to use the resultingoperating concern productively.
88 © 2004 SAP AG. All rights reserved. 04-02-2005

Unit 369 Master Data
This unit covers characteristic derivation and valuation. When you explaincharacteristic derivation, explain in-depth the cases in which participants mustdefine their own derivation steps. In addition, when you explain valuation, explainextensively that for actual data in particular, valuation is used only if the participantwants to calculate or estimate values to supplement the existing actual values.
Unit OverviewThis unit discusses the concepts of derivation and valuation. It explains the derivationstrategy and how to evaluate the derivation techniques. In addition, it discussesvaluation using product cost information and outlines valuation using a CO-PAcosting sheet.
Unit ObjectivesAfter completing this unit, you will be able to:
� Explain the derivation concepts� Explain the valuation concepts� Explain the derivation strategy� Evaluate derivation techniques� Understand valuation using the product cost information� Outline valuation using a CO-PA costing sheet� Use the Customizing Monitor to perform valuation analysis
Unit ContentsLesson: Introduction to Characteristic Derivation and Valuation ... . . . . . . . . . . . 91Lesson: Characteristic Derivation .. . . . . . . . . . . . . . . . . . . . . . . . . . . . . . . . . . . . . . . . . . . . . . . . 97
Demonstration: Check Tables .. . . . . . . . . . . . . . . . . . . . . . . . . . . . . . . . . . . . . . . . . . . . . . . . 99
04-02-2005 © 2004 SAP AG. All rights reserved. 89

Unit 3: Master Data AC605
Demonstration: Characteristic Derivation .. . . . . . . . . . . . . . . . . . . . . . . . . . . . . . . . . .100Demonstration: Characteristic Derivation with Move ... . . . . . . . . . . . . . . . . . . .109Exercise 4: Derivation .. . . . . . . . . . . . . . . . . . . . . . . . . . . . . . . . . . . . . . . . . . . . . . . . . . . . . . . . 111
Lesson: Valuation .. . . . . . . . . . . . . . . . . . . . . . . . . . . . . . . . . . . . . . . . . . . . . . . . . . . . . . . . . . . . . . . . . .120Demonstration: Valuation Using a Product Cost Estimate .. . . . . . . . . . . . . . .133Demonstration: Valuation Using a Costing Sheet .. . . . . . . . . . . . . . . . . . . . . . . . .136Demonstration: Valuation Strategy.. . . . . . . . . . . . . . . . . . . . . . . . . . . . . . . . . . . . . . . . . .137Demonstration: Periodic Valuation .. . . . . . . . . . . . . . . . . . . . . . . . . . . . . . . . . . . . . . . . . .138Demonstration: Customizing Monitor .. . . . . . . . . . . . . . . . . . . . . . . . . . . . . . . . . . . . . . .140Exercise 5: Valuation.. . . . . . . . . . . . . . . . . . . . . . . . . . . . . . . . . . . . . . . . . . . . . . . . . . . . . . . . . .143
90 © 2004 SAP AG. All rights reserved. 04-02-2005

AC605 Lesson: Introduction to Characteristic Derivation and Valuation
Lesson:70
Introduction to Characteristic Derivation and ValuationLesson Duration: 30 Minutes
Lesson OverviewThis lesson helps you to understand the concept of characteristic derivation. It alsodescribes the concept of valuation.
Lesson ObjectivesAfter completing this lesson, you will be able to:
� Explain the derivation concepts� Explain the valuation concepts
Characteristic derivation is used to determine the value of one characteristic basedon the value of another, provided there is a logical dependency between the two.It is important for the participant to realize that most derivation steps are createdautomatically by the system during generation. Explain extensively the cases in whichthe users must define their own derivation steps and the possibilities that the systemoffers for doing this.
Valuation can only be used in the costing-based approach and it can be used for bothplanning and actual values. Explain that for actual data in particular, valuation is onlyused if the user wants to calculate or estimate the values to supplement the existingactual values. Valuation is also used to read cost estimates for materials and, as aresult, retain the cost component split for the cost of goods manufactured. This costcomponent split for the cost of goods manufactured is the only way in which fixed andvariable manufacturing costs can be displayed separately, and contribution marginaccounting according to full and partial costs can be realized.
Business ExampleThe management of your company wants to implement a profitability accountingapplication in the SAP system. As a member of the project team, you are supposedto advise on the question of whether to implement CO-PA or EC-PCA in the SAPsystem. You then will be responsible to implement the selected applications.
Mr. Udo, Mrs. Veloce, and Mrs. Schnell have requirements for profitability reportsalong the lines of many characteristics, some of which are available on the selling andinvoicing transactions, such as sales organization and sold-to, product, and some ofwhich are available only on master records, such as product group and state. Mr. Udorequests that, for sales reports, the state and country should be determined first from
04-02-2005 © 2004 SAP AG. All rights reserved. 91

Unit 3: Master Data AC605
the ship-to if there is one for the COPA-relevant transaction, and from the sold-to asa backup if there is no ship-to. Mrs. Veloce is familiar with the customer hierarchythat is defined in sales order management and demands the ability to report along thelines of that hierarchy out of CO-PA. She also requires profitability reporting alongthe lines of a special characteristic known as the �strategic business unit�, whichis determined solely by the product group. This special categorization of productgroups has meaning only within CO-PA. True freight costs are not known at the timeof invoicing but are only known at the month-end when the invoices are receivedfrom the freight vendors. These costs will not be accrued during the month in FI butthey are to be estimated in CO-PA. This would enable Mrs. Schnell to estimate trueprofitability for her plant prior to the month-end. Mr. Cash, responsible for corporateplanning, requests that sales demand in terms of material quantities is to be plannedin CO-PA. It is required that the system access the pricing and cost information andautomatically apply it towards the planned quantities, so the revenue, cost-of-sales,and profit can be reasonably determined accordingly. The Product Costing module isbeing used. The detail results are to be imported into CO-PA so that true cost-of-salescan be analyzed extensively and different types of margins can be calculated andanalyzed, such as the margin after fixed costs and the margin after all costs.
For this purpose, an understanding about the characteristic derivation and valuationconcepts is required.
Characteristic Derivation: Key Points
� Some keys point about derivation:
� Derivation supplements or overwrites certain automatically mappedcharacteristic values.
� A derivation strategy is a sequence of steps, where each step uses onederivation technique to calculate one or more values for one or morecharacteristics, respectively.
� Control attributes can be assigned to each step, such as conditions forexecution, reactions when unsuccessful, and overwrite authority.
� Some derivation steps are created by the system at generation time, ofwhich some are modifiable. Others are created by the configurator fromthe beginning.
92 © 2004 SAP AG. All rights reserved. 04-02-2005

AC605 Lesson: Introduction to Characteristic Derivation and Valuation
Valuation: Key Points
� Some key points about valuation are:
� Valuation supplements the data being passed directly from transactions intoControlling Profitability Analysis with calculated, retrieved, or otherwiseaccessed values.
� A valuation strategy can contain CO-PA costing sheets, Sales OrderManagement pricing procedures (in planning), product costing calls, anduser exit calls, in a sequence that can be customized.
� Valuation strategies must be assigned to record types, points of valuation,and plan versions when applicable to be activated.
� Using valuation is optional. It is merely a tool that can be used in anattempt to get the most complete and useful information out of CO-PA.
Example of Characteristic Derivation and Valuation
Figure 36: Example: Characteristic Derivation and Valuation
Each CO-PA relevant transaction in SAP, such as invoicing, triggers the creation ofline items in CO-PA. The data posted in CO-PA is determined through automatic andmanual mappings and through derivation and valuation configuration.
04-02-2005 © 2004 SAP AG. All rights reserved. 93

Unit 3: Master Data AC605
For each sales order management transaction, the system automatically imports thesales organization, distribution channel, division, customer, product, profit center,business area, and any sales order management partners for each sales order or invoiceitem. Notice that the values for all of these, except customer and product, can beoverwritten with derivation.
In addition to those values determined through the automatic mappings, derivationcan access additional information, such as characteristic values, both on and off theoriginating transaction. For example, it could supply the sales district from the invoiceand the product group from the material master.
In addition to the values imported through the manual mappings, valuation can importinformation that is off of the originating transaction as well. For example, it couldsupply in-depth product cost breakdown information from Product Costing, whichis not available on the sales document.
All CO-PA-relevant transactions are affected by derivation configuration, and some ofthese are affected potentially by valuation configuration, which is optional.
94 © 2004 SAP AG. All rights reserved. 04-02-2005

AC605 Lesson: Introduction to Characteristic Derivation and Valuation
Facilitated Discussion
Discussion QuestionsUse the following questions to engage the participants in the discussion.Feel free touse your own additional questions.
Outline the use of characteristic derivation and valuation.
04-02-2005 © 2004 SAP AG. All rights reserved. 95

Unit 3: Master Data AC605
Lesson Summary
You should now be able to:� Explain the derivation concepts� Explain the valuation concepts
96 © 2004 SAP AG. All rights reserved. 04-02-2005

AC605 Lesson: Characteristic Derivation
Lesson:74
Characteristic DerivationLesson Duration: 40 Minutes
Lesson OverviewThis lesson helps you to understand the derivation strategy. In addition, it explainshow to evaluate derivation techniques.
Lesson ObjectivesAfter completing this lesson, you will be able to:
� Explain the derivation strategy� Evaluate derivation techniques
In this lesson, establish that the system automatically generates a derivation strategywhen you generate your operating concern. Describe the standard derivation steps.Next, show the options available for users to add derivation steps. Underline that thisis normally only required for the user-defined characteristics that were not transferredfrom an SAP table.
Business ExampleThe management of your company wants to implement a profitability accountingapplication in the SAP system. As a member of the project team of your company, youare supposed to provide advise on the question of whether to implement CO-PA orEC-PCA in the SAP system. You then will be responsible to implement the selectedapplications.
Mr. Udo, Mrs. Veloce, and Mrs. Schnell have requirements for profitability reportsalong the lines of many characteristics, some of which are available on the selling andinvoicing transactions, such as sales organization and sold-to, product, and some ofwhich are available only on master records, such as product group and state. Mr. Udorequests that for sales reports, the state and country should be determined first fromthe ship-to if there is one for the COPA-relevant transaction, and from the sold-to as abackup if there is no ship-to). Mrs. Veloce is familiar with the customer hierarchythat is defined in sales order management and demands the ability to report along thelines of that hierarchy out of CO-PA. She also requires Profitability reporting alongthe lines of a special characteristic known as the �strategic business unit�, which isdetermined solely by the product group. This special categorization of product groupshas meaning only within CO-PA.
04-02-2005 © 2004 SAP AG. All rights reserved. 97

Unit 3: Master Data AC605
As a result, for reporting, sales organization, distribution channel, division, sold-to,ship-to, and product, the information is required from each order/invoice item. Theproduct group and product hierarchy information is required from the material masterrecord. The country and state are required from either the ship-to record or the sold-torecord. The customer hierarchy information is required for each transaction involvinga customer. Product groups are to be categorized into special categories called�strategic business units� for reporting.
For this purpose, the characteristic derivation strategy and techniques need to be used.
Characteristic Derivation Concept
Characteristic Derivation Concept
At this point, quiz the participants on the following aspects: If you think about abasic sales order, what characteristic values can the system read of the sales order?Answers will include: product, customer, and sales organization. The next questionis � where could the system find values such as the customer group and the productgroup? In addition, explain the concept of check tables extensively at this point.Highlight the fact that most check tables are maintained in other applications butthe check tables for user-defined characteristics need to be maintained by someonewith access to CO-PA configuration. Further, point out that the system �attempts� toderive all characteristic values.
98 © 2004 SAP AG. All rights reserved. 04-02-2005

AC605 Lesson: Characteristic Derivation
Figure 37: Characteristic Derivation Concept
For each CO-PA-relevant transaction, if the derivation strategy is complete, the systemtries to derive a characteristic value for each characteristic in the operating concern.Notice that derivation is not always successful. If the system cannot determine acharacteristic value for a characteristic, then a blank, null, or unassigned characteristicvalue is posted.
The total combination of segment-level characteristic values for a given transactionconsists of the definition of the relevant profitability segment, which is the accountassignment object for CO-PA.
Demonstration: Check Tables
PurposeTo demonstrate the steps to check tables
System DataSystem:Client:User ID:Password:Set up instructions:
04-02-2005 © 2004 SAP AG. All rights reserved. 99

Unit 3: Master Data AC605
1. Show the check table for �Sales District��.
Application Menu→ COPA→Master Data→ Display Characteristic Values:All Characteristics On/Off→ Copied Characteristics→ Sales District→Define Sales District: Execute
Maintain the check table for the characteristic, WWMGR, which you created inthe previous chapter:
001 = Miller
002= Jones
003= Smith
Emphasize that so far we have not instructed the system under whichcircumstances Miller, Jones, or Smith will be the Regional Manager.
Demonstration: Characteristic Derivation
PurposeTo demonstrate the characteristic derivation concept
System DataSystem:Client:User ID:Password:Set up instructions:1. Create a line item in Profitability Analysis:
Accounting→ Controlling→ Profitability analysis→ Actual postings→Create line item .
Posting date: today�s date
Record type: F
Customer: 1000
Sales organization: 1000
Distribution channel: 10
Company code: 1000
100 © 2004 SAP AG. All rights reserved. 04-02-2005

AC605 Lesson: Characteristic Derivation
Product: P-100
Plant: 1000
Execute the derivation function. Talk about the derivation analysis function.
Extras→ Derivation Analysis .
Point out that certain fields were derived while others, such as the sales orderreason, were not derived.
Invoiced quantity in sales units: 100 units
Revenue: 200,000.00
Post the document.
Display the line item and call up the characteristics.
Accounting→ Controlling→ Profitability analysis→ Information system→Display line items→ Display .
In a second session, use these characteristic values to explain the derivationtechniques table look-up and the derivation rule. To do this, display thecharacteristic derivation function in Customizing and demonstrate three differentviews of characteristic derivation.
IMG→ Controlling→ Profitability Analysis→Master Data→ Characteristicvalues→ Characteristic Derivation .
Explain that the Initial screen displays only customer-specific derivation steps.
Use �Expand All� to show all derivation steps. Highlight the following examplefor each derivation technique:
Standard Derivation: Function Call: Company Code from Plant
Table Look-up: Sales District: Sales District from Customer/Sale-sOrg./Dist.Channel/Division
Derivation Rule: Strategic BU: Prod.Cat. + Industry→ SBU
Show the information behind the table look-up and explain the concept of akey field (in another application), which accesses the table in which the targetcharacteristic value is stored. This means the key field values need to be known ifderivation is to be successful for a particular field. The required field in that tableis mapped to a CO-PA characteristic. Customers normally do not set up tablelook-ups and they need to know how the look-ups work because it may not bethe way they want a field to be derived. A good example is the field �Division�,which can be derived from the sales order, the customer, or the product.
04-02-2005 © 2004 SAP AG. All rights reserved. 101

Unit 3: Master Data AC605
Show the derivation rule and rule entries. Underline that derivation rules accessonly the characteristic values in CO-PA and function on the principle of sourcefield(s) derive target field(s).
Set up your own derivation rule for the Regional Manager:
IMG→ Controlling→ Profitability Analysis→Master Data→ Characteristicvalues→ Characteristic Derivation→ Display change: Create
Select: Derivation Rule and name it : Regional Manager from Sales District
Source: Sales District Target: Regional Manager
Save and create �Rule entries�
First turn column on/off so you can enter from � to values. Next, enter thefollowing information:
Sales District 00001- 00005 = Regional Manager 001
Sales District DE0010 � GB0025 = 002
Sales District IT0010 � US0025 = 003
Most derivation steps can be modified and enhanced with the following options:
Attributes: Define the system reaction if no value is found. This can be an errormessage (default) or no message. An example could be that the sales district,00006, is added in the SD module, and a posting is made to the sales district.The derivation of the regional manager in this case would fail because no ruleentry has been maintained. Should the system post anyway or issue an errormessage to the user?
For derivation rules, you can also define effective dates if required. Condition:This feature controls whether a particular derivation step should be executedonly under certain conditions, such as if the plant = 1000.
Sequence of derivation steps: Certain derivation steps have to take place beforeothers can be successfully executed. The Derivation strategy table allows theuser to move steps up or down the list. If you intend to demo this feature, makesure you do not save your entries. To highlight a derivation step, click thesquare to the left. To select the destination, click the description field. Do notselect the square. Next, click the �Move� button. All steps are executed fromthe top to the bottom.
Enter another line item to test the Derivation Strategy.
102 © 2004 SAP AG. All rights reserved. 04-02-2005

AC605 Lesson: Characteristic Derivation
Derivation Strategy and Techniques
Figure 38: Derivation from a Customizing Viewpoint
A derivation strategy consists of a number of different steps, which derive the differentcharacteristic values. Each derivation step defines the logical interrelationshipbetween known source characteristics and the characteristics to be derived.
The system automatically creates a standard derivation strategy for each operatingconcern. This strategy contains the derivation steps for all the dependencies that arealready known between characteristics. You can then change this strategy to meet therequirements of your organization. If you define your own characteristics that need tobe derived from other characteristics, you need to add your own derivation steps to thestandard strategy to define this derivation.
04-02-2005 © 2004 SAP AG. All rights reserved. 103

Unit 3: Master Data AC605
Figure 39: Options for Derivation Steps
The system goes through a sequence of steps in attempting to locate a characteristicvalue for each characteristic for a COPA-relevant transaction. This step sequence isknown as the derivation strategy.
The steps are performed in a customizable sequence to maximize the possibilities tolocate or determine valid characteristic values. The following items can be configuredfor each step:
� Conditions under which the step should be executed� Whether or not initial values are allowed for source fields in a step� Whether or not the step should overwrite an existing characteristic value� Whether or not an error message should generate if the step is unsuccessful
Each step normally represents one of the customizable derivation techniques,such as table lookups, derivation rules, region, product and customer hierarchies,moves, clears, and enhancements. The values for one or more characteristics canbe determined in a single step.
Derivation occurs for every CO-PA-relevant transaction, including direct entry intoCO-PA and external data uploads into CO-PA. Note: For more information oncustomer exit functions, see the Appendix.
104 © 2004 SAP AG. All rights reserved. 04-02-2005

AC605 Lesson: Characteristic Derivation
Figure 40: Standard Derivation of Organizational Units
Certain characteristics, such as division and profit center, have fixed derivation steps.This means that the system automatically generates nonmodifiable steps that may beused to determine their values. These may take the form of one of the six standardderivation techniques or may be function calls.
You can use other derivation steps to overwrite the values determined through thefixed derivation steps. This can be normally achieved with all characteristics, exceptfor controlling area, company code, product, and customer. These have fixed,nonmodifiable derivation.
The system incorporates fixed derivation to force, at high levels, or at least enhancethe possibility of reconciliation with data in other modules in the SAP system, atother levels.
04-02-2005 © 2004 SAP AG. All rights reserved. 105

Unit 3: Master Data AC605
Figure 41: Derivation through Table Lookup
A table lookup is a derivation method used by CO-PA to access the characteristicvalues from SAP master data tables when this information is not available on theoriginating transaction. For example, an invoice may not contain the purchasing groupfor a material that is being sold. Notice that CO-PA can capture this information forthe invoice item using a table lookup.
Table lookups can be performed when the key of the table to be accessed can be filledwith the characteristic values that are already known to CO-PA for the transaction.For example, a country value can be determined when a customer is known. This isbecause the customer is the only key to the KNA1 table that contains general customerinformation, such as addresses.
The ability to customize table lookup derivation allows the configurator to controlexactly which types of characteristic values are used to access other characteristicvalues. For example, you can configure the table lookup for the characteristic countryto find the country value for the ship-to instead of the country value for the sold-to.
Using table lookups, you can access entire field values or parts of field values for thefields in the tables in which keys can be filled with the known characteristic valuesfor transactions. For example, the derivation lookup for product hierarchy couldbe configured to import the entire product hierarchy value or only the first severalcharacters of the hierarchy into CO-PA.
106 © 2004 SAP AG. All rights reserved. 04-02-2005

AC605 Lesson: Characteristic Derivation
Some table lookups are generated automatically on the basis of a characteristic�sdefinition. These are generated when the operating concern environment is generated.Notice that the nonfixed lookups can be modified. Other tables lookups, such as theones for user-defined characteristics must be created from the beginning.
Figure 42: Derivation Rule
Derivation rules are used to determine characteristic values through user-definedlogic. They are frequently used with user-defined characteristics although they arenot limited to this application.
With derivation rules, characteristic values, known as target values, are determineddirectly based on the values of other characteristic values, known as source values.
Similar to other derivation steps, derivation rules can be configured either to applyfor all situations or to only when certain conditions are met. For example, whena sales organization is 1000. Akin to other steps, derivation rules can be configuredto produce an error when a value cannot be determined through the rule entries or toignore this failure and proceed.
In contrast to other derivation steps, derivation rule entries can be configured tobe either related to a specific interval or time, which is being time-dependent, orapplicable for all times, which is being time-independent. Derivation rules can be setup in sequence with other derivation steps and methods to produce complex derivationlogic.
04-02-2005 © 2004 SAP AG. All rights reserved. 107

Unit 3: Master Data AC605
Figure 43: Derivation with Move and Clear
The move function is available to either directly move a value or s part of a valuefrom one characteristic to another, or to move a constant into a characteristic, whencertain conditions arise.
In the above example, the sold-to value is copied into the ship-to value with the movefunction if the ship-to field is originally not populated by any previous derivation step.When certain conditions arise, the clear function is available to clear a value from acharacteristic. In addition, the employee value is cleared to �not assigned� whenthe product is a specific value because the employees should not get sales creditfor certain items.
The system automatically generates a move derivation step to move the dummyprofit center value from EC-PCA into CO-PA if no profit center can be determinedby other steps.
108 © 2004 SAP AG. All rights reserved. 04-02-2005

AC605 Lesson: Characteristic Derivation
Customizing Monitor Derivation Analysis
Figure 44: Customizing Monitor: Derivation Analysis
The Customizing Monitor provides an overview of all derivation steps. Additionalfunctions are available when you use the SAP list viewer to display derivationanalysis. You can search for specific value fields and determine their use in derivation.
Demonstration: Characteristic Derivation with Move
PurposeTo demonstrate the steps to perform characteristic derivation with Move
System DataSystem:Client:User ID:Password:Set up instructions:1. We have set up an example for �Move�. Show custom step: Ship-to party
IMG→ Controlling→ Profitability Analysis→Master Data→ CharacteristicValues→ Characteristic Derivation: Display .
Customizing Monitor:
04-02-2005 © 2004 SAP AG. All rights reserved. 109

Unit 3: Master Data AC605
IMG → Controlling → Profitability Analysis→ Tools→ Analysis→Customizing Monitor→ Analyze Derivation→ Characteristic Derivation→Search for Regional Manager using: Edit→ Find or scroll down the list.
110 © 2004 SAP AG. All rights reserved. 04-02-2005

AC605 Lesson: Characteristic Derivation
83 Exercise 4: DerivationExercise Duration: 20 Minutes
Exercise ObjectivesAfter completing this exercise, you will be able to:� Customize derivation techniques and place them in a sequence to obtain
characteristic values from desired sources for all CO-PA-relevant transactions� Test and analyze the derivation strategy settings
Business ExampleThe country and area are required from either the ship-to record (if there is one) orthe sold-to record.
Product groups are to be categorized into strategic business units for reporting.
Your Sales Manager requires reports for the customer group and sales district andwould like to know whether the values for these fields can be read directly fromcustomer master and sales document tables.
Note: The term characteristic value refers to an actual individual quantitydefined for a particular characteristic. All data transferred to CO-PA ischecked against the valid characteristic values, which are stored in checktables. These check tables may already exist in the application from which thecharacteristic originates or may need to be manually maintained in CO-PA.Characteristic derivation refers to the process of determining characteristicvalues for each transaction processed by CO-PA.
Task 1:1. In the CO-PA application menu, display the check tables for each of the
following characteristics, and find two valid values for each characteristic:
Sales District:
Strategic Business Unit:
Continued on next page
04-02-2005 © 2004 SAP AG. All rights reserved. 111

Unit 3: Master Data AC605
Task 2:Display the derivation strategy in the Customizing settings for CO-PA. The first screenonly displays custom-defined derivation steps. You can expand the display to view allderivation steps, including predefined derivation steps.
1. Why can some derivation steps be modified and others cannot?
2. Display the derivation rule for the Strategic Business Unit characteristic. Whatare the source fields?
In which application do the source fields originate?
3. Strategic Business Unit is a user-defined field in CO-PA.
Rule values have been defined that determine the valid characteristic valuecombinations used to derive a new value, the strategic business unit. What is therule used to determine the CHEMFOOD strategic business unit?
4. Display the table lookup for the Customer Classification from Customercharacteristic. What is the table of origin for this characteristic?
Why are there no rule values for this characteristic?
Task 3:In the Customizing settings for Profitability Analysis, under Master Data→ DefineCharacteristic Derivation:
1. Display the MOVE step for the Ship-to Party characteristic.
What are the source and target fields?
An attribute has been maintained for this characteristic, to apply the derivationrule only under certain conditions. What is the attribute for this derivation step?
What is the purpose of this particular step?
Continued on next page
112 © 2004 SAP AG. All rights reserved. 04-02-2005

AC605 Lesson: Characteristic Derivation
Task 4:To test the derivation strategy, enter a line item for your sample customer and theproduct P-100 directly in costing-based profitability analysis. Select Derivation toexecute. As you can see, some of the fields have remained blank. Use the derivationanalysis to view the various derivation steps.
Posting Date: Today�s dateRecord Type: FCustomer: T-CO05A##Product: P-100Plant: 1000Sales Org.: 1000Distribution Channel: 10Company Code: 1000
1. The order reason field is blank. Why?
2. How did the system determine the sales office field?
04-02-2005 © 2004 SAP AG. All rights reserved. 113

Unit 3: Master Data AC605
Solution 4: DerivationTask 1:1. In the CO-PA application menu, display the check tables for each of the
following characteristics, and find two valid values for each characteristic:
Sales District:
Strategic Business Unit:
a) In the CO-PA application menu, display the check tables for each of thefollowing characteristics, and find two valid values for each characteristic:
Accounting→ Controlling→ Profitability Analysis→ Master Data→ Characteristic Values → Display Characteristic Values → AllCharacteristics On/Off→ Referenced Characteristics→ Sales District→ Define Sales Districts:
Sales District:
Sales District: District Name000001 Northern region000002 Southern region000003 Western region000004 Eastern region
Strategic Business Unit:
Use the same menu path as above, but select Strategic Business Unitunder user-defined characteristics.
Strat.Business Unit Name:CHEMAGRA Agricultural ChemicalsCHEMCHEM ChemicalsCHEMFOOD Food chemicalsCOMPINDU Industrial computers
Continued on next page
114 © 2004 SAP AG. All rights reserved. 04-02-2005

AC605 Lesson: Characteristic Derivation
Task 2:Display the derivation strategy in the Customizing settings for CO-PA. The first screenonly displays custom-defined derivation steps. You can expand the display to view allderivation steps, including predefined derivation steps.
1. Why can some derivation steps be modified and others cannot?
a) Display the derivation strategy table in the Customizing settings forCO-PA. The first screen only displays custom-defined derivation steps. Youcan expand the display to view all derivation steps, including predefinedderivation steps.
IMG: Controlling→ Profitability Analysis→ Master Data→ DefineCharacteristic Derivation: View→ DisplayAll Steps
Why can some derivation steps be modified and others cannot?
Nearly all fixed characteristics have programmed derivation steps thatcannot be changed for technical reasons, for example, the derivation of thecompany code from the sales organization.
2. Display the derivation rule for the Strategic Business Unit characteristic. Whatare the source fields?
In which application do the source fields originate?
a) Display the derivation rule for the Strategic Business Unit (SBU)characteristic. What are the source fields?
Select the Prod.Cat. + Industry→ SBU derivation rule. Select Choose.
WWPRC Product Category BRSCH Industry Key
In which application do the source fields originate?
CO-PA
3. Strategic Business Unit is a user-defined field in CO-PA.
Continued on next page
04-02-2005 © 2004 SAP AG. All rights reserved. 115

Unit 3: Master Data AC605
Rule values have been defined that determine the valid characteristic valuecombinations used to derive a new value, the strategic business unit. What is therule used to determine the CHEMFOOD strategic business unit?
a) Strategic Business Unit is a user-defined field in CO-PA.
Rule values have been defined that determine the valid characteristic valuecombinations used to derive the strategic business unit. What is the ruleused to determine the CHEMFOOD strategic business unit?
Select the Prod.Cat. + Industry→ SBU derivation rule. Select MaintainRule Values.
Product category Industry key
SBU
CHEM FOOD
= CHEMFOOD
4. Display the table lookup for the Customer Classification from Customercharacteristic. What is the table of origin for this characteristic?
Why are there no rule values for this characteristic?
a) Display the table lookup for the Customer Classification from Customercharacteristic. What is the table of origin for this characteristic?
Select Table lookup for Customer Classification from Customer andthen select : KNA1
Why are there no rule values for this characteristic?
This field is populated from the customer master general data table. Inthis case, CO-PA derives the customer classification directly from thecustomer master record, and no CO-PA-specific rules (check tables)are required.
Task 3:In the Customizing settings for Profitability Analysis, under Master Data→ DefineCharacteristic Derivation:
1. Display the MOVE step for the Ship-to Party characteristic.
What are the source and target fields?
An attribute has been maintained for this characteristic, to apply the derivationrule only under certain conditions. What is the attribute for this derivation step?
Continued on next page
116 © 2004 SAP AG. All rights reserved. 04-02-2005

AC605 Lesson: Characteristic Derivation
What is the purpose of this particular step?
a) In the Customizing settings for Profitability Analysis, underMaster Data→ Define Characteristic Derivation:
Display the MOVE step for the Ship-to Party characteristic. What arethe source and target fields?
To display ALL derivation steps, select: View→ Display All Steps.
Select the Move Step for Ship-to Party, and select Choose.
Source: → CO-PA→ KNDNR→ Choose Customer.
Target: → CO-PA→ KUNWE→ Ship-to party
An attribute has been maintained for this characteristic, to apply thederivation rule only under certain conditions. What is the attribute forthis derivation step?
Select the Condition tab. This derivation step is only carried out if theShip-to field is blank.
What is the purpose of this particular step?
In this case, the Ship-to field is filled with the value in the Customer field.
Task 4:To test the derivation strategy, enter a line item for your sample customer and theproduct P-100 directly in costing-based profitability analysis. Select Derivation toexecute. As you can see, some of the fields have remained blank. Use the derivationanalysis to view the various derivation steps.
Posting Date: Today�s dateRecord Type: FCustomer: T-CO05A##Product: P-100Plant: 1000Sales Org.: 1000Distribution Channel: 10Company Code: 1000
1. The order reason field is blank. Why?
Continued on next page
04-02-2005 © 2004 SAP AG. All rights reserved. 117

Unit 3: Master Data AC605
a) To test the derivation strategy, enter a line item for your sample customerand the product P-100 directly in costing-based profitability analysis. SelectDerivation to execute. As you can see, some of the fields have remainedblank. Use the derivation analysis to view the various derivation steps.
The order reason field is blank. Why?
Accounting→ Controlling→ Profitability Analysis→ Actual Postings→ Create Line Items:
Record Type: FPosting Date: Today
Choose Enter
Customer: T-CO05A##Product P-100Company Code 1000Plant: 1000Sales Org.: 1000Distribution Channel: 10
Select Derivation, then Extras→ Derivation Analysis. Select the iconnext to the table lookup to view the Order Reason.
The sales order number source field is blank as no sales order numberwas entered when this line item was created. Since the order reason ismaintained in the sales order, this derivation step was not carried out.
2. How did the system determine the sales office field?
a) How did the system determine the sales office field?
Select the icon next to the table lookup to view the Sales Office. Thesource fields for this derivation step are Customer, Sales Organization,Distribution Channel, and Division.
The system found values in these fields in the line item, and a valuefor the sales office was derived.
118 © 2004 SAP AG. All rights reserved. 04-02-2005

AC605 Lesson: Characteristic Derivation
Lesson Summary
You should now be able to:� Explain the derivation strategy� Evaluate derivation techniques
04-02-2005 © 2004 SAP AG. All rights reserved. 119

Unit 3: Master Data AC605
Lesson:92
ValuationLesson Duration: 50 Minutes
Lesson OverviewThis lesson helps you to understand valuation using the product cost information. Italso outlines the valuation using a CO-PA costing sheet.
Lesson ObjectivesAfter completing this lesson, you will be able to:
� Understand valuation using the product cost information� Outline valuation using a CO-PA costing sheet� Use the Customizing Monitor to perform valuation analysis
Explain that with the valuation function, you can supplement the informationprovided directly by a transaction. Valuation can be performed both when updatingactual values and within planning. It is used in costing-based profitability analysisonly because account-based profitability analysis is reconciled with FinancialAccounting and does not use estimated values.
There are various valuation techniques within CO-PA, such as valuation withconditions and costing sheets, valuation using material cost estimates, and valuationusing user-defined valuation routines or user exits.
The condition technique can be used to estimate the values that are needed foranalysis in Profitability Analysis but which are not known at the time the document isposted. As a result, to evaluate a sales transaction, any commissions, cash discounts,discounts, or freight costs, which are not known at the time of invoicing, can beestimated.
The product cost estimate technique is used to determine the manufacturing costswhen data is updated to Profitability Analysis. This technique can be used tosupplement the revenues and sales deductions transferred from the invoice in the caseof a sales transaction with the fixed and variable manufacturing cost componentsbelonging to the product.
User-defined valuation routines are supported to allow you to determine the valuesthat cannot be determined using the other two techniques. This allows for theimplementation of user-defined valuation logic, should this be required.
Valuation Using Material Cost Estimates
120 © 2004 SAP AG. All rights reserved. 04-02-2005

AC605 Lesson: Valuation
Valuation using material cost estimates is primarily used to determine themanufacturing costs when billing documents are transferred to Profitability Analysis.By valuating transactions using cost estimates from Product Cost Planning, you cansupplement the revenues and sales deductions transferred from the billing documentwith the fixed and variable manufacturing cost components belonging to the product.Transactions can be valuated with up to six different cost estimates in parallel. Thisoption is available only for the costing key assigned to �other� characteristics.
The cost component split can be transferred in either the company code currencyor the Management Accounting area currency. The manufacturing costs can betransferred to Profitability Analysis both according to the cost component split and theprimary cost component split. Based on the customizing settings made for ProductCost Planning, the cost component split and the primary cost component split arestored either in the main cost component split or in the auxiliary cost componentsplit of a cost estimate.
The relevant cost estimates are assigned either on the basis of the material ormaterial type or on the basis of any other characteristics in an operating concern.Either using the plant of the CO-PA line item or a special valuation plant stored incustomizing can access the costing data. To set up valuation using material costestimates, work through the steps described in Customizing. There, you will alsofind further information on this subject.
Valuation Using a Costing Sheet
The condition technique in the case of CO-PA is used to determine estimatedvalues. Some technical terms need to be explained to familiarize participants withthis technique. Explain that the condition technique is widely used throughout SAPsystem. Although participants do not need to become experts on conditions, they needto have at minimum a basic understanding.
The background for the condition technique is explained extensively in the unit,Actual Data, and in the online documentation.
Business ExampleThe management of your company would like to implement a profitability accountingapplication in the SAP system. As a member of your the project team, you aresupposed to advise on the question of whether to implement CO-PA or EC-PCA in theSAP system. You then will be responsible for implementing the selected applications.
Mrs. Schnell has requirements for profitability reports along the lines of manycharacteristics, some of which are available on the selling and invoicing transactions,such as the sales organization, sold-to, and product, and some of which are availableonly on master records, such as the product group and state. True freight costs are
04-02-2005 © 2004 SAP AG. All rights reserved. 121

Unit 3: Master Data AC605
not known at the time of invoicing but are known only at the month-end when theinvoices are received from the freight vendors. These costs will not be accruedduring the month in FI but they are to be estimated in CO-PA. This is to enable Mrs.Schnell to estimate true profitability for her plant prior to the month-end. Mr. Cash,responsible for corporate planning, requests that sales demand in terms of materialquantities is to be planned in CO-PA. It is required that the system access the pricingand cost information and automatically apply it towards the planned quantities so thatthe revenue, cost-of-sales, and profit can be reasonably determined accordingly. TheProduct Costing module is being used, and the detail results are to be imported intoCO-PA. This is to analyze true cost-of-sales extensively, and to analyze and calculatethe types of margins, such as the margin after fixed costs and the margin after all costs.
As a result, freight and packaging costs are to be estimated for each line itemon each order/invoice (transaction-based billing). Revenue and COGS are to beprojected automatically for the materials with planned quantities in aggregate. TheDetail Product Costing information is to be brought in for each line item on eachorder/invoice (transaction-based billing).
For this purpose, the valuation strategy and techniques need to be used.
Valuation Concept
Valuation: Overview
Emphasize that valuation is relevant only for costing-based CO-PA. In addition,explain that many value fields will be populated through the Sales Order Managementand Management Accounting interfaces. As a result, valuation will populate valuefields if the data was not transferred from any other source.
122 © 2004 SAP AG. All rights reserved. 04-02-2005

AC605 Lesson: Valuation
Figure 45: Valuation Concept
In costing-based Profitability Analysis, you can configure a function known asvaluation to supplement the performance information provided directly by atransaction. The additional information may be estimated, calculated, or retrievedfrom a different source. For example, you can configure the system to calculate theestimated values for internal sales commission and freight costs at the time an invoiceis billed so that profitability can be projected prior to knowing the actual values.Similarly, you can access the detailed product costing information.
04-02-2005 © 2004 SAP AG. All rights reserved. 123

Unit 3: Master Data AC605
Figure 46: Valuation: Overview
Valuation can be used with either actual or planning data. It is often used inControlling Profitability Analysis (CO-PA) planning to access the pricing and productcost information for the products that have planned quantities. This enables theautomatic calculation of projected revenue and cost-of-sales figures.
Valuation can be configured to function either in real-time, which means at the timedata is first posted to CO-PA, or periodically, which means at some later point whenmanually triggered. Periodic valuation might be preferred if posting-time performanceis an issue. Similarly, it gives the option of re-evaluating the posted data.
Valuation Strategy and Techniques
Valuation Using Costing Sheets: Customizing
Valuation Using a Costing Sheet
Condition Types � Condition Records
Begin by explaining the terms: condition type, condition records, access sequence,and base versus calculated conditions.
Use the example of the condition type, Outgoing Freight (OUTF). The conditiondefinition is a surcharge or reduction, meaning the value to be calculated will eitherbe positive or negative so in the case of freight, it is a freight cost or a freight charge.The Detail button reveals the plus/minus sign logic, which controls whether the
124 © 2004 SAP AG. All rights reserved. 04-02-2005

AC605 Lesson: Valuation
condition results in an amount that is negative or positive. A negative amount is adiscount and a positive amount is a surcharge. This logic also controls whenever bothpositive and negative amounts are possible.
The surcharge or reduction overhead type determines whether a percentage of acertain value should be calculated or an absolute value multiplied by a quantity fieldshould be calculated. The issue to be decided is whether the freight should be 10% ofCOGS or $10 for each pound shipped.
Scales are basically look-up tables for the percentage or quantity-based values.Examples are weight = 10 pounds, freight rate = $5, weight = 100 pounds, and freightrate = $8. Scales are not required although you can just take into account a flat rateor %.
The Access Sequence is directly related to the condition record. It defines at whichorganizational level a particular value is calculated. For example, the freight rate inthe plant, 1000, access sequence, �Plant�, is $10, and in the plant, 2000, the rate is$12. The condition record contains the value itself.
The costing sheet combines calculated conditions and so called Base Conditions.Base conditions are used in calculations so if you use COGS to calculate freight,COGS has to be set up as a base condition. The value for the base condition originatesin an application other than CO-PA.
Draw a map:
Condition Type Value Field CostingSheet
From/To Source
OUTF = OutgoingFreight
VV280 Step 60 30 N/A
COGS = Cost ofGoods Sold
VV140 Step 30 SDInterface
04-02-2005 © 2004 SAP AG. All rights reserved. 125

Unit 3: Master Data AC605
Figure 47: Valuation Strategy
The valuation strategy is central to valuation configuration. A valuation strategy maycontain references to multiple valuation techniques, such as costing sheets, user exits,and product costing information, which are to be applied to a given COPA-relevanttransaction.
You need to decide to what record types, F, A, B, C, and 0-9, and at what points, knownas points of valuation, each valuation strategy should apply. Similarly, if a strategy isto be applied to planning data, the relevant planning version must be specified.
The various valuation techniques that populate the value fields in different ways are:
� With costing sheets, condition types are mapped to value fields.� From Product Costing, cost components are mapped to value fields.� Value fields are updated directly through user exits.
126 © 2004 SAP AG. All rights reserved. 04-02-2005

AC605 Lesson: Valuation
Figure 48: Product Cost Estimates in Product Costing
The Product Cost Controlling (CO-PC) module is used to generate the product costestimates for materials. The results of a product cost estimate can be viewed indifferent ways, such as by item, cost element, or cost component. Through valuation,the product cost estimate information for CO-PC can be transferred into CO-PA,through cost component values. This function can be used to import extensivecost-of-sales information into CO-PA for flexible margin reporting.
In configuration, cost components are mapped to value fields. You can map eachcomponent to its own value field or multiple components to a single value field. Youcan also map the fixed and variable portions of a component to separate value fields.This function exists so that cost-of-sales can be analyzed extensively in CO-PA andmultiple margin values can be calculated and analyzed in CO-PA.
04-02-2005 © 2004 SAP AG. All rights reserved. 127

Unit 3: Master Data AC605
Figure 49: Valuation Using Product Costing: Customizing (1)
Using a costing key, you can determine which cost estimate, meaning which costingvariant should be used with which validity date for valuation. By assigning a costingkey, you control which cost estimate, standard, modified standard, or current costestimate should be used in which case, depending on the material, material type, orany other combination of characteristics.
If an entry exists for the material, this has priority over the entry for the materialtype. The entry for the material type has priority over any entries defined for othercharacteristics.
In the assignment lines, you determine which values of the cost component structureare transferred to which value fields in the operating concern.
128 © 2004 SAP AG. All rights reserved. 04-02-2005

AC605 Lesson: Valuation
Figure 50: Valuation Using Product Costing: Customizing (2)
When you define a costing key, you can enter either a costing date or a period or avalue for the period indicator. Using the plan period indicator, you specify the datefor which the system should look for a valid material cost estimate in the database,for Product Cost Controlling.
The following options are available for the plan period indicator:
0 for the future standard cost estimate.
1 for the current standard cost estimate.
2 for the past standard cost estimate.
3 for the standard cost estimate valid on the posting date.
4 for the standard cost estimate valid on the date of goods issue.
If you enter 0, 1, or 2 for the plan period indicator, the system reads the standard costestimate valid on the first day of the period. This refers to the future, current, or pastperiod for which the standard cost estimate is valid according to the entries in thevaluation segment of the relevant material master record. If you enter 3 or 4 forthe plan period indicator, the system reads the standard cost estimate valid on the givenposting date or date of goods issue, regardless of what is stored in the material master.
04-02-2005 © 2004 SAP AG. All rights reserved. 129

Unit 3: Master Data AC605
Figure 51: Valuation Using Product Costing: Customizing (3)
In addition to assigning the costing keys to products or material types, you can assignthe costing keys to any combination of characteristics. This allows greater flexibilityand control in using costing keys.
You can use up to three characteristics as source fields�, such as plant, product, andgroup. In this way, you do not need to assign costing keys to one specific materialor material type. You can also assign costing keys to a combination of differentcharacteristics. This makes it possible to access the cost of goods manufactured fromdifferent plants, which is useful if you want to use the costs from the production plantwhen the product is sold by different sales plants.
130 © 2004 SAP AG. All rights reserved. 04-02-2005

AC605 Lesson: Valuation
Figure 52: Valuation Using Costing Sheets
Costing sheets are a vehicle through which special values can be accessed orcalculated. They are the central piece to the condition technique, a method usedthroughout SAP for performing calculations.
Costing sheets consist of a sequence of user-defined condition types, each of whichaccesses a value or performs specific calculations, as dictated by the definitions ofthe condition types. Each condition type is mapped to a value field in the operatingconcern.
04-02-2005 © 2004 SAP AG. All rights reserved. 131

Unit 3: Master Data AC605
Figure 53: Condition Types - Condition Records
A condition type represents one step in a costing sheet. What calculation the systemcarries out in that step depends on the following control indicators:
� Condition category� Calculation type� Condition class� Scale basis
Calculation Type: The calculation type determines how the system calculates prices,deductions, or additions for a condition type. For example, it can specify that a salesdeduction should be dependent on the quantity sold or a value scale.
Scale Basis: The scale basis determines how the system interprets the value or quantityscale for a condition. Scales can be dependent on a quantity or a currency amount.
132 © 2004 SAP AG. All rights reserved. 04-02-2005

AC605 Lesson: Valuation
Figure 54: Valuation Using a Costing Sheet: Customizing
Base condition types form the basis for calculations. They signify the value fields thathave already been populated through other means. These condition types must haveon their master record, a condition category of �K�, a calculation rule of �B�, and acondition class of �B�.
Calculation condition types perform calculations on the lines in the costing sheets thatrepresent subtotals of amounts, such as base amounts. These condition types actuallypopulate the value fields with values. Notice that their definitions can vary.
Calculation condition types each have an access sequence and a set of conditionrecords, which store surcharges, deductions, or absolute values for certaincombinations of characteristic values.
For complete information about how to use the condition technique, refer to pricingdocumentation or take a class on pricing or the condition technique.
Demonstration: Valuation Using a Product Cost Estimate
PurposeTo demonstrate the steps to perform valuation using a product cost estimate
System DataSystem:Client:User ID:
04-02-2005 © 2004 SAP AG. All rights reserved. 133

Unit 3: Master Data AC605
Password:Set up instructions:1. Begin your demonstration by entering another line item. This time focus on the
value fields and point out that certain value fields, such as Material Input, werepopulated although there was no billing document.
Accounting→ Controlling→ Profitability analysis→ Actual postings→Create line item
Posting date: today�s date
Record type: F
Customer: 1000
Sales organization: 1000
Distribution channel: 10
Company code: 1000
Product: P-100
Plant: 1000
Posting date: today�s date
Record type: F
Execute the valuation function and take a look at the value field, Material Input.
As of release 4.6, you can analyze how the system populated a value field. Select:
Extras→ Analyze Valuation
2. Open up another session and display the material cost estimate for the material,P-100:
Costing variant: PPC1
Plant: 1000
Costing version: 1
Valid on: Today
3. Call up the cost Component view for the currently released material cost estimate.
Accounting→ Controlling→ Product Cost Controlling→ Product costplanning→ Material costing→ Cost estimate with quantity structure→Display
134 © 2004 SAP AG. All rights reserved. 04-02-2005

AC605 Lesson: Valuation
To get to the cost component view, you may have to click the �Cost comp�icon next to the magnifying glass. It will then display in the lower section ofthe screen. Explain cost components as high level breakdown of product costinformation.
4. In your second session, review the line item in Profitability Analysis:
If you have not done so, execute the valuation function and take a look at thevalue field, Material Input.
5. Based on the valuation analysis, show the individual customizing steps, whichlead to this result. You know that the costing key, I10, was used to populatevalue field, �Material Input�. Depending on the expertise and interest in theclass, you can spend more or less time on the following demonstration. This isnot an easy topic so be prepared to reiterate the main points.
Assign costing key to product→ Costing key, I10.
Explain that with this step, you define what type of cost estimate will betransferred (costing variant) and which date the system will look at. Standard costestimates allow the user to define whether to transfer current, future, or past, andthe date control here defines whether the cost estimate should be brought over asof goods issue date, posting date, or the date on the material master. Here, youalso define which cost component split to use. Additive costs refer to the costsnot included in the quantity structure and added manually to the cost estimate.
Define access to material cost estimate (costing key, I10). This can be done at theproduct level, the material type level, or any other characteristic, such as Plant.When showing the related tables, explain the concept of �Point of Valuation�(when) and record type (for what type of transaction).
Assign value fields (cost component structure, 01). The confusion here is �where does the cost component structure come from. It is configured in thePersonal Computer and is basically a roll-up of cost elements into higher levelcategories � cost components.
IMG→ Controlling→ Profitability Analysis→ Master Data→ Valuation→ Product Costing ...
6. Mention the possibility of assigning the costing key to any other characteristics.An example has been set up for the material type and material type/plantlevel. The advantage of using this table is that you not only decide for whichcharacteristics product cost information should be pulled but also determineunder which circumstances it should be pulled, such as only if the plant is 1000.In addition, effective dates are not required in this table.
04-02-2005 © 2004 SAP AG. All rights reserved. 135

Unit 3: Master Data AC605
Demonstration: Valuation Using a Costing Sheet
PurposeTo demonstrate the steps to perform valuation using a costing sheet
System DataSystem:Client:User ID:Password:Set up instructions:1. Create a line item in Profitability Analysis:
Posting date: today�s date
Record type: F
Customer: 1000
Sales organization: 1000
Distribution channel: 10
Company code: 1000
Product: P-100
Plant: 1000
Revenue: 10,000.00
Customer discount: 300.00
Price reduction: 700.00
Cost of goods sold: 4000.00
Execute the condition analysis function and display the value field, OutgoingFreight�.
Accounting→ Controlling→ Profitability analysis→ Actual postings→Create line item
Extras→ Analyze valuation
2. Next, show the individual customizing steps that lead to this result and explainthe terms in their context:
Condition types and Costing sheet i.e. ACT001
136 © 2004 SAP AG. All rights reserved. 04-02-2005

AC605 Lesson: Valuation
Access sequences i.e. Z200
Condition tables i.e. 502
Value field assignment
IMG→ Controlling→ Profitability Analysis→Master Data→ Valuation→Define Conditions and Costing Sheets ...
3. When you get to the condition types, refer to the IMG documentation. Here, allthe options relating to the condition types in CO-PA are described and examplesare given.
Demonstration: Valuation Strategy
PurposeTo demonstrate the valuation strategy
System DataSystem:Client:User ID:Password:Set up instructions:1. Show the valuation strategy, 001, and explain the idea behind the individual
steps. Make sure to point out that without a valuation strategy, none of the aboveconfiguration will take effect. Explain the concepts of periodic revaluation andvaluation in planning. Periodic valuation enables users to select the actual datathat has already been posted and revaluate the data using a valuation strategyspecially defined for the point of valuation, 02 � periodic revaluation � actual.With periodic valuation you can use the updated costs or the actual manufacturingcosts to revaluate the line items posted with standard manufacturing costs at thestart of the period. The difference between the original values of the line itemand the newly determined values is posted to CO-PA as a delta line item.
If periodic valuation is carried out more than one time, a new delta line item isposted every time a difference is determined. When periodic valuation has takenplace, the Information System can be used to display the updated values.
IMG→ Controlling→ Profitability Analysis→Master Data→ Valuation→Valuation Strategy→ Define valuation strategy
04-02-2005 © 2004 SAP AG. All rights reserved. 137

Unit 3: Master Data AC605
Display the assignment of the valuation strategy, 001, and explain the point ofvaluation and the record type.
IMG→ Controlling→ Profitability Analysis→Master data→ Valuation→Valuation Strategy→ Define valuation strategy
Demonstration: Periodic Valuation
PurposeTo demonstrate the steps to perform periodic valuation
System DataSystem:Client:User ID:Password:Set up instructions:1. Show the periodic valuation function.
Accounting→ Controlling→ Profitability analysis→ Actual postings→Periodic adjustments→ Periodic valuation
138 © 2004 SAP AG. All rights reserved. 04-02-2005

AC605 Lesson: Valuation
Customizing Monitor Valuation Analysis
Figure 55: Customizing Monitor Valuation Analysis
The value field analysis function enables you to analyze all the flows of actual data toProfitability Analysis. You can find inconsistencies by looking at the individual valuefields. The report shows you what value flows the value field is involved in and whatcondition types or cost elements it gets its values from. In all, you can analyze thefollowing actual value flows:
� Transfer of billing documents and incoming sales orders from Sales OrderManagement.
� Direct postings from Financial Accounting and operations.� Order and project settlement from Overhead Cost Orders (CO-OPA), and
the Project System Cost center assessment from Cost Center Accounting(CO-OM-CCA).
� External data transfer.
04-02-2005 © 2004 SAP AG. All rights reserved. 139

Unit 3: Master Data AC605
Figure 56: Analysis of Valuation
Valuation analysis is available to you when entering of plan or actual data. Noticethat you have the possibility of checking valuation by simulating the entry of singleline items. You can specify different valuation points in time and in this way checkdifferent valuation strategies.
To analyze the valuation errors during billing document transfer, you can execute asimulation of previously transferred billing documents and then analyze the results ofyour valuation strategies. For further options for the simulation of billing documenttransfers, refer to the section, Tools.
Demonstration: Customizing Monitor
PurposeTo demonstrate the steps to use a Customizing Monitor
System DataSystem:Client:User ID:Password:Set up instructions:
140 © 2004 SAP AG. All rights reserved. 04-02-2005

AC605 Lesson: Valuation
1. IMG→ Controlling→ Profitability Analysis→ Tools→ Analysis→Customizing Monitor→ Valuation Analysis
Point of Valuation: 01
Record Type: Billing document
Execute
Expand the hierarchy in which the first level is the overall valuation strategyused for this point of valuation and record type, the next level are the valuationtechniques within the valuation strategy, and the following level shows how avalue field will be populated.
04-02-2005 © 2004 SAP AG. All rights reserved. 141

Unit 3: Master Data AC605
142 © 2004 SAP AG. All rights reserved. 04-02-2005

AC605 Lesson: Valuation
105 Exercise 5: ValuationExercise Duration: 10 Minutes
Exercise ObjectivesAfter completing this exercise, you will be able to:� Create a link to material costing, to obtain extensive information about the key
cost of manufacturing components, such as material and production labor� Use costing sheets to determine specific values, such as the cost of packaging
materials
Business ExampleYour controlling manager wants to ensure that sales and product managers understandthe key cost components for the manufactured products.
You want to determine the estimated costs for packing the finished products. Thisis normally 1.50 for each unit.
Note: If you implement material costing in your SAP system, you can transferextensive information to CO-PA, to calculate and analyze the estimatedcost of sales and different contribution margins, such as the margin afterfixed costs, and the margin after all costs. Valuation signifies the concept ofsupplementing the performance information provided directly by a transactionand allows access to in-depth material costing information.
04-02-2005 © 2004 SAP AG. All rights reserved. 143

Unit 3: Master Data AC605
Task 1:In the Customizing settings for CO-PA, display the entries configured under CostingKeys for Valuation.
What type of cost estimate is assigned to the costing key, I10?
For which period does the system access the material cost estimate?
Note: Costing keys can be assigned to an individual product, a material type,or any characteristic, such as plant. This step defines the level at which thesystem accesses the material costing information. You can assign a valuationstrategy to determine the transactions valuated. To allocate the estimatedproduction costs, such as materials and labor, to CO-PA value fields, you canassign the cost components of a material cost estimate to value fields.
1. Display the costing key assignment for the product, P-100. Which costing keyis assigned?
What is the point of valuation at which the system will use the costing key,I10, for the product, P-100?
What is the record type for which the system will use the costing key, I10, for theproduct, P-100?
2. Display the currently released (status FR) standard cost estimate for the product,P-100, in the Product Cost Planning component. Use the costing variant, PPC1.Notice that the costing lot size for the product is 100.
What is the total raw material cost? What is the Cost Component number anddescription?
3. Display the value field assignments for the cost component structure, 01.
To which value field is the raw material cost component assigned?
Continued on next page
144 © 2004 SAP AG. All rights reserved. 04-02-2005

AC605 Lesson: Valuation
Task 2:To test your valuation strategy, enter a line item for your customer directly in CO-PA.Fill in the header data, as required, and enter the product, P-100, in the plant, 1000,in the Line item entry screen. After carrying out derivation, enter 100 pieces in theInvoiced Quantity field with a Revenue of $100,000. Carry out the valuation.
Posting Date: Today�s dateRecord Type: FCustomer: T-CO05A##Sales Org.: 1000Distribution Channel: 10Company Code: 1000Product: P-100Plant: 1000Invoiced Quantity: 100Revenue: 100,000
1. What is the value for Material Input? Why?
2. Next, carry out a valuation analysis: How was the Material Overhead fieldpopulated?
Save the line item and write down the document number.
Task 3:The true costs for packaging and accessories are not known at the time of invoicingbut are known at the month-end when the packaging materials are posted and allocatedto various cost centers. These costs are not accrued during the month in FI but they areto be estimated in CO-PA so that your Plant Manager can estimate true profitability ofall plants prior to the month-end. You can use valuation to configure the system tocalculate the estimated values for packaging supplies at the time an invoice is billed.
1. Display the costing sheet under the Valuation settings in the IMG. What basisis used to calculate estimated packaging (OUPA)?
2. Display the condition record for the condition type, OUPA. Which conditiontype is used?
3. What overhead type is used for OUPA?
Continued on next page
04-02-2005 © 2004 SAP AG. All rights reserved. 145

Unit 3: Master Data AC605
4. In the plant, 1000, what rate does the system use to estimate the packagingfor one piece of the material, P-100?
Task 4:1. To verify that the costing sheet has been configured correctly, enter another
line item in costing-based CO-PA. Enter the customer and all the relevantinformation. Enter the product, P-100. Enter 10 for Invoiced Quantity, 10,000for Revenue, and 8,000 in the Cost of Goods Sold field. Carry out valuation.What is the value for Dispatch Packaging?
Task 5:1. Review the documentation for Valuation in CO-PA.
Task 6:You can use the Customizing Monitor to analyze in one step all the configurationsettings you have made. It also allows you to evaluate the existing settings, the use ofcharacteristics, and value fields.
1. Analyze the Customizing settings for the planning data entered manually.
If you decided to create a sales plan for the billed orders manually, how does thesystem valuate your data, assuming you are using the version, 100?
Field Name or Data Type ValuesPoint of Valuation 03Plan Version 100Record Type Billing
2. Next, you try to establish where the characteristic, WWSBU, is used in yourclient. Which origin and target fields are assigned in this step? Use theCustomizing Monitor to establish this.
Reports:
146 © 2004 SAP AG. All rights reserved. 04-02-2005

AC605 Lesson: Valuation
Solution 5: ValuationTask 1:In the Customizing settings for CO-PA, display the entries configured under CostingKeys for Valuation.
What type of cost estimate is assigned to the costing key, I10?
For which period does the system access the material cost estimate?
Note: Costing keys can be assigned to an individual product, a material type,or any characteristic, such as plant. This step defines the level at which thesystem accesses the material costing information. You can assign a valuationstrategy to determine the transactions valuated. To allocate the estimatedproduction costs, such as materials and labor, to CO-PA value fields, you canassign the cost components of a material cost estimate to value fields.
1. Display the costing key assignment for the product, P-100. Which costing keyis assigned?
What is the point of valuation at which the system will use the costing key,I10, for the product, P-100?
Continued on next page
04-02-2005 © 2004 SAP AG. All rights reserved. 147

Unit 3: Master Data AC605
What is the record type for which the system will use the costing key, I10, for theproduct, P-100?
a) In the Customizing settings for CO-PA, display the entries configuredunder Costing Keys for Valuation.
IMG: Controlling→ Profitability Analysis→Master Data→ Valuation→ Set Up Valuation Using Material Cost Estimates→ Define Access toStandard Cost Estimates
What type of cost estimate is assigned to the costing key, I10?
Select I10 and Details:
Costing Variant, PPC1, which is the Standard Cost Estimate
For which period does the system access the material cost estimate?
Released standard cost estimate matching goods issue date.
Note: Costing keys can be assigned to an individual product, amaterial type, or any characteristic, such as a plant. This stepdefines the level at which the system accesses the product-costinginformation. You can assign a valuation strategy to determine thetransactions valuated. To allocate the estimated production costs,such as materials and labor, to CO-PA value fields, you can assignthe cost components of a material cost estimate to value.
Display the costing key assignment for the product, P-100. Which costingkey is assigned?
IMG: Controlling→ Profitability Analysis→Master Data→ Valuation→ Set Up Valuation using Material Cost Estimates→ Assign CostingKeys to Products
Product, P-100, is assigned to the costing key, I10.
What is the point of valuation at which the system will use the costingkey, I10, for the product, P-100?
For real-time, online valuation. PV = 1
What is the record type for which the system will use the costing key,I10, for the product, P-100?
For the record type, A, incoming sales orders, and F, billed sales orders.
Continued on next page
148 © 2004 SAP AG. All rights reserved. 04-02-2005

AC605 Lesson: Valuation
2. Display the currently released (status FR) standard cost estimate for the product,P-100, in the Product Cost Planning component. Use the costing variant, PPC1.Notice that the costing lot size for the product is 100.
What is the total raw material cost? What is the Cost Component number anddescription?
a) Display the currently released (status FR) standard cost estimate for theproduct, P-100, in the Product Cost Planning component.
Accounting→ Controlling→ Product Cost Controlling→ Product CostPlanning→Material Costing→ Cost Estimate with Quantity Structure→ Display
Field Name or Data Type ValuesMaterial P-100Plant 1000Costing Variant PPC1Costing Version 1Date Leave Default
Click Find Cost Estimates (Binoculars icon) and make sure the costingstatus is set to FR. Select Execute.
After you have accessed the product cost estimate, click the Detail List Officon on the toolbar. Click the Cost Comps icon (bottom right).
What is the total raw material cost? What is the Cost Component numberand description?
3. Display the value field assignments for the cost component structure, 01.
To which value field is the raw material cost component assigned?
a) Display the value field assignments for the cost component structure, 01.To which value field is the raw material cost component assigned?
IMG: Controlling→ Profitability Analysis→Master Data→ Valuation→ Set Up Valuation Using Material Cost Estimates→ Assign ValueFields .
Use the cost component layout 01.
Cost component, 10, Raw Materials is assigned to Value Field, VV150,Material Input .
Continued on next page
04-02-2005 © 2004 SAP AG. All rights reserved. 149

Unit 3: Master Data AC605
Task 2:To test your valuation strategy, enter a line item for your customer directly in CO-PA.Fill in the header data, as required, and enter the product, P-100, in the plant, 1000,in the Line item entry screen. After carrying out derivation, enter 100 pieces in theInvoiced Quantity field with a Revenue of $100,000. Carry out the valuation.
Posting Date: Today�s dateRecord Type: FCustomer: T-CO05A##Sales Org.: 1000Distribution Channel: 10Company Code: 1000Product: P-100Plant: 1000Invoiced Quantity: 100Revenue: 100,000
1. What is the value for Material Input? Why?
a) To test your valuation strategy, enter a line item for your customer directlyin CO? PA. Fill in the header data, as required, and enter the product,P-100, in the plant, 1000, in the line Item entry screen. After carrying outderivation, enter 100 pieces in the Invoiced Quantity field with a Revenueof $100,000. Carry out the valuation.
Accounting→ Controlling→ Profitability Analysis→ Actual Postings→ Create Line Items:
Field Name or Data Type ValuesPosting Date Today�s dateRecord Type F
Select Enter: Characteristics tab
Continued on next page
150 © 2004 SAP AG. All rights reserved. 04-02-2005

AC605 Lesson: Valuation
Field Name or Data Type ValuesCustomer T-CO05A##Product P-100Distribution Channel 10Plant 1000Sales Organization 1000Company Code 1000
Select the Value fields tab.
Field Name or Data Type ValuesInvoiced Quantity 100Revenue 100000
Select the Origin data tab.
Field Name or Data Type ValuesGoods Issue Date Today�s date
Select Valuation.
What is the value for Material Input? Why?
Compare this with the value for 2-1-2. The standard cost estimate for theproduct, P-100, for actual online valuation has been mapped to CO-PAusing the costing key. In addition, the Material Input value field has beenmapped to the cost component, 01, of the cost estimate.
2. Next, carry out a valuation analysis: How was the Material Overhead fieldpopulated?
Continued on next page
04-02-2005 © 2004 SAP AG. All rights reserved. 151

Unit 3: Master Data AC605
Save the line item and write down the document number.
a) Carry out a valuation analysis:
Extras→ Valuation Analysis
How was the Material Overhead field populated?
With the costing key, I10, which is linked to the costing variant, PPC.Value field VV250 was linked to the cost component, 080, in the costcomponent structure, 01.
Save the line item and write down the document number.
Task 3:The true costs for packaging and accessories are not known at the time of invoicingbut are known at the month-end when the packaging materials are posted and allocatedto various cost centers. These costs are not accrued during the month in FI but they areto be estimated in CO-PA so that your Plant Manager can estimate true profitability ofall plants prior to the month-end. You can use valuation to configure the system tocalculate the estimated values for packaging supplies at the time an invoice is billed.
1. Display the costing sheet under the Valuation settings in the IMG. What basisis used to calculate estimated packaging (OUPA)?
a) The true costs for packaging and accessories are not known at the time ofinvoicing but are known at the month-end when the packaging materialsare posted and allocated to the various cost centers. These costs are notaccrued during the month in FI but they are to be estimated in CO-PA soyour Plant Manager can estimate true profitability for her plants prior to themonth-end. You can use valuation to configure the system to calculate theestimated values for packaging supplies at the time an invoice is billed.
Display the costing sheet under the Valuation settings in the IMG. Whatbasis is used to calculate estimated packaging (OUPA)?
IMG: Controlling→ Profitability Analysis→Master Data→ Valuation→ Set Up Conditions and Costing Sheets→ Create Condition Typesand Costing Sheets .
Select the Pricing Procedure, ACT001, from the list on the bottom left ofthe screen. The pricing procedure appears on the right of the screen .
Outgoing packaging (OUPA) is calculated based on the invoiced quantity.(Line 300) .
Continued on next page
152 © 2004 SAP AG. All rights reserved. 04-02-2005

AC605 Lesson: Valuation
2. Display the condition record for the condition type, OUPA. Which conditiontype is used?
a) Display the condition record for the condition type, OUPA. Whichcondition type is used?
IMG: Controlling→ Profitability Analysis→Master Data→ Valuation→ Set Up Conditions and Costing Sheets→ Create Condition Types andCosting Sheets. Select OUPA from the list of pricing procedures in thetable on the upper left of the screen.
The condition type is Surcharge/Reduction.
3. What overhead type is used for OUPA?
a) What overhead type is used for OUPA?
This condition type is quantity-based.
4. In the plant, 1000, what rate does the system use to estimate the packagingfor one piece of the material, P-100?
a) In the plant 1000, what rate does the system use to estimate packaging forone piece of the material, P-100?
Select CondRcrds-Access and display the condition record for the plant,1000 .
Execute→ Choose Plant 1000→ Display .
Using this condition record, the packaging costs 3 per unit .
Task 4:1. To verify that the costing sheet has been configured correctly, enter another
line item in costing-based CO-PA. Enter the customer and all the relevantinformation. Enter the product, P-100. Enter 10 for Invoiced Quantity, 10,000for Revenue, and 8,000 in the Cost of Goods Sold field. Carry out valuation.What is the value for Dispatch Packaging?
a) To verify that the costing sheet has been configured correctly, enter anotherline item in costing-based CO-PA. Enter the customer and all the relevantinformation. Enter the product, P-100. Enter 10 for Invoiced Quantity,10,000 for Revenue, and 8,000 in the Cost of Goods Sold field. Carry outvaluation. What is the value for Dispatch Packaging?
What value appears in the Dispatch Packaging field? A rate of 30 wascalculated, based on the costing sheet.
Continued on next page
04-02-2005 © 2004 SAP AG. All rights reserved. 153

Unit 3: Master Data AC605
Task 5:1. Review the documentation for Valuation in CO-PA.
a) Review the documentation for Valuation in CO-PA.
Open the SAP Library and select the Financials submenu. Choose CO andthen Profitability Analysis (CO-PA).
In the Master Data submenu, select Valuation. Read the sections onValuation Using Material Cost Estimates and Valuation Using Conditions.
Task 6:You can use the Customizing Monitor to analyze in one step all the configurationsettings you have made. It also allows you to evaluate the existing settings, the use ofcharacteristics, and value fields.
1. Analyze the Customizing settings for the planning data entered manually.
If you decided to create a sales plan for the billed orders manually, how does thesystem valuate your data, assuming you are using the version, 100?
Continued on next page
154 © 2004 SAP AG. All rights reserved. 04-02-2005

AC605 Lesson: Valuation
Field Name or Data Type ValuesPoint of Valuation 03Plan Version 100Record Type Billing
a) You can use the Customizing Monitor to analyze in one step all theconfiguration settings you have made. It also allows you to evaluate theexisting settings, the use of characteristics, and value fields.
Analyze the Customizing settings for the planning data entered manually.
IMG: Controlling→ Profitability Analysis→ Tools→ Analysis→Check Customizing Settings
Select Overview of Valuation:
If you decided to create a sales plan for the billed orders manually, howdoes the system valuate your data, assuming you are using the version, 100?
Field Name or Data Type ValuesPoint of Valuation 03Plan Version 100Record Type Billing Document
Execute.
The system first accesses the Costing Sheet, COPA10, and then theCosting Sheet, ACT001. It then looks for information about material costestimates and finally, it accesses a user exit.
2. Next, you try to establish where the characteristic, WWSBU, is used in yourclient. Which origin and target fields are assigned in this step? Use theCustomizing Monitor to establish this.
Continued on next page
04-02-2005 © 2004 SAP AG. All rights reserved. 155

Unit 3: Master Data AC605
Reports:
a) You now try to establish where the WWSBU characteristic is used in yourclient. Which origin and target fields are assigned in this step? Use theCustomizing Monitor to establish this.
IMG: Controlling→ Profitability Analysis→ Tools→ Analysis→Check Customizing Settings
Select Where-Used List
Field Name or Data Type ValuesCharacteristic WWSBUClient Current Client
Select Execute, and then Information System → Reports →Costing-Based
Reports: IDES-300, IDES-310 � IDES-314
156 © 2004 SAP AG. All rights reserved. 04-02-2005

AC605 Lesson: Valuation
Lesson Summary
You should now be able to:� Understand valuation using the product cost information� Outline valuation using a CO-PA costing sheet� Use the Customizing Monitor to perform valuation analysis
04-02-2005 © 2004 SAP AG. All rights reserved. 157

Unit Summary AC605
Unit SummaryYou should now be able to:� Explain the derivation concepts� Explain the valuation concepts� Explain the derivation strategy� Evaluate derivation techniques� Understand valuation using the product cost information� Outline valuation using a CO-PA costing sheet� Use the Customizing Monitor to perform valuation analysis
158 © 2004 SAP AG. All rights reserved. 04-02-2005

AC605 Test Your Knowledge
121Test Your Knowledge
1. supplements the data being passed directly fromtransactions into CO-PA with calculated, retrieved, or otherwise accessed values.Fill in the blanks to complete the sentence.
2. What is a derivation strategy?
3. What is a table lookup?
4. The system automatically creates a standard derivation strategy for eachoperating concern.Determine whether this statement is true or false.□ True□ False
5. Using a , you can determine which cost estimate shouldbe used with which validity date for valuation.Fill in the blanks to complete the sentence.
6. What do costing sheets consist of?
04-02-2005 © 2004 SAP AG. All rights reserved. 159

Test Your Knowledge AC605
7. The value field analysis function enables you to analyze all the flows of actualdata to Profitability Analysis.Determine whether this statement is true or false.□ True□ False
160 © 2004 SAP AG. All rights reserved. 04-02-2005

AC605 Test Your Knowledge
123Answers
1. Valuation supplements the data being passed directly from transactions intoCO-PA with calculated, retrieved, or otherwise accessed values.
Answer: Valuation
2. What is a derivation strategy?
Answer: A derivation strategy is a sequence of steps, where each step usesone derivation technique to calculate one or more values for one or morecharacteristics, respectively.
3. What is a table lookup?
Answer: A table lookup is a derivation technique that is utilized by CO-PA toaccess the characteristic values from SAP master data tables.
4. The system automatically creates a standard derivation strategy for eachoperating concern.
Answer: True
The system automatically creates a standard derivation strategy for eachoperating concern. This strategy contains the derivation steps for all thedependencies that are already known between characteristics. You can thenchange this strategy to meet your organization�s requirements.
5. Using a costing key, you can determine which cost estimate should be usedwith which validity date for valuation.
Answer: costing key
6. What do costing sheets consist of?
Answer: Costing sheets consist of a sequence of user-defined condition types,each of which accesses a value or performs specific calculations, as dictated bythe definitions of the condition types.
04-02-2005 © 2004 SAP AG. All rights reserved. 161

Test Your Knowledge AC605
7. The value field analysis function enables you to analyze all the flows of actualdata to Profitability Analysis.
Answer: True
The value field analysis function enables you to analyze all the flows of actualdata to Profitability Analysis. You can find inconsistencies by looking atindividual value fields.
162 © 2004 SAP AG. All rights reserved. 04-02-2005

Unit 4125 Actual Data
This unit covers the flow of actual values. Participants should be made aware ofthe modules from which Profitability Analysis can be supplied with data. Forcosting-based Profitability Analysis in particular, it is important that the participantslearn how to maintain the respective interfaces to obtain the corresponding data.Further, explain the differences between the value flows from the point of view ofcosting-based Profitability Analysis and account-based Profitability Analysis. Theselected example processes and the exercises help to deepen the understanding ofthe participants.
Unit OverviewThis unit explains the flow of actual data. It explains condition types and the transferand allocation of costs. In addition, it provides an overview of settlement orders anddiscusses direct and automatic posting, variance calculation, and schedule manager.
Unit ObjectivesAfter completing this unit, you will be able to:
� Explain the flow of actual data in CO-PA� List the sources of value fields� Understand the data flow from sales order management to CO-PA� Outline the concept of a condition type� Explain the transfer and allocation of costs� Explain the settlement of orders� Explain direct postings� Make automatic posting to CO-PA� Explain variance calculation� Work with the schedule manager
04-02-2005 © 2004 SAP AG. All rights reserved. 163

Unit 4: Actual Data AC605
Unit ContentsLesson: Flow of Actual Data... . . . . . . . . . . . . . . . . . . . . . . . . . . . . . . . . . . . . . . . . . . . . . . . . . . . .165
Demonstration: Steps to set up number assignment ... . . . . . . . . . . . . . . . . . . .168Lesson: Integration with Sales Order Management ... . . . . . . . . . . . . . . . . . . . . . . . . .172
Demonstration: Transferring Data from the SD Module .. . . . . . . . . . . . . . . . .178Exercise 6: Sales Order Processing ... . . . . . . . . . . . . . . . . . . . . . . . . . . . . . . . . . . . . . .189Exercise 7: Value Flows between Sales Order Management andCO-PA... . . . . . . . . . . . . . . . . . . . . . . . . . . . . . . . . . . . . . . . . . . . . . . . . . . . . . . . . . . . . . . . . . . . . . . . . .197
Lesson: Transfer of Overhead ... . . . . . . . . . . . . . . . . . . . . . . . . . . . . . . . . . . . . . . . . . . . . . . . . .202Demonstration: Assessing Cost Center and Process Costs... . . . . . . . . . . .209Demonstration: Settling Orders... . . . . . . . . . . . . . . . . . . . . . . . . . . . . . . . . . . . . . . . . . . . .215Exercise 8: Cost Center Assessment.. . . . . . . . . . . . . . . . . . . . . . . . . . . . . . . . . . . . . . .219Exercise 9: Internal Orders... . . . . . . . . . . . . . . . . . . . . . . . . . . . . . . . . . . . . . . . . . . . . . . . . .227Exercise 10: Activity Allocation ... . . . . . . . . . . . . . . . . . . . . . . . . . . . . . . . . . . . . . . . . . . . .235
Lesson: Direct Postings.. . . . . . . . . . . . . . . . . . . . . . . . . . . . . . . . . . . . . . . . . . . . . . . . . . . . . . . . . . .242Demonstration: Direct Postings from Financial Accounting.. . . . . . . . . . . . . .244Demonstration: Automatic Account Assignment (Optional � if timeallows).. . . . . . . . . . . . . . . . . . . . . . . . . . . . . . . . . . . . . . . . . . . . . . . . . . . . . . . . . . . . . . . . . . . . . . . . . . .246Exercise 11: Direct Postings from Financial Accounting .. . . . . . . . . . . . . . . . .249Exercise 12: Direct Posting from Financial Accounting/Operations .. . . .255
Lesson: Value Flow from Cost Object CO... . . . . . . . . . . . . . . . . . . . . . . . . . . . . . . . . . . . .260Demonstration: Production Order Variances (if time allows) .. . . . . . . . . . . .270
164 © 2004 SAP AG. All rights reserved. 04-02-2005

AC605 Lesson: Flow of Actual Data
Lesson:127
Flow of Actual DataLesson Duration: 30 Minutes
Lesson OverviewThis lesson will help you to understand the flow of actual data in CO-PA. You will alsolearn about the steps required to prepare Profitability Analysis for actual value flows.
Lesson ObjectivesAfter completing this lesson, you will be able to:
� Explain the flow of actual data in CO-PA� List the sources of value fields
Value Flow: Overview This lesson gives the participants an initial impression ofthe actual value flows in Profitability Analysis. Based on the example report forcosting-based or account-based Profitability Analysis, first explain the modules fromwhich the individual values in a profitability report are derived.
Business ExampleThe management of your company wants to implement a profitability accountingapplication in the SAP system. As a member of the project team, you are supposedto advise on the question of whether to implement CO-PA or EC-PCA in the SAPsystem. You then will be responsible to implement the selected applications.
Your corporate controller asks you to explain the differences of actual data flowsbetween account-based and costing-based Profitability Analysis. Mr. Udo, yourJapanese sales manager is familiar with the sales order process. He asks you toexplain at what point data is posted to CO-PA. He also wants to know which salesorder data is posted in CO-PA.
To fully allocate the Research and Development costs that are currently collected atthe product group level using CO Internal Orders, Mr. Cash inquires whether internalorders can be settled to CO-PA. Your corporate Logistics department wants to allocatecosts across the two manufacturing plants, and the distribution centers in Canada, theUS, and Japan. They can track the services they provided at the division level andwant to ensure that Logistics costs are included in the contribution margin reports.
Your Marketing department has spent an extensive amount of time training the worldwide sales force and product management on the advantages of the new �Blue Bicycle�product line. They have tracked training hours and want to allocate costs to all the
04-02-2005 © 2004 SAP AG. All rights reserved. 165

Unit 4: Actual Data AC605
products within the �Blue Bicycle� product group. Mr. Ding, your Taiwanese productmanager has been informed of price increases for bicycle seats, which are purchasedexternally, and wonders how that will affect contribution margins. He also wants toanalyze the cost of production variances due to the scrap and use of reflectors for thethree models within the �Blue Bicycle� product group.
Flow of Actual Values: Overview and Results
Flow of Actual Values � Overview
Flow of Actual Values � Results
Sources of Value Fields
Explain the steps required to prepare Profitability Analysis for actual value flows.Briefly introduce number assignment and the function for activating CO-PA. Inaddition, explain the concepts of record types and show where additional record typescan be configured, if needed. A reason may be that data is manually transferred forplanning.
Figure 57: Flows of Actual Values - Overview
166 © 2004 SAP AG. All rights reserved. 04-02-2005

AC605 Lesson: Flow of Actual Data
Revenues and discounts are transferred to profitability segments in ProfitabilityAnalysis at the point of billing in Sales Order management. Quantities sold arevaluated at the same time with the standard cost of goods manufactured according tothe cost component split from Product Cost Controlling (CO-PC).
In Overhead Cost Controlling, primary postings are posted to the objects in OverheadCost Controlling and allocated to the cost object by the most source-related meansavailable. The actual cost of goods manufactured is also allocated to the cost object,and the cost centers that perform the activity are credited. From the viewpoint ofProfitability Analysis, this leads to under absorption or over absorption for the costcenters performing the activity and production variances for the corresponding costobjects, such as production orders.
Production variances: The difference between the actual costs of goods manufacturedand the standard costs determined for cost objects, in this case production orders, aredivided into variance categories and settled to profitability segments.
Overhead costs remaining on the Overhead Cost Controlling objects are allocated tothe originating profitability segments.
Figure 58: Flow of Actual Values � Results
04-02-2005 © 2004 SAP AG. All rights reserved. 167

Unit 4: Actual Data AC605
The method of determining period operating results in Profitability Analysis is basedon the assumption that the success of a company can be measured primarily onthe basis of its transactions with other companies. The aim is to supply the sales,marketing, product management, controlling, and corporate planning teams withdecision-support information.
This sales-oriented approach in Controlling Profitability Analysis means that nocontribution to the success of the organization is made until a sales transaction iscompleted. As a result, the products sold are transferred to CO-PA in accordancewith the cost of sales accounting method and provide the information about the salesrevenue and sales deductions.
This net revenue is compared with the cost of sales. The costs consist of the cost ofgoods manufactured, products sold, or services rendered in addition to any productionvariances known.
To complete your profitability data, you can also assign overhead costs to profitabilitysegments in the course of your period-end closing activities.
Demonstration: Steps to set up number assignment
PurposeTo demonstrate the steps to set up the number assignment.
System DataSystem:Client:User ID:Password:Set up instructions:1. Show how to set up the number assignment.
IMG→ Controlling→ Profitability Analysis→ Flow of Actual Values→Initial Steps→ define number range for actual postings
Make the participants aware of the fact that this is the number assignmentfor costing-based Profitability Analysis and that number assignment foraccount-based Profitability Analysis is located under the general Controllingmenu of IMG.
IMG→ Controlling→ General Controlling→ Organization→Maintain thenumber ranges for controlling documents .
168 © 2004 SAP AG. All rights reserved. 04-02-2005

AC605 Lesson: Flow of Actual Data
Demonstrate the Activate Profitability Analysis function. Here, you not onlydecide to activate PA but also which type of PA to use.
IMG→ Controlling→ Profitability Analysis→ Flow of Actual Values→Activate Profitability Analysis .
To demonstrate how to define additional record types:
IMG→ Controlling→ Profitability Analysis→ Tools→ Data Transfers. →Initial Steps→ define record types .
Sources of Value Fields
Figure 59: Sources of Value Fields
The value fields in the costing-based CO-PA contain the amounts and quantities thatyou want to report on. They represent the finest level of detail at which costs andrevenues are broken down. One of the most important tasks in Customizing for thecosting-based CO-PA is to assign your costs and revenues to the required value fields.This enables you to calculate the contribution margins that your organization requiresin the Information System.
04-02-2005 © 2004 SAP AG. All rights reserved. 169

Unit 4: Actual Data AC605
Facilitated Discussion
Discussion QuestionsUse the following questions to engage the participants in the discussion.Feel free touse your own additional questions.
Outline the flow of actual values in Profitability Analysis.
170 © 2004 SAP AG. All rights reserved. 04-02-2005

AC605 Lesson: Flow of Actual Data
Lesson Summary
You should now be able to:� Explain the flow of actual data in CO-PA� List the sources of value fields
04-02-2005 © 2004 SAP AG. All rights reserved. 171

Unit 4: Actual Data AC605
Lesson:132
Integration with Sales Order ManagementLesson Duration: 50 Minutes
Lesson OverviewThis lesson helps you to understand the data flow from sales order management toCO-PA. In addition, it explains the condition type.
Lesson ObjectivesAfter completing this lesson, you will be able to:
� Understand the data flow from sales order management to CO-PA� Outline the concept of a condition type
Transferring Data from the Sales Order Management Module
First, explain the classical process flow of a sales order in some detail, includingcreating the sales order in the system, the goods issue posting, and billing. Work onestablishing the differences between the two approaches and explain the possibilitiesthat the costing-based approach offers on account of the valuation function.
Business ExampleThe management of your company would like to implement a profitability accountingapplication in the SAP system. As a member of your the project team, you aresupposed to advise on the question of whether to implement CO-PA or EC-PCA in theSAP system. You then will be responsible for implementing the selected applications.
Your corporate controller asks you to explain the differences of actual data flowsbetween account-based and costing-based Profitability Analysis. Mr. Udo, yourJapanese sales manager is familiar with the sales order process. He asks you toexplain at what point data is posted to CO-PA. He also would like to know which salesorder data is posted in CO-PA.
To fully allocate Research and Development costs, which are currently collected at theproduct group level, using CO Internal Orders, Mr. Cash inquires whether internalorders can be settled to CO-PA. For this reason, you need to explain the flow of actualdata in CO-PA and identify the differences between the value flows in costing-basedand account-based CO-PA. In addition, you need to outline the data flow from thesales order management.
172 © 2004 SAP AG. All rights reserved. 04-02-2005

AC605 Lesson: Integration with Sales Order Management
Data Flow from Sales Order Management to CO-PA
Differences in the Data Transfer from Sales Order Management
Sales from Stock: Business Background
Sales from Stock: Transferring incoming orders
Sales from Stock: Posting Delivery
Sales from Stock: Billing
Sales Order Management: Condition Types � Pricing Procedure
Condition Types
Transfer Billing Documents to CO-PA.
Reflect on the debits and credits in the various applications and the generic sales orderflow. You also may want to emphasize that you are currently talking only about thesales from stock and not about make to order or service orders.
Figure 60: Differences in the Data Transfer from Sales Order Management
The interface with the Sales Order Management plays a central role in ProfitabilityAnalysis. In particular, note the differences when data is transferred to costing-basedand account-based Controlling Profitability Analysis (CO-PA).
04-02-2005 © 2004 SAP AG. All rights reserved. 173

Unit 4: Actual Data AC605
The main purpose of costing-based CO-PA is to provide sales management with a toolfor analyzing the expected results generated by sales transactions. Its main featureis the use of value fields and the automatic calculation of anticipated or accrual data(valuation). The advantage of this method is that the data is up-to-the-minute.
Account-based CO-PA enables you to reconcile cost and Financial Accounting at anytime at the account level. In contrast to costing-based CO-PA, the system stores valuesin cost and revenue elements, which form the common account structure for all theFinancials applications. All the costs and revenues are posted to account-based CO-PAsimultaneously and using the same valuation approach as Financial Accounting. Themain difference here is that the cost of sales is transferred at the point of goods issueand not together with the revenues.
Figure 61: Sales from Stock: Business Background
The sales order management application component consists of the functions forhandling quotations, orders, deliveries, and billing. Each of these areas has its ownsales documents, which contain the relevant data for that activity.
The central document in sales order management is the sales order. This order may bebased on the existing inquiries and customer quotations. When you create an order,the information about the customer and the products or services sold is stored inthe document.
174 © 2004 SAP AG. All rights reserved. 04-02-2005

AC605 Lesson: Integration with Sales Order Management
The following information is passed on to all the subsequent documents created forthis business transaction:
� The delivery is created when the product is shipped to the customer, whichmeans the goods issue.
� A billing document is created to bill the customer for the goods or servicesprovided.
This is a central process in the SAP system and the starting point for the data transferto Financial Analytics. In some cases, data is transferred to costing-based andaccount-based CO-PA at different times using different valuation approaches.
Figure 62: Sales from Stock: Transferring Incoming Orders
You can valuate incoming sales orders as expected revenues and transfer them fromsales order management to costing-based CO-PA to obtain an early analysis ofanticipated profits. As a result, you can create reports that not only reflect the courseof actual profits and contribution margins on the basis of billing documents but alsoallow you to analyze these developments on the basis of incoming orders. To analyzeincoming orders, indicate the record type, A, in the report. To analyze billing data,indicate the record type, F.
04-02-2005 © 2004 SAP AG. All rights reserved. 175

Unit 4: Actual Data AC605
The two options available to activate the transfer of incoming orders are:
� Activate for date of entry: Updates the orders under the same period in whichthey were created in the system.
� Transfer with date of delivery/scheduled billing date: Displays the order inProfitability Analysis in the period of the planned delivery or the scheduledbilling date. As a result, it comes closer to reflecting the expected billinginformation.
If you activate Profitability Analysis after you have gone productive with Sales OrderManagement, you can post the existing sales orders for the current or past periodssubsequently to CO-PA.
Another function is available to identify the sales orders that are already assigned toa profitability segment although the order was not yet active and to transfer theseorders to CO-PA.
Figure 63: Sales from Stock: Postings Delivery
The goods issue is triggered by a delivery in Sales Order Management. This affectsthe values in Materials Management and Financial Accounting. Balance sheet andstock change postings are made in FI when the goods issue is posted.
Note: Notice that the goods issue posting does not cause any data to beposted in costing-based CO-PA. The cost of goods sold is only transferred tocosting-based CO-PA when the billing document is transferred.
176 © 2004 SAP AG. All rights reserved. 04-02-2005

AC605 Lesson: Integration with Sales Order Management
Figure 64: Sales from Stock: Billing
A business transaction is normally concluded in Sales Order Management withthe billing document. The billing data is automatically transferred to FinancialAccounting (FI), where the revenue and receivable postings are made at the same time.
When a billing document is created, Sales Order Management calculates all salesrevenues, sales deductions, and other values, such as the standard cost usingpricing procedures, and stores these values in condition types. By assigning thesecondition types to the value fields in Profitability Analysis, you can have the systemautomatically transfer their values to CO-PA.
By valuating this billing data from Sales Order Management using a material or salesorder cost estimate, you can assign further anticipated costs and sales deductionsto this transaction. The billing data is transferred to Profitability Analysis with therecord type, F.
In addition, you can transfer the quantities from the Sales Order Managementquantity fields, such as the sales quantity or gross weight, by assigning them to thecorresponding quantity fields in CO-PA.
04-02-2005 © 2004 SAP AG. All rights reserved. 177

Unit 4: Actual Data AC605
Figure 65: Transfer Billing Document to CO-PA: In Detail
During billing, the system checks whether the update can be made in FI and CO-PA.If one of the postings cannot be made due to an error, the other posting is also notcarried out. In this way, data is updated in parallel, reconciling FI and CO-PA. If youchoose �Release to Accounting� (VF02), you can post the invoice in FI and CO-PAafter having removed the error.
Demonstration: Transferring Data from the SD Module
PurposeTo demonstrate the steps to transfer data from the sales order management module
System DataSystem:Client:User ID:Password:Set up instructions:1. Create a sales order:
Order type: OR
Sales organization: 1000
178 © 2004 SAP AG. All rights reserved. 04-02-2005

AC605 Lesson: Integration with Sales Order Management
Distribution channel: 10
Division: 00
Ordering party: 1000
Ship-to party: 1000
Purchase order number: AC605-20
Material: P-100
Order quantity: 10
Display the conditions in the sales order and refer to the topic, Transferringincoming sales orders. Explain that a line item in costing-based profitabilityanalysis is created with the record type, A.
Note: Make sure that the material, P-100, is available in the stock inthe appropriate quantity.
Logistics→ Sales and distribution→ Sales→ Order→ Create .
2. Create the delivery and post the goods issue:
Shipping point: 1000
Selection date: Set to one month later
Order: Current order number
Choose PICKING
Pick quantity: 10
Choose Post goods issue
Logistics→ Sales and distribution→ Sales→ Order→ Subsequent functions→ Delivery .
3. Bill the sales order.
Document: Current delivery document number
Choose Save .
Logistics→ Sales and distribution→ Sales→ Order→ Subsequent functions→ Billing document .
4. Display the document flow of the sales order and explain the various FinancialAccounting documents and Management Accounting-documents from aProfitability Analysis perspective.
04-02-2005 © 2004 SAP AG. All rights reserved. 179

Unit 4: Actual Data AC605
Logistics→ Sales and distribution→ Sales→ Order→ Display Environment→ Display document flow .
5. Explain how the quantities and values from the sales order management moduleare mapped to the value fields in Profitability Analysis.
IMG→ Controlling→ Profitability Analysis→ Flow of Actual Values→Transfer of Billing Documents→ Assign value fields .
IMG→ Controlling→ Profitability Analysis→ Flow of Actual Values→Transfer of Billing Documents→ Assign quantity fields .
Note: Draw attention to the fact that a condition type from sales ordermanagement with a value that leads to a posting in the FinancialAccounting module is transferred to costing-based CO-PA only if theG/L account is defined as a cost element of the categories, 11 or 12.
180 © 2004 SAP AG. All rights reserved. 04-02-2005

AC605 Lesson: Integration with Sales Order Management
Condition Types
Sales Order Flow:
Transaction Costing-based
Account-based
FI
Create SalesOrder Revenue
Discounts
COS
Record Type A
Post GoodsIssue
DR COS
DR COS
CR Inventory
Billing
Revenue
Discounts
COS
Record Type F
CR Revenue
DR Discounts
CR Revenue
DR Discount
DR Cust. AR
Explain again the condition technique, which works similar to the condition techniqueexplained under the lesson, �Valuation�. Notice that the set-up is a little bit moreelaborate here because you are not posting estimated values but the values that affectFinancial Accounting and Management Accounting. A generic overview of all thepieces in sales order management Pricing configuration will have to suffice at thispoint.
Sales Order Type, i.e. OR→ Pricing Procedure, i.e. RV001A→ Condition Type(s), i.ePR00 Price→ Value Fields i.e. VV10
Account Key, i.e. ERL
GL Accounts i.e. 800000
04-02-2005 © 2004 SAP AG. All rights reserved. 181

Unit 4: Actual Data AC605
Should you be interested in exploring the configuration in more detail, refer to the SDportion of the implementation guide. You will find most steps under: Basic Functions.
Remind the participants that the product cost information can be retrieved whentransferring sales order management documents. Highlight the differences betweenthe condition type, VPRS, and other COGS or COGM fields that are populatedthrough valuation. VPRS can be reconciled to FI �. It is the legal Cost of Sales, andCOGM or COGS may refer to a future or current standard cost estimate.
To familiarize yourself with the concept of customer agreements, there is an excellentIDES demo script on this topic that you can execute in the training system if timepermits.
Figure 66: Sales Order Management: Condition Types - Pricing Procedure
A pricing procedure defines the conditions that are permitted for a particular documentand the sequence in which the system takes these conditions into account duringpricing. In addition, you assign the pricing procedures to the transactions by definingthe following dependencies: customer, sales document type, or sales area. In thepricing procedure, you define which condition types should be taken into accountand in which sequence. During pricing, the SAP System automatically determinesthe pricing procedure that is valid for a business transaction and it takes the conditiontypes contained in it into account one after the other.
182 © 2004 SAP AG. All rights reserved. 04-02-2005

AC605 Lesson: Integration with Sales Order Management
Figure 67: Condition Types
A condition type is a representation in the system of some aspect of your daily pricingactivities. For example, you can define a different condition type for each type ofprice, discount, or surcharge that occurs in your business transactions.
A condition table defines the combination of fields that identifies an individualcondition record. A condition record is how the system stores the specific conditiondata that you enter in the system as condition records. For example, when you enterthe price for a product or a special discount for a good customer, you create individualcondition records.
An access sequence is a search strategy that the system uses to find valid data for aparticular condition type. It determines the sequence in which the system searchesfor data. The access sequence consists of one or more accesses. The sequence of theaccesses establishes which condition records have priority over others. The accessesinstructs the system where to look first, second, and continue in this way until it findsa valid condition record. You specify an access sequence for each condition typefor which you create condition records.
04-02-2005 © 2004 SAP AG. All rights reserved. 183

Unit 4: Actual Data AC605
Figure 68: Valuation Using Product Costing: Process
Transfer the Material Value at the time of goods issue through the condition, VPRS.
The condition type, VPRS, transfers the cost of goods sold (COGS) posted at the timeof goods issue to CO-PA. Despite the standard price being changed between goodsissue and billing, VPRS saves this value and ensures that COGS can be reconciledwith Financial Accounting.
Valuation with Product Cost Estimate
Valuation using material cost estimates enables you to determine the cost of goodsmanufactured for the product sold whenever a sales document is transferred toProfitability Analysis. For example, you can find the variable and fixed costcomponents for the product sold and compare these to the revenues and salesdeductions transferred from the billing document for the sales transaction. You canvaluate your billing items using the date of goods issue. The customizing is donein the costing key.
184 © 2004 SAP AG. All rights reserved. 04-02-2005

AC605 Lesson: Integration with Sales Order Management
Figure 69: Simulation of the Transfer of Billing Document Data to CO-PA
In the activity, Simulating the Transfer of Documents from Billing, you have theoption of simulating the transfer of billing document data into Profitability Analysis.Simulation occurs on the basis of the Customizing settings valid at the time it iscarried out. You can view the characteristics and value fields of the line item to bewritten to CO-PA.
The function, Valuation analysis, allows you to perform an analysis of the valuationstrategy valid for valuating the billing document data.
You can also restart the simulation of document transfers for the billing documentsthat have already been transferred. Performing this simulation causes no data to beposted to CO-PA or to other modules.
04-02-2005 © 2004 SAP AG. All rights reserved. 185

Unit 4: Actual Data AC605
Figure 70: Reconciliation Report FI / SD and CO-PA
In Sales Order Management, billing document values are assigned to conditiontypes, posted to accounts in accounting, and placed into value fields in CO-PA.Correspondingly, the reconciliation report CO-PA represents a list of the balances forvalue fields, condition types, and P&L accounts. This list offers you the followingfundamental functions:
� Using posted data, you can check and understand, through post-analysis, theassignments in Customizing of the Sales Order Management conditions to theaccounts in FI and to the value fields in CO-PA, as well as the flows of valuesresulting from the assignments.
� You can analyze the differences between CO-PA and SD as well as betweenCO-PA and FI with a view to locating their origin. This is particularly useful forreconciling FI and CO-PA. This report is also available to check the value flowfrom order/project settlement. In the example above, the Delta SD/CO-PA iscaused by the fact that accrued freight is calculated in CO-PA through valuationand has accordingly no SD counterpart.
186 © 2004 SAP AG. All rights reserved. 04-02-2005

AC605 Lesson: Integration with Sales Order Management
Figure 71: Transferring Customer Agreements
During market segment planning and sales and profit planning, you can createbudgets for sales support measures, such as sales promotions and related special offerdiscounts. This budget is then used in the Sales Order Management when conditions,such as special offer discounts, are maintained for the customer agreement. You canmonitor the budgeting process from the assignments within the customer agreement tothe billing document in CO-PA. This is because the budget assignments are transferredto CO-PA when you maintain the conditions.
You can keep checking the budget assignments by carrying out variance analysesof the planned and available budget. This allows you to monitor sales promotionsextensively right from the early stages of profitability analysis.
Data can be passed on to CO-PA:
� When the condition record is created as part of the sales agreement� When the sales order is created� When the billing document is created
This allows for accurate reporting through all the stages of the process.
04-02-2005 © 2004 SAP AG. All rights reserved. 187

Unit 4: Actual Data AC605
188 © 2004 SAP AG. All rights reserved. 04-02-2005

AC605 Lesson: Integration with Sales Order Management
145 Exercise 6: Sales Order ProcessingExercise Duration: 15 Minutes
Exercise ObjectivesAfter completing this exercise, you will be able to:� Understand data flow from Sales Order Management to CO-PA
Business ExampleYour company is now ready to test the mapping of the SD condition types to theCO-PA value fields and the effect this has on valuation and derivation.
Task:Review the condition types mapped to the value fields in your operating concern.Ensure that both the quantities and values have been mapped to CO-PA so that thecorresponding value fields are populated when a sales order is posted.
Hint: The generic sales order cycle is executed as follows: Create a salesorder. At this point, the system will determine the price, cost, discount, andother values based on the SD condition types configured. After you save theorder, the system assigns a sales order number. The next step is the orderdelivery process. It includes the tasks to pick the materials ordered, post thegoods issue, and create a delivery document for the actual delivery of theproduct. After delivery, a billing document is created, which ends the salesorder process from an SD perspective.
The condition technique used in the Sales and Distribution componentdetermines the prices and estimated costs (statistical conditions) for the order.
1. To which value field is the condition type, PR00 (Price), mapped?
2. To which value field is the SD quantity field, FKIMG, mapped?
3. To test your configuration settings, create a standard sales order for yourcustomer as follows:
Standard Order
Order Type: OR
Sales Organization: 1000Continued on next page
04-02-2005 © 2004 SAP AG. All rights reserved. 189

Unit 4: Actual Data AC605
Distribution Channel: 10
Division: 00
Sold-to Party: T-CO05A##_Becker
Ship-to Party: T-CO05A##_Becker
Material: P-100
Quantity: 1
4. What is the value for the condition type, PR00, and the condition type, VPRS?
Save your sales order. Order Number: _______________
5. Review the sales order line item you just created in CO-PA. Which record typewas used to post the line item?
What value is entered in the Revenue field?
6. Process the delivery: The delivery process includes the picking process andgoods issue for your sales order.
7. Use Subsequent Functions again to create the billing document using thedocument number from the previous step.
Billing document number: ____________________
8. In CO-PA, display the line item for your billing document. Enter the customerand the product, P-100, when displaying line items.
What is the total value of revenue: ________________
Why do two lines appear for the line item you have displayed?
From the line item report, how do you drill down to the sales order that youoriginally created?
190 © 2004 SAP AG. All rights reserved. 04-02-2005

AC605 Lesson: Integration with Sales Order Management
Solution 6: Sales Order ProcessingTask:Review the condition types mapped to the value fields in your operating concern.Ensure that both the quantities and values have been mapped to CO-PA so that thecorresponding value fields are populated when a sales order is posted.
Hint: The generic sales order cycle is executed as follows: Create a salesorder. At this point, the system will determine the price, cost, discount, andother values based on the SD condition types configured. After you save theorder, the system assigns a sales order number. The next step is the orderdelivery process. It includes the tasks to pick the materials ordered, post thegoods issue, and create a delivery document for the actual delivery of theproduct. After delivery, a billing document is created, which ends the salesorder process from an SD perspective.
The condition technique used in the Sales and Distribution componentdetermines the prices and estimated costs (statistical conditions) for the order.
1. To which value field is the condition type, PR00 (Price), mapped?
a) To which value field is the condition type, PR00 (Price), mapped?
IMG: Controlling→ Profitability Analysis→ Flow of Actual Values→ Transfer of Billing Documents→ Assign Value Fields→ MaintainAssignment of SD Conditions to COPA Value Fields.
The condition type, PR00, is mapped to the value field, VV010 Revenue.
2. To which value field is the SD quantity field, FKIMG, mapped?
a) To which value field is the SD quantity field, FKIMG, mapped?
IMG: Controlling→ Profitability Analysis→ Flow of Actual Values→Transfer of Billing Documents→ Assign Quantity Fields
The field, FKIMG, is mapped to the value field, VVIQT Invoiced Quantity.
3. To test your configuration settings, create a standard sales order for yourcustomer as follows:
Standard Order
Order Type: OR
Sales Organization: 1000
Continued on next page
04-02-2005 © 2004 SAP AG. All rights reserved. 191

Unit 4: Actual Data AC605
Distribution Channel: 10
Division: 00
Sold-to Party: T-CO05A##_Becker
Ship-to Party: T-CO05A##_Becker
Material: P-100
Quantity: 1
a) To test your configuration settings, create a standard sales order for yourcustomer as follows:
Logistics→ Sales and Distribution→ Sales→ Order→ Create
Order Type: OR
Sales Organization: 1000
Distribution Channel: 10
Division 00
Choose Enter.
Sold-to Party: T-CO05A## Becker
Ship-to Party: T-CO05A## Becker
PO Number: GR## Item 10
Material: P-100
Quantity: 1
Choose Enter.
4. What is the value for the condition type, PR00, and the condition type, VPRS?
Save your sales order. Order Number: _______________
a) What is the value for the condition type, PR00, and for the condition type,VPRS?
Select the item and then the Item conditions icon on the sales orderscreen.
The value for the condition, PR00 (Price), is 2,600.
The value for the condition, VPRS (Cost), is 480.14.
Save your sales order. Order number ____________
Continued on next page
192 © 2004 SAP AG. All rights reserved. 04-02-2005

AC605 Lesson: Integration with Sales Order Management
5. Review the sales order line item you just created in CO-PA. Which record typewas used to post the line item?
What value is entered in the Revenue field?
a) Review the sales order line item you have just created in CO-PA. Whichrecord type was used to post the line item?
Accounting→ Controlling→ Profitability Analysis→ InformationSystem→ Display Line Item List→ Actual
Sales Order: Your sales order number
→ Execute
Select Enter to confirm Line Items: Selection Criteria.
The CO-PA document was posted under the record type, A (incomingsales orders).
What value is entered in the Revenue field?
Settings→ Layout→ Change
Select Revenue from the column set. The value is 2,600.00.
6. Process the delivery: The delivery process includes the picking process andgoods issue for your sales order.
a) Process the delivery: The delivery process includes the picking process andgoods issue for your sales order.
Select Subsequent Functions in the menu to create the delivery for yoursales order. Use a delivery date of one month from today and the shippingpoint, 1000.
Logistics→ Sales and Distribution→ Sales→ Order→ SubsequentFunctions→ Outbound Delivery
Field Name or Data Type ValuesShipping Point 1000Selection Date Today�s date + 1 monthOrder Your order number
Choose Enter
Select Subsequent Functions→ Create Transfer Order
Continued on next page
04-02-2005 © 2004 SAP AG. All rights reserved. 193

Unit 4: Actual Data AC605
Select Yes to confirm that you wish to change the delivery.
Delivery document number: _______________
Field Name or Data Type ValuesAdopt Pick Quantity 1
Select Enter to create the transfer order.
Choose Post.
When you have created the transfer order, post the delivery for your salesorder.
Logistics→ Sales and Distribution→ Sales→ Subsequent Functions→Outbound Delivery
Field Name or Data Type ValuesShipping Point 1000Selection Date Today�s date + 1 monthOrder Your sales order number
Select Outbound Delivery→ Change
Delivery: Number of your delivery document
Select Post Goods Issue.
Delivery document number: __________________
7. Use Subsequent Functions again to create the billing document using thedocument number from the previous step.
Billing document number: ____________________
a) Use Subsequent Functions again to create the billing document using thedocument number from the previous step.
Logistics→ Sales and Distribution→ Sales→ Order→ SubsequentFunctions→ Billing Document
Your delivery number appears on the screen. To create the billingdocument, select Save.
Billing document number: ______________________
Continued on next page
194 © 2004 SAP AG. All rights reserved. 04-02-2005

AC605 Lesson: Integration with Sales Order Management
8. In CO-PA, display the line item for your billing document. Enter the customerand the product, P-100, when displaying line items.
What is the total value of revenue: ________________
Why do two lines appear for the line item you have displayed?
From the line item report, how do you drill down to the sales order that youoriginally created?
a) In CO-PA, display the actual line item for your sales order. Enter thecustomer and the product, P-100, when displaying line items.
Accounting→ Controlling→ Profitability Analysis→ InformationSystem→ Display Line Item List→ Actual
What is the total value of revenue? $2,600.00
Why do two lines appear for the line item you have displayed?
As a result of the currency settings for the operating concern, IDEA, boththe operating concern currency and the company code currency are stored.Both of them are displayed here.
Record Type: F
Period/Year: Current
Entered by: Your user ID
Customer: T-CO05A##
Product: P-100
What is the total value of revenue? 2,600.00
Why do two lines appear for the line item you have displayed?
As a result of the currency settings for the operating concern IDEA, boththe operating concern currency and the company code currency are stored.Both of them are displayed here.
From the line item report, how do you drill down to the sales order that youoriginally created?
Double-click the line item to select it.
Environment→ Integration→ Display Sales Order
04-02-2005 © 2004 SAP AG. All rights reserved. 195

Unit 4: Actual Data AC605
196 © 2004 SAP AG. All rights reserved. 04-02-2005

AC605 Lesson: Integration with Sales Order Management
153 Exercise 7: Value Flows between SalesOrder Management and CO-PAExercise Duration: 15 Minutes
Exercise ObjectivesAfter completing this exercise, you will be able to:� Understand the data flow from Sales Order Management to CO-PA
Business ExampleYour company is now ready to test the mapping of the SD condition types to theCO-PA value fields and the effect this has on valuation and derivation.
Task:You want to compare the actual data from profitability analysis with the values postedin Financial Accounting.
Hint: You can use the CO-PA reconciliation report to compare the actualdata from Profitability Analysis with the corresponding values posted inFinancial Accounting.
This enables you to see the value flow to CO-PA when invoicing takes place.It also shows the discrepancies between the applications and allows you toanalyze them.
In Sales Order Management, billing document values are assigned tocondition types, posted to accounts in Financial Accounting, and placed inthe value fields in CO-PA. The reconciliation report contains a list of thecorresponding balances of value fields, condition types, and P&L accounts.
1. In Customizing for CO-PA, choose Tools→ Analysis to analyze the value flowfrom the billing documents of your sales order.
Continued on next page
04-02-2005 © 2004 SAP AG. All rights reserved. 197

Unit 4: Actual Data AC605
Field Name or Data Type ValuesCompany Code 1000Currency Type 00Billing No. of billing document for your sales
order
Take a look at the color legend. Which color is used to represent the value fields?
Which color is used to show the discrepancies between Financial Accountingand CO-PA?
Why is there no corresponding Financial Accounting value for Accrued freight?
198 © 2004 SAP AG. All rights reserved. 04-02-2005

AC605 Lesson: Integration with Sales Order Management
Solution 7: Value Flows between SalesOrder Management and CO-PATask:You want to compare the actual data from profitability analysis with the values postedin Financial Accounting.
Hint: You can use the CO-PA reconciliation report to compare the actualdata from Profitability Analysis with the corresponding values posted inFinancial Accounting.
This enables you to see the value flow to CO-PA when invoicing takes place.It also shows the discrepancies between the applications and allows you toanalyze them.
In Sales Order Management, billing document values are assigned tocondition types, posted to accounts in Financial Accounting, and placed inthe value fields in CO-PA. The reconciliation report contains a list of thecorresponding balances of value fields, condition types, and P&L accounts.
1. In Customizing for CO-PA, choose Tools→ Analysis to analyze the value flowfrom the billing documents of your sales order.
Field Name or Data Type ValuesCompany Code 1000Currency Type 00Billing No. of billing document for your sales
order
Take a look at the color legend. Which color is used to represent the value fields?
Which color is used to show the discrepancies between Financial Accountingand CO-PA?
Continued on next page
04-02-2005 © 2004 SAP AG. All rights reserved. 199

Unit 4: Actual Data AC605
Why is there no corresponding Financial Accounting value for Accrued freight?
a) In Customizing for CO-PA, choose Tools→ Analysis to analyze the valueflow from the billing documents of your sales order.
IMG→ Controlling→ Profitability Analysis→ Tools→ Analysis→Check Value Flow in Billing Document Transfer
Field Name or Data Type ValuesCompany Code 1000Currency Type 00Billing No. of billing document for your
sales order
Take a look at the color legend. Which color is used to represent the valuefields?
Information icon
Blue
Which color is used to show the discrepancies between FinancialAccounting and CO-PA?
Red
Why is there no corresponding Financial Accounting value for Accruedfreight?
The accrued freight costs were calculated when the document wastransferred to CO-PA and were not transferred from the billing document.You can double-click to drill down to the billing document and from therego to the Financial Accounting document. This document contains realizedvalues but not the costing-based calculations from CO-PA.
200 © 2004 SAP AG. All rights reserved. 04-02-2005

AC605 Lesson: Integration with Sales Order Management
Lesson Summary
You should now be able to:� Understand the data flow from sales order management to CO-PA� Outline the concept of a condition type
04-02-2005 © 2004 SAP AG. All rights reserved. 201

Unit 4: Actual Data AC605
Lesson:158
Transfer of OverheadLesson Duration: 50 Minutes
Lesson OverviewThis lesson helps you understand the transfer and allocation of costs. It also explainssettlement of orders.
Lesson ObjectivesAfter completing this lesson, you will be able to:
� Explain the transfer and allocation of costs� Explain the settlement of orders
Transfer of Overhead
Explain the business concept behind assessing the cost center and process costs inProfitability Analysis. To allow full analysis of the costs that have arisen in OverheadCost Controlling, you can periodically transfer the overhead costs that are not directlyattributable to the cost centers or business processes to Profitability Analysis. Theseare sometimes referred to as below the line expenses or SG expenses.
These costs can be allocated to any market segment or profitability segment and, asa result, to any level of the contribution margin hierarchies. This function allows youto transfer the sales, marketing, and administration costs, as well as the variances inservice cost centers or production cost centers to Profitability Analysis. Underline thefact that CO-PA uses the same assessment tool as Overhead Cost Controlling.
Remind the participants that the product cost information can be retrieved whentransferring sales order management documents. Highlight the differences betweencondition type VPRS and other COGS or COGM fields that are populated throughvaluation. VPRS can be reconciled to Financial Accounting. It is the legal Cost ofSales, and COGM or COGS may indicate a future or current standard cost estimate.
To familiarize yourself with the concept of customer agreements, there is an excellentIDES demo script on this topic, which you can execute in the training system if timepermits.
202 © 2004 SAP AG. All rights reserved. 04-02-2005

AC605 Lesson: Transfer of Overhead
Business ExampleThe management of your company would like to implement a profitability accountingapplication in the SAP system. As a member of your the project team, you aresupposed to advise on the question of whether to implement CO-PA or EC-PCA in theSAP system. You then will be responsible for implementing the selected applications.
Your corporate operations department would like to allocate costs across the twomanufacturing plants and the distribution centers in Canada, the US, and Japan. Theycan track the services they provided at the division level and want to ensure that theLogistics costs are included in the contribution margin reports.
For this reason, you need to execute allocations and settlements of overhead costs.
Transfer and Activity Allocation
Allocating Processes
Describe the process of activity allocations. Mention that this starts from the CostCenter Accounting screens.
Accounting→ Controlling→ Cost Center accounting→ Actual Posting→ ActivityAllocation→ enter→ Controlling Area 1000
Comment on the options under screen variant→ profit segment/cost ctr .
After the screen has changed, to show this screen variant, direct your attention to theProfitability Segment arrow appearing on the receiver side.
04-02-2005 © 2004 SAP AG. All rights reserved. 203

Unit 4: Actual Data AC605
Figure 72: Transfer of Overhead Costs: Overview
To show in Profitability Analysis all the costs incurred in Overhead Costs Controlling,you can transfer to Controlling Profitability Analysis (CO-PA) the particular overheadcosts for the cost centers and the business processes that are not allocated to theinventory. This can be done using periodic assessment.
You can also perform direct or indirect allocation of internal activities for the costcenter and the business processes in CO-PA. Along with the sender, which means thecost center or process and the receiver, which means the profitability segment, youenter the quantity of the activity performed and valuate it with the planned price of theactivity type. The amount that is arrived at is credited to the sender and debited tothe profitability segment receiving the quantity. This means that a transport activitycan be directly posted to particular customers without the need to be posted to a costcenter or an order.
If you use the cost component split in Cost Center Accounting or Activity-BasedCosting for price calculation, you can update the prices divided into cost componentsduring allocations to Profitability Analysis.
Comparison: Credit object What Timebasis
Cost center assessment Cost center Cost periodic
Dir. activity allocation Cost center Quantity/Price ad-hoc
Indir. activity allocation Cost center Quantity/Price periodic
Process assessment Process Cost periodic
204 © 2004 SAP AG. All rights reserved. 04-02-2005

AC605 Lesson: Transfer of Overhead
Template allocation Process Quantity/Price periodic
Figure 73: Activity Allocation
You can transfer overhead costs from Cost Center Accounting either on anactivity-allocation or a periodic basis. You can transfer the activities either directlyor indirectly to Profitability Analysis.
You can use a PA transfer structure to control the secondary cost element of activityallocation in the value fields for costing-based profitability analysis.
You can transfer the cost component split of cost center prices to CO-PA. You mustactivate the appropriate Customizing settings and then enter the cost components inthe different value fields.
04-02-2005 © 2004 SAP AG. All rights reserved. 205

Unit 4: Actual Data AC605
Figure 74: Assessing Cost Center and Process Costs
The Overhead Cost Controlling Activity-Based Costing (CO-OM-ABC) applicationcomponent provides an alternative form of overhead control that is particularly usefulwhen indirect activities generate a large share of the value added to products. It usescost drivers to allocate the internal activities to the overhead processes, which canthen be transferred to profitability segments using the process assessment function.Reference values for the transfer can be quantities and values posted in CO-PA oradditional cost driver information, such as the number of sales orders created.
The assessment of cost center costs function allows you to transfer the variances inproduction cost centers as well as the costs in sales and administrative cost centersto Profitability Analysis.
The cost centers and processes are credited by the amount allocated. As a result, allcosts can only be allocated one time. You assess cost center and process costs in thesame way as done within Overhead Cost Controlling, which is by defining cycles andexecuting them on a periodic basis. These cycles contain the control information forthe assessment and can be maintained in Customizing.
206 © 2004 SAP AG. All rights reserved. 04-02-2005

AC605 Lesson: Transfer of Overhead
Figure 75: Defining and Executing an Assessment Cycle
A cycle controls how assessment is processed. It contains all the relevant informationabout the senders, receivers, sender rules, receiver rules, and tracing factors. Eachcycle can contain a number of segments. The segment describes a combination ofsenders and receivers that are to be processed together.
In theory, you could create one cycle for transferring all the overhead costs toProfitability Analysis. Notice that for performance reasons as well as for technicalones, it is a good idea to create several cycles and process them sequentially in theorder entered.
You should divide your assessment into separate cycles if you want to allocate thedifferent areas of your organization to CO-PA at different times. This also has theadvantage that when errors or changes occur, you only need to repeat the affectedcycles.
A cycle can contain the sender cost centers or sender processes from one controllingarea and can use the values from either costing-based or account-based ProfitabilityAnalysis as tracing factors.
The sender cost centers or processes are credited in the assessment cost elementspecified in the segment of the cycle.
The receiver is defined by a combination of characteristic values, which means aprofitability segment. The values are debited to the profitability segment using theassessment cost element, such as account-based CO-PA and value fields, such ascosting-based CO-PA, which you specified for each segment of the cycle.
04-02-2005 © 2004 SAP AG. All rights reserved. 207

Unit 4: Actual Data AC605
Figure 76: Allocating Processes
In the SAP system, you allocate the process costs incurred for individual profitabilitysegments, such as a sales organization, to Profitability Analysis. Notice that hereyou transfer the valuated process quantities and not the activity type quantities aswith cost centers.
When you create the process allocation, you can specify a profitability segment asthe receiver by selecting the Profit segment field. Then, when you press ENTER, thesystem displays a dialog box in which you can specify the characteristic values towhich you want to allocate the process.
The process quantity is then valuated using the planned price for that process andcredited to the cost center as actual data with the allocation cost element that wasassigned to the relevant business process.
In account-based CO-PA, the costs are debited with the same allocation cost element.For costing-based CO-PA, you need to assign this allocation cost element to therequired value field in the PA transfer structure CO.
In dynamic process allocation, you can determine to a great extent, which profitabilitysegment used the process and, as a result, should receive the process costs. In thiscase, you can use a process template to define the formulae and functions that selectthe cost drivers from Profitability Analysis or other sources to assign the costs mostaccurately to their cause.
208 © 2004 SAP AG. All rights reserved. 04-02-2005

AC605 Lesson: Transfer of Overhead
In Customizing, you assign this process template to characteristics, which are usedto select the cost drivers. Then, you need to assign update characteristics, whichultimately determine the profitability segments to which the business process costsare allocated.
Demonstration: Assessing Cost Center and ProcessCosts
Purpose
To demonstrate the steps to assess the cost center and process costs
System DataSystem:Client:User ID:Password:Set up instructions:1. In Financial Accounting, post expenses (account, 417000) to the cost center for
sales and distribution of pumps (3200).
Document date: today�s date
Company code: 1000 (should default)
G/L Account: 417000
Amount: 10,000.00
D/C: Debit
Tax code: 0I
Cost center: 3200
Account: 113100
D/C: Credit
Amount: 10000
Choose Post
Accounting→ Financial accounting→ General ledger→ Document Entry→G/L account posting.
04-02-2005 © 2004 SAP AG. All rights reserved. 209

Unit 4: Actual Data AC605
2. Define an assessment cycle, which assigns the cost center, 3200, to Division,01, 02, and 06, in Profitability Analysis, according to the rule, fixed percentagerates. Explain the effects of the tracing factor field. Explain the following keypoints: Cost are assessed from within CO-PA (pull) and not from cost centeraccounting (push). Allocations cannot cross controlling areas. Assessment is theonly value allocation method available. Distribution and Periodic Reposting donot work in conjunction with PA. During the allocation run, postings are madeto both account-based and costing-based PA. The record type for the postingsmade to costing-based PA is �D�. Derivation takes place during the allocationrun. Not all the expenses in CCA have to be allocated to PA. For example,production-related expenses, such as production labor, is already included in thecost of goods manufactured.
Cycle: H100
Start date: 01/01/XXXX
Controlling area: 1000
Tracing factor: 1
Select: Create Segment and create the segment header:
Assessment cost element: 692000
Value field: VV380 (fixed and variable)
Sender values: Rule 1; Percentage 100%
Tracing factor: Rule 3
Select Sender/Receiver:
Sender: Cost center 3200
Receiver: Division 01 through 06
Choose Receiving Tracing factors
Maintain the percentage rates and save the cycle.
Accounting→ Controlling→ Profitability analysis→ Actual postings→ CostCenter Costs/Process Costs→ Assessment Extras→ Cycle→ Create
3. Start the cycle you have created, H100, for the current period with updating,which means not as a test run.
Cycle→ Execute
4. Display the plan/actual comparison for the cost center, 3200, and the currentperiod.
210 © 2004 SAP AG. All rights reserved. 04-02-2005

AC605 Lesson: Transfer of Overhead
Accounting→ Controlling→ Cost centers→ Information system→ Reportselection
Drill down to the line item and explain the audit trail and object type.
5. Display the line items in Profitability Analysis. Take account of the fact that incosting-based Profitability Analysis, the assessment is posted under the recordtype, D.
Accounting→ Controlling→ Profitability analysis→ Information system→Display line items
Settlement of Orders
Settlement of Orders
In SAP system, internal orders (CO), sales orders (SD), projects (PS), and productionorders (PP), can be settled to profitability segments. Briefly explain the variousorders in SAP system. Make clear that essentially settlement to Profitability Analysisalways follows the same pattern. Here, the settlement process is demonstrated usingan internal order.
Give the business example of an internal order, which captures the costs for a tradefair or collects the various marketing costs, such as that of TV, radio, and newspapersfor each product, and settles them to Profitability Analysis. Take some time todescribe the PA transfer structure and its significance for costing-based ProfitabilityAnalysis. Then, draw a diagram to depict the overall picture:
Settlement Structure:
Assignments Source Rec Type Settlement CESupplies 400000 � 417000 PSG 650000 Mktg
SuppliesPersonnel 420000 � 431000 PSG 651000 Mktg
Labor
PA Transfer Structure:
04-02-2005 © 2004 SAP AG. All rights reserved. 211

Unit 4: Actual Data AC605
Assignments Source Value FieldSupplies 400000 � 417000 VV380 Marketing ExpensePersonnel 420000 � 431000 VV381 Marketing Labor
Figure 77: Settlement of Orders
212 © 2004 SAP AG. All rights reserved. 04-02-2005

AC605 Lesson: Transfer of Overhead
In the SAP system, you settle internal orders, sales orders, projects, as well asproduction orders, and run schedules with production cost collectors to profitabilitysegments. These objects are used for the various purposes that are relevant toProfitability Analysis.
� Internal orders and projects can be used to control the costs of an internal activity,such as the costs of an advertising campaign. The costs of the activity are postedto the order and collected there. At the end of the activity, they are settled to theappropriate profitability segments, such as the product range and sales area.
� You can also use Management Accounting orders to calculate the anticipatedvalues to be able to evaluate the accuracy of your accrual method. First, youcredit the accrual costs calculated in CO-PA to a special cost order for accruals,currently by manual posting only. When the costs are actually incurred, they areposted to that order as well so that the difference between the anticipated costsand the actual costs can be displayed at the order level.
� A third possible use of internal orders or projects is in make-to-ordermanufacturing. If you are handling sales orders, a customer project or aManagement Accounting order to which revenue postings are allowed, you canpost costs, such as production costs and S costs, as well as revenue and salesdeductions to the order or project. When the product is complete, the costsand revenues can be settled to Profitability Analysis. You can also transfer theaccrued values that are particularly important for progress billing.
Figure 78: Settling Orders - Customizing (1)
04-02-2005 © 2004 SAP AG. All rights reserved. 213

Unit 4: Actual Data AC605
In a settlement profile, you define which receivers are allowed for order settlement.You define a default settlement structure and a default PA transfer structure. Whenyou create an order, you need to specify an order type. The system uses this ordertype to determine which settlement profile and, as a result, which settlement structureand PA transfer structure to use.
In account-based CO-PA, costs are settled to the settlement cost element specified inthe settlement structure.
In costing-based CO-PA, costs are settled from the original cost elements to the valuefields to which they are assigned in the PA transfer structure.
Figure 79: Settling Orders - Customizing (2)
The PA transfer structure contains the assignment of costs and revenues to the valuefields in costing-based CO-PA. PA transfer structures are used in order settlement,direct postings from FI, and the internal activity allocations in ManagementAccounting.
A PA transfer structure consists of any number of �assignment lines�. Each assignmentline contains the assignment of one interval or a group of cost or revenue elements tothe required value field.
214 © 2004 SAP AG. All rights reserved. 04-02-2005

AC605 Lesson: Transfer of Overhead
A PA transfer structure must meet the following criteria:
� It must be complete: All the cost and revenue elements that can receive costs orrevenues must be assigned to a value field in the PA transfer structure.
� The assignments must be unique: Each cost or revenue element can only occurone time within a PA transfer structure.
Allocation Structure: During settlement, the costs incurred under the primary andsecondary cost elements by a sender are allocated to one or more receivers. Whenyou settle by cost element, you settle using the appropriate original cost element. Anallocation structure consists of one or several settlement assignments. An assignmentshows which costs (origin: cost element groups from debit cost elements) are to besettled to which receiver type, such as cost center and order. You have two alternativesin settlement assignment:
� You can assign the debit cost element groups to a settlement cost element.� You can settle by cost element, which means the debit cost element is the
settlement cost element.
Demonstration: Settling Orders
PurposeTo demonstrate the steps to settle orders
System DataSystem:Client:User ID:Password:Set up instructions:1. Create an internal order for the Marketing expenses with the order type, 0450,
and the settlement rule, Profitability segment.
Order type: 0450
Choose Settlement rule
Choose Detail
Maintain the settlement rule for the profitability segment
Product: P-100
Sales organization: 1000
04-02-2005 © 2004 SAP AG. All rights reserved. 215

Unit 4: Actual Data AC605
Distribution channel: 10
Division: 00
Show the Settlement Structure and the PA Transfer structure defaulted for thisorder. Save the internal order and make a note of the number.
Accounting→ Controlling→ Orders→Master data→ Order→ Create
2. In Financial Accounting, post the marketing cost, 477000, to the order youhave created.
Document date: today�s date
Company code: 1000 (should default)
Account: 477000
D/C: Debit
Amount: 20,000.00
Tax code: V0
Order: Enter order number
Account: 113100
D/C: Credit
Amount: 20,000
Choose Post
Accounting→ Financial accounting→ General ledger→ Document Entry→G/L account posting
3. Settle your order in the current period.
Accounting→ Controlling→ Orders→ Actual postings→ Period-end closing→ Settlement→ Individual processing
4. Display the plan/actual comparison for your order.
Accounting→ Controlling→ Orders→ Information system→ Reportselection
5. Display the line item in Profitability Analysis. Take account of the fact thatin costing-based Profitability Analysis, the order settlement is posted underthe record type, C.
Accounting→ Controlling→ Profitability analysis→ Information system→ Display line items
216 © 2004 SAP AG. All rights reserved. 04-02-2005

AC605 Lesson: Transfer of Overhead
6. Go to Customizing and explain the PA transfer structure, 10, and its connectionto the settlement profile, 100.
IMG→ Controlling→ Profitability Analysis→ Flow of Actual Values→Order and project settlement ...
04-02-2005 © 2004 SAP AG. All rights reserved. 217

Unit 4: Actual Data AC605
218 © 2004 SAP AG. All rights reserved. 04-02-2005

AC605 Lesson: Transfer of Overhead
169 Exercise 8: Cost Center AssessmentExercise Duration: 10 Minutes
Exercise ObjectivesAfter completing this exercise, you will be able to:� Allocate costs using Cost Center Assessment
Business ExampleThe costs of a marketing survey conducted by an outside service provider are to beallocated from the marketing cost center to the products, P-101 and P-102.
Note: The primary source of the data for CO-PA is normally sales ordermanagement billing. The primary source of period costs, such as sales andadministration costs, for CO-PA is normally Cost Center Accounting. Withcost center assessments, you can allocate responsibility-oriented costs acrossprofitability segments for P&L reporting.
Task:Create the cost center, 3200-##, for your group.
Cost Center: 3200-## MarketingPerson Responsible: Paula ProductCost Center Category: 3Business Area: 5000Hierarchy Area: H1320 MarketingCompany Code: 1000Profit Center: 1000
1. Post an invoice from CEB Berlin, the Marketing firm, against this cost center topay for a market survey it conducted.
The credit entry in this case will be posted to the vendor account number, andthe debit entry will be posted against the cost center using the external servicesaccount number. The posting is made in the company code, 1000.
Continued on next page
04-02-2005 © 2004 SAP AG. All rights reserved. 219

Unit 4: Actual Data AC605
Vendor : 1000 C.E.B BerlinInvoice Number: 1234##Invoice Amount: 10,000.00Account Number: 417000 External ServicesAccount Assignment: Marketing Cost Center
3200-##
2. From costing-based CO-PA, allocate the costs from the cost center to theproducts, P-101 and P-102. You want to distribute the costs equally betweenthe two products.
Create an allocation cycle, CYC-##, starting January 01, XXXX, to allocate themarketing costs to the Marketing Costs value field. Use the assessment costelement, 692000, Marketing Assessments.
Field Name or Data Type ValuesSender Selection Type 1 (unsplit costs)CO Area 1000Tracing factor 1 (costing-based CO-PA)
Attach Segment 1.
Field Name or Data Type ValuesSegment Number/Name 1Assessment Cost Element 692000Value field VV380Sender Values Posted AmountsShare in % 100Rule for receiver tracing factor Fixed percentages
Enter 50% as the receiver tracing factor for each product.
3. Execute your allocation cycle without the test mode for the current period.Display the actual line item you just created for the product, P-101.
Which record type was used to post the line item?
What is the value for General Marketing Costs?
220 © 2004 SAP AG. All rights reserved. 04-02-2005

AC605 Lesson: Transfer of Overhead
Solution 8: Cost Center AssessmentTask:Create the cost center, 3200-##, for your group.
Cost Center: 3200-## MarketingPerson Responsible: Paula ProductCost Center Category: 3Business Area: 5000Hierarchy Area: H1320 MarketingCompany Code: 1000Profit Center: 1000
1. Post an invoice from CEB Berlin, the Marketing firm, against this cost center topay for a market survey it conducted.
The credit entry in this case will be posted to the vendor account number, andthe debit entry will be posted against the cost center using the external servicesaccount number. The posting is made in the company code, 1000.
Vendor : 1000 C.E.B BerlinInvoice Number: 1234##Invoice Amount: 10,000.00Account Number: 417000 External ServicesAccount Assignment: Marketing Cost Center
3200-##
a) Create the cost center, 3200-##, for your group.
Cost Center: 3200-## MarketingPerson Responsible: Paula ProductCost Center Category: 3Business Area: 5000
Continued on next page
04-02-2005 © 2004 SAP AG. All rights reserved. 221

Unit 4: Actual Data AC605
Hierarchy Area: H1320 MarketingCompany Code: 1000Profit Center: 1000
Accounting→ Controlling→ Cost Center Accounting→ Master Data→Cost Center→ Individual Processing→ Create:
Use the Controlling Area, 1000, if prompted.
Validity Dates: From January 1 to December 31, 9999 of the current year.
Post an invoice from CEB Berlin the Marketing firm against this costcenter to pay for a market survey it conducted.
The credit entry in this case is posted to the vendor account number, andthe debit entry is posted against the cost center using the external servicesaccount number. The posting is made in the company code, 1000.
Accounting→ Financial Accounting→ Accounts Payable→ DocumentEntry→ Invoice:
Field Name or Data Type ValuesVendor 1000Invoice Date Today�s datePosting Date Today�s dateAmount (due to vendor) 10,000Account Number 417000D/C DebitAmount 10,000Tax Code 0ICost Center 3200-##
Post your document.
Hint: During your posting, several messages may appear that theaccount, 417000, is relevant for tax. These are warning messagesand can be confirmed by selecting Enter.
Continued on next page
222 © 2004 SAP AG. All rights reserved. 04-02-2005

AC605 Lesson: Transfer of Overhead
2. From costing-based CO-PA, allocate the costs from the cost center to theproducts, P-101 and P-102. You want to distribute the costs equally betweenthe two products.
Create an allocation cycle, CYC-##, starting January 01, XXXX, to allocate themarketing costs to the Marketing Costs value field. Use the assessment costelement, 692000, Marketing Assessments.
Field Name or Data Type ValuesSender Selection Type 1 (unsplit costs)CO Area 1000Tracing factor 1 (costing-based CO-PA)
Attach Segment 1.
Field Name or Data Type ValuesSegment Number/Name 1Assessment Cost Element 692000Value field VV380Sender Values Posted AmountsShare in % 100Rule for receiver tracing factor Fixed percentages
Enter 50% as the receiver tracing factor for each product.
a) From costing-based CO-PA, allocate the costs from the cost center tothe products, P-101 and P-102. You want to distribute the costs equallybetween the two products.
Create an allocation cycle, CYC-## , valid as of January 01, XXXX, toallocate the marketing costs to the Marketing Costs value field. Use theassessment cost element, 692000, and assessment result marketing.
Accounting→ Controlling→ Profitability Analysis→ Actual Postings→ Period-End Closing→ Transfer Cost Center Costs/Process Costs→Assessment: Extras→ Cycle→ Create
Continued on next page
04-02-2005 © 2004 SAP AG. All rights reserved. 223

Unit 4: Actual Data AC605
Field Name or Data Type ValuesCycle Name CYC-##Start Date 1/1/XXXX
Enter:
Field Name or Data Type ValuesSender Selection Type 1 (unsplit costs)CO Area 1000Tracing Factor 1 (costing-based CO-PA)
Attach Segment 1.
Select: Attach Segment: Segment Header
Field Name or Data Type ValuesSegment Number/Name 1Assessment Cost Element 692000Value Field VV380Sender Values Posted AmountsrShare in % 100Rule for Receiver Tracing Factor Fixed percentages
Choose Sender/Receiver.
Field Name or Data Type ValuesCost Center 3200-##Cost Element 417000Receivers Products P-101 to P-102
Select the Receiver Tracing Factor tab and enter 50% for each product.
Save your cycle and return to the initial Assessment screen.
3. Execute your allocation cycle without the test mode for the current period.Display the actual line item you just created for the product, P-101.
Continued on next page
224 © 2004 SAP AG. All rights reserved. 04-02-2005

AC605 Lesson: Transfer of Overhead
Which record type was used to post the line item?
What is the value for General Marketing Costs?
a) Execute your allocation cycle without the test mode for the current period.
To execute your cycle, enter its number in the field provided. Deselect TestRun but select Detailed Lists. Execute your cycle for the current period.
Display the actual line item you just created for the product, P-101.
Accounting→ Controlling→ Profitability Analysis→ Information System→ Display Line Items→ Actual
Field Name or Data Type ValuesRecord Type DPeriod/Year CurrentEntered by Your user IDProduct P-101
Which record type was used to post the line item? D
What is the value for General Marketing Costs? 5000
04-02-2005 © 2004 SAP AG. All rights reserved. 225

Unit 4: Actual Data AC605
226 © 2004 SAP AG. All rights reserved. 04-02-2005

AC605 Lesson: Transfer of Overhead
177 Exercise 9: Internal OrdersExercise Duration: 15 Minutes
Exercise ObjectivesAfter completing this exercise, you will be able to:� Allocate the costs collected on an internal order to profitability analysis
Business ExampleYour sales manager has planned to participate in a number of trade fairs this year. Thecosts for the trade fairs are collected on internal orders to track the cost for each fairseparately from the recurring cost center costs.
Note: In CO, internal orders can be used to collect the costs for specificprojects, such as research and development, or marketing events. Theyallow you to view and monitor costs on an alternate controlling object andperiodically settle these costs to a cost center or profitability segment. Thisallows you to separate project costs from recurring expenditures.
Task 1:Create an internal order in the company code, 1000, to capture the costs for the Fun &Rec Show in Las Vegas.
Order Type: 0450 Exhibitions
Short Text: FUN & REC SHOW
Business Area: 5000
Profit Center: 1000
Make sure you release the internal order, as the costs will be posted to it.
1. Create a settlement rule that determines where the costs for your internal orderare allocated at the period close. The settlement receiver is a profitabilitysegment. In the settlement information, you need to specify that the settlementwill be made to the material group, 001.
Save the internal order number.
Order Number:
Continued on next page
04-02-2005 © 2004 SAP AG. All rights reserved. 227

Unit 4: Actual Data AC605
2. Charge costs to the internal order with a journal entry in Financial Accounting.So far, you have incurred the following costs for the Las Vegas trade fair:
Amount: 1000.00 Cost Element: 476000
All costs are exempt from tax, tax code V0. These costs have been paid frombank account, 113100.
Financial Accounting document number:
3. In the CO internal order application, process the internal order settlement for thecurrent period to Profitability Analysis.
Amount settled:
4. View the line item you created with the settlement of your internal order inCO-PA.
Which value fields were populated? Why?
5. In the IMG, view the settlement configuration for the order type, 0450. To whichsettlement profile is this order type assigned?
Display the settlement profile settings. What allocation structure is used inthe settlement profile?
Which PA transfer structure is linked to this settlement profile?
6. What is the purpose of the PA transfer structure?
To which value fields are Total Costs assigned?
Task 2:1. Read the online documentation regarding assigning the operating concern.
Task 3:1. Read the online documentation regarding the types of Profitability Analysis and
its applications for your company.
228 © 2004 SAP AG. All rights reserved. 04-02-2005

AC605 Lesson: Transfer of Overhead
Solution 9: Internal OrdersTask 1:Create an internal order in the company code, 1000, to capture the costs for the Fun &Rec Show in Las Vegas.
Order Type: 0450 Exhibitions
Short Text: FUN & REC SHOW
Business Area: 5000
Profit Center: 1000
Make sure you release the internal order, as the costs will be posted to it.
1. Create a settlement rule that determines where the costs for your internal orderare allocated at the period close. The settlement receiver is a profitabilitysegment. In the settlement information, you need to specify that the settlementwill be made to the material group, 001.
Save the internal order number.
Continued on next page
04-02-2005 © 2004 SAP AG. All rights reserved. 229

Unit 4: Actual Data AC605
Order Number:
a) Create an internal order to capture the costs for the Fun & Rec Show inLas Vegas.
Accounting→ Controlling→ Internal Orders→ Master Data→ SpecialFunctions→ Order→ Create:
Field Name or Data Type ValuesOrder Type 0450Short Text Fun & Rec ShowCompany Code 1000Business Area 5000Profit Center 1000
Check whether the internal order is released.
Select the Control data tab. If the System Status is CRTD, click theReleased icon to change the System Status to REL.
Create a settlement rule that determines where the costs for your internalorder are allocated at the period close. The settlement receiver is aprofitability segment. In the settlement information, you need to specifythat the settlement will be made to the material group, 001.
Select Settlement Rule. From the Settlement rule entry screen, selectDetails. From the Distribution Rules screen, select Profitability. EnterMaterial Group, 001, and select Enter to continue. To view the profitsegment number, go back to the distribution rule and choose Hierarchy.
Save the internal order.
Order number:
2. Charge costs to the internal order with a journal entry in Financial Accounting.So far, you have incurred the following costs for the Las Vegas trade fair:
Amount: 1000.00 Cost Element: 476000
All costs are exempt from tax, tax code V0. These costs have been paid frombank account, 113100.
Continued on next page
230 © 2004 SAP AG. All rights reserved. 04-02-2005

AC605 Lesson: Transfer of Overhead
Financial Accounting document number:
a) Charge costs to the internal order with a journal entry in FinancialAccounting. So far, you have incurred the following costs for the LasVegas trade fair:
Amount: 1000.00 Cost Element: 476000
All costs are exempt from tax, tax code V0. These costs have been paidfrom the bank account, 113100.
Accounting→ Financial Accounting→ General Ledger→ DocumentEntry→ Enter G/L Account Document
Header
Field Name or Data Type ValuesDocument Date Today�s date
Row 1:
G/L Account 476000D/C DebitAmount 1000Tax Code V0Order Your internal order number
Row 2:
Field Name or Data Type ValuesG/L Account 113100D/C CreditAmount 1000
Post your document.
Financial Accounting document number:
3. In the CO internal order application, process the internal order settlement for thecurrent period to Profitability Analysis.
Continued on next page
04-02-2005 © 2004 SAP AG. All rights reserved. 231

Unit 4: Actual Data AC605
Amount settled:
a) In the CO internal order application, process the internal order settlementfor the current period to Profitability Analysis.
Accounting→ Controlling→ Internal Orders→ Period-End Closing→Single Functions→ Settlement→ Individual Processing:
Field Name or Data Type ValuesPurchase Order Number Your order numberSettlement Period CurrentFiscal Year CurrentTest Run Not selected
Amount settled: 1000
4. View the line item you created with the settlement of your internal order inCO-PA.
Which value fields were populated? Why?
a) View the line item you created with the settlement of your internal orderin CO-PA.
Accounting→ Controlling→ Profitability Analysis→ Information System→ Display Line Item List→ Actual:
Field Name or Data Type ValuesRecord Type CPeriod/Year CurrentEntered by Your user ID
Which value fields were populated? Why?
Settings→ Layout→ Change
Select Marketing Activities from the column set.
Marketing Activities - Based on the configuration of the PA transferstructure that determines which costs are settled and to which value field.
5. In the IMG, view the settlement configuration for the order type, 0450. To whichsettlement profile is this order type assigned?
Continued on next page
232 © 2004 SAP AG. All rights reserved. 04-02-2005

AC605 Lesson: Transfer of Overhead
Display the settlement profile settings. What allocation structure is used inthe settlement profile?
Which PA transfer structure is linked to this settlement profile?
a) In the IMG, view the settlement configuration for the order type, 0450.
To which settlement profile is this order type assigned?
IMG: Controlling→ Internal Orders→ Order Master Data→ DefineOrder Types: Select Details for order type 0450.
The settlement profile is 100.
Display the settlement profile settings. Which allocation structure is usedin the settlement profile?
IMG: Controlling→ Internal Orders→ Actual Postings→ Settlement→Maintain Settlement Profiles: Select profile 100
The CO allocation structure relevant for account-based CO-PA is A1.
Which PA transfer structure is linked to this settlement profile?
10
6. What is the purpose of the PA transfer structure?
To which value fields are Total Costs assigned?
a) What is the purpose of the PA transfer structure?
The transfer structure determines the value fields to which costs will besettled. It consists of:
The settlement assignment � groups costs together.
The source � cost element group.
The value fields to which each assignment group is settled.
To which value fields the Total Costs are assigned.
IMG: Controlling→ Profitability Analysis→ Flows of Actual Values→ Order and Project Settlement→ Define PA Transfer Structure forSettlement
Select: Structure 10→ Assignment Lines
Select: Total Costs→ Value Fields
VV410 � Marketing Activities
Continued on next page
04-02-2005 © 2004 SAP AG. All rights reserved. 233

Unit 4: Actual Data AC605
Task 2:1. Read the online documentation regarding assigning the operating concern.
a) Read the online documentation regarding assigning the operating concern.
Open the SAP Library and select the Financials submenu.
Choose CO and then Profitability Analysis (COPA). In the Structuressubmenu, select Operating Concern and then Assigning the OperatingConcern.
Task 3:1. Read the online documentation regarding the types of Profitability Analysis
and its applications for your company.
a) Read the online documentation regarding the types of Profitability Analysisand its applications for your company.
Open the SAP Library and select the Financials submenu.
Choose CO and then Profitability Analysis (COPA). Select ProfitabilityAccounting Applications and then Accounting Applications.
234 © 2004 SAP AG. All rights reserved. 04-02-2005

AC605 Lesson: Transfer of Overhead
185 Exercise 10: Activity AllocationExercise Duration: 10 Minutes
Exercise ObjectivesAfter completing this exercise, you will be able to:� Allocate the costs from Overhead Cost Accounting to CO-PA using activity types
Business ExampleYour R&D cost center manager wants to allocate R&D costs to products wheneverpossible. The Product Development group spent 10 hours last month improving theproduct, P-101. Your management accountants have set a rate of $100.00 for onedevelopment hour.
Note: In addition to cost center assessments, you can use activities to allocatethe costs from cost centers to Profitability Analysis. The activities in the SAPsystem are normally defined as the productive output of a cost center and canbe measured in time increments or units. Activity prices can be plannedmanually or calculated by the system based on planned or actual costs.Activities can be allocated using a process called Direct Activity Allocation,which credits the sending cost center and debits one or more receivers.
Task 1:1. Create the activity type, EH##, for product development hours with a validity
period from January 1 of the current year to December 31, 9999.
All the cost center categories should be able to use this activity. The activitytype category is 1 because the costs are allocated manually. The secondary costelement, 621000, will debit the activity receiver and credit the cost center.
Save the activity type.
Task 2:1. Plan the activity price for this activity type for the current fiscal year in the
plan version, 0.
The development department plans to spend 1200 hours R&D time on bluebicycles.
Continued on next page
04-02-2005 © 2004 SAP AG. All rights reserved. 235

Unit 4: Actual Data AC605
In Cost Center Accounting, choose Planning→ Activities/Prices to plan a rateof 100 for the activity type, EH##, and the cost center, 4500.
Task 3:1. Process the actual activity allocation for the current period to the product, P-101,
in the company code, 1000, and the business area 1000, also in Cost CenterAccounting.
The screen variant, Profitability Segment/Cost Center, allows you to allocate thecosts from a cost center to a profitability segment using an activity type. Savethe document.
Sender: Cost Center, 4500, activity type, EH##
Receiver: Profitability segment (product, P-101, company code, 1000, businessarea, 1000)
Hours consumed: 10
Document number:
Task 4:1. View the line item you have just created during allocation in CO-PA. Which
order type was used to post this line item?
Which value field has been debited with the activity allocation? Why?
236 © 2004 SAP AG. All rights reserved. 04-02-2005

AC605 Lesson: Transfer of Overhead
Solution 10: Activity AllocationTask 1:1. Create the activity type, EH##, for product development hours with a validity
period from January 1 of the current year to December 31, 9999.
All the cost center categories should be able to use this activity. The activitytype category is 1 because the costs are allocated manually. The secondary costelement, 621000, will debit the activity receiver and credit the cost center.
Save the activity type.
a) Create the activity type, EH##, for product development hours with avalidity period from January 1 of the current year to December 31, 9999.
All the cost center categories should be able to use this activity. Theactivity type category is 1 because the costs are allocated manually. Thesecondary cost element, 621000, will debit the activity receiver and creditthe cost center.
Accounting→ Controlling→ Cost Center Accounting→ Master Data→Activity Type→ Individual Processing→ Create:
Save the activity type.
Name: Development Hours
Activity Unit HCCtr Category: *ATyp Category: 1Allocation Cost Element: 621000Price Indicator: 3
Task 2:1. Plan the activity price for this activity type for the current fiscal year in the
plan version, 0.
The development department plans to spend 1200 hours R&D time on bluebicycles.
Continued on next page
04-02-2005 © 2004 SAP AG. All rights reserved. 237

Unit 4: Actual Data AC605
In Cost Center Accounting, choose Planning→ Activities/Prices to plan a rateof 100 for the activity type, EH##, and the cost center, 4500.
a) Plan the activity price for this activity type for the current fiscal year inthe plan version, 0.
The development department plans to spend 1200 hours R&D time onblue bicycles.
In Cost Center Accounting, choose Planning→ Activities/Prices to plan arate of 100 for the activity type, EH##, and the cost center, 4500.
Accounting→ Controlling→ Cost Center Accounting→ Planning→Activity Output/Prices→ Change:
Field Name or Data Type ValuesVersion 0Period 1 �12Fiscal Year CurrentCost Center 4500Activity Type EH##
Select Form-based.
Select Overview and enter the following:
Plan Activity: 1200Fixed Price: 100
Save your plan price.
Task 3:1. Process the actual activity allocation for the current period to the product, P-101,
in the company code, 1000, and the business area 1000, also in Cost CenterAccounting.
The screen variant, Profitability Segment/Cost Center, allows you to allocate thecosts from a cost center to a profitability segment using an activity type. Savethe document.
Sender: Cost Center, 4500, activity type, EH##
Continued on next page
238 © 2004 SAP AG. All rights reserved. 04-02-2005

AC605 Lesson: Transfer of Overhead
Receiver: Profitability segment (product, P-101, company code, 1000, businessarea, 1000)
Hours consumed: 10
Document number:
a) Process the actual activity allocation for the current period to the product,P-101, in the company code, 1000, and the business area, 1000, also inCost Center Accounting.
You can use a screen variant to allocate the costs from a cost center to aprofitability segment using an activity type. Save the document.
Accounting→ Controlling→ Cost Center Accounting→ Actual Postings→ Activity Allocation→ Enter:
Select the Profit Segment/Cost Center screen variant and chooseIndividual Entry.
Field Name or Data Type ValuesSend. CCtr (Sender Cost Center) 4500SAtyTyp (Sender Act.Type) EH##Total Quantity: 10Receiver: Choose the profitability segment
Select Profitability segment and choose Enter. Enter the product, P-101,in the company code, 1000, and the business area, 1000. Post your entry.
Document number:
Task 4:1. View the line item you have just created during allocation in CO-PA. Which
order type was used to post this line item?
Continued on next page
04-02-2005 © 2004 SAP AG. All rights reserved. 239

Unit 4: Actual Data AC605
Which value field has been debited with the activity allocation? Why?
a) View the line item you created during the allocation in CO-PA. Whichorder type was used to post this line item?
Accounting→ Controlling→ Profitability Analysis→ InformationSystem→ Display Line Item List→ Actual
Record Type: DPeriod/Year : CurrentEntered by : Your user IDProduct: P-101
Which value field has been debited with the activity allocation? Why?
Settings→ Layout→ Change
Select Marketing Activities from the column set.
Marketing Activities. The PA transfer structure, CO, is referenced duringthe activity allocation to CO-PA.
240 © 2004 SAP AG. All rights reserved. 04-02-2005

AC605 Lesson: Transfer of Overhead
Lesson Summary
You should now be able to:� Explain the transfer and allocation of costs� Explain the settlement of orders
04-02-2005 © 2004 SAP AG. All rights reserved. 241

Unit 4: Actual Data AC605
Lesson:192
Direct PostingsLesson Duration: 35 Minutes
Lesson OverviewThis lesson helps you understand direct postings. In addition, it covers how to makeautomatic posting to CO-PA.
Lesson ObjectivesAfter completing this lesson, you will be able to:
� Explain direct postings� Make automatic posting to CO-PA
Direct Postings from Financial Accounting
Using direct postings in Financial Accounting, you can post actual sales reductionsor actual costs, such as freight costs estimated when the period was closed to allowshort-term analysis to the corresponding profitability segments. This supplementsthe estimated costs with the actual costs.
In a profitability report, you can display both the estimated costs and the actual costs.You can then post the actual costs to the original profitability segment, customer order,or combination of customer and product, or if detailed allocation is no longer possibleor required, to any higher level, such as freight costs to the �Division� level.
Explain that the PA transfer structure, Financial Accounting, is always used forthe costing-based CO-PA to map costs to value fields.
Business ExampleThe management of your company wants to implement a profitability accountingapplication in the SAP system. As a member of the project team of your company, youare supposed to advise on the question of whether to implement CO-PA or EC-PCA inthe SAP system. You then will be responsible to implement the selected applications.
Your Marketing department has spent an extensive amount of time training theworld-wide sales force and product management on the advantages of the new �BlueBicycle� product line. They have tracked training hours and want to allocate costs toall the products within the �Blue Bicycle� product group.
For this reason, you need to show the integration between Financial Accounting directpostings and CO-PA.
242 © 2004 SAP AG. All rights reserved. 04-02-2005

AC605 Lesson: Direct Postings
Direct Posting from Financial Accounting
Figure 80: Direct Posting from Financial Accounting
Direct posting enables you to post direct costs, revenue, and sales deductionsto profitability segments. Examples of this include licensing fees for purchasedmerchandise, special direct costs from sales, such as transportation insurance for acertain shipment, cost and revenues for services, or invoices received for a marketingcampaign.
You assign the values to a profitability segment directly in the Financial Accounting(FI) posting transaction. There, you can call up a special assignment dialog box foreach posting line by clicking the Prof. segment field.
In this dialog box, the system displays the characteristics that you can choose from theoperating concern you are working in. You can predefine what is displayed on thisscreen by defining a �characteristic group� for the activity, RFBU, in Customizing.The characteristic group defines which characteristics are displayed for selection.
For direct postings in Financial Accounting, all the assignments of values andquantities to the value fields in costing-based Controlling Profitability Analysis(CO-PA) are defined in the PA transfer structure, FI, which you maintain inCustomizing.
In account-based CO-PA, the data is posted in the same cost or revenue element.
04-02-2005 © 2004 SAP AG. All rights reserved. 243

Unit 4: Actual Data AC605
If your system allows dual postings to both a profitability segment and a cost center,the real posting always goes to the profitability segment. The cost center is postedonly for statistical purposes.
Demonstration: Direct Postings from FinancialAccounting
PurposeTo demonstrate the steps to make direct postings from Financial Accounting
System DataSystem:Client:User ID:Password:Set up instructions:1. In Financial Accounting, post the expenses for an annual bonus, 435000, to a
profitability segment.
Document date: today�s date
Company code: 1000 ( should default)
Use the account assignment template, AC605. This will default the following:
Account: 435000
Amount: 10,000.00
D/C: Debit
Drill down to the Profitability segment:
Sales organization: 1000
Distribution channel: 10
Division: 00
Account: 1131000
Amount: 10,000
Choose Post
Accounting→ Financial accounting→ General ledger→ Posting→ G/Laccount posting
244 © 2004 SAP AG. All rights reserved. 04-02-2005

AC605 Lesson: Direct Postings
Display the line item in Profitability Analysis. In costing-based ProfitabilityAnalysis, the direct posting from Financial Accounting is always posted underThe record type, B.
Accounting→ Controlling→ Profitability analysis→ Information system→ Display line items
Show the associated configuration PA Transfer Structure, Financial Accounting.
IMG→ Controlling→ Profitability Analysis→ Flow of Actual Values→Direct Postings from FI/MM→Maintain PA Transfer Structure
Automatic Account Assignment
Figure 81: Automatic Account Assignment
Automatic postings, such as those generated in Materials Management, can be passedon to Profitability Analysis using automatic PA assignment functions. The documentsare updated in CO-PA for the profitability segment found on the basis of characteristicinformation in the corresponding Financial Accounting document.
04-02-2005 © 2004 SAP AG. All rights reserved. 245

Unit 4: Actual Data AC605
This function should be used only in special cases for specific accounts and forrepresenting rare business transactions. The transactions for which it is prudent todefine an automatic PA assignment include the activities to:
� Transfer the price differences that are posted in the Purchasing applicationcomponent due to the price changes in an invoice.
� Transfer the income or expenses that arise through the revaluation of materialinventories.
� Transfer inventory differences.
Remember that the cost or revenue elements that receive automatic postings areassigned to the value fields in the costing-based CO-PA in the PA transfer structure,FI, which you maintain in Customizing.
Demonstration: Automatic Account Assignment(Optional � if time allows)
PurposeTo demonstrate the steps to perform account assignment automatically
System DataSystem:Client:User ID:Password:Set up instructions:1. This type of posting will not take place frequently but can be used to post
any type of automatic transaction to CO-PA. Examples include InventoryRevaluations or Currency Revaluations.
Enter a manual price change for the product, M-18, in the plant, 1000. Thevendor has increased the price of this product by $100.
Material: M-18
Plant: 1000
Logistics→Material Management→ Inventory Management→ Valuation→Price Determination→ Change Price
Enter a price that is higher than the currently displayed price and save. Show thedocuments created by selecting Document Display→ Accounting Documents
246 © 2004 SAP AG. All rights reserved. 04-02-2005

AC605 Lesson: Direct Postings
Drill�down to the CO-PA document and point out which value field waspopulated.
Explain the configuration settings: The FI � PA Transfer Structure will need toinclude the accounts posted to during inventory revaluation. These accountsneed to be set up as cost elements. The �Automatic Account Assignment� tableneeds to be maintained by adding the appropriate account to the table.
IMG→ Controlling→ Profitability Analysis→ Flow of Actual Values→Direct Postings from FI/MM→ Automatic Account Assignment
04-02-2005 © 2004 SAP AG. All rights reserved. 247

Unit 4: Actual Data AC605
248 © 2004 SAP AG. All rights reserved. 04-02-2005

AC605 Lesson: Direct Postings
197 Exercise 11: Direct Postings from FinancialAccountingExercise Duration: 10 Minutes
Exercise ObjectivesAfter completing this exercise, you will be able to:� Process a journal entry in Financial Accounting with a profitability segment as
the account assignment
Business ExampleYour sales manager has decided to pay the top salesperson a special $10,000 bonus fora major order that the salesperson has won from one of your top customers, BeckerAG. A special payment is processed directly in FI as commission but should also berecorded in CO-PA as a commission cost with a reference to the relevant customer.
Note: Although costs normally flow through other areas of Controllingto Profitability Analysis, you can also post them directly from FinancialAccounting to CO-PA. The �real� account assignment in this case is aprofitability segment that is determined based on the characteristic valuesyou specified in the posting.
Task 1:1. Create a journal entry in Financial Accounting for the customer, T-CO05A##,
and enter the sales organization, 1000, distribution channel, 10, and division,00. Because this is a recurring entry that takes place every month, use the Withprofitability segment entry aid and assignment template, AC605, located onthe left of the screen. This automatically populates all necessary characteristicvalues and accounts. Your entry should appear as follows:
Debit: SalesCommissions
Account 435000 Amount10,000.00
Credit: Bank Account 113100 Amount10,000.00
Go to the detail screen for the profitability segment and enter the customer.Save your entry. Document number:
Continued on next page
04-02-2005 © 2004 SAP AG. All rights reserved. 249

Unit 4: Actual Data AC605
Task 2:1. View the entry you just created in the costing-based CO-PA. Which record
type do you use to view the posting?
Which value field has been debited in CO-PA?
250 © 2004 SAP AG. All rights reserved. 04-02-2005

AC605 Lesson: Direct Postings
Solution 11: Direct Postings from FinancialAccountingTask 1:1. Create a journal entry in Financial Accounting for the customer, T-CO05A##,
and enter the sales organization, 1000, distribution channel, 10, and division,00. Because this is a recurring entry that takes place every month, use the Withprofitability segment entry aid and assignment template, AC605, located onthe left of the screen. This automatically populates all necessary characteristicvalues and accounts. Your entry should appear as follows:
Debit: SalesCommissions
Account 435000 Amount10,000.00
Credit: Bank Account 113100 Amount10,000.00
Continued on next page
04-02-2005 © 2004 SAP AG. All rights reserved. 251

Unit 4: Actual Data AC605
Go to the detail screen for the profitability segment and enter the customer.Save your entry. Document number:
a) Create a journal entry in Financial Accounting for the customer,T-CO05A##, and enter the sales organization, 1000, distribution channel,10, and division, 00. Because this is a recurring entry that takes place everymonth, use the assignment template, AC605, located on the left of thescreen. This automatically populates all the necessary characteristic valuesand accounts. Your entry should appear as follows:
Debit: Sales Com-missions
Account 435000 Amount10,000.00
Credit: Bank Account 113100 Amount10,000.00
Go to the detail screen for the profitability segment and enter the customernumber.
Accounting→ Financial Accounting→ General Ledger→ DocumentEntry→ Enter G/L Account Document. Enter today�s date and selectEnter
Select the With profitability segment entry variant and the assignmenttemplate, AC605. This will populate the line items. Select ProfitSegment in the debit line and enter the customer, T-CO05A##.
Post your Financial Accounting document
Save your entry. Document number
Task 2:1. View the entry you just created in the costing-based CO-PA. Which record
type do you use to view the posting?
Continued on next page
252 © 2004 SAP AG. All rights reserved. 04-02-2005

AC605 Lesson: Direct Postings
Which value field has been debited in CO-PA?
a) View the entry you just created in the costing-based CO-PA. Which recordtype do you use to view the posting?
Accounting→ Controlling→ Profitability Analysis→ InformationSystem→ Display Line Item List→ Actual
Record Type: B
Period/Year: Current
Entered by: Your user ID
Which value field has been debited in CO-PA?
Settings→ Layout→ Change
Select Miscellaneous Costs from the column set.
Miscellaneous costs, based on the FI-CO-PA transfer structure.
04-02-2005 © 2004 SAP AG. All rights reserved. 253

Unit 4: Actual Data AC605
254 © 2004 SAP AG. All rights reserved. 04-02-2005

AC605 Lesson: Direct Postings
203 Exercise 12: Direct Posting from FinancialAccounting/OperationsExercise Duration: 10 Minutes
Exercise ObjectivesAfter completing this exercise, you will be able to:� Post a revaluation and view the Profitability Analysis document
Business ExampleYour sales manager has decided to pay his top salesperson a special $10,000 bonus fora major order that the salesperson has won from one of your top customers, BeckerAG. A special payment is processed directly in Financial Accounting as commissionbut should also be revaluated and viewed in the Profitability Analysis document.
Note: Automatic postings, such as the ones created in Materials Management,can be posted to Profitability Analysis using automatic account assignment.
In the following cases, it is a good idea to use direct posting to post to aprofitability segment:
� Transfer of price differences as period costs. For example: InPurchasing, prices that deviate from the order are posted on receiptof the invoice.
� Transfer of revenues and expenses by material valuation as period costs.For example: Price changes can lead to a revaluation of material stocks,which can be posted as revenues or expenses.
� Transfer of inventory differences as period costs.
Task:Post a revaluation for your product, M-##, in Materials Management. For this purpose,assume that the price has increased by $100.00 and that this material is not revaluatedwith Product Cost Controlling. Use the company code, 1000, and the plant, 1000.
Save the document. Document number.
1. Call the material document you have just created and go to AccountingDocuments. View the Profitability Analysis document.
To which cost element was the posting made?
Continued on next page
04-02-2005 © 2004 SAP AG. All rights reserved. 255

Unit 4: Actual Data AC605
To which value field was the revaluation posted? Why?
Which characteristics were derived for this transaction? Why?
256 © 2004 SAP AG. All rights reserved. 04-02-2005

AC605 Lesson: Direct Postings
Solution 12: Direct Posting from FinancialAccounting/OperationsTask:Post a revaluation for your product, M-##, in Materials Management. For this purpose,assume that the price has increased by $100.00 and that this material is not revaluatedwith Product Cost Controlling. Use the company code, 1000, and the plant, 1000.
Save the document. Document number.
1. Call the material document you have just created and go to AccountingDocuments. View the Profitability Analysis document.
To which cost element was the posting made?
To which value field was the revaluation posted? Why?
Which characteristics were derived for this transaction? Why?
a) Post a revaluation for your product, M-##, in Materials Management. Forthis purpose, assume that the price has increased by $100.00 and that thismaterial is not revaluated with Product Cost Controlling.
Logistics→ Materials Management→ Valuation→ Change in MaterialPrice→ Change Material Prices
Field Name or Data Type ValuesPosting Date Today�s dateCompany Code 1000Plant Document 1000Header Text Price change
Choose Enter and enter the following information in the overview screen:
Field Name or Data Type ValuesMaterial M-##New Price Old price (visible after pressing Enter)
+ 100
Save the document. Document number:
Continued on next page
04-02-2005 © 2004 SAP AG. All rights reserved. 257

Unit 4: Actual Data AC605
Call the material document you have just created and go to AccountingDocuments. View the Profitability Analysis document.
Logistics→ Materials Management→ Valuation→ Change in MaterialPrice→ Change Material Prices→ Price Change: Display Documents:Choose Enter and select→ Accounting Documents→ Cost AccountingDocument
To which cost element was the posting made?
Cost element, 282500
To which value field was the revaluation posted? Why?
IMG: Controlling→ Profitability Analysis→ Flows of Actual Values→ Direct Postings from FI/MM→ Maintain PA Transfer Structure forDirect Postings→
Select PA Transfer Structure: FI
Choose→ Assignments→ Select Assignment 40 Change in Inventory.Select Value Fields
In the PA transfer structure, FI, the cost element, 282500, was assigned tothe value field, VV365 Price Differences.
IMG: Controlling→ Profitability Analysis→ Flows of Actual Values→Direct Postings from FI/MM→ Automatic Account Assignment
For the cost type, 282500, Profitability segment was set as the accountassignment.
The original document contains the product number and the correspondingplant. As a result, the system finds the characteristic values that are derivedfrom the product number and the plant.
258 © 2004 SAP AG. All rights reserved. 04-02-2005

AC605 Lesson: Direct Postings
Lesson Summary
You should now be able to:� Explain direct postings� Make automatic posting to CO-PA
04-02-2005 © 2004 SAP AG. All rights reserved. 259

Unit 4: Actual Data AC605
Lesson:207
Value Flow from Cost Object COLesson Duration: 30 Minutes
Lesson OverviewThis lesson helps you to understand variance calculation. It also describes how tosettle variances to Profitability Analysis. In addition, it covers how to work withthe schedule manager.
Lesson ObjectivesAfter completing this lesson, you will be able to:
� Explain variance calculation� Work with the schedule manager
Order-related Manufacturing
Variance Calculation
Settlement of Variances to PA (1) & (2)
Sales Order with cost collector
Explain the possibility of settling production variances to Profitability Analysis. Thevariance categories contained in the PA transfer structure are mapped to value fields.Briefly show the participants the PA transfer structure, E1. The settlement structure,in turn, is linked to the production order type.
Business ExampleThe management of your company would like to implement a profitability accountingapplication in the SAP system. As a member of the project team, you are supposedto advise on the question of whether to implement CO-PA or EC-PCA in the SAPsystem. You then will be responsible for implementing the selected applications.
Mr. Ding, your Taiwanese product manager has been informed of the price increasesfor bicycle seats, which are purchased externally, and wonders how that will affectcontribution margins. He also wants to analyze the cost of production variances dueto scrap and use of reflectors for the three models within the �Blue Bicycle� productgroup. For this reason, you need to explain the integration of production variances.
260 © 2004 SAP AG. All rights reserved. 04-02-2005

AC605 Lesson: Value Flow from Cost Object CO
Variance Calculation
Costs, revenues, and sales reductions can be posted to sales orders in the SD system,which allow revenue postings. After completion, the costs and revenues can be settledin Profitability Analysis.
Accrued values, such as the costs of sales and provisions for imminent losses, can alsobe transferred to Profitability Analysis. This is particularly important for milestonebilling. See the Cost Object Controlling documentation for information.
Explain the differences between a cost bearing and revenue bearing sales order anda normal sales order from the point of view of CO-PA. In addition, recommend thecorresponding course, (AC515).
There will be a more extensive discussion on settlements later in this lesson.
Refer to planning here because the same function is available there too. Explain thatin for actual values, only the top down method �not assigned� is available.
Figure 82: Order-Related Manufacturing- Variance Calculation
This course demonstrates cost object controlling using the logistic scenario oforder-related manufacturing. The controlling view is �controlling by lot size�. Theprocess may have the steps discussed here.
04-02-2005 © 2004 SAP AG. All rights reserved. 261

Unit 4: Actual Data AC605
When the cost object is created, a preliminary cost estimate will be carried outautomatically to calculate the planned costs for the cost object. Actual costs areincurred when the materials from stock or activity types of cost centers are consumed.Primary costs can be posted directly from the other system components to theproduction order. Process costs can be incurred by allocating process quantities usingthe process template. Because the related costs are posted to the production ordersimultaneously with the consumption of materials and activity, production order costscan be reviewed and analyzed at any time.
When the produced goods are delivered to the stock, the cost object is credited with thevalue of the delivered quantity and the goods are capitalized in inventory. Dependingon the method of price control, this may result in a revaluation of the finished goodsinventory. In this example, you use a standard price controlled material.
After finishing the production process or at the end of the period, the production orderwill be settled to a price difference account. Additional period-end closing activitiesmay be performed:
� Calculation of overhead� Calculation of work in process (WIP)� Calculation of variances
Figure 83: Settlement of Variances to PA (1)
262 © 2004 SAP AG. All rights reserved. 04-02-2005

AC605 Lesson: Value Flow from Cost Object CO
You can settle or transfer the production variances calculated in Product CostControlling for both final production orders as well as run schedule headers, settledperiodically to Controlling Profitability Analysis (CO-PA). The individual variancecategories, such as material price variance and material quantity variance, can betransferred separately.
A PA transfer structure consists of one or more items called assignment lines. In theseassignment lines, you assign a cost element group and a variance category to a valuefield of the operating concern. To assure correct settlement to Profitability Analysis,you must assign each combination of the cost element group and the variance categoryto one value field.
Notice the following when you define a PA transfer structure:
� Every debit cost element must be in the PA transfer structure. You can eithergroup all the cost elements into a cost element group or define a number ofgroups for materials, internal activities, business processes, and other overheadcosts. These groups are entered under the section, �cost elements�.
� Every variance category must be represented in the PA transfer structure. Thevariance categories are specified by the system and are entered under the�source� section.
� Each debit cost element or combination of cost element group and variancecategory can only be assigned to one value field.
You should make sure that:
� The current standard cost estimate is selected for valuation in ProfitabilityAnalysis.
� The cost components of the standard cost estimate are linked to value fields.
04-02-2005 © 2004 SAP AG. All rights reserved. 263

Unit 4: Actual Data AC605
Figure 84: Settlement of Variances to PA (2)
In account-based Profitability Analysis, how variances are updated depends on howthe price difference account is defined. This account must be defined as a cost elementin Management Accounting for the variances to be assigned to a profitability segment(general posting assignment logic). The account for the price difference posting isfound automatically in operations.
In costing-based CO-PA, you can assign these variances to the different value fieldsaccording to variance categories and cost elements. To transfer variances, theVariances flag must be selected in the settlement profile assigned to the relevantproduction order. Again, the costs are assigned to the value fields in a PA transferstructure. There, you can assign variance categories and cost elements to the requiredvalue fields.
The system finds the profitability segment automatically in order settlement based onthe information found in the production order and using characteristic derivation.
Note: Only the variances calculated in the target version, 0, can be settledto a profitability segment.
264 © 2004 SAP AG. All rights reserved. 04-02-2005

AC605 Lesson: Value Flow from Cost Object CO
Figure 85: Sales Order with Cost-Collector
You use cost bearing and revenue bearing sales order items for the valuated salesorder stock if you have complex manufacturing procedures but still want to be ableto valuate your stock. In complex make-to-order production, you need to be able tomonitor the progress of costs and revenues for a product that is manufactured for aspecific customer.
If the costs and revenues have been generated for a sales order item but the amountbilled does not correspond with the costs incurred up to that point, you can useresults analysis to calculate the cost of sales expected on the basis of the existingactual revenues. To transfer the costs and revenues for the sales order item toProfitability Analysis, you need to settle the item. The purpose of settlement isto pass the revenues, cost of sales, and any reserves for imminent loss for the itemon to Profitability Analysis for the period. You can carry out results analysis usingdifferent methods. For extensive information, see the documentation on ManagementAccounting Cost Object Controlling in the section �Product Cost by Sales Order�.
For the nonvaluated sales order stock, you always need to use a cost bearingand revenue bearing sales order item. Consequently, in complex make-to-ordermanufacturing, you are always controlling at the sales order item level.
SAP recommends that you work with the valuated sales order stocks.
04-02-2005 © 2004 SAP AG. All rights reserved. 265

Unit 4: Actual Data AC605
Figure 86: Top Down Distribution
In Profitability Analysis, sales revenues, sales deductions, and costs of goodsmanufactured are normally stored at the customer or product level. Notice that manybusiness transactions, such as freight invoices, insurance expenses, or advertisingcannot easily be assigned to such an extensive level in CO-PA. As a result, theseneed to be posted at a summarized level, such as the division, sales organization,or company-code level.
Top down distribution of actual data is a periodic function that enables you to distributethis aggregated data to extensive levels, such as the division level or the customerlevel in CO-PA, based on reference information, such as the data from the previousyear. This function works in the same way as top down distribution of plan data.
You can select the values posted to any profitability segments and value fields andthen distribute this data to a predefined distribution level. You can use the existingactual or plan data as the basis for this distribution. You can also distribute period byperiod or aggregate the period values to smooth out variances.
Note: Actual top down distribution can only be used in costing-based CO-PA.As opposed to planned top down distribution, only the unassigned procedureis available.
266 © 2004 SAP AG. All rights reserved. 04-02-2005

AC605 Lesson: Value Flow from Cost Object CO
Figure 87: Periodic Valuation
If you use parallel valuation, which means the legal valuation together withprofit-center valuation, you can valuate the valuation views again separately inperiodic valuation. If you want to valuate only one valuation view again, you canconsiderably reduce the run-time of the new valuation and the data volume by makingthis setting.
The new selection criteria, Document number, and Reference document number, allowyou to valuate again selected documents, reference documents, or intervals betweenthese. You can also exclude documents or intervals from the new valuation.
04-02-2005 © 2004 SAP AG. All rights reserved. 267

Unit 4: Actual Data AC605
Schedule Manager
Figure 88: Scope of the Schedule Manager
A number of periodic tasks are executed on a regular basis, which means daily, weekly,or monthly in the SAP System. An example of such a task is period-end closing. Thisrequires the processing of a large number of individual objects at certain times. Thisprocess is supported by the individual components of the schedule manager.
Benefits include:
� The closing process is more transparent and easy to handle.� Event-driven processing means that the SAP system automatically performs the
necessary steps.� Monitoring the complete process is user-friendly.� Worklist-driven error analysis and integrated error-handling procedures reduce
the time needed for error correction.� Total processing time is minimized by optimized worklist processing.
268 © 2004 SAP AG. All rights reserved. 04-02-2005

AC605 Lesson: Value Flow from Cost Object CO
Figure 89: Schedule Manager: Components
Features
Flow definition: Enables you to link the tasks to each other if they are related or ifyou want to use a worklist in them. You can, as a result, schedule a flow definition asa task in the scheduler.
Scheduler: Enables you to schedule tasks in a structure tree. You can usedrag-and-drop in a daily overview to enable the system to execute the tasks at acertain time.
Monitor: Provides an overview of the scheduled tasks during and after processing.You can correct faulty objects in a worklist.
Worklist: Manages the objects that are to be processed in a processing step sequence.The worklist monitor presents information, such as the objects that were processedwithout errors and the objects that could not be processed. You can display informationon the cause of errors and in this way control the way in which the object is processedfurther. The worklist ensures that when a processing step sequence is processed again,the system only processes the objects that had errors or which you manually instructedthe system to reprocess. Define the processing step sequence in the flow definition.
04-02-2005 © 2004 SAP AG. All rights reserved. 269

Unit 4: Actual Data AC605
Figure 90: Schedule Manager - Process
Task List: A structured group of tasks that are executed periodically and possibly bymore than one user to complete a certain process, such as period-end closing.
Scheduler: To enable the system to start tasks at certain times, you need to schedulethe tasks from the task list in the daily overview.
� Use drag and drop to schedule a task from the task list in the daily overview.� Transactions and programs can only be started directly by the user.
The Monitor: Tool to display all the information on an active or completed job thatwas scheduled in the schedule.
Flow steps include scheduling programs with variants in the job control of the SAPsystem and interaction with the users in the form of an e-mail with information.
A flow definition is inserted in the task list of the scheduler and then scheduled itin the daily overview to run it.
Demonstration: Production Order Variances (if timeallows)
PurposeTo demonstrate production order variances
System DataSystem:
270 © 2004 SAP AG. All rights reserved. 04-02-2005
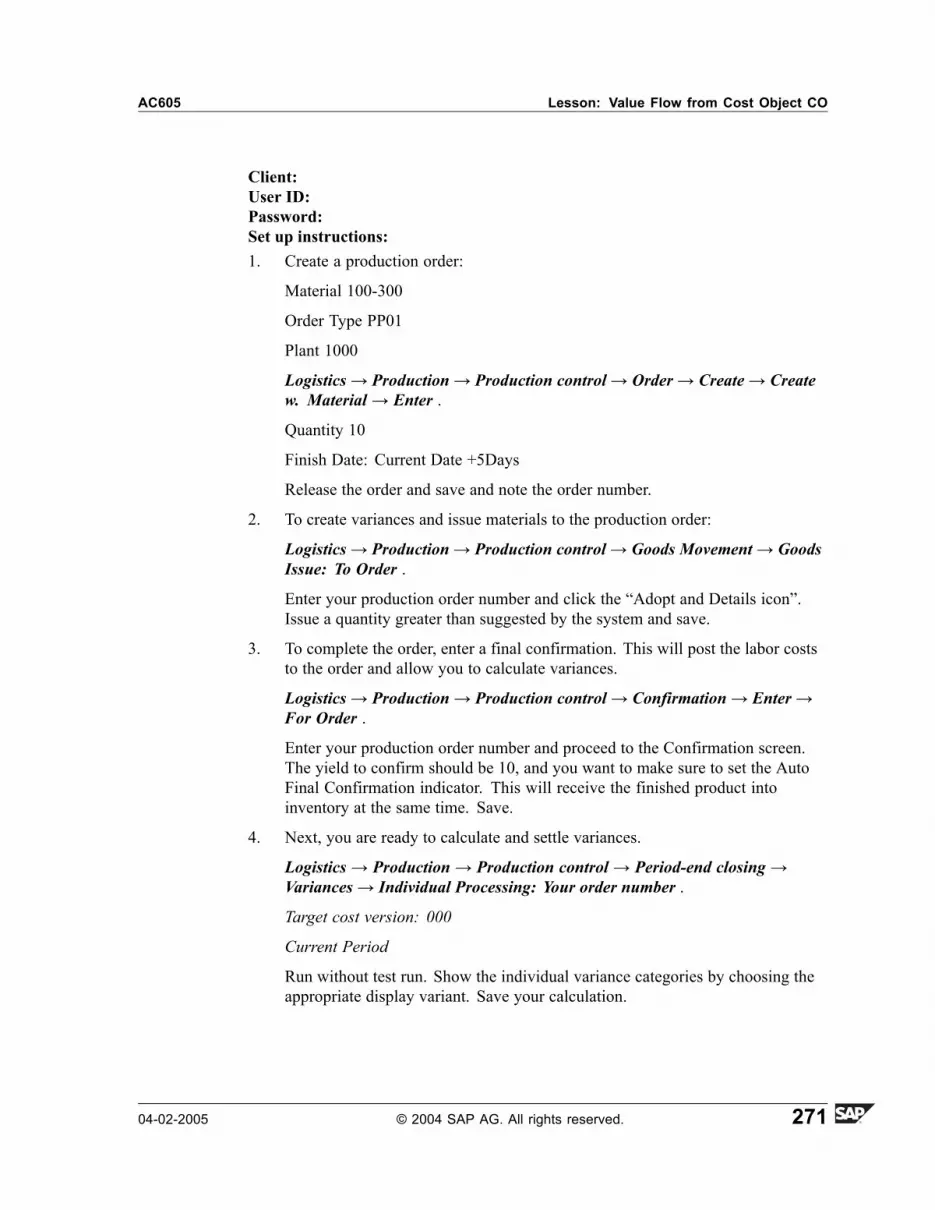
AC605 Lesson: Value Flow from Cost Object CO
Client:User ID:Password:Set up instructions:1. Create a production order:
Material 100-300
Order Type PP01
Plant 1000
Logistics→ Production→ Production control→ Order→ Create→ Createw. Material→ Enter .
Quantity 10
Finish Date: Current Date +5Days
Release the order and save and note the order number.
2. To create variances and issue materials to the production order:
Logistics→ Production→ Production control→ Goods Movement→ GoodsIssue: To Order .
Enter your production order number and click the �Adopt and Details icon�.Issue a quantity greater than suggested by the system and save.
3. To complete the order, enter a final confirmation. This will post the labor coststo the order and allow you to calculate variances.
Logistics→ Production→ Production control→ Confirmation→ Enter→For Order .
Enter your production order number and proceed to the Confirmation screen.The yield to confirm should be 10, and you want to make sure to set the AutoFinal Confirmation indicator. This will receive the finished product intoinventory at the same time. Save.
4. Next, you are ready to calculate and settle variances.
Logistics→ Production→ Production control→ Period-end closing→Variances→ Individual Processing: Your order number .
Target cost version: 000
Current Period
Run without test run. Show the individual variance categories by choosing theappropriate display variant. Save your calculation.
04-02-2005 © 2004 SAP AG. All rights reserved. 271

Unit 4: Actual Data AC605
5. Next, settle your production order. This will make an entry to the price differenceaccount in FI and account-based PA and post the variance detail by variancecategory in costing-based PA.
Logistics→ Production→ Production control→ Period-end closing→Settlement→ Individual Processing: Your Order Number .
Current Period
Test Run: off
Drill-down to the account documents and show both the costing-based andaccount-based entry.
6. The last step is to demonstrate the settlement structure:
CO-PA Configuration→ Flow of Actual Values→ Settlement of ProductionVariances→ Define PA Transfer Structure: E1 .
272 © 2004 SAP AG. All rights reserved. 04-02-2005

AC605 Lesson: Value Flow from Cost Object CO
Facilitated Discussion
Discussion QuestionsUse the following questions to engage the participants in the discussion.Feel free touse your own additional questions.
� Outline how variances are settled to Profitability Analysis.� Describe the components of the schedule manager.
04-02-2005 © 2004 SAP AG. All rights reserved. 273

Unit 4: Actual Data AC605
Lesson Summary
You should now be able to:� Explain variance calculation� Work with the schedule manager
274 © 2004 SAP AG. All rights reserved. 04-02-2005

AC605 Unit Summary
Unit SummaryYou should now be able to:� Explain the flow of actual data in CO-PA� List the sources of value fields� Understand the data flow from sales order management to CO-PA� Outline the concept of a condition type� Explain the transfer and allocation of costs� Explain the settlement of orders� Explain direct postings� Make automatic posting to CO-PA� Explain variance calculation� Work with the schedule manager
04-02-2005 © 2004 SAP AG. All rights reserved. 275

Unit Summary AC605
276 © 2004 SAP AG. All rights reserved. 04-02-2005

AC605 Test Your Knowledge
219Test Your Knowledge
1. One of the important tasks in Customizing for the costing-based CO-PA is toassign your costs and revenues to the required value fields.Determine whether this statement is true or false.□ True□ False
2. in the costing-based CO-PA contain the amounts andquantities on which you want to report.Fill in the blanks to complete the sentence.
3. A business transaction is normally concluded in sales order management withthe .Fill in the blanks to complete the sentence.
4. The condition type, transfers the COGS posted at the time ofgoods issue to CO-PA.Fill in the blanks to complete the sentence.
5. The application componentprovides an alternative form of overhead control.Fill in the blanks to complete the sentence.
6. In , costs are settled to thesettlement cost element specified in the settlement structure.Fill in the blanks to complete the sentence.
7. For direct postings in Financial Accounting, all the assignments of values andthe quantities to the value fields in the CO-PA aredefined in the PA transfer structure, FI.Fill in the blanks to complete the sentence.
04-02-2005 © 2004 SAP AG. All rights reserved. 277

Test Your Knowledge AC605
8. Revenue elements that receive automatic postings are assigned to the value fieldsin the account-based CO-PA in the PA transfer structure, FI.Determine whether this statement is true or false.□ True□ False
9. Every variance category must be represented in the PA transfer structure.Determine whether this statement is true or false.□ True□ False
10. When you perform the scheduling process, you will be:Choose the correct answer(s).□ A Creating task lists□ B Scheduling tasks in daily overview□ C Monitoring the execution of tasks□ D Displaying results
278 © 2004 SAP AG. All rights reserved. 04-02-2005

AC605 Test Your Knowledge
221Answers
1. One of the important tasks in Customizing for the costing-based CO-PA is toassign your costs and revenues to the required value fields.
Answer: True
One of the important tasks in Customizing for the costing-based CO-PA is toassign your costs and revenues to the required value fields.
2. Value fields in the costing-based CO-PA contain the amounts and quantitieson which you want to report.
Answer: Value fields
3. A business transaction is normally concluded in sales order management withthe billing document.
Answer: billing document
4. The condition type, VPRS, transfers the COGS posted at the time of goodsissue to CO-PA.
Answer: VPRS,
5. The Activity-Based Costing application component provides an alternative formof overhead control.
Answer: Activity-Based Costing
6. In account-based CO-PA, costs are settled to the settlement cost elementspecified in the settlement structure.
Answer: account-based CO-PA
7. For direct postings in Financial Accounting, all the assignments of values andthe quantities to the value fields in the costing-based CO-PA are defined inthe PA transfer structure, FI.
Answer: costing-based
04-02-2005 © 2004 SAP AG. All rights reserved. 279

Test Your Knowledge AC605
8. Revenue elements that receive automatic postings are assigned to the value fieldsin the account-based CO-PA in the PA transfer structure, FI.
Answer: False
The cost or revenue elements that receive automatic postings are assigned to thevalue fields in the costing-based CO-PA in the PA transfer structure FI, whichyou maintain in Customizing.
9. Every variance category must be represented in the PA transfer structure.
Answer: True
Each variance category must be represented in the PA transfer structure. Thevariance categories are specified by the system and entered under the sourcesection.
10. When you perform the scheduling process, you will be:
Answer: A, B, C
When you perform the scheduling process, you perform activities, such as createtask lists, schedule tasks in daily overview, monitor the execution of tasks, andanalyze results.
280 © 2004 SAP AG. All rights reserved. 04-02-2005

Unit 5223 Planning
In this unit, you explain the various possibilities that CO-PA provides for sales andprofit planning. The lessons explain planning from a business process standpoint,rather than instead of listing all the planning functions. First, talk about versionsbecause these are a prerequisite for planning. Go on to talk about manual planning.New as of Release 4.6 are the concepts of planning levels, packages, and parameters.At the end of the unit, participants should be able to define their own planning layoutsand integrate these into planner profiles. Explain the various aspects of planning withratios and ratio schemes. Draw attention to the fact that ratio schemes can be used inboth manual planning and automatic planning. Provide an overview of the automaticplanning options that the system provides. If you have time, demonstrate some ofthese options in the system. Finally, introduce the subject of integrated planning andexplain the concept from a CO-PA perspective.
Note: Emphasize that planning in CO-PA is performed separately foreach approach, costing-based or account-based. Because costing-basedProfitability Analysis is used more often than account-based ProfitabilityAnalysis and only a few customers use the account-based approach on itsown, the focus in this unit is on costing-based Profitability Analysis.
Unit OverviewThis unit helps you to understand the concepts of planning in CO-PA and create asales plan using a planning level and planning packages. The unit explains how todefine a planning layout and enter data. In addition, this unit describes how to executeautomatic planning functions, integrate the plan data within Management Accounting,and define the planning aids to enable planning.
Unit ObjectivesAfter completing this unit, you will be able to:
04-02-2005 © 2004 SAP AG. All rights reserved. 281

Unit 5: Planning AC605
� Outline the overall process flow of profit planning� Work with planning layouts� Plan target values� Perform top down distribution of planning data� Change and delete plan data and create forecasts� Explain the integrated transfer of plan data
Unit ContentsLesson: The Profit Planning Process ... . . . . . . . . . . . . . . . . . . . . . . . . . . . . . . . . . . . . . . . . .283
Demonstration: Maintaining Versions.. . . . . . . . . . . . . . . . . . . . . . . . . . . . . . . . . . . . . . .291Demonstration: Planning Levels, Packages, and Parameters ... . . . . . . . .292
Lesson: Planning Methods .. . . . . . . . . . . . . . . . . . . . . . . . . . . . . . . . . . . . . . . . . . . . . . . . . . . . . . .297Demonstration: Planning with Ratios .. . . . . . . . . . . . . . . . . . . . . . . . . . . . . . . . . . . . . . .302Demonstration: Top down Distribution... . . . . . . . . . . . . . . . . . . . . . . . . . . . . . . . . . . . . 311Demonstration: Planning using Excel.. . . . . . . . . . . . . . . . . . . . . . . . . . . . . . . . . . . . . . .320Demonstration: Automatic Planning ... . . . . . . . . . . . . . . . . . . . . . . . . . . . . . . . . . . . . . .322Demonstration: Integrated Planning ... . . . . . . . . . . . . . . . . . . . . . . . . . . . . . . . . . . . . . .328Exercise 13: Manual Planning Functions .. . . . . . . . . . . . . . . . . . . . . . . . . . . . . . . . . .331Exercise 14: Automatic Planning Functions .. . . . . . . . . . . . . . . . . . . . . . . . . . . . . . .345Exercise 15: Integrated Planning Functions .. . . . . . . . . . . . . . . . . . . . . . . . . . . . . . .355
282 © 2004 SAP AG. All rights reserved. 04-02-2005

AC605 Lesson: The Profit Planning Process
Lesson:224
The Profit Planning ProcessLesson Duration: 30 Minutes
Lesson OverviewThis lesson explains how to design the overall process of profit planning. It alsodescribes the basic terminology used in CO-PA planning. In addition, it examines howto create a planning level and work with planning layouts.
Lesson ObjectivesAfter completing this lesson, you will be able to:
� Outline the overall process flow of profit planning� Work with planning layouts
Communicating the budgets
Explain the business background for the sales planning process. Initially, a corporategoal is set at a high level within an organization. This goal drives the overall salesbudget from a revenue and quantity standpoint. A breakdown of the budget to thelower levels in the organization, in turn, drives the product budget, if applicable,which then drives the direct production costs. In the next step, the overhead expensesare added to the direct costs, which in turn, yields the complete contribution marginplan. The plan can then be broken down to any level of detail needed.
Business ExampleThe management of your company would like to implement a profitability accountingapplication in the SAP system. As a member of your the project team, you aresupposed to advise on the question of whether to implement CO-PA or EC-PCA in theSAP system. You then will be responsible for implementing the selected applications.
Sam Sales and Randy Revenue would like to use the CO-PA module to plan the salesof the two main product lines of the company, bicycles and motorcycles. Sam wantsto plan his sales by customer and product. He would like to plan the sales quantitiesand selling prices for each customer/product combination and he expects the systemto calculate the planned revenue from the results. Randy wants to plan his sales byproduct group and then he would like to use the system to automatically distributethe planned values to the product level using a reasonable allocation basis. Planningquantity and straight revenue are the only key figures Sam is interested in. PaulaProduct would like to perform a what-if analyses on the planning data for the variousscenarios to analyze the possible effects of strategic decisions on sales. For example,
04-02-2005 © 2004 SAP AG. All rights reserved. 283

Unit 5: Planning AC605
they might want to analyze the effect that price increases might have on revenue. PeterPlant wants to use the projected sales quantities from CO-PA to plan his productionand material procurement schedules. He would like to have access to the CO-PA planvalues in Sales and Operations Planning. For this reason, planning quantities, prices,and revenue at the product/customer level is required. Planning at the product grouplevel is required with systematic distribution of values to the product level. Masschanges to plan values are required for analyzing the different business scenarios.Transferring the CO-PA plan data to Sales and Operations Planning is required toaid production scheduling. For this purpose, you need to know the overall processof profit planning.
Process Flow of Profit Planning
Planning Levels are new from Release 4.6 onwards. Explain that the set-up of theselevels would be performed by a planning coordinator/administrator. Planning levelsand packages afford the opportunity to provide the planner with the characteristicsor the characteristic values the planner needs. For example, the goal is to establish afull contribution margin plan for a division. The sales force will provide the quantityand revenue plan figures, the sales managers will add selling expenses, and theplanning coordinator will complete the plan with direct costs and other overheads.Each �planner� needs a different view of the planning data:
Salesperson: Customers for their territory, revenue, and quantity.
Sales manager: Divisions they manage, quantity, revenue, discounts, and cost.
Planning Coordinator: Salesorg, division, quantity, revenue, discounts, direct cost,and overhead.
In addition, mention the importance of the versions that are needed to accomplishany type of planning. Versions are valid throughout Controlling and across allthe operating concerns. In Profitability Analysis, versions are used to enter andstore different plan data for profitability segments. In the general version definitionfunction for Profitability Analysis, the fields, Actual and Exclusive use, are, as aresult, irrelevant.
Each version incorporates the settings that are made in reference to the plan version ofan operating concern. These attributes determine whether planning is allowed for theplan version, in which currency the data for the version is managed, the exchange rateused to translate the foreign currency amounts into the operating concern currency, andwhether the characteristic derivation logic is checked when you enter the plan data.
284 © 2004 SAP AG. All rights reserved. 04-02-2005

AC605 Lesson: The Profit Planning Process
Figure 91: Planning Functions in a Process View
Sales and profit planning is normally perceived as an integrated process involvingdifferent roles within profitability and sales accounting, such as sales manager,regional manager, and sales employee. Distinctions are often made between thedifferent approaches used, such as central top down planning and local bottom upplanning.
The planning tool in Profitability Analysis offers all the people involved in theplanning process a uniform, graphical planning interface that is straightforwardand modern. This interface ensures that the poweruser, such as the central plannerwho models and monitors the planning process, and occasional users who onlyoccasionally confirm planning values can work in unison.
Because the contents and the level of information of the individual plans varydepending on the role and the area of responsibility, the Planning screen allows youto structure planning selectively according to specific planning levels and planningcontents, and to assign that planning structure to the individual users. Your planningstructure is represented in a tree hierarchy. From the initial Planning screen, you canexecute almost all the planning functions, right from modeling the planning processand monitoring the planning tasks to manual entry of the planning data.
04-02-2005 © 2004 SAP AG. All rights reserved. 285

Unit 5: Planning AC605
Figure 92: Planning on Different Levels
Figure 93: Overview of Planning Framework
286 © 2004 SAP AG. All rights reserved. 04-02-2005

AC605 Lesson: The Profit Planning Process
Taking into account a typical sales and profit planning process, a professionalplanning tool has to:
� Support the individual planning tasks by guiding the user to the planning levelsthe user needs to plan. For example, a key account manager needs to plan on thekey customer, sales organization, and product level.
� Support the individual planners by providing personalized access to the requiredplan data using planning packages.
� Provide a set of relevant planning functions, such as valuations and simulations,to apply the required planning packages using planning methods and parameters.
Figure 94: Manual Planning: Accessing the Overview Screen
04-02-2005 © 2004 SAP AG. All rights reserved. 287

Unit 5: Planning AC605
Figure 95: Elements in Planning
During a planning process, you can plan on many different levels in CO-PA. Forexample, you can plan product groups, or specific products, or the customer/productlevel, or simply the customer level. In fact, you can plan on any profitability segmentin CO-PA.
By design, the system ensures that the data remains consistent across all the levelsthroughout the planning process. Because all the subtotals of the different levels addup to totals, the values from the different levels can always be reconciled althoughchanges are being made on the different levels during the process.
For example, you first enter planned quantities at the customer/product level for twocustomers and three products. Then, by definition, the totals by product will coincidewith the customer/product information. If additions are made at the product level, theadditions are displayed at the customer/product level with an unassigned customer.
Derivation is automatically carried out in the background when the plan data is saved.This means that the values planned under one or more characteristic values are alsoautomatically summarized under other higher-level characteristics.
For example, you have added the product group characteristic to the operatingconcern. When you plan at the product level, the values are automatically rolled upunder the appropriate product groups although you did not specify a product groupwhen entering the plan data. Again, this roll-up happens automatically at everylocation where the derivation occurs.
288 © 2004 SAP AG. All rights reserved. 04-02-2005

AC605 Lesson: The Profit Planning Process
Planning Layout
Figure 96: Defining a Planning Layout (1)
Planning layouts are customized screens for entering plan data. The definition of aplanning layout controls not only the appearance of the Planning screen but alsosome of the functions. This allows for complete flexibility in controlling the planningentry process.
A planning layout definition consists of three parts, the general data selection, the leadcolumns, and the value columns. The general data selection is where the characteristicvalues are specified that are valid for the entire layout. The lead columns are whereadditional characteristics that are to be planned may be specified. The value columnscontain characteristic/value field combinations.
The valid values for the special characteristics version, record type (for costing-basedCO-PA), and the plan/actual indicator are required for each row/column intersectionin a planning layout definition. By employing these properly in the layout design, thelayouts can be created in which the values can be planned for more than one version ata time and in which actual history data may be displayed for reference.
Variables may be used when defining planning layouts to give them maximumflexibility. Variables can be used for any characteristic and they can be installedanywhere necessary, such as rows, columns, or the general data selection. Users willbe prompted to enter the values for these variables when planning.
04-02-2005 © 2004 SAP AG. All rights reserved. 289

Unit 5: Planning AC605
Separate planning layouts are required for costing-based CO-PA and account-basedCO-PA because planning figures on the two sides of CO-PA are not related orlinked in any way. When defining layouts in costing-based CO-PA, you need thecharacteristic record type. When defining layouts in account-based CO-PA, you needthe characteristic cost element.
Figure 97: Defining a Planning Layout (2)
A general planning layout that corresponds to the selections made in the plan level andthe package can be created automatically. Specific layout features can be maintainedmanually.
There are two basic options for defining the lead column(s):
� Each row in the lead column can be defined separately and consists of acombination of characteristic values (in this case, the columns are value columns)or each row is a value row (in this case, the columns are characteristic values).
� The entire lead column can be selected to represent a characteristic (the columnsare value columns). With this option, you can obtain multiple lead columnsbut you cannot hard-code any rows.
Value columns are defined using characteristics, value fields, attributes, or formulas.If the lead column contains only characteristics, then each value column must containat the minimum a value field. The column can also contain the characteristic valuesthat pertain to the value field.
290 © 2004 SAP AG. All rights reserved. 04-02-2005

AC605 Lesson: The Profit Planning Process
The following attributes can be tagged to each value column:
� A distribution key for distributing the summarized values to periods.� A unit for the value field (either a currency or a unit).� A long text indicator (indicating some long text can exist).� All characteristics.
Figure 98: Planning Variables
You can define the variables for your planning levels and planning packages. Forexample, you use a variable instead of a planning package to specify the planningperiod.
You can use all the planning packages for planning runs in subsequent fiscal yearswithout the need to change each planning package. Instead, you just change thevariable�s characteristic centrally.
You maintain variables directly from the Planning screen using Edit→ Variable.
Demonstration: Maintaining Versions
PurposeTo create a planning version and maintain it
04-02-2005 © 2004 SAP AG. All rights reserved. 291

Unit 5: Planning AC605
System DataSystem:Client:User ID:Password:Set up instructions:1. Create a plan version named 555 and maintain the version� settings for the
operating concern, IDEA. Select the currency type, B0, and the exchange ratetype, M.
Profitability Analysis Configuration→ Planning→ Initial Steps→MaintainVersions: Choose the �new entries� button
Demonstration: Planning Levels, Packages, andParameters
Purpose
To demonstrate planning levels, packages, and parameters
System DataSystem:Client:User ID:Password:Set up instructions:1. Begin by showing an existing planning level to show the terminology and show
what it does.
Controlling→ Profitability Analysis→ Planning→ Create/Display PlanningData : Select Node, AC605, and double-click
Point the characteristics selected for this planning level. Example: SalesTerritory Plans for the sales organization, 1000. If required characteristic valuescan be entered under the selection tab. In this case, the sales organization washard-coded, which means that all the plan packages will have to use the salesorganization, 1000.
Expand Node, AC605, and double-click the plan package, AC60500.
292 © 2004 SAP AG. All rights reserved. 04-02-2005

AC605 Lesson: The Profit Planning Process
Notice that the selection tab shows the characteristic values for mostcharacteristics selected for this level. Example: Package for a certaincustomer/product combination.
Select Planning Method �Enter Planning� and display the plan parameterset, Plan00, by right-clicking click.
Currently, only two planning methods exist: Enter & Display. In the future,product management plans to add further methods, such as Top down. The planparameter set specifies the planning layout and the distribution keys. The sameparameter set can be used for all the planning packages within a level.
Double-click the parameter set, Plan00. This will launch the Planning screen.You may want to postpone an extensive description of the Planning screen andfunctions until the next topic.
Each user can be linked to �default� planning level, packages, and parameters.In the above business example, the salesperson needs to access only a certainplanning level, package, and parameter set. Instead of having to search throughthe entire structure, the salesperson can select a personalization profile,which will display only what is required. You can add your own user to thepersonalization profile, AC605, to demonstrate the point.
2. Create a planning level, package, and parameter set, and have the systemgenerate the planning layout.
From the top of the structure, right-click one time and select �Create PlanningPackage.�
Select �Material Group�, �Product� , Sales Organization from the characteristicslist. Under �Selection� specify currency type, B0, and sales organization, 1000.
3. Create a new planning package and enter the following:
Select your planning level, right-click one time, and select �Create PlanningPackage�
Period/Year: Current
Version: 110
Record Type: F
Description: Optional
Material Group: 003
Save.
4. Next create a plan parameter set for the method, �Enter plan data�:
04-02-2005 © 2004 SAP AG. All rights reserved. 293

Unit 5: Planning AC605
Double-click your plan package Select Planning Methods � Enter Plan Data�and press the right mouse button. Select �Create Parameter Set�. Name theparameter set, Plan##.
To create the Data entry screen, create your planning layout dynamically, byclicking the �Create Layout� button
Name the layout, Plan##. Indicate the appropriate level for the displayedcharacteristics. Material group and product should be in the lead column. ValueFields should be Invoiced Quantity and Revenue.
Save and display the results by double-clicking the parameter set.
5. To demonstrate the planning layout, change your parameter set and click the�Display� icon next to the planning layout. Then, select change. Add a columnto the layout, such as the unit of measure. (Attribute)
Alternately, you can demonstrate the creation of a layout manually. The layoutwould then have to be linked to a parameter set.
IMG → Controlling → Profitability Analysis→ Planning→ ManualPlanning→ Define planning layout.
Select the operating concern currency.
Define the two lead columns, customer and product, and always choose * asthe characteristic value.
Define the three columns, invoiced quantity in sales units, price per unit, andrevenue. Mention that the price for each unit is a ratio and that this subjectwill be examined later.
In the general data selection, select the characteristics record type, (F), salesorganization, (1000), version, (variable) and period/year, (variable).
Save the planning layout and mention the Check function.
294 © 2004 SAP AG. All rights reserved. 04-02-2005

AC605 Lesson: The Profit Planning Process
Facilitated Discussion
Discussion QuestionsUse the following questions to engage the participants in the discussion.Feel free touse your own additional questions.
� Outline the attributes that can be tagged to the value columns.
04-02-2005 © 2004 SAP AG. All rights reserved. 295

Unit 5: Planning AC605
Lesson Summary
You should now be able to:� Outline the overall process flow of profit planning� Work with planning layouts
296 © 2004 SAP AG. All rights reserved. 04-02-2005

AC605 Lesson: Planning Methods
Lesson:233
Planning MethodsLesson Duration: 50 Minutes
Lesson OverviewThis lesson outlines how to create manual plan data using various planning aids. Italso explains how to create forecasts and perform top down distribution of planningdata. In addition, it shows how to change and delete plan data.
Lesson ObjectivesAfter completing this lesson, you will be able to:
� Plan target values� Perform top down distribution of planning data� Change and delete plan data and create forecasts� Explain the integrated transfer of plan data
Introduce the various planning methods available. Again, the planning functionsare introduced within the planning business process to help understand why aparticular function may be used. The process can be iterative and is performed byvarious functions within a corporation. The functions are administered by planningcoordinators.
Business ExampleThe management of your company would like to implement a profitability accountingapplication in the SAP system. As a member of the project team, you are supposedto advise on the question of whether to implement CO-PA or EC-PCA in the SAPsystem. You then will be responsible to implement the selected applications. SamSales and Randy Revenue would like to use the CO-PA module to plan the sales of thetwo main product lines of the company, bicycles and motorcycles. Sam wants to planhis sales by customer and product. He wants to plan the sales quantities and sellingprices for each customer/product combination, and he expects the system to calculatethe planned revenue from the results. Randy wants to plan his sales by productgroup and then he wants to use the system to automatically distribute the plannedvalues to the product level using a reasonable allocation basis. Planning quantityand straight revenue are the only key figures Sam is interested in. Paula Productwould like to perform a what-if analyses on the planning data for various scenariosto analyze the possible affects of strategic decisions on sales. For example, theymight want to analyze the affect that pricing increases might have on revenue. Peter
04-02-2005 © 2004 SAP AG. All rights reserved. 297

Unit 5: Planning AC605
Plant wants to use the projected sales quantities from CO-PA to plan his productionand material procurement schedules. He would like to have access to the CO-PAplan values in Sales and Operations Planning. For this reason, planning quantities,prices, and revenue at the product/customer level is required. Planning at the productgroup level is required with the systematic distribution of values to the product level.Mass changes to plan values are required to analyze different business scenarios.Transferring CO-PA plan data to Sales and Operations Planning is required to aidproduction scheduling. For this purpose, you need to know the profit planning processand the phases in sales planning.
Phases in Sales Planning
Figure 99: Typical Phases in Sales Planning
The figure above shows an example of one possible integrated planning process forsales and profit planning.
The process begins with the planning of target values, such as at the material grouplevel. Average prices and cost of goods manufactured can be determined at this stage.
In the next planning phase, plan data is distributed top down. The plan data formaterial groups is broken down into combinations of customer groups and products.
In bottom up planning, the plan data can be entered manually for each salesrepresentative and then brought together in a single plan version.
In the fourth planning step, the additional plan data can be transferred to sales andprofit planning from other business areas, such as cost center accounting or incomingorders.
298 © 2004 SAP AG. All rights reserved. 04-02-2005

AC605 Lesson: Planning Methods
After planning has been finalized, the plan data can be transferred to productionplanning, allowing production plan data to be reconciled with sales planning.
By means of ratios, which are quotients of two value fields, used directly in theplanning layout, you can calculate prices quickly and simply, and simulate price,value, and quantity changes.
You can use ratios and ratio schemes, which are similar to costing sheets, to valueyour current plan version with the average prices from reference data, such as theactual data or another plan version. This allows you to plan prices and quantitiesseparately and simultaneously use the valuation prices for quantity planning. Thisfunction is available for both manual planning and automatic planning.
Planning Target Values
Figure 100: Planning Target Values
At the start of the first planning phase, in which you plan target values, you defineaverage prices and the cost of goods manufactured. Introducing ratios helps simplifyplanning prices manually.
With the Goal Seek function, you can enter a target revenue and have the systemcalculate the planned price required to attain it.
04-02-2005 © 2004 SAP AG. All rights reserved. 299

Unit 5: Planning AC605
Figure 101: Planning with Ratios
A ratio is a quotient involving two value fields, such as price = sales/quantity, andit can be used as a basis for simulating corresponding adjustments and alterations ofquantities and prices in the planning layout.
You define ratios centrally in Customizing. They can be selected in the same way asnormal value fields when you define the planning layout.
Ratios or prices are not saved on the database. Instead, they are calculated dynamicallyfrom the quantities and values at each planning level. This avoids the build-up ofredundant data and ensures a consistent dataset.
300 © 2004 SAP AG. All rights reserved. 04-02-2005

AC605 Lesson: Planning Methods
Figure 102: Planning with a Ratio Scheme
You can summarize ratios in a ratio scheme. Ratios can be combined into ratioschemes, which can then be applied against The existing plan data for the purpose ofvaluing the existing plan base values with ratio values or the rates that are calculatedbased on specific reference data. The reference data can be the actual data or the datafrom another planning version.
For example, if a ratio scheme contains a ratio for per-unit price, you can use a ratioscheme to valuate a sales quantity plan and determine the price for each piece fromthe actual data.
You can use ratio schemes in both manual planning and in automatic planning. Inboth cases, you indicate the ratio scheme and the reference data (plan/actual data,plan version, record type, and reference time interval). In automatic planning, ratioschemes can be applied using the Copy and Change functions.
04-02-2005 © 2004 SAP AG. All rights reserved. 301

Unit 5: Planning AC605
Figure 103: Reaching Objectives Using Goal Seek
You can perform data simulations in planning using the Goal Seek function. Thisfunction allows you to enter a target contribution margin in manual planning and tohave the system calculate the corresponding quantity sold.
To use the goal seek function, both sides must be mathematically related either in aformula or a ratio. In the above example, ratios, which are hidden in the layout, createthe relationship between the contribution margin and the quantity sold. To carry outthis function, first select the two relevant data cells and choose Edit→ Goal Seek.In the dialog box that appears, enter the target value, such as a contribution marginof 120,000. The system then calculates the appropriate quantity, which is 6000items in this case.
Demonstration: Planning with Ratios
PurposeTo demonstrate planning with ratios
System DataSystem:Client:User ID:Password:Set up instructions:
302 © 2004 SAP AG. All rights reserved. 04-02-2005

AC605 Lesson: Planning Methods
1. Use the planning level, AC605, and enter plan data.
2. To demonstrate the ratio concept, use the plan level, AC605, package AC60500.Enter the plan data for:
Customer 1000
Product P-100
Quantity 100
Price 1,500
Accounting → Controlling → Profitability analysis → Planning →Create/Display plan data.
Double-click the Planning Level, AC605 and select the planning package,AC60500. From the lower left side, select the plan parameter, Plan00 bydouble-clicking the node.
Change the entries for all three value fields and show the results. The ratioused here is set up as follows:
ERL = Revenue(Numerator) ./. Invoiced Quantity (Denominator) and is set torecalculate the base amount or to keep the ratio constant.
3. In Customizing, display the ratio, ERL (price per unit), and explain thecalculation rule. Mention that ratios, in conjunction with a ratio scheme, can beused in both manual planning and automatic planning.
IMG→ Controlling→ Profitability Analysis→ Planning→ Planning Aids→ Define ratios and ratio schemes
4. Go to the display ratio scheme, AC40, and the ratios assigned to it. Explainthe access-level characteristics. Ratio schemes are used to valuate the existingvalues. For example, you are planning the sales quantities for the next year andwant use last year�s average price at the material level to calculate revenue.
IMG→ Controlling→ Profitability Analysis→ Planning→ Planning Aids→ Define ratios and ratio schemes
If time permits, you can demonstrate the results on planning. Use the planninglevel, IDES140, for your demonstration. Enter the data for:
Customer 1000
Product P-100
Planned Quantity: 100
The intent here is to have the system find the values for Revenue and COGM,with the help of the ratio scheme, AC40. Use 1999 actual values.
04-02-2005 © 2004 SAP AG. All rights reserved. 303

Unit 5: Planning AC605
Click one time in the row that you filled in:
Edit→ Planning Functions→ Ratios
Ratio Scheme AC40
Period from/to: 1/99 � 12/99
Record Type F
Actual Data
The system will valuate the quantity you entered with the 1999� price and costfor the customer/product combination driven by the access level characteristic).
5. Save the plan data and point out the document number that is created. Highlightthe fact that in the planning area, line items are always written to CO PA andthat the method used to set up the number assignment is the same as that usedfor the actual data.
IMG→ Controlling→ Profitability Analysis→ Planning→ Initial Steps→Set up number assignment for plan data
With the top down distribution function, you distribute the data from a higher planninglevel to the underlying levels. You could initially plan on the product group level andthen break the plan down into products. The plan data is distributed in the same wayas the existing reference data. Both plan data and actual data can be used. You candistribute the data for a certain period or based on the accumulated period values tosmooth out fluctuations.
Top down Distribution in Planning
Method: Distributing �Non-assigned Values�
Method: Distributing Entire Values
304 © 2004 SAP AG. All rights reserved. 04-02-2005

AC605 Lesson: Planning Methods
Breakdown of Target Values
Figure 104: Breakdown of Objectives
You can use an extensive top down distribution function available in both manualand automatic planning for the second planning phase, which involves the top downdistribution of the target values to an extensive planning level.
04-02-2005 © 2004 SAP AG. All rights reserved. 305

Unit 5: Planning AC605
Figure 105: Top Down Distribution in Planning
Top down distribution is a process for distributing data that has been planned at onelevel in CO-PA to the additional levels based on some reference data, which can beplan or actual CO-PA data. It can only be done in automatic planning.
One example of this might be planning values at the product group level and thendistributing these values to the individual products in a group. Another examplemight be planning values at the product level and then distributing the values to theplants from which the products are sold.
Plan values can be distributed strictly according to the reference data by period orbased on the reference data aggregated across the periods. The latter has the effect ofequalizing the distribution percentages across periods for the receivers.
When performing a top down distribution, you need to specify the field(s) in thereference data, the values of which should be used as the reference base. The optionsare:
� Single value field: The data of all value fields is distributed according to thedistribution of values of this single value field.
� All value fields: The data of each value field is distributed according to therelative reference data for each profitability segment for the same value field.
306 © 2004 SAP AG. All rights reserved. 04-02-2005

AC605 Lesson: Planning Methods
Figure 106: Method: Distributing Non-Assigned Values
Top down distribution enables you to distribute the data from a higher planning levelto lower levels. For example, you can perform planning first of all at the productgroup level and then distribute the values to the product level.
The plan data is distributed in the same way as the existing reference data. Forthis distribution, you can use either plan or actual data. You can distribute the dataseparately by period or you can aggregate the values over several periods to level outfluctuations.
In the above example, the nonassigned plan data (value 1000) at the product grouplevel is distributed to the individual products in the same way as the base values(the actual quantities sold) are distributed. This means at a ratio of 1:2. The productgroup is credited with 1000 and the products are debited with 333 (product, P1) and666 (product, P2).
04-02-2005 © 2004 SAP AG. All rights reserved. 307

Unit 5: Planning AC605
Figure 107: Method: Distributing Total Values
In the above example, the overall sum of the plan data for the product group is theindividual values of the products (each prior value) and the nonassigned values (value#) at product group level. The overall sum is distributed to the individual products inthe same way as the base values (actual quantities sold), which means at a ratio of 1:2.The product group is credited and the products are debited.
308 © 2004 SAP AG. All rights reserved. 04-02-2005

AC605 Lesson: Planning Methods
Figure 108: Automatic Planning: Top-Down Distribution (2)
In the parameter set, you can specify the following:
You can choose between two top down methods that determine precisely whichvalues are to be distributed: You can either only distribute values that are posteddirectly at the higher level with the method, Only distribute "nonassigned�, or youcan distribute all the values located at the higher level, regardless of whether theywere posted there directly or rolled up from more extensive levels, with the method,Distribute total value. When you use this method, the values taken from the extensivelevel are overwritten by the new, distributed value.
You specify the receiver characteristic for the distribution under Receivercharacteristic. You can select several characteristics from the characteristics specifiedin the planning level.
Under Reference value field, you can enter as the basis for distribution, a specificvalue field for the reference data or a key figure calculated from value fields.Alternatively, you can specify that the distribution occurs by value fields. In this way,each value field is taken as the basis for its distribution.
To smooth out incidental differences that occurred from period to period in thereference data, you can select the Aggregate periods indicator.
You specify the time frame for the reference data that is to be used as the basis forexecuting the planning method.
04-02-2005 © 2004 SAP AG. All rights reserved. 309

Unit 5: Planning AC605
Figure 109: Automatic Planning: Top-Down Distribution (3)
In addition, you can make the following settings in the parameter set:
You specify whether the data to be used as the reference data is the actual data orthe data from the plan version for the planning package or from a different planversion that is yet to be specified.
You can specify for a sender characteristic that a different characteristic value inthe reference data forms the basis for distribution. This means that you can indicatethat the distribution of product groups to the products in the country, 1, occurs onthe basis of the product data in the country, 2. For this purpose, use the Transformcharacteristic values function.
By making the appropriate setting, you specify whether the planning method is to beexecuted in a test run or in an update run, or whether this decision is to be postponeduntil the point of execution of the parameter set.
You can jump to a background processing screen.
In the Value fields tab page, you specify the specific value fields that are to bedistributed.
310 © 2004 SAP AG. All rights reserved. 04-02-2005

AC605 Lesson: Planning Methods
Demonstration: Top down Distribution
PurposeTo demonstrate the top down method of planning
System DataSystem:Client:User ID:Password:Set up instructions:1. In this demonstration, you show top down distribution along the lines of the task
set in the exercise, 4. Use the planning layout, IDES125, to plan the followingdata:
2. Create a new planning package, Top20, for your plan version ( or version, 500),under the plan level, IDES125. Enter the planning timeframe, 1/XXXX through12/XXXX, and your version number.
Controlling→ Profitability Analysis→ Planning→ Create/Display PlanningData : Select Planning Level IDES125.
Right-click one time and select �Create Planning Package�. Add the followingdata to your planning package:
Field Name or Data Type ValuesPeriod/Year 1-12, XXXXUnit Inv. Qty CARVersion 500 or 5xx
Save your planning package.
3. Enter the plan data using your plan package and the plan parameter, IDES125.From the lower left side, select the plan parameter, IDES125. Plan your valuesfor the material group, 003.
Plan Quantity: 100,000
Plan Revenue: 200,000,000
Period/Year: 01 through 12 in the next fiscal year
Save the plan data.
04-02-2005 © 2004 SAP AG. All rights reserved. 311

Unit 5: Planning AC605
4. Display the plan data in the Information System. To do this, execute the report,IDES?125, with the following selection criteria:
Period: 01 through 12 in the next fiscal year
Plan/actual indicator: 1
Version: 125
Record type: F
Move to the product level for the material group, 003, and explain thenonassigned values.
Accounting→ Controlling→ Profitability analysis→ Information system→ Execute report
5. Next, display the actual data (reference data) in the Information System. To dothis, execute the report, IDES-125, with the following selection criteria:
Period: 01 through 12 1998
Plan/actual indicator: 0
Version: Do not enter a version
Record type: F
Move to the product level for the material group 003:
Accounting→ Controlling→ Profitability analysis→ Information system→ Execute report
6. 2-1-5 Verify the results by actually conducting this top down distribution.
7. Return to the planning framework, and select your planning package within theplanning level, IDES125. Select the planning method, �Top down Distribution�.Show the parameter settings that have been made for the parameter set, IDES125.
Distribute the nonassigned values only.
Distribute values to the product level.
Distribution will be based on invoice quantity in 1998.
8. Execute the parameter set, IDES125, in a production mode.
9. Display the result of the top down distribution in the Information System. To dothis, execute the report, IDES-125, with the following selection criteria:
Period: 01 through 12 in the next fiscal year
Plan/actual indicator: 1
312 © 2004 SAP AG. All rights reserved. 04-02-2005

AC605 Lesson: Planning Methods
Version: 125
Record type: F
Move to the product level for the material group, 003, and point out the valueswhich are found there.
Accounting→ Controlling→ Profitability analysis→ Information system→ Execute report
Bottom up planning signifies manual planning at lower level characteristics, whichin turn, rolls up to higher-level characteristic. The most granularity you can getis the customer and product levels. Explain that most sales companies performa combination of bottom up and top down planning. For example, certain keycustomers are planned at the product/customer level for the highest selling product.Miscellaneous customers are planned at the customer group level. You alreadydemonstrated bottom up planning in the earlier class example so focus on the Excelintegration option at this point.
Bottom up Planning Example
Data Entry with Excel Integration
Hint: Interactive Excel may not have been set up for your Personal Computer.You should test this demo. If it does not work, try to install Interactive Excelfrom the Programs→ SAP Frontend→ Set-up Interactive Excel menu
In addition, you may get an error message when saving the data from Excel into SAPR/3 Enterprise, just continue, the system will post anyway.
The automatic planning functions enable the automatic processing of a large numberof profitability segments for planning purposes. The functions support copying,forecasting, top down distribution, changing, and deleting plan data.
The copy function can be used to process a large number of profitability segmentsautomatically. With this function, you can copy the existing reference data to the plandata and process several profitability segments simultaneously. Additional planningfunctions for changing the plan, such as period distribution or revaluation, can beexecuted at the same time as the copy function. You can plan for any period, evenfor years at a time.
With the forecast function, you can forecast the planned values for several profitabilitysegments at a time using a specified forecast profile. The plan data that is forecast isgenerated on the basis of existing reference data.
04-02-2005 © 2004 SAP AG. All rights reserved. 313

Unit 5: Planning AC605
The change function allows you to change the existing plan data automatically. Thedelete function can be used to recreate a plan at a certain point in time.
Note: Demonstrate some of the automatic planning functions forcosting-based CO-PA. Exactly the same functions are available for theaccount-based approach, provided you bear in mind that no valuation,revaluation, top down distribution, or planning with ratios is possible in theaccount-based approach.
Analytical Bottom Up Planning
Figure 110: Bottom Up Planning
The third planning phase in which plan values are planned bottom up and mergedcould occur in several steps. For example, the default plan values could be createdautomatically (copied or revaluated) and then used as a plan basis for the individualsales representatives.
Integrated Microsoft Excel allows individual sales representatives to create theirsales plan data locally.
Finally, the individual plans can be merged into a single version and valuated withthe operative prices and costs of goods manufactured.
314 © 2004 SAP AG. All rights reserved. 04-02-2005

AC605 Lesson: Planning Methods
Figure 111: Example: Bottom up Planning
In bottom up planning, plan data is created at the customer and product group leveland aggregated to the corresponding higher levels.
Figure 112: Data Entry with Excel Integration
04-02-2005 © 2004 SAP AG. All rights reserved. 315

Unit 5: Planning AC605
The integration of Microsoft Excel into profit planning means that you can use Excelfunctions such as the ones for additional calculations, graphics and printing, and theSAP system ensures the consistency of the data centrally, providing central functionssuch as derivation and valuation.
To perform local planning, you can save Excel sheets that have been created in theSAP system locally on a personal Computer or laptop and then work on them inExcel outside the SAP environment. The data can then be loaded back into the SAPsystem later using the upload functions.
Figure 113: Automatic Planning
Automatic Planning Functions These functions can be used to simultaneouslyprocess a large number of profitability segments for planning. They can be executedeither online or in the background. You must have the appropriate authorizationsto use these functions.
When you use automatic planning, you must specify the characteristics and valuefields that you want to process. This allows you to set the planning scope in each case.
Automatic planning functions have been included in the concept of planning levelsand planning packages. There are 12 planning methods. You select the characteristicsto be planned at the planning level and in the planning package. You enter all othersettings and select the value fields in a parameter set for the corresponding planningmethod, such as Copy. Planning Management You use this function to track which
316 © 2004 SAP AG. All rights reserved. 04-02-2005

AC605 Lesson: Planning Methods
automatic planning functions were executed and by whom. It provides a complete logof the mass changes made to plan data, the log information when certain functionswere carried out, who carried them out, and what profitability segments were changed.
Figure 114: Copying plan data
Copying Plan Data (1)
In the target fields, specify the following:
� The posting periods to be updated with the copied data.
� The plan version to be updated.� The record type under which the plan data is to be saved.
In the source fields, specify the following:
� The posting periods from which data is to be copied.� The plan version from which the data is to be copied (if copying plan data).� The record type of the plan data you want to copy.� The plan/actual indicator.
Specify a distribution key if you want to summarize the source data for all the periodsand then distribute them across the target periods. If you leave this field blank, thevalues are copied straight from the source periods to the target periods.
Select the Valuate radio button box if you want the system to automatically performvaluation during the copy process. Then, target value fields may be populated withvalues from costing sheets, product costing, and user-exits.
04-02-2005 © 2004 SAP AG. All rights reserved. 317

Unit 5: Planning AC605
Specify whether the source data should overwrite, add to, or subtract from the existingdata in the target plan version.
Figure 115: Copying plan data: Characteristic Transformation
The options, Add and Post, have been added to characteristic transformation.
If you use the Add function, the copied values are added to the existing recipientcharacteristics.
If you do not select Add, the copied values overwrite the existing plan data in therecipient characteristic.
If you select the Clear indicator, the values in the original characteristic are removed.
318 © 2004 SAP AG. All rights reserved. 04-02-2005

AC605 Lesson: Planning Methods
Figure 116: Forecasting
You can use the forecasting function to automatically calculate new plan data usingthe existing data and customizable forecast profiles. You can use forecasting inmanual planning and in automatic planning.
A forecast profile is a combination of a forecast model delivered by SAP and a set ofuser-defined parameters. You can create forecast profiles in the CO-PA user menu.The SAP system supports a number of predefined forecast models, including trendmodels, seasonal models, and exponential models. For more information on forecastmodels, see the documentation on Sales and Operating Planning.
Weighting groups are sometimes required as a parameter for the forecast profile,depending on the model you have selected. You can also create weighting groups inthe CO-PA application menu.
To forecast inmanual planning, simply select a data value or column to be forecasted,choose Forecast, and specify the required parameters in a dialog box, such as thelength of time to be forecasted, the reference data to be used, and the forecast profile.
To forecast in automatic planning, select Automatic Planning→ Forecast in theapplication menu and enter a forecast profile and the required parameters on theInitial screen.
04-02-2005 © 2004 SAP AG. All rights reserved. 319

Unit 5: Planning AC605
Figure 117: Planning Sequences
You can use planning sequences to combine several automatic planning methods, sortthem, and execute them in one run. For example, you can start by copying the planvalues, distribute them using the top down method, and then revaluate these values.
Demonstration: Planning using Excel
PurposeTo demonstrate planning using Excel
System DataSystem:Client:User ID:Password:Set up instructions:1. Accounting → Controlling → Profitability analysis → Planning →
Create/Display plan data.
320 © 2004 SAP AG. All rights reserved. 04-02-2005

AC605 Lesson: Planning Methods
Select Planning Level & Package, IDES100, and enter plan data using theparameter set: IDES100E.
Hint: Interactive Excel may not have been set up for your PC. Youshould test this demo. If it does not work, try to install Interactive Excelfrom the Programs→ SAP Frontend→ Set-up Interactive Excel menu.
In addition, you may get an error message when saving the data fromExcel into SAP system. Just continue. The system will post anyway.
Create a planning package with the same information as the planning package,AC60500, EXCEPT only use Customer not Customer/Product. Activate Excelin your plan parameters.
Choose Settings→ formatting and your screen will change to allow formattingof the Excel Layout. Choose �Generic File� and type in SALES*.TXT as a filename. Continue the Excel planning demo.
Choose �save file description� and then �save Excel layout�.
Save (using Excel functions) this spreadsheet to your C drive as an >XLS file(name this file SALES01.XLS.
Go out to your C drive and call up your file. Fill in some data.
Customer 1000; revenue � 50000; quantity � 5000
Customer 1200; revenue � 40000; quantity � 4000.
Save this file as a .TXT file (SALES01.TXT).
Note: Use �tab delimited� file type and prompt through all of thesave requests.
From the main menu:
Application→ controlling→ profitability analysis→ planning→ integratedplanning→ upload to excel→ execute:
Operating Concern: IDEA
Type: 1
Planning layout: the layout you created
Import single file: activate
Path file: do a pull-down and it will prompt you through your C drive to getyour file.
04-02-2005 © 2004 SAP AG. All rights reserved. 321

Unit 5: Planning AC605
Execute.
You will receive an �ok� response.
Go back into your planning screen and you will see your data uploaded to SAPsystem.
Demonstration: Automatic Planning
PurposeTo demonstrate automatic planning
System DataSystem:Client:User ID:Password:Set up instructions:1. Copy some of the plan data you planned earlier for the version, 500, to the
version, 100. Copy Plan is one of the automatic planning methods available inthe planning framework beginning with release 4.6C. If you are working with a4.6B system, follow the steps under 4.6B.
4.6B Demo
Accounting→ Controlling→ Profitability analysis→ Planning→ Automaticplanning→ Copy
Goto→ Variants→ Get
Goto→ Variants→ Save as variant
Plan Data:
Period: 1 � 12, XXXX
Version 100
Record Type F
Source Data:
Period 1 � 12, XXXX
Plan Data
322 © 2004 SAP AG. All rights reserved. 04-02-2005

AC605 Lesson: Planning Methods
Version 125
Record Type F
Selection Criteria: Sales Org 1000
Processing Instructions: Retain (all)
Value Fields: Invoiced Qty, Revenue
Retain means: Characteristics are not changed 1:1 copy
Summarized: Characteristics are aggregated across this characteristic
Copy to: Old value is copied to the new value 1:2
Execute without test run.
2. In this context, explain the individual functions, such as revaluate, ratio scheme,and copy to.
Accounting→ Controlling→ Profitability analysis→ Planning→ Automaticplanning→ Copy
3. Next, demonstrate the functions for changing and deleting plan data in automaticplanning. Do not actually change or delete any plan data at this point.
Accounting→ Controlling→ Profitability analysis→ Planning→ Automaticplanning→ Change
Accounting→ Controlling→ Profitability analysis→ Planning→ Automaticplanning→ Delete
4. Start the forecast function and refer to the forecast profile.
Accounting→ Controlling→ Profitability analysis→ Planning→ Automaticplanning→ Forecast
5. Go to Customizing and display the forecast profile, 1100. Talk about the forecaststrategies delivered by SAP.
IMG→ Controlling→ Profitability Analysis→ Planning→ Planning Aids→ Maintain forecast profile
6. 4.6C Demo Copy Plan Data
Make sure you have planned values for the version, 500, using the planninglevel/package, AC60500.
Select the planning package, AC605C, and double-click. Note the version onthis package is the version, 100 ( the version you will copy data to).
04-02-2005 © 2004 SAP AG. All rights reserved. 323

Unit 5: Planning AC605
Select the planning method �Copy� from the list of methods and open the node.Display the parameter set COPY00. Under the selection tab, the followingsettings are made:
Copy/Add/Subtract of plan data once copied Reference data � source ofwhere data comes from � in this case period 1-12,2000, version, 500 for thecharacteristics specified in the plan package/level. Data conversion � in this casenothing is specified, but you could elect to copy values from the customer, 1000,to the customer, 2000. Productive versus test run.
The parameter set is set to run in test first, which allows you to show a reportduring execution of what will be copied.
Execute the parameter set. At the prompt whether to execute a report, selectYES. When prompted for a report, select BR00. Make sure to execute the reportfor the plan data and the version, 100. The report will show what will be copiedto the version, 100.
Exit the report and execute the parameter set one more time in production.
This section presents the options offered by the integrated planning functions inCO-PA. Mention that within integrated planning, data transfers to SOP, and valuationswith manufacturing costs, or conditions from Sales Order Management, are onlypossible for costing-based CO-PA. Data can be transferred from costing-based andaccount based CO-PA to PCA. Only the cost center cost assessment for plan values issupported for both approaches.
Note: Cost center and process assessment in the planning area is not explainedin detail here. Explain that the assessment for the plan data functions inexactly the same way as the assessment of the actual data.
Integration of Planning
CO-PA Plan Integration. Discuss the topics in this unit with the participants.
324 © 2004 SAP AG. All rights reserved. 04-02-2005

AC605 Lesson: Planning Methods
Integrated Transfer of Plan Data
Figure 118: Integrated Transfers of Plan Data
In the fifth planning phase, you can complete your sales and profit planning data withthe additional plan data from other application components.
04-02-2005 © 2004 SAP AG. All rights reserved. 325

Unit 5: Planning AC605
Figure 119: Integration of Planning
By design, the SAP system supports integrated planning in controlling, whereplanning is conducted separately for multiple business activities but the different plansare linked to ensure consistency and to drive realistic corporate-wide planning. Asa result, the separate planning results for sales, service, production, procurement,general, and administration activities coincide to form one corporate operational plan.
This integration is accomplished in the SAP system through both real-time andperiodic synchronization of the data in the plan versions across modules. For example,the sales quantities planned in SIS may be transferred in batch to SOP, which thenuses the information to generate the necessary planned production and procurementactivities. This can be integrated with the overhead plans in CCA, and the end resultsfor everything can be passed to CO-PA, where the resulting overall profitability planmay reside.
This example flow of planning data is one example of the many possible planningstrategies that can be used in the SAP system. The flow that should be used for agiven company depends on many factors, such as the modules being implemented, theplanning functions in those modules, the integration functions between modules, andthe necessary maintenance steps to achieve integration.
326 © 2004 SAP AG. All rights reserved. 04-02-2005

AC605 Lesson: Planning Methods
Figure 120: CO Plan Integration
To reflect Plan costs from Cost Center Accounting in Profitability Analysis, you needto transfer those costs into the CO-PA portion of a plan version through a cost centerassessment. With this tool, planned costs can be allocated across profitability segmentsin the same way that actual costs can be allocated across profitability segments.
Again, a cost center assessment cycle must be defined and executed to move anyplanned CO-CCA costs into CO-PA. The assessment cycle consists of a series ofsegments, each of which defines a unique relationship between senders, receivers, andassessment rules. These can be defined on the user side of CO-PA.
When assessment cycles are defined, you need to specify the controlling area fromwhich the assessment will take place. This is because allocations in ManagementAccounting can only take place within a single controlling area through the restrictionsof SAP cost accounting rules. It is not possible even when allocating to CO-PA tocross controlling areas (the area is part of the receiver profitability segments).
You also need to specify the side of CO-PA from which the tracing factors shouldbe drawn for any �variable portions� assessment rules that are defined. This settingcontrols whether values will be distributed based on account balances for profitabilitysegments or key figures amounts for profitability segments.
Assessments affect both costing-based CO-PA and account-based CO-PA, if bothare active. This is necessary from an SAP costing perspective because costs aretechnically being moved off from the originating account assignment objects and costcenters, and placed on to the receiving objects and Profitability Segments, what areshared between the two sides of CO-PA.
04-02-2005 © 2004 SAP AG. All rights reserved. 327

Unit 5: Planning AC605
Demonstration: Integrated Planning
PurposeTo demonstrate integrated planning
System DataSystem:Client:User ID:Password:Set up instructions:1. Use the planning layout, IDES125, to plan the following data:
Version: 100
Period/Year: 01 through 12 in the current fiscal year
Product: P-100
Plan quantity: 1200
Revenue: 1,200,000
Save the plan data.
Accounting→ Controlling→ Profitability analysis→ Planning→ Enterplan data
2. Next, transfer the plan data to SOP.
Plan data:
Period: 01 through 12 current fiscal year
Version: 100
Record type: F
Characteristic: Product
Quantity: VVIQT (Invoiced quantity in sales units)
SOP:
Version: A00
Don�t use a test run!
Selection criteria:
328 © 2004 SAP AG. All rights reserved. 04-02-2005

AC605 Lesson: Planning Methods
Product: P-100
Other characteristics: *
Execute the transfer.
Accounting→ Controlling→ Profitability analysis→ Planning→ Integratedplanning→ Transfer quantities to SOP
3. Display the management function and mention that this function is available forall automatic activities.
Accounting → Controlling → Profitability analysis → Planning →Management
4. Display the result in SOP.
Material: P-100
Plant: 1000
Choose active version.
Logistics→ Production→ SOP→ Planning→ For material→ Change
04-02-2005 © 2004 SAP AG. All rights reserved. 329

Unit 5: Planning AC605
330 © 2004 SAP AG. All rights reserved. 04-02-2005

AC605 Lesson: Planning Methods
255 Exercise 13: Manual Planning FunctionsExercise Duration: 15 Minutes
Exercise ObjectivesAfter completing this exercise, you will be able to:� Create a plan version for CO-PA� Create a planning level, planning method, and plan parameters� Calculate revenues automatically in costing-based CO-PA using ratio schemes
and in account-based CO-PA using inverse formulae� Explore other manual planning features
Business ExampleThe management of your company would like to implement a profitability accountingapplication in the SAP system. As a member of the project team, you are supposedto advise on the question of whether to implement CO-PA or EC-PCA in the SAPsystem. You then will be responsible to implement the selected applications. SamSales and Randy Revenue would like to use the CO-PA module to plan the sales of thetwo main product lines of the company, bicycles and motorcycles. Sam wants to planhis sales by customer and product. He wants to plan the sales quantities and sellingprices for each customer/product combination, and he expects the system to calculatethe planned revenue from the results. Randy wants to plan his sales by productgroup and then he wants to use the system to automatically distribute the plannedvalues to the product level using a reasonable allocation basis. Planning quantityand straight revenue are the only key figures Sam is interested in. Paula Productwould like to perform a what-if analyses on the planning data for various scenariosto analyze the possible affects of strategic decisions on sales. For example, theymight want to analyze the affect that pricing increases might have on revenue. PeterPlant wants to use the projected sales quantities from CO-PA to plan his productionand material procurement schedules. He would like to have access to the CO-PAplan values in Sales and Operations Planning. For this reason, planning quantities,prices, and revenue at the product/customer level is required. Planning at the productgroup level is required with the systematic distribution of values to the product level.Mass changes to plan values are required to analyze different business scenarios.Transferring CO-PA plan data to Sales and Operations Planning is required to aidproduction scheduling. For this purpose, you need to know the profit planning processand the phases in sales planning.
04-02-2005 © 2004 SAP AG. All rights reserved. 331

Unit 5: Planning AC605
System DataSystem:Client:User ID:Password:
CATT:Set up instructions:
Task 1:1. Create a new plan version for CO-PA. Name the version, 5##, and enter a clear
description for your group. Set up the version for the operating concern, IDEA,so that values can be stored in Profitability Analysis. Set the derivation date asthe beginning of the current fiscal year.
Name: 5## Description: Plan 5##
Task 2:Your sales managers have asked you to create the following Planning screen so thateach sales employee can enter the top products and customers using the version, 5##,the current fiscal year, and sales the organization, 1000.
Customer Product Inv. Quantity inSales Unit
Sales Rev.
1. Review Planning Level, AC605. Which characteristics have been selected?
2. Create a new planning package under the planning level, AC605, incosting-based CO-PA that can be used for planning the information requested byyour sales managers.
Name the package, Plan##, and enter an appropriate description.
The planning package is to be used for the period, 1 � 12 XXXX, for yourversion, 5##, record type, F, in the sales organization, 1000.
Save your planning package. The planning package should appear under theplanning level, AC605, on the left of the screen.
3. Create a parameter set for the plan method Entering and Displaying PlanningData for your planning package.
Continued on next page
332 © 2004 SAP AG. All rights reserved. 04-02-2005

AC605 Lesson: Planning Methods
Choose the Enter Planning Data planning method and right-click. Select CreateParameter Set. Name the parameter set, Plan##.
Select Create Layout to create the data entry screen and create your planninglayout dynamically.
Name the layout, Plan##. Indicate the appropriate level for the displayedcharacteristics. The Customer and Product should appear in the lead column andall the other characteristics should be displayed in the header.
Next, define the appropriate value fields from the list of value fields, based onthe above requirement.
Change the distribution key for the currency and the quantities to Equaldistribution (1) and save your parameter set.
Task 3:1. Create another parameter set for the Display planning method.
Follow the same steps as above. You do not need to define another planninglayout. Use the Layout, Plan##, created in 1-2-3.
Task 4:1. Plan values for the customer, XXXX.
Enter the following planning data:
Customer Product Inv. Quantity inSales Unit
Sales Rev.
T-CO05A## P-100 100 100,000T-CO05A## P-101 50 75,000T-CO05A## P-102 120 13,0000
Save your planning data but remain in the Planning screen.
2. Increase all the planned quantity and revenue values by 5%. What are the twooptions that you could use to do this?
Continued on next page
04-02-2005 © 2004 SAP AG. All rights reserved. 333

Unit 5: Planning AC605
DO NOT SAVE THE REVALUATED DATA
Hint: To use the Change values option, you must enter a fixed value orpercentage. To use the Revaluate feature, you must select one or morelines (and revaluation factors must have been predefined).
3. Find the additional characteristic values for any of the profitability segmentsbeing planned that are not displayed on the Layout screen (For example, theones determined behind the scenes by derivation). What planning principledoes this show?
Exit the Planning screen without saving.
Task 5:Your sales managers are quite pleased with the Planning screen you have designed forthem but they would like to add a field for Price. They want to be able to plan theinvoice quantity and the product price and then have the system calculate revenue.Because they also know that their revenue goals are often changed, they would like tobe able to change the revenue figure without impacting on the price, to establish howmany units of a product need to be sold.
They have asked you to add a unit of measure because products are often stored invarious units.
Sort all the columns in the following sequence:
Customer Product Inv. Quantity inSales Unit
Unit Price Sales Rev.
1. To add the ratio for the Price column, change your layout accordingly. You canaccess the layout by changing the Plan## parameter set. Insert a new columnand select Price/unit � product.
You also want to adjust the settings for the quantity column to display 0 decimalplaces.
Make sure you save your settings after the changes are made.
Click the Plan## planning package one time to select it. From the planningmethods, select the arrow next to Enter Planning and then select the Plan##parameter set. Right-click to change the parameter set.
Continued on next page
334 © 2004 SAP AG. All rights reserved. 04-02-2005

AC605 Lesson: Planning Methods
2. Test your changed planning layout by entering another product, P-103, foryour customer. In addition, enter the price, 1500. Notice how the revenueis calculated.
Customer Product Inv. Quantity in SalesUnit
Sales Rev.
T-CO05A## P-103 100 1,500
Next, change the planned price for the product, P-100, to 1,500 and selectEnter. Is the corresponding revenue or the quantity recalculated? Why?
Next, change the revenue value for P-101 to 50,000 and select Enter. Is thecorresponding price or the quantity recalculated? Why?
3. Your sales manager informs you that normally a certain revenue target is set fora customer or product. Assume that the revenue target for the product, P-100, is200,000 at constant prices and your sales manager would now like the systemto calculate the units to be sold, to reach this target. Show him the Goal Seekfeature.
SAVE YOUR PLANNING DATA.
04-02-2005 © 2004 SAP AG. All rights reserved. 335

Unit 5: Planning AC605
Solution 13: Manual Planning FunctionsTask 1:1. Create a new plan version for CO-PA. Name the version, 5##, and enter a clear
description for your group. Set up the version for the operating concern, IDEA,so that values can be stored in Profitability Analysis. Set the derivation date asthe beginning of the current fiscal year.
Name: 5## Description: Plan 5##
a) IMG: Controlling→ Profitability Analysis→ Planning→ Initial Steps→ Maintain Versions
Choose New Entries.
Name: 5## Description: Plan 5##
Select the Plan check box for the new version. Choose Enter.
Select the Plan, 5##, from the list and choose Settings in operatingconcern. Confirm the �Confirm transfer from version� dialog box bychoosing Yes. Enter the currency type, B0. Choose Save.
Task 2:Your sales managers have asked you to create the following Planning screen so thateach sales employee can enter the top products and customers using the version, 5##,the current fiscal year, and sales the organization, 1000.
Customer Product Inv. Quantity inSales Unit
Sales Rev.
1. Review Planning Level, AC605. Which characteristics have been selected?
a) Accounting→ Controlling→ Profitability Analysis→ Planning→ EditPlanning Data: Double-click the node AC605. Characteristics tab
Customer, Product, Period/Year, Record Type, Sales Organization, Version
2. Create a new planning package under the planning level, AC605, incosting-based CO-PA that can be used for planning the information requested byyour sales managers.
Name the package, Plan##, and enter an appropriate description.
Continued on next page
336 © 2004 SAP AG. All rights reserved. 04-02-2005

AC605 Lesson: Planning Methods
The planning package is to be used for the period, 1 � 12 XXXX, for yourversion, 5##, record type, F, in the sales organization, 1000.
Save your planning package. The planning package should appear under theplanning level, AC605, on the left of the screen.
a) Right-click the planning level, AC605, and choose Create PlanningPackage.
Name the package, Plan##, and enter an appropriate description.
Enter the following data:
Field Name or Data Type ValuesVersion 5##Record Type FSales Organization 1000
Save your planning package. The planning package should appear underthe planning level, AC605, on the left of the screen.
3. Create a parameter set for the plan method Entering and Displaying PlanningData for your planning package.
Choose the Enter Planning Data planning method and right-click. Select CreateParameter Set. Name the parameter set, Plan##.
Select Create Layout to create the data entry screen and create your planninglayout dynamically.
Name the layout, Plan##. Indicate the appropriate level for the displayedcharacteristics. The Customer and Product should appear in the lead column andall the other characteristics should be displayed in the header.
Next, define the appropriate value fields from the list of value fields, based onthe above requirement.
Continued on next page
04-02-2005 © 2004 SAP AG. All rights reserved. 337

Unit 5: Planning AC605
Change the distribution key for the currency and the quantities to Equaldistribution (1) and save your parameter set.
a) Double-click the Plan## planning package
Choose the Enter Plan Data planning method and right-click. SelectCreate Parameter Set. Name the parameter set, Plan##.
To generate the planning layout for data entry, name the layout, Plan##,and choose Create Layout. Add an appropriate description.
The Customer and Product should appear in the lead column with thecharacteristic Sales organization in the header selection.
Field Name or Data Type ValuesCustomer Lead ColumnProduct Lead ColumnSales Organization Header
Define the appropriate value fields from the list of value fields.
Field Name or Data Type ValuesInvoiced quantity in sales units SelectRevenue Select
Click the create icon.
Change the distribution key for the currency and the quantities to Equaldistribution (1) and save your parameter set.
Task 3:1. Create another parameter set for the Display planning method.
Follow the same steps as above. You do not need to define another planninglayout. Use the Layout, Plan##, created in 1-2-3.
a) Create another parameter set for the Display planning method.
Follow the same steps as above. You do not need to define another planninglayout. Use the Layout, Plan##, created in 1-2-3.
Continued on next page
338 © 2004 SAP AG. All rights reserved. 04-02-2005

AC605 Lesson: Planning Methods
Task 4:1. Plan values for the customer, XXXX.
Enter the following planning data:
Customer Product Inv. Quantity inSales Unit
Sales Rev.
T-CO05A## P-100 100 100,000T-CO05A## P-101 50 75,000T-CO05A## P-102 120 13,0000
Save your planning data but remain in the Planning screen.
a) Plan values for the customer, T-CO05A##.
Double-click the planning level, AC605, and select the planning package,Plan##.
From the Planning Methods, double-click the node to select yourplanning method, Plan##.
Enter the following plan data:
Customer Product Inv. Quantity in SalesUnit
Sales Rev.
T-CO05A## P-100 100 100,000T-CO05A## P-101 50 75,000T-CO05A## P-102 120 130,000
Save your planning data but remain on the Planning screen.
2. Increase all the planned quantity and revenue values by 5%. What are the twooptions that you could use to do this?
Continued on next page
04-02-2005 © 2004 SAP AG. All rights reserved. 339

Unit 5: Planning AC605
DO NOT SAVE THE REVALUATED DATA
Hint: To use the Change values option, you must enter a fixed value orpercentage. To use the Revaluate feature, you must select one or morelines (and revaluation factors must have been predefined).
a) Use a planning feature to increase all the planned quantity and revenuevalues by 5%. What are two options that you could use to do this?
DO NOT SAVE THE REVALUATED DATA
Edit→ Planning Method→ Change Values
Edit→ Planning Method→ Revaluate (for lines) using revaluationkey ID2
3. Find the additional characteristic values for any of the profitability segmentsbeing planned that are not displayed on the Layout screen (For example, theones determined behind the scenes by derivation). What planning principledoes this show?
Exit the Planning screen without saving.
a) Select a line and click the Characteristics information icon. This showsautomatic bottom up planning by the system based on the principle ofconducting derivation on all the planned characteristic values.
Exit the Planning screen without saving.
Continued on next page
340 © 2004 SAP AG. All rights reserved. 04-02-2005

AC605 Lesson: Planning Methods
Task 5:Your sales managers are quite pleased with the Planning screen you have designed forthem but they would like to add a field for Price. They want to be able to plan theinvoice quantity and the product price and then have the system calculate revenue.Because they also know that their revenue goals are often changed, they would like tobe able to change the revenue figure without impacting on the price, to establish howmany units of a product need to be sold.
They have asked you to add a unit of measure because products are often stored invarious units.
Sort all the columns in the following sequence:
Customer Product Inv. Quantity inSales Unit
Unit Price Sales Rev.
1. To add the ratio for the Price column, change your layout accordingly. You canaccess the layout by changing the Plan## parameter set. Insert a new columnand select Price/unit � product.
You also want to adjust the settings for the quantity column to display 0 decimalplaces.
Make sure you save your settings after the changes are made.
Continued on next page
04-02-2005 © 2004 SAP AG. All rights reserved. 341

Unit 5: Planning AC605
Click the Plan## planning package one time to select it. From the planningmethods, select the arrow next to Enter Planning and then select the Plan##parameter set. Right-click to change the parameter set.
a) To add the ratio for the Price column, change your layout accordingly. Youcan access the layout by changing the Plan## parameter set. Insert a newcolumn and select Price/unit � product.
You also want to adjust the settings for the quantity column to display 0decimal places.
Accounting→ Controlling→ Profitability Analysis→ Planning→ EditPlanning Data: Double-click the node, AC605
Select your planning package, Plan##, and double-click it. Fromthe planning methods, expand the node next to Enter planning dataand select your plan parameter set, Plan##. Right-click to change theparameter set.
Click the Display icon (next to Layout Plan##), Highlight Layout Plan##in the list and double-click it. Click Display/Change icon from the toolbar.
Double-click between the Invoiced Quantity and Revenue column. Inthe dialog box that appears, select the Value field with the Characteristicoption. From the list of value fields, select the field, Price/unit � product.Confirm the dialog box.
To add the unit of measure, double-click between the Invoiced Quantityand Revenue column. In the dialog box that appears, select Attribute andthen Unit. From the list of value fields, select the Invoiced quantity andchange the Short Text to UM. Click the Copy Short Text icon. Confirmthe dialog box.
Using the Select and Move icons, place the columns in the appropriateorder.
Select the column for which you would like to change the number format.
Formatting→ Number format: 0 decimal places
Select Save.
Make sure you save your settings after the changes are made.
2. Test your changed planning layout by entering another product, P-103, foryour customer. In addition, enter the price, 1500. Notice how the revenueis calculated.
Continued on next page
342 © 2004 SAP AG. All rights reserved. 04-02-2005

AC605 Lesson: Planning Methods
Customer Product Inv. Quantity in SalesUnit
Sales Rev.
T-CO05A## P-103 100 1,500
Next, change the planned price for the product, P-100, to 1,500 and selectEnter. Is the corresponding revenue or the quantity recalculated? Why?
Next, change the revenue value for P-101 to 50,000 and select Enter. Is thecorresponding price or the quantity recalculated? Why?
a) Test your changed planning layout by entering another product, P-103,for your customer. In addition, enter the price, 1500. Observe how therevenue is calculated.
Customer Product Inv. Quantity inSales Unit
Sales Rev.
T-CO05A## P-103 100 1,500
Next, change the planned price for the product, P-100, to 1,500 and selectEnter. Is the corresponding revenue or the quantity recalculated? Why?
IMG: Controlling→ Profitability Analysis→ Planning→ Planning Aids→ Define Ratios and Ratio Schemes
The revenue is recalculated because the system has been programmedwith fixed rules to recalculate the numerator of the formula if this valueis not blocked against changes.
Next, change the revenue value for P-101 to 50,000 and select Enter. Isthe corresponding price or the quantity recalculated? Why?
The quantity is recalculated because the Calculation type in the definitionof the ratio is set to Recalculate base value instead of the Recalculateratio.
3. Your sales manager informs you that normally a certain revenue target is set fora customer or product. Assume that the revenue target for the product, P-100, is200,000 at constant prices and your sales manager would now like the systemto calculate the units to be sold, to reach this target. Show him the Goal Seekfeature.
Continued on next page
04-02-2005 © 2004 SAP AG. All rights reserved. 343

Unit 5: Planning AC605
SAVE YOUR PLANNING DATA.
a) Your sales manager informs you that normally a certain revenue targetis set for a customer or product. Assume that the revenue target for theproduct, P-100, is 200,000 at constant prices and your sales manager wouldnow like the system to calculate the units to be sold, to reach this target.Show him the Goal Seek feature.
In the plan, select the cells Invoiced Quantity and Revenue using theSelect icon for each cell, for the product, P-100. Execute the GoalSeek function:
Edit→ Planning Methods→ Goal Seek: Revenue 200,000
SAVE YOUR PLANNING DATA.
344 © 2004 SAP AG. All rights reserved. 04-02-2005

AC605 Lesson: Planning Methods
269 Exercise 14: Automatic Planning FunctionsExercise Duration: 15 Minutes
Exercise ObjectivesAfter completing this exercise, you will be able to:� Conduct a top down planning run� Change a plan using valuation and revaluation
Business Example
Task:You want to plan miscellaneous sales quantities and revenues for the material group,003, in the version, 5## . You then want to distribute these planned values top downbased on the actual 2002 sales quantities and revenues.
1. Enter the planning figures for your planning version, 5##, using the planninglevel, IDES125. The planned values are for the current year.
Under the planning level, IDES125, create a new planning package, Top##,for your plan version.
Right-click one time and select Create Planning Package.
Add the following data to your planning package.
Field Name or Data Type ValuesPeriod/Year 1-12, XXXXUnit Inv. Qty BOXVersion 5##
Save your planning package.
2. Enter the planning data for the planning package you just created:
At the bottom left of the screen, double-click the node to select the planparameter, IDES125. Plan your values for the material group, 003.
Continued on next page
04-02-2005 © 2004 SAP AG. All rights reserved. 345

Unit 5: Planning AC605
Field Name or Data Type ValuesMat. Group 003 (should default)Plan Quantity 100,000Revenue 200,000,000.00
3. Display your plan postings using the report, IDES-125, for:
Field Name or Data Type ValuesPeriod From-To 1-12, XXXXPlan/Actual Indicator 1Version 5##Record Type F
Drill down to the individual product level and double-click Product. Why arethere values in the unassigned category?
4. Using the same report, display the actual postings for January throughDecember 2002. Use the Actual indicator and the record type, F. Drill downto the product level for the material group, 003.
If you wanted to perform a top down distribution for the planned quantity and theplanned revenue in the version, 5##, and use the actual quantity as a distributionfactor, what would the weighting factors be?
Material Group: Product: Plan Qty:003 L-40C003 L-40F003 L-40R
5. Verify the results by carrying out this top down distribution.
Return to the planning framework and select your planning package withinthe planning level, IDES125. Which parameter settings have been made forthe parameter set, IDES125?
Execute the parameter set, IDES125, in a production mode.
6. After executing distribution , how many postings does the system make?
Continued on next page
346 © 2004 SAP AG. All rights reserved. 04-02-2005

AC605 Lesson: Planning Methods
12
Review the report, IDES-125, for the current year, version, 5##, to examinethe results for the current fiscal year.
Drill down to the individual product level. Are there any values at the productlevel?
04-02-2005 © 2004 SAP AG. All rights reserved. 347

Unit 5: Planning AC605
Solution 14: Automatic Planning FunctionsTask:You want to plan miscellaneous sales quantities and revenues for the material group,003, in the version, 5## . You then want to distribute these planned values top downbased on the actual 2002 sales quantities and revenues.
1. Enter the planning figures for your planning version, 5##, using the planninglevel, IDES125. The planned values are for the current year.
Under the planning level, IDES125, create a new planning package, Top##,for your plan version.
Right-click one time and select Create Planning Package.
Add the following data to your planning package.
Field Name or Data Type ValuesPeriod/Year 1-12, XXXXUnit Inv. Qty BOXVersion 5##
Continued on next page
348 © 2004 SAP AG. All rights reserved. 04-02-2005

AC605 Lesson: Planning Methods
Save your planning package.
a) Enter the planning timeframe, 1/XXXX ,through 12/XXXX and yourversion number.
Accounting→ Controlling→ Profitability Analysis→ Planning→Create/Display Planning Data: Select Planning Level IDES125.
Right-click one time and select Create Planning Package.
Enter the Package, TOP##, and an appropriate description.
Add the following data to your planning package:
Field Name or Data Type ValuesPeriod/Year 1 - 12,.XXXX
Unit Inv. Qty BOXVersion 5##
Save your planning package.
2. Enter the planning data for the planning package you just created:
At the bottom left of the screen, double-click the node to select the planparameter, IDES125. Plan your values for the material group, 003.
Continued on next page
04-02-2005 © 2004 SAP AG. All rights reserved. 349

Unit 5: Planning AC605
Field Name or Data Type ValuesMat. Group 003 (should default)Plan Quantity 100,000Revenue 200,000,000.00
a) Enter the planning data for the planning package and the plan parameter,IDES125.
Choose the plan parameter, IDES125, at the bottom left of the screen. Planyour values for the material group, 003.
Field Name or Data Type ValuesMat. Group 003 (should default)Plan Quantity 100,000Revenue 200,000,000.00
Choose Save.
3. Display your plan postings using the report, IDES-125, for:
Field Name or Data Type ValuesPeriod From-To 1-12, XXXXPlan/Actual Indicator 1Version 5##Record Type F
Continued on next page
350 © 2004 SAP AG. All rights reserved. 04-02-2005

AC605 Lesson: Planning Methods
Drill down to the individual product level and double-click Product. Why arethere values in the unassigned category?
a) Display your plan postings using the report, IDES-125 for:
Accounting→ Controlling→ Profitability Analysis→ InformationSystem→ Execute Report→ IDES-125
Field Name or Data Type ValuesPeriod From-To 1-12, XXXXPlan/Actual Indicator 1Version 5##Record Type F
Drill down to the individual product level by double-clicking Product.Why are there values in the unassigned category?
In the report, the individual products as well as material types are selected.The plan values for the product group are not assigned to the Productcharacteristic.
4. Using the same report, display the actual postings for January throughDecember 2002. Use the Actual indicator and the record type, F. Drill downto the product level for the material group, 003.
If you wanted to perform a top down distribution for the planned quantity and theplanned revenue in the version, 5##, and use the actual quantity as a distributionfactor, what would the weighting factors be?
Continued on next page
04-02-2005 © 2004 SAP AG. All rights reserved. 351

Unit 5: Planning AC605
Material Group: Product: Plan Qty:003 L-40C003 L-40F003 L-40R
a) Using the same report, display the actual postings for January throughDecember 2002. Use the Actual indicator and the record type, F. Drilldown to the product level for the material group, 003.
Accounting→ Controlling→ Profitability Analysis→ InformationSystem→ Execute Report→ IDES-25
Field Name or Data Type ValuesPeriod From-To 1-12, 2002Plan/Actual Indicator 0Version BlankRecord Type F
If you wanted to perform a top down distribution for the planned quantityand the planned revenue in the version, 5##, and use the actual quantity asa distribution factor, what would the weighting factors be?
Material Group: Product: Plan Qty:003 L-40C 6858003 L-40F 3062003 L-40R 1886
5. Verify the results by carrying out this top down distribution.
Return to the planning framework and select your planning package withinthe planning level, IDES125. Which parameter settings have been made forthe parameter set, IDES125?
Execute the parameter set, IDES125, in a production mode.
a)
6. After executing distribution , how many postings does the system make?
12Continued on next page
352 © 2004 SAP AG. All rights reserved. 04-02-2005

AC605 Lesson: Planning Methods
Review the report, IDES-125, for the current year, version, 5##, to examinethe results for the current fiscal year.
Drill down to the individual product level. Are there any values at the productlevel?
a) Yes, the unassigned portion of the plan has been distributed to theindividual product level, based on the 2002 actual invoiced quantities.
04-02-2005 © 2004 SAP AG. All rights reserved. 353

Unit 5: Planning AC605
354 © 2004 SAP AG. All rights reserved. 04-02-2005

AC605 Lesson: Planning Methods
279 Exercise 15: Integrated Planning FunctionsExercise Duration: 15 Minutes
Exercise ObjectivesAfter completing this exercise, you will be able to:� Transfer the planned quantities to SOP
Business Example
Task:Read the online documentation to help you answer the following questions.
Open the SAP Library and select the Financials submenu: Choose CO and thenProfitability Analysis (COPA). Under the Planning submenu, choose IntegratedPlanning and then Transfer Sales and Operations Planning (SOP).
1. Can you transfer the planning data to SOP from both costing-based CO-PAand account-based CO-PA?
2. Can the plan quantities be transferred to SOP at the product group level and theproduct level? If so, are there any special Customizing requirements in CO-PA?
04-02-2005 © 2004 SAP AG. All rights reserved. 355

Unit 5: Planning AC605
Solution 15: Integrated Planning FunctionsTask:Read the online documentation to help you answer the following questions.
Open the SAP Library and select the Financials submenu: Choose CO and thenProfitability Analysis (COPA). Under the Planning submenu, choose IntegratedPlanning and then Transfer Sales and Operations Planning (SOP).
1. Can you transfer the planning data to SOP from both costing-based CO-PAand account-based CO-PA?
a) No, you can transfer only the planning data from costing-based CO-PA.
2. Can the plan quantities be transferred to SOP at the product group level and theproduct level? If so, are there any special Customizing requirements in CO-PA?
a) Yes, quantities can be transferred at the product group level if acharacteristic has been set up in the operating concern to represent theSOP product groups.
356 © 2004 SAP AG. All rights reserved. 04-02-2005

AC605 Lesson: Planning Methods
Lesson Summary
You should now be able to:� Plan target values� Perform top down distribution of planning data� Change and delete plan data and create forecasts� Explain the integrated transfer of plan data
04-02-2005 © 2004 SAP AG. All rights reserved. 357

Unit Summary AC605
Unit SummaryYou should now be able to:� Outline the overall process flow of profit planning� Work with planning layouts� Plan target values� Perform top down distribution of planning data� Change and delete plan data and create forecasts� Explain the integrated transfer of plan data
358 © 2004 SAP AG. All rights reserved. 04-02-2005

AC605 Test Your Knowledge
283Test Your Knowledge
1. are defined using characteristics, value fields,attributes, or formulas.Fill in the blanks to complete the sentence.
2. Derivation needs to be carried out manually after saving the plan data.Determine whether this statement is true or false.□ True□ False
3. is a function that allows you to enter a target contributionmargin in manual planning and to have the system calculate the correspondingquantity sold.Fill in the blanks to complete the sentence.
4. Which of the following represents a process for distributing data, which hasbeen planned at one level in CO-PA to the additional levels based on somereference data?Choose the correct answer(s).□ A Top down distribution□ B Bottom up planning□ C Integrated data distribution□ D Forecasting
5. How do you forecast in manual planning?
6. When assessment cycles are defined, you need to specify the controlling areafrom which the assessment will take place.Determine whether this statement is true or false.□ True□ False
04-02-2005 © 2004 SAP AG. All rights reserved. 359

Test Your Knowledge AC605
284Answers
1. Value columns are defined using characteristics, value fields, attributes, orformulas.
Answer: Value columns
2. Derivation needs to be carried out manually after saving the plan data.
Answer: False
Derivation is automatically carried out in the background when the plan datais saved.
3. Goal Seek is a function that allows you to enter a target contribution margin inmanual planning and to have the system calculate the corresponding quantitysold.
Answer: Goal Seek
4. Which of the following represents a process for distributing data, which hasbeen planned at one level in CO-PA to the additional levels based on somereference data?
Answer: A
Top down distribution is a process for distributing data, which has been plannedat one level in CO-PA to the additional levels based on some reference data.
5. How do you forecast in manual planning?
Answer: To forecast in manual planning, simply select a data value or columnto be forecasted, choose Forecast, and specify the necessary parameters in adialog box, such as the length of time to be forecasted, the reference data to beused, and the forecast profile.
360 © 2004 SAP AG. All rights reserved. 04-02-2005

AC605 Test Your Knowledge
6. When assessment cycles are defined, you need to specify the controlling areafrom which the assessment will take place.
Answer: True
When assessment cycles are defined, you need to specify the controlling areafrom which the assessment will take place. This is because allocations in COcan only take place within a single controlling area through the restrictions ofSAP cost accounting rules.
04-02-2005 © 2004 SAP AG. All rights reserved. 361

Unit Summary AC605
362 © 2004 SAP AG. All rights reserved. 04-02-2005

Unit 6287 Information System
This unit introduces the drill-down analytics tool and its use in CO-PA. First, explainthe architecture and principle of drill-down analytics and show the various output andnavigation options. Then, use a basic report to demonstrate how to create a report andhow to use the drill-down analytics functions. Next, introduce the various topicswithin drill-down analytics, such as characteristic hierarchies and key figure schemes.Explain the features that form reports offer and that the forms, such as the planninglayouts, are created using the Report Painter. When you get to the subject of variables,provide an in-depth explanation of the different variables and their use in the variousreports. At the end of the unit, explain about line item analytics and mention that it ispossible to create your own line item layouts.
Unit OverviewThis unit helps you to define and execute various reports. The unit describes how tocreate various report forms. In addition, it explains the difference between reports andforms and the functions available for line item reports.
Unit ObjectivesAfter completing this unit, you will be able to:
� Evaluate the reporting options� Introduce drill-down reporting� Create basic reports� Create form reports� Create line item reports� Transfer the report data� Explain the integration between CO-PA and SAP BI� Evaluate the benefits of Financial Analytics in SAP BI
04-02-2005 © 2004 SAP AG. All rights reserved. 363

Unit 6: Information System AC605
Unit ContentsLesson: Overview of Financial Analytics .. . . . . . . . . . . . . . . . . . . . . . . . . . . . . . . . . . . . . . .365
Demonstration: Drill-down Reporting .. . . . . . . . . . . . . . . . . . . . . . . . . . . . . . . . . . . . . . .373Demonstration: Ranking Report Data ... . . . . . . . . . . . . . . . . . . . . . . . . . . . . . . . . . . . .375Exercise 16: Financial Analytics Overview.... . . . . . . . . . . . . . . . . . . . . . . . . . . . . . .377
Lesson: Creating Reports... . . . . . . . . . . . . . . . . . . . . . . . . . . . . . . . . . . . . . . . . . . . . . . . . . . . . . . .386Demonstration: Basic Report .. . . . . . . . . . . . . . . . . . . . . . . . . . . . . . . . . . . . . . . . . . . . . . . .391Demonstration: Key Figure Scheme ... . . . . . . . . . . . . . . . . . . . . . . . . . . . . . . . . . . . . . .392Demonstration: Characteristic Hierarchies.. . . . . . . . . . . . . . . . . . . . . . . . . . . . . . . . .393Demonstration: Form Reports .. . . . . . . . . . . . . . . . . . . . . . . . . . . . . . . . . . . . . . . . . . . . . . .401Demonstration: Variables.. . . . . . . . . . . . . . . . . . . . . . . . . . . . . . . . . . . . . . . . . . . . . . . . . . . . .404Demonstration: Reports Based on Line Items... . . . . . . . . . . . . . . . . . . . . . . . . . . .408Demonstration: Line Item Layout . .. . . . . . . . . . . . . . . . . . . . . . . . . . . . . . . . . . . . . . . . . .408Exercise 17: Creating Reports.. . . . . . . . . . . . . . . . . . . . . . . . . . . . . . . . . . . . . . . . . . . . . . . 411Exercise 18: Report Components ... . . . . . . . . . . . . . . . . . . . . . . . . . . . . . . . . . . . . . . . . .417Exercise 19: Form Report . . . . . . . . . . . . . . . . . . . . . . . . . . . . . . . . . . . . . . . . . . . . . . . . . . . . .437Exercise 20: Line Item-Based Reports .. . . . . . . . . . . . . . . . . . . . . . . . . . . . . . . . . . . . .455
Lesson: Financial Analytics in SAP BI .. . . . . . . . . . . . . . . . . . . . . . . . . . . . . . . . . . . . . . . . . .461
364 © 2004 SAP AG. All rights reserved. 04-02-2005

AC605 Lesson: Overview of Financial Analytics
Lesson:288
Overview of Financial AnalyticsLesson Duration: 30 Minutes
Lesson OverviewThis lesson introduces you to Financial Analytics. it describes drill-down reportingand its functions. In addition, it explains the principles of drill-down reporting.
Lesson ObjectivesAfter completing this lesson, you will be able to:
� Evaluate the reporting options� Introduce drill-down reporting
Give the participants a rough overview of drill-down analytics, the various reportoutput options (new in 4.6), and the options available when executing a report
Business ExampleThe management of your company wants to implement a profitability accountingapplication in the SAP system. As a member of the project team of your company,you are supposed to e advise on the question of whether to implement CO-PA orEC-PCA in the SAP system. You then will be responsible to implement the selectedapplications.
You need to evaluate data in profitability analysis. To do this, you need to drill downthe data to analyze it.
For this reason, you need to know the main features of multidimensional reports.
04-02-2005 © 2004 SAP AG. All rights reserved. 365

Unit 6: Information System AC605
Introduction to Reporting and Drill-Down Reporting
Figure 121: Reporting - Introduction
In SAP system, drill-down reporting is an online reporting tool that allows you tointeractively evaluate the data in Profitability Analysis. You can select the requireddataset using any characteristic in your CO-PA system and draw on any key figuresusing the dynamic drill-down function. You can display several profitability segmentsfor a key figure or several key figures for any profitability segment. You can alsoperform variance analyses, such as plan/actual comparisons, fiscal year comparisons,or comparisons of profitability segments.
In drill-down reporting, you can display both reports with a simple, fixed layout, basicreports, and reports with a more complex structure and formatting, form reports.
The drill-down functions are divided into three groups, each with a differentscope. Each user can choose or be assigned the function level that suits the user�srequirements.
The menus and the functions available in the drill-down report are user-friendly.
Drill-down reporting is used in both costing-based and account-based CO-PA. Thedifferences between the two methods are explained in a later figure.
366 © 2004 SAP AG. All rights reserved. 04-02-2005

AC605 Lesson: Overview of Financial Analytics
Figure 122: Drill-down Reporting: Overview
You can summarize the data according to the derived characteristics and then drilldown interactively in reporting. At each level of the report, you can display thedrill-down list (overview) or extensive information (margin analysis).
04-02-2005 © 2004 SAP AG. All rights reserved. 367

Unit 6: Information System AC605
Principles of Drilldown Reporting
Explain why you want to execute reports in the background. In addition, point out thatthe output of the job will not be a drill-down report but a list view.
Steps:
1. Maintain a variant for the report, IDES-050, to run the report in backgroundand freeze the data.
Accounting→ Controlling→ Profitability analysis→ Information system→Report data→ Maintain variants.
2. Next, define a variant group.
Accounting→ Controlling→ Profitability analysis→ Information system→Report data→ Define variant group.
3. Maintain your variant group by assigning the report, IDES-050, to the variantyou created in the step, 1.
Accounting→ Controlling→ Profitability Analysis→ Information system→Report data→ Maintain variant group.
Schedule your variant group for the report, IDES-050, by defining a start date.
Accounting→ Controlling→ Profitability analysis→ Information system→Report data→ Schedule variant group.
368 © 2004 SAP AG. All rights reserved. 04-02-2005

AC605 Lesson: Overview of Financial Analytics
Figure 123: Report Output Types (1)
Drill-down reporting allows flexible analysis of business data. According to thetype of data you report, drill-down reporting offers different output and navigationpossibilities. Each output type has an individual emphasis, as shown above.
Figure 124: Functions in Drill-down Reporting
04-02-2005 © 2004 SAP AG. All rights reserved. 369

Unit 6: Information System AC605
The functions of drill-down reporting are divided into three levels so that you can giveeach user only the functions that the user requires:
� Level 1: Contains the basic functions of drill-down reporting and enables you tosend reports by SAPmail. This level is designed for users who do not require theentire functions of drill-down reporting.
� Level 2: Contains the rest of the drill-down functions and enables you to displaygraphics and download reports to Microsoft Excel.
� All functions: Offers you all the functions in drill-down reporting, includingthe print setup function and the functions for saving report data and definingexceptions. This level is designed for users who need to print and modify reportsin addition to all the interactive drill-down functions.
You can define the required level for each user by entering the parameter, RLV (0 =All functions, 1 = Level 1, 2 = Level 2) in the user�s user parameters.
Remember: The individual function levels are subjected to an authorization check.
Figure 125: ABC- Analysis
With the help of the various analysis functions, you can classify and rank your CO-PAdata. There are three analysis functions available:
� Cumulative curve� ABC analysis� Classification
370 © 2004 SAP AG. All rights reserved. 04-02-2005

AC605 Lesson: Overview of Financial Analytics
Figure 126: Ranking Report Data
An exception is a rule that determines whether the performance of a profitabilitysegment differs significantly from what had been expected. You can define theexceptions for any key figure in a cell or an entire column of a report.
An exception consists of two threshold values that determine the range of tolerancewithin which the value might move. If the value exceeds the upper threshold or fallsbelow the lower threshold, the system displays it in the color that was defined for thatthreshold, green or red. There are two basic types of exceptions. You can define anexception for a single cell, which is an intersection between one row and one column,or for an entire column. You can only define an exception on a drill-down list. Afteryou have done so, the exception is also applied to the corresponding detail list and canbe changed from there.
That means that the exception is valid for that column on every list at every levelof the report. In the above example, the list on the left contains the revenuefor thevarious countries and the variance compared with the previous year. An exception isdefined for the column, �Percentage variance�. When you drill down on the country,�USA�, you see the regions in the US, the revenue earned in each region, and thepercentage variance. The exception rule defined for the second column is also appliedto this list. This means that the exception is checked for the individual countries aswell as the individual regions.
When you define an exception for a cell, it only applies to that cell on that particularlist. That means that the exception is not visible if you drill down to the next level.
04-02-2005 © 2004 SAP AG. All rights reserved. 371

Unit 6: Information System AC605
Figure 127: Formatting Options
You can make a number of settings directly from a displayed report list to define howthe data should be displayed and printed. The settings include changing the currency,the characteristic display, how the total rows are displayed, sorting functions, suchas sort columns, switching display variants, such as cumulative on/off, and variousprint settings.
Currency: Translates the displayed currency to any other currency for the selectedcolumn(s). The currency translation key is used to automatically find the exchangerate. You define the currency translation keys in Customizing.
Sort: Enables you to sort the rows of the list in ascending or descending orderaccording to the values contained in the column where you have positioned thecursor. The system displays a dialog box in which you can decide whether youwant to sort the column or column group alphabetically according to the key ortext of the characteristic values, the key figure, or where applicable, a hierarchy orhierarchy display.
Number Format: Enables you to change the number format and the sign for individualcolumns. Which settings you can make depends on the report and the list typedisplayed, which can be a drill-down or detail list.
372 © 2004 SAP AG. All rights reserved. 04-02-2005

AC605 Lesson: Overview of Financial Analytics
Figure 128: Executing Reports
When you execute a drill-down report online, the system displays a Selection screenwhere you specify what data you want to see. You can define the selection variantsto simplify this process. A selection variant contains a set of selection parametersand other settings for a report.
You can also use the selection variants to execute reports in the background. You dothis by first defining a variant group and entering a number of selection variants forthe different reports in that group. Then, you can schedule the entire variant group forbackground processing.
In this way, a variant group enables you to combine separate tasks into one step:
� Schedule different combinations of variables for one report� Schedule variants for different reports
You can schedule a job after you have defined the variant group and selected therequired reports. This job can also be scheduled for execution in regular intervals.For more information, see the documentation, BC Computing Center ManagementSystem.
Demonstration: Drill-down Reporting
PurposeTo demonstrate drill-down reporting
04-02-2005 © 2004 SAP AG. All rights reserved. 373

Unit 6: Information System AC605
System DataSystem:Client:User ID:Password:Set up instructions:1. Start by showing a drill-down report using the graphical report output option.
Use the report, IDES-050.
Controlling→ Profitability Analysis→ Information System→ Execute Report:IDES-050.
Sales Organization 1000
Period from 001/1999
Period to 012/1999
Plan/Actual Indicator 0
Record Type F
Output Type Graphical Report-output
Explain the sections of the report:
Drill-down List
Detail List
Graphics
Explain that the content as well as the background of the screen layout can becustomized using HTML templates.
Navigate through the report.
Drill-down from Division to Customer.
Drill-down from Customer to Product.
Show in which divisions the product, M-01, was sold.
Show how to cancel a drill-down selection.
Select the �Attributes� for the customer, 1000, Becker.
Drill-down to a customer�s master data and line items.
Change the key of a column.
374 © 2004 SAP AG. All rights reserved. 04-02-2005

AC605 Lesson: Overview of Financial Analytics
Modify the bar chart and make it into a pie chart. Show a legend and changethe colors.
Note: Currently, you cannot save all settings or print from the graphicalreport output option.
Re-run the same report but this time, choose the classical navigation. Explainthe drill-down reporting options and point out where to find the detail list andhow to access graphics.
Demonstration: Ranking Report Data
PurposeTo demonstrate how to rank the report data
System DataSystem:Client:User ID:Password:Set up instructions:1. Re-run the report, IDES-050, and show ABC Analysis, and various ranking
options.
Controlling→ Profitability Analysis→ Information System→ ExecuteReport: IDES-050 .
Export the data to ABAP list viewer but select only characteristics �Division�and �Customer�.
Select the �Sales Quantity Column� and select �ABC� Analysis. Rank the datainto the A,B, and C segments of your choice. This type of analysis is oftenperformed for top versus low selling products or customers.
Return to the Report Overview. Drill-down to the customer level and displaythe top ten customers, based on the sales quantity.
Right-click→ Ranking List .
Show all the customers with sales quantities greater than 5000 by creatinga condition.
Right-click→ Condition .
04-02-2005 © 2004 SAP AG. All rights reserved. 375

Unit 6: Information System AC605
Create an exception for the sales quantity column. Display the customers withquantities below 100 in red and above 1000 in green.
Extras→ exceptions.
376 © 2004 SAP AG. All rights reserved. 04-02-2005

AC605 Lesson: Overview of Financial Analytics
297 Exercise 16: Financial Analytics OverviewExercise Duration: 15 Minutes
Exercise ObjectivesAfter completing this exercise, you will be able to:� Use the basic navigation functions in drill-down reporting� Explore the options available in drill-down reporting
Business ExampleYou observe some existing CO-PA reports to evaluate their use in the day-to-dayreporting needs of your company and establish how data can be viewed, sorted, anddisplayed online.
Task 1:Execute the CO-PA report, IDES-050. This report consists of the variousproduct-related navigation levels. Execute the report for actual data for the period ofmonths from 1 through 12 in the current fiscal year for the sales organization, 1000.
1. Explore basic drill-down navigation. The initial report displays the data forthe current fiscal year sorted by division. Drill down to all the customers inDivision, 01. How many customers are displayed?
Drill down to the products sold to the customer, 1000, Becker Berlin. Whichproducts were sold to Becker Berlin in the current fiscal year?
View all the products sold in all the divisions for all the customers in the salesorganization, 1000. You want to find the product, M-11, to establish the divisionin which it was sold.
Position your cursor on Customer 1000, right-click, and cancel Selection.Position the cursor on the Division, 01, right-click, and cancel Selection. Thisshould display ALL products sold in sales the organization, 1000. Find theproduct, M-11, in the list displayed to start your search.
2. Your managers have asked you to identify the top ten customers, based onrevenue in the sales organization, 1000. Who is the top customer? Cancel yourdrill-down selection for the product, M-11, first.
Where is this customer located?
Position the cursor on the customer and select Attributes.Continued on next page
04-02-2005 © 2004 SAP AG. All rights reserved. 377

Unit 6: Information System AC605
Delete the ranking after you have reviewed your results.
3. Your sales manager would like to view all the customers with the sales greaterthan 5,000.00, and the ones with the sales less than 1,000.00. You create anexception so that he can view these figures.
How many customers fall into the upper bracket?
Delete the condition after reviewing your results.
4. Next, change the number format of the Sales quantity column.
Aggregate your report data back up to the division level by canceling anydrill-down selections you have made.
Next, you want to display the sales quantities for each division as a pie chart andwould also like to display a legend for the data displayed.
You also want to change some of the colors for easy viewing.
5. One of your sales people would like to perform an ABC analysis for all theproducts sold in the sales organization, 1000. She would like to view the best20%, the next 50%, and the following 30% of products grouped together basedon revenue. You show her the ABC analysis feature in the ABAP list viewer,which can be directly accessed from the report.
Which products are grouped in the top 20%?
Exit the report without saving your data.
Task 2:Next, take a look at a standard drill-down report. Again, execute the report, IDES-050,but this time select the Classic Navigation output type. Use the same parametersas above.
Execute the report.
1. Drill down to the customer and product level.
Navigate so that you can see all the key figure columns defined in the report.
Double-click the characteristic values in the columns to drill down through thecharacteristic sort order and use the green hotspot to return to the next higherlevel.
Display all the key figure columns.
2. Next, re-sort the columns in the report so that they appear in the reverse order. Inaddition, hide the Contribution Margin I column. Finally, go to the line items fora line in the report list. What menu paths do you use to do this?
378 © 2004 SAP AG. All rights reserved. 04-02-2005

AC605 Lesson: Overview of Financial Analytics
Solution 16: Financial Analytics OverviewTask 1:Execute the CO-PA report, IDES-050. This report consists of the variousproduct-related navigation levels. Execute the report for actual data for the period ofmonths from 1 through 12 in the current fiscal year for the sales organization, 1000.
1. Explore basic drill-down navigation. The initial report displays the data forthe current fiscal year sorted by division. Drill down to all the customers inDivision, 01. How many customers are displayed?
Drill down to the products sold to the customer, 1000, Becker Berlin. Whichproducts were sold to Becker Berlin in the current fiscal year?
View all the products sold in all the divisions for all the customers in the salesorganization, 1000. You want to find the product, M-11, to establish the divisionin which it was sold.
Position your cursor on Customer 1000, right-click, and cancel Selection.Position the cursor on the Division, 01, right-click, and cancel Selection. Thisshould display ALL products sold in sales the organization, 1000. Find theproduct, M-11, in the list displayed to start your search.
a) Execute the CO-PA report, IDES-050. This report consists of variousproduct-related navigation levels. Execute the report for actual data forthe period of months from 1 through 12 in the current fiscal year for thesales organization, 1000.
First, select the Graphical report output option.
Accounting→ Controlling→ Profitability Analysis→ InformationSystem→ Execute Report: IDES-050 .
Field Name or Data Type ValuesSales Organization 1000Period from 001/Current fiscal yearPeriod to 012/Current fiscal yearPlan/Actual Indicator 0Record Type FOutput Type Graphical Report Output
Continued on next page
04-02-2005 © 2004 SAP AG. All rights reserved. 379

Unit 6: Information System AC605
Explore basic drill-down navigation. The initial report displays the data forthe current fiscal year sorted by division. Drill down to all the customers inthe Division, 01. How many customers are displayed?
Using drag and drop, move Division, 01, to the Customer drill-downcharacteristic.
The answers to this question vary .
Drill down to the products sold to the customer, 1321, Becker Stuttgart.Which products were sold to Becker Berlin in the current fiscal year?
Using drag and drop, move Becker Berlin to the Product drill-downcharacteristic.
The answers to this question vary .
View all the products sold in all the divisions for all the customers in thesales organization, 1000. You want to find the product, M-11, to establishthe division in which it was sold.
Position the cursor on the Customer, 1321, right-click, and cancelSelection. Position the cursor on the Division, 01, right-click, and cancelSelection. This should display ALL products sold in the sales organization,1000. Find the product, M-11, in the list to start drill-down reporting.
Position the cursor on the first product in the list, right click, and selectFind. Enter the product, M-11. Drag the product, M-11, to the Divisiondrill-down characteristic .
Division 07
2. Your managers have asked you to identify the top ten customers, based onrevenue in the sales organization, 1000. Who is the top customer? Cancel yourdrill-down selection for the product, M-11, first.
Where is this customer located?
Position the cursor on the customer and select Attributes.
Continued on next page
380 © 2004 SAP AG. All rights reserved. 04-02-2005

AC605 Lesson: Overview of Financial Analytics
Delete the ranking after you have reviewed your results.
a) Your managers have asked you to identify the top ten customers, based onrevenue in the sales organization, 1000. Who is the top customer? Cancelyour drill-down selection for the product, M-11, first.
Right-click the product and select Cancel Selection. Position the cursoron the header of the Revenue column and right-click Select RankingList→ Top N: 10 .
The answers to this question vary .
Where is this customer located?
Position the cursor on the customer and select Attributes from the toolbar.
The answers to this question vary .
Delete the ranking after you have reviewed your results.
Position the cursor on the header of the Revenue column and right-click.
Choose Condition→ Delete .
3. Your sales manager would like to view all the customers with the sales greaterthan 5,000.00, and the ones with the sales less than 1,000.00. You create anexception so that he can view these figures.
How many customers fall into the upper bracket?
Delete the condition after reviewing your results.
a) Your sales manager would like to view all the customers with the salesgreater than 5,000.00 and all the ones with sales less than 1,000.00. Youcreate an exception so that he can view these figures.
Select Gross Revenue and choose Exceptions from the toolbar. ChooseColumn and Continue. Enter the thresholds, as specified. Follow thesame steps to delete the exception .
How many customers fall into the upper bracket?
The answers to this question vary .
Delete the exception after reviewing your results.
4. Next, change the number format of the Sales quantity column.
Aggregate your report data back up to the division level by canceling anydrill-down selections you have made.
Continued on next page
04-02-2005 © 2004 SAP AG. All rights reserved. 381

Unit 6: Information System AC605
Next, you want to display the sales quantities for each division as a pie chart andwould also like to display a legend for the data displayed.
You also want to change some of the colors for easy viewing.
a) Next, change the number format of the Sales quantity column.
Choose Sales Quantity→ Settings→ Number Format .
Aggregate your report data back up to the division level by canceling anydrill-down selections you have made.
Double-click Division .
Next, you want to display the sales quantities for each division as a piechart and would also like to display a legend for the data displayed.
You also want to change some of the colors for easy viewing.
Position your cursor in the graphical section of the report, right-click, andchoose Chart Type→ Pies Chart . Select a Chart Subtype and click OK .
Position your cursor in the graphical section of the report, right-click,and choose Chart Options→ Legend . Select a Legend and click OK .
Position your cursor in the graphical section of the report, double-clickeach colored square, select a Color, and choose a color from the list.
5. One of your sales people would like to perform an ABC analysis for all theproducts sold in the sales organization, 1000. She would like to view the best20%, the next 50%, and the following 30% of products grouped together basedon revenue. You show her the ABC analysis feature in the ABAP list viewer,which can be directly accessed from the report.
Which products are grouped in the top 20%?
Continued on next page
382 © 2004 SAP AG. All rights reserved. 04-02-2005

AC605 Lesson: Overview of Financial Analytics
Exit the report without saving your data.
a) One of your sales people would like to perform an ABC analysis for allthe products sold in the sales organization, 1000. She would like to viewthe best 20%, the next 50%, and the following 30% of products groupedtogether based on revenue. You show her the ABC analysis feature inABAP list viewer, which can be directly accessed from the report.
Which products are grouped in the top 20%?
Double-click Product. Select Report→ Export→ Object List: Product→ Confirm .
Select the Gross Revenue column .
Go to→ ABC Analysis→ Choose Key Figures Percent :
Segment A: 20%, Segment B: 50%, Segment C: 30% .
The answers to this question vary .
Exit the report without saving your data.
Task 2:Next, take a look at a standard drill-down report. Again, execute the report, IDES-050,but this time select the Classic Navigation output type. Use the same parametersas above.
Execute the report.
1. Drill down to the customer and product level.
Navigate so that you can see all the key figure columns defined in the report.
Double-click the characteristic values in the columns to drill down through thecharacteristic sort order and use the green hotspot to return to the next higherlevel.
Continued on next page
04-02-2005 © 2004 SAP AG. All rights reserved. 383

Unit 6: Information System AC605
Display all the key figure columns.
a) Next, take a look at a standard drill-down report. Again, execute the report,IDES-050, but this time select the Classic Navigation output type. Use thesame parameters as above.
Accounting→ Controlling→ Profitability Analysis→ InformationSystem→ Execute Report: IDES-050 .
Field Name or Data Type ValuesSales Organization 1000Period from 001/Current fiscal yearPeriod to 012/Current fiscal yearPlan/Actual Indicator 0Record Type FOutput Type Graphical Report Output
Execute the report.
Drill down to the customer and product level. Navigate so that you can seeall the key figure columns defined in the report.
Double-click the characteristic values in the columns to drill down throughthe characteristic sort order and use the green hotspot to return to the nexthigher level.
Display all the key figure columns.
Use the navigation functions to move from side to side to see all thekey figure columns. You need to do this only if you cannot display allthe columns on a single screen .
2. Next, re-sort the columns in the report so that they appear in the reverse order. Inaddition, hide the Contribution Margin I column. Finally, go to the line items fora line in the report list. What menu paths do you use to do this?
a) Next, re-sort the columns in the report so that they appear in the reverseorder. In addition, hide the Contribution Margin I column. Finally, go tothe line items for a line in the report list. What menu paths do you useto do this?
Edit→ Column(s)→ On/Off .
Edit→ Column(s)→ Sort .
Go to→ Line Items .
384 © 2004 SAP AG. All rights reserved. 04-02-2005

AC605 Lesson: Overview of Financial Analytics
Lesson Summary
You should now be able to:� Evaluate the reporting options� Introduce drill-down reporting
04-02-2005 © 2004 SAP AG. All rights reserved. 385

Unit 6: Information System AC605
Lesson:306
Creating ReportsLesson Duration: 50 Minutes
Lesson OverviewThis lesson helps you to learn how to create basic, form, and line item reports. It alsoexplains the use of variables in forms. Finally, it enables you to learn the processto transfer report data.
Lesson ObjectivesAfter completing this lesson, you will be able to:
� Create basic reports� Create form reports� Create line item reports� Transfer the report data
Introduce the report types. Basic reports are used to quickly and easily define ananalysis. Explain that a basic report has certain limitations when compared to a formreport, including the fact that only the plan data or the actual data can be displayed,not both. In addition, only one plan version can be displayed at a time, no formulae orformatting of the data is possible, and only one record type at a time is allowed. Formreports offer all these options.
Business ExampleThe management of your company wants to implement a profitability accountingapplication in the SAP system. As a member of the project team of your company,you are supposed to provide advise on the question of whether to implement CO-PAand/or EC-PCA in the SAP system. You then will be responsible to implement theselected applications.
You need to create reports for your retail dealers. For this reason, you need tostandardize the contribution margin reports using a key figure scheme, create basicprofitability reports, design the report forms to be used by several users, and insertreport variables and report headers.
386 © 2004 SAP AG. All rights reserved. 04-02-2005

AC605 Lesson: Creating Reports
Report Types and Architecture
Figure 129: Report Types in Drill-down Reporting
The drill-down reporting tool was designed to provide you with simple means todefine straightforward reports and at the same time offer all the functions required tocreate more complex, formatted reports. A distinction is made between two differenttypes of reports.
Run a quick, ad-hoc analysis to search for a specific effect. These reports have apredefined basic structure for general use.
Represent more complex reports and can be designed according to their specificpurpose. These reports are used for official reports and are suited for printing.
Form reports are defined on the basis of �forms� that are separate objects, which canbe used for a number of reports. There are different types of forms, which differ interms of what elements are defined where in their structure.
Basic reports do not require the use of a form. When you define a basic report, yousimply need to select the characteristics, characteristic values, and key figures thatyou want to analyze.
Remember that each report that you define is valid only for either costing-based oraccount-based Profitability Analysis, and not for both.
04-02-2005 © 2004 SAP AG. All rights reserved. 387

Unit 6: Information System AC605
Figure 130: Architecture of Drill-down Reporting
You can use characteristics, key figures, and forms to define a report. As a result,when you display the report, a number of lists and graphics that you can call up andanalyze interactively appear.
A form determines the content and formal structure of a report list. A form can bethought of as a semifinished report, which you complete by indicating characteristicsand key figures when you define the individual report. You can indicate characteristicsin the form as well as in the report. Key figures can be contained only in either theform or the report.
Drill-down reporting in CO-PA provides you with easy-to-use functions to movethrough the dataset. For example, you can move from one segment to the next levelor the next segment at the same level, deactivate a level of the drill-down hierarchy,and switch between detail lists and overview lists. You also have a number of otherfunctions available to edit online reports, such as conditions, sort orders, and rankinglists. You can send report lists by fax or electronic mail, or download them toMicrosoft Word or Excel. In addition to the various interactive functions for onlinelists, Drill-down reporting provides special functions to define the report layout toprint, such as page breaks, headers, footers, and underscores.
388 © 2004 SAP AG. All rights reserved. 04-02-2005

AC605 Lesson: Creating Reports
Basic Report
Key Figure Scheme
Explain how to create key figure schemes and how they can be used in reports.Underline that this function is not available in account-based Profitability Analysis.
Characteristic Hierarchies
Figure 131: Basic Report
You can access the functions to define reports from Customizing or the CO-PAapplication menu. From the Initial screen to create a report, you can process any of thecomponents of the report in any order you want.
When you define a basic report, the system first asks you to enter a from and a toperiod, a plan/actual indicator, a version, and in costing-based CO-PA, a record type.
Next, the system displays a list of all the characteristics in the operating concern.Here, you can select the ones you want to analyze. These characteristics will form thedimensions of your multidimensional �data cube�. If characteristic groups have beendefined for the operating concern, the system also displays the Characteristic groupfield. If you enter a characteristic group, the system displays only the characteristicsin that group, instead of all the characteristics of the operating concern.
04-02-2005 © 2004 SAP AG. All rights reserved. 389

Unit 6: Information System AC605
In the costing-based CO-PA, on the Create Profitability Report: Key Figures screen,the system allows you to enter a key figure scheme (see the graphic, �Defining KeyFigures�) to display a list of all the key figures in that scheme. When you selectValue fields, you can extend the list to include all the value fields of the operatingconcern. In account-based CO-PA, the system automatically displays a list of all thefixed basic key figures.
If you want to delete a report, you can do this using the Change report function.Notice that if you want to delete an entire group of reports, it is easy to do this inCustomizing using the Reorganize reports function.
Figure 132: Key Figure Scheme
The formula editor allows you not only to enter value fields but also to define complexformulae. This means that constants as well as any elements of the key figure schemecan be linked up by standard arithmetic operations or user-defined ABAP functions.
The function, Check key figure scheme, allows you to run a syntax check on the useof arithmetic operations and parenthesis. It also checks for empty formulae, recursiveformulae, and any circular conclusions.
390 © 2004 SAP AG. All rights reserved. 04-02-2005

AC605 Lesson: Creating Reports
Figure 133: Use of Characteristic Hierarchies
You can define hierarchical relationships between different characteristic values inProfitability Analysis and analyze these later in drill-down reporting. For example,you can define a hierarchy of products or customers for your organization. You canalso define different variants of the same hierarchy and display these in reports.These variants allow you to perform simulations and �What if?� analyses.
A characteristic hierarchy is defined using the master data (characteristic values)that belong to a characteristic. Notice that different characteristics that use the samemaster data table have the same master data hierarchy. You cannot define hierarchiesfor the characteristics that do not use a master data table. This applies for thecharacteristics that were defined with no check table and text table.
Note: These hierarchies are only hierarchies of values of a singlecharacteristic. For this reason, each hierarchy can contain only the values ofthat particular characteristic. In addition, each characteristic value can occuronly one time in a hierarchy. This means that each value remains uniquethroughout the entire hierarchy.
Demonstration: Basic Report
PurposeTo create a basic report and explain the sorting of characteristics
04-02-2005 © 2004 SAP AG. All rights reserved. 391

Unit 6: Information System AC605
System DataSystem:Client:User ID:Password:Set up instructions:1. Create a basic report. Explain the sorting of characteristics.
Profitability Analysis→ Information System→ Define Report→ CreateProfitability Report: DEMOXX .
Select characteristics:
Sales Organization 1000
Division --
Customer --
Product --
Select Value Fields:
Invoiced Quantity
Revenue
Select Variables:
Enter the period/year as default
Hard-code record type, F, actual data
Output Type:
Graphical, and select an HTML template of your choice.
Options: Using Summarization Data
(You will explain the performance settings later).
Execute the report.
Demonstration: Key Figure Scheme
PurposeTo demonstrate key figure schemes
392 © 2004 SAP AG. All rights reserved. 04-02-2005

AC605 Lesson: Creating Reports
System DataSystem:Client:User ID:Password:Set up instructions:1. Begin by showing an existing key figure scheme, VC.
IMG→ Profitability Analysis→ Information System→ Report Components→ Define key figure scheme: Select Detail for the key figure scheme, VC .
Drill down to the elements of the key figure scheme and show the function behinda simple key figure scheme element and a formula. Point out that users will notsee the value field number but a system assigned number starting with, 9XXX.
2. Change the report you created above to include the key figure scheme to showits benefits over simply selecting value fields.
Application Menu→ Controlling→ Profitability analysis→ InformationSystem→ Define Report→ Change Report .
Go to the key figures tab and remove the value fields, and add key figure scheme�Sales Control�. Re-run the report and show the effect.
3. Create a new key figure scheme, A6. Two or three elements will do.
IMG→ Controlling→ Profitability analysis→ Information system→ Reportcomponents→ Define key figure scheme .
Element
Net Sales : Revenue minus discounts and rebates (incl. accrued items).
Std Margin: Net sales minus standard cost-of-goods-sold.
Gross Margin: Standard margin minus production variances.
Oper. Profit: Gross margin minus period expenses (CCA and Marketing).
Demonstration: Characteristic Hierarchies
PurposeTo demonstrate characteristic hierarchies
04-02-2005 © 2004 SAP AG. All rights reserved. 393

Unit 6: Information System AC605
System DataSystem:Client:User ID:Password:Set up instructions:1. Display the characteristic hierarchy for the characteristic, �Customer�, using
the hierarchy variant, 0.
2. Add the hierarchy to your basic report created in the above demonstration orexecute the report, BR00. The hierarchy has been added to that report. Expandand collapse the hierarchy and show how you select the other hierarchies fromwithin the report.
Edit→ Hierarchy Selection .
3. Create a master data hierarchy for the characteristic, Ship-to Country. Explainthe difference between the nodes that allow direct posting and the nodes thatdo not allow direct posting.
Characteristic: Ship-to country
Hierarchy variant: 100
Accounting→ Controlling→ Profitability analysis→Master data→Masterdata hierarchy .
Form Reports
There are two categories of reports in drill-down analytics: basic reports and formreports. In contrast to basic reports, the user defines the layout of a form report. Givean in-depth explanation of the features the Report Painter offers to change the layoutof a report to meet the requirements of an organization.
How many of the demonstrations you use for this topic depends on how much timeyou have left. If you have sufficient time, demonstrate all the three form types. If youare short of time, demonstrate only the form type, �one axis without key figure�.
In drill-down analytics, local and global variables are used to enter characteristicvalues, such as company codes, when executing a report, and to automatically entertexts, such as column headings. You can help participants understand the concept bymaking use of variables in some of the previous demonstrations.
394 © 2004 SAP AG. All rights reserved. 04-02-2005

AC605 Lesson: Creating Reports
The aim is to give participants a general overview of what variables are and how theyare used. Demonstrate how to create global variables and how to integrate variablesinto drill-down analytics and forms.
Figure 134: Form Reports
A form determines the content and formal structure of a report list. A form can beregarded as a semifinished report structure, which you complete if you indicateadditional characteristics and key figures when you define the final report.
The content of a form should normally be regarded as fixed and should only bechanged under exceptional circumstances. This is because when you change a form, itchanges all the reports that use that form.
A distinction is made between the forms with one axis and the forms with two axes.Forms with one axis consist of only one dimension, which is either rows or columns.Forms with two axes contain both rows and columns. This means that you can definethe forms with one axis, which may not be useful as a basis for final reports, and usethem as templates to create the forms with two axes. Such forms can then be usedas often as you like. The type of form you use will depend on the type of layout andcontent you want to display in your reports.
04-02-2005 © 2004 SAP AG. All rights reserved. 395

Unit 6: Information System AC605
Figure 135: Different Types of Forms
There are three types of forms:
� One axis without key figure:
� In a form with one axis and without the key figure, you define either therows or the columns using characteristics. When you press Basic list, thesystem displays a blank list with columns.
� One axis with key figure:
� In a form with one axis and with the key figure, you define either the rowsor the columns using characteristics and key figures. When you press Basiclist, the system displays a blank list with rows.
� Two axes with key figure:
� In a form with two axes and with the key figure, you define both the rowsand the columns using characteristics and key figures. When you pressBasic list, the system displays a blank list with both rows and columns.You can decide whether the key figures should appear in the rows or thecolumns, depending on what you want to report. Characteristics can bedisplayed in both the rows and the columns.
To create a form, enter a name and the required type of form.
396 © 2004 SAP AG. All rights reserved. 04-02-2005

AC605 Lesson: Creating Reports
Figure 136: One Axis Without Key Figure
In a form with one axis and without the key figure, you only need to define thecolumns. To do this, you indicate characteristics and characteristic values. If youwant, you can also define additional columns using formulae, such as Plan - Actual= Variance. The characteristics and values you indicate determine the content ofthe columns.
You decide which key figures you want to see, such as revenue, contribution margins.You also decide the drill-down characteristics you want to analyze when you definethe report.
When you execute a report, you obtain a drill-down list with two headers, with eachkey figure standing above a group of columns that contains the characteristics youspecified in the form. The individual values of the first drill-down characteristic,Industries, �Retail� and �Media�, are displayed in the rows.
The detail list shows the columns you defined using characteristics in the formdefinition. The key figures are displayed in the rows. The detail list displays theresults of one selected characteristic value (industry �Retail�).
04-02-2005 © 2004 SAP AG. All rights reserved. 397

Unit 6: Information System AC605
Figure 137: One Axis With Key Figure
In a form with one axis and with the key figure, you set the key figures you want toanalyze, such as planned revenue and actual revenue, in the rows of the form. You canalso limit the key figures further if you specify characteristics and their values as well.
When you define the report, you need to only select the drill-down characteristics,such as Industry or Customer. The drill-down list shows the key figures andcharacteristics from the form in the columns, and the values of the first drill-downcharacteristics, �Retail� and �Media�, are displayed in the rows.
The detail list contains only one column that shows the selected characteristic value(�Retail�). The key figures are shown in the rows.
Remember that in a form with one axis and with the key figure, you define either therows or the columns of the form. When you press Basic list, the system displays ablank list with only rows. Notice that you can �tip� this form by moving the rows tothe columns using the Column display function.
Notice that when you define a form, you define the layout of the detail list. Thismeans that the position of the elements in the form determine their position in thedetail list. This is the reason why e key figures are shown in the rows by default in theforms with one axis and with the key figure.
398 © 2004 SAP AG. All rights reserved. 04-02-2005

AC605 Lesson: Creating Reports
Figure 138: Two Axes (Matrix)
In a form with two axes (matrix form), you define both the rows and the columnsusing characteristics and key figures. The key figures must appear in either the rowsor the columns of the form, but not both. Conversely, characteristics can be used todefine both rows and columns.
When you define the report, you need to only select the drill-down characteristics,such as Industry and Customer.
When you execute the report, you obtain a drill-down list with two headers, with eachkey figure, revenue and contribution margin 1, standing above a group of columnscontaining the characteristics you specified in the form, such as plan, actual, andvariance. The individual values of the first drill-down characteristic, the industries,�Retail� and �Media�, are displayed in the rows.
The detail list shows the columns you defined using characteristics in the formdefinition. The key figures are displayed in the rows. The detail list displays theresults of one selected characteristic value, Industry �Retail�.
Remember that all the three types of forms offer you a number of functions todetermine the final layout of your reports, such as colors, number format, line spacing,and text lines.
04-02-2005 © 2004 SAP AG. All rights reserved. 399

Unit 6: Information System AC605
Figure 139: Form Settings
The following functions are available when you define a form:
� Colors: Used to highlight certain elements of the form.� Number Format: Allows you to specify a display factor and the number of
decimal places. This function is always applied to a specific column or row.When you have executed the report, you can make additional settings for eachrow or column.
� Reverse signs: Used to reverse the signs of a specific column. Negative valuesare displayed as positive, and positive values as negative. In the form, �-� isused to indicate this.
� Suppress zeros: Used to hide all the rows with the value, 0. �xxx.xxx.xxx� isused to indicate this in the form definition.
� Text type: Allows you to specify whether you want to see the short, medium, orlong text of each element in the lines or columns.
� Column width: Allows you to change the width of a column.
To use any of these functions, first select the required column and then choose thefunction.
400 © 2004 SAP AG. All rights reserved. 04-02-2005

AC605 Lesson: Creating Reports
Demonstration: Form Reports
PurposeTo demonstrate form reports
System DataSystem:Client:User ID:Password:Set up instructions:1. Create a form of the type, �one axis without key figure�.
Note: You can help the participants by creating a form along the lines ofthe task set in exercise 4-1.
IMG→ Controlling→ Profitability Analysis→ Information System→ ReportComponents→ Define forms→ define forms for Profitability Analysis
2. Create a form report using the form you have defined. Explain the differencebetween the drill-down list and the detail list. Show the report results using boththe graphical and classical navigation interfaces.
Accounting→ Controlling→ Profitability analysis→ Information system→ Define report→ Create
04-02-2005 © 2004 SAP AG. All rights reserved. 401

Unit 6: Information System AC605
Variables
Figure 140: Variables: Overview
Variables allow you more flexibility to define your forms and reports. Variables arereport or form parameters, which you do not want to specify until you define orexecute a report. You can use different methods to replace variables. Depending onhow often you want to use them, you can define your variables globally or locally.
If you want to create a variable which you need only in one particular form or report,you can create a local variable. Notice that local variables are only known withinthe relevant form or report. If you define a local variable in a form, it is also validfor every report which uses that form.
If you define a variable in the report definition, it is only valid for that one report. Ifyou use a variable frequently, you can define it globally. You can then use globalvariables in all your forms and reports. Global variables are maintained in theCustomizing. If you then want to use global variables in a form or a report, they aredisplayed for selection in the input help.
Note: Notice that when you change an existing global variable, this activitymay affect a number of reports and forms, which already use it.
402 © 2004 SAP AG. All rights reserved. 04-02-2005

AC605 Lesson: Creating Reports
Figure 141: Variables in Forms: Examples
You use a variable for characteristic values if you want to leave the value of acharacteristic undefined in the report. You can use variables for characteristic valuesin both forms and reports, and these are replaced when a report is changed or executed.Variables used in the report definition are replaced when the report is executed.
Note: Certain variables for characteristic values, such as Current fiscalperiod, are contained in the SAP system. To see which other standardvariables are available, see Customizing.
If you want to use a variable for the line or column text in a form, you need to definea text variable. For example, if you use a variable for the value of the Countrycharacteristic, the text to be used in the column is not yet known when you define theform. In this case, you can define a text variable. Notice that text variables can be usedonly in form reports and are always defined directly in the form. They are replacedautomatically by the text of the characteristic value when you execute the report. Inthe above example, you can specify any country, which means any characteristic valuevariable, when you execute the report. The system then automatically enters the nameof that country, characteristic value, in the column header, text variable.
Note: Certain text variables are contained in the SAP system. To see the otherstandard variables that are available, see Customizing.
04-02-2005 © 2004 SAP AG. All rights reserved. 403

Unit 6: Information System AC605
Demonstration: Variables
PurposeTo demonstrate the function of variables
System DataSystem:Client:User ID:Password:Set up instructions:1. Create a global variable for the characteristic, Country, which is replaced with
a manual entry.
IMG→ Controlling→ Profitability Analysis→ Information System→ ReportComponents→ Define variables for reports .
Line Item Reports
Line item analytics is used to analyze individual business transactions. Becauseparticipants use this function fairly frequently throughout the course, it is sufficient toexplain how they can define and apply their own line item layouts. Highlight the factthat line item reports can also be called up from within drill-down analytics. FromRelease 4.5, drill-down analytics is available for line items. Caution the participantsthat the line item reports access the Ce1 and Ce2 tables and, for this reason, mayprocess for some time.
404 © 2004 SAP AG. All rights reserved. 04-02-2005

AC605 Lesson: Creating Reports
Figure 142: Drilldown Reports Based On Line Items
To supplement the basic line item list previously available, you can define drill-downreports based on line items. This type of report allows you to execute a line itemanalysis and simultaneously to use all navigation functions in drill-down reporting.
Reports based on line items permit you to use the following characteristics:
� Characteristics in the segment level� Characteristics that are not activated as segment-level characteristics� The date the line item was created� The person who created the line item
You need to create special forms and reports in Customizing for reports based on lineitems. When you select additional report components such as key figure schemes,variables, and authorization objects, you can refer back to the ones created forstandard drill-down reports.
Reports based on line items are available only for costing-based Profitability Analysis.
Notice that the system read time for reports based on line items is very high, andsummarization data and summarization levels are not supported for this type of report.
04-02-2005 © 2004 SAP AG. All rights reserved. 405

Unit 6: Information System AC605
Figure 143: Functions in Line Item Reports
The line item list is defined using the layout functions in the ABAP list viewer.This means that you can display a list, adapt it to your requirements, and then savethe changes as a layout.
When you display a line item list, a number of additional functions are available toenable you to display additional information, such as all the characteristic values ofthe current profitability segment or long texts for plan data.
Note: Before the system selects the line items, it checks whether the selectioncriteria allow it to use database indexes. If not, a warning appears so thatyou need to narrow down the selection further. The warning also containsa suggestion as to how you could do this. If you call up the line items fromwithin a drill-down report and receive a warning, you should first drill downto a deeper level and then call up line items from there.
406 © 2004 SAP AG. All rights reserved. 04-02-2005

AC605 Lesson: Creating Reports
Figure 144: Account-based Profitability Analysis
The Information System offers some special features for account-based ProfitabilityAnalysis.
This type of Profitability Analysis is supported by separate forms, reports, andauthorization objects for combinations of characteristics. In addition to theseauthorization objects, account-based CO-PA uses the same ones as costing-basedProfitability Analysis.
You can represent a hierarchy based on the characteristic, Cost element, by specifyinga set in Customizing. The following display forms are available:
� Compact display� Line display� Asterisk display
You can display different currencies in the same report:
� Controlling area currency� Company code currency� Transaction currency
You can display line item lists in account-based Profitability Analysis. You can alsoformat the lists as you want using your own line item layouts. If you do not specify alayout, the system uses the standard line item layout.
04-02-2005 © 2004 SAP AG. All rights reserved. 407

Unit 6: Information System AC605
Demonstration: Reports Based on Line Items
PurposeTo create reports based on line items
System DataSystem:Client:User ID:Password:Set up instructions:1. Demonstrate a line item drill-down report using the report, LI00. Execute the
report for the current period, actual data, and the record type, F.
Information System→ Execute Report: LI00 .
2. If time allows, create a line item report following the menu paths in the exercises.
Demonstration: Line Item Layout
PurposeTo demonstrate a line item layout
System DataSystem:Client:User ID:Password:Set up instructions:1. Create a line item layout. Select any fields, such as posting date, product,
customer, and revenue. Show some of the graphics functions available andmention that the Report Painter is used here too.
IMG→ Controlling→ Profitability Analysis→ Information System→ ReportComponents→ Define line item layout .
Display some line items using the layout you have created. To do this, select thecorresponding line item layout on the Initial screen.
408 © 2004 SAP AG. All rights reserved. 04-02-2005

AC605 Lesson: Creating Reports
Accounting→ Controlling→ Profitability analysis→ Information system→ Display line item .
Transfer of Report Data
Figure 145: Transfer of Report Data
You can use this function to export a report in the XXL format, a special formatto transfer data to a spreadsheet application. Using this format, you can downloadall the selected characteristics in the report so that you can drill down through thecharacteristics in the spreadsheet application. You can select this function when:
� The list currently displayed is a drill-down list. For technical reasons, thisfunction is not available in detail lists.
� You are displaying the report values as absolute values (functionPercentage/absolute). The function is not active when you switch to percentages.
In a dialog box, you can select the characteristics that you want to transfer. It is a goodidea to select All characteristics. Select only some of the characteristics if the reportlist would otherwise be too large for your spreadsheet application to handle.
The interface with Microsoft Word enables you to download drill-down reports toWord and print them from there. You can print all reports using Word, except the onesthat you called up from another report using the report/report interface.
04-02-2005 © 2004 SAP AG. All rights reserved. 409

Unit 6: Information System AC605
This function is active if:
� You are working under one of the following operating systems: OS/2Presentation Manager, Windows, Windows NT, Windows 32bit, or Windows 95.
� You have Microsoft Word Version 6.0 or higher installed on your local serverand entered in your path.
410 © 2004 SAP AG. All rights reserved. 04-02-2005

AC605 Lesson: Creating Reports
325 Exercise 17: Creating ReportsExercise Duration: 15 Minutes
Exercise ObjectivesAfter completing this exercise, you will be able to:� Create a basic report in costing-based CO-PA, execute it, and navigate through it� Create a basic report in account-based CO-PA, execute it, and navigate through it
Business ExampleYour sales manager wants to see a simple report example by division, customer, andproduct.
Task:Create a basic report in costing-based CO-PA for analyzing various contributionmargins by division, customer, and product. You have been asked to display theinvoiced quantity and the revenue in the report.
1. Call the new basic report, BRXX, where XX is your group number, andenter an appropriate description. Create the report definition so that the salesorganization, division, customer, and product are sorted in this order.
Select the value fields, Invoiced Quantity and Revenue.
Set the default values for the months from 1 to 12 of the current fiscal year, selectthe plan/actual indicator, 0, and the record type, F. Set the report so that it isexecuted in the operating concern currency using summarized and current data.
Name: BRXX
Description: (for example) Sales and Profit 1
Select Basic report and then Create.
Select Operating Concern Currency. From the table on the right, select theappropriate characteristics and copy them to the table on the left using the singlearrow icon. Remember to sort your characteristics.
Select the required key figures on the Key Figures screen. All value fields aredisplayed by default on the right.
Select the Variable tab and make the appropriate settings. All variables shouldbe changeable at execution.
Continued on next page
04-02-2005 © 2004 SAP AG. All rights reserved. 411

Unit 6: Information System AC605
For the report output, you have decided to use the Graphical report outputoption, with the Info Control, Navigation Control, Drill-down output area .
Select the Options tab. In the Performance dialog box, select Display CurrentData. You want to read summarization levels and, if no summarization isavailable, you want the report to be executed without any warning or errormessages being issued. These performance settings will be discussed at a laterpoint.
Save the basic report definition.
2. Execute your report using the default settings you have made. You may receivea system warning message that no summarization data exists. Confirm thismessage.
How does this report layout differ from the report you carried out in exercise 1-1?
412 © 2004 SAP AG. All rights reserved. 04-02-2005

AC605 Lesson: Creating Reports
Solution 17: Creating ReportsTask:Create a basic report in costing-based CO-PA for analyzing various contributionmargins by division, customer, and product. You have been asked to display theinvoiced quantity and the revenue in the report.
1. Call the new basic report, BRXX, where XX is your group number, andenter an appropriate description. Create the report definition so that the salesorganization, division, customer, and product are sorted in this order.
Select the value fields, Invoiced Quantity and Revenue.
Set the default values for the months from 1 to 12 of the current fiscal year, selectthe plan/actual indicator, 0, and the record type, F. Set the report so that it isexecuted in the operating concern currency using summarized and current data.
Name: BRXX
Description: (for example) Sales and Profit 1
Select Basic report and then Create.
Select Operating Concern Currency. From the table on the right, select theappropriate characteristics and copy them to the table on the left using the singlearrow icon. Remember to sort your characteristics.
Select the required key figures on the Key Figures screen. All value fields aredisplayed by default on the right.
Select the Variable tab and make the appropriate settings. All variables shouldbe changeable at execution.
For the report output, you have decided to use the Graphical report outputoption, with the Info Control, Navigation Control, Drill-down output area .
Select the Options tab. In the Performance dialog box, select Display CurrentData. You want to read summarization levels and, if no summarization isavailable, you want the report to be executed without any warning or errormessages being issued. These performance settings will be discussed at a laterpoint.
Save the basic report definition.
a) Create a basic report in costing-based CO-PA to analyze variouscontribution margins by division, customer, and product. You have beenasked to display the invoiced quantity and the revenue in the report.
Continued on next page
04-02-2005 © 2004 SAP AG. All rights reserved. 413

Unit 6: Information System AC605
Call the new basic report, BRXX, where XX is your group number, andenter an appropriate description. Create the report definition so that thesales organization, division, customer, and product are sorted in this order.
Select all the values from the Sales Control key figure scheme for yourreport.
Set the default values for the months from 1 to 12 of the current fiscal year,select the plan/actual indicator, 0, and the record type, F. Set the report sothat it is executed in the operating concern currency using summarizedand current data.
Profitability Analysis→ Information System→ Define Report→ CreateProfitability Report.
Name: BRXX
Description: (for example) Sales and Profit 1
Select Basic report and then Create.
Select Operating Concern Currency. From the table on the right, select theappropriate characteristics and copy them to the table on the left using thesingle arrow icon. Remember to sort your characteristics.
Field Name or Data Type ValuesSales Organization 1000Division --Customer --Product --
Select Sort (Free) Characteristic, and make the necessary changes.
Select the required key figures on the Key Figures screen. All value fieldsare displayed by default on the right.
Select Invoiced Quantity and Revenues. Copy the key figures to the tableon the left using the single arrow.
Select the Variable tab and make the appropriate settings. All variablesshould be changeable at execution.
Continued on next page
414 © 2004 SAP AG. All rights reserved. 04-02-2005

AC605 Lesson: Creating Reports
Field Name or Data Type ValuesFrom period 001/Current fiscal year Enter at
ExecutionTo period 012/ Current fiscal year Enter at
executionPlan/Actual Indicator 0 Do not enter at executionVersion Blank: Do not enter at executionRecord Type F: Do not enter at execution
For the report output, you have decided to use the Graphical report outputoption, with the Info Control, Navigation Control, and Drill-down controloutput area.
Select the Options tab. In the Performance dialog box, select DisplayCurrent Data. You want to read summarization levels and, if nosummarization is available, you want the report to be executed withoutany warning or error messages being issued. These performance settingswill be discussed at a later point.
Save the basic report definition. Confirm the Choose Hierarchy Dialog box.
2. Execute your report using the default settings you have made. You may receivea system warning message that no summarization data exists. Confirm thismessage.
How does this report layout differ from the report you carried out in exercise 1-1?
a) Execute your report using the default settings you have made. You mayreceive a system warning message that no summarization data exists.Confirm this message.
Report→ Execute
How does this report layout differ from the report you carried out inexercise 1-1?
The report shows both a drill-down list and the detailed list but nographical display of the report data.
04-02-2005 © 2004 SAP AG. All rights reserved. 415

Unit 6: Information System AC605
416 © 2004 SAP AG. All rights reserved. 04-02-2005

AC605 Lesson: Creating Reports
331 Exercise 18: Report ComponentsExercise Duration: 15 Minutes
Exercise ObjectivesAfter completing this exercise, you will be able to:� Evaluate the existing key figure schemes� Create a key figure scheme� Create a master data hierarchy
Business ExampleYour controlling manager wants to see an initial draft of a contribution margin report.The manager has given you an outline of the line items that the manager wants to seein the report.
Your sales manager wants to group customers in different ways to evaluate customerperformance shares.
The CEO wants the following items to have consistent definitions whenever theyare used in costing-based CO-PA reports: Net revenue, Contribution margin I,Contribution margin II, and Operating profit. When one of these items is used in areport, it should have a specific meaning.
Task 1:To create a sample contribution margin report, display the Sales Control Sales Controlkey figure scheme in the CO-PA Customizing settings Report Components.
Hint: A key figure scheme consists of a group of formulae used to definekey figures. The individual formulae are known as elements of the keyfigure scheme. They are based on previous elements and value fields. Theelements of the key figure scheme can be based on existing elements of thesame scheme and database fields. You can define the text and special displayparameters for each element. As with value fields, you can use the elementsof the key figure scheme in the form or the report itself.
1. What are the elements of this key figure scheme? Indicate which elements areformulae:
Continued on next page
04-02-2005 © 2004 SAP AG. All rights reserved. 417

Unit 6: Information System AC605
Display the basic formula for the Net Revenue key figure component. What isthe formula associated with this component?
2. Modify the report you created in exercise 1-1, to include this key figure scheme.Make sure you delete the existing value fields in your report before you addthe key figure scheme. Execute the report and write down the key figures thatappear in the drill-down and detail lists.
Select the Key Figures tab and remove the selected value fields from the table onthe left.
Add all the key figures from the Sales Control key figure scheme to your report.To do this, select the double arrow that points to the left.
Save your report and execute it for the same parameters as above.
Continued on next page
418 © 2004 SAP AG. All rights reserved. 04-02-2005

AC605 Lesson: Creating Reports
Task 2:Create a new key figure scheme in costing-based CO-PA reports, which will containthe definitions for the marketing key figures that your CEO wants to view in theprofitability report.
Name the scheme, ##, where ## is your group number, and enter a clear description.Create the following four elements in the scheme: Net revenue, Contribution margin I,Contribution margin II, and Operating profit.
The CEO has stipulated that these key figures be defined as follows:
Element MeaningNet revenue Revenue minus discounts and rebates
(incl. cost-accounting value)Contribution margin I Net revenue minus standard cost of
goods soldContribution margin II Contribution margin I minus
production variancesOperating profit Contribution margin II minus period
costs (Sales and administrativeoverheads)
Name: ##
Description: (for example, Group ## Scheme)
1. Save and then define the information about the scheme. Select Details and thenchoose New Entries to define the first element. For example:
Element of KF Scheme 010Short Text Net RevenueMedium-Length Text Net RevenueLong Text Net Revenue
Choose Basic Formula. Select Choose Entries and the following value fields:
Continued on next page
04-02-2005 © 2004 SAP AG. All rights reserved. 419

Unit 6: Information System AC605
Element Description9005 Sales Rev.9006 Quantity Discount9007 Customer Discount9008 Material Discount9010 Other Discount9011 Cash Discount
After you have confirmed the selected items, change the + signs to - signs infront of the sales deductions, except Revenue. Save the definition.
If time allows, create a new basic report using your key figure scheme.
Task 3:Your sales manager wants to group customers in the sales organization into segmentsbased on revenue performance. Create a characteristics hierarchy for customers.Name this hierarchy variant, ##1, where ## is your group number, and enter anappropriate description that also contains your group number. Next, maintain thehierarchy so that customers are broken down into the following four categories:
Segment A Segment B Segment C NewCustomer no. 1174, 1300,
1900, 1175,1032,2004
1901, 2140,1001, 1321,2200, 1033,2007, 2130,1460
1171, 2141,1034, 2300,2000
T-CO05A##
1. For nodes in the hierarchy with no direct posting, create the following values,where ## is your group number. Enter the customers under each node, asindicated in the table above.
Select the characteristic, Customer, from the list of characteristics on the left.Enter the variant number for your group and select Create.
Enter a description and select Hierarchy.
Starting with the top node, enter the number, 999999##, where ## is your groupnumber, directly in the node and select ENTER. Enter a description, CustomerHier Gr##, in the text box for the node.
Continued on next page
420 © 2004 SAP AG. All rights reserved. 04-02-2005

AC605 Lesson: Creating Reports
Create other nodes in the same way, following the instructions below and fill inthe characteristic values for each node. To enter node text, select ENTER onceyou have added a node key.
99999## Customer Hierarchy Gr.## | ----
99991## Segment A
|__1174
|__1300
|__�..
---- 99992## Segment B
|__1901
|__2140
|__�
---- 99993## Segment C
|__1171
|__�
---- 99994## New
T-CO05A##
|__�.
Save the hierarchy.
2. Next, add the characteristic hierarchy to the basic report you created in exercise1-1. Notice that you can insert a master data hierarchy when you add acharacteristic to a report. Enter the hierarchy variant, ##1, save, and execute thereport for the same parameters as above.
Select the Hierarchy option next to the customer characteristic. At the prompt,select your hierarchy from the list displayed. Execute the report.
3. Use the master data hierarchy to move through the report.
Expand and collapse the branches of the hierarchy using the hierarchy navigationfeatures in the report list. How would you remove the hierarchy from the reportdata displayed?
Continued on next page
04-02-2005 © 2004 SAP AG. All rights reserved. 421

Unit 6: Information System AC605
Task 4:Your manager requires profitability reports at the month-end along the strategicbusiness units of the company by the income statement account in two currencies.The manager requires one particular report where the manager can select only thetransactions that took place for a given company code in a specific transactioncurrency. This enables the manager to analyze and report the business volume thateach SBU generates in the local and foreign currencies.
1. To generate these reports, create a basic report for the controlling area, 1000,in account-based CO-PA and name it BRXX, where XX is your group number.Enter a suitable description.
Create the report definition so that the cost element, SBU, customer group, andmaterial group are sorted in this order. Select key figures so that it is possible toreport on the selected transactions in three currencies (total only; do not includequantities or fixed portions).
2. Set up a variable so that you can enter the company code and the transactioncurrency when you execute the report. Enter the following default values:Company code, 1000, the currency, EURO, the current fiscal year, the plan/actualindicator, 0 (actual data), and no plan version. In addition, set the report toexecute without warnings against summarization levels.
Save the basic report definition. In the Performance dialog box, choose DisplayCurrent Data. You want to use a summarization level. You do not want anymessages to appear if there is no level (Execute report).
3. When you create the report definition, were the characteristics, Customer andProduct, available? Why is it not possible to analyze the cost elements bycustomer and product in the IDEA operating concern in account-based CO-PA?
When you created the report definition, was the Record type characteristicavailable as either a characteristic choice or a variable? When you created thereport definition, was the Record type characteristic available as a drill-downcharacteristic or variable? What is the purpose of the record type in costing-basedCO-PA, and why is this object missing in account-based CO-PA?
4. Execute the report you just created for the actual data in the company code,1000, and for the current fiscal year. When using basic reports in account-basedCO-PA, place the cost element at the top of the characteristic sort order becausethe values in the columns are only useful if they are linked to a cost element.Drilling down to the other characteristics in a cost element makes sense, butthe opposite is not true.
422 © 2004 SAP AG. All rights reserved. 04-02-2005

AC605 Lesson: Creating Reports
Solution 18: Report ComponentsTask 1:To create a sample contribution margin report, display the Sales Control Sales Controlkey figure scheme in the CO-PA Customizing settings Report Components.
Hint: A key figure scheme consists of a group of formulae used to definekey figures. The individual formulae are known as elements of the keyfigure scheme. They are based on previous elements and value fields. Theelements of the key figure scheme can be based on existing elements of thesame scheme and database fields. You can define the text and special displayparameters for each element. As with value fields, you can use the elementsof the key figure scheme in the form or the report itself.
1. What are the elements of this key figure scheme? Indicate which elements areformulae:
Display the basic formula for the Net Revenue key figure component. What isthe formula associated with this component?
a) To create a sample contribution margin report, display the Sales Controlkey figure scheme in the CO-PA Customizing settings Report Components.
Hint: A key figure scheme consists of a group of formulae used todefine key figures. The individual formulae are known as elementsof the key figure scheme and are based on previous elements andvalue fields. The elements of the key figure scheme can be basedon the existing elements of the same scheme and on databasefields. You can define the text and special display parameters foreach element. As with value fields, you can use the elements of thekey figure scheme in the form or in the report itself.
What are the elements of this key figure scheme? Indicate which elementsare formulae:
IMG → Profitability Analysis→ Information System → ReportComponents→ Define Key Figure Scheme. Select the key figure scheme,VC, and select Details→ Elements of the Key Figure Scheme .
Sales quantity
RevenuesContinued on next page
04-02-2005 © 2004 SAP AG. All rights reserved. 423

Unit 6: Information System AC605
Sales deductions
Net revenue
Raw material
Variable production costs
Variable cost of goods manufactured
Contribution margin I
CM I/Quantity
Fixed costs of goods manufactured
Total overhead costs
Contribution margin II
CM II/Quantity
Administration costs
Sales costs
Contribution margin III
CM III/Quantity
Display the basic formula for the Net Revenue key figure component. Whatis the formula associated with this component?
Select Net Revenue Element and choose Basic Formula from the toolbar.
Revenues � Sales Deductions
2. Modify the report you created in exercise 1-1, to include this key figure scheme.Make sure you delete the existing value fields in your report before you addthe key figure scheme. Execute the report and write down the key figures thatappear in the drill-down and detail lists.
Select the Key Figures tab and remove the selected value fields from the table onthe left.
Add all the key figures from the Sales Control key figure scheme to your report.To do this, select the double arrow that points to the left.
Continued on next page
424 © 2004 SAP AG. All rights reserved. 04-02-2005

AC605 Lesson: Creating Reports
Save your report and execute it for the same parameters as above.
a) Modify the report you created in exercise 1-1, to include this key figurescheme. Make sure you delete the existing value fields in your reportbefore you add the key figure scheme. Execute the report and write downthe key figures that appear in the drill-down and detail lists.
Accounting→ Controlling→ Profitability Analysis→ InformationSystem→ Define Report→ Change Report.
Field Name or Data Type ValuesReport BR##
Select the Key Figures tab and remove the selected value fields from thetable on the left.
Choose Value Field On/Off and click it one time. This will remove thevalue fields from the selection table on the right. Enter the Sales Controlkey figure scheme in the appropriate selection field.
Add all the key figures from the Sales Control key figure scheme to yourreport. To do this, select the double arrow that points to the left.
Save your report and execute it for the same parameters as above.
Continued on next page
04-02-2005 © 2004 SAP AG. All rights reserved. 425

Unit 6: Information System AC605
Task 2:Create a new key figure scheme in costing-based CO-PA reports, which will containthe definitions for the marketing key figures that your CEO wants to view in theprofitability report.
Name the scheme, ##, where ## is your group number, and enter a clear description.Create the following four elements in the scheme: Net revenue, Contribution margin I,Contribution margin II, and Operating profit.
The CEO has stipulated that these key figures be defined as follows:
Element MeaningNet revenue Revenue minus discounts and rebates
(incl. cost-accounting value)Contribution margin I Net revenue minus standard cost of
goods soldContribution margin II Contribution margin I minus
production variancesOperating profit Contribution margin II minus period
costs (Sales and administrativeoverheads)
Name: ##
Description: (for example, Group ## Scheme)
1. Save and then define the information about the scheme. Select Details and thenchoose New Entries to define the first element. For example:
Element of KF Scheme 010Short Text Net RevenueMedium-Length Text Net RevenueLong Text Net Revenue
Choose Basic Formula. Select Choose Entries and the following value fields:
Continued on next page
426 © 2004 SAP AG. All rights reserved. 04-02-2005

AC605 Lesson: Creating Reports
Element Description9005 Sales Rev.9006 Quantity Discount9007 Customer Discount9008 Material Discount9010 Other Discount9011 Cash Discount
After you have confirmed the selected items, change the + signs to - signs infront of the sales deductions, except Revenue. Save the definition.
If time allows, create a new basic report using your key figure scheme.
a) Create a new key figure scheme in costing-based CO-PA reports, whichwill contain the definitions for the marketing key figures that the CEOwants to view in the profitability report.
Name the scheme, ##, where ## is your group number, and enter a cleardescription. Create the following four elements in the scheme: Net revenue,Contribution margin I, Contribution margin II, and Operating profit.
The CEO has stipulated that these key figures be defined as follows:
Element MeaningNet revenue Revenue minus discounts and
rebates (incl. cost-accountingvalue)
Contribution margin I Net revenue minus standard costof goods sold
Contribution margin II Contribution margin I minusproduction variances
Operating profit Contribution margin IIminus period costs (Salesand administrative overheads)
Profitability Analysis→ Environment→ Set Operating Concern. Choosecosting-based CO-PA for the IDEA operating concern.
Continued on next page
04-02-2005 © 2004 SAP AG. All rights reserved. 427

Unit 6: Information System AC605
IMG→ Controlling→ Profitability Analysis→ Information System→Report Components→ Define Key Figure Schemes. Choose New Entries.
Key Figure Scheme: ##
Medium-Length Text: (for example, Group ## Scheme)
Define the information about the scheme. Select Details and choose NewEntries to define the first element. For example:
Double-click Elements of Key Figure Scheme and choose New entries:
Element Number: 010Short Text: Net revenueMedium-Length Text: Net revLong Text: Net revenue
Choose Basic formula. Select Choose Entries and choose the followingvalue fields:
Element Description9008 Sales Rev.9009 Quantity Discount9010 Customer Discount9011 Material Discount9012 Other Discount9011 Cash Discount
After you have confirmed the selected items, change the + signs to - signsin front of the sales deductions, except Revenue. Confirm the entries.Save the definition.
Use the navigation buttons or the menu path Go to→ Next Entry tocreate more elements in the scheme. Each subsequent element can use theprevious element as a reference. This makes it relatively easy to carryout the definition process.
After the last element has been defined, save the structure.
If time permits, create a new basic report using your key figure scheme.
Continued on next page
428 © 2004 SAP AG. All rights reserved. 04-02-2005

AC605 Lesson: Creating Reports
Task 3:Your sales manager wants to group customers in the sales organization into segmentsbased on revenue performance. Create a characteristics hierarchy for customers.Name this hierarchy variant, ##1, where ## is your group number, and enter anappropriate description that also contains your group number. Next, maintain thehierarchy so that customers are broken down into the following four categories:
Segment A Segment B Segment C NewCustomer no. 1174, 1300,
1900, 1175,1032,2004
1901, 2140,1001, 1321,2200, 1033,2007, 2130,1460
1171, 2141,1034, 2300,2000
T-CO05A##
1. For nodes in the hierarchy with no direct posting, create the following values,where ## is your group number. Enter the customers under each node, asindicated in the table above.
Select the characteristic, Customer, from the list of characteristics on the left.Enter the variant number for your group and select Create.
Enter a description and select Hierarchy.
Starting with the top node, enter the number, 999999##, where ## is your groupnumber, directly in the node and select ENTER. Enter a description, CustomerHier Gr##, in the text box for the node.
Create other nodes in the same way, following the instructions below and fill inthe characteristic values for each node. To enter node text, select ENTER onceyou have added a node key.
99999## Customer Hierarchy Gr.## | ----
99991## Segment A
|__1174
|__1300
|__�..
---- 99992## Segment B
|__1901
|__2140
Continued on next page
04-02-2005 © 2004 SAP AG. All rights reserved. 429

Unit 6: Information System AC605
|__�
---- 99993## Segment C
|__1171
|__�
---- 99994## New
T-CO05A##
|__�.
Save the hierarchy.
a) Your sales manager wants to group customers in the sales organization intosegments based on revenue performance. Create a characteristics hierarchyfor customers. Name this hierarchy variant, ##1, where ## is your groupnumber, and enter an appropriate description that also contains your groupnumber. Next, maintain the hierarchy so that customers are broken downinto the following four categories:
Segment A Segment B Segment C NewCustomerno.
1174, 1300,1900, 1175,1032,2004
1901, 2140,1001, 1321,2200, 1033,2007, 2130,1460
1171, 2141,1034, 2300,2000
T-CO05A##
For nodes in the hierarchy with no direct posting, create the followingvalues, where ## is your group number. Enter the customers under eachnode, as indicated in the table above.
Profitability Analysis→Master Data→ Characteristic Values→ DefineCharacteristics Hierarchy
Select the characteristic, Customer, from the list of characteristics on theleft. Enter the variant number for your group and select Create.
Enter a description and select Hierarchy.
Starting with the top node, enter the number, 999999##, where ## is yourgroup number, directly in the node and select ENTER. Enter a description,Customer Hier Gr##, in the text box for the node.
Continued on next page
430 © 2004 SAP AG. All rights reserved. 04-02-2005

AC605 Lesson: Creating Reports
Create other nodes in the same way, following the instructions below, andfill in the characteristic values for each node. To enter node text, selectENTER after you have added a node key.
Use the corresponding icons or the options in the Edit menu to insertnodes or levels.
Create and use 999999## for the top node with no direct posting (call itCustomer Hierarchy).
99999## Customer Hierarchy Gr.## | ----
99991## Segment A
|__1174
|__1300
|__�..
---- 99992## Segment B
|__1901
|__2140
|__�
---- 99993## Segment C
|__1171
|__�
---- 99994## New
T-CO05A##
|__�.
Save the hierarchy.
2. Next, add the characteristic hierarchy to the basic report you created in exercise1-1. Notice that you can insert a master data hierarchy when you add acharacteristic to a report. Enter the hierarchy variant, ##1, save, and execute thereport for the same parameters as above.
Continued on next page
04-02-2005 © 2004 SAP AG. All rights reserved. 431

Unit 6: Information System AC605
Select the Hierarchy option next to the customer characteristic. At the prompt,select your hierarchy from the list displayed. Execute the report.
a) Next, add the characteristic hierarchy to the basic report you created inexercise 1-1. Notice that you can insert a master data hierarchy when youadd a characteristic to a report. Enter the hierarchy variant, ##1, save, andexecute the report for the same parameters as above.
Accounting→ Controlling→ Profitability Analysis→ InformationSystem→ Define Reports→ Change Report.
Field Name or Data Type ValuesReport BR##
Select the Hierarchy option (second check box) next to the customercharacteristic. At the prompt, select your hierarchy from the list displayed.Execute the report.
Report→ Execute
3. Use the master data hierarchy to move through the report.
Expand and collapse the branches of the hierarchy using the hierarchy navigationfeatures in the report list. How would you remove the hierarchy from the reportdata displayed?
a) Use the master data hierarchy to move through the report.
Expand and collapse the branches of the hierarchy using the hierarchynavigation features in the report itself. How would you remove thehierarchy from the report data displayed?
Edit→ Hierarchy Selection: No Hierarchy
Task 4:Your manager requires profitability reports at the month-end along the strategicbusiness units of the company by the income statement account in two currencies.The manager requires one particular report where the manager can select only thetransactions that took place for a given company code in a specific transactioncurrency. This enables the manager to analyze and report the business volume thateach SBU generates in the local and foreign currencies.
1. To generate these reports, create a basic report for the controlling area, 1000,in account-based CO-PA and name it BRXX, where XX is your group number.Enter a suitable description.
Continued on next page
432 © 2004 SAP AG. All rights reserved. 04-02-2005

AC605 Lesson: Creating Reports
Create the report definition so that the cost element, SBU, customer group, andmaterial group are sorted in this order. Select key figures so that it is possible toreport on the selected transactions in three currencies (total only; do not includequantities or fixed portions).
a) Your manager requires profitability reports at the month-end along thestrategic business units of the company by the income statement accountin two currencies. The manager requires one particular report wherethe manager can select only the transactions that took place for a givencompany code in a specific transaction currency. This enables the managerto analyze and report the business volume that each SBU generates inthe local and foreign currencies.
To generate these reports, create a basic report for the controlling area,1000, in account-based CO-PA and name it BRXX, where XX is yourgroup number. Enter a suitable description.
Create the report definition so that the cost element, SBU, customer group,and material group are sorted in this order. Select key figures so that it ispossible to report on the selected transactions in three currencies (totalonly; do not include quantities or fixed portions).
2. Set up a variable so that you can enter the company code and the transactioncurrency when you execute the report. Enter the following default values:Company code, 1000, the currency, EURO, the current fiscal year, the plan/actualindicator, 0 (actual data), and no plan version. In addition, set the report toexecute without warnings against summarization levels.
Save the basic report definition. In the Performance dialog box, choose DisplayCurrent Data. You want to use a summarization level. You do not want anymessages to appear if there is no level (Execute report).
a) Set up a variable so that you can enter the company code and the transactioncurrency when you execute the report. Enter the following default values:Company code, 1000, the currency, EUR, the current fiscal year, theplan/actual indicator, 0 (actual data), and no plan version. In addition, setthe report to execute without warnings against summarization levels.
Profitability Analysis→ Environment→ Set Operating Concern.Chooseaccount-based CO-PA for the IDEA operating concern .
Select Environment→ Set Controlling Area. Select the ControllingArea 1000 .
Choose Profitability Analysis→ Information System→ Define Report→Create Profitability Report .
Continued on next page
04-02-2005 © 2004 SAP AG. All rights reserved. 433

Unit 6: Information System AC605
Name: BRXX Description: Business by Trans. Currency
Choose Basic report and then Create .
Select the required six characteristics on the Characteristics screen (usethe Page up and down functions, as necessary; remember to enter theCompany code and Currency). You can access this screen by selectingGo to→ Characteristics. After you have chosen the characteristics,select Sort User-defined Characteristics. Position Company code andCurrency at the top.
To create a variable, position the cursor on the Company code field andselect Variable on/off.
Choose the required key figures on the Key Figures screen (ValueObjCurr, Value TranCurr, and Value COCurr). Select the required keyfigures. You can access this screen using the scroll keys or by selectingGo to→ Select Key Figures. Select the required key figures and chooseAdd Key Figures.
Enter default values for the from/to periods and the Plan/actual indicator,such as the period from 001 to 012 in the current fiscal year, on theVariable screen. You can access this screen using the scroll keys or byselecting Go to→ Variables .
Save the report definition. In the Performance dialog box, choose DisplayCurrent Data. You want to use a summarization level. You do not wantany messages to appear if there is no level (Execute report).
3. When you create the report definition, were the characteristics, Customer andProduct, available? Why is it not possible to analyze the cost elements bycustomer and product in the IDEA operating concern in account-based CO-PA?
Continued on next page
434 © 2004 SAP AG. All rights reserved. 04-02-2005

AC605 Lesson: Creating Reports
When you created the report definition, was the Record type characteristicavailable as either a characteristic choice or a variable? When you created thereport definition, was the Record type characteristic available as a drill-downcharacteristic or variable? What is the purpose of the record type in costing-basedCO-PA, and why is this object missing in account-based CO-PA?
a) When you create the report definition, were the characteristics, Customerand Product, available? Why is it not possible to analyze the cost elementsby customer and product in the IDEA operating concern in account-basedCO-PA?
The customer and product are not available because they arenonsegment-level characteristics for the operating concern IDEAACCOUNT-BASED PA, which means that separate summary recordsare not available for the values of these characteristics .
When you created the report definition, was the Record type characteristicavailable as either a characteristic choice or a variable? When you createdthe report definition, was the Record type characteristic available as adrill-down characteristic or variable? What is the purpose of the record typein costing-based CO-PA, and why is this object missing in account-basedCO-PA?
The purpose of the record type in costing-based CO-PA is to indicate thesource of the data transferred to Profitability Analysis, such as billing,cost center assessment, and settlement. You cannot store the record typefor account-based CO-PA because its transaction and summary recordsare stored in general CO transaction data tables. Run the report youhave just created .
4. Execute the report you just created for the actual data in the company code,1000, and for the current fiscal year. When using basic reports in account-basedCO-PA, place the cost element at the top of the characteristic sort order becausethe values in the columns are only useful if they are linked to a cost element.Drilling down to the other characteristics in a cost element makes sense, butthe opposite is not true.
a) Execute the report you just created for the actual data in the companycode, 1000, and for the current fiscal year. When using basic reports inaccount-based CO-PA, place the cost element at the top of the characteristicsort order because the values in the columns are only useful if they arelinked to a cost element. Drilling down to the other characteristics in a costelement makes sense, but the opposite is not true.
End of optional exercises
04-02-2005 © 2004 SAP AG. All rights reserved. 435

Unit 6: Information System AC605
436 © 2004 SAP AG. All rights reserved. 04-02-2005

AC605 Lesson: Creating Reports
351 Exercise 19: Form ReportExercise Duration: 10 Minutes
Exercise ObjectivesAfter completing this exercise, you will be able to:� Create a simple form report in costing-based CO-PA, execute it, and navigate
through it� Create a more complex form report in costing-based CO-PA, execute it, and
navigate through it� Understand how to use variables in reporting
Business ExampleYour sales manager wants to obtain a quarterly trend report with regard to thecustomer and the product, using the Sales Control key figure scheme. Another salesmanager requires a similar report but wants to focus on the sales divisions anddistribution channels. A head of department also requires quarterly information sortedby the product and quantities sold.
Task 1:Most companies draw up quarterly reports. The most efficient way of doing this is touse form reporting in CO-PA.
Hint: A form is a formal structure of rows and columns that you can use inany number of reports in the same operating concern. A form represents thecontent and the formal structure of a report. It is a type of template. When youcreate a report, you can decide whether or not you want to use a form. Youdo not need a form to define simple reports. Notice that if you want to runmore complex reports or format the display for official reports, it is a goodidea to define a form before you create the reports.
1. In costing-based CO-PA, create a one axis form without key figures to be usedfor a specific fiscal year. The form should have the company code, 1000, actualdata, the record type, F, and the following layout:
Quarter 1 Quarter 2 Quarter 3 Quarter 4 Total
Continued on next page
04-02-2005 © 2004 SAP AG. All rights reserved. 437

Unit 6: Information System AC605
Name the form, FR1## Description: Sales Report Quarterly Form.
Select the One axis without key figure option to create the form. Select OperatingConcern Currency.
Double-click the first element and choose Characteristics. Choose Period andthen enter the values, 001 to 003.
Enter Quarter 1 in the text fields.
Define the columns for the quarters, 2, 3, and 4, in a similar way, changing theperiod values to correspond with the quarters.
Use a formula to create the Total column.
In general data selection, select the characteristics, Plan/act., Record type, Fiscalyear, and Company code. Specify the values or variables for these characteristics.
Field Name or Data Type ValuesCompany Code 1000Record Type FPlan/Actual Indicator 0Fiscal Year Variable √
Dialog box: Local Variable Year
Save the form definition.
2. Next, use the form you just created to define a new report. You can do thisdirectly from the form by selecting Create Report.
Select Report with form and enter the name of your form in the Form field.Select Create.
Note: The report and form names do not have to be the same.
Select the characteristics, Customer and Product, for the report. Select allthe key figures from the Sales Control key figure scheme.
In addition, indicate the current fiscal year as the default year for the report.Ensure that both the company code and the current fiscal year appear in theheader of the report list.
Select Classic Drill-down as the output type and use summarization data.
Continued on next page
438 © 2004 SAP AG. All rights reserved. 04-02-2005

AC605 Lesson: Creating Reports
Save the form report definition without selecting any hierarchies.
3. Create a header to enter the company code and the fiscal year.
Save the header definition and the report definition.
4. Execute the report for the current fiscal year. Move to all the columns in thereport using the Page left/Page right arrows. Notice how the columns in the formappear below the key figure that you selected in the report definition. Next,move from this overview to the detail view for a profitability segment. Noticethat the result is a contribution margin scheme for each quarter, which presentsan easy way to view the data for a single market segment.
Task 2:In addition to quarterly reporting, most companies draw up some type of plan/actualreports.
You can use form reports to do this. In costing-based CO-PA, create a two axis formfor a to-be-specified time interval for the company code, 1000 billing documents.Define a column for Actual values and a column for Plan Values, Version 5##. Inaddition, define two formula columns for the absolute and percentage variancebetween the actual and plan figures. The form should appear as follows:
Actual Plan Variance Var.%Gross revenueSales deductionsNet revenue afterdeductionsContribution marginIFixed COGMMaterial OHContribution marginII
1. Name your report, FR2XX, and enter a description such as: Plan/Actual Form
For the Variance column, choose Formula instead of Characteristic. Define theformula as the Actual column minus the Plan column. Enter the text, Variance.
Continued on next page
04-02-2005 © 2004 SAP AG. All rights reserved. 439

Unit 6: Information System AC605
Select Formula as the screen element for the Variance % column. Define theformula as Variance x 100 / Plan column. Enter the text, Var. %.
2. For the first row, use the key figure element, IDES DET CM, by selecting KeyFigure Scheme when defining the row. Select the appropriate key figure. Do notselect any characteristics, and adopt the text for the key figure. Proceed in thesame way for the remaining six rows.
3. Next, define the general data for the report:
Field Name or Data Type ValuesRecord Type FPeriod/Year From Variable √ Identifier: PFPeriod/Year To Variable √ Identifier: PTCompany Code 1000
4. To make it easy to read the drill-down list, you have decided to show onlycertain key figures in the report columns. Select both plan and actual values forRevenue and CM II.
5. To enhance the appearance of the report, you decide to highlight some of thekey rows.
Save the form definition.
6. Next, use the form you just created to define a new report. Name the report,FR2XX, and enter an appropriate description. Select the following drill-downcharacteristics: Sales Organization, Division, and Customer.
Notice that you cannot select any key figures because you have already createdthem in your form definition.
Save and execute the report for a time interval that produces results and movebetween the Drill-down and Detail screens.
Task 3:1. Read the online documentation on variables to help you answer the following
questions.
Call the Online Help and select the Cross-Application Components submenu.
Choose Drill-down Reporting→ Variables→ Variables: Overview
Name and briefly describe two classes of variables.Continued on next page
440 © 2004 SAP AG. All rights reserved. 04-02-2005

AC605 Lesson: Creating Reports
Task 4:1. Name the four types of variables. Which type is used most frequently in reports?
Which type is used to customize the appearance of a report? Which type is usedto customize the meaning of a column in a report?
04-02-2005 © 2004 SAP AG. All rights reserved. 441

Unit 6: Information System AC605
Solution 19: Form ReportTask 1:Most companies draw up quarterly reports. The most efficient way of doing this is touse form reporting in CO-PA.
Hint: A form is a formal structure of rows and columns that you can use inany number of reports in the same operating concern. A form represents thecontent and the formal structure of a report. It is a type of template. When youcreate a report, you can decide whether or not you want to use a form. Youdo not need a form to define simple reports. Notice that if you want to runmore complex reports or format the display for official reports, it is a goodidea to define a form before you create the reports.
1. In costing-based CO-PA, create a one axis form without key figures to be usedfor a specific fiscal year. The form should have the company code, 1000, actualdata, the record type, F, and the following layout:
Quarter 1 Quarter 2 Quarter 3 Quarter 4 Total
Name the form, FR1## Description: Sales Report Quarterly Form.
Select the One axis without key figure option to create the form. Select OperatingConcern Currency.
Double-click the first element and choose Characteristics. Choose Period andthen enter the values, 001 to 003.
Enter Quarter 1 in the text fields.
Define the columns for the quarters, 2, 3, and 4, in a similar way, changing theperiod values to correspond with the quarters.
Use a formula to create the Total column.
In general data selection, select the characteristics, Plan/act., Record type, Fiscalyear, and Company code. Specify the values or variables for these characteristics.
Continued on next page
442 © 2004 SAP AG. All rights reserved. 04-02-2005

AC605 Lesson: Creating Reports
Field Name or Data Type ValuesCompany Code 1000Record Type FPlan/Actual Indicator 0Fiscal Year Variable √
Dialog box: Local Variable Year
Save the form definition.
a) In costing-based CO-PA, create a one axis form without key figures to beused for a specific fiscal year. The form should have the company code,1000, actual data, the record type, F, and the following layout:
Quarter1
Quarter 2 Quarter 3 Quarter 4 Total
Profitability Analysis→ Environment→ Set Operating Concern.Selectcosting-based CO-PA for the IDEA operating concern.
Profitability Analysis→ Information System→ Current Settings→Define Forms for Profitability Analysis or in CO-PA Customizing→Information System→ Report Components→ Define Forms→ DefineForms for Profitability Reports.
Name the form, FR1##.
Description: Sales Quarter Report
Select the One axis without key figure option. Select Create to constructthe form. Select Operating Concern Currency.
Double-click the first element and choose Characteristics. Choose Periodand enter the values, 001 to 003.
Click the Change Short, Middle, Long Texts icon and enter Quarter 1in the text fields. Select Confirm.
Define the columns for the quarters, 2, 3, and 4, in a similar way, changingthe period values to correspond with the quarters.
Continued on next page
04-02-2005 © 2004 SAP AG. All rights reserved. 443

Unit 6: Information System AC605
Use a formula to create the Total column.
Double-click the empty spaces adjacent to the fourth column. ChooseFormula for the Total column. Define the formula as the sum of the firstfour columns. Enter Total as the text for the columns.
In general data selection, select the, Plan/act., Record type, Fiscal year, andCompany code. Specify the values or variables for these characteristics.
Edit→ Gen. Data Selection→ Gen. Data Selection.
Select Characteristics in the table on the right and select the single arrowthat points to the left to copy characteristics to General Data Selection.
Field Name or Data Type ValuesCompany Code 1000Record Type FPlan/Actual Indicator 0Fiscal Year Variable √ Dialog box: Local Variable
Year
Save the form definition.
2. Next, use the form you just created to define a new report. You can do thisdirectly from the form by selecting Create Report.
Select Report with form and enter the name of your form in the Form field.Select Create.
Note: The report and form names do not have to be the same.
Select the characteristics, Customer and Product, for the report. Select allthe key figures from the Sales Control key figure scheme.
In addition, indicate the current fiscal year as the default year for the report.Ensure that both the company code and the current fiscal year appear in theheader of the report list.
Select Classic Drill-down as the output type and use summarization data.
Continued on next page
444 © 2004 SAP AG. All rights reserved. 04-02-2005

AC605 Lesson: Creating Reports
Save the form report definition without selecting any hierarchies.
a) Next, use the form you have just created to define a new report. You can dothis directly from the form by selecting Create Report.
Profitability Analysis→ Information System→ Define Report→ CreateProfitability Report.
Select Report with form and enter the name of your form in the Form fieldand the Report field. Select Create.
Note: The report and form names do not have to be the same.
Select the characteristics, Customer and Product, for the report. Select allthe key figures from the Sales Control key figure scheme.
Tab→ Characteristics: Select the appropriate characteristics from thetable on the right and copy them to the left.
Tab→ Value Fields: Select the Sales Control key figure scheme.
Click Value Fields on/off one time to deactivate value fields. Use thedouble arrow that points to the left to copy all key figures.
In addition, indicate the current fiscal year as the default year for the report.Ensure that both the company code and the current fiscal year appear inthe header of the report list.
Tab→ Variables: Current Fiscal Year
Select Classic Drill-down as the output type- and use summarization data.
Tab→ Output Type
Tab→ Options:
Save the form report definition without selecting any hierarchies.
3. Create a header to enter the company code and the fiscal year.
Continued on next page
04-02-2005 © 2004 SAP AG. All rights reserved. 445

Unit 6: Information System AC605
Save the header definition and the report definition.
a) Create a header to enter the company code and the fiscal year.
Report→ Change→ Change: Output Type tab
Note: To edit the report header layout, make sure you are in thechange mode and not the create mode.
Choose Maintain (pencil icon) to add a new header. → Create
Click the Features icon. From the variables displayed in the window,select Company Code. Change the text type settings to Description andchange the width to 20. Choose Enter. Place your cursor in the emptyspace next to the �Company Code� text that appears in the header. Clickthe Characteristics icon. Select Company Code from the list of variablesdisplayed in the window. Change the text type settings to Value andchange the width to 4. Next, go to the next line and repeat these stepsfor the Fiscal Year field.
Save the header definition and the report definition.
4. Execute the report for the current fiscal year. Move to all the columns in thereport using the Page left/Page right arrows. Notice how the columns in the formappear below the key figure that you selected in the report definition. Next,
Continued on next page
446 © 2004 SAP AG. All rights reserved. 04-02-2005

AC605 Lesson: Creating Reports
move from this overview to the detail view for a profitability segment. Noticethat the result is a contribution margin scheme for each quarter, which presentsan easy way to view the data for a single market segment.
a) Execute the report for the current fiscal year. Move to all the columnsin the report using the Page left/Page right arrows. Notice how thecolumns in the form appear below the key figure that you selected in thereport definition. Next, move from this overview to the detail view fora profitability segment. Notice that the result is a contribution marginscheme for each quarter, which presents an easy way to view the data fora single market segment.
Profitability Analysis→ Information System→ Execute Report.
Specify the report name and continue.
Use the navigation functions to move from side to side to view all thekey figure columns.
Click the Detail hotspot one time and click the highlighted area thatappears adjacent to any of the rows of the report.
To return to the drill-down list, click the Overview hotspot one time andclick any of the highlighted characteristics.
Continued on next page
04-02-2005 © 2004 SAP AG. All rights reserved. 447

Unit 6: Information System AC605
Task 2:In addition to quarterly reporting, most companies draw up some type of plan/actualreports.
You can use form reports to do this. In costing-based CO-PA, create a two axis formfor a to-be-specified time interval for the company code, 1000 billing documents.Define a column for Actual values and a column for Plan Values, Version 5##. Inaddition, define two formula columns for the absolute and percentage variancebetween the actual and plan figures. The form should appear as follows:
Actual Plan Variance Var.%Gross revenueSales deductionsNet revenue afterdeductionsContribution marginIFixed COGMMaterial OHContribution marginII
1. Name your report, FR2XX, and enter a description such as: Plan/Actual Form
For the Variance column, choose Formula instead of Characteristic. Define theformula as the Actual column minus the Plan column. Enter the text, Variance.
Continued on next page
448 © 2004 SAP AG. All rights reserved. 04-02-2005

AC605 Lesson: Creating Reports
Select Formula as the screen element for the Variance % column. Define theformula as Variance x 100 / Plan column. Enter the text, Var. %.
a) Name your report, FR2XX, and enter a description such as: Plan/ActualForm.
Profitability Analysis→ Environment→ Set Operating Concern.
Choose costing-based CO-PA for the IDEA operating concern.
Profitability Analysis→ Information System→ Current Settings→Define the forms for Profitability Reports.
Select the two axis option and Continue.
Select Operating concern currency.
Double-click the column, 1. Choose Characteristics. In the dialog boxthat appears, select Plan/Act.Ind. Enter the characteristic Value, 0, anduse the default text.
Double-click the column, 2, and choose Characteristics. ChoosePlan/Act.Ind. and Version and specify 1 and 5## for the respectivevalues. Enter Plan for the texts.
For the Variance column, choose Formula instead of Characteristic.Define the formula as the Actual column minus the Plan column. Enter thetext, Variance.
Double-click the next column, which may be represented by a dot, andselect Formula. Use the formula editor as directed.
Select Formula as the screen element for the Variance % column. Definethe formula as Variance x 100 / Plan column. Enter the text, Var. %.
Continued on next page
04-02-2005 © 2004 SAP AG. All rights reserved. 449

Unit 6: Information System AC605
2. For the first row, use the key figure element, IDES DET CM, by selecting KeyFigure Scheme when defining the row. Select the appropriate key figure. Do notselect any characteristics, and adopt the text for the key figure. Proceed in thesame way for the remaining six rows.
a) For the first row, use the key figure element, IDES DET CM, by selectingKey Figure Scheme when defining the row. Select the appropriate keyfigure. Do not select any characteristics, and adopt the text for the keyfigure. Proceed in the same way for the remaining six rows.
Double-click the first row and choose Key Figure Scheme Element.Choose the appropriate Key figure Scheme, IDES DET CM. Choose theappropriate Value field. Do not select any characteristics and accept thedefault values by choosing Confirm.
Define the other rows in a similar way.
3. Next, define the general data for the report:
Field Name or Data Type ValuesRecord Type FPeriod/Year From Variable √ Identifier: PF
Period/Year To Variable √ Identifier: PTCompany Code 1000
a) Next, define the general data for the report:
Field Name or Data Type ValuesRecord Type FPeriod/Year From Variable √ Identifier: PFPeriod/Year To Variable √ Identifier: PTCompany Code 1000
Choose Edit→ Gen. Data Selection→ Gen. Data Selection. SelectionSelect Record Type, Period/Year, and Company Code. Continue andspecify values, and create local variables as appropriate. This means thevariables for period/year from and to.
Continued on next page
450 © 2004 SAP AG. All rights reserved. 04-02-2005

AC605 Lesson: Creating Reports
4. To make it easy to read the drill-down list, you have decided to show onlycertain key figures in the report columns. Select both plan and actual values forRevenue and CM II.
a) To make it easy to read the - list, you have decided to show only certainkey figures in the report columns. Select both plan and actual values forRevenue and CM II.
Extras→ Drilldown Display→ Select Rows/Columns.
Select Revenue and Contribution Margin from the row selection. SelectActual and Plan from the columns displayed by placing the cursor on thecolumn or row and choosing Select. Notice how each selection changescolor. Select Save Selections.
Hint: Although form reports allow the report writer to customizethe report layout using any number of key figures, the report outputmay be difficult to read when you access the report drill-down list.You can customize which key figures to display in the drill-downlist for comparison and display all the key figures selected in thedetail list.
5. To enhance the appearance of the report, you decide to highlight some of thekey rows.
Save the form definition.
a) To enhance the appearance of the report, you decide to highlight some ofthe key rows in the report.
Save the form definition.
6. Next, use the form you just created to define a new report. Name the report,FR2XX, and enter an appropriate description. Select the following drill-downcharacteristics: Sales Organization, Division, and Customer.
Notice that you cannot select any key figures because you have already createdthem in your form definition.
Continued on next page
04-02-2005 © 2004 SAP AG. All rights reserved. 451

Unit 6: Information System AC605
Save and execute the report for a time interval that produces results and movebetween the Drill-down and Detail screens.
a) Next, use the form you have just created to define a new report. Name thereport, FR2XX, and enter an appropriate description. Select the followingdrill-down characteristics: Sales Organization, Division, and Customer.
Notice that you cannot select any key figures because you have alreadycreated them in your form definition.
Save and execute the report for a time interval that produces results andmove between the Drill-down and Detail screens.
Choose Profitability Analysis→ Information System→ Define Report→Create Profitability Report.
Name: FR2XX Description: Plan/Actual Reports
Select the Report with the form option and enter the form name, FR2XX,in the Form field. Select Create.
Note: The report and form names do not have to be the same.
Enter any values on the Variables screen. For example, you can choosethe current fiscal year as the Period/Year.
Choose any combination of characteristics from the Characteristicsscreen. You can access this screen using a navigation function orchoosing Go to→ Characteristics.
Save the form report definition. In the Performance dialog box, chooseDisplay Current Data. You want to use a summarization level and do notwant any messages to appear if there is no level (Execute report). Do notspecify any characteristic hierarchies.
Profitability Analysis→ Information System→ Execute Report.
Specify the report name and continue.
To return to the drill-down list, click the Overview hotspot one time andclick any of the highlighted characteristics.
Click the Detail hotspot one time and click the highlighted area thatappears adjacent to any of the rows of the report.
Continued on next page
452 © 2004 SAP AG. All rights reserved. 04-02-2005

AC605 Lesson: Creating Reports
Task 3:1. Read the online documentation on variables to help you answer the following
questions.
Call the Online Help and select the Cross-Application Components submenu.
Choose Drill-down Reporting→ Variables→ Variables: Overview
Name and briefly describe two classes of variables.
a) Read the online documentation on variables to help you answer thefollowing questions.
Open the SAP Library, and select the Cross-Application Componentssubmenu. Choose CA - Drill-down Reporting→ Report→ Variables.
Name and briefly describe two classes of variables.
Global variables are variables that have the same meaning across manyforms and reports. If variables are used frequently, it makes senseto define them globally. Global variables have a more sophisticatedsubstitution logic than local variables.
Local variables are variables that only have meaning within a particularform or report. When a local variable is used in a form, it has the samemeaning across all the reports that share that form.
Task 4:1. Name the four types of variables. Which type is used most frequently in reports?
Which type is used to customize the appearance of a report? Which type is usedto customize the meaning of a column in a report?
a) Name the four types of variables. Which type is used most frequently inreports? Which type is used to customize the appearance of a report?Which type is used to customize the meaning of a column in a report?
Characteristic value; Hierarchy and hierarchy node; Text; and Formula.Characteristic value variables are used most frequently in report andform definitions. Hierarchy and hierarchy node variables are similarto Characteristic values. Text variables are used to customize theappearance of a report. Formula variables are used to customize themeaning of a column or a row in a report.
04-02-2005 © 2004 SAP AG. All rights reserved. 453

Unit 6: Information System AC605
454 © 2004 SAP AG. All rights reserved. 04-02-2005

AC605 Lesson: Creating Reports
369 Exercise 20: Line Item-Based ReportsExercise Duration: 10 Minutes
Exercise ObjectivesAfter completing this exercise, you will be able to:� Create a drill-down report based on line items
Business ExampleYour sales manager wants to obtain a daily sales report on customer sales figures andallow drill-down to the billing document and billing date.
Task:
Hint: You can create reports based on line items. For this purpose, bothbasic reports and the reports with forms are available. During characteristicselection, you can access both characteristics at the segment level and thecharacteristics in the operating concern. For example, you can access thereference document number or the order number.
1. Create a basic line item report, LR##, which displays all the reference documentnumbers in the current period for the customer, T-CO05A##. You want to viewonly the revenue and invoiced quantity.
You also want to view the billing date. Choose Actual Data for your reportand as the record type.
Characteristics:
Field Name or Data Type ValuesCustomer T-CO05A##Reference Document Number √Billing Date √
Sort the characteristics so that the customer appears first, the reference documentsecond, and the billing date third.
Execute:
Continued on next page
04-02-2005 © 2004 SAP AG. All rights reserved. 455

Unit 6: Information System AC605
Field Name or Data Type ValuesFrom period CurrentTo period CurrentPlan/actual key figure 0Version -Record Type F
2. How many reference documents are displayed?
3. View the total revenue at the material group level. How much does the totalrevenue amount to?
456 © 2004 SAP AG. All rights reserved. 04-02-2005

AC605 Lesson: Creating Reports
Solution 20: Line Item-Based ReportsTask:
Hint: You can create reports based on line items. For this purpose, bothbasic reports and the reports with forms are available. During characteristicselection, you can access both characteristics at the segment level and thecharacteristics in the operating concern. For example, you can access thereference document number or the order number.
1. Create a basic line item report, LR##, which displays all the reference documentnumbers in the current period for the customer, T-CO05A##. You want to viewonly the revenue and invoiced quantity.
You also want to view the billing date. Choose Actual Data for your reportand as the record type.
Characteristics:
Field Name or Data Type ValuesCustomer T-CO05A##Reference Document Number √Billing Date √
Sort the characteristics so that the customer appears first, the reference documentsecond, and the billing date third.
Execute:
Field Name or Data Type ValuesFrom period CurrentTo period CurrentPlan/actual key figure 0Version -Record Type F
a) Create a basic line item report, LR##, which displays all the referencedocument numbers in the current period for the customer, T-CO05A##.
Continued on next page
04-02-2005 © 2004 SAP AG. All rights reserved. 457

Unit 6: Information System AC605
You also want to view the billing date. Choose Actual Data for your reportand select Billing as the record type.
Profitability Analysis→ Information System→ Define Report→ CreateReport Based on Line Items.
Choose Operating Concern Currency.
Characteristics:
Field Name or Data Type ValuesCustomer T-CO05A##Reference Document Number √Billing Date √
Sort the characteristics so that the customer appears first, the referencedocument second, and the billing date third.
Key Figures:
Field Name or Data Type ValuesSales Revenue √Invoiced quantity in SKUn √
Execute:
Field Name or Data Type ValuesFrom period CurrentTo period CurrentPlan/actual key figure 0Version -Record Type F
2. How many reference documents are displayed?
a) How many reference documents are displayed?
The answers to this question vary.
Continued on next page
458 © 2004 SAP AG. All rights reserved. 04-02-2005

AC605 Lesson: Creating Reports
3. View the total revenue at the material group level. How much does the totalrevenue amount to?
a) View the total revenue at the material group level. What is the totalrevenue amount?
The answers to this question vary.
04-02-2005 © 2004 SAP AG. All rights reserved. 459

Unit 6: Information System AC605
Lesson Summary
You should now be able to:� Create basic reports� Create form reports� Create line item reports� Transfer the report data
460 © 2004 SAP AG. All rights reserved. 04-02-2005

AC605 Lesson: Financial Analytics in SAP BI
Lesson:375
Financial Analytics in SAP BILesson Duration: 30 Minutes
Lesson OverviewThis lesson helps you obtain an overview of SAP BI. It describes the integrationbetween CO-PA and SAP BI. In addition, it enables you to evaluate the benefits ofprofitability reporting in BI.
Lesson ObjectivesAfter completing this lesson, you will be able to:
� Explain the integration between CO-PA and SAP BI� Evaluate the benefits of Financial Analytics in SAP BI
Account-based Profitability Analysis
Create an account-based basic report. You can help the participants by defining thereport along the lines of the task set in the exercise, 3-4, which can be an optionalexercise. At this point, explain once again why the characteristics, customer andproduct, cannot be selected. Show how to integrate a cost element group and howthese groups are used in drill-down analytics.
Note: Remember to set account-based CO-PA beforehand and set theManagement Accounting area to 1000.
Accounting→ Controlling→ Profitability analysis→ Environment → Setoperating concern (IDEA and account-based)
Accounting→ Controlling→ Profitability analysis→ Information system→Define report→ Create
Business ExampleThe management of your company would like to implement a profitability accountingapplication in the SAP system. As a member of your the project team, you aresupposed to advise on the question of whether to implement CO-PA or EC-PCA in theSAP system. You will then be responsible for implementing the selected applications.
You need to analyze your plans to ensure maximum profits. For this reason, you needto understand the concept of Financial Analytics in SAP BI.
04-02-2005 © 2004 SAP AG. All rights reserved. 461

Unit 6: Information System AC605
Overview of SAP BW
Figure 146: SAP BW: Business Intelligence
Supply chain planning is a key component because you can use it to improve theperformance of the supply chain of a company and create shareholder value. Themajor benefits are improved customer service, reduced inventories, cycle timecompression, lower supply chain variability, and maximized ROA.
SAP APO enables a company to implement the best business practices to achieveoutstanding improvements. These include Sales and Operations Planning (SOP),Vendor Managed Inventory, Synchronous Manufacturing, and Capable-to-Promise.
Coordinating the many different tasks, people, and technical resources associatedwith running a warehouse, and transporting goods has never been easy. Despite thisfact, warehouse and transportation processes are a vital part of the supply chain andessential to creating a responsive and efficient business organization. In recent years,the pressure and complexity of the following factors have increased at a rapid pace:Globalization, mergers, fiercely competitive markets that highlight the importance ofcustomer service, and the emergence of new technologies, such as the Web.
The Logistics Execution System (LES) is a part of the unique Supply ChainManagement Initiative of SAP. It allows you to forge strong yet flexible links betweenthe production, procurement, storage, distribution, transportation, and sales andservice processes.
462 © 2004 SAP AG. All rights reserved. 04-02-2005

AC605 Lesson: Financial Analytics in SAP BI
Figure 147: BW and the Business Framework
The requirements placed on a modern solution for a data warehouse are coveredby the considerations that SAP has collected under the generic term of BusinessFramework Architecture.
Thoughts on the topics of quicker implementation of new functions, flexibility, andopenness have formed the background for this strategy. The technical prerequisites forthe componentization of business standard software are fulfilled by the availability oftried and tested ALE and techniques in the SAP system.
A business component provides self-contained business functions with stableinterfaces. Such a component has its own cycle with regard to development,implementation, and maintenance. Some components can run on their own, dedicateddatabase.
The business components make use of the object-oriented interface technology basedon Business Application Programming Interfaces (BAPIs). A BAPI is a methodof an SAP Business Object and attains a new level of interoperability between theencapsulated SAP Business components that can be networked.
SAP uses Application Link Enabling (ALE) and SAP Business Workflow to ensurethe integration of the whole system. This means that business processes can alsobe formed across components.
04-02-2005 © 2004 SAP AG. All rights reserved. 463

Unit 6: Information System AC605
Figure 148: Business Content Overview
The Business Information Warehouse is preconfigured with SAP business know-howor Business Content.
Business Content covers information models, queries, and extractors, as well asexternal data and company benchmarking.
SAP BI functions also include a number of standard evaluation possibilities for keybusiness areas.
The Business Content strategy allows SAP to:
� Map the content of the standard SAP ERP system.� Display the industry-specific models.� Provide a platform for partners� content.� Include external data such as:
� Consolidated POS data� Market research data� Demographic data� Company benchmark data
464 © 2004 SAP AG. All rights reserved. 04-02-2005

AC605 Lesson: Financial Analytics in SAP BI
Figure 149: Business Information Warehouse Architecture
This figure provides an overview of the SAP Business Information Warehousestructure in a heterogeneous system landscape.
SAP systems and external systems are displayed as OLTP systems in the lower sectionof the screen.
Metadata and application data is managed on the Business Information Warehouseserver.
You use the Business Information Warehouse to manage the various source systems.You also use the components of the Administrator Workbench, Scheduler andMonitor, to schedule and monitor the transfer of meta and transaction data from theassigned legacy systems.
The Business Explorer, with its reporting tools, forms a third layer.
The individual areas will be explained extensively in the following units.
As components of the Business Framework, the OLTP applications and the BusinessInformation Warehouse communicate using Business Application ProgrammingInterfaces (BAPIs).
SAP delivers Production Data Extractors that prepare SAP ERP data for eachapplication for extraction into the Business Information Warehouse.
For nonSAP OLTP systems, the BW BAPI interface allows the use of third-partyextraction tools to prepare and extract data.
04-02-2005 © 2004 SAP AG. All rights reserved. 465

Unit 6: Information System AC605
Integration Between CO-PA and BW
Integration with BW
Refer to the product management white paper available through SAPNET if youneed to know more.
Figure 150: Extraction of Data from CO-PA to SAP BW
The Administrator Workbench is the tool used to get data from the source systemsinto the Business Information Warehouse.
All the systems that provide the SAP Business Information Warehouse with dataare indicated as source systems.
An InfoSource is a summarized quantity of information that logically belongs togetherfor a unit. InfoSources can either encompass transaction data or master data, such asattributes, texts and hierarchies.
An InfoSource is always a quantity of an InfoObject collection. An InfoSource alwayssignifies one scenario from an application, such as Financial Accounting.
The business evaluation objects, such as customer and sales revenue, are knownas InfoObjects in the BW. They are divided into characteristics, key figures, units,and time characteristics.
466 © 2004 SAP AG. All rights reserved. 04-02-2005

AC605 Lesson: Financial Analytics in SAP BI
The scheduler is the connecting link between the source systems and the InfoCubes.With this tool, you establish what data is requested from the source system and atwhat time it is updated in the InfoCube and the Operational Data Store (ODS). Theprinciple of the scheduler goes back to the functions of the SAP ERP backgroundjobs. The data request can be scheduled either straightaway or with a background job,and automatically at a later point in time.
Figure 151: Profitability Analysis with BW
Reporting with the Business Explorer: The Business Information Warehouse deliversthe information for the analysis of all of the factors that influence the businessactivities of an enterprise. The databasis of the Business Information Warehouse isstructured into self-contained business data areas (InfoCubes). An InfoCube containsthe InfoObjects of the type characteristics and key figures. It is best to imagine anInfoCube as a data cube with a key figure axis. Each characteristic stretches along oneaxis of the cube with all its different values. The number of characteristics determinesthe complexity of the data cube, and the number of characteristic values determinesthe length of the edge of the cube with this dimension. The amount of the key figuresin the InfoCube also forms an axis (+1). The dataset of the InfoCube can be evaluated
04-02-2005 © 2004 SAP AG. All rights reserved. 467

Unit 6: Information System AC605
according to different characteristics and key figures using the Business InformationWarehouse reporting function. As a result, you have the possibility of carrying out alltypes of variance analyses, such as plan-actual comparison and fiscal year comparison.
� Database Considerations
� High Data Volume� Cross Application Reporting� Collecting Data from Different Systems� Combining Legacy System Data with CO-PA Data
In a scenario of how SAP BI is used in profitability reporting, you move thereporting tasks from SAP ERP into an independent system. For such a scenario,SAP ERP operates as an Online Transaction Processing (OLTP) system, which runsthe operational business, and the SAP BI system serves as an Online AnalyticalProcessing (OLAP) system.
For environments involving several SAP ERP systems that represent slightly differentmethods of profitability analysis for various countries or business units, you need togain a cross-system view. In this scenario, the results from the different organizationalsubunits are combined into a single InfoCube in SAP BI that contains the samereporting levels and calculations of contribution margins. CO-PA provides thenecessary functions for preparing your data basis for group profitability.
A third scenario for the implementation of CO-PA with an SAP BI installation is whenthe affiliated companies or the parts of your company operate systems other than SAPand their data has to be consolidated in your reporting of group profitability.
468 © 2004 SAP AG. All rights reserved. 04-02-2005

AC605 Lesson: Financial Analytics in SAP BI
Facilitated Discussion
Discussion QuestionsUse the following questions to engage the participants in the discussion.Feel free touse your own additional questions.
� Outline how you would combine the results from the different organizationalsubunits into a single InfoCube in SAP BW that contains the same reportinglevels and calculations of contribution margins.
04-02-2005 © 2004 SAP AG. All rights reserved. 469

Unit 6: Information System AC605
Lesson Summary
You should now be able to:� Explain the integration between CO-PA and SAP BI� Evaluate the benefits of Financial Analytics in SAP BI
470 © 2004 SAP AG. All rights reserved. 04-02-2005

AC605 Unit Summary
Unit SummaryYou should now be able to:� Evaluate the reporting options� Introduce drill-down reporting� Create basic reports� Create form reports� Create line item reports� Transfer the report data� Explain the integration between CO-PA and SAP BI� Evaluate the benefits of Financial Analytics in SAP BI
04-02-2005 © 2004 SAP AG. All rights reserved. 471

Unit Summary AC605
472 © 2004 SAP AG. All rights reserved. 04-02-2005

AC605 Test Your Knowledge
385Test Your Knowledge
1. Identify the main difference between basic and form reports.
2. List the analysis functions used to classify and rank CO-PA data.
3. How will you delete a report?
4. What are the three types of forms?
5. What is a line item report?
6. The format is a special format used to transfer the data from a reportto a spreadsheet application.Fill in the blanks to complete the sentence.
04-02-2005 © 2004 SAP AG. All rights reserved. 473
Test Your Knowledge AC605
7. The is the tool used to getdata from the source systems into the Business Information Warehouse.Fill in the blanks to complete the sentence.
8. All the systems that provide the SAP Business Information Warehouse with dataare indicated as .Fill in the blanks to complete the sentence.
9. When you move reporting tasks from SAP R/3 Enterprise intoan independent system, e SAP R/3 Enterprise operates as an
system.Fill in the blanks to complete the sentence.
474 © 2004 SAP AG. All rights reserved. 04-02-2005

AC605 Test Your Knowledge
387Answers
1. Identify the main difference between basic and form reports.
Answer: Reports with a simple, fixed layout are basic reports, and reports witha more complex structure and formatting are form reports.
2. List the analysis functions used to classify and rank CO-PA data.
Answer: You can classify and rank your CO-PA data using the following threeanalysis functions:
� Cumulative curve� ABC analysis� Classification
3. How will you delete a report?
Answer: A report can be deleted using the Change report function.
4. What are the three types of forms?
Answer: The three types of forms are:
� One axis without key figure.� One axis with key figure.� Two axes with key figure.
5. What is a line item report?
Answer: A line item report is a report that allows you to execute a line itemanalysis and simultaneously use all navigation functions in drill-down reporting.
6. The XXL format is a special format used to transfer the data from a report to aspreadsheet application.
Answer: XXL
04-02-2005 © 2004 SAP AG. All rights reserved. 475

Test Your Knowledge AC605
7. The Administrator Workbench is the tool used to get data from the sourcesystems into the Business Information Warehouse.
Answer: Administrator Workbench
8. All the systems that provide the SAP Business Information Warehouse withdata are indicated as source systems.
Answer: source systems
9. When you move reporting tasks from SAP R/3 Enterprise into an independentsystem, e SAP R/3 Enterprise operates as an Online Transaction Processingsystem.
Answer: Online Transaction Processing
476 © 2004 SAP AG. All rights reserved. 04-02-2005

Unit 7389 Tools
This unit covers performance settings, realignments, and the Customizing Monitor.These topics are technical to an extent and they are not discussed extensively. Makeparticipants aware of the fact that when using these functions they need to seekfurther information from the documentation and the notes that can be found in OSS.Particularly draw their attention to the �Technical Aspects in CO-PA� section ofthe documentation.
Unit OverviewThis unit explains the various tools in Planning. It defines the summarization levelsfor CO-PA and explains the concept of summarized data and frozen data. It also helpsexecute realignments of data.
Unit ObjectivesAfter completing this unit, you will be able to:
� Define and activate summarization levels� Understand summarized data and frozen data� Re-organize data after organizational changes have occurred� Analyze the Customizing Settings using the different options of the Customizing
Monitor
Unit ContentsLesson: Performance Tools .. . . . . . . . . . . . . . . . . . . . . . . . . . . . . . . . . . . . . . . . . . . . . . . . . . . . . .479
Demonstration: Summarization Levels and Frozen Data .. . . . . . . . . . . . . . . .486Exercise 21: Performance Tools... . . . . . . . . . . . . . . . . . . . . . . . . . . . . . . . . . . . . . . . . . . .489Exercise 22: Summarization Levels ... . . . . . . . . . . . . . . . . . . . . . . . . . . . . . . . . . . . . . .491
Lesson: Realignment and Customizing Monitors.. . . . . . . . . . . . . . . . . . . . . . . . . . . . . .497Demonstration: Realignments .. . . . . . . . . . . . . . . . . . . . . . . . . . . . . . . . . . . . . . . . . . . . . . .500
04-02-2005 © 2004 SAP AG. All rights reserved. 477

Unit 7: Tools AC605
Demonstration: Customizing Monitors... . . . . . . . . . . . . . . . . . . . . . . . . . . . . . . . . . . . .502Exercise 23: Realignment Concept . . . . . . . . . . . . . . . . . . . . . . . . . . . . . . . . . . . . . . . . . .503
478 © 2004 SAP AG. All rights reserved. 04-02-2005

AC605 Lesson: Performance Tools
Lesson:390
Performance ToolsLesson Duration: 45 Minutes
Lesson OverviewThis lesson covers how to define and activate summarization levels. It also helps youto understand summarized data and frozen data.
Lesson ObjectivesAfter completing this lesson, you will be able to:
� Define and activate summarization levels� Understand summarized data and frozen data
Explain that there are three main performance-tuning tools used to improve theretrieval of CO-PA data such as summarized data, frozen data, and summarizationlevels. Each tool has its distinct advantages.
Summarization levels: Improve CO-PA performance when there are large volumesof data. Draw attention to the fact that the summarization levels are not just usedwithin data selection in the Information System, but also within planning and foractual data, cost center assessment, and top-down distribution.
Business ExampleThe management of your company would like to implement a profitability accountingapplication in the SAP system. As a member of your the project team, you aresupposed to advise on the question of whether to implement CO-PA or EC-PCA in theSAP system. You then will be responsible to implement the selected applications. Toincrease data retrieval speed on some of your routine reports, you have decided to usefrozen data. For this purpose, you need an understanding about the summarizationlevels, summarized data, and frozen data.
04-02-2005 © 2004 SAP AG. All rights reserved. 479

Unit 7: Tools AC605
Summarization Levels
Figure 152: CO-PA Database Structures
Segment Table and Segment Level
The lowest levels from which the application reads data is the segment table andthe segment level. This level contains the data from the line item in a primarysummarized form.
The segment table contains the profitability segments and their characteristic values.
The segment level contains the value fields for profitability segments and thecharacteristics of time.
The segment level always contains the most up-to-date data because it is updatedsimultaneously with each transaction instead of periodically. The division of thisinformation into two tables according to characteristics, segment table, value fields,and segment level, reduces data volume by eliminating redundancy. This methodalso has two other important advantages:
� Storing historic data: If you do not need the origin information for data fromprevious periods, you can archive the line items and retain only the segment level.
� Realigning posted data: For example, you can retroactively assign a customer toa different sales representative. This only changes the segment table, and the lineitems retain the assignment they had when you originally posted the documents.No change is required in the segment level because the change in the segmenttable implicitly affects the data for the periods in the segment level.
480 © 2004 SAP AG. All rights reserved. 04-02-2005

AC605 Lesson: Performance Tools
Figure 153: How Performance Settings Work
The data in Profitability Analysis is stored at the individual document level. Thismeans that every item of a sales order is sent to the CO-PA database as a line item.This can lead to a huge amount of data within a very short period of time. As a result,you may experience run-times of several hours when you run a report that displaysdata summarized to a high degree but has to read the entire dataset. Often, you cannotselect the data online. To improve run-times, you need to reduce the volume of datathat has to be read online. You can achieve this by creating summarized versionsof the dataset.
In reports, you can display:
� Only the data from the summarization level, which means the data up to the lasttime you updated the level.
� The current data, in which case the system reads the summarization level andthen adds the line items that have been posted since the last update.
If no suitable summarization level exists, the system displays a warning.
You should you use the current data when you want to display the data from thecurrent period. Use themost recent summarized data when you want to display dataonly after the end of the period, which means when the data is not going to changeanymore.
04-02-2005 © 2004 SAP AG. All rights reserved. 481

Unit 7: Tools AC605
If you choose to store the summarization data for a report, the system creates thisdata by reading a summarization level. This means that the fewer characteristics youuse in the report, the less data the system has to read from the level, and consequentlythe less time it takes to display the report.
Figure 154: Summarization Levels
When defining a report in Financial Analytics, you need to specify whether a reportshould continue with execution if it cannot find a suitable summarization level, whichcould take some time, or it should continue executing with a warning that it could takesome time, or if it should stop executing.
You also need to define whether a report should access the data from a summarizationlevel alone or it should read current data, requiring the addition of data from any lineitems that have been posted since the level was last updated. Other CO-PA functionsautomatically access the current data.
To use summarization levels, you need to perform the following steps:
1. Define the summarization levels in configuration.2. Fill the summarization levels with data from the segment-level summary records
on the user side.3. Update the summarization levels periodically in the background, on the user side.
482 © 2004 SAP AG. All rights reserved. 04-02-2005

AC605 Lesson: Performance Tools
Each summarization level is physically two tables in the database, a key table and asummary record table, which act like the CE4 and CE3 tables in costing-based CO-PA.You can analyze the statistics on the levels in configuration to determine whether ornot they are efficient. How many times they are being used by CO-PA functions andtheir relative size compared with the std summary table?
Performing a realignment on CO-PA data automatically invalidates all the data thathad been previously summarized in the summarization levels. After a realignment hasbeen performed, the summarization levels have to be filled and rebuilt from scratchagain instead of being updated.
Figure 155: Summarization Level Proposals
For both forms of Profitability Analysis, account-based and costing-based, you canobtain from the system:
� A record of user behavior in reporting.� Proposals for new summarization levels appropriate to this behavior.� You can determine the period to be used for analyzing user behavior.
You can decide whether the system should take into account the existingsummarization levels when generating proposals or completely new levels shouldbe created instead.
Proposals should be generated in the background.
04-02-2005 © 2004 SAP AG. All rights reserved. 483

Unit 7: Tools AC605
Each proposal displays how much time is expected to be saved when the report is runusing that particular summarization level. The suggested summarization levels arelisted in the order of time saved, starting with the level that saves most time.
After you have accepted a proposal and the system has created the correspondinglevels, you need to supply the levels with data using the report, RKETRERU, orchoosing Tools→ Summarization levels→ Update in the menu.
Summarized Data and Frozen Data
Figure 156: Summarization Data & Frozen Data
Summarization data signifies a set of summarized data for a combination of variablesfor a specific report. When you execute a report that has existing summarization data,the system accesses the summarization data and updates it by adding the line itemsthat have been posted since the last time the report was executed. The report outputthen displays the new summarization data.
Summarization data is normally only really efficient for a specific report if youexecute that report frequently. SAP, for this reason, does not recommend that you usesummarization data for most or all CO-PA reports.
484 © 2004 SAP AG. All rights reserved. 04-02-2005

AC605 Lesson: Performance Tools
When you define a report, you can specify whether the report will accesssummarization levels or use summarization data. Within the same operating concern,you can define reports with summarization data and reports with summarization levels.For each report, you must also specify how the system will react if no summarizeddata or summarization level can be found during report execution.
Frozen data signifies the data stored for a specific report and a specific set of variablevalues at a specific point in time. There can only be one set of frozen data for eachcombination of variables in a report.
Similar to summarization data, frozen data is valid for only a single report, thedifference is that frozen data cannot be updated. Frozen data is literally a snapshot intime of report data, which may have been generated directly from the segment level,or using summarization data or summarization levels.
Figure 157: Performance Settings - Key Points
You can use the function, Freeze Report Data, to save the data selected for the report.When you choose this function, the system also saves any changes you have madeto the report definition. You should use this function if you want to be able to callup exactly the same set of data at a later point in time. You can use variants andvariant groups to freeze report data at specified times in the background. By freezingreport data, you can execute the report online later without the system needingto read any data from the database. This reduces run-times substantially when youexecute reports online.
04-02-2005 © 2004 SAP AG. All rights reserved. 485

Unit 7: Tools AC605
Demonstration: Summarization Levels and Frozen Data
PurposeTo demonstrate how to create summarization levels and use frozen data
System DataSystem:Client:User ID:Password:Set up instructions:1. Show an existing summarization level, such as 310, and point out the
characteristics selected as well as the detailed statistics.
IMG → Controlling → Profitability Analysis → Tools → Definesummarization levels
Select Level 310 and Detail
2. Create a new summarization level for one of the reports you created in theInformation System unit using the proposal function. Explain the automaticselection of characteristics and indices. Save the new summarization level.
IMG→ Controlling→ Profitability Analysis→ Tools→ Have ProposalsCreated Automatically
Select the option: Suggest enhancements for reports run the past week
3. Next, populate the new summarization level with data. Take this opportunity toexplain the �update� and �delete and rebuild� functions.
Accounting→ Controlling→ Profitability analysis→ Tools→ summarizationlevels→ Update
4. Demonstrate the setting for using summarization levels for the report.
Accounting→ Controlling→ Profitability analysis→ Information system→Define report→ Change→ Options: Use a summarization level
5. Next, start the report again and draw the participants� attention to the message inthe message line. There, you can see that the report is reading the summarizationlevel you created.
Accounting→ Controlling→ Profitability analysis→ Information system→ Execute report
486 © 2004 SAP AG. All rights reserved. 04-02-2005

AC605 Lesson: Performance Tools
6. Show the statistical information (detailed information) for the summarizationlevel you created.
IMG→ Controlling→ Profitability analysis→ Tools→ Define summarizationlevels
7. Demonstrate how to create �Summarized data�.
Accounting→ Controlling→ Profitability analysis→ Information system→Define report→ Change→ Options: Use summarization data
Show the Frozen Data Option by executing the report, IDES-050, one more time.
Accounting→ Controlling→ Profitability analysis→ Information system→ Execute report
IDES-050
To create Frozen Data, select:
Report→ Save Data
Re-execute the report for the same parameters and point out the Frozen Dataoption. In addition, emphasize that frozen data can be created when runningreports in the background.
04-02-2005 © 2004 SAP AG. All rights reserved. 487

Unit 7: Tools AC605
488 © 2004 SAP AG. All rights reserved. 04-02-2005

AC605 Lesson: Performance Tools
397 Exercise 21: Performance ToolsExercise Duration: 15 Minutes
Exercise ObjectivesAfter completing this exercise, you will be able to:� Retrieve the frozen data produced by CO-PA reports run in the background� Understand summarization levels
Business ExampleTo increase data retrieval speed on some of your routine reports, you have decided touse frozen data. To further increase performance in CO-PA, your controlling managerhas decided to use summarization levels. You have created the summarization, level310, which contains a number of characteristics. You show her the effects of using thesummarization levels on performance when running reports.
Task 1:1. Execute BRXX, the first basic report that you created, where XX is your group
number in the background, for the company code, 1000, actual billing data, forthe previous and current fiscal years. Save instead of printing the report datagenerated in the background.
Specify the required characteristic values and select Freeze report data underthe Background Execution options.
Task 2:1. Retrieve the frozen data for the report you just ran in the background.
State the exact characteristic values that you used when you executed the reportin the background and then execute.
In the dialog box that appears, choose the Frozen Data option instead of CurrentData.
04-02-2005 © 2004 SAP AG. All rights reserved. 489

Unit 7: Tools AC605
Solution 21: Performance ToolsTask 1:1. Execute BRXX, the first basic report that you created, where XX is your group
number in the background, for the company code, 1000, actual billing data, forthe previous and current fiscal years. Save instead of printing the report datagenerated in the background.
Specify the required characteristic values and select Freeze report data underthe Background Execution options.
a) Execute BRXX, the first basic report that you created, where XX is yourgroup number in the background, for the company code, 1000, actualbilling data, for the previous and current fiscal years. Freeze instead ofprinting the data generated in the background.
Profitability Analysis Information System → Current Settings →Background Processing→ Maintain Variants. Enter the report name,BRXX, and select Rebuild Frozen Report Data.
Indicate the required characteristic values and select Freeze report dataunder the Background Execution options.
Select the following menu items: Program→ Execute in Background.
In the Background Print Parameters dialog box, select Enter. (Select Enterif any warnings appear). Select �Immediate� for the start time and saveyour entries. This starts the job in the background.
Task 2:1. Retrieve the frozen data for the report you just ran in the background.
State the exact characteristic values that you used when you executed the reportin the background and then execute.
In the dialog box that appears, choose the Frozen Data option instead of CurrentData.
a) Retrieve the frozen data for the report you just ran in the background.
Profitability Analysis→ Information System→ Execute Report: Enter thereport Name, BRXX and, execute.
Indicate the exact characteristic values that you used when you executedthe report in the background and then execute.
In the dialog box that appears, choose Saved Data instead of Current Data.
490 © 2004 SAP AG. All rights reserved. 04-02-2005

AC605 Lesson: Performance Tools
399 Exercise 22: Summarization LevelsExercise Duration: 15 Minutes
Exercise ObjectivesAfter completing this exercise, you will be able to:� Display the characteristics for a summarization level� Retrieve the analytical data on the location, size, and performance of a
summarization level� Schedule background jobs to update summarization levels� Write reports that use summarization levels
Business Example
Note: If you frequently run reports based on operating concern data that is notextensive, it is useful for you to be able to access the summarized data storedin summarization levels. Summarization levels are normally updated nightlyso that you can access the data at certain levels quickly during the day.
Task 1:1. Display the definition for the summarization level, 310. Which characteristics
have been selected?
Task 2:1. How can you display the number of times a level has been accessed by the various
CO-PA functions, such as reporting, planning, and cost center assessments?
2. What other key information is available on the Details screen for a summarizationlevel?
Task 3:1. Write and execute a basic report that uses the summarization level, 310.
Specify the following characteristics:
Company Code, Controlling Area, and Strategic Business Unit .
Currency Type (B0 Only) .
Continued on next page
04-02-2005 © 2004 SAP AG. All rights reserved. 491

Unit 7: Tools AC605
Execute the report for:
Fiscal Year: Current Fiscal Year
Period: 1 - 12
Plan/Actual Indicator: 0
Version: Blank
Record Type: F
2. How can you be sure that a report accesses a specific summarization level? Canyou assign a specific summarization level to a particular report?
492 © 2004 SAP AG. All rights reserved. 04-02-2005

AC605 Lesson: Performance Tools
Solution 22: Summarization LevelsTask 1:1. Display the definition for the summarization level, 310. Which characteristics
have been selected?
a) Display the definition for the summarization level, 310. Whichcharacteristics have been selected?
IMG→ Profitability Analysis→ Tools→ Summarization Levels→ DefineSummarization Levels.
Select the level, 310, and choose Characteristics.
Answer: Fiscal Year, Controlling Area, Currency Type (B0 Only), Period,Plan/Actual Indicator, Version, Record Type, Strategic Business Unit.
Task 2:1. How can you display the number of times a level has been accessed by the various
CO-PA functions, such as reporting, planning, and cost center assessments?
a) How can you display the number of times a level has been accessed byvarious CO-PA functions (for example, reporting, planning, cost centerassessments)?
IMG→ Profitability Analysis→ Tools→ Summarization Levels→ DefineSummarization Levels.
Select a level and choose Details (magnifying glass icon) or use the menuoption Goto→ Details.
View the information under Accesses.
2. What other key information is available on the Details screen for a summarizationlevel?
a) What other key information is available on the Details screen for asummarization level?
The names of the key table and the totals table in the ABAP Dictionary.
The number of entries in the key table and the totals table.
The number of CO-PA summary records read for the build.
The number of CO-PA records read for the updates.
Continued on next page
04-02-2005 © 2004 SAP AG. All rights reserved. 493

Unit 7: Tools AC605
Task 3:1. Write and execute a basic report that uses the summarization level, 310.
Specify the following characteristics:
Company Code, Controlling Area, and Strategic Business Unit .
Currency Type (B0 Only) .
Execute the report for:
Fiscal Year: Current Fiscal Year
Period: 1 - 12
Plan/Actual Indicator: 0
Version: Blank
Record Type: F
a) Write and execute a basic report that uses summarization level 310. Specifythe following characteristics:
Controlling Area, Strategic Business Unit .
Currency Type (B0 Only) .
Execute the report for:
Fiscal Year: Current Fiscal Year
Period: 1 - 12
Plan/Actual Indicator: 0
Version: Blank
Record Type: F
Accounting→ Controlling→ Profitability Analysis→ Information System→ Create Profitability Report. Follow the instructions for writing reportsoutlined in the solutions for the exercises in unit 7, but choose ONLY thecharacteristics contained in the summarization level. This applies to bothform and report definitions.
Continued on next page
494 © 2004 SAP AG. All rights reserved. 04-02-2005

AC605 Lesson: Performance Tools
2. How can you be sure that a report accesses a specific summarization level? Canyou assign a specific summarization level to a particular report?
a) How can you be sure that a report accesses a specific summarization level?Can you assign a specific summarization level to a particular report?
When a report is executed, the message, Reading from summarization levelXX, appears on the screen sometimes very briefly, when the report readsdata from a summarization level.
You cannot assign a report to a specific summarization level because thereport automatically searches for the most efficient (smallest) one thatcorresponds to the selection criteria.
04-02-2005 © 2004 SAP AG. All rights reserved. 495

Unit 7: Tools AC605
Lesson Summary
You should now be able to:� Define and activate summarization levels� Understand summarized data and frozen data
496 © 2004 SAP AG. All rights reserved. 04-02-2005

AC605 Lesson: Realignment and Customizing Monitors
Lesson:405
Realignment and Customizing MonitorsLesson Duration: 30 Minutes
Lesson OverviewThis lesson explains how to re-organize your data after organizational changes haveoccurred. It also describes how to use the various options of the Customizing Monitorto carry out some key analysis functions.
Lesson ObjectivesAfter completing this lesson, you will be able to:
� Re-organize data after organizational changes have occurred� Analyze the Customizing Settings using the different options of the Customizing
Monitor
The realignment function enables organizational changes in the data structures forproducts, customers, or sales. For example, it reassigns sales districts to areas orproducts to product groups. After realignment has been carried out, only the newdefinition is recognized in the Information System and in planning. You can onlydisplay the characteristic values that were previously valid using line item reports.Because the existing profitability segments, (Ce4 Table!!), are adjusted to the newdefinition, all the objects posted to a profitability segment, such as sales orders orprojects, and all the available documents, such as bills or Financial Accountingdocuments, are assigned to the characteristics in Profitability Analysis based on thenew definition.
Business ExampleThe management of your company would like to implement a profitability accountingapplication in the SAP system. As a member of your the project team, you aresupposed to advise on the question of whether to implement CO-PA or EC-PCA in theSAP system. You then will be responsible for implementing the selected applications.
The sales manager of the company has initiated changes in dealerships. To display thenew data, you need to use the various tools in planning.
04-02-2005 © 2004 SAP AG. All rights reserved. 497

Unit 7: Tools AC605
The Realignment Concept
Figure 158: Realignment Concept
The realignment function alters the definitions of the profitability segments in thedatabase. Its primary use is for restating historic data so that it makes sense in thecontext of the current market situation. Notice that it can also be used to correct themistakes in CO-PA and populate the characteristics that have recently been added toan operating concern on historic summary records.
Because realignments alter the definitions of profitability segments, a realignmentaffects all the historic data in the CO-PA data structures. Realignments, in effect,create new definitions for sales channels. You cannot execute drill-down reports underthe old perspective after a realignment has been conducted although you can displayline items under either the old or new perspectives.
Realignment is an excellent tool but it needs to be understood that realignment affectsthe entire CO-PA summary database. Ideally, the person or persons conductingrealignments should have a working understanding of derivation logic to avoidmaking mistakes. Realignments can be reversible but achieving the required resultswith reversal is only possible under ideal conditions.
The realignment interface is entirely on the user side of CO-PA. Realignment isconducted by executing a realignment run, which is first defined with one or morerealignment orders or requests. Each of these determines how selected profitabilitysegments, as determined by the selection criteria, should be modified as determinedby a conversion rule.
498 © 2004 SAP AG. All rights reserved. 04-02-2005

AC605 Lesson: Realignment and Customizing Monitors
With the selection criteria, characteristic values are specified to point the profitabilitysegments that are to be changed. With conversion rules, it is specified whether thecharacteristic values in the selected profitability segments are changed throughoverwriting them to some specified value, or rederived based on any new values andcurrent derivation logic, or fixed and do not change at all.
Figure 159: Realignments in Operation
Realignments can be executed in the test mode before they are run to actually changethe database. The test monitor is a flexible tool that can be used to show exactly whatthe effects of the realignment will be, and why. It is highly recommended that this beused extensively when learning the tool.
Realignments can be executed online or in the background from the Transactionscreen. Multiple realignments can run at one time, unless two or more specify thatcharacteristics are to receive fixed values. To avoid discrepancies, these types ofrealignments must be run in a sequence.
Reversing a realignment using the restore function has the effect of restoring thedefinitions of the profitability segments that were changed to the definitions prior tothat time. Reversal is only possible if the definition of the realignment run has beenpreserved.
Realignments affect both costing-based and account-based profitability analysisbecause both these submodules share the profitability segment definitions in thedatabase.
04-02-2005 © 2004 SAP AG. All rights reserved. 499

Unit 7: Tools AC605
Realignments invalidate both frozen data and data in summarization levels. Thismeans that both these items have to be constructed again from the beginning after avalid realignment run.
Demonstration: Realignments
PurposeTo demonstrate realignments
System DataSystem:Client:User ID:Password:Set up instructions:1. Display the line item that you posted when transferring billing documents
and make a note of the reference document number. Show that characteristicderivation was used to determine the customer group, 01, for the customer, 1000.(Typically, the customer group would be changed in the customer master, andyou could use the �Re-derive� option).
Accounting→ Controlling→ Profitability analysis→ Information system→ Display actual line items.
2. Create a realignment run with a realignment request for a subsequentrealignment: Customer, 1000 now belongs to the customer group, 04.
Create the realignment run: AC605XX.
Create a realignment request for the realignment run: 605XX.
Selected characteristics: Customer, 1000.
Conversion rule:
Overwrite characteristics with fixed values: Customer group, 04.
Save.
Accounting→ Controlling→ Profitability analysis→ Master data→Maintain Realignments
3. Start the realignment run in the test monitor or run it immediately in production.
Accounting→ Controlling→ Profitability analysis→ Master data→Maintain Realignments
500 © 2004 SAP AG. All rights reserved. 04-02-2005

AC605 Lesson: Realignment and Customizing Monitors
Run/Request→ Test monitor
Record type: F.
Reference document number: The number from step 1.
4. Execute the realignment run and display the corresponding detail data (results).
Accounting→ Controlling→ Profitability analysis→ Master data→Maintain Realignments
Run/Request→ Execute with start date (immediately)
Customizing Monitors
Customizing Monitor
This monitor can be used to analyze the various aspects of CO-PA configuration. Ithelps with master data maintenance as well as trouble-shooting transaction data errorsor issues. The customizing monitor was not available in the releases prior to 4.6A.
Figure 160: Customizing Monitor
04-02-2005 © 2004 SAP AG. All rights reserved. 501

Unit 7: Tools AC605
You can use the Customizing Monitor to carry out three key analysis functions:
� Overview of organizational structures: This is where the organizationalstructures for the current operating concern are displayed.
� Where-used list: In this list, you can display an overview of the objects inwhich a characteristic or value field is used in CO-PA Customizing. You canobtain this overview for the current client or for all the clients in the system. Youcan double-click to access the corresponding maintenance transaction directlyfrom the overview and then delete the corresponding characteristic or value field.
� The report overview specifies the reports in which particular characteristics areused. In this way, you can set up certain useful summarization levels.
For more information on the analysis options available in value field analysis,valuation analysis, and derivation analysis, see the IMG documentation.
Demonstration: Customizing Monitors
PurposeTo demonstrate customizing monitors
System DataSystem:Client:User ID:Password:Set up instructions:1. Go to Customizing and briefly introduce the functions for the Customizing
Monitor.
IMG→ Controlling→ Profitability Analysis→ Tools→ Analysis→ Checkcustomizing settings
2. Display the organization structure for the operating concern, IDEA.
Double-click the plant, 1000, to show extensive organizational data.
3. Select the analysis options and show the analysis of the value fields:
Flow of Actual Values for Incoming Orders/Billing Documents.
Point out the various sources of one of the value fields displayed by expandingthe hierarchy.
502 © 2004 SAP AG. All rights reserved. 04-02-2005

AC605 Lesson: Realignment and Customizing Monitors
409 Exercise 23: Realignment ConceptExercise Duration: 15 Minutes
Exercise ObjectivesAfter completing this exercise, you will be able to:� Set up a realignment run
Business Example
Task 1:Display the line item created in the unit on master data, exercise 4, task4.
1. What is the characteristic value for the Industry characteristic?
Industry:
Task 2:Set up a realignment run for the customer number allocated to you, T-CO05A##. Eachrealignment run summarizes a number of realignment requests. A realignment requestconsists of a selection condition and a conversion rule.
1. Create a realignment run.
Name the run, Industry Group##. ## is the number assigned to you. Select Enter.
2. Next, set up a realignment request. Place the cursor on the run, click the Requesticon and enter Group## as the name of the realignment request.
From the selection of CO-PA characteristics, choose the Customer characteristicand use the selection arrow to add this characteristic to the list of selectedcharacteristics. Next, enter the customer number, T-CO05A##, undercharacteristic value.
3. Define a conversion rule:
Enter the characteristics to be realigned.
Hint: The table on the left shows the characteristics to be derived again,and the table on the right contains the characteristics that are not to berealigned.
Continued on next page
04-02-2005 © 2004 SAP AG. All rights reserved. 503

Unit 7: Tools AC605
In this exercise, you want to realign all the selected market segments. Set thevalue of the Industry field to the characteristic Value, CHEM.
Choose the Industry field from the table on the right and add it to the table below:Replace values with fixed values. Realign the characteristic value to CHEM.
Save your entries.
4. Carry out the realignment run without a test.
5. Check the status of your realignment run. When the status, Successful, appears,choose Refresh to see the line item that you posted in the previous exercise.
Which industry is displayed?
a) If you select Read according to the current structure?
b) If you select Read as posted?
504 © 2004 SAP AG. All rights reserved. 04-02-2005

AC605 Lesson: Realignment and Customizing Monitors
Solution 23: Realignment ConceptTask 1:Display the line item created in the unit on master data, exercise 4, task4.
1. What is the characteristic value for the Industry characteristic?
Industry:
a) Display the line item created in the unit on master data.
Accounting→ Controlling→ Profitability Analysis→ Actual Postings→Display Line Items:
Record Type: F
Period: Current Period
Customer: T-CO05A##
Execute (confirm any warnings)
What is the characteristic value for the Industry characteristic?
Industry: __________ HITE (Hitech) _____________
Add Industry to the Layout
Task 2:Set up a realignment run for the customer number allocated to you, T-CO05A##. Eachrealignment run summarizes a number of realignment requests. A realignment requestconsists of a selection condition and a conversion rule.
1. Create a realignment run.
Continued on next page
04-02-2005 © 2004 SAP AG. All rights reserved. 505

Unit 7: Tools AC605
Name the run, Industry Group##. ## is the number assigned to you. Select Enter.
a) Set up a realignment run for the customer number allocated to you,T-CO05A##. Each realignment run summarizes a number of realignmentrequests. A realignment request consists of a selection condition and aconversion rule.
Accounting→ Controlling→ Profitability Analysis→ Master Data→Maintain Realignments
Create a realignment run.
Click the Realignment run icon (Create). Short text: Industry group, ##.
Name the run, Industry Group##. ## is the number assigned to you. SelectEnter.
2. Next, set up a realignment request. Place the cursor on the run, click the Requesticon and enter Group## as the name of the realignment request.
From the selection of CO-PA characteristics, choose the Customer characteristicand use the selection arrow to add this characteristic to the list of selectedcharacteristics. Next, enter the customer number, T-CO05A##, undercharacteristic value.
a) Next, set up a realignment request. Place the cursor on the run, click theRequest icon and enter Group## as the name of the realignment request.
From the selection of CO-PA characteristics, choose the Customercharacteristic and use the selection arrow to add this characteristic to the listof selected characteristics. Next, enter the customer number, T?CO05A##,under characteristic value.
3. Define a conversion rule:
Enter the characteristics to be realigned.
Hint: The table on the left shows the characteristics to be derived again,and the table on the right contains the characteristics that are not to berealigned.
In this exercise, you want to realign all the selected market segments. Set thevalue of the Industry field to the characteristic Value, CHEM.
Choose the Industry field from the table on the right and add it to the table below:Replace values with fixed values. Realign the characteristic value to CHEM.
Continued on next page
506 © 2004 SAP AG. All rights reserved. 04-02-2005

AC605 Lesson: Realignment and Customizing Monitors
Save your entries.
a) Define a conversion rule:
Enter the characteristics to be realigned.
Hint: The table on the left shows the characteristics to be derivedagain, and the table on the right contains the characteristics thatare not to be realigned.
In this exercise, you want to realign all the selected market segments. Setthe value of the Industry field to the characteristic Value, CHEM.
Choose the Industry field from the table on the right and add it to the tablebelow: Replace values with fixed values. Realign the characteristic valueto CHEM.
Save your entries.
4. Carry out the realignment run without a test.
a) Carry out the realignment run without a test.
Accounting→ Controlling→ Profitability Analysis→ Master Data→Maintain Realignments→ Run/Request→ Execute: With Starting Time:Immediately
Remove the Test Run Indicator.
5. Check the status of your realignment run. When the status, Successful, appears,choose Refresh to see the line item that you posted in the previous exercise.
Which industry is displayed?
a) If you select Read according to the current structure?
Continued on next page
04-02-2005 © 2004 SAP AG. All rights reserved. 507

Unit 7: Tools AC605
b) If you select Read as posted?
a) Check the status of your realignment run. When the status, Successful,appears, choose Refresh to see the line item that you posted in the previousexercise.
Accounting→ Controlling→ Profitability Analysis→ Information System→ Display Line Items→ Actual
Field Name or Data Type ValuesCust.No. T-CO05A##Product P-101Date Entry date
Which industry is displayed?
a) If you select Read according to the current structure?
CHEM
b) If you select Read as posted?
HITE
508 © 2004 SAP AG. All rights reserved. 04-02-2005

AC605 Lesson: Realignment and Customizing Monitors
Lesson Summary
You should now be able to:� Re-organize data after organizational changes have occurred� Analyze the Customizing Settings using the different options of the Customizing
Monitor
04-02-2005 © 2004 SAP AG. All rights reserved. 509

Unit Summary AC605
Unit SummaryYou should now be able to:� Define and activate summarization levels� Understand summarized data and frozen data� Re-organize data after organizational changes have occurred� Analyze the Customizing Settings using the different options of the Customizing
Monitor
510 © 2004 SAP AG. All rights reserved. 04-02-2005

AC605 Test Your Knowledge
417Test Your Knowledge
1. To use summarization levels, you need to define, fill, and update thesummarization levels.Determine whether this statement is true or false.□ True□ False
2. signifies the data stored for a specific report and aspecific set of variable values at a specific point in time.Fill in the blanks to complete the sentence.
3. The organizational structures for the current operating concern are displayedin the Where-used list.Determine whether this statement is true or false.□ True□ False
4. Reversing a realignment using the restore function has the effect of restoring thedefinitions of the .Fill in the blanks to complete the sentence.
04-02-2005 © 2004 SAP AG. All rights reserved. 511

Test Your Knowledge AC605
418Answers
1. To use summarization levels, you need to define, fill, and update thesummarization levels.
Answer: True
To use summarization levels, you need to define them (in configuration), fillthem with data from the segment level summary records (on the user side), andupdate them periodically in the background (on user side).
2. Frozen data signifies the data stored for a specific report and a specific set ofvariable values at a specific point in time.
Answer: Frozen data
3. The organizational structures for the current operating concern are displayedin the Where-used list.
Answer: False
The organizational structures for the current operating concern are displayed inthe overview of organizational structures.
4. Reversing a realignment using the restore function has the effect of restoring thedefinitions of the profitability segments .
Answer: profitability segments
512 © 2004 SAP AG. All rights reserved. 04-02-2005

AC605 Course Summary
Course SummaryYou should now be able to:
� Understand the functions in Profitability Analysis and obtain an insight on howto implement the component
� Set up the structures of an operating concern and examine characteristicderivation and valuation
� Explain how the integration betweenSales Order Management, FinancialAccounting and Management Accounting works
� Create planning layouts, reports, and report forms
04-02-2005 © 2004 SAP AG. All rights reserved. 513

Course Summary AC605
514 © 2004 SAP AG. All rights reserved. 04-02-2005

Appendix 1Appendix
Figure 161: Appendix
Figure 162: Master Data : Additional Topics
04-02-2005 © 2004 SAP AG. All rights reserved. 515

Appendix 1: Appendix AC605
Figure 163: Working with a Standard Unit of Measure
Working with standard units of measure allows you to convert the different units ofmeasure into one single unit of measure of universal application. This conversioncan occur in two different ways.
First, you can define the standard unit of measure in such a way that the unit ofmeasure transferred from the previous applications of the source quantity field can beconverted into the CO-PA standard unit of measure for all materials. When you dothis, you should ensure that the unit of measure selected as the standard is maintainedin the material master for all materials either as a base unit of measure or as analternative unit of measure.
If the definition of a uniform standard unit of measure is not possible due to theheterogeneity of the materials affected, you can define a comparable standard unit ofmeasure using the same methods as with derivation of characteristics. For this, youneed to take a characteristic value, such as a product group, as your basis.
This straightforward feature enables you to compare the different units of measure inCO-PA.
516 © 2004 SAP AG. All rights reserved. 04-02-2005

AC605 Appendix 1: Appendix
Figure 164: Aggregating the Tracing Factor
Normally, periodic allocation is carried out using tracing factors defined specificallyin the period concerned. This means that the periodic sender values posted are settledon the basis of the tracing factors defined in this period.
Notice that if these tracing factors are subject to significant periodic fluctuations, youcannot allocate the values according to their cause.
As of Release 4.0A, you can use the Aggregated tracing factor indicator to eliminatethe fluctuations between periods.
04-02-2005 © 2004 SAP AG. All rights reserved. 517

Appendix 1: Appendix AC605
Figure 165: CO-PA Derivation: (1)
Characteristic derivation refers to the attempts of the system to determine thecharacteristic values for the characteristics for all COPA-relevant transactions(supplementing the automatic mappings).
Supplementing the values determined through the automatic mappings, derivation canaccess additional information (characteristic values) both on and off the originatingtransaction.
For every COPA-relevant transaction, the system will attempt to derive a characteristicvalue for each and every characteristic in the operating concern if the derivationconfiguration is complete.
Derivation is not always successful. Unsuccessful derivation for a characteristicresults in the posting of a blank, null, or unassigned characteristic value.
The total combination of (segment-level) characteristic values for a given transactionconsists of the definition of the relevant profitability segment, which is the accountassignment object for CO-PA.
The dependant characteristics, such as the customer group and the sales district can bederived only if the characteristic values for the independent characteristics, customer,sales organization, distribution channel, and division are all specified.
518 © 2004 SAP AG. All rights reserved. 04-02-2005

AC605 Appendix 1: Appendix
Figure 166: CO-PA Derivation: (2)
Derivation rules are used to determine characteristic values through user-definedlogic. They are frequently used with user-defined characteristics, although they arenot limited to this application.
With derivation rules, characteristic values, also known as target values, aredetermined directly based on the values of other characteristic values called sourcevalues.
Similar to other derivation steps, derivation rules can be configured either to applyfor all situations, or to apply only when certain conditions are met, such as when asales organization is 1000.
Like other steps, derivation rules can be configured to produce an error when a valuecannot be determined through the rule entries or to ignore this failure and proceed.
Unlike other derivation steps, derivation rule entries can be configured to either berelated to a specific interval or time (time-dependent), or to be applicable for all time(time-independent).
Derivation rules can be set up in sequence with other derivation steps and methods toproduce complex derivation logic.
If a CO-PA derivation rule is not maintained properly, the system will issue an errormessage when the CO-PA derivation is performed. A faulty derivation rule mayprevent billing documents from being released to accounting.
04-02-2005 © 2004 SAP AG. All rights reserved. 519

Appendix 1: Appendix AC605
Figure 167: Special Characteristics
Figure 168: Product Hierarchy
The product hierarchy entered in the material master is contained in an 18-characterfield that is logically divided into different levels. If you simply choose this fieldfrom the reference table, the tables MARA or MVKE, as you would for othercharacteristics, the Information System cannot recognize its encrypted hierarchicalstructure. This means that you can only drill down on one level of the hierarchy.
520 © 2004 SAP AG. All rights reserved. 04-02-2005

AC605 Appendix 1: Appendix
Figure 169: Transfer "Product Hierarchy" before Rel. 4.5
If you want to drill down through all the levels of the product hierarchy in the report,you need to represent each of the individual levels as a separate characteristic inCO-PA. Example: The product hierarchy contains three parts, the first two with thelength 5 and the third with the length 8. This means that the first level of the producthierarchy is of the length 5, the second one of the length 10 (because it is composedof the first two parts) and the third level is of the length 18. In CO-PA, you need todefine the following three characteristics for these three levels (transaction KEA0):
WWPH1 �Product Hierarchy. Level 1� CHAR 5
WWPH2 �Product Hierarchy. Level 2� CHAR 10 (5 + 5 !)
WWPH3 �Product Hierarchy. Level 3� CHAR 18 (5 + 5 + 8 !)
Next, you need to inform the system that the characteristics defined above are to besupplied with the values from a product hierarchy. By maintaining the appropriatederivation table entries, you can supply these levels automatically with the producthierarchy contained in the material master. Check OSS note 62690 for moreinformation. In CO-PA, you need to maintain master data for your user-defined fields.For the above example, enter all the valid product hierarchy elements for all threecharacteristics, WWPH1, WWPH2, and WWPH3 (transaction KES1).
04-02-2005 © 2004 SAP AG. All rights reserved. 521

Appendix 1: Appendix AC605
Figure 170: Transfer �Product Hierarchy� Release 4.5 (1)
From Release 4.5, you can transfer the levels of the characteristic, �Producthierarchy�, from the material master to CO-PA.
The product hierarchy levels are defined in Customizing under: Logistics - General→ Logistics Basic Data: Material Master→ Material→ Data Relevant to Sales andDistribution→ Define Product Hierarchies.
The fields, PAPH1 and PAPH2 are generated in CO-PA to correspond to the producthierarchy levels. With the CO-PA Customizing function, �Transfer from SAP table�,you can select the required fields from the MVKE table to be used as characteristics inCO-PA. This enables you to perform the evaluations in reporting for the individualhierarchy levels.
In contrast to when you define your own characteristics, you do not need to maintainany characteristic values or derivation rules when you adopt the characteristics froman SAP table.
You can still use any user-defined characteristics for the product hierarchy, whichyou were already using.
522 © 2004 SAP AG. All rights reserved. 04-02-2005

AC605 Appendix 1: Appendix
Figure 171: Transfer �Region� from an SAP Table
From Release 4.5, you can transfer the �Region� field from the customer master to useit as a characteristic in Profitability Analysis.
The PAREG field is available through the �Transfer from SAP table� function inCO-PA Customizing and can be transferred from the customer master, the tableKNA1. This field is composed of the characteristic values from country and region.
In contrast to when you define your own characteristics, you do not need to maintainany characteristic values or derivation rules when you adopt the characteristics froman SAP table.
You can still use the �Region� characteristic (possibly a user-defined characteristic)that you were already using.
04-02-2005 © 2004 SAP AG. All rights reserved. 523

Appendix 1: Appendix AC605
Figure 172: Customer Hierarchies
In Profitability Analysis, the customer hierarchy from SD Sales and Distribution isrepresented using special characteristics, which you can insert in the data structuresof your operating concern from structure PAPARTNER. Each individual level of thecustomer hierarchy is assigned to a separate CO-PA characteristic, HIE01, HIE02,and HIE10.
When you transfer sales orders or billing documents, the customer hierarchydetermined by SD is automatically transferred to CO-PA with the order or document.In other Profitability Analysis transactions, the customer hierarchy is determinedby derivation with the help of the characteristics, customer, sales organization,distribution channel, and division, with regard to the customer hierarchy categoryallocated to the respective operating concern.
524 © 2004 SAP AG. All rights reserved. 04-02-2005

AC605 Appendix 1: Appendix
Figure 173: Determination of the division in SD
Figure 174: Partner functions
You can use the partner functions from SD as characteristics in Profitability Analysis.Certain standard partner functions are available for this purpose. Further, you candefine your own partner functions in SD. The customer-defined partner functions canalso be transferred to the Profitability Analysis data structures as characteristics.
04-02-2005 © 2004 SAP AG. All rights reserved. 525

Appendix 1: Appendix AC605
A clear distinction must be made between the standard partner functions and theuser-defined partner functions. Between both the standard partner functions andthe user-defined partner functions, a further distinction is made between personnelrepresentative functions and partner functions, which signify the customer master datatable and the vendor master data tables, KNA1 or LFA1. Partner functions, whichrefer to the customer master data table or the vendor master data tables, are assignedto the corresponding master data tables, KNA1 or LFA1, as value tables. Personnelrepresentative functions do not have any value tables. The sales employee is anexample of a personnel representative function, which is available in the standardsystem.
Please study the OSS note 36557 for in-depth explanation on how to transfer partnerfunctions from SD into CO-PA.
Figure 175: Value Flows
Figure 176: SD/CO-PA interface (transfer of sales revenue/revenue deductions)
526 © 2004 SAP AG. All rights reserved. 04-02-2005

AC605 Appendix 1: Appendix
The system transfers only the condition types from SD that have been assignedto a CO-PA value field in Customizing for CO-PA. Regardless of this value fieldassignment, you must observe that only certain condition types in SD can betransferred to COPA. These are:
� Revenues and sales deductions, the G/L account of which was created in COwith the cost element types, 11 = �revenue� or 12 = �sales deduction�,
� Conditions that are defined as statistical in SD, such as the condition type,VPRS, which contains the costs of goods sold. Statistical conditions do not leadto a posting to a G/L account. In addition, please note that only active conditionsare transferred to CO-PA. Inactive conditions are not transferred. If all theconditions in an item are inactive, the order item is not transferred to CO-PA.
For make-to-order production (the VBRP-VBELV field in the billing document isfilled), the data has to be transferred to CO-PA using order settlement.
Figure 177: SD/CO-PA interface: The sign logic
All values are transferred to COPA with a positive sign. For credit memos, billingtype G2, all signs are reversed. Only in CO-PA reporting, it is defined that the salesdeductions are subtracted from the gross revenues. The reason for this procedureis that the revenues in the different SAP applications have different +/- signs. Therevenues in the SD Module are managed as positive amounts but as negative amountsin the FI Module. Because revenues can be transferred to CO-PA from both systems,the +/- signs have to be processed. Please note that this solution requires that conditiontypes that are managed as negative amounts in SD, such as, discounts, are assigned toother CO-PA value fields as the positive condition types, such as, special revenues.
04-02-2005 © 2004 SAP AG. All rights reserved. 527

Appendix 1: Appendix AC605
Figure 178: FI/CO-PA Interface versus SD/CO-PA Interface : Sign logic
Figure 179: Project System: New Analyses in CO-PA
Settlement of incoming sales orders for each billing element.
Copying the revenues and costs relating to incoming orders into CO-PA so that anexpected result can be derived from the orders that belong to the current period(taxable under the indicator �processing type�).
Order balance = settled incoming orders together with consideration of revenuesand of the cost of sales already billed.
528 © 2004 SAP AG. All rights reserved. 04-02-2005

AC605 Appendix 1: Appendix
You can monitor the history of the value of incoming orders by distinguishing:
� New orders� Changed orders� Cancellations� Change of plans
Analysis possible in CO-PA and Information System.
Customizing settings - See the release notes.
Figure 180: How to Compare Estimated Values with Actuals?
The accrued discount is transferred to costing-based CO-PA through a statisticalcondition, Cash discount, from the billing document at the point of time when thebilling document is released to accounting.
The cash discount is calculated during the run of the payment program in FI. Totransfer the actual cash discount to CO-PA, you have two options.
Firstly, you can use automatic account assignment to post actual cash discount at ahigher level into CO-PA.
Secondly, you can start the program �Profit and Loss Readjustment�, SAPF181, inyour period closing activities as shown above. Actual cash discount will now beassigned to the customer level to trace your true customer profitability.
04-02-2005 © 2004 SAP AG. All rights reserved. 529

Appendix 1: Appendix AC605
In both cases, make sure that accrued cash discounts and actual cash discounts arestored in two different value fields. The reporting must be designed accordingly.
Figure 181: Top Down Distribution of Single Valuation Views
Previously, in top down distribution for actual data, the data for all the valuation viewsfrom legal valuation and profit center valuation used to be distributed. Currently,individual valuation views can be processed separately within a top down valuationrun.
In cases where you use both valuation views but are only interested in one valuationview at an extensive level, it is a good idea that you perform top down distributionjust for this view. This allows you to reduce runtimes in top down distribution andavoid generating unnecessarily large volumes of data.
530 © 2004 SAP AG. All rights reserved. 04-02-2005

AC605 Appendix 1: Appendix
Figure 182: Top Down Distribution of Various Record Types
With top down distribution, you can concurrently distribute data from several recordtypes, in a single run. This eliminates the need to re-enter the same parameters forseparate runs for each individual record type.
Figure 183: Specifying the Currency Type for Reference Data
04-02-2005 © 2004 SAP AG. All rights reserved. 531

Appendix 1: Appendix AC605
Top down distribution offers you more flexibility in entering reference data. Insteadof automatically applying the respective currencies of the reference data, you can nowindicate a fixed reference currency � the company code currency or the operatingconcern currency.
Figure 184: Reference Data with Various Record Types
In top down distribution, you can select different record types as reference data.You can specify whether the reference data for the different record types should becumulated or handled separately.
If you choose �Cumulate Record Type�, the reference data is summarized at the recordtype level. This means that the data is processed as if the same record type applied.
If the record type is not cumulated, the number of record types needs to be the samefor the actual data and the reference data. Processing observes the sequence in whichthe record types are entered for the multiple selection. In this way, the actual data withthe first record type is distributed according to the reference data of the record typeoccurring first in the sequence. See the elaborate example in the next graphic. (Thisexample is also found in the F1 Help documentation.)
532 © 2004 SAP AG. All rights reserved. 04-02-2005

AC605 Appendix 1: Appendix
Figure 185: Aggregating Record Types - Example
Additional cost estimate: Aggregating without record type
100 = 1000*10/ (10+40+50)
400 = 1000*40/ (10+40+50)
500 = 1000*50/ (10+40+50)
3000
1600 = 2000*80/ (80+20)
400 = 2000*20/ (80+20)
Additional cost estimate: Aggregating with record type
360 = 1000*(10+80) / ((10+80)+(40+50+20)+50)
440 = 1000*(40+50+20) / ((10+80)+(40+50+20)+50)
200 = 1000*50 / ((10+80)+(40+50+20)+50)
1080 = 3000*(10+80) / ((10+80)+(40+50+20)+50)
1320 = 3000*(40+50+20) /((10+80)+(40+50+20)+50)
600 = 3000*50 / ((10+80)+(40+50+20)+50)
720 = 2000*(10+80) / ((10+80)+(40+50+20)+50)
04-02-2005 © 2004 SAP AG. All rights reserved. 533

Appendix 1: Appendix AC605
880 = 2000 *(40+50+20) /((10+80)+(40+50+20)+50)
400 = 2000 *50 / ((10+80)+(40+50+20)+50)
Figure 186: Event Planning with Object-Dependent Revaluation Key
Events, such as special sales campaigns, can have a short-term influence on thesales of products.
In Release 4.5, events can be taken into account in manual and automatic sales andprofit planning.
From the functional perspective, an event can be seen as a revaluation key linked to aspecific length of time.
Events can influence the data of an entire plan or be defined with reference to specifiedcharacteristics, such as a specific region.
Figure 187: Additional Functions
534 © 2004 SAP AG. All rights reserved. 04-02-2005

AC605 Appendix 1: Appendix
Figure 188: Recommendations on How to Use Excel (1)
When you define your Excel template, you should distinguish between two typesof Excel sheet in Customizing:
� An SAP spreadsheet, which is used to transfer data into the R/3 Enterprise.� Further Excel sheets in which the planner processes the data.
Macros are used to transfer data between the sheets.
When you plan with the SAP spreadsheet, you should be aware of the special features:
� You cannot make any further alterations to the position of the data in Excel whenplanning. You cannot delete columns or move cells at this stage.
� You can add new entries in the SAP spreadsheet only in the line below the totalsline.
� To display possible entries, you can use the button in the R/3 environmentdesigned for this purpose.
� All other R/3 planning functions require you to select the required line in Exceland to perform the required function in the R/3 menu bar.
04-02-2005 © 2004 SAP AG. All rights reserved. 535

Appendix 1: Appendix AC605
Figure 189: Recommendations on How to Use Excel (2)
Due to the restrictions of the SAP sheet, a procedure can be followed in which data iscopied from the SAP sheet on to a different Excel sheet.
You can use all the Excel functions to create data, depict with graphics or calculateusing models.
After you have finished working on the appropriate record, data is transferred backinto the SAP sheet using a macro. For more information, see the appropriate examplein the documentation.
Note: When you develop the macro, it is good idea to test your solutionoutside of R/3 Customizing first and then transfer it using Cut and Paste.
536 © 2004 SAP AG. All rights reserved. 04-02-2005

AC605 Appendix 1: Appendix
Figure 190: Using Attributes to Display More Information
In previous releases, it was only possible to determine how the lead column shouldbe displayed, such as the key, characteristic name, or both. Currently, you can useattributes to have further information from the master data tables of characteristicsdisplayed in the lead column.
Selecting � Settings → Characteristic display � allows you to determine howcharacteristics are to be displayed in the lead column. The characteristic name isdisplayed in the above example.
If you select the lead column and choose � Settings→ Characteristic display→ Leadcolumn �, a dialog box appears prompting you to select the attributes to be displayedin the additional columns of the report list. The �City� attribute was selected in theabove example.
Finally, selecting � Extras→ Attributes � allows you to display a dialog box showingall the attributes for a characteristic.
04-02-2005 © 2004 SAP AG. All rights reserved. 537

Appendix 1: Appendix AC605
Figure 191: The Transport Concept (1)
Each independent installation of R/3 is known as an R/3 instance. Normally, thereis a 1:1 ratio between R/3 instances and database servers. In addition, there are atleast three instances for each SAP project, for development, integration testing, andproduction activities, respectively.
Each operating entity within an instance is called a client. There are normally severalclients in any instance, which are used for different tasks, such as playgrounds,development, unit testing, and backups. The way in which the clients and instancesare used in a project is known as a client strategy.
The technical operating level of an instance is known as the data dictionary, DDIC.Notice that the DDIC contains objects, such as tables, programs, and data elements,which are client-independent. This means they pertain to all the clients in an instance.Certain objects contain data, which is client-dependent.
Data can be classified as master data, configuration data, and transaction data. Themaster data is meant to be maintained on the user side of system. The configurationdata represents the settings that define the transactions for R/3 Enterprise. Thetransaction data is produced by the transactions in R/3 Enterprise.
Transporting indicates the SAP process to move items between clients within aninstance and among instances. With transporting, items, such as objects and data, arecollected into transportable bundles which are then processed at the operating systemlevel by a systems administrator.
538 © 2004 SAP AG. All rights reserved. 04-02-2005

AC605 Appendix 1: Appendix
Normally, the configuration data is transportable between clients within or amonginstances. Conversely, the master data and transaction data are not transportable inthis way. DDIC objects are transportable between instances with the CTS tool butthere is no need to transport them among clients because they are client-independent.
Figure 192: The Transport Concept (2)
Each independent installation of R/3 is known as an R/3 instance. Normally, thereis a 1:1 ratio between R/3 instances and database servers. Notice that there are atleast three instances for each SAP project, for development, integration testing, andproduction activities, respectively.
Each operating entity within an instance is called a client. There are normally severalclients in any instance which are used for different tasks, such as playgrounds,development, unit testing, and backups. The way in which the clients and instancesare used in a project is known as a client strategy.
The technical operating level of an instance is known as the data dictionary, DDIC.The DDIC contains objects, such as tables, programs, and data elements, which areclient-independent. This means they pertain to all the clients in an instance. Certainobjects contains data, which is client-dependent.
Data can be classified as master data, configuration data, and transaction data. Themaster data is meant to be maintained on the user side of system. The configurationdata signifies the settings, which define the transactions for R/3 Enterprise. Thetransaction data is produced by the transactions in R/3 Enterprise.
04-02-2005 © 2004 SAP AG. All rights reserved. 539

Appendix 1: Appendix AC605
Transporting indicates the SAP process to move items between the clients within aninstance and among instances. With transporting, items, such as objects and data, arecollected into transportable bundles that are then processed at the operating systemlevel by a systems administrator.
Normally, configuration data is transportable between clients within or amonginstances. Conversely, the master data and the transaction data are not transportable inthis way. DDIC objects are transportable between instances with the CTS tool butthere is no need to transport them between clients because they are client-independent.
Figure 193: Transports in CO-PA
The transport functionality for CO-PA is quite flexible and sophisticated, allowingfor a number of ways to accomplish the required goals.
Option #1: Most CO-PA configuration changes are designed to trigger automaticchange requests when the change management system is active for a client. Thechange requests can be transported with standard functions. This approach isencouraged for small configuration changes, especially deletions.
Note: Not all configuration can be transported with this option. This is because notall configuration generates automatic change requests. Apart from this, deletions ofmappings are required to be transported with this option.
Option #2: Most configuration which takes the form of entries in a table (technicallyspeaking, that configuration which is modified through view maintenance) can beselectively added to manually triggered transports. Manually created transports aretriggered through an option in the Table View menu.
540 © 2004 SAP AG. All rights reserved. 04-02-2005

AC605 Appendix 1: Appendix
Note: This option is for transporting the selected entries in a table, such as mappingsof condition types to the op concern. Again, only some configuration can betransported in this manner.
Option #3: Transportation of CO-PA configuration can be managed en masse througha special tool which has been developed to simplify this process and enhance thechances of consistency and success in CO-PA development. This transport tool cantransport all or some pieces of an operating concern.
Notes: This option is required for transporting certain pieces of configuration, such asthe operating concern structures, other client-independent objects, and a few otheritems (see next page).
Option #4: Copying of certain items, such as reports, forms, line item layouts, reportline structures, and planning layouts, from client to client within an instance andwithin an operating concern is possible with an import tool, without going throughany CTS procedures at all.
Figure 194: CO-PA Transport Tool - Operating Concern
04-02-2005 © 2004 SAP AG. All rights reserved. 541

Appendix 1: Appendix AC605
The method that needs to be used to process any transports generated by the threeCTS-relevant transport options (recall that this excludes the import tool) dependson the location of the receiver.
� If the receiver is a client in a different SAP instance, then the standardsystem-to-system transport method is required to process the transport(s).
� If the receiver is a client in the same instance, then a client copy according to thetransport request needs to be performed. This ignores any client-independentobjects.
It is recommended that the operating concern and summarization levels be regeneratedin the target after the transport of any configuration changes. This ensures that all thenecessary items in the DDIC are updated for the change.
The special transport tool is capable of transporting operating concern configurationpieces separately or together. The pieces basically fall into the following categories:
� Client-independent structures for data structures and summarization levels� Client-dependent configuration for actual postings and planning� Derivation and valuation configuration pieces� Table entries for check tables and derivation rules� Miscellaneous, such as number range groups and plan structures
Note that number range groups and their record type assignments are transported withthis tool but the number intervals themselves need to be transported separately. It is agood idea to use the same number range intervals in all instances to avoid possibleconflicts as a result of transports.
542 © 2004 SAP AG. All rights reserved. 04-02-2005

AC605 Appendix 1: Appendix
Figure 195: Authorization Concept
The authorization concept in the R/3 system can be described briefly, as follows:
� SAP delivers certain authorization objects with the standard system. Theseauthorization objects consist of up to 10 fields, each of which represents anelement, which is to be protected, such as �Operating concern�, �Form�, and�Activity�.
Authorizations are defined by the system owners against these authorizations objects.Authorizations contain specific combinations of values that are to be allowed for thefields of an object during a transaction that accesses that particular object.
Authorizations are grouped into simple profiles, which are either assigned to usersdirectly or to other complex profiles, which can likewise be assigned to users or othercomplex profiles. These frequently represent a collection of all the authorizationsan individual needs to perform the job.
A user can have more than one assigned profile. This means that it is possible todefine profiles as a set of duties and then assign the profiles to all persons by theduties they perform or are responsible for.
04-02-2005 © 2004 SAP AG. All rights reserved. 543

Appendix 1: Appendix AC605
Figure 196: Authorization Objects in CO-PA
Profitability Analysis uses the standard R/3 functions for authorizations. A number ofpredefined authorization objects for CO-PA are delivered with the system, which canbe used to generate the authorizations and profiles that can be used to restrict accessrights to configuration functions and user functions in CO-PA.
For example, in most implementations, most CO-PA users will be restricted toenter plan data and execute reports. Cost accountants may be allowed to performcost center assessments and other allocations to CO-PA. Special support personnelmay be allowed to make direct entries, update derivation rule entries, and performrealignments of CO-PA data.
To restrict the data level in CO-PA, you need to create custom authorization objectsagainst particular characteristics, value fields, and key figures. The default settings foran Operation Concern outline that all data is unprotected (freely accessible) on the datalevel until a custom authorization object is created on a field or a combination of fields.
For example, an authorization object might be created to control access to the salesemployee information in CO-PA or to control access to the commissions or productcost information in CO-PA. You need different authorization objects to control theplan data and the actual data. To control on the same level in each, two authorizationobjects need to be created.
544 © 2004 SAP AG. All rights reserved. 04-02-2005
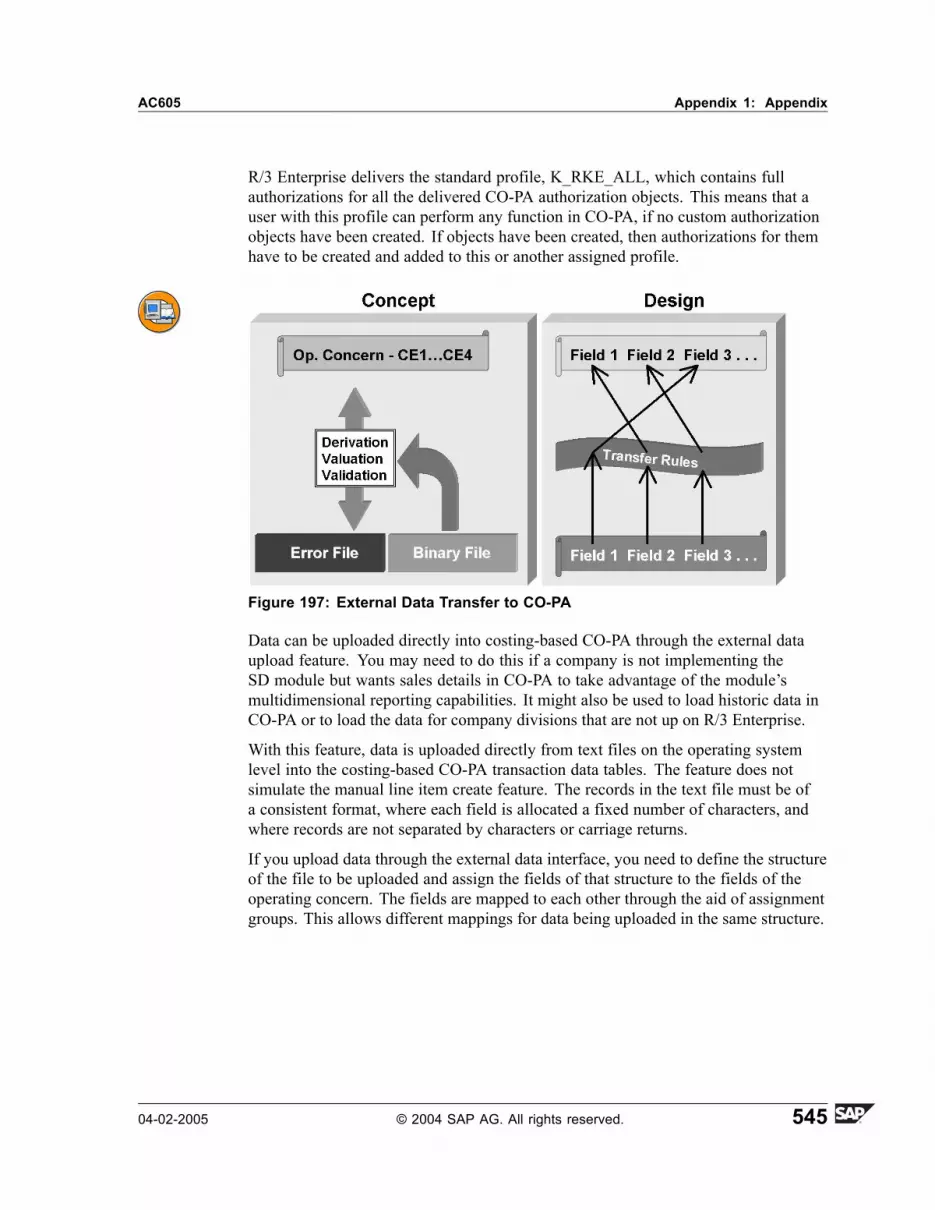
AC605 Appendix 1: Appendix
R/3 Enterprise delivers the standard profile, K_RKE_ALL, which contains fullauthorizations for all the delivered CO-PA authorization objects. This means that auser with this profile can perform any function in CO-PA, if no custom authorizationobjects have been created. If objects have been created, then authorizations for themhave to be created and added to this or another assigned profile.
Figure 197: External Data Transfer to CO-PA
Data can be uploaded directly into costing-based CO-PA through the external dataupload feature. You may need to do this if a company is not implementing theSD module but wants sales details in CO-PA to take advantage of the module�smultidimensional reporting capabilities. It might also be used to load historic data inCO-PA or to load the data for company divisions that are not up on R/3 Enterprise.
With this feature, data is uploaded directly from text files on the operating systemlevel into the costing-based CO-PA transaction data tables. The feature does notsimulate the manual line item create feature. The records in the text file must be ofa consistent format, where each field is allocated a fixed number of characters, andwhere records are not separated by characters or carriage returns.
If you upload data through the external data interface, you need to define the structureof the file to be uploaded and assign the fields of that structure to the fields of theoperating concern. The fields are mapped to each other through the aid of assignmentgroups. This allows different mappings for data being uploaded in the same structure.
04-02-2005 © 2004 SAP AG. All rights reserved. 545

Appendix 1: Appendix AC605
The configuration described above is performed in customizing but the upload itselfis conducted on the user side of CO-PA. The upload feature is available for bothplanning and actual data but these must be uploaded separately. During the upload,derivation, valuation, and validation occur just as they would for any other transactiontransmitting data into CO-PA.
Any records that do not pass the validation checks are written to an error file,which can be corrected. That file can then be uploaded into CO-PA. Each file canonly be uploaded into CO-PA one time because the system keeps track of the filesto ensure that data is not duplicated. Each file can only be uploaded into CO-PAone time, because the system keeps track of the files to ensure that the data is notduplicated. Multiple files can be uploaded into CO-PA at the same time for maximumperformance.
Figure 198: Archiving and Deleting CO-PA Data
Profitability Analysis uses the standard R/3 functions to archive and delete. In SAP,archiving signifies the task to copy the data from R/3 datatables to an archive file.Delete signifies the removal of data from R/3 datatables. As a result, you can archivewithout deletion or with deletion. For the latter, archiving and deleting can beconfigured to function separately or together.
In Profitability Analysis, line items can be archived/deleted for selected periods,except the current period, but summary records can only be archived/deleted bythe year. The actual and plan data is archived/deleted separately, as is the data inaccount-based CO-PA and costing-based CO-PA. Records can be archived/deleted bythe record type as well.
546 © 2004 SAP AG. All rights reserved. 04-02-2005

AC605 Appendix 1: Appendix
Incidentally, there are standard functions in the Implementation Guide to reorganize ordelete the other types of data and other items in CO-PA, such as frozen data, reportdefinitions, form definitions, planning layouts, and line item layouts. Notice thatdeleting frozen data does not delete the transaction data in the standard tables but onlydeletes the stored frozen data against specific reports.
Figure 199: SAP Enhancement Concept
The R/3 enhancement tool is used to add customized functions to SAP�s standardbusiness applications. Through enhancements, customers can implement their ownfunctions without the need to modify the standard SAP code. Each enhancementhas a specific purpose.
Enhancements are beneficial because they provide the exits and entrances at theappropriate places in R/3 along with the necessary data that may be used, manipulated,and returned. Enhancements also isolate custom functions so they will not harmSAP transactions nor upgrades.
To use enhancements, custom functions must be programmed into the enhancements.The enhancements must be assigned to enhancement projects. In addition, eachproject must be activated for all of the functions contained in the related enhancementsto take effect.
04-02-2005 © 2004 SAP AG. All rights reserved. 547

Appendix 1: Appendix AC605
Figure 200: CO-PA Enhancement Overview (1)
With the enhancement, COPA0001, you can program the steps to determine thecharacteristic values during derivation. The programmed steps in this enhancementcan be given step IDs and sorted with the other derivation steps. For example,this enhancement might be used to determine the value for a special user-definedcharacteristic, which is determined by complex logic not achievable throughderivation rules.
With the enhancement, COPA0002, you can program the steps to calculate or retrievethe special values during valuation. Separate calculations can be defined for theplanned and actual data. Calculations are assigned user exit numbers, which mustbe placed in active CO-PA valuation strategies for the calculations to occur duringthe posting of data. For example, this enhancement might be used to zero out thevalues that are being passed to Profitability Analysis for certain products that shouldnot appear in the standard sales and marketing reports, such as �dummy� productsfor freight, documentation, and services.
With the enhancement, COPA0003, you can program the characteristic group thatshould be used whenever a manual assignment to a profitability segment is required,using more extensive criteria than strictly the transaction code (standard CO-PAconfiguration). This means the same transaction could require the specification ofvalues for different characteristics when different situations arise.
For example, this enhancement might be used so that the characteristic group isdetermined by the account number that is being posted to so that product-relatedaccounts might have the product number as a required field in the profit segment andcustomer-related accounts might need customer.
548 © 2004 SAP AG. All rights reserved. 04-02-2005

AC605 Appendix 1: Appendix
Figure 201: CO-PA Enhancement Overview (2)
With the enhancement, COPA0004, you can program the exchange rate type thatshould be used for currency transaction when actual data is processed in costing-basedCO-PA to something other than the type �M� (the default).
For example, this enhancement might be used if translation is required at the bankbuying rate, the type �G�, or the bank selling rate, the type �B�, instead of the averagerate, the type �M�.
With the enhancement, COPA0005, you can program the changes to the CO-PAinterfaces with other modules to determine characteristic values or value field valuesusing information from the originating documents. You cannot do this through thederivation and valuation enhancements because these can only utilize the informationcaptured by CO-PA in their processing.
For example, this enhancement might be used to change the characteristic valuesbeing derived for an FI journal entry to CO-PA based on information in the allocationfield or the text field of the document.
With the enhancement, COPA0006, you can program the special functions forprocessing planning data during the manual and automatic planning processes. Eachfunction is given an exit number, which must be specified when conducting the tasksto access the required calculations.
For example, this enhancement can be used to perform distributions using acharacteristic-specific distribution key, or to revalue using a time-dependentrevaluation factor, or to roll forward plan/actual variances into future periods.
04-02-2005 © 2004 SAP AG. All rights reserved. 549

Appendix 1: Appendix AC605
With the enhancement, COPA0007, you can program special processing instructionsfor externally uploaded data only. This means you can modify the line items beingtransferred into costing-based CO-PA through the standard interface with some specialcoding programmed here.
Figure 202: Recommended Follow-Up Activities
Data Used in the Exercises
Data Data in TrainingSystem
Data in IDES System
Operating Concern IDEA IDEAControlling Area 1000 1000Company Code 1000 1000Sales Organization 1000 1000Distribution Channel 10 10Division 00 00Products P-100, P-101, P-102,
P-103P-100, P-101, P-102, P-103
Customer T-CO05A## T-CO05A##Sales Order Type TA TAInternal Order Type 0450 0450Cost Center 4500 4500Activity Type EH##Currency UNI UNIBusiness Area 5000 5000Plan Version 100 5## 100
550 © 2004 SAP AG. All rights reserved. 04-02-2005

IndexAActual Postings, 20Administrator Workbench, 466Application Link Enabling, 463Assignment lines, 128BBase condition types, 133Basic reports, 366Basic reports:, 387Bottom up planning, 285Business ApplicationProgramming Interfaces,463
Business Content, 464CCalculation condition types,133
Calculation Type, 132Change report, 390Characteristic derivation, 99Characteristic group, 389Characteristic hierarchy, 391Characteristic Values, 47Characteristics, 47�48CO orders, 213CO-OM, 19CO-PA, 19�20, 481CO-PA relevant transaction, 93CO-PC, 19Company code, 27, 45Condition type, 132Controlling (CO), 19Controlling area, 27, 45
Controlling ProfitabilityAnalysis, 173
Controlling ProfitabilityAnalysis (CO-PA), 124
Cost Accounting, 6Cost object, 261Cost of Sales, 18Cost-of-sales accounting, 8Costing key, 128Costing sheets, 131Currency, 372Customizing Monitor, 109, 502DDecision-Support Information,18
Derivation rules, 107Derivation strategy, 103Detail list, 397Drill-down reporting, 366,369�370, 387
EException, 371FForm reports, 366Form reports:, 387Frozen data, 485GGlobal variables, 402Goal Seek, 299IInfoObject, 466InfoSource, 466
04-02-2005 © 2004 SAP AG. All rights reserved. 551

Index AC605
integration, 316KKey figure scheme, 390LLine item, 406Local variable, 402Logistics Execution System,462
MMarket Segments, 15Material Ledger, 6NNet Revenue, 18Number Format, 372OOnline Analytical Processing,468
Online Transaction Processing,468
Operating concern, 27, 45Operational Data Store, 467Overhead Cost Controlling, 167Overhead Costs Controlling,204
PPA transfer structure, 214, 263Parallel valuation, 267Performance Figures, 15Period accounting, 8Period indicator, 129Periodic valuation, 124Planning layout, 289Plant, 27, 45Product Cost Controlling(CO-PC), 127
Product Costing, 126Production variances, 167, 263Profit Center, 17
Profit Center Accounting, 5Profit Center Accounting(EC-PCA), 16, 21
Profit centers, 26Profitability Analysis, 5, 14, 18,123, 168, 173
Profitability Data, 18Profitability Management, 5Profitability Reporting, 6Profitability segment, 99Profitability segments, 25Rratio scheme, 301Ratios, 299Realignment, 498Reorganize reports, 390Responsibility Reporting, 10Ssales order managementtransaction, 94
Sales Reporting, 10SAP Business Workflow, 463Scale Basis, 132Schedule Manager, 268segment level, 480segment table, 480settlement profile, 214Sort, 372Statistical Postings, 21Summarization data, 484Summarization level, 482TTable lookup, 106Top down planning, 285Transaction Data, 21VValuation analysis, 140, 185Valuation configuration, 126Value Fields, 50
552 © 2004 SAP AG. All rights reserved. 04-02-2005

FeedbackSAP AG has made every effort in the preparation of this course to ensure the accuracyand completeness of the materials. If you have any corrections or suggestions forimprovement, please record them in the appropriate place in the course evaluation.
04-02-2005 © 2004 SAP AG. All rights reserved. 553