Embed Size (px)
Citation preview

Electrical Power and Energy Systems 45 (2013) 331–339
Contents lists available at SciVerse ScienceDirect
Electrical Power and Energy Systems
journal homepage: www.elsevier .com/locate / i jepes
Power customer satisfaction and profitability analysis using multi-criteriadecision making methods
Rabah Medjoudj a,⇑, Djamil Aissani b, Klaus Dieter Haim c
a Lamos Laboratory, Electrical Engineering Department, University of Bejaia, Algeriab Lamos Laboratory, Operational Research Department, University of Bejaia, Algeriac University of Sciences and Technology, Zittau, Germany
a r t i c l e i n f o
Article history:Received 8 November 2010Received in revised form 22 August 2012Accepted 29 August 2012Available online 24 October 2012
Keywords:Electrical distribution systemDecision making methodsEconomic criteriaCustomer satisfaction
0142-0615/$ - see front matter � 2012 Elsevier Ltd. Ahttp://dx.doi.org/10.1016/j.ijepes.2012.08.062
⇑ Corresponding author. Fax: +213 34218716.E-mail addresses: [email protected] (R. Medjoudj
(D. Aissani), [email protected] (K.D. Haim).
a b s t r a c t
Nowadays, the consumer demands for electrical energy are increasingly growing, because this energy ispresent in all fields of human activity. Any company producing and distributing electric power sets twomain objectives, namely: customer satisfaction and profit making. The aim of this paper is to investigateappropriate tools (multi-criteria decision making methods) aiding decision makers to achieve these goals.The criteria adopted revolve around quality of service and include: cost, reliability, availability, maintain-ability and power quality. However, the alternatives are technical and organizational measures oftentaken in planning and operation phases of electrical power systems. Three methods are used, namely:the analytic hierarchy process (AHP), the cost benefit analysis (CBA) and the economic criteria inspiredfrom game theory (ECIGT). The first method highlights the impact of the experts’ views in the formalismof the final decision of the manager and it is viewed as a transparent decision process. As for the ECIGT, itprovides several scenarios to define a strategy according to the decision maker’s behavior. One of itsimportant finding resides in the possibility of evaluating the reactions of the customers towards the deci-sions taken by the system manager. Consequently, it allows the analysis of the enterprise profitability.However, the CBA method is efficiently integrated into these two complex methods decision making.The application developed in this paper shows that RAM (reliability, availability and maintainability) cri-teria are significant stakes in the performance of a business and are an important asset for new projectsjustification.
� 2012 Elsevier Ltd. All rights reserved.
1. Introduction
Distributors of electrical energy are often working to meet abalance between the requirements’ satisfaction of the end usersof the power system and the containment of the generated costs.This issue requires the knowledge of useful criteria aiding to leadto an appropriate management without prejudicial constraints. Inseveral cases, the decisions taken by managers are resulted fromthe ultimate reflections of a group of experts who associatesweights to the importance of both suitable criteria and suggestedalternatives. In both competitive and monopoly markets, customersatisfaction is a prerequisite and a critical business objective. In aliberal environment, the customer has free choice to provide thebest services and in this case the non-competitive company riskslosing much of the market, consequently it reduces its profitability.In the case of a monopoly market, the consumer dissatisfaction canlead to a conflict of interest which undoubtedly will have adverse
ll rights reserved.
consequences for both parties. This paradigm is addressed in thecontext of multi-criteria decision making. The aim of this paperis to investigate mechanisms leading to simultaneously analysecustomer satisfaction and enterprise profitability in both monop-oly and liberal environments. It provides decision makers with sci-entific tools aiding them to choose the best alternative from onesample to meet the fixed goals, objectives, desires values and so.Compared to this issue, three multi-criteria decision making meth-ods are introduced, insuring the development of mathematicalmodels taking into account the psychological side of both decisionmakers and customers, namely: the analytic hierarchy process(AHP), the cost benefit analysis (CBA) and the economic criteria in-spired from game theory (ECIGT). The AHP method is a transparentprocess that remains very useful for a company insuring a publicservice. It is also a measurement theory that prioritizes the hierar-chy and consistency of judgmental data provided by a group ofdecision makers. As for the ECIGT approach, it presents a certainvirtue, like the ability to simulate different possible states of themanager (optimistic, pessimistic, prudent or gambler) and allowsto understand the reactions of consumers (not satisfied, satisfiedor quite satisfied) in relation to the attitude of the decision maker.
332 R. Medjoudj et al. / Electrical Power and Energy Systems 45 (2013) 331–339
This method is widely used in the resolution of problems posed inan uncertain future. The third proposed method; CBA is an appro-priate tool for costs assessment and efficiently integrated into AHPand ECIGT decision making methods cited above. To achieve theobjectives set, five criteria were selected namely: the cost, the reli-ability, the availability and the maintainability of the network, aswell as the power quality. These criteria highlight, with a highfidelity and in a simultaneous manner, the consumer’s and thecompany’s interests. The consumer seeks a product with both highavailability and quality encompassed in terms of quality of service.However, the enterprise privileges profitability, which is heavilyreliant to the cost of the services, to the system reliability and tothe applicability of the needed maintenance actions, which in turnshould be performed easily and leading to efficient results. A gen-eral decision making process can be divided into eight steps suchas: problem definition, requirements determination, goals estab-lishment, alternatives identification, criteria definition, decisionsmaking tool selection, alternatives against criteria evaluation andfinally solutions against problem statement validation. The devel-opments expressed in the present paper follow these requirementswhere steps order is quite respected, considering a part of the dis-tribution network of Bejaia city (Algeria) as a practical case. Afteranalyzing the current state of the network which is consideredpoor in terms of quality of service, decision-makers had to taketechnical and organizational measures to improve the supply ofelectric energy. Experts’ opinions and consumers’ reactions weresupported with great interest to avoid inconvenience leading toconflicts. For purposes of simulations, a software program wasdeveloped to implement the mathematical models developed foreach method. The obtained results provide decision-makers witha range of choices enabling them to target a well-defined goaland take appropriate actions according to the means of the powersupply company. The rest of the paper is organized as follows: Sec-tion 2 sets the decision methodology overview. Section 3 developsbriefly the three used multi-criteria decision making methods, eas-ily applicable to electric power system. The criteria and the alter-natives useful in the case study application are presented inSection 4. The description of the system under study is dressedin Section 5; however, Section 6 is devoted to the applicationand where the results are discussed. Finally, the conclusions ofthe research are presented in Section 7.
2. Decision methodology overview
Electric utilities need to provide energy delivery services at thelowest cost. The customer satisfaction has become a critical busi-ness objective. Combined to the enterprise profitability, it is di-rectly related to reliability, availability and maintainability of thenetwork, as well as to the power quality. The association of thesecriteria to the strategies developed by the company to attain thefixed objectives and goals constitute the multi-criteria decisionmaking paradigm. To analyse customer satisfaction and enterpriseprofitability, three methods are developed, namely: the analytichierarchy process (AHP), the cost benefit analysis (CBA) and theeconomic criteria inspired from game theory (ECIGT). Regardingcustomer’s wants treatment on manufacturer products, Yang [1]relates reliability to customer satisfaction and presents reliabilityand quality techniques as important parameters for improving cus-tomer satisfaction. Considering Kano model, the author describedthe relationships between customer satisfaction and customers’wants. Bollen et al. [2] have introduced the customer dissatisfac-tion index (CDI) defined as the probability that the supply for a gi-ven customer is of insufficient reliability. Elliot and Serna [3] statedthat utilities are facing new challenges to managing customer sat-isfaction. They have discussed key elements summarized as fol-lows: the first order drivers are service, price and reliability and
the second perception drivers are customer responsiveness, com-pany reputation, and outage frequency and duration. Once themanagers understand these drivers, the next step is to assessopportunities for improvement. To evaluate the satisfaction ofusers of the electric power, in a recent publication, Guo and Niu[4] developed a method based on decision tree, where the analysisis conducted by choosing 20 customer questionnaires. To highlightthe importance of the AHP method, a review of a total of 150 AHPapplication papers is provided by Omkarprasad and Sushil [5] as aninformative summary kit for researchers and practitioners. How-ever, AHP has recently been applied to solve problems concerningelectric power systems. It has been used by Negim et al. [6] as anexpert system to identify the vulnerability of special protectionschemes (SPS), and by Malik and Sumaoy [7] for impact evaluationand logical prioritization of demand side resources to planning cri-teria. ANP and AHP processes were jointly used by Chen et al. [8]for the strategic selection of a feeder management system appliedto the power industry in china. The development with practicalapplication given in the present paper has proven that AHP methodmakes the selection process very transparent with a great benefitto a company assuring public services. The approximated valuesof weights representing the degrees of importance of criteria andalternatives are validated by the results obtained using the CBAmethod. To investigate the behaviors of the decision-makers inan uncertain future and to highlight the reactions of the customers,we have introduced some economic criteria inspired from gametheory. According to this issue, Voropai and Ivanova [9,10] haveconducted some investigations in relation to both game theoryand the problem of expansion planning of power systems. It is sta-ted that if the power supply company invests in the installation,the investment project may call for a multi-criteria assessment.For an independent investor, one should allow for an incentivefor the behavior of the other concerned subjects and the problemcan be associated with the game statement. The AHP, the CBAand the ECIGT methods were adopted in the present paper becausecustomer satisfaction refers to customers’ mental state after com-paring the products and services received with their expectations.
3. Decision making tools
3.1. Analytic hierarchy process
The decision method decomposes a complex multi-criteriadecision problem into a hierarchy. AHP is also a measurement the-ory that prioritizes the hierarchy and consistency of judgmentaldata provided by a group of decision makers. AHP incorporatesthe evaluations of all decision makers into a final decision, withouthaving to elicit their utility functions on subjective and objectivecriteria, by pair-wise comparisons of the alternatives. Five selec-tion criteria Cj (for j = 1–5) are considered to be relevant and arerespectively: the cost, the reliability, the availability, the maintain-ability and the power quality. Four alternatives are selected de-noted by Ai (for i = 1–4) highlighting technical and organizationalmeasures taken during planning and operation phases of thepower system. Steps to general use of the AHP method are summa-rized in Ref. [11] and its application to power customer satisfactionand enterprise profitability is described as follows:
(1) Model the problem as a hierarchy containing the decisiongoal (customer satisfaction and enterprise profitability),the alternatives (technical and organizational measures)for reaching it, and the criteria for evaluating the alterna-tives (cost, reliability indices, and power quality).
(2) Establish priorities among the elements of the hierarchy bymaking a series of judgments based on pair-wise compari-sons of the elements.
R. Medjoudj et al. / Electrical Power and Energy Systems 45 (2013) 331–339 333
(3) Synthesize these judgments to yield a set of overall prioritiesfor the hierarchy.
(4) Check the consistency of the judgments.(5) Come to a final decision based on the results of this process.(6) Analyze the sensitivity to changes in judgment to study the
margin of stability and the decision.
In the matrix QJ representing a quantified judgment on a pair ofelements qij, given by Eq. (1), the problem becomes one of assign-ing to the n elements e1, e2, . . .,en a set of numerical weights W1,W2, . . .,Wn that reflects the recorded judgments. If QJ is a consis-tency matrix, the relation between weights Wi and judgments qij
is simply given by qij = Wj/Wi (for i, j = 1, 2, . . .,n). The largest eigen-value kmax and the eigenvector X can be calculated using Eqs. (2)and (3) respectively. The consistency ratio (CRI) is given accordingto the size of the matrix QJ and the consistency index (CI) is as-sessed using Eq. (4).
QJ ¼ ½qij� ¼
1 q12 : : : q1n1
q121 : : : q2n
: : : : : :
: : : : : :
: : : : : :1
q1n
1q2n
: : : 1
:
26666666664
37777777775
ð1Þ
kmax ¼Xn
j¼1
qijWj
Wið2Þ
ðQJ � kmaxIÞX ¼ 0 ð3Þ
CI ¼ kmax � nn� 1
ð4Þ
In the AHP, pair-wise comparisons in a judgment matrix areconsidered to be adequately consistent if the corresponding consis-tency ratio (CR) is less than 10%.
3.2. Economic criteria inspired from game theory
Usually, game theory is applied when several players are com-peting. Compared with electricity grids, there are several compa-nies in a competitive environment. To solve the issue on thebasis of game theory, a game matrix is constructed where rowscorrespond to scenarios of customer satisfaction and reactions ofthe customers to the future investment, however, the columns cor-respond to the strategies developed by the decision makers. Theelements of the game matrix designate the costs of the given alter-natives. The economic criteria used in the present paper are the La-place–Bayes criterion, the Wald or max–min criterion, the Savageor min–max Regret criterion and the Hurwitz criteria. For electricalnetworks restructuring, these criteria were briefly introduced byNeimane [12], and explained as follows.
Under the Bayes–Laplace criterion (ZBL), a probability or aweight is associated to each scenario i. The cost associated to sce-nario i for a strategy j is Vij and the probability of each scenario isQj. The advantage of this criterion is that each scenario is taken intoaccount and the importance of the scenario is reflected through itsprobability of occurrence, however it may lead to a risky decision.
The Laplace’s criterion (ZL) can be based on the statement thatthe probabilities are unknown and there are no sufficient reasonsto consider them to be different. In many cases such assumptioncan turn out to be groundless. The optimal solution is the one min-imizing the arithmetical mean of costs over n scenarios. The min–max decision rule (ZmM) is to seek decision-makers action, whichminimizes the maximum potential loss. A decision-maker who
uses the min–max criterion acts extremely conservatively. Heseeks the actions that achieve the best outcome under the worstscenario. Adopting the Wald (max–min) criterion (ZMm) corre-sponds to a prudent attitude of a decision maker. It will seek toidentify for every possible strategy, a scenario that would lead toworse outcomes. Afterwards, he will try to cover himself by adopt-ing a strategy that is likely to provide the least bad possible result,if the evolution of competition (scenarios) is detrimental to thecompany.
Hurwitz proposes a criterion (ZH) which consists to calculate foreach strategy a weighted average of the worst and the best of itspotential outcomes and chooses the one for which the solution isthe largest. According to this criterion the best strategy is theone minimizing the linear combination of minimal and maximalcosts. The five described economic criteria are formulated in thefollowing equations, respectively.
ZBL ¼mini
Xj
Q jVij ð5Þ
ZL ¼mini
1n
Xj
V ij ð6Þ
ZmM ¼mini
maxj
V ij ð7Þ
ZMm ¼maxi
minj
V ij ð8Þ
ZH ¼mini½a �max
jðVijÞ þ ð1� aÞ �min
jðVijÞ� ð9Þ
where 0 6 a 6 1 is a parameter indicating planers attitude towardsthe risk. The value a = 1 reduces the Hurwitz’ criterion to min–maxcriterion described above and corresponds to an extremely pessi-mistic decision-maker. The value a = 0 corresponds to an extremeoptimism.
3.3. Cost benefit analysis
The cost benefit analysis (CBA) is efficiently integrated intocomplex methods decision making such as: AHP and ECIGT. A bal-ance is achieved by minimizing the total cost (TOC) gathering allcosts in three terms given by the following expression:
Total cost ðTOCÞ ¼ Utility cost ðUCÞþ Customer interruption cost ðCICÞþ Losses cost ðLCÞ
The sub-criteria derived from the total cost are defined as fol-lows: for an item k, with a unit capital cost Ik, the updated annualcost is Iak ¼ Ikcnðc� 1Þ=cn�1. The utility cost for k0 items over theperiod T = [t1, t2] of planning updated is:
UCt ¼Xt2
t¼t1
Xk0
k¼1
IakðtÞc�t ð10Þ
The customer interruption cost (CIC) is used as a substitute inthe assessment of reliability-worth in electric power systems[13]. Numerous studies have been conducted to provide estimatesof CICs and a wide range of methodologies has evolved. A powernetwork should supply its customers with minimal outages andmaximal power quality. This is evaluated using the current totalharmonic distortion (ITHD) index which determines the degreeto which harmonics distort the sinusoidal wave form of the currentin the network and based on expected energy not supplied (EENS)index assessment [14]. The customer interruption cost can be
334 R. Medjoudj et al. / Electrical Power and Energy Systems 45 (2013) 331–339
given by the following expression: CIC ¼ LðKp � EFLC2 þ Kw � EDLCÞor CIC ¼ L � Kp � EFLC2 þ Kw � EENS. It is a quadratic function of fail-ures number and the updated value is assessed as follows:
CICt ¼ KW
Xt2
t¼t1
EENS � c�t þ Kp
Xt2
t¼t1
L � EFLC2 � c�t ð11Þ
This valorization directs the investments in priority on the mostdisturbed zones. The losses cost depends on the maximum losseswhich appear in overhead transmission lines, underground cablesand sub-stations. If the dissipated active power in a section k isPmax, the annual cost of losses is given by the following expression:Rk ¼ ðKp þ Kw � h � TaÞPmax � t, and the total updated losses cost for k0
sections, is given as:
LCt ¼Xt2
t¼t1
Xk0
k¼1
Rk � c�t ð12Þ
where cnðc� 1Þ=cn�1 is the capital recovery factor (CRF) withc = i + 1 and i, the worth rate characterizing the financial policy ofthe company. The parameters Kw, Kp, h, t, Ta and n are the tariff ofkilowatt-hour (kW h), the tariff of kilowatt (kW), the ratio definingthe use of the network, the demand variation factor, the annual useduration of the network and the year of use, respectively.
Finally, the optimum reliability level is determined byminimizing the expected cost as:
ECOSTt ¼ UCt þ LCt þ CICt ð13Þ
Compared to the formulation of the ECOST given in Ref. [15], theformula given by Eq. (13) includes the cost of the loss of quality.
4. Criteria definition and alternatives identification
4.1. Criteria definition
Deregulation of electric power industry has motivated electric-ity customers to pay more attention in evaluating both the directcost of electric service and the monetary value of the reliable elec-tric service [16]. To evaluate the service reliability value, three costsub-criteria quantifying utility cost (UC), customer interruptioncost (CIC) and losses cost (LC) were developed in Section 3 of thepresent paper in the cost–benefit analysis context. The primaryobjective of an energy producer and distributor is to acquire qual-ity product that satisfies user needs (customer) with measurableimprovements to mission capability and operational support inat a fair and reasonable price. Reliability (R), availability (A) andmaintainability (M) are addressed as essential elements of missioncapability. These elements are three related characteristics of asystem and its operational support. From technical point of viewthey are defined as follows.
Reliability is the probability of an item to perform a requiredfunction under stated conditions for a specified period of time. Itis further divided into mission reliability and logistics reliability.Analysis of recurrence data from repairable systems and analysisof lifetime data for components and non-repairable units requiredifferent statistical models and methods of analysis [17]. However,in all cases, reliability should be defined with respect to a well-de-fined mission and condition of use. In addition to consider it as aprobability, in the case of electric power system, reliability canbe treated on the basis of a well-known indices, namely: expectedfrequency of load curtailment (EFLC (fault/yr)), expected durationof load curtailment (EDLC (h/yr)), expected duration of a curtail-ment (EDC (hrs)) and expected energy not supplied (EENS(kWh/yr)) [18], expressed by the following equations, respectively:
EFLC ¼Xn
k¼1
kk ð14Þ
EDLC ¼Xn
k¼1
kkTk ð15Þ
EENS ¼ L � EDLC ð16Þ
where kk, Tk are the failure rate and the failure duration of an itemk, respectively and L is the load. Availability, as measured by theuser, is a function of how often failures occur and corrective main-tenance is required, how quickly indicated failures can be isolatedand repaired, how quickly preventive maintenance tasks can beperformed, and how long logistics support delays contribute todown time. Maintainability is the ability of an item to be retainedin, or restored to, a specified condition when maintenance is per-formed by personnel having specified skill levels, using prescribedprocedures and resources, at each prescribed level of maintenanceand repair. Therefore, in practice, before recording a maintenanceaction, it is useful to ensure its applicability which is the resultantof ease of implementation and effectiveness of its results.Achieving power quality of power systems affects all connectedelectrical and electronic equipment. It is a measure of deviationsin voltage and frequency of the particular supply system. In recentyears, there has been a considerable increase in nonlinear loads; inparticular distributed loads, such as computers, TV monitors andlighting. These draw harmonic currents which, when distorted,have detrimental effects including interference, loss of reliability,increased operating costs, equipment overheating, motor failures,capacitor failure and inaccurate power metering. It has been dis-covered that the 85% of power supply malfunctions attributed topoor power quality are caused by voltage sag or interruptions ofless than a second duration [19]. Recently, new technologies likecustom power devices based on power electronic concepts havebeen developed to provide protection against power qualityproblems.
4.2. Alternatives identification and development
Based on the level of performances of the electric power systemat the actual state, when the fixed objectives are not satisfied;technical and organizational measures should be taken to ensureits improvement; they are translated as follows:
– Intensification of the maintenance operations, to reduce thenumber of failures.
– Reorganization of the networks for more flexibility in failureconditions, by building more high voltage/medium voltage(HV/MV) stations, so that lengths of outgoing MV transmissionlines will be decreased.
– Automation of networks by adding remote control switches onoutgoing MV lines to better control restoration of supply and tolimit the interruption duration, and the geographical areaaffected by failures.
– Realization of work under voltage and automation of failureresearch by installing fault detectors.
– Load transfer between feeders, undergrounding circuits andreplacement of aging equipment [20].
These actions are grouped in four alternatives, as follows:
– Alternative 1 (A1): Corresponds to the actual state of the electricpower system under study,
– Alternative 2 (A2): Faults detectors are installed at each sub-station; consequently the time to fault research is reduced.

R. Medjoudj et al. / Electrical Power and Energy Systems 45 (2013) 331–339 335
– Alternative 3 (A3): To alternative 2 (A2), are added remote con-trol switches on outgoing MV lines to reduce the number of cus-tomers concerned by a failure.
– Alternative 4 (A4): Some overhead circuits are undergroundedand sections of the aging cables are replaced by new ones (areconcerned the sections with a number of joints exceeding thethreshold value).
5. Electric power system under study
It has been frequently observed that a major part of serviceinterruptions experienced by individual customer, has its originin the distribution system failures. Therefore a particular interestis given to this part of the network.
The voltage level of the studied distribution system (Bejaia city,Algeria) is medium and about 30,000 V. Each feeder is made up ofserial-connected components and consists on a succession ofunderground and overhead circuits. As shown in Fig. 1, the wholesystem is in a bridge structure, where the main components are:two HV/MV transformers Tr1 and Tr2 with circuit-breakers CBHV
and CBMV at the both sides. The key component is the switchgearSW connecting the MV bare buses. The MV geographical distribu-tion part is partitioned in ten (10) feeders. In normal operatingconditions, the feeder structure is radial. If a fault occurs on a fee-der, the defaulting section is isolated and the parts not concernedby the fault are rescued from the source side and also from theopening node (N�O) side which will be closed at the occasion. Thisgives the advantage of looping circuit and allows minimizing thenumber of load points (Li) disconnected after fault’s appearance.Data are derived from collections that are based on interruption re-ports obtained from the fields in the last 10 years or so [17].
6. Case study application
6.1. Reliability indices and costs evaluation versus alternatives
The application is done on a part of a real distribution systemactually under operation where the main inputs are: First, the net-work topology (serial configuration for feeder), the lengths of sec-tions, the power values at load points, the evolution of the demandtendency and the fault research method. Second, the reliability
Fig. 1. The electric system under study.
parameters of the components dressed in Table 1. These parame-ters were obtained using a statistical assessment of data, collectedover a period of 17 years. The treatment consisted of the selectionof numbers of failures for each element of the network, the dura-tions of failures and the response times after a failure or a mainte-nance action.
Using Eqs. (14)–(16), we have computed the reliability indicesand the results are dressed in Table 2 for the four alternatives Ai,i = 1–4.
The first information derived from this evaluation is that it isobvious that some reliability indices, such as the failure frequencyare not sensitive to certain alternatives. However, the alternatives2, 3 and 4 have a very visible influence on the reliability indiceslinked to down time and to energy not supplied. It is shown thatthese indices are improved depending on the importance of the en-gaged alternative.
To evaluate the costs versus alternatives, additional inputs areproduced with the specificity of the Algerian case and are givenas follows:
– t = 1.07, this means that the annual evolution of the electricitydemand is around 07%.
– T = 5 years, is given with relation to the period of governmentplanning; 5-year program period.
– Kw = 0.6 US$ and Kp = 0.23 US$, these values seem quite lowercompared to the international values, because electricity priceis still partially supported by the government unless the ten-dency goes to the enterprises autonomy.
– h = 30%, this ratio gives an idea that in Bejaia city, the electricnetwork is not used at its nominal level. This is due to theabsence of strong industrial activities, and the city is in develop-ing stage. However, Ta = 8760 h, gives the total hours in theyear.
From practical point of view, the alternatives are described withthe enumeration of items’ costs as follows:
– Alternative A1 is carried without investments;– Alternative A2 corresponds to the installation of 205 fault indi-
cators on the system where the unit cost is If = 600 US$.– Alternative A3 corresponds to A2 with the addition of five reclos-
ers in line where the unit cost is Ir = 3500 US$.– Alternative A4, as described above, corresponds to underg-
rounding a length of 2.75 km of cable (70 mm2) and replacinga length of 7.25 km of oldest sections. The cost of the cable is18,000 US$ per km.
The costs per unit given in the investment evaluation are takenfollowing international standards, because the equipment used isimported from abroad, consequently it is entirely supported bythe enterprise.
The costs given by Eqs. (10)–(13) were assessed using Matlab6.5 software package. The obtained results for three distinguishedvalues of the worth rate ‘‘i’’ are dressed in Table 3.
The cost-benefit analysis aids to evaluate the importances ofsub-criteria relative to cost. For example, the CIC is more important
Table 1System reliability inputs parameters.
System reliability parameters
tgs: Mean time to travel to a sub-station 15.0 mintrs: Mean time to repair of an MV/LV sub-station 1200.0 mintrc: Mean to repair of underground cable 900.0 minks: Average failure rate of an MV/LV sub-station 0.01(1/yr)kc: Average failure rate of underground cable 0.38 (1/km yr)

Table 5Pair-wise comparison matrix of the sub-criteria with respect to the cost.
LC CIC UC Priorities
Losses cost (LC) 1 1/3 1/6 0.0914Customer interruption cost (CIC) 3 1 1/4 0.2176Utility cost (UC) 6 4 1 0.6910
Table 6Pair-wise comparison matrix of the sub-criteria with respect to the reliability.
Ag EDLC EFLC Priorities
Aging (Ag) 1 1/3 1/5 0.1047Expected duration load curtailment (EDLC) 3 1 1/3 0.2583Expected frequency load curtailment (EFLC) 5 3 1 0.6370
Table 2System reliability indices according to alternatives.
Overall system reliability indices Alternatives (Ai)
A1 A2 A3 A4
EFLC (fault/yr) 2.716 2.716 2.716 0.464EDLC (h/yr) 826.6 604.0 322.0 164.0EENS (kW h/yr) 80320.0 58650.0 31380.0 16020.0MDF (h) 4.1 2.8 1.8 0.8
Table 3The matrix of costs (US$) versus alternatives.
Worth rate values i = 0.02 i = 0.03 i = 0.04
AlternativesA1 52108 50629 48215A2 49671 53683 57655A3 33923 38863 43625A4 858320 833970 810680
336 R. Medjoudj et al. / Electrical Power and Energy Systems 45 (2013) 331–339
than the LC. It is shown that the costs are highest when using alter-native 4. This means that to achieve a high level of performance, itis necessary to go through an important investment which is anecessity especially in the case of aging and overhead networks.
6.2. Analytic hierarchy process implementation
The application of the AHP method follows the sixth steps enu-merated in Section 3. This first step is summarized in a flowchartgiven in Fig. 2.
The second step is the pair-wise comparison of the importanceof criteria, this is done by assigning a weight between 1 and 9 [21]and the reciprocal of this value is then assigned to the other crite-rion in the pair. The first results are given in Table 4, and corre-spond to the pair-wise comparison of the main criteria withrespect to the goal.
Reliability Cost
Aging
Failure occurrence
Failure duration
Utility cost
Failure cost
Losses cost
Customer satisfactio
Install faults indicators Undergrounding and aging circuits’ replaceme
Goal
Criteria
Sub-Criteria
Alternatives
Fig. 2. Decomposition of the
Table 4Pair-wise comparison matrix of the main criteria with respect to the goal.
Power quality Maintainability
Power quality 1 1/4Maintainability 4 1Availability 4 3Reliability 6 4Cost 8 7
The third step is to extract the relative importance implied bythe previous comparisons. In the judgment matrix with pair-wisecomparisons, the corresponding maximum left eigenvector isapproximated by using the geometric mean of each row. Next,the numbers are normalized by dividing them with their sum[22]. To assess the priority vector Pj (eigenvector), the maximumeigenvalue kmax, the consistency index CI and the consistency ratioCR using Eqs. (1)–(4) respectively, we have developed a programunder Matlab 6.5 software package where the algorithm is givenas follows:
Step 0: Read the inputs– The judgment matrix order N.– The elements of the judgment matrix qij; i ¼ 1 : N; j ¼ 1 : N,
the relative consistency index RCI value corresponding to N.
Step 1: Compute the geometric means, mðiÞ QN
j¼1Qði; jÞ� �1
Nfor
i ¼ 1 : N.
Step 2: Compute the priorities, PðiÞ mðiÞPN
l¼1mðlÞ
for i ¼ 1 : N.
Power quality Maitainabiliy Availability
n and profitability
Keep the system at the actual state
nt
Install fault indicators and reclosers in line
problem into hierarchy.
Availability Reliability Cost Priorities
1/4 1/6 1/8 0.03521/3 1/4 1/7 0.07211 1/3 1/7 0.11853 1 1/2 0.27157 2 1 0.5027

Table 7Comparison matrices and local priorities.
P Q A1 A2 A3 A4 Priority A A1 A2 A3 A4 Priority M A1 A2 A3 A4 Priority
A1 1 1 1/3 1/7 0.0797 A1 1 1/3 1/5 1/7 0.0537 A1 1 1/5 1/2 2 0.1432A2 1 1 1/2 1/6 0.0917 A2 3 1 1/3 1/5 0.1151 A2 5 1 1/2 3 0.3543A3 3 2 1 1/5 0.1787 A3 5 3 1 1/4 0.2394 A3 2 2 1 3 0.3985A4 7 6 5 1 0.6499 A4 7 5 4 1 0.5918 A4 1/2 1/3 1/3 1 0.1040kmax ¼ 4:0649CI ¼ 0:0216CR ¼ 0:0240 kmax ¼ 4:1776CI ¼ 0:0592CR ¼ 0:0658 kmax ¼ 4:2990CI ¼ 0:0997CR ¼ 0:0110
Ag A1 A2 A3 A4 Priority EDLC A1 A2 A3 A4 Priority EFLC A1 A2 A3 A4 Priority
A1 1 1 1/3 1/6 0.0937 A1 1 1/3 1/5 1/7 0.0537 A1 1 1 1/3 1/7 0.0756A2 1 1 1/2 1/4 0.1147 A2 3 1 1/3 1/5 0.1151 A2 1 1 1/3 1/5 0.0756A3 3 2 1 1/3 0.2295 A3 5 3 1 1/4 0.2394 A3 3 3 1 1/6 0.1790A4 6 4 3 1 0.5621 A4 7 5 4 1 0.5918 A4 7 7 6 1 0.6698kmax ¼ 4:0412CI ¼ 0:0137CR ¼ 0:0153 kmax ¼ 4:1776CI ¼ 0:0592CR ¼ 0:0658 kmax ¼ 4:1135CI ¼ 0:0378CR ¼ 0:0420
LC A1 A2 A3 A4 Priority CIC A1 A2 A3 A4 Priority UC A1 A2 A3 A4 Priority
A1 1 1 2 1/6 0.1279 A1 1 1/3 1/5 1/7 0.0539 A1 1 3 5 7 0.5627A2 1 1 2 1/6 0.1279 A2 3 1 1/3 1/6 0.1103 A2 1/3 1 2 6 0.2487A3 1/2 1/2 1 1/7 0.0733 A3 5 3 1 1/3 0.2579 A3 1/5 1/2 1 4 0.1398A4 6 6 7 1 0.6709 A4 7 6 3 1 0.5779 A4 1/7 1/6 1/4 1 0.0488kmax ¼ 4:0365CI ¼ 0:0122CR ¼ 0:0135 kmax ¼ 4:1256CI ¼ 0:0419CR ¼ 0:0465 kmax ¼ 4:1344CI ¼ 0:0448CR ¼ 0:0498
Table 8Final results using synthesis.
Criteria C R A M P.Q. Overall priority
Priorities 0.5027 0.5027 0.5027 0.2715 0.2715 0.2715 0.1185 0.0721 0.0351Sub-criteria UC CIC LC Ag EFLC EDLCPriorities 0.6910 0.2176 0.0914 0.1047 0.6370 0.2583 1.0 1.0 1.0
A1 0.5627 0.0539 0.1279 0.0937 0.0756 0.0537 0.0537 0.1432 0.0797 0.2670A2 0.2487 0.1103 0.1279 0.1147 0.0756 0.1151 0.1151 0.3543 0.0917 0.1710A3 0.1398 0.2579 0.0733 0.2295 0.1790 0.2394 0.2394 0.3985 0.1787 0.1810A4 0.0488 0.5779 0.6709 0.5621 0.6698 0.5918 0.5918 0.1040 0.6499 0.3810
Table 9Synthesizing results for sensitivity analysis.
Criteria C R A M P.Q. Overall priority
Priorities 0.1660 0.1660 0.1660 0.3765 0.3765 0.3765 0.1258 0.0588 0.2729Sub-criteria UC CIC LC Ag EFLC EDLCPriorities 0.6910 0.2176 0.0914 0.1047 0.6370 0.2583 1.0 1.0 1.0
A1 0.5627 0.0539 0.1279 0.0937 0.0756 0.0537 0.0537 0.1432 0.0797 0.1335A2 0.2487 0.1103 0.1279 0.1147 0.0756 0.1151 0.1151 0.3543 0.0917 0.1355A3 0.1398 0.2579 0.0733 0.2295 0.1790 0.2394 0.2394 0.3985 0.1787 0.2035A4 0.0488 0.5779 0.6709 0.5621 0.6698 0.5918 0.5918 0.1040 0.6499 0.5275
Table 10Example illustrating the expected cost and Laplace’s criterion.
Scenarios Weights Alternatives (strategies)
A1 A2 A3 A4
Scenario 1 0.15 52,108 49,671 33,923 858,320Scenario 2 0.70 50,629 53,683 38,863 833,970Scenario 3 0.15 49,215 57,555 43,625 810,680Expected cost
PQiVij 50,638 53,662 38,800 834,129
Mean 1n
PðVijÞ 50,650 53,636 38,803 834,323
Minimum maxiðVijÞ 52,108 57,555 43,625 858,320
Minimum miniðVijÞ 49,215 49,671 33,923 810,680
R. Medjoudj et al. / Electrical Power and Energy Systems 45 (2013) 331–339 337
Step 3: Compute the spectra of the matrix QJ, SPQJ eigðQJÞ.Step 4: Determinate the maximum of the eigenvalues of QJ,k max maxðSPQJÞ.Step 5: Compute the consistency index CI, CI ðlambda max�NÞ=ðN � 1Þ.Step 6: Compute the consistency rate CR, CR CI=RCI.Step 7: End.
The validity of the obtained results was confirmed by compar-ing them with those obtained using software developed by Whi-taker and Adams [23]. The pair-wise matrices of the sub-criteriawith respect to both cost and reliability are given in Tables 5 and6, respectively.
In the fourth step, is cheeked the consistency of judgments andall particular results of comparison between the sub-criteria andalternatives are summarized in Table 7.
Column’s values ‘‘Priority’’ dressed in Table 7 constitute theelements of Table 8 where the synthesis corresponding to therankings of the four alternatives against the nine criteria and
sub-criteria confounded is given. With this synthesis, we come tothe final step involving the final decision of this process.
For customer satisfaction, based on alternatives proposedinitially, the highest priority is given to alternative A4. To judge
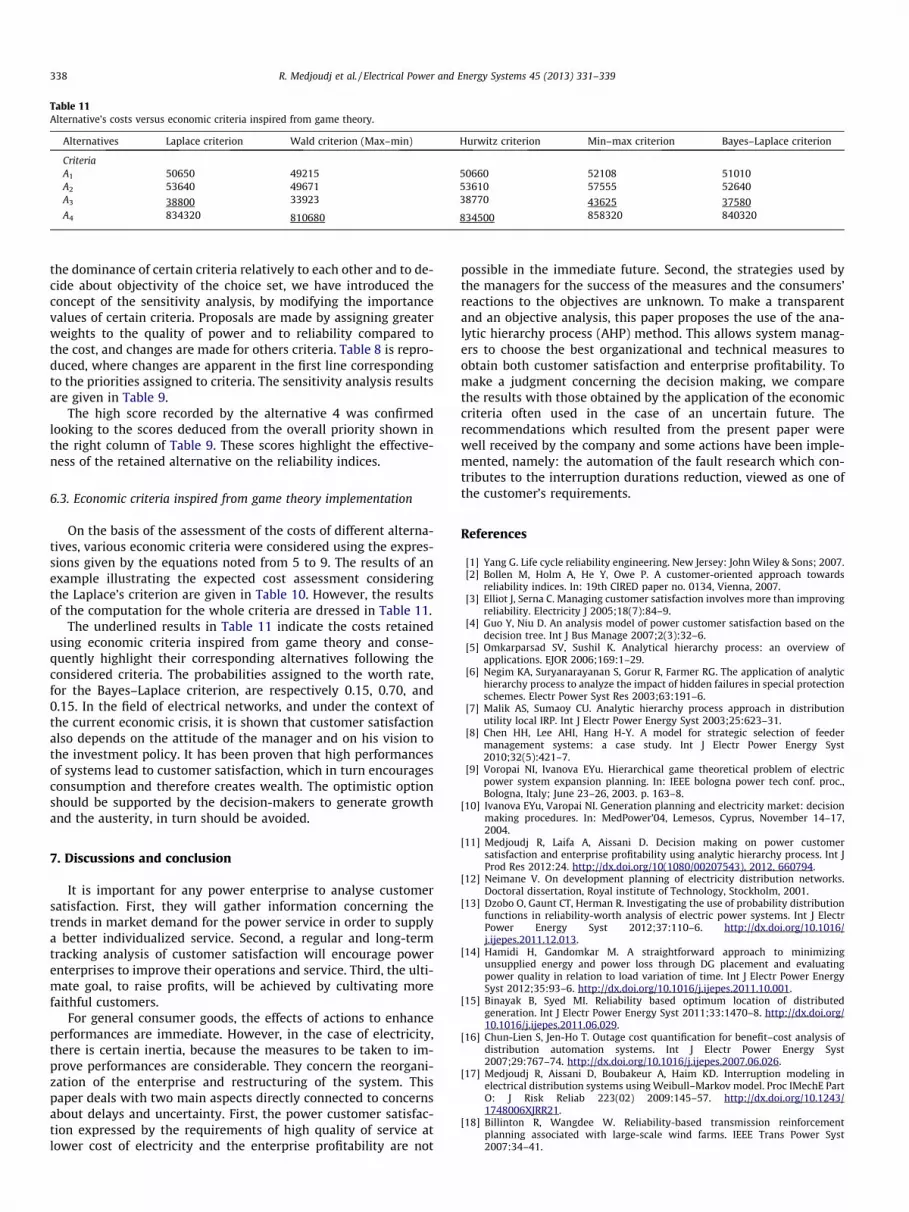
Table 11Alternative’s costs versus economic criteria inspired from game theory.
Alternatives Laplace criterion Wald criterion (Max–min) Hurwitz criterion Min–max criterion Bayes–Laplace criterion
CriteriaA1 50650 49215 50660 52108 51010A2 53640 49671 53610 57555 52640A3 38800 33923 38770 43625 37580A4 834320 810680 834500 858320 840320
338 R. Medjoudj et al. / Electrical Power and Energy Systems 45 (2013) 331–339
the dominance of certain criteria relatively to each other and to de-cide about objectivity of the choice set, we have introduced theconcept of the sensitivity analysis, by modifying the importancevalues of certain criteria. Proposals are made by assigning greaterweights to the quality of power and to reliability compared tothe cost, and changes are made for others criteria. Table 8 is repro-duced, where changes are apparent in the first line correspondingto the priorities assigned to criteria. The sensitivity analysis resultsare given in Table 9.
The high score recorded by the alternative 4 was confirmedlooking to the scores deduced from the overall priority shown inthe right column of Table 9. These scores highlight the effective-ness of the retained alternative on the reliability indices.
6.3. Economic criteria inspired from game theory implementation
On the basis of the assessment of the costs of different alterna-tives, various economic criteria were considered using the expres-sions given by the equations noted from 5 to 9. The results of anexample illustrating the expected cost assessment consideringthe Laplace’s criterion are given in Table 10. However, the resultsof the computation for the whole criteria are dressed in Table 11.
The underlined results in Table 11 indicate the costs retainedusing economic criteria inspired from game theory and conse-quently highlight their corresponding alternatives following theconsidered criteria. The probabilities assigned to the worth rate,for the Bayes–Laplace criterion, are respectively 0.15, 0.70, and0.15. In the field of electrical networks, and under the context ofthe current economic crisis, it is shown that customer satisfactionalso depends on the attitude of the manager and on his vision tothe investment policy. It has been proven that high performancesof systems lead to customer satisfaction, which in turn encouragesconsumption and therefore creates wealth. The optimistic optionshould be supported by the decision-makers to generate growthand the austerity, in turn should be avoided.
7. Discussions and conclusion
It is important for any power enterprise to analyse customersatisfaction. First, they will gather information concerning thetrends in market demand for the power service in order to supplya better individualized service. Second, a regular and long-termtracking analysis of customer satisfaction will encourage powerenterprises to improve their operations and service. Third, the ulti-mate goal, to raise profits, will be achieved by cultivating morefaithful customers.
For general consumer goods, the effects of actions to enhanceperformances are immediate. However, in the case of electricity,there is certain inertia, because the measures to be taken to im-prove performances are considerable. They concern the reorgani-zation of the enterprise and restructuring of the system. Thispaper deals with two main aspects directly connected to concernsabout delays and uncertainty. First, the power customer satisfac-tion expressed by the requirements of high quality of service atlower cost of electricity and the enterprise profitability are not
possible in the immediate future. Second, the strategies used bythe managers for the success of the measures and the consumers’reactions to the objectives are unknown. To make a transparentand an objective analysis, this paper proposes the use of the ana-lytic hierarchy process (AHP) method. This allows system manag-ers to choose the best organizational and technical measures toobtain both customer satisfaction and enterprise profitability. Tomake a judgment concerning the decision making, we comparethe results with those obtained by the application of the economiccriteria often used in the case of an uncertain future. Therecommendations which resulted from the present paper werewell received by the company and some actions have been imple-mented, namely: the automation of the fault research which con-tributes to the interruption durations reduction, viewed as one ofthe customer’s requirements.
References
[1] Yang G. Life cycle reliability engineering. New Jersey: John Wiley & Sons; 2007.[2] Bollen M, Holm A, He Y, Owe P. A customer-oriented approach towards
reliability indices. In: 19th CIRED paper no. 0134, Vienna, 2007.[3] Elliot J, Serna C. Managing customer satisfaction involves more than improving
reliability. Electricity J 2005;18(7):84–9.[4] Guo Y, Niu D. An analysis model of power customer satisfaction based on the
decision tree. Int J Bus Manage 2007;2(3):32–6.[5] Omkarparsad SV, Sushil K. Analytical hierarchy process: an overview of
applications. EJOR 2006;169:1–29.[6] Negim KA, Suryanarayanan S, Gorur R, Farmer RG. The application of analytic
hierarchy process to analyze the impact of hidden failures in special protectionschemes. Electr Power Syst Res 2003;63:191–6.
[7] Malik AS, Sumaoy CU. Analytic hierarchy process approach in distributionutility local IRP. Int J Electr Power Energy Syst 2003;25:623–31.
[8] Chen HH, Lee AHI, Hang H-Y. A model for strategic selection of feedermanagement systems: a case study. Int J Electr Power Energy Syst2010;32(5):421–7.
[9] Voropai NI, Ivanova EYu. Hierarchical game theoretical problem of electricpower system expansion planning. In: IEEE bologna power tech conf. proc.,Bologna, Italy; June 23–26, 2003. p. 163–8.
[10] Ivanova EYu, Varopai NI. Generation planning and electricity market: decisionmaking procedures. In: MedPower’04, Lemesos, Cyprus, November 14–17,2004.
[11] Medjoudj R, Laifa A, Aissani D. Decision making on power customersatisfaction and enterprise profitability using analytic hierarchy process. Int JProd Res 2012:24. http://dx.doi.org/10(1080/00207543), 2012, 660794.
[12] Neimane V. On development planning of electricity distribution networks.Doctoral dissertation, Royal institute of Technology, Stockholm, 2001.
[13] Dzobo O, Gaunt CT, Herman R. Investigating the use of probability distributionfunctions in reliability-worth analysis of electric power systems. Int J ElectrPower Energy Syst 2012;37:110–6. http://dx.doi.org/10.1016/j.ijepes.2011.12.013.
[14] Hamidi H, Gandomkar M. A straightforward approach to minimizingunsupplied energy and power loss through DG placement and evaluatingpower quality in relation to load variation of time. Int J Electr Power EnergySyst 2012;35:93–6. http://dx.doi.org/10.1016/j.ijepes.2011.10.001.
[15] Binayak B, Syed MI. Reliability based optimum location of distributedgeneration. Int J Electr Power Energy Syst 2011;33:1470–8. http://dx.doi.org/10.1016/j.ijepes.2011.06.029.
[16] Chun-Lien S, Jen-Ho T. Outage cost quantification for benefit–cost analysis ofdistribution automation systems. Int J Electr Power Energy Syst2007;29:767–74. http://dx.doi.org/10.1016/j.ijepes.2007.06.026.
[17] Medjoudj R, Aissani D, Boubakeur A, Haim KD. Interruption modeling inelectrical distribution systems using Weibull–Markov model. Proc IMechE PartO: J Risk Reliab 223(02) 2009:145–57. http://dx.doi.org/10.1243/1748006XJRR21.
[18] Billinton R, Wangdee W. Reliability-based transmission reinforcementplanning associated with large-scale wind farms. IEEE Trans Power Syst2007:34–41.

R. Medjoudj et al. / Electrical Power and Energy Systems 45 (2013) 331–339 339
[19] Moreno-Munoz A, De la Rasa JJG, Lopez-Rodriguez MA, Flores-Aras, Bellido-Ottenrino FJ, Ruiz de Adana M. Improvement of power quality usingdistributed generation. Int J Electr Power Energy Syst 2010;32:1069–76.http://dx.doi.org/10.1016/j.ijepes.2010.06.00.
[20] Brown RE, Hanson AP, Willis HL, Luedtke FA, Born FM. Assessing the reliabilityof distribution systems. IEEE Trans Computer Appl Power 2001;1(1):44–9.
[21] Triantaphyllou E, Kovalerchuk B, Mann Jr L, Knapp GM. Determining the mostimportant criteria in maintenance decision making. J Qual Mainten Eng1997;3(1):16–28.
[22] Saaty TL. Decision making with the analytic hierarchy process. Int J Services Sci2008;1(1):83–97.
[23] Whitaker R, Adams W. Developers of superdecisions software. DecisionsFoundation, Pittsburgh; 2005. <http://www.superdecisions.com>.