Embed Size (px)
Citation preview
Land mobile radio network services
Profitability methodology approach 13 December 2021
This is one of a series of consultative working papers which will be published during the course of the investigation. This paper should be read alongside the issues statement and the other working papers which will be prepared in due course. These papers do not form the inquiry group’s provisional findings. The group is carrying forward its information-gathering and analysis work and will proceed to prepare its provisional findings, which are currently scheduled for publication in April, taking into consideration responses to the consultation on the issues statement and the working papers. Parties wishing to comment on this paper should send their comments to [email protected] by 10 January 2022.
© Crown copyright 2021
You may reuse this information (not including logos) free of charge in any format or medium, under the terms of the Open Government Licence.
To view this licence, visit www.nationalarchives.gov.uk/doc/open-government-licence/ or write to the Information Policy Team, The National Archives, Kew, London TW9 4DU, or email: [email protected].
The Competition and Markets Authority has excluded from this published version of the working paper information which the inquiry group considers should be
excluded having regard to the three considerations set out in section 244 of the Enterprise Act 2002 (specified information: considerations relevant to disclosure).
The omissions are indicated by []. [Some numbers have been replaced by a range. These are shown in square brackets.] [Non-sensitive wording is also
indicated in square brackets.]
3
Contents Page
Introduction ................................................................................................................ 4
Role of profitability and financial analysis ................................................................... 5
Diagnosis ................................................................................................................ 5
Detriment ................................................................................................................ 6
Scope of our analysis ................................................................................................. 6
Business activities ................................................................................................... 6
Time period under consideration ............................................................................. 7
Proposed approach to profitability analysis ................................................................ 9
Overarching conceptual approach .......................................................................... 9
Additional analysis.................................................................................................... 17
Internal documents ............................................................................................... 17
Price or margin benchmarking .............................................................................. 18
Our analysis ............................................................................................................. 18
Introduction to our preliminary analysis ................................................................. 18
Financial information ............................................................................................. 19
The three models .................................................................................................. 25
Initial results .......................................................................................................... 27
4
Introduction
1. The purpose of this paper is twofold: to set out the CMA’s proposed methodology to financial and profitability analysis, and to set out illustrative analysis and results adopting this approach using the financial information that we have collected to date.
2. We first discuss our proposed approach to financial and profitability analysis of Airwave Solutions Limited (Airwave, or the Company), which will inform our assessment of profitability.1 In this section, we discuss the role of profitability and financial analysis, the scope of our analysis, our proposed approach, and some additional analysis that we propose to undertake.
3. In the second section, we set out our illustrative analysis and results, including:
(a) The financial information we have used;
(b) the three models we have built; and
(c) the initial results of our modelling and analysis.
4. We highlight that this analysis and the results are preliminary, that they have been included for the purposes of illustrating our proposed approach. We are not drawing any conclusions at this stage as to the significance of these results. We expect these results to be revised both in response to submissions that we receive on our profitability methodology and as a result of the further analysis that we propose to undertake on Airwave’s operating and capital costs. Further detail on this analysis is set out in paragraphs 62 to 94.
5. We invite Airwave and other interested parties to comment, providing supporting evidence and reasoning as appropriate, on the approach that we have set out in this paper by 10 January 2022. Throughout this paper, we have highlighted specific areas on which we are particularly seeking submissions. However, interested parties should feel free to comment on any aspect of our approach, as set out in this paper.
1 We note that Airwave is a subsidiary of Motorola Solutions Inc (“Motorola”). As set out in this paper, we are proposing to focus our analysis on the profitability of Airwave rather than the wider Motorola group. However, as set out in paragraph 40(b), we are proposing to review transactions between Airwave and the rest of the Motorola group to the extent that they may affect the profitability of Airwave as set out in its financial statements.
5
Role of profitability and financial analysis
6. The information obtained from our profitability analysis will be used across two main areas:
(a) Diagnosis: as part of our assessment of market outcomes which can help us determine whether there are any adverse effects on competition (AECs) in the market for land mobile radio (LMR) for public safety in Great Britain; and
(b) Detriment: as part of our assessment of the degree and nature of any detrimental effect on customers so far as it has resulted from, or may be expected to result from, any AECs.
7. The rest of this section explains each of these two areas in more detail.
Diagnosis
8. When reaching a view concerning the functioning of a market, we consider the outcomes of the competitive process in that market, including, inter alia, the prices charged by firms and their profitability.2
9. The aim of profitability analysis is to understand competitive conditions within a market, by examining the outcomes of that market in terms of the financial performance of the participating firms. The Market Investigation Guidelines (the Guidelines)3 state that:
‘Firms in a competitive market would generally earn no more than a ‘normal’ rate of profit – the minimum level of profits required to keep the factors of production in their current use in the long run, ie the rate of return on capital employed for a particular business activity would be equal to the opportunity cost of capital for that activity.’4
10. The purpose of conducting profitability analysis, therefore, is to understand whether the levels of profitability (and therefore prices) achieved by Airwave are consistent with the levels we might expect in a competitive market. If excess profits (ie profits above the levels that we would expect in a competitive market) have been sustained over a sufficiently long period of time, this could indicate limitations in competition.
2 CC3 (Revised) paragraph 103 3 Market Investigation Guidelines (CC3 Revised) 4 CC3 (Revised) paragraph 116
6
11. On the other hand, the Guidelines highlight that a finding of low profitability does not necessarily signify that competition is working well, since low profitability may be concealing ineffective competition. For example, incumbent firms, despite being protected from new entry, may not earn high profits because they are inefficient and operate with higher costs than would be sustainable with stronger competition in the market.5
12. We shall interpret the results from our profitability assessment in the wider context of our market investigation, including our understanding of the broader competitive dynamics. In reaching a view about the functioning of the reference market, and identifying any market features that may have an adverse effect on competition, profitability is one of the outcomes of the competitive process we may be considering, alongside evidence on product pricing and quality and/or innovation.
Detriment
13. Profitability analysis can also be used as an indicator of the degree and nature of customer detriment arising from any AECs.6 Should we find profits to be above the ‘normal level’ (as defined above in paragraph 9), we plan to use these excess profits to inform our understanding of the extent of customer detriment.
14. We do not comment further on our empirical approach to estimating detriment using the profitability analysis, as the assumptions and judgments used in the analyses for quantifying detriment will be the same as those used in the diagnosis phase.
Scope of our analysis
15. In this section we set out the proposed scope of our profitability assessment and the relationship with our terms of reference, highlighting which business activities we consider to be relevant, which firms we propose to analyse and the time periods over which we propose to assess profitability.
Business activities
16. LMR services for public safety (including all relevant ancillary services) in Great Britain is defined in our Terms of Reference as follows:
5 CC3 (Revised) paragraph 125 6 CC3 (Revised) paragraph 104
7
services provided through a secure private communications network, based on land mobile radio technology, that is used by personnel involved in public safety (namely the police, emergency and fire services, and those who need to communicate with such services) when in the field.7
and ancillary services is defined in our Terms of Reference as follows:
services that are interlinked with the provision of LMR network services for public safety and for which customers have limited alternative suppliers including for example services such as those provided at the testing facilities for radio terminals used by LMR network public safety users.
17. The only supplier of these services in Great Britain is Airwave, and thus our profitability assessment focusses on this firm only. We understand that Airwave’s revenue streams comprise revenue from police contracts, the ambulance contract, and the Firelink contract, as well as revenue from contracts with non-emergency services users (for example the Highways Agency, RSPCA, DEFRA). Our starting point is to analyse the profitability of Airwave Solutions Limited’s GB business activities, and we assume that all revenue streams are linked to the provision of LMR services for public safety (including all ancillary services).
18. We invite Airwave (and/or Motorola) to confirm if this is the correct assumption, and if not, explain i) whether any activities which take place outside Airwave Solutions Limited (ie within the rest of the Motorola group) should be included in our analysis and/or ii) whether any services within Airwave Solutions Limited should be excluded, and, if so, on what grounds. If certain services should be excluded, we invite Airwave and/or Motorola to explain how shared operating costs within Airwave Solutions Limited should be apportioned between included and excluded activities.
Time period under consideration
19. We aim to examine profitability over a time period that is sufficiently long to provide a representative picture of profitability and that is not unduly distorted by unusual macroeconomic conditions or one-off events. Our Guidelines
7 In this working paper, we refer to the secure private communications network, based on land mobile radio technology as the “Airwave Network”, which can be distinguished from the ancillary and other services that may be included within the operations of Airwave Solutions Limited.
8
recognise that the appropriate time period may vary depending on the specific market. 8
20. Motorola told us that the correct analysis of the profitability of Airwave should combine the profits and losses made during the lifetime of the PFI Agreement with those from the post-PFI (or extension) period, ie from 2000 to 2026. Motorola stated that the extension discussions in relation to 2026 were a matter already agreed between the Home Office and Airwave, and that the terms for the extension were agreed in 2018.9 It also stated that it made no sense to split the original PFI contract period (2000-2019) from the extension period to look at profitability, in circumstances where the tail of the contract was extended through the exercise of an option that was already agreed; and that the only fair way to measure profitability was over the entire contract.10
21. As extensions of the original PFI Agreement have in each case involved negotiations spanning several months, our preliminary view is that these extensions may not be integral to the original PFI Agreement. The profitability of Airwave during the extension period(s) may therefore reflect the respective negotiating powers of the Home Office and Motorola at the time of each negotiation to extend the contract. We note that this position may differ from that at the time of the negotiation of the original PFI Agreement, and that the relative negotiating powers of the Home Office and Airwave may be reflected in the profitability of Airwave from its inception up to the end of 2019. We shall explore this issue through other working papers.
22. We propose to assess the profitability of Airwave over the period from 2000 to 2026, as Motorola suggested. However, we also propose to divide that period into two separate time periods: 2000 to 2019 (the ‘PFI Period’) and 2020 to 2026 (referred to as the ‘Extension Period’ in the rest of this working paper) as well as considering the profitability of the 2000 to 2026 period as a whole. This will allow us to understand the levels of profitability resulting from the original negotiation of the PFI agreement and the subsequent negotiations to extend the Airwave Network beyond the original period. In interpreting the analysis we will look at returns in the wider commercial context, that is, the circumstances of the original and subsequent negotiations.
23. We note that we may also consider the profitability of Airwave during other time periods to the extent that our review of the business’ internal documents, including those relating to the various negotiations between Airwave and the
8 CC3 (Revised) paragraph 121 9 Motorola’s response to the CMA’s final report and decision on a market investigation reference, 15 November 2021, paragraph 141. 10 Ibid, paragraph 144.
9
Home Office, suggests that this may be meaningful. For example, we may consider the likely profitability of the business if the Airwave network were extended beyond 2026, and/or we may consider dividing our profitability analysis into pre- and post-2016 periods, which is when we understand that the first set of extension negotiations took place.
24. Our analysis of the profits earned from the operation of the Airwave network over the PFI Period includes all actual (historical) data, whereas our analysis of the profits made from the operation of the Airwave network in the period from 2020 to 2026, ie from the beginning of the Extension Period to the time when it is currently expected that the Airwave network will be switched off includes one year (2020) of actual (historic) data, with the remainder (2021 to 2026) being forecast data.
25. We have already been able to collect some financial information from Airwave covering both the PFI Period and the Extension Period. We shall incorporate updated figures reflecting 2021 actual performance in due course.
26. We invite Airwave and other interested parties to make submissions on the relevant time period for our profitability analysis, including the appropriateness of truncating into two or more periods the analysis as of the end of 2019 (or at any other point), as well as the possibility of considering profitability over an extended timeframe, for example to the end of 2029.11
Proposed approach to profitability analysis
Overarching conceptual approach
Internal rate of return versus cost of capital
27. The analysis of profitability as a means of understanding competitive conditions in a market is based on the premise that in a competitive market firms would generally earn no more than a ‘normal’ rate of profit.12 Our Guidelines define a ‘normal’ level of profit as:
‘the minimum level of profits required to keep the factors of production in their current use in the long run, i.e. the rate of
11 We note that a further extension of the Airwave contract(s) may be required if the replacement ESN system is not operational in time for all customers to transition away from Airwave by the end of 2026. 12 CC3 (Revised) paragraph 116
10
return on capital employed for a particular business activity would be equal to the opportunity cost of capital for that activity.’
28. The opportunity cost of capital is the weighted average return on capital,13 which investors expect for providing capital to firms undertaking the in-scope activities. This can be thought of as a market-based return on investment, to compensate investors for providing money to firms in the market.
29. The rationale for benchmarking return on capital with the opportunity cost of capital is that in a competitive market, if firms persistently earned in excess of the return required to compensate investors for the risks taken, we would expect entry and/or expansion. This entry/expansion would serve to compete away profits14 in excess of the cost of capital up until the point where firms cover their total costs, including a market-based cost of capital and no more. Where firms persistently earn in excess of a normal return, this therefore signals that there may be limitations in the competitive process.
30. Our Guidelines, therefore, refer to the rate of return on capital as a means of measuring profitability. Return on capital can be based on cash flows (internal rate of return (IRR)) or profits (return on capital employed (ROCE)). Our approach to profitability analysis in market investigations draws significantly on a report prepared by Oxera for the OFT (the “Oxera Report”).15 As this report highlights:
In particular, economic and finance theory inform that the internal rate of return (IRR) and the net present value (NPV) are the appropriate measures of profitability of an activity. The assessment of profitability in competition policy analysis should be based on these measures. Other measures of profitability — such as accounting ratios and market-based valuations — are only useful to the extent that they are related to, and provide information about, the IRR and NPV, in which case they can be used as ‘proxy’ measures…
…a sound theoretical framework for assessing profitability based on the IRR and NPV has already been developed in the academic literature. In particular, this literature demonstrates that it is possible to apply the IRR methodology using accounting data (the primary source
13 Specifically, the mean ex ante expected return on capital of debt and equity holders, weighted by gearing. 14 The time period over which this process may take place may differ between different sectors due to the time taken for entry and/or expansion of capacity. 15 See: Assessing profitability in competition policy analysis (oxera.com).
11
of information for such assessments) and over segments of an activity’s lifespan (i.e. over truncated periods).16
31. We propose therefore, to adopt the (truncated) IRR approach in this case given its strong theoretical basis, including that it reflects the economic principle of the time value of money.17
32. The IRR is then benchmarked against the weighted average cost of capital (WACC), over the relevant period(s) of analysis. The WACC is the return on investment that providers of capital – both debt and equity – expect, given the risks associated with the relevant activity.18
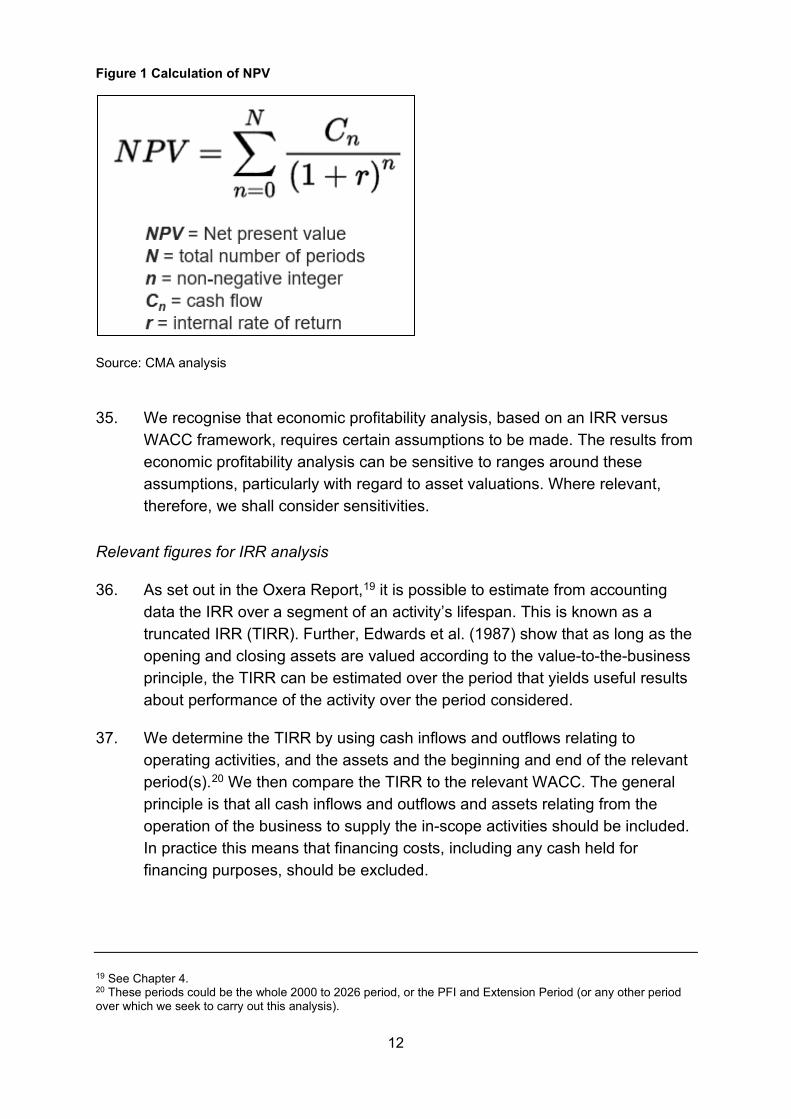
33. We note that the scale of any excess profits, and therefore detriment, is not immediately clear from a percentage gap between IRR and WACC. We therefore propose to calculate economic profits as well as IRR. Economic profits are the profits left over, after the providers of capital have been paid a market-based return on their investment, which is equal to the net present value (NPV) of profits when the internal rate of return is set equal to the WACC. They can therefore be calculated using the same input data and analysis as IRR versus WACC.
34. Figure 1 below illustrates how NPV is calculated. We solve for a value of r that equates the present value of future cashflows to the asset input value and compare this to a market-based cost of capital.
16 Assessing profitability in competition policy analysis (oxera.com), page 28. 17 Due to data limitations, the CMA often uses ROCE analysis for its assessment of profitability. Provided that analysis is undertaken carefully, with various adjustments made, it is equivalent to an IRR assessment and is also, therefore, conceptually robust. See The Economic Analysis of Accounting Profitability (1987), Jeremy Edwards, J A Kay, Colin P Mayer, for a fuller discussion of the conditions under which the ROCE and IRR approaches are equivalent. 18 WACC is therefore expected return on equity and expected return on debt, weighted by gearing – the relevant proportions of debt and equity.
12
Figure 1 Calculation of NPV
Source: CMA analysis
35. We recognise that economic profitability analysis, based on an IRR versus WACC framework, requires certain assumptions to be made. The results from economic profitability analysis can be sensitive to ranges around these assumptions, particularly with regard to asset valuations. Where relevant, therefore, we shall consider sensitivities.
Relevant figures for IRR analysis
36. As set out in the Oxera Report,19 it is possible to estimate from accounting data the IRR over a segment of an activity’s lifespan. This is known as a truncated IRR (TIRR). Further, Edwards et al. (1987) show that as long as the opening and closing assets are valued according to the value-to-the-business principle, the TIRR can be estimated over the period that yields useful results about performance of the activity over the period considered.
37. We determine the TIRR by using cash inflows and outflows relating to operating activities, and the assets and the beginning and end of the relevant period(s).20 We then compare the TIRR to the relevant WACC. The general principle is that all cash inflows and outflows and assets relating from the operation of the business to supply the in-scope activities should be included. In practice this means that financing costs, including any cash held for financing purposes, should be excluded.
19 See Chapter 4. 20 These periods could be the whole 2000 to 2026 period, or the PFI and Extension Period (or any other period over which we seek to carry out this analysis).
13
38. A simplifying assumption in carrying out TIRR analysis is to treat all cashflows as though they happened at a single point in the year, either in the middle or at the end of the year. We note that where cash in and out-flows are distributed fairly evenly across the year, the middle of the year assumption will not result in any distortion to the analysis.
39. We invite Airwave and other interested parties to make submissions as to whether this assumption is reasonable in this case or, to the extent that cashflows are not evenly distributed, to provide more detailed / granular cashflow data.
Economic versus accounting profitability
40. When estimating IRR, our approach is to start with accounting figures from the profit and loss account and balance sheet of the relevant activities, and then make adjustments to arrive at an economically meaningful measure of profitability. Deriving an economically meaningful measure of profitability from accounting data, in practice, usually requires adjustments to the following areas:
(a) Identification and valuation of the capital employed by investors at the beginning and end of the relevant period(s): an assessment of economic profitability requires an estimate of the value of the capital employed by investors at the beginning and end of the relevant period(s) in order to estimate a cash outflow at the beginning of the relevant period(s) and a cash inflow at the end of the relevant period(s). In order to estimate the value of capital employed by investors, we look to ensure that all assets owned by the business have been identified and valued according to the current opportunity cost of owning the asset or the value to the business (VTB).21 This ordinarily requires an adjustment to one or more balance sheet values, as explained below.
(b) Common cost and asset allocations: where a firm undertakes other business activities, in addition to those which we are reviewing in the market investigation, and/or where there are material intercompany transactions, all costs should be recorded on an objectively-justifiable basis that reflects the arm’s-length value of such costs. We note that Airwave is a subsidiary of a significantly larger group, Motorola Solutions Inc., and that there are significant intercompany/intragroup transactions. Our current understanding is that such transactions are relevant in the context of both Airwave’s income statement and its balance sheet. Our
21 In practice this is only necessary where the impact of including assets at book value, rather than VTB, has a material impact on the outturn results and conclusions.
14
profitability analysis will seek to review the basis on which all operating and capital costs are recorded in Airwave’s financial statements to ensure that these reflect arm’s-length values.22
Our approach to asset valuation
41. The assets included should reflect their VTB.23 The VTB approach aims to value assets in such a way that the assets included in our analysis allows for:
(a) The existing firms in the market to recover the opportunity cost of using the assets to supply the in-scope activities; and
(b) A hypothetical entrant to recover the costs of the assets, required to supply the relevant activities.
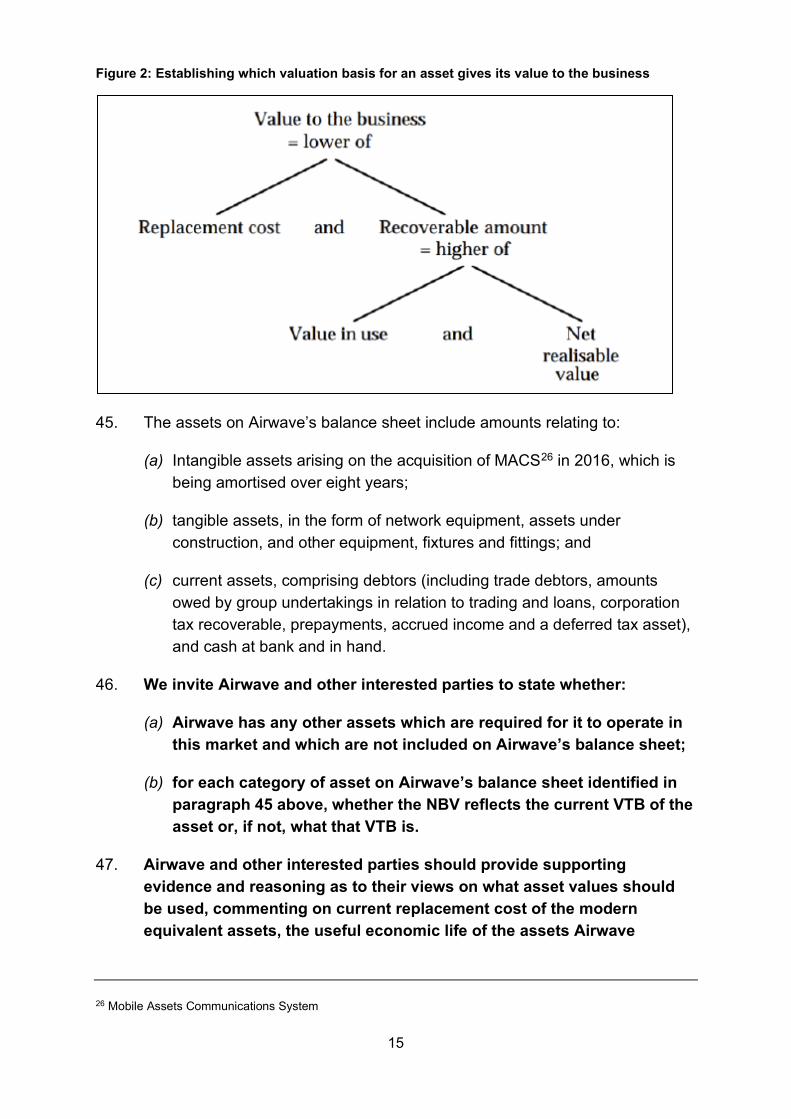
42. A valuation based on replacement cost of modern equivalent asset value (MEA)24 value is the most common outcome of a VTB assessment. This approach is consistent with our Guidelines, which state that the CMA considers MEA values to be the most economically meaningful measure for the purpose of measuring profitability in most cases.25
43. However, in some circumstances the recoverable amount may be lower than the replacement cost. An asset will not be replaced if the cost of replacing it exceeds its recoverable amount. In such circumstances, the asset’s current value is determined as follows:
(a) When the most profitable use of an asset is to sell it, the asset’s recoverable amount will be the amount that can be obtained by selling it, net of expenses; in other words, its net realisable value (NRV).
(b) When the most profitable use of an asset is to consume it – for example, by continuing to operate it – its recoverable amount will be the net present value of the future cash flows; in other words, its value in use.
44. This can be portrayed diagrammatically as shown in figure 2.
22 “Arm’s-length” values can be thought of as the price at which the transaction would have taken place between two unconnected parties transacting in a (reasonably) competitive market. This approach to cost accounting avoids the transfer of economic profit from one activity to another. 23 Also referred to as the deprival value, or value to the owner principle. 24 The Oxera Report explains the MEA in the following terms: “theoretically, this is the lowest cost of purchasing assets today that can deliver the same set of goods and services as the existing assets. The MEA is based on current, best-practice technology and uses the optimal configuration of assets to deliver the goods and services as efficiently as possible. For example, the design of an existing telecommunications network may have been optimal given the technology and services offered at the time, but sub-optimal when considering current technology and services. An operator setting up from scratch would be likely to use a superior network configuration to deliver the same set of services (hence the term modern equivalent asset), see paragraph 4.12. 25 Annex A paragraph 114
15
Figure 2: Establishing which valuation basis for an asset gives its value to the business
45. The assets on Airwave’s balance sheet include amounts relating to:
(a) Intangible assets arising on the acquisition of MACS26 in 2016, which is being amortised over eight years;
(b) tangible assets, in the form of network equipment, assets under construction, and other equipment, fixtures and fittings; and
(c) current assets, comprising debtors (including trade debtors, amounts owed by group undertakings in relation to trading and loans, corporation tax recoverable, prepayments, accrued income and a deferred tax asset), and cash at bank and in hand.
46. We invite Airwave and other interested parties to state whether:
(a) Airwave has any other assets which are required for it to operate in this market and which are not included on Airwave’s balance sheet;
(b) for each category of asset on Airwave’s balance sheet identified in paragraph 45 above, whether the NBV reflects the current VTB of the asset or, if not, what that VTB is.
47. Airwave and other interested parties should provide supporting evidence and reasoning as to their views on what asset values should be used, commenting on current replacement cost of the modern equivalent assets, the useful economic life of the assets Airwave
26 Mobile Assets Communications System
16
currently has in use, taking into account both physical wear and tear and technological obsolescence, and differences in operating costs of modern equivalent assets as compared with existing assets.
Approach to estimating the WACC
48. There are several factors that we shall take into account in estimating an appropriate benchmark cost of capital for LMR services for public safety. These include:
(a) How to estimate the WACC – we propose to use the capital asset pricing model (CAPM) to estimate the cost of equity for a firm/industry and combine that with information on actual levels of gearing and debt costs over the relevant period(s). While other approaches have been developed (for example, Fama & French’s Three Factor Model27), we consider that the CAPM has the advantage of robust theoretical underpinnings as well as being widely used in estimating WACC by both equity analysts and regulators.
(b) How to calibrate the CAPM and cost of debt – in particular, which benchmarks should be used to identify a reasonable level of the risk-free rate, the total market return and/or equity risk premium, beta, gearing levels and costs of debt. We note the CMA’s recent PR19 Redetermination28 considered many of these issues in detail and we propose to use that decision as the starting point for our assessment of the cost of capital for the Extension Period.29
(c) Over which time period should the cost of capital be measured – we propose to focus on assessing a cost of capital for the 2020 to 2026 Extension Period, however, we shall consider what adjustments should be made when looking back at the 2000 to 2019 PFI Period, and what this may imply for the relevant cost of capital for the whole 2000 to 2026 period.
49. We invite Airwave and other interested parties to make submissions on these proposals, both in terms of the high-level approach set out, as well as in relation to any more detailed considerations that parties believe should be taken into account, including, for example, relevant
27 Fama, E.F. & French, K.R., (1993). Common risk factors in the returns on stocks and bonds. Journal of Financial Economics, 33, No.1, pp. 3-56 28 CMA PR19 Redetermination 29 We highlight that some elements of the CAPM are common across industries, including the risk-free rate and the total market return, while other elements, such as beta and gearing are specific to a particular industry.
17
comparator firms for the purposes of assessing beta and gearing, relevant debt costs etc.
50. Our estimate of the WACC(s) will be set out in a separate Working Paper, taking into account the submissions that we receive in response to this paper.
Assessment of potential inefficiencies
51. As set out at paragraph 9, a finding of low profitability would not necessarily signify that competition is working well. Low profitability may be concealing inefficiencies: incumbent firms, despite being protected from new entry, may not earn high profits because they are inefficient and operate with higher costs than would be sustainable with stronger competition in the market.
52. We may seek to assess potential inefficiencies through an analysis of operating costs and capex, as well as through a review of Airwave’s internal documents.
Additional analysis
53. Economic profitability analysis requires a number of assumptions to be made. In order to move from accounting profits to economic profits, we will need to estimate the value of the assets at the beginning and end of the relevant period(s) in order to estimate a cash outflow at the beginning of the relevant period(s), and a cash inflow at the end of those periods (see paragraph 40). The results from economic profitability analysis can be sensitive to ranges around these assumptions.
54. In our profitability analysis, we shall be mindful of the impact on our analysis and results of changes in key assumptions and undertake sensitivity analysis where appropriate.
55. We shall also be critically reviewing both the historical financial information and the forecasts provided by Motorola and the assumptions underlying them.
56. In addition, we propose to undertake additional analysis to test the results obtained through our economic profitability assessment. The rest of this section sets out the areas of additional analysis, which we propose to conduct.
Internal documents
57. We propose to review internal documents on financial performance, prepared for the board and/or management of Airwave and/or Motorola. Whilst we
18
recognise that internal documents are produced for a number of different purposes, we consider that when assessed in the round, alongside other evidence, statements by Airwave and/or Motorola on Airwave’s profitability are relevant and informative to our overall assessment.
Price or margin benchmarking
58. We consider that broader price or margin benchmarking may provide useful insight into the extent to which Airwave’s prices and/or profits reflect those that one would expect to see in a well-functioning market. For example, a comparison of the prices of, or profit margins earned on the supply of, similar products or services in other countries might provide an alternative view on GB prices and/or profits.
59. However, we also recognise that price or margin benchmarking may have some limitations. In particular, where firms operate in different countries, they may:
(a) Provide services beyond the services which are in the scope of our investigation;
(b) face different risks to those faced by Airwave in the UK;
(c) face different costs to the cost base faced by Airwave in the UK;
(d) have different reporting requirements and/or accounting policies for material items within the profit and loss account such as capitalisation and subsequent write-off of capital expenditure.
60. Nevertheless, we consider that in principle, price or margin benchmarking provides context and additional background information on profitability, which when considered in the round is useful evidence.
61. We invite Airwave and other interested parties to make submissions on whether there are specific price/profit benchmarks from other countries and/or from other telecoms networks that we should consider and the extent to which these are comparable with the situation of supply of LMR (and ancillary services) in GB.
Our analysis
Introduction to our preliminary analysis
62. In this section we present the preliminary analysis that we have carried out. This includes setting out the financial information we used, an explanation of
19
the three models we built, the results of our modelling and analysis, and initial results of our sensitivity analysis.
63. We highlight that this analysis has been provided at this stage to illustrate the methodology that we have set out in this working paper. We expect to revise this analysis in response to both submissions on this methodology paper and as a result of any further analysis we undertake with respect to Airwave’s historical and forecast financial performance.
Financial information
64. As explained in paragraphs 22 and 23 above, we propose to assess the profitability of Airwave over the period from 2000 to 2026, and also divide that period into separate time periods, reflecting the original PFI contract and the subsequent extensions. At this stage, we have done this on the basis of the 2000 to 2019 period (the PFI Period) and 2020 to 2026 period (the Extension Period).
65. We set out in the following paragraphs the source of the financial information we used for our preliminary analysis.
66. The financial information contained in Airwave’s publicly available annual report and financial statements contained profit and loss account and balance sheet information but did not contain cashflow information.
67. We found financial information dated 14 June 2021 during a review of documentary evidence Motorola had provided to the CMA in response to a request for information issued on 9 July 2021. Motorola subsequently provided us with different actual and forecast financial information contained in a model it had prepared in August 2021. In the rest of this paper we call these two sets of forecast financial information the June Information and the August Information, respectively.
68. The June Information contained profit and loss, cashflow, and capex and depreciation information for the seven years ended 31 December 2019 to 2026 (that is, covering two years of actual, or historical, financial information, and five years of forecast financial information).
69. Motorola told us that the model provided in August 2021 covered network services under contract with the Home Office, and included cashflows for the extension years 2023 to 2026 based on current contract pricing.
20
70. The model provided in the August Information contained cashflow, capex and depreciation information covering the 2002 to 2026 period as a whole.30 For the periods 2002 to 2015, it also contained profit and loss information which corresponded to the financial information contained in the statutory accounts. []:
[];
[];
[];
[];
[]
71. []
72. []
73. Motorola did not explain to us the reasoning behind the changes in assumptions between the forecasts in the June Information and the August Information and we shall be critically reviewing the assumptions used in both sets of forecasts in due course. We note that, in general, the CMA attaches more weight to figures which are prepared for management purposes in the ordinary course of business than to figures and assumptions that have been assembled specifically for the purpose of making representations in the context of a CMA investigation.
PFI Period
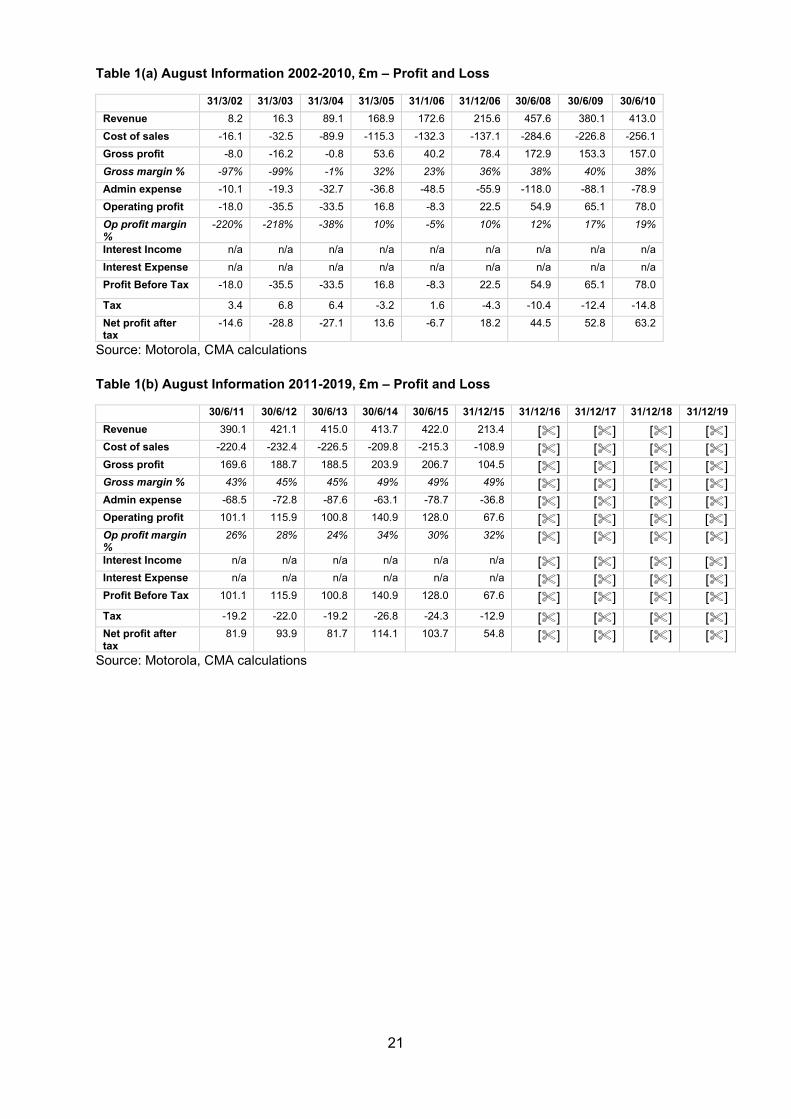
74. For the PFI Period, we used the financial information contained in the August Information, as set out in Tables 1(a) and (b).
30 Please note that this period comprises all activities undertaken from March 2001 onwards. We understand that the Airwave Network was under development prior to March 2001 but ASL was not trading and there are no financial statements available prior to the year ended 31st March 2002.
21
Table 1(a) August Information 2002-2010, £m – Profit and Loss
31/3/02 31/3/03 31/3/04 31/3/05 31/1/06 31/12/06 30/6/08 30/6/09 30/6/10 Revenue 8.2 16.3 89.1 168.9 172.6 215.6 457.6 380.1 413.0 Cost of sales -16.1 -32.5 -89.9 -115.3 -132.3 -137.1 -284.6 -226.8 -256.1 Gross profit -8.0 -16.2 -0.8 53.6 40.2 78.4 172.9 153.3 157.0 Gross margin % -97% -99% -1% 32% 23% 36% 38% 40% 38% Admin expense -10.1 -19.3 -32.7 -36.8 -48.5 -55.9 -118.0 -88.1 -78.9 Operating profit -18.0 -35.5 -33.5 16.8 -8.3 22.5 54.9 65.1 78.0 Op profit margin %
-220% -218% -38% 10% -5% 10% 12% 17% 19%
Interest Income n/a n/a n/a n/a n/a n/a n/a n/a n/a Interest Expense n/a n/a n/a n/a n/a n/a n/a n/a n/a Profit Before Tax -18.0 -35.5 -33.5 16.8 -8.3 22.5 54.9 65.1 78.0
Tax 3.4 6.8 6.4 -3.2 1.6 -4.3 -10.4 -12.4 -14.8 Net profit after tax
-14.6 -28.8 -27.1 13.6 -6.7 18.2 44.5 52.8 63.2
Source: Motorola, CMA calculations
Table 1(b) August Information 2011-2019, £m – Profit and Loss
30/6/11 30/6/12 30/6/13 30/6/14 30/6/15 31/12/15 31/12/16 31/12/17 31/12/18 31/12/19 Revenue 390.1 421.1 415.0 413.7 422.0 213.4 [] [] [] [] Cost of sales -220.4 -232.4 -226.5 -209.8 -215.3 -108.9 [] [] [] [] Gross profit 169.6 188.7 188.5 203.9 206.7 104.5 [] [] [] [] Gross margin % 43% 45% 45% 49% 49% 49% [] [] [] [] Admin expense -68.5 -72.8 -87.6 -63.1 -78.7 -36.8 [] [] [] [] Operating profit 101.1 115.9 100.8 140.9 128.0 67.6 [] [] [] [] Op profit margin %
26% 28% 24% 34% 30% 32% [] [] [] []
Interest Income n/a n/a n/a n/a n/a n/a [] [] [] [] Interest Expense n/a n/a n/a n/a n/a n/a [] [] [] [] Profit Before Tax 101.1 115.9 100.8 140.9 128.0 67.6 [] [] [] [] Tax -19.2 -22.0 -19.2 -26.8 -24.3 -12.9 [] [] [] [] Net profit after tax
81.9 93.9 81.7 114.1 103.7 54.8 [] [] [] []
Source: Motorola, CMA calculations
22
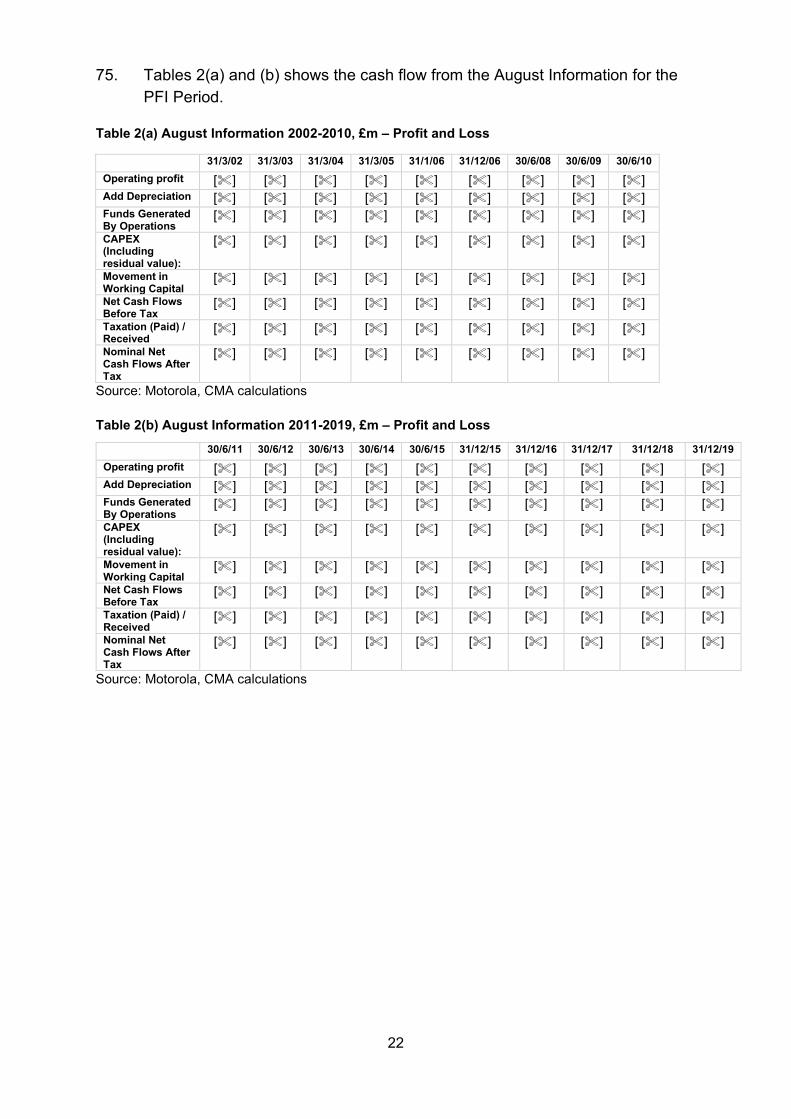
75. Tables 2(a) and (b) shows the cash flow from the August Information for the PFI Period.
Table 2(a) August Information 2002-2010, £m – Profit and Loss
31/3/02 31/3/03 31/3/04 31/3/05 31/1/06 31/12/06 30/6/08 30/6/09 30/6/10 Operating profit [] [] [] [] [] [] [] [] [] Add Depreciation [] [] [] [] [] [] [] [] [] Funds Generated By Operations
[] [] [] [] [] [] [] [] []
CAPEX (Including residual value):
[] [] [] [] [] [] [] [] []
Movement in Working Capital
[] [] [] [] [] [] [] [] []
Net Cash Flows Before Tax
[] [] [] [] [] [] [] [] []
Taxation (Paid) / Received
[] [] [] [] [] [] [] [] []
Nominal Net Cash Flows After Tax
[] [] [] [] [] [] [] [] []
Source: Motorola, CMA calculations
Table 2(b) August Information 2011-2019, £m – Profit and Loss
Source: Motorola, CMA calculations
30/6/11 30/6/12 30/6/13 30/6/14 30/6/15 31/12/15 31/12/16 31/12/17 31/12/18 31/12/19
Operating profit [] [] [] [] [] [] [] [] [] [] Add Depreciation [] [] [] [] [] [] [] [] [] [] Funds Generated By Operations
[] [] [] [] [] [] [] [] [] []
CAPEX (Including residual value):
[] [] [] [] [] [] [] [] [] []
Movement in Working Capital
[] [] [] [] [] [] [] [] [] []
Net Cash Flows Before Tax
[] [] [] [] [] [] [] [] [] []
Taxation (Paid) / Received
[] [] [] [] [] [] [] [] [] []
Nominal Net Cash Flows After Tax
[] [] [] [] [] [] [] [] [] []
23
Forward-looking analysis
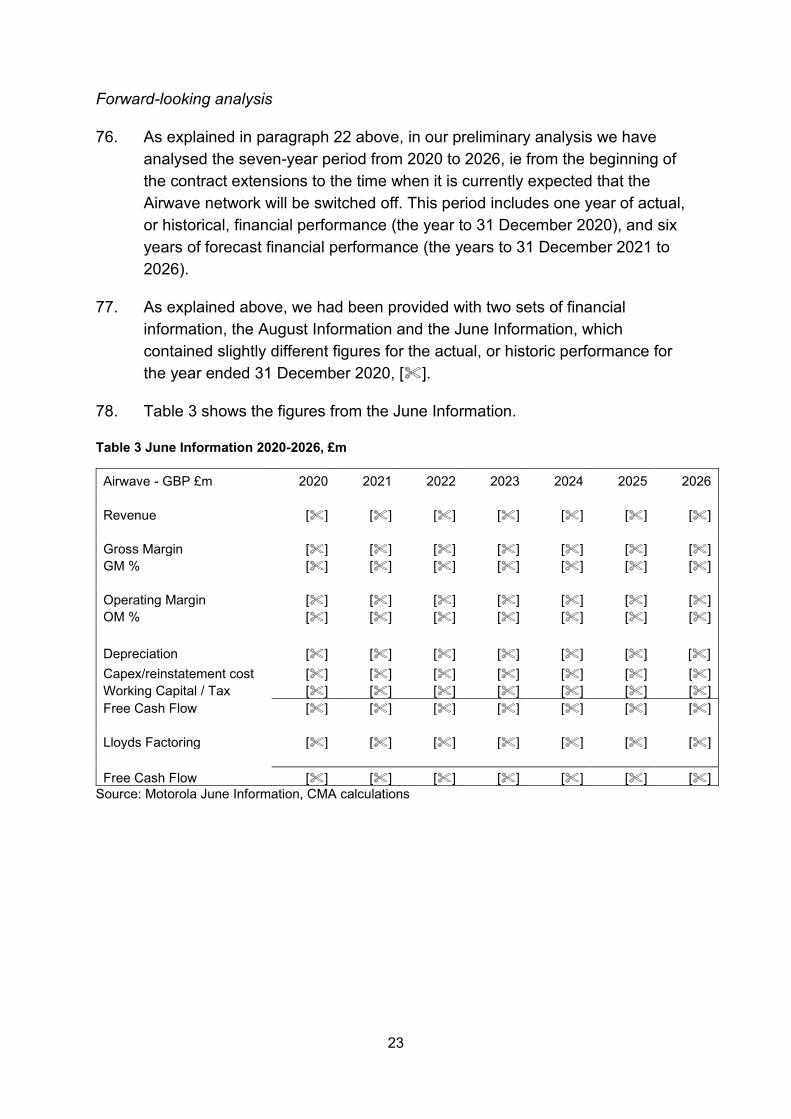
76. As explained in paragraph 22 above, in our preliminary analysis we have analysed the seven-year period from 2020 to 2026, ie from the beginning of the contract extensions to the time when it is currently expected that the Airwave network will be switched off. This period includes one year of actual, or historical, financial performance (the year to 31 December 2020), and six years of forecast financial performance (the years to 31 December 2021 to 2026).
77. As explained above, we had been provided with two sets of financial information, the August Information and the June Information, which contained slightly different figures for the actual, or historic performance for the year ended 31 December 2020, [].
78. Table 3 shows the figures from the June Information.
Table 3 June Information 2020-2026, £m
Airwave - GBP £m 2020 2021 2022 2023 2024 2025 2026
Revenue [] [] [] [] [] [] []
Gross Margin [] [] [] [] [] [] [] GM % [] [] [] [] [] [] []
Operating Margin [] [] [] [] [] [] [] OM % [] [] [] [] [] [] []
Depreciation [] [] [] [] [] [] [] Capex/reinstatement cost [] [] [] [] [] [] [] Working Capital / Tax [] [] [] [] [] [] [] Free Cash Flow [] [] [] [] [] [] []
Lloyds Factoring [] [] [] [] [] [] []
Free Cash Flow [] [] [] [] [] [] []
Source: Motorola June Information, CMA calculations
24
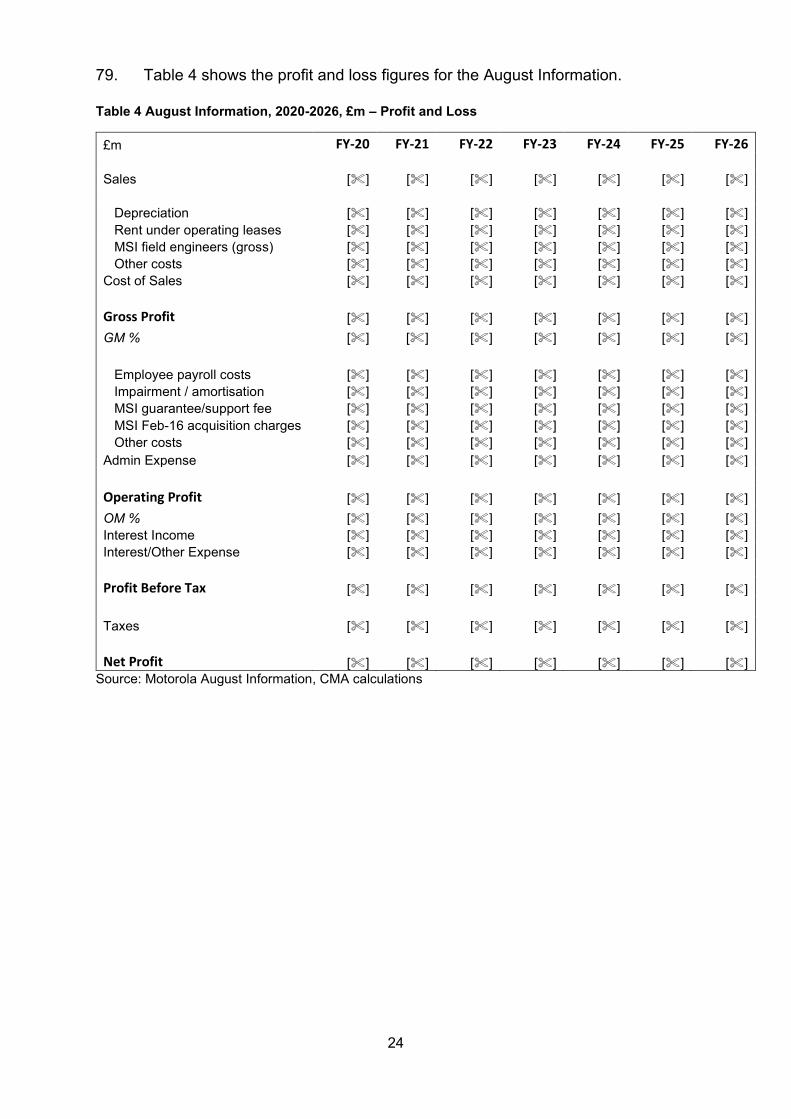
79. Table 4 shows the profit and loss figures for the August Information.
Table 4 August Information, 2020-2026, £m – Profit and Loss
£m FY-20 FY-21 FY-22 FY-23 FY-24 FY-25 FY-26
Sales [] [] [] [] [] [] []
Depreciation [] [] [] [] [] [] [] Rent under operating leases [] [] [] [] [] [] [] MSI field engineers (gross) [] [] [] [] [] [] [] Other costs [] [] [] [] [] [] [] Cost of Sales [] [] [] [] [] [] []
Gross Profit [] [] [] [] [] [] [] GM % [] [] [] [] [] [] [] Employee payroll costs [] [] [] [] [] [] [] Impairment / amortisation [] [] [] [] [] [] [] MSI guarantee/support fee [] [] [] [] [] [] [] MSI Feb-16 acquisition charges [] [] [] [] [] [] [] Other costs [] [] [] [] [] [] [] Admin Expense [] [] [] [] [] [] []
Operating Profit [] [] [] [] [] [] [] OM % [] [] [] [] [] [] [] Interest Income [] [] [] [] [] [] [] Interest/Other Expense [] [] [] [] [] [] []
Profit Before Tax [] [] [] [] [] [] [] Taxes [] [] [] [] [] [] []
Net Profit [] [] [] [] [] [] []
Source: Motorola August Information, CMA calculations
25
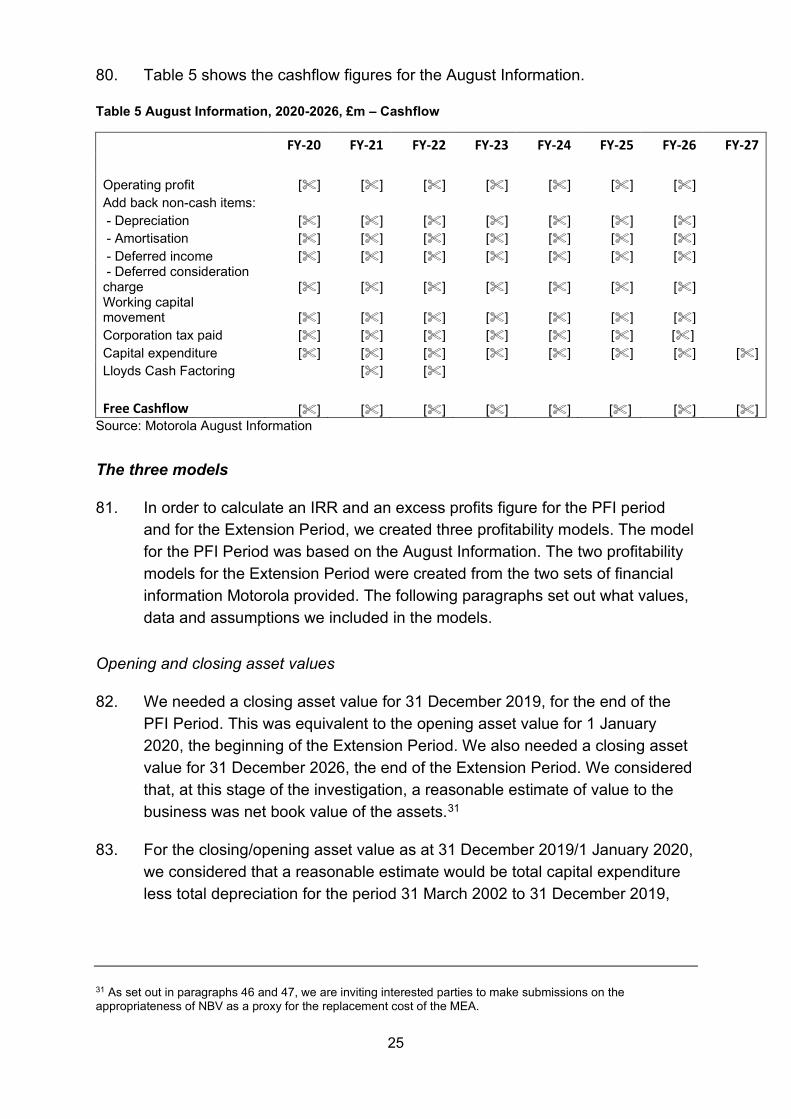
80. Table 5 shows the cashflow figures for the August Information.
Table 5 August Information, 2020-2026, £m – Cashflow
FY-20 FY-21 FY-22 FY-23 FY-24 FY-25 FY-26 FY-27
Operating profit [] [] [] [] [] [] [] Add back non-cash items: - Depreciation [] [] [] [] [] [] [] - Amortisation [] [] [] [] [] [] [] - Deferred income [] [] [] [] [] [] [] - Deferred consideration charge [] [] [] [] [] [] [] Working capital movement [] [] [] [] [] [] [] Corporation tax paid [] [] [] [] [] [] [] Capital expenditure [] [] [] [] [] [] [] [] Lloyds Cash Factoring [] [] Free Cashflow [] [] [] [] [] [] [] []
Source: Motorola August Information
The three models
81. In order to calculate an IRR and an excess profits figure for the PFI period and for the Extension Period, we created three profitability models. The model for the PFI Period was based on the August Information. The two profitability models for the Extension Period were created from the two sets of financial information Motorola provided. The following paragraphs set out what values, data and assumptions we included in the models.
Opening and closing asset values
82. We needed a closing asset value for 31 December 2019, for the end of the PFI Period. This was equivalent to the opening asset value for 1 January 2020, the beginning of the Extension Period. We also needed a closing asset value for 31 December 2026, the end of the Extension Period. We considered that, at this stage of the investigation, a reasonable estimate of value to the business was net book value of the assets.31
83. For the closing/opening asset value as at 31 December 2019/1 January 2020, we considered that a reasonable estimate would be total capital expenditure less total depreciation for the period 31 March 2002 to 31 December 2019,
31 As set out in paragraphs 46 and 47, we are inviting interested parties to make submissions on the appropriateness of NBV as a proxy for the replacement cost of the MEA.
26
the figures for which were contained in the financial information provided by Motorola in August, an amount totalling £[].32
84. We also needed a closing asset value for 31 December 2026. Motorola’s August Information assumed [] at the end of 31 December 2026 ([]). By contrast, Motorola’s June Information assumed []. In our modelling to date, we have assumed [], however we shall seek to obtain information from Motorola on the type of assets in Airwave and consider what value to place on them as at the end of 31 December 2026.
85. We invite Airwave and other interested parties to provide their views on what the residual value of assets is likely to be as of 2026 (or any alternative end date for the Extension Period). In particular, we invite submissions on:
(a) What alternative use these assets might be put to within the Motorola Group and/or whether they could be sold to other businesses and, if so, what value they might attract;
(b) The likelihood of further extensions to the Airwave contract, ie beyond 2026, and the date on which the Airwave Network may be expected to be “switched off”.
86. Other than estimating a closing/opening asset value as at 31 December 2019/1 January 2020, we did not make any other adjustments to the two profitability models based on the August Information.33
Tax
87. Motorola’s August Information calculated the tax charge as profits before tax (unadjusted) multiplied by the relevant tax rate for the year.34
88. In the June Information, the tax charge for 2021 was [].35 The tax charge for 2022 to 2026 was [].
89. We note that as we revise our analysis we may seek to use pre-tax cashflows and costs of capital in order to avoid the complexities of estimating accurate tax charges.
32 We note that the net book value in Airwave’s statutory accounts is [] than this, at a value of £170m. We shall seek to understand the difference between the two figures, but note for the moment that []. 33 That is, the profitability model for the PFI Period and one profitability model for the Extension Period. 34 2020-2022: 19%; 2023-2025: 25%. []. 35 [].
27
Inflation
90. Motorola’s August Information used an inflation figure of []% for the whole of the period from 2002 to 2026. We did not change this assumption in the profitability model based on the August Information. However, we changed the figure to 2% in the profitability model based on the June Forecast, on the basis that CPI over the whole of the PFI Period was 2.15%.
Decommissioning costs
91. Motorola’s August Information included decommissioning costs of £[]m in the year ended 31 December []. The June Information []. Nonetheless, we included these costs in both models.
Initial results
PFI period
92. The model for the PFI Period (based on the August Information) shows a post-tax real IRR of []%. This is [] Motorola’s internal estimate of its cost of capital. The NPV of discounted cashflows is £[]m, based on the []% real post-tax WACC included by Motorola in its August Information.
Extension Period
Model based on August Information
93. The model based on the August Information shows a post-tax real IRR of []% which is [] Motorola’s internal estimate of its cost of capital. The NPV of discounted cashflows is £[]m, based on the []% real post-tax WACC included by Motorola in its August Information.
Model based on June Information
94. The model based on the June Information shows a post-tax real IRR of []% which is [] Motorola’s internal estimate of its cost of capital. The NPV of discounted cashflows is £[]m based on the []% real post-tax WACC included by Motorola in its August Information.