Embed Size (px)
Citation preview
WHELDON ACT AND AD FACILITY
ENVIRONMENTAL STATEMENT VOLUME 1: MAIN TEXT
R57016Y001/D
Pell Frischmann Page | 46
7. AIR QUALITY
7.1 INTRODUCTION
7.1.1 This chapter of the ES assesses the likely significant effects of the proposed
development in terms of air quality. The assessment has been carried out by Air
Quality Consultants Ltd.
7.1.2 The assessment covers the potential effects of emissions of dust associated with
construction activities, as well as the operational air quality effects associated with
on-site emissions from the proposed pyrolysis plant and gas engines of the ERF,
and the off-site emissions arising from the vehicles accessing the ERF and rail
emissions from trains using the proposed train terminal.
7.1.3 The key pollutants arising from the gas engines are: nitrogen oxides (NOx
expressed as NO2), and carbon monoxide (CO). In addition, there will be
emissions to air from the pyrolyser; these are governed by the Industrial
Emissions Directive (IED), which requires adherence to emission limits for the
following pollutants:
total dust (as PM10 and PM2.5);
total organic carbon (as Benzene);
carbon monoxide (CO)
nitrogen oxides (NOx)
sulphur dioxide (SO2);
hydrogen chloride (HCl);
hydrogen fluoride (HF);
twelve trace metals; and
dioxins and furans.
7.1.4 The key pollutants emitted by road traffic associated with the development are:
nitrogen dioxide (NO2); and
fine particles (PM10 and PM2.5).
7.1.5 Where pollutants are emitted from both point sources and road traffic, the
combined effects have been assessed.
7.1.6 The proposed development includes a rail terminal platform to accommodate the
transfer of material to and from the ERF.
WHELDON ACT AND AD FACILITY
ENVIRONMENTAL STATEMENT VOLUME 1: MAIN TEXT
R57016Y001/D
Pell Frischmann Page | 47
7.1.7 During construction there will be dust emissions that need to be assessed in
relation to:
dust soiling; and
elevated concentrations of fine particles (PM10 and PM2.5).
7.1.8 The assessment of potential effects from odour associated with the ERF have
been scoped out of the ES, as agreed with Wakefield District Council (WDC).
Further information on the proposed development is provided in Chapter 5.
7.1.9 The chapter describes the assessment methodology; the baseline conditions at
the Application Site and surroundings; the potential environmental effects; the
mitigation measures required to prevent, reduce or offset any significant adverse
effects; and the likely residual effects after the measures have been employed.
7.1.10 The effects have been assessed at nearby sensitive receptor locations including
residential properties, neighbouring commercial premises, and sensitive habitats
and ecosystems including the Fairburn and Newton Ings Site of Special Scientific
Interest (SSSI) and Local Nature Reserve (LNR).
7.1.11 This chapter on air quality is supported by the information set out in Technical
Appendix 7.
7.2 PLANNING POLICY CONTEXT
European Legislation
European Framework Directive on Ambient Air Quality and Cleaner Air for
Europe, May 2008
7.2.1 The European Union has set limit values for seven key air pollutants, nitrogen
dioxide, PM10, PM2.5, sulphur dioxide, benzene, carbon monoxide, and lead.
These limit values are set out in the EU Framework Directive 2008/50/EC (2008).
Achievement of these values is a national obligation and was required by 2010 for
nitrogen dioxide and benzene, and 2005 for all other pollutants apart from PM2.5,
which will not apply until 2015.
European Waste Framework Directive, November 2008
7.2.2 The Waste Framework Directive (Directive 2008/98/EC) (2008b) sets out the EU
member state obligations to the planning, operation and management of waste
sites and processes. With respect to air quality, the Directive states:
“Member States shall take the necessary measures to ensure that waste
management is carried out without endangering human health, without harming
the environment and, in particular:
WHELDON ACT AND AD FACILITY
ENVIRONMENTAL STATEMENT VOLUME 1: MAIN TEXT
R57016Y001/D
Pell Frischmann Page | 48
1. without risk to water, air, soil, plants or animals;
2. without causing nuisance through noise or odours; and
3. without adversely affecting the countryside or places of special interest.”
European Industrial Emissions Directive, December 2010
7.2.3 The Industrial Emissions Directive (IED) (2010/75/EU) brings together seven
existing directives, including the Waste Incineration Directive, into one piece of
legislation. The IED outlines total emission limit values (ELVs) for a number of
pollutants typically emitted during waste incineration. These are NOx and
nitrogen dioxide, NO, total dust, HCl, hydrogen fluoride, sulphur dioxide, organic
substances, trace metals, and dioxins and furans. The design and operation of all
new waste incinerations facilities must ensure compliance with the ELVs.
European Councils Directive on Conservation of Natural Habitats and of Wild
Fauna and Flora, May 1992
7.2.4 European Council Directive 92/43/EEC on the Conservation of Natural Habitats
and of Wild Fauna and Flora (the “Habitats Directive”) requires member states to
introduce a range of measures for the protection of habitats and species. The
Conservation of Habitats and Species Regulations (2010) (The Air Quality
Standards Regulations 2010 (No. 1001), 2010), transposes the Directive into law
in England and Wales. The Regulations require the Secretary of State to provide
the European Commission with a list of sites which are important for the habitats
or species listed in the Directive. The Commission then designates worthy sites
as Special Areas of Conservation (SACs). The Regulations also require the
compilation and maintenance of a register of European sites, to include SACs and
Special Protection Areas (SPAs); with these classified under the Council Directive
79/409/EEC on the Conservation of Wild Birds (Directive 2009/147/EC of the
European Parliament and of the Council, 2009). These sites form a network
termed “Natura 2000”.
National Legislation
The Environmental Permitting Regulations in England and Wales, March 2010
7.2.5 The Environmental Permitting Regulations (2010) set the legislative background
for environmental permitting in England and Wales. The regulations include a
commitment to minimising emissions to air from permitted processes, and include
obligations of compliance with all legislated emissions limits for permitted
processes, including the IED emission limits for waste incineration processes.
WHELDON ACT AND AD FACILITY
ENVIRONMENTAL STATEMENT VOLUME 1: MAIN TEXT
R57016Y001/D
Pell Frischmann Page | 49
The Environmental Permitting Regulations in England and Wales (Amendment)
Regulation (2013)
7.2.6 The requirements of the IED were transposed into UK law on 6th January 2013 by
the Environmental Permitting (England and Wales) (Amendment) Regulations
(2013). This requires that any new installation seeking a permit after 7th January
2013 be subject to the IED.
The Waste (England and Wales) Regulations 2011, March 2011
7.2.7 The Waste Framework Directive 2008/98/EC and its obligations, including those
on air quality, is transposed in English law by The Waste (England and Wales)
Regulations 2011 (2011).
The UK Air Quality Strategy, 2007
7.2.8 The Air Quality Strategy published by the Department for Environment, Food, and
Rural Affairs (Defra) provides the policy framework for air quality management
and assessment in the UK. It provides air quality standards (AQS) and objectives
for key air pollutants, which are designed to protect human health and the
environment (Defra, 2007). The ‘standards’ are set as pollutant concentrations
below which health effects are unlikely even in sensitive population groups, or
below which risks to public health would be exceedingly small. They are based
purely upon the scientific and medical evidence of the effects of an individual
pollutant. The ‘objectives’ set out the extent to which the Government expects the
standards to be achieved by a certain date. They take account of economic
efficiency, practicability, technical feasibility and timescale.
7.2.9 The Strategy also sets out how the different sectors: industry, transport and local
government, can contribute to achieving the air quality objectives (AQO). Local
authorities are seen to play a particularly important role. The strategy describes
the Local Air Quality Management (LAQM) regime that has been established,
whereby every authority has to carry out regular reviews and assessments of air
quality in its area to identify whether the objectives have been, or will be, achieved
at relevant locations, by the applicable date. If this is not the case, the authority
must declare an Air Quality Management Area (AQMA), and prepare an action
plan which identifies appropriate measures that will be introduced in pursuit of the
objectives.
Air Quality (England) Regulations, 2000 and Air Quality (England) (Amendment)
Regulations 2002
7.2.10 Some of the objectives are for the use of local authorities as part of the LAQM
regime, and these are set out in regulations.
WHELDON ACT AND AD FACILITY
ENVIRONMENTAL STATEMENT VOLUME 1: MAIN TEXT
R57016Y001/D
Pell Frischmann Page | 50
Air Quality Standards Regulations, 2010
7.2.11 The air quality limit values set out in EU Directive 2008/50/EC are transposed in
English law by the Air Quality Standards Regulations 2010 (2010). This imposes
duties on the Secretary of State relating to achieving the limit values.
The Conservation of Habitats and Species Regulations 2010
7.2.12 The Conservation of Habitats and Species Regulations (2010) transposes the
Habitats Directive (EC Directive 92/43/EEC) into law in England and Wales. The
Regulations require the Secretary of State to compile and maintain a register of
European designated habitats, to include SACs and SPAs; with the latter
classified under the Council Directive 79/409/EEC on the Conservation of Wild
Birds.
7.2.13 The Regulations primarily provide measures for the protection of European Sites
and European Protected Species, but also require local planning authorities to
encourage the management of other features that are of major importance for wild
flora and fauna.
7.2.14 In addition to SACs and SPAs, some internationally important UK sites are
designated under the Ramsar Convention. Originally intended to protect waterfowl
habitat, the Convention has broadened its scope to cover all aspects of wetland
conservation.
7.2.15 The Habitats Directive (as implemented by the Regulations) requires the
competent authority, which in this case will be the planning authority, to firstly
evaluate whether the development is likely to give rise to a significant effect on the
European site. Where this is the case, it has to carry out an ‘appropriate
assessment’ in order to determine whether the development will adversely affect
the integrity of the site.
The Wildlife and Countryside Act 1981
7.2.16 Sites of national importance may be designated as Sites of Special Scientific
Interest (SSSIs). Originally notified under the National Parks and Access to the
Countryside Act (1949), SSSIs have been re-notified under the Wildlife and
Countryside Act (1981).
The Countryside and Rights of Way Act 2000
7.2.17 Improved provisions for the protection and management of SSSIs (in England and
Wales) were introduced by the Countryside and Rights of Way Act (2000) (the
“CROW” Act). If a development is “likely to damage” a SSSI, the CROW Act
requires that a relevant conservation body (i.e. Natural England) is consulted.
The CROW Act also provides protection to local nature conservation sites, which
can be particularly important in providing ‘stepping stones’ or ‘buffers’ to SSSIs
WHELDON ACT AND AD FACILITY
ENVIRONMENTAL STATEMENT VOLUME 1: MAIN TEXT
R57016Y001/D
Pell Frischmann Page | 51
and European sites.
7.2.18 In addition, the Environment Act (1995) and the Natural Environment and Rural
Communities Act (2006) both require the conservation of biodiversity.
National Planning Policy
National Planning Policy Framework, March 2012
7.2.19 The National Planning Policy Framework (NPPF) (NPPF, 2012) introduced in
March 2012 now sets out planning policy for the UK in one place. It replaces
previous Planning Policy Statements, including PPS23 on Planning and Pollution
Control. The NPPF contains advice on when air quality should be a material
consideration in development control decisions. Existing, and likely future, air
quality should be taken into account, as well as the EU limit values or national
objectives for pollutants, the presence of any AQMAs and the appropriateness of
both the development for the site, and the site for the development.
7.2.20 The NPPF places a general presumption in favour of sustainable development,
stressing the importance of local development plans, and states that the planning
system should perform an environmental role to minimise pollution. One of the
twelve core planning principles notes that planning should “contribute
to…reducing pollution”. To prevent unacceptable risks from air pollution, planning
decisions should ensure that new development is appropriate for its location. The
NPPF states that the effects of pollution on health and the sensitivity of the area
and the development should be taken into account.
7.2.21 The need for compliance with any statutory air quality limit values and objectives
is stressed, and the presence of AQMAs must be accounted for in terms of the
cumulative impacts on air quality from individual sites in local areas. New
developments in AQMAs should be consistent with local air quality action plans.
7.2.22 The NPPF also sets out the National planning policy on biodiversity and
conservation. This emphasises that the planning system should seek to minimise
impacts on biodiversity and provide net gains in biodiversity wherever possible as
part of the Government’s commitment to halting declines in biodiversity and
establishing coherent and resilient ecological networks.
7.2.23 PPS10 on Planning for Sustainable Waste Management (HMSO, 2011), which
has not been replaced by the NPPF, sets out several objectives for ‘sustainable’
waste management. The overall objective of the Government policy on waste is to
protect human health and the environment by producing less waste and by using
it as a resource wherever possible. PPS10 contains Annex E, for consideration of
local environmental impacts, including dust, odours and litter. In considering
planning applications for waste management facilities waste planning authorities
should consider the likely impact on the local environment and on amenity, i.e.
through consideration of the proximity of sensitive receptors and the extent to
WHELDON ACT AND AD FACILITY
ENVIRONMENTAL STATEMENT VOLUME 1: MAIN TEXT
R57016Y001/D
Pell Frischmann Page | 52
which adverse emissions can be controlled through the use of appropriate and
well-maintained and managed equipment.
Local Planning Policy
Wakefield Local Development Framework and Core Strategy, Adopted 2009
7.2.24 Changes to the planning legislation require the Council to implement a Local
Development Framework (LDF). The LDF is a portfolio of planning documents,
individually known as Local Development Documents, will deliver the spatial
development strategy for Wakefield and build upon existing local and regional
strategies and initiatives.
7.2.25 The Core Strategy (WDC, 2009) sets out Policy CS 10 – Design, Safety and
Environmental Quality, which states that:
“In all parts of the district, new development will:
e. minimise the risk from all forms of pollution and contamination for existing and
future occupants, the wider community and the environment, particularly within the
defined Air Quality Management Areas along the M1, M62 and A1 corridors and in
the urban areas in the western and northern parts of the district.”
7.2.26 Development Policy D20 – Pollution Control (Wakefield MBC, 2010), also states
that:
“Development proposals which are likely to cause pollution or are likely to be
exposed to potential sources of pollution will only be permitted if it can be
demonstrated that measures can be implemented to minimise emissions to a
satisfactory level that protects health, environmental quality and amenity.”
7.2.27 With respect to designated ecological sites, local planning authorities should set
criteria based policies against which proposals for any development on or
affecting protected wildlife sites will be judged, making distinctions between
different levels of site designation. If significant harm from a development cannot
be prevented, adequately mitigated against, or compensated for, then planning
permission should be refused.
Air Quality Action Plan
7.2.28 WDC has declared eight AQMAs, one of which is located in Castleford. The
Castleford AQMA is declared for nitrogen dioxide and covers the area around the
A6032 and A656 (see Technical Appendix 7.5). The Council has developed an
Air Quality Action Plan for the Castleford AQMA (WDC, 2012) which is currently
out for consultation.
WHELDON ACT AND AD FACILITY
ENVIRONMENTAL STATEMENT VOLUME 1: MAIN TEXT
R57016Y001/D
Pell Frischmann Page | 53
Key Guidance Documents
Environment Agency Guidance
7.2.29 The Environment Agency’s H1 Environmental Risk Assessment Guidance Note
(Environment Agency, 2011a) provides methods for quantifying the environmental
impacts of emissions to all media; Annex F of H1 covers Emissions to Air. It
contains long- and short-term Environment Assessment Levels (EALs) and
Environmental Quality Standards (EQS) for releases to air derived from a number
of published UK and International sources.
7.2.30 In addition, the Environment Agency’s Interim Guidance Note for Metals provides
guidance for Applicants for Environmental Permits, on how to consider the air
quality impacts from Group III metal stack emissions from incineration and co-
incineration plant (including energy from waste) (Environment Agency, 2012).
Health and Safety Executive, Workplace Exposure Limits, 2005
7.2.31 The Health and Safety Executive’s EH40/2005 Workplace exposure limits (HSE,
2005) document contains a list of the workplace exposure limits for use with the
control of substances hazardous to health regulations. In the absence of AQOs
and EALs for the pollutants assessed in this chapter, the emissions limits in EH40
have been used.
7.3 ASSESSMENT METHODOLOGY
Study Area
7.3.1 For the purposes of this air quality assessment the study area has been defined
using a combination of the following:
Construction phase
within 350 m of the site boundary
Operational phase:
all road links likely to be materially affected by the proposed
development;
the proposed train terminal platform;
areas likely to be materially affected by the pyrolyser and gas engine
emissions of the proposed ERF.
monitoring locations used for model verification; and
ecological areas within 2 km and international designations within 10
km of the proposed ERF.
WHELDON ACT AND AD FACILITY
ENVIRONMENTAL STATEMENT VOLUME 1: MAIN TEXT
R57016Y001/D
Pell Frischmann Page | 54
Consultation
7.3.2 The assessment follows a methodology agreed with WDC via a telephone
discussion and email between Stephen Douglas (Scientific Officer at WDC) and
Suzanne Hodgson (Air Quality Consultants) held on 27th June 2012.
Existing Conditions
7.3.3 Existing sources of emission within the study area have been defined using a
number of approaches. A site visit (undertaken on 2 July 2012) has been carried
out to identify existing sources from a visual inspection of the area. Industrial and
waste management sources that exist close to the Application Site have been
identified to determine the likelihood of cumulative effects of multiple point
sources. They have been identified using Defra’s Pollutant Release and Transfer
Register (Defra, 2012c). Local sources have also been identified through
discussion with WDC’s Environmental Health Services, as well as through
examination of the Council’s air quality Review and Assessment reports.
7.3.4 Information on existing air quality has been obtained by collating the results of
monitoring carried out by the local authority. This covers both the study area and
nearby sites, the latter being used to provide context for the assessment. The
background concentrations across the study area have been defined using the
national pollution maps published by Defra (2012a). These cover the whole
country on a 1x1 km grid.
Operational Effects
Sensitive Locations
7.3.5 The assessment considers concentrations for specified human and ecological
receptors and concentrations across a modelled grid. Further details of the
receptors assessed are provided in Technical Appendix 7.1.
Human Receptors
7.3.6 Relevant sensitive locations are places where members of the public might be
expected to be regularly present over the averaging period of the objectives. The
annual mean objectives are considered to apply at the façades of residential
properties, schools, hospitals etc.; they do not apply at hotels. The 24-hour
objective for PM10 is considered to apply at the same locations as the annual
mean objective, as well as in gardens of residential properties and at hotels. The
1-hour mean objective for nitrogen dioxide and 15-minute mean objective for
sulphur dioxide apply wherever members of the public might regularly spend 1-
hour, or more, or 15 minutes, or more, respectively, including outdoor eating
locations and pavements of busy shopping streets.
WHELDON ACT AND AD FACILITY
ENVIRONMENTAL STATEMENT VOLUME 1: MAIN TEXT
R57016Y001/D
Pell Frischmann Page | 55
7.3.7 Concentrations of nitrogen dioxide, PM10 and PM2.5 arising from emissions from
traffic have been predicted at a number of locations close to the proposed
development. In addition, concentrations of nitrogen dioxide and carbon
monoxide associated with the proposed pyrolysis plant and gas engines; and
PM10, PM2.5, sulphur dioxide, total organic carbon (as benzene), HCl , hydrogen
fluoride, toxic metals dioxins and furans associated with the proposed pyrolysis
plant, have also been predicted for assessment of the effects of emissions from
the ERF stacks.
Ecological Receptors
7.3.8 The Environment Agency’s H1 guidance states that the impact of emissions to air
on vegetation and ecosystems should be assessed for the following habitat sites
within 10 km of the source:
Special Areas of Conservation (SACs) and candidate SACs (cSACs)
designated under the Habitats Directive;
Special Protection Areas (SPAs) and potential SPAs designated under the
Birds Directive ; and
Ramsar Sites designated under the Convention on Wetlands of International
Importance.
Within 2 km of the source:
Sites of Special Scientific Interest (SSSI) established by the 1981 Wildlife and Countryside Act;
National Nature Reserves (NNR);
Local Nature Reserves (LNR);
local wildlife sites; and
ancient woodland.
7.3.9 There are no European or internationally designated sites within 10 km of the
proposed ERF facility. Within 2 km there is the Fairburn and Newton Ings
SSSI/LNR, which has been assessed.
Assessment Scenarios
Road Traffic Effects
7.3.10 Predictions of nitrogen dioxide, PM10 and PM2.5 concentrations have been carried
out for a base year (2011), and the proposed year of opening (2015). For 2015,
predictions have been made assuming both that the development does proceed
(With Scheme), and does not proceed (Without Scheme). A further 2015
WHELDON ACT AND AD FACILITY
ENVIRONMENTAL STATEMENT VOLUME 1: MAIN TEXT
R57016Y001/D
Pell Frischmann Page | 56
sensitivity test has been carried out for nitrogen dioxide that involves assuming no
reduction in emission factors for road traffic from the baseline year. This is to
address the issue recently identified by Defra (Carslaw et al., 2011) that road
traffic emissions have not been declining as expected (see later section on
Uncertainty). Nitrogen dioxide concentrations in 2015 with and without the
scheme are thus presented for two scenarios: ‘With Emissions Reduction’ and
‘Without Emissions Reduction’.
Rail Effects
7.3.11 An assessment of the potential effects of rail emissions at the proposed freight
terminal has not been included, as this planning application covers the
construction of the freight terminal only. Additional assessments will be required
to evaluate the operation impacts once the number of rail movements and
volumes of waste to be transported by rail have been identified.
ERF Stack Emission Effects
7.3.12 Predictions of pollutants emitted from the ERF stacks have been carried out for
the ‘With Scheme’ scenario.
7.3.13 For assessment of effects on human health, nitrogen dioxide, PM10 and PM2.5,
concentrations arising from the ERF stacks have been added to predicted road
traffic concentrations, to provide a total combined effect at specified receptors and
across a modelled grid, where relevant. For the other assessed pollutants
(sulphur dioxide, TOC, HCl, hydrogen fluoride, trace metals, and dioxins and
furans) the ERF stack emissions have been assessed in isolation since there is no
associated road effect with these pollutants.
7.3.14 For assessment of effects on ecological health, the assessment of the relevant
pollutants has been carried out for the ERF stack emissions only. For the
assessment of road schemes, the Highways Agency requires an assessment of
the effects of roads traffic emissions on conservation sites (Designated Sites)
within 200 m of a road (Highways Agency, 2007). The SSSI is located more than
200 m from any main roads and therefore the effects of development traffic on the
SSSI have not been assessed.
Modelling Methodology
7.3.15 For the roads, pollutant concentrations have been predicted for the baseline and
future years using the ADMS-Roads (v3.1) dispersion model. For the ERF stacks,
pollutant concentrations have been predicted using ADMS-5 dispersion model.
These models have been widely used in the UK for this type of assessment.
Further details on the modelling methodology used for the assessment are
provided in Technical Appendix 7.2.
WHELDON ACT AND AD FACILITY
ENVIRONMENTAL STATEMENT VOLUME 1: MAIN TEXT
R57016Y001/D
Pell Frischmann Page | 57
Construction Effects
7.3.16 Locations sensitive to dust emitted during construction will be places where
members of the public are regularly present. Residential properties and
commercial operations close to the site will be most sensitive to construction dust.
Any areas of sensitive vegetation or ecology that are very close to dust sources
may also be susceptible to some negative effects.
7.3.17 It is very difficult to quantify emissions of dust from construction activities. It is
thus common practice to provide a qualitative assessment of potential effects,
making reference to the assessment criteria set out Appendix 7.3.
Assessment Criteria
Health Criteria
7.3.18 The Government has established a set of air quality standards and objectives to
protect human health. The ‘standards’ are set as concentrations below which
effects are unlikely even in sensitive population groups, or below which risks to
public health would be exceedingly small. They are based purely upon the
scientific and medical evidence of the effects of an individual pollutant. The
‘objectives’ set out the extent to which the Government expects the standards to
be achieved by a certain date. They take account of economic efficiency,
practicability, technical feasibility and timescale. The objectives for use by local
authorities are prescribed within the Air Quality Regulations, 2000, Statutory
Instrument 928 (2000) and the Air Quality (England) (Amendment) Regulations
2002, Statutory Instrument 3043 (2002).
7.3.19 The objectives for nitrogen dioxide and PM10 were to have been achieved by 2005
and 2004 respectively, and continue to apply in all future years thereafter. The
PM2.5 objective is to be achieved by 2020.
7.3.20 The UK objectives for nitrogen dioxide and PM10 are the same as the EU limit
values. The EU limit value for PM2.5 is the same as the UK objective, but is to be
met by 2015.
7.3.21 The objectives apply at locations where members of the public are likely to be
regularly present and are likely to be exposed over the averaging period of the
objective. Defra explains where these objectives will apply in its Local Air Quality
Management Technical Guidance (Defra, 2009).
7.3.22 Where there is no EAL quoted in Environment Agency guidance, one has been
derived from the Health and Safety Executive’s workplace exposure limits (HSE,
2005). This applies to the short term EAL for chromium VI, and the short- and
long-term EALs for thallium and cobalt.
7.3.23 There are no assessment criteria for dioxins and furans. The World Health
WHELDON ACT AND AD FACILITY
ENVIRONMENTAL STATEMENT VOLUME 1: MAIN TEXT
R57016Y001/D
Pell Frischmann Page | 58
Organisation (WHO,2000) provides an indicator on the air concentrations above
which WHO consider it necessary to identify and control local emission sources;
this value is 0.3 pg/m3 (300 fg/m3). In the absence of suitable criteria, the process
contributions have been compared against the relevant background concentration,
as well as the WHO indicator concentration for which it is considered necessary to
identify and control emission sources.
Vegetation and Ecosystem Criteria
7.3.24 Objectives for the protection of vegetation and ecosystems, set by the UK
Government, are summarised in Technical Appendix 7.1 and are the same as the
EU limit values. The objectives only strictly apply a) more than 20 km from an
agglomeration (about 250,000 people), and b) more than 5 km from Part A
industrial sources, motorways and built up areas of more than 5,000 people.
However, Natural England has adopted a more precautionary approach and
applies the objective to all internationally designated conservation sites and
SSSIs.
7.3.25 Critical loads for nitrogen deposition onto sensitive ecosystems have been
specified by the United Nations Economic Commission for Europe (UNECE).
They are defined as the amount of pollutant deposited to a given area over a year,
below which significant harmful effects on sensitive elements of the environment
do not occur, according to present knowledge. The critical loads for the
ecosystems under consideration in this assessment, as defined in the Air Pollution
Information System (APIS, 2007), are provided in Technical Appendix 7.1.
7.3.26 Where there is no air quality objective, the Environment Agency’s EALs have
been applied.
Environment Agency Screening Criteria
7.3.27 The Environment Agency has adopted criteria that allow process contributions to
be screened out as insignificant regardless of the baseline environmental
conditions Environment Agency (2011). The emissions from a process can be
considered to be insignificant if:
the long-term (annual mean) process contribution is <1% of the long-term
environmental standard; and
the short-term (24-hour mean or shorter) process contribution is <10% of the
short-term environmental standard.
7.3.28 It should be recognised that these criteria determine when an effect can be
screened out as insignificant. They do not imply that effects will necessarily be
significant above these levels, but that above these levels there is a potential for
significant effects that should be assessed using a detailed assessment
WHELDON ACT AND AD FACILITY
ENVIRONMENTAL STATEMENT VOLUME 1: MAIN TEXT
R57016Y001/D
Pell Frischmann Page | 59
methodology such as detailed dispersion modelling (as has been carried out for
this project in any event) and taking into account background concentrations.
7.3.29 In addition, Environment Agency H1 guidance explains that “As a guide, detailed
dispersion modelling of long term emissions maybe useful where:
local receptors may be sensitive to long term emissions;
released substances fall under an Air Quality Management Plan;
the sum of the background concentration and process contribution exceed
70% of the appropriate long term standard”;
and that: “As a guide, detailed dispersion modelling of short term emissions
maybe useful where:
local receptors maybe sensitive to short term emissions;
the short term process contribution is more than 20% of the relevant short
term environmental standard minus twice the long term background
concentration.”
7.3.30 For the assessment of trace metals, the Environment Agency’s Interim Guidance
Note for Metals has been used. The guidance note applies to Group III metals in
stack emissions, but the approach has been used for all metals. It provides a
three step approach to the assessment, which is outlined below:
Step 1 – Screening Scenario: Model predictions assume each metal is
emitted at the maximum Emission Limit Value (ELV) of 0.5 mg/Nm3 as a
worst-case. Assessment of the impact is then made against the following
parameters:
Long-term Process Contribution (PC) < 1% or short-term PC < 10% of the
EAL; or
Long-term and short-term Predicted Environmental Concentrations
(PEC)1 <100% of the EAL (taking likely modelling uncertainties into
account)
Step 2 – Worst Case Scenario Based On Currently Operating Plant: Where
the Step 1 screening criteria set out in the guidance are not met, an
emission concentration equal to 1/9th of the ELV for Group III metals and
1/3rd of the ELV for Group I and II metals have been assumed, and
assessment made against the same criteria specified for Step 1.
1 PEC = Process Contribution + Background Concentration
WHELDON ACT AND AD FACILITY
ENVIRONMENTAL STATEMENT VOLUME 1: MAIN TEXT
R57016Y001/D
Pell Frischmann Page | 60
Step 3: If the screening criteria are not met in Step 2, typical emission
concentrations for ERFs have been used, as specified in the guidance. The
guidance does not specify typical emission concentrations for cadmium. In
the absence of this, typical emission concentrations for cadmium from ERFs
have been taken from a study undertaken by ERM on Emissions from Waste
Facilities (ERM, 2011).
Assessment of Significance
7.3.31 There is no official guidance in the UK on how to describe air quality effects nor to
assess their significance. The approach developed by the IAQM (IAQM, 2009),
and incorporated in Environmental Protection UK’s (EPUK) guidance document
on planning and air quality (EPUK, 2010), has therefore been used. This
approach includes elements of professional judgement. Full details of this
approach are provided in Technical Appendix 7.4.
7.3.32 As described above, where there is no air quality objective, the EALs have been
applied. The approach taken in this assessment is to use detailed dispersion
modelling in the first instance, and to apply the Environment Agency screening
criteria to the model outputs. Where process contributions are shown to be below
these screening criteria, they are judged to be insignificant.
7.3.33 AQOs, EALs and criteria derived from the HSE workspace exposure limits, that
have been used to assess the effects of the proposed development are presented
in Appendix 7.1.
7.3.34 In the case of nitrogen dioxide, PM10 and PM2.5, where this initial screening shows
a requirement for a more detailed assessment, then total concentrations have
been calculated and assessed following the IAQM guidance described in
Technical Appendix 7.2.
7.3.35 In the case of nitrogen oxides, sulphur dioxide and hydrogen fluoride
concentrations and the nitrogen and acid deposition rates at the SSSI, where this
initial screening shows the potential for significant effects, then the predicted total
concentrations have been assessed against the critical levels and critical loads
described in Technical Appendix 7.2.
7.3.36 In the case of the sulphur dioxide, TOC, HCl, hydrogen fluoride and carbon
monoxide, if the EAL is exceeded, interrogation of the area of exceedence has
been undertaken to determine if there is relevant exposure at the location.
Construction Dust Criteria
7.3.37 There are no formal assessment criteria for dust. In the absence of formal criteria,
the approach developed by the Institute of Air Quality Management (IAQM)
(IAQM, 2011) has therefore been used. Full details of this approach are provided
in Technical Appendix 7.2.
WHELDON ACT AND AD FACILITY
ENVIRONMENTAL STATEMENT VOLUME 1: MAIN TEXT
R57016Y001/D
Pell Frischmann Page | 61
7.3.38 In the absence of official guidance, the approach developed by the IAQM (IAQM,
2011) to assess the significance of construction dust has been used. This
approach includes elements of professional judgement. Full details of this
approach are provided in Technical Appendix 7.3.
7.4 BASELINE CONDITIONS
Site Location
7.4.1 The proposed development site is located approximately 800 m to the east of
Castleford town centre, which has been declared an Air Quality Management Area
by WDC. The site is bounded by Wheldon Road to the north and a railway line to
the south. There are existing residential properties in the areas of Wheldale,
Castleford and Airedale which are located approximately 600 m to the east, 500 m
to the southeast and 170 m to the south, respectively, of the Application Site.
Approximately 250 m northeast of the Application site is the commercial area of
Castleford Ings and 500 m to the north is the Fairburn and Newton Ings
SSSI/LNR.
Existing Industrial and Railway Sources
7.4.2 A search of the UK Pollutant Release and Transfer Register website (Defra,
2012c) identified one industrial process (the Eon Cogeneration combined heat
and power (CHP) plant), located within 1 km of the Application Site. In addition, a
number of other industrial processes (a confectionary factory and a timber
treatment centre) were identified during the site visit. The railway line immediately
south of the Application Site boundary runs freight, but no passenger trains.
7.4.3 Emissions from the industrial processes and the railway line will already be
included within Defra’s background maps. Traffic associated with the operation of
the industrial facilities will have been included in the current and future baseline
traffic data. The probability of short-term emissions from the various industrial
processes occurring in the same location at the same time is extremely low due to
the geography of the stacks, and therefore the chances of impacts combining and
exceeding the short-term AQO/EALs are also extremely low.
Wakefield District Council Monitoring
7.4.4 WDC has investigated air quality within its area as part of its responsibilities under
the LAQM regime. In June 2007, an AQMA was declared in Castleford town
centre, in the area around the A6032 and the A656 (WDC, 2011). The Castleford
AQMA is located approximately 700 m west of the application site and is shown in
Technical Appendix 7.5. Seven further AQMAs have also been declared by the
Council, however these are located some distance from the application site and
are unlikely to affect or be affected by the proposed development.
WHELDON ACT AND AD FACILITY
ENVIRONMENTAL STATEMENT VOLUME 1: MAIN TEXT
R57016Y001/D
Pell Frischmann Page | 62
7.4.5 In terms of PM10, WDC concluded that there are no exceedences of the
objectives. It is therefore highly unlikely that existing PM10 levels will exceed the
objectives within the study area (WDC, 2011).
7.4.6 WDC operates seven permanent automatic monitoring stations within its area,
one of which is located within Castleford (located approximately 1 km from the
Application Site), along Pontefract Road, measuring both nitrogen dioxide and
PM10. The Council also operates a number of nitrogen dioxide monitoring sites
using diffusion tubes prepared and analysed by Harwell Scientifics (using the 50%
TEA in acetone method). Results for the years 2007 to 2011 and PM10 monitoring
results are presented in Technical Appendix 7.5.
7.4.7 Monitored annual mean concentrations exceeded the annual mean nitrogen
dioxide objective at diffusion tubes along Ferrybridge Road, the eastern end of
Savile Road and Pontefract Road in recent years. Annual mean concentrations
are below the objective at diffusion tubes at the western end of Savile Road and
Wood Street. The measured concentrations at the automatic analyser on
Pontefract Road were below the annual mean objective and there have been no
exceedences of the 1-hour objective value since monitoring commenced at the
new site in 2009.
7.4.8 There are no clear trends in monitoring results for the past five years. This
contrasts with the expected decline due to the progressive introduction of new
vehicles operating to more stringent standards. The implications of this are
discussed later in Section 7.5 of this chapter.
7.4.9 Measured PM10 concentrations at automatic monitor on Pontefract Road were
below the annual mean objective and there have been no exceedences of the 24-
hour objective value since monitoring commenced at the new site in 2009.
Background Concentrations
7.4.10 In addition to these locally measured concentrations, estimated background
concentrations in the study area have been determined for 2011 and the opening
year 2015. These are presented in Appendix 7.5. In the case of nitrogen oxides
and nitrogen dioxide, two sets of future-year backgrounds are presented to take
into account uncertainty in future year vehicle emission factors. The derivation of
background concentrations is described in Technical Appendix 7.2. The
background concentrations are all well below the objectives.
7.4.11 For sulphur dioxide and carbon monoxide predicted annual mean background
concentration maps for the whole of the UK were issued as part of the original
technical guidance for Local Air Quality Management (LAQM.TG(03)). For 2001
the background concentrations for the grid where the ERF is proposed were
predicted to be 6.2 µg/m3 for sulphur dioxide and 0.36 mg/m3 for carbon
monoxide.
WHELDON ACT AND AD FACILITY
ENVIRONMENTAL STATEMENT VOLUME 1: MAIN TEXT
R57016Y001/D
Pell Frischmann Page | 63
7.4.12 There is little data available on background concentrations of the other pollutants
assessed, as they are typically measured only close to sources of pollution.
7.4.13 Estimated background nitrogen deposition rates (2009 – 2011) in the study area
have been obtained from the APIS website (APIS, 2007). These are presented in
Technical Appendix 7.5. These shown that the background deposition rates are in
excess of the critical load.
Baseline Conditions for Trace Metals
7.4.14 Defra has undertaken monitoring of trace elements at a number of locations in the
UK since 1976 as part of the UK Urban and Rural Heavy Metals Monitoring
Networks. To provide an indication of the range of trace metal concentrations that
occur in the Yorkshire area, measured concentrations at four nearby monitoring
sites (Sheffield Centre, Sheffield Brinksworth, Scunthorpe Town and Scunthorpe
Low Santon), in 2011, have been summarised and are provided in Technical
Appendix 7.5.
Baseline Conditions for Dioxins and Furans
7.4.15 Monitoring of PCDD/Fs (dioxins and furans) is currently carried out by Defra at
seven locations in the UK (Hazelrigg, High Muffles, London, Manchester,
Auchencorth Moss, Middlesbrough and Weybourne).
7.4.16 To provide an indication of the range of PCDD/Fs concentrations that occur in the
UK, a summary of the annual mean concentrations measured between 2008 and
2010 is presented in Appendix 7.5. The average concentration measured in
Manchester, the nearest monitoring site to the Application Site, from 2008 to 2010
is 27.3 fg/m3. This monitoring data is assumed to be representative of the
baseline dioxin and furan concentrations at the Application site.
Predicted Baseline Concentrations
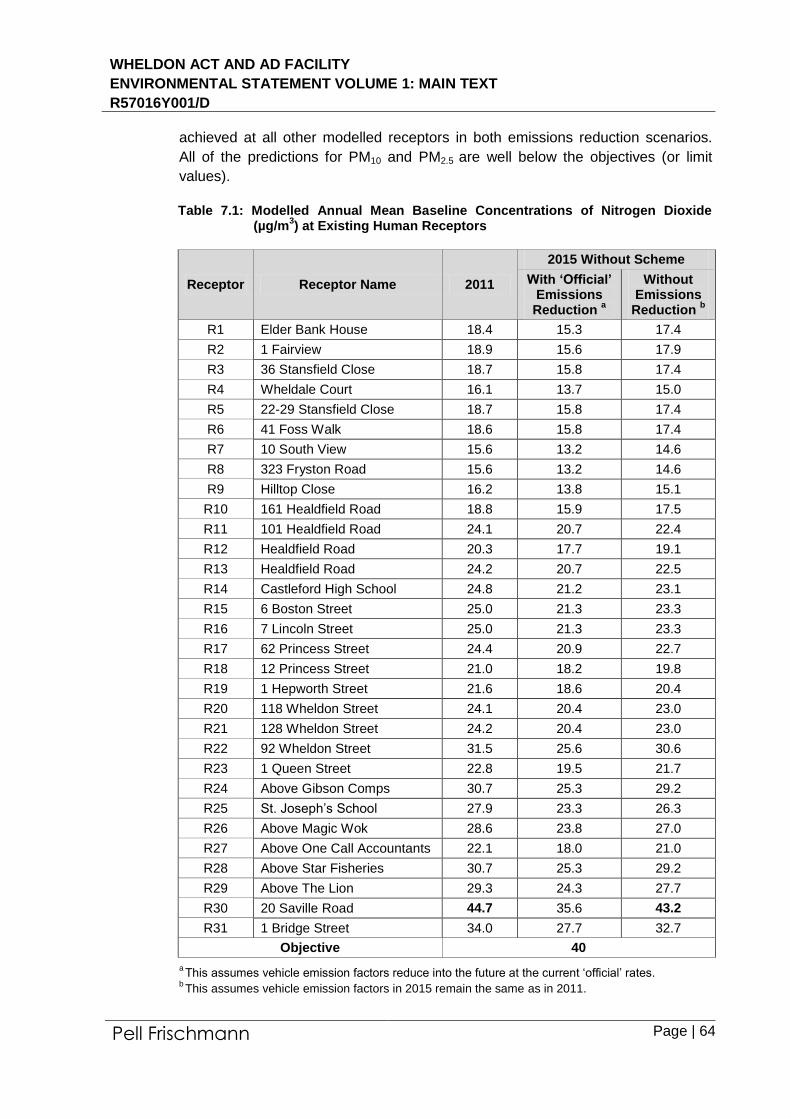
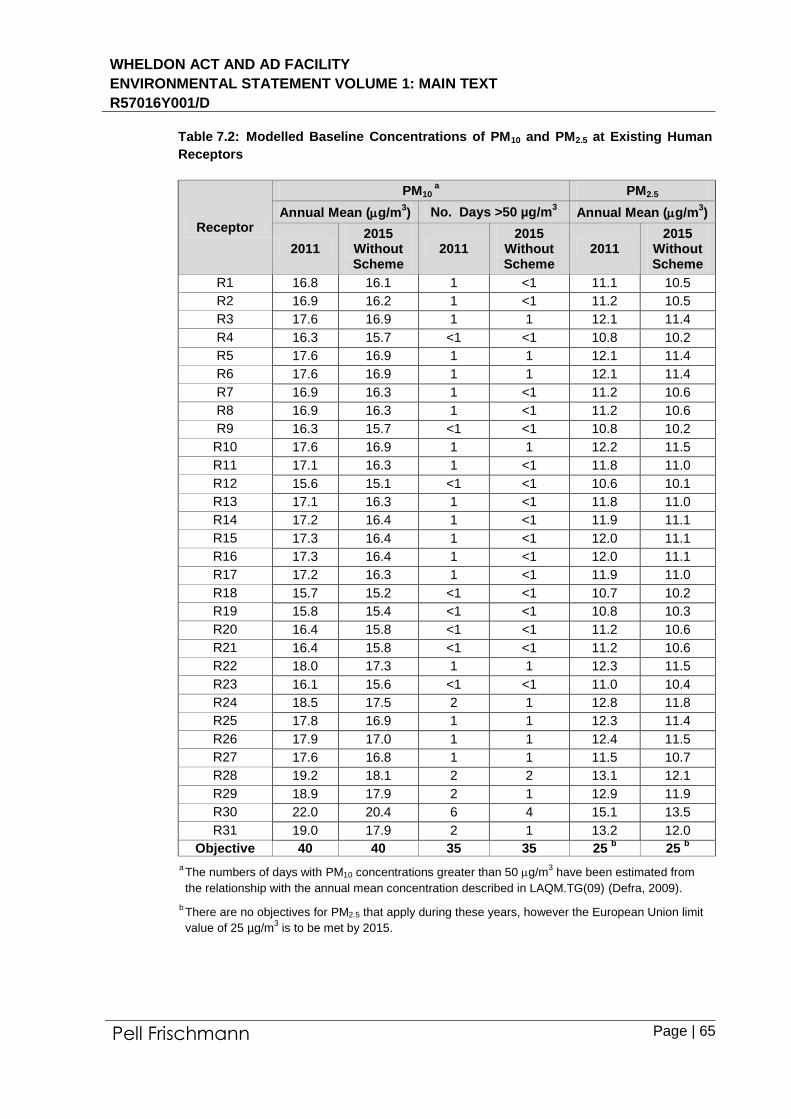
7.4.17 Baseline concentrations of nitrogen dioxide, PM10 and PM2.5 have been modelled
at each of the existing receptor locations. These locations are shown in Technical
Appendix 7.1. The results, which cover both existing (2011) and future year
(2015) baseline (Without Scheme), are presented in Table 7.1 and Table 7.2. The
future baseline for nitrogen dioxide covers the two scenarios: with the official
reductions in vehicle emission factors and without these reductions. The
modelled road nitrogen oxides contributions have been adjusted by a verification
factor of 3.2 and the total NO2 has been adjusted by a secondary verification
factor of 0.99, see Technical Appendix 7.2 for details of the model verification.
7.4.18 Predicted annual mean concentrations of nitrogen dioxide exceed the objective at
20 Saville Road (R30) in 2011; at other modelled receptors the objective is
predicted to be achieved. Assuming that road traffic emissions do not decline, the
objective continues to be exceeded in 2015 at R30. The objective continues to be
WHELDON ACT AND AD FACILITY
ENVIRONMENTAL STATEMENT VOLUME 1: MAIN TEXT
R57016Y001/D
Pell Frischmann Page | 64
achieved at all other modelled receptors in both emissions reduction scenarios.
All of the predictions for PM10 and PM2.5 are well below the objectives (or limit
values).
Table 7.1: Modelled Annual Mean Baseline Concentrations of Nitrogen Dioxide (µg/m
3) at Existing Human Receptors
Receptor Receptor Name 2011
2015 Without Scheme
With ‘Official’ Emissions Reduction
a
Without Emissions
Reduction b
R1 Elder Bank House 18.4 15.3 17.4
R2 1 Fairview 18.9 15.6 17.9
R3 36 Stansfield Close 18.7 15.8 17.4
R4 Wheldale Court 16.1 13.7 15.0
R5 22-29 Stansfield Close 18.7 15.8 17.4
R6 41 Foss Walk 18.6 15.8 17.4
R7 10 South View 15.6 13.2 14.6
R8 323 Fryston Road 15.6 13.2 14.6
R9 Hilltop Close 16.2 13.8 15.1
R10 161 Healdfield Road 18.8 15.9 17.5
R11 101 Healdfield Road 24.1 20.7 22.4
R12 Healdfield Road 20.3 17.7 19.1
R13 Healdfield Road 24.2 20.7 22.5
R14 Castleford High School 24.8 21.2 23.1
R15 6 Boston Street 25.0 21.3 23.3
R16 7 Lincoln Street 25.0 21.3 23.3
R17 62 Princess Street 24.4 20.9 22.7
R18 12 Princess Street 21.0 18.2 19.8
R19 1 Hepworth Street 21.6 18.6 20.4
R20 118 Wheldon Street 24.1 20.4 23.0
R21 128 Wheldon Street 24.2 20.4 23.0
R22 92 Wheldon Street 31.5 25.6 30.6
R23 1 Queen Street 22.8 19.5 21.7
R24 Above Gibson Comps 30.7 25.3 29.2
R25 St. Joseph’s School 27.9 23.3 26.3
R26 Above Magic Wok 28.6 23.8 27.0
R27 Above One Call Accountants 22.1 18.0 21.0
R28 Above Star Fisheries 30.7 25.3 29.2
R29 Above The Lion 29.3 24.3 27.7
R30 20 Saville Road 44.7 35.6 43.2
R31 1 Bridge Street 34.0 27.7 32.7
Objective 40
a This assumes vehicle emission factors reduce into the future at the current ‘official’ rates.
b This assumes vehicle emission factors in 2015 remain the same as in 2011.
WHELDON ACT AND AD FACILITY
ENVIRONMENTAL STATEMENT VOLUME 1: MAIN TEXT
R57016Y001/D
Pell Frischmann Page | 65
Table 7.2: Modelled Baseline Concentrations of PM10 and PM2.5 at Existing Human
Receptors
Receptor
PM10 a
PM2.5
Annual Mean (g/m3) No. Days >50 µg/m
3 Annual Mean (g/m
3)
2011 2015
Without Scheme
2011 2015
Without Scheme
2011 2015
Without Scheme
R1 16.8 16.1 1 <1 11.1 10.5
R2 16.9 16.2 1 <1 11.2 10.5
R3 17.6 16.9 1 1 12.1 11.4
R4 16.3 15.7 <1 <1 10.8 10.2
R5 17.6 16.9 1 1 12.1 11.4
R6 17.6 16.9 1 1 12.1 11.4
R7 16.9 16.3 1 <1 11.2 10.6
R8 16.9 16.3 1 <1 11.2 10.6
R9 16.3 15.7 <1 <1 10.8 10.2
R10 17.6 16.9 1 1 12.2 11.5
R11 17.1 16.3 1 <1 11.8 11.0
R12 15.6 15.1 <1 <1 10.6 10.1
R13 17.1 16.3 1 <1 11.8 11.0
R14 17.2 16.4 1 <1 11.9 11.1
R15 17.3 16.4 1 <1 12.0 11.1
R16 17.3 16.4 1 <1 12.0 11.1
R17 17.2 16.3 1 <1 11.9 11.0
R18 15.7 15.2 <1 <1 10.7 10.2
R19 15.8 15.4 <1 <1 10.8 10.3
R20 16.4 15.8 <1 <1 11.2 10.6
R21 16.4 15.8 <1 <1 11.2 10.6
R22 18.0 17.3 1 1 12.3 11.5
R23 16.1 15.6 <1 <1 11.0 10.4
R24 18.5 17.5 2 1 12.8 11.8
R25 17.8 16.9 1 1 12.3 11.4
R26 17.9 17.0 1 1 12.4 11.5
R27 17.6 16.8 1 1 11.5 10.7
R28 19.2 18.1 2 2 13.1 12.1
R29 18.9 17.9 2 1 12.9 11.9
R30 22.0 20.4 6 4 15.1 13.5
R31 19.0 17.9 2 1 13.2 12.0
Objective 40 40 35 35 25 b 25
b
a The numbers of days with PM10 concentrations greater than 50 g/m
3 have been estimated from
the relationship with the annual mean concentration described in LAQM.TG(09) (Defra, 2009).
b There are no objectives for PM2.5 that apply during these years, however the European Union limit
value of 25 µg/m3 is to be met by 2015.
WHELDON ACT AND AD FACILITY
ENVIRONMENTAL STATEMENT VOLUME 1: MAIN TEXT
R57016Y001/D
Pell Frischmann Page | 66
7.5 POTENTIAL SIGNIFICANT EFFECTS
Construction
7.5.1 The construction works will give rise to a risk of dust effects during earthworks and
construction, as well as from trackout of dust and dirt by vehicles onto the public
highway. There are various sensitive receptors that may be affected by dust,
including residential properties, and less sensitive commercial premises. There
are no sensitive ecological receptors near to the Application Site boundary that
might be affected.
7.5.2 The Fairburn and Newton Ings SSSI is located approximately 500 m north of the
Application site, and at this distance it considered there will be no significant
effects on the SSSI from on-site construction activities.
Demolition
7.5.3 There is no requirement for demolition on site.
Earthworks
7.5.4 The site covers some 3.5 hectares and most of this will be subject to earthworks,
which will occur predominantly on the main site where the ERF buildings will be
located.
7.5.5 Some earthworks will occur in the vicinity of the proposed train terminal platform,
where there will be approximately six receptors within 20 m, and a further 60
between 20 to 100 m of the area subject to works. There will be a small number
of dwellings (approximately 30) and Castleford Tigers Rugby Football Ground
between 100 - 200 m from the main site. There will be a large number of
dwellings (approximately 450) and commercial premises between 200 – 350 m
from the whole site (ERF buildings and proposed train terminal platform), on all
sides. It is noted that the earthworks associated with the development of the train
terminal platform is covered by Network Rails planning application
(12/00998/FUL) which has been approved.
7.5.6 The earthworks will last around six months and dust will arise mainly from the
vehicles travelling over unpaved ground and from the handling of dusty materials.
Most of the earthworks will involve the removal of subsoil, which will largely be
damp and not prone to creating dust. The dust emission class for the earthworks
is considered to be large, using the criteria outlined in Technical Appendix 7.3.
Construction Activities
7.5.7 The construction will involve a total building volume of less than 25,000 m3. Dust
will arise from vehicles travelling over unpaved ground and the handling and
storage of dusty materials. There will be approximately six sensitive receptors
within 20 m, and a further 60 between 20 to 100 m of the area subject to
WHELDON ACT AND AD FACILITY
ENVIRONMENTAL STATEMENT VOLUME 1: MAIN TEXT
R57016Y001/D
Pell Frischmann Page | 67
construction activities near to the proposed train terminal platform. There will also
be a small number of dwellings (approximately 30) and Castleford Tigers Rugby
Football Ground between 100 - 200 m of the main site. There will be a large
number of dwellings (approximately 450) and commercial premises between 200
– 350 m from the whole site, on all sides. The construction will take place over a
16 to 18 month period. The dust emission class for the construction is considered
to be small, using the criteria outlined in Technical Appendix 7.3.
Trackout
7.5.8 The exact number of vehicles accessing the site, which may track out dust and
dirt is currently unknown, however it is considered likely there will be less than 25
vehicle movements per day. The nearest sensitive receptors within 50 m of the
site entrance/exit, which may be affected by dust, lie 50 m from the public
highway. The dust emission class for trackout is considered to be small, using the
criteria outlined in Technical Appendix 7.3.
Risk and Significance
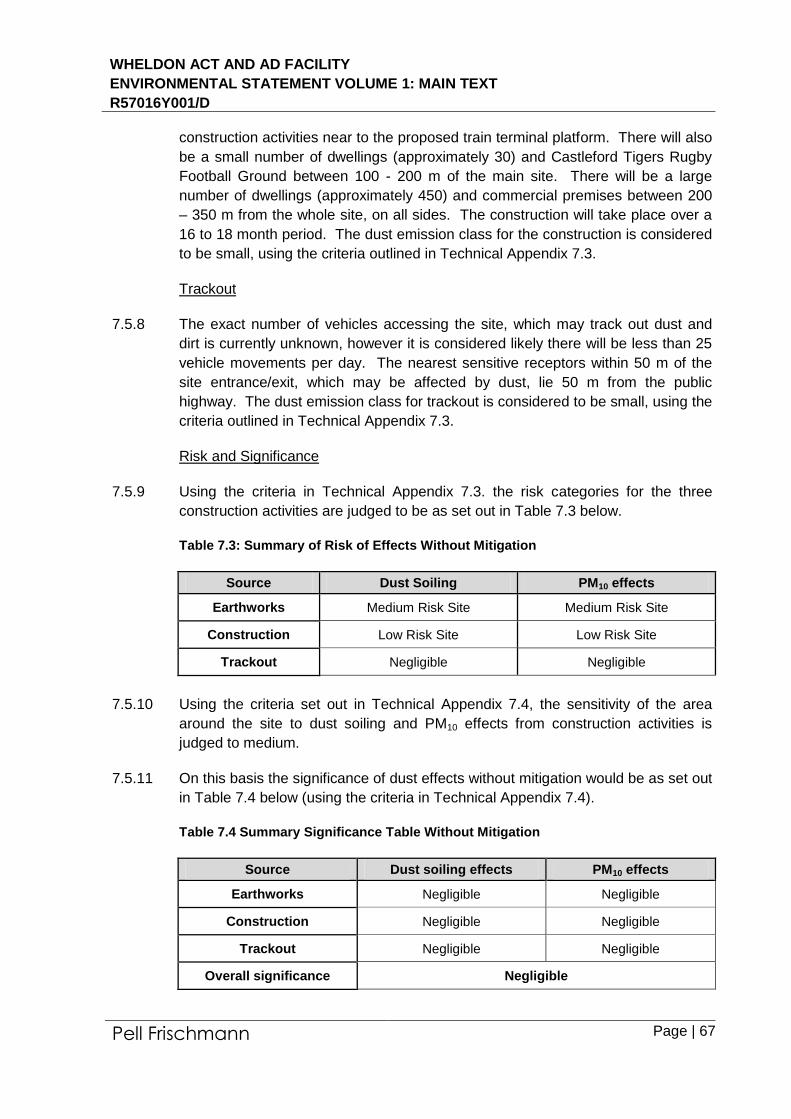
7.5.9 Using the criteria in Technical Appendix 7.3. the risk categories for the three
construction activities are judged to be as set out in Table 7.3 below.
Table 7.3: Summary of Risk of Effects Without Mitigation
Source Dust Soiling PM10 effects
Earthworks Medium Risk Site Medium Risk Site
Construction Low Risk Site Low Risk Site
Trackout Negligible Negligible
7.5.10 Using the criteria set out in Technical Appendix 7.4, the sensitivity of the area
around the site to dust soiling and PM10 effects from construction activities is
judged to medium.
7.5.11 On this basis the significance of dust effects without mitigation would be as set out
in Table 7.4 below (using the criteria in Technical Appendix 7.4).
Table 7.4 Summary Significance Table Without Mitigation
Source Dust soiling effects PM10 effects
Earthworks Negligible Negligible
Construction Negligible Negligible
Trackout Negligible Negligible
Overall significance Negligible
WHELDON ACT AND AD FACILITY
ENVIRONMENTAL STATEMENT VOLUME 1: MAIN TEXT
R57016Y001/D
Pell Frischmann Page | 68
Operation
Road Traffic
7.5.12 It should be noted that the traffic data used in the assessment assume that all
material delivered to/from the ERF would be transported via road. The
implications of this assumption are considered later in this section.
Human Exposure
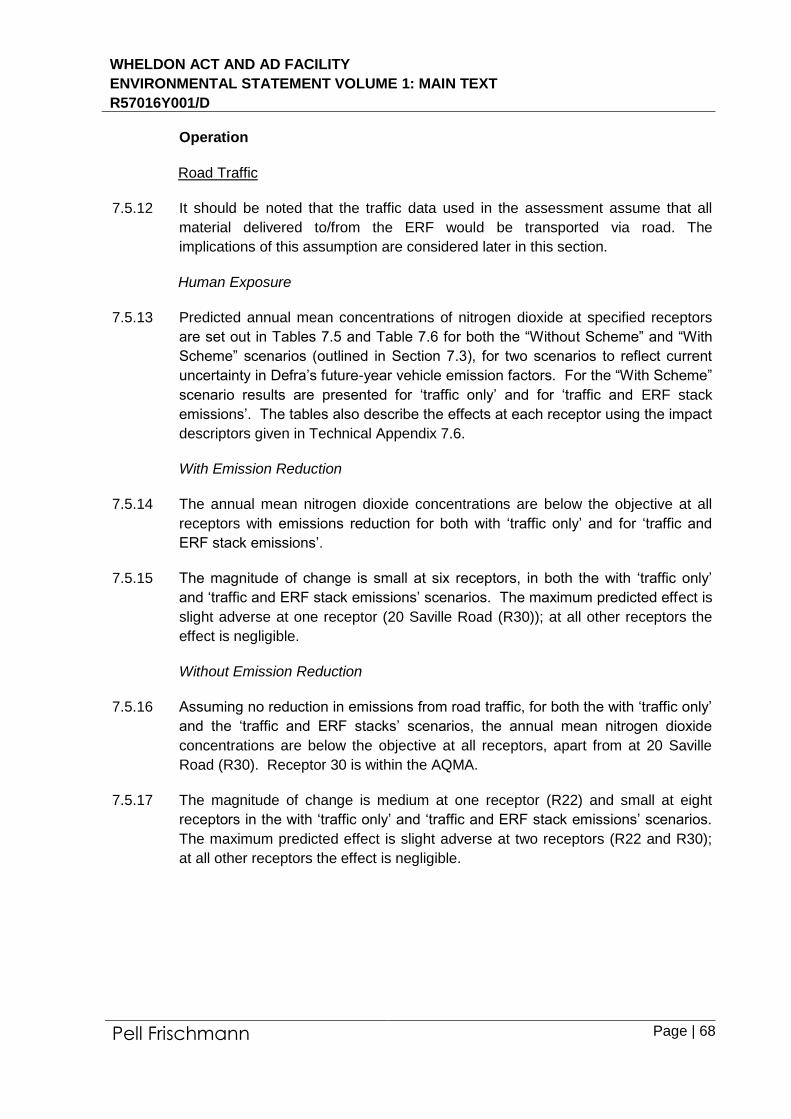
7.5.13 Predicted annual mean concentrations of nitrogen dioxide at specified receptors
are set out in Tables 7.5 and Table 7.6 for both the “Without Scheme” and “With
Scheme” scenarios (outlined in Section 7.3), for two scenarios to reflect current
uncertainty in Defra’s future-year vehicle emission factors. For the “With Scheme”
scenario results are presented for ‘traffic only’ and for ‘traffic and ERF stack
emissions’. The tables also describe the effects at each receptor using the impact
descriptors given in Technical Appendix 7.6.
With Emission Reduction
7.5.14 The annual mean nitrogen dioxide concentrations are below the objective at all
receptors with emissions reduction for both with ‘traffic only’ and for ‘traffic and
ERF stack emissions’.
7.5.15 The magnitude of change is small at six receptors, in both the with ‘traffic only’
and ‘traffic and ERF stack emissions’ scenarios. The maximum predicted effect is
slight adverse at one receptor (20 Saville Road (R30)); at all other receptors the
effect is negligible.
Without Emission Reduction
7.5.16 Assuming no reduction in emissions from road traffic, for both the with ‘traffic only’
and the ‘traffic and ERF stacks’ scenarios, the annual mean nitrogen dioxide
concentrations are below the objective at all receptors, apart from at 20 Saville
Road (R30). Receptor 30 is within the AQMA.
7.5.17 The magnitude of change is medium at one receptor (R22) and small at eight
receptors in the with ‘traffic only’ and ‘traffic and ERF stack emissions’ scenarios.
The maximum predicted effect is slight adverse at two receptors (R22 and R30);
at all other receptors the effect is negligible.
WHELDON ACT AND AD FACILITY
ENVIRONMENTAL STATEMENT VOLUME 1: MAIN TEXT
R57016Y001/D
Pell Frischmann Page | 69
Table 7.5: Predicted Impacts on Annual Mean Nitrogen Dioxide Concentrations in
2015 (µg/m3), With ‘Official’ Emission Reduction
a
Receptor Without Scheme
Annual Mean Concentration Impact Descriptor
With Scheme
(Traffic only) (Traffic and ERF stacks)
(Traffic only) (Traffic and ERF stacks)
R1 15.3 15.7 15.8 Negligible Negligible
R2 15.6 16.1 16.2 Negligible Negligible
R3 15.8 15.8 15.9 Negligible Negligible
R4 13.7 13.7 13.8 Negligible Negligible
R5 15.8 15.8 15.9 Negligible Negligible
R6 15.8 15.8 15.9 Negligible Negligible
R7 13.2 13.2 13.2 Negligible Negligible
R8 13.2 13.2 13.2 Negligible Negligible
R9 13.8 13.8 13.9 Negligible Negligible
R10 15.9 15.9 16.0 Negligible Negligible
R11 20.7 20.7 20.8 Negligible Negligible
R12 17.7 17.8 17.8 Negligible Negligible
R13 20.7 20.7 20.8 Negligible Negligible
R14 21.2 21.2 21.2 Negligible Negligible
R15 21.3 21.3 21.3 Negligible Negligible
R16 21.3 21.3 21.3 Negligible Negligible
R17 20.9 21.0 21.0 Negligible Negligible
R18 18.2 18.4 18.4 Negligible Negligible
R19 18.6 18.9 18.9 Negligible Negligible
R20 20.4 21.1 21.1 Negligible Negligible
R21 20.4 21.1 21.2 Negligible Negligible
R22 25.6 27.5 27.5 Negligible Negligible
R23 19.5 19.8 19.8 Negligible Negligible
R24 25.3 25.4 25.4 Negligible Negligible
R25 23.3 23.4 23.4 Negligible Negligible
R26 23.8 23.9 23.9 Negligible Negligible
R27 18.0 18.0 18.1 Negligible Negligible
R28 25.3 25.5 25.6 Negligible Negligible
R29 24.3 24.5 24.5 Negligible Negligible
R30 35.6 36.3 36.3 Slight Adverse Slight Adverse
R31 27.7 27.8 27.9 Negligible Negligible
Objective 40 - -
a This assumes vehicle emission factors reduce into the future at the current ‘official’ rates.
b This assumes vehicle emission factors in 2015 remain the same as in 2011.
WHELDON ACT AND AD FACILITY
ENVIRONMENTAL STATEMENT VOLUME 1: MAIN TEXT
R57016Y001/D
Pell Frischmann Page | 70
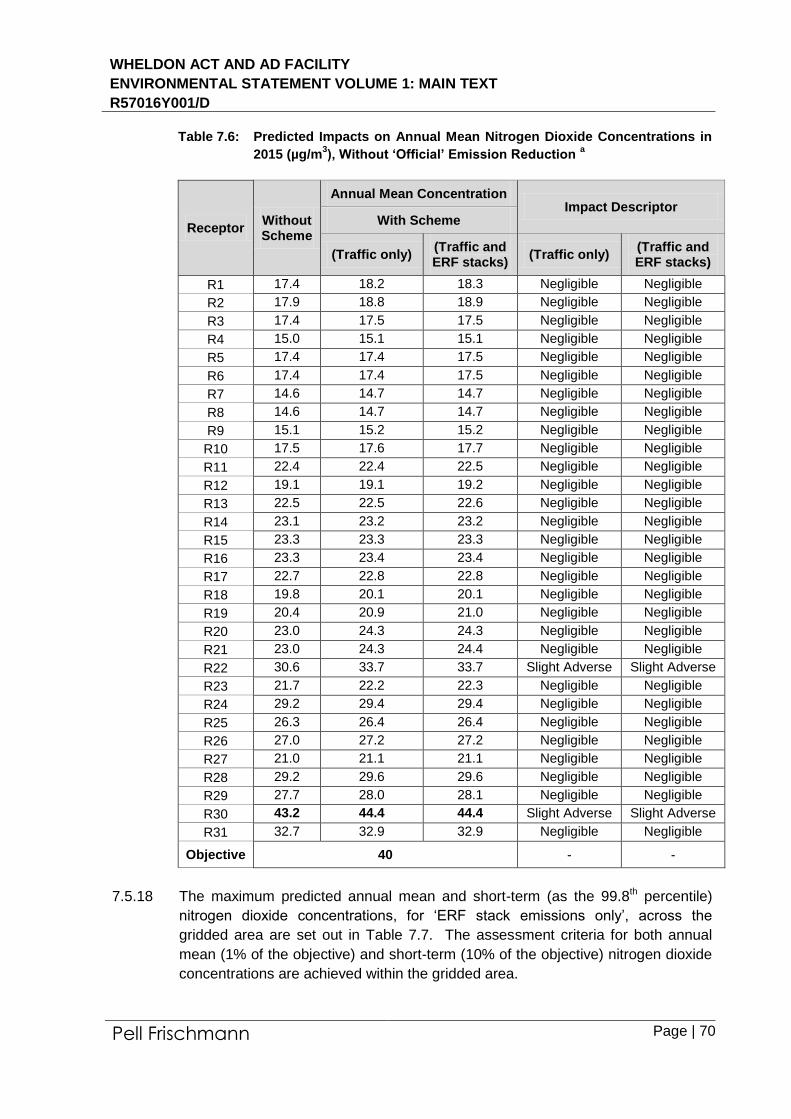
Table 7.6: Predicted Impacts on Annual Mean Nitrogen Dioxide Concentrations in
2015 (µg/m3), Without ‘Official’ Emission Reduction
a
Receptor Without Scheme
Annual Mean Concentration Impact Descriptor
With Scheme
(Traffic only) (Traffic and ERF stacks)
(Traffic only) (Traffic and ERF stacks)
R1 17.4 18.2 18.3 Negligible Negligible
R2 17.9 18.8 18.9 Negligible Negligible
R3 17.4 17.5 17.5 Negligible Negligible
R4 15.0 15.1 15.1 Negligible Negligible
R5 17.4 17.4 17.5 Negligible Negligible
R6 17.4 17.4 17.5 Negligible Negligible
R7 14.6 14.7 14.7 Negligible Negligible
R8 14.6 14.7 14.7 Negligible Negligible
R9 15.1 15.2 15.2 Negligible Negligible
R10 17.5 17.6 17.7 Negligible Negligible
R11 22.4 22.4 22.5 Negligible Negligible
R12 19.1 19.1 19.2 Negligible Negligible
R13 22.5 22.5 22.6 Negligible Negligible
R14 23.1 23.2 23.2 Negligible Negligible
R15 23.3 23.3 23.3 Negligible Negligible
R16 23.3 23.4 23.4 Negligible Negligible
R17 22.7 22.8 22.8 Negligible Negligible
R18 19.8 20.1 20.1 Negligible Negligible
R19 20.4 20.9 21.0 Negligible Negligible
R20 23.0 24.3 24.3 Negligible Negligible
R21 23.0 24.3 24.4 Negligible Negligible
R22 30.6 33.7 33.7 Slight Adverse Slight Adverse
R23 21.7 22.2 22.3 Negligible Negligible
R24 29.2 29.4 29.4 Negligible Negligible
R25 26.3 26.4 26.4 Negligible Negligible
R26 27.0 27.2 27.2 Negligible Negligible
R27 21.0 21.1 21.1 Negligible Negligible
R28 29.2 29.6 29.6 Negligible Negligible
R29 27.7 28.0 28.1 Negligible Negligible
R30 43.2 44.4 44.4 Slight Adverse Slight Adverse
R31 32.7 32.9 32.9 Negligible Negligible
Objective 40 - -
7.5.18 The maximum predicted annual mean and short-term (as the 99.8th percentile)
nitrogen dioxide concentrations, for ‘ERF stack emissions only’, across the
gridded area are set out in Table 7.7. The assessment criteria for both annual
mean (1% of the objective) and short-term (10% of the objective) nitrogen dioxide
concentrations are achieved within the gridded area.
WHELDON ACT AND AD FACILITY
ENVIRONMENTAL STATEMENT VOLUME 1: MAIN TEXT
R57016Y001/D
Pell Frischmann Page | 71
Table 7.7: Maximum Predicted Nitrogen Dioxide Concentrations from ERF Stack
Emissions
Pollutant Averaging period
Maximum
Concentration
(Process Contribution)
AQO/EAL
(µg/m3)
(µg/m3) % of AQO
NO2 Annual mean 0.2 0.4 40
1-hour mean (99.8 percentile) 1.7 0.9 200
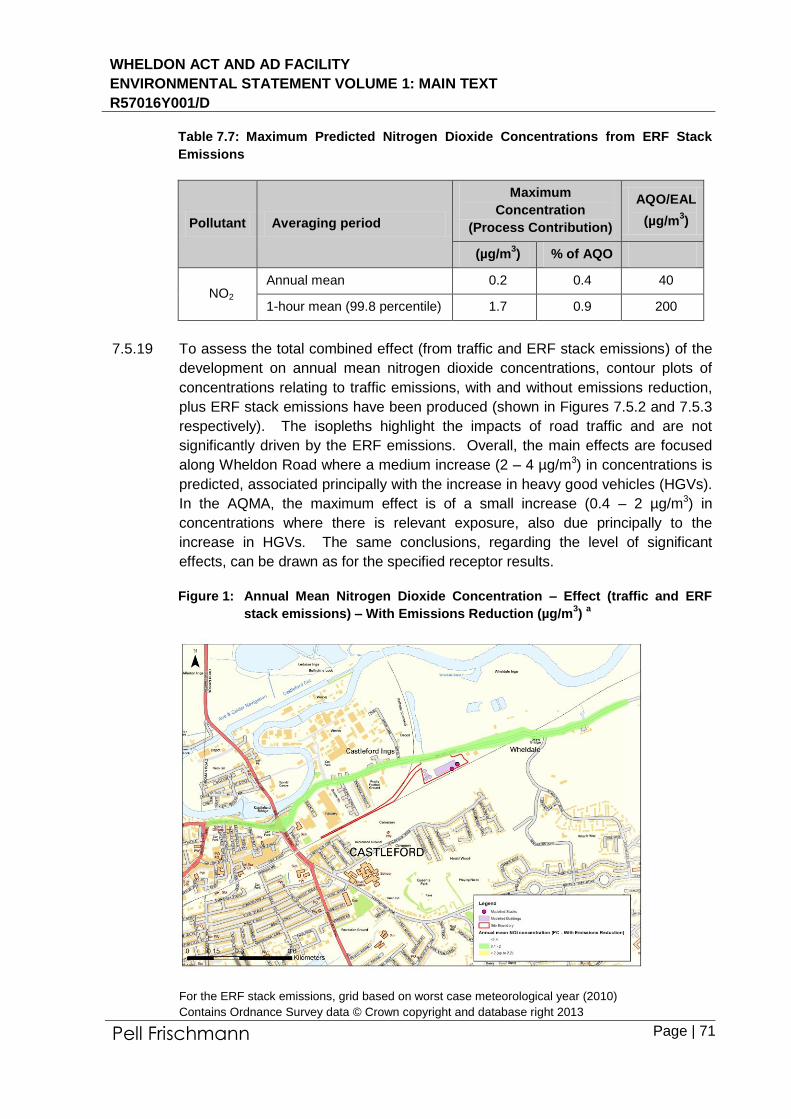
7.5.19 To assess the total combined effect (from traffic and ERF stack emissions) of the
development on annual mean nitrogen dioxide concentrations, contour plots of
concentrations relating to traffic emissions, with and without emissions reduction,
plus ERF stack emissions have been produced (shown in Figures 7.5.2 and 7.5.3
respectively). The isopleths highlight the impacts of road traffic and are not
significantly driven by the ERF emissions. Overall, the main effects are focused
along Wheldon Road where a medium increase (2 – 4 µg/m3) in concentrations is
predicted, associated principally with the increase in heavy good vehicles (HGVs).
In the AQMA, the maximum effect is of a small increase (0.4 – 2 µg/m3) in
concentrations where there is relevant exposure, also due principally to the
increase in HGVs. The same conclusions, regarding the level of significant
effects, can be drawn as for the specified receptor results.
Figure 1: Annual Mean Nitrogen Dioxide Concentration – Effect (traffic and ERF
stack emissions) – With Emissions Reduction (µg/m3)
a
For the ERF stack emissions, grid based on worst case meteorological year (2010)
Contains Ordnance Survey data © Crown copyright and database right 2013
WHELDON ACT AND AD FACILITY
ENVIRONMENTAL STATEMENT VOLUME 1: MAIN TEXT
R57016Y001/D
Pell Frischmann Page | 72
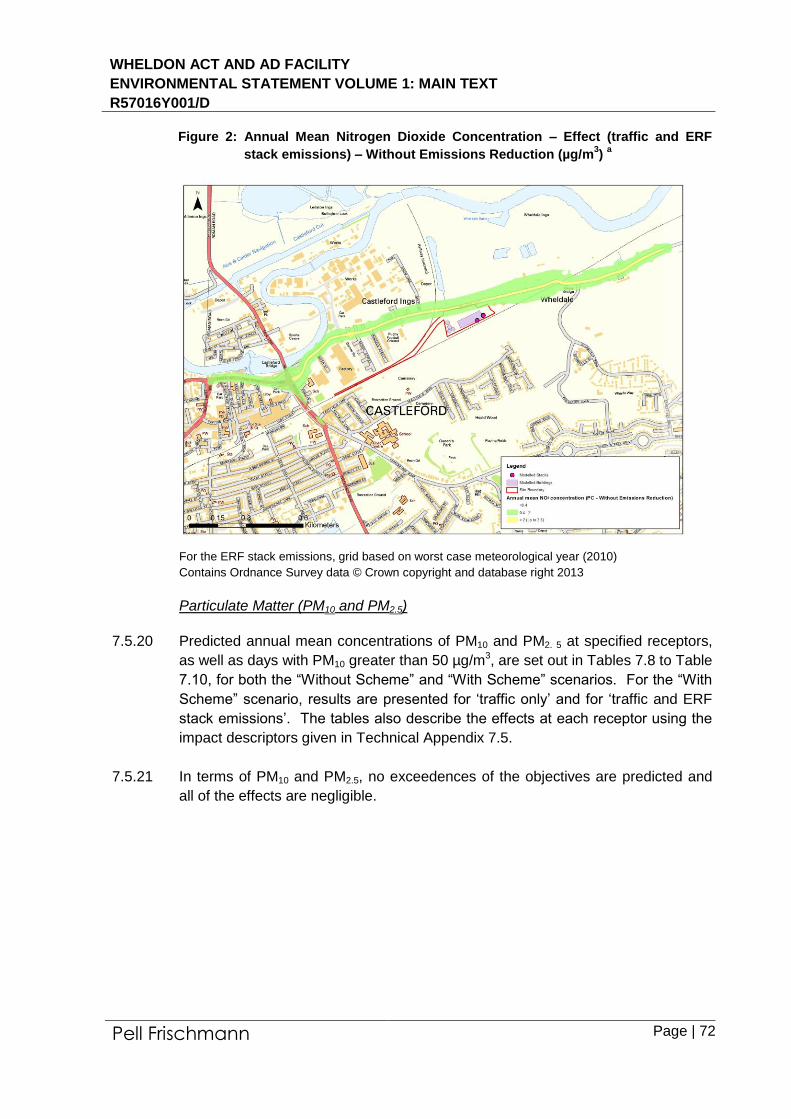
Figure 2: Annual Mean Nitrogen Dioxide Concentration – Effect (traffic and ERF
stack emissions) – Without Emissions Reduction (µg/m3)
a
For the ERF stack emissions, grid based on worst case meteorological year (2010)
Contains Ordnance Survey data © Crown copyright and database right 2013
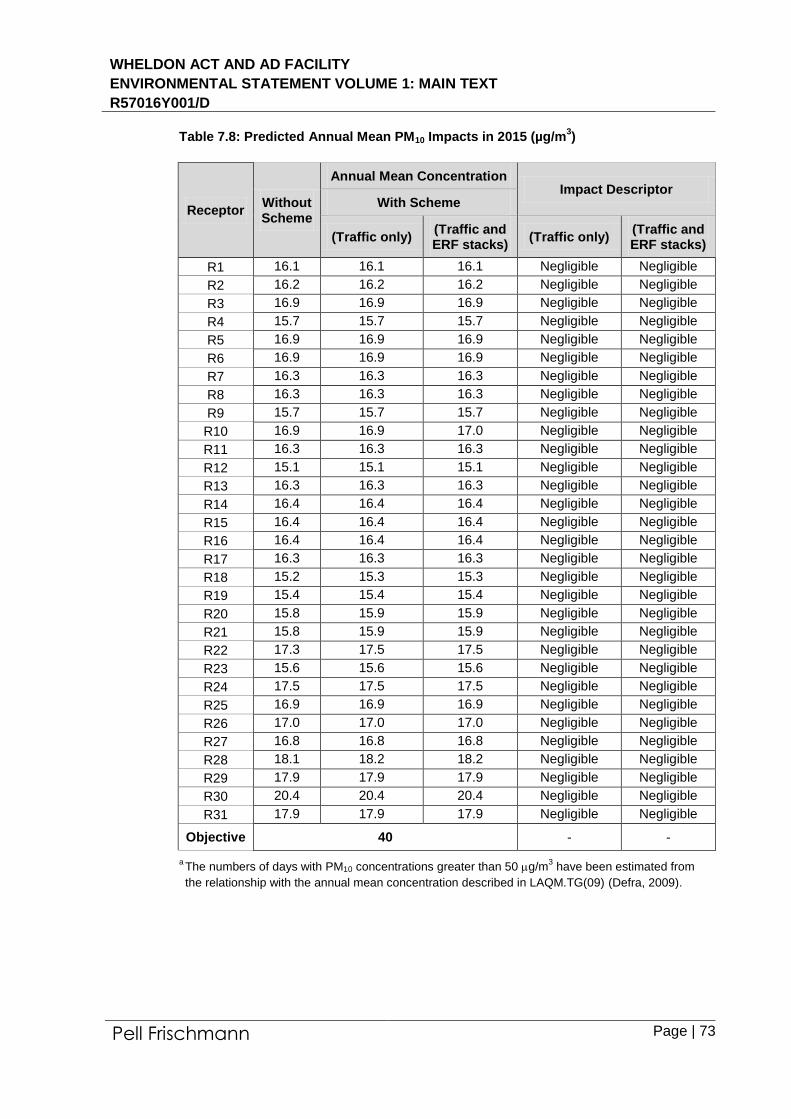
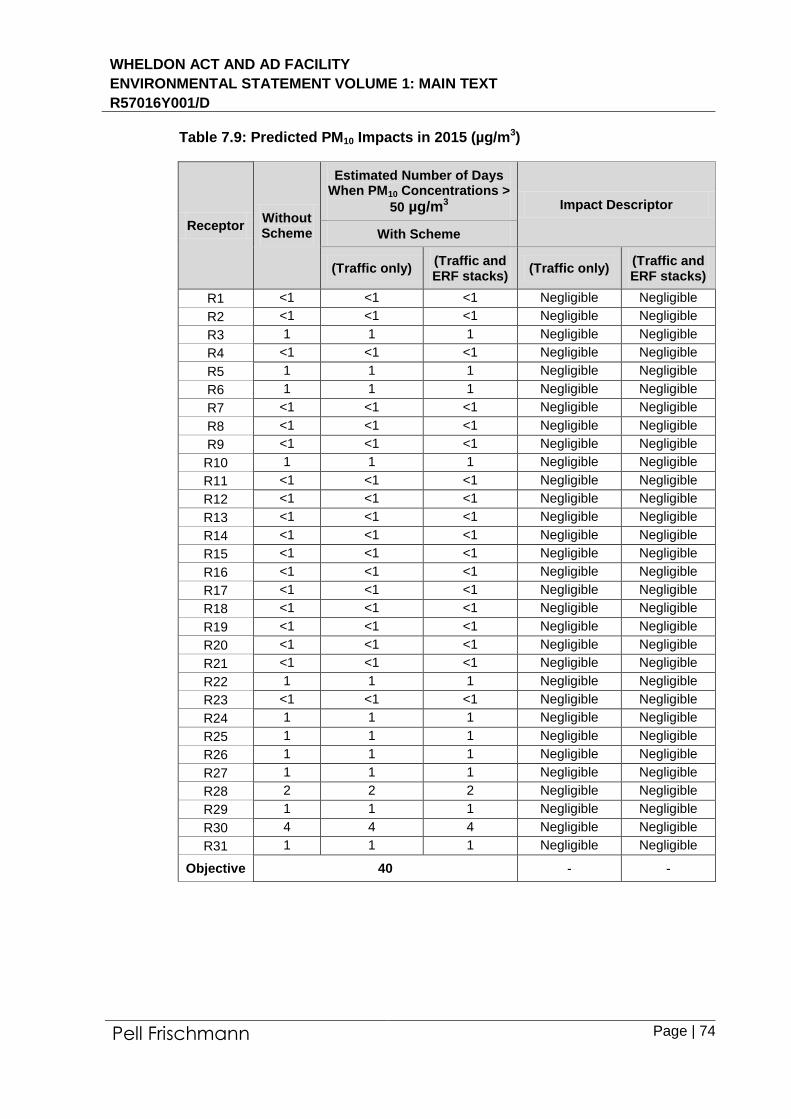
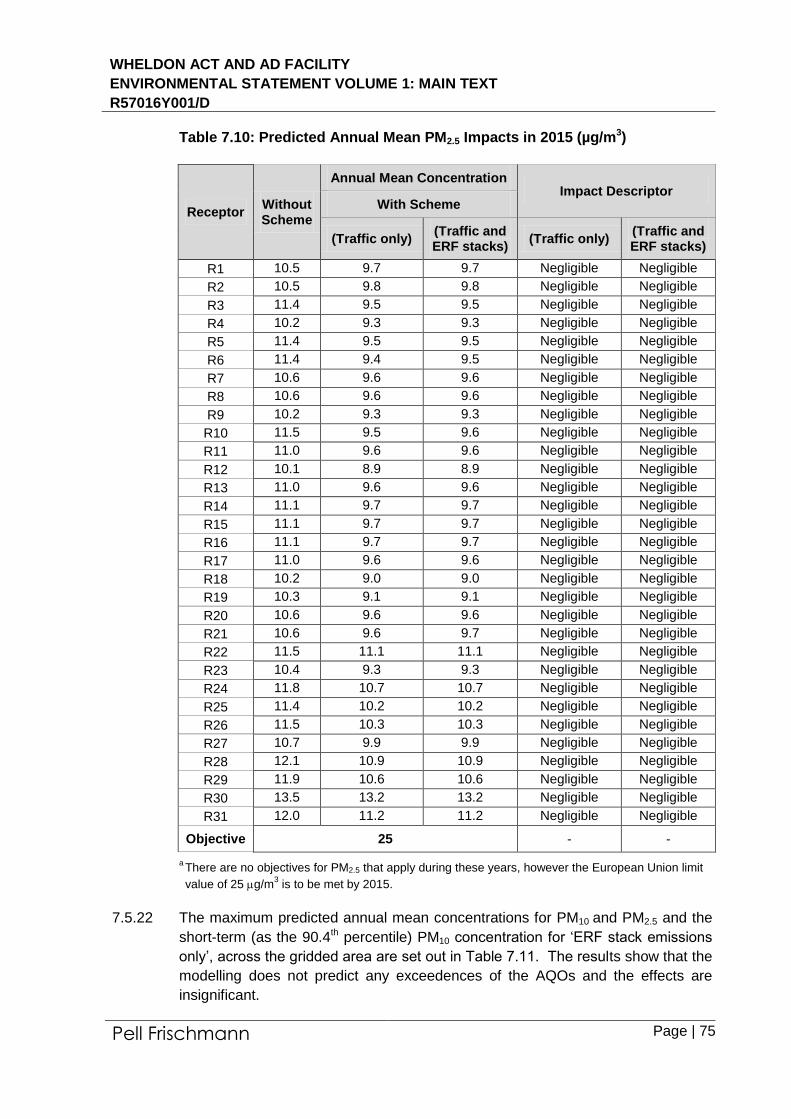
Particulate Matter (PM10 and PM2.5)
7.5.20 Predicted annual mean concentrations of PM10 and PM2. 5 at specified receptors,
as well as days with PM10 greater than 50 µg/m3, are set out in Tables 7.8 to Table
7.10, for both the “Without Scheme” and “With Scheme” scenarios. For the “With
Scheme” scenario, results are presented for ‘traffic only’ and for ‘traffic and ERF
stack emissions’. The tables also describe the effects at each receptor using the
impact descriptors given in Technical Appendix 7.5.
7.5.21 In terms of PM10 and PM2.5, no exceedences of the objectives are predicted and
all of the effects are negligible.
WHELDON ACT AND AD FACILITY
ENVIRONMENTAL STATEMENT VOLUME 1: MAIN TEXT
R57016Y001/D
Pell Frischmann Page | 73
Table 7.8: Predicted Annual Mean PM10 Impacts in 2015 (µg/m3)
Receptor Without Scheme
Annual Mean Concentration Impact Descriptor
With Scheme
(Traffic only) (Traffic and ERF stacks)
(Traffic only) (Traffic and ERF stacks)
R1 16.1 16.1 16.1 Negligible Negligible
R2 16.2 16.2 16.2 Negligible Negligible
R3 16.9 16.9 16.9 Negligible Negligible
R4 15.7 15.7 15.7 Negligible Negligible
R5 16.9 16.9 16.9 Negligible Negligible
R6 16.9 16.9 16.9 Negligible Negligible
R7 16.3 16.3 16.3 Negligible Negligible
R8 16.3 16.3 16.3 Negligible Negligible
R9 15.7 15.7 15.7 Negligible Negligible
R10 16.9 16.9 17.0 Negligible Negligible
R11 16.3 16.3 16.3 Negligible Negligible
R12 15.1 15.1 15.1 Negligible Negligible
R13 16.3 16.3 16.3 Negligible Negligible
R14 16.4 16.4 16.4 Negligible Negligible
R15 16.4 16.4 16.4 Negligible Negligible
R16 16.4 16.4 16.4 Negligible Negligible
R17 16.3 16.3 16.3 Negligible Negligible
R18 15.2 15.3 15.3 Negligible Negligible
R19 15.4 15.4 15.4 Negligible Negligible
R20 15.8 15.9 15.9 Negligible Negligible
R21 15.8 15.9 15.9 Negligible Negligible
R22 17.3 17.5 17.5 Negligible Negligible
R23 15.6 15.6 15.6 Negligible Negligible
R24 17.5 17.5 17.5 Negligible Negligible
R25 16.9 16.9 16.9 Negligible Negligible
R26 17.0 17.0 17.0 Negligible Negligible
R27 16.8 16.8 16.8 Negligible Negligible
R28 18.1 18.2 18.2 Negligible Negligible
R29 17.9 17.9 17.9 Negligible Negligible
R30 20.4 20.4 20.4 Negligible Negligible
R31 17.9 17.9 17.9 Negligible Negligible
Objective 40 - -
a The numbers of days with PM10 concentrations greater than 50 g/m
3 have been estimated from
the relationship with the annual mean concentration described in LAQM.TG(09) (Defra, 2009).
WHELDON ACT AND AD FACILITY
ENVIRONMENTAL STATEMENT VOLUME 1: MAIN TEXT
R57016Y001/D
Pell Frischmann Page | 74
Table 7.9: Predicted PM10 Impacts in 2015 (µg/m3)
Receptor Without Scheme
Estimated Number of Days When PM10 Concentrations >
50 µg/m3 Impact Descriptor
With Scheme
(Traffic only) (Traffic and ERF stacks)
(Traffic only) (Traffic and ERF stacks)
R1 <1 <1 <1 Negligible Negligible
R2 <1 <1 <1 Negligible Negligible
R3 1 1 1 Negligible Negligible
R4 <1 <1 <1 Negligible Negligible
R5 1 1 1 Negligible Negligible
R6 1 1 1 Negligible Negligible
R7 <1 <1 <1 Negligible Negligible
R8 <1 <1 <1 Negligible Negligible
R9 <1 <1 <1 Negligible Negligible
R10 1 1 1 Negligible Negligible
R11 <1 <1 <1 Negligible Negligible
R12 <1 <1 <1 Negligible Negligible
R13 <1 <1 <1 Negligible Negligible
R14 <1 <1 <1 Negligible Negligible
R15 <1 <1 <1 Negligible Negligible
R16 <1 <1 <1 Negligible Negligible
R17 <1 <1 <1 Negligible Negligible
R18 <1 <1 <1 Negligible Negligible
R19 <1 <1 <1 Negligible Negligible
R20 <1 <1 <1 Negligible Negligible
R21 <1 <1 <1 Negligible Negligible
R22 1 1 1 Negligible Negligible
R23 <1 <1 <1 Negligible Negligible
R24 1 1 1 Negligible Negligible
R25 1 1 1 Negligible Negligible
R26 1 1 1 Negligible Negligible
R27 1 1 1 Negligible Negligible
R28 2 2 2 Negligible Negligible
R29 1 1 1 Negligible Negligible
R30 4 4 4 Negligible Negligible
R31 1 1 1 Negligible Negligible
Objective 40 - -
WHELDON ACT AND AD FACILITY
ENVIRONMENTAL STATEMENT VOLUME 1: MAIN TEXT
R57016Y001/D
Pell Frischmann Page | 75
Table 7.10: Predicted Annual Mean PM2.5 Impacts in 2015 (µg/m3)
Receptor Without Scheme
Annual Mean Concentration Impact Descriptor
With Scheme
(Traffic only) (Traffic and ERF stacks)
(Traffic only) (Traffic and ERF stacks)
R1 10.5 9.7 9.7 Negligible Negligible
R2 10.5 9.8 9.8 Negligible Negligible
R3 11.4 9.5 9.5 Negligible Negligible
R4 10.2 9.3 9.3 Negligible Negligible
R5 11.4 9.5 9.5 Negligible Negligible
R6 11.4 9.4 9.5 Negligible Negligible
R7 10.6 9.6 9.6 Negligible Negligible
R8 10.6 9.6 9.6 Negligible Negligible
R9 10.2 9.3 9.3 Negligible Negligible
R10 11.5 9.5 9.6 Negligible Negligible
R11 11.0 9.6 9.6 Negligible Negligible
R12 10.1 8.9 8.9 Negligible Negligible
R13 11.0 9.6 9.6 Negligible Negligible
R14 11.1 9.7 9.7 Negligible Negligible
R15 11.1 9.7 9.7 Negligible Negligible
R16 11.1 9.7 9.7 Negligible Negligible
R17 11.0 9.6 9.6 Negligible Negligible
R18 10.2 9.0 9.0 Negligible Negligible
R19 10.3 9.1 9.1 Negligible Negligible
R20 10.6 9.6 9.6 Negligible Negligible
R21 10.6 9.6 9.7 Negligible Negligible
R22 11.5 11.1 11.1 Negligible Negligible
R23 10.4 9.3 9.3 Negligible Negligible
R24 11.8 10.7 10.7 Negligible Negligible
R25 11.4 10.2 10.2 Negligible Negligible
R26 11.5 10.3 10.3 Negligible Negligible
R27 10.7 9.9 9.9 Negligible Negligible
R28 12.1 10.9 10.9 Negligible Negligible
R29 11.9 10.6 10.6 Negligible Negligible
R30 13.5 13.2 13.2 Negligible Negligible
R31 12.0 11.2 11.2 Negligible Negligible
Objective 25 - -
a There are no objectives for PM2.5 that apply during these years, however the European Union limit
value of 25 g/m3 is to be met by 2015.
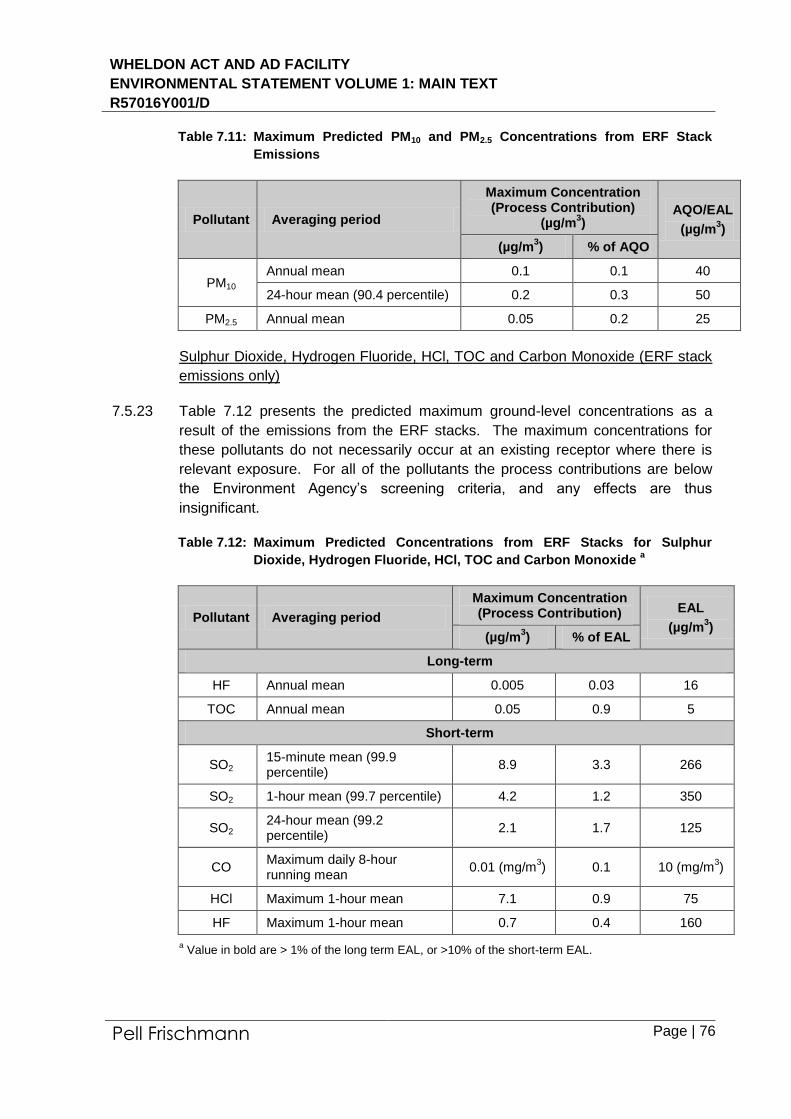
7.5.22 The maximum predicted annual mean concentrations for PM10 and PM2.5 and the
short-term (as the 90.4th percentile) PM10 concentration for ‘ERF stack emissions
only’, across the gridded area are set out in Table 7.11. The results show that the
modelling does not predict any exceedences of the AQOs and the effects are
insignificant.
WHELDON ACT AND AD FACILITY
ENVIRONMENTAL STATEMENT VOLUME 1: MAIN TEXT
R57016Y001/D
Pell Frischmann Page | 76
Table 7.11: Maximum Predicted PM10 and PM2.5 Concentrations from ERF Stack
Emissions
Pollutant Averaging period
Maximum Concentration (Process Contribution)
(µg/m3)
AQO/EAL
(µg/m3)
(µg/m3) % of AQO
PM10 Annual mean 0.1 0.1 40
24-hour mean (90.4 percentile) 0.2 0.3 50
PM2.5 Annual mean 0.05 0.2 25
Sulphur Dioxide, Hydrogen Fluoride, HCl, TOC and Carbon Monoxide (ERF stack
emissions only)
7.5.23 Table 7.12 presents the predicted maximum ground-level concentrations as a
result of the emissions from the ERF stacks. The maximum concentrations for
these pollutants do not necessarily occur at an existing receptor where there is
relevant exposure. For all of the pollutants the process contributions are below
the Environment Agency’s screening criteria, and any effects are thus
insignificant.
Table 7.12: Maximum Predicted Concentrations from ERF Stacks for Sulphur
Dioxide, Hydrogen Fluoride, HCl, TOC and Carbon Monoxide a
Pollutant Averaging period
Maximum Concentration (Process Contribution) EAL
(µg/m3)
(µg/m3) % of EAL
Long-term
HF Annual mean 0.005 0.03 16
TOC Annual mean 0.05 0.9 5
Short-term
SO2 15-minute mean (99.9 percentile)
8.9 3.3 266
SO2 1-hour mean (99.7 percentile) 4.2 1.2 350
SO2 24-hour mean (99.2 percentile)
2.1 1.7 125
CO Maximum daily 8-hour running mean
0.01 (mg/m3) 0.1 10 (mg/m
3)
HCl Maximum 1-hour mean 7.1 0.9 75
HF Maximum 1-hour mean 0.7 0.4 160
a Value in bold are > 1% of the long term EAL, or >10% of the short-term EAL.
WHELDON ACT AND AD FACILITY
ENVIRONMENTAL STATEMENT VOLUME 1: MAIN TEXT
R57016Y001/D
Pell Frischmann Page | 77
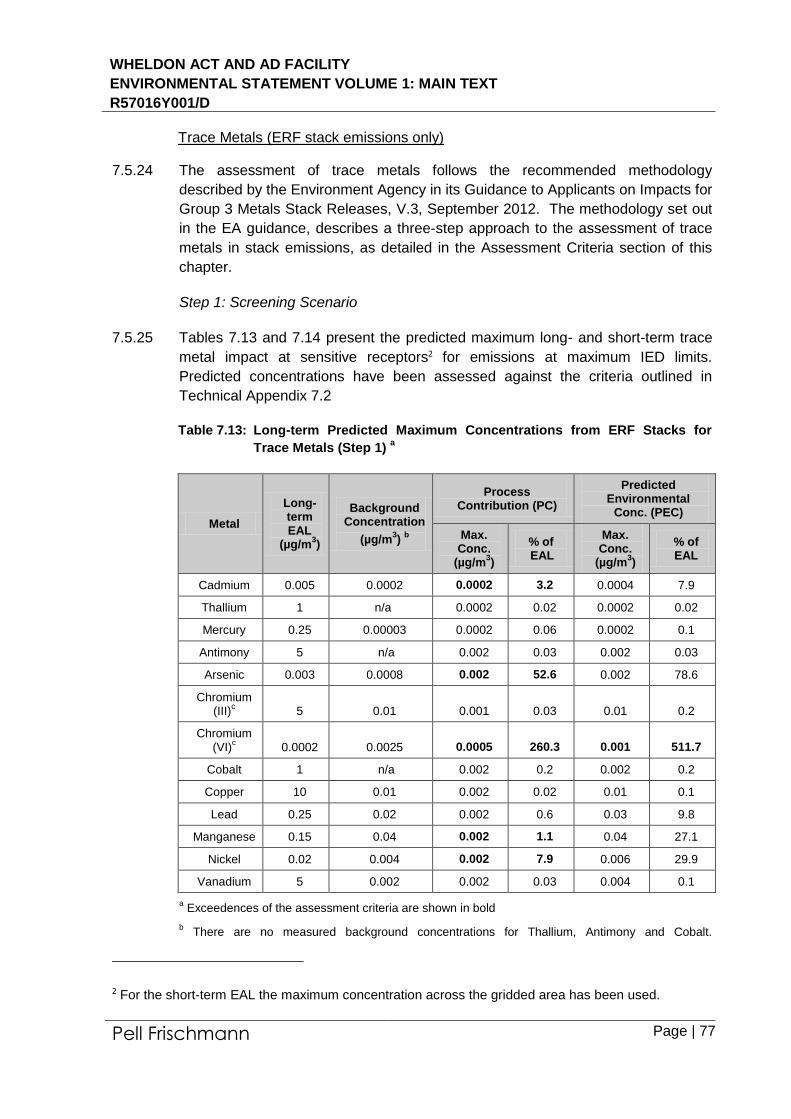
Trace Metals (ERF stack emissions only)
7.5.24 The assessment of trace metals follows the recommended methodology
described by the Environment Agency in its Guidance to Applicants on Impacts for
Group 3 Metals Stack Releases, V.3, September 2012. The methodology set out
in the EA guidance, describes a three-step approach to the assessment of trace
metals in stack emissions, as detailed in the Assessment Criteria section of this
chapter.
Step 1: Screening Scenario
7.5.25 Tables 7.13 and 7.14 present the predicted maximum long- and short-term trace
metal impact at sensitive receptors2 for emissions at maximum IED limits.
Predicted concentrations have been assessed against the criteria outlined in
Technical Appendix 7.2
Table 7.13: Long-term Predicted Maximum Concentrations from ERF Stacks for
Trace Metals (Step 1) a
Metal
Long-term EAL
(µg/m3)
Background Concentration
(µg/m3)
b
Process Contribution (PC)
Predicted Environmental
Conc. (PEC)
Max. Conc.
(µg/m3)
% of EAL
Max. Conc.
(µg/m3)
% of EAL
Cadmium 0.005 0.0002 0.0002 3.2 0.0004 7.9
Thallium 1 n/a 0.0002 0.02 0.0002 0.02
Mercury 0.25 0.00003 0.0002 0.06 0.0002 0.1
Antimony 5 n/a 0.002 0.03 0.002 0.03
Arsenic 0.003 0.0008 0.002 52.6 0.002 78.6
Chromium (III)
c 5 0.01 0.001 0.03 0.01 0.2
Chromium (VI)
c 0.0002 0.0025 0.0005 260.3 0.001 511.7
Cobalt 1 n/a 0.002 0.2 0.002 0.2
Copper 10 0.01 0.002 0.02 0.01 0.1
Lead 0.25 0.02 0.002 0.6 0.03 9.8
Manganese 0.15 0.04 0.002 1.1 0.04 27.1
Nickel 0.02 0.004 0.002 7.9 0.006 29.9
Vanadium 5 0.002 0.002 0.03 0.004 0.1
a Exceedences of the assessment criteria are shown in bold
b There are no measured background concentrations for Thallium, Antimony and Cobalt.
2 For the short-term EAL the maximum concentration across the gridded area has been used.
WHELDON ACT AND AD FACILITY
ENVIRONMENTAL STATEMENT VOLUME 1: MAIN TEXT
R57016Y001/D
Pell Frischmann Page | 78
Assessment has been made against the Process Contribution only
c The predicted and background concentrations are apportioned 80% Cr (III), 20% CR (VI) in
accordance with the EA’s Interim Guidance Note for Metals (Environment Agency, 2012)
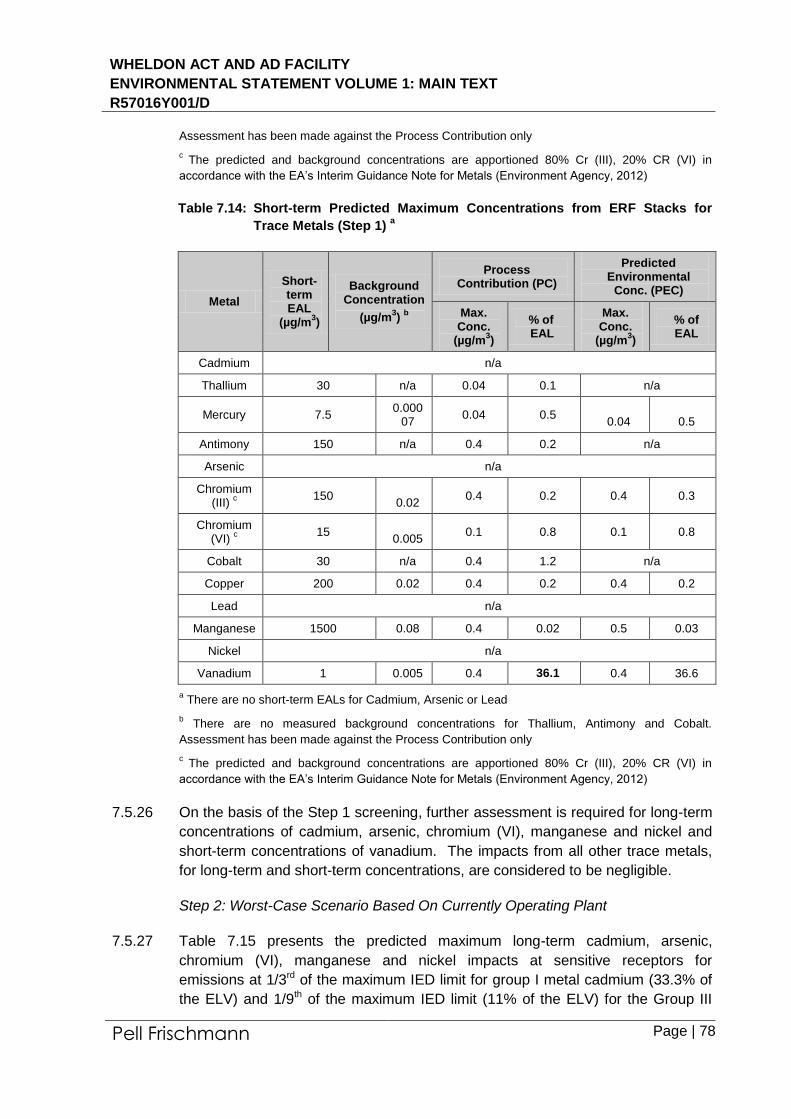
Table 7.14: Short-term Predicted Maximum Concentrations from ERF Stacks for
Trace Metals (Step 1) a
Metal
Short-term EAL
(µg/m3)
Background Concentration
(µg/m3)
b
Process Contribution (PC)
Predicted Environmental
Conc. (PEC)
Max. Conc.
(µg/m3)
% of EAL
Max. Conc.
(µg/m3)
% of EAL
Cadmium n/a
Thallium 30 n/a 0.04 0.1 n/a
Mercury 7.5 0.000
07 0.04 0.5
0.04 0.5
Antimony 150 n/a 0.4 0.2 n/a
Arsenic n/a
Chromium (III)
c 150 0.02
0.4 0.2 0.4 0.3
Chromium (VI)
c 15 0.005
0.1 0.8 0.1 0.8
Cobalt 30 n/a 0.4 1.2 n/a
Copper 200 0.02 0.4 0.2 0.4 0.2
Lead n/a
Manganese 1500 0.08 0.4 0.02 0.5 0.03
Nickel n/a
Vanadium 1 0.005 0.4 36.1 0.4 36.6
a There are no short-term EALs for Cadmium, Arsenic or Lead
b There are no measured background concentrations for Thallium, Antimony and Cobalt.
Assessment has been made against the Process Contribution only
c The predicted and background concentrations are apportioned 80% Cr (III), 20% CR (VI) in
accordance with the EA’s Interim Guidance Note for Metals (Environment Agency, 2012)
7.5.26 On the basis of the Step 1 screening, further assessment is required for long-term
concentrations of cadmium, arsenic, chromium (VI), manganese and nickel and
short-term concentrations of vanadium. The impacts from all other trace metals,
for long-term and short-term concentrations, are considered to be negligible.
Step 2: Worst-Case Scenario Based On Currently Operating Plant
7.5.27 Table 7.15 presents the predicted maximum long-term cadmium, arsenic,
chromium (VI), manganese and nickel impacts at sensitive receptors for
emissions at 1/3rd of the maximum IED limit for group I metal cadmium (33.3% of
the ELV) and 1/9th of the maximum IED limit (11% of the ELV) for the Group III
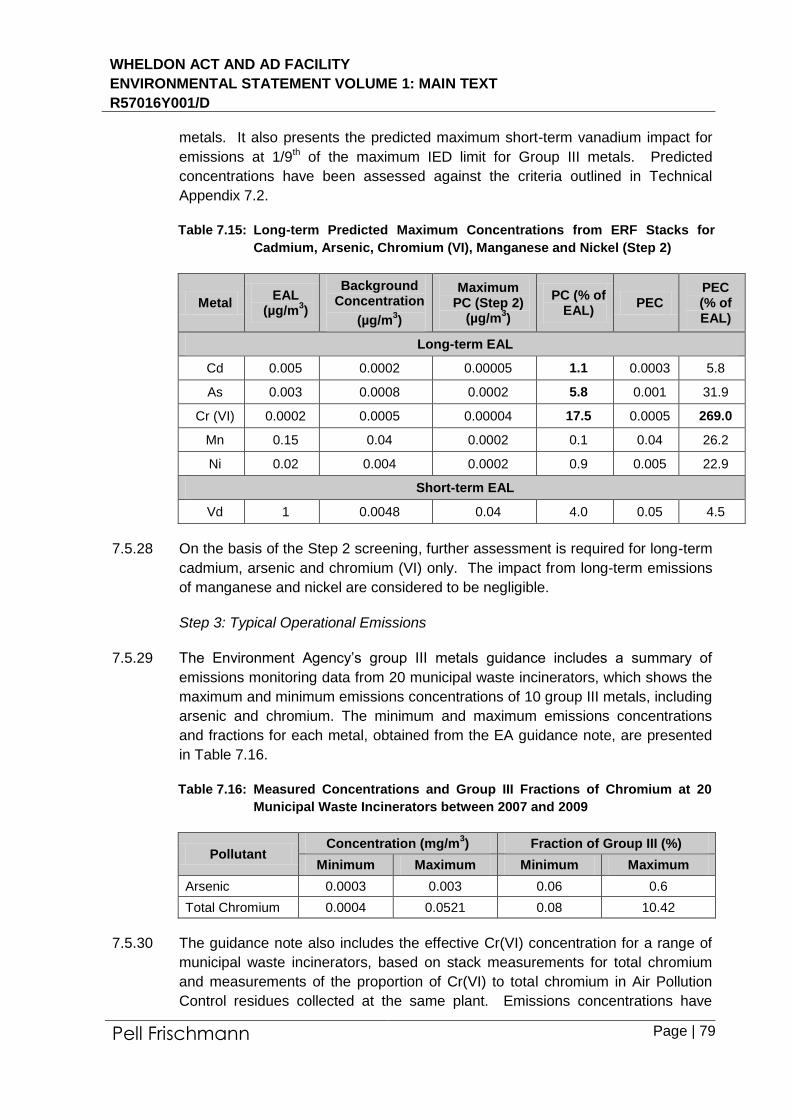
WHELDON ACT AND AD FACILITY
ENVIRONMENTAL STATEMENT VOLUME 1: MAIN TEXT
R57016Y001/D
Pell Frischmann Page | 79
metals. It also presents the predicted maximum short-term vanadium impact for
emissions at 1/9th of the maximum IED limit for Group III metals. Predicted
concentrations have been assessed against the criteria outlined in Technical
Appendix 7.2.
Table 7.15: Long-term Predicted Maximum Concentrations from ERF Stacks for
Cadmium, Arsenic, Chromium (VI), Manganese and Nickel (Step 2)
Metal EAL
(µg/m3)
Background Concentration
(µg/m3)
Maximum PC (Step 2)
(µg/m3)
PC (% of EAL)
PEC PEC (% of EAL)
Long-term EAL
Cd 0.005 0.0002 0.00005 1.1 0.0003 5.8
As 0.003 0.0008 0.0002 5.8 0.001 31.9
Cr (VI) 0.0002 0.0005 0.00004 17.5 0.0005 269.0
Mn 0.15 0.04 0.0002 0.1 0.04 26.2
Ni 0.02 0.004 0.0002 0.9 0.005 22.9
Short-term EAL
Vd 1 0.0048 0.04 4.0 0.05 4.5
7.5.28 On the basis of the Step 2 screening, further assessment is required for long-term
cadmium, arsenic and chromium (VI) only. The impact from long-term emissions
of manganese and nickel are considered to be negligible.
Step 3: Typical Operational Emissions
7.5.29 The Environment Agency’s group III metals guidance includes a summary of
emissions monitoring data from 20 municipal waste incinerators, which shows the
maximum and minimum emissions concentrations of 10 group III metals, including
arsenic and chromium. The minimum and maximum emissions concentrations
and fractions for each metal, obtained from the EA guidance note, are presented
in Table 7.16.
Table 7.16: Measured Concentrations and Group III Fractions of Chromium at 20
Municipal Waste Incinerators between 2007 and 2009
Pollutant Concentration (mg/m
3) Fraction of Group III (%)
Minimum Maximum Minimum Maximum
Arsenic
0.0003 0.003 0.06 0.6
Total Chromium 0.0004 0.0521 0.08 10.42
7.5.30 The guidance note also includes the effective Cr(VI) concentration for a range of
municipal waste incinerators, based on stack measurements for total chromium
and measurements of the proportion of Cr(VI) to total chromium in Air Pollution
Control residues collected at the same plant. Emissions concentrations have
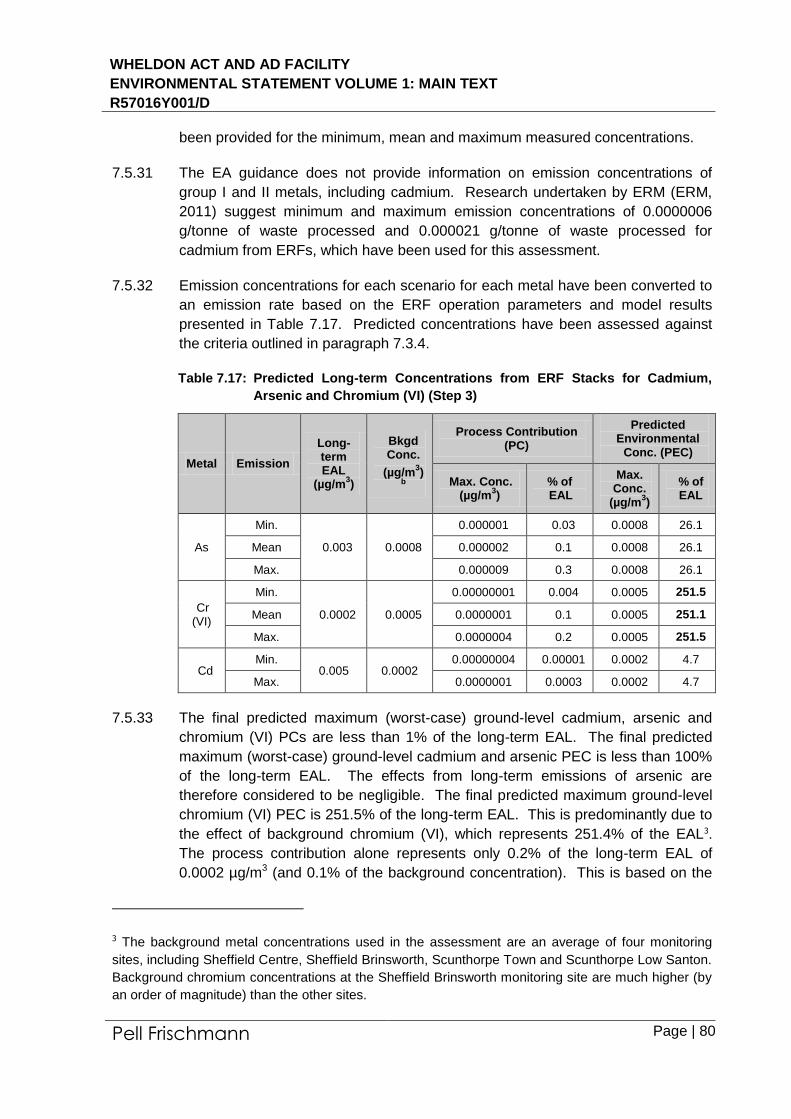
WHELDON ACT AND AD FACILITY
ENVIRONMENTAL STATEMENT VOLUME 1: MAIN TEXT
R57016Y001/D
Pell Frischmann Page | 80
been provided for the minimum, mean and maximum measured concentrations.
7.5.31 The EA guidance does not provide information on emission concentrations of
group I and II metals, including cadmium. Research undertaken by ERM (ERM,
2011) suggest minimum and maximum emission concentrations of 0.0000006
g/tonne of waste processed and 0.000021 g/tonne of waste processed for
cadmium from ERFs, which have been used for this assessment.
7.5.32 Emission concentrations for each scenario for each metal have been converted to
an emission rate based on the ERF operation parameters and model results
presented in Table 7.17. Predicted concentrations have been assessed against
the criteria outlined in paragraph 7.3.4.
Table 7.17: Predicted Long-term Concentrations from ERF Stacks for Cadmium,
Arsenic and Chromium (VI) (Step 3)
Metal Emission
Long-term EAL
(µg/m3)
Bkgd Conc.
(µg/m3)
b
Process Contribution (PC)
Predicted Environmental
Conc. (PEC)
Max. Conc. (µg/m
3)
% of EAL
Max. Conc.
(µg/m3)
% of EAL
As
Min.
0.003 0.0008
0.000001 0.03 0.0008 26.1
Mean 0.000002 0.1 0.0008 26.1
Max. 0.000009 0.3 0.0008 26.1
Cr (VI)
Min.
0.0002 0.0005
0.00000001 0.004 0.0005 251.5
Mean 0.0000001 0.1 0.0005 251.1
Max. 0.0000004 0.2 0.0005 251.5
Cd Min.
0.005 0.0002 0.00000004 0.00001 0.0002 4.7
Max. 0.0000001 0.0003 0.0002 4.7
7.5.33 The final predicted maximum (worst-case) ground-level cadmium, arsenic and
chromium (VI) PCs are less than 1% of the long-term EAL. The final predicted
maximum (worst-case) ground-level cadmium and arsenic PEC is less than 100%
of the long-term EAL. The effects from long-term emissions of arsenic are
therefore considered to be negligible. The final predicted maximum ground-level
chromium (VI) PEC is 251.5% of the long-term EAL. This is predominantly due to
the effect of background chromium (VI), which represents 251.4% of the EAL3.
The process contribution alone represents only 0.2% of the long-term EAL of
0.0002 µg/m3 (and 0.1% of the background concentration). This is based on the
3 The background metal concentrations used in the assessment are an average of four monitoring
sites, including Sheffield Centre, Sheffield Brinsworth, Scunthorpe Town and Scunthorpe Low Santon.
Background chromium concentrations at the Sheffield Brinsworth monitoring site are much higher (by
an order of magnitude) than the other sites.
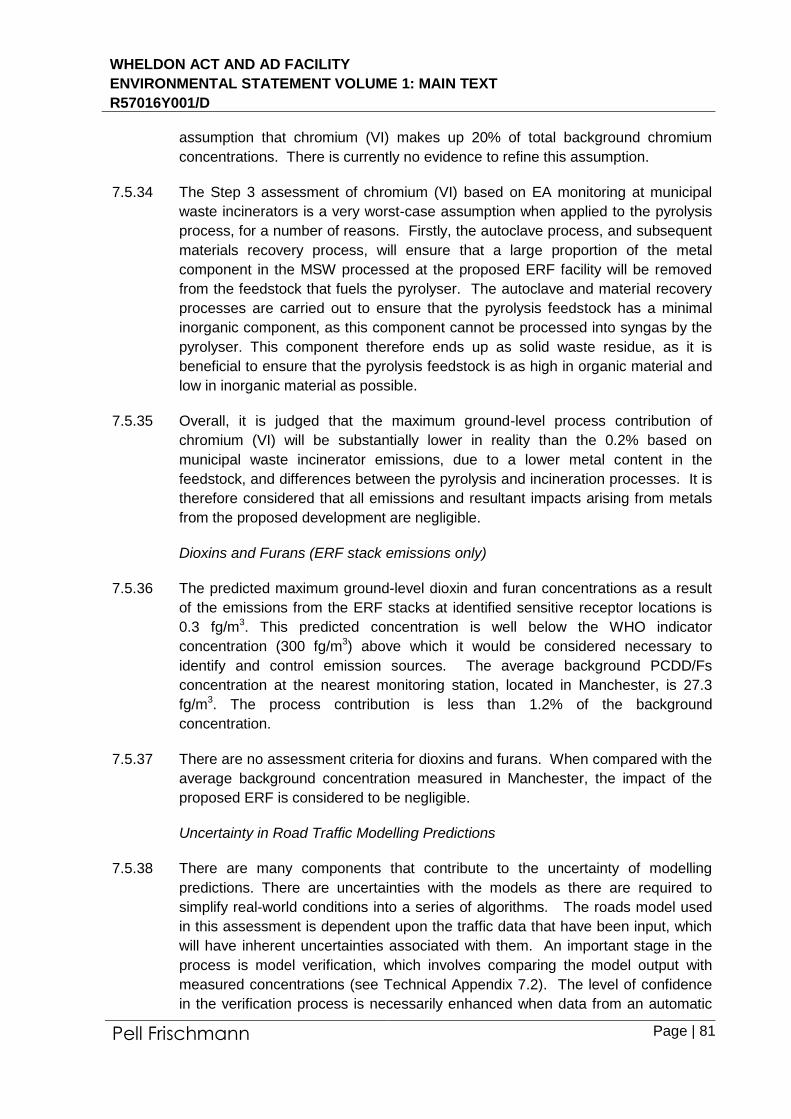
WHELDON ACT AND AD FACILITY
ENVIRONMENTAL STATEMENT VOLUME 1: MAIN TEXT
R57016Y001/D
Pell Frischmann Page | 81
assumption that chromium (VI) makes up 20% of total background chromium
concentrations. There is currently no evidence to refine this assumption.
7.5.34 The Step 3 assessment of chromium (VI) based on EA monitoring at municipal
waste incinerators is a very worst-case assumption when applied to the pyrolysis
process, for a number of reasons. Firstly, the autoclave process, and subsequent
materials recovery process, will ensure that a large proportion of the metal
component in the MSW processed at the proposed ERF facility will be removed
from the feedstock that fuels the pyrolyser. The autoclave and material recovery
processes are carried out to ensure that the pyrolysis feedstock has a minimal
inorganic component, as this component cannot be processed into syngas by the
pyrolyser. This component therefore ends up as solid waste residue, as it is
beneficial to ensure that the pyrolysis feedstock is as high in organic material and
low in inorganic material as possible.
7.5.35 Overall, it is judged that the maximum ground-level process contribution of
chromium (VI) will be substantially lower in reality than the 0.2% based on
municipal waste incinerator emissions, due to a lower metal content in the
feedstock, and differences between the pyrolysis and incineration processes. It is
therefore considered that all emissions and resultant impacts arising from metals
from the proposed development are negligible.
Dioxins and Furans (ERF stack emissions only)
7.5.36 The predicted maximum ground-level dioxin and furan concentrations as a result
of the emissions from the ERF stacks at identified sensitive receptor locations is
0.3 fg/m3. This predicted concentration is well below the WHO indicator
concentration (300 fg/m3) above which it would be considered necessary to
identify and control emission sources. The average background PCDD/Fs
concentration at the nearest monitoring station, located in Manchester, is 27.3
fg/m3. The process contribution is less than 1.2% of the background
concentration.
7.5.37 There are no assessment criteria for dioxins and furans. When compared with the
average background concentration measured in Manchester, the impact of the
proposed ERF is considered to be negligible.
Uncertainty in Road Traffic Modelling Predictions
7.5.38 There are many components that contribute to the uncertainty of modelling
predictions. There are uncertainties with the models as there are required to
simplify real-world conditions into a series of algorithms. The roads model used
in this assessment is dependent upon the traffic data that have been input, which
will have inherent uncertainties associated with them. An important stage in the
process is model verification, which involves comparing the model output with
measured concentrations (see Technical Appendix 7.2). The level of confidence
in the verification process is necessarily enhanced when data from an automatic
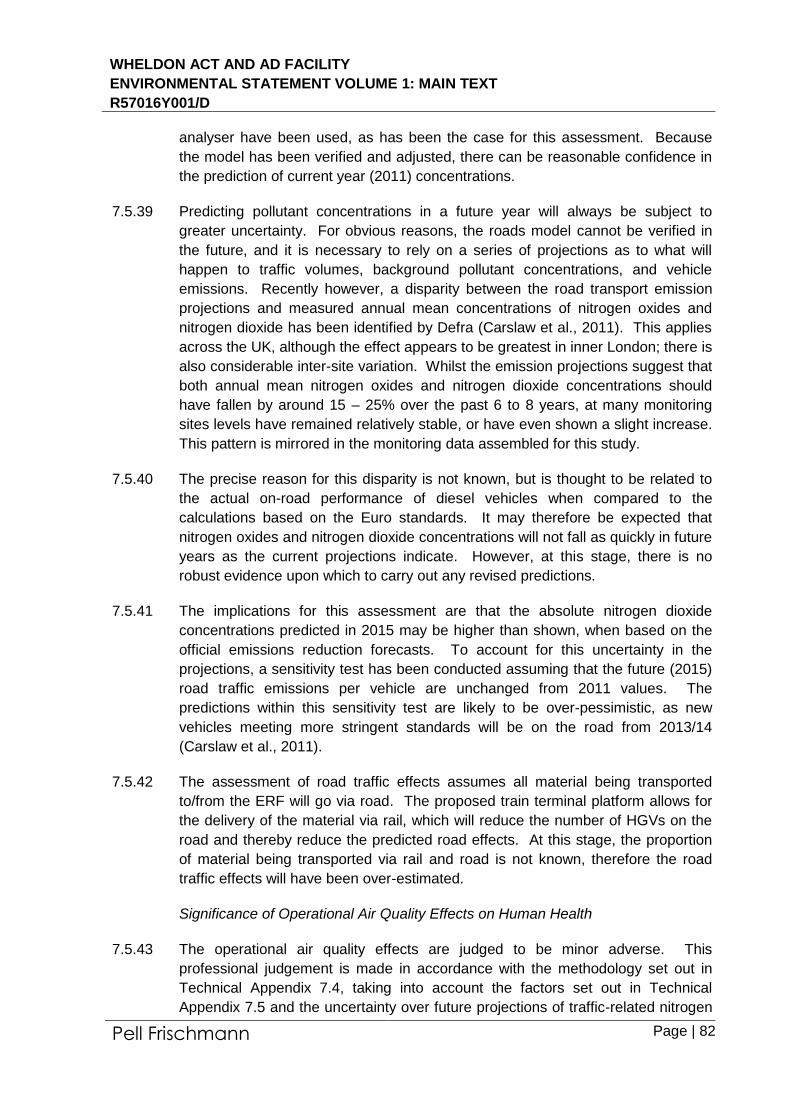
WHELDON ACT AND AD FACILITY
ENVIRONMENTAL STATEMENT VOLUME 1: MAIN TEXT
R57016Y001/D
Pell Frischmann Page | 82
analyser have been used, as has been the case for this assessment. Because
the model has been verified and adjusted, there can be reasonable confidence in
the prediction of current year (2011) concentrations.
7.5.39 Predicting pollutant concentrations in a future year will always be subject to
greater uncertainty. For obvious reasons, the roads model cannot be verified in
the future, and it is necessary to rely on a series of projections as to what will
happen to traffic volumes, background pollutant concentrations, and vehicle
emissions. Recently however, a disparity between the road transport emission
projections and measured annual mean concentrations of nitrogen oxides and
nitrogen dioxide has been identified by Defra (Carslaw et al., 2011). This applies
across the UK, although the effect appears to be greatest in inner London; there is
also considerable inter-site variation. Whilst the emission projections suggest that
both annual mean nitrogen oxides and nitrogen dioxide concentrations should
have fallen by around 15 – 25% over the past 6 to 8 years, at many monitoring
sites levels have remained relatively stable, or have even shown a slight increase.
This pattern is mirrored in the monitoring data assembled for this study.
7.5.40 The precise reason for this disparity is not known, but is thought to be related to
the actual on-road performance of diesel vehicles when compared to the
calculations based on the Euro standards. It may therefore be expected that
nitrogen oxides and nitrogen dioxide concentrations will not fall as quickly in future
years as the current projections indicate. However, at this stage, there is no
robust evidence upon which to carry out any revised predictions.
7.5.41 The implications for this assessment are that the absolute nitrogen dioxide
concentrations predicted in 2015 may be higher than shown, when based on the
official emissions reduction forecasts. To account for this uncertainty in the
projections, a sensitivity test has been conducted assuming that the future (2015)
road traffic emissions per vehicle are unchanged from 2011 values. The
predictions within this sensitivity test are likely to be over-pessimistic, as new
vehicles meeting more stringent standards will be on the road from 2013/14
(Carslaw et al., 2011).
7.5.42 The assessment of road traffic effects assumes all material being transported
to/from the ERF will go via road. The proposed train terminal platform allows for
the delivery of the material via rail, which will reduce the number of HGVs on the
road and thereby reduce the predicted road effects. At this stage, the proportion
of material being transported via rail and road is not known, therefore the road
traffic effects will have been over-estimated.
Significance of Operational Air Quality Effects on Human Health
7.5.43 The operational air quality effects are judged to be minor adverse. This
professional judgement is made in accordance with the methodology set out in
Technical Appendix 7.4, taking into account the factors set out in Technical
Appendix 7.5 and the uncertainty over future projections of traffic-related nitrogen
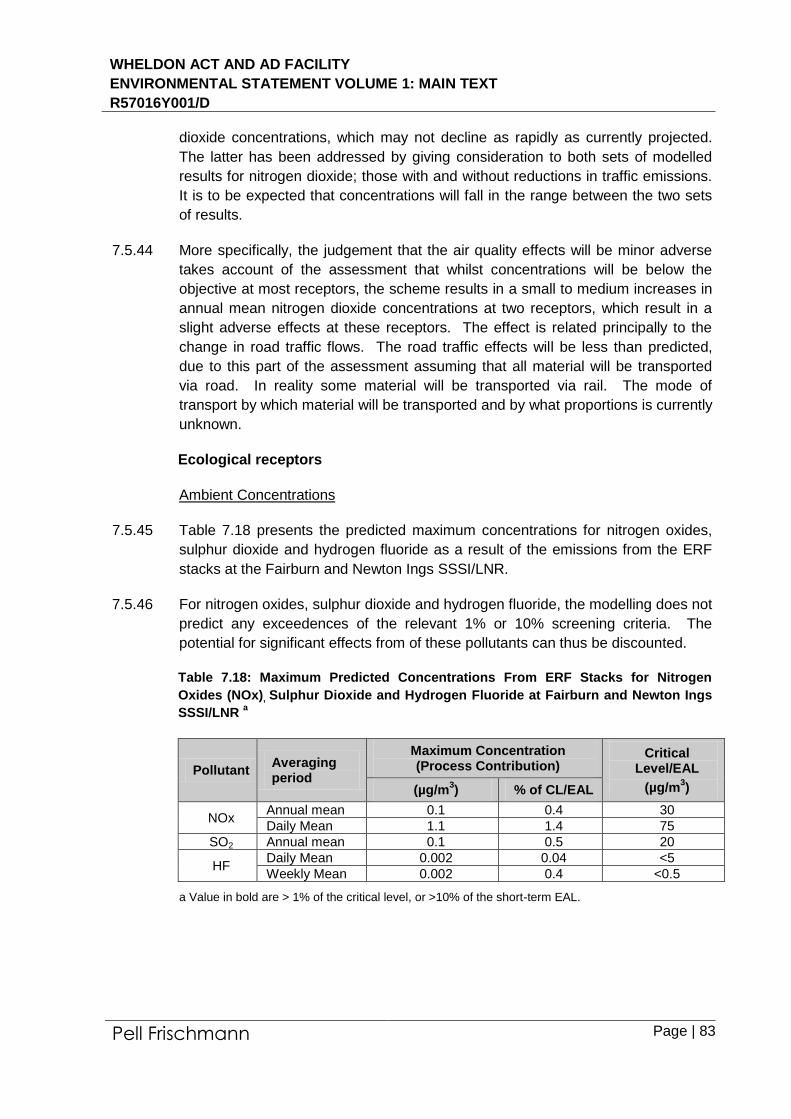
WHELDON ACT AND AD FACILITY
ENVIRONMENTAL STATEMENT VOLUME 1: MAIN TEXT
R57016Y001/D
Pell Frischmann Page | 83
dioxide concentrations, which may not decline as rapidly as currently projected.
The latter has been addressed by giving consideration to both sets of modelled
results for nitrogen dioxide; those with and without reductions in traffic emissions.
It is to be expected that concentrations will fall in the range between the two sets
of results.
7.5.44 More specifically, the judgement that the air quality effects will be minor adverse
takes account of the assessment that whilst concentrations will be below the
objective at most receptors, the scheme results in a small to medium increases in
annual mean nitrogen dioxide concentrations at two receptors, which result in a
slight adverse effects at these receptors. The effect is related principally to the
change in road traffic flows. The road traffic effects will be less than predicted,
due to this part of the assessment assuming that all material will be transported
via road. In reality some material will be transported via rail. The mode of
transport by which material will be transported and by what proportions is currently
unknown.
Ecological receptors
Ambient Concentrations
7.5.45 Table 7.18 presents the predicted maximum concentrations for nitrogen oxides,
sulphur dioxide and hydrogen fluoride as a result of the emissions from the ERF
stacks at the Fairburn and Newton Ings SSSI/LNR.
7.5.46 For nitrogen oxides, sulphur dioxide and hydrogen fluoride, the modelling does not
predict any exceedences of the relevant 1% or 10% screening criteria. The
potential for significant effects from of these pollutants can thus be discounted.
Table 7.18: Maximum Predicted Concentrations From ERF Stacks for Nitrogen
Oxides (NOx), Sulphur Dioxide and Hydrogen Fluoride at Fairburn and Newton Ings
SSSI/LNR a
Pollutant Averaging period
Maximum Concentration (Process Contribution)
Critical Level/EAL
(µg/m3) (µg/m
3) % of CL/EAL
NOx Annual mean 0.1 0.4 30
Daily Mean 1.1 1.4 75
SO2 Annual mean 0.1 0.5 20
HF Daily Mean 0.002 0.04 <5
Weekly Mean 0.002 0.4 <0.5
a Value in bold are > 1% of the critical level, or >10% of the short-term EAL.
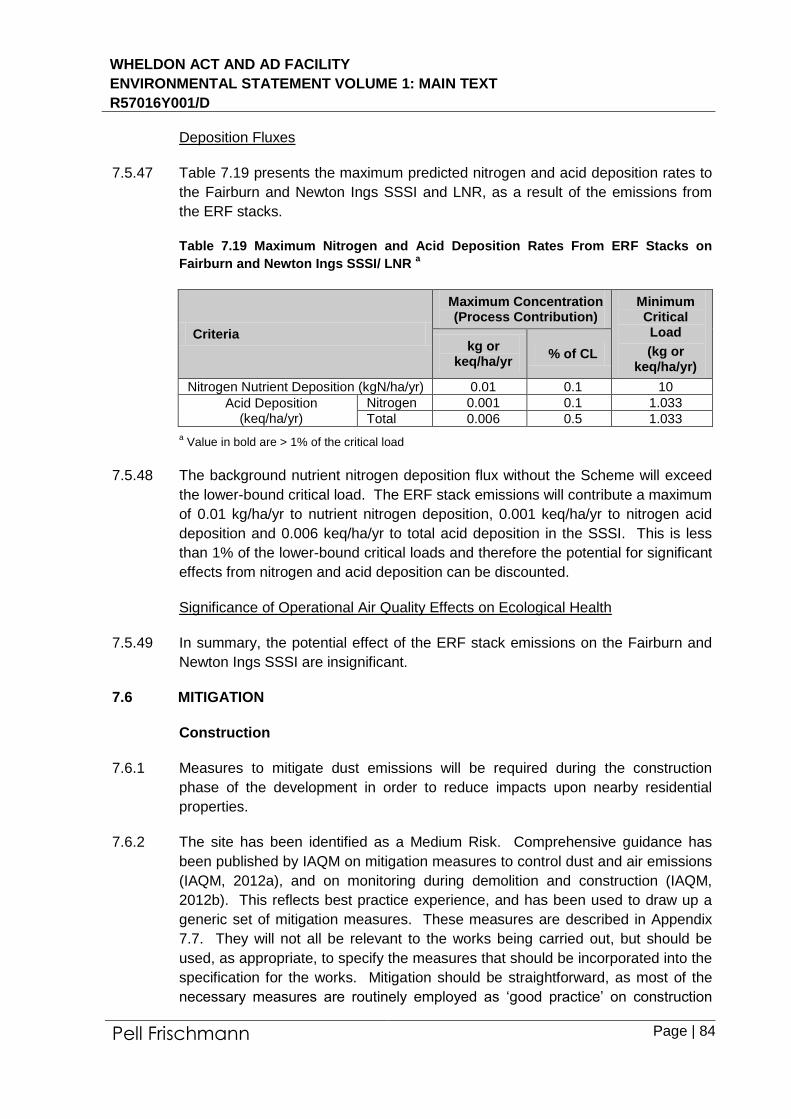
WHELDON ACT AND AD FACILITY
ENVIRONMENTAL STATEMENT VOLUME 1: MAIN TEXT
R57016Y001/D
Pell Frischmann Page | 84
Deposition Fluxes
7.5.47 Table 7.19 presents the maximum predicted nitrogen and acid deposition rates to
the Fairburn and Newton Ings SSSI and LNR, as a result of the emissions from
the ERF stacks.
Table 7.19 Maximum Nitrogen and Acid Deposition Rates From ERF Stacks on
Fairburn and Newton Ings SSSI/ LNR a
Criteria
Maximum Concentration (Process Contribution)
Minimum Critical Load
(kg or keq/ha/yr)
kg or keq/ha/yr
% of CL
Nitrogen Nutrient Deposition (kgN/ha/yr) 0.01 0.1 10
Acid Deposition (keq/ha/yr)
Nitrogen 0.001 0.1 1.033
Total 0.006 0.5 1.033
a Value in bold are > 1% of the critical load
7.5.48 The background nutrient nitrogen deposition flux without the Scheme will exceed
the lower-bound critical load. The ERF stack emissions will contribute a maximum
of 0.01 kg/ha/yr to nutrient nitrogen deposition, 0.001 keq/ha/yr to nitrogen acid
deposition and 0.006 keq/ha/yr to total acid deposition in the SSSI. This is less
than 1% of the lower-bound critical loads and therefore the potential for significant
effects from nitrogen and acid deposition can be discounted.
Significance of Operational Air Quality Effects on Ecological Health
7.5.49 In summary, the potential effect of the ERF stack emissions on the Fairburn and
Newton Ings SSSI are insignificant.
7.6 MITIGATION
Construction
7.6.1 Measures to mitigate dust emissions will be required during the construction
phase of the development in order to reduce impacts upon nearby residential
properties.
7.6.2 The site has been identified as a Medium Risk. Comprehensive guidance has
been published by IAQM on mitigation measures to control dust and air emissions
(IAQM, 2012a), and on monitoring during demolition and construction (IAQM,
2012b). This reflects best practice experience, and has been used to draw up a
generic set of mitigation measures. These measures are described in Appendix
7.7. They will not all be relevant to the works being carried out, but should be
used, as appropriate, to specify the measures that should be incorporated into the
specification for the works. Mitigation should be straightforward, as most of the
necessary measures are routinely employed as ‘good practice’ on construction
WHELDON ACT AND AD FACILITY
ENVIRONMENTAL STATEMENT VOLUME 1: MAIN TEXT
R57016Y001/D
Pell Frischmann Page | 85
sites.
7.6.3 The mitigation measures should to be written into a dust management plan
(DMP). For major sites The DMP may be integrated into a Code of Construction
Practice or the Construction Environmental Management Plan, and may require
monitoring.
7.6.4 Where mitigation measures rely on water, it is expected that only sufficient water
will be applied to damp down the material. There should not be any excess to
potentially contaminate local watercourses.
Operation
Road Traffic
7.6.5 Whilst the assessment has demonstrated that the scheme would not cause any
exceedences of the nitrogen dioxide air quality objective in areas where they are
not currently exceeded, it has shown that the effect of the proposed development
would be slight adverse at a small number of receptors within the AQMA declared
within Castleford town centre. This slight adverse impacts is anticipated with or
without the proposed ERF scheme, given the approved network rail depot and the
anticipated growth within the local area, as detailed within the Castleford Growth
Delivery Plan, which show the site to be allocated for employment led
development.
7.6.6 Mitigation measures to reduce pollutant emissions from road traffic are principally
being delivered in the longer term by the introduction of more stringent emissions
standards, largely via European legislation. There will also be a contribution
through the Air Quality Action Plan developed by WDC.
7.6.7 Specific mitigation measures to improve emissions from the vehicles serving the
site are still being developed. These are likely to include the provision of electric-
car charging points on-site, the use of bio-gas produced at the ERF facility to
provide fuel for some of the development HGVs. The transport of material via rail
will reduce the effects from emissions from HGVs transporting material to the
ERF, however it is not possible to quantify this effect at this stage.
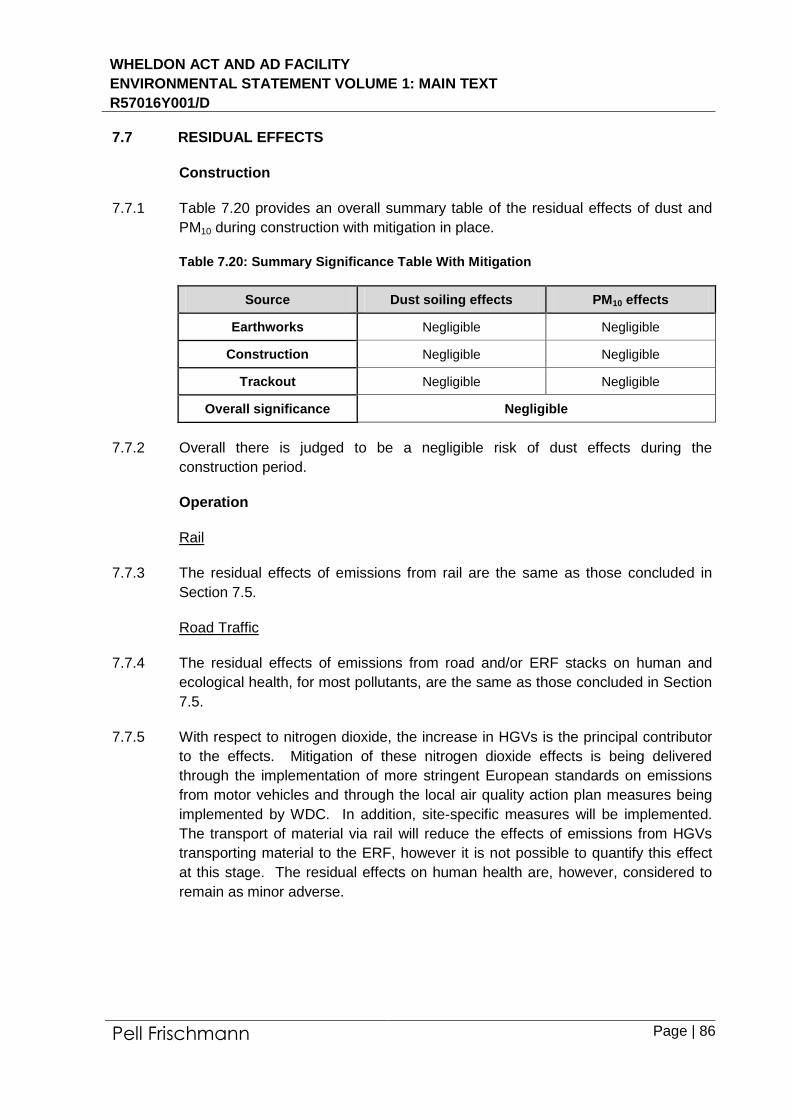
WHELDON ACT AND AD FACILITY
ENVIRONMENTAL STATEMENT VOLUME 1: MAIN TEXT
R57016Y001/D
Pell Frischmann Page | 86
7.7 RESIDUAL EFFECTS
Construction
7.7.1 Table 7.20 provides an overall summary table of the residual effects of dust and
PM10 during construction with mitigation in place.
Table 7.20: Summary Significance Table With Mitigation
Source Dust soiling effects PM10 effects
Earthworks Negligible Negligible
Construction Negligible Negligible
Trackout Negligible Negligible
Overall significance Negligible
7.7.2 Overall there is judged to be a negligible risk of dust effects during the
construction period.
Operation
Rail
7.7.3 The residual effects of emissions from rail are the same as those concluded in
Section 7.5.
Road Traffic
7.7.4 The residual effects of emissions from road and/or ERF stacks on human and
ecological health, for most pollutants, are the same as those concluded in Section
7.5.
7.7.5 With respect to nitrogen dioxide, the increase in HGVs is the principal contributor
to the effects. Mitigation of these nitrogen dioxide effects is being delivered
through the implementation of more stringent European standards on emissions
from motor vehicles and through the local air quality action plan measures being
implemented by WDC. In addition, site-specific measures will be implemented.
The transport of material via rail will reduce the effects of emissions from HGVs
transporting material to the ERF, however it is not possible to quantify this effect
at this stage. The residual effects on human health are, however, considered to
remain as minor adverse.
WHELDON ACT AND AD FACILITY
ENVIRONMENTAL STATEMENT VOLUME 1: MAIN TEXT
R57016Y001/D
Pell Frischmann Page | 87
7.8 SUMMARY
7.8.1 The air quality effects associated with the construction and operation of the
proposed ERF facility at Wheldon Road have been assessed. Existing conditions
within the study area show poor air quality, with concentrations of nitrogen dioxide
exceeding the annual mean objective within Castleford town centre, located less
than 1 km to the west of the Application Site. An AQMA has been declared for
this area.
7.8.2 The operational impacts of increased traffic emissions arising from the additional
traffic on local roads, due to the development, and emissions from the ERF stacks
have been assessed. Concentrations have been modelled for worst-case human
receptors, representing existing properties where impacts are expected to be
greatest, as well as for ecological receptors on the Fairburn and Newton Ings
SSSI. In the case of nitrogen dioxide, the modelling has been carried out
assuming both a) vehicle emissions decrease (using ‘official’ emission factors)
and b) do not decrease in future years. This is to allow for current uncertainty
over emission factors for nitrogen oxides that has been identified by Defra
(Carslaw et al., 2011). A qualitative assessment of the effects of emissions from
trains using the proposed train terminal platform has also been made.
7.8.3 It is concluded that concentrations of PM10 and PM2.5 remain below the objectives
at all existing receptors in 2015, whether the scheme is developed or not. This
conclusion is consistent with the outcomes of the review and assessments
prepared by WDC, which show that exceedences of the PM10 objective are
unlikely at any location. In the case of nitrogen dioxide, the annual mean
concentrations are above the objective at one modelled receptor (R30), which is
located within the Castleford AQMA, both with or without the scheme, assuming
that vehicle emissions do not reduce between 2011 and 2015.
7.8.4 The assessment has assumed the proposed scheme increases HGVs on the local
roads by 164 vehicles per day. This leads to an imperceptible increase in
concentrations of PM10 and PM2.5 at all modelled receptors, and the effects are all
insignificant. In the case of nitrogen dioxide, there are small increases at most of
the modelled receptors, with medium increases at eight receptors. Assuming that
vehicle emissions do not reduce between 2011 and 2015 the impacts are small at
most receptors, with medium increases at seven receptors, with a large increase
at one receptor. With and without a reduction in vehicle emissions over this
period, the impacts are slight adverse at between one and two receptors,
respectively. In practice, the effects will be less than this since the actual number
of HGVs will be less, as some material will be transported via rail.
7.8.5 In the case of sulphur dioxide, total organic carbon (as Benzene), HCl and
hydrogen fluoride concentrations, the effects of the ERF stack emissions are
below the screening criteria, and the effects are therefore judged to be
insignificant.
WHELDON ACT AND AD FACILITY
ENVIRONMENTAL STATEMENT VOLUME 1: MAIN TEXT
R57016Y001/D
Pell Frischmann Page | 88
7.8.6 For most trace metals, the effects of the ERF stack emissions are below the
screening criteria and considered to be insignificant. The annual mean
background concentration for chromium (VI) is already well above (251% of) the
Environment Agency’s Environmental Assessment Level, but the contribution from
the proposed ERF facility with typical emissions is negligible at sensitive receptors
and thus insignificant.
7.8.7 The predicted dioxin and furan concentrations arising from the ERF facility are
1.2% of the background concentration and this is considered to be negligible and
thus insignificant.
7.8.8 The operational air quality effects of the development on human health are judged
to be minor. This takes account of the assessment that whilst concentrations will
be below the objective at most receptors, the scheme results in a medium to large
increase in annual mean nitrogen dioxide concentrations at a number of receptors
and this results in a slight adverse effect at up to two receptors. The effect is
related principally to the change in road traffic flows, and not the ERF stack
emissions.
7.8.9 Mitigation of the nitrogen dioxide effects is being delivered through the
implementation of more stringent European standards on emissions from motor
vehicles and through the local air quality action plan measures being implemented
by WDC. In addition, site-specific measures will be implemented. The transport
of material via rail will reduce the effects from emissions from HGVs transporting
material to the ERF, however it is not possible to quantify this effect at this stage.
The residual effects on human health are, however, considered to remain as
minor adverse.
7.8.10 The effects of the ERF stack emissions of nitrogen oxides, sulphur dioxide and
hydrogen fluoride on the SSSI are below the screening criteria, and the impacts
are therefore insignificant. The effects of the proposed development on nutrient
nitrogen and acid deposition at the SSSI are also below the screening criterion
and therefore insignificant.
7.8.11 The construction works have the potential to create dust. During construction a
package of mitigation measures should be applied to minimise dust emission.
The overall impacts during construction are judged to be insignificant.
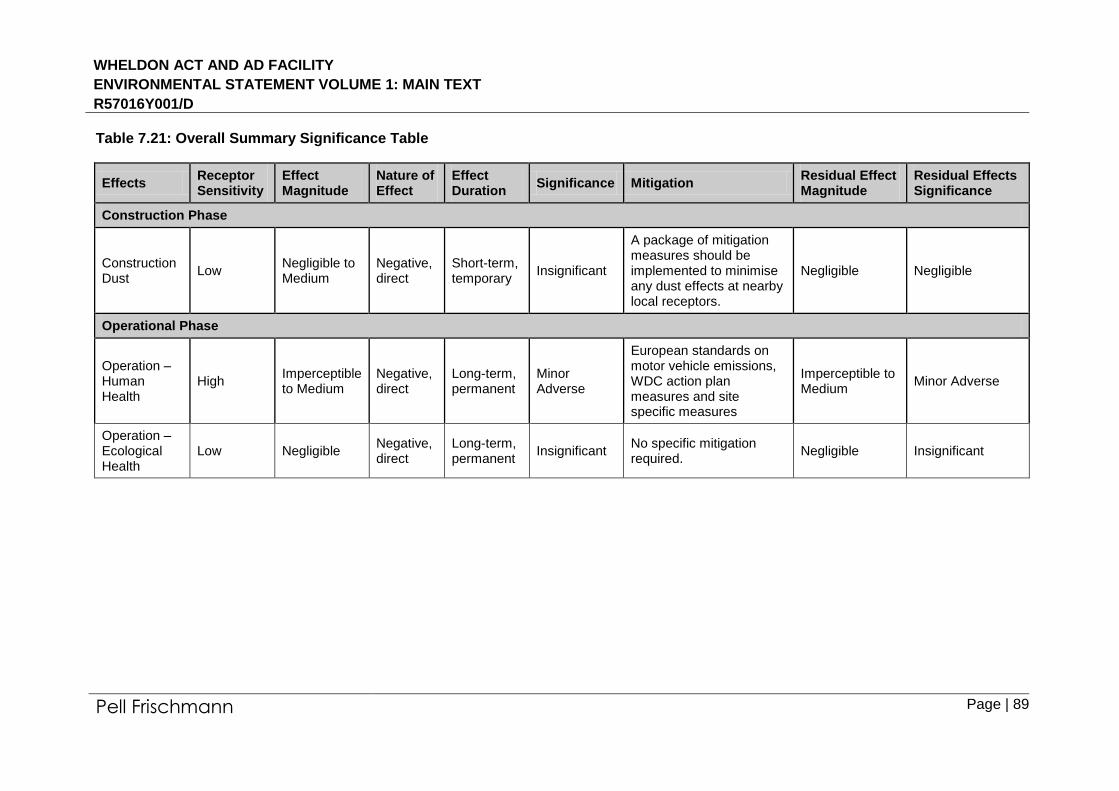
WHELDON ACT AND AD FACILITY
ENVIRONMENTAL STATEMENT VOLUME 1: MAIN TEXT
R57016Y001/D
Pell Frischmann Page | 89
Table 7.21: Overall Summary Significance Table
Effects Receptor Sensitivity
Effect Magnitude
Nature of Effect
Effect Duration
Significance Mitigation Residual Effect Magnitude
Residual Effects Significance
Construction Phase
Construction Dust
Low Negligible to Medium
Negative, direct
Short-term, temporary
Insignificant
A package of mitigation measures should be implemented to minimise any dust effects at nearby local receptors.
Negligible Negligible
Operational Phase
Operation – Human Health
High Imperceptible to Medium
Negative, direct
Long-term, permanent
Minor Adverse
European standards on motor vehicle emissions, WDC action plan measures and site specific measures
Imperceptible to Medium
Minor Adverse
Operation – Ecological Health
Low Negligible Negative, direct
Long-term, permanent
Insignificant No specific mitigation required.
Negligible Insignificant

WHELDON ACT AND AD FACILITY
ENVIRONMENTAL STATEMENT VOLUME 2: TECNICAL APPENDIX
R57016Y002/C
Pell Frischmann
APPENDIX 7.1
ASSESSMENT METHODOLOGY
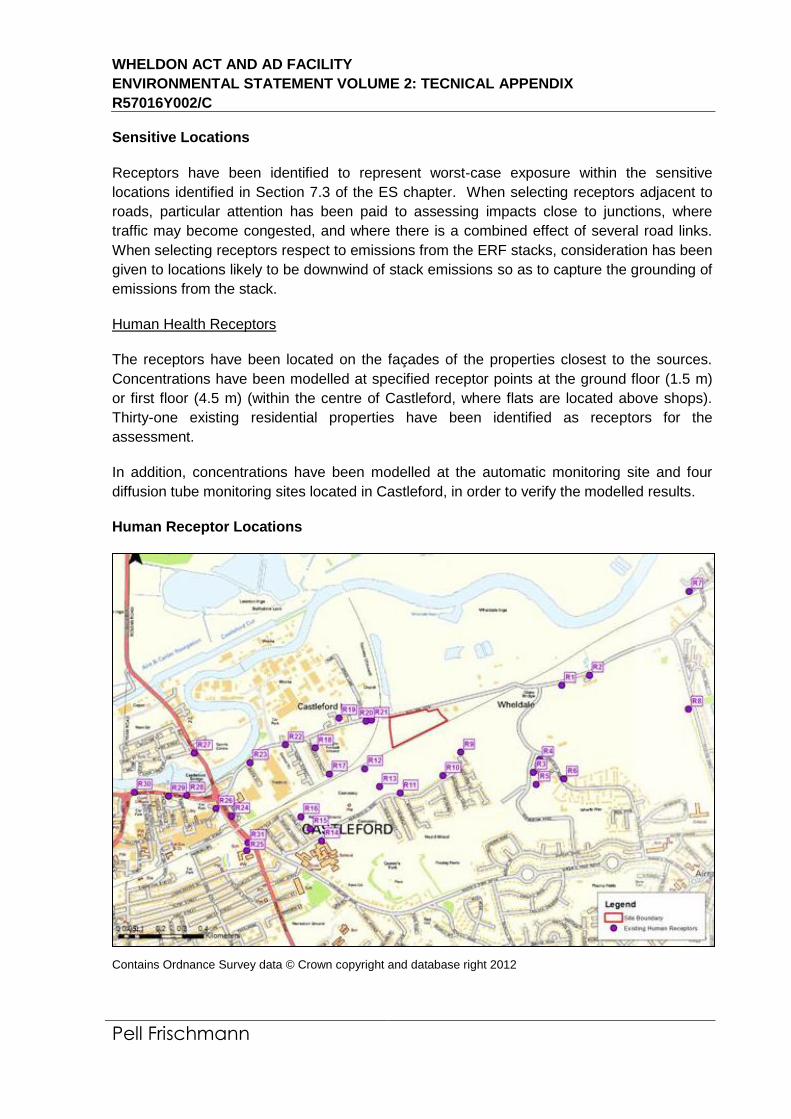
WHELDON ACT AND AD FACILITY
ENVIRONMENTAL STATEMENT VOLUME 2: TECNICAL APPENDIX
R57016Y002/C
Pell Frischmann
Sensitive Locations
Receptors have been identified to represent worst-case exposure within the sensitive
locations identified in Section 7.3 of the ES chapter. When selecting receptors adjacent to
roads, particular attention has been paid to assessing impacts close to junctions, where
traffic may become congested, and where there is a combined effect of several road links.
When selecting receptors respect to emissions from the ERF stacks, consideration has been
given to locations likely to be downwind of stack emissions so as to capture the grounding of
emissions from the stack.
Human Health Receptors
The receptors have been located on the façades of the properties closest to the sources.
Concentrations have been modelled at specified receptor points at the ground floor (1.5 m)
or first floor (4.5 m) (within the centre of Castleford, where flats are located above shops).
Thirty-one existing residential properties have been identified as receptors for the
assessment.
In addition, concentrations have been modelled at the automatic monitoring site and four
diffusion tube monitoring sites located in Castleford, in order to verify the modelled results.
Human Receptor Locations
Contains Ordnance Survey data © Crown copyright and database right 2012
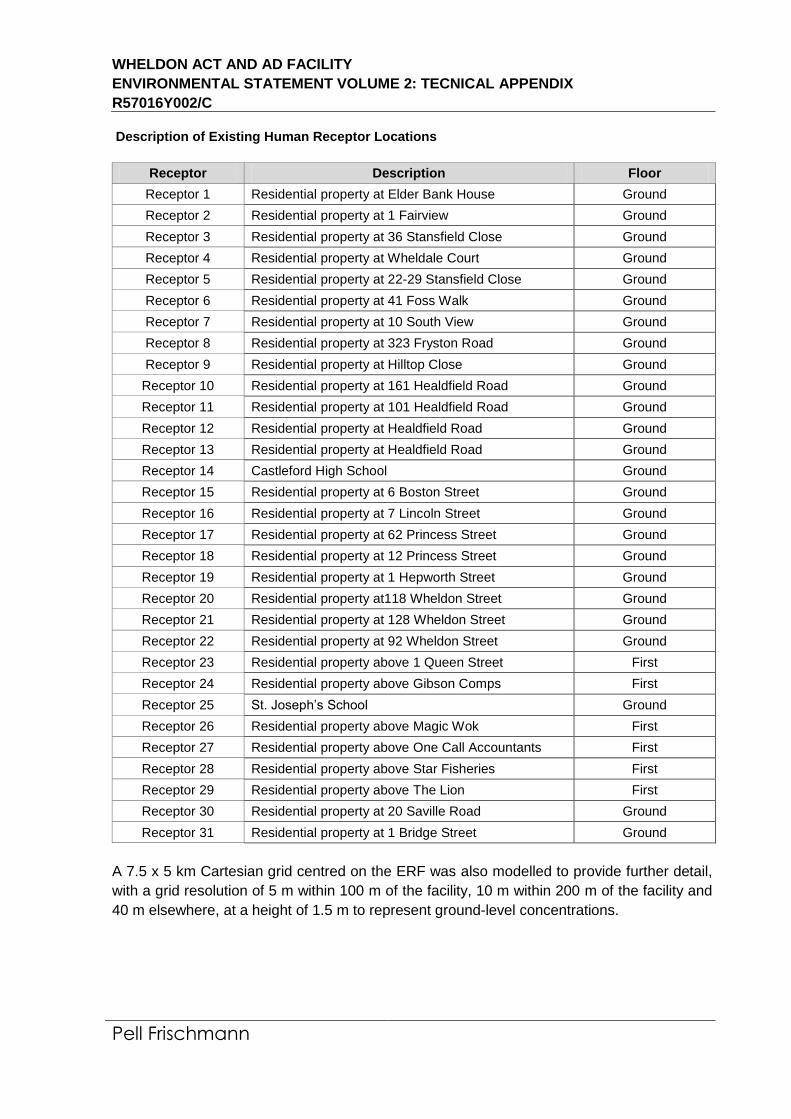
WHELDON ACT AND AD FACILITY
ENVIRONMENTAL STATEMENT VOLUME 2: TECNICAL APPENDIX
R57016Y002/C
Pell Frischmann
Description of Existing Human Receptor Locations
Receptor Description Floor
Receptor 1 Residential property at Elder Bank House Ground
Receptor 2 Residential property at 1 Fairview Ground
Receptor 3 Residential property at 36 Stansfield Close Ground
Receptor 4 Residential property at Wheldale Court Ground
Receptor 5 Residential property at 22-29 Stansfield Close Ground
Receptor 6 Residential property at 41 Foss Walk Ground
Receptor 7 Residential property at 10 South View Ground
Receptor 8 Residential property at 323 Fryston Road Ground
Receptor 9 Residential property at Hilltop Close Ground
Receptor 10 Residential property at 161 Healdfield Road Ground
Receptor 11 Residential property at 101 Healdfield Road Ground
Receptor 12 Residential property at Healdfield Road Ground
Receptor 13 Residential property at Healdfield Road Ground
Receptor 14 Castleford High School Ground
Receptor 15 Residential property at 6 Boston Street Ground
Receptor 16 Residential property at 7 Lincoln Street Ground
Receptor 17 Residential property at 62 Princess Street Ground
Receptor 18 Residential property at 12 Princess Street Ground
Receptor 19 Residential property at 1 Hepworth Street Ground
Receptor 20 Residential property at118 Wheldon Street Ground
Receptor 21 Residential property at 128 Wheldon Street Ground
Receptor 22 Residential property at 92 Wheldon Street Ground
Receptor 23 Residential property above 1 Queen Street First
Receptor 24 Residential property above Gibson Comps First
Receptor 25 St. Joseph’s School Ground
Receptor 26 Residential property above Magic Wok First
Receptor 27 Residential property above One Call Accountants First
Receptor 28 Residential property above Star Fisheries First
Receptor 29 Residential property above The Lion First
Receptor 30 Residential property at 20 Saville Road Ground
Receptor 31 Residential property at 1 Bridge Street Ground
A 7.5 x 5 km Cartesian grid centred on the ERF was also modelled to provide further detail,
with a grid resolution of 5 m within 100 m of the facility, 10 m within 200 m of the facility and
40 m elsewhere, at a height of 1.5 m to represent ground-level concentrations.
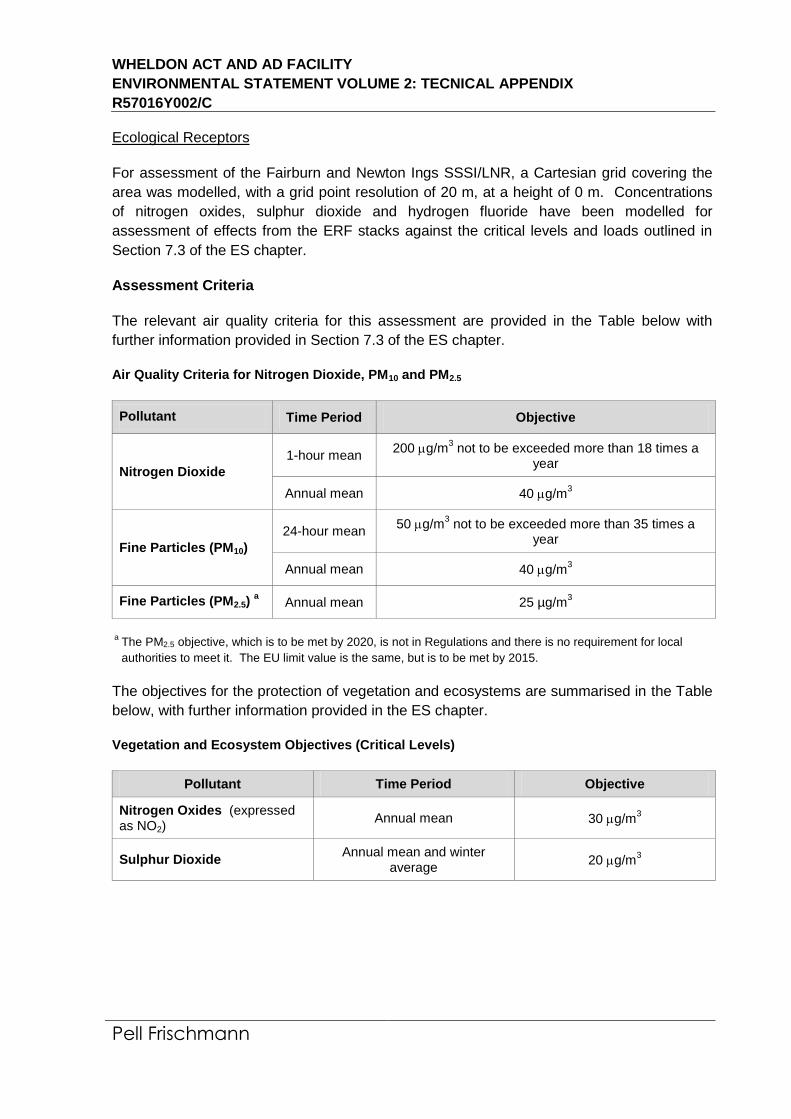
WHELDON ACT AND AD FACILITY
ENVIRONMENTAL STATEMENT VOLUME 2: TECNICAL APPENDIX
R57016Y002/C
Pell Frischmann
Ecological Receptors
For assessment of the Fairburn and Newton Ings SSSI/LNR, a Cartesian grid covering the
area was modelled, with a grid point resolution of 20 m, at a height of 0 m. Concentrations
of nitrogen oxides, sulphur dioxide and hydrogen fluoride have been modelled for
assessment of effects from the ERF stacks against the critical levels and loads outlined in
Section 7.3 of the ES chapter.
Assessment Criteria
The relevant air quality criteria for this assessment are provided in the Table below with
further information provided in Section 7.3 of the ES chapter.
Air Quality Criteria for Nitrogen Dioxide, PM10 and PM2.5
Pollutant Time Period Objective
Nitrogen Dioxide
1-hour mean 200 g/m
3 not to be exceeded more than 18 times a
year
Annual mean 40 g/m3
Fine Particles (PM10)
24-hour mean 50 g/m
3 not to be exceeded more than 35 times a
year
Annual mean 40 g/m3
Fine Particles (PM2.5) a Annual mean 25 µg/m
3
a The PM2.5 objective, which is to be met by 2020, is not in Regulations and there is no requirement for local
authorities to meet it. The EU limit value is the same, but is to be met by 2015.
The objectives for the protection of vegetation and ecosystems are summarised in the Table
below, with further information provided in the ES chapter.
Vegetation and Ecosystem Objectives (Critical Levels)
Pollutant Time Period Objective
Nitrogen Oxides (expressed as NO2)
Annual mean 30 g/m3
Sulphur Dioxide Annual mean and winter
average 20 g/m
3
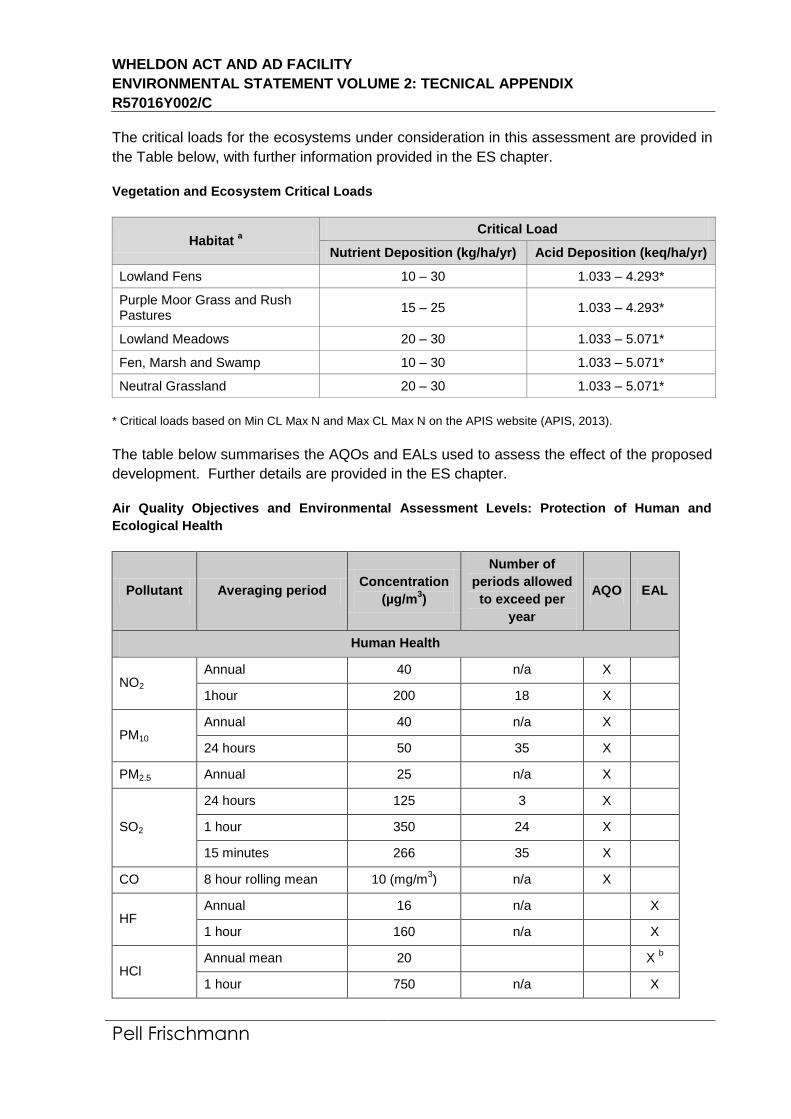
WHELDON ACT AND AD FACILITY
ENVIRONMENTAL STATEMENT VOLUME 2: TECNICAL APPENDIX
R57016Y002/C
Pell Frischmann
The critical loads for the ecosystems under consideration in this assessment are provided in
the Table below, with further information provided in the ES chapter.
Vegetation and Ecosystem Critical Loads
Habitat a
Critical Load
Nutrient Deposition (kg/ha/yr) Acid Deposition (keq/ha/yr)
Lowland Fens 10 – 30 1.033 – 4.293*
Purple Moor Grass and Rush Pastures
15 – 25 1.033 – 4.293*
Lowland Meadows 20 – 30 1.033 – 5.071*
Fen, Marsh and Swamp 10 – 30 1.033 – 5.071*
Neutral Grassland 20 – 30 1.033 – 5.071*
* Critical loads based on Min CL Max N and Max CL Max N on the APIS website (APIS, 2013).
The table below summarises the AQOs and EALs used to assess the effect of the proposed
development. Further details are provided in the ES chapter.
Air Quality Objectives and Environmental Assessment Levels: Protection of Human and
Ecological Health
Pollutant Averaging period Concentration
(µg/m3)
Number of
periods allowed
to exceed per
year
AQO EAL
Human Health
NO2
Annual 40 n/a X
1hour 200 18 X
PM10
Annual 40 n/a X
24 hours 50 35 X
PM2.5 Annual 25 n/a X
SO2
24 hours 125 3 X
1 hour 350 24 X
15 minutes 266 35 X
CO 8 hour rolling mean 10 (mg/m3) n/a X
HF Annual 16 n/a X
1 hour 160 n/a X
HCl Annual mean 20 X
b
1 hour 750 n/a X
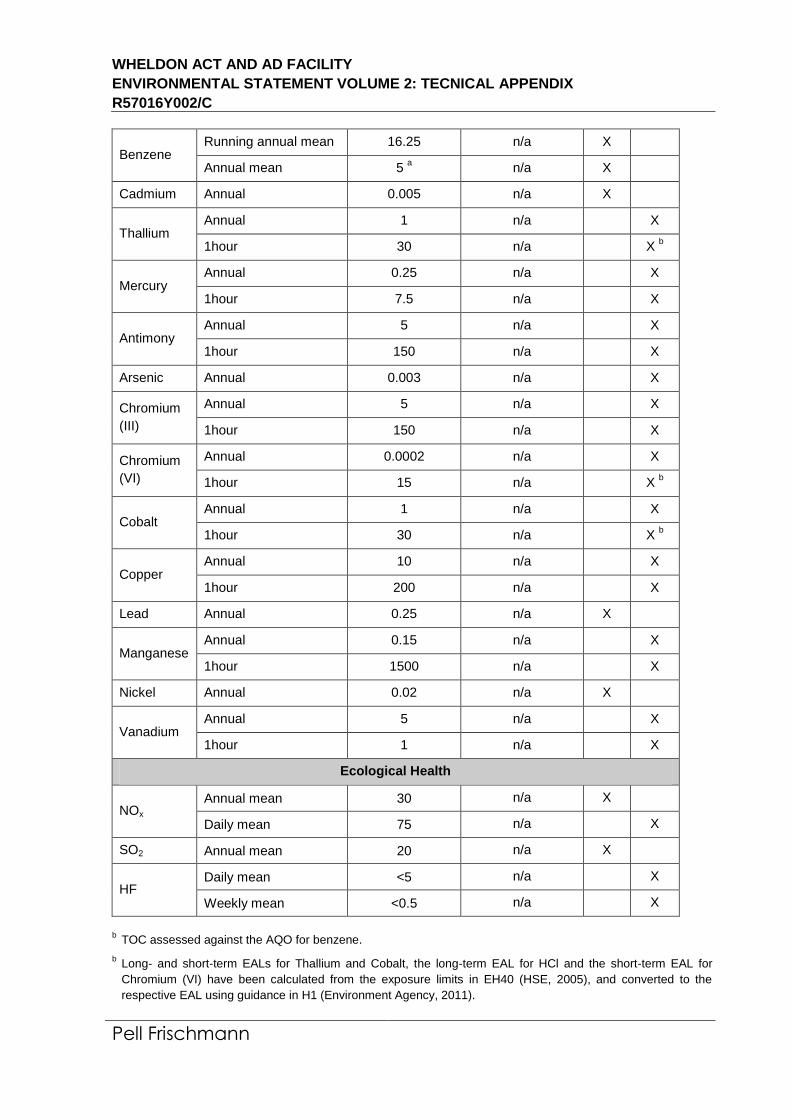
WHELDON ACT AND AD FACILITY
ENVIRONMENTAL STATEMENT VOLUME 2: TECNICAL APPENDIX
R57016Y002/C
Pell Frischmann
Benzene
Running annual mean 16.25 n/a X
Annual mean 5 a
n/a X
Cadmium Annual 0.005 n/a X
Thallium Annual 1 n/a X
1hour 30 n/a X b
Mercury Annual 0.25 n/a X
1hour 7.5 n/a X
Antimony Annual 5 n/a X
1hour 150 n/a X
Arsenic Annual 0.003 n/a X
Chromium
(III)
Annual 5 n/a X
1hour 150 n/a X
Chromium
(VI)
Annual 0.0002 n/a X
1hour 15 n/a X b
Cobalt Annual 1 n/a X
1hour 30 n/a X b
Copper Annual 10 n/a X
1hour 200 n/a X
Lead Annual 0.25 n/a X
Manganese Annual 0.15 n/a X
1hour 1500 n/a X
Nickel Annual 0.02 n/a X
Vanadium Annual 5 n/a X
1hour 1 n/a X
Ecological Health
NOx
Annual mean 30 n/a X
Daily mean 75 n/a X
SO2 Annual mean 20 n/a X
HF Daily mean <5 n/a X
Weekly mean <0.5 n/a X
b TOC assessed against the AQO for benzene.
b Long- and short-term EALs for Thallium and Cobalt, the long-term EAL for HCl and the short-term EAL for
Chromium (VI) have been calculated from the exposure limits in EH40 (HSE, 2005), and converted to the
respective EAL using guidance in H1 (Environment Agency, 2011).
WHELDON ACT AND AD FACILITY
ENVIRONMENTAL STATEMENT VOLUME 2: TECNICAL APPENDIX
R57016Y002/C
Pell Frischmann
APPENDIX 7.2
MODELLING METHODOLOGY
WHELDON ACT AND AD FACILITY
ENVIRONMENTAL STATEMENT VOLUME 2: TECNICAL APPENDIX
R57016Y002/C
Pell Frischmann
Background Concentrations
The background concentrations across the study area have been defined using the national
pollution maps published by Defra (2012a). These cover the whole country on a 1x1 km grid
and are published for each year from 2008 until 2020. The maps include the influence of
emissions from a range of different sources; one of which is road traffic. As noted in
paragraph 7.4.10 of the ES chapter, there are some concerns that Defra may have over-
predicted the rate at which road traffic emissions of nitrogen oxides will fall in the future. The
maps currently in use were verified against measurements made during 2008 at a large
number of automatic monitoring stations and so there can be reasonable confidence that the
maps are representative of conditions during 2008. Similarly, there is reasonable confidence
that the reductions which Defra predicts from other sectors (e.g. rail) will be achieved.
In order to calculate background nitrogen dioxide and nitrogen oxides concentrations in
2011, it is assumed that there was no reduction in the road traffic component of backgrounds
between 20081 and 2011. This has been done using the source-specific background
nitrogen oxides maps provided by Defra (2012a). For each grid square, the road traffic
component has been held constant at 2008 levels, while 2011 values have been taken for
the other components. Nitrogen dioxide concentrations have then been calculated using the
background nitrogen dioxide calculator which Defra (2012a) publishes to accompany the
maps. The result is a set of ‘adjusted 2011 background’ concentrations.
As an additional step, the background maps have been calibrated against national
measurements made as part of the AURN during 2011. The published background maps
were calibrated against 2010 monitoring data. 2010 was identified as a ‘high pollution’ year,
as a result the background maps may over predict the local background concentrations.
Therefore a comparison between the 2011 annual mean nitrogen dioxide concentration at all
background monitoring sites within the AURN and the background mapped concentrations
has been carried out. These are shown on the chart overleaf. Based on the 68 sites with
more than 75% data capture for 2011 the maps over-predict the background concentrations
by 5%, on average. This has been allowed for in production of the calibrated ‘adjusted’ 2011
background concentrations.
1 This approach assumes that has been no reduction in emissions per vehicle but also that traffic volumes
have remained constant. This is not the same as the assumption made for dispersion modelling, in which emissions per vehicle are held constant while traffic volumes are assumed to change year on year. Overall, this discrepancy is unlikely to influence the overall conclusions of the assessment.
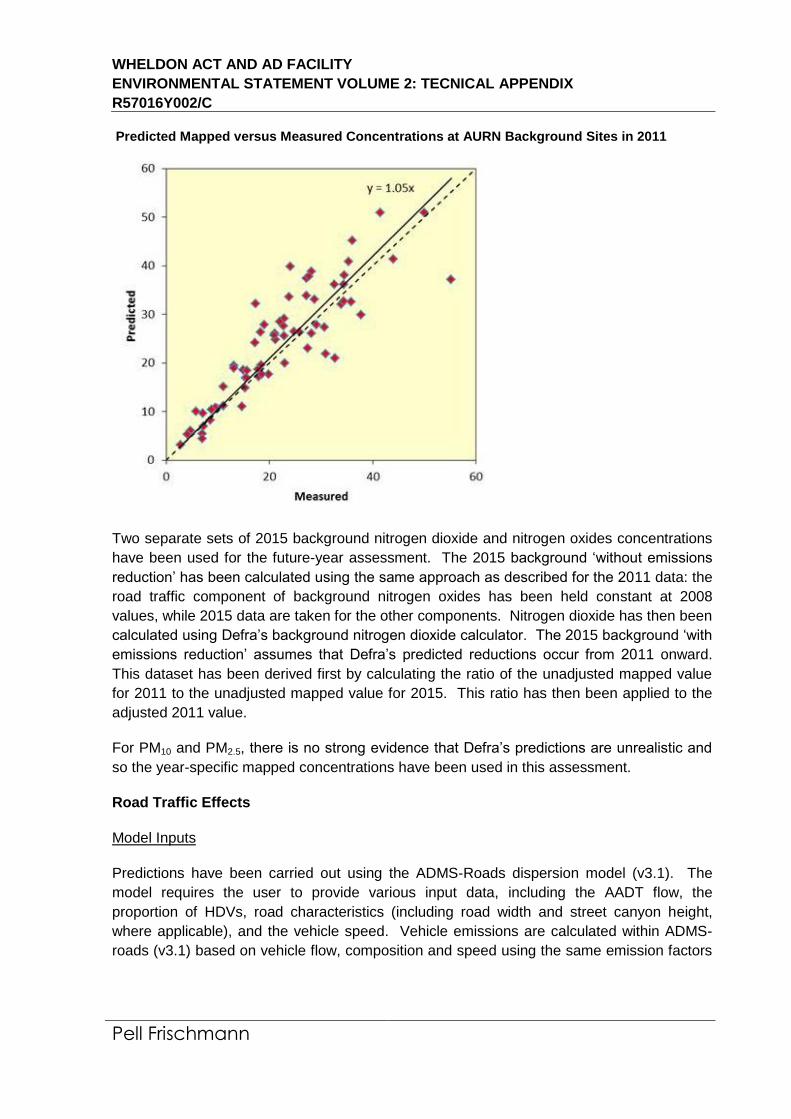
WHELDON ACT AND AD FACILITY
ENVIRONMENTAL STATEMENT VOLUME 2: TECNICAL APPENDIX
R57016Y002/C
Pell Frischmann
Predicted Mapped versus Measured Concentrations at AURN Background Sites in 2011
Two separate sets of 2015 background nitrogen dioxide and nitrogen oxides concentrations
have been used for the future-year assessment. The 2015 background ‘without emissions
reduction’ has been calculated using the same approach as described for the 2011 data: the
road traffic component of background nitrogen oxides has been held constant at 2008
values, while 2015 data are taken for the other components. Nitrogen dioxide has then been
calculated using Defra’s background nitrogen dioxide calculator. The 2015 background ‘with
emissions reduction’ assumes that Defra’s predicted reductions occur from 2011 onward.
This dataset has been derived first by calculating the ratio of the unadjusted mapped value
for 2011 to the unadjusted mapped value for 2015. This ratio has then been applied to the
adjusted 2011 value.
For PM10 and PM2.5, there is no strong evidence that Defra’s predictions are unrealistic and
so the year-specific mapped concentrations have been used in this assessment.
Road Traffic Effects
Model Inputs
Predictions have been carried out using the ADMS-Roads dispersion model (v3.1). The
model requires the user to provide various input data, including the AADT flow, the
proportion of HDVs, road characteristics (including road width and street canyon height,
where applicable), and the vehicle speed. Vehicle emissions are calculated within ADMS-
roads (v3.1) based on vehicle flow, composition and speed using the same emission factors
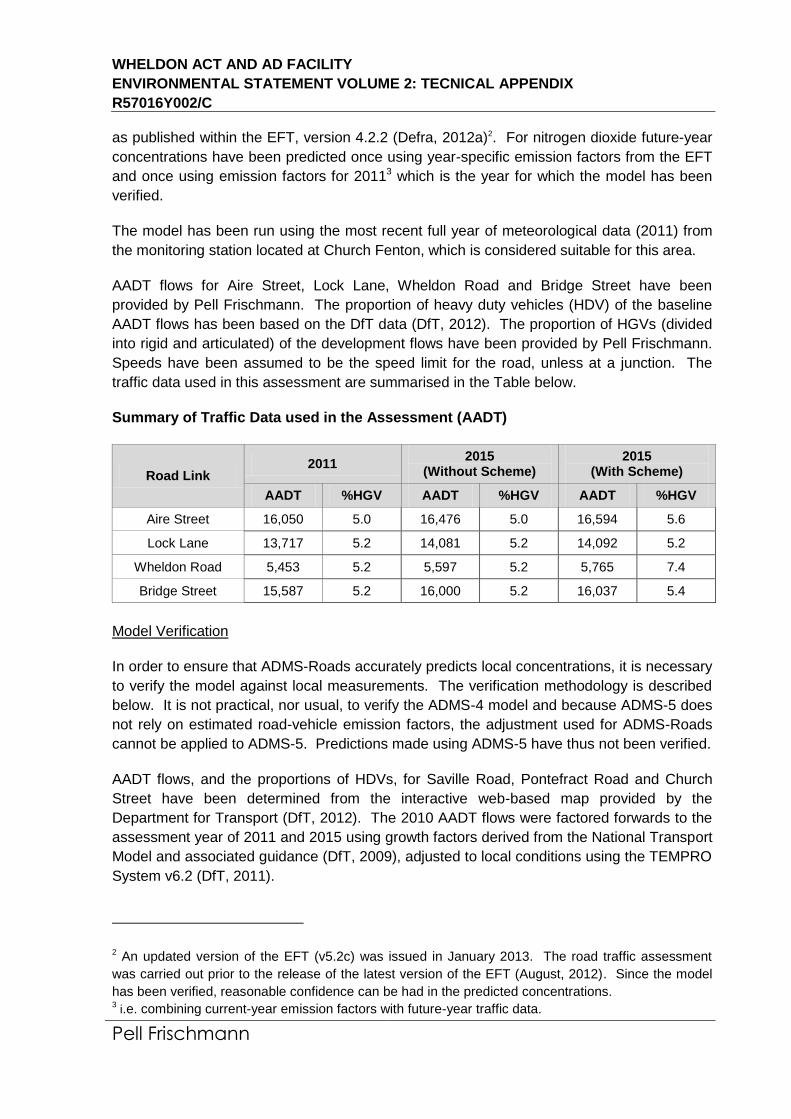
WHELDON ACT AND AD FACILITY
ENVIRONMENTAL STATEMENT VOLUME 2: TECNICAL APPENDIX
R57016Y002/C
Pell Frischmann
as published within the EFT, version 4.2.2 (Defra, 2012a)2. For nitrogen dioxide future-year
concentrations have been predicted once using year-specific emission factors from the EFT
and once using emission factors for 20113 which is the year for which the model has been
verified.
The model has been run using the most recent full year of meteorological data (2011) from
the monitoring station located at Church Fenton, which is considered suitable for this area.
AADT flows for Aire Street, Lock Lane, Wheldon Road and Bridge Street have been
provided by Pell Frischmann. The proportion of heavy duty vehicles (HDV) of the baseline
AADT flows has been based on the DfT data (DfT, 2012). The proportion of HGVs (divided
into rigid and articulated) of the development flows have been provided by Pell Frischmann.
Speeds have been assumed to be the speed limit for the road, unless at a junction. The
traffic data used in this assessment are summarised in the Table below.
Summary of Traffic Data used in the Assessment (AADT)
Road Link 2011
2015 (Without Scheme)
2015 (With Scheme)
AADT %HGV AADT %HGV AADT %HGV
Aire Street 16,050 5.0 16,476 5.0 16,594 5.6
Lock Lane 13,717 5.2 14,081 5.2 14,092 5.2
Wheldon Road 5,453 5.2 5,597 5.2 5,765 7.4
Bridge Street 15,587 5.2 16,000 5.2 16,037 5.4
Model Verification
In order to ensure that ADMS-Roads accurately predicts local concentrations, it is necessary
to verify the model against local measurements. The verification methodology is described
below. It is not practical, nor usual, to verify the ADMS-4 model and because ADMS-5 does
not rely on estimated road-vehicle emission factors, the adjustment used for ADMS-Roads
cannot be applied to ADMS-5. Predictions made using ADMS-5 have thus not been verified.
AADT flows, and the proportions of HDVs, for Saville Road, Pontefract Road and Church
Street have been determined from the interactive web-based map provided by the
Department for Transport (DfT, 2012). The 2010 AADT flows were factored forwards to the
assessment year of 2011 and 2015 using growth factors derived from the National Transport
Model and associated guidance (DfT, 2009), adjusted to local conditions using the TEMPRO
System v6.2 (DfT, 2011).
2 An updated version of the EFT (v5.2c) was issued in January 2013. The road traffic assessment
was carried out prior to the release of the latest version of the EFT (August, 2012). Since the model
has been verified, reasonable confidence can be had in the predicted concentrations. 3 i.e. combining current-year emission factors with future-year traffic data.
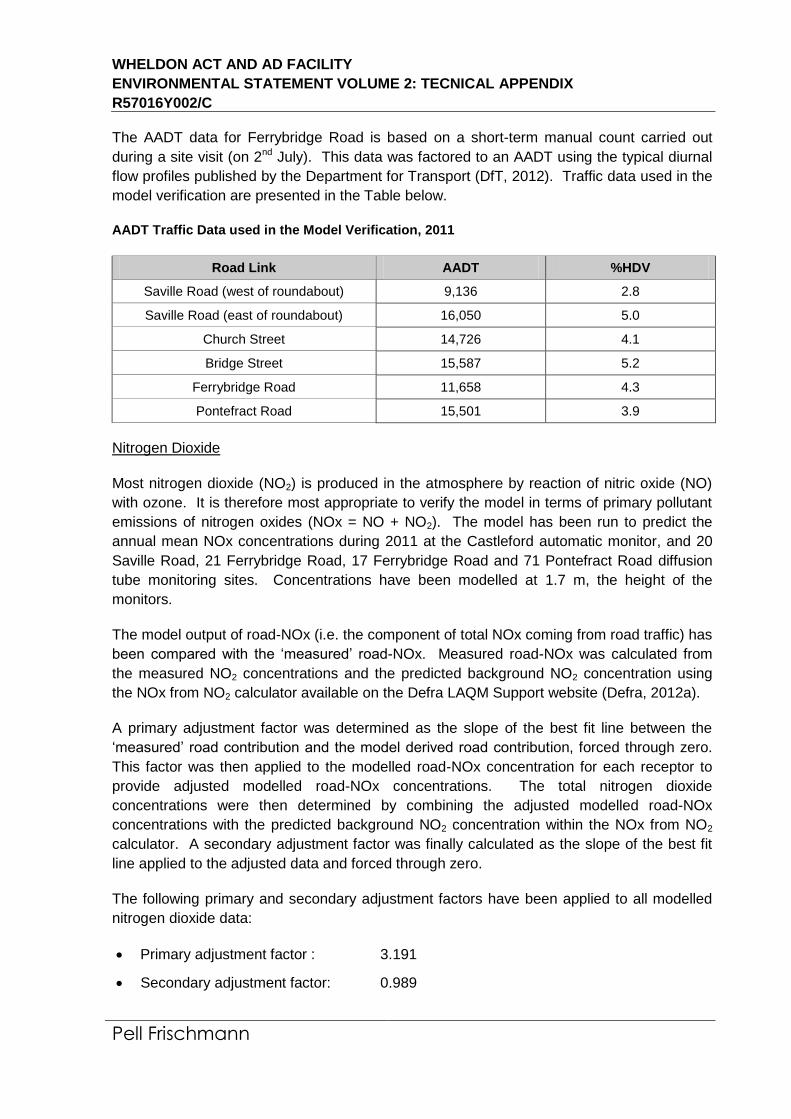
WHELDON ACT AND AD FACILITY
ENVIRONMENTAL STATEMENT VOLUME 2: TECNICAL APPENDIX
R57016Y002/C
Pell Frischmann
The AADT data for Ferrybridge Road is based on a short-term manual count carried out
during a site visit (on 2nd July). This data was factored to an AADT using the typical diurnal
flow profiles published by the Department for Transport (DfT, 2012). Traffic data used in the
model verification are presented in the Table below.
AADT Traffic Data used in the Model Verification, 2011
Road Link AADT %HDV
Saville Road (west of roundabout) 9,136 2.8
Saville Road (east of roundabout) 16,050 5.0
Church Street 14,726 4.1
Bridge Street 15,587 5.2
Ferrybridge Road 11,658 4.3
Pontefract Road 15,501 3.9
Nitrogen Dioxide
Most nitrogen dioxide (NO2) is produced in the atmosphere by reaction of nitric oxide (NO)
with ozone. It is therefore most appropriate to verify the model in terms of primary pollutant
emissions of nitrogen oxides (NOx = NO + NO2). The model has been run to predict the
annual mean NOx concentrations during 2011 at the Castleford automatic monitor, and 20
Saville Road, 21 Ferrybridge Road, 17 Ferrybridge Road and 71 Pontefract Road diffusion
tube monitoring sites. Concentrations have been modelled at 1.7 m, the height of the
monitors.
The model output of road-NOx (i.e. the component of total NOx coming from road traffic) has
been compared with the ‘measured’ road-NOx. Measured road-NOx was calculated from
the measured NO2 concentrations and the predicted background NO2 concentration using
the NOx from NO2 calculator available on the Defra LAQM Support website (Defra, 2012a).
A primary adjustment factor was determined as the slope of the best fit line between the
‘measured’ road contribution and the model derived road contribution, forced through zero.
This factor was then applied to the modelled road-NOx concentration for each receptor to
provide adjusted modelled road-NOx concentrations. The total nitrogen dioxide
concentrations were then determined by combining the adjusted modelled road-NOx
concentrations with the predicted background NO2 concentration within the NOx from NO2
calculator. A secondary adjustment factor was finally calculated as the slope of the best fit
line applied to the adjusted data and forced through zero.
The following primary and secondary adjustment factors have been applied to all modelled
nitrogen dioxide data:
Primary adjustment factor : 3.191
Secondary adjustment factor: 0.989
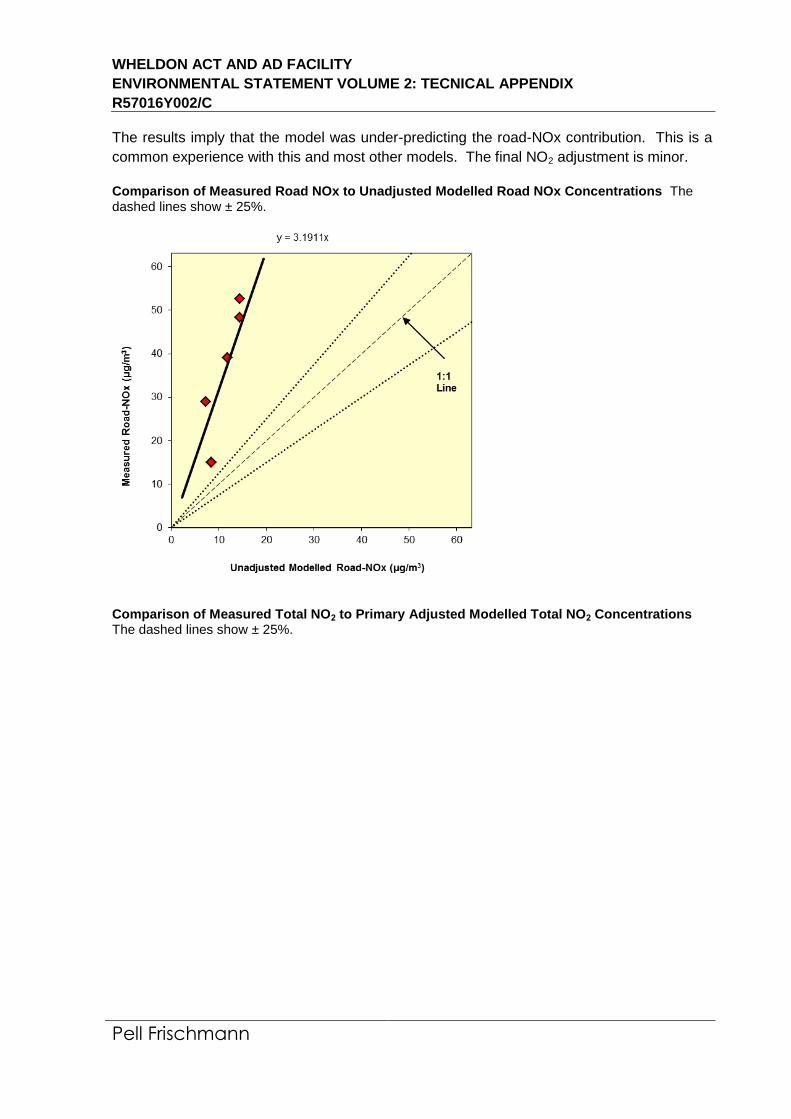
WHELDON ACT AND AD FACILITY
ENVIRONMENTAL STATEMENT VOLUME 2: TECNICAL APPENDIX
R57016Y002/C
Pell Frischmann
The results imply that the model was under-predicting the road-NOx contribution. This is a
common experience with this and most other models. The final NO2 adjustment is minor.
Comparison of Measured Road NOx to Unadjusted Modelled Road NOx Concentrations The dashed lines show ± 25%.
Comparison of Measured Total NO2 to Primary Adjusted Modelled Total NO2 Concentrations The dashed lines show ± 25%.
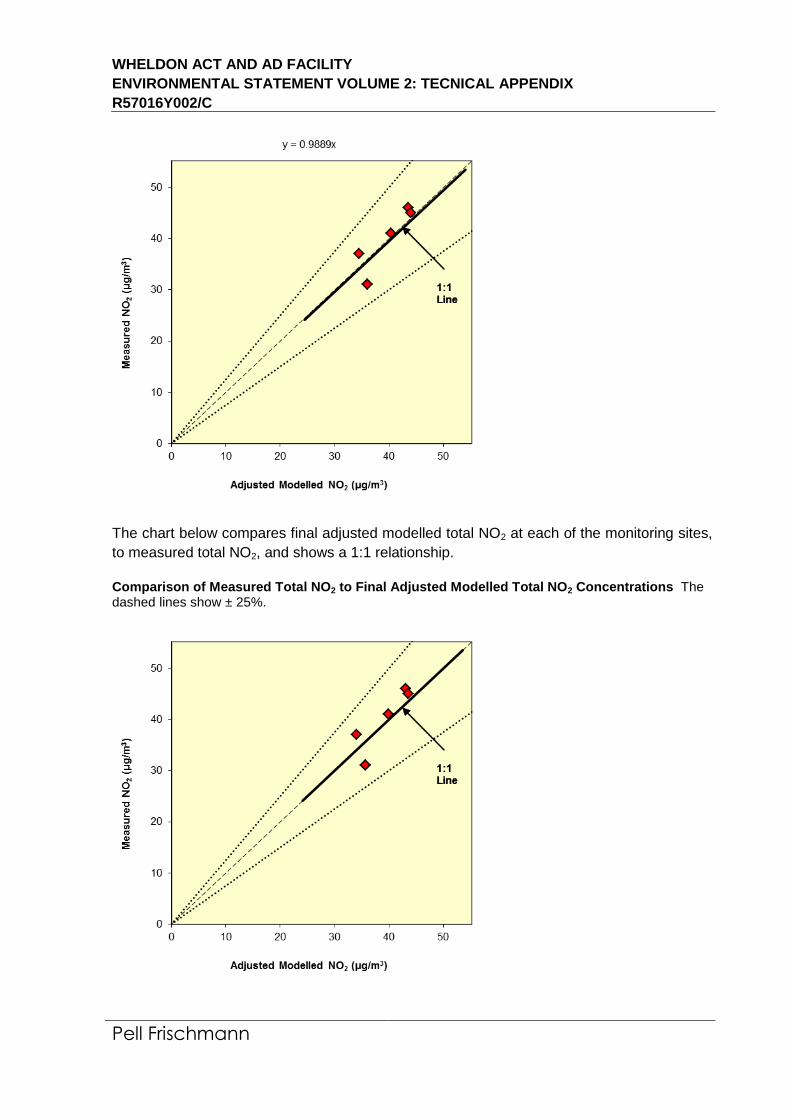
WHELDON ACT AND AD FACILITY
ENVIRONMENTAL STATEMENT VOLUME 2: TECNICAL APPENDIX
R57016Y002/C
Pell Frischmann
The chart below compares final adjusted modelled total NO2 at each of the monitoring sites,
to measured total NO2, and shows a 1:1 relationship.
Comparison of Measured Total NO2 to Final Adjusted Modelled Total NO2 Concentrations The dashed lines show ± 25%.
WHELDON ACT AND AD FACILITY
ENVIRONMENTAL STATEMENT VOLUME 2: TECNICAL APPENDIX
R57016Y002/C
Pell Frischmann
PM10 and PM2.5
The model has been run to predict annual mean road-PM10 concentrations during 2011 at
the Castleford automatic monitor. A similar process to calculate the road-NOx adjustment
factor was followed.
The measured road-PM10 and modelled road-PM10 concentrations are compared to provide
the factor for PM10. The data used to calculate the adjustment factor are provided below:
Measured PM10: 20 μg/m3
‘Measured’ road-PM10 (measured – background at monitor): 20.0 –17.0 = 3.0 μg/m3
Modelled road-PM10 = 0.85 μg/m3
Road-PM10 adjustment factor: 3.0/0.9 = 3.5
There are no nearby PM2.5 monitors. It has therefore not been possible to verify the model
for PM2.5. The model outputs of road-PM2.5 have therefore been adjusted by applying the
adjustment factor calculated for road-PM10.
The number of exceedences of 50 μg/m3 as a 24-hour mean PM10 concentration has been
calculated from the adjusted-modelled total annual mean concentration following the
relationship advised by (Defra, 2009):
A = -18.5 + 0.00145 B3 + 206/B
where A is the number of exceedences of 50 μg/m3 as a 24-hour mean PM10 concentration
and B is the annual mean PM10 concentration. The relationship is only applied to annual
mean concentrations greater than 16.5 μg/m3, below this concentration, the number of 24-
hour exceedences is assumed to be zero.
Deposition Calculations
Deposition has not been included within the dispersion model because the principal
depositing component of concern is nitrogen dioxide and this is calculated from nitrogen
oxides outside of the model. Instead, deposition has been calculated from the predicted
ambient concentrations using the deposition velocities set out in the Table below. The
velocities are applied simply by multiplying a concentration (µg/m3) by the velocity (m/s) to
predict a deposition flux (µg/m2/s). Subsequent calculations required to present the data as
kg/ha/yr of nitrogen or sulphur and as keq/ha/yr for acidity follow basic chemical and
mathematical rules.
Wet deposition has been discounted. Wet deposition of the emitted pollutants this close to
the emission source will be restricted to wash-out, or below cloud scavenging. For this to
occur, rain droplets must come into contact with the gas molecules before they hit the
ground. Falling raindrops displace the air around them, effectively pushing gasses away.
The low solubility of nitrogen dioxide means that any scavenging of this gas will be a
negligible factor. While wash-out of sulphur dioxide might be more significant, the very low
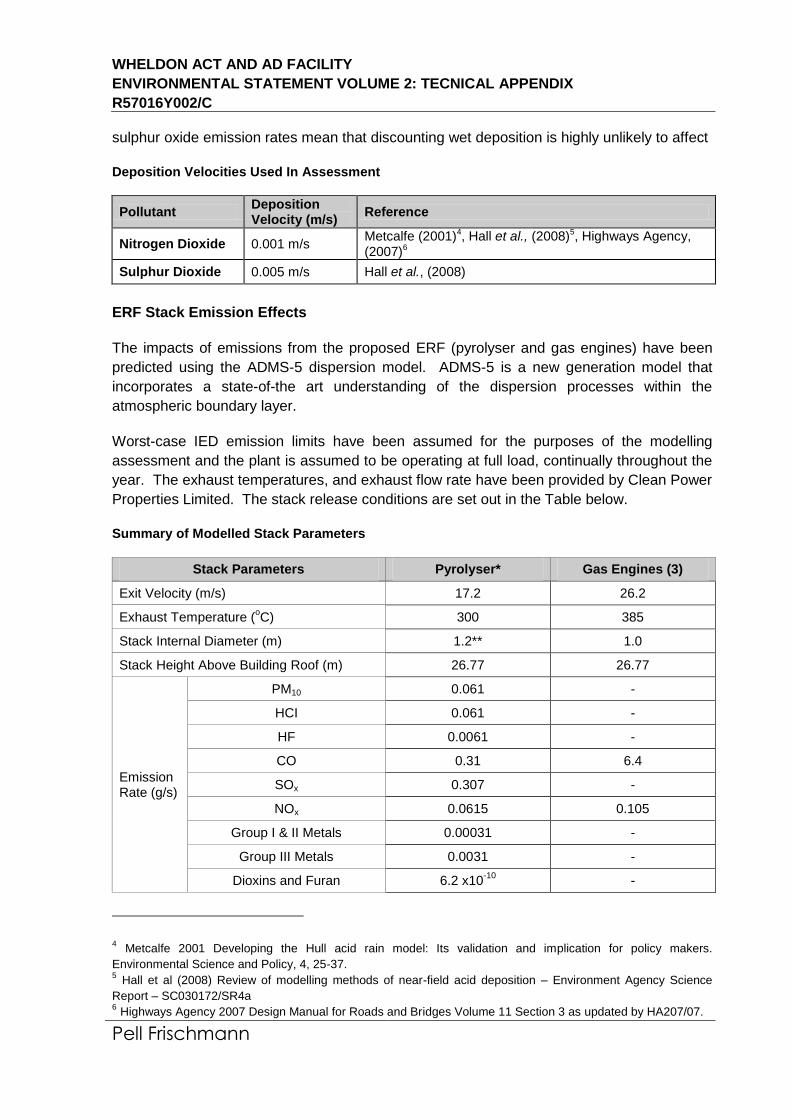
WHELDON ACT AND AD FACILITY
ENVIRONMENTAL STATEMENT VOLUME 2: TECNICAL APPENDIX
R57016Y002/C
Pell Frischmann
sulphur oxide emission rates mean that discounting wet deposition is highly unlikely to affect
Deposition Velocities Used In Assessment
Pollutant Deposition Velocity (m/s)
Reference
Nitrogen Dioxide 0.001 m/s Metcalfe (2001)4, Hall et al., (2008)5, Highways Agency, (2007)6
Sulphur Dioxide 0.005 m/s Hall et al., (2008)
ERF Stack Emission Effects
The impacts of emissions from the proposed ERF (pyrolyser and gas engines) have been
predicted using the ADMS-5 dispersion model. ADMS-5 is a new generation model that
incorporates a state-of-the art understanding of the dispersion processes within the
atmospheric boundary layer.
Worst-case IED emission limits have been assumed for the purposes of the modelling
assessment and the plant is assumed to be operating at full load, continually throughout the
year. The exhaust temperatures, and exhaust flow rate have been provided by Clean Power
Properties Limited. The stack release conditions are set out in the Table below.
Summary of Modelled Stack Parameters
Stack Parameters Pyrolyser* Gas Engines (3)
Exit Velocity (m/s) 17.2 26.2
Exhaust Temperature (oC) 300 385
Stack Internal Diameter (m) 1.2** 1.0
Stack Height Above Building Roof (m) 26.77 26.77
Emission Rate (g/s)
PM10 0.061 -
HCI 0.061 -
HF 0.0061 -
CO 0.31 6.4
SOx 0.307 -
NOx 0.0615 0.105
Group I & II Metals 0.00031 -
Group III Metals 0.0031 -
Dioxins and Furan 6.2 x10⁻¹⁰
-
4 Metcalfe 2001 Developing the Hull acid rain model: Its validation and implication for policy makers.
Environmental Science and Policy, 4, 25-37. 5 Hall et al (2008) Review of modelling methods of near-field acid deposition – Environment Agency Science
Report – SC030172/SR4a 6 Highways Agency 2007 Design Manual for Roads and Bridges Volume 11 Section 3 as updated by HA207/07.
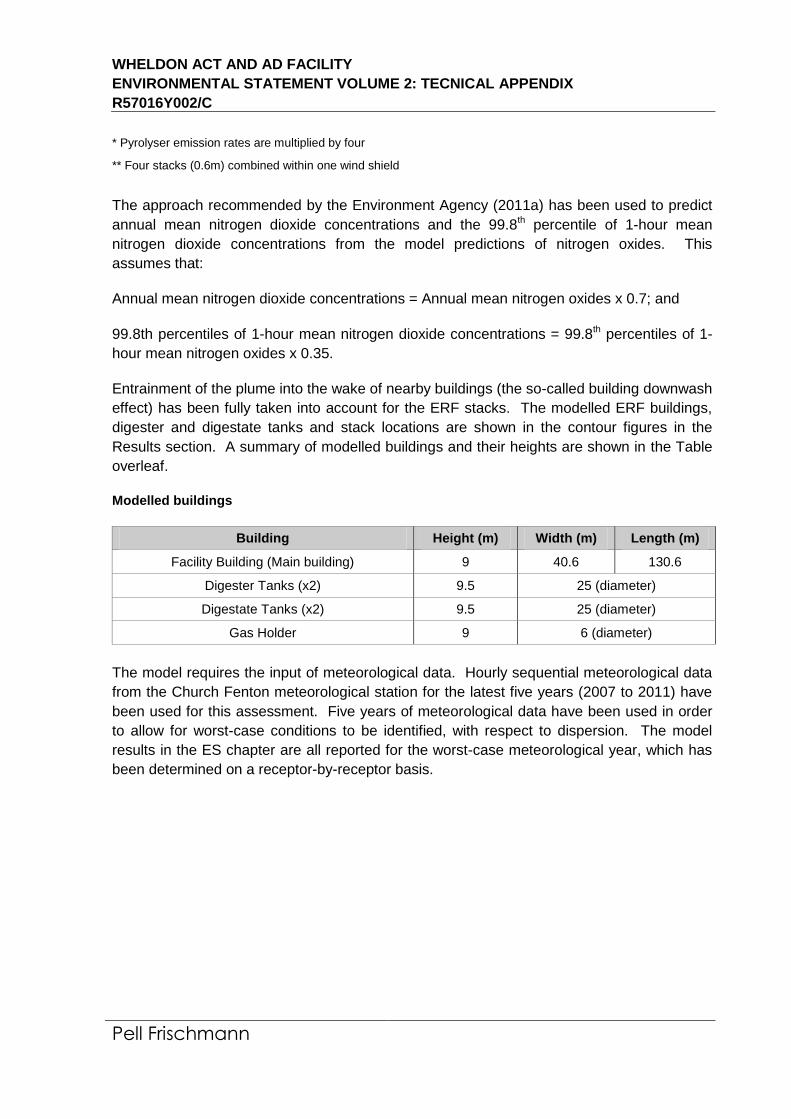
WHELDON ACT AND AD FACILITY
ENVIRONMENTAL STATEMENT VOLUME 2: TECNICAL APPENDIX
R57016Y002/C
Pell Frischmann
* Pyrolyser emission rates are multiplied by four
** Four stacks (0.6m) combined within one wind shield
The approach recommended by the Environment Agency (2011a) has been used to predict
annual mean nitrogen dioxide concentrations and the 99.8th percentile of 1-hour mean
nitrogen dioxide concentrations from the model predictions of nitrogen oxides. This
assumes that:
Annual mean nitrogen dioxide concentrations = Annual mean nitrogen oxides x 0.7; and
99.8th percentiles of 1-hour mean nitrogen dioxide concentrations = 99.8th percentiles of 1-
hour mean nitrogen oxides x 0.35.
Entrainment of the plume into the wake of nearby buildings (the so-called building downwash
effect) has been fully taken into account for the ERF stacks. The modelled ERF buildings,
digester and digestate tanks and stack locations are shown in the contour figures in the
Results section. A summary of modelled buildings and their heights are shown in the Table
overleaf.
Modelled buildings
Building Height (m) Width (m) Length (m)
Facility Building (Main building) 9 40.6 130.6
Digester Tanks (x2) 9.5 25 (diameter)
Digestate Tanks (x2) 9.5 25 (diameter)
Gas Holder 9 6 (diameter)
The model requires the input of meteorological data. Hourly sequential meteorological data
from the Church Fenton meteorological station for the latest five years (2007 to 2011) have
been used for this assessment. Five years of meteorological data have been used in order
to allow for worst-case conditions to be identified, with respect to dispersion. The model
results in the ES chapter are all reported for the worst-case meteorological year, which has
been determined on a receptor-by-receptor basis.

WHELDON ACT AND AD FACILITY
ENVIRONMENTAL STATEMENT VOLUME 2: TECNICAL APPENDIX
R57016Y002/C
Pell Frischmann
APPENDIX 7.3
CONSTRUCTION DUST ASSESSMENT CRITERIA
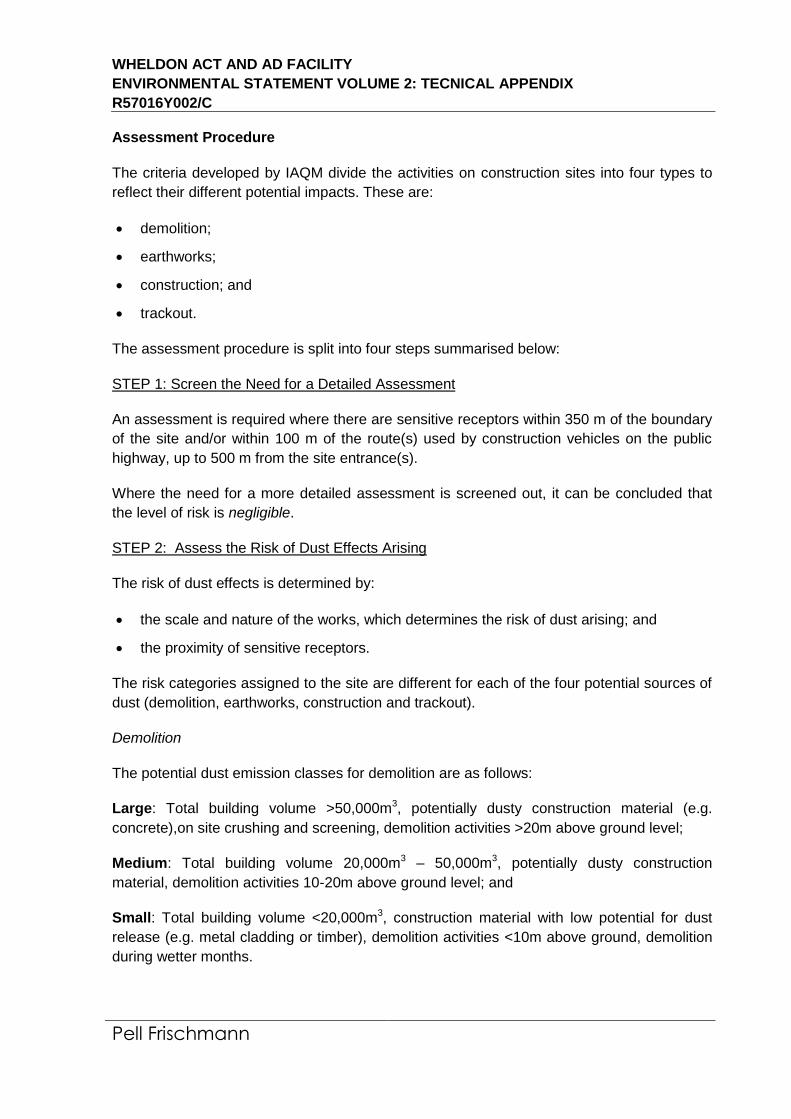
WHELDON ACT AND AD FACILITY
ENVIRONMENTAL STATEMENT VOLUME 2: TECNICAL APPENDIX
R57016Y002/C
Pell Frischmann
Assessment Procedure
The criteria developed by IAQM divide the activities on construction sites into four types to
reflect their different potential impacts. These are:
demolition;
earthworks;
construction; and
trackout.
The assessment procedure is split into four steps summarised below:
STEP 1: Screen the Need for a Detailed Assessment
An assessment is required where there are sensitive receptors within 350 m of the boundary
of the site and/or within 100 m of the route(s) used by construction vehicles on the public
highway, up to 500 m from the site entrance(s).
Where the need for a more detailed assessment is screened out, it can be concluded that
the level of risk is negligible.
STEP 2: Assess the Risk of Dust Effects Arising
The risk of dust effects is determined by:
the scale and nature of the works, which determines the risk of dust arising; and
the proximity of sensitive receptors.
The risk categories assigned to the site are different for each of the four potential sources of
dust (demolition, earthworks, construction and trackout).
Demolition
The potential dust emission classes for demolition are as follows:
Large: Total building volume >50,000m3, potentially dusty construction material (e.g.
concrete),on site crushing and screening, demolition activities >20m above ground level;
Medium: Total building volume 20,000m3 – 50,000m3, potentially dusty construction
material, demolition activities 10-20m above ground level; and
Small: Total building volume <20,000m3, construction material with low potential for dust
release (e.g. metal cladding or timber), demolition activities <10m above ground, demolition
during wetter months.
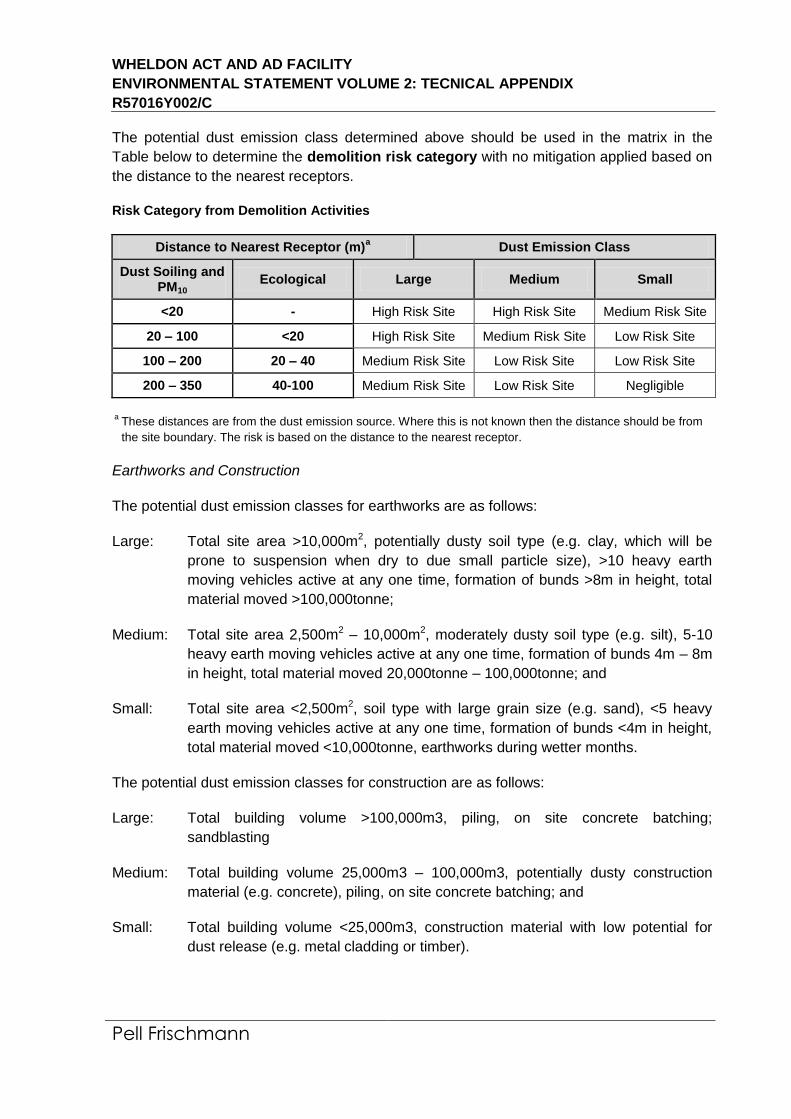
WHELDON ACT AND AD FACILITY
ENVIRONMENTAL STATEMENT VOLUME 2: TECNICAL APPENDIX
R57016Y002/C
Pell Frischmann
The potential dust emission class determined above should be used in the matrix in the
Table below to determine the demolition risk category with no mitigation applied based on
the distance to the nearest receptors.
Risk Category from Demolition Activities
Distance to Nearest Receptor (m)a Dust Emission Class
Dust Soiling and PM10
Ecological Large Medium Small
<20 - High Risk Site High Risk Site Medium Risk Site
20 – 100 <20 High Risk Site Medium Risk Site Low Risk Site
100 – 200 20 – 40 Medium Risk Site Low Risk Site Low Risk Site
200 – 350 40-100 Medium Risk Site Low Risk Site Negligible
a These distances are from the dust emission source. Where this is not known then the distance should be from
the site boundary. The risk is based on the distance to the nearest receptor.
Earthworks and Construction
The potential dust emission classes for earthworks are as follows:
Large: Total site area >10,000m2, potentially dusty soil type (e.g. clay, which will be
prone to suspension when dry to due small particle size), >10 heavy earth
moving vehicles active at any one time, formation of bunds >8m in height, total
material moved >100,000tonne;
Medium: Total site area 2,500m2 – 10,000m2, moderately dusty soil type (e.g. silt), 5-10
heavy earth moving vehicles active at any one time, formation of bunds 4m – 8m
in height, total material moved 20,000tonne – 100,000tonne; and
Small: Total site area <2,500m2, soil type with large grain size (e.g. sand), <5 heavy
earth moving vehicles active at any one time, formation of bunds <4m in height,
total material moved <10,000tonne, earthworks during wetter months.
The potential dust emission classes for construction are as follows:
Large: Total building volume >100,000m3, piling, on site concrete batching;
sandblasting
Medium: Total building volume 25,000m3 – 100,000m3, potentially dusty construction
material (e.g. concrete), piling, on site concrete batching; and
Small: Total building volume <25,000m3, construction material with low potential for
dust release (e.g. metal cladding or timber).
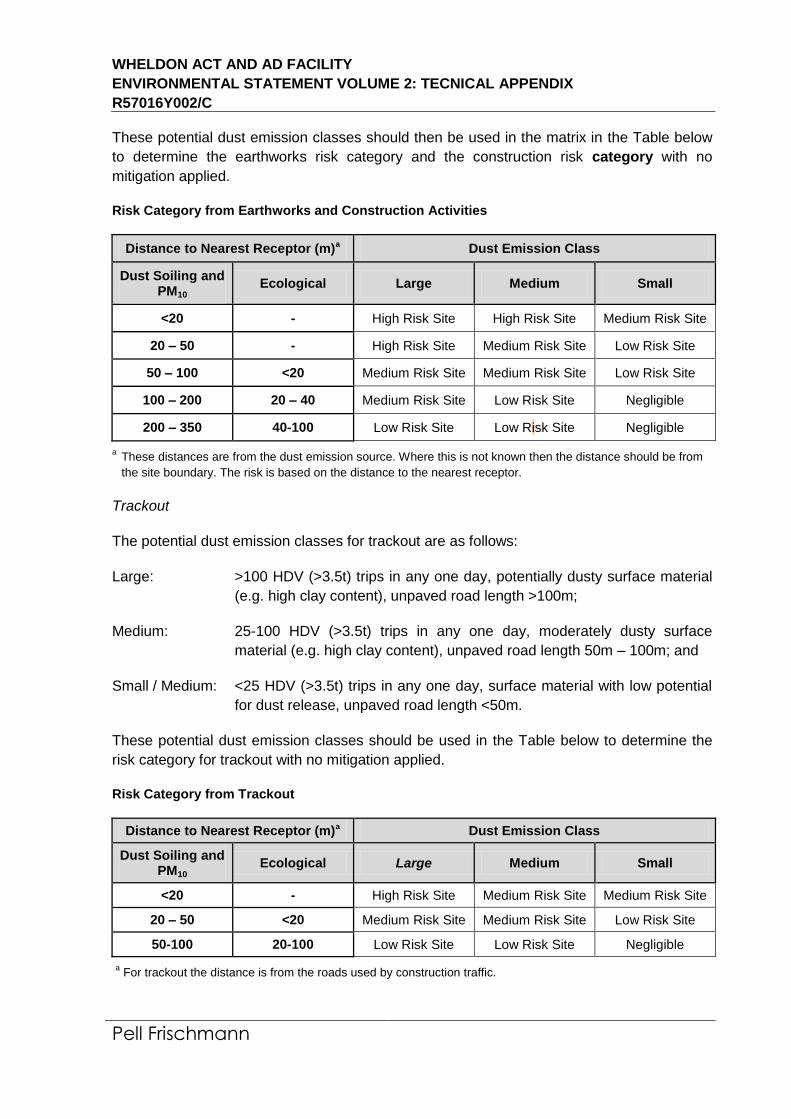
WHELDON ACT AND AD FACILITY
ENVIRONMENTAL STATEMENT VOLUME 2: TECNICAL APPENDIX
R57016Y002/C
Pell Frischmann
These potential dust emission classes should then be used in the matrix in the Table below
to determine the earthworks risk category and the construction risk category with no
mitigation applied.
Risk Category from Earthworks and Construction Activities
Distance to Nearest Receptor (m)a Dust Emission Class
Dust Soiling and PM10
Ecological Large Medium Small
<20 - High Risk Site High Risk Site Medium Risk Site
20 – 50 - High Risk Site Medium Risk Site Low Risk Site
50 – 100 <20 Medium Risk Site Medium Risk Site Low Risk Site
100 – 200 20 – 40 Medium Risk Site Low Risk Site Negligible
200 – 350 40-100 Low Risk Site Low Risk Site Negligible
a These distances are from the dust emission source. Where this is not known then the distance should be from
the site boundary. The risk is based on the distance to the nearest receptor.
Trackout
The potential dust emission classes for trackout are as follows:
Large: >100 HDV (>3.5t) trips in any one day, potentially dusty surface material
(e.g. high clay content), unpaved road length >100m;
Medium: 25-100 HDV (>3.5t) trips in any one day, moderately dusty surface
material (e.g. high clay content), unpaved road length 50m – 100m; and
Small / Medium: <25 HDV (>3.5t) trips in any one day, surface material with low potential
for dust release, unpaved road length <50m.
These potential dust emission classes should be used in the Table below to determine the
risk category for trackout with no mitigation applied.
Risk Category from Trackout
Distance to Nearest Receptor (m)a Dust Emission Class
Dust Soiling and PM10
Ecological Large Medium Small
<20 - High Risk Site Medium Risk Site Medium Risk Site
20 – 50 <20 Medium Risk Site Medium Risk Site Low Risk Site
50-100 20-100 Low Risk Site Low Risk Site Negligible
a For trackout the distance is from the roads used by construction traffic.
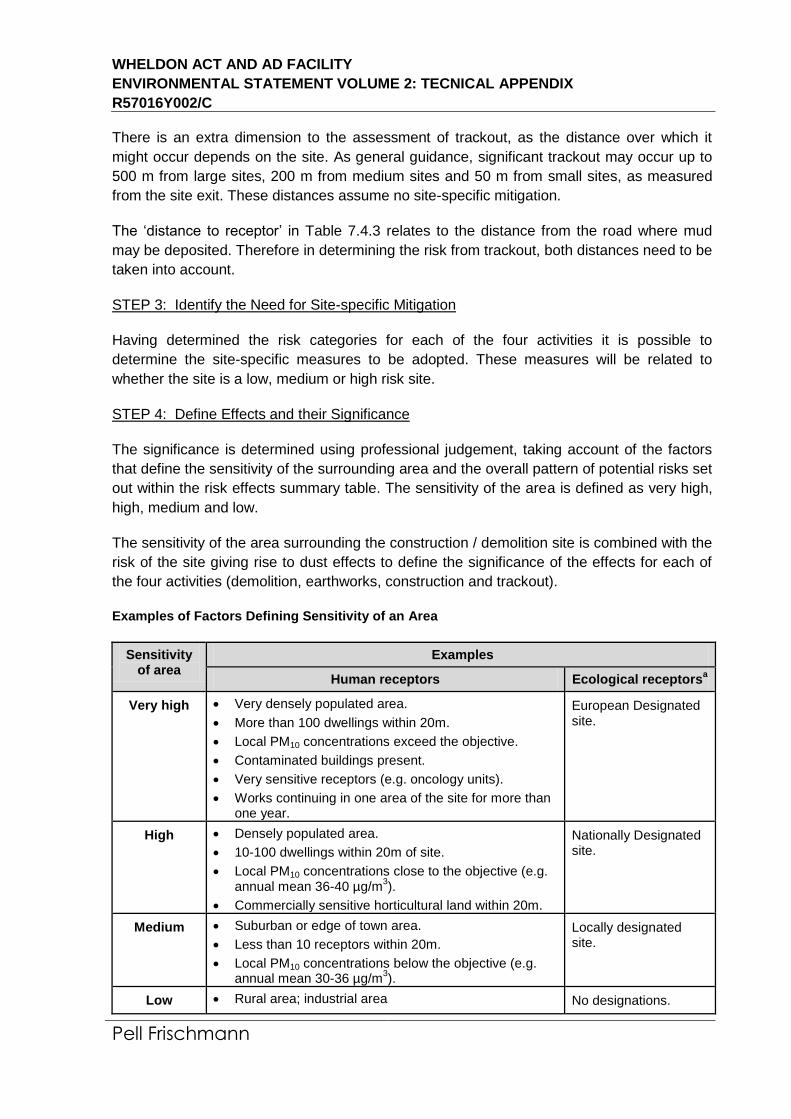
WHELDON ACT AND AD FACILITY
ENVIRONMENTAL STATEMENT VOLUME 2: TECNICAL APPENDIX
R57016Y002/C
Pell Frischmann
There is an extra dimension to the assessment of trackout, as the distance over which it
might occur depends on the site. As general guidance, significant trackout may occur up to
500 m from large sites, 200 m from medium sites and 50 m from small sites, as measured
from the site exit. These distances assume no site-specific mitigation.
The ‘distance to receptor’ in Table 7.4.3 relates to the distance from the road where mud
may be deposited. Therefore in determining the risk from trackout, both distances need to be
taken into account.
STEP 3: Identify the Need for Site-specific Mitigation
Having determined the risk categories for each of the four activities it is possible to
determine the site-specific measures to be adopted. These measures will be related to
whether the site is a low, medium or high risk site.
STEP 4: Define Effects and their Significance
The significance is determined using professional judgement, taking account of the factors
that define the sensitivity of the surrounding area and the overall pattern of potential risks set
out within the risk effects summary table. The sensitivity of the area is defined as very high,
high, medium and low.
The sensitivity of the area surrounding the construction / demolition site is combined with the
risk of the site giving rise to dust effects to define the significance of the effects for each of
the four activities (demolition, earthworks, construction and trackout).
Examples of Factors Defining Sensitivity of an Area
Sensitivity of area
Examples
Human receptors Ecological receptorsa
Very high Very densely populated area.
More than 100 dwellings within 20m.
Local PM10 concentrations exceed the objective.
Contaminated buildings present.
Very sensitive receptors (e.g. oncology units).
Works continuing in one area of the site for more than one year.
European Designated site.
High Densely populated area.
10-100 dwellings within 20m of site.
Local PM10 concentrations close to the objective (e.g. annual mean 36-40 µg/m
3).
Commercially sensitive horticultural land within 20m.
Nationally Designated site.
Medium Suburban or edge of town area.
Less than 10 receptors within 20m.
Local PM10 concentrations below the objective (e.g. annual mean 30-36 µg/m
3).
Locally designated site.
Low Rural area; industrial area No designations.
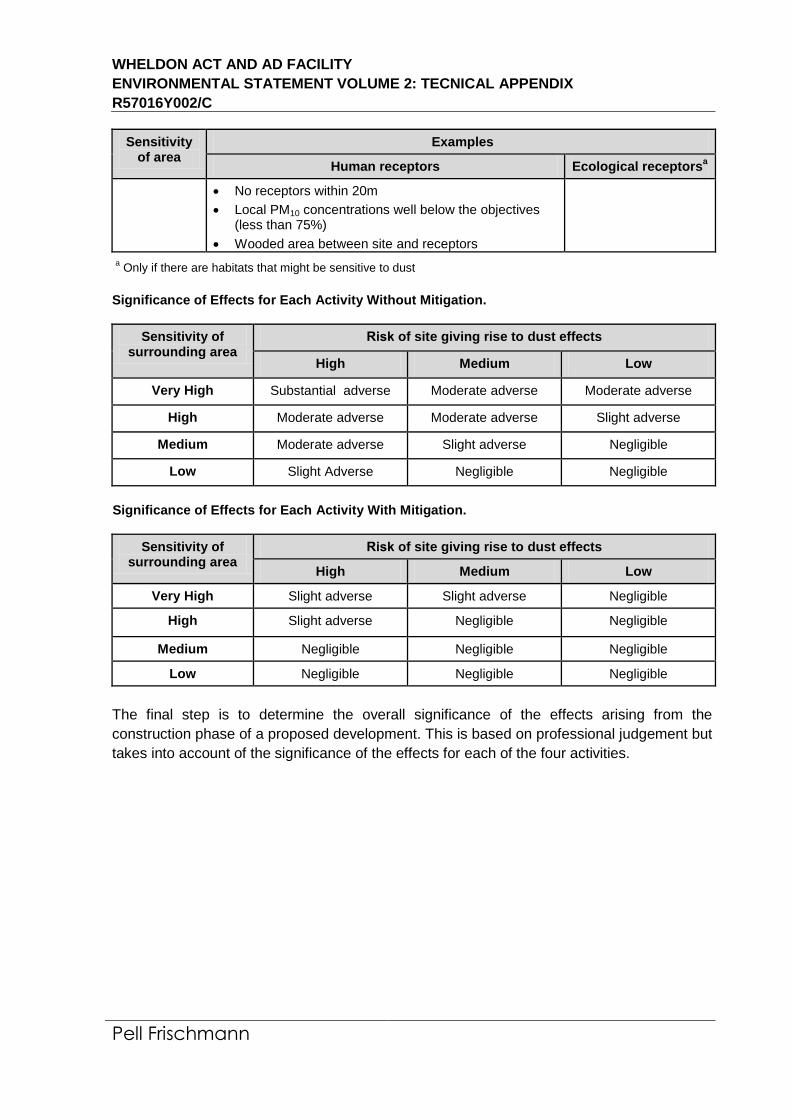
WHELDON ACT AND AD FACILITY
ENVIRONMENTAL STATEMENT VOLUME 2: TECNICAL APPENDIX
R57016Y002/C
Pell Frischmann
Sensitivity of area
Examples
Human receptors Ecological receptorsa
No receptors within 20m
Local PM10 concentrations well below the objectives (less than 75%)
Wooded area between site and receptors
a Only if there are habitats that might be sensitive to dust
Significance of Effects for Each Activity Without Mitigation.
Sensitivity of surrounding area
Risk of site giving rise to dust effects
High Medium Low
Very High Substantial adverse Moderate adverse Moderate adverse
High Moderate adverse Moderate adverse Slight adverse
Medium Moderate adverse Slight adverse Negligible
Low Slight Adverse Negligible Negligible
Significance of Effects for Each Activity With Mitigation.
Sensitivity of surrounding area
Risk of site giving rise to dust effects
High Medium Low
Very High Slight adverse Slight adverse Negligible
High Slight adverse Negligible Negligible
Medium Negligible Negligible Negligible
Low Negligible Negligible Negligible
The final step is to determine the overall significance of the effects arising from the
construction phase of a proposed development. This is based on professional judgement but
takes into account of the significance of the effects for each of the four activities.
WHELDON ACT AND AD FACILITY
ENVIRONMENTAL STATEMENT VOLUME 2: TECNICAL APPENDIX
R57016Y002/C
Pell Frischmann
APPENDIX 7.4
IMPACT DESCRIPTORS AND ASSESSMENT OF SIGNIFICANCE

WHELDON ACT AND AD FACILITY
ENVIRONMENTAL STATEMENT VOLUME 2: TECNICAL APPENDIX
R57016Y002/C
Pell Frischmann
There is no official guidance in the UK on how to describe the nature of air quality impacts
nor to assess their significance. The approach developed by the Institute of Air Quality
Management7 (Institute of Air Quality Management, 2009), and incorporated in
Environmental Protection UK’s guidance document on planning and air quality
(Environmental Protection UK, 2010), has therefore been used. This involves three distinct
stages: the application of descriptors for magnitude of change; the description of the impact
at each sensitive receptor; and then the assessment of overall significance of the scheme.
Impact Descriptors
The definition of impact magnitude is solely related to the degree of change in pollutant
concentrations, expressed in microgrammes per cubic metre, but originally determined as a
percentage of the air quality objective. Impact description takes account of the impact
magnitude and of the absolute concentrations and how they relate to the air quality
objectives or other relevant standards. The descriptors for the magnitude of change due to
the scheme and the impact descriptors are presented in the Tables below. These tables
have been designed to assist with describing air quality impacts at each specific receptor.
They apply to the pollutants relevant to this scheme and the objectives against which they
are being assessed.
Definition of Impact Magnitude for Changes in Ambient Pollutant Concentrations
Magnitude of Change
Annual Mean NO2/PM10 No. days with PM10
concentration greater than 50 µg/m
3
Annual Mean PM2.5
Large Increase/decrease
≥4 µg/m3
Increase/decrease >4 days
Increase/decrease ≥2.5 µg/m
3
Medium Increase/decrease 2 - <4
µg/m3
Increase/decrease 3 or 4 days
Increase/decrease 1.25 - <2.5 µg/m
3
Small Increase/decrease 0.4 -
<2 µg/m3
Increase/decrease 1 or 2 days
Increase/decrease 0.25 - <1.25 µg/m
3
Imperceptible Increase/decrease
<0.4 µg/m3
Increase/decrease <1 day
Increase/decrease <0.25 µg/m
3
Air Quality Impact Descriptors for Changes to Annual Mean Nitrogen Dioxide, PM10 and PM2.5 Concentrations and Changes to Number of Days with PM10 Concentration Greater than 50 µg/m3 at a Receptor a
Absolute Concentration b in Relation to
Objective/Limit Value
Change in Concentration/day c
Small Medium Large
Above Objective/Limit Value d Slight Moderate Substantial
Just Below Objective/Limit Value e Slight Moderate Moderate
Below Objective/Limit Value f Negligible Slight Slight
7 The IAQM is the professional body for air quality practitioners in the UK.
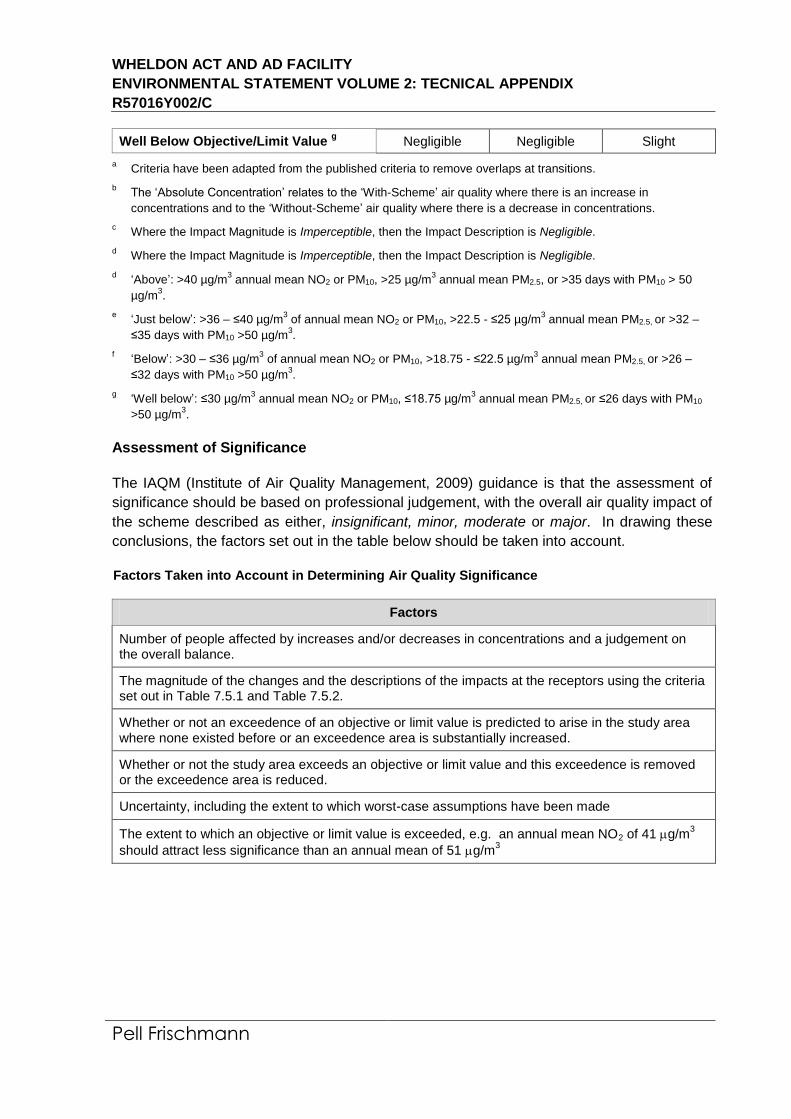
WHELDON ACT AND AD FACILITY
ENVIRONMENTAL STATEMENT VOLUME 2: TECNICAL APPENDIX
R57016Y002/C
Pell Frischmann
Well Below Objective/Limit Value g Negligible Negligible Slight
a Criteria have been adapted from the published criteria to remove overlaps at transitions.
b The ‘Absolute Concentration’ relates to the ‘With-Scheme’ air quality where there is an increase in
concentrations and to the ‘Without-Scheme’ air quality where there is a decrease in concentrations.
c Where the Impact Magnitude is Imperceptible, then the Impact Description is Negligible.
d Where the Impact Magnitude is Imperceptible, then the Impact Description is Negligible.
d ‘Above’: >40 µg/m
3 annual mean NO2 or PM10, >25 µg/m
3 annual mean PM2.5, or >35 days with PM10 > 50
µg/m3.
e ‘Just below’: >36 – ≤40 µg/m
3 of annual mean NO2 or PM10, >22.5 - ≤25 µg/m
3 annual mean PM2.5, or >32 –
≤35 days with PM10 >50 µg/m3.
f ‘Below’: >30 – ≤36 µg/m
3 of annual mean NO2 or PM10, >18.75 - ≤22.5 µg/m
3 annual mean PM2.5, or >26 –
≤32 days with PM10 >50 µg/m3.
g ‘Well below’: ≤30 µg/m
3 annual mean NO2 or PM10, ≤18.75 µg/m
3 annual mean PM2.5, or ≤26 days with PM10
>50 µg/m3.
Assessment of Significance
The IAQM (Institute of Air Quality Management, 2009) guidance is that the assessment of
significance should be based on professional judgement, with the overall air quality impact of
the scheme described as either, insignificant, minor, moderate or major. In drawing these
conclusions, the factors set out in the table below should be taken into account.
Factors Taken into Account in Determining Air Quality Significance
Factors
Number of people affected by increases and/or decreases in concentrations and a judgement on the overall balance.
The magnitude of the changes and the descriptions of the impacts at the receptors using the criteria set out in Table 7.5.1 and Table 7.5.2.
Whether or not an exceedence of an objective or limit value is predicted to arise in the study area where none existed before or an exceedence area is substantially increased.
Whether or not the study area exceeds an objective or limit value and this exceedence is removed or the exceedence area is reduced.
Uncertainty, including the extent to which worst-case assumptions have been made
The extent to which an objective or limit value is exceeded, e.g. an annual mean NO2 of 41 g/m3
should attract less significance than an annual mean of 51 g/m3
WHELDON ACT AND AD FACILITY
ENVIRONMENTAL STATEMENT VOLUME 2: TECNICAL APPENDIX
R57016Y002/C
Pell Frischmann
APPENDIX 7.5
BASELINE CONDITIONS
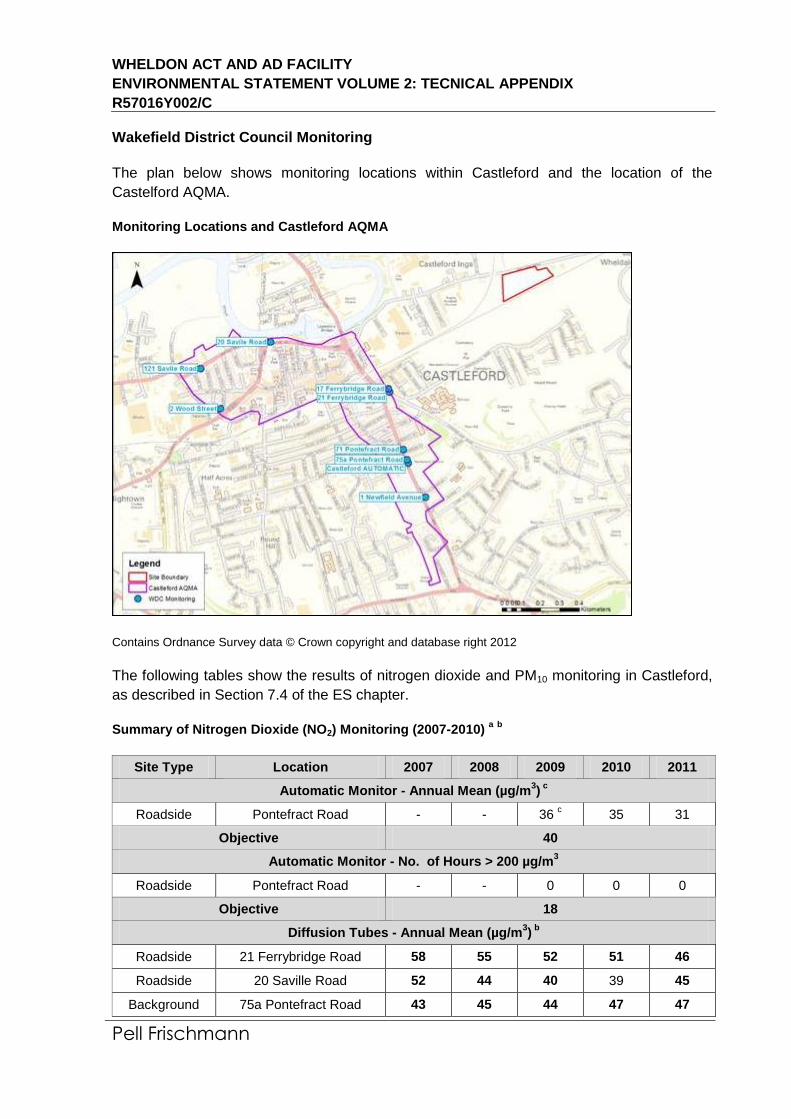
WHELDON ACT AND AD FACILITY
ENVIRONMENTAL STATEMENT VOLUME 2: TECNICAL APPENDIX
R57016Y002/C
Pell Frischmann
Wakefield District Council Monitoring
The plan below shows monitoring locations within Castleford and the location of the
Castelford AQMA.
Monitoring Locations and Castleford AQMA
Contains Ordnance Survey data © Crown copyright and database right 2012
The following tables show the results of nitrogen dioxide and PM10 monitoring in Castleford,
as described in Section 7.4 of the ES chapter.
Summary of Nitrogen Dioxide (NO2) Monitoring (2007-2010) a b
Site Type Location 2007 2008 2009 2010 2011
Automatic Monitor - Annual Mean (µg/m3) c
Roadside Pontefract Road - - 36 c
35 31
Objective 40
Automatic Monitor - No. of Hours > 200 µg/m3
Roadside Pontefract Road - - 0 0 0
Objective 18
Diffusion Tubes - Annual Mean (µg/m3) b
Roadside 21 Ferrybridge Road 58 55 52 51 46
Roadside 20 Saville Road 52 44 40 39 45
Background 75a Pontefract Road 43 45 44 47 47
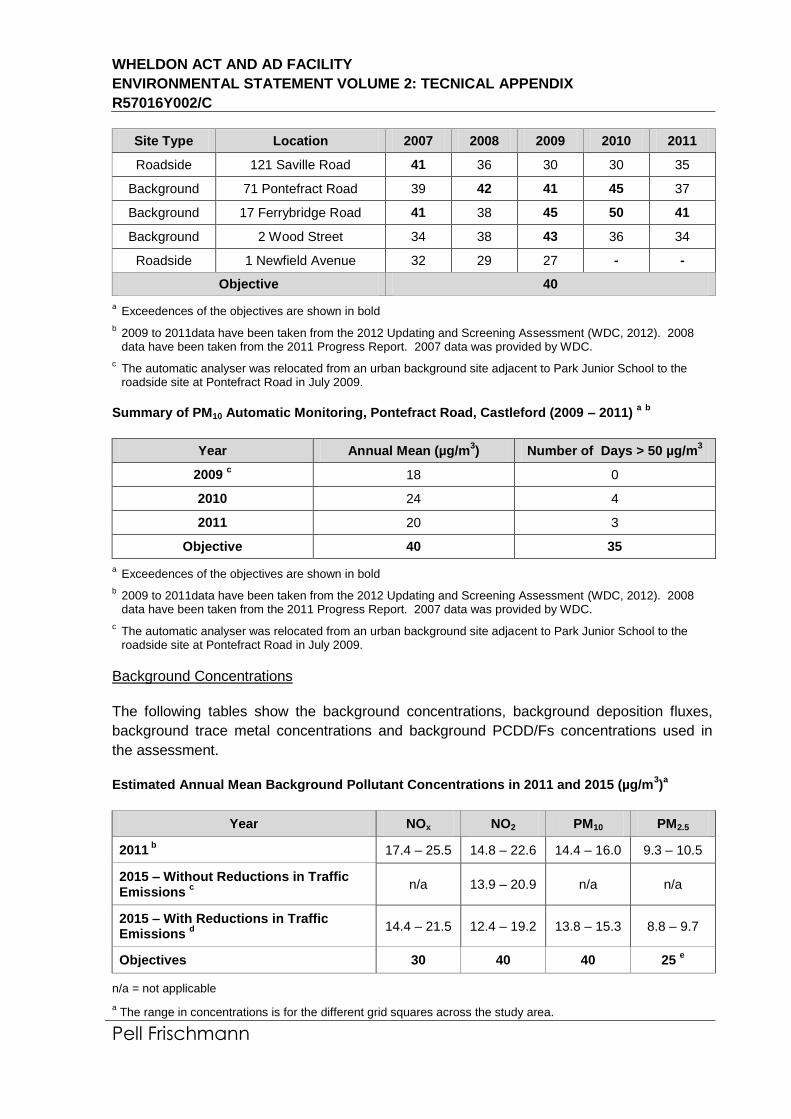
WHELDON ACT AND AD FACILITY
ENVIRONMENTAL STATEMENT VOLUME 2: TECNICAL APPENDIX
R57016Y002/C
Pell Frischmann
Site Type Location 2007 2008 2009 2010 2011
Roadside 121 Saville Road 41 36 30 30 35
Background 71 Pontefract Road 39 42 41 45 37
Background 17 Ferrybridge Road 41 38 45 50 41
Background 2 Wood Street 34 38 43 36 34
Roadside 1 Newfield Avenue 32 29 27 - -
Objective 40
a Exceedences of the objectives are shown in bold
b 2009 to 2011data have been taken from the 2012 Updating and Screening Assessment (WDC, 2012). 2008 data have been taken from the 2011 Progress Report. 2007 data was provided by WDC.
c The automatic analyser was relocated from an urban background site adjacent to Park Junior School to the roadside site at Pontefract Road in July 2009.
Summary of PM10 Automatic Monitoring, Pontefract Road, Castleford (2009 – 2011) a b
Year Annual Mean (µg/m3) Number of Days > 50 µg/m
3
2009 c
18 0
2010 24 4
2011 20 3
Objective 40 35
a Exceedences of the objectives are shown in bold
b 2009 to 2011data have been taken from the 2012 Updating and Screening Assessment (WDC, 2012). 2008 data have been taken from the 2011 Progress Report. 2007 data was provided by WDC.
c The automatic analyser was relocated from an urban background site adjacent to Park Junior School to the roadside site at Pontefract Road in July 2009.
Background Concentrations
The following tables show the background concentrations, background deposition fluxes,
background trace metal concentrations and background PCDD/Fs concentrations used in
the assessment.
Estimated Annual Mean Background Pollutant Concentrations in 2011 and 2015 (µg/m3)a
Year NOx NO2 PM10 PM2.5
2011 b
17.4 – 25.5 14.8 – 22.6 14.4 – 16.0 9.3 – 10.5
2015 – Without Reductions in Traffic Emissions
c
n/a 13.9 – 20.9 n/a n/a
2015 – With Reductions in Traffic Emissions
d
14.4 – 21.5 12.4 – 19.2 13.8 – 15.3 8.8 – 9.7
Objectives 30 40 40 25 e
n/a = not applicable
a The range in concentrations is for the different grid squares across the study area.
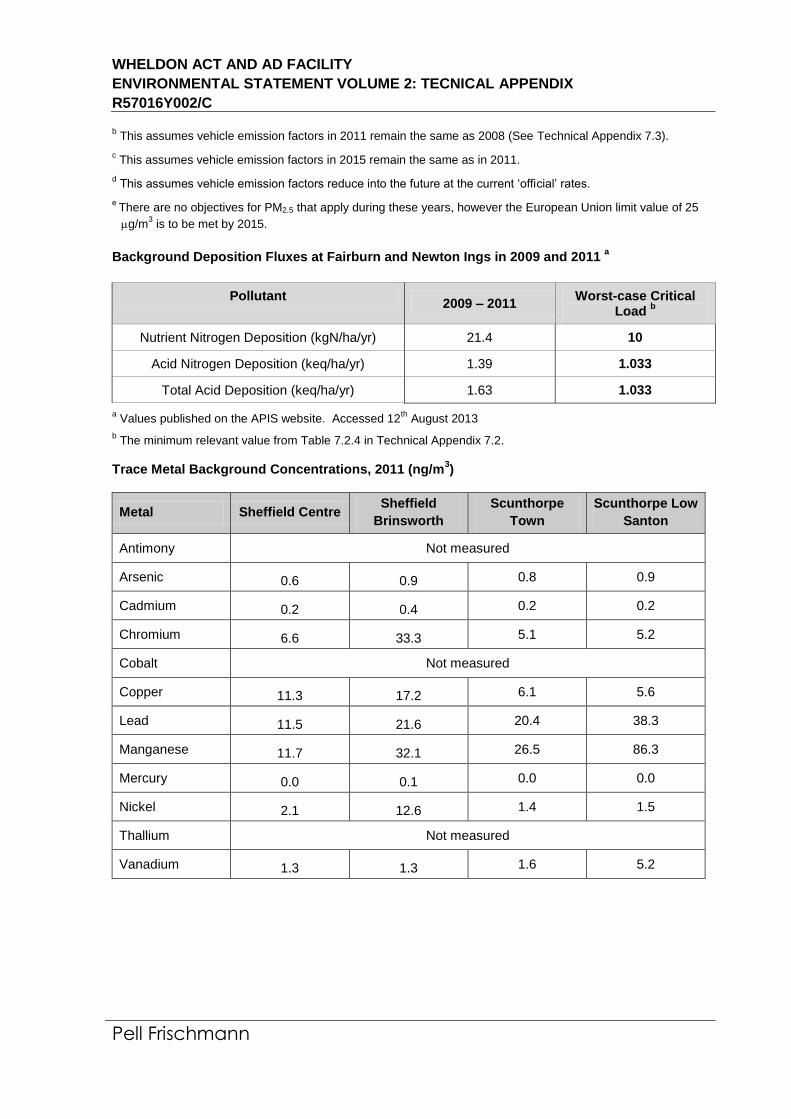
WHELDON ACT AND AD FACILITY
ENVIRONMENTAL STATEMENT VOLUME 2: TECNICAL APPENDIX
R57016Y002/C
Pell Frischmann
b This assumes vehicle emission factors in 2011 remain the same as 2008 (See Technical Appendix 7.3).
c This assumes vehicle emission factors in 2015 remain the same as in 2011.
d This assumes vehicle emission factors reduce into the future at the current ‘official’ rates.
e There are no objectives for PM2.5 that apply during these years, however the European Union limit value of 25
g/m3 is to be met by 2015.
Background Deposition Fluxes at Fairburn and Newton Ings in 2009 and 2011 a
Pollutant 2009 – 2011
Worst-case Critical Load
b
Nutrient Nitrogen Deposition (kgN/ha/yr) 21.4 10
Acid Nitrogen Deposition (keq/ha/yr) 1.39 1.033
Total Acid Deposition (keq/ha/yr) 1.63 1.033
a Values published on the APIS website. Accessed 12
th August 2013
b The minimum relevant value from Table 7.2.4 in Technical Appendix 7.2.
Trace Metal Background Concentrations, 2011 (ng/m3)
Metal Sheffield Centre Sheffield
Brinsworth
Scunthorpe
Town
Scunthorpe Low
Santon
Antimony Not measured
Arsenic 0.6 0.9 0.8 0.9
Cadmium 0.2 0.4 0.2 0.2
Chromium 6.6 33.3 5.1 5.2
Cobalt Not measured
Copper 11.3 17.2 6.1 5.6
Lead 11.5 21.6 20.4 38.3
Manganese 11.7 32.1 26.5 86.3
Mercury 0.0 0.1 0.0 0.0
Nickel 2.1 12.6 1.4 1.5
Thallium Not measured
Vanadium 1.3 1.3 1.6 5.2
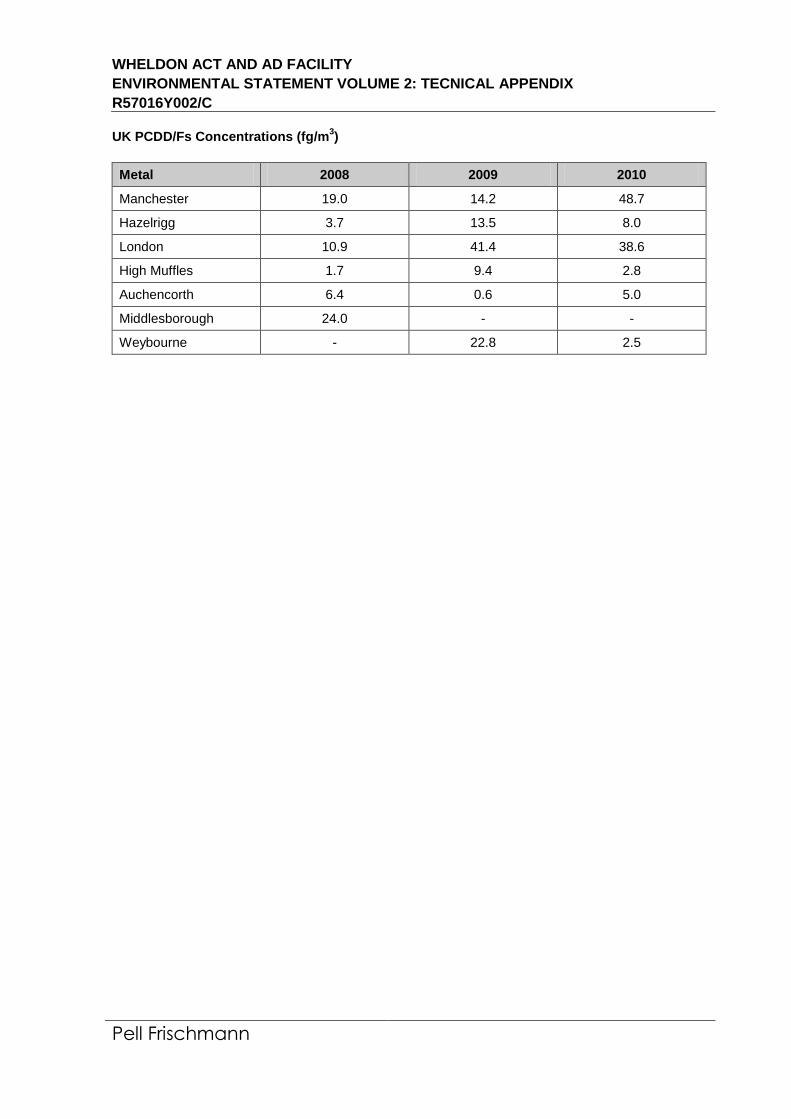
WHELDON ACT AND AD FACILITY
ENVIRONMENTAL STATEMENT VOLUME 2: TECNICAL APPENDIX
R57016Y002/C
Pell Frischmann
UK PCDD/Fs Concentrations (fg/m3)
Metal 2008 2009 2010
Manchester 19.0 14.2 48.7
Hazelrigg 3.7 13.5 8.0
London 10.9 41.4 38.6
High Muffles 1.7 9.4 2.8
Auchencorth 6.4 0.6 5.0
Middlesborough 24.0 - -
Weybourne - 22.8 2.5
WHELDON ACT AND AD FACILITY
ENVIRONMENTAL STATEMENT VOLUME 2: TECNICAL APPENDIX
R57016Y002/C
Pell Frischmann
APPENDIX 7.6
POTENTIAL SIGNIFICANT EFFECTS - OPERATION
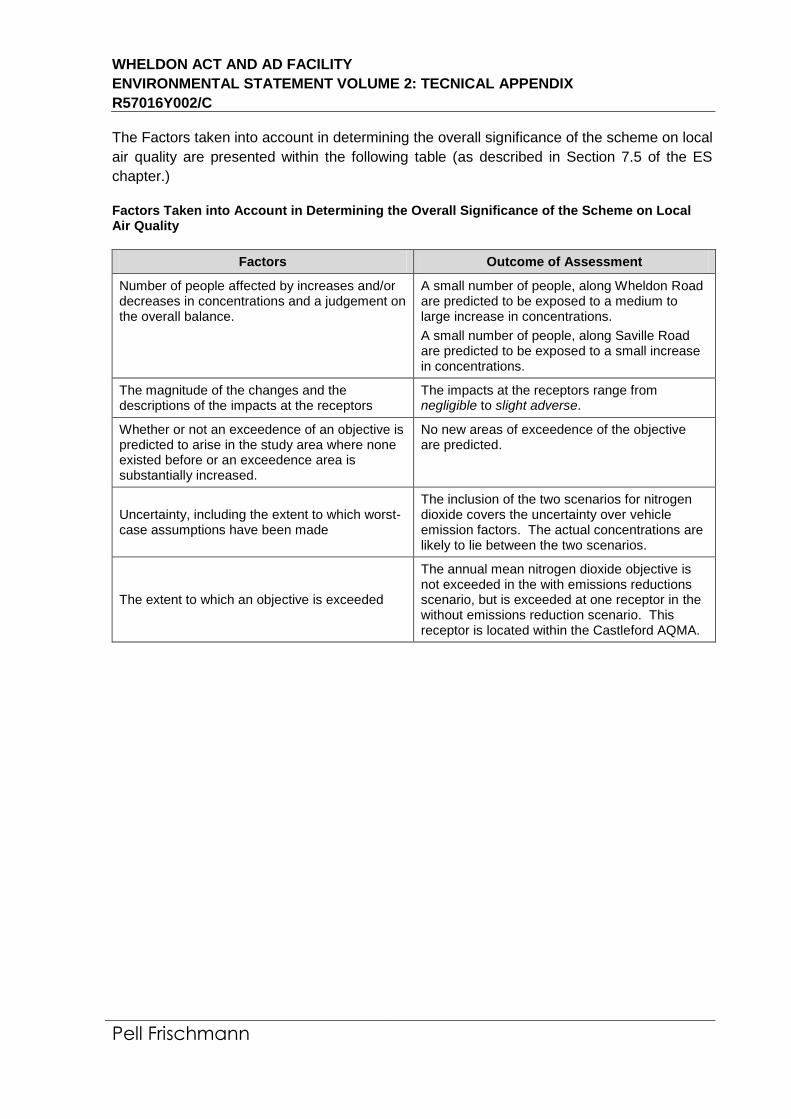
WHELDON ACT AND AD FACILITY
ENVIRONMENTAL STATEMENT VOLUME 2: TECNICAL APPENDIX
R57016Y002/C
Pell Frischmann
The Factors taken into account in determining the overall significance of the scheme on local
air quality are presented within the following table (as described in Section 7.5 of the ES
chapter.)
Factors Taken into Account in Determining the Overall Significance of the Scheme on Local Air Quality
Factors Outcome of Assessment
Number of people affected by increases and/or decreases in concentrations and a judgement on the overall balance.
A small number of people, along Wheldon Road are predicted to be exposed to a medium to large increase in concentrations.
A small number of people, along Saville Road are predicted to be exposed to a small increase in concentrations.
The magnitude of the changes and the descriptions of the impacts at the receptors
The impacts at the receptors range from negligible to slight adverse.
Whether or not an exceedence of an objective is predicted to arise in the study area where none existed before or an exceedence area is substantially increased.
No new areas of exceedence of the objective are predicted.
Uncertainty, including the extent to which worst-case assumptions have been made
The inclusion of the two scenarios for nitrogen dioxide covers the uncertainty over vehicle emission factors. The actual concentrations are likely to lie between the two scenarios.
The extent to which an objective is exceeded
The annual mean nitrogen dioxide objective is not exceeded in the with emissions reductions scenario, but is exceeded at one receptor in the without emissions reduction scenario. This receptor is located within the Castleford AQMA.
WHELDON ACT AND AD FACILITY
ENVIRONMENTAL STATEMENT VOLUME 2: TECNICAL APPENDIX
R57016Y002/C
Pell Frischmann
APPENDIX 7.7
CONSTRUCTION MITIGATION
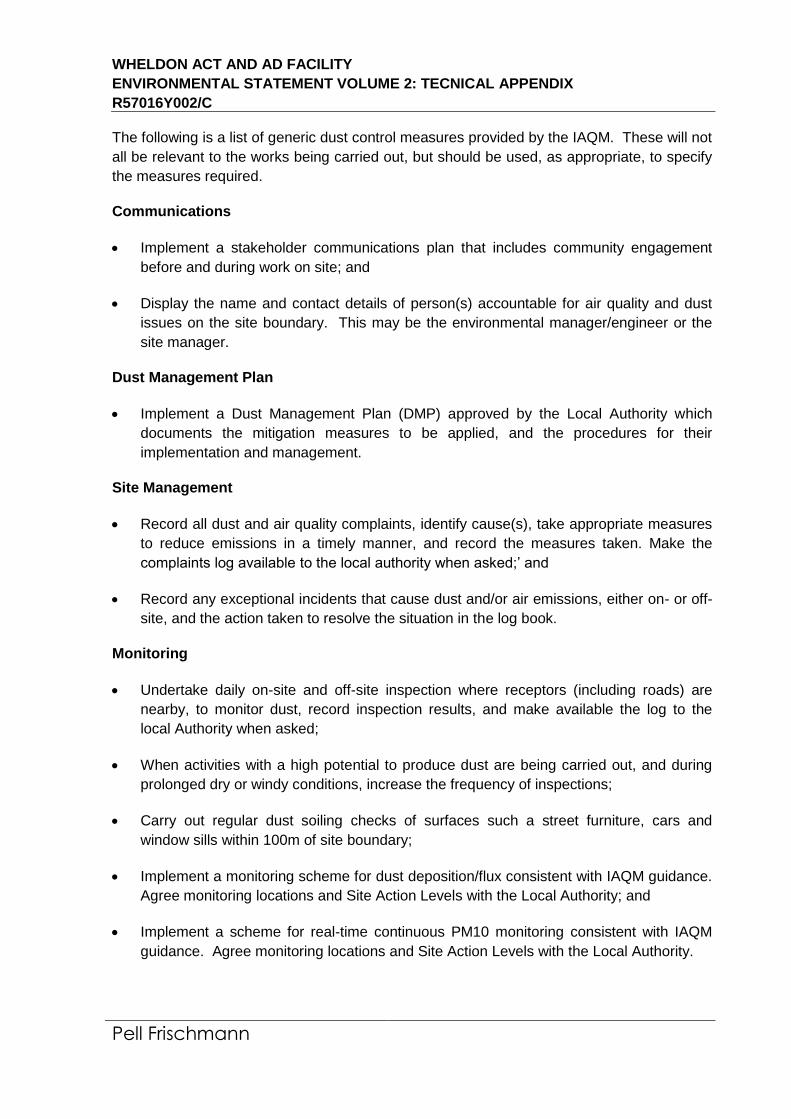
WHELDON ACT AND AD FACILITY
ENVIRONMENTAL STATEMENT VOLUME 2: TECNICAL APPENDIX
R57016Y002/C
Pell Frischmann
The following is a list of generic dust control measures provided by the IAQM. These will not
all be relevant to the works being carried out, but should be used, as appropriate, to specify
the measures required.
Communications
Implement a stakeholder communications plan that includes community engagement
before and during work on site; and
Display the name and contact details of person(s) accountable for air quality and dust
issues on the site boundary. This may be the environmental manager/engineer or the
site manager.
Dust Management Plan
Implement a Dust Management Plan (DMP) approved by the Local Authority which
documents the mitigation measures to be applied, and the procedures for their
implementation and management.
Site Management
Record all dust and air quality complaints, identify cause(s), take appropriate measures
to reduce emissions in a timely manner, and record the measures taken. Make the
complaints log available to the local authority when asked;’ and
Record any exceptional incidents that cause dust and/or air emissions, either on- or off-
site, and the action taken to resolve the situation in the log book.
Monitoring
Undertake daily on-site and off-site inspection where receptors (including roads) are
nearby, to monitor dust, record inspection results, and make available the log to the
local Authority when asked;
When activities with a high potential to produce dust are being carried out, and during
prolonged dry or windy conditions, increase the frequency of inspections;
Carry out regular dust soiling checks of surfaces such a street furniture, cars and
window sills within 100m of site boundary;
Implement a monitoring scheme for dust deposition/flux consistent with IAQM guidance.
Agree monitoring locations and Site Action Levels with the Local Authority; and
Implement a scheme for real-time continuous PM10 monitoring consistent with IAQM
guidance. Agree monitoring locations and Site Action Levels with the Local Authority.
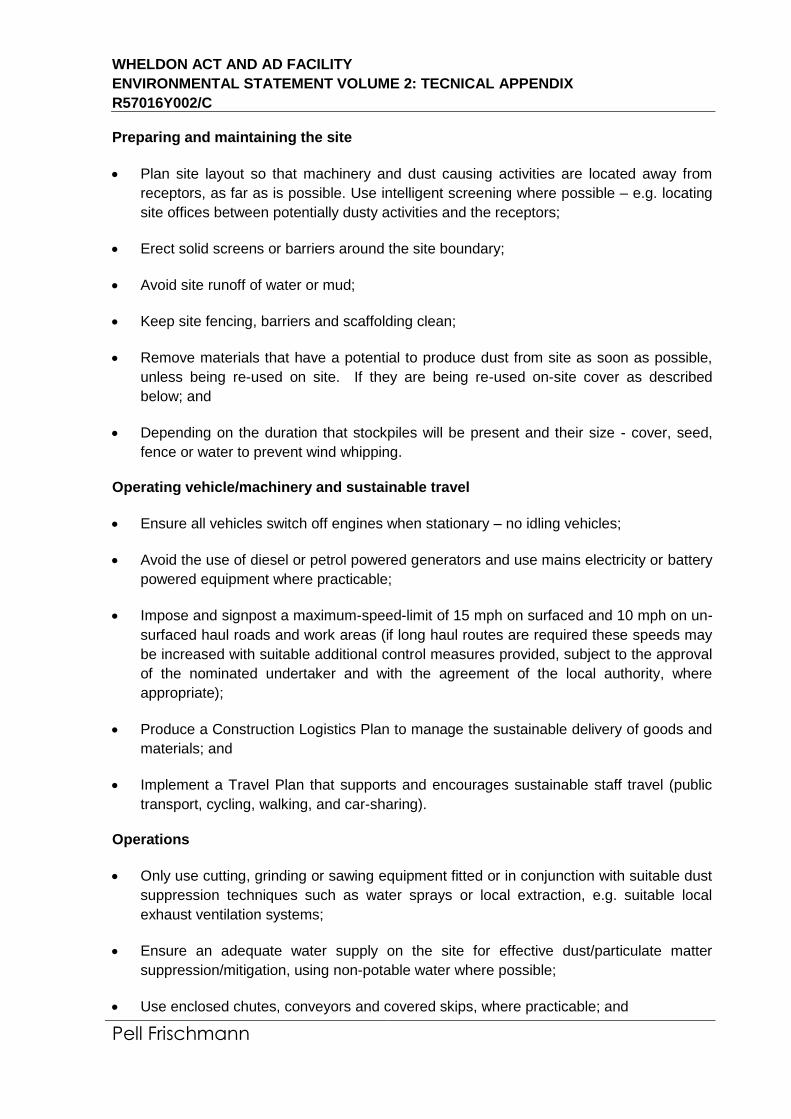
WHELDON ACT AND AD FACILITY
ENVIRONMENTAL STATEMENT VOLUME 2: TECNICAL APPENDIX
R57016Y002/C
Pell Frischmann
Preparing and maintaining the site
Plan site layout so that machinery and dust causing activities are located away from
receptors, as far as is possible. Use intelligent screening where possible – e.g. locating
site offices between potentially dusty activities and the receptors;
Erect solid screens or barriers around the site boundary;
Avoid site runoff of water or mud;
Keep site fencing, barriers and scaffolding clean;
Remove materials that have a potential to produce dust from site as soon as possible,
unless being re-used on site. If they are being re-used on-site cover as described
below; and
Depending on the duration that stockpiles will be present and their size - cover, seed,
fence or water to prevent wind whipping.
Operating vehicle/machinery and sustainable travel
Ensure all vehicles switch off engines when stationary – no idling vehicles;
Avoid the use of diesel or petrol powered generators and use mains electricity or battery
powered equipment where practicable;
Impose and signpost a maximum-speed-limit of 15 mph on surfaced and 10 mph on un-
surfaced haul roads and work areas (if long haul routes are required these speeds may
be increased with suitable additional control measures provided, subject to the approval
of the nominated undertaker and with the agreement of the local authority, where
appropriate);
Produce a Construction Logistics Plan to manage the sustainable delivery of goods and
materials; and
Implement a Travel Plan that supports and encourages sustainable staff travel (public
transport, cycling, walking, and car-sharing).
Operations
Only use cutting, grinding or sawing equipment fitted or in conjunction with suitable dust
suppression techniques such as water sprays or local extraction, e.g. suitable local
exhaust ventilation systems;
Ensure an adequate water supply on the site for effective dust/particulate matter
suppression/mitigation, using non-potable water where possible;
Use enclosed chutes, conveyors and covered skips, where practicable; and
WHELDON ACT AND AD FACILITY
ENVIRONMENTAL STATEMENT VOLUME 2: TECNICAL APPENDIX
R57016Y002/C
Pell Frischmann
Ensure equipment is readily available on site to clean any dry spillages, and clean up
spillages as soon as reasonably practicable after the event using wet cleaning methods.
Waste Management
Only use registered waste carriers to take waste off-site; and
Avoid bonfires and burning of waste materials.
Measures Specific to Earthworks
Re-vegetate earthworks and exposed areas/soil stockpiles to stabilise surfaces as soon
as practicable. Use Hessian, mulches or trackifiers where it is not possible to re-
vegetate or cover with topsoil, as soon as practicable. Only remove the cover in a small
areas during work and not all at once.
Measures Specific to Construction
Avoid scabbling, if possible;
Ensure sand and other aggregates are stored in bunded areas and are not allowed to
dry out, unless this is required for a particular process, in which case ensure that
appropriate additional control measures are in place; and
Ensure bulk cement and other fine powder materials are delivered in enclosed tankers
and stored in silos with suitable emission control systems to prevent escape of material
and overfilling during delivery.
Measures Specific to Trackout
Use water-assisted dust sweeper(s) on the access and local roads, to remove, as soon
as practicable any material tracked out of the site. This may require the sweeper being
continuously in use;
Ensure vehicles entering and leaving sites are covered to prevent escape of materials
during transport;
Record all inspections of haul routes and any subsequent action in a site log book;
Install hard surfaced haul routes, which are regularly damped down with fixed or mobile
sprinkler systems, or mobile water bowsers and regularly cleaned;
Inspect on-site haul routes for integrity and instigate necessary repairs to the surface as
soon as practicable;
Implement a wheel washing system (with rumble grids to dislodge accumulated dust
and mud prior to leaving the site); and

WHELDON ACT AND AD FACILITY
ENVIRONMENTAL STATEMENT VOLUME 2: TECNICAL APPENDIX
R57016Y002/C
Pell Frischmann
Ensure there is an adequate area of hard surfaced road between the wheel wash facility
and the site exit, wherever site size and layout permits. This can be in the form or a
static drive through facility or a manually operated power jet.
WHELDON Advanced Conversion Technology and Anaerobic Digestion Facility FLOOD RISK ASSESSMENT R57016T11Y001-B July 2013 Submitted by Pell Frischmann
WHELDON, CASTLEFORD FLOOD RISK ASSESSMENT R57016T11Y001A
Pell Frischmann Page 1
This report is to be regarded as confidential to our Client and it is intended for their use only and may not be assigned. Consequently and in accordance with current practice, any liability to any third party in respect of the whole or any part of its contents is hereby expressly excluded. Before the report or any part of it is reproduced or referred to in any document, circular or statement and before its contents or the contents of any part of it are disclosed orally to any third party, our written approval as to the form and context of such a publication or disclosure must be obtained
Prepared for:
Prepared by:
Clean Power Properties Ltd Forte Anne, Douglas Isle of Man IM1 5PD
Pell Frischmann Burrator House
Peninsula House Rydon Lane
Exeter EX2 7NT
REVISION RECORD Report Ref: P:\DATA\PROJINFO\E57016 WHELDON EIA\18 ENGINEERING\09
REPORTS_MEMOS\WORKING DOCUMENTS\FRA\R57016T11Y001B.DOC Rev Description Date Originator Checked Approved
A Initial Issue July 12 HM SG PDG
B Updated following site layout change
July 13 HM SS BAL
WHELDON, CASTLEFORD FLOOD RISK ASSESSMENT R57016T11Y001A
Pell Frischmann Page 2
CONTENTS
1. INTRODUCTION ........................................................................................................ 3
2. THE SITE ................................................................................................................... 3 2.1 SITE LOCATION............................................................................................... 3 2.2 SITE DESCRIPTION ........................................................................................ 4 2.3 WATERCOURSE .............................................................................................. 4
3. TOPOGRAPHY .......................................................................................................... 5
4. GEOLOGY ................................................................................................................. 5
5. EXISTING FLOOD RISK ............................................................................................ 5 5.1 FLUVIAL FLOOD RISK ..................................................................................... 5 5.2 GROUNDWATER FLOOD RISK ....................................................................... 6 5.3 SURFACE WATER FLOOD RISK .................................................................... 6 5.4 EXISTING FLOOD DEFENCES ........................................................................ 6 5.5 FLOOD HISTORY ............................................................................................. 7
6. PROPOSED DEVELOPMENT ................................................................................... 7 6.1 SEQUENTIAL TEST ......................................................................................... 7 6.2 FLOOD LEVELS ............................................................................................... 7
6.2.1 Analysis of Flood Levels and Topographic Survey ................................... 8 6.2.2 EA Consultation ....................................................................................... 8
6.3 DEVELOPMENT DESIGN HORIZON ............................................................... 8 6.4 CLIMATE CHANGE IMPACTS ......................................................................... 8 6.5 INCREASED RAINFALL INTENSITY ................................................................ 9 6.6 INCREASED FLUVIAL FLOW .......................................................................... 9
7. SURFACE WATER DRAINAGE STRATEGY ............................................................. 9 7.1 EXISTING SURFACE WATER DRAINAGE ...................................................... 9 7.2 EXISTING SURFACE WATER RUNOFF RATES ............................................. 9 7.3 PROPOSED SURFACE WATER DRAINAGE SYSTEM ................................... 9
7.3.1 Sustainable Drainage Systems ................................................................ 9 7.4 SURFACE WATER MANAGEMENT HIERARCHY ......................................... 10
7.4.1 Store rainwater for later use ................................................................... 10 7.4.2 British Geological Survey Infiltration SuDS Map .................................... 10
7.5 PROPOSED INFILTRATION STORAGE ........................................................ 10
8. SUMMARY ............................................................................................................... 11
9. LIMITATIONS AND UNCERTAINTIES ....................................................................... 1
APPENDICES A TOPOGRAPHIC SURVEY B PROPOSED SITE PLAN C ENVIRONMENT AGENCY INFORMATION D EXISTING SURFACE WATER RUNOFF RATES E PROPOSED STORAGE DESIGN F BRITISH GEOLOGICAL SURVEY SUDS INFILTRATION MAP

WHELDON, CASTLEFORD FLOOD RISK ASSESSMENT R57016T11Y001A
Pell Frischmann Page 3
1. INTRODUCTION
Pell Frischmann has been appointed by Clean Power Properties Ltd to undertake a Flood Risk Assessment (FRA) in support of the planning application for the proposed Advanced Conversion Technology and Anaerobic Digestion Facility at Wheldon near Castleford. This report has been provided to meet current legislative requirements and industry best practice. It is anticipated that the National Standards for sustainable drainage will be finalised and released in 2014. Following the release of this guidance, the surface water drainage strategy for the proposed development may need to be revised to take into account the changes set out in this document.
2. THE SITE 2.1 SITE LOCATION
The proposed site covers an area of approximately 5.3 ha and is roughly rectangular in shape. The site is located north of Castleford and 27 km to the east of Wakefield. The River Aire is located to the north of the site as illustrated in Figure 1 below.
Figure 1 – Location Plan of the site
Crown Copyright. All Rights Reserved. Licence Number 100004912.
Approximate
Site Location
River Aire
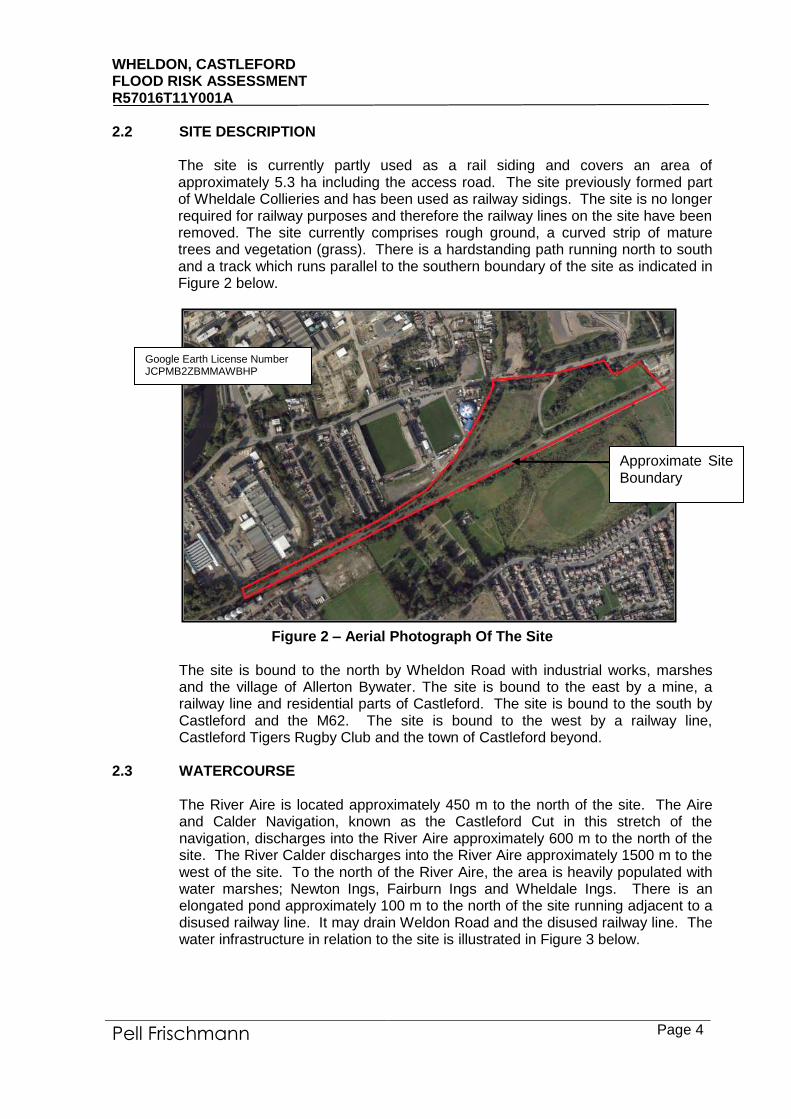
WHELDON, CASTLEFORD FLOOD RISK ASSESSMENT R57016T11Y001A
Pell Frischmann Page 4
2.2 SITE DESCRIPTION
The site is currently partly used as a rail siding and covers an area of approximately 5.3 ha including the access road. The site previously formed part of Wheldale Collieries and has been used as railway sidings. The site is no longer required for railway purposes and therefore the railway lines on the site have been removed. The site currently comprises rough ground, a curved strip of mature trees and vegetation (grass). There is a hardstanding path running north to south and a track which runs parallel to the southern boundary of the site as indicated in Figure 2 below.
Figure 2 – Aerial Photograph Of The Site
The site is bound to the north by Wheldon Road with industrial works, marshes and the village of Allerton Bywater. The site is bound to the east by a mine, a railway line and residential parts of Castleford. The site is bound to the south by Castleford and the M62. The site is bound to the west by a railway line, Castleford Tigers Rugby Club and the town of Castleford beyond.
2.3 WATERCOURSE
The River Aire is located approximately 450 m to the north of the site. The Aire and Calder Navigation, known as the Castleford Cut in this stretch of the navigation, discharges into the River Aire approximately 600 m to the north of the site. The River Calder discharges into the River Aire approximately 1500 m to the west of the site. To the north of the River Aire, the area is heavily populated with water marshes; Newton Ings, Fairburn Ings and Wheldale Ings. There is an elongated pond approximately 100 m to the north of the site running adjacent to a disused railway line. It may drain Weldon Road and the disused railway line. The water infrastructure in relation to the site is illustrated in Figure 3 below.
Google Earth License Number JCPMB2ZBMMAWBHP
Approximate Site Boundary
WHELDON, CASTLEFORD FLOOD RISK ASSESSMENT R57016T11Y001A
Pell Frischmann Page 5
Figure 3 – Watercourses Near To The Site
3. TOPOGRAPHY
A topographical survey was undertaken in June 2012 by David J Webb Surveys and is included in Appendix B. It indicates that the site slopes from the south east at 21.35 mAOD to the west at 14.08 mAOD. Wheldon Road to the north of the site lies at a level of 14.98 mAOD and the access track lies at 15.41 mAOD.
4. GEOLOGY
The Geo-Environmental Assessment Report (ref E57016/VBA/T08/01) states that the north western section of the site is underlain by superficial deposits of Alluvium comprising Clay, Silt, Sand and Gravel. The site is underlain by the Pennine Middle Coal Measures Formation comprising Mudstone, Siltstone and Sandstone. Furthermore, the site is not located within a Source Protection Zone (SPZ).
5. EXISTING FLOOD RISK
5.1 FLUVIAL FLOOD RISK
The Environment Agency’s (EA) Flood Map indicates that the north western boundary of the site lies within an area at medium risk of flooding, Flood Zone 2. Also Flood Zone 2 is shown to extend up to the railway embankment at the south
Crown Copyright. All Rights Reserved. Licence Number 100004912.
Pond
Approximate Site Boundary
Aire and Calder Navigation / Castleford Cut
River Aire
WHELDON, CASTLEFORD FLOOD RISK ASSESSMENT R57016T11Y001A
Pell Frischmann Page 6
west of the site. Flood Zone 2 comprises land assessed as having between a 1 in 100 and 1 in 1000 annual probability of river flooding (1 % - 0.1 %) in any year. It appears that the railway embankment to the north west of the site, demarks the edge of the Flood Zone 3; an area at high risk of flooding as illustrated in Figure 4 below and in Appendix C.
Figure 4 – EA Flood Map
The EA Flood Map indicates that all proposed development as well as the vehicular access road is outside of Flood Zone 2 and 3. There is considered to be a low risk of fluvial flooding to the site. The EA Flood Map also identifies that there is ‘An Area Benefitting From Flood Defences’ situated to the west of the site. This area includes the school to the south of Wheldon Road and the residential area sandwiched between the River Aire and the Aire and Calder Navigation.
5.2 GROUNDWATER FLOOD RISK
British Geological Survey maps illustrate that the site is shown to be underlain by Mudstone, Siltstone and Sandstone from the Pennine Lower Coal Measures Formation. Furthermore, the groundwater levels are low in the area therefore the site is considered to have a low risk of groundwater flooding.
5.3 SURFACE WATER FLOOD RISK
There are no known surface water flooding issues on the site. It is recommended that surface water from the proposed development will be controlled using appropriate Sustainable Drainage Systems (SuDS) to ensure the development does not have a negative impact on the downstream catchment. There is considered to be a low risk of flooding from surface water.
5.4 EXISTING FLOOD DEFENCES The EA provided information about flood defences near the site and is included in Appendix C. A defence map of the site indicates that there are defences along the River Aire which comprise ‘high ground’ which extend from Bulholme Lock, situated to the north of the site, to Fairburn Ings, situated to the north east of the site.
Edge of Flood Zone 3
WHELDON, CASTLEFORD FLOOD RISK ASSESSMENT R57016T11Y001A
Pell Frischmann Page 7
The defences are considered to have a design standard of 1 in 100 years. The EA rate the condition of defences based on performance. Each asset is given a rating between one and five with one being very good condition and five being very poor. A condition rating of three or 'fair' is the minimal acceptable standard for a critical asset, such as a defence wall that protects properties. The defences along the River Aire north of the site have been rated as two.
5.5 FLOOD HISTORY
The EA provided information about historical flooding for the site and is included in Appendix C. It indicates that the site has not flooded in the past. The flood history map illustrates that flood levels on the River Aire during the Autumn 2000 flood event were 11.37 mAOD. The River Aire flooded in January 2008, 2007, February 2002, Autumn 2000, 1995 and 1978. The flood history map indicates that the flood waters were at least 300 m or more away from the site during these flood events.
6. PROPOSED DEVELOPMENT
The proposed development comprises an Advanced Conversion Technology and Anaerobic Digestion Facility. The proposed site layout is included in Appendix B. The proposals comprise one rectangular shaped building which will be split into four zones including a reception and offices. The proposals also indicate a rail unloading area to the north corner of the site, car parking to the east of the building and four tanks situated to the western site boundary. It is proposed that the existing access road, situated to the north east of the site will be utilised within the scheme. An additional access road will be constructed to the north east of the site from Wheldon Road.
6.1 SEQUENTIAL TEST
The Technical Guidance to the National Planning Policy Framework (NPPF) identifies that the Sequential Test should be carried out to ensure that sites are chosen within low areas of flood risk. The Technical Guidance to the NPPF states that waste treatment facilities are classified as ‘Less Vulnerable’ within the Flood Risk Vulnerability Classification. The Flood Risk Vulnerability and Flood Zone Compatibility (Table 3) in the Technical Guidance to the NPPF indicates that ‘Less Vulnerable’ developments are appropriate for location in all flood zones, except Flood Zone 3b ‘Functional Floodplain’. The site lies 2 m above the 1 in 100 year flood level with an allowance for climate change therefore the site is considered to be within Flood Zone 1. As a result, the proposed development is considered to meet the requirements of the Sequential Test.
6.2 FLOOD LEVELS The EA provided modelled flood levels at various nodes along the River Aire. A map showing the location of the nodes is included in Appendix C. Node 2671203687 and node 2671203432 are located on the River Aire north of the
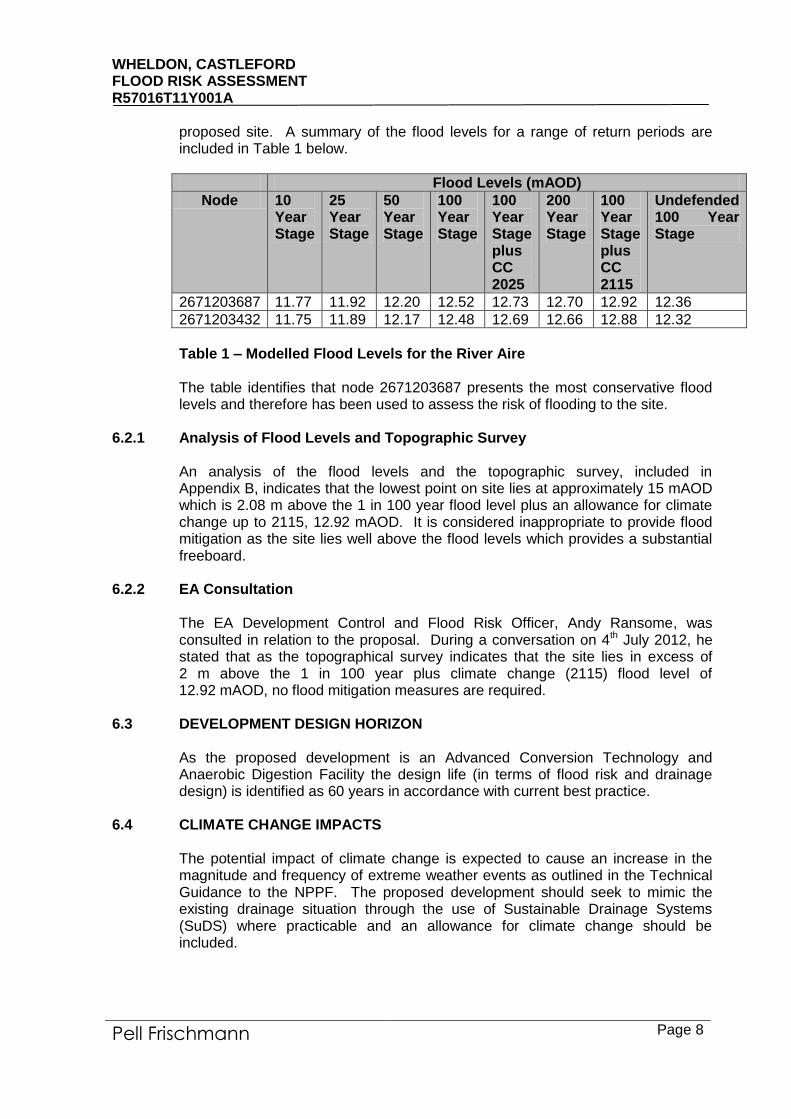
WHELDON, CASTLEFORD FLOOD RISK ASSESSMENT R57016T11Y001A
Pell Frischmann Page 8
proposed site. A summary of the flood levels for a range of return periods are included in Table 1 below.
Flood Levels (mAOD)
Node 10 Year Stage
25 Year Stage
50 Year Stage
100 Year Stage
100 Year Stage plus CC 2025
200 Year Stage
100 Year Stage plus CC 2115
Undefended 100 Year Stage
2671203687 11.77 11.92 12.20 12.52 12.73 12.70 12.92 12.36
2671203432 11.75 11.89 12.17 12.48 12.69 12.66 12.88 12.32
Table 1 – Modelled Flood Levels for the River Aire The table identifies that node 2671203687 presents the most conservative flood levels and therefore has been used to assess the risk of flooding to the site.
6.2.1 Analysis of Flood Levels and Topographic Survey
An analysis of the flood levels and the topographic survey, included in Appendix B, indicates that the lowest point on site lies at approximately 15 mAOD which is 2.08 m above the 1 in 100 year flood level plus an allowance for climate change up to 2115, 12.92 mAOD. It is considered inappropriate to provide flood mitigation as the site lies well above the flood levels which provides a substantial freeboard.
6.2.2 EA Consultation
The EA Development Control and Flood Risk Officer, Andy Ransome, was consulted in relation to the proposal. During a conversation on 4th July 2012, he stated that as the topographical survey indicates that the site lies in excess of 2 m above the 1 in 100 year plus climate change (2115) flood level of 12.92 mAOD, no flood mitigation measures are required.
6.3 DEVELOPMENT DESIGN HORIZON As the proposed development is an Advanced Conversion Technology and Anaerobic Digestion Facility the design life (in terms of flood risk and drainage design) is identified as 60 years in accordance with current best practice.
6.4 CLIMATE CHANGE IMPACTS
The potential impact of climate change is expected to cause an increase in the magnitude and frequency of extreme weather events as outlined in the Technical Guidance to the NPPF. The proposed development should seek to mimic the existing drainage situation through the use of Sustainable Drainage Systems (SuDS) where practicable and an allowance for climate change should be included.
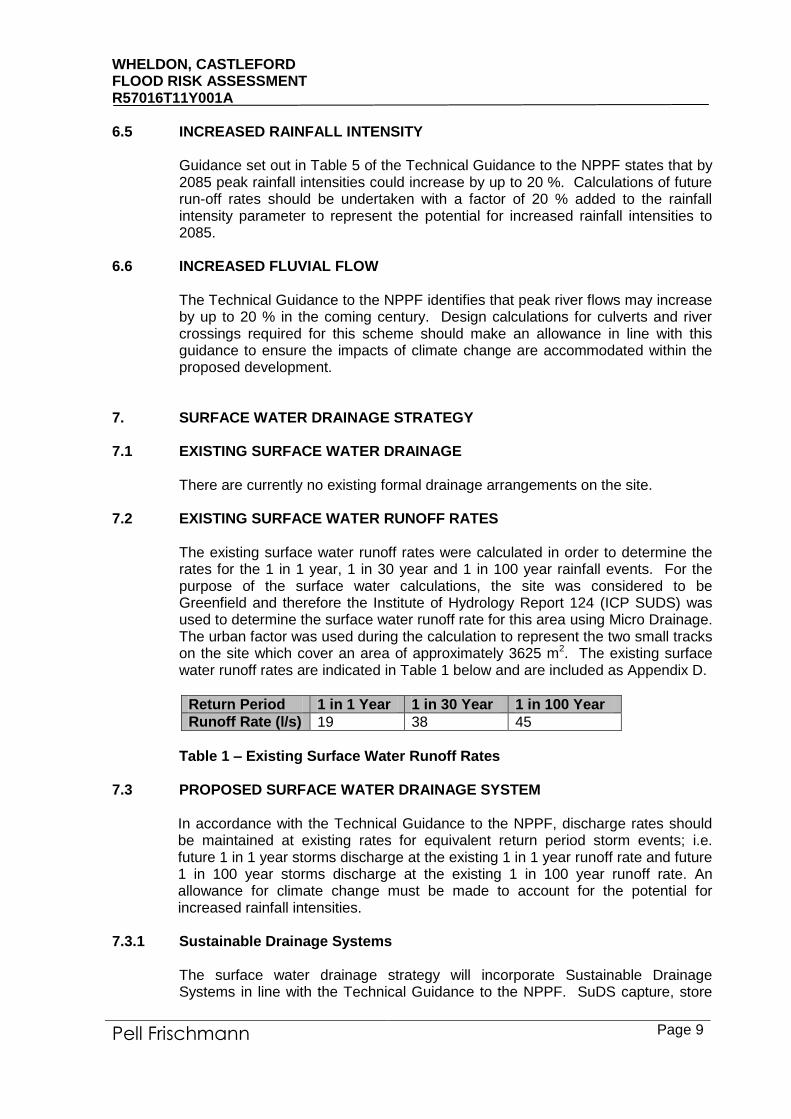
WHELDON, CASTLEFORD FLOOD RISK ASSESSMENT R57016T11Y001A
Pell Frischmann Page 9
6.5 INCREASED RAINFALL INTENSITY Guidance set out in Table 5 of the Technical Guidance to the NPPF states that by 2085 peak rainfall intensities could increase by up to 20 %. Calculations of future run-off rates should be undertaken with a factor of 20 % added to the rainfall intensity parameter to represent the potential for increased rainfall intensities to 2085.
6.6 INCREASED FLUVIAL FLOW
The Technical Guidance to the NPPF identifies that peak river flows may increase by up to 20 % in the coming century. Design calculations for culverts and river crossings required for this scheme should make an allowance in line with this guidance to ensure the impacts of climate change are accommodated within the proposed development.
7. SURFACE WATER DRAINAGE STRATEGY
7.1 EXISTING SURFACE WATER DRAINAGE
There are currently no existing formal drainage arrangements on the site.
7.2 EXISTING SURFACE WATER RUNOFF RATES The existing surface water runoff rates were calculated in order to determine the rates for the 1 in 1 year, 1 in 30 year and 1 in 100 year rainfall events. For the purpose of the surface water calculations, the site was considered to be Greenfield and therefore the Institute of Hydrology Report 124 (ICP SUDS) was used to determine the surface water runoff rate for this area using Micro Drainage. The urban factor was used during the calculation to represent the two small tracks on the site which cover an area of approximately 3625 m2. The existing surface water runoff rates are indicated in Table 1 below and are included as Appendix D.
Return Period 1 in 1 Year 1 in 30 Year 1 in 100 Year
Runoff Rate (l/s) 19 38 45
Table 1 – Existing Surface Water Runoff Rates
7.3 PROPOSED SURFACE WATER DRAINAGE SYSTEM
In accordance with the Technical Guidance to the NPPF, discharge rates should be maintained at existing rates for equivalent return period storm events; i.e. future 1 in 1 year storms discharge at the existing 1 in 1 year runoff rate and future 1 in 100 year storms discharge at the existing 1 in 100 year runoff rate. An allowance for climate change must be made to account for the potential for increased rainfall intensities.
7.3.1 Sustainable Drainage Systems
The surface water drainage strategy will incorporate Sustainable Drainage Systems in line with the Technical Guidance to the NPPF. SuDS capture, store
WHELDON, CASTLEFORD FLOOD RISK ASSESSMENT R57016T11Y001A
Pell Frischmann Page 10
and release surface water and are designed to replicate predevelopment discharge rates and volumes as far as practical.
7.4 SURFACE WATER MANAGEMENT HIERARCHY
The surface water management hierarchy CIRIA SuDS Manual C697 states that surface water run-off should be managed as close to its source as possible in line with the following hierarchy detailed below:
1. Store rainwater for later use 2. Infiltration techniques 3. Attenuate in ponds or open water features for gradual release 4. Attenuate in tanks or sealed water features for gradual release 5. Discharge direct to a watercourse 6. Discharge to a surface water sewer 7. Discharge to a combined sewer
7.4.1 Store rainwater for later use
The report entitled Technical Description Clean Power Properties Ltd January 2012 indicates that “the rainwater falling onto buildings will be harvested, treated and used within the process for steam generation and cleaning. All rainwater falling on hardstanding areas on the site will be harvested in a greywater storage tank and used for process wash down, floor cleaning and vehicle wash. During periods of excess rain and when both the rainwater and greywater storage tanks are full, rain water shall be discharged directly from the site in accordance with the surface water drainage strategy”.
7.4.2 British Geological Survey Infiltration SuDS Map
The British Geological Survey Infiltration SuDS Map was reviewed in relation to the proposed site. It indicates there are ‘very significant’ constraints at the site in the form of high groundwater levels which are shown to be less than 3 m below the ground level. It is recommended that site specific infiltration testing is carried out to determine the infiltration rate at the site as well as the level of the ground water.
7.5 PROPOSED INFILTRATION STORAGE
For the purpose of drainage design it is assumed that both the rainwater harvesting tank and the greywater storage tanks are full and therefore attenuation or appropriately sized soakaways must be provided in addition to these tanks. The EA require that attenuation is designed to accommodate the 1 in 100 year rainfall event plus 20 % for climate change. The infiltration rate was assumed to be 0.1 m/hr as the Penine Lower Coal Measures are known to have good infiltration characteristics and 0.1 m/hr is a ‘low infiltration’ / conservative figure. The attenuation storage was calculated in outline in Micro Drainage. The calculation assumes that all rainwater infiltrates and there is no positive surface water runoff from the site. The calculation indicates that a cellular soakaway with a volume of 1360 m3 is required. This is based on a cellular soakaway with a plan area of 1440 m2, 1 m deep and 95 % porosity. The calculation has been included in Appendix E. It should be noted that the storage volume may change subject to
WHELDON, CASTLEFORD FLOOD RISK ASSESSMENT R57016T11Y001A
Pell Frischmann Page 11
the results of site specific infiltration testing, but that this figure is likely to be an upper limit. It is also recommended that any soakaway device is situated at least 5 m from any building in line with current best practice.
8. SUMMARY
This FRA has been prepared in support of a planning application for the proposed development of an Advanced Conversion Technology and Anaerobic Digestion Facility at Wheldon near Castleford.
The EA Flood Map indicates that the north west of the site is located within Flood Zone 2; an area at medium risk of flooding. This zone comprises land assessed as having between a 1 in 100 and 1 in 1000 annual probability of river flooding (1% - 0.1%).
The proposal is classed as ‘Less Vulnerable’ in the Flood Risk Vulnerability Classification in the Technical Guidance to NPPF. As the site is not located within Flood Zone 3, it is recommended that the proposal meets the requirements of the Sequential Test.
The EA provided flood levels for the 1 in 100 year return period plus an allowance for climate change (2115). It indicates that the ground level of the site lies in excess of 2 m above the flood level. As a result, the site is at low risk of flooding from the River Aire. The site plan indicates that there will be safe access and egress from the site during flood events as the vehicular access road is outside of Flood Zone 2 or 3. Furthermore the EA stated that no flood mitigation is required at this site.
Sustainable Drainage Systems (SuDS) have been proposed to manage the surface water runoff at the site to mimic the natural drainage scenario.
It is proposed that grey water on the site will be harvested, treated and used within the process for steam generation and cleaning. In addition, rain falling onto other hardstanding areas will be collected and used for process wash down, floor cleaning and vehicle wash.
It is proposed to infiltrate the surface water runoff in line with the Surface Water Management Hierarchy. An initial review of the geology indicates that infiltration should be feasible on the site as the sole method of surface water drainage disposal. It is recommended that site specific infiltration testing is carried out on site to verify this.
In addition, the surface water will be attenuated on the site to accommodate the 1 in 100 year event plus 20 % rainfall event. Outline calculations in Micro Drainage indicate that a soakaway with volume of 1360 m3 is required to attenuate the surface water runoff from the site. The site was treated as a Greenfield site, with an urban factor to take account of the existing impermeable on the site, for the purpose of the drainage calculations.
Soakaways should be located at least 5 m away from any building.

WHELDON, CASTLEFORD FLOOD RISK ASSESSMENT R57016T11Y001A
Pell Frischmann Page 12
It should be noted that the storage volume may alter depending on the infiltration rate determined from site specific testing.
WHELDON, CASTLEFORD FLOOD RISK ASSESSMENT R57016T11Y001A
Pell Frischmann
9. LIMITATIONS AND UNCERTAINTIES
This report has been prepared by Pell Frischmann with all reasonable skill, care and diligence, and taking account of the manpower and resources devoted to it by agreement with the client.
The information reviewed should not be considered exhaustive and has been accepted in good faith as providing true representative data with respect to site conditions. The information reported herein is based on the interpretation of data collected during a desk based assessment of flood risk including information held by third parties for which we cannot be held responsible. Should additional information become available that may influence the opinions expressed in this report, Pell Frischmann reserves the right to review such information and, if warranted, to alter the opinions accordingly.
The evaluation and conclusions do not preclude the existence of other site conditions which could not reasonably have been revealed at the time of writing. This report should be used for information purposes only and should not be construed as a comprehensive characterisation of all site conditions. In addition, this report has been prepared solely for the use of the client, and may not be relied upon by other parties without written consent from Pell Frischmann.
Pell Frischmann disclaims any responsibility to the client and others in respect of any matters outside the agreed scope of the work.

Pell Frischmann
APPENDIX A
TOPOGRAPHIC SURVEY
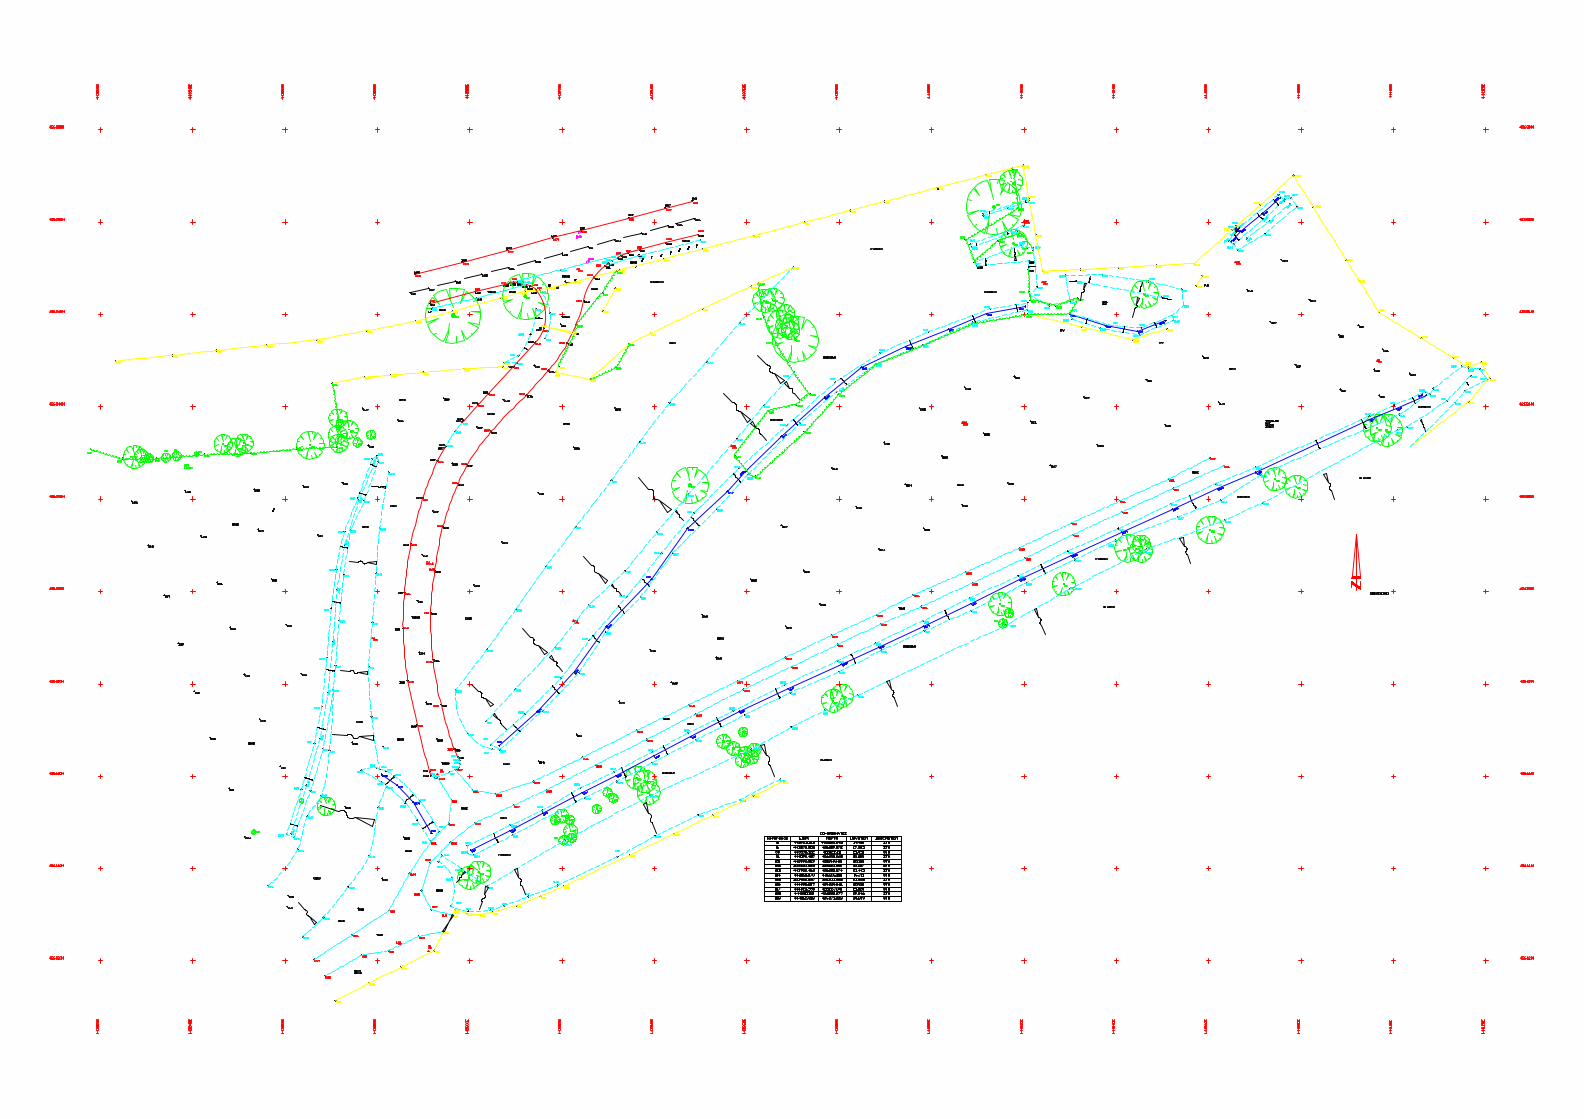

Pell Frischmann
APPENDIX B
PROPOSED SITE PLAN
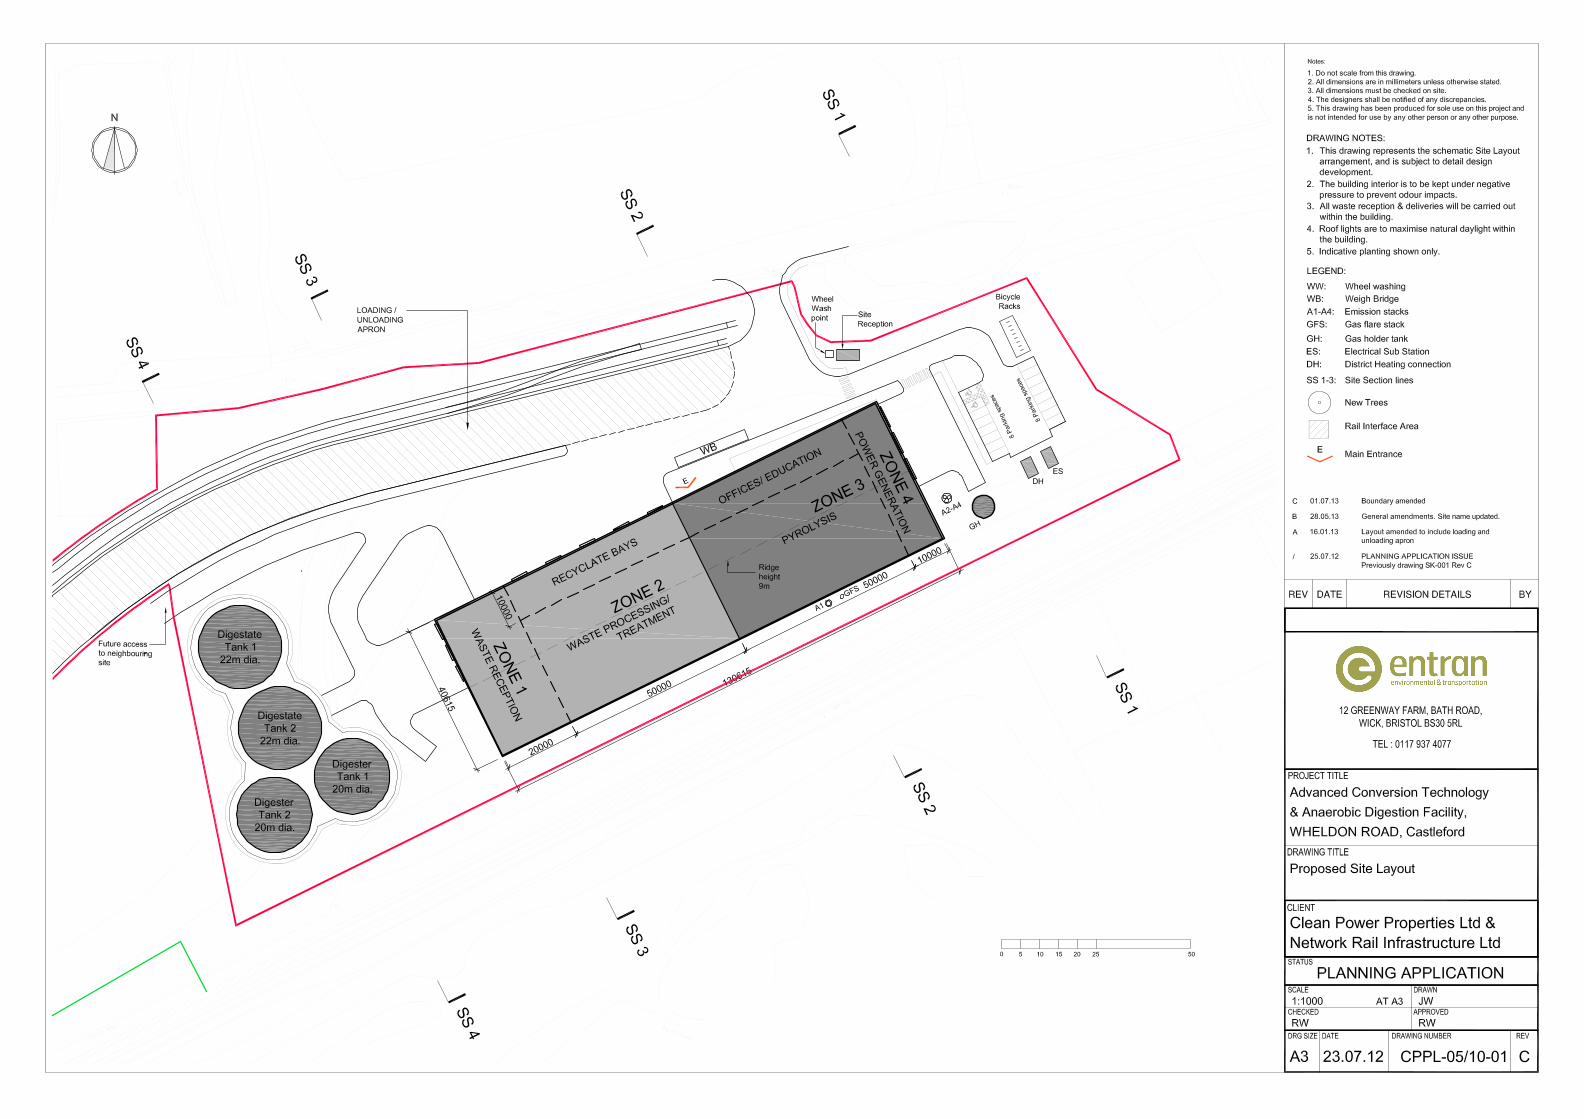
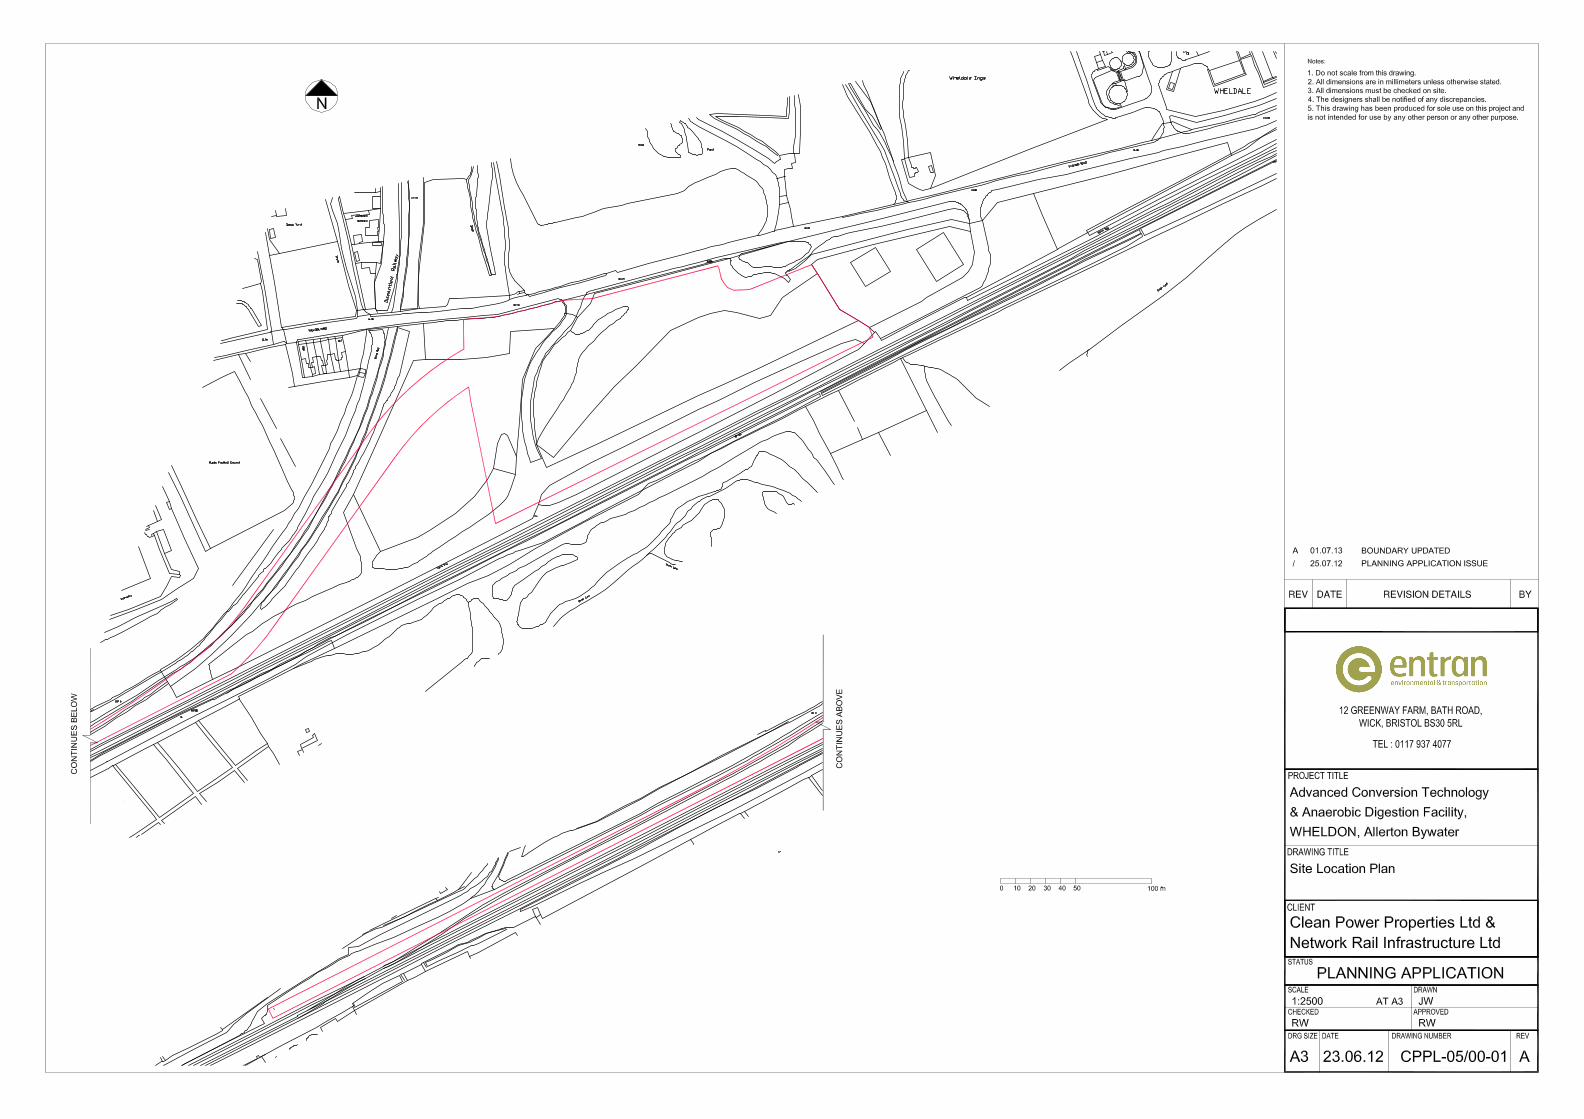
Pell Frischmann
APPENDIX C
ENVIRONMENT AGENCY INFORMATION
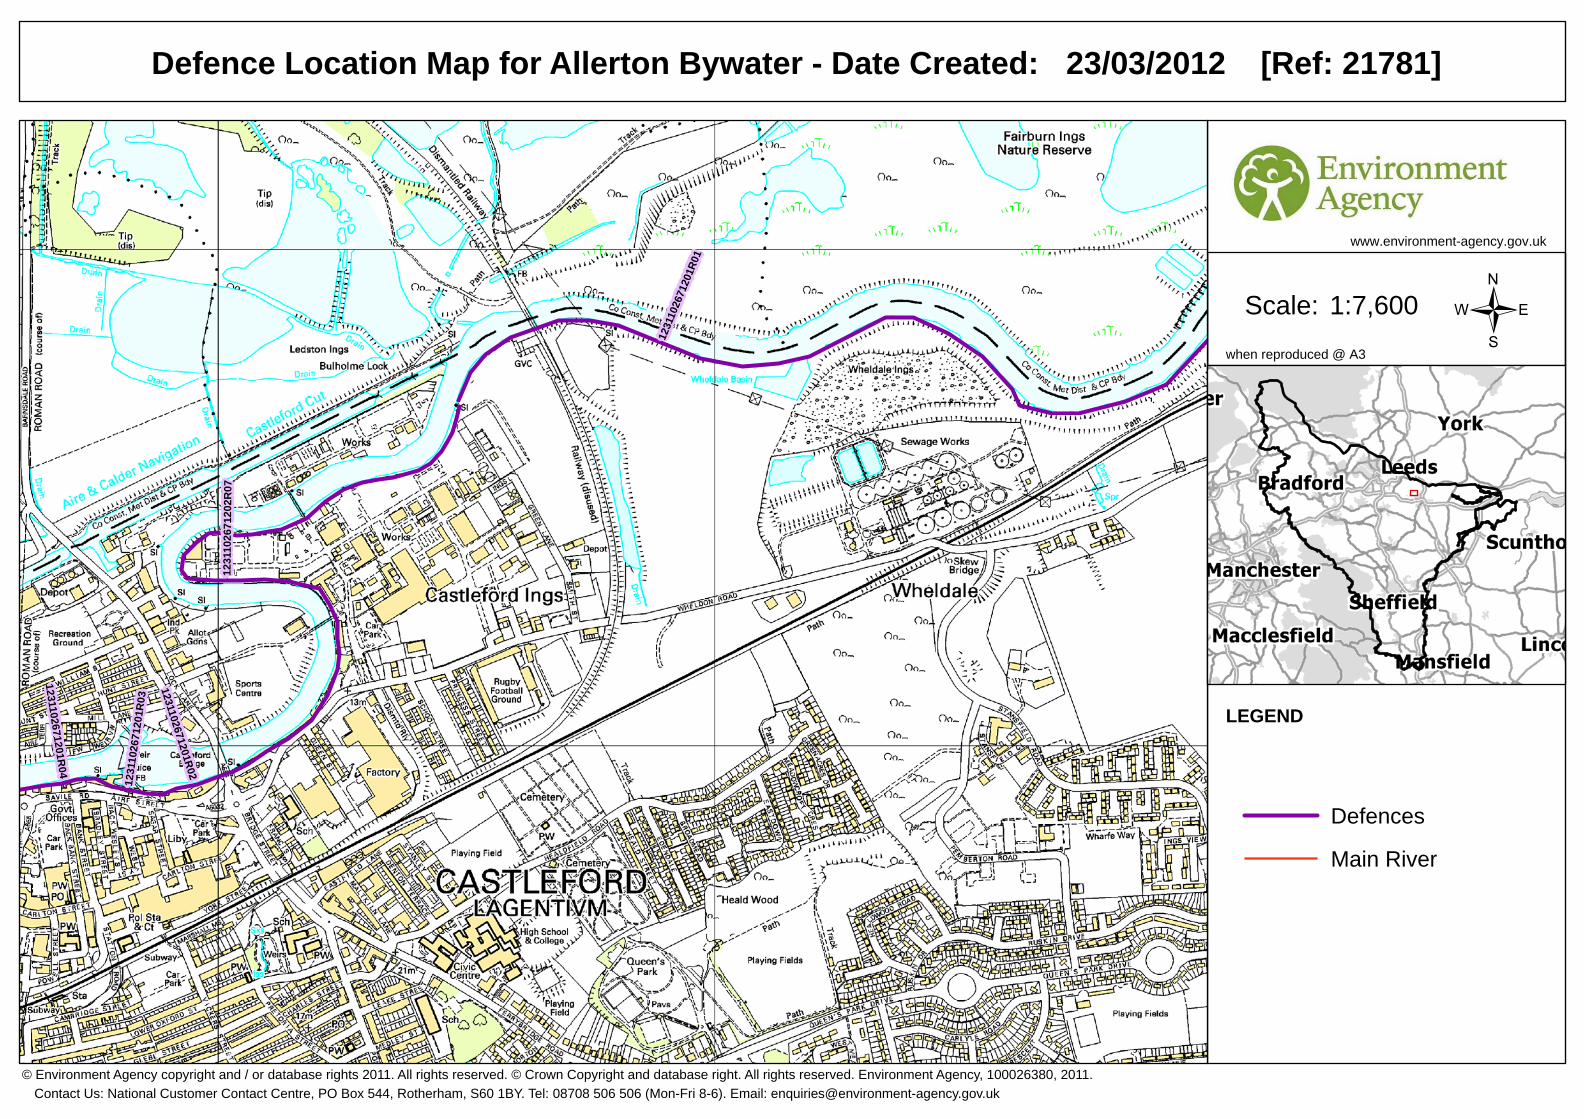
when reproduced @ A3
Scale:
23/03/2012
LEGEND
www.environment-agency.gov.uk
1231
1026
7120
1R01
1231
1026
7120
2R07
1231102671201R04
1231102671201R02
1231
1026
7120
1R03
1:7,600
Defences
Main River
/
Defence Location Map for Allerton Bywater - Date Created: [Ref: 21781]
Contact Us: National Customer Contact Centre, PO Box 544, Rotherham, S60 1BY. Tel: 08708 506 506 (Mon-Fri 8-6). Email: [email protected]© Environment Agency copyright and / or database rights 2011. All rights reserved. © Crown Copyright and database right. All rights reserved. Environment Agency, 100026380, 2011.
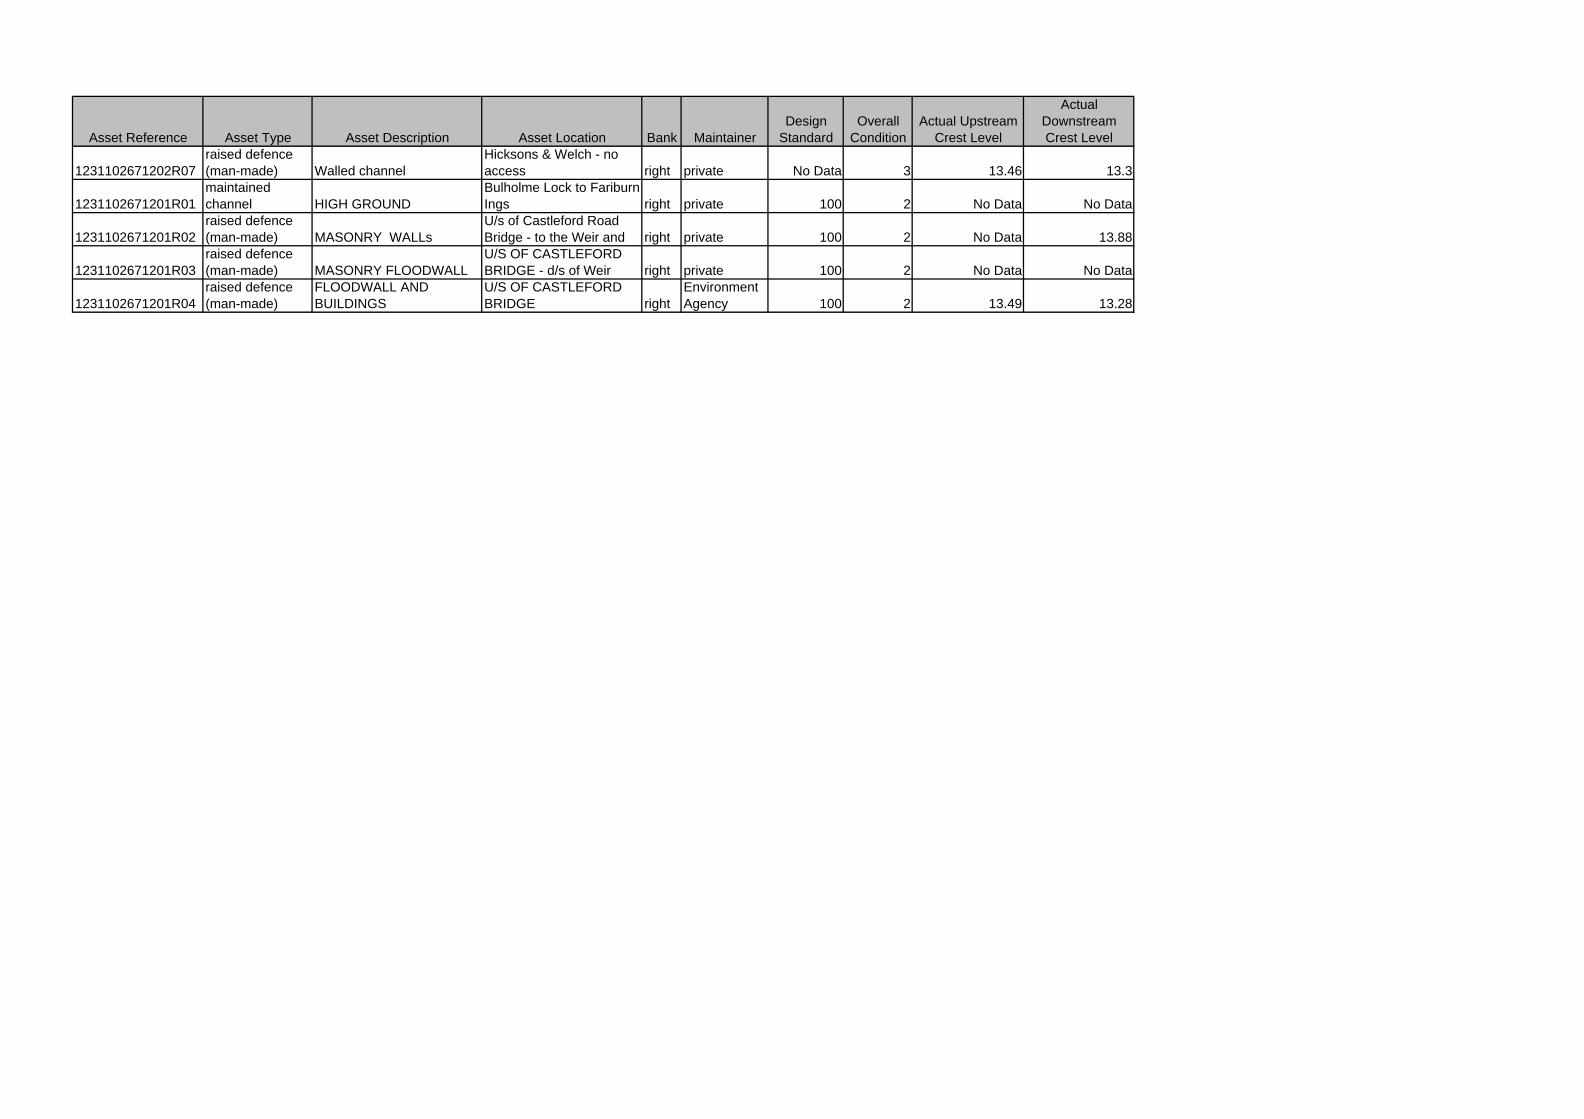
Asset Reference Asset Type Asset Description Asset Location Bank MaintainerDesign
StandardOverall
ConditionActual Upstream
Crest Level
Actual Downstream Crest Level
1231102671202R07raised defence (man-made) Walled channel
Hicksons & Welch - no access right private No Data 3 13.46 13.3
1231102671201R01maintained channel HIGH GROUND
Bulholme Lock to FariburnIngs
right private 100 2 No Data No Data
1231102671201R02raised defence (man-made) MASONRY WALLs
U/s of Castleford Road Bridge - to the Weir and right private 100 2 No Data 13.88
1231102671201R03raised defence (man-made) MASONRY FLOODWALL
U/S OF CASTLEFORD BRIDGE - d/s of Weir right private 100 2 No Data No Data
1231102671201R04raised defence (man-made)
FLOODWALL AND BUILDINGS
U/S OF CASTLEFORD BRIDGE right
Environment Agency 100 2 13.49 13.28
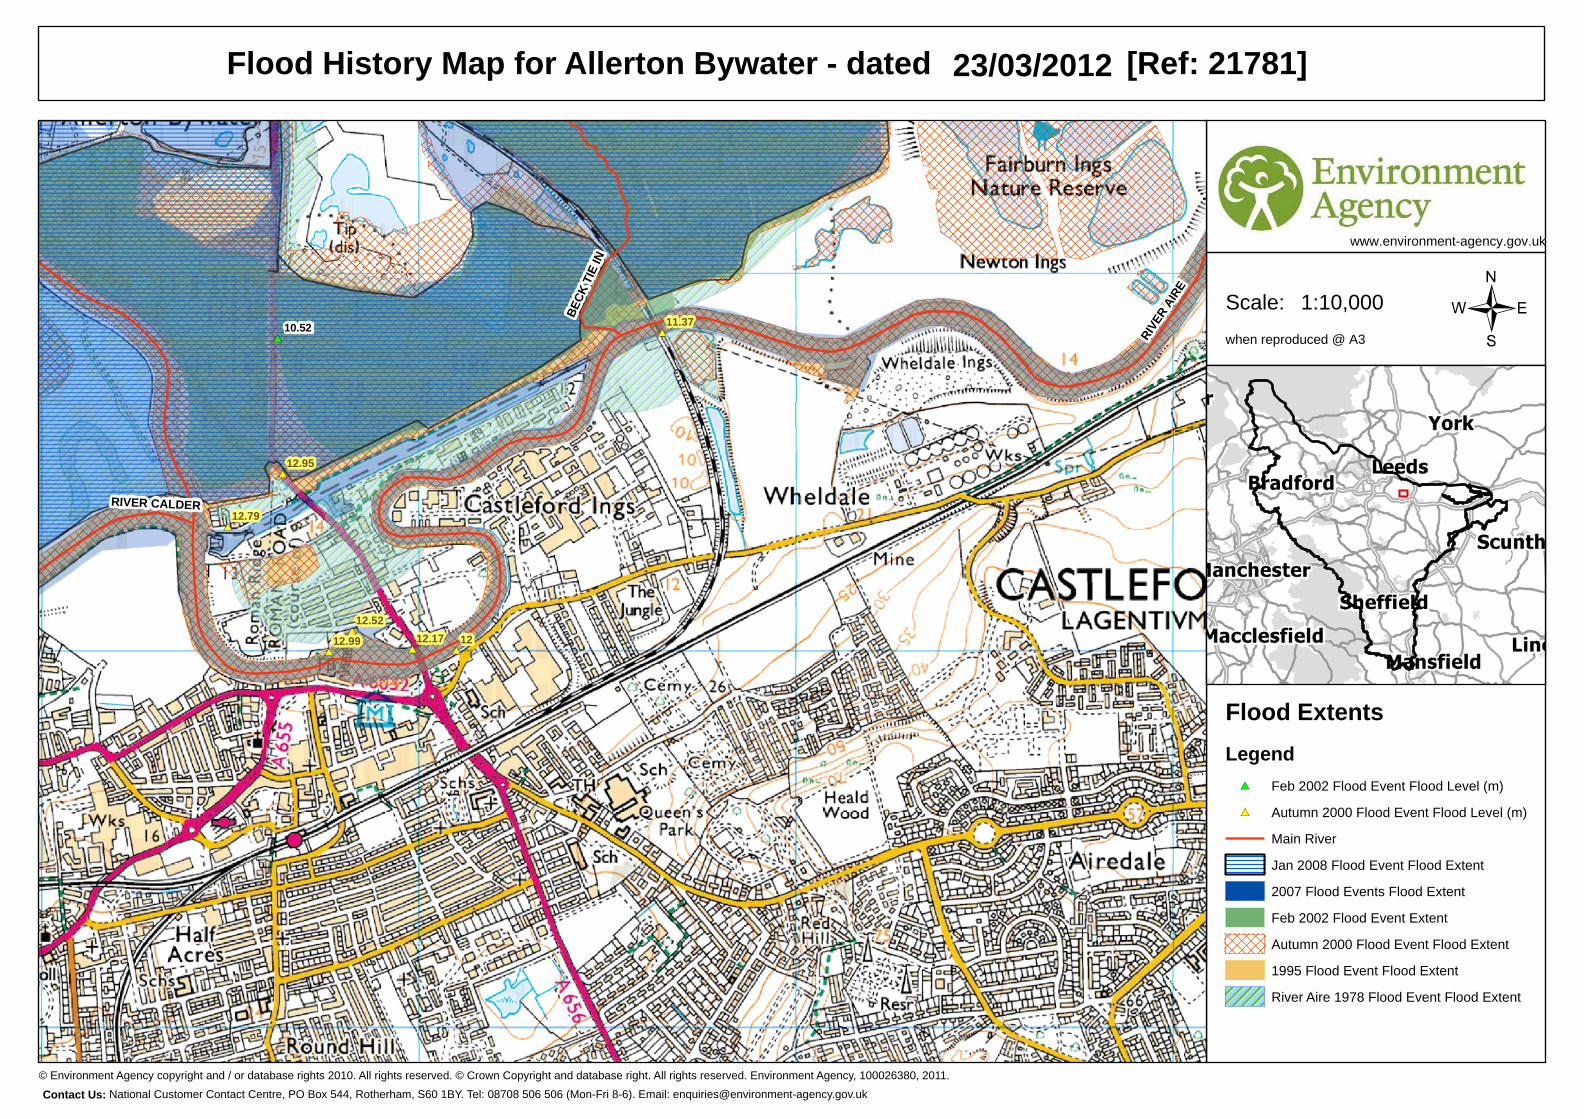
when reproduced @ A3
Scale:
23/03/2012
#* #*
#*
#*
#*
#*
#*
#*
#*
RIVE
R AI
RE
BECK
TIE
IN
RIVER CALDER
12
12.79
12.95
11.37
12.99
12.5212.17
10.52
Flood Extents
1:10,000
www.environment-agency.gov.uk
/
© Environment Agency copyright and / or database rights 2010. All rights reserved. © Crown Copyright and database right. All rights reserved. Environment Agency, 100026380, 2011.
Contact Us: National Customer Contact Centre, PO Box 544, Rotherham, S60 1BY. Tel: 08708 506 506 (Mon-Fri 8-6). Email: [email protected]
Flood History Map for Allerton Bywater - dated [Ref: 21781]
Legend#* Feb 2002 Flood Event Flood Level (m)
#* Autumn 2000 Flood Event Flood Level (m)
Main River
Jan 2008 Flood Event Flood Extent
2007 Flood Events Flood Extent
Feb 2002 Flood Event Extent
Autumn 2000 Flood Event Flood Extent
1995 Flood Event Flood Extent
River Aire 1978 Flood Event Flood Extent
when reproduced @ A3
Scale:
23/03/2012
LEGEND
www.environment-agency.gov.uk
RIVE
R AI
RE
BECK
TIE
IN
RIVER CALDER
1:10,010
Main River
Flood Map Flood Defences
Flood Zone 2 (FZ2)
Flood Zone 3 (FZ3)
Areas Benefitting From Flood Defences
Flood Storage Areas
/
Flood Map for Allerton Bywater - Date Created: [Ref: 21781]
Contact Us: National Customer Contact Centre, PO Box 544, Rotherham, S60 1BY. Tel: 08708 506 506 (Mon-Fri 8-6). Email: [email protected]© Environment Agency copyright and / or database rights 2011. All rights reserved. © Crown Copyright and database right. All rights reserved. Environment Agency, 100026380, 2011.
when reproduced @ A3
Scale:
23/03/2012
LEGEND
www.environment-agency.gov.uk
#*
#*
#*
#*
#*
#*#*
#*
#*#*
#* #*
#*
#*
[RIVER_SECTION_02671205479]
[RIVER_SECTION_02671205249][RIVER_SECTION_02671205079]
[RIVER_SECTION_02671204939]
[RIVER_SECTION_02671204384]
[RIVER_SECTION_02671204060]
[RIVER_SECTION_02671203912]
[RIVER_SECTION_02671203687]
[RIVER_SECTION_02671203432]
[RIVER_SECTION_02671205730B]
[RIVER_SECTION_02671204199B][RIVER_SECTION_02671204199A]
1:7,500
#* Node Points
Main River
/
Model Node Point Location Map for Allerton Bywater - Date Created: [Ref: 21781]
Contact Us: National Customer Contact Centre, PO Box 544, Rotherham, S60 1BY. Tel: 08708 506 506 (Mon-Fri 8-6). Email: [email protected]© Environment Agency copyright and / or database rights 2011. All rights reserved. © Crown Copyright and database right. All rights reserved. Environment Agency, 100026380, 2011.
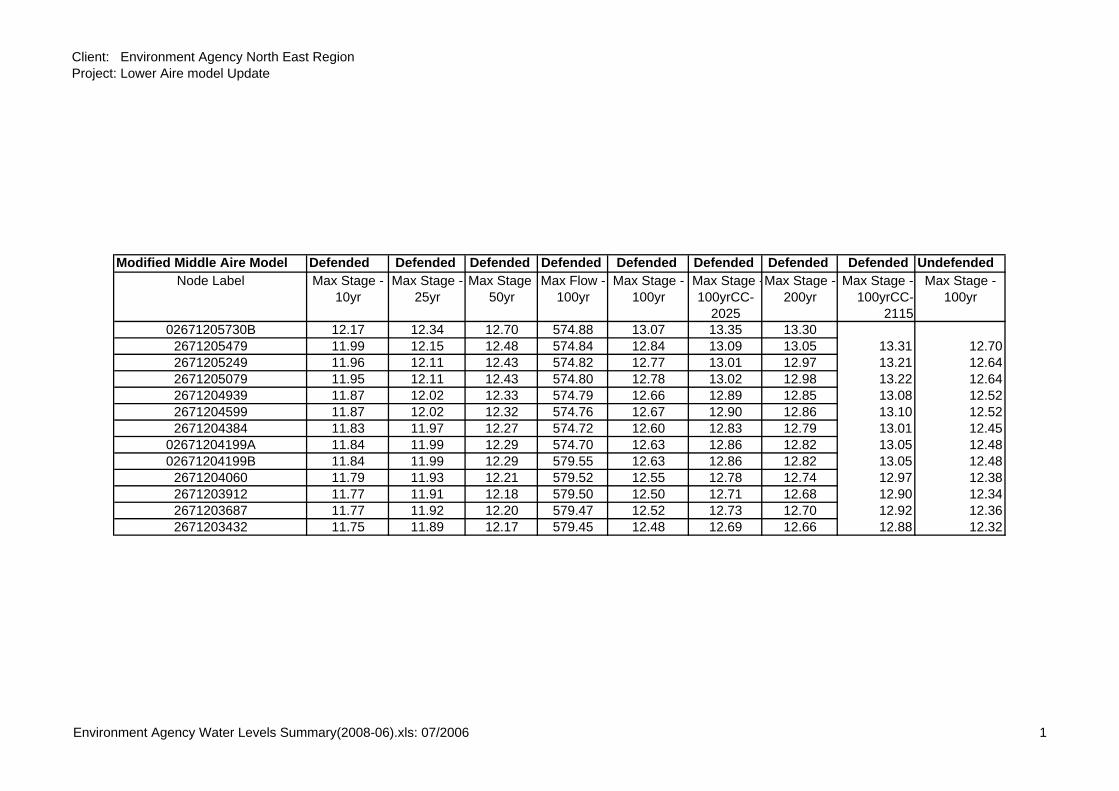
Client: Environment Agency North East RegionProject: Lower Aire model Update
Modified Middle Aire Model Defended Defended Defended Defended Defended Defended Defended Defended UndefendedNode Label Max Stage -
10yrMax Stage -
25yrMax Stage -
50yrMax Flow -
100yrMax Stage -
100yrMax Stage -100yrCC-
2025
Max Stage - 200yr
Max Stage - 100yrCC-
2115
Max Stage - 100yr
02671205730B 12.17 12.34 12.70 574.88 13.07 13.35 13.302671205479 11.99 12.15 12.48 574.84 12.84 13.09 13.05 13.31 12.702671205249 11.96 12.11 12.43 574.82 12.77 13.01 12.97 13.21 12.642671205079 11.95 12.11 12.43 574.80 12.78 13.02 12.98 13.22 12.642671204939 11.87 12.02 12.33 574.79 12.66 12.89 12.85 13.08 12.522671204599 11.87 12.02 12.32 574.76 12.67 12.90 12.86 13.10 12.522671204384 11.83 11.97 12.27 574.72 12.60 12.83 12.79 13.01 12.45
02671204199A 11.84 11.99 12.29 574.70 12.63 12.86 12.82 13.05 12.4802671204199B 11.84 11.99 12.29 579.55 12.63 12.86 12.82 13.05 12.48
2671204060 11.79 11.93 12.21 579.52 12.55 12.78 12.74 12.97 12.382671203912 11.77 11.91 12.18 579.50 12.50 12.71 12.68 12.90 12.342671203687 11.77 11.92 12.20 579.47 12.52 12.73 12.70 12.92 12.362671203432 11.75 11.89 12.17 579.45 12.48 12.69 12.66 12.88 12.32
Environment Agency Water Levels Summary(2008-06).xls: 07/2006 1
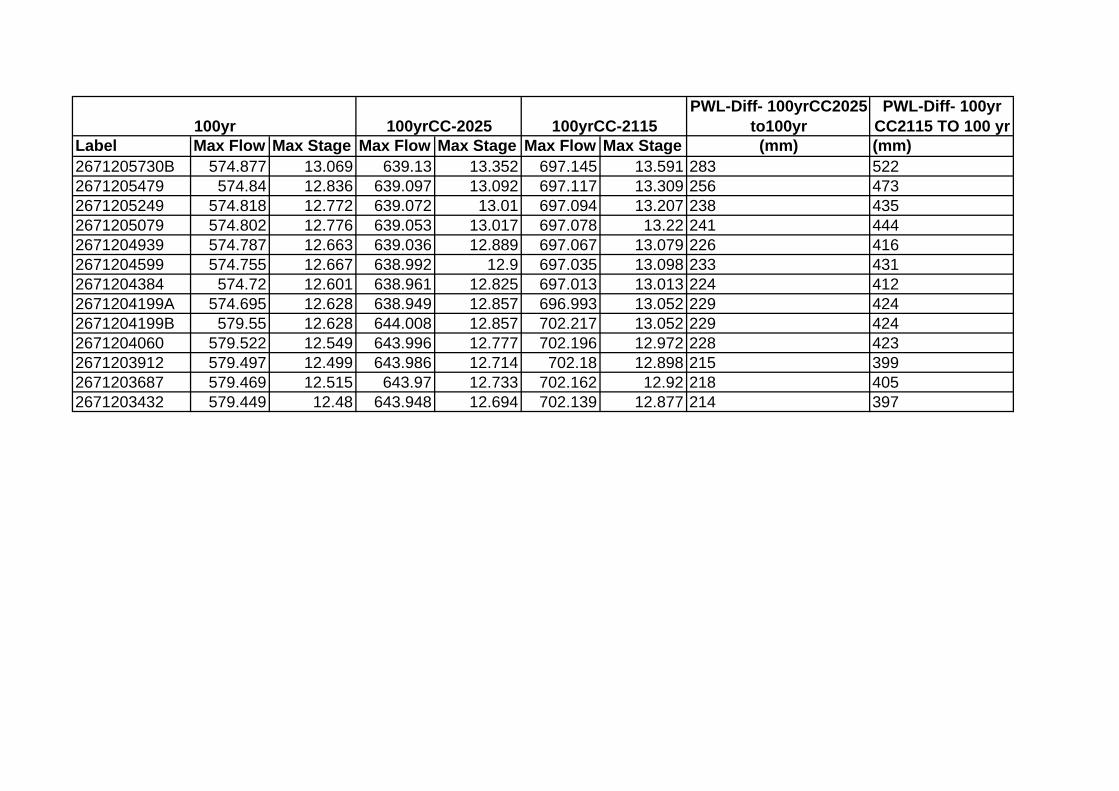
100yr 100yrCC-2025 100yrCC-2115PWL-Diff- 100yrCC2025
to100yrPWL-Diff- 100yr
CC2115 TO 100 yr
Label Max Flow Max Stage Max Flow Max Stage Max Flow Max Stage (mm) (mm)2671205730B 574.877 13.069 639.13 13.352 697.145 13.591 283 5222671205479 574.84 12.836 639.097 13.092 697.117 13.309 256 4732671205249 574.818 12.772 639.072 13.01 697.094 13.207 238 4352671205079 574.802 12.776 639.053 13.017 697.078 13.22 241 4442671204939 574.787 12.663 639.036 12.889 697.067 13.079 226 4162671204599 574.755 12.667 638.992 12.9 697.035 13.098 233 4312671204384 574.72 12.601 638.961 12.825 697.013 13.013 224 4122671204199A 574.695 12.628 638.949 12.857 696.993 13.052 229 4242671204199B 579.55 12.628 644.008 12.857 702.217 13.052 229 4242671204060 579.522 12.549 643.996 12.777 702.196 12.972 228 4232671203912 579.497 12.499 643.986 12.714 702.18 12.898 215 3992671203687 579.469 12.515 643.97 12.733 702.162 12.92 218 4052671203432 579.449 12.48 643.948 12.694 702.139 12.877 214 397
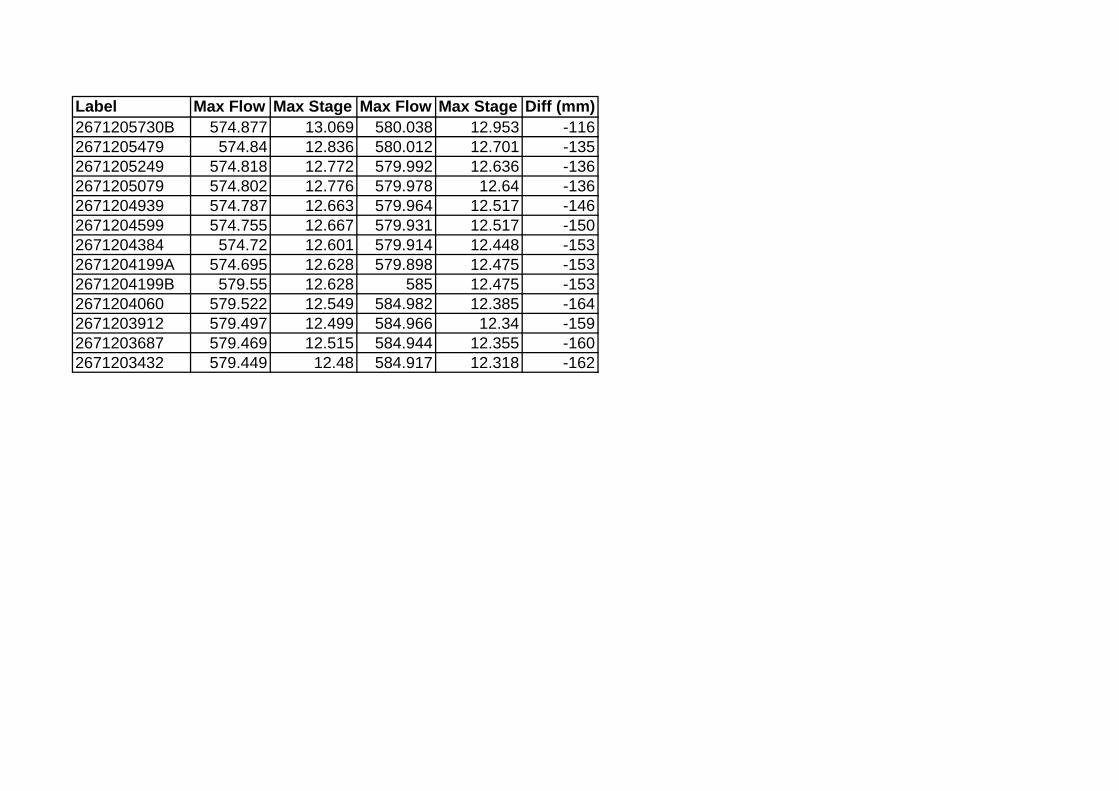
Label Max Flow Max Stage Max Flow Max Stage Diff (mm)2671205730B 574.877 13.069 580.038 12.953 -1162671205479 574.84 12.836 580.012 12.701 -1352671205249 574.818 12.772 579.992 12.636 -1362671205079 574.802 12.776 579.978 12.64 -1362671204939 574.787 12.663 579.964 12.517 -1462671204599 574.755 12.667 579.931 12.517 -1502671204384 574.72 12.601 579.914 12.448 -1532671204199A 574.695 12.628 579.898 12.475 -1532671204199B 579.55 12.628 585 12.475 -1532671204060 579.522 12.549 584.982 12.385 -1642671203912 579.497 12.499 584.966 12.34 -1592671203687 579.469 12.515 584.944 12.355 -1602671203432 579.449 12.48 584.917 12.318 -162
Pell Frischmann
APPENDIX D
EXISTING SURFACE WATER RUNOFF RATES
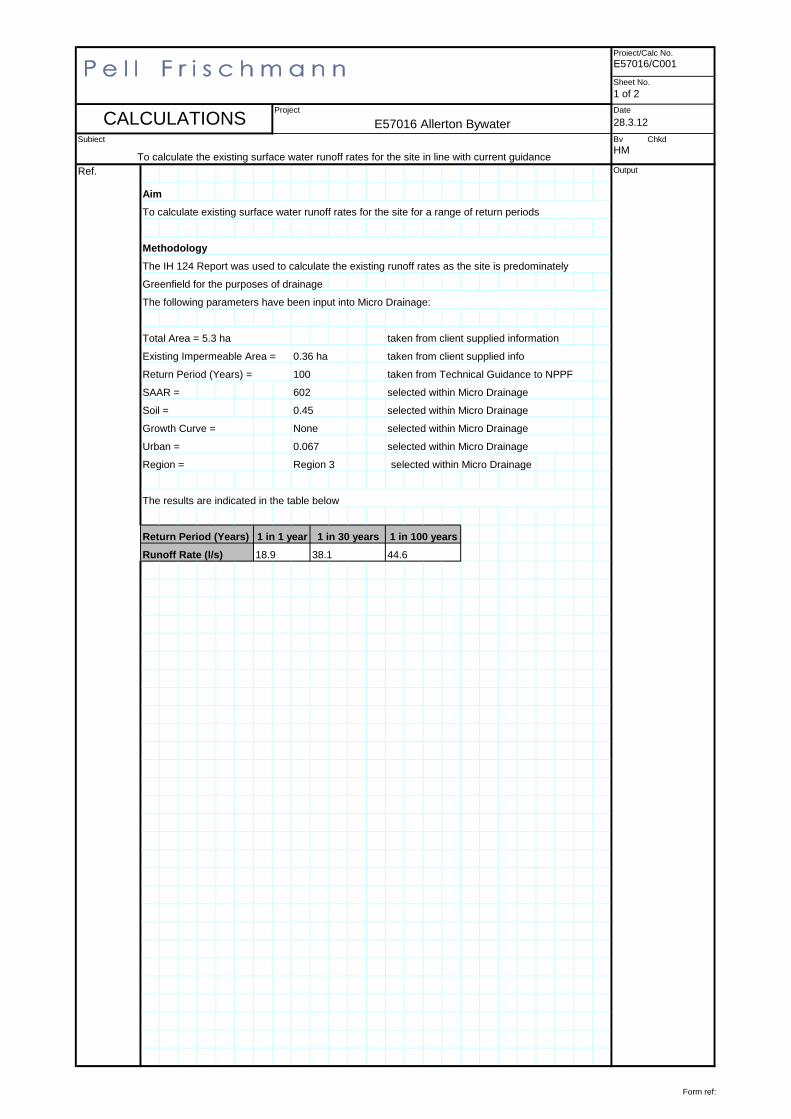
Project/Calc No.
E57016/C001
Sheet No.
1 of 2
Date
28.3.12
Subject By Chkd
HM
Ref. Output
The IH 124 Report was used to calculate the existing runoff rates as the site is predominately
Greenfield for the purposes of drainage
taken from client supplied information
SAAR =
selected within Micro Drainage
selected within Micro Drainage
38.1 44.6
0.067
Region 3
The results are indicated in the table below
Return Period (Years)
Runoff Rate (l/s)
1 in 1 year 1 in 30 years 1 in 100 years
18.9
Urban =
Region =
100
602
0.45
None
Return Period (Years) = taken from Technical Guidance to NPPF
selected within Micro Drainage
To calculate the existing surface water runoff rates for the site in line with current guidance
CALCULATIONS
The following parameters have been input into Micro Drainage:
Methodology
Existing Impermeable Area =
Total Area = 5.3 ha
Project
E57016 Allerton Bywater
Aim
To calculate existing surface water runoff rates for the site for a range of return periods
Growth Curve =
0.36 ha
selected within Micro Drainage
selected within Micro Drainage
Soil =
taken from client supplied info
Form ref:
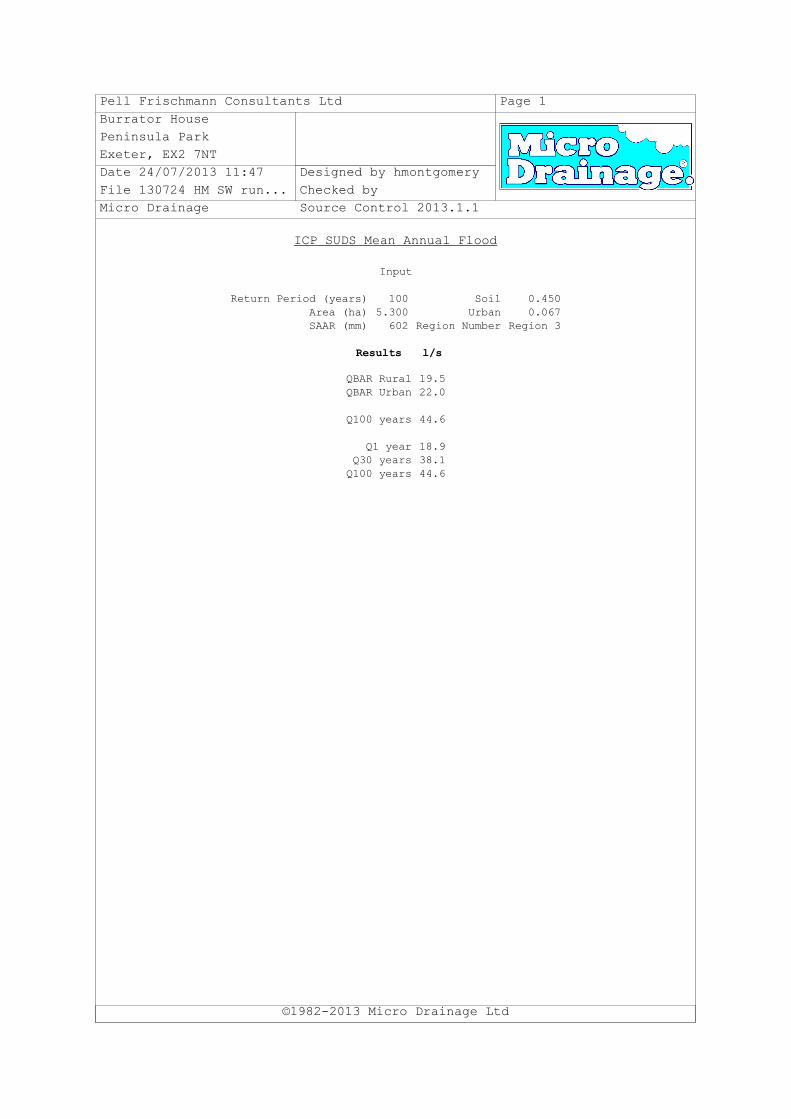
Pell Frischmann Consultants Ltd Page 1
Burrator House
Peninsula Park
Exeter, EX2 7NT
Date 24/07/2013 11:47 Designed by hmontgomery
File 130724 HM SW run... Checked by
Micro Drainage Source Control 2013.1.1
ICP SUDS Mean Annual Flood
©1982-2013 Micro Drainage Ltd
Input
Return Period (years) 100 Soil 0.450Area (ha) 5.300 Urban 0.067SAAR (mm) 602 Region Number Region 3
Results l/s
QBAR Rural 19.5QBAR Urban 22.0
Q100 years 44.6
Q1 year 18.9Q30 years 38.1Q100 years 44.6

Pell Frischmann
APPENDIX E
PROPOSED STORAGE DESIGN
Project/Calc No.
E57016/C002
Sheet No.
1 of 5
Date
04.07.12
Subject By Chkd
HM PMS
Ref. Output
Cellular Storage Structure
Infiltration Coefficient Base (m/hr) =
2
Impermeable Area (ha) =
selected within Micro Drainage
selected within Micro Drainage
Length (m) = 30
Cover Level (m) =
0.95
Invert Level (m) = 1
selected within Micro Drainage
selected within Micro Drainage
To calculate the amount of storage required at Allerton Bywater to comply with Technical Guidance to NPPF
an allowance of 20 % for climate change.
The following parameters were input into Micro Drainage:
Inflow =
Aim
To calculate the amount of storage required at the site to control the 1 in 100 year storm event plus
selected within Micro Drainage
selected within Micro Drainage
selected within Micro Drainage
selected within Micro Drainage
0.1
Infiltration Coefficient Side (m/hr) = 0.1
CALCULATIONSProject
E57016 Allerton Bywater
Porosity =
is required to attenuate the 1 in 100 year plus 20 % allowance for climate change.
2.75 taken from drawing number SK001
Additional Inflow =
Rainfall Model = FEH selected within Micro Drainage
Rainfall Data
An outline calculation in Micro Drainage indicates that approximately 1360 m3 of storage
This is based on a plan area of 1440 m2 using a conservative estimate of infiltration
selected within Micro Drainage
selected within Micro Drainage
Return Period = 100 years selected within Micro Drainage
Storage Structure =
None
Safety Factor = 2
Form ref:
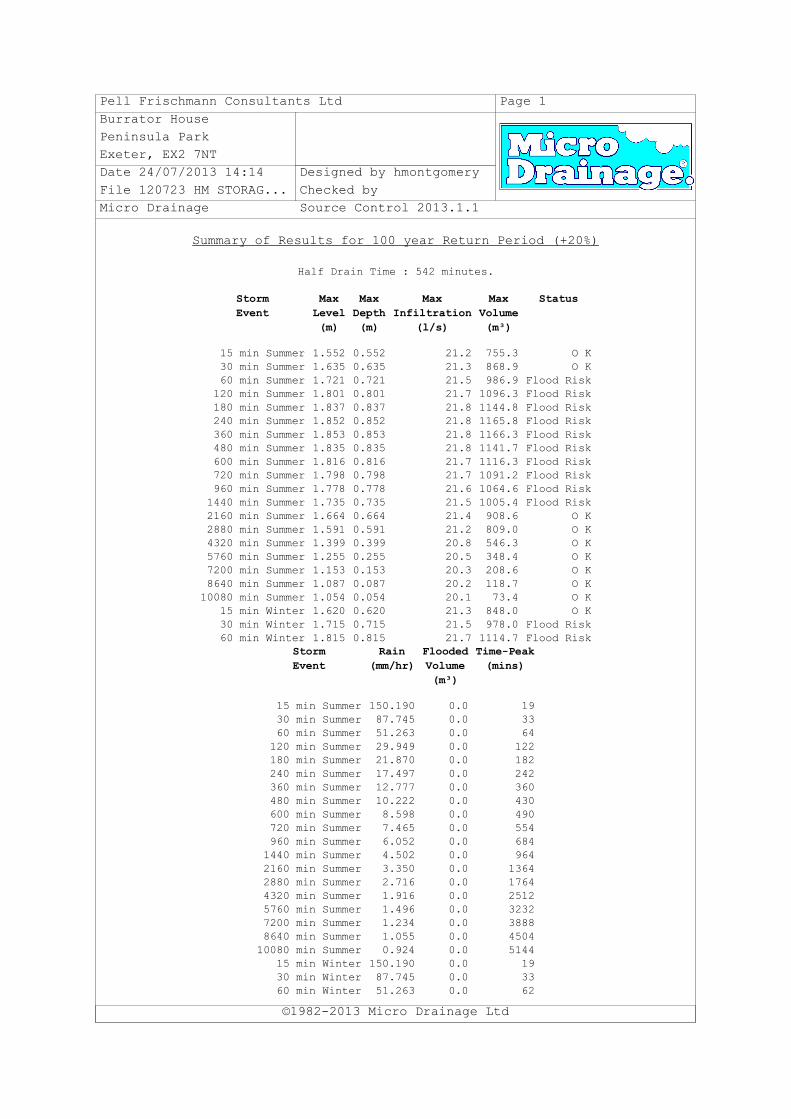
Pell Frischmann Consultants Ltd Page 1
Burrator House
Peninsula Park
Exeter, EX2 7NT
Date 24/07/2013 14:14 Designed by hmontgomery
File 120723 HM STORAG... Checked by
Micro Drainage Source Control 2013.1.1
Summary of Results for 100 year Return Period (+20%)
©1982-2013 Micro Drainage Ltd
Half Drain Time : 542 minutes.
Storm
Event
Max
Level
(m)
Max
Depth
(m)
Max
Infiltration
(l/s)
Max
Volume
(m³)
Status
15 min Summer 1.552 0.552 21.2 755.3 O K30 min Summer 1.635 0.635 21.3 868.9 O K60 min Summer 1.721 0.721 21.5 986.9 Flood Risk120 min Summer 1.801 0.801 21.7 1096.3 Flood Risk180 min Summer 1.837 0.837 21.8 1144.8 Flood Risk240 min Summer 1.852 0.852 21.8 1165.8 Flood Risk360 min Summer 1.853 0.853 21.8 1166.3 Flood Risk480 min Summer 1.835 0.835 21.8 1141.7 Flood Risk600 min Summer 1.816 0.816 21.7 1116.3 Flood Risk720 min Summer 1.798 0.798 21.7 1091.2 Flood Risk960 min Summer 1.778 0.778 21.6 1064.6 Flood Risk1440 min Summer 1.735 0.735 21.5 1005.4 Flood Risk2160 min Summer 1.664 0.664 21.4 908.6 O K2880 min Summer 1.591 0.591 21.2 809.0 O K4320 min Summer 1.399 0.399 20.8 546.3 O K5760 min Summer 1.255 0.255 20.5 348.4 O K7200 min Summer 1.153 0.153 20.3 208.6 O K8640 min Summer 1.087 0.087 20.2 118.7 O K10080 min Summer 1.054 0.054 20.1 73.4 O K
15 min Winter 1.620 0.620 21.3 848.0 O K30 min Winter 1.715 0.715 21.5 978.0 Flood Risk60 min Winter 1.815 0.815 21.7 1114.7 Flood Risk
Storm
Event
Rain
(mm/hr)
Flooded
Volume
(m³)
Time-Peak
(mins)
15 min Summer 150.190 0.0 1930 min Summer 87.745 0.0 3360 min Summer 51.263 0.0 64120 min Summer 29.949 0.0 122180 min Summer 21.870 0.0 182240 min Summer 17.497 0.0 242360 min Summer 12.777 0.0 360480 min Summer 10.222 0.0 430600 min Summer 8.598 0.0 490720 min Summer 7.465 0.0 554960 min Summer 6.052 0.0 6841440 min Summer 4.502 0.0 9642160 min Summer 3.350 0.0 13642880 min Summer 2.716 0.0 17644320 min Summer 1.916 0.0 25125760 min Summer 1.496 0.0 32327200 min Summer 1.234 0.0 38888640 min Summer 1.055 0.0 450410080 min Summer 0.924 0.0 5144
15 min Winter 150.190 0.0 1930 min Winter 87.745 0.0 3360 min Winter 51.263 0.0 62
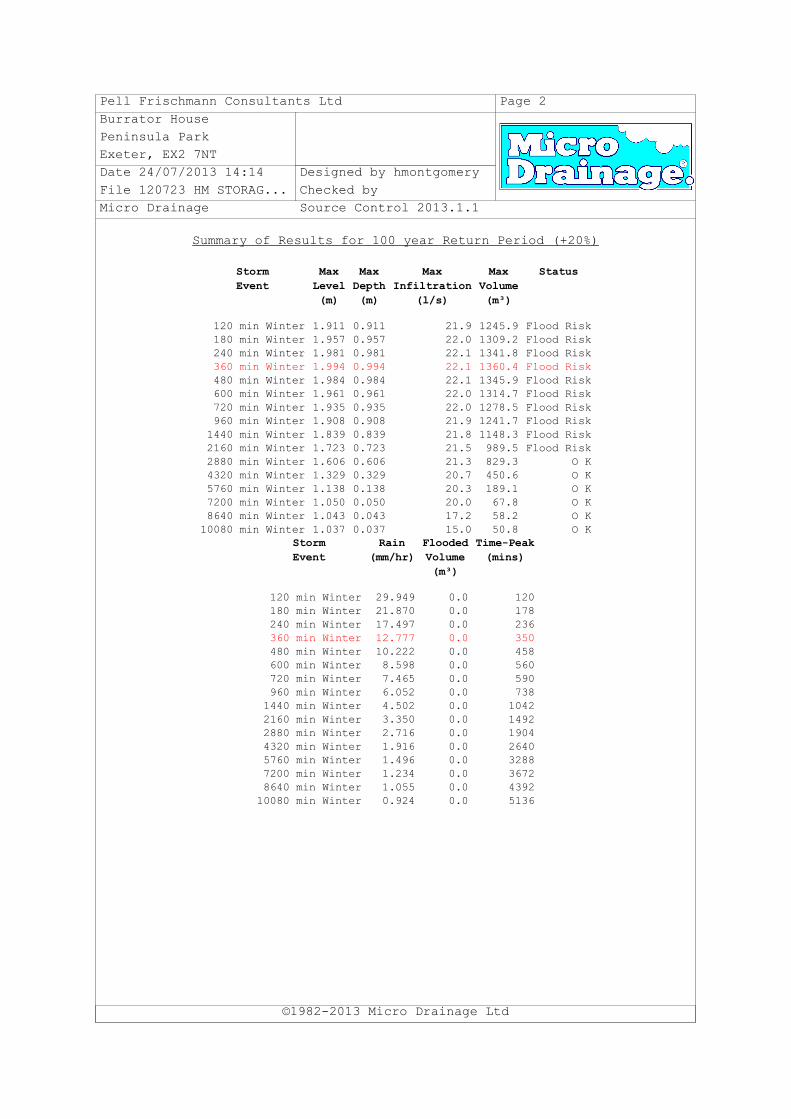
Pell Frischmann Consultants Ltd Page 2
Burrator House
Peninsula Park
Exeter, EX2 7NT
Date 24/07/2013 14:14 Designed by hmontgomery
File 120723 HM STORAG... Checked by
Micro Drainage Source Control 2013.1.1
Summary of Results for 100 year Return Period (+20%)
©1982-2013 Micro Drainage Ltd
Storm
Event
Max
Level
(m)
Max
Depth
(m)
Max
Infiltration
(l/s)
Max
Volume
(m³)
Status
120 min Winter 1.911 0.911 21.9 1245.9 Flood Risk180 min Winter 1.957 0.957 22.0 1309.2 Flood Risk240 min Winter 1.981 0.981 22.1 1341.8 Flood Risk360 min Winter 1.994 0.994 22.1 1360.4 Flood Risk480 min Winter 1.984 0.984 22.1 1345.9 Flood Risk600 min Winter 1.961 0.961 22.0 1314.7 Flood Risk720 min Winter 1.935 0.935 22.0 1278.5 Flood Risk960 min Winter 1.908 0.908 21.9 1241.7 Flood Risk1440 min Winter 1.839 0.839 21.8 1148.3 Flood Risk2160 min Winter 1.723 0.723 21.5 989.5 Flood Risk2880 min Winter 1.606 0.606 21.3 829.3 O K4320 min Winter 1.329 0.329 20.7 450.6 O K5760 min Winter 1.138 0.138 20.3 189.1 O K7200 min Winter 1.050 0.050 20.0 67.8 O K8640 min Winter 1.043 0.043 17.2 58.2 O K10080 min Winter 1.037 0.037 15.0 50.8 O K
Storm
Event
Rain
(mm/hr)
Flooded
Volume
(m³)
Time-Peak
(mins)
120 min Winter 29.949 0.0 120180 min Winter 21.870 0.0 178240 min Winter 17.497 0.0 236360 min Winter 12.777 0.0 350480 min Winter 10.222 0.0 458600 min Winter 8.598 0.0 560720 min Winter 7.465 0.0 590960 min Winter 6.052 0.0 7381440 min Winter 4.502 0.0 10422160 min Winter 3.350 0.0 14922880 min Winter 2.716 0.0 19044320 min Winter 1.916 0.0 26405760 min Winter 1.496 0.0 32887200 min Winter 1.234 0.0 36728640 min Winter 1.055 0.0 439210080 min Winter 0.924 0.0 5136
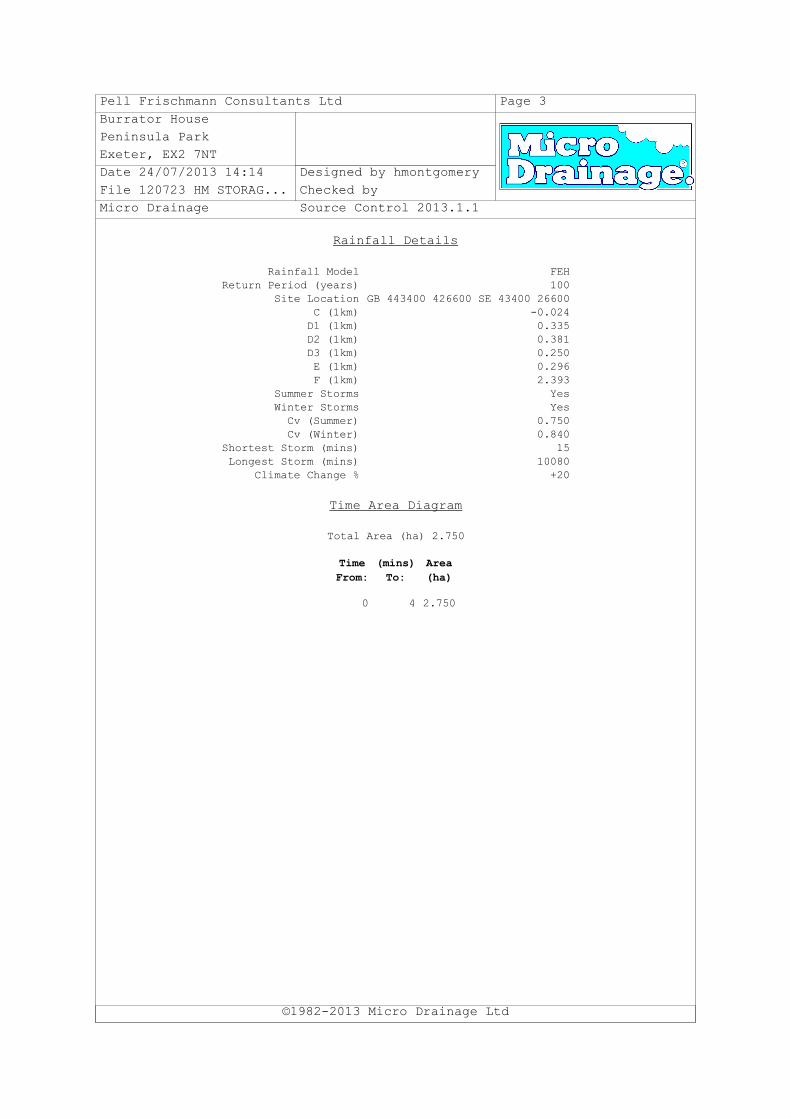
Pell Frischmann Consultants Ltd Page 3
Burrator House
Peninsula Park
Exeter, EX2 7NT
Date 24/07/2013 14:14 Designed by hmontgomery
File 120723 HM STORAG... Checked by
Micro Drainage Source Control 2013.1.1
Rainfall Details
©1982-2013 Micro Drainage Ltd
Rainfall Model FEHReturn Period (years) 100
Site Location GB 443400 426600 SE 43400 26600C (1km) -0.024D1 (1km) 0.335D2 (1km) 0.381D3 (1km) 0.250E (1km) 0.296F (1km) 2.393
Summer Storms YesWinter Storms YesCv (Summer) 0.750Cv (Winter) 0.840
Shortest Storm (mins) 15Longest Storm (mins) 10080
Climate Change % +20
Time Area Diagram
Total Area (ha) 2.750
Time
From:
(mins)
To:
Area
(ha)
0 4 2.750
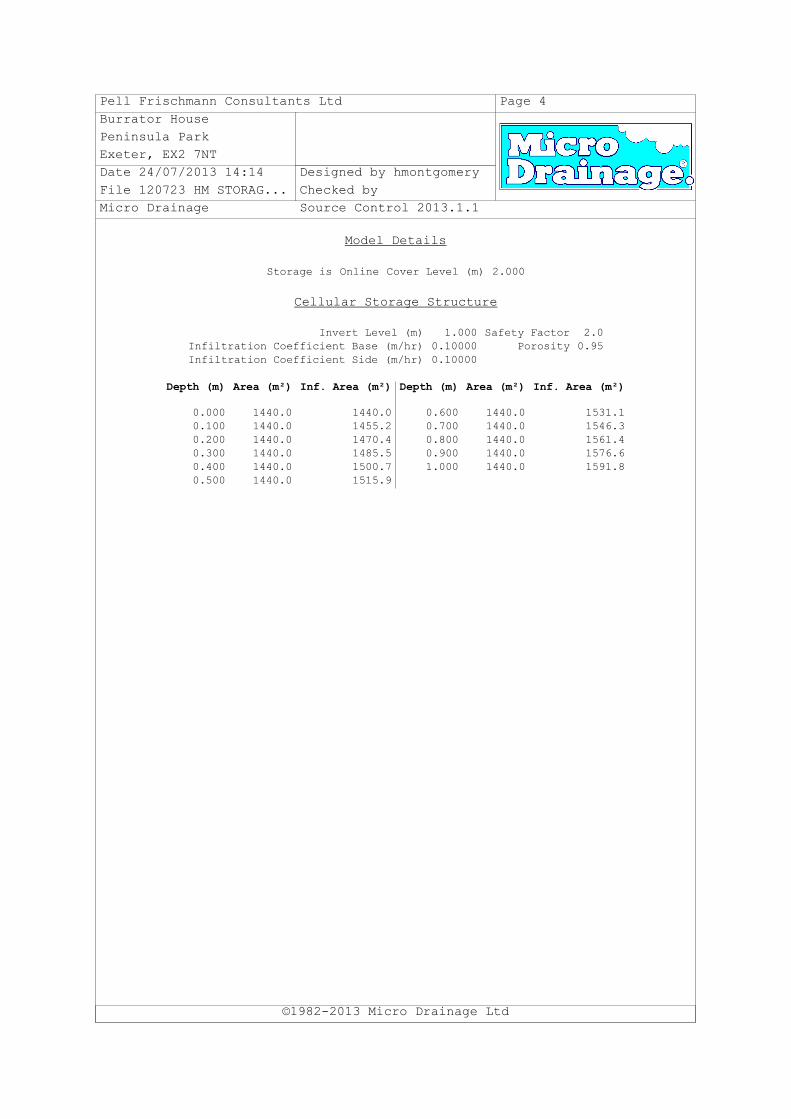
Pell Frischmann Consultants Ltd Page 4
Burrator House
Peninsula Park
Exeter, EX2 7NT
Date 24/07/2013 14:14 Designed by hmontgomery
File 120723 HM STORAG... Checked by
Micro Drainage Source Control 2013.1.1
Model Details
©1982-2013 Micro Drainage Ltd
Storage is Online Cover Level (m) 2.000
Cellular Storage Structure
Invert Level (m) 1.000 Safety Factor 2.0Infiltration Coefficient Base (m/hr) 0.10000 Porosity 0.95Infiltration Coefficient Side (m/hr) 0.10000
Depth (m) Area (m²) Inf. Area (m²) Depth (m) Area (m²) Inf. Area (m²)
0.000 1440.0 1440.0 0.600 1440.0 1531.10.100 1440.0 1455.2 0.700 1440.0 1546.30.200 1440.0 1470.4 0.800 1440.0 1561.40.300 1440.0 1485.5 0.900 1440.0 1576.60.400 1440.0 1500.7 1.000 1440.0 1591.80.500 1440.0 1515.9
Pell Frischmann
APPENDIX F
BRITISH GEOLOGICAL SURVEY SUDS INFILTRATION MAP
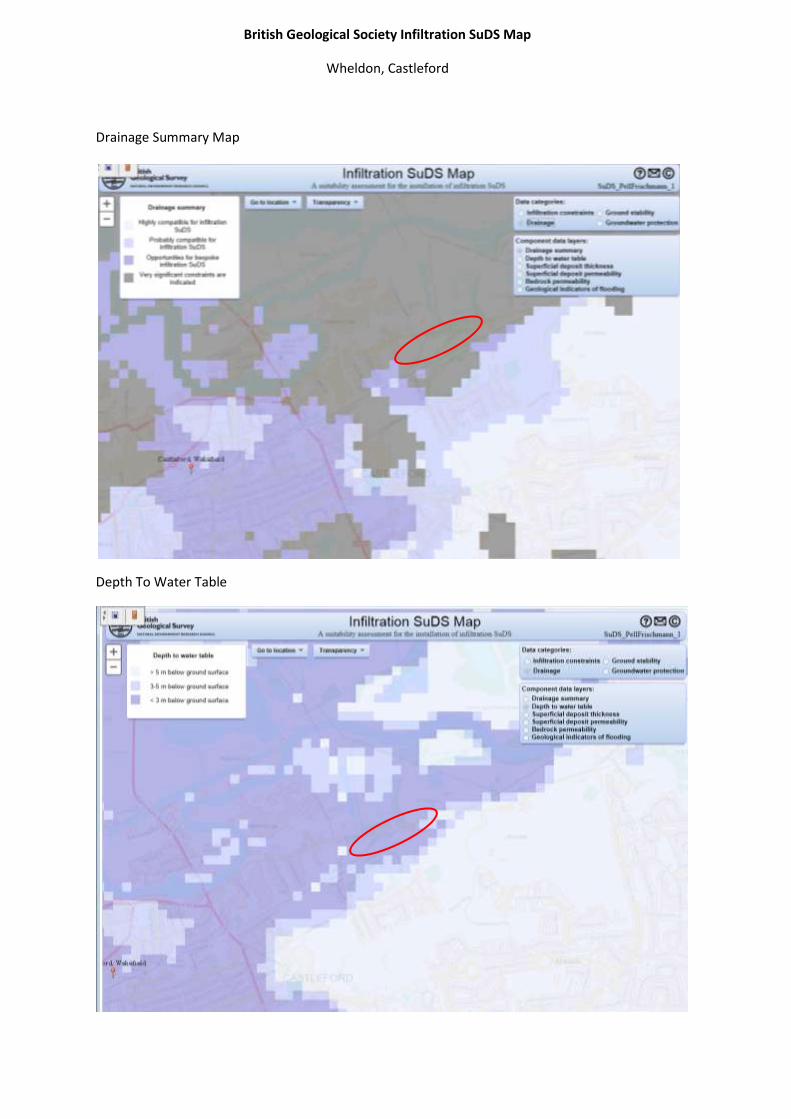
Drainage Summary Map
Depth To Water Table
British Geological Society Infiltration SuDS Map
Wheldon, Castleford
WHELDON ACT AND AD FACILITY
ENVIRONMENTAL STATEMENT VOLUME 1: MAIN TEXT
R57016Y001/D
Pell Frischmann Page | 151
11. NOISE AND VIBRATION
11.1 INTRODUCTION
11.1.1 This chapter of the ES assesses the likely significant effects of the Proposed
Development in terms of Noise and Vibration.
11.1.2 This chapter describes the assessment methodology; the baseline conditions at
the Site and surroundings; the likely significant environmental effects; the
mitigation measures required to prevent, reduce or offset any significant adverse
effects; and the likely residual effects after the measures have been employed.
11.1.3 This chapter does not assess the operational noise and vibration impacts from the
proposed on-site rail terminal – but does consider impacts from its construction.
11.2 PLANNING POLICY CONTEXT
National Policy
National Planning Policy Framework
11.2.1 The National Planning Policy Framework (March 2012) states that:
“The planning system should contribute to and enhance the natural and local
environment by:
preventing both new and existing development from contributing to or being put at
unacceptable risk from, or being adversely affected by unacceptable levels of soil,
air, water or noise pollution or land instability;”
Local Policy – Wakefield Council Local Development Framework Core
Strategy
11.2.2 The Core Strategy document has the following Policies relevant to managing and
controlling development with respect to Noise effects:
Policy D20 - Pollution Control
“…In determining proposals particular consideration will be given to:
an appropriate impact assessment is submitted with the planning application;
and
approved mitigation measures are carried out prior to occupation or operation
of the development commencing.”
WHELDON ACT AND AD FACILITY
ENVIRONMENTAL STATEMENT VOLUME 1: MAIN TEXT
R57016Y001/D
Pell Frischmann Page | 152
Noise Pollution
When considering a proposal for development the presence of noise generating
uses close to the Site, and the potential noise generated by the proposal will be
taken into account. Some uses are particularly sensitive to noise. Examples
include housing, educational establishments, care establishments such as
hospitals and nursing homes, public buildings such as libraries and museums, and
offices. Planning conditions and/or legal agreements may be used to control the
impact of noise in relation to the proposed development or to the benefit of the
wider community.
Highways, railways and aircraft are a major source of noise nuisance. Noise
generated may vary at different times, and there are maximum levels set out in
government regulations that are considered to be reasonable. Measures can
sometimes be incorporated into development to reduce noise to acceptable limits.
Buildings can be sited away from the noise and constructed with materials that
reduce noise. Externally recreation areas and gardens can be sited away from
highways, and protected by planting, mounding or fencing. Where a development
proposal is acceptable in principle, and appropriate noise reduction measures are
incorporated to achieve an acceptable degree of amenity for occupiers,
permission may be granted. However, sites that are adjacent to existing noisy
transport uses will generally not be acceptable for noise sensitive development.
Proposals for industrial development or other uses which have implications for
generating noise will be assessed on their circumstances. Locational
characteristics will be taken into account and consideration given to appropriate
noise reduction. The applicant will be required to demonstrate that the
development is constructed to a standard and/or incorporates noise reduction
measures which will ensure that the resulting noise levels at specified locations
will not exceed acceptable maximum levels.”
Policy W6 - Assessing Applications for Waste Management Facilities
“Proposals for waste management facilities will be permitted where it can be
demonstrated that:
there would be no unacceptable adverse environmental, social or economic
effects, particularly in relation to urban regeneration, economic development,
environmental improvement, and growth priorities;
adequate means of controlling noise, dust, litter, odours, vermin and other
emissions are incorporated in the scheme, such that there would be no
unacceptable adverse effects on the amenity of sensitive receptors;
Planning conditions and, where necessary, legal agreements will be used as
appropriate to ensure mitigation measures are put in place to manage any effects
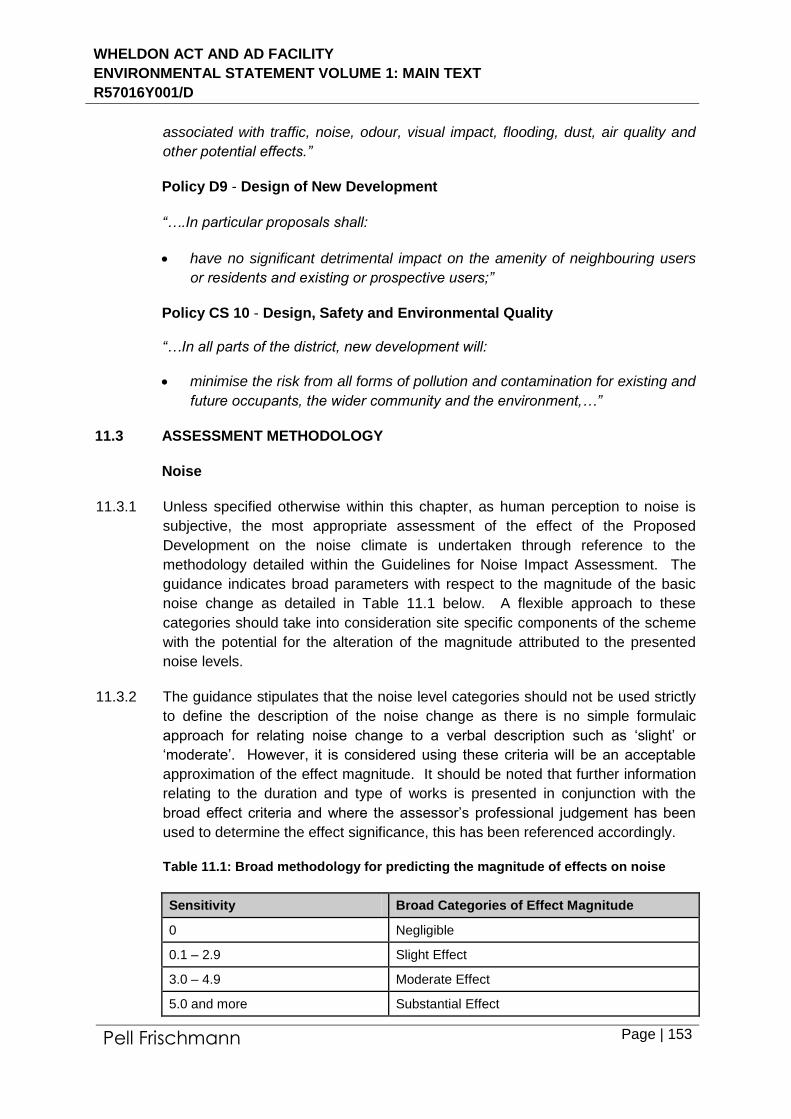
WHELDON ACT AND AD FACILITY
ENVIRONMENTAL STATEMENT VOLUME 1: MAIN TEXT
R57016Y001/D
Pell Frischmann Page | 153
associated with traffic, noise, odour, visual impact, flooding, dust, air quality and
other potential effects.”
Policy D9 - Design of New Development
“….In particular proposals shall:
have no significant detrimental impact on the amenity of neighbouring users
or residents and existing or prospective users;”
Policy CS 10 - Design, Safety and Environmental Quality
“…In all parts of the district, new development will:
minimise the risk from all forms of pollution and contamination for existing and
future occupants, the wider community and the environment,…”
11.3 ASSESSMENT METHODOLOGY
Noise
11.3.1 Unless specified otherwise within this chapter, as human perception to noise is
subjective, the most appropriate assessment of the effect of the Proposed
Development on the noise climate is undertaken through reference to the
methodology detailed within the Guidelines for Noise Impact Assessment. The
guidance indicates broad parameters with respect to the magnitude of the basic
noise change as detailed in Table 11.1 below. A flexible approach to these
categories should take into consideration site specific components of the scheme
with the potential for the alteration of the magnitude attributed to the presented
noise levels.
11.3.2 The guidance stipulates that the noise level categories should not be used strictly
to define the description of the noise change as there is no simple formulaic
approach for relating noise change to a verbal description such as ‘slight’ or
‘moderate’. However, it is considered using these criteria will be an acceptable
approximation of the effect magnitude. It should be noted that further information
relating to the duration and type of works is presented in conjunction with the
broad effect criteria and where the assessor’s professional judgement has been
used to determine the effect significance, this has been referenced accordingly.
Table 11.1: Broad methodology for predicting the magnitude of effects on noise
Sensitivity Broad Categories of Effect Magnitude
0 Negligible
0.1 – 2.9 Slight Effect
3.0 – 4.9 Moderate Effect
5.0 and more Substantial Effect
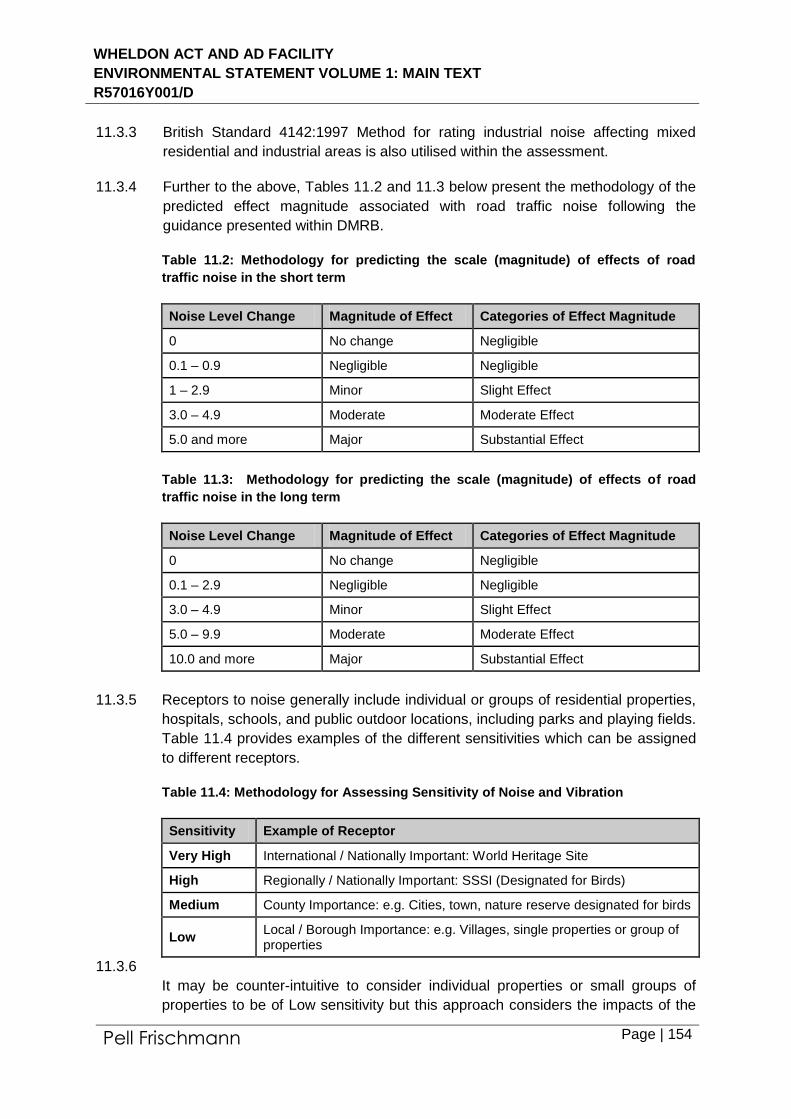
WHELDON ACT AND AD FACILITY
ENVIRONMENTAL STATEMENT VOLUME 1: MAIN TEXT
R57016Y001/D
Pell Frischmann Page | 154
11.3.3 British Standard 4142:1997 Method for rating industrial noise affecting mixed
residential and industrial areas is also utilised within the assessment.
11.3.4 Further to the above, Tables 11.2 and 11.3 below present the methodology of the
predicted effect magnitude associated with road traffic noise following the
guidance presented within DMRB.
Table 11.2: Methodology for predicting the scale (magnitude) of effects of road
traffic noise in the short term
Noise Level Change Magnitude of Effect Categories of Effect Magnitude
0 No change Negligible
0.1 – 0.9 Negligible Negligible
1 – 2.9 Minor Slight Effect
3.0 – 4.9 Moderate Moderate Effect
5.0 and more Major Substantial Effect
Table 11.3: Methodology for predicting the scale (magnitude) of effects of road
traffic noise in the long term
Noise Level Change Magnitude of Effect Categories of Effect Magnitude
0 No change Negligible
0.1 – 2.9 Negligible Negligible
3.0 – 4.9 Minor Slight Effect
5.0 – 9.9 Moderate Moderate Effect
10.0 and more Major Substantial Effect
11.3.5 Receptors to noise generally include individual or groups of residential properties,
hospitals, schools, and public outdoor locations, including parks and playing fields.
Table 11.4 provides examples of the different sensitivities which can be assigned
to different receptors.
Table 11.4: Methodology for Assessing Sensitivity of Noise and Vibration
Sensitivity Example of Receptor
Very High International / Nationally Important: World Heritage Site
High Regionally / Nationally Important: SSSI (Designated for Birds)
Medium County Importance: e.g. Cities, town, nature reserve designated for birds
Low Local / Borough Importance: e.g. Villages, single properties or group of properties
11.3.6
It may be counter-intuitive to consider individual properties or small groups of
properties to be of Low sensitivity but this approach considers the impacts of the
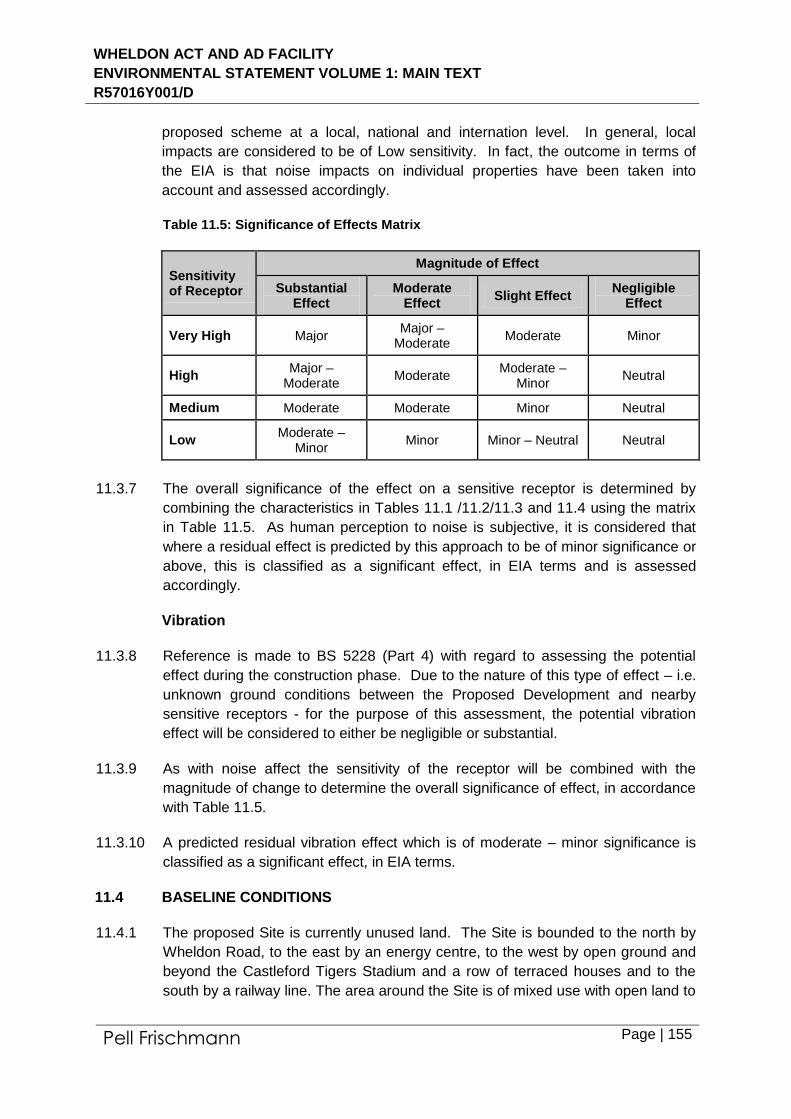
WHELDON ACT AND AD FACILITY
ENVIRONMENTAL STATEMENT VOLUME 1: MAIN TEXT
R57016Y001/D
Pell Frischmann Page | 155
proposed scheme at a local, national and internation level. In general, local
impacts are considered to be of Low sensitivity. In fact, the outcome in terms of
the EIA is that noise impacts on individual properties have been taken into
account and assessed accordingly.
Table 11.5: Significance of Effects Matrix
Sensitivity of Receptor
Magnitude of Effect
Substantial Effect
Moderate Effect
Slight Effect Negligible
Effect
Very High Major Major –
Moderate Moderate Minor
High Major –
Moderate Moderate
Moderate – Minor
Neutral
Medium Moderate Moderate Minor Neutral
Low Moderate –
Minor Minor Minor – Neutral Neutral
11.3.7 The overall significance of the effect on a sensitive receptor is determined by
combining the characteristics in Tables 11.1 /11.2/11.3 and 11.4 using the matrix
in Table 11.5. As human perception to noise is subjective, it is considered that
where a residual effect is predicted by this approach to be of minor significance or
above, this is classified as a significant effect, in EIA terms and is assessed
accordingly.
Vibration
11.3.8 Reference is made to BS 5228 (Part 4) with regard to assessing the potential
effect during the construction phase. Due to the nature of this type of effect – i.e.
unknown ground conditions between the Proposed Development and nearby
sensitive receptors - for the purpose of this assessment, the potential vibration
effect will be considered to either be negligible or substantial.
11.3.9 As with noise affect the sensitivity of the receptor will be combined with the
magnitude of change to determine the overall significance of effect, in accordance
with Table 11.5.
11.3.10 A predicted residual vibration effect which is of moderate – minor significance is
classified as a significant effect, in EIA terms.
11.4 BASELINE CONDITIONS
11.4.1 The proposed Site is currently unused land. The Site is bounded to the north by
Wheldon Road, to the east by an energy centre, to the west by open ground and
beyond the Castleford Tigers Stadium and a row of terraced houses and to the
south by a railway line. The area around the Site is of mixed use with open land to
WHELDON ACT AND AD FACILITY
ENVIRONMENTAL STATEMENT VOLUME 1: MAIN TEXT
R57016Y001/D
Pell Frischmann Page | 156
the north, industrial, commercial and residential properties to the west and
residential properties to the south across the railway line.
11.4.2 The noise climate at the Site was found to be dominated by noise from road traffic
on Wheldon Road to the north with occasional train noise from the railway line to
the south.
11.4.3 The nearest existing sensitive receptors with regard to the Proposed Development
are residential premises on Wheldon Road to the west, a possible travellers site
across Wheldon Road to the north and new residential properties off Healdfield
Road (Clarity Development) across the railway line to the south. Residential
premises are also located, more distantly from the Site, along Healdfield Road to
the south. Commercial premises are considered to be of far less sensitivity than
residential properties.
11.4.4 A summary of the existing noise sources at the properties on Wheldon Road is
outlined below:
Residents vehicle movements;
Road traffic noise from Wheldon Road;
Noise from trains passing along the railway line; and,
Noise from the adjacent industrial and commercial premises.
11.4.5 A summary of the existing noise sources at the possible traveller’s site is outlined
below:
Road traffic noise from Wheldon Road; and,
Occasional distant noise from the industrial and commercial premises on
Wheldon Road to the east.
11.4.6 A summary of the existing noise sources at the Clarity Development on Healdfield
Road is outlined below:
Road traffic noise from Healdfield Road;
Industrial noise from the nearby industrial premises; and,
Noise from trains passing by on the railway line to the north.
11.4.7 During the night-time noise monitoring survey, existing noise sources observed at
the measurement locations included:
Road traffic noise on Wheldon Road (properties on Wheldon Road/Princess
Street and travellers site) and Healdfield Road (Clarity Development);
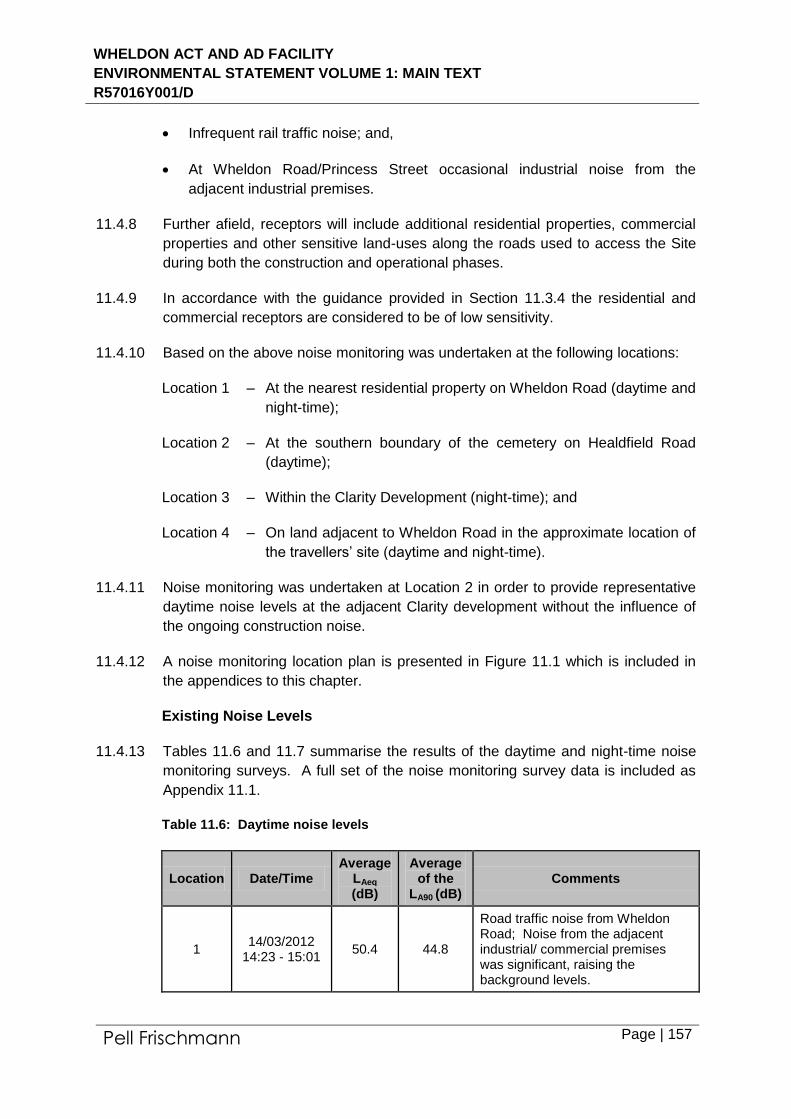
WHELDON ACT AND AD FACILITY
ENVIRONMENTAL STATEMENT VOLUME 1: MAIN TEXT
R57016Y001/D
Pell Frischmann Page | 157
Infrequent rail traffic noise; and,
At Wheldon Road/Princess Street occasional industrial noise from the
adjacent industrial premises.
11.4.8 Further afield, receptors will include additional residential properties, commercial
properties and other sensitive land-uses along the roads used to access the Site
during both the construction and operational phases.
11.4.9 In accordance with the guidance provided in Section 11.3.4 the residential and
commercial receptors are considered to be of low sensitivity.
11.4.10 Based on the above noise monitoring was undertaken at the following locations:
Location 1 – At the nearest residential property on Wheldon Road (daytime and
night-time);
Location 2 – At the southern boundary of the cemetery on Healdfield Road
(daytime);
Location 3 – Within the Clarity Development (night-time); and
Location 4 – On land adjacent to Wheldon Road in the approximate location of
the travellers’ site (daytime and night-time).
11.4.11 Noise monitoring was undertaken at Location 2 in order to provide representative
daytime noise levels at the adjacent Clarity development without the influence of
the ongoing construction noise.
11.4.12 A noise monitoring location plan is presented in Figure 11.1 which is included in
the appendices to this chapter.
Existing Noise Levels
11.4.13 Tables 11.6 and 11.7 summarise the results of the daytime and night-time noise
monitoring surveys. A full set of the noise monitoring survey data is included as
Appendix 11.1.
Table 11.6: Daytime noise levels
Location Date/Time Average
LAeq (dB)
Average of the
LA90 (dB) Comments
1 14/03/2012
14:23 - 15:01 50.4 44.8
Road traffic noise from Wheldon Road; Noise from the adjacent industrial/ commercial premises was significant, raising the background levels.
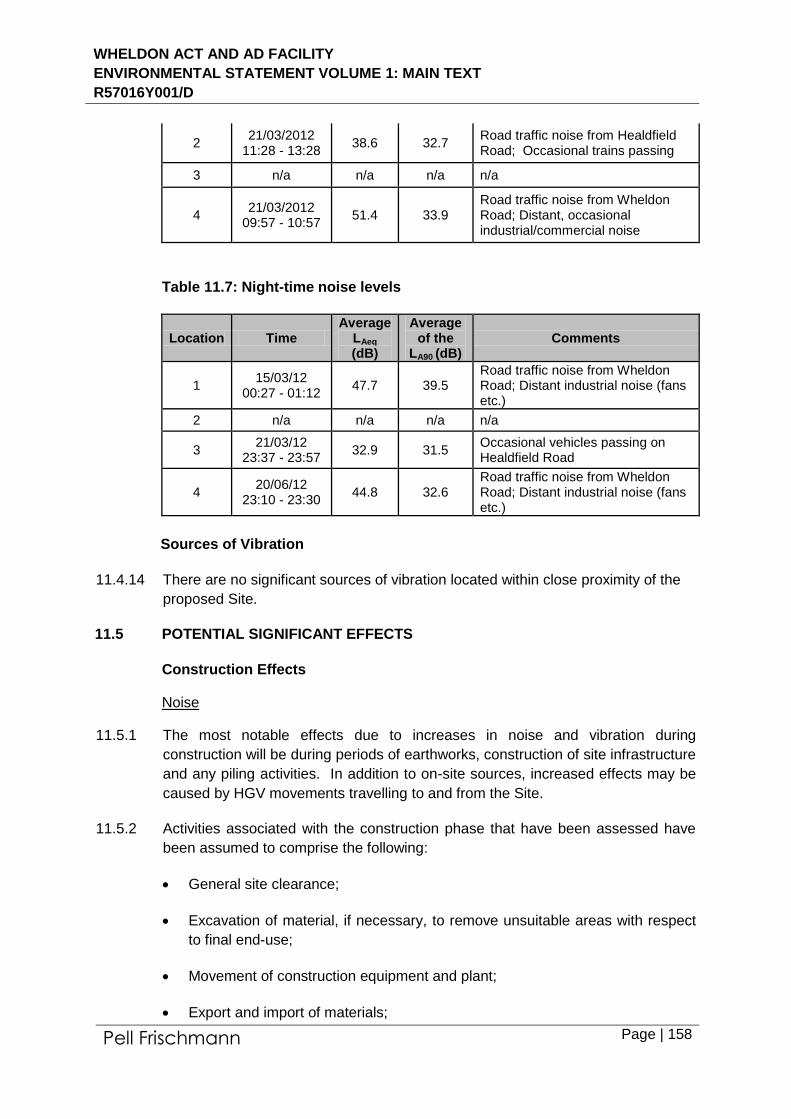
WHELDON ACT AND AD FACILITY
ENVIRONMENTAL STATEMENT VOLUME 1: MAIN TEXT
R57016Y001/D
Pell Frischmann Page | 158
2 21/03/2012
11:28 - 13:28 38.6 32.7
Road traffic noise from Healdfield Road; Occasional trains passing
3 n/a n/a n/a n/a
4 21/03/2012
09:57 - 10:57 51.4 33.9
Road traffic noise from Wheldon Road; Distant, occasional industrial/commercial noise
Table 11.7: Night-time noise levels
Location Time Average
LAeq (dB)
Average of the
LA90 (dB) Comments
1 15/03/12
00:27 - 01:12 47.7 39.5
Road traffic noise from Wheldon Road; Distant industrial noise (fans etc.)
2 n/a n/a n/a n/a
3 21/03/12
23:37 - 23:57 32.9 31.5
Occasional vehicles passing on Healdfield Road
4 20/06/12
23:10 - 23:30 44.8 32.6
Road traffic noise from Wheldon Road; Distant industrial noise (fans etc.)
Sources of Vibration
11.4.14 There are no significant sources of vibration located within close proximity of the
proposed Site.
11.5 POTENTIAL SIGNIFICANT EFFECTS
Construction Effects
Noise
11.5.1 The most notable effects due to increases in noise and vibration during
construction will be during periods of earthworks, construction of site infrastructure
and any piling activities. In addition to on-site sources, increased effects may be
caused by HGV movements travelling to and from the Site.
11.5.2 Activities associated with the construction phase that have been assessed have
been assumed to comprise the following:
General site clearance;
Excavation of material, if necessary, to remove unsuitable areas with respect
to final end-use;
Movement of construction equipment and plant;
Export and import of materials;
WHELDON ACT AND AD FACILITY
ENVIRONMENTAL STATEMENT VOLUME 1: MAIN TEXT
R57016Y001/D
Pell Frischmann Page | 159
Excavation, movement and grading of material on site to facilitate suitable
ground conditions for the installation of below ground level services,
construction of the foundations for buildings and associated infrastructure;
Compaction of material to create suitable ground conditions;
Concreting works to create the foundations;
The potential that piling will be undertaken during the construction works;
Activities associated with the erection of buildings; and
Highway and infrastructure improvements.
11.5.3 Exact details regarding the construction techniques and types of plant can only be
estimated at present and therefore it is difficult to predict accurately the potential
magnitude of potential noise effects on local receptors. Therefore, the potential
effect of construction noise is assessed qualitatively.
11.5.4 It is appreciated that during certain periods of the construction phase the effect will
be substantial in magnitude at the nearby sensitive residential and commercial
receptors which have a low sensitivity. The effect will be negative, direct,
temporary and short-term. The unmitigated effect significance is considered to
be moderate – minor adverse in scale, in accordance with the stated
assessment methodology. However, effects will reduce to a negligible magnitude
depending on the location of the construction activities on a daily basis in the Site
area, with noise levels being attenuated as the distance between source and
receptor increases and the equipment being used varies. This will result in a
neutral effect in scale for certain periods of the working day.
11.5.5 Overall effects to local residential receptors during the construction phase are
expected to be temporary and relatively short term in duration and it is anticipated
that compliance with the additional mitigation measures identified below will
reduce this effect.
11.5.6 As very limited data is available for the construction noise assessment confidence
in the prediction is low. However, the qualitative assessment has produced an
impact that is substantial in magnitude and so the assessment represents a
conservative approach.
Construction Traffic Noise
11.5.7 In addition to the on-site sources mentioned, increased noise may be caused by
HGV movements and from site workers travelling to and from the Site during the
construction period.
11.5.8 During the construction works the number of vehicles used during site preparation
and construction will vary over each phase. The Site entrance will be from
WHELDON ACT AND AD FACILITY
ENVIRONMENTAL STATEMENT VOLUME 1: MAIN TEXT
R57016Y001/D
Pell Frischmann Page | 160
Wheldon Road. The nearest sensitive receptors are located at the possible
traveller’s site on Wheldon Road at a distance of approximately 60m from the Site
access.
11.5.9 It is considered that the worst-case scenario effect during the daytime at the
above location will be substantial in magnitude with the effect being negative,
direct, temporary and short-term for certain periods of the day. The unmitigated
effect significance is considered to be moderate – minor adverse. However, it is
considered that the overall effect will be negligible and significance neutral as
the movements will be spread over the working day and will be for a short time
period. Mitigation measures to minimise the potential noise effect are presented
below.
11.5.10 As the assessment has been undertaken qualitatively due to the unknown number
of proposed construction vehicle movements confidence in the prediction is low.
Vibration
11.5.11 The magnitude of vibrations from activities such as piling to support foundations
diminishes exponentially and rapidly with increasing distance from the source. The
highest energy piling operations are considered unlikely to unduly disturb people
should they occur at a distance of more than 100m. Given that the nearest
existing residential property is more than 130m away from the nearest proposed
building on the Site the potential for vibration from construction operations is
considered minimal and it is considered that there will be a negligible effect
relating to human response with a neutral significance.
11.5.12 As the assessment of the potential vibration effects of the scheme has been
undertaken qualitatively, due to unknown variables with regard to the intervening
ground conditions between the Site and sensitive receptors and the proposed
location of any piling, confidence in the prediction is low.
Operational Effects
Noise
11.5.13 There is the potential for noise from the Proposed Development, once it becomes
operational, to effect on nearby sensitive receptors. Consideration has been given
to operational noise effects during the outline design stage, however these effects
on existing noise sensitive receptors will be considered further during the detailed
design stage following the findings of this assessment.
11.5.14 The potential noise sources to be considered comprise:
Noise from operations/plant external to the main building
Noise from operations/plant within the main building; and
Noise from deliveries.
WHELDON ACT AND AD FACILITY
ENVIRONMENTAL STATEMENT VOLUME 1: MAIN TEXT
R57016Y001/D
Pell Frischmann Page | 161
Operations/plant external to the main building
11.5.15 With reference to drawing CPPL-05/10-01 produced by Entran Architects and to
Section 5 the main fixed noise sources external to the main building are:
Pyrolysis stack (approx. 26.77 m high)
Engine stacks (3no. at 26.77 m high)
Gas flue stack (26.77 m high)
11.5.16 Anaerobic digestion is essentially a silent process so no contribution from the
anaerobic digesters is anticipated.
11.5.17 The gas house is a fully enclosed and attenuated building so noise issues are not
anticipated.
11.5.18 Given the distances between the noise sources and the receptors it can be
assumed that they act as point sources for the purposes of the calculations.
Operations/plant within the main building
11.5.19 With reference to Section 5 the internal operations are divided between four zones
within the building:
Waste reception
Autoclaving
Pyrolysis
Energy generation
11.5.20 The plant items/operations present within each of these four zones are also taken
from Section 5.
11.5.21 Each of these zones is assumed to be a separate area source for the purposes of
the calculations.
Deliveries
11.5.22 Pell Frischmann has provided traffic data for the operational phase of the
Proposed Development which indicates that 135 waste delivery/collection trips will
be undertaken each day. The assumptions within the traffic data are that the
deliveries will take place within a 12hr (7am – 7pm) day Monday to Friday with a
half day (7am to 1pm) on Saturday. Therefore approximately 11.25 vehicles per
hour visit the Proposed Development to either deliver waste or collect bi-products.
It is anticipated that there will be a weighting of these vehicles in the afternoon
WHELDON ACT AND AD FACILITY
ENVIRONMENTAL STATEMENT VOLUME 1: MAIN TEXT
R57016Y001/D
Pell Frischmann Page | 162
period and therefore the calculations will use a figure of 20 vehicles per hour to
represent the peak operation.
11.5.23 For the purposes of assessing a number of discrete events such as refuse
collection vehicles arriving and loading/unloading it is appropriate to use the
Single Event Levels of each of these activities and to calculate from these, by
using the frequency of these activities, the equivalent LAeq,1hr for use in the
assessment. A Single Event Level (SEL) is the LAeq of an activity corrected to a
time period of 1 second and represents the equivalent noise level of that activity if
all of the sound energy was released in one second.
11.5.24 As vehicles will travel along the Site access road the distance between the source
and receptor will vary – an average distance has been assigned within the
calculations.
Combined Operational Noise
11.5.25 The methodology of British Standard BS 4142: Method for rating industrial noise
affecting mixed residential and industrial areas has been used in part, along with
reference to Table 11.1, to assess the effect of operational noise sources from the
Proposed Development. Due to the potential character of the noise (e.g. hums,
bangs, etc.) a character correction of 5 dB has been added to each calculated
noise level.
11.5.26 The night-time predicted noise levels do not include contributions from deliveries
as deliveries will take place during daytime only as detailed in the Transport and
Access Chapter.
11.5.27 The noise levels at each sensitive receptor from each of the sources mentioned
above has been added together to give an overall noise level due to operational
activities at the Proposed Development.
11.5.28 Details of the calculations, assumptions and the data used are contained within
Technical Appendix 11.2.
11.5.29 The predicted overall daytime and night-time operational noise levels at each of
the receptors are described in Tables 11.8 and 11.9 below:
Table 11.8 – Daytime operational noise levels at nearby sensitive receptors
Location Combined noise
level with character correction (dB(A))
Background daytime noise level
(LA90 dB(A)) Predicted difference
Wheldon Road 39.5 44.8 -5.3
Clarity 36.6 32.7 3.9
Travellers 43.3 33.9 9.4
WHELDON ACT AND AD FACILITY
ENVIRONMENTAL STATEMENT VOLUME 1: MAIN TEXT
R57016Y001/D
Pell Frischmann Page | 163
Table 11.9 – Night time operational noise levels at nearby sensitive receptors
Location Combined noise
level with character correction (dB(A))
Background night time noise level
(LA90 dB(A)) Predicted difference
Wheldon Road 38 39.5 -1.5
Clarity 35.7 31.5 4.2
Travellers 41.6 32.6 9
11.5.30 Table 11.8 shows the difference between the predicted noise levels from
operational noise sources and existing background noise levels at those sensitive
receptors likely to experience effects from operational noise. During the daytime
the specific noise level is less than 10 dB above the prevailing background noise
level which will suggest that the likelihood of complaints is of above marginal
significance according to BS 4142. At 10 dB and more above background
complaints are likely. With reference to Table 11.1 the daytime effect magnitude
will range between negligible and substantial with a moderate/minor-neutral
significance. The effects are direct and permanent.
11.5.31 With reference to Table 11.9, at night-time the specific noise level is again less
than 5 dB above the lowest background level at these receptors indicating that the
likelihood of complaints is of marginal significance according to BS 4142. With
reference to Table 11.1 the night-time effect will range between negligible and
substantial with a moderate/minor-neutral significance. The effects again are
direct and permanent.
11.5.32 Mitigation will be required in order to reduce the effect at the nearest sensitive
receptors and this is discussed in Section 11.6 of this chapter.
Road Traffic Noise
11.5.6 A further potential effect from the Proposed Development which needs
considering is the noise effect resulting from increases in road traffic movements
along existing traffic routes. In order to bring about perceptible changes in noise
levels, relatively sizeable changes in traffic levels are required according to the
DMRB method which states that a change in noise level of 1dB (A) will be
produced by a change in traffic flow of approximately 25%. A change in noise
level of less than 1 dB (A) is barely perceptible and therefore it is considered that
such a level change will constitute a negligible effect with respect to road traffic
noise.
11.5.7 For each link in the road traffic model for the local road network the flow with and
without the Proposed Development were compared for the opening year (2015). It
was found that links in the local road network experienced increases in traffic
flows of between 0.2% and 5.9% which suggests that, with reference to Table
11.1, the effect of changes in road traffic noise on the local road network as a
result of the Proposed Development is negligible at all locations.
WHELDON ACT AND AD FACILITY
ENVIRONMENTAL STATEMENT VOLUME 1: MAIN TEXT
R57016Y001/D
Pell Frischmann Page | 164
Vibration
11.5.8 It is considered that there will be no significant sources of vibration present during
the operational phase of the Proposed Development. Therefore, the effect will be
negligible in magnitude and neutral in significance.
11.5.9 Confidence in the prediction is high.
11.6 MITIGATION
Construction
11.6.1 Construction works will usually be subject to control by planning conditions and
the following points should be considered reasonable to control and minimise
noise effects from such associated activities. These points are to be included
within a Construction Environmental Management Plan for the scheme as they
represent ‘Best Practicable Means’ that should be employed to minimise
construction and demolition effects. These measures have been included as an
example of suitable mitigation measures and should not be regarded as an
exhaustive list.
Careful selection of working methods and programme;
Consultation with the Local Authority regarding construction traffic routes;
Selection of quietest working equipment available (e.g. electric/battery
powered equipment which is generally quieter than petrol/diesel powered
equipment);
Positioning equipment behind physical barriers, i.e. existing features,
hoarding, etc., or provision of lined and sealed acoustic covers for equipment
that could potentially contribute to a noise nuisance;
Directing noise emissions away from plant including exhausts or engines
away from sensitive locations;
Ensuring that regularly maintained and appropriately silenced equipment is
used;
Shutting down equipment when not in use, i.e. maintain a ‘no idling policy’;
Handling all materials in a manner which minimises noise;
If piling is undertaken, methods which minimise noise and vibration should be
selected by the contractor.
Switch all audible warning systems to the minimum setting required by the
Health and Safety Executive;
WHELDON ACT AND AD FACILITY
ENVIRONMENTAL STATEMENT VOLUME 1: MAIN TEXT
R57016Y001/D
Pell Frischmann Page | 165
Restricting hours of site operation to the hours defined in Section 3.3.3;
Employ best practices and follow guidance of British Standard 5228, Code of
Practice for Noise Control on Construction and Open Sites (Parts 1 & 2) 1997;
and
If it is necessary to operate equipment outside normal working hours or a
significant noise effect is anticipated then the Best Practicable Means as
defined under Section 72 of the Control of Pollution Act 1974 will be employed
to minimise noise from such equipment.
The Local Authority is provided with powers under the Control of Pollution Act
to control noise and vibration from construction sites including, if necessary,
serving notices under Section 60.
Operation
11.6.2 Without mitigation the Proposed Development has the potential to cause effects of
moderate significance at the nearest sensitive receptor. Consideration will,
therefore, be given within the design to the following mitigation measures with
regard to noise:
Internal noise – acoustic enclosures for specific plant items, absorptive
material on the walls/ceiling to reduce reverberant sound within the buildings.
Attenuation will be chosen to reduce the noise level within each area of the
building to below 78 dB(A).
Stacks – in-stack noise attenuators which reduce the in-stack noise level to
below 70 dB (A);
Noise barriers – noise barriers will be installed along the inward access road.
The barriers will provide screening of the waste reception area for all
receptors and will therefore need to run from the Site entrance along the
access road and around the waste reception area. The barrier will be 3m in
height to account for the height of noise sources (e.g. refuse vehicles). The
design of the barriers can be finalised during the detailed design stage to
ensure that operational viability is not affected.
A general noise management plan will be produced for the operation of the
Site and will include good practice relating to such things as materials
handling, no idling of engines, radios to be turned off etc. The requirement for
this can be included in a suitably worded condition attached to the planning
permission.
Further to the above, if it is determined during the detailed design stage that
there could be an adverse effect associated with general noise generating
WHELDON ACT AND AD FACILITY
ENVIRONMENTAL STATEMENT VOLUME 1: MAIN TEXT
R57016Y001/D
Pell Frischmann Page | 166
activities the Local Authority can ensure appropriate noise control measures
by:
Attaching planning conditions with regards to the above for the Proposed
Development; and
Attaching planning conditions to control delivery hours.
11.6.3 Calculations have been undertaken to predict the operational noise levels
following the implementation of the above mitigation measures. The results are
given in Tables 11.10 and 11.11 below. Details of the assumptions made and data
used are contained within Appendix 11.2.
Table 11.10: Daytime operational noise levels at nearby sensitive receptors
following mitigation
Location Combined noise level with character correction (dB(A))
Background daytime noise level (LA90 dB(A))
Predicted difference
Wheldon Road 30.6 44.8 -14.2
Clarity 26.3 32.7 -6.4
Travellers 34.8 33.9 0.9
Table 11.11 – Night-time operational noise levels at nearby sensitive receptors
following mitigation
Location Combined noise level with character correction (dB(A))
Background daytime noise level (LA90 dB(A))
Predicted difference
Wheldon Road 21.7 39.5 -17.8
Clarity 19 31.5 -12.5
Travellers 25.4 32.6 -7.2
11.6.4 Tables 11.10 and 11.11 show the difference between the predicted noise levels
from operational noise sources following mitigation and existing background noise
levels at those sensitive receptors likely to experience effects from operational
noise. During the daytime the specific noise level is the same as or below the
prevailing background noise level which will suggest that the likelihood of
complaints is of below marginal significance according to BS 4142. At 10 dB and
more below background complaints are unlikely. With reference to Table 11.1 the
daytime effect magnitude will be negligible with a neutral significance at all
locations.
11.7 RESIDUAL EFFECTS
Table 11.12 provides an assessment summary of the potential environmental
effects and the anticipated residual environmental effects, following the
WHELDON ACT AND AD FACILITY
ENVIRONMENTAL STATEMENT VOLUME 1: MAIN TEXT
R57016Y001/D
Pell Frischmann Page | 167
implementation of the proposed mitigation, compensation or enhancement
measures.
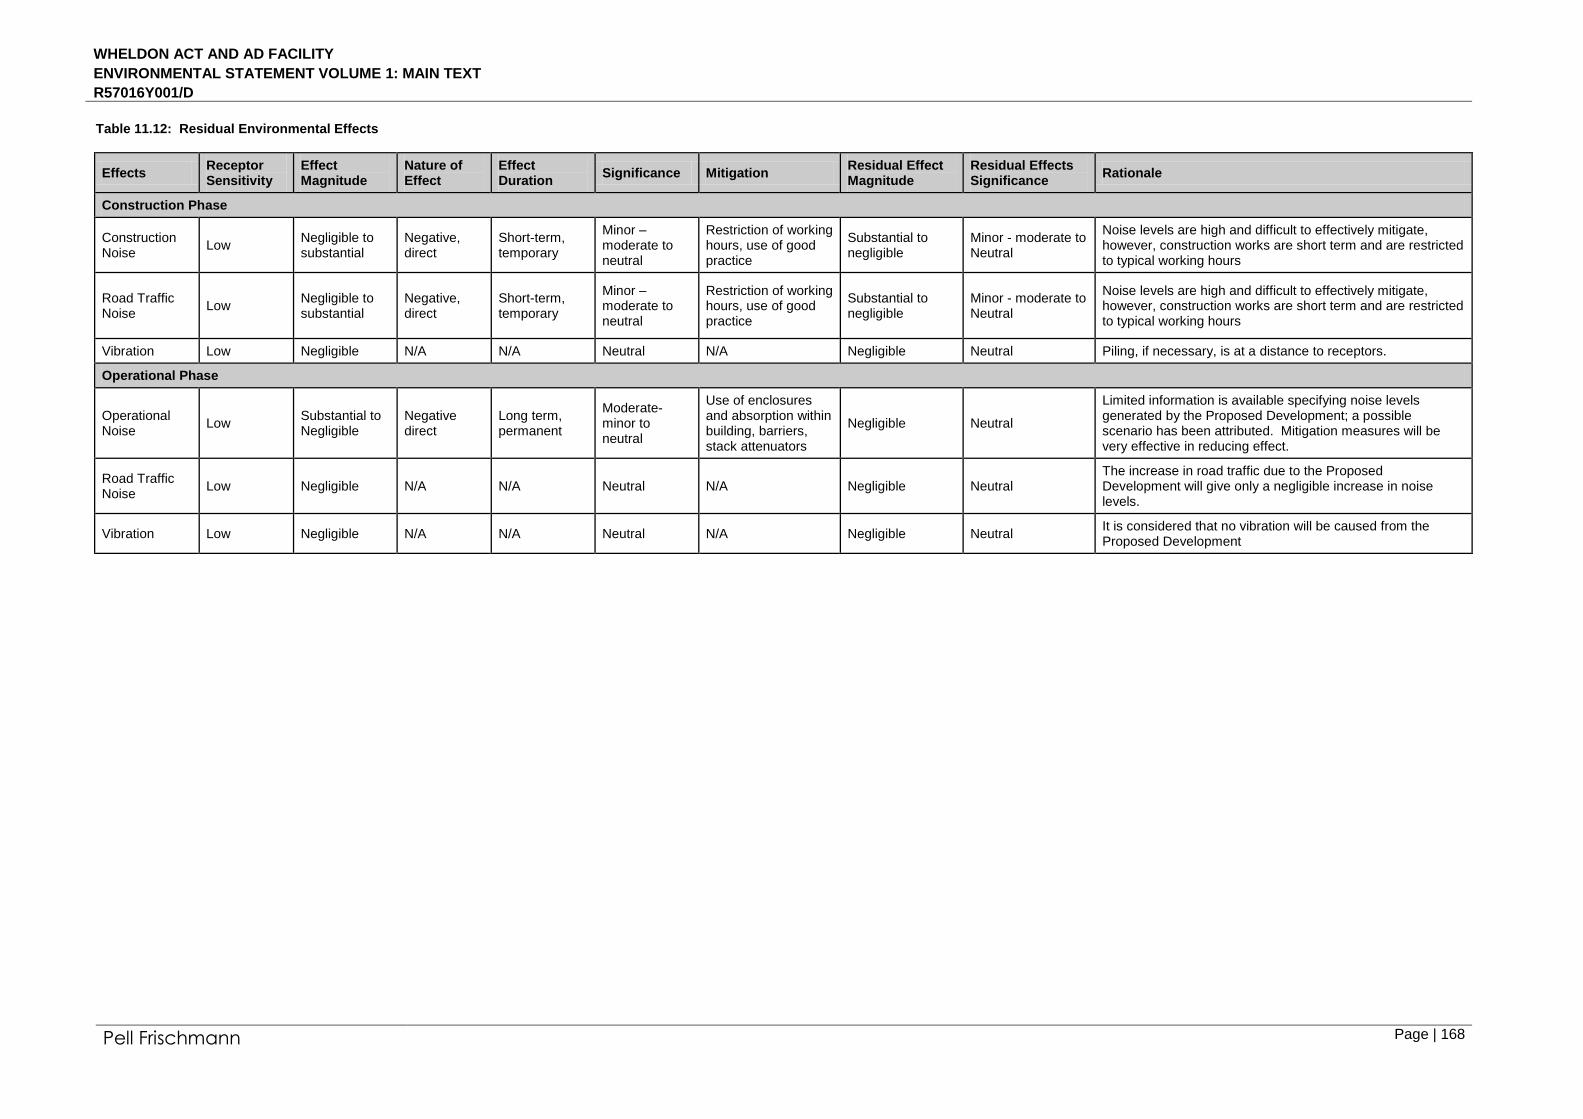
WHELDON ACT AND AD FACILITY
ENVIRONMENTAL STATEMENT VOLUME 1: MAIN TEXT
R57016Y001/D
Pell Frischmann Page | 168
Table 11.12: Residual Environmental Effects
Effects Receptor Sensitivity
Effect Magnitude
Nature of Effect
Effect Duration
Significance Mitigation Residual Effect Magnitude
Residual Effects Significance
Rationale
Construction Phase
Construction Noise
Low Negligible to substantial
Negative, direct
Short-term, temporary
Minor – moderate to neutral
Restriction of working hours, use of good practice
Substantial to negligible
Minor - moderate to Neutral
Noise levels are high and difficult to effectively mitigate, however, construction works are short term and are restricted to typical working hours
Road Traffic Noise
Low Negligible to substantial
Negative, direct
Short-term, temporary
Minor – moderate to neutral
Restriction of working hours, use of good practice
Substantial to negligible
Minor - moderate to Neutral
Noise levels are high and difficult to effectively mitigate, however, construction works are short term and are restricted to typical working hours
Vibration Low Negligible N/A N/A Neutral N/A Negligible Neutral Piling, if necessary, is at a distance to receptors.
Operational Phase
Operational Noise
Low Substantial to Negligible
Negative direct
Long term, permanent
Moderate-minor to neutral
Use of enclosures and absorption within building, barriers, stack attenuators
Negligible Neutral
Limited information is available specifying noise levels generated by the Proposed Development; a possible scenario has been attributed. Mitigation measures will be very effective in reducing effect.
Road Traffic Noise
Low Negligible N/A N/A Neutral N/A Negligible Neutral The increase in road traffic due to the Proposed Development will give only a negligible increase in noise levels.
Vibration Low Negligible N/A N/A Neutral N/A Negligible Neutral It is considered that no vibration will be caused from the Proposed Development

WHELDON ACT AND AD FACILITY
ENVIRONMENTAL STATEMENT VOLUME 1: MAIN TEXT
R57016Y001/D
Pell Frischmann Page | 169
11.8 SUMMARY
11.8.1 A noise and vibration assessment has been undertaken to determine the potential
effect of the proposed scheme at identified receptors. Such receptors include
residential properties located to the north, west and south of the Proposed
Development.
11.8.2 With regard to effects during the construction phase, the worst case unmitigated
noise effect magnitude for certain periods of the construction works is predicted to
be substantial adverse at receptors which have a low sensitivity. The effect will be
negative, direct, temporary and short-term. The unmitigated effect significance is
considered to be moderate – minor adverse, in accordance with the stated
assessment methodology. Construction works are temporary and through Best
Practice the effects can be minimised.
11.8.3 The potential vibration effect during the construction phase is considered to be
negligible in magnitude and neutral in significance.
11.8.4 With regard to operational effects, due to the nature of the proposed development
and, where appropriate, through good design, the general effect of the proposed
development will be moderate to negligible in magnitude and minor to neutral in
significance. It should be noted that there is likely to be the requirement to employ
mitigation measures to minimise noise associated with plant and waste deliveries
with particular regard to the nearest residential dwellings. Mitigation measures are
very effective in reducing noise and the residual effects following mitigation are
expected to be negligible in magnitude and neutral in significance. The effect is
predicted to be long term and permanent.
11.8.5 The potential operational vibration effect is considered to be negligible in
magnitude and neutral in significance.