Embed Size (px)
Citation preview
PROJECT REPORT (17MBAPR407)
“A STUDY ON WORKING CAPITAL MANAGEMENT” AT PIXEL CONTROLS,
BENGALURU
BY
BHAVYASHREE T S
1AY17MBA05
Submitted to
VISVESVARAYA TECHNOLOGICAL UNIVERSITY, BELAGAVI
In partial fulfilment of the requirements for the award of the degree of
MASTER OF BUSINESS ADMINISTRATION
Under the guidance of
INTERNAL GUIDE EXTERNAL GUIDE
Mrs. Sandhya S Mr. Narasimha Reddy
Assistant professor H R Manager
Department of MBA,AIT Pixel controls, Bengaluru
Department of MBA
Acharya Institute of Technology, Soldevanahalli,
Hesaragatta Main Road, Bengaluru
March 2019
€::::ipg5LROLsServeToreve>
TO WHOMSOEVHR IT MAY CONCERN
Date: 16/02/2019
This is to certify that Ms. BHAVYASHREE T S bearing USN IAY17MBA05, student ofAcharya Institute of Technology Bengaluru. To pursuing MBA 4th semester as successfullycompleted her internship on "PROJECT ON WORKING CAPITAL MANAGEMENT ATPIXEL CONTROLS" for a period of 6 weeks from 03/01/2019 to 16/02/2019. During thisassociation with us, she executed the work assigned to her very diligently.
Durilig this tcnurc we l`ound her to be vei.y keen in learning. Her conduct during this period
uras satisfactol.v .
Regards
:.i
I-IR MANAGER
Bongaluru
# 32, Kalyana Nagar, `D' Group Employees Layout, Near The Great Eastern International Public School,
Herohalli -Andrahalli Main Road, Bangalore -560 091 Ph: 080-23245583, Website; ww\^/.pixelcontrols.com

-++- f!ACIIARYA INSTITUTEOF TECHNOLOGY
(Affiliated to visvesva raya Technological university, Belagavi, Approved byAICTE, N ew Delhi and Accredited by N BA a nd NAAC)
Date: 23/03/2019
CERTIFICATE
This is to certify that Ms. Bhavyashree T S bearing USN
IAY17MBA05 is a bonafide student of Master of Business Administration
course of the Institute 2017-19 batch, affiliated to Visvesvaraya
Technological University, Belgaum. Project l`epoll on ``Workirig Ca|)ital
Management at Pixel Controls, Bengalui.u," is prepared by her under the
guidance of Prof. Sandllya S, in partial fulfillment of the requirements for
the award of the degree of Master of Business Administration, Visvesvaraya
Technological University, Belgaum, Kamataka.
Signature of Internal Guide
/trujI?; r? i; ` `. : ; .'r6 :3 i'.I i. c `f f\.''; :; t':``
'=i : ` ::`j.5'-3 c,,;;Tee-;T,`'
Signature of principal/Dean Academics
Dr. Devarajaiah R.M.Dean-Academies
C\CHARVA INSTITUTE 0F TECHNOLOGY
Bengaluru-107.
Acharya Dr Sarvepalli Fladhakrishnan Road, Soladevanahalli. Acharya PO , Bengaluru 560107, Kamataka, Inclla . www.acharya ac ln/all• Ph +91-80-225 555 55 Extn 2102 . Fax: +91-801237 002 42 . E-mail principalalt@acharya ac ln

DECLARATION
I, Bllavyashree T S, hereby declare that tile Project report entitled "A STUDY ONWORKING
CAPITAL MANAGEMENT" at "PIXEL CONTROLS, Bengaluni prepared by me under the
guidance of Prof. SANDHYA.S, faculty of M.B.A Department, Acharya institute of
Technology and extemal assistance by Mr. Narasimha Reddy, Manager, PIXEL
CONTROLS. I also declare that this Project work is towards the partial fulfilment of the
university regulations for the award of degree of Master of Business Administration by
Vjsvesvaraya Technologlcal University, Belagavi. I have undergone a sunimer project for a
period of Six weeks. I further declare that this Project is based on the ongmal study undertaken
by me and has not been submitted for the award of any degree/diploma from any other
University / Institution.
Place: BengaluruDate: 10/04/2019

ACKNOWLEDEMENT
I wish to express my sincere thanks to our respected Principal, Dr. Prakash M R, beloved
Dean-Academics, Dr. Devarajaiah R M, and deep sense of gratitude to Dr. M M Bagali,
HOD, Acharya Institute of Technology, Bengaluru for their kind support and encouragement
in completion of the Project Report.
I would like to thank SANDHYA S, Asst. Professor, Department of MBA, Acharya Institute
of Technology, Bengaluru and external guide Mr. Narasimha Reddy, HR Manager, Pixel
controls, Bengaluru, who gave me golden opportunity to do this wonderful Project in the
esteemed organization, which helped me to learn various concepts.
Finally, I express my sincere thanks to my Parents, Friends and all the Staff of MBA department
of AIT for their valuable suggestions in completing this Project Report.
Place: Bengaluru Name: Bhavyashree T S
Date: 10/04/2019 (1AY17MBA05)
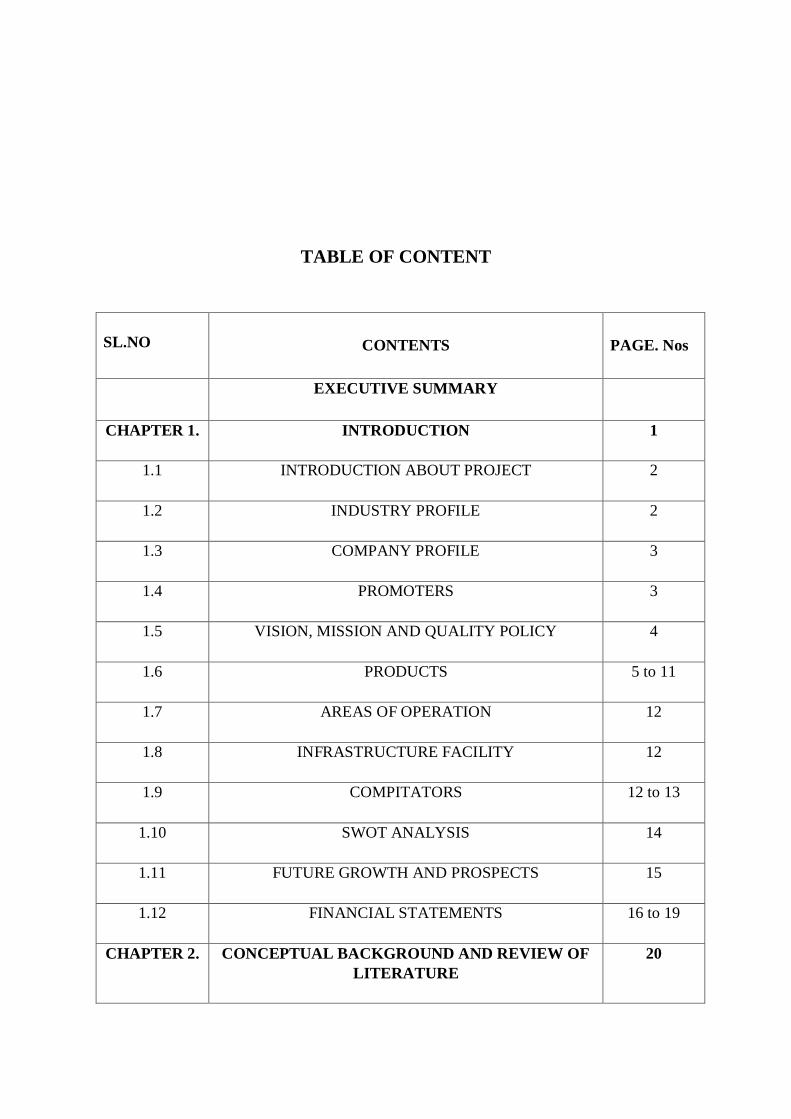
TABLE OF CONTENT
SL.NO
CONTENTS
PAGE. Nos
EXECUTIVE SUMMARY
CHAPTER 1. INTRODUCTION 1
1.1 INTRODUCTION ABOUT PROJECT 2
1.2 INDUSTRY PROFILE 2
1.3 COMPANY PROFILE 3
1.4 PROMOTERS 3
1.5 VISION, MISSION AND QUALITY POLICY 4
1.6 PRODUCTS 5 to 11
1.7 AREAS OF OPERATION 12
1.8 INFRASTRUCTURE FACILITY 12
1.9 COMPITATORS 12 to 13
1.10 SWOT ANALYSIS 14
1.11 FUTURE GROWTH AND PROSPECTS 15
1.12 FINANCIAL STATEMENTS 16 to 19
CHAPTER 2. CONCEPTUAL BACKGROUND AND REVIEW OF
LITERATURE
20
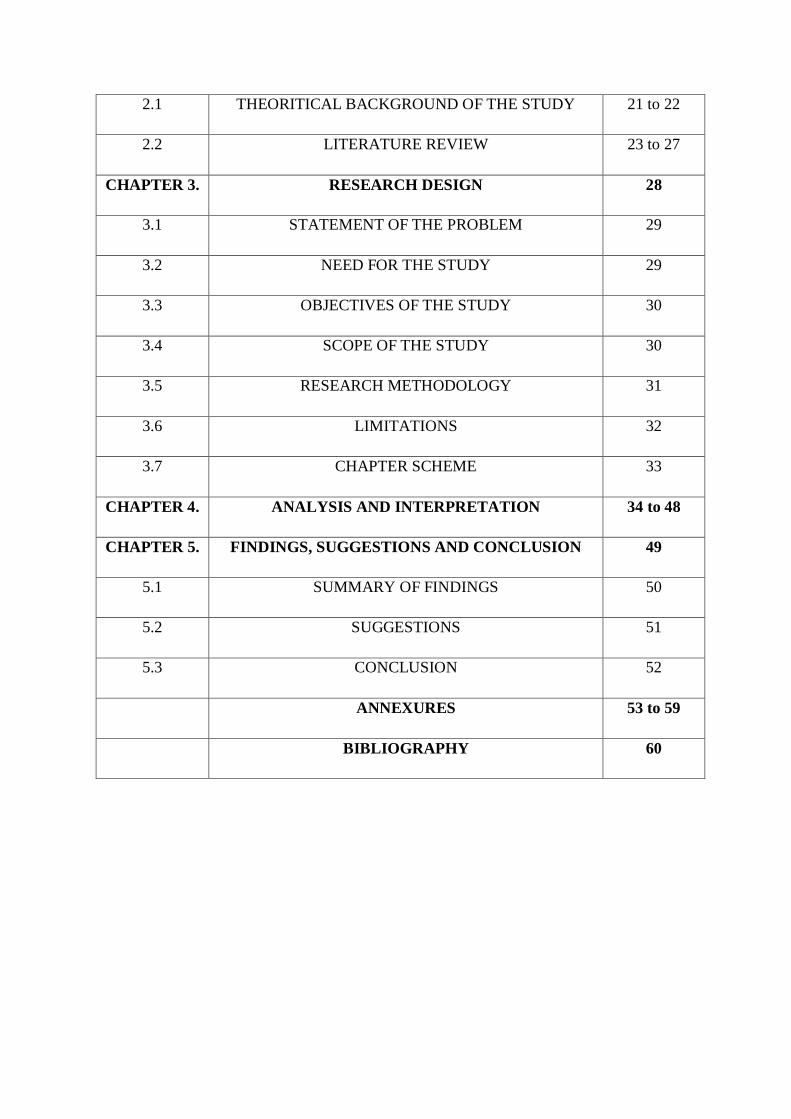
2.1 THEORITICAL BACKGROUND OF THE STUDY 21 to 22
2.2 LITERATURE REVIEW 23 to 27
CHAPTER 3. RESEARCH DESIGN 28
3.1 STATEMENT OF THE PROBLEM 29
3.2 NEED FOR THE STUDY 29
3.3 OBJECTIVES OF THE STUDY 30
3.4 SCOPE OF THE STUDY 30
3.5 RESEARCH METHODOLOGY 31
3.6 LIMITATIONS 32
3.7 CHAPTER SCHEME 33
CHAPTER 4. ANALYSIS AND INTERPRETATION 34 to 48
CHAPTER 5. FINDINGS, SUGGESTIONS AND CONCLUSION 49
5.1 SUMMARY OF FINDINGS 50
5.2 SUGGESTIONS 51
5.3 CONCLUSION 52
ANNEXURES 53 to 59
BIBLIOGRAPHY 60
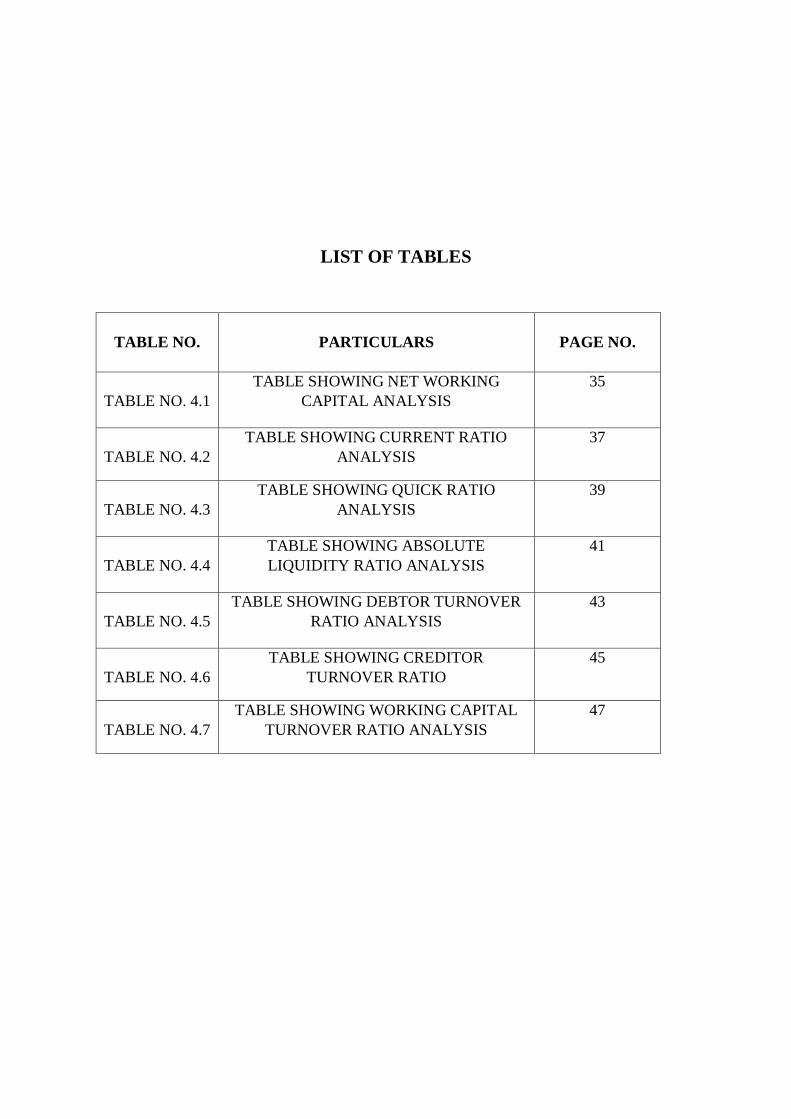
LIST OF TABLES
TABLE NO.
PARTICULARS
PAGE NO.
TABLE NO. 4.1
TABLE SHOWING NET WORKING
CAPITAL ANALYSIS
35
TABLE NO. 4.2
TABLE SHOWING CURRENT RATIO
ANALYSIS
37
TABLE NO. 4.3
TABLE SHOWING QUICK RATIO
ANALYSIS
39
TABLE NO. 4.4
TABLE SHOWING ABSOLUTE
LIQUIDITY RATIO ANALYSIS
41
TABLE NO. 4.5
TABLE SHOWING DEBTOR TURNOVER
RATIO ANALYSIS
43
TABLE NO. 4.6
TABLE SHOWING CREDITOR
TURNOVER RATIO
45
TABLE NO. 4.7
TABLE SHOWING WORKING CAPITAL
TURNOVER RATIO ANALYSIS
47
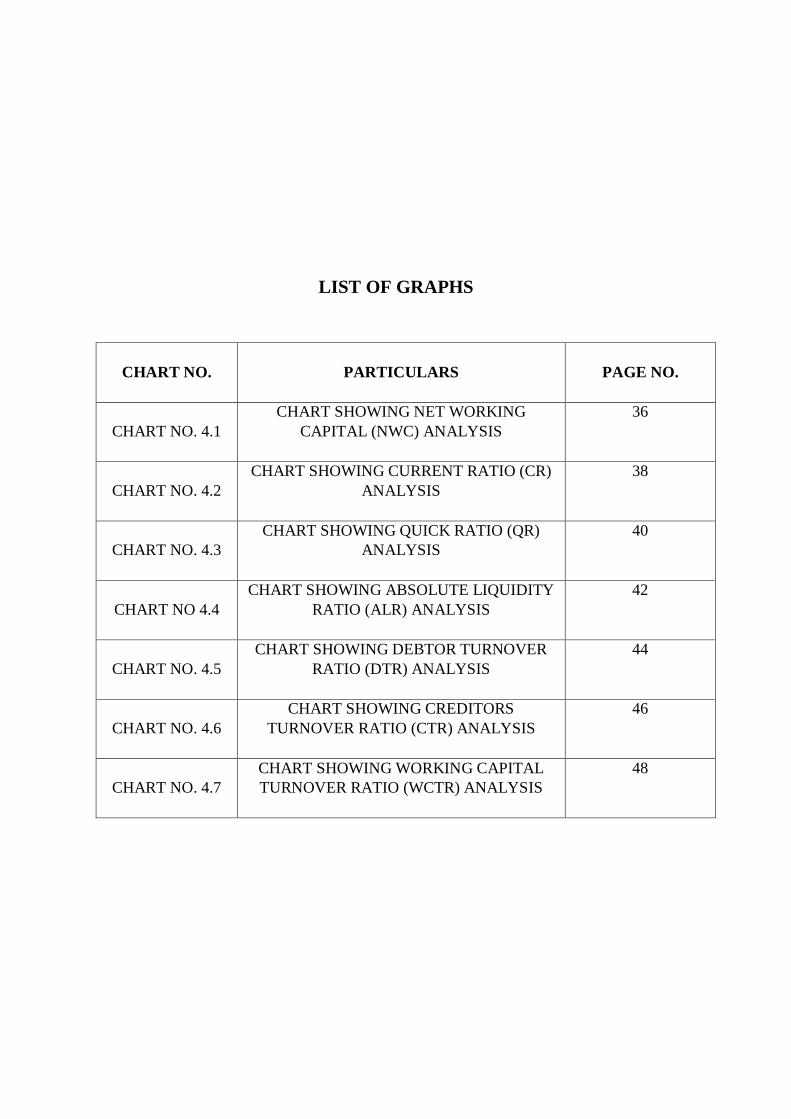
LIST OF GRAPHS
CHART NO.
PARTICULARS
PAGE NO.
CHART NO. 4.1
CHART SHOWING NET WORKING
CAPITAL (NWC) ANALYSIS
36
CHART NO. 4.2
CHART SHOWING CURRENT RATIO (CR)
ANALYSIS
38
CHART NO. 4.3
CHART SHOWING QUICK RATIO (QR)
ANALYSIS
40
CHART NO 4.4
CHART SHOWING ABSOLUTE LIQUIDITY
RATIO (ALR) ANALYSIS
42
CHART NO. 4.5
CHART SHOWING DEBTOR TURNOVER
RATIO (DTR) ANALYSIS
44
CHART NO. 4.6
CHART SHOWING CREDITORS
TURNOVER RATIO (CTR) ANALYSIS
46
CHART NO. 4.7
CHART SHOWING WORKING CAPITAL
TURNOVER RATIO (WCTR) ANALYSIS
48

1
EXECUTIVE SUMMARY
Being part of education programs, each student studying considering MBA must take up
project on a particular subject assign to him or her likewise I was also entrusted with the work
of managing working capital in Pixel Controls.
Working Capital (WC) is (Current Asset - Current Liabilities) and short - term financing is
called Working Capital Management. It includes the connection between a company’s short -
term assets and short - term liabilities. The objective of Working Capital Management (WCM)
is to ensure that the company is able to fulfil its task and has sufficient income to pay for both
short - term debt maturity and future operating costs.
For the accompanying reason, the working capital is used in Pixel Controls: raw material,
ongoing work, stock, finished goods, sundry debtors and daily cash prerequisites. The Pixel
Controls maintain certain finances that are therefore available to fund the preconditions of the
present resources. The diverse information concerning working capital administration, for
example, determinants, grouping, sources have been inspected identifying with Pixel Controls.
The ratio analysis has been completed using two years money related data that is from 2015-
16 and 2016-17. Ratios such as Net Working Capital Ratio (NWCR), Absolute Quick Ratio
(AQR), Working Capital Turnover Ratio (WCTR), Current Ratio (CR), Quick Ratio (QR),
Creditors Turnover Ratio (CTR) were examined.
At pixel Controls, Management of working capital expanded during the season of study. This
demonstrates that working capital is sustainably supervised and that various offices work in
ideal coordination to guarantee the advancement of Pixel Controls, yet I have given a couple
of recommendations and conclusion on my project study.

2
CHAPTER 1
INTRODUCTION
3
1.1 INTODUCTION ABOUT PROJECT
Project gives us a good opportunity to improve the practical knowledge of the study which
helps to gain an in-depth knowledge of study. The project period where is from 6 to 7 weeks
of time.
In the starting weeks I got a chance to learn about the company and structure of company’s
management structure. Later I learned about the product and services that are available in the
company and the quality of each products and the different types of customers. The product
and services where broadly classified on the customers. The company provides sources like
data and limitations of the study.
Project offered me a great opportunity to share my insights, to describe my academic
preparation and internship helps the students to develop the key research report.
Benefits of Project
projects are very useful for the efficiency of individuals and trainees when it comes to fulfilling
promises and to understand the real corporate world. Project helps the students to create their
own professional network, and also helps the company to find future employees and increase
retention rates for its employees.
1.2 INDUSTRY PROFILE
Industrial automation is the use of various control devices such as PC’s/PLC’s/DCS, which are
used to control various functions of an industry and provide automatic control performance
without significant intervention of humans. In industries, the control strategy uses a set of
techniques that are implemented to achieve the desired output or performance, making the
automation system most necessary for the industries.
The automotive industry is growing at incredible speed. However, the goal remains primarily
work more efficiently and bring product quickly to the market.
Automotive manufacturing capabilities, strategic relationships and automation and control
solutions enhance the entire automotive supply chain that can help achieve the goals of
experience and expertise at the start of the global programme Including development of global
specifications, integration of IT and manufacturing systems, local support and coordination of
machine builders and training of the workforce.
Deep knowledge of operations and process optimization of automotive manufacturers. To help
automotive manufacturers and their tire suppliers, they provide comprehensive enterprise -
wide solutions and services.
Secure business process enhances manufacturing elasticity, increases access to production
information in real time, and improves enterprise supply chain integration.
4
1.3 COMPANY PROFILE
Pixel control is one of the biggest service provider and supplier in the industrial automation
and communication field, which offers an active and passive fibre component to its major
customers in iron & steel and telecom industries since 2007.
Pixel controls recognised as a service provider as team of leading experts in the industrial
automation and communication filed to execute the installation, commissioning and testing.
Pixel control is the company which is having a large stock of fibre products, electrical products,
networking products. Pixel control welcomes all the requests for customer from large to small
products. As a solution partner, the company is providing a complete and well-balanced
product range with which they can simplify the complex solution for their customers.
Pixel control have bonded relationship with their customers and in-depth knowledge of their
technical team which allows pixel continuous growth.
Pixel controls grown into a flexible and progressive consulting engineering firm in assembling,
testing, erecting and maintenance for the energy industry.
Pixel control truly care about their clients and do whatever to deliver complete customer
satisfaction. While company take their project seriously, they enjoy their work value in the
long relationship.
Pixel control understand the value of having an experienced and qualified force, so the
company have invested in technology training to ensure that they services will have the
expertise to expertly the complete their projects.
1.4 PROMOTERS
a. Shankar Murthy N
A vice president at pixel controls who completed B.E (Bachelor of Engineering)
b. Venkataramana Reddy
c. Narasimahalu M V
A Managing Director and Manager in pixel controls who completed B.E(Bachelor of
Engineering) & MTech (Masters in Technology)
5
1.5 VISION MISSION AND QUALITY POLICY
VISION
“With a customer-oriented strategy to provide high quality products and timely technical
services to enable our customers to implement their projects faster”
MISSION
“Continuous commitment to our customer for innovative solutions at the most economical cost
and stringent delivery schedules”
Quality Policy
We are focused to furnishing our clients with items and services of the most noteworthy quality
possible, reliable with the objective and core values of our company. To accomplish this, we
will persistently improve procedure, products and services that meet or exceed customer
desires. Our quality approach provides a framework for defining and amending quality
objectives, keeping up regulatory, customer necessities and fostering nonstop improvement.
6
1.6 PRODUCTS
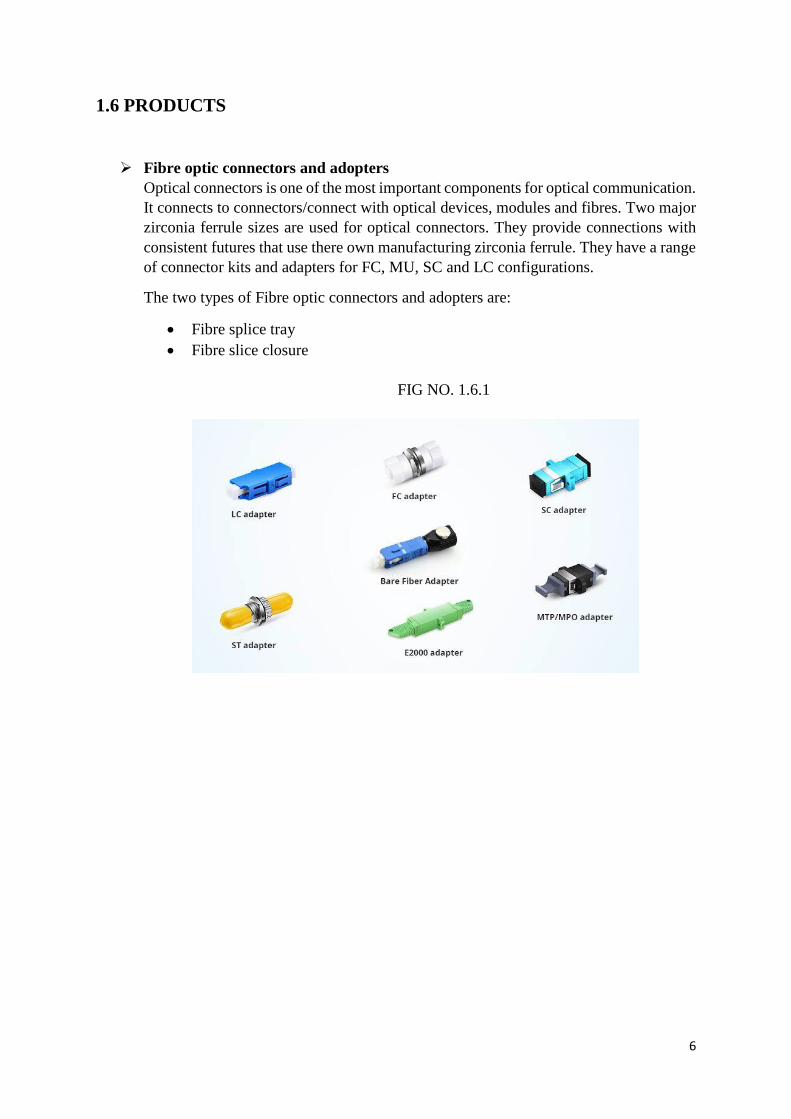
➢ Fibre optic connectors and adopters
Optical connectors is one of the most important components for optical communication.
It connects to connectors/connect with optical devices, modules and fibres. Two major
zirconia ferrule sizes are used for optical connectors. They provide connections with
consistent futures that use there own manufacturing zirconia ferrule. They have a range
of connector kits and adapters for FC, MU, SC and LC configurations.
The two types of Fibre optic connectors and adopters are:
• Fibre splice tray
• Fibre slice closure
FIG NO. 1.6.1

7
➢ Patch panels / LIU
A patch panel is a device or unit in which many sockets are generally similar or same.
They can be used in a convenient way for the use of connection and a routing circuits
for connections, texting of circuits and monitoring. They are designed to be flexible.
Patch panels are deeply used in computer networks, radio, T V and recording studios.
The word PATCH comes from the first use in wireless studios and telephone, where it
is possible to replace additional backup equipment for temporarily non-functional
equipment. This cohesion was achieved through the patch cord and patch panel.
FIG NO. 1.6.2
8
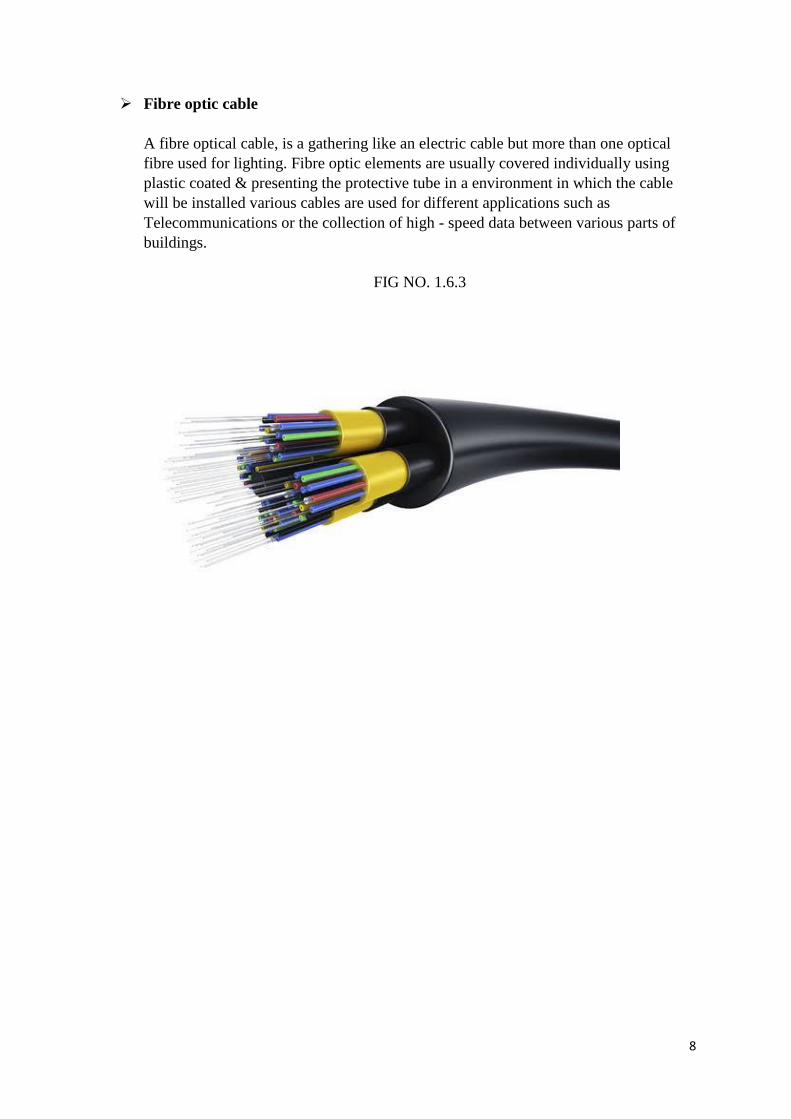
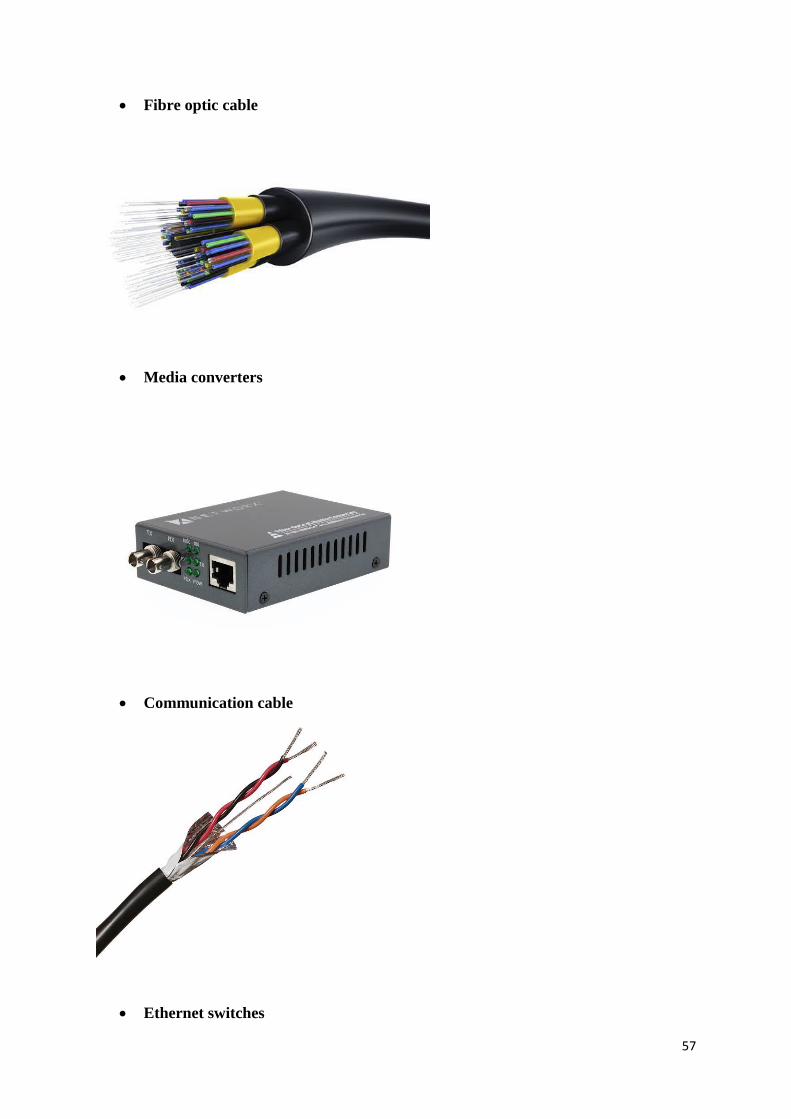
➢ Fibre optic cable
A fibre optical cable, is a gathering like an electric cable but more than one optical
fibre used for lighting. Fibre optic elements are usually covered individually using
plastic coated & presenting the protective tube in a environment in which the cable
will be installed various cables are used for different applications such as
Telecommunications or the collection of high - speed data between various parts of
buildings.
FIG NO. 1.6.3

9
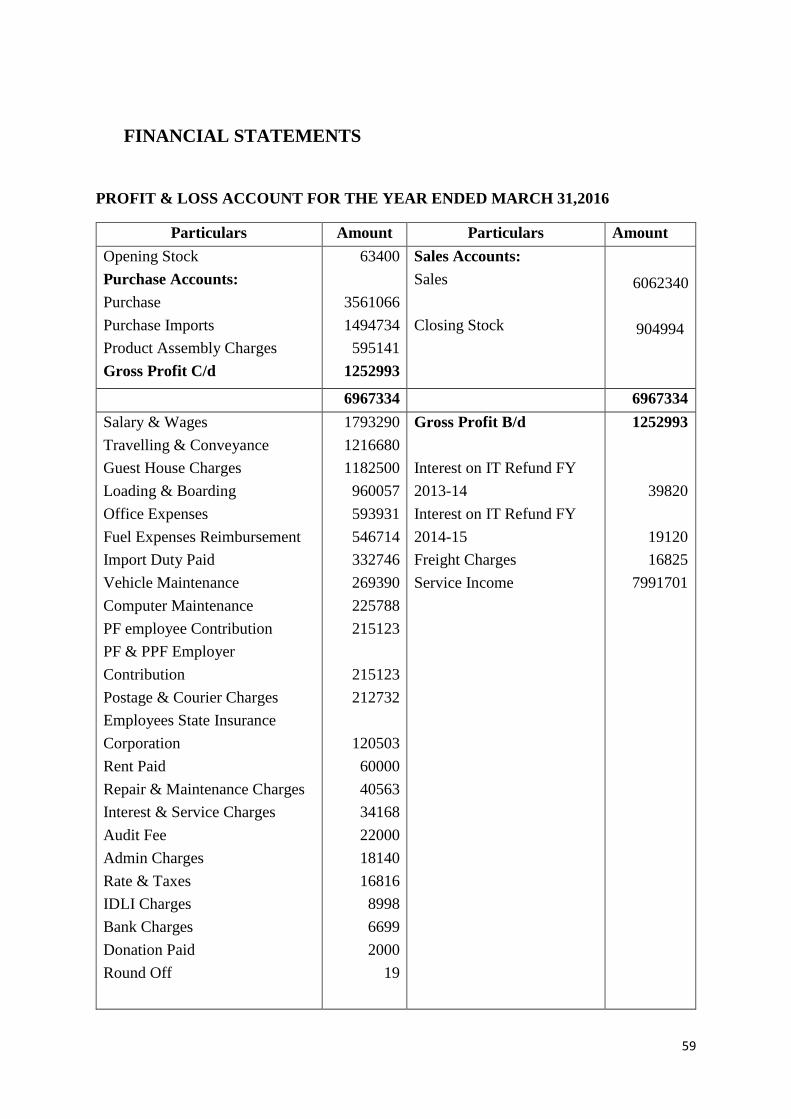
➢ Media converters
A media converter is a simple networking device that connects to uneven media types
such as distorted pairing with fibre optic cabling. They were introduced to the industry
in 1990’s and are among the among the fibre optic cable-based system that integrate
with existing copper based, structured cabling system. They also use Metropolitan Area
Network (MAN) access and data transport services to enterprise users.
Types of media converters are as follows
• Small form factor plugging
• Fibre optic communication
• Gigabit interface converter
FIG NO. 1.6.4
10
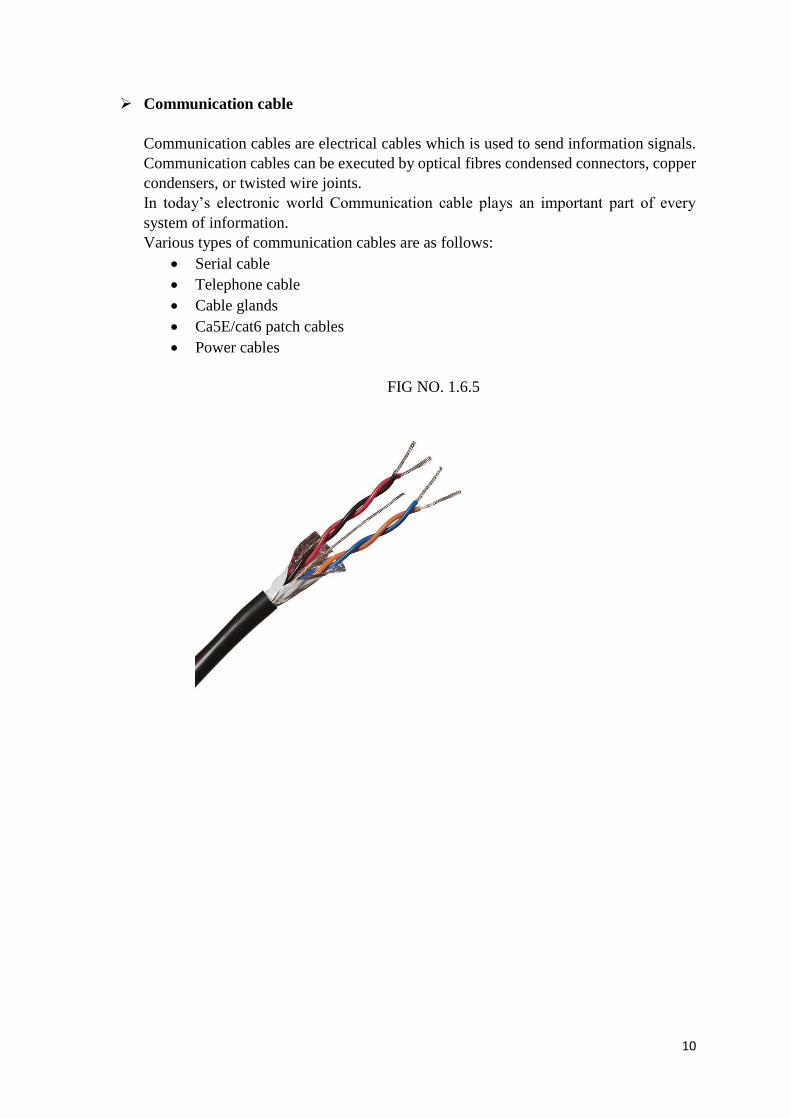
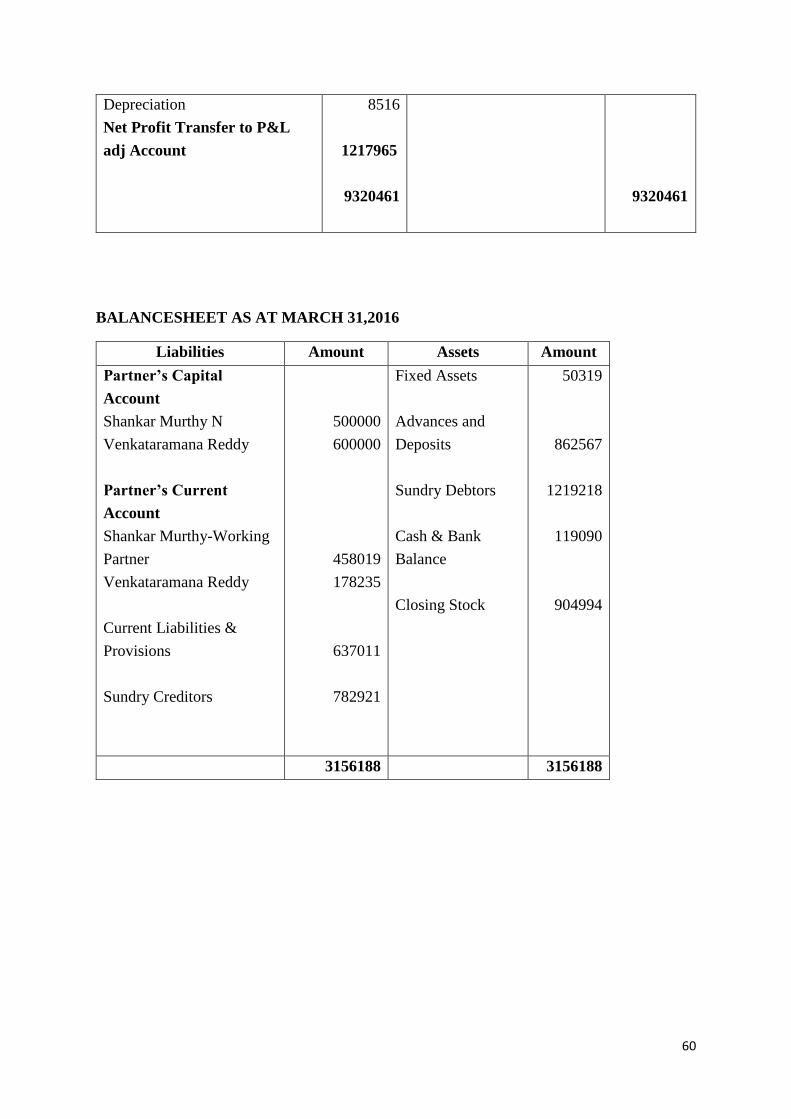
➢ Communication cable
Communication cables are electrical cables which is used to send information signals.
Communication cables can be executed by optical fibres condensed connectors, copper
condensers, or twisted wire joints.
In today’s electronic world Communication cable plays an important part of every
system of information.
Various types of communication cables are as follows:
• Serial cable
• Telephone cable
• Cable glands
• Ca5E/cat6 patch cables
• Power cables
FIG NO. 1.6.5
11
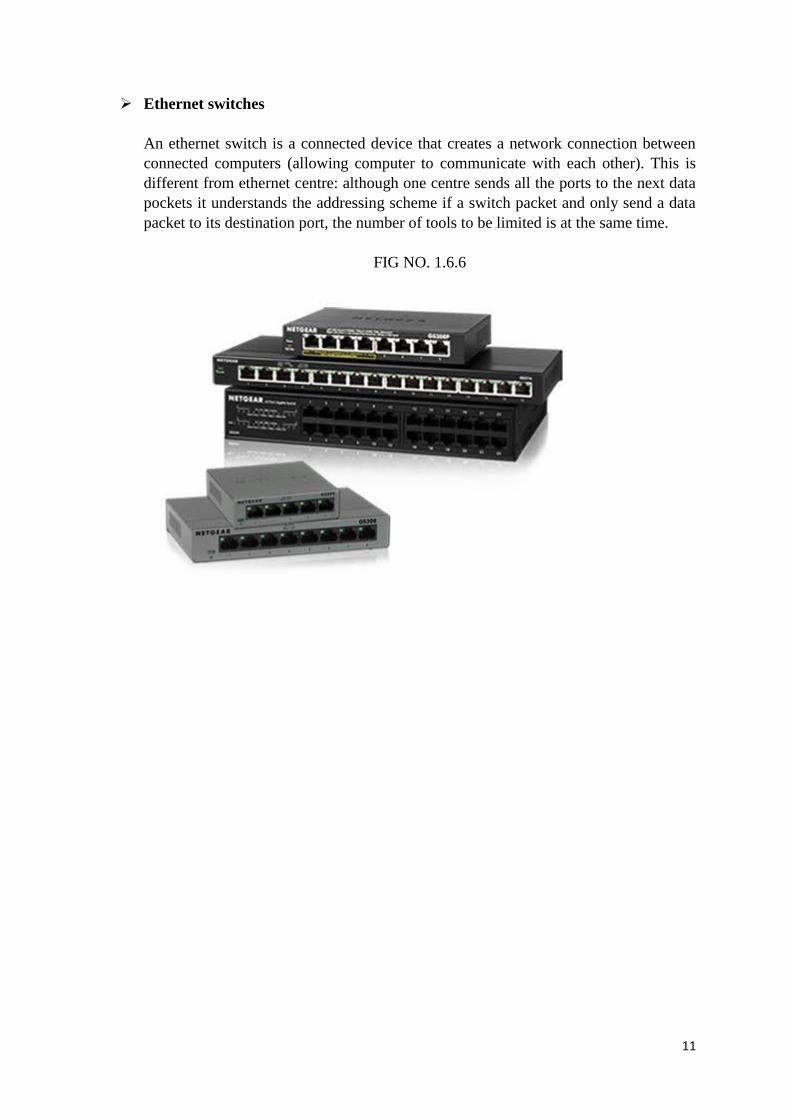
➢ Ethernet switches
An ethernet switch is a connected device that creates a network connection between
connected computers (allowing computer to communicate with each other). This is
different from ethernet centre: although one centre sends all the ports to the next data
pockets it understands the addressing scheme if a switch packet and only send a data
packet to its destination port, the number of tools to be limited is at the same time.
FIG NO. 1.6.6

12
➢ Ethernet routers
A router is a networking tool which forward the data between the computer networks.
A router performs traffic instruction on internet data sent by the internet such as email
and web pages, in the format of data packets. A packet is usually from a router to
another network through which the network has access to the internet as long it reaches
its destination node.
A router is connected from various networks to more than two data lines. The router
reads a network address information packet when the database comes in arrow to
determine the final destination. Then, using a routing policy in the information in its
routing table, it guides the packet to its packet's next network.
FIG NO. 1.6.7
13
1.7 AREAS OF OPERATION
Bangalore
#32, Kalyan Nagara, D Group Employees Layout, Near the Great Eastern International Public
School, Lingaderanahalli, Bangalore- 560091
Website: www.pixelcontrols.com
1.8 INFRASTRUCTURE FACILITY
• Good cabins with more than 30 computers
• Provides water and air conditioning to the employees in the office
• Good ventilation facility
Equipment includes
• Automatic and manual equipment
• Cycling testing equipment
• High speed automatic coilers for long run purpose
• Commissioning and erection equipment
1.9 COMPITATORS
Madox technology pvt. Ltd
Madox technologies pvt, ltd is an certified engineering and manufacturing solution company
which got incorporated in 2009. The headquarter is located in Bangalore with the team of 60+
employees. In 2010 Madox technologies started panel manufacturing. Madox technologies
become private limited company and started giving Turn key automation solution in 2013 and
in 2014 it become an ISO 9001-2008 companies. Madox technologies an office in KSA for
middle east marketing with an alliance. It become an ISO 9001-2015 company team strength
as increase to 50+ in 2016.
14
Anubhavi automation
Anubhavi automation was established in 2004 as a proprietorship company and later turned as
a partnership firm in 2009. It is a full-service provider of automated industrial control system.
The core of Anubhavi automation business philosophy is to provide the highest level of quality
products combined with customer services.
Anubhavi automation take up projects on complete turn key basis where the complete
consulting desire hardware and software supply and commissioning is carried out.
Power dot automation
Power dot automation is registered in 2012 located in Bangalore which gained immense
expertise in offering industrial automation, scada system, installation of PLC drives etc. power
dot automation place as a service provider/ supplier/ trading company.
Ellen automation
Ellen automation is an acknowledged organisation which is a sole proprietorship-based
company which engaged as manufacturer of control panel, bobbin winder machine etc.
Ellen automation was established in 2009 at Bangalore, which holds specialisation in rendering
CNC retrofitting services and PLC automation services. The team members of Allen
automation are well experience in electrical control panel and machine tool industry for the
past many years. The company involves in the projects with major companies all over India.
Venson electric private limited
Venson electric was set up in the year 1973 as little-scale industry by production of custom-
constructed control and security equipment for age, transmission and distribution shift gear
equipment. Today it is the most leading maker of relay panels for the voltages up to 220kv.
Venson electric private limited entered into 400kv protection segment and it is providing more
items for essential projects in India and it is likewise sending out its products to other nations.
Venson enjoying an excellence market notoriety.
SUPINCO automation private limited
Supinco automation is operating its business from 2005. It is the subsidiary company of
SUPCON which is working for Indian projects in different segments like including design,
engineering, supply, commissioning. The global engineering centre is located in Bangalore.
15
1.10 SWOT ANALYSIS
STRENGTHS
1. Products identified for renovation and excellence
2. Acquires the plant broad optimisation technique reach productivity and
effectiveness
3. There is a flexible, technical automation solution for low cost to design
4. Demonstrates integrated architecture for enhancing efficiency and productivity on
the customer’s organisation
5. Dedicated customer relationship management as able to reach a high level of
customer satisfaction.
WEAKNESSES
1. Lack of skilled workers
2. Cost of raw material will increase
3. Increasing cost of energy
Different laws fluctuations regarding the production standards in the markets can be
challenged in various markets given by the company
OPPURTUNITIES
1. Research and development
2. A huge investment through emerging markets in automation and technology
3. Lot leveraging to improve the company’s integrated enterprise visions
4. New technology provides the opportunity to practice the division pricing strategy in the
new market
THREATS
1. Serious competition leads to limited growth in market share
2. Low margins can hurt economic instability
3. Furthermore, the demand for manufacturers is not comparable to its competitors
4. The financial planning is not effective and efficient
5. Limited success outside main business

16
1.11 FUTURE GROWTH AND PROSPECTS
Pixel controls are looking for the opportunity to get maximum profit at the lower cost. Their
hard-earned money will be fully utilized for the benefit of their future.
The company is planning to expand their services to other automation industries, and also it is
planning to provide services to the power generation industries like Jindal coal, solar, water
power generation etc,
In future pixel controls is planning to provide services to telecommunication sector such as
installation and commissioning, and also it expands its production unit.
17
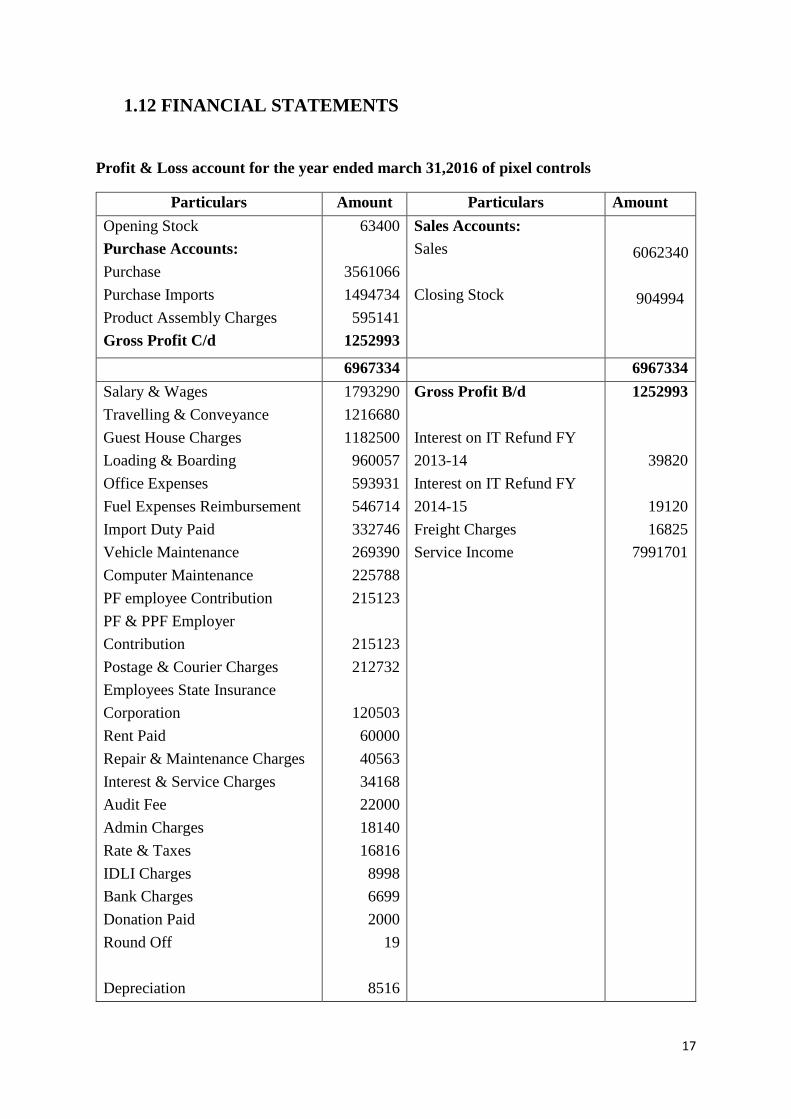
1.12 FINANCIAL STATEMENTS
Profit & Loss account for the year ended march 31,2016 of pixel controls
Particulars Amount Particulars Amount
Opening Stock
Purchase Accounts:
Purchase
Purchase Imports
Product Assembly Charges
Gross Profit C/d
63400
3561066
1494734
595141
1252993
Sales Accounts:
Sales
Closing Stock
6062340
904994
6967334 6967334
Salary & Wages
Travelling & Conveyance
Guest House Charges
Loading & Boarding
Office Expenses
Fuel Expenses Reimbursement
Import Duty Paid
Vehicle Maintenance
Computer Maintenance
PF employee Contribution
PF & PPF Employer
Contribution
Postage & Courier Charges
Employees State Insurance
Corporation
Rent Paid
Repair & Maintenance Charges
Interest & Service Charges
Audit Fee
Admin Charges
Rate & Taxes
IDLI Charges
Bank Charges
Donation Paid
Round Off
Depreciation
1793290
1216680
1182500
960057
593931
546714
332746
269390
225788
215123
215123
212732
120503
60000
40563
34168
22000
18140
16816
8998
6699
2000
19
8516
Gross Profit B/d
Interest on IT Refund FY
2013-14
Interest on IT Refund FY
2014-15
Freight Charges
Service Income
1252993
39820
19120
16825
7991701
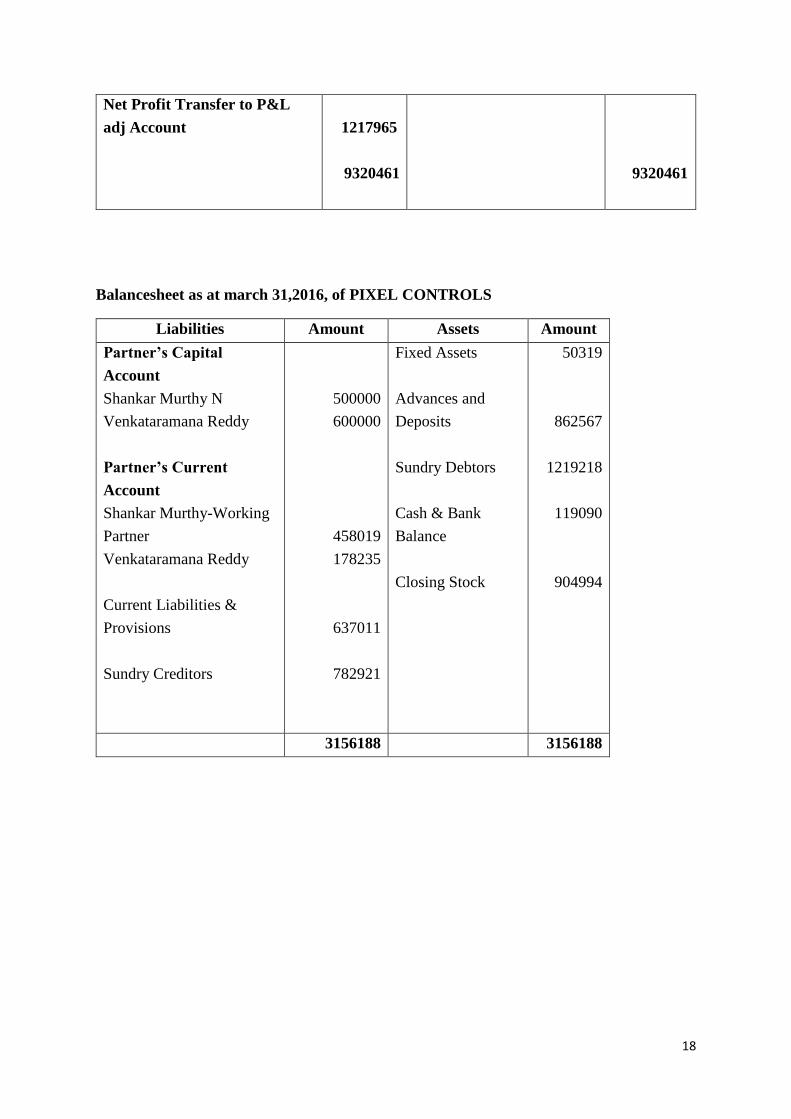
18
Net Profit Transfer to P&L
adj Account
1217965
9320461
9320461
Balancesheet as at march 31,2016, of PIXEL CONTROLS
Liabilities Amount Assets Amount
Partner’s Capital
Account
Shankar Murthy N
Venkataramana Reddy
Partner’s Current
Account
Shankar Murthy-Working
Partner
Venkataramana Reddy
Current Liabilities &
Provisions
Sundry Creditors
500000
600000
458019
178235
637011
782921
Fixed Assets
Advances and
Deposits
Sundry Debtors
Cash & Bank
Balance
Closing Stock
50319
862567
1219218
119090
904994
3156188 3156188
19
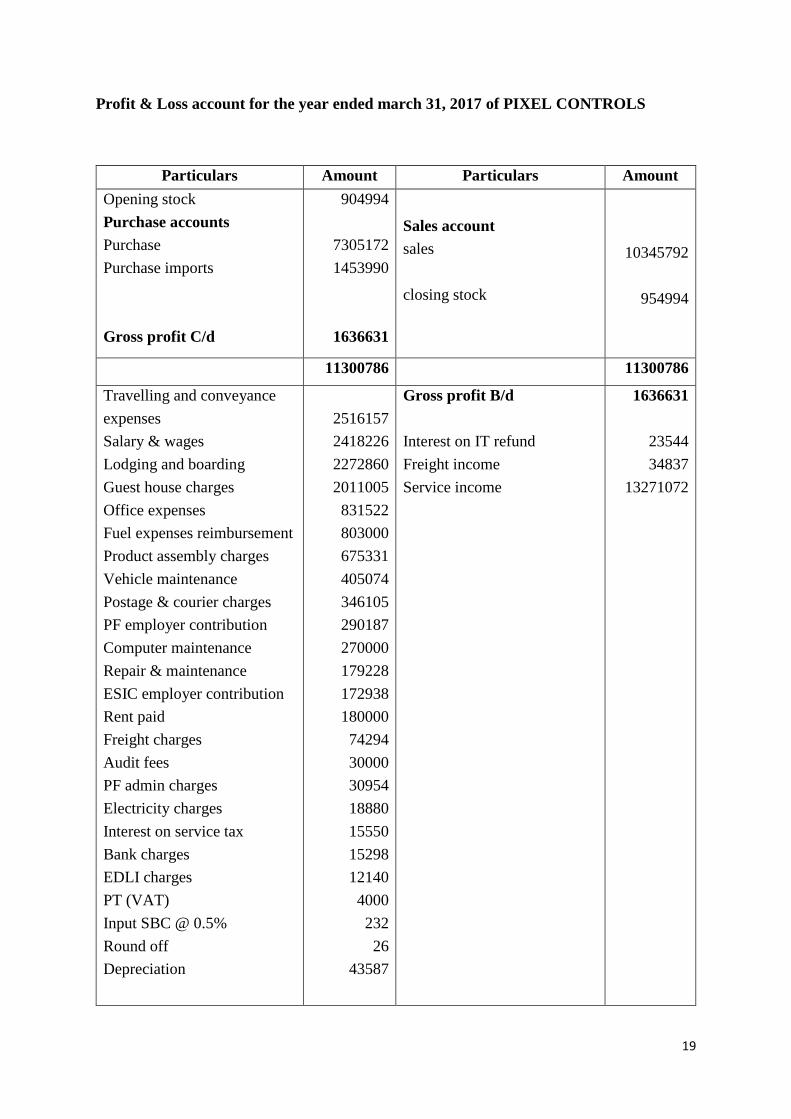
Profit & Loss account for the year ended march 31, 2017 of PIXEL CONTROLS
Particulars Amount Particulars Amount
Opening stock
Purchase accounts
Purchase
Purchase imports
Gross profit C/d
904994
7305172
1453990
1636631
Sales account
sales
closing stock
10345792
954994
11300786 11300786
Travelling and conveyance
expenses
Salary & wages
Lodging and boarding
Guest house charges
Office expenses
Fuel expenses reimbursement
Product assembly charges
Vehicle maintenance
Postage & courier charges
PF employer contribution
Computer maintenance
Repair & maintenance
ESIC employer contribution
Rent paid
Freight charges
Audit fees
PF admin charges
Electricity charges
Interest on service tax
Bank charges
EDLI charges
PT (VAT)
Input SBC @ 0.5%
Round off
Depreciation
2516157
2418226
2272860
2011005
831522
803000
675331
405074
346105
290187
270000
179228
172938
180000
74294
30000
30954
18880
15550
15298
12140
4000
232
26
43587
Gross profit B/d
Interest on IT refund
Freight income
Service income
1636631
23544
34837
13271072
20
Net profit transferred to
P&L Adj account
1349490
Total 14966084 Total 14966084
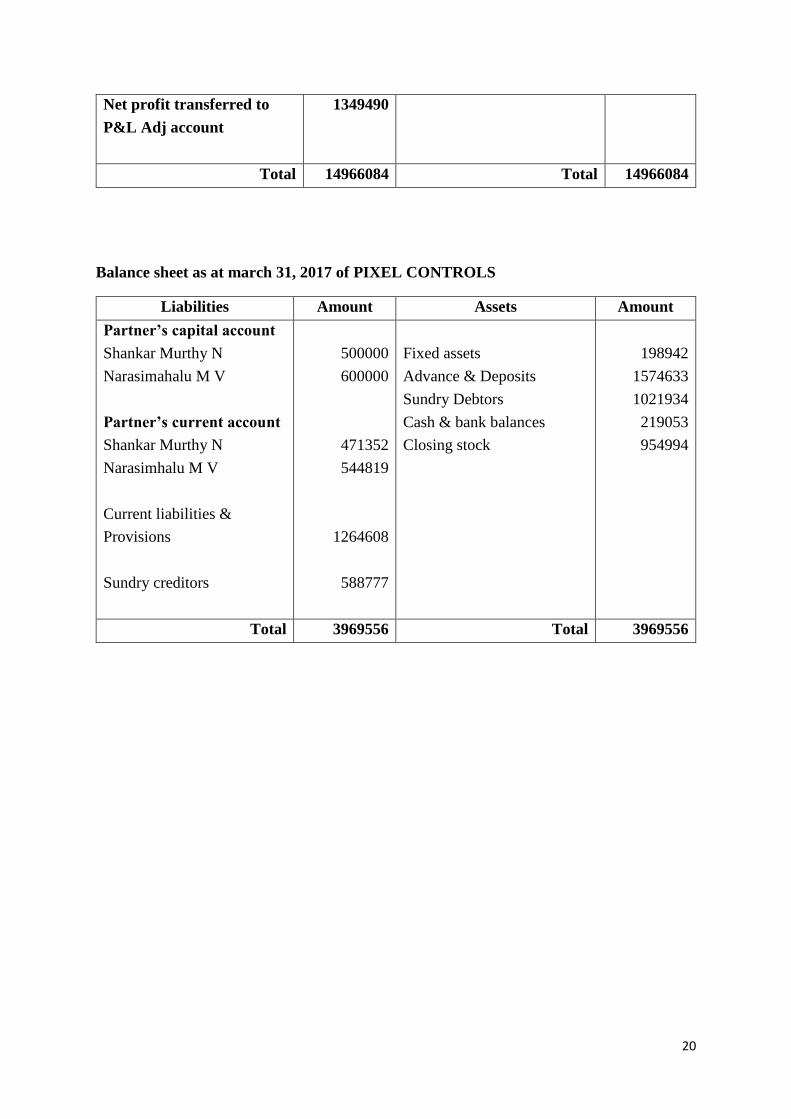
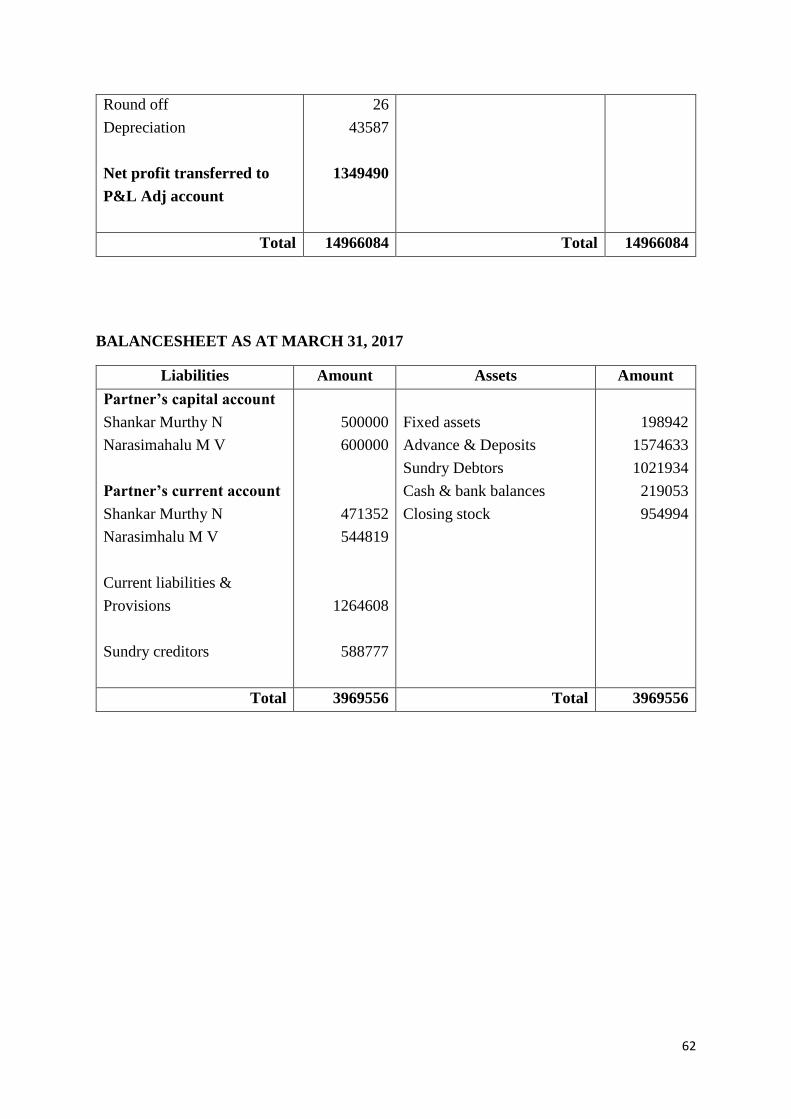
Balance sheet as at march 31, 2017 of PIXEL CONTROLS
Liabilities Amount Assets Amount
Partner’s capital account
Shankar Murthy N
Narasimahalu M V
Partner’s current account
Shankar Murthy N
Narasimhalu M V
Current liabilities &
Provisions
Sundry creditors
500000
600000
471352
544819
1264608
588777
Fixed assets
Advance & Deposits
Sundry Debtors
Cash & bank balances
Closing stock
198942
1574633
1021934
219053
954994
Total 3969556 Total 3969556

21
Chapter 2
Conceptual Background and Review of Literature
22
2.1 Theoretical background of the study
Working Capital Management (WCM)
Working Capital Management suggest an organisation accounting strategy of an enterprise
design to monitors and uses both the Working Capital (current asset and liabilities) and the two
components of current obligation to ensure the company's most cost - effective operation.
Working capital management's primary cause is to maintain its cash flow to meet its short -
term operating costs and short - term commitments.
Bookkeeping is an administration procedure as for each other Working capita (current assets
and current liabilities) are both focused on skilled management. Working capital management
guarantees that an organisation as enough money to meet its transient obligation commitments
and working cost stream.
Definition
“Working capital refers to corporate investment in short - term assets such as receivable cash
amounts, inventories etc.”
- Weston and Brigham
“The total of current assets is the working capital of business”
- J S Mill
“Exceeding current assets of business owned by employees and others on current items.”
- Park and Gladson
It is possible to group working capital in two different ways
1. Concept based working capital
2. Time based working capital
Concept of working Capital
1. Gross working capital
2. Net working capital
3. Negative working capital
23
Gross working capital
It represents the entire current or revolving company’s investment assets.
Net working capital
The term networking capital is defined as two types;
i. It is more than current liabilities and current assets. Definitely, this is most commonly
accepted definition only few are defined between current liabilities and current assets.
The former is a good definition compared with the latter.
ii. This is part of current asset of the company that has a long-term funding.
Negative working capital
This situation happens when current liabilities surpasses current assets. This is a reference to
the crisis to the organisation.
Time based working capital
1. Permanent trading capital
2. Temporary working capital
Permanent trading capital
It represents the base amount of capital in all current assets required for keep up a minimum
dimension of business activity. At the end of the day, it refers to the current assets required in
the continuation based on the entire. The Tandon committee refers to this kind of working
capital as ‘core current assets’
Temporary working capital
It keeps the measure of working capital sustainable occasional business activities. In other
words, it represents the additional current assets at different times of the operating year. For
example, additional inventory as to extra list includes supports top selling during sales.
Similarly, adoption will also increase and must be economically in the period of higher sales.
24
2.2 Literature review
1. Bhatt V. V. 1972 he broadly contacts on technique for evaluating working capital account
uses extensive assembling concerns. It expresses that comparative strategies should be
contrived for different areas, for example, horticulture, exchange and so forth. The author has
a view on the bank while providing short-term financing, focuses on the diversity of security
and repayment capabilities of their existence. On being happy if they meet these two criteria
details examination of the working of the concerns.
2. Smith Keith V. 1973 He trusts that Research that concerned research of working capital
and short-range basic leadership would seems productivity is falling. Budget manager has no
ability to plan and control legitimately the current liabilities and current assets of the particular
organisation has been the reasonable justification of business disappointment lately. Current
assets aggregately speak to the single biggest venture for some organizations, while current
liabilities represent a noteworthy piece of all out financing in numerous occurrences. His paper
covers eight unmistakable ways to deal with working capital Management. The initial three -
total rules, limitations set and cost adjusting are incomplete models; two different
methodologies - likelihood models and portfolio hypothesis, underline future vulnerability and
bury subordinate while the staying three methodologies - scientific programming, various
objectives and budgetary recreation have a more extensive deliberate core interest.
3.S.K. Chakraborthy 1974 He tries to distinguish between working capital cash v / s work
capital balance sheet. The scope of the analysis is as follows: 1) Common Parlance Working
Capital (CPWC), 2) Operating Cycle Concept (OCC) 3) Calculation of the operating cycle
period (OCP) in each of the four cases. The purpose of the analysis is to show the operational
cycle concept based on the company's published annual reports.
4.Natarajan Sundar 1980 he believes that Working Capital is critical in both domestic and
business dimensions. Working Capital Control is mainly exercised at national level by means
of credit controls. The Tandon group of study has made available the equivalent with an
exhaustive operating system. Effective working capital operationally involves deciding the
ideal dimension of Working Capital, creatively financing it and exercising power over it. He
assumes that interest in working capital in the corporate dimension is as vital as interest in fixed
resources. moreover, survival will be conceivable, especially for an organisation that is not
developing, just in so far as it can coordinate operational expenditure increases Improved
operational productivity, of which working capital executives are one of the most critical parts.
25
5. V.S Kaveri 1985 Based on her consideration of large open, restricted organizations ' funds
by RBI in its composition. This audit of working capital finances refers to two times, i.e. the
accounting years that ended in 1979 and 1983, and depends on the information provided by
Reserve Bank of India on individual dates of investigation by these organizations. She sees
that, with regard to the standards proposed by the Chore Committee, the Indian business has
neglected to change its working capital funding example. While the situation of Working
Capital Management (WCM) showed some venture between 1975 - 79 and 1979 - 83 when
expanding the long - haul asset base, businesses did not prevail to the ideal degree. The writer
concludes with the perception that the progress made towards this end missed the mark on what
was wanted under the second working capital money strategy, despite giving the ventures
sufficient time to correct the capital structure to move from the main strategy to the second
technique.
6.Bhattacharyya Rishikesh 1987 He is trying to build a far-reaching hypothesis and device
of working capital management from the perspective of the framework. According to this
study, capital is regularly used to refer to capital products consisting of an incredible variety of
things, specifically in-process machines of different types, plants, houses, tools, raw materials
and goods. On the balance sheet asset side, the account manager of a company searches for
these things. In contrast to the balance sheet, he directs his concentration for capital and never
makes an error. His motivation is to adjust the opposing sides to increase the company's total
assets without increasing the company's risk. This adjustment is financing, i.e. financing the
company's assets by consistently generating liability surges to coordinate with past dynamism.
The study is an enhancement of the concept of Park and Gladson that was not ready to catch
the entire techno - money - related company’s work structure. The study is an enhancement of
the concept of Park and Gladson that was not ready to catch the entire techno - money - related
company’s work structure.
7.Rao K.V. and Rao Chinta 1991 Watch conventional methods of working capital analysis
for strong and weak purposes. The result was clearly blended as a portion of the ordinary
systems that could appreciate the working capital performed well; others flopped in properly
fulfilling the responsibility. Using regular procedures, i.e. ratio analysis, authors have tried to
assess the effectiveness of managing Working Capital. The article ends with prospective
researchers looking for a comprehensive and definitive measuring stick to evaluate the
productivity of working capital.
26
8.Heath field and David F Hamlin Alan P. 1991 Working Capital is an important
contribution to the creation process, but is then unknown in the financial models of most
generations. The ramifications of the time measurement of creation and later the requirement
of working capital of the company are investigated, with the specific upper hand pressure being
captured by companies that maintained adaptability in the time structure of their generation.
They have tried in this article to investigate this very fundamental. Time work in the generation
process is therefore centred around the ramifications of an unequivocal perception of the
working capital requirement.
9.Zaman M. 1991 He studies the Jute Enterprises Public Sector Working Capital Management
Practices in Bangladesh that have been found to be truly influenced. This has been attributed
to some variables such as low interest in jute products and genuine challenges on the world
market, lack of stock 96 Board arrangements, poor strategy to collect and a wasteful approach
to money. A long - haul adaptable and operational work capital management show has been
detailed by the creator. Ultimately, he recommended the model that would also help improve
the working capital management practices of Bangladesh's particularly jute business and other
open enterprises.
10. Petersen, Bruce C. And Steven M. Fazzari (1993) illuminates new financial constraint
tests by highlighting work capital's often ignored work as both a use and a source of assets. The
creators are confident that working capital is also a source of liquidity that should be used when
firms face fund limitations to smooth speculation on fixed revenue stunts. They discovered
that speculation on working capital is "exorbitantly sensitive" to variances in income. In
addition, it has a negative coefficient when working capital speculation is incorporated as a
utilization or wellspring of assets into a fixed - venture relapse. They assume that controlling
for the smoothing work of working capital outcomes in a much larger gage of the long - run
effect of account imperatives than revealed in different investigations.
11.Akon Md. Habibur Rahman and Hossain Saiyed Zabid 1997. Highlight the essential
objective of managing working capital, i.e. arranging the required working capital assets at the
right time, at the right expense and from the right source with the ultimate objective of
achieving liquidity and profitability trade - offs. The review reveals that BTMC has been
pursuing a policy of aggressive liquidity risk work capital funding. Throughout the duration of
the study, there was a continuous pattern of expansion of negative net working capital, which
recommended that BTMC had exploited all the available short-term sources without taking
into account real needs.
27
12.Ahmed Habib 1998 points out that when the interest rate is interest incorporated; cash loses
its precious yield efficiency. Examination explains this finding by using a rational expectation
template where business-required bond creation choices fund working capital. Working Capital
is a major factor and its cost, interest rate, influences businesses ' supply of goods. In line with
these lines, monetary policy shocks influence the cost of financing and the supply side, and
subsequently the cost and yield of companies. The template shows this can result in lowering
the prescient intensity of monetary policy shocks on yield when using the interest rate in 97
accurate investigations. In line with these lines, shocks in monetary policy influence financing
costs and supply side, and subsequently firms ' costs and yield. The model shows that this can
lead to a lowering in 97 accurate investigations of the prescient intensity of monetary policy
shocks on yield.
13.Sur Debasish and Prof. Mallick Amit 1998 Efforts to conduct an empirical analysis of
AFT Industries limited, an association providing tea in Assam, to investigate the effect of
Working Capital on its Profitability in the period from1986 - 87 to 1995 - 96. Author
investigated the ROI co - connection and a few working capital management related ratios. All
in all, this investigation into the correlation between the selected ratios in working capital
management area & the organization's profitability Negative and positive results uncovered.
Furthermore, the organization's WCL during the investigation period, a fluctuating pattern was
recorded.
14. Syed Zabid and Hossain 1999 The various parts of the working capital (WC) position are
illuminated. Using ratio analysis, he evaluated working capital and its parts. Some ratio is
figured for every aspect of the investigation and subsequently the results are contrasted and
Standard or normal industry ratio.
15. P.Singaravel 1999 Concentrate on interdependence between working capital, liquidity and
productivity, the primary preference of which is the adequacy of Profitability and working
capital. The article is a top - to - bottom liquidity analysis and its working capital and
productivity interrelationship. Due to the triangular position of working capital, liquidity and
productivity, none is non - essential when the other is fulfilled. The abundance of stocks - in -
exchange over bank overdraft and excess liquid assets over non - current liabilities - creates
business capital. On the other hand, necessities of working capital are made for long - haul
finances that affect productivity.
28
16.Garg Pawan Kumar 1999 Focuses around the investigation of working capital trend and
liquidity examination in the chose open division endeavours of Haryana. The examination
proposes Working capital necessity forecasting is largely linked to different working capital
segments. The author understood the requirement for adequate evaluation and Working capital
forecast in the public sector undertaking after the actualities are taken into account. For this
reason, the analysis of the production plan, the sales pattern, the cost of work, etc., should be
considered. He also recommended the requirement that parts of working capital be better
managed.
17.Sharma A. K. and Batra G. S. (1999)
He examines Goetze (I) Ltd.'s working capital position Using different ratios. They believe the
working capital position of the organization is acceptable because they have recommended
some further improvement measures Similar to the need for more notable consideration in stock
control in the management of working capital; dynamic deals office, rapid dispatch of requests
and reduced reliance on exchange banks.
18. Batra Gurdeep Singh (1999) Provides a working capital diagram with its determinants.
Settling on the sum and piece of current assets and how to fund them, as indicated by the author
working capital management. He emphasizes the supporting way of dealing with current
financial assets. He also states that the working capital ratio analysis can be used by a
management as method of verifying the skills employed by working capital in companies.
19. Bansal S. P. 1999 notes that's because the partnership's preservationist strategy I) the short
- term position of creditors ii) The organization did not follow a uniform approach to the
accumulation of account holders, and iii) Inefficiency with respect to the administration causes
over interest in inventories. Accordingly, a difficult circumstance emerged because of lack of
working capital. The creator cautions the organization that in the event that it didn't design its
money needs appropriately, it was going to be insolvency.
20.Bansal S. P. (1999) Management opinions referring to current asset management and
current liabilities in order to maintain the ideal dimensions of the various segments and to
increase the productivity of a company. The author has requested the use of various working
capital board strategies and their three-principle parts of money, receivables and inventories.

29
CHAPTER 3
RESEARCH DESIGN
30
RESEARCH DESIGN
Research design is characterized as a system of techniques and methods that an analyst has
chosen to join various parts of research in a sensibly consistent manner with the goal of taking
productive care of the examination issue. It provides bits of "how" knowledge to direct research
using a particular system. As a list of research questions that should be examined, each
specialist should be able to do so with research design.
3.1 Statement of the problem
Organizational Working Capital Management is facing two problems
1. To begin with, given dimension of sales related expense, what are the ideal
measures of cash, accounts receivables and inventories that an organisation ought
to choose to keep up.
2. Second, this is the best what is the most affordable approach to finance this working
capital investment? To deliver the best possible results, the organisation should be
kept noun productive resources and it should do again least expensive sources of
money is available. Why? generally, it is very favourable to the organisation to
invest in short-term assets and liabilities. Besides this following are some other
issue an organisation is facing. Through this examination I attempt to find answers
for all this problem.
TITLE OF THE PROJECT
A report on “Working Capital Management” at Pixel Controls, Bengaluru.
3.2 NEED FOR THE STUDY
Working capital is a basic element for a company and it is heart of company. The capital of the
business is utilized as a part of everyday operations. It can be ascertained by limiting the current
liability from current asset. It has the inter relation between the short-term asset and short-term
liability of the company which includes the working capital. The effective provision guarantees
the significance to internal and external analysis.
Working capital has a connection between profitability because it impact the profitability by
working capital and it is negatively impact an productivity and working capital of a firm.
The organisation has a specific measure of cash which depends on the credit accessible for the
buy of crude materials as required. At that point the organisation will be changed crude
materials, work and manufacturing plant overhead and work in advance, lastly spend some
measure of products. An assortment of these wares as credit on the premise of borrowers to
31
change over to deals. An assortment of credit borrowers is changing over into money in the
wake of shutting time. In this way a specific measure of money for crude materials, work in
progress, completed merchandise, and the sundry borrowers and the money needs of the day is
blocked.
3.3 OBJECTIVES OF STUDY
The primary objectives of study are as follows
• To study the effectiveness of working capital management adopted in pixel controls
• To understand the effect of working capital management on the Liquidity position of
the organisation.
• To know the components of working capital and its implications on the profitability
and solvency of the firm
• To summarize the findings, conclude and offer valid suggestions.
3.4 SCOPE OF THE STUDY
Distinguishes after and throughout the study the scope of the study. The study's main objective
was to incorporate real work experience into the practical aspect of the study. Working capital
study is dependent on tools such as analysing the ratio, explaining changes in working capital.
Working capital covers the details of organisation data in the current frame for the primary
division and learning principal of the company. No business can be successful without
satisfactory absorbing effective funds. The study's main goal is to examine the efficiency of
effective investment system adopted by pixel controls. It also focuses on the techniques of
statement analysis and financial ratios of 3 years.
32
3.5 RESEARCH METHODOLOGY
What is research?
Research means looking for facts to find answer to certain questions or to find remedy to some
problems. It is referred as “scientific research” or “scientific investigation” for a particular
situation or problem. Because of this the search for truth must be instead of control methods,
the scientific method is systematically using the rational approach method of finding the truth,
but the arbitrary approach tries to find the answers ideas and questions on one’s believes and
judgement.
Research in simple terms is systematic process of finding problem between problem unstable
by investigating outside and inside of the company and providing better solution.
Types of research
Types of research is important in company or somewhere else. There are several findings to
find different areas organisation problems, e.g. quantitative research in statistical area. I used
2 types of research in my project that is descriptive research and quantitative research.
Methodology
Descriptive research
Descriptive research has helped me to find out the details and facts of pixel controls. I have
asked directly to senior officer and senior employees. About what is happening in the company
and what has happened.
Sources of data collection
Secondary data
Information gathering strategy, optional information gathered are those which have as of now
been gathered. The auxiliary data available records, diaries. Optional information likewise
represents the venture division, SQC and department of finance and other concerned associates,
the leader of the office, leader of a business in light of essential information gathered through
an individual meeting, magazines, asset reports, books and so forth accessible. The review was
gone for working capital administration; information gathering depends on the organisation
project.
33
• Annual report of Pixel controls 2015-16
• Annual report of Pixel controls 2016-17
3.6 LIMITATIONS
Limitations were experienced while preparing the project is as follows:
• Limited data: The accumulation of primary data was limited because of privacy. It is
finished with yearly reports. It composes secondary data collection
• Limited period: This report is based on two years of reports. Conclusion is based
limited information. The most recent multiyear reflects the Real organizational working
capital position.
• Limited area: It’s also hard to gather the data about the competitors and their financial
data.
• Since the financial matters are sensitive in nature the same could not acquire easily.
• Due to busy work schedule, detailed discussions were not possible
• Lastly, because of lack of time it is not possible to cover every one of the factors and
details regarding the subject of study.
34
3.7 CHAPTER SCHEME
Chapter 1: Introduction
The first chapter includes the introduction about the project, industry profile and company
profile with the promoters of the company, mission vision and quality policy of the company
and the products of the company’s, company’s SWOT analysis and the details about the
competitors.
Chapter 2: Conceptual background and Literature review
This chapter includes the theoretical background and literature review of the study.
Chapter 3: Research design
In this chapter Statement of the problem, Objectives, Need for the study, Research
methodology, Scope of the study, Limitations of the study.
Chapter 4: Analysis and interpretation
The fourth chapter shows that the detailed analysis of data and interpretation of the results.
Chapter 5: Findings, suggestions and conclusion
The fifth chapter includes all the findings, suggestions and conclusions of the study.

35
CHAPTER 4
DATA ANALYSIS AND DATA INTERPRETATION
36
ANALYSIS AND INTERPRETATION
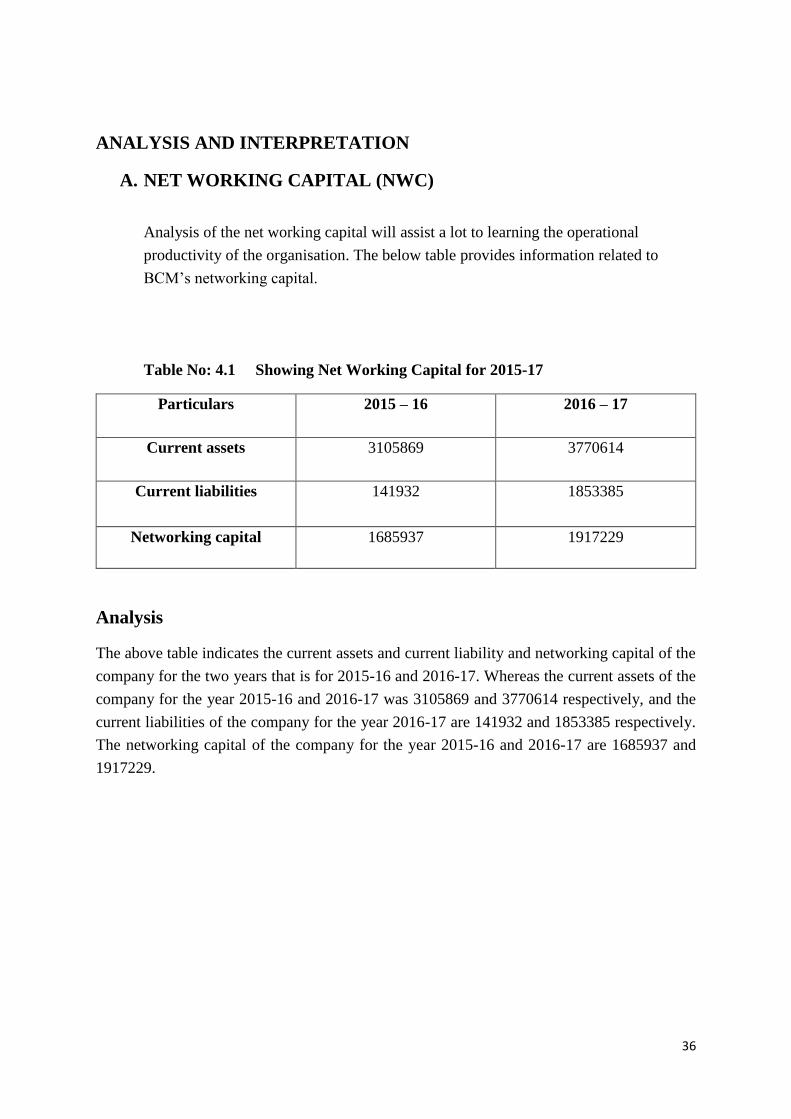
A. NET WORKING CAPITAL (NWC)
Analysis of the net working capital will assist a lot to learning the operational
productivity of the organisation. The below table provides information related to
BCM’s networking capital.
Table No: 4.1 Showing Net Working Capital for 2015-17
Particulars 2015 – 16 2016 – 17
Current assets 3105869 3770614
Current liabilities 141932 1853385
Networking capital 1685937 1917229
Analysis
The above table indicates the current assets and current liability and networking capital of the
company for the two years that is for 2015-16 and 2016-17. Whereas the current assets of the
company for the year 2015-16 and 2016-17 was 3105869 and 3770614 respectively, and the
current liabilities of the company for the year 2016-17 are 141932 and 1853385 respectively.
The networking capital of the company for the year 2015-16 and 2016-17 are 1685937 and
1917229.
37
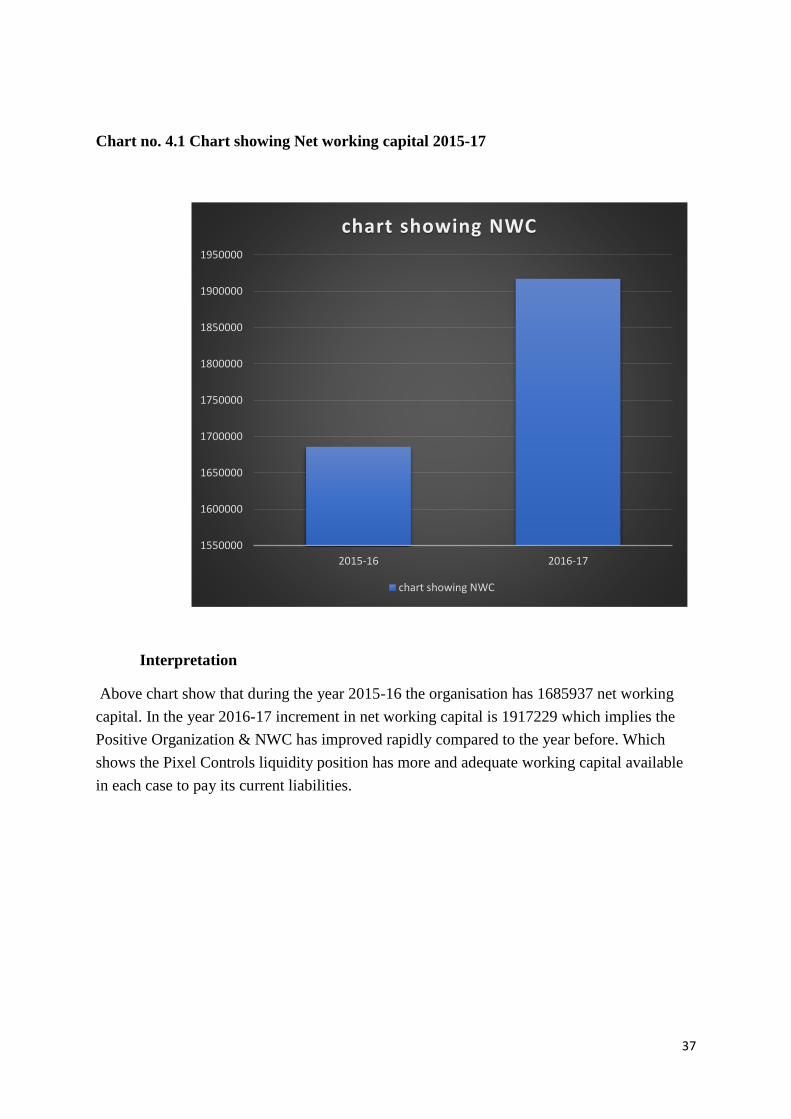
Chart no. 4.1 Chart showing Net working capital 2015-17
Interpretation
Above chart show that during the year 2015-16 the organisation has 1685937 net working
capital. In the year 2016-17 increment in net working capital is 1917229 which implies the
Positive Organization & NWC has improved rapidly compared to the year before. Which
shows the Pixel Controls liquidity position has more and adequate working capital available
in each case to pay its current liabilities.
1550000
1600000
1650000
1700000
1750000
1800000
1850000
1900000
1950000
2015-16 2016-17
chart showing NWC
chart showing NWC
38
B. RATIO ANALYSIS
I used the ratio analysis to support working capital management. I was used portion of the
ratios to obtain the required yield for this.
1. LIQUIDUTY RATIO
A. Current ratio
B. Quick ratio
C. Absolute liquid ratio
2. TURNOVER RATIO
A. Debtors turnover ratio
B. Creditor turnover ratio
C. Working capital turnover ratio
1. Liquidity ratio
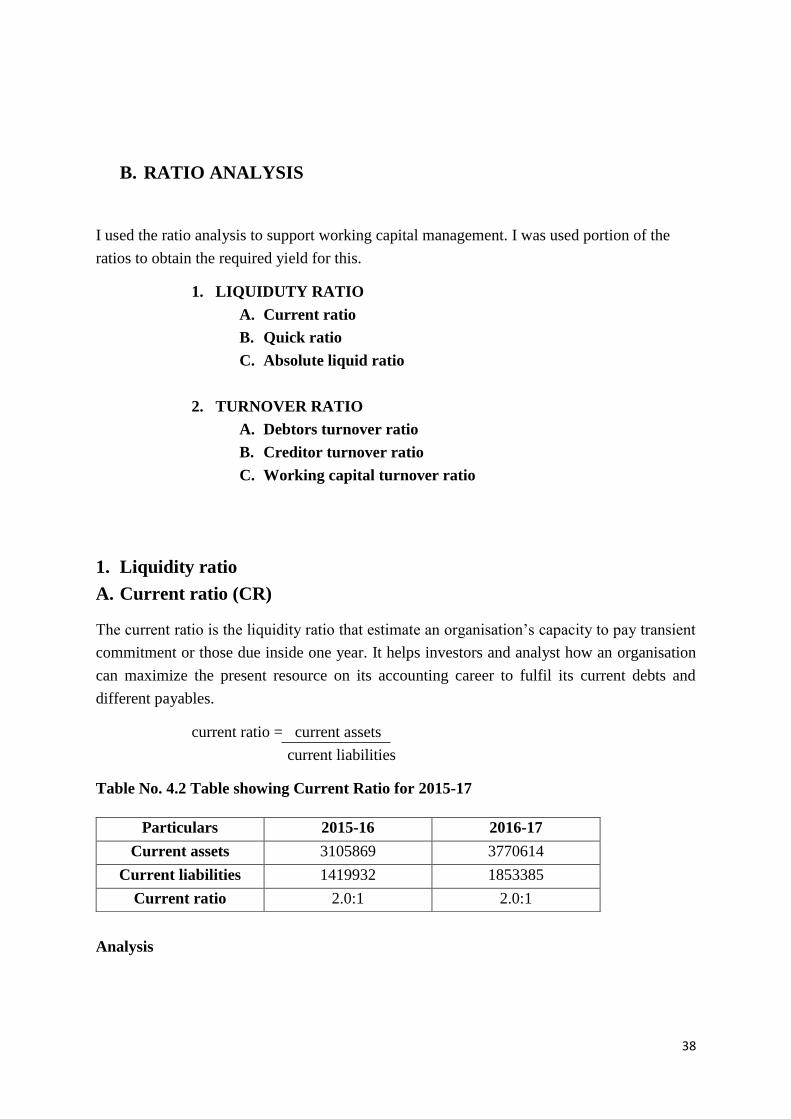
A. Current ratio (CR)
The current ratio is the liquidity ratio that estimate an organisation’s capacity to pay transient
commitment or those due inside one year. It helps investors and analyst how an organisation
can maximize the present resource on its accounting career to fulfil its current debts and
different payables.
current ratio = current assets
current liabilities
Table No. 4.2 Table showing Current Ratio for 2015-17
Analysis
Particulars 2015-16 2016-17
Current assets 3105869 3770614
Current liabilities 1419932 1853385
Current ratio 2.0:1 2.0:1
39
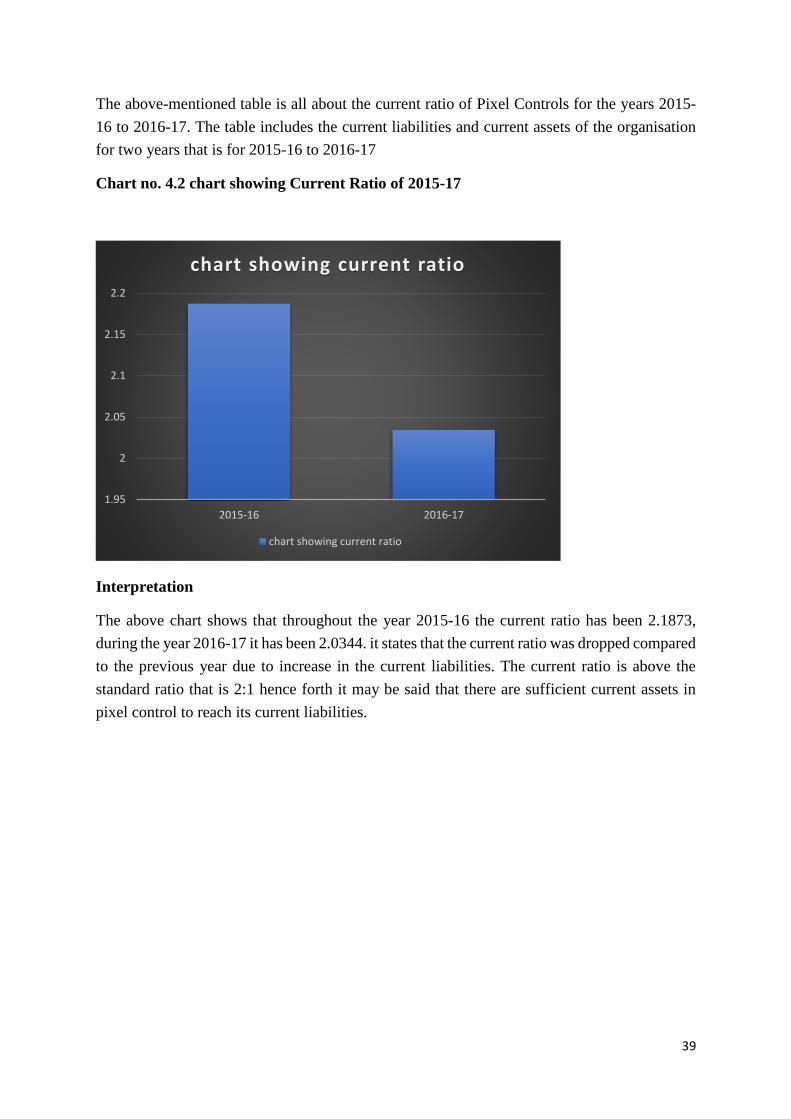
The above-mentioned table is all about the current ratio of Pixel Controls for the years 2015-
16 to 2016-17. The table includes the current liabilities and current assets of the organisation
for two years that is for 2015-16 to 2016-17
Chart no. 4.2 chart showing Current Ratio of 2015-17
Interpretation
The above chart shows that throughout the year 2015-16 the current ratio has been 2.1873,
during the year 2016-17 it has been 2.0344. it states that the current ratio was dropped compared
to the previous year due to increase in the current liabilities. The current ratio is above the
standard ratio that is 2:1 hence forth it may be said that there are sufficient current assets in
pixel control to reach its current liabilities.
1.95
2
2.05
2.1
2.15
2.2
2015-16 2016-17
chart showing current ratio
chart showing current ratio
40
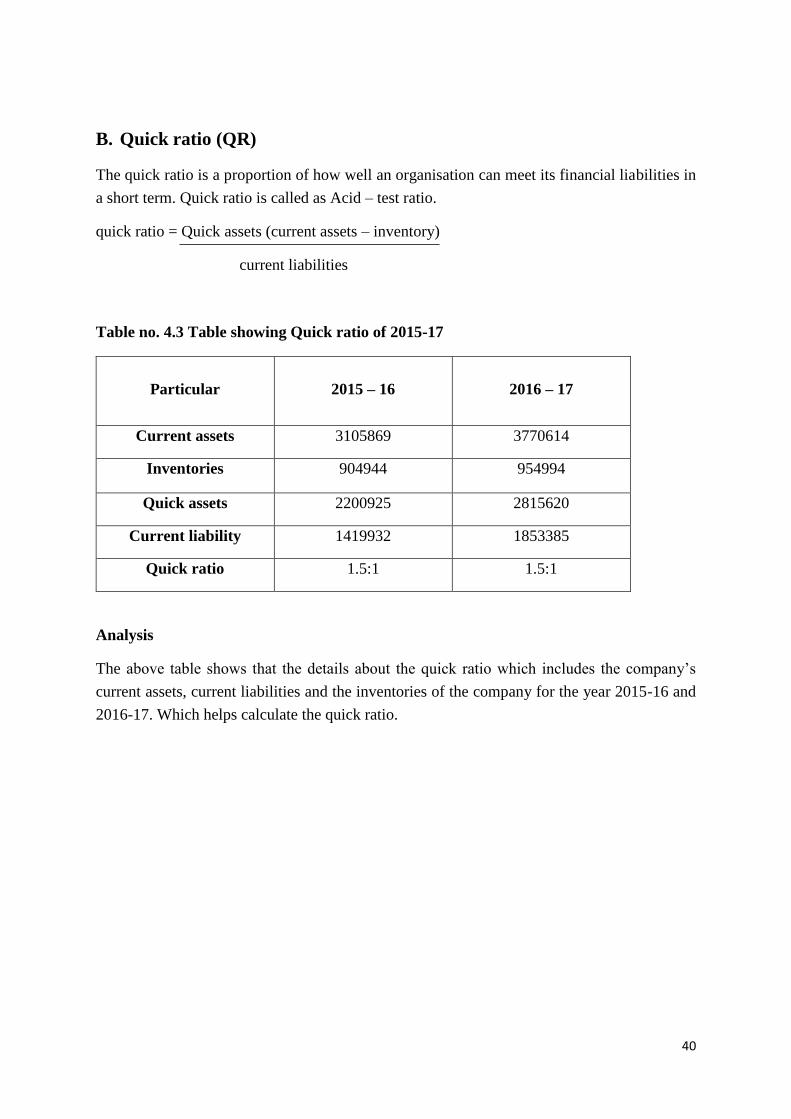
B. Quick ratio (QR)
The quick ratio is a proportion of how well an organisation can meet its financial liabilities in
a short term. Quick ratio is called as Acid – test ratio.
quick ratio = Quick assets (current assets – inventory)
current liabilities
Table no. 4.3 Table showing Quick ratio of 2015-17
Particular
2015 – 16
2016 – 17
Current assets 3105869 3770614
Inventories 904944 954994
Quick assets 2200925 2815620
Current liability 1419932 1853385
Quick ratio 1.5:1 1.5:1
Analysis
The above table shows that the details about the quick ratio which includes the company’s
current assets, current liabilities and the inventories of the company for the year 2015-16 and
2016-17. Which helps calculate the quick ratio.
41
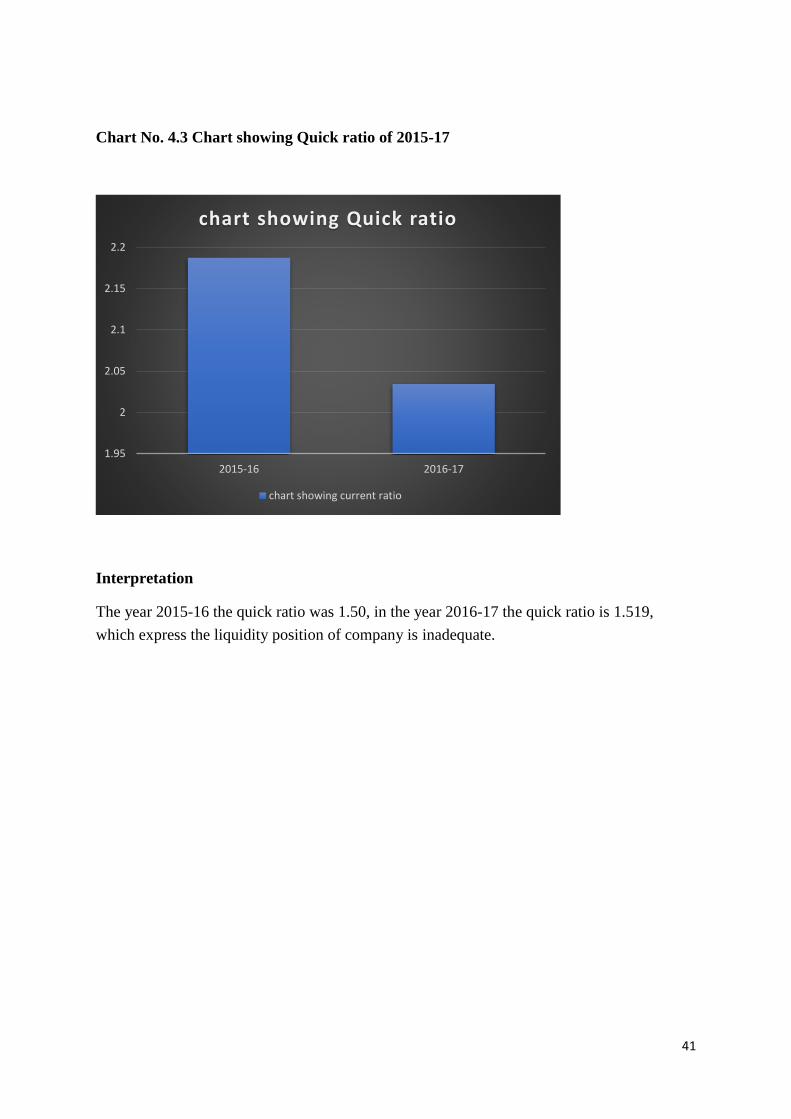
Chart No. 4.3 Chart showing Quick ratio of 2015-17
Interpretation
The year 2015-16 the quick ratio was 1.50, in the year 2016-17 the quick ratio is 1.519,
which express the liquidity position of company is inadequate.
1.95
2
2.05
2.1
2.15
2.2
2015-16 2016-17
chart showing Quick ratio
chart showing current ratio
42
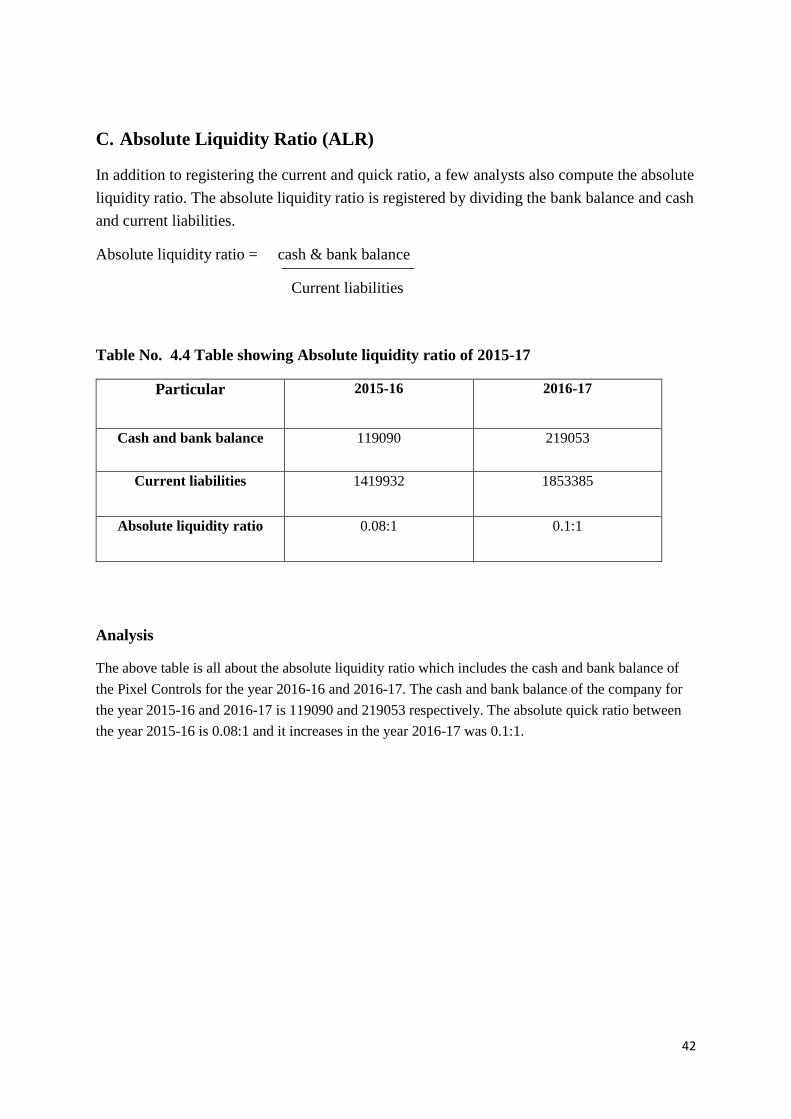
C. Absolute Liquidity Ratio (ALR)
In addition to registering the current and quick ratio, a few analysts also compute the absolute
liquidity ratio. The absolute liquidity ratio is registered by dividing the bank balance and cash
and current liabilities.
Absolute liquidity ratio = cash & bank balance
Current liabilities
Table No. 4.4 Table showing Absolute liquidity ratio of 2015-17
Particular 2015-16 2016-17
Cash and bank balance 119090 219053
Current liabilities 1419932 1853385
Absolute liquidity ratio 0.08:1 0.1:1
Analysis
The above table is all about the absolute liquidity ratio which includes the cash and bank balance of
the Pixel Controls for the year 2016-16 and 2016-17. The cash and bank balance of the company for
the year 2015-16 and 2016-17 is 119090 and 219053 respectively. The absolute quick ratio between
the year 2015-16 is 0.08:1 and it increases in the year 2016-17 was 0.1:1.
43
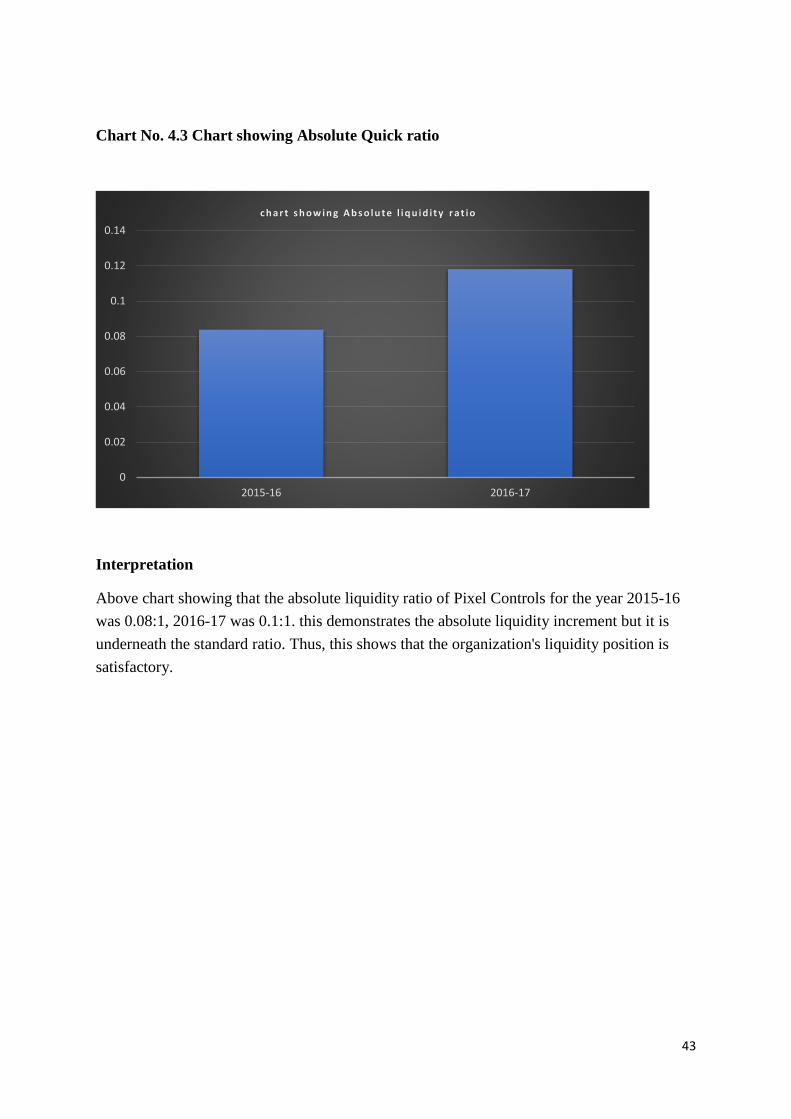
Chart No. 4.3 Chart showing Absolute Quick ratio
Interpretation
Above chart showing that the absolute liquidity ratio of Pixel Controls for the year 2015-16
was 0.08:1, 2016-17 was 0.1:1. this demonstrates the absolute liquidity increment but it is
underneath the standard ratio. Thus, this shows that the organization's liquidity position is
satisfactory.
0
0.02
0.04
0.06
0.08
0.1
0.12
0.14
2015-16 2016-17
c h a r t s h o w in g A b s o lu t e l iq u id i t y r a t io
44
2. TURNOVER RATIO
A. Debtor Turnover Ratio (DTR)
Debtor turnover ratio is also known as the turnover ratio of receivables shows how quickly
credit sales are transformed into cash. This ratio evaluates the organization's productivity
in overseeing and collecting credit from customers.
Debtor turnover ratio = Net credit sales
Average debtors
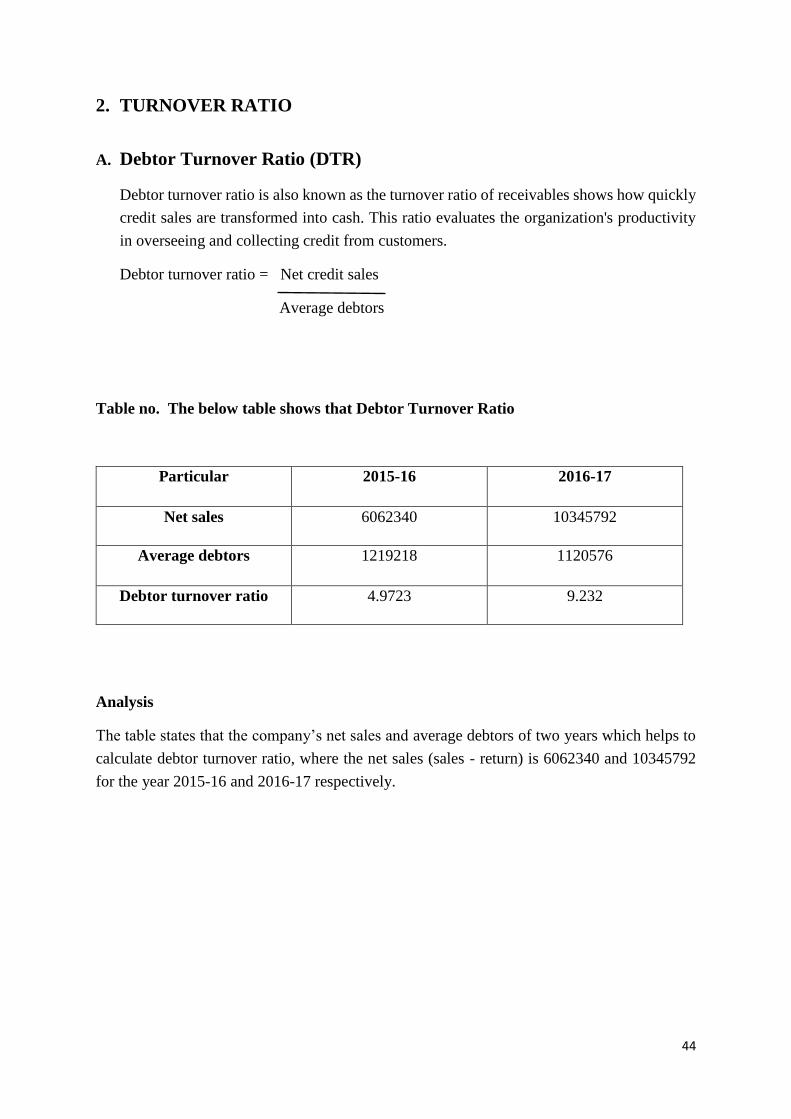
Table no. The below table shows that Debtor Turnover Ratio
Particular 2015-16 2016-17
Net sales 6062340 10345792
Average debtors 1219218 1120576
Debtor turnover ratio 4.9723 9.232
Analysis
The table states that the company’s net sales and average debtors of two years which helps to
calculate debtor turnover ratio, where the net sales (sales - return) is 6062340 and 10345792
for the year 2015-16 and 2016-17 respectively.
45
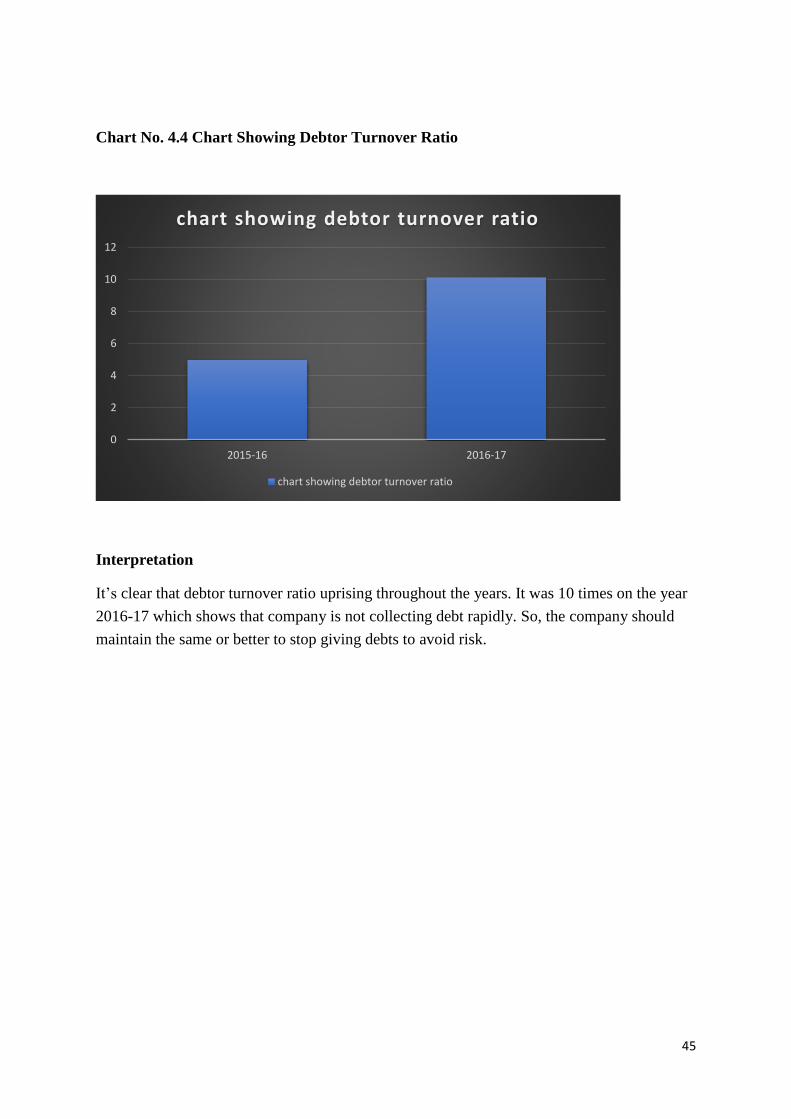
Chart No. 4.4 Chart Showing Debtor Turnover Ratio
Interpretation
It’s clear that debtor turnover ratio uprising throughout the years. It was 10 times on the year
2016-17 which shows that company is not collecting debt rapidly. So, the company should
maintain the same or better to stop giving debts to avoid risk.
0
2
4
6
8
10
12
2015-16 2016-17
chart showing debtor turnover ratio
chart showing debtor turnover ratio
46
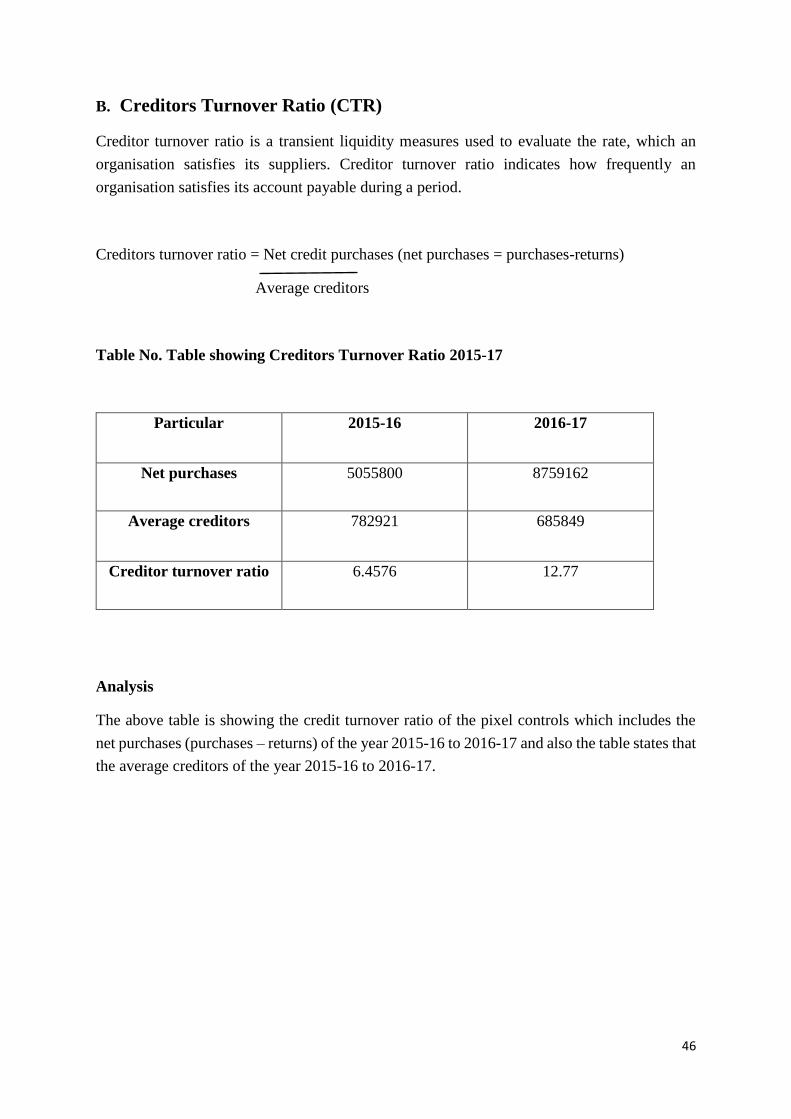
B. Creditors Turnover Ratio (CTR)
Creditor turnover ratio is a transient liquidity measures used to evaluate the rate, which an
organisation satisfies its suppliers. Creditor turnover ratio indicates how frequently an
organisation satisfies its account payable during a period.
Creditors turnover ratio = Net credit purchases (net purchases = purchases-returns)
Average creditors
Table No. Table showing Creditors Turnover Ratio 2015-17
Particular 2015-16 2016-17
Net purchases 5055800 8759162
Average creditors 782921 685849
Creditor turnover ratio 6.4576 12.77
Analysis
The above table is showing the credit turnover ratio of the pixel controls which includes the
net purchases (purchases – returns) of the year 2015-16 to 2016-17 and also the table states that
the average creditors of the year 2015-16 to 2016-17.
47
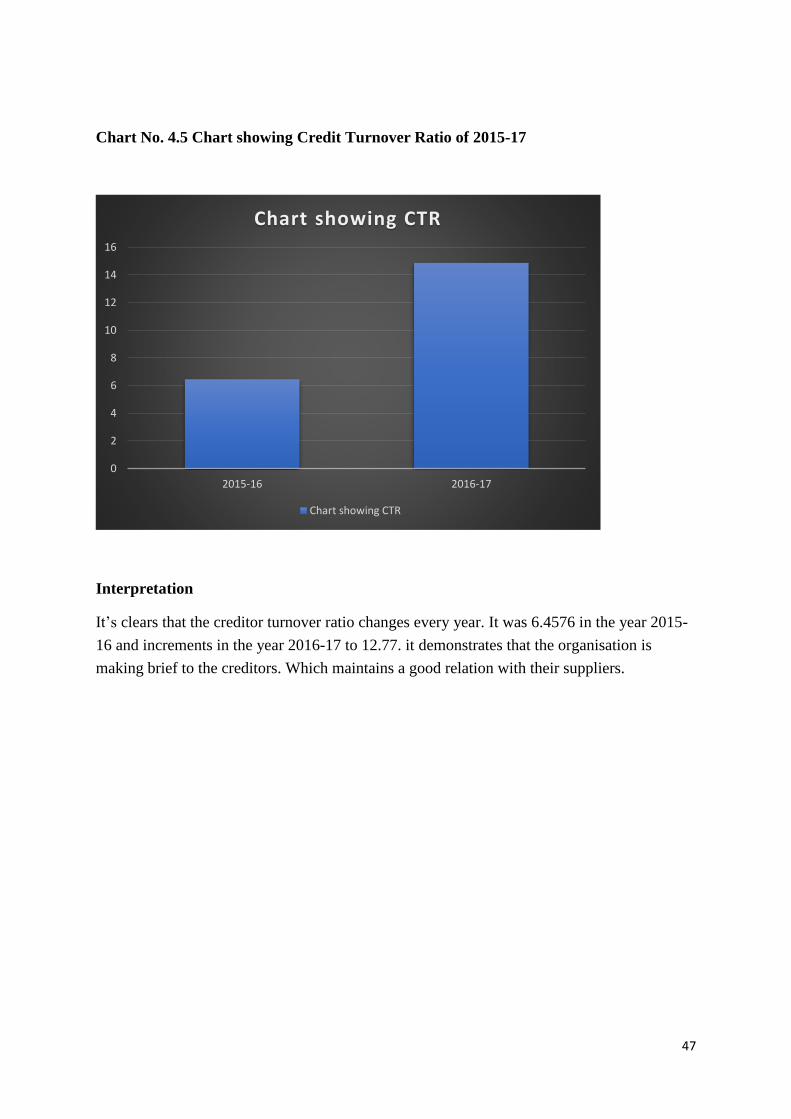
Chart No. 4.5 Chart showing Credit Turnover Ratio of 2015-17
Interpretation
It’s clears that the creditor turnover ratio changes every year. It was 6.4576 in the year 2015-
16 and increments in the year 2016-17 to 12.77. it demonstrates that the organisation is
making brief to the creditors. Which maintains a good relation with their suppliers.
0
2
4
6
8
10
12
14
16
2015-16 2016-17
Chart showing CTR
Chart showing CTR
48
C. Working Capital Turnover Ratio (WCTR)
Working capital turnover is the ratio that determines how well an organization uses its
working cash flow to enable a given offer dimension. Also referred to as net working capital
deals, working capital turnover shows the connection between the assets used to finance the
activities of an organization and therefore the revenues produced by an organization.
working capital turnover ratio = Net sales
Net working capital
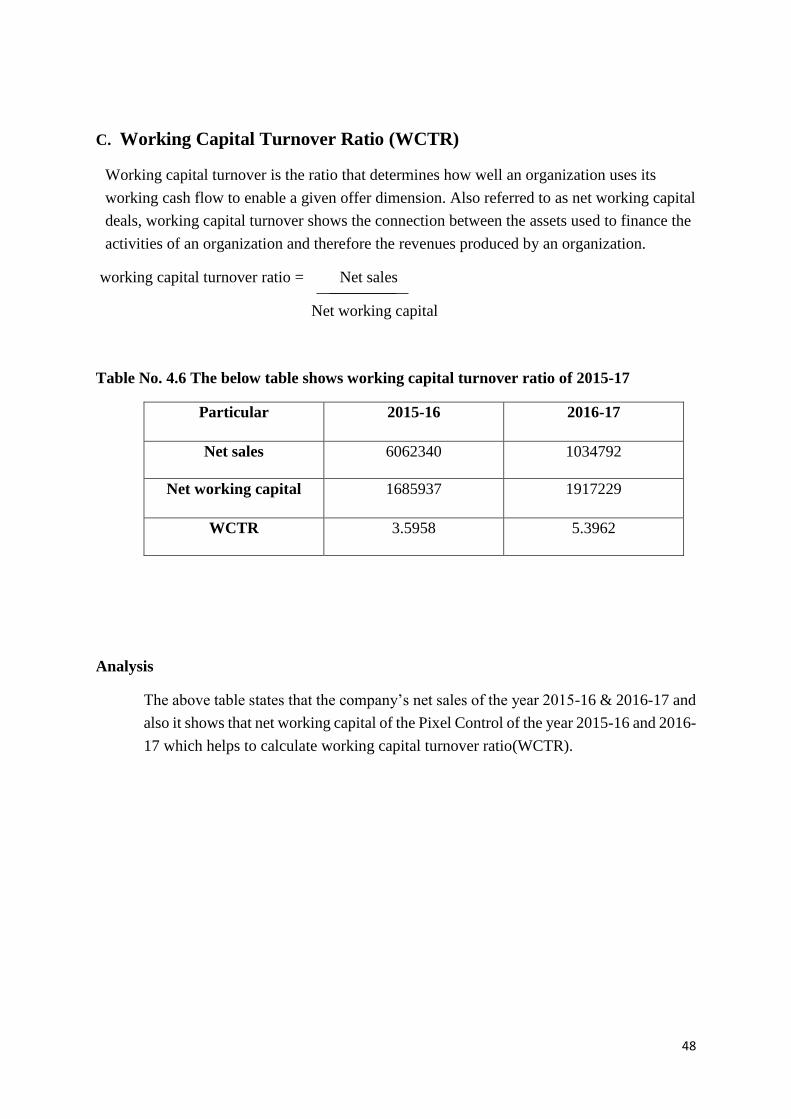
Table No. 4.6 The below table shows working capital turnover ratio of 2015-17
Particular 2015-16 2016-17
Net sales 6062340 1034792
Net working capital 1685937 1917229
WCTR 3.5958 5.3962
Analysis
The above table states that the company’s net sales of the year 2015-16 & 2016-17 and
also it shows that net working capital of the Pixel Control of the year 2015-16 and 2016-
17 which helps to calculate working capital turnover ratio(WCTR).
49
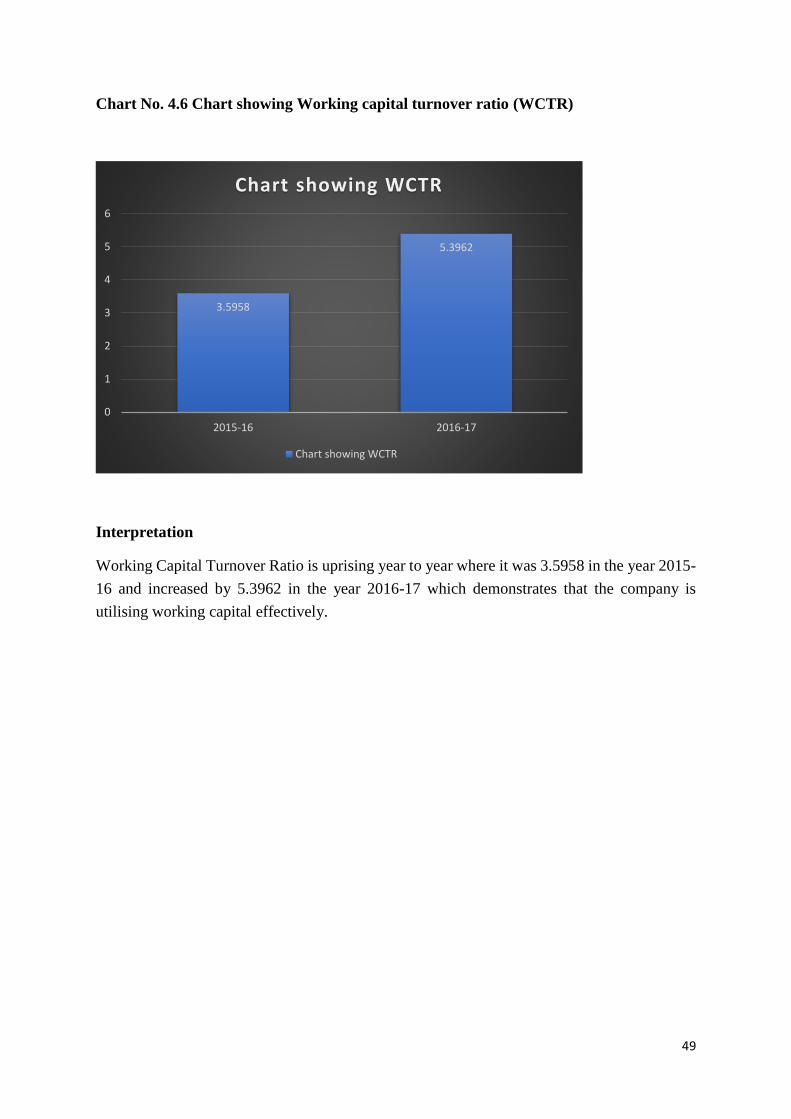
Chart No. 4.6 Chart showing Working capital turnover ratio (WCTR)
Interpretation
Working Capital Turnover Ratio is uprising year to year where it was 3.5958 in the year 2015-
16 and increased by 5.3962 in the year 2016-17 which demonstrates that the company is
utilising working capital effectively.
3.5958
5.3962
0
1
2
3
4
5
6
2015-16 2016-17
Chart showing WCTR
Chart showing WCTR

50
CHAPTER 5
FINDINGS, CONCLISIONS & SUGGESTIONS
51
5.1 SUMMARY OF FINDINGS
a. Working capital of Pixel controls is increasing expanding working capital every year.
b. The Pixel controls have higher current ratio is 2.1873, it states that the current ratio was
dropped contrasted with the earlier year because of increase in the current liabilities. The
current ratio exceeds the standard 2:1 ratio., so it tends to be said that the current assets in
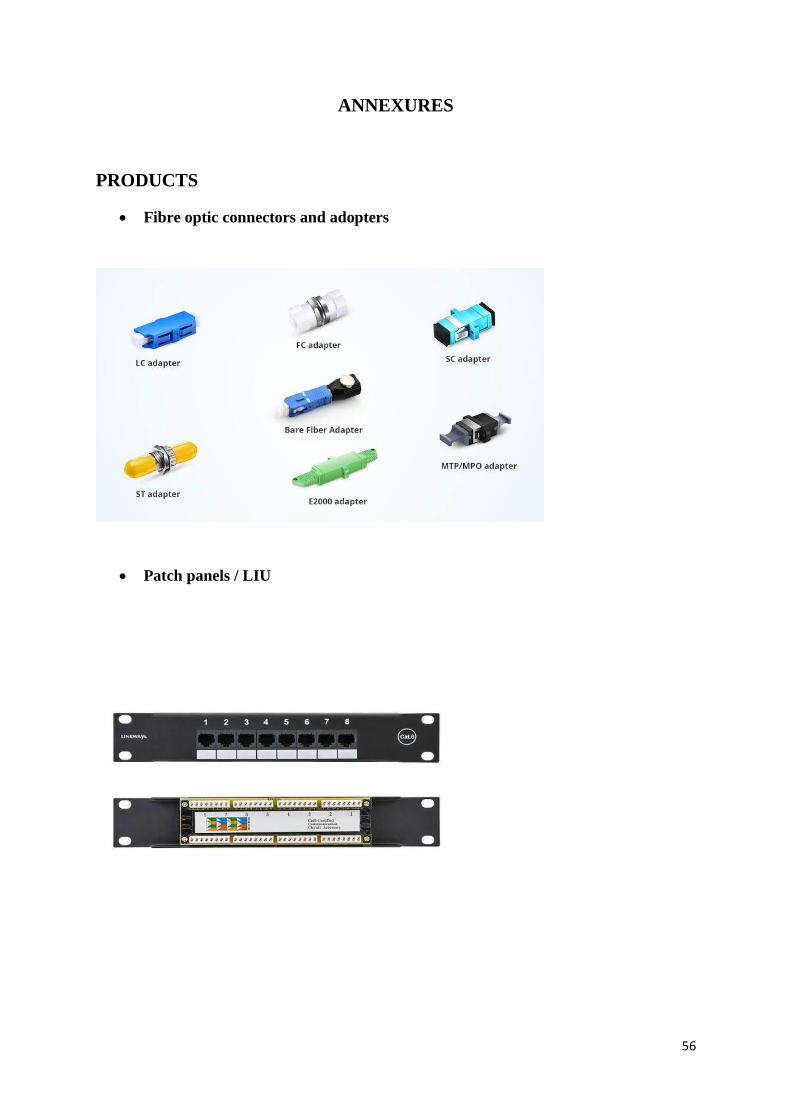
pixel control are sufficient to meet current liabilities.
c. Quick ratio is 2.30 of the year 2015-16 & 1.519 in 2016-17, which express that liquidity
position of organisation is inadequate.
d. Absolute liquidity ratio of the organisation high in the year 2016-17 compared to the
previous year, this demonstrate the absolute liquidity increment but it is underneath the
standard ratio. consequently, it demonstrates the company’s liquidity position is
satisfactory.
e. Debtors turnover ratio is exceptionally high in the year 2016-17 compared to 2015-16,
which shows that company is not collecting debt rapidly.
f. Creditors turnover ratio has expanding in the long stretches of 2015-16 & 2016-17 it has
increased. which states that company is making prompt making to the creditors.
g. The working capital turnover ratio is exceptionally smaller in the year 2015 - 16 and is
increased by 5,3962 in the year 2016 - 17, which shows that the company is making
effective use of working capital
52
5.2 SUGGESTIONS
• In Pixel Controls the working capital is increasing every year. And also, Pixel controls
increasing their profit every year which shows a great organisation's sign. The company
needs to maintain it to be more extreme in order to maintain a long - term business. The
company needs to keep up it for more extreme, to maintain a business with long term.
• The quick and current ratio is almost to meet the standard requirement so that
management of Working Capital of Pixel Controls is attractive and must be maintained
further.
• Organisation have adequate working capital and a better liquidity position by
systematically making use of short-term capital than by building up turnover utilising
the short-term capital then they have to build the turnover.
• Organisation should take care full steps for contributing and gathering assets from
receivable and to pay off the bad debts.
• The debtor turnover ratio is clear over the years, unstable. The year 2016 - 17 has been
repeatedly showing that the company is not collecting debt quickly. So, to stop giving
debts to avoid risk, the company should keep the same or better.
• Creditors turnover ratio has expanding from 2015-16 to 2017-18. The organisation is
making brief instalment to its creditors. This is a great sign to the organisation. Ontime
instalment to providers will expand the believability of the organisation. It has
maintained further to get by in the market.
• Organisation using working capital adequately that is useful for organisation. It needs
to keep up it further.
53
5.3 CONCLUSIONS
The study on working capital management directed at the Pixel controls to analyse the financial
position of firm. The financial position of the organisation analysed by using method of annual
reports from 2015 to16 to 2016-17
Financial status of Pixel control is great. Organisation’s liquidity position is great has to interest
in the current assets there are satisfactory assets put resource into that. The organisation should
take care not to do further investment in current assets, as might be hinder the assets, this is
possible some way or another be successfully used for some profitable reason. In general, the
organisation pushing ahead with phenomenal management.
54
BIBLIOGRAPHY
1. Bhatt, V. V., (1972), Working Capital Finance: Criteria of Appraisal,
Economic and Political Weekly, Vol. 7 No. 17, pp. 842-845
2. Smith, Keith V., (1973), State of the Art of Working Capital Management,
Financial Management, Vol. 2 No. 3, pp. 50-55
3. Chakraborthy, S. K., (1974), Cash Working Capital vs. Balance Sheet
Working Capital: An Analysis Based on Four Cases, Economic and Political
Weekly, Vol.9 No. 10, pp. M11+ M13+ M15- M22
4. Natarajan, Sundar, (1980), Working Capital Management and Finance,
Economic and Political Weekly, Vol.15 No.8, pp. M25+M27-M31
5. Kaveri, V. S., (1985), Financing of Working Capital in Indian Industry,
Economic and Political Weekly, Vol. 20. No.35, pp. M123-M128’
6. Bhattacharyya, Hrishikes, (1987), Towards a Comprehensive Theory of
Working Capital: A Techno-Financial Approach, economic and Political
Weekly, Vol. 22 No. 35, pp. M101-M110
7. Rao, K.V. and Rao, Chinta. (1991), Evaluating Efficiency of Working
Capital Management – Are the Conventional Techniques Adequate?
Decision, Vol.18 No. 2, pp. 81-97
8. Hamlin, Alan P. and Heath field David F., (1991), Competitive Management
and Working Capital, Managerial and Decision Economics, Vol. 12 No. 3,
pp. 207- 217
9. Zaman, M., (1991), Working Capital Management Practices of Public Sector
Jute Enterprises in Bangladesh, Indian Journal of Accounting, Vol. XXII, pp.
45-60
10. Fazzari, Steven M., and Petersen, Bruce C., (1993), Working Capital and
fixed Investment: New Evidence on Financing Constraints, RAND Journal
of Economics, Vol.24, No.3, pp. 328-342

55
TEXT BOOKS
• M.Y Khan/ P.K Jain, Financial Management text, 5th Edition
• Prasanna Chandra, Financial Management, 5th edition
• Annual reports of Pixel Controls
• Last project reports
WEBSITE VISITED
www.pixelcontrols.com
https://en.wikipedia.org/wiki/Pixel
www.managementparadise.com
www.scribd.com
56
ANNEXURES
PRODUCTS
• Fibre optic connectors and adopters
• Patch panels / LIU
57
• Fibre optic cable
• Media converters
• Communication cable
• Ethernet switches

58
• Ethernet routers
59
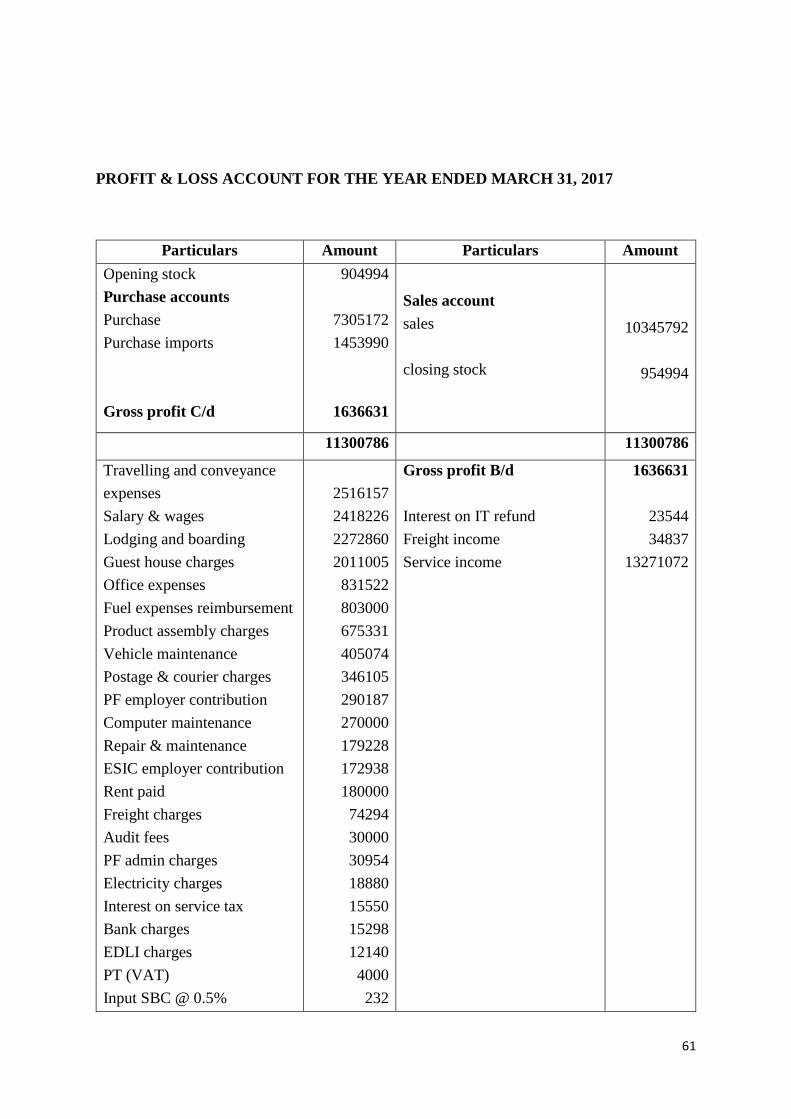
FINANCIAL STATEMENTS
PROFIT & LOSS ACCOUNT FOR THE YEAR ENDED MARCH 31,2016
Particulars Amount Particulars Amount
Opening Stock
Purchase Accounts:
Purchase
Purchase Imports
Product Assembly Charges
Gross Profit C/d
63400
3561066
1494734
595141
1252993
Sales Accounts:
Sales
Closing Stock
6062340
904994
6967334 6967334
Salary & Wages
Travelling & Conveyance
Guest House Charges
Loading & Boarding
Office Expenses
Fuel Expenses Reimbursement
Import Duty Paid
Vehicle Maintenance
Computer Maintenance
PF employee Contribution
PF & PPF Employer
Contribution
Postage & Courier Charges
Employees State Insurance
Corporation
Rent Paid
Repair & Maintenance Charges
Interest & Service Charges
Audit Fee
Admin Charges
Rate & Taxes
IDLI Charges
Bank Charges
Donation Paid
Round Off
1793290
1216680
1182500
960057
593931
546714
332746
269390
225788
215123
215123
212732
120503
60000
40563
34168
22000
18140
16816
8998
6699
2000
19
Gross Profit B/d
Interest on IT Refund FY
2013-14
Interest on IT Refund FY
2014-15
Freight Charges
Service Income
1252993
39820
19120
16825
7991701
60
Depreciation
Net Profit Transfer to P&L
adj Account
8516
1217965
9320461
9320461
BALANCESHEET AS AT MARCH 31,2016
Liabilities Amount Assets Amount
Partner’s Capital
Account
Shankar Murthy N
Venkataramana Reddy
Partner’s Current
Account
Shankar Murthy-Working
Partner
Venkataramana Reddy
Current Liabilities &
Provisions
Sundry Creditors
500000
600000
458019
178235
637011
782921
Fixed Assets
Advances and
Deposits
Sundry Debtors
Cash & Bank
Balance
Closing Stock
50319
862567
1219218
119090
904994
3156188 3156188
61
PROFIT & LOSS ACCOUNT FOR THE YEAR ENDED MARCH 31, 2017
Particulars Amount Particulars Amount
Opening stock
Purchase accounts
Purchase
Purchase imports
Gross profit C/d
904994
7305172
1453990
1636631
Sales account
sales
closing stock
10345792
954994
11300786 11300786
Travelling and conveyance
expenses
Salary & wages
Lodging and boarding
Guest house charges
Office expenses
Fuel expenses reimbursement
Product assembly charges
Vehicle maintenance
Postage & courier charges
PF employer contribution
Computer maintenance
Repair & maintenance
ESIC employer contribution
Rent paid
Freight charges
Audit fees
PF admin charges
Electricity charges
Interest on service tax
Bank charges
EDLI charges
PT (VAT)
Input SBC @ 0.5%
2516157
2418226
2272860
2011005
831522
803000
675331
405074
346105
290187
270000
179228
172938
180000
74294
30000
30954
18880
15550
15298
12140
4000
232
Gross profit B/d
Interest on IT refund
Freight income
Service income
1636631
23544
34837
13271072
62
Round off
Depreciation
Net profit transferred to
P&L Adj account
26
43587
1349490
Total 14966084 Total 14966084
BALANCESHEET AS AT MARCH 31, 2017
Liabilities Amount Assets Amount
Partner’s capital account
Shankar Murthy N
Narasimahalu M V
Partner’s current account
Shankar Murthy N
Narasimhalu M V
Current liabilities &
Provisions
Sundry creditors
500000
600000
471352
544819
1264608
588777
Fixed assets
Advance & Deposits
Sundry Debtors
Cash & bank balances
Closing stock
198942
1574633
1021934
219053
954994
Total 3969556 Total 3969556

63
riACHARYA
ACHARYA INSTITUTE 0F THCHNOLOGY
DEPARTMENT 0F MBA
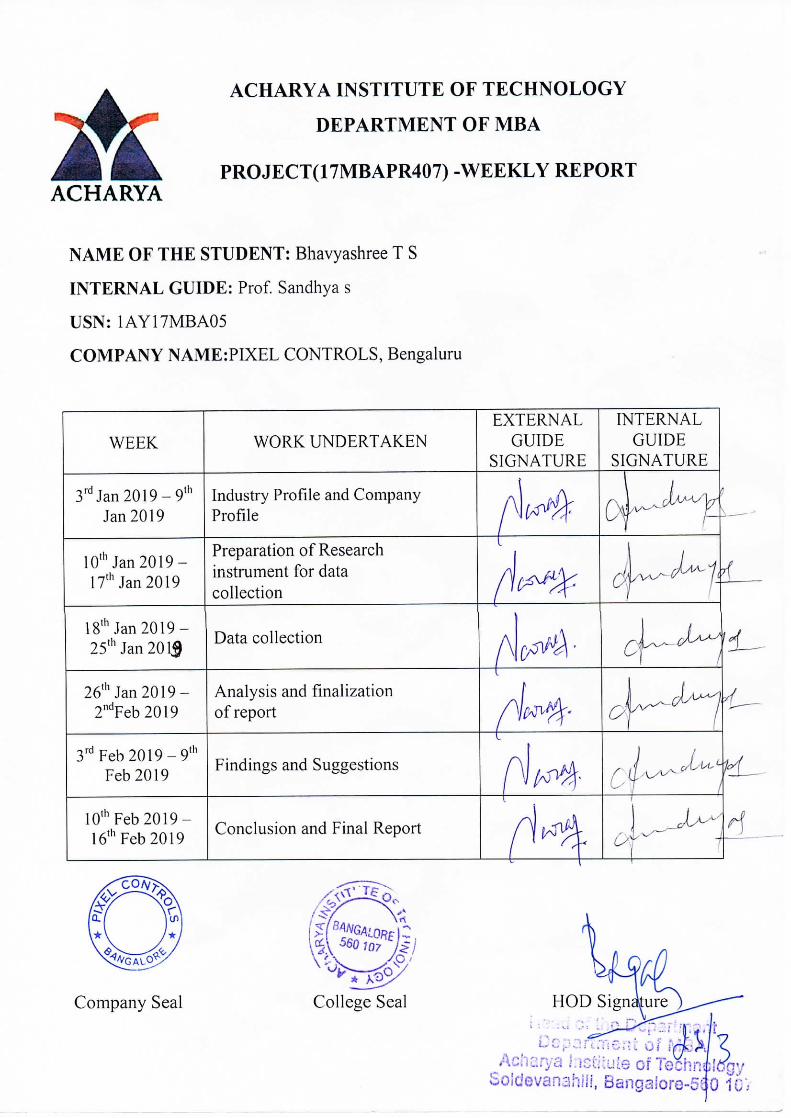
PROJECT(17MBAPR407) -WEEKLY REPORT
NAME OF THE STUDENT: Bhavyashree T S
INTERNAL GUIDE: Prof. Sandhya s
USN: 1AY17MBA05
COMPANY NAME:PIXEL CONTROLS , Bengaluru
WEEK WORK UNDERTAKENEXTERNALGUIDESIGNATURE INTERNALGUIDESIGNATURE
i-¢_.
3rd Jam 2019 -9t'` Industry Profile and Company
/lgiv^#4
Jam 2019 Proflle
1 oth Jam 2019 -I7thJam2019Preparation of Research
/frof# dr7instrument for datacollection
1 8th Jan 2019 -25thJam2019Data collection
A)cgivva +26th Jam 2019 - Analysis and finalization
1/'"try#< oir,|2ndFeb 2019 of report
3rd Feb 20 1 9 -9'hFeb2019 Findings and Suggestions
1 ^j/m4j``!`` ..``
loth Feb 2019 -16thFeb2019Conclusion and Final Report
1 /w#\ ',,+dr
Company Seal College Seal


