Embed Size (px)
Citation preview
Working capital optimization
Simon RockcliffeErnst & Young
February 2013
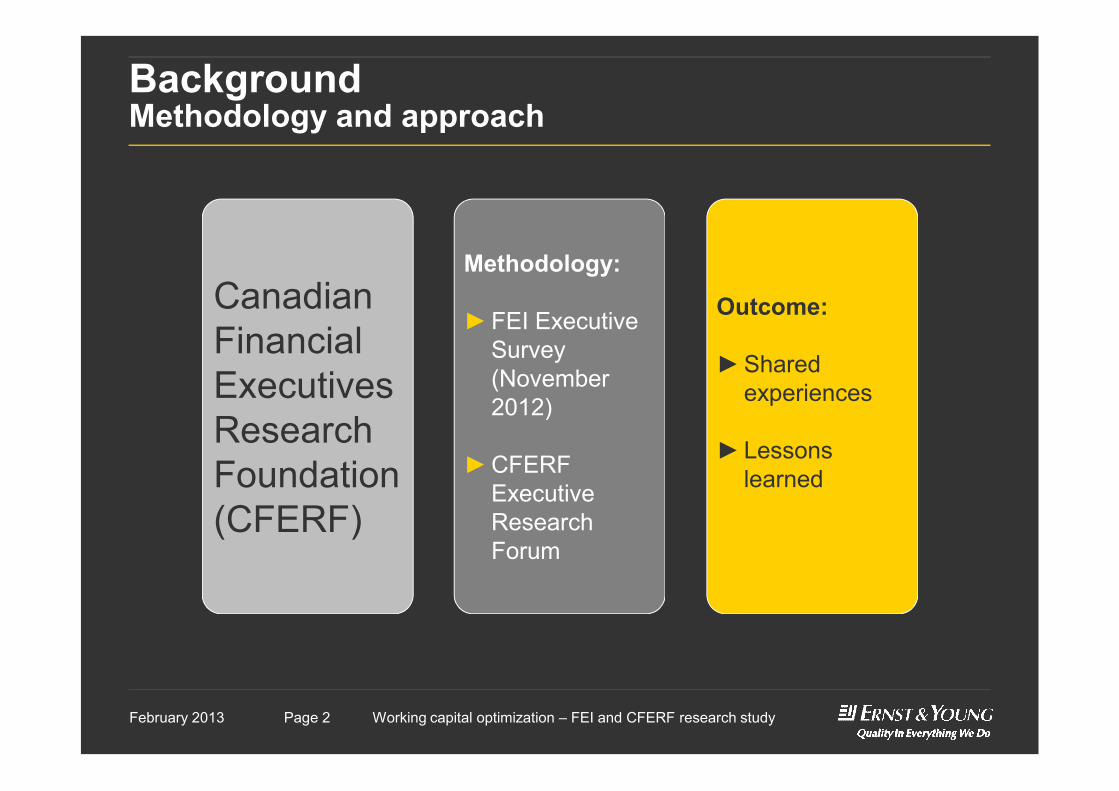
Background Methodology and approach
Canadian Financial Executives
Methodology:
►FEI Executive Survey (November 2012)
Outcome:
►Shared experiences
Presentation titlePage 2 Working capital optimization – FEI and CFERF research studyPage 2February 2013
Executives Research Foundation(CFERF)
2012)
►CFERF Executive Research Forum
experiences
►Lessons learned
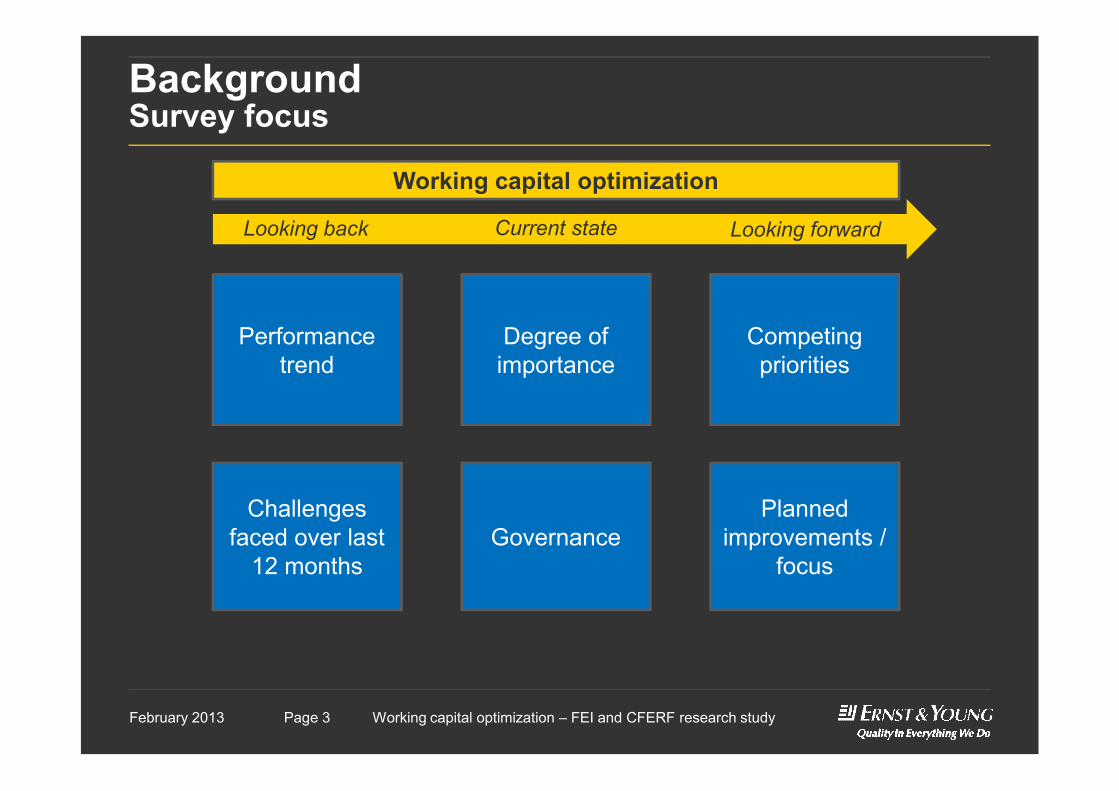
BackgroundSurvey focus
Working capital optimization
Performance trend
Degree of importance
Competing priorities
Looking back Current state Looking forward
Presentation titlePage 3 Working capital optimization – FEI and CFERF research studyPage 3February 2013
Challenges faced over last
12 months
Planned improvements /
focusGovernance
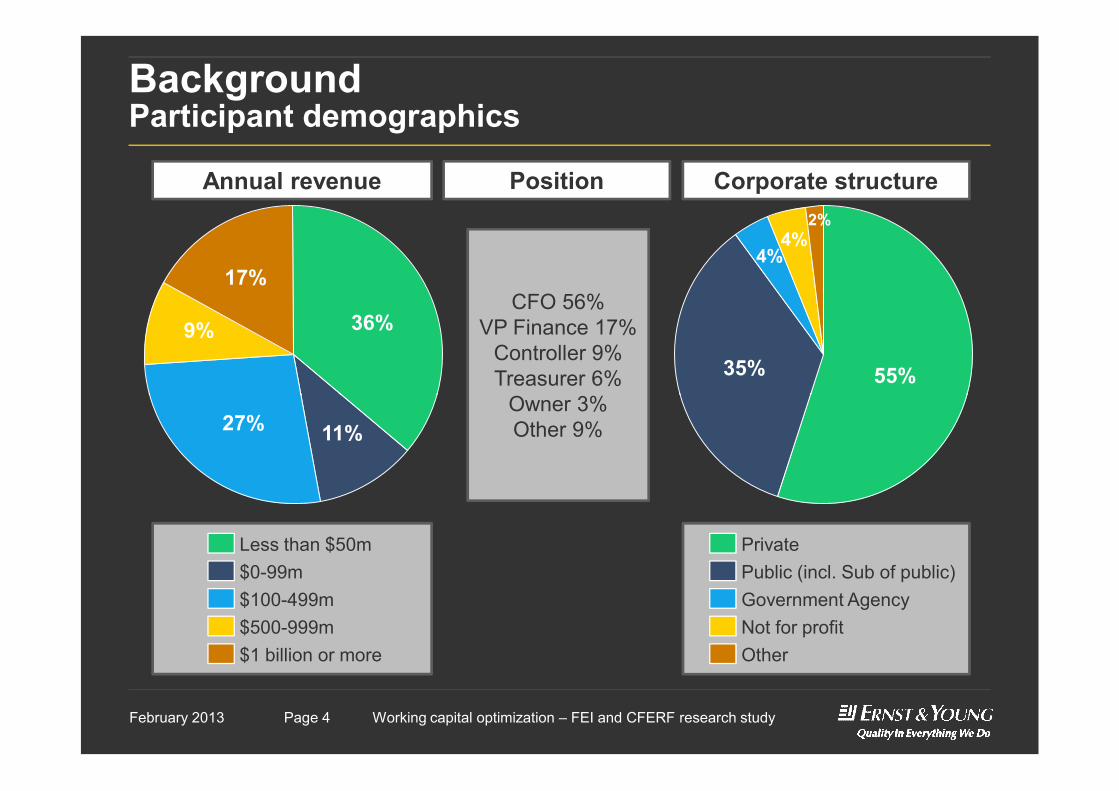
BackgroundParticipant demographics
36%9%
17%
55%
2%
35%
4%4%
Annual revenue Corporate structurePosition
CFO 56%VP Finance 17%
Controller 9%Treasurer 6%
Owner 3%
Presentation titlePage 4 Working capital optimization – FEI and CFERF research studyPage 4February 2013
Less than $50m$0-99m$100-499m$500-999m$1 billion or more
11%27%
PrivatePublic (incl. Sub of public)Government AgencyNot for profitOther
Owner 3%Other 9%
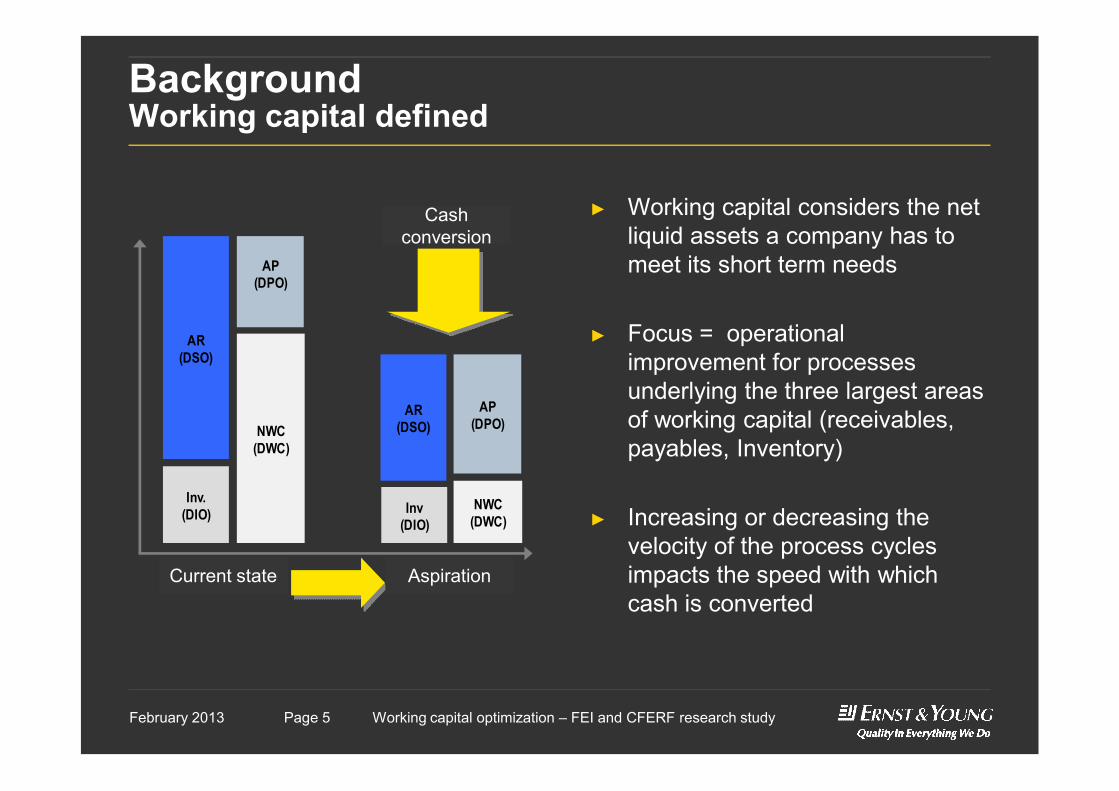
BackgroundWorking capital defined
► Working capital considers the net liquid assets a company has to meet its short term needs
► Focus = operational improvement for processes underlying the three largest areas
AR(DSO)
AP(DPO)
Cash conversion
Presentation titlePage 5 Working capital optimization – FEI and CFERF research studyPage 5February 2013
underlying the three largest areas of working capital (receivables, payables, Inventory)
► Increasing or decreasing the velocity of the process cycles impacts the speed with which cash is converted
NWC(DWC)
Inv.(DIO)
AP(DPO)
AR(DSO)
Inv(DIO)
NWC(DWC)
As Is To BeAspirationCurrent state
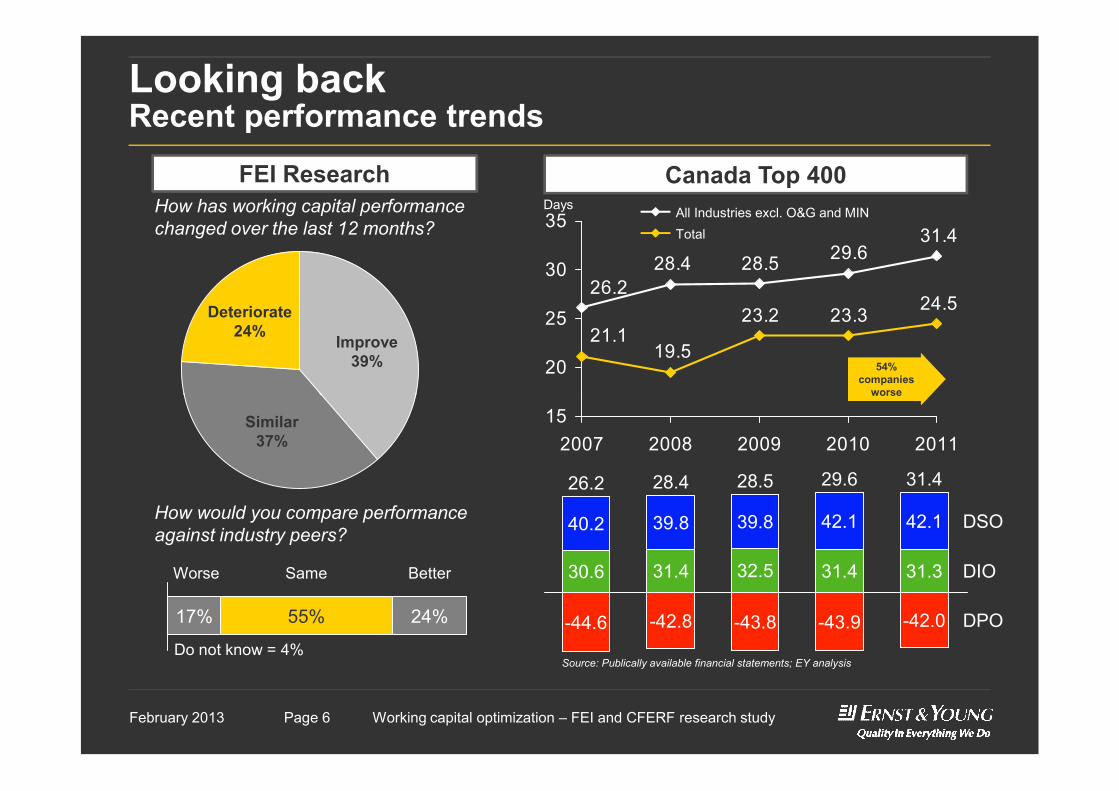
Looking backRecent performance trends
FEI Research Canada Top 400
31.429.628.528.4
26.224.523.323.2
19.521.1
20
25
30
35 All Industries excl. O&G and MINTotal
54% companies
worse
Improve39%
Deteriorate24%
DaysHow has working capital performance changed over the last 12 months?
Presentation titlePage 6 Working capital optimization – FEI and CFERF research studyPage 6February 2013
152007 2008 2009 2010 2011
-43.8
39.8
32.5
28.528.4 29.6 31.4
31.4 31.3
42.1
-42.0
42.1
-43.9
26.2
31.4
39.8
-44.6
30.6 DIO
-42.8 DPO
DSO40.2
worse
Similar37%
Source: Publically available financial statements; EY analysis
How would you compare performance against industry peers?
24%
BetterSameWorse
17% 55%
Do not know = 4%
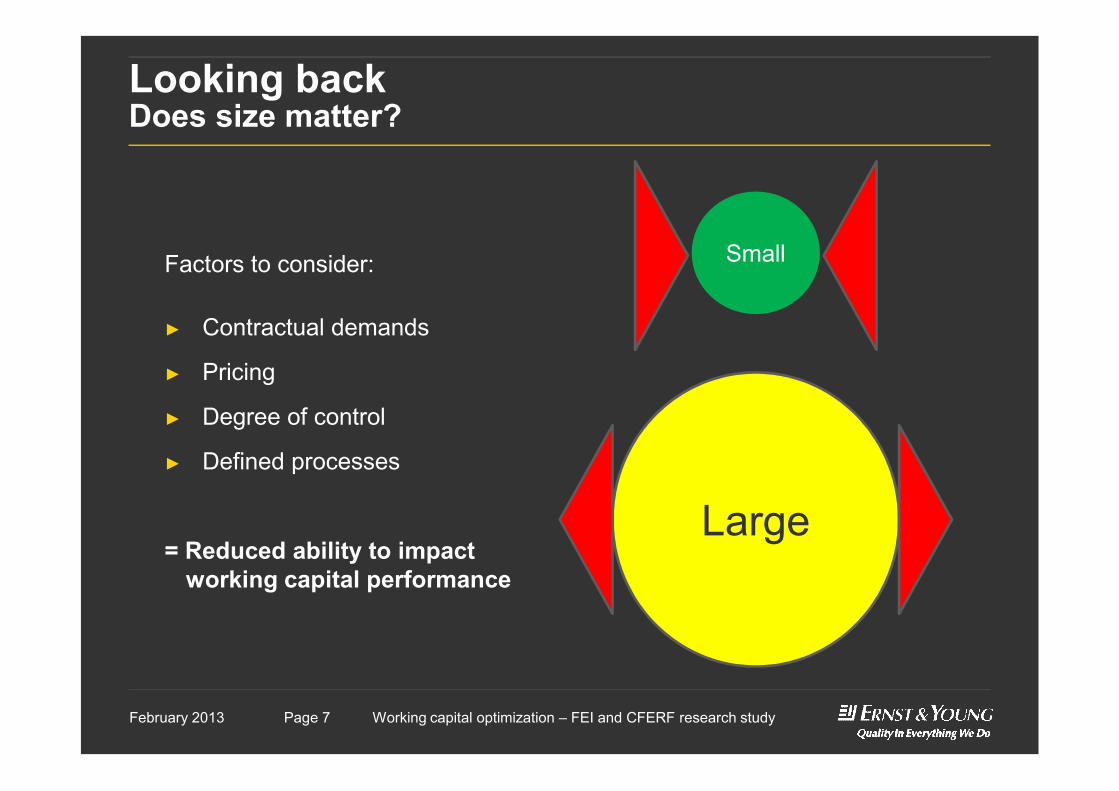
Looking backDoes size matter?
SmallFactors to consider:
► Contractual demands
► Pricing
Presentation titlePage 7 Working capital optimization – FEI and CFERF research studyPage 7February 2013
Large
► Degree of control
► Defined processes
= Reduced ability to impact working capital performance
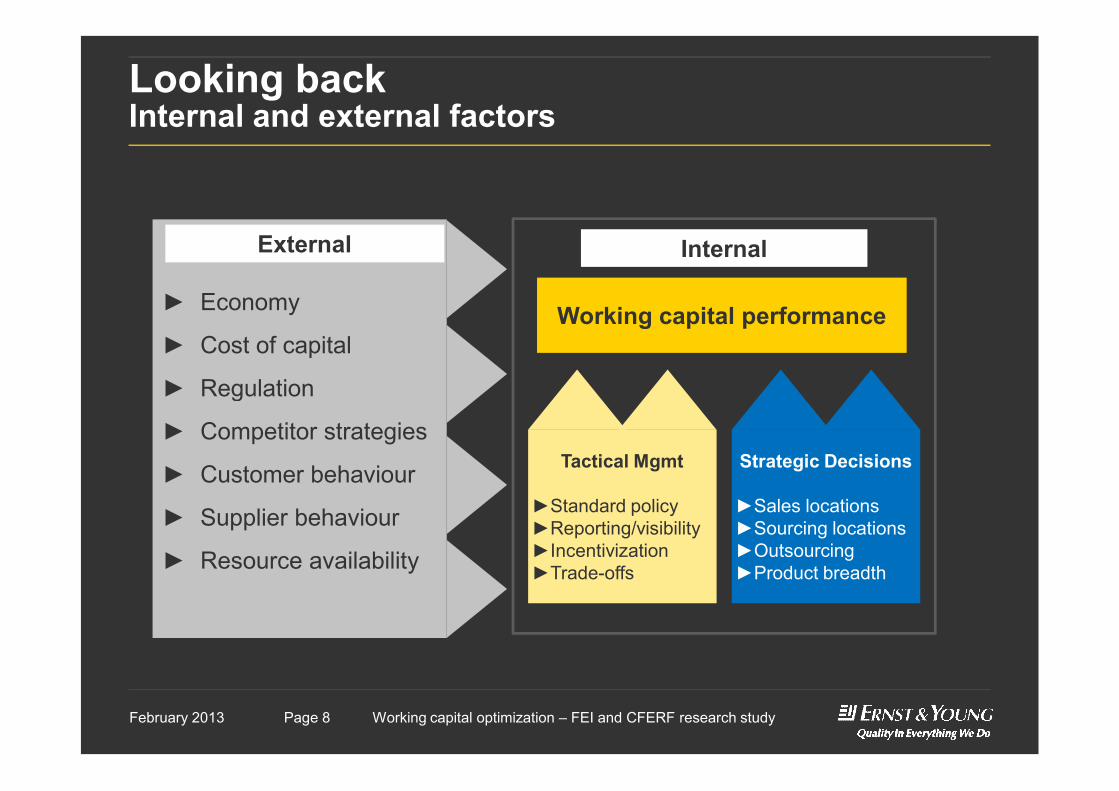
Looking backInternal and external factors
► Economy
► Cost of capital
► Regulation
Working capital performance
External Internal
Presentation titlePage 8 Working capital optimization – FEI and CFERF research studyPage 8February 2013
► Regulation
► Competitor strategies
► Customer behaviour
► Supplier behaviour
► Resource availability
Tactical Mgmt
►Standard policy►Reporting/visibility►Incentivization►Trade-offs
Strategic Decisions
►Sales locations►Sourcing locations►Outsourcing►Product breadth
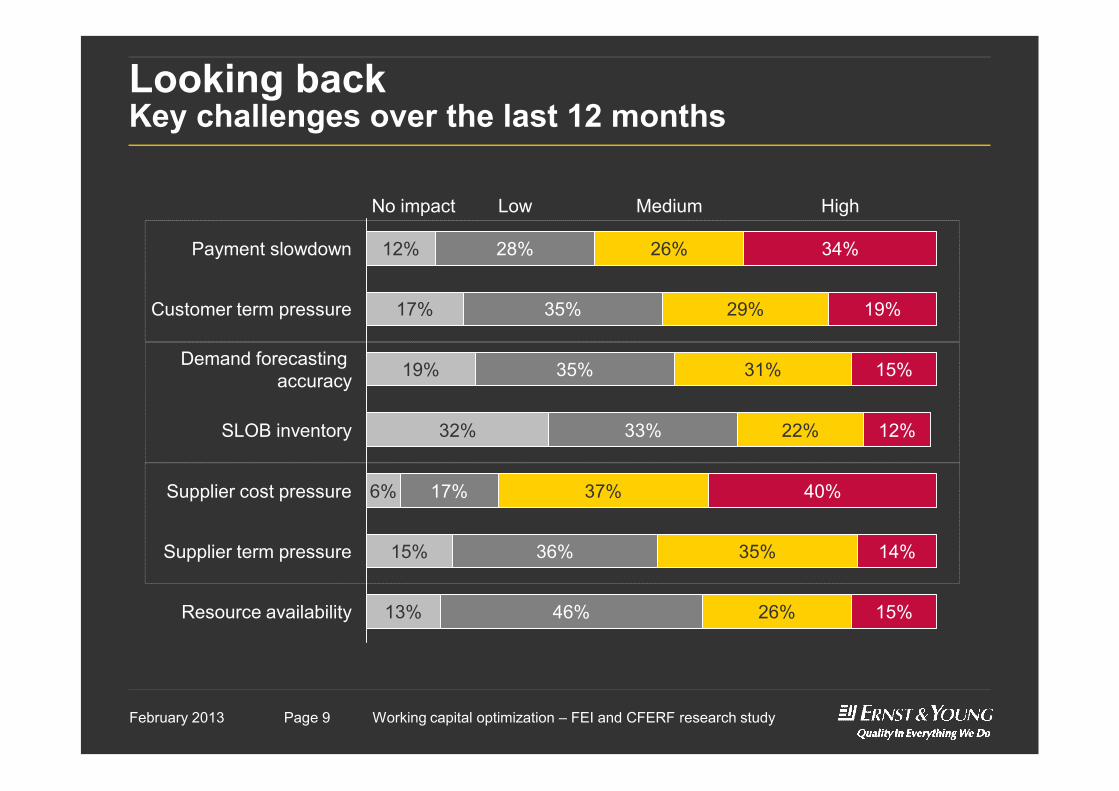
Looking backKey challenges over the last 12 months
No impact
Payment slowdown
Low High
Customer term pressure
19%Demand forecasting accuracy
12%
31%
17%
35%
Medium
28%
15%
26%
19%29%
34%
35%
Presentation titlePage 9 Working capital optimization – FEI and CFERF research studyPage 9February 2013
15%
SLOB inventory
6%
36% 35%
17%
22%
37%
33%32%
Supplier cost pressure
Supplier term pressure
Resource availability 13% 26%
14%
15%46%
40%
12%
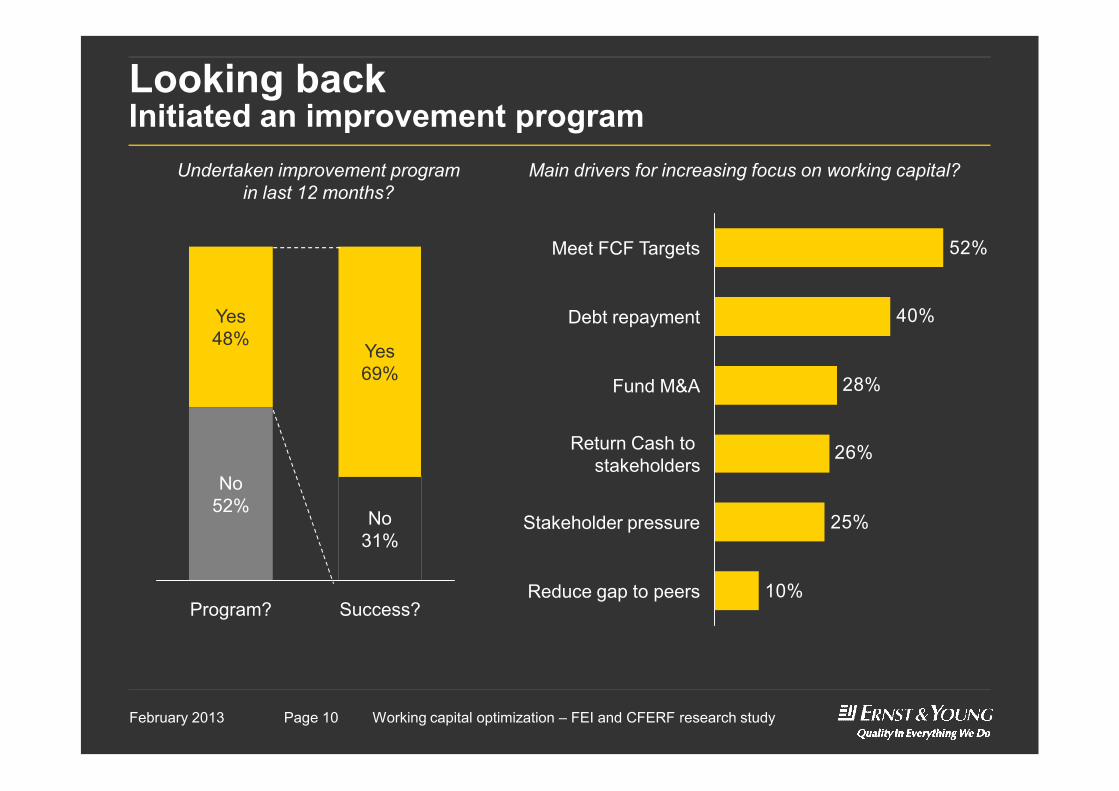
Looking backInitiated an improvement program
28%
40%
52%
Fund M&A
Meet FCF Targets
Debt repayment
Main drivers for increasing focus on working capital?
Yes48%
Yes69%
Undertaken improvement program in last 12 months?
Presentation titlePage 10 Working capital optimization – FEI and CFERF research studyPage 10February 2013
10%
25%
26%
28%
Return Cash to stakeholders
Reduce gap to peers
Stakeholder pressure
Fund M&A
No52%
No31%
Program? Success?
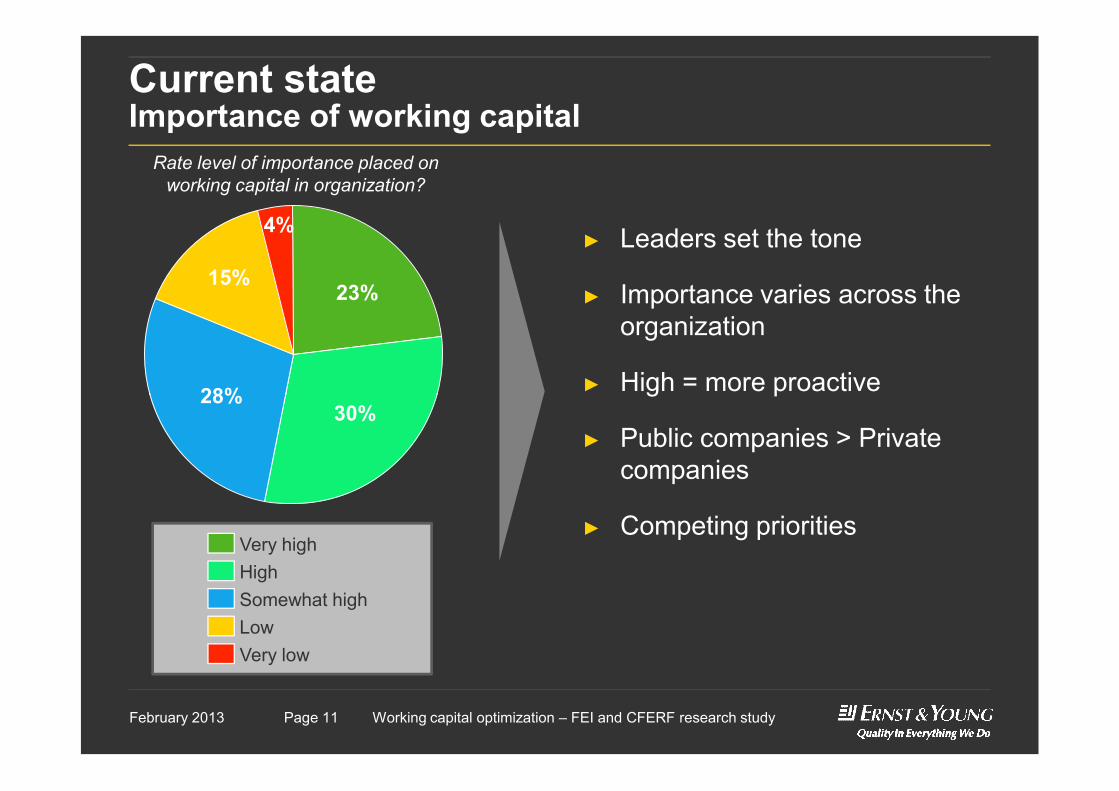
Current stateImportance of working capital
23%
28%
4%
15%
Rate level of importance placed on working capital in organization?
► Leaders set the tone
► Importance varies across the organization
► High = more proactive
Presentation titlePage 11 Working capital optimization – FEI and CFERF research studyPage 11February 2013
Somewhat high
Very low
High
Low
Very high
30%28% ► High = more proactive
► Public companies > Private companies
► Competing priorities
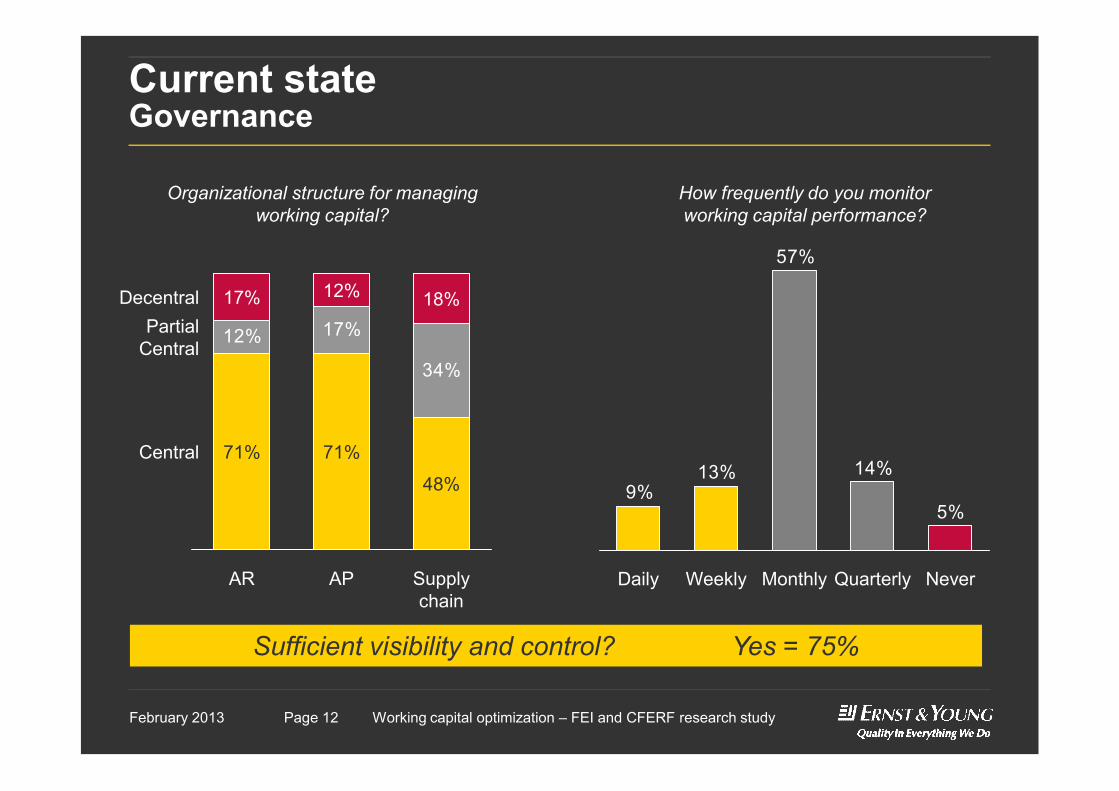
Current stateGovernance
57%
How frequently do you monitor working capital performance?
Organizational structure for managing working capital?
12% 17%
34%
Decentral 17%Partial
Central
18%12%
Presentation titlePage 12 Working capital optimization – FEI and CFERF research studyPage 12February 2013
5%
14%13%9%
Daily Quarterly NeverWeekly Monthly
48%
AR
Central
Supply chain
AP
71% 71%
Sufficient visibility and control? Yes = 75%
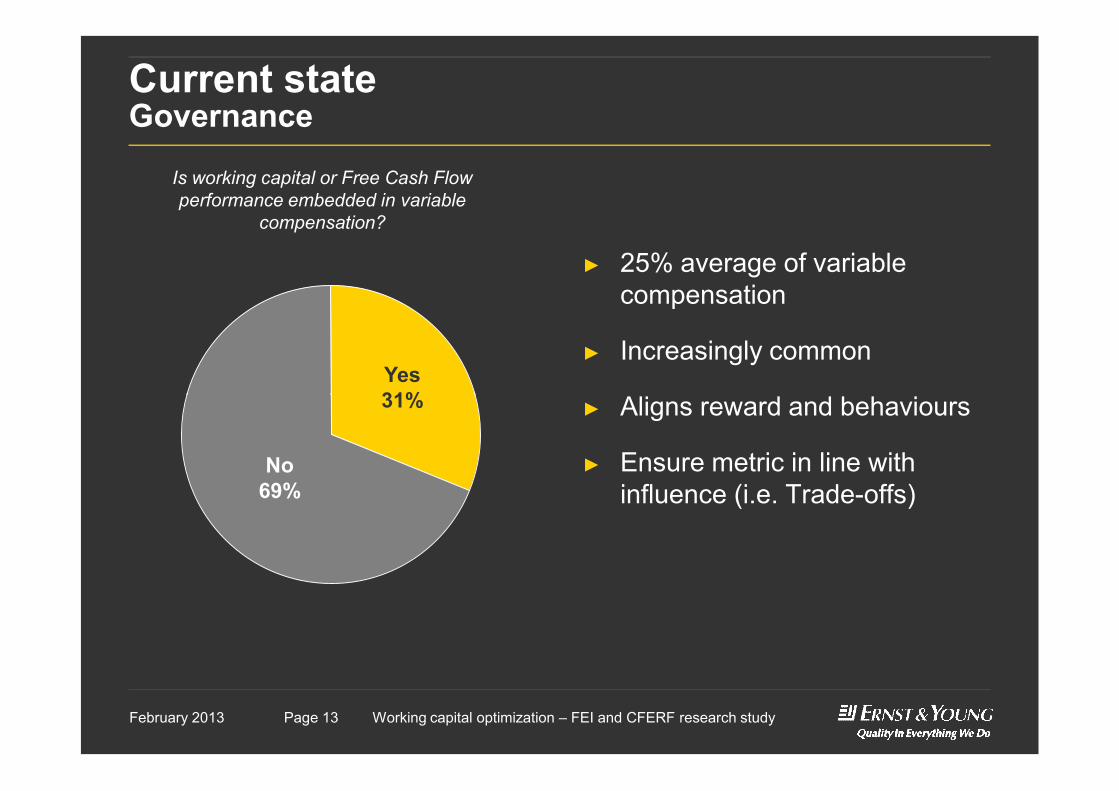
Current stateGovernance
Yes31%
Is working capital or Free Cash Flow performance embedded in variable
compensation?
► 25% average of variable compensation
► Increasingly common
Aligns reward and behaviours
Presentation titlePage 13 Working capital optimization – FEI and CFERF research studyPage 13February 2013
31%
No69%
► Aligns reward and behaviours
► Ensure metric in line with influence (i.e. Trade-offs)
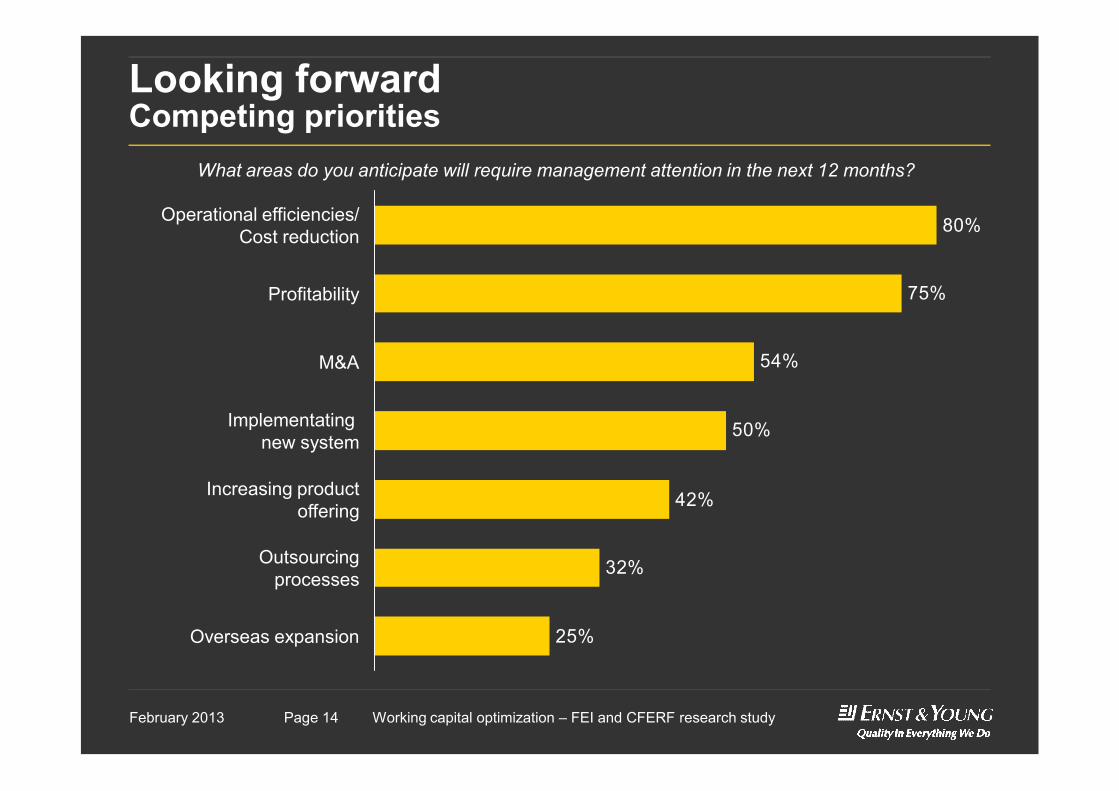
Looking forwardCompeting priorities
54%
75%
80%Operational efficiencies/Cost reduction
Profitability
M&A
What areas do you anticipate will require management attention in the next 12 months?
Presentation titlePage 14 Working capital optimization – FEI and CFERF research studyPage 14February 2013
25%
32%
42%
50%
Increasing productoffering
Outsourcingprocesses
Implementating new system
Overseas expansion
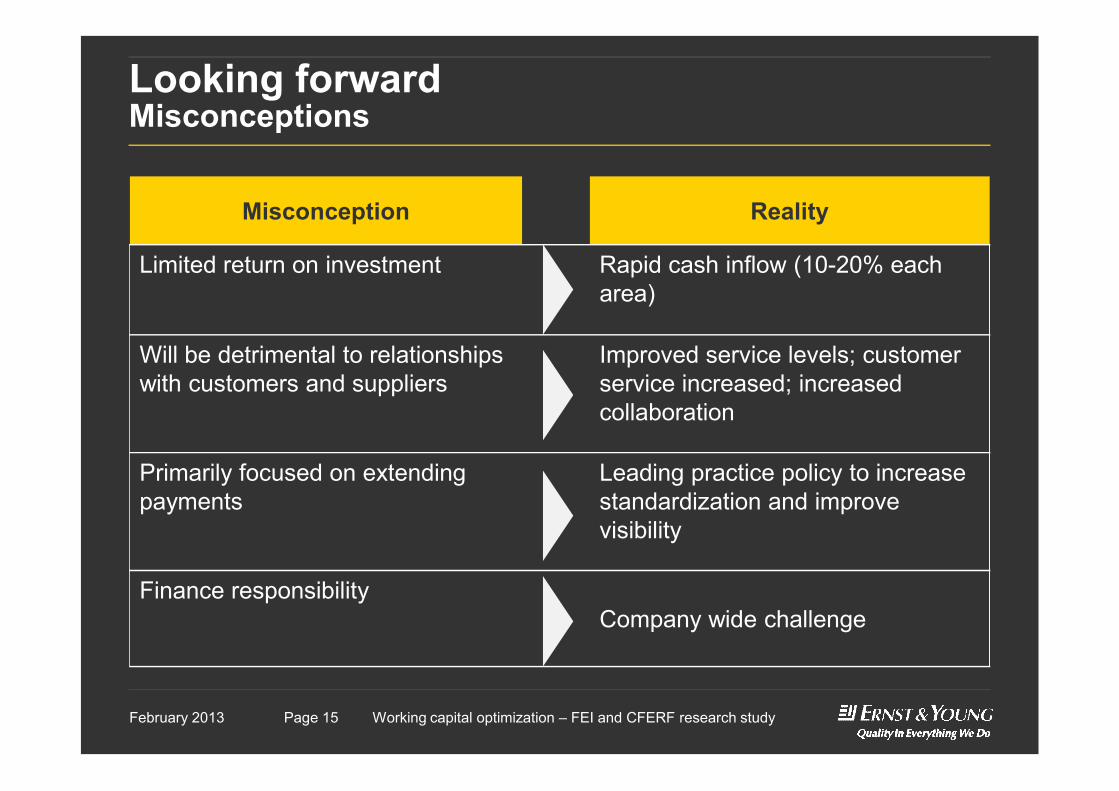
Looking forwardMisconceptions
Misconception Reality
Limited return on investment Rapid cash inflow (10-20% each area)
Will be detrimental to relationships with customers and suppliers
Improved service levels; customer service increased; increased
Presentation titlePage 15 Working capital optimization – FEI and CFERF research studyPage 15February 2013
with customers and suppliers service increased; increased collaboration
Primarily focused on extending payments
Leading practice policy to increase standardization and improve visibility
Finance responsibilityCompany wide challenge
Panel introduction
Experienced panel for today’s discussion:
► Danielle Parent – VP Finance, Fujitsu Canada► Derek Petridis – VP Finance, Shikatani Lacroix Design► Nancy Lala – CFO, About Communications
Presentation titlePage 16 Working capital optimization – FEI and CFERF research studyPage 16February 2013
► Nancy Lala – CFO, About Communications► Barry Levine – Associate Partner, Ernst & Young
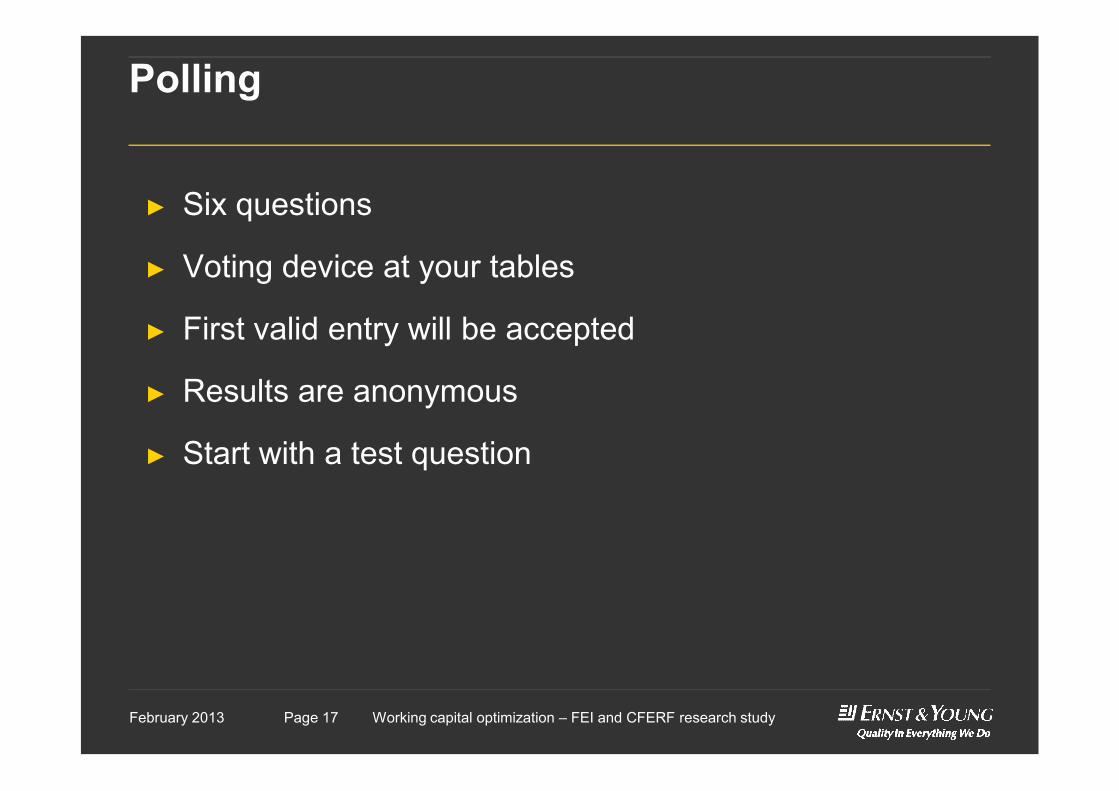
Polling
► Six questions
► Voting device at your tables
► First valid entry will be accepted
► Results are anonymous
Presentation titlePage 17 Working capital optimization – FEI and CFERF research studyPage 17February 2013
► Results are anonymous
► Start with a test question

Q&A
XX Month 200X Presentation titlePage 18
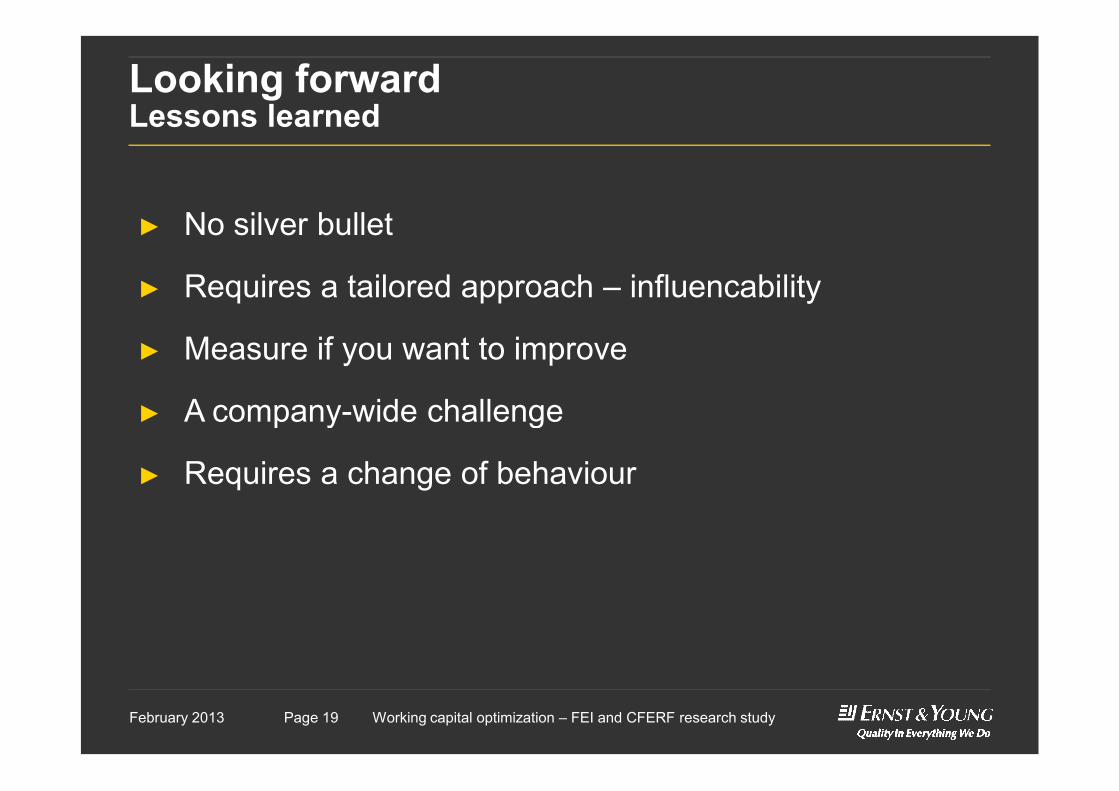
Looking forwardLessons learned
► No silver bullet
► Requires a tailored approach – influencability
► Measure if you want to improve
A company-wide challenge
Presentation titlePage 19 Working capital optimization – FEI and CFERF research studyPage 19February 2013
► A company-wide challenge
► Requires a change of behaviour
Many thanks for attending!
XX Month 200X Presentation titlePage 20


