Embed Size (px)
Citation preview
Volume: II, Issue:III ISSN: 2581-5830
An International Peer-Reviewed Open Access Journal of Social Sciences
GAP GYAN-
GAP GYAN- VOLUME II-ISSUE III
AUGUST - 2019
103
http
s://ww
w.gap
jou
rnals.o
rg/
COMPARATIVE STUDY WORKING CAPITAL OF INDIAN SELECTED SECTORS
Prof. Mukesh Kumar M Bavaliya
Research scholar,
S.D. SCHOOL OF COMMERCE,
Gujarat University
Dr. Amit Mehta
S.D. SCHOOL OF COMMERCE
Gujarat university
INTRODUCTION
“Working Capital is the Life-Blood and Controlling Nerve Center of a business”
Working capital is commonly defined as the difference between current assets and current liabilities.
WORKING CAPITAL = CURRENT ASSETS-CURRENT LIABILITIES
The management of current assets on the basis of the following points:1) Current assets are for short period while
fixed assets are for more than one year
2) The large holding of current assets, especially cash, strengthens liquidity position but also reduce overall
profitability, and to maintain an optimal level of liquidity and profitability, risk return tradeoff is involved holding
current assets.
3) Only current assets can be adjusted with sales fluctuating in the short run. Thus, the Firm has greater degree of
flexibility in managing current assets. The management assets help a firm in building a good market reputation
regarding its business and economic conditions.
The working capital management precisely refers to management of current assets. A firm’s working capital
consists of its investment in current assets, which include short-term assets such as: Cash and bank balance,
Inventories, Receivables (including debtors and bills), Marketable securities.
There are two major concepts of working capital:
1) Gross working capital
2) Net working capital
CONCEPT OF WORKING CAPITAL
➢ Gross working capital:
It refers to firm's investment in current assets. Current assets are the assets, which can be converted into cash
with in a financial year. The gross working capital points to the need of arranging funds to finance current assets.
➢ Net working capital:
It refers to the difference between current assets and current liabilities. Net working capital can be
positive or negative. A positive net working capital will arise when current assets exceed current liabilities. And
vice-versa for negative net working capital.
DEFINITIONS OF WORKING CAPITAL
According to C.W. Gestenbergh-
“A Working capital is ordinarily defined as the excess of the current assets over current liabilities”.
According to Lawrence. J. Gitmen-
“The most common¬ definition of working capital is the difference of the firm’s current assets and current
liabilities.”
According to one school of thought, working capital represent all current assets of a company.
According to Hoagland “working capital is descriptive of that which is not fixed. but the more common use of
working capital is to consider it as the difference the book value of the current assets and current liabilities”
Volume: II, Issue:III ISSN: 2581-5830
An International Peer-Reviewed Open Access Journal of Social Sciences
GAP GYAN-
GAP GYAN- VOLUME II-ISSUE III
AUGUST - 2019
104
http
s://ww
w.gap
jou
rnals.o
rg/
FACTORS AFFECTING THE WORKING CAPITAL
The firm must estimate its working capital very accurately because excessive working capital results in
unnecessary accumulation of inventory and wastage of capital whereas shortage of working capital affects the
smooth flow of operating cycle and business fails to meet commitment. So, finance manager must estimate right
amount of working capital. The finance manager must keep in mind following factors before estimating the
amount of working capital.
1. Length of operating cycle: The amount of working capital directly depends upon the length of operating
cycle. Operating cycle refers to time period involved in production. It starts right from acquisition of raw
material and ends till payment is received after sale. The working capital is very important for smooth
flow of operating cycle. If operating cycle is long than more working capital is required whereas for
company having short operating cycle, the working capital requirement is less.
2. Nature of business: The type of business, firm is involved in, is the next consideration while deciding the
working capital. In case of trading concern or retail shop the requirement is less because length of
operating cycle is less. The wholesalers as compared to retail shop require more working capital as they
have to maintain large stock and generally sells goods on credit which increases length of operating
cycle. The manufacturing company requires huge amount of working capital because they have to
convert raw material into finished goods, sell on credit, maintain the inventory of raw material as well as
finished goods.
3. Scale of operations: The firms operating at large scale need to maintain more inventory, debtors, etc. So,
they generally require large working capital whereas firms operating at small scale require less working
capital.
4. Business cycle fluctuation: During boom period the market is flourishing so more demand, more
production, more stock, more debtors, which means more working capital is required. Whereas during
depression period low demand less inventory to be maintained, less debtors, so less working capital will
be required.
5. Seasonal factors: The working capital requirement is constant for the companies which are selling goods
throughout the season whereas the companies which are selling seasonal goods require huge amount
during season as more demand, more stock has to be maintained and fast supply is needed whereas off
season or slack season demand is very low so less working capital is needed.
6. Technology and Production cycle: If a company is using labour intensive technique of production then
more working capital is required because company needs to maintain enough cash flow for making
payments to labour whereas if company is using machine intensive technique of production then less
working capital is required because investment in machinery if fixed capital requirement and there will
be less operative expenses.
In case of production cycle, if production cycle is long then more working capital will be required
because it will take long time for converting raw material into finished goods whereas when production
cycle is small lesser funds are tied up in inventory and raw material so less working capital is required.
7. Credit allowed: Credit policy refers to average period for collection of sale proceeds. It depends on
number of factors such as creditworthiness, of clients, industry norms, etc. If company is following strict
or short-term credit policy, then it can manage with less working capital also.
8. Credit avail: Another factor related to credit policy is how much and for how long period company is
getting credit from the suppliers. If suppliers of raw material are giving long term credit then company
can manage with less amount of working capital whereas if suppliers are giving only short period credit
then company will acquire more working capital to make payments to creditors
9. Operating efficiency: The firm having high degree of operating efficiency which requires more working
capital as compared to firms having low degree of efficiency which requires more working capital. Firms
having high degree of efficiency have low wastage and can manage with low level of inventory also and
during operating cycle also these firms bear less expenses so they can manage with less working capital
also.
10. Availability of raw materials: If raw materials are easily available and there is ready supply of raw
materials and inputs then firms can manage with less amount of working capital also, they need not
Volume: II, Issue:III ISSN: 2581-5830
An International Peer-Reviewed Open Access Journal of Social Sciences
GAP GYAN-
GAP GYAN- VOLUME II-ISSUE III
AUGUST - 2019
105
http
s://ww
w.gap
jou
rnals.o
rg/
maintain any stock of raw materials or they can manage with very less stock. Whereas if supply of raw
material is not smooth then firm needs to maintain large inventory to carry on operating cycle smoothly.
So, they require more working capital.
11. Level of competition: If the market is competitive then company will have to adopt liberal credit policy
and to supply goods on time. Higher inventories have to be maintained so more working capital is
required. A business with less competition or with monopoly position will require less working capital
as it can dictate terms according to its own requirements.
12. Inflation: If there is increase r rise in price then the price of raw materials and cost of labour will rise, it
will result in an increase in working capital requirement.
But if company is able to increase the price of its own goods as well, then there will be less problem of
working capital. The effect of rise in price on working capital will be different for different businessmen.
13. Growth prospectus: Firms planning to expand their activities will require more amount of working
capital as for expansion they need to increase scale of production which means more raw materials,
more inputs, etc. So more working capital also.
FACTORS AFFECTING WORKING CAPITAL.
• 1.LENGTH OF OPERATING CYCLE
2.SCALE OF OPERATION
3. SEASONAL FACTORS
4. CREDIT ALLOWED
5.OPERATING EFFICIENCY
6.LEVEL OF COMPETITION
7.GROWTH PROSPECTS
• 8.NATURE OF BUSINESS
9.BUSINESS CYCLE FLUCTUATION
10. TECHNOLOGY AND PRODUCTION CYCLE
11. CREDIT AVAIL
12. AVAILABILITY OF RAW MATERIAL
13. INFLATION
FACTORS AFFECTING REQUIREMENT OF WORKING CAPITAL
NAME OF THE
FACTOR
REQUIREMENT OF MORE WORKING CAPITAL REQUIREMENT OF LESS
WORKING CAPITAL
Nature of business Manufacturing concern because of processing work. Trading concern because
of production.
Scale of operation Large scale operation because of huge inventory. Small scale operation
because of small
inventories.
Business cycle During boom period because of more production. During depression
because of less production.
Seasonal factors Peak season because of more demand. Lean season because of
low demand.
Credit allowed to
customers
Sales on ‘credit basis’ Sales on ‘cash basis’
Credit availed from
suppliers
Purchase on ‘cash basis’ Purchase on ‘credit basis’
Inflation Vs Deflation During inflation, due to high price level for raw material,
wages, etc.
During deflation, due to
low price level.
Operating
cycle/Turnover of
working capital. It is
time period from
Long operating cycle Short operating cycle.
Volume: II, Issue:III ISSN: 2581-5830
An International Peer-Reviewed Open Access Journal of Social Sciences
GAP GYAN-
GAP GYAN- VOLUME II-ISSUE III
AUGUST - 2019
106
http
s://ww
w.gap
jou
rnals.o
rg/
purchase of raw
material to realisation
from debtors.
WORK IN STOCK OF
GOODS
CREDIT SALES DEBTORS&
CASH
Availability
material
of
raw
Higher lead time to acquire raw material, so higher stock
of raw material would be needed.
Lower lead time, so less
stock of raw material
would be needed.
Growth prospectus High growth prospectus. Low growth prospectus.
Level of competition High competition would require high amount of stock
keeping.
Low competition would
require less amount of
stock keeping.
Productive cycle Long production cycle Short
cycle.
production
LITURATURE REVIEWS
According to Ghosh & Maji, (2003) conclude that in the study the efficiency of working capital management of
the Indian cement companies during 1992 – 1993 to 2001 – 2002. For measuring the efficiency of working capital
management, performance, utilization, and overall efficiency indices were calculated instead of using some
common working capital management ratios. Setting industry norms as target-efficiency levels of the individual
firms, this paper also tested the speed of achieving that target level of efficiency by an individual firm during the
period of study. Findings of the study indicated that the Indian Cement Industry as a whole did not perform
remarkably well during this period.
Mohammad, Morshedur & Rahman, (2011) observe in his research study to identify the relationship between
working capital management and profitability of the Textiles industry. In the study they found out that there is no
significant relationship between the working capital management and profitability.
Sayeda Tahmina Quayyum, (2012) examine in the research several industries. The main objective of the
research is to find out which industry is significantly influenced by the working capital components. In the study
the concluded that except the food industry there exists is a significant relationship between the working capital
components and profitability.
Asghar ali & Syed Atif ali, (2012) investigated the impact of working capital management on profitability by
analyzing the 15 companies at random from chemical textile and engineering sectors undertaken 5 companies
from each sector listed on Karachi stock exchange for period 2003 to 2008. Regression analysis technique was
used for analyzing data the result revealed that working capital management having positive effect on total assets
and profitability of the 15 firms listed Karachi stock exchange and the also highlight that efficient management of
inventories can enhance the profitability.
According to Fayaz Ali shah and wajjid khan, (2012) in this paper observe the impact of cash conversion cycle
on profitability of the firms undertaken 46 companies from textile sector listed on Karachi stock exchange for a
period of (2003-2009). They used ordinary least square and was taken the return on assets as dependent variable
and cash conversion cycle, number of days account payable, number of days account receivable and number of
Volume: II, Issue:III ISSN: 2581-5830
An International Peer-Reviewed Open Access Journal of Social Sciences
GAP GYAN-
GAP GYAN- VOLUME II-ISSUE III
AUGUST - 2019
107
http
s://ww
w.gap
jou
rnals.o
rg/
days inventory were taken as independent variables. So, the result shows that the dependent variable is affected
by all independent variables.
According to Iqbal and Zhuqman, (2012) examined the relationship between working capital management and
profitability of 85 non-financial firms in Pakistan for a period from 2008 to 2013. The data was obtained from the
firm’s financial statements. Panel least square and correlation techniques were used for data analysis. Result of
the study show that there is strong positive relation between ROA and size, GDPGR and sales growth of the firms.
They also suggested that profitability and value of the firm managers can improve by dropping account payable
days, account receivable days and inventory turnover in days.
According to Kirva, (2012) examined the relationship between the working capital management variables and
the gross profit of the manufacturing firms listed on Nairobi stock securities exchange for the period (2006-2010).
Multiple regression and correlation analysis techniques were used for analyzing data. According to the study their
profitability of the firm has positive relationship with average payment period and average collection period but
has negative relationship with inventory turnover in days. They also recommended that managers should collect
the receivables soon as possible and reduce the cash conversion cycle.
According to Bashir and Ahmed, (2013) studied that the impacts of working capital management on
profitability of the 100 non-financial firms listed on Karachi stock exchange for the period 2005-2009. They used
panel data in the research and have analyzed by regression and Lagrange multiplier test. The result of the study
suggested that there is positive relationship between the average collection period, current ratio, size, leverage
and profitability. But there is significant negative relationship between average payment period, inventory
turnover in days and profitability of the firms.
According to malik.M and waseem ullah, (2013) the relationship between the working capital management
variables and profitability of the firms on the basis of 25 companies from textile sector listed on Karachi stock
exchange. The data were taken from the secondary data and correlation and regression analysis techniques used
for data analysis. They observed that there is positive relationship between the firm’s profitability and the
inventory, cash and account receivable while there is significantly negative relationship between account payable
and profitability of the firms.
According to Rehman and khan, (2013) the influence of working capital management variables on the
performance of small medium enterprise for period from 2006 to 2012 in Pakistan. Return on assets was taken as
dependent variable and independent variables were cash conversion cycle, number of days account receivable,
number of days account payable and number of days inventory. In addition, some other variables were taken as
debt ratio, growth and size of the firm. In the result they found that account payable, growth and size have
negative relationship with the firm profitability whereas account receivable, cash conversion cycle, number of
days inventory and debt ratio has positive relationship with the firm profitability.
According to Ponsian & chrispin ( 2014) analyzed three manufacturing companies listed on dar es Salam
stock exchange for the period (2002-2012) and they take the data from the annual report of the companies and
dar se Salam stock exchange. For the quantification basis they used the Pearson’s correlation and regression
analysis. Result suggested that there is strong positive relationship between the profitability and cash conversion
cycle and there is strong negative relationship between the profitability and average payment period, average
collection period, inventory turnover in days and liquidity.
According to Gachira, (2014) investigated the impact of working capital management on the profitability of the
39 non-financial firms for period 2009 to 2013 listed on the Zimbabwe stock exchange. Panel and regression
analysis techniques were used for analyzing the data the result show that there is a positive relationship among
cash conversion cycle, inventory turnover, and debtors’ days on the profitability and there is negative relationship
between debt to assets ratio, current ratio and creditors days on the profitability.
RESEARCH METHODOLOGY
3.1 Research Objectives:
This study has the following objectives:
1. To assess trends of working capital on profitability of selected Indian sectors.
2. To analyse of working capital management sectors
Volume: II, Issue:III ISSN: 2581-5830
An International Peer-Reviewed Open Access Journal of Social Sciences
GAP GYAN-
GAP GYAN- VOLUME II-ISSUE III
AUGUST - 2019
108
http
s://ww
w.gap
jou
rnals.o
rg/
Significance of this Research:
It seems obvious that working capital policy has some impact on the profitability of the Indian selected companies
like cement, steel, IT and FMCG. There exists a relationship between working capital policy and profitability of the
selected Indian four sector cement, steel, IT and FMCG, but still diminutive research had conducted Indian
selected companies. Therefore, the purpose of the study is to find out the relationship between impact of working
capital on profitability by using the profitability ratio measurement.
Furthermore, I tried to develop better and practical understanding of the association between the variables and
tried to meet the gap in the academic literature over this issue.
Scope of the research study:
Researchers all over the world established the concept that working capital management policy is the way of
achieving high profitability. Any Indian enterprises should have a strong policy in order to manage properly their
working capital. There are many ways to measure the profitability of a business entity. Return on equity, return on
assets, and return on capital employed etc, are some of the methods employed to measure the profitability of a
business.
Research method:
Quantitative method followed in this study because the collected data in the form of numerical digits and I have
used statistical tools for analysis.
Sample size:
Various manufacturing companies listed at Indian Stock Exchange were selected for this study, the main reason
for selecting only the 40 listed companies is the reliability and accuracy of the information given by them, then
compare to other. In this study Total 40 Indian selected companies out of total companies listed at BSE/NSE in
2018. Convenient sampling methods used to choose the sample and availability of reports set as a standard to
select a company for sample.
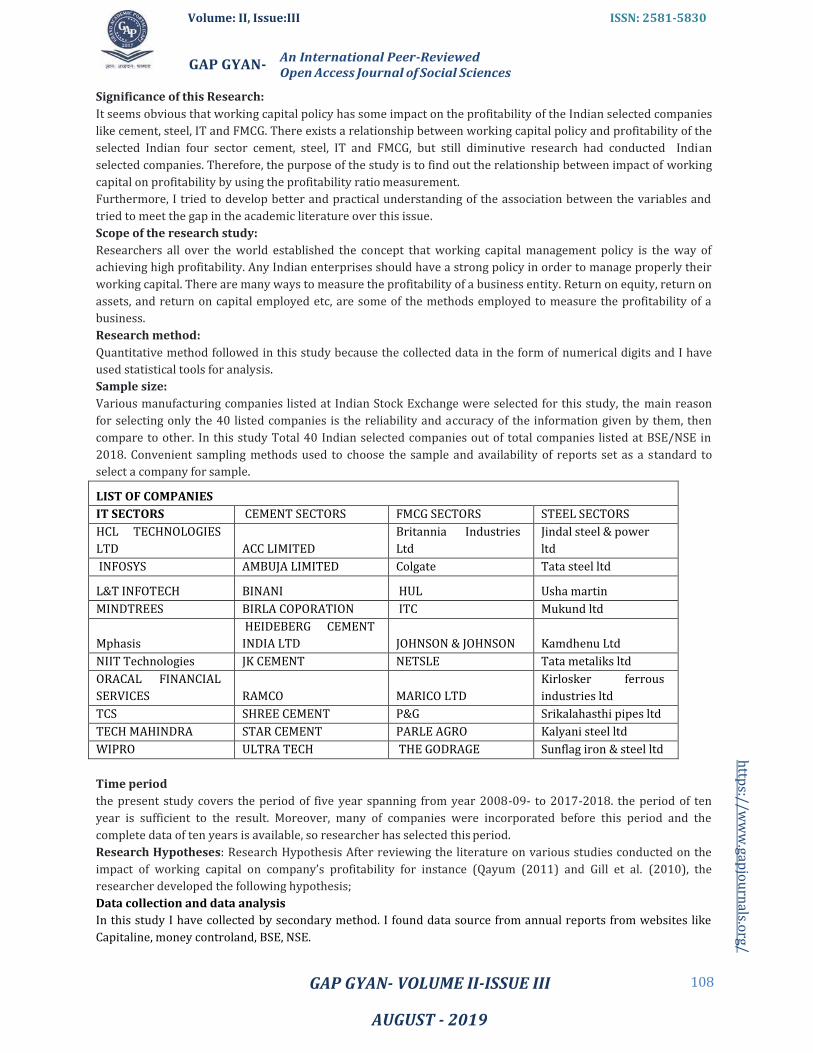
LIST OF COMPANIES
IT SECTORS CEMENT SECTORS FMCG SECTORS STEEL SECTORS
HCL TECHNOLOGIES
LTD
ACC LIMITED
Britannia Industries
Ltd
Jindal steel & power
ltd
INFOSYS AMBUJA LIMITED Colgate Tata steel ltd
L&T INFOTECH BINANI HUL Usha martin
MINDTREES BIRLA COPORATION ITC Mukund ltd
Mphasis
HEIDEBERG CEMENT
INDIA LTD
JOHNSON & JOHNSON
Kamdhenu Ltd
NIIT Technologies JK CEMENT NETSLE Tata metaliks ltd
ORACAL FINANCIAL
SERVICES
RAMCO
MARICO LTD
Kirlosker ferrous
industries ltd
TCS SHREE CEMENT P&G Srikalahasthi pipes ltd
TECH MAHINDRA STAR CEMENT PARLE AGRO Kalyani steel ltd
WIPRO ULTRA TECH THE GODRAGE Sunflag iron & steel ltd
Time period
the present study covers the period of five year spanning from year 2008-09- to 2017-2018. the period of ten
year is sufficient to the result. Moreover, many of companies were incorporated before this period and the
complete data of ten years is available, so researcher has selected this period.
Research Hypotheses: Research Hypothesis After reviewing the literature on various studies conducted on the
impact of working capital on company’s profitability for instance (Qayum (2011) and Gill et al. (2010), the
researcher developed the following hypothesis;
Data collection and data analysis
In this study I have collected by secondary method. I found data source from annual reports from websites like
Capitaline, money controland, BSE, NSE.
Volume: II, Issue:III ISSN: 2581-5830
An International Peer-Reviewed Open Access Journal of Social Sciences
GAP GYAN-
GAP GYAN- VOLUME II-ISSUE III
AUGUST - 2019
109
http
s://ww
w.gap
jou
rnals.o
rg/
I have used tool for data analysis: 1) Accounting tool: Ratio analysis and Trend analysis
2) statistical tool: average (mean), variance, ANOVA
DATA ANALYSIS
Data analysis of Working Capital
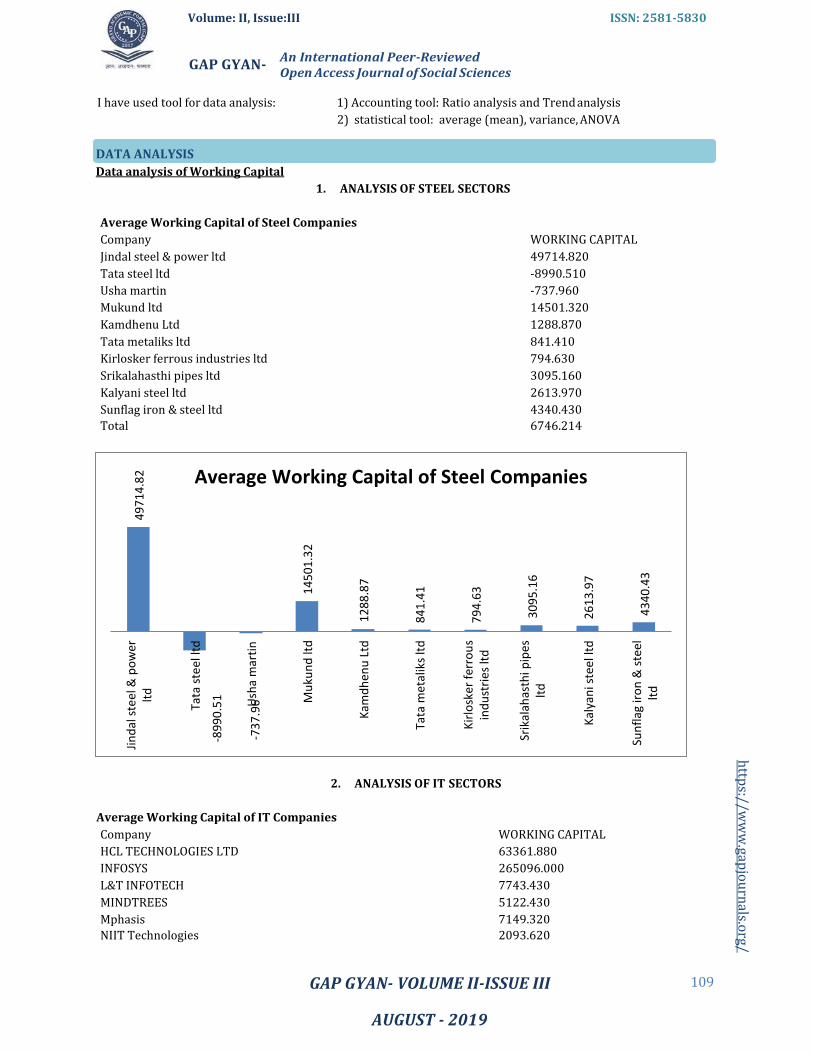
1. ANALYSIS OF STEEL SECTORS
Average Working Capital of Steel Companies
Company WORKING CAPITAL
Jindal steel & power ltd 49714.820
Tata steel ltd -8990.510
Usha martin -737.960
Mukund ltd 14501.320
Kamdhenu Ltd 1288.870
Tata metaliks ltd 841.410
Kirlosker ferrous industries ltd 794.630
Srikalahasthi pipes ltd 3095.160
Kalyani steel ltd 2613.970
Sunflag iron & steel ltd 4340.430
Total 6746.214
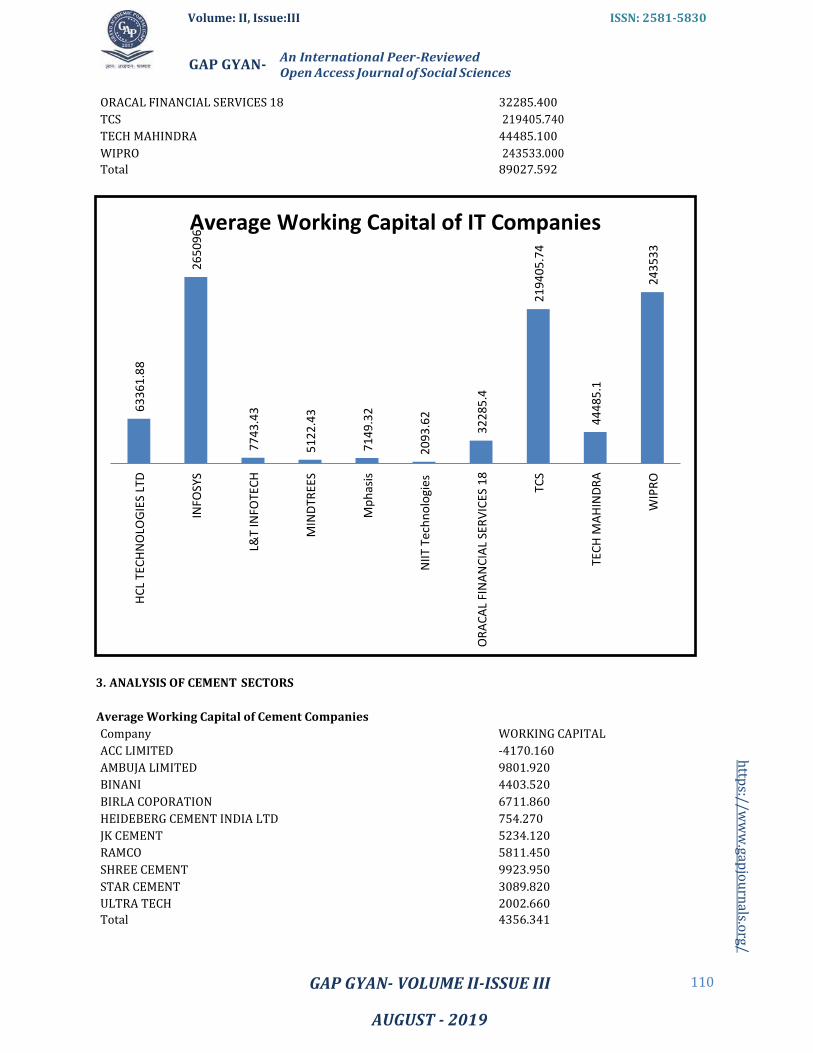
2. ANALYSIS OF IT SECTORS
Average Working Capital of IT Companies
Company WORKING CAPITAL
HCL TECHNOLOGIES LTD 63361.880
INFOSYS 265096.000
L&T INFOTECH 7743.430
MINDTREES 5122.430
Mphasis 7149.320
NIIT Technologies 2093.620
Average Working Capital of Steel Companies
Jin
dal
ste
el &
po
wer
lt
d
49
71
4.8
2
Tata
ste
el lt
d
-89
90
.51
-73
7.9
U 6 sh
a m
arti
n
Mu
kun
d lt
d
14
50
1.3
2
Kam
dh
enu
Ltd
1
28
8.8
7
Tata
met
alik
s lt
d
84
1.4
1
Kir
losk
er f
erro
us
ind
ust
ries
ltd
7
94
.63
Srik
alah
asth
i pip
es
ltd
3
09
5.1
6
Kal
yan
i ste
el lt
d
26
13
.97
Sun
flag
iro
n &
ste
el
ltd
4
34
0.4
3
Volume: II, Issue:III ISSN: 2581-5830
An International Peer-Reviewed Open Access Journal of Social Sciences
GAP GYAN-
GAP GYAN- VOLUME II-ISSUE III
AUGUST - 2019
110
http
s://ww
w.gap
jou
rnals.o
rg/
ORACAL FINANCIAL SERVICES 18 32285.400
TCS 219405.740
TECH MAHINDRA 44485.100
WIPRO 243533.000
Total 89027.592
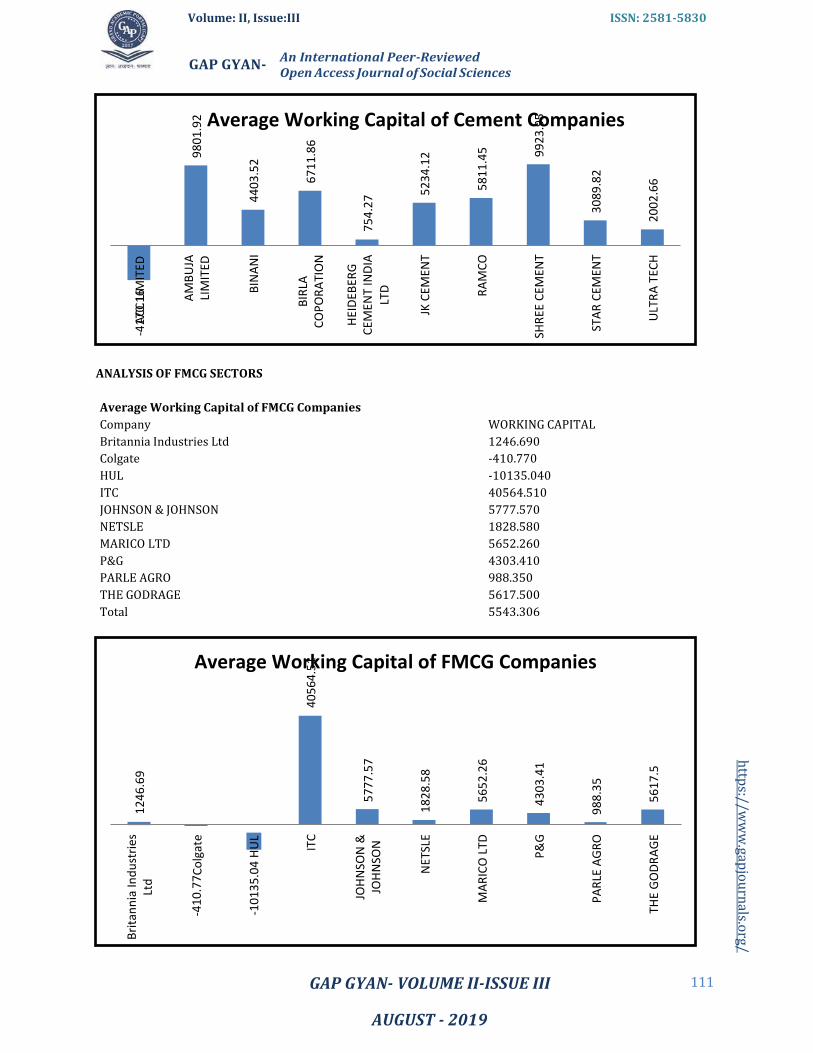
3. ANALYSIS OF CEMENT SECTORS
Average Working Capital of Cement Companies
Company WORKING CAPITAL
ACC LIMITED -4170.160
AMBUJA LIMITED 9801.920
BINANI 4403.520
BIRLA COPORATION 6711.860
HEIDEBERG CEMENT INDIA LTD 754.270
JK CEMENT 5234.120
RAMCO 5811.450
SHREE CEMENT 9923.950
STAR CEMENT 3089.820
ULTRA TECH 2002.660
Total 4356.341
Average Working Capital of IT Companies
HC
L TE
CH
NO
LOG
IES
LTD
6
33
61
.88
INFO
SYS
26
50
96
L&T
INFO
TEC
H
77
43
.43
MIN
DTR
EES
51
22
.43
Mp
has
is
71
49
.32
NII
T Te
chn
olo
gie
s 2
09
3.6
2
OR
AC
AL
FIN
AN
CIA
L SE
RV
ICES
18
3
22
85
.4
TCS
21
94
05
.74
TEC
H M
AH
IND
RA
4
44
85
.1
WIP
RO
2
43
53
3
Volume: II, Issue:III ISSN: 2581-5830
An International Peer-Reviewed Open Access Journal of Social Sciences
GAP GYAN-
GAP GYAN- VOLUME II-ISSUE III
AUGUST - 2019
111
http
s://ww
w.gap
jou
rnals.o
rg/
ANALYSIS OF FMCG SECTORS
Average Working Capital of FMCG Companies
Company WORKING CAPITAL
Britannia Industries Ltd 1246.690
Colgate -410.770
HUL -10135.040
ITC 40564.510
JOHNSON & JOHNSON 5777.570
NETSLE 1828.580
MARICO LTD 5652.260
P&G 4303.410
PARLE AGRO 988.350
THE GODRAGE 5617.500
Total 5543.306
Average Working Capital of Cement Companies
Average Working Capital of FMCG Companies
Bri
tan
nia
Ind
ust
ries
Lt
d
12
46
.69
-4
1A7C0
C.1L6
IMIT
ED
AM
BU
JA
LIM
ITED
-4
10
.77
Co
lgat
e
98
01
.92
-10
13
5.0
4 H
UL
B
INA
NI
44
03
.52
BIR
LA
CO
PO
RA
TIO
N
ITC
4
05
64
.51
6
71
1.8
6
HEI
DEB
ERG
C
EMEN
T IN
DIA
LTD
JOH
NSO
N &
JO
HN
SON
5
77
7.5
7
75
4.2
7
NET
SLE
18
28
.58
JK
CEM
ENT
52
34
.12
MA
RIC
O L
TD
56
52
.26
R
AM
CO
5
81
1.4
5
P&
G
43
03
.41
SH
REE
CEM
ENT
99
23
.95
PA
RLE
AG
RO
9
88
.35
ST
AR
CEM
ENT
30
89
.82
ULT
RA
TEC
H
20
02
.66
TH
E G
OD
RA
GE
5
61
7.5
Volume: II, Issue:III ISSN: 2581-5830
An International Peer-Reviewed Open Access Journal of Social Sciences
GAP GYAN-
GAP GYAN- VOLUME II-ISSUE III
AUGUST - 2019
112
http
s://ww
w.gap
jou
rnals.o
rg/
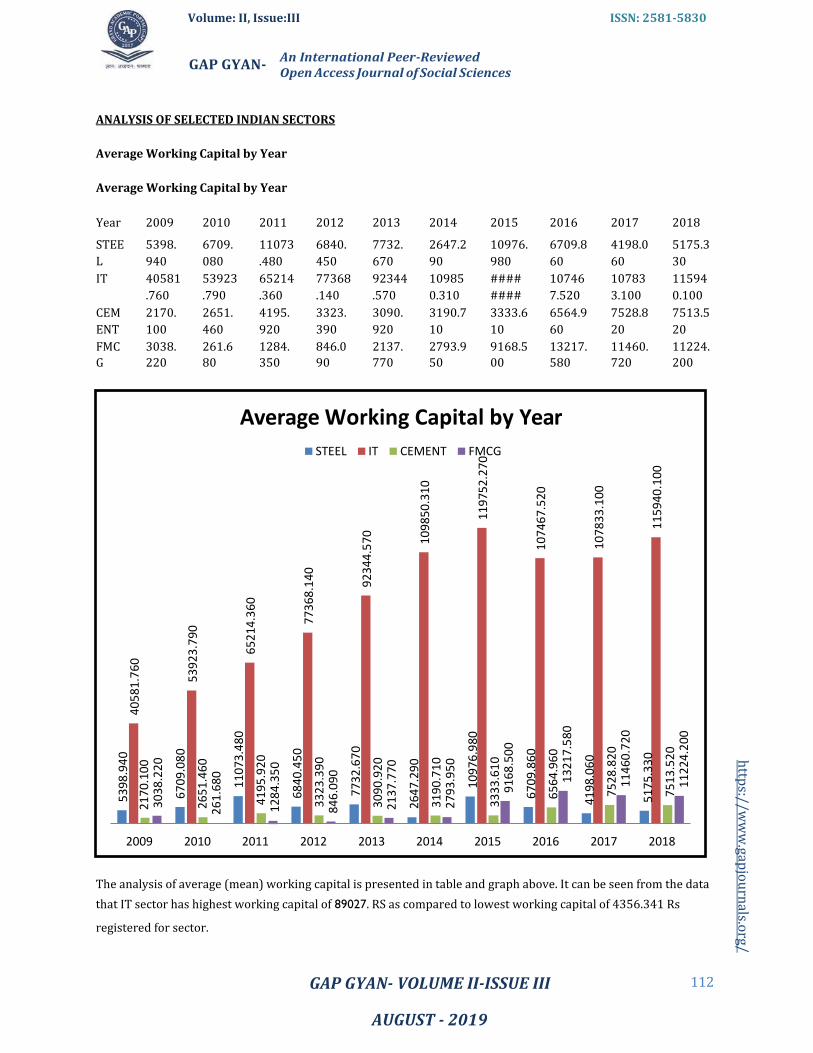
ANALYSIS OF SELECTED INDIAN SECTORS
Average Working Capital by Year
Average Working Capital by Year
Year 2009 2010 2011 2012 2013 2014 2015 2016 2017 2018
STEE
L
5398.
940
6709.
080
11073
.480
6840.
450
7732.
670
2647.2
90
10976.
980
6709.8
60
4198.0
60
5175.3
30
IT 40581
.760
53923
.790
65214
.360
77368
.140
92344
.570
10985
0.310
####
####
10746
7.520
10783
3.100
11594
0.100
CEM
ENT
2170.
100
2651.
460
4195.
920
3323.
390
3090.
920
3190.7
10
3333.6
10
6564.9
60
7528.8
20
7513.5
20
FMC
G
3038.
220
261.6
80
1284.
350
846.0
90
2137.
770
2793.9
50
9168.5
00
13217.
580
11460.
720
11224.
200
The analysis of average (mean) working capital is presented in table and graph above. It can be seen from the data
that IT sector has highest working capital of 89027. RS as compared to lowest working capital of 4356.341 Rs
registered for sector.
Average Working Capital by Year
STEEL IT CEMENT FMCG
2009 2010 2011 2012 2013 2014 2015 2016 2017 2018
53
98
.94
0
21
70
.10
0
30
38
.22
0
67
09
.08
0
26
51
.46
0
26
1.6
80
11
07
3.4
80
41
95
.92
0
12
84
.35
0
68
40
.45
0
33
23
.39
0
84
6.0
90
77
32
.67
0
30
90
.92
0
21
37
.77
0
26
47
.29
0
31
90
.71
0
27
93
.95
0
10
97
6.9
80
33
33
.61
0
91
68
.50
0
67
09
.86
0
65
64
.96
0
13
21
7.5
80
41
98
.06
0
75
28
.82
0
11
46
0.7
20
51
75
.33
0
75
13
.52
0
11
22
4.2
00
40
58
1.7
60
53
92
3.7
90
65
21
4.3
60
77
36
8.1
40
92
34
4.5
70
10
98
50
.31
0
11
97
52
.27
0
10
74
67
.52
0
10
78
33
.10
0
11
59
40
.10
0
Volume: II, Issue:III ISSN: 2581-5830
An International Peer-Reviewed Open Access Journal of Social Sciences
GAP GYAN-
GAP GYAN- VOLUME II-ISSUE III
AUGUST - 2019
113
http
s://ww
w.gap
jou
rnals.o
rg/
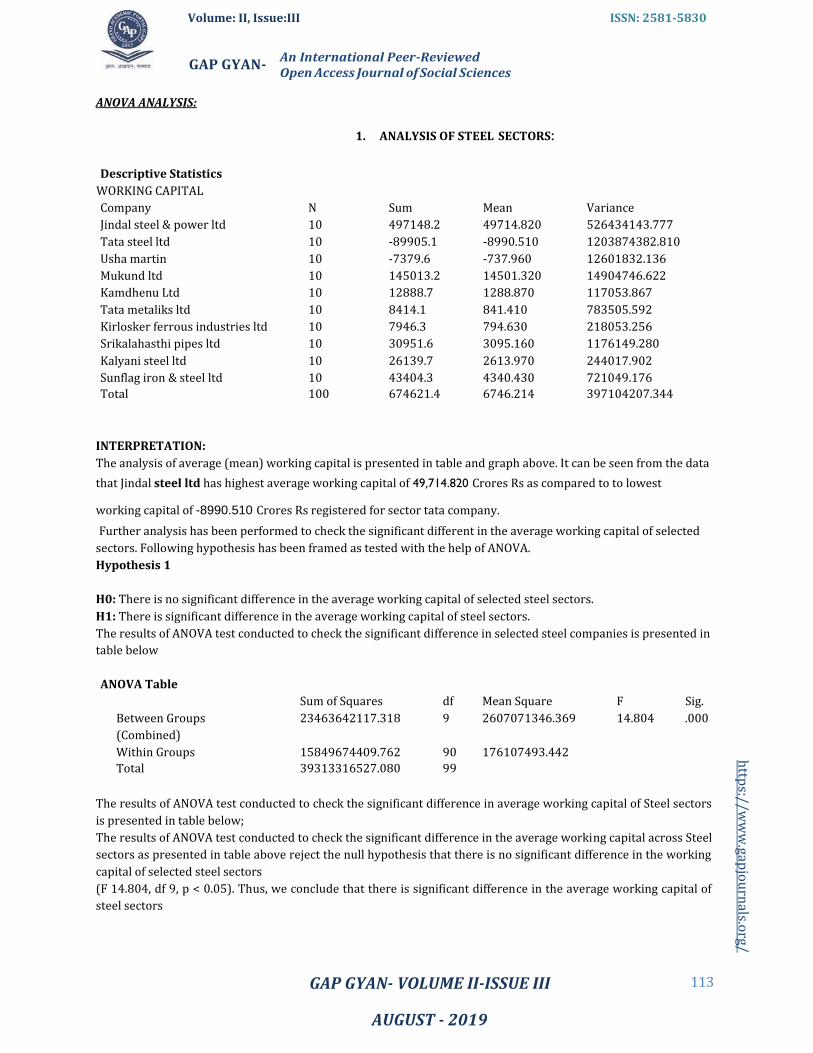
ANOVA ANALYSIS:
1. ANALYSIS OF STEEL SECTORS:
Descriptive Statistics
WORKING CAPITAL
Company N Sum Mean Variance
Jindal steel & power ltd 10 497148.2 49714.820 526434143.777
Tata steel ltd 10 -89905.1 -8990.510 1203874382.810
Usha martin 10 -7379.6 -737.960 12601832.136
Mukund ltd 10 145013.2 14501.320 14904746.622
Kamdhenu Ltd 10 12888.7 1288.870 117053.867
Tata metaliks ltd 10 8414.1 841.410 783505.592
Kirlosker ferrous industries ltd 10 7946.3 794.630 218053.256
Srikalahasthi pipes ltd 10 30951.6 3095.160 1176149.280
Kalyani steel ltd 10 26139.7 2613.970 244017.902
Sunflag iron & steel ltd 10 43404.3 4340.430 721049.176
Total 100 674621.4 6746.214 397104207.344
INTERPRETATION:
The analysis of average (mean) working capital is presented in table and graph above. It can be seen from the data
that Jindal steel ltd has highest average working capital of 49,714.820 Crores Rs as compared to to lowest
working capital of -8990.510 Crores Rs registered for sector tata company.
Further analysis has been performed to check the significant different in the average working capital of selected
sectors. Following hypothesis has been framed as tested with the help of ANOVA.
Hypothesis 1
H0: There is no significant difference in the average working capital of selected steel sectors.
H1: There is significant difference in the average working capital of steel sectors.
The results of ANOVA test conducted to check the significant difference in selected steel companies is presented in
table below
ANOVA Table
Sum of Squares df Mean Square F Sig.
Between Groups
(Combined)
23463642117.318 9 2607071346.369 14.804 .000
Within Groups 15849674409.762 90 176107493.442
Total 39313316527.080 99
The results of ANOVA test conducted to check the significant difference in average working capital of Steel sectors
is presented in table below;
The results of ANOVA test conducted to check the significant difference in the average working capital across Steel
sectors as presented in table above reject the null hypothesis that there is no significant difference in the working
capital of selected steel sectors
(F 14.804, df 9, p < 0.05). Thus, we conclude that there is significant difference in the average working capital of
steel sectors
Volume: II, Issue:III ISSN: 2581-5830
An International Peer-Reviewed Open Access Journal of Social Sciences
GAP GYAN-
GAP GYAN- VOLUME II-ISSUE III
AUGUST - 2019
114
http
s://ww
w.gap
jou
rnals.o
rg/
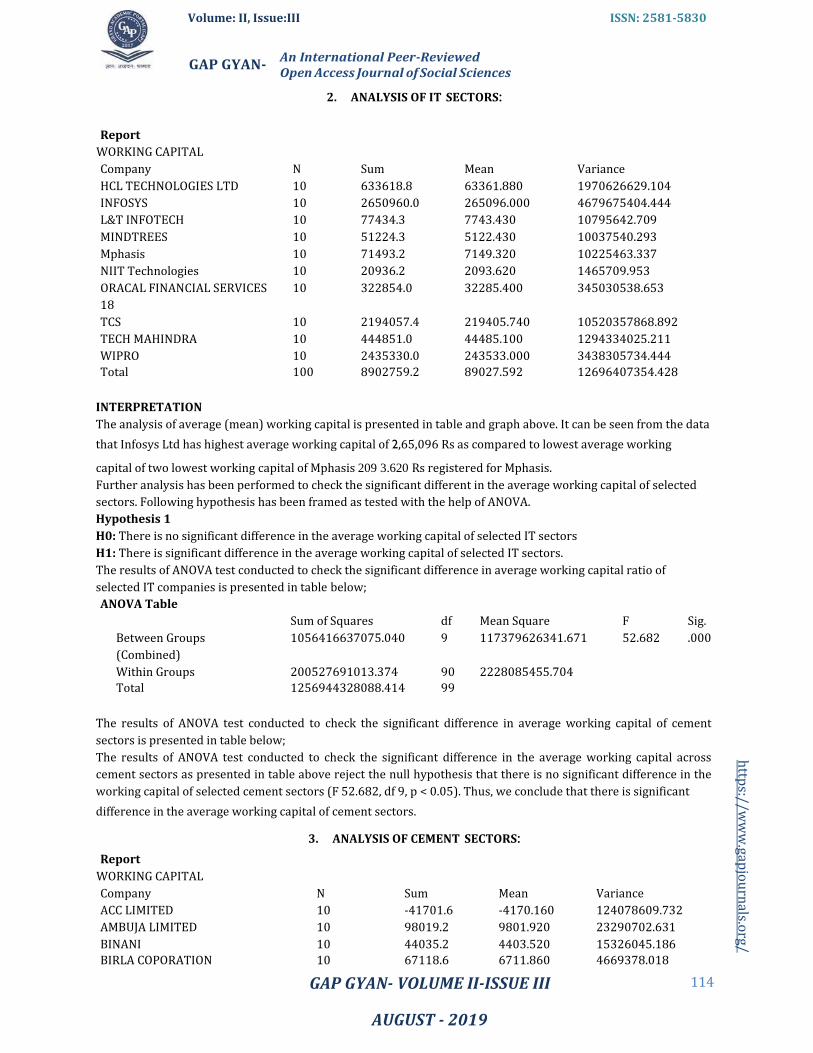
2. ANALYSIS OF IT SECTORS:
Report
WORKING CAPITAL
Company N Sum Mean Variance
HCL TECHNOLOGIES LTD 10 633618.8 63361.880 1970626629.104
INFOSYS 10 2650960.0 265096.000 4679675404.444
L&T INFOTECH 10 77434.3 7743.430 10795642.709
MINDTREES 10 51224.3 5122.430 10037540.293
Mphasis 10 71493.2 7149.320 10225463.337
NIIT Technologies 10 20936.2 2093.620 1465709.953
ORACAL FINANCIAL SERVICES
18
10 322854.0 32285.400 345030538.653
TCS 10 2194057.4 219405.740 10520357868.892
TECH MAHINDRA 10 444851.0 44485.100 1294334025.211
WIPRO 10 2435330.0 243533.000 3438305734.444
Total 100 8902759.2 89027.592 12696407354.428
INTERPRETATION
The analysis of average (mean) working capital is presented in table and graph above. It can be seen from the data
that Infosys Ltd has highest average working capital of 2,65,096 Rs as compared to lowest average working
capital of two lowest working capital of Mphasis 209 3.620 Rs registered for Mphasis.
Further analysis has been performed to check the significant different in the average working capital of selected
sectors. Following hypothesis has been framed as tested with the help of ANOVA.
Hypothesis 1
H0: There is no significant difference in the average working capital of selected IT sectors
H1: There is significant difference in the average working capital of selected IT sectors.
The results of ANOVA test conducted to check the significant difference in average working capital ratio of
selected IT companies is presented in table below;
ANOVA Table
Sum of Squares df Mean Square F Sig.
Between Groups
(Combined)
1056416637075.040 9 117379626341.671 52.682 .000
Within Groups 200527691013.374 90 2228085455.704
Total 1256944328088.414 99
The results of ANOVA test conducted to check the significant difference in average working capital of cement
sectors is presented in table below;
The results of ANOVA test conducted to check the significant difference in the average working capital across
cement sectors as presented in table above reject the null hypothesis that there is no significant difference in the
working capital of selected cement sectors (F 52.682, df 9, p < 0.05). Thus, we conclude that there is significant
difference in the average working capital of cement sectors.
3. ANALYSIS OF CEMENT SECTORS:
Report
WORKING CAPITAL
Company N Sum Mean Variance
ACC LIMITED 10 -41701.6 -4170.160 124078609.732
AMBUJA LIMITED 10 98019.2 9801.920 23290702.631
BINANI 10 44035.2 4403.520 15326045.186
BIRLA COPORATION 10 67118.6 6711.860 4669378.018
Volume: II, Issue:III ISSN: 2581-5830
An International Peer-Reviewed Open Access Journal of Social Sciences
GAP GYAN-
GAP GYAN- VOLUME II-ISSUE III
AUGUST - 2019
115
http
s://ww
w.gap
jou
rnals.o
rg/
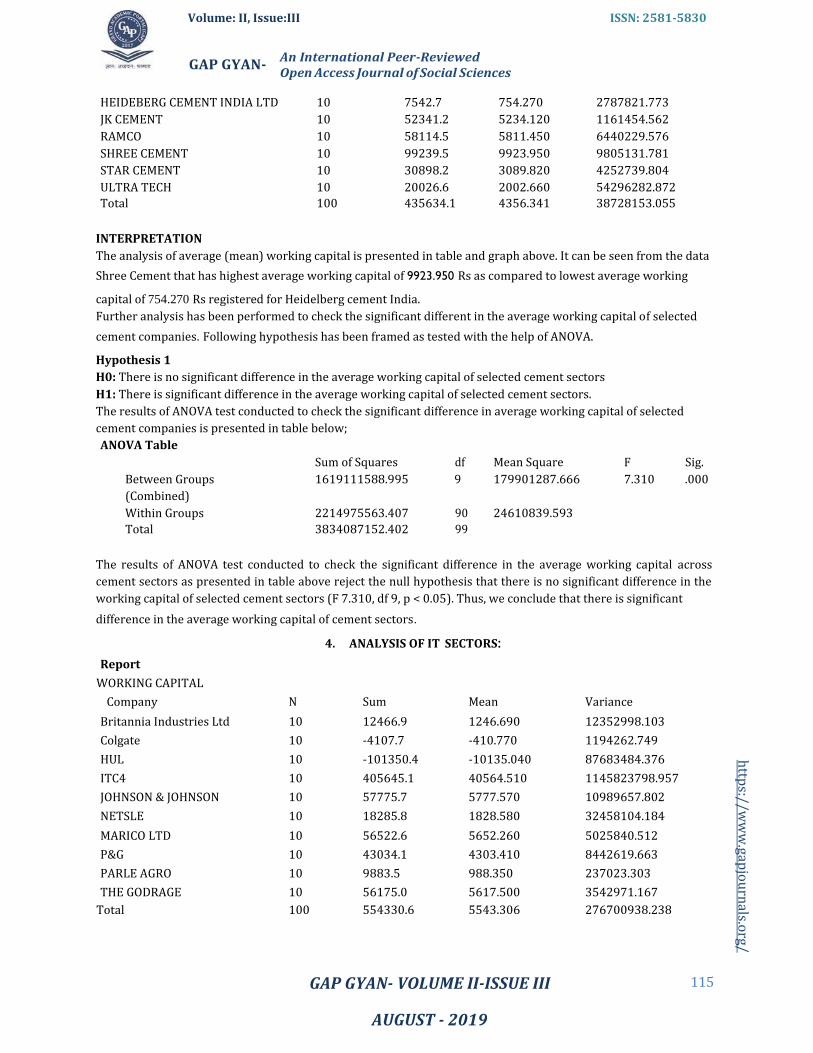
HEIDEBERG CEMENT INDIA LTD 10 7542.7 754.270 2787821.773
JK CEMENT 10 52341.2 5234.120 1161454.562
RAMCO 10 58114.5 5811.450 6440229.576
SHREE CEMENT 10 99239.5 9923.950 9805131.781
STAR CEMENT 10 30898.2 3089.820 4252739.804
ULTRA TECH 10 20026.6 2002.660 54296282.872
Total 100 435634.1 4356.341 38728153.055
INTERPRETATION
The analysis of average (mean) working capital is presented in table and graph above. It can be seen from the data
Shree Cement that has highest average working capital of 9923.950 Rs as compared to lowest average working
capital of 754.270 Rs registered for Heidelberg cement India.
Further analysis has been performed to check the significant different in the average working capital of selected
cement companies. Following hypothesis has been framed as tested with the help of ANOVA.
Hypothesis 1
H0: There is no significant difference in the average working capital of selected cement sectors
H1: There is significant difference in the average working capital of selected cement sectors.
The results of ANOVA test conducted to check the significant difference in average working capital of selected
cement companies is presented in table below;
ANOVA Table
Sum of Squares df Mean Square F Sig.
Between Groups
(Combined)
1619111588.995 9 179901287.666 7.310 .000
Within Groups 2214975563.407 90 24610839.593
Total 3834087152.402 99
The results of ANOVA test conducted to check the significant difference in the average working capital across
cement sectors as presented in table above reject the null hypothesis that there is no significant difference in the
working capital of selected cement sectors (F 7.310, df 9, p < 0.05). Thus, we conclude that there is significant
difference in the average working capital of cement sectors.
4. ANALYSIS OF IT SECTORS:
Report
WORKING CAPITAL
Company N Sum Mean Variance
Britannia Industries Ltd 10 12466.9 1246.690 12352998.103
Colgate 10 -4107.7 -410.770 1194262.749
HUL 10 -101350.4 -10135.040 87683484.376
ITC4 10 405645.1 40564.510 1145823798.957
JOHNSON & JOHNSON 10 57775.7 5777.570 10989657.802
NETSLE 10 18285.8 1828.580 32458104.184
MARICO LTD 10 56522.6 5652.260 5025840.512
P&G 10 43034.1 4303.410 8442619.663
PARLE AGRO 10 9883.5 988.350 237023.303
THE GODRAGE 10 56175.0 5617.500 3542971.167
Total 100 554330.6 5543.306 276700938.238
Volume: II, Issue:III ISSN: 2581-5830
An International Peer-Reviewed Open Access Journal of Social Sciences
GAP GYAN-
GAP GYAN- VOLUME II-ISSUE III
AUGUST - 2019
116
http
s://ww
w.gap
jou
rnals.o
rg/
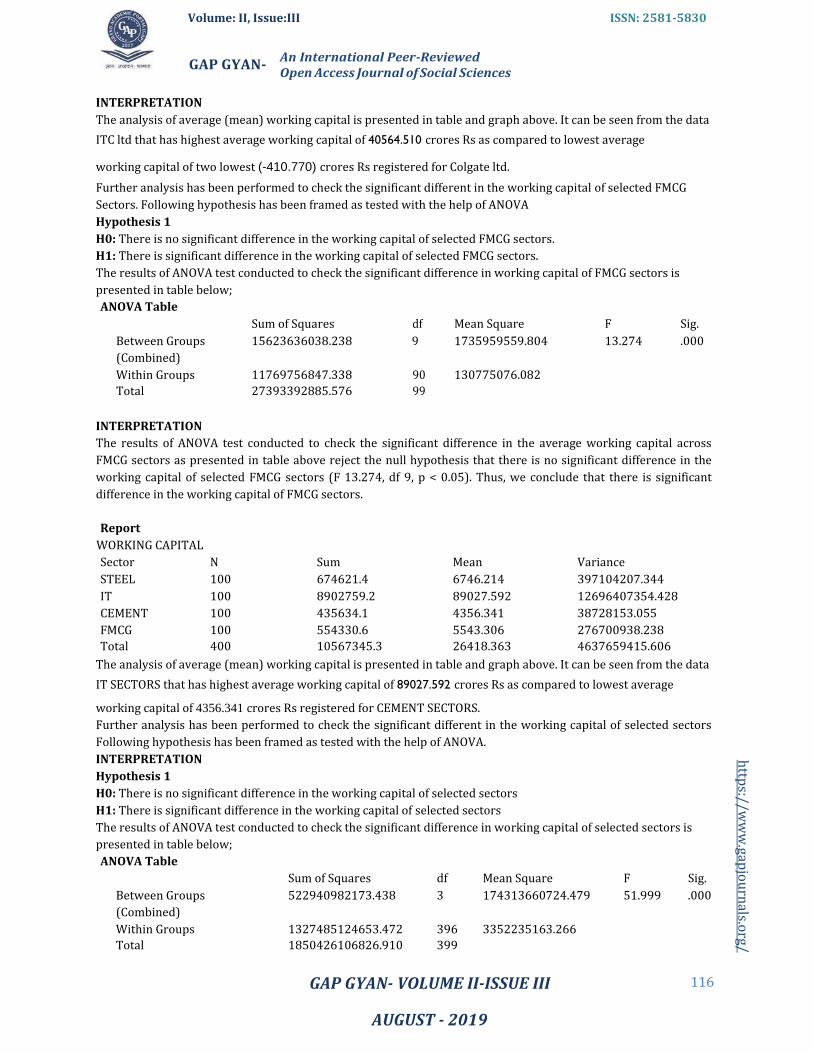
INTERPRETATION
The analysis of average (mean) working capital is presented in table and graph above. It can be seen from the data
ITC ltd that has highest average working capital of 40564.510 crores Rs as compared to lowest average
working capital of two lowest (-410.770) crores Rs registered for Colgate ltd.
Further analysis has been performed to check the significant different in the working capital of selected FMCG
Sectors. Following hypothesis has been framed as tested with the help of ANOVA
Hypothesis 1
H0: There is no significant difference in the working capital of selected FMCG sectors.
H1: There is significant difference in the working capital of selected FMCG sectors.
The results of ANOVA test conducted to check the significant difference in working capital of FMCG sectors is
presented in table below;
ANOVA Table
Sum of Squares df Mean Square F Sig.
Between Groups
(Combined)
15623636038.238 9 1735959559.804 13.274 .000
Within Groups 11769756847.338 90 130775076.082
Total 27393392885.576 99
INTERPRETATION
The results of ANOVA test conducted to check the significant difference in the average working capital across
FMCG sectors as presented in table above reject the null hypothesis that there is no significant difference in the
working capital of selected FMCG sectors (F 13.274, df 9, p < 0.05). Thus, we conclude that there is significant
difference in the working capital of FMCG sectors.
Report
WORKING CAPITAL
Sector N Sum Mean Variance
STEEL 100 674621.4 6746.214 397104207.344
IT 100 8902759.2 89027.592 12696407354.428
CEMENT 100 435634.1 4356.341 38728153.055
FMCG 100 554330.6 5543.306 276700938.238
Total 400 10567345.3 26418.363 4637659415.606
The analysis of average (mean) working capital is presented in table and graph above. It can be seen from the data
IT SECTORS that has highest average working capital of 89027.592 crores Rs as compared to lowest average
working capital of 4356.341 crores Rs registered for CEMENT SECTORS.
Further analysis has been performed to check the significant different in the working capital of selected sectors
Following hypothesis has been framed as tested with the help of ANOVA.
INTERPRETATION
Hypothesis 1
H0: There is no significant difference in the working capital of selected sectors
H1: There is significant difference in the working capital of selected sectors
The results of ANOVA test conducted to check the significant difference in working capital of selected sectors is
presented in table below;
ANOVA Table
Sum of Squares df Mean Square F Sig.
Between Groups
(Combined)
522940982173.438 3 174313660724.479 51.999 .000
Within Groups 1327485124653.472 396 3352235163.266
Total 1850426106826.910 399
Volume: II, Issue:III ISSN: 2581-5830
An International Peer-Reviewed Open Access Journal of Social Sciences
GAP GYAN-
GAP GYAN- VOLUME II-ISSUE III
AUGUST - 2019
117
http
s://ww
w.gap
jou
rnals.o
rg/
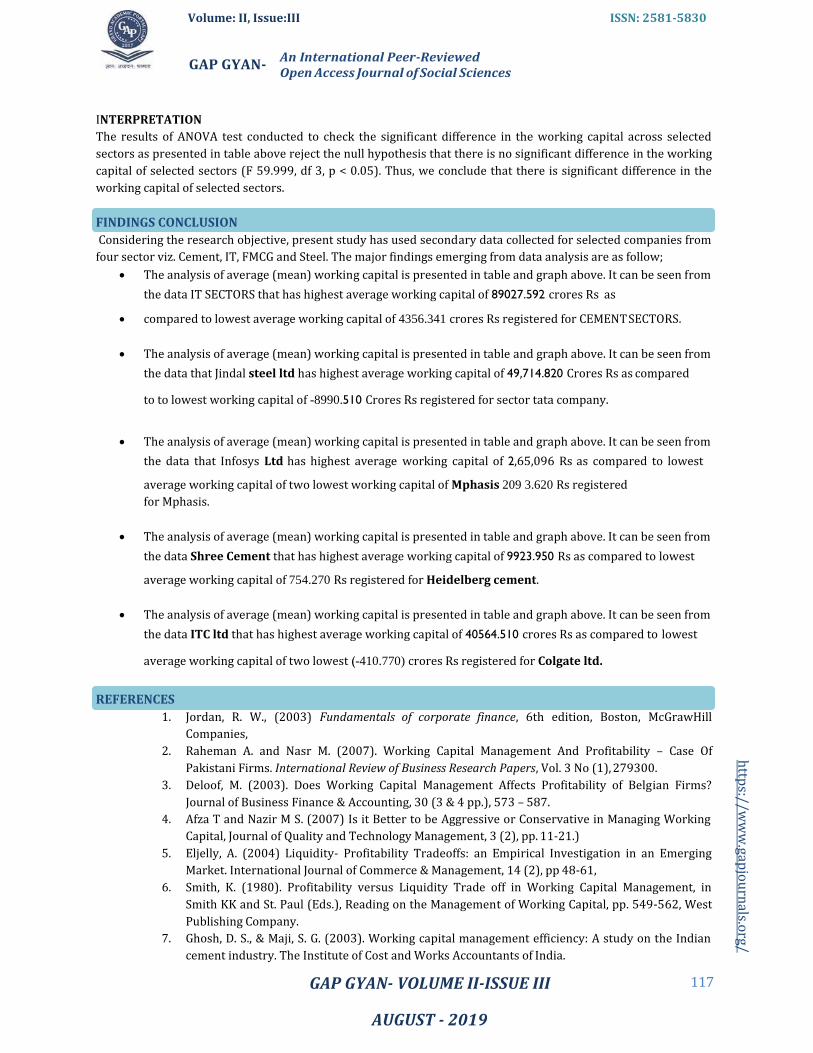
INTERPRETATION
The results of ANOVA test conducted to check the significant difference in the working capital across selected
sectors as presented in table above reject the null hypothesis that there is no significant difference in the working
capital of selected sectors (F 59.999, df 3, p < 0.05). Thus, we conclude that there is significant difference in the
working capital of selected sectors.
FINDINGS CONCLUSION
Considering the research objective, present study has used secondary data collected for selected companies from
four sector viz. Cement, IT, FMCG and Steel. The major findings emerging from data analysis are as follow;
• The analysis of average (mean) working capital is presented in table and graph above. It can be seen from
the data IT SECTORS that has highest average working capital of 89027.592 crores Rs as
• compared to lowest average working capital of 4356.341 crores Rs registered for CEMENT SECTORS.
• The analysis of average (mean) working capital is presented in table and graph above. It can be seen from
the data that Jindal steel ltd has highest average working capital of 49,714.820 Crores Rs as compared
to to lowest working capital of -8990.510 Crores Rs registered for sector tata company.
• The analysis of average (mean) working capital is presented in table and graph above. It can be seen from
the data that Infosys Ltd has highest average working capital of 2,65,096 Rs as compared to lowest
average working capital of two lowest working capital of Mphasis 209 3.620 Rs registered
for Mphasis.
• The analysis of average (mean) working capital is presented in table and graph above. It can be seen from
the data Shree Cement that has highest average working capital of 9923.950 Rs as compared to lowest
average working capital of 754.270 Rs registered for Heidelberg cement.
• The analysis of average (mean) working capital is presented in table and graph above. It can be seen from
the data ITC ltd that has highest average working capital of 40564.510 crores Rs as compared to lowest
average working capital of two lowest (-410.770) crores Rs registered for Colgate ltd.
REFERENCES
1. Jordan, R. W., (2003) Fundamentals of corporate finance, 6th edition, Boston, McGrawHill
Companies,
2. Raheman A. and Nasr M. (2007). Working Capital Management And Profitability – Case Of
Pakistani Firms. International Review of Business Research Papers, Vol. 3 No (1), 279300.
3. Deloof, M. (2003). Does Working Capital Management Affects Profitability of Belgian Firms?
Journal of Business Finance & Accounting, 30 (3 & 4 pp.), 573 – 587.
4. Afza T and Nazir M S. (2007) Is it Better to be Aggressive or Conservative in Managing Working
Capital, Journal of Quality and Technology Management, 3 (2), pp. 11-21.)
5. Eljelly, A. (2004) Liquidity- Profitability Tradeoffs: an Empirical Investigation in an Emerging
Market. International Journal of Commerce & Management, 14 (2), pp 48-61,
6. Smith, K. (1980). Profitability versus Liquidity Trade off in Working Capital Management, in
Smith KK and St. Paul (Eds.), Reading on the Management of Working Capital, pp. 549-562, West
Publishing Company.
7. Ghosh, D. S., & Maji, S. G. (2003). Working capital management efficiency: A study on the Indian
cement industry. The Institute of Cost and Works Accountants of India.
Volume: II, Issue:III ISSN: 2581-5830
An International Peer-Reviewed Open Access Journal of Social Sciences
GAP GYAN-
GAP GYAN- VOLUME II-ISSUE III
AUGUST - 2019
118
http
s://ww
w.gap
jou
rnals.o
rg/
8. Abdul, R. and Mohamed, N. (2007), “Working Capital Management and Profitability – Case of
Pakistani Firms”, International Review of Business Research Papers Vol. 3 No.1. pp.279 – 300.
9. Ponsian and chrispin (2014) the effects Working capital management on profitability-case of
Pakistani manufacturing firms. International journal of economics, finance and management
sciences Vol. 2 No. 6, 2014 pp. 347-355.
10. Ali and Atif .A (2012) working capital management: IS it really affects the profitability? Evidence
from Pakistan, global journal of management and business research Vol. 12 No 17, 2012 pp. 150-
201.
11. Gharchira, chiwanzwa, nkmo and chikore (20014). Working capital management and the
profitability of non-financial firms in Zimbabwe. Harare institute of technology, zembabwe Vol. 9
No. (2), 1804-5839.
12. Nimalathasan (2010). Working capital management and its impact on profitability: A study of
selected listed manufacturing companies in sari Lanka. University of Jaffna sari Lanka 26(3), 250-
229.
13. Ani, okwo, Ugwunta and Okelue (2010) Effects of working capital management on profitability:
Evidence from the top five Beer Brewery firms in the world. Asian and economic review 2(8):
966-982.
14. Iqbal and zhuquan (2015). Working capital management and profitability Evidence from firms
listed on Karachi stock exchange. International business of journal and management Vol. 10 No.(
2 ) 1833-8119.
15. Iqbal, Ahmed and riaz (2014) the relationship between working capital management and
profitability: Evidence from Pakistan. International letters of social and humanistic science Vol.
20(2014) pp. 14-25