Embed Size (px)
Citation preview
Working Capital Management Project: O2 and Orange
FIN340.4
1. Ahmed Refayee Hasan 1110321030 2. Fariha Tasnim 1120928030 3. Hossain M. Fozle Elahi 1110275030 4. Nafis Bin Alam 1111322530 5. Naushaba Oishee 1120228530 6. Rezaul Karim 1111363530 7. Sinthia Afrin 0910411030
Prepared For: Saad Mohammad Maroof Hossain
School of Business
North South University
Submission date: 05.02.2014
2
Table of Contents
1. Introduction ..................................................... 3
2. Industry Overview ................................................ 5
3. Comparative Overview between O2 and Orange ....................... 8
4. Company Profile: ................................................ 10 Orange: ...................................................................................................................................................... 11
O2: ................................................................................................................................................. 12
5. Financial Review ................................................ 14 Financial Ratios of O2 ................................................................................................................................ 15 Financial Ratio Analysis of O2 .................................................................................................................... 16 Financial Ratios of Orange ......................................................................................................................... 19 Financial Ratio Analysis of Orange ............................................................................................................. 20
6. Comparative Study ............................................... 23
7. Recommendations ................................................. 27 For O2 ........................................................................................................................................................ 28 For Orange ................................................................................................................................................. 28
8. Appendix…………………………………………………………………………………………………………………………..…………… ……….29
9. References: ..................................................... 33 Orange: Balance sheet ............................................................................................................................... 35 Orange: Income Statement ....................................................................................................................... 38 O2: Balance sheet ...................................................................................................................................... 39 O2: Income Statement ............................................................................................................................... 43

3
Introduction
4
1. Introduction
Working capital management involves the relationship between a firm's short-‐term assets and its short-‐term liabilities. The goal
of working capital management is to ensure that a firm is able to continue its operations and that it has sufficient ability to
satisfy both maturing short-‐term debt and upcoming operational expenses. The management of working capital involves
managing inventories, accounts receivable and payable, and cash.
Working capital ensures a company has sufficient cash flow in order to meet its short term debt obligation and operating
expenses. Implementing an effective working capital management system is an excellent way for many companies to improve
their earnings. The two main aspect of working capital management are:
v Ratio analysis
v Management of individual components of working capital
A few key performance ratios of a working capital management system are the working capital ratio, inventory turnover and
the collection ratio. Ratio analysis will lead management to identify areas of focus such as inventory management, cash
management and payable management. he key to understanding a company’s working capital cycle is to know where payments
are collected and made, and to identify areas where the cycle is stretched—and can potentially be reduced.
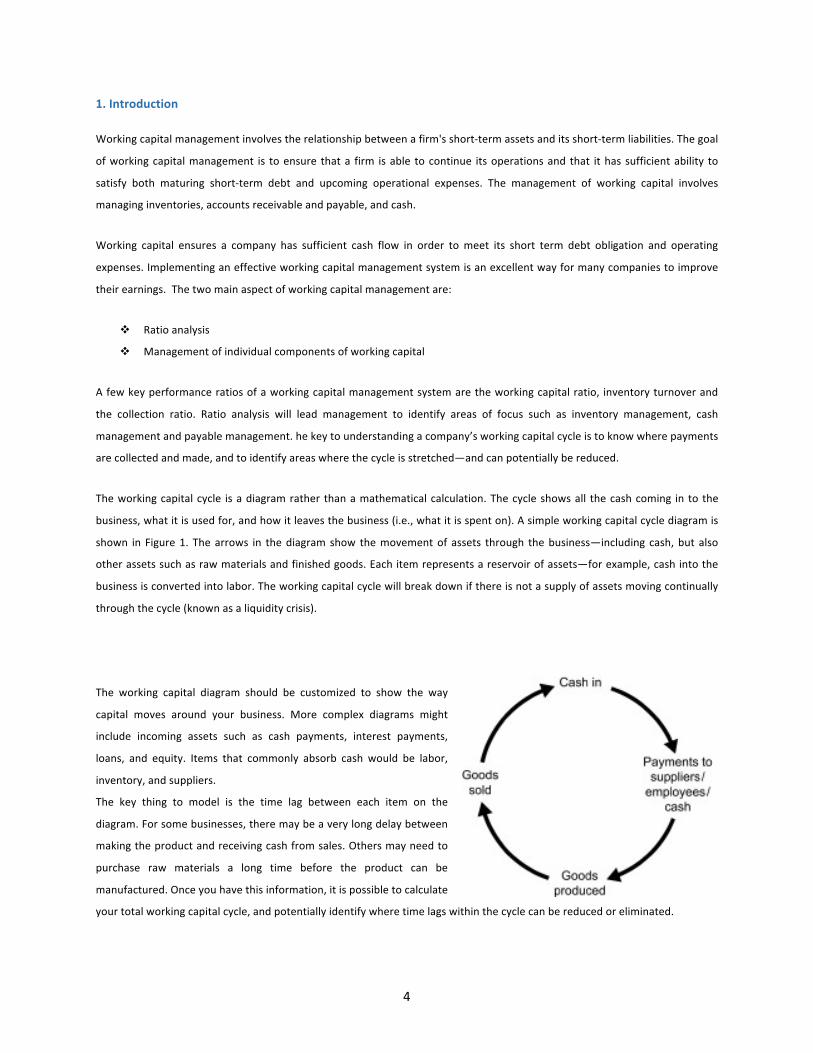
The working capital cycle is a diagram rather than a mathematical calculation. The cycle shows all the cash coming in to the
business, what it is used for, and how it leaves the business (i.e., what it is spent on). A simple working capital cycle diagram is
shown in Figure 1. The arrows in the diagram show the movement of assets through the business—including cash, but also
other assets such as raw materials and finished goods. Each item represents a reservoir of assets—for example, cash into the
business is converted into labor. The working capital cycle will break down if there is not a supply of assets moving continually
through the cycle (known as a liquidity crisis).
The working capital diagram should be customized to show the way
capital moves around your business. More complex diagrams might
include incoming assets such as cash payments, interest payments,
loans, and equity. Items that commonly absorb cash would be labor,
inventory, and suppliers.
The key thing to model is the time lag between each item on the
diagram. For some businesses, there may be a very long delay between
making the product and receiving cash from sales. Others may need to
purchase raw materials a long time before the product can be
manufactured. Once you have this information, it is possible to calculate
your total working capital cycle, and potentially identify where time lags within the cycle can be reduced or eliminated.

5
Industry Overview
6
2. Industry Overview
Until 1982, the main civil telecommunications system in the UK was a state monopoly known (since reorganization in 1969)
as Post Office Telecommunications. National Telephone Company (NTC) was a British telephone company from 1881 until 1911,
which brought together smaller local companies in the early years of the telephone. This industry can be characterized as a
mixture of monopolistic competition and oligopoly. Liberalization allowed induction of new competition, which introduced new
and differentiated products and services. In addition to this, the market can be categorized as mass due to presence of large
number of customers. Moreover, industry structure demands capital and intensive approach, which means a lot of money, is
required to enter this market. This also acts as a barrier to new entrants. Service is loosely based on infrastructure e.g. 3G,
EDGE, etc. Another characteristic, which provides benefit to present firms, is large economies of scale, which put them in cost-‐
advantage against new competition. The UK telecommunication sector has experienced phenomenal growth in last few years.
In2007, it was able to generate revenues of £61.5bn, which made it one of the largest industries in the country. There are many
firms competing in the industry but there are only few, which can be, characterized as major players. Among these players,
British Telecom is the oldest player but lately has been losing its market share from new vibrant competitors. Other than BT,
the major players in UK telecommunication industry are Orange, Vodafone, T-‐Mobile, O2 and Virgin (Gallacci, 2006).
The competition is high in the industry which has forced competitors to indulge in both price and non-‐price competition.
Mobile retail is the leading factor in industry’s revenue stream. New technologies such as 3G are also gaining popularity, which
has further stepped up the competition. Voice and data-‐related revenues have reached figure of £15.1 billion. In similar
fashion, revenues form SMS has also seen an increase of 28%. The figures relating to the industry paint a very healthy picture
(Ofcom, 2010). Subscriptions: 3.7 million new subscriptions3G connections increase of 60%SMS 59 billion SMS in 2007 alone
(an increase by 28%)MMS 59.1 billion Revenue rose by 4% in 2007SMS revenue per connection 17% increase Adopted from:
(Ofcom, 2010) O2 is currently the market leader as it took the number one position in 2007. It enjoys fine run as it shares keep
on increasing in comparison to other competitors. The position of O2can is measured from the fact that it generated revenue of
about £4.1 billion whereas T-‐Mobile and Virgin Mobile generated revenue £2.7 billion. Vodafone 16.5 million subscriptions, O2
20.0 million subscriptions, T-‐Mobile 17.3 million subscriptions, Orange 15.7 million subscriptions, 3UK 4.0 million subscriptions
Adopted from: (Ofcom, 2010)
United Kingdom has total population of 60 million. Around 48 million people use mobile phones that not only show consumer
inclination towards cellular technology but also make visible the potential of growth. Moreover, around 70 million people have
active connections, which show consumers’ preference for multiple connections (Ofcom, 2010). Around 57% of the mobile
users belong to male gender whereas rest is female users. It also indicates that advertisement targeted towards male members
of the society is more effective than their counterparts. In addition to this, population under the age of 34 mostly uses mobile.
Around 59% of mobile usage is done by market of age 34 and below. On the other hand, people above age of 65 represent the
smallest segment for mobile companies. This can be seen from the fact that this segment makes only 7% of total calls while
their contribution towards SMS stands at 5% (Ofcom, 2010).Mobile internet has been very popular in public and has fuelled the
7
demand of not only mobiles but also service providers. In 2007, there was increase of 7.8 million 3G connections which only
substantiates the popularity of new technology in public.
New Trends Mobile advertisement is one of new trends, which have gripped the UK telecommunication industry. This trend has
taken birth from the explosion of mobile Internet and new devices such as IPhone and Google Android phone which are more
internet friendly than other mobile devices. These mobile devices are more supportive to multimedia content such as YouTube,
which are very popular among general public. Resultantly, mobile advertisement has increased manifolds. It is estimated that
there have been an increase of 300% in this segment. It is also estimated that mobile advertisement segment will stand at
£187m by the end of 2011. Similarly, mobile devices have also witnessed different trends. As technology intensive field, it has
seen many new innovations which have completely reshaped the landscape of the cellular technology. Apple iPhone and the
iPhone 3G have completely revolutionized the market. Similarly, O2 has also changed the market dynamics with the
introduction of unlimited bandwidth utility. However, there is still potential of growth in Internet mobile market. Only 11% of
mobile users use mobile for the purpose of accessing Internet.
Internet usage stands at 50%, which means that half of mobile owners in UK use Internet feature of their mobile devices. Usage
of mobile for downloading and uploading video and pictorial content stands at 25%. GPS is gaining popularity but it currently
used by 20% of mobile population. Video streaming is done by almost 18% of the population. The application of e-‐commerce
through cellular technology is still low as only 9% of the mobile users use it to either make purchases or pay utility bills.
8
Orange & O2 Company
Overviews
9
3. Comparative Overview between O2 and Orange
The current mobile phone market in the UK is worth in excess of 22 Billion GBP, accounting for approximately 2.2% of UK GDP.
This is a very important growth area for the UK economy. Two of the largest mobile phone businesses in the UK are Orange and
O2.
Telefónica O2 UK Limited is a leading communications company for consumers and businesses in the UK, with 21million mobile
customers and over527,126 fixed broadband customers as at 30 September 2009.On its launch in May 2002, O2 has become
the largest UK mobile network based on customer numbers. O2 UK Limited is part of Telefónica Europe plc which is a business
division of Telefónica S.A. and which owns O2 in the UK, Ireland, Slovakia, Germany and the Czech Republic, and has 46 million
customers. O2 has the right to market and use the name that is now the O2 arena in Grenwich, London, once known as the
Millenium Dome. O2 has won recognition from many leading industry awards and consumer groups for its high levels of
customer satisfaction and customer service. O2's UK mobile network covers 99% of the UK's population. O2's 3G network
covers over 80% of the UK population and is fully HSDPA-‐enabled, providing speeds of up to 3.6 Mbps for customers with an
HSDPA-‐enabled device. Telefónica Europe also owns 50% of the Tesco Mobile and TchiboMobilfunk joint venture businesses in
the UK and Germany. (O2:2009).
Orange was launched on April 28th 1994 with the main idea to change the way people of the UK communicate. Orange was the
fourth company to enter the UK mobile market at this time, and had to stamp its own identity in a crowded market place. The
company introduced services like split second billing, and this innovation has continued to this day. The Orange group now
serves over 175 million customers in five different continents. By 1997, Orange had gained over 1 million customers, and was
the youngest company to be listed on the FTSE 100 stock index with a market value of 2.4 billion GBP at the time. Orange is the
fastest growing UK based mobile company. It is the largest provider of broadband internet services in Europe, and the third
largest mobile network provider in Europe. (Orange: 2009)

10
Company Profile
11
4. Company Profile:
Orange:
Orange is a mobile network operator and Internet service provider in the United Kingdom, which launched in 1993. It was once
a constituent of the FTSE 100 Index but was purchased by France Telecom (now Orange S.A.) in 2000, which then adopted the
Orange brand for all its other mobile communications activities. Orange UK has since merged with Deutsche Telekom's T-‐
Mobile UK to form a joint venture, EE. Orange UK has over 17 million customers through its mobile and
former broadband services. Orange UK currently offers two mobile phone packages; pay as you go and pay monthly service
plans. As with other prepaid plans, pay as you go mobile users are given the option to top-‐up their phone via a swipe card. They
can also recharge over the internet by a voucher bought as a receipt or via a credit or debit card. The pay monthly service gives
customers an option of 1, 6, 12, 18 or 24-‐month contracts. The contracts come 'bundled' with minutes, text messages and
within some contracts data and insurance services; additional charges can be incurred for Multimedia Messaging Services
(MMS) and Mobile Data services. Orange UK operates a GPRS, EDGE, 3G and 4G services and is in the process of rolling out
a HSDPA network. Orange's 2G network covers 99% of the UK population and has the largest integrated 3G/2.5G network in the
UK, Orange claimed in 2008 it spent up to £1.5 million per day investing in its network. In 2009, Orange UK decided to
outsource its mobile network. Therefore, in March 2009, Nokia Siemens Networks was chosen to manage, plan, expand,
optimize and provide maintenance services for the Orange UK 2G/3G mobile network for the next five years. In addition to this
Orange UK provides DSL services, under the same brand. Orange, like its competitors, operates a retail estate, with over 300
stores. These are branded as "The Orange Shop" and operate as an indirect sales channel. Orange also has some concession
stores in HMV branches across the UK.
In September 2012, Orange's parent company EE announced that all Orange and T-‐Mobile stores were to be re-‐branded as 'EE'
stores by 30 October 2012, the launch date of their 4G network, offering products from all three brands of the company. After
the re-‐brand there will be around 700 EE stores open in the UK.
Contracts and pay as you go phones with Orange are also available from other retailers, such as Carphone Warehouse, Phones
4u, Argos and smaller independent mobile phone dealers, operating either in physical retail, online, through call centers or
even supermarkets.
12
O2:
Telephonic UK Limited (trading as O2 – stylized as O2) is a telecommunications, Internet and financial services provider in
the United Kingdom owned by Telephonic, forming part of its Telephonic Europe division. It is the second-‐largest mobile
telecommunications provider in the United Kingdom (after EE) and is headquartered in Slough.O2 was formed in 1985 as Cell
net, a 60:40 joint venture between BT Group and Securicor. In 1999, BT Group acquired Securicor's 40 percent share of Cell net
and the company was later rebranded as BT Cell net. In June 2000 BT Cell net launched the world’s first commercial General
Packet Radio Service. BT Cell net, together with BT Group's mobile telecommunications businesses in Germany, Ireland and the
Netherlands were part of the BT Wireless division. This was spun-‐off from the BT Group in 2002 to form a new holding
company, mmO2 plc, which introduced the new "O2" brand for the businesses. MmO2plc. was subsequently renamed O2 plc.
In 2005, it was announced that the Spanish telecommunications company Telephonic had agreed to acquire O2 plc. for
£18 billion. As part of the terms of the acquisition Telephonic agreed to retain the "O2" brand and the company's UK
headquarters.BT Cell net launched as "O2" on 18 June 2002, along with other former BT subsidiaries; EsatDigifone in
Ireland, ViaIntercom in Germany and TelfortMobile in the Netherlands. The rebranding was supported by a European
advertising campaign, which began on 16 April 2002, across all four countries, at a cost of £130 million. The main launch
campaign ran from 18 June and was developed by VallanceCaruthers Coleman Priest, working alongside brand
consultancy Lambie-‐Nairn, creators of the "O2" brand identity. On 30 November 2005, O2 agreed to a takeover by Telephonic,
a Spanish telecommunications company, for £17.7 billion (£2 per share) in cash. According to the merger announcement, O2
retained its name and continued to be based in the United Kingdom, keeping both the brand and the management team. The
merger became unconditional on 23 January 2006.
Following the acquisition of O2, Telephonic undertook a corporate organizational change that saw the merging of its fixed and
mobile businesses in Spain, and the transfer of Telephonic non-‐Spanish European telecommunications properties into the O2
brand. Thus, the Cesky Telecom and Eurotel operations in the Czech Republic as well as the Telephonic Deutschland business in
Germany were brought under the control of O2, which retained its U.K.-‐registered public company status with its own board of
directors and corporate structures and processes. On 15 July 2009, O2 entered the financial services industry with the launch
of O2 Money, which was the first step in the process of incorporating financial services into mobile phones. Future plans
include manufacturing Near Field Communication (NFC) technology in mobile phones in the United Kingdom. It was also
announced that its NFC technology is ready, but pending support from large retailers and handset manufacturers before a mass
rollout.
O2 and Vodafone signed a deal in June 2012, which will see the two companies ‘pool’, their network technology, creating a
single national grid of 18,500 transmitter sites. Both networks will continue to carry their own independent mobile spectrum.BT
Cell net launched the world’s first GPRS network on 22 June 2000, although GPRS-‐enabled devices were uncommon at that
time.
O2 publicly announced on 15 December 2009 that it had successfully demonstrated a 4G connection using LTE technology
installed in six masts in Slough. The technology, which was supplied by Huawei, achieved a peak downlink rate of 150 Mbps. In
January 2012, the company announced plans to provide free Internet to millions of residents and visitors in central London, by
launching Europe's largest free Wi-‐Fi zone, along with free Wi-‐Fi access for anyone on any network in and around every O2
retail store. On 20 February 2013, Ofcom announced that O2 had been awarded spectrum in the 800 MHz band for 4G LTE
13
coverage, bidding around £550 million for the spectrum. The service became available to customers in London, Leeds and
Bradford on 29 August 2013, and will expand to a further ten cities by the end of 2013.
In February 2009, O2 became the first mobile telecommunications provider to be certified with the Carbon Trust Standard in
recognition of its commitment to reduce its carbon footprint. O2 attained the standard after saving 47,000 tons of carbon over
the previous three years through its energy efficiency measures, including a £1.4 million distribution of smart metering
technology across the company's cell sites, offices and retail stores, and upgrades to more energy efficient systems across
its mobile phone network.

14
FINANCIAL REVIEW
15
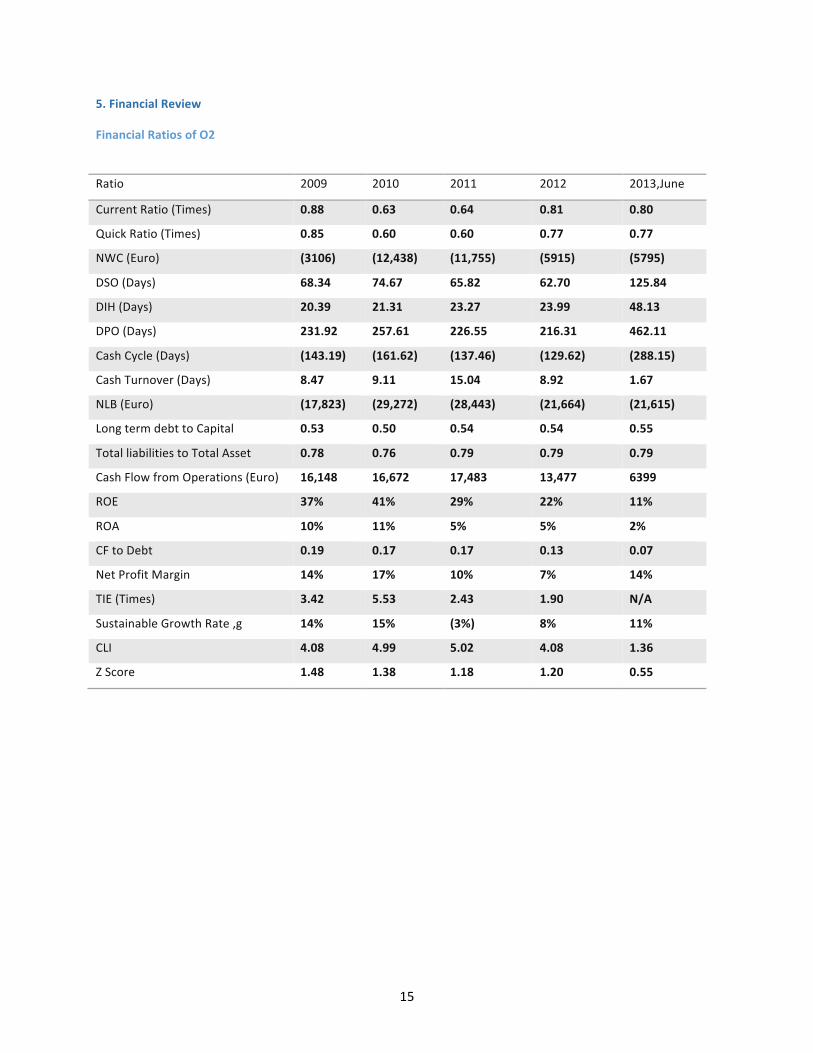
5. Financial Review
Financial Ratios of O2
Ratio 2009 2010 2011 2012 2013,June
Current Ratio (Times) 0.88 0.63 0.64 0.81 0.80
Quick Ratio (Times) 0.85 0.60 0.60 0.77 0.77
NWC (Euro) (3106) (12,438) (11,755) (5915) (5795)
DSO (Days) 68.34 74.67 65.82 62.70 125.84
DIH (Days) 20.39 21.31 23.27 23.99 48.13
DPO (Days) 231.92 257.61 226.55 216.31 462.11
Cash Cycle (Days) (143.19) (161.62) (137.46) (129.62) (288.15)
Cash Turnover (Days) 8.47 9.11 15.04 8.92 1.67
NLB (Euro) (17,823) (29,272) (28,443) (21,664) (21,615)
Long term debt to Capital 0.53 0.50 0.54 0.54 0.55
Total liabilities to Total Asset 0.78 0.76 0.79 0.79 0.79
Cash Flow from Operations (Euro) 16,148 16,672 17,483 13,477 6399
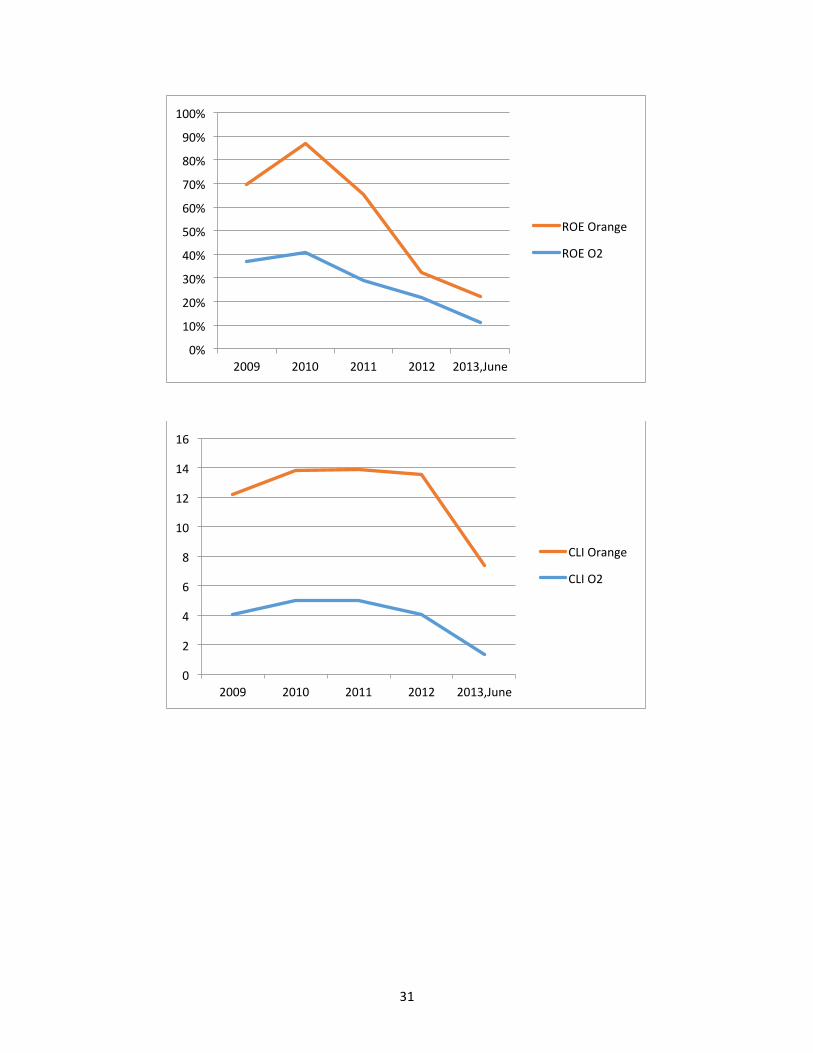
ROE 37% 41% 29% 22% 11%
ROA 10% 11% 5% 5% 2%
CF to Debt 0.19 0.17 0.17 0.13 0.07
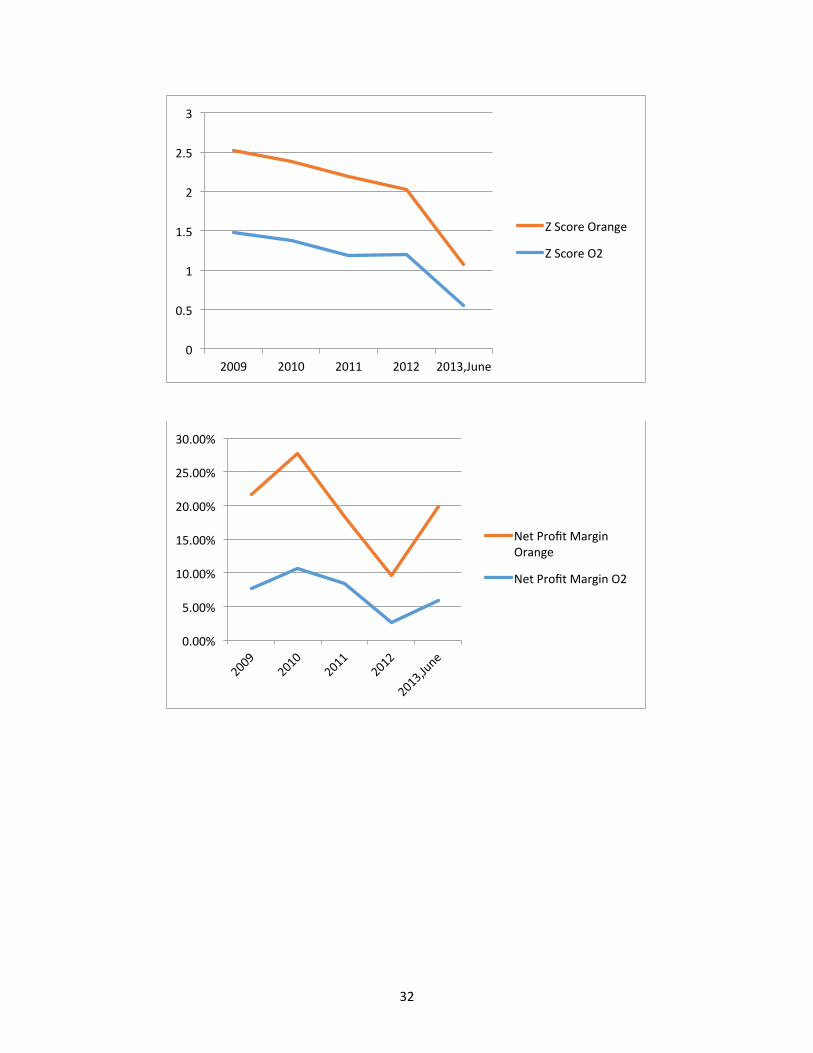
Net Profit Margin 14% 17% 10% 7% 14%
TIE (Times) 3.42 5.53 2.43 1.90 N/A
Sustainable Growth Rate ,g 14% 15% (3%) 8% 11%
CLI 4.08 4.99 5.02 4.08 1.36
Z Score 1.48 1.38 1.18 1.20 0.55
16
Financial Ratio Analysis of O2
Current ratio is a liquidity ratio that measures a company's ability to pay short-‐term obligations. The quick ratio measures a
company’s ability to meet its short-‐term obligations with its most liquid assets. The financial data shows that O2’s liquidity
position is recovering after a fallback. All the three liquidity ratios dropped dramatically in 2010 and 2011. But after that it
showed signs of improvement and has been increasing till now. The reason in the major fall for Current Ratio in 2010 and 2011
is mainly because the current liabilities increased whereas current assets decreased. But it is not necessarily a bad thing since
the Cash of the current asset section has decreased which means the company is not holding cash rather it is utilizing properly
and buying long term assets. Current liabilities increased mainly due to the increase in accounts payable. Inventories also had
an effect regarding the Quick Ratio though the gap between Current Ratio and Quick Ratio is very little which is a good sign. The
increasing inventory value suggests the company is holding inventories and they are not selling more than they are keeping in
stock, which also reflects in the company’s DIH figure. Like current ratio, quick ratio also had a fallback in 2010 and 2011 mainly
because of the increasing current liabilities and decreasing current assets. Net Working Capital of the company quite
predictably will show a fallback as well and it does. As discussed the reason has been mainly due to the increased current
liabilities and decreasing current assets which can be seen to be going more negative in value.
After the fallback the company improved their situation in 2012 and 2013 regarding the numbers. They had increasing current
assets and at the same time their current liability also decreased. But the thing here is their current assets had increased but it
has been mainly because their Cash increased. Now the company is keeping more cash on hand and not utilizing it properly
which in a sense is not good. Their A/R has decreased which means the company is effectively collecting their receivables which
can be reflected too in the decreasing DSO figure especially in 2012. On the other hand they are paying their payables quicker
comparatively hence the decreasing current liabilities. The net working capital has also improved because of the increased
current assets and decreased current liabilities. So the increasing liquidity ratio is not necessarily suggesting that the company is
doing great in all departments.
Days Sales Outstanding (DSO) measures the number of days on average the company takes to collect its account receivables.
The company’s DSO has been in an increasing trend from 2008-‐2010 but then it dropped during 2011 and 2012. The more the
DSO the more time it takes for a company to collect it’s receivables. As it had been the case for the company from 2008-‐2010.
A/R increased in these 3 years and hence DSO also has increased. But then in 2011 and 2012 DSO decreased which means the
company has taken less time to collect their receivables. The reason for this increase is because of the decrease in A/R and
increase in daily sales. It means the company is making more cash sales rather than credit sales. So the company had obviously
more cash in hand during this period which can be reflected in the increasing current and quick ratio. The company has to
utilize these cash properly and not just keep them in hand. In 2013 first half, the company’s DSO increased because of the low
first half sales data. The company has not been making enough sales till the first half of 2013. In terms of DPO (the average
number of days the company takes to pay its payables), a similar trend can be seen. It has increased till 2010 then decreasing in
2011 and 2012 and a jump in 2013 first half. The more the DPO the more late the company pays its receivables. So, the more is
the DPO, the better it is for the company. During 2008-‐2010 DPO has increased because of the increasing current liabilities
which means the company is taking more time to pay their payables. But in 2011 and 2012 current liabilities decreased and also
DPO decreased slightly which means the company is taking less time to pay their payables. It is not necessarily good because
the more the DPO the better. Then in 2013, DPO increased mainly because of the decrease in daily COGS and the declining
17
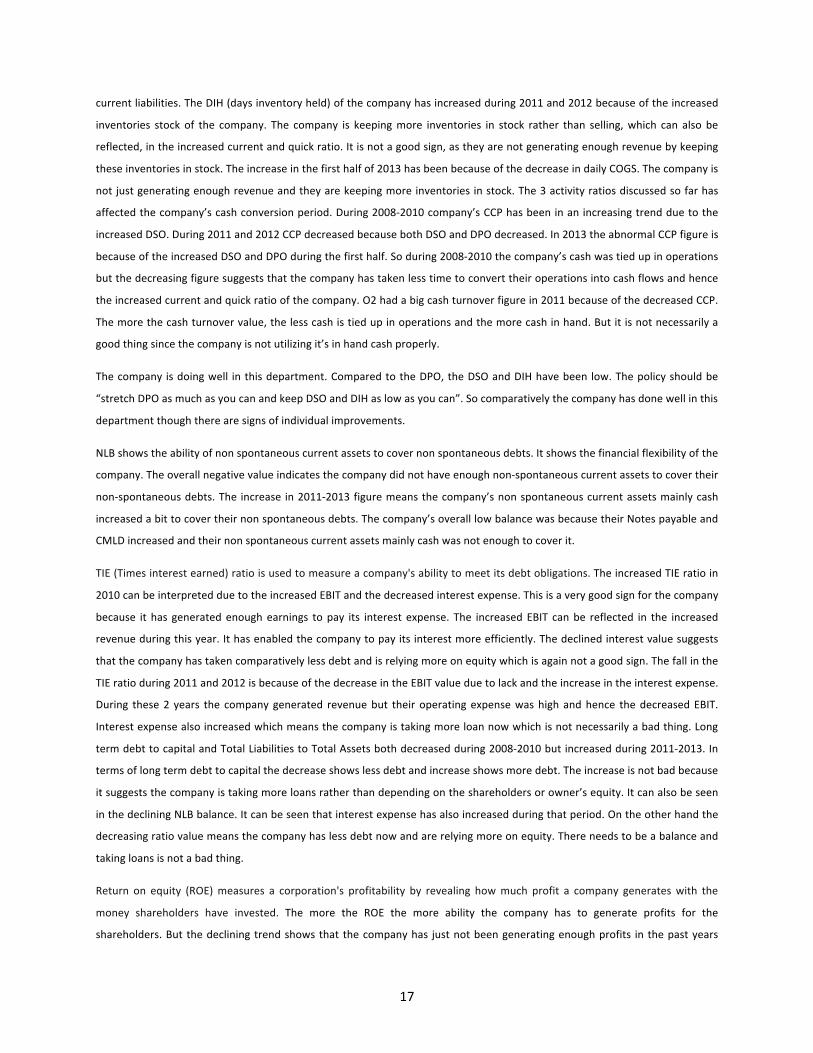
current liabilities. The DIH (days inventory held) of the company has increased during 2011 and 2012 because of the increased
inventories stock of the company. The company is keeping more inventories in stock rather than selling, which can also be
reflected, in the increased current and quick ratio. It is not a good sign, as they are not generating enough revenue by keeping
these inventories in stock. The increase in the first half of 2013 has been because of the decrease in daily COGS. The company is
not just generating enough revenue and they are keeping more inventories in stock. The 3 activity ratios discussed so far has
affected the company’s cash conversion period. During 2008-‐2010 company’s CCP has been in an increasing trend due to the
increased DSO. During 2011 and 2012 CCP decreased because both DSO and DPO decreased. In 2013 the abnormal CCP figure is
because of the increased DSO and DPO during the first half. So during 2008-‐2010 the company’s cash was tied up in operations
but the decreasing figure suggests that the company has taken less time to convert their operations into cash flows and hence
the increased current and quick ratio of the company. O2 had a big cash turnover figure in 2011 because of the decreased CCP.
The more the cash turnover value, the less cash is tied up in operations and the more cash in hand. But it is not necessarily a
good thing since the company is not utilizing it’s in hand cash properly.
The company is doing well in this department. Compared to the DPO, the DSO and DIH have been low. The policy should be
“stretch DPO as much as you can and keep DSO and DIH as low as you can”. So comparatively the company has done well in this
department though there are signs of individual improvements.
NLB shows the ability of non spontaneous current assets to cover non spontaneous debts. It shows the financial flexibility of the
company. The overall negative value indicates the company did not have enough non-‐spontaneous current assets to cover their
non-‐spontaneous debts. The increase in 2011-‐2013 figure means the company’s non spontaneous current assets mainly cash
increased a bit to cover their non spontaneous debts. The company’s overall low balance was because their Notes payable and
CMLD increased and their non spontaneous current assets mainly cash was not enough to cover it.
TIE (Times interest earned) ratio is used to measure a company's ability to meet its debt obligations. The increased TIE ratio in
2010 can be interpreted due to the increased EBIT and the decreased interest expense. This is a very good sign for the company
because it has generated enough earnings to pay its interest expense. The increased EBIT can be reflected in the increased
revenue during this year. It has enabled the company to pay its interest more efficiently. The declined interest value suggests
that the company has taken comparatively less debt and is relying more on equity which is again not a good sign. The fall in the
TIE ratio during 2011 and 2012 is because of the decrease in the EBIT value due to lack and the increase in the interest expense.
During these 2 years the company generated revenue but their operating expense was high and hence the decreased EBIT.
Interest expense also increased which means the company is taking more loan now which is not necessarily a bad thing. Long
term debt to capital and Total Liabilities to Total Assets both decreased during 2008-‐2010 but increased during 2011-‐2013. In
terms of long term debt to capital the decrease shows less debt and increase shows more debt. The increase is not bad because
it suggests the company is taking more loans rather than depending on the shareholders or owner’s equity. It can also be seen
in the declining NLB balance. It can be seen that interest expense has also increased during that period. On the other hand the
decreasing ratio value means the company has less debt now and are relying more on equity. There needs to be a balance and
taking loans is not a bad thing.
Return on equity (ROE) measures a corporation's profitability by revealing how much profit a company generates with the
money shareholders have invested. The more the ROE the more ability the company has to generate profits for the
shareholders. But the declining trend shows that the company has just not been generating enough profits in the past years
18
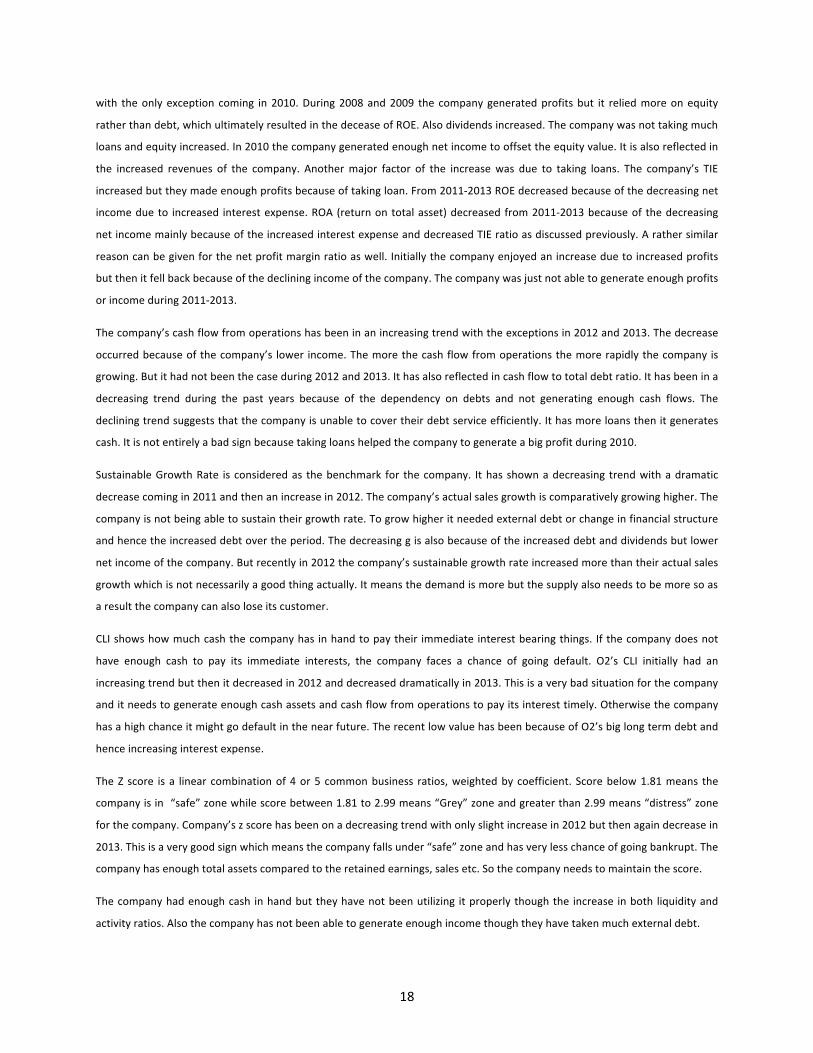
with the only exception coming in 2010. During 2008 and 2009 the company generated profits but it relied more on equity
rather than debt, which ultimately resulted in the decease of ROE. Also dividends increased. The company was not taking much
loans and equity increased. In 2010 the company generated enough net income to offset the equity value. It is also reflected in
the increased revenues of the company. Another major factor of the increase was due to taking loans. The company’s TIE
increased but they made enough profits because of taking loan. From 2011-‐2013 ROE decreased because of the decreasing net
income due to increased interest expense. ROA (return on total asset) decreased from 2011-‐2013 because of the decreasing
net income mainly because of the increased interest expense and decreased TIE ratio as discussed previously. A rather similar
reason can be given for the net profit margin ratio as well. Initially the company enjoyed an increase due to increased profits
but then it fell back because of the declining income of the company. The company was just not able to generate enough profits
or income during 2011-‐2013.
The company’s cash flow from operations has been in an increasing trend with the exceptions in 2012 and 2013. The decrease
occurred because of the company’s lower income. The more the cash flow from operations the more rapidly the company is
growing. But it had not been the case during 2012 and 2013. It has also reflected in cash flow to total debt ratio. It has been in a
decreasing trend during the past years because of the dependency on debts and not generating enough cash flows. The
declining trend suggests that the company is unable to cover their debt service efficiently. It has more loans then it generates
cash. It is not entirely a bad sign because taking loans helped the company to generate a big profit during 2010.
Sustainable Growth Rate is considered as the benchmark for the company. It has shown a decreasing trend with a dramatic
decrease coming in 2011 and then an increase in 2012. The company’s actual sales growth is comparatively growing higher. The
company is not being able to sustain their growth rate. To grow higher it needed external debt or change in financial structure
and hence the increased debt over the period. The decreasing g is also because of the increased debt and dividends but lower
net income of the company. But recently in 2012 the company’s sustainable growth rate increased more than their actual sales
growth which is not necessarily a good thing actually. It means the demand is more but the supply also needs to be more so as
a result the company can also lose its customer.
CLI shows how much cash the company has in hand to pay their immediate interest bearing things. If the company does not
have enough cash to pay its immediate interests, the company faces a chance of going default. O2’s CLI initially had an
increasing trend but then it decreased in 2012 and decreased dramatically in 2013. This is a very bad situation for the company
and it needs to generate enough cash assets and cash flow from operations to pay its interest timely. Otherwise the company
has a high chance it might go default in the near future. The recent low value has been because of O2’s big long term debt and
hence increasing interest expense.
The Z score is a linear combination of 4 or 5 common business ratios, weighted by coefficient. Score below 1.81 means the
company is in “safe” zone while score between 1.81 to 2.99 means “Grey” zone and greater than 2.99 means “distress” zone
for the company. Company’s z score has been on a decreasing trend with only slight increase in 2012 but then again decrease in
2013. This is a very good sign which means the company falls under “safe” zone and has very less chance of going bankrupt. The
company has enough total assets compared to the retained earnings, sales etc. So the company needs to maintain the score.
The company had enough cash in hand but they have not been utilizing it properly though the increase in both liquidity and
activity ratios. Also the company has not been able to generate enough income though they have taken much external debt.
19
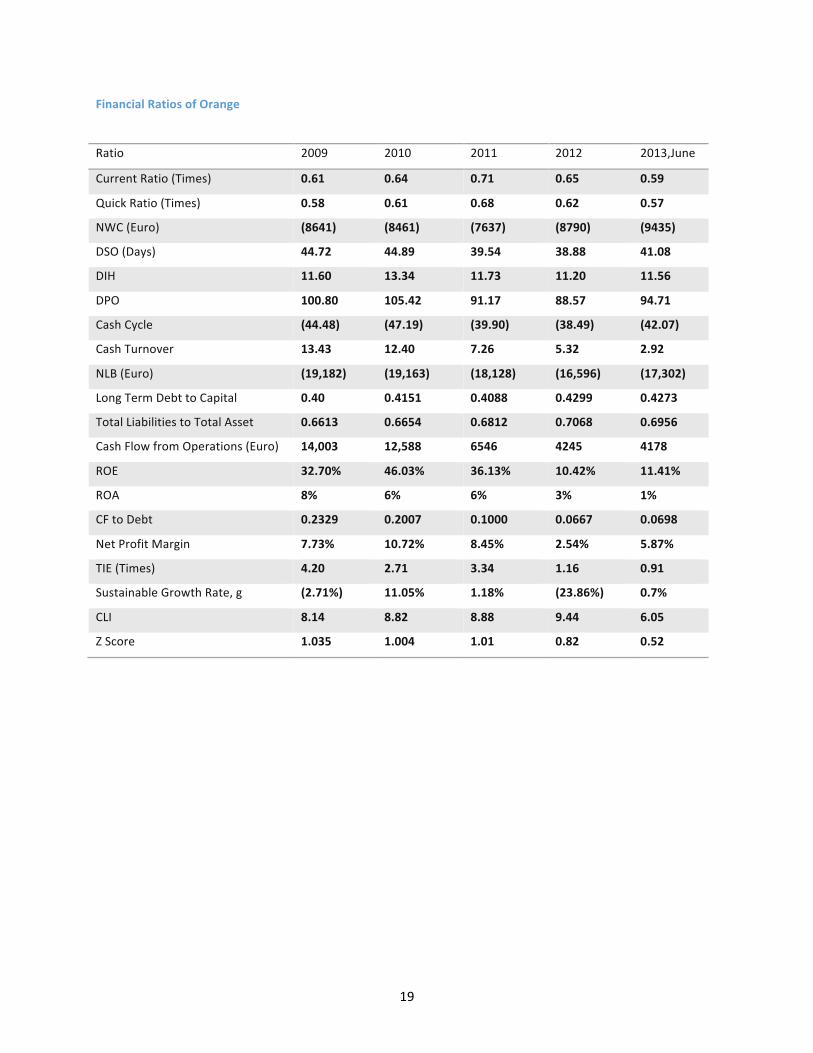
Financial Ratios of Orange
Ratio 2009 2010 2011 2012 2013,June
Current Ratio (Times) 0.61 0.64 0.71 0.65 0.59
Quick Ratio (Times) 0.58 0.61 0.68 0.62 0.57
NWC (Euro) (8641) (8461) (7637) (8790) (9435)
DSO (Days) 44.72 44.89 39.54 38.88 41.08
DIH 11.60 13.34 11.73 11.20 11.56
DPO 100.80 105.42 91.17 88.57 94.71
Cash Cycle (44.48) (47.19) (39.90) (38.49) (42.07)
Cash Turnover 13.43 12.40 7.26 5.32 2.92
NLB (Euro) (19,182) (19,163) (18,128) (16,596) (17,302)
Long Term Debt to Capital 0.40 0.4151 0.4088 0.4299 0.4273
Total Liabilities to Total Asset 0.6613 0.6654 0.6812 0.7068 0.6956
Cash Flow from Operations (Euro) 14,003 12,588 6546 4245 4178
ROE 32.70% 46.03% 36.13% 10.42% 11.41%
ROA 8% 6% 6% 3% 1%
CF to Debt 0.2329 0.2007 0.1000 0.0667 0.0698
Net Profit Margin 7.73% 10.72% 8.45% 2.54% 5.87%
TIE (Times) 4.20 2.71 3.34 1.16 0.91
Sustainable Growth Rate, g (2.71%) 11.05% 1.18% (23.86%) 0.7%
CLI 8.14 8.82 8.88 9.44 6.05
Z Score 1.035 1.004 1.01 0.82 0.52
20
Financial Ratio Analysis of Orange
Orange’s current ratio shows an increasing trend during 2009-‐2011 but a decrease during 2012 and 2013. Same goes for the
other two liquidity ratios the quick ratio and net working capital. The increase in current ratio can be seen in relation with the
increase in cash especially during 2011. The company had more cash in hand and they had less A/R meaning the company was
making more cash sales rather than credit sales hence also the lower DSO. But then in 2012 and 2013 current ratio decreased
because of the decrease in current assets mainly because of cash and inventories. It is not a bad sign because the company is
not holding much inventories and they are selling it which results in low inventories thus current assets value. Low cash also is
not a bad thing as it means the company is making more credit sales now and hence the higher DSO. Same can be interpreted
for the company’s quick ratio. The company enjoyed an increase in the ratio but faced fallback during 2012 and 2013.
Inventories were less which means that the company did not have inventories in stock rather they were generating revenues
but the reason for the decrease in quick ratio was mainly due to the decrease in current assets and more importantly the
decrease in cash. Company was making more credit sales which can be seen in their increased DSO value because of increased
A/R. Higher A/R is not a good thing because it means the company is taking more time to collect their receivables which is
further discussed in the activity ratio section. NWC increased in 2011 but decreased again in 2012 and 2013 mainly because the
company’s current assets were just not adequate to match its current liabilities. The liquidity position of the company is not
strong enough now to pay its current liabilities it’s current assets.
The company’s DSO has been in a declining trend from 2009-‐2012, which is a good sign. The company is taking lesser and lesser
time to collect its A/R. But sales have also been decreasing over this period which needs to increase. The less A/R has not
shown much effect in the liquidity of the company but sales has been low over the period. The increase in 2013 figure has been
due to the increase in A/R and the decrease in sales. Company has not been generating enough revenues in the period.
According to the DPO, the company used to pay its payable at longer dates during 2008-‐2010 but then it decreased which
suggests that during 2011-‐2013, the company paid its payables quicker. The reason behind this is the decreasing A/P. Company
is following the credit policy more efficiently but it is not quite good for the company as the longer they take the more money
they can have. During 2013 DPO increased again because of the increased A/P and the decreased daily COGS which show a
good sign for the company compared to the past years. According to the DIH, it shows on an average a declining trend. It is
good for the company as it suggests that the company is keeping their inventories less time in stock which also reflects in the
Quick ratio figure. Only exception came in 2010, where DIH increased because the company kept more inventories in stock
during that year. The CCP of the company has been on a declining trend from 2008-‐2010 but then increased during 2011 and
2012 and then again decreased in 2013. It’s pretty obvious because over the time the CCP decreased it was because of the
higher DPO and the lower Operating cycle which includes DSO and DIH. But the declining CCP indicates that the company is
taking more time to convert into cash but still negative value indicates good position of the company. The value decreased
because of the less DPO. In 2013, CCP again decreased which is very good for the company. Cash turnover of the company has
been in a decreasing trend throughout. Less cash is tied up in operations which is not neither good nor that bad. The company
has lower and lower amount of cash tied up in operations throughout the period.
When compared between these ratios, the company is performing better. It is collecting their receivables quickly and paying
their payables lately. But the gap is not that much. So the company needs to stretch their DPO as much as they can and shorten
DSO as low as they can.
21
Orange’s NLB shows a declining trend and more importantly negative values during the past years with only improvement
coming in 2012. The reason behind this is the increased current liabilities and the decreased cash of the company. The company
has not made short term investments and their amount of cash in hand has been very low compared to the current liabilities of
the company. The company needs to make more short-‐term investments and needs to generate more cash to pay off their
current liabilities which includes notes payable and current maturity of long term debt like bond, stock etc.
Company’s TIE ratio decreased during 2010 and 2012 and 2013. The reason is because the very low EBIT of the company which
can be reflected in their low sales figure. Interest expense has also increased during this period which means the company has
taken more loans which is not actually a bad sign but the declining revenues and hence the low EBIT has injured the company
greatly.
The increasing long term debt to capital figure indicates that the company has taken more long term loan which is not
necessarily a bad sign for the company. The ratio slightly deceased during 2011 but overall it shows an increase. More long
term debt means less the NLB which can also be seen. So the company needs a balance so that they do not have a much
greater long term debt. Total Liabilities to total asset decreased during 2008-‐2010 and then again in the first half of 2013. Low
ratio means more assets and low liabilities. The increasing value has been mainly because of the increase in current liabilities.
ROE has significantly dropped during 2012 and 2013 along with a somewhat declining period over the years with 2010 only
being the exception. The dramatic fall during 2012 and 2013 has been because of the drop in net income of the company. The
increased interest expense is also behind the fall. Company has relied more on long term debt which can also be reflected in
the long term debt to capital ratio. Shareholder’s equity had been constant over the period but the increased interest expense
and the low sales has lowered the net income of the company and hence the ROE. It is not necessarily that bad because the
company has been financing through loans and long term debt which is not bad necessarily. ROA has been constant with only
increase in 2009 and the fall in 2012 and 2013. The low income of the company has again affected this ratio. Rather similar
interpretation can be made for net profit margin as well. It had been in a declining trend on average because of the low income
of the company only slight increase coming in 2010 and 2013 because of the much lower sales.
Both cash flow from operations and cash flow to debt have been following a decreasing trend. The main reason is due to the
decrease in net income over the period. Income dropped dramatically and liabilities for the company increased which suggests
the low and decreasing figures. The company is unable to pay it’s debt service properly. It is taking enough loans but it is not
generating more revenues which show the inability to pay properly.
Sustainable growth rate which measures how a firm can go grow without borrowing more money. After the firm has passed this
rate, it must borrow funds from another source to facilitate growth. Sustainable growth rate for the company has increased
during 2008-‐2010 but then decreased during 2011, 2012 and 2013. The decrease has been because of the net profit and also
the increased debt of the company and also the low sales. Orange’s g has been very low throughout and that’s why the
company has needed external debt to facilitate growth.
As discussed before, CLI is a very important measurement and it shows how much cash is there to pay the immediate interests.
The more the value the better off the company is and the better chance that it will not default in the near future. But Orange’s
CLI has been decreasing over the period with only increase in 2012 but then again dropping in 2013. It is not a good sign for the
company. The decline occurred mainly due to increasing interest expense and company’s reliance on debt. The company has
22
also not been able to generate enough cash and revenues in recent period which shows decrease in CLI. Having long term debt
is not bad but the company needs to have enough cash assets and cash flow from operations to pay it’s interests accordingly.
Otherwise the company might face worse situation in the future and might have a chance to go default.
The z score for the company has been below 1.81 throughout which means the company is in “safe” zone meaning it has very
low probability of going bankrupt in near future. The decreasing trend in 2012 and 2013 shows the company has lesser chance
of going bankrupt. The company is showing signs of improvements. Compared with the total assets, retained earnings, working
capital, sales of the company has been relatively less. The company has enough assets to sustain in the future.
Overall the company has declining liquidity position in recent times but it does not necessarily indicate negative signs. The
activity ratios are also not bad but the gap is less between them. The more important fact is that the company has not been
able to generate enough revenues and hence enough net income. Especially in the recent times they both have dropped
significantly. Taking help from external debt also has not helped it.
23
COMPARATIVE STUDY
24
6. Comparative Study
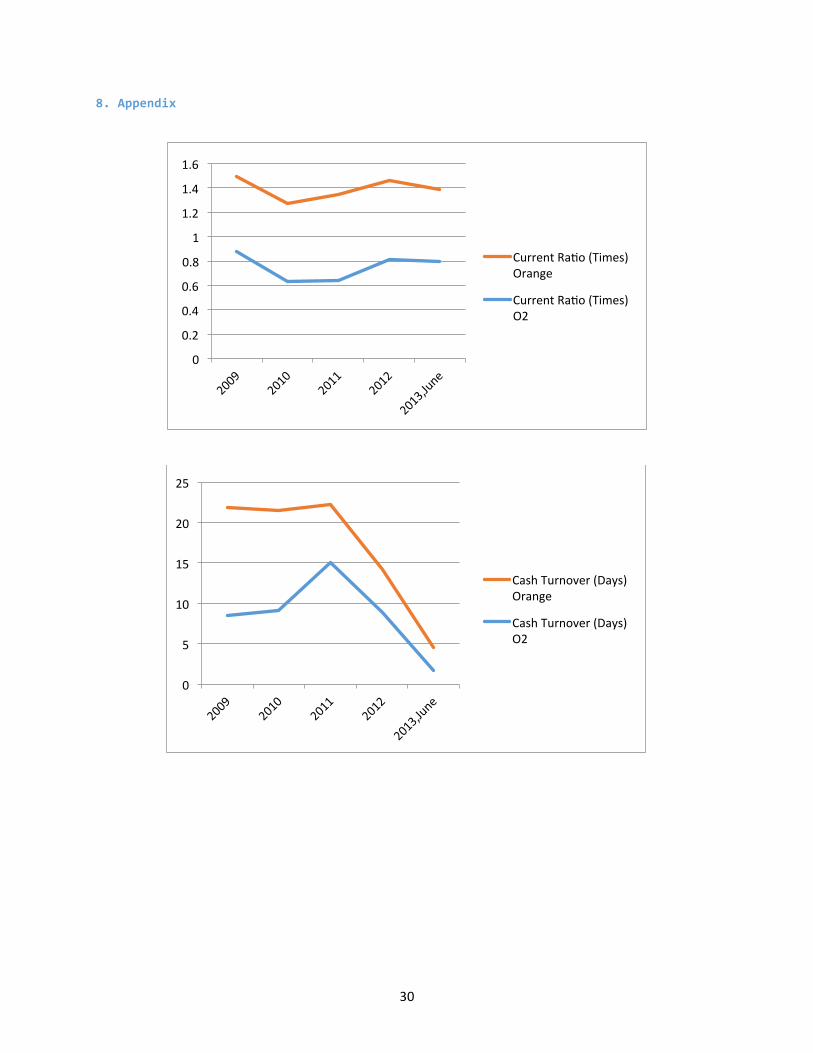
Current ratio indicates how efficiently a company is paying it’s current liabilities using it’s current assets. The recent increasing
trend of 02 shows the company is paying it’s current liabilities more efficiently than Orange which shows a decreasing trend in
the recent years 2012 and 2013. Orange had more current ratio than O2 only in the year 2010. O2 improved in the recent years
after their fallback in the early years. But the company has more cash in hand now but they are not utilizing it properly. The
company is making more cash sales rather than credit sales. While as the decreasing value of Orange suggests that the
company is making more credit sales and they have less cash in hand as a result their inventory has also gone down. So not
necessarily it is a bad sign for Orange. When talking about Quick Ratio, inventory plays the most important part. For Orange the
inventory in stock has been much less compared to O2 as it can be seen in DIH figure too. Orange has shown a decrease in
Quick ratio in the recent times due to the same reason as their fall in current ratio. The company does not have enough current
assets to pay their current liabilities compared with O2. O2’s quick ratio increased in recent times because they generated more
cash because of more revenues which Orange has failed to do so but their inventories also increased in the period which can
also be seen in the increasing DIH figure. So in terms of which company is more liquid, definitely O2 is the winner here. O2 has
been improving and it has got enough current assets to pay their current liabilities but they also need to check so that they are
utilizing their cash in hand properly.
The main ratios in the activity ratios are DIH, DSO and DPO. The idea is to keep the DIH and DSO as low as possible and stretch
DPO as longer as possible. DIH and DSO are together called operating cycle. The gap between the operating cycle and DPO
should be high. It suggests that the company is taking more days to pay their payables and taking less days to collect it’s
receivables. O2’s operating cycle (DIH+DSO) both have been high compared with Orange but then again O2’s DPO has been
very high compared to Orange. Both the companies have shown decreasing trend in 2011 and 2012 in terms of both the
operating cycle and DPO but O2’s DPO had still been very high. When talking about two companies, O2 definitely had higher
DSO but the higher DPO meant that the company had more cash and they were able to generate more revenues than Orange.
In the first half of the latest year 2013, O2’s DSO jumped pretty high but then again it’s DPO increased higher. Where as
Orange’s DSO increased and their DPO increased very slightly. According to the cash conversion period the more negative the
value the better the company is and yet again O2 dominated. Their CCP had been much low in amount compared to Orange
and the lowest amount coming in the recent year 2013. Both company’s CCP increased during 2011 and 2012 but O2 had still a
very low value. It meant that O2 was more efficient in collecting their receivables quickly compared with their paying off dates.
In recent years 2012 and 2013 both the companies had decreasing cash turnover where O2 was the lower in 2013. It means
that both the companies more specifically have lower cash tied up in operations. So the company has low non-‐earning asset
which is not necessarily a bad thing. After reviewing these ratios, it can be interpreted that O2 dominated again though there
DSO was relatively bit higher than Orange. But O2 paid it’s payables much later than Orange and it had a vast difference
between it’s DSO and DPO. The high DPO means that the company had enough days to keep the cash in hand and utilize it
properly and to generate enough sales and income before they paid off their payables. On the other hand, Orange has not been
that lucky. Their low sales and income also reflects it. They had very less time between Operating cycle and DPO to pay off their
payables. So the company did not have enough time to utilize their cash or revenues properly.
The higher the NLB balance the more cash and short-‐term investments company is making and the lesser the current liabilities
of the company. Both the company had very low NLB balance with O2 having lower value because of their higher non-‐
25
spontaneous liabilities. It is not a bad thing but also not a good thing. Both the companies need to generate higher cash and
make short term investments to have a positive NLB balance.
Long term debt to capital ratio indicates how much long term debt the company has against it’s equity. The more the value of
the ratio, the more dependent the company is on long term debts rather than equity. It gives us a peek at the company’s
financial structure. Both O2 and Orange have increasing trend in the recent times with O2 having a slight higher value. It means
that both the company has relied on long term debt like long term notes, bonds, loans, capital lease obligations etc than on
shareholder’s equity. It is not necessarily a bad thing to have a low value though it reduces financial flexibility of the company.
But if the liabilities like interest expense are paid properly it is not that bad to have increasing long term debt. Rather similar
results can be shown too in total liabilities to total asset ratio. Both the company have increasing trend mainly because of the
company’s dependency on long term debt and hence the higher the ratio. Yet again it cannot be said that is entirely a bad thing
if the long term debt are managed properly and are used to generate more revenues and income.
ROE shows the picture that how much income the company has generated for the stockholders of the company. The higher the
value the more appropriately the company has utilized the equity of the company. Both the company’s ROE dropped
dramatically in recent years. The reason behind is the decrease in net income because of declining sales. Both the companies
have not been able to generate enough revenues and hence their net income has also decreased. Increased Interest expense
has also paid an important part in declining net income. Still both the companies have good ROE but they need to overcome the
declining downward trend by generating more income. A similar concept can also be analyzed in both the company’s declining
ROA in recent years also due to lower net income. In terms of net profit margin, O2 shows an increase in the latest year
because of their dramatic decrease in sales. Orange’s net profit margin also increased in 2013 but the amount is very less
comparatively. The increase is also due to the low sales as it considers only the first half of the year. In 2012 too, O2 had greater
net profit margin compared with Orange because of greater net income. Overall over this period, O2 had both greater net
income and sales than Orange. So O2 again had better performance comparatively.
Cash flow from operations and cash flow to debt ratio both measures how much cash the company generates through it’s
operations. The greater the amount the better it is for the company. O2 had better off Orange in both the numbers. The
company had far greater cash flow from operations than Orange hence the larger cash flow from operations and cash flow to
debt ratio. Both the companies have significantly large debt but there is a big difference from cash generated from operating
activities.
TIE ratio measures the interest expense of the company and how much EBIT the company has to pay them off. In 2010, O2 had
greater TIE ratio where as Orange had more in 2009. But both the companies had downward trend in recent years because of
the low EBIT occurring mainly due to low revenues and increased long term debt and hence interest expense. Orange also had
greater TIE ratio in 2011 comparatively. It suggests that over the period O2 had to pay more interest expense because they had
more long term debt and relied more on it compared with Orange. Thus it had shown that Orange had better TIE ratio over the
years compared with O2. But it does not necessarily mean that O2 has been doing bad. It just means they have taken more
external debt which has actually helped them to increase revenues and generate more income than Orange.
Sustainable growth rate calculates how quickly the firm can grow. And when it is O2 against Orange, O2 had better off it. O2
had only one negative value in the period where as Orange had thrice. Especially in the recent times in 2012 g of O2 was higher
than Orange. At the present financial condition, O2 can grow at a higher rate without taking help from external debt or change
26
in financial policy compared to Orange who definitely needs to have an increasing g value if it wants to grow more in the future.
There need to be change in the financial policy or the company needs to take more external debt to overcome this situation.
In terms of CLI (Current Liquidity Index) both O2 and Orange have on an average declining trend throughout but Orange has
been the more dominant one with higher values. The reason is because O2 had greater long term debt compared to Orange
which also was previously discussed in long term debt to capital ratio. Both the company had high interest expense and both
had enough long term debt but O2 had greater value comparatively and hence the lower CLI of the company. The company had
increasing cash but still it was not enough to match with the increasing interest expenses. On the other hand Orange had lower
interest expenses and the cash they generated was enough to match their interest expense accordingly. So comparatively O2
has more chance to go default than Orange.
In terms of z score, both O2 and Orange are under “safe” zone but Orange had lower value meaning they have lesser chance to
go bankrupt than O2. In recent times in 2012 and till the first half of 2013, Orange had lower z score value. O2 had higher value
because of their increased retained earnings, sales, EBIT etc compared with the total assets of the company.
Comparing between O2 and Orange, O2 has obviously better working capital management during the period. Especially in
recent 1-‐2 year their liquidity position and activity ratio has been stronger. O2 also has more cash in hand compared to Orange
and their DPO has been much longer than Orange too which has enable them to keep the cash in hand for longer period. O2
made greater sales and it has also generated more income than Orange. Both the companies have relied on long term debt
with O2 relying more but they have used it to their advantage in generating more revenues and hence more income. O2 also
generated more cash flow from operations compared to Orange. But Orange had greater CLI. This happened mainly because
O2’s greater long term debt and thus greater interest expenses which has put the company into a slightly greater chance than
Orange to default. Same can be reflected in TIE ratio. Orange had more TIE ratio because their debt was not that high as O2.
Also in terms of z score Orange performed well though both the companies had very less chance of going bankrupt.
So overall combining all these, O2 performed better and they managed their working capital efficiently. The recent years 2012
and the first half f 2013 definitely shows that in near future O2 will still be able to dominate Orange.

27
RECOMMENDATIONS
28
7. Recommendations
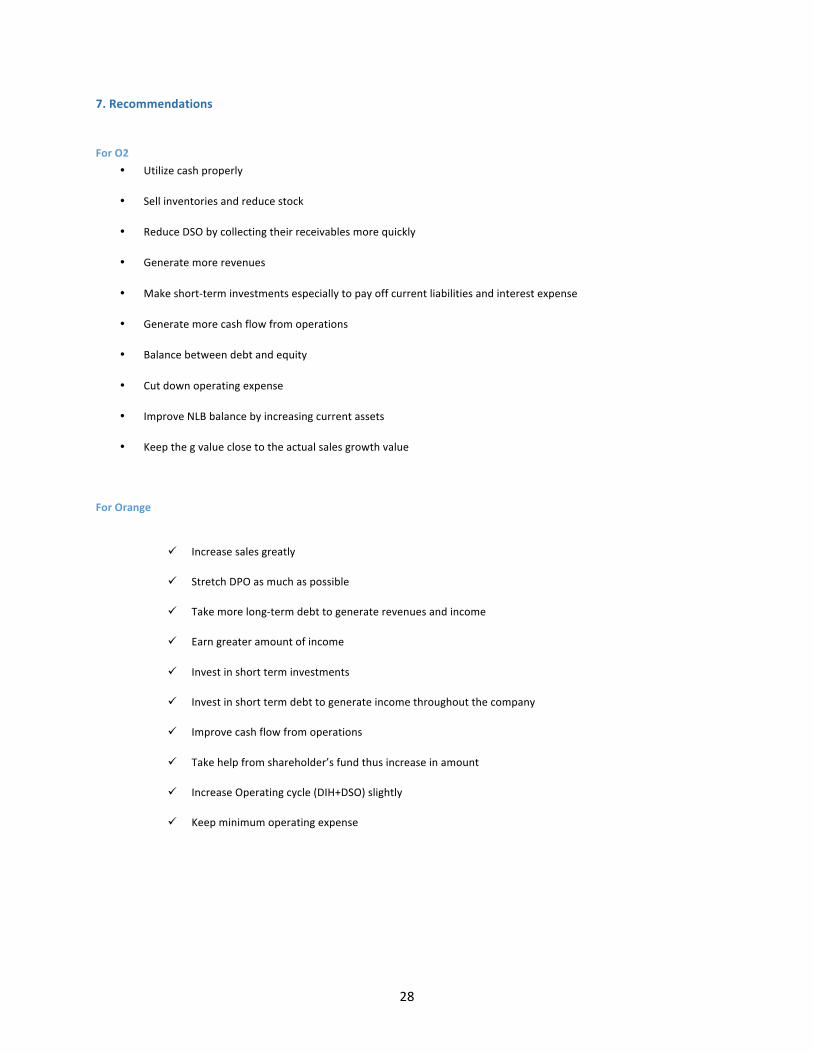
For O2 • Utilize cash properly
• Sell inventories and reduce stock
• Reduce DSO by collecting their receivables more quickly
• Generate more revenues
• Make short-‐term investments especially to pay off current liabilities and interest expense
• Generate more cash flow from operations
• Balance between debt and equity
• Cut down operating expense
• Improve NLB balance by increasing current assets
• Keep the g value close to the actual sales growth value
For Orange
ü Increase sales greatly
ü Stretch DPO as much as possible
ü Take more long-‐term debt to generate revenues and income
ü Earn greater amount of income
ü Invest in short term investments
ü Invest in short term debt to generate income throughout the company
ü Improve cash flow from operations
ü Take help from shareholder’s fund thus increase in amount
ü Increase Operating cycle (DIH+DSO) slightly
ü Keep minimum operating expense

29
Appendix
30
8. Appendix
0
0.2
0.4
0.6
0.8
1
1.2
1.4
1.6
Current Raso (Times) Orange
Current Raso (Times) O2
0
5
10
15
20
25
Cash Turnover (Days) Orange
Cash Turnover (Days) O2
31
0%
10%
20%
30%
40%
50%
60%
70%
80%
90%
100%
2009 2010 2011 2012 2013,June
ROE Orange
ROE O2
0
2
4
6
8
10
12
14
16
2009 2010 2011 2012 2013,June
CLI Orange
CLI O2
32
0
0.5
1
1.5
2
2.5
3
2009 2010 2011 2012 2013,June
Z Score Orange
Z Score O2
0.00%
5.00%
10.00%
15.00%
20.00%
25.00%
30.00%
Net Profit Margin Orange
Net Profit Margin O2

33
References
34
9. References:
http://en.wikipedia.org/wiki/Orange_(UK)
http://en.wikipedia.org/wiki/O2_(United_Kingdom)
http://www.ukessays.com/essays/management/orange-‐and-‐o2-‐company.php#ixzz2pQ3OWhA5
http://www.investopedia.com/terms/r/receivableturnoverratio.asp
http://www.investopedia.com/university/ratios/liquidity-‐measurement/ratio1.asp
http://www.investopedia.com/terms/s/sustainablegrowthrate.asp
http://www.investopedia.com/terms/c/cashconversioncycle.asp
http://www.londonstockexchange.com/exchange/prices-‐and-‐markets/stocks/exchange-‐insight/technical-‐
analysis.html?fourWayKey=FR0000133308ZZEUREQS
http://seekingalpha.com/article/1445651-‐what-‐is-‐going-‐on-‐with-‐france-‐telecom
http://www.accountingtools.com/liquidity-‐index
http://www.telefonica.com/en/shareholders_investors/html/financyreg/informesanuales.shtml
http://quicktake.morningstar.com/stocknet/secdocuments.aspx?symbol=fte
35
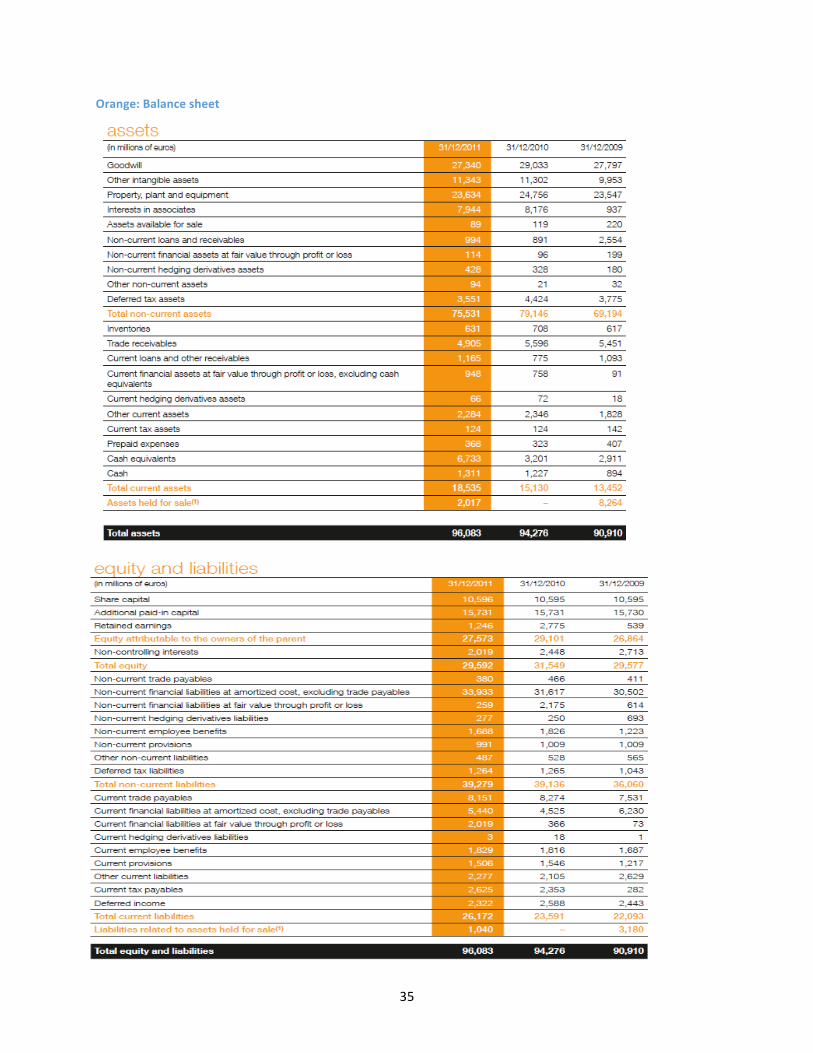
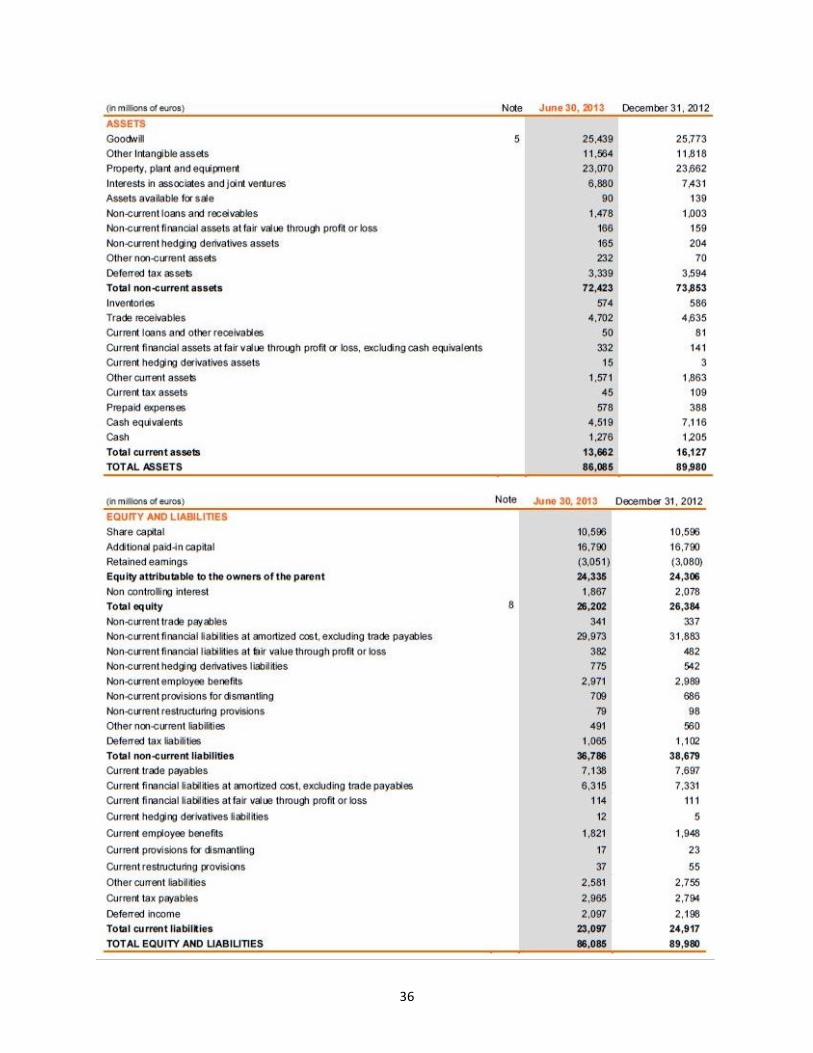
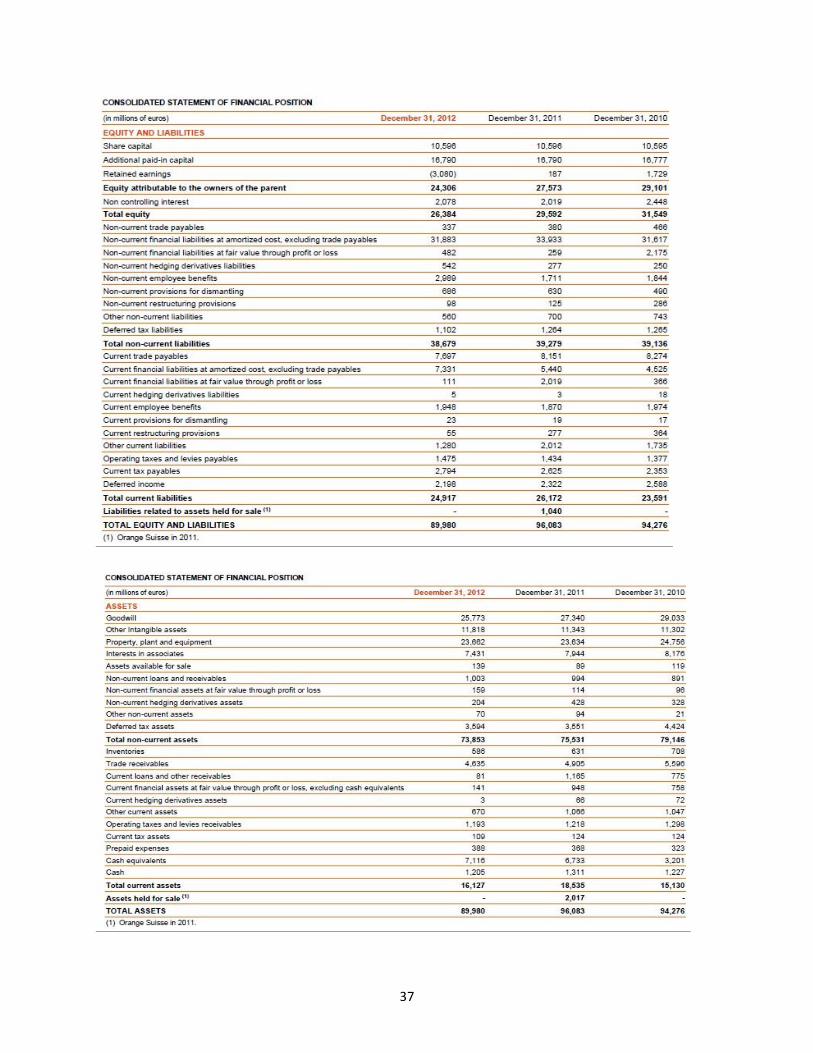
Orange: Balance sheet
36
37
38
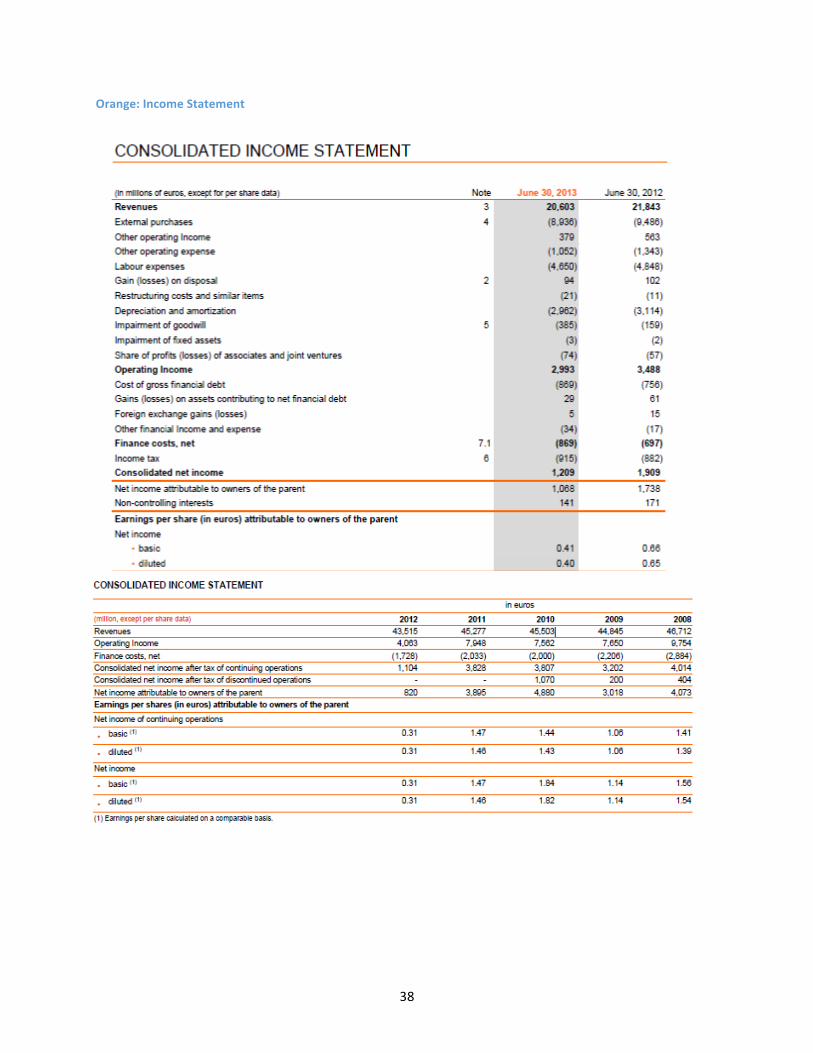
Orange: Income Statement
39
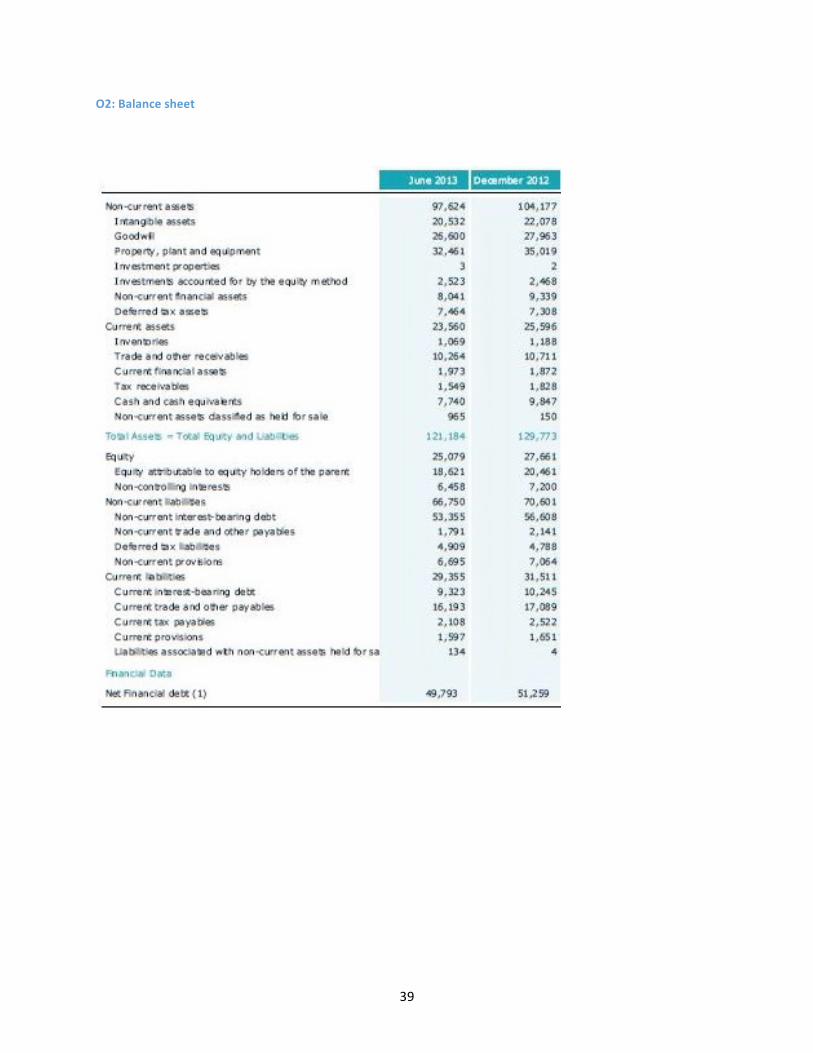
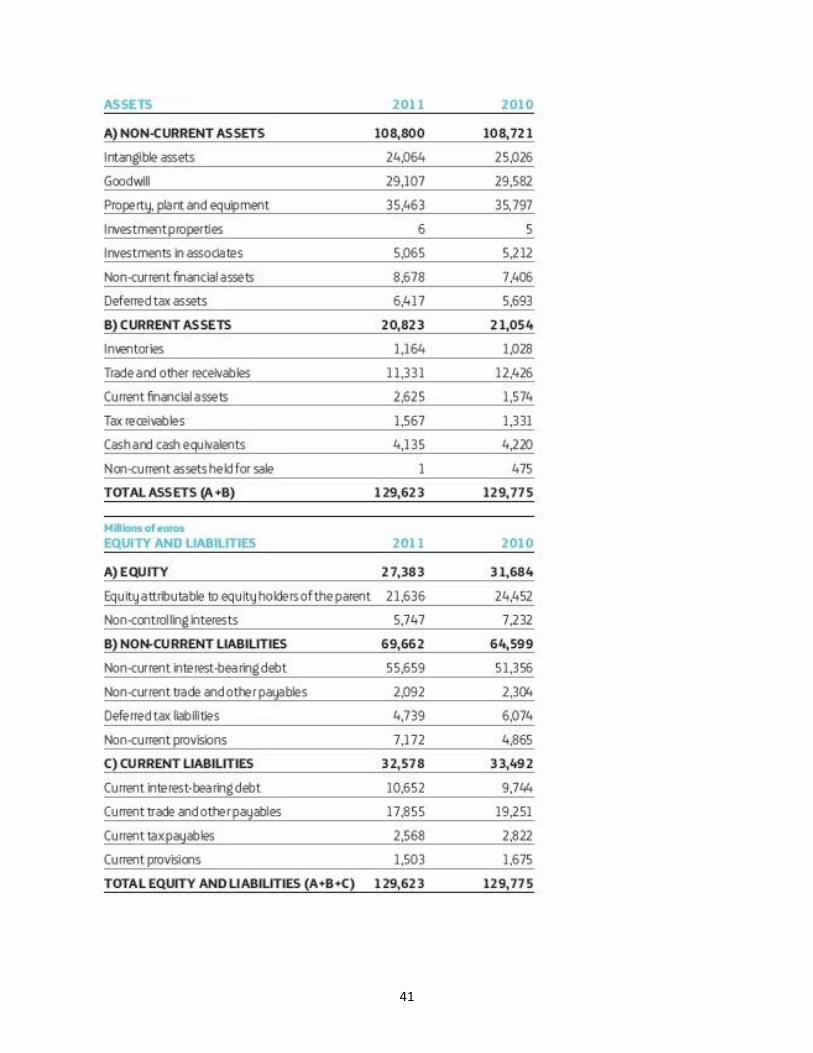
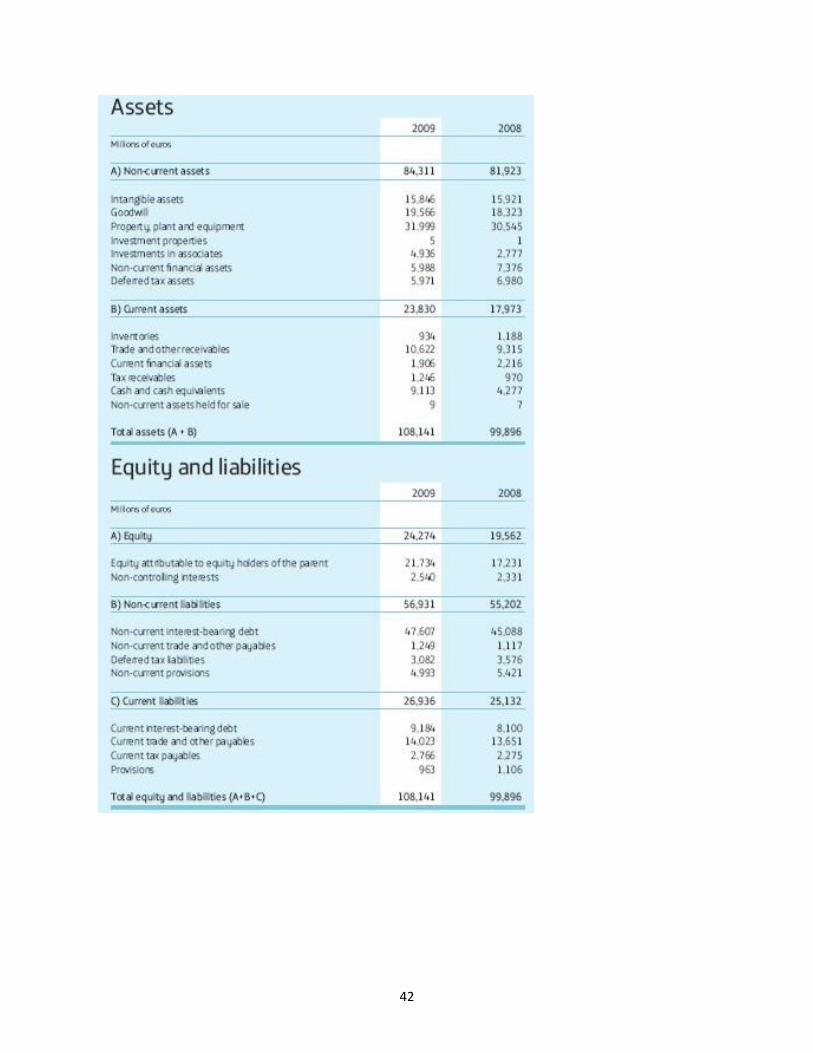
O2: Balance sheet
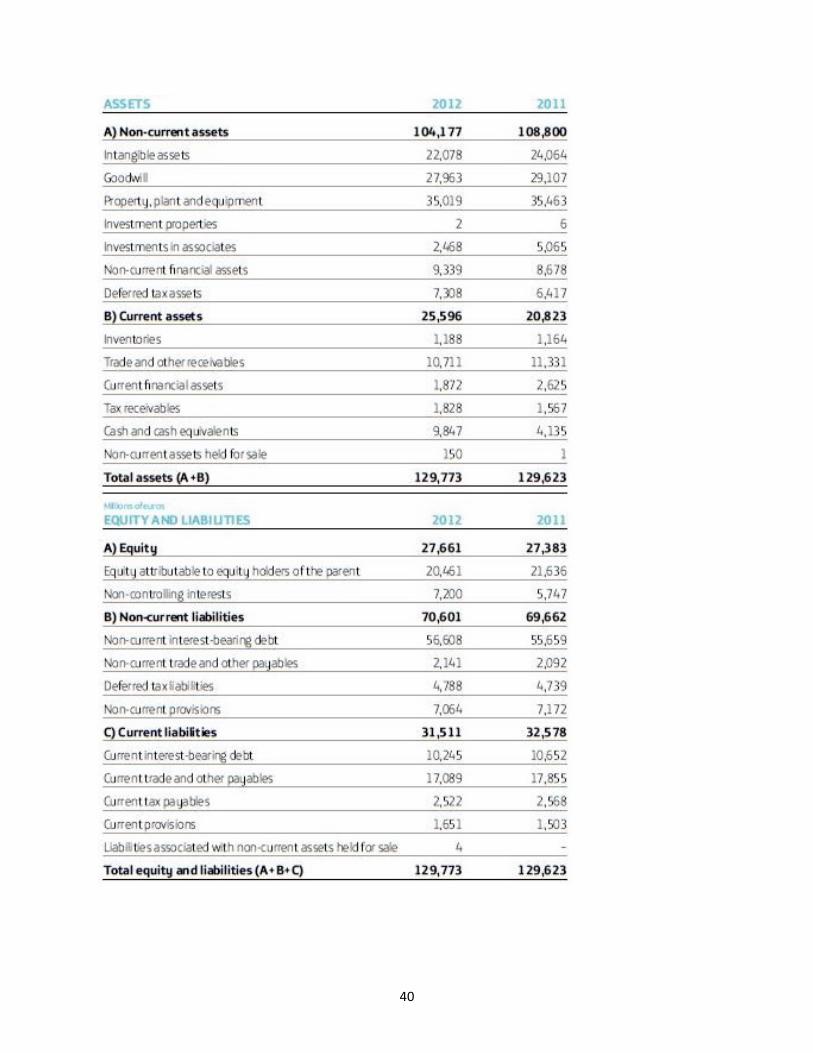
40
41
42
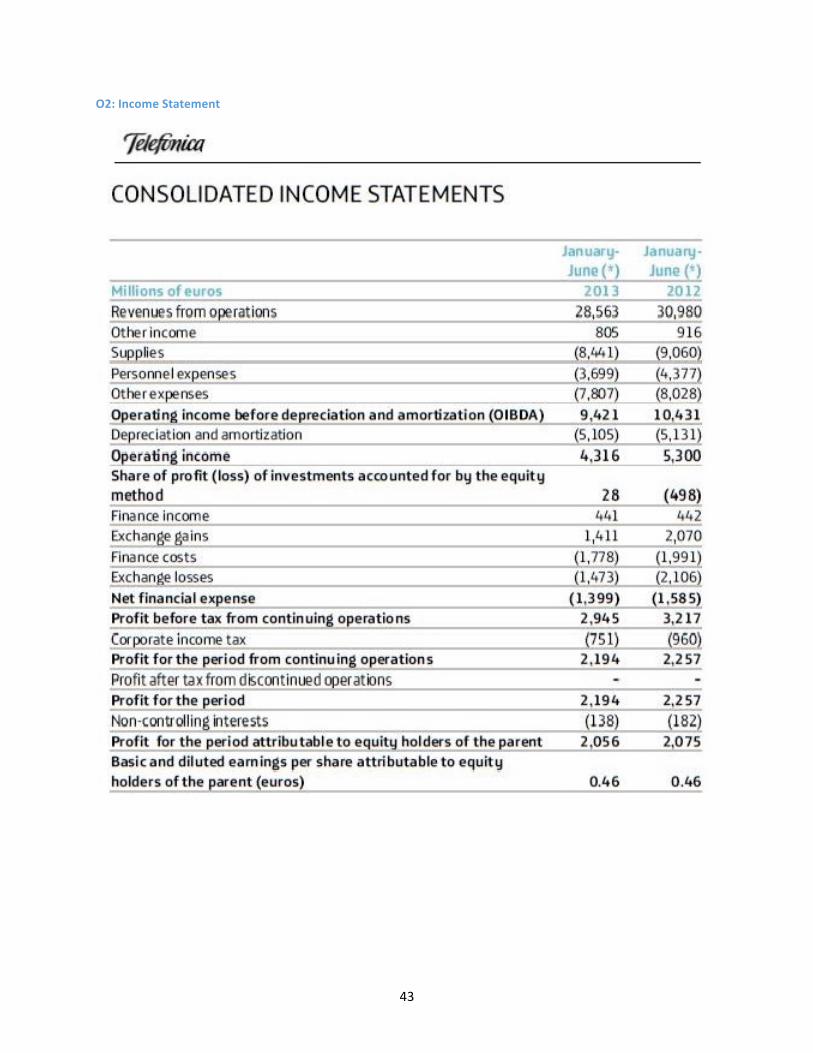
43
O2: Income Statement
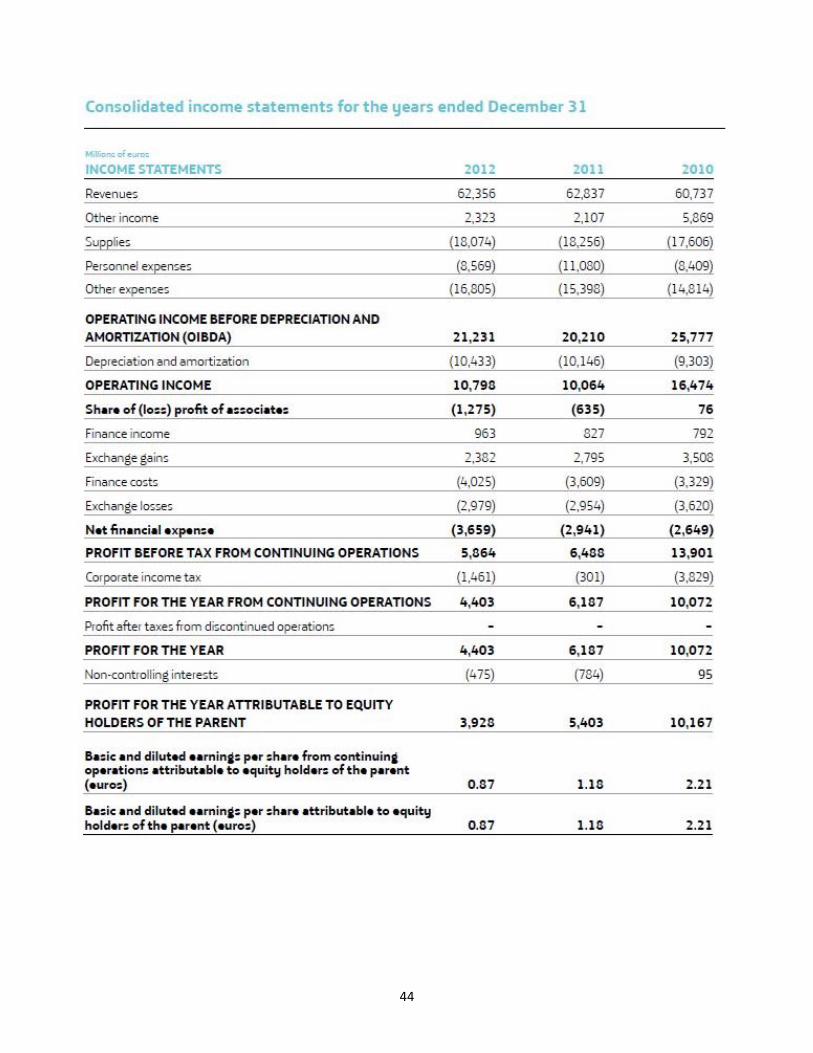
44


