Embed Size (px)
Citation preview
WORKING CAPITAL MANAGEMENT OF SELECTED
PHARMACEUTICAL COMPANIES IN INDIA
By
Nirmal Chakraborty
Department of Commerce with Farm Management
Vidyasagar University
2016


(iii)
Acknowledgement
The present thesis “Working Capital Management of Selected Pharmaceutical Companies
in India” is an outcome of my intensive study. During this research work, I have been
immensely helped by the faculty of the Department of Commerce with Farm
Management, Vidyasagar University, West Bengal. I am thankful to them.
I am deeply indebted to my research guide Dr. Samir Ghosh , Professor, Department of
Commerce with Farm Management, Vidyasagar University for his continuous support,
guidance and affection.
I am also deeply indebted to Prof Purnendu Sekhar Das, Vidyasagar University and Dr.
Dipti Chakraborty, Professor, Department of Commerce, University of Calcutta who
have helped me in shaping and completing this research work.
I am indebted to our Hon’ble Vice Chancellor sir, Prof. Ranjan Chakraborty for his
continuous inspiration in doing this research work.
A number of individuals especially Mr. Mridul Dasbayen, have extended their
understanding, sympathy and help in completing my research work. I express my
gratitude to all of them.
At last but not the least, I am indebted to my wife Mrs. Suchismita Chakraborty , my son
Sagnik Chakraborty and my elder sister Binapani Chakraborty whose sacrifice and
dedication, my research work came to an end.
Of Course, I am alone responsible for any kind of omissions and commissions in my
study.
Dated : August, 2016 (Nirmal Chakraborty)
(iv)
INDEX
PAGE NO
Certificate i
Declaration ii
Acknowledgement iii
List of Tables xv - xix
CONTENTS
CHAPTER NO. TITLE PAGE NO.
CHAPTER – 1 INRODUCTION 1 – 5
1.1. Meaning of Working Capital Management 1
1.2. Objectives of Working Capital Management 1
1.3. Nature of Pharmaceutical Industry 2
1.4. Objectives of the study 3
1.5. Selection of the samples 4
1.6. Study Period 4
1.7. Chapter Plan 5
CHAPTER – 2 DATABASE AND METHODOLOGY 6 – 23
2.1. Sources of Data and Sample Size Determination
2.1.1. Sources of Data 6
2.1.2. Sample Profile 6
2.1.3. Sample size determination 12
2.2. Methodology 13
2.3. Summary of the Chapter 23
CHAPTER – 3 LITERATURE REVIEW 24 – 44
3.1. Review of the Existing Literature 24
3.2. Summary of the Chapter 43
(v)
CHAPTER NO. TITLE PAGE NO.
CHAPTER – 4 ASSESSMENT OF WORKING CAPITAL 45 – 150
MANAGEMENT OF SOME SELECTED
PHARMACEUTICAL COMPANIES FROM
ECONOMIC POINT OF VIEW
4.1. LUPIN 46 – 50
4.1.1. Inventory analysis 46
4.1.2. Debtors analysis 46
4.1.3. Cash analysis 47
4.1.4. Loans and Advance Analysis 47
4.1.5. Creditors analysis 48
4.1.6. Current Liabilities and Provisions Analysis 48
4.1.7. Current Assets analysis 49
4.1.8. Net Working capital analysis 49
4.2. Dr. Reddy’s Laboratories 50 – 55
4.2.1. Inventory analysis 50
4.2.2. Debtors analysis 51
4.2.3 Cash analysis 51
4.2.4. Loans and Advance Analysis 52
4.2.5. Creditors analysis 52
4.2.6. Current Liabilities and Provisions Analysis 53
4.2.7. Current Assets analysis 53
4.2.8. Net Working capital analysis 54
4.3. CIPLA 55 – 59
4.3.1. Inventory analysis 55
4.3.2. Debtors analysis 55
4.3.3 Cash analysis 56
4.3.4. Loans and Advance Analysis 56

(vi)
CHAPTER NO. TITLE PAGE NO.
4.3.5. Creditors analysis 57
4.3.6. Current Liabilities and Provisions Analysis 57
4.3.7. Current Assets analysis 58
4.3.8. Net Working capital analysis 59
4.4. Piramal Enterprises 60 – 64
4.4.1. Inventory analysis 60
4.4.2. Debtors analysis 60
4.4.3 Cash analysis 61
4.4.4. Loans and Advance Analysis 61
4.4.5. Creditors analysis 61
4.4.6. Current Liabilities and Provisions Analysis 62
4.4.7. Current Assets analysis 63
4.4.8. Net Working capital analysis 63
4.5. Aurobindo Pharmaceuticals 64 – 69
4.5.1. Inventory analysis 64
4.5.2. Debtors analysis 65
4.5.3 Cash analysis 65
4.5.4. Loans and Advance Analysis 66
4.5.5. Creditors analysis 66
4.5.6. Current Liabilities and Provisions Analysis 67
4.5.7. Current Assets analysis 67
4.5.8. Net Working capital analysis 68
4.6. Cadila Health Care Ltd 69 – 73
4.6.1. Inventory analysis 69
4.6.2. Debtors analysis 69
4.6.3 Cash analysis 70
4.6.4. Loans and Advance Analysis 70
(vii)
CHAPTER NO. TITLE PAGE NO.
4.6.5. Creditors analysis 71
4.6.6. Current Liabilities and Provisions Analysis 71
4.6.7. Current Assets analysis 72
4.6.8. Net Working capital analysis 72
4.7. Divis Labs 73 – 78
4.7.1. Inventory analysis 73
4.7.2. Debtors analysis 74
4.7.3 Cash analysis 74
4.7.4. Loans and Advance Analysis 75
4.7.5. Creditors analysis 75
4.7.6. Current Liabilities and Provisions Analysis 76
4.7.7. Current Assets analysis 76
4.7.8. Net Working capital analysis 77
4.8. Strides Archolabs 78 – 82
4.8.1. Inventory analysis 78
4.8.2. Debtors analysis 78
4.8.3 Cash analysis 79
4.8.4. Loans and Advance Analysis 79
4.8.5. Creditors analysis 80
4.8.6. Current Liabilities and Provisions Analysis 80
4.8.7. Current Assets analysis 81
4.8.8. Net Working capital analysis 82
4.9. Sun Pharmaceuticals 83 – 87
4.9.1. Inventory analysis 83
4.9.2. Debtors analysis 83
4.9.3 Cash analysis 84
4.9.4. Loans and Advance Analysis 84
4.9.5. Creditors analysis 85
(viii)
CHAPTER NO. TITLE PAGE NO.
4.9.6. Current Liabilities and Provisions Analysis 85
4.9.7. Current Assets analysis 86
4.9.8. Net Working capital analysis 86
4.10. Biocon Pharmaceuticals 87 – 92
4.10.1. Inventory analysis 87
4.10.2. Debtors analysis 88
4.10.3 Cash analysis 88
4.10.4. Loans and Advance Analysis 89
4.10.5. Creditors analysis 89
4.10.6. Current Liabilities and Provisions Analysis 90
4.10.7. Current Assets analysis 91
4.10.8. Net Working capital analysis 91
4.11. Kopran 92 – 96
4.11.1. Inventory analysis 92
4.11.2. Debtors analysis 93
4.11.3 Cash analysis 93
4.11.4. Loans and Advance Analysis 94
4.11.5. Creditors analysis 94
4.11.6. Current Liabilities and Provisions Analysis 94
4.11.7. Current Assets analysis 95
4.11.8. Net Working capital analysis 95
4.12. Biofil Chemicals and Pharmaceutical Ltd. 97 – 102
4.12.1. Inventory analysis 97
4.12.2. Debtors analysis 97
4.12.3 Cash analysis 98
4.12.4. Loans and Advance Analysis 98
4.12.5. Creditors analysis 99
4.12.6. Current Liabilities and Provisions Analysis 99
(ix)
CHAPTER NO. TITLE PAGE NO
4.12.7. Current Assets analysis 100
4.12.8. Net Working capital analysis 101
4.13. Ambalal Sarabhai Enterprises 102 – 106
4.13.1. Inventory analysis 102
4.13.2. Debtors analysis 102
4.13.3 Cash analysis 103
4.13.4. Loans and Advance Analysis 103
4.13.5. Creditors analysis 104
4.13.6. Current Liabilities and Provisions Analysis 104
4.13.7. Current Assets analysis 105
4.13.8. Net Working capital analysis 105
4.14. Parenteral Drugs (India) Ltd. 106 – 110
4.14.1. Inventory analysis 106
4.14.2. Debtors analysis 107
4.14.3 Cash analysis 107
4.14.4. Loans and Advance Analysis 108
4.14.5. Creditors analysis 108
4.14.6. Current Liabilities and Provisions Analysis 109
4.14.7. Current Assets analysis 109
4.6.8. Net Working capital analysis 110
4.15. Sequent Scientific Ltd. 110 – 115
4.15.1. Inventory analysis 110
4.15.2. Debtors analysis 111
4.15.3 Cash analysis 112
4.15.4. Loans and Advance Analysis 112
4.15.5. Creditors analysis 112
4.15.6. Current Liabilities and Provisions Analysis 113
4.15.7. Current Assets analysis 114
4.15.8. Net Working capital analysis 114
(x)
CHAPTER NO. TITLE PAGE NO
4.16. Zenotech Laboratories 115 – 120
4.16.1. Inventory analysis 115
4.16.2. Debtors analysis 116
4.16.3 Cash analysis 116
4.16.4. Loans and Advance Analysis 117
4.16.5. Creditors analysis 117
4.16.6. Current Liabilities and Provisions Analysis 118
4.16.7. Current Assets analysis 118
4.16.8. Net Working capital analysis 119
4.17. Marksans Pharma Ltd. 120 – 124
4.17.1. Inventory analysis 120
4.17.2. Debtors analysis 120
4.17.3 Cash analysis 121
4.17.4. Loans and Advance Analysis 121
4.17.5. Creditors analysis 122
4.17.6. Current Liabilities and Provisions Analysis 122
4.17.7. Current Assets analysis 123
4.6.8. Net Working capital analysis 123
4.18. Wanbury Ltd. 124 – 129
4.18.1. Inventory analysis 124
4.18.2. Debtors analysis 125
4.18.3 Cash analysis 125
4.18.4. Loans and Advance Analysis 126
4.18.5. Creditors analysis 126
4.18.6. Current Liabilities and Provisions Analysis 127
4.18.7. Current Assets analysis 127
4.18.8. Net Working capital analysis 128
(xi)
CHAPTER NO. TITLE PAGE NO.
4.19. Morepen Labs 129 – 133
4.19.1. Inventory analysis 129
4.19.2. Debtors analysis 129
4.19.3 Cash analysis 130
4.19.4. Loans and Advance Analysis 130
4.19.5. Creditors analysis 131
4.19.6. Current Liabilities and Provisions Analysis 131
4.19.7. Current Assets analysis 132
4.19.8. Net Working capital analysis 132
4.20. Hiran Orgochem Ltd 133 – 138
4.20.1. Inventory analysis 133
4.20.2. Debtors analysis 134
4.20.3 Cash analysis 134
4.20.4. Loans and Advance Analysis 135
4.20.5. Creditors analysis 135
4.20.6. Current Liabilities and Provisions Analysis 136
4.20.7. Current Assets analysis 136
4.20.8. Net Working capital analysis 137
4.21. Summary of the Chapter 138
CHAPTER – 5 ASSESSMENT OF WORKING CAPITAL 171 – 305
MANAGEMENT OF SOME SELECTED
PHARMACEUTICAL COMPANIES FROM
ACCOUNTING POINT OF VIEW.
5.1. Liquidity Analysis 171 – 180
5.1.1. Current Ratio 172
5.1.2. Quick Ratio (QR) 175
5.1.3. Absolute Liquid Ratio (ALR) 176
5.1.4 Summary 178
(xii)
CHAPTER NO. TITLE PAGE NO.
5.2. Profitability Analysis 180 – 193
5.2.1. Gross Profit Ratio 181
5.2.2. Net Profit Ratio 184
5.2.3. Return on Capital Employed (ROCE) 188
5.2.4. Summary 191
5.3. Efficiency Analysis 193 – 211
5.3.1. Inventory Turnover Ratio (ITR) 193
5.3.2. Debtors Turnover Ratio (DTR) 197
5.3.3. Cash Turnover Ratio (CTR) 200
5.3.4. Creditors Turnover Ratio (CRTR) 203
5.3.5. Operating Cycle Period 206
5.3.6. Summary 209
5.4. Component wise Ratio Analysis 211 – 230
5.4.1. Current Assets to Total Assets Ratio (CATA) 212
5.4.2. Inventory to Current Assets Ratio 215
5.4.3. Sundry debtors To Current Assets Ratio 219
5.4.4. Cash and Bank to Current Assets Ratio 222
5.4.5. Loans and Advances to Current Assets 226
5.4.6.Summary 228
5.5. Financing Strategy Analysis. 230 – 240
5.5.1. Working Capital Leverage (WCL) 230
5.5.2. Trade off between risk and profitability 234
5.6.2. Summary 239
5.6. Liquidity Ranking Analysis by using Motaal 240
Liquidity Test
(xiii)
5.7. Factor analysis of Liquidity, Profitability and 245
efficiency position of the selected Pharmaceutical
companies
5.7.1 Lupin Ltd. 245
5.7.2 Dr. Reddys’ Laboratories Ltd. 248
5.7.3 CIPLA 250
5.7.4 Piramal Enterprises 253
5.7.5 Aurobindo Pharmaceuticals Ltd. 255
5.7.6 Cadila Health Care Ltd. 258
5.7.7 Divis Labs. 260
5.7.8 Strides Archolabs Ltd. 263
5.7.9 Sun Pharmaceuticals. 265
5.7.10 Biocon Pharmaceuticals 268
5.7.11 Kopran 270
5.7.12 Biofil Chemicals and Pharmaceuticals Ltd. 273
5.7.13 Ambalal Sarabhai Enterprises. 275
5.7.14 Parenteral Drugs (India) Ltd. 278
5.7.15 Sequent Scientific Ltd 280
5.7.16 Zenotech Laboratories Ltd. 283
5.7.17 Marksans Pharma Ltd. 285
5.7.18 Wanbury Ltd. 288
5.7.19 Morepen Labs. 290
5.7.20 Hiran Orgochem Ltd. 293
5.8 Summary of the Chapter 295
CHAPTER-6 SUMMARY AND CONCLUSIONS 334-353
6.1 Findings
6.1.1 Trend Analysis 335
6.1.2. Liquidity Analysis 337
6.1.3. Profitability Analysis 339
6.1.4. Efficiency Analysis 340
(xiv)
CHAPTER NO. TITLE PAGE NO.
6.1.5. Component wise Working Capital 342
position Analysis
6.1.6. Working Capital financing Strategy 345
Analysis
6.1.7. Motaal Comprehensive Liquidity test 345
Analysis
6.1.8. Principal component of Liquidity, 346
Profitability and Efficiency Analysis
6.1.9. Regression Analysis 346
6.1.10. Conclusions 350
6.2. Suggestions 351
6.3. Limitation of the study 352
6.4. Scope for Further Study 353
BIBLIOGRAPHY 354 – 359
(xv)
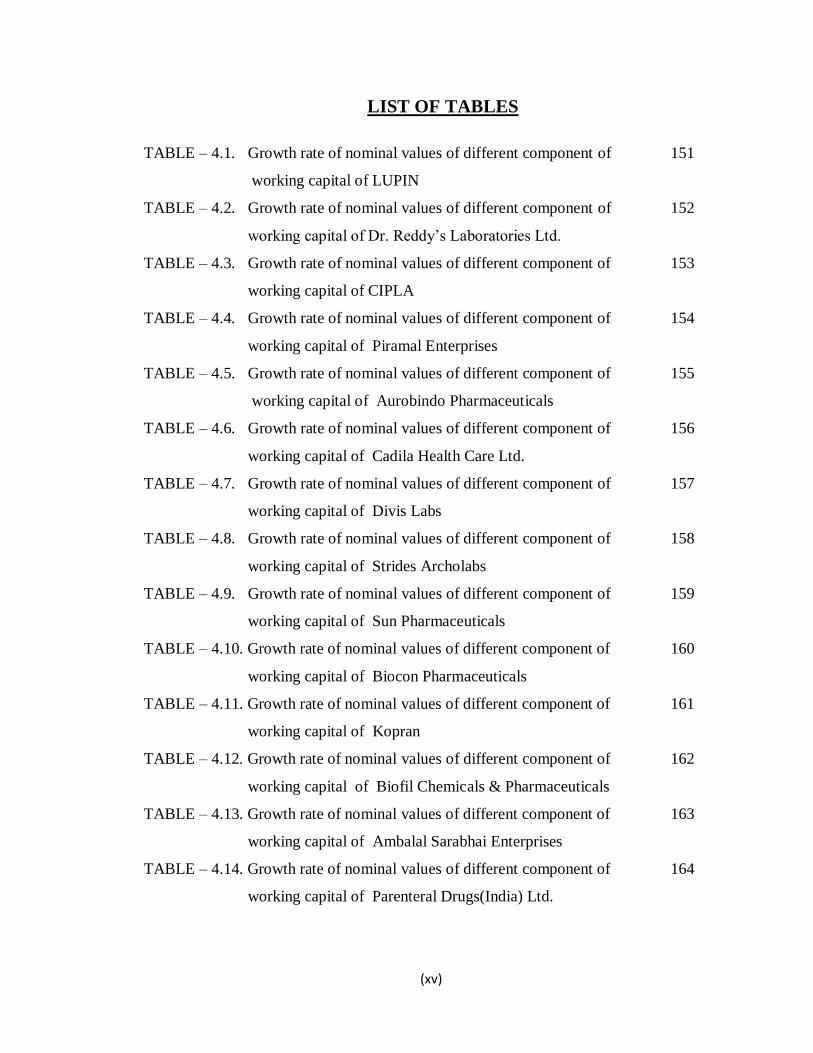
LIST OF TABLES
TABLE – 4.1. Growth rate of nominal values of different component of 151
working capital of LUPIN
TABLE – 4.2. Growth rate of nominal values of different component of 152
working capital of Dr. Reddy’s Laboratories Ltd.
TABLE – 4.3. Growth rate of nominal values of different component of 153
working capital of CIPLA
TABLE – 4.4. Growth rate of nominal values of different component of 154
working capital of Piramal Enterprises
TABLE – 4.5. Growth rate of nominal values of different component of 155
working capital of Aurobindo Pharmaceuticals
TABLE – 4.6. Growth rate of nominal values of different component of 156
working capital of Cadila Health Care Ltd.
TABLE – 4.7. Growth rate of nominal values of different component of 157
working capital of Divis Labs
TABLE – 4.8. Growth rate of nominal values of different component of 158
working capital of Strides Archolabs
TABLE – 4.9. Growth rate of nominal values of different component of 159
working capital of Sun Pharmaceuticals
TABLE – 4.10. Growth rate of nominal values of different component of 160
working capital of Biocon Pharmaceuticals
TABLE – 4.11. Growth rate of nominal values of different component of 161
working capital of Kopran
TABLE – 4.12. Growth rate of nominal values of different component of 162
working capital of Biofil Chemicals & Pharmaceuticals
TABLE – 4.13. Growth rate of nominal values of different component of 163
working capital of Ambalal Sarabhai Enterprises
TABLE – 4.14. Growth rate of nominal values of different component of 164
working capital of Parenteral Drugs(India) Ltd.
(xvi)
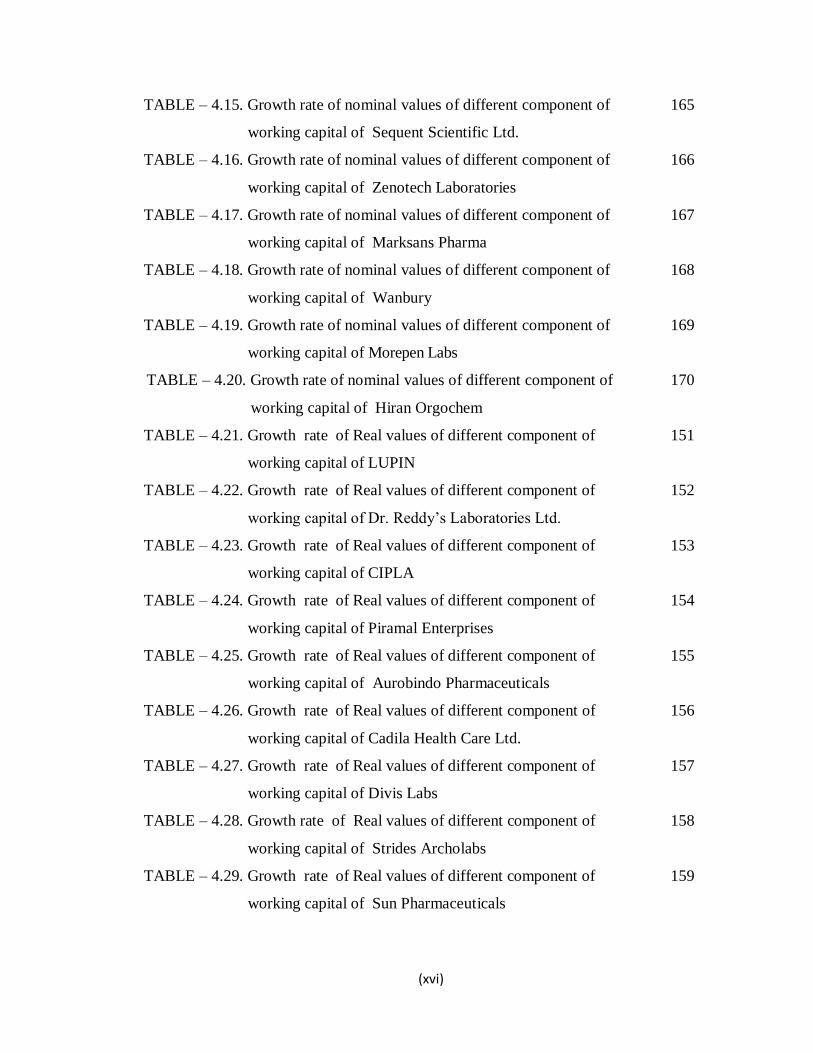
TABLE – 4.15. Growth rate of nominal values of different component of 165
working capital of Sequent Scientific Ltd.
TABLE – 4.16. Growth rate of nominal values of different component of 166
working capital of Zenotech Laboratories
TABLE – 4.17. Growth rate of nominal values of different component of 167
working capital of Marksans Pharma
TABLE – 4.18. Growth rate of nominal values of different component of 168
working capital of Wanbury
TABLE – 4.19. Growth rate of nominal values of different component of 169
working capital of Morepen Labs
TABLE – 4.20. Growth rate of nominal values of different component of 170
working capital of Hiran Orgochem
TABLE – 4.21. Growth rate of Real values of different component of 151
working capital of LUPIN
TABLE – 4.22. Growth rate of Real values of different component of 152
working capital of Dr. Reddy’s Laboratories Ltd.
TABLE – 4.23. Growth rate of Real values of different component of 153
working capital of CIPLA
TABLE – 4.24. Growth rate of Real values of different component of 154
working capital of Piramal Enterprises
TABLE – 4.25. Growth rate of Real values of different component of 155
working capital of Aurobindo Pharmaceuticals
TABLE – 4.26. Growth rate of Real values of different component of 156
working capital of Cadila Health Care Ltd.
TABLE – 4.27. Growth rate of Real values of different component of 157
working capital of Divis Labs
TABLE – 4.28. Growth rate of Real values of different component of 158
working capital of Strides Archolabs
TABLE – 4.29. Growth rate of Real values of different component of 159
working capital of Sun Pharmaceuticals
(xvii)
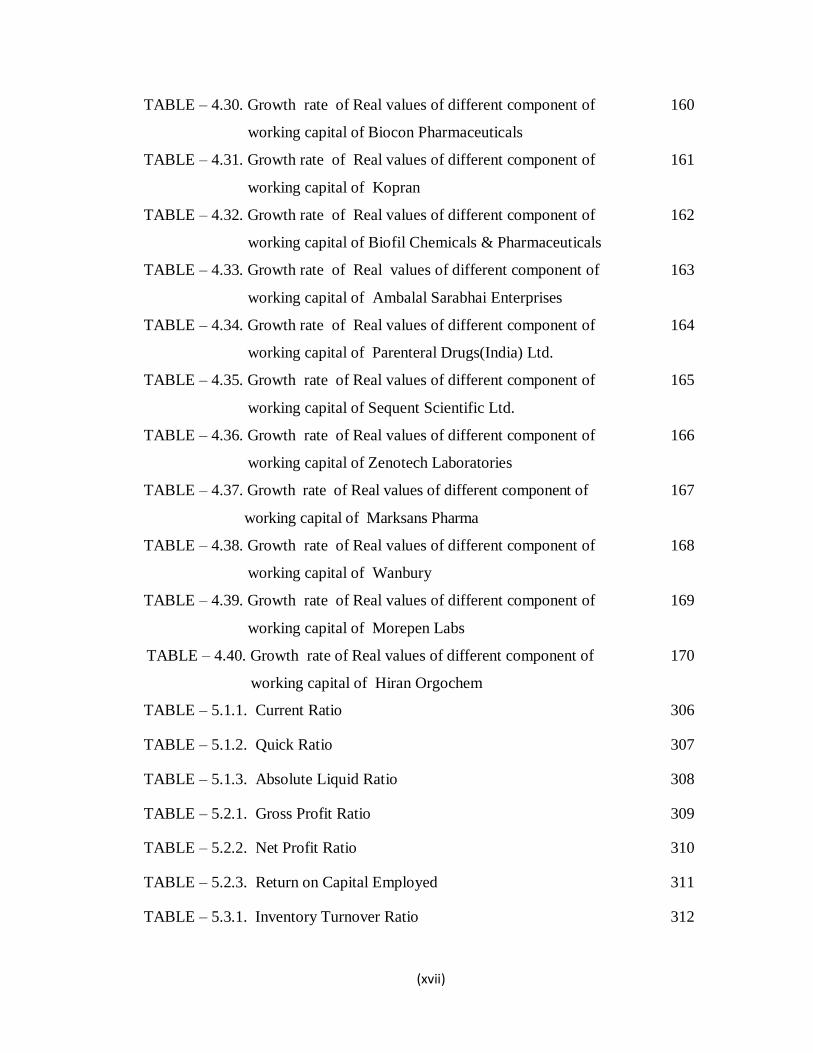
TABLE – 4.30. Growth rate of Real values of different component of 160
working capital of Biocon Pharmaceuticals
TABLE – 4.31. Growth rate of Real values of different component of 161
working capital of Kopran
TABLE – 4.32. Growth rate of Real values of different component of 162
working capital of Biofil Chemicals & Pharmaceuticals
TABLE – 4.33. Growth rate of Real values of different component of 163
working capital of Ambalal Sarabhai Enterprises
TABLE – 4.34. Growth rate of Real values of different component of 164
working capital of Parenteral Drugs(India) Ltd.
TABLE – 4.35. Growth rate of Real values of different component of 165
working capital of Sequent Scientific Ltd.
TABLE – 4.36. Growth rate of Real values of different component of 166
working capital of Zenotech Laboratories
TABLE – 4.37. Growth rate of Real values of different component of 167
working capital of Marksans Pharma
TABLE – 4.38. Growth rate of Real values of different component of 168
working capital of Wanbury
TABLE – 4.39. Growth rate of Real values of different component of 169
working capital of Morepen Labs
TABLE – 4.40. Growth rate of Real values of different component of 170
working capital of Hiran Orgochem
TABLE – 5.1.1. Current Ratio 306
TABLE – 5.1.2. Quick Ratio 307
TABLE – 5.1.3. Absolute Liquid Ratio 308
TABLE – 5.2.1. Gross Profit Ratio 309
TABLE – 5.2.2. Net Profit Ratio 310
TABLE – 5.2.3. Return on Capital Employed 311
TABLE – 5.3.1. Inventory Turnover Ratio 312
(xviii)
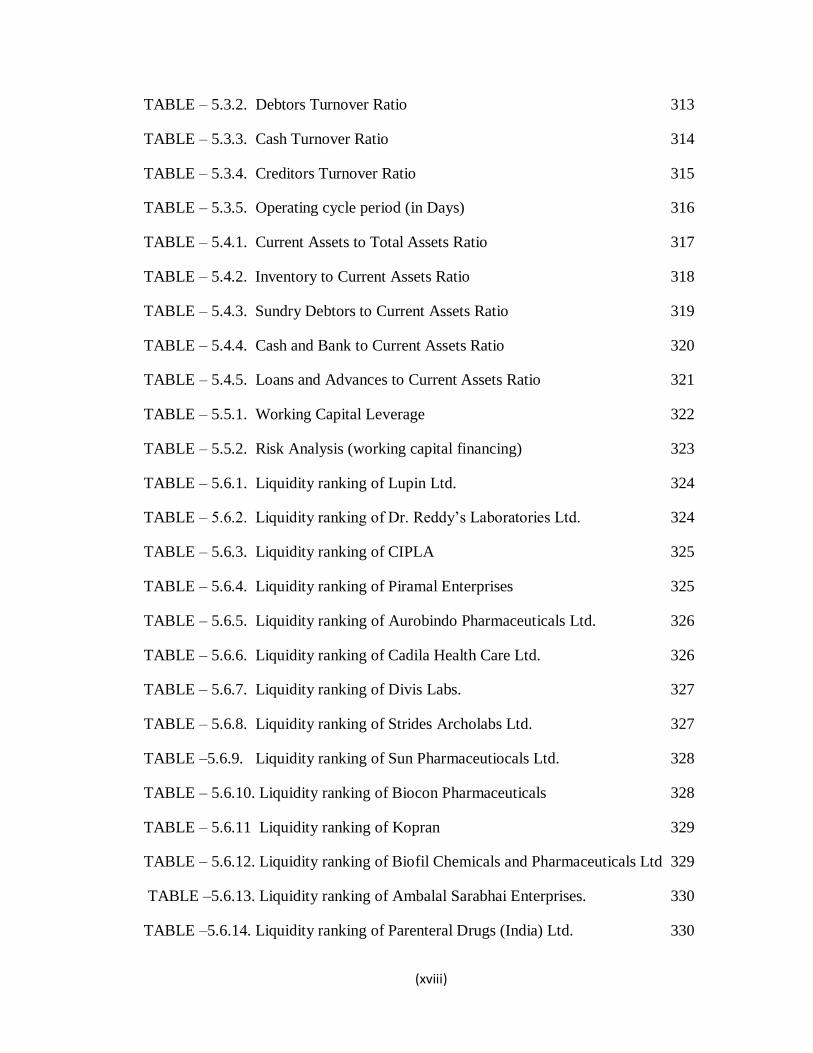
TABLE – 5.3.2. Debtors Turnover Ratio 313
TABLE – 5.3.3. Cash Turnover Ratio 314
TABLE – 5.3.4. Creditors Turnover Ratio 315
TABLE – 5.3.5. Operating cycle period (in Days) 316
TABLE – 5.4.1. Current Assets to Total Assets Ratio 317
TABLE – 5.4.2. Inventory to Current Assets Ratio 318
TABLE – 5.4.3. Sundry Debtors to Current Assets Ratio 319
TABLE – 5.4.4. Cash and Bank to Current Assets Ratio 320
TABLE – 5.4.5. Loans and Advances to Current Assets Ratio 321
TABLE – 5.5.1. Working Capital Leverage 322
TABLE – 5.5.2. Risk Analysis (working capital financing) 323
TABLE – 5.6.1. Liquidity ranking of Lupin Ltd. 324
TABLE – 5.6.2. Liquidity ranking of Dr. Reddy’s Laboratories Ltd. 324
TABLE – 5.6.3. Liquidity ranking of CIPLA 325
TABLE – 5.6.4. Liquidity ranking of Piramal Enterprises 325
TABLE – 5.6.5. Liquidity ranking of Aurobindo Pharmaceuticals Ltd. 326
TABLE – 5.6.6. Liquidity ranking of Cadila Health Care Ltd. 326
TABLE – 5.6.7. Liquidity ranking of Divis Labs. 327
TABLE – 5.6.8. Liquidity ranking of Strides Archolabs Ltd. 327
TABLE –5.6.9. Liquidity ranking of Sun Pharmaceutiocals Ltd. 328
TABLE – 5.6.10. Liquidity ranking of Biocon Pharmaceuticals 328
TABLE – 5.6.11 Liquidity ranking of Kopran 329
TABLE – 5.6.12. Liquidity ranking of Biofil Chemicals and Pharmaceuticals Ltd 329
TABLE –5.6.13. Liquidity ranking of Ambalal Sarabhai Enterprises. 330
TABLE –5.6.14. Liquidity ranking of Parenteral Drugs (India) Ltd. 330
(xix)
TABLE –5.6.15. Liquidity ranking of Sequent Scientific Ltd 331
TABLE –5.6.16. Liquidity ranking of Zenotech Laboratories Ltd. 331
TABLE –5.6.17. Liquidity ranking of Marksans Pharma Ltd. 332
TABLE –5.6.18. Liquidity ranking of Wanbury Ltd. 332
TABLE –5.6.19. Liquidity ranking of Morepen Labs. 333
TABLE – 5.6.20. Liquidity ranking of Hiran Orgochem Ltd. 333

1
CHAPTER-1
INTRODUCTION
1.1. Meaning of working Capital Management:
Working Capital consists of that portion of the assets of a business, which are used, in
current operations. It includes receivables, inventories or raw materials, stores, work-in-
progress and finished goods, merchandise, bill receivable and cash.
There are two concepts of working capital, Gross concept and Net Concept. Gross
working capital refers to total current assets. This concept is also known as quantitative
concept and the net concept refers to the difference between current assets and current
liabilities. Working Capital can be positive or negative (positive is net working capital
and negative is deficit working capital.)
1.2. Objectives of Working Capital Management
The aim of working capital management is to manage a firm's current assets e.g. debtors,
receivables, cash in hand, cash at bank, stock etc. and firm's current liabilities viz.
creditors, bills payable etc. in best possible manner. If it does not maintain it in good
manner, it is likely to become insolvent and may also become bankrupt. The current
assets should be large enough to cover current liabilities in order to ensure a reasonable
margin of safety. Each of the current assets must be managed efficiently in order to
maintain the liquidity of a concern while not keeping too high level of any one of them so
that the cost increases. Each of short term sources of finance must be continuously
manageable to ensure that they are obtained and used in the best possible way. Proper
management of working capital is very important for the success of a concern. "It aims at
protecting the purchasing power of assets and maximizing the return on investment."
The management of working capital also helps the management in evaluating various
existing or proposed financial constraints and financial offerings. All these factors clearly
indicate the importance of working capital of an enterprise. It has been emphasized that a
firm should maintain a sound working capital position and that there should be optimum
investment in working capital. Thus, there is a great need to manage working capital
2
adequately. Small firms may not have much investment in fixed assets, but they have to
invest in current assets such as cash, debtors and inventories. Further, the role of current
liabilities in financing current assets is far more significant in case of small firms, as
unlike large firms, they face difficulties in raising long-term finances. There is great
relationship between sales and working capital needs. As sales grow, a firm needs to
invest more in inventories and book debts. These needs become very frequent and fast
when sales grow continuously. Continuous growth in sales may also require additional
investment in fixed assets but they do not indicate the same urgency as displayed by
current assets.
1.3. Nature of Pharmaceutical Industry
The pharmaceutical industry has been one of the successful industries in India. The
reasons are many good quality essentials drugs are available at affordable prices to the
vast population of the country. The Indian pharmaceutical companies are competing with
some of the best companies in the global market, cost of drugs ranges from 5% to 50%
less as compared to the developed countries and third largest in the world in terms of
volume and 14th in terms of value. The industry is capital intensive and intellectual in
nature. The March‟12 estimates sales from pharmaceuticals to go from 11 billion US $
currently to 74 billion US $ by 2020. The increasing population of the higher income
group in the country will open a potential US $ 8 billion market by 2015. Besides this,
the report said that the domestic pharmaceutical market is likely to touch 20 billion by
2015, making India a lucrative destination for clinical trials for global giants.
The accelerated growth over the year has been fuelled by exports to more than 200
countries with a sizable share in the advanced regulated markets of U.S. and Western
Europe. 40 % of the world‟s active ingredient requirement is met by India.
Pharmaceutical industry in India ranks very high in terms of technology, quality and
range of medicines manufactured. Many different medicines varieties are now made
domestically by Indian industries. The industry has made significant progress in creation
of infrastructure, meeting global needs for supply of quality medicines and active
3
pharmaceutical ingredients as also entering into the opportune area of „Contract Research
And Manufacturing‟(C.R.A.M) and clinical trials.
In the present day context of rising capital cost and scars funds, the importance of
working capital needs special emphasis. It has been widely accepted that the profitability
of a business concern likely depends upon the manner in which working capital is
managed. On the other hand, proper management of working capital leads to a material
savings and ensures financial returns at the optimum level even on the minimum level of
capital employed. We also know that both excessive and inadequate working capital is
harmful of a firm. There are many instances of a business failure for inadequate working
capital. Further working capital has to play a vital role to keep pace with the scientific
and technological developments that are taking place in the concerned area of
pharmaceutical industry. On study it is found that the pharmaceutical companies are
maintaining current assets at a level which is eight times of its current liabilities on an
average. It is also observed that fifty percent of the total assets, on an average, were
invested in current assets. Inventory and debtors are the major components of working
capital in terms of value of the pharmaceutical companies in India. Under the
circumstances, if new ideas, methods and techniques are not been injected or brought into
practice for want of working capital, the companies certainly not able to face competition
and survive. In this context working capital management has a special relevance and a
thorough investigation regarding working capital practice in the pharmaceutical industry
is of utmost importance. An attempt has therefore been made to undertake an in depth
study on working capital management of selected pharmaceutical companies in India.
1.4. Objectives of the study
The main objective is
1. To assess the performance of working capital management of some selected
pharmaceutical companies in India.

4
To attain the main objective, the following objectives are to be attained:
1. To make component wise analysis of working capital of the selected companies.
2. To assess the relative significance of various sources of financing of working
capital.
3. To analyze the liquidity position of the selected companies.
4. To analyse the profitability position of the selected companies.
5. To analyse the efficiency position of the selected companies.
6. To analyse the impact of liquidity and efficiency on profitability of the companies
under study.
1.5. Study period
The study have been covered a period of fifteen years starting from the financial
year 1999-2000 to 2013-2014. The financial year starts from 1st day of April
every year and ends on 31st March of the next year.
1.6. Selection of the samples
The average net profit of pharmaceutical companies listed in BSE, have been
calculated. Twenty pharmaceutical companies have been selected out of total
pharmaceutical companies, enlisted in BSE, of which, ten were chosen from top
(all were profit making) and remaining ten were chosen from the bottom (all were
incurring losses).
The top ten profit making companies are:
1. Lupin Ltd.
2. Dr. Reddys‟ Laboratories Ltd.
3. CIPLA
4. Piramal Enterprises
5. Aurobindo Pharmaceuticals Ltd.
6. Cadila Health Care Ltd.
7. Divis Labs.

5
8. Strides Archolabs Ltd.
9. Sun Pharmaceutiocals Ltd.
10. Biocon Pharmaceuticals
Selected Ten loss making companies are:
1. Kopran
2. Biofil Chemicals and Pharmaceuticals Ltd.
3. Ambalal Sarabhai Enterprises.
4. Parenteral Drugs (India) Ltd.
5. Sequent Scientific Ltd
6. Zenotech Laboratories Ltd.
7. Marksans Pharma Ltd.
8. Wanbury Ltd.
9. Morepen Labs.
10. Hiran Orgochem Ltd.
1.7. Chapter plan
To assess the working capital management of some selected pharmaceutical companies in
India, the chapter plan is made as following:
Chapter 1 : Introduction
Chapter 2 : Literature Survey
Chapter 3 : Database and methodology
Chapter 4 : Assessment of working capital management of some selected
Pharmaceutical companies from economic point of view.
Chapter 5 : Assessment of working capital management of some selected
Pharmaceutical companies from accounting point of view.
Chapter 6 : Summary and Conclusions.
Bibliography
6
CHAPTER-2
DATABASE AND METHODOLOGY
To assess the working capital performance of the selected companies, secondary data had
been collected and used.
2.1. Sources of Data, Sample profile and Sample Size Determination:
2.1.1. Sources of Data:
Secondary data on different items like Inventory, Debtors, Bills Receivable, Cash in
hand , Cash at bank , Sundry creditors, Bills payable , Gross Working Capital, Net
Working Capital, blocking period of each components of Current Assets, Gross Profit,
turnover etc. of the selected pharmaceutical companies had been collected from published
annual reports. Besides these annual reports, the statistical hand book, published by the
Govt. of West Bengal had been collected to get the CPI values and different websites had
been used.
2.1.2. Sample Profile:
2.1.2.1. LUPIN Ltd.
Lupin Pharmaceuticals is among the top five pharmaceutical companies in India. Lupin
Pharmaceuticals is dedicated to delivering high-quality, branded and generic medications
trusted by healthcare professionals and patients across geographies. It‟s headquarter is in
Mumbai, India, the company is strongly research focused. It has a program for
developing New Chemical Entities. The company has a state-of-the-art R&D center in
Pune and is a leading global player in Anti-TB, Cephalosporins (anti-infectives) and
Cardiovascular drugs (ACE-inhibitors and cholesterol reducing agents) and has a notable
presence in the areas of diabetes, anti-inflammatory and respiratory therapy. The
company has been earning profit since 1999-2000 continuously. For the financial year
ended 31st March 2014, Lupin's Consolidated turnover and Profit after Tax were Rs.
8939.38 crore and Rs. 2324.22 crore respectively.
7
2.1.2.2. Dr Reddy's Laboratories
Dr Reddy's Laboratories is a 32–year old company catering to the needs of the
pharmaceutical sector. Dr Reddy's started its operation in 1984 in the Active
Pharmaceutical Ingredients (API) segment, with a single drug in 60 tonne facility
near Hyderabad. Dr Reddy's, a global pharmaceutical company, has its headquarters
located in India. It has a global presence in more than 100 countries, representative
offices in 16 countries and third–party distribution set ups in 21 countries. It is first
pharmaceutical company in Asia, outside Japan, to be listed on the NYSE. It is largest
player in the custom pharmaceutical services (CPS) business in India. The company has
been earning profit from 1999-2000 continuously. For the financial year ended 31st
March 2014, the Consolidated turnover and Profit after Tax of the company were Rs.
9728 crore and Rs. 1932.80 crore respectively.
2.1.2.3. CIPLA
Cipla Limited is a pharmaceutical company. The Company's business units include
Active Pharmaceutical Ingredients (APIs), Respiratory and Cipla Global Access. The
Company offers APIs, formulations and veterinary products. As of March 31, 2015, the
Company offered its services across five continents across the world. It offers its services
in India, South Africa, Europe and North America, among others. The Company offers
over 1,000 products across about 120 countries. The company has been earning profits
from 1999-2000. For the financial year ended 31st March 2014, the Consolidated
turnover and Profit after Tax of the company were Rs. 9380.29 crore and Rs. 1388.34
crore respectively.
2.1.2.4. Piramal Enterprises
Piramal Enterprises Limited, an Indian-based company is focused on pharmaceutical
business, financial services and information management. The information management
segment is a provider of syndicated research, information and analytics to the healthcare
industry. The company has been earning profits from 1999-2000 till date except in 2012-
2013 & 2013-2014. For the financial year ended 31st March 2014, the Consolidated
8
turnover and Profit after Tax of the company were Rs. 1843.14 crore and Rs. (-) 370
crore respectively.
2.1.2.5. Aurobindo Pharmaceuticals
Aurobindo Pharma Limited (Aurobindo) is an India-based pharmaceutical company. The
Company is engaged in producing oral and injectable generic formulations and active
pharmaceutical. Aurobindo also manufactures and commercializes active pharmaceutical
ingredients (APIs) and generic finished dosages for various markets. The company is a
profit making company
2.1.2.6. Cadila Health Care Ltd
Cadila Healthcare Limited is an India-based pharmaceutical company. The Company's
subsidiaries include Zydus Wellness Limited, Liva Pharmaceuticals Limited, Biochem
Pharmaceutical Industries Limited, Zydus Technologies Limited, German Remedies
Limited, Dialforhealth India Limited, Dialforhealth Unity Limited and Dialforhealth
Greencross Limited, among others. The reported net profit of the company was 903 crore
against sales turnover during 2013-2014.
2.1.2.7. Divi's Laboratories Limited
Divi's Laboratories Limited is engaged in the manufacturing of generic active
pharmaceutical ingredients (APIs), custom synthesis of active ingredients for companies,
other specialty chemicals and nutraceuticals. The Company exports its products to
European and the American countries. The Company's main manufacturing and research
and development facilities are located in the state of Andhra Pradesh and Telangana,
India. The Company operates in India and other countries. The Company has two
subsidiaries, which include Divis Laboratories (USA) Inc. and Divi's Laboratories
Europe AG. It is a profit making company during the study period. For the financial year
ended 31st March 2014, the Consolidated turnover and Profit after Tax of the company
were Rs. 2513.97 crore and Rs. 791.72 crore respectively.

9
2.1.2.8. Strides Arcolab
Strides Arcolab is an Indian pharmaceutical company with a key focus on development
and manufacture of IP-led niche generics and bio-pharmaceuticals. It is also among the
world's largest manufacturers of specialty soft gelatin capsules. With world-class
manufacturing facilities, an innovative R&D hub in Bangalore and a strong commercial
platform to market branded and commodity generics globally, Strides has earned a
reputation for building and scaling profitable businesses in a short span of time. During
2013-2014, the company‟s reported net profit was 3512.93 crore.
2.1.2.9 Sun Pharmaceuticals
Sun Pharmaceutical is an India-based generic and pharmaceutical company. The
Company's business segments include US Business, which includes Western Europe,
Canada, Australia, New Zealand and Other Markets; Indian Branded Generics Business,
including Global Consumer Healthcare Business, and Emerging Markets, which include
Active Pharmaceutical Ingredients (APIs). The company is a profit making company
during the study period except in 2013-2014. The reported net loss of the company was
2828.52 crore in 2013-2014.
2.1.2.10. Biocon Pharmaceuticals
Biocon Limited is a biopharmaceutical company, which is engaged in the manufacture of
pharmaceuticals, medicinal chemical and botanical products. The Company operates
through two segments: active pharmaceutical ingredients (Pharma), and contract research
and manufacturing services (Contract Research). It is engaged in manufacture of
biotechnology products for the pharmaceutical sector. The Company is engaged in
research and development in the biotechnology sector. It offers a portfolio of bio similar
insulins, recombinant proteins and monoclonal antibodies. In 2013-2014, the reported
turnover and reported net profit of the company was 2202 crore and 329.90 crore
respectively.

10
2.1.2.11. Kopran
Kopran Limited is a pharmaceutical company. The Company manufactures active
pharmaceutical ingredients (APIs) and finished dosage forms. It operates through the
segments: Pharmaceutical and Consumer Care Division. Its business units include
Finished Dosage Forms, Active Pharmaceutical Ingredients, Research and Development,
and Consumer Healthcare. It offers its products in the therapeutic categories, In addition,
it offers oral care, lifestyle, beauty and personalized hygiene products. In most of the
years of the study the company had incurred losses and in the recent years of the study,
the reported net profit was 17.04 crore.
2.1.2.12. Biofil Chemicals and Pharmaceuticals Ltd.
Biofil Chemicals & Pharmaceuticals Ltd. is engaged in manufacturing pharmaceutical
products. The company offer antibiotics, anti-analgesics, diuretics, antimalarial vitamins,
antacids, and anti-inflammatory therapeutics. Biofil Chemicals & Pharmaceuticals Ltd. is
based in Indore, India. The company was incorporated in 1985. It is a loss making
company. In 2013-2014, the net profit of the company was 0.52 crore.
2.1.2.13. Ambalal Sarabhai Enterprises.
Ambalal Sarabhai Enterprises Limited is an India-based holding company. The Company
is engaged in the business of manufacturing, trading and dealing in the pharmaceuticals.
The Company is also engaged in the manufacturing of drugs, formulations, electronics
instruments and services. The Pharmaceuticals segment is engaged in manufacture of
drugs and formulations. The Company offers its drug and pharmaceutical formulations in
the form of injectable, liquids, ointments, powders, tablets, capsules and others. The
Company's plant is located at Ranoli village, Vadoda. In most of the years, the company
had been incurring losses.
2.1.2.14. Parenteral Drugs (India) Ltd.
Parenteral Drugs (India) Limited is an India-based healthcare company. The Company is
principally engaged in the business of pharmaceutical. PDPL is engaged in research,
production and manufacturing of pharmaceutical products include intravenous infusion,

11
tablets, capsules, liquids syrups and injections. The Company has manufacturing facilities
located in Madhya Pradesh, Himachal Pradesh, Punjab and Goa, India, as well as
overseas in countries, such as Mauritius, Nairobi and Kazakhstan. The reported net profit
of the company was very low and in 2013-2014, the company had a net loss of Rs 58.70
crore.
2.1.2.15. Sequent Scientific Ltd
Sequent Scientific Limited is a pharmaceutical company. The Company operates in the
domains of animal health (active pharmaceutical ingredients (APIs) and finished dosage
formulations), human health (APIs) and analytical services. It services the API,
pharmaceutical, personal care and nutraceutical companies in analytical and bio-
analytical services.
2.1.2.16. Zenotech Laboratories Ltd.
Zenotech Laboratories Limited (Zenotech) is an India-based pharmaceutical company.
The Company is engaged in a business of manufacture and trading of pharmaceuticals
products. The Company operates in India. The reported turnover and loss of the company
were 340.96 crore and 114.42 crore respectively.
2.1.2.17. Marksans Pharma Ltd.
Marksans Pharma Limited is an India-based holding company. The Company is a
pharmaceutical company, which is engaged in the research, manufacturing and marketing
of generic pharmaceutical formulations. The Company manufactures products for
segments, such as pain management, cough and cold, diabetes, cardiovascular, central
nervous system, antibiotics, gastrointestinal, anti-allergic and oncology. The Company is
engaged in research and development, and offers contract research and manufacturing
services to global pharmaceutical companies. The company has been incurring losses in
most of years, starting from 1999-2000.
12
2.1.2.18. Wanbury Ltd.
Wanbury Limited, one of India‟s fastest growing pharmaceutical companies amongst the
„Top 50 Companies‟ in India (as per ORG-IMS), has a strong presence in API global
market and domestic branded Formulation. Wanbury‟s major thrust area lies in Active
Pharmaceutical Ingredient (API) sale in over 70 countries and Pan-India Formulation
presence.
2.1.2.19. Morepen Labs.
Morepen Laboratories Limited is an India-based pharmaceutical company. The Company
operates through four segments; they are Active Pharmaceutical Ingredients (API),
Domestic Formulations, Diagnostics and Over the Counter (OTC). The Company has 3
manufacturing facilities, for manufacture of API, formulations and OTC products with
international standings. It is also a loss making company.
2.1.2.20. Hiran Orgochem Ltd.
Hiran Orgochem Limited manufactures active pharmaceutical ingredients (APIs) and
formulations. The Company is engaged in dealing in APIs drugs. The Company operates
through two segments: Pharmaceuticals and Construction. The Pharmaceuticals segment
consists of manufacture and trading of pharmaceutical intermediates and chemicals. It is
manufacturing the Quinolones group of APIs. The company has been facing losses in
most of the years of the study.
2.1.3. Sample Size Determination:
The average net profit for fifteen years (1999-2000 to 2013-2014) of pharmaceutical
companies enlisted in BSE had been calculated for sample selection. Twenty
pharmaceutical companies have been selected out of total pharmaceutical companies,
enlisted in BSE, of which, ten were chosen from top (all were profit making) and
remaining ten were chosen from the bottom (all were incurring losses). The top ten profit
making companies are 1) Lupin Ltd. 2) Dr. Reddys‟ Laboratories Ltd. 3) CIPLA, 4)
Piramal Enterprises, 5) Aurobindo Pharmaceuticals Ltd, 6) Cadila Health Care Ltd.
7) Divis Labs. 8) Strides Archolabs Ltd. 9) Sun Pharmaceutiocals Ltd. 10) Biocon
13
Pharmaceuticals where as selected ten loss making companies are: 1) Kopran 2) Biofil
Chemicals and Pharmaceuticals Ltd. 3) Ambalal Sarabhai Enterprises. 4) Parenteral
Drugs (India) Ltd. 5) Sequent Scientific Ltd 6) Zenotech Laboratories Ltd. 7) Marksans
Pharma Ltd. 8) Wanbury Ltd. 9) Morepen Labs. and 10) Hiran Orgochem Ltd.
2.2. Methodology:
Entire secondary data of the selected companies relating to working capital had been
analysed from two broad angles, Economic Point of view and Accounting Point of view.
To assess the Working Capital Management of some selected pharmaceutical companies
from economic angle, trend analysis of different components of working capital as well
as net working capital as a whole had been done. After necessary adjustments in the data
sets, the growth rates of different components of working capital of the selected
pharmaceutical companies had been estimated both in nominal and real terms from the
estimated coefficients of the chosen trend equation. The growth rates had been directly
measured from the estimated co-efficient of „t‟ (i.e. time) in case exponential and log
quadratic (with normalization of time i.e. shifting the origin to the mid-point of the time
period ) trend equations or the models used to estimate the growth rates of different
performance indicators are (i) Log yt=a+bt; (ii) Logyt= a+bt+ct2, where yt is the variable
whose over time growth is measured and t is the time variable. Log implies natural
logarithm (loge) and all others (a, b, c) are the parameters to be estimated.
The growth rates, expressed in percent per annum, the trend lines fitted to the time series
of the performance indicators give goodness of fits. Further, from the values of DW
statistic, the disturbance term suffer from auto-correlation problem had been measured.
Besides this, I had calculated mean values, standard deviation in order to measure the
extents of fluctuations or variation about the mean values of the financial variables.
To assess the Working Capital Management of some selected pharmaceutical companies
from accounting angle, ratio analysis had been done on different performance parameters.
Ratio is a number which expresses the relationship between two variables. In this study
ratio analysis include
14
1. Liquidity analysis,
2. Profitability analysis,
3. Efficiency analysis,
4. working capital financing analysis
5. Component wise analysis of working capital
In liquidity analysis, I had judged the short term solvency of the selected companies.
Liquidity analyses include current ratio, quick ratio and absolute liquid ratio. These were
calculated as follows:
1. Current Ratio (CR): It expresses the relation of the amount of current assets to
the amount of current liabilities. It had been calculated by dividing current assets
to current liabilities. Current assets include Inventories, Trade Receivables and
Cash and Bank balance. The Current Liabilities includes mainly Trade Payables.
It is a traditional measure used in ascertaining the ability of a firm to meet its
short-term obligations. The higher the current ratio, the larger is the amount
available per rupee to meet short-term obligations and the greater is the security
available to the creditors. Traditionally a current ratio of 2:1 is considered
satisfactory for a firm and it is taken to represent a good short-term solvency
position.
2. Quick Ratio (QR): This ratio is a more rigorous measure of liquidity as
compared to the current ratio. It is a refinement of current ratio as it excludes non
liquid current assets such as inventories, prepaid expenses etc from the total
current assets. This ratio has been calculated by dividing the liquid assets by
liquid liabilities. Liquid liabilities had been calculated by subtracting the bank
overdraft from the entire current liabilities. Thus by using it, the liquidity of a
company can be judged more precisely. Conventionally, a quick ratio of 1:1 is
considered as satisfactory. In other words, if a company has quick ratio of at least
100 percent it is considered to be in a fairly good liquidity condition.
3. Absolute Liquid Ratio (ALR): This ratio is known as super quick ratio or cash
position ratio. The ratio is useful only when used in conjunction with current ratio
and quick ratio. It expresses the relation of the amount of absolute liquid assets to
15
the amount of current liabilities. The absolute liquid assets are computed by
subtracting accounts receivables from its liquid assets. The accounts receivables
are excluded from the liquid assets on the ground that there may be some doubt
about their quick collection. The Current Liabilities includes mainly Trade
Payables excluding bank overdraft. It is a traditional measure used in ascertaining
the ability of a firm to meet its immediate obligations. The higher the absolute
liquid ratio, the larger is the amount available per rupee to meet immediate
obligations and the greater is the security available to the creditors. Traditionally
an absolute liquid ratio of 0.5:1 is considered satisfactory for a firm and it is taken
to represent a good spot payment position and it is taken as accepted conventional
standard.
In Profitability analysis I had judged the profitability position of the selected
companies. Profitability ratios include the following:
1. Gross Profit margin ratio: It has been calculated dividing gross profit by net
sales and multiplied by 100. This can be expressed as
Gross Profit
Gross Profit Margin Ratio =
Net sales
Gross profit is the profit in sales after deducting all the trading expenses like the cost of
raw materials, the direct expenses on purchases, excise duty, etc.
Gross Profit margin is an indicator of the percentage of sales revenue which is above the
cost. For making a pricing decision this margin can be utilized for decreasing the price.
Theoretically it can be said that the price of a product can be decreased maximum up to
the extent of gross profit margin, decrease in price up to this margin would give the firm
enough revenue to continue the operations. The more is the gross profit margin, the more
is the strength to meet competition in the competitive market.
2. Net Profit Margin Ratio: The net profit margin, also known as net margin,
indicates how much net income a company makes with total sales achieved. It has
been calculated as dividing net profit by net sales and multiplied by 100. This can
be expressed as
X 100
16
Net Profit
Net Profit Margin Ratio =
Net sales
A higher net profit margin means that a company is more efficient at converting sales
into actual profit. With net profit margin ratio all costs are excluded to find the final
benefit of the income of a business. It measures how successful a company has been at
the business of making a profit on each rupee sales. It is one of the most essential
financial ratios. Net profit margin includes all the factors that influence profitability
whether under management control or not. The higher the ratio, the more effective a
company is at cost control.
3. Return on Capital Employed (ROCE): Return on Capital Employed or ROCE
is a profitability ratio that measures how efficiently a company can generate
profits from its capital employed by comparing net operating profit to capital
employed.
It has been calculated as dividing operating profit by capital employed and
multiplied by 100. This can be expressed as
Operating Profit
Return on capital employed =
Capital employed
Capital employed has been calculated by adding fixed assets to net working
capital. Net working capital has been calculated by subtracting current liabilities
from current assets. This ratio is based on two important calculations: Operating
Profit and capital employed. Return on capital employed shows investors how
many rupees in profits in each rupees of capital employed generates. Return on
capital employed is long term profitability ratio because it shows how effectively
assets are performing while taking into consideration long term financing. This is
why return on capital employed is a more useful ratio than return on equity to
evaluate longevity of a company. Capital employed is a fairly convoluted term
because it can be used to refer to many different financial ratios. A higher return
on capital employed ratio will be more preferable because it means that more
rupees of profits are generated by each rupees of capital employed.
X 100
X 100
17
In efficiency analysis I had judged the management efficiency of current assets and
current liabilities of the selected companies. Efficiency ratios include:
1. Inventory Turnover Ratio (ITR): This ratio measures the efficiency of
inventory management of a firm. It is computed dividing cost of goods sold by
average inventory maintained during the year. The average inventory had
calculated as half of the total of opening and closing inventory in a year. If the
inventory is efficiently managed, it will help in enhancing the liquidity of the
firm. It also indicated the managerial efficiency. A high Inventory turnover ratio
indicates more frequently the stock are sold which implied less amount is blocked
in inventory , resulting a high level of efficiency in inventory management and it
is good from the liquidity point of view whereas a low ratio implies excessive
inventory levels than warranted by volume of operation. Higher inventory
turnover ratio, lesser the working capital requirement and vise versa.
2. Debtors Turnover Ratio (DTR): Debtors turnover ratio highlights credit and
collection policy pursued by a firm. It is calculated dividing credit sales by
average debtors. An average debtor is the half of opening debtors and closing
debtors. The quality of debtors influences the liquidity of a firm. It tests the speed
with which debtors are converted into cash. The liquidity of a firm is directly
influenced by this speed. Thus, debtors‟ velocity indicates the efficiency of
receivables management in a company. A high Debtors turnover ratio reflects the
promptness of debtors‟ collectivity i.e. smooth flow of liquidity and a low Debtors
turnover ratio indicates longer average collection period i.e. shrinkage of liquidity
and also proves inefficiency in credit management.
3. Cash Turnover Ratio (CTR): This ratio measures how many times per year it
replenishes its cash balance with its sales revenue. It measures the efficiency of
cash management. High cash turnovers mean that a company is going through its
cash cycles quickly. The higher CTR, the higher is the efficiency of cash
management and vice-versa. A higher cash turnover ratio is generally better than
a lower one.
4. Working Capital Turnover Ratio (Operating Cycle Period): It is known as
cash conversion cycle. Operating cycle is the no. of days a company takes in

18
realizing its inventories in cash. It equals the time taken in selling inventories plus
the time taken in recovering cash from trade receivables. It is called Operating
Cycle because this process of producing / purchasing inventories, selling them,
recovering cash from customers, using that cash to purchase / produce inventories
and so on is repeated as long as the company is in operations.
Net Operating Cycle = Days Inventory Outstanding (+) Days Sales Outstanding
(-) Days Payables Outstanding.
Operating Cycle is a measure of operating efficiency and working capital
management of a company. A short operating cycle is good as it tells that the
company‟s cash is tied up for a shorter period. A longer operating cycle tells that
the company‟s cash is blocked for a long period which is not good for the
company.
5. Creditors Turnover Ratio: It highlights credit and payment policy pursued by a
firm. It is calculated dividing credit purchase by average creditors. An average
creditors is the half of opening creditors and closing creditors. The quality of
creditors influences the liquidity of a firm. It tests the speed with which cash are
being paid to creditors. The liquidity of a firm is directly influenced by this speed.
Thus, creditors‟ velocity indicates the efficiency of payables management in a
company. A high creditors turnover ratio reflects the promptness of creditors‟
payment i.e. shrinkage of liquidity and also proves inefficiency in credit
management and a low creditors turnover ratio indicates longer average payment
period i.e. high liquidity.
In component wise analysis of working capital, all the components of working
capital had been considered. These includes Inventory, debtors, cash, loans and
advances and creditors were expressed as percentage of total current assets and the
following ratios had been considered:
1. Current assets to total assets ratio: it is computed dividing current assets by
total assets. It indicates the extent of total funds invested for the purpose of
working capital and throws light on the importance of current assets of a firm.
Total assets include fixed assets and current assets as a whole taken together.
19
Fixed assets include net block in fixed assets, capital work in progress and
investment. Current assets include inventories, sundry debtors, cash and its
equivalent and loans and advances. It should be worthwhile to observe that how
much of that portion of total assets is occupied by the current assets, as current
assets are essentially involved in forming working capital and also take an active
part in increasing liquidity. Thus, this ratio should not be so large to ignore the
application of the funds in fixed assets. Also care should be taken that principal
investment of the firm should be in the operating items. This key ratio is
important from the view point of liquidity. The higher CATA, the higher is
liquidity and vice-versa.
2. Inventory to total current assets ratio: Inventory to Current Assets Ratio is
calculated dividing inventory by total assest. It defined as what portion of a
company‟s inventories is financed from its available cash, is essential to business
which hold inventory and survive on cash supplies. It is an indicator of a
company‟s efficiency. In general, the lower the ratio, the higher the liquidity of a
company is. A low value of inventory to current assets ratio means that the
company is carrying low level of inventory in stock which is the indicator of high
liquidity. However, it is indicated insufficient inventories which may affect the
production at the time of emergency. A high value of Inventory to Current Assets
Ratio means that the company is carrying too much inventory in stock. It is not
favorable for management because excessive inventories can place a heavy
burden on the cash resources of a company. Effective inventory management is
essential. The goal is to have enough Inventories to complete orders. Excessive
inventory creates additional costs such as paying for storage space and inventory
spoilage. A key issue for a company to improve its operation efficiency is to
identify the optimum inventory levels and thus minimize the cost tied up in
inventories.
3. Debtor to total current assets ratio: It indicates sundry debtors as total current
assets and throws light on the importance of sundry debtors of a firm. Accounts
receivables must be collected in a timely manner. The sooner company received
the money owed, the sooner it can be re-invested to earn a profit. It should be

20
worthwhile to observe that how much of that portion of current assets is occupied
by the sundry debtors as debtors are essentially involved in forming working
capital and also take an active part in increasing liquidity. Funds that are
employed in the business carry opportunity cost. Hence, if this ratio is very high,
it means that credit policy of the company may not be sound; too much money
was locked up in the debtors. If the money were not locked up in debtors, it could
have been invested elsewhere to earn a return or may have been repaid to the
financier. Higher the ratio, higher is the cost of carrying debtors. It is, therefore,
desired that a company need to carry the least percentage of debtors as possible
without affecting the sales volume. The lower the ratio, the higher is the liquidity
and vice – versa.
4. Cash to total current assets ratio: It indicates cash as total current assets and
throws light on the importance of cash of a firm. It measures the liquidity of a
company. A high and increasing cash to current assets ratio generally a positive
sign, showing the company‟s most liquid assets represent a larger portion of its
current assets. A high volume of cash and cash equivalent means that the cash are
idle which involved opportunity income forgone. Low cash to current assets may
give better result but it has another affect to liquidity of the company. Therefore,
both high and low value of cash to current ratio is not expected. The company
should find an optimum level of cash to current assets.
5. Loans and advances to total current assets ratio: Loans and advances of
pharmaceutical companies includes Loans and advances to related parties,
Security deposit, Advance payment of Income Tax, Mat Credit Entitlement,
Balance with govt. authorities(draw backs, custom duties receivables), loans to
employee benefit trust, loan to employee and other loans and advances. It
indicates loans and advances as total current assets and throws light on the
importance of loans and advances of a firm. It measures the liquidity of a
company. A high and increasing loans and advances to current assets ratio
generally a positive sign, showing the company‟s most liquid assets represent a
larger portion of its current assets. A high volume of loans and advances means
that the loans and advances which involved opportunity income forgone. Low
21
loans and advances to current assets may give better result but it has another
affect to liquidity of the company. Therefore, both high and low value of loans
and advances to current assets ratio is not expected.
To analyse the working Capital financing strategy of the selected pharmaceuticals
companies, Working Capital Leverage and Trade off between Risk and Profitability had
been taken into consideration.
1. Working capital leverage: It measures the sensitivity of operating profit due to
variability in the level of working capital (gross) with the help of computing the
working capital leverage of the company for all years under study. The formula
used for calculating the working capital leverage is:
WCL= WC/ (TA + CWC), where WCL= working capital leverage, WC=
Working Capital investment, TA= Total Assets Investment and CWC= Change in
working Capital Investment. In computing the WCL it has been assumed that the
change in working capital investment in the previous year will be maintained in
the current year also. The higher the degree of WCL, the greater is the risk and
vice versa. But at the same time, it increases the possibility of higher ROI.
2. Trade off between risk and profitability: Tradeoff between risk and
profitability can be made by calculating the risk factor. The analysis can be done
through which it can be said about the policies adopted while managing the
working capital of the company, Risk factor had been calculated. Risk factor can
be calculated through the following formula:
(Ej + Lj) - Aj
Rk =
Cj
Where, Rk = Risk factor, E j= Equity + Retained Earnings, Lj = Long term Loans, Aj =
Fixed Assets, Cj = Current Assets
The above formula helps to know about the financing of the current assets through long
term funds after fixed assets are financed in full. Based on the above formula, following
inferences can be drawn:
22
1. Value of R is zero or less would mean that the firm is using the aggressive
policy and normally the profitability would be high.
2. Value of R is 1 or close to 1 would mean that the firm is using a conservative
policy and the profitability would be low.
Under aggressive policy the firm opts for a lower level of working capital thereby
investing in current assets at lower proportion to total assets. When a firm adopts
this policy, the profitability is high but at higher risk of liquidity. In case of
conservative policy, the firm adopts a conservative approach of having high
proportion of working capital. The profitability is relatively low as the return on
current assets is normally less. But ensuring good liquidity as the risk of meeting
current obligations is reduced.
Motaal Liquidity Test: To determine the liquidity position of the selected companies
more precisely, a comprehensive test known as Motaals test has been done. In this test,
Inventory to Current Assets ratio, Debtors to Current Assets ratio, Cash and bank to
Current Assets ratio and Loans and Advances to Current assets ratio (each expressed as a
fraction) are taken into consideration. For Inventory to Current assets ratio, lower the
ratio, the more favorable is the liquidity position and vice versa; ranking has been done
accordingly. For Debtors to Current Assets ratio, Cash and bank to Current Assets ratio
and Loans and Advances to Current Assets ratio, higher the ratio, the more favorable is
the position and ranking has been done accordingly. Ultimate ranking has been done on
the basis of points; lower the points scored the more favorable are the position and vice
versa. All these ranking point have been converted into value on the principle that higher
the ranking point scored the more unfavorable and vice versa. All these values have been
plotted in the graph and a linear trend line has been drawn to forecast the trend of
liquidity of the selected samples.
To know the principal component of liquidity, profitability and efficiency, the factor
analysis had been done. An attempt had been made here to club the homogeneous ratios
in the form of liquidity, profitability or efficiency ratio through factor analysis. The
principal component of liquidity had been chosen from Current ratio, quick ratio and
absolute liquid ratios, the principal component of profitability had been chosen from
23
gross profit ratio, net profit ratio and return on capital employed and the principal
component of efficiency had been chosen from inventory turnover ratio, debtors turnover
ratio, cash turnover ratio, creditors turnover ratio and working capital turnover ratio.
2.3. Summary of the Chapter:
To assess the working capital performance of the selected companies, secondary data had
been collected and used. Secondary data on different components of working capital as
well as gross snd net working capital of the selected pharmaceutical companies had been
collected from published annual reports. Besides these annual reports, the statistical hand
book, published by the Govt. of West Bengal had been collected to get the CPI values
and different websites had been used.
In methodological part to analyse the data from economic point of view best fitted trend
equation was taken and auto-correlation was checked.
Different ratios were calculated to judge the selected companies liquidity, profitability
and efficiency position.
Mortalls test was done to analyse selected companies liquidity position in depth. Working
capital leverage and Risk factor were calculated to analyse working capital financing risk.
To know the principal component of liquidity, profitability and efficiency, the factor
analysis had been done.

24
CHAPTER-3
LITERATURE REVIEW:
In this chapter I have attempted to review critically the earlier methodology used at
research work to get an idea on the working capital management and to identify the
lacuna of the earlier researchers. Some of the reviewed articles are mentioned below:
3.1. REVIEW OF THE EXISTING LITERATURE
Sagan, J(1955) in his article entitled “Towards a theory of Working Capital
Management” Published in „ The Journal Of Finance‟, May 1955,PP 121-129
emphasized the need for management of working Capital and on cash flow generation.
Beside control of inventories, receivables and payables because all these accounts affect
cash position. The article was confined to mainly on the cash component. The other
components of working capital were not reflected.. The traditional working capital ratios
were not considered for decision making. The paper had not highlighted specifically on
working capital management. in pharmaceutical industries. Further it had not focused
how the managerial returns could be maximized.
Appavadhanulu ,V.(1971) in his article “ Working Capital and Choice of
Techniques” published in „ Indian Economic Journal‟ July-September, 1971, vol,xix, pp.
34-41, recognizing the lack of attention being given to investment in working capital,
analyzed working capital management by examining the impact of method of production
on investment in working capital. He emphasized that different production techniques
require different amount of working capital by affecting goods in process because
different techniques have differences in the length of production period, the rate of output
flow per unit of time and time pattern of value addition. Different techniques would also
affect the stock of raw materials and finished goods, by affecting lead time, optimum lot
size and marketing lag of output disposals. He, therefore, hypothesized that choice of
production technique could reduce the working capital needs. The study is mainly based
on inventory management which is one of the components of working capital. The other
components of working capital are not considered. The study is based on the choice of
techniques by which the requirement of working capital may be reduced. Moreover, the
25
relation between working capital management and profitability is not examined. The
article had not support the pharmaceutical industry.
Smith K.V. (1973) in his article entitled “State of the art of working capital
management” published in „Financial Management‟ autumn, PP50-55. He stressed the
need for the development of a viable model with the dual finance goals of profitability
and liquidity and argues that only such models will assist practicing financial managers in
their day to day decision making. The study based on theory without any empirical
support. The study did not mentioned about working capital management in
pharmaceutical industry.
Grablowsky, B.J. (1976) in his article entitled “Mismanagement of Accounting
Receivable by Small Business” published in the journal „Journal of Business‟, vol-14
PP23-28. He found that there is a significant relationship between various success
measures in the employment of formal working capital policies and procedures. The
article had analyzed working capital management in small scale industry. The large scale
industry like pharmaceutical industry had not covered by the article. Moreover, the
liquidity and profitability relationship is not examined by the article. The article is mainly
based on account receivables which is one of the components of working capital. The
article analyzed the traditional working capital policy. The article had not shown the way
by which the managerial returns, the profitability of the firm could be maximized.
Lawrance Gitman, D Keith Forrester and John R Forresterin (1976) in their article
entitled “Maximizing Cash Disbursement Float” published in „Financial Management
(summer 1976) pp 15-24. They have found that almost all large firms prepare cash
forecast. In particular, the survey indicates that substantial number of firms keeps a stock
of short term investments for precaution reasons. The other conclusion that may, firms
also borrow to address un anticipated cash needs, either directly from banks or through
the commercial paper market.
The study had mainly focused on the cash disbursement policy of the firms. The article
had not focused on how the other component of working capital be managed suitably by
which the liquidity and profitability be optimized. The study was confined to a limited
26
no. of sample data which may lead to some constraint for the universal application to all
the firms. The pharmaceutical companies had not considered in the article.
Walker, E. and Petty W. (1978) in their article on “ Financial differences between
large and small firms” published in „ Financial Management‟, Winter PP 61-68. They
pointed out that managing cash flow and cash conversion cycle is a critical component of
overall financial management for all firms, especially those who are capital constrained
and more reliant on short term sources of finance. The article had stressed only two
components, cash flow and cash conversion cycle, as the critical component of financial
management. However, the working capital management, which is the vital component of
financial management had not considered here. The article had not discussed how the
liquidity of the firm be strengthen. The article had not covered the profit maximization
policy. Moreover, the article had not discussed about the consequences on
pharmaceutical industry.
Banerjee, B (1982) in his article on “Corporate Liquidity and Profitability in India”
published in Research Bulletin, ICWAI, Kolkata, July 1982, pp 225.234 had examined
the interrelationship between liquidity and profitability by testing Gentry‟s hypothesis in
the context of Indian corporate sector. He found that the liquidity and profitability of
Indian corporate sector was highly influenced by liquidity. However, the article had
confined liquidity only. The profitability is largely dependent on working capital
management also.
Ghose,S.P (1983) in his article on “Working Capital in Crane manufacturer-A Case
Study” Published in The Management Accountant, June 1983, PP218-221, had assessed
the contemporary working capital management in Crane manufacturing industry in India.
He had found that the short term debt paying capacity of the sample companies was not
satisfactory. Moreover the credit management policy of the sample companies was
ineffective.
The article had not focused the component of working capital instead of sundry creditors.
The article had not covered the working capital management of Indian Pharmaceutical
industry.
27
N. Hill, W Sartories and D Farguson (1983) in their article on “Corporate Credit and
Payable Policy: A survey, Size and industry effects” presented in the Financial
Management Association‟s 1983 Annual Meeting. They had conducted a survey of the
accounts payable managers of 1479 firms of various sizes in various industries. A major
thrust of this survey on two methods of obtaining finance from accounts payable by (1)
skipping the discount and (2) stretching account payable.
The survey revealed that the vast majority of the firms generally take the discount. In
deciding whether to take the discount, the primary criterion of most firms is the amount
of discount. This makes good financial sense, since the amount of discount (along with
the delay period from the discount date to the due date) determines the cost of skipping as
a source of financing. The other financing strategies in connection with accounts payable
are the stretching of payables beyond the due date.
Their survey revealed three important factors that are considered by firms in deciding
whether to use this strategy; the value of using the funds (i.e. the cost of funds relative to
other funding sources), the effects on relationships with supplies and the impact on the
firm‟s credit rating.
The survey is limited to the corporate credit and payable policy. The profitability of the
firms depends on the efficient working capital management policy, in addition to credit
and payable policy. The article had not highlighted the point. The article had not covered
the whole things about the liquidity position of the firm. The article had not used the
different accounting ratio which leads to the measurement of liquidity of the firms. The
survey was made from the companies except pharmaceutical industry in India.
Khandelwal, N.M (1985) in his article on “Working Capital Management in Small
Scale Industries” Published in Ashis Publishing House, New Delhi, revealed that the
immediate liquidity position in respect of inventory and receivables of the selected units
was unsatisfactory.
The study had not considered the other component of working capital. It had not focused
on how the managerial return could be maximized. The study had not also focused
liquidity position of Pharmaceutical industry in India.
28
Farragher, E (1986) in his article on “Factoring Accounts Receivable” published in
„Journal of cash management‟ (March-April, 1986). He has surveyed 33 firms. It
revealed that most of the firms use the traditional forms of financing. The researcher also
found that there is a growing interest among the firm in using factoring as an alternative
means of financing. The article confined to the „factoring‟ as a short term source of
working capital. The article had not highlighted the working capital management policy.
Venkatachalam and Murthy, D (1986) in their article on “Working Capital Trends in
Private Corporate Sector” Published in „Indian Management‟, June 1986, PP 30-38,
suggested that the liquidity status of the medium and large public limited companies was
not impressive.
The study confined to the liquidity only. The profitability as well as working capital
leverage was not considered. The article had not considered the real values as well as
nominal values of the different component of working capital. It had failed to discuss the
managerial return.
Panda, G.S (1986) in his article on“Management of Working Capital in Small Scale
Industries”, Deep and Deep Publishers, New Delhi, 1986 studied the pattern of current
assets financing on working capital management of 50 small scale industries. The study
suggested that the selected samples possessed a low level of current ratio during the study
period. The study also reflected that most of the sample units incurred huge losses and the
samples units absolutely dependent on short term funds instead of long term funds to
meet their working capital management requirements.
The study confined to small scale units in the state of Orissa only. The study had
highlighted current assets financing instead of current asset management. The component
of working capital like inventories, receivables, cash and bank and loans and advances
were not taken into consideration for working capital management. The study had not
focused the liquidity and its effect on profitability. The study had not also discussed on
pharmaceutical industries in India.
Sarkar, S.N (1987) in his article on “Liquidity Management in the Public Sector – A
case study of a Government of West Bengal Undertaking”, The Management
29
Accountant, Vol. 22, No. 7, PP 496-498 had found the different aspects of liquidity
management of Durgapur Project Limited. Current ratio and liquidity ratio showed a
satisfactory level.
The study had failed to analyze the turnover ratios for efficiency analysis. Moreover, no
trade off between risk and profitability of the selected company in connection with its
liquidity management was observed during the study period. The study had not focused
how the managerial returns could be improved. The analysis was not considered
pharmaceutical industries in India.
Mukherjee, A. K. (1988) in his article on “Management of Working Capital in Public
Enterprises”, Vohra Publishers and Distributors, Allahabad examined the working
capital management practices of the selected public enterprises in India. He found that the
liquidity and profitability were inversely related.
The study had not discussed about the working capital management in the
Pharmaceutical Companies in India. The study had not considered the efficiency ratio for
determining working capital efficiency. Cash management, receivables management,
Payables management are also the key factors for liquidity management which had not
considered.
Mishra, R. K. and Khan, N.C. (1990) in their article on “Management of Working
Capital in ECIL” Published in Journal of Accounting and Finance, Vol.4, No.3, PP-22-
28 had observed that increasing trend in current ratio produced low return in Electric
Corporation of India Ltd (ECIL).
The study only based on current ratio and its impact on return only. The liquid ratio,
absolute liquid ratio which is the major parameter of determining liquidity had not been
considered. The study was not related to Pharmaceutical companies in India. Moreover,
the payables management had not been discussed in the article. The study had not also
discussed how efficiently the components of working capital were managed.
Prasad, B and Erasi, K (1990) in their article on “Working Capital Management in
SSI- An Empirical Study”, Journal of Accounting and Finance, Vol. 4, No. 3, PP-31-35

30
observed that more than fifty percent of total assets of the selected samples were in the
form of current assets. The study also found that liquidity position of the selected samples
was very poor due to huge investment was blocked in Inventories and Receivables during
the study period.
The study confined to liquidity only. Moreover, the study had not considered cash and
payables management which plays vital role for liquidity of a company. The study was
done in small scale industries instead of large scale companies like Pharmaceuticals.
Jain, P.K. (1993) in his article on “Management of Working Capital” Published in
RBSA Publishers, Jaipur, India, 1993 had made a comparative study of public sector and
private sector companies in paper industries. The study showed that inventory
management in private sector companies was comparatively better than that of public
sector companies. Current ratio was taken as the key liquidity ratio.
The study had failed to analyse the other ratios of liquidity, efficiency and profitability.
The study was confined in paper industries only. The study had failed to highlight how
the return be maximized.
Chakraborty, P.K and De, A.K. (1994) in their article on “Working Capital
Management; A Case Study in the Eastern Coalfields Limited” Published in Journal
of Accounting and Finance, Vol.8 No. 3, PP-113-117 had found that the liquidity position
was very poor. The long term funds were used in large proportion to meet the company‟s
short term obligations which affect the profitability of the company to a great extent.
The study was limited to liquidity only instead of efficiency and pattern of working
capital financing. The study had not focused on growth of different component of
working capital.
Gilbert, E & Reichert, A (1995) in their article on “The practice of financial
management among large United States Corporation”, published in „Financial
Practice and Education‟ vol. 5(1), pp 16-23 found that account receivables management
model are used by 59% of the firm to improve working capital management projects,
while inventory management models were used by 60% of the companies out of a total
31
500 companies study. The article had confined to the selection between receivable
management and inventory management in working capital management project.
However, the article had not focused how the working capital is managed efficiently for
enhancing the profitability of the firms. The cash management is the important factor in
the working capital management including inventory and receivables. The article had
untouched to the managerial return.
Vijayakumar , A. and Venkatachalam,A. (1995) in their article on “Working Capital
and Profitability – An Empirical Analysis, Published in The Management Accountant,
June 1995, PP748-750 revealed that liquidity and profitability were inversely related.
However, Inventory turnover ratio and Debtors turnover ratio, both had a positive impact
on profitability.
The study was confined to sugar industry in the state of Tamil Nadu. Current liabilities,
cash were not considered as the key element of liquidity. The study had failed to focus
how the liquidity and profitability could be improved.
Peel, M.J. Wilson, N. (1996) in their article on “ Working Capital and Financial
Management Practices in the small firm sector” published in „ Small Business
Journal‟ Vol. 14 (2) PP 52-68, found that for small firm and growing business, an
efficient working capital management is a vital component of success and survival i.e.
both liquidity and profitability.
They have stressed on the efficient management of working capital and more recently
good credit management practices as being pivotal to the health and performance of the
small firm sector.
The article had not covered the liquidity and profitability in large firms. The article had
failed to analyze how the profit could be maximized.
Majumdar, C. (1996) in his article on “Borrowing as a source of Financing Working
Capital in the Corporate Sector in India: An Empirical Analysis” Published in Finance
India, Vol. 10(1), PP-103-107 had suggested that the impact of working capital
management on liquidity position of public sector companies was more significant than

32
that of in the private sector companies. The study mainly based on comparative study
between public sector and Private Sector Company.
The study focused on working capital financing instead of working capital management.
Liquidity and profitability had not analyzed in the articles. Moreover, the article had
failed to indicate how the credit management be done efficiently.
Refuse. M.E. (1996) in his article on “Working Capital Management: An urgent need
to refocus” published in „Management Decision Journal‟, Vol. 34(2) concluded that the
idea of delaying payment to the creditors as a strategy of improving capital. He also
concluded that companies should strategize more on stock management based on lean
supply chain techniques. The article had analyzed the necessity for working capital
management. The article had not highlighted the possible way by which it can be done
efficiently. Liquidity and profitability are two vital things which had not discussed in the
article. The article was based on theoretical study rather empirical study. Delaying
payment to the creditors may have the adverse effect in the mind of the creditors. The
article had not discussed how the creditors would be satisfied.
Smith, M. Beamount, Begemann, E (1997) in his article on “Measuring Association
between Working Capital and Return on Investment”, Published in „South African
Journals of Business Management, Vol-28 No-1. They emphasized that those who
promoted working capital theory shared that profitability and liquidity comprise the
salient goals of working capital management. The problem arose because the
maximization of firm‟s returns could seriously threaten its liquidity and the pursuit of
liquidity had a tendency to dilute returns.
The article evaluated the association between traditional and alternative working capital
measures and returns on investment. They have attempted to examine whether more
recently developed alternative working capital concepts showed improved association
with return on investment to that of working capital ratios or not. They found that there
were no significant differences amongst the years with respect to the independent
variables. The result of regression shows that total current liabilities divided by fund
flow, displayed the greatest association with return on investment. The statistical test
33
result showed that a traditional working capital leverage ratio, current liabilities divided
by fund flow, displayed the greatest association with return on investment. Well known
liquidity concept like current ratio, q1uick ratios registered insignificant associations only
one of the working capital concepts, the comprehensive liquidity index indicated
significant associations with return on investment.
Sur,D. (1997) in his article on “ Working Capital Management in Colgate Palmolive
(India) Ltd- a case study” published in the Management Accountant, November, 1997,
PP-828-831 &833 suggested the immense attention on inventories is required for
satisfactory liquidity position.
The study was confined to a single company only. The study was conducted mainly
based on four ratios namely, inventories to current assets, debtors to current assets, loans
and advances to current assets and cash and bank to current assets. However, the study
had not analyzed the turnover ratios for determining liquidity of the company. The study
had not focused the profitability and how it be optimized.
Shin, H, H. and Sonen, L (1998) in his article on “Efficiency of Working Capital
Management and Corporate Profitability” Published in Financial Practice and
Evolution, Vol 8 no 2, PP 37-45. They suggested that efficient working capital
management was very important for creating value for the shareholders. The way
working capital was managed had significant impact on both profitability and liquidity.
Using correlation and regression analysis they justified the relationship between the
length of the firm‟s net trading cycle, corporate profitability and risk adjusted stock
return. They found a strong negative relationship between lengths of the firm‟s net
trading cycle and its profitability. In addition, they also found that shorter net trade cycles
were associated with high risk adjusted stock returns.
Weinraub, H and Visscher, S (1998) in their article on “Industry Practice related to
aggressive/ conservative policies” published in „Journal of Financial Strategic Decision‟
vol 11(2). They found that the firms have a tendency of low level of current ratios with
low levels of current liabilities.

34
Shin, H, H. and Sonen, L (1998) in his article on “Efficiency of working capital
management in the profitability of Hindal co industries Ltd” published in the journal
„ICFAI, University Journal of Financial Economics‟ vol 6(4), pp 62-72. They used a
sample of 58895 firms‟ year covering the period 1975-1994 in order to investigate the
relation between net trade cycle that was used to measure the efficiency of working
capital management and corporate profitability. In all cases they found a strong negative
relation between the length of the firm‟s net trade cycle and its profitability.
Mallick, A.K and Sur, D. (1999) in their article on “Working Capital Management: A
Case Study of Hindustan Unilever Limited”, Finance India, September 1999, Vol.
13(3), pp-857-887 had found a close relations0hip among the liquidity of various
components of working capital. The study also observed that a high degree of positive
relationship between liquidity and profitability in the selected samples.
The study confined to a single company only. Moreover, the study related to liquidity and
profitability only. Working capital financing, working capital leverage, growth of
different component of working capital and how the components of working capital were
used efficiently had not discussed in the article. The article had not related to
pharmaceutical companies in India.
Peel,M.J. Wilson, N Howarth, C A(2000) in their article on “ Late Payment and
Credit Management in the Small Firm Sector: Some Empirical Evidence” ,
Published in „ International Small Business Journal‟ Vol-18 (2), PP 52-68, suggested that
small firms tend to have a relatively high proportion of current assets , less liquidity.
They also opine that small firm exhibit volatile cash flows. They found that small firms
are highly reliance on short term credit. The article did not cover for large scale industry.
It had not highlighted specifically in pharmaceutical Industry.
Narasimhan, M.S and Murty L.S (2001) in their article on “Emerging manufacturing
Industry: A financial prospective” published in „Management Review‟, June, PP 105-
112. They stress on the need money industries to improve their return on capital
employed by focusing on some critical areas like cost containment, reducing investment
in working capital and improving working capital efficiency.

35
Deloof, M. (2003) in his article on “Does working capital management affect
profitability of Belgian Firms?” published in „Journal of Business Finance and
Accounting „, Vol 3&4 PP573-587. He discussed that most firms had a large amount of
cash invested in working capital using correlation and regression test , he found a
significant relationship between gross operating income and the no. of days amount
receivables inventories and accounts payables of Belgians firms. He suggested that
manager could create value for their shareholders by reducing on the no. of days the
accounts receivables and inventories to a reasonable minimum. The negative relationship
between accounts payables and profitability is consistent with the view that less
profitable firms wait longer to pay their bills.
Ghosh. S.K and Maji, S.G (2003) in his article on “working capital management
Efficiency: A study on the Indian cement industry” published in „The Institute of Cost
and Works Accountants of India‟.
They had attempted to examine the efficiency of working capital management of the
Indian cement companies during 1992-93 top 2001-02. For measuring the efficiency of
working capital management, they have used performance and overall efficiency indices
instead working capital management ratios. They had set industry norms as the target
efficiency level of the individual firms. The study indicated that the cement industry as a
whole did not perform remarkably well during this period.
Howarth . C and Westhead, P. (2003) in their article on “The focus of working capital
management in UK small firms” published in „Management Accounting Research‟
Vol-14 No-2, PP. 94-111. They have focused that small companies stressed on working
capital management to improve marginal returns. But the article had not highlighted
specifically on working capital management in pharmaceutical industries. Further, it had
not focused how the managerial returns could be maximized.
Eljelly, A. (2004) in his article on “Liquidity Profitability Trade off: An empirical
investigation in an emerging market”, published in „International Journal of Commerce
And Management‟, vol-14 no-2 PP 48-61. He has elucidated that efficient liquidity
management involves planning and controlling current assets and current liabilities in
36
such a manner that eliminates the risk of inability to meet short term obligations and
avoids excessive investment in these assets.
The relation between profitability and liquidity was examined as a measure by current
ratio and cash conversion cycle (cash gap) on a sample of joint stock companies in Saudi
Arabia using correlation and regression analysis.
The study found that the cash conversion cycle was more important as a measure of
liquidity than the current ratio that affects the profitability.
The size variable was found to have significant effect on profitability at the industry
level. The results were stable and had importance implications for liquidity management
in various Saudi companies. He found that there was a negative relationship between
profitability and liquidity indicator such as current ratio and cash gap. He also found that
there was a great variation among industries with respect to the significant measure of
liquidity.
He has measured the liquidity and profitability by current ratio and cash conversion cycle
(cash gap) on a sample of joint stock companies in Saudi Arabia and it was examined by
using the correlation and regression analysis. However, the article did not consider the
other ratios of measuring liquidity and profitability of the firms.
Gareia-Terupel, P.J. & Martinez-Solano, P (2004) in their article on “Effect of
Working Capital Management on SME profitability” published in „International
Journal of Managerial Finance‟ vol 13(2). They found that managers stand the chance of
creating value by reducing the inventories and the no. of days in which there accounts are
outstanding. They had used the sample of small and medium sized Spanish firms.
Mallick, A.k., Sur, D. and Rakshit, D.(2005) in their article on “Woirking Capital
and Profitability: A Study On Their Relationship With Reference To Selected
Companies In Indian Pharmaceutical Industry”, published in GITAM Journal of
Management , July- December 2005, Vol. -3 No.-2, PP-51-52 had found that there was a
positive influence of inventory management and debtors management on profitability in

37
majority of the selected samples but no definite relationship was established between
liquidity and profitability from the empirical findings.
The study had not analysed working capital financing, component of different working
capital and working capital leverage which are the important part of working capital
management.
Lazaridis, I. Tryfonidis, D, (2006) in their article on “Relationship between working
capital management and profitability of companies listed in the Athens Stock
Exchange” published in „Journal of Financial Management and Analysis‟ vol. 19(1), PP
26-35. They have investigated the relation between working capital management and
profitability of listed companies in the Athens stock Exchange. The result from the
regression analysis showed that there was a statistical significance between profitability
measured through gross operating profit and the cash conversion cycle. From those
results, they claimed that the managers could create value for shareholders by handling
correctly the cash conversion cycle and keeping each different component to an optimum
level.
Padachi, Kesseven (2006) in his article on “Trend in working capital management
and its impact on firm‟s performance: An analysis of Mauritian small
manufacturing firms”, published in „International Review of Business Research
papers‟, vol.2 no. 2 pp 45-58. The objective of the study was to investigate the impact of
Working Capital Management on corporate profitability of Mauritian Small
Manufacturing firms. The study had shown that the paper and printing industry had been
able to achieve high scores on various components of working capital and it had positive
impact on its profitability.
The different analysis had identified critical management practices and is expected to
assist managers in identifying areas where they might improve the financial performance
of their operation. The working capital needs of an organization change over time as does
its internal cash generation rate. The small firm should ensure a good synchronization of
its assets and liabilities.
38
The analysis has been constrained by the sample size and the nature of the data which
have well affected the data. The study did not also cover the large scale industry like
Pharmaceutical.
Jafar, A. & Sur. D. (2006) in their article on “Efficiency of working capital
management in Indian Public enterprises during the post liberalization era: A case
study of N.T.P.C” published in „The IFCAI Journal of Management Research‟. They
concluded that the environmental influence arising from liberalization, globalization and
competitiveness has a high influence in the management of working capital.
Chowdhury, Anup. Amin, Md. Muntasir, (2007) in their article on “Working Capital
Management Practiced in Pharmaceutical companies Listed in Dhaka Stock
Exchange”, published in „BRAC University Journal‟ vol. - IV, no-2, PP75-86. The
objective of the study was to critically evaluate working capital management as practiced
in the selected firms of the Pharmaceutical industry.
They had achieved the policy and practices of cash management, evaluated principles,
procedures and techniques of inventory management, receivable management and
payable management. They concluded that pharmaceutical firms operated in Bangladesh
are efficiently deal with their liquidity preferences and investment criteria and this is due
to competitive nature of this industry.
However, they did not examine the political and economic impact on the working capital
management.
They concluded that pharmaceutical industry in their country is a profitable sector. It was
due to the reason that the firms in the industry are competitive and has gained efficiency
in managing its resources competently.
The impact of overall working capital policy on profitability in this industry was proved
to be significant and the ratios related to working capital can explain the differences
between the firms.
A positive correlation had been found in the mathematical model, between current assets
management and financial performance of pharmaceutical firms. Their findings from the
39
questionnaire that the sample firms have been efficient in managing cash Account
Receivables and Payables.
Raheman Abdul, Nasir, Mohammad (2007) in their article on “Working Capital
Management and Profitability- case of Pakistani Firms” published in „International
Review of Business Research papers, vol-3 no 1 PP279-300. They had found that there
is a significant relationship between net operating profitability and average collection
period, average payment period, cash conversion cycle for a sample of Pakistani firms
listed in Karachi stock exchange. The result also indicates that managers can create value
for their shareholders by reducing the no. of day‟s accounts receivables and inventories to
a reasonable minimum. The negative relationship was found between accounts payable
and profitability. The less profitable firms wait longer to pay their bills. They also
suggested that the working capital management significantly affect the profitability of
Pakistani firms. The negative relationship was found between the liquidity and
profitability of the firms. They also found the positive relationship between size and
profitability of the firm. There is an inverse relationship between debt financing and
profitability. Debt financing affects the financial cost which leads to decreasing
profitability. Strong negative relationship was found between the measures of working
capital management and corporate profitability.
Gareia – Teruel, P.J, Martinez-Solano, P, (2007) in their article on “Effects of
working capital management on SME profitability”, published in „International
Journal of Managerial Finance‟, Vol-3. They had studied the effects of working capital
management on the profitability of a sample of 8872 small and medium sized enterprises
(SME‟s) from Spain covering the period 1996-2002. They found that managers can
create value by reducing their inventories and the no. of days for which their accounts are
outstanding. Moreover, shortening the cash conversion cycle also improves the firm‟s
profitability.
Appuhami, Ranjit B A (2008) in their article on “The Impact of Firms Capital
Expenditure on Working Capital Management: An Empirical Study across
industries in Thailand” published in „International Management Review, vol4 no 1 pp8-
21. They had found that capital expenditure has positive relationship. They also found
40
that operating expenditure and interest expenditure also have a positive significant
relationship with working capital requirement. Operating cash flow shows significant
relationship with working capital requirement. They also concluded that Leverage,
performance and growth have positive relationship with working capital requirement.
Chakraborty, K. (2008) in his article on “Working Capital and Profitability: An
empirical analysis of their relationship with reference to selected companies in the
Indian pharmaceutical Industry” published in “The ICFAI Journal of Management
Research. He had evaluated the relationship between the working capital and profitability
of Indian Pharmaceutical Companies. According to one school of thought, working
capital was not a factor of improving profitability and there might be a negative
relationship between them. The other schools indicated that investment in working capital
plays a vital role to improve corporate profitability and unless there is a minimum level
of investment of working capital, output and sales can not be mentioned- in fact, the
inadequate of working capital would keep fixed assets in operative.
Singh, P. (2008) in his article on “Inventory and Working capital management: An
Empirical Analysis”, published in „ICFAI University Journal of Accounting Research‟.
He found that a significant positive relationship existed between the size of inventories
and working capital management. He also concluded that as the inventory was the major
component of working capital it required carefully controlled.
Afza,T. Nazir,M.(2009) in their article on “ Impact of aggressive working capital
management policy on firm‟s profitability”, published in „ The IUP Journal of applied
Finance‟, Vol-15(8), PP 20-30. They had tried to investigate the international relation
between working capital management policy and a firm‟s profitability for a sample of
204 non financial firms listed on Karachi Stock Exchange for the period of 1998-2005.
The study found significant different among their working capital requirements and
financial policies across different industries. Moreover regression result found a negative
relationship between the profitability of firms and degree of aggressiveness of working
capital investment and financing policy. They suggested that managers could create
decrease value if they adopt a conservative approach towards working capital investment
and working capital financing policies.
41
Uyar. A. (2009) in his article on “The relation of cash conversion cycle with size and
profitability: An empirical investigation in Turkey”, published in „International
Research Journal of Finance and Economics‟, PP 186-193. He found the lowest mean
value of the cash conversion cycle in the retail/whole sale industry. He also found that
there is a negative correlation between the cash conversion cycle and the variables, the
size of the firm and the profitability.
Mandal, N and Goswami, S. (2010) in their article entitled “ Impact of Working Capital
Management on Liquidity, Profitability and Non-Insurable Risk and Uncertainty Bearing:
A Case study of Oil and Natural Gas Commission(ONGC)”, published in Great Lakes
Herald, Vo.4, No 2, September 2010, PP – 21-42 had identified that the short term debt
capacity of the company was satisfactory. The study also reflected that the liquidity
position of the company was more or less improving over the period under study. The
study had found a high degree of positive correlation between liquidity and profitability.
The study also reflected that the company had maintained its bank balance at a higher
level as compared to the other component of working capital.
The study focused on ONGC. The study had not discussed from which source, working
capital be financed. Moreover, the study may not related to pharmaceutical companies in
India.
Gill. A & Biger. N (2010) in their article on “The relation between working capital
management and Profitability: Evidence from the United States”, published in
„Business and Economics Journal‟ vol. 2010, BEJ-10. They had tried to find out a
relationship between working capital management and profitability. A sample of 88
American firms listed on New York Stock Exchange for a period of three years from
2005-2007 was selected. They found statistically significant relation between the cash
conversion cycle and profitability measure through gross operating profit. It follows that
managers can create profit s for their companies by handling correctly the cash
conversion cycle and by keeping accounts receivables at an optimum level.
Danuletiu, Adina Elena (2010) in her article on “Working Capital Management and
Profitability: A case study of Alba county companies”, published in Annales
42
Universitatis Apulensis Series oeconomica, vol. 12(1) pp 364-374. The relation between
the working capital management and profitability was examined by using Pearson
correlation analysis and using a sample of 20 annual financial statements of companies,
covering the period 2004-2008. She had concluded that there is a weak negative linear
correlation between working capital management indicators and rate of profitability.
H. Jamal Zubairy (2010) in his article on “Impact of Working Capital Management
and Capital Structure on Profitability of Automobiles Firms in Pakistan, studied the
effect of working capital management on profitability on the automobile production
industry in Pakistan during the period 2000-2008. Current ratio has been used as the
indicator of working capital management and financial leverage has been used as the
indicator of capital structure. With the help of correlation coefficient and regression
analysis, he concluded that companies must increase current assets and decrease current
liabilities for maximizing profitability. There is a positive relation existing between
profitability and financial leverage and an inverse relation existed between operational
leverage and profitability.
Chatterjee, Saswata (2010) in his article on “The Impact of Working Capital
Management on the Profitability of the listed Companies in the London Stock
Exchange” found that a negative relation ship exist between working capital
management and profitability i.e. increase in cash transformation cycle would result in a
reduction in profitability and a negative relationship exists between liquidity and
profitability as well.
Mojtahedzadeh, Vida. Tabari S.H.Alavi. & Mosayebi, R (2011) in their article on
“The relationship between working capital management and profitability of the
companies (Case studies: Listed companies on (T.S.E) published in „International
Research Journal of Finance and Economics‟ issue 76, PP 158-166. The objective of the
study was to find out the relationship working capital management and corporate
profitability. The finding established a negative relationship between cash conversion
cycle, no. of days of accounts receivable and corporate profitability but no significant
relationship was found between average period of retention and profitability. They
concluded that there existed a significant relationship between corporate profitability and
43
working capital management. They also concluded that a positive relationship between
sales and profitability and a negative significant relationship between financial debt ratio
and profitability.
Aminu, Yusuf. (2012) in his article on “A nexus between liquidity and profitability
trade offs for working capital management in Nigerias manufacturing sector”
published in „International Journal of Arts and Commerce‟ vol-1 no-6, PP 55-58 had
concluded that the profitability/liquidity trade off had always been in conducive. The
motive to strategy and practical existing circumstances are always critical factors that
must be considered in maintaining a balance between liquidity and profitability.
The article had focused on liquidity and profitability on manufacturing sector in Nigeria.
It had not discussed the components of working capital. However, the article had not
considered how the working capital financing be made for optimum level of working
capital.
3.2. SUMMARY OF THE CHAPTER
From the review of the literatures, the following point can be summed up:
The assessment of operating performance of liquidity management had been made
by considering either by a particular company or a few companies belonging to
particular industry like sugar, paper, steel, textile etc for a period of five to seven
years only.
A very few studies had been carried on liquidity management of pharmaceutical
companies in India. Most of the studies are descriptive.
A very few studies had been carried empirical studies where Karl Pearsons
correlation co-efficient had been used to establish relationship between liquidity
and profitability. Current ratio, Liquid ratio, inventory turnover ratio and debtors
turnover ratio had been taken as the liquid ratio in most of the studies.
A very few articles had been analysed working capital performance of a particular
company or a few companies belonging to a particular industry. Moreover, in
many of the cases the findings of the studies had failed to draw any meaningful
44
conclusion. However, payables which are the important part of working capital
management had been omitted by most of the articles.
A very few articles had considered payables as the important of liquidity
component of a company.
Most of the articles had failed to conclude how the liquidity be improved.
The articles had not analysed working capital management in depth. Moreover,
component wise analysis of total current assets had not been done, trend analysis
of different component of working capital, working capital financing risk and
working capital leverage had not been considered in most of the articles,
particularly, in pharmaceutical companies in India. Principal component analysis
to identify the major components which are responsible for changing liquidity,
profitability and efficiency has not been done in the articles.
However, while making the present study it has been attempted to
consider the significant pharmaceutical companies belonging to the
pharmaceutical industry in India. Component wise analysis, trend analysis of
different component of working capital, growth of different component of
working capital, working capital financing risk and working capital leverage had
been considered.
45
CHAPTER – 4
ASSESSMENT OF WORKING CAPITAL MANAGEMENT OF SOME SELECTED
PHARMACEUTICAL COMPANIES FROM ECONOMIC POINT OF VIEW
To assess the Working Capital Management of some selected pharmaceutical companies
from economic angle, trend analysis of different components of working capital as well
as net working capital as a whole has been done. The parameters considered for
evaluating the Working Capital Management are (i) Inventory, (ii) Debtors, (iii) Cash,
(iv) Loans and Advances, (v) Creditors, (vi) Current liabilities and provisions, (vii) Total
Current Assets, (viii) Net Working Capital
After necessary adjustments in the data sets the growth rates of different components of
working capital of the selected pharmaceutical companies have been estimated both in
nominal and real terms from the estimated coefficients of the chosen trend equation. The
growth rates have been directly measured from the estimated co-efficient of „t‟ (i.e. time)
in case exponential and log quadratic (with normalization of time i.e. shifting the origin
to the mid-point of the time period ) trend equations or the models used to estimate the
growth rates of different performance indicators are (i) Log yt=a+bt; (ii) Logyt= a+bt+ct2,
where yt is the variable whose over time growth is measured and t is the time variable.
Log implies natural logarithm (loge) and all others (a,b,c) are the parameters to be
estimated.
The growth rates, expressed in percent per annum, are presented in Table (Table no 4.1 to
4.40), it is seen that the trend lines fitted to the time series of the performance indicators
give good fits since R-2
(adjusted R-2
), which is a measure of goodness of fit of each of
the trend equations is statistically significantly different from zero. Further, from the
values of DW statistic it is seen that the disturbance term did not present i.e. there was no
auto-correlation problem in any of the trend equations.
46
4.1. LUPIN
4.1.1. Inventory analysis
From the estimated values of parameters presented in Table.4.1, it is found that the
nominal amount of Inventory of Lupin Ltd., had increased at an annual rate of 50.4%
during the period 2000-2014 and this growth rate was significant at 1% probability level.
It is also found that the growth rate of Inventory of Lupin had been increasing at
diminishing rates. These discouraging rates were also significant at 5% probability level.
This implies a discouraging trend in the inter temporal growth of total inventory.
To separate out the influence of inflation on the growth rate of inventory amount
necessary adjustment in the nominal values of the inventory amount have been done by
deflating the nominal values by the wholesale price index as then the chosen trend lines
have been fitted. From the estimated parameters presented in Table 4.21, it is found that
real amount of Inventory of Lupin had grown at the annual rate of 47.3% and at the time
of 1999-2000 to 2013-2014. The growth rate of real amount of Inventory of Lupin Ltd.
was significant at 1% probability level.
4.1.2. Debtors analysis:
From the estimated values of parameters presented in Table-4.1, it is found that the
nominal amount of Debtors of Lupin Ltd., had increased at an annual rate of 22% during
the period 1999-2000 to 2013-2014 and this growth rate is significant at 1% probability
level.
To separate out the influence of inflation on the growth rate of deposit amount necessary
adjustment in the nominal values of the debtors amount have been done by deflating the
nominal values by the wholesale price index as then the chosen trend lines have been
fitted. From the estimated parameters presented in Table 4.21, it is found that real amount
of debtors of Lupin has grown at the annual rate of 19.7% and at the time of 1999-2000
to 2013- 2014. The growth rate of real amount of debtors of Lupin Ltd. is significant at
1% probability level.
47
4.1.3 Cash analysis:
From the estimated values of parameters presented in Table-4.1, it is found that the
nominal amount of cash of Lupin Ltd., had increased at an annual rate of 73.20% during
the period 1999-2000 to 2013-2014 and this growth rate was significant at 5% probability
level. It is also found that the growth rate of cash of Lupin had been increasing at
diminishing rates. This discouraging rate was also significant at 10% probability level.
This implies a discouraging trend in the inter temporal growth of total cash.
To separate out the influence of inflation on the growth rate of cash amount necessary
adjustment in the nominal values of the cash amount have been done by deflating the
nominal values by the wholesale price index as then the chosen trend lines have been
fitted. From the estimated parameters presented in Table 4.21, it is found that real amount
of cash of Lupin had grown at the annual rate of 70.1% and at the time of 1999-2000 to
2013- 2014. The growth rate of real amount of cash of Lupin Ltd. was significant at 5%
probability level.
4.1.4. Loans and Advance Analysis:
From the estimated values of parameters presented in Table-4.1, it is found that the
nominal amount of Loans And Advances of Lupin Ltd., had increased at an annual rate of
16.50% during the period 1999-2000 to 2013-2014 and this growth rate was significant at
1% probability level.
To separate out the influence of inflation on the growth rate of Loans And Advance
amount necessary adjustment in the nominal values of the Loans And Advances amount
have been done by deflating the nominal values by the wholesale price index as then the
chosen trend lines have been fitted. From the estimated parameters presented in Table
4.21, it is found that real amount of Loans And Advances of Lupin had grown at the
annual rate of 14.1% and at the time of 1999-2000 to 2013- 2014. The growth rate of real
amount of Loans And Advances of Lupin Ltd. was significant at 1% probability level.
48
4.1.5. Creditors analysis:
From the estimated values of parameters presented in Table-4.1, it is found that the
nominal amount of Creditors of Lupin Ltd., had increased at an annual rate of 54%
during the period 1999-2000 to 2013-2014 and this growth rate was significant at 1%
probability level. It is also found that the growth rate of cash of Lupin had been
increasing at diminishing rates and this diminishing rate was significant at 5% probability
level. This implies a discouraging trend in the inter temporal growth of total creditors.
To separate out the influence of inflation on the growth rate of Creditors amount
necessary adjustment in the nominal values of the creditors amount have been done by
deflating the nominal values by the wholesale price index as then the chosen trend lines
have been fitted. From the estimated parameters presented in Table 4.21, it is found that
real amount of debtors of Lupin had grown at the annual rate of 50.9% and at the time of
1999-2000 to 2013- 2014. The growth rate of real amount of Creditors of Lupin Ltd. was
significant at 1% probability level.
4.1.6. Current Liabilities and Provisions Analysis:
From the estimated values of parameters presented in Table-4.1, it is found that the
nominal amount of Current Liabilities and Provisions Analysis of Lupin Ltd., had
increased at an annual rate of 62.8% during the period 1999-2000 to 2013-2014 and this
growth rate was significant at 10% probability level. It is also found that the growth rate
of Current Liabilities and Provisions Analysis of Lupin had been increasing at
encouraging rates but this encouraging rate was not significant upto 10% probability
level. This implies a encouraging trend in the inter temporal growth of total Current
Liabilities and Provisions.
To separate out the influence of inflation on the growth rate of Current Liabilities and
Provisions amount necessary adjustment in the nominal values of the creditors amount
have been done by deflating the nominal values by the wholesale price index as then the
chosen trend lines have been fitted. From the estimated parameters presented in Table
4.21, it is found that real amount of Current Liabilities and Provisions Analysis of Lupin
had grown at the annual rate of 59.7% and at the time of 1999-2000 to 2013- 2014. The
49
growth rate of real amount of Current Liabilities and Provisions Analysis of Lupin Ltd.
was insignificant.
4.1.7. Current Assets analysis
From the estimated values of parameters presented in Table.4.1, it is found that the
nominal amount of current assets of Lupin Ltd., had increased at an annual rate of 34.8%
during the period 1999-2000 to 2013-2014 and this growth rate was significant at 5%
probability level. It is also found that the growth rate of Inventory of Lupin had been
increasing at diminishing rates. This implies a discouraging trend in the inter temporal
growth of total current assets.
To separate out the influence of inflation on the growth rate of inventory amount
necessary adjustment in the nominal values of the current assets amount have been done
by deflating the nominal values by the wholesale price index as then the chosen trend
lines have been fitted. From the estimated parameters presented in Table 4.21, it is found
that real amount of current assets of Lupin had grown at the annual rate of 31.7% and at
the time of 1999-2000 to 2013-2014. The growth rate of real amount of current assets of
Lupin Ltd. was significant at 5% probability level.
4.1.8. Net Working capital analysis
From the estimated values of parameters presented in Table.4.1, it is found that the
nominal amount of Net Working Capital of Lupin Ltd., had increased at an annual rate of
26.2% during the period 1999-2000 to 2013-2014 and this growth rate was significant at
5% probability level. It is also found that the growth rate of net working capital of Lupin
had been increasing at increasing rates. This implies an encouraging trend in the inter
temporal growth of total net working capital.
To separate out the influence of inflation on the growth rate of Net Working Capital
amount necessary adjustment in the nominal values of the inventory amount have been
done by deflating the nominal values by the wholesale price index as then the chosen
trend lines have been fitted. From the estimated parameters presented in Table 4.21, it is
50
found that real amount of Net Working Capital of Lupin had grown at the annual rate of
18.2% and at the time of 1999-2000 to 2013-2014.
From Table – 4.1 and Table-4.21, it was found that the regression equation of different
component of working capital were best fitted with time because adjusted R2 values
were
high in all cases. Moreover, there was no autocorrelation problem in different items of
working capital (reflected by DW values). The growth rates of both nominal amount and
real amount of cash were highest followed by the growth rate of Current Liabilities and
Provision, growth rate of Creditors, growth rate of Inventory, growth rate of Current
Assets, growth rate of Net Working Capital, growth rate of Debtors, and growth rate of
Loans and Advances. These entire growth rate were significant at 1% probability level
except cash balance (5% Level), Current Liabilities and Provision (10% Level), Current
Assets (5% Level) and Net Working Capital (5% Level). In Inventory, Cash, Creditors,
Current Liabilities and Provision, Current Assets and Net Working Capital parabolic
equations were fitted of which it was found significantly discouraging trend in Inventory
(5% Level), Cash (10% Level), and Creditors (5% Level) but the discouraging trend in
current Assets was not significant up to 10% probability level. Moreover, the
encouraging trend of Current Liabilities and Provision, and Net Working Capital were
not also significant up to 10% probability level.
4.2. Dr. Reddy‟s Laboratories
4.2.1. Inventory analysis
From the estimated values of parameters presented in Table.4.2, it is found that the
nominal amount of Inventory of Dr. Reddy‟s Laboratories ., had increased at an annual
rate of 29.9% during the period 1999-2000 to 2013-2014 and this growth rate was
significant at 1% probability level. It is also found that the growth rate of Inventory of Dr.
Reddy‟s Laboratories had been increasing at diminishing rates. This implies a
discouraging trend in the inter temporal growth of total Inventory.
To separate out the influence of inflation on the growth rate of inventory amount
necessary adjustment in the nominal values of the inventory amount have been done by
deflating the nominal values by the wholesale price index as then the chosen trend lines

51
have been fitted. From the estimated parameters presented in Table 4.22, it is found that
real amount of Inventory of Dr. Reddy‟s Laboratories had grown at the annual rate of
26.9% and at the time of 1999-2000 to 2013-2014. The growth rate of real amount of
Inventory of Dr. Reddy‟s Laboratories was significant at 5% probability level.
4.2.2. Debtors analysis:
From the estimated values of parameters presented in Table-4.2, it is found that the
nominal amount of Debtors of Dr. Reddy‟s Laboratories., has increased at an annual rate
of 18.30% during the period 1999-2000 to 2013-2014 and this growth rate is significant
at 5% probability level. It is also found that the growth rate of Debtors of Dr. Reddy‟s
Laboratories had been increasing at increasing rates. This implies an encouraging trend in
the inter temporal growth of total debtors.
To separate out the influence of inflation on the growth rate of deposit amount necessary
adjustment in the nominal values of the debtors amount have been done by deflating the
nominal values by the wholesale price index as then the chosen trend lines have been
fitted. From the estimated parameters presented in Table 4.22, it is found that real amount
of debtors of Dr. Reddy‟s Laboratories has grown at the annual rate of 18.5% and at the
time of 1999-2000 to 2013- 2014.
4.2.3 Cash analysis:
From the estimated values of parameters presented in Table-4.2, it is found that the
nominal amount of cash of Dr. Reddy‟s Laboratories had increased at an annual rate of
71.7% during the period 1999-2000 to 2013-2014 and this growth rate was significant at
5% probability level. It is also found that the growth rate of cash of Dr. Reddy‟s
Laboratories had been increasing at diminishing rates. This implies a discouraging trend
in the inter temporal growth of total cash.
To separate out the influence of inflation on the growth rate of deposit amount necessary
adjustment in the nominal values of the cash amount have been done by deflating the
nominal values by the wholesale price index as then the chosen trend lines have been
fitted. From the estimated parameters presented in Table 4.22, it is found that real amount
52
of cash of Dr. Reddy‟s had grown at the annual rate of 68.7% and at the time of 1999-
2000 to 2013- 2014. The growth rate of real amount of cash of Dr. Reddy‟s Laboratories
was significant at 10% probability level.
4.2.4. Loans and Advance Analysis:
From the estimated values of parameters presented in Table-4.2, it is found that the
nominal amount of Loans And Advances of Dr. Reddy‟s Laboratories., had increased at
an annual rate of 57.3% during the period 1999-2000 to 2013-2014 and this growth rate
was significant at 1% probability level. It is also found that the growth rate of Loans And
Advances of Dr. Reddy‟s Laboratories.had been increasing at diminishing rates and this
diminishing rate was significant at 1% probability level. This implies a discouraging
trend in the inter temporal growth of total loans and advances.
To separate out the influence of inflation on the growth rate of Loans And Advance
amount necessary adjustment in the nominal values of the Loans And Advances amount
have been done by deflating the nominal values by the wholesale price index as then the
chosen trend lines have been fitted. From the estimated parameters presented in Table
4.22, it is found that real amount of Loans And Advances of Dr. Reddy‟s Laboratpries
had grown at the annual rate of 54.2% and at the time of 1999-2000 to 2013- 2014. The
growth rate of real amount of Loans And Advances of Dr. Reddy‟s Laboratories was
significant at 1% probability level.
4.2.5. Creditors analysis:
From the estimated values of parameters presented in Table-4.2, it is found that the
nominal amount of Creditors of Dr. Reddy‟s Laboratpries had increased at an annual rate
of 47.7% during the period 1999-2000 to 2013-2014 and this growth rate was significant
at 1% probability level. It is also found that the growth rate of cash of Dr. Reddy‟s
Laboratpries had been increasing at increasing rates and this increasing rate was
significant at 1% probability level. This implies an encouraging trend in the inter
temporal growth of total creditors.
53
To separate out the influence of inflation on the growth rate of Creditors amount
necessary adjustment in the nominal values of the creditors amount have been done by
deflating the nominal values by the wholesale price index as then the chosen trend lines
have been fitted. From the estimated parameters presented in Table 4.22, it is found that
real amount of creditors of Dr. Reddy‟s Laboratpries had grown at the annual rate of
44.6% and at the time of 1999-2000 to 2013- 2014. The growth rate of real amount of
Creditors of Dr. Reddy‟s Laboratpries was significant at 1% probability level.
4.2.6. Current Liabilities and Provisions Analysis:
From the estimated values of parameters presented in Table-4.2, it is found that the
nominal amount of Current Liabilities and Provisions Analysis of Dr. Reddy‟s
Laboratpries had increased at an annual rate of 53.9% during the period 1999-2000 to
2013-2014 and this growth rate was significant at 1% probability level. It is also found
that the growth rate of Current Liabilities and Provisions Analysis of Dr. Reddy‟s
Laboratpries had been increasing at diminishing rates and this diminishing rate was
significant at 1% probability level. This implies a descouraging trend in the inter
temporal growth of total Current Liabilities and Provisions.
To separate out the influence of inflation on the growth rate of Current Liabilities and
Provisions amount necessary adjustment in the nominal values of the creditors amount
have been done by deflating the nominal values by the wholesale price index as then the
chosen trend lines have been fitted. From the estimated parameters presented in Table
4.22, it is found that real amount of Current Liabilities and Provisions Analysis of Dr.
Reddy‟s Laboratpries had grown at the annual rate of 50.8% and at the time of 1999-2000
to 2013- 2014. The growth rate of real amount of Current Liabilities and Provisions
Analysis of Dr. Reddy‟s Laboratpries was significant at 1% Probability level.
4.2.7. Current Assets analysis
From the estimated values of parameters presented in Table.4.2, it is found that the
nominal amount of current assets of Dr. Reddy‟s Laboratpries had increased at an annual
rate of 39.4% during the period 1999-2000 to 2013-2014 and this growth rate was
significant at 1% probability level. It is also found that the growth rate of Inventory of Dr.
54
Reddy‟s Laboratpries had been increasing at diminishing rates. This implies a
discouraging trend in the inter temporal growth of total current assets.
To separate out the influence of inflation on the growth rate of inventory amount
necessary adjustment in the nominal values of the current assets amount have been done
by deflating the nominal values by the wholesale price index as then the chosen trend
lines have been fitted. From the estimated parameters presented in Table 4.22, it is found
that real amount of current assets of Dr. Reddy‟s Laboratpries had grown at the annual
rate of 36.3% and at the time of 1999-2000 to 2013-2014. The growth rate of real amount
of current assets of Dr. Reddy‟s Laboratpries was significant at 1% probability level.
4.2.8. Net Working capital analysis
From the estimated values of parameters presented in Table.4.2, it is found that the
nominal amount of Net Working Capital of Dr. Reddy‟s Laboratpries had increased at an
annual rate of 36.40% during the period 1999-2000 to 2013-2014 and this growth rate
was significant at 1% probability level. It is also found that the growth rate of net
working capital of Dr. Reddy‟s Laboratpries had been increasing at decreasing rates. This
implies a discouraging trend in the inter temporal growth of total net working capital.
To separate out the influence of inflation on the growth rate of Net Working Capital
amount necessary adjustment in the nominal values of the inventory amount have been
done by deflating the nominal values by the wholesale price index as then the chosen
trend lines have been fitted. From the estimated parameters presented in Table 4.22, it is
found that real amount of Net Working Capital of Dr. Reddy‟s Laboratpries had grown at
the annual rate of 33.33% and at the time of 1999-2000 to 2013-2014. It is also
significant at 1% probability level.
From Table – 4.2 and Table-4.22, it was found that the regression equation of different
component of working capital were best fitted with time because adjusted R2 values
were
high in all cases. Moreover, there was no autocorrelation problem in different items of
working capital (reflected by DW values). The growth rates of both nominal amount and
real amount of cash were highest followed by growth rate of Loans and Advances, the
growth rate of Current Liabilities and Provision, growth rate of Creditors, growth rate of
55
Current Assets, growth rate of Net Working Capital, growth rate of Inventory and growth
rate of Debtors. These entire growth rate were significant at 1% probability level except
Debtors (5% Level) and Cash (5% Probability Level). In all cases, the parabolic equation
were fitted and found there were a discouraging trend of Inventory (significant at 5%
probability level), Cash (significant at 10% Probability level), Loans and Advances
(significant at 1% probability level), Current Liabilities and Provisions (significant at 1%
probability level), Current Assets (significant at 1% probability level) and Net Working
Capital (significant at 5% probability level). However, an encouraging trend was
observed in Debtors (not significant up to 10% probability level) and Creditors
(significant at 1% probability level).
4.3 CIPLA
4.3.1. Inventory analysis
From the estimated values of parameters presented in Table.4.3, it is found that the
nominal amount of Inventory of CIPLA had increased at an annual rate of 28% during
the period 1999-2000 to 2013-2014 and this growth rate was significant at 1% probability
level. It is also found that the growth rate of Inventory of CIPLA had been increasing at
diminishing rates. This implies a discouraging trend in the inter temporal growth of total
inventory.
To separate out the influence of inflation on the growth rate of inventory amount
necessary adjustment in the nominal values of the inventory amount have been done by
deflating the nominal values by the wholesale price index as then the chosen trend lines
have been fitted. From the estimated parameters presented in Table 4.23, it is found that
real amount of Inventory of CIPLA had grown at the annual rate of 24.9% and at the time
of 1999-2000 to 2013-2014. The growth rate of real amount of Inventory of CIPLA was
significant at 1% probability level.
4.3.2. Debtors analysis:
From the estimated values of parameters presented in Table-4.3, it is found that the
nominal amount of CIPLA has increased at an annual rate of 55.5% during the period
56
1999-2000 to 2013-2014 and this growth rate is significant at 1% probability level. It is
also found that the growth rate of Debtors of CIPLA had been increasing at decreasing
rates. This implies an discouraging trend in the inter temporal growth of total debtors.
To separate out the influence of inflation on the growth rate of deposit amount necessary
adjustment in the nominal values of the debtors amount have been done by deflating the
nominal values by the wholesale price index as then the chosen trend lines have been
fitted. From the estimated parameters presented in Table 4.23, it is found that real amount
of debtors of CIPLA has grown at the annual rate of 52.5% and at the time of 1999-2000
to 2013- 2014.
4.3.3 Cash analysis:
From the estimated values of parameters presented in Table-4.2, it is found that the
nominal amount of cash of CIPLA had increased at an annual rate of 57.7% during the
period 1999-2000 to 2013-2014 and this growth rate was significant at 1% probability
level. It is also found that the growth rate of cash of CIPLA had been increasing at
diminishing rates. This implies a discouraging trend in the inter temporal growth of total
cash.
To separate out the influence of inflation on the growth rate of deposit amount necessary
adjustment in the nominal values of the cash amount have been done by deflating the
nominal values by the wholesale price index as then the chosen trend lines have been
fitted. From the estimated parameters presented in Table 4.23, it is found that real amount
of cash of CIPLA had grown at the annual rate of 54.6% and at the time of 1999-2000 to
2013- 2014. The growth rate of real amount of cash of CIPLA was significant at 5%
probability level.
4.3.4. Loans and Advance Analysis:
From the estimated values of parameters presented in Table-4.3, it is found that the
nominal amount of Loans and Advances of CIPLA had increased at an annual rate of
33.8% during the period 1999-2000 to 2013-2014 and this growth rate was significant at
1% probability level. It is also found that the growth rate of Loans and Advances of
57
CIPLA had been increasing at diminishing rates and this diminishing rate was significant
at 5% probability level. This implies a discouraging trend in the inter temporal growth of
total Loans and Advances.
To separate out the influence of inflation on the growth rate of Loans And Advance
amount necessary adjustment in the nominal values of the Loans And Advances amount
have been done by deflating the nominal values by the wholesale price index as then the
chosen trend lines have been fitted. From the estimated parameters presented in Table
4.23, it is found that real amount of Loans And Advances of CIPLA had grown at the
annual rate of 30.8% and at the time of 1999-2000 to 2013- 2014. The growth rate of real
amount of Loans and Advances of CIPLA was significant at 5% probability level.
4.3.5. Creditors analysis:
From the estimated values of parameters presented in Table-4.3, it is found that the
nominal amount of Creditors of CIPLA had increased at an annual rate of 39.4% during
the period 1999-2000 to 2013-2014 and this growth rate was significant at 1% probability
level. It is also found that the growth rate of cash of CIPLA had been increasing at
decreasing rates and this decreasing rate was significant at 1% probability level. This
implies a discouraging trend in the inter temporal growth of total creditors.
To separate out the influence of inflation on the growth rate of Creditors amount
necessary adjustment in the nominal values of the creditors amount have been done by
deflating the nominal values by the wholesale price index as then the chosen trend lines
have been fitted. From the estimated parameters presented in Table 4.23, it is found that
real amount of creditors of CIPLA had grown at the annual rate of 36.3% and at the time
of 1999-2000 to 2013- 2014. The growth rate of real amount of Creditors of CIPLA was
significant at 1% probability level.
4.3.6. Current Liabilities and Provisions Analysis:
From the estimated values of parameters presented in Table-4.3, it is found that the
nominal amount of Current Liabilities and Provisions Analysis of CIPLA had increased
at an annual rate of 35.4% during the period 1999-2000 to 2013-2014 and this growth
58
rate was significant at 1% probability level. It is also found that the growth rate of
Current Liabilities and Provisions Analysis of CIPLA had been increasing at diminishing
rates and this diminishing rate was significant at 1% probability level. This implies a
descouraging trend in the inter temporal growth of total Current Liabilities and
Provisions.
To separate out the influence of inflation on the growth rate of Current Liabilities and
Provisions amount necessary adjustment in the nominal values of the creditors amount
have been done by deflating the nominal values by the wholesale price index as then the
chosen trend lines have been fitted. From the estimated parameters presented in Table
4.23, it is found that real amount of Current Liabilities and Provisions Analysis of CIPLA
had grown at the annual rate of 32.3% and at the time of 1999-2000 to 2013- 2014. The
growth rate of real amount of Current Liabilities and Provisions Analysis of CIPLA was
significant at 1% Probability level.
4.3.7. Current Assets analysis
From the estimated values of parameters presented in Table.4.3, it is found that the
nominal amount of current assets of CIPLA had increased at an annual rate of 38.3%
during the period 1999-2000 to 2013-2014 and this growth rate was significant at 1%
probability level. It is also found that the growth rate of Inventory of CIPLA had been
increasing at diminishing rates. This implies a discouraging trend in the inter temporal
growth of total current assets.
To separate out the influence of inflation on the growth rate of inventory amount
necessary adjustment in the nominal values of the current assets amount have been done
by deflating the nominal values by the wholesale price index as then the chosen trend
lines have been fitted. From the estimated parameters presented in Table 4.23, it is found
that real amount of current assets of CIPLA had grown at the annual rate of 35.2% and at
the time of 1999-2000 to 2013-2014. The growth rate of real amount of current assets of
CIPLA was significant at 1% probability level.
59
4.3.8. Net Working capital analysis
From the estimated values of parameters presented in Table.4.3, it is found that the
nominal amount of Net Working Capital of CIPLA had increased at an annual rate of
37.8% during the period 1999-2000 to 2013-2014 and this growth rate was significant at
1% probability level. It is also found that the growth rate of net working capital of CIPLA
had been increasing at decreasing rates. This implies a discouraging trend in the inter
temporal growth of total net working capital.
To separate out the influence of inflation on the growth rate of Net Working Capital
amount necessary adjustment in the nominal values of the inventory amount have been
done by deflating the nominal values by the wholesale price index as then the chosen
trend lines have been fitted. From the estimated parameters presented in Table 4.23, it is
found that real amount of Net Working Capital of CIPLA had grown at the annual rate of
34.8% and at the time of 1999-2000 to 2013-2014. It is also significant at 1% probability
level.
From Table – 4.3 and Table-4.23, it was found that the regression equation of different
component of working capital were best fitted with time because adjusted R2 values
were
high in all cases. Moreover, there was no autocorrelation problem in different items of
working capital (reflected by DW values). The growth rates of both nominal amount and
real amount of cash were highest followed by growth rate of Debtors, growth rate of
Creditors, growth rate of Current Assets, growth rate of Net Working Capital, the growth
rate of Current Liabilities and Provision, growth rate of Loans and Advances and growth
rate of Inventory. These entire growth rate were significant at 1% probability level. In all
cases, parabolic equations were fitted and found there were discouraging trends. All these
discouraging trends were significant at 1% probability level except Cash (Significant at
5% probability level) and Loans and Advances (significant at 5% probability level).
60
4.4 Piramal Enterprises
4.4.1. Inventory analysis
From the estimated values of parameters presented in Table.4.4, it is found that the
nominal amount of Inventory of Piramal Enterprises had increased at an annual rate of
23.1% during the period 1999-2000 to 2013-2014 and this growth rate was significant at
1% probability level. It is also found that the growth rate of Inventory of Piramal
Enterprises had been increasing at diminishing rates. This implies a discouraging trend in
the inter temporal growth of total inventory.
To separate out the influence of inflation on the growth rate of inventory amount
necessary adjustment in the nominal values of the inventory amount have been done by
deflating the nominal values by the wholesale price index as then the chosen trend lines
have been fitted. From the estimated parameters presented in Table 4.24, it is found that
real amount of Inventory of Piramal Enterprises had grown at the annual rate of 20% and
at the time of 1999-2000 to 2013-2014.
4.4.2. Debtors analysis:
From the estimated values of parameters presented in Table-4.4, it is found that the
nominal amount of Piramal Enterprises has increased at an annual rate of 24.7% during
the period 1999-2000 to 2013-2014 and this growth rate is significant at 1% probability
level. It is also found that the growth rate of Debtors of Piramal Enterprises had been
increasing at decreasing rates. This implies an discouraging trend in the inter temporal
growth of total debtors.
To separate out the influence of inflation on the growth rate of debtors amount necessary
adjustment in the nominal values of the debtors amount have been done by deflating the
nominal values by the wholesale price index as then the chosen trend lines have been
fitted. From the estimated parameters presented in Table 4.24, it is found that real amount
of debtors of Piramal Enterprises has grown at the annual rate of 21.7% and at the time of
1999-2000 to 2013- 2014.
61
4.4.3 Cash analysis:
From the estimated values of parameters presented in Table-4.4, it is found that the
nominal amount of cash of Piramal Enterprises had increased at an annual rate of 5.38%
during the period 1999-2000 to 2013-2014 and this growth rate was insignificant.
To separate out the influence of inflation on the growth rate of cash amount necessary
adjustment in the nominal values of the cash amount have been done by deflating the
nominal values by the wholesale price index as then the chosen trend lines have been
fitted. From the estimated parameters presented in Table 4.24, it is found that real amount
of cash of Piramal Enterprises had grown at the annual rate of -33.10% and at the time of
1999-2000 to 2013- 2014. The growth rate of real amount of cash of Piramal Enterprises
was insignificant.
4.4.4. Loans and Advance Analysis:
From the estimated values of parameters presented in Table-4.4, it is found that the
nominal amount of Loans and Advances of Piramal Enterprises had increased at an
annual rate of 35.7% during the period 1999-2000 to 2013-2014 and this growth rate was
significant at 1% probability level.
To separate out the influence of inflation on the growth rate of Loans and Advance
amount necessary adjustment in the nominal values of the Loans And Advances amount
have been done by deflating the nominal values by the wholesale price index as then the
chosen trend lines have been fitted. From the estimated parameters presented in Table
4.24, it is found that real amount of Loans and Advances of Piramal Enterprises had
grown at the annual rate of 33.3% and at the time of 1999-2000 to 2013- 2014. The
growth rate of real amount of Loans and Advances of Piramal Enterprises was significant
at 1% probability level.
4.4.5. Creditors analysis:
From the estimated values of parameters presented in Table-4.4, it is found that the
nominal amount of Creditors of Piramal Enterprises had increased at an annual rate of
19.7% during the period 1999-2000 to 2013-2014 and this growth rate was significant at
62
1% probability level. It is also found that the growth rate of cash of Piramal Enterprises
had been increasing at decreasing rates and this decreasing rate was insignificant. This
implies an discouraging trend in the intertemporal growth of total creditors.
To separate out the influence of inflation on the growth rate of Creditors amount
necessary adjustment in the nominal values of the creditors amount have been done by
deflating the nominal values by the wholesale price index as then the chosen trend lines
have been fitted. From the estimated parameters presented in Table 4.24, it is found that
real amount of creditors of Piramal Enterprises had grown at the annual rate of 13.7% and
at the time of 1999-2000 to 2013- 2014. The growth rate of real amount of Creditors of
Piramal Enterprises was significant at 1% probability level.
4.4.6. Current Liabilities and Provisions Analysis:
From the estimated values of parameters presented in Table-4.4, it is found that the
nominal amount of Current Liabilities and Provisions Analysis of Piramal Enterprises
had increased at an annual rate of 16.4% during the period 1999-2000 to 2013-2014 and
this growth rate was significant at 1% probability level. It is also found that the growth
rate of Current Liabilities and Provisions of Piramal Enterprises had been increasing at
increasing rates and this increasing rate was significant at 1% probability level. This
implies an encouraging trend in the intertemporal growth of total Current Liabilities and
Provisions.
To separate out the influence of inflation on the growth rate of Current Liabilities and
Provisions amount necessary adjustment in the nominal values of the creditors amount
have been done by deflating the nominal values by the wholesale price index as then the
chosen trend lines have been fitted. From the estimated parameters presented in Table
4.24, it is found that real amount of Current Liabilities and Provisions of Piramal
Enterprises had grown at the annual rate of 16.2% and at the time of 1999-2000 to 2013-
2014. The growth rate of real amount of Current Liabilities and Provisions of Piramal
Enterprises was significant at 1% Probability level.
63
4.4.7. Current Assets analysis
From the estimated values of parameters presented in Table.4.4, it is found that the
nominal amount of current assets of Piramal Enterprises had increased at an annual rate
of 21.6% during the period 1999-2000 to 2013-2014 and this growth rate was significant
at 1% probability level. It is also found that the growth rate of Inventory of Piramal
Enterprises had been increasing at diminishing rates. This implies a discouraging trend in
the intertemporal growth of total current assets.
To separate out the influence of inflation on the growth rate of inventory amount
necessary adjustment in the nominal values of the current assets amount have been done
by deflating the nominal values by the wholesale price index as then the chosen trend
lines have been fitted. From the estimated parameters presented in Table 4.24, it is found
that real amount of current assets of Piramal Enterprises had grown at the annual rate of
18.5% and at the time of 1999-2000 to 2013-2014. The growth rate of real amount of
current assets of Piramal Enterprises was significant at 1% probability level.
4.4.8. Net Working capital analysis
From the estimated values of parameters presented in Table.4.4, it is found that the
nominal amount of Net Working Capital of Piramal Enterprises had increased at an
annual rate of 16.7% during the period 1999-2000 to 2013-2014 and this growth rate was
insignificant. It is also found that the growth rate of net working capital of Piramal
Enterprises had been increasing at decreasing rates. This implies a discouraging trend in
the intertemporal growth of total net working capital.
To separate out the influence of inflation on the growth rate of Net Working Capital
amount necessary adjustment in the nominal values of the inventory amount have been
done by deflating the nominal values by the wholesale price index as then the chosen
trend lines have been fitted. From the estimated parameters presented in Table 4.24, it is
found that real amount of Net Working Capital of Piramal Enterprises had grown at the
annual rate of 13.8% and at the time of 1999-2000 to 2013-2014.
64
From Table – 4.4 and Table-4.24, it was found that the regression equation of different
component of working capital were best fitted with time because adjusted R2 values
were
high in all cases. Moreover, there was no autocorrelation problem in different items of
working capital (reflected by DW values). The growth rates of both nominal amount and
real amount of Loans and Advances were highest followed by the growth rate of Debtors,
growth rate of Inventory, growth rate of Current Assets, growth rate of Creditors, growth
rate of Net Working Capital, growth rate of Current Liabilities and Provision and
growth rate of Cash. These entire growth rate were significant at 1% probability level
except the growth rate of cash and Net Working Capital were not significant up to 10%
probability level. Parabolic equations were fitted in all cases except in Cash and Loans
and Advances and it was found that there were a discouraging trend in all cases except in
Current Liabilities and Provision (encouraging trend). The discouraging trend in
Inventory, Debtors and Current Assets were significant at 1% probability level but the
trend Creditors, Current Liabilities and Provision and Net Working Capital were not
significant up to 10% probability level.
4.5 Aurobindo Pharmaceuticals
4.5.1. Inventory analysis
From the estimated values of parameters presented in Table.4.5, it is found that the
nominal amount of Inventory of Aurobindo Pharmaceuticals had increased at an annual
rate of 26.5% during the period 1999-2000 to 2013-2014 and this growth rate was
significant at 1% probability level. It is also found that the growth rate of Inventory of
Aurobindo Pharmaceuticals had been increasing at diminishing rates. This implies a
discouraging trend in theinter temporal growth of total inventory.
To separate out the influence of inflation on the growth rate of inventory amount
necessary adjustment in the nominal values of the inventory amount have been done by
deflating the nominal values by the wholesale price index as then the chosen trend lines
have been fitted. From the estimated parameters presented in Table 4.25, it is found that
real amount of Inventory of Aurobindo Pharmaceuticals had grown at the annual rate of
65
23.4% and at the time of 1999-2000 to 2013-2014 but this growth rate of real amount of
Inventory of Aurobindo Pharmaceuticals was insignificant.
4.5.2. Debtors analysis:
From the estimated values of parameters presented in Table-4.5, it is found that the
nominal amount of Aurobindo Pharmaceuticals has increased at an annual rate of 21.2%
during the period 1999-2000 to 2013-2014 and this growth rate is significant at 1%
probability level. It is also found that the growth rate of Debtors of Aurobindo
Pharmaceuticals had been increasing at decreasing rates. This implies an discouraging
trend in the intertemporal growth of total debtors.
To separate out the influence of inflation on the growth rate of deposit amount necessary
adjustment in the nominal values of the debtors amount have been done by deflating the
nominal values by the wholesale price index as then the chosen trend lines have been
fitted. From the estimated parameters presented in Table 4.25, it is found that real amount
of debtors of Aurobindo Pharmaceuticals has grown at the annual rate of 18% and at the
time of 1999-2000 to 2013- 2014.
4.5.3 Cash analysis:
From the estimated values of parameters presented in Table-4.5, it is found that the
nominal amount of cash of Aurobindo Pharmaceuticals had increased at an annual rate of
79.9% during the period 1999-2000 to 2013-2014 and this growth rate was significant at
5% probability level. It is also found that the growth rate of cash of Aurobindo
Pharmaceuticals had been increasing at diminishing rates. This implies a discouraging
trend in the intertemporal growth of total cash.
To separate out the influence of inflation on the growth rate of deposit amount necessary
adjustment in the nominal values of the cash amount have been done by deflating the
nominal values by the wholesale price index as then the chosen trend lines have been
fitted. From the estimated parameters presented in Table 4.25, it is found that real amount
of cash of Aurobindo Pharmaceuticals had grown at the annual rate of 76.8% and at the

66
time of 1999-2000 to 2013- 2014. The growth rate of real amount of cash of Aurobindo
Pharmaceuticals was significant at 5% probability level.
4.5.4. Loans and Advance Analysis:
From the estimated values of parameters presented in Table-4.5, it is found that the
nominal amount of Loans and Advances of Aurobindo Pharmaceuticals had increased at
an annual rate of 46.5% during the period 1999-2000 to 2013-2014 and this growth rate
was significant at 1% probability level. It is also found that the growth rate of Loans and
Advances of Aurobindo Pharmaceuticals had been increasing at diminishing rates and
this diminishing rate was significant at 1% probability level. This implies a discouraging
trend in the intertemporal growth of total Loans and Advances.
To separate out the influence of inflation on the growth rate of Loans And Advance
amount necessary adjustment in the nominal values of the Loans And Advances amount
have been done by deflating the nominal values by the wholesale price index as then the
chosen trend lines have been fitted. From the estimated parameters presented in Table
4.25, it is found that real amount of Loans And Advances of Aurobindo Pharmaceuticals
had grown at the annual rate of 43.4% and at the time of 1999-2000 to 2013- 2014. The
growth rate of real amount of Loans and Advances of Aurobindo Pharmaceuticals was
significant at 1% probability level.
4.5.5. Creditors analysis:
From the estimated values of parameters presented in Table-4.5, it is found that the
nominal amount of Creditors of Aurobindo Pharmaceuticals had increased at an annual
rate of 23.9% during the period 1999-2000 to 2013-2014 and this growth rate was
significant at 1% probability level. It is also found that the growth rate of cash of
Aurobindo Pharmaceuticals had been increasing at decreasing rates and this decreasing
rate was significant at 1% probability level. This implies a discouraging trend in the inter
temporal growth of total creditors.
To separate out the influence of inflation on the growth rate of Creditors amount
necessary adjustment in the nominal values of the creditors amount have been done by
67
deflating the nominal values by the wholesale price index as then the chosen trend lines
have been fitted. From the estimated parameters presented in Table 4.25, it is found that
real amount of creditors of Aurobindo Pharmaceuticals had grown at the annual rate of
23.9% and at the time of 1999-2000 to 2013- 2014. The growth rate of real amount of
Creditors of Aurobindo Pharmaceuticals was insignificant.
4.5.6. Current Liabilities and Provisions Analysis:
From the estimated values of parameters presented in Table-4.5, it is found that the
nominal amount of Current Liabilities and Provisions Analysis of Aurobindo
Pharmaceuticals had increased at an annual rate of 22.2% during the period 1999-2000 to
2013-2014 and this growth rate was significant at 1% probability level. It is also found
that the growth rate of Current Liabilities and Provisions Analysis of Aurobindo
Pharmaceuticals had been increasing at diminishing rates but this diminishing rate was
not significant up to 10% probability level. This implies a descouraging trend in the
intertemporal growth of total Current Liabilities and Provisions.
To separate out the influence of inflation on the growth rate of Current Liabilities and
Provisions amount necessary adjustment in the nominal values of the creditors amount
have been done by deflating the nominal values by the wholesale price index as then the
chosen trend lines have been fitted. From the estimated parameters presented in Table
4.25, it is found that real amount of Current Liabilities and Provisions Analysis of
Aurobindo Pharmaceuticals had grown at the annual rate of 19.2% and at the time of
1999-2000 to 2013- 2014. The growth rate of real amount of Current Liabilities and
Provisions Analysis of Aurobindo Pharmaceuticals was insignificant.
4.5.7. Current Assets analysis
From the estimated values of parameters presented in Table.4.5, it is found that the
nominal amount of current assets of Aurobindo Pharmaceuticals had increased at an
annual rate of 32.6% during the period 1999-2000 to 2013-2014 and this growth rate was
significant at 1% probability level. It is also found that the growth rate of Inventory of
Aurobindo Pharmaceuticals had been increasing at diminishing rates and this diminishing
68
rate was significant at 1% probability level. This implies a discouraging trend in the
intertemporal growth of total current assets.
To separate out the influence of inflation on the growth rate of inventory amount
necessary adjustment in the nominal values of the current assets amount have been done
by deflating the nominal values by the wholesale price index as then the chosen trend
lines have been fitted. From the estimated parameters presented in Table 4.25, it is found
that real amount of current assets of Aurobindo Pharmaceuticals had grown at the annual
rate of 29.5% and at the time of 1999-2000 to 2013-2014. The growth rate of real amount
of current assets of Aurobindo Pharmaceuticals was significant at 1% probability level.
4.5.8. Net Working capital analysis
From the estimated values of parameters presented in Table.4.5, it is found that the
nominal amount of Net Working Capital of Aurobindo Pharmaceuticals had increased at
an annual rate of 35.7% during the period 1999-2000 to 2013-2014 and this growth rate
was significant at 1% probability level. It is also found that the growth rate of net
working capital of Aurobindo Pharmaceuticals had been increasing at decreasing rates.
This discouraging rate of growth was significant at 1% probability level. This implies a
discouraging trend in the intertemporal growth of total net working capital.
To separate out the influence of inflation on the growth rate of Net Working Capital
amount necessary adjustment in the nominal values of the inventory amount have been
done by deflating the nominal values by the wholesale price index as then the chosen
trend lines have been fitted. From the estimated parameters presented in Table 4.25, it is
found that real amount of Net Working Capital of Aurobindo Pharmaceuticals had grown
at the annual rate of 32.6% and at the time of 1999-2000 to 2013-2014. It is also
significant at 1% probability level.
From Table – 4.5 and Table-4.25, it was found that the regression equation of different
component of working capital were best fitted with time because adjusted R2 values
were
high in all cases. Moreover, there was no autocorrelation problem in different items of
working capital (reflected by DW values). The growth rates of both nominal amount and
real amount of cash were highest followed by the growth rate of Loans and Advances,
69
growth rate of Net Working Capital, growth rate of Current Assets, growth rate of
Inventory, growth rate of Creditors, growth rate of Current Liabilities and Provision and
growth rate of Debtors. These entire growth rates were significant at 1% probability level
except Cash (5% level). In all these cases parabolic equations were fitted and found there
were a discouraging trend and these trend were significant at 1% probability level except
Inventory (10% probability level), cash (5% probability level) and the discouraging trend
of Debtors, Creditors and Current Liabilities were not significant up to 10% probability
level.
4.6 Cadila Health Care Ltd
4.6.1. Inventory analysis
From the estimated values of parameters presented in Table.4.6, it is found that the
nominal amount of Inventory of Cadila Health Care Ltd had increased at an annual rate
of 24.3% during the period 1999-2000 to 2013-2014 and this growth rate was significant
at 1% probability level. It is also found that the growth rate of Inventory of Cadila Health
Care Ltd had been increasing at diminishing rates. This implies a discouraging trend in
the inter temporal growth of total inventory.
To separate out the influence of inflation on the growth rate of inventory amount
necessary adjustment in the nominal values of the inventory amount have been done by
deflating the nominal values by the wholesale price index as then the chosen trend lines
have been fitted. From the estimated parameters presented in Table 4.26, it is found that
real amount of Inventory of Cadila Health Care Ltd had grown at the annual rate of
21.2% and at the time of 1999-2000 to 2013-2014 and this growth rate of real amount of
Inventory of Cadila Health Care Ltd was significant at 1% probability level.
4.6.2. Debtors analysis:
From the estimated values of parameters presented in Table-4.6, it is found that the
nominal amount of Cadila Health Care Ltd has increased at an annual rate of 25.3%
during the period 1999-2000 to 2013-2014 and this growth rate is significant at 1%
probability level. It is also found that the growth rate of Debtors of Cadila Health Care
70
Ltd had been increasing at decreasing rates. This implies an discouraging trend in the
inter temporal growth of total debtors.
To separate out the influence of inflation on the growth rate of deposit amount necessary
adjustment in the nominal values of the debtors amount have been done by deflating the
nominal values by the wholesale price index as then the chosen trend lines have been
fitted. From the estimated parameters presented in Table 4.26, it is found that real amount
of debtors of Cadila Health Care Ltd has grown at the annual rate of 22.2% and at the
time of 1999-2000 to 2013- 2014 which is significant at 1% probability level.
4.6.3 Cash analysis:
From the estimated values of parameters presented in Table-4.6, it is found that the
nominal amount of cash of Cadila Health Care Ltd had decreased at an annual rate of
79.9% during the period 1999-2000 to 2013-2014 and this growth rate was significant at
5% probability level. It is also found that the growth rate of cash of Cadila Health Care
Ltd had been decreasing at increasing rates. This implies a discouraging trend in the inter
temporal growth of total cash.
To separate out the influence of inflation on the growth rate of deposit amount necessary
adjustment in the nominal values of the cash amount have been done by deflating the
nominal values by the wholesale price index as then the chosen trend lines have been
fitted. From the estimated parameters presented in Table 4.26, it is found that real amount
of cash of Cadila Health Care Ltd had declined at the annual rate of 77.6% and at the
time of 1999-2000 to 2013- 2014. The declined rate of real amount of cash of Cadila
Health Care Ltd was significant at 5% probability level.
4.6.4. Loans and Advance Analysis:
From the estimated values of parameters presented in Table-4.6, it is found that the
nominal amount of Loans and Advances of Cadila Health Care Ltd had increased at an
annual rate of 19.8% during the period 1999-2000 to 2013-2014 and this growth rate was
significant at 1% probability level. This implies a discouraging trend in the intertemporal
growth of total Loans and Advances.
71
To separate out the influence of inflation on the growth rate of Loans And Advance
amount necessary adjustment in the nominal values of the Loans And Advances amount
have been done by deflating the nominal values by the wholesale price index as then the
chosen trend lines have been fitted. From the estimated parameters presented in Table
4.26, it is found that real amount of Loans And Advances of Cadila Health Care Ltd had
grown at the annual rate of 17.5% and at the time of 1999-2000 to 2013- 2014.
4.6.5. Creditors analysis:
From the estimated values of parameters presented in Table-4.6, it is found that the
nominal amount of Creditors of Cadila Health Care Ltd had increased at an annual rate of
31.8% during the period 1999-2000 to 2013-2014 and this growth rate was significant at
1% probability level. It is also found that the growth rate of cash of Cadila Health Care
Ltd had been increasing at decreasing rates and this decreasing rate was significant at 1%
probability level. This implies a discouraging trend in the intertemporal growth of total
creditors.
To separate out the influence of inflation on the growth rate of Creditors amount
necessary adjustment in the nominal values of the creditors amount have been done by
deflating the nominal values by the wholesale price index as then the chosen trend lines
have been fitted. From the estimated parameters presented in Table 4.26, it is found that
real amount of creditors of Cadila Health Care Ltd had grown at the annual rate of 28.7%
and at the time of 1999-2000 to 2013- 2014. The growth rate of real amount of Creditors
of Cadila Health Care Ltd was significant at 5% probability level.
4.6.6. Current Liabilities and Provisions Analysis:
From the estimated values of parameters presented in Table-4.6, it is found that the
nominal amount of Current Liabilities and Provisions of Cadila Health Care Ltd had
increased at an annual rate of 29.9% during the period 1999-2000 to 2013-2014 and this
growth rate was significant at 1% probability level. It is also found that the growth rate of
Current Liabilities and Provisions Analysis of Cadila Health Care Ltd had been
increasing at diminishing rates but this diminishing rate was significant at 5% probability
72
level. This implies a discouraging trend in the inter temporal growth of total Current
Liabilities and Provisions.
To separate out the influence of inflation on the growth rate of Current Liabilities and
Provisions amount necessary adjustment in the nominal values of the creditors amount
have been done by deflating the nominal values by the wholesale price index as then the
chosen trend lines have been fitted. From the estimated parameters presented in Table
4.26, it is found that real amount of Current Liabilities and Provisions Analysis of Cadila
Health Care Ltd had grown at the annual rate of 26.9% and at the time of 1999-2000 to
2013- 2014. The growth rate of real amount of Current Liabilities and Provisions
Analysis of Cadila Health Care Ltd was significant at 5% probability level.
4.6.7. Current Assets analysis
From the estimated values of parameters presented in Table.4.5, it is found that the
nominal amount of current assets of Cadila Health Care Ltd had increased at an annual
rate of 15.1% during the period 1999-2000 to 2013-2014 and this growth rate was
significant at 1% probability level. This implies a discouraging trend in the inter temporal
growth of total current assets.
To separate out the influence of inflation on the growth rate of inventory amount
necessary adjustment in the nominal values of the current assets amount have been done
by deflating the nominal values by the wholesale price index as then the chosen trend
lines have been fitted. From the estimated parameters presented in Table 4.26, it is found
that real amount of current assets of Cadila Health Care Ltd had grown at the annual rate
of 12.7% and at the time of 1999-2000 to 2013-2014. The growth rate of real amount of
current assets of Cadila Health Care Ltd was significant at 1% probability level.
4.6.8. Net Working capital analysis
From the estimated values of parameters presented in Table.4.6, it is found that the
nominal amount of Net Working Capital of Cadila Health Care Ltd had increased at an
annual rate of 15.4% during the period 1999-2000 to 2013-2014 and this growth rate was

73
significant at 1% probability level. This implies a discouraging trend in the inter temporal
growth of total net working capital.
To separate out the influence of inflation on the growth rate of Net Working Capital
amount necessary adjustment in the nominal values of the inventory amount have been
done by deflating the nominal values by the wholesale price index as then the chosen
trend lines have been fitted. From the estimated parameters presented in Table 4.26, it is
found that real amount of Net Working Capital of Cadila Health Care Ltd had declined at
the annual rate of 17.4% and at the time of 1999-2000 to 2013-2014. It is also significant
at 10% probability level.
From Table – 4.6 and Table-4.26, it was found that the regression equation of different
component of working capital were best fitted with time because adjusted R2 values
were
high in all cases. Moreover, there was no autocorrelation problem in different items of
working capital (reflected by DW values). The growth rates of both nominal amount and
real amount of Creditors were highest followed by the growth rate of Current Liabilities
and Provision, growth rate of Debtors, growth rate of Inventory, growth rate of Loans
and Advances, growth rate of Net Working Capital, growth rate of Current Assets and
growth rate of cash. All these growth rates were significant at 1% probability level except
Cash (5% probability level). In some cases parabolic equations were fitted and found
discouraging trend of Cash, Debtors, Creditors and Current Liabilities and encouraging
trend of cash. All these trends were significant at 1% probability level except Creditors
(5% level), Current Liabilities and Provisions (5% level) and and the trend of Debtors
was not significant up to 10% probability level.
4.7 Divis Labs
4.7.1. Inventory analysis
From the estimated values of parameters presented in Table.4.7, it is found that the
nominal amount of Inventory of Divis Labs had increased at an annual rate of 25.6%
during the period 2000-2014 and this growth rate was significant at 1% probability level.
It is also found that the growth rate of Inventory of Divis Labs had been increasing at
74
diminishing rates. This implies a discouraging trend in the inter temporal growth of total
inventory.
To separate out the influence of inflation on the growth rate of inventory amount
necessary adjustment in the nominal values of the inventory amount have been done by
deflating the nominal values by the wholesale price index as then the chosen trend lines
have been fitted. From the estimated parameters presented in Table 4.27, it is found that
real amount of Inventory of Divis Labs had grown at the annual rate of 28.7% and at the
time of 2000 to 2014. The growth rate of real amount of Inventory of Divis Labs. was
significant at 1% probability level.
4.7.2. Debtors analysis:
From the estimated values of parameters presented in Table-4.7, it is found that the
nominal amount of Debtors of Divis Labs has increased at an annual rate of 29.6% during
the period 1999-2000 to 2013-2014 and this growth rate is significant at 1% probability
level. It is also found that the growth rate of Inventory of Divis Labs had been increasing
at diminishing rates. This implies a discouraging trend in the inter temporal growth of
total inventory.
To separate out the influence of inflation on the growth rate of deposit amount necessary
adjustment in the nominal values of the debtors amount have been done by deflating the
nominal values by the wholesale price index as then the chosen trend lines have been
fitted. From the estimated parameters presented in Table 4.27, it is found that real amount
of debtors of Divis Labs has grown at the annual rate of 32.7% and at the time of 1999-
2000 to 2013- 2014. The growth rate of real amount of debtors of Divis Labs is
significant at 1% probability level.
4.7.3 Cash analysis:
From the estimated values of parameters presented in Table-4.7, it is found that the
nominal amount of cash of Divis Labs had increased at an annual rate of 12.9% during
the period 1999-2000 to 2013-2014 and this growth rate was significant at 1% probability
level.
75
To separate out the influence of inflation on the growth rate of cash amount necessary
adjustment in the nominal values of the cash amount have been done by deflating the
nominal values by the wholesale price index as then the chosen trend lines have been
fitted. From the estimated parameters presented in Table 4.27, it is found that real amount
of cash of Divis Labs had grown at the annual rate of 15.2% and at the time of 1999-2000
to 2013- 2014. The growth rate of real amount of cash of Divis Labs was significant at
1% probability level.
4.7.4. Loans and Advance Analysis:
From the estimated values of parameters presented in Table-4.7, it is found that the
nominal amount of Loans and Advances of Divis Labs had increased at an annual rate of
32.4% during the period 1999-2000 to 2013-2014 and this growth rate was significant at
1% probability level. It is also found that the growth rate of Loans and Advances of Divis
Labs had been increasing at diminishing rates. This implies a discouraging trend in the
inter temporal growth of total inventory.
To separate out the influence of inflation on the growth rate of Loans And Advance
amount necessary adjustment in the nominal values of the Loans And Advances amount
have been done by deflating the nominal values by the wholesale price index as then the
chosen trend lines have been fitted. From the estimated parameters presented in Table
4.27, it is found that real amount of Loans and Advances of Divis Labs had grown at the
annual rate of 35.40% and at the time of 1999-2000 to 2013- 2014. The growth rate of
real amount of Loans and Advances of Divis Labs was significant at 1% probability
level.
4.7.5. Creditors analysis:
From the estimated values of parameters presented in Table-4.7, it is found that the
nominal amount of Creditors of Divis Labs had increased at an annual rate of 54% during
the period 1999-2000 to 2013-2014 and this growth rate was significant at 1% probability
level. It is also found that the growth rate of cash of Divis Labs had been increasing at
diminishing rates and this diminishing rate was significant at 5% probability level. This
implies a discouraging trend in the intertemporal growth of total creditors.
76
To separate out the influence of inflation on the growth rate of Creditors amount
necessary adjustment in the nominal values of the creditors amount have been done by
deflating the nominal values by the wholesale price index as then the chosen trend lines
have been fitted. From the estimated parameters presented in Table 4.27, it is found that
real amount of Creditors of Divis Labs had grown at the annual rate of 20.5% and at the
time of 1999-2000 to 2013- 2014. The growth rate of real amount of Creditors of Divis
Labs was significant at 1% probability level.
4.7.6. Current Liabilities and Provisions Analysis:
From the estimated values of parameters presented in Table-4.7, it is found that the
nominal amount of Current Liabilities and Provisions Analysis of Divis Labs had
increased at an annual rate of 15.3% during the period 1999-2000 to 2013-2014 and this
growth rate was significant at 1% probability level. It is also found that the growth rate of
Current Liabilities and Provisions Analysis of Divis Labs had been increasing at
encouraging rates but this encouraging rate was insignificant. This implies an
encouraging trend in the intertemporal growth of total Current Liabilities and Provisions.
To separate out the influence of inflation on the growth rate of Current Liabilities and
Provisions amount necessary adjustment in the nominal values of the creditors amount
have been done by deflating the nominal values by the wholesale price index as then the
chosen trend lines have been fitted. From the estimated parameters presented in Table
4.27, it is found that real amount of Current Liabilities and Provisions of Divis Labs had
grown at the annual rate of 18.3% and at the time of 1999-2000 to 2013- 2014. The
growth rate of real amount of Current Liabilities and Provisions Analysis of Divis Labs
was significant at 1% probability level.
4.7.7. Current Assets analysis
From the estimated values of parameters presented in Table.4.7, it is found that the
nominal amount of current assets of Divis Labs had increased at an annual rate of 27.7%
during the period 1999-2000 to 2013-2014 and this growth rate was significant at 1%
probability level. It is also found that the growth rate of Inventory of Divis Labs had been
increasing at diminishing rates. This discouraging rate was also significant at 1%
77
probability level. This implies a discouraging trend in the inter temporal growth of total
current assets.
To separate out the influence of inflation on the growth rate of inventory amount
necessary adjustment in the nominal values of the current assets amount have been done
by deflating the nominal values by the wholesale price index as then the chosen trend
lines have been fitted. From the estimated parameters presented in Table 4.27, it is found
that real amount of current assets of Divis Labs had grown at the annual rate of 30.8%
and at the time of 1999-2000 to 2013-2014. The growth rate of real amount of current
assets of Divis Labs was significant at 1% probability level.
4.7.8. Net Working capital analysis
From the estimated values of parameters presented in Table.4.7, it is found that the
nominal amount of Net Working Capital of Divis Labs had increased at an annual rate of
38.4% during the period 1999-2000 to 2013-2014 and this growth rate was significant at
1% probability level. It is also found that the growth rate of net working capital of Divis
Labs had been increasing at decreasing rates. This implies a discouraging trend in the
inter temporal growth of total net working capital.
To separate out the influence of inflation on the growth rate of Net Working Capital
amount necessary adjustment in the nominal values of the inventory amount have been
done by deflating the nominal values by the wholesale price index as then the chosen
trend lines have been fitted. From the estimated parameters presented in Table 4.27, it is
found that real amount of Net Working Capital of Divis Labs had grown at the annual
rate of 41.5% and at the time of 1999-2000 to 2013-2014. The growth rate of real amount
of Net Working Capital of Divis Labs was significant at 1% probability level.
From Table – 4.7 and Table-4.27, it was found that the regression equation of different
component of working capital were best fitted with time because adjusted R2 values
were
high in all cases. Moreover, there was no autocorrelation problem in different items of
working capital (reflected by DW values). The growth rates of both nominal amount and
real amount of Net Working Capital were highest followed by the growth rate of Loans
and Advances, growth rate of Debtors, growth rate of Current Assets, growth rate of
78
Inventory, growth rate of Creditors, growth rate of Current Liabilities and Provision and
growth rate of cash. All these growth rates were significant at 1% probability level. All
cases parabolic equations were fitted except of Cash. It was found discouraging trend of
Inventory, Debtors, Loans and Advances, Creditors, Current Assets and Net Working
Capital and encouraging trend of Current Liabilities and Provisions. It was also found
that all these discouraging trends and encouraging trend were not significant up to 10%
probability level except Debtors (10% level), Current Assets (1% level) and Net Working
Capital (1% level)
4.8. Strides Archolabs
4.8.1. Inventory analysis
From the estimated values of parameters presented in Table.4.8, it is found that the
nominal amount of Inventory of Strides Archolabs had increased at an annual rate of
9.86% during the period 1999-2000 to 2013-2014 and this growth rate was significant at
1% probability level. This implies a discouraging trend in the inter temporal growth of
total inventory.
To separate out the influence of inflation on the growth rate of inventory amount
necessary adjustment in the nominal values of the inventory amount have been done by
deflating the nominal values by the wholesale price index as then the chosen trend lines
have been fitted. From the estimated parameters presented in Table 4.28, it is found that
real amount of Inventory of Strides Archolabs had grown at the annual rate of 7.51% and
at the time of 1999-2000 to 2013-2014 and this growth rate of real amount of Inventory
of Strides Archolabs was significant at 1% probability level.
4.8.2. Debtors analysis:
From the estimated values of parameters presented in Table-4.8, it is found that the
nominal amount of Strides Archolabs has increased at an annual rate of 18.7% during the
period 1999-2000 to 2013-2014 and this growth rate is significant at 1% probability level.
It is also found that the growth rate of Debtors of Strides Archolabs had been increasing
79
at decreasing rates. This discouraging trend was also significant at 5% probability level.
This implies an discouraging trend in the inter temporal growth of total debtors.
To separate out the influence of inflation on the growth rate of debtors amount necessary
adjustment in the nominal values of the debtors amount have been done by deflating the
nominal values by the wholesale price index as then the chosen trend lines have been
fitted. From the estimated parameters presented in Table 4.28, it is found that real amount
of debtors of Strides Archolabs has grown at the annual rate of 15.7% and at the time of
1999-2000 to 2013- 2014. The declined rate of real amount of Debtors of Strides
Archolabs was significant at 1% probability level.
4.8.3 Cash analysis:
From the estimated values of parameters presented in Table-4.8, it is found that the
nominal amount of cash of Strides Archolabs had increased at an annual rate of 16.4%
during the period 1999-2000 to 2013-2014 and this growth rate was significant at 1%
probability level. This implies a discouraging trend in the inter temporal growth of total
cash.
To separate out the influence of inflation on the growth rate of cash amount necessary
adjustment in the nominal values of the cash amount have been done by deflating the
nominal values by the wholesale price index as then the chosen trend lines have been
fitted. From the estimated parameters presented in Table 4.28, it is found that real amount
of cash of Strides Archolabs had declined at the annual rate of 14.1% and at the time of
1999-2000 to 2013- 2014. The declined rate of real amount of cash of Strides Archolabs
was significant at 1% probability level.
4.8.4. Loans and Advance Analysis:
From the estimated values of parameters presented in Table-4.8, it is found that the
nominal amount of Loans and Advances of Strides Archolabs had increased at an annual
rate of 36.4% during the period 1999-2000 to 2013-2014 and this growth rate was
significant at 5% probability level. It is also found that the growth rate of cash of Strides
Archolabs had been increasing at decreasing rates and this decreasing rate was
80
insignificant. This implies a discouraging trend in the inter temporal growth of total
Loans and Advances.
To separate out the influence of inflation on the growth rate of Loans And Advance
amount necessary adjustment in the nominal values of the Loans And Advances amount
have been done by deflating the nominal values by the wholesale price index as then the
chosen trend lines have been fitted. From the estimated parameters presented in Table
4.28, it is found that real amount of Loans And Advances of Strides Archolabs had grown
at the annual rate of 21.1% and at the time of 1999-2000 to 2013- 2014. The growth rate
of real amount was also significant at 1% probability level.
4.8.5. Creditors analysis:
From the estimated values of parameters presented in Table-4.8, it is found that the
nominal amount of Creditors of Strides Archolabs had increased at an annual rate of 17%
during the period 1999-2000 to 2013-2014 and this growth rate was significant at 1%
probability level. This implies a discouraging trend in the inter temporal growth of total
creditors.
To separate out the influence of inflation on the growth rate of Creditors amount
necessary adjustment in the nominal values of the creditors amount have been done by
deflating the nominal values by the wholesale price index as then the chosen trend lines
have been fitted. From the estimated parameters presented in Table 4.28, it is found that
real amount of creditors of Strides Archolabs had grown at the annual rate of 14.6% and
at the time of 1999-2000 to 2013- 2014. The growth rate of real amount of Creditors of
Strides Archolabs was significant at 1% probability level.
4.8.6. Current Liabilities and Provisions Analysis:
From the estimated values of parameters presented in Table-4.8, it is found that the
nominal amount of Current Liabilities and Provisions of Strides Archolabs had increased
at an annual rate of 31.1% during the period 1999-2000 to 2013-2014 and this growth
rate was significant at 1% probability level. It is also found that the growth rate of
Current Liabilities and Provisions Analysis of Strides Archolabs had been increasing at
81
diminishing rates but this diminishing rate was significant at 5% probability level. This
implies a discouraging trend in the inter temporal growth of total Current Liabilities and
Provisions.
To separate out the influence of inflation on the growth rate of Current Liabilities and
Provisions amount necessary adjustment in the nominal values of the creditors amount
have been done by deflating the nominal values by the wholesale price index as then the
chosen trend lines have been fitted. From the estimated parameters presented in Table
4.28, it is found that real amount of Current Liabilities and Provisions of Strides
Archolabs had grown at the annual rate of 28.1% and at the time of 1999-2000 to 2013-
2014. The growth rate of real amount of Current Liabilities and Provisions Analysis of
Strides Archolabs was significant at 5% probability level.
4.8.7. Current Assets analysis
From the estimated values of parameters presented in Table.4.8, it is found that the
nominal amount of current assets of Strides Archolabs d had increased at an annual rate
of 26.7% during the period 1999-2000 to 2013-2014 and this growth rate was significant
at 5% probability level. It is also found that the growth rate of Current Assets of Strides
Archolabs had been increasing at diminishing rates but this diminishing rate was
insignificant. This implies a discouraging trend in the inter temporal growth of total
current assets.
To separate out the influence of inflation on the growth rate of inventory amount
necessary adjustment in the nominal values of the current assets amount have been done
by deflating the nominal values by the wholesale price index as then the chosen trend
lines have been fitted. From the estimated parameters presented in Table 4.28, it is found
that real amount of current assets of Strides Archolabs had grown at the annual rate of
15.2% and at the time of 1999-2000 to 2013-2014. The growth rate of real amount of
current assets of Strides Archolabs was significant at 1% probability level.
82
4.8.8. Net Working capital analysis:
From the estimated values of parameters presented in Table.4.8, it is found that the
nominal amount of Net Working Capital of Strides Archolabs had increased at an annual
rate of 15.4% during the period 1999-2000 to 2013-2014 and this growth rate was
significant at 5% probability level. It is also found that the growth rate of Current Assets
of Strides Archolabs had been increasing at diminishing rates but this diminishing rate
was insignificant. This implies a discouraging trend in the inter temporal growth of total
net working capital.
To separate out the influence of inflation on the growth rate of Net Working Capital
amount necessary adjustment in the nominal values of the inventory amount have been
done by deflating the nominal values by the wholesale price index as then the chosen
trend lines have been fitted. From the estimated parameters presented in Table 4.28, it is
found that real amount of Net Working Capital of Strides Archolabs had declined at the
annual rate of 28.1% and at the time of 1999-2000 to 2013-2014. The growth rate of real
amount was significant at 10% probability level.
From Table – 4.8 and Table-4.28, it was found that the regression equation of different
component of working capital were best fitted with time because adjusted R2 values
were
high in all cases. Moreover, there was no autocorrelation problem in different items of
working capital (reflected by DW values). The growth rates of both nominal amount and
real amount of Loans and Advances were highest followed by the growth rate of Net
Working Capital, growth rate of Current Liabilities and Provision, growth rate of Current
Assets, growth rate of Debtors, growth rate of Creditors, growth rate of cash and growth
rate of Inventory. All these growth rates were significant at 1% probability level except
Loans and Advances ( 5% level), Current Assets (5% level), and Net Working Capital
(5% level). In some cases parabolic equations were fitted and found discouraging trend.
All these trends were not significant up to 10% probability level except Debtors (5%
level) and Current Liabilities (5% level).

83
4.9. Sun Pharmaceuticals
4.9.1. Inventory analysis
From the estimated values of parameters presented in Table.4.9, it is found that the
nominal amount of Inventory of Sun Pharmaceuticals had increased at an annual rate of
20.3% during the period 1999-2000 to 2013-2014 and this growth rate was significant at
1% probability level. It is also found that the growth rate of Inventory of Sun
Pharmaceuticals had been increasing at decreasing rates. This implies a discouraging
trend in the inter temporal growth of total inventory.
To separate out the influence of inflation on the growth rate of inventory amount
necessary adjustment in the nominal values of the inventory amount have been done by
deflating the nominal values by the wholesale price index as then the chosen trend lines
have been fitted. From the estimated parameters presented in Table 4.29, it is found that
real amount of Inventory of Sun Pharmaceuticals had grown at the annual rate of 14.8%
and at the time of 1999-2000 to 2013-2014 and this growth rate of real amount of
Inventory of Sun Pharmaceuticals was significant at 1% probability level.
4.9.2. Debtors analysis:
From the estimated values of parameters presented in Table-4.9, it is found that the
nominal amount of Sun Pharmaceuticals has increased at an annual rate of 41.3% during
the period 1999-2000 to 2013-2014 and this growth rate is significant at 1% probability
level. It is also found that the growth rate of Debtors of Sun Pharmaceuticals had been
increasing at decreasing rates. This discouraging trend was also significant at 5%
probability level. This implies an discouraging trend in the inter temporal growth of total
debtors.
To separate out the influence of inflation on the growth rate of debtors amount necessary
adjustment in the nominal values of the debtors amount have been done by deflating the
nominal values by the wholesale price index as then the chosen trend lines have been
fitted. From the estimated parameters presented in Table 4.29, it is found that real amount
of debtors of Sun Pharmaceuticals has grown at the annual rate of 38.2% and at the time

84
of 1999-2000 to 2013- 2014. The declined rate of real amount of Debtors of Sun
Pharmaceuticals was significant at 1% probability level.
4.9.3 Cash analysis:
From the estimated values of parameters presented in Table-4.9, it is found that the
nominal amount of cash of Sun Pharmaceuticals had increased at an annual rate of
148.3% during the period 1999-2000 to 2013-2014 and this growth rate was significant at
1% probability level. It is also found that the growth rate of Cash of Sun Pharmaceuticals
had been increasing at decreasing rates. This discouraging trend was also significant at
1% probability level. This implies a discouraging trend in the inter temporal growth of
total cash.
To separate out the influence of inflation on the growth rate of cash amount necessary
adjustment in the nominal values of the cash amount have been done by deflating the
nominal values by the wholesale price index as then the chosen trend lines have been
fitted. From the estimated parameters presented in Table 4.29, it is found that real amount
of cash of Sun Pharmaceuticals had declined at the annual rate of 145.2% and at the time
of 1999-2000 to 2013- 2014. The declined rate of real amount of cash of Sun
Pharmaceuticals was significant at 1% probability level.
4.9.4. Loans and Advance Analysis:
From the estimated values of parameters presented in Table-4.9, it is found that the
nominal amount of Loans and Advances of Sun Pharmaceuticals had increased at an
annual rate of 23.2% during the period 1999-2000 to 2013-2014 and this growth rate was
significant at 1% probability level. It is also found that the growth rate of Loans and
Advance of Sun Pharmaceuticals had been increasing at decreasing rates and this
decreasing rate was significant at 1% probability level. This implies a discouraging trend
in the inter temporal growth of total Loans and Advances.
To separate out the influence of inflation on the growth rate of Loans And Advance
amount necessary adjustment in the nominal values of the Loans And Advances amount
have been done by deflating the nominal values by the wholesale price index as then the
85
chosen trend lines have been fitted. From the estimated parameters presented in Table
4.29, it is found that real amount of Loans And Advances of Sun Pharmaceuticals had
grown at the annual rate of 20.9% and at the time of 1999-2000 to 2013- 2014. The
growth rate of real amount was also significant at 1% probability level.
4.9.5. Creditors analysis:
From the estimated values of parameters presented in Table-4.9, it is found that the
nominal amount of Creditors of Sun Pharmaceuticals had increased at an annual rate of
42.3% during the period 1999-2000 to 2013-2014 and this growth rate was significant at
1% probability level. It is also found that the growth rate of Creditors of Sun
Pharmaceuticals had been increasing at decreasing rates and this decreasing rate was
significant at 1% probability level.This implies a discouraging trend in the inter temporal
growth of total creditors.
To separate out the influence of inflation on the growth rate of Creditors amount
necessary adjustment in the nominal values of the creditors amount have been done by
deflating the nominal values by the wholesale price index as then the chosen trend lines
have been fitted. From the estimated parameters presented in Table 4.29, it is found that
real amount of creditors of Sun Pharmaceuticals had grown at the annual rate of 39.2%
and at the time of 1999-2000 to 2013- 2014. The growth rate of real amount of Creditors
of Sun Pharmaceuticals was significant at 1% probability level.
4.9.6. Current Liabilities and Provisions Analysis:
From the estimated values of parameters presented in Table-4.9, it is found that the
nominal amount of Current Liabilities and Provisions of Sun Pharmaceuticals had
increased at an annual rate of 31.9% during the period 1999-2000 to 2013-2014 and this
growth rate was significant at 1% probability level. It is also found that the growth rate of
Current Liabilities and Provisions Analysis of Sun Pharmaceuticals had been increasing
at diminishing rates. This implies a discouraging trend in the inter temporal growth of
total Current Liabilities and Provisions.
86
To separate out the influence of inflation on the growth rate of Current Liabilities and
Provisions amount necessary adjustment in the nominal values of the creditors amount
have been done by deflating the nominal values by the wholesale price index as then the
chosen trend lines have been fitted. From the estimated parameters presented in Table
4.29, it is found that real amount of Current Liabilities and Provisions of Sun
Pharmaceuticals had grown at the annual rate of 25.2% and at the time of 1999-2000 to
2013- 2014. The growth rate of real amount of Current Liabilities and Provisions of Sun
Pharmaceuticals was significant at 1% probability level.
4.9.7. Current Assets analysis
From the estimated values of parameters presented in Table.4.9, it is found that the
nominal amount of current assets of Sun Pharmaceuticals had increased at an annual rate
of 44% during the period 1999-2000 to 2013-2014 and this growth rate was significant at
5% probability level. It is also found that the growth rate of Current Assets of Sun
Pharmaceuticals had been increasing at diminishing rates. This diminishing rate was also
significant at 5%probability level. This implies a discouraging trend in the inter temporal
growth of total current assets.
To separate out the influence of inflation on the growth rate of inventory amount
necessary adjustment in the nominal values of the current assets amount have been done
by deflating the nominal values by the wholesale price index as then the chosen trend
lines have been fitted. From the estimated parameters presented in Table 4.29, it is found
that real amount of current assets of Sun Pharmaceuticals had grown at the annual rate of
40.9% and at the time of 1999-2000 to 2013-2014. The growth rate of real amount of
current assets of Sun Pharmaceuticals was significant at 1% probability level.
4.9.8. Net Working capital analysis:
From the estimated values of parameters presented in Table.4.9, it is found that the
nominal amount of Net Working Capital of Sun Pharmaceuticals had increased at an
annual rate of 43.7% during the period 1999-2000 to 2013-2014 and this growth rate was
significant at 1% probability level. It is also found that the growth rate of Current Assets
of Sun Pharmaceuticals had been increasing at diminishing rates. This diminishing rate
87
was significant at 10% probability level. This implies a discouraging trend in the inter
temporal growth of total net working capital.
To separate out the influence of inflation on the growth rate of Net Working Capital
amount necessary adjustment in the nominal values of the inventory amount have been
done by deflating the nominal values by the wholesale price index as then the chosen
trend lines have been fitted. From the estimated parameters presented in Table 4.29, it is
found that real amount of Net Working Capital of Sun Pharmaceuticals had declined at
the annual rate of 40.6% and at the time of 1999-2000 to 2013-2014. The growth rate of
real amount was significant at 1% probability level.
From Table – 4.9 and Table-4.29, it was found that the regression equation of different
component of working capital were best fitted with time because adjusted R2 values
were
high in all cases. Moreover, there was no autocorrelation problem in different items of
working capital (reflected by DW values). The growth rates of both nominal amount and
real amount of cash were highest followed by the growth rate of Current Assets, growth
rate of Net Working Capital, growth rate of Creditors, growth rate of Debtors, growth
rate of Current Liabilities and Provision, growth rate of Loans and Advances and growth
rate of Inventory. All these growth rates were significant at 1% probability level. In all
cases trend equations were fitted except of Loans and Advances and found discouraging
trends. It was found that trend of Debtors and trend of Current Assets were significant at
5% probability level. trend of Cash, trend of Creditors were significance at 1%
probability level, and trend of Net Working Capital was significance at 10% probability
level. It was also found that the trend of Inventory, Current Liabilities and Provisions
were not significant up to 10% probability level.
4.10. Biocon Pharmaceuticals
4.10.1. Inventory analysis
From the estimated values of parameters presented in Table.4.10, it is found that the
nominal amount of Inventory of Biocon Pharmaceuticals had increased at an annual rate
of 39.2% during the period 1999-2000 to 2013-2014 and this growth rate was significant
at 1% probability level. It is also found that the growth rate of Inventory of Biocon
88
Pharmaceuticals had been increasing at decreasing rates. This discouraging trend was
also significant at 1% probability level. This implies a discouraging trend in the inter
temporal growth of total inventory.
To separate out the influence of inflation on the growth rate of inventory amount
necessary adjustment in the nominal values of the inventory amount have been done by
deflating the nominal values by the wholesale price index as then the chosen trend lines
have been fitted. From the estimated parameters presented in Table 4.30, it is found that
real amount of Inventory of Biocon Pharmaceuticals had grown at the annual rate of
36.10% and at the time of 1999-2000 to 2013-2014 and this growth rate of real amount of
Inventory of Biocon Pharmaceuticals was significant at 1% probability level.
4.10.2. Debtors analysis:
From the estimated values of parameters presented in Table-4.10, it is found that the
nominal amount of Biocon Pharmaceuticals has increased at an annual rate of 39.6%
during the period 1999-2000 to 2013-2014 and this growth rate is significant at 1%
probability level. It is also found that the growth rate of Debtors of Biocon
Pharmaceuticals had been increasing at decreasing rates. This discouraging trend was
also significant at 1% probability level. This implies an discouraging trend in the inter
temporal growth of total debtors.
To separate out the influence of inflation on the growth rate of debtors amount necessary
adjustment in the nominal values of the debtors amount have been done by deflating the
nominal values by the wholesale price index as then the chosen trend lines have been
fitted. From the estimated parameters presented in Table 4.30, it is found that real amount
of debtors of Biocon Pharmaceuticals s has grown at the annual rate of 36.5% and at the
time of 1999-2000 to 2013- 2014. The declined rate of real amount of Debtors of Biocon
Pharmaceuticals was significant at 1% probability level.
4.10.3 Cash analysis:
From the estimated values of parameters presented in Table-4.10, it is found that the
nominal amount of cash of Biocon Pharmaceuticals had increased at an annual rate of
89
142.7% during the period 1999-2000 to 2013-2014 and this growth rate was significant at
10% probability level. It is also found that the growth rate of Cash of Biocon
Pharmaceuticals had been increasing at decreasing rates. This implies a discouraging
trend in the inter temporal growth of total cash.
To separate out the influence of inflation on the growth rate of cash amount necessary
adjustment in the nominal values of the cash amount have been done by deflating the
nominal values by the wholesale price index as then the chosen trend lines have been
fitted. From the estimated parameters presented in Table 4.30, it is found that real amount
of cash of Biocon Pharmaceuticals had grown at the annual rate of 139.7% and at the
time of 1999-2000 to 2013- 2014. The growth rate of real amount of cash of Biocon
Pharmaceuticals was significant at 5% probability level.
4.10.4. Loans and Advance Analysis:
From the estimated values of parameters presented in Table-4.10, it is found that the
nominal amount of Loans and Advances of Biocon Pharmaceuticals had increased at an
annual rate of 41.7% during the period 1999-2000 to 2013-2014 and this growth rate was
significant at 1% probability level. It is also found that the growth rate of Loans and
Advance of Biocon Pharmaceuticals had been increasing at decreasing rates. This implies
a discouraging trend in the inter temporal growth of total Loans and Advances.
To separate out the influence of inflation on the growth rate of Loans And Advance
amount necessary adjustment in the nominal values of the Loans And Advances amount
have been done by deflating the nominal values by the wholesale price index as then the
chosen trend lines have been fitted. From the estimated parameters presented in Table
4.30, it is found that real amount of Loans And Advances of Biocon Pharmaceuticals had
grown at the annual rate of 35% and at the time of 1999-2000 to 2013- 2014. The growth
rate of real amount was also significant at 1% probability level.
4.10.5. Creditors analysis:
From the estimated values of parameters presented in Table-4.10, it is found that the
nominal amount of Creditors of Biocon Pharmaceuticals had increased at an annual rate
90
of 39.9% during the period 1999-2000 to 2013-2014 and this growth rate was significant
at 1% probability level. It is also found that the growth rate of Creditors of Biocon
Pharmaceuticals had been increasing at decreasing rates and this decreasing rate was
significant at 1% probability level. This implies a discouraging trend in the inter
temporal growth of total creditors.
To separate out the influence of inflation on the growth rate of Creditors amount
necessary adjustment in the nominal values of the creditors amount have been done by
deflating the nominal values by the wholesale price index as then the chosen trend lines
have been fitted. From the estimated parameters presented in Table 4.30, it is found that
real amount of creditors of Biocon Pharmaceuticals had grown at the annual rate of
36.8% and at the time of 1999-2000 to 2013- 2014. The growth rate of real amount of
Creditors of Biocon Pharmaceuticals was significant at 1% probability level.
4.10.6. Current Liabilities and Provisions Analysis:
From the estimated values of parameters presented in Table-4.10, it is found that the
nominal amount of Current Liabilities and Provisions of Biocon Pharmaceuticals had
increased at an annual rate of 43.5% during the period 1999-2000 to 2013-2014 and this
growth rate was significant at 1% probability level. It is also found that the growth rate of
Current Liabilities and Provisions Analysis of Biocon Pharmaceuticals had been
increasing at diminishing rates. This diminishing rate was also significant at
1%probability level. This implies a discouraging trend in the inter temporal growth of
total Current Liabilities and Provisions.
To separate out the influence of inflation on the growth rate of Current Liabilities and
Provisions amount necessary adjustment in the nominal values of the creditors amount
have been done by deflating the nominal values by the wholesale price index as then the
chosen trend lines have been fitted. From the estimated parameters presented in Table
4.30, it is found that real amount of Current Liabilities and Provisions of Biocon
Pharmaceuticals had grown at the annual rate of 40.4% and at the time of 1999-2000 to
2013- 2014. The growth rate of real amount of Current Liabilities and Provisions of
Biocon Pharmaceuticals was significant at 1% probability level.
91
4.10.7. Current Assets analysis
From the estimated values of parameters presented in Table.4.10, it is found that the
nominal amount of current assets of Biocon Pharmaceuticals had increased at an annual
rate of 41.3% during the period 1999-2000 to 2013-2014 and this growth rate was
significant at 1% probability level. It is also found that the growth rate of Current Assets
of Biocon Pharmaceuticals had been increasing at diminishing rates. This diminishing
rate was also significant at 5%probability level. This implies a discouraging trend in the
inter temporal growth of total current assets.
To separate out the influence of inflation on the growth rate of inventory amount
necessary adjustment in the nominal values of the current assets amount have been done
by deflating the nominal values by the wholesale price index as then the chosen trend
lines have been fitted. From the estimated parameters presented in Table 4.30, it is found
that real amount of current assets of Biocon Pharmaceuticals had grown at the annual rate
of 38.2% and at the time of 1999-2000 to 2013-2014. The growth rate of real amount of
current assets of Biocon Pharmaceuticals was significant at 1% probability level.
4.10.8. Net Working capital analysis:
From the estimated values of parameters presented in Table.4.10, it is found that the
nominal amount of Net Working Capital of Biocon Pharmaceuticals had increased at an
annual rate of 39.8% during the period 1999-2000 to 2013-2014 and this growth rate was
significant at 1% probability level. It is also found that the growth rate of Current Assets
of Biocon Pharmaceuticals had been increasing at diminishing rates. This implies a
discouraging trend in the inter temporal growth of total net working capital.
To separate out the influence of inflation on the growth rate of Net Working Capital
amount necessary adjustment in the nominal values of the inventory amount have been
done by deflating the nominal values by the wholesale price index as then the chosen
trend lines have been fitted. From the estimated parameters presented in Table 4.30, it is
found that real amount of Net Working Capital of Biocon Pharmaceuticals had declined
at the annual rate of 26% and at the time of 1999-2000 to 2013-2014. The growth rate of
real amount was significant at 1% probability level.
92
From Table – 4.10 and Table-4.30, it was found that the regression equation of different
component of working capital were best fitted with time because adjusted R2 values
were
high in all cases. Moreover, there was no autocorrelation problem in different items of
working capital (reflected by DW values). The growth rates of both nominal amount and
real amount of cash were highest followed by the growth rate of Current Liabilities and
Provision, growth rate of Loans and Advances, growth rate of Current Assets, growth rate
of Creditors, growth rate of Net Working Capital, growth rate of Debtors and growth rate
of Inventory. All these growth rates were significant at 1% probability level except cash
(5% level). In all cases, parabolic equations were fitted and found discouraging trends.
All these trends were not significant up to 10% probability level except Debtors (1%
level), Inventory (1% level), Creditors (1% level), Current Liabilities and Provisions (1%
level) and Current Assets (5% level).
4.11. Kopran
4.11.1. Inventory analysis
From the estimated values of parameters presented in Table.4.11, it is found that the
nominal amount of Inventory of Kopran had decreased at an annual rate of 36.10%
during the period 1999-2000 to 2013-2014 and this growth rate was significant at 1%
probability level. It is also found that the declined rate of Inventory of Kopran had been
increasing at increasing rates. This encouraging trend was also significant at 1%
probability level. This implies an encouraging trend in the inter temporal growth of total
inventory.
To separate out the influence of inflation on the growth rate of inventory amount
necessary adjustment in the nominal values of the inventory amount have been done by
deflating the nominal values by the wholesale price index as then the chosen trend lines
have been fitted. From the estimated parameters presented in Table 4.31, it is found that
real amount of Inventory of Kopran had declined at the annual rate of 39.10% and at the
time of 1999-2000 to 2013-2014 and this declined rate of real amount of Inventory of
Kopran was significant at 1% probability level.
93
4.11.2. Debtors analysis:
From the estimated values of parameters presented in Table-4.11, it is found that the
nominal amount of Kopran had decreased at an annual rate of 21.9% during the period
1999-2000 to 2013-2014 and this growth rate is significant at 5% probability level. It is
also found that the declined rate of Debtors of Kopran had been increasing at increasing
rates. This encouraging trend was also significant at 5% probability level. This implies an
encouraging trend in the inter temporal growth of total debtors.
To separate out the influence of inflation on the growth rate of debtors amount necessary
adjustment in the nominal values of the debtors amount have been done by deflating the
nominal values by the wholesale price index as then the chosen trend lines have been
fitted. From the estimated parameters presented in Table 4.31, it is found that real amount
of debtors of Kopran has grown at the annual rate of (-)25% and at the time of 1999-2000
to 2013- 2014. The declined rate of real amount of Debtors of Kopran was significant at
5% probability level.
4.11.3 Cash analysis:
From the estimated values of parameters presented in Table-4.11, it is found that the
nominal amount of cash of Kopran had decreased at an annual rate of 11.1% during the
period 1999-2000 to 2013-2014 and this growth rate was insignificant. It is also found
that the growth rate of Cash of Kopran had been increasing at increasing rates. This
implies an encouraging trend in the inter temporal growth of total cash.
To separate out the influence of inflation on the growth rate of cash amount necessary
adjustment in the nominal values of the cash amount have been done by deflating the
nominal values by the wholesale price index as then the chosen trend lines have been
fitted. From the estimated parameters presented in Table 4.31, it is found that real amount
of cash of Kopran had declined at the annual rate of 14.10% and at the time of 1999-2000
to 2013- 2014. The declined rate of real amount of cash of Kopran was significant at 10%
probability level.
94
4.11.4. Loans and Advance Analysis:
From the estimated values of parameters presented in Table-4.11, it is found that the
nominal amount of Loans and Advances of Kopran had increased at an annual rate of
0.043% during the period 1999-2000 to 2013-2014 and this growth rate was insignificant.
To separate out the influence of inflation on the growth rate of Loans And Advance
amount necessary adjustment in the nominal values of the Loans And Advances amount
have been done by deflating the nominal values by the wholesale price index as then the
chosen trend lines have been fitted. From the estimated parameters presented in Table
4.31, it is found that real amount of Loans And Advances of Kopran had grown at the
annual rate of -1.92% and at the time of 1999-2000 to 2013- 2014. The growth rate of
real amount was also insignificant.
4.11.5. Creditors analysis:
From the estimated values of parameters presented in Table-4.11, it is found that the
nominal amount of Creditors of Kopran had increased at an annual rate of 3.08% during
the period 1999-2000 to 2013-2014 and this growth rate was insignificant.
To separate out the influence of inflation on the growth rate of Creditors amount
necessary adjustment in the nominal values of the creditors amount have been done by
deflating the nominal values by the wholesale price index as then the chosen trend lines
have been fitted. From the estimated parameters presented in Table 4.31, it is found that
real amount of creditors of Kopran had grown at the annual rate of -1.37% and at the time
of 1999-2000 to 2013- 2014. The growth rate of real amount of Creditors of Kopran was
also insignificant.
4.11.6. Current Liabilities and Provisions Analysis:
From the estimated values of parameters presented in Table-4.11, it is found that the
nominal amount of Current Liabilities and Provisions of Kopran had increased at an
annual rate of .09% during the period 1999-2000 to 2013-2014 and this growth rate was
insignificant. It is also found that the growth rate of Current Liabilities and Provisions
95
Analysis of Kopran had been increasing at diminishing rates. This diminishing rate was
also insignificant.
To separate out the influence of inflation on the growth rate of Current Liabilities and
Provisions amount necessary adjustment in the nominal values of the creditors amount
have been done by deflating the nominal values by the wholesale price index as then the
chosen trend lines have been fitted. From the estimated parameters presented in Table
4.31, it is found that real amount of Current Liabilities and Provisions of Kopran had
grown at the annual rate of -1.45% and at the time of 1999-2000 to 2013- 2014. The
growth rate of real amount of Current Liabilities and Provisions of Kopran was
insignificant .
4.11.7. Current Assets analysis
From the estimated values of parameters presented in Table.4.11, it is found that the
nominal amount of current assets of Kopran had increased at an annual rate of -15.5%
during the period 1999-2000 to 2013-2014 and this growth rate was significant at 1%
probability level. It is also found that the growth rate of Current Assets of Kopran had
been increasing at increasing rates. This increasing rate was also significant at
5%probability level. This implies a discouraging trend in the inter temporal growth of
total current assets.
To separate out the influence of inflation on the growth rate of inventory amount
necessary adjustment in the nominal values of the current assets amount have been done
by deflating the nominal values by the wholesale price index as then the chosen trend
lines have been fitted. From the estimated parameters presented in Table 4.31, it is found
that real amount of current assets of Kopran had grown at the annual rate of -18.5% and
at the time of 1999-2000 to 2013-2014. The growth rate of real amount of current assets
of Kopran was significant at 1% probability level.
4.11.8. Net Working capital analysis:
From the estimated values of parameters presented in Table.4.11, it is found that the
nominal amount of Net Working Capital of Kopran had increased at an annual rate of -

96
24.10% during the period 1999-2000 to 2013-2014 and this growth rate was significant at
1% probability level. It is also found that the growth rate of Current Assets of Kopran had
been increasing at increasing rates and the increasing rate of real amount of net working
capital of Kopran was significany at 1% probability level. This implies a discouraging
trend in the inter temporal growth of total net working capital.
To separate out the influence of inflation on the growth rate of Net Working Capital
amount necessary adjustment in the nominal values of the inventory amount have been
done by deflating the nominal values by the wholesale price index as then the chosen
trend lines have been fitted. From the estimated parameters presented in Table 4.31, it is
found that real amount of Net Working Capital of Kopran had declined at the annual rate
of 27.2% and at the time of 1999-2000 to 2013-2014. The growth rate of real amount of
Kopran was significant at 1% probability level.
From Table – 4.11 and Table-4.31, it was found that the regression equation of different
component of working capital were best fitted with time because adjusted R2 values
were
high in all cases. Moreover, there was no autocorrelation problem in different items of
working capital (reflected by DW values). The growth rates of both nominal amount and
real amount of Creditors were highest followed by the growth rate of Loans and
Advances, growth rate of Current Liabilities and Provision, growth rate of Cash, growth
rate of Current Assets, growth rate of Debtors, growth rate of Net Working Capital and
growth rate of Inventory. All these rates were declined except Loans and Advances,
Creditors and Current Liabilities and Provisions. It was found that the growth rates were
not significant up to 10% probability level except Inventory (1% level), Debtors (5%
level), Current Assets (1% level) and Net Working Capital (1% level). In all cases
parabolic equations were fitted except Loans and Advances and Current Liabilities and
Provisions and found encouraging trends except of Creditors (discouraging trend). All
these trends were significant at 1% probability level except Debtors (5% level) and
Current Assets (5% level) but the trend of Cash, Creditors were not significant up to 10
% probability level.
97
4.12. Biofil Chemicals and Pharmaceutical Ltd.
4.12.1. Inventory analysis
From the estimated values of parameters presented in Table.4.12, it is found that the
nominal amount of Inventory of Biofil Chemicals and Pharmaceuticals Ltd. had
decreased at an annual rate of 70.6% during the period 1999-2000 to 2013-2014 and this
growth rate was significant at 1% probability level. It is also found that the growth rate of
Inventory of Biofil Chemicals and Pharmaceuticals Ltd. had been increasing at increasing
rates. This encouraging trend was also significant at 5% probability level. This implies a
encouraging trend in the inter temporal growth of total inventory.
To separate out the influence of inflation on the growth rate of inventory amount
necessary adjustment in the nominal values of the inventory amount have been done by
deflating the nominal values by the wholesale price index as then the chosen trend lines
have been fitted. From the estimated parameters presented in Table 4.32, it is found that
real amount of Inventory of Biofil Chemicals and Pharmaceuticals Ltd.had grown at the
annual rate of -73.80% and at the time of 1999-2000 to 2013-2014 and this growth rate of
real amount of Inventory of Biofil Chemicals and Pharmaceuticals Ltd. was significant at
1% probability level.
4.12.2. Debtors analysis:
From the estimated values of parameters presented in Table-4.12, it is found that the
nominal amount of Biofil Chemicals and Pharmaceuticals Ltd. has decreased at an annual
rate of 77.7% during the period 1999-2000 to 2013-2014 and this growth rate is
significant at 1% probability level. It is also found that the growth rate of Debtors of
Biofil Chemicals and Pharmaceuticals Ltd.had been increasing at increasing rates. This
encouraging trend was also significant at 1% probability level. This implies an
encouraging trend in the inter temporal growth of total debtors.
To separate out the influence of inflation on the growth rate of debtors amount necessary
adjustment in the nominal values of the debtors amount have been done by deflating the
nominal values by the wholesale price index as then the chosen trend lines have been

98
fitted. From the estimated parameters presented in Table 4.32, it is found that real amount
of debtors of Biofil Chemicals and Pharmaceuticals Ltd. has grown at the annual rate of -
80.7% and at the time of 1999-2000 to 2013- 2014. The decreasing rate of real amount of
Debtors of Biofil Chemicals and Pharmaceuticals Ltd.was significant at 1% probability
level.
4.12.3 Cash analysis:
From the estimated values of parameters presented in Table-4.12, it is found that the
nominal amount of cash of Biofil Chemicals and Pharmaceuticals Ltd. had decreased at
an annual rate of 35.4% during the period 1999-2000 to 2013-2014 and this growth rate
was insignificant. It is also found that the growth rate of Cash of Biofil Chemicals and
Pharmaceuticals Ltd.had been increasing at increasing rates. This implies a encouraging
trend in the inter temporal growth of total cash.
To separate out the influence of inflation on the growth rate of cash amount necessary
adjustment in the nominal values of the cash amount have been done by deflating the
nominal values by the wholesale price index as then the chosen trend lines have been
fitted. From the estimated parameters presented in Table 4.32, it is found that real amount
of cash of Biofil Chemicals and Pharmaceuticals Ltd. had grown at the annual rate of -
38.4% and at the time of 1999-2000 to 2013- 2014. The growth rate of real amount of
cash of Biofil Chemicals and Pharmaceuticals Ltd.was insignificant.
4.12.4. Loans and Advance Analysis:
From the estimated values of parameters presented in Table-4.12, it is found that the
nominal amount of Loans and Advances of Biofil Chemicals and Pharmaceuticals
Ltd.had decreased at an annual rate of 50.5% during the period 1999-2000 to 2013-2014
and this growth rate was significant at 10% probability level. It is also found that the
growth rate of Loans and Advance of Biofil Chemicals and Pharmaceuticals Ltd.had been
increasing at increasing rates. This implies a encouraging trend in the inter temporal
growth of total Loans and Advances.
99
To separate out the influence of inflation on the growth rate of Loans And Advance
amount necessary adjustment in the nominal values of the Loans And Advances amount
have been done by deflating the nominal values by the wholesale price index as then the
chosen trend lines have been fitted. From the estimated parameters presented in Table
4.32, it is found that real amount of Loans And Advances of Biofil Chemicals and
Pharmaceuticals Ltd. had grown at the annual rate of -53.5% and at the time of 1999-
2000 to 2013- 2014. The growth rate of real amount was also significant at 10%
probability level.
4.12.5. Creditors analysis:
From the estimated values of parameters presented in Table-4.12, it is found that the
nominal amount of Creditors of Biofil Chemicals and Pharmaceuticals Ltd.had increased
at an annual rate of 13.7% during the period 1999-2000 to 2013-2014 and this growth
rate was significant at 1% probability level. It is also found that the growth rate of
Creditors of Biofil Chemicals and Pharmaceuticals Ltd. had been increasing at decreasing
rates. This implies a discouraging trend in the inter temporal growth of total creditors.
To separate out the influence of inflation on the growth rate of Creditors amount
necessary adjustment in the nominal values of the creditors amount have been done by
deflating the nominal values by the wholesale price index as then the chosen trend lines
have been fitted. From the estimated parameters presented in Table 4.32, it is found that
real amount of creditors of Biofil Chemicals and Pharmaceuticals Ltd.had grown at the
annual rate of 4.80% and at the time of 1999-2000 to 2013- 2014. The growth rate of real
amount of Creditors of Biofil Chemicals and Pharmaceuticals Ltd.was significant at 5%
probability level.
4.12.6. Current Liabilities and Provisions Analysis:
From the estimated values of parameters presented in Table-4.12, it is found that the
nominal amount of Current Liabilities and Provisions of Biofil Chemicals and
Pharmaceuticals Ltd.had increased at an annual rate of .064% during the period 1999-
2000 to 2013-2014 and this growth rate was significant at 1% probability level. This
100
implies a discouraging trend in the inter temporal growth of total Current Liabilities and
Provisions.
To separate out the influence of inflation on the growth rate of Current Liabilities and
Provisions amount necessary adjustment in the nominal values of the creditors amount
have been done by deflating the nominal values by the wholesale price index as then the
chosen trend lines have been fitted. From the estimated parameters presented in Table
4.32, it is found that real amount of Current Liabilities and Provisions Biofil Chemicals
and Pharmaceuticals Ltd.had grown at the annual rate of 4.05% and at the time of 1999-
2000 to 2013- 2014. The growth rate of real amount of Current Liabilities and Provisions
of Biofil Chemicals and Pharmaceuticals Ltd.was significant at 5% probability level.
4.12.7. Current Assets analysis
From the estimated values of parameters presented in Table.4.12, it is found that the
nominal amount of current assets of Biofil Chemicals and Pharmaceuticals Ltd.had
decreased at an annual rate of 62.10% during the period 1999-2000 to 2013-2014 and this
growth rate was significant at 1% probability level. It is also found that the growth rate of
Current Assets of Biofil Chemicals and Pharmaceuticals Ltd.had been increasing at
encouraging rates. This encouraging rate was also significant at 1%probability level. This
implies an encouraging trend in the inter temporal growth of total current assets.
To separate out the influence of inflation on the growth rate of inventory amount
necessary adjustment in the nominal values of the current assets amount have been done
by deflating the nominal values by the wholesale price index as then the chosen trend
lines have been fitted. From the estimated parameters presented in Table 4.32, it is found
that real amount of current assets of Biofil Chemicals and Pharmaceuticals Ltd.had
grown at the annual rate of -65.2% and at the time of 1999-2000 to 2013-2014. The
growth rate of real amount of current assets of Biofil Chemicals and Pharmaceuticals Ltd.
was significant at 1% probability level.
101
4.12.8. Net Working capital analysis:
From the estimated values of parameters presented in Table.4.12, it is found that the
nominal amount of Net Working Capital of Biofil Chemicals and Pharmaceuticals
Ltd.had decreased at an annual rate of 90.3% during the period 1999-2000 to 2013-2014
and this growth rate was significant at 5% probability level. It is also found that the
growth rate of Current Assets of Biofil Chemicals and Pharmaceuticals Ltd.had been
increasing at increasing rates. This implies a encouraging trend in the inter temporal
growth of total net working capital.
To separate out the influence of inflation on the growth rate of Net Working Capital
amount necessary adjustment in the nominal values of the inventory amount have been
done by deflating the nominal values by the wholesale price index as then the chosen
trend lines have been fitted. From the estimated parameters presented in Table 4.32, it is
found that real amount of Net Working Capital of Biofil Chemicals and Pharmaceuticals
Ltd.had declined at the annual rate of -93% and at the time of 1999-2000 to 2013-2014.
The growth rate of real amount was significant at 5% probability level.
From Table – 4.12 and Table-4.32, it was found that the regression equation of different
component of working capital (except Cash and Loans and Advances ) were best fitted
with time because adjusted R2 values
were high in all cases. Moreover, there was no
autocorrelation problem in different items of working capital (reflected by DW values).
The growth rates of both nominal amount and real amount of Creditors were highest
followed by the growth rate of Current Liabilities and Provision, growth rate of cash,
growth rate of Loans and Advances, growth rate of Current Assets, growth rate of
Inventory, growth rate of Debtors and growth rate of Net Working Capital. all these
growth rates were significant at 1% probability level except Loans and Advances (10%
level), Net Working Capital (5% level) and cash not significant up to 10% probability
level. All these cases, parabolic equations were fitted except of Current Liabilities and
Provisions and was found encouraging trend except Creditors (discouraging trend). All
these trends were significant except the trend of Loans and Advances and Creditors were
not significant up to 10% probability level. The trends of Inventory, Cash and Net
102
Working Capital were significant at 5% probability level and the trends of Debtors, and
Current Assets were significant at 1% probability level.
4.13. Ambalal Sarabhai Enterprises
4.13.1. Inventory analysis
From the estimated values of parameters presented in Table.4.13, it is found that the
nominal amount of Inventory of Ambalal Sarabhai Enterprises had decreased at an annual
rate of 30.9% during the period 1999-2000 to 2013-2014 and this growth rate was
significant at 1% probability level.
To separate out the influence of inflation on the growth rate of inventory amount
necessary adjustment in the nominal values of the inventory amount have been done by
deflating the nominal values by the wholesale price index as then the chosen trend lines
have been fitted. From the estimated parameters presented in Table 4.33, it is found that
real amount of Inventory of Ambalal Sarabhai Enterprises had grown at the annual rate of
-33.2% and at the time of 1999-2000 to 2013-2014 and this growth rate of real amount of
Inventory of Ambalal Sarabhai Enterprises was significant at 1% probability level.
4.13.2. Debtors analysis:
From the estimated values of parameters presented in Table-4.13, it is found that the
nominal amount of Ambalal Sarabhai Enterprises has increased at an annual rate of
19.9% during the period 1999-2000 to 2013-2014 and this growth rate is significant at
5% probability level. It is also found that the growth rate of Debtors of Ambalal Sarabhai
Enterprises had been increasing at diminishing rates. This discouraging trend was also
significant at 1% probability level. This implies an discouraging trend in the inter
temporal growth of total debtors.
To separate out the influence of inflation on the growth rate of debtors amount necessary
adjustment in the nominal values of the debtors amount have been done by deflating the
nominal values by the wholesale price index as then the chosen trend lines have been
fitted. From the estimated parameters presented in Table 4.33, it is found that real amount
of debtors of Ambalal Sarabhai Enterprises has grown at the annual rate of 16.9% and at
103
the time of 1999-2000 to 2013- 2014. The inclined rate of real amount of Debtors of
Ambalal Sarabhai Enterprises was significant at 1% probability level.
4.13.3 Cash analysis:
From the estimated values of parameters presented in Table-4.13, it is found that the
nominal amount of cash of Ambalal Sarabhai Enterprises had decreased at an annual rate
of 11.60% during the period 1999-2000 to 2013-2014 and this growth rate was significant
at 5% probability level.
To separate out the influence of inflation on the growth rate of cash amount necessary
adjustment in the nominal values of the cash amount have been done by deflating the
nominal values by the wholesale price index as then the chosen trend lines have been
fitted. From the estimated parameters presented in Table 4.33, it is found that real amount
of cash of Ambalal Sarabhai Enterprises had grown at the annual rate of -13.9% and at
the time of 1999-2000 to 2013- 2014. The growth rate of real amount of cash of Ambalal
Sarabhai Enterprises was significant at 1% probability level.
4.13.4. Loans and Advance Analysis:
From the estimated values of parameters presented in Table-4.13, it is found that the
nominal amount of Loans and Advances of Ambalal Sarabhai Enterprises had decreased
at an annual rate of 7.88% during the period 1999-2000 to 2013-2014 and this growth
rate was significant at 1% probability level.
To separate out the influence of inflation on the growth rate of Loans And Advance
amount necessary adjustment in the nominal values of the Loans And Advances amount
have been done by deflating the nominal values by the wholesale price index as then the
chosen trend lines have been fitted. From the estimated parameters presented in Table
4.33, it is found that real amount of Loans And Advances of Ambalal Sarabhai
Enterprises had grown at the annual rate of -10.2% and at the time of 1999-2000 to 2013-
2014. The growth rate of real amount was also significant at 1% probability level.
104
4.13.5. Creditors analysis:
From the estimated values of parameters presented in Table-4.13, it is found that the
nominal amount of Creditors of Ambalal Sarabhai Enterprises had increased at an annual
rate of 10.1% during the period 1999-2000 to 2013-2014 and this growth rate was
significant at 10% probability level. It is also found that the growth rate of Creditors of
Ambalal Sarabhai Enterprises had been increasing at decreasing rates and this decreasing
rate was also significant at 10% probability level. This implies a discouraging trend in the
inter temporal growth of total creditors.
To separate out the influence of inflation on the growth rate of Creditors amount
necessary adjustment in the nominal values of the creditors amount have been done by
deflating the nominal values by the wholesale price index as then the chosen trend lines
have been fitted. From the estimated parameters presented in Table 4.33, it is found that
real amount of creditors of Ambalal Sarabhai Enterprises had grown at the annual rate of
-0.064% and at the time of 1999-2000 to 2013- 2014. The growth rate of real amount of
Creditors of Ambalal Sarabhai Enterprises was significant at 1% probability level.
4.13.6. Current Liabilities and Provisions Analysis:
From the estimated values of parameters presented in Table-4.13, it is found that the
nominal amount of Current Liabilities and Provisions of Ambalal Sarabhai Enterprises
had increased at an annual rate of 17% during the period 1999-2000 to 2013-2014 and
this growth rate was significant at 1% probability level. It is also found that the growth
rate of Current Liabilities and Provisions of Ambalal Sarabhai Enterprises had been
increasing at discouraging rates. This discouraging rate was also significant at
1%probability level. This implies a discouraging trend in the inter temporal growth of
total Current Liabilities and Provisions.
To separate out the influence of inflation on the growth rate of Current Liabilities and
Provisions amount necessary adjustment in the nominal values of the creditors amount
have been done by deflating the nominal values by the wholesale price index as then the
chosen trend lines have been fitted. From the estimated parameters presented in Table
4.33, it is found that real amount of Current Liabilities and Provisions Ambalal Sarabhai
105
Enterprises had grown at the annual rate of 14% and at the time of 1999-2000 to 2013-
2014. The growth rate of real amount of Current Liabilities and Provisions of Ambalal
Sarabhai Enterprises was significant at 1% probability level.
4.13.7. Current Assets analysis
From the estimated values of parameters presented in Table.4.13, it is found that the
nominal amount of current assets of Ambalal Sarabhai Enterprises had increased at an
annual rate of 13.4% during the period 1999-2000 to 2013-2014 and this growth rate was
significant at 10% probability level. It is also found that the growth rate of Current Assets
of Ambalal Sarabhai Enterprises had been increasing at discouraging rates. This
discouraging rate was also significant at 1%probability level. This implies an
discouraging trend in the inter temporal growth of total current assets.
To separate out the influence of inflation on the growth rate of inventory amount
necessary adjustment in the nominal values of the current assets amount have been done
by deflating the nominal values by the wholesale price index as then the chosen trend
lines have been fitted. From the estimated parameters presented in Table 4.33, it is found
that real amount of current assets of Ambalal Sarabhai Enterprises had grown at the
annual rate of –14.2% and at the time of 1999-2000 to 2013-2014. The growth rate of real
amount of current assets of Ambalal Sarabhai Enterprises was significant at 1%
probability level.
4.13.8. Net Working capital analysis:
From the estimated values of parameters presented in Table.4.13, it is found that the
nominal amount of Net Working Capital of Ambalal Sarabhai Enterprises had decreased
at an annual rate of 17.4% during the period 1999-2000 to 2013-2014 and this growth
rate was significant at 1% probability level.
To separate out the influence of inflation on the growth rate of Net Working Capital
amount necessary adjustment in the nominal values of the inventory amount have been
done by deflating the nominal values by the wholesale price index as then the chosen
trend lines have been fitted. From the estimated parameters presented in Table 4.33, it is
106
found that real amount of Net Working Capital of Ambalal Sarabhai Enterprises had
declined at the annual rate of -35.2% and at the time of 1999-2000 to 2013-2014. The
growth rate of real amount was significant at 5% probability level.
From Table – 4.13 and Table-4.33, it was found that the regression equation of different
component of working capital EXCEPT Cash and Loans and Advances, were best fitted
with time because adjusted R2 values
were high in all cases. Moreover, there was no
autocorrelation problem in different items of working capital (reflected by DW values).
The growth rates of both nominal amount and real amount of Debtors were highest
followed by the growth rate of Current Liabilities and Provision, growth rate of Current
Assets, growth rate of Creditors, growth rate of Loans and Advances, growth rate of
cash, growth rate of Net Working Capital and growth rate of Inventory. All these growth
rates were significant at 1% probability level except Debtors (5% level), Cash (5% level),
Creditors (10% level) and Current Assets (10% level). In some cases patabolic equations
were fitted and found discouraging trend of Debtors, Creditors, Current Liabilities and
Current Assets. All these discouraging trends were significant at 1% probability level
except creditors at 10% probability level.
4.14. Parenteral Drugs (India) Ltd
4.14.1. Inventory analysis
From the estimated values of parameters presented in Table.4.14, it is found that the
nominal amount of Inventory of Parenteral Drugs (India) Ltd had increased at an annual
rate of 21.5% during the period 1999-2000 to 2013-2014 and this growth rate was
significant at 5% probability level. It is also found that the growth rate of Inventory of
Parenteral Drugs (India) Ltd had been increasing at diminishing rates. This implies an
discouraging trend in inter temporal growth of total debtors.
To separate out the influence of inflation on the growth rate of inventory amount
necessary adjustment in the nominal values of the inventory amount have been done by
deflating the nominal values by the wholesale price index as then the chosen trend lines
have been fitted. From the estimated parameters presented in Table 4.34, it is found that
real amount of Inventory of Parenteral Drugs (India) Ltd had grown at the annual rate of
107
18.4% and at the time of 1999-2000 to 2013-2014 but this growth rate of real amount of
Inventory of Parenteral Drugs (India) Ltd was insignificant.
4.14.2. Debtors analysis:
From the estimated values of parameters presented in Table-4.14, it is found that the
nominal amount of Parenteral Drugs (India) Ltd had increased at an annual rate of 11.4%
during the period 1999-2000 to 2013-2014 and this growth rate is significant at 1%
probability level.
To separate out the influence of inflation on the growth rate of debtors amount necessary
adjustment in the nominal values of the debtors amount have been done by deflating the
nominal values by the wholesale price index as then the chosen trend lines have been
fitted. From the estimated parameters presented in Table 4.34, it is found that real amount
of debtors of Parenteral Drugs (India) Ltd has grown at the annual rate of 9.04% and at
the time of 1999-2000 to 2013- 2014. The inclined rate of real amount of Debtors of
Parenteral Drugs (India) Ltd was significant at 1% probability level.
4.14.3 Cash analysis:
From the estimated values of parameters presented in Table-4.14, it is found that the
nominal amount of cash of Parenteral Drugs (India) Ltd had increased at an annual rate of
23.80% during the period 1999-2000 to 2013-2014 and this growth rate was significant at
5% probability level.
To separate out the influence of inflation on the growth rate of cash amount necessary
adjustment in the nominal values of the cash amount have been done by deflating the
nominal values by the wholesale price index as then the chosen trend lines have been
fitted. From the estimated parameters presented in Table 4.34, it is found that real amount
of cash of Parenteral Drugs (India) Ltd had grown at the annual rate of 21.5% and at the
time of 1999-2000 to 2013- 2014. The growth rate of real amount of cash of Parenteral
Drugs (India) Ltd was significant at 1% probability level.
108
4.14.4. Loans and Advance Analysis:
From the estimated values of parameters presented in Table-4.14, it is found that the
nominal amount of Loans and Advances of Parenteral Drugs (India) Ltd had increased at
an annual rate of 24.70% during the period 1999-2000 to 2013-2014 and this growth rate
was significant at 5% probability level. It is also found that the growth rate of Loans and
Advances of Parenteral Drugs (India) Ltd had been increasing at decreasing rates but this
decreasing rate was insignificant. This implies a discouraging trend in inter temporal
growth of total creditors.
To separate out the influence of inflation on the growth rate of Loans And Advance
amount necessary adjustment in the nominal values of the Loans And Advances amount
have been done by deflating the nominal values by the wholesale price index as then the
chosen trend lines have been fitted. From the estimated parameters presented in Table
4.34, it is found that real amount of Loans And Advances of Parenteral Drugs (India) Ltd
had grown at the annual rate of 14.8% and at the time of 1999-2000 to 2013- 2014. The
growth rate of real amount was also significant at 1% probability level.
4.14.5. Creditors analysis:
From the estimated values of parameters presented in Table-4.14, it is found that the
nominal amount of Creditors of Parenteral Drugs (India) Ltd had increased at an annual
rate of 16.7% during the period 1999-2000 to 2013-2014 and this growth rate was
significant at 1% probability level.
To separate out the influence of inflation on the growth rate of Creditors amount
necessary adjustment in the nominal values of the creditors amount have been done by
deflating the nominal values by the wholesale price index as then the chosen trend lines
have been fitted. From the estimated parameters presented in Table 4.34, it is found that
real amount of creditors of Parenteral Drugs (India) Ltd had grown at the annual rate of
14.3% and at the time of 1999-2000 to 2013- 2014. The growth rate of real amount of
Creditors of Parenteral Drugs (India) Ltd was significant at 1% probability level.
109
4.14.6. Current Liabilities and Provisions Analysis:
From the estimated values of parameters presented in Table-4.14, it is found that the
nominal amount of Current Liabilities and Provisions of Parenteral Drugs (India) Ltd had
increased at an annual rate of 16.7% during the period 1999-2000 to 2013-2014 and this
growth rate was significant at 1% probability level.
To separate out the influence of inflation on the growth rate of Current Liabilities and
Provisions amount necessary adjustment in the nominal values of the creditors amount
have been done by deflating the nominal values by the wholesale price index as then the
chosen trend lines have been fitted. From the estimated parameters presented in Table
4.34, it is found that real amount of Current Liabilities and Provisions Parenteral Drugs
(India) Ltd had grown at the annual rate of 14.3% and at the time of 1999-2000 to 2013-
2014. The growth rate of real amount of Current Liabilities and Provisions of Parenteral
Drugs (India) Ltd was significant at 1% probability level.
4.14.7. Current Assets analysis
From the estimated values of parameters presented in Table.4.14, it is found that the
nominal amount of current assets of Parenteral Drugs (India) Ltd had increased at an
annual rate of 16.7% during the period 1999-2000 to 2013-2014 and this growth rate was
significant at 1% probability level.
To separate out the influence of inflation on the growth rate of inventory amount
necessary adjustment in the nominal values of the current assets amount have been done
by deflating the nominal values by the wholesale price index as then the chosen trend
lines have been fitted. From the estimated parameters presented in Table 4.34, it is found
that real amount of current assets of Parenteral Drugs (India) Ltd had grown at the
annual rate of 9.99% and at the time of 1999-2000 to 2013-2014. The growth rate of real
amount of current assets of Parenteral Drugs (India) Ltd was significant at 1% probability
level.
110
4.14.8. Net Working capital analysis:
From the estimated values of parameters presented in Table.4.14, it is found that the
nominal amount of Net Working Capital of Parenteral Drugs (India) Ltd had decreased at
an annual rate of 10.2% during the period 1999-2000 to 2013-2014 and this growth rate
was significant at 1% probability level.
To separate out the influence of inflation on the growth rate of Net Working Capital
amount necessary adjustment in the nominal values of the inventory amount have been
done by deflating the nominal values by the wholesale price index as then the chosen
trend lines have been fitted. From the estimated parameters presented in Table 4.34, it is
found that real amount of Net Working Capital of Parenteral Drugs (India) Ltd had
increased at the annual rate of 7.88% and at the time of 1999-2000 to 2013-2014. The
growth rate of real amount was significant at 1% probability level.
From Table – 4.14 and Table-4.34, it was found that the regression equation of different
component of working capital were best fitted with time because adjusted R2 values
were
high in all cases. Moreover, there was no autocorrelation problem in different items of
working capital (reflected by DW values). The growth rates of both nominal amount and
real amount of Loans and Advances were highest followed by the growth rate of cash,
growth rate of Inventory, growth rate of Current Liabilities and Provision, growth rate of
Creditors, growth rate of Current Assets, growth rate of Debtors and growth rate of Net
Working Capital. All these growth rates were significant at 1% probability level except
Inventory (5% level) and Loans and Advances ( 5% level). In Inventory and Loans and
Advances, parabolic equations were fitted and found discouraging trend. These trends
were not significant up to 10% of probability level.
4.15. Sequent Scientific Ltd.
4.15.1. Inventory analysis
From the estimated values of parameters presented in Table.4.15, it is found that the
nominal amount of Inventory of Sequent Scientific Ltd. had increased at an annual rate of
99.2% during the period 1999-2000 to 2013-2014 and this growth rate was significant at

111
1% probability level. It is also found that the growth rate of Inventory of Sequent
Scientific Ltd. had been increasing at diminishing rates. This discouraging trend was also
significant at 10% probability level. This implies an discouraging trend in the inter
temporal growth of total debtors.
To separate out the influence of inflation on the growth rate of inventory amount
necessary adjustment in the nominal values of the inventory amount have been done by
deflating the nominal values by the wholesale price index as then the chosen trend lines
have been fitted. From the estimated parameters presented in Table 4.35, it is found that
real amount of Inventory of Sequent Scientific Ltd. had grown at the annual rate of
95.3% and at the time of 1999-2000 to 2013-2014 and this growth rate of real amount of
Inventory of Sequent Scientific Ltd. was significant at 1% probability level.
4.15.2. Debtors analysis:
From the estimated values of parameters presented in Table-4.15, it is found that the
nominal amount of Sequent Scientific Ltd. has increased at an annual rate of 59.3%
during the period 1999-2000 to 2013-2014 and this growth rate is significant at 5%
probability level. It is also found that the growth rate of Debtors of Sequent Scientific
Ltd. had been increasing at diminishing rates. This discouraging trend was also
significant at 1% probability level. This implies a discouraging trend in the inter
temporal growth of total debtors.
To separate out the influence of inflation on the growth rate of debtors amount necessary
adjustment in the nominal values of the debtors amount have been done by deflating the
nominal values by the wholesale price index as then the chosen trend lines have been
fitted. From the estimated parameters presented in Table 4.35, it is found that real amount
of debtors of Sequent Scientific Ltd. has grown at the annual rate of 55.3% and at the
time of 1999-2000 to 2013- 2014. The inclined rate of real amount of Debtors of Sequent
Scientific Ltd. was significant at 5% probability level.
112
4.15.3 Cash analysis:
From the estimated values of parameters presented in Table-4.15, it is found that the
nominal amount of cash of Sequent Scientific Ltd. had increased at an annual rate of
28.9% during the period 1999-2000 to 2013-2014 and this growth rate was significant at
1% probability level.
To separate out the influence of inflation on the growth rate of cash amount necessary
adjustment in the nominal values of the cash amount have been done by deflating the
nominal values by the wholesale price index as then the chosen trend lines have been
fitted. From the estimated parameters presented in Table 4.35, it is found that real amount
of cash of Sequent Scientific Ltd. had grown at the annual rate of 28.9% and at the time
of 1999-2000 to 2013- 2014. The growth rate of real amount of cash of Sequent Scientific
Ltd. was significant at 1% probability level.
4.15.4. Loans and Advance Analysis:
From the estimated values of parameters presented in Table-4.15, it is found that the
nominal amount of Loans and Advances of Sequent Scientific Ltd. had decreased at an
annual rate of 23.7% during the period 1999-2000 to 2013-2014 and this growth rate was
significant at 1% probability level.
To separate out the influence of inflation on the growth rate of Loans And Advance
amount necessary adjustment in the nominal values of the Loans And Advances amount
have been done by deflating the nominal values by the wholesale price index as then the
chosen trend lines have been fitted. From the estimated parameters presented in Table
4.35, it is found that real amount of Loans And Advances of Sequent Scientific Ltd. had
grown at the annual rate of 23.7% and at the time of 1999-2000 to 2013- 2014. The
growth rate of real amount was also significant at 1% probability level.
4.15.5. Creditors Analysis:
From the estimated values of parameters presented in Table-4.15, it is found that the
nominal amount of Creditors of Sequent Scientific Ltd. had increased at an annual rate of
149.9% during the period 1999-2000 to 2013-2014 and this growth rate was significant at
113
1% probability level. It is also found that the growth rate of Creditors of Sequent
Scientific Ltd. had been increasing at decreasing rates and this decreasing rate was also
significant at 1% probability level. This implies a discouraging trend in the inter
temporal growth of total creditors.
To separate out the influence of inflation on the growth rate of Creditors amount
necessary adjustment in the nominal values of the creditors amount have been done by
deflating the nominal values by the wholesale price index as then the chosen trend lines
have been fitted. From the estimated parameters presented in Table 4.35, it is found that
real amount of creditors of Sequent Scientific Ltd. had grown at the annual rate of
149.9% and at the time of 1999-2000 to 2013- 2014. The growth rate of real amount of
Creditors of Sequent Scientific Ltd. was significant at 1% probability level.
4.15.6. Current Liabilities and Provisions Analysis:
From the estimated values of parameters presented in Table-4.15, it is found that the
nominal amount of Current Liabilities and Provisions of Sequent Scientific Ltd. had
increased at an annual rate of 159.5% during the period 1999-2000 to 2013-2014 and this
growth rate was significant at 1% probability level. It is also found that the growth rate of
Current Liabilities and Provisions of Sequent Scientific Ltd. had been increasing at
discouraging rates. This discouraging rate was also significant at 1%probability level.
This implies a discouraging trend in the inter temporal growth of total Current Liabilities
and Provisions.
To separate out the influence of inflation on the growth rate of Current Liabilities and
Provisions amount necessary adjustment in the nominal values of the creditors amount
have been done by deflating the nominal values by the wholesale price index as then the
chosen trend lines have been fitted. From the estimated parameters presented in Table
4.35, it is found that real amount of Current Liabilities and Provisions Sequent Scientific
Ltd. had grown at the annual rate of 159.5% and at the time of 1999-2000 to 2013- 2014.
The growth rate of real amount of Current Liabilities and Provisions of Sequent Scientific
Ltd. was significant at 1% probability level.

114
4.15.7. Current Assets analysis
From the estimated values of parameters presented in Table.4.15, it is found that the
nominal amount of current assets of Sequent Scientific Ltd. had increased at an annual
rate of 26.2% during the period 1999-2000 to 2013-2014 and this growth rate was
significant at 5% probability level. It is also found that the growth rate of Current Assets
of Sequent Scientific Ltd. had been increasing at encouraging rates. This encouraging
rate was insignificant. This implies a discouraging trend in the inter temporal growth of
total current assets.
To separate out the influence of inflation on the growth rate of inventory amount
necessary adjustment in the nominal values of the current assets amount have been done
by deflating the nominal values by the wholesale price index as then the chosen trend
lines have been fitted. From the estimated parameters presented in Table 4.35, it is found
that real amount of current assets of Sequent Scientific Ltd. had grown at the annual rate
of 31.5% and at the time of 1999-2000 to 2013-2014. The growth rate of real amount of
current assets of Sequent Scientific Ltd. was significant at 1% probability level.
4.15.8. Net Working capital analysis:
From the estimated values of parameters presented in Table.4.15, it is found that the
nominal amount of Net Working Capital of Sequent Scientific Ltd. had decreased at an
annual rate of 24% during the period 1999-2000 to 2013-2014 and this growth rate was
significant at 1% probability level.
To separate out the influence of inflation on the growth rate of Net Working Capital
amount necessary adjustment in the nominal values of the inventory amount have been
done by deflating the nominal values by the wholesale price index as then the chosen
trend lines have been fitted. From the estimated parameters presented in Table 4.35, it is
found that real amount of Net Working Capital of Sequent Scientific Ltd. had declined at
the annual rate of 21.6% and at the time of 1999-2000 to 2013-2014. The growth rate of
real amount was significant at 1% probability level.
115
From Table – 4.15 and Table-4.35, it was found that the regression equation of different
component of working capital were best fitted with time because adjusted R2 values
were
high in all cases. Moreover, there was no autocorrelation problem in different items of
working capital (reflected by DW values). The growth rates of both nominal amount and
real amount of Current Liabilities and Provision were highest followed by the growth rate
of Creditors, growth rate of Inventory, growth rate of Debtors, growth rate of cash,
growth rate of Current Assets, growth rate of Net Working Capital, and growth rate of
Loans and Advances. All these growth rates were significant at 1% probability level
except Debtors (5% level) and Current Assets (5% level). In some cases, parabolic
equations were fitted and found discouraging trends except Current Assets (encouraging
trends). The discouraging trends of Creditors and Current Liabilities were significant at
1% probability level and the discouraging trend of Inventory was significant at 10%
probability level. However, the discouraging trends of Debtors and Current Assets were
not significant up to 10 % probability level.
4.16. Zenotech Laboratories
4.16.1. Inventory analysis
From the estimated values of parameters presented in Table.4.16, it is found that the
nominal amount of Inventory of Zenotech Laboratories had increased at an annual rate of
71.4% during the period 1999-2000 to 2013-2014 and this growth rate was insignificant.
It is also found that the growth rate of Inventory of Zenotech Laboratories had been
increasing at decreasing rates. This discouraging trend was also insignificant.
To separate out the influence of inflation on the growth rate of inventory amount
necessary adjustment in the nominal values of the inventory amount have been done by
deflating the nominal values by the wholesale price index as then the chosen trend lines
have been fitted. From the estimated parameters presented in Table 4.36, it is found that
real amount of Inventory of Zenotech Laboratories had grown at the annual rate of 67.5%
and at the time of 1999-2000 to 2013-2014 and this growth rate of real amount of
Inventory of Zenotech Laboratories was insignificant .
116
4.16.2. Debtors analysis:
From the estimated values of parameters presented in Table-4.16, it is found that the
nominal amount of Zenotech Laboratories has increased at an annual rate of 53.8%
during the period 1999-2000 to 2013-2014 and this growth rate is significant at 5%
probability level. It is also found that the growth rate of Debtors of Zenotech Laboratories
had been increasing at decreasing rates. This discouraging trend was also significant at
1% probability level. This implies an discouraging trend in the inter temporal growth of
total debtors.
To separate out the influence of inflation on the growth rate of debtors amount necessary
adjustment in the nominal values of the debtors amount have been done by deflating the
nominal values by the wholesale price index as then the chosen trend lines have been
fitted. From the estimated parameters presented in Table 4.36, it is found that real amount
of debtors of Zenotech Laboratories had grown at the annual rate of 50.8% and at the
time of 1999-2000 to 2013- 2014. The declined rate of real amount of Debtors of
Zenotech Laboratories was significant at 5% probability level.
4.16.3 Cash analysis:
From the estimated values of parameters presented in Table-4.16, it is found that the
nominal amount of cash of Zenotech Laboratories had increased at an annual rate of
209.6% during the period 1999-2000 to 2013-2014 and this growth rate was significant at
5% probability level. It is also found that the growth rate of Cash of Zenotech
Laboratories had been increasing at decreasing rates. This discouraging trend was also
significant at 1% probability level. This implies a discouraging trend in the inter
temporal growth of total cash.
To separate out the influence of inflation on the growth rate of cash amount necessary
adjustment in the nominal values of the cash amount have been done by deflating the
nominal values by the wholesale price index as then the chosen trend lines have been
fitted. From the estimated parameters presented in Table 4.36, it is found that real amount
of cash of Zenotech Laboratories had grown at the annual rate of 205.9% and at the time
117
of 1999-2000 to 2013- 2014. The growth rate of real amount of cash of Zenotech
Laboratories was significant at 5% probability level.
4.16.4. Loans and Advance Analysis:
From the estimated values of parameters presented in Table-4.16, it is found that the
nominal amount of Loans and Advances of Zenotech Laboratories had increased at an
annual rate of 165.40% during the period 1999-2000 to 2013-2014 and this growth rate
was significant at 1% probability level. It is also found that the growth rate of Loans and
Advance of Zenotech Laboratories had been increasing at decreasing rates. This
discouraging trend was also significant at 1% probability level. This implies a
discouraging trend in the inter temporal growth of total Loans and Advances.
To separate out the influence of inflation on the growth rate of Loans And Advance
amount necessary adjustment in the nominal values of the Loans And Advances amount
have been done by deflating the nominal values by the wholesale price index as then the
chosen trend lines have been fitted. From the estimated parameters presented in Table
4.36, it is found that real amount of Loans And Advances of Zenotech Laboratories had
grown at the annual rate of 162.40% and at the time of 1999-2000 to 2013- 2014. The
growth rate of real amount was also significant at 1% probability level.
4.16.5. Creditors analysis:
From the estimated values of parameters presented in Table-4.10, it is found that the
nominal amount of Creditors of Zenotech Laboratories had increased at an annual rate of
213.4% during the period 1999-2000 to 2013-2014 and this growth rate was significant at
1% probability level. It is also found that the growth rate of Creditors of Zenotech
Laboratories had been increasing at decreasing rates and this decreasing rate was
significant at 1% probability level. This implies a discouraging trend in the inter
temporal growth of total creditors.
To separate out the influence of inflation on the growth rate of Creditors amount
necessary adjustment in the nominal values of the creditors amount have been done by
deflating the nominal values by the wholesale price index as then the chosen trend lines

118
have been fitted. From the estimated parameters presented in Table 4.36, it is found that
real amount of creditors of Zenotech Laboratories had grown at the annual rate of 209.7%
and at the time of 1999-2000 to 2013- 2014. The growth rate of real amount of Creditors
of Zenotech Laboratories was significant at 1% probability level.
4.16.6. Current Liabilities and Provisions Analysis:
From the estimated values of parameters presented in Table-4.16, it is found that the
nominal amount of Current Liabilities and Provisions of Zenotech Laboratories had
increased at an annual rate of 217.5% during the period 1999-2000 to 2013-2014 and this
growth rate was significant at 1% probability level. It is also found that the growth rate of
Current Liabilities and Provisions Analysis of Zenotech Laboratories had been increasing
at diminishing rates. This diminishing rate was also significant at 1%probability level.
This implies a discouraging trend in the inter temporal growth of total Current Liabilities
and Provisions.
To separate out the influence of inflation on the growth rate of Current Liabilities and
Provisions amount necessary adjustment in the nominal values of the creditors amount
have been done by deflating the nominal values by the wholesale price index as then the
chosen trend lines have been fitted. From the estimated parameters presented in Table
4.36, it is found that real amount of Current Liabilities and Provisions of Zenotech
Laboratories had grown at the annual rate of 213.8% and at the time of 1999-2000 to
2013- 2014. The growth rate of real amount of Current Liabilities and Provisions of
Zenotech Laboratories was significant at 1% probability level.
4.16.7. Current Assets analysis
From the estimated values of parameters presented in Table.4.16, it is found that the
nominal amount of current assets of Zenotech Laboratories had increased at an annual
rate of 77.6% during the period 1999-2000 to 2013-2014 and this growth rate was
significant at 1% probability level. It is also found that the growth rate of Current Assets
of Zenotech Laboratories had been increasing at diminishing rates. This diminishing rate
was also significant at 1%probability level. This implies a discouraging trend in the inter
temporal growth of total current assets.

119
To separate out the influence of inflation on the growth rate of inventory amount
necessary adjustment in the nominal values of the current assets amount have been done
by deflating the nominal values by the wholesale price index as then the chosen trend
lines have been fitted. From the estimated parameters presented in Table 4.36, it is found
that real amount of current assets of Zenotech Laboratories had grown at the annual rate
of 74.5% and at the time of 1999-2000 to 2013-2014. The growth rate of real amount of
current assets of Zenotech Laboratories was significant at 1% probability level.
4.16.8. Net Working capital analysis:
From the estimated values of parameters presented in Table.4.16, it is found that the
nominal amount of Net Working Capital of Zenotech Laboratories had increased at an
annual rate of 80.3% during the period 1999-2000 to 2013-2014 and this growth rate was
insignificant. It is also found that the growth rate of Current Assets of Zenotech
Laboratories had been increasing at diminishing rates. This implies a discouraging trend
in the inter temporal growth of total net working capital.
To separate out the influence of inflation on the growth rate of Net Working Capital
amount necessary adjustment in the nominal values of the inventory amount have been
done by deflating the nominal values by the wholesale price index as then the chosen
trend lines have been fitted. From the estimated parameters presented in Table 4.36, it is
found that real amount of Net Working Capital of Zenotech Laboratories had declined at
the annual rate of 77.3% and at the time of 1999-2000 to 2013-2014. The growth rate of
real amount was also insignificant.
From Table – 4.16 and Table-4.36, it was found that the regression equation of different
component of working capital except Inventory and Net Working Capital, were best
fitted with time because adjusted R2 values
were high in all cases. Moreover, there was
no autocorrelation problem in different items of working capital (reflected by DW
values). The growth rates of both nominal amount and real amount of Current Liabilities
and Provision were highest followed by the growth rate of Creditors, growth rate of cash,
growth rate of Loans and Advances, growth rate of Net Working Capital, growth rate of
Current Assets,growth rate of Inventory and growth rate of Debtors.all these growth rates
120
were significant were significant at 1% probability level except Debtors (5% level), Cash
(5% level). The growth rates of Inventory and Net working Capital were not significant
up to 10% probability level. In all cases, the parabolic equations were fitted and found
discouraging trend. The discouraging trends of Inventory and Net Working Capital were
not significant up to 10% probability level. All these discouraging trends were significant
at 1% probability level except Cash (5% level).
4.17. Marksans Pharma Ltd.
4.17.1. Inventory analysis
From the estimated values of parameters presented in Table.4.17, it is found that the
nominal amount of Inventory of Marksans Pharma Ltd. had increased at an annual rate of
64.2% during the period 1999-2000 to 2013-2014 and this growth rate was significant at
1% probability level. It is also found that the growth rate of Inventory of Marksans
Pharma Ltd. had been increasing at decreasing rates. This discouraging trend was also
significant at 1% probability level. This implies an discouraging trend in the inter
temporal growth of total Inventory
To separate out the influence of inflation on the growth rate of inventory amount
necessary adjustment in the nominal values of the inventory amount have been done by
deflating the nominal values by the wholesale price index as then the chosen trend lines
have been fitted. From the estimated parameters presented in Table 4.37, it is found that
real amount of Inventory of Marksans Pharma Ltd. had grown at the annual rate of 61.1%
and at the time of 1999-2000 to 2013-2014 and this growth rate of real amount of
Inventory of Marksans Pharma Ltd. was significant at 1% probability level. .
4.17.2. Debtors analysis:
From the estimated values of parameters presented in Table-4.17, it is found that the
nominal amount of Marksans Pharma Ltd. has increased at an annual rate of 34.10%
during the period 1999-2000 to 2013-2014 and this growth rate is significant at 1%
probability level. It is also found that the growth rate of Debtors of Marksans Pharma
Ltd. had been increasing at decreasing rates. This discouraging trend was also significant
121
at 1% probability level. This implies an discouraging trend in the inter temporal growth
of total debtors.
To separate out the influence of inflation on the growth rate of debtors amount necessary
adjustment in the nominal values of the debtors amount have been done by deflating the
nominal values by the wholesale price index as then the chosen trend lines have been
fitted. From the estimated parameters presented in Table 4.37, it is found that real amount
of debtors of Marksans Pharma Ltd. had grown at the annual rate of 31% and at the time
of 1999-2000 to 2013- 2014. The declined rate of real amount of Debtors of Marksans
Pharma Ltd. was significant at 1% probability level.
4.17.3 Cash analysis:
From the estimated values of parameters presented in Table-4.17, it is found that the
nominal amount of cash of Marksans Pharma Ltd. had increased at an annual rate of
117.10% during the period 1999-2000 to 2013-2014 and this growth rate was significant
at 1% probability level. It is also found that the growth rate of Cash of Marksans Pharma
Ltd. had been increasing at decreasing rates. This discouraging trend was also significant
at 1% probability level. This implies a discouraging trend in the inter temporal growth of
total cash.
To separate out the influence of inflation on the growth rate of cash amount necessary
adjustment in the nominal values of the cash amount have been done by deflating the
nominal values by the wholesale price index as then the chosen trend lines have been
fitted. From the estimated parameters presented in Table 4.37, it is found that real amount
of cash of Marksans Pharma Ltd. had grown at the annual rate of 114% and at the time of
1999-2000 to 2013- 2014. The growth rate of real amount of cash of Marksans Pharma
Ltd. was significant at 5% probability level.
4.17.4. Loans and Advance Analysis:
From the estimated values of parameters presented in Table-4.17, it is found that the
nominal amount of Loans and Advances of Marksans Pharma Ltd. had increased at an
annual rate of 56.6% during the period 1999-2000 to 2013-2014 and this growth rate was
122
significant at 1% probability level. It is also found that the growth rate of Loans and
Advance of Marksans Pharma Ltd. had been increasing at decreasing rates. This
discouraging trend was also significant at 10% probability level. This implies a
discouraging trend in the inter temporal growth of total Loans and Advances.
To separate out the influence of inflation on the growth rate of Loans And Advance
amount necessary adjustment in the nominal values of the Loans And Advances amount
have been done by deflating the nominal values by the wholesale price index as then the
chosen trend lines have been fitted. From the estimated parameters presented in Table
4.37, it is found that real amount of Loans and Advances of Marksans Pharma Ltd. had
grown at the annual rate of 53.5% and at the time of 1999-2000 to 2013- 2014. The
growth rate of real amount was also significant at 5% probability level.
4.17.5. Creditors analysis:
From the estimated values of parameters presented in Table-4.17, it is found that the
nominal amount of Creditors of Marksans Pharma Ltd. had increased at an annual rate of
21.8% during the period 1999-2000 to 2013-2014 and this growth rate was significant at
1% probability level..
To separate out the influence of inflation on the growth rate of Creditors amount
necessary adjustment in the nominal values of the creditors amount have been done by
deflating the nominal values by the wholesale price index as then the chosen trend lines
have been fitted. From the estimated parameters presented in Table 4.37, it is found that
real amount of creditors of Marksans Pharma Ltd. had grown at the annual rate of 19.5%
and at the time of 1999-2000 to 2013- 2014. The growth rate of real amount of Creditors
of Marksans Pharma Ltd. was significant at 1% probability level.
4.17.6. Current Liabilities and Provisions Analysis:
From the estimated values of parameters presented in Table-4.17, it is found that the
nominal amount of Current Liabilities and Provisions of Marksans Pharma Ltd. had
increased at an annual rate of 22.10% during the period 1999-2000 to 2013-2014 and this
growth rate was significant at 1% probability level.
123
To separate out the influence of inflation on the growth rate of Current Liabilities and
Provisions amount necessary adjustment in the nominal values of the creditors amount
have been done by deflating the nominal values by the wholesale price index as then the
chosen trend lines have been fitted. From the estimated parameters presented in Table
4.37, it is found that real amount of Current Liabilities and Provisions of Marksans
Pharma Ltd. had grown at the annual rate of 19.8% and at the time of 1999-2000 to 2013-
2014. The growth rate of real amount of Current Liabilities and Provisions of Marksans
Pharma Ltd. was significant at 1% probability level.
4.17.7. Current Assets analysis
From the estimated values of parameters presented in Table.4.17, it is found that the
nominal amount of current assets of Marksans Pharma Ltd. had increased at an annual
rate of 60.8% during the period 1999-2000 to 2013-2014 and this growth rate was
significant at 1% probability level. It is also found that the growth rate of Current Assets
of Marksans Pharma Ltd. had been increasing at diminishing rates. This diminishing rate
was also significant at 1%probability level. This implies a discouraging trend in the inter
temporal growth of total current assets.
To separate out the influence of inflation on the growth rate of inventory amount
necessary adjustment in the nominal values of the current assets amount have been done
by deflating the nominal values by the wholesale price index as then the chosen trend
lines have been fitted. From the estimated parameters presented in Table 4.37, it is found
that real amount of current assets of Marksans Pharma Ltd. had grown at the annual rate
of 57.8% and at the time of 1999-2000 to 2013-2014. The growth rate of real amount of
current assets of Marksans Pharma Ltd. was significant at 1% probability level.
4.17.8. Net Working capital analysis:
From the estimated values of parameters presented in Table.4.17, it is found that the
nominal amount of Net Working Capital of Marksans Pharma Ltd. had increased at an
annual rate of 78.40% during the period 1999-2000 to 2013-2014 and this growth rate
was significant at 1% probability level . It is also found that the growth rate of Current
Assets of Marksans Pharma Ltd. had been increasing at diminishing rates. This
124
discouraging trend was also significant at 5% probability level. This implies a
discouraging trend in the inter temporal growth of total net working capital.
To separate out the influence of inflation on the growth rate of Net Working Capital
amount necessary adjustment in the nominal values of the inventory amount have been
done by deflating the nominal values by the wholesale price index as then the chosen
trend lines have been fitted. From the estimated parameters presented in Table 4.37, it is
found that real amount of Net Working Capital of Marksans Pharma Ltd. had grown at
the annual rate of 75.40% and at the time of 1999-2000 to 2013-2014. The growth rate of
real amount was also significant at 5% probability level.
From Table – 4.17 and Table-4.37, it was found that the regression equation of different
component of working capital were best fitted with time because adjusted R2 values
were
high in all cases. Moreover, there was no autocorrelation problem in different items of
working capital (reflected by DW values). The growth rates of both nominal amount and
real amount of cash were highest followed by the growth rate of Net Working Capital,
growth rate of Inventory, growth rate of Current Assets, growth rate of Loans and
Advances, growth rate of Debtors, growth rate of Current Liabilities and Provision and
growth rate of Creditors. All these growth rates were significant at 1% probability level.
In all cases, the parabolic equations were fitted except in Creditors and Current Liabilities
and Provisions and found discouraging trends. These discouraging trends were significant
of Inventory (1% Level), Debtors(10% level), Cash (5% level), Loans and
Advances(10% level), Current assets(1% Level) and Net Working Capital(5% level).
4.18. Wanbury Ltd.
4.18.1. Inventory analysis
From the estimated values of parameters presented in Table.4.18, it is found that the
nominal amount of Inventory of Wanbury Ltd. had increased at an annual rate of 39.2%
during the period 1999-2000 to 2013-2014 and this growth rate was significant at 1%
probability level. It is also found that the growth rate of Inventory of Wanbury Ltd. had
been increasing at decreasing rates. This discouraging trend was also significant at 5%
125
probability level. This implies an discouraging trend in the inter temporal growth of total
Inventory
To separate out the influence of inflation on the growth rate of inventory amount
necessary adjustment in the nominal values of the inventory amount have been done by
deflating the nominal values by the wholesale price index as then the chosen trend lines
have been fitted. From the estimated parameters presented in Table 4.38, it is found that
real amount of Inventory of Wanbury Ltd. had grown at the annual rate of 36.2% and at
the time of 1999-2000 to 2013-2014 and this growth rate of real amount of Inventory of
Wanbury Ltd.was significant at 1% probability level. .
4.18.2. Debtors analysis:
From the estimated values of parameters presented in Table-4.18, it is found that the
nominal amount of Wanbury Ltd. has increased at an annual rate of 67.7% during the
period 1999-2000 to 2013-2014 and this growth rate is significant at 1% probability level.
It is also found that the growth rate of Debtors of Wanbury Ltd. had been increasing at
decreasing rates. This discouraging trend was also significant at 1% probability level.
This implies an discouraging trend in the inter temporal growth of total debtors.
To separate out the influence of inflation on the growth rate of debtors amount necessary
adjustment in the nominal values of the debtors amount have been done by deflating the
nominal values by the wholesale price index as then the chosen trend lines have been
fitted. From the estimated parameters presented in Table 4.38, it is found that real amount
of debtors of Wanbury Ltd. had grown at the annual rate of 64.6% and at the time of
1999-2000 to 2013- 2014. The declined rate of real amount of Debtors of Wanbury Ltd.
was significant at 1% probability level.
4.18.3 Cash analysis:
From the estimated values of parameters presented in Table-4.18, it is found that the
nominal amount of cash of Wanbury Ltd. had increased at an annual rate of 138.7%
during the period 1999-2000 to 2013-2014 and this growth rate was significant at 1%
probability level. It is also found that the growth rate of Cash of Wanbury Ltd. had been
126
increasing at decreasing rates. This discouraging trend was also significant at 1%
probability level. This implies a discouraging trend in the inter temporal growth of total
cash.
To separate out the influence of inflation on the growth rate of cash amount necessary
adjustment in the nominal values of the cash amount have been done by deflating the
nominal values by the wholesale price index as then the chosen trend lines have been
fitted. From the estimated parameters presented in Table 4.38, it is found that real amount
of cash of Wanbury Ltd. had grown at the annual rate of 135.60% and at the time of
1999-2000 to 2013- 2014. The growth rate of real amount of cash of Wanbury Ltd. was
significant at 1% probability level.
4.18.4. Loans and Advance Analysis:
From the estimated values of parameters presented in Table-4.18, it is found that the
nominal amount of Loans and Advances of Wanbury Ltd. had increased at an annual rate
of 88.9% during the period 1999-2000 to 2013-2014 and this growth rate was significant
at 1% probability level. It is also found that the growth rate of Loans and Advance of
Wanbury Ltd. had been increasing at decreasing rates. This discouraging trend was also
significant at 1% probability level. This implies a discouraging trend in the inter
temporal growth of total Loans and Advances.
To separate out the influence of inflation on the growth rate of Loans And Advance
amount necessary adjustment in the nominal values of the Loans And Advances amount
have been done by deflating the nominal values by the wholesale price index as then the
chosen trend lines have been fitted. From the estimated parameters presented in Table
4.38, it is found that real amount of Loans and Advances of Wanbury Ltd. had grown at
the annual rate of 85.8% and at the time of 1999-2000 to 2013- 2014. The growth rate of
real amount was also significant at 1% probability level.
4.18.5. Creditors analysis:
From the estimated values of parameters presented in Table-4.18, it is found that the
nominal amount of Creditors of Wanbury Ltd. had increased at an annual rate of 67.2%
127
during the period 1999-2000 to 2013-2014 and this growth rate was significant at 1%
probability level..
To separate out the influence of inflation on the growth rate of Creditors amount
necessary adjustment in the nominal values of the creditors amount have been done by
deflating the nominal values by the wholesale price index as then the chosen trend lines
have been fitted. From the estimated parameters presented in Table 4.38, it is found that
real amount of creditors of Wanbury Ltd. had grown at the annual rate of 64.1% and at
the time of 1999-2000 to 2013- 2014. The growth rate of real amount of Creditors of
Wanbury Ltd. was significant at 1% probability level.
4.18.6. Current Liabilities and Provisions Analysis:
From the estimated values of parameters presented in Table-4.18, it is found that the
nominal amount of Current Liabilities and Provisions of Wanbury Ltd. had increased at
an annual rate of 85.8% during the period 1999-2000 to 2013-2014 and this growth rate
was significant at 1% probability level. It is also found that the growth rate of Current
Liabilities and Provisions of Wanbury Ltd. had been increasing at diminishing rates. This
diminishing rate was also significant at 1%probability level. This implies a discouraging
trend in the inter temporal growth of total Current Liabilities and Provisions
To separate out the influence of inflation on the growth rate of Current Liabilities and
Provisions amount necessary adjustment in the nominal values of the creditors amount
have been done by deflating the nominal values by the wholesale price index as then the
chosen trend lines have been fitted. From the estimated parameters presented in Table
4.38, it is found that real amount of Current Liabilities and Provisions of Wanbury Ltd.
had grown at the annual rate of 82.7% and at the time of 1999-2000 to 2013- 2014. The
growth rate of real amount of Current Liabilities and Provisions of Wanbury Ltd. was
significant at 1% probability level.
4.18.7. Current Assets analysis
From the estimated values of parameters presented in Table.4.18, it is found that the
nominal amount of current assets of Wanbury Ltd. had increased at an annual rate of
128
71.3% during the period 1999-2000 to 2013-2014 and this growth rate was significant at
1% probability level. It is also found that the growth rate of Current Assets of Wanbury
Ltd. had been increasing at diminishing rates. This diminishing rate was also significant
at 1%probability level. This implies a discouraging trend in the inter temporal growth of
total current assets.
To separate out the influence of inflation on the growth rate of inventory amount
necessary adjustment in the nominal values of the current assets amount have been done
by deflating the nominal values by the wholesale price index as then the chosen trend
lines have been fitted. From the estimated parameters presented in Table 4.38, it is found
that real amount of current assets of Wanbury Ltd. had grown at the annual rate of 68.2%
and at the time of 1999-2000 to 2013-2014. The growth rate of real amount of current
assets of Wanbury Ltd. was significant at 1% probability level.
4.18.8. Net Working capital analysis:
From the estimated values of parameters presented in Table.4.18, it is found that the
nominal amount of Net Working Capital of Wanbury Ltd. had increased at an annual rate
of 92.6% during the period 1999-2000 to 2013-2014 and this growth rate was significant
at 1% probability level. It is also found that the growth rate of Current Assets of Wanbury
Ltd. had been increasing at diminishing rates. This discouraging trend was also
significant at 1% probability level. This implies a discouraging trend in the inter temporal
growth of total net working capital.
To separate out the influence of inflation on the growth rate of Net Working Capital
amount necessary adjustment in the nominal values of the inventory amount have been
done by deflating the nominal values by the wholesale price index as then the chosen
trend lines have been fitted. From the estimated parameters presented in Table 4.38, it is
found that real amount of Net Working Capital of Wanbury Ltd. had grown at the annual
rate of 89.5% and at the time of 1999-2000 to 2013-2014. The growth rate of real amount
was also significant at 1% probability level.
From Table – 4.18 and Table-4.38, it was found that the regression equation of different
component of working capital were best fitted with time because adjusted R2 values
were
129
high in all cases. Moreover, there was no autocorrelation problem in different items of
working capital (reflected by DW values). The growth rates of both nominal amount and
real amount of cash were highest followed by the growth rate of Net Working Capital,
growth rate of Loans and Advances, growth rate of Current Liabilities and Provision, ,
growth rate of Current Assets, growth rate of Debtors, growth rate of Creditors and
growth rate of Inventory. All these growth rates were significant at 1% probability level.
In all the cases, the parabolic equations were fitted and found discouraging trends.the
discouraging trend of Creditors were not significant up to 10% probability level. All other
discouraging trends were significant at 1% probability level except of Inventory (5%
level).
4.19. Morepen Labs
4.19.1. Inventory analysis
From the estimated values of parameters presented in Table.4.19, it is found that the
nominal amount of Inventory of Morepen Labs had increased at an annual rate of -8.48%
during the period 1999-2000 to 2013-2014 and this growth rate was significant at 5%
probability level.
To separate out the influence of inflation on the growth rate of inventory amount
necessary adjustment in the nominal values of the inventory amount have been done by
deflating the nominal values by the wholesale price index as then the chosen trend lines
have been fitted. From the estimated parameters presented in Table 4.39, it is found that
real amount of Inventory of Morepen Labs had grown at the annual rate of -10.8% and at
the time of 1999-2000 to 2013-2014 and this growth rate of real amount of Inventory of
Morepen Labs was significant at 1% probability level. .
4.19.2. Debtors analysis:
From the estimated values of parameters presented in Table-4.19, it is found that the
nominal amount of Morepen Labs has decreased at an annual rate of 12.9% during the
period 1999-2000 to 2013-2014 and this growth rate is significant at 5% probability level.
130
To separate out the influence of inflation on the growth rate of debtors amount necessary
adjustment in the nominal values of the debtors amount have been done by deflating the
nominal values by the wholesale price index as then the chosen trend lines have been
fitted. From the estimated parameters presented in Table 4.39, it is found that real amount
of debtors of Morepen Labs had declined at the annual rate of 15.3% and at the time of
1999-2000 to 2013- 2014. The declined rate of real amount of Debtors of Morepen Labs
was significant at 1% probability level.
4.19.3 Cash analysis:
From the estimated values of parameters presented in Table-4.19, it is found that the
nominal amount of cash of Morepen Labs had decreased at an annual rate of 29.5%
during the period 1999-2000 to 2013-2014 and this growth rate was significant at 5%
probability level.
To separate out the influence of inflation on the growth rate of cash amount necessary
adjustment in the nominal values of the cash amount have been done by deflating the
nominal values by the wholesale price index as then the chosen trend lines have been
fitted. From the estimated parameters presented in Table 4.39, it is found that real amount
of cash of Morepen Labs had declined at the annual rate of 31.8% and at the time of
1999-2000 to 2013- 2014. The growth rate of real amount of cash of Morepen Labs was
significant at 1% probability level.
4.19.4. Loans and Advance Analysis:
From the estimated values of parameters presented in Table-4.19, it is found that the
nominal amount of Loans and Advances of Morepen Labs had decreased at an annual
rate of 18.4% during the period 1999-2000 to 2013-2014 and this growth rate was
significant at 5% probability level.
To separate out the influence of inflation on the growth rate of Loans And Advance
amount necessary adjustment in the nominal values of the Loans And Advances amount
have been done by deflating the nominal values by the wholesale price index as then the
chosen trend lines have been fitted. From the estimated parameters presented in Table
131
4.39 it is found that real amount of Loans and Advances of Morepen Labs had declined at
the annual rate of 20.7% and at the time of 1999-2000 to 2013- 2014. The growth rate of
real amount was also significant at 1% probability level.
4.19.5. Creditors analysis:
From the estimated values of parameters presented in Table-4.19, it is found that the
nominal amount of Creditors of Morepen Labs had increased at an annual rate of 3.72%
during the period 1999-2000 to 2013-2014 and this growth rate was insignificant.
To separate out the influence of inflation on the growth rate of Creditors amount
necessary adjustment in the nominal values of the creditors amount have been done by
deflating the nominal values by the wholesale price index as then the chosen trend lines
have been fitted. From the estimated parameters presented in Table 4.39, it is found that
real amount of creditors of Morepen Labs had grown at the annual rate of 1.37% and at
the time of 1999-2000 to 2013- 2014. The growth rate of real amount of Creditors of
Morepen Labs was insignificant.
4.19.6. Current Liabilities and Provisions Analysis:
From the estimated values of parameters presented in Table-4.19, it is found that the
nominal amount of Current Liabilities and Provisions of Morepen Labs had increased at
an annual rate of 1.84% during the period 1999-2000 to 2013-2014 and this growth rate
was insignificant.
To separate out the influence of inflation on the growth rate of Current Liabilities and
Provisions amount necessary adjustment in the nominal values of the creditors amount
have been done by deflating the nominal values by the wholesale price index as then the
chosen trend lines have been fitted. From the estimated parameters presented in Table
4.39, it is found that real amount of Current Liabilities and Provisions of Morepen Labs
had grown at the annual rate of .05% and at the time of 1999-2000 to 2013- 2014. The
growth rate of real amount of Current Liabilities and Provisions of Morepen Labs was
insignificant.
132
4.19.7. Current Assets analysis
From the estimated values of parameters presented in Table.4.19, it is found that the
nominal amount of current assets of Morepen Labs had decreased at an annual rate of
15.3% during the period 1999-2000 to 2013-2014 and this growth rate was significant at
1% probability level..
To separate out the influence of inflation on the growth rate of inventory amount
necessary adjustment in the nominal values of the current assets amount have been done
by deflating the nominal values by the wholesale price index as then the chosen trend
lines have been fitted. From the estimated parameters presented in Table 4.39, it is found
that real amount of current assets of Morepen Labs had declined at the annual rate of
17.7% and at the time of 1999-2000 to 2013-2014. The growth rate of real amount of
current assets of Morepen Labs was significant at 1% probability level.
4.19.8. Net Working Capital Analysis:
From the estimated values of parameters presented in Table.4.19, it is found that the
nominal amount of Net Working Capital of Morepen Labs had increased at an annual rate
of 42.6% during the period 1999-2000 to 2013-2014 and this growth rate was significant
at 10% probability level. It is also found that the growth rate of Current Assets of
Morepen Labs had been increasing at diminishing rates. This discouraging trend was also
significant at 1% probability level. This implies a discouraging trend in the inter temporal
growth of total net working capital.
To separate out the influence of inflation on the growth rate of Net Working Capital
amount necessary adjustment in the nominal values of the inventory amount have been
done by deflating the nominal values by the wholesale price index as then the chosen
trend lines have been fitted. From the estimated parameters presented in Table 4.39, it is
found that real amount of Net Working Capital of Morepen Labs had grown at the annual
rate of 39.7% and at the time of 1999-2000 to 2013-2014. The growth rate of real amount
was also significant at 10% probability level.
133
From Table – 4.19 and Table-4.39, it was found that the regression equation of different
component of working capital except were best fitted with time because adjusted R2
values
were high in all cases. Moreover, there was no autocorrelation problem in
different items of working capital (reflected by DW values). The growth rates of both
nominal amount and real amount of Net Working Capital were highest followed by the
growth rate of Creditors, growth rate of Current Liabilities and Provision, growth rate of
Inventory, growth rate of Debtors, growth rate of Current Assets, growth rate of Loans
and Advances and growth rate of cash. The growth rates of Creditors and Current
liabilities were not significant up to 10% probability level. All other growth rates were
significant at 5% probability level except Current assets (1% level) and Net Working
Capital (10% level). Parabolic equation was fitted in Net working Capital and found
discouraging trend. This discouraging trend was significant at 1% probability level.
4.20. Hiran Orgochem Ltd.
4.20.1. Inventory analysis
From the estimated values of parameters presented in Table.4.20, it is found that the
nominal amount of Inventory of Hiran Orgochem Ltd. had increased at an annual rate of
96.6% during the period 1999-2000 to 2013-2014 and this growth rate was significant at
1% probability level. It is also found that the growth rate of Inventory of Hiran Orgochem
Ltd. had been increasing at diminishing rates. This discouraging trend was also
significant at 1% probability level. This implies a discouraging trend in the inter temporal
growth of total Inventory.
To separate out the influence of inflation on the growth rate of inventory amount
necessary adjustment in the nominal values of the inventory amount have been done by
deflating the nominal values by the wholesale price index as then the chosen trend lines
have been fitted. From the estimated parameters presented in Table 4.40, it is found that
real amount of Inventory of Hiran Orgochem Ltd. had grown at the annual rate of 93.5%
and at the time of 1999-2000 to 2013-2014. The growth rate of real amount of Inventory
of Hiran Orgochem Ltd. was significant at 1% probability level.
134
4.20.2. Debtors analysis:
From the estimated values of parameters presented in Table-4.20, it is found that the
nominal amount of Debtors of Hiran Orgochem Ltd. has increased at an annual rate of
36.10% during the period 1999-2000 to 2013-2014 and this growth rate is significant at
5% probability level. It is also found that the growth rate of Debtors of Hiran Orgochem
Ltd. had been increasing at discouraging rates. This discouraging trend was also
significant at 5% probability level. This implies an discouraging trend in the inter
temporal growth of total debtors.
To separate out the influence of inflation on the growth rate of deposit amount necessary
adjustment in the nominal values of the debtors amount have been done by deflating the
nominal values by the wholesale price index as then the chosen trend lines have been
fitted. From the estimated parameters presented in Table 4.40, it is found that real amount
of debtors of Hiran Orgochem Ltd. has grown at the annual rate of 33.10% and at the
time of 1999-2000 to 2013- 2014. The growth rate of real amount of Debtors of Hiran
Orgochem Ltd. was significant at 5% probability level.
4.20.3 Cash analysis:
From the estimated values of parameters presented in Table-4.20, it is found that the
nominal amount of cash of Hiran Orgochem Ltd. had increased at an annual rate of
85.6% during the period 1999-2000 to 2013-2014 and this growth rate was significant at
10% probability level. It is also found that the growth rate of cash of Hiran Orgochem
Ltd. had been increasing at diminishing rates. This discouraging trend was also
significant at 10% probability level. This implies a discouraging trend in the inter
temporal growth of total cash.
To separate out the influence of inflation on the growth rate of deposit amount necessary
adjustment in the nominal values of the cash amount have been done by deflating the
nominal values by the wholesale price index as then the chosen trend lines have been
fitted. From the estimated parameters presented in Table 4.40, it is found that real amount
of cash of Hiran Orgochem Ltd. had grown at the annual rate of 82.5% and at the time of
135
1999-2000 to 2013- 2014. The growth rate of real amount of cash of Hiran Orgochem
Ltd. was significant at 10% probability level.
4.20.4. Loans and Advance Analysis:
From the estimated values of parameters presented in Table-4.20, it is found that the
nominal amount of Loans And Advances of Hiran Orgochem Ltd. had increased at an
annual rate of 71.2% during the period 1999-2000 to 2013-2014 and this growth rate was
significant at 1% probability level. It is also found that the growth rate of Loans And
Advances of Hiran Orgochem Ltd. had been increasing at diminishing rates and this
diminishing rate was significant at 10% probability level. This implies a discouraging
trend in the inter temporal growth of total loans and advances.
To separate out the influence of inflation on the growth rate of Loans And Advance
amount necessary adjustment in the nominal values of the Loans And Advances amount
have been done by deflating the nominal values by the wholesale price index as then the
chosen trend lines have been fitted. From the estimated parameters presented in Table
4.40, it is found that real amount of Loans And Advances of Hiran Orgochem Ltd. had
grown at the annual rate of 71.2% and at the time of 1999-2000 to 2013- 2014. The
growth rate of real amount of Loans and Advances of Hiran Orgochem Ltd. was
significant at 1% probability level.
4.20.5. Creditors analysis:
From the estimated values of parameters presented in Table-4.20, it is found that the
nominal amount of Creditors of Hiran Orgochem Ltd. had increased at an annual rate of
46% during the period 1999-2000 to 2013-2014 and this growth rate was significant at
1% probability level. It is also found that the growth rate of cash of Hiran Orgochem Ltd.
had been increasing at decreasing rates and this decreasing rate was significant at 1%
probability level. This implies an encouraging trend in the inter temporal growth of total
creditors.
To separate out the influence of inflation on the growth rate of Creditors amount
necessary adjustment in the nominal values of the creditors amount have been done by
136
deflating the nominal values by the wholesale price index as then the chosen trend lines
have been fitted. From the estimated parameters presented in Table 4.40, it is found that
real amount of creditors of Hiran Orgochem Ltd. had grown at the annual rate of 43%
and at the time of 1999-2000 to 2013- 2014. The growth rate of real amount of Creditors
of Hiran Orgochem Ltd. was significant at 1% probability level.
4.20.6. Current Liabilities and Provisions Analysis:
From the estimated values of parameters presented in Table-4.20, it is found that the
nominal amount of Current Liabilities and Provisions Analysis of Hiran Orgochem Ltd.
had increased at an annual rate of 49.40% during the period 1999-2000 to 2013-2014 and
this growth rate was significant at 1% probability level. It is also found that the growth
rate of Current Liabilities and Provisions Analysis of Hiran Orgochem Ltd. had been
increasing at diminishing rates and this diminishing rate was significant at 1% probability
level. This implies a descouraging trend in the inter temporal growth of total Current
Liabilities and Provisions.
To separate out the influence of inflation on the growth rate of Current Liabilities and
Provisions amount necessary adjustment in the nominal values of the creditors amount
have been done by deflating the nominal values by the wholesale price index as then the
chosen trend lines have been fitted. From the estimated parameters presented in Table
4.40, it is found that real amount of Current Liabilities and Provisions Analysis of Hiran
Orgochem Ltd. had grown at the annual rate of 46.3% and at the time of 1999-2000 to
2013- 2014. The growth rate of real amount of Current Liabilities and Provisions
Analysis of Hiran Orgochem Ltd. was significant at 1% Probability level.
4.20.7. Current Assets analysis
From the estimated values of parameters presented in Table.4.20, it is found that the
nominal amount of current assets of Hiran Orgochem Ltd. had increased at an annual rate
of 0.689% during the period 1999-2000 to 2013-2014 and this growth rate was significant
at 1% probability level. It is also found that the growth rate of Current Assets of Hiran
Orgochem Ltd. had been increasing at diminishing rates. This discouraging rate was also
137
significant at 1% probability level. This implies a discouraging trend in the inter temporal
growth of total current assets.
To separate out the influence of inflation on the growth rate of inventory amount
necessary adjustment in the nominal values of the current assets amount have been done
by deflating the nominal values by the wholesale price index as then the chosen trend
lines have been fitted. From the estimated parameters presented in Table 4.40, it is found
that real amount of current assets of Hiran Orgochem Ltd. had grown at the annual rate of
65.8% and at the time of 1999-2000 to 2013-2014. The growth rate of real amount of
current assets of Hiran Orgochem Ltd. was significant at 1% probability level.
4.20.8. Net Working capital analysis
From the estimated values of parameters presented in Table.4.20, it is found that the
nominal amount of Net Working Capital of Hiran Orgochem Ltd. had increased at an
annual rate of .838% during the period 1999-2000 to 2013-2014 and this growth rate was
significant at 1% probability level. It is also found that the growth rate of net working
capital of Hiran Orgochem Ltd. had been increasing at decreasing rates. The
discouraging trend is also significant at 1% probability level. This implies a discouraging
trend in the inter temporal growth of total net working capital.
To separate out the influence of inflation on the growth rate of Net Working Capital
amount necessary adjustment in the nominal values of the inventory amount have been
done by deflating the nominal values by the wholesale price index as then the chosen
trend lines have been fitted. From the estimated parameters presented in Table 4.40, it is
found that real amount of Net Working Capital of Hiran Orgochem Ltd. had grown at the
annual rate of 80.8% and at the time of 1999-2000 to 2013-2014. The growth rate of real
amount of Net Working Capital of Hiran Orgochem Ltd. was significant at 1%
probability level.
.From Table – 4.20 and Table-4.40, it was found that the regression equation of different
component of working capital were best fitted with time because adjusted R2 values
were
high in all cases. Moreover, there was no autocorrelation problem in different items of
working capital (reflected by DW values). The growth rates of both nominal amount and
138
real amount of Inventory were highest followed by the growth rate of cash, growth rate of
Loans and Advances, growth rate of Current Liabilities and Provision, growth rate of
Creditors, growth rate of Debtors, growth rate of Net Working Capital and growth rate of
Current Assets. All these growth rates were significant at 1% probability level except
cash balance (10% Level), Debtors (5% Level). Parabolic equations were fitted in all
cases and found discouraging trends. All these discouraging trends were significant at 1%
probability level except Debtors (5%level), Cash (10% level), Loans and Advances (10%
level).
4.21. Summary of the Chapter
From the above analysis of the selected pharmaceutical companies the following
information was obtained:
Inventory:
The regression equations of Inventory of the selected pharmaceutical companies were
best fitted because adjusted R square values were very high in all the cases except in
Zenotech Ltd. There was no autocorrelation problem in Inventory (reflected by DW
values) of all the selected pharmaceutical companies. The growth rates of both nominal
amount and real amount of Inventory was highest in Sequent Scientific Ltd. followed by
Hiran Orgochem Ltd., Zenotech Laboratories Ltd. Marksans Pharma Ltd.,Lupin, Biocon
Pharmaceuticals, Wanbury Ltd, Dr Reddy‟s Laboratories, Divis Labs, CIPLA, Aurobindo
Pharmaceuticals, Cadila Health Care Ltd., Piramal Enterprises, Parenteral Drugs (India)
Ltd., Sun Pharmaceuticals, Strides Archolabs, Morepen Labs, Ambalal Sarabhai
Enterprises, Kopran, Biofil Chemicals and Pharmaceuticals Ltd. respectively. All these
growth rates were significant at 1% probability level except for Biofil Chemicals and
Pharmaceuticals Ltd, Kopran, Parenteral Drugs (India) Ltd., and Morepen Labs whose
growth rates of Inventory were significant at 5% probability level. The growth rates of all
these pharmaceutical companies were positive except the growth rate of Kopran, Biofil
Chemicals and Pharmaceuticals Ltd, Morepen Labs and Ambalal Sarabhai Enterprises
whose growth rates were negative.
139
In Inventory, the log quadratic equations were fitted in all the selected pharmaceutical
companies except in Strides Archolabs and Sun Pharmaceuticals. All these growth rates
were followed a discouraging trend except Kopran and Biofil Chemicals and
Pharmaceuticals Ltd where it was found an encouraging trend. All these trends were
significant at 1% probability level except of Lupin(5% level), Dr Reddy‟s
Laboratories(5% level), Aurobindo Pharmaceuticals(10% level), Divis Labs(not
significant up to 10% level), Sun Pharmaceuticals(not significant up to 10% level),
Biofil Chemicals and Pharmaceuticals Ltd(5% level), Parenteral Drugs (India) Ltd. (not
significant up to 10% level), Sequent Scientific Ltd. (10% level), Zenotech Laboratories
Ltd. (not significant up to 10% level) and Wanbury Ltd(5% level).
Debtors:
The regression equations of Debtors of the selected pharmaceutical companies were best
fitted because adjusted R square values were very high in all the cases except in Kopran,
Morepen Labs and Hiran Orgochem Ltd. Moreover, all these adjusted R square values
were significant at 1% probability level except of Morepen Labs and Hiran Orgochem
Ltd. where it was significant at 5% probability level. There was no autocorrelation
problem in Inventory (reflected by DW values) of all the selected pharmaceutical
companies. The growth rates of nominal amount of debtors was highest in Wanbury
Ltd(67.7), followed by the growth rates of Sequent Scientific Ltd.(59.3), CIPLA(55.5),
Zenotech Laboratories Ltd.(53.8), Sun Pharmaceuticals(41.3), Biocon
Pharmaceuticals(39.6), Hiran Orgochem Ltd.(36.10), Marksans Pharma Ltd.(34.10),
Divis Labs(32.7), Cadila Health Care Ltd.(25.3), Piramal Enterprises(24.7), Lupin(22%),
Aurobindo Pharmaceuticals(21.2), Ambalal Sarabhai Enterprises(19.9), Strides
Archolabs(18.7), Dr Reddy‟s Laboratories(18.3), Parenteral Drugs (India) Ltd.(11.4),
Morepen Labs(-12.9), Kopran(-21.9), Biofil Chemicals and Pharmaceuticals Ltd.(-77.7)
respectively. All these growth rates were significant at 1% probability level except the
growth rates of Dr Reddy‟s Laboratories (5% level), Kopran (5% level), Ambalal
Sarabhai Enterprises (5% level), Sequent Scientific Ltd. (5% level), Zenotech
Laboratories Ltd. (5% level), Morepen Labs (5% level) and Hiran Orgochem Ltd. (5%
level).
140
The growth rates of real amount of Debtors was highest in Wanbury Ltd(64.6%),
followed by the growth rate of Sequent Scientific Ltd.(55.3%), CIPLA(52.5%), Zenotech
Laboratories Ltd.(50.8%), Sun Pharmaceuticals(38.2%), Biocon Pharmaceuticals(36.5%),
Hiran Orgochem Ltd.(33.10%), Marksans Pharma Ltd.(31%), Divis Labs(29.6%), Cadila
Health Care Ltd.(22.2%), Piramal Enterprises(21.7%), Lupin(19.7%), Dr Reddy‟s
Laboratories(18.5%), Aurobindo Pharmaceuticals(18%), Ambalal Sarabhai
Enterprises(16.9%), Strides Archolabs(15.7%), Parenteral Drugs (India) Ltd.(9.04%),
Morepen Labs(-15.3%), Kopran(-25%), Biofil Chemicals and Pharmaceuticals Ltd.(-
80.7%) respectively. All these growth rates were significant at 1% probability level
except the growth rates of Kopran (5% level), Ambalal Sarabhai Enterprises (5% level),
Sequent Scientific Ltd. (5% level), Zenotech Laboratories Ltd. (5% level) and Hiran
Orgochem Ltd. (5% level).
In most of the cases the growth rates of nominal amount and real amount of Debtors was
found positive except in Morepen Labs (-15.3%), Kopran(-25%), Biofil Chemicals and
Pharmaceuticals Ltd.(-80.7%) where both the growth rates of nominal amount and real
amount of Debtors were found to be negative.
In Debtors, the log quadratic equations were fitted in all the selected pharmaceutical
companies except in Lupin, Dr Reddy‟s Laboratories, Parenteral Drugs (India) Ltd. and
Morepen Labs. All these growth trends of the selected pharmaceutical companies were
followed a discouraging trend except the trend of Dr Reddy‟s Laboratories and Kopran
where it was an encouraging trend. Moreover, all these trends in nominal amount of
Debtors were significant at 1% probability level except the trends of Dr Reddy‟s
Laboratories(not significant up to 10 % level), Aurobindo Pharmaceuticals(not
significant up to level) Divis Labs(10% level), Strides Archolabs(5% level) Sun
Pharmaceuticals(5% level) Kopran(5% level) Sequent Scientific Ltd. ( no significant up
to 10% level) Marksans Pharma Ltd(10% level) Hiran Orgochem Ltd. (5% level).
Cash and Bank:
The regression equations of Cash of the selected pharmaceutical companies were best
fitted because adjusted R square values were very high in all the cases except in Lupin,
141
Dr. Reddy‟s Laboratories, Piramal Enterprises, Aurobindo Pharmaceuticals,
Kopran,Biofil Chemicals, and Pharmaceuticals Ltd. Ambalal Sarabhai Enterprises, and
Hiran Orgochem Ltd. There was no autocorrelation problem in Cash (reflected by DW
values) of all the selected pharmaceutical companies during the study period. The growth
rates of nominal amount of Cash was highest in Zenotech Laboratories Ltd.(209.6%),
followed by Sun Pharmaceuticals(148.3%), Biocon Pharmaceuticals(142.7%), Wanbury
Ltd(138.70%), Marksans Pharma Ltd.(117.10%), Hiran Orgochem Ltd.(85.60%),
Aurobindo Pharmaceuticals(79.9%), Lupin(73.20%), Dr Reddy‟s Laboratories(71.7%),
CIPLA(57.7%), Sequent Scientific Ltd.(28.9%), Parenteral Drugs (India) Ltd.(23.80%),
Strides Archolabs(16.4%), Divis Labs(15.2%), Piramal Enterprises.(5.38%), Kopran(-
11.10%), Ambalal Sarabhai Enterprises(-11.6%), Morepen Labs(-29.50%), Biofil
Chemicals and Pharmaceuticals Ltd.(-35.40%), Cadila Health Care Ltd.(-74.5%)
respectively. All these growth rates of nominal amount of Cash were significant at 1%
probability level except in Lupin (10% level), Dr Reddy‟s Laboratories(5% level),
Piramal Enterprises.( not significant up to 10% level) Aurobindo Pharmaceuticals(5%
level), Cadila Health Care Ltd (5% level), Biocon Pharmaceuticals(5% level), Kopran(
not significant up to 10% level), Biofil Chemicals and Pharmaceuticals Ltd.( not
significant up to 10% level), Ambalal Sarabhai Enterprises(5% level), Zenotech
Laboratories Ltd.( 5% level), Morepen Labs(5% level), Hiran Orgochem Ltd.( 10%
level).
The growth rates of real amount of Cash was highest in Zenotech Laboratories
Ltd.(205.9%), followed by Sun Pharmaceuticals(145.2%), Biocon
Pharmaceuticals(139.7%), Wanbury Ltd(135.60%), Marksans Pharma Ltd.(114%), Hiran
Orgochem Ltd.(82.5%), Aurobindo Pharmaceuticals(76.8%), Lupin(70.1%), Dr Reddy‟s
Laboratories(68.7%), CIPLA(54.6%), Sequent Scientific Ltd.(28.9%), Parenteral Drugs
(India) Ltd.(21.50%), Strides Archolabs(14.10%), Divis Labs(12.9%), Ambalal Sarabhai
Enterprises(-13.9%), Kopran(-14.10%), Morepen Labs(-31.80%), Piramal Enterprises.(-
33.10%), Biofil Chemicals and Pharmaceuticals Ltd.(-38.40%), Cadila Health Care Ltd.(-
77.60%). All these growth rates of real amount of Cash were significant at 1% probability
level except in Lupin (10% level), Dr Reddy‟s Laboratories(5% level), Piramal
Enterprises.( not significant up to 10% level) Aurobindo Pharmaceuticals(5% level),
142
Biocon Pharmaceuticals(5% level), Kopran(10% level), Biofil Chemicals and
Pharmaceuticals Ltd.( not significant up to 10% level), Zenotech Laboratories Ltd.( 5%
level), Marksans Pharma Ltd.( 5% level), Hiran Orgochem Ltd.( 10% level).
In most of the cases the growth rates of nominal amount and real amount of Cash was
found positive except in Ambalal Sarabhai Enterprises (-13.9%), Kopran (-14.10%),
Morepen Labs(-31.80%), Piramal Enterprises.(-33.10%), Biofil Chemicals and
Pharmaceuticals Ltd.(-38.40%), Cadila Health Care Ltd.(-77.60%) where both the growth
rates of nominal amount and real amount of Cash were found to be negative.
In Cash, the log quadratic equations were fitted in all the selected pharmaceutical
companies except in Piramal Enterprises, Divis Labs, Strides Archolabs, Ambalal
Sarabhai Enterprises, Parenteral Drugs (India) Ltd., Sequent Scientific Ltd and Morepen
Labs. All these growth trends of the selected pharmaceutical companies were followed a
discouraging trend except the trend of Cadila Health Care Ltd., Kopran and Biofil
Chemicals and Pharmaceuticals Ltd where it was found an encouraging trend. All these
encouraging and discouraging trends were significant at 1% probability level except
Lupin (10% level), Dr Reddy‟s Laboratories(10% level), CIPLA (5% level), Aurobindo
Pharmaceuticals(5% level), Biocon Pharmaceuticals(5% level), Biocon
Pharmaceuticals(not significant up to 10% level), Kopran(not significant up to 10%
level), Biofil Chemicals and Pharmaceuticals Ltd.( not significant up to 10% level),
Zenotech Laboratories Ltd.( 5% level), Marksans Pharma Ltd.( 10% level), Hiran
Orgochem Ltd.( 10% level).
Loans and Advances:
The regression equations of Loans and Advances of the selected pharmaceutical
companies were best fitted because adjusted R square values were very high in all the
cases except in Kopran, Biofil Chemicals, and Pharmaceuticals Ltd and the value of
adjusted R square value found to be significant at 1% probability level. There was no
autocorrelation problem in Loans and Advances (reflected by DW values) of all the
selected pharmaceutical companies during the study period. The growth rates of nominal
amount of Loans and Advances were highest in Zenotech Laboratories Ltd.(165.40%),
143
followed by Wanbury Ltd(88.9%), Hiran Orgochem Ltd.(71.2%), Dr Reddy‟s
Laboratories(57.3%), Marksans Pharma Ltd.(56.6%), Aurobindo
Pharmaceuticals(46.5%), Biocon Pharmaceuticals(41.7%), Strides Archolabs(36.4%),
Piramal Enterprises.(35.7%), Divis Labs(35.40%), CIPLA(33.8%), Parenteral Drugs
(India) Ltd.(24.70%), Sequent Scientific Ltd.(23.7%), Sun Pharmaceuticals(23.2%),
Cadila Health Care Ltd.(19.8%), Lupin(16.50%), Kopran(.043%), Ambalal Sarabhai
Enterprises(-7.88%), Morepen Labs(-18.4%), Biofil Chemicals and Pharmaceuticals
Ltd.(-50.5%) respectively. All these growth rates of nominal amount of Loan and
Advances were significant at 1% probability level except the growth rates of Strides
Archolabs (5% level), Kopran (not significant up to 10% level), Biofil Chemicals and
Pharmaceuticals Ltd.(10 % level), Parenteral Drugs (India) Ltd.(5% level) and Morepen
Labs (5% level).
The growth rates of real amount of Loans and Advances were highest in Zenotech
Laboratories Ltd.(162.40%), followed by Wanbury Ltd(85.8%), Hiran Orgochem
Ltd.(71.2%), Dr Reddy‟s Laboratories(54.2%), Marksans Pharma Ltd.(53.5%),
Aurobindo Pharmaceuticals(43.4%), Biocon Pharmaceuticals(41.7%), Piramal
Enterprises.(33.3%), Divis Labs(32.40%), CIPLA(30.8%), Sequent Scientific
Ltd.(23.7%), Strides Archolabs(21.1%), Sun Pharmaceuticals(20.9%), Cadila Health
Care Ltd.(17.5%), Parenteral Drugs (India) Ltd.(14.80%), Lupin(14.1%), Kopran(-
1.92%), Ambalal Sarabhai Enterprises(-10.2%), Morepen Labs(-20.7%), Biofil
Chemicals and Pharmaceuticals Ltd.(-53.5%) respectively. All these growth rates of real
amount of Loan and Advances were significant at 1% probability level except the growth
rates of Kopran (not significant up to 10% level), Biofil Chemicals and Pharmaceuticals
Ltd.(10 % level), Marksans Pharma Ltd. (5% level).
In most of the cases the growth rates of nominal amount and real amount of Loans and
Advances were found to be positive except in Kopran (.043%), Ambalal Sarabhai
Enterprises(-7.88%), Morepen Labs(-18.4%), Biofil Chemicals and Pharmaceuticals
Ltd.(-50.5%) respectively where both the growth rates of nominal amount and real
amount of Loans and Advances were found to be negative.
144
In Loans and Advances, the log quadratic equations were fitted in all the selected
pharmaceutical companies except in Lupin, Piramal Enterprises, Cadila Health Care Ltd.,
Sun Pharmaceuticals, Kopran, Ambalal Sarabhai Enterprises, Sequent Scientific Ltd,
Morepen Labs.All these growth trends of the selected pharmaceutical companies were
followed a discouraging trend except the trend of Biofil Chemicals and Pharmaceuticals
Ltd. where it was found an encouraging trend. All these encouraging and discouraging
trends were significant at 1% probability level except CIPLA (5% level), Divis Labs (not
significant up to 10% level), Strides Archolabs ( not significant up to 10% level), Biocon
Pharmaceuticals(not significant up to 10% level), Biofil Chemicals and Pharmaceuticals
Ltd.( not significant up to 10% level), Parenteral Drugs (India) Ltd. (not significant up to
10% level), Marksans Pharma Ltd.( 10% level) and Hiran Orgochem Ltd.( 10% level).
Creditors:
The regression equations of Creditors of the selected pharmaceutical companies were
best fitted because adjusted R square values were very high in all the cases except in
Kopran, Morepen Labs and the value of adjusted R square value found to be significant at
1% probability level. There was no autocorrelation problem in Creditors (reflected by
DW values) of all the selected pharmaceutical companies during the study period.
The growth rates of nominal amount of Creditors were highest in Zenotech Laboratories
Ltd.(213.40%), followed by Sequent Scientific Ltd.(149.9%), Wanbury Ltd(67.2%),
Lupin(54%), Dr Reddy‟s Laboratories(47.7%), Hiran Orgochem Ltd.(46%), Sun
Pharmaceuticals(42.3%), Biocon Pharmaceuticals(39.9%), CIPLA(39.4%), Cadila Health
Care Ltd.(31.8%), Aurobindo Pharmaceuticals(23.9%), Marksans Pharma Ltd.(21.8%),
Divis Labs(20.5%), Piramal Enterprises.(19.7%), Strides Archolabs(17.0%), Parenteral
Drugs (India) Ltd.(16.70%), Biofil Chemicals and Pharmaceuticals Ltd.(13.7 %),
Ambalal Sarabhai Enterprises(10.1%), Morepen Labs(3.72%) and Kopran(3.08%)
respectively. All these growth rates of nominal amount of Creditors were significant at
1% probability level except the growth rates of Kopran (not significant up to 10% level),
Ambalal Sarabhai Enterprises(10% level), and Morepen Labs (not significant up to 10%
level).
145
The growth rates of real amount of Creditors were highest in Zenotech Laboratories
Ltd.(209.7%), followed by Sequent Scientific Ltd.(149.9%), Wanbury Ltd(64.10%),
Lupin(50.9%), Dr Reddy‟s Laboratories(44.6%), Hiran Orgochem Ltd.(43%), Sun
Pharmaceuticals(39.2%), Biocon Pharmaceuticals(36.8%), CIPLA(36.3%), Cadila Health
Care Ltd.(28.7%), Aurobindo Pharmaceuticals(23.9%), Marksans Pharma Ltd.(19.5%),
Divis Labs(17.4%), Strides Archolabs(14.6%), Parenteral Drugs (India) Ltd.(14.3%),
Piramal Enterprises.(13.7%),Biofil Chemicals and Pharmaceuticals Ltd.(4.80 %),
Morepen Labs(1.37%), Ambalal Sarabhai Enterprises(-.064%), and Kopran(-1.37%)
respectively. All these growth rates of nominal amount of Creditors were significant at
1% probability level except the growth rates of Kopran (not significant up to 10% level),
and Morepen Labs (not significant up to 10% level). In most of the cases the growth
rates of nominal amount and real amount of Creditors were found to be positive except in
Kopran (-1.37%), Ambalal Sarabhai Enterprises (-.064%) where both the growth rates of
nominal amount and real amount of Creditors were found to be negative.
In Creditors, the log quadratic equations were fitted in all the selected pharmaceutical
companies except in Strides Archolabs, Parenteral Drugs (India) Ltd., Marksans Pharma
Ltd. and Morepen Labs. All these growth trends of the selected pharmaceutical
companies were followed a discouraging trend except the trend of Dr Reddy‟s
Laboratories where it was found an encouraging trend. All these encouraging and
discouraging trends were significant at 1% probability level except Lupin(5% level),
Piramal Enterprises ( not significant up to 10% level), Aurobindo Pharmaceuticals ( not
significant up to 10% level), Cadila Health Care Ltd. (5% level), Divis Labs (not
significant up to 10% level), Kopran (not significant up to 10% level), Biofil Chemicals
and Pharmaceuticals Ltd.( not significant up to 10% level), Ambalal Sarabhai Enterprises
( 10% level) and Wanbury Ltd(not significant up to 10% level).
Current Liabilities and Provisions:
The regression equations of Current Liabilities and Provisions of the selected
Pharmaceuticals companies were best fitted because adjusted R square values were very
high in all the cases except in Kopran and Morepen Labs and the adjusted R square value
found to be significant at 1% probability level. There was no autocorrelation problem in
146
Current Liabilities and Provisions (reflected by DW values) of all the selected
pharmaceutical companies during the study period.
The growth rates of nominal amount of Current Liabilities and Provisions were highest
in Zenotech Laboratories Ltd.(217.5%), followed by Sequent Scientific Ltd.(159.5%),
Wanbury Ltd(85.80%), Lupin(62.8%), Dr Reddy‟s Laboratories(53.9%), Hiran
Orgochem Ltd.(49.4%), Biocon Pharmaceuticals(43.5%), CIPLA(35.4%), Sun
Pharmaceuticals(31.9%), Strides Archolabs(31.1%), Cadila Health Care Ltd.(29.9%),
Aurobindo Pharmaceuticals(22.2%), Marksans Pharma Ltd.(22.10%), Divis
Labs(18.3%), Ambalal Sarabhai Enterprises(17%), Parenteral Drugs (India)
Ltd.(16.70%), Piramal Enterprises.(16.4%), Morepen Labs(1.84%), Kopran(.09%) and
Biofil Chemicals and Pharmaceuticals Ltd.(.064 %) respectively.
All these growth rates of nominal amount of Current Liabilities and Provisions were
significant at 1% probability level except the growth rates of Lupin( 10% level), Kopran
(not significant up to 10% level) and Morepen Labs (not significant up to 10% level).
The growth rates of real amount of Current Liabilities and Provisions were highest in
Zenotech Laboratories Ltd.(213.8%), followed by Sequent Scientific Ltd.(159.5%),
Wanbury Ltd(82.7%), Lupin(59.7%), Dr Reddy‟s Laboratories(50.8%), Hiran Orgochem
Ltd.(46.3%), Biocon Pharmaceuticals(40.4%), CIPLA(32.3%), Strides
Archolabs(28.1%), Cadila Health Care Ltd.(26.9%), Sun Pharmaceuticals(25.2%),
Marksans Pharma Ltd.(19.8%), Aurobindo Pharmaceuticals(19.2%), Piramal
Enterprises.(16.2%), Divis Labs(15.3%), Parenteral Drugs (India) Ltd.(14.30%),
Ambalal Sarabhai Enterprises(14%), Biofil Chemicals and Pharmaceuticals Ltd.(4.05
%),Morepen Labs(.05%) and Kopran(-1.45%) respectively. All these growth rates were
significant at 1% probability level except the growth rate of Lupin (10% level), Kopran
(not significant up to 10% level), Biofil Chemicals and Pharmaceuticals Ltd ( 5% level)
and Morepen Labs (not significant up to 10% level).
The growth rate of both nominal amount and real amount of Current Liabilities and
Provisions of all the selected pharmaceutical companies were found to be positive during
the period under study.
147
In Current Liabilities and Provisions, the log quadratic equations were fitted in all the
selected pharmaceutical companies except in Kopran, Biofil Chemicals and
Pharmaceuticals Ltd, Parenteral Drugs (India) Ltd., Marksans Pharma Ltd., Morepen
Labs. All these growth trends of the selected pharmaceutical companies were followed a
discouraging trend except the trend of Lupin, Piramal Enterprises and Divis Labs where it
was found to be positive. All these encouraging and discouraging trends were significant
at 1% probability level except the trends of Lupin(not significant up to 10% level),
Kopran (not significant up to 10% level), Biofil Chemicals and Pharmaceuticals Ltd( 5%
level) and Morepen Labs (not significant up to 10% level) Piramal Enterprises ( not
significant up to 10% level), Aurobindo Pharmaceuticals ( not significant up to 10%
level), Divis Labs (not significant up to 10% level), Strides Archolabs(5%level), Sun
Pharmaceuticals( not significant up to 10% level).
Current Assets:
The regression equations of Current Liabilities and Provisions of the selected
Pharmaceuticals companies were best fitted because adjusted R square values were very
high in all the selected pharmaceutical companies and the adjusted R square value found
to be significant at 1% probability level. There was no autocorrelation problem in Current
Liabilities and Provisions (reflected by DW values) of all the selected pharmaceutical
companies during the study period.
The growth rates of nominal values of Current assets of the selected pharmaceutical
companies were highest in Zenotech Laboratories Ltd.(77.6%), followed by Wanbury
Ltd(71.30%), Hiran Orgochem Ltd.(68.9%), Marksans Pharma Ltd.(60.8%), Sun
Pharmaceuticals(44%), Biocon Pharmaceuticals(41.3%), Dr Reddy‟s
Laboratories(39.4%), CIPLA(38.3%), Lupin (34.8%), Aurobindo
Pharmaceuticals(32.6%), Divis Labs(30.8%), Strides Archolabs(26.7%), Sequent
Scientific Ltd.(26.2%), Piramal Enterprises.(21.6%), Cadila Health Care Ltd.(15.1%),
Ambalal Sarabhai Enterprises(13.4%), Parenteral Drugs (India) Ltd.(12.30%), Morepen
Labs(-15.30%), Kopran(-15.5%) and Biofil Chemicals and Pharmaceuticals Ltd.(-62.10
%) respectively. All these growth rate of nominal values of Current Assets were
significant at 1% probability level except Lupin( 5% level), Strides Archolabs
148
( 5% level), Ambalal Sarabhai Enterprises( 10% level) and Sequent Scientific Ltd( 5%
level). The growth rates of nominal values of all the selected pharmaceuticals were found
to be positive except the growth rates of nominal values of Kopran, Biofil Chemicals and
Pharmaceuticals Ltd. and Morepen Labs where it was found to be negative.
The growth rates of real values of Current Assets of the selected pharmaceutical
companies were highest in Zenotech Laboratories Ltd. (74.5%), followed by Wanbury
Ltd (68.2%), Hiran Orgochem Ltd. (65.8%), Marksans Pharma Ltd. (57.8%), Sun
Pharmaceuticals (40.9%), Biocon Pharmaceuticals (38.2%), Dr Reddy‟s Laboratories
(36.3%), CIPLA(35.2%), Lupin (31.7%), Sequent Scientific Ltd. (31.5%), Divis
Labs(30.8%), Aurobindo Pharmaceuticals (29.5%), Cadila Health Care Ltd.(27.7%),
Piramal Enterprises.(18.5%), Strides Archolabs (15.2%), Parenteral Drugs (India)
Ltd.(9.99%), Ambalal Sarabhai Enterprises(-14.2%), Morepen Labs (-17.7%), Kopran (-
18.5%) and Biofil Chemicals and Pharmaceuticals Ltd.(-65.2 %) respectively. All these
growth rate of real values of Current Assets were significant at 1% probability level
except Lupin (5% level). The growth rates of real values of all the selected
pharmaceuticals were found to be positive except the growth rates of real values of
Kopran, Biofil Chemicals and Pharmaceuticals Ltd., Ambalal Sarabhai Enterprises and
Morepen Labs where it was found to be negative. The growth rates of all the real values
of selected pharmaceutical companies were significant at 1% probability level except that
of Lupin (5% level).
In Current Assets, the log quadratic equations were fitted in all the selected
pharmaceutical companies except in Cadila Health Care Ltd. Parenteral Drugs (India)
Ltd. Morepen Labs. All these growth trends of the selected pharmaceutical companies
were followed a discouraging trend except the trend of Kopran, Biofil Chemicals and
Pharmaceuticals Ltd. and Sequent Scientific Ltd. where it was found to be positive.
All these encouraging and discouraging trends were significant at 1% probability level
except the trends of Lupin(not significant up to 10% level), Strides Archolabs( not
significant up to 10% level), Sun Pharmaceuticals (5%level), Biocon Pharmaceuticals
(5%level), Kopran (5%level), and Sequent Scientific Ltd. (not significant up to 10%
level).
149
Net Working Capital:
The regression equations of Net Working Capital of the selected Pharmaceuticals
companies were best fitted because adjusted R square values were very high in all the
selected pharmaceutical companies except the adjusted R square values of Piramal
Enterprises and Zenotech Laboratories Ltd. and the adjusted R square values were found
to be significant at 1% probability level except of Biofil Chemicals and Pharmaceuticals
Ltd. (5%level). There was no autocorrelation problem in Current Liabilities and
Provisions (reflected by DW values) of all the selected pharmaceutical companies during
the study period.
The growth rates of nominal values of Net Working Capital of the selected
pharmaceutical companies were highest in Wanbury Ltd(92.60%) followed by Hiran
Orgochem Ltd.(83.8%), Zenotech Laboratories Ltd.(80.3%), Marksans Pharma
Ltd.(78.4%), Sun Pharmaceuticals(43.7%), Morepen Labs(42.6%), Divis Labs(41.5%),
Biocon Pharmaceuticals(39.8%), CIPLA(37.8%), Dr Reddy‟s Laboratories(36.40%),
Aurobindo Pharmaceuticals(35.7%), Strides Archolabs(31.1%), Lupin (26.2%), Sequent
Scientific Ltd.(24%), Piramal Enterprises.(16.7%), Cadila Health Care Ltd.(15.4%),
Parenteral Drugs (India) Ltd.(10.20%), Ambalal Sarabhai Enterprises(-17.4%), Kopran(-
24.10%) and Biofil Chemicals and Pharmaceuticals Ltd.(-90.3 %) respectively.
All these growth rate of nominal values of Net Working Capital were significant at 1%
probability level except Lupin ( 5% level), Piramal Enterprises( not significant up to 10%
level), Strides Archolabs( 5% level), Biofil Chemicals and Pharmaceuticals Ltd. ( 5%
level), Zenotech Laboratories Ltd. ( not significant up to 10% level), Morepen Labs(10%
level), The growth rates of nominal values of all the selected pharmaceuticals were found
to be positive except the growth rates of nominal values of Kopran, Biofil Chemicals and
Pharmaceuticals Ltd. and Ambalal Sarabhai Enterprises, where it was found to be
negative.
The growth rates of real values of Net Working Capital of the selected pharmaceutical
companies were highest in Wanbury Ltd(89.5%) followed by Hiran Orgochem
Ltd.(80.8%), Zenotech Laboratories Ltd.(77.3%), Marksans Pharma Ltd.(75.4%), Sun
150
Pharmaceuticals(40.6%), Morepen Labs(39.7%), Divis Labs(38.4%), CIPLA(34.8%), Dr
Reddy‟s Laboratories(33.3%), Aurobindo Pharmaceuticals(32.6%), Strides
Archolabs(28.1%), Biocon Pharmaceuticals(26%), Sequent Scientific Ltd.(21.6%),
Lupin (18.2%), Piramal Enterprises.(13.8%), Parenteral Drugs (India) Ltd.(7.88%),Cadila
Health Care Ltd.(-17.4%), Kopran(-27.2%) Ambalal Sarabhai Enterprises (-35.2%), and
Biofil Chemicals and Pharmaceuticals Ltd.(-93 %) respectively.
All these growth rate of real values of Net Working Capital were significant at 1%
probability level except Piramal Enterprises( not significant up to 10% level), Cadila
Health Care Ltd (10% level), Strides Archolabs( 10% level), Zenotech Laboratories Ltd. (
not significant up to 10% level), Marksans Pharma Ltd( 5% level) and Morepen
Labs(10% level). The growth rates of real values of all the selected pharmaceuticals were
found to be positive except the growth rates of real values of Kopran, Biofil Chemicals
and Pharmaceuticals Ltd. Cadila Health Care Ltd and Ambalal Sarabhai Enterprises,
where it was found to be negative.
In Net Working Capital, the log quadratic equations were fitted in all the selected
pharmaceutical companies except in Cadila Health Care Ltd., Parenteral Drugs (India)
Ltd., Sequent Scientific Ltd.All these growth trends of the selected pharmaceutical
companies were followed a discouraging trend except the trend of Lupin, Kopran and
Biofil Chemicals and Pharmaceuticals Ltd. where it was found to be positive.
All these encouraging and discouraging trends were significant at 1% probability level
except the trends of Lupin(not significant up to 10% level), Dr Reddy‟s
Laboratories(5%level), Piramal Enterprises(not significant up to 10% level). Strides
Archolabs (not significant up to 10% level), Sun Pharmaceuticals (10%level), Biocon
Pharmaceuticals (not significant up to 10% level), Biofil Chemicals and Pharmaceuticals
Ltd. (5%level), Zenotech Laboratories Ltd. (not significant up to 10% level), Marksans
Pharma Ltd. (5%level).
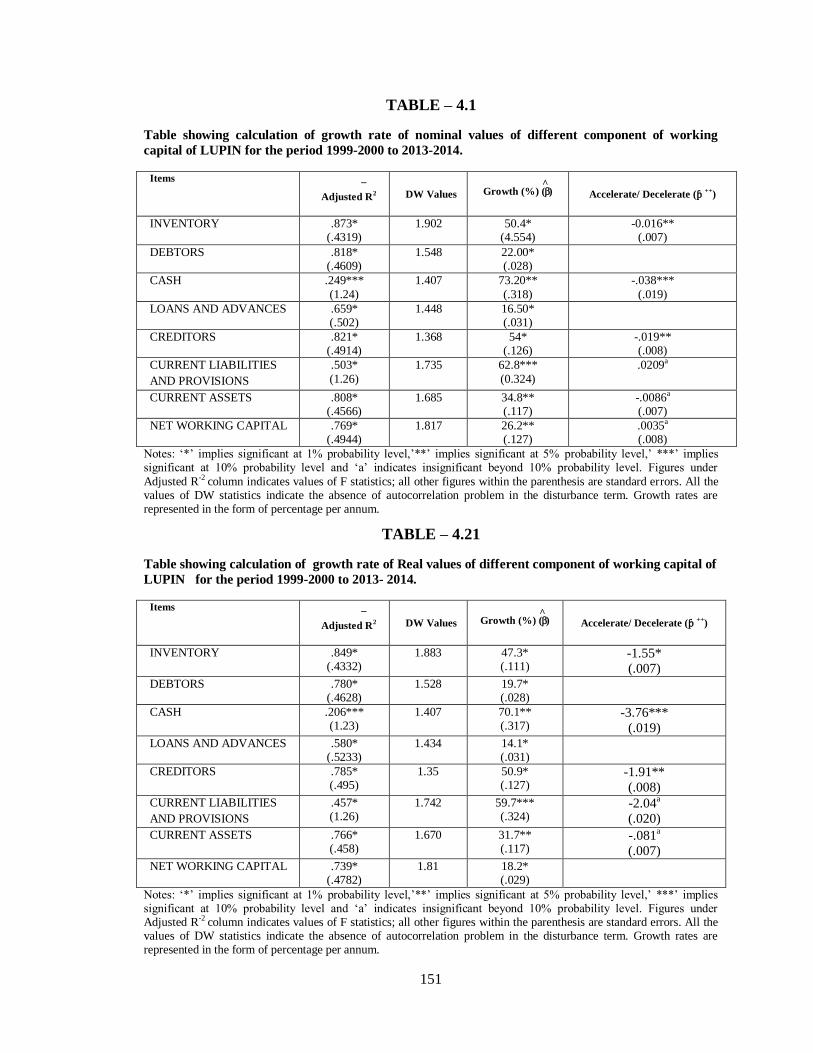
151
TABLE – 4.1
Table showing calculation of growth rate of nominal values of different component of working
capital of LUPIN for the period 1999-2000 to 2013-2014.
Items
Adjusted R2
_
DW Values Growth (%) (^
) Accelerate/ Decelerate (ƥ ++)
INVENTORY .873* (.4319)
1.902 50.4* (4.554)
-0.016** (.007)
DEBTORS .818* (.4609)
1.548 22.00* (.028)
CASH .249***
(1.24)
1.407 73.20**
(.318)
-.038***
(.019)
LOANS AND ADVANCES .659* (.502)
1.448 16.50* (.031)
CREDITORS .821* (.4914)
1.368 54* (.126)
-.019** (.008)
CURRENT LIABILITIES
AND PROVISIONS
.503*
(1.26)
1.735 62.8***
(0.324)
.0209a
CURRENT ASSETS .808* (.4566)
1.685 34.8** (.117)
-.0086a (.007)
NET WORKING CAPITAL .769* (.4944)
1.817 26.2** (.127)
.0035a (.008)
Notes: „*‟ implies significant at 1% probability level,‟**‟ implies significant at 5% probability level,‟ ***‟ implies significant at 10% probability level and „a‟ indicates insignificant beyond 10% probability level. Figures under
Adjusted R-2 column indicates values of F statistics; all other figures within the parenthesis are standard errors. All the values of DW statistics indicate the absence of autocorrelation problem in the disturbance term. Growth rates are represented in the form of percentage per annum.
TABLE – 4.21
Table showing calculation of growth rate of Real values of different component of working capital of
LUPIN for the period 1999-2000 to 2013- 2014.
Items
Adjusted R2
_
DW Values Growth (%) (^
) Accelerate/ Decelerate (ƥ ++)
INVENTORY .849* (.4332)
1.883 47.3* (.111)
-1.55*
(.007) DEBTORS .780*
(.4628) 1.528 19.7*
(.028)
CASH .206*** (1.23)
1.407 70.1** (.317)
-3.76***
(.019) LOANS AND ADVANCES .580*
(.5233) 1.434 14.1*
(.031)
CREDITORS .785* (.495)
1.35 50.9* (.127)
-1.91**
(.008) CURRENT LIABILITIES
AND PROVISIONS
.457* (1.26)
1.742 59.7*** (.324)
-2.04a
(.020)
CURRENT ASSETS .766* (.458)
1.670 31.7** (.117)
-.081a
(.007) NET WORKING CAPITAL .739*
(.4782) 1.81 18.2*
(.029)
Notes: „*‟ implies significant at 1% probability level,‟**‟ implies significant at 5% probability level,‟ ***‟ implies significant at 10% probability level and „a‟ indicates insignificant beyond 10% probability level. Figures under Adjusted R-2 column indicates values of F statistics; all other figures within the parenthesis are standard errors. All the values of DW statistics indicate the absence of autocorrelation problem in the disturbance term. Growth rates are represented in the form of percentage per annum.
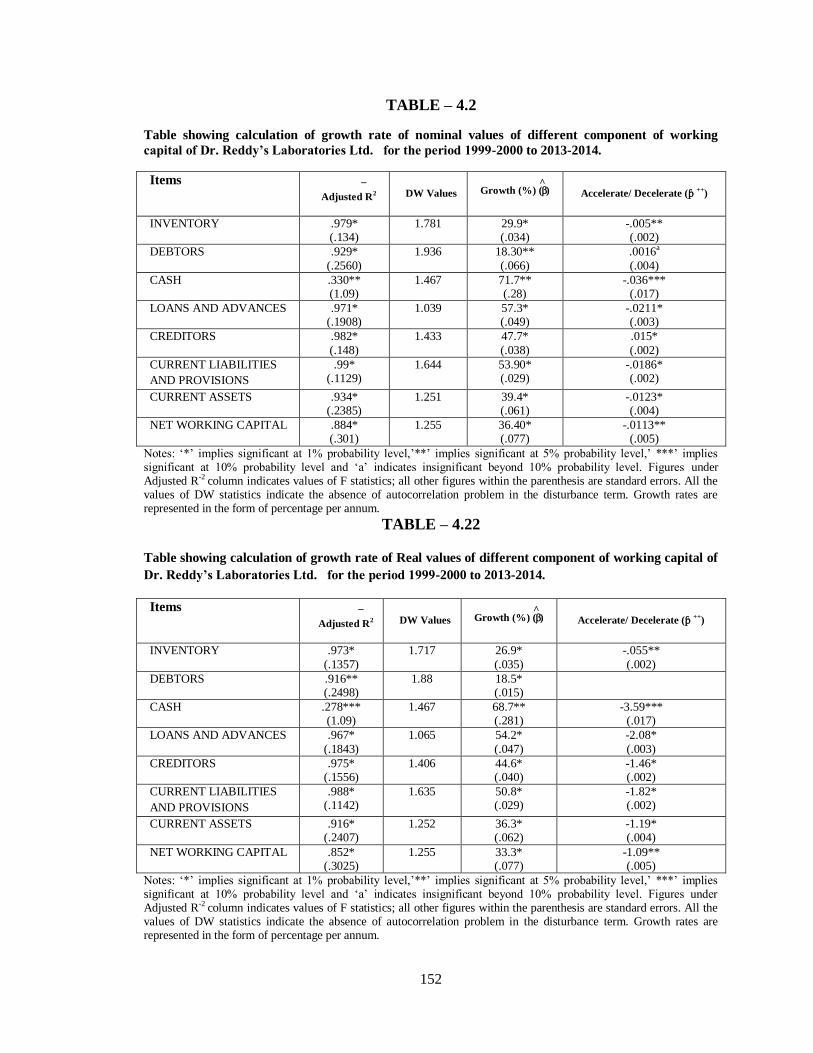
152
TABLE – 4.2
Table showing calculation of growth rate of nominal values of different component of working
capital of Dr. Reddy‟s Laboratories Ltd. for the period 1999-2000 to 2013-2014.
Items
Adjusted R2
_
DW Values Growth (%) (^
) Accelerate/ Decelerate (ƥ ++)
INVENTORY .979* (.134)
1.781 29.9* (.034)
-.005** (.002)
DEBTORS .929*
(.2560)
1.936 18.30**
(.066)
.0016a
(.004)
CASH .330** (1.09)
1.467 71.7** (.28)
-.036*** (.017)
LOANS AND ADVANCES .971* (.1908)
1.039 57.3* (.049)
-.0211* (.003)
CREDITORS .982*
(.148)
1.433 47.7*
(.038)
.015*
(.002)
CURRENT LIABILITIES
AND PROVISIONS
.99* (.1129)
1.644 53.90* (.029)
-.0186* (.002)
CURRENT ASSETS .934* (.2385)
1.251 39.4* (.061)
-.0123* (.004)
NET WORKING CAPITAL .884* (.301)
1.255 36.40* (.077)
-.0113** (.005)
Notes: „*‟ implies significant at 1% probability level,‟**‟ implies significant at 5% probability level,‟ ***‟ implies significant at 10% probability level and „a‟ indicates insignificant beyond 10% probability level. Figures under Adjusted R-2 column indicates values of F statistics; all other figures within the parenthesis are standard errors. All the values of DW statistics indicate the absence of autocorrelation problem in the disturbance term. Growth rates are represented in the form of percentage per annum.
TABLE – 4.22
Table showing calculation of growth rate of Real values of different component of working capital of
Dr. Reddy‟s Laboratories Ltd. for the period 1999-2000 to 2013-2014.
Items
Adjusted R2
_
DW Values Growth (%) (^
) Accelerate/ Decelerate (ƥ ++)
INVENTORY .973*
(.1357)
1.717 26.9*
(.035)
-.055**
(.002)
DEBTORS .916** (.2498)
1.88 18.5* (.015)
CASH .278*** (1.09)
1.467 68.7** (.281)
-3.59*** (.017)
LOANS AND ADVANCES .967*
(.1843)
1.065 54.2*
(.047)
-2.08*
(.003)
CREDITORS .975* (.1556)
1.406 44.6* (.040)
-1.46* (.002)
CURRENT LIABILITIES
AND PROVISIONS
.988* (.1142)
1.635 50.8* (.029)
-1.82* (.002)
CURRENT ASSETS .916* (.2407)
1.252 36.3* (.062)
-1.19* (.004)
NET WORKING CAPITAL .852* (.3025)
1.255 33.3* (.077)
-1.09** (.005)
Notes: „*‟ implies significant at 1% probability level,‟**‟ implies significant at 5% probability level,‟ ***‟ implies significant at 10% probability level and „a‟ indicates insignificant beyond 10% probability level. Figures under Adjusted R-2 column indicates values of F statistics; all other figures within the parenthesis are standard errors. All the values of DW statistics indicate the absence of autocorrelation problem in the disturbance term. Growth rates are represented in the form of percentage per annum.
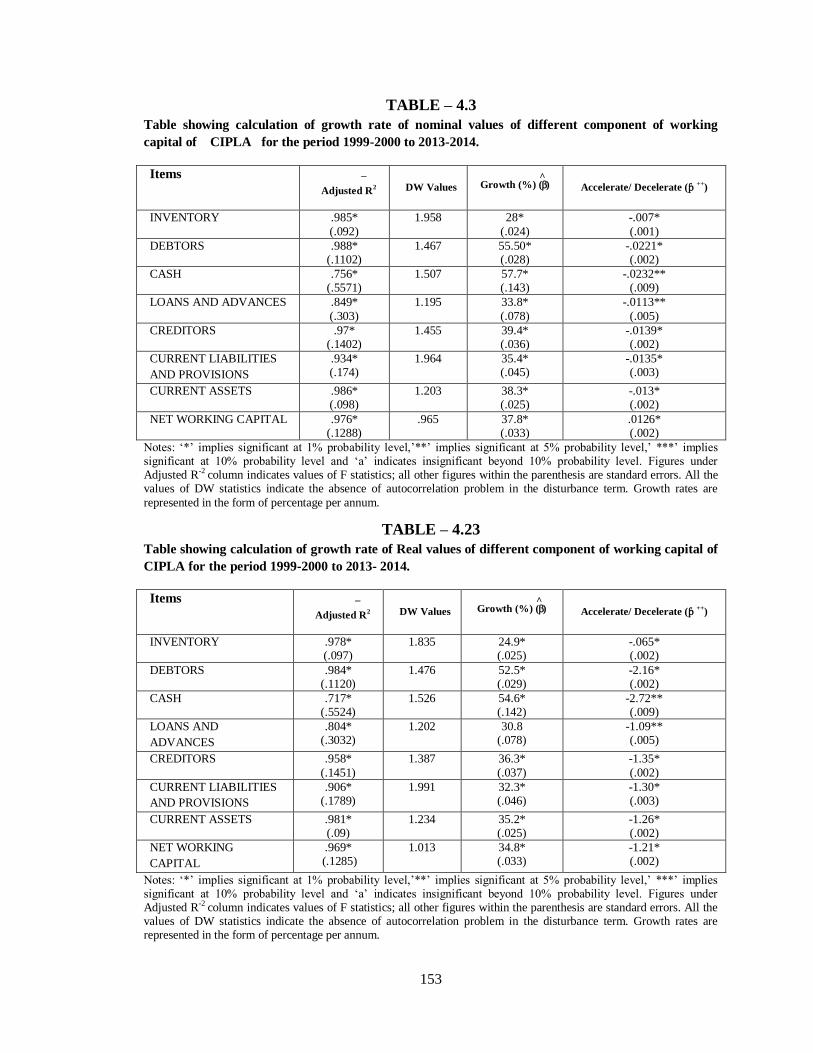
153
TABLE – 4.3 Table showing calculation of growth rate of nominal values of different component of working
capital of CIPLA for the period 1999-2000 to 2013-2014.
Items
Adjusted R2
_
DW Values Growth (%) (^
) Accelerate/ Decelerate (ƥ ++)
INVENTORY .985*
(.092)
1.958 28*
(.024)
-.007*
(.001)
DEBTORS .988* (.1102)
1.467 55.50* (.028)
-.0221* (.002)
CASH .756* (.5571)
1.507 57.7* (.143)
-.0232** (.009)
LOANS AND ADVANCES .849*
(.303)
1.195 33.8*
(.078)
-.0113**
(.005)
CREDITORS .97* (.1402)
1.455 39.4* (.036)
-.0139* (.002)
CURRENT LIABILITIES
AND PROVISIONS
.934* (.174)
1.964 35.4* (.045)
-.0135* (.003)
CURRENT ASSETS .986* (.098)
1.203 38.3* (.025)
-.013* (.002)
NET WORKING CAPITAL .976* (.1288)
.965 37.8* (.033)
.0126* (.002)
Notes: „*‟ implies significant at 1% probability level,‟**‟ implies significant at 5% probability level,‟ ***‟ implies significant at 10% probability level and „a‟ indicates insignificant beyond 10% probability level. Figures under Adjusted R-2 column indicates values of F statistics; all other figures within the parenthesis are standard errors. All the values of DW statistics indicate the absence of autocorrelation problem in the disturbance term. Growth rates are
represented in the form of percentage per annum.
TABLE – 4.23 Table showing calculation of growth rate of Real values of different component of working capital of
CIPLA for the period 1999-2000 to 2013- 2014.
Items
Adjusted R2
_
DW Values Growth (%) (^
) Accelerate/ Decelerate (ƥ ++)
INVENTORY .978* (.097)
1.835 24.9* (.025)
-.065* (.002)
DEBTORS .984* (.1120)
1.476 52.5* (.029)
-2.16* (.002)
CASH .717* (.5524)
1.526 54.6* (.142)
-2.72** (.009)
LOANS AND
ADVANCES
.804* (.3032)
1.202 30.8 (.078)
-1.09** (.005)
CREDITORS .958*
(.1451)
1.387 36.3*
(.037)
-1.35*
(.002)
CURRENT LIABILITIES
AND PROVISIONS
.906* (.1789)
1.991 32.3* (.046)
-1.30* (.003)
CURRENT ASSETS .981* (.09)
1.234 35.2* (.025)
-1.26* (.002)
NET WORKING
CAPITAL
.969* (.1285)
1.013 34.8* (.033)
-1.21* (.002)
Notes: „*‟ implies significant at 1% probability level,‟**‟ implies significant at 5% probability level,‟ ***‟ implies significant at 10% probability level and „a‟ indicates insignificant beyond 10% probability level. Figures under Adjusted R-2 column indicates values of F statistics; all other figures within the parenthesis are standard errors. All the values of DW statistics indicate the absence of autocorrelation problem in the disturbance term. Growth rates are represented in the form of percentage per annum.
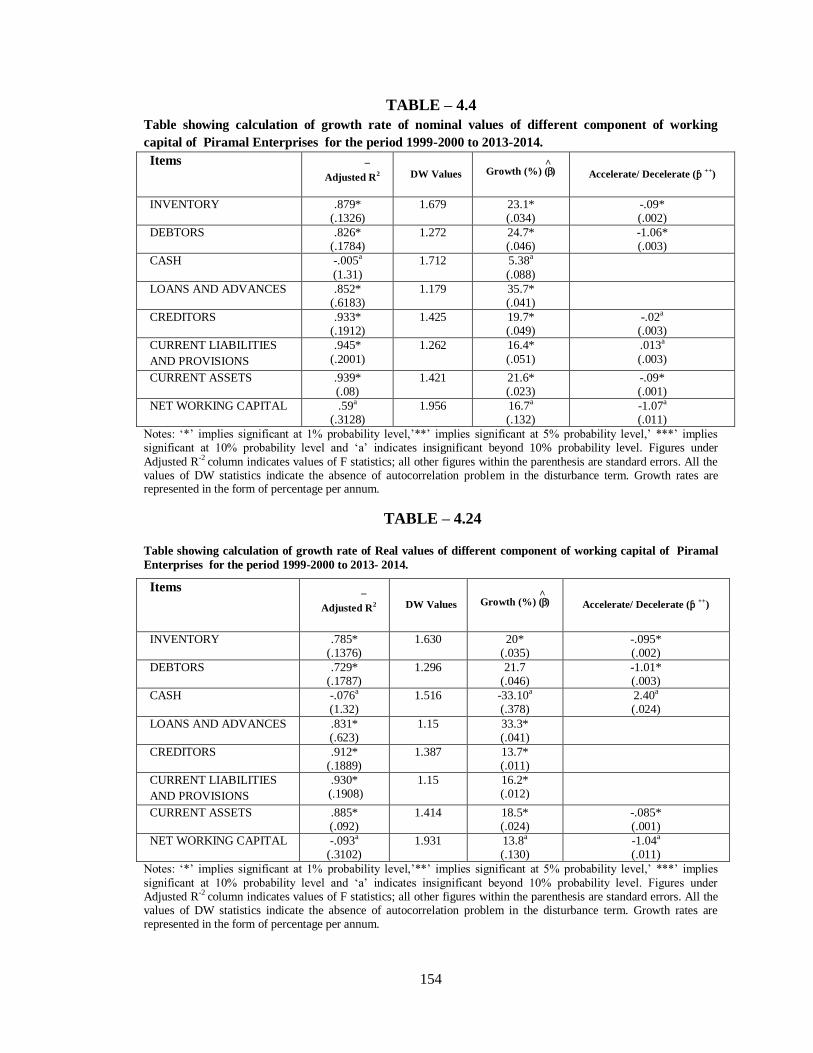
154
TABLE – 4.4 Table showing calculation of growth rate of nominal values of different component of working
capital of Piramal Enterprises for the period 1999-2000 to 2013-2014.
Items
Adjusted R2
_
DW Values Growth (%) (^
) Accelerate/ Decelerate (ƥ ++)
INVENTORY .879* (.1326)
1.679 23.1* (.034)
-.09* (.002)
DEBTORS .826* (.1784)
1.272 24.7* (.046)
-1.06* (.003)
CASH -.005a
(1.31)
1.712 5.38a
(.088)
LOANS AND ADVANCES .852* (.6183)
1.179 35.7* (.041)
CREDITORS .933* (.1912)
1.425 19.7* (.049)
-.02a (.003)
CURRENT LIABILITIES
AND PROVISIONS
.945*
(.2001)
1.262 16.4*
(.051)
.013a
(.003)
CURRENT ASSETS .939* (.08)
1.421 21.6* (.023)
-.09* (.001)
NET WORKING CAPITAL .59a (.3128)
1.956 16.7a (.132)
-1.07a (.011)
Notes: „*‟ implies significant at 1% probability level,‟**‟ implies significant at 5% probability level,‟ ***‟ implies significant at 10% probability level and „a‟ indicates insignificant beyond 10% probability level. Figures under
Adjusted R-2 column indicates values of F statistics; all other figures within the parenthesis are standard errors. All the values of DW statistics indicate the absence of autocorrelation problem in the disturbance term. Growth rates are represented in the form of percentage per annum.
TABLE – 4.24
Table showing calculation of growth rate of Real values of different component of working capital of Piramal
Enterprises for the period 1999-2000 to 2013- 2014.
Items
Adjusted R2
_
DW Values Growth (%) (^
) Accelerate/ Decelerate (ƥ ++)
INVENTORY .785* (.1376)
1.630 20* (.035)
-.095* (.002)
DEBTORS .729* (.1787)
1.296 21.7 (.046)
-1.01* (.003)
CASH -.076a (1.32)
1.516 -33.10a (.378)
2.40a (.024)
LOANS AND ADVANCES .831* (.623)
1.15 33.3* (.041)
CREDITORS .912* (.1889)
1.387 13.7* (.011)
CURRENT LIABILITIES
AND PROVISIONS
.930* (.1908)
1.15 16.2* (.012)
CURRENT ASSETS .885* (.092)
1.414 18.5* (.024)
-.085* (.001)
NET WORKING CAPITAL -.093a (.3102)
1.931 13.8a (.130)
-1.04a (.011)
Notes: „*‟ implies significant at 1% probability level,‟**‟ implies significant at 5% probability level,‟ ***‟ implies
significant at 10% probability level and „a‟ indicates insignificant beyond 10% probability level. Figures under Adjusted R-2 column indicates values of F statistics; all other figures within the parenthesis are standard errors. All the values of DW statistics indicate the absence of autocorrelation problem in the disturbance term. Growth rates are represented in the form of percentage per annum.
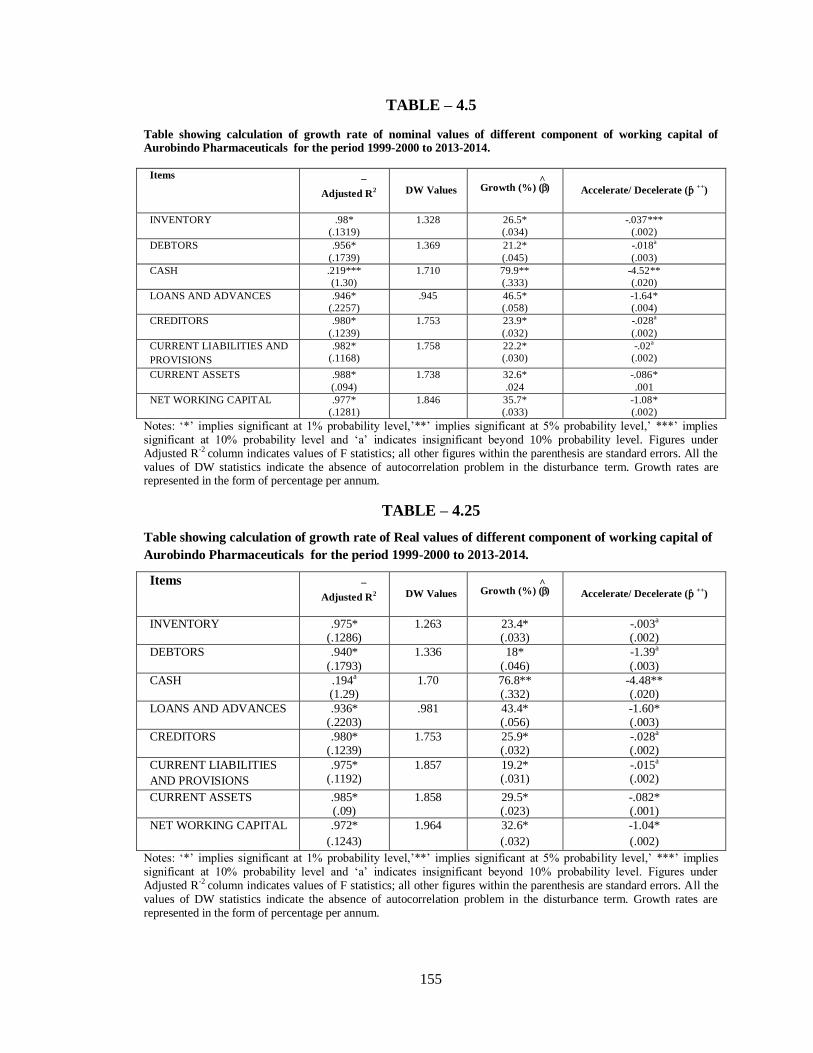
155
TABLE – 4.5
Table showing calculation of growth rate of nominal values of different component of working capital of Aurobindo Pharmaceuticals for the period 1999-2000 to 2013-2014.
Items
Adjusted R2
_
DW Values Growth (%) (^
) Accelerate/ Decelerate (ƥ ++)
INVENTORY .98*
(.1319)
1.328 26.5*
(.034)
-.037***
(.002)
DEBTORS .956*
(.1739)
1.369 21.2*
(.045)
-.018a
(.003)
CASH .219***
(1.30)
1.710 79.9**
(.333)
-4.52**
(.020)
LOANS AND ADVANCES .946*
(.2257)
.945 46.5*
(.058)
-1.64*
(.004)
CREDITORS .980*
(.1239)
1.753 23.9*
(.032)
-.028a
(.002)
CURRENT LIABILITIES AND
PROVISIONS
.982*
(.1168)
1.758 22.2*
(.030)
-.02a
(.002)
CURRENT ASSETS .988*
(.094)
1.738 32.6*
.024
-.086*
.001
NET WORKING CAPITAL .977*
(.1281)
1.846 35.7*
(.033)
-1.08*
(.002)
Notes: „*‟ implies significant at 1% probability level,‟**‟ implies significant at 5% probability level,‟ ***‟ implies significant at 10% probability level and „a‟ indicates insignificant beyond 10% probability level. Figures under Adjusted R-2 column indicates values of F statistics; all other figures within the parenthesis are standard errors. All the values of DW statistics indicate the absence of autocorrelation problem in the disturbance term. Growth rates are represented in the form of percentage per annum.
TABLE – 4.25
Table showing calculation of growth rate of Real values of different component of working capital of
Aurobindo Pharmaceuticals for the period 1999-2000 to 2013-2014.
Items
Adjusted R2
_
DW Values Growth (%) (^
) Accelerate/ Decelerate (ƥ ++)
INVENTORY .975* (.1286)
1.263 23.4* (.033)
-.003a (.002)
DEBTORS .940*
(.1793)
1.336 18*
(.046)
-1.39a
(.003)
CASH .194a (1.29)
1.70 76.8** (.332)
-4.48** (.020)
LOANS AND ADVANCES .936* (.2203)
.981 43.4* (.056)
-1.60* (.003)
CREDITORS .980* (.1239)
1.753 25.9* (.032)
-.028a (.002)
CURRENT LIABILITIES
AND PROVISIONS
.975* (.1192)
1.857 19.2* (.031)
-.015a (.002)
CURRENT ASSETS .985* (.09)
1.858 29.5* (.023)
-.082* (.001)
NET WORKING CAPITAL .972*
(.1243)
1.964 32.6*
(.032)
-1.04*
(.002)
Notes: „*‟ implies significant at 1% probability level,‟**‟ implies significant at 5% probability level,‟ ***‟ implies significant at 10% probability level and „a‟ indicates insignificant beyond 10% probability level. Figures under Adjusted R-2 column indicates values of F statistics; all other figures within the parenthesis are standard errors. All the values of DW statistics indicate the absence of autocorrelation problem in the disturbance term. Growth rates are represented in the form of percentage per annum.
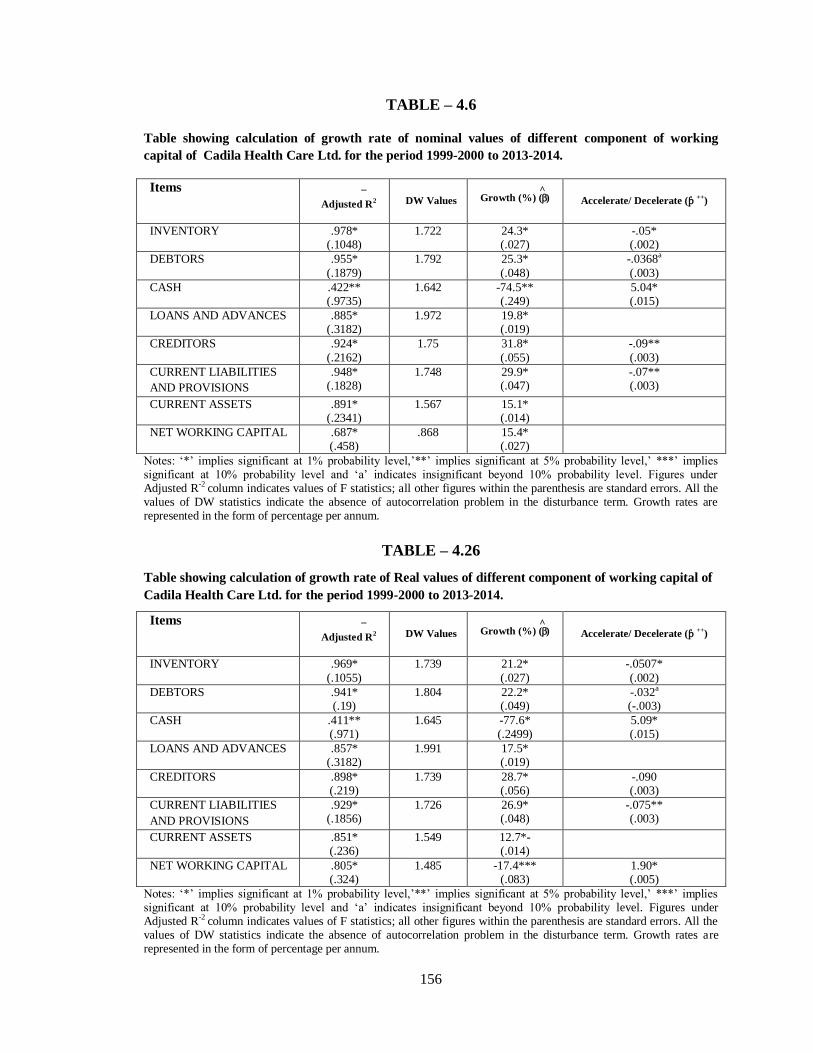
156
TABLE – 4.6
Table showing calculation of growth rate of nominal values of different component of working
capital of Cadila Health Care Ltd. for the period 1999-2000 to 2013-2014.
Items
Adjusted R2
_
DW Values Growth (%) (^
) Accelerate/ Decelerate (ƥ ++)
INVENTORY .978* (.1048)
1.722 24.3* (.027)
-.05* (.002)
DEBTORS .955*
(.1879)
1.792 25.3*
(.048)
-.0368a
(.003)
CASH .422** (.9735)
1.642 -74.5** (.249)
5.04* (.015)
LOANS AND ADVANCES .885* (.3182)
1.972 19.8* (.019)
CREDITORS .924*
(.2162)
1.75 31.8*
(.055)
-.09**
(.003)
CURRENT LIABILITIES
AND PROVISIONS
.948* (.1828)
1.748 29.9* (.047)
-.07** (.003)
CURRENT ASSETS .891* (.2341)
1.567 15.1* (.014)
NET WORKING CAPITAL .687* (.458)
.868 15.4* (.027)
Notes: „*‟ implies significant at 1% probability level,‟**‟ implies significant at 5% probability level,‟ ***‟ implies significant at 10% probability level and „a‟ indicates insignificant beyond 10% probability level. Figures under Adjusted R-2 column indicates values of F statistics; all other figures within the parenthesis are standard errors. All the values of DW statistics indicate the absence of autocorrelation problem in the disturbance term. Growth rates are represented in the form of percentage per annum.
TABLE – 4.26
Table showing calculation of growth rate of Real values of different component of working capital of
Cadila Health Care Ltd. for the period 1999-2000 to 2013-2014.
Items
Adjusted R2
_
DW Values Growth (%) (^
) Accelerate/ Decelerate (ƥ ++)
INVENTORY .969*
(.1055)
1.739 21.2*
(.027)
-.0507*
(.002)
DEBTORS .941* (.19)
1.804 22.2* (.049)
-.032a (-.003)
CASH .411** (.971)
1.645 -77.6* (.2499)
5.09* (.015)
LOANS AND ADVANCES .857* (.3182)
1.991 17.5* (.019)
CREDITORS .898* (.219)
1.739 28.7* (.056)
-.090 (.003)
CURRENT LIABILITIES
AND PROVISIONS
.929* (.1856)
1.726 26.9* (.048)
-.075** (.003)
CURRENT ASSETS .851* (.236)
1.549 12.7*- (.014)
NET WORKING CAPITAL .805* (.324)
1.485 -17.4*** (.083)
1.90* (.005)
Notes: „*‟ implies significant at 1% probability level,‟**‟ implies significant at 5% probability level,‟ ***‟ implies significant at 10% probability level and „a‟ indicates insignificant beyond 10% probability level. Figures under Adjusted R-2 column indicates values of F statistics; all other figures within the parenthesis are standard errors. All the values of DW statistics indicate the absence of autocorrelation problem in the disturbance term. Growth rates are represented in the form of percentage per annum.
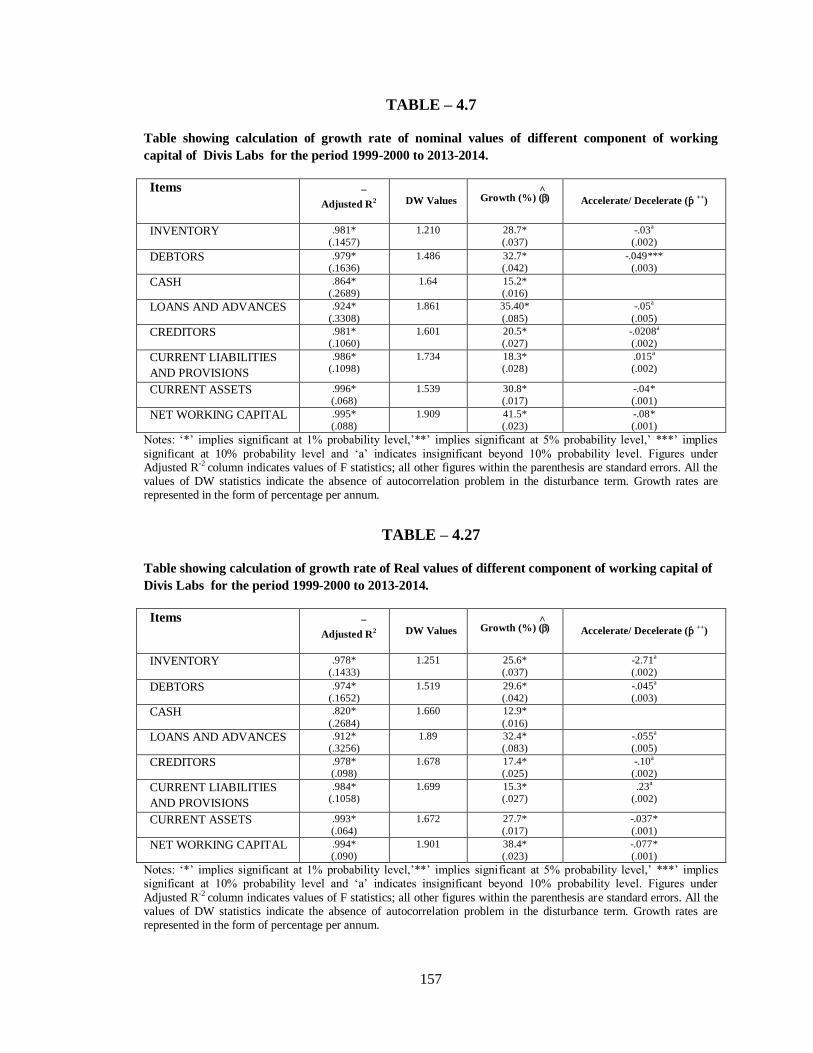
157
TABLE – 4.7
Table showing calculation of growth rate of nominal values of different component of working
capital of Divis Labs for the period 1999-2000 to 2013-2014.
Items
Adjusted R2
_
DW Values Growth (%) (^
) Accelerate/ Decelerate (ƥ ++)
INVENTORY .981*
(.1457)
1.210 28.7*
(.037)
-.03a
(.002)
DEBTORS .979*
(.1636)
1.486 32.7*
(.042)
-.049***
(.003)
CASH .864*
(.2689)
1.64 15.2*
(.016)
LOANS AND ADVANCES .924*
(.3308)
1.861 35.40*
(.085)
-.05a
(.005)
CREDITORS .981*
(.1060)
1.601 20.5*
(.027)
-.0208a
(.002)
CURRENT LIABILITIES
AND PROVISIONS
.986*
(.1098)
1.734 18.3*
(.028)
.015a
(.002)
CURRENT ASSETS .996*
(.068)
1.539 30.8*
(.017)
-.04*
(.001)
NET WORKING CAPITAL .995*
(.088)
1.909 41.5*
(.023)
-.08*
(.001)
Notes: „*‟ implies significant at 1% probability level,‟**‟ implies significant at 5% probability level,‟ ***‟ implies
significant at 10% probability level and „a‟ indicates insignificant beyond 10% probability level. Figures under Adjusted R-2 column indicates values of F statistics; all other figures within the parenthesis are standard errors. All the values of DW statistics indicate the absence of autocorrelation problem in the disturbance term. Growth rates are represented in the form of percentage per annum.
TABLE – 4.27
Table showing calculation of growth rate of Real values of different component of working capital of
Divis Labs for the period 1999-2000 to 2013-2014.
Items
Adjusted R2
_
DW Values Growth (%) (^
) Accelerate/ Decelerate (ƥ ++)
INVENTORY .978*
(.1433)
1.251 25.6*
(.037)
-2.71a
(.002)
DEBTORS .974*
(.1652)
1.519 29.6*
(.042)
-.045a
(.003)
CASH .820*
(.2684)
1.660 12.9*
(.016)
LOANS AND ADVANCES .912*
(.3256)
1.89 32.4*
(.083)
-.055a
(.005)
CREDITORS .978*
(.098)
1.678 17.4*
(.025)
-.10a
(.002)
CURRENT LIABILITIES
AND PROVISIONS
.984*
(.1058)
1.699 15.3*
(.027)
.23a
(.002)
CURRENT ASSETS .993*
(.064)
1.672 27.7*
(.017)
-.037*
(.001)
NET WORKING CAPITAL .994*
(.090)
1.901 38.4*
(.023)
-.077*
(.001)
Notes: „*‟ implies significant at 1% probability level,‟**‟ implies significant at 5% probability level,‟ ***‟ implies significant at 10% probability level and „a‟ indicates insignificant beyond 10% probability level. Figures under
Adjusted R-2 column indicates values of F statistics; all other figures within the parenthesis are standard errors. All the values of DW statistics indicate the absence of autocorrelation problem in the disturbance term. Growth rates are represented in the form of percentage per annum.
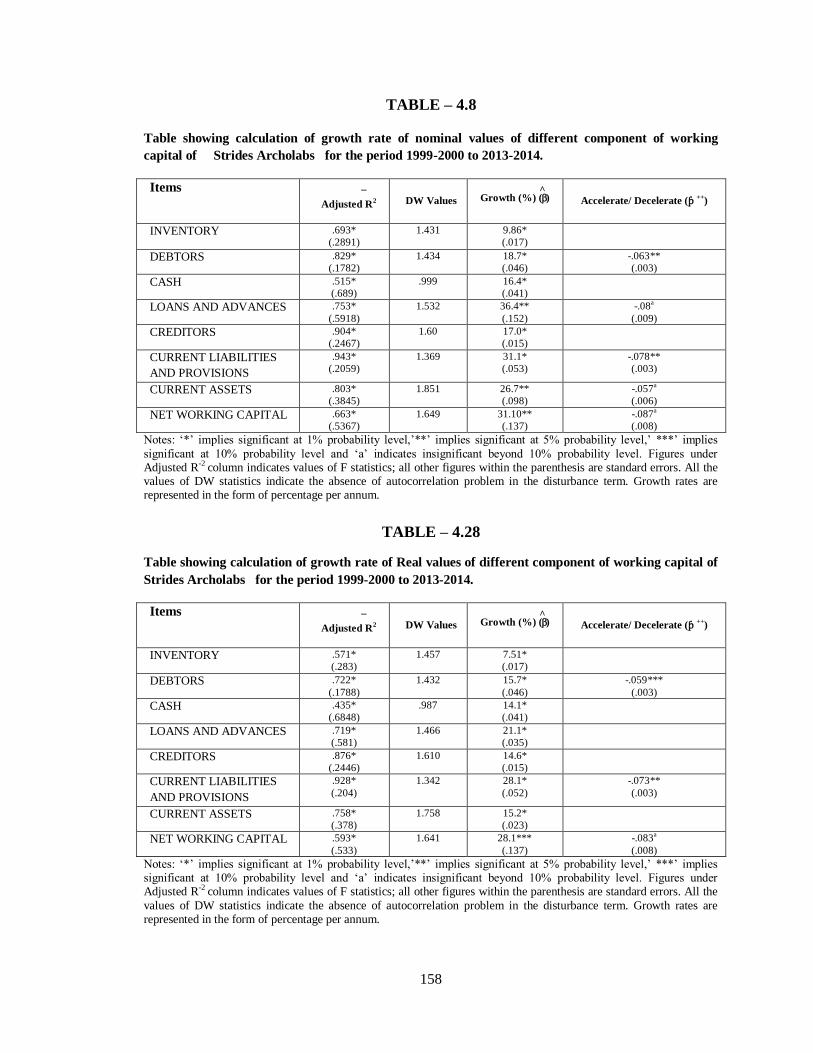
158
TABLE – 4.8
Table showing calculation of growth rate of nominal values of different component of working
capital of Strides Archolabs for the period 1999-2000 to 2013-2014.
Items
Adjusted R2
_
DW Values Growth (%) (^
) Accelerate/ Decelerate (ƥ ++)
INVENTORY .693*
(.2891)
1.431 9.86*
(.017)
DEBTORS .829*
(.1782)
1.434 18.7*
(.046)
-.063**
(.003)
CASH .515*
(.689)
.999 16.4*
(.041)
LOANS AND ADVANCES .753*
(.5918)
1.532 36.4**
(.152)
-.08a
(.009)
CREDITORS .904*
(.2467)
1.60 17.0*
(.015)
CURRENT LIABILITIES
AND PROVISIONS
.943*
(.2059)
1.369 31.1*
(.053)
-.078**
(.003)
CURRENT ASSETS .803*
(.3845)
1.851 26.7**
(.098)
-.057a
(.006)
NET WORKING CAPITAL .663*
(.5367)
1.649 31.10**
(.137)
-.087a
(.008)
Notes: „*‟ implies significant at 1% probability level,‟**‟ implies significant at 5% probability level,‟ ***‟ implies
significant at 10% probability level and „a‟ indicates insignificant beyond 10% probability level. Figures under Adjusted R-2 column indicates values of F statistics; all other figures within the parenthesis are standard errors. All the values of DW statistics indicate the absence of autocorrelation problem in the disturbance term. Growth rates are represented in the form of percentage per annum.
TABLE – 4.28
Table showing calculation of growth rate of Real values of different component of working capital of
Strides Archolabs for the period 1999-2000 to 2013-2014.
Items
Adjusted R2
_
DW Values Growth (%) (^
) Accelerate/ Decelerate (ƥ ++)
INVENTORY .571*
(.283)
1.457 7.51*
(.017)
DEBTORS .722*
(.1788)
1.432 15.7*
(.046)
-.059***
(.003)
CASH .435*
(.6848)
.987 14.1*
(.041)
LOANS AND ADVANCES .719*
(.581)
1.466 21.1*
(.035)
CREDITORS .876*
(.2446)
1.610 14.6*
(.015)
CURRENT LIABILITIES
AND PROVISIONS
.928*
(.204)
1.342 28.1*
(.052)
-.073**
(.003)
CURRENT ASSETS .758*
(.378)
1.758 15.2*
(.023)
NET WORKING CAPITAL .593*
(.533)
1.641 28.1***
(.137)
-.083a
(.008)
Notes: „*‟ implies significant at 1% probability level,‟**‟ implies significant at 5% probability level,‟ ***‟ implies significant at 10% probability level and „a‟ indicates insignificant beyond 10% probability level. Figures under Adjusted R-2 column indicates values of F statistics; all other figures within the parenthesis are standard errors. All the
values of DW statistics indicate the absence of autocorrelation problem in the disturbance term. Growth rates are represented in the form of percentage per annum.
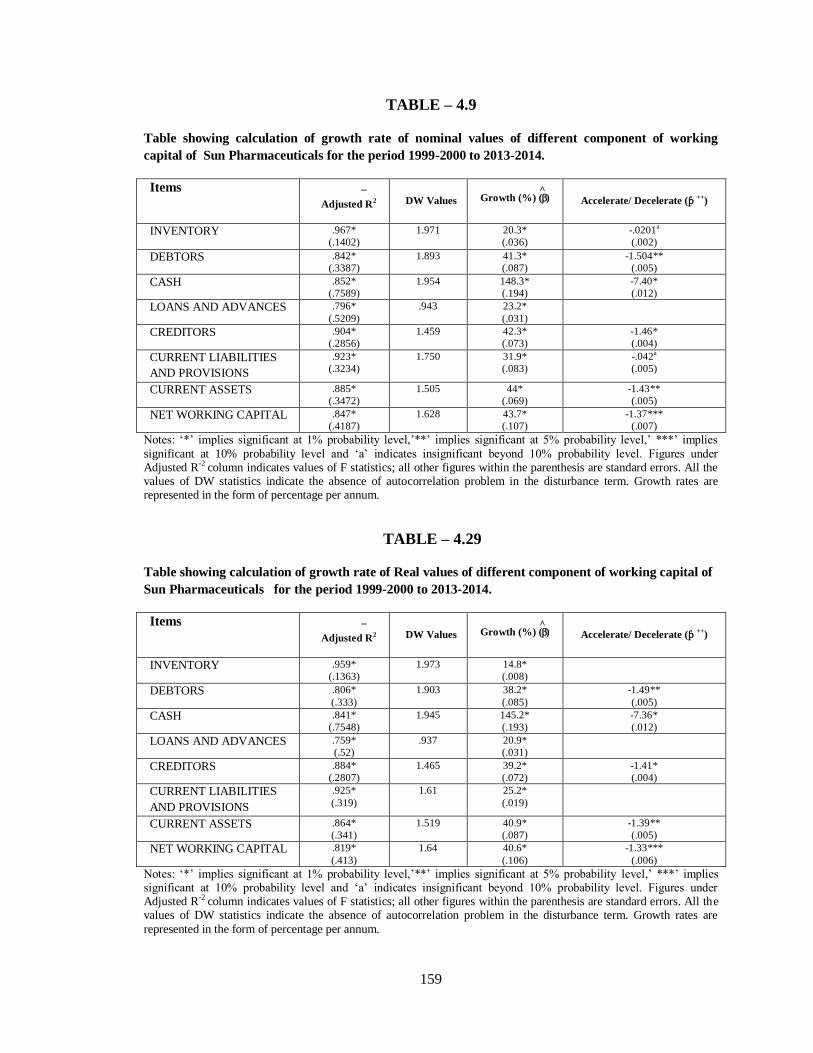
159
TABLE – 4.9
Table showing calculation of growth rate of nominal values of different component of working
capital of Sun Pharmaceuticals for the period 1999-2000 to 2013-2014.
Items
Adjusted R2
_
DW Values Growth (%) (^
) Accelerate/ Decelerate (ƥ ++)
INVENTORY .967*
(.1402)
1.971 20.3*
(.036)
-.0201a
(.002)
DEBTORS .842*
(.3387)
1.893 41.3*
(.087)
-1.504**
(.005)
CASH .852*
(.7589)
1.954 148.3*
(.194)
-7.40*
(.012)
LOANS AND ADVANCES .796*
(.5209)
.943 23.2*
(.031)
CREDITORS .904*
(.2856)
1.459 42.3*
(.073)
-1.46*
(.004)
CURRENT LIABILITIES
AND PROVISIONS
.923*
(.3234)
1.750 31.9*
(.083)
-.042a
(.005)
CURRENT ASSETS .885*
(.3472)
1.505 44*
(.069)
-1.43**
(.005)
NET WORKING CAPITAL .847*
(.4187)
1.628 43.7*
(.107)
-1.37***
(.007)
Notes: „*‟ implies significant at 1% probability level,‟**‟ implies significant at 5% probability level,‟ ***‟ implies
significant at 10% probability level and „a‟ indicates insignificant beyond 10% probability level. Figures under Adjusted R-2 column indicates values of F statistics; all other figures within the parenthesis are standard errors. All the values of DW statistics indicate the absence of autocorrelation problem in the disturbance term. Growth rates are represented in the form of percentage per annum.
TABLE – 4.29
Table showing calculation of growth rate of Real values of different component of working capital of
Sun Pharmaceuticals for the period 1999-2000 to 2013-2014.
Items
Adjusted R2
_
DW Values Growth (%) (^
) Accelerate/ Decelerate (ƥ ++)
INVENTORY .959*
(.1363)
1.973 14.8*
(.008)
DEBTORS .806*
(.333)
1.903 38.2*
(.085)
-1.49**
(.005)
CASH .841*
(.7548)
1.945 145.2*
(.193)
-7.36*
(.012)
LOANS AND ADVANCES .759*
(.52)
.937 20.9*
(.031)
CREDITORS .884*
(.2807)
1.465 39.2*
(.072)
-1.41*
(.004)
CURRENT LIABILITIES
AND PROVISIONS
.925*
(.319)
1.61 25.2*
(.019)
CURRENT ASSETS .864*
(.341)
1.519 40.9*
(.087)
-1.39**
(.005)
NET WORKING CAPITAL .819*
(.413)
1.64 40.6*
(.106)
-1.33***
(.006)
Notes: „*‟ implies significant at 1% probability level,‟**‟ implies significant at 5% probability level,‟ ***‟ implies significant at 10% probability level and „a‟ indicates insignificant beyond 10% probability level. Figures under Adjusted R-2 column indicates values of F statistics; all other figures within the parenthesis are standard errors. All the values of DW statistics indicate the absence of autocorrelation problem in the disturbance term. Growth rates are
represented in the form of percentage per annum.

160
TABLE – 4.10
Table showing calculation of growth rate of nominal values of different component of working
capital Biocon Pharmaceuticals for the period 1999-2000 to 2013-2014.
Items
Adjusted R2
_
DW Values Growth (%) (^
) Accelerate/ Decelerate (ƥ ++)
INVENTORY .973*
(.17)
1.98 39.2*
(.044)
-1.05*
(.003)
DEBTORS .978*
(.1314)
1.952 39.6*
(.034)
-1.28*
(.002)
CASH .699*
(1.89)
1.62 142.7**
(.485)
-4.94a
(.029)
LOANS AND ADVANCES .938*
(.4286)
1.07 41.7*
(.11)
-.027a
(.007)
CREDITORS .952*
(.202)
1.35 39.9*
(.052)
-1.27*
(.003)
CURRENT LIABILITIES
AND PROVISIONS
.966*
(.1899)
1.356 43.5*
(.049 )
-1.35*
(.003)
CURRENT ASSETS .933*
(.2951)
1.814 41.3*
(.076)
-1.06**
(.005)
NET WORKING CAPITAL .861*
(.506)
1.407 39.8*
(.130)
-.071a
(.008)
Notes: „*‟ implies significant at 1% probability level,‟**‟ implies significant at 5% probability level,‟ ***‟ implies
significant at 10% probability level and „a‟ indicates insignificant beyond 10% probability level. Figures under Adjusted R-2 column indicates values of F statistics; all other figures within the parenthesis are standard errors. All the values of DW statistics indicate the absence of autocorrelation problem in the disturbance term. Growth rates are represented in the form of percentage per annum.
TABLE – 4.30
Table showing calculation of growth rate of Real values of different component of working capital of
Biocon Pharmaceuticals for the period 1999-2000 to 2013-2014.
Items
Adjusted R2
_
DW Values Growth (%) (^
) Accelerate/ Decelerate (ƥ ++)
INVENTORY .966*
(.1693)
1.992 36.10*
(.043)
-1.01*
(.003)
DEBTORS .972*
(.1324)
1.885 36.5*
(.034)
-1.23*
(.002)
CASH .681*
(1.89)
1.621 139.7*
(.487)
-4.90a
(.030)
LOANS AND ADVANCES .934*
(.4154)
1.070 35*
(.025)
CREDITORS .937*
(.2060)
1.348 36.8*
(.053)
-1.22*
(.003)
CURRENT LIABILITIES
AND PROVISIONS
.956*
(.1931)
1.353 40.4*
(.049)
-1.30*
(.003)
CURRENT ASSETS .917*
(.2989)
1.84 38.2*
(.077)
-1.01*
(.005)
NET WORKING CAPITAL .840*
(.5029)
1.553 26*
(.030)
Notes: „*‟ implies significant at 1% probability level,‟**‟ implies significant at 5% probability level,‟ ***‟ implies significant at 10% probability level and „a‟ indicates insignificant beyond 10% probability level. Figures under Adjusted R-2 column indicates values of F statistics; all other figures within the parenthesis are standard errors. All the values of DW statistics indicate the absence of autocorrelation problem in the disturbance term. Growth rates are
represented in the form of percentage per annum.
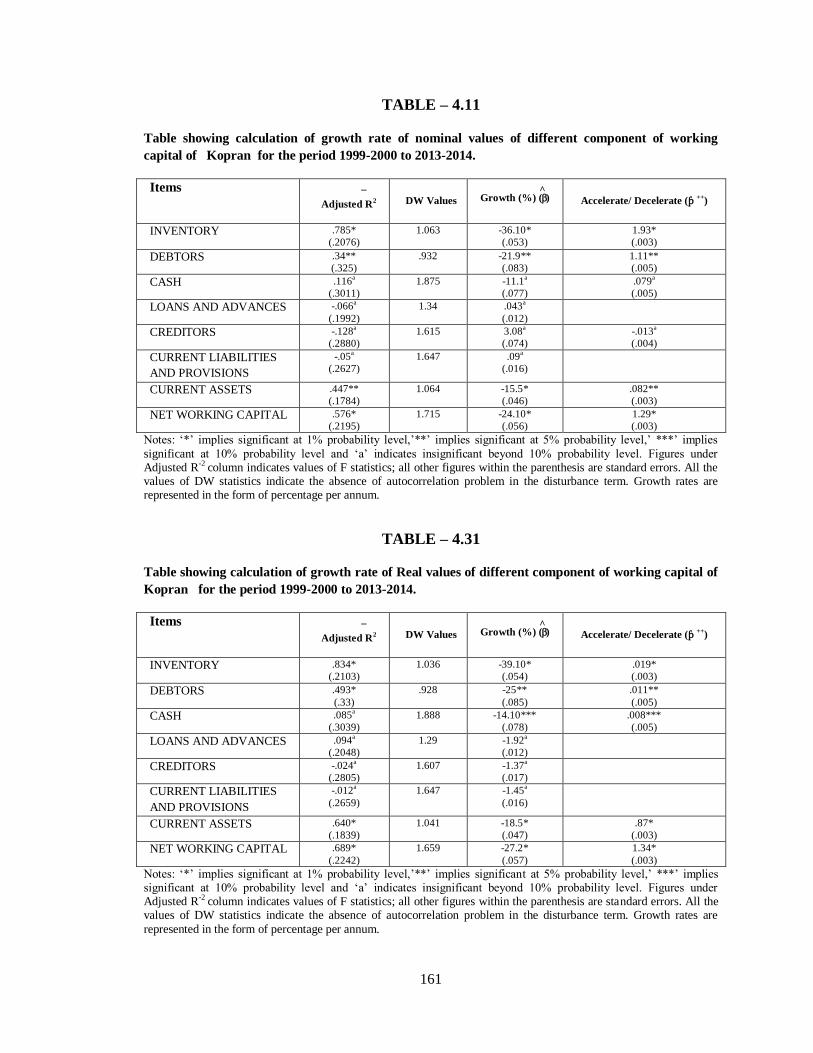
161
TABLE – 4.11
Table showing calculation of growth rate of nominal values of different component of working
capital of Kopran for the period 1999-2000 to 2013-2014.
Items
Adjusted R2
_
DW Values Growth (%) (^
) Accelerate/ Decelerate (ƥ ++)
INVENTORY .785*
(.2076)
1.063 -36.10*
(.053)
1.93*
(.003)
DEBTORS .34**
(.325)
.932 -21.9**
(.083)
1.11**
(.005)
CASH .116a
(.3011)
1.875 -11.1a
(.077)
.079a
(.005)
LOANS AND ADVANCES -.066a
(.1992)
1.34 .043a
(.012)
CREDITORS -.128a
(.2880)
1.615 3.08a
(.074)
-.013a
(.004)
CURRENT LIABILITIES
AND PROVISIONS
-.05a
(.2627)
1.647 .09a
(.016)
CURRENT ASSETS .447**
(.1784)
1.064 -15.5*
(.046)
.082**
(.003)
NET WORKING CAPITAL .576*
(.2195)
1.715 -24.10*
(.056)
1.29*
(.003)
Notes: „*‟ implies significant at 1% probability level,‟**‟ implies significant at 5% probability level,‟ ***‟ implies
significant at 10% probability level and „a‟ indicates insignificant beyond 10% probability level. Figures under Adjusted R-2 column indicates values of F statistics; all other figures within the parenthesis are standard errors. All the values of DW statistics indicate the absence of autocorrelation problem in the disturbance term. Growth rates are represented in the form of percentage per annum.
TABLE – 4.31
Table showing calculation of growth rate of Real values of different component of working capital of
Kopran for the period 1999-2000 to 2013-2014.
Items
Adjusted R2
_
DW Values Growth (%) (^
) Accelerate/ Decelerate (ƥ ++)
INVENTORY .834*
(.2103)
1.036 -39.10*
(.054)
.019*
(.003)
DEBTORS .493*
(.33)
.928 -25**
(.085)
.011**
(.005)
CASH .085a
(.3039)
1.888 -14.10***
(.078)
.008***
(.005)
LOANS AND ADVANCES .094a
(.2048)
1.29 -1.92a
(.012)
CREDITORS -.024a
(.2805)
1.607 -1.37a
(.017)
CURRENT LIABILITIES
AND PROVISIONS
-.012a
(.2659)
1.647 -1.45a
(.016)
CURRENT ASSETS .640*
(.1839)
1.041 -18.5*
(.047)
.87*
(.003)
NET WORKING CAPITAL .689*
(.2242)
1.659 -27.2*
(.057)
1.34*
(.003)
Notes: „*‟ implies significant at 1% probability level,‟**‟ implies significant at 5% probability level,‟ ***‟ implies significant at 10% probability level and „a‟ indicates insignificant beyond 10% probability level. Figures under Adjusted R-2 column indicates values of F statistics; all other figures within the parenthesis are standard errors. All the values of DW statistics indicate the absence of autocorrelation problem in the disturbance term. Growth rates are
represented in the form of percentage per annum.

162
TABLE – 4.12
Table showing calculation of growth rate of nominal values of different component of working
capital of Biofil Chemicals & Pharmaceuticals for the period 1999-2000 to 2013-2014.
Items
Adjusted R2
_
DW Values Growth (%) (^
) Accelerate/ Decelerate (ƥ ++)
INVENTORY .723*
(.732)
.849 -70.6*
(.191)
2.87**
(.012)
DEBTORS .636*
(.5903)
1.362 -77.7*
(.151)
.045*
(.009)
CASH .171a
(.947)
1.803 -35.4a
(.243)
2.66**
(.015)
LOANS AND ADVANCES .186a
(1.04)
1.369 -50.5***
(.267)
2.5a
(.016)
CREDITORS .517*
(.297)
1.636 13.7*
(.076)
-.0409a
(.005)
CURRENT LIABILITIES
AND PROVISIONS
.476*
(.289)
1.66 .064*
(.017)
CURRENT ASSETS .615*
(.5305)
1.083 -62.10*
(.136)
3.31*
(.008)
NET WORKING CAPITAL .610**
(.874)
1.293 -90.3**
(.288)
4.38**
(.017)
Notes: „*‟ implies significant at 1% probability level,‟**‟ implies significant at 5% probability level,‟ ***‟ implies
significant at 10% probability level and „a‟ indicates insignificant beyond 10% probability level. Figures under Adjusted R-2 column indicates values of F statistics; all other figures within the parenthesis are standard errors. All the values of DW statistics indicate the absence of autocorrelation problem in the disturbance term. Growth rates are represented in the form of percentage per annum.
TABLE – 4.32
Table showing calculation of growth rate of Real values of different component of working capital of
Biofil Chemicals & Pharmaceuticals for the period 1999-2000 to 2013-2014.
Items
Adjusted R2
_
DW Values Growth (%) (^
) Accelerate/ Decelerate (ƥ ++)
INVENTORY .752*
(.7388)
.848 -73.80*
(.193)
2.92**
(.012)
DEBTORS .663*
(.589)
1.35 -80.7*
(.151)
4.56*
(.009)
CASH .131a
(.949)
1.805 -38.4a
(.243)
2.70***
(.015)
LOANS AND ADVANCES .248*
(1.04)
1.36 -53.5***
(.269)
2.54a
(.016)
CREDITORS .314**
(.295)
1.783 4.80**
(.018)
CURRENT LIABILITIES
AND PROVISIONS
.241**
(.2908)
1.668 4.05**
(.017)
CURRENT ASSETS .660*
(.535)
1.071 -65.2*
(.137)
3.35*
(.008)
NET WORKING CAPITAL .648**
(.879)
1.28 -93**
(.29)
4.41**
(.017)
Notes: „*‟ implies significant at 1% probability level,‟**‟ implies significant at 5% probability level,‟ ***‟ implies significant at 10% probability level and „a‟ indicates insignificant beyond 10% probability level. Figures under Adjusted R-2 column indicates values of F statistics; all other figures within the parenthesis are standard errors. All the values of DW statistics indicate the absence of autocorrelation problem in the disturbance term. Growth rates are represented in the form of percentage per annum.
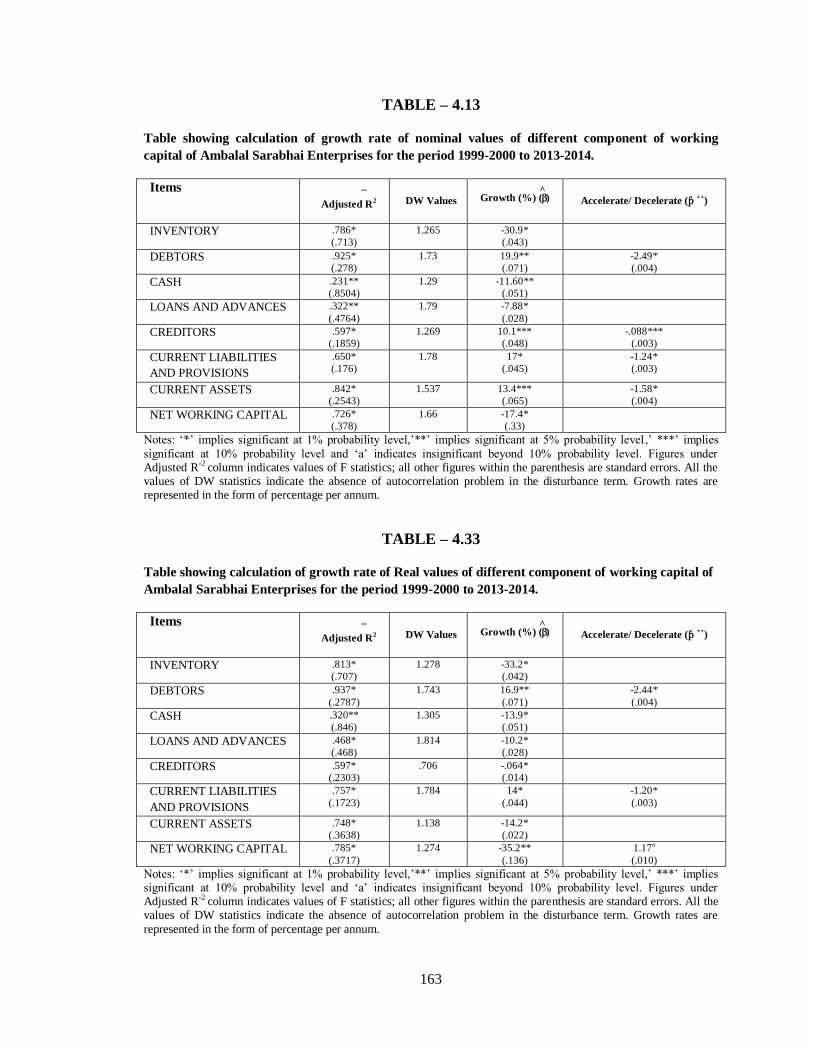
163
TABLE – 4.13
Table showing calculation of growth rate of nominal values of different component of working
capital of Ambalal Sarabhai Enterprises for the period 1999-2000 to 2013-2014.
Items
Adjusted R2
_
DW Values Growth (%) (^
) Accelerate/ Decelerate (ƥ ++)
INVENTORY .786*
(.713)
1.265 -30.9*
(.043)
DEBTORS .925*
(.278)
1.73 19.9**
(.071)
-2.49*
(.004)
CASH .231**
(.8504)
1.29 -11.60**
(.051)
LOANS AND ADVANCES .322**
(.4764)
1.79 -7.88*
(.028)
CREDITORS .597*
(.1859)
1.269 10.1***
(.048)
-.088***
(.003)
CURRENT LIABILITIES
AND PROVISIONS
.650*
(.176)
1.78 17*
(.045)
-1.24*
(.003)
CURRENT ASSETS .842*
(.2543)
1.537 13.4***
(.065)
-1.58*
(.004)
NET WORKING CAPITAL .726*
(.378)
1.66 -17.4*
(.33)
Notes: „*‟ implies significant at 1% probability level,‟**‟ implies significant at 5% probability level,‟ ***‟ implies
significant at 10% probability level and „a‟ indicates insignificant beyond 10% probability level. Figures under Adjusted R-2 column indicates values of F statistics; all other figures within the parenthesis are standard errors. All the values of DW statistics indicate the absence of autocorrelation problem in the disturbance term. Growth rates are represented in the form of percentage per annum.
TABLE – 4.33
Table showing calculation of growth rate of Real values of different component of working capital of
Ambalal Sarabhai Enterprises for the period 1999-2000 to 2013-2014.
Items
Adjusted R2
_
DW Values Growth (%) (^
) Accelerate/ Decelerate (ƥ ++)
INVENTORY .813*
(.707)
1.278 -33.2*
(.042)
DEBTORS .937*
(.2787)
1.743 16.9**
(.071)
-2.44*
(.004)
CASH .320**
(.846)
1.305 -13.9*
(.051)
LOANS AND ADVANCES .468*
(.468)
1.814 -10.2*
(.028)
CREDITORS .597*
(.2303)
.706 -.064*
(.014)
CURRENT LIABILITIES
AND PROVISIONS
.757*
(.1723)
1.784 14*
(.044)
-1.20*
(.003)
CURRENT ASSETS .748*
(.3638)
1.138 -14.2*
(.022)
NET WORKING CAPITAL .785*
(.3717)
1.274 -35.2**
(.136)
1.17a
(.010)
Notes: „*‟ implies significant at 1% probability level,‟**‟ implies significant at 5% probability level,‟ ***‟ implies significant at 10% probability level and „a‟ indicates insignificant beyond 10% probability level. Figures under Adjusted R-2 column indicates values of F statistics; all other figures within the parenthesis are standard errors. All the values of DW statistics indicate the absence of autocorrelation problem in the disturbance term. Growth rates are
represented in the form of percentage per annum.
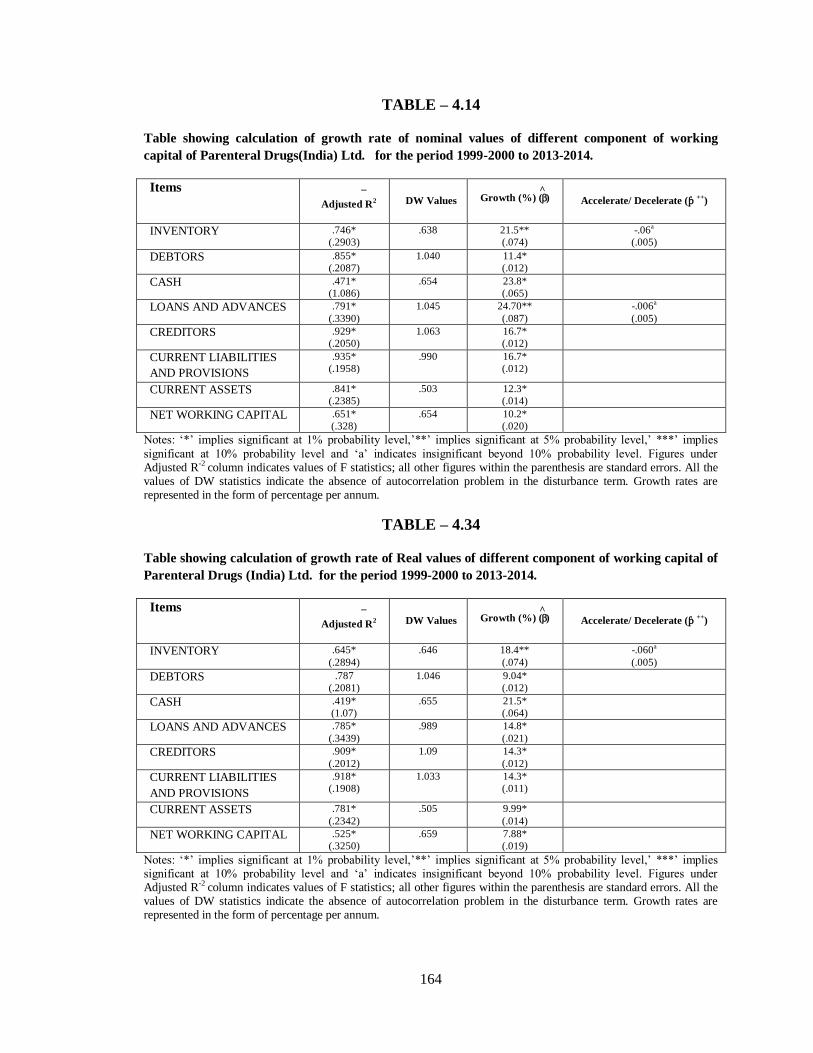
164
TABLE – 4.14
Table showing calculation of growth rate of nominal values of different component of working
capital of Parenteral Drugs(India) Ltd. for the period 1999-2000 to 2013-2014.
Items
Adjusted R2
_
DW Values Growth (%) (^
) Accelerate/ Decelerate (ƥ ++)
INVENTORY .746*
(.2903)
.638 21.5**
(.074)
-.06a
(.005)
DEBTORS .855*
(.2087)
1.040 11.4*
(.012)
CASH .471*
(1.086)
.654 23.8*
(.065)
LOANS AND ADVANCES .791*
(.3390)
1.045 24.70**
(.087)
-.006a
(.005)
CREDITORS .929*
(.2050)
1.063 16.7*
(.012)
CURRENT LIABILITIES
AND PROVISIONS
.935*
(.1958)
.990 16.7*
(.012)
CURRENT ASSETS .841*
(.2385)
.503 12.3*
(.014)
NET WORKING CAPITAL .651*
(.328)
.654 10.2*
(.020)
Notes: „*‟ implies significant at 1% probability level,‟**‟ implies significant at 5% probability level,‟ ***‟ implies
significant at 10% probability level and „a‟ indicates insignificant beyond 10% probability level. Figures under Adjusted R-2 column indicates values of F statistics; all other figures within the parenthesis are standard errors. All the values of DW statistics indicate the absence of autocorrelation problem in the disturbance term. Growth rates are represented in the form of percentage per annum.
TABLE – 4.34
Table showing calculation of growth rate of Real values of different component of working capital of
Parenteral Drugs (India) Ltd. for the period 1999-2000 to 2013-2014.
Items
Adjusted R2
_
DW Values Growth (%) (^
) Accelerate/ Decelerate (ƥ ++)
INVENTORY .645*
(.2894)
.646 18.4**
(.074)
-.060a
(.005)
DEBTORS .787
(.2081)
1.046 9.04*
(.012)
CASH .419*
(1.07)
.655 21.5*
(.064)
LOANS AND ADVANCES .785*
(.3439)
.989 14.8*
(.021)
CREDITORS .909*
(.2012)
1.09 14.3*
(.012)
CURRENT LIABILITIES
AND PROVISIONS
.918*
(.1908)
1.033 14.3*
(.011)
CURRENT ASSETS .781*
(.2342)
.505 9.99*
(.014)
NET WORKING CAPITAL .525*
(.3250)
.659 7.88*
(.019)
Notes: „*‟ implies significant at 1% probability level,‟**‟ implies significant at 5% probability level,‟ ***‟ implies significant at 10% probability level and „a‟ indicates insignificant beyond 10% probability level. Figures under Adjusted R-2 column indicates values of F statistics; all other figures within the parenthesis are standard errors. All the values of DW statistics indicate the absence of autocorrelation problem in the disturbance term. Growth rates are represented in the form of percentage per annum.
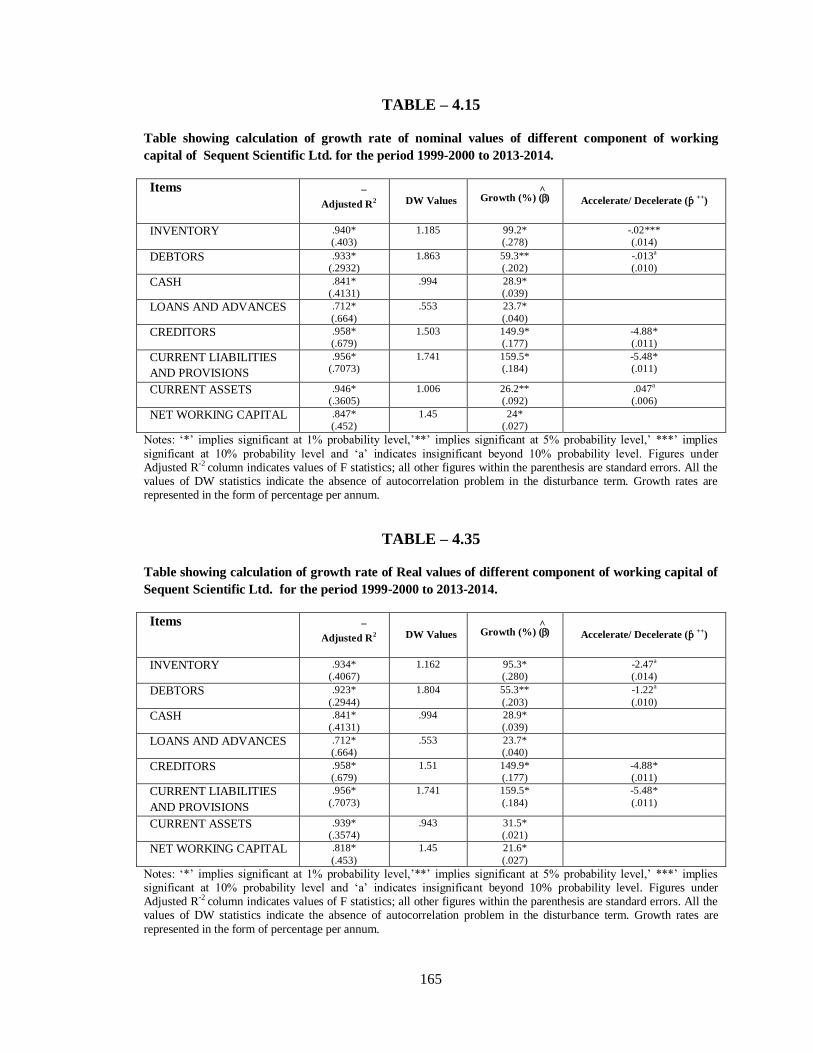
165
TABLE – 4.15
Table showing calculation of growth rate of nominal values of different component of working
capital of Sequent Scientific Ltd. for the period 1999-2000 to 2013-2014.
Items
Adjusted R2
_
DW Values Growth (%) (^
) Accelerate/ Decelerate (ƥ ++)
INVENTORY .940*
(.403)
1.185 99.2*
(.278)
-.02***
(.014)
DEBTORS .933*
(.2932)
1.863 59.3**
(.202)
-.013a
(.010)
CASH .841*
(.4131)
.994 28.9*
(.039)
LOANS AND ADVANCES .712*
(.664)
.553 23.7*
(.040)
CREDITORS .958*
(.679)
1.503 149.9*
(.177)
-4.88*
(.011)
CURRENT LIABILITIES
AND PROVISIONS
.956*
(.7073)
1.741 159.5*
(.184)
-5.48*
(.011)
CURRENT ASSETS .946*
(.3605)
1.006 26.2**
(.092)
.047a
(.006)
NET WORKING CAPITAL .847*
(.452)
1.45 24*
(.027)
Notes: „*‟ implies significant at 1% probability level,‟**‟ implies significant at 5% probability level,‟ ***‟ implies
significant at 10% probability level and „a‟ indicates insignificant beyond 10% probability level. Figures under Adjusted R-2 column indicates values of F statistics; all other figures within the parenthesis are standard errors. All the values of DW statistics indicate the absence of autocorrelation problem in the disturbance term. Growth rates are represented in the form of percentage per annum.
TABLE – 4.35
Table showing calculation of growth rate of Real values of different component of working capital of
Sequent Scientific Ltd. for the period 1999-2000 to 2013-2014.
Items
Adjusted R2
_
DW Values Growth (%) (^
) Accelerate/ Decelerate (ƥ ++)
INVENTORY .934*
(.4067)
1.162 95.3*
(.280)
-2.47a
(.014)
DEBTORS .923*
(.2944)
1.804 55.3**
(.203)
-1.22a
(.010)
CASH .841*
(.4131)
.994 28.9*
(.039)
LOANS AND ADVANCES .712*
(.664)
.553 23.7*
(.040)
CREDITORS .958*
(.679)
1.51 149.9*
(.177)
-4.88*
(.011)
CURRENT LIABILITIES
AND PROVISIONS
.956*
(.7073)
1.741 159.5*
(.184)
-5.48*
(.011)
CURRENT ASSETS .939*
(.3574)
.943 31.5*
(.021)
NET WORKING CAPITAL .818*
(.453)
1.45 21.6*
(.027)
Notes: „*‟ implies significant at 1% probability level,‟**‟ implies significant at 5% probability level,‟ ***‟ implies significant at 10% probability level and „a‟ indicates insignificant beyond 10% probability level. Figures under Adjusted R-2 column indicates values of F statistics; all other figures within the parenthesis are standard errors. All the values of DW statistics indicate the absence of autocorrelation problem in the disturbance term. Growth rates are
represented in the form of percentage per annum.
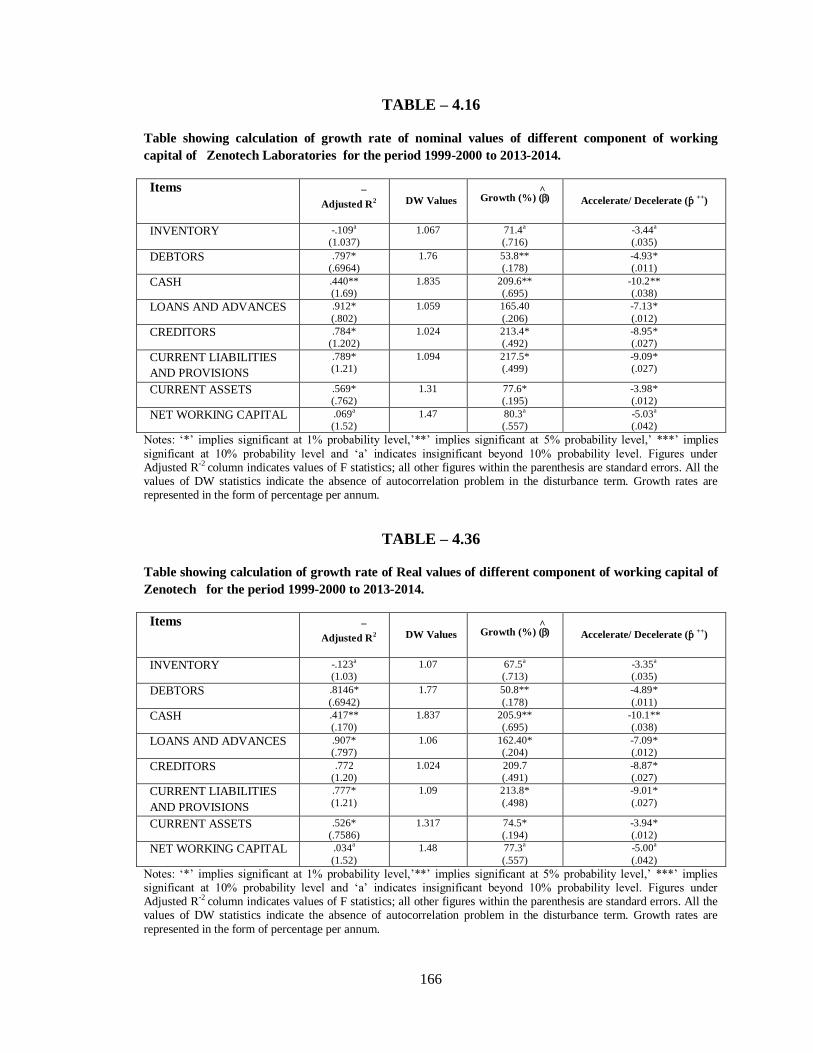
166
TABLE – 4.16
Table showing calculation of growth rate of nominal values of different component of working
capital of Zenotech Laboratories for the period 1999-2000 to 2013-2014.
Items
Adjusted R2
_
DW Values Growth (%) (^
) Accelerate/ Decelerate (ƥ ++)
INVENTORY -.109a
(1.037)
1.067 71.4a
(.716)
-3.44a
(.035)
DEBTORS .797*
(.6964)
1.76 53.8**
(.178)
-4.93*
(.011)
CASH .440**
(1.69)
1.835 209.6**
(.695)
-10.2**
(.038)
LOANS AND ADVANCES .912*
(.802)
1.059 165.40
(.206)
-7.13*
(.012)
CREDITORS .784*
(1.202)
1.024 213.4*
(.492)
-8.95*
(.027)
CURRENT LIABILITIES
AND PROVISIONS
.789*
(1.21)
1.094 217.5*
(.499)
-9.09*
(.027)
CURRENT ASSETS .569*
(.762)
1.31 77.6*
(.195)
-3.98*
(.012)
NET WORKING CAPITAL .069a
(1.52)
1.47 80.3a
(.557)
-5.03a
(.042)
Notes: „*‟ implies significant at 1% probability level,‟**‟ implies significant at 5% probability level,‟ ***‟ implies
significant at 10% probability level and „a‟ indicates insignificant beyond 10% probability level. Figures under Adjusted R-2 column indicates values of F statistics; all other figures within the parenthesis are standard errors. All the values of DW statistics indicate the absence of autocorrelation problem in the disturbance term. Growth rates are represented in the form of percentage per annum.
TABLE – 4.36
Table showing calculation of growth rate of Real values of different component of working capital of
Zenotech for the period 1999-2000 to 2013-2014.
Items
Adjusted R2
_
DW Values Growth (%) (^
) Accelerate/ Decelerate (ƥ ++)
INVENTORY -.123a
(1.03)
1.07 67.5a
(.713)
-3.35a
(.035)
DEBTORS .8146*
(.6942)
1.77 50.8**
(.178)
-4.89*
(.011)
CASH .417**
(.170)
1.837 205.9**
(.695)
-10.1**
(.038)
LOANS AND ADVANCES .907*
(.797)
1.06 162.40*
(.204)
-7.09*
(.012)
CREDITORS .772
(1.20)
1.024 209.7
(.491)
-8.87*
(.027)
CURRENT LIABILITIES
AND PROVISIONS
.777*
(1.21)
1.09 213.8*
(.498)
-9.01*
(.027)
CURRENT ASSETS .526*
(.7586)
1.317 74.5*
(.194)
-3.94*
(.012)
NET WORKING CAPITAL .034a
(1.52)
1.48 77.3a
(.557)
-5.00a
(.042)
Notes: „*‟ implies significant at 1% probability level,‟**‟ implies significant at 5% probability level,‟ ***‟ implies significant at 10% probability level and „a‟ indicates insignificant beyond 10% probability level. Figures under Adjusted R-2 column indicates values of F statistics; all other figures within the parenthesis are standard errors. All the values of DW statistics indicate the absence of autocorrelation problem in the disturbance term. Growth rates are
represented in the form of percentage per annum.
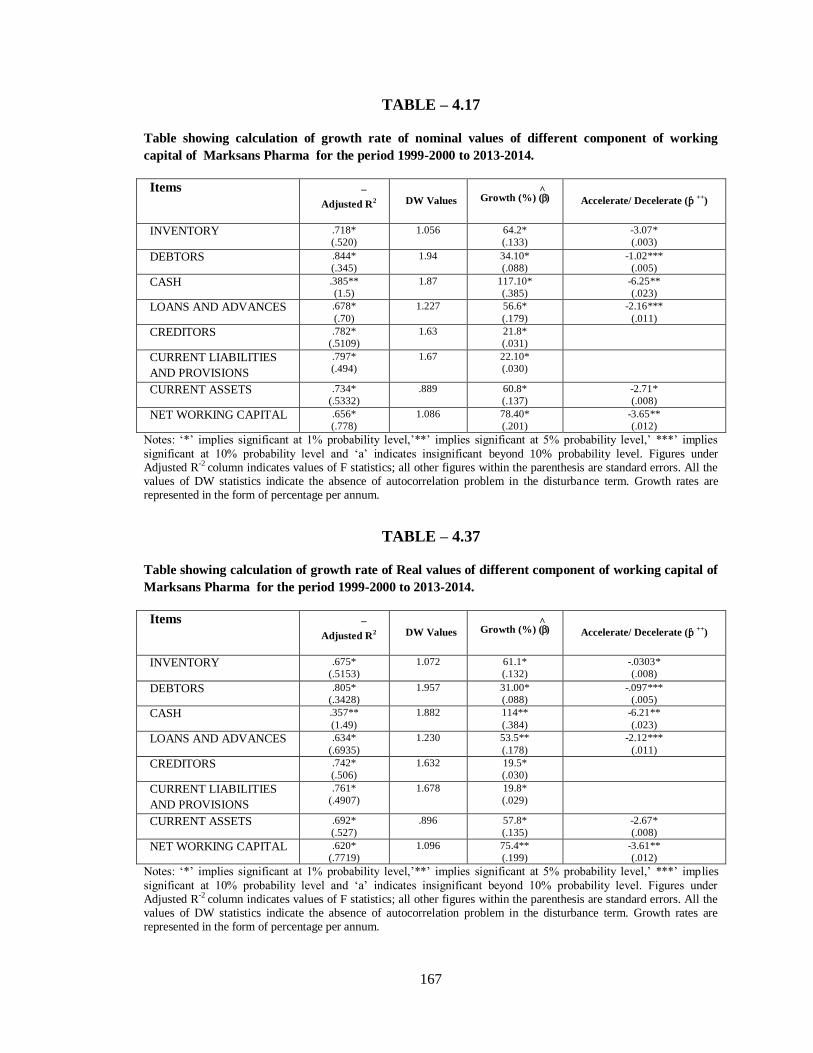
167
TABLE – 4.17
Table showing calculation of growth rate of nominal values of different component of working
capital of Marksans Pharma for the period 1999-2000 to 2013-2014.
Items
Adjusted R2
_
DW Values Growth (%) (^
) Accelerate/ Decelerate (ƥ ++)
INVENTORY .718*
(.520)
1.056 64.2*
(.133)
-3.07*
(.003)
DEBTORS .844*
(.345)
1.94 34.10*
(.088)
-1.02***
(.005)
CASH .385**
(1.5)
1.87 117.10*
(.385)
-6.25**
(.023)
LOANS AND ADVANCES .678*
(.70)
1.227 56.6*
(.179)
-2.16***
(.011)
CREDITORS .782*
(.5109)
1.63 21.8*
(.031)
CURRENT LIABILITIES
AND PROVISIONS
.797*
(.494)
1.67 22.10*
(.030)
CURRENT ASSETS .734*
(.5332)
.889 60.8*
(.137)
-2.71*
(.008)
NET WORKING CAPITAL .656*
(.778)
1.086 78.40*
(.201)
-3.65**
(.012)
Notes: „*‟ implies significant at 1% probability level,‟**‟ implies significant at 5% probability level,‟ ***‟ implies
significant at 10% probability level and „a‟ indicates insignificant beyond 10% probability level. Figures under Adjusted R-2 column indicates values of F statistics; all other figures within the parenthesis are standard errors. All the values of DW statistics indicate the absence of autocorrelation problem in the disturbance term. Growth rates are represented in the form of percentage per annum.
TABLE – 4.37
Table showing calculation of growth rate of Real values of different component of working capital of
Marksans Pharma for the period 1999-2000 to 2013-2014.
Items
Adjusted R2
_
DW Values Growth (%) (^
) Accelerate/ Decelerate (ƥ ++)
INVENTORY .675*
(.5153)
1.072 61.1*
(.132)
-.0303*
(.008)
DEBTORS .805*
(.3428)
1.957 31.00*
(.088)
-.097***
(.005)
CASH .357**
(1.49)
1.882 114**
(.384)
-6.21**
(.023)
LOANS AND ADVANCES .634*
(.6935)
1.230 53.5**
(.178)
-2.12***
(.011)
CREDITORS .742*
(.506)
1.632 19.5*
(.030)
CURRENT LIABILITIES
AND PROVISIONS
.761*
(.4907)
1.678 19.8*
(.029)
CURRENT ASSETS .692*
(.527)
.896 57.8*
(.135)
-2.67*
(.008)
NET WORKING CAPITAL .620*
(.7719)
1.096 75.4**
(.199)
-3.61**
(.012)
Notes: „*‟ implies significant at 1% probability level,‟**‟ implies significant at 5% probability level,‟ ***‟ imp lies
significant at 10% probability level and „a‟ indicates insignificant beyond 10% probability level. Figures under Adjusted R-2 column indicates values of F statistics; all other figures within the parenthesis are standard errors. All the values of DW statistics indicate the absence of autocorrelation problem in the disturbance term. Growth rates are represented in the form of percentage per annum.
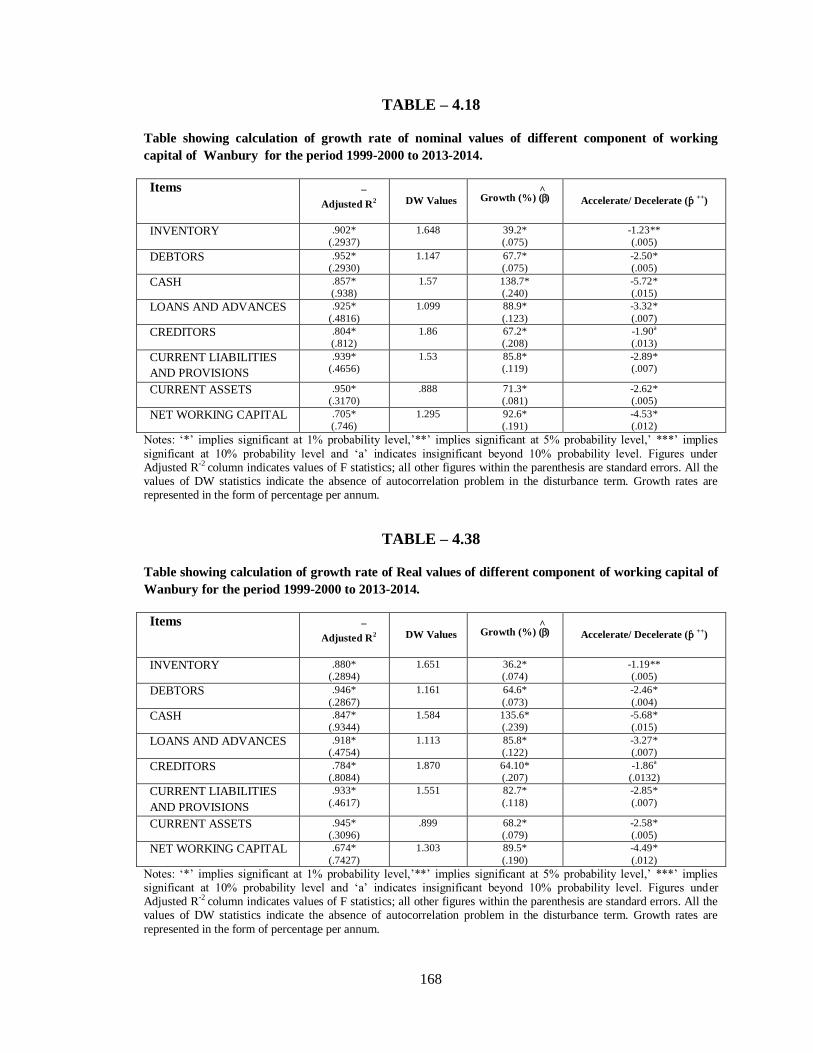
168
TABLE – 4.18
Table showing calculation of growth rate of nominal values of different component of working
capital of Wanbury for the period 1999-2000 to 2013-2014.
Items
Adjusted R2
_
DW Values Growth (%) (^
) Accelerate/ Decelerate (ƥ ++)
INVENTORY .902*
(.2937)
1.648 39.2*
(.075)
-1.23**
(.005)
DEBTORS .952*
(.2930)
1.147 67.7*
(.075)
-2.50*
(.005)
CASH .857*
(.938)
1.57 138.7*
(.240)
-5.72*
(.015)
LOANS AND ADVANCES .925*
(.4816)
1.099 88.9*
(.123)
-3.32*
(.007)
CREDITORS .804*
(.812)
1.86 67.2*
(.208)
-1.90a
(.013)
CURRENT LIABILITIES
AND PROVISIONS
.939*
(.4656)
1.53 85.8*
(.119)
-2.89*
(.007)
CURRENT ASSETS .950*
(.3170)
.888 71.3*
(.081)
-2.62*
(.005)
NET WORKING CAPITAL .705*
(.746)
1.295 92.6*
(.191)
-4.53*
(.012)
Notes: „*‟ implies significant at 1% probability level,‟**‟ implies significant at 5% probability level,‟ ***‟ implies
significant at 10% probability level and „a‟ indicates insignificant beyond 10% probability level. Figures under Adjusted R-2 column indicates values of F statistics; all other figures within the parenthesis are standard errors. All the values of DW statistics indicate the absence of autocorrelation problem in the disturbance term. Growth rates are represented in the form of percentage per annum.
TABLE – 4.38
Table showing calculation of growth rate of Real values of different component of working capital of
Wanbury for the period 1999-2000 to 2013-2014.
Items
Adjusted R2
_
DW Values Growth (%) (^
) Accelerate/ Decelerate (ƥ ++)
INVENTORY .880*
(.2894)
1.651 36.2*
(.074)
-1.19**
(.005)
DEBTORS .946*
(.2867)
1.161 64.6*
(.073)
-2.46*
(.004)
CASH .847*
(.9344)
1.584 135.6*
(.239)
-5.68*
(.015)
LOANS AND ADVANCES .918*
(.4754)
1.113 85.8*
(.122)
-3.27*
(.007)
CREDITORS .784*
(.8084)
1.870 64.10*
(.207)
-1.86a
(.0132)
CURRENT LIABILITIES
AND PROVISIONS
.933*
(.4617)
1.551 82.7*
(.118)
-2.85*
(.007)
CURRENT ASSETS .945*
(.3096)
.899 68.2*
(.079)
-2.58*
(.005)
NET WORKING CAPITAL .674*
(.7427)
1.303 89.5*
(.190)
-4.49*
(.012)
Notes: „*‟ implies significant at 1% probability level,‟**‟ implies significant at 5% probability level,‟ ***‟ implies significant at 10% probability level and „a‟ indicates insignificant beyond 10% probability level. Figures under Adjusted R-2 column indicates values of F statistics; all other figures within the parenthesis are standard errors. All the values of DW statistics indicate the absence of autocorrelation problem in the disturbance term. Growth rates are
represented in the form of percentage per annum.
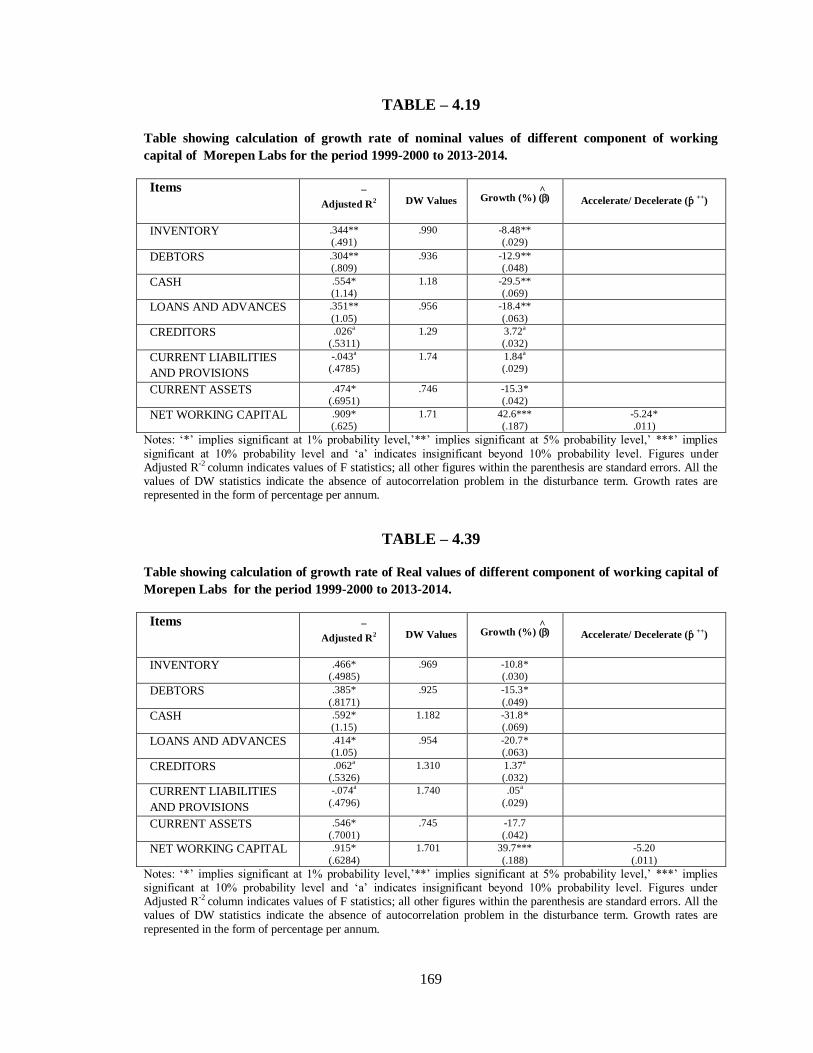
169
TABLE – 4.19
Table showing calculation of growth rate of nominal values of different component of working
capital of Morepen Labs for the period 1999-2000 to 2013-2014.
Items
Adjusted R2
_
DW Values Growth (%) (^
) Accelerate/ Decelerate (ƥ ++)
INVENTORY .344**
(.491)
.990 -8.48**
(.029)
DEBTORS .304**
(.809)
.936 -12.9**
(.048)
CASH .554*
(1.14)
1.18 -29.5**
(.069)
LOANS AND ADVANCES .351**
(1.05)
.956 -18.4**
(.063)
CREDITORS .026a
(.5311)
1.29 3.72a
(.032)
CURRENT LIABILITIES
AND PROVISIONS
-.043a
(.4785)
1.74 1.84a
(.029)
CURRENT ASSETS .474*
(.6951)
.746 -15.3*
(.042)
NET WORKING CAPITAL .909*
(.625)
1.71 42.6***
(.187)
-5.24*
.011)
Notes: „*‟ implies significant at 1% probability level,‟**‟ implies significant at 5% probability level,‟ ***‟ implies
significant at 10% probability level and „a‟ indicates insignificant beyond 10% probability level. Figures under Adjusted R-2 column indicates values of F statistics; all other figures within the parenthesis are standard errors. All the values of DW statistics indicate the absence of autocorrelation problem in the disturbance term. Growth rates are represented in the form of percentage per annum.
TABLE – 4.39
Table showing calculation of growth rate of Real values of different component of working capital of
Morepen Labs for the period 1999-2000 to 2013-2014.
Items
Adjusted R2
_
DW Values Growth (%) (^
) Accelerate/ Decelerate (ƥ ++)
INVENTORY .466*
(.4985)
.969 -10.8*
(.030)
DEBTORS .385*
(.8171)
.925 -15.3*
(.049)
CASH .592*
(1.15)
1.182 -31.8*
(.069)
LOANS AND ADVANCES .414*
(1.05)
.954 -20.7*
(.063)
CREDITORS .062a
(.5326)
1.310 1.37a
(.032)
CURRENT LIABILITIES
AND PROVISIONS
-.074a
(.4796)
1.740 .05a
(.029)
CURRENT ASSETS .546*
(.7001)
.745 -17.7
(.042)
NET WORKING CAPITAL .915*
(.6284)
1.701 39.7***
(.188)
-5.20
(.011)
Notes: „*‟ implies significant at 1% probability level,‟**‟ implies significant at 5% probability level,‟ ***‟ implies significant at 10% probability level and „a‟ indicates insignificant beyond 10% probability level. Figures under Adjusted R-2 column indicates values of F statistics; all other figures within the parenthesis are standard errors. All the values of DW statistics indicate the absence of autocorrelation problem in the disturbance term. Growth rates are
represented in the form of percentage per annum.
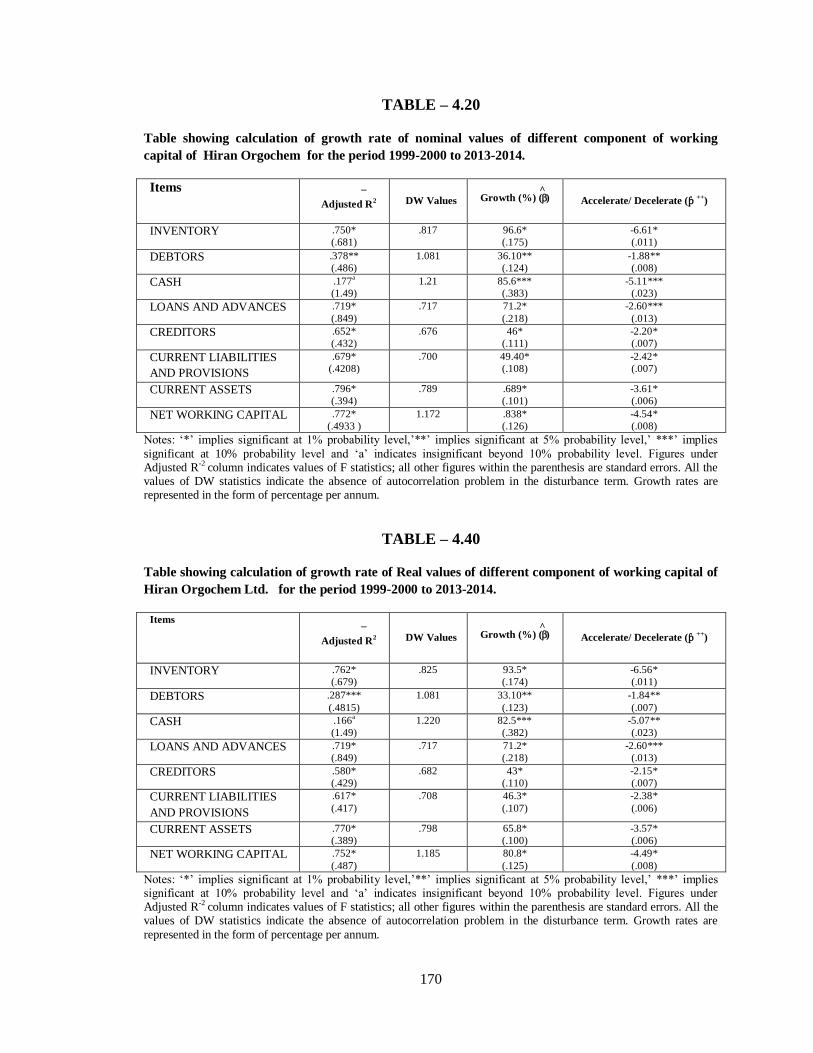
170
TABLE – 4.20
Table showing calculation of growth rate of nominal values of different component of working
capital of Hiran Orgochem for the period 1999-2000 to 2013-2014.
Items
Adjusted R2
_
DW Values Growth (%) (^
) Accelerate/ Decelerate (ƥ ++)
INVENTORY .750*
(.681)
.817 96.6*
(.175)
-6.61*
(.011)
DEBTORS .378**
(.486)
1.081 36.10**
(.124)
-1.88**
(.008)
CASH .177a
(1.49)
1.21 85.6***
(.383)
-5.11***
(.023)
LOANS AND ADVANCES .719*
(.849)
.717 71.2*
(.218)
-2.60***
(.013)
CREDITORS .652*
(.432)
.676 46*
(.111)
-2.20*
(.007)
CURRENT LIABILITIES
AND PROVISIONS
.679*
(.4208)
.700 49.40*
(.108)
-2.42*
(.007)
CURRENT ASSETS .796*
(.394)
.789 .689*
(.101)
-3.61*
(.006)
NET WORKING CAPITAL .772*
(.4933 )
1.172 .838*
(.126)
-4.54*
(.008)
Notes: „*‟ implies significant at 1% probability level,‟**‟ implies significant at 5% probability level,‟ ***‟ implies
significant at 10% probability level and „a‟ indicates insignificant beyond 10% probability level. Figures under Adjusted R-2 column indicates values of F statistics; all other figures within the parenthesis are standard errors. All the values of DW statistics indicate the absence of autocorrelation problem in the disturbance term. Growth rates are represented in the form of percentage per annum.
TABLE – 4.40
Table showing calculation of growth rate of Real values of different component of working capital of
Hiran Orgochem Ltd. for the period 1999-2000 to 2013-2014.
Items
Adjusted R2
_
DW Values Growth (%) (^
) Accelerate/ Decelerate (ƥ ++)
INVENTORY .762*
(.679)
.825 93.5*
(.174)
-6.56*
(.011)
DEBTORS .287***
(.4815)
1.081 33.10**
(.123)
-1.84**
(.007)
CASH .166a
(1.49)
1.220 82.5***
(.382)
-5.07**
(.023)
LOANS AND ADVANCES .719*
(.849)
.717 71.2*
(.218)
-2.60***
(.013)
CREDITORS .580*
(.429)
.682 43*
(.110)
-2.15*
(.007)
CURRENT LIABILITIES
AND PROVISIONS
.617*
(.417)
.708 46.3*
(.107)
-2.38*
(.006)
CURRENT ASSETS .770*
(.389)
.798 65.8*
(.100)
-3.57*
(.006)
NET WORKING CAPITAL .752*
(.487)
1.185 80.8*
(.125)
-4.49*
(.008)
Notes: „*‟ implies significant at 1% probability level,‟**‟ implies significant at 5% probability level,‟ ***‟ implies significant at 10% probability level and „a‟ indicates insignificant beyond 10% probability level. Figures under Adjusted R-2 column indicates values of F statistics; all other figures within the parenthesis are standard errors. All the values of DW statistics indicate the absence of autocorrelation problem in the disturbance term. Growth rates are
represented in the form of percentage per annum.

171
CHAPTER – 5
ASSESSMENT OF WORKING CAPITAL MANAGEMENT OF SOME
SELECTED PHARMACEUTICAL COMPANIES FROM ACCOUNTING POINT
OF VIEW.
To assess the Working Capital Management of some selected pharmaceutical companies
from accounting angle, analysis from different accounting point of view had been done.
Liquidity analysis, Profitability analysis, Efficiency analysis, working capital financing
analysis as well as component wise analysis of working capital had been done with the
help of different accounting ratios. In Liquidity analysis, Current Ratio (CR), Quick Ratio
(QR) and Absolute Liquid Ratio (ALR) had been considered. Profitability analysis had
been analysed with the help of Gross Profit, Net Profit and Return on Capital Employed
(ROCE). In efficiency analysis, Inventory Turnover Ratio (ITR), Debtors Turnover Ratio
(DTR), Cash Turnover Ratio (CTR), Working Capital Turnover Ratio (Operating Cycle
Period) and Creditors Turnover Ratio had been analysed. In component wise analysis of
working capital, all the components of working capital like inventory, debtors, cash,
loans and advances and creditors were expressed as percentage of total current assets. To
analyse the working Capital financing strategy of the selected pharmaceuticals
companies, Working Capital Leverage and Trade off between Risk and Profitability had
been taken into consideration. Gross Profit Ratio, Net Profit Ratio and Return on Capital
Employed had been expressed in percent and Inventory Turnover Ratio, Debtor Turnover
Ratio, Cash Turnover Ratio, Working Capital Turnover Ratio; Creditors Turnover Ratio
had been expresses in times. All the liquidity analysis ratios like Current Ratio, Quick
Ratio and Absolute Liquid Ratio were expressed in proportion.
5.1. Liquidity Analysis
Liquidity is the ability of a company to meet the short term obligations. It is the ability of
the company to convert its assets into cash. Short term, generally, signifies obligations
which mature within one accounting year. Short term also reflects the operating cycle:
buying, manufacturing, selling, and collecting.
172
A company that cannot pay its creditors on time and continue not to honor its obligations
to the suppliers of credit, services, and goods can be declared a sick company or bankrupt
company. Inability to meet the short term liabilities may affect the company‟s operations
and in many cases it may affect its reputation too. Lack of cash or liquid assets on hand
may force a company to miss the incentives given by the suppliers of credit, services, and
goods. Loss of such incentives may result in higher cost of goods which in turn affect the
profitability of the business. So there is always a need for the company to maintain
certain degree of liquidity. However, there is no standard norm for liquidity. It depends
on the nature of the business, scale of operations, location of the business and many other
factors.
Every stakeholder has interest in the liquidity position of a company. Supplier of goods
will check the liquidity of the company before selling goods on credit. Employees are
also having interest in the liquidity to know whether the company can meet its
employees‟ related obligations: salary, pension, provident fund etc. Shareholders are
interested in understanding the liquidity due to its huge impact on the profitability.
Shareholders may not like high liquidity as profitability and liquidity are inversely
related. However, shareholders are also aware that non-liquidity will deprive the
company from getting incentives from the suppliers, creditors, and bankers. Liquidity is
normally measured with the help of some ratios.
Liquidity ratios are the ratios that measure the ability of a company to meet its short term
debt obligations. These ratios measure the ability of a company to pay off its short-term
liabilities when they fall due. Current Ratio, Quick ratio and Absolute Liquid Ratio had
been taken for liquidity measures from accounting point of view of the selected
pharmaceutical companies during the study period.
5.1.1. Current Ratio:
It expresses the relation of the amount of current assets to the amount of current
liabilities. Current assets include Inventories, Trade Receivables and Cash and Bank
balance. The Current Liabilities includes mainly Trade Payables. It is a traditional
measure used in ascertaining the ability of a firm to meet its short-term obligations. The
higher the current ratio, the larger is the amount available per rupee to meet short-term

173
obligations and the greater is the security available to the creditors. Traditionally a
current ratio of 2:1 is considered satisfactory for a firm and it is taken to represent a good
short-term liquidty position. But this standard ratio generally varies from industry to
industry. Each industry has to develop its own standard or ideal ratio from past
experience and this can only be taken as a norm (Sur, 1997, p.829).
It is an index of sound working capital position for the business. The higher the current
ratio, greater the margin of safety and vise versa. Conventionally, a current ratio of 2:1 is
considered as satisfactory. In other words, if a company has current ratio of at least 200
percent of its current liabilities, it is considered to be in a fairly good liquidity condition.
From Table – 5.1.1, the current Ratio of the selected Pharmaceuticals Companies had
been displayed during the study period. It was found that the current ratio of Lupin was
always above the standard norms (2:1) except in 2008-2009. In Dr. Reddy‟s Laboratories,
the current ratio was above the standard norms (2:1) in all the years during the study
period. In CIPLA, the current ratio was always above the standard norms. The ratio
fluctuated in a narrow band. In Aurobindo Pharmaceuticals, the current ratio was also
always above the standard norms (2:1). Since 2006-2007, the ratio followed a decreasing
trend. The Current Ratio of Sun Pharmaceuticals was always above the standard norms
(2:1). Since 2008-2009, the ratio was in increasing trend. The Current Ratio of Kopran
was always above the standard norms of 2:1 except in 2004-2005. Initially, the ratio was
in decreasing trend but the ratio was in increasing trend during the last six years of the
study. The current ratio of Parenteral Drugs (India) Ltd was always higher than the
standard norms of 2:1. The ratio had not followed any trend during the period under
study.
Therefore, among the selected samples Lupin, Dr. Reddy‟s Laboratories, CIPLA,
Aurobindo Pharmaceuticals, Sun Pharmaceuticals, Kopran and Parenteral Drugs (India)
Ltd were always holding higher amount of current assets to meet its current obligations.
In other words, there number of operating cycle was low and holding higher amount of
current assets. They were taken no risk to meet their current obligations. They had
adopted conservative strategy in working capital management.
174
In Cadila Health Care Ltd, the Current Ratio fluctuated time to time. In most of the years
the current ratio was above the standard norms (2:1) but in few years (2002-2003, 2003-
2004, 2004-2005, 2005-2006 and 2006-2007) the current ratio was below the standard
norms of 2:1. The current ratio of Divis Labs was below the standard norms in initial two
years of the study. The Current Ratio was above the standard norms (2:1) in rest of the
years. Recent, the ratio was in increasing trend. The Current Ratio of Strides Archolabs
was always above the standard norms (2:1) except in 2001-2002, 2013-2014. Recent, the
ratio was below the standard norms. The current ratio of Biocon Pharmaceuticals was
above the standard norms in most of the years but in 1999-2000, 2000-2001, 2001-2002,
2002-2003, 2004-2005 and 2005-2006 the ratio was below the standard norms of 2:1.
During the last three years, Biocon Pharmaceuticals had maintained a uniform rate of
current ratio and it was above the standard norms. The current ratio of Biofil Chemicals
and Pharmaceuticals Ltd. was above the standard norms (2:1) during the initial five years.
In rest of the years the current ratio of Biofil Chemicals and Pharmaceuticals Ltd. was
below the standard norms. Recently, the ratio started increasing but still it was below the
standard norms (2:1). In last four years, the current ratio of Sequent Scientific Ltd. was
below the standard norms but in rest of the years, the current ratio was above the standard
norms (2:1). Since 2010-2011, the current ratio of Zenotech Laboratories Ltd. was
remarkably below the standard norms (2:1). The current ratio of Marksans Pharma Ltd.
was above the standard norms (2:1) except in 2000-2001, 2002-2003, 2003-2004, 2010-
2011, 2011-2012 and 2012-2013. Since 2010-2011, the current ratio followed an
increasing trend. The current ratio of Wanbury Ltd. was above the standard norms of 2:1
in all the years except in last three years and in 2004-2005. Since 2006-2007, the current
ratio of Morepen Labs was below the standard norms (2:1). The current ratio of Morepen
Labs was above the standard norm in initial six years.
Therefore, in Cadila Health Care Ltd, Divis Labs, Strides Archolabs, Biocon
Pharmaceuticals, Biofil Chemicals and Pharmaceuticals Ltd., Sequent Scientific Ltd.,
Zenotech Laboratories Ltd., Marksans Pharma Ltd., Wanbury Ltd. and Morepen Labs,
the amount of working capital had fluctuated time to time. In Divis Labs and Biocon
Pharmaceuticals at the initial stage of the study period, they were holding lower amount
of current assets to meet their obligations but latter they were holding more Current
175
Assets than their current obligations. In other words, management attitude had changed
from aggressive policy to conservative policy. In Strides Archolabs, Biofil Chemicals and
Pharmaceuticals Ltd., Sequent Scientific Ltd., Zenotech Laboratories Ltd., Wanbury Ltd.
and Morepen Labs at the initial years of the study period, they were holding higher
amount of current assets to meet their current obligations but latter they were holding
lower amount of current assets than their current liabilities. In other words, management
attitude had changed from conservative to aggressive policy.
The current ratio of Piramal Enterprises was always below the standard norms (2:1). The
current ratio of Ambalal Sarabhai Enterprises was also below the standard norms (2:1) in
all the years of the study period. The ratio was still declining in recent years. The current
ratio of Hiran Orgochem Ltd. was below the standard norms (2:1) in all the years except
in 2005-2006 and 2006-2007. However, the ratio started increasing in recent years.
Therefore, in Piramal Enterprises, Ambalal Sarabhai Enterprises and Hiran Orgochem
Ltd were always holding lower amount of current assets to meet their current obligations.
In other words, there number of operating cycle was higher and holding lower amount of
current assets. They were taken high risk to meet their current obligations. They had
adopted aggressive strategy in working capital management.
5.1.2. Quick Ratio (QR):
This ratio is a more rigorous measure of liquidity as compared to the current ratio. It is a
refinement of current ratio as it excludes non liquid current assets such as inventories,
prepaid expenses etc from the total current assets. This ratio has been calculated by
dividing the liquid assets by liquid liabilities. Liquid liabilities had been calculated by
subtracting the bank overdraft from the entire current liabilities. Thus by using it, the
liquidity of a company can be judged more precisely. Conventionally, a quick ratio of 1:1
is considered as satisfactory. In other words, if a company has quick ratio of at least 100
percent it is considered to be in a fairly good liquidity condition.
From Table 5.1.2, the quick ratios of the selected pharmaceutical companies had been
reflected where it was found, In Lupin, Piramal Enterprises, Strides Archolabs, Biofil
Chemicals and Pharmaceuticals Ltd., Ambalal Sarabhai Enterprises, Parenteral drugs
176
(India) Ltd., Sequent Scientific Ltd., Zenotech Laboratories Ltd,, Morepen Labs, Quick
Ratio was always in declining trend, which implies they were holding large amount of
stock. It also indicated there was less amount of short term loan for financing current
assets. These companies mainly doing business on own capital. There operating cycle
was low and they were following conservative strategy in financing current assets.
In Cadila Health Care Ltd., Divis Labs and Biocon Pharmaceuticals quick ratio was
always upward trend, which implies that they were holding less amount of stock and as
stock was excluded, quick ratio was in inclining trend. It also indicated there were large
amount of short term loan for financing current assets. Their operating cycle was high
and they were following aggressive strategy in financing current assets.
In Dr. Reddy‟s Laboratories, quick ratio was declining trend but later part of the study
period it was in inclining trend. In Aurobindo Pharmaceuticals, quick ratio was inclining
trend but later part of the study it was in declining trend. In CIPLA,Sun Pharmaceuticals ,
Kopran, Marksans Pharma Ltd., Wanbury Ltd. and Hiran Orgochem Ltd. there were no
discernable trend in quick ratio, it was fluctuated time to time.
5.1.3. Absolute Liquid Ratio (ALR):
This ratio is known as super quick ratio or cash position ratio. In addition to current ratio
and quick ratio, absolute liquid ratio computed to test the liquidity of the business. The
ratio is useful only when used in conjunction with current ratio and quick ratio. It
expresses the relation of the amount of absolute liquid assets to the amount of current
liabilities. Absolute liquid assets include cash and bank balance, and marketable
securities. Alternatively, the absolute liquid assets are computed by subtracting accounts
receivables from its liquid assets. The accounts receivables are excluded from the liquid
assets on the ground that there may be some doubt about their quick collection. It refers
to the spot payment capacity of the company. The Current Liabilities includes mainly
Trade Payables excluding bank overdraft. It is a traditional measure used in ascertaining
the ability of a firm to meet its immediate obligations. The higher the absolute liquid
ratio, the larger is the amount available per rupee to meet immediate obligations and the
greater is the security available to the creditors. This ratio also signified that the firm is
177
not paying attention to credit purchases and avoids the use of short term loans from bank.
Traditionally an absolute liquid ratio of 0.5:1 is considered satisfactory for a firm and it is
taken to represent a good spot payment position and it is taken as accepted conventional
standard. But this standard ratio generally varies from industry to industry. Each industry
has to develop its own standard or ideal ratio from past experience and this can only be
taken as a norm (Sur, 1997, p.829).
It is also an index of sound working capital position for the business. The higher the
absolute liquid ratio, greater the margin of safety and vise versa. The absolute liquid
ratios of the selected companies are being analysed below under the study period:
The Absolute Liquid Ratio of the selected pharmaceutical Companies had been displayed
in Table- 5.1.3. In CIPLA, Divis labs, Strides Archolabs, Kopran, Biofil Chemicals and
Pharmaceuticals and Ambalal Sarabhai Enterprises, the absolute liquid ratio was always
below the standard norms (0.5:1). It implied that immediate debt paying capacity of the
company was very low. In other words, these companies had followed aggressive Policy
in this respect.
In Lupin, the Absolute Liquid Ratio was always below the standard norms of 0.5:1 except
in 2005-2006 and 2006-2007. Since 2007-2008, the ratio was declining. In Piramal
Enterprises, the Absolute Liquid Ratio was also below the standard norms except in
2010-2011. The ratio had followed no trend. In Aurobindo Pharmaceuticals, the Absolute
liquid ratio was always below the standard norms except 2006-2007. In Cadila Health
Care Ltd., the Absolute Liquid Ratio was below the standard norms except in initial two
years. In Biocon Pharmaceuticals, The ALR was always below the standard norms except
in 2003-2004 & 2010-2011. Recently, the ratio was in inclining trend. The absolute liquid
ratio of Parenteral Drugs (India) Ltd., the ALR was always below the standard norms
except in 2007-2008. No trend was observed from the absolute liquid ratio of Sequent
Scientific Ltd. The absolute liquid ratio of sequent scientific Ltd. was always below the
standard norms except in 2004-2005. In Wanbury Ltd, the Absolute Liquid Ratio was
below the standard norms (0.5:1) except in 2009-2010. In Hiran Orgochem Ltd, the
Absolute Liquid Ratio was always below the standard norms except in 2011-2012.
178
In Dr. Reddy‟s Laboratories, the Absolute Liquid Ratio was below the standard norms
except in 2001-2002, 2002-2003, 2003-2004, 2004-2005, 2005-2006, 2006-2007, 2007-
2008 and 2013-2014. In Zenotech Laboratories Ltd., the absolute liquid ratio was above
the standard norms of 0.5:1 in 2001-2002 to 2004-2005 & 2007-2008 to 2009-2010. The
ratio was in declining trend in recent years. In Marksans Pharma Ltd., the Absolute
Liquid Ratio was below the standard norms except in 2005-2006, 2006-2007. 2007-2008
and 2009-2010. In Morepen Labs, The Absolute Liquid Ratio was above the standard
norms in the first part of the study period but in the later part the ratio was below the
standard norms.
5.1.4. Summary of the Liquidity Analysis
From the above liquidity analysis of the selected pharmaceutical companies the following
information is obtained:
Among of the selected pharmaceutical companies Lupin, Dr. Reddy‟s Laboratories,
CIPLA, Aurobindo Pharmaceuticals, Sun Pharmaceuticals, Kopran and Parenteral Drugs
(India) Ltd were always holding higher amount of current assets to meet its current
obligations. In other words, there number of operating cycle was low and holding higher
amount of current assets. They were taken no risk to meet their current obligations. They
had adopted conservative strategy in working capital management.
Cadila Health Care Ltd, Divis Labs, Strides Archolabs, Biocon Pharmaceuticals, Biofil
Chemicals and Pharmaceuticals Ltd., Sequent Scientific Ltd., Zenotech Laboratories Ltd.,
Marksans Pharma Ltd., Wanbury Ltd. and Morepen Labs, the amount of working capital
had fluctuated time to time. In Divis Labs and Biocon Pharmaceuticals at the initial stage
of the study period, they were holding lower amount of current assets to meet their
obligations but latter they were holding more Current Assets than their current
obligations. In other words, they had changed from aggressive policy to conservative
policy. In Strides Archolabs, Biofil Chemicals and Pharmaceuticals Ltd., Sequent
Scientific Ltd., Zenotech Laboratories Ltd., Wanbury Ltd. and Morepen Labs at the
initial years of the study period, they were holding higher amount of current assets to
meet their current obligations but latter they were holding lower amount of current assets
179
than their current liabilities. They had changed their current assets financing from
conservative to aggressive policy.
Piramal Enterprises, Ambalal Sarabhai Enterprises and Hiran Orgochem Ltd were always
holding lower amount of current assets to meet their current obligations. There number of
operating cycle was higher and holding lower amount of current assets. They were taken
high risk to meet their current obligations. They had adopted aggressive strategy in
working capital management.
Lupin, Piramal Enterprises, Strides Archolabs, Biofil Chemicals and Pharmaceuticals
Ltd., Ambalal Sarabhai Enterprises, Parenteral drugs (India) Ltd., Sequent Scientific Ltd.,
Zenotech Laboratories Ltd, Morepen Labs, Quick Ratio was always in declining trend.
These companies were holding larger amount of stock in their current assets. There
operating cycle was low and they were following conservative strategy in financing
current assets.
Dr. Reddy‟s Laboratories, quick ratio was declining trend but later part of the study
period it was in inclining trend. In Aurobindo Pharmaceuticals, quick ratio was inclining
trend but later part of the study it was in declining trend. In CIPLA,Sun Pharmaceuticals ,
Kopran, Marksans Pharma Ltd., Wanbury Ltd. and Hiran Orgochem Ltd. There were no
discernable trend in quick ratio; it was fluctuated time to time.
However, the average current ratio as well as quick ratio maintained by the selected
pharmaceutical companies during the study period was highest in Sequent Scientific Ltd.
followed by Zenotech Laboratories Ltd., Wanbury Ltd., Sun Pharmaceuticals, Dr.
Reddy‟s Laboratories , Aurobindo Pharmaceuticals, Cipla, Strides Archolabs, Parenteral
Drugs (India) Ltd., Kopran, Lupin, Divis Labs, Marksans Pharma Ltd., Morepen Labs,
Biofil Chemicals and Pharmaceuticals Ltd., Cadila Health Care Ltd., Hiran Orgochem
Ltd., Biocon Pharmaceuticals Ltd., Piramal Enterprises and Ambalal Sarabhai
Enterprises.
The spot payment capacity of Lupin, CIPLA, Piramal Enterprises, Aurobindo
Pharmaceuticals, Cadila Health Care Ltd., Divis Labs, Strides Archolabs, Biocon
Pharmaceuticals, Kopran, Biofil Chemicals and Pharmaceuticals Ltd., Ambalal Sarabhai
180
Enterprises, Parenteral Drugs (India) Ltd., Sequent Scientific Ltd., Marksans Pharma
Ltd., Wanbury Ltd., Morepen Labs and Hiran Orgochem Ltd. of the selected companies
were very poor and much dependent on collection from debtors for paying its short term
debt. These companies were followed aggressive policy for short term debt paying
capacity.
However, the spot payment capacity of Dr. Reddy‟s Laboratories, Zenotech Laboratories
Ltd., Marksans Pharma Ltd. and Morepen Labs was fluctuated time to time as their
absolute liquid ratio was fluctuated.
The average absolute liquid ratio was highest in Zenotech Laboratories Ltd. followed by
Sun Pharmaceuticals, Dr. Reddy‟s Laboratories, Marksans Pharma Ltd., Morepen Labs,
Cadila Health Care Ltd., Biocon Pharmaceuticals Ltd., Strides Archolabs, Sequent
Scientific Ltd., Piramal Enterprises, Aurobindo Pharmaceuticals, Lupin, Wanbury Ltd.,
Hiran Orgochem Ltd., Parenteral Drugs (India) Ltd., Cipla, Divis Labs, Kopran, Biofil
Chemicals and Pharmaceuticals Ltd., and Ambalal Sarabhai Enterprises.
5.2. Profitability Analysis
Business is conducted primarily to earn profits. The amount of profit earned measures the
efficiency of a business. The greater the volume of profit, the higher is the efficiency of
the concern. The profit of a business may be measured and analyzed by studying the
profitability of investments attained by the business
Profitability is the ability to earn profit from all the activities of an enterprise. It indicates
how well management of an enterprise generates earnings by using the resources at its
disposal. In the other words the ability to earn profit e.g. profitability, it is composed of
two words profit and ability. The word profit represents the absolute figure of profit but
an absolute figure alone does not give an exact ideas of the adequacy or otherwise of
increase or change in performance as shown in the financial statement of the enterprise.
The word „ability‟ reflects the power of an enterprise to earn profits, it is called earning
performance. Earnings are an essential requirement to continue the business. So we can
say that a healthy enterprise is that which has good profitability. According to hermenson
Edward and salmonson „profitability is the relationship of income to some balance sheet
181
measure which indicates the relative ability to earn income on assets employed.
Profitability normally measured with the help of some ratios. Profit is more of a
motivator or a driving force rather than bread and butter. To make the total profitability
analysis we have chosen to analyze the profitability (of the selected companies of
pharmaceutical industry of India) step by step i.e. to start with the calculation and
analysis of Gross Profit margin has been done and then net profit margin and Return on
Capital Employed has been calculated and analyzed. These are discussed below:
5.2.1. Gross Profit Ratio:
The gross profit margin is a measurement of a company‟s manufacturing and distribution
efficiency during the production process. Gross profit is the profit in sales after deducting
all the trading expenses like the cost of raw materials, the direct expenses on purchases,
excise duty, etc. The effect of stock adjustment is also given along with deducting factory
overheads at this stage, and the result is Gross Profit. In other words when manufacturing
cost of goods sold is deducted from the sales the resultant profit are referred to as Gross
Profit. The gross profit margin informs an investor about the percentage of revenue /
sales left after subtracting the manufacturing cost of goods sold. A company that boasts a
higher gross profit margin than its competitors and industry is more efficient.
Gross Profit
Gross Profit Margin Ratio =
Sales
Gross Profit margin is an indicator of the percentage of sales revenue which is above the
cost. For making a pricing decision this margin can be utilized for decreasing the price.
Theoretically it can be said that the price of a product can be decreased maximum up to
the extent of gross profit margin, decrease in price up to this margin would give the firm
enough revenue to continue the operations.
A higher gross profit margin ratio is generally better than a lower one. It is difficult to
develop any standard ratio in this respect. It can be only judged by a particular firm or
industry only from his past experience. There is no „rule of thumb‟ which may be used as
a norm to examine the gross profit margin ratio. Different standards are generally used
for different industries in order to examine the gross profit margin ratio. The average
X 100
182
gross profit ratio of the selected companies taken together was 9.01 during the period
under study which may be taken as the accepted standard during the period under study.
Table 5.2.1 displyed that the Gross Profit Ratio of Lupin was always above the average
gross profit percentage of the selected samples. The ratio reflected an increasing trend
during the study period. The average value of gross profit ratio of Lupin was 21.41 with
its standard deviation 5.32. The Gross Profit Ratio of Dr. Reddy‟s Laboratories was also
above the average gross profit percentage of the selected samples during the study period.
The Gross Profit Ratio of Dr. Reddy‟s Laboratories had not followed any trend during the
period under study. On an average, the company maintained its gross profit ratio at 24.50
with a standard deviation 7.28. The gross profit Ratio of CIPLA was always above the
average gross profit percentage of the selected samples i.e. 9.01. The gross profit Ratio of
CIPLA showed a marginally declining trend during the period under study. The Gross
Profit Ratio of Aurobindo Pharmaceuticals was always above the average gross profit
percentage of the selected samples. The ratio showed an increasing trend. Particularly in
recent years the ratio was very high. In Divis Labs, the Gross Profit Ratio was always
above the average gross profit percentage of the selected samples. The ratio increased
marginally during the entire period. The average Gross profit Ratio was 35.16 with its
standard deviation 7.04. In Biocon Pharmaceuticals, the Gross Profit Ratio was above the
average gross profit percentage of the selected samples in all the years of the study
period. On an average, the Gross Profit Ratio of the company was 19.35 with its standard
deviation 5.14. The ratio had followed no trend during the period under study.
Lupin, Dr. Reddy‟s Laboratories, CIPLA, Aurobindo Pharmaceuticals, Divis Labs and
Biocon Pharmaceuticals maintaining their gross profit ratio at a level above the average
gross profit percentage of the selected pharmaceutical companies in all the years of the
study period. Operating expenses of these companies was below the sales volume in all
the years of the study.
The Gross Profit Ratio of Piramal Enterprises was above the average gross profit
percentage of the selected samples 9.01 in all the years except in the years 2010-2011 to
2013-2014. The ratio was tremendously declined in the recent furs years of the study. In
Cadila Health Care, the gross Profit Ratio was always above the average gross profit
183
percentage of the selected samples except in the year 2009-2010 & 2010-2011. The Gross
Profit Ratio of Cadila Health Care Ltd. had not followed any trend during the period
under study. On an average, the Gross Profit Ratio of Cadila Health Care Ltd. was 15.55
with a standard deviation 5.87. In Strides Archolabs, the Gross Profit Ratio was above the
average of the selected samples of 9.01 in all the years except in 2003-2004, 2007-2008.
The ratio of the company had not followed any trend. In recent years, the gross Profit
Ratio of Strides Archolabs had been declined. The average Gross Profit of the company
was 19.95 with a standard deviation 4.71 during the study period. In Sun
Pharmaceuticals, the Gross Profit Ratio was above the accepted standard of 9.01 in all the
years except in the years 2007-2008, 2008-2009 & 2013-2014. In the recent year, the
company incurred a Gross loss. The average Gross Profit earned by the company was
18.82 with a standard deviation 15.20. The Gross Profit of Sun Pharmaceuticals had not
followed any trend during the period under study. In Kopran, the Gross Profit Ratio was
above the standard norms in all the years except in 2002-2003 to 2012-2013. Recently the
gross profit ratio of the company was just begun to increase. The average gross profit
ratio of the company was 9.93 and its standard deviation was 9.87 during the period
under study. The Gross Profit Ratio of Parenteral Drugs (India) Ltd. was below the
average gross profit percentage of the selected samples i.e. 9.01 in most of the years of
the study except in the years 1999-2000, 2001-2002 to 2006-2007 and 2010-2011 to
2013-2014. During the last two years of the study, the company had incurred a gross loss.
On an average, the gross profit ratio was 8.01 and its standard deviation was 10.92. The
Gross profit Ratio of Sequent Scientific Ltd. was always above the accepted standard in
all the years except in 1999-2000 to 2002-2003, 2007-2008 and 2011-2012 to 2013-2014.
Recently, the Gross Profit Ratio of the company had been deteriorated. The average
Gross Profit Ratio of the company was 16.48 with a standard deviation 26.10. In
Marksans Pharma Ltd., the Gross Profit Ratio was above the accepted standard norms
except in 2000-2001 to 2002-2003, 2006-2007, and 2008-2009 to 2011-2012. Recently
the gross profit ratio of the company was in increasing trend. The average gross profit
ratio of the company was 4.77 with a standard deviation 28.86. The Gross Profit Ratio of
Wanbury Ltd. was above the standard norms of 9.01 in all the years except in 1999-2000
to 2003-2004 and 2010-2011 to the ultimate years of the study. The average value of
184
gross profit ratio was 12.77 and its standard deviation was 6.65. In Morpen Labs, the
gross profit ratio was below the standard norms except in 1999-2000 to 2002-2003 and in
2005-2006. The company had gross loss since 2006-2007 to 2012-2013. In 2013-2014,
the company was at breakeven point. The average gross profit ratio of the company was -
8.10 with its standard deviation 15.06.
The Gross Profit Ratio of Piramal Enterprises, Cadila Health Care Ltd., Strides
Archolabs, Sun Pharmaceuticals, Kopran, Parenteral Drugs (India) Ltd., Sequent
Scientific Ltd., Marksans Pharma, Wanbury Ltd. and Morpen Labs had followed no trend
during the period under study.
In Biofil Chemicals and Pharmaceuticals Ltd, the Gross Profit Ratio was below the
accepted standard norms of 9.01 in all the years except in 2009-2010 and 2012-2013 to
2013-2014. In recent two years, the gross profit ratio of the company started increasing.
On an average, the company maintained its gross profit margin at -243.49 with its
standard deviation 889.94. In Ambalal Sarabhai Enterprises, the gross Profit Ratio was
always below the standard norms of 9.01. The average value of Gross Profit Ratio was –
47.65 and its standard deviation was 48.22 during the study period. Recently, the Gross
Profit Ratio of the company had been decreased. In Zenotech Ltd, the Gross Profit Ratio
was below the accepted standard in all the years except in 2003-2004 and in 2006-2007.
The gross profit ratio of Hiran Orgochem Ltd. was always below the average of the
selected samples except in 2005-2006. Recently, the company had incurred huge gross
loss.
Biofil Chemicals and Pharmaceuticals, Ambalal Sarabhai Enterprises, Zenotech Ltd. and
Horan Orgochem Ltd. were unable to earn gross profit during the study period. It
indicated that the operating expenses of these companies were very high.
5.2.2. Net Profit Ratio:
The net profit margin, also known as net margin, indicates how much net income a
company makes with total sales achieved. A higher net profit margin means that a
company is more efficient at converting sales into actual profit. Net profit margin
analysis is not the same as gross profit margin. Under gross profit, fixed costs are
185
excluded from calculation. With net profit margin ratio all costs are included to find the
final benefit of the income of a business. Similar terms used to describe net profit
margins include net margin, net profit, net profit ratio, net profit margin percentage, and
more. To calculate net profit margin and provide net profit margin ratio analysis requires
skills ranging from those of a small business owner to an experienced CFO. This depends
on the size and complexity of the company. Net margin measures how successful a
company has been at the business of making a profit on each rupee sales. It is one of the
most essential financial ratios. Net margin includes all the factors that influence
profitability whether under management control or not. The higher the ratio, the more
effective a company is at cost control. Compared with industry average, it tells investors
how well the management and operations of a company are performing against its
competitors. Compared with different industries, it tells investors which industries are
relatively more profitable than others. Net profit margin analysis is also used among
many common methods for business valuation. There is no „rule of thumb‟ which may be
used as a norm to examine the net profit margin ratio. Different standards are generally
used for different industries in order to examine the net profit margin ratio. The average
net profit ratio of the companies taken as a whole was 7.74 during the period under study
which may be taken as the accepted standard during the period under study.
Table 5.2.2 reflected that Dr. Reddy‟s Laboratories, CIPLA, Cadila Health Care Ltd.,
Divis Labs and Biocon Pharmaceuticals had always maintained their Net Profit Ratio at a
rate above the industry average of 7.74 during the period under study. In Dr. Reddy‟s
Laboratories, Net Profit Ratio had followed no trend. On an average, the company
maintained its net profit margin at 17.20 with its standard deviation 6.41. In CIPLA, net
profit ratio had followed a marginally declined trend. The average value of net profit ratio
was 17.08 with its standard deviation 1.7. The net profit ratio of Cadila Health Care Ltd.
had followed a marginally increasing trend since 2002-2003. The average net profit
margin was 14.17 with a standard deviation 4.14. In Divis Labs, net profit ratio had not
maintained any trend during the period under study. The net profit ratios fluctuated
closely with a standard deviation 7.75. The net profit ratio of Biocon Pharmaceuticals
Ltd. fluctuated randomly with no trend during the study period. The average value of net
profit ratio was 19.24 with a standard deviation 9.37.
186
Therefore, among the selected companies, Dr. Reddy‟s Laboratories, CIPLA, Cadila
Health Care Ltd, Divis Labs and Biocon Pharmaceuticals had maintained their net profit
ratio at a high level. These companies were controlling their non-operating cost more
effectively. The management and operation of these companies are very well against its
competitors. The non operating costs of these companies are comparatively low.
Lupin, Aurobindo Pharmaceuticals, Piramal Enterprises, Strides Archolabs, Sun
Pharmaceuticals, Kopran, Sequent Scientific Ltd, Marksans Pharma, Wanbury Ltd. and
Morpen Labs were unable to recover its non-operating expenses in all the years of the
study. In Lupin, the net profit ratio was above the industry average in all the years except
in 1999-2000, 2000-2001, 2002-2003 and 2004-2005. In the recent year, the net profit
ratio of Lupin was the maximum. In Aurobindo Pharmaceuticals, Net profit Ratio was
above the industry average except in 2000-2001, 2001-2002, 2004-2005, 2005-2006,
2008-2009, and 2011-2012. The ratio had followed no trend during the study period. Net
Profit Ratio of Piramal Enterprises was above the industry average in all the years except
in the last two years of the study. Recently, the net profit ratio of Piramal Enterprises
reached at the minimum value. In strides Archolabs, net profit ratio fluctuated time to
time and followed no trend during the entire study period. On an average, the company
had net profit ratio of 26.35 with its standard deviation 75.50. In Sun Pharmaceuticals,
the net profit ratio was above the industry average in all the years of the study period
except in 2013-2014. The company had earned a huge loss in the recent years of the
study. Kopran had followed no trend during the study period. The net profit ratio was
below the industry average in all the years except 2007-2008. The average net profit ratio
was -3.84 with a standard deviation 15.47. In sequent scientific Ltd., the net profit ratio in
all the years except in 2003-2004 to 2006-2007 & 2009-2010 was below the industry
average of 7.74. The ratio had a declined trend in recent years of the study. In recent
years, the net profit ratio of Marksans Pharma Ltd. started inclining. In most of the years,
the net profit ratio was below the industry average. The average net profit ratio of
Marksans Pharma Ltd. was -12.51 with a standard deviation 47.47. The net profit ratio of
Marksans Pharma Ltd. had followed no trend during the study period. The net profit ratio
of Wanbury Ltd. also fluctuated time to time. The ratio was below the industry average in
most of the years except in 2004-2005 to 2006-2007 and 2009-2010. It had followed no

187
trend during the period under study. During the recent four years of the study, Wanbury
Ltd. had incurred net loss. In Morepen Labs, net profit ratio was fluctuating time to time
and had followed no trend. In most of the years, the net profit ratio was below the
industry average of 7.74. The company had incurred successive loss since 2003-2004. On
an average, the net profit ratio maintained by Morepen Labs was -16.81 with a standard
deviation 34.34.
Therefore, in Lupin, Aurobindo Pharmaceuticals, Piramal Enterprises, Strides Archolabs,
Sun Pharmaceuticals, Kopran, Sequent Scientific Ltd, Marksans Pharma, Wanbury Ltd.
and Morpen Labs net profit ratio were fluctuating from time to time. In most of the years,
net profit ratios were below the industry average and these companies had incurred net
loss instead of net profit in most of the years. It indicated that non-operating expenses of
these companies were exceeds its gross profit. Non-operating expenses of these
companies were comparatively high. These companies were unable to control non-
operating cost efficiently. Management and operation of these companies are not
performing efficiently against their competitors.
In Biofil Chemicals and Pharmaceuticals Ltd., Ambalal Sarabhai Enterprises, Parenteral
Drugs (India) Ltd, Zenotech Laboratories Ltd. and Hiran Orgochem Ltd., the net profit
ratios were always below the average net profit percentage of the selected samples and
negative during the entire study period. It indicated that non- operating expenses of these
companies were very high. In Biofil Chemicals and Pharmaceuticals Ltd., the average net
profit ratio was -290.76 with its standard deviation 907.43. The ratio fluctuated randomly
and had followed no trend throughout the study period. Net profit ratio of Ambalal
Sarabhai Enterprises was always below the industry average except in 2008-2009. The
net profit ratio of Ambalal Sarabhai Enterprises sharply declined since 2009-2010. In
Parenteral Drugs (India) Ltd., the net profit ratio was below the industry average except
in 2009-2010. The average net profit ratio of Parenteral Drugs(India) Ltd, Ambalal
Sarabhai Enterprises, Zenotech Ltd. and Hiran Orgochem Ltd. were -3.21 , -13.52, -
166.14 and -32.61 respectively with its standard deviation 15.12, 28.40, 228.95 and 77.50
respectively.
188
5.2.3. Return on Capital Employed (ROCE):
Return on Capital Employed or ROCE is a profitability ratio that measures how
efficiently a company can generate profits from its capital employed by comparing net
operating profit to capital employed. In other words, return on capital employed shows
investors how many rupees in profits in each rupees of capital employed generates.
ROCE is long term profitability ratio because it shows how effectively assets are
performing while taking into consideration long term financing. This is why ROCE is a
more useful ratio than return on equity to evaluate longevity of a company. This ratio is
based on two important calculations: Operating Profit and capital employed. Net
operating profit is often called EBIT. EBIT is often reported on the income statement
because it shows the company profits generated from operations. Capital employed is a
fairly convoluted term because it can be used to refer to many different financial ratios. It
refers to the total assets of a company less all current liabilities. Return on Capital
Employed is calculated by dividing net operating profit by the capital employed. A higher
return on capital employed ratio will be more preferable because it means that more
rupees of profits are generated by each rupees of capital employed. Investors are
interested in the ratio to see how efficiently a company uses its capital employed as well
as long term financing strategies. Company‟s returns should always be higher than the
rate at which they are borrowing to fund the assets. There is no „rule of thumb‟ which
may be used as a norm to examine the return on capital employed. Different standards are
generally used for different industries in order to examine the return on capital employed.
The average return on capital employed of the companies taken as a whole was 7.39%
during the period under study which may be taken as the accepted standard during the
period under study.
In Table – 5.2.3 it was found that the ROCE of Lupin, Dr. Reddy‟s Laboratories, CIPLA,
Aurobindo Pharmaceuticals, Cadila Health Care Ltd., Divis Labs, Biocon
Pharmaceuticals was always above the industry average (7.39%). The average ROCE of
Lupin was 23.11% with its standard deviation 7.86. The ratio had followed no trend
during the entire study period. In Dr. Reddy‟s Laboratories, ROCE fluctuated time to
time and it followed no trend. The ROCE was above the industry average in all the years
189
except in 2004-2005. In CIPLA, the average ROCE was 19.65% with a standard
deviation 8.36. The ratio fluctuated marginally. In Aurobindo Pharmaceuticals, ROCE
was above the industry average except in 2004-2005 & 2005-2006. On an average, the
ROCE of Aurobindo Pharmaceuticals was 16.25% with its standard deviation 7.87. The
ROCE of Cadila Health Care fluctuated marginally with a standard deviation 6.10. The
mean ROCE of Cadila Health Care was 14.12%. In Divis Labs, the ROCE was above the
industry average in all the years of the study period. The mean value of ROCE of Divis
Lab was 33.92% and its standard deviation was 6.08. The ROCE of Divis Lab was in
increasing trend since 2009-2010. In Biocon Pharmaceuticals, the ROCE followed no
trend. It fluctuated time to time. The ROCE of Biocon Pharmaceuticals was always above
the industry average.
Therefore, ROCE of Lupin, Dr. Reddy‟s Laboratories, CIPLA, Aurobindo
Pharmaceuticals, Cadila Health Care ltd., Divis Labs and Biocon Pharmaceuticals was
much higher than that of average ROCE of selected pharmaceutical companies. On an
average, the ROCE of Lupin, Dr. Reddy‟s Laboratories, CIPLA, Aurobindo
Pharmaceuticals, Cadila Health Care Ltd. Divis Labs and Biocon Pharmaceuticals as a
whole was 21.30% as compared to industry average 7.39% during the study period. It is
indicated that Lupin, Dr. Reddy‟s Laboratories, CIPLA, Aurobindo Pharmaceuticals,
Cadila Health Care Ltd., Divis Lab and Biocon Pharmaceuticals generate more earnings
per rupee of capital employed. The ROCE of Lupin, Dr. Reddy‟s Laboratories, CIPLA,
Aurobindo Pharmaceuticals, Cadila Health Care Ltd., Divis Labs, and Biocon
Pharmaceuticals indicated the higher profitability during the entire study period.
The ROCE of Piramal Enterprises, Strides Archolabs, Sun Pharmaceuticals, Parenteral
Drugs(India) Ltd., Sequent Scientific Ltd., Marksans Pharma, Wanbury Ltd. and Hiran
Orgochem Ltd. fluctuated time to time. In few years, the ROCE was above the industry
average of 7.39% and in rest of the years the ROCE was below the industry average. In
Piramal Enterprises, ROCE was above the industry average in all the years except in
2010-2011 to 2013-2014. In the recent four years of the study, ROCE of Piramal
Enterprises declined significantly. The mean ROCE of Piramal Enterprises was 16.17%
with a standard deviation 10.99. The ratio had followed no trend. In Strides Archolabs,
190
ROCE was above the industry average except 2007-2008 to 2011-2012. Recently, ROCE
of Strides Archolabs started inclining. In Sun Pharmaceuticals, ROCE was always above
the industry average except in 2012-2013 & 2013-2014. Recently, ROCE of Sun
Pharmaceuticals was declining. The mean ROCE of Sun Pharmaceuticals was 14.17 with
its standard deviation 14.13. The ROCE of Parenteral Drugs (India) Ltd. was above the
industry average in most of the years but in 2002-2003 to 2003-2004, 2008-2009, 2010-
2011 to 2013-2014, the ROCE was below the industry average. ROCE of Parenteral
Drugs(India) Ltd. shows a declining trend during the recent six years of the study. During
the last two years of the study, ROCE of Sequent Scientific Ltd. was negative. In
Marksans Pharma, ROCE was above the industry average in most of the years but in
2002-2003, 2006-2007 to 2012-2013 the ratio was below the industry average. In recent
year, ROCE of Marksans Pharma started inclining. The average ROCE of parenteral
drugs (India) Ltd., Sequent Scientific Ltd. and Marksans Pharma was 8.91, 18.30 and
12.12 respectively. The ROCE of Marksans Pharma fluctuated time to time and it shows
no trend during the entire study period. ROCE of Wanbury Ltd. was above the industry
average in all the years except in 1999-2000, 2008-2009and 2010-2011 to 2013-2014.
Recently, ROCE of Wanbury Ltd. had declined and followed no trend. Since 2006-2007,
the ROCE of Hiran Orgochem Ltd. was found to be negative. On an average, ROCE of
Horan Orgochem Ltd. was -3.19 with a standard deviation 38.29.
Therefore, ROCE of Piramal Enterprises, Strides Archolabs, Sun Pharmaceuticals,
Parenteral Drugs (India) Ltd., Sequent Scientific Ltd., Marksans Pharma, Wanbury Ltd.
and Hiran Orgochem Ltd. was above the average ROCE of the selected samples in most
of the years and in rest of the years of the study period, ROCE was below the industry
average. In few years, ROCE of some selected sample found to be negative which
indicated that the company had a net operating loss in those years. It signified that the net
operating expenses in those years of the selected sample were higher than the gross
profit. In few years, the profitability of these companies was high and in rest of the years
the profitability of these companies was poor. On an average ROCE of Piramal
Enterprises, Strides Archolabs, Sun Pharmaceuticals, Parenteral Drugs (India) Ltd.,
Sequent Scientific Ltd., Marksans Pharma, Wanbury Ltd. and Hiran Orgochem Ltd. were
10.50 as a whole.
191
The ROCE of Kopran, Biofil Chemicals and Pharmaceuticals Ltd., Ambalal Sarabhai
Enterprises, Zenotech Ltd. and Morepen Labs was always below the average ROCE of
the selected pharmaceutical Compoanies (7.39%) during the study period. The ROCE of
these companies had followed no trend. On an average, the ROCE of Kopran, Biofil
Chemicals and Pharmaceuticals Ltd. Ambalal Sarabhai Enterprises, Zenotech Ltd. and
Morepen Labs were -17.06 as a whole which was much lower than the industry average.
The profitability position of these companies was very poor.
5.2.4.Summary of the Profitability Analysis
From the above profitability analysis , it was observed that the gross profit ratio of Lupin,
Dr. Reddy‟s Laboratories, CIPLA, Aurobindo Pharmaceuticals, Divis Labs and Biocon
Pharmaceuticals maintaining their gross profit ratio at a level above the average gross
profit percentage of the selected pharmaceutical companies in all the years of the study
period. Operating expenses of these companies was below the sales volume in all the
years of the study. The Gross Profit Ratio of Piramal Enterprises, Cadila Health Care
Ltd., Strides Archolabs, Sun Pharmaceuticals, Kopran, Parenteral Drugs (India) Ltd.,
Sequent Scientific Ltd., Marksans Pharma Ltd., Wanbury Ltd. and Morpen Labs had
followed no trend during the period under study. Biofil Chemicals and Pharmaceuticals
Ltd., Ambalal Sarabhai Enterprises, Zenotech Laboratories Ltd. and Hiran Orgochem
Ltd. were unable to earn gross profit during the study period. It indicated that the
operating expenses of these companies were very high. The average gross profit
percentage of the selected pharmaceutical companies was highest in Divis Labs followed
by Dr. Reddy‟s Laboratories, Sun Pharmaceuticals, Cipla, Biocon Pharmaceuticals Ltd.,
Lupin, Aurobindo Pharmaceuticals, Cadila Health Care Ltd., Strides Archolabs, Piramal
Enterprises, Wanbury Ltd., Parenteral Drugs (India) Ltd., Kopran, Marksans Pharma
Ltd., Morepen Labs, Hiran Orgochem Ltd., Ambalal Sarabhai Enterprises, Zenotech
Laboratories Ltd. Biofil Chemicals and Pharmaceuticals Ltd. and Sequent Scientific Ltd.
The Net Profit Ratio of Dr. Reddy‟s Laboratories, CIPLA, Cadila Health Care Ltd, Divis
Labs and Biocon Pharmaceuticals were very high. These companies were controlling
their non-operating cost more effectively. The management and operation of these

192
companies are very well against its competitors. The non operating costs of these
companies are comparatively low.
The net profit ratio of Lupin, Aurobindo Pharmaceuticals, Piramal Enterprises, Strides
Archolabs, Sun Pharmaceuticals, Kopran, Sequent Scientific Ltd, Marksans Pharma,
Wanbury Ltd. and Morpen Labs were fluctuating from time to time. In most of the years,
net profit ratios were below the average net profit percentage of the selected
pharmaceutical companies and these companies had incurred net loss instead of net profit
in most of the years. Non-operating expenses of these companies were very high and it
exceeds its gross profit. The net profit ratio of Biofil Chemicals and Pharmaceuticals
Ltd., Ambalal Sarabhai Enterprises, Parenteral Drugs (India) Ltd, Zenotech Laboratories
Ltd. and Hiran Orgochem Ltd. were always below the average net profit percentage of
the selected samples and negative during the entire study period. The average net profit
percentage was highest in Piramal Enterprises followed by Strides Archolabs, Divis Labs,
Sun Pharmaceuticals, Biocon Pharmaceuticals Ltd., Dr. Reddy‟s Laboratories, Cipla,
Cadila Health Care Ltd., Lupin, Aurobindo Pharmaceuticals, Wanbury Ltd., Parenteral
Drugs (India) Ltd., Kopran, Marksans Pharma Ltd., Ambalal Sarabhai Enterprises,
Zenotech Laboratories Ltd. Morepen Labs, Hiran Orgochem Ltd., Biofil Chemicals and
Pharmaceuticals Ltd. and Sequent Scientific Ltd.
ROCE of Lupin, Dr. Reddy‟s Laboratories, CIPLA, Aurobindo Pharmaceuticals, Cadila
Health Care ltd., Divis Labs and Biocon Pharmaceuticals was much higher than that of
average ROCE of selected pharmaceutical companies. ROCE of Piramal Enterprises,
Strides Archolabs, Sun Pharmaceuticals, Parenteral Drugs (India) Ltd., Sequent Scientific
Ltd., Marksans Pharma, Wanbury Ltd. and Hiran Orgochem Ltd. fluctuated time to time.
ROCE of Kopran, Biofil Chemicals and Pharmaceuticals Ltd., Ambalal Sarabhai
Enterprises, Zenotech Laboratories Ltd. and Morepen Labs was always below the
average ROCE of the selected pharmaceutical Companies (7.39%) during the study
period. Moreover, the average ROCE of the selected pharmaceutical companies was
highest in Divis Labs followed by CIPLA, Lupin, Biocon Pharmaceuticals Ltd., Cadila
Health Care Ltd., Dr. Reddy‟s Laboratories, Piramal Enterprises, Aurobindo
Pharmaceuticals, Sun Pharmaceuticals, Sequent Scientific Ltd, Wanbury Ltd., Strides
193
Archolabs, Marksans Pharma Ltd., Parenteral Drugs (India) Ltd., Kopran, Morepen Labs,
Hiran Orgochem Ltd., Zenotech Laboratories Ltd., Ambalal Sarabhai Enterprises and
Biofil Chemicals and Pharmaceuticals Ltd.
5.3. Efficiency Analysis
Efficiency indicated a level of performance that describes a process which uses the
lowest amount of inputs to create the greatest amount of outputs. Efficiency relates to the
use of all inputs in producing any given output, including personal time and energy.
Efficiency Ratios, those are typically used to analyze how well a company uses its assets
and liabilities internally. There are many types of efficiency ratios, but all measure how
well a company utilizes its resources to make a profit. Business managers use these ratios
to determine how well they are operating. Efficiency ratios are used to measure the
quality of the company's receivables and how efficiently it uses its other assets. It
includes Inventory Turnover Ratio, Debtors Turnover Ratio, Cash Turnover Ratio,
Working Capital Turnover Ratio and Creditors Turnover Ratio.
5.3.1. Inventory Turnover Ratio (ITR):
This ratio measures the efficiency of inventory management of a firm. It is computed
dividing cost of goods sold by average inventory maintained during the year. The average
inventory had calculated as half of the total of opening and closing inventory in a year. If
the inventory is efficiently managed, it will help in enhancing the liquidity of the firm. It
also indicated the managerial efficiency. A high Inventory turnover ratio indicates more
frequently the stock are sold which implied less amount is blocked in inventory ,
resulting a high level of efficiency in inventory management and it is good from the
liquidity point of view whereas a low ratio implies excessive inventory levels than
warranted by volume of operation. Higher inventory turnover ratio, lesser the working
capital requirement and vise versa. There is no „rule of thumb‟ for the Inventory turnover
ratio for interpreting the results. The norms may be different for different industries
which actually depend upon the nature of industry and business conditions. The average
inventory turnover ratio of the selected samples taken as a whole was 5.80 during the
period under study.
194
From Table 5.3.1, it was found that the average Inventory Turnover Ratio of Dr. Reddy‟s
Laboratories, Piramal Enterprises, Cadila Health Care Ltd., Strides Archolabs, Biocon
Pharmaceuticals, Biofil Chemicals and Pharmaceuticals Ltd., Ambalal Sarabhai
Enterprises, Sequent Scientific Ltd., Wanbury Ltd. and Morepen Labs was above the
above the average of the selected samples. In Dr. Reddy‟s Laboratories the inventory
turnover ratio was above the average of the selected samples in all the years except 2004-
2005, 2005-2006 and 2009-2010 to 2012-2013. The inventory turnover ratio of Dr.
Reddy‟s Laboratories fluctuated marginally and followed no trend. It began to incline in
the recent years of the study. In Piramal Enterprises, the mean inventory turnover ratio
was 5.43 with a standard deviation 0.93. The inventory turnover ratio of Piramal
Enterprises was above the average of the selected companies in all the years except in
1999-2000 to 2000-2001, 2004-2005and 2011-2012 to 2012-2013. The inventory
turnover ratio of Piramal Enterprises had followed no trend during the period under
study. In Cadila Health Care Ltd., the inventory turnover ratio was above the average of
the selected sample, except 2001-2002 to 2002-2003, 2006-2007 to 2010-2011. The
average inventory turnover ratio of Cadila Health Care Ltd. was 4.69 with a standard
deviation 0.51 during the study period. The average inventory turnover ratio of Strides
Archolabs was 4.52 with a standard deviation 1.82. The Inventory turnover ratio of
Biocon Pharmaceuticals fluctuated time to time. In most of the years the inventory
turnover ratio was above the average of the selected samples except 1999-2000 to 2000-
2001 & 2007-2008 to 2012-2013. The average inventory turnover ratio of Biocon
Pharmaceuticals was 4.12 with a standard deviation 1.15 during the period under study.
The inventory turnover ratio of Biofil Chemicals and Pharmaceuticals Ltd. was much
higher than the average of the selected samples during the recent four years of the study.
In most of the years, the inventory turnover ratio was above the average of the selected
samples of 3.59 except 1999-2000 to 2005-2006 and 2009-2010 during the study period.
The inventory turnover ratio of Biofil Chemicals and Pharmaceuticals Ltd. had followed
no trend during the study period. The inventory turnover ratio of Ambalal Sarabhai
Enterprises was fluctuated time to time and it followed no trend. The inventory turnover
ratio of Ambalal Sarabhai Enterprises was above the average of the selected samples of
22.32 in most of the years except in 2000-2001, 2001-2002, 2003-2004 and 2005-2006.
195
In Sequent Scientific Ltd., the inventory turnover ratio was below the average of the
selected samples in most of the years except in 2003-2004 to 2006-2007. The average
inventory turnover ratio of Sequent Scientific Ltd. was 4.41 with a high standard
deviation of 4.23. The inventory turnover ratio of Ambalal Sarabhai Enterprises was in
inclining trend since 2009-2010. The inventory turnover ratio of Wanbury Ltd. was above
the average of the selected samples in most of the years except 1999-2000 to 2002-2003.
The inventory turnover ratio of Wanbury Ltd. was the highest in recent years of the
study. The mean value of inventory turnover ratio of Wanbury Ltd. was 6.92 with a
standard deviation 4.09. The inventory turnover ratio of Morepen Labs was fluctuated
time to time. In most of the years, the inventory turnover ratio of Morepen Labs was
above the average of the selected samples of 5.80 except in 2001-2002 and 2004-2005 to
2005-2006, on an average, the inventory turnover ratio of Morepen Labs was 5.84 and its
standard deviation was 2.52.
Thus, Inventory Turnover Ratio of Dr. Reddy‟s Laboratories, Piramal Enterprises,
Cadila Health Care Ltd., Strides Archolabs, Biocon Pharmaceuticals, Biofil Chemicals
and Pharmaceuticals Ltd., Ambalal Sarabhai Enterprises, Sequent Scientific Ltd.,
Wanbury Ltd. and Morepen Labs was above the above the average of the selected
samples in most of the years of the study. It indicated that these companies have strong
sales in most of the years. These companies are maintaining their inventory level
efficiently during the entire study period. The liquidity position of these companies was
also better. High level of inventory turnover ratio may lead to shortage or inadequate
level of inventory which may cause to a loss of the business. The inventory turnover ratio
of Ambalal Sarabhai Enterprises was very high as compared to the average of the
selected samples. A high inventory turnover level was also unhealthy because they
represent an investment with a rate of return of zero. It also opens the company up to
trouble if the prices begin to fall.
The average inventory turnover ratio of Lupin, CIPLA, Aurobindo Pharmaceuticals,
Divis Labs, Sun Pharmaceuticals, Kopran, Parentaral Drugs (India) Ltd., Zenotech
Laboratories, Marksans Pharma Ltd. and Hiran Orgochem Ltd. was below the average of
the selected samples during the period under study. These companies are maintaining a
196
low inventory turnover ratio which is an indicator of inefficiency. It also indicated either
poor sales or excessive inventory. The liquidity position of these companies was very
poor. There was a huge possibility of overstocking and obsolescence but it reflected a
planned inventory buildup in the case of material shortages or in anticipation of rapid
rising prices. The inventory turnover ratio of Lupin was fluctuated from time to time. In
most of the years the inventory turnover ratio was below the average of the selected
samples of 5.8 except in 2001-2002 to 2002-2003 and 2013-2014. The average inventory
turnover ratio of Lupin was 4.15 with its standard deviation 0.72. In CIPLA, the average
inventory turnover ratio was 2.64 with its standard deviation 0.28. The inventory turnover
ratio of CIPLA was below the average of the selected samples in all the years of the
study. The inventory turnover ratio of Aurobindo Pharmaceuticals was below the average
of the selected samples in all the years of the study period except in 1999-2000 and 2001-
2002. The ratio was much below the average of the selected samples since 2002-2003.
The mean inventory turnover ratio was 3.71 with its standard deviation 1.26. In Divis
Labs, the inventory turnover ratio was always below the average of the selected samples
of 5.8. The ratio fluctuated marginally during the study period. The inventory turnover
ratio of Sun Pharmaceuticals was much below the average of the selected samples in
recent two years of the study. The ratio was above the average of the selected samples in
most of the years except in 2000-2001 to 2002-2003, 2009-2010 to 2010-2011 and 2012-
2013to 2013-2014. In Kopran, the inventory turnover ratio was above the standard
norms in all the years of the study except 1999-2000 to 2007-2008. The inventory
turnover ratio of Kopran was satisfactory since 2008-2009. The mean inventory turnover
ratio of Parenteral Drugs (India) Ltd. was 4.46 and its standard deviation was 0.94. In
most of the years the inventory turnover ratio was below the average of the selected
samples of 5.8 except 2000-2001 and 2006-2007. The inventory turnover ratio of
Zenotech Ltd. was always below the average of the selected samples of 5.8 except in
2010-2011. The average value of inventory turnover ratio was 6.37 with a standard
deviation 7.80. The inventory turnover ratio of Marksans Pharma Ltd. was always below
the average of the selected samples of 5.8 except 2000-2001. During the recent years of
the study, the inventory turnover ratio of Marksans Pharma Ltd. was in increasing trend.
In Hiran Orgochem Ltd., the inventory turnover ratio was below the average of the
197
selected samples in all the years except 2010-2011 to 2012-2013. The ratio of the
company had followed no trend during the study period.
Thus, Cadila Health Care Ltd. and Biocon Pharmaceuticals was maintaining their average
inventory turnover ratio at a level of the average of selected samples during the study
period followed by Dr. Reddy‟s Laboratories, Piramal Enterprises, Strides Archolabs
Ltd., Sequenti Scientific Ltd. and Morepen labs respectively. The inventory turnover ratio
of Biofil Chemicals and Pharmaceuticals Ltd. and Ambalal Sarabhai Enterprises was
remarkably higher than the average of the selected samples which is unhealthy as it
represents an investment with rate of return zero. The inventory turnover ratio of CIPLA,
Divis Labs and Zenotech Ltd. was remarkably low which is representing a high volume
of stock. It is also indicated poor liquidity. The inventory turnover ratio of Zenotech
Ltd., Divis Labs, Sun Pharmaceuticals and Hiran Orgochem Ltd. was remarkably below
the average of the selected samples of 5.8 in the recent year of the study.
5.3.2. Debtors Turnover Ratio (DTR):
Debtors Turnover Ratio highlights credit and collection policy pursued by a firm. It is
calculated dividing credit sales by average debtors. An average debtor is the half of
opening debtors and closing debtors. The quality of debtors influences the liquidity of a
firm. It tests the speed with which debtors are converted into cash. The liquidity of a firm
is directly influenced by this speed. Thus, debtors‟ velocity indicates the efficiency of
receivables management in a company. A high Debtors turnover ratio reflects the
promptness of debtors‟ collectivity i.e. smooth flow of liquidity and a low Debtors
turnover ratio indicates longer average collection period i.e. shrinkage of liquidity and
also proves inefficiency in credit management. There is no „rule of thumb‟ which may be
used as a norm to examine the Debtors turnover ratio. Different standards are generally
used for different industries in order to examine the Debtors turnover ratio. The average
debtor turnover ratio of the selected companies taken as a whole was 4.53.
Table – 5.3.2 displayed that the average DTR of Piramal Enterprises and Cadila Health
Care Ltd. was above the average of the selected samples. The debtors collection of these
companies were very prompt which indicated efficient in DTR during the period under
198
study. These companies were managed their receivables efficiently. In Piramal
Enterprises, the DTR was always above the average of the selected companies of 4.53
during the study period. It indicated that the debtors are converted into cash speedily.
Since 2011-2012, the DTR started increasing. In Piramal Enterprises, the mean value of
DTR was 6.96 and standard deviation was 1.44. The DTR of Cadila Health Care Ltd. was
always above the average of the selected samples. On an average, Cadila Health Care
Ltd. had maintained its DTR at 6.49 with a standard deviation 1.64. The DTR of Cadila
Health Care Ltd. fluctuated marginally and had followed no trend.
In most of the years the DTR of CIPLA, Sun Pharmaceuticals, Sequent Scientific Ltd.,
Zenotech Ltd, Morepen Labs and Hiran Orgochem Ltd. was above the average DTR of
the selected samples but in rest of the years it was below the average DTR of the selected
samples. The average DTR of CIPLA, Sun Pharmaceuticals, Sequent Scientific Ltd.,
Zenotech Ltd., Morepen Labs and Hiran Orgochem Ltd. was above the average of the
selected samples of 4.53. In CIPLA the DTR was above the average of the selected
samples of 4.53 in all the years except 2004-2005 to 2010-2011. The DTR increased in
the recent three years. The average value of DTR was 4.52 with standard deviation 1.52.
In Sun Pharmaceuticals, the DTR was above the average of the selected samples of 4.53
except 2007-2008 to 2009-2010 and 2012-2013 to 2013-2014. During the first eight
years, the DTR was always above the average of the selected samples of 4.53 but in the
recent two years, the DTR was remarkably low. The DTR of Sequent Scientific was
fluctuated time to time. In most of the years the DTR was above the average of the
selected samples except 1999-2000 to 2000-2001, 2003-2004, 2005-2006 and 2012-2013.
The DTR of Zenotech Ltd. was remarkably lower than the average of the selected
samples during the first ten years of the study but in rest of the years, the DTR was a
remarkably higher than the average of the selected samples. In Zenotech Ltd., the mean
value of DTR was 9.50 with standard deviation 14.04. In the last seven years, the DTR
was above the average of the selected samples. The DTR fluctuated time to time and
followed no trend. The DTR of Hiran Orgochem Ltd. was always below the average of
the selected samples except 2003-2004 to 2009-2010. In the last four years of the study,
the DTR was remarkably low. On an average, the DTR was above the average of the
selected samples.

199
Therefore, CIPLA, Sun Pharmaceuticals, Sequent Scientific Ltd., Zenotech Ltd.,
Morepen Labs and Hiran Orgochem Ltd. maintained their DTR high in few years and
low in rest of the years of the study.
The average value of DTR of Lupin, Divis Labs, Biocon Pharmaceuticals, Kopran,
Marksans Pharma Ltd. and Wanbury Ltd. was below the average of the selected samples.
In few years, the DTR was above the average of the selected samples but in rest of the
years, the DTR was below the average of the selected samples. The DTR of these
companies had followed no trend. In Lupin, the DTR was always below the average of
the selected samples except 2000-2001, 2004-2005 to 2007-2008 and 2009-2010. The
mean value of DTR of Divis Labs was 4.52 with a standard deviation 1.71. In the last five
years, the DTR of Divis Labs was below the average DTR of the selected samples. The
DTR of Biocon Pharmaceuticals was below the average of the selected samples in most
of the years. In the last five years the DTR was in increasing trend. The mean value of
DTR of Biocon Pharmaceuticals was 3.16 with its standard deviation 1.00. The DTR of
Kopran was below the average of the selected samples in the first nine years but it was
above the average of the selected samples in the last six years. In the last five years, the
ratio was in marginally increasing trend. In the recent eight years, the DTR of Marksans
Pharma was below the average of 4.53. In Wanbury Ltd., the DTR was above the average
of the selected samples in most of the years but in few years it was below the average. In
the last three years, the ratio followed an increasing trend. The average DTR was 3.96
with standard deviation 1.12.
Therefore, in most of the years, the debtors collection period of Lupin, Divis Labs,
Biocon Pharmaceuticals, Kopran , Marksans Pharma Ltd. and Wanbury Ltd. was very
long and in few years it was the average of the selected samples.
The DTR of Dr. Reddy‟s Laboratories, Aurobindo Pharmaceuticals, Strides Archolabs,
Biofil Chemicals and Pharmaceuticals Ltd., Ambalal Sarabhai Enterprises and Parenteral
Drugs (India) Ltd. was always below the average of the selected samples during the
entire study period. These companies are offering liberal credit policy to their customer.
The liquidity position of these companies was very weak. The DTR of Dr. Reddy‟s
Laboratories was in marginally decreasing trend. The average DTR was 3.40 with a
200
standard deviation 0.57. In the last year, the DTR was very low. The DTR of Aurobindo
Pharmaceuticals was below the average of the selected samples except in the first two
years of the study. The DTR of Strides Archolabs fluctuated randomly and had followed
no trend. In the last year, the DTR was just the average of the selected samples. The mean
DTR of Strides Archolabs was 2.58 with a standard deviation 0.75. The DTR of Biofil
Chemiocals and Pharmaceuticals Ltd. were always remarkably lower than the average of
the selected samples. The mean DTR was 2.06 with standard deviation 1.86. The DTR of
Ambalal Sarabhai Enterprises was always below the average of the selected samples. The
average DTR was 3.30 with a standard deviation 1.11. In the last four years, the DTR of
Parenteral Drugs (India) Ltd was in decreasing trend. The average DTR was 3.12 with a
standard deviation 0.80.
The study revealed that the DTR of Biofil Chemicals and Pharmaceuticals Ltd., Ambalal
Sarabhai Enterprises and Strides Archolabs were remarkably longer. The collection
period of these companies was very longer. The collection period of Piramal Enterprises,
Cadila Health Care Ltd. and Morepen labs was very shorter. The DTR of rest of the
companies was longer in few years and shorter in rest of the years of the study period.
5.3.3. Cash Turnover Ratio (CTR):
This ratio measures how many times per year it replenishes its cash balance with its sales
revenue. It measures the efficiency of cash management. High cash turnovers mean that
a company is going through its cash cycles quickly. The higher CTR, the higher is the
efficiency of cash management and vice-versa. A higher cash turnover ratio is generally
better than a lower one. It is difficult to develop any standard ratio in this respect. It can
be only judged by a particular firm or industry only from his past experience. There is no
„rule of thumb‟ which may be used as a norm to examine the cash turnover ratio.
Different standards are generally used for different industries in order to examine the
cash turnover ratio. The average cash turnover ratio of the selected companies taken as a
whole was 60.80 during the period under study.
Table 5.3.3 displayed that the average CTR of Lupin, CIPLA, Piramal Enterprises,
Aurobindo Pharmaceuticals, Cadila Health Care Ltd, Divis Lab, Biocon Pharmaceuticals,

201
Parenteral Drugs (India) Ltd. and Wanbury Ltd. was above the average of the selected
samples. The cash management of these companies is very efficient. On an average, the
cash cycles of these companies are very short. These companies had followed no trend
during the study period. In Lupin, the CTR was above the average of selected samples of
60.80 except 1999-2000 to 2001-2002 and 2004-2005 to 2007-2008. The ratio fluctuated
widely. The CTR of CIPLA was always above the average of the selected samples except
2006-2007 to 2007-2008. On an average, the CTR of CIPLA was 114.32 with a standard
deviation 66.71. Cash conversion period of CIPLA was very short. The CTR of CIPLA
had followed no trend. The CTR of Piramal Enterprises above the average of the selected
samples in most of the years but in few years it was below the average of the selected
samples. In the first six years, the CTR of Piramal Enterprises was increasing trend. The
Mean value of CTR of Aurobindo Pharmaceuticals was 158.30 with a standard deviation
242.91. In the recent year, the CTR was very high. It had followed no trend during the
study period. The CTR of Cadila Health Care Ltd. was below the average of the selected
samples in most of the years but in few years it was above the average. In the recent four
years, the CTR of Cadila Health Care Ltd. was very low. The CTR of Divis Lab was
above the average of the selected samples in the recent seven years of the study but in the
first five years it was very low. The CTR of Divis Lab fluctuated with a narrow band. In
Biocon Pharmaceuticals, CTR was very high during 1999-2000 to 2008-2009 except
2003-2004. In the recent five years, the CTR was very low. The average CTR of Biocon
Pharmaceuticals was 102.66 with a standard deviation 45.14. The cash cycle period of
Biocon Pharmaceuticals in the recent five years was very slow but in the beginning of the
years, it was very prompt. The mean value of CTR of Parenteral Drugs (India) Ltd. was
102.51 and its standard deviation was 111.19. The CTR of Parenteral Drugs (India) Ltd.
fluctuated widely and it had followed no trend during the study period. The CTR of
Parenteral drugs (India) Ltd. was very low since 2006-2007. But in the first seven years,
the CTR of Parenteral drugs (India) Ltd. was above the average of the selected samples.
The CTR of Wanbury Ltd. was always below the average of the selected samples except
1999-2000 to 2003-2004 and 2013-2014. The cash conversion cycle of Wanbury Ltd.
was very slow during 2004-2005 to 2012-2013. In the recent year, the CTR of Wanbury
Ltd. was very high.
202
Therefore, cash conversion cycle of Lupin, CIPLA, Piramal Enterprises, Aurobindo
Pharmaceuticals, Cadila Health Care Ltd., Divis Lab, Biocon Pharmaceuticals, Parenteral
Drugs (India) Ltd. and Wanbury Ltd. was very prompt in most of the years but very slow
in rest of the years of the study.
The average CTR of Dr. Reddy‟s Laboratories, Strides Archolabs, Sun Pharmaceuticals,
Kopran, Biofil Chemicals and Pharmaceuticals Ltd., Ambalal Sarabhai Enterprises,
Sequent Scientific Ltd., Zenotech Laboratories Ltd., Marksans Pharma Ltd., Morepen
Labs and Hiran Orgochem Ltd. was below the average of the selected samples. In most of
the years, the CTR was very low. It indicated that the cash conversion period of these
companies were very long. Cash management of these companies was inefficient in most
of the years of the study. In Dr. Reddy‟s Laboratories, the CTR was always below the
average of the selected samples except 2010-2011. The mean CTR of Dr. Reddy‟s
Laboratories was 14.84 with standard deviation 21. The CTR of Strides Archolabs was
always below the average of the selected samples. On an average, the CTR of Strides
Archolabs was 15.97 with a standard deviation 9.93. The CTR of Strides Archolabs
fluctuated widely and followed no trend. The CTR of Sun Pharmaceuticals was
remarkably low during the entire study period except 1999-2000. The mean and Standard
deviation of CTR of Sun Pharmaceuticals was 18.11 and 28.23 respectively. The average
CTR of Kopran was lower than the average of the selected samples in most of the years.
In few years, it was above the average of 60.80. In the recent five years of the study, the
CTR started increasing and it was just above the average of 60.80. The mean CTR of
Biofil Chemicals and Pharmaceuticals Ltd. were 44.02 with a standard deviation 33.24.
In the recent seven years, the CTR of Biofil Chemicals and Pharmaceuticals Ltd. was
below the average of the selected samples. It had followed no trend during the entire
study period. The CTR of Ambalal Sarabhai Enterprises was always below the average of
the selected samples of 60.80. The cash conversion period of Ambalal Sarabhai
Enterprises was very long. The CTR of Sequent Scientific Ltd. was remarkably low
during the entire study period. On an average, the CTR of Sequent Scientific Ltd. was
13.50 and its standard deviation was 11.63. The CTR of Sequent Scientific Ltd.
fluctuated marginally during the study period. In Zenotech laboratories Ltd., the CTR
was always below the average of the selected samples. The average CTR of Zenotech
203
Laboratories Ltd. was 2.09 and standard deviation was 2.71. The CTR of Marksans
Pharma Ltd. was also below the average of the selected samples except 2012-2013. In
most of the years, the CTR of Moirepen Labs was below the average of 60.80 but in few
years it was above in few years. In the first eight years of the syudy, the CTR of Morepen
Lab was remarkably low. The cash conversion period of Morepen Labs in first eightr
years was remarkably longer than that of the rest of the years of the study. The CTR of
Hiran Orgochem Ltd. was always below the average of the selected samples of 60.80
except 2012-2013.
Therefore, the cash conversion period of Dr. Reddy‟s Laboratories, Strides Archolabs,
Sun Pharmaceuticals, Kopran, Biofil Chemicals and Pharmaceuticals Ltd., Ambalal
Sarabhai Enterprises, Sequent Scientific Ltd., Zenotech Laboratories Ltd., Marksans
Pharma Ltd., Morepen Labs and Hiran Orgochem Ltd. was very long. It indicated that the
cash was not properly managed in these companies during the entire study period.
Moreover, these companies were followed no trend uniformly throughout the study
period.
The cash conversion period of Aurobindo Pharmaceuticals, CIPLA, Biocon
Pharmaceuticals, Lupin, Parenteral Drugs (India) Ltd. and Wanbury Ltd. was very speedy
but the cash conversion period of Zenotech Labopratories Ltd., Sequent Scientific Ltd.,
Ambalal Sarabhai Enterprises, Dr. Reddy‟s Laboratories, Strides Archolabs and Sun
Pharmaceuticals was very slow. The cash conversion cycle of Piramal Enterprises,
Cadila Health Care Ltd., Divis Labs, Kopran, Biofil Chemicals and Pharmaceuticals Ltd.,
Marksans Pharma Ltd., Morepen Labs and Hiran Orgochem Ltd. was neither slow nor
fast.
5.3.4. Creditors Turnover Ratio (CRTR):
Creditors Turnover Ratio (CRTR) highlights credit and payment policy pursued by a
firm. It is calculated dividing credit purchase by average creditors. An average creditors
is the half of opening creditors and closing creditors. The quality of creditors influences
the liquidity of a firm. It tests the speed with which cash are being paid to creditors. The
liquidity of a firm is directly influenced by this speed. Thus, creditors‟ velocity indicates

204
the efficiency of payables management in a company. A high creditors turnover ratio
reflects the promptness of creditors‟ payment i.e. shrinkage of liquidity and also proves
inefficiency in credit management and a low creditors turnover ratio indicates longer
average payment period i.e. high liquidity. There is no „rule of thumb‟ which may be
used as a norm to examine the creditors turnover ratio. Different standards are generally
used for different industries in order to examine the creditors turnover ratio. The average
creditor turnover ratio of the selected companies taken as a whole was 2.795.
Table – 5.3.4 displayed that the average CRTR of Lupin Ltd., Dr. Reddys‟ Laboratories,
CIPLA, Aurobindo Pharmaceuticals Ltd., Cadila Health Care Ltd., Sun Pharmaceuticals
Ltd., Biofil Chemicals, Parenteral Drugs (India) Ltd, Wanbury and Morepen Labs was
above the average of the selected samples. The creditors payment of these companies
were very prompt which indicated inefficient in CRTR during the period under study.
These companies were managed their payables inefficiently. In Lupin Ltd, the CRTR was
always above the average of the selected companies of 2.795 except in 2001-02 to 2005-
06 and 2008-09. The average CRTR of Lupin was 2.93 with SD 0.48 during the study
period. In DR. Reddy‟s Laboreatories, the average CRTR was 2.90 with standard
deviation 0.93. Since 1999-2000, the CRTR fluctuated marginally and followed no trend.
In CIPLA, The CRTR was always above the average of the selected companies in all the
years except in 2001-02 to 2005-06. In Aurobindo Pharmaceuticals, the average CRTR
was 3.47 with standard deviation 0.97. In 1999-2000 to 2005-06, the CRTR of Aurobindo
Pharmaceuticals followed a declining trend. In rest of the study period, it followed no
trend. The mean value of CRTR of Aurobindo Pharmaceuticals was 3.47 with standard
deviation 0.97. The CRTR of Cadila Health Care Ltd was always above the average of
the selected samples except in 2002-03 to 2006-07 and 2011-12. In Sun Pharmaceuticals
Ltd. the CRTR was maximum (7.48) in 2000-2001 and followed declining trend and
reached to minimum (2.24) in 2007-08. The average CRTR maintained by Sun
Pharmaceutical Ltd. was 4.38 with Standard deviation 1.54. The CRTR of Biofil
Chemicals Ltd ranged between 14.10 in 2003-2004 (maximum) and 0.16 in 2009-2010
(minimum). Since 2004-05, the CRTR of Biofil Chemicals Ltd was very low which
indicated delaying payment to the creditor for credit purchases and signified efficient
payables management. In Parenteral Drugs (India) Ltd., the CRTR was above the average
205
of the selected samples in all the years except in 2011-12 & 2013-14. The mean CRTR
and S.D of Parenteral Drugs (India) Ltd. were 3.95 and 1.20 respectively. The average
CRTR maintained by Wanbury Ltd was 4.84 with S.D 6.29 which indicated that the
ratios were widely fluctuated during the study period. In Morepen Labs, the CRTR was
always below the average of the selected samples in all the years except in 1999 -2000,
2000-01, and 2002-03 to 2004-05. The CRTR of Morepen Labs fluctuated marginally
and followed no trend during the period under study.
Therefore, CRTR of Lupin Ltd., Dr. Reddys‟ Laboratories, CIPLA, Aurobindo
Pharmaceuticals Ltd., Cadila Health Care Ltd., Sun Pharmaceuticals Ltd., Biofil
Chemicals, Parenteral Drugs (India) Ltd, Wanbury and Morepen Labs was not
satisfactory during the study period. In most of the years, the creditors payment period of
Lupin Ltd., Dr. Reddys‟ Laboratories, CIPLA, Aurobindo Pharmaceuticals Ltd., Cadila
Health Care Ltd., Sun Pharmaceuticals Ltd., Biofil Chemicals and Pharmaceuticals Ltd.,
Parenteral Drugs (India) Ltd, Wanbury and Morepen Labs was very short and in few
years it was below the average of the selected samples.
The average CRTR of Piramal Enterprises, Divis Labs, Strides Archolabs, Biocon
Pharmaceuticals, Kopran, Ambalal Sarabhai Enterprises, Sequent Scientific Ltd.,
Zenotech Laboratories, Marksans Pharma, and Hiran Orgochen Ltd. was always below
the average of the selected samples during the study period. It is indicated that these
companies were enjoying longer credit facilities from creditors by credit purchase of raw
materials. In Piramal Enterprises, the CRTR was always above the average of the
selected samples of 2.795 except in 2010-11 to 2013-14. The average CRTR of Piramal
enterprises was 2.72 with standard deviation 0.93. The mean value of CRTR of Divis
Labs was 2.40 with SD 0.40 during the study period. The CRTR of Divis Labs was
always below the average of the selected samples in all the years except in 2012-13 and
2013-14. Strides Archolabs had mainitained its CRTR at a level below the average of the
selected samples in all the years except in 1999-2000. In Biocon Pharmaceutical, the
mean value of CRTR was 2.09 and its SD was 0.65. The CRTR of Biocon
Pharmaceuticals fluctuated marginally and it had followed no trend during the study
period. The CRTR of Kopran ranged between 4.46 (maximum) in 2000-01 and 1.21
206
(minimum) in 2007-08. Except 2000-01 and 2013-14, the CRTR of Kopran was always
below the average of the selected samples. The average CRTR maintained by Ambalal
Sarabhai Enterprises was 0.79 with its SD 0.42 during the period of study. The CRTR of
Ambalal Sarabhai Enterprises was always very low as compared to the average of the
selected samples. In Sequent Scientific Ltd., the CRTR was always very low as compared
to the average of the selected samples in all the years except in 2003-04 to 2006-07 and
2008-09. The CRTR of Sequent Scientific fluctuated widely during the study period. In
Zenotech Laboratories, the CRTR was always below the average of 2.795 in all the years
except 2001-02, 2002-03 and 2008-09 to 2010-11 and had fluctuated randomly. The
CRTR of Zenotech Laboratories had followed no trend during the study period. The
mean value and SD of CRTR of Zenotech Laboratories were 2.21 and 2.26 respectively
during the study period. the CRTR of Marksans Pharma fluctuated widely with a
standard deviation 1.14 and had followed no trend. In the recent years, the CRTR was
very low. The average CRTR of Hiran Orgochem Ltd was 2.10 with standard deviation
0.65 during the study period.
Therefore, CRTR of Piramal Enterprises, Divis Labs, Strides Archolabs, Biocon
Pharmaceuticals, Kopran, Ambalal Sarabhai Enterprises, Sequent Scientific Ltd.,
Zenotech Laboratories, Marksans Pharma, and Hiran Orgochen Ltd. was always below
the average of the selected samples. The payables management of these companies was
comparatively satisfactory.
5.3.5. Operating Cycle Period:
It is known as cash conversion cycle. Operating cycle is the no. of days a company takes
in realizing its inventories in cash. It equals the time taken in selling inventories plus the
time taken in recovering cash from trade receivables. It is called Operating Cycle because
this process of producing / purchasing inventories, selling them, recovering cash from
customers, using that cash to purchase / produce inventories and so on is repeated as long
as the company is in operations.
Net Operating Cycle = Days Inventory Outstanding (+) Days Sales Outstanding (-) Days
Payables Outstanding.
207
Operating Cycle is a measure of operating efficiency and working capital management of
a company. A short operating cycle is good as it tells that the company‟s cash is tied up
for a shorter period. A longer operating cycle tells that the company‟s cash is blocked for
a long period which is not good for the company. It is difficult to develop any standard
ratio in this respect. It can be only judged by a particular firm or industry only from his
past experience. There is no „rule of thumb‟ which may be used as a norm to examine the
cash turnover ratio. Different standards are generally used for different industries in order
to examine the cash turnover ratio. The average cash turnover ratio of the selected
companies taken as a whole was 153.21 days during the period under study.
From Table – 5.3.5 it was found that the operating cycle period of Dr. Reddy‟s
Laboratories, Kopran, was always above the average of the selected samples. The
operating cycle period of Dr. Reddy‟s Laboratories and Kopran was much longer which
indicated that the company‟s cash is blocked for a long time. It is not good for the
company. In Dr. Reddy‟s Laboratories, the average operating cycle period was 217.83
days with a standard deviation 49.35. The ratio followed an increasing trend since 2009-
2010. In Kopran, the operating cycle period was always above the average of the selected
samples. The average operating cycle period was 252.67 Days with its standard deviation
85.49. This ratio was inclining trend since 2010-2011.
Therefore, working capital management in respect of operating efficiency of Dr. Reddy‟s
Laboratories and Kopran was inefficient during the entire study period.
The average operating cycle period of Lupin, CIPLA, Aurobindo Pharmaceuticals,
Strides Archolabs, Sun Pharmaceuticals, Parenteral Drugs (India) Ltd., Zenotech
Laboratories Ltd., Wanbury Ltd., Morepen Labs and Hiran Orgochem Ltd. was above the
average of the selected samples. In Lupin, the operating cycle period was above the
average of the selected samples except in 2003-2004 to 2004-2005 and 2007-2008 to
2013-2014. The operating cycle period of Lupin was declining trend since 2005-2006.
The operating cycle period of CIPLA was below the average of the selected samples of
153.21 days except 2002-2003, 2005-2006 to 2012-2013. The mean operating cycle
period of CIPLA was 161.15 days with its standard deviation 28.36. The operating cycle
period of CIPLA followed a uniform trend throughout the study period. The average

208
operating cycle period of Aurobindo Pharmaceuticals was 209.88 days and its standard
deviation was 63.91. In the first six years, the operating cycle period of Aurobindo
pharmaceuticals was inclining trend and it followed an overall declining trend during the
rest of the years of the study. The operating cycle period of Strides Archolabs was
declining trend in the recent four years of the study. The operating cycle period of Strides
Archolabs widely fluctuated during the study period. In Sun Pharmaceuticals the
operating cycle period was above the average of the selected samples except 1999-2000,
2001-2002 to 2003-2004 and 2013-2014. In the recent year, the operating cycle period
was negative which indicated that days payable outstanding was more than days
inventory outstanding and days sales outstanding. The company can effectively cover its
short term payments as they come due. In Parenteral Drugs (India) Ltd., the operating
cycle periods was always above the average of the selected samples except 2004-2005 to
2006-2007 and 2010-2011. The ratio was inclining trend since 2009-2010. The average
operating cycle period of Zenotech Laboratories Ltd. was above the average of the
selected samples. In 1999-2000, 2002-2003, 2003-2004, 2005-2006, 2009-2010, 2010-
2011, 2011-2012 and 2013-2014, the operating cycle period was above this average. The
operating cycle period of Wanbury Ltd. was negative in the recent year. The mean value
of operating cycle period of Wanbury Ltd. was 175.95 with a standard deviation 87.97.
The ratio followed no trend entire the study period. In Morepen Labs, the operating cycle
period was above the average of the selected samples except 2006-2007 to 2013-2014.
The ratio was declining trend since 2004-2005. In the recent six years, it was negative.
The average operating cycle period of Hiran Orgochem Ltd. was above the average of the
selected samples except 1999-2000 to 2005-2006. The ratio followed an inclining trend
since2008-2009.
Therefore, working capital of Lupin, CIPLA, Aurobindo Pharmaceuticals, Strides
Archolabs, Sun Pharmaceuticals, Parenteral Drugs (India) Ltd., Zenotech Laboratories
Ltd., Wanbury Ltd., Morepen Labs and Hiran Orgochem Ltd. was not managed
efficiently in most of the years. Working capital management was efficiently done in few
years, when their operating cycle period was shorter.
209
The operating cycle period of Piramal Enterprises, Cadila Health Care Ltd., Divis Lab,
Biocon Pharmaceuticvals, Biofil Chemicals and Pharmaceuticals Ltd., Ambalal Sarabhai
Enterprises, Sequent Scientific Ltd. and Marksans Pharma was always below the average
of the selected samples. In Piramal Enterprises, the ratio was below the average of the
selected samples except 2010-2011, 2012-2013 and 2013-2014. In the recent two years,
the operating cycle period was the maximum. In Cadila Health Care Ltd., the ratio was
always below the average except 1999-2000. The mean operating cycle period was
114.91 with its standard deviation 80.67. In Divis Lab, the operating cycle period was
below the average of the selected samples except 2004-2005, 2005-2006 and 2008-2009
to 2013-2014. In Biocon Pharmaceuticals, operating cycle period was above in 2003-
2004 and 2008-2009 to 2013-2014. The mean value of operating cycle period of Biofil
Chemicals and Pharmaceuticals Ltd. was 39.71 days with its standard deviation 329.47.
The ratio had a negative value during 2005-2006 to 2010-2011. The operating cycle
period of Ambalal Sarabhai Enterprises was always below the average of the selected
samples. It was always negative except 1999-2000 to 2001-2002 and 2003-2004. The
operating cycle period of Sequent Scientific was below the average of the selected
samples since 2009-2010. On an average, the company maintained its operating cycle
period at 111.21 with its standard deviation 53.41. The operating cycle period of
Marksans Pharma followed no trend during the entire study period.
Therefore, working capital of Piramal Enterprises, Cadila Health Care Ltd., Divis Lab,
Biocon Pharmaceruicals, Biofil Chemicals and pharmaceuticals Ltd, Ambalal Sarabhai
Enterprises, Sequent Scientific Ltd. and Marksans Pharma was efficiently managed in
respect of operating cycle period, during the period under study.
5.3.6. Summary of the Efficiency Analysis
Inventory Turnover Ratio of Dr. Reddy‟s Laboratories, Piramal Enterprises, Cadila
Health Care Ltd., Strides Archolabs, Biocon Pharmaceuticals Ltd., Biofil Chemicals and
Pharmaceuticals Ltd., Ambalal Sarabhai Enterprises, Sequent Scientific Ltd., Wanbury
Ltd. and Morepen Labs was above the average of the selected samples in most of the
years of the study. The average inventory turnover ratio of Lupin, CIPLA, Aurobindo
Pharmaceuticals, Divis Labs, Sun Pharmaceuticals, Kopran, Parentaral Drugs (India)
210
Ltd., Zenotech Laboratories, Marksans Pharma Ltd. and Hiran Orgochem Ltd. was below
the average of the selected samples during the period under study. The average inventory
turnover ratio was highest in Ambalal Sarabhai Enterprises followed by Biofil Chemicals
and Pharmaceuticals Ltd., Wanbury Ltd., Piramal Enterprises, Sequent Scientific Ltd,
Morepen Labs, Strides Archolabs, Dr. Reddy‟s Laboratories, Biocon Pharmaceuticals
Ltd., Cadila Health Care Ltd., Sun Pharmaceuticals, Lupin, Hiran Orgochem Ltd.,
Parenteral Drugs (India) Ltd., Kopran, Aurobindo Pharmaceuticals, Marksans Pharma
Ltd., Zenotech Laboratories Ltd., CIPLA, and Divis Labs .
The debtors collections of average DTR of Piramal Enterprises and Cadila Health Care
Ltd. were very prompt as the average DTR of the selected companies were above the
average of the selected samples. In most of the years, the debtors collection period of
Lupin, Divis Labs, Biocon Pharmaceuticals, Kopran, Marksans Pharma Ltd. and
Wanbury Ltd. was very long. The DTR of Biofil Chemicals and Pharmaceuticals Ltd.,
Ambalal Sarabhai Enterprises and Strides Archolabs were remarkably longer. The DTR
of rest of the companies was longer in few years and shorter in rest of the years of the
study period.
Cash conversion cycle of Lupin, CIPLA, Piramal Enterprises, Aurobindo
Pharmaceuticals, Cadila Health Care Ltd., Divis Lab, Biocon Pharmaceuticals, Parenteral
Drugs (India) Ltd. and Wanbury Ltd. was very prompt in most of the years but very slow
in rest of the years of the study. The cash conversion period of Dr. Reddy‟s Laboratories,
Strides Archolabs, Sun Pharmaceuticals, Kopran, Biofil Chemicals and Pharmaceuticals
Ltd., Ambalal Sarabhai Enterprises, Sequent Scientific Ltd., Zenotech Laboratories Ltd.,
Marksans Pharma Ltd., Morepen Labs and Hiran Orgochem Ltd. was very long. It
indicated that the cash was not properly managed in these companies during the entire
study period. Moreover, these companies were followed no trend uniformly throughout
the study period.
The cash conversion period of Aurobindo Pharmaceuticals, CIPLA, Biocon
Pharmaceuticals, Lupin, Parenteral Drugs (India) Ltd. and Wanbury Ltd. was very speedy
but the cash conversion period of Zenotech Labopratories Ltd., Sequent Scientific Ltd.,
Ambalal Sarabhai Enterprises, Dr. Reddy‟s Laboratories, Strides Archolabs and Sun

211
Pharmaceuticals was very slow. The cash conversion cycle of Piramal Enterprises,
Cadila Health Care Ltd., Divis Labs, Kopran, Biofil Chemicals and Pharmaceuticals Ltd.,
Marksans Pharma Ltd., Morepen Labs and Hiran Orgochem Ltd. was neither slow nor
fast.
Creditors Management of Lupin Ltd., Dr. Reddys‟ Laboratories, CIPLA, Aurobindo
Pharmaceuticals Ltd., Cadila Health Care Ltd., Sun Pharmaceuticals Ltd., Biofil
Chemicals, Parenteral Drugs (India) Ltd, Wanbury and Morepen Labs was not
satisfactory during the study period. In most of the years, the creditors payment period of
Lupin Ltd., Dr. Reddys‟ Laboratories, CIPLA, Aurobindo Pharmaceuticals Ltd., Cadila
Health Care Ltd., Sun Pharmaceuticals Ltd., Biofil Chemicals and Pharmaceuticals Ltd.,
Parenteral Drugs (India) Ltd, Wanbury and Morepen Labs was very short and in few
years it was below the average of the selected samples. Creditors Management of Piramal
Enterprises, Divis Labs, Strides Archolabs, Biocon Pharmaceuticals, Kopran, Ambalal
Sarabhai Enterprises, Sequent Scientific Ltd., Zenotech Laboratories, Marksans Pharma,
and Hiran Orgochen Ltd. were always below the average of the selected samples. The
payables management of these companies was comparatively satisfactory.
Operating capital cycle period of Lupin, CIPLA, Aurobindo Pharmaceuticals, Strides
Archolabs, Sun Pharmaceuticals, Parenteral Drugs (India) Ltd., Zenotech Laboratories
Ltd., Wanbury Ltd., Morepen Labs and Hiran Orgochem Ltd. was not managed
efficiently in most of the years. Working capital cycle period was efficiently done in few
years, when their operating cycle period was shorter. Working capital cycle period of
Piramal Enterprises, Cadila Health Care Ltd., Divis Lab, Biocon Pharmaceruicals, Biofil
Chemicals and pharmaceuticals Ltd, Ambalal Sarabhai Enterprises, Sequent Scientific
Ltd. and Marksans Pharma was efficiently managed in respect of operating cycle period,
during the period under study.
5.4. Component wise Ratio Analysis
Companies must measure risk, develop, and then implement strategies for maintaining a
positive cash flow. This strategy is called a working capital management strategy. The
goal of an efficient working capital management strategy is to balance different
212
component of working capital so a company may meet its short-term obligations and
maintain operating expenses. The major components of a working capital management
strategy are inventories, debtors, cash and its equivalent, loans and advances and current
liabilities.
5.4.1. Current Assets to Total Assets Ratio (CATA):
It indicates the extent of total funds invested for the purpose of working capital and
throws light on the importance of current assets of a firm. Total assets include fixed
assets and current assets as a whole taken together. Fixed assets include net block in fixed
assets, capital work in progress and investment. Current assets include inventories,
sundry debtors, cash and its equivalent and loans and advances. It should be worthwhile
to observe that how much of that portion of total assets is occupied by the current assets,
as current assets are essentially involved in forming working capital and also take an
active part in increasing liquidity. Thus, this ratio should not be so large to ignore the
application of the funds in fixed assets. Also care should be taken that principal
investment of the firm should be in the operating items. This key ratio is important from
the view point of liquidity. The higher CATA, the higher is liquidity and vice-versa.
There is no „rule of thumb‟ which may be used as a norm to examine the Current Assets
to Total Assets Ratio. Different standards are generally used for different industries in
order to examine the Current Assets to Total assets Ratio. The average Current Assets to
Total Assets Ratio of the selected companies taken as a whole was 0.48 during the period
under study.
From Table -5.4.1 it was reflected that the CATA of LUPIN, Dr. Reddy‟s Laboratories,
CIPLA, Piramal Enterprises, Aurobindo Pharmaceuticals, Divis Lab, Kopran, Sequent
Scientific Ltd., Marksans Pharma Ltd., Wanbury Ltd. and Hiran Orgochem Ltd. was
above the average of the selected samples. The current assets investment of these
companies was very high. The liquidity position of these companies was also very high.
Principal investment of these companies was in the operating items. In Lupin, average
CATA was 0.56 with standard deviation 0.05. The ratio ranged between 0.46 and 0.66.
The CATA of Dr. Reddy‟s Laboratories was inclining trend since 2009-2010. The ratio
varied between 0.42 and 0.73. The mean value of CATA of Dr. Reddy‟s Laboratories

213
was 0.55 with a standard deviation 0.09. The CATA of CIPLA was declining trend since
2002-2003. The CATA was always above the average of the selected samples except
2012-2013 and 2013-2014. In Piramal enterprises, the CATA ranged between 0.25 and
0.82. The average CATA of Piramal Enterprises was 0.48 with its standard deviation
0.12. The CATA of Piramal Enterprises was declining trend since 2008-2009. In
Aurobindo Pharmaceuticals, the CATA was always above the average of the selected
samples. On an average, Piramal Enterprises maintained its CATA at 0.60 with its
standard deviation 0.05. The CATA of Divis Lab had followed no trend during the period
under study. The CATA fluctuated between 0.38 and 0.59. The mean CATA of Divis Lab
was 0.48 with its standard deviation 0.04. The CATA of Divis Labs was always above
the average of the selected samples except 1999-2000, 2000-2001 and 2009-2010 to
2011-2012. In Kopran, the average CATA was just above the average of the selected
samples of 0.48. The CATA was inclining trend since 2004-2005. In Sequent Scientific,
the CATA was declining trend throughout the entire study period. During 1999-2000 to
2001-2002, the CATA was nearest to 1 which indicated that current assets of the
company occupied major portion out of total assets. The company possessed high
liquidity in those years. The CATA of Marksans Pharma Ltd. was always above the
average of the selected samples except 2000-2001 to 2003-2004 and 2008-2009. The
average CATA of Marksans Pharma Ltd. was 0.49 with its standard deviation 0.12. The
ratio varied between 0.34 (minimum) and 0.72 (maximum). The CATA of Wanbury Ltd.
was always above the average of the selected samples except 1999-2000 to 2000-2001
and 2008-2009. The CATA of Wanbury Ltd. had followed no trend during the period
under study. In Hiran Orgochem Ltd., the CATA was always above the average of the
selected samples. The mean value of CATA of Hiran Orgochem was 0.72 with its
standard deviation 0.07.
Therefore, the CATA of LUPIN, Dr. Reddy‟s Laboratories, CIPLA, Piramal Enterprises,
Aurobindo Pharmaceuticals, Divis Lab, Kopran, Sequent Scientific Ltd. Marksans
Pharma Ltd, Wanbury Ltd. and Hiran Orgochem Ltd. was very high. The major portion
of total assets of these companies was current assets. The liquidity position of these
companies was very high.

214
The average CATA of Cadila Health Care Ltd., Strides Archo Labs, Sun
Pharmaceuticals, Biocon Pharmaceuticals, Biofil Chemicals and Pharmaceuticals Ltd.,
Ambalal Sarabhai Enterprises, Parenteral Drugs(India) Ltd., Zenotech Ltd. and Morepen
Labs was below the average of the selected samples. In Cadila Health Care Ltd., the
CATA was always below the average of the selected samples of 0.48 except 1999-2000.
On an average, Cadila Health Care Ltd. maintained its CATA at 0.41 with its standard
deviation 0.07. It had followed no trend during the period under study. The CATA of
Strides Archolabs fluctuated widely during the study period. The CATA of Strides
Archolabs was always below the average of the selected samples of 0.48 except 2003-
2004 and 2010-2011 to 2011-2012. In Sun Pharmaceuticals, the average CATA was
0.46. The CATA of Sun Pharmaceuticals was below the average of the selected samples
since 2009-2010. The ratio ranged between 0.26 and 0.62 during the study period. The
CATA of Sun Pharmaceuticals followed an overall declining trend during the entire study
period. The CATA of Biocon Pharmaceuticals was below the average of the selected
samples in 2001-2002 and 2004-2005 to 2008-2009. The mean value of CATA of Biocon
Pharmaceuticals was 0.45 with standard deviation 0.11. The ratio followed an inclining
trend since 2004-2005. In Biofil Chemicals and Pharmaceuticals Ltd., the CATA was
always below the average of the selected samples except 2003-2004 and 2004-2005. The
average CATA of Biofil Chemicals and Pharmaceuticals Ltd. was 0.25 with its standard
deviation 0.14. The CATA of Biofil Chemicals and Pharmaceuticals Ltd. fluctuated
widely during the entire study period. The CATA of Ambalal Sarabhai Enterprises
followed a declining trend since 2007-2008. In the recent three years of the study, the
CATA of Ambalal Sarabhai Enterprises was 0.25 which was much below the average of
the selected samples of 0.48. The CATA of Parenteral Drugs ( India) Ltd. followed an
overall declining trend throughout the entire study period. The ratio was very low during
the recent four years of the study. In Zenotech ltd., the CATA was always below the
average of the selected samples of 0.48 except 1999-2000 to 2003-2004 and 2007-2008.
The average CATA of Zenotech Ltd. was 0.35 with standard deviation 0.21. The CATA
of Zenotech Ltd. varied between 0.09 and 0.63. The CATA of Morepen Labs was always
below the average of the selected samples. The value of CATA of Morepen Labs was
0.24 with a standard deviation 0.13. The ratio followed a declining trend during 1999-
215
2000 to 2008-2009 and followed an inclining trend during the rest of the years. Thus, it
showed a mixed trend during the period under study.
Therefore, the CATA of Cadila Health Care Ltd., Strides Archolabs, Sun
Pharmaceuticals, Biocon Pharmaceuticals, Biofil Chemicals and Pharmaceuticals Ltd.,
Ambalal Sarabhai Enterprises, Parenteral Drugs (India) Ltd., Zenotech Ltd. and Morepen
Labs were very low as compared to the average of the selected samples during the period
under study. Investment in current assets out of total assets of these companies was low.
Liquidity position of these companies was lower.
Therefore, Piramal Enterprises, Divis Lab, Sun Pharmaceuticals, Biocon
Pharmaceuticals, Kopran, Ambalal Sarabhai Enterprises and Parenteral Drugs (India)
Ltd. were maintaining CATA at a level of average of the selected samples. LUPIN, Dr.
Reddy‟s Laboratories, CIPLA, Aurobindo Pharmaceuticals, Sequent Scientific, Marksans
Pharma Ltd., Wanbury Ltd. and Hiran Orgochem Ltd. were maintaining their CATA at a
level above the average of the selected samples. Cadila Health Care Ltd., Strides Archo
Labs, Biofil Chemicals and Pharmaceuticals Ltd., Zenotech Ltd and Morepen Labs
maintaining their CATA at a level below the average of the selected samples.
5.4.2. Inventory to Current Assets Ratio:
Inventory to Current Assets Ratio defined as a method to show what portion of a
company‟s inventories is financed from its available cash, is essential to business which
hold inventory and survive on cash supplies. It is an indicator of a company‟s efficiency.
In general, the lower the ratio, the higher the liquidity of a company is. A low value of
inventory to current assets ratio means that the company is carrying low level of
inventory in stock which is the indicator of high liquidity. However, it is indicated
insufficient inventories which may affect the production at the time of emergency. A high
value of Inventory to Current Assets Ratio means that the company is carrying too much
inventory in stock. It is not favorable for management because excessive inventories can
place a heavy burden on the cash resources of a company. Effective inventory
management is essential. The goal is to have enough Inventories to complete orders.
Excessive inventory creates additional costs such as paying for storage space and
216
inventory spoilage. A key issue for a company to improve its operation efficiency is to
identify the optimum inventory levels and thus minimize the cost tied up in inventories.
There is no „rule of thumb‟ which may be used as a norm to examine the Inventory to
Current Assets. Different standards are generally used for different industries in order to
examine the Inventory to Current Assets. The average Inventory to Current Assets Ratio
of the selected companies taken as a whole was 26.98% during the period under study.
From Table -5.4.2, it was found that the average Inventory to Current Assets ratio of
LUPIN, CIPLA, Aurobindo Pharmaceuticals, Cadila Health Care Ltd., Divis Lab,
Marksans Pharma Ltd., Parenteral Drugs (India) Ltd., Morepen Labs and Hiran
Orgochem Ltd. was above the average of the selected samples. These companies were
carrying too much inventory in stock. Additional cost such as paying for storage space
and inventory spoilage are very of these companies. Short term liquidity of these
companies is very low. The mean inventory to current assets ratio of Lupin was 28.29%
with standard deviation 7.16. The ratio followed an overall increasing trend. In CIPLA,
the inventory to current assets ratio was always above the average of the selected
samples. On an average, the Inventory to current assets Ratio of CIPLA was 39.56% with
a standard deviation 5.98 during the period under study. The ratio followed an increasing
trend since 2009-2010. In Aurobindo Pharmaceuticals, the Inventory to current assets
ratio was always above the average of the selected samples except 2001-2002, 2002-
2003, 2005-2006 and 2006-2007. In the recent five years, Aurobindo Pharmaceuticals
maintained a uniform rate of inventory to current assets ratio. The average value of
inventory to current assets ratio of Aurobindo Pharmaceuticals was 31 and its standard
deviation was 5. In Cadila Health Care Ltd. also, the inventory to current assets ratio was
always above the average of the selected samples except 1999-2000 and 2011-2012 to
2013-2014. In the recent three years, Cadila Health Care Ltd. maintained its inventory to
current assets ratio at a uniform rate which was just below the average of the selected
samples of 26.98%. The mean value of inventory to current assets ratio was 31.36 with a
standard deviation 7.62. In Divis Lab, the inventory to current assets ratio was always
above the average of the selected samples. On an average, the inventory to current assets
ratio of Divis Lab was 50.75% with standard deviation 4.86 during the study period. The
ratio fluctuated randomly and it had followed no trend. The mean inventory to current

217
assets ratio of Parenteral Drugs (India) Ltd. was 30.56 with its standard deviation 3.95.
The ratio was always above the average of the selected samples of 26.98% except 2012-
2013 to 2013-2014.The Inventory to current assets ratio of Marksans Pharma Ltd. had
followed declining trend since 2008-2009. The inventory to current assets ratio of
Marksans pharma Ltd. was always above the average of the selected samples of 26.98%
except 2005-2006, 2010-2011 and 2013-2014. The Inventory to current assets ratio of
Marksans Pharma Ltd. fluctuated widely with a standard deviation 10.91. The average
inventory to current assets ratio of Marksans Pharma Ltd. was 35.90%. The inventory to
current assets ratio of Morepen Labs was above the average of the selected samples since
2007-2008 but in rest of the years it was below the average of the selected samples of
26.98%. The mean inventory to current assets ratio of Morepen Labs was just above the
average of the selected samples. The inventory to current assets ratio of Hiran Orgochem
Ltd. was much above the average of the selected samples during 1999-2000 to 2009-2010
and was much below the average of the selected samples in the rest of the study period.
On an average, Hiran Orgochem Ltd. maintained its inventory to current assets ratio at
50.57% with a standard deviation 25.10 during the period under study.
Therefore, the inventory to current assets ratio of LUPIN, CIPLA, Aurobindo
Pharmaceuticals, Cadila Health Care Ltd., Divis Lab, Marksans Pharma Ltd., Parenteral
Drugs (India) Ltd., Morepen Labs and Hiran Orgochem Ltd. was very high. They were
maintaining conservative policy for managing its inventory level. The average inventory
to current assets ratio of Lupin, Biocon Pharmaceuticals and Morepen Labs was just
equivalent to the average of the selected samples. The average inventory to current assets
ratio of Divis Lab and Hiran Orgochem Ltd. was near about 50% which is very high.
These two companies followed highly conservative policy for managing their inventory
level.
The average inventory to current assets ratio of Dr. Reddy‟s Laboratories, Piramal
Enterprises, Strides Archo Labs, Sun Pharmaceuticals, Biocon Pharmaceuticals, Kopran,
Biofil Chemicals and Pharmaceuticals Ltd., Ambalal Sarabhai Enterprises, Sequent
Scientific Ltd, Zenotech Ltd. and Wanbury Ltd. was always below the average of the
selected samples of 26.98%. These companies followed aggressive policy in managing
218
their inventory to current assets level. The liquidity position of these companies was very
high as the company carrying low level of inventory in its stock. However, low level of
inventory may affect the production at the time of emergency or accepting additional
order. The mean inventory to current assets ratio was 20.02 with standard deviation 4.40.
The ratio had followed no trend during the study period. In Piramal Enterprises, the
inventory turnover ratio was even below the 7% in the recent four years of the study. The
average inventory to current assets ratio was 23.69% with a standard deviation 13.87. In
Strides Archolabs, the Inventory to current assets ratio was always below the average of
the selected samples of 26.98% except 1999-2000 to 2001-2002 and 2004-2005. The
average inventory to current assets ratio was 18.36% with a standard deviation 9.27. The
average inventory to current assets ratio of Sun Pharmaceuticals was 24.10%. The
inventory to current assets ratio of Kopran was above the average of the selected samples
in the initial two years but it was below the average of the selected samples in the rest of
the years of the study. The average inventory to current assets ratio of Kopran was
22.84%. In Biofil Chemicals and Pharmaceuticals Ltd., average inventory to current
assets ratio was 16.33 with a standard deviation 11.27. The ratio was much below the
average of the selected samples of 26.98 in the recent five years of the study. In Ambalal
Sarabhai Enterprises, inventory to current assets ratio was always below the average of
the selected samples. The average inventory to current assets ratio was 10.38 with its
standard deviation 6.32. In the recent years, the ratio was still declining. The inventory to
current assets ratio of Sequent Scientific Ltd. was overall declining trend. The ratio was
above the average of the selected samples since 2007-2008 but in the rest of the years, it
was below the average of the selected samples of 26.98%. In the initial eight years of the
study, the company followed aggressive policy in managing its inventory to current
assets level but in the rest of the years, it was conservative motive. The mean inventory to
current assets ratio was 18.09% with a standard deviation 13.78. The average inventory to
current assets ratio of Zenotech Ltd. was 10.22% with standard deviation 10.14. The
inventory to current assets ratio was always below the average of the selected samples of
26.98% except in the recent two years of the study and followed no trend during the
study period. In Wanbury Ltd., the inventory to current assets ratio was always below the
average of the selected samples except in 1999-2000 to 2002-2003. The ratio followed an

219
over declining trend throughout the study period. The mean value of inventory to current
assets ratio of Wanbury Ltd. was 22.20 with a standard deviation 15.24.
Therefore, Dr. Reddy‟s Laboratories, Piramal Enterprises, Strides Archo Labs, Sun
Pharmaceuticals, Biocon, Kopran, Biofil Chemicals Ltd., Ambalal Sarabhai Enterprises,
Sequent Scientific Ltd., Zenotech Ltd. and Wanbury Ltd. had maintained its inventory to
current assets level at a rate below the average of the selected samples of 26.98%.
Inventory to current assets ratio of Zenotech Ltd. was highly aggressive followed by
Ambalal Sarabhai Enterprises, Biofil Chemicals and Pharmaceuticals Ltd., Sequent
Scientific Ltd., Strides Archolabs, Dr. Reddy‟s Laboratories, Wanbury Ltd., Kopran, Sun
Pharmaceuticals, and so on. The inventory to current assets ratio of Divis Lab and Hiran
Orgochem Ltd. was highly conservative as compared to the selected samples. Lupin,
Biocon Pharmaceuticals, maintained their average inventory to current assets ratio at a
level of the average of the selected samples of 26.98%.
5.4.3. Sundry debtors To Current Assets Ratio:
It indicates sundry debtors as total current assets and throws light on the importance of
sundry debtors of a firm. Accounts receivables must be collected in a timely manner.
The sooner company received the money owed, the sooner it can be re-invested to earn a
profit. It should be worthwhile to observe that how much of that portion of current assets
is occupied by the sundry debtors as debtors are essentially involved in forming working
capital and also take an active part in increasing liquidity. Funds that are employed in the
business carry opportunity cost. Hence, if this ratio is very high, it means that credit
policy of the company may not be sound; too much money was locked up in the debtors.
If the money were not locked up in debtors, it could have been invested elsewhere to earn
a return or may have been repaid to the financier. Higher the ratio, higher is the cost of
carrying debtors. It is, therefore, desired that a company need to carry the least
percentage of debtors as possible without affecting the sales volume. The lower the ratio,
the higher is the liquidity and vice – versa. There is no „rule of thumb‟ which may be
used as a norm to examine the Sundry Debtors to Current assets ratio. Different standards
are generally used for different industries in order to examine the Sundry Debtors to
220
current assets ratio. The average Sundry debtor to current assets ratio of the selected
companies taken as a whole was 0.33 during the period under study.
From Table -5.4.3, it was found that the sundry debtors to current assets ratio of Lupin,
Aurobindo Pharmaceuticals, Strides Archolabs, Biocon Pharmaceuticals, Biofil
Chemicals and Pharmaceuticals Ltd., Parenteral Drugs (India) Ltd., Zenotech Ltd. and
Marksans Pharma Ltd. was above the average of the selected samples of 34.05%. These
companies offered longer credit period to its customers as compared to the other selected
samples. These companies locked up much money in debtors which could be reinvested
to earn a return. Moreover, it is indicated that carrying cost of debtors was very high.
There is a high possibility of being bad debt. In Lupin, the sundry debtors to current
assets ratio was ranged between 25.72% (minimum) and 55.12% (maximum) with mean
and standard deviation 40.46% and 7.18% respectively. The sundry debtors to current
assets ratio of Lupin was always above the average of the selected samples of 34.05%.
The ratio followed an inclining trend since 2005-2006. In the recent year, debtor‟s
balance of Lupin was 45.67% of total current assets. The average sundry debtors to
current assets ratio of Aurobindo Pharmaceuticals was 45.41% with its standard deviation
9.44% during the study period. The ratio was always above the average of the selected
samples except 2006-2007. Since 2006-2007, the sundry debtors to current assets ratio
were increasing trend. Moreover, in the recent year, 63% of the total current assets
occupied debtors value. The sundry debtors to current assets ratio of Strides Archolabs
was always above the average of the selected samples except 2007-2008, 2009-2010 to
2013-2014. In the recent four years, the ratio was much lower than that of the rest of the
years. It indicated that the company had shifted its selling policy from credit to cash. The
mean value of sundry debtors to current assets ratio of Strides Archolabs was 38.35%
with a standard deviation 16.46%. The ratio fluctuated between 64.26% (maximum) and
11.95% (minimum). In Biocon Pharmaceuticals, the average sundry debtors to current
assets ratio were 45.10% with a standard deviation 14.80%. The ratio followed a
marginally declining trend during the study period. In Biofil Chemicals and
Pharmaceuticals Ltd., the sundry debtors to current assets ratio were very high. The ratio
ranged between 9.20% and 82.20%. Sundry debtors took the major part of current assets
in 1999-2000 to 2000-2001, 2007-2008 to 2008-2009 and 2010-2011 to 2013-2014. The
221
average sundry debtors to current assets ratio was 51.83% with standard deviation
22.89%. In Biofil Chemicals and pharmaceuticals Ltd, the sundry debtors to current
assets ratio were always above the average of the selected samples of 34.05% except
2003-2004 to 2004-2005 and 2009-2010.The sundry debtors to current assets ratio of
Parenteral Drugs (India) Ltd. ranged between 40.60% and 59.98% with mean and
standard deviation 48.30% and 6.46% respectively. It fluctuated marginally with no
trend. In Zenotech Ltd., the sundry debtors to current assets ratio followed a declining
trend. Initially the ratio starts with 99.3% and finally it step down to 36.92% in the
ultimate year of the study. It indicated that company‟s sales had been converted from
credit to sales. In the recent seven years, the ratio was very low. The sundry debtors to
current assets ratio of Marksans Pharma Ltd. was always above the average of the
selected samples except 2006-2007 to 2009-2010 and 2002-2003.
Dr. Reddy‟s Laboratories, Divis Lab, Wanbury Ltd. followed their sundry debtors to
current assets ratio at a rate equivalent to the average of the selected samples of 34.05%
during the period under study. The debtors value of these companies was neither high nor
low as compared to the average of the selected samples during the study period. The
average sundry debtors to current assets ratio of Dr. Reddy‟s Laboratories, Divis Lab,
Wanbury Ltd. were 34.88%, 36.38% and 33.46%respectively.
The average Sundry Debtors to Current Assets ratio of CIPLA, Piramal Enterprises,
Cadila Health Care Ltd., Sun Pharmaceuticals, Kopran, Ambalal Sarabhai Enterprises,
Sequent Scientific Ltd., Morepen Labs and Hiran Orgochem Ltd. was below the average
of the selected samples of 34.05%. In CIPLA, the sundry debtors to current assets ratio
varied between 17.07% (minimum) and 41.57% (maximum) with mean and standard
deviation 31.51% and 6.23% respectively. The ratio fluctuated marginally and followed
no trend. It is always below the average of the selected samples during 2003-2004 to
2008-2009. In the recent three years the ratio followed a marginally declining trend. In
Piramal Enterprises, the sundry debtors to current assets ratio were always below the
average of the selected samples of 34.05%. The ratio followed an overall declining trend
since 2003-2004. In the recent three years the ratio was much below the average of the
selected samples of 34.05%. Sundry debtors to current assets ratio of Cadila Health Care
222
Ltd. was always below the average of the selected samples of 34.05% except 2002-2003
to 2003-2004. It followed decreasing trend since 2008-2009. The mean sundry debtors to
current assets ratio of Sun Pharmaceuticals was 23.80% with a standard deviation 9.51%.
The ratio fluctuated between 8.92% and 40.46%. Kopran maintained its average sundry
debtors to current assets ratio at 25.50% with a standard deviation 4.19%. The ratio
fluctuated marginally with no trend. In Ambalal Sarabhai Enterprises, the sundry debtors
to current assets ratio were always below the average of the selected samples of 34.05%
except 2008-2009. The sundry debtors to current assets ratio of Sequent scientific Ltd.
was almost zero in the initial years. In the recent six years, sundry debtors to current
assets ratio were nearer to the average of the selected samples of 34.05%. On an average,
sequent scientific Ltd. maintained their sundry debtors to current assets ratio at 25.14%
with standard deviation 17.20%.
5.4.4. Cash and Bank to Current Assets Ratio:
It indicates cash as total current assets and throws light on the importance of cash of a
firm. It measures the liquidity of a company. A high and increasing cash to current assets
ratio generally a positive sign, showing the company‟s most liquid assets represent a
larger portion of its current assets. A high volume of cash and cash equivalent means that
the cash are idle which involved opportunity income forgone. Low cash to current assets
may give better result but it has another affect to liquidity of the company. Therefore,
both high and low value of cash to current ratio is not expected. The company should find
an optimum level of cash to current assets. There is no „rule of thumb‟ which may be
used as a norm to examine the cash and bank to Current assets ratio. Different standards
are generally used for different industries in order to examine the cash and bank to
current assets ratio. The average cash and bank to current assets ratio of the selected
companies taken as a whole was 4.32% during the period under study.
From Table – 5.4.4, it was displayed that in Strides Archelabs, Sun Pharmaceutical,
Biofil Chemicals and Pharmaceuticals Ltd., Ambalal Sarabhai Enterprises, Sequent
Scientific Ltd., Zenotech Ltd., Marksans Pharma Ltd., Morepen Labs and Hiran
Orgochem Ltd., average cash and bank to current assets was above the average of the
selected samples of 4.32% during the study period. it indicated that the liquidity position
223
of Strides Archelabs, Sun Pharmaceutical, Biofil Chemicals and Pharmaceuticals Ltd.,
Ambalal Sarabhai Enterprises, Sequent Scientific Ltd, Zenotech Ltd, Marksans Pharma,
Morepenlabs and Hiran Orgochem Ltd. was high as compared to the rest of the selected
samples. Strides Archolab, the average cash and bank to current assets ratio was 4.69%
with a standard deviation 4.82. In the recent year, the ratio was very high which indicated
high liquidity position. But the company had a high volume of cash and bank which was
remain idle, involved opportunity income forgone. The ratio showed an increasing trend
since 2008-2009. In Sun Pharmaceutical, the cash and bank to current assets ratio was
always below the average of the selected samples of 4.32% except 2001-2002, 2010-2011
to 2012-2013. The cash and bank to current assets of Sun Pharmaceutical was very low
during 1999-2000 to 2009-2010 but very high during 2010-2011 to 2012-2013 which
indicated that the company had shifted from aggressive to conservative policy in
maintaining its cash and bank balance. The ratio followed a sharply decreasing trend
since 2010-2011. In Biofil Chemicals and Pharmaceuticals Ltd., the cash and bank to
current assets was always below the average of the selected samples of 4.32% except
2007-2008 to 2011-2012. The ratio followed no trend during the study period. The mean
cash and bank to current assets ratio of Biofil Chemicals and Pharmaceuticals Ltd. was
6.37 with a standard deviation 14.11. In Ambalal Sarabhai Enterprises, the average cash
and bank to current asset ratio was 4.96 with a standard deviation 3.41. In the recent three
years of the study, the cash and bank to current assets ratio of Ambalal Sarabhai
Enterprises was inclining. The ratio was below the average of the selected samples of
4.32% except 1999-2000, 2001-2002, 2005-2006, 2008-2009 to 2009-2010 and 2013-
2014. In Sequent Scientific Ltd., the cash and bank top current assets ratio was always
above the average of the selected samples of 4.32% except 1999-2000 to 2003-2004,
2008-2009 and 2010-2011. The ratio fluctuated widely and followed no trend. The cash
and bank to current assets ratio of Zenotech Ltd. was always above the average of the
selected samples of 4.32% except 1999-2000 to 2002-2003, 2005-2006 to 2009-20140. In
the recent three years, the ratio was much above the average of the selected samples
which indicated high liquidity but the company had not managed its cash and bank
balance efficiently. In the initial four years of the study the cash and bank to current
assets ratio was very low. In the recent three years of the study, the company‟s cash and
224
bank balance was highly conservative. The cash and bank to current asset ratio of
Marksans Pharma Ltd. was much lowers the average of the selected samples of 4.32%.
The company maintained its cash and bank in aggressive approach. However, in 2007-
2008, 2010-2011, 2011-2012 and 2013-2014, the cash and bank to current assets ratio
was very high which indicated that the company followed conservative approach in
managing cash and bank. The average cash and bank to current assets ratio of Marksans
Pharma Ltd. was 4.83 with a standard deviation 6.12. In Morepen Labs, the cash and
bank to current assets ratio was always above the average of the selected samples except
2007-2008, 2009-2010 and 2010-2011. The ratio followed an inclining trend since 2009-
2010. The mean value of Hiran Orgochem Ltd. was 6.97 with a standard deviation 16.03.
In the recent two years, the ratio was very low which indicated a lower liquidity.
Therefore, the study revealed that Lupin, Sun Pharmaceuticals, Biofil Chemicals and
Pharmaceuticals Ltd., Hiran Orgochem Ltd. followed declining trend in cash and bank to
current assets ratio in the recent years of the study but Strides Archolabs, Ambalal
Sarabhai Enterprises, Sequent Scientific Ltd., Zenotech Ltd. and Morepen Labs followed
an inclining trend in the recent years of the study.
The average cash and bank to current assets ratio of Lupin, Dr, Reddy‟s Laboratories,
CIPLA, Piramal Enterprises, Aurobindo Pharmaceuticals, Cadila Health Care Ltd., Divis
Lab, Biocon Pharmaceuticals., Kopran, Parenteral Drugs (India) Ltd. and Wanbury Ltd.
was always below the average of the selected samples of 4.32% during the study period.
These companies maintained low level of cash and bank to its current assets which affect
the short term liquidity. They followed aggressive policy in managing their cash and bank
out of total current assets. Low level of cash and bank balance indicated that the cash and
bank amount was not idle but the companies were not in a position to pay its short term
obligation due to want of liquid cash. In Lupin, cash and bank to current assets was
always below the average of the selected samples and mean and standard deviation of
cash and bank to current assts was 1.23 and 0.68 respectively. The ratio followed
declining trend since 2009-2010 except 2013-2014. The cash and bank to current assets
ratio of Dr. Reddy‟s Laboratories was always below the average of the selected samples
except 2003-2004, 2012-2013 and 2013-2014. The ratio followed an inclining trend since
225
2009-2010. Lupin followed aggressive policy for maintaining cash and bank during
1999-2000 to 2011-2012 but followed conservative policy in the recent two years of the
study. The mean value of cash and bank to current assets ratio was 3.23 with a standard
deviation 3.36. In CIPLA, the cash and bank to current assets was always below the
average of the selected samples of 4.32% with mean and standard deviation 1.20 and 0.61
respectively. The ratio fluctuated marginally during the study period. In Piramal
Enterprises, the cash and bank to current assets ratio was always below the average of the
selected samples of 4.32% except 1999-2000 to 2001-2002. The ratio followed an overall
decreasing trend during the entire study period. The mean and standard deviation of cash
and bank to current assets ratio of Piramal enterprises was 2.68 and 2.99 respectively. In
Aurobindo Pharmaceuticals, the cash and bank to current assets ratio was always below
the average of the selected samples of 4.32%. On an average, the cash and bank to
current assets ratio of Aurobindo Pharmaceuticals was 1.48 with a standard deviation
1.40. In Cadila Health Care Ltd, the mean and standard deviation of cash and bank was
2.82 and 3.62 respectively. The cash and bank to current assets ratio was always below
the average of the selected samples of 4.32% except 2000-2001, 2003-200 and 2011-
2012. The ratio followed a declining trend in the recent three years. The mean and
standard deviation of cash and bank to current assets ratio of Divis Lab was 1.21 and 0.55
respectively. The ratio had followed no trend and it fluctuated marginally during the
study period. In Biocon Pharmaceuticals, the cash and bank to current assets ratio
followed an overall inclining trend during the study period. The ratio was always below
the average of the selected samples except 2009-2010, 2010-2011, 2012-2013 and 2013-
2014. On an average, the cash and bank to current assets ratio maintained by Biocon
Pharmaceuticals was 3.44 with a standard deviation 5.15. In the initial eleven years of the
study, Biocon Pharmaceuticals had followed highly aggressive policy in maintaining cash
and bank but in the rest of the years it had followed conservative policy in maintaining
cash and bank. The mean value of cash and bank of Kopran was 0.90 with a standard
deviation 1.13 against the average of the selected samples of 4.32%. The ratio followed
an increasing trend since 2006-2007. In Parenteral Drugs (India) Ltd., the cash and bank
to current assets ratio was always below the average of the selected samples of 4.32%.
Initially, the ratio followed a declining trend but in the recent three years the ratio
226
followed an inclining trend. The mean value and standard deviation of cash and bank to
current assets of Parenteral Drugs (India) Ltd. was 1.91 and 1.32 respectively. In
Wanbury Ltd., the cash and bank to current assets ratio was always below the average of
the selected samples of 4.32% except 2005-2006, 2008-2009, 2011-2012 and 2012-2013.
In the initial six years of the study, the company had followed aggressive policy but in
the recent three years it had followed conservative policy. On an average, the cash and
bank to current assets ratio of Wanbury Ltd. was 2.51 with a standard deviation 3.10.
Therefore, cash and bank to current assets ratio of Lupin, Dr, Reddy‟s Laboratories,
CIPLA, Piramal Enterprises, Aurobindo Pharmaceuticals, Cadila Health Care Ltd., Divis
Lab, Biocon Phasrmaceuticals, Kopran, Parenteral Drugs (India) Ltd. and Wanbury Ltd.
was very low as compared to the average of the selected samples of 4.32%. In the recent
years, Lupin, Cadila Health Care Ltd. Divis labs and Wanbury Ltd. followed declining
trend but Dr. Reddy‟s Laboratories, Piramal Enterprises, Aurobindo Pharmaceuticals,
Biocon Pharmaceuticals Ltd. had followed increasing trend.
5.4.5. Loans and Advances to Current Assets:
Loans and advances of pharmaceutical companies includes Loans and advances to related
parties, Security deposit, Advance payment of Income Tax, Mat Credit Entitlement,
Balance with govt. authorities(draw backs, custom duties receivables), loans to employee
benefit trust, loan to employee and other loans and advances. It indicates loans and
advances as total current assets and throws light on the importance of loans and advances
of a firm. It measures the liquidity of a company. A high and increasing loans and
advances to current assets ratio generally a positive sign, showing the company‟s most
liquid assets represent a larger portion of its current assets. A high volume of loans and
advances means that the loans and advances which involved opportunity income forgone.
Low loans and advances to current assets may give better result but it has another affect
to liquidity of the company. Therefore, both high and low value of loans and advances to
current assets ratio is not expected. The company should find an optimum level of loans
and advances to current assets. There is no „rule of thumb‟ which may be used as a norm
to examine the loans and advances to Current assets ratio. Different standards are
generally used for different industries in order to examine the loans and advances to
227
current assets ratio. The average loans and advances to current assets ratio of the selected
companies taken as a whole was 30.31% during the period under study.
From Table -5.4.5, it is found that the average loans and advances to current assets of
Piramal Enterprises, Cadila Health Care Ltd., Strides Archolabs, Kopran, Ambalal
Sarabhai Enterprises, Sequent Scientific Ltd., Wanbury and Hiran Orgochem were above
the average of the selected companies. In Piramal Enterprises, it was found to be an
increasing trend. The average loans and advances to current assets ratio was 0.50 with a
standard deviation 25.26. In Cadila Health Care Ltd. the average loans and advances to
current assets ratio was 32.56 with standard deviation 10.80. In Strides Archolabs, the
ratio followed a mixed trend. The average loans and advances to current assets ratio of
Kopran was 49.48 with a standard deviation 9.15. in Ambalal Sarabhai Enterprises, on an
average 60.15% of the total current assets was invested in loans and advances. In Sequent
Scientific Ltd. the loans and advances to current assets ratio followed a decreasing trend.
The average loans and advances to current assets ratio of Wanbury was 40.68 with a
standard deviation 15.46. In Hiran Orgochem, the ratio was 32.88, on an average with a
standard deviation 25.70.
The average loans and advances to current assets ratio of Lupin Ltd., Dr. Reddy‟s
Laboratories, CIPLA, Aurobindo Pharmaceuticals, Divis Labs, Sun Pharma, Biocon
Pharmaceuticals, Biofil Chemicals and Pharmaceuticals Ltd., Parenteral Drugs (India)
Ltd., Zenotech Laboratories, Marksans Pharma and Morepen Laboratories was always
below the average of the selected samples. In Lupin Ltd., the average loans and advances
to current assets ratio was 25.08 with a standard deviation 7.42. In Dr. Reddy‟s
Laboratories, the average ratio was 24.48 and its standard deviation was 8.736. It had
followed no trend during the study period. CIPLA ltd had followed a uniform trend in
loans and advances to current assets ratio. The average loans and advances to current
assets ratio of CIPLA Ltd. was 27.41 and its standard deviation was 6.56. In Aurobindo
Pharmaceuticals Ltd., the loans and advances to current assets ratio fluctuated narrowly.
The loans and advances to current assets ratio of Divis Labs was 10.50 with a standard
deviation 2.71. in Biocon Pharmaceuticals, the loans and advances to current assets ratio
was found to be marginally increasing trend. In Biofil chemicals and Pharmaceuticals
228
Ltd., the loans and advances to current assets ratio was always below the average of the
selected samples. The average loans and advances to current assets ratio of Parenteral
Drugs (India) Ltd was 17.56 with a standard deviation 10.69. In case of Zenotech
Laboratories, on an average, 22.11% of the total current assets had been invested in loans
and advances and its standard deviation was 22.66. The ratio fluctuated widely. Average
loans and advances to current assets ratio of Marksans Pharma was 10.83 with a standard
deviation 5.14. In Morepen Labs, the mean value of Loans and advances to current assets
ratio was 24.71 with a standard deviation 14.05.
Piramal Enterprises, Cadila Health Care, Strides Archolabs, Kopran, Ambalal Sarabhai
Enterprises, Sequent Scientific Ltd., Wanbury and Hiran Orgochem had invested very
high amount of loans and advances and Lupin Ltd., Dr. Reddy‟s Laboratories, CIPLA,
Aurobindo Pharmaceuticals, Divis Labs, Sun Pharma, Biocon Pharmaceuticals, Biofil
Chemicals and Pharmaceuticals Ltd., Parenteral Drugs (India) Ltd., Zenotech
Laboratories, Marksans Pharma and Morepen Laboratories had invested low amount of
loans and advances of the total current assets during the study period.
5.4.6. Summary of the Component wise ratio Analysis
The CATA of LUPIN, Dr. Reddy‟s Laboratories, CIPLA, Piramal Enterprises,
Aurobindo Pharmaceuticals, Divis Lab, Kopran, Sequent Scientific Ltd. Marksans
Pharma Ltd, Wanbury Ltd. and Hiran Orgochem Ltd. was very high. The major portion
of total assets of these companies was current assets. The liquidity position of these
companies was very high as compared to others selected companies.
The CATA of Cadila Health Care Ltd., Strides Archolabs, Sun Pharmaceuticals, Biocon
Pharmaceuticals, Biofil Chemicals and Pharmaceuticals Ltd., Ambalal Sarabhai
Enterprises, Parenteral Drugs (India) Ltd., Zenotech Ltd. and Morepen Labs were very
low as compared to the average of the selected samples during the period under study.
Investment in current assets out of total assets of these companies was low. Liquidity
position in respect of CATA of these companies was lower. Piramal Enterprises, Divis
Lab, Sun Pharmaceuticals, Biocon Pharmaceuticals, Kopran, Ambalal Sarabhai
Enterprises and Parenteral Drugs (India) Ltd. were maintaining CATA at a level of
229
average of the selected samples. LUPIN, Dr. Reddy‟s Laboratories, CIPLA, Aurobindo
Pharmaceuticals, Sequent Scientific, Marksans Pharma Ltd., Wanbury Ltd. and Hiran
Orgochem Ltd. were maintaining their CATA at a level above the average of the selected
samples. Cadila Health Care Ltd., Strides Archo Labs, Biofil Chemicals and
Pharmaceuticals Ltd., Zenotech Ltd and Morepen Labs maintaining their CATA at a level
below the average of the selected samples.
The inventory to current assets ratio of LUPIN, CIPLA, Aurobindo Pharmaceuticals,
Cadila Health Care Ltd., Divis Lab, Marksans Pharma Ltd., Parenteral Drugs (India) Ltd.,
Morepen Labs and Hiran Orgochem Ltd. was very high. They were maintaining
conservative policy for managing its inventory level. The average inventory to current
assets ratio of Lupin, Biocon Pharmaceuticals and Morepen Labs was just equivalent to
the average of the selected samples. The average inventory to current assets ratio of
Divis Lab and Hiran Orgochem Ltd. was near about 50% which is very high. These two
companies followed highly conservative policy for managing their inventory level. Dr.
Reddy‟s Laboratories, Piramal Enterprises, Strides Archo Labs, Sun Pharmaceuticals,
Biocon, Kopran, Biofil Chemicals Ltd., Ambalal Sarabhai Enterprises, Sequent Scientific
Ltd., Zenotech Ltd. and Wanbury Ltd. had maintained its inventory to current assets level
at a rate below the average of the selected samples of 26.98%. Inventory to current assets
ratio of Zenotech Ltd. was highly aggressive followed by Ambalal Sarabhai Enterprises,
Biofil Chemicals and Pharmaceuticals Ltd., Sequent Scientific Ltd., Strides Archolabs,
Dr. Reddy‟s Laboratories, Wanbury Ltd., Kopran, Sun Pharmaceuticals, and so on. The
inventory to current assets ratio of Divis Lab and Hiran Orgochem Ltd. was highly
conservative as compared to the selected samples. Lupin, Biocon Pharmaceuticals,
maintained their average inventory to current assets ratio at a level of the average of the
selected samples of 26.98%.
Dr. Reddy‟s Laboratories, Divis Lab, Wanbury Ltd. followed their sundry debtors to
current assets ratio at a rate equivalent to the average of the selected samples of 0.33
during the period under study. The debtors value of these companies was neither high nor
low as compared to the average of the selected samples during the study period. The
average sundry debtors to current assets ratio of Dr. Reddy‟s Laboratories, Divis Lab,
230
Wanbury Ltd. were 0.34, 0.35 and 0.33 respectively. The average Sundry Debtors to
Current Assets ratio of CIPLA, Piramal Enterprises, Cadila Health Care Ltd., Sun
Pharmaceuticals, Kopran, Ambalal Sarabhai Enterprises, Sequent Scientific Ltd.,
Morepen Labs and Hiran Orgochem Ltd. was below the average of the selected samples
of 0.33.
Lupin, Sun Pharmaceuticals, Biofil Chemicals and Pharmaceuticals Ltd., Hiran
Orgochem Ltd. followed declining trend in cash and bank to current assets ratio in the
recent years of the study but Strides Archolabs, Ambalal Sarabhai Enterprises, Sequent
Scientific Ltd., Zenotech Ltd. and Morepen Labs followed an inclining trend in the recent
years of the study. Cash and bank to current assets ratio of Dr, Reddy‟s Laboratories,
CIPLA, Piramal Enterprises, Aurobindo Pharmaceuticals, Cadila Health Care Ltd., Divis
Lab, Biocon Phasrmaceuticals, Kopran, Parenteral Drugs (India) Ltd. and Wanbury Ltd.
was very low as compared to the average of the selected samples of 4.32%. In the recent
years, Lupin, Cadila Health Care Ltd. Divis labs and Wanbury Ltd. followed declining
trend but Dr. Reddy‟s Laboratories, Piramal Enterprises, Aurobindo Pharmaceuticals,
Biocon Pharmaceuticals Ltd. followed increasing trend.
5.5. Financing Strategy Analysis.
A financing Strategy is integral parts to an organization‟s strategic plan. It sets out how
the organization plans to finance its overall operations to meet its objectives now and in
the future. A financing strategy summarises targets and the actions to be taken over a
three to five year period to achieve the targets. It also clearly states key policies which
will guide those actions.
5.5.1. Working Capital Leverage (WCL):
It concerned with the risk associated with the amount of working capital employed in
relation to sales. If the working capital is varied relative to sales, the amount of risk that a
firm assumes is also varied and the opportunity for gain and loss is increased. There is a
positive relationship between risk and the rate of return. The more risk the more return is
involved. If the level of working capital increased, the amount of risk is increased and the
opportunity for gain or loss is also increased. A more conservative management therefore

231
employs more working capital for a given volume of sales than one which can and is
willing to assume more risk. Rate of return is caused by changes in working capital in
industries like Pharmaceuticals, chemicals etc., are much larger than those in the iron and
steel, paper etc., industries.
Working capital leverage may be defined as the variability in return on capital employed
due to variability in working capital (current assets). The impact of working capital
management on return on capital employed may also be explained by working capital
leverage. Working capital leverage helps to understand the reason why certain industries
are much more responsive to working capital management. The higher the degree of
leverage the higher is the risk and the lower the degree of leverage, the lower the risk.
But at the same time it increases the possibility of higher rate of return on capital
employed
It measures the sensitivity of operating profit due to variability in the level of working
capital (gross) with the help of computing the working capital leverage of the company
for all years under study. The formula used for calculating the working capital leverage
is:
WCL= WC/ (TA + CWC), where WCL= working capital leverage, WC= Working
Capital investment, TA= Total Assets Investment and CWC= Change in working Capital
Investment. In computing the WCL it has been assumed that the change in working
capital investment in the previous year will be maintained in the current year also. The
higher the degree of WCL, the greater is the risk and vice versa. But at the same time, it
increases the possibility of higher ROI. The average working capital leverage of the
selected samples is 0.39 during the study period.
From Table 5.5.1, it was found that the WCL of Lupin, Dr. Reddy‟s Laboratories,
CIPLA, Aurobindo Pharmaceuticals, Kopran, Wanbury Ltd. and Hiran Orgochem Ltd.
was always above the average of the selected samples of 0.39 throughout the study
period. The WCL of Lupin varied between 0.56 and 0.37 with mean 0.46 and standard
deviation 0.06. No trend was observed from WCL of Lupin during the study period. The
average WCL of Dr. Reddy‟s Laboratories was 0.47 with a standard deviation 0.08. The
232
WCL of Dr. Reddy‟s Laboratories followed marginally inclining trend since 2009-2010.
In CIPLA, WCL followed decreasing trend since 2009-2010. The mean WCL was 0.55
with standard deviation 0.09. The WCL of CIPLA varied between 0.34 and 0.65. The
WCL of Aurobindo Pharmaceuticals followed a marginally declining trend since 2007-
2008. The ratio varied between 0.66 and 0.34 with mean and standard deviation 0.50 and
0.07 respectively. In Kopran, the WCL was always above the average of the selected
sample of 0.39 except 1999-2000 and 2004-2005 to 2009-2010. The ratio followed an
inclining trend since 2005-2006. The mean WCL of Kopran was 0.40 with a standard
deviation 0.07. The WCL of Wanbury Ltd. was always above the average of the selected
samples of 0.39 except 2008-2009, and 2001-2012 to 2012-2013. The mean WCL of
Wanbury Ltd. was 0.42 and its standard deviation was 0.05. The WCL of Wanbury Ltd.
varied between 0.33 and 0.50 during the study period. In Hiran Orgochem Ltd., the WCL
was always above the average of the selected samples of 0.39 except in the recent year.
The mean value and standard deviation of WCL of Hiran Orgochem Ltd. was 1.34 and
2.57 respectively. The WCL of Hiran Orgochem Ltd. fluctuated between 0.36 and 10.63.
Therefore, WCL of Lupin, Dr. Reddy‟s Laboratories, CIPLA, Aurobindo
Pharmaceuticals, Kopran, Wanbury Ltd. and Hiran Orgochem Ltd. maintained a higher
degree of WCL as compared to the other selected samples. It indicated that Lupin, Dr.
Reddy‟s Laboratories, CIPLA, Aurobindo Pharmaceuticals, Kopran, Wanbury Ltd. and
Hiran Orgochem Ltd. accepting the higher risk for possibility of higher return on
investment. These companies are much more responsive to working capital management
as compared to others.
The average WCL of Piramal Enterprises, Divis Labs, Strides Archolabs, Sun
Pharmaceuticals, Biocon Pharmaceuticals, Parenteral Drugs (India) Ltd, Sequent
Scientific Ltd. and Marksans Pharma Ltd. was above the average of the selected samples
of 0.39. In Piramal Enterprises, the WCL was always above the average of the selected
samples of 0.39 except 1999-2000 to 2001-2002, 2004-2005 to 2007-2008 and 2012-
2013. The ratio fluctuated randomly and followed no trend during the study period. The
mean and standard deviation of WCL of Piramal Enterprises was 0.47 and 0.30
respectively. It fluctuated between 0.26 and 1.48 during the study period. The WCL of

233
Divis Lab was always above the average of the selected samples of 0.39 except 1999-
2000 to 2003-2004 and 2006-2007 to 2010-2011.The WCL of Divis Lab followed
marginally inclining trend since 2006-2007. The mean value of WCL of Divis Lab was
0.36 with a standard deviation 0.07. The ratio followed marginally inclining trend since
2006-2007. The mean value of Strides Archolab was 0.36 with a standard deviation 0.18.
The WCL ranged between 0.17 and 0.88 from 2008-2009, the WCL followed an
inclining trend. In the recent year, the WCL of Strides Archolab was remarkably low.
The average value of WCL of Sun Pharmaceuticals was 0.41 with a standard deviation
0.09. The WCL of Sun Pharmaceuticals varied between 0.26 and 0.55. In the recent five
years of the study, the WCL of Sun Pharmaceuticals followed an inclining trend. The
WCL of Sun pharmaceuticals was always above the average of the selected samples of
0.39 except 2003-2004 to 2004-2005 and 2009-2010 to 2013-2014. In Biocon
Pharmaceuticals, the WCL was always below the average of the selected samples of 0.39
except 2003-2004 and 2010-2011 to 2013-2014. The WCL of Biocon Pharmaceuticals
followed an increasing trend since 2007-2008. The mean and standard deviation of WCL
of Biocon Pharmaceuticals was 0.31 and 0.10 respectively. The ratio fluctuated between
0.13 and 0.43. The WCL of Parenteral Drugs (India) Ltd. varied between 0.16 and 0.58.
The mean value of WCL of Parenteral drugs (India) Ltd. was 0.39 with a standard
deviation 0.15. The WCL of Parenteral Drugs (India) Ltd followed marginally declining
trend since 2001-2002. The WCL of Parenteral drugs (India) Ltd. was below the average
of the selected samples of 0.39 since 2008-2009 and followed a marginally declining
trend. In Sequent Scientific Ltd., the WCL was always below the average of the selected
samples of 0.39 except 1999-2000 to 2005-2006 and 2008-2009. The WCL of Sequent
Scientific Ltd. followed an overall decreasing trend throughout the study period. In the
recent five years, the WCL was remarkably low. On an average, Sequent Scientific Ltd.
maintained its WCL at a level of 0.52 with a standard deviation 0.32. The mean value of
WCL of Marksans Pharma Ltd. was 0.49 with a standard deviation 0.44. The WCL of
Marksans Pharma Ltd. fluctuated widely with a no trend during the period under study.
Therefore, Piramal Enterprises, Divis Labs, Strides Archolabs, Sun Pharmaceuticals,
Biocon Pharmaceuticals, Parenteral Drugs (India) Ltd., Sequent Scientific Ltd. and
Marksans Pharma Ltd. followed mixed strategy for managing their working capital. The
234
WCL of these companies followed a declining trend since 2008-2009. It indicated that
they are avoiding taking high risk. They had shifted high risk with a high return policy in
the initial years of the study to low risk with a low return policy since 2008-2009 to the
recent year of the study. These companies are moderate responsive to working capital
management as compared to others selected samples during the period under study.
The average WCL of Cadila Health Care Ltd., Biofil Chemicals and Pharmaceuticals
Ltd., Ambalal Sarabhai Enterprises, Zenotech Laboratories, Morepen Labs was always
below the average of the selected samples of 0.39 during the period under study. In
Cadila Health Care Ltd., the WCL was always below the average of the selected samples
0.39 except 1999-2000 to 2000-2001. The ratio followed a marginally inclining trend
since 2003-2004. The mean value and standard deviation of WCL was 0.31 and 0.14
respectively during the study period. The WCL ranged between 0.16 and 0.65. In Biofil
Chemicals and Pharmaceuticals Ltd., WCL varied between -0.41 and 0.53. On an
average, the WCL of Biofil Chemicals and Pharmaceuticals Ltd. was 0.05 with a standard
deviation 0.25.
5.5.2. Trade off between risk and profitability:
Trade off between risk and profitability can be made by calculating the risk factor. The
analysis can be done through which it can be said about the policies adopted while
managing the working capital of the company, Risk factor has been calculated. Risk
factor can be calculated through the following formula:
(Ej + Lj) - Aj
Rk =
Cj
Where, Rk = Risk factor, Ej= Equity + Retained Earnings, Lj = Long term Loans, Aj =
Fixed Assets, Cj = Current Assets
The above formula helps to know about the financing of the current assets through long
term funds after fixed assets are financed in full. Based on the above formula, following
inferences can be drawn:
235
1. Value of R is zero or less would mean that the firm is using the aggressive policy
and normally the profitability would be high.
2. Value of R is 1 or close to 1 would mean that the firm is using a conservative
policy and the profitability would be low.
Under aggressive policy the firm opts for a lower level of working capital thereby
investing in current assets at lower proportion to total assets. When a firm adopts this
policy, the profitability is high but at higher risk of liquidity. In case of conservative
policy, the firm adopts a conservative approach of having high proportion of working
capital. The profitability is relatively low as the return on current assets is normally less.
But ensuring good liquidity as the risk of meeting current obligations is reduced.
Following analysis discloses the risk factor that has been ranked and is indicating the
policy adopted by the company in various periods. The average risk factor of the selected
samples during the study period was 0.46.
From Table 5.5.2, it was displayed that the risk in working capital financing of Dr
Reddy‟s Laboratories, CIPLA, Aurobindo Pharmaceuticals, Kopran and Parenteral Drugs
(India) Ltd. was always above the average of the selected samples of 0.46 during the
period under study. In Dr. Reddy‟s Laboratories, risk factor ranged between 0.48 and
0.80. The average risk factor was 0.67 with a standard deviation 0.09. From 2009-2010,
the risk factor followed an inclining trend. It indicated that the company approaching to
conservative policy from matching policy. In CIPLA, the mean value of risk factor was
0.58 with a standard deviation 0.08. It indicated that CIPLA followed a matching policy,
on an average, in financing working capital. It had not followed trend during the period
under study. The ratio ranged between 0.48 and 0.71 during the study period. In
Aurobindo Pharmaceuticals, working capital had been financed 69% on an average from
the long trem sources and remaining 31% from short term sources. It indicated that
Aurobindo Pharmaceuticals followed conservative policy for working capital financing.
In Kopran, the risk factor ranged between 0.47 and 0.84 with mean 0.64 and standard
deviation 0.10. The ratio had followed no trend. In Parenteral Drugs (India) Ltd. the ratio
followed a declining trend since 2008-2009. It ranged between 0.48 and 0.76. On an
236
average, the risk factor of Parenteral drugs (India) Ltd. was 0.66 with a standard
deviation 0.09.
Therefore, Dr Reddy‟s Laboratories, CIPLA, Aurobindo Pharmaceuticals, Kopran and
Parenteral Drugs (India) Ltd. were always above the average of the selected samples. It
indicated that Dr Reddy‟s Laboratories, CIPLA, Aurobindo Pharmaceuticals, Kopran and
Parenteral Drugs (India) Ltd. used, on an average, 60% of long term funds to finance
their current assets. These companies approached conservative policy for working capital
financing.
The risk for financing working capital of Lupin, Piramal Enterprises, Cadila Health Care
Ltd, Divis Lab, Strides Archolab, Sun Pharmaceuticals, Biocon Pharmaceuticals Ltd.,
Sequent Scientific Ltd., Wanbury Ltd. and Hiran Orgochem Ltd. was above the average
risk for financing working capital of the selected samples of 0.46 during the study period.
In Lupin, the risk for financing working capital was always above the average of the
selected samples of 0.46 except 2003-2004, 2004-2005 and 2008-2009. The mean and
standard deviation of risk for financing working capital was 0.60 and 0.10 respectively.
The ratio followed a declining trend since 2008-2009. The ratio ranged between 0.41 and
0.76. The risk for financing working capital of Piramal Enterprises was above the
average of the selected samples of 0.46 except 2001-2002 and 2003-2004 to 2005-2006.
The ratio varied between 0.89 and 0.33 with mean and standard deviation 0.57 and 0.15
respectively. In the initial years, Piramal Enterprises moved conservative policy to
aggressive and thereafter it moved to aggressive policy in financing working capital. In
the recent year, the company followed matching policy in working capital management.
The risk factor of Cadila Health Care Ltd. was always below the average of the selected
samples of 0.46 except 1999-2000 to 2001-2002 and 2012-2013 to 2013-2014. On an
average, Cadila Health Care Ltd. maintained risk for financing working capital at 0.46
with a standard deviation 0.16. It varied between 0.80 and 0.23 during the study period.
In Divis lab, the ratio ranged between 0.43 and 0.67 with mean and standard deviation
0.56 and 0.08 respectively. Strides Archolabs Ltd. maintained its risk for financing
working capital at 0.64, on an average. Since 2010-2011, the ratio followed sharply
declining trend. The risk for financing working capital ratio of Sun Pharmaceuticals was

237
always above the average of the selected samples of 0.46 except 2003-2004 and 2013-
2014. In the initial year, the ratio was very low (0.21). It followed a declining trend since
2010-2011. Biocon Pharmaceuticals Ltd. had maintained a matching policy during the
recent six years of the study. The ratio ranged between 0.12 and 0.73 during the study
period. Sequent Scientific Ltd. showed an overall declining trend during the entire study
period. In the initial four years, Sequent Scientific Ltd. followed conservative policy. It
had financed its entire current assets form the long term source after financing fixed
assets in full. But, in the recent years, the ratio was very low which indicated that the
company turned up to aggressive policy. Sequent Scientific Ltd. shifted its working
capital financing policy from conservative to aggressive over the period of times during
the study period. Wanbury Ltd. had also followed a declining trend during the entire
study period. In the initial four years, the ratio was closer to 1 which indicated
conservative policy adopted in working capital financing. But in the recent year, the ratio
was closer to 0 which indicated aggressive policy. The ratio of Wanbury Ltd. varied
between 0.01 and 0.89. In Hiran Orgochem Ltd., the ratio was always above the average
of the selected samples except 2000-2001, 2001-2002, 2004-2005 and 2013-2014. The
ratio fluctuated between 0.39 and 0.72. In the recent three years, the ratio followed a
declining trend.
Therefore, Lupin, Piramal Enterprises, Cadila Health Care Ltd., Divis Lab, Strides
Archolab Ltd., Sun Pharmaceuticals, Biocon Pharmaceuticals Ltd., Sequent Scientific
Ltd., Wanbury Ltd. and Hiran Orgochem Ltd. adopted aggressive policy, conservative
policy as well as matching policy in financing working capital in different years of the
study.
Risk in Working capital financing of Biofil Chemicals and Pharmaceuticals Ltd.,
Zenotech Laboratories Ltd., Marksans Pharma Ltd. and Morepen Labs was following a
declining trend during the entire study period. In Biofil Chemicals and Pharmaceuticals
Ltd., the ratio followed a declining trend during 1999-2000 to 2010-2011 and an
increasing trend was observed in the rest of the years of the study. Initially, the company
had followed conservative policy but in the recent years it followed aggressive policy for
risk in financing working capital. The average risk in financing working capital of

238
Zenotech Ltd. (0.52) was above the average risk in financing working capital of the
selected companies of 0.46. In the recent four years, the ratio was negative which
indicated that the company had adopted highly aggressive policy and profitability in these
years was very high. In Marksans Pharma Ltd., the average risk in working capital
financing was 0.34 which was lower the average risk of the selected samples of 0.46. The
ratio had followed no trend during the study period. In 199-2000 to 2003-2004, the ratio
ranged between 0.38 to 0.55 which indicated matching policy in financing working
capital but in 2004-2005 to 2009-2010, the ratio ranged between 0.72 and .087 which
indicated aggressive policy in working capital financing. In the recent four years, the
ratio started inclining trend. In Morepen Labs, the ratio followed an overall declining
trend during the study period. in 2007-2008 to 2013-2014, the ratio was negative and it
indicated aggressive policy in working capital financing but in 1999-2000 to 2006-2007,
the company moved to matching policy from conservative policy in financing working
capital.
Therefore, Biofil Chemicals and Pharmaceuticals Ltd., Zenotech Laboratopries Ltd.,
Marksans Pharma Ltd. and Morepen Labs had shifted their risk in financing working
capital from conservative policy to aggressive policy during the study period.
The risk in financing working capital of Ambalal Sarabhai Enterprises was always below
the average of the selected samples. The mean risk in working capital financing was -0.40
with a standard deviation 0.63. The ratio ranged between -1.83 to 0.29 which indicated
that the company was always in aggressive policy in working capital financing during the
study period.
Dr Reddy‟s Laboratories, CIPLA, Aurobindo Pharmaceuticals, Kopran and Parenteral
Drugs (India) Ltd. were always above the average of the selected samples. It indicated
that Dr Reddy‟s Laboratories, CIPLA, Aurobindo Pharmaceuticals, Kopran and
Parenteral Drugs (India) Ltd. used, on an average, 60% of long term funds to finance
their current assets. These companies approached conservative policy for working capital
financing. Lupin, Piramal Enterprises, Cadila Health Care Ltd., Divis Lab, Strides
Archolab, Sun Pharmaceuticals, Biocon Phasrmaceuticals Ltd., Sequent Scientific Ltd,
Wanbury Ltd. and Hiran Orgochem Ltd. adopted aggressive policy, conservative policy

239
as well as matching policy in financing working capital in different years of the study.
Biofil Chemicals and Pharmaceuticals Ltd., Zenotech Laboratories Ltd., Marksans
Pharma Ltd. and Morepen Labs had shifted their risk in financing working capital from
conservative policy to aggressive policy during the study period. Ambalal Sarabhai
Enterprises was always in aggressive policy in working capital financing during the study
period.
5.5.3. Summary of the Financing Strategy Analysis
WCL of Lupin, Dr. Reddy‟s Laboratories, CIPLA, Aurobindo Pharmaceuticals, Kopran,
Wanbury Ltd. and Hiran Orgochem Ltd. maintained a higher degree of WCL as
compared to the other selected samples. It indicated that Lupin, Dr. Reddy‟s
Laboratories, CIPLA, Aurobindo Pharmaceuticals, Kopran, Wanbury Ltd. and Hiran
Orgochem Ltd. accepting the higher risk for possibility of higher return on investment.
These companies are much more responsive to working capital management as compared
to others. Piramal Enterprises, Divis Labs, Strides Archolabs, Sun Pharmaceuticals,
Biocon Pharmaceuticals, Parenteral Drugs (India) Ltd., Sequent Scientific Ltd. and
Marksans Pharma Ltd. followed mixed strategy for managing their working capital. The
WCL of these companies followed a declining trend since 2008-2009. It indicated that
they are avoiding taking high risk. They had shifted high risk with a high return policy in
the initial years of the study to low risk with a low return policy since 2008-2009 to the
recent year of the study. These companies are moderate responsive to working capital
management as compared to others selected samples during the period under study. The
average WCL of Cadila Health Care Ltd., Biofil Chemicals and Pharmaceuticals Ltd.,
Ambalal Sarabhai Enterprises, Zenotech Laboratories, Morepen Labs was always below
the average of the selected samples of 0.39 during the period under study.
Dr Reddy‟s Laboratories, CIPLA, Aurobindo Pharmaceuticals, Kopran and Parenteral
Drugs (India) Ltd. were always above the average of the selected samples. It indicated
that Dr Reddy‟s Laboratories, CIPLA, Aurobindo Pharmaceuticals, Kopran and
Parenteral Drugs (India) Ltd. used, on an average, 60% of long term funds to finance
their current assets. These companies approached conservative policy for working capital
financing. Lupin, Piramal Enterprises, Cadila Health Care Ltd., Divis Lab, Strides
240
Archolab, Sun Pharmaceuticals, Biocon Phasrmaceuticals Ltd., Sequent Scientific Ltd,
Wanbury Ltd. and Hiran Orgochem Ltd. adopted aggressive policy, conservative policy
as well as matching policy in financing working capital in different years of the study.
Biofil Chemicals and Pharmaceuticals Ltd., Zenotech Laboratories Ltd., Marksans
Pharma Ltd. and Morepen Labs had shifted their risk in financing working capital from
conservative policy to aggressive policy during the study period. Ambalal Sarabhai
Enterprises was always in aggressive policy in working capital financing during the study
period.
5.6. LIQUIDITY RANKING ANALYSIS BY USING MOTAAL TEST
The liquidity position of a firm is largely affected by the composition of working capital.
Any considerable shifts from the relatively more current assets to the relatively less
current assets and vice versa will materially affect a firm‟s ability to pay its current debts
promptly. To determine the liquidity position of the selected companies more precisely, a
comprehensive test known as Motaals test has been done. In this test, Inventory to
Current Assets ratio, Debtors to Current Assets ratio, Cash and bank to Current Assets
ratio and Loans and Advances to Current assets ratio (each expressed as a fraction) are
taken into consideration. For Inventory to Current assets ratio, lower the ratio, the more
favorable is the liquidity position and vice versa; ranking has been done accordingly. For
Debtors to Current Assets ratio, Cash and bank to Current Assets ratio and Loans and
Advances to Current Assets ratio, higher the ratio, the more favorable is the position and
ranking has been done accordingly. Ultimate ranking has been done on the basis of
points; lower the points scored the more favorable are the position and vice versa. All
these ranking point have been converted into value on the principle that higher the
ranking point scored the more unfavorable and vice versa. All these values have been
plotted in the graph and a linear trend line has been drawn to forecast the trend of
liquidity of the selected samples.
From Table -5.6.1, it was observed that in case of LUPIN the most sound liquidity
position was in the year 1999-2000 and it was followed by 2001-2002, 2002-2003, 2000-
2001, 2013-2014, 2009-2010, 2010-2011, 2011-2012, 2004-2005, 2012-2013, 2003-
2004, 2005-2006, 2006-2007, 2008-2009 and 2007-2008 respectively. The linear trend
241
line forecasted a declining trend in liquidity performance (as reflected in Figure-5.6.1) of
LUPIN during the study period.
From Table -5.6.2, it was observed that in case of Dr. Reddy‟s Laboratories registered
the most sound liquidity position in the year 2013-2014 and it was followed by 2006-
2007, 2012-2013, 2008-2009, 2007-2008, 2010-2011, 1999-2000, 2003-2004, 2000-
2001, 2005-2006, 2001-2002, 2004-2005, 2009-2010, 2011-2012 and 2012-2013
respectively. The linear trend line forecasted an inclining trend in liquidity performance
(as reflected in Figure-5.6.2) of Dr. Reddy‟s Laboratories during the study period.
From Table -5.6.3, it was observed that in case of CIPLA registered the most sound
liquidity position in the year 2007-2008 and it was followed by 2006-2007, 2008-2009,
2009-2010, 2010-2011, 2005-2006, 2011-2012, 2001-2002, 2003-2004, 2000-2001,
2004-2005, 1999-2000, 2012-2013, 2013-2014 and 2002-2003 respectively. The linear
trend line forecasted an inclining trend in liquidity performance (as reflected in Figure-
5.6.3) of CIPLA during the study period
From Table -5.6.4, it was observed that Piramal Enterprises registered the most sound
liquidity position in the year 2006-2007 and it was followed by 2002-2003, 2007-2008,
2009-2010, 1999-2000, 2010-2011, 2013-2014, 2008-2009, 2001-2002, 2009-2010,
2011-2012, 1999-2000, 2003-2004, 2005-2006 and 2004-2005 respectively. The linear
trend line forecasted a declining trend in liquidity performance (as reflected in Figure-
5.6.4) of Piramal Enterprises during the study period.
From Table -5.6.5, it was observed that in case of Aurobindo Pharmaceuticals registered
the most sound liquidity position in the year 2008-2009 and it was followed by 2002-
2003, 2003-2004, 2001-2002, 2005-2006, 2006-2007, 1999-2000, 2004-2005, 2012-
2013, 2013-2014, 2007-2008, 2009-2010, 2011-2012, 2010-2011 and 2000-2001
respectively. The linear trend line forecasted a declining trend in liquidity performance
(as reflected in Figure-5.6.5) of Aurobindo Pharmaceuticals during the study period.
From Table -5.6.6, it was observed that in case of Cadila Health Care Ltd. registered the
most sound liquidity position in the year 2011-2012 and it was followed by 2012-2013,
2013-2014, 2010-2011, 2009-2010, 2007-2008, 2001-2002, 2000-2001, 2008-2009,

242
2003-2004, 2006-2007, 1999-2000, 2005-2006, 2002-2003 and 2004-2005 respectively.
The linear trend line forecasted an inclining trend in liquidity performance (as reflected in
Figure-5.6.6) of Cadila Health Care Ltd. during the study period.
From Table -5.6.7, it was observed that Divis Labs. registered the most sound liquidity
position in the year 2013-2014 and it was followed by 2007-2008, 2001-2002, 2006-
2007, 2002-2003, 2011-2012, 2012-2013, 2008-2009, 2010-2011, 2004-2005, 2003-
2004,2005-2006, 1999-2000, 2000-2001 and 2009-2010 respectively. The linear trend
line forecasted an inclining trend in liquidity performance (as reflected in Figure-5.6.7) of
Divis Labs during the study period.
From Table -5.6.8, it was observed that Strides Archolabs registered the most sound
liquidity position in the year 2007-2008 and it was followed by 2010-2011, 2011-2012,
2013-2014, 2009-2010, 2002-2003, 2012-2013, 2003-2004, 2004-2005, 2001-2002,
2006-2007,1999-2000, 2005-2006, 2008-2009 and 2000-2001 respectively. The linear
trend line forecasted an inclining trend in liquidity performance (as reflected in Figure-
5.6.8) of Strides Archolabs during the study period.
From Table -5.6.9, it was observed that Sun Pharmaceuticals registered the most sound
liquidity position in the year 2012-2013 and it was followed by 1999-2000, 2011-2012,
2013-2014, 2007-2008, 2001-2002, 2010-2011, 2000-2001, 2009-2010, 2004-2005,
2002-2003,2003-2004, 2006-2007, 2005-2006 and 2008-2009 respectively. The linear
trend line forecasted an inclining trend in liquidity performance (as reflected in Figure-
5.6.9) of Sun Pharmaceuticals during the study period.
From Table -5.6.10, it was observed that Biocon Pharmaceuticals registered the most
sound liquidity position in the year 2013-2014 and it was followed by 2009-2010, 2010-
2011, 2011-2012, 2004-2005, 2012-2013, 2008-2009, 2001-2002, 2007-2008, 2006-
2007, 2005-2006,1999-2000, 2000-2001, 2003-2004 and 2002-2003 respectively. The
linear trend line forecasted an inclining trend in liquidity performance (as reflected in
Figure-5.6.10) of Biocon Pharmaceuticals during the study period.
From Table-5.6.11, it was observed that Kopran regiatered the most sound liquidity
position in the year 2003-2004 and it was followed by 2012-2013, 2008-2009, 2006-
243
2007, 2011-2012, 2007-2008, 2009-2010, 2013-2014, 2002-2003, 2005-2006,2000-
2001,2004-2005,2010-2011, 2001-2002 and 1999-2000 respectively. The linear trend
line fore casted in increasing trend in liquidity performance (as reflected in Figure 5.6.11)
of Kopran during the study period.
From Table -5.6.12, it was observed that Biofil Chemicals and Pharmaceuticals Ltd.
registered the most sound liquidity position in the year 2010-2011 and it was followed by
2009-2010, 2011-2012, 2007-2008, 2012-2013, 2013-2014, 2008-2009, 2006-2007,
2005-2006, 2003-2004, 2001-2002, 1999-2000,2002-2003, 2004-2005, and 2000-2001
respectively. The linear trend line forecasted an inclining trend in liquidity performance
(as reflected in Figure-5.6.12) of Biofil Chemicals and Pharmaceuticals Ltd. during the
study period.
From Table -5.6.13, it was observed that Ambalal Sarabhai Enterprises registered the
most sound liquidity position in the year 2013-2014 and it was followed by 2010-2011,
2007-2008, 2008-2009, 2009-2010, 2005-2006, 2011-2012, 2012-2013, 2006-2007,
2001-2002, 2002-2003, 2004-2005, 1999-2000, 2003-2004, and 2000-2001 respectively.
The linear trend line forecasted an increasing trend in liquidity performance (as reflected
in Figure-5.6.13) of Ambalal Sarabhai Enterprises during the study period.
From Table -5.6.14, it was observed that Parenteral Drugs (India) Ltd. registered the
most sound liquidity position in the year 2012-2013 and it was followed by 2001-2002,
2011-2012, 1999-2000, 2000-2001, 2009-2010, 2010-2011, 2007-2008, 2005-2006,
2013-2014, 2006-2007, 2008-2009, 2004-2005, 2002-2003, 2003-2004, and 2012-2013
respectively. The linear trend line forecasted a fluctuating trend in liquidity performance
(as reflected in Figure-5.6.14) of Parenteral Drugs (India) Ltd. during the study period. In
the initial three years of the study, the liquidity position was high. It started declining
during 2002-2003 to 2004-2005. However, it followed an increasing trend during 2009-
2010 to 2012-2013, in the recent year, it started declining.
From Table -5.6.15, it was observed that Sequent Scientific Ltd. registered the most
sound liquidity position in the year 2004-2005 and it was followed by 2003-2004, 2011-
2012, 2006-2007, 2005-2006, 1999-2000, 2000-2001, 2001-2002, 2002-2003, 2007-
244
2008, 2009-2010, 2008-20092012-2013 and 2013-2014 respectively. The linear trend
line forecasted a decreasing trend in liquidity performance (as reflected in Figure-5.6.15)
of Sequent Scientific Ltd. during the study period.
From Table -5.6.16, it was observed that Zenotech Laboratories registered the most
sound liquidity position in the year 2011-2012 and it was followed by 2010-2011, 2002-
2003, 2001-2002, 2003-2004, 1999-2000, 2006-2007, 2000-2001, 2004-2005, 2012-
2013, 2005-2006, 2013-2014, 2009-2010, 2008-2009 and 2007-2008 respectively. The
linear trend line forecasted a decreasing trend in liquidity performance (as reflected in
Figure-5.6.16) of Zenotech Laboratories during the study period.
From Table -5.6.17, it was observed that Marksans Pharma Ltd. registered the most
sound liquidity position in the year 2013-2014 and it was followed by 2010-2011, 2000-
2001, 2011-2012, 2012-2013, 2007-2008, 2009-2010, 2001-2002, 2004-2005, 2003-
2004, 2005-2006, 1999-2000, 2008-2009, 2006-2007 and 2002-2003 respectively. The
linear trend line forecasted an increasing trend in liquidity performance (as reflected in
Figure-5.6.17) of Marksans Pharma Ltd. during the study period.
From Table -5.6.18, it was observed that Wanbury Ltd. registered the most sound
liquidity position in the year 2005-2006 and it was followed by 2012-2013, 2013-2014,
2008-2009, 2011-2012, 2009-2010, 2007-2008, 2010-2011, 2004-2005, 2001-2002,
2003-2004, 1999-2000, 2002-2003, 2000-2001 and 2000-2001 respectively. The linear
trend line forecasted an increasing trend in liquidity performance (as reflected in Figure-
5.6.18) of Wanbury Ltd. during the study period.
From Table -5.6.19, it was observed that Morepen Labs registered the most sound
liquidity position in the year 2003-2004 and it was followed by 2004-2005, 2002-2003,
2005-2006, 2001-2002, 1999-2000, 2000-2001, 2006-2007, 2013-2014, 2012-2013,
2011-2012, 2010-2011, 2007-2008 and 2009-2010 respectively. The linear trend line
forecasted a mixed trend in liquidity performance (as reflected in Figure-5.6.19) of
Morepen Labs. during the study period.
From Table -5.6.20, it was observed that Hiran Orgochem Ltd. registered the most sound
liquidity position in the year 2010-2011 and it was followed by 2011-2012, 2009-2010,

245
2007-2008, 2004-2005, 2003-2004, 2002-2003, 2006-2007, 2005-2006, 2000-2001,
2008-2009, 2001-2002, 2013-2014 and 1999-2000 respectively. The linear trend line
forecasted a mixed trend in liquidity performance (as reflected in Figure-5.6.20) of Hiran
Orgochem Ltd. during the study period.
The study revealed that the liquidity in most of the selected companies had been
increased during the study period.
5.7. FACTOR ANALYSAIS OF LIQUIDITY, PROFITABILITY AND
EFFICIENCY POSITION OF THE SELECTED PHARMACEUTICAL
COMPANIES
In the above section the pharmaceutical companies‟ liquidity, profitability and efficiency
position have been analysed by using the relevant ratios for each of these positions and
the performance of the selected pharmaceutical companies was assessed on the basis of
these positions. But it can be safely said that not all these three factors with their
constituent ratios were not equally important in determining performance of the selected
pharmaceutical companies. Someone of these factors may be more important than others
in the sense of its explaining power or predictive power. Further, all the ratios may not
move in the same direction to derive valid conclusion. An attempt is made here to club
the homogeneous ratios in the form of either liquidity or efficiency ratio through factor
analysis.
5.7.1 LUPIN
Liquidity Factor:
To construct liquidity factor, three ratios namely, current ratio, absolute liquid ratio and
liquid ratio have been clubbed through factor analysis and it is observed from table below
that the principal component (or factor) represents 93.37% of the total sampling
variations of the three related ratios and its Eigen value is 1.605. As the Eigen value of
the first factor is only greater than one, so according to Kaiser‟s criterion only first
principal component is to be chosen as the liquidity factor. It should be mentioned in this
connection that according to Kaiser‟s criterion only those principal components will be
chosen whose Eigen values are greater than one. Further Bartlett‟s test sphericity is
estimated to be 43.225, which found to be significant at 1% probability level; this implies
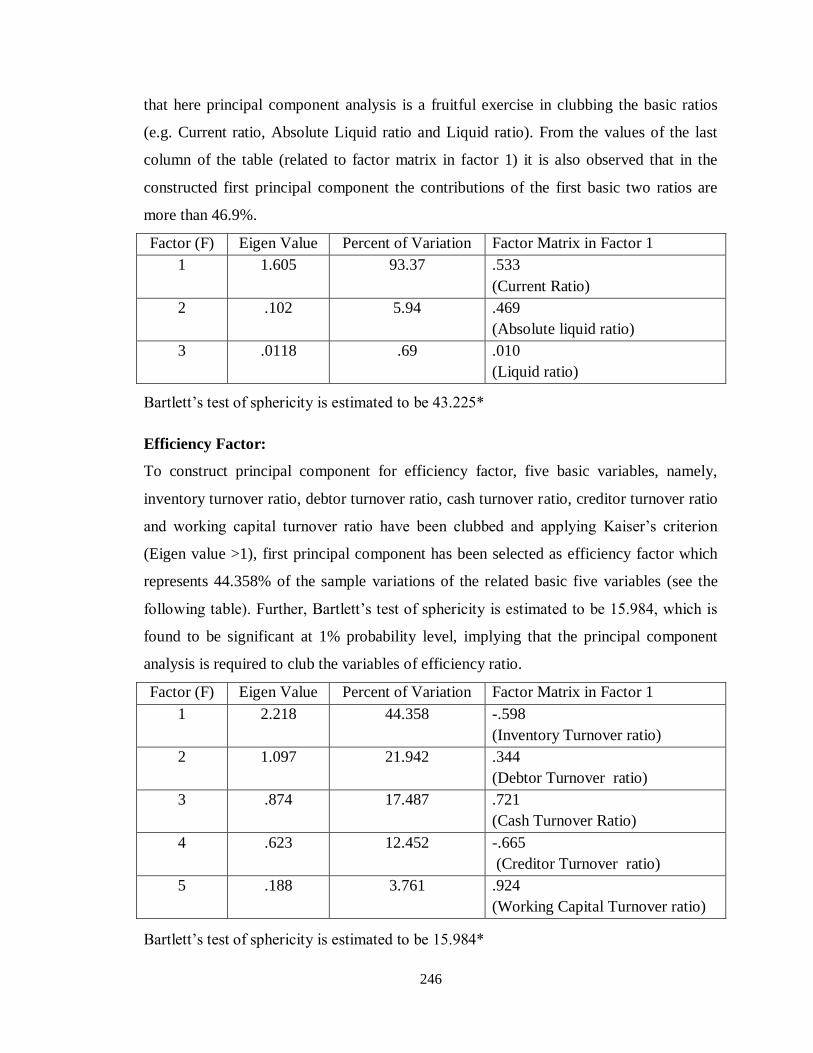
246
that here principal component analysis is a fruitful exercise in clubbing the basic ratios
(e.g. Current ratio, Absolute Liquid ratio and Liquid ratio). From the values of the last
column of the table (related to factor matrix in factor 1) it is also observed that in the
constructed first principal component the contributions of the first basic two ratios are
more than 46.9%.
Factor (F) Eigen Value Percent of Variation Factor Matrix in Factor 1
1 1.605 93.37 .533
(Current Ratio)
2 .102 5.94 .469
(Absolute liquid ratio)
3 .0118 .69 .010
(Liquid ratio)
Bartlett‟s test of sphericity is estimated to be 43.225*
Efficiency Factor:
To construct principal component for efficiency factor, five basic variables, namely,
inventory turnover ratio, debtor turnover ratio, cash turnover ratio, creditor turnover ratio
and working capital turnover ratio have been clubbed and applying Kaiser‟s criterion
(Eigen value >1), first principal component has been selected as efficiency factor which
represents 44.358% of the sample variations of the related basic five variables (see the
following table). Further, Bartlett‟s test of sphericity is estimated to be 15.984, which is
found to be significant at 1% probability level, implying that the principal component
analysis is required to club the variables of efficiency ratio.
Factor (F) Eigen Value Percent of Variation Factor Matrix in Factor 1
1 2.218 44.358 -.598
(Inventory Turnover ratio)
2 1.097 21.942 .344
(Debtor Turnover ratio)
3 .874 17.487 .721
(Cash Turnover Ratio)
4 .623 12.452 -.665
(Creditor Turnover ratio)
5 .188 3.761 .924
(Working Capital Turnover ratio)
Bartlett‟s test of sphericity is estimated to be 15.984*
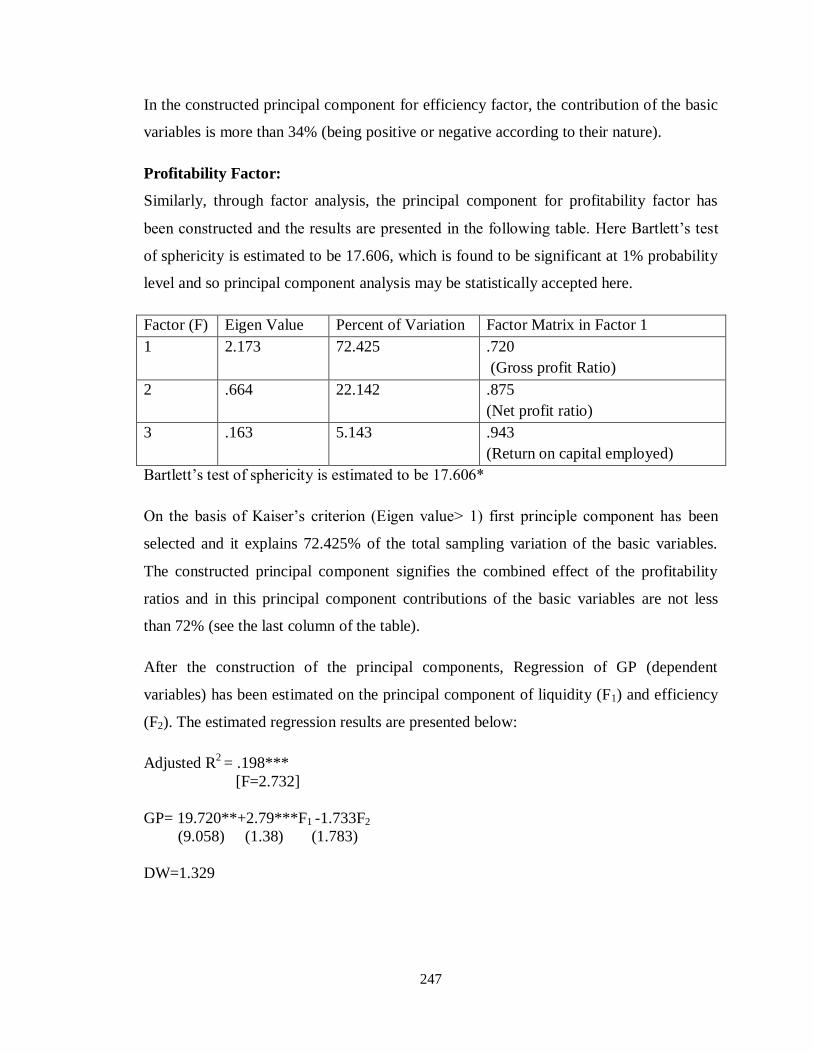
247
In the constructed principal component for efficiency factor, the contribution of the basic
variables is more than 34% (being positive or negative according to their nature).
Profitability Factor:
Similarly, through factor analysis, the principal component for profitability factor has
been constructed and the results are presented in the following table. Here Bartlett‟s test
of sphericity is estimated to be 17.606, which is found to be significant at 1% probability
level and so principal component analysis may be statistically accepted here.
Factor (F) Eigen Value Percent of Variation Factor Matrix in Factor 1
1 2.173 72.425 .720
(Gross profit Ratio)
2 .664 22.142 .875
(Net profit ratio)
3 .163 5.143 .943
(Return on capital employed)
Bartlett‟s test of sphericity is estimated to be 17.606*
On the basis of Kaiser‟s criterion (Eigen value> 1) first principle component has been
selected and it explains 72.425% of the total sampling variation of the basic variables.
The constructed principal component signifies the combined effect of the profitability
ratios and in this principal component contributions of the basic variables are not less
than 72% (see the last column of the table).
After the construction of the principal components, Regression of GP (dependent
variables) has been estimated on the principal component of liquidity (F1) and efficiency
(F2). The estimated regression results are presented below:
Adjusted R2 = .198***
[F=2.732]
GP= 19.720**+2.79***F1 -1.733F2
(9.058) (1.38) (1.783)
DW=1.329
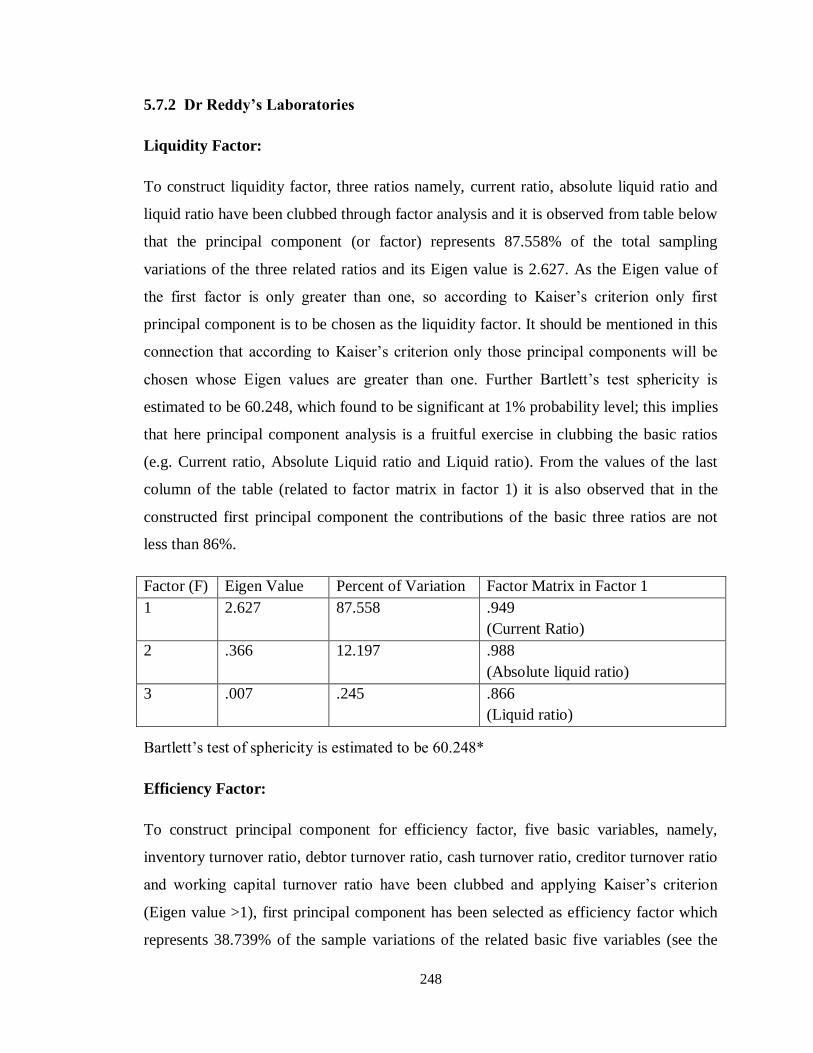
248
5.7.2 Dr Reddy‟s Laboratories
Liquidity Factor:
To construct liquidity factor, three ratios namely, current ratio, absolute liquid ratio and
liquid ratio have been clubbed through factor analysis and it is observed from table below
that the principal component (or factor) represents 87.558% of the total sampling
variations of the three related ratios and its Eigen value is 2.627. As the Eigen value of
the first factor is only greater than one, so according to Kaiser‟s criterion only first
principal component is to be chosen as the liquidity factor. It should be mentioned in this
connection that according to Kaiser‟s criterion only those principal components will be
chosen whose Eigen values are greater than one. Further Bartlett‟s test sphericity is
estimated to be 60.248, which found to be significant at 1% probability level; this implies
that here principal component analysis is a fruitful exercise in clubbing the basic ratios
(e.g. Current ratio, Absolute Liquid ratio and Liquid ratio). From the values of the last
column of the table (related to factor matrix in factor 1) it is also observed that in the
constructed first principal component the contributions of the basic three ratios are not
less than 86%.
Factor (F) Eigen Value Percent of Variation Factor Matrix in Factor 1
1 2.627 87.558 .949
(Current Ratio)
2 .366 12.197 .988
(Absolute liquid ratio)
3 .007 .245 .866
(Liquid ratio)
Bartlett‟s test of sphericity is estimated to be 60.248*
Efficiency Factor:
To construct principal component for efficiency factor, five basic variables, namely,
inventory turnover ratio, debtor turnover ratio, cash turnover ratio, creditor turnover ratio
and working capital turnover ratio have been clubbed and applying Kaiser‟s criterion
(Eigen value >1), first principal component has been selected as efficiency factor which
represents 38.739% of the sample variations of the related basic five variables (see the
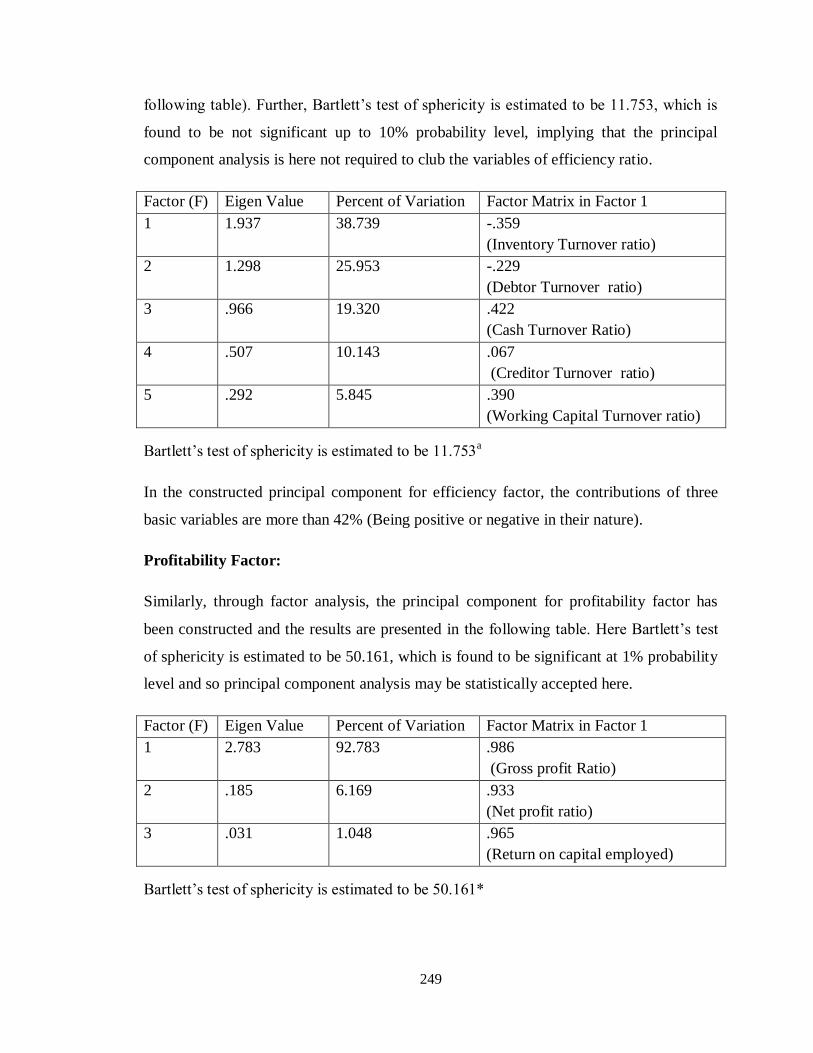
249
following table). Further, Bartlett‟s test of sphericity is estimated to be 11.753, which is
found to be not significant up to 10% probability level, implying that the principal
component analysis is here not required to club the variables of efficiency ratio.
Factor (F) Eigen Value Percent of Variation Factor Matrix in Factor 1
1 1.937 38.739 -.359
(Inventory Turnover ratio)
2 1.298 25.953 -.229
(Debtor Turnover ratio)
3 .966 19.320 .422
(Cash Turnover Ratio)
4 .507 10.143 .067
(Creditor Turnover ratio)
5 .292 5.845 .390
(Working Capital Turnover ratio)
Bartlett‟s test of sphericity is estimated to be 11.753a
In the constructed principal component for efficiency factor, the contributions of three
basic variables are more than 42% (Being positive or negative in their nature).
Profitability Factor:
Similarly, through factor analysis, the principal component for profitability factor has
been constructed and the results are presented in the following table. Here Bartlett‟s test
of sphericity is estimated to be 50.161, which is found to be significant at 1% probability
level and so principal component analysis may be statistically accepted here.
Factor (F) Eigen Value Percent of Variation Factor Matrix in Factor 1
1 2.783 92.783 .986
(Gross profit Ratio)
2 .185 6.169 .933
(Net profit ratio)
3 .031 1.048 .965
(Return on capital employed)
Bartlett‟s test of sphericity is estimated to be 50.161*
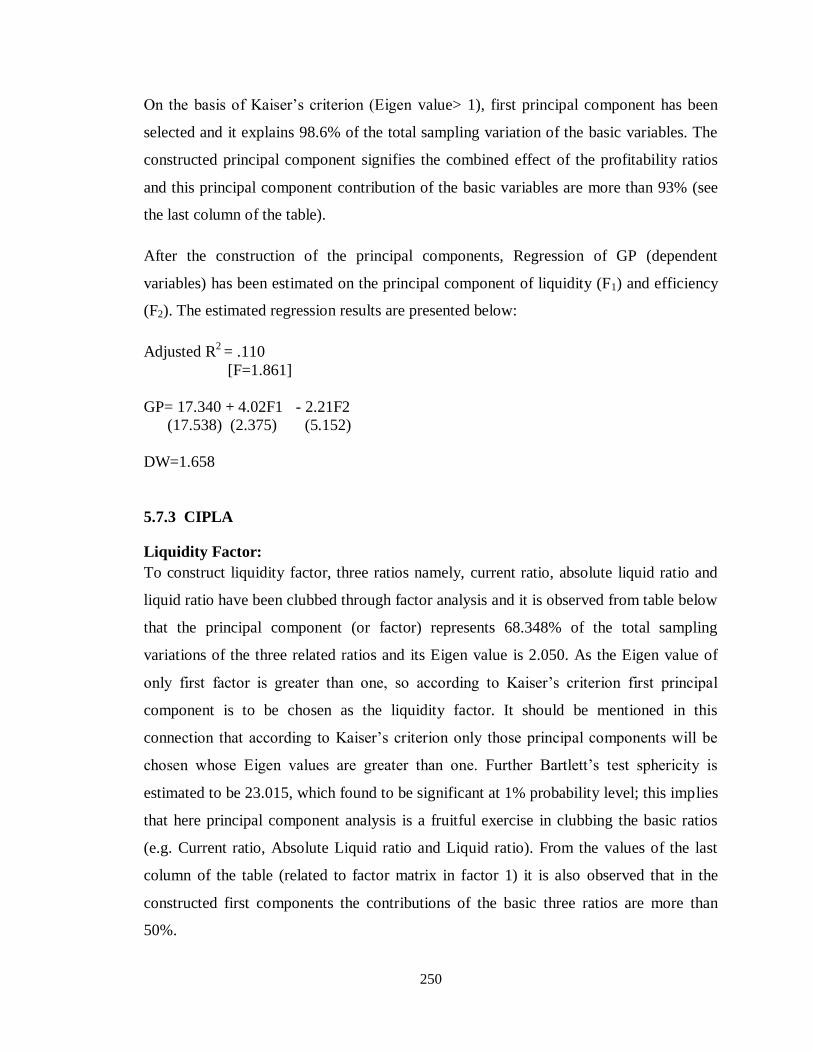
250
On the basis of Kaiser‟s criterion (Eigen value> 1), first principal component has been
selected and it explains 98.6% of the total sampling variation of the basic variables. The
constructed principal component signifies the combined effect of the profitability ratios
and this principal component contribution of the basic variables are more than 93% (see
the last column of the table).
After the construction of the principal components, Regression of GP (dependent
variables) has been estimated on the principal component of liquidity (F1) and efficiency
(F2). The estimated regression results are presented below:
Adjusted R2 = .110
[F=1.861]
GP= 17.340 + 4.02F1 - 2.21F2
(17.538) (2.375) (5.152)
DW=1.658
5.7.3 CIPLA
Liquidity Factor:
To construct liquidity factor, three ratios namely, current ratio, absolute liquid ratio and
liquid ratio have been clubbed through factor analysis and it is observed from table below
that the principal component (or factor) represents 68.348% of the total sampling
variations of the three related ratios and its Eigen value is 2.050. As the Eigen value of
only first factor is greater than one, so according to Kaiser‟s criterion first principal
component is to be chosen as the liquidity factor. It should be mentioned in this
connection that according to Kaiser‟s criterion only those principal components will be
chosen whose Eigen values are greater than one. Further Bartlett‟s test sphericity is
estimated to be 23.015, which found to be significant at 1% probability level; this implies
that here principal component analysis is a fruitful exercise in clubbing the basic ratios
(e.g. Current ratio, Absolute Liquid ratio and Liquid ratio). From the values of the last
column of the table (related to factor matrix in factor 1) it is also observed that in the
constructed first components the contributions of the basic three ratios are more than
50%.

251
Factor (F) Eigen Value Percent of Variation Factor Matrix in Factor 1
1 2.050 68.348 .929
(Current Ratio)
2 .864 28.816 .966
(Liquid ratio)
3 .085 2.836 .507
(Absolute Liquid ratio)
Bartlett‟s test of sphericity is estimated to be 23.015*
Profitability Factor:
Similarly, through factor analysis, the principal component for profitability factor has
been constructed and the results are presented in the following table. Here Bartlett‟s test
of sphericity is estimated to be 8.460, which is found to be significant at 5% probability
level and so principal component analysis may be statistically accepted here.
Factor (F) Eigen Value Percent of Variation Factor Matrix in Factor 1
1 1.949 64.954 .764
(Gross profit Ratio)
2 .668 22.275 .876
(Net profit ratio)
3 .383 12.771 .773 (Return on capital employed)
Bartlett‟s test of sphericity is estimated to be 8.460**
On the basis of Kaiser‟s criterion (Eigen value> 1), the first two basic variables but the
Eigen values of the first basic variables are the highest. Therefore, first principal
component has been selected and it explains 46.558% of the total sampling variation of
the basic variables. The constructed principal component signifies the combined effect of
the profitability ratios and this principal component contribution of the basic variables are
more than 76% (see the last column of the table).
Efficiency Factor:
To construct principal component for efficiency factor, five basic variables, namely,
inventory turnover ratio, debtor turnover ratio, cash turnover ratio, creditor turnover ratio
and working capital turnover ratio have been clubbed and applying Kaiser‟s criterion
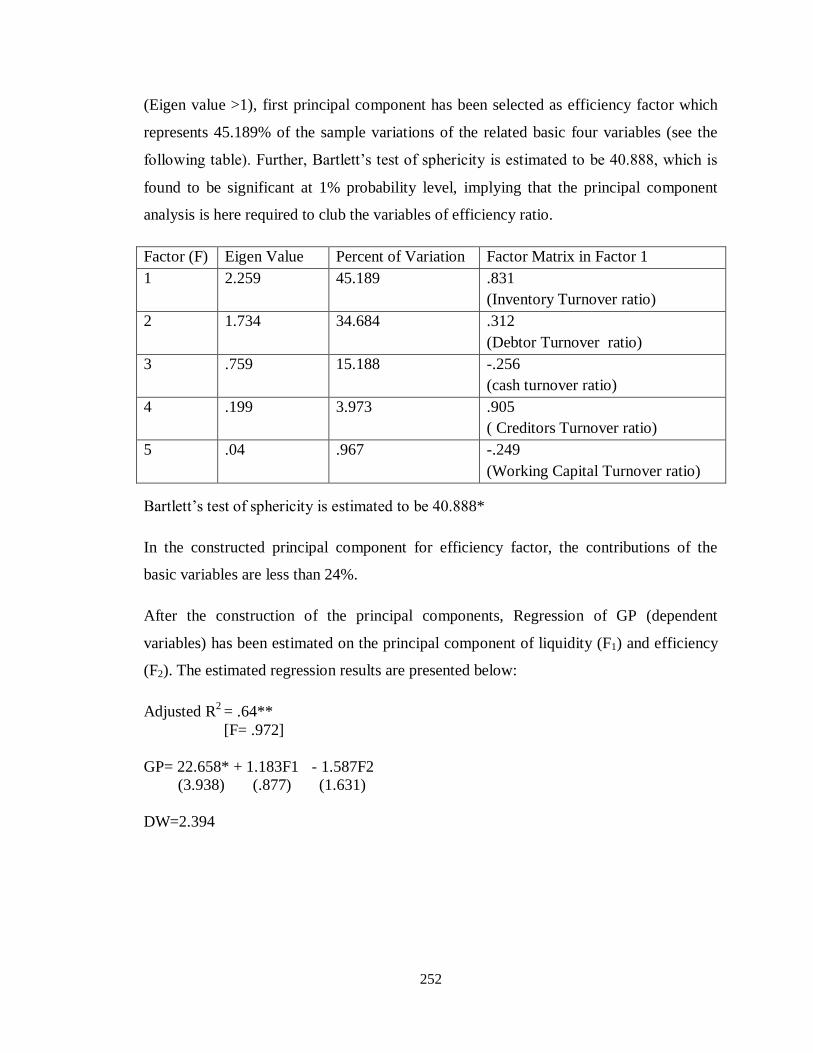
252
(Eigen value >1), first principal component has been selected as efficiency factor which
represents 45.189% of the sample variations of the related basic four variables (see the
following table). Further, Bartlett‟s test of sphericity is estimated to be 40.888, which is
found to be significant at 1% probability level, implying that the principal component
analysis is here required to club the variables of efficiency ratio.
Factor (F) Eigen Value Percent of Variation Factor Matrix in Factor 1
1 2.259 45.189 .831
(Inventory Turnover ratio)
2 1.734 34.684 .312
(Debtor Turnover ratio)
3 .759 15.188 -.256
(cash turnover ratio)
4 .199 3.973 .905
( Creditors Turnover ratio)
5 .04 .967 -.249
(Working Capital Turnover ratio)
Bartlett‟s test of sphericity is estimated to be 40.888*
In the constructed principal component for efficiency factor, the contributions of the
basic variables are less than 24%.
After the construction of the principal components, Regression of GP (dependent
variables) has been estimated on the principal component of liquidity (F1) and efficiency
(F2). The estimated regression results are presented below:
Adjusted R2 = .64**
[F= .972]
GP= 22.658* + 1.183F1 - 1.587F2
(3.938) (.877) (1.631)
DW=2.394
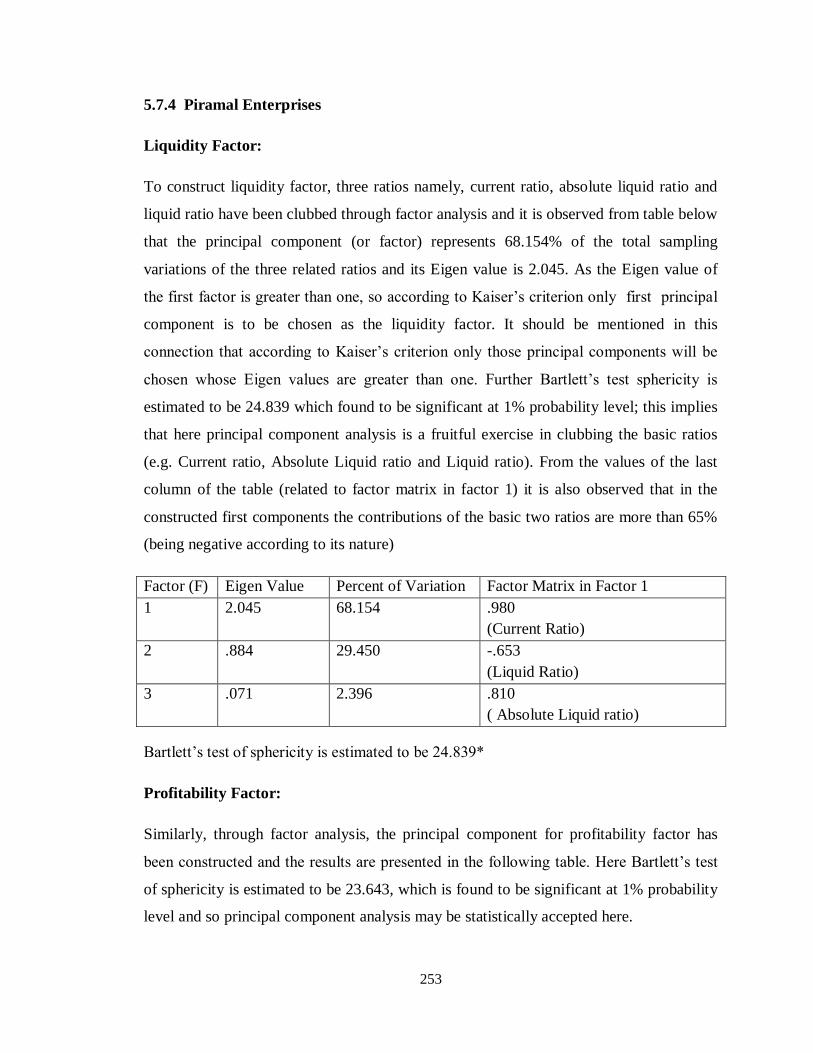
253
5.7.4 Piramal Enterprises
Liquidity Factor:
To construct liquidity factor, three ratios namely, current ratio, absolute liquid ratio and
liquid ratio have been clubbed through factor analysis and it is observed from table below
that the principal component (or factor) represents 68.154% of the total sampling
variations of the three related ratios and its Eigen value is 2.045. As the Eigen value of
the first factor is greater than one, so according to Kaiser‟s criterion only first principal
component is to be chosen as the liquidity factor. It should be mentioned in this
connection that according to Kaiser‟s criterion only those principal components will be
chosen whose Eigen values are greater than one. Further Bartlett‟s test sphericity is
estimated to be 24.839 which found to be significant at 1% probability level; this implies
that here principal component analysis is a fruitful exercise in clubbing the basic ratios
(e.g. Current ratio, Absolute Liquid ratio and Liquid ratio). From the values of the last
column of the table (related to factor matrix in factor 1) it is also observed that in the
constructed first components the contributions of the basic two ratios are more than 65%
(being negative according to its nature)
Factor (F) Eigen Value Percent of Variation Factor Matrix in Factor 1
1 2.045 68.154 .980
(Current Ratio)
2 .884 29.450 -.653
(Liquid Ratio)
3 .071 2.396 .810
( Absolute Liquid ratio)
Bartlett‟s test of sphericity is estimated to be 24.839*
Profitability Factor:
Similarly, through factor analysis, the principal component for profitability factor has
been constructed and the results are presented in the following table. Here Bartlett‟s test
of sphericity is estimated to be 23.643, which is found to be significant at 1% probability
level and so principal component analysis may be statistically accepted here.

254
Factor (F) Eigen Value Percent of Variation Factor Matrix in Factor 1
1 2.053 68.424 .921
(Gross profit Ratio)
2 .867 28.892 -.513
(Net profit ratio)
3 .080 2.684 .970
(Return on capital employed)
Bartlett‟s test of sphericity is estimated to be 23.643*
On the basis of Kaiser‟s criterion (Eigen value> 1), first principal component has been
selected and it explains 68.424% of the total sampling variation of the basic variables. The
constructed principal component signifies the combined effect of the profitability ratios and
the principal component contribution of the basic variables are more than 51.3%, being
positive or negative according to their nature. (See the last column of the table).
Efficiency Factor:
To construct principal component for efficiency factor, five basic variables, namely,
inventory turnover ratio, debtor turnover ratio, cash turnover ratio, creditor turnover ratio
and working capital turnover ratio have been clubbed and applying Kaiser‟s criterion
(Eigen value >1), first principal component has been selected as efficiency factor which
represents 52.618% of the sample variations of the related basic five variables (see the
following table). Further, Bartlett‟s test of sphericity is estimated to be 22.780, which is
found to be significant at 1% probability level, implying that the principal component
analysis is here required to club the variables of efficiency ratio.
Factor (F) Eigen Value Percent of Variation Factor Matrix in Factor 1
1 2.631 52.618 .550
(Inventory Turnover ratio)
2 1.148 22.967 .846
(Debtor Turnover ratio)
3 .677 13.549 .813
(cash turnover ratio)
4 .352 7.033 .713
( Creditors Turnover ratio)
5 .192 3.834 .806
(Working Capital Turnover ratio)
Bartlett‟s test of sphericity is estimated to be 22.780*
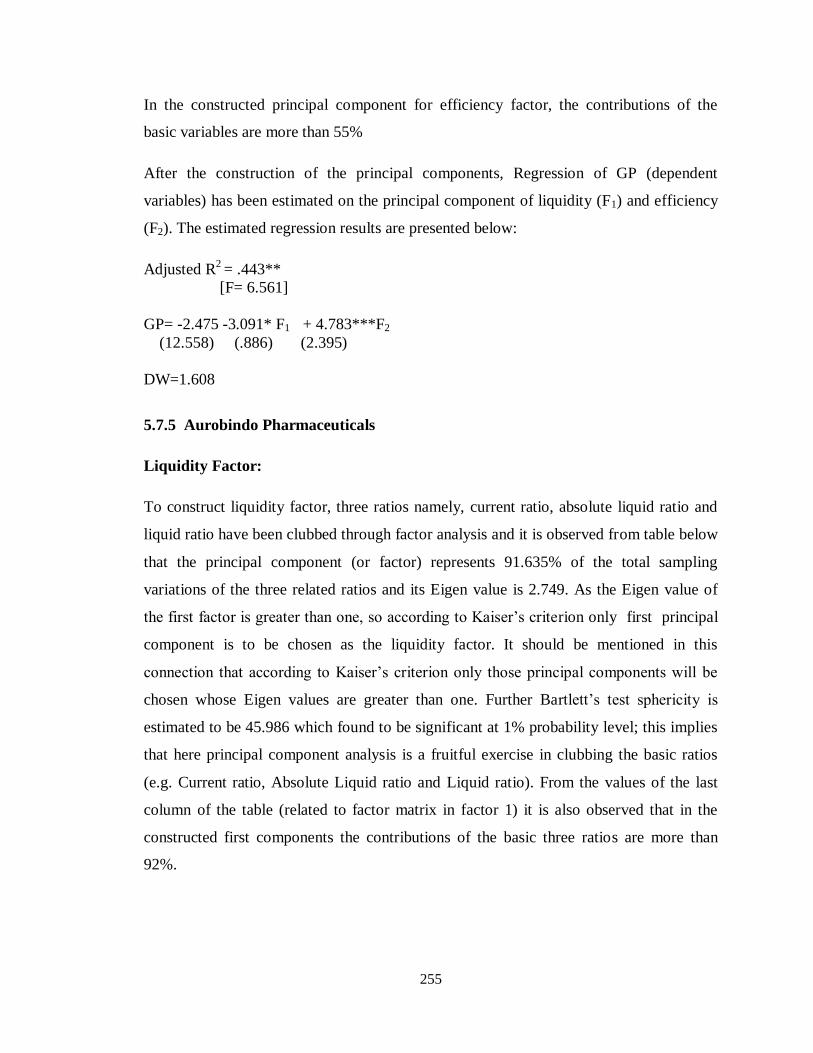
255
In the constructed principal component for efficiency factor, the contributions of the
basic variables are more than 55%
After the construction of the principal components, Regression of GP (dependent
variables) has been estimated on the principal component of liquidity (F1) and efficiency
(F2). The estimated regression results are presented below:
Adjusted R2 = .443**
[F= 6.561]
GP= -2.475 -3.091* F1 + 4.783***F2
(12.558) (.886) (2.395)
DW=1.608
5.7.5 Aurobindo Pharmaceuticals
Liquidity Factor:
To construct liquidity factor, three ratios namely, current ratio, absolute liquid ratio and
liquid ratio have been clubbed through factor analysis and it is observed from table below
that the principal component (or factor) represents 91.635% of the total sampling
variations of the three related ratios and its Eigen value is 2.749. As the Eigen value of
the first factor is greater than one, so according to Kaiser‟s criterion only first principal
component is to be chosen as the liquidity factor. It should be mentioned in this
connection that according to Kaiser‟s criterion only those principal components will be
chosen whose Eigen values are greater than one. Further Bartlett‟s test sphericity is
estimated to be 45.986 which found to be significant at 1% probability level; this implies
that here principal component analysis is a fruitful exercise in clubbing the basic ratios
(e.g. Current ratio, Absolute Liquid ratio and Liquid ratio). From the values of the last
column of the table (related to factor matrix in factor 1) it is also observed that in the
constructed first components the contributions of the basic three ratios are more than
92%.
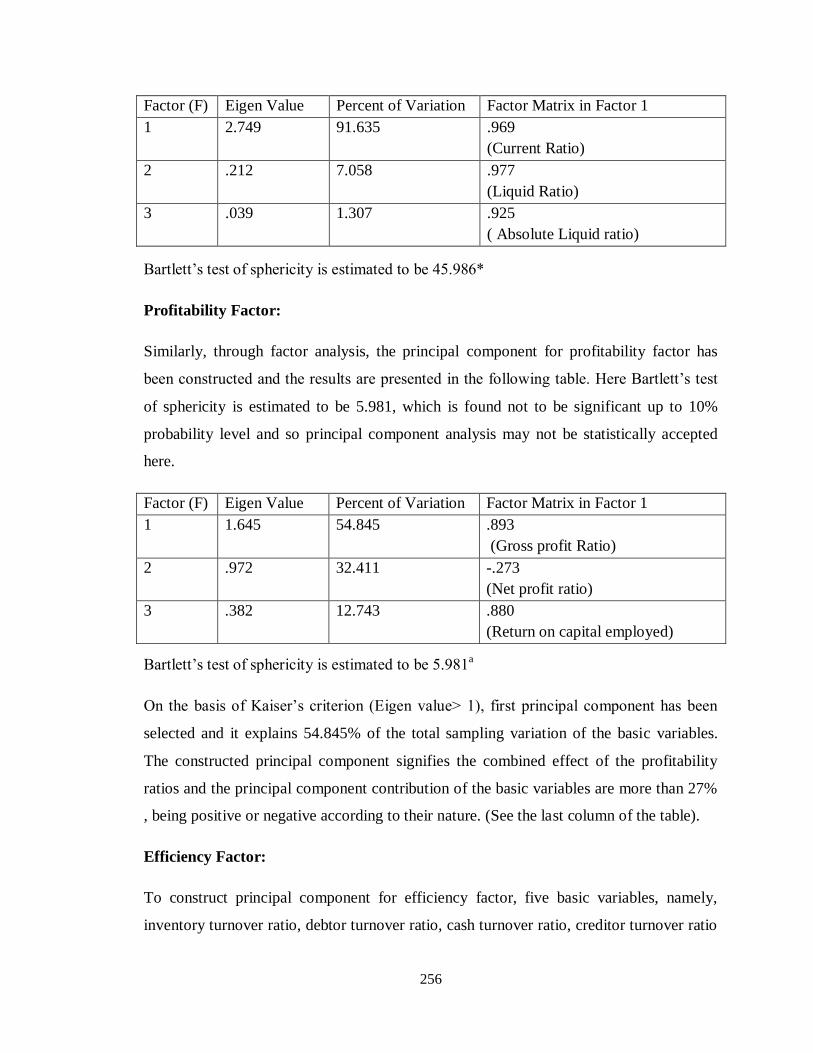
256
Factor (F) Eigen Value Percent of Variation Factor Matrix in Factor 1
1 2.749 91.635 .969
(Current Ratio)
2 .212 7.058 .977
(Liquid Ratio)
3 .039 1.307 .925
( Absolute Liquid ratio)
Bartlett‟s test of sphericity is estimated to be 45.986*
Profitability Factor:
Similarly, through factor analysis, the principal component for profitability factor has
been constructed and the results are presented in the following table. Here Bartlett‟s test
of sphericity is estimated to be 5.981, which is found not to be significant up to 10%
probability level and so principal component analysis may not be statistically accepted
here.
Factor (F) Eigen Value Percent of Variation Factor Matrix in Factor 1
1 1.645 54.845 .893
(Gross profit Ratio)
2 .972 32.411 -.273
(Net profit ratio)
3 .382 12.743 .880
(Return on capital employed)
Bartlett‟s test of sphericity is estimated to be 5.981a
On the basis of Kaiser‟s criterion (Eigen value> 1), first principal component has been
selected and it explains 54.845% of the total sampling variation of the basic variables.
The constructed principal component signifies the combined effect of the profitability
ratios and the principal component contribution of the basic variables are more than 27%
, being positive or negative according to their nature. (See the last column of the table).
Efficiency Factor:
To construct principal component for efficiency factor, five basic variables, namely,
inventory turnover ratio, debtor turnover ratio, cash turnover ratio, creditor turnover ratio
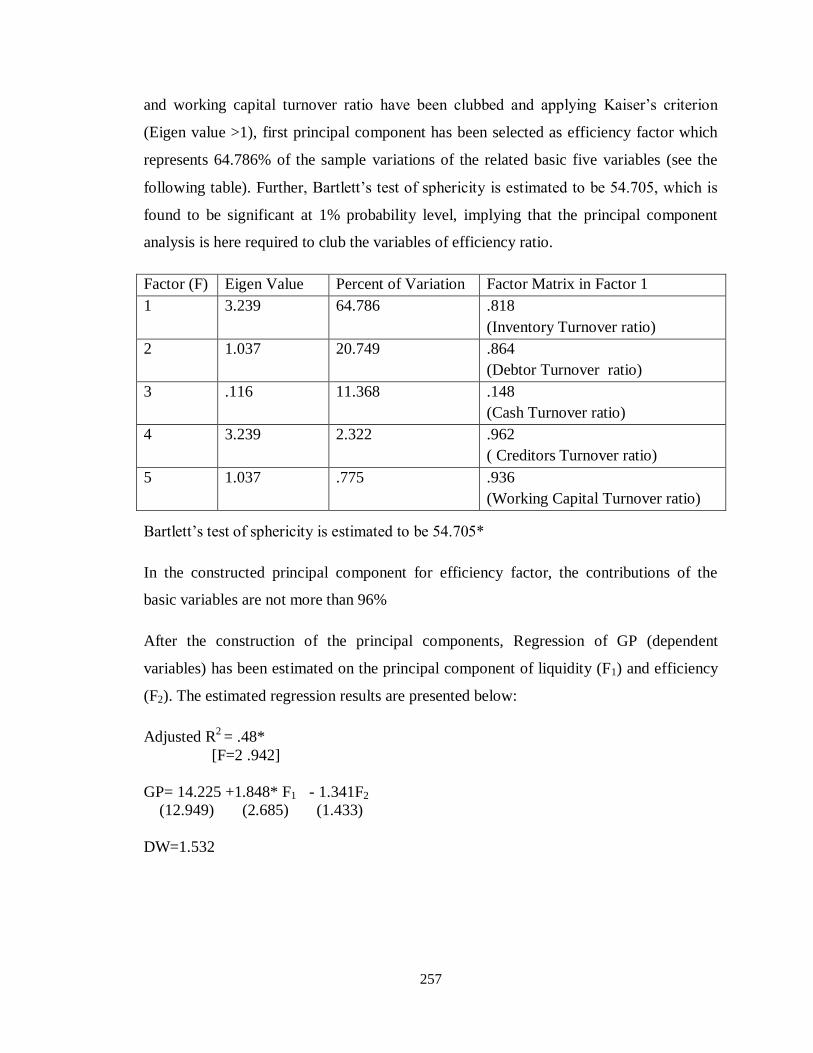
257
and working capital turnover ratio have been clubbed and applying Kaiser‟s criterion
(Eigen value >1), first principal component has been selected as efficiency factor which
represents 64.786% of the sample variations of the related basic five variables (see the
following table). Further, Bartlett‟s test of sphericity is estimated to be 54.705, which is
found to be significant at 1% probability level, implying that the principal component
analysis is here required to club the variables of efficiency ratio.
Factor (F) Eigen Value Percent of Variation Factor Matrix in Factor 1
1 3.239 64.786 .818
(Inventory Turnover ratio)
2 1.037 20.749 .864
(Debtor Turnover ratio)
3 .116 11.368 .148
(Cash Turnover ratio)
4 3.239 2.322 .962
( Creditors Turnover ratio)
5 1.037 .775 .936
(Working Capital Turnover ratio)
Bartlett‟s test of sphericity is estimated to be 54.705*
In the constructed principal component for efficiency factor, the contributions of the
basic variables are not more than 96%
After the construction of the principal components, Regression of GP (dependent
variables) has been estimated on the principal component of liquidity (F1) and efficiency
(F2). The estimated regression results are presented below:
Adjusted R2 = .48*
[F=2 .942]
GP= 14.225 +1.848* F1 - 1.341F2
(12.949) (2.685) (1.433)
DW=1.532
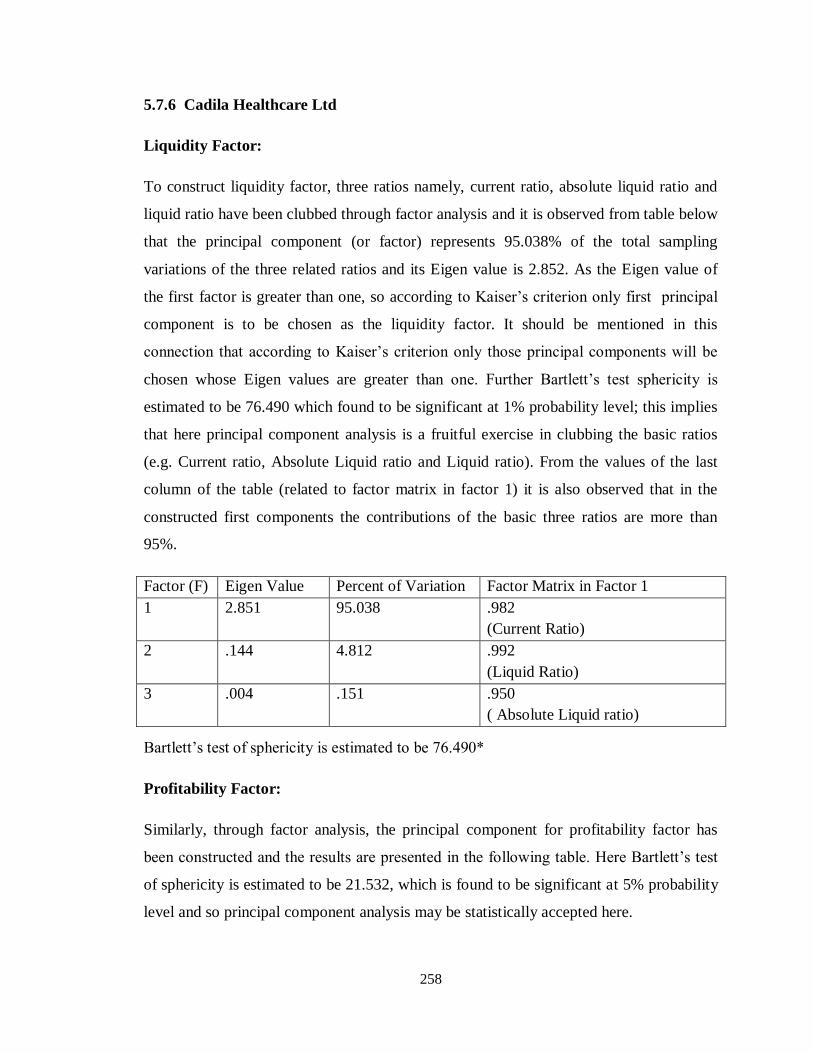
258
5.7.6 Cadila Healthcare Ltd
Liquidity Factor:
To construct liquidity factor, three ratios namely, current ratio, absolute liquid ratio and
liquid ratio have been clubbed through factor analysis and it is observed from table below
that the principal component (or factor) represents 95.038% of the total sampling
variations of the three related ratios and its Eigen value is 2.852. As the Eigen value of
the first factor is greater than one, so according to Kaiser‟s criterion only first principal
component is to be chosen as the liquidity factor. It should be mentioned in this
connection that according to Kaiser‟s criterion only those principal components will be
chosen whose Eigen values are greater than one. Further Bartlett‟s test sphericity is
estimated to be 76.490 which found to be significant at 1% probability level; this implies
that here principal component analysis is a fruitful exercise in clubbing the basic ratios
(e.g. Current ratio, Absolute Liquid ratio and Liquid ratio). From the values of the last
column of the table (related to factor matrix in factor 1) it is also observed that in the
constructed first components the contributions of the basic three ratios are more than
95%.
Factor (F) Eigen Value Percent of Variation Factor Matrix in Factor 1
1 2.851 95.038 .982
(Current Ratio)
2 .144 4.812 .992
(Liquid Ratio)
3 .004 .151 .950
( Absolute Liquid ratio)
Bartlett‟s test of sphericity is estimated to be 76.490*
Profitability Factor:
Similarly, through factor analysis, the principal component for profitability factor has
been constructed and the results are presented in the following table. Here Bartlett‟s test
of sphericity is estimated to be 21.532, which is found to be significant at 5% probability
level and so principal component analysis may be statistically accepted here.
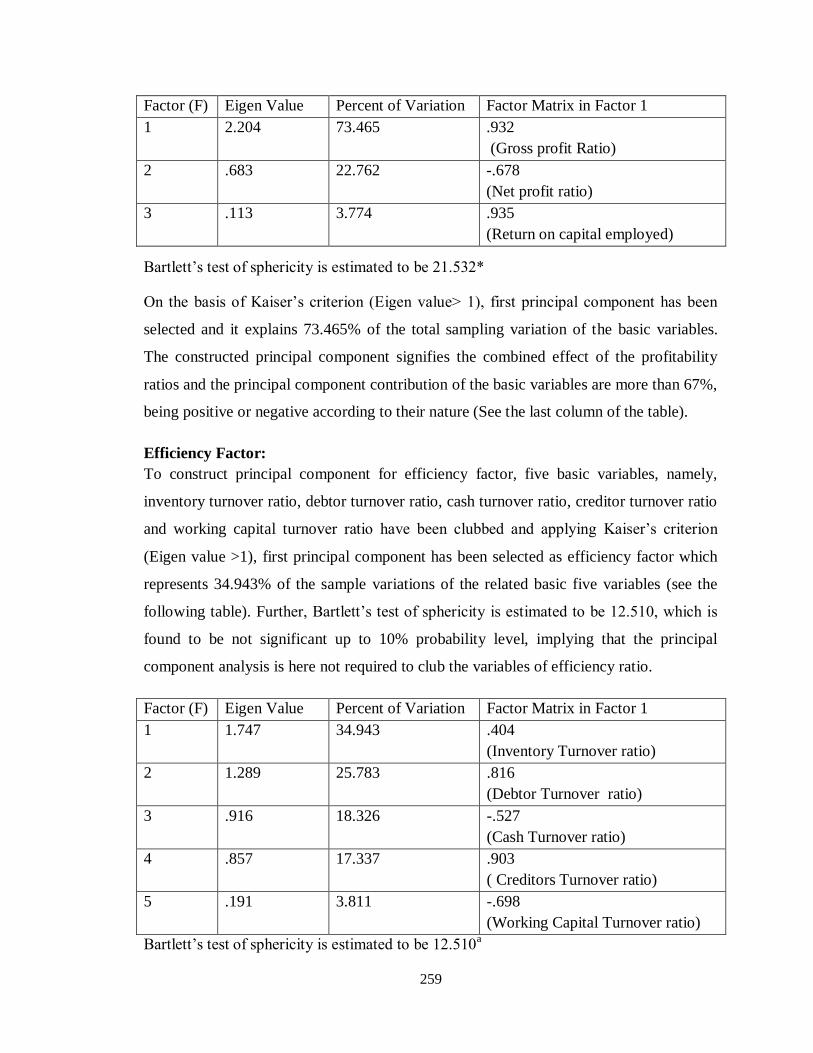
259
Factor (F) Eigen Value Percent of Variation Factor Matrix in Factor 1
1 2.204 73.465 .932
(Gross profit Ratio)
2 .683 22.762 -.678
(Net profit ratio)
3 .113 3.774 .935
(Return on capital employed)
Bartlett‟s test of sphericity is estimated to be 21.532*
On the basis of Kaiser‟s criterion (Eigen value> 1), first principal component has been
selected and it explains 73.465% of the total sampling variation of the basic variables.
The constructed principal component signifies the combined effect of the profitability
ratios and the principal component contribution of the basic variables are more than 67%,
being positive or negative according to their nature (See the last column of the table).
Efficiency Factor:
To construct principal component for efficiency factor, five basic variables, namely,
inventory turnover ratio, debtor turnover ratio, cash turnover ratio, creditor turnover ratio
and working capital turnover ratio have been clubbed and applying Kaiser‟s criterion
(Eigen value >1), first principal component has been selected as efficiency factor which
represents 34.943% of the sample variations of the related basic five variables (see the
following table). Further, Bartlett‟s test of sphericity is estimated to be 12.510, which is
found to be not significant up to 10% probability level, implying that the principal
component analysis is here not required to club the variables of efficiency ratio.
Factor (F) Eigen Value Percent of Variation Factor Matrix in Factor 1
1 1.747 34.943 .404
(Inventory Turnover ratio)
2 1.289 25.783 .816
(Debtor Turnover ratio)
3 .916 18.326 -.527
(Cash Turnover ratio)
4 .857 17.337 .903
( Creditors Turnover ratio)
5 .191 3.811 -.698
(Working Capital Turnover ratio)
Bartlett‟s test of sphericity is estimated to be 12.510a

260
In the constructed principal component for efficiency factor, the contributions of the
basic variables are more than40%, being positive or negative according to their nature.
After the construction of the principal components, Regression of GP (dependent
variables) has been estimated on the principal component of liquidity (F1) and efficiency
(F2). The estimated regression results are presented below:
Adjusted R2 = .167*
[F=2 .942]
GP= 15.663 + .017 F1 - .032F2
(15.660) (1.550) (3.491)
DW=1.417
5.7.7 Divis Lab
Liquidity Factor:
To construct liquidity factor, three ratios namely, current ratio, absolute liquid ratio and
liquid ratio have been clubbed through factor analysis and it is observed from table below
that the principal component (or factor) represents 69.096% of the total sampling
variations of the three related ratios and its Eigen value is 2.073. As the Eigen value of
the first factor is greater than one, so according to Kaiser‟s criterion only first principal
component is to be chosen as the liquidity factor. It should be mentioned in this
connection that according to Kaiser‟s criterion only those principal components will be
chosen whose Eigen values are greater than one. Further Bartlett‟s test sphericity is
estimated to be 34.524 which found to be significant at 1% probability level; this implies
that here principal component analysis is a fruitful exercise in clubbing the basic ratios
(e.g. Current ratio, Absolute Liquid ratio and Liquid ratio). From the values of the last
column of the table (related to factor matrix in factor 1) it is also observed that in the
constructed first components the contributions of the basic three ratios are more than
43%, being positive or negative according to their nature .
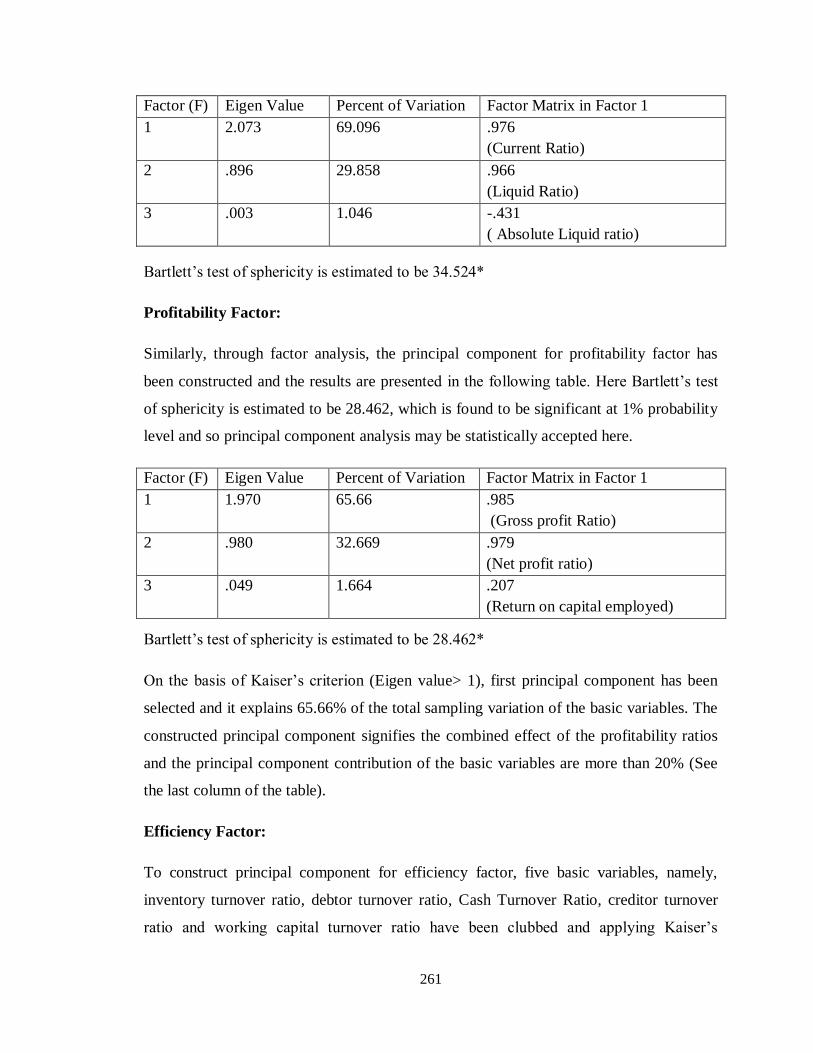
261
Factor (F) Eigen Value Percent of Variation Factor Matrix in Factor 1
1 2.073 69.096 .976
(Current Ratio)
2 .896 29.858 .966
(Liquid Ratio)
3 .003 1.046 -.431
( Absolute Liquid ratio)
Bartlett‟s test of sphericity is estimated to be 34.524*
Profitability Factor:
Similarly, through factor analysis, the principal component for profitability factor has
been constructed and the results are presented in the following table. Here Bartlett‟s test
of sphericity is estimated to be 28.462, which is found to be significant at 1% probability
level and so principal component analysis may be statistically accepted here.
Factor (F) Eigen Value Percent of Variation Factor Matrix in Factor 1
1 1.970 65.66 .985
(Gross profit Ratio)
2 .980 32.669 .979
(Net profit ratio)
3 .049 1.664 .207
(Return on capital employed)
Bartlett‟s test of sphericity is estimated to be 28.462*
On the basis of Kaiser‟s criterion (Eigen value> 1), first principal component has been
selected and it explains 65.66% of the total sampling variation of the basic variables. The
constructed principal component signifies the combined effect of the profitability ratios
and the principal component contribution of the basic variables are more than 20% (See
the last column of the table).
Efficiency Factor:
To construct principal component for efficiency factor, five basic variables, namely,
inventory turnover ratio, debtor turnover ratio, Cash Turnover Ratio, creditor turnover
ratio and working capital turnover ratio have been clubbed and applying Kaiser‟s
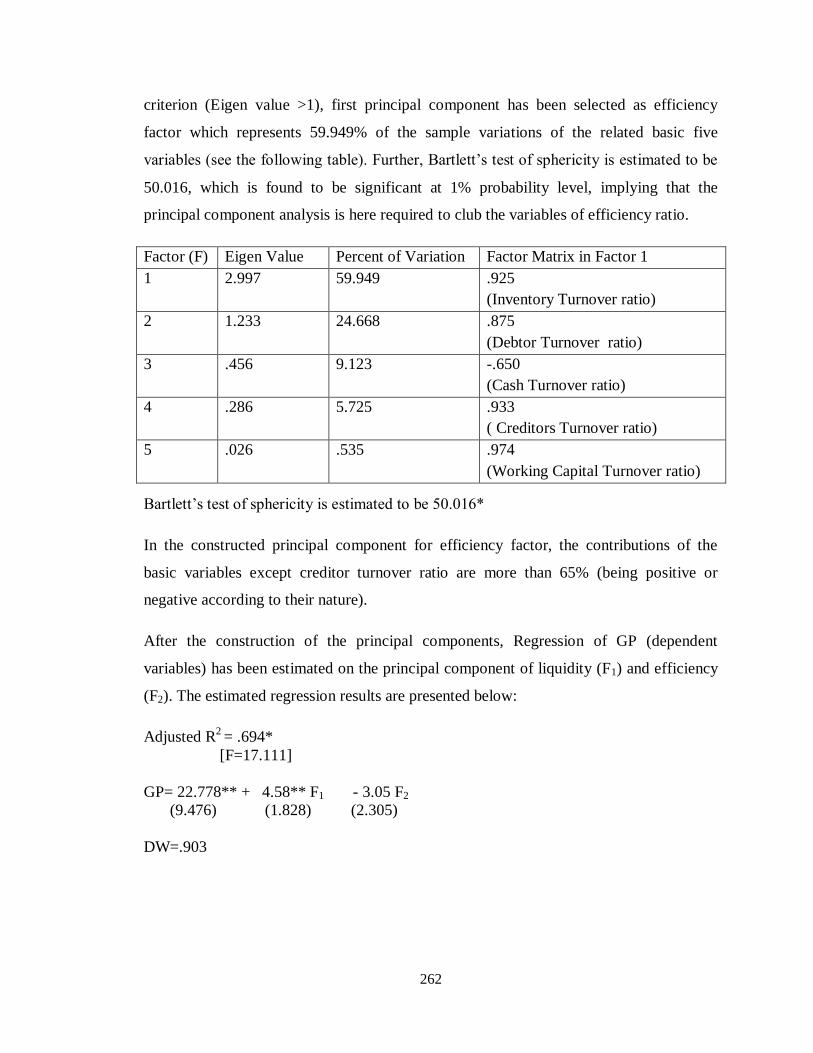
262
criterion (Eigen value >1), first principal component has been selected as efficiency
factor which represents 59.949% of the sample variations of the related basic five
variables (see the following table). Further, Bartlett‟s test of sphericity is estimated to be
50.016, which is found to be significant at 1% probability level, implying that the
principal component analysis is here required to club the variables of efficiency ratio.
Factor (F) Eigen Value Percent of Variation Factor Matrix in Factor 1
1 2.997 59.949 .925
(Inventory Turnover ratio)
2 1.233 24.668 .875
(Debtor Turnover ratio)
3 .456 9.123 -.650
(Cash Turnover ratio)
4 .286 5.725 .933
( Creditors Turnover ratio)
5 .026 .535 .974
(Working Capital Turnover ratio)
Bartlett‟s test of sphericity is estimated to be 50.016*
In the constructed principal component for efficiency factor, the contributions of the
basic variables except creditor turnover ratio are more than 65% (being positive or
negative according to their nature).
After the construction of the principal components, Regression of GP (dependent
variables) has been estimated on the principal component of liquidity (F1) and efficiency
(F2). The estimated regression results are presented below:
Adjusted R2 = .694*
[F=17.111]
GP= 22.778** + 4.58** F1 - 3.05 F2
(9.476) (1.828) (2.305)
DW=.903

263
5.7.8 Strides Archolabs
Liquidity Factor:
To construct liquidity factor, three ratios namely, current ratio, absolute liquid ratio and
liquid ratio have been clubbed through factor analysis and it is observed from table below
that the principal component (or factor) represents 69.383% of the total sampling
variations of the three related ratios and its Eigen value is 2.080. As the Eigen value of
the first factor is greater than one, so according to Kaiser‟s criterion only first principal
component is to be chosen as the liquidity factor. It should be mentioned in this
connection that according to Kaiser‟s criterion only those principal components will be
chosen whose Eigen values are greater than one. Further Bartlett‟s test sphericity is
estimated to be 40.806 which found to be significant at 1% probability level; this implies
that here principal component analysis is a fruitful exercise in clubbing the basic ratios
(e.g. Current ratio, Absolute Liquid ratio and Liquid ratio). From the values of the last
column of the table (related to factor matrix in factor 1) it is also observed that in the
constructed first components the contributions of the basic three ratios are more than
42%.
Factor (F) Eigen Value Percent of Variation Factor Matrix in Factor 1
1 2.080 69.383 .980
(Current Ratio)
2 .900 29.995 .971
(Liquid Ratio)
3 .018 .622 .423
( Absolute Liquid ratio)
Bartlett‟s test of sphericity is estimated to be 40.806*
Profitability Factor:
Similarly, through factor analysis, the principal component for profitability factor has
been constructed and the results are presented in the following table. Here Bartlett‟s test
of sphericity is estimated to be 13.222, which is found to be significant at 1% probability
level and so principal component analysis may be statistically accepted here.
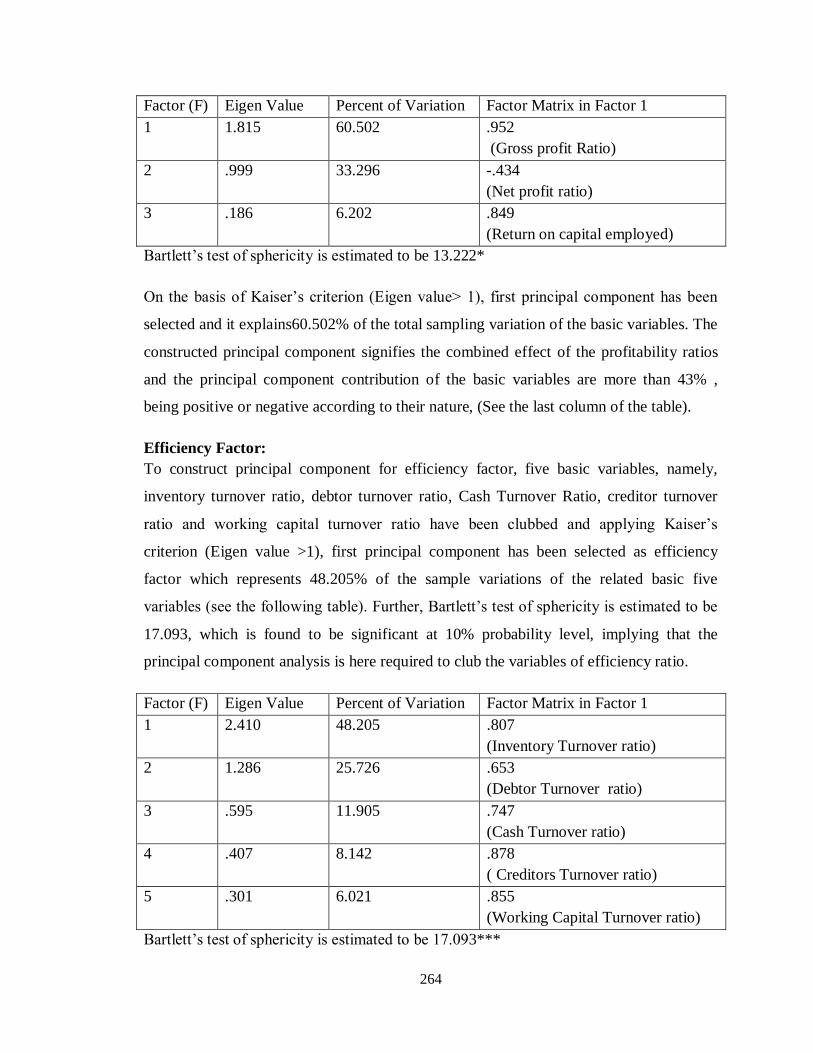
264
Factor (F) Eigen Value Percent of Variation Factor Matrix in Factor 1
1 1.815 60.502 .952
(Gross profit Ratio)
2 .999 33.296 -.434
(Net profit ratio)
3 .186 6.202 .849
(Return on capital employed)
Bartlett‟s test of sphericity is estimated to be 13.222*
On the basis of Kaiser‟s criterion (Eigen value> 1), first principal component has been
selected and it explains60.502% of the total sampling variation of the basic variables. The
constructed principal component signifies the combined effect of the profitability ratios
and the principal component contribution of the basic variables are more than 43% ,
being positive or negative according to their nature, (See the last column of the table).
Efficiency Factor:
To construct principal component for efficiency factor, five basic variables, namely,
inventory turnover ratio, debtor turnover ratio, Cash Turnover Ratio, creditor turnover
ratio and working capital turnover ratio have been clubbed and applying Kaiser‟s
criterion (Eigen value >1), first principal component has been selected as efficiency
factor which represents 48.205% of the sample variations of the related basic five
variables (see the following table). Further, Bartlett‟s test of sphericity is estimated to be
17.093, which is found to be significant at 10% probability level, implying that the
principal component analysis is here required to club the variables of efficiency ratio.
Factor (F) Eigen Value Percent of Variation Factor Matrix in Factor 1
1 2.410 48.205 .807
(Inventory Turnover ratio)
2 1.286 25.726 .653
(Debtor Turnover ratio)
3 .595 11.905 .747
(Cash Turnover ratio)
4 .407 8.142 .878
( Creditors Turnover ratio)
5 .301 6.021 .855
(Working Capital Turnover ratio)
Bartlett‟s test of sphericity is estimated to be 17.093***
265
In the constructed principal component for efficiency factor, the contributions of the
basic variables are more than 65%.
After the construction of the principal components, Regression of GP (dependent
variables) has been estimated on the principal component of liquidity (F1) and efficiency
(F2). The estimated regression results are presented below:
Adjusted R2 = .415*
[F=5.965]
GP= 31.506* + .809 F1 - 1.899* F2
(3.841) (.579) (.554)
DW= 1.669
5.7.9 Sun Pharmaceuticals
Liquidity Factor:
To construct liquidity factor, three ratios namely, current ratio, absolute liquid ratio and
liquid ratio have been clubbed through factor analysis and it is observed from table below
that the principal component (or factor) represents 90.125% of the total sampling
variations of the three related ratios and its Eigen value is 2.704. As the Eigen value of
the first factor is greater than one, so according to Kaiser‟s criterion only first principal
component is to be chosen as the liquidity factor. It should be mentioned in this
connection that according to Kaiser‟s criterion only those principal components will be
chosen whose Eigen values are greater than one. Further Bartlett‟s test sphericity is
estimated to be 49.726 which found to be significant at 1% probability level; this implies
that here principal component analysis is a fruitful exercise in clubbing the basic ratios
(e.g. Current ratio, Absolute Liquid ratio and Liquid ratio). From the values of the last
column of the table (related to factor matrix in factor 1) it is also observed that in the
constructed first components the contributions of the basic ratios except liquid ratio are
more than 90%.

266
Factor (F) Eigen Value Percent of Variation Factor Matrix in Factor 1
1 2.704 90.125 .952
(Current Ratio)
2 .274 9.118 .988
(Liquid Ratio)
3 .022 .757 .906
( Absolute Liquid ratio)
Bartlett‟s test of sphericity is estimated to be 49.726*
Profitability Factor:
Similarly, through factor analysis, the principal component for profitability factor has
been constructed and the results are presented in the following table. Here Bartlett‟s test
of sphericity is estimated to be 14.797, which is found to be significant at 1% probability
level and so principal component analysis may be statistically accepted here.
Factor (F) Eigen Value Percent of Variation Factor Matrix in Factor 1
1 2.013 67.107 .934
(Gross profit Ratio)
2 .804 26.787 .587
(Net profit ratio)
3 .183 6.106 .893
(Return on capital employed)
Bartlett‟s test of sphericity is estimated to be 14.797*
On the basis of Kaiser‟s criterion (Eigen value> 1), first principal component has been
selected and it explains 67.107% of the total sampling variation of the basic variables.
The constructed principal component signifies the combined effect of the profitability
ratios and the principal component contribution of the basic variables are more than 58%
(See the last column of the table).
Efficiency Factor:
To construct principal component for efficiency factor, five basic variables, namely,
inventory turnover ratio, debtor turnover ratio, Cash Turnover Ratio, creditor turnover
ratio and working capital turnover ratio have been clubbed and applying Kaiser‟s

267
criterion (Eigen value >1), first principal component has been selected as efficiency
factor which represents 47.493% of the sample variations of the related basic five
variables (see the following table). Further, Bartlett‟s test of sphericity is estimated to be
15.713, which is found to be significant at 10% probability level, implying that the
principal component analysis is here required to club the variables of efficiency ratio.
Factor (F) Eigen Value Percent of Variation Factor Matrix in Factor 1
1 2.375 47.493 .796
(Inventory Turnover ratio)
2 1.044 20.884 .732
(Debtor Turnover ratio)
3 .845 16.893 .780
(Cash Turnover ratio)
4 .486 9.720 .908
( Creditors Turnover ratio)
5 .251 5.011 .528
(Working Capital Turnover ratio)
Bartlett‟s test of sphericity is estimated to be 15.713***
In the constructed principal component for efficiency factor, the contributions of the
basic variables are more than 52%.
After the construction of the principal components, Regression of GP (dependent
variables) has been estimated on the principal component of liquidity (F1) and efficiency
(F2). The estimated regression results are presented below:
Adjusted R2 = .227***
[F=3.057]
GP= 58.801** + 1.915 F1 - 7.645** F2
(17.711) (2.143) (3.265)
DW= 1.378
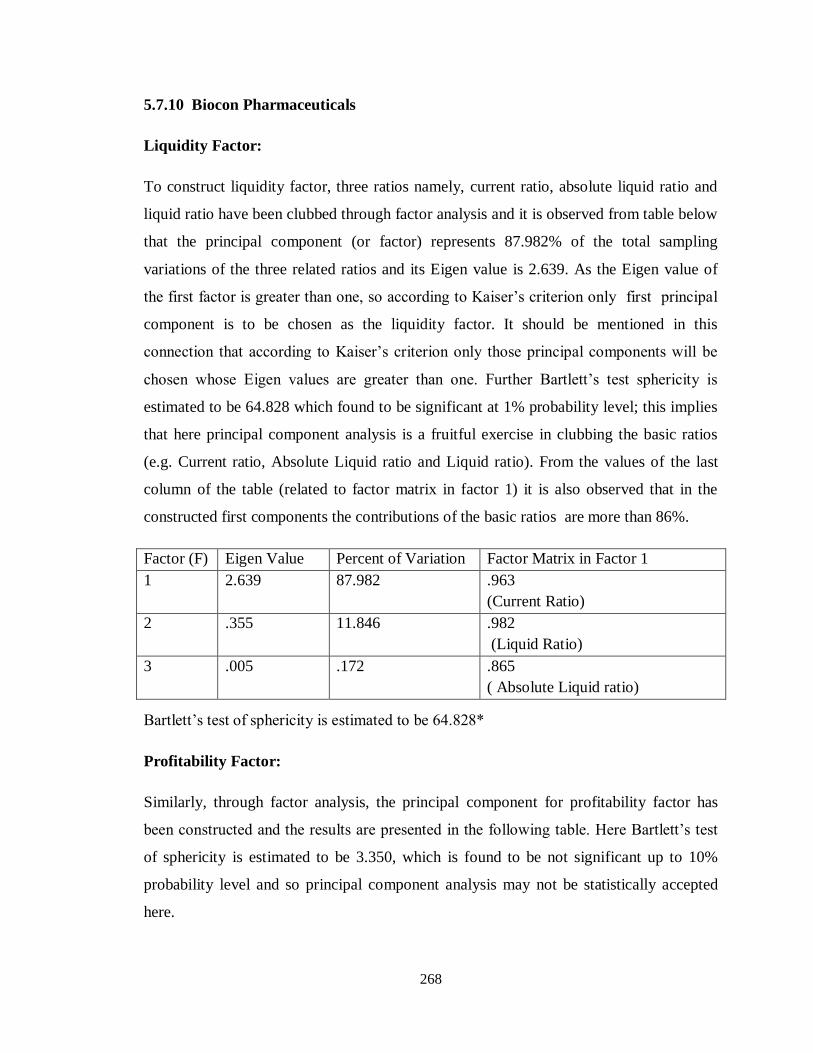
268
5.7.10 Biocon Pharmaceuticals
Liquidity Factor:
To construct liquidity factor, three ratios namely, current ratio, absolute liquid ratio and
liquid ratio have been clubbed through factor analysis and it is observed from table below
that the principal component (or factor) represents 87.982% of the total sampling
variations of the three related ratios and its Eigen value is 2.639. As the Eigen value of
the first factor is greater than one, so according to Kaiser‟s criterion only first principal
component is to be chosen as the liquidity factor. It should be mentioned in this
connection that according to Kaiser‟s criterion only those principal components will be
chosen whose Eigen values are greater than one. Further Bartlett‟s test sphericity is
estimated to be 64.828 which found to be significant at 1% probability level; this implies
that here principal component analysis is a fruitful exercise in clubbing the basic ratios
(e.g. Current ratio, Absolute Liquid ratio and Liquid ratio). From the values of the last
column of the table (related to factor matrix in factor 1) it is also observed that in the
constructed first components the contributions of the basic ratios are more than 86%.
Factor (F) Eigen Value Percent of Variation Factor Matrix in Factor 1
1 2.639 87.982 .963
(Current Ratio)
2 .355 11.846 .982
(Liquid Ratio)
3 .005 .172 .865
( Absolute Liquid ratio)
Bartlett‟s test of sphericity is estimated to be 64.828*
Profitability Factor:
Similarly, through factor analysis, the principal component for profitability factor has
been constructed and the results are presented in the following table. Here Bartlett‟s test
of sphericity is estimated to be 3.350, which is found to be not significant up to 10%
probability level and so principal component analysis may not be statistically accepted
here.
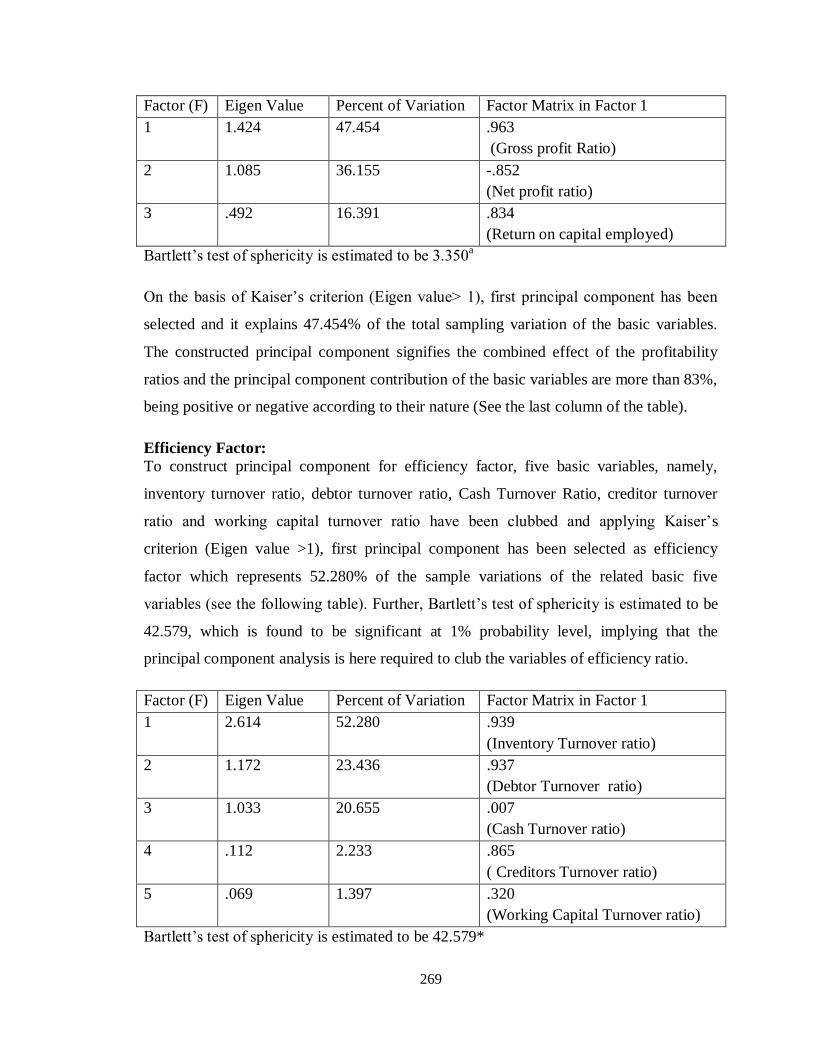
269
Factor (F) Eigen Value Percent of Variation Factor Matrix in Factor 1
1 1.424 47.454 .963
(Gross profit Ratio)
2 1.085 36.155 -.852
(Net profit ratio)
3 .492 16.391 .834
(Return on capital employed)
Bartlett‟s test of sphericity is estimated to be 3.350a
On the basis of Kaiser‟s criterion (Eigen value> 1), first principal component has been
selected and it explains 47.454% of the total sampling variation of the basic variables.
The constructed principal component signifies the combined effect of the profitability
ratios and the principal component contribution of the basic variables are more than 83%,
being positive or negative according to their nature (See the last column of the table).
Efficiency Factor:
To construct principal component for efficiency factor, five basic variables, namely,
inventory turnover ratio, debtor turnover ratio, Cash Turnover Ratio, creditor turnover
ratio and working capital turnover ratio have been clubbed and applying Kaiser‟s
criterion (Eigen value >1), first principal component has been selected as efficiency
factor which represents 52.280% of the sample variations of the related basic five
variables (see the following table). Further, Bartlett‟s test of sphericity is estimated to be
42.579, which is found to be significant at 1% probability level, implying that the
principal component analysis is here required to club the variables of efficiency ratio.
Factor (F) Eigen Value Percent of Variation Factor Matrix in Factor 1
1 2.614 52.280 .939
(Inventory Turnover ratio)
2 1.172 23.436 .937
(Debtor Turnover ratio)
3 1.033 20.655 .007
(Cash Turnover ratio)
4 .112 2.233 .865
( Creditors Turnover ratio)
5 .069 1.397 .320
(Working Capital Turnover ratio)
Bartlett‟s test of sphericity is estimated to be 42.579*

270
In the constructed principal component for efficiency factor, the contributions of the
basic variables are not more than 93%.
After the construction of the principal components, Regression of GP (dependent
variables) has been estimated on the principal component of liquidity (F1) and efficiency
(F2). The estimated regression results are presented below:
Adjusted R2 = .769*
[F=24.311]
GP= 1840.084* - 151.716*** F1 - 326.05* F2
(370.211) (93.021) (48.135)
DW= 1.496
5.7.11 Kopran
Liquidity Factor:
To construct liquidity factor, three ratios namely, current ratio, absolute liquid ratio and
liquid ratio have been clubbed through factor analysis and it is observed from table below
that the principal component (or factor) represents 71.366% of the total sampling
variations of the three related ratios and its Eigen value is 2.141. As the Eigen value of
the first factor is greater than one, so according to Kaiser‟s criterion only first principal
component is to be chosen as the liquidity factor. It should be mentioned in this
connection that according to Kaiser‟s criterion only those principal components will be
chosen whose Eigen values are greater than one. Further Bartlett‟s test sphericity is
estimated to be 34.801 which found to be significant at 1% probability level; this implies
that here principal component analysis is a fruitful exercise in clubbing the basic ratios
(e.g. Current ratio, Absolute Liquid ratio and Liquid ratio). From the values of the last
column of the table (related to factor matrix in factor 1) it is also observed that in the
constructed first components the contributions of the basic ratios are more than 54%.

271
Factor (F) Eigen Value Percent of Variation Factor Matrix in Factor 1
1 2.141 71.366 .976
(Current Ratio)
2 .827 27.556 .946
(Liquid Ratio)
3 .032 1.078 .542
( Absolute Liquid ratio)
Bartlett‟s test of sphericity is estimated to be 34.770*
Profitability Factor:
Similarly, through factor analysis, the principal component for profitability factor has
been constructed and the results are presented in the following table. Here Bartlett‟s test
of sphericity is estimated to be 17.947, which is found to be significant at 1% probability
level and so principal component analysis may be statistically accepted here.
Factor (F) Eigen Value Percent of Variation Factor Matrix in Factor 1
1 2.050 68.349 .904
(Gross profit Ratio)
2 .812 27.072 .577
(Net profit ratio)
3 .137 4.579 .949
(Return on capital employed)
Bartlett‟s test of sphericity is estimated to be 17.947*
On the basis of Kaiser‟s criterion (Eigen value> 1), first principal component has been
selected and it explains 68.349% of the total sampling variation of the basic variables.
The constructed principal component signifies the combined effect of the profitability
ratios and the principal component contribution of the basic variables are more than 57%
(See the last column of the table).
Efficiency Factor:
To construct principal component for efficiency factor, five basic variables, namely,
inventory turnover ratio, debtor turnover ratio, Cash Turnover Ratio, creditor turnover
ratio and working capital turnover ratio have been clubbed and applying Kaiser‟s
criterion (Eigen value >1), first principal component has been selected as efficiency
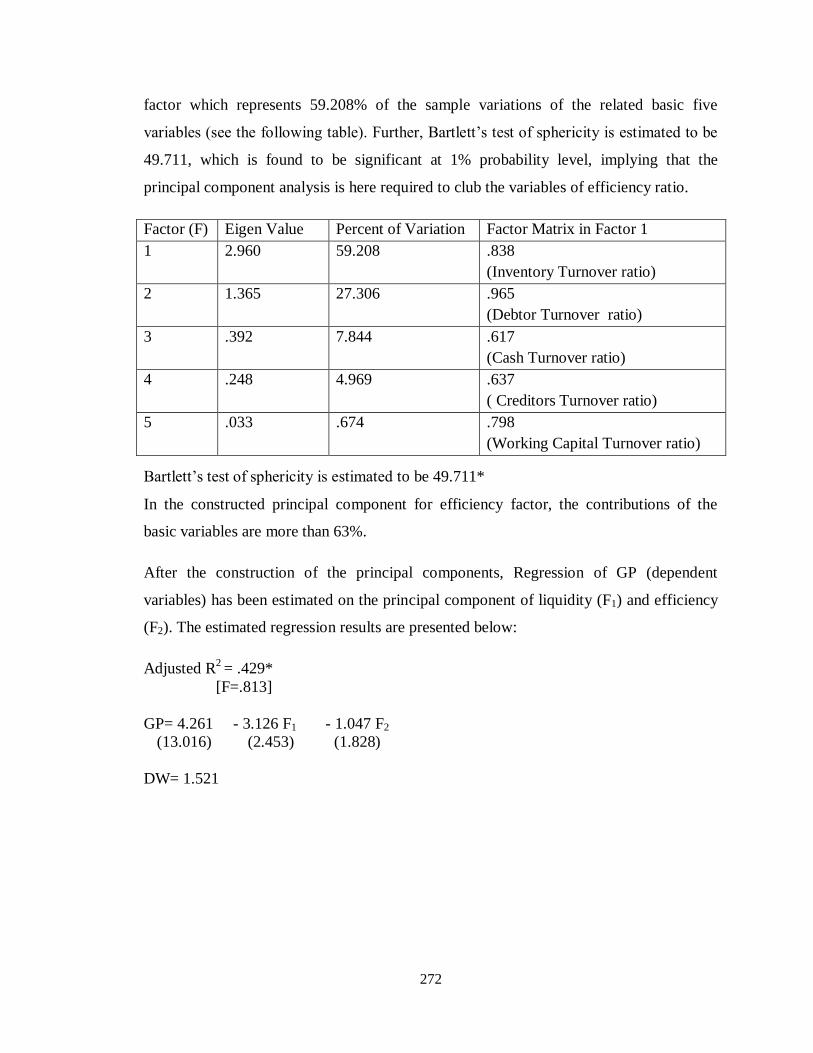
272
factor which represents 59.208% of the sample variations of the related basic five
variables (see the following table). Further, Bartlett‟s test of sphericity is estimated to be
49.711, which is found to be significant at 1% probability level, implying that the
principal component analysis is here required to club the variables of efficiency ratio.
Factor (F) Eigen Value Percent of Variation Factor Matrix in Factor 1
1 2.960 59.208 .838
(Inventory Turnover ratio)
2 1.365 27.306 .965
(Debtor Turnover ratio)
3 .392 7.844 .617
(Cash Turnover ratio)
4 .248 4.969 .637
( Creditors Turnover ratio)
5 .033 .674 .798
(Working Capital Turnover ratio)
Bartlett‟s test of sphericity is estimated to be 49.711*
In the constructed principal component for efficiency factor, the contributions of the
basic variables are more than 63%.
After the construction of the principal components, Regression of GP (dependent
variables) has been estimated on the principal component of liquidity (F1) and efficiency
(F2). The estimated regression results are presented below:
Adjusted R2 = .429*
[F=.813]
GP= 4.261 - 3.126 F1 - 1.047 F2
(13.016) (2.453) (1.828)
DW= 1.521
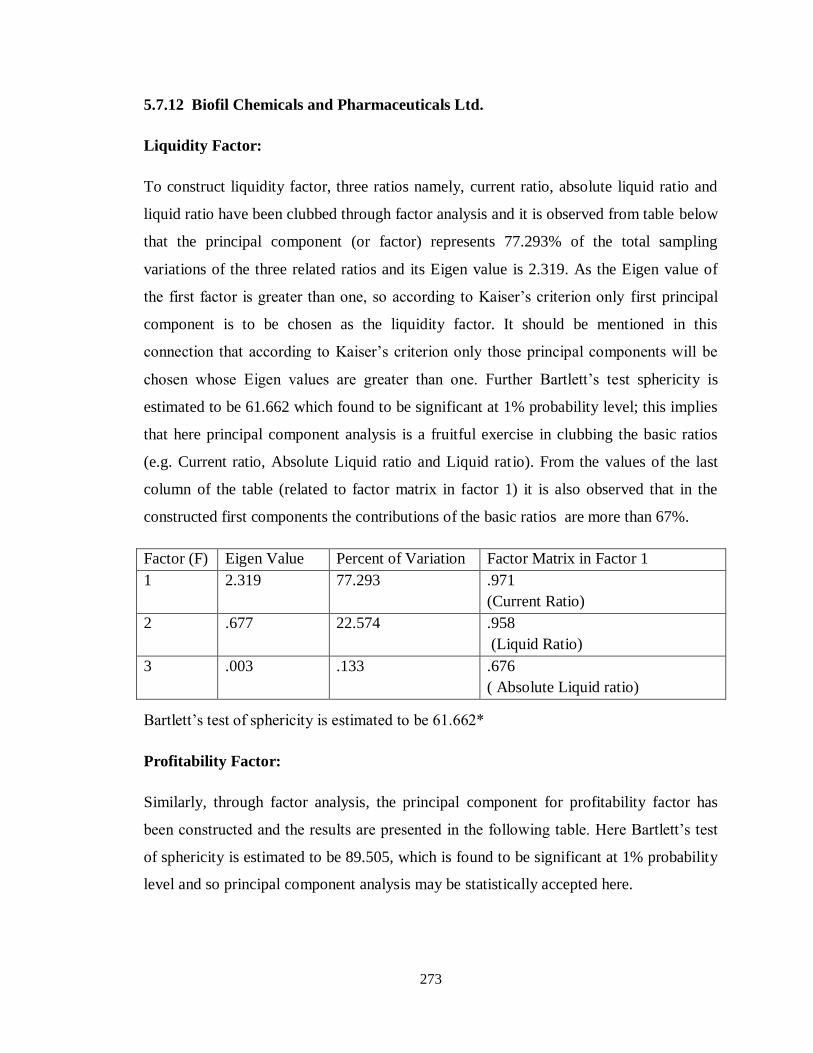
273
5.7.12 Biofil Chemicals and Pharmaceuticals Ltd.
Liquidity Factor:
To construct liquidity factor, three ratios namely, current ratio, absolute liquid ratio and
liquid ratio have been clubbed through factor analysis and it is observed from table below
that the principal component (or factor) represents 77.293% of the total sampling
variations of the three related ratios and its Eigen value is 2.319. As the Eigen value of
the first factor is greater than one, so according to Kaiser‟s criterion only first principal
component is to be chosen as the liquidity factor. It should be mentioned in this
connection that according to Kaiser‟s criterion only those principal components will be
chosen whose Eigen values are greater than one. Further Bartlett‟s test sphericity is
estimated to be 61.662 which found to be significant at 1% probability level; this implies
that here principal component analysis is a fruitful exercise in clubbing the basic ratios
(e.g. Current ratio, Absolute Liquid ratio and Liquid ratio). From the values of the last
column of the table (related to factor matrix in factor 1) it is also observed that in the
constructed first components the contributions of the basic ratios are more than 67%.
Factor (F) Eigen Value Percent of Variation Factor Matrix in Factor 1
1 2.319 77.293 .971
(Current Ratio)
2 .677 22.574 .958
(Liquid Ratio)
3 .003 .133 .676
( Absolute Liquid ratio)
Bartlett‟s test of sphericity is estimated to be 61.662*
Profitability Factor:
Similarly, through factor analysis, the principal component for profitability factor has
been constructed and the results are presented in the following table. Here Bartlett‟s test
of sphericity is estimated to be 89.505, which is found to be significant at 1% probability
level and so principal component analysis may be statistically accepted here.

274
Factor (F) Eigen Value Percent of Variation Factor Matrix in Factor 1
1 2.008 66.922 .998
(Gross profit Ratio)
2 .992 33.067 .126
(Net profit ratio)
3 .003 .01 .998
(Return on capital employed)
Bartlett‟s test of sphericity is estimated to be 89.505*
On the basis of Kaiser‟s criterion (Eigen value> 1), first principal component has been
selected and it explains 66.922% of the total sampling variation of the basic variables.
The constructed principal component signifies the combined effect of the profitability
ratios and the principal component contribution of the basic variables are not more than
99% (See the last column of the table).
Efficiency Factor:
To construct principal component for efficiency factor, five basic variables, namely,
inventory turnover ratio, debtor turnover ratio, Cash Turnover Ratio, creditor turnover
ratio and working capital turnover ratio have been clubbed and applying Kaiser‟s
criterion (Eigen value >1), first principal component has been selected as efficiency
factor which represents 38.846% of the sample variations of the related basic five
variables (see the following table). Further, Bartlett‟s test of sphericity is estimated to be
19.084, which is found to be significant up to 5% probability level, implying that the
principal component analysis is here required to club the variables of efficiency ratio.
Factor (F) Eigen Value Percent of Variation Factor Matrix in Factor 1
1 1.942 38.846 .869
(Inventory Turnover ratio)
2 1.309 26.181 -.519
(Debtor Turnover ratio)
3 1.066 21.322 -.884
(Cash Turnover ratio)
4 .556 11.129 .951
( Creditors Turnover ratio)
5 .126 2.523 .848
(Working Capital Turnover ratio)
Bartlett‟s test of sphericity is estimated to be 19.084**
275
In the constructed principal component for efficiency factor, the contributions of the
basic variables are more than 51% (being positive or negative in their nature).
After the construction of the principal components, Regression of GP (dependent
variables) has been estimated on the principal component of liquidity (F1) and efficiency
(F2). The estimated regression results are presented below:
Adjusted R2 = .988*
[F=594.474]
GP= 290.845* - 10.340 F1 - 141.458* F2
(36.681) (8.472) (4.103)
DW= 1.775
5.7.13 Ambalal Sarabhai Enterprises
Liquidity Factor:
To construct liquidity factor, three ratios namely, current ratio, absolute liquid ratio and
liquid ratio have been clubbed through factor analysis and it is observed from table below
that the principal component (or factor) represents 76.083% of the total sampling
variations of the three related ratios and its Eigen value is 2.282. As the Eigen value of
the first factor is greater than one, so according to Kaiser‟s criterion only first principal
component is to be chosen as the liquidity factor. It should be mentioned in this
connection that according to Kaiser‟s criterion only those principal components will be
chosen whose Eigen values are greater than one. Further Bartlett‟s test sphericity is
estimated to be 31.534 which found to be significant at 1% probability level; this implies
that here principal component analysis is a fruitful exercise in clubbing the basic ratios
(e.g. Current ratio, Absolute Liquid ratio and Liquid ratio). From the values of the last
column of the table (related to factor matrix in factor 1) it is also observed that in the
constructed first components the contributions of the basic ratios are more than 68%.
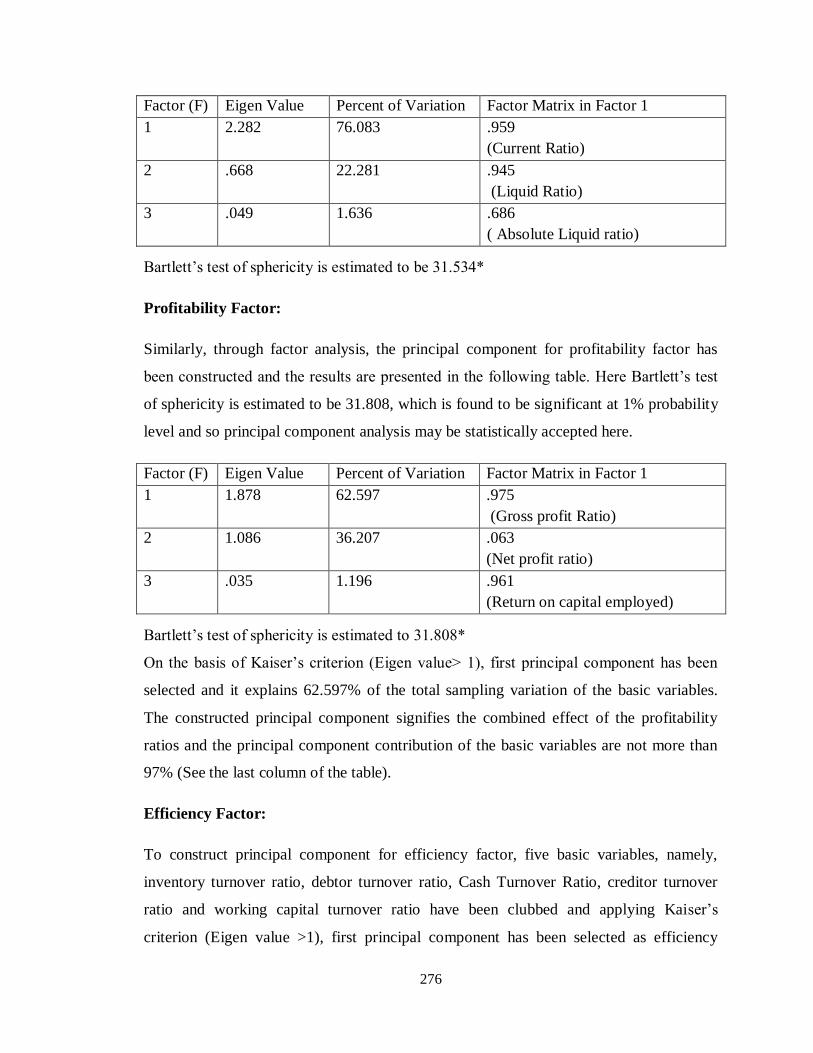
276
Factor (F) Eigen Value Percent of Variation Factor Matrix in Factor 1
1 2.282 76.083 .959
(Current Ratio)
2 .668 22.281 .945
(Liquid Ratio)
3 .049 1.636 .686
( Absolute Liquid ratio)
Bartlett‟s test of sphericity is estimated to be 31.534*
Profitability Factor:
Similarly, through factor analysis, the principal component for profitability factor has
been constructed and the results are presented in the following table. Here Bartlett‟s test
of sphericity is estimated to be 31.808, which is found to be significant at 1% probability
level and so principal component analysis may be statistically accepted here.
Factor (F) Eigen Value Percent of Variation Factor Matrix in Factor 1
1 1.878 62.597 .975
(Gross profit Ratio)
2 1.086 36.207 .063
(Net profit ratio)
3 .035 1.196 .961
(Return on capital employed)
Bartlett‟s test of sphericity is estimated to 31.808*
On the basis of Kaiser‟s criterion (Eigen value> 1), first principal component has been
selected and it explains 62.597% of the total sampling variation of the basic variables.
The constructed principal component signifies the combined effect of the profitability
ratios and the principal component contribution of the basic variables are not more than
97% (See the last column of the table).
Efficiency Factor:
To construct principal component for efficiency factor, five basic variables, namely,
inventory turnover ratio, debtor turnover ratio, Cash Turnover Ratio, creditor turnover
ratio and working capital turnover ratio have been clubbed and applying Kaiser‟s
criterion (Eigen value >1), first principal component has been selected as efficiency
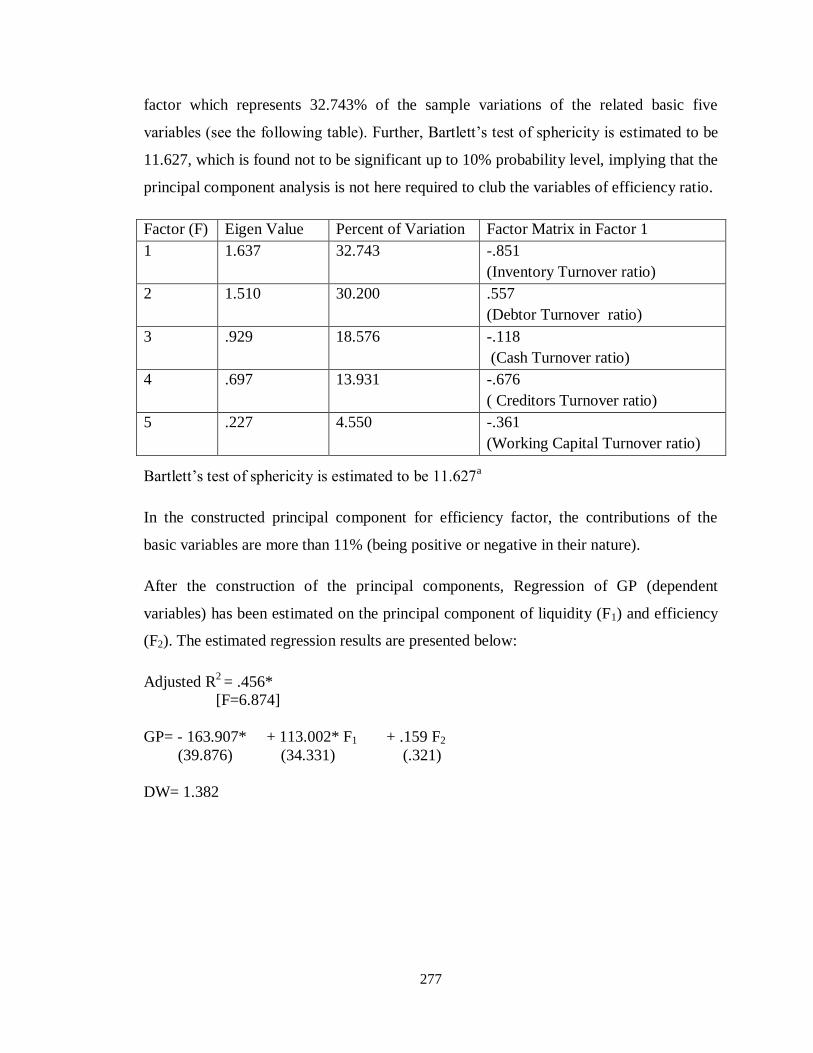
277
factor which represents 32.743% of the sample variations of the related basic five
variables (see the following table). Further, Bartlett‟s test of sphericity is estimated to be
11.627, which is found not to be significant up to 10% probability level, implying that the
principal component analysis is not here required to club the variables of efficiency ratio.
Factor (F) Eigen Value Percent of Variation Factor Matrix in Factor 1
1 1.637 32.743 -.851
(Inventory Turnover ratio)
2 1.510 30.200 .557
(Debtor Turnover ratio)
3 .929 18.576 -.118
(Cash Turnover ratio)
4 .697 13.931 -.676
( Creditors Turnover ratio)
5 .227 4.550 -.361
(Working Capital Turnover ratio)
Bartlett‟s test of sphericity is estimated to be 11.627a
In the constructed principal component for efficiency factor, the contributions of the
basic variables are more than 11% (being positive or negative in their nature).
After the construction of the principal components, Regression of GP (dependent
variables) has been estimated on the principal component of liquidity (F1) and efficiency
(F2). The estimated regression results are presented below:
Adjusted R2 = .456*
[F=6.874]
GP= - 163.907* + 113.002* F1 + .159 F2
(39.876) (34.331) (.321)
DW= 1.382

278
5.7.14 Parenteral Drugs (India) Ltd.
Liquidity Factor:
To construct liquidity factor, three ratios namely, current ratio, absolute liquid ratio and
liquid ratio have been clubbed through factor analysis and it is observed from table below
that the principal component (or factor) represents 73.188% of the total sampling
variations of the three related ratios and its Eigen value is 2.196. As the Eigen value of
the first factor is greater than one, so according to Kaiser‟s criterion only first principal
component is to be chosen as the liquidity factor. It should be mentioned in this
connection that according to Kaiser‟s criterion only those principal components will be
chosen whose Eigen values are greater than one. Further Bartlett‟s test sphericity is
estimated to be 45.851 which found to be significant at 1% probability level; this implies
that here principal component analysis is a fruitful exercise in clubbing the basic ratios
(e.g. Current ratio, Absolute Liquid ratio and Liquid ratio). From the values of the last
column of the table (related to factor matrix in factor 1) it is also observed that in the
constructed first components the contributions of the basic ratios are more than 57%.
Factor (F) Eigen Value Percent of Variation Factor Matrix in Factor 1
1 2.196 73.188 .957
(Current Ratio)
2 .791 26.371 .974
(Liquid Ratio)
3 .013 .441 .574
( Absolute Liquid ratio)
Bartlett‟s test of sphericity is estimated to be 45.851*
Profitability Factor:
Similarly, through factor analysis, the principal component for profitability factor has
been constructed and the results are presented in the following table. Here Bartlett‟s test
of sphericity is estimated to be 38.934, which is found to be significant at 1% probability
level and so principal component analysis may be statistically accepted here.
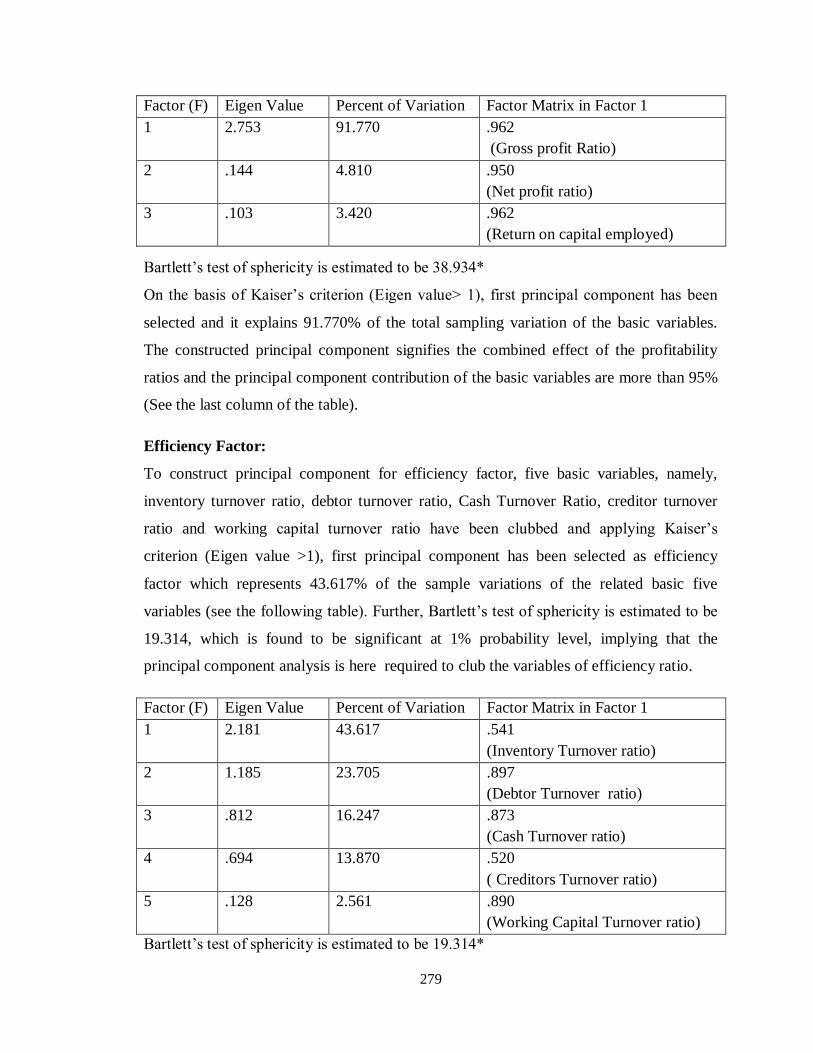
279
Factor (F) Eigen Value Percent of Variation Factor Matrix in Factor 1
1 2.753 91.770 .962
(Gross profit Ratio)
2 .144 4.810 .950
(Net profit ratio)
3 .103 3.420 .962
(Return on capital employed)
Bartlett‟s test of sphericity is estimated to be 38.934*
On the basis of Kaiser‟s criterion (Eigen value> 1), first principal component has been
selected and it explains 91.770% of the total sampling variation of the basic variables.
The constructed principal component signifies the combined effect of the profitability
ratios and the principal component contribution of the basic variables are more than 95%
(See the last column of the table).
Efficiency Factor:
To construct principal component for efficiency factor, five basic variables, namely,
inventory turnover ratio, debtor turnover ratio, Cash Turnover Ratio, creditor turnover
ratio and working capital turnover ratio have been clubbed and applying Kaiser‟s
criterion (Eigen value >1), first principal component has been selected as efficiency
factor which represents 43.617% of the sample variations of the related basic five
variables (see the following table). Further, Bartlett‟s test of sphericity is estimated to be
19.314, which is found to be significant at 1% probability level, implying that the
principal component analysis is here required to club the variables of efficiency ratio.
Factor (F) Eigen Value Percent of Variation Factor Matrix in Factor 1
1 2.181 43.617 .541
(Inventory Turnover ratio)
2 1.185 23.705 .897
(Debtor Turnover ratio)
3 .812 16.247 .873
(Cash Turnover ratio)
4 .694 13.870 .520
( Creditors Turnover ratio)
5 .128 2.561 .890
(Working Capital Turnover ratio)
Bartlett‟s test of sphericity is estimated to be 19.314*
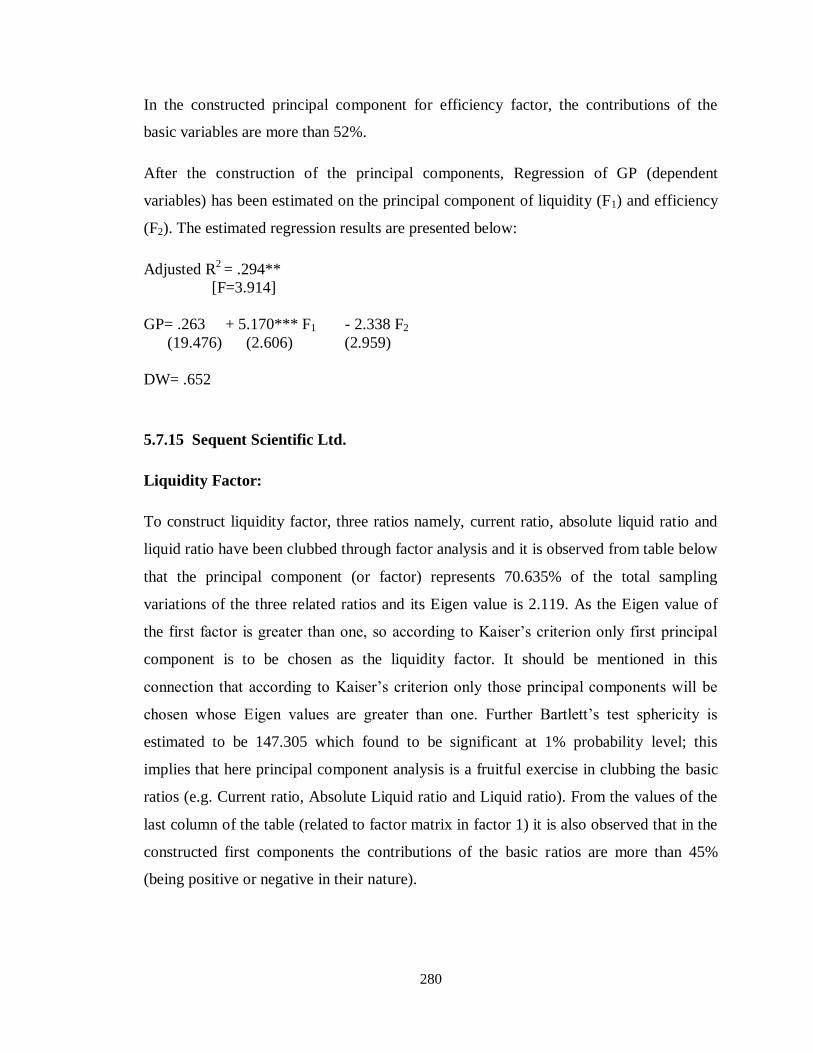
280
In the constructed principal component for efficiency factor, the contributions of the
basic variables are more than 52%.
After the construction of the principal components, Regression of GP (dependent
variables) has been estimated on the principal component of liquidity (F1) and efficiency
(F2). The estimated regression results are presented below:
Adjusted R2 = .294**
[F=3.914]
GP= .263 + 5.170*** F1 - 2.338 F2
(19.476) (2.606) (2.959)
DW= .652
5.7.15 Sequent Scientific Ltd.
Liquidity Factor:
To construct liquidity factor, three ratios namely, current ratio, absolute liquid ratio and
liquid ratio have been clubbed through factor analysis and it is observed from table below
that the principal component (or factor) represents 70.635% of the total sampling
variations of the three related ratios and its Eigen value is 2.119. As the Eigen value of
the first factor is greater than one, so according to Kaiser‟s criterion only first principal
component is to be chosen as the liquidity factor. It should be mentioned in this
connection that according to Kaiser‟s criterion only those principal components will be
chosen whose Eigen values are greater than one. Further Bartlett‟s test sphericity is
estimated to be 147.305 which found to be significant at 1% probability level; this
implies that here principal component analysis is a fruitful exercise in clubbing the basic
ratios (e.g. Current ratio, Absolute Liquid ratio and Liquid ratio). From the values of the
last column of the table (related to factor matrix in factor 1) it is also observed that in the
constructed first components the contributions of the basic ratios are more than 45%
(being positive or negative in their nature).
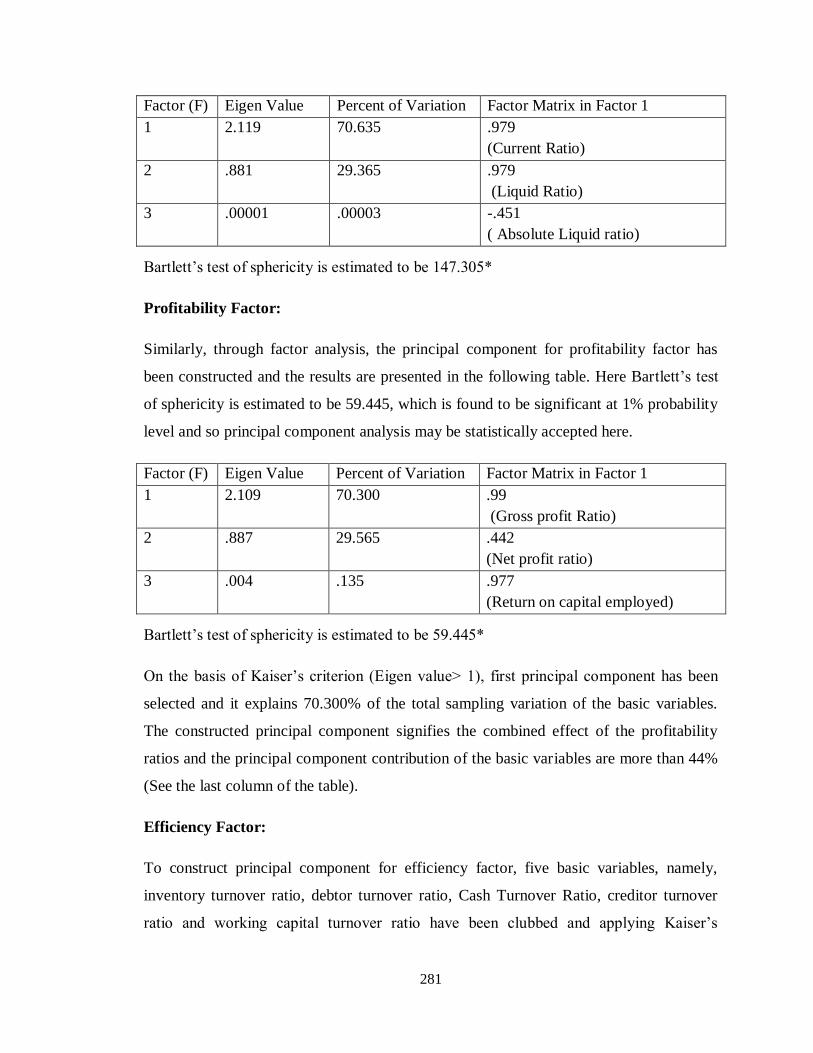
281
Factor (F) Eigen Value Percent of Variation Factor Matrix in Factor 1
1 2.119 70.635 .979
(Current Ratio)
2 .881 29.365 .979
(Liquid Ratio)
3 .00001 .00003 -.451
( Absolute Liquid ratio)
Bartlett‟s test of sphericity is estimated to be 147.305*
Profitability Factor:
Similarly, through factor analysis, the principal component for profitability factor has
been constructed and the results are presented in the following table. Here Bartlett‟s test
of sphericity is estimated to be 59.445, which is found to be significant at 1% probability
level and so principal component analysis may be statistically accepted here.
Factor (F) Eigen Value Percent of Variation Factor Matrix in Factor 1
1 2.109 70.300 .99
(Gross profit Ratio)
2 .887 29.565 .442
(Net profit ratio)
3 .004 .135 .977
(Return on capital employed)
Bartlett‟s test of sphericity is estimated to be 59.445*
On the basis of Kaiser‟s criterion (Eigen value> 1), first principal component has been
selected and it explains 70.300% of the total sampling variation of the basic variables.
The constructed principal component signifies the combined effect of the profitability
ratios and the principal component contribution of the basic variables are more than 44%
(See the last column of the table).
Efficiency Factor:
To construct principal component for efficiency factor, five basic variables, namely,
inventory turnover ratio, debtor turnover ratio, Cash Turnover Ratio, creditor turnover
ratio and working capital turnover ratio have been clubbed and applying Kaiser‟s
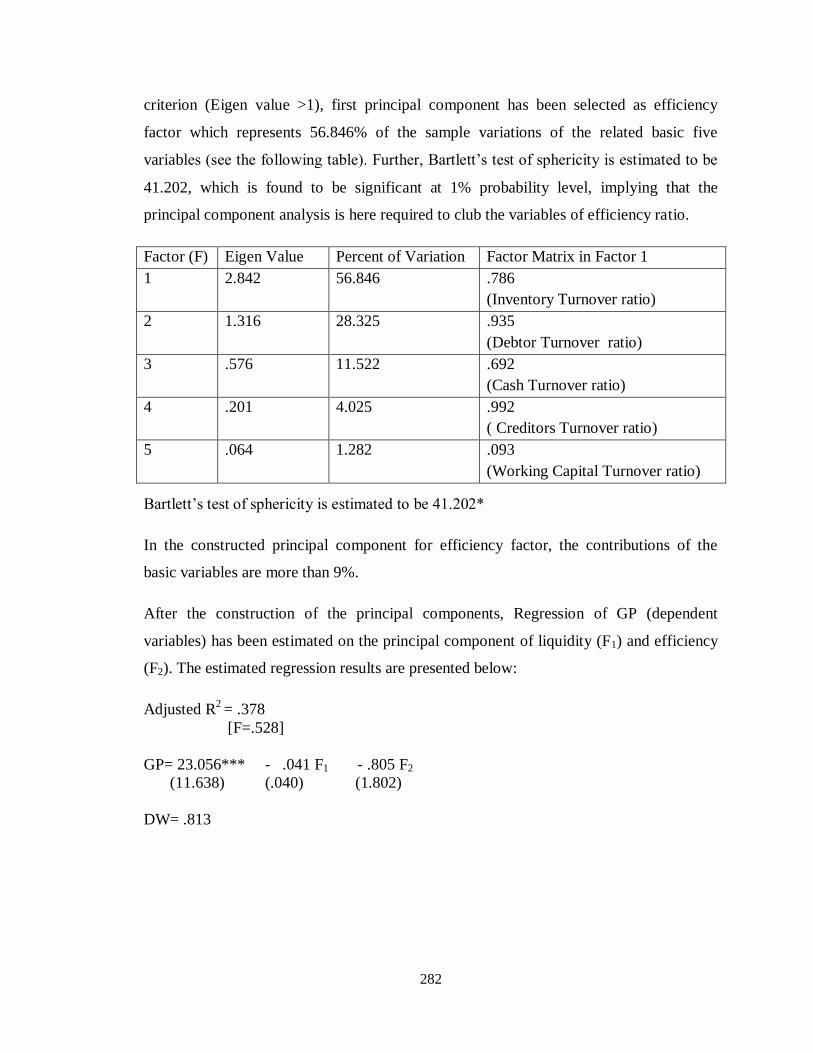
282
criterion (Eigen value >1), first principal component has been selected as efficiency
factor which represents 56.846% of the sample variations of the related basic five
variables (see the following table). Further, Bartlett‟s test of sphericity is estimated to be
41.202, which is found to be significant at 1% probability level, implying that the
principal component analysis is here required to club the variables of efficiency ratio.
Factor (F) Eigen Value Percent of Variation Factor Matrix in Factor 1
1 2.842 56.846 .786
(Inventory Turnover ratio)
2 1.316 28.325 .935
(Debtor Turnover ratio)
3 .576 11.522 .692
(Cash Turnover ratio)
4 .201 4.025 .992
( Creditors Turnover ratio)
5 .064 1.282 .093
(Working Capital Turnover ratio)
Bartlett‟s test of sphericity is estimated to be 41.202*
In the constructed principal component for efficiency factor, the contributions of the
basic variables are more than 9%.
After the construction of the principal components, Regression of GP (dependent
variables) has been estimated on the principal component of liquidity (F1) and efficiency
(F2). The estimated regression results are presented below:
Adjusted R2 = .378
[F=.528]
GP= 23.056*** - .041 F1 - .805 F2
(11.638) (.040) (1.802)
DW= .813
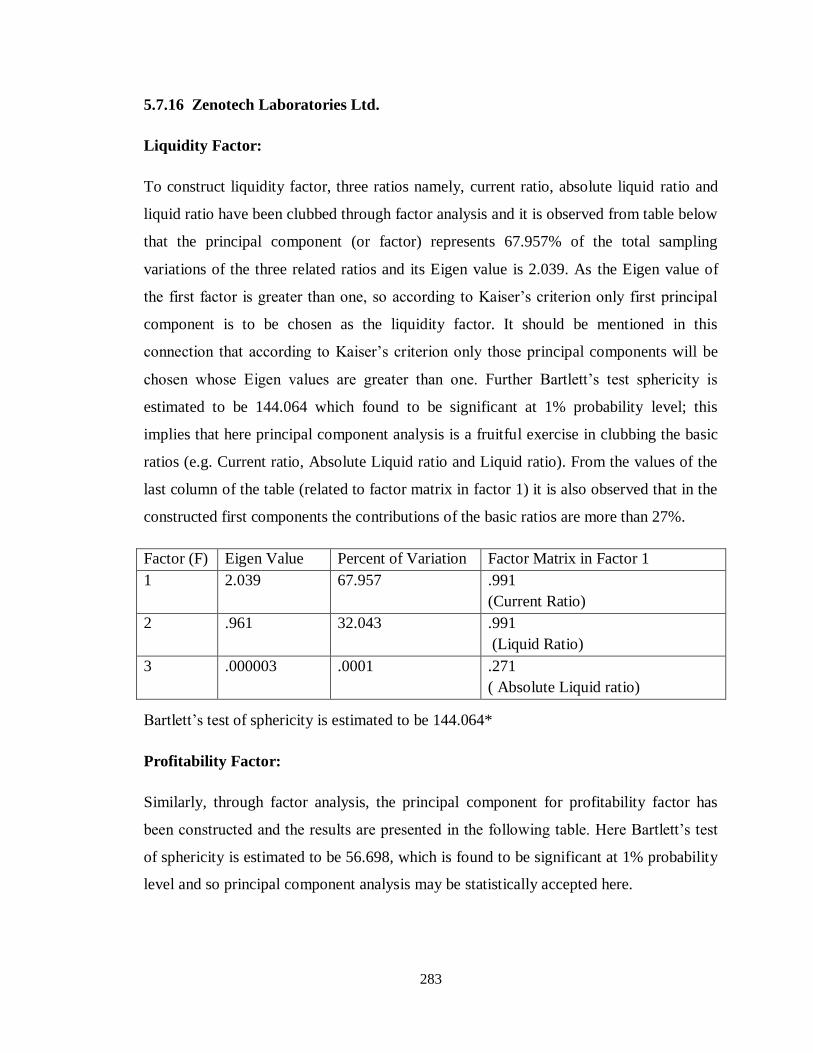
283
5.7.16 Zenotech Laboratories Ltd.
Liquidity Factor:
To construct liquidity factor, three ratios namely, current ratio, absolute liquid ratio and
liquid ratio have been clubbed through factor analysis and it is observed from table below
that the principal component (or factor) represents 67.957% of the total sampling
variations of the three related ratios and its Eigen value is 2.039. As the Eigen value of
the first factor is greater than one, so according to Kaiser‟s criterion only first principal
component is to be chosen as the liquidity factor. It should be mentioned in this
connection that according to Kaiser‟s criterion only those principal components will be
chosen whose Eigen values are greater than one. Further Bartlett‟s test sphericity is
estimated to be 144.064 which found to be significant at 1% probability level; this
implies that here principal component analysis is a fruitful exercise in clubbing the basic
ratios (e.g. Current ratio, Absolute Liquid ratio and Liquid ratio). From the values of the
last column of the table (related to factor matrix in factor 1) it is also observed that in the
constructed first components the contributions of the basic ratios are more than 27%.
Factor (F) Eigen Value Percent of Variation Factor Matrix in Factor 1
1 2.039 67.957 .991
(Current Ratio)
2 .961 32.043 .991
(Liquid Ratio)
3 .000003 .0001 .271
( Absolute Liquid ratio)
Bartlett‟s test of sphericity is estimated to be 144.064*
Profitability Factor:
Similarly, through factor analysis, the principal component for profitability factor has
been constructed and the results are presented in the following table. Here Bartlett‟s test
of sphericity is estimated to be 56.698, which is found to be significant at 1% probability
level and so principal component analysis may be statistically accepted here.
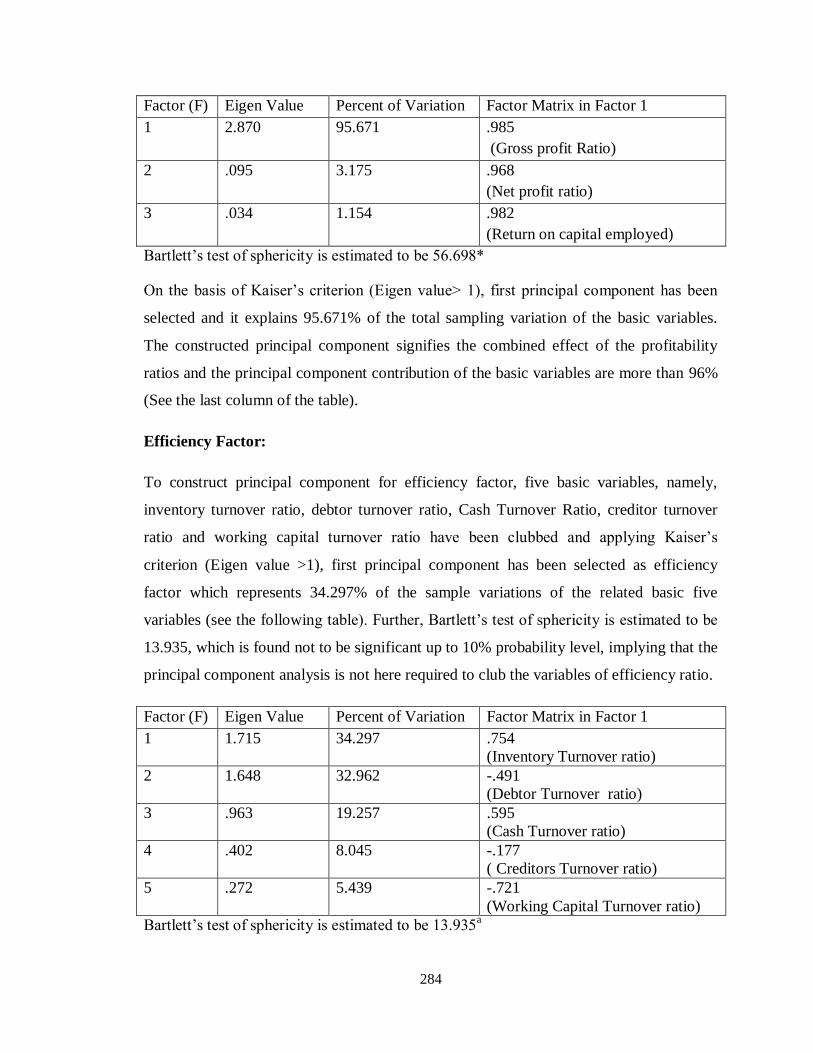
284
Factor (F) Eigen Value Percent of Variation Factor Matrix in Factor 1
1 2.870 95.671 .985
(Gross profit Ratio)
2 .095 3.175 .968
(Net profit ratio)
3 .034 1.154 .982
(Return on capital employed)
Bartlett‟s test of sphericity is estimated to be 56.698*
On the basis of Kaiser‟s criterion (Eigen value> 1), first principal component has been
selected and it explains 95.671% of the total sampling variation of the basic variables.
The constructed principal component signifies the combined effect of the profitability
ratios and the principal component contribution of the basic variables are more than 96%
(See the last column of the table).
Efficiency Factor:
To construct principal component for efficiency factor, five basic variables, namely,
inventory turnover ratio, debtor turnover ratio, Cash Turnover Ratio, creditor turnover
ratio and working capital turnover ratio have been clubbed and applying Kaiser‟s
criterion (Eigen value >1), first principal component has been selected as efficiency
factor which represents 34.297% of the sample variations of the related basic five
variables (see the following table). Further, Bartlett‟s test of sphericity is estimated to be
13.935, which is found not to be significant up to 10% probability level, implying that the
principal component analysis is not here required to club the variables of efficiency ratio.
Factor (F) Eigen Value Percent of Variation Factor Matrix in Factor 1
1 1.715 34.297 .754
(Inventory Turnover ratio)
2 1.648 32.962 -.491
(Debtor Turnover ratio)
3 .963 19.257 .595
(Cash Turnover ratio)
4 .402 8.045 -.177
( Creditors Turnover ratio)
5 .272 5.439 -.721
(Working Capital Turnover ratio)
Bartlett‟s test of sphericity is estimated to be 13.935a
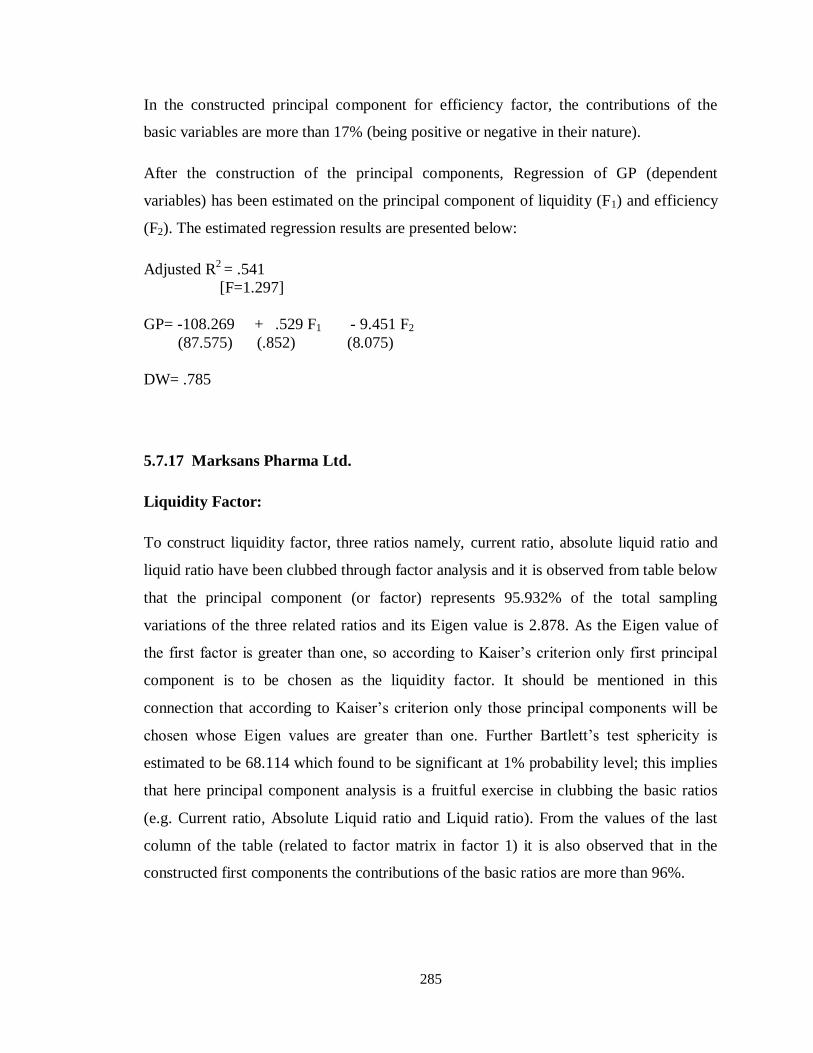
285
In the constructed principal component for efficiency factor, the contributions of the
basic variables are more than 17% (being positive or negative in their nature).
After the construction of the principal components, Regression of GP (dependent
variables) has been estimated on the principal component of liquidity (F1) and efficiency
(F2). The estimated regression results are presented below:
Adjusted R2 = .541
[F=1.297]
GP= -108.269 + .529 F1 - 9.451 F2
(87.575) (.852) (8.075)
DW= .785
5.7.17 Marksans Pharma Ltd.
Liquidity Factor:
To construct liquidity factor, three ratios namely, current ratio, absolute liquid ratio and
liquid ratio have been clubbed through factor analysis and it is observed from table below
that the principal component (or factor) represents 95.932% of the total sampling
variations of the three related ratios and its Eigen value is 2.878. As the Eigen value of
the first factor is greater than one, so according to Kaiser‟s criterion only first principal
component is to be chosen as the liquidity factor. It should be mentioned in this
connection that according to Kaiser‟s criterion only those principal components will be
chosen whose Eigen values are greater than one. Further Bartlett‟s test sphericity is
estimated to be 68.114 which found to be significant at 1% probability level; this implies
that here principal component analysis is a fruitful exercise in clubbing the basic ratios
(e.g. Current ratio, Absolute Liquid ratio and Liquid ratio). From the values of the last
column of the table (related to factor matrix in factor 1) it is also observed that in the
constructed first components the contributions of the basic ratios are more than 96%.

286
Factor (F) Eigen Value Percent of Variation Factor Matrix in Factor 1
1 2.878 95.932 .976
(Current Ratio)
2 .111 3.679 .996
(Liquid Ratio)
3 .011 .389 .967
( Absolute Liquid ratio)
Bartlett‟s test of sphericity is estimated to be 68.114*
Profitability Factor:
Similarly, through factor analysis, the principal component for profitability factor has
been constructed and the results are presented in the following table. Here Bartlett‟s test
of sphericity is estimated to be 49.125, which is found to be significant at 1% probability
level and so principal component analysis may be statistically accepted here.
Factor (F) Eigen Value Percent of Variation Factor Matrix in Factor 1
1 1.995 66.487 .967
(Gross profit Ratio)
2 .997 33.217 .998
(Net profit ratio)
3 .008 .296 .251
(Return on capital employed)
Bartlett‟s test of sphericity is estimated to be 49.125*
On the basis of Kaiser‟s criterion (Eigen value> 1), first principal component has been
selected and it explains 66.487% of the total sampling variation of the basic variables.
The constructed principal component signifies the combined effect of the profitability
ratios and the principal component contribution of the basic variables are more than 25%
(See the last column of the table).
Efficiency Factor:
To construct principal component for efficiency factor, five basic variables, namely,
inventory turnover ratio, debtor turnover ratio, Cash Turnover Ratio, creditor turnover
ratio and working capital turnover ratio have been clubbed and applying Kaiser‟s

287
criterion (Eigen value >1), first principal component has been selected as efficiency
factor which represents 44.720% of the sample variations of the related basic five
variables (see the following table). Further, Bartlett‟s test of sphericity is estimated to be
20.240, which is found to be significant at 5% probability level, implying that the
principal component analysis is here required to club the variables of efficiency ratio.
Factor (F) Eigen Value Percent of Variation Factor Matrix in Factor 1
1 2.236 44.720 -.535
(Inventory Turnover ratio)
2 1.268 25.362 .924
(Debtor Turnover ratio)
3 .996 19.920 -.373
(Cash Turnover ratio)
4 .289 5.787 .916
( Creditors Turnover ratio)
5 .211 4.211 .344
(Working Capital Turnover ratio)
Bartlett‟s test of sphericity is estimated to be 20.240**
In the constructed principal component for efficiency factor, the contributions of the
basic variables are more than 34% (being positive or negative in their nature).
After the construction of the principal components, Regression of GP (dependent
variables) has been estimated on the principal component of liquidity (F1) and efficiency
(F2). The estimated regression results are presented below:
Adjusted R2 = .399***
[F=2.737]
GP= 32.559 + 1.102 F1 - 8.312 F2
(28.296) (3.926) (4.993)
DW= 1.068
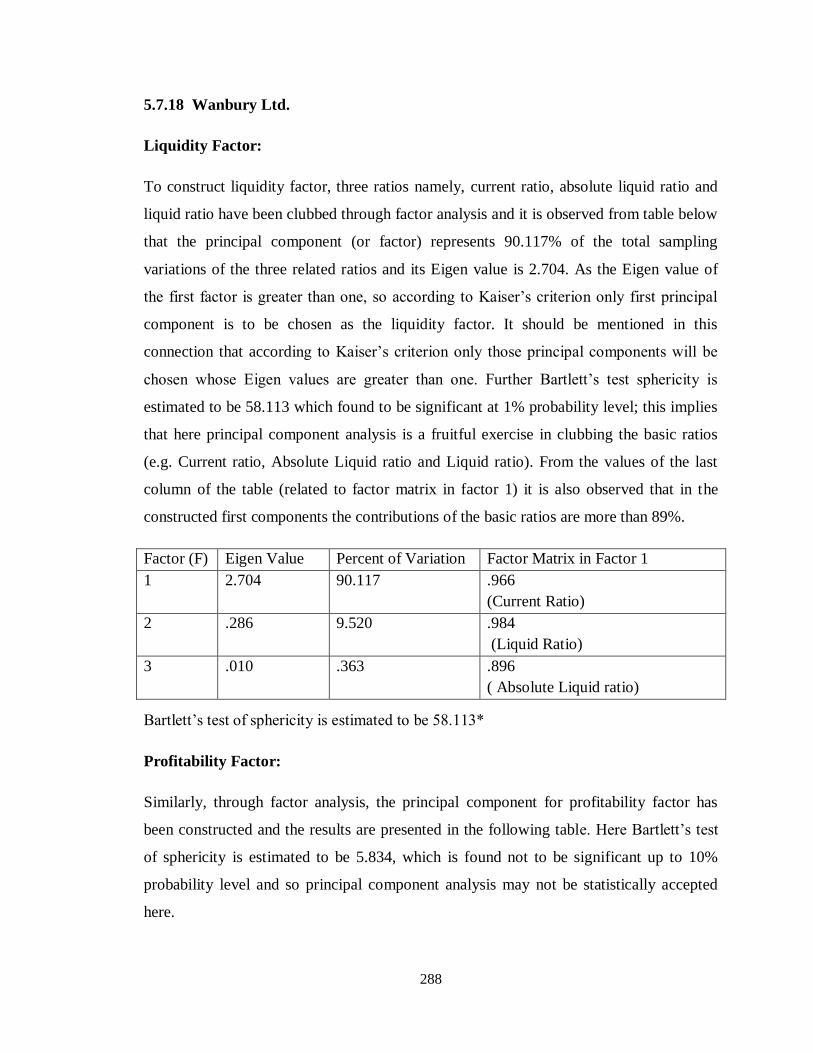
288
5.7.18 Wanbury Ltd.
Liquidity Factor:
To construct liquidity factor, three ratios namely, current ratio, absolute liquid ratio and
liquid ratio have been clubbed through factor analysis and it is observed from table below
that the principal component (or factor) represents 90.117% of the total sampling
variations of the three related ratios and its Eigen value is 2.704. As the Eigen value of
the first factor is greater than one, so according to Kaiser‟s criterion only first principal
component is to be chosen as the liquidity factor. It should be mentioned in this
connection that according to Kaiser‟s criterion only those principal components will be
chosen whose Eigen values are greater than one. Further Bartlett‟s test sphericity is
estimated to be 58.113 which found to be significant at 1% probability level; this implies
that here principal component analysis is a fruitful exercise in clubbing the basic ratios
(e.g. Current ratio, Absolute Liquid ratio and Liquid ratio). From the values of the last
column of the table (related to factor matrix in factor 1) it is also observed that in the
constructed first components the contributions of the basic ratios are more than 89%.
Factor (F) Eigen Value Percent of Variation Factor Matrix in Factor 1
1 2.704 90.117 .966
(Current Ratio)
2 .286 9.520 .984
(Liquid Ratio)
3 .010 .363 .896
( Absolute Liquid ratio)
Bartlett‟s test of sphericity is estimated to be 58.113*
Profitability Factor:
Similarly, through factor analysis, the principal component for profitability factor has
been constructed and the results are presented in the following table. Here Bartlett‟s test
of sphericity is estimated to be 5.834, which is found not to be significant up to 10%
probability level and so principal component analysis may not be statistically accepted
here.
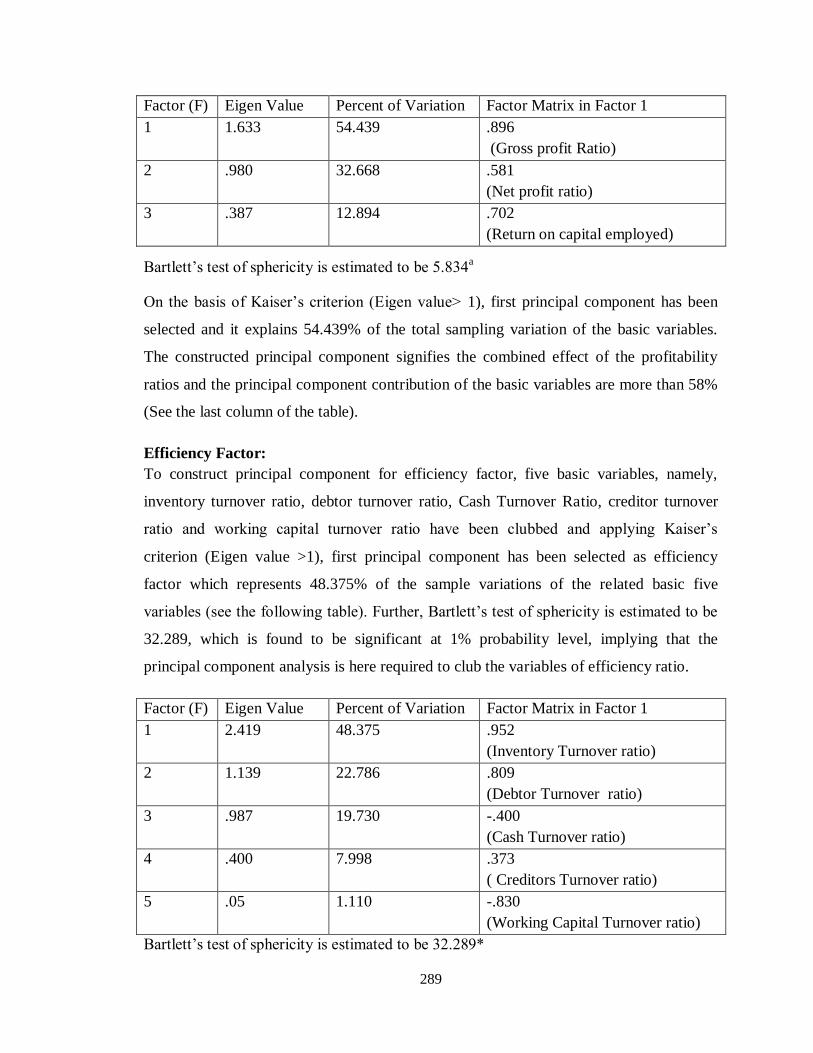
289
Factor (F) Eigen Value Percent of Variation Factor Matrix in Factor 1
1 1.633 54.439 .896
(Gross profit Ratio)
2 .980 32.668 .581
(Net profit ratio)
3 .387 12.894 .702
(Return on capital employed)
Bartlett‟s test of sphericity is estimated to be 5.834a
On the basis of Kaiser‟s criterion (Eigen value> 1), first principal component has been
selected and it explains 54.439% of the total sampling variation of the basic variables.
The constructed principal component signifies the combined effect of the profitability
ratios and the principal component contribution of the basic variables are more than 58%
(See the last column of the table).
Efficiency Factor:
To construct principal component for efficiency factor, five basic variables, namely,
inventory turnover ratio, debtor turnover ratio, Cash Turnover Ratio, creditor turnover
ratio and working capital turnover ratio have been clubbed and applying Kaiser‟s
criterion (Eigen value >1), first principal component has been selected as efficiency
factor which represents 48.375% of the sample variations of the related basic five
variables (see the following table). Further, Bartlett‟s test of sphericity is estimated to be
32.289, which is found to be significant at 1% probability level, implying that the
principal component analysis is here required to club the variables of efficiency ratio.
Factor (F) Eigen Value Percent of Variation Factor Matrix in Factor 1
1 2.419 48.375 .952
(Inventory Turnover ratio)
2 1.139 22.786 .809
(Debtor Turnover ratio)
3 .987 19.730 -.400
(Cash Turnover ratio)
4 .400 7.998 .373
( Creditors Turnover ratio)
5 .05 1.110 -.830
(Working Capital Turnover ratio)
Bartlett‟s test of sphericity is estimated to be 32.289*
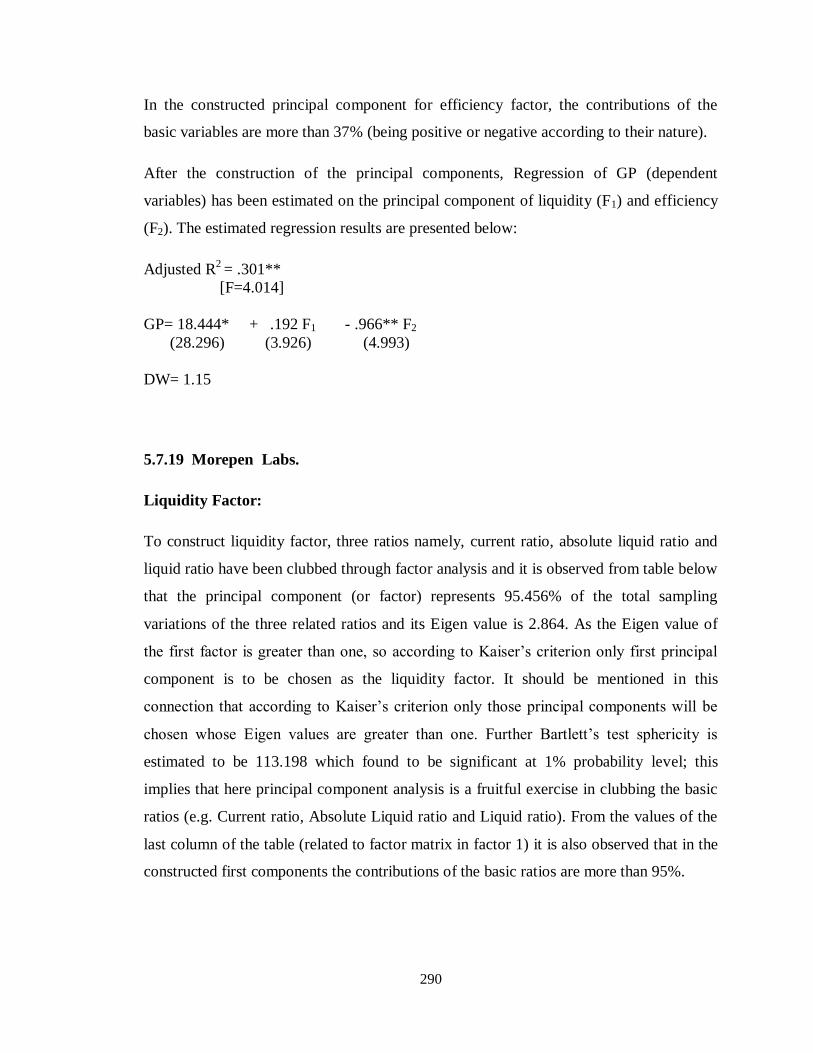
290
In the constructed principal component for efficiency factor, the contributions of the
basic variables are more than 37% (being positive or negative according to their nature).
After the construction of the principal components, Regression of GP (dependent
variables) has been estimated on the principal component of liquidity (F1) and efficiency
(F2). The estimated regression results are presented below:
Adjusted R2 = .301**
[F=4.014]
GP= 18.444* + .192 F1 - .966** F2
(28.296) (3.926) (4.993)
DW= 1.15
5.7.19 Morepen Labs.
Liquidity Factor:
To construct liquidity factor, three ratios namely, current ratio, absolute liquid ratio and
liquid ratio have been clubbed through factor analysis and it is observed from table below
that the principal component (or factor) represents 95.456% of the total sampling
variations of the three related ratios and its Eigen value is 2.864. As the Eigen value of
the first factor is greater than one, so according to Kaiser‟s criterion only first principal
component is to be chosen as the liquidity factor. It should be mentioned in this
connection that according to Kaiser‟s criterion only those principal components will be
chosen whose Eigen values are greater than one. Further Bartlett‟s test sphericity is
estimated to be 113.198 which found to be significant at 1% probability level; this
implies that here principal component analysis is a fruitful exercise in clubbing the basic
ratios (e.g. Current ratio, Absolute Liquid ratio and Liquid ratio). From the values of the
last column of the table (related to factor matrix in factor 1) it is also observed that in the
constructed first components the contributions of the basic ratios are more than 95%.

291
Factor (F) Eigen Value Percent of Variation Factor Matrix in Factor 1
1 2.864 95.456 .990
(Current Ratio)
2 .136 4.536 .988
(Liquid Ratio)
3 .0002 .007 .952
( Absolute Liquid ratio)
Bartlett‟s test of sphericity is estimated to be 113.198*
Profitability Factor:
Similarly, through factor analysis, the principal component for profitability factor has
been constructed and the results are presented in the following table. Here Bartlett‟s test
of sphericity is estimated to be 35.765, which is found to be significant at 1% probability
level and so principal component analysis may be statistically accepted here.
Factor (F) Eigen Value Percent of Variation Factor Matrix in Factor 1
1 2.378 79.271 .960
(Gross profit Ratio)
2 .584 19.459 .743
(Net profit ratio)
3 .038 1.270 .951
(Return on capital employed)
Bartlett‟s test of sphericity is estimated to be 35.765*
On the basis of Kaiser‟s criterion (Eigen value> 1), first principal component has been
selected and it explains 79.271% of the total sampling variation of the basic variables.
The constructed principal component signifies the combined effect of the profitability
ratios and the principal component contribution of the basic variables are more than 74%
(See the last column of the table).
Efficiency Factor:
To construct principal component for efficiency factor, five basic variables, namely,
inventory turnover ratio, debtor turnover ratio, Cash Turnover Ratio, creditor turnover
ratio and working capital turnover ratio have been clubbed and applying Kaiser‟s
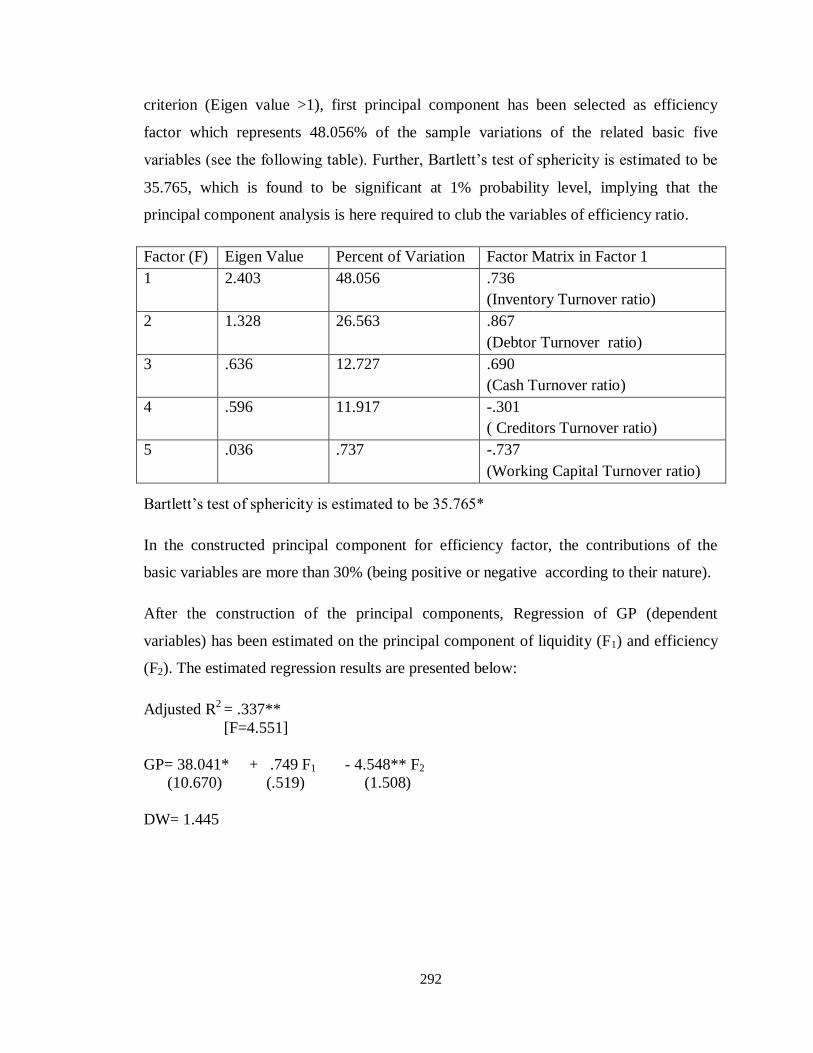
292
criterion (Eigen value >1), first principal component has been selected as efficiency
factor which represents 48.056% of the sample variations of the related basic five
variables (see the following table). Further, Bartlett‟s test of sphericity is estimated to be
35.765, which is found to be significant at 1% probability level, implying that the
principal component analysis is here required to club the variables of efficiency ratio.
Factor (F) Eigen Value Percent of Variation Factor Matrix in Factor 1
1 2.403 48.056 .736
(Inventory Turnover ratio)
2 1.328 26.563 .867
(Debtor Turnover ratio)
3 .636 12.727 .690
(Cash Turnover ratio)
4 .596 11.917 -.301
( Creditors Turnover ratio)
5 .036 .737 -.737
(Working Capital Turnover ratio)
Bartlett‟s test of sphericity is estimated to be 35.765*
In the constructed principal component for efficiency factor, the contributions of the
basic variables are more than 30% (being positive or negative according to their nature).
After the construction of the principal components, Regression of GP (dependent
variables) has been estimated on the principal component of liquidity (F1) and efficiency
(F2). The estimated regression results are presented below:
Adjusted R2 = .337**
[F=4.551]
GP= 38.041* + .749 F1 - 4.548** F2
(10.670) (.519) (1.508)
DW= 1.445
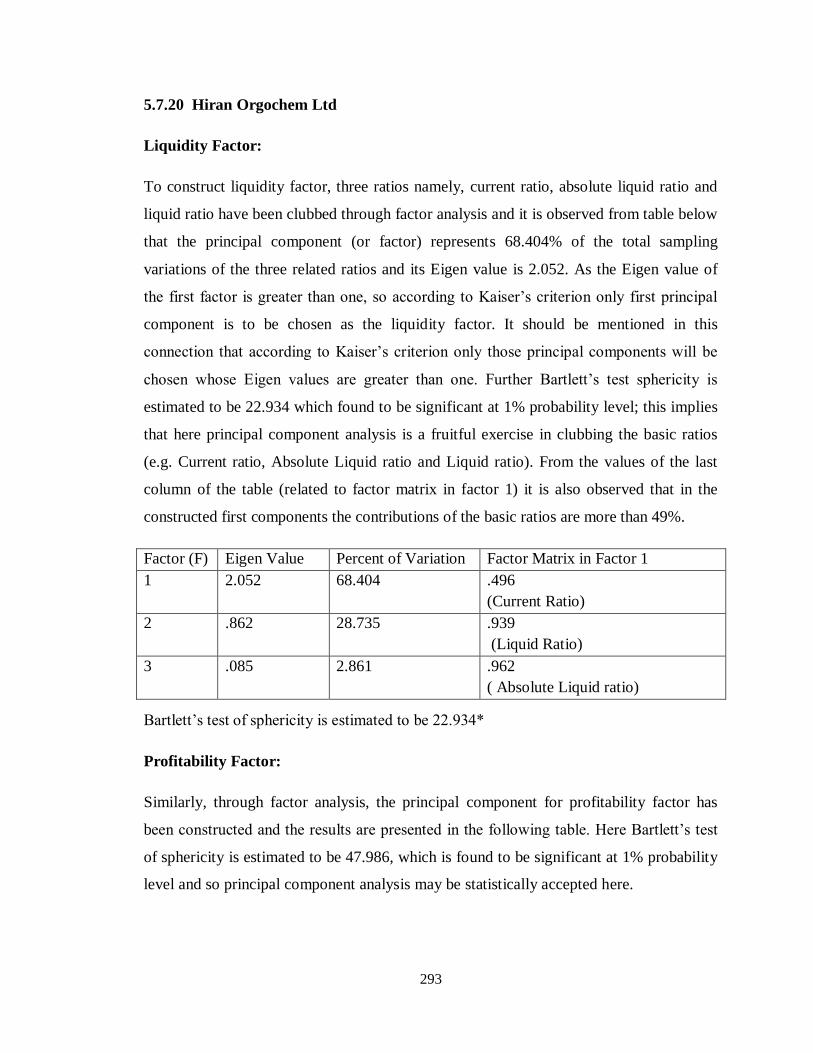
293
5.7.20 Hiran Orgochem Ltd
Liquidity Factor:
To construct liquidity factor, three ratios namely, current ratio, absolute liquid ratio and
liquid ratio have been clubbed through factor analysis and it is observed from table below
that the principal component (or factor) represents 68.404% of the total sampling
variations of the three related ratios and its Eigen value is 2.052. As the Eigen value of
the first factor is greater than one, so according to Kaiser‟s criterion only first principal
component is to be chosen as the liquidity factor. It should be mentioned in this
connection that according to Kaiser‟s criterion only those principal components will be
chosen whose Eigen values are greater than one. Further Bartlett‟s test sphericity is
estimated to be 22.934 which found to be significant at 1% probability level; this implies
that here principal component analysis is a fruitful exercise in clubbing the basic ratios
(e.g. Current ratio, Absolute Liquid ratio and Liquid ratio). From the values of the last
column of the table (related to factor matrix in factor 1) it is also observed that in the
constructed first components the contributions of the basic ratios are more than 49%.
Factor (F) Eigen Value Percent of Variation Factor Matrix in Factor 1
1 2.052 68.404 .496
(Current Ratio)
2 .862 28.735 .939
(Liquid Ratio)
3 .085 2.861 .962
( Absolute Liquid ratio)
Bartlett‟s test of sphericity is estimated to be 22.934*
Profitability Factor:
Similarly, through factor analysis, the principal component for profitability factor has
been constructed and the results are presented in the following table. Here Bartlett‟s test
of sphericity is estimated to be 47.986, which is found to be significant at 1% probability
level and so principal component analysis may be statistically accepted here.

294
Factor (F) Eigen Value Percent of Variation Factor Matrix in Factor 1
1 2.555 85.173 .975
(Gross profit Ratio)
2 .427 14.235 .956
(Net profit ratio)
3 .017 .592 .831
(Return on capital employed)
Bartlett‟s test of sphericity is estimated to be 47.986*
On the basis of Kaiser‟s criterion (Eigen value> 1), first principal component has been
selected and it explains 85.173% of the total sampling variation of the basic variables.
The constructed principal component signifies the combined effect of the profitability
ratios and the principal component contribution of the basic variables are more than 83%
(See the last column of the table).
Efficiency Factor:
To construct principal component for efficiency factor, five basic variables, namely,
inventory turnover ratio, debtor turnover ratio, Cash Turnover Ratio, creditor turnover
ratio and working capital turnover ratio have been clubbed and applying Kaiser‟s
criterion (Eigen value >1), first principal component has been selected as efficiency
factor which represents 41.249% of the sample variations of the related basic five
variables (see the following table). Further, Bartlett‟s test of sphericity is estimated to be
34.863, which is found to be significant at 1% probability level, implying that the
principal component analysis is here required to club the variables of efficiency ratio.
Factor (F) Eigen Value Percent of Variation Factor Matrix in Factor 1
1 2.062 41.249 .985
(Inventory Turnover ratio)
2 1.842 36.845 -.278
(Debtor Turnover ratio)
3 .694 13.880 .948
(Cash Turnover ratio)
4 .349 6.977 .289
( Creditors Turnover ratio)
5 .052 1.049 -.183
(Working Capital Turnover ratio)
Bartlett‟s test of sphericity is estimated to be 34.863*

295
In the constructed principal component for efficiency factor, the contributions of the
basic variables are more than 18% (being positive or negative according to their nature).
After the construction of the principal components, Regression of GP (dependent
variables) has been estimated on the principal component of liquidity (F1) and efficiency
(F2). The estimated regression results are presented below:
Adjusted R2 = .530*
[F=8.883]
GP= 63.102* - 21.533 F1 - 3.081* F2
(47.279) (15.059) (.863)
DW= 1.014
5.8. SUMMARY OF THE CHAPTER
Liquidity:
Among of the selected pharmaceutical companies Lupin, Dr. Reddy‟s Laboratories,
CIPLA, Aurobindo Pharmaceuticals, Sun Pharmaceuticals, Kopran and Parenteral Drugs
(India) Ltd were always holding higher amount of current assets to meet its current
obligations. In other words, there number of operating cycle was low and holding higher
amount of current assets. They were taken no risk to meet their current obligations. They
had adopted conservative strategy in working capital management.
Cadila Health Care Ltd, Divis Labs, Strides Archolabs, Biocon Pharmaceuticals, Biofil
Chemicals and Pharmaceuticals Ltd., Sequent Scientific Ltd., Zenotech Laboratories Ltd.,
Marksans Pharma Ltd., Wanbury Ltd. and Morepen Labs, the amount of working capital
had fluctuated time to time. In Divis Labs and Biocon Pharmaceuticals at the initial stage
of the study period, they were holding lower amount of current assets to meet their
obligations but latter they were holding more Current Assets than their current
obligations. In other words, they had changed from aggressive policy to conservative
policy. In Strides Archolabs, Biofil Chemicals and Pharmaceuticals Ltd., Sequent
Scientific Ltd., Zenotech Laboratories Ltd., Wanbury Ltd. and Morepen Labs at the
296
initial years of the study period, they were holding higher amount of current assets to
meet their current obligations but latter they were holding lower amount of current assets
than their current liabilities they had changed their current assets financing from
conservative to aggressive policy.
Piramal Enterprises, Ambalal Sarabhai Enterprises and Hiran Orgochem Ltd were always
holding lower amount of current assets to meet their current obligations. There number of
operating cycle was higher and holding lower amount of current assets. They were taken
high risk to meet their current obligations. They had adopted aggressive strategy in
working capital management.
Lupin, Piramal Enterprises, Strides Archolabs, Biofil Chemicals and Pharmaceuticals
Ltd., Ambalal Sarabhai Enterprises, Parenteral drugs (India) Ltd., Sequent Scientific Ltd.,
Zenotech Laboratories Ltd, Morepen Labs, Quick Ratio was always in declining trend.
These companies were holding larger amount of stock in their current assets. There
operating cycle was low and they were following conservative strategy in financing
current assets.
Dr. Reddy‟s Laboratories, quick ratio was declining trend but later part of the study
period it was in increasing trend. In Aurobindo Pharmaceuticals, quick ratio was
increasing trend but later part of the study it was in declining trend. In CIPLA,Sun
Pharmaceuticals , Kopran, Marksans Pharma Ltd., Wanbury Ltd. and Hiran Orgochem
Ltd. There were no discernable trend in quick ratio; it was fluctuated time to time.
However, the average current ratio as well as quick ratio maintained by the selected
pharmaceutical companies during the study period was highest in Sequent Scientific Ltd.
followed by Zenotech Laboratories Ltd., Wanbury Ltd., Sun Pharmaceuticals, Dr.
Reddy‟s Laboratories , Aurobindo Pharmaceuticals, Cipla, Strides Archolabs, Parenteral
Drugs (India) Ltd., Kopran, Lupin, Divis Labs, Marksans Pharma Ltd., Morepen Labs,
Biofil Chemicals and Pharmaceuticals Ltd., Cadila Health Care Ltd., Hiran Orgochem
Ltd., Biocon Pharmaceuticals Ltd., Piramal Enterprises and Ambalal Sarabhai
Enterprises.
297
The spot payment capacity of Lupin, CIPLA, Piramal Enterprises, Aurobindo
Pharmaceuticals, Cadila Health Care Ltd., Divis Labs, Strides Archolabs, Biocon
Pharmaceuticals, Kopran, Biofil Chemicals and Pharmaceuticals Ltd., Ambalal Sarabhai
Enterprises, Parenteral Drugs (India) Ltd., Sequent Scientific Ltd., Marksans Pharma
Ltd., Wanbury Ltd., Morepen Labs and Hiran Orgochem Ltd. of the selected companies
were very poor and much dependent on collection from debtors for paying its short term
debt. These companies were followed aggressive policy for short term debt paying
capacity.
However, the spot payment capacity of Dr. Reddy‟s Laboratories, Zenotech Laboratories
Ltd., Marksans Pharma Ltd. and Morepen Labs was fluctuated time to time as their
absolute liquid ratio was fluctuated.
The average absolute liquid ratio was highest in Zenotech Laboratories Ltd. followed by
Sun Pharmaceuticals, Dr. Reddy‟s Laboratories, Marksans Pharma Ltd., Morepen Labs,
Cadila Health Care Ltd., Biocon Pharmaceuticals Ltd., Strides Archolabs, Sequent
Scientific Ltd., Piramal Enterprises, Aurobindo Pharmaceuticals, Lupin, Wanbury Ltd.,
Hiran Orgochem Ltd., Parenteral Drugs (India) Ltd., Cipla, Divis Labs, Kopran, Biofil
Chemicals and Pharmaceuticals Ltd., and Ambalal Sarabhai Enterprises.
Profitability:
From the profitability analysis , it was observed that the gross profit ratio of Lupin, Dr.
Reddy‟s Laboratories, CIPLA, Aurobindo Pharmaceuticals, Divis Labs and Biocon
Pharmaceuticals maintaining their gross profit ratio at a level above the average gross
profit percentage of the selected pharmaceutical companies in all the years of the study
period. Operating expenses of these companies was below the sales volume in all the
years of the study. The Gross Profit Ratio of Piramal Enterprises, Cadila Health Care
Ltd., Strides Archolabs, Sun Pharmaceuticals, Kopran, Parenteral Drugs (India) Ltd.,
Sequent Scientific Ltd., Marksans Pharma Ltd., Wanbury Ltd. and Morpen Labs had
followed no trend during the period under study. Biofil Chemicals and Pharmaceuticals
Ltd., Ambalal Sarabhai Enterprises, Zenotech Laboratories Ltd. and Hiran Orgochem
Ltd. were unable to earn gross profit during the study period. It indicated that the
298
operating expenses of these companies were very high. The average gross profit
percentage of the selected pharmaceutical companies was highest in Divis Labs followed
by Dr. Reddy‟s Laboratories, Sun Pharmaceuticals, Cipla, Biocon Pharmaceuticals Ltd.,
Lupin, Aurobindo Pharmaceuticals, Cadila Health Care Ltd., Strides Archolabs, Piramal
Enterprises, Wanbury Ltd., Parenteral Drugs (India) Ltd., Kopran, Marksans Pharma
Ltd., Morepen Labs, Hiran Orgochem Ltd., Ambalal Sarabhai Enterprises, Zenotech
Laboratories Ltd. Biofil Chemicals and Pharmaceuticals Ltd. and Sequent Scientific Ltd.
The Net Profit Ratio of Dr. Reddy‟s Laboratories, CIPLA, Cadila Health Care Ltd, Divis
Labs and Biocon Pharmaceuticals were very high. These companies were controlling
their non-operating cost more effectively. The management and operation of these
companies are very well against its competitors. The non operating costs of these
companies are comparatively low.
The net profit ratio of Lupin, Aurobindo Pharmaceuticals, Piramal Enterprises, Strides
Archolabs, Sun Pharmaceuticals, Kopran, Sequent Scientific Ltd, Marksans Pharma,
Wanbury Ltd. and Morpen Labs were fluctuating from time to time. In most of the years,
net profit ratios were below the average net profit percentage of the selected
pharmaceutical companies and these companies had incurred net loss instead of net profit
in most of the years. Non-operating expenses of these companies were very high and it
exceeds its gross profit. The net profit ratio of Biofil Chemicals and Pharmaceuticals
Ltd., Ambalal Sarabhai Enterprises, Parenteral Drugs (India) Ltd, Zenotech Laboratories
Ltd. and Hiran Orgochem Ltd. were always below the average net profit percentage of
the selected samples and negative during the entire study period. The average net profit
percentage was highest in Piramal Enterprises followed by Strides Archolabs, Divis Labs,
Sun Pharmaceuticals, Biocon Pharmaceuticals Ltd., Dr. Reddy‟s Laboratories, Cipla,
Cadila Health Care Ltd., Lupin, Aurobindo Pharmaceuticals, Wanbury Ltd., Parenteral
Drugs (India) Ltd., Kopran, Marksans Pharma Ltd., Ambalal Sarabhai Enterprises,
Zenotech Laboratories Ltd. Morepen Labs, Hiran Orgochem Ltd., Biofil Chemicals and
Pharmaceuticals Ltd. and Sequent Scientific Ltd.
ROCE of Lupin, Dr. Reddy‟s Laboratories, CIPLA, Aurobindo Pharmaceuticals, Cadila
Health Care ltd., Divis Labs and Biocon Pharmaceuticals was much higher than that of
299
average ROCE of selected pharmaceutical companies. ROCE of Piramal Enterprises,
Strides Archolabs, Sun Pharmaceuticals, Parenteral Drugs (India) Ltd., Sequent Scientific
Ltd., Marksans Pharma, Wanbury Ltd. and Hiran Orgochem Ltd. fluctuated time to time.
ROCE of Kopran, Biofil Chemicals and Pharmaceuticals Ltd., Ambalal Sarabhai
Enterprises, Zenotech Laboratories Ltd. and Morepen Labs was always below the
average ROCE of the selected pharmaceutical Companies (7.39%) during the study
period. Moreover, the average ROCE of the selected pharmaceutical companies was
highest in Divis Labs followed by CIPLA, Lupin, Biocon Pharmaceuticals Ltd., Cadila
Health Care Ltd., Dr. Reddy‟s Laboratories, Piramal Enterprises, Aurobindo
Pharmaceuticals, Sun Pharmaceuticals, Sequent Scientific Ltd, Wanbury Ltd., Strides
Archolabs, Marksans Pharma Ltd., Parenteral Drugs (India) Ltd., Kopran, Morepen Labs,
Hiran Orgochem Ltd., Zenotech Laboratories Ltd., Ambalal Sarabhai Enterprises and
Biofil Chemicals and Pharmaceuticals Ltd.
Efficiency:
Inventory Turnover Ratio of Dr. Reddy‟s Laboratories, Piramal Enterprises, Cadila
Health Care Ltd., Strides Archolabs, Biocon Pharmaceuticals Ltd., Biofil Chemicals and
Pharmaceuticals Ltd., Ambalal Sarabhai Enterprises, Sequent Scientific Ltd., Wanbury
Ltd. and Morepen Labs was above the average of the selected samples in most of the
years of the study. The average inventory turnover ratio of Lupin, CIPLA, Aurobindo
Pharmaceuticals, Divis Labs, Sun Pharmaceuticals, Kopran, Parentaral Drugs (India)
Ltd., Zenotech Laboratories, Marksans Pharma Ltd. and Hiran Orgochem Ltd. was below
the average of the selected samples during the period under study. The average inventory
turnover ratio was highest in Ambalal Sarabhai Enterprises followed by Biofil Chemicals
and Pharmaceuticals Ltd., Wanbury Ltd., Piramal Enterprises, Sequent Scientific Ltd,
Morepen Labs, Strides Archolabs, Dr. Reddy‟s Laboratories, Biocon Pharmaceuticals
Ltd., Cadila Health Care Ltd., Sun Pharmaceuticals, Lupin, Hiran Orgochem Ltd.,
Parenteral Drugs (India) Ltd., Kopran, Aurobindo Pharmaceuticals, Marksans Pharma
Ltd., Zenotech Laboratories Ltd., CIPLA, and Divis Labs .
The debtors collections of average DTR of Piramal Enterprises and Cadila Health Care
Ltd. were very prompt as the average DTR of the selected companies were above the
300
average of the selected samples. In most of the years, the debtors collection period of
Lupin, Divis Labs, Biocon Pharmaceuticals, Kopran , Marksans Pharma Ltd. and
Wanbury Ltd. was very long. The DTR of Biofil Chemicals and Pharmaceuticals Ltd.,
Ambalal Sarabhai Enterprises and Strides Archolabs were remarkably longer. The DTR
of rest of the companies was longer in few years and shorter in rest of the years of the
study period.
Cash conversion cycle of Lupin, CIPLA, Piramal Enterprises, Aurobindo
Pharmaceuticals, Cadila Health Care Ltd., Divis Lab, Biocon Pharmaceuticals, Parenteral
Drugs (India) Ltd. and Wanbury Ltd. was very prompt in most of the years but very slow
in rest of the years of the study. The cash conversion period of Dr. Reddy‟s Laboratories,
Strides Archolabs, Sun Pharmaceuticals, Kopran, Biofil Chemicals and Pharmaceuticals
Ltd., Ambalal Sarabhai Enterprises, Sequent Scientific Ltd., Zenotech Laboratories Ltd.,
Marksans Pharma Ltd., Morepen Labs and Hiran Orgochem Ltd. was very long. It
indicated that the cash was not properly managed in these companies during the entire
study period. Moreover, these companies were followed no trend uniformly throughout
the study period.
The cash conversion period of Aurobindo Pharmaceuticals, CIPLA, Biocon
Pharmaceuticals, Lupin, Parenteral Drugs (India) Ltd. and Wanbury Ltd. was very speedy
but the cash conversion period of Zenotech Labopratories Ltd., Sequent Scientific Ltd.,
Ambalal Sarabhai Enterprises, Dr. Reddy‟s Laboratories, Strides Archolabs and Sun
Pharmaceuticals was very slow. The cash conversion cycle of Piramal Enterprises,
Cadila Health Care Ltd., Divis Labs, Kopran, Biofil Chemicals and Pharmaceuticals Ltd.,
Marksans Pharma Ltd., Morepen Labs and Hiran Orgochem Ltd. was neither slow nor
fast.
Creditors Management of Lupin Ltd., Dr. Reddys‟ Laboratories, CIPLA, Aurobindo
Pharmaceuticals Ltd., Cadila Health Care Ltd., Sun Pharmaceuticals Ltd., Biofil
Chemicals, Parenteral Drugs (India) Ltd, Wanbury and Morepen Labs was not
satisfactory during the study period. In most of the years, the creditors payment period of
Lupin Ltd., Dr. Reddys‟ Laboratories, CIPLA, Aurobindo Pharmaceuticals Ltd., Cadila
Health Care Ltd., Sun Pharmaceuticals Ltd., Biofil Chemicals and Pharmaceuticals Ltd.,
Parenteral Drugs (India) Ltd, Wanbury and Morepen Labs was very short and in few
301
years it was below the average of the selected samples. Creditors Management of Piramal
Enterprises, Divis Labs, Strides Archolabs, Biocon Pharmaceuticals, Kopran, Ambalal
Sarabhai Enterprises, Sequent Scientific Ltd., Zenotech Laboratories, Marksans Pharma,
and Hiran Orgochen Ltd. were always below the average of the selected samples. The
payables management of these companies was comparatively satisfactory.
Working capital cycle period of Lupin, CIPLA, Aurobindo Pharmaceuticals, Strides
Archolabs, Sun Pharmaceuticals, Parenteral Drugs (India) Ltd., Zenotech Laboratories
Ltd., Wanbury Ltd., Morepen Labs and Hiran Orgochem Ltd. was not managed
efficiently in most of the years. Working capital cycle period was efficiently done in few
years, when their operating cycle period was shorter. Working capital cycle period of
Piramal Enterprises, Cadila Health Care Ltd., Divis Lab, Biocon Pharmaceruicals, Biofil
Chemicals and pharmaceuticals Ltd, Ambalal Sarabhai Enterprises, Sequent Scientific
Ltd. and Marksans Pharma was efficiently managed in respect of operating cycle period,
during the period under study.
The current assets to total assets of LUPIN, Dr. Reddy‟s Laboratories, CIPLA, Piramal
Enterprises, Aurobindo Pharmaceuticals, Divis Lab, Kopran, Sequent Scientific Ltd.
Marksans Pharma Ltd, Wanbury Ltd. and Hiran Orgochem Ltd. was very high. The
major portion of total assets of these companies was current assets. The liquidity position
of these companies was very high as compared to others selected companies.
The current assets to total assets of Cadila Health Care Ltd., Strides Archolabs, Sun
Pharmaceuticals, Biocon Pharmaceuticals, Biofil Chemicals and Pharmaceuticals Ltd.,
Ambalal Sarabhai Enterprises, Parenteral Drugs (India) Ltd., Zenotech Ltd. and Morepen
Labs were very low as compared to the average of the selected samples during the period
under study. Investment in current assets out of total assets of these companies was low.
Liquidity position in respect of current assets to total assets of these companies was
lower. Piramal Enterprises, Divis Lab, Sun Pharmaceuticals, Biocon Pharmaceuticals,
Kopran, Ambalal Sarabhai Enterprises and Parenteral Drugs (India) Ltd. were
maintaining current assets to total assets at a level of average of the selected samples.
LUPIN, Dr. Reddy‟s Laboratories, CIPLA, Aurobindo Pharmaceuticals, Sequent
302
Scientific, Marksans Pharma Ltd., Wanbury Ltd. and Hiran Orgochem Ltd. were
maintaining their current assets to total assets at a level above the average of the selected
samples. Cadila Health Care Ltd., Strides Archo Labs, Biofil Chemicals and
Pharmaceuticals Ltd., Zenotech Ltd and Morepen Labs maintaining their current assets to
total assets at a level below the average of the selected samples.
The inventory to current assets ratio of LUPIN, CIPLA, Aurobindo Pharmaceuticals,
Cadila Health Care Ltd., Divis Lab, Marksans Pharma Ltd., Parenteral Drugs (India) Ltd.,
Morepen Labs and Hiran Orgochem Ltd. was very high. They were maintaining
conservative policy for managing its inventory level. The average inventory to current
assets ratio of Lupin, Biocon Pharmaceuticals and Morepen Labs was just equivalent to
the average of the selected samples. The average inventory to current assets ratio of
Divis Lab and Hiran Orgochem Ltd. was near about 50% which is very high. These two
companies followed highly conservative policy for managing their inventory level. Dr.
Reddy‟s Laboratories, Piramal Enterprises, Strides Archo Labs, Sun Pharmaceuticals,
Biocon, Kopran, Biofil Chemicals Ltd., Ambalal Sarabhai Enterprises, Sequent Scientific
Ltd., Zenotech Ltd. and Wanbury Ltd. had maintained its inventory to current assets level
at a rate below the average of the selected samples of 26.98%. Inventory to current assets
ratio of Zenotech Ltd. was highly aggressive followed by Ambalal Sarabhai Enterprises,
Biofil Chemicals and Pharmaceuticals Ltd., Sequent Scientific Ltd., Strides Archolabs,
Dr. Reddy‟s Laboratories, Wanbury Ltd., Kopran, Sun Pharmaceuticals, and so on. The
inventory to current assets ratio of Divis Lab and Hiran Orgochem Ltd. was highly
conservative as compared to the selected samples. Lupin, Biocon Pharmaceuticals,
maintained their average inventory to current assets ratio at a level of the average of the
selected samples of 26.98%.
Dr. Reddy‟s Laboratories, Divis Lab, Wanbury Ltd. followed their sundry debtors to
current assets ratio at a rate equivalent to the average of the selected samples of 0.33
during the period under study. The debtors value of these companies was neither high nor
low as compared to the average of the selected samples during the study period. The
average sundry debtors to current assets ratio of Dr. Reddy‟s Laboratories, Divis Lab,
Wanbury Ltd. were 0.34, 0.35 and 0.33 respectively. The average Sundry Debtors to

303
Current Assets ratio of CIPLA, Piramal Enterprises, Cadila Health Care Ltd., Sun
Pharmaceuticals, Kopran, Ambalal Sarabhai Enterprises, Sequent Scientific Ltd.,
Morepen Labs and Hiran Orgochem Ltd. was below the average of the selected samples
of 0.33.
Lupin, Sun Pharmaceuticals, Biofil Chemicals and Pharmaceuticals Ltd., Hiran
Orgochem Ltd. followed declining trend in cash and bank to current assets ratio in the
recent years of the study but Strides Archolabs, Ambalal Sarabhai Enterprises, Sequent
Scientific Ltd., Zenotech Ltd. and Morepen Labs followed an inclining trend in the recent
years of the study. Cash and bank to current assets ratio of Dr, Reddy‟s Laboratories,
CIPLA, Piramal Enterprises, Aurobindo Pharmaceuticals, Cadila Health Care Ltd., Divis
Lab, Biocon Phasrmaceuticals, Kopran, Parenteral Drugs (India) Ltd. and Wanbury Ltd.
was very low as compared to the average of the selected samples of 4.32%. In the recent
years, Lupin, Cadila Health Care Ltd. Divis labs and Wanbury Ltd. followed declining
trend but Dr. Reddy‟s Laboratories, Piramal Enterprises, Aurobindo Pharmaceuticals,
Biocon Pharmaceuticals Ltd. followed increasing trend.
Working Capital Financing Strategy:
Working capital leverage of Lupin, Dr. Reddy‟s Laboratories, CIPLA, Aurobindo
Pharmaceuticals, Kopran, Wanbury Ltd. and Hiran Orgochem Ltd. maintained a higher
degree of Working capital leverage as compared to the other selected samples. It
indicated that Lupin, Dr. Reddy‟s Laboratories, CIPLA, Aurobindo Pharmaceuticals,
Kopran, Wanbury Ltd. and Hiran Orgochem Ltd. accepting the higher risk for possibility
of higher return on investment. These companies are much more responsive to working
capital management as compared to others. Piramal Enterprises, Divis Labs, Strides
Archolabs, Sun Pharmaceuticals, Biocon Pharmaceuticals, Parenteral Drugs (India) Ltd.,
Sequent Scientific Ltd. and Marksans Pharma Ltd. followed mixed strategy for managing
their working capital. The Working capital leverage of these companies followed a
declining trend since 2008-2009. It indicated that they are avoiding taking high risk. They
had shifted high risk with a high return policy in the initial years of the study to low risk
with a low return policy since 2008-2009 to the recent year of the study. These
companies are moderate responsive to working capital management as compared to
304
others selected samples during the period under study. The average Working capital
leverage of Cadila Health Care Ltd., Biofil Chemicals and Pharmaceuticals Ltd., Ambalal
Sarabhai Enterprises, Zenotech Laboratories, Morepen Labs was always below the
average of the selected samples of 0.39 during the period under study.
Dr Reddy‟s Laboratories, CIPLA, Aurobindo Pharmaceuticals, Kopran and Parenteral
Drugs (India) Ltd. were always above the average of the selected samples. It indicated
that Dr Reddy‟s Laboratories, CIPLA, Aurobindo Pharmaceuticals, Kopran and
Parenteral Drugs (India) Ltd. used, on an average, 60% of long term funds to finance
their current assets. These companies approached conservative policy for working capital
financing. Lupin, Piramal Enterprises, Cadila Health Care Ltd., Divis Lab, Strides
Archolab, Sun Pharmaceuticals, Biocon Phasrmaceuticals Ltd., Sequent Scientific Ltd,
Wanbury Ltd. and Hiran Orgochem Ltd. adopted aggressive policy, conservative policy
as well as matching policy in financing working capital in different years of the study.
Biofil Chemicals and Pharmaceuticals Ltd., Zenotech Laboratories Ltd., Marksans
Pharma Ltd. and Morepen Labs had shifted their risk in financing working capital from
conservative policy to aggressive policy during the study period. Ambalal Sarabhai
Enterprises was always in aggressive policy in working capital financing during the study
period.
Results of regression analysis of gross profit on current ratio shows that out of total 14
companies under study, 10 companies earned profit and 4 incurred loss almost during the
entire period. Loss making companies are found to maintain, on an average, relatively
lower current ratio than the profit –making companies, though, excepting only one
company, namely Ambalal Sarabhai enterprises with current ratio of 1.0, the three other
companies maintained, on an average, more than 2.0, a standard current ratio. normally
construed as a safe liquidity ratio. For the profit-making companies, on the other hand,
the average current ratio ranged between 3.0 and 5.23. (The sequent Scientific is a glaring
exception, with an average C.R. of 76.36, minimum current ratio of 0 and maximum of
558).
Thus, maintaining a very high current ratio, might have been an important factor in
helping her ailing husband.
305
So far as the relation between the gross profit and inventory turn-over ratio is concerned,
some baffling results come out. Each of three out of 4 loss-making companies has much
higher inventory turn-over ratio than any of the profit-making companies. Therefore, we
can conclude that, in addition to the inventory management problem, there might be some
other factors in the group of the liquidity measures that might have outweighed the gain
accruing from high inventory turnover ratio.
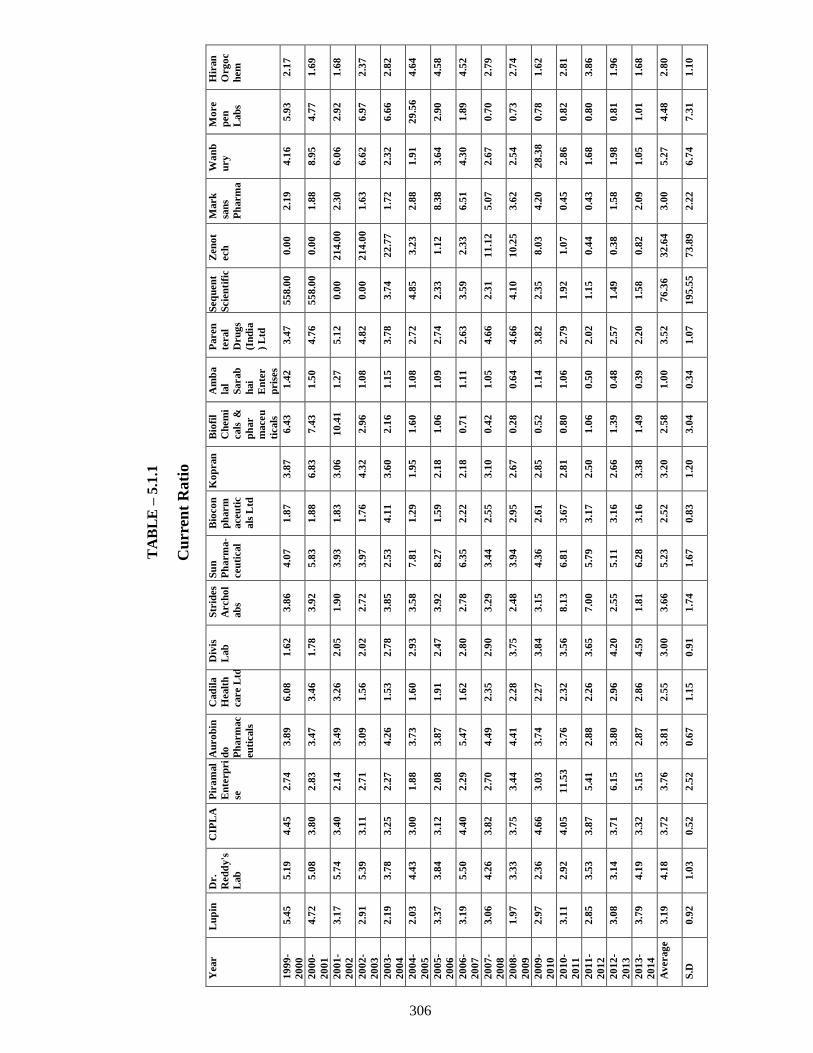
TA
BL
E –
5.1
.1
Cu
rren
t R
ati
o
Year
Lu
pin
D
r.
Red
dy's
Lab
CIP
LA
P
ira
mal
En
terp
ri
se
Au
ro
bin
do
Ph
arm
ac
eu
ticals
Cad
ila
Healt
h
care L
td
Div
is
Lab
Str
ides
Arch
ol
ab
s
Su
n
Ph
arm
a-
ceu
tical
Bio
co
n
ph
arm
aceu
tic
als
Ltd
Ko
pran
B
iofi
l
Ch
em
i
cals
&
ph
ar
maceu
ticals
Am
ba
lal
Sarab
hai
En
ter
pris
es
Paren
teral
Dru
gs
(In
dia
) L
td
Seq
uen
t
Scie
nti
fic
Zen
ot
ech
Mark
san
s
Ph
arm
a
Wa
nb
ury
Mo
re
pen
Lab
s
Hir
an
Org
oc
hem
19
99
-
20
00
5.4
5
5.1
9
4.4
5
2.7
4
3.8
9
6.0
8
1.6
2
3.8
6
4.0
7
1.8
7
3.8
7
6.4
3
1.4
2
3.4
7
55
8.0
0
0.0
0
2.1
9
4.1
6
5.9
3
2.1
7
20
00
-
20
01
4.7
2
5.0
8
3.8
0
2.8
3
3.4
7
3.4
6
1.7
8
3.9
2
5.8
3
1.8
8
6.8
3
7.4
3
1.5
0
4.7
6
55
8.0
0
0.0
0
1.8
8
8.9
5
4.7
7
1.6
9
20
01
-
20
02
3.1
7
5.7
4
3.4
0
2.1
4
3.4
9
3.2
6
2.0
5
1.9
0
3.9
3
1.8
3
3.0
6
10
.41
1.2
7
5.1
2
0.0
0
21
4.0
0
2.3
0
6.0
6
2.9
2
1.6
8
20
02
-
20
03
2.9
1
5.3
9
3.1
1
2.7
1
3.0
9
1.5
6
2.0
2
2.7
2
3.9
7
1.7
6
4.3
2
2.9
6
1.0
8
4.8
2
0.0
0
21
4.0
0
1.6
3
6.6
2
6.9
7
2.3
7
20
03
-
20
04
2.1
9
3.7
8
3.2
5
2.2
7
4.2
6
1.5
3
2.7
8
3.8
5
2.5
3
4.1
1
3.6
0
2.1
6
1.1
5
3.7
8
3.7
4
22
.77
1.7
2
2.3
2
6.6
6
2.8
2
20
04
-
20
05
2.0
3
4.4
3
3.0
0
1.8
8
3.7
3
1.6
0
2.9
3
3.5
8
7.8
1
1.2
9
1.9
5
1.6
0
1.0
8
2.7
2
4.8
5
3.2
3
2.8
8
1.9
1
29
.56
4.6
4
20
05
-
20
06
3.3
7
3.8
4
3.1
2
2.0
8
3.8
7
1.9
1
2.4
7
3.9
2
8.2
7
1.5
9
2.1
8
1.0
6
1.0
9
2.7
4
2.3
3
1.1
2
8.3
8
3.6
4
2.9
0
4.5
8
20
06
-
20
07
3.1
9
5.5
0
4.4
0
2.2
9
5.4
7
1.6
2
2.8
0
2.7
8
6.3
5
2.2
2
2.1
8
0.7
1
1.1
1
2.6
3
3.5
9
2.3
3
6.5
1
4.3
0
1.8
9
4.5
2
20
07
-
20
08
3.0
6
4.2
6
3.8
2
2.7
0
4.4
9
2.3
5
2.9
0
3.2
9
3.4
4
2.5
5
3.1
0
0.4
2
1.0
5
4.6
6
2.3
1
11
.12
5.0
7
2.6
7
0.7
0
2.7
9
20
08
-
20
09
1.9
7
3.3
3
3.7
5
3.4
4
4.4
1
2.2
8
3.7
5
2.4
8
3.9
4
2.9
5
2.6
7
0.2
8
0.6
4
4.6
6
4.1
0
10
.25
3.6
2
2.5
4
0.7
3
2.7
4
20
09
-
20
10
2.9
7
2.3
6
4.6
6
3.0
3
3.7
4
2.2
7
3.8
4
3.1
5
4.3
6
2.6
1
2.8
5
0.5
2
1.1
4
3.8
2
2.3
5
8.0
3
4.2
0
28
.38
0.7
8
1.6
2
20
10
-
20
11
3.1
1
2.9
2
4.0
5
11
.53
3.7
6
2.3
2
3.5
6
8.1
3
6.8
1
3.6
7
2.8
1
0.8
0
1.0
6
2.7
9
1.9
2
1.0
7
0.4
5
2.8
6
0.8
2
2.8
1
20
11
-
20
12
2.8
5
3.5
3
3.8
7
5.4
1
2.8
8
2.2
6
3.6
5
7.0
0
5.7
9
3.1
7
2.5
0
1.0
6
0.5
0
2.0
2
1.1
5
0.4
4
0.4
3
1.6
8
0.8
0
3.8
6
20
12
-
20
13
3.0
8
3.1
4
3.7
1
6.1
5
3.8
0
2.9
6
4.2
0
2.5
5
5.1
1
3.1
6
2.6
6
1.3
9
0.4
8
2.5
7
1.4
9
0.3
8
1.5
8
1.9
8
0.8
1
1.9
6
20
13
-
20
14
3.7
9
4.1
9
3.3
2
5.1
5
2.8
7
2.8
6
4.5
9
1.8
1
6.2
8
3.1
6
3.3
8
1.4
9
0.3
9
2.2
0
1.5
8
0.8
2
2.0
9
1.0
5
1.0
1
1.6
8
Av
erag
e
3.1
9
4.1
8
3.7
2
3.7
6
3.8
1
2.5
5
3.0
0
3.6
6
5.2
3
2.5
2
3.2
0
2.5
8
1.0
0
3.5
2
76
.36
32
.64
3.0
0
5.2
7
4.4
8
2.8
0
S.D
0.9
2
1.0
3
0.5
2
2.5
2
0.6
7
1.1
5
0.9
1
1.7
4
1.6
7
0.8
3
1.2
0
3.0
4
0.3
4
1.0
7
19
5.5
5
73
.89
2.2
2
6.7
4
7.3
1
1.1
0
306
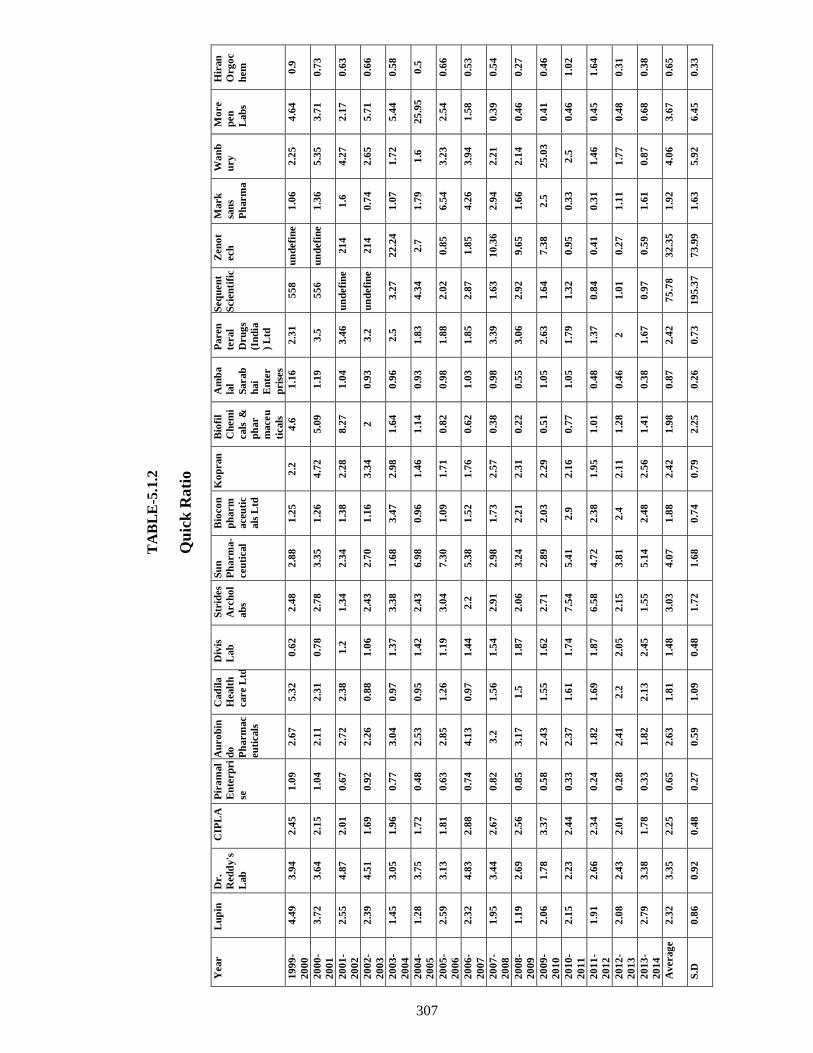
TA
BL
E-5
.1.2
Qu
ick
Rati
o
Year
Lu
pin
D
r.
Red
dy's
Lab
CIP
LA
P
ira
mal
En
terp
ri
se
Au
ro
bin
do
Ph
arm
ac
eu
ticals
Cad
ila
Healt
h
care L
td
Div
is
Lab
Str
ides
Arch
ol
ab
s
Su
n
Ph
arm
a-
ceu
tical
Bio
co
n
ph
arm
aceu
tic
als
Ltd
Ko
pran
B
iofi
l
Ch
em
i
cals
&
ph
ar
maceu
ticals
Am
ba
lal
Sarab
hai
En
ter
pris
es
Paren
teral
Dru
gs
(In
dia
) L
td
Seq
uen
t
Scie
nti
fic
Zen
ot
ech
Mark
san
s
Ph
arm
a
Wa
nb
ury
Mo
re
pen
Lab
s
Hir
an
Org
oc
hem
19
99
-
20
00
4.4
9
3.9
4
2.4
5
1.0
9
2.6
7
5.3
2
0.6
2
2.4
8
2.8
8
1.2
5
2.2
4
.6
1.1
6
2.3
1
55
8
un
defi
ne
1.0
6
2.2
5
4.6
4
0.9
20
00
-
20
01
3.7
2
3.6
4
2.1
5
1.0
4
2.1
1
2.3
1
0.7
8
2.7
8
3.3
5
1.2
6
4.7
2
5.0
9
1.1
9
3.5
5
56
un
defi
ne
1.3
6
5.3
5
3.7
1
0.7
3
20
01
-
20
02
2.5
5
4.8
7
2.0
1
0.6
7
2.7
2
2.3
8
1.2
1
.34
2.3
4
1.3
8
2.2
8
8.2
7
1.0
4
3.4
6
un
defi
ne
21
4
1.6
4
.27
2.1
7
0.6
3
20
02
-
20
03
2.3
9
4.5
1
1.6
9
0.9
2
2.2
6
0.8
8
1.0
6
2.4
3
2.7
0
1.1
6
3.3
4
2
0.9
3
3.2
u
nd
efi
ne
21
4
0.7
4
2.6
5
5.7
1
0.6
6
20
03
-
20
04
1.4
5
3.0
5
1.9
6
0.7
7
3.0
4
0.9
7
1.3
7
3.3
8
1.6
8
3.4
7
2.9
8
1.6
4
0.9
6
2.5
3
.27
22
.24
1.0
7
1.7
2
5.4
4
0.5
8
20
04
-
20
05
1.2
8
3.7
5
1.7
2
0.4
8
2.5
3
0.9
5
1.4
2
2.4
3
6.9
8
0.9
6
1.4
6
1.1
4
0.9
3
1.8
3
4.3
4
2.7
1
.79
1.6
2
5.9
5
0.5
20
05
-
20
06
2.5
9
3.1
3
1.8
1
0.6
3
2.8
5
1.2
6
1.1
9
3.0
4
7.3
0
1.0
9
1.7
1
0.8
2
0.9
8
1.8
8
2.0
2
0.8
5
6.5
4
3.2
3
2.5
4
0.6
6
20
06
-
20
07
2.3
2
4.8
3
2.8
8
0.7
4
4.1
3
0.9
7
1.4
4
2.2
5
.38
1.5
2
1.7
6
0.6
2
1.0
3
1.8
5
2.8
7
1.8
5
4.2
6
3.9
4
1.5
8
0.5
3
20
07
-
20
08
1.9
5
3.4
4
2.6
7
0.8
2
3.2
1
.56
1.5
4
2.9
1
2.9
8
1.7
3
2.5
7
0.3
8
0.9
8
3.3
9
1.6
3
10
.36
2.9
4
2.2
1
0.3
9
0.5
4
20
08
-
20
09
1.1
9
2.6
9
2.5
6
0.8
5
3.1
7
1.5
1
.87
2.0
6
3.2
4
2.2
1
2.3
1
0.2
2
0.5
5
3.0
6
2.9
2
9.6
5
1.6
6
2.1
4
0.4
6
0.2
7
20
09
-
20
10
2.0
6
1.7
8
3.3
7
0.5
8
2.4
3
1.5
5
1.6
2
2.7
1
2.8
9
2.0
3
2.2
9
0.5
1
1.0
5
2.6
3
1.6
4
7.3
8
2.5
2
5.0
3
0.4
1
0.4
6
20
10
-
20
11
2.1
5
2.2
3
2.4
4
0.3
3
2.3
7
1.6
1
1.7
4
7.5
4
5.4
1
2.9
2
.16
0.7
7
1.0
5
1.7
9
1.3
2
0.9
5
0.3
3
2.5
0
.46
1.0
2
20
11
-
20
12
1.9
1
2.6
6
2.3
4
0.2
4
1.8
2
1.6
9
1.8
7
6.5
8
4.7
2
2.3
8
1.9
5
1.0
1
0.4
8
1.3
7
0.8
4
0.4
1
0.3
1
1.4
6
0.4
5
1.6
4
20
12
-
20
13
2.0
8
2.4
3
2.0
1
0.2
8
2.4
1
2.2
2
.05
2.1
5
3.8
1
2.4
2
.11
1.2
8
0.4
6
2
1.0
1
0.2
7
1.1
1
1.7
7
0.4
8
0.3
1
20
13
-
20
14
2.7
9
3.3
8
1.7
8
0.3
3
1.8
2
2.1
3
2.4
5
1.5
5
5.1
4
2.4
8
2.5
6
1.4
1
0.3
8
1.6
7
0.9
7
0.5
9
1.6
1
0.8
7
0.6
8
0.3
8
Av
erag
e
2.3
2
3.3
5
2.2
5
0.6
5
2.6
3
1.8
1
1.4
8
3.0
3
4.0
7
1.8
8
2.4
2
1.9
8
0.8
7
2.4
2
75
.78
32
.35
1.9
2
4.0
6
3.6
7
0.6
5
S.D
0.8
6
0.9
2
0.4
8
0.2
7
0.5
9
1.0
9
0.4
8
1.7
2
1.6
8
0.7
4
0.7
9
2.2
5
0.2
6
0.7
3
19
5.3
7
73
.99
1.6
3
5.9
2
6.4
5
0.3
3
307
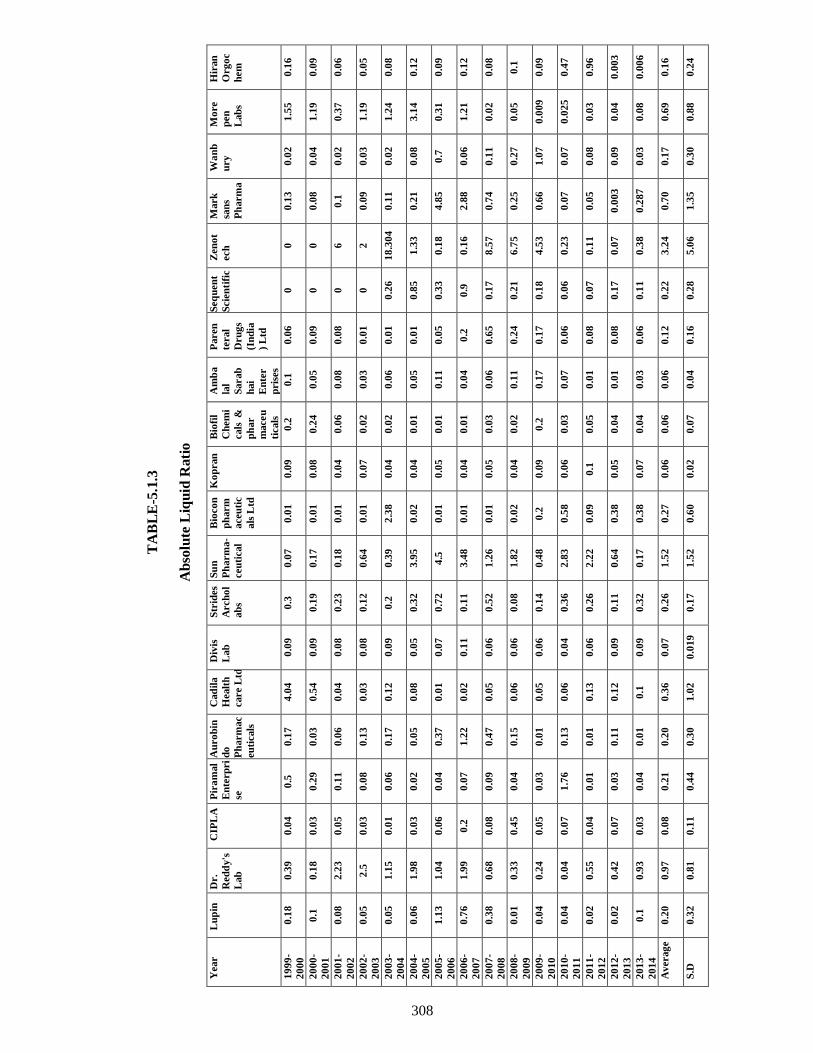
TA
BL
E-5
.1.3
Ab
solu
te L
iqu
id R
ati
o
Year
Lu
pin
D
r.
Red
dy's
Lab
CIP
LA
P
ira
mal
En
terp
ri
se
Au
ro
bin
do
Ph
arm
ac
eu
ticals
Cad
ila
Healt
h
care L
td
Div
is
Lab
Str
ides
Arch
ol
ab
s
Su
n
Ph
arm
a-
ceu
tical
Bio
co
n
ph
arm
aceu
tic
als
Ltd
Ko
pran
B
iofi
l
Ch
em
i
cals
&
ph
ar
maceu
ticals
Am
ba
lal
Sarab
hai
En
ter
pris
es
Paren
teral
Dru
gs
(In
dia
) L
td
Seq
uen
t
Scie
nti
fic
Zen
ot
ech
Mark
san
s
Ph
arm
a
Wa
nb
ury
Mo
re
pen
Lab
s
Hir
an
Org
oc
hem
19
99
-
20
00
0.1
8
0.3
9
0.0
4
0.5
0
.17
4.0
4
0.0
9
0.3
0
.07
0.0
1
0.0
9
0.2
0
.1
0.0
6
0
0
0.1
3
0.0
2
1.5
5
0.1
6
20
00
-
20
01
0.1
0
.18
0.0
3
0.2
9
0.0
3
0.5
4
0.0
9
0.1
9
0.1
7
0.0
1
0.0
8
0.2
4
0.0
5
0.0
9
0
0
0.0
8
0.0
4
1.1
9
0.0
9
20
01
-
20
02
0.0
8
2.2
3
0.0
5
0.1
1
0.0
6
0.0
4
0.0
8
0.2
3
0.1
8
0.0
1
0.0
4
0.0
6
0.0
8
0.0
8
0
6
0.1
0
.02
0.3
7
0.0
6
20
02
-
20
03
0.0
5
2.5
0
.03
0.0
8
0.1
3
0.0
3
0.0
8
0.1
2
0.6
4
0.0
1
0.0
7
0.0
2
0.0
3
0.0
1
0
2
0.0
9
0.0
3
1.1
9
0.0
5
20
03
-
20
04
0.0
5
1.1
5
0.0
1
0.0
6
0.1
7
0.1
2
0.0
9
0.2
0
.39
2.3
8
0.0
4
0.0
2
0.0
6
0.0
1
0.2
6
18
.30
4
0.1
1
0.0
2
1.2
4
0.0
8
20
04
-
20
05
0.0
6
1.9
8
0.0
3
0.0
2
0.0
5
0.0
8
0.0
5
0.3
2
3.9
5
0.0
2
0.0
4
0.0
1
0.0
5
0.0
1
0.8
5
1.3
3
0.2
1
0.0
8
3.1
4
0.1
2
20
05
-
20
06
1.1
3
1.0
4
0.0
6
0.0
4
0.3
7
0.0
1
0.0
7
0.7
2
4.5
0
.01
0.0
5
0.0
1
0.1
1
0.0
5
0.3
3
0.1
8
4.8
5
0.7
0
.31
0.0
9
20
06
-
20
07
0.7
6
1.9
9
0.2
0
.07
1.2
2
0.0
2
0.1
1
0.1
1
3.4
8
0.0
1
0.0
4
0.0
1
0.0
4
0.2
0
.9
0.1
6
2.8
8
0.0
6
1.2
1
0.1
2
20
07
-
20
08
0.3
8
0.6
8
0.0
8
0.0
9
0.4
7
0.0
5
0.0
6
0.5
2
1.2
6
0.0
1
0.0
5
0.0
3
0.0
6
0.6
5
0.1
7
8.5
7
0.7
4
0.1
1
0.0
2
0.0
8
20
08
-
20
09
0.0
1
0.3
3
0.4
5
0.0
4
0.1
5
0.0
6
0.0
6
0.0
8
1.8
2
0.0
2
0.0
4
0.0
2
0.1
1
0.2
4
0.2
1
6.7
5
0.2
5
0.2
7
0.0
5
0.1
20
09
-
20
10
0.0
4
0.2
4
0.0
5
0.0
3
0.0
1
0.0
5
0.0
6
0.1
4
0.4
8
0.2
0
.09
0.2
0
.17
0.1
7
0.1
8
4.5
3
0.6
6
1.0
7
0.0
09
0.0
9
20
10
-
20
11
0.0
4
0.0
4
0.0
7
1.7
6
0.1
3
0.0
6
0.0
4
0.3
6
2.8
3
0.5
8
0.0
6
0.0
3
0.0
7
0.0
6
0.0
6
0.2
3
0.0
7
0.0
7
0.0
25
0.4
7
20
11
-
20
12
0.0
2
0.5
5
0.0
4
0.0
1
0.0
1
0.1
3
0.0
6
0.2
6
2.2
2
0.0
9
0.1
0
.05
0.0
1
0.0
8
0.0
7
0.1
1
0.0
5
0.0
8
0.0
3
0.9
6
20
12
-
20
13
0.0
2
0.4
2
0.0
7
0.0
3
0.1
1
0.1
2
0.0
9
0.1
1
0.6
4
0.3
8
0.0
5
0.0
4
0.0
1
0.0
8
0.1
7
0.0
7
0.0
03
0.0
9
0.0
4
0.0
03
20
13
-
20
14
0.1
0
.93
0.0
3
0.0
4
0.0
1
0.1
0
.09
0.3
2
0.1
7
0.3
8
0.0
7
0.0
4
0.0
3
0.0
6
0.1
1
0.3
8
0.2
87
0.0
3
0.0
8
0.0
06
Av
erag
e
0.2
0
0.9
7
0.0
8
0.2
1
0.2
0
0.3
6
0.0
7
0.2
6
1.5
2
0.2
7
0.0
6
0.0
6
0.0
6
0.1
2
0.2
2
3.2
4
0.7
0
0.1
7
0.6
9
0.1
6
S.D
0.3
2
0.8
1
0.1
1
0.4
4
0.3
0
1.0
2
0.0
19
0.1
7
1.5
2
0.6
0
0.0
2
0.0
7
0.0
4
0.1
6
0.2
8
5.0
6
1.3
5
0.3
0
0.8
8
0.2
4
308
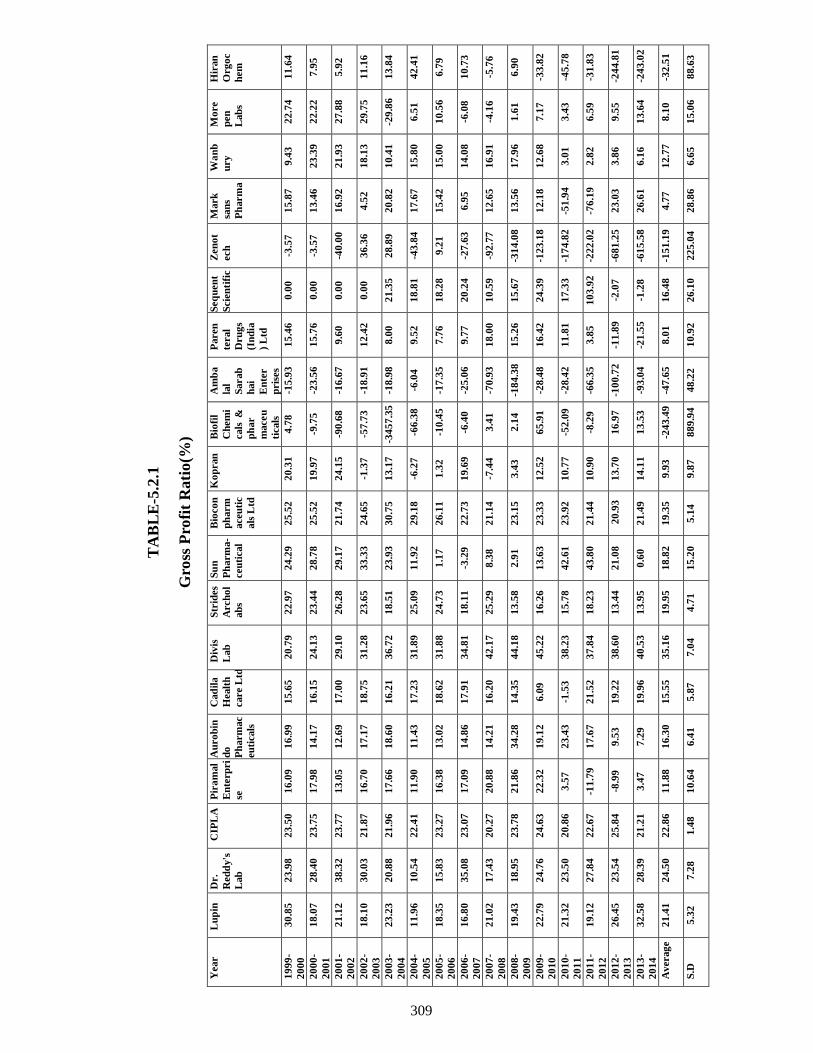
TA
BL
E-5
.2.1
Gro
ss P
rofi
t R
ati
o(%
)
Year
Lu
pin
D
r.
Red
dy's
Lab
CIP
LA
P
ira
mal
En
terp
ri
se
Au
ro
bin
do
Ph
arm
ac
eu
ticals
Cad
ila
Healt
h
care L
td
Div
is
Lab
Str
ides
Arch
ol
ab
s
Su
n
Ph
arm
a-
ceu
tical
Bio
co
n
ph
arm
aceu
tic
als
Ltd
Ko
pran
B
iofi
l
Ch
em
i
cals
&
ph
ar
maceu
ticals
Am
ba
lal
Sarab
hai
En
ter
pris
es
Paren
teral
Dru
gs
(In
dia
) L
td
Seq
uen
t
Scie
nti
fic
Zen
ot
ech
Mark
san
s
Ph
arm
a
Wa
nb
ury
Mo
re
pen
Lab
s
Hir
an
Org
oc
hem
19
99
-
20
00
30
.85
23
.98
23
.50
16
.09
16
.99
15
.65
20
.79
22
.97
24
.29
25
.52
20
.31
4.7
8
-15
.93
15
.46
0.0
0
-3.5
7
15
.87
9.4
3
22
.74
11
.64
20
00
-
20
01
18
.07
28
.40
23
.75
17
.98
14
.17
16
.15
24
.13
23
.44
28
.78
25
.52
19
.97
-9.7
5
-23
.56
15
.76
0.0
0
-3.5
7
13
.46
23
.39
22
.22
7.9
5
20
01
-
20
02
21
.12
38
.32
23
.77
13
.05
12
.69
17
.00
29
.10
26
.28
29
.17
21
.74
24
.15
-90
.68
-16
.67
9.6
0
0.0
0
-40
.00
16
.92
21
.93
27
.88
5.9
2
20
02
-
20
03
18
.10
30
.03
21
.87
16
.70
17
.17
18
.75
31
.28
23
.65
33
.33
24
.65
-1.3
7
-57
.73
-18
.91
12
.42
0.0
0
36
.36
4.5
2
18
.13
29
.75
11
.16
20
03
-
20
04
23
.23
20
.88
21
.96
17
.66
18
.60
16
.21
36
.72
18
.51
23
.93
30
.75
13
.17
-34
57
.35
-18
.98
8.0
0
21
.35
28
.89
20
.82
10
.41
-29
.86
13
.84
20
04
-
20
05
11
.96
10
.54
22
.41
11
.90
11
.43
17
.23
31
.89
25
.09
11
.92
29
.18
-6.2
7
-66
.38
-6.0
4
9.5
2
18
.81
-43
.84
17
.67
15
.80
6.5
1
42
.41
20
05
-
20
06
18
.35
15
.83
23
.27
16
.38
13
.02
18
.62
31
.88
24
.73
1.1
7
26
.11
1.3
2
-10
.45
-17
.35
7.7
6
18
.28
9.2
1
15
.42
15
.00
10
.56
6.7
9
20
06
-
20
07
16
.80
35
.08
23
.07
17
.09
14
.86
17
.91
34
.81
18
.11
-3.2
9
22
.73
19
.69
-6.4
0
-25
.06
9.7
7
20
.24
-27
.63
6.9
5
14
.08
-6.0
8
10
.73
20
07
-
20
08
21
.02
17
.43
20
.27
20
.88
14
.21
16
.20
42
.17
25
.29
8.3
8
21
.14
-7.4
4
3.4
1
-70
.93
18
.00
10
.59
-92
.77
12
.65
16
.91
-4.1
6
-5.7
6
20
08
-
20
09
19
.43
18
.95
23
.78
21
.86
34
.28
14
.35
44
.18
13
.58
2.9
1
23
.15
3.4
3
2.1
4
-18
4.3
8
15
.26
15
.67
-31
4.0
8
13
.56
17
.96
1.6
1
6.9
0
20
09
-
20
10
22
.79
24
.76
24
.63
22
.32
19
.12
6.0
9
45
.22
16
.26
13
.63
23
.33
12
.52
65
.91
-28
.48
16
.42
24
.39
-12
3.1
8
12
.18
12
.68
7.1
7
-33
.82
20
10
-
20
11
21
.32
23
.50
20
.86
3.5
7
23
.43
-1.5
3
38
.23
15
.78
42
.61
23
.92
10
.77
-52
.09
-28
.42
11
.81
17
.33
-17
4.8
2
-51
.94
3.0
1
3.4
3
-45
.78
20
11
-
20
12
19
.12
27
.84
22
.67
-11
.79
17
.67
21
.52
37
.84
18
.23
43
.80
21
.44
10
.90
-8.2
9
-66
.35
3.8
5
10
3.9
2
-22
2.0
2
-76
.19
2.8
2
6.5
9
-31
.83
20
12
-
20
13
26
.45
23
.54
25
.84
-8.9
9
9.5
3
19
.22
38
.60
13
.44
21
.08
20
.93
13
.70
16
.97
-10
0.7
2
-11
.89
-2.0
7
-68
1.2
5
23
.03
3.8
6
9.5
5
-24
4.8
1
20
13
-
20
14
32
.58
28
.39
21
.21
3.4
7
7.2
9
19
.96
40
.53
13
.95
0.6
0
21
.49
14
.11
13
.53
-93
.04
-21
.55
-1.2
8
-61
5.5
8
26
.61
6.1
6
13
.64
-24
3.0
2
Av
erag
e
21
.41
24
.50
22
.86
11
.88
16
.30
15
.55
35
.16
19
.95
18
.82
19
.35
9.9
3
-24
3.4
9
-47
.65
8.0
1
16
.48
-15
1.1
9
4.7
7
12
.77
8.1
0
-32
.51
S.D
5.3
2
7.2
8
1.4
8
10
.64
6.4
1
5.8
7
7.0
4
4.7
1
15
.20
5.1
4
9.8
7
88
9.9
4
48
.22
10
.92
26
.10
22
5.0
4
28
.86
6.6
5
15
.06
88
.63
309

TA
BL
E-5
.2.2
Net
Pro
fit
Rati
o(%
)
Year
Lu
pin
D
r.
Red
dy's
Lab
CIP
LA
P
ira
mal
En
terp
ri
se
Au
ro
bin
do
Ph
arm
ac
eu
ticals
Cad
ila
Healt
h
care L
td
Div
is
Lab
Str
ides
Arch
ol
ab
s
Su
n
Ph
arm
a-
ceu
tical
Bio
co
n
ph
arm
aceu
tic
als
Ltd
Ko
pran
B
iofi
l
Ch
em
i
cals
&
ph
ar
maceu
ticals
Am
ba
lal
Sarab
hai
En
ter
pris
es
Pare
nte
r
al
Dru
gs(
I
nd
ia
) Ltd
Seq
uen
t
Scie
nti
fic
Zen
ot
ech
Mark
san
s
Ph
arm
a
Wa
nb
ury
Mo
re
pen
Lab
s
Hir
an
Org
oc
hem
19
99
-
20
00
3.4
6
13
.62
18
.31
12
.1
10
.72
8.7
7
14
.28
12
.46
20
.41
11
.72
5.9
7
-4.0
3
3.2
5
.62
0
-24
.45
5.2
8
-8.5
2
12
.25
3.2
8
20
00
-
20
01
7.1
5
15
.6
17
.92
13
.64
7.1
8
13
.1
13
.33
16
.23
23
.85
11
.74
6.4
5
-29
.1
7.2
8
5.7
2
-13
068
12
-12
.26
4.6
9
0.1
8
15
.31
2.8
5
20
01
-
20
02
8.0
5
29
.67
17
.95
5.2
2
6.9
6
12
.28
16
.8
8.4
2
4.3
9
12
.31
3.5
2
-14
0.3
2
-4.2
8
0.4
1
0
-26
.73
0.4
8
2.4
4
14
.94
1.6
9
20
02
-
20
03
7.0
8
24
.81
16
.81
10
.63
9.1
9
7.9
1
21
.18
6.9
9
28
.98
13
.96
-17
.97
-95
.73
-18
.27
0.4
9
-15
804
00
-0.3
2
-12
.64
4.0
9
10
.67
-0.0
5
20
03
-
20
04
12
.34
16
.47
15
.76
13
.35
10
.05
12
.3
22
.97
2.2
9
25
.29
24
.5
0.4
4
-35
40
.44
3.4
4
1.2
5
14
.63
-4.8
7
6.0
9
4.0
9
-16
.7
2.3
20
04
-
20
05
7.1
9
8.3
1
18
.02
12
.41
3.1
9
11
.49
18
.12
9.4
2
4.7
8
26
.2
-35
.16
-47
1.2
9
-8.1
8
1.3
7
11
.81
-78
.15
8.4
6
9.4
2
-36
.2
2.3
5
20
05
-
20
06
10
.98
9.8
5
20
.12
11
.62
4.8
9
12
.43
17
.99
13
.63
25
.85
19
.12
-3.5
7
-10
.08
-5.8
7
1.0
3
12
.28
-5.9
2
7.9
1
9.3
7
-30
.01
11
.51
20
06
-
20
07
14
.89
29
.77
18
.41
11
.26
11
.74
13
.42
25
.94
7.8
2
26
.69
18
.3
-39
.54
-45
.62
-13
.62
2.7
9
20
.71
16
.44
2.8
8
13
.74
-12
2.5
3
0.9
6
20
07
-
20
08
16
.3
13
.57
16
.43
15
.14
12
.41
13
.17
33
.77
-28
.19
31
.01
46
.7
11
.04
-75
.89
-11
.61
9
2.9
9
-14
2.8
3
6.1
4
7.4
1
-38
.59
3.2
1
20
08
-
20
09
14
.09
13
.2
14
.58
11
.08
4.5
4
13
.31
34
.97
0.9
8
31
.43
11
.31
-11
.03
-18
.7
16
.6
4.7
5
3.2
5
-20
1.5
0
.23
-18
.22
-22
.43
-9.1
1
20
09
-
20
10
17
.52
18
.48
18
.97
15
.83
16
.09
20
.39
35
.99
13
.44
33
.99
20
.2
6.0
5
28
.87
3.5
8
8.1
8
.32
-14
2.9
4
0.1
4
8.1
7
-0.8
8
3.6
3
20
10
-
20
11
17
.95
16
.84
14
.95
64
9.8
1
14
.33
20
.57
32
.48
13
.24
41
.91
28
.38
2.7
6
22
.45
-2.6
3
2.2
9
5.6
3
-18
7.9
3
-
13
9.2
6
-7.0
6
-19
.85
-54
.61
20
11
-
20
12
14
.92
13
.51
15
.77
9.6
9
-0.9
9
19
.41
29
15
.39
38
.94
15
.74
3.0
1
2.3
8
-24
.26
-21
.45
0.4
2
-44
2.7
2
-
11
5.6
6
-4.5
4
-8.9
3
-19
.39
20
12
-
20
13
17
.63
14
.75
17
.87
-13
.01
9.0
9
13
.37
28
.08
6.7
3
19
.35
13
.85
4.7
8
8.9
3
-48
.47
-45
.47
-17
.21
-79
3.5
9
20
.14
-6.0
8
-7.4
-2
35
.52
20
13
-
20
14
24
.84
19
.56
14
.37
16
.22
16
.31
20
.76
30
.47
29
6.5
-9
4.6
5
14
.57
5.6
1
7.1
4
-99
.78
-24
.09
-33
.05
-44
4.4
4
17
.45
-40
.46
-1.8
2
-20
2.3
5
Av
erag
e
12
.95
17
.20
17
.08
52
.99
9.0
4
14
.17
25
.02
26
.35
20
.14
19
.24
-3.8
4
-29
0.7
6
-13
.52
-3.2
1
-19
247
8.8
-1
66
.14
-12
.51
-1.7
3
-16
.81
-32
.61
S.D
5.6
6
6.4
1
1.7
1
16
5.2
5
4.8
7
4.1
4
7.7
5
75
.50
32
.37
9.3
7
15
.47
90
7.4
3
28
.40
15
.12
51
058
0.9
3
22
8.9
5
47
.47
13
.70
34
.34
77
.50
310
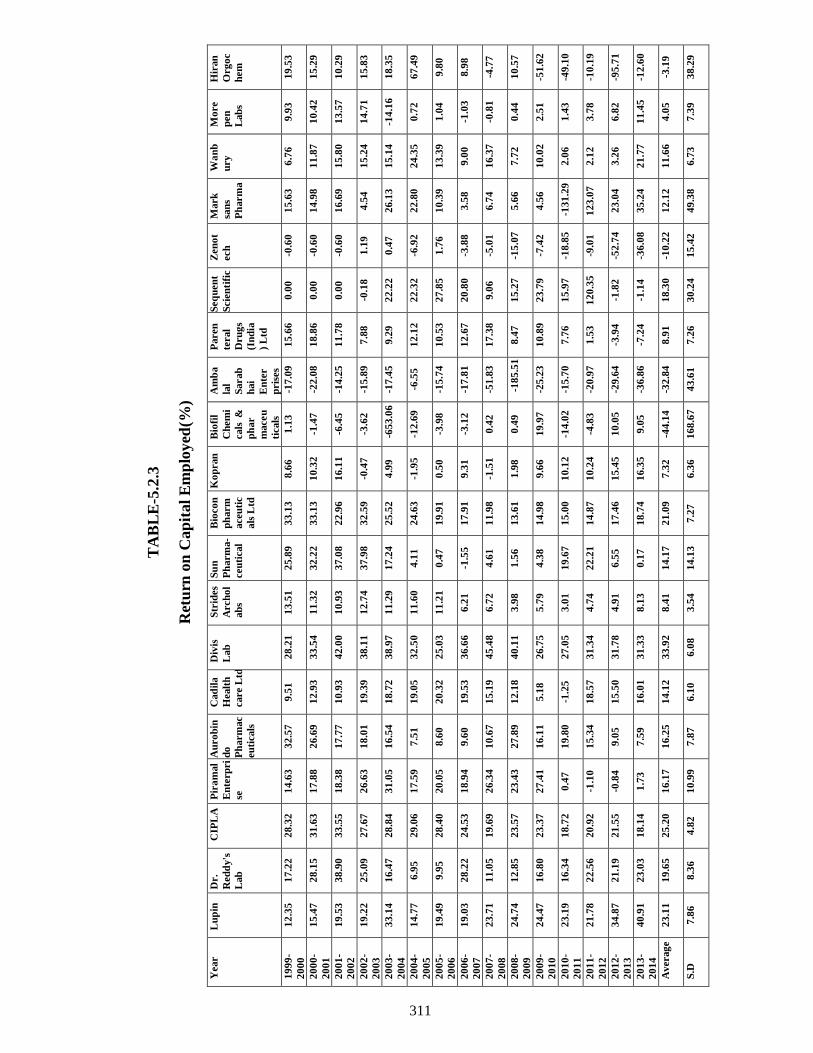
TA
BL
E-5
.2.3
Ret
urn
on
Cap
ital
Em
plo
yed
(%)
Year
Lu
pin
D
r.
Red
dy's
Lab
CIP
LA
P
ira
mal
En
terp
ri
se
Au
ro
bin
do
Ph
arm
ac
eu
ticals
Cad
ila
Healt
h
care L
td
Div
is
Lab
Str
ides
Arch
ol
ab
s
Su
n
Ph
arm
a-
ceu
tical
Bio
co
n
ph
arm
aceu
tic
als
Ltd
Ko
pran
B
iofi
l
Ch
em
i
cals
&
ph
ar
maceu
ticals
Am
ba
lal
Sarab
hai
En
ter
pris
es
Paren
teral
Dru
gs
(In
dia
) L
td
Seq
uen
t
Scie
nti
fic
Zen
ot
ech
Mark
san
s
Ph
arm
a
Wa
nb
ury
Mo
re
pen
Lab
s
Hir
an
Org
oc
hem
19
99
-
20
00
12
.35
17
.22
28
.32
14
.63
32
.57
9.5
1
28
.21
13
.51
25
.89
33
.13
8.6
6
1.1
3
-17
.09
15
.66
0.0
0
-0.6
0
15
.63
6.7
6
9.9
3
19
.53
20
00
-
20
01
15
.47
28
.15
31
.63
17
.88
26
.69
12
.93
33
.54
11
.32
32
.22
33
.13
10
.32
-1.4
7
-22
.08
18
.86
0.0
0
-0.6
0
14
.98
11
.87
10
.42
15
.29
20
01
-
20
02
19
.53
38
.90
33
.55
18
.38
17
.77
10
.93
42
.00
10
.93
37
.08
22
.96
16
.11
-6.4
5
-14
.25
11
.78
0.0
0
-0.6
0
16
.69
15
.80
13
.57
10
.29
20
02
-
20
03
19
.22
25
.09
27
.67
26
.63
18
.01
19
.39
38
.11
12
.74
37
.98
32
.59
-0.4
7
-3.6
2
-15
.89
7.8
8
-0.1
8
1.1
9
4.5
4
15
.24
14
.71
15
.83
20
03
-
20
04
33
.14
16
.47
28
.84
31
.05
16
.54
18
.72
38
.97
11
.29
17
.24
25
.52
4.9
9
-65
3.0
6
-17
.45
9.2
9
22
.22
0.4
7
26
.13
15
.14
-14
.16
18
.35
20
04
-
20
05
14
.77
6.9
5
29
.06
17
.59
7.5
1
19
.05
32
.50
11
.60
4.1
1
24
.63
-1.9
5
-12
.69
-6.5
5
12
.12
22
.32
-6.9
2
22
.80
24
.35
0.7
2
67
.49
20
05
-
20
06
19
.49
9.9
5
28
.40
20
.05
8.6
0
20
.32
25
.03
11
.21
0.4
7
19
.91
0.5
0
-3.9
8
-15
.74
10
.53
27
.85
1.7
6
10
.39
13
.39
1.0
4
9.8
0
20
06
-
20
07
19
.03
28
.22
24
.53
18
.94
9.6
0
19
.53
36
.66
6.2
1
-1.5
5
17
.91
9.3
1
-3.1
2
-17
.81
12
.67
20
.80
-3.8
8
3.5
8
9.0
0
-1.0
3
8.9
8
20
07
-
20
08
23
.71
11
.05
19
.69
26
.34
10
.67
15
.19
45
.48
6.7
2
4.6
1
11
.98
-1.5
1
0.4
2
-51
.83
17
.38
9.0
6
-5.0
1
6.7
4
16
.37
-0.8
1
-4.7
7
20
08
-
20
09
24
.74
12
.85
23
.57
23
.43
27
.89
12
.18
40
.11
3.9
8
1.5
6
13
.61
1.9
8
0.4
9
-18
5.5
1
8.4
7
15
.27
-15
.07
5.6
6
7.7
2
0.4
4
10
.57
20
09
-
20
10
24
.47
16
.80
23
.37
27
.41
16
.11
5.1
8
26
.75
5.7
9
4.3
8
14
.98
9.6
6
19
.97
-25
.23
10
.89
23
.79
-7.4
2
4.5
6
10
.02
2.5
1
-51
.62
20
10
-
20
11
23
.19
16
.34
18
.72
0.4
7
19
.80
-1.2
5
27
.05
3.0
1
19
.67
15
.00
10
.12
-14
.02
-15
.70
7.7
6
15
.97
-18
.85
-13
1.2
9
2.0
6
1.4
3
-49
.10
20
11
-
20
12
21
.78
22
.56
20
.92
-1.1
0
15
.34
18
.57
31
.34
4.7
4
22
.21
14
.87
10
.24
-4.8
3
-20
.97
1.5
3
12
0.3
5
-9.0
1
12
3.0
7
2.1
2
3.7
8
-10
.19
20
12
-
20
13
34
.87
21
.19
21
.55
-0.8
4
9.0
5
15
.50
31
.78
4.9
1
6.5
5
17
.46
15
.45
10
.05
-29
.64
-3.9
4
-1.8
2
-52
.74
23
.04
3.2
6
6.8
2
-95
.71
20
13
-
20
14
40
.91
23
.03
18
.14
1.7
3
7.5
9
16
.01
31
.33
8.1
3
0.1
7
18
.74
16
.35
9.0
5
-36
.86
-7.2
4
-1.1
4
-36
.08
35
.24
21
.77
11
.45
-12
.60
Av
erag
e
23
.11
19
.65
25
.20
16
.17
16
.25
14
.12
33
.92
8.4
1
14
.17
21
.09
7.3
2
-44
.14
-32
.84
8.9
1
18
.30
-10
.22
12
.12
11
.66
4.0
5
-3.1
9
S.D
7.8
6
8.3
6
4.8
2
10
.99
7.8
7
6.1
0
6.0
8
3.5
4
14
.13
7.2
7
6.3
6
16
8.6
7
43
.61
7.2
6
30
.24
15
.42
49
.38
6.7
3
7.3
9
38
.29
311
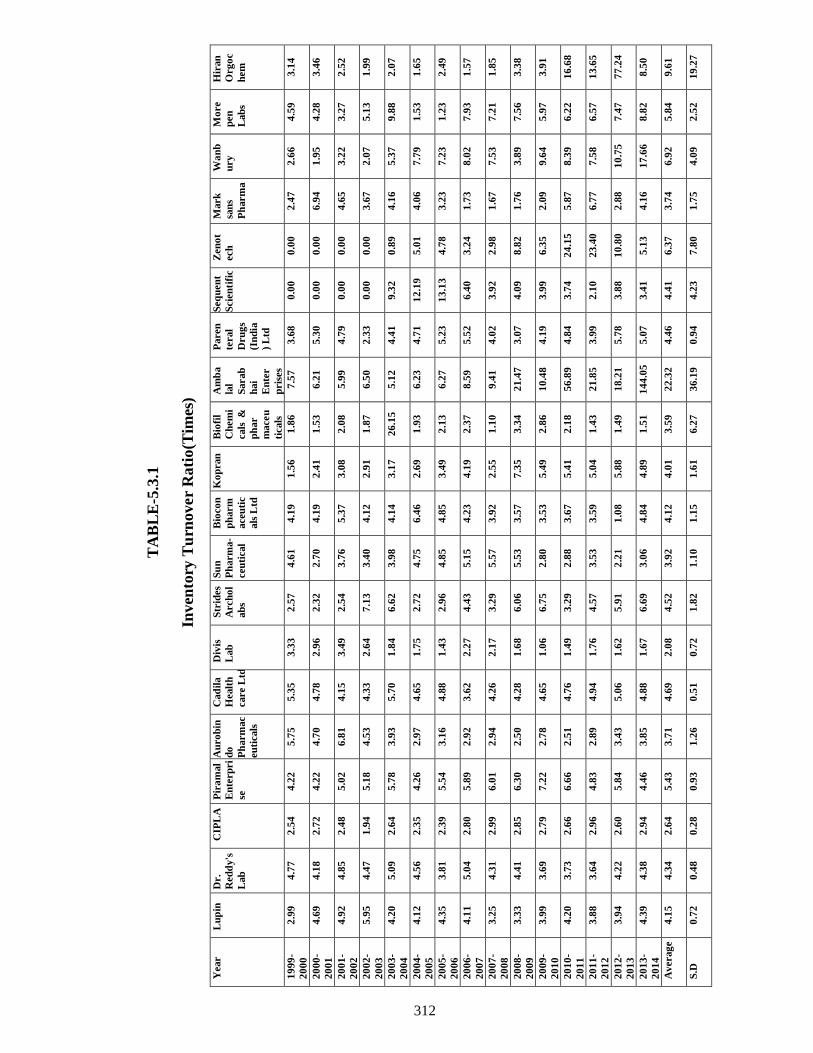
TA
BL
E-5
.3.1
Inven
tory
Tu
rnover
Rati
o(T
imes
)
Year
Lu
pin
D
r.
Red
dy's
Lab
CIP
LA
P
ira
mal
En
terp
ri
se
Au
ro
bin
do
Ph
arm
ac
eu
ticals
Cad
ila
Healt
h
care L
td
Div
is
Lab
Str
ides
Arch
ol
ab
s
Su
n
Ph
arm
a-
ceu
tical
Bio
co
n
ph
arm
aceu
tic
als
Ltd
Ko
pran
B
iofi
l
Ch
em
i
cals
&
ph
ar
maceu
ticals
Am
ba
lal
Sarab
hai
En
ter
pris
es
Paren
teral
Dru
gs
(In
dia
) L
td
Seq
uen
t
Scie
nti
fic
Zen
ot
ech
Mark
san
s
Ph
arm
a
Wa
nb
ury
Mo
re
pen
Lab
s
Hir
an
Org
oc
hem
19
99
-
20
00
2.9
9
4.7
7
2.5
4
4.2
2
5.7
5
5.3
5
3.3
3
2.5
7
4.6
1
4.1
9
1.5
6
1.8
6
7.5
7
3.6
8
0.0
0
0.0
0
2.4
7
2.6
6
4.5
9
3.1
4
20
00
-
20
01
4.6
9
4.1
8
2.7
2
4.2
2
4.7
0
4.7
8
2.9
6
2.3
2
2.7
0
4.1
9
2.4
1
1.5
3
6.2
1
5.3
0
0.0
0
0.0
0
6.9
4
1.9
5
4.2
8
3.4
6
20
01
-
20
02
4.9
2
4.8
5
2.4
8
5.0
2
6.8
1
4.1
5
3.4
9
2.5
4
3.7
6
5.3
7
3.0
8
2.0
8
5.9
9
4.7
9
0.0
0
0.0
0
4.6
5
3.2
2
3.2
7
2.5
2
20
02
-
20
03
5.9
5
4.4
7
1.9
4
5.1
8
4.5
3
4.3
3
2.6
4
7.1
3
3.4
0
4.1
2
2.9
1
1.8
7
6.5
0
2.3
3
0.0
0
0.0
0
3.6
7
2.0
7
5.1
3
1.9
9
20
03
-
20
04
4.2
0
5.0
9
2.6
4
5.7
8
3.9
3
5.7
0
1.8
4
6.6
2
3.9
8
4.1
4
3.1
7
26
.15
5.1
2
4.4
1
9.3
2
0.8
9
4.1
6
5.3
7
9.8
8
2.0
7
20
04
-
20
05
4.1
2
4.5
6
2.3
5
4.2
6
2.9
7
4.6
5
1.7
5
2.7
2
4.7
5
6.4
6
2.6
9
1.9
3
6.2
3
4.7
1
12
.19
5.0
1
4.0
6
7.7
9
1.5
3
1.6
5
20
05
-
20
06
4.3
5
3.8
1
2.3
9
5.5
4
3.1
6
4.8
8
1.4
3
2.9
6
4.8
5
4.8
5
3.4
9
2.1
3
6.2
7
5.2
3
13
.13
4.7
8
3.2
3
7.2
3
1.2
3
2.4
9
20
06
-
20
07
4.1
1
5.0
4
2.8
0
5.8
9
2.9
2
3.6
2
2.2
7
4.4
3
5.1
5
4.2
3
4.1
9
2.3
7
8.5
9
5.5
2
6.4
0
3.2
4
1.7
3
8.0
2
7.9
3
1.5
7
20
07
-
20
08
3.2
5
4.3
1
2.9
9
6.0
1
2.9
4
4.2
6
2.1
7
3.2
9
5.5
7
3.9
2
2.5
5
1.1
0
9.4
1
4.0
2
3.9
2
2.9
8
1.6
7
7.5
3
7.2
1
1.8
5
20
08
-
20
09
3.3
3
4.4
1
2.8
5
6.3
0
2.5
0
4.2
8
1.6
8
6.0
6
5.5
3
3.5
7
7.3
5
3.3
4
21
.47
3.0
7
4.0
9
8.8
2
1.7
6
3.8
9
7.5
6
3.3
8
20
09
-
20
10
3.9
9
3.6
9
2.7
9
7.2
2
2.7
8
4.6
5
1.0
6
6.7
5
2.8
0
3.5
3
5.4
9
2.8
6
10
.48
4.1
9
3.9
9
6.3
5
2.0
9
9.6
4
5.9
7
3.9
1
20
10
-
20
11
4.2
0
3.7
3
2.6
6
6.6
6
2.5
1
4.7
6
1.4
9
3.2
9
2.8
8
3.6
7
5.4
1
2.1
8
56
.89
4.8
4
3.7
4
24
.15
5.8
7
8.3
9
6.2
2
16
.68
20
11
-
20
12
3.8
8
3.6
4
2.9
6
4.8
3
2.8
9
4.9
4
1.7
6
4.5
7
3.5
3
3.5
9
5.0
4
1.4
3
21
.85
3.9
9
2.1
0
23
.40
6.7
7
7.5
8
6.5
7
13
.65
20
12
-
20
13
3.9
4
4.2
2
2.6
0
5.8
4
3.4
3
5.0
6
1.6
2
5.9
1
2.2
1
1.0
8
5.8
8
1.4
9
18
.21
5.7
8
3.8
8
10
.80
2.8
8
10
.75
7.4
7
77
.24
20
13
-
20
14
4.3
9
4.3
8
2.9
4
4.4
6
3.8
5
4.8
8
1.6
7
6.6
9
3.0
6
4.8
4
4.8
9
1.5
1
14
4.0
5
5.0
7
3.4
1
5.1
3
4.1
6
17
.66
8.8
2
8.5
0
Av
erag
e
4.1
5
4.3
4
2.6
4
5.4
3
3.7
1
4.6
9
2.0
8
4.5
2
3.9
2
4.1
2
4.0
1
3.5
9
22
.32
4.4
6
4.4
1
6.3
7
3.7
4
6.9
2
5.8
4
9.6
1
S.D
0.7
2
0.4
8
0.2
8
0.9
3
1.2
6
0.5
1
0.7
2
1.8
2
1.1
0
1.1
5
1.6
1
6.2
7
36
.19
0.9
4
4.2
3
7.8
0
1.7
5
4.0
9
2.5
2
19
.27
312
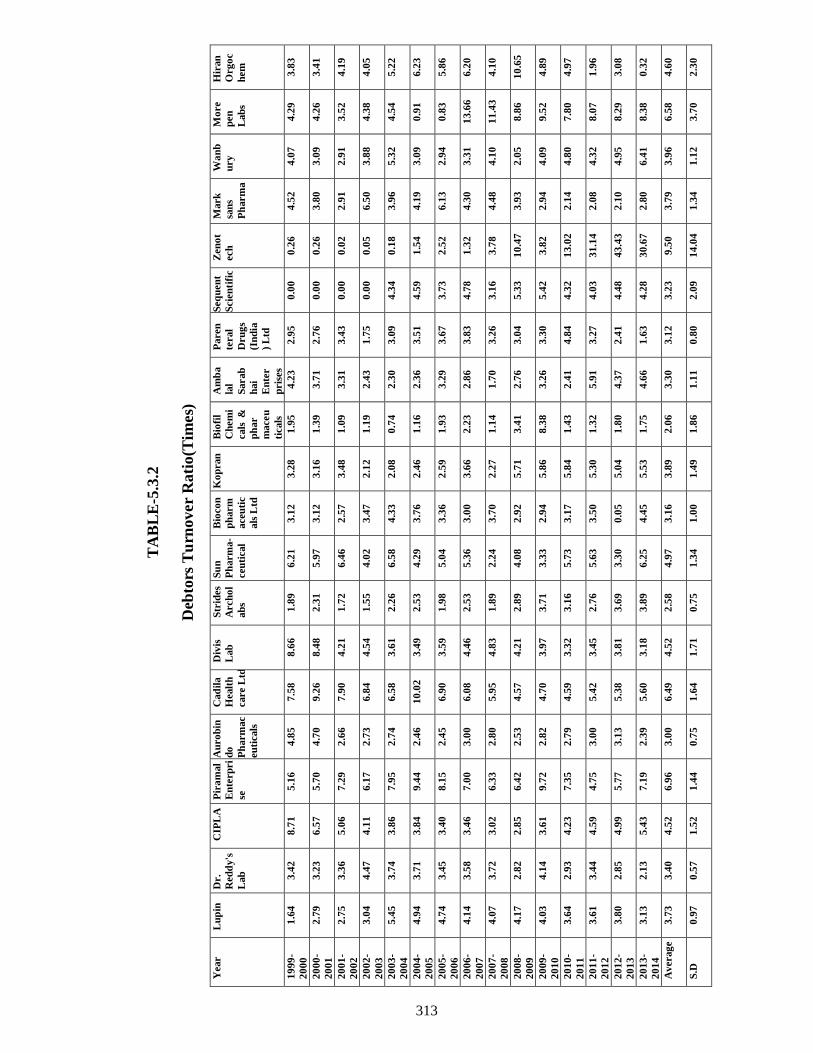
TA
BL
E-5
.3.2
Deb
tors
Tu
rnover
Rati
o(T
imes)
Year
Lu
pin
D
r.
Red
dy's
Lab
CIP
LA
P
ira
mal
En
terp
ri
se
Au
ro
bin
do
Ph
arm
ac
eu
ticals
Cad
ila
Healt
h
care L
td
Div
is
Lab
Str
ides
Arch
ol
ab
s
Su
n
Ph
arm
a-
ceu
tical
Bio
co
n
ph
arm
aceu
tic
als
Ltd
Ko
pran
B
iofi
l
Ch
em
i
cals
&
ph
ar
maceu
ticals
Am
ba
lal
Sarab
hai
En
ter
pris
es
Paren
teral
Dru
gs
(In
dia
) L
td
Seq
uen
t
Scie
nti
fic
Zen
ot
ech
Mark
san
s
Ph
arm
a
Wa
nb
ury
Mo
re
pen
Lab
s
Hir
an
Org
oc
hem
19
99
-
20
00
1.6
4
3.4
2
8.7
1
5.1
6
4.8
5
7.5
8
8.6
6
1.8
9
6.2
1
3.1
2
3.2
8
1.9
5
4.2
3
2.9
5
0.0
0
0.2
6
4.5
2
4.0
7
4.2
9
3.8
3
20
00
-
20
01
2.7
9
3.2
3
6.5
7
5.7
0
4.7
0
9.2
6
8.4
8
2.3
1
5.9
7
3.1
2
3.1
6
1.3
9
3.7
1
2.7
6
0.0
0
0.2
6
3.8
0
3.0
9
4.2
6
3.4
1
20
01
-
20
02
2.7
5
3.3
6
5.0
6
7.2
9
2.6
6
7.9
0
4.2
1
1.7
2
6.4
6
2.5
7
3.4
8
1.0
9
3.3
1
3.4
3
0.0
0
0.0
2
2.9
1
2.9
1
3.5
2
4.1
9
20
02
-
20
03
3.0
4
4.4
7
4.1
1
6.1
7
2.7
3
6.8
4
4.5
4
1.5
5
4.0
2
3.4
7
2.1
2
1.1
9
2.4
3
1.7
5
0.0
0
0.0
5
6.5
0
3.8
8
4.3
8
4.0
5
20
03
-
20
04
5.4
5
3.7
4
3.8
6
7.9
5
2.7
4
6.5
8
3.6
1
2.2
6
6.5
8
4.3
3
2.0
8
0.7
4
2.3
0
3.0
9
4.3
4
0.1
8
3.9
6
5.3
2
4.5
4
5.2
2
20
04
-
20
05
4.9
4
3.7
1
3.8
4
9.4
4
2.4
6
10
.02
3.4
9
2.5
3
4.2
9
3.7
6
2.4
6
1.1
6
2.3
6
3.5
1
4.5
9
1.5
4
4.1
9
3.0
9
0.9
1
6.2
3
20
05
-
20
06
4.7
4
3.4
5
3.4
0
8.1
5
2.4
5
6.9
0
3.5
9
1.9
8
5.0
4
3.3
6
2.5
9
1.9
3
3.2
9
3.6
7
3.7
3
2.5
2
6.1
3
2.9
4
0.8
3
5.8
6
20
06
-
20
07
4.1
4
3.5
8
3.4
6
7.0
0
3.0
0
6.0
8
4.4
6
2.5
3
5.3
6
3.0
0
3.6
6
2.2
3
2.8
6
3.8
3
4.7
8
1.3
2
4.3
0
3.3
1
13
.66
6.2
0
20
07
-
20
08
4.0
7
3.7
2
3.0
2
6.3
3
2.8
0
5.9
5
4.8
3
1.8
9
2.2
4
3.7
0
2.2
7
1.1
4
1.7
0
3.2
6
3.1
6
3.7
8
4.4
8
4.1
0
11
.43
4.1
0
20
08
-
20
09
4.1
7
2.8
2
2.8
5
6.4
2
2.5
3
4.5
7
4.2
1
2.8
9
4.0
8
2.9
2
5.7
1
3.4
1
2.7
6
3.0
4
5.3
3
10
.47
3.9
3
2.0
5
8.8
6
10
.65
20
09
-
20
10
4.0
3
4.1
4
3.6
1
9.7
2
2.8
2
4.7
0
3.9
7
3.7
1
3.3
3
2.9
4
5.8
6
8.3
8
3.2
6
3.3
0
5.4
2
3.8
2
2.9
4
4.0
9
9.5
2
4.8
9
20
10
-
20
11
3.6
4
2.9
3
4.2
3
7.3
5
2.7
9
4.5
9
3.3
2
3.1
6
5.7
3
3.1
7
5.8
4
1.4
3
2.4
1
4.8
4
4.3
2
13
.02
2.1
4
4.8
0
7.8
0
4.9
7
20
11
-
20
12
3.6
1
3.4
4
4.5
9
4.7
5
3.0
0
5.4
2
3.4
5
2.7
6
5.6
3
3.5
0
5.3
0
1.3
2
5.9
1
3.2
7
4.0
3
31
.14
2.0
8
4.3
2
8.0
7
1.9
6
20
12
-
20
13
3.8
0
2.8
5
4.9
9
5.7
7
3.1
3
5.3
8
3.8
1
3.6
9
3.3
0
0.0
5
5.0
4
1.8
0
4.3
7
2.4
1
4.4
8
43
.43
2.1
0
4.9
5
8.2
9
3.0
8
20
13
-
20
14
3.1
3
2.1
3
5.4
3
7.1
9
2.3
9
5.6
0
3.1
8
3.8
9
6.2
5
4.4
5
5.5
3
1.7
5
4.6
6
1.6
3
4.2
8
30
.67
2.8
0
6.4
1
8.3
8
0.3
2
Av
erag
e
3.7
3
3.4
0
4.5
2
6.9
6
3.0
0
6.4
9
4.5
2
2.5
8
4.9
7
3.1
6
3.8
9
2.0
6
3.3
0
3.1
2
3.2
3
9.5
0
3.7
9
3.9
6
6.5
8
4.6
0
S.D
0.9
7
0.5
7
1.5
2
1.4
4
0.7
5
1.6
4
1.7
1
0.7
5
1.3
4
1.0
0
1.4
9
1.8
6
1.1
1
0.8
0
2.0
9
14
.04
1.3
4
1.1
2
3.7
0
2.3
0
313

TA
BL
E-5
.3.3
Cash
Tu
rnover
Rati
o (
Tim
es)
Year
Lu
pin
D
r.
Red
dy's
Lab
CIP
LA
P
ira
mal
En
terp
ri
se
Au
ro
bin
do
Ph
arm
ac
eu
ticals
Cad
ila
Healt
h
care L
td
Div
is
Lab
Str
ides
Arch
ol
ab
s
Su
n
Ph
arm
a-
ceu
tical
Bio
co
n
ph
arm
aceu
tic
als
Ltd
Ko
pran
B
iofi
l
Ch
em
i
cals
&
ph
ar
maceu
ticals
Am
ba
lal
Sarab
hai
En
ter
pris
es
Paren
teral
Dru
gs
(In
dia
) L
td
Seq
uen
t
Scie
nti
fic
Zen
ot
ech
Mark
san
s
Ph
arm
a
Wa
nb
ury
Mo
re
pen
Lab
s
Hir
an
Org
oc
hem
19
99
-
20
00
23
.17
19
.96
16
4.5
4
8.7
7
49
.36
1.1
8
45
.84
15
.23
10
1.2
5
12
.23
34
.46
34
.65
16
.67
81
.96
0
0
25
.34
26
7.7
5
4.8
8
20
.86
20
00
-
20
01
54
.72
47
.34
16
9.4
5
15
.15
20
7.5
5
11
.41
45
.2
18
.33
53
.12
12
.23
77
.29
12
6.5
2
4.9
6
80
.04
0
0
50
.34
20
8.6
4
.86
26
.05
20
01
-
20
02
45
.57
3.0
5
82
.79
37
.96
87
.89
94
.83
47
.53
8.3
3
47
.11
77
.83
70
.25
59
13
.7
10
7.8
1
0
0.8
3
38
.46
33
1
3.9
4
40
.01
20
02
-
20
03
69
.63
2.2
2
11
1.3
6
6.1
3
33
.56
10
3.9
4
6.8
9
22
.98
10
.08
25
0.6
2
39
.72
63
.4
25
.5
23
5.5
0
5
.5
35
.83
29
6.5
7
.69
50
.29
20
03
-
20
04
78
.26
4.0
7
30
7.6
8
88
.77
33
.51
29
.33
43
.56
18
.62
11
.14
1.5
8
45
.51
22
.66
12
.69
33
7.3
9
19
.71
0.0
3
28
.64
13
7.4
8
7.3
6
33
.52
20
04
-
20
05
51
.01
1.7
3
14
6.5
8
17
7.5
2
78
.59
41
.28
79
.37
13
.1
1.1
3
19
.01
29
.06
29
16
.32
34
3.4
6
8.9
5
1.3
7
25
.19
32
.33
1.8
8
24
.41
20
05
-
20
06
3.6
2
3.0
7
67
.02
13
0.3
8
9.8
5
55
.04
37
.98
4.7
5
1.0
4
34
.40
31
.52
50
.25
5.3
8
80
.26
14
.66
7.5
1
.44
4.8
7
1.6
3
38
.5
20
06
-
20
07
5.6
2
2.5
9
27
.08
73
3.7
5
11
6.9
5
42
.56
28
.98
1.3
8
10
.81
46
.15
10
1.2
5
13
.03
23
.22
6.3
7
.38
1.4
4
48
.33
1.8
9
24
.07
20
07
-
20
08
11
.97
6.2
2
53
.01
56
.28
9.3
3
88
.51
82
.17
3.1
2
2.2
1
0.2
7
23
.79
12
.57
5.7
6
9.4
9
16
.76
0.1
3
5.4
8
35
.15
82
.88
26
.78
20
08
-
20
09
24
3.5
8
10
.4
98
.76
13
2.9
3
2.1
4
68
.1
92
.72
36
.21
2.1
9
14
.94
57
.59
28
5.5
2
3.9
4
26
.66
0.1
9
15
.36
6.7
9
38
.16
25
.94
20
09
-
20
10
98
.61
11
.94
92
.13
16
9.7
2
71
3.1
7
66
.86
72
.38
24
.52
9.8
5
14
.63
35
.17
1.3
6
4.2
4
34
.67
19
.75
0.4
6
.08
34
.26
23
5.9
3
22
.72
20
10
-
20
11
11
9.9
9
78
.37
75
.38
0.9
5
33
.76
51
.39
10
2.9
2
6.2
2
2.4
8
6.3
1
57
.1
23
.88
5.4
2
81
.55
40
.78
4.4
4
5.8
9
41
.45
92
.44
5.8
8
20
11
-
20
12
28
0.4
5
7.8
7
12
6.7
2
87
.06
30
3.2
2
26
.64
84
.54
8.9
4
3.0
2
38
.88
28
.13
21
.72
32
.73
30
.4
21
.08
1.2
6
8.7
9
20
.25
67
.55
1.3
9
20
12
-
20
13
35
4
9.1
7
78
.06
57
.88
47
.35
40
.12
61
.38
24
.27
5.6
4
0.1
1
68
.93
46
.23
19
.86
35
.25
10
.1
1.9
3
46
9.0
2
24
.72
64
.26
23
9.7
20
13
-
20
14
61
.11
14
.62
11
4.3
2
57
.87
73
1.5
5
45
.21
70
.28
6.0
8
20
.03
10
.79
66
.51
39
.83
4.4
3
32
.72
17
.82
0.4
3
9.4
3
10
1.2
4
1.6
3
18
.92
Av
erag
e
10
0.0
8
14
.84
11
4.3
2
77
.35
15
8.3
0
89
.38
63
.68
15
.97
18
.11
19
.27
47
.41
44
.02
13
.74
10
2.5
1
13
.50
2.0
9
48
.44
10
6.0
4
43
.79
39
.93
S.D
10
6.9
9
21
.00
66
.71
54
.77
24
2.9
1
13
3.1
8
21
.11
9.9
3
28
.23
10
2.6
0
17
.60
33
.24
8.9
7
11
1.1
9
11
.63
2.7
1
11
7.3
1
11
3.9
3
62
.31
56
.60
314
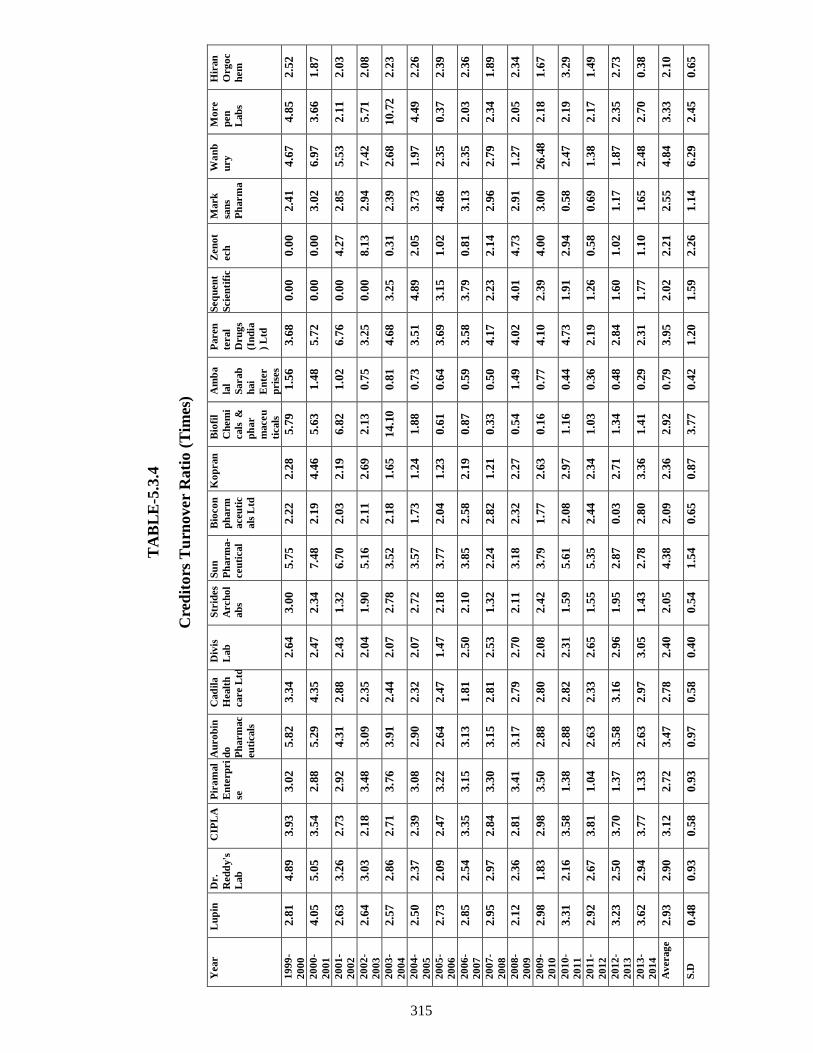
TA
BL
E-5
.3.4
Cre
dit
ors
Tu
rnover
Rati
o (
Tim
es)
Year
Lu
pin
D
r.
Red
dy's
Lab
CIP
LA
P
ira
mal
En
terp
ri
se
Au
ro
bin
do
Ph
arm
ac
eu
ticals
Cad
ila
Healt
h
care L
td
Div
is
Lab
Str
ides
Arch
ol
ab
s
Su
n
Ph
arm
a-
ceu
tical
Bio
co
n
ph
arm
aceu
tic
als
Ltd
Ko
pran
B
iofi
l
Ch
em
i
cals
&
ph
ar
maceu
ticals
Am
ba
lal
Sarab
hai
En
ter
pris
es
Paren
teral
Dru
gs
(In
dia
) L
td
Seq
uen
t
Scie
nti
fic
Zen
ot
ech
Mark
san
s
Ph
arm
a
Wa
nb
ury
Mo
re
pen
Lab
s
Hir
an
Org
oc
hem
19
99
-
20
00
2.8
1
4.8
9
3.9
3
3.0
2
5.8
2
3.3
4
2.6
4
3.0
0
5.7
5
2.2
2
2.2
8
5.7
9
1.5
6
3.6
8
0.0
0
0.0
0
2.4
1
4.6
7
4.8
5
2.5
2
20
00
-
20
01
4.0
5
5.0
5
3.5
4
2.8
8
5.2
9
4.3
5
2.4
7
2.3
4
7.4
8
2.1
9
4.4
6
5.6
3
1.4
8
5.7
2
0.0
0
0.0
0
3.0
2
6.9
7
3.6
6
1.8
7
20
01
-
20
02
2.6
3
3.2
6
2.7
3
2.9
2
4.3
1
2.8
8
2.4
3
1.3
2
6.7
0
2.0
3
2.1
9
6.8
2
1.0
2
6.7
6
0.0
0
4.2
7
2.8
5
5.5
3
2.1
1
2.0
3
20
02
-
20
03
2.6
4
3.0
3
2.1
8
3.4
8
3.0
9
2.3
5
2.0
4
1.9
0
5.1
6
2.1
1
2.6
9
2.1
3
0.7
5
3.2
5
0.0
0
8.1
3
2.9
4
7.4
2
5.7
1
2.0
8
20
03
-
20
04
2.5
7
2.8
6
2.7
1
3.7
6
3.9
1
2.4
4
2.0
7
2.7
8
3.5
2
2.1
8
1.6
5
14.1
0
0.8
1
4.6
8
3.2
5
0.3
1
2.3
9
2.6
8
10.7
2
2.2
3
20
04
-
20
05
2.5
0
2.3
7
2.3
9
3.0
8
2.9
0
2.3
2
2.0
7
2.7
2
3.5
7
1.7
3
1.2
4
1.8
8
0.7
3
3.5
1
4.8
9
2.0
5
3.7
3
1.9
7
4.4
9
2.2
6
20
05
-
20
06
2.7
3
2.0
9
2.4
7
3.2
2
2.6
4
2.4
7
1.4
7
2.1
8
3.7
7
2.0
4
1.2
3
0.6
1
0.6
4
3.6
9
3.1
5
1.0
2
4.8
6
2.3
5
0.3
7
2.3
9
20
06
-
20
07
2.8
5
2.5
4
3.3
5
3.1
5
3.1
3
1.8
1
2.5
0
2.1
0
3.8
5
2.5
8
2.1
9
0.8
7
0.5
9
3.5
8
3.7
9
0.8
1
3.1
3
2.3
5
2.0
3
2.3
6
20
07
-
20
08
2.9
5
2.9
7
2.8
4
3.3
0
3.1
5
2.8
1
2.5
3
1.3
2
2.2
4
2.8
2
1.2
1
0.3
3
0.5
0
4.1
7
2.2
3
2.1
4
2.9
6
2.7
9
2.3
4
1.8
9
20
08
-
20
09
2.1
2
2.3
6
2.8
1
3.4
1
3.1
7
2.7
9
2.7
0
2.1
1
3.1
8
2.3
2
2.2
7
0.5
4
1.4
9
4.0
2
4.0
1
4.7
3
2.9
1
1.2
7
2.0
5
2.3
4
20
09
-
20
10
2.9
8
1.8
3
2.9
8
3.5
0
2.8
8
2.8
0
2.0
8
2.4
2
3.7
9
1.7
7
2.6
3
0.1
6
0.7
7
4.1
0
2.3
9
4.0
0
3.0
0
26.4
8
2.1
8
1.6
7
20
10
-
20
11
3.3
1
2.1
6
3.5
8
1.3
8
2.8
8
2.8
2
2.3
1
1.5
9
5.6
1
2.0
8
2.9
7
1.1
6
0.4
4
4.7
3
1.9
1
2.9
4
0.5
8
2.4
7
2.1
9
3.2
9
20
11
-
20
12
2.9
2
2.6
7
3.8
1
1.0
4
2.6
3
2.3
3
2.6
5
1.5
5
5.3
5
2.4
4
2.3
4
1.0
3
0.3
6
2.1
9
1.2
6
0.5
8
0.6
9
1.3
8
2.1
7
1.4
9
20
12
-
20
13
3.2
3
2.5
0
3.7
0
1.3
7
3.5
8
3.1
6
2.9
6
1.9
5
2.8
7
0.0
3
2.7
1
1.3
4
0.4
8
2.8
4
1.6
0
1.0
2
1.1
7
1.8
7
2.3
5
2.7
3
20
13
-
20
14
3.6
2
2.9
4
3.7
7
1.3
3
2.6
3
2.9
7
3.0
5
1.4
3
2.7
8
2.8
0
3.3
6
1.4
1
0.2
9
2.3
1
1.7
7
1.1
0
1.6
5
2.4
8
2.7
0
0.3
8
Av
erag
e
2.9
3
2.9
0
3.1
2
2.7
2
3.4
7
2.7
8
2.4
0
2.0
5
4.3
8
2.0
9
2.3
6
2.9
2
0.7
9
3.9
5
2.0
2
2.2
1
2.5
5
4.8
4
3.3
3
2.1
0
S.D
0.4
8
0.9
3
0.5
8
0.9
3
0.9
7
0.5
8
0.4
0
0.5
4
1.5
4
0.6
5
0.8
7
3.7
7
0.4
2
1.2
0
1.5
9
2.2
6
1.1
4
6.2
9
2.4
5
0.6
5
315
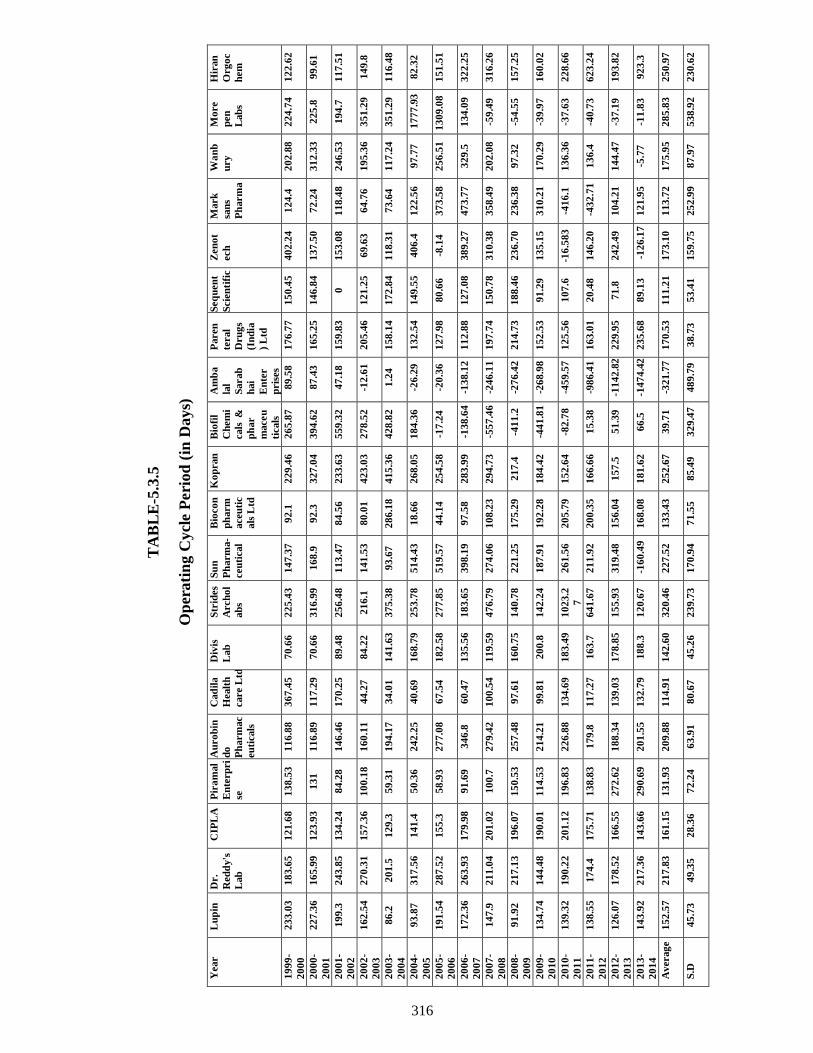
TA
BL
E-5
.3.5
Op
erati
ng C
ycl
e P
eri
od
(in
Days)
Year
Lu
pin
D
r.
Red
dy's
Lab
CIP
LA
P
ira
mal
En
terp
ri
se
Au
ro
bin
do
Ph
arm
ac
eu
ticals
Cad
ila
Healt
h
care L
td
Div
is
Lab
Str
ides
Arch
ol
ab
s
Su
n
Ph
arm
a-
ceu
tical
Bio
co
n
ph
arm
aceu
tic
als
Ltd
Ko
pran
B
iofi
l
Ch
em
i
cals
&
ph
ar
maceu
ticals
Am
ba
lal
Sarab
hai
En
ter
pris
es
Paren
teral
Dru
gs
(In
dia
) L
td
Seq
uen
t
Scie
nti
fic
Zen
ot
ech
Mark
san
s
Ph
arm
a
Wa
nb
ury
Mo
re
pen
Lab
s
Hir
an
Org
oc
hem
19
99
-
20
00
23
3.0
3
18
3.6
5
12
1.6
8
13
8.5
3
11
6.8
8
36
7.4
5
70
.66
22
5.4
3
14
7.3
7
92
.1
22
9.4
6
26
5.8
7
89
.58
17
6.7
7
15
0.4
5
40
2.2
4
12
4.4
2
02
.88
22
4.7
4
12
2.6
2
20
00
-
20
01
22
7.3
6
16
5.9
9
12
3.9
3
13
1
11
6.8
9
11
7.2
9
70
.66
31
6.9
9
16
8.9
9
2.3
3
27
.04
39
4.6
2
87
.43
16
5.2
5
14
6.8
4
13
7.5
0
72
.24
31
2.3
3
22
5.8
9
9.6
1
20
01
-
20
02
19
9.3
2
43
.85
13
4.2
4
84
.28
14
6.4
6
17
0.2
5
89
.48
25
6.4
8
11
3.4
7
84
.56
23
3.6
3
55
9.3
2
47
.18
15
9.8
3
0
15
3.0
8
11
8.4
8
24
6.5
3
19
4.7
1
17
.51
20
02
-
20
03
16
2.5
4
27
0.3
1
15
7.3
6
10
0.1
8
16
0.1
1
44
.27
84
.22
21
6.1
1
41
.53
80
.01
42
3.0
3
27
8.5
2
-12
.61
20
5.4
6
12
1.2
5
69
.63
64
.76
19
5.3
6
35
1.2
9
14
9.8
20
03
-
20
04
86
.2
20
1.5
1
29
.3
59
.31
19
4.1
7
34
.01
14
1.6
3
37
5.3
8
93
.67
28
6.1
8
41
5.3
6
42
8.8
2
1.2
4
15
8.1
4
17
2.8
4
11
8.3
1
73
.64
11
7.2
4
35
1.2
9
11
6.4
8
20
04
-
20
05
93
.87
31
7.5
6
14
1.4
5
0.3
6
24
2.2
5
40
.69
16
8.7
9
25
3.7
8
51
4.4
3
18
.66
26
8.0
5
18
4.3
6
-26
.29
13
2.5
4
14
9.5
5
40
6.4
1
22
.56
97
.77
17
77
.93
82
.32
20
05
-
20
06
19
1.5
4
28
7.5
2
15
5.3
5
8.9
3
27
7.0
8
67
.54
18
2.5
8
27
7.8
5
51
9.5
7
44
.14
25
4.5
8
-17
.24
-20
.36
12
7.9
8
80
.66
-8.1
4
37
3.5
8
25
6.5
1
13
09
.08
15
1.5
1
20
06
-
20
07
17
2.3
6
26
3.9
3
17
9.9
8
91
.69
34
6.8
6
0.4
7
13
5.5
6
18
3.6
5
39
8.1
9
97
.58
28
3.9
9
-13
8.6
4
-13
8.1
2
11
2.8
8
12
7.0
8
38
9.2
7
47
3.7
7
32
9.5
1
34
.09
32
2.2
5
20
07
-
20
08
14
7.9
2
11
.04
20
1.0
2
10
0.7
2
79
.42
10
0.5
4
11
9.5
9
47
6.7
9
27
4.0
6
10
8.2
3
29
4.7
3
-55
7.4
6
-24
6.1
1
19
7.7
4
15
0.7
8
31
0.3
8
35
8.4
9
20
2.0
8
-59
.49
31
6.2
6
20
08
-
20
09
91
.92
21
7.1
3
19
6.0
7
15
0.5
3
25
7.4
8
97
.61
16
0.7
5
14
0.7
8
22
1.2
5
17
5.2
9
21
7.4
-4
11
.2
-27
6.4
2
21
4.7
3
18
8.4
6
23
6.7
0
23
6.3
8
97
.32
-54
.55
15
7.2
5
20
09
-
20
10
13
4.7
4
14
4.4
8
19
0.0
1
11
4.5
3
21
4.2
1
99
.81
20
0.8
1
42
.24
18
7.9
1
19
2.2
8
18
4.4
2
-44
1.8
1
-26
8.9
8
15
2.5
3
91
.29
13
5.1
5
31
0.2
1
17
0.2
9
-39
.97
16
0.0
2
20
10
-
20
11
13
9.3
2
19
0.2
2
20
1.1
2
19
6.8
3
22
6.8
8
13
4.6
9
18
3.4
9
10
23
.2
7
26
1.5
6
20
5.7
9
15
2.6
4
-82
.78
-45
9.5
7
12
5.5
6
10
7.6
-1
6.5
83
-41
6.1
1
36
.36
-37
.63
22
8.6
6
20
11
-
20
12
13
8.5
5
17
4.4
1
75
.71
13
8.8
3
17
9.8
1
17
.27
16
3.7
6
41
.67
21
1.9
2
20
0.3
5
16
6.6
6
15
.38
-98
6.4
1
16
3.0
1
20
.48
14
6.2
0
-43
2.7
1
13
6.4
-4
0.7
3
62
3.2
4
20
12
-
20
13
12
6.0
7
17
8.5
2
16
6.5
5
27
2.6
2
18
8.3
4
13
9.0
3
17
8.8
5
15
5.9
3
31
9.4
8
15
6.0
4
15
7.5
5
1.3
9
-11
42
.82
22
9.9
5
71
.8
24
2.4
9
10
4.2
1
14
4.4
7
-37
.19
19
3.8
2
20
13
-
20
14
14
3.9
2
21
7.3
6
14
3.6
6
29
0.6
9
20
1.5
5
13
2.7
9
18
8.3
1
20
.67
-16
0.4
9
16
8.0
8
18
1.6
2
66
.5
-14
74
.42
23
5.6
8
89
.13
-12
6.1
7
12
1.9
5
-5.7
7
-11
.83
92
3.3
Av
erag
e
15
2.5
7
21
7.8
3
16
1.1
5
13
1.9
3
20
9.8
8
11
4.9
1
14
2.6
0
32
0.4
6
22
7.5
2
13
3.4
3
25
2.6
7
39
.71
-32
1.7
7
17
0.5
3
11
1.2
1
17
3.1
0
11
3.7
2
17
5.9
5
28
5.8
3
25
0.9
7
S.D
45
.73
49
.35
28
.36
72
.24
63
.91
80
.67
45
.26
23
9.7
3
17
0.9
4
71
.55
85
.49
32
9.4
7
48
9.7
9
38
.73
53
.41
15
9.7
5
25
2.9
9
87
.97
53
8.9
2
23
0.6
2
316
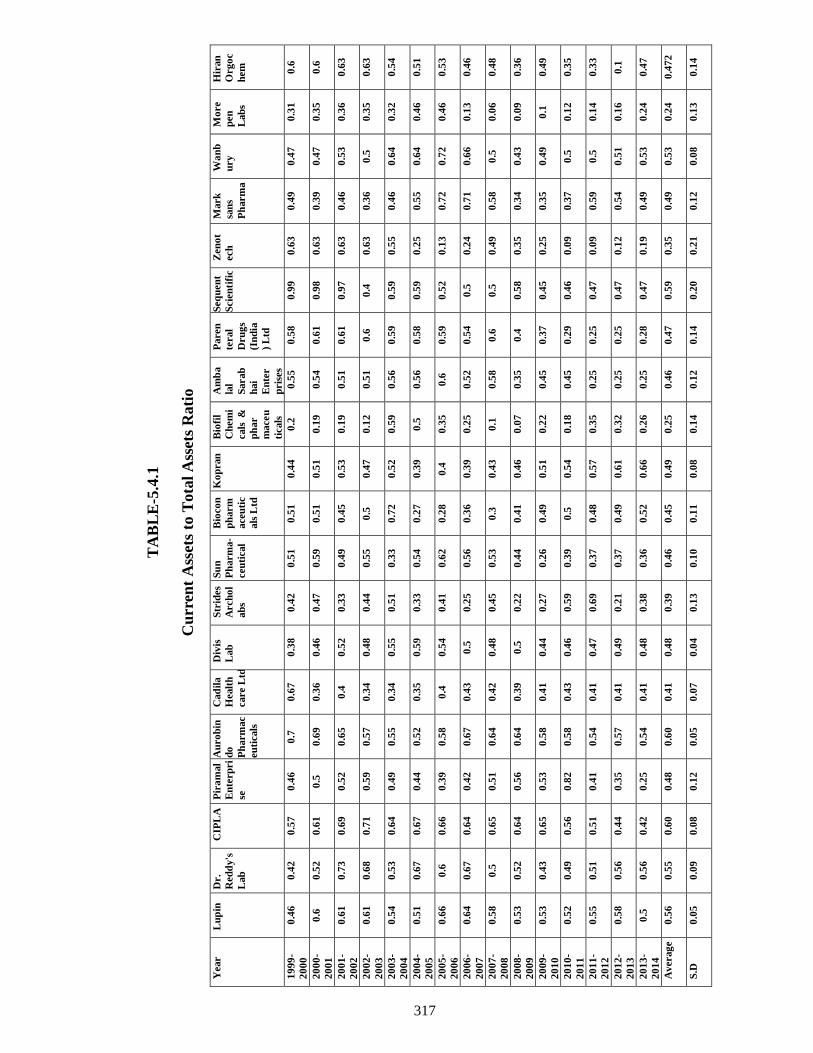
TA
BL
E-5
.4.1
Cu
rren
t A
sset
s to
Tota
l A
sset
s R
ati
o
Year
Lu
pin
D
r.
Red
dy's
Lab
CIP
LA
P
ira
mal
En
terp
ri
se
Au
ro
bin
do
Ph
arm
ac
eu
ticals
Cad
ila
Healt
h
care L
td
Div
is
Lab
Str
ides
Arch
ol
ab
s
Su
n
Ph
arm
a-
ceu
tical
Bio
co
n
ph
arm
aceu
tic
als
Ltd
Ko
pran
B
iofi
l
Ch
em
i
cals
&
ph
ar
maceu
ticals
Am
ba
lal
Sarab
hai
En
ter
pris
es
Paren
teral
Dru
gs
(In
dia
) L
td
Seq
uen
t
Scie
nti
fic
Zen
ot
ech
Mark
san
s
Ph
arm
a
Wa
nb
ury
Mo
re
pen
Lab
s
Hir
an
Org
oc
hem
19
99
-
20
00
0.4
6
0.4
2
0.5
7
0.4
6
0.7
0
.67
0.3
8
0.4
2
0.5
1
0.5
1
0.4
4
0.2
0
.55
0.5
8
0.9
9
0.6
3
0.4
9
0.4
7
0.3
1
0.6
20
00
-
20
01
0.6
0
.52
0.6
1
0.5
0
.69
0.3
6
0.4
6
0.4
7
0.5
9
0.5
1
0.5
1
0.1
9
0.5
4
0.6
1
0.9
8
0.6
3
0.3
9
0.4
7
0.3
5
0.6
20
01
-
20
02
0.6
1
0.7
3
0.6
9
0.5
2
0.6
5
0.4
0
.52
0.3
3
0.4
9
0.4
5
0.5
3
0.1
9
0.5
1
0.6
1
0.9
7
0.6
3
0.4
6
0.5
3
0.3
6
0.6
3
20
02
-
20
03
0.6
1
0.6
8
0.7
1
0.5
9
0.5
7
0.3
4
0.4
8
0.4
4
0.5
5
0.5
0
.47
0.1
2
0.5
1
0.6
0
.4
0.6
3
0.3
6
0.5
0
.35
0.6
3
20
03
-
20
04
0.5
4
0.5
3
0.6
4
0.4
9
0.5
5
0.3
4
0.5
5
0.5
1
0.3
3
0.7
2
0.5
2
0.5
9
0.5
6
0.5
9
0.5
9
0.5
5
0.4
6
0.6
4
0.3
2
0.5
4
20
04
-
20
05
0.5
1
0.6
7
0.6
7
0.4
4
0.5
2
0.3
5
0.5
9
0.3
3
0.5
4
0.2
7
0.3
9
0.5
0
.56
0.5
8
0.5
9
0.2
5
0.5
5
0.6
4
0.4
6
0.5
1
20
05
-
20
06
0.6
6
0.6
0
.66
0.3
9
0.5
8
0.4
0
.54
0.4
1
0.6
2
0.2
8
0.4
0
.35
0.6
0
.59
0.5
2
0.1
3
0.7
2
0.7
2
0.4
6
0.5
3
20
06
-
20
07
0.6
4
0.6
7
0.6
4
0.4
2
0.6
7
0.4
3
0.5
0
.25
0.5
6
0.3
6
0.3
9
0.2
5
0.5
2
0.5
4
0.5
0
.24
0.7
1
0.6
6
0.1
3
0.4
6
20
07
-
20
08
0.5
8
0.5
0
.65
0.5
1
0.6
4
0.4
2
0.4
8
0.4
5
0.5
3
0.3
0
.43
0.1
0
.58
0.6
0
.5
0.4
9
0.5
8
0.5
0
.06
0.4
8
20
08
-
20
09
0.5
3
0.5
2
0.6
4
0.5
6
0.6
4
0.3
9
0.5
0
.22
0.4
4
0.4
1
0.4
6
0.0
7
0.3
5
0.4
0
.58
0.3
5
0.3
4
0.4
3
0.0
9
0.3
6
20
09
-
20
10
0.5
3
0.4
3
0.6
5
0.5
3
0.5
8
0.4
1
0.4
4
0.2
7
0.2
6
0.4
9
0.5
1
0.2
2
0.4
5
0.3
7
0.4
5
0.2
5
0.3
5
0.4
9
0.1
0
.49
20
10
-
20
11
0.5
2
0.4
9
0.5
6
0.8
2
0.5
8
0.4
3
0.4
6
0.5
9
0.3
9
0.5
0
.54
0.1
8
0.4
5
0.2
9
0.4
6
0.0
9
0.3
7
0.5
0
.12
0.3
5
20
11
-
20
12
0.5
5
0.5
1
0.5
1
0.4
1
0.5
4
0.4
1
0.4
7
0.6
9
0.3
7
0.4
8
0.5
7
0.3
5
0.2
5
0.2
5
0.4
7
0.0
9
0.5
9
0.5
0
.14
0.3
3
20
12
-
20
13
0.5
8
0.5
6
0.4
4
0.3
5
0.5
7
0.4
1
0.4
9
0.2
1
0.3
7
0.4
9
0.6
1
0.3
2
0.2
5
0.2
5
0.4
7
0.1
2
0.5
4
0.5
1
0.1
6
0.1
20
13
-
20
14
0.5
0
.56
0.4
2
0.2
5
0.5
4
0.4
1
0.4
8
0.3
8
0.3
6
0.5
2
0.6
6
0.2
6
0.2
5
0.2
8
0.4
7
0.1
9
0.4
9
0.5
3
0.2
4
0.4
7
Av
erag
e
0.5
6
0.5
5
0.6
0
0.4
8
0.6
0
0.4
1
0.4
8
0.3
9
0.4
6
0.4
5
0.4
9
0.2
5
0.4
6
0.4
7
0.5
9
0.3
5
0.4
9
0.5
3
0.2
4
0.4
72
S.D
0.0
5
0.0
9
0.0
8
0.1
2
0.0
5
0.0
7
0.0
4
0.1
3
0.1
0
0.1
1
0.0
8
0.1
4
0.1
2
0.1
4
0.2
0
0.2
1
0.1
2
0.0
8
0.1
3
0.1
4
317
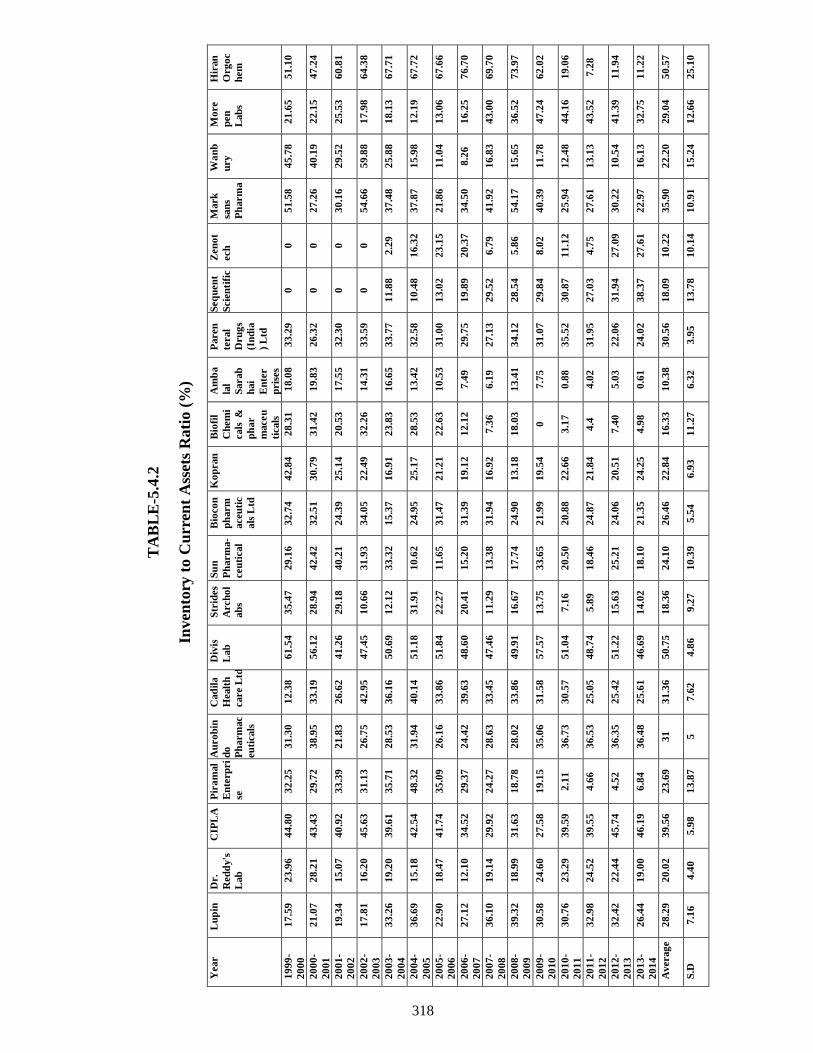
TA
BL
E-5
.4.2
Inven
tory
to C
urr
ent
Ass
ets
Rati
o (
%)
Year
Lu
pin
D
r.
Red
dy's
Lab
CIP
LA
P
ira
mal
En
terp
ri
se
Au
ro
bin
do
Ph
arm
ac
eu
ticals
Cad
ila
Healt
h
care L
td
Div
is
Lab
Str
ides
Arch
ol
ab
s
Su
n
Ph
arm
a-
ceu
tical
Bio
co
n
ph
arm
aceu
tic
als
Ltd
Ko
pran
B
iofi
l
Ch
em
i
cals
&
ph
ar
maceu
ticals
Am
ba
lal
Sarab
hai
En
ter
pris
es
Paren
teral
Dru
gs
(In
dia
) L
td
Seq
uen
t
Scie
nti
fic
Zen
ot
ech
Mark
san
s
Ph
arm
a
Wa
nb
ury
Mo
re
pen
Lab
s
Hir
an
Org
oc
hem
19
99
-
20
00
17
.59
23
.96
44
.80
32
.25
31
.30
12
.38
61
.54
35
.47
29
.16
32
.74
42
.84
28
.31
18
.08
33
.29
0
0
51
.58
45
.78
21
.65
51
.10
20
00
-
20
01
21
.07
28
.21
43
.43
29
.72
38
.95
33
.19
56
.12
28
.94
42
.42
32
.51
30
.79
31
.42
19
.83
26
.32
0
0
27
.26
40
.19
22
.15
47
.24
20
01
-
20
02
19
.34
15
.07
40
.92
33
.39
21
.83
26
.62
41
.26
29
.18
40
.21
24
.39
25
.14
20
.53
17
.55
32
.30
0
0
30
.16
29
.52
25
.53
60
.81
20
02
-
20
03
17
.81
16
.20
45
.63
31
.13
26
.75
42
.95
47
.45
10
.66
31
.93
34
.05
22
.49
32
.26
14
.31
33
.59
0
0
54
.66
59
.88
17
.98
64
.38
20
03
-
20
04
33
.26
19
.20
39
.61
35
.71
28
.53
36
.16
50
.69
12
.12
33
.32
15
.37
16
.91
23
.83
16
.65
33
.77
11
.88
2.2
9
37
.48
25
.88
18
.13
67
.71
20
04
-
20
05
36
.69
15
.18
42
.54
48
.32
31
.94
40
.14
51
.18
31
.91
10
.62
24
.95
25
.17
28
.53
13
.42
32
.58
10
.48
16
.32
37
.87
15
.98
12
.19
67
.72
20
05
-
20
06
22
.90
18
.47
41
.74
35
.09
26
.16
33
.86
51
.84
22
.27
11
.65
31
.47
21
.21
22
.63
10
.53
31
.00
13
.02
23
.15
21
.86
11
.04
13
.06
67
.66
20
06
-
20
07
27
.12
12
.10
34
.52
29
.37
24
.42
39
.63
48
.60
20
.41
15
.20
31
.39
19
.12
12
.12
7.4
9
29
.75
19
.89
20
.37
34
.50
8.2
6
16
.25
76
.70
20
07
-
20
08
36
.10
19
.14
29
.92
24
.27
28
.63
33
.45
47
.46
11
.29
13
.38
31
.94
16
.92
7.3
6
6.1
9
27
.13
29
.52
6.7
9
41
.92
16
.83
43
.00
69
.70
20
08
-
20
09
39
.32
18
.99
31
.63
18
.78
28
.02
33
.86
49
.91
16
.67
17
.74
24
.90
13
.18
18
.03
13
.41
34
.12
28
.54
5.8
6
54
.17
15
.65
36
.52
73
.97
20
09
-
20
10
30
.58
24
.60
27
.58
19
.15
35
.06
31
.58
57
.57
13
.75
33
.65
21
.99
19
.54
0
7.7
5
31
.07
29
.84
8.0
2
40
.39
11
.78
47
.24
62
.02
20
10
-
20
11
30
.76
23
.29
39
.59
2.1
1
36
.73
30
.57
51
.04
7.1
6
20
.50
20
.88
22
.66
3.1
7
0.8
8
35
.52
30
.87
11
.12
25
.94
12
.48
44
.16
19
.06
20
11
-
20
12
32
.98
24
.52
39
.55
4.6
6
36
.53
25
.05
48
.74
5.8
9
18
.46
24
.87
21
.84
4.4
4
.02
31
.95
27
.03
4.7
5
27
.61
13
.13
43
.52
7.2
8
20
12
-
20
13
32
.42
22
.44
45
.74
4.5
2
36
.35
25
.42
51
.22
15
.63
25
.21
24
.06
20
.51
7.4
0
5.0
3
22
.06
31
.94
27
.09
30
.22
10
.54
41
.39
11
.94
20
13
-
20
14
26
.44
19
.00
46
.19
6.8
4
36
.48
25
.61
46
.69
14
.02
18
.10
21
.35
24
.25
4.9
8
0.6
1
24
.02
38
.37
27
.61
22
.97
16
.13
32
.75
11
.22
Av
erag
e
28
.29
20
.02
39
.56
23
.69
31
31
.36
50
.75
18
.36
24
.10
26
.46
22
.84
16
.33
10
.38
30
.56
18
.09
10
.22
35
.90
22
.20
29
.04
50
.57
S.D
7.1
6
4.4
0
5.9
8
13
.87
5
7.6
2
4.8
6
9.2
7
10
.39
5.5
4
6.9
3
11
.27
6.3
2
3.9
5
13
.78
10
.14
10
.91
15
.24
12
.66
25
.10
318
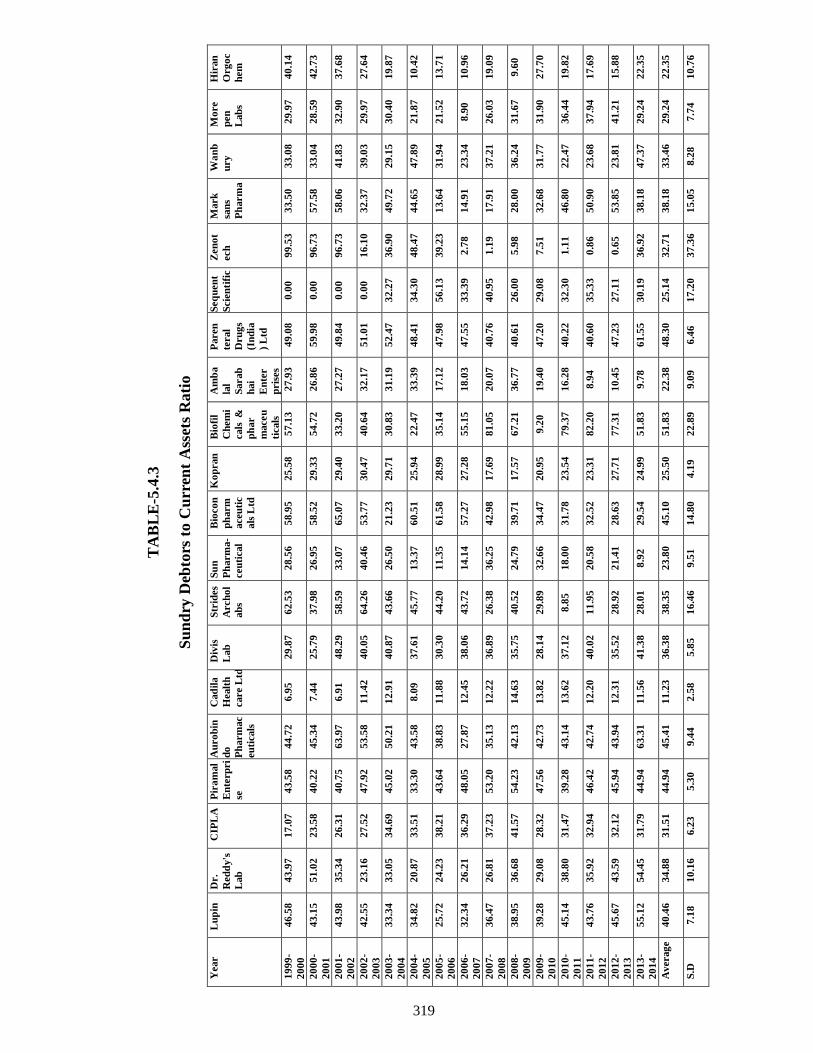
TA
BL
E-5
.4.3
Su
nd
ry D
ebto
rs t
o C
urr
ent
Ass
ets
Rati
o
Year
Lu
pin
D
r.
Red
dy's
Lab
CIP
LA
P
ira
mal
En
terp
ri
se
Au
ro
bin
do
Ph
arm
ac
eu
ticals
Cad
ila
Healt
h
care L
td
Div
is
Lab
Str
ides
Arch
ol
ab
s
Su
n
Ph
arm
a-
ceu
tical
Bio
co
n
ph
arm
aceu
tic
als
Ltd
Ko
pran
B
iofi
l
Ch
em
i
cals
&
ph
ar
maceu
ticals
Am
ba
lal
Sarab
hai
En
ter
pris
es
Paren
teral
Dru
gs
(In
dia
) L
td
Seq
uen
t
Scie
nti
fic
Zen
ot
ech
Mark
san
s
Ph
arm
a
Wa
nb
ury
Mo
re
pen
Lab
s
Hir
an
Org
oc
hem
19
99
-
20
00
46
.58
43
.97
17
.07
43
.58
44
.72
6.9
5
29
.87
62
.53
28
.56
58
.95
25
.58
57
.13
27
.93
49
.08
0.0
0
99
.53
33
.50
33
.08
29
.97
40
.14
20
00
-
20
01
43
.15
51
.02
23
.58
40
.22
45
.34
7.4
4
25
.79
37
.98
26
.95
58
.52
29
.33
54
.72
26
.86
59
.98
0.0
0
96
.73
57
.58
33
.04
28
.59
42
.73
20
01
-
20
02
43
.98
35
.34
26
.31
40
.75
63
.97
6.9
1
48
.29
58
.59
33
.07
65
.07
29
.40
33
.20
27
.27
49
.84
0.0
0
96
.73
58
.06
41
.83
32
.90
37
.68
20
02
-
20
03
42
.55
23
.16
27
.52
47
.92
53
.58
11
.42
40
.05
64
.26
40
.46
53
.77
30
.47
40
.64
32
.17
51
.01
0.0
0
16
.10
32
.37
39
.03
29
.97
27
.64
20
03
-
20
04
33
.34
33
.05
34
.69
45
.02
50
.21
12
.91
40
.87
43
.66
26
.50
21
.23
29
.71
30
.83
31
.19
52
.47
32
.27
36
.90
49
.72
29
.15
30
.40
19
.87
20
04
-
20
05
34
.82
20
.87
33
.51
33
.30
43
.58
8.0
9
37
.61
45
.77
13
.37
60
.51
25
.94
22
.47
33
.39
48
.41
34
.30
48
.47
44
.65
47
.89
21
.87
10
.42
20
05
-
20
06
25
.72
24
.23
38
.21
43
.64
38
.83
11
.88
30
.30
44
.20
11
.35
61
.58
28
.99
35
.14
17
.12
47
.98
56
.13
39
.23
13
.64
31
.94
21
.52
13
.71
20
06
-
20
07
32
.34
26
.21
36
.29
48
.05
27
.87
12
.45
38
.06
43
.72
14
.14
57
.27
27
.28
55
.15
18
.03
47
.55
33
.39
2.7
8
14
.91
23
.34
8.9
0
10
.96
20
07
-
20
08
36
.47
26
.81
37
.23
53
.20
35
.13
12
.22
36
.89
26
.38
36
.25
42
.98
17
.69
81
.05
20
.07
40
.76
40
.95
1.1
9
17
.91
37
.21
26
.03
19
.09
20
08
-
20
09
38
.95
36
.68
41
.57
54
.23
42
.13
14
.63
35
.75
40
.52
24
.79
39
.71
17
.57
67
.21
36
.77
40
.61
26
.00
5.9
8
28
.00
36
.24
31
.67
9.6
0
20
09
-
20
10
39
.28
29
.08
28
.32
47
.56
42
.73
13
.82
28
.14
29
.89
32
.66
34
.47
20
.95
9.2
0
19
.40
47
.20
29
.08
7.5
1
32
.68
31
.77
31
.90
27
.70
20
10
-
20
11
45
.14
38
.80
31
.47
39
.28
43
.14
13
.62
37
.12
8.8
5
18
.00
31
.78
23
.54
79
.37
16
.28
40
.22
32
.30
1.1
1
46
.80
22
.47
36
.44
19
.82
20
11
-
20
12
43
.76
35
.92
32
.94
46
.42
42
.74
12
.20
40
.02
11
.95
20
.58
32
.52
23
.31
82
.20
8.9
4
40
.60
35
.33
0.8
6
50
.90
23
.68
37
.94
17
.69
20
12
-
20
13
45
.67
43
.59
32
.12
45
.94
43
.94
12
.31
35
.52
28
.92
21
.41
28
.63
27
.71
77
.31
10
.45
47
.23
27
.11
0.6
5
53
.85
23
.81
41
.21
15
.88
20
13
-
20
14
55
.12
54
.45
31
.79
44
.94
63
.31
11
.56
41
.38
28
.01
8.9
2
29
.54
24
.99
51
.83
9.7
8
61
.55
30
.19
36
.92
38
.18
47
.37
29
.24
22
.35
Av
erag
e
40
.46
34
.88
31
.51
44
.94
45
.41
11
.23
36
.38
38
.35
23
.80
45
.10
25
.50
51
.83
22
.38
48
.30
25
.14
32
.71
38
.18
33
.46
29
.24
22
.35
S.D
7.1
8
10
.16
6.2
3
5.3
0
9.4
4
2.5
8
5.8
5
16
.46
9.5
1
14
.80
4.1
9
22
.89
9.0
9
6.4
6
17
.20
37
.36
15
.05
8.2
8
7.7
4
10
.76
319
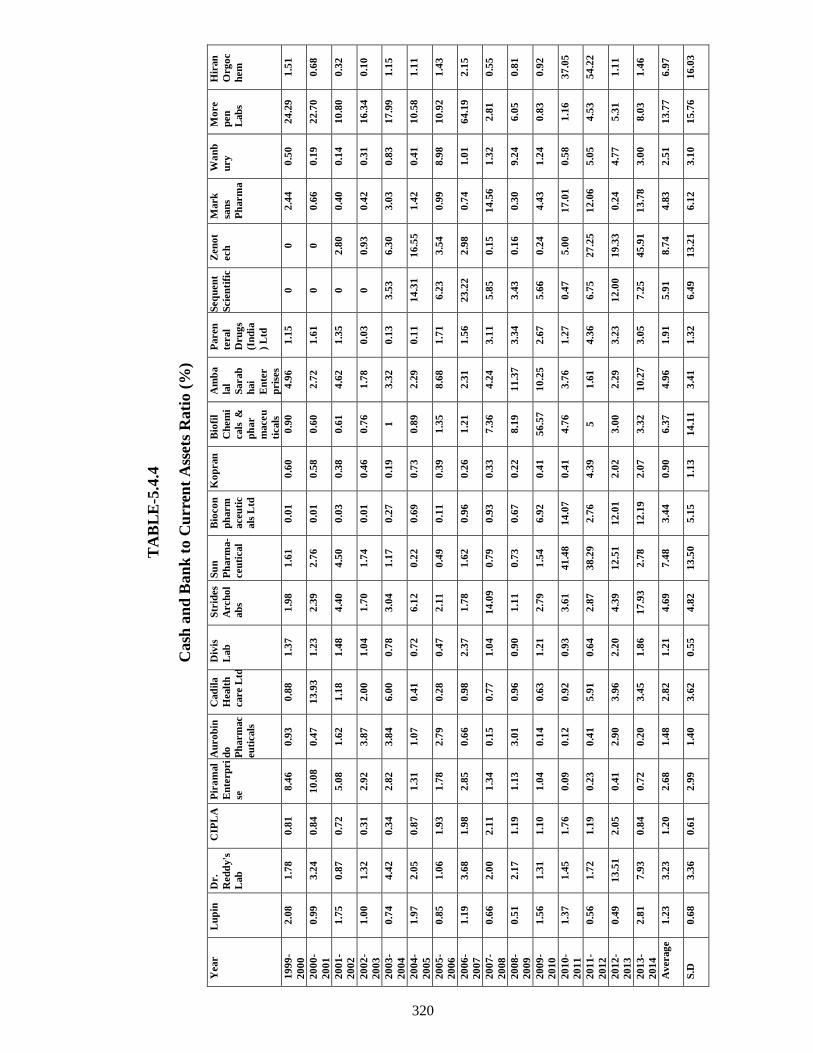
TA
BL
E-5
.4.4
Cash
an
d B
an
k t
o C
urr
ent
Ass
ets
Rati
o (
%)
Year
Lu
pin
D
r.
Red
dy's
Lab
CIP
LA
P
ira
mal
En
terp
ri
se
Au
ro
bin
do
Ph
arm
ac
eu
ticals
Cad
ila
Healt
h
care L
td
Div
is
Lab
Str
ides
Arch
ol
ab
s
Su
n
Ph
arm
a-
ceu
tical
Bio
co
n
ph
arm
aceu
tic
als
Ltd
Ko
pran
B
iofi
l
Ch
em
i
cals
&
ph
ar
maceu
ticals
Am
ba
lal
Sarab
hai
En
ter
pris
es
Paren
teral
Dru
gs
(In
dia
) L
td
Seq
uen
t
Scie
nti
fic
Zen
ot
ech
Mark
san
s
Ph
arm
a
Wa
nb
ury
Mo
re
pen
Lab
s
Hir
an
Org
oc
hem
19
99
-
20
00
2.0
8
1.7
8
0.8
1
8.4
6
0.9
3
0.8
8
1.3
7
1.9
8
1.6
1
0.0
1
0.6
0
0.9
0
4.9
6
1.1
5
0
0
2.4
4
0.5
0
24
.29
1.5
1
20
00
-
20
01
0.9
9
3.2
4
0.8
4
10
.08
0.4
7
13
.93
1.2
3
2.3
9
2.7
6
0.0
1
0.5
8
0.6
0
2.7
2
1.6
1
0
0
0.6
6
0.1
9
22
.70
0.6
8
20
01
-
20
02
1.7
5
0.8
7
0.7
2
5.0
8
1.6
2
1.1
8
1.4
8
4.4
0
4.5
0
0.0
3
0.3
8
0.6
1
4.6
2
1.3
5
0
2.8
0
0.4
0
0.1
4
10
.80
0.3
2
20
02
-
20
03
1.0
0
1.3
2
0.3
1
2.9
2
3.8
7
2.0
0
1.0
4
1.7
0
1.7
4
0.0
1
0.4
6
0.7
6
1.7
8
0.0
3
0
0.9
3
0.4
2
0.3
1
16
.34
0.1
0
20
03
-
20
04
0.7
4
4.4
2
0.3
4
2.8
2
3.8
4
6.0
0
0.7
8
3.0
4
1.1
7
0.2
7
0.1
9
1
3.3
2
0.1
3
3.5
3
6.3
0
3.0
3
0.8
3
17
.99
1.1
5
20
04
-
20
05
1.9
7
2.0
5
0.8
7
1.3
1
1.0
7
0.4
1
0.7
2
6.1
2
0.2
2
0.6
9
0.7
3
0.8
9
2.2
9
0.1
1
14
.31
16
.55
1.4
2
0.4
1
10
.58
1.1
1
20
05
-
20
06
0.8
5
1.0
6
1.9
3
1.7
8
2.7
9
0.2
8
0.4
7
2.1
1
0.4
9
0.1
1
0.3
9
1.3
5
8.6
8
1.7
1
6.2
3
3.5
4
0.9
9
8.9
8
10
.92
1.4
3
20
06
-
20
07
1.1
9
3.6
8
1.9
8
2.8
5
0.6
6
0.9
8
2.3
7
1.7
8
1.6
2
0.9
6
0.2
6
1.2
1
2.3
1
1.5
6
23
.22
2.9
8
0.7
4
1.0
1
64
.19
2.1
5
20
07
-
20
08
0.6
6
2.0
0
2.1
1
1.3
4
0.1
5
0.7
7
1.0
4
14
.09
0.7
9
0.9
3
0.3
3
7.3
6
4.2
4
3.1
1
5.8
5
0.1
5
14
.56
1.3
2
2.8
1
0.5
5
20
08
-
20
09
0.5
1
2.1
7
1.1
9
1.1
3
3.0
1
0.9
6
0.9
0
1.1
1
0.7
3
0.6
7
0.2
2
8.1
9
11
.37
3.3
4
3.4
3
0.1
6
0.3
0
9.2
4
6.0
5
0.8
1
20
09
-
20
10
1.5
6
1.3
1
1.1
0
1.0
4
0.1
4
0.6
3
1.2
1
2.7
9
1.5
4
6.9
2
0.4
1
56
.57
10
.25
2.6
7
5.6
6
0.2
4
4.4
3
1.2
4
0.8
3
0.9
2
20
10
-
20
11
1.3
7
1.4
5
1.7
6
0.0
9
0.1
2
0.9
2
0.9
3
3.6
1
41
.48
14
.07
0.4
1
4.7
6
3.7
6
1.2
7
0.4
7
5.0
0
17
.01
0.5
8
1.1
6
37
.05
20
11
-
20
12
0.5
6
1.7
2
1.1
9
0.2
3
0.4
1
5.9
1
0.6
4
2.8
7
38
.29
2.7
6
4.3
9
5
1.6
1
4.3
6
6.7
5
27
.25
12
.06
5.0
5
4.5
3
54
.22
20
12
-
20
13
0.4
9
13
.51
2.0
5
0.4
1
2.9
0
3.9
6
2.2
0
4.3
9
12
.51
12
.01
2.0
2
3.0
0
2.2
9
3.2
3
12
.00
19
.33
0.2
4
4.7
7
5.3
1
1.1
1
20
13
-
20
14
2.8
1
7.9
3
0.8
4
0.7
2
0.2
0
3.4
5
1.8
6
17
.93
2.7
8
12
.19
2.0
7
3.3
2
10
.27
3.0
5
7.2
5
45
.91
13
.78
3.0
0
8.0
3
1.4
6
Av
erag
e
1.2
3
3.2
3
1.2
0
2.6
8
1.4
8
2.8
2
1.2
1
4.6
9
7.4
8
3.4
4
0.9
0
6.3
7
4.9
6
1.9
1
5.9
1
8.7
4
4.8
3
2.5
1
13
.77
6.9
7
S.D
0.6
8
3.3
6
0.6
1
2.9
9
1.4
0
3.6
2
0.5
5
4.8
2
13
.50
5.1
5
1.1
3
14
.11
3.4
1
1.3
2
6.4
9
13
.21
6.1
2
3.1
0
15
.76
16
.03
320
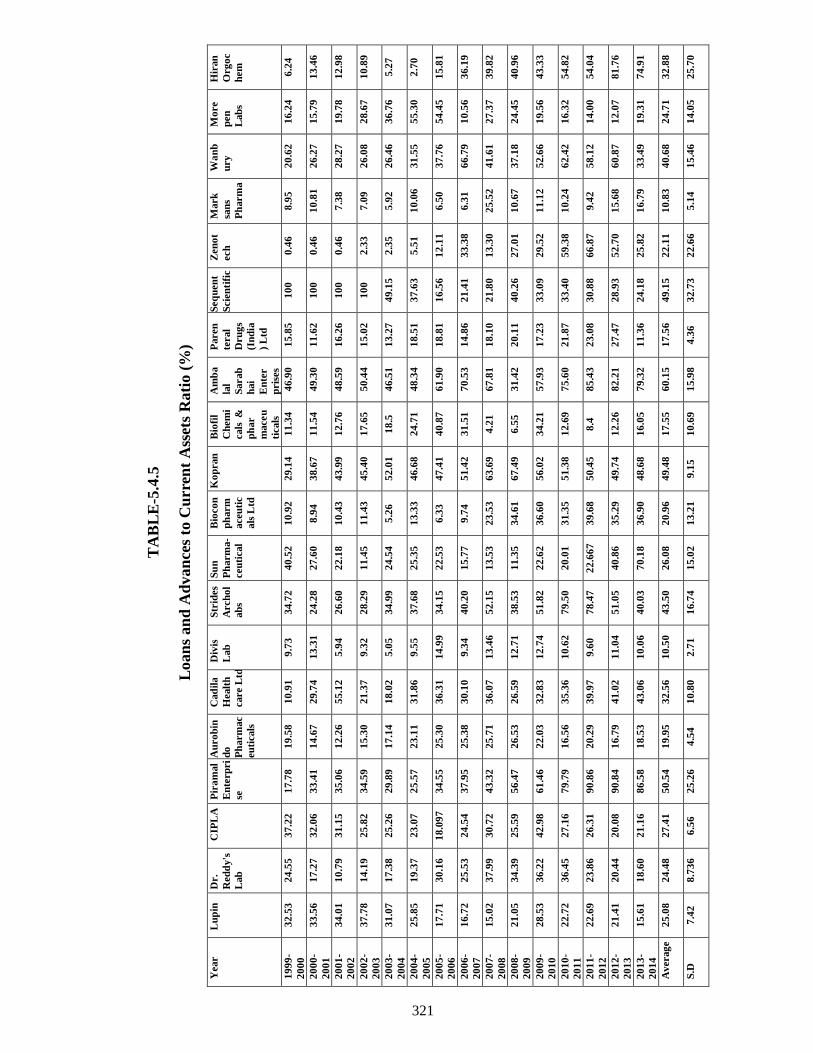
TA
BL
E-5
.4.5
Loan
s an
d A
dvan
ces
to C
urr
ent
Ass
ets
Rati
o (
%)
Year
Lu
pin
D
r.
Red
dy's
Lab
CIP
LA
P
ira
mal
En
terp
ri
se
Au
ro
bin
do
Ph
arm
ac
eu
ticals
Cad
ila
Healt
h
care L
td
Div
is
Lab
Str
ides
Arch
ol
ab
s
Su
n
Ph
arm
a-
ceu
tical
Bio
co
n
ph
arm
aceu
tic
als
Ltd
Ko
pran
B
iofi
l
Ch
em
i
cals
&
ph
ar
maceu
ticals
Am
ba
lal
Sarab
hai
En
ter
pris
es
Paren
teral
Dru
gs
(In
dia
) L
td
Seq
uen
t
Scie
nti
fic
Zen
ot
ech
Mark
san
s
Ph
arm
a
Wa
nb
ury
Mo
re
pen
Lab
s
Hir
an
Org
oc
hem
19
99
-
20
00
32
.53
24
.55
37
.22
17
.78
19
.58
10
.91
9.7
3
34
.72
40
.52
10
.92
29
.14
11
.34
46
.90
15
.85
10
0
0.4
6
8.9
5
20
.62
16
.24
6.2
4
20
00
-
20
01
33
.56
17
.27
32
.06
33
.41
14
.67
29
.74
13
.31
24
.28
27
.60
8.9
4
38
.67
11
.54
49
.30
11
.62
10
0
0.4
6
10
.81
26
.27
15
.79
13
.46
20
01
-
20
02
34
.01
10
.79
31
.15
35
.06
12
.26
55
.12
5.9
4
26
.60
22
.18
10
.43
43
.99
12
.76
48
.59
16
.26
10
0
0.4
6
7.3
8
28
.27
19
.78
12
.98
20
02
-
20
03
37
.78
14
.19
25
.82
34
.59
15
.30
21
.37
9.3
2
28
.29
11
.45
11
.43
45
.40
17
.65
50
.44
15
.02
10
0
2.3
3
7.0
9
26
.08
28
.67
10
.89
20
03
-
20
04
31
.07
17
.38
25
.26
29
.89
17
.14
18
.02
5.0
5
34
.99
24
.54
5.2
6
52
.01
18
.5
46
.51
13
.27
49
.15
2.3
5
5.9
2
26
.46
36
.76
5.2
7
20
04
-
20
05
25
.85
19
.37
23
.07
25
.57
23
.11
31
.86
9.5
5
37
.68
25
.35
13
.33
46
.68
24
.71
48
.34
18
.51
37
.63
5.5
1
10
.06
31
.55
55
.30
2.7
0
20
05
-
20
06
17
.71
30
.16
18
.09
7
34
.55
25
.30
36
.31
14
.99
34
.15
22
.53
6.3
3
47
.41
40
.87
61
.90
18
.81
16
.56
12
.11
6.5
0
37
.76
54
.45
15
.81
20
06
-
20
07
16
.72
25
.53
24
.54
37
.95
25
.38
30
.10
9.3
4
40
.20
15
.77
9.7
4
51
.42
31
.51
70
.53
14
.86
21
.41
33
.38
6.3
1
66
.79
10
.56
36
.19
20
07
-
20
08
15
.02
37
.99
30
.72
43
.32
25
.71
36
.07
13
.46
52
.15
13
.53
23
.53
63
.69
4.2
1
67
.81
18
.10
21
.80
13
.30
25
.52
41
.61
27
.37
39
.82
20
08
-
20
09
21
.05
34
.39
25
.59
56
.47
26
.53
26
.59
12
.71
38
.53
11
.35
34
.61
67
.49
6.5
5
31
.42
20
.11
40
.26
27
.01
10
.67
37
.18
24
.45
40
.96
20
09
-
20
10
28
.53
36
.22
42
.98
61
.46
22
.03
32
.83
12
.74
51
.82
22
.62
36
.60
56
.02
34
.21
57
.93
17
.23
33
.09
29
.52
11
.12
52
.66
19
.56
43
.33
20
10
-
20
11
22
.72
36
.45
27
.16
79
.79
16
.56
35
.36
10
.62
79
.50
20
.01
31
.35
51
.38
12
.69
75
.60
21
.87
33
.40
59
.38
10
.24
62
.42
16
.32
54
.82
20
11
-
20
12
22
.69
23
.86
26
.31
90
.86
20
.29
39
.97
9.6
0
78
.47
22
.66
7
39
.68
50
.45
8.4
8
5.4
3
23
.08
30
.88
66
.87
9.4
2
58
.12
14
.00
54
.04
20
12
-
20
13
21
.41
20
.44
20
.08
90
.84
16
.79
41
.02
11
.04
51
.05
40
.86
35
.29
49
.74
12
.26
82
.21
27
.47
28
.93
52
.70
15
.68
60
.87
12
.07
81
.76
20
13
-
20
14
15
.61
18
.60
21
.16
86
.58
18
.53
43
.06
10
.06
40
.03
70
.18
36
.90
48
.68
16
.05
79
.32
11
.36
24
.18
25
.82
16
.79
33
.49
19
.31
74
.91
Av
erag
e
25
.08
24
.48
27
.41
50
.54
19
.95
32
.56
10
.50
43
.50
26
.08
20
.96
49
.48
17
.55
60
.15
17
.56
49
.15
22
.11
10
.83
40
.68
24
.71
32
.88
S.D
7.4
2
8.7
36
6.5
6
25
.26
4.5
4
10
.80
2.7
1
16
.74
15
.02
13
.21
9.1
5
10
.69
15
.98
4.3
6
32
.73
22
.66
5.1
4
15
.46
14
.05
25
.70
321
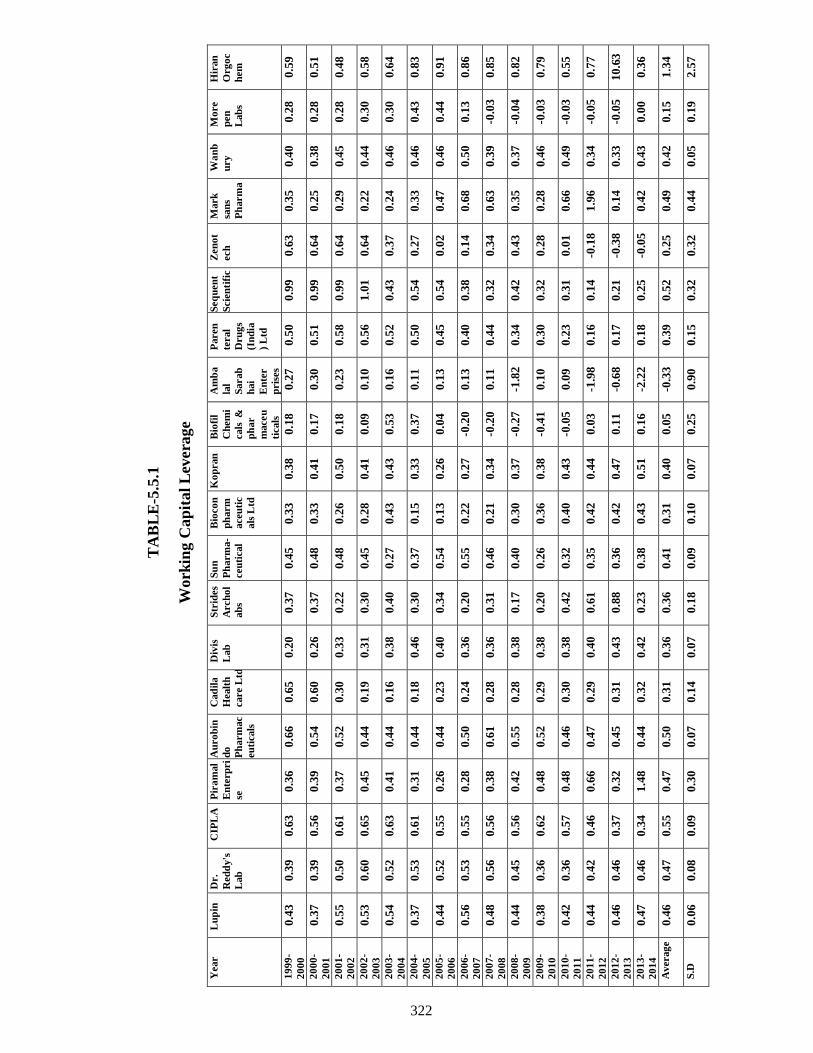
TA
BL
E-5
.5.1
Work
ing C
ap
ital
Lev
era
ge
Year
Lu
pin
D
r.
Red
dy's
Lab
CIP
LA
P
ira
mal
En
terp
ri
se
Au
ro
bin
do
Ph
arm
ac
eu
ticals
Cad
ila
Healt
h
care L
td
Div
is
Lab
Str
ides
Arch
ol
ab
s
Su
n
Ph
arm
a-
ceu
tical
Bio
co
n
ph
arm
aceu
tic
als
Ltd
Ko
pran
B
iofi
l
Ch
em
i
cals
&
ph
ar
maceu
ticals
Am
ba
lal
Sarab
hai
En
ter
pris
es
Paren
teral
Dru
gs
(In
dia
) L
td
Seq
uen
t
Scie
nti
fic
Zen
ot
ech
Mark
san
s
Ph
arm
a
Wa
nb
ury
Mo
re
pen
Lab
s
Hir
an
Org
oc
hem
19
99
-
20
00
0.4
3
0.3
9
0.6
3
0.3
6
0.6
6
0.6
5
0.2
0
0.3
7
0.4
5
0.3
3
0.3
8
0.1
8
0.2
7
0.5
0
0.9
9
0.6
3
0.3
5
0.4
0
0.2
8
0.5
9
20
00
-
20
01
0.3
7
0.3
9
0.5
6
0.3
9
0.5
4
0.6
0
0.2
6
0.3
7
0.4
8
0.3
3
0.4
1
0.1
7
0.3
0
0.5
1
0.9
9
0.6
4
0.2
5
0.3
8
0.2
8
0.5
1
20
01
-
20
02
0.5
5
0.5
0
0.6
1
0.3
7
0.5
2
0.3
0
0.3
3
0.2
2
0.4
8
0.2
6
0.5
0
0.1
8
0.2
3
0.5
8
0.9
9
0.6
4
0.2
9
0.4
5
0.2
8
0.4
8
20
02
-
20
03
0.5
3
0.6
0
0.6
5
0.4
5
0.4
4
0.1
9
0.3
1
0.3
0
0.4
5
0.2
8
0.4
1
0.0
9
0.1
0
0.5
6
1.0
1
0.6
4
0.2
2
0.4
4
0.3
0
0.5
8
20
03
-
20
04
0.5
4
0.5
2
0.6
3
0.4
1
0.4
4
0.1
6
0.3
8
0.4
0
0.2
7
0.4
3
0.4
3
0.5
3
0.1
6
0.5
2
0.4
3
0.3
7
0.2
4
0.4
6
0.3
0
0.6
4
20
04
-
20
05
0.3
7
0.5
3
0.6
1
0.3
1
0.4
4
0.1
8
0.4
6
0.3
0
0.3
7
0.1
5
0.3
3
0.3
7
0.1
1
0.5
0
0.5
4
0.2
7
0.3
3
0.4
6
0.4
3
0.8
3
20
05
-
20
06
0.4
4
0.5
2
0.5
5
0.2
6
0.4
4
0.2
3
0.4
0
0.3
4
0.5
4
0.1
3
0.2
6
0.0
4
0.1
3
0.4
5
0.5
4
0.0
2
0.4
7
0.4
6
0.4
4
0.9
1
20
06
-
20
07
0.5
6
0.5
3
0.5
5
0.2
8
0.5
0
0.2
4
0.3
6
0.2
0
0.5
5
0.2
2
0.2
7
-0.2
0
0.1
3
0.4
0
0.3
8
0.1
4
0.6
8
0.5
0
0.1
3
0.8
6
20
07
-
20
08
0.4
8
0.5
6
0.5
6
0.3
8
0.6
1
0.2
8
0.3
6
0.3
1
0.4
6
0.2
1
0.3
4
-0.2
0
0.1
1
0.4
4
0.3
2
0.3
4
0.6
3
0.3
9
-0.0
3
0.8
5
20
08
-
20
09
0.4
4
0.4
5
0.5
6
0.4
2
0.5
5
0.2
8
0.3
8
0.1
7
0.4
0
0.3
0
0.3
7
-0.2
7
-1.8
2
0.3
4
0.4
2
0.4
3
0.3
5
0.3
7
-0.0
4
0.8
2
20
09
-
20
10
0.3
8
0.3
6
0.6
2
0.4
8
0.5
2
0.2
9
0.3
8
0.2
0
0.2
6
0.3
6
0.3
8
-0.4
1
0.1
0
0.3
0
0.3
2
0.2
8
0.2
8
0.4
6
-0.0
3
0.7
9
20
10
-
20
11
0.4
2
0.3
6
0.5
7
0.4
8
0.4
6
0.3
0
0.3
8
0.4
2
0.3
2
0.4
0
0.4
3
-0.0
5
0.0
9
0.2
3
0.3
1
0.0
1
0.6
6
0.4
9
-0.0
3
0.5
5
20
11
-
20
12
0.4
4
0.4
2
0.4
6
0.6
6
0.4
7
0.2
9
0.4
0
0.6
1
0.3
5
0.4
2
0.4
4
0.0
3
-1.9
8
0.1
6
0.1
4
-0.1
8
1.9
6
0.3
4
-0.0
5
0.7
7
20
12
-
20
13
0.4
6
0.4
6
0.3
7
0.3
2
0.4
5
0.3
1
0.4
3
0.8
8
0.3
6
0.4
2
0.4
7
0.1
1
-0.6
8
0.1
7
0.2
1
-0.3
8
0.1
4
0.3
3
-0.0
5
10.6
3
20
13
-
20
14
0.4
7
0.4
6
0.3
4
1.4
8
0.4
4
0.3
2
0.4
2
0.2
3
0.3
8
0.4
3
0.5
1
0.1
6
-2.2
2
0.1
8
0.2
5
-0.0
5
0.4
2
0.4
3
0.0
0
0.3
6
Av
erag
e
0.4
6
0.4
7
0.5
5
0.4
7
0.5
0
0.3
1
0.3
6
0.3
6
0.4
1
0.3
1
0.4
0
0.0
5
-0.3
3
0.3
9
0.5
2
0.2
5
0.4
9
0.4
2
0.1
5
1.3
4
S.D
0.0
6
0.0
8
0.0
9
0.3
0
0.0
7
0.1
4
0.0
7
0.1
8
0.0
9
0.1
0
0.0
7
0.2
5
0.9
0
0.1
5
0.3
2
0.3
2
0.4
4
0.0
5
0.1
9
2.5
7
322
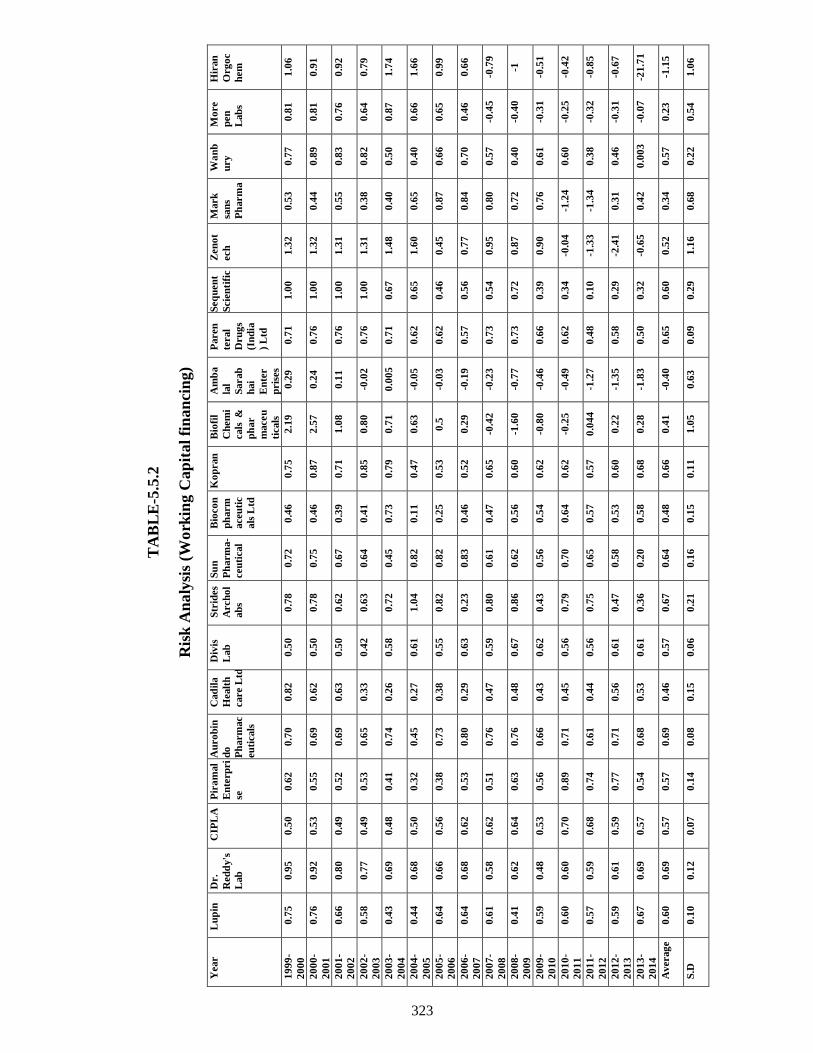
TA
BL
E-5
.5.2
Ris
k A
na
lysi
s (W
ork
ing C
ap
ital
fin
an
cin
g)
Year
Lu
pin
D
r.
Red
dy's
Lab
CIP
LA
P
ira
mal
En
terp
ri
se
Au
ro
bin
do
Ph
arm
ac
eu
ticals
Cad
ila
Healt
h
care L
td
Div
is
Lab
Str
ides
Arch
ol
ab
s
Su
n
Ph
arm
a-
ceu
tical
Bio
co
n
ph
arm
aceu
tic
als
Ltd
Ko
pran
B
iofi
l
Ch
em
i
cals
&
ph
ar
maceu
ticals
Am
ba
lal
Sarab
hai
En
ter
pris
es
Paren
teral
Dru
gs
(In
dia
) L
td
Seq
uen
t
Scie
nti
fic
Zen
ot
ech
Mark
san
s
Ph
arm
a
Wa
nb
ury
Mo
re
pen
Lab
s
Hir
an
Org
oc
hem
19
99
-
20
00
0.7
5
0.9
5
0.5
0
0.6
2
0.7
0
0.8
2
0.5
0
0.7
8
0.7
2
0.4
6
0.7
5
2.1
9
0.2
9
0.7
1
1.0
0
1.3
2
0.5
3
0.7
7
0.8
1
1.0
6
20
00
-
20
01
0.7
6
0.9
2
0.5
3
0.5
5
0.6
9
0.6
2
0.5
0
0.7
8
0.7
5
0.4
6
0.8
7
2.5
7
0.2
4
0.7
6
1.0
0
1.3
2
0.4
4
0.8
9
0.8
1
0.9
1
20
01
-
20
02
0.6
6
0.8
0
0.4
9
0.5
2
0.6
9
0.6
3
0.5
0
0.6
2
0.6
7
0.3
9
0.7
1
1.0
8
0.1
1
0.7
6
1.0
0
1.3
1
0.5
5
0.8
3
0.7
6
0.9
2
20
02
-
20
03
0.5
8
0.7
7
0.4
9
0.5
3
0.6
5
0.3
3
0.4
2
0.6
3
0.6
4
0.4
1
0.8
5
0.8
0
-0.0
2
0.7
6
1.0
0
1.3
1
0.3
8
0.8
2
0.6
4
0.7
9
20
03
-
20
04
0.4
3
0.6
9
0.4
8
0.4
1
0.7
4
0.2
6
0.5
8
0.7
2
0.4
5
0.7
3
0.7
9
0.7
1
0.0
05
0.7
1
0.6
7
1.4
8
0.4
0
0.5
0
0.8
7
1.7
4
20
04
-
20
05
0.4
4
0.6
8
0.5
0
0.3
2
0.4
5
0.2
7
0.6
1
1.0
4
0.8
2
0.1
1
0.4
7
0.6
3
-0.0
5
0.6
2
0.6
5
1.6
0
0.6
5
0.4
0
0.6
6
1.6
6
20
05
-
20
06
0.6
4
0.6
6
0.5
6
0.3
8
0.7
3
0.3
8
0.5
5
0.8
2
0.8
2
0.2
5
0.5
3
0.5
-0
.03
0.6
2
0.4
6
0.4
5
0.8
7
0.6
6
0.6
5
0.9
9
20
06
-
20
07
0.6
4
0.6
8
0.6
2
0.5
3
0.8
0
0.2
9
0.6
3
0.2
3
0.8
3
0.4
6
0.5
2
0.2
9
-0.1
9
0.5
7
0.5
6
0.7
7
0.8
4
0.7
0
0.4
6
0.6
6
20
07
-
20
08
0.6
1
0.5
8
0.6
2
0.5
1
0.7
6
0.4
7
0.5
9
0.8
0
0.6
1
0.4
7
0.6
5
-0.4
2
-0.2
3
0.7
3
0.5
4
0.9
5
0.8
0
0.5
7
-0.4
5
-0.7
9
20
08
-
20
09
0.4
1
0.6
2
0.6
4
0.6
3
0.7
6
0.4
8
0.6
7
0.8
6
0.6
2
0.5
6
0.6
0
-1.6
0
-0.7
7
0.7
3
0.7
2
0.8
7
0.7
2
0.4
0
-0.4
0
-1
20
09
-
20
10
0.5
9
0.4
8
0.5
3
0.5
6
0.6
6
0.4
3
0.6
2
0.4
3
0.5
6
0.5
4
0.6
2
-0.8
0
-0.4
6
0.6
6
0.3
9
0.9
0
0.7
6
0.6
1
-0.3
1
-0.5
1
20
10
-
20
11
0.6
0
0.6
0
0.7
0
0.8
9
0.7
1
0.4
5
0.5
6
0.7
9
0.7
0
0.6
4
0.6
2
-0.2
5
-0.4
9
0.6
2
0.3
4
-0.0
4
-1.2
4
0.6
0
-0.2
5
-0.4
2
20
11
-
20
12
0.5
7
0.5
9
0.6
8
0.7
4
0.6
1
0.4
4
0.5
6
0.7
5
0.6
5
0.5
7
0.5
7
0.0
44
-1.2
7
0.4
8
0.1
0
-1.3
3
-1.3
4
0.3
8
-0.3
2
-0.8
5
20
12
-
20
13
0.5
9
0.6
1
0.5
9
0.7
7
0.7
1
0.5
6
0.6
1
0.4
7
0.5
8
0.5
3
0.6
0
0.2
2
-1.3
5
0.5
8
0.2
9
-2.4
1
0.3
1
0.4
6
-0.3
1
-0.6
7
20
13
-
20
14
0.6
7
0.6
9
0.5
7
0.5
4
0.6
8
0.5
3
0.6
1
0.3
6
0.2
0
0.5
8
0.6
8
0.2
8
-1.8
3
0.5
0
0.3
2
-0.6
5
0.4
2
0.0
03
-0.0
7
-21
.71
Av
erag
e
0.6
0
0.6
9
0.5
7
0.5
7
0.6
9
0.4
6
0.5
7
0.6
7
0.6
4
0.4
8
0.6
6
0.4
1
-0.4
0
0.6
5
0.6
0
0.5
2
0.3
4
0.5
7
0.2
3
-1.1
5
S.D
0.1
0
0.1
2
0.0
7
0.1
4
0.0
8
0.1
5
0.0
6
0.2
1
0.1
6
0.1
5
0.1
1
1.0
5
0.6
3
0.0
9
0.2
9
1.1
6
0.6
8
0.2
2
0.5
4
1.0
6
323
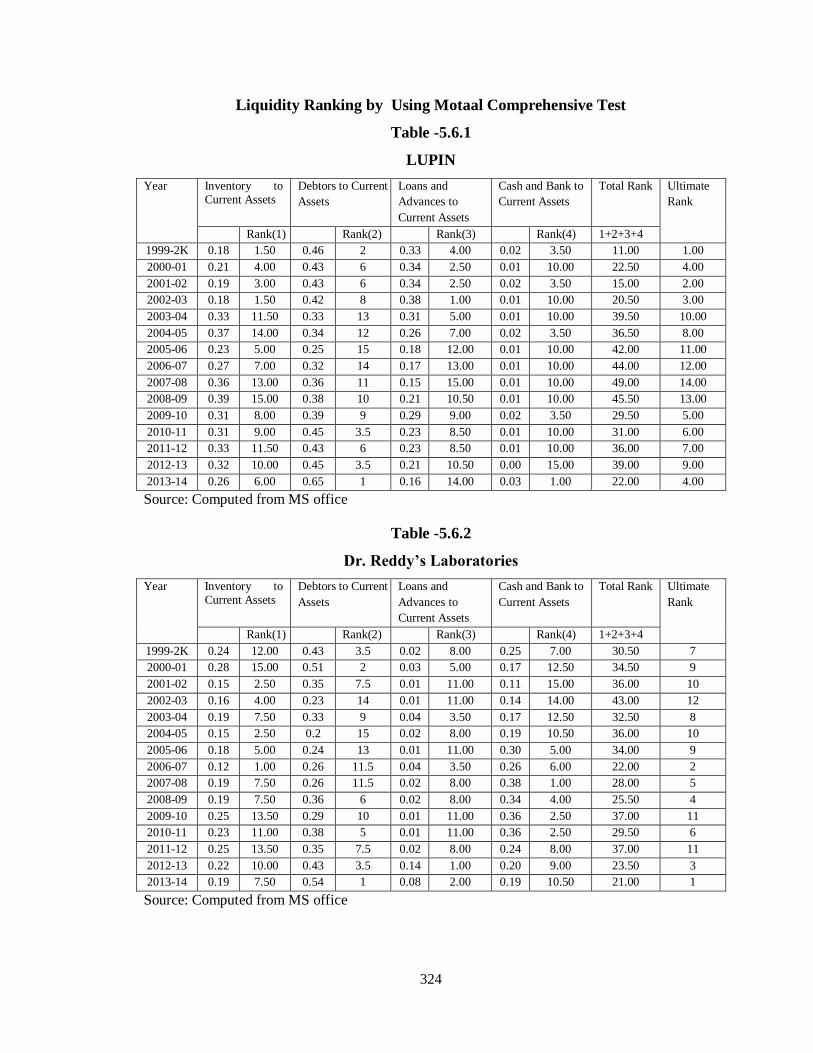
324
Liquidity Ranking by Using Motaal Comprehensive Test
Table -5.6.1
LUPIN
Year Inventory to Current Assets
Debtors to Current
Assets
Loans and
Advances to
Current Assets
Cash and Bank to
Current Assets
Total Rank Ultimate
Rank
Rank(1) Rank(2) Rank(3) Rank(4) 1+2+3+4
1999-2K 0.18 1.50 0.46 2 0.33 4.00 0.02 3.50 11.00 1.00
2000-01 0.21 4.00 0.43 6 0.34 2.50 0.01 10.00 22.50 4.00
2001-02 0.19 3.00 0.43 6 0.34 2.50 0.02 3.50 15.00 2.00
2002-03 0.18 1.50 0.42 8 0.38 1.00 0.01 10.00 20.50 3.00
2003-04 0.33 11.50 0.33 13 0.31 5.00 0.01 10.00 39.50 10.00
2004-05 0.37 14.00 0.34 12 0.26 7.00 0.02 3.50 36.50 8.00
2005-06 0.23 5.00 0.25 15 0.18 12.00 0.01 10.00 42.00 11.00
2006-07 0.27 7.00 0.32 14 0.17 13.00 0.01 10.00 44.00 12.00
2007-08 0.36 13.00 0.36 11 0.15 15.00 0.01 10.00 49.00 14.00
2008-09 0.39 15.00 0.38 10 0.21 10.50 0.01 10.00 45.50 13.00
2009-10 0.31 8.00 0.39 9 0.29 9.00 0.02 3.50 29.50 5.00
2010-11 0.31 9.00 0.45 3.5 0.23 8.50 0.01 10.00 31.00 6.00
2011-12 0.33 11.50 0.43 6 0.23 8.50 0.01 10.00 36.00 7.00
2012-13 0.32 10.00 0.45 3.5 0.21 10.50 0.00 15.00 39.00 9.00
2013-14 0.26 6.00 0.65 1 0.16 14.00 0.03 1.00 22.00 4.00
Source: Computed from MS office
Table -5.6.2
Dr. Reddy‟s Laboratories
Year Inventory to Current Assets
Debtors to Current
Assets
Loans and
Advances to
Current Assets
Cash and Bank to
Current Assets
Total Rank Ultimate
Rank
Rank(1) Rank(2) Rank(3) Rank(4) 1+2+3+4
1999-2K 0.24 12.00 0.43 3.5 0.02 8.00 0.25 7.00 30.50 7
2000-01 0.28 15.00 0.51 2 0.03 5.00 0.17 12.50 34.50 9
2001-02 0.15 2.50 0.35 7.5 0.01 11.00 0.11 15.00 36.00 10
2002-03 0.16 4.00 0.23 14 0.01 11.00 0.14 14.00 43.00 12
2003-04 0.19 7.50 0.33 9 0.04 3.50 0.17 12.50 32.50 8
2004-05 0.15 2.50 0.2 15 0.02 8.00 0.19 10.50 36.00 10
2005-06 0.18 5.00 0.24 13 0.01 11.00 0.30 5.00 34.00 9
2006-07 0.12 1.00 0.26 11.5 0.04 3.50 0.26 6.00 22.00 2
2007-08 0.19 7.50 0.26 11.5 0.02 8.00 0.38 1.00 28.00 5
2008-09 0.19 7.50 0.36 6 0.02 8.00 0.34 4.00 25.50 4
2009-10 0.25 13.50 0.29 10 0.01 11.00 0.36 2.50 37.00 11
2010-11 0.23 11.00 0.38 5 0.01 11.00 0.36 2.50 29.50 6
2011-12 0.25 13.50 0.35 7.5 0.02 8.00 0.24 8.00 37.00 11
2012-13 0.22 10.00 0.43 3.5 0.14 1.00 0.20 9.00 23.50 3
2013-14 0.19 7.50 0.54 1 0.08 2.00 0.19 10.50 21.00 1
Source: Computed from MS office

325
Table -5.6.3
CIPLA
Year Inventory to Current Assets
Debtors to Current
Assets
Loans and
Advances to
Current Assets
Cash and Bank to
Current Assets
Total Rank Ultimate
Rank
Rank(1) Rank(2) Rank(3) Rank(4) 1+2+3+4
1999-2K 0.45 12.00 0.17 15 0.01 9.50 0.37 2.00 38.50 10
2000-01 0.43 10.50 0.23 14 0.01 9.50 0.32 3.00 37.00 8
2001-02 0.41 8.00 0.26 13 0.01 9.50 0.31 4.50 35.00 6
2002-03 0.46 14.00 0.27 12 0.00 14.50 0.26 8.00 48.50 13
2003-04 0.40 6.00 0.34 5 0.00 14.50 0.25 10.50 36.00 7
2004-05 0.43 10.50 0.33 6 0.01 9.50 0.23 12.00 38.00 9
2005-06 0.42 9.00 0.38 2 0.02 3.00 0.18 15.00 29.00 4
2006-07 0.35 4.00 0.36 4 0.02 3.00 0.25 10.50 21.50 2
2007-08 0.30 2.00 0.37 3 0.02 3.00 0.31 4.50 12.50 1
2008-09 0.32 3.00 0.41 1 0.01 9.50 0.26 8.00 21.50 2
2009-10 0.28 1.00 0.28 11 0.01 9.50 0.43 1.00 22.50 2
2010-11 0.40 6.00 0.31 9.5 0.02 3.00 0.27 6.00 24.50 3
2011-12 0.40 6.00 0.32 7.5 0.01 9.50 0.26 8.00 31.00 5
2012-13 0.46 14.00 0.32 7.5 0.02 3.00 0.20 14.00 38.50 11
2013-14 0.46 14.00 0.31 9.5 0.01 9.50 0.21 13.00 46.00 12
Source: Computed from MS office
Table -5.6.4
Piramal Enterprises
Year Inventory to
Current Assets
Debtors to Current
Assets
Loans and
Advances to
Current Assets
Cash and Bank to
Current Assets
Total Rank Ultimate
Rank
Rank(1) Rank(2) Rank(3) Rank(4) 1+2+3+4
1999-2K 0.32 11.00 0.31 2 0.08 2.00 0.18 15.00 30.00 5
2000-01 0.30 9.00 0.26 7.7 0.10 1.00 0.33 12.00 29.70 4
2001-02 0.33 12.00 0.26 7.5 0.05 3.00 0.35 10.00 32.50 7
2002-03 0.31 10.00 0.31 2 0.03 5.00 0.35 10.00 27.00 2
2003-04 0.36 14.00 0.31 2 0.03 5.00 0.30 13.00 34.00 8
2004-05 0.48 15.00 0.25 9 0.01 10.00 0.26 14.00 48.00 10
2005-06 0.35 13.00 0.28 6 0.02 7.00 0.35 10.00 36.00 9
2006-07 0.29 8.00 0.29 4.5 0.03 5.00 0.38 8.00 25.50 1
2007-08 0.24 7.00 0.29 4.5 0.01 10.00 0.43 7.00 28.50 3
2008-09 0.19 5.50 0.24 10 0.01 10.00 0.56 6.00 31.50 6
2009-10 0.19 5.50 0.18 12 0.01 10.00 0.61 5.00 32.50 7
2010-11 0.02 1.00 0.19 11 0.00 14.00 0.80 4.00 30.00 5
2011-12 0.05 2.50 0.04 14.5 0.00 14.00 0.91 1.50 32.50 7
2012-13 0.05 2.50 0.04 14.5 0.00 14.00 0.91 1.50 32.50 7
2013-14 0.07 4.00 0.05 13 0.01 10.00 0.87 3.00 30.00 5
Source: Computed from MS office
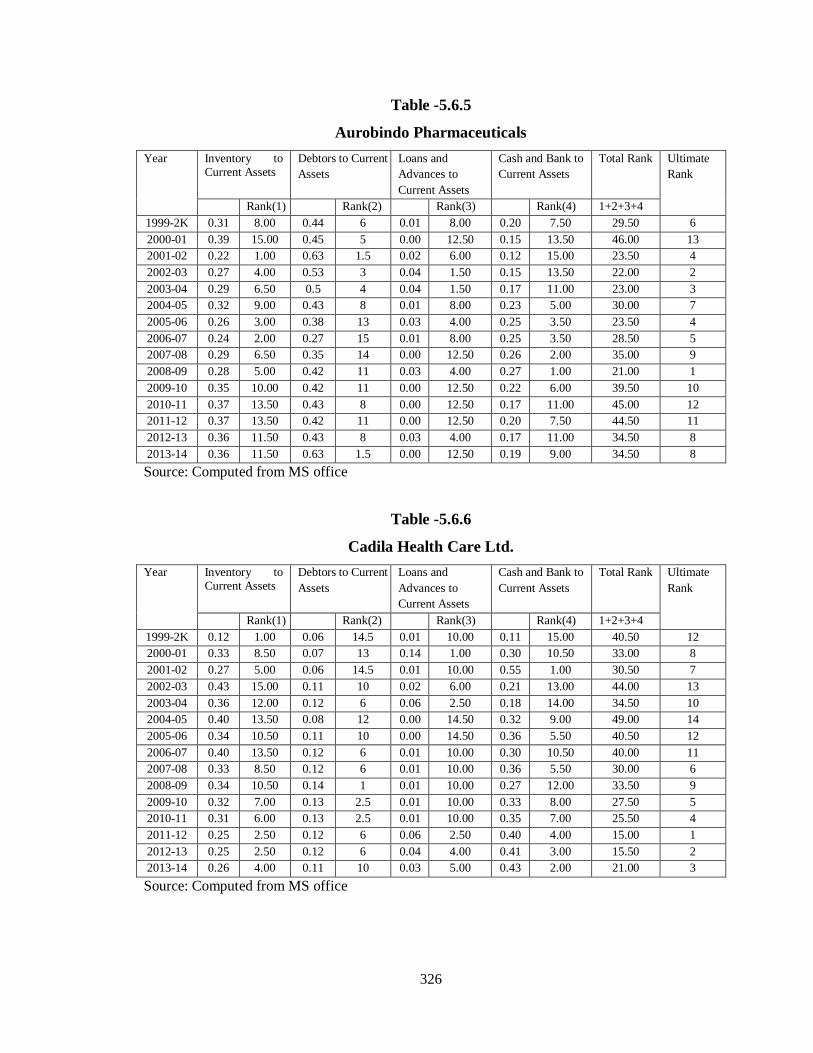
326
Table -5.6.5
Aurobindo Pharmaceuticals
Year Inventory to Current Assets
Debtors to Current
Assets
Loans and
Advances to
Current Assets
Cash and Bank to
Current Assets
Total Rank Ultimate
Rank
Rank(1) Rank(2) Rank(3) Rank(4) 1+2+3+4
1999-2K 0.31 8.00 0.44 6 0.01 8.00 0.20 7.50 29.50 6
2000-01 0.39 15.00 0.45 5 0.00 12.50 0.15 13.50 46.00 13
2001-02 0.22 1.00 0.63 1.5 0.02 6.00 0.12 15.00 23.50 4
2002-03 0.27 4.00 0.53 3 0.04 1.50 0.15 13.50 22.00 2
2003-04 0.29 6.50 0.5 4 0.04 1.50 0.17 11.00 23.00 3
2004-05 0.32 9.00 0.43 8 0.01 8.00 0.23 5.00 30.00 7
2005-06 0.26 3.00 0.38 13 0.03 4.00 0.25 3.50 23.50 4
2006-07 0.24 2.00 0.27 15 0.01 8.00 0.25 3.50 28.50 5
2007-08 0.29 6.50 0.35 14 0.00 12.50 0.26 2.00 35.00 9
2008-09 0.28 5.00 0.42 11 0.03 4.00 0.27 1.00 21.00 1
2009-10 0.35 10.00 0.42 11 0.00 12.50 0.22 6.00 39.50 10
2010-11 0.37 13.50 0.43 8 0.00 12.50 0.17 11.00 45.00 12
2011-12 0.37 13.50 0.42 11 0.00 12.50 0.20 7.50 44.50 11
2012-13 0.36 11.50 0.43 8 0.03 4.00 0.17 11.00 34.50 8
2013-14 0.36 11.50 0.63 1.5 0.00 12.50 0.19 9.00 34.50 8
Source: Computed from MS office
Table -5.6.6
Cadila Health Care Ltd.
Year Inventory to Current Assets
Debtors to Current
Assets
Loans and
Advances to
Current Assets
Cash and Bank to
Current Assets
Total Rank Ultimate
Rank
Rank(1) Rank(2) Rank(3) Rank(4) 1+2+3+4
1999-2K 0.12 1.00 0.06 14.5 0.01 10.00 0.11 15.00 40.50 12
2000-01 0.33 8.50 0.07 13 0.14 1.00 0.30 10.50 33.00 8
2001-02 0.27 5.00 0.06 14.5 0.01 10.00 0.55 1.00 30.50 7
2002-03 0.43 15.00 0.11 10 0.02 6.00 0.21 13.00 44.00 13
2003-04 0.36 12.00 0.12 6 0.06 2.50 0.18 14.00 34.50 10
2004-05 0.40 13.50 0.08 12 0.00 14.50 0.32 9.00 49.00 14
2005-06 0.34 10.50 0.11 10 0.00 14.50 0.36 5.50 40.50 12
2006-07 0.40 13.50 0.12 6 0.01 10.00 0.30 10.50 40.00 11
2007-08 0.33 8.50 0.12 6 0.01 10.00 0.36 5.50 30.00 6
2008-09 0.34 10.50 0.14 1 0.01 10.00 0.27 12.00 33.50 9
2009-10 0.32 7.00 0.13 2.5 0.01 10.00 0.33 8.00 27.50 5
2010-11 0.31 6.00 0.13 2.5 0.01 10.00 0.35 7.00 25.50 4
2011-12 0.25 2.50 0.12 6 0.06 2.50 0.40 4.00 15.00 1
2012-13 0.25 2.50 0.12 6 0.04 4.00 0.41 3.00 15.50 2
2013-14 0.26 4.00 0.11 10 0.03 5.00 0.43 2.00 21.00 3
Source: Computed from MS office
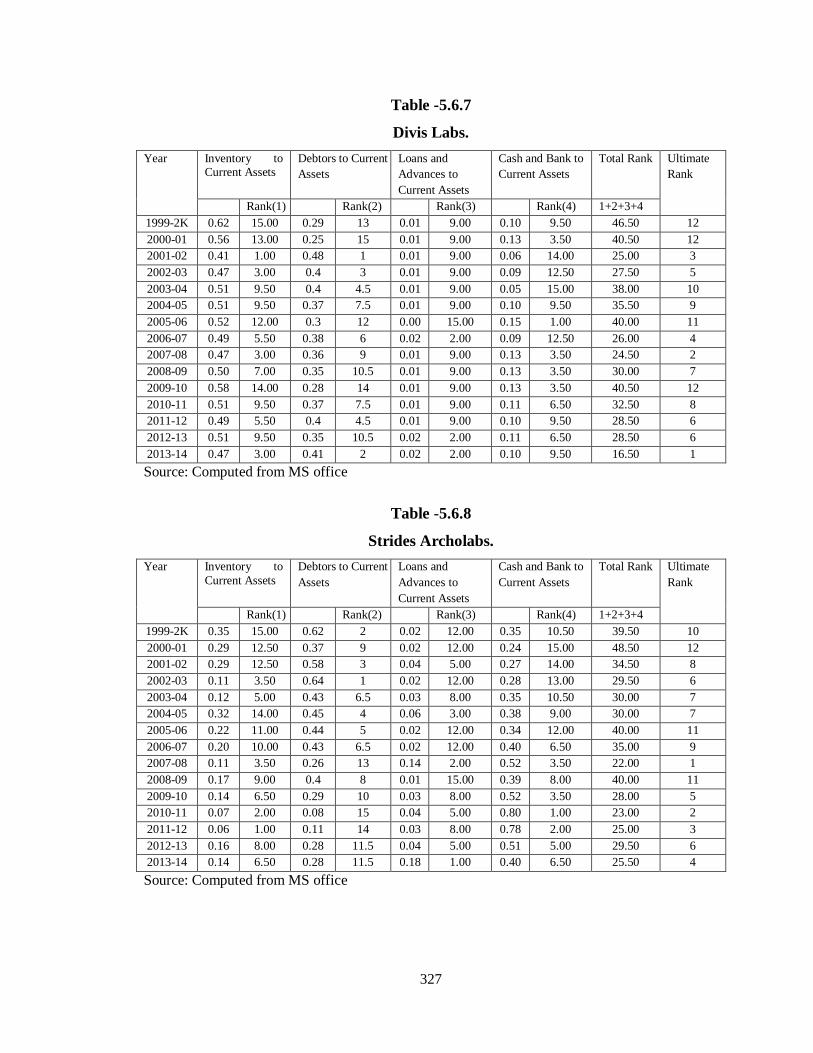
327
Table -5.6.7
Divis Labs.
Year Inventory to Current Assets
Debtors to Current
Assets
Loans and
Advances to
Current Assets
Cash and Bank to
Current Assets
Total Rank Ultimate
Rank
Rank(1) Rank(2) Rank(3) Rank(4) 1+2+3+4
1999-2K 0.62 15.00 0.29 13 0.01 9.00 0.10 9.50 46.50 12
2000-01 0.56 13.00 0.25 15 0.01 9.00 0.13 3.50 40.50 12
2001-02 0.41 1.00 0.48 1 0.01 9.00 0.06 14.00 25.00 3
2002-03 0.47 3.00 0.4 3 0.01 9.00 0.09 12.50 27.50 5
2003-04 0.51 9.50 0.4 4.5 0.01 9.00 0.05 15.00 38.00 10
2004-05 0.51 9.50 0.37 7.5 0.01 9.00 0.10 9.50 35.50 9
2005-06 0.52 12.00 0.3 12 0.00 15.00 0.15 1.00 40.00 11
2006-07 0.49 5.50 0.38 6 0.02 2.00 0.09 12.50 26.00 4
2007-08 0.47 3.00 0.36 9 0.01 9.00 0.13 3.50 24.50 2
2008-09 0.50 7.00 0.35 10.5 0.01 9.00 0.13 3.50 30.00 7
2009-10 0.58 14.00 0.28 14 0.01 9.00 0.13 3.50 40.50 12
2010-11 0.51 9.50 0.37 7.5 0.01 9.00 0.11 6.50 32.50 8
2011-12 0.49 5.50 0.4 4.5 0.01 9.00 0.10 9.50 28.50 6
2012-13 0.51 9.50 0.35 10.5 0.02 2.00 0.11 6.50 28.50 6
2013-14 0.47 3.00 0.41 2 0.02 2.00 0.10 9.50 16.50 1
Source: Computed from MS office
Table -5.6.8
Strides Archolabs.
Year Inventory to
Current Assets
Debtors to Current
Assets
Loans and
Advances to
Current Assets
Cash and Bank to
Current Assets
Total Rank Ultimate
Rank
Rank(1) Rank(2) Rank(3) Rank(4) 1+2+3+4
1999-2K 0.35 15.00 0.62 2 0.02 12.00 0.35 10.50 39.50 10
2000-01 0.29 12.50 0.37 9 0.02 12.00 0.24 15.00 48.50 12
2001-02 0.29 12.50 0.58 3 0.04 5.00 0.27 14.00 34.50 8
2002-03 0.11 3.50 0.64 1 0.02 12.00 0.28 13.00 29.50 6
2003-04 0.12 5.00 0.43 6.5 0.03 8.00 0.35 10.50 30.00 7
2004-05 0.32 14.00 0.45 4 0.06 3.00 0.38 9.00 30.00 7
2005-06 0.22 11.00 0.44 5 0.02 12.00 0.34 12.00 40.00 11
2006-07 0.20 10.00 0.43 6.5 0.02 12.00 0.40 6.50 35.00 9
2007-08 0.11 3.50 0.26 13 0.14 2.00 0.52 3.50 22.00 1
2008-09 0.17 9.00 0.4 8 0.01 15.00 0.39 8.00 40.00 11
2009-10 0.14 6.50 0.29 10 0.03 8.00 0.52 3.50 28.00 5
2010-11 0.07 2.00 0.08 15 0.04 5.00 0.80 1.00 23.00 2
2011-12 0.06 1.00 0.11 14 0.03 8.00 0.78 2.00 25.00 3
2012-13 0.16 8.00 0.28 11.5 0.04 5.00 0.51 5.00 29.50 6
2013-14 0.14 6.50 0.28 11.5 0.18 1.00 0.40 6.50 25.50 4
Source: Computed from MS office
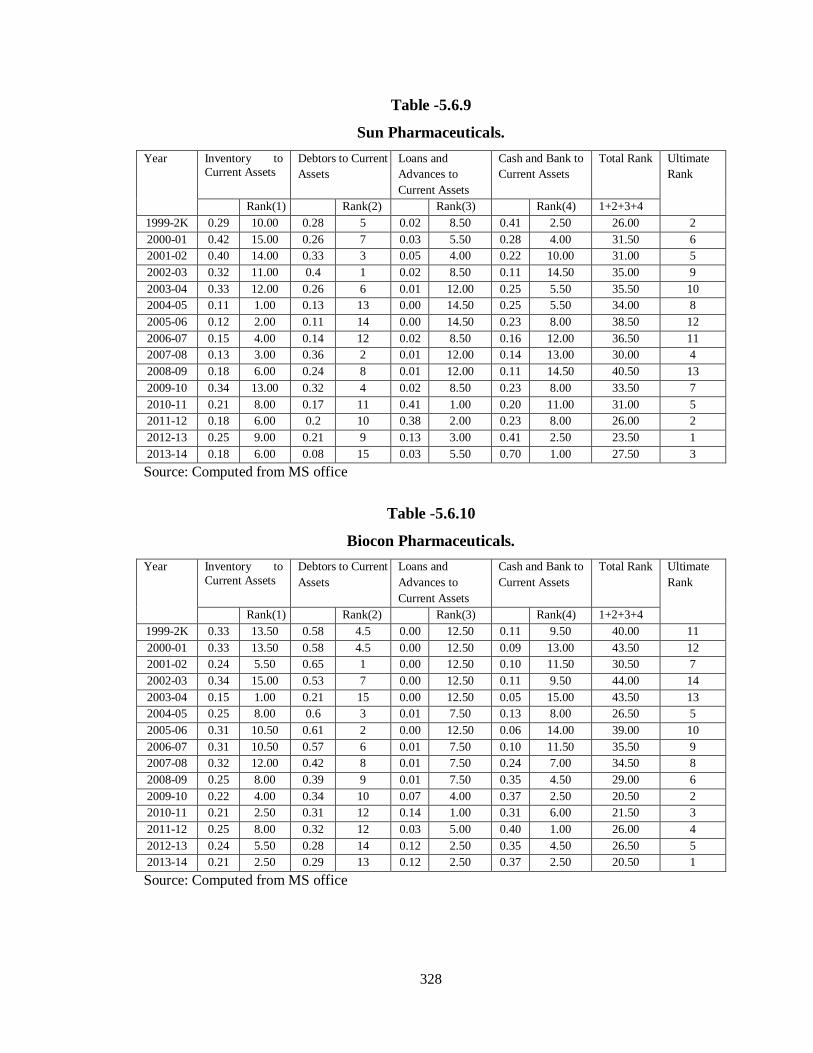
328
Table -5.6.9
Sun Pharmaceuticals.
Year Inventory to Current Assets
Debtors to Current
Assets
Loans and
Advances to
Current Assets
Cash and Bank to
Current Assets
Total Rank Ultimate
Rank
Rank(1) Rank(2) Rank(3) Rank(4) 1+2+3+4
1999-2K 0.29 10.00 0.28 5 0.02 8.50 0.41 2.50 26.00 2
2000-01 0.42 15.00 0.26 7 0.03 5.50 0.28 4.00 31.50 6
2001-02 0.40 14.00 0.33 3 0.05 4.00 0.22 10.00 31.00 5
2002-03 0.32 11.00 0.4 1 0.02 8.50 0.11 14.50 35.00 9
2003-04 0.33 12.00 0.26 6 0.01 12.00 0.25 5.50 35.50 10
2004-05 0.11 1.00 0.13 13 0.00 14.50 0.25 5.50 34.00 8
2005-06 0.12 2.00 0.11 14 0.00 14.50 0.23 8.00 38.50 12
2006-07 0.15 4.00 0.14 12 0.02 8.50 0.16 12.00 36.50 11
2007-08 0.13 3.00 0.36 2 0.01 12.00 0.14 13.00 30.00 4
2008-09 0.18 6.00 0.24 8 0.01 12.00 0.11 14.50 40.50 13
2009-10 0.34 13.00 0.32 4 0.02 8.50 0.23 8.00 33.50 7
2010-11 0.21 8.00 0.17 11 0.41 1.00 0.20 11.00 31.00 5
2011-12 0.18 6.00 0.2 10 0.38 2.00 0.23 8.00 26.00 2
2012-13 0.25 9.00 0.21 9 0.13 3.00 0.41 2.50 23.50 1
2013-14 0.18 6.00 0.08 15 0.03 5.50 0.70 1.00 27.50 3
Source: Computed from MS office
Table -5.6.10
Biocon Pharmaceuticals.
Year Inventory to
Current Assets
Debtors to Current
Assets
Loans and
Advances to
Current Assets
Cash and Bank to
Current Assets
Total Rank Ultimate
Rank
Rank(1) Rank(2) Rank(3) Rank(4) 1+2+3+4
1999-2K 0.33 13.50 0.58 4.5 0.00 12.50 0.11 9.50 40.00 11
2000-01 0.33 13.50 0.58 4.5 0.00 12.50 0.09 13.00 43.50 12
2001-02 0.24 5.50 0.65 1 0.00 12.50 0.10 11.50 30.50 7
2002-03 0.34 15.00 0.53 7 0.00 12.50 0.11 9.50 44.00 14
2003-04 0.15 1.00 0.21 15 0.00 12.50 0.05 15.00 43.50 13
2004-05 0.25 8.00 0.6 3 0.01 7.50 0.13 8.00 26.50 5
2005-06 0.31 10.50 0.61 2 0.00 12.50 0.06 14.00 39.00 10
2006-07 0.31 10.50 0.57 6 0.01 7.50 0.10 11.50 35.50 9
2007-08 0.32 12.00 0.42 8 0.01 7.50 0.24 7.00 34.50 8
2008-09 0.25 8.00 0.39 9 0.01 7.50 0.35 4.50 29.00 6
2009-10 0.22 4.00 0.34 10 0.07 4.00 0.37 2.50 20.50 2
2010-11 0.21 2.50 0.31 12 0.14 1.00 0.31 6.00 21.50 3
2011-12 0.25 8.00 0.32 12 0.03 5.00 0.40 1.00 26.00 4
2012-13 0.24 5.50 0.28 14 0.12 2.50 0.35 4.50 26.50 5
2013-14 0.21 2.50 0.29 13 0.12 2.50 0.37 2.50 20.50 1
Source: Computed from MS office
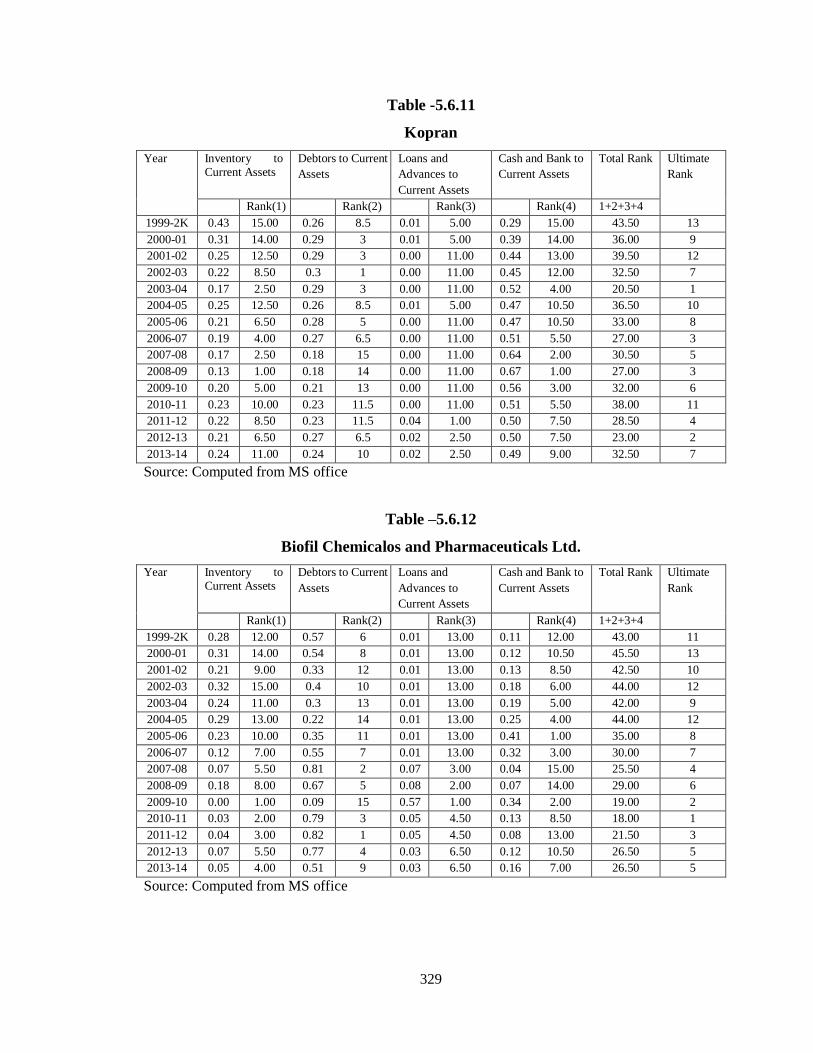
329
Table -5.6.11
Kopran
Year Inventory to Current Assets
Debtors to Current
Assets
Loans and
Advances to
Current Assets
Cash and Bank to
Current Assets
Total Rank Ultimate
Rank
Rank(1) Rank(2) Rank(3) Rank(4) 1+2+3+4
1999-2K 0.43 15.00 0.26 8.5 0.01 5.00 0.29 15.00 43.50 13
2000-01 0.31 14.00 0.29 3 0.01 5.00 0.39 14.00 36.00 9
2001-02 0.25 12.50 0.29 3 0.00 11.00 0.44 13.00 39.50 12
2002-03 0.22 8.50 0.3 1 0.00 11.00 0.45 12.00 32.50 7
2003-04 0.17 2.50 0.29 3 0.00 11.00 0.52 4.00 20.50 1
2004-05 0.25 12.50 0.26 8.5 0.01 5.00 0.47 10.50 36.50 10
2005-06 0.21 6.50 0.28 5 0.00 11.00 0.47 10.50 33.00 8
2006-07 0.19 4.00 0.27 6.5 0.00 11.00 0.51 5.50 27.00 3
2007-08 0.17 2.50 0.18 15 0.00 11.00 0.64 2.00 30.50 5
2008-09 0.13 1.00 0.18 14 0.00 11.00 0.67 1.00 27.00 3
2009-10 0.20 5.00 0.21 13 0.00 11.00 0.56 3.00 32.00 6
2010-11 0.23 10.00 0.23 11.5 0.00 11.00 0.51 5.50 38.00 11
2011-12 0.22 8.50 0.23 11.5 0.04 1.00 0.50 7.50 28.50 4
2012-13 0.21 6.50 0.27 6.5 0.02 2.50 0.50 7.50 23.00 2
2013-14 0.24 11.00 0.24 10 0.02 2.50 0.49 9.00 32.50 7
Source: Computed from MS office
Table –5.6.12
Biofil Chemicalos and Pharmaceuticals Ltd.
Year Inventory to Current Assets
Debtors to Current
Assets
Loans and
Advances to
Current Assets
Cash and Bank to
Current Assets
Total Rank Ultimate
Rank
Rank(1) Rank(2) Rank(3) Rank(4) 1+2+3+4
1999-2K 0.28 12.00 0.57 6 0.01 13.00 0.11 12.00 43.00 11
2000-01 0.31 14.00 0.54 8 0.01 13.00 0.12 10.50 45.50 13
2001-02 0.21 9.00 0.33 12 0.01 13.00 0.13 8.50 42.50 10
2002-03 0.32 15.00 0.4 10 0.01 13.00 0.18 6.00 44.00 12
2003-04 0.24 11.00 0.3 13 0.01 13.00 0.19 5.00 42.00 9
2004-05 0.29 13.00 0.22 14 0.01 13.00 0.25 4.00 44.00 12
2005-06 0.23 10.00 0.35 11 0.01 13.00 0.41 1.00 35.00 8
2006-07 0.12 7.00 0.55 7 0.01 13.00 0.32 3.00 30.00 7
2007-08 0.07 5.50 0.81 2 0.07 3.00 0.04 15.00 25.50 4
2008-09 0.18 8.00 0.67 5 0.08 2.00 0.07 14.00 29.00 6
2009-10 0.00 1.00 0.09 15 0.57 1.00 0.34 2.00 19.00 2
2010-11 0.03 2.00 0.79 3 0.05 4.50 0.13 8.50 18.00 1
2011-12 0.04 3.00 0.82 1 0.05 4.50 0.08 13.00 21.50 3
2012-13 0.07 5.50 0.77 4 0.03 6.50 0.12 10.50 26.50 5
2013-14 0.05 4.00 0.51 9 0.03 6.50 0.16 7.00 26.50 5
Source: Computed from MS office

330
Table –5.6.13
Ambalal Sarabhai Enterprises.
Year Inventory to Current Assets
Debtors to Current
Assets
Loans and
Advances to
Current Assets
Cash and Bank to
Current Assets
Total Rank Ultimate
Rank
Rank(1) Rank(2) Rank(3) Rank(4) 1+2+3+4
1999-2K 0.18 13.50 0.27 5.5 0.05 5.50 0.47 13.50 38.00 10
2000-01 0.20 15.00 0.26 7 0.03 9.50 0.49 10.50 42.00 12
2001-02 0.18 13.50 0.27 5.5 0.05 5.50 0.49 10.50 35.00 7
2002-03 0.14 11.00 0.32 3 0.02 13.00 0.50 9.00 36.00 8
2003-04 0.17 12.00 0.31 4 0.03 9.50 0.47 13.50 39.00 11
2004-05 0.13 9.50 0.33 2 0.02 13.00 0.48 12.00 36.50 9
2005-06 0.11 8.00 0.17 11 0.09 4.00 0.62 7.00 30.00 4
2006-07 0.07 6.00 0.18 10 0.02 13.00 0.71 5.00 34.00 6
2007-08 0.06 5.00 0.2 8 0.04 7.50 0.68 6.00 26.50 3
2008-09 0.13 9.50 0.36 1 0.11 1.00 0.31 15.00 26.50 3
2009-10 0.08 7.00 0.19 9 0.10 2.50 0.58 8.00 26.50 3
2010-11 0.01 1.50 0.16 12 0.04 7.50 0.76 4.00 25.00 2
2011-12 0.04 3.00 0.08 15 0.02 13.00 0.85 1.00 32.00 5
2012-13 0.05 4.00 0.1 13 0.02 13.00 0.82 2.00 32.00 5
2013-14 0.01 1.50 0.09 14 0.10 2.50 0.79 3.00 21.00 1
Source: Computed from MS office
Table -5.6.14
Parenteral Drugs (India) Ltd.
Year Inventory to Current Assets
Debtors to Current
Assets
Loans and
Advances to
Current Assets
Cash and Bank to
Current Assets
Total Rank Ultimate
Rank
Rank(1) Rank(2) Rank(3) Rank(4) 1+2+3+4
1999-2K 0.33 10.50 0.49 4.5 0.01 1.00 0.16 9.50 25.50 4
2000-01 0.26 3.00 0.59 1 0.02 8.00 0.12 14.00 26.00 5
2001-02 0.32 8.50 0.49 4.5 0.01 1.00 0.16 9.50 23.50 2
2002-03 0.34 13.00 0.51 3 0.00 14.00 0.15 11.50 41.50 14
2003-04 0.34 13.00 0.52 2 0.00 14.00 0.13 13.00 42.00 15
2004-05 0.33 10.50 0.48 6 0.00 14.00 0.19 5.50 36.00 13
2005-06 0.31 6.50 0.47 9 0.02 8.00 0.19 5.50 29.00 9
2006-07 0.30 5.00 0.47 9 0.02 8.00 0.15 11.50 33.50 11
2007-08 0.27 4.00 0.4 13.5 0.03 4.00 0.18 7.00 28.50 8
2008-09 0.34 13.00 0.4 13.5 0.03 4.00 0.20 4.00 34.50 12
2009-10 0.31 6.50 0.47 9 0.03 4.00 0.17 8.00 27.50 6
2010-11 0.36 15.00 0.47 9 0.01 1.00 0.22 3.00 28.00 7
2011-12 0.32 8.50 0.4 13.5 0.04 1.00 0.23 2.00 25.00 3
2012-13 0.22 1.00 0.4 13.5 0.03 4.00 0.27 1.00 19.50 1
2013-14 0.24 2.00 0.47 9 0.03 4.00 0.11 15.00 30.00 10
Source: Computed from MS office
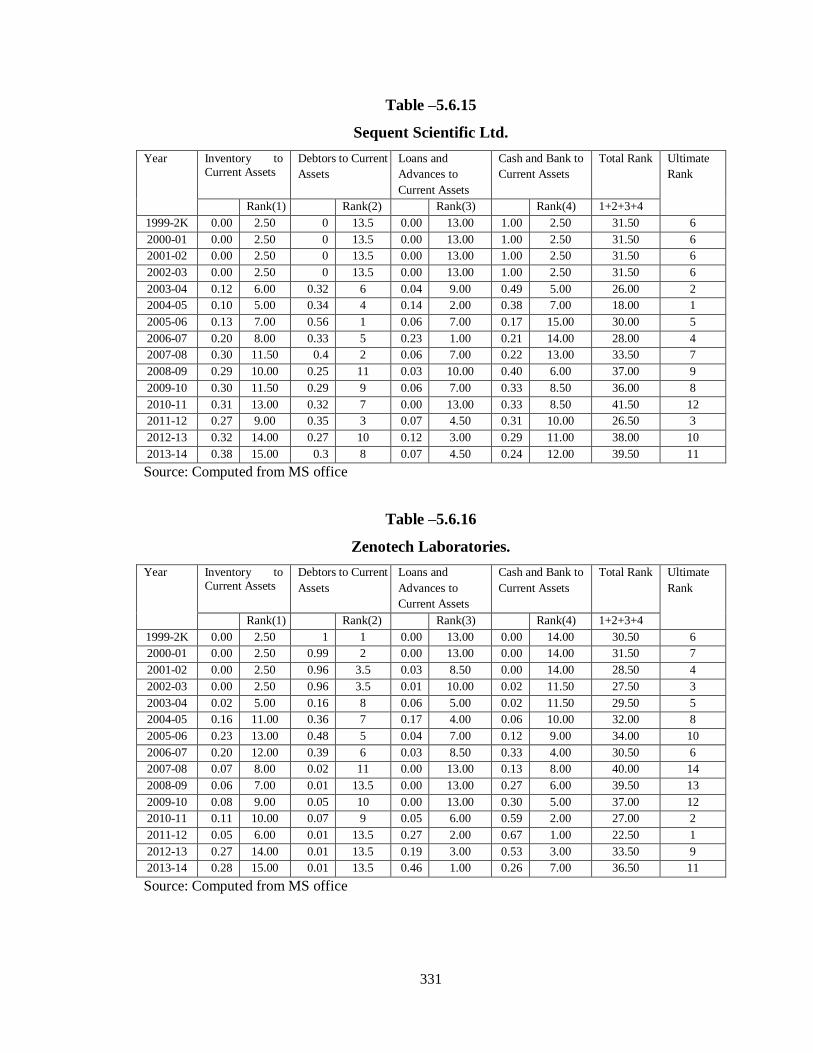
331
Table –5.6.15
Sequent Scientific Ltd.
Year Inventory to Current Assets
Debtors to Current
Assets
Loans and
Advances to
Current Assets
Cash and Bank to
Current Assets
Total Rank Ultimate
Rank
Rank(1) Rank(2) Rank(3) Rank(4) 1+2+3+4
1999-2K 0.00 2.50 0 13.5 0.00 13.00 1.00 2.50 31.50 6
2000-01 0.00 2.50 0 13.5 0.00 13.00 1.00 2.50 31.50 6
2001-02 0.00 2.50 0 13.5 0.00 13.00 1.00 2.50 31.50 6
2002-03 0.00 2.50 0 13.5 0.00 13.00 1.00 2.50 31.50 6
2003-04 0.12 6.00 0.32 6 0.04 9.00 0.49 5.00 26.00 2
2004-05 0.10 5.00 0.34 4 0.14 2.00 0.38 7.00 18.00 1
2005-06 0.13 7.00 0.56 1 0.06 7.00 0.17 15.00 30.00 5
2006-07 0.20 8.00 0.33 5 0.23 1.00 0.21 14.00 28.00 4
2007-08 0.30 11.50 0.4 2 0.06 7.00 0.22 13.00 33.50 7
2008-09 0.29 10.00 0.25 11 0.03 10.00 0.40 6.00 37.00 9
2009-10 0.30 11.50 0.29 9 0.06 7.00 0.33 8.50 36.00 8
2010-11 0.31 13.00 0.32 7 0.00 13.00 0.33 8.50 41.50 12
2011-12 0.27 9.00 0.35 3 0.07 4.50 0.31 10.00 26.50 3
2012-13 0.32 14.00 0.27 10 0.12 3.00 0.29 11.00 38.00 10
2013-14 0.38 15.00 0.3 8 0.07 4.50 0.24 12.00 39.50 11
Source: Computed from MS office
Table –5.6.16
Zenotech Laboratories.
Year Inventory to Current Assets
Debtors to Current
Assets
Loans and
Advances to
Current Assets
Cash and Bank to
Current Assets
Total Rank Ultimate
Rank
Rank(1) Rank(2) Rank(3) Rank(4) 1+2+3+4
1999-2K 0.00 2.50 1 1 0.00 13.00 0.00 14.00 30.50 6
2000-01 0.00 2.50 0.99 2 0.00 13.00 0.00 14.00 31.50 7
2001-02 0.00 2.50 0.96 3.5 0.03 8.50 0.00 14.00 28.50 4
2002-03 0.00 2.50 0.96 3.5 0.01 10.00 0.02 11.50 27.50 3
2003-04 0.02 5.00 0.16 8 0.06 5.00 0.02 11.50 29.50 5
2004-05 0.16 11.00 0.36 7 0.17 4.00 0.06 10.00 32.00 8
2005-06 0.23 13.00 0.48 5 0.04 7.00 0.12 9.00 34.00 10
2006-07 0.20 12.00 0.39 6 0.03 8.50 0.33 4.00 30.50 6
2007-08 0.07 8.00 0.02 11 0.00 13.00 0.13 8.00 40.00 14
2008-09 0.06 7.00 0.01 13.5 0.00 13.00 0.27 6.00 39.50 13
2009-10 0.08 9.00 0.05 10 0.00 13.00 0.30 5.00 37.00 12
2010-11 0.11 10.00 0.07 9 0.05 6.00 0.59 2.00 27.00 2
2011-12 0.05 6.00 0.01 13.5 0.27 2.00 0.67 1.00 22.50 1
2012-13 0.27 14.00 0.01 13.5 0.19 3.00 0.53 3.00 33.50 9
2013-14 0.28 15.00 0.01 13.5 0.46 1.00 0.26 7.00 36.50 11
Source: Computed from MS office
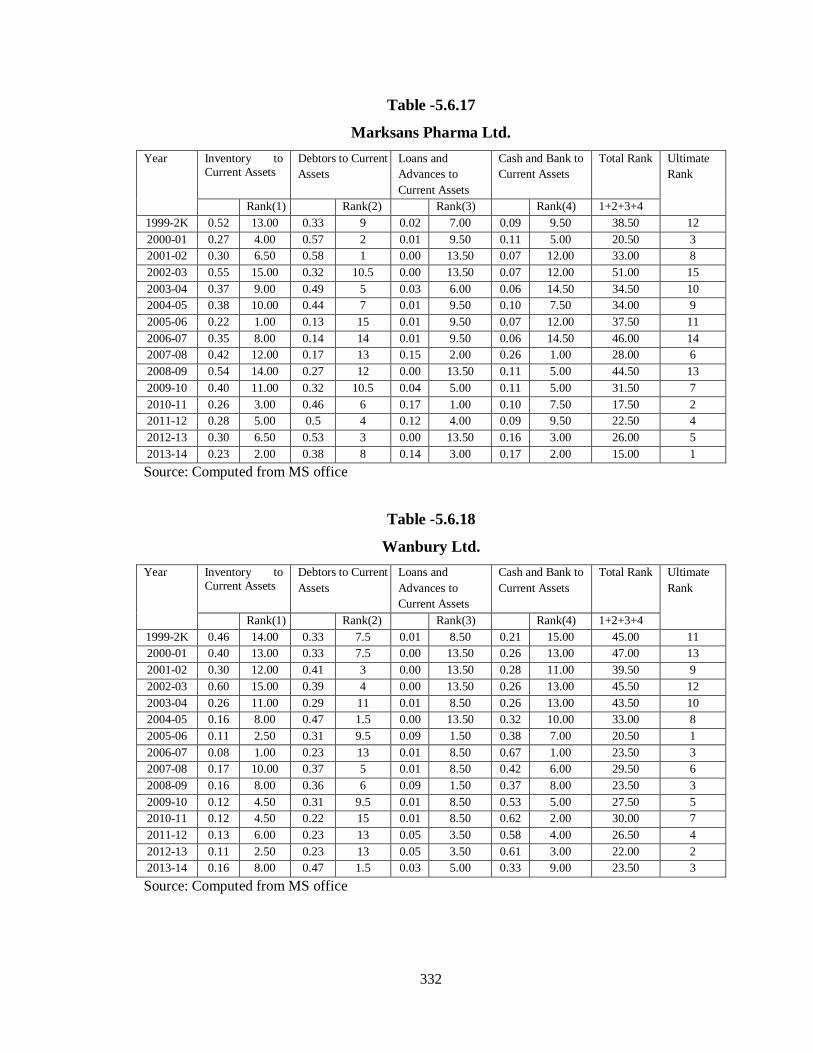
332
Table -5.6.17
Marksans Pharma Ltd.
Year Inventory to Current Assets
Debtors to Current
Assets
Loans and
Advances to
Current Assets
Cash and Bank to
Current Assets
Total Rank Ultimate
Rank
Rank(1) Rank(2) Rank(3) Rank(4) 1+2+3+4
1999-2K 0.52 13.00 0.33 9 0.02 7.00 0.09 9.50 38.50 12
2000-01 0.27 4.00 0.57 2 0.01 9.50 0.11 5.00 20.50 3
2001-02 0.30 6.50 0.58 1 0.00 13.50 0.07 12.00 33.00 8
2002-03 0.55 15.00 0.32 10.5 0.00 13.50 0.07 12.00 51.00 15
2003-04 0.37 9.00 0.49 5 0.03 6.00 0.06 14.50 34.50 10
2004-05 0.38 10.00 0.44 7 0.01 9.50 0.10 7.50 34.00 9
2005-06 0.22 1.00 0.13 15 0.01 9.50 0.07 12.00 37.50 11
2006-07 0.35 8.00 0.14 14 0.01 9.50 0.06 14.50 46.00 14
2007-08 0.42 12.00 0.17 13 0.15 2.00 0.26 1.00 28.00 6
2008-09 0.54 14.00 0.27 12 0.00 13.50 0.11 5.00 44.50 13
2009-10 0.40 11.00 0.32 10.5 0.04 5.00 0.11 5.00 31.50 7
2010-11 0.26 3.00 0.46 6 0.17 1.00 0.10 7.50 17.50 2
2011-12 0.28 5.00 0.5 4 0.12 4.00 0.09 9.50 22.50 4
2012-13 0.30 6.50 0.53 3 0.00 13.50 0.16 3.00 26.00 5
2013-14 0.23 2.00 0.38 8 0.14 3.00 0.17 2.00 15.00 1
Source: Computed from MS office
Table -5.6.18
Wanbury Ltd.
Year Inventory to Current Assets
Debtors to Current
Assets
Loans and
Advances to
Current Assets
Cash and Bank to
Current Assets
Total Rank Ultimate
Rank
Rank(1) Rank(2) Rank(3) Rank(4) 1+2+3+4
1999-2K 0.46 14.00 0.33 7.5 0.01 8.50 0.21 15.00 45.00 11
2000-01 0.40 13.00 0.33 7.5 0.00 13.50 0.26 13.00 47.00 13
2001-02 0.30 12.00 0.41 3 0.00 13.50 0.28 11.00 39.50 9
2002-03 0.60 15.00 0.39 4 0.00 13.50 0.26 13.00 45.50 12
2003-04 0.26 11.00 0.29 11 0.01 8.50 0.26 13.00 43.50 10
2004-05 0.16 8.00 0.47 1.5 0.00 13.50 0.32 10.00 33.00 8
2005-06 0.11 2.50 0.31 9.5 0.09 1.50 0.38 7.00 20.50 1
2006-07 0.08 1.00 0.23 13 0.01 8.50 0.67 1.00 23.50 3
2007-08 0.17 10.00 0.37 5 0.01 8.50 0.42 6.00 29.50 6
2008-09 0.16 8.00 0.36 6 0.09 1.50 0.37 8.00 23.50 3
2009-10 0.12 4.50 0.31 9.5 0.01 8.50 0.53 5.00 27.50 5
2010-11 0.12 4.50 0.22 15 0.01 8.50 0.62 2.00 30.00 7
2011-12 0.13 6.00 0.23 13 0.05 3.50 0.58 4.00 26.50 4
2012-13 0.11 2.50 0.23 13 0.05 3.50 0.61 3.00 22.00 2
2013-14 0.16 8.00 0.47 1.5 0.03 5.00 0.33 9.00 23.50 3
Source: Computed from MS office

333
Table -5.6.19
Morepen Labs.
Year Inventory to Current Assets
Debtors to Current
Assets
Loans and
Advances to
Current Assets
Cash and Bank to
Current Assets
Total Rank Ultimate
Rank
Rank(1) Rank(2) Rank(3) Rank(4) 1+2+3+4
1999-2K 0.22 6.50 0.29 9 0.24 2.00 0.16 11.00 28.50 5
2000-01 0.22 6.50 0.28 11 0.23 3.00 0.16 11.00 31.50 6
2001-02 0.26 8.00 0.32 4 0.11 7.00 0.20 7.50 26.50 4
2002-03 0.18 4.50 0.29 9 0.16 5.00 0.29 4.00 22.50 2
2003-04 0.18 4.50 0.3 7 0.18 4.00 0.37 3.00 18.50 1
2004-05 0.12 1.00 0.21 13.5 0.11 7.00 0.55 1.00 22.50 2
2005-06 0.13 2.00 0.21 13.5 0.11 7.00 0.54 2.00 24.50 3
2006-07 0.16 3.00 0.09 15 0.64 1.00 0.11 15.00 34.00 7
2007-08 0.43 12.00 0.26 12 0.03 13.00 0.27 5.00 42.00 12
2008-09 0.37 10.00 0.31 5.5 0.06 10.00 0.24 6.00 31.50 6
2009-10 0.47 15.00 0.31 5.5 0.01 15.00 0.20 7.50 43.00 13
2010-11 0.44 13.50 0.36 3 0.01 14.00 0.16 11.00 41.50 11
2011-12 0.44 13.50 0.37 2 0.05 11.50 0.14 13.00 40.00 10
2012-13 0.41 11.00 0.41 1 0.05 11.50 0.12 14.00 37.50 9
2013-14 0.33 9.00 0.29 9 0.08 9.00 0.19 9.00 36.00 8
Source: Computed from MS office
Table -5.6.20
Hiran Orgochem Ltd.
Year Inventory to Current Assets
Debtors to Current
Assets
Loans and
Advances to
Current Assets
Cash and Bank to
Current Assets
Total Rank Ultimate
Rank
Rank(1) Rank(2) Rank(3) Rank(4) 1+2+3+4
1999-2K 0.68 11.00 0.10 14.5 0.01 9.00 0.03 15.00 49.50 14
2000-01 0.77 15.00 0.11 13 0.02 3.50 0.36 8.00 39.50 10
2001-02 0.68 11.00 0.20 7.5 0.01 9.00 0.05 14.00 41.50 12
2002-03 0.61 7.00 0.38 2 0.00 14.50 0.13 10.50 34.00 7
2003-04 0.51 6.00 0.27 5 0.02 3.50 0.06 13.00 27.50 6
2004-05 0.47 5.00 0.43 1 0.01 9.00 0.13 10.50 25.50 5
2005-06 0.64 9.00 0.28 3.5 0.00 14.50 0.11 12.00 39.00 9
2006-07 0.70 13.00 0.19 9 0.01 9.00 0.40 7.00 38.00 8
2007-08 0.12 3.00 0.16 11 0.01 9.00 0.82 1.00 24.00 4
2008-09 0.68 11.00 0.14 12 0.01 9.00 0.16 9.00 41.00 11
2009-10 0.11 2.00 0.21 6 0.01 9.00 0.75 2.00 19.00 3
2010-11 0.07 1.00 0.18 10 0.54 1.00 0.54 4.00 16.00 1
2011-12 0.19 4.00 0.20 7.5 0.37 2.00 0.55 3.00 16.50 2
2012-13 0.62 8.00 0.28 3.5 0.01 9.00 0.43 5.00 25.50 5
2013-14 0.74 14.00 0.10 14.5 0.01 9.00 0.41 6.00 43.50 13
Source: Computed from MS office
334
CHAPTER-6
SUMMARY AND CONCLUSIONS
Working capital means the capital which is required for day to day operation of the
business. It is a vital factor in business operations. Every firm must have requisite level of
working capital in order to run its business wheel smoothly. The working capital of a firm
should neither excessive nor inadequate. Both excess and inadequate level of working
capital may hurt profitability. A proper balance between these two extreme situations
should therefore be maintained for efficient operation of business and this can be done by
the efficient working capital management. Thus, the need for proper working capital
management cannot be ignored.
After in depth analysis of exixting literature it is found that, no comprehensive effort has
so far been made to study the working capital management of the Indian pharmaceutical
companies. Thus, the existing literature has failed to make an in-depth analysis of the
status of Indian pharmaceutical companies in respect of the working capital management
during the study period. The present study has endevour to bridge the gap.
The objective of the study was to assess the performance of working capital management
of some selected pharmaceutical companies in India. While conducting this study twenty
companies, enlisted in BSE, were chosen on the basis of average net profit for last fifteen
years ( 1999-2000 to 2013-2014). Among these twenty pharmaceutical companies, ten
were top earning and ten were loss making. The study period was fifteen years i.e. 1999-
2000 to 2013-2014. The data were collected from the annual reports of the selected
companies. Various statistical tools and techniques were used in the present study to
assess the working capital management of the selected companies. Trend analysis of
different components of working capital were done using log linear equation, logYt =
a+bt or parabolic equation logYt = a+bt+ ct2, which ever was best fitted. Ratio analysis
was done to measure liquidity, profitability and efficiency position of the selected
335
companies. Principal component was done to identify the leading factor of liquidity,
profitability and efficiency. Motaal test for liquidity was also done.
The parameters considered for evaluating the Working Capital Management are (i)
Inventory, (ii) Debtors, (iii) Cash, (iv)Loans and Advances, (v) Creditors, (vi) Current
liabilities and provisions, (VI) Total Current Assets, (vii) Net Working Capital. While
making such comparison on the basis of growth of these components, the following
comments can be made:
6.1. Findings
6.1.1. Trend Analysis:
From the trend analysis of inventory component, it is found that in sixteen out
of twenty cases of the selected companies maintained their inventory growth at
increasing rate during the study period. In most cases, it was significant at or
below 5% probability level. It is also observed that in fifteen cases (out of sixteen
cases whose inventory was significantly increasing) the inventory was increasing
at a decreasing rate and most of them were significant at 5% probability level. In
three cases no trend is found. However, in most of the selected companies,
inventory was one important component of working capital and it increased at a
decreasing rate.
The trend analysis of debtor component showed that in seventeen out of twenty
cases of the selected companies maintained their growth rate of debtors was
increasing during the period. In most cases, it was significant at or below 5%
probability level. It is also observed that in fourteen cases (out of seventeen cases
whose debtor was significantly increasing) the debtor was increasing at a
decreasing rate and most of them were significant at 5% probability level.
However, in most of the selected companies, debtor, is one of the most important
component of working capital, increased at a decreasing rate
The growth analysis of cash and bank reflected that in fifteen out of twenty
cases of the selected companies maintained their cash and bank growth at
336
increasing rate during the period. In most cases, it was significant at or below 5%
probability level. It is also observed that in ten cases (out of fifteen cases whose
cash and bank was significantly increasing) the cash and bank was increasing at a
decreasing rate and most of them were significant at 5% probability level.
However, in most of the selected companies, cash and bank is one important
component of liquidity, increased at a decreasing rate.
The trend analysis of loans and advances showed that in seventeen out of
twenty cases of the selected companies maintained their loans and advances
growth at increasing rate during the period. In most cases, it was significant at or
below 5% probability level. It is also observed that in eleven cases (out of
seventeen cases whose loans and advances was significantly increasing) the loans
and advances was increasing at a decreasing rate and most of them were
significant at 5% probability level. However, in most of the selected companies,
loans and advances is one of the most important component of current assets,
increased at a decreasing rate.
The trend analysis of creditor showed that in all of the selected companies
maintained their creditors growth at increasing rate during the period. In most
cases, it was significant at or below 5% probability level. It is also observed that
in fifteen cases (out of all twenty cases whose creditor was significantly
increasing), the creditor was increasing at a decreasing rate and most of them
were statistically significant at 5% probability level. However, in most of the
selected companies, creditors is one of the most important component of net
current assets, increased at a decreasing rate.
From the trend analysis of current liabilities and provisions showed that in all
of the selected companies maintained their current liabilities and provisions
growth at increasing rate during the period. In most cases, it was significant at or
below 5% probability level. It is also observed that in twelve cases (out of all
twenty cases whose current liabilities and provisions was significantly
increasing), the current liabilities and provisions had increased at a decreasing rate
and most of them were statistically significant at 5% probability level. However,

337
in most of the selected companies, current liabilities and provisions is one most
important component of net working capital, increased at a decreasing rate.
The trend analysis of current assets stated that in seventeen out of twenty cases
of the selected companies maintained their current assets growth at increasing rate
during the period. In most cases, it was significant at or below 5% probability
level. It is also observed that in fourteen cases (out of seventeen cases whose
current assets was significantly increasing), the current assets was increasing at a
decreasing rate and most of them were statistically significant at 5% probability
level. However, in most of the selected companies, current assets, the gross
working capital as a whole is increased at a decreasing rate.
The trend analysis of net working capital signified that in seventeen out of
twenty cases of the selected companies maintained their net working capital
growth at increasing rate during the period. In most cases, it was significant at or
below 5% probability level. It is also observed that in thirteen cases (out of
seventeen cases whose net working capital was significantly increasing), net
working capital was increasing at a decreasing rate and most of them were
statistically significant at 5% probability level. In four cases no trend is found.
However, in most of the selected companies, the net working capital as a whole,
increased at a decreasing rate.
A. From accounting point of view, ratio analysis was done on the performance
parameters of the selected pharmaceutical companies. All these ratios had been
grouped for (i) liquidity analysis (ii) profitability analysis (iii) efficiency analysis
(iv) working capital component wise analysis and (v) working capital leverage.
6.1.2. LIQUIDITY ANALYSIS:
The liquidity of the selected companies has been analyzed by using current ratio,
quick ratio and absolute liquid ratio. These ratios of the companies under study were
compared with their accepted standard norms. While making such comparison on the
basis of mean of these ratios, the following comments can be made.
338
The analysis of CR shows that in one out of twenty cases of the selected
companies maintained their CR at a level below the conventional standard of 2:1
during the period under study while in the remaining nineteen cases the average
CR values were higher as compared to the standard norms of 2:1 during the same
period. It reveals that in 95 percent of the selected companies the liquidity reached
satisfactory level whereas in the remaining 5 per cent cases it was not at all
satisfactory. It implies that the most of the companies under study were able to
prove themselves as good performers in terms of their short term debt paying
capability. The average CR of all the selected companies was 8.52 during the
study period. The average CR maintained by the selected companies whose
average net profit was positive was 3.56 whereas the average CR of the selected
companies whose average net profits were negative was 13.48 during the study
period.
The Quick ratio of the selected companies exhibit that out of twenty companies,
seventeen companies were higher than conventional standard norms whereas only
in three cases (one of profit making and two of loss making), the values of QR
were at a level less than the conventional standard norms of 1:1. It indicated that
in most of the sample companies (85 per cent), the immediate debt paying
capability was satisfactory throughout the study period. Thus, the net outcome
obtained from the analysis of CR properly matches with that obtained from the
analysis of QR during the study period. The average QR of all the selected
companies was 7.28 during the study period. The average QR maintained by the
selected companies whose average net profit was positive was 1.96 whereas the
average QR of the selected companies whose average net profits were negative
was 12.61 during the study period.
The Absolute liquid ratio of the selected companies exhibited that out of twenty
companies absolute liquid ratios, five companies absolute liquid ratios were find
to place in the above conventional standard norms, whereas only in fifteen cases,
the values of absolute liquid ratios were at a level less than the conventional
standard norms of 0.5:1. It indicates that in most of the sample companies (75 per
cent), the spot debt paying capability was not satisfactory throughout the study
339
period. Thus, the net outcome obtained from the analysis of CR and QR were not
properly matches with that obtained from the analysis of absolute liquid ratio
during the study period. The average absolute liquid ratio of all the selected
companies was 0.48 during the study period. The average absolute liquid ratio
maintained by the selected companies whose average net profit was positive was
0.41 whereas the average absolute liquid ratio of the selected companies whose
average net profits were negative was 0.55 during the study period.
6.1.3. PROFITABILITY ANALYSIS:
The profitability of the selected companies was analyzed during the period under
study by using gross profit ratio, net profit ratios and return on capital employed.
These ratios of the companies under study were compared with the industry average.
While making such comparison on the basis of mean of these ratios, the following
comments can be made.
The gross profit ratio of the selected companies exhibits that out of twenty
companies gross profit ratios, fourteen companies gross profit ratios were above
average whereas remaining six companies gross profit ratios were less than the
average. It indicates that in most of the sample companies (70 per cent) the gross
profit ratio was above average of the selected samples throughout the study
period. The average gross profit ratio of the selected samples taken as a whole
was -3.30 during the period under study. The average gross profit ratio
maintained by the selected companies whose average net profits were positive
was 34.87% whereas the average gross profit ratio of the selected companies
whose average net profits were negative was -41.47% during the study period.
The net profit ratio of the selected companies reflects that out of twenty
companies net profit ratios, ten companies net profit ratios were above average
whereas remaining ten companies net profit ratios were less than the average. It
indicates that in half of the sample companies (50 per cent) the net profit ratio was
not satisfactory throughout the study period. The average net profit ratio of the
selected samples taken as a whole was -0.52 during the period under study. The
average net profit ratio maintained by the selected companies whose average net
340
profits were positive was 17.20% whereas the average net profit ratio of the
selected companies whose average net profits were negative was -18.24% during
the study period.
The Return on capital employed (ROCE) of the selected companies exhibits that
out of twenty companies Return on capital employed, fourteen companies Return
on capital employed were above average whereas remaining six companies
Return on capital employed were less than the average. It indicates that in most of
the sample companies (70 per cent) the Return on capital employed was
satisfactory throughout the study period. The average Return on capital employed
of the selected samples taken as a whole was 7.39 during the period under study.
The average Return on capital employed maintained by the selected companies
whose average net profits were positive was 19.20% whereas the average Return
on capital employed of the selected companies whose average net profits were
negative was -2.80% during the study period.
6.1.4. EFFICIENCY ANALYSIS:
The efficiency position of the selected companies has been analyzed by using some
traditional efficiency ratios such as inventory turnover ratio, debtors turnover ratios,
cash turnover ratios, creditors turnover ratios and working capital turnover ratios.
These ratios of the companies under study were compared with their industry
average. While making such comparison on the basis of mean of these ratios, the
following comments can be made.
The inventory turnover ratio of the selected companies exhibits that out of
twenty inventory turnover ratios, five companies inventory turnover ratios were
above average of the selected companies whereas remaining fifteen cases, the
values of inventory turnover ratios were at a level less than the average of the
selected companies. It indicates that in most of the sample companies (75 per
cent) the inventory turnover was not satisfactory throughout the study period. The
average inventory turnover ratio of all the selected companies was 5.54 times
during the study period. The average inventory turnover ratio of the selected
341
samples taken as a whole was 5.53during the period under study. The average
inventory turnover ratio maintained by the selected companies whose average net
profit was positive was 3.96 times whereas the average inventory turnover ratio of
the selected companies whose average net profits were negative was 7.12 times
during the study period.
The debtors turnover ratio of the selected companies exhibits that out of twenty
companies debtors turnover ratios, eight companies debtors turnover ratios were
above average whereas remaining twelve cases, the values of debtors turnover
ratios were less than the average. It indicates that in most of the sample
companies (60 per cent) the debtors turnover was not satisfactory throughout the
study period. The average debtors turnover ratio of all the selected companies was
4.37 times during the study period. The average debtors turnover ratio maintained
by the selected companies whose average net profit was positive was 4.33 times
whereas the average debtors turnover ratio of the selected companies whose
average net profits were negative was 4.40 times during the study period.
The cash turnover ratio of the selected companies exhibits that out of twenty
companies cash turnover ratios, eight companies cash turnover ratios were above
average whereas remaining twelve companies cash turnover ratios were less than
the average. It indicates that in most of the sample companies (60 per cent) the
cash turnover was not satisfactory throughout the study period. The average cash
turnover ratio of the selected samples taken as a whole was 60.80 during the study
period. The average Cash turnover ratio maintained by the selected companies
whose average net profit was positive was 67.13 times whereas the average Cash
turnover ratio of the selected companies whose average net profits were negative
was 46.15 times during the study period.
The working capital turnover ratio of the selected companies exhibits that out of
selected twenty companies working capital turnover ratios, nine working capital
turnover ratios were above average whereas remaining eleven companies working
capital turnover ratios were less than the average. It indicates that in most of the
sample companies (55 per cent) the working capital turnover was not satisfactory
throughout the study period. The average working capital turnover ratio of the
342
selected samples taken as a whole was 2.27 during the period under study. The
average Working Capital turnover ratio maintained by the selected companies
whose average net profit was positive was 2.71 times whereas the average
Working Capital turnover ratio of the selected companies whose average net
profits were negative was 1.82 times during the study period.
The study of creditors turnover ratio of the selected companies exhibits that out of
twenty companies creditors turnover ratios, ten companies creditors turnover
ratios were above average whereas remaining ten companies creditors turnover
ratios were less than the average. It indicates that in half of the sample companies
(50 per cent) the creditors turnover was not satisfactory throughout the study
period. The average creditors turnover ratio of the selected samples taken as a
whole was 2.79 during the period under study. The average creditors turnover
ratio maintained by the selected companies whose average net profit was positive
was 2.88 times whereas the average creditors turnover ratio of the selected
companies whose average net profits were negative was 2.70 times during the
study period.
6.1.5. COMPONENT WISE WORKING CAPITAL POSITION ANALYSIS:
The component of working capital of the selected companies was analyzed during
the period of study by current assets to total assets, inventory to current assets,
debtors to current assets, cash to current assets, loans and advances to current assets
and creditors to current assets. These ratios of the companies under study were
compared with their industry average. While making such comparison on the basis of
mean of these ratios, the following comments can be made.
The Current assets to total assets ratio (CATA) of the selected companies exhibit
that out of twenty companies Current assets to total assets ratios, eleven
companies Current assets to total assets ratios were above average whereas
remaining nine companies Current assets to total assets ratios were less than the
average. It indicates that in this ratio half (near about) of the sample companies
(55 per cent) the Current assets to total assets ratios was satisfactory throughout
the study period. The average Current asset to total assets ratios of the selected

343
samples taken as a whole was 0.48 during the period under study. The average
Current assets to total assets ratios maintained by the selected companies whose
average net profits were positive was 0.50 whereas the average Current assets to
total assets ratios of the selected companies whose average net profits were
negative was 0.46 during the study period.
The inventory to current assets ratios of the selected companies exhibits that out
of twenty companies inventory to current assets reatios, ten companies inventory
to current assets ratios were above average whereas remaining ten companies
inventory to current assets ratios were less than the average. It indicates that in
half of the sample companies (50 per cent) the inventory to current assets ratios
was satisfactory throughout the study period. The average inventory to current
assets ratios of the selected samples taken as a whole was 0.27 during the period
under study. The average inventory to current assets ratios maintained by the
selected companies whose average net profits were positive was 0.29 whereas the
average inventory to current assets ratio of the selected companies whose average
net profits were negative was 0.25 during the study period.
The debtors to current assets ratios of the selected companies exhibits that out of
twenty companies debtors to current assets ratios, eleven companies debtors to
current assets ratios were above average whereas remaining nine companies
debtors to current assets ratios were less than the average. It indicates that in half
of the sample companies (45 per cent) the debtors to current assets ratios was
below the average of the selected companies throughout the study period. The
average debtors to current assets ratio of the selected samples taken as a whole
were 0.33during the period under study. The average debtors to current assets
ratio maintained by the selected companies whose average net profits were
positive was 0.34 whereas the average debtors to current assets ratio of the
selected companies whose average net profits were negative was 0.32 during the
study period.
The cash to current assets ratios of the selected companies exhibits that out of
twenty companies cash to current assets ratios, nine companies cash to current
assets ratios were above average whereas remaining eleven companies cash to
344
current assets ratios were less than the average. It indicates that in half of the
sample companies (55 per cent) the cash and bank to current assets ratios was
below the average of the selected companies throughout the study period. The
average cash and bank to current assets ratio of the selected samples taken as a
whole was 0.0432 during the period under study. The average cash and bank to
current assets ratio maintained by the selected companies whose average net
profits were positive was 0.0569 whereas the average cash and bank to current
assets ratio of the selected companies whose average net profits were negative
was 0.029 during the study period.
The loans and advances to current assets ratios of the selected companies exhibits
that out of twenty companies loans and advances to current assets ratios, eight
companies loans and advances to current assets ratios were above average
whereas remaining twelve companies loans and advances to current assets ratios
were less than the average. It indicates that in less than half of the sample
companies (40per cent) the loans and advances to current assets ratios were above
the average of the selected companies throughout the study period. The average
loans and advances to current assets ratios of the selected samples taken as a
whole were 0.30 during the period under study. The average loans and advances
to current assets ratios maintained by the selected companies whose average net
profits were positive was 0.281 whereas the average loans and advances to current
assets ratios of the selected companies whose average net profits were negative
was 0.325 during the study period.
The creditors to current assets ratios of the selected companies exhibits that out of
twenty companies creditors to current assets ratios, five companies creditors to
current assets ratios were above average whereas remaining fifteen companies
creditors to current assets ratios were less than the average. It indicates that in
most of the sample companies (75 per cent) the creditors to current assets ratios
was below the average of the selected companies throughout the study period.
The average creditors to current assets ratio of the selected samples taken as a
whole were 0.46 during the period under study.
345
6.1.6. WORING CAPITAL FINANCING STRATEGY:
The working capital leverage of the selected companies exhibits that out of twenty
companies working capital leverage, twelve companies working capital leverage
were above average whereas remaining eight companies working capital leverage
were less than the average. It indicates that in half of the sample companies (60
per cent) the working capital leverage was high risky with a high return
throughout the study period. The average working capital leverage of the selected
samples taken as a whole was 0.39 during the period under study. The average
working capital leverage maintained by the selected companies whose average net
profits were positive was 0.42 whereas the average working capital leverage of
the selected companies whose average net profits were negative was 0.36 during
the study period.
The working capital financing risk ratios of the selected companies exhibits that
out of twenty companies risk ratios, fifteen companies risk ratios were above
average whereas remaining five companies risk ratios were less than the average.
It indicates that in most of the sample companies (75 per cent) the working capital
financing risk ratios was high and these companies were adopted either matching
or aggressive policy in working capital financing during the study period. The
average risk ratios for working capital financing of the selected samples taken as a
whole was 0.42 during the period under study. The average risk ratios in working
capital financing maintained by the selected companies whose average net profits
were positive was 0.59 whereas the average risk ratios in working capital
financing of the selected companies whose average net profits were negative was
0.24 during the study period.
6.1.7. Motaal Comprehensive Liquidity Test
The liquidity rank of the selected companies was analyzed using Motaal
comprehensive liquidity test. While making such comparison on the basis of
ultimate rank, the test shows that in fourteen cases out of twenty selected
pharmaceutical companies, the liquidity followed an increasing trend and in
remaining six cases the liquidity followed a decreasing trend.
346
6.1.8. Principal component of liquidity, profitability and efficiency
The principal component of liquidity, profitability and efficiency of the selected
companies was determined by factor analysis during the period under study. The
principal component of liquidity had been chosen among Current ratio, Quick ratio
and Absolute liquid ratios, the principal component of profitability had been chosen
from Gross profit ratio, Net profit ratio and Return on capital employed and the
principal component of efficiency had been chosen from Inventory Turnover ratio,
Debtors Turnover ratio, Cash Turnover ratio, Creditors Turnover ratio and Working
capital Turnover ratio. While making such chosen on the basis of factor analysis, the
following comments can be made:
1. The identification of principal component of liquidity shows that in all twenty
cases, current ratio was the principal component (Eigen Value>1) of liquidity
during the period under study and it was significant at 1% probability level.
2. The identification of principal component of profitability shows that in all twenty
cases, gross profit ratio was the principal component (Eigen Value>1) of
profitability during the period under study and it was significant at 1%
probability level in most cases ( thirteen companies), except in four cases, it was
significant at 5% probability level and in one case, it was significant at 10%
probability level.
3. The identification of principal component of efficiency shows that in all twenty
cases, inventory turnover ratio was the principal component (Eigen Value>1) of
efficiency during the period under study and out of these twenty cases, twelve
cases were significant at 1% probability level, one case was significant at 10%
probability level and seven cases, it was not significant up to 10% probability
level.
6.1.9. REGRESSION ANALYSIS
From the regression results of Gross Profit on Current ratio reveals that out of
total 14 companies under study, 10 companies earned profit and 4 incurred loss
almost during the entire period. Loss making companies are found to maintain,
347
on an average, relatively lower current ratio than the profit –making companies,
though, excepting only one company, namely Ambalal Sarabhai enterprises with
current ratio of 1.0, the three other companies maintained, on an average, more
than 2.0, a standard Current ratio normally construed as a safe liquidity ratio.
For the profit-making companies, on the other hand, the average Current ratio.
ranged between 3.0 and 5.23. (The sequent Scientific is a glaring exception, with
an average Current ratio of 76.36, minimum Current ratio of 0 and maximum of
558).
Thus, maintaining a very high Current ratio might have been an important factor in
helping her ailing husband.
So far as the relation between the gross profit and inventory turn-over is concerned,
some baffling results come out. Each of three out of 4 loss-making companies has much
higher Inventory Turnover ratio than any of the profit-making companies. Therefore, we
can conclude that, in addition to the inventory management problem, there might be some
other factors in the group of the liquidity measures that might have outweighed the gain
accruing from high Inventory Turnover ratio.
Before conclusion, the findings may be summarized as follows:
1. In most of the selected pharmaceutical companies (fifteen out of twenty), the
amount of inventory had increased at decreasing rate. In few cases (10% cases),
the inventory had increased at increasing rate and it was significant at or below
5% probability level in most of the cases during the period under study. It
represented that the amount of investment in inventories of selected
pharmaceutical companies had significantly increased during the period under
study.
2. In most of the selected companies (70% of the total twenty selected companies),
the amount had increased at a decreasing rate and in few cases (three out of
twenty) the amount of debtors had decreased at an increasing rate. Most of them
were also significant at or below 5% probability level. Therefore, it is revealed
348
that the amount debtors of pharmaceutical companies had increased at a
decreasing rate during the study period.
3. In most of the selected pharmaceutical companies ( seventeen out of twenty ), the
amount of cash and bank had increased , out of which in ten selected
pharmaceutical companies, the amount of cash and bank balance had increased at
a decreasing rate and in seven cases no trend lines could be found. In three
selected companies; the amount cash and bank had decreased at an increasing
rate.
4. In most of the selected pharmaceutical companies (seventeen out of twenty), the
amount of loans and advances had increased during the study period and in most
of the cases, it was significant at or below 5% probability level.
5. In 75% of the selected pharmaceutical companies (fifteen out of twenty), the
amount of creditors had increased at a decreasing rate during the study period and
most of them were statistically significant at 5% probability level. It indicated that
the amount of creditors of pharmaceutical companies had increased at a
decreasing rate during the period under study.
6. In most of the selected companies ( twelve out of twenty), the amount of current
liabilities and provisions, one important source of short term working capital, had
increased at decreasing rates which were also statistically significant at 5%
probability level during the period under study.
7. In 85% of the selected pharmaceutical companies (seventeen out of twenty), the
amount of current assets had increased at a decreasing rate during the study
period. In most of the cases, it was statistically significant at 5% probability level.
It signified that, the pharmaceutical company had increased its investment in
gross working capital throughout the study period.
8. In eighty five percent of the selected companies (seventeen out of twenty), the
amount of net working capital had increased significantly at 5% probability level.
9. In most of the selected companies (Ninety five percent of total selected
companies) maintained their average current ratio at higher level as compared to
conventional standard of 2:1 during the study period.
349
10. In 85% of the average quick ratios (seventeen average quick ratios Out of twenty
average quick ratios), were above the conventional standard of 1:1.
11. In 75% of the average absolute liquid ratios (fifteen out of twenty) of selected
companies, it was below the conventional standard norms of 0.5:1.
12. In most of the selected pharmaceutical companies (fifteen out of twenty), the
average inventory turnover ratios (in times) were below the average of the
selected samples. It indicated that the average inventory holding in most of the
selected pharmaceutical companies was longer as compared to the average
inventory holding of the selected companies.
13. The average debtors turnover ratio (in times) of 60% of the selected companies
(twelve out of twenty) were below the average of the selected samples. It
represented that most of the pharmaceutical companies offered longer credit
facilities to its customer.
14. The study of cash turnover ratio (in times) of 40% (eight out twenty) of selected
companies was above the average of the selected samples and most of the cash
turnover ratios were not satisfactory during the period under study.
15. Working capital turnover ratios (in times) of 55% (eleven out of twenty) of the
selected companies were below the average of the selected companies.
16. The average creditors turnover ratio of half (ten out of twenty) of the selected
companies were below the average of the selected samples.
17. In most of the cases (fourteen out of twenty), the average gross profit ratios of the
selected companies were above the average of the selected companies.
18. The average net profits of half of the selected companies were below the average
of the selected companies. 50% of the selected companies, the average net profit
ratios were negative and in remaining 50% cases, the net profit ratios were
positive.
19. In most of the selected companies (fourteen out of twenty), the average ROCE
were above the average of the selected samples during the study period.
20. In half of selected companies ( ten out of twenty), the average CATA, Inventory
to Current Assets, Debtors to Current Assets & Cash and bank to Current Assets
were above the average of the selected companies.
350
21. Forty percent of the average of loans and advances were below the average of the
selected samples.
22. Seventy five percent of the selected companies, the creditors to current assets
were above the average of selected companies.
23. The average working capital leverage of twelve selected companies were above
the average of the selected companies and these companies were taking high risky
with a high return.
24. The average working capital financing risks of fifteen selected companies were
above the average of total samples.
25. The Motaal comprehensive liquidity test exhibited that in 70% of the cases
(fourteen cases out of twenty), the liquidity followed an increasing trend during
the study period.
26. Principal component analysis stated that CR was the principal component of
liquidity, Gross profit ratio was the principal component of profitability and
Inventory turnover ratio was the principal component of efficiency.
27. The results of regression of gross profit on current ratio it is seen that out of total
14 companies under study, 10 companies earned profit and 4 incurred loss almost
during the entire period. Loss making companies are found to maintain, on an
average, relatively lower current ratio than the profit –making companies.
Moreover, Pharmaceutical Industry in our country is a profitable sector. It is due
to the reason that the firms in the industry are very competitive and has gained
efficiency in managing its resources competently. The impact of overall working
capital policy on profitability in this industry is proved to be significant and the
ratios related to working capital can explain the differences among the firms and
it is also evident that overall performance of this industry, working capital plays a
vital role.
6.1.10. Conclusion
Amount of gross working capital as well as net working capital of all the selected
companies are increasing at a decreasing rate during the period under study. The
selected companies had been generating about 42% of the total working capital, on an
351
average, from long term sources of fund in order to finance for working capital during
the study period. The liquidity trends in most of the selected companies were
increasing during the recent years of the study. Amount of investment in the entire
component of working capital like, inventories, debtors, cash and bank, loans and
advances of all the selected companies were increasing in the recent years during the
period under study. The selected companies had invested about 48% on an average, in
current assets out of the total assets. The principal component of working capital
comprises of inventories and sundry debtors. Most of the pharmaceutical companies
have little amount of cash and bank invested in working capital. Moreover,
Pharmaceutical Industry in our country is a profitable sector. It is due to the reason
that the firms in the industry are very competitive and has gained efficiency in
managing its resources competently. The impact of overall working capital policy on
profitability in this industry is proved to be significant and the ratios related to
working capital can explain the differences among the firms and it is also evident that
overall performance of this industry, working capital plays a vital role.
6.2 Suggestions:
From the analysis the following suggestions can be made for maintaining optimum level
of working capital.
1. The Pharmaceutical companies should try to maintain a definite proportion among
different component of working capital in regard to keep overall current assets
and adequate quantum of liquidity all the times.
2. The Pharmaceutical companies should maintain considerable amount of cash and
bank balance in order to meet its short term commitments and for emergency
requirement. This will help the companies to increase their margin of working
capital and also to make adequate arrangement of credit facilities with banks so as
to maintain good amount of liquidity.
3. Operating cycle period should be decreased in order to avoid cash blocked for a
long period.

352
4. Creditors turnover ratio found to be significant inverse relationship during the
study period. It suggested that the Pharmaceutical companies need to increase
credit facilities period from their suppliers.
6.3 Limitation of the study
The study is not free from any limitation. The following limitation was observed from the
study:
1. Analysis of working capital management has been made from 20 selected
companies out of a large number of companies belonging in the pharmaceutical
industry. Therefore the sample size is small and our analysis may be more
accurate if sample size could be increased.
2. Considering the problems of availability of data samples have been selected on
the basis of average net profit earned by the companies during the entire study
period. But one year‟s huge loss may cause the company in the loss making and
may not be selected.
3. The study has been undertaken only through the analysis of quantitative financial
data. The qualitative aspect of pharmaceutical industry having significant impact
on their performances which remain untouched such as employee‟s relation,
working capital environment etc.
4. The data collected for the present study are entirely secondary data i.e, collected
from published annual reports. But beside secondary data, primary data on
customers‟ satisfaction, employees‟ promotion and relation could be done. So the
study carries all the limitations inherent to the secondary data.
5. All statistical tools used for the present study have their usual limitations.
6. Analysis had been done on the basis of their mean value of the selected
companies without considering the average of the pharmaceutical industry as a
whole which is one of the key limitations in the study.
7. The performance of pharmaceutical companies based on abroad had not been
compared with the Indian pharmaceutical companies.
353
8. Longer period of study may give better result than the study period of 15 years.
9. Impact of profitability on different component of working capital has remained
untouched.
6.4 Scope for Further Study
The following are the areas in the field of working capital management which can be
addressed in the research studies to be carried out in future.
1. The present study has made only twenty companies belonging to pharmaceutical
industries in India. A larger sample of fifty or more may be considered to get
better result.
2. The present study is based on Indian Pharmaceutical Industry. However, a
comparative study may be done with the multinational companies or the
pharmaceutical companies based on abroad.
3. The present study has made a comparative study between top ten pharmaceutical
companies and bottom ten pharmaceutical companies based on fifteen years
average net profit. However, a comparative study may be done among the
different manufacturing industries and the industries belonging to service sector in
India.
4. The present study has not been analysed the impact of profitability on different
component of working capital. However, a further study may be carried on.

354
BIBLIOGRAPHY
1. Afza,T. Nazir, M.(2009) Impact of aggressive working capital management
policy on firm‟s profitability, The IUP Journal of applied Finance, Vol-15(8), PP
20-30.
2. Aminu,Yusuf. (2012), A nexus between liquidity and profitability trade offs for
working capital management in Nigerias manufacturing sector, International
Journal of Arts and Commerce‟ vol-1 no-6, pp55-58.
3. Appavadhanulu ,V.(1971) Working Capital and Choice of Techniques, Indian
Economic Journal, July-September, 1971, vol. xix, pp. 34-41,
4. Appuhami, Ranjit B A (2008) The Impact of Firms Capital Expenditure on
Working Capital Management: An Empirical Study across industries in Thailand,
International Management Review, vol4 no 1 pp8-21.
5. Archer, S H., and Ambrosio‟D, C. A. (1972): “Business Finance – Theory and
Management “,
p-445.
6. Banerjee, B. (1982): “Corporate Liquidity and Profitability in India”, Research
Bulletin, ICWAI, Kolkata, July 1982, pp- 225-234.
7. Banerjee, B. (1982): “Cash Management: A Practical Approach”, The World
Press Private Ltd., p-57.
8. Banerjee, B. (2008): ”Financial Policy and Management Accounting”, Prentice-
Hall of India Ltd., New Delhi, p-114.
9. Bardia, S.C. (2004): “Liquidity Management: A Case study of Steel Authority of
India Ltd.”, The Management Accountant, ICWAI, Kolkata, June, pp -463- 467.
10. Bhattacharya, H. (2007): “Working Capital Management –Strategies and
Techniques “, Prentice-Hall of India Pvt. Ltd., New Delhi, pp-279-282.
11. Bierman,H. Jr., and Hass. J E., (1975): “An Introduction to Managerial Finance”,
Pitman Publishing Ltd., London, pp-21-23.
12. Chakraborty, K. (2008), Working Capital and Profitability: An empirical analysis
of their relationship with reference to selected companies in the Indian
pharmaceutical Industry, The ICFAI Journal of Management Research.
355
13. Chakraborty, P.K and De, A.K. (1994) “Working Capital Management; A Case
Study in the Eastern Coalfields Limited” Accounting and Finance, Vol.8 No. 3,
PP-113-117
14. Chatterjee, Saswata (2010) ,The Impact of Working Capital Management on the
Profitability of the listed Companies in the London Stock Exchange”
15. Chowdhury, Anil B. R. (1987): “Working Capital Management – A Workbook on
Corporate Liquidity”, Management Technologists, Calcutta, pp-1-2.
16. Danuletiu, Adina Elena (2010) Working Capital Management and Profitability: A
case study of Alba county companies, Annales Universitatis Apulensis Series
oeconomica, 2010 vol. 12(1) pp364-374.
17. Deloof, M. (2003) Does working capital management affect profitability of
Belgian Firms?” Journal of Business Finance and Accounting „, Vol. 3&4 PP573-
587.
18. Eljelly, A.(2004) Liquidity Profitability Trade off: An empirical investigation in
an emerging market, International Journal of Commerce And Management, vol-
14 no-2 PP 48-61.
19. Farragher, E(1986) Factoring Accounts Receivable, Journal of cash management‟
( March-April,1986).
20. Gareia-Terupel,P.J. & Martinez-Solano, P(2004) Effect of Working Capital
Management on SME profitability, International Journal of Managerial Finance,
vol. 13(2).
21. Gareia – Teruel, P.J, Martinez-Solano, P, (2007), Effects of working capital
management on SME profitability, International Journal of Managerial Finance,
Vol-3.
22. Gentry, J.A., Mehta, D.R., Bhattacharya, S.K., Cobbaut, R., and Scaringella, J.L.
(1979):” An introduction study of management perceptions of the working capital
process”, Journal of International Business Studies, Vol.- 10(1), pp-28-38.
23. Ghosh. S.K and Maji, S.G (2003) working capital management Efficiency: A
study on the Indian cement industry, The Institute of Cost and Works
Accountants of India

356
24. Gilbert, E & Reichert, A (1995). The practice of financial management among
large United States Corporation, Financial Practice and Education, vol. 5(1), pp
16-23.
25. Gill. A, & Biger. N (2010). The relation between working capital management
and Profitability: Evidence from the United States, Business and Economics
Journal, vol 2010, BEJ-10.
26. Grablowsky ,B.J. (1976) Mismanagement of Accounting Receivable by Small
Business, Journal of Business, vol-14 PP23-28.
27. Gupta, R.K. (1990): “Profitability, Financial Structure and Liquidity”, Printwell
Publishers, Jaipur, p-133.
28. H. Jamal Zubairy(2010), Impact of Working Capital Management and Capital
Structure on Profitability of Automobiles Firms in Pakistan,
29. Hampton, J.J. (1979): “Financial Decision Making”, The Prentice- Hall of India
Pvt. Ltd., p-12.
30. Howarth, C and Westhead, P. (2003) The focus of working capital management in
UK small firms, Management Accounting Research, Vol-14 No-2, PP. 94-111.
31. Howard, L. R. (1971): “Working Capital-Its Management and Control”,
Macdonald & Evans Ltd., London. , Pp-16-21.
32. Jafar, A. & Sur. D. (2006) Efficiency of working capital management in Indian
Public enterprises during the post liberalization era: A case study of N.T.P.C, The
IFCAI Journal of Management Research.
33. Jain, P.K. (1993) “Management of Working Capital” RBSA Publishers, Jaipur,
India, 1993
34. Kallberg, J G. and Parkinson, K L. (1984): “Current Asset Management-Cash,
Credit and Investment”, John Wiley &Sons., New York, U.S.A., pp-85-87.
35. Khandelwal, N.M (1985) “Working Capital Management in Small Scale
Industries” Ashis Publishing House, New Delhi,
36. Lawrance Gitman, D Keith Forrester and John R Forresterin (1976), Maximizing
Cash Disbursement Float, Financial Management( summer 1976) pp 15-24
357
37. Lazaridis, I. Tryfonidis, D,(2006) Relationship between working capital
management and profitability of companies listed in the Athens Stock Exchange,
Journal of Financial Management and Analysis, vol. 19(1), PP26-35.
38. Mallick, A.K and Sur, D. (1999) “Working Capital Management: A Case Study of
Hindustan Unilever Limited”, Finance India, September 1999, Vol. 13(3), pp-
857-871
39. Mallick, A.k., Sur, D. and Rakshit, D.(2005) “Working Capital and Profitability:
A Study On Their Relationship With Reference To Selected Companies In Indian
Pharmaceutical Industry”, GITAM Journal of Management , July- December
2005, Vol. -3 No.-2, PP-51-62.
40. Mallick, A.K. and Sur, D. (1998): “Working Capital and Profitability: A Case
Study in Interrelation”, The Management Accountant, ICWAI, Kolkata,
November, pp -805-809.
41. Majumdar, C. (1996) “Borrowing as a source of Financing Working Capital in the
Corporate Sector in India: An Empirical Analysis” Finance India, Vol. 10(1), PP-
103-107
42. Mojtahedzadeh, Vida. Tabari S.H.Alavi. & Mosayebi, R(2011), The relationship
between working capital management and profitability of the companies ( Case
studies: Listed companies on (T.S.E),International Research Journal of Finance
and Economics‟ issue 76, PP 158-166.
43. Mukherjee, A.K. (1988): “Management of Working Capital in Public
Enterprises”, Vohra Publishers& Distributers, Allahabad, India.
44. N. Hill, W Sartories and D Farguson (1983) Corporate Credit and Payable Policy:
A survey, Size and industry effects, Financial Management Association‟s 1983
Annual Meeting.
45. Narasimhan, M.S and Murty L.S (2001) Emerging manufacturing Industry: A
financial prospective, Management Review, June, PP 105-112.
46. Padachi, Kesseven (2006), Trend in working capital management and its impact
on firm‟s performance: An analysis of Mauritian small manufacturing firms,
International Review of Business Research papers, vol.2 no. 2 pp 45-58.

358
47. Panda, G.S (1986) “Management of Working Capital in Small Scale Industries”,
Deep and Deep Publishers, New Delhi, 1986
48. Peel, M.J. Wilson, N. (1996) Working Capital and Financial Management
Practices in the small firm sector,Small Business Journal, Vol. 14 (2) PP 52-68,
49. Peel, M.J. Wilson, N Howarth, C A(2000), Late Payment and Credit Management
in the Small Firm Sector: Some Empirical Evidence, International Small
Business Journal, Vol-18 (2), PP 52-68,
50. Prasad, B and Erasi, K (1990) “Working Capital Management in SSI- An
Empirical Study”, Journal of Accounting and Finance, Vol. 4, No. 3, PP-31-35
51. Parashar, S. P. (1986): “Liquidity Management-Principles and practice of
Managing Cash Flow”, Vision Books Pvt. Ltd, New Delhi, pp-9-31.
52. Rao, K.V. (1990): “Management of Working Capital in Public Enterprises”, Deep
& Deep Publications, New Delhi, pp-269-275.
53. Raheman Abdul, Nasir , Mohammad (2007) ,Working Capital Management and
Profitability- case of Pakistani Firms, International Review of Business Research
papers, vol-3 no 1 PP279-300.
54. Refuse. M.E(1996) Working Capital Management : An urgent need to refocus,
Management Decision Journal‟, Vol. 34(2)
55. Sagan, J(1955), Towards a theory of Working Capital Management , The Journal
Of Finance, May 1955,PP 121-129
56. Sarkar, S.N (1987) “Liquidity Management in the Public Sector – A case study of
a Government of West Bengal Undertaking”, The Management Accountant, Vol.
22, No. 7, PP 496-498
57. Shin, H, H. and Sonen, L (1998) Efficiency of Working Capital Management and
Corporate Profitability, Financial Practice and Evolution, Vol.8 no 2, PP 37-45.
58. Shin, H,H. and Sonen, L (1998) Efficiency of working capital management in the
profitability of Hindal co industries Ltd ,ICFAI, University Journal of Financial
Economics‟ vol. 6(4), pp 62-72.
59. Singh, P.(2008), Inventory and Working capital management : An Empirical
Analysis, ICFAI University Journal of Accounting Research‟
359
60. Smith, M. Beamount, Begemann,E (1997 Measuring Association Between
Working Capital and Return on Investment, South African Journals Of Business
Management, Vol-28 No-1.
61. Sur,D. (1997) “ Working Capital Management in Colgate Palmolive (India) Ltd- a
case study” The Management Accountant, November, 1997, PP-828-831 &833
62. Sur, D. (2000): “Liquidity Management: An overview of Four Companies in
Indian Electric Industry”, The Management Accountant, June, pp-407-412.
63. Uyar. A. (2009) The relation of cash conversion cycle with size and profitability:
An empirical investigation in Turkey, International Research Journal of Finance
and Economics‟, PP 186-193
64. Van Horne, J.C. (1993): “Financial Management and Policy”, Prentice-Hall of
India Pvt. Ltd., New Delhi, pp-374-376.
65. Venkatachalam and Murthy, D (1986) “Working Capital Trends in Private
Corporate Sector” „Indian Management‟, June 1986, PP 30-38.
66. Vijaya Kumar, A. & Venkatachalam, A. (1995): “Working Capital and
Profitability-An Empirical Analysis”, The Management Accountant, ICWAI,
June, pp-748-750.
67. Walker, E. and Petty W. (1978) Financial differences between large and small
firms, Financial Management‟, Winter PP 61-68.
68. Weinraub, H and Visscher, S (1998) Industry Practice related to aggressive/
conservative policies, Journal of Financial Strategic Decision‟ vol. 11(2).