Embed Size (px)
Citation preview
ÖSTERREICHISCHES BUNDESINSTITUT FÜR GESUNDHEITSWESEN AUSTRIAN HEALTH INSTITUTE
BENCHMARKING PHARMACEUTICAL EXPENDITURE
Cost-Containment Strategies in the European Union
COMMISSIONED BY THE FEDERAL MINISTRY OF SOCIAL SECURITY AND GENERATIONS
Österreichisches Bundesinstitut für Gesundheitswesen Austrian Health Institute
ÖBIG
BENCHMARKING PHARMACEUTICAL EXPENDITURE
Cost-Containment Strategies in the European Union
Ingrid Rosian
Katja Antony Claudia Habl
Sabine Vogler Marion Weigl
Vienna, December 2001
Commissioned by the Federal Ministry of Social Security and Generations
ISBN 3-85159-026-0
No.: 4320-01
Owner and publisher: Österreichisches Bundesinstitut für Gesundheitswesen (ÖBIG) – responsible for the contents: Sebastian Kux – copy-editor: Johannes M. Treytl – secretariat: Silvia Laskaridis – graphic design: Renate Weidenhofer – cover design and technical pro-duction: Ferenc Schmauder - all: A-1010 Vienna, Stubenring 6, telephone +43 1 515 61-0, fax +43 1 513 84 72, e-mail: [email protected], http://www.oebig.at
Translation: Gabriela Dorn, Martina Flor
For a better environment: This study is printed on chlorine-free paper without optical bright-eners.
Countries are listed in alphabetical order of their German names..
III
Summary
Tight public budgets and a tough economic situation as well as changed basic conditions (in-creased life expectancy, medical-technological progress) created a need for health reforms in the Europe of the 1990s. Alterations to the systems were implemented which were primar-ily aimed at cost-containment.
Pharmaceutical expenditure, which accounts for between eight per cent (Denmark) and 26 per cent (Portugal) of health expenditure in the European Union, is in most countries the third-largest health budget item. In the 1990s pharmaceutical expenditure rose drastically in Europe, in most countries more sharply than the gross domestic product and health expendi-ture.
ÖBIG study covering all European Member States
As a consequence, nearly all fifteen EU Member States initiated reforms: Between 1990 and 1999 an average of more than ten radical measures for the containment of pharmaceutical expenditure were taken per Member State. Belgium, Germany, Spain, Italy, Denmark and the Netherlands adopted most cost-containment measures. Only Luxembourg did not follow the general trend towards cost-containment.
This is one of the results of the study “Benchmarking Pharmaceutical Expenditure. Cost-Containment Strategies in the European Union” of the Austrian Health Institute (ÖBIG), which offers a detailed investigation of the health and pharmaceutical systems in the EU Member States and an analysis of cost-containment measures for pharmaceuticals.
Cost-containment strategies in the European Union
Reform efforts were not only characterised by numerous measures, but also by a variety of strategies which were aimed at price and volume control (pharmaceutical prescriptions).
Price strategies involved statutory pricing as well as implementing price freezes and reduc-tions. Since the mid 90s there has also been pressure on pharmaceutical wholesalers and pharmacies, via repeated reductions in margins in many EU countries. An EU-wide tendency which intensified especially during the late 1990s is to promote generics (pharmaceuticals with patent-expired active substances).
A further cost-containment measure has been to fix pharmaceutical budgets on a national level and/or for physicians. Additionally, increased control of the prescription patterns of phy-sicians was established in all EU Member States.
In order to reduce public budgets a considerable number of pharmaceuticals were de-listed in the 1990s. Another frequent measure was switching prescription-only-medicines to OTC which shifted expenditure from public sector to private households. A standard cost-contain-ment strategy was to increase co-payment: In Belgium co-payments were raised considera-bly, five times during the 90s, and in Germany, Italy and Sweden four times.
IV
The influence of the European Union on the control of the national pharmaceutical markets became more evident in the past decade. The registration of pharmaceuticals within the EU has already been harmonised to a great extent. The influence of the European Union also became apparent in recent years in the introduction and form of certain measures as regards pricing and reimbursement, which fall within the competence of the Member States, as the EU Transparency Directive asks for certain requirements to be fulfilled for the listing of phar-maceuticals and for transparent criteria as prerequisite of the decisions by the responsible authorities.
Benchmarking of pharmaceutical expenditure
Belgium, Germany, France and Austria have the highest pharmaceutical expenditure per in-habitant: Belgium did not succeed in containing expenditure despite massive interventions in the pharmaceutical sector, but in the other three countries the growth rate for pharmaceutical expenditure could at least be contained. An additional problem is the high pharmaceutical consumption in France and the decrease in contribution revenues of the health insurance funds in Austria and Germany.
The ÖBIG study concluded that – with the exception of Belgium – countries which adopted cost-containment measures to a greater extent succeeded in stemming the increase in public pharmaceutical expenditure – at least for a while. Simultaneous volume control and price control measures enhanced the effects. Countries with minor growth rates within the Euro-pean Union are Denmark, Germany, Italy and the Netherlands.
The analyses proved that the development of pharmaceutical expenditure and of prescrip-tions differed. Prescriptions could be contained much more drastically: Between 1990 and 1999 the number of prescriptions decreased by 40 per cent in Italy, and by at least 25 per cent in Germany. In the remaining EU countries the number of prescriptions covered by the health insurance funds or the national health services only increased moderately, in any case considerably less than public pharmaceutical expenditure.
Average costs per prescription rose drastically in the 90s in Europe. This can be seen in the light of the increasing number of new, expensive pharmaceuticals on the market. Some EU countries are adopting measures to oppose this trend (e.g. the foundation of institutions for the evaluation of the therapeutic and economic benefit of new pharmaceuticals, e.g. NICE in Great Britain).
Successful savings?
The price for the “success” of savings measures, which aimed at cost-containment in public pharmaceutical expenditure, had to be borne by the patients: Pharmaceutical expenditure was shifted to the private households via higher co-payments and/or increased self-medication.
V
Basically, the “pendulum” which is characteristic of many fields of policy can be observed: Dissatisfaction with the original condition leads to reforms (pendulum swings in one direc-tion), which are reversed after some time because of problems and/or altered circumstances (e.g. new government). Instead, new, contrary strategies are implemented (pendulum swings back in the other direction). Examples can be found both in predominantly liberal countries, which fell back on state intervention if necessary (e.g. Denmark, Great Britain, the Nether-lands), and in more strictly regulated countries which had switched to market instruments (e.g. introduction of a reference price system in Spain and Italy).
The success of reforms is limited in time: As every control strategy has a loophole, no bundle of measures can last forever. Due to the tight budgets cost-containment efforts have to be continued in the following years, which is also evident from recent developments. An end of the savings policy is not in sight.
VI
ÖBIG: Pharmaceutical expenditure. Cost-containment strategies
November / December 2001, Vienna
Arzneimittelausgaben. Strategien zur Kosten-dämpfung in der Europäischen Union 474 p., 115 tables, 85 figures ISBN 3-85159-024-4, ATS 4,816.10 / € 350.-
Benchmarking Arzneimittelausgaben. Strategien zur Kostendämpfung in der Europäischen Union 97 p., 17 tables, 8 figures ISBN 3-85159-025-2, ATS 894.40 / € 65.-
Benchmarking Pharmaceutical Expenditure. Cost-Containment Strategies in the European Union ISBN 3-85159-026-0, ATS 894.40 / € 65.-
Arzneimittelausgaben. Strategien zur Kosten-dämpfung. BELGIEN Approx. 30 p., 6 tables, 4 figures ISBN 3-85159-027-9, ATS 247.70 / € 18.-
Arzneimittelausgaben. Strategien zur Kosten-dämpfung. DÄNEMARK Approx. 30 p., 8 tables, 6 figures ISBN 3-85159-028-7, ATS 247.70 / € 18.-
Arzneimittelausgaben. Strategien zur Kosten-dämpfung. DEUTSCHLAND Approx. 30 p., 9 tables, 6 figures ISBN 3-85159-029-5, ATS 247.70 / € 18.-
Arzneimittelausgaben. Strategien zur Kosten-dämpfung. FINNLAND Approx. 30 p., 8 tables, 7 figures ISBN 3-85159-030-9, ATS 247.70 / € 18.-
Arzneimittelausgaben. Strategien zur Kosten-dämpfung. FRANKREICH Approx. 30 p., 5 tables, 4 figures ISBN 3-85159-031-7, ATS 247.70 / € 18.-
Arzneimittelausgaben. Strategien zur Kosten-dämpfung. GRIECHENLAND Approx. 30 p., 5 tables, 5 figures ISBN 3-85159-032-5, ATS 247.70 / € 18.-
Arzneimittelausgaben. Strategien zur Kosten-dämpfung. GROSSBRITANNIEN Approx. 30 p., 6 tables, 6 figures ISBN 3-85159-033-3, ATS 247.70 / € 18.-
Arzneimittelausgaben. Strategien zur Kosten-dämpfung. IRLAND Approx. 30 p., 7 tables, 4 figures ISBN 3-85159-034-1, ATS 247.70 / € 18.-
Arzneimittelausgaben. Strategien zur Kosten-dämpfung. ITALIEN Approx. 30 p., 6 tables, 6 figures ISBN 3-85159-035-X, ATS 247.70 / € 18.-
Arzneimittelausgaben. Strategien zur Kosten-dämpfung. LUXEMBURG Approx. 30 p., 6 tables, 4 figures ISBN 3-85159-036-8, ATS 247.70 / € 18.-
Arzneimittelausgaben. Strategien zur Kosten-dämpfung. NIEDERLANDE Approx. 30 p., 6 tables, 5 figures ISBN 3-85159-037-6, ATS 247.70 / € 18.-
Arzneimittelausgaben. Strategien zur Kosten-dämpfung. ÖSTERREICH Approx. 30 p., 8 tables, 6 figures ISBN 3-85159-038-4, ATS 247.70 / € 18.-
Arzneimittelausgaben. Strategien zur Kosten-dämpfung. PORTUGAL Approx. 30 p., 8 tables, 6 figures ISBN 3-85159-039-2, ATS 247.70 / € 18.-
Arzneimittelausgaben. Strategien zur Kosten-dämpfung. SCHWEDEN Approx. 30 p., 8 tables, 6 figures ISBN 3-85159-040-6, ATS 247.70 / € 18.-
Arzneimittelausgaben. Strategien zur Kosten-dämpfung. SPANIEN Approx. 30 p., 7 tables, 7 figures ISBN 3-85159-041-4, ATS 247.70 / € 18.-
Detailed information on ÖBIG-studies can be found in the attached list of publications and/or on the
ÖBIG-homepage http://www.oebig.at
by selecting “publications”
VII
Acknowledgements
In order to obtain first-hand, up-to-date information and data on the pharmaceutical systems in the countries analysed, ÖBIG contacted numerous institutions and persons in writing and/or orally. Interest and readiness to help have been high.
We would like to extend special thanks to all those who helped us and provided material and data. Our contact persons are members of the following institutions and authorities:
Belgium Association Générale de l’Industrie du Médicament (AGIM) Association Pharmaceutique Belgique (APB) Institut National d’Assurance Maladie – Invalidité (INAMI)
Denmark Sundhedsministeriet (SUM), 4 Kontor Danmarks Apotekerforeningen Lægemiddelindustriforeningen (LIF)
Germany Bundesministerium für Gesundheit (BMG) Bundesvereinigung Deutscher Apothekerverbände (ABDA)
Finland Kansaneläkelaitos (KELA) Lääkelaitos Lääkeiden hintalautakunta Suomen Apteekkariliitto / Tiedotus
France Caisse Nationale d’Assurance Maladie des Travailleurs Salariés (CNAMTS) Syndicat National de l’Industrie Pharmaceutique (SNIP)
Greece National Drug Organisation (EOF) Pharmetrica S.A. Hellenic Association of Pharmaceutical Companies (SFEE) Social Insurance Institute (IKA)
VIII
Great Britain Association of British Pharmaceutical Industry (ABPI) British Association of Pharmaceutical Wholesalers (BAPW) Department of Health (DoH), Medicines Pharmacy and Industry Branch Medicines Control Agency (MCA) Pharma Pricing & Reimbursement (PPR) Royal Pharmaceutical Society of Great Britain (RPSGB)
Ireland Department of Health and Children, General Medical Services (GMS) Division General Medical Services (Payments) Board Irish Medicines Board (IMB) Irish Pharmaceutical Healthcare Association (IPHA) Irish Pharmaceutical Union (IPU)
Italy Federfarma
Luxembourg Groupement des Grossistes Ministère de l’Economie, Office des Prix Union des Caisses de Maladie
The Netherlands Ministerie van Volksgezondheit, Welzijn en Sport (VWS)
Austria Bundesministerium für Soziale Sicherheit und Generationen (BMSG) Hauptverband der österreichischen Sozialversicherungsträger Österreichische Apothekerkammer (ÖAK) Statistik Austria
Portugal Instituto Nacional da Farmácia e do Medicamento (INFARMED)
Sweden Kronans Droghandel Läkemedelsverket Landstingsførbundet Riksförsäkringsverket (RFV) Apoteket
Spain Ministerio de Sanidad y Consumo
IX
List of contents
1 Introduction ....................................................................................................................................... 1
1.1 Background .............................................................................................................................. 1
1.2 Objectives................................................................................................................................. 2
1.3 Methodology ............................................................................................................................. 2
1.4 Structure ................................................................................................................................... 3
2 Pharmaceutical expenditure............................................................................................................ 5
2.1 Importance................................................................................................................................ 5
2.2 Determinants ............................................................................................................................ 6
2.3 Control measures ..................................................................................................................... 6
3 European Union ................................................................................................................................ 9
3.1 Current provisions .................................................................................................................... 9
3.2 The future ............................................................................................................................... 11
4 Health care systems ....................................................................................................................... 13
4.1 Institutional framework ........................................................................................................... 13
4.2 Financing ................................................................................................................................ 14
4.3 Out-patient and in-patient health care .................................................................................... 17
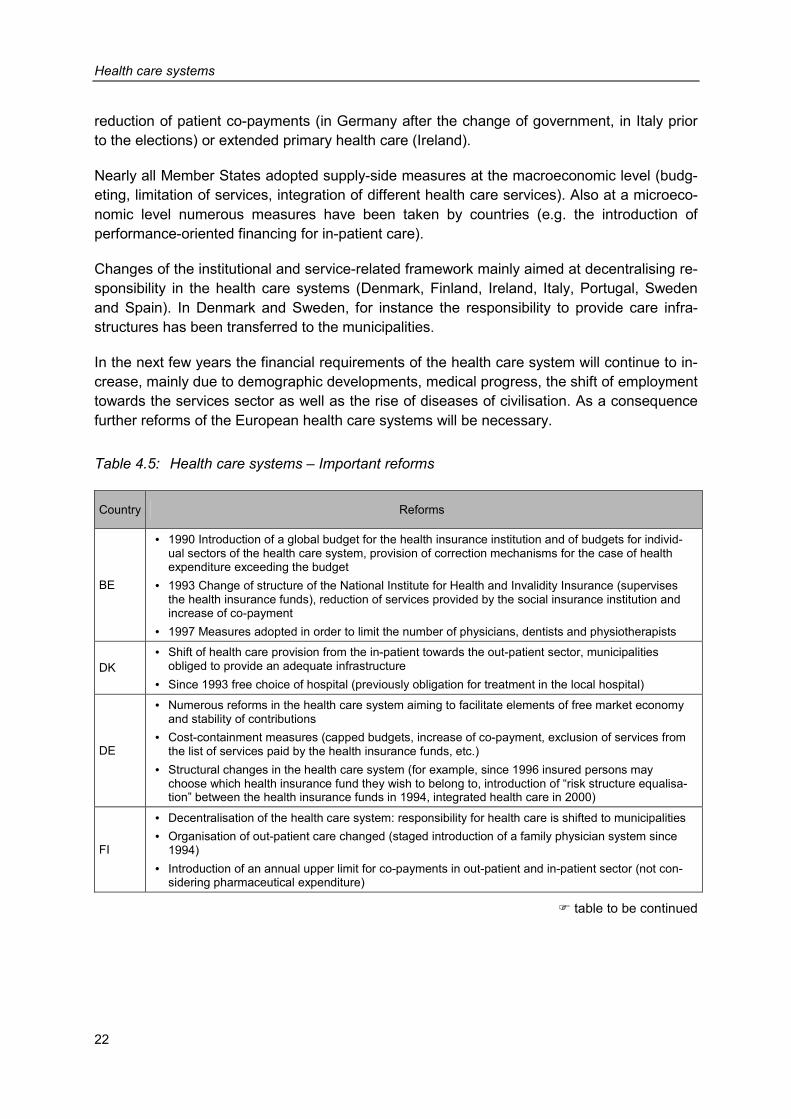
4.4 Reforms .................................................................................................................................. 21
5 Pharmaceutical systems................................................................................................................ 25
5.1 Registration ............................................................................................................................ 25
5.2 Reimbursement ...................................................................................................................... 25
5.3 Pricing..................................................................................................................................... 29
5.4 Margins................................................................................................................................... 32
5.5 Co-payment ............................................................................................................................ 37
6 Cost-containment strategies ......................................................................................................... 41
6.1 Analysis by countries.............................................................................................................. 41
6.2 Analysis by frequency of interventions ................................................................................... 44
6.3 Analysis by desired impact..................................................................................................... 44 6.3.1 Price .......................................................................................................................... 44 6.3.2 Volume ...................................................................................................................... 45
6.4 Analysis by actors................................................................................................................... 45
6.5 Summary ................................................................................................................................ 46
X
7 Benchmarking ................................................................................................................................. 47
7.1 Comparison of indicators........................................................................................................ 47 7.1.1 Expenditure ............................................................................................................... 47 7.1.2 Financing................................................................................................................... 49 7.1.3. Prescriptions ............................................................................................................. 51
7.2 Country analyses.................................................................................................................... 53 7.2.1 Belgium ..................................................................................................................... 53 7.2.2 Denmark.................................................................................................................... 54 7.2.3 Germany ................................................................................................................... 55 7.2.4 Finland....................................................................................................................... 56 7.2.5 France ....................................................................................................................... 57 7.2.6 Greece....................................................................................................................... 58 7.2.7 Great Britain .............................................................................................................. 58 7.2.8 Ireland ....................................................................................................................... 59 7.2.9 Italy............................................................................................................................ 60 7.2.10 Luxembourg .............................................................................................................. 61 7.2.11 The Netherlands........................................................................................................ 62 7.2.12 Austria ....................................................................................................................... 63 7.2.13 Portugal ..................................................................................................................... 64 7.2.14 Sweden ..................................................................................................................... 65 7.2.15 Spain ......................................................................................................................... 66
8 Conclusion ...................................................................................................................................... 75
Bibliography ........................................................................................................................................... 79
Annex..................................................................................................................................................... 83
XI
List of figures
Figure 2.1: Pharmaceutical expenditure – Share of pharmaceutical expenditure in total health expenditure 1997 / 1998 / 1999................................................................................ 5
Figure 5.1: Pharmaceutical systems – Value added tax rates 2001 ................................................... 34
Figure 5.2: Pharmaceutical systems – Average wholesale and pharmacy margins 1999.................. 36
Figure 7.1: Benchmarking – Pharmaceutical expenditure per capita in Euro 1999 ............................ 48
Figure 7.2: Benchmarking – Public spending in per cent of total pharmaceutical expenditure 1999................................................................................................................................... 50
Figure 7.3: Benchmarking – Number of prescriptions per capita at the expense of National Health Service / social insurance institutions 1999........................................................... 52
Figure 7.4: Benchmarking – Expenditure per prescription at the expense of National Health Service / social insurance institutions 1999 ...................................................................... 53
Figure 8.1: Conclusion – Changes in public pharmaceutical expenditure and in the number of prescriptions (figures adjusted to demographic development), 1999 compared to 1990 (indexed)............................................................................................................................ 77
XII
List of tables
Table 1.1: Introduction – Institutions contacted.................................................................................. 3
Table 2.1: Pharmaceutical expenditure – Control measures for cost-containment ........................... 7
Table 3.1: European Union – Overview of the most important statutory provisions regarding pharmaceuticals ................................................................................................................ 9
Table 3.2: European Union – Proposals for the revision of Community procedures for pharmaceuticals for human use ...................................................................................... 11
Table 4.1: Health care systems – Organisational types................................................................... 13
Table 4.2: Health care systems – General indicators of the countries............................................. 15
Table 4.3: Health care systems – Services and access .................................................................. 18
Table 4.4: Health care systems – Remuneration ............................................................................. 20
Table 4.5: Health care systems – Important reforms ....................................................................... 22
Table 5.1: Pharmaceutical systems – Pharmaceutical lists and reimbursement rates 2001........... 27
Table 5.2: Pharmaceutical systems – Further regulations at reimbursement level 2001 ................ 28
Table 5.3: Pharmaceutical systems – Regulation of prices at manufacturing level 2001................ 31
Table 5.4: Pharmaceutical systems – Regulation of wholesale and pharmacy margins 2001........ 33
Table 5.5: Pharmaceutical systems – Co-payment regulations 2001.............................................. 39
Table 6.1: Cost-containment strategies – Interventions for cost-containment at price and volume level 1990 – 2001 ............................................................................................... 42
Table 7.1: Benchmarking – Central indicators, 1999 ....................................................................... 68
Table 7.2: Benchmarking – Central indicators, developments 1990 until 1999............................... 71
XIII
List of abbreviations
ABDA Bundesvereinigung Deutscher Apothekerverbände (Germany) ABPI Association of British Pharmaceutical Industry (Great Britain) AESGP Association Européene des Spécialités Pharmaceutiques Grand Public (EU) AGIM Association Générale de l’Industrie du Médicament (Belgium) APB Association Pharmaceutique Belgique (Belgium) approx. approximately AT Austria BAPW British Association of Pharmaceutical Wholesalers (Great Britain) BASYS Beratungsgesellschaft für angewandte Systemforschung mbH (Germany) BE Belgium BMAGS Bundesministerium für Arbeit, Gesundheit und Soziales (Austria) BMG Bundesministerium für Gesundheit (Germany) BMSG Bundesministerium für soziale Sicherheit und Generationen (Austria) CENSIS Centro Studi Investimenti Sociali (Italy) cf. compare cit. cited CNAMTS Caisse Nationale d’Assurance Maladie des Travailleurs Salariés (France) DE Germany DK Denmark DoH Department of Health (Great Britain) € Euro EC European Community EEC European Economic Community EFP Especialidades Farmacéuticas Publicitarias (Spain) EFPIA European Federation of Pharmaceutical Industries Associations (EU) e.g. for example EMEA European Medicines’ Evaluation Agency (EU) EOF National Drug Organisation (Greece) ES Spain EU European Union FI Finland FR France
XIV
GB Great Britain GDP gross domestic product GMS General Medical Services (Ireland) GR Greece HE health expenditure HTA Health Technology Assessment IE Ireland IKA Social Insurance Institute (Greece) IMB Irish Medicines Board (Ireland) IN inhabitant INAMI Institut National d'Assurance Malarie – Invalidité (Belgium) INFARMED Instituto Nacional da Farmácia e do Medicamento (Portugal) IPHA Irish Pharmaceutical Health Association (Ireland) IPU Irish Pharmaceutical Society (Ireland) IT Italy IWI Industriewissenschaftliches Institut (Austria) KELA Kansaneläkelaitos (Finland) LIF Lægemiddelindustriforeningen (Denmark), Läkemedelsindustrieföreningen
(Sweden) LU Luxembourg MCA Medicines Control Agency (Great Britain) MRFG Mutual Recognition Facilitation Group (EU) n.a. not available NHS National Health Service (Great Britain) NICE National Institute for Clinical Excellence (Great Britain) NL the Netherlands no. number ÖAK Österreichische Apothekerkammer (Austria) ÖBIG Österreichisches Bundesinstitut für Gesundheitswesen (Austria) OECD Organisation for Economic Co-operation and Development OTC Over-the-Counter
XV
p. page PE pharmaceutical expenditure pharm. pharmaceutical pkg. package POM prescription-only medicines PPP pharmacy purchase price PPR Pharma Pricing Review, since May 1999: Pharma Pricing & Reimbursement PPRS Pharmaceutical Price Regulation Scheme (Great Britain) PR prescription priv. private PRP pharmacy retail price PT Portugal pub. public reimb. reimbursable RFV Riksförsäkringsverket (Sweden) RPSGB Royal Pharmaceutical Society of Great Britain (Great Britain) SE Sweden SFEE Hellenic Association of Pharmaceutical Companies (Greece) SNIP Syndicat National de l’Industrie Pharmaceutique (France) SNS Sistema Nacional de Salud (Spain) SUM Sundhedsministeriet (Denmark) VAT value-added tax VMRFG Veterinary Mutual Recognition Facilitation Group (EU) vol. volume VWS Ministerie voor Volksgezondheid, Welzijn en Sport (the Netherlands) WS wholesale
Introduction
1
1 Introduction
The Austrian Health Institute ÖBIG (Österreichisches Bundesinstitut für Gesundheitswesen) has been commissioned by the Federal Ministry of Labour, Health and Social Affairs (BMAGS), which is now called the Federal Ministry of Social Security and Generations (BMSG), to prepare a study on the regulation of pharmaceutical markets in the European Member States. The German version of this study was published in November 2001 under the title “Arzneimittelausgaben. Strategien zur Kostendämpfung in der Europäischen Union“ (ÖBIG 2001a). This comprehensive study of approx. 500 pages (long version) describes and analyses the current health and pharmaceutical systems and cost-containment measures in the pharmaceutical sector in all 15 individual Member States, and presents a comparison of results on the EU level.
With the publication at hand “Benchmarking Pharmaceutical Expenditure. Cost-Containment Strategies in the European Union“ ÖBIG is taking a further step and meeting the demand for a compact summary of results: The compact version “Benchmarking Pharmaceutical Expen-diture. Cost-Containment Strategies in the European Union“ offers a systematic description of the health care systems of the EU member countries, a comparative study of the pharma-ceutical systems, a chronological survey of central cost-containment measures for pharma-ceuticals and an analysis of the effects of these cost-containment measures.
The study, published in December 2001, is available in German as “Benchmarking Arznei-mittelausgaben. Strategien zur Kostendämpfung in der Europäischen Union” and in English as “Benchmarking Pharmaceutical Expenditure. Cost-Containment Strategies in the Euro-pean Union“.
Furthermore, country portraits of all EU Member States are available at ÖBIG (cf. list of pub-lications).
1.1 Background
Low economic growth, high unemployment and restricted public spending characterised the economic situation of European countries during the 90s. The aggravated economic situation in connection with changed basic conditions in the health sector (aging population, increas-ing life expectancy, medical-technological progress) have created need for reforms, to which all Member States of the European Union (EU) have reacted with cost-containment meas-ures.
In most countries pharmaceutical spending represents the third-largest amount in the health budget after the in-patient and out-patient sectors. The average spending of EU countries on the pharmaceutical sector amounts to 15 per cent of the health budget (1999).
Introduction
2
During the 90s public interest in the pharmaceutical sector increased steadily. In the last decade a series of measures have been taken in the EU countries, among them various drastic alterations to the system. In the ÖBIG studies published in 1998 “Pharmaceuticals. Market Control in nine European Countries“ (ÖBIG 1998a) and “Arzneimittel. Vertrieb in Eu-ropa“ [German version only] (ÖBIG 1998b) control measures of the European pharmaceuti-cal markets during the first half of the 1990s were documented and analysed. However, the reform process has been continued in all EU countries and has by no means been finished yet.
1.2 Objectives
The main objective of the study at hand is to analyse cost-containment measures in the pharmaceutical sector in the fifteen Member States of the European Union and the success of reforms in containing – public – pharmaceutical expenditure.
The study
• describes and compares health and pharmaceutical systems as regards common features and differences;
• comprehensively documents and analyses trends in the pharmaceutical sector during the 90s;
• analyses cost-containment strategies of pharmaceutical expenditure by ranking key indica-tors (benchmarking) and
• evaluates them according to their effectiveness.
1.3 Methodology
The collection of information and data has essentially been based on three methodological tools:
• literature and Internet research (up to late June 2001), • collection of key data from international publications and databases (e.g. OECD Health
Data 2000) and • surveys made by ÖBIG (written inquiries such as questionnaires and lists of questions,
telephone and other personal interviews).
When collecting and processing data major importance has been attached to comparability and continuity.
During the empirical inquiries between June 2000 and April 2001 the project team contacted a total of 49 institutions in the fifteen EU countries (cf. Table 1.1). Primarily, we contacted health ministries, medicines agencies and health insurance funds, complemented by interest
Introduction
3
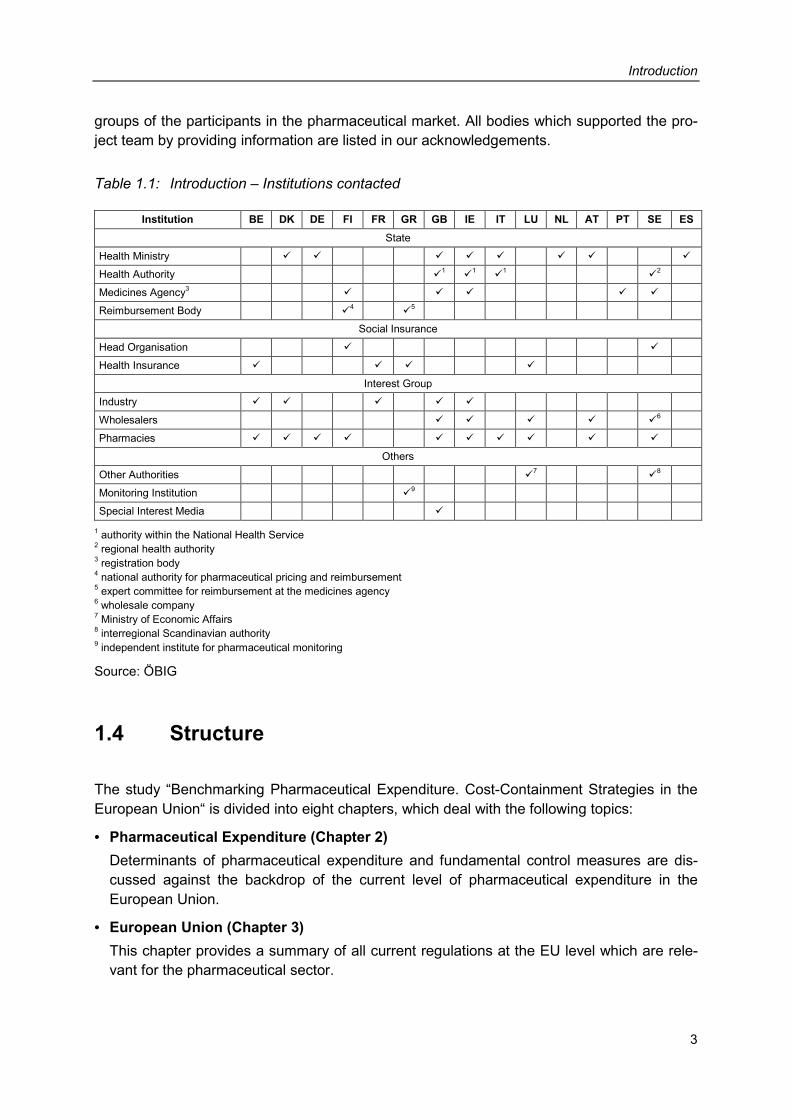
groups of the participants in the pharmaceutical market. All bodies which supported the pro-ject team by providing information are listed in our acknowledgements.
Table 1.1: Introduction – Institutions contacted
Institution BE DK DE FI FR GR GB IE IT LU NL AT PT SE ES State
Health Ministry � � � � � � � �
Health Authority �1 �
1 �1 �
2 Medicines Agency3 � � � � � Reimbursement Body �
4 �5
Social Insurance
Head Organisation � � Health Insurance � � � �
Interest Group Industry � � � � � Wholesalers � � � � �
6 Pharmacies � � � � � � � � � �
Others
Other Authorities �7 �
8 Monitoring Institution �
9 Special Interest Media �
1 authority within the National Health Service 2 regional health authority 3 registration body 4 national authority for pharmaceutical pricing and reimbursement 5 expert committee for reimbursement at the medicines agency 6 wholesale company 7 Ministry of Economic Affairs 8 interregional Scandinavian authority 9 independent institute for pharmaceutical monitoring
Source: ÖBIG
1.4 Structure
The study “Benchmarking Pharmaceutical Expenditure. Cost-Containment Strategies in the European Union“ is divided into eight chapters, which deal with the following topics:
• Pharmaceutical Expenditure (Chapter 2) Determinants of pharmaceutical expenditure and fundamental control measures are dis-cussed against the backdrop of the current level of pharmaceutical expenditure in the European Union.
• European Union (Chapter 3) This chapter provides a summary of all current regulations at the EU level which are rele-vant for the pharmaceutical sector.
Introduction
4
• Health Care Systems (Chapter 4) In this chapter the health care systems of the fifteen Member States are compared as re-gards the institutional framework and their organisation (social insurance systems versus national health service) as well as their financing. The services offered in the out-patient and in-patient sectors and access to those services (keyword: gatekeeper) are described for each Member State. The chapter concludes with a survey of the reforms in the health care sector.
• Pharmaceutical Systems (Chapter 5) This chapter gives a comparative presentation of the pharmaceutical systems of the fifteen EU countries including registration, reimbursement, pricing and co-payment regulations. One sub-chapter is dedicated to regulations as regards margins for pharmaceuticals as well as to a comparison of average wholesale and pharmacy margins and VAT in the pharmaceutical sector.
• Cost-containment Strategies (Chapter 6) A comprehensive table gives a chronological overview of cost-containment measures in the pharmaceutical sector. Control measures are analysed taking into consideration the objectives of the activities (price control versus volume control), the frequency, the coun-tries concerned and the actors.
• Benchmarking (Chapter 7) Key indicators of the pharmaceutical sector (pharmaceutical expenditure, public and pri-vate financing, regulations, etc.) of the fifteen countries are ranked in a table. A connection between the development of public pharmaceutical expenditure between 1990 and 1999 and cost-containment measures is established and evaluated.
• Conclusion (Chapter 8) In a final conclusion the effectiveness of the control measures in the EU Member States is assessed as regards cost-containment of pharmaceutical expenditure.
Pharmaceutical expenditure
5
2 Pharmaceutical expenditure
2.1 Importance
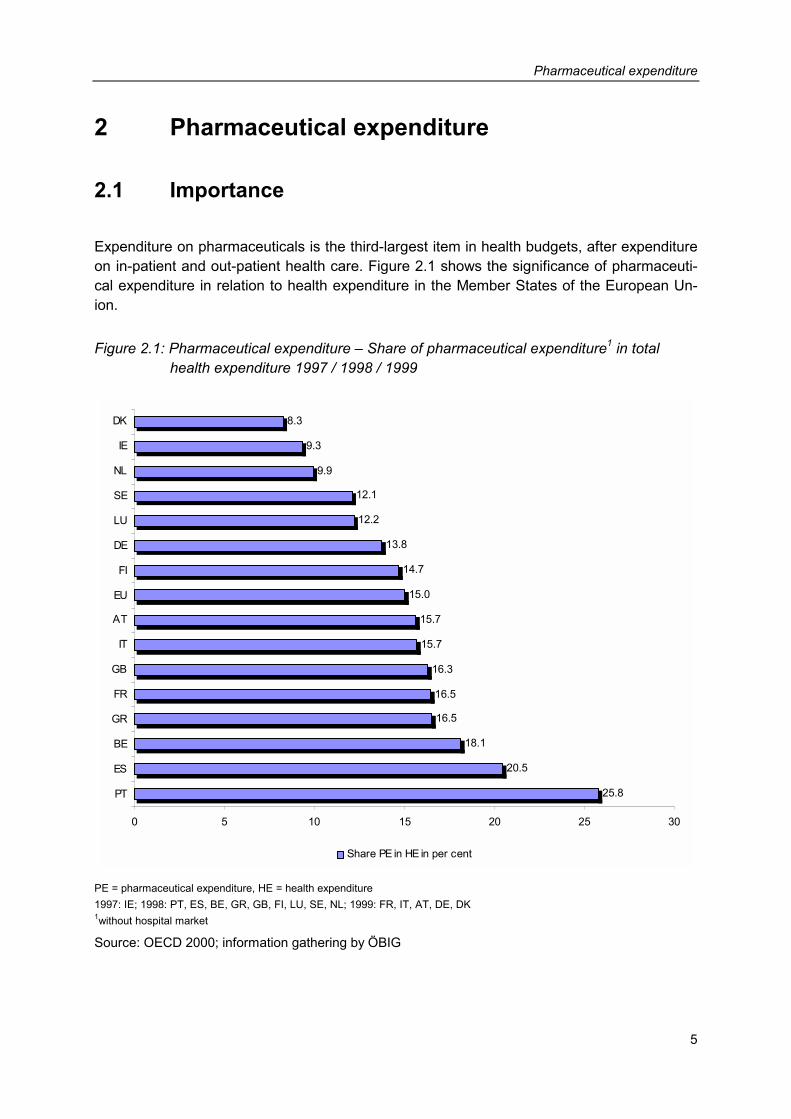
Expenditure on pharmaceuticals is the third-largest item in health budgets, after expenditure on in-patient and out-patient health care. Figure 2.1 shows the significance of pharmaceuti-cal expenditure in relation to health expenditure in the Member States of the European Un-ion.
Figure 2.1: Pharmaceutical expenditure – Share of pharmaceutical expenditure1 in total health expenditure 1997 / 1998 / 1999
25.8
20.5
18.1
16.5
16.5
16.3
15.7
15.7
15.0
14.7
13.8
12.2
12.1
9.9
9.3
8.3
0 5 10 15 20 25 30
PT
ES
BE
GR
FR
GB
IT
AT
EU
FI
DE
LU
SE
NL
IE
DK
Share PE in HE in per cent
PE = pharmaceutical expenditure, HE = health expenditure 1997: IE; 1998: PT, ES, BE, GR, GB, FI, LU, SE, NL; 1999: FR, IT, AT, DE, DK 1without hospital market
Source: OECD 2000; information gathering by ÖBIG
Pharmaceutical expenditure
6
2.2 Determinants
The level of pharmaceutical expenditure is determined by several factors:
• General level of income: The higher the per capita gross domestic product, the higher the expenditure on health care and/or pharmaceuticals.
• Remuneration system for practising physicians: Flat-rate capitation fees for practising physicians lead to lower pharmaceutical expendi-ture if access to specialist health care is restricted, whereas fees for services in a system with a free choice of physicians generally lead to increased pharmaceutical expenditure (BASYS 1995, Wieninger 1998).
• Age structure of the population: The older the population, the higher the need for pharmaceuticals, and the higher the ex-penditure.
• Regulatory framework: Intervention by the state and measures taken to control the pharmaceutical market also have an impact on pharmaceutical expenditure.
In addition, political and economic conditions, such as the significance of the pharmaceutical industry in a country, can play an important role.
The level and development of pharmaceutical expenditure is affected by several factors which may often be interrelated. Without any doubt, the decisive factor is the structure of the regulation and control systems.
2.3 Control measures
In its broadest sense, the term ‘control’ includes any kind of state intervention in the behav-iour of economic subjects. Depending on the degree of influence exerted, one distinguishes between orders and prohibitions (direct control), and monetary and non-monetary incentives or deterrents (indirect control). In its narrow sense, the term “control” only refers to direct interventions (cf. Ewers 1989, Weizäcker 1982, cited in: Schöffski 1995). Control measures aim at replacing missing market impacts or correcting undesired market impacts.
Pharmaceutical expenditure
7
In the health care sector in general and also in the pharmaceuticals system, there is broad consensus that control measures are required because of the peculiarities of the market such as
• the three-tier demand system (physician = demander, patient = consumer, health care system = payer),
• limited competition on the supply side (partly restricted competition among the suppliers) and
• positive and negative external effects (e.g. treatment or non-treatment of infectious illnesses has an impact on society as a whole)
This is to say that the health care and the pharmaceutical market cannot be left to the free market forces.
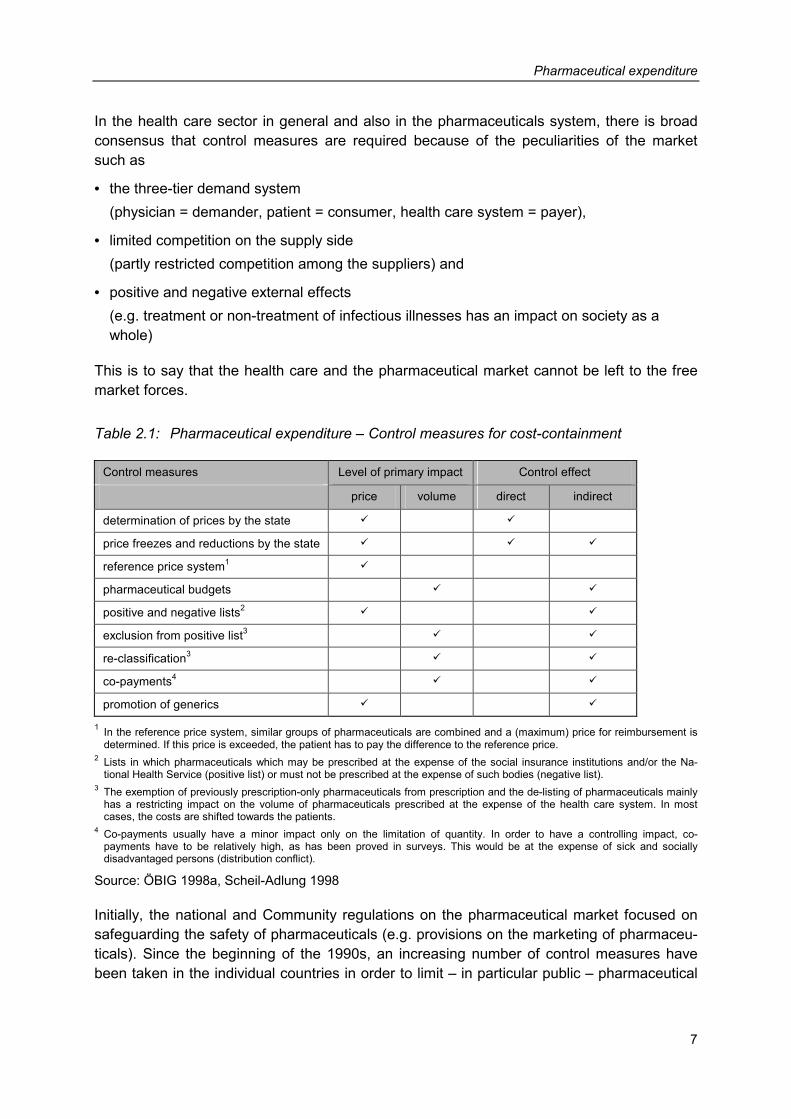
Table 2.1: Pharmaceutical expenditure – Control measures for cost-containment
Control measures Level of primary impact Control effect
price volume direct indirect
determination of prices by the state � �
price freezes and reductions by the state � � �
reference price system1 �
pharmaceutical budgets � �
positive and negative lists2 � �
exclusion from positive list3 � �
re-classification3 � �
co-payments4 � �
promotion of generics � �
1 In the reference price system, similar groups of pharmaceuticals are combined and a (maximum) price for reimbursement is determined. If this price is exceeded, the patient has to pay the difference to the reference price.
2 Lists in which pharmaceuticals which may be prescribed at the expense of the social insurance institutions and/or the Na-tional Health Service (positive list) or must not be prescribed at the expense of such bodies (negative list).
3 The exemption of previously prescription-only pharmaceuticals from prescription and the de-listing of pharmaceuticals mainly has a restricting impact on the volume of pharmaceuticals prescribed at the expense of the health care system. In most cases, the costs are shifted towards the patients.
4 Co-payments usually have a minor impact only on the limitation of quantity. In order to have a controlling impact, co-payments have to be relatively high, as has been proved in surveys. This would be at the expense of sick and socially disadvantaged persons (distribution conflict).
Source: ÖBIG 1998a, Scheil-Adlung 1998
Initially, the national and Community regulations on the pharmaceutical market focused on safeguarding the safety of pharmaceuticals (e.g. provisions on the marketing of pharmaceu-ticals). Since the beginning of the 1990s, an increasing number of control measures have been taken in the individual countries in order to limit – in particular public – pharmaceutical
Pharmaceutical expenditure
8
expenditure. However, various different ways have been chosen in order to achieve one and the same goal.
In general, control measures for the limitation of expenditure may be aimed at effecting price and/or volume. Furthermore, direct or indirect strategies can be applied:
• direct strategies include statutory provisions having a direct impact on the actors involved (suppliers of pharmaceuticals, patients) (control in the narrow sense of the term).
• indirect strategies are behaviour incentives, usually entailing financial consequences for the actors.
Table 2.1 shows typical control instruments for the limitation of expenditure on the pharma-ceutical market according to the distinction described above.
In most countries, a combination of market-economic and state control elements is used to control pharmaceutical expenditure.
European Union
9
3 European Union
3.1 Current provisions
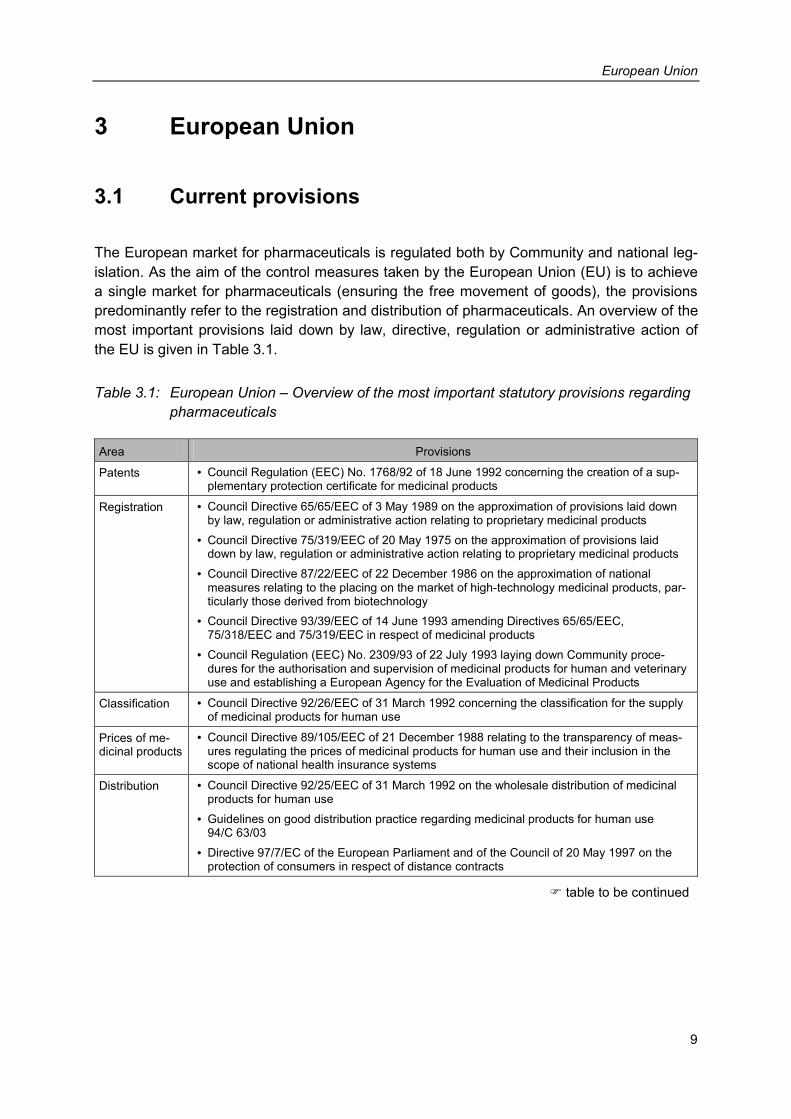
The European market for pharmaceuticals is regulated both by Community and national leg-islation. As the aim of the control measures taken by the European Union (EU) is to achieve a single market for pharmaceuticals (ensuring the free movement of goods), the provisions predominantly refer to the registration and distribution of pharmaceuticals. An overview of the most important provisions laid down by law, directive, regulation or administrative action of the EU is given in Table 3.1.
Table 3.1: European Union – Overview of the most important statutory provisions regarding pharmaceuticals
Area Provisions
Patents • Council Regulation (EEC) No. 1768/92 of 18 June 1992 concerning the creation of a sup-plementary protection certificate for medicinal products
Registration • Council Directive 65/65/EEC of 3 May 1989 on the approximation of provisions laid down by law, regulation or administrative action relating to proprietary medicinal products
• Council Directive 75/319/EEC of 20 May 1975 on the approximation of provisions laid down by law, regulation or administrative action relating to proprietary medicinal products
• Council Directive 87/22/EEC of 22 December 1986 on the approximation of national measures relating to the placing on the market of high-technology medicinal products, par-ticularly those derived from biotechnology
• Council Directive 93/39/EEC of 14 June 1993 amending Directives 65/65/EEC, 75/318/EEC and 75/319/EEC in respect of medicinal products
• Council Regulation (EEC) No. 2309/93 of 22 July 1993 laying down Community proce-dures for the authorisation and supervision of medicinal products for human and veterinary use and establishing a European Agency for the Evaluation of Medicinal Products
Classification • Council Directive 92/26/EEC of 31 March 1992 concerning the classification for the supply of medicinal products for human use
Prices of me-dicinal products
• Council Directive 89/105/EEC of 21 December 1988 relating to the transparency of meas-ures regulating the prices of medicinal products for human use and their inclusion in the scope of national health insurance systems
Distribution • Council Directive 92/25/EEC of 31 March 1992 on the wholesale distribution of medicinal products for human use
• Guidelines on good distribution practice regarding medicinal products for human use 94/C 63/03
• Directive 97/7/EC of the European Parliament and of the Council of 20 May 1997 on the protection of consumers in respect of distance contracts
� table to be continued
European Union
10
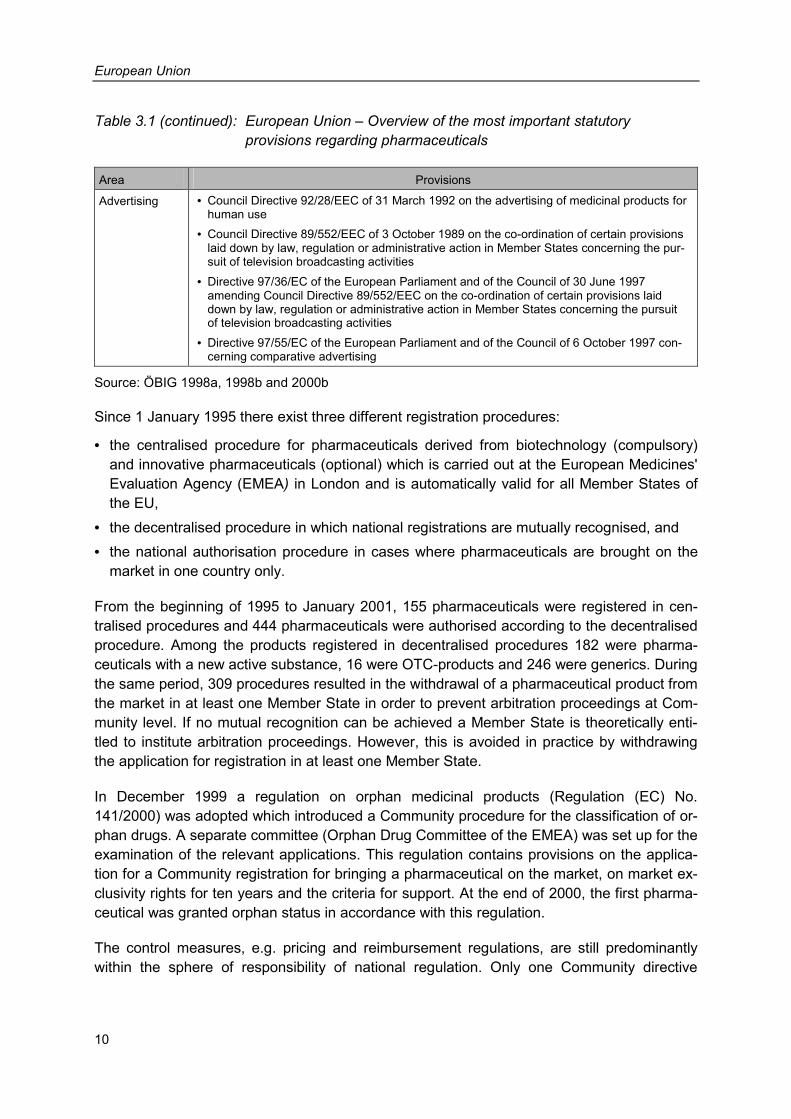
Table 3.1 (continued): European Union – Overview of the most important statutory provisions regarding pharmaceuticals
Area Provisions
Advertising • Council Directive 92/28/EEC of 31 March 1992 on the advertising of medicinal products for human use
• Council Directive 89/552/EEC of 3 October 1989 on the co-ordination of certain provisions laid down by law, regulation or administrative action in Member States concerning the pur-suit of television broadcasting activities
• Directive 97/36/EC of the European Parliament and of the Council of 30 June 1997 amending Council Directive 89/552/EEC on the co-ordination of certain provisions laid down by law, regulation or administrative action in Member States concerning the pursuit of television broadcasting activities
• Directive 97/55/EC of the European Parliament and of the Council of 6 October 1997 con-cerning comparative advertising
Source: ÖBIG 1998a, 1998b and 2000b
Since 1 January 1995 there exist three different registration procedures:
• the centralised procedure for pharmaceuticals derived from biotechnology (compulsory) and innovative pharmaceuticals (optional) which is carried out at the European Medicines' Evaluation Agency (EMEA) in London and is automatically valid for all Member States of the EU,
• the decentralised procedure in which national registrations are mutually recognised, and • the national authorisation procedure in cases where pharmaceuticals are brought on the
market in one country only.
From the beginning of 1995 to January 2001, 155 pharmaceuticals were registered in cen-tralised procedures and 444 pharmaceuticals were authorised according to the decentralised procedure. Among the products registered in decentralised procedures 182 were pharma-ceuticals with a new active substance, 16 were OTC-products and 246 were generics. During the same period, 309 procedures resulted in the withdrawal of a pharmaceutical product from the market in at least one Member State in order to prevent arbitration proceedings at Com-munity level. If no mutual recognition can be achieved a Member State is theoretically enti-tled to institute arbitration proceedings. However, this is avoided in practice by withdrawing the application for registration in at least one Member State.
In December 1999 a regulation on orphan medicinal products (Regulation (EC) No. 141/2000) was adopted which introduced a Community procedure for the classification of or-phan drugs. A separate committee (Orphan Drug Committee of the EMEA) was set up for the examination of the relevant applications. This regulation contains provisions on the applica-tion for a Community registration for bringing a pharmaceutical on the market, on market ex-clusivity rights for ten years and the criteria for support. At the end of 2000, the first pharma-ceutical was granted orphan status in accordance with this regulation.
The control measures, e.g. pricing and reimbursement regulations, are still predominantly within the sphere of responsibility of national regulation. Only one Community directive
European Union
11
(89/105/EC – Transparency Directive) has been adopted which aims at safeguarding trans-parency of national pricing and limiting the duration of pricing procedures.
3.2 The future
As the legal framework of the EU in the area of pharmaceuticals is composed of a multitude of directives, a proposal for the preparation of a Community code for medicinal products for human use was submitted in 1999. This Community code is to create a harmonised source of law without substantially changing existing legislation.
In order to optimise registration procedures, the EU has made numerous recommendations in recent years, e.g. to the Member States regarding the increase of acceptance of bio-equivalence studies from other countries, or to the applicants regarding the reduction of for-mal problems.
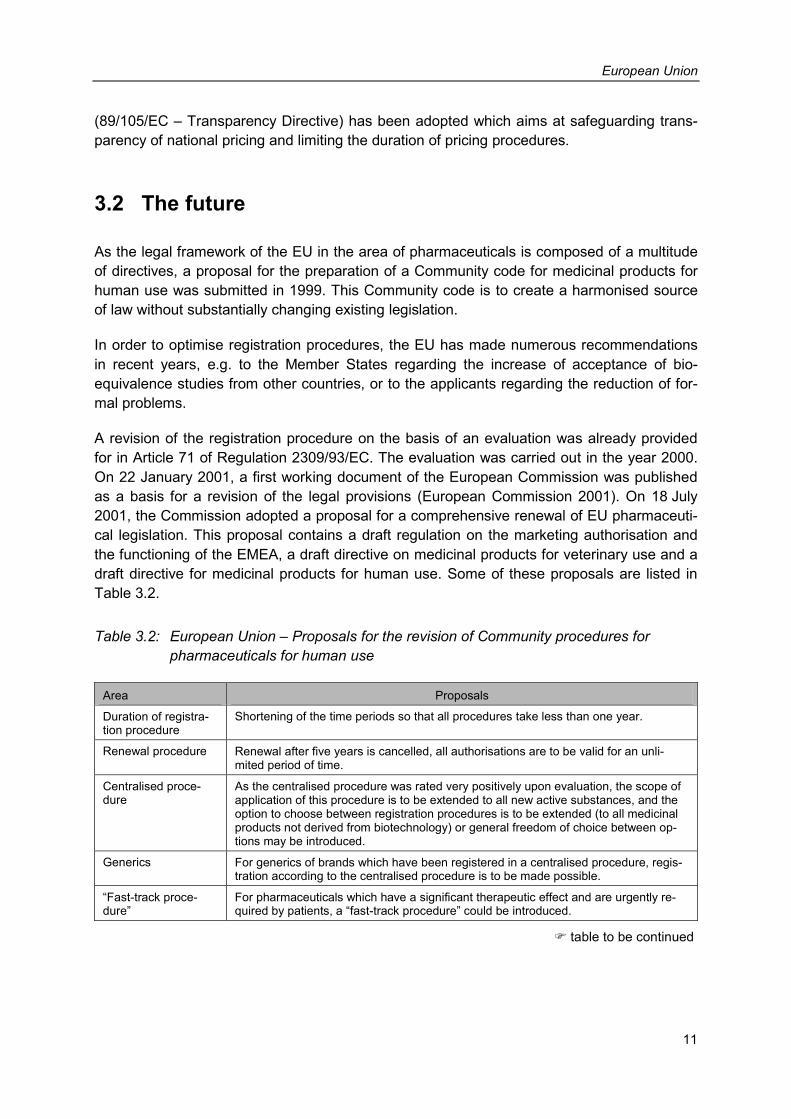
A revision of the registration procedure on the basis of an evaluation was already provided for in Article 71 of Regulation 2309/93/EC. The evaluation was carried out in the year 2000. On 22 January 2001, a first working document of the European Commission was published as a basis for a revision of the legal provisions (European Commission 2001). On 18 July 2001, the Commission adopted a proposal for a comprehensive renewal of EU pharmaceuti-cal legislation. This proposal contains a draft regulation on the marketing authorisation and the functioning of the EMEA, a draft directive on medicinal products for veterinary use and a draft directive for medicinal products for human use. Some of these proposals are listed in Table 3.2.
Table 3.2: European Union – Proposals for the revision of Community procedures for pharmaceuticals for human use
Area Proposals
Duration of registra-tion procedure
Shortening of the time periods so that all procedures take less than one year.
Renewal procedure Renewal after five years is cancelled, all authorisations are to be valid for an unli-mited period of time.
Centralised proce-dure
As the centralised procedure was rated very positively upon evaluation, the scope of application of this procedure is to be extended to all new active substances, and the option to choose between registration procedures is to be extended (to all medicinal products not derived from biotechnology) or general freedom of choice between op-tions may be introduced.
Generics For generics of brands which have been registered in a centralised procedure, regis-tration according to the centralised procedure is to be made possible.
“Fast-track proce-dure”
For pharmaceuticals which have a significant therapeutic effect and are urgently re-quired by patients, a “fast-track procedure” could be introduced.
� table to be continued

European Union
12
Table 3.2 (continued): European Union – Proposals for the revision of Community procedures for medicinal products for human use
Area Proposals
“Compassionate use” The use of pharmaceuticals not yet registered could be tolerated under certain condi-tions by creating a European system of “compassionate use”.
Decentralised proce-dure
Different modalities for pharmaceuticals already registered and those not yet regis-tered are to be introduced. The informal groups for mutual recognition (MRFG and VMRFG) are to be given formal and legal status. Arbitration proceedings have to be improved and the time periods for evaluation shortened.
EMEA As regards the EMEA, organisational changes are proposed in order to increase its independence, quality and efficiency.
Procedures for the adoption of resolu-tions
In order to shorten the decision making process at the Commission, authorisations have been extended and signing powers granted.
Source: European Commission 2001a and 2001b
Furthermore, in discussions on the different price levels of pharmaceuticals within the EU, the Council and the Commission found that fixing of prices at Community level was not de-sirable as regards safeguarding health and economic interests. However, the single market could be promoted by a process differentiating between certain groups of pharmaceuticals (OTC/prescription-only products, pharmaceuticals with/without patent protection).
Given the significance of innovations in the pharmaceutical sector for health policy and the economy, research is to be promoted at Community level. Such promotion is to focus on co-operation between the Member States (e.g. strategies against antibiotic resistance) on the one hand and concrete programmes facilitating innovations at the EU level on the other hand.
Health care systems
13
4 Health care systems
This chapter contains an overview of the health care systems of the 15 EU Member States. The main characteristics of the health care systems are described briefly, for example the in-stitutional framework, financing, organisation and particularities of out-patient and in-patient health care as well as the reform measures adopted in the past decade. The core subject of this study – pharmaceuticals – is dealt with and analysed in detail in Chapters 5 to 8.
4.1 Institutional framework
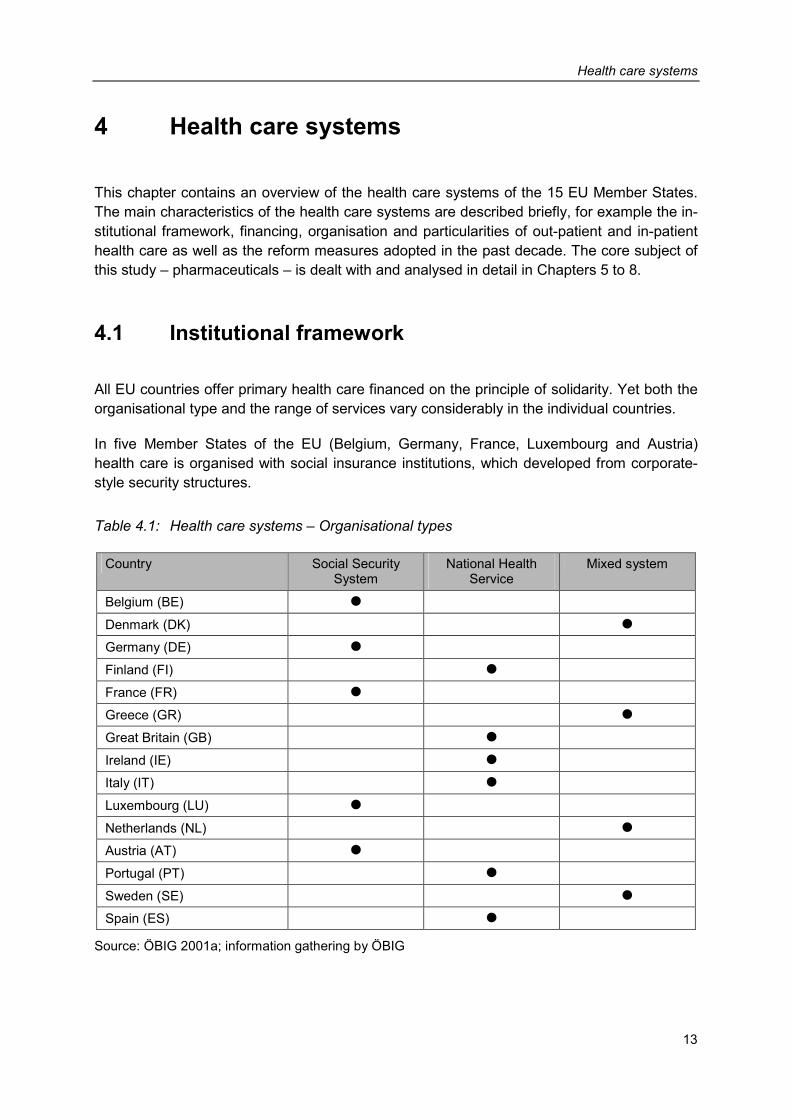
All EU countries offer primary health care financed on the principle of solidarity. Yet both the organisational type and the range of services vary considerably in the individual countries.
In five Member States of the EU (Belgium, Germany, France, Luxembourg and Austria) health care is organised with social insurance institutions, which developed from corporate-style security structures.
Table 4.1: Health care systems – Organisational types
Country Social Security System
National Health Service
Mixed system
Belgium (BE) �
Denmark (DK) �
Germany (DE) �
Finland (FI) �
France (FR) � Greece (GR) �
Great Britain (GB) �
Ireland (IE) � Italy (IT) �
Luxembourg (LU) �
Netherlands (NL) �
Austria (AT) �
Portugal (PT) �
Sweden (SE) �
Spain (ES) �
Source: ÖBIG 2001a; information gathering by ÖBIG
Health care systems
14
In six Member States (Finland, Great Britain, Ireland, Italy, Portugal and Spain) basic health care is guaranteed by National Health Services.
In the remaining Member States of the EU there are mixed systems made up of social insur-ance institutions and the National Health Service (Denmark, Greece, Sweden). Only in the Netherlands does the health care system consist of a combined system of public and private health insurance. Statutory health insurance against acute diseases is obligatory for persons whose incomes do not exceed a certain limit (insurance obligation); persons with higher in-comes as well as self-employed persons may opt for private health insurance. During the 1990s not only the Netherlands but also Germany largely changed the concept of obligatory insurance.
In addition to the institutional framework also the range of services in primary health care is of importance. Normally this is only defined very generally, but in some countries selected medical services are explicitly excluded from primary health care. In the mid-1990s in the Netherlands, for example, dental care for adults as well as the costs of physiotherapeutic treatment were de-listed.
The extent of medical care is not only determined by the exclusion of entire groups of health services from primary health care but also by the amount of co-payment. Co-payments for health care services differ considerably in the Member States. In Finland, for example, co-payments for out-patient and in-patient care are limited to about € 600.- per year. Besides, additional payments for pharmaceuticals up to a limit of about € 600.- per year may have to be made. In other countries, for example Great Britain, co-payments are not required for out-patient and in-patient basic health care, but they are for pharmaceuticals.
4.2 Financing
In the EU countries at present health expenditure amounts to an average of 8.0 per cent of the gross domestic product (cf. Table 4.2). In Germany, France and Belgium a much higher percentage of the gross domestic product is spent on health services, whereas in Luxem-bourg, Ireland, Finland, Great Britain and Spain this percentage is below the average of the Member States.
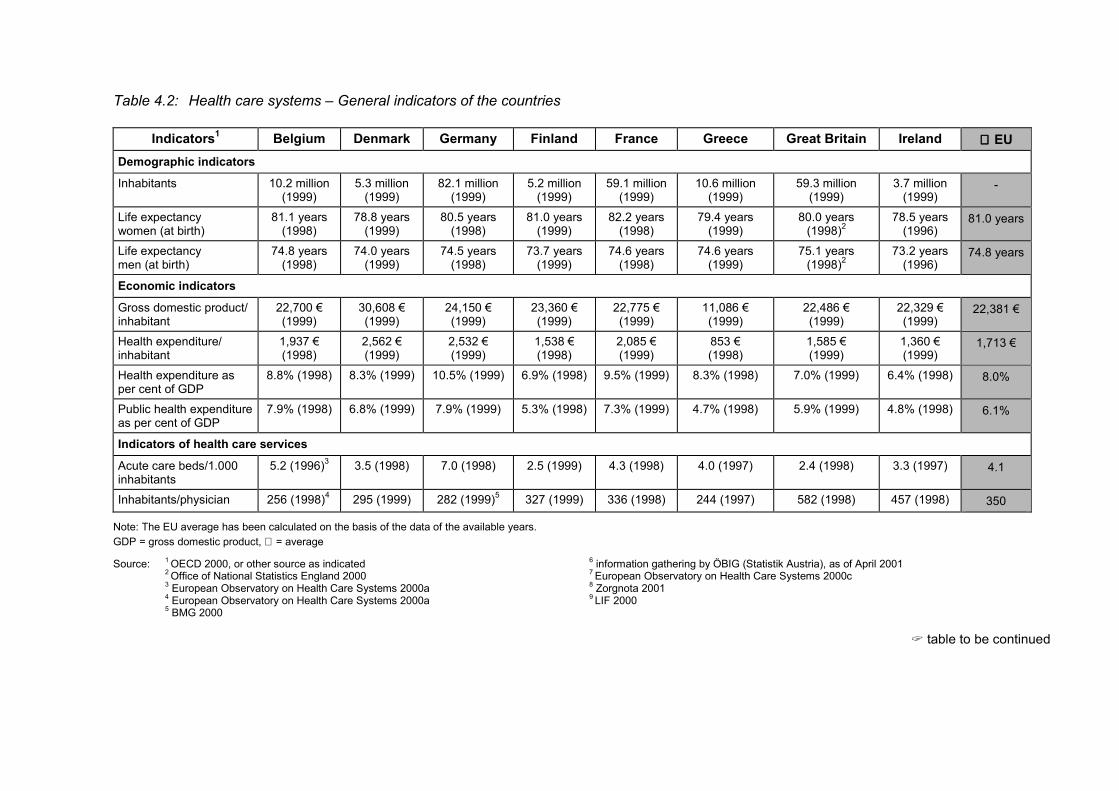
Table 4.2: Health care systems – General indicators of the countries
Indicators1 Belgium Denmark Germany Finland France Greece Great Britain Ireland ∅∅∅∅ EU Demographic indicators
Inhabitants 10.2 million (1999)
5.3 million (1999)
82.1 million (1999)
5.2 million (1999)
59.1 million (1999)
10.6 million (1999)
59.3 million (1999)
3.7 million (1999)
-
Life expectancy women (at birth)
81.1 years (1998)
78.8 years (1999)
80.5 years (1998)
81.0 years (1999)
82.2 years (1998)
79.4 years (1999)
80.0 years (1998)2
78.5 years (1996)
81.0 years
Life expectancy men (at birth)
74.8 years (1998)
74.0 years (1999)
74.5 years (1998)
73.7 years (1999)
74.6 years (1998)
74.6 years (1999)
75.1 years (1998)2
73.2 years (1996)
74.8 years
Economic indicators
Gross domestic product/ inhabitant
22,700 € (1999)
30,608 € (1999)
24,150 € (1999)
23,360 € (1999)
22,775 € (1999)
11,086 € (1999)
22,486 € (1999)
22,329 € (1999)
22,381 €
Health expenditure/ inhabitant
1,937 € (1998)
2,562 € (1999)
2,532 € (1999)
1,538 € (1998)
2,085 € (1999)
853 € (1998)
1,585 € (1999)
1,360 € (1999)
1,713 €
Health expenditure as per cent of GDP
8.8% (1998) 8.3% (1999) 10.5% (1999) 6.9% (1998) 9.5% (1999) 8.3% (1998) 7.0% (1999) 6.4% (1998) 8.0%
Public health expenditure as per cent of GDP
7.9% (1998) 6.8% (1999) 7.9% (1999) 5.3% (1998) 7.3% (1999) 4.7% (1998) 5.9% (1999) 4.8% (1998) 6.1%
Indicators of health care services
Acute care beds/1.000 inhabitants
5.2 (1996)3 3.5 (1998) 7.0 (1998) 2.5 (1999) 4.3 (1998) 4.0 (1997) 2.4 (1998) 3.3 (1997) 4.1
Inhabitants/physician 256 (1998)4 295 (1999) 282 (1999)5 327 (1999) 336 (1998) 244 (1997) 582 (1998) 457 (1998) 350
Note: The EU average has been calculated on the basis of the data of the available years. GDP = gross domestic product, ∅ = average
Source: 1 OECD 2000, or other source as indicated 6 information gathering by ÖBIG (Statistik Austria), as of April 2001 2 Office of National Statistics England 2000 7 European Observatory on Health Care Systems 2000c
3 European Observatory on Health Care Systems 2000a 4 European Observatory on Health Care Systems 2000a
8 Zorgnota 2001 9 LIF 2000
5 BMG 2000
� table to be continued
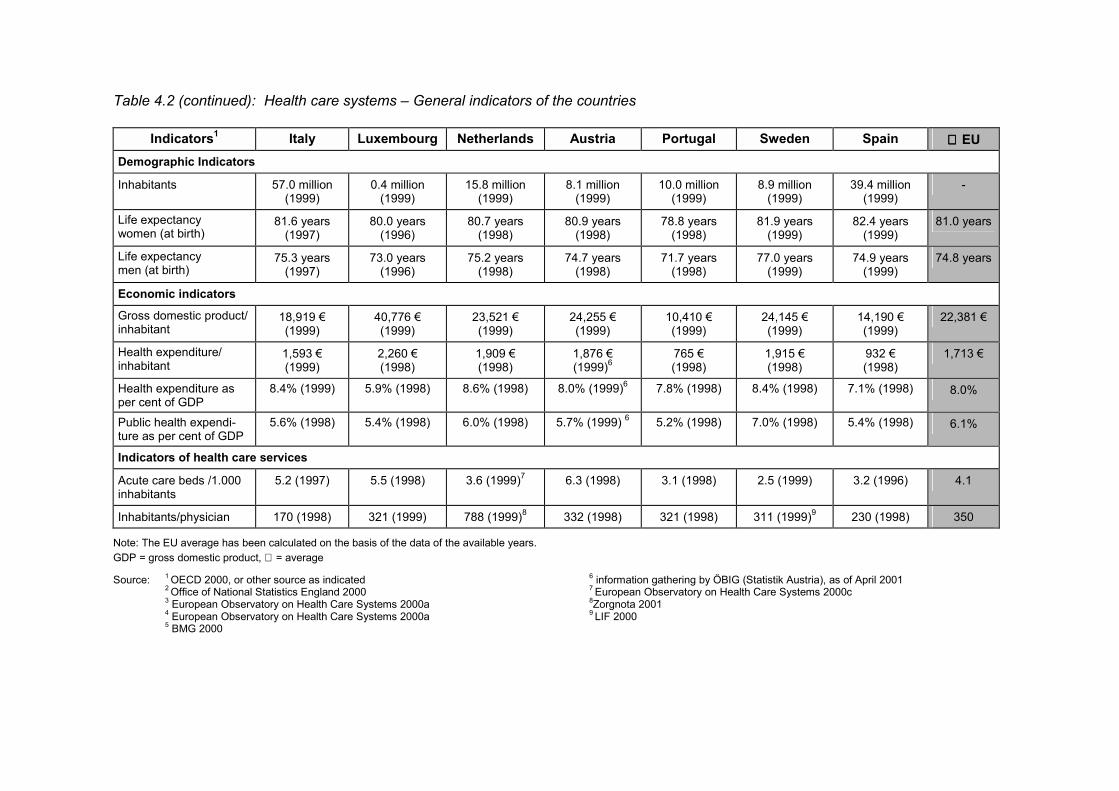
Table 4.2 (continued): Health care systems – General indicators of the countries
Indicators1 Italy Luxembourg Netherlands Austria Portugal Sweden Spain ∅∅∅∅ EU
Demographic Indicators
Inhabitants 57.0 million (1999)
0.4 million (1999)
15.8 million (1999)
8.1 million (1999)
10.0 million (1999)
8.9 million (1999)
39.4 million (1999)
-
Life expectancy women (at birth)
81.6 years (1997)
80.0 years (1996)
80.7 years (1998)
80.9 years (1998)
78.8 years (1998)
81.9 years (1999)
82.4 years (1999)
81.0 years
Life expectancy men (at birth)
75.3 years (1997)
73.0 years (1996)
75.2 years (1998)
74.7 years (1998)
71.7 years (1998)
77.0 years (1999)
74.9 years (1999)
74.8 years
Economic indicators
Gross domestic product/ inhabitant
18,919 € (1999)
40,776 € (1999)
23,521 € (1999)
24,255 € (1999)
10,410 € (1999)
24,145 € (1999)
14,190 € (1999)
22,381 €
Health expenditure/ inhabitant
1,593 € (1999)
2,260 € (1998)
1,909 € (1998)
1,876 € (1999)6
765 € (1998)
1,915 € (1998)
932 € (1998)
1,713 €
Health expenditure as per cent of GDP
8.4% (1999) 5.9% (1998) 8.6% (1998) 8.0% (1999)6 7.8% (1998) 8.4% (1998) 7.1% (1998) 8.0%
Public health expendi-ture as per cent of GDP
5.6% (1998) 5.4% (1998) 6.0% (1998) 5.7% (1999) 6 5.2% (1998) 7.0% (1998) 5.4% (1998) 6.1%
Indicators of health care services
Acute care beds /1.000 inhabitants
5.2 (1997) 5.5 (1998) 3.6 (1999)7 6.3 (1998) 3.1 (1998) 2.5 (1999) 3.2 (1996) 4.1
Inhabitants/physician 170 (1998) 321 (1999) 788 (1999)8 332 (1998) 321 (1998) 311 (1999)9 230 (1998) 350
Note: The EU average has been calculated on the basis of the data of the available years. GDP = gross domestic product, ∅ = average
Source: 1 OECD 2000, or other source as indicated 6 information gathering by ÖBIG (Statistik Austria), as of April 2001 2 Office of National Statistics England 2000 7 European Observatory on Health Care Systems 2000c
3 European Observatory on Health Care Systems 2000a 4 European Observatory on Health Care Systems 2000a
8Zorgnota 2001 9 LIF 2000
5 BMG 2000
Health care systems
17
Considering health expenditure per inhabitant, the average EU expenditure for health care is € 1,713.- per head (cf. Table 4.2). Joining Spain at the bottom end of the table are Greece and Portugal with health expenditures per inhabitant below € 1,000.-. France, Luxembourg, Germany and Denmark were at the top of the list with expenditures exceeding € 2,000.-. Considering also purchasing power in the comparison of per capita health expenditure, the ranking of the countries does not change essentially, but the spectrum of expenditure is smaller.
In the majority of EU Member States public health expenditure as a proportion of overall health expenditure declined in the 1990s. This development, i.e. the increase of the share of private health expenditure, was particularly remarkable in Italy, Sweden, Greece and Finland. Also in Austria and Spain the burden for private households increased. In Germany and the Netherlands the share of public sector health expenditure rose in the first half of the 1990s, but then went down again due to public cost-containment. In Ireland and Portugal the share of public sector health expenditure increased a little in the past decade. Great Britain is plan-ning to raise public funds for health care in order to improve the health care situation.
4.3 Out-patient and in-patient health care
The average number of inhabitants per physician in the EU is 350 – considering both practis-ing physicians and physicians working in in-patient care. However the density of physicians varies considerably between the individual Member States. In Italy, 170 inhabitants share one physician, whereas according to statistics in the Netherlands there are 788 inhabitants per physician (cf. Table 4.2).
In the Member States of the EU out-patient health care is organised in individual practices, group practices, health centres and hospital out-patient departments. In countries with Na-tional Health Services or mixed systems basic medical care is mainly provided in health cen-tres, while specialist health care normally is guaranteed in out-patient departments of hospi-tals. In this case general practitioners normally act as gatekeepers “controlling” the access to specialists and in-patient health care. In Member States of the EU with a social security sys-tem individual practices preponderate. These countries also offer free choice of physicians and free access to specialists (cf. Table 4.3).
The different types of remuneration imply different kinds of incentives for the care providers. Fee for service implies the incentive to enlarge quantities, thereby maximising income in-stead of optimising treatment. Capitation fees and fixed salaries, on the other hand, entail the risk of quality deficiencies and insufficient health care for the chronically ill. Member States in which primary health care is organised by National Health Services tend to prefer remunera-tion by salaries or capitation fees. In countries with social security systems remuneration normally is based on tariffs for individual services, which are fixed after negotiations with the health insurance institutions. In addition, remuneration is also organised as a combination of remuneration through flat rates and fee for service, in an attempt to reduce the disadvan-tages of both systems (cf. Table 4.4).
Health care systems
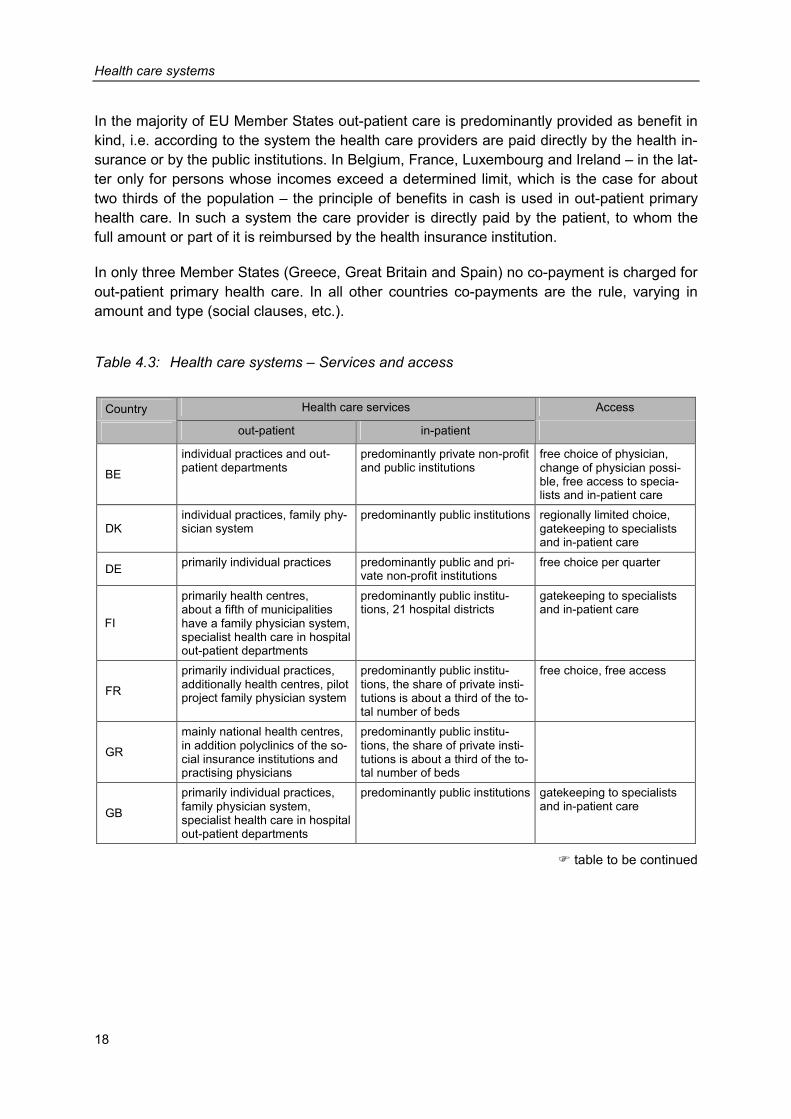
18
In the majority of EU Member States out-patient care is predominantly provided as benefit in kind, i.e. according to the system the health care providers are paid directly by the health in-surance or by the public institutions. In Belgium, France, Luxembourg and Ireland – in the lat-ter only for persons whose incomes exceed a determined limit, which is the case for about two thirds of the population – the principle of benefits in cash is used in out-patient primary health care. In such a system the care provider is directly paid by the patient, to whom the full amount or part of it is reimbursed by the health insurance institution.
In only three Member States (Greece, Great Britain and Spain) no co-payment is charged for out-patient primary health care. In all other countries co-payments are the rule, varying in amount and type (social clauses, etc.).
Table 4.3: Health care systems – Services and access
Country Health care services Access
out-patient in-patient
BE
individual practices and out-patient departments
predominantly private non-profit and public institutions
free choice of physician, change of physician possi-ble, free access to specia-lists and in-patient care
DK individual practices, family phy-sician system
predominantly public institutions regionally limited choice, gatekeeping to specialists and in-patient care
DE primarily individual practices predominantly public and pri-vate non-profit institutions
free choice per quarter
FI
primarily health centres, about a fifth of municipalities have a family physician system, specialist health care in hospital out-patient departments
predominantly public institu-tions, 21 hospital districts
gatekeeping to specialists and in-patient care
FR
primarily individual practices, additionally health centres, pilot project family physician system
predominantly public institu-tions, the share of private insti-tutions is about a third of the to-tal number of beds
free choice, free access
GR
mainly national health centres, in addition polyclinics of the so-cial insurance institutions and practising physicians
predominantly public institu-tions, the share of private insti-tutions is about a third of the to-tal number of beds
GB
primarily individual practices, family physician system, specialist health care in hospital out-patient departments
predominantly public institutions gatekeeping to specialists and in-patient care
� table to be continued
Health care systems
19
Table 4.3 (continued): Health care systems – Services and access
Country Health care services Access
out-patient in-patient
IE
primarily individual practices, specialist health care predomi-nantly in hospital out-patient departments
predominantly public institutions regionally limited choice for about a third of the popula-tion, free choice for the rest of the population, gatekee-ping to specialists and in-patient care
IT primarily individual practices, family physician system
predominantly public institutions gatekeeping to specialists and in-patient care, free but regionally limited choice
LU primarily individual practices public and private non-profit in-
stitutions free choice, free access to specialists and in-patient health care
NL
primarily individual and group practices, family physician sys-tem, specialist health care predomi-nantly in hospital out-patient departments
primarily private non-profit institutions
free choice of physician, gatekeeping to specialists
AT primarily individual practices primarily public and private non-profit institutions
free choice (per quarter), limited access to specialists
PT
primarily health centres, family physician system, specialist health care in health centres, hospitals and individual practices
primarily public institutions, 50 per cent of private institu-tions profit-oriented
gatekeeping to specialists, free choice
SE
primarily health centres, in addi-tion public practices of family physicians and individual prac-tices, specialist health care predominantly in hospital out-patient departments
primarily public institutions, six health care regions
direct access to specialists
ES
individual and group practices as well as health centres, family physician system, specialist health care primarily in out-patient clinics
primarily public institutions, plus private profit-oriented institu-tions
gatekeeping to specialists, free choice
Source: ÖBIG 2001a; information gathering by ÖBIG
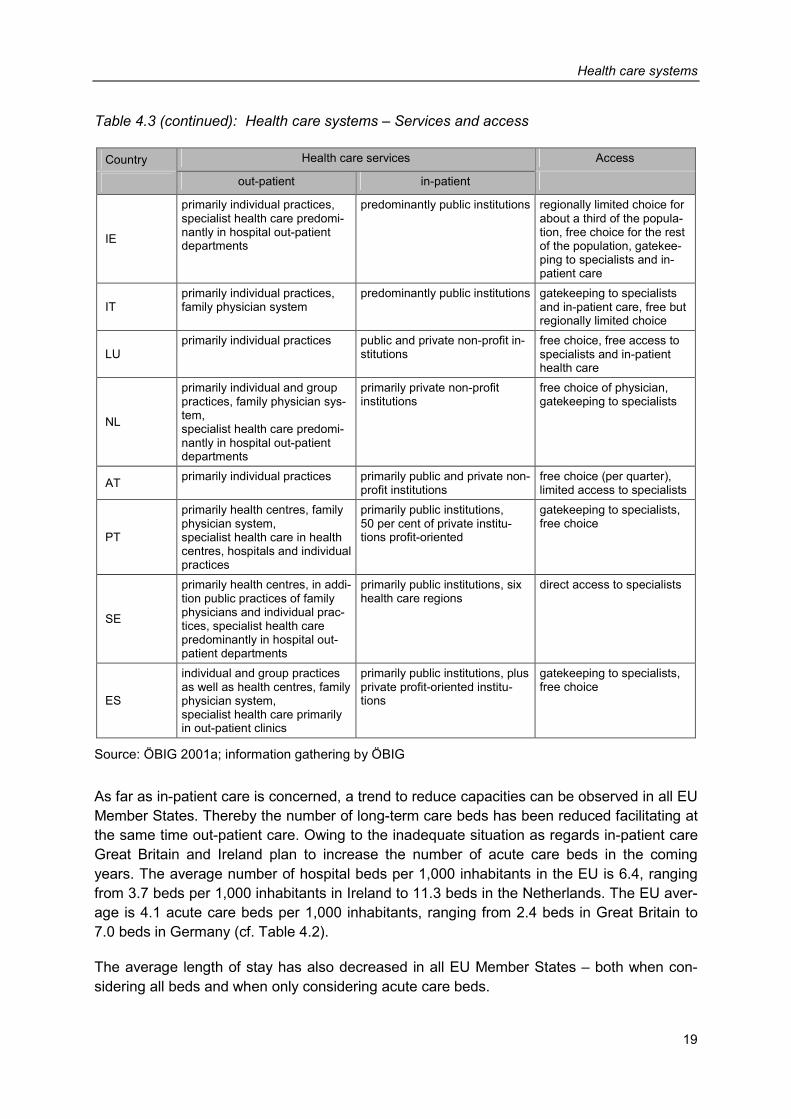
As far as in-patient care is concerned, a trend to reduce capacities can be observed in all EU Member States. Thereby the number of long-term care beds has been reduced facilitating at the same time out-patient care. Owing to the inadequate situation as regards in-patient care Great Britain and Ireland plan to increase the number of acute care beds in the coming years. The average number of hospital beds per 1,000 inhabitants in the EU is 6.4, ranging from 3.7 beds per 1,000 inhabitants in Ireland to 11.3 beds in the Netherlands. The EU aver-age is 4.1 acute care beds per 1,000 inhabitants, ranging from 2.4 beds in Great Britain to 7.0 beds in Germany (cf. Table 4.2).
The average length of stay has also decreased in all EU Member States – both when con-sidering all beds and when only considering acute care beds.
Health care systems
20
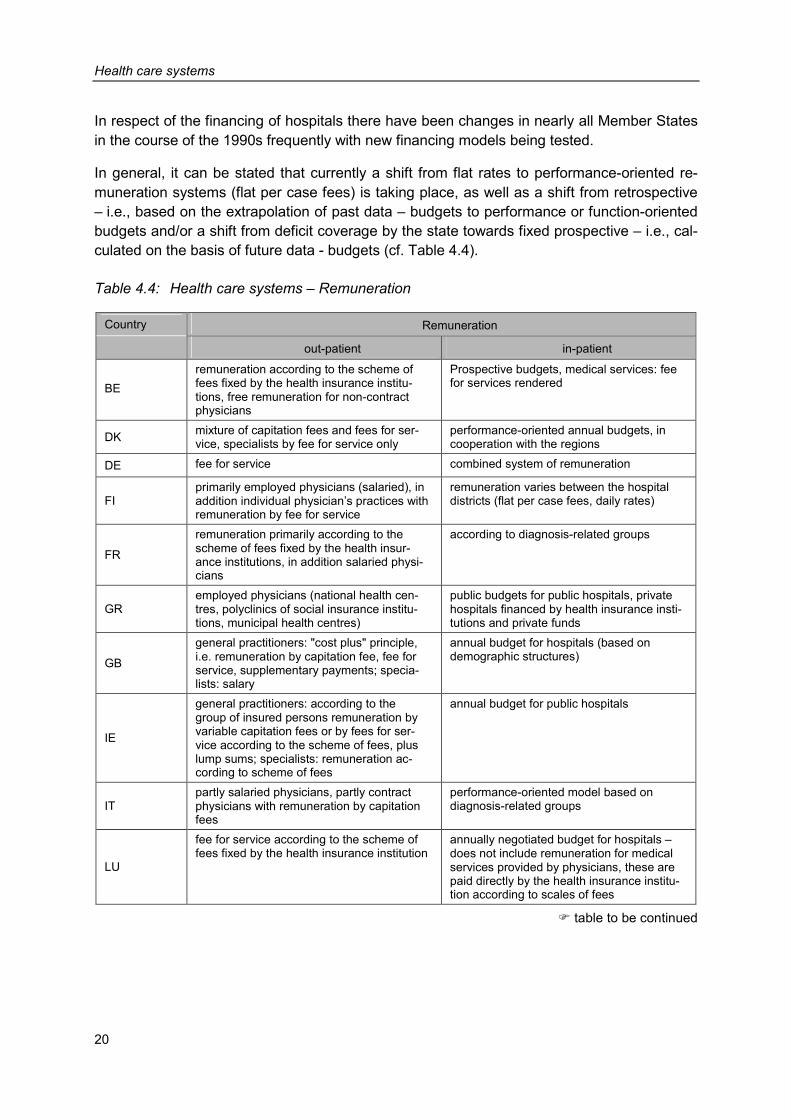
In respect of the financing of hospitals there have been changes in nearly all Member States in the course of the 1990s frequently with new financing models being tested.
In general, it can be stated that currently a shift from flat rates to performance-oriented re-muneration systems (flat per case fees) is taking place, as well as a shift from retrospective – i.e., based on the extrapolation of past data – budgets to performance or function-oriented budgets and/or a shift from deficit coverage by the state towards fixed prospective – i.e., cal-culated on the basis of future data - budgets (cf. Table 4.4).
Table 4.4: Health care systems – Remuneration
Country Remuneration
out-patient in-patient
BE remuneration according to the scheme of fees fixed by the health insurance institu-tions, free remuneration for non-contract physicians
Prospective budgets, medical services: fee for services rendered
DK mixture of capitation fees and fees for ser-vice, specialists by fee for service only
performance-oriented annual budgets, in cooperation with the regions
DE fee for service combined system of remuneration
FI primarily employed physicians (salaried), in addition individual physician’s practices with remuneration by fee for service
remuneration varies between the hospital districts (flat per case fees, daily rates)
FR
remuneration primarily according to the scheme of fees fixed by the health insur-ance institutions, in addition salaried physi-cians
according to diagnosis-related groups
GR employed physicians (national health cen-tres, polyclinics of social insurance institu-tions, municipal health centres)
public budgets for public hospitals, private hospitals financed by health insurance insti-tutions and private funds
GB
general practitioners: "cost plus" principle, i.e. remuneration by capitation fee, fee for service, supplementary payments; specia-lists: salary
annual budget for hospitals (based on demographic structures)
IE
general practitioners: according to the group of insured persons remuneration by variable capitation fees or by fees for ser-vice according to the scheme of fees, plus lump sums; specialists: remuneration ac-cording to scheme of fees
annual budget for public hospitals
IT partly salaried physicians, partly contract physicians with remuneration by capitation fees
performance-oriented model based on diagnosis-related groups
LU
fee for service according to the scheme of fees fixed by the health insurance institution
annually negotiated budget for hospitals – does not include remuneration for medical services provided by physicians, these are paid directly by the health insurance institu-tion according to scales of fees
� table to be continued
Health care systems
21
Table 4.4 (continued): Health care systems – Remuneration
Country Remuneration
out-patient in-patient
NL
capitation fees for insured under the statu-tory health insurance, fee for services ren-dered for privately insured persons
“function-oriented” budgeting (considering demographic structure and infrastructure as well as number of out-patients, in-patient days, etc), furthermore pilot projects of a performance-oriented remuneration system
AT
contract physicians: general practitioners are paid via health insurance vouchers and fee for services rendered, specialists: fee for service according to the scheme of fees fixed by the health insur-ance institution
performance-oriented financing (diagnosis-related groups plus structural factor)
PT salaried physicians in the National Health Service, fee for service for contract physi-cians
hospitals in the National Health Service: ret-rospective budgets
SE
primarily salaried physicians, fee for service for self-employed physicians
form of financing varies between health care regions, partly fixed annual budgets, partly flat per case fees but also fees per service
ES employed physicians in primary health care: monthly salary plus capitation fees; resident physicians: capitation fees
financing through retrospective global budgets, testing of new forms of financing in some regions
Source: ÖBIG 2001a; information gathering by ÖBIG
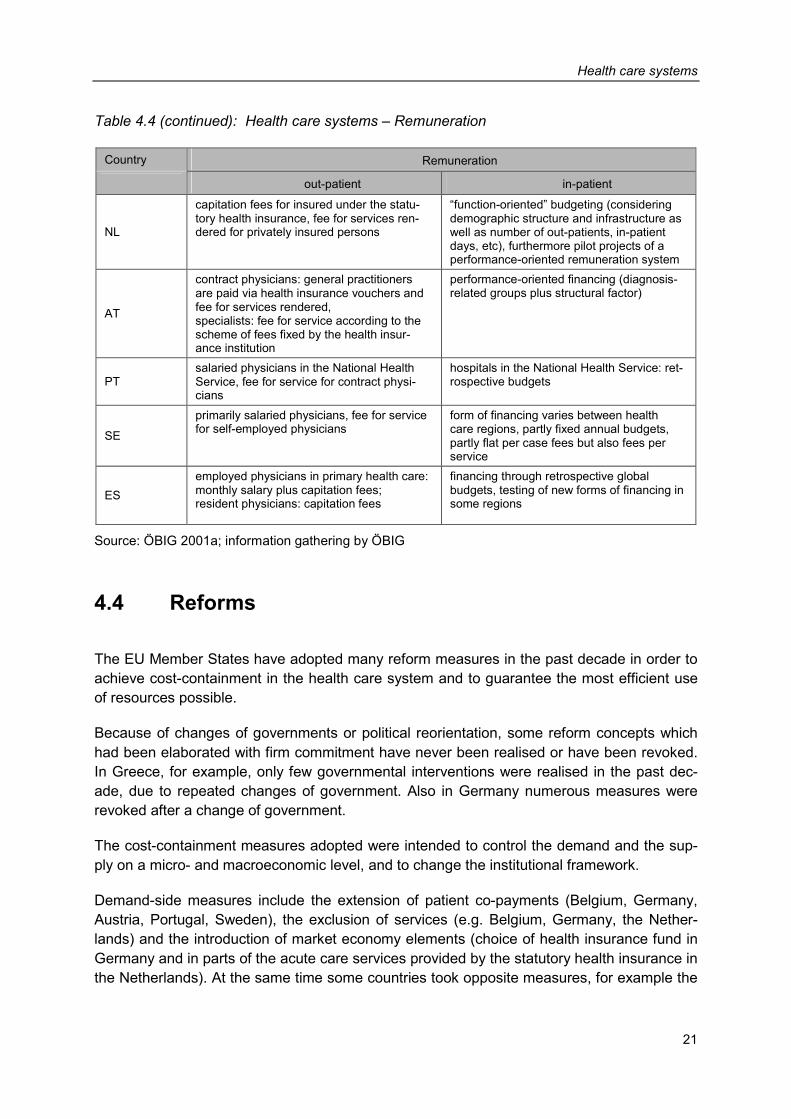
4.4 Reforms
The EU Member States have adopted many reform measures in the past decade in order to achieve cost-containment in the health care system and to guarantee the most efficient use of resources possible.
Because of changes of governments or political reorientation, some reform concepts which had been elaborated with firm commitment have never been realised or have been revoked. In Greece, for example, only few governmental interventions were realised in the past dec-ade, due to repeated changes of government. Also in Germany numerous measures were revoked after a change of government.
The cost-containment measures adopted were intended to control the demand and the sup-ply on a micro- and macroeconomic level, and to change the institutional framework.
Demand-side measures include the extension of patient co-payments (Belgium, Germany, Austria, Portugal, Sweden), the exclusion of services (e.g. Belgium, Germany, the Nether-lands) and the introduction of market economy elements (choice of health insurance fund in Germany and in parts of the acute care services provided by the statutory health insurance in the Netherlands). At the same time some countries took opposite measures, for example the
Health care systems
22
reduction of patient co-payments (in Germany after the change of government, in Italy prior to the elections) or extended primary health care (Ireland).
Nearly all Member States adopted supply-side measures at the macroeconomic level (budg-eting, limitation of services, integration of different health care services). Also at a microeco-nomic level numerous measures have been taken by countries (e.g. the introduction of performance-oriented financing for in-patient care).
Changes of the institutional and service-related framework mainly aimed at decentralising re-sponsibility in the health care systems (Denmark, Finland, Ireland, Italy, Portugal, Sweden and Spain). In Denmark and Sweden, for instance the responsibility to provide care infra-structures has been transferred to the municipalities.
In the next few years the financial requirements of the health care system will continue to in-crease, mainly due to demographic developments, medical progress, the shift of employment towards the services sector as well as the rise of diseases of civilisation. As a consequence further reforms of the European health care systems will be necessary.
Table 4.5: Health care systems – Important reforms
Country Reforms
BE
• 1990 Introduction of a global budget for the health insurance institution and of budgets for individ-ual sectors of the health care system, provision of correction mechanisms for the case of health expenditure exceeding the budget
• 1993 Change of structure of the National Institute for Health and Invalidity Insurance (supervises the health insurance funds), reduction of services provided by the social insurance institution and increase of co-payment
• 1997 Measures adopted in order to limit the number of physicians, dentists and physiotherapists
DK • Shift of health care provision from the in-patient towards the out-patient sector, municipalities
obliged to provide an adequate infrastructure • Since 1993 free choice of hospital (previously obligation for treatment in the local hospital)
DE
• Numerous reforms in the health care system aiming to facilitate elements of free market economy and stability of contributions
• Cost-containment measures (capped budgets, increase of co-payment, exclusion of services from the list of services paid by the health insurance funds, etc.)
• Structural changes in the health care system (for example, since 1996 insured persons may choose which health insurance fund they wish to belong to, introduction of “risk structure equalisa-tion” between the health insurance funds in 1994, integrated health care in 2000)
FI
• Decentralisation of the health care system: responsibility for health care is shifted to municipalities • Organisation of out-patient care changed (staged introduction of a family physician system since
1994) • Introduction of an annual upper limit for co-payments in out-patient and in-patient sector (not con-
sidering pharmaceutical expenditure)
� table to be continued
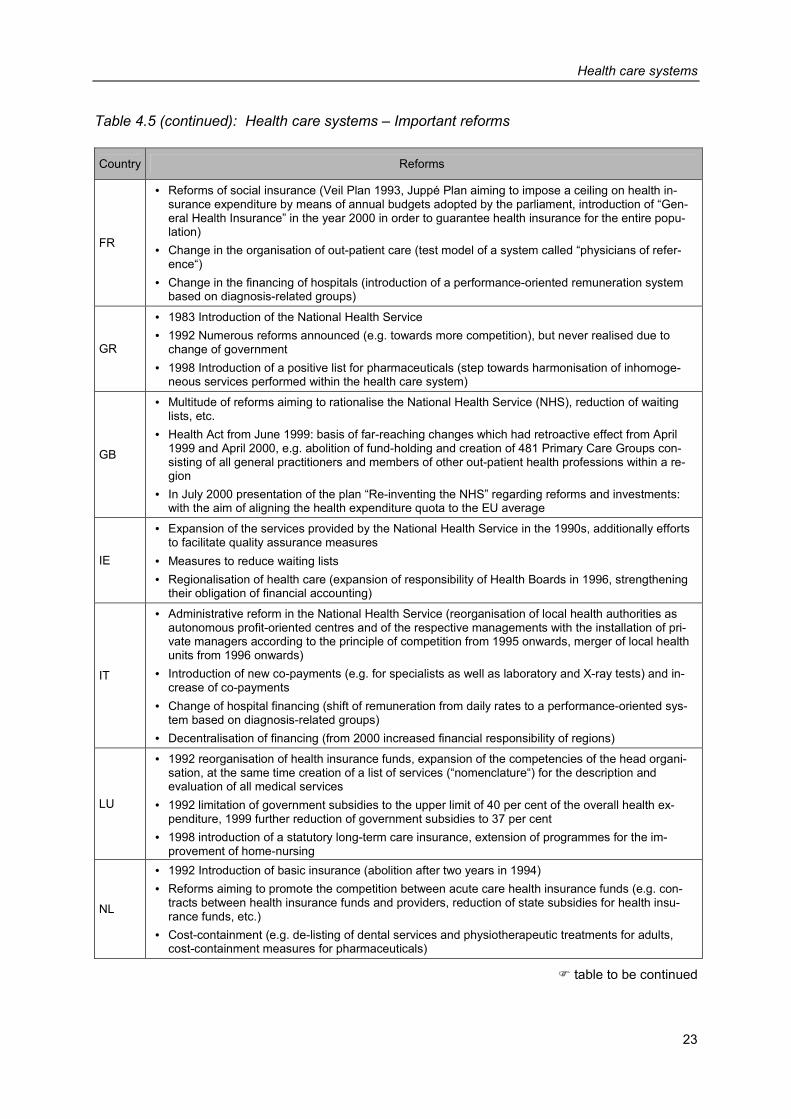
Health care systems
23
Table 4.5 (continued): Health care systems – Important reforms
Country Reforms
FR
• Reforms of social insurance (Veil Plan 1993, Juppé Plan aiming to impose a ceiling on health in-surance expenditure by means of annual budgets adopted by the parliament, introduction of “Gen-eral Health Insurance” in the year 2000 in order to guarantee health insurance for the entire popu-lation)
• Change in the organisation of out-patient care (test model of a system called “physicians of refer-ence“)
• Change in the financing of hospitals (introduction of a performance-oriented remuneration system based on diagnosis-related groups)
GR
• 1983 Introduction of the National Health Service • 1992 Numerous reforms announced (e.g. towards more competition), but never realised due to
change of government • 1998 Introduction of a positive list for pharmaceuticals (step towards harmonisation of inhomoge-
neous services performed within the health care system)
GB
• Multitude of reforms aiming to rationalise the National Health Service (NHS), reduction of waiting lists, etc.
• Health Act from June 1999: basis of far-reaching changes which had retroactive effect from April 1999 and April 2000, e.g. abolition of fund-holding and creation of 481 Primary Care Groups con-sisting of all general practitioners and members of other out-patient health professions within a re-gion
• In July 2000 presentation of the plan “Re-inventing the NHS” regarding reforms and investments: with the aim of aligning the health expenditure quota to the EU average
IE
• Expansion of the services provided by the National Health Service in the 1990s, additionally efforts to facilitate quality assurance measures
• Measures to reduce waiting lists • Regionalisation of health care (expansion of responsibility of Health Boards in 1996, strengthening
their obligation of financial accounting)
IT
• Administrative reform in the National Health Service (reorganisation of local health authorities as autonomous profit-oriented centres and of the respective managements with the installation of pri-vate managers according to the principle of competition from 1995 onwards, merger of local health units from 1996 onwards)
• Introduction of new co-payments (e.g. for specialists as well as laboratory and X-ray tests) and in-crease of co-payments
• Change of hospital financing (shift of remuneration from daily rates to a performance-oriented sys-tem based on diagnosis-related groups)
• Decentralisation of financing (from 2000 increased financial responsibility of regions)
LU
• 1992 reorganisation of health insurance funds, expansion of the competencies of the head organi-sation, at the same time creation of a list of services (“nomenclature“) for the description and evaluation of all medical services
• 1992 limitation of government subsidies to the upper limit of 40 per cent of the overall health ex-penditure, 1999 further reduction of government subsidies to 37 per cent
• 1998 introduction of a statutory long-term care insurance, extension of programmes for the im-provement of home-nursing
NL
• 1992 Introduction of basic insurance (abolition after two years in 1994) • Reforms aiming to promote the competition between acute care health insurance funds (e.g. con-
tracts between health insurance funds and providers, reduction of state subsidies for health insu-rance funds, etc.)
• Cost-containment (e.g. de-listing of dental services and physiotherapeutic treatments for adults, cost-containment measures for pharmaceuticals)
� table to be continued
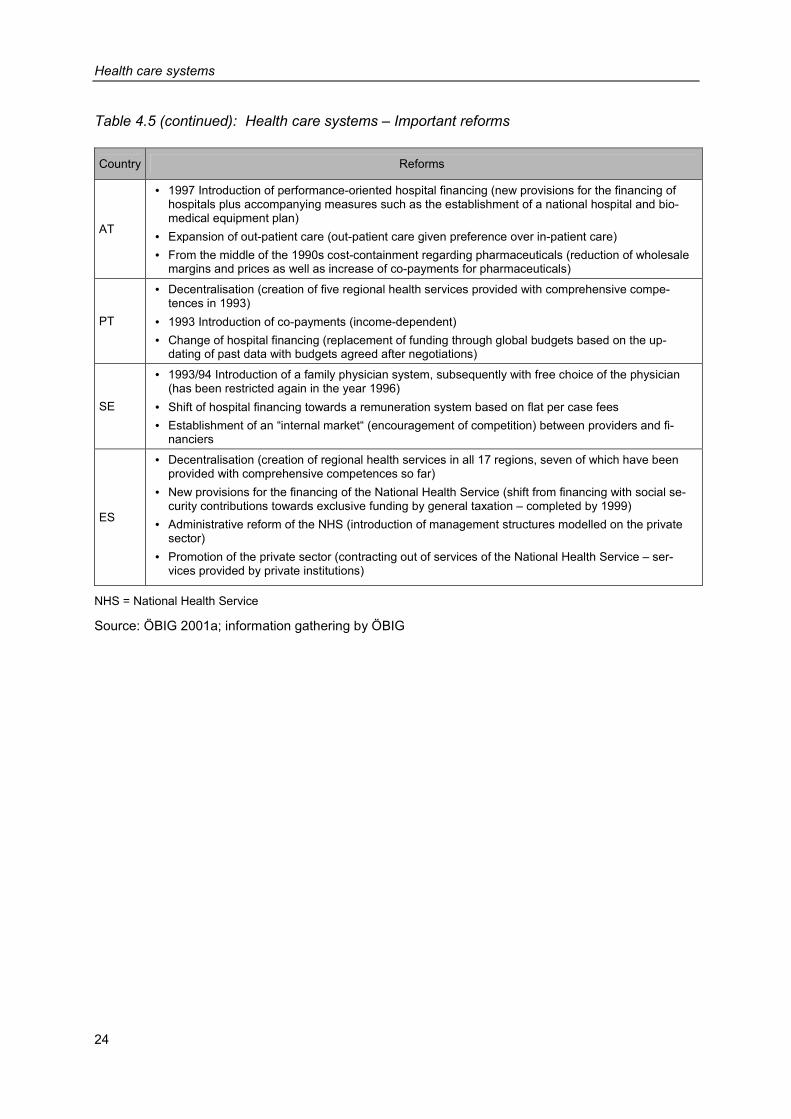
Health care systems
24
Table 4.5 (continued): Health care systems – Important reforms
Country Reforms
AT
• 1997 Introduction of performance-oriented hospital financing (new provisions for the financing of hospitals plus accompanying measures such as the establishment of a national hospital and bio-medical equipment plan)
• Expansion of out-patient care (out-patient care given preference over in-patient care) • From the middle of the 1990s cost-containment regarding pharmaceuticals (reduction of wholesale
margins and prices as well as increase of co-payments for pharmaceuticals)
PT
• Decentralisation (creation of five regional health services provided with comprehensive compe-tences in 1993)
• 1993 Introduction of co-payments (income-dependent) • Change of hospital financing (replacement of funding through global budgets based on the up-
dating of past data with budgets agreed after negotiations)
SE
• 1993/94 Introduction of a family physician system, subsequently with free choice of the physician (has been restricted again in the year 1996)
• Shift of hospital financing towards a remuneration system based on flat per case fees • Establishment of an “internal market“ (encouragement of competition) between providers and fi-
nanciers
ES
• Decentralisation (creation of regional health services in all 17 regions, seven of which have been provided with comprehensive competences so far)
• New provisions for the financing of the National Health Service (shift from financing with social se-curity contributions towards exclusive funding by general taxation – completed by 1999)
• Administrative reform of the NHS (introduction of management structures modelled on the private sector)
• Promotion of the private sector (contracting out of services of the National Health Service – ser-vices provided by private institutions)
NHS = National Health Service
Source: ÖBIG 2001a; information gathering by ÖBIG
Pharmaceutical systems
25
5 Pharmaceutical systems
This chapter outlines the current regulatory framework of pharmaceutical systems in the fif-teen EU Member States (status: June 2001). Highlighting relevant regulations for a pharma-ceutical on its way to the market, main characteristics in the individual countries are pre-sented and patterns shown.
This chapter is subdivided into the sections registration, reimbursement, pricing, margins and co-payment.
5.1 Registration
As stated in Section 3.1, there have been three registration procedures in the European Un-ion since 1995:
• centralised registration for pharmaceuticals derived from biotechnology (compulsory) and innovative pharmaceuticals (optional),
• decentralised registration on the basis of the mutual recognition of national registrations and
• national registration, which is gradually becoming less important.
Centralised registration is in the hands of the European Medicines’ Evaluation Agency (EMEA) which has its seat in London, whereas the responsibility for the two other registration procedures lies with national authorities. Only in four EU countries (Belgium, Italy, Luxem-bourg, Austria) do the Ministries of Health still function as registration authorities, whereas in all other countries registration applications are dealt with by specific institutions. Most of these institutions – usually called medicines agencies or institutes – are subordinated to the Ministries of Health and were established in the course of the 1990s (e.g. in Sweden as early as in 1990, in Spain in 1999). In some countries (Denmark, France, Ireland, Portugal) the competence of such authorities includes not only pharmaceuticals but also medical devices.
5.2 Reimbursement
In many EU countries, the step following registration is the decision on reimbursement, i.e., whether the pharmaceutical is to be supplied at the expense of social security institutions and/or the National Health Service. Reimbursable pharmaceuticals may be reimbursed either in full or in part. In some countries, the price of a pharmaceutical is determined and/or nego-tiated prior to the decision on reimbursement, in some countries (e.g., Sweden) both ques-tions are dealt with in one and the same procedure.
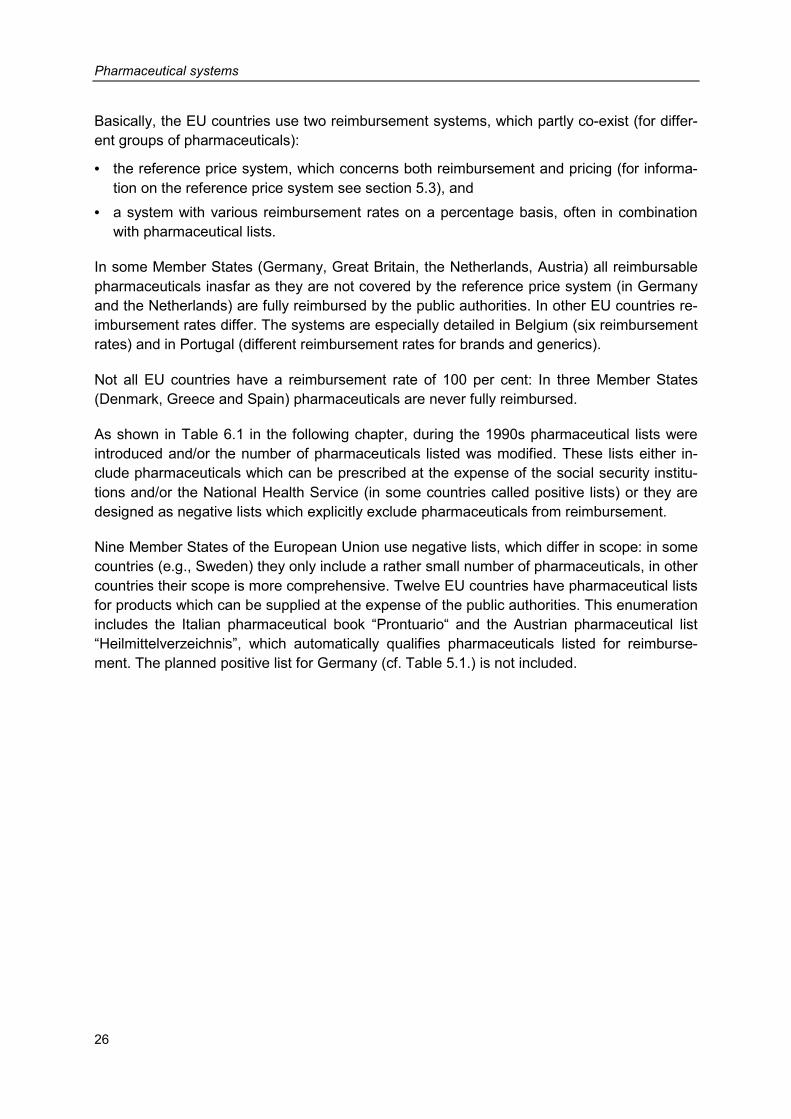
Pharmaceutical systems
26
Basically, the EU countries use two reimbursement systems, which partly co-exist (for differ-ent groups of pharmaceuticals):
• the reference price system, which concerns both reimbursement and pricing (for informa-tion on the reference price system see section 5.3), and
• a system with various reimbursement rates on a percentage basis, often in combination with pharmaceutical lists.
In some Member States (Germany, Great Britain, the Netherlands, Austria) all reimbursable pharmaceuticals inasfar as they are not covered by the reference price system (in Germany and the Netherlands) are fully reimbursed by the public authorities. In other EU countries re-imbursement rates differ. The systems are especially detailed in Belgium (six reimbursement rates) and in Portugal (different reimbursement rates for brands and generics).
Not all EU countries have a reimbursement rate of 100 per cent: In three Member States (Denmark, Greece and Spain) pharmaceuticals are never fully reimbursed.
As shown in Table 6.1 in the following chapter, during the 1990s pharmaceutical lists were introduced and/or the number of pharmaceuticals listed was modified. These lists either in-clude pharmaceuticals which can be prescribed at the expense of the social security institu-tions and/or the National Health Service (in some countries called positive lists) or they are designed as negative lists which explicitly exclude pharmaceuticals from reimbursement.
Nine Member States of the European Union use negative lists, which differ in scope: in some countries (e.g., Sweden) they only include a rather small number of pharmaceuticals, in other countries their scope is more comprehensive. Twelve EU countries have pharmaceutical lists for products which can be supplied at the expense of the public authorities. This enumeration includes the Italian pharmaceutical book “Prontuario“ and the Austrian pharmaceutical list “Heilmittelverzeichnis”, which automatically qualifies pharmaceuticals listed for reimburse-ment. The planned positive list for Germany (cf. Table 5.1.) is not included.
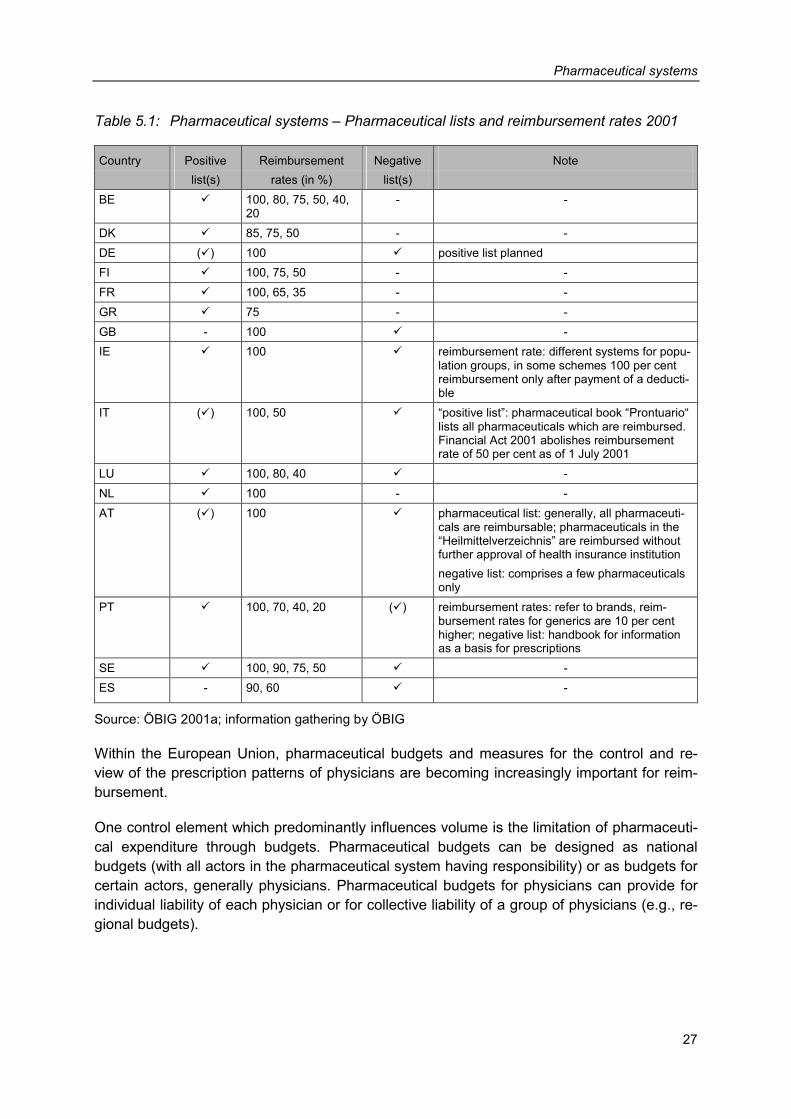
Pharmaceutical systems
27
Table 5.1: Pharmaceutical systems – Pharmaceutical lists and reimbursement rates 2001
Country Positive Reimbursement Negative Note list(s) rates (in %) list(s) BE � 100, 80, 75, 50, 40,
20 - -
DK � 85, 75, 50 - - DE (�) 100 � positive list planned FI � 100, 75, 50 - - FR � 100, 65, 35 - - GR � 75 - - GB - 100 � - IE � 100 � reimbursement rate: different systems for popu-
lation groups, in some schemes 100 per cent reimbursement only after payment of a deducti-ble
IT (�) 100, 50 � “positive list”: pharmaceutical book “Prontuario“ lists all pharmaceuticals which are reimbursed. Financial Act 2001 abolishes reimbursement rate of 50 per cent as of 1 July 2001
LU � 100, 80, 40 � - NL � 100 - - AT (�) 100 � pharmaceutical list: generally, all pharmaceuti-
cals are reimbursable; pharmaceuticals in the “Heilmittelverzeichnis” are reimbursed without further approval of health insurance institution negative list: comprises a few pharmaceuticals only
PT � 100, 70, 40, 20 (�) reimbursement rates: refer to brands, reim-bursement rates for generics are 10 per cent higher; negative list: handbook for information as a basis for prescriptions
SE � 100, 90, 75, 50 � - ES - 90, 60 � -
Source: ÖBIG 2001a; information gathering by ÖBIG
Within the European Union, pharmaceutical budgets and measures for the control and re-view of the prescription patterns of physicians are becoming increasingly important for reim-bursement.
One control element which predominantly influences volume is the limitation of pharmaceuti-cal expenditure through budgets. Pharmaceutical budgets can be designed as national budgets (with all actors in the pharmaceutical system having responsibility) or as budgets for certain actors, generally physicians. Pharmaceutical budgets for physicians can provide for individual liability of each physician or for collective liability of a group of physicians (e.g., re-gional budgets).
Pharmaceutical systems
28
Table 5.2: Pharmaceutical systems – Further regulations at reimbursement level 2001
Country Pharmaceutical budgets Measures for the control of physicians’ prescription patterns BE national pharmaceutical budgets (annual
target budgets), sanctions may be im-posed in the form of repayments
prescription guidelines review of the prescription patterns of physicians review of pharmaceuticals as regards their reimbursement status within three years
DK upper limit to pharmaceutical expendi-ture of the health insurance institutions 1998 and 1999
promotion of generics analysis and review of the reimbursement system institute for rational pharmaco-therapy
DE regional pharmaceutical budgets for physicians (collective and individual li-ability) abolition of collective liability in 2002
prescription guidelines review of the prescription patterns of physicians promotion of generics
FI - analysis and review of the reimbursement system FR national pharmaceutical budgets (annual
target budgets) release of pharmaceutical companies from a general repayment clause if they had agreed to sales targets in individual contracts
prescription guidelines “physicians of reference”: obligation of physicians to economic prescribing review of pharmaceuticals as regards their prescription status
GR - pharmaceutical monitoring obligation of the pharmaceutical industry to supply sales fig-ures
GB global budgets in out-patient health care (including pharmaceuticals)
institute for evaluation review of prescription patterns of physicians
IE individual pharmaceutical budgets for physicians with financial incentives
promotion of the prescription of generics
IT national pharmaceutical budgets (annual target budgets, from 1998 to 2000 sanc-tions could be imposed in the form of re-payments), pharmaceutical budgets for physicians (pilot project)
prescription guidelines promotion of generics obligation of regions and pharmacies to supply sales figures
LU - guidelines for physicians concerning prescription pattern NL national pharmaceutical budgets (annual
target budget), without liability provisions pharma-economic guidelines promotion of generics
AT - prescription guidelines list of economical pharmaceuticals co-operation projects for “reasonable use of pharmaceuticals” review of the prescription patterns of physicians
PT national pharmaceutical budgets (annual target budgets), since 1997 sanctions may be imposed in the form of repay-ments
handbook for information as a basis for prescriptions review of pharmaceuticals as regards their reimbursement status after three years
SE - prescription guidelines institute for evaluation revision of reimbursement system
ES national pharmaceutical budgets with repayment clauses (contract with the in-dustry) individual pharmaceutical budgets for physicians in pilot projects at regional level
prescription guidelines (pilot projects at regional level) individual pharmaceutical budgets for physicians (pilot project at regional level)
Source: ÖBIG 2001a; information gathering by ÖBIG
Pharmaceutical systems
29
In ten of the fifteen Member States of the European Union, a cap has been imposed on pub-lic pharmaceutical expenditure with differences in structure and the sanctions imposed if the limits are exceeded. Individual pharmaceutical budgets for physicians exist in Germany, Great Britain, Ireland and in regional pilot projects in Spain. In Belgium, France, Italy, the Netherlands, Portugal and Spain annual target budgets determining the amount of the public pharmaceutical expenditure are prepared at national level on a regular basis. In Denmark, measures for an annual ceiling on pharmaceutical expenditure were taken in the years 1998 and 1999.
Except for the Netherlands, these countries have also provided for repayments on the part of the actors should the target budgets be exceeded. In most cases, however, in spite of ex-ceeded budgets no repayments were made and/or repayments could not be enforced so that the measures have lost their credibility and eventually their effectiveness. For instance, both collective and individual liability of physicians was provided for in the pharmaceutical budgets in Germany. As, however, collective recourse has never been enforced and missing and de-layed data impaired the timely information of physicians on their budgets, a new draft bill now provides for the abolition of collective recourse in the future with retroactive effect as of the beginning of 2002. Self-governing bodies will be allowed increased scope, they will be enti-tled to determine the caps on expenditure for their region and target figures for physicians.
In order to control the prescription patterns of physicians, prescription guidelines and/or re-commendations have been adopted in eight countries (in Spain only in certain regions) which, however, are not binding. In all EU countries, the prescription patterns of physicians are reviewed on a regular basis; physicians have to inform the competent bodies of their rea-sons for major deviations from such guidelines.
Other important regulations at reimbursement level are listed in Table 5.2. The following fur-ther trends can be observed in the EU countries: establishment of pharmaceutical monitor-ing, promotion of generics and investment into Health Technology Assessment (HTA) for in-stance by creating specific institutes for evaluation (e.g. the National Institute for Clinical Ex-cellence, NICE, in Great Britain).
5.3 Pricing
Generally, manufacturer prices for pharmaceuticals can be fixed in three different ways. Manufacturer prices are either:
• determined by pharmaceutical companies or • negotiated by pharmaceutical companies and the state, which is mostly represented
through special committees in the medicines agencies or Ministries of Health, or with health insurance institutions or
• official prices fixed by the authorities, based on (prices) acts.
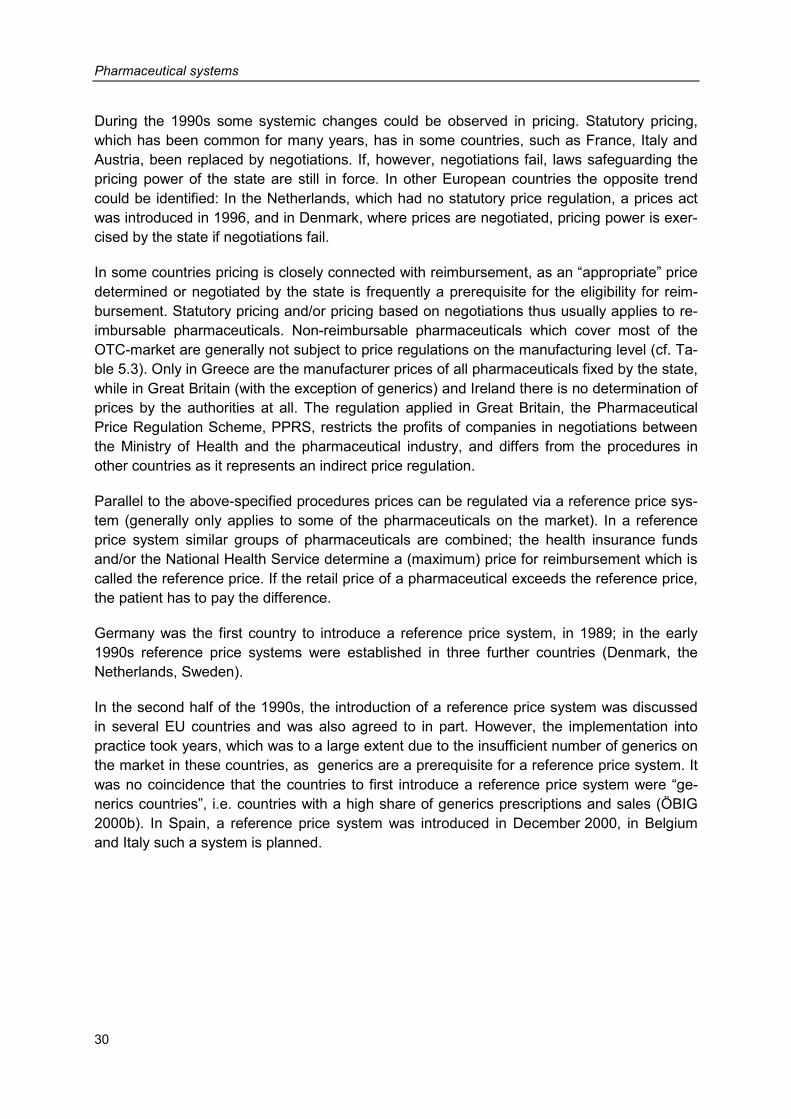
Pharmaceutical systems
30
During the 1990s some systemic changes could be observed in pricing. Statutory pricing, which has been common for many years, has in some countries, such as France, Italy and Austria, been replaced by negotiations. If, however, negotiations fail, laws safeguarding the pricing power of the state are still in force. In other European countries the opposite trend could be identified: In the Netherlands, which had no statutory price regulation, a prices act was introduced in 1996, and in Denmark, where prices are negotiated, pricing power is exer-cised by the state if negotiations fail.
In some countries pricing is closely connected with reimbursement, as an “appropriate” price determined or negotiated by the state is frequently a prerequisite for the eligibility for reim-bursement. Statutory pricing and/or pricing based on negotiations thus usually applies to re-imbursable pharmaceuticals. Non-reimbursable pharmaceuticals which cover most of the OTC-market are generally not subject to price regulations on the manufacturing level (cf. Ta-ble 5.3). Only in Greece are the manufacturer prices of all pharmaceuticals fixed by the state, while in Great Britain (with the exception of generics) and Ireland there is no determination of prices by the authorities at all. The regulation applied in Great Britain, the Pharmaceutical Price Regulation Scheme, PPRS, restricts the profits of companies in negotiations between the Ministry of Health and the pharmaceutical industry, and differs from the procedures in other countries as it represents an indirect price regulation.
Parallel to the above-specified procedures prices can be regulated via a reference price sys-tem (generally only applies to some of the pharmaceuticals on the market). In a reference price system similar groups of pharmaceuticals are combined; the health insurance funds and/or the National Health Service determine a (maximum) price for reimbursement which is called the reference price. If the retail price of a pharmaceutical exceeds the reference price, the patient has to pay the difference.
Germany was the first country to introduce a reference price system, in 1989; in the early 1990s reference price systems were established in three further countries (Denmark, the Netherlands, Sweden).
In the second half of the 1990s, the introduction of a reference price system was discussed in several EU countries and was also agreed to in part. However, the implementation into practice took years, which was to a large extent due to the insufficient number of generics on the market in these countries, as generics are a prerequisite for a reference price system. It was no coincidence that the countries to first introduce a reference price system were “ge-nerics countries”, i.e. countries with a high share of generics prescriptions and sales (ÖBIG 2000b). In Spain, a reference price system was introduced in December 2000, in Belgium and Italy such a system is planned.
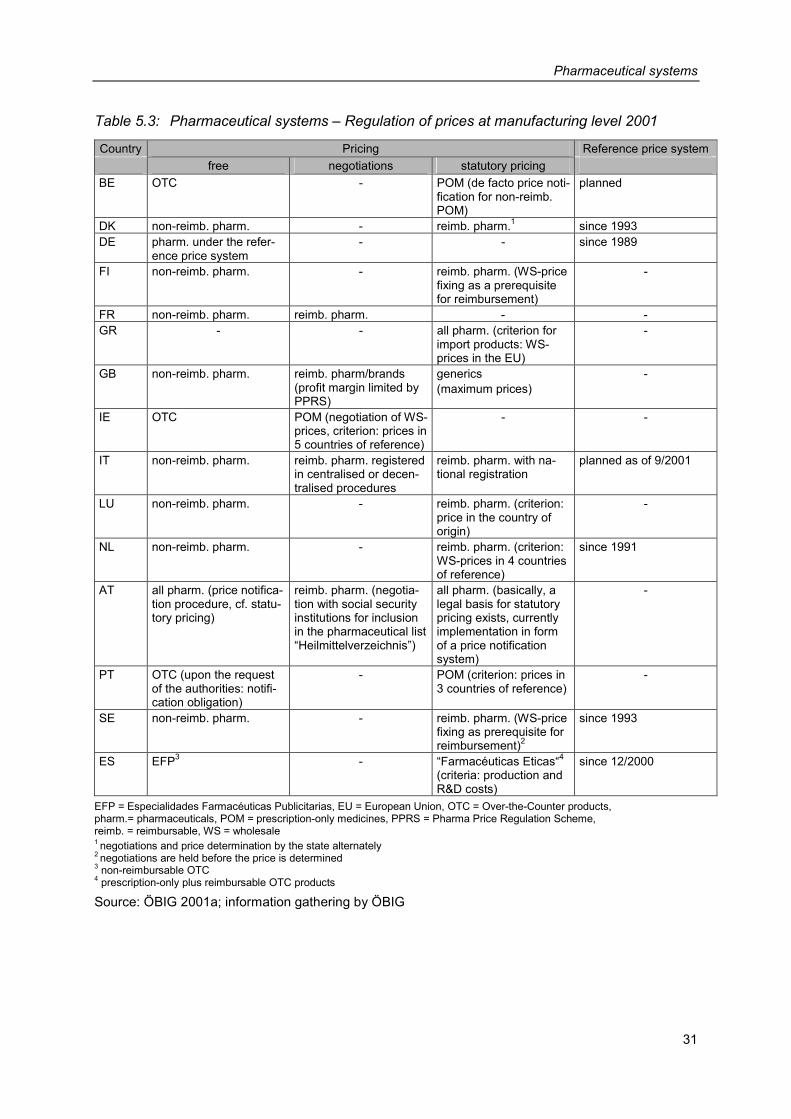
Pharmaceutical systems
31
Table 5.3: Pharmaceutical systems – Regulation of prices at manufacturing level 2001
Country Pricing Reference price system free negotiations statutory pricing
BE OTC - POM (de facto price noti-fication for non-reimb. POM)
planned
DK non-reimb. pharm. - reimb. pharm.1 since 1993 DE pharm. under the refer-
ence price system - - since 1989
FI non-reimb. pharm. - reimb. pharm. (WS-price fixing as a prerequisite for reimbursement)
-
FR non-reimb. pharm. reimb. pharm. - - GR - - all pharm. (criterion for
import products: WS-prices in the EU)
-
GB non-reimb. pharm. reimb. pharm/brands (profit margin limited by PPRS)
generics (maximum prices)
-
IE OTC POM (negotiation of WS-prices, criterion: prices in 5 countries of reference)
- -
IT non-reimb. pharm. reimb. pharm. registered in centralised or decen-tralised procedures
reimb. pharm. with na-tional registration
planned as of 9/2001
LU non-reimb. pharm. - reimb. pharm. (criterion: price in the country of origin)
-
NL non-reimb. pharm. - reimb. pharm. (criterion: WS-prices in 4 countries of reference)
since 1991
AT all pharm. (price notifica-tion procedure, cf. statu-tory pricing)
reimb. pharm. (negotia-tion with social security institutions for inclusion in the pharmaceutical list “Heilmittelverzeichnis”)
all pharm. (basically, a legal basis for statutory pricing exists, currently implementation in form of a price notification system)
-
PT OTC (upon the request of the authorities: notifi-cation obligation)
- POM (criterion: prices in 3 countries of reference)
-
SE non-reimb. pharm. - reimb. pharm. (WS-price fixing as prerequisite for reimbursement)2
since 1993
ES EFP3 - “Farmacéuticas Eticas“4 (criteria: production and R&D costs)
since 12/2000
EFP = Especialidades Farmacéuticas Publicitarias, EU = European Union, OTC = Over-the-Counter products, pharm.= pharmaceuticals, POM = prescription-only medicines, PPRS = Pharma Price Regulation Scheme, reimb. = reimbursable, WS = wholesale 1 negotiations and price determination by the state alternately 2 negotiations are held before the price is determined 3 non-reimbursable OTC 4 prescription-only plus reimbursable OTC products
Source: ÖBIG 2001a; information gathering by ÖBIG
Pharmaceutical systems
32
5.4 Margins
In spite of new distribution channels (e.g., mail order business, purchasing via the Internet, cf. ÖBIG 2000c) and new retail outlets (e.g., health food stores, supermarkets for specific pharmaceuticals in some countries, cf. ÖBIG 1998b), the distribution of pharmaceuticals via pharmaceutical wholesalers and the pharmacies as retailer is still the usual distribution channel in the countries of the European Union.
The prices for pharmaceuticals at wholesale and pharmacy level depend to a great extent on statutorily regulated margins (cf. Table 5.4).
Denmark is the only EU country in which wholesale margins are not statutorily regulated. In Finland, the Netherlands and Sweden, the margins have not been explicitly regulated by law either, but are de facto laid down by official determination of "appropriate" wholesale prices which form the prerequisite for eligibility for reimbursement. In Great Britain, the wholesale margins have been regulated by the PPRS (cf. section 5.3 above).
In the ten remaining EU Member States the wholesale margins have been regulated by law. In some countries, the provisions only apply to some pharmaceuticals: in Germany to phar-macy-only pharmaceuticals, in France and Italy to reimbursable pharmaceuticals and in Por-tugal to prescription-only pharmaceuticals.
The detailed regulation of the margins varies: In most cases, the wholesale margins are fixed as linear rates, there are, however, also degressive schemes with two (France, Spain) to ten or more levels (Germany, Austria).
The pharmacy margins have been statutorily regulated in all Member States of the European Union, in a majority of countries for all pharmaceuticals. In France, Great Britain and the Netherlands, the statutory regulation of the pharmacy margins applies only to reimbursable pharmaceuticals, in Portugal to prescription-only pharmaceuticals.
In some countries, there were changes in the regulation of the pharmacy margins – predomi-nantly in the second half of the 1990s. When implementing various strategies for cost-containment the margins were not merely lowered but the regulations were revised and re-newed. Currently the pharmacy margins are regulated as linear rates in five countries (Bel-gium, Greece, Luxembourg, Portugal and Italy for pharmaceuticals registered in decentral-ised and national procedures) and in the form of a degressive scheme with two (France, Spain) up to 19 levels (Austria) in seven countries. In Great Britain, Ireland and the Nether-lands the services provided by the pharmacies are reimbursed by a lump sum payment.
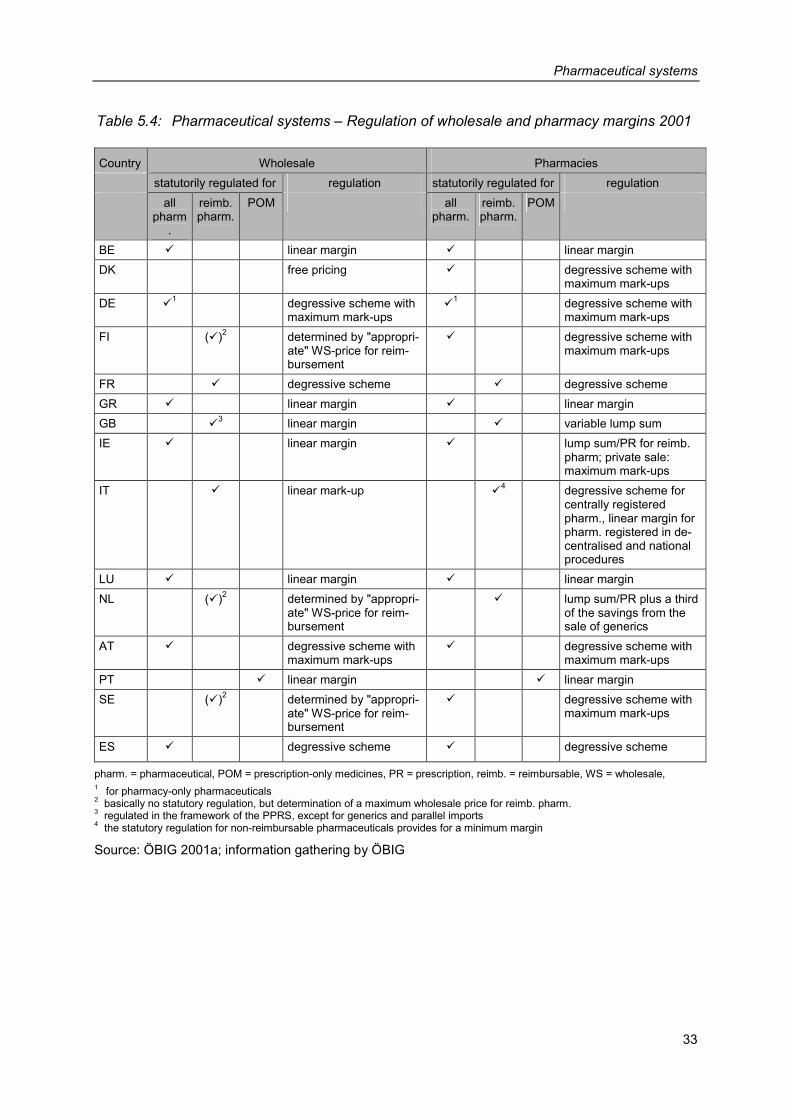
Pharmaceutical systems
33
Table 5.4: Pharmaceutical systems – Regulation of wholesale and pharmacy margins 2001
Country Wholesale Pharmacies statutorily regulated for regulation statutorily regulated for regulation all
pharm.
reimb. pharm.
POM all pharm.
reimb. pharm.
POM
BE � linear margin � linear margin DK free pricing � degressive scheme with
maximum mark-ups DE �
1 degressive scheme with maximum mark-ups
�1 degressive scheme with
maximum mark-ups FI (�)2 determined by "appropri-
ate" WS-price for reim-bursement
� degressive scheme with maximum mark-ups
FR � degressive scheme � degressive scheme GR � linear margin � linear margin GB �
3 linear margin � variable lump sum IE � linear margin � lump sum/PR for reimb.
pharm; private sale: maximum mark-ups
IT � linear mark-up �4 degressive scheme for
centrally registered pharm., linear margin for pharm. registered in de-centralised and national procedures
LU � linear margin � linear margin NL (�)2 determined by "appropri-
ate" WS-price for reim-bursement
� lump sum/PR plus a third of the savings from the sale of generics
AT � degressive scheme with maximum mark-ups
� degressive scheme with maximum mark-ups
PT � linear margin � linear margin SE (�)2 determined by "appropri-
ate" WS-price for reim-bursement
� degressive scheme with maximum mark-ups
ES � degressive scheme � degressive scheme
pharm. = pharmaceutical, POM = prescription-only medicines, PR = prescription, reimb. = reimbursable, WS = wholesale, 1 for pharmacy-only pharmaceuticals 2 basically no statutory regulation, but determination of a maximum wholesale price for reimb. pharm. 3 regulated in the framework of the PPRS, except for generics and parallel imports 4 the statutory regulation for non-reimbursable pharmaceuticals provides for a minimum margin
Source: ÖBIG 2001a; information gathering by ÖBIG
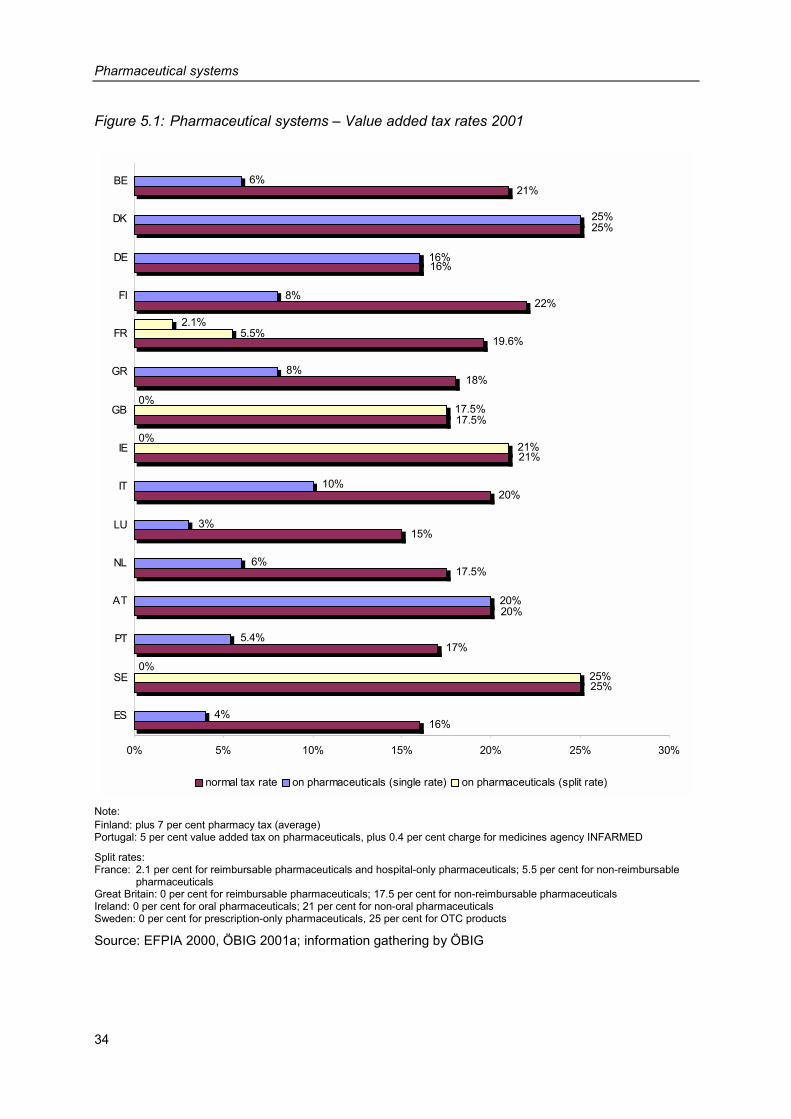
Pharmaceutical systems
34
Figure 5.1: Pharmaceutical systems – Value added tax rates 2001
0%
0%
0%
25%
17%
20%
18%
19.6%
22%
16%
25%
21%
17.5%
21%
20%
15%
17.5%
16%4%
25%
5.4%
20%
8%
5.5%
8%
16%
25%
6%
17.5%
21%
10%
3%
6%
2.1%
0% 5% 10% 15% 20% 25% 30%
ES
SE
PT
AT
NL
LU
IT
IE
GB
GR
FR
FI
DE
DK
BE
normal tax rate on pharmaceuticals (single rate) on pharmaceuticals (split rate)
Note: Finland: plus 7 per cent pharmacy tax (average) Portugal: 5 per cent value added tax on pharmaceuticals, plus 0.4 per cent charge for medicines agency INFARMED
Split rates: France: 2.1 per cent for reimbursable pharmaceuticals and hospital-only pharmaceuticals; 5.5 per cent for non-reimbursable
pharmaceuticals Great Britain: 0 per cent for reimbursable pharmaceuticals; 17.5 per cent for non-reimbursable pharmaceuticals Ireland: 0 per cent for oral pharmaceuticals; 21 per cent for non-oral pharmaceuticals Sweden: 0 per cent for prescription-only pharmaceuticals, 25 per cent for OTC products
Source: EFPIA 2000, ÖBIG 2001a; information gathering by ÖBIG
Pharmaceutical systems
35
For those financing pharmaceuticals (public authorities and/or patients) the amount of the value added tax on pharmaceuticals is of relevance as such amount co-determines the pharmacy retail price. In Finland, there is an additional pharmacy tax of seven per cent.
Except for Denmark, Germany and Austria, the value added tax rates on pharmaceuticals are lower than the standard tax rate. In four countries the value added tax rates are split: In Great Britain, Ireland and Sweden specific pharmaceuticals (reimbursable, oral, prescription-only) are fully exempt from value added tax and in France reimbursable pharmaceuticals are subject to a lower rate of value added tax.
Figure 5.1 provides an overview of the value added tax rates on pharmaceuticals as com-pared to the standard tax rate in the EU Member States. The value added tax rates on phar-maceuticals are extremely diverse: they range from 2.1 per cent in France (reduced value added tax on reimbursable pharmaceuticals) to 25 per cent in Denmark.
In the course of the present study, the average percentage margins for wholesale and phar-macies were surveyed (cf. Figure 5.2).
When comparing the percentage margins, first the different manufacturer price levels in the individual countries have to be taken into consideration. For instance, it is possible that, in absolute figures, a wholesale company or a pharmacy in a country with high production prices earns more than a wholesale company or pharmacy in a “low price country” although its percentage mark-up rate is lower.
Second, the wholesale systems in the various countries may differ considerably. Comparing wholesale in the individual countries shows that Sweden and Finland have extremely low margins. In these countries the number of both wholesale companies and warehouses is relatively low. For instance, in Sweden there are only two wholesale companies with seven warehouses and in Finland there are three wholesalers with ten warehouses. Furthermore, these two countries use the “single-channel system” which means that a wholesaler is granted the exclusive distribution right for a manufacturer's entire range of products. In Aus-tria, for comparison, there are twelve wholesalers with 27 warehouses, in Germany 16 com-panies with 102 warehouses and in Ireland five companies with 13 warehouses.
Comparing the average wholesale margins for 1999, Austria ranks in the middle of the EU countries with 12.6 per cent. In mid-2000 the wholesale margins were statutorily lowered as the result of government cost-containment measures. The average margin for the year 2000 – i.e. after reducing the margins – amounted to 11.6 per cent.
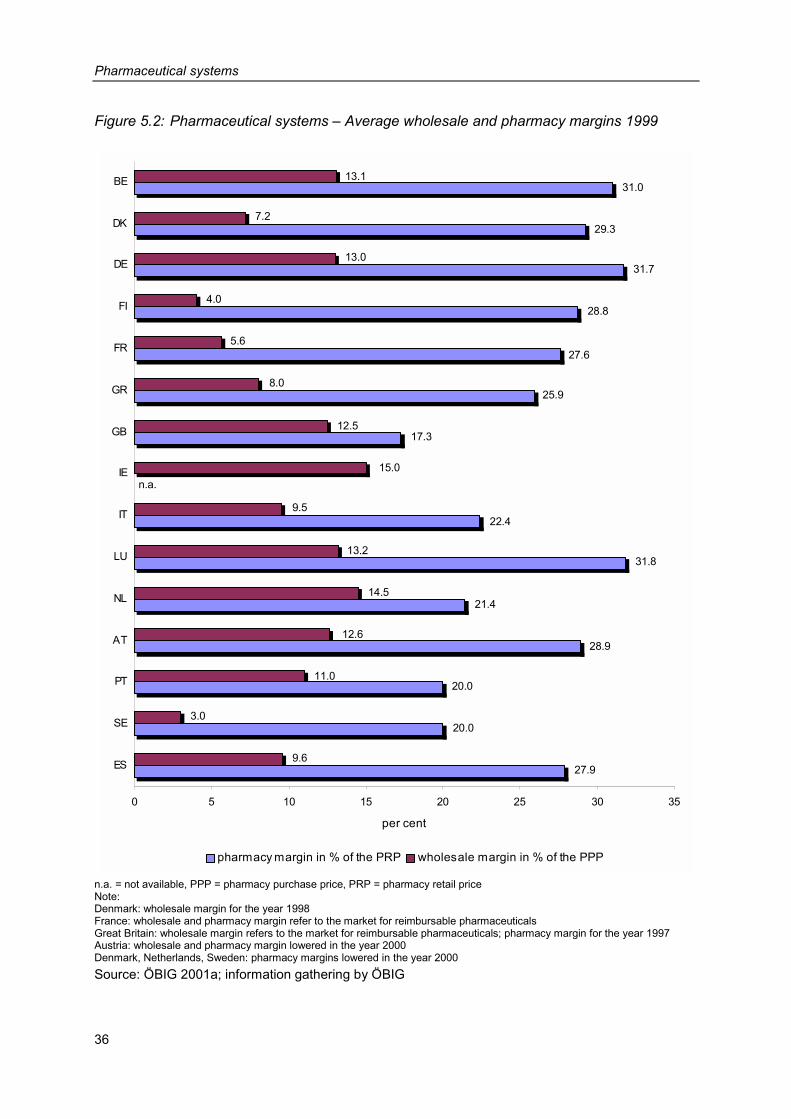
Pharmaceutical systems
36
Figure 5.2: Pharmaceutical systems – Average wholesale and pharmacy margins 1999
17.3
25.9
27.6
28.8
31.7
29.3
31.0
n.a.
22.4
31.8
21.4
28.9
20.0
20.0
27.9
12.5
8.0
5.6
4.0
13.0
7.2
13.1
15.0
9.5
13.2
14.5
12.6
11.0
3.0
9.6
0 5 10 15 20 25 30 35
ES
SE
PT
AT
NL
LU
IT
IE
GB
GR
FR
FI
DE
DK
BE
per cent
pharmacy margin in % of the PRP wholesale margin in % of the PPP
n.a. = not available, PPP = pharmacy purchase price, PRP = pharmacy retail price Note: Denmark: wholesale margin for the year 1998 France: wholesale and pharmacy margin refer to the market for reimbursable pharmaceuticals Great Britain: wholesale margin refers to the market for reimbursable pharmaceuticals; pharmacy margin for the year 1997 Austria: wholesale and pharmacy margin lowered in the year 2000 Denmark, Netherlands, Sweden: pharmacy margins lowered in the year 2000 Source: ÖBIG 2001a; information gathering by ÖBIG
Pharmaceutical systems
37
The average pharmacy margins in the European Union ranged from 31.8 per cent (Luxem-bourg) to 17.3 per cent (Great Britain). Luxembourg, Germany and Belgium showed an aver-age margin of more than 30 per cent, in Portugal, Sweden and Great Britain the average margin was 20 per cent or lower. The average pharmacy margin of 28.9 per cent in Austria sank to 27.9 per cent in the year 2000 as a consequence of the “Agreement on Solidarity Contribution” between the Austrian Chamber of Pharmacists and the Federation of Austrian Social Insurance Institutions. This agreement provides for part of the increases in turnover of the pharmacies to be paid over to the health insurance institutions.
Luxembourg, Germany and Belgium showed high wholesale and pharmacy margins in the 1999 EU-comparison; in Sweden both the wholesale margin and the pharmacy margin was low.
5.5 Co-payment
In the 1990s, the increase in patient co-payments has often been used as an important con-trol instrument (see also chapter 6 below).
There are different co-payment schemes, which are connected to the reimbursement system of a country. Typical co-payment systems for pharmaceuticals are the following:
• payments for pharmaceuticals which are covered by a reference price system. All differ-ences, if any, between the reimbursed reference price and the retail price of a pharmaceu-tical have to be paid by the patients.
• deductibles (e.g., prescription fees) and • additional percentage payments for reimbursable pharmaceuticals.
In the European Union, the following co-payment schemes, which often co-exist in one and the same country, are used in the pharmaceutical sector:
• As specified in Section 5.2, reference price systems have been introduced in five coun-tries so far (Denmark, Germany, the Netherlands, Sweden, Spain), in Belgium and Italy they are about to be introduced.
• In six countries, patients have to pay deductibles when purchasing pharmaceuticals in pharmacies. These deductibles are lump sums, either per prescription (Denmark, Great Britain, Austria), or depending on the size of the package (Germany) or related to the indi-cation of the pharmaceutical (Finland, France). In Italy the prescription fee, which was abolished in 2001, depended on the number of items prescribed within a single prescrip-tion. The deductibles range from € 0.53 to € 9.25.
Pharmaceutical systems
38
• In eleven of the 15 EU Member States the co-payment regulations are percentage based. The amount of the percentage payment mainly depends on the severity and duration of the illness e.g., higher rates of co-payments for pharmaceuticals are demanded for phar-maceuticals which are regarded as less important for therapy. The additional payments can also amount to zero per cent, e.g., in the case of pharmaceuticals for chronic ill-nesses. On the other hand, in Denmark, Ireland and Sweden the reimbursement regula-tions currently in force allow for co-payments of 100 per cent for pharmaceuticals which have been classified as reimbursable pharmaceuticals.
Speaking of patient co-payments, we must not forget the non-reimbursable pharmaceuticals which have to be paid for by the patients in full.
Table 5.5 provides an overview of the co-payment regulations in the fifteen EU Member States including upper limits, if any, for co-payments.
The table does not include the exemption provisions by means of which individual population groups are fully or partly exempt from co-payment. Such exemption provisions exist in all EU countries except for Finland. Exemption (in part) from co-payments is possible for the chroni-cally ill and/or certain social groups (persons with low income, senior citizens, unemployed persons, orphans, pregnant women, children, etc.). As a consequence of these exemptions, 85 per cent of the pharmaceuticals in Great Britain are dispensed without co-payments.
In Ireland, approximately one third of the population is exempt from all co-payments (includ-ing pharmaceuticals) according to the criteria income, number of family members and age (the so-called GMS Scheme). Persons allocated to other schemes have to make co-payments (up to € 54.30 per month for pharmaceuticals).
In the European Union, the share of co-payments and private spending on total pharmaceu-tical expenditure differ considerably (cf. also Table 7.1). Comparing the data of the EU Mem-ber States showed that Finland has by far the highest share of co-payments, followed by Denmark and Sweden, whereas Spain and France are countries with comparably low co-payment quotas.
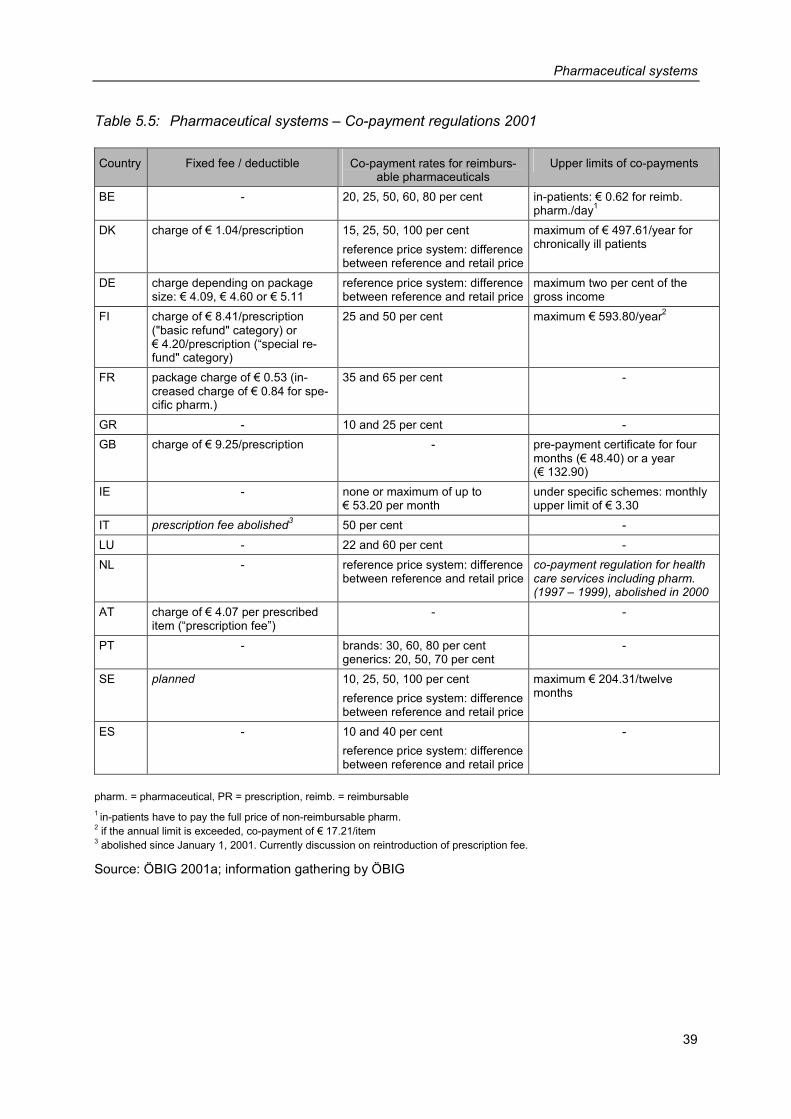
Pharmaceutical systems
39
Table 5.5: Pharmaceutical systems – Co-payment regulations 2001
Country Fixed fee / deductible Co-payment rates for reimburs-able pharmaceuticals
Upper limits of co-payments
BE - 20, 25, 50, 60, 80 per cent in-patients: € 0.62 for reimb. pharm./day1
DK charge of € 1.04/prescription 15, 25, 50, 100 per cent reference price system: difference between reference and retail price
maximum of € 497.61/year for chronically ill patients
DE charge depending on package size: € 4.09, € 4.60 or € 5.11
reference price system: difference between reference and retail price
maximum two per cent of the gross income
FI charge of € 8.41/prescription ("basic refund" category) or € 4.20/prescription (“special re-fund" category)
25 and 50 per cent maximum € 593.80/year2
FR package charge of € 0.53 (in-creased charge of € 0.84 for spe-cific pharm.)
35 and 65 per cent -
GR - 10 and 25 per cent - GB charge of € 9.25/prescription - pre-payment certificate for four
months (€ 48.40) or a year (€ 132.90)
IE - none or maximum of up to € 53.20 per month
under specific schemes: monthly upper limit of € 3.30
IT prescription fee abolished3 50 per cent - LU - 22 and 60 per cent - NL - reference price system: difference
between reference and retail priceco-payment regulation for health care services including pharm. (1997 – 1999), abolished in 2000
AT charge of € 4.07 per prescribed item (“prescription fee”)
- -
PT - brands: 30, 60, 80 per cent generics: 20, 50, 70 per cent
-
SE planned 10, 25, 50, 100 per cent reference price system: difference between reference and retail price
maximum € 204.31/twelve months
ES - 10 and 40 per cent reference price system: difference between reference and retail price
-
pharm. = pharmaceutical, PR = prescription, reimb. = reimbursable 1 in-patients have to pay the full price of non-reimbursable pharm. 2 if the annual limit is exceeded, co-payment of € 17.21/item 3 abolished since January 1, 2001. Currently discussion on reintroduction of prescription fee.
Source: ÖBIG 2001a; information gathering by ÖBIG

Cost-containment strategies
41
6 Cost-containment strategies
The current structure of the pharmaceutical systems in the European Union as described in Chapter 5 is the result of numerous savings measures, as different cost-containment strate-gies were tested in the 1990s: measures having an impact on the prices of pharmaceuticals and activities aiming at consumption and volume were used (for introductory information on control instruments in the pharmaceutical sector see Section 2.3).
For the publication at hand, all control measures taken in EU countries during the time period 1990 to 2001 were surveyed. Table 6.1 gives a chronological overview of important meas-ures taken for the containment of costs, taking into consideration the desired impact of the activities (price vs. volume). An analysis of the measures shows that in spite of country-specific characteristics there are some key trends in the attempts of the European countries to gain control of pharmaceutical expenditure.
6.1 Analysis by countries
Belgium, Germany, Spain, Italy and Denmark are the countries within the European Union which most frequently intervened in the pharmaceutical market in the 1990s.
Compared to these countries, significantly fewer measures were taken in Portugal, Greece, Great Britain and Ireland.
According to the available information, Luxembourg has not imposed any relevant cost-containment measures; obviously the development of pharmaceutical expenditure does not seem to pose a problem in that country.
Basically, analysis of the control measures shows that even countries which are generally regarded as liberal and which usually rely on market instruments for controlling public phar-maceutical expenditure (e.g. Denmark, the Netherlands, Germany) are increasingly using state instruments.
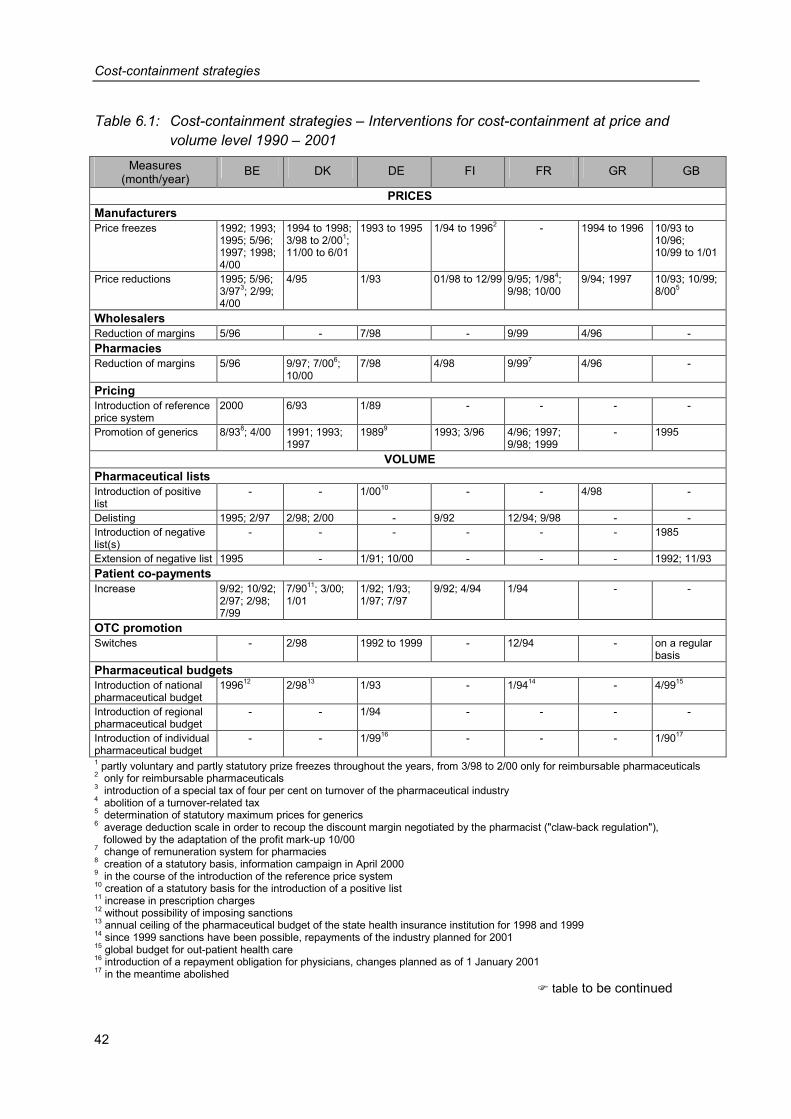
Cost-containment strategies
42
Table 6.1: Cost-containment strategies – Interventions for cost-containment at price and volume level 1990 – 2001
Measures (month/year)
BE DK DE FI FR GR GB
PRICES Manufacturers Price freezes 1992; 1993;
1995; 5/96; 1997; 1998; 4/00
1994 to 1998; 3/98 to 2/001; 11/00 to 6/01
1993 to 1995 1/94 to 19962 - 1994 to 1996 10/93 to 10/96; 10/99 to 1/01
Price reductions 1995; 5/96; 3/973; 2/99; 4/00
4/95 1/93 01/98 to 12/99 9/95; 1/984; 9/98; 10/00
9/94; 1997 10/93; 10/99; 8/005
Wholesalers Reduction of margins 5/96 - 7/98 - 9/99 4/96 - Pharmacies Reduction of margins 5/96 9/97; 7/006;
10/00 7/98 4/98 9/997 4/96 -
Pricing Introduction of reference price system
2000 6/93 1/89 - - - -
Promotion of generics 8/938; 4/00 1991; 1993; 1997
19899 1993; 3/96 4/96; 1997; 9/98; 1999
- 1995
VOLUME Pharmaceutical lists Introduction of positive list
- - 1/0010 - - 4/98 -
Delisting 1995; 2/97 2/98; 2/00 - 9/92 12/94; 9/98 - - Introduction of negative list(s)
- - - - - - 1985
Extension of negative list 1995 - 1/91; 10/00 - - - 1992; 11/93 Patient co-payments Increase 9/92; 10/92;
2/97; 2/98; 7/99
7/9011; 3/00; 1/01
1/92; 1/93; 1/97; 7/97
9/92; 4/94 1/94 - -
OTC promotion Switches - 2/98 1992 to 1999 - 12/94 - on a regular
basis Pharmaceutical budgets Introduction of national pharmaceutical budget
199612 2/9813 1/93 - 1/9414 - 4/9915
Introduction of regional pharmaceutical budget
- - 1/94 - - - -
Introduction of individual pharmaceutical budget
- - 1/9916 - - - 1/9017
1 partly voluntary and partly statutory prize freezes throughout the years, from 3/98 to 2/00 only for reimbursable pharmaceuticals 2 only for reimbursable pharmaceuticals 3 introduction of a special tax of four per cent on turnover of the pharmaceutical industry 4 abolition of a turnover-related tax 5 determination of statutory maximum prices for generics 6 average deduction scale in order to recoup the discount margin negotiated by the pharmacist ("claw-back regulation"), followed by the adaptation of the profit mark-up 10/00 7 change of remuneration system for pharmacies 8 creation of a statutory basis, information campaign in April 2000 9 in the course of the introduction of the reference price system 10 creation of a statutory basis for the introduction of a positive list 11 increase in prescription charges 12 without possibility of imposing sanctions 13 annual ceiling of the pharmaceutical budget of the state health insurance institution for 1998 and 1999 14 since 1999 sanctions have been possible, repayments of the industry planned for 2001 15 global budget for out-patient health care 16 introduction of a repayment obligation for physicians, changes planned as of 1 January 2001 17 in the meantime abolished � table to be continued
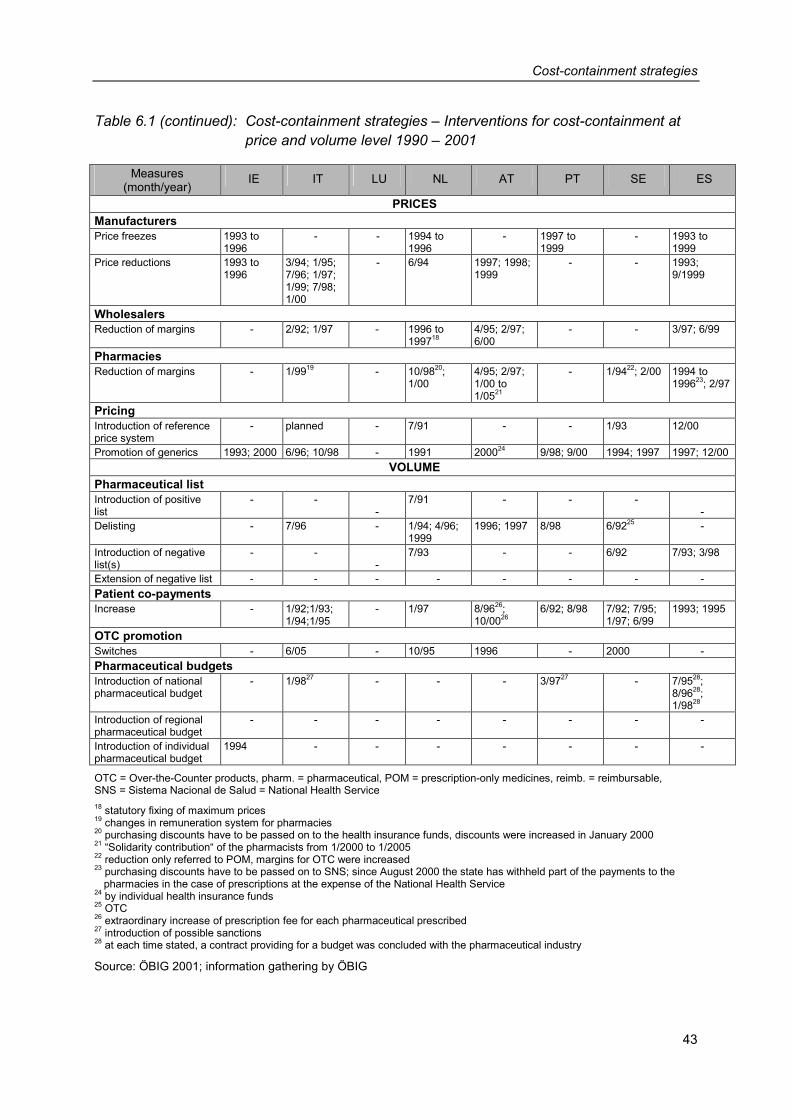
Cost-containment strategies
43
Table 6.1 (continued): Cost-containment strategies – Interventions for cost-containment at price and volume level 1990 – 2001
Measures (month/year)
IE IT LU NL AT PT SE ES
PRICES Manufacturers Price freezes 1993 to
1996 - - 1994 to
1996 - 1997 to
1999 - 1993 to
1999 Price reductions 1993 to
1996 3/94; 1/95; 7/96; 1/97; 1/99; 7/98; 1/00
- 6/94 1997; 1998; 1999
- - 1993; 9/1999
Wholesalers Reduction of margins - 2/92; 1/97 - 1996 to
199718 4/95; 2/97; 6/00
- - 3/97; 6/99
Pharmacies Reduction of margins - 1/9919 - 10/9820;
1/00 4/95; 2/97; 1/00 to 1/0521
- 1/9422; 2/00 1994 to 199623; 2/97
Pricing Introduction of reference price system
- planned - 7/91 - - 1/93 12/00
Promotion of generics 1993; 2000 6/96; 10/98 - 1991 200024 9/98; 9/00 1994; 1997 1997; 12/00 VOLUME
Pharmaceutical list Introduction of positive list
- - -
7/91 - - - -
Delisting - 7/96 - 1/94; 4/96; 1999
1996; 1997 8/98 6/9225 -
Introduction of negative list(s)
- - -
7/93 - - 6/92 7/93; 3/98
Extension of negative list - - - - - - - - Patient co-payments Increase - 1/92;1/93;
1/94;1/95 - 1/97 8/9626;
10/0026 6/92; 8/98 7/92; 7/95;
1/97; 6/99 1993; 1995
OTC promotion Switches - 6/05 - 10/95 1996 - 2000 - Pharmaceutical budgets Introduction of national pharmaceutical budget
- 1/9827 - - - 3/9727 - 7/9528; 8/9628; 1/9828
Introduction of regional pharmaceutical budget
- - - - - - - -
Introduction of individual pharmaceutical budget
1994 - - - - - - -
OTC = Over-the-Counter products, pharm. = pharmaceutical, POM = prescription-only medicines, reimb. = reimbursable, SNS = Sistema Nacional de Salud = National Health Service 18 statutory fixing of maximum prices 19 changes in remuneration system for pharmacies 20 purchasing discounts have to be passed on to the health insurance funds, discounts were increased in January 2000 21 “Solidarity contribution“ of the pharmacists from 1/2000 to 1/2005 22 reduction only referred to POM, margins for OTC were increased 23 purchasing discounts have to be passed on to SNS; since August 2000 the state has withheld part of the payments to the
pharmacies in the case of prescriptions at the expense of the National Health Service 24 by individual health insurance funds 25 OTC 26 extraordinary increase of prescription fee for each pharmaceutical prescribed 27 introduction of possible sanctions 28 at each time stated, a contract providing for a budget was concluded with the pharmaceutical industry
Source: ÖBIG 2001; information gathering by ÖBIG
Cost-containment strategies
44
6.2 Analysis by frequency of interventions
In spite of country-specific differences, it can be said for (almost) all EU countries that in the 1990s barely a year passed without major interventions in the pharmaceutical sector. On av-erage, more than ten radical cost-containment measures were taken in each Member State. The number ranges from no interventions at all (Luxembourg) to 20 (Belgium).
6.3 Analysis by desired impact
The measures targeted both the price level and the volume level (cf. Table 6.1).
6.3.1 Price
At the price level, besides the introduction of reference price systems and the promotion of generics, in particular price reductions played an important role.
Except for Luxembourg and Sweden, all Member States witnessed price freezes or reduc-tions of ex-factory prices in the 1990s. In numerous EU countries with statutory regulation of wholesale margins (cf. Section 5.4), these margins were lowered and in most countries pharmacy margins were reduced – sometimes several times - and/or the remuneration sys-tem was changed (France, Italy).
As described in Section 5.3, the introduction of reference price systems is connected to the promotion of generics, as a certain volume of generics on the market is a basic prerequisite for a reference price system. In Europe, the Netherlands, Denmark and Germany are con-sidered “generics countries”, in which less expensive, patent expired products have been strongly present on the market for a long time. In these countries, reference price systems were introduced in the early 1990s and incentive mechanisms for the promotion of generics (e.g. obligatory generic substitution) were created. In recent years, several countries have followed their example: In France, where generic substitution was introduced in 1999, the amount received by pharmacies for the dispensing of generics is the same as for brands, in Ireland, the physicians who have individual pharmaceutical budgets are provided on a regu-lar basis with information on savings potentials from the prescription of generics and in Swe-den information campaigns for the public are launched repeatedly.
Cost-containment strategies
45
6.3.2 Volume
Except for Ireland and Luxembourg, all EU Member States have taken one or more meas-ures as regards reimbursement in the 1990s: numerous pharmaceuticals – in particular OTC products – are not (or no longer) reimbursed (delisting) or put on a (newly created) negative list.
During the period under review, nine EU countries limited their pharmaceutical expenditure through budgets. As already described in Section 5.2, different models (at national, regional or individual level, responsibility of the physicians or of several actors within the pharmaceu-tical system, taking into consideration the possibility of imposing sanctions) were tried out.
A key instrument for the containment of public pharmaceutical expenditure in almost all EU countries (except Greece, Great Britain, Ireland and Luxembourg) was to increase patient co-payments (for the various forms of patient co-payments in the pharmaceutical sector cf. Section 5.5). In some countries co-payments were increased several times (approximately every two or three years). In this respect, Sweden, Germany, Italy and Belgium were clearly in the lead. In Germany and Italy, where co-payments had been massively increased in the mid-1990s, the co-payments were reduced for the first time at the end of the decade.
6.4 Analysis by actors
Considering the shift of the financing burden from public authorities to private households (increase of patient co-payments, delisting of pharmaceuticals) it is not surprising that pa-tients were severely affected by specific cost-containment measures. A significant shift of the financial burden to the patients was witnessed in Italy, Spain, Great Britain and Germany, where the patients have to make increased co-payments and/or pay for an increasing num-ber of pharmaceuticals out of their own pockets (expansion of self-medication).
As regards the actors on the pharmaceutical market, it may be observed that until the mid-1990s it was primarily the pharmaceutical industry which was affected by the measures for the containment of pharmaceutical prices. Thereafter, also the actors in the pharmaceutical distribution sector came under pressure, as is evidenced by the reduction of the profit mar-gins for wholesalers and pharmacies in several Member States. In Austria, the wholesale and pharmacy margins were reduced on several occasions.
Cost-containment strategies
46
6.5 Summary
In spite of the massive savings policy in the pharmaceutical sector during the last decade, there is no end in sight. As can be seen from Table 6.1, the intervals between the individual measures are becoming shorter, as in most cases the success of the cost-containment strategies was only temporary.
Therefore, most of the EU countries plan further interventions. In particular, some countries regard the increased volume of new, expensive pharmaceuticals on the market as a prob-lem. In order to cope with it, they have recently relied on a therapeutic-economic evaluation as one criterion for the decision regarding the inclusion of such pharmaceuticals into the re-imbursement scheme (e.g. Great Britain, the Netherlands). Furthermore, the EU countries want to limit the consumption of pharmaceuticals at the expense of the public authorities, for example by increasingly relying on reviews of the prescription patterns of physicians and of pharmaceutical budgets.
Benchmarking
47
7 Benchmarking
In this chapter key indicators of all EU countries, i.e. pharmaceutical expenditure, financing and consumption are compared and ranked in Section 7.1.
In Section 7.2 a detailed analysis of the individual EU Member States is undertaken. It pro-vides an overview of regulations for the listing of pharmaceuticals in the reimbursement sys-tem and describes pharmaceutical pricing strategies. Furthermore, a connection between the development of public pharmaceutical expenditure between 1990 and 1999 and cost-containment measures is established and results are analysed.
At the end of the chapter, the central indicators of the countries are listed in Tables 7.1 and 7.2.
7.1 Comparison of indicators
7.1.1 Expenditure
In 1999 the average per capita expenditure on pharmaceuticals within the European Union amounted to € 252.-. Among the individual EU Member States, however, major differences can be observed, as is shown in Figure 7.1.
Reasons for these differences between the EU Member States could be the economic wealth of a country and the age structure of the population. Those countries, for instance, with a very low per capita gross domestic product (cf. Chapter 4, Table 4.2), such as Portugal, Greece and Spain, have a lower pharmaceutical expenditure. Ireland has the lowest per cap-ita pharmaceutical expenditure of all EU Member States. The proportion of elderly people in the population is the lowest of all fifteen EU countries and only five per cent of the population are older than 75 years. Besides, the Irish gross domestic product is only slightly below the EU average.
Richer countries generally display higher pharmaceutical expenditure in comparison with the EU average. Only in Denmark and the Netherlands, both rich countries, pharmaceutical ex-penditure is below the EU average. This may be caused by the relatively low consumption of medicines (cf. Figure 7.3 and Table 7.1). Those countries with high per capita pharmaceuti-cal expenditure are mostly “social insurance countries”, such as Luxembourg, Austria, Ger-many, France and Belgium.
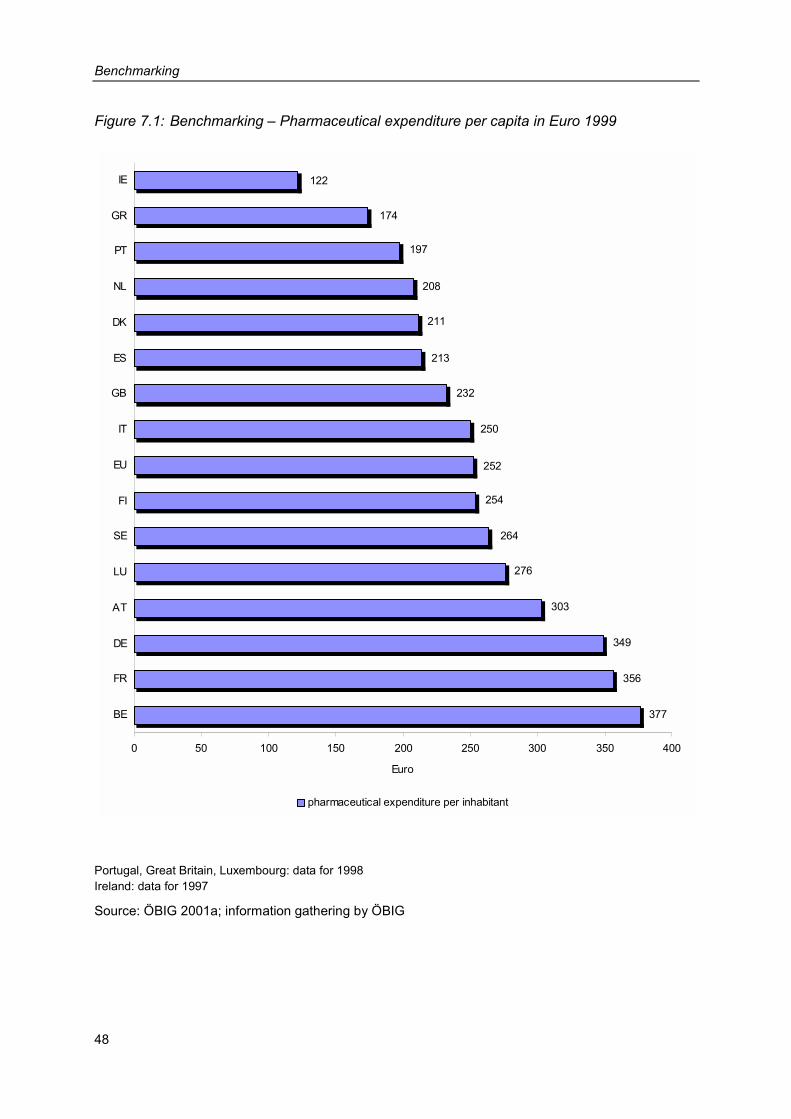
Benchmarking
48
Figure 7.1: Benchmarking – Pharmaceutical expenditure per capita in Euro 1999
213
211
208
197
174
122
232
250
252
254
264
276
303
349
356
377
0 50 100 150 200 250 300 350 400
BE
FR
DE
AT
LU
SE
FI
EU
IT
GB
ES
DK
NL
PT
GR
IE
Euro
pharmaceutical expenditure per inhabitant
Portugal, Great Britain, Luxembourg: data for 1998 Ireland: data for 1997
Source: ÖBIG 2001a; information gathering by ÖBIG
Benchmarking
49
7.1.2 Financing
Within the European Union an average of almost two thirds of pharmaceutical expenditure is borne by the public sector, i.e. social insurance institutions or the National Health Service (cf. Figure 7.2). The remaining third is financed privately, either through co-payments or self-medication.
A public sector share of less than 50 per cent of the financing can be found in Greece, Por-tugal and Finland. For Greece only the data of the largest health insurance institution, the Social Insurance Institute, which covers approx. half the population, were available. Accord-ing to these data private financing of pharmaceuticals in Greece has the highest share among all EU countries. In Portugal the share of the public sector contribution increased slightly during the 1990s. However, a large share of pharmaceutical expenditure was still borne by private households in 1999, more than half of the contribution being made via co-payments for reimbursable pharmaceuticals and the rest via self-medication. In Finland the high co-payments made by patients for reimbursable medicines are the main reason for the low public sector share of pharmaceutical expenditure: In 1999 co-payments amounted to 77 per cent of public pharmaceutical expenditure. Co-payment figures have risen considerably since the mid 90s because of the increase in the percentage of co-payments made by pa-tients. For the majority of reimbursable pharmaceuticals patients get only half the costs re-funded by the social insurance institution, but only if a deductible of € 8.4 or € 4.2 is ex-ceeded.
In most EU Member States the share of public financing in total pharmaceutical expenditure decreased during the 90s. A notable development occurred in Italy, where the public sector share of pharmaceutical expenditure decreased from about 67 per cent in 1990 to 50 per cent in 1995 and increased to approx. 53 per cent in 1999.
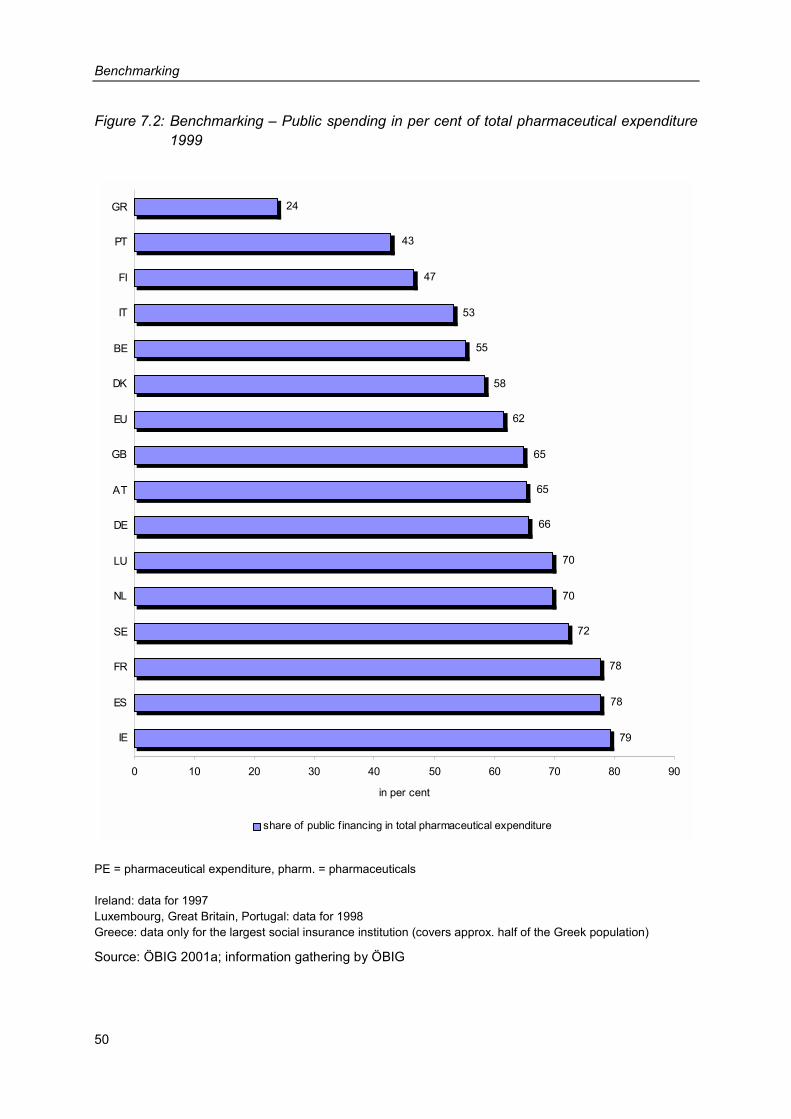
Benchmarking
50
Figure 7.2: Benchmarking – Public spending in per cent of total pharmaceutical expenditure 1999
78
78
72
70
70
66
65
65
62
58
24
43
47
53
55
79
0 10 20 30 40 50 60 70 80 90
IE
ES
FR
SE
NL
LU
DE
AT
GB
EU
DK
BE
IT
FI
PT
GR
in per cent
share of public f inancing in total pharmaceutical expenditure
PE = pharmaceutical expenditure, pharm. = pharmaceuticals Ireland: data for 1997 Luxembourg, Great Britain, Portugal: data for 1998 Greece: data only for the largest social insurance institution (covers approx. half of the Greek population)
Source: ÖBIG 2001a; information gathering by ÖBIG
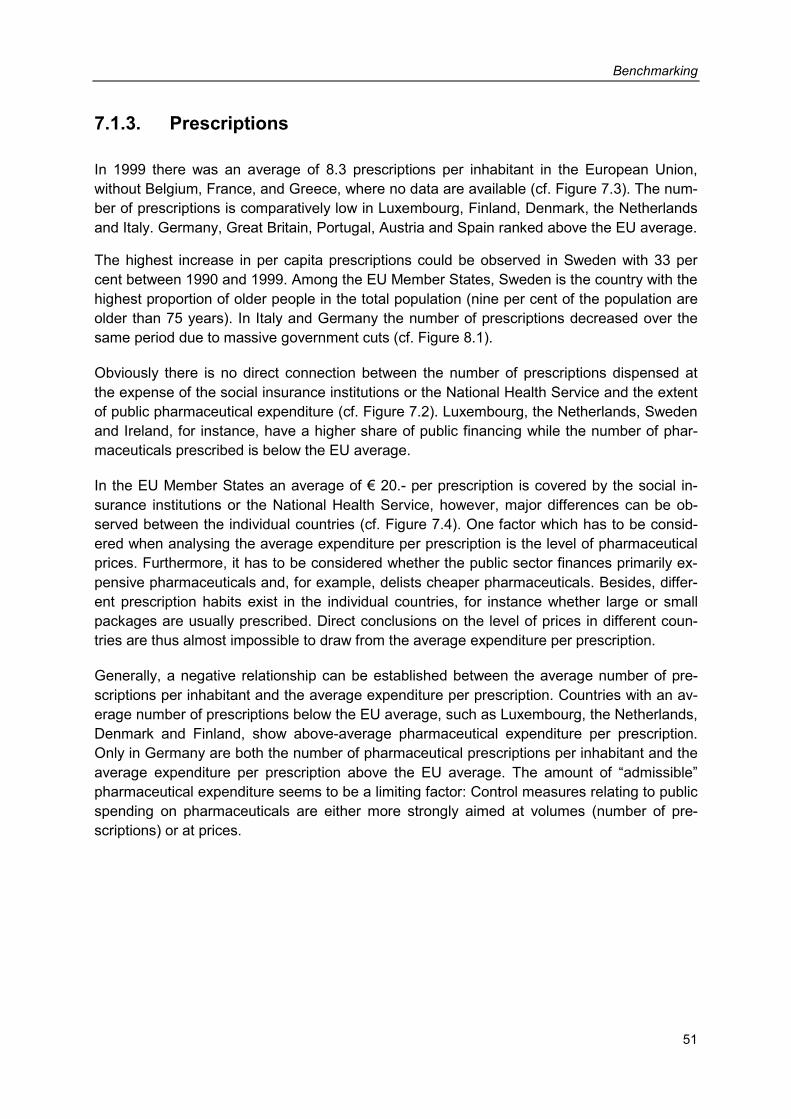
Benchmarking
51
7.1.3. Prescriptions
In 1999 there was an average of 8.3 prescriptions per inhabitant in the European Union, without Belgium, France, and Greece, where no data are available (cf. Figure 7.3). The num-ber of prescriptions is comparatively low in Luxembourg, Finland, Denmark, the Netherlands and Italy. Germany, Great Britain, Portugal, Austria and Spain ranked above the EU average.
The highest increase in per capita prescriptions could be observed in Sweden with 33 per cent between 1990 and 1999. Among the EU Member States, Sweden is the country with the highest proportion of older people in the total population (nine per cent of the population are older than 75 years). In Italy and Germany the number of prescriptions decreased over the same period due to massive government cuts (cf. Figure 8.1).
Obviously there is no direct connection between the number of prescriptions dispensed at the expense of the social insurance institutions or the National Health Service and the extent of public pharmaceutical expenditure (cf. Figure 7.2). Luxembourg, the Netherlands, Sweden and Ireland, for instance, have a higher share of public financing while the number of phar-maceuticals prescribed is below the EU average.
In the EU Member States an average of € 20.- per prescription is covered by the social in-surance institutions or the National Health Service, however, major differences can be ob-served between the individual countries (cf. Figure 7.4). One factor which has to be consid-ered when analysing the average expenditure per prescription is the level of pharmaceutical prices. Furthermore, it has to be considered whether the public sector finances primarily ex-pensive pharmaceuticals and, for example, delists cheaper pharmaceuticals. Besides, differ-ent prescription habits exist in the individual countries, for instance whether large or small packages are usually prescribed. Direct conclusions on the level of prices in different coun-tries are thus almost impossible to draw from the average expenditure per prescription.
Generally, a negative relationship can be established between the average number of pre-scriptions per inhabitant and the average expenditure per prescription. Countries with an av-erage number of prescriptions below the EU average, such as Luxembourg, the Netherlands, Denmark and Finland, show above-average pharmaceutical expenditure per prescription. Only in Germany are both the number of pharmaceutical prescriptions per inhabitant and the average expenditure per prescription above the EU average. The amount of “admissible” pharmaceutical expenditure seems to be a limiting factor: Control measures relating to public spending on pharmaceuticals are either more strongly aimed at volumes (number of pre-scriptions) or at prices.
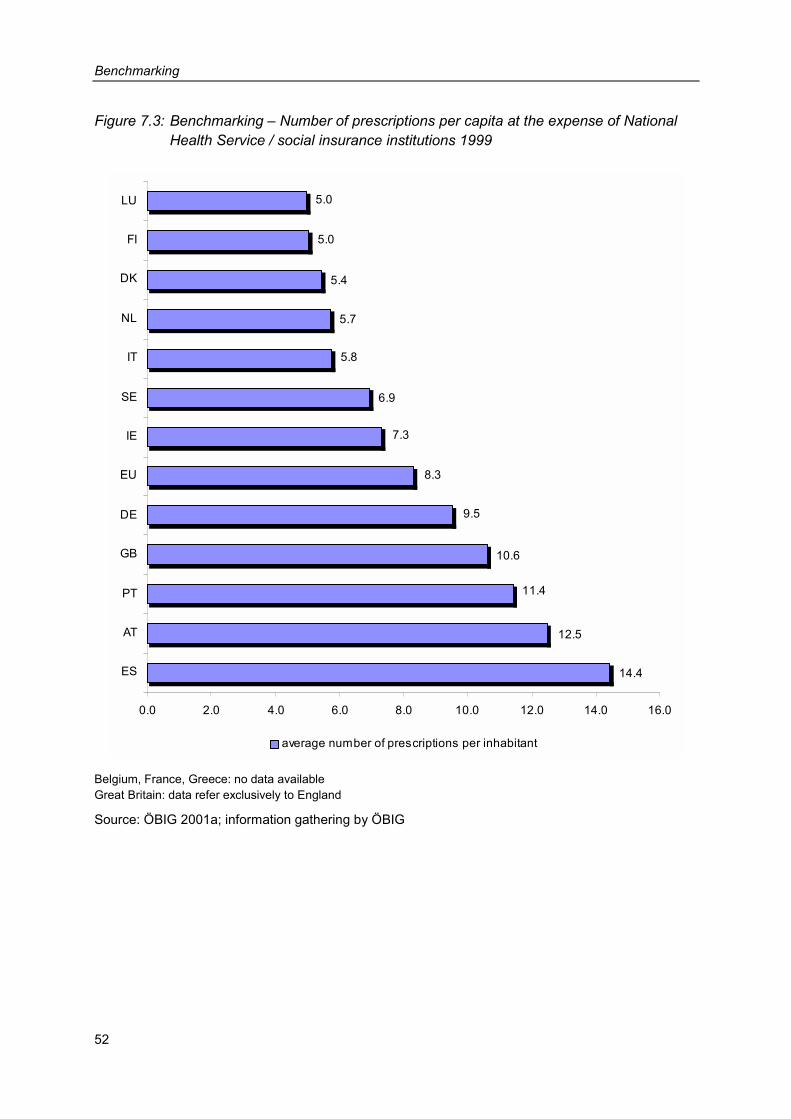
Benchmarking
52
Figure 7.3: Benchmarking – Number of prescriptions per capita at the expense of National Health Service / social insurance institutions 1999
10.6
9.5
8.3
7.3
6.9
5.8
5.7
5.4
5.0
5.0
11.4
12.5
14.4
0.0 2.0 4.0 6.0 8.0 10.0 12.0 14.0 16.0
ES
AT
PT
GB
DE
EU
IE
SE
IT
NL
DK
FI
LU
average number of prescriptions per inhabitant
Belgium, France, Greece: no data available Great Britain: data refer exclusively to England
Source: ÖBIG 2001a; information gathering by ÖBIG
Benchmarking
53
Figure 7.4: Benchmarking – Expenditure per prescription at the expense of National Health Service / social insurance institutions 1999
24
23
23
23
20
18
16
12
11
8
42
28
25
0 5 10 15 20 25 30 35 40 45
LU
SE
NL
DE
FI
IT
DK
EU
AT
IE
GB
ES
PT
Euro
average expenditure per prescription
Belgium, France, Greece: no data available Great Britain: data refer exclusively to England
Source: ÖBIG 2001a; information gathering by ÖBIG
7.2 Country analyses
7.2.1 Belgium
The central institution in the Belgian pharmaceutical system is the Ministry of Social Affairs, Public Health and the Environment, which is supported by a committee for social insurance.
Benchmarking
54
The Ministry of Social Affairs, Public Health and the Environment decides on listing pharma-ceuticals (in the positive list) and on the level of reimbursement. The Ministry of Economic Af-fairs is responsible for the pricing of prescription-only and reimbursable pharmaceuticals and also fixes maximum prices. The decisions are based on a recommendation of the pricing committee, which consists of, among others, representatives of the pharmaceutical industry, wholesalers, pharmacists, trade unions and health insurance funds.
As compared to the EU average Belgium has the highest pharmaceutical expenditure per in-habitant. A major part of pharmaceutical expenditure is financed privately, the public sector share is relatively low with approx. 55 per cent. Concerning the consumption of pharmaceuti-cals (only data on the consumption measured in packages is available) Belgium ranks among the upper third of the EU countries.
With a plus of 40 per cent, public pharmaceutical expenditure rose considerably between 1995 and 1999. In the mid 90s public expenditure showed two-digit growth rates. Numerous cost-containment measures followed, such as raised co-payments, multiple price freezes and reductions for pharmaceuticals and the introduction of a national pharmaceutical budget, which was unaccompanied by incentives or sanctions. Further measures were the implemen-tation of a database for the optimisation and documentation of prescription patterns of physi-cians, a limitation on pharmacy and wholesale margins and the introduction of an extraordi-nary tax on sales of the pharmaceutical industry. As a consequence the dynamics of expen-diture slowed down, but by the end of the 90s the growth rates had again increased consid-erably. Thus, strategies have been developed in order to reduce pharmaceutical expenditure on a long term basis, such as campaigns to promote so-called “reasonable” prescriptions and increased prescription of generics, as well as the introduction of a reference price sys-tem and a new reimbursement scheme as of June 2001.
Belgium took the largest number of cost-containment measures during the period analysed. However, despite numerous interventions it has not succeeded in containing expenditure.
7.2.2 Denmark
An important role in the Danish pharmaceutical system is played by the Medicines Agency. The Medicines Agency decides on listing pharmaceuticals (positive list), on reimbursement rates, which range between 50 and 100 per cent, and on the reimbursement price. Basically the manufacturers of pharmaceuticals are free to decide on pricing, however, they have to report the price to the Medicines Agency after the registration of the product. As a conse-quence, the Medicines Agency fixes a reference price for equivalent pharmaceuticals – i.e. those for which generics are available. The reference price is calculated from the mean value of the two cheapest pharmaceuticals within a group. For new pharmaceuticals, for which no generics or parallel imports are available, the price is determined on the basis of the Euro-pean average price, whereby the prices in Italy and Greece are considered less important.
Denmark has a low per capita pharmaceutical expenditure, which can also be attributed to the low pharmaceutical consumption in general in Scandinavian countries. Pharmaceutical
Benchmarking
55
expenditure in relation to the number of inhabitants has decreased considerably as a result of numerous cost-containment measures.
Public pharmaceutical expenditure rose in one year (from 1990 to 1991) by more than 50 per cent. The reason for such an extreme increase was the abolition of the so-called “800-Kroner rule”, which stated that patients were only reimbursed part of the costs of pharmaceuticals if an annual limit of 800 Kroner/€ 101.78 was exceeded. This rule led to massive public pro-tests, and was therefore abolished only 18 months after its adoption. In the following years the development of expenditure could be slowed down considerably through numerous inter-ventions, which affected prices (statutory price freezes, increased promotion of generics, re-duction of pharmacy margins) as well as volumes (e.g. delisting of pharmaceuticals). How-ever, the costs have not shifted to private households. The share of public expenditure – which is still relatively low – rose gradually between 1990 and 1999. Private pharmaceutical expenditure has even declined as compared to public expenditure.
At the beginning of 2000 – i.e. after the period of analysis – the co-payment system was changed. Up to an annual total limit of € 484.20 patients have to pay up to € 67.24 for each prescribed pharmaceutical.
In the last decade Denmark has succeeded in controlling pharmaceutical expenditure through a bundle of measures. However, from the point of view of the government the meas-ures have not sufficed; above all prices for pharmaceuticals are still deemed to be too high. Thus, numerous alterations to the system were introduced in the years 2000 and 2001 (ad-aptation of reimbursement system, increased co-payment, prize freezes and reduction of margins). Furthermore, liberalisation steps have been started in the pharmacy sector. As a consequence, selected OTC products can be sold under certain circumstances at supermar-kets and petrol stations. The opening hours of pharmacies have also been liberalised.
7.2.3 Germany
The Ministry of Health has an important role in controlling the pharmaceutical market in Ger-many. The Ministry is, after consultation of expert committees, responsible for the listing of pharmaceuticals in negative lists or in the planned positive list. Basically, ex-factory prices are determined by manufacturers. Indirectly, prices are influenced by the reference-price sys-tem. Firstly, the Federal Standing Committee of Physicians and Sickness Funds groups equi-valent pharmaceuticals and then the top associations of the health insurance funds deter-mine the maximum amount which will be reimbursed for a certain pharmaceutical, the so-called reference price. The difference between the reference price and the retail price has to be borne by the insured person.
Public pharmaceutical expenditure developed rather moderately in Germany with a total in-crease of approx. 30 per cent between 1991 and 1999. As regards consumption of pharma-ceuticals (number of prescriptions per inhabitant) Germany ranked slightly above the EU av-erage in 1999. Due to numerous cost-containment measures, however, the number of pre-scriptions paid for by the compulsory health insurance declined dramatically. With a pharma-
Benchmarking
56
ceutical expenditure of € 349.- per inhabitant, Germany ranked third among EU countries in 1999. In 1990 Germany still had the second highest per capita pharmaceutical expenditure. With a public financing share of approx. two-thirds Germany is close to the EU average.
With numerous cost-containment interventions aimed at stabilising statutory health insurance contributions, Germany succeeded in reducing the increase in public pharmaceutical expen-diture considerably between 1992 and 1998. The rigid savings policy tried to control both the prices and the consumption of pharmaceuticals (e.g. multiple rises in co-payments, introduc-tion of a pharmaceutical budget for physicians, price freezes and margin reduction), and bur-dened the patients. Fewer pharmaceuticals were prescribed and the private share in phar-maceutical expenditure increased. After a new government came into power the financial burden on the patients was relieved for the first time in 1999 (reduction of co-payments).
Faced with currently increasing pharmaceutical expenditure (more than ten per cent growth) the government decided on new cuts in October 2001. As a result pharmacists are in the fu-ture to be allowed to dispense less expensive but equivalent pharmaceuticals, if the physi-cian does not prescribe a brand. The legally required discount which pharmacies have to grant to health insurance funds will be increased from five to six per cent and manufacturer prices will be reduced by 4 per cent (valid for the years 2002 and 2003). In the future the pa-tient’s report upon discharge from hospital has to include the active substance of the phar-maceutical prescribed and less expensive alternative suggestions for out-patient therapy.
7.2.4 Finland
An authority subordinate to the Ministry of Health, the Pharmaceuticals Pricing Board is re-sponsible for the listing of pharmaceuticals (in the positive list) and has to decide on the re-imbursement rate of a pharmaceutical (50, 75 or 100 per cent). It also determines the whole-sale price for those pharmaceuticals which are included in the positive list. Decisions are based on a comparison of prices and on health-economic assessment.
Finland ranks near the EU average as regards per capita pharmaceutical expenditure. How-ever the Finish population has to bear more than 50 per cent of the cost of their pharmaceu-ticals privately. The share of public expenditure is rather low. In Finland co-payments for re-imbursable pharmaceuticals are very high. Comparatively few – but mainly expensive – pharmaceuticals have to be refunded by the social insurance KELA. Finland has high aver-age expenditure per prescription.
Between 1990 and 1999 public expenditure almost doubled. Cost-containment measures were originally aimed at the restriction of the already low consumption of pharmaceuticals supported by the public sector. The effect has been that the number of prescriptions has hardly increased and that even more pharmaceuticals have to be financed privately. A coun-terproductive measure for the development of pharmaceutical expenditure was the end of di-rect state price control and the increase of VAT in June 1994, which led to a two-digit growth rate. However, since 1998 measures to contain prices have also been taken (price reduc-tions for more than 250 pharmaceuticals and reduction of pharmacy margins). Above all, the
Benchmarking
57
new and expensive pharmaceuticals have been identified as a problem in the development of expenditure. However, cost-containing measures had only short-term effects, and in-creases soon reached the old level.
7.2.5 France
The Medicines Agency subordinate to the Ministry of Employment and Solidarity is responsi-ble for the listing of pharmaceuticals (in positive lists). The Medicines Agency is supported by a so-called “transparency commission” which consists of representatives of the Ministry, the social insurance organisations and the interest group of the pharmaceutical industry. A pre-requisite for listing a pharmaceutical in one of the two positive lists (one for the pharmacy market and one for the hospital market) is its therapeutic benefit. Pharma-economic studies are also critically evaluated by a group of experts. The transparency commission also evalu-ates the “innovation value” of pharmaceuticals as compared to equivalent products. The as-sessment by the transparency commission is relevant in the following price negotiations. The transparency commission was asked to check all reimbursable pharmaceuticals for their therapeutic benefit. The result of the evaluation was that one in five reimbursable pharma-ceuticals was graded “inadequate”.
The ex-factory prices of reimbursable pharmaceuticals are negotiated with the industry by an interministerial price committee and determined in individual contracts. The system of price negotiations which was introduced in 1994 replaced the former state pricing system.
France stands out because it has the highest pharmaceutical consumption within the EU, more than twice as high as the EU average with approx. 50 packages per inhabitant per year. Correspondingly, per capita pharmaceutical expenditure is also very high: France ranks second, after Belgium. The cost of the majority of pharmaceuticals is borne by the social in-surance institutions (public financing of approx. 78 per cent).
Between 1990 and 1999 public pharmaceutical expenditure increased in accordance with the average of EU countries. Therefore, only a few cost-containment measures were taken in France. As the pharmaceutical expenditure of the health insurance funds rose by more than 20 per cent between 1991 and 1992, cost-containment measures started in 1993 (introduc-tion of a nine per cent advertising tax for reimbursable pharmaceuticals, reduction of reim-bursement rates, therapy and prescribing guidelines for physicians). Because of the deficits of the health insurance funds cost-containment measures were intensified. Control measures started with volumes and were next also applied to prices (e.g. price reductions, increased support of generics, reduction of margins). Thus, pharmaceutical consumption could be kept at a relatively constant – though rather high – level. As compared to other EU countries France has a low pharmaceutical price level. A tendency can be observed to align prices with European average prices – innovative pharmaceuticals are conceded higher prices.
Benchmarking
58
7.2.6 Greece
In Greece a positive list binding for all health insurance funds was only established in 1998. An expert committee which is part of the Ministry of Health, Welfare and Social Insurance decides on the listing of pharmaceuticals considering criteria such as the cost of treatment compared to effectiveness). In Greece all pharmaceuticals (prescription-only products, OTC, hospital-only pharmaceuticals) are subject to statutory pricing. The Ministry of Trade and In-dustry is responsible for pricing, but a distinction between import products and national prod-ucts is made. For import products the lowest wholesale price of the European Union is taken as a basis. For national products with expired patents (generics) a price 20 per cent lower than the original product is set, in case that the pharmaceuticals are sold under their generic names; if a brand name is used, the price has to be 10 per cent lower.
Greece is one of the poorest countries in the EU and has the second-lowest pharmaceutical expenditure per capita after Ireland. Consumption of pharmaceuticals, however, is very high in Greece (measured in packages, the highest after France).
In the past decade Greece has tried to improve the access to health care services. Also in terms of pharmaceuticals Greece had to catch up, which is shown in the highest increases in pharmaceutical expenditure among EU countries. No complete data on the financing struc-ture of pharmaceutical expenditure is available for Greece. Probably, the majority of pharma-ceuticals – as with many other health services – is financed privately (high share of self-medication).
Cost-containment measures only became necessary in the mid 90s when economic growth slowed down. Interventions were mostly directed at prices (e.g. price freezes for reimburs-able pharmaceuticals, legally fixed price reductions for generics, introduction of a new pricing system in 1997), although Greece has one of the lowest price levels in Europe. When the positive list was introduced (1998) numerous products were excluded from reimbursement, the positive list, however, has been re-filled in the meantime.
7.2.7 Great Britain
The Medicines Control Agency is responsible for registration and licensing of pharmaceuti-cals in Great Britain. Once registered, all pharmaceuticals are automatically reimbursed by the National Health Service, if they are not listed in the negative lists. The Department of Health, supported by a board of experts, decides on the listing of pharmaceuticals in the negative list considering criteria such as “low therapeutic value”, “excessive cost or availabil-ity generics. Especially for innovative and/or expensive pharmaceuticals recommendations by the National Institute for Clinical Excellence (NICE), which was founded for the evaluation of new technologies, are of importance concerning eligibility for reimbursement.
The Department of Health is also responsible for pricing within the Pharmaceutical Price Regulation Scheme. In this scheme prices are not determined for individual pharmaceuticals,
Benchmarking
59
but a maximum allowed (percentage) profit of a company is agreed in individual contracts be-tween the Association of the British Pharmaceutical Industry and the National Health Service.
Per capita pharmaceutical expenditure ranks below the EU average in Great Britain whereas the number of prescriptions ranks slightly above the EU average. Approx. 65 per cent of pharmaceutical expenditure is financed by the National Health Service. Consumption – measured in packages – is low, which is partly due to the very common practice, until 1999, of ‘splitting up’ (dispensing single units from large pharmaceutical packages).
Pharmaceutical expenditure increased in the early 1990s noticeably (two-digit growth rates). Due to cost-containment measures in the mid 1990s (extension of the negative list, price re-ductions of the industry) the increase in public pharmaceutical expenditure was halted and shifted to private expenditure. As of 1997 private expenditure decreased, and public expendi-ture increased more substantially. This was partly a result of the growing number of persons exempt from prescription fees.
Great Britain only intervened slightly in the pharmaceutical market, probably because other problems prevailed in the health sector (e.g. long waiting lists, underfinancing of the National Health Service). Since 2000, however, state maximum prices for generics have been fixed for the first time, after their prices had risen sharply and the National Health Service had been confronted with high pharmaceutical expenditure. Another remarkable innovation was the foundation of the National Institute for Clinical Excellence (NICE) in early 1999, with the task of evaluating new and expensive pharmaceuticals, which are still entering the British market in growing numbers. NICE evaluates the therapeutic and economic benefit of new health technologies including pharmaceuticals and the clinical management of specific condi-tions.
7.2.8 Ireland
In Ireland the Department of Health and Children decides whether or not to list a pharmaceu-tical (on the positive list). The criteria are therapeutic necessity and generics on the market. Pharmaceuticals which can be easily replaced by generics are not reimbursed and are listed in the National Drug Formulary.
The Department of Health and Children also fixes the prices for prescription-only pharmaceu-ticals. Since mid-1997 a pricing agreement between the representatives of the industry and the Department of Health and Children has been in force, defining the average wholesale price in Great Britain, Germany, Denmark, the Netherlands and France as a basis for pricing. OTC products are not subject to pricing.
In Ireland per capita pharmaceutical expenditure is very low. In the ranking – data for Ireland from 1997 – Ireland ranked last. Also, pharmaceutical consumption (considering both the number of prescriptions paid for by the National Health Service and the number of packages sold) is below the EU average.
Benchmarking
60
As during the 80s drastic reductions took place in the health care sector, which led to a dete-rioration of health care provisions. Therefore the primary objective of the last decade has been to improve access to health care services and to pharmaceuticals. Public pharmaceuti-cal expenditure increased between 1995 and 1999 by more than 60 per cent. In the same period the number of prescriptions increased by approx. 28 per cent. The public sector share in pharmaceutical expenditure – with 80 per cent the highest in the EU – also rose. On the other hand the government goal to decrease private pharmaceutical expenditure was achieved.
7.2.9 Italy
After the registration of pharmaceuticals a pharmaceutical commission of the Ministry of Health classifies them. This pharmaceutical commission evaluates pharmaceuticals with re-gard to their therapeutic benefit and the severity of illness, which is relevant for reimburse-ment: Since July 2001 there have been only two categories of pharmaceutical products: Class A (essential pharmaceuticals and pharmaceuticals for the chronically ill), which are to-tally reimbursed, and Class C, which is not reimbursed. Previously, Class B pharmaceuticals had also existed, which were reimbursed at 50 percent. Class B applied to approx. seven per cent of the reimbursable market and mostly comprised oral contraceptives, which are now ei-ther allocated to Class A or C.
In connection with the pricing of pharmaceuticals, an important role is played by the so-called Interministerial Committee for Economic Planning, which is part of the Ministry of the Treas-ury, Budget and Economic Planning, and the Pharmaceutical Commission of the Ministry of Health. The pricing mode differs according to whether a new pharmaceutical has been ap-proved in accordance with an EU procedure (centralised or decentralised registration proce-dure) or nationally. To nationally authorised pharmaceuticals the “European average price” method is applied, the prices are calculated according to purchasing power and compared with all EU Member States except Denmark and Luxembourg. For pharmaceuticals approved according to the centralised or decentralised procedure prices have been negotiated be-tween the pharmaceutical companies and the pharmaceutical commission since 1998, also applying price comparisons.
Prices of non-reimbursable pharmaceuticals (Class C) can be freely fixed by the companies. However, the prices may only be changed once per year and have to be reported to the Min-istry of Health and the Interministerial Committee for Economic Planning in advance. The Ministry can interfere in case of “unjustified” price increases.
In Italy the state has intervened massively in the pharmaceutical market. Especially in the first half of the 90s numerous cost-containment measures were taken, which were first and foremost aimed at volume control (e.g. increases in prescription fees, de-listing of pharma-ceuticals), but also at price control (e.g. price reductions, reduction of wholesale margins). Control measures have been so successful that public spending was not only slowed down but also reduced in absolute terms (between 1992 and 1996). Currently, per capita pharma-
Benchmarking
61
ceutical expenditure in Italy is in line with the EU average. At the beginning of the 90s Italy was top of the field in this respect.
Public pharmaceutical consumption (prescriptions) has been reduced drastically. In 1999 al-most 40 per cent fewer pharmaceuticals were prescribed than in 1990. This reduction is the biggest among all the countries compared. The reduction of prescriptions has been accom-panied by a massive increase in private expenditure for self-medication. As a result, the pro-portion of private expenditure has risen considerably. In 1999 the National Health Service accounted for only slightly more than half of the overall pharmaceutical expenditure, the other half was financed by the private households. The consumption of pharmaceuticals – measured in average packages per inhabitant – is high as compared with other EU coun-tries, but it has declined slightly.
In the mid 90s when public expenditure increased considerably and prescriptions slightly, cost-containment measures were introduced, which were primarily aimed at the price level (price reductions, reduction of wholesale and pharmacy margins). To take the burden from the population the prescription fee was abolished in early 2001, although a reintroduction is now being considered. These measures and fixing budgets for pharmaceutical expenditure, which, if exceeded, theoretically created an obligation to refund overspending, though these were not consistently implemented, did not produce the desired effects. Thus, the govern-ment considers taking new measures to control the development of pharmaceutical expendi-ture. In 2001, for instance, pharmaceutical budgets for physicians and a reference price sys-tem were introduced on a trial basis.
7.2.10 Luxembourg
In Luxembourg the head organisation of the health insurance funds decides to what extent pharmaceuticals are reimbursed by health insurance funds. Pharmaceuticals for certain chronic or very serious diseases are reimbursed totally (no co-payment). For the majority of pharmaceuticals the normal reimbursement rate with a co-payment of 22 per cent applies, for so-called “comfort” pharmaceuticals (e.g. mild pain relievers) co-payment amounts to 40 per cent. The negative list includes pharmaceuticals with disputed active substances, but also OTC and products for general sale. These pharmaceuticals are not reimbursed.
The prices of reimbursable pharmaceuticals are fixed by the Price Office of the Ministry of Economic Affairs, which decides on the basis of the prices in the country of origin.
Public expenditure on pharmaceuticals rose by only approx. a quarter between 1995 and 1999; prescriptions increased by approx. eight per cent. It is rather striking that the average expenditure per prescription is the highest in Luxembourg (probably because of the high price level and the funding of expensive pharmaceuticals by the health insurance institu-tions). With a public financing share of approx. 70 per cent, Luxembourg is above the EU average.
Luxembourg has the highest per capita gross domestic product in the European Union. Both health care expenditure and pharmaceutical expenditure have increased less than the gross
Benchmarking
62
domestic product in the period of analysis (1995 until 1999). Thanks to the good economic situation Luxembourg has been the only EU member country – according to the information available – with no cost-containment measures.
7.2.11 The Netherlands
In the Netherlands the Ministry of Health, Welfare and Sport, supported by a pharmaceutical commission (independent body of experts), decides on the reimbursement status of pharma-ceuticals. There are two different categories: List 1A contains pharmaceuticals which are part of the reference price systems ("exchangeable" pharmaceuticals). For pharmaceuticals in this group the patients have to pay the difference, if any, between the reference price and the actual retail price. If a pharmaceutical is not part of the reference price system, a therapeutic and economic evaluation by the pharmaceutical commission is carried out. The Ministry of Health, Welfare and Sport decides whether or not a pharmaceutical is included in the reim-bursement system. In case of a positive decision these pharmaceuticals are listed in List 1B and may be prescribed at the expense of the health insurance funds. Generally, homeo-pathic and OTC products are not reimbursed, except a few for chronic diseases.
Until the end of 1995 no national regulation of pharmaceutical prices on manufacturers’ and wholesale level existed in the Netherlands. Prices were indirectly influenced by the reference price system. After the government had recognised that the reference price system did not suffice to achieve the planned cost-containment, a law on pharmaceutical prices was passed on January 1, 1996. In accordance with this law the Ministry of Health, Welfare and Sport is authorised to fix a maximum pharmacy purchasing price for reimbursable pharmaceuticals. As a basis for the maximum price the Ministry takes the average pharmacy purchasing price for comparable products in the four reference countries Belgium, Germany, France and Great Britain.
In the Netherlands two major alterations to the system took place in the 90s, which also af-fected the pharmaceutical market. A basic insurance covering almost the entire pharmaceu-tical expenditure was introduced. However, this measure was abolished in 1996. Further-more a general co-payment rule was applied between 1997 till late 1999, which stated that the insured persons had to pay a deductible of 20 per cent, up to a limit of € 90.76 or € 45.38 (for people with low income) per year for certain services provided by obligatory health insur-ance. This regulation also applied to pharmaceuticals thus leading to an enormous increase in pharmaceutical expenditure.
The Netherlands have low pharmaceutical expenditure and low pharmaceutical consumption. Neither pharmaceutical expenditure nor pharmaceutical consumption borne by the health in-surance funds have increased extraordinarily.
During the 90s the Netherlands have taken numerous cost-containment measures which were aimed at prices on the one hand and on volumes on the other hand, with the effect that the increase in public pharmaceutical expenditure was kept down. With a public financing share of approx. 70 per cent (1999) the Netherlands rank above the EU average. It is rather
Benchmarking
63
striking however, that the average expenditure per prescription is among the highest. This may be due to increasing prices or to the fact that health insurance funds no longer reim-burse OTC products, which are usually less expensive. The cost-containment measures in-troduced in the mid 90s had positive effects in the Netherlands.
The current government considers the steps taken as short-term cost-containment measures only. For 1999 the government had the ambitious goal of limiting the increase to 2.3 per cent, a limit which was ultimately exceeded, however. In order to achieve long-term effects, the government will in the future rely on the control of new and expensive pharmaceuticals, measures to reduce consumption (e.g. improving prescription patterns) and increased com-petition between health insurance funds. According to the suggestions of a pharmaceutical commission, for instance, the health insurance funds should offer different service packages and premiums, negotiate pharmaceutical prices directly with the manufacturers and conclude separate agreements with the wholesale industry and with pharmacies.
7.2.12 Austria
According to the Austrian General Social Insurance Act all pharmaceuticals are reimbursable in Austria, if they are required for effective and sufficient medical treatment which does not exceed the necessary level. However, two different types of reimbursement are distin-guished: Those pharmaceuticals which are part of the pharmaceutical list “Heimittelverzeich-nis” qualify for automatic reimbursement. Those pharmaceuticals which are not listed in the “Heilmittelverzeichnis” are only funded by the social insurance if they are approved by the health insurance fund (through a so called “head doctor”). The Federation of Austrian Social Insurance Institutions decides whether or not a pharmaceutical should be included in the “Heilmittelverzeichnis”. In the course of the approval procedure the Federation considers formal criteria, medical-therapeutic criteria and economic criteria (e.g. comparison of costs of medical treatment, of price comparison in other European countries) for evaluation. There is a fixed prescription fee for pharmaceuticals which are reimbursed by the social insurance (2001: € 4.07).
Pricing of pharmaceuticals is based on the 1992 Price Act. According to this act the Federal Ministry of Social Security and Generations is authorised to determine a “maximum price which is justified by the national economic situation” after discussion with a consulting body (price commission). Following an agreement between the social partners (representatives of employees and employers) signed in September 1999, the way the Price Act is applied has been changed. Now, the pharmaceutical companies do no longer have to apply for the ap-proval of a price or a price increase by the Federal Ministry for Social Security and Genera-tions. Instead, a notification procedure has been introduced. This means that the maximum price of a pharmaceutical or any price change has to be reported to the Federal Ministry. If required – e.g. in case of an excessive price – the Federal Ministry can fix the price.
In the period of investigation Austria recorded a dynamic increase in public pharmaceutical expenditure and now takes place four in the EU rankings for average per capita pharmaceu-tical expenditure. Public pharmaceutical expenditure shows the second-highest increase of
Benchmarking
64
all EU countries, immediately after Greece. It must be considered, however, that part of the increase can be attributed to the introduction of VAT on reimbursable pharmaceuticals. How-ever, even VAT-adjusted pharmaceutical expenditure more than doubled between 1990 and 1999, and consequently Austria is still among those countries with the most dynamic in-crease in public pharmaceutical expenditure.
Regarding consumption Austria also ranks high, with an annual average of 12.5 prescriptions per inhabitant, although the number of prescriptions has increased one quarter less than public expenditure during the period of investigation.
In the face of deficits in the health insurance sector since the mid 90s, cost-containment measures have been started. Primarily, the measures were aimed at curbing price develop-ment (multiple price reductions and freezes in the pharmaceutical industry, reduction of pharmacy and wholesaler margins, etc.). The prescription fee was also raised in 1996 by 20 per cent. The effects of the measures lasted only for a short time, and after two to three years the effects vanished and new ones were required. The last government cuts became effective in 2000. Among other measures wholesale margins have again been reduced and a “Solidarity Contribution Agreement” has been concluded with the pharmacies. According to this agreement part of the increase in pharmacy sales has to be refunded to the health insur-ance funds. The agreement has been concluded for a period of five years. By the end of 2000 prescription fees had again been raised considerably. According to recent data, these measures have resulted in a significant containment of increases in pharmaceutical expendi-ture by the social insurance funds. It remains to be seen, however, for how long the meas-ures will be effective and when the next will follow, especially as the health insurance funds again show deficits, and also because of the weak development of insurance contribution revenues.
7.2.13 Portugal
In Portugal the Ministry of Health decides on the listing of pharmaceuticals eligible for reim-bursement (positive list) and on the reimbursement rates in consultation with the Medicines Agency. Criteria for the listing of pharmaceuticals are legally fixed via decrees. The criteria applied are therapeutic benefit, effectiveness of economic criteria, price comparisons and re-sults of pharma-economic studies, which pharmaceutical companies have to provide since 1999.
Reimbursement is divided into four categories: Category A comprises vital pharmaceuticals and pharmaceuticals for the chronically ill and do not require any co-payment. Category B contains important pharmaceuticals which are used for long, serious diseases, the co-payment amounting to 30 per cent. Category C comprises pharmaceuticals which are not re-garded as “priority” but which have a proven therapeutic benefit (e.g. vaccination, serum). For these pharmaceuticals co-payment amounts to 50 per cent. Category D, which was only introduced in September 2000, will be applied as an interim category for new pharmaceuti-cals with still uncertain therapeutic benefit. Co-payment is 80 per cent. In spring 2001, how-ever, no pharmaceutical product was listed in this category. Another new regulation since
Benchmarking
65
September 2000 is that for generics co-payment is 10 per cent less than for the correspond-ing brand.
Prices of prescription-only pharmaceuticals are fixed by the Ministry of Economic Affairs. The decision is based on the prices in the reference countries Spain, Italy and France. The ex-factory sales price must not be higher than the lowest price of an identical or similar pharma-ceutical with the equivalent active substance in the reference countries. Upon request, manu-facturers have to report prices or increases in prices of OTC products which are already on the market to the Ministry of Economic Affairs. The pricing mode for OTC products entering the market is not regulated.
Portugal is the EU country with the lowest per capita gross domestic product. Portugal has the lowest pharmaceutical expenditure per inhabitant after Ireland and Greece. Only a small part of this expenditure (approx. 43 per cent) is covered by the National Health Service. Co-payments for pharmaceuticals are considerable in Portugal. However, pharmaceutical con-sumption is rather high – similar to many southern countries.
Although public pharmaceutical expenditure has increased significantly in Portugal (many years with two-digit increase rates), only few cost-containment measures have been taken (e.g. prize freezes and increased co-payments). In recent years generics have been increas-ingly promoted, e.g. by demanding lower co-payments than for brands.
The government regards the dynamic development of public pharmaceutical expenditure at a two-digit rate as the major future problem, as the general economic upswing is also slowing.
7.2.14 Sweden
In Sweden the National Social Insurance Board decides on the inclusion of pharmaceuticals in the "Pharmaceuticals benefit system", i.e. the reimbursement scheme. Apart from thera-peutic criteria also the price of a pharmaceutical is a decisive factor for the eligibility for reim-bursement. In the year 1993 state pricing for pharmaceuticals was abolished. Since then the National Social Insurance Board has been responsible for fixing an “appropriate” wholesale price for reimbursable pharmaceuticals. These are mainly prescription-only products. Pricing criteria are, among others, prices of pharmaceuticals in other countries – especially in the country of origin – and the prices for similar products in Sweden. In practice, pricing takes place only after negotiations with the industry. Upon request of the Medicines Agency, phar-maceuticals, for which generics or parallel imports are on the market, can be priced within the reference price system.
At the beginning of 1998 major alterations to the system took place in Sweden. In the course of decentralisation the responsibility for pharmaceutical expenditure was shifted from the Na-tional Social Insurance Board to local authorities, the county councils. The county councils are allocated an annual budget by the central state, which has to be used for the health care of a region including pharmaceuticals. Because of the continued increase in pharmaceutical expenditure the allocated budget has sometimes been exceeded. Consequently, the county councils are demanding increased power of co-decision in price negotiations between the in-
Benchmarking
66
dustry and the National Social Insurance Board, as they have to bear the pharmaceutical ex-penditure.
Sweden ranks slightly above the EU-average per capita pharmaceutical expenditure; none-theless pharmaceutical consumption (both packages and prescriptions) is below the EU av-erage. Sweden stands out with a high increase in public pharmaceutical expenditure and high average expenditure per prescription. In the first half of the 90s the average rate of in-crease amounted to 12.5 per cent per year, as a consequence many cost-containment inter-ventions were made. These were primarily aimed at a reduction of the number of prescrip-tions. Consequently, co-payment has been raised five times, co-payment regulations have been changed several times and finally pharmaceuticals have been delisted. These meas-ures only succeeded in containing the massive increase in public expenditure slightly, whereas private expenditure – due to higher co-payments and more self-medication – con-tinued to rise. In the late 90s the pharmacy margins were also reduced and information cam-paigns for improved use of generics were started.
In October 2000 a report of a government commission containing proposals for alterations of the current reimbursement system was published. According to this report the now rather complicated reimbursement scheme is to be simplified in such way that patients will have to pay the full costs for pharmaceuticals up to a limit of € 204.31 per year. This change would mean that co-payments are to be increased considerably, a fact which has led to massive public criticism. According to further proposals of the government report the county councils would have to monitor the prescription patterns of physicians more closely and develop pharmaco-therapy guidelines. As a high percentage of pharmaceuticals is financed by public spending, the government wants to exercise more rigid control and limit the listing of phar-maceuticals in future. Among other measures, the establishment of an evaluation institute is planned which is to evaluate new therapies, pharmaceuticals and medical technologies.
7.2.15 Spain
The Ministry of Health decides on the listing of pharmaceuticals. The key criteria are the se-verity of the disease and the therapeutic benefit. In some cases the Ministry of Health de-mands pharma-economic studies from the companies. The patients generally have to pay a deductible of 40 per cent. For chronic and serious diseases a reduced co-payment rate of ten per cent is applied.
All reimbursable pharmaceuticals are subject to state pricing. An interministerial price com-mittee, which consists of representatives of the Ministry of Economic Affairs, Financial Af-fairs, the Industry and Health, is responsible for pricing. The price committee fixes the ex-factory sales price on the basis of production and development costs plus a profit margin.
In Spain the high public financing share of pharmaceutical expenditure and the high pharma-ceutical consumption (measured in packages and in prescriptions) stands out. Per capita pharmaceutical expenditure lies below the EU average, but has increased tremendously in
Benchmarking
67
recent years. Public pharmaceutical expenditure increased by two and a half times between 1990 and 1999.
Also, in Spain many cost-containment measures – above all on price level – have been taken since the mid 90s. As a result the financial burden of pharmaceutical expenditure has been shifted to the private households. Especially out-of-pocket spending for self-medication has increased drastically. But the numerous cost-containment measures have not succeeded in containing the increasing pharmaceutical expenditure. Thus, reforms continue. By the end of 2000 a reference price system and obligatory generic substitution in pharmacies were intro-duced. In mid 2001 the Ministry of Health presented a new cost-containment plan, which proposes an obligation for physicians to prescribe pharmaceuticals using their international non-proprietary name, the dispensing of the cheapest pharmaceutical available in pharma-cies, a reduction of the wholesale margin and annual refunds of the pharmaceutical industry.
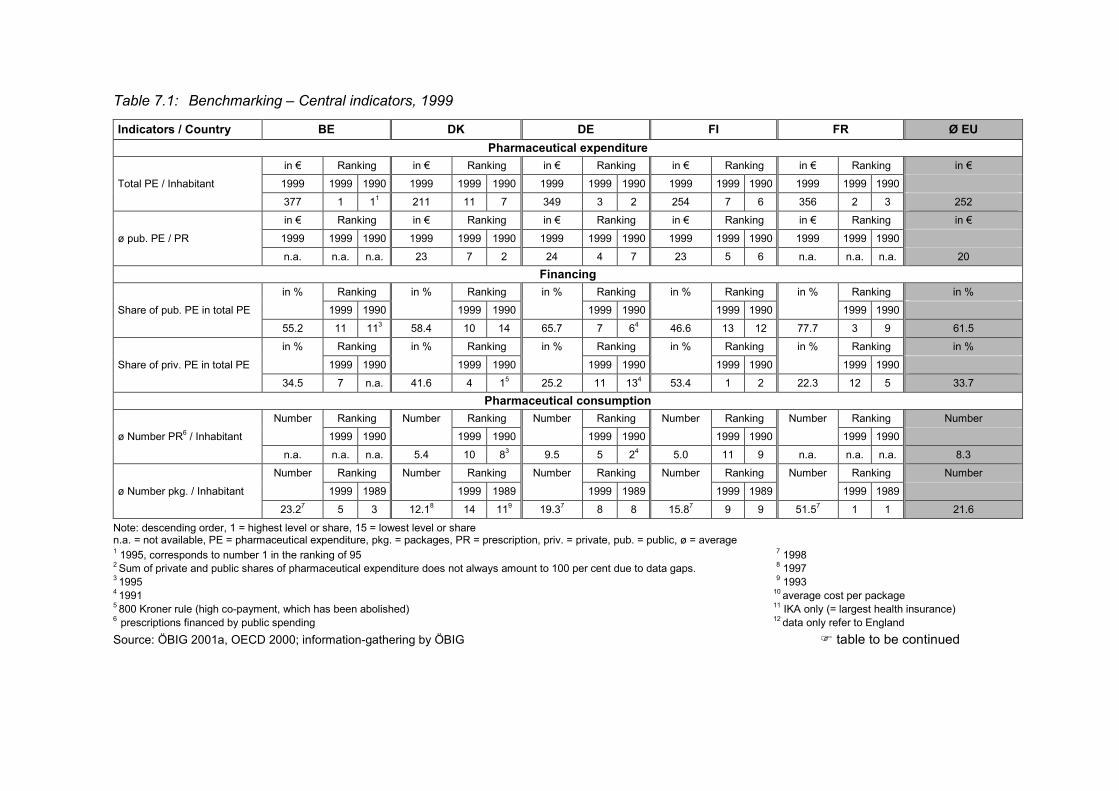
Table 7.1: Benchmarking – Central indicators, 1999
Indicators / Country BE DK DE FI FR Ø EU Pharmaceutical expenditure
in € Ranking in € Ranking in € Ranking in € Ranking in € Ranking in € Total PE / Inhabitant 1999 1999 1990 1999 1999 1990 1999 1999 1990 1999 1999 1990 1999 1999 1990 377 1 11 211 11 7 349 3 2 254 7 6 356 2 3 252 in € Ranking in € Ranking in € Ranking in € Ranking in € Ranking in €
ø pub. PE / PR 1999 1999 1990 1999 1999 1990 1999 1999 1990 1999 1999 1990 1999 1999 1990 n.a. n.a. n.a. 23 7 2 24 4 7 23 5 6 n.a. n.a. n.a. 20
Financing in % Ranking in % Ranking in % Ranking in % Ranking in % Ranking in % Share of pub. PE in total PE 1999 1990 1999 1990 1999 1990 1999 1990 1999 1990 55.2 11 113 58.4 10 14 65.7 7 64 46.6 13 12 77.7 3 9 61.5 in % Ranking in % Ranking in % Ranking in % Ranking in % Ranking in %
Share of priv. PE in total PE 1999 1990 1999 1990 1999 1990 1999 1990 1999 1990 34.5 7 n.a. 41.6 4 15 25.2 11 134 53.4 1 2 22.3 12 5 33.7
Pharmaceutical consumption Number Ranking Number Ranking Number Ranking Number Ranking Number Ranking Number ø Number PR6 / Inhabitant 1999 1990 1999 1990 1999 1990 1999 1990 1999 1990 n.a. n.a. n.a. 5.4 10 83 9.5 5 24 5.0 11 9 n.a. n.a. n.a. 8.3 Number Ranking Number Ranking Number Ranking Number Ranking Number Ranking Number
ø Number pkg. / Inhabitant 1999 1989 1999 1989 1999 1989 1999 1989 1999 1989 23.27 5 3 12.18 14 119 19.37 8 8 15.87 9 9 51.57 1 1 21.6
Note: descending order, 1 = highest level or share, 15 = lowest level or share n.a. = not available, PE = pharmaceutical expenditure, pkg. = packages, PR = prescription, priv. = private, pub. = public, ø = average 1 1995, corresponds to number 1 in the ranking of 95 7 1998 2 Sum of private and public shares of pharmaceutical expenditure does not always amount to 100 per cent due to data gaps. 8 1997 3 1995 9 1993 4 1991 10 average cost per package 5 800 Kroner rule (high co-payment, which has been abolished) 11 IKA only (= largest health insurance) 6 prescriptions financed by public spending 12 data only refer to England Source: ÖBIG 2001a, OECD 2000; information-gathering by ÖBIG � table to be continued
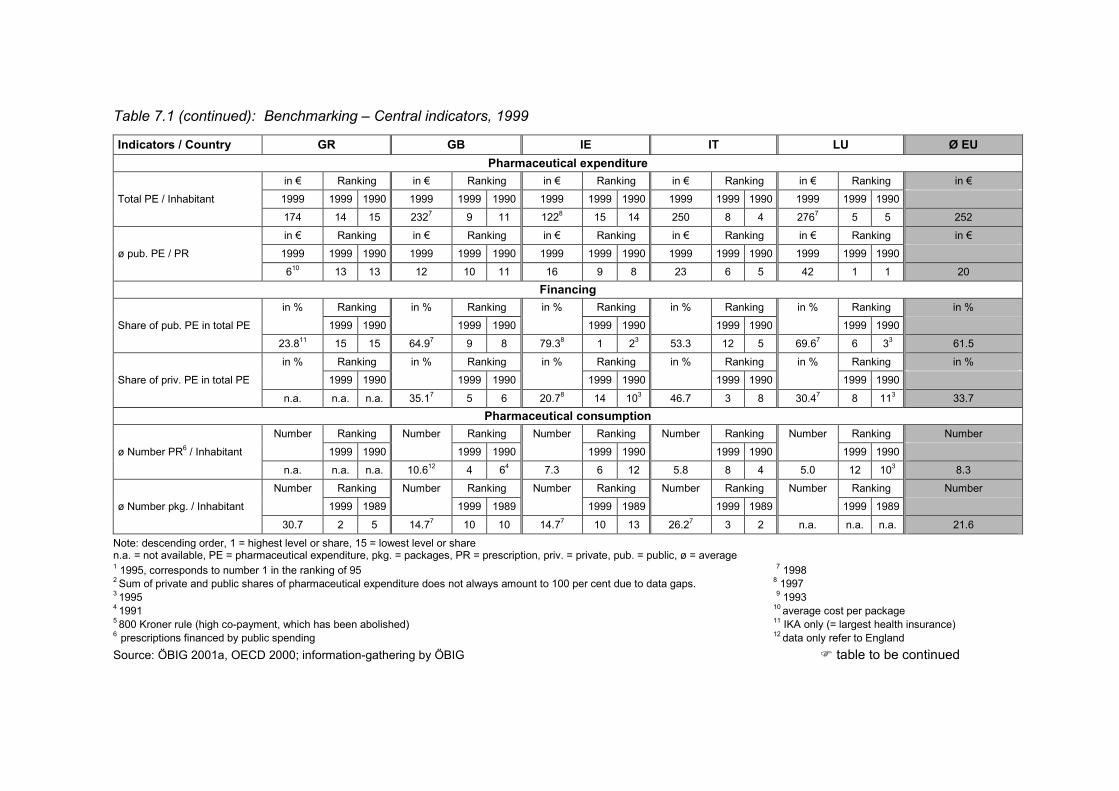
Table 7.1 (continued): Benchmarking – Central indicators, 1999
Indicators / Country GR GB IE IT LU Ø EU Pharmaceutical expenditure
in € Ranking in € Ranking in € Ranking in € Ranking in € Ranking in € Total PE / Inhabitant 1999 1999 1990 1999 1999 1990 1999 1999 1990 1999 1999 1990 1999 1999 1990 174 14 15 2327 9 11 1228 15 14 250 8 4 2767 5 5 252 in € Ranking in € Ranking in € Ranking in € Ranking in € Ranking in € ø pub. PE / PR 1999 1999 1990 1999 1999 1990 1999 1999 1990 1999 1999 1990 1999 1999 1990 610 13 13 12 10 11 16 9 8 23 6 5 42 1 1 20
Financing in % Ranking in % Ranking in % Ranking in % Ranking in % Ranking in % Share of pub. PE in total PE 1999 1990 1999 1990 1999 1990 1999 1990 1999 1990 23.811 15 15 64.97 9 8 79.38 1 23 53.3 12 5 69.67 6 33 61.5 in % Ranking in % Ranking in % Ranking in % Ranking in % Ranking in % Share of priv. PE in total PE 1999 1990 1999 1990 1999 1990 1999 1990 1999 1990
n.a. n.a. n.a. 35.17 5 6 20.78 14 103 46.7 3 8 30.47 8 113 33.7 Pharmaceutical consumption
Number Ranking Number Ranking Number Ranking Number Ranking Number Ranking Number ø Number PR6 / Inhabitant 1999 1990 1999 1990 1999 1990 1999 1990 1999 1990 n.a. n.a. n.a. 10.612 4 64 7.3 6 12 5.8 8 4 5.0 12 103 8.3 Number Ranking Number Ranking Number Ranking Number Ranking Number Ranking Number ø Number pkg. / Inhabitant 1999 1989 1999 1989 1999 1989 1999 1989 1999 1989
30.7 2 5 14.77 10 10 14.77 10 13 26.27 3 2 n.a. n.a. n.a. 21.6
Note: descending order, 1 = highest level or share, 15 = lowest level or share n.a. = not available, PE = pharmaceutical expenditure, pkg. = packages, PR = prescription, priv. = private, pub. = public, ø = average 1 1995, corresponds to number 1 in the ranking of 95 7 1998 2 Sum of private and public shares of pharmaceutical expenditure does not always amount to 100 per cent due to data gaps. 8 1997 3 1995 9 1993 4 1991 10 average cost per package 5 800 Kroner rule (high co-payment, which has been abolished) 11 IKA only (= largest health insurance) 6 prescriptions financed by public spending 12 data only refer to England Source: ÖBIG 2001a, OECD 2000; information-gathering by ÖBIG � table to be continued
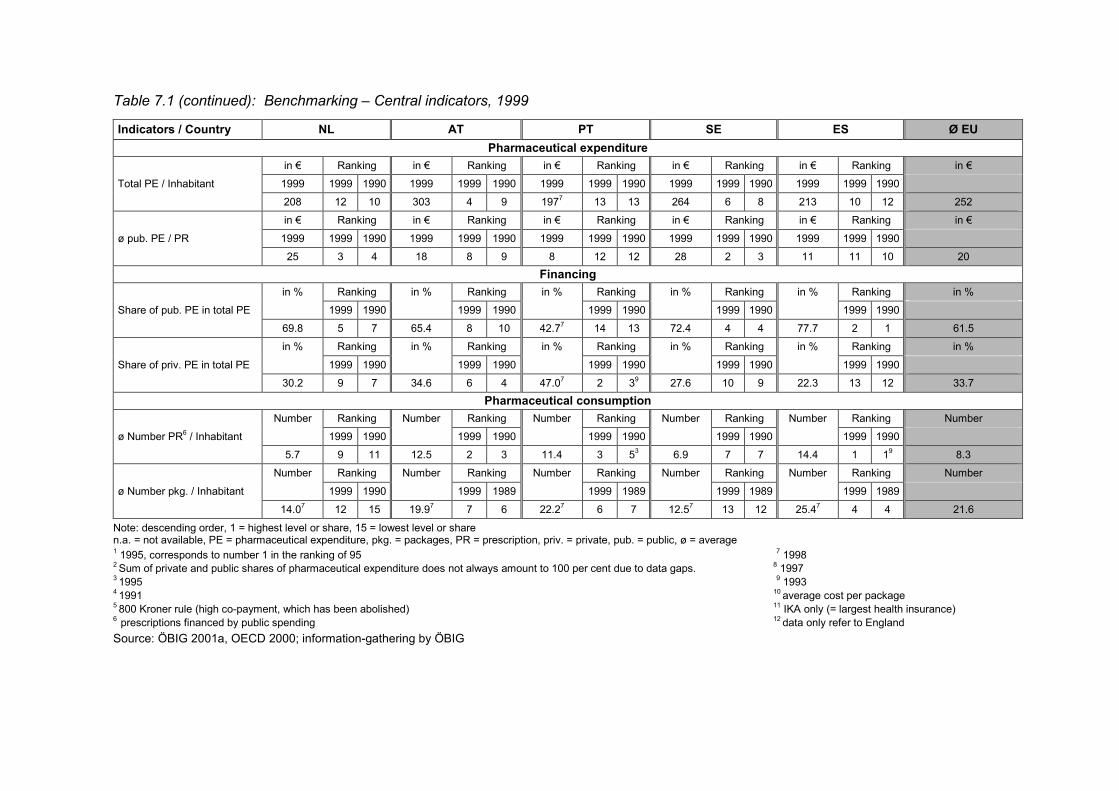
Table 7.1 (continued): Benchmarking – Central indicators, 1999
Indicators / Country NL AT PT SE ES Ø EU Pharmaceutical expenditure
in € Ranking in € Ranking in € Ranking in € Ranking in € Ranking in € Total PE / Inhabitant 1999 1999 1990 1999 1999 1990 1999 1999 1990 1999 1999 1990 1999 1999 1990 208 12 10 303 4 9 1977 13 13 264 6 8 213 10 12 252 in € Ranking in € Ranking in € Ranking in € Ranking in € Ranking in €
ø pub. PE / PR 1999 1999 1990 1999 1999 1990 1999 1999 1990 1999 1999 1990 1999 1999 1990 25 3 4 18 8 9 8 12 12 28 2 3 11 11 10 20
Financing in % Ranking in % Ranking in % Ranking in % Ranking in % Ranking in % Share of pub. PE in total PE 1999 1990 1999 1990 1999 1990 1999 1990 1999 1990 69.8 5 7 65.4 8 10 42.77 14 13 72.4 4 4 77.7 2 1 61.5 in % Ranking in % Ranking in % Ranking in % Ranking in % Ranking in %
Share of priv. PE in total PE 1999 1990 1999 1990 1999 1990 1999 1990 1999 1990 30.2 9 7 34.6 6 4 47.07 2 39 27.6 10 9 22.3 13 12 33.7
Pharmaceutical consumption Number Ranking Number Ranking Number Ranking Number Ranking Number Ranking Number ø Number PR6 / Inhabitant 1999 1990 1999 1990 1999 1990 1999 1990 1999 1990 5.7 9 11 12.5 2 3 11.4 3 53 6.9 7 7 14.4 1 19 8.3 Number Ranking Number Ranking Number Ranking Number Ranking Number Ranking Number
ø Number pkg. / Inhabitant 1999 1990 1999 1989 1999 1989 1999 1989 1999 1989 14.07 12 15 19.97 7 6 22.27 6 7 12.57 13 12 25.47 4 4 21.6
Note: descending order, 1 = highest level or share, 15 = lowest level or share n.a. = not available, PE = pharmaceutical expenditure, pkg. = packages, PR = prescription, priv. = private, pub. = public, ø = average 1 1995, corresponds to number 1 in the ranking of 95 7 1998 2 Sum of private and public shares of pharmaceutical expenditure does not always amount to 100 per cent due to data gaps. 8 1997 3 1995 9 1993 4 1991 10 average cost per package 5 800 Kroner rule (high co-payment, which has been abolished) 11 IKA only (= largest health insurance) 6 prescriptions financed by public spending 12 data only refer to England Source: ÖBIG 2001a, OECD 2000; information-gathering by ÖBIG
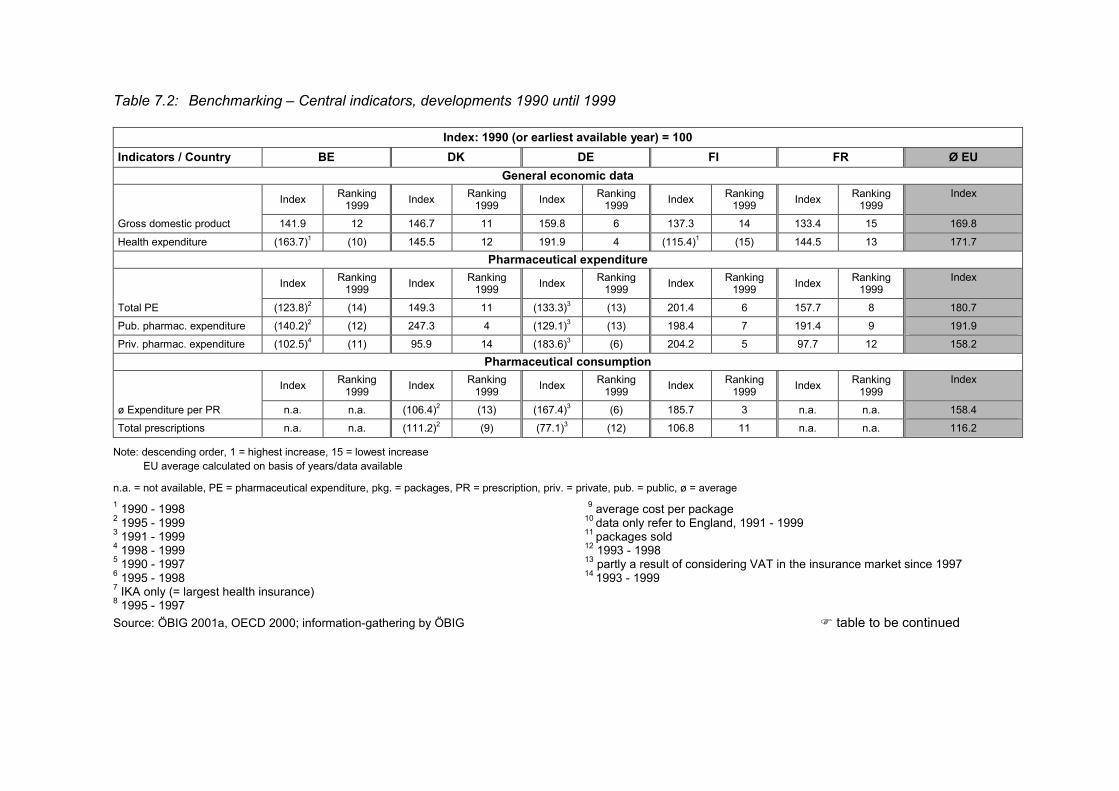
Table 7.2: Benchmarking – Central indicators, developments 1990 until 1999
Index: 1990 (or earliest available year) = 100 Indicators / Country BE DK DE FI FR Ø EU
General economic data Index Ranking
1999 Index Ranking 1999 Index Ranking
1999 Index Ranking 1999 Index Ranking
1999 Index
Gross domestic product 141.9 12 146.7 11 159.8 6 137.3 14 133.4 15 169.8
Health expenditure (163.7)1 (10) 145.5 12 191.9 4 (115.4)1 (15) 144.5 13 171.7 Pharmaceutical expenditure
Index Ranking 1999 Index Ranking
1999 Index Ranking 1999 Index Ranking
1999 Index Ranking 1999
Index
Total PE (123.8)2 (14) 149.3 11 (133.3)3 (13) 201.4 6 157.7 8 180.7 Pub. pharmac. expenditure (140.2)2 (12) 247.3 4 (129.1)3 (13) 198.4 7 191.4 9 191.9 Priv. pharmac. expenditure (102.5)4 (11) 95.9 14 (183.6)3 (6) 204.2 5 97.7 12 158.2
Pharmaceutical consumption Index Ranking
1999 Index Ranking 1999 Index Ranking
1999 Index Ranking 1999 Index Ranking
1999 Index
ø Expenditure per PR n.a. n.a. (106.4)2 (13) (167.4)3 (6) 185.7 3 n.a. n.a. 158.4 Total prescriptions n.a. n.a. (111.2)2 (9) (77.1)3 (12) 106.8 11 n.a. n.a. 116.2
Note: descending order, 1 = highest increase, 15 = lowest increase EU average calculated on basis of years/data available
n.a. = not available, PE = pharmaceutical expenditure, pkg. = packages, PR = prescription, priv. = private, pub. = public, ø = average 1 1990 - 1998 9 average cost per package 2 1995 - 1999 10 data only refer to England, 1991 - 1999 3 1991 - 1999 11 packages sold 4 1998 - 1999 12 1993 - 1998 5 1990 - 1997 13 partly a result of considering VAT in the insurance market since 1997 6 1995 - 1998 14 1993 - 1999 7 IKA only (= largest health insurance) 8 1995 - 1997 Source: ÖBIG 2001a, OECD 2000; information-gathering by ÖBIG � table to be continued

Table 7.2 (continued): Benchmarking – Central indicators, developments from 1990 until 1999
Index: 1990 (or earliest available year) = 100 Indicators / Country GR GB IE IT LU Ø EU
General economic data Index Ranking
1999 Index Ranking 1999 Index Ranking
1999 Index Ranking 1999 Index Ranking
1999 Index
Gross domestic product 290.0 1 158.6 8 239.3 2 159.2 7 205.1 4 169.8
Health expenditure (296.1)1 (1) 186.2 5 208.4 3 165.0 9 (173.0)1 (7) 171.7 Pharmaceutical expenditure
Index Ranking 1999 Index Ranking
1999 Index Ranking 1999 Index Ranking
1999 Index Ranking 1999
Index
Total PE 412.0 1 (205.0)1 (5) (155.6)5 (9) 146.4 12 (117.2)6 (15) 180.7 Pub. pharmac. expenditure (332.3)7 (1) 225.0 6 (162.6)2 (11) 113.7 15 (124.7)2 (14) 191.9 Priv. pharmac. expenditure n.a. n.a. (215.1)1 (4) (96.5)8 (13) 218.0 3 (124.0)6 (10) 158.2
Pharmaceutical consumption Index Ranking
1999 Index Ranking 1999 Index Ranking
1999 Index Ranking 1999 Index Ranking
1999 Index
ø Expenditure per PR (275.9)9 (1) (160.1)10 (7) (126.8)2 (10) 183.4 4 (115.4)2 (12) 158.4 Total prescriptions (149.4)11 (2) (130.3)10 (5) 186.8 1 62.0 13 (108.0)2 (10) 116.2
Note: descending order, 1 = highest increase, 15 = lowest increase EU average calculated on basis of years/data available
n.a. = not available, PE = pharmaceutical expenditure, pkg. = packages, PR = prescription, priv. = private, pub. = public, ø = average 1 1990 - 1998 9 average cost per package 2 1995 - 1999 10 data only refer to England, 1991 - 1999 3 1991 - 1999 11 packages sold 4 1998 - 1999 12 1993 - 1998 5 1990 - 1997 13 partly a result of considering VAT in the insurance market since 1997 6 1995 - 1998 14 1993 - 1999 7 IKA only (= largest health insurance) 8 1995 - 1997
Source: ÖBIG 2001a, OECD 2000; information-gathering by ÖBIG
� table to be continued
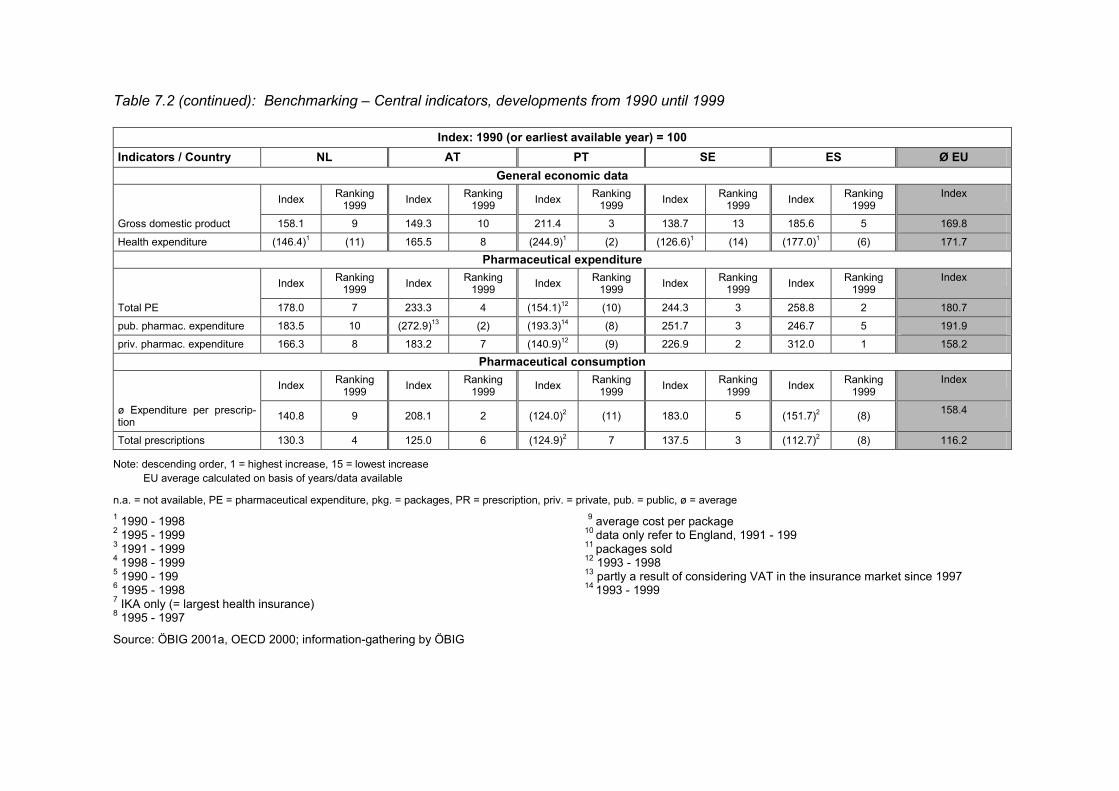
Table 7.2 (continued): Benchmarking – Central indicators, developments from 1990 until 1999
Index: 1990 (or earliest available year) = 100 Indicators / Country NL AT PT SE ES Ø EU
General economic data Index Ranking
1999 Index Ranking 1999 Index Ranking
1999 Index Ranking 1999 Index Ranking
1999 Index
Gross domestic product 158.1 9 149.3 10 211.4 3 138.7 13 185.6 5 169.8
Health expenditure (146.4)1 (11) 165.5 8 (244.9)1 (2) (126.6)1 (14) (177.0)1 (6) 171.7 Pharmaceutical expenditure
Index Ranking 1999 Index Ranking
1999 Index Ranking 1999 Index Ranking
1999 Index Ranking 1999
Index
Total PE 178.0 7 233.3 4 (154.1)12 (10) 244.3 3 258.8 2 180.7 pub. pharmac. expenditure 183.5 10 (272.9)13 (2) (193.3)14 (8) 251.7 3 246.7 5 191.9 priv. pharmac. expenditure 166.3 8 183.2 7 (140.9)12 (9) 226.9 2 312.0 1 158.2
Pharmaceutical consumption Index Ranking
1999 Index Ranking 1999 Index Ranking
1999 Index Ranking 1999 Index Ranking
1999 Index
ø Expenditure per prescrip-tion 140.8 9 208.1 2 (124.0)2 (11) 183.0 5 (151.7)2 (8) 158.4
Total prescriptions 130.3 4 125.0 6 (124.9)2 7 137.5 3 (112.7)2 (8) 116.2
Note: descending order, 1 = highest increase, 15 = lowest increase EU average calculated on basis of years/data available
n.a. = not available, PE = pharmaceutical expenditure, pkg. = packages, PR = prescription, priv. = private, pub. = public, ø = average 1 1990 - 1998 9 average cost per package 2 1995 - 1999 10 data only refer to England, 1991 - 199 3 1991 - 1999 11 packages sold 4 1998 - 1999 12 1993 - 1998 5 1990 - 199 13 partly a result of considering VAT in the insurance market since 1997 6 1995 - 1998 14 1993 - 1999 7 IKA only (= largest health insurance) 8 1995 - 1997
Source: ÖBIG 2001a, OECD 2000; information-gathering by ÖBIG
Conclusion
75
8 Conclusion
The most important findings of this study on the pharmaceutical systems within the EU and on the cost-containment strategies including their impacts can be summarised as follows:
Pharmaceutical markets are subject to a multitude of regulations both at the Community and at the national level. In order to safeguard the principle of the free single market, the Euro-pean Union has meanwhile gained great influence on the registration of pharmaceuticals. The relevant regulations have been implemented in all countries and harmonisation within the European Union has been achieved.
Basically, the individual EU countries are responsible for pricing and reimbursement of pharmaceuticals. Therefore, the Member States have very different regulations in this area, some of which are very complex. In recent years, however, a growing influence of the Euro-pean Union on this sector could be observed. For instance, the individual countries have to prove that reimbursement decisions are based on transparent criteria and that there is no discrimination or preferred treatment, for example, of the national pharmaceutical industry.
Member States are strongly interested in controlling public pharmaceutical expenditure. Thus, in most Member States manufacturer prices as well as wholesale and pharmacy mar-gins are regulated for reimbursable pharmaceuticals only.
In almost all EU Member States, the increase in pharmaceutical expenditure was significantly higher than the increase in the gross domestic product and in health expenditure. As a con-sequence, all EU Member States, except Luxembourg, have taken a multitude of cost-containment measures. However, the scope, intensity and control measures used varied as the problems and “control strategies” were country-specific.
The following conclusions can be drawn with regard to the cost-containing measures and their impacts:
� Except for Luxembourg, all EU countries intervened more or less strongly in order to con-trol of pharmaceutical expenditure.
� The cost-containment measures focused on publicly funded pharmaceuticals. The meas-ures became urgent whenever the general economic situation had deteriorated and/or the health care funds had run into a deficit.
� Less containing measures were taken by countries with a low level of per capita health and pharmaceutical expenditure and a need for investment in pharmaceutical care.
� The countries which intervened most frequently were Belgium, Germany, Spain and Italy, Denmark and the Netherlands. The measures actually had an impact. It could be ob-served that those countries which intervened at the price level and at the volume level at the same time, were “more successful”.
Conclusion
76
� The success of the cost-containment measures was, however, mostly to the detriment of the patients, who have to make increased co-payments and/or have to pay for an in-creasing number of pharmaceuticals out of their own pockets (expansion of self-medication).
� Compared to public pharmaceutical expenditure the number of pharmaceuticals pre-scribed fell or rose less (cf. Figure 8.1). This is especially true for Germany and Italy, where massive savings have been made.
� In most countries, the increase in average public expenditure per prescription was con-siderably higher than the increase in the number of prescriptions. This is an indication that more new and expensive pharmaceuticals are entering the market. Many countries try to react with counter-strategies as the price-containing effect of less expensive phar-maceuticals such as generics obviously does not suffice to compensate for the price in-crease of the new pharmaceuticals.
� Some countries (Great Britain, the Netherlands) have already reacted to the increasing number of new, expensive pharmaceuticals on the market by evaluating the therapeutic-economic benefit of such pharmaceuticals.
� Another trend is to improve the prescription habits of physicians by continuous reviewing and enhancing prescription patterns which also contributes to cost-containment.
Again, the conclusions regarding control strategies as expressed in the ÖBIG-study “Phar-maceuticals. Market Control in nine European Countries” (ÖBIG 1998a) have been con-firmed in this study. A “pendulum effect” typical of many fields of policy could be observed. Discontentment with the original situation leads to a number of fundamental changes causing the pendulum to swing in the desired direction. If deficiencies or problems occur or the gov-ernment changes, the pendulum begins to move back towards the initial situation. Some more liberal countries had moved back to state interventions (e.g. Denmark, Great Britain, the Netherlands). Other countries, which had used rigid state control attempted to attain their goals by means of market instruments (e.g. Spain and Italy with the introduction of reference price systems). The Scandinavian countries and the Netherlands, known as pioneers in many fields, have combined both strategies lately. All in all, many countries – due to budget-ary restrictions – give the impression of a certain insecurity and helplessness when it comes to controlling the pharmaceutical systems.
Furthermore, the assessment of the short-term impact of measures made in the above-cited ÖBIG-study (ÖBIG 1998a) was confirmed: There are loopholes in every control approach. Therefore, its effect is limited in time, i.e. until the market participants have adjusted to the new situation and have learned to take advantage of the loopholes. No system for cost-containment in the health care sector will be effective in the long run, but all systems are permanently subject to change.
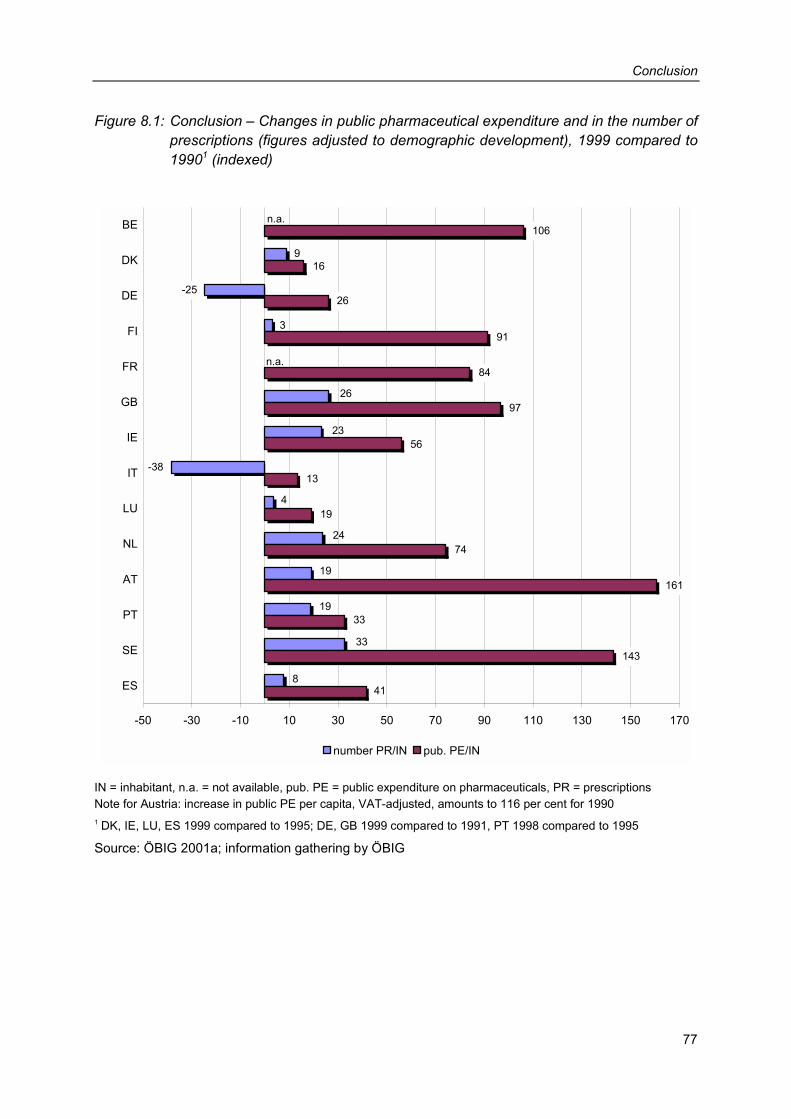
Conclusion
77
Figure 8.1: Conclusion – Changes in public pharmaceutical expenditure and in the number of prescriptions (figures adjusted to demographic development), 1999 compared to 19901 (indexed)
-38
8
33
19
19
24
4
23
26
3
-25
9
n.a.
n.a.
41
143
33
161
74
19
56
13
97
84
91
26
16
106
-50 -30 -10 10 30 50 70 90 110 130 150 170
BE
DK
DE
FI
FR
GB
IE
IT
LU
NL
AT
PT
SE
ES
number PR/IN pub. PE/IN
IN = inhabitant, n.a. = not available, pub. PE = public expenditure on pharmaceuticals, PR = prescriptions Note for Austria: increase in public PE per capita, VAT-adjusted, amounts to 116 per cent for 1990 1 DK, IE, LU, ES 1999 compared to 1995; DE, GB 1999 compared to 1991, PT 1998 compared to 1995
Source: ÖBIG 2001a; information gathering by ÖBIG

79
Bibliography
AESGP 1997 Economic and Legal Framework for Non-Prescription Medicines in Europe. Brussels
AESGP 1999 Economic and Legal Framework for Non-Prescription Medicines in Europe. Brussels
AESGP 2000 Economic and Legal Framework for Non-Prescription Medicines in Europe. Brussels
Arzneimittel Zeitung 1996 Europäische Gesundheitssysteme und Pharmamärkte. Ärzte Zeitung Verlagsgesellschaft, Neu-Isenburg
Arzneimittel Zeitung 1998 Europäische Gesundheitssysteme und Pharmamärkte. Ärzte Zeitung Verlagsgesellschaft, Neu-Isenburg
BASYS 1995 Gesundheitssysteme im internationalen Vergleich. Laufende Berichterstattung zu ausländi-schen Gesundheitssystemen. Augsburg
BASYS 1999 Die deutschen Arzneimittelpreise im europäischen Vergleich. Gutachten für den Verband Forschender Arzneimittelhersteller und die Bundesvereinigung Deutscher Apothekerverbän-de. Augsburg
BASYS 2000 Die Regulierung von Arzneimittelmärkten im internationalen Vergleich. Auswirkungen von Positivlisten, Festbeträgen, Zuzahlungen und Arzneimittelbudgets. Augsburg
Bauer, E. 2001 Pharma-Länder-Dossiers: Die Arzneimittelversorgung in Europa. Eschborn 2001
BfAI (publ.) 1999 Europäische Union. Arzneimittel. Köln
BMG 2000 Statistisches Taschenbuch Gesundheit 2000. Bonn
BMG 2001 Qualität zu vernünftigen Preisen. Press release no. 107 of 19 October 2001. cit. in online: www.bmgesundheit.de/presse/2001/2001/107.htm
80
CENSIS 1997 Farmaco e distribuzione. Un’indagine sulla farmacia in Italia e in Europa. Franco Angeli, Mi-lano
Datamonitor 1998 The role of pharmaco-economics in pricing and reimbursement. O.O
EFPIA 2000 The Pharmaceutical Industry in Figures. 2000 Edition. Brussels
Europäische Kommission 2001a Revision der Pharmazeutischen Gesetzgebung. Diskussionsdokument / Review of Pharma-ceutical Legislation. Discussion Document. Brüssel / Brussels
Europäische Kommission 2001b Reform der EU-Rechtsvorschriften für Arzneimittel / Reform of EU-Pharmaceutical Legislati-on. cit. in online: http://pharmacos.eudra.org of 9 August 2001
European Observatory on Health Care Systems 1996a Health Care Systems in Transition (preliminary version). Sweden. Copenhagen
European Observatory on Health Care Systems 1996b Health Care Systems in Transition. Greece. Copenhagen
European Observatory on Health Care Systems 1996c Health Care Systems in Transition. Finland. Copenhagen
European Observatory on Health Care Systems 1999a Health Care Systems in Transition. Luxembourg. Copenhagen
European Observatory on Health Care Systems 1999b Health Care Systems in Transition. Portugal. Copenhagen
European Observatory on Health Care Systems 2000a Health Care Systems in Transition. Belgium. Copenhagen
European Observatory on Health Care Systems 2000b Health Care Systems in Transition. Spain. Draft, Copenhagen
European Observatory on Health Care Systems 2000c Health Care Systems in Transition. The Netherlands. Draft, Copenhagen
European Observatory on Health Care Systems 2000d Health Care Systems in Transition. United Kingdom. Copenhagen
Ewers, H. J.; Wein, T. 1989 Gründe und Richtlinien für eine Deregulierungspolitik. Diskussionspapier 139 der Wirt-schaftswissenschaftlichen Dokumentation der Technischen Universität Berlin
81
IWI 2000 Die Entwicklung des Arzneimittelsektors am Apothekenmarkt Österreichs im internationalen Vergleich 1989 – 1998. Wien
Kemenade van, Y. W. 1997 Health care in Europe 1997. The finance and reimbursement systems of 18 European coun-tries. Zoetermeer
LIF 2000 Fakta 2000. Läkemedelsmarknaden och hälso- och sjukvården. Stockholm
Macarthur, D. 1997 Pharmaceutical Distribution in Europe. 1997 Edition. London
ÖÄK 1999 Vergleich: Gesundheitssysteme in der EU. cit. in online: www.aek.or.at/text.html?systeme.html of 23 November 1999
ÖBIG 1993 Arzneimittelpreise im internationalen Vergleich / An International Comparison of Pharmaceu-tical Prices. Wien / Vienna
ÖBIG 1998a Arzneimittel. Steuerung der Märkte in neun europäischen Ländern / Pharmaceuticals. Market Control in Nine European Countries. Wien / Vienna
ÖBIG 1998b Arzneimittel. Vertrieb in Europa. Wien
ÖBIG 2000a Öffentliche Apotheken in Europa. Performance - Benchmarking (not published). Wien
ÖBIG 2000b Generika. Wien
ÖBIG 2000c E-Pharma. Arzneimittelvertrieb im Internet. Wien
ÖBIG 2001a Arzneimittelausgaben. Strategien zur Kostendämpfung in der Europäischen Union. Wien
ÖBIG 2001b Qualität der ärztlichen Versorgung in Österreich. Wien
OECD 2000 Health Database 2000. Paris
82
Office of National Statistics England 2000 Latest figures. cit. in online: www.statistics.gov.uk/press_release/default.asp
Rosian, I.; Vogler, S.; Habl, C. 2000 Frankreich, Großbritannien, Italien. In: Klauber, J.; Schröder, H.; Selke, G.W. (publ.): Innova-tion im Arzneimittelmarkt. Springer, Berlin et al.
Scheil-Adlung, X. 1998 Marktorientierte Kostenkontrolle in Gesundheitssystemen: Wirkungen von Verhaltens-anreizen in ausgewählten OECD-Ländern. In: Soziale Sicherheit 3/98
Schöffski, O. 1995 Die Regulierung des deutschen Apothekenwesens. Eine ökonomische Analyse. Gesund-heitsökonomische Beiträge, vol. 21, Baden-Baden
Weizsäcker, C. C. 1982 Staatliche Regulierung - positive und normative Theorie. In: Schweizerische Zeitschrift für Volkswirtschaft und Statistik 118, No. 3, p. 324-343
Wieninger, P. 1998 Honorierungssysteme ambulanter ärztlicher Leistungen. In: Soziale Sicherheit 3/98
Zorgnota 2001 Ministerie voor Volksgezondheit, Welzijn en Sport: Zorgnota 2001 (Care memorandum). cit. in online: www.minvws.nl/zoek/zoek_index.htm of 19 September 2000

ANNEX
List of available publications
An up-dated list of publications can also be found at our homepage http://www.oebig.at Information on ÖBIG Jahresbericht 2000 / Annual report 2000 (in German) 90 p., fig., spiral binding ÖBIG, Vienna 2001, available free of charge at ÖBIG OLD-AGE AND LONG-TERM CARE
Wie behindertengerecht sind Österreichs Kul-tureinrichtungen? / How barrier-free are Aus-tria’s cultural institutions? (in German) 304 p., numerous tab., charts, plans, colour photographs, spiral binding ÖBIG and Institut für soziales Design, Vienna 1993, ATS 440.-- / € 31.98
IGSS - Integrierte Gesundheits- und Sozial-sprengel/Handbuch / Integrated health care and social services districts/Handbook (in German) 308 p., 41 fig., samples and work sheets, spiral binding ÖBIG, Vienna 1993, ATS 175.--/ € 12.72
Approaches to co-operation and co-ordination between medical and social services in five European countries (Germany, the Netherlands, Austria, Sweden, Czech Re-public):
New Forms of Health and Social Care - Five Na-tional Reports (in English) 100 p., 3 tab., 11 fig., spiral binding ÖBIG, Vienna 1994, ATS 255.-- / € 18.53
Kultur ohne Barrieren - Hinweise für Kulturver-anstalter / Culture without barriers – Guidelines for cultural event managers (in German) 87 p., numerous fig., list of addresses, literature and acts prepared by ÖBIG and Institut für soziales Design, pub-lished by the Federal Ministry of Science, Research and Cultural Affairs, Vienna 1995, available free of charge at ÖBIG
Pflegevorsorge in der Steiermark / Nursing pro-vision in Styria (in German) Teil A: Seniorenbereich/Kurzfassung / Part A: Senior Citizens/Abridged Version 51 p., numerous tab., fig. and maps, spiral binding ÖBIG, Vienna 1996, ATS 145.-- / € 10.45
Teil B: Behindertenbereich/Kurzfassung / Part B: Di-sabled Citizens/Abridged Version 87 p., numerous tab., fig. and maps, spiral binding ÖBIG, Vienna 1996, ATS 180.-- / € 13.08
Teil A: Seniorenbereich/Langfassung / Part A: Senior Citizens/Long Version 573 p., comprehensive annex, numerous tab., fig. and maps, spiral binding ÖBIG, Vienna 1996, ATS 595.-- / € 43.24
Teil B: Behindertenbereich/Langfassung / Part B: Di-sabled Citizens/Long Version
287 p., annex, numerous tab., fig. and maps, spiral bind-ing ÖBIG, Vienna 1996, ATS 350.-- / € 25.44 /
Partnerschaften zur Förderung des sozialen Zu-sammenhalts - Länderbericht Österreich / Part-nerships for the support of social co-operation – country report Austria (in German) 127 p., tab. and fig. prepared by ÖBIG, publ. by the Federal Ministry of La-bour, Health and Social Affairs, series “Soziales Europa“ no. 7, Vienna 1997, available free of charge at the Fed-eral Ministry of Social Security and Generations
Report to the Austrian Chapter of the Club of Rome: Alte Menschen in Österreich. Lebensverhältnis-se, Probleme, Zukunftsperspektiven / The elder-ly in Austria. Their life situation, problems, fu-ture perspectives (in German) 65 p., numerous tab. and charts, spiral binding ÖBIG, Vienna 1998, available free of charge at ÖBIG
Dienste und Einrichtungen für pflegebedürftige Menschen in Österreich. Übersicht über die Be-darfs- und Entwicklungspläne der Länder / Ser-vices and institutions for people in need of nur-sing care. Overview of the demand and devel-opment plans of the Provinces (in German) 171 p., numerous tab., fig. and maps prepared by ÖBIG, publ. by the Federal Ministry of La-bour, Health and Social Affairs, Vienna 1999, available free of charge at the Federal Ministry of Social Security and Generations: Tel. +43 1/71100-6140, e-mail: [email protected], Internet: www.bmsg.gv.at
Nutzung von Gesundheitsleistungen durch sozial schwächere Gruppen – Expertise / Accep-tance of health care services by socially disad-vantaged groups (in German) 47 p., tab.; prepared by ÖBIG, publ. by the Federal Minis-try f of Labour, Health and Social Affairs in the series “Originalarbeiten - Studien - Forschungsberichte“, no. 2/99, available free of charge at the Federal Ministry of Social Security and Generations: Tel. +43 1/71100-4370 Ms. Brigitte Haferl, e-mail: [email protected], In-ternet: www.bmsg.gv.at ILLEGAL DRUGS
REITOX Focal Point Österreich: Bericht zur Dro-gensituation 2001 / REITOX Focal Point Austria: Report on the drug situation in Austria 2001 VIII and 121 p., numerous tab., charts and maps, spiral binding ÖBIG, Vienna, October 2001, German and English ver-sion, available free of charge at ÖBIG Remaining copies of the reports on the drug situation 1996, 1997, 1998 (English only), 1999 and 2000 are also available free of charge at ÖBIG.
Current information on the topic “Illegal Drugs” in Europe and Austria (literature, abstracts, calendar of events, Internet-tips, etc.):
Zeitschrift DrugNet Austria (zweimonatlich) / Ma-gazine DrugNet Austria (bi-monthly) 20 p. per issue, available free of charge at ÖBIG
Europäische Woche der Suchtprävention 1998 - Aktivitäten und Erfahrungen in Österreich / Eu-ropean drug prevention week 1998 – Activities and experience in Austria (in German) VI and 66 p., annex, spiral binding ÖBIG, Vienna 1999, available free of charge at ÖBIG HEALTH CARE OCCUOPATIONS & CURRICULUM DEVELOPMENT
Amtsarzt – Tätigkeitsbereich und Ausbildung / National Health Service physician – Work and training (in German) 239 p., numerous tab. and fig., spiral binding ÖBIG, Vienna 1991, ATS 150.-- / € 10.90
Arbeitssituation ambulante Pflege- und Sozialdienste Wiens / Job situation in the field of nursing and social services (in German) 196 p., Annex questionnaire, tab., spiral binding ÖBIG, Vienna 1997, ATS 250.-- / € 18.17
Schulungsmodelle für Typ-2 Diabetes / Type 2 diabetes instruction programmes (in German) 60 p., tab., annex, spiral binding ÖBIG, Vienna 1999, ATS 150.-- / € 10.90
Curriculum Kinderkrankenpflege und Säug-lingspflege / Curriculum paediatrics and infant care (in German) 3 volumes, total of 800 p., spiral binding ÖBIG, Vienna 1991, ATS 350.-- / € 25.44
Curriculum Pflegehelfer und Ergänzungs- curricula / Curriculum assistant nurses and additional curricula (in German) 278 p. ÖBIG, Vienna 1991, ATS 105.-- / € 7.63
Curriculum Heimhelferinnen und Heimhelfer / Curriculum home care aides (in German) 113 p., spiral binding ÖBIG, Vienna 1993, ATS 175.-- / € 12.72
Curriculum Hebammen / Curriculum for mid-wives’ training (in German) 468 p., spiral binding ÖBIG, Vienna 1996, ATS 290.-- / € 21.08
Newsletter Curriculum (in German) publ. by Facultas Universitätsverlag in co-operation with ÖBIG, quaterly, annual subscription ATS 100.-- / € 7.27, at Facultas Universitätsverlag
Offenes Curriculum Allgemeine Gesundheits- und Krankenpflege - Zwischenbericht (Projekt-phase II) / Open curriculum general health care services – interim report (project phase II) (in German) approx. 180 p., tab., fig., stitched ÖBIG, Vienna 1999, available free of charge at ÖBIG
Offenes Curriculum Allgemeine Gesundheits- und Krankenpflege - Zwischenbericht (Projekt-phase III) / Open curriculum general health care services – interim report (project phase III) (in German) approx. 200 p., tab., fig., stitched ÖBIG, Vienna, July 2000, available free of charge at ÖBIG
HEALTH ECONOMICS
Arzneimittelpreise im internationalen Vergleich / International comparison of pharmaceutical prices (in German and English) 134 p., 32 tab., 22 fig. ÖBIG, Vienna 1993, ATS 280.-- / € 20.35
Arzneimittel. Steuerung der Märkte in neun europäischen Ländern / Pharmaceuticals Market Control in Nine European Countries (in German and English) 280 p., 84 tab., 40 fig., spiral binding ÖBIG, Vienna 1998, ATS 490.-- / € 35.61
Arzneimittel. Vertrieb in Europa / Pharmaceuti-cals. Distribution in Europe (in German) 400 p., 76 tab., 31 fig., spiral binding ÖBIG, Vienna 1998, ATS 650.-- / € 47.24
Biotechnologie - Pharmazeutische Industrie und Forschung in Österreich / Biotechnology – Pharmaceutical Industry and Research in Austria (in German) 154 p., annex, numerous tab. and fig., spiral binding ÖBIG, Vienna 1998, ATS 390.-- / € 28.34
Gesundheitssysteme in Mittel- und Osteuropa / Health Care Systems in Central and Eastern Europe (in German) 220 p., numerous tab. and fig., spiral binding ÖBIG, Vienna 1999, ATS 480.-- / € 34.88
Health Care Systems in Central and Eastern Europe (in English) Booklet - 30 pages, 20 tables, 4 figures ÖBIG, Vienna 1999, ATS 65.-- / € 4.72 Double pack: Report (in German) and Booklet (in Eng-lish): ATS 520.-- / € 37.79
Generika / Generics (in German) XII and 103 p., numerous tab. and fig., spiral binding ÖBIG, Vienna, July 2000, ATS 550.-- / € 39.97
E-Pharma. Arzneimittelvertrieb im Internet / E-Pharma. Distribution of Pharmaceuticals over the Internet (in German) XIII and 111 p., annex, numerous tab. and fig., spiral binding ÖBIG, Vienna, August 2000, ATS 690.-- / € 50.14
Apothekenleistungen im europäischen Vergleich – Kurzzusammenfassung / Performance of Pharmacies: A European Comparison (in Ger-man) 9 p., spiral binding ÖBIG, Vienna, August 2000, ATS 70.-- / € 5.07
Medikamente aus dem Internet / Pharmaceuti-cals off the Internet (in German) Booklet 16 p., ÖBIG, Vienna 2001, available free of charge at ÖBIG
Präventionsausgaben / Prevention expenditure (in German) 44 p., tab. and fig. prepared by ÖBIG, publ. by the Federal Ministry of Social Security and Generations, Vienna 2001, available free of charge at the Federal Ministry / Brigitte Haferl Tel. +43/1/71100-4370, E-mail: [email protected]
Generika – Modell Burgenland / Generics – Mo-del Burgenland (in German) 50 p., 7 tab., 12 fig., spiral binding ÖBIG, Vienna, October 2001, ATS 330.25 / € 24.-- (incl. shipping, excl. bank charges)
Arzneimittelausgaben. Strategien zur Kostendämpfung in der Europäischen Union / Pharmaceutical Expendi-ture. Cost-containment strategies in the Euro-pean Union (in German) 474 p., 115 tab., 85 fig., comprehensive glossary, spiral binding ÖBIG, Vienna, November 2001, ATS 4,816.10 / € 350.-- (inc. shipping, excl. bank charges) Benchmarking Arzneimittelausgaben. Strategien zur Kostendämpfung in der Europäischen Union / Benchmarking pharma-ceutical expenditure. Cost-containment strate-gies in the European Union (in German and Eng-lish)
97 p., 17 tab., 8 fig., spiral binding ÖBIG, Vienna, December 2001 ATS 894.40 / € 65.- (incl. shipping, excl. bank charges)
Arzneimittelausgaben. Strategien zur Kostendämpfung - Länder-portraits / Pharmaceutical expenditure. Cost-containment strategies – country portraits (in German) Country portraits are available for every Member State of the European Union. A country portrait has approx. 30 pages ÖBIG, Vienna, December 2001, ATS 247.70 / € 18.-- per country portrait (incl. shipping, excl. bank charges) HEALTH CARE PLANNING
Kooperationsformen in der ambulanten Ge-sundheitsversorgung in Österreich / Forms of co-operation in out-patient health care in Austria (in German) 106 p., 19 tab. and fig. ÖBIG, Vienna 1990, ATS 115.-- / € 8.36
Ärztliche Versorgung in Österreich 1990 – 2010 / Medical care as provided by physicians in Aus-tria 1990 – 2010 (in German) 224 p., approx. 100 tab., fig. and maps ÖBIG, Vienna 1991, ATS 165.-- / € 11.99
Turnusärzte in Österreich / Postgraduate practi-cal medical training in Austria (in German) 216 p., more than 100 tab. and fig. ÖBIG, Vienna 1991, ATS 235.-- / € 17.08
The current study with a time horizon until 2020:
Qualität der ärztlichen Versorgung in Österreich/ Quality of medical care as provided by physi-cians in Austria (in German) 67 p., annex, numerous tab., fig. and maps, spiral binding ÖBIG, Vienna 2000, ATS 290.-- / € 21.08
Österreichischer Krankenanstalten- und Groß-geräteplan 2001 (ÖKAP/GGP 2001) / Austrian hospital and biomedical equipment plan 2001 (in German) supplement to the agreement pursuant to sect. 15a of the Austrian Constitution on re-structuring health care and the financing of hospitals, published by the Federal Ministry of Social Security and Generations 143 p., numerous tab., spiral binding ÖBIG, Vienna, November 2000, ATS 350.-- / € 25.44
Gerhard Fülöp Raumplanung der Gesundheitsfürsorge in Österreich - Analyse und Steuerung regionaler Ungleichheiten in der gesundheitlichen Ver-sorgung / Regional planning of health care ser-vices in Austria – Analysis and control of differ-ences in the supply of health services (in Ger-man)
157 p., tab. and fig., maps Department “Institut für Stadt- und Regionalforschung“ of the Vienna University of Technology/ÖBIG, Vienna 1999, ATS 250.-- / € 18.17
Development of labour supply in 14 selected health care occupations (qualified nursing staff, ward assistants and nursing assistants, senior medical technicians, qualified medical technicians, midwives) until the year 2010 under the respective basic conditions and targeted interven-tions:
Personalangebot in ausgewählten Gesundheits-berufen / Labour supply in selected health care occupations (in German) Prognosis in scenarios 1993 - 2010 242 p., numerous tab. and fig., spiral binding ÖBIG, Vienna 1995, ATS 230.-- / € 14.71
Medizinische Versorgung im Katastrophenfall / Medical care in disasters (in German) 210 p., numerous tab. and fig., spiral binding ÖBIG, Vienna 1995, ATS 275.-- / € 19.99 PSYCHOSOCIAL CARE
Ambulante psychotherapeutische Versorgung in Österreich / Outpatient psychotherapy in Austria (in German) 175 p. plus annex, numerous tab. and charts ÖBIG, Vienna 1997, ATS 250.-- / € 18.17
Psychotherapie. Wenn die Seele Hilfe braucht. / Psychotherapy. When the soul needs help (in German) Information brochure, prepared by ÖBIG in co-operation with the Federal Ministry of Labour, Health and Social Af-fairs (publ.), 46 p., service pages, Vienna 1999 Available free of charge at the Federal Ministry of Social Security and Generations: Tel. +43/1/71100-6140, e-mail: [email protected], Internet: www.bmsg.gv.at
Psychotherapeuten, Klinische Psychologen, Gesundheitspsychologen - Entwicklungsstatis-tik 1991 – 2000 / Psychotherapists, clinical psy-chologists, health psychologists – development statistics 1991 – 2000 (in German) 124 p., numerous tab. and fig., spiral binding ÖBIG, Vienna 2001 (revised edition), ATS 190.-- / € 13.81
PUBLIC HEALTH
Gesundheitsbericht an den Nationalrat 1994 / Health Report to the Austrian Parliament 1994 (in German) Report period 1989 - 1992 160 p., numerous tab., fig. and maps Publ. by the Federal Ministry of Health, Sports and Con-sumer Protection, Vienna 1994, ATS 180.-- / € 13.08
Gesundheitsbericht an den Nationalrat 1997 / Health Report to the Austrian Parliament 1997 (in German) Report period 1993 - 1995 174 p., numerous tab., fig. and maps Publ. by the Federal Ministry of Labour, Social Affairs and Health, Vienna 1997, ATS 200.-- / € 14.53
Gesundheitsbericht an den Nationalrat 2000 / Health Report to the Austrian Parliament 2000 (in German) Report period 1996 - 1998 176 p., numerous tab. and fig. Publ. by the Federal Ministry of Social Security and Gen-erations, Vienna 2000, ATS 250.-- / € 18.17 Combined offers: a) one issue of the health report 2000, in combination
with either one issue of the health report 1994 or the health report 1997, ATS 350.-- / € 25.44
b) one issue each of the health report 1994, the health report 1997 and the health report 2000, ATS 440.-- / € 31.98
Stillen in Österreich / Breast-feeding in Austria (in German) 97 p., numerous tab. and fig., plus annex, spiral binding ÖBIG, Vienna 1998, ATS 175.-- / € 12.72
Neubewertung von Fluoriden zur Kariesprophy-laxe / Re-evaluation of fluoride for caries prophylaxis (in German) 188 p., 7 tab., 4 fig., spiral binding ÖBIG, Vienna 1993, ATS 155.-- / € 11.26
Vergleichende Bewertung kariesprophylakti-scher Maßnahmen / Comparative evaluation of measures of caries prophylaxis (in German) 87 p., 4 tab., 9 fig., spiral binding ÖBIG, Vienna 1994, ATS 100.-- / € 7.27
Zahnstatuserhebung 1996 bei fünf- bis sechsjährigen Kindergartenkindern / Oral health survey 1996 among kindergarten children aged between five and six (in German) 35 p. plus annex, 20 tab., 23 fig., 1 colour chart, spiral binding ÖBIG, Vienna 1997, ATS 100.-- / € 7.27
Zahnstatuserhebung 1997 bei Zwölfjährigen / Oral health in Austria 1997: The group aged 12 (in German) 35 p., numerous tab. and fig., spiral binding ÖBIG, Vienna 1998, ATS 100.-- / € 7.27
Zahnstatuserhebung 1998 bei Achtzehnjährigen / Oral health in Austria 1998: The group aged 18 (in German) 47 p., numerous tab. and fig., spiral binding ÖBIG, Vienna 1999, ATS 100.-- / € 7.27
Kariesprophylaxe in Österreich / Dental caries prevention in Austria (in German) Documentation of activities, data of 1997, 61 p. plus annex, spiral binding ÖBIG, Vienna 1998, ATS 150.-- / € 10.90
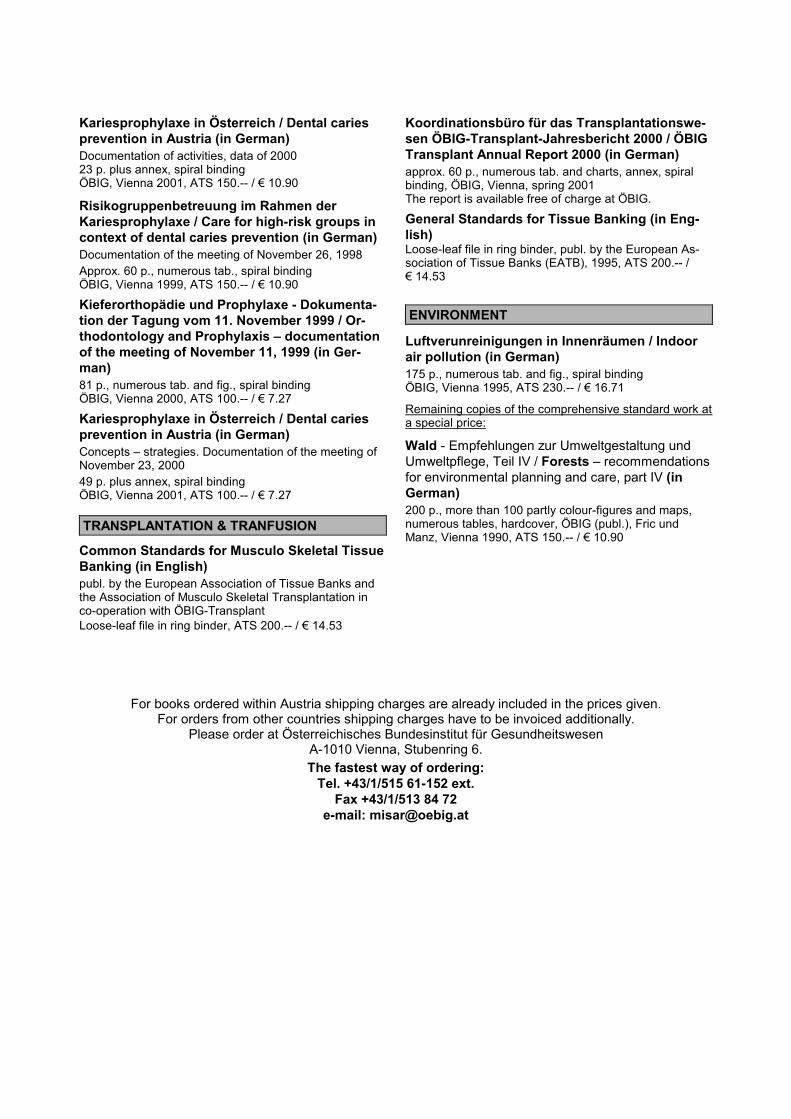
Kariesprophylaxe in Österreich / Dental caries prevention in Austria (in German) Documentation of activities, data of 2000 23 p. plus annex, spiral binding ÖBIG, Vienna 2001, ATS 150.-- / € 10.90
Risikogruppenbetreuung im Rahmen der Kariesprophylaxe / Care for high-risk groups in context of dental caries prevention (in German) Documentation of the meeting of November 26, 1998 Approx. 60 p., numerous tab., spiral binding ÖBIG, Vienna 1999, ATS 150.-- / € 10.90
Kieferorthopädie und Prophylaxe - Dokumenta-tion der Tagung vom 11. November 1999 / Or-thodontology and Prophylaxis – documentation of the meeting of November 11, 1999 (in Ger-man) 81 p., numerous tab. and fig., spiral binding ÖBIG, Vienna 2000, ATS 100.-- / € 7.27
Kariesprophylaxe in Österreich / Dental caries prevention in Austria (in German) Concepts – strategies. Documentation of the meeting of November 23, 2000 49 p. plus annex, spiral binding ÖBIG, Vienna 2001, ATS 100.-- / € 7.27 TRANSPLANTATION & TRANFUSION
Common Standards for Musculo Skeletal Tissue Banking (in English) publ. by the European Association of Tissue Banks and the Association of Musculo Skeletal Transplantation in co-operation with ÖBIG-Transplant Loose-leaf file in ring binder, ATS 200.-- / € 14.53
Koordinationsbüro für das Transplantationswe-sen ÖBIG-Transplant-Jahresbericht 2000 / ÖBIG Transplant Annual Report 2000 (in German) approx. 60 p., numerous tab. and charts, annex, spiral binding, ÖBIG, Vienna, spring 2001 The report is available free of charge at ÖBIG.
General Standards for Tissue Banking (in Eng-lish) Loose-leaf file in ring binder, publ. by the European As-sociation of Tissue Banks (EATB), 1995, ATS 200.-- / € 14.53
ENVIRONMENT
Luftverunreinigungen in Innenräumen / Indoor air pollution (in German) 175 p., numerous tab. and fig., spiral binding ÖBIG, Vienna 1995, ATS 230.-- / € 16.71
Remaining copies of the comprehensive standard work at a special price:
Wald - Empfehlungen zur Umweltgestaltung und Umweltpflege, Teil IV / Forests – recommendations for environmental planning and care, part IV (in German) 200 p., more than 100 partly colour-figures and maps, numerous tables, hardcover, ÖBIG (publ.), Fric und Manz, Vienna 1990, ATS 150.-- / € 10.90
For books ordered within Austria shipping charges are already included in the prices given. For orders from other countries shipping charges have to be invoiced additionally.
Please order at Österreichisches Bundesinstitut für Gesundheitswesen A-1010 Vienna, Stubenring 6. The fastest way of ordering:
Tel. +43/1/515 61-152 ext. Fax +43/1/513 84 72
e-mail: [email protected]

ISBN 3-85159-026-0


