Embed Size (px)
Citation preview

PharmaceuticalISSUE1
SJ20_0081 ISSN 2188-0484
Vol
Note from the Director
The new coronavirus (COVID-19) has now
become a global pandemic. Shimadzu Corpo-
ration would like to express our greatest
sympathies to those affected by COVID-19. We
would also like to offer our deepest condo-
lences to the loved ones of those who lost their
lives from the disease.
In order to prevent further spread of the new
coronavirus, we intend to implement measures
in accordance with government instructions for
the safety of our customers, the local commu-
nity, business partners, employees, and others.
At the same time, as a company with the cor-
porate philosophy of contributing to society
through science and technology, we intend to
develop products and technologies that can
contribute to ameliorating the situation.
We recently announced the release of the
“2019 Novel Coronavirus Detection Kit”, with
sales beginning on 20th April in Japan. The
“2019 Novel Coronavirus Detection Kit” uses
our unique Ampdirect technology, which
allows the PCR reaction solution to be added
directly to the biological sample without the
need for extracting and purifying RNA. There-
fore, this detection kit significantly reduces the
amount of work required to prepare samples
and, moreover, halves the overall time required
for PCR detection. Preparations are underway
to export these kits overseas. We will make
every effort to combat this crisis, applying the
full capabilities of the Shimadzu Group.
In this issue, we describe the application of
Shimadzu products in the pharmaceuticals
market. It’s highlighted by an interview with Dr.
Mirlinda Biba, Principal Scientist at Merck &
Co., Inc. Dr. Biba was a member of the semi-pre-
parative SFC project team at the Enabling Tech-
nologies Consortium. Shimadzu was selected
by them as a collaborative partner, a partner-
ship that resulted in the development of the
Nexera UC Prep SFC system. This issue also in-
troduces multiple applications using various an-
alytical techniques. These include the use of
LC-MS/MS for the identification of the geno-
toxic impurity NDMA in ranitidine and met-
formin, and the identification of an impurity
related to the ICH Q3D elemental impurities
guideline using ICP-MS and EDX.
At Shimadzu, we are integrating techniques
from analytical instruments, medical systems
and other fields, aiming to contribute globally
at an even deeper level to the advanced health-
care field. We hope that this issue will prove to
be a great help to all of you. Your generous
feedback is always appreciated.
Shuzo MaruyamaGeneral Manager, Analytical & Measurement Instruments Division
Yours Sincerely,
Shimadzu Journal vol.8 Issue1 1
CONTENTSPharmaceutical Issue1
Interview
Interview with Dr. Mirlinda Biba
We interviewed Dr. Mirlinda Biba, a Principal Scientist in the Analytical R&D department at Merck in the United States. She has been working with Supercritical Fluid Chromatography (SFC) for almost 20 years. She is also a member of the Enabling Technologies Consortium (ETC) and joined the project to develop a new preparative SFC instrument.
04
08Report
Cross-Pharma Collaboration on the Development and Evaluation of a New Mid-Scale Preparative Supercritical Fluid Chromatography Instrument
Precompetitive collaborations focused on the development of new technologies for conducting pharmaceutical research and development are becoming increasingly popular. This article reports on one of the first development projects from the recently formed Enabling Technologies Consortium (ETC): the creation of a new instrument for carrying out mid-scale preparative supercritical fluid chromatography purifications.
INSIGHT FROM CUSTOMER
Report 1
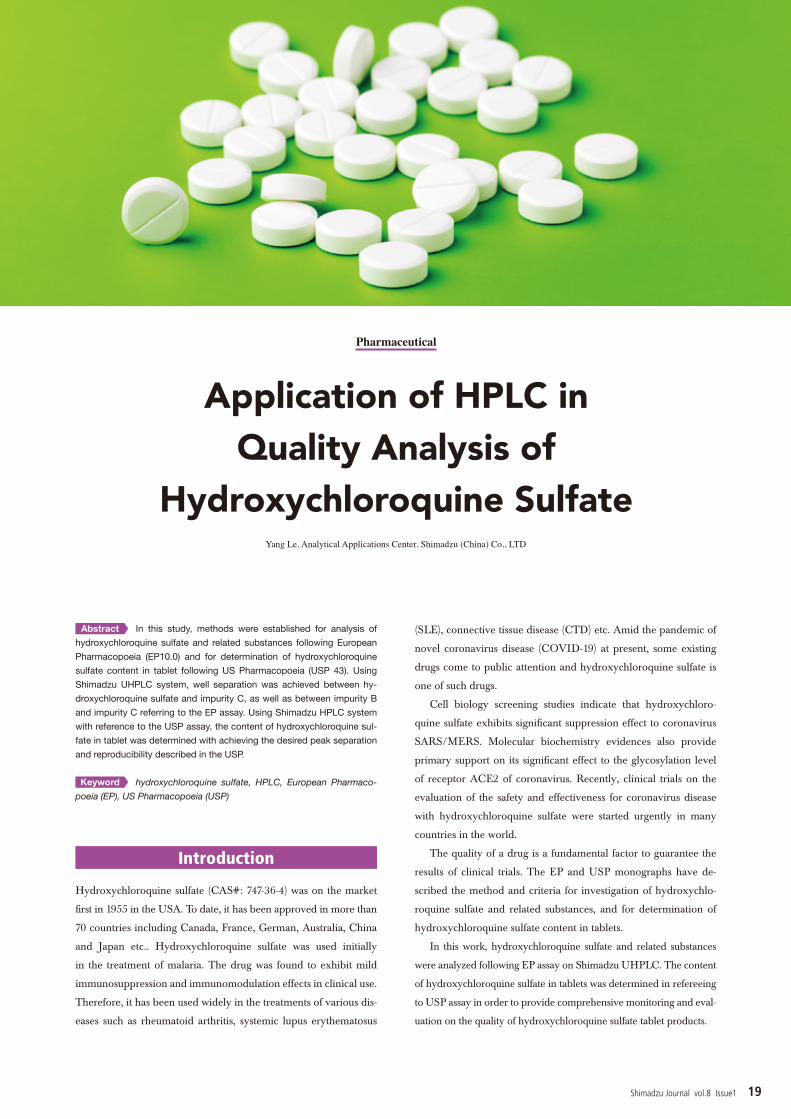
Application of HPLC in Quality Analysis of Hydroxychloroquine Sulfate
In this study, methods were established for analysis of hydroxychloroquine sulfate and related substances following European Pharmacopoeia (EP10.0) and for determination of hydroxychloroquine sulfate content in tablets following US Pharmacopoeia (USP 43). Using a Shimadzu UHPLC system, excellent separation was achieved between hydroxychloroquine sulfate and impurity C, as well as between impurity B and impurity C referring to the EP assay.
19
Report 2
Determination of genotoxic impurity NDMA in Ranitidine by LCMS-8050 and LCMS-9030
Based on the conditions recorded in FDA documents, we developed a method for the analysis of NDMA in ranitidine drug substance and capsule preparations using the Shimadzu LCMS-8050 Liquid Chromatograph-Tandem Mass Spectrometer, and a method using the LCMS-9030 Q-TOF Mass Spectrometer for the reference of relevant testers.
23
Report 3
Determination of genotoxic impurity NDMA in Metformin by LCMS-8050 and GCMS-TQ8050 NX
This study presents the development of three methods to detect NDMA in metformin using the Shimadzu LCMS-8050, GCMS-TQ8050 NX and GCMS-QP2020 NX, based on the recipe published by the National Institutes for Food and Drug Control and Health Sciences Authority of Singapore.
28
Report 4
The Necessity of Analyzing Elemental Impurities in Drug products, and Approaches to Their Measurement
This article introduces approaches to analyzing elemental impurities by ICP-MS or EDX-RF based on ICH Q3D (ICH: International Conference on Harmonisation of Technical Requirements for Registration of Pharmaceuticals for Human Use, Q3D: Guideline for Elemental Impurity).
33
REPORT
Shimadzu Journal vol.8 Issue1 2
LATEST TOPICS
37 Latest Topics 1
Global Pharma Summit 2019 Report
On November 14th, 2019, Shimadzu (Asia Pacific) hosted The Global Pharma Summit in Singapore. This was seventh chapter of the event, with theme of “Transforming the Future of Pharma”. The event brought 103 pharmaceutical industry leaders, health-care providers and researchers to Singapore from 20 countries around the world.
39Latest Topics 2
Shimadzu Scientific Instruments Partners with Northern Michigan University to Support Medicinal Plant Chemistry Program
Shimadzu Scientific Instruments (SSI) and Northern Michigan University (NMU) have partnered to establish the Shimadzu Analytical Core Laboratory for Medicinal Plant Sciences. Through this collaboration, SSI has donated instrumentation for the laboratory to support NMU’s first-in-the-nation medicinal plant chemistry program.
40Latest Topics 3
Shimadzu and Providence Cancer Institute Partner to Advance Cancer Immunotherapy Research
Shimadzu Corporation (Shimadzu) and the Earle A. Chiles Research Institute, a division of Providence Cancer Institute (Providence) in Portland, Oregon, have entered into a joint research agreement to apply mass spectrometry technology to develop tools for personalized cancer immunotherapeutics.
41 Latest Topics 4
Celebrating 50 Years of Mass Spectrometry Innovation
The year 2020 marks 50 years since the release of Shimadzu’s first mass spectrometry device, the LKB-9000. To celebrate this occasion, Shimadzu is planning a number of activities throughout the year.
These article were selected by Shimadzu. Relating pharmaceutical analysis and development, they are from posters presented at ASMS 2019 and from application notes. They feature a variety of instruments we produce and include cutting-edge technologies. Please obtain the articles of your interest through the links on the titles.
35
SHIMADZU SELECTION
LCMS-8060NX, UV-i Selection, Shim-pack Bio HIC
43
NEW PRODUCTS
CONTENTSPharmaceutical Issue1
Shimadzu Journal vol.8 Issue1 3

INSIGHTfromCUSTOMER
Supercritical fluidchromatography
Mirlinda Biba is a Principal Scientist in the Analytical R&D at Merck. She has almost 20 years of experience working with analytical and preparative supercritical fluid chromatography. She joined Merck in 2001 in the Separations Lab where she worked with some of the first preparative SFC instruments. She also led the SFC team and helped with advancing the SFC technology for GMP chiral analysis in commercial space. Over the years she has partnered with many industrial and academic collaborators to advance the supercritical fluid chroma-tography technology and applications. Her research work in this area has resulted in over 40 publications and numerous presentations at various conferences.
Dr. MIRLINDA BIBAINTERVIEW
Shimadzu Journal vol.8 Issue1 4

Dr. Biba, thank you very much for
spending some time for this interview.
Please tell us a little bit about yourself
and how you got involved in the project?
Thank you for the opportunity to share my experi-
ence. I have been working with supercritical fluid
chromatography (SFC) for almost 20 years. I joined
Merck in the Process Chemistry department in 2001
and worked in Dr. Chris Welch’s Separations lab. The
group had just acquired one of the first Multigram II
preparative SFC systems by Dr. Terry Berger and this
became my first project. During that time, chiral chro-
matography was key for delivering enantiomerically
pure compounds for pharmaceutical development and
clinical studies. Due to its unique selectivity for chiral
resolution, speed, and ‘greener’ approach compared to
preparative HPLC, preparative SFC quickly became the
technique of choice for preparative chiral separations.
Over the years, the use of preparative SFC has expanded
to achiral separations, impurity isolations, and more re-
cently for pep- tides and proteins. Pre-
parative SFC is now widely used in the
pharmaceu- tical industry for small
scale purifications to sup-
port drug discovery and development.
The rapid growth of preparative SFC
area led to a few startup companies en-
tering the market-
place, and smaller
companies merging
or continu- ously being acquired by
larger ones which ultimately led to
es tab l i shed products becoming un-
available. Therefore, re-
placing aging or obsolete
instruments was diffi-
cult with the few
suitable options
available. As a result,
preparative SFC users
who were participating members of Enabling Technologies
Consortium (ETC) got together to solve this problem.
Could you outline the project and
let us know why the project was started?
Why was Shimadzu selected as the partner?
Preparative SFC users across the pharmaceutical indus-
try were faced with the challenges to replace aging and
obsolete instruments and felt that the available instru-
ments on the market had some limitations and did not
meet their requirements. In order to address this prob-
lem, participating members of ETC got together and
created a request for information (RFI) for developing a
new preparative SFC instrument that would meet their
list of requirements. The team generated a list of de-
sired features, including both hardware and software
instrument specifications. The RFI was published
through the ETC website in July, 2016 and received in-
terest from a number of potential suppliers. After care-
ful review and discussions with several vendors, the
INSIGHT from CUSTOMER
Dr.
Dr. M
irlin
da B
iba
Mir
linda
Bib
a
Shimadzu Journal vol.8 Issue1 5

Dr.
Dr. M
irlin
da B
iba
Mir
linda
Bib
a
team selected Shimadzu Corporation as the partner for
this collaboration and the project was initiated in April,
2017. The ETC team selected Shimadzu Corporation as
the partner for this collaboration project based on con-
siderations of technical expertise, anticipated project
timeline, and overall collaborative spirit.
As the leader of the project, was there any
difficulty in managing the project?
This was one of the very first projects that was initiated
by the new Analytical and Purification Working Group
of ETC. So some of the general
guidelines were not well estab-
lished yet and this project
became the pilot for this work-
ing group. There was also a lot
of interest from all participating
ETC members to join this proj-
ect and ultimately we had a
large group of over 30 partici-
pating members from 10 major
pharmaceutical companies.
Given this large and di-
verse SFC user group,
initially there were
some differences of
opinion for the
desired system specifications, where
some team members preferred a larger
scale prep SFC instrument while others
were more interested in a smaller scale system
capable of high-throughput milligram scale
with an open bed fraction collector. However,
in order to have a successful collaboration, the
team needed to align and focus on the development of
a prep SFC instrument with the most important current
need for all participating companies, so the team
agreed on the development of a semi-preparative
scale SFC instrument. This was a highly collabo-
rative team which met regularly for monthly tele-
conference meetings and a few in-person meetings.
All participating members provided regular and great
feedback to the Shimadzu teams the product
development progressed and overall it was a very suc-
cessful collaboration.
Now that the Nexera UC Prep system has been
released, could you provide a review of the
instrument and explain the key features that
are important and unique to the Nexera UC
Prep? Are there any additional features that
you would like to see in the future?
The new Nexera UC Prep system was developed based on
SFC user feedback and desired instrument features and
specifications. The ETC project
team was very pleased with the
provided features and overall
design of the system. The over-
all footprint of the new instru-
ment is considerably smaller
than most conventional prep
SFC systems. The system also
appears to be quiet, which is
very important for labs that
have multiple prep SFC instru-
ments. The new Nexera UC
Prep system also does not con-
tain an external chiller, which
can be large and take up a lot
of valuable laboratory space,
create a lot of noise, and can be prone to leaks and spills.
Some of the other key features of the Nexera UC Prep
system include the novel gas-liquid separator for im-
proved recovery and ease of use and cleaning, a newly
designed fraction collector that can be customized per
customer needs, and an innovative injector flow path for
on-column dilution to help with peak
shape and loading.
INSIGHT from CUSTOMER
Shimadzu Journal vol.8 Issue1 6
Dr.
Dr. M
irlin
da B
iba
Mir
linda
Bib
aINSIGHT from CUSTOMER
Software control that is simple and user-friendly is
also very important and the newly developed Prep Solu-
tion software provides some key important features.
The method editor function allows the user to quickly
build a method and input all key method parameters,
including fraction collection by slope, threshold, and
time. The instrument monitor function allows the user
to view the complete status of the system and be able to
make on-the-fly changes, which is very important for a
prep SFC instrument to minimize downtime and maxi-
mize recovery and productivity. The data viewer func-
tion allows the user to visualize previously collected
chromatograms and compare data files.
Some additional features to see in the future that might
be of interest to many preparative SFC users include the
mass spectrometry directed preparative purifications,
ability to install and run multiple columns, and open bed
fraction collection for high-throughput purifications.
Finally, could you share Shimadzu’s strengths
compared to other vendors (not limited to the
instruments)?
Shimadzu has an amazing team of hardware and soft-
ware engineers that are highly innovative and profes-
sional, collaborative, and great to work with! More
importantly, they listened to every user feedback, were
flexible and open to any suggestions, and tried to pro-
vide solutions based on customer needs.
It was significant to know what you think
of us and our collaboration. We will strive
to meet your expectation more than ever.
Thank you very much.
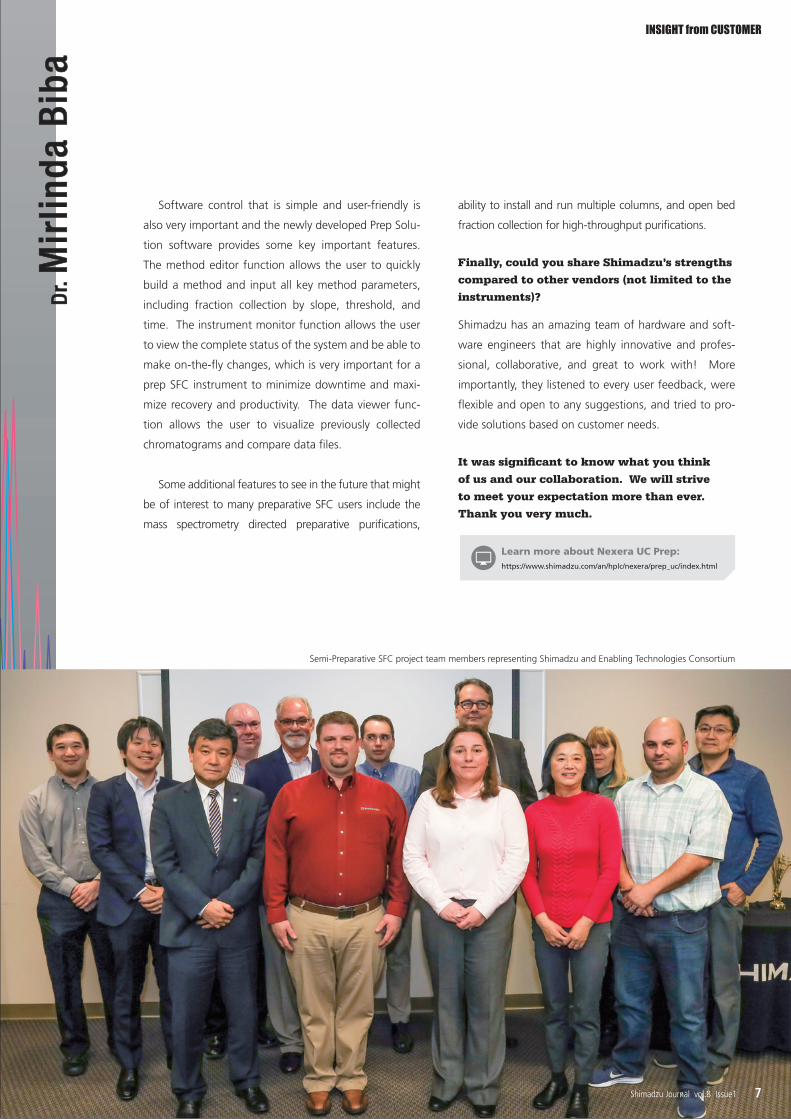
Semi-Preparative SFC project team members representing Shimadzu and Enabling Technologies Consortium
Learn more about Nexera UC Prep:https://www.shimadzu.com/an/hplc/nexera/prep_uc/index.html
Shimadzu Journal vol.8 Issue1 7
Cross-Pharma Collaboration on the Development and Evaluation of
a New Mid-Scale Preparative Supercritical Fluid Chromatography Instrument
Mirlinda Biba,* Mengling Wong,* Anne Akin,* Eric T. Manning,* Lisa Schaffter, Larry Miller, Yingru Zhang, William Farrell, Jimmy O. DaSilva, Lisa Nogle, Benjamin Hritzko, Frank Riley, Robert P. DePianta, Kevin Barry, Donghong A. Gao, Eric Seest, Meenakshi Goel, Loanne Chung,James Paulson, Heewon Lee, Douglas B. Moore, Shuping Dong, William Leister, Nobumitsu Fukushima, Andy Sasaki, Timothy Lee, Takayuki Iriki, Masayuki Nishimura, Masami Tomita,
Michiaki Owa, Katsuhiro Tanaka, Tomohiro Shagawa, Thomas J. Moran, Takeshi Bamba, and Christopher J. Welch
Insight from customer / Report
Introduction
Precompetitive collaborations on the development of new enabling
research technologies are becoming increasingly popular in the
pharmaceutical industry.1 In addition to the financial benefit of cost
sharing across multiple participants, the collective identification
and articulation of technological needs can give potential solution
providers a clear understanding of what is needed, with joint tech-
nology evaluation facilitating the creation of new research tools that
better fit the demands of a broader group of end users. The Enabling
Technologies Consortium (ETC) was founded in 2015 to enable the
rapid, collaborative development of new enabling technologies for
pharmaceutical development and manufacturing. 2–4 Although sev-
eral information-sharing projects have already been reported,5,6 we
now report the first ETC project, which has resulted in the develop-
ment of a new commercial instrument for pharmaceutical research.
The creation of a semipreparative supercritical fluid chroma-
tography (SFC) purification instrument addresses an important,
long-standing, and somewhat unusual capability gap identified
by the Analytical and Purification Working Group of the ETC.
Precompetitive collaborations on the development of new enabling technologies for conducting pharmaceutical research and development are becoming increasingly popular, as pharmaceutical companies recognize the economic and practical benefits of cross-industry collaborations. We report here one of the first new technology development projects from the recently formed Enabling Technologies Consortium, the creation of a new instrument for carrying out mid-scale preparative supercritical fluid chromatography purifications. Input from a team of experienced separation scientists from 10 pharmaceutical companies helped to define a set of critical product attributes that provided guidance to a team of instrument developers in the creation of a new instrument prototype, with testing and feedback from the group helping to improve and refine the final product features. Two beta test units were placed in laboratories at two ETC member companies, allowing for an in-depth performance testing, following an extensive testing procedures developed by the project team. The evaluation results showed that the system met all required specifications. We describe here the development and testing of the new instrument and provide several examples of its use in carrying out chromatographic purifications in support of pharmaceutical discovery and development research.
preparative supercritical fluid chromatography, EnablingTechnologiesConsortium,cross-pharmacollaboration,chiralseparation
Abstract
Keyword
Shimadzu Journal vol.8 Issue1 8
Gram-scale preparative SFC purifications have been widely used in
the pharmaceutical industry for nearly 20 years and have become
an important enabling technology for the rapid exploration of ste-
reochemical complexity in drug discovery and development.7–21
The rapid growth of the field led to a tumult in the industry supply-
ing instrumentation to carry out this task, with startup companies
entering the arena, small companies merging or being acquired
by larger ones, new products entering the marketplace, and es-
tablished products becoming unavailable. An upshot of this flux
was the disappearance of one of the standard instruments for car-
rying out mid-scale SFC purifications, leaving few suitable options
in the marketplace for the replacement of aging units. To address
this problem, the participating ETC members created a request for
information (RFI) for a project aimed at development of a new
preparative SFC instrument meeting a prescribed list of specifica-
tions. The group publicized this request through the ETC website
and received expressions of interest from a number of potential
suppliers. Subsequent review and discussions with several vendors
led to the commission of a collaborative development project with
Shimadzu Corporation. We now describe the results of this collab-
oration on the development and testing of this new preparative
SFC instrument, providing several examples of its use in carrying
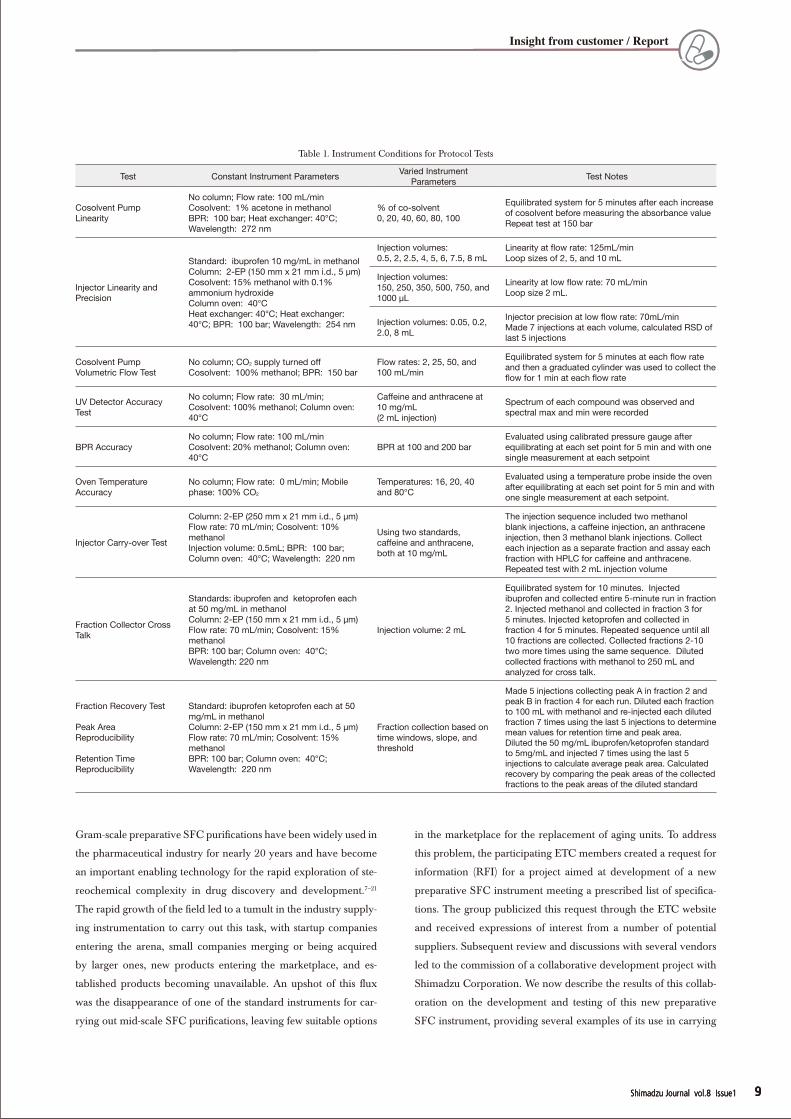
Table 1. Instrument Conditions for Protocol Tests
Test Constant Instrument Parameters Varied Instrument Parameters Test Notes
Cosolvent Pump Linearity
No column; Flow rate: 100 mL/minCosolvent: 1% acetone in methanolBPR: 100 bar; Heat exchanger: 40°C; Wavelength: 272 nm
% of co-solvent0, 20, 40, 60, 80, 100
Equilibrated system for 5 minutes after each increase of cosolvent before measuring the absorbance valueRepeat test at 150 bar
Injector Linearity and Precision
Standard: ibuprofen 10 mg/mL in methanolColumn: 2-EP (150 mm x 21 mm i.d., 5 µm)Cosolvent: 15% methanol with 0.1% ammonium hydroxideColumn oven: 40°CHeat exchanger: 40°C; Heat exchanger: 40°C; BPR: 100 bar; Wavelength: 254 nm
Injection volumes: 0.5, 2, 2.5, 4, 5, 6, 7.5, 8 mL
Linearity at flow rate: 125mL/minLoop sizes of 2, 5, and 10 mL
Injection volumes: 150, 250, 350, 500, 750, and 1000 µL
Linearity at low flow rate: 70 mL/minLoop size 2 mL.
Injection volumes: 0.05, 0.2, 2.0, 8 mL
Injector precision at low flow rate: 70mL/minMade 7 injections at each volume, calculated RSD of last 5 injections
Cosolvent Pump Volumetric Flow Test
No column; CO2 supply turned offCosolvent: 100% methanol; BPR: 150 bar
Flow rates: 2, 25, 50, and 100 mL/min
Equilibrated system for 5 minutes at each flow rate and then a graduated cylinder was used to collect the flow for 1 min at each flow rate
UV Detector Accuracy Test
No column; Flow rate: 30 mL/min; Cosolvent: 100% methanol; Column oven: 40°C
Caffeine and anthracene at 10 mg/mL(2 mL injection)
Spectrum of each compound was observed and spectral max and min were recorded
BPR AccuracyNo column; Flow rate: 100 mL/minCosolvent: 20% methanol; Column oven: 40°C
BPR at 100 and 200 barEvaluated using calibrated pressure gauge after equilibrating at each set point for 5 min and with one single measurement at each setpoint
Oven Temperature Accuracy
No column; Flow rate: 0 mL/min; Mobile phase: 100% CO2
Temperatures: 16, 20, 40 and 80°C
Evaluated using a temperature probe inside the oven after equilibrating at each set point for 5 min and with one single measurement at each setpoint.
Injector Carry-over Test
Column: 2-EP (250 mm x 21 mm i.d., 5 µm)Flow rate: 70 mL/min; Cosolvent: 10% methanol Injection volume: 0.5mL; BPR: 100 bar; Column oven: 40°C; Wavelength: 220 nm
Using two standards, caffeine and anthracene, both at 10 mg/mL
The injection sequence included two methanol blank injections, a caffeine injection, an anthracene injection, then 3 methanol blank injections. Collect each injection as a separate fraction and assay each fraction with HPLC for caffeine and anthracene.Repeated test with 2 mL injection volume
Fraction Collector Cross Talk
Standards: ibuprofen and ketoprofen each at 50 mg/mL in methanolColumn: 2-EP (150 mm x 21 mm i.d., 5 µm)Flow rate: 70 mL/min; Cosolvent: 15% methanolBPR: 100 bar; Column oven: 40°C; Wavelength: 220 nm
Injection volume: 2 mL
Equilibrated system for 10 minutes. Injected ibuprofen and collected entire 5-minute run in fraction 2. Injected methanol and collected in fraction 3 for 5 minutes. Injected ketoprofen and collected in fraction 4 for 5 minutes. Repeated sequence until all 10 fractions are collected. Collected fractions 2-10 two more times using the same sequence. Diluted collected fractions with methanol to 250 mL and analyzed for cross talk.
Fraction Recovery Test
Peak Area Reproducibility
Retention Time Reproducibility
Standard: ibuprofen ketoprofen each at 50 mg/mL in methanolColumn: 2-EP (150 mm x 21 mm i.d., 5 µm)Flow rate: 70 mL/min; Cosolvent: 15% methanolBPR: 100 bar; Column oven: 40°C; Wavelength: 220 nm
Fraction collection based on time windows, slope, and threshold
Made 5 injections collecting peak A in fraction 2 and peak B in fraction 4 for each run. Diluted each fraction to 100 mL with methanol and re-injected each diluted fraction 7 times using the last 5 injections to determine mean values for retention time and peak area.Diluted the 50 mg/mL ibuprofen/ketoprofen standard to 5mg/mL and injected 7 times using the last 5 injections to calculate average peak area. Calculated recovery by comparing the peak areas of the collected fractions to the peak areas of the diluted standard
Shimadzu Journal vol.8 Issue1 9Shimadzu Journal vol.8 Issue1 9Shimadzu Journal vol.8 Issue1 9
Insight from customer / Report

out chromatographic purifications in support of pharmaceutical
discovery and development research.
Experimental section
Two beta test models of the Shimadzu semipreparative SFC in-
struments were used for this work and installed on-site at two ETC
member companies. Each unit consisted of a CO2 pump with an
integrated chiller, cosolvent pump, make-up pump, column oven,
back-pressure regulator (BPR), diode array detector, syringestyle
injection system, and a very versatile fraction collection system
with a novel gas–liquid separation (GLS) system. The system
is controlled through PrepSolution and LabSolutions software.
A commercial version of the instrument is now available as the
Nexera UCPrep SFC.22,23
Testing of the instrument was conducted in two phases. In the
first phase, the prep SFC instrument was tested against a protocol
developed and agreed upon between the participating ETC mem-
bers and Shimadzu Corporation. Details of the protocol tests are
found in Table 1. In the second phase, the system was tested using
“real-world” development samples to see how it compared to other
instruments currently used in the two labs.
Model compounds, caffeine, anthracene, ibuprofen, ketoprofen,
and trans-stilbene oxide (TSO), were obtained from Sigma-Aldrich,
St. Louis, MO. The solvents, methanol and acetone, were obtained
from EMD, Temecula, CA. Carbon dioxide was obtained from
Praxair, San Francisco, CA. Compounds depicted in Figures 7–9
are from ongoing projects under investigation in these laboratories.
Results and discussion
The preparative SFC project originated in the analytical and puri-
fication working group of ETC. Interested members in the working
group from several pharmaceutical companies formed a project
team and met to decide on target specifications. Given the large
and diverse user group, some differences of opinion on desired
specifications and features of the targeted prep SFC instrument
were perhaps inevitable. Some project team memberswanted
larger scale prep SFC systems that could accommodate preparative
columns up to 10 cm in diameter while others were interested in
systems capable of high-throughput milligram-scale mass-directed
purification with an open-bed fraction collector. The project team
soon settled on the development of a semipreparative-scale SFC
system with features illustrated in Table 2 as representative of the
most important current need for the participating companies.
In addition to the features outlined in Table 2, the ETC project
team agreed that safety, affordability, ruggedness, dependability,
and ease of use would be critical attributes for success of the project.
Interestingly, a group dynamic soon evolved that coalesced around
a shared vision for a successful outcome. Individual requests to add
new features or capabilities were considered, when consistent with
this shared vision, but were overruled when jeopardizing cost, de-
velopment of timeline, safety, or ease of use.
When clear on the project requirements, the group issued a
RFI, which was announced via publication on the ETC website
and a press release in July 2016. The project team reviewed sev-
eral responses and selected three suppliers to submit a formal pro-
posal. The ETC group ultimately chose Shimadzu for the project
partner based on considerations of technical expertise, anticipated
Table 2. Desired Prep SFC System Features and Specifications
instrument feature desired instrument specifications a
column size 2–3 cm i.d. × 25 cm length
flow rate CO2 pump: 25–200 mL/minmodifier pump: 1–100 mL/min
modifier pump
minimum modifier percentage of 5% across the entire flowrate range (25–200 mL/min)
solvent selection valve on modifier pump allowing selection and mixing multiple modifiers
outlet pressure programmable up to at least 200 bar
column temperature efficient temperature control up to at least 60°C
Injector
modifier or mixed-stream modeloop/syringe pump (0.5−10 mL)total time for injection less than one minutestacked injection capability
fraction collection
6–8 fractions + wastelow-pressure with visible GLS (allow fast visual
assurance that system is operating correctly and for cleaning verification)
separate ventilated collection cabinet to allow up to at least 2 L collection vessels
fraction collection settings
point and click time point settings from saved chromatogram
fraction collection triggering
UV and/or MS using time, slope, and/or threshold manual fraction collection option
method editing simple, graphical (visual), “on-the-fly” editing
Detection UV (190–700 nm) other: MS, CAD, ELSD, polarimeter, and so forth.(optional)
CO2 recycling option available as an option
GMP qualification available as an option
Safety
shutdown triggers: leak detection in collection cabinet (both liquid and CO2), high pressure on CO2 and modifier pump and on column, high temperature on column secondary containment in collection cabinet
FootprintBenchtopmodular components to allow flexibility in stacking separate collection cabinet
Serviceresponse time in less than 2 dayslocal service technicianreasonably priced service contracts
system control Windows 7 or higher operating systemexternal PC preferred
a The desired instrument specifications listed here are the minimum requirements from the SFC users for the development of a new prep SFC instrument, which were listed in the RFI. All detailed instrument specifications for the final product can be found in the product brochure.23
Shimadzu Journal vol.8 Issue1 10Shimadzu Journal vol.8 Issue1 10Shimadzu Journal vol.8 Issue1 10
Insight from customer / Report

project timeline, and overall collabora-
tive spirit. In April 2017, ETC signed a
collaboration agreement with Shimadzu,
and the project began in earnest. One of
the key benefits of the ETC mechanism is
that it allows for multiple ETC member
companies to engage in a collaboration
with a third party as a single entity. It was
noted by Shimadzu that the execution of
the legal framework defining this collab-
oration was streamlined by the ability to
negotiate with ETC versus the effort that
would have been required negotiating
with all of the participating ETC members
on an individual basis. Furthermore, an-
other key benefit of the ETC mechanism
is that from an individual company per-
spective, the shared funding mechanism
afforded by ETC allows for more work to
be accomplished for only a fraction of the
necessary monetary investment relative to accomplishing the same
work alone.
The participating ETC members next met with Shimadzu sci-
entists and engineers to discuss many of the key hardware and
software design details. In addition to face-to-face meetings and
teleconferences, ongoing discussions between seasoned prep SFC
users and instrument designers were very important. When the
project team reached general agreement on the design specifica-
tions, the Shimadzu design team undertook the creation of a new
instrument prototype. Ongoing discussions between participating
ETC project team members took place over the next few months,
as the project progressed. In particular, the software development
team spent a lot of time learning about detailed workflows from the
experienced SFC users to better understand why certain features
were needed and how to best implement them into the software.
A precommercial prototype instrument embodying most of the
anticipated features of the commercial instrument was first eval-
uated by participating ETC members in May 2018 at Shimadzu
headquarters in Columbia, MD (Figure 1). An overall assessment
was conducted, and feedback and requested improvements were
collected by Shimadzu hardware and software engineers. Subse-
quently, beta test units incorporating these design changes were
placed within laboratories at two ETC member companies, al-
lowing for in-depth performance testing and evaluation under re-
al-world conditions.
The ETC project team was pleased with the overall design and
functionality of the new instrument (Figure 2a). The newly designed
preparative SFC instrument also included some improved hard-
ware features. A new patented technology for the GLS provided
increased recovery as well as ease of use and cleaning (Figure 2b).
Figure 1. Flow diagram of the new preparative SFC instrument.
Figure 2. Key hardware features of the new mid-scale preparative SFC instrument. (a) Photo of final product design, (b) innovative gas–liquid separator with branched channel design improves sample re-covery and reduces formation of aerosols, (c) an internal chiller within the instrument eliminates the re-quirement for a large, noisy, and spill-prone external chiller, reducing the overall instrument footprint.
Shimadzu Journal vol.8 Issue1 11Shimadzu Journal vol.8 Issue1 11Shimadzu Journal vol.8 Issue1 11
Insight from customer / Report
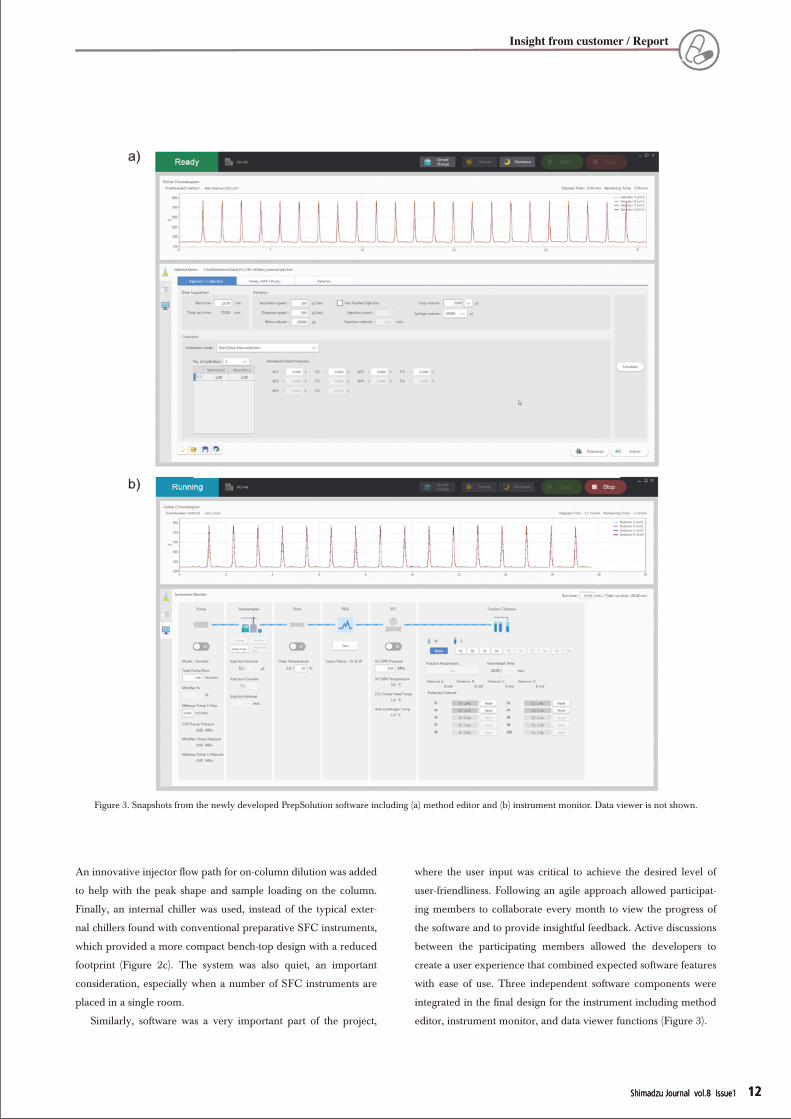
Figure 3. Snapshots from the newly developed PrepSolution software including (a) method editor and (b) instrument monitor. Data viewer is not shown.
An innovative injector flow path for on-column dilution was added
to help with the peak shape and sample loading on the column.
Finally, an internal chiller was used, instead of the typical exter-
nal chillers found with conventional preparative SFC instruments,
which provided a more compact bench-top design with a reduced
footprint (Figure 2c). The system was also quiet, an important
consideration, especially when a number of SFC instruments are
placed in a single room.
Similarly, software was a very important part of the project,
where the user input was critical to achieve the desired level of
user-friendliness. Following an agile approach allowed participat-
ing members to collaborate every month to view the progress of
the software and to provide insightful feedback. Active discussions
between the participating members allowed the developers to
create a user experience that combined expected software features
with ease of use. Three independent software components were
integrated in the final design for the instrument including method
editor, instrument monitor, and data viewer functions (Figure 3).
Shimadzu Journal vol.8 Issue1 12Shimadzu Journal vol.8 Issue1 12Shimadzu Journal vol.8 Issue1 12
Insight from customer / Report
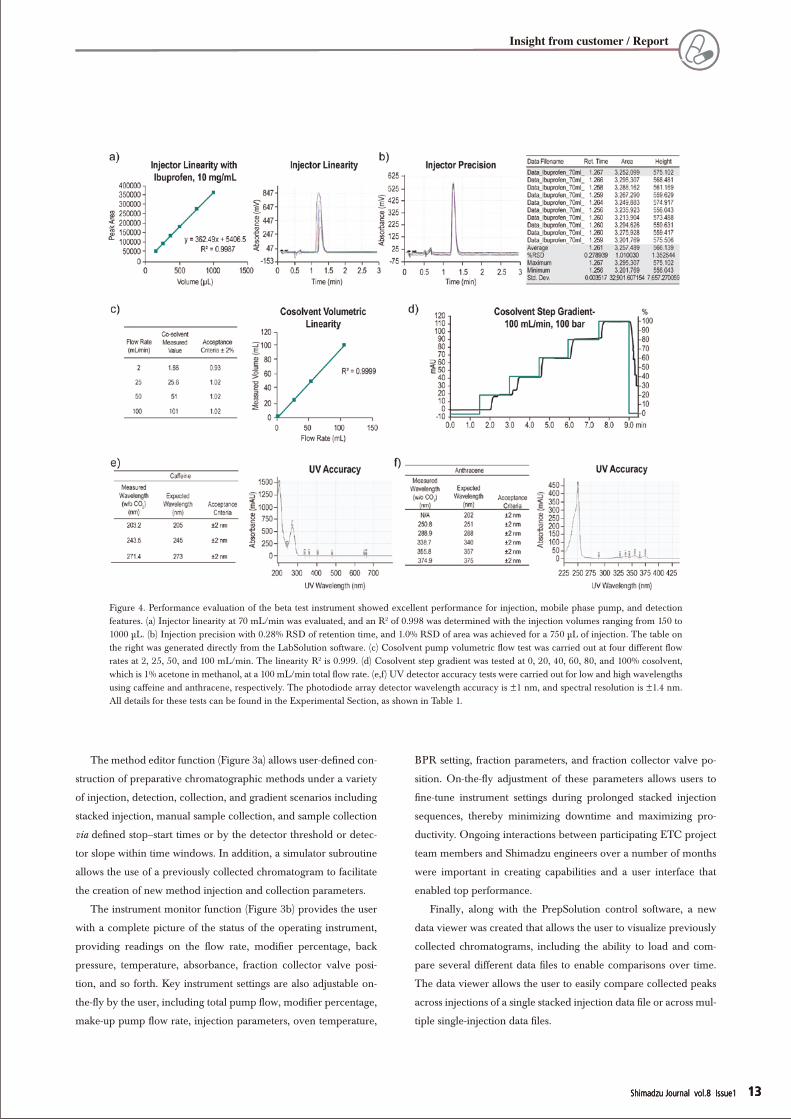
Figure 4. Performance evaluation of the beta test instrument showed excellent performance for injection, mobile phase pump, and detection features. (a) Injector linearity at 70 mL/min was evaluated, and an R2 of 0.998 was determined with the injection volumes ranging from 150 to 1000 μL. (b) Injection precision with 0.28% RSD of retention time, and 1.0% RSD of area was achieved for a 750 μL of injection. The table on the right was generated directly from the LabSolution software. (c) Cosolvent pump volumetric flow test was carried out at four different flow rates at 2, 25, 50, and 100 mL/min. The linearity R2 is 0.999. (d) Cosolvent step gradient was tested at 0, 20, 40, 60, 80, and 100% cosolvent, which is 1% acetone in methanol, at a 100 mL/min total flow rate. (e,f) UV detector accuracy tests were carried out for low and high wavelengths using caffeine and anthracene, respectively. The photodiode array detector wavelength accuracy is ±1 nm, and spectral resolution is ±1.4 nm. All details for these tests can be found in the Experimental Section, as shown in Table 1.
The method editor function (Figure 3a) allows user-defined con-
struction of preparative chromatographic methods under a variety
of injection, detection, collection, and gradient scenarios including
stacked injection, manual sample collection, and sample collection
via defined stop–start times or by the detector threshold or detec-
tor slope within time windows. In addition, a simulator subroutine
allows the use of a previously collected chromatogram to facilitate
the creation of new method injection and collection parameters.
The instrument monitor function (Figure 3b) provides the user
with a complete picture of the status of the operating instrument,
providing readings on the flow rate, modifier percentage, back
pressure, temperature, absorbance, fraction collector valve posi-
tion, and so forth. Key instrument settings are also adjustable on-
the-fly by the user, including total pump flow, modifier percentage,
make-up pump flow rate, injection parameters, oven temperature,
BPR setting, fraction parameters, and fraction collector valve po-
sition. On-the-fly adjustment of these parameters allows users to
fine-tune instrument settings during prolonged stacked injection
sequences, thereby minimizing downtime and maximizing pro-
ductivity. Ongoing interactions between participating ETC project
team members and Shimadzu engineers over a number of months
were important in creating capabilities and a user interface that
enabled top performance.
Finally, along with the PrepSolution control software, a new
data viewer was created that allows the user to visualize previously
collected chromatograms, including the ability to load and com-
pare several different data files to enable comparisons over time.
The data viewer allows the user to easily compare collected peaks
across injections of a single stacked injection data file or across mul-
tiple single-injection data files.
Shimadzu Journal vol.8 Issue1 13Shimadzu Journal vol.8 Issue1 13Shimadzu Journal vol.8 Issue1 13
Insight from customer / Report

With these hardware and software features in place, the project
team’s next objective was to test the performance of the instrument.
Initial testing focused on the simple protocols to ensure the proper
functioning of the various hardware and software components of
the instrument. Suitable performance was observed for a number
of parameters, including detector linearity, minimal injection car-
ryover, suitable sample recovery and precision, variability of flow,
back pressure, temperature, and injection volume (Figures 4 and 5).
System stability was investigated by making a series of injections
with each run consisting of 50 stacked injections of TSO. Over the
course of 48 h of continuous running, more than 1750 injections
were made. Overlaying chromatograms from the beginning,
middle, and end of the sequence, showed no drift in retention times
or changes in peak shape (Figure 6), indicating that the instrument
is rugged enough to run for several days without issue.
Given the satisfactory performance of the prototype instrument,
we next investigated instrument performance in the purification of
a number of “real-world” samples. Figure 7 shows representative
chromatograms from the resolution of the enantiomers of 385 mg
of a proprietary development compound. A single injection of 32
mg of racemate (Figure 7a) affords baseline resolution. Automated
injection and fraction collection (Figure 7b) enable rapid enanti-
oseparation with excellent purity and recovery. The instrument
provided outstanding ease of use and maneuverability in carrying
Figure 5. Performance evaluation of the BPR, oven, and injection carryover: (a) the BPR accuracy was determined using a calibrated pressure gauge at 100 and 200 bars. (b) Oven accuracy was evaluated using a temperature probe inside the oven at the following temperatures: 16, 20, 40, and 80°C. (c) Fraction collector cross-talk was evaluated to determine carryover from fraction-to-fraction using ibuprofen and ketoprofen. There was no observed cross-talk between each fraction collected. Additionally, there was no observed carryover from injection-to-injection (data not shown). (d) System performance was evaluated for overall recovery, peak area, and retention time reproducibility for fractions collected based on retention time windows, threshold, and slope values. Details for these tests can be found in the Experimental Section.
Shimadzu Journal vol.8 Issue1 14Shimadzu Journal vol.8 Issue1 14Shimadzu Journal vol.8 Issue1 14
Insight from customer / Report
out such small-scale enantioseparations, thereby powerfully ena-
bling synthetic route investigations, a critical need in pharmaceuti-
cal discovery and development.
In addition to the resolution of racemic mixtures, preparative
chromatography is often used for rescue purifications in pharma-
ceutical research and development. Thus, preparative chroma-
tography can play a valuable role as a “safety net” for chemical
synthesis, providing valuable upgrades in chemical or enantiopu-
rity when needed. Figure 8 shows a typical example, where pre-
parative SFC using the beta instrument was used to remove an
unwanted regioisomer from a development compound.
The isolation and characterization of chemical impurities is
another important function of pharmaceutical research that is
powerfully enabled by preparative SFC. Although analytical
chromatography with MS detection can be useful for develop-
ing hypotheses regarding the identity of impurities, preparative
chromatographic enrichment is often essential for unambiguous
structure elucidation. In addition, assessing the biological activity
of impurities is greatly facilitated by preparative chromatographic
purification. In the example presented in Figure 9, isolation of a
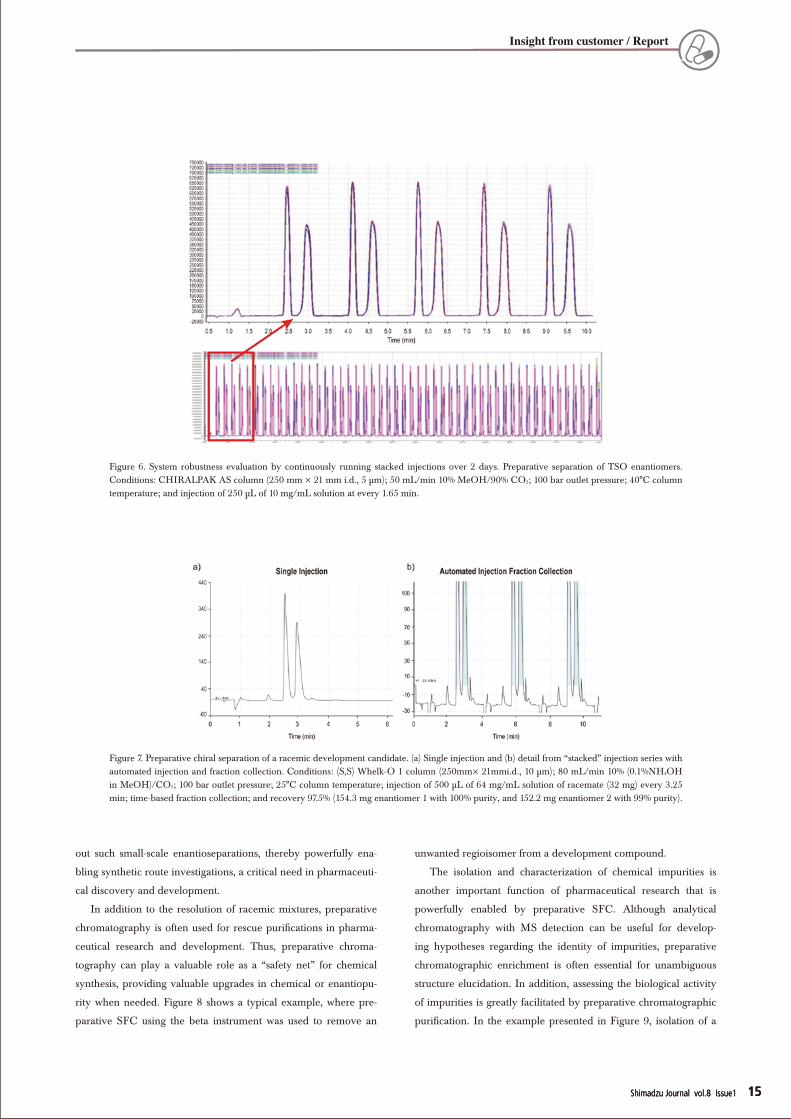
Figure 6. System robustness evaluation by continuously running stacked injections over 2 days. Preparative separation of TSO enantiomers. Conditions: CHIRALPAK AS column (250 mm × 21 mm i.d., 5 μm); 50 mL/min 10% MeOH/90% CO2; 100 bar outlet pressure; 40°C column temperature; and injection of 250 μL of 10 mg/mL solution at every 1.65 min.
Figure 7. Preparative chiral separation of a racemic development candidate. (a) Single injection and (b) detail from “stacked” injection series with automated injection and fraction collection. Conditions: (S,S) Whelk-O 1 column (250mm× 21mmi.d., 10 μm); 80 mL/min 10% (0.1%NH4OH in MeOH)/CO2; 100 bar outlet pressure; 25°C column temperature; injection of 500 μL of 64 mg/mL solution of racemate (32 mg) every 3.25 min; time-based fraction collection; and recovery 97.5% (154.3 mg enantiomer 1 with 100% purity, and 152.2 mg enantiomer 2 with 99% purity).
Shimadzu Journal vol.8 Issue1 15Shimadzu Journal vol.8 Issue1 15Shimadzu Journal vol.8 Issue1 15
Insight from customer / Report

minor impurity from 1 g of a developmental compound was facili-
tated by preparative SFC separation.
Conclusions
A new paradigm for the creation of enabling technologies for
pharmaceutical research and development was employed in the
successful creation of a commercial gram-scale preparative SFC
instrument. The project brought together, under the auspices of
the Enabling Technologies Consortium, a team of preparative
SFC experts from across the pharmaceutical industry and a team
of seasoned instrument designers and software engineers. Ongo-
ing discussions, candid feedback, and a close working relationship
within the project team led to rapid progress and convergence on
instrument and software features that are well suited to the practi-
cal preparative SFC workflows that are in current use within the
pharmaceutical industry. The instrument developed through this
collaboration more than met the SFC user’s expectations. The
new system was easy to use, rugged, reliable, and not only did it
Figure 8. Preparative SFC purity upgrade to remove an unwanted regioisomeric impurity from a development candidate. (a) Single preparative injection of the crude product containing 2.3% regioisomeric impurity and (b) detail from “stacked” injection series with automated injection and fraction collection. Preparative conditions: Lux Cellulose-3 column (250 mm× 21 mm i.d., 5 μm); 70 mL/min, 35% (0.1% NH4OH in MeOH)/CO2; 100 bar outlet pressure; 40°C column temperature; UV 260 nm; 500 μL injection of 6.25 mg/mL solution of crude product in 1:2 MeOH, ACN every 4 min; and recovery 15 mg of R2, >99.5% purity. (c) Analytical chromatogram of purified API, >99.5% pure. Analytical conditions: Lux Cellulose-3 column (50 mm × 4.6 mm i.d., 3 μm); 4 mL/min, 25% (0.1 NH4OH in MeOH)/CO2; 120 bar outlet pressure; 40°C column temperature; UV 254 nm; and 2 μL of injection of 1 mg/mL solution of API.
Figure 9. Preparative SFC purification of a minor impurity to facilitate chemical and biological characterization. (a) Analytical injection showing the crude development compound containing ∼1% impurity and (b) “stacked” injection series with automated injection and fraction collection; preparative conditions: Synergi Polar-RP column (150 mm × 21 mm i.d., 5 μm); 70 mL/min 10% (0.1% NH4OH in MeOH)/CO2; 100 bar outlet pressure; 25°C column temperature; injection of 1 mL of 25 mg/mL solution of 10:1 API: impurity (1 g) every 2.25 min; time-based fraction col-lection; and recovery 98% (971 mg API, and 9.1 mg impurity). (c) Expanded view of stacked injection sequence and (d) analytical chromatogram showing isolated impurity. Analytical conditions: Synergi Polar-RP column (50 mm × 2.0 mm i.d., 2.5 μm); 1.5 mL/min 10% (0.1% NH4OH in MeOH)/CO2; 120 bar outlet pressure; 40°C column temperature; and injection of 2 μL of injection of 1 mg/mL solution of impurity.
Shimadzu Journal vol.8 Issue1 16Shimadzu Journal vol.8 Issue1 16Shimadzu Journal vol.8 Issue1 16
Insight from customer / Report
have most of the physical features requested by the team but there
were additional and unexpected improvements such as the internal
chiller, the novel gas–liquid separator, and the ability to perform
on-column sample dilutions. We believe that this form of collabo-
rative instrument development represents an important new para-
digm for facilitating the creation of new research technologies that
better address the collective needs of researchers within the phar-
maceutical industry.
Meenakshi Goel − Genentech, Inc., South San Francisco,
California 94080, United States
Loanne Chung − Pfizer, San Diego, California 92121, United
States
James Paulson − Bristol Myers Squibb, Princeton, New Jersey
08540, United States
Heewon Lee − Boehringer-Ingelheim, Ridgefield, Connecticut
06877, United States
Douglas B. Moore − Bristol Myers Squibb, Princeton, New Jersey
08540, United States
Shuping Dong − GSK, Upper Providence, Pennsylvania 19426,
United States
William Leister − GSK, Upper Providence, Pennsylvania 19426,
United States
Nobumitsu Fukushima − Shimadzu Corporation, Kyoto
604- 8511, Japan
Andy Sasaki − Shimadzu Scientific Instruments, Columbia,
Maryland 21046, United States
Timothy Lee − Shimadzu Scientific Instruments, Columbia,
Maryland 21046, United States
Takayuki Iriki − Shimadzu Scientific Instruments, Columbia,
Maryland 21046, United States
Masayuki Nishimura − Shimadzu Scientific Instruments,
Columbia, Maryland 21046, United States
Masami Tomita − Shimadzu Corporation, Kyoto 604-8511, Japan
Michiaki Owa − Shimadzu Corporation, Kyoto 604-8511, Japan
Katsuhiro Tanaka − Shimadzu Corporation, Kyoto 604-8511,
Japan
Tomohiro Shagawa − Shimadzu Corporation, Kyoto 604-8511,
Japan
Thomas J. Moran − Shimadzu Scientific Instruments, Columbia,
Maryland 21046, United States
Takeshi Bamba − Kyushu University, Fukuoka 812-8582, Japan;
orcid.org/0000-0002-7442-2738
Christopher J. Welch − Indiana Consortium for Analytical Science
& Engineering (ICASE), Indianapolis, Indiana 46202, United
States; orcid.org/0000-0002-8899-4470
Complete contact information is available at: https://pubs.acs.org/doi/10.1021/acs.oprd.0c00136
FundingThis research was financially supported by Shimadzu Corporation.
NotesThe authors declare no competing financial interest.
Acknowledgments
We are grateful to Regina Black and Glenn Wilcox for valuable input at
the outset of this project and to James Vergis, Alexis Myers and Ann
Marie Stanley for valuable contributions in the administration of the
functions of the Enabling Technologies Consortium. We are also
Author information
Corresponding AuthorsMirlinda Biba − Merck & Co., Inc., Rahway, New Jersey 07065,
United States; orcid.org/0000-0002-9888-0821;
Email: [email protected]
Mengling Wong − Genentech, Inc., South San Francisco,
California 94080, United States; Email: wong.mengling@gene.
com
Anne Akin − Pfizer Central Research, Groton, Connecticut 06340,
United States; Email: [email protected]
Eric T. Manning − Shimadzu Scientific Instruments, Columbia,
Maryland 21046, United States; Email: [email protected]
AuthorsLisa Schaffter − Abbvie, Worcester, Massachusetts 01605, United
States
Larry Miller − Amgen Research, Cambridge, Massachusetts
02142, United States
Yingru Zhang − Bristol Myers Squibb, Princeton, New Jersey
08540, United States
William Farrell − Pfizer, San Diego, California 92121, United
States
Jimmy O. DaSilva − Merck & Co., Inc., Rahway, New Jersey
07065, United States; orcid.org/0000-0001-7044-0640
Lisa Nogle − Merck & Co., Inc., Boston, Massachusetts 02115,
United States
Benjamin Hritzko − Bristol Myers Squibb, Princeton, New Jersey
08540, United States
Frank Riley − Pfizer Central Research, Groton, Connecticut 06340,
United States
Robert P. DePianta − Pfizer Central Research, Groton,
Connecticut 06340, United States
Kevin Barry − Biogen, Cambridge, Massachusetts 02142, United
States
Donghong A. Gao − Boehringer-Ingelheim, Ridgefield,
Connecticut 06877, United States
Eric Seest − Eli Lilly & Co., Indianapolis, Indiana 46285, United
States
Shimadzu Journal vol.8 Issue1 17Shimadzu Journal vol.8 Issue1 17Shimadzu Journal vol.8 Issue1 17
Insight from customer / Report
grateful to Philip Searle, Justin Simanis, Christian Mueller, Erin Jordan,
Chandan Barhate, Dauh-Rurng Wu, Jingfang Cutrone, Shiuhang Yip,
Kanaka Hettiarachchi, Michael Hayes, Min Liu, and Amber Guillen for
their valuable suggestions, Peter Ratsep, Michael Parks, Charlie Wang,
Kelly de la Torre, and Tessa Burt for their help with the beta instrument
installations and testing, and to Sue Wilks and Merck Creative Studios
for their help with the manuscript figures.
Dedication
Dedication: This paper is dedicated to the memory of Atsu Apedo, an
excellent scientist, esteemed colleague, and a valuable team member
in the early days of the project.
References
(1) Welch, C. J.; Hawkins, J. M.; Tom, J. Precompetitive Collaboration
on Enabling Technologies for the Pharmaceutical Industry. Org.
Process Res. Dev. 2014, 18, 481–487.
(2) Welch, C. J.; Faul, M. M.; Tummala, S.; Papageorgiou, C. D.; Hicks,
F.; Hawkins, J. M.; Thomson, N.; Cote, A.; Bordawekar, S.; Witten-
berger, S. J.; Laffan, D.; Purdie, M.; Boulas, P.; Irdam, E.; Horspool,
K.; Yang, B.-S.; Fernandez, J.; Fernandez, P.; Ferretti, A.; May, S.;
Seibert, K.; Wells, K.; McKeown, R. The Enabling Technologies
Consortium (ETC): Fostering Precompetitive Collaborations on New
Enabling Technologies for Pharmaceutical Research and Develop-
ment. Org. Process Res. Dev. 2017, 21, 414−419.
(3) Arnaud, C. H. The Enabling Technologies Consortium fills in
pharma technology gaps: Consortium works with outside vendors
to improve supporting technologies for drug development. Chem.
Eng. News 2018, 96, 22−23.
(4) Enabling Technologies Consortium. https://www.etconsortium.org/
(accessed on March 28,2020).
(5) Conder, E. W.; Cosbie, A. S.; Gaertner, J.; Hicks, W.; Huggins, S.;
MacLeod, C. S.; Remy, B.; Yang, B.-S.; Engstrom, J. D.; Lamberto,
D. J.; Papageorgiou, C. D. The Pharmaceutical Drying Unit Opera-
tion: An Industry Perspective on Advancing the Science and
Development Approach for Scale-Up and Technology Transfer. Org.
Process Res. Dev. 2017, 21, 420−429.
(6) Bahr, M. N.; Damon, D. B.; Yates, S. D.; Chin, A. S.; Christopher, J.
D.; Cromer, S.; Perrotto, N.; Quiroz, J.; Rosso, V. Collaborative
Evaluation of Commercially Available Automated Powder Dispens-
ing Platforms for High-Throughput Experimentation in Pharmaceu-
tical Applications. Org. Process Res. Dev. 2018, 22, 1500−1508.
(7) Berger, T. A.; Fogleman, K.; Staats, T.; Bente, P.; Crocket, I.; Farrell,
W.; Osonubi, M. The development of a semi-preparatory scale
supercritical-fluid chromatograph for high-throughput purification
of ‘combi-chem’ libraries. J. Biochem. Biophys. Methods 2000, 43,
87−111.
(8) Welch, C. J.; Leonard, W. R.; DaSilva, J. O.; Biba, M.; Albaneze-
Walker, J.; Henderson, D. W.; Laing, B.; Mathre, D. J. Preparative
Chiral SFC as a ‘Green’ Technology for Rapid Access to Enantiopu-
rity in Pharmaceutical Process Research. LC-GC Eur. 2005, 23,
16−29.
(9) Welch, C. J. Chiral Chromatography in Support of Pharmaceutical
Process Research. In Preparative Enantioselective Chromatography;
Cox, G., Ed.; Blackwell: London, 2005; pp 1–18.
(10) White, C. Integration of supercritical fluid chromatography into
drug discovery as a routine support tool. J. Chromatogr. A 2005,
1074, 163–173.
(11) White, C.; Burnett, J. Integration of supercritical fluid chromatog-
raphy into drug discovery as a routine support tool. J. Chromatogr.
A 2005, 1074, 175–185.
(12) Phinney, K. W. Enantioselective separations by packed column
subcritical and supercritical fluid chromatography. Anal. Bioanal.
Chem. 2005, 382, 639–645.
(13) Leonard, W. R.; Henderson, D. W.; Miller, R. A.; Spencer, G. A.;
Sudah, O. S.; Biba, M.; Welch, C. J. Strategic use of preparative
chiral chromatography for the synthesis of a preclinical pharma-
ceutical candidate. Chirality 2007, 19, 693–700.
(14) Miller, L.; Potter, M. Preparative chromatographic resolution of
racemates using HPLC and SFC in a pharmaceutical discovery
environment. J. Chromatogr. B: Anal. Technol. Biomed. Life Sci.
2008, 875, 230–236.
(15) Taylor, L. T. Supercritical fluid chromatography for the 21st
century. J. Supercrit. Fluids 2009, 47, 566–573.
(16) McClain, R. T.; Dudkina, A.; Barrow, J.; Hartman, G.; Welch, C. J.
Evaluation and Implementation of a Commercially Available
Mass-Guided SFC Purification Platform in a High Throughput
Purification Laboratory in Drug Discovery. J. Liq. Chromatogr.
Relat. Technol. 2009, 32, 483–499.
(17) Welch, C. J.; Henderson, D. W.; Pipik, B.; Shaimi, M.; Schenk, D.;
Conlon, D. Shortcut to Selectivity: Make Them All and Let Prepar-
ative Chromatography Sort it Out. Org. Process Res. Dev. 2010,
14, 905–907.
(18) De la Puente, M. L.; López Soto-Yarritu, P.; Burnett, J. Supercritical
Fluid Chromatography in Research Laboratories: Design, Develop-
ment and Implementation of an Efficient Generic Screening for
Exploiting this Technique in the Achiral Environment. J. Chromato-
gr. A 2011, 1218, 8551–8560.
(19) Hamman, C.; Schmidt, D. E., Jr.; Wong, M.; Hayes, M. The Use of
Ammonium Hydroxide as an Additive in Supercritical Fluid
Chromatography for Achiral and Chiral Separations and Purifica-
tions of Small, Basic Medicinal Molecules. J. Chromatogr. A 2011,
1218, 7886–7894.
(20) Berger, T. A.; Berger, B. K. Minimizing UV Noise in Supercritical
Fluid Chromatography. I. Improving Back Pressure Regulator
Pressure Noise. J. Chromatogr. A 2011, 1218, 2320–2326.
(21) Welch, C. J. The Use of Preparative Chiral Chromatography for
Accessing Enantiopurity in Pharmaceutical Discovery and Develop-
ment. In Comprehensive Organic Synthesis; Welch, C., Ed.;
Newnes, 2013; Vol. 9, pp 143–159.
(22) Nexera Prep SFC Preparative Supercritical Fluid Chromatography
System. https://www.ssi.shimadzu.com/products/liquid-chromatogra-
phy/nexera/nexera-prep-sfc.html (accessed on May 12, 2020).
(23) Nexera UC Prep. https://www.ssi.shimadzu.com/sites/ssi.shimadzu.
com/files/Products/literature/hplc/c190-e236-NexeraUC_Prep_SSI.
pdf (accessed on May 12, 2020).
Reprinted with permission from “Org. Process Res. Dev. 2020, 24, 7, 1271–1280”. Copyright 2020 American Chemical Society.
Shimadzu Journal vol.8 Issue1 18Shimadzu Journal vol.8 Issue1 18Shimadzu Journal vol.8 Issue1 18
Insight from customer / Report
Application of HPLC in Quality Analysis of
Hydroxychloroquine SulfateYang Le, Analytical Applications Center, Shimadzu (China) Co., LTD
Introduction
Hydroxychloroquine sulfate (CAS#: 747-36-4) was on the market
first in 1955 in the USA. To date, it has been approved in more than
70 countries including Canada, France, German, Australia, China
and Japan etc.. Hydroxychloroquine sulfate was used initially
in the treatment of malaria. The drug was found to exhibit mild
immunosuppression and immunomodulation effects in clinical use.
Therefore, it has been used widely in the treatments of various dis-
eases such as rheumatoid arthritis, systemic lupus erythematosus
(SLE), connective tissue disease (CTD) etc. Amid the pandemic of
novel coronavirus disease (COVID-19) at present, some existing
drugs come to public attention and hydroxychloroquine sulfate is
one of such drugs.
Cell biology screening studies indicate that hydroxychloro-
quine sulfate exhibits significant suppression effect to coronavirus
SARS/MERS. Molecular biochemistry evidences also provide
primary support on its significant effect to the glycosylation level
of receptor ACE2 of coronavirus. Recently, clinical trials on the
evaluation of the safety and effectiveness for coronavirus disease
with hydroxychloroquine sulfate were started urgently in many
countries in the world.
The quality of a drug is a fundamental factor to guarantee the
results of clinical trials. The EP and USP monographs have de-
scribed the method and criteria for investigation of hydroxychlo-
roquine sulfate and related substances, and for determination of
hydroxychloroquine sulfate content in tablets.
In this work, hydroxychloroquine sulfate and related substances
were analyzed following EP assay on Shimadzu UHPLC. The content
of hydroxychloroquine sulfate in tablets was determined in refereeing
to USP assay in order to provide comprehensive monitoring and eval-
uation on the quality of hydroxychloroquine sulfate tablet products.
In this study, methods were established for analysis of hydroxychloroquine sulfate and related substances following European Pharmacopoeia (EP10.0) and for determination of hydroxychloroquine sulfate content in tablet following US Pharmacopoeia (USP 43). Using Shimadzu UHPLC system, well separation was achieved between hy-droxychloroquine sulfate and impurity C, as well as between impurity B and impurity C referring to the EP assay. Using Shimadzu HPLC system with reference to the USP assay, the content of hydroxychloroquine sul-fate in tablet was determined with achieving the desired peak separation and reproducibility described in the USP.
hydroxychloroquine sulfate, HPLC, European Pharmaco-poeia(EP),USPharmacopoeia(USP)
Abstract
Keyword
Pharmaceutical
Shimadzu Journal vol.8 Issue1 19
Experimental
1.1 InstrumentShimadzu UHPLC system LC-30A and HPLC system LC-2040C
3D were used in this work.
The s/w used is LabSolutionsTM DB ver 6.87, a chromatography
workstation.
1.2 Analytical conditions- EP assay (LC-30A UHPLC system)
Column : EP10.0 01/2017:2849, C18 50 X 2.1 mm I.D., 1.7 μm
Mobile phase : A - Methanol / Buffer (10:90 v:v); B Methanol /
Buffer (85:15 v:v) *
Flow rate : 0.7 mL/min
Injection volume : 4 μL
Column Temperature : 40°C
Autosampler temperature : 6°C
Elution mode: gradient solution, B initial conc. 0%, see time
program in Table 1
*Buffer is described in the monograph in the EP 10.0
- USP assay (LC-2040C 3D HPLC system)
Column : Shim-packTM GIST C18 250×4.6mmI.D., 5 μm
(PN: 227-30017-08)
Mobile phase : Water/MeOH/CAN/phosphoric acid
(800mL/100mL/100mL/2mL), containing 96 mg
Sodium 1-pentanesulphonate
Flow rate : 1.0 mL/min
Injection volume : 20 μL
Column Temperature : 40°C
Autosampler temperature : 6°C
Elution mode : isocratic gradient
1.3 Sample preparationAs mentioned in EP 10.0 and USP 43.
Results and Discussion
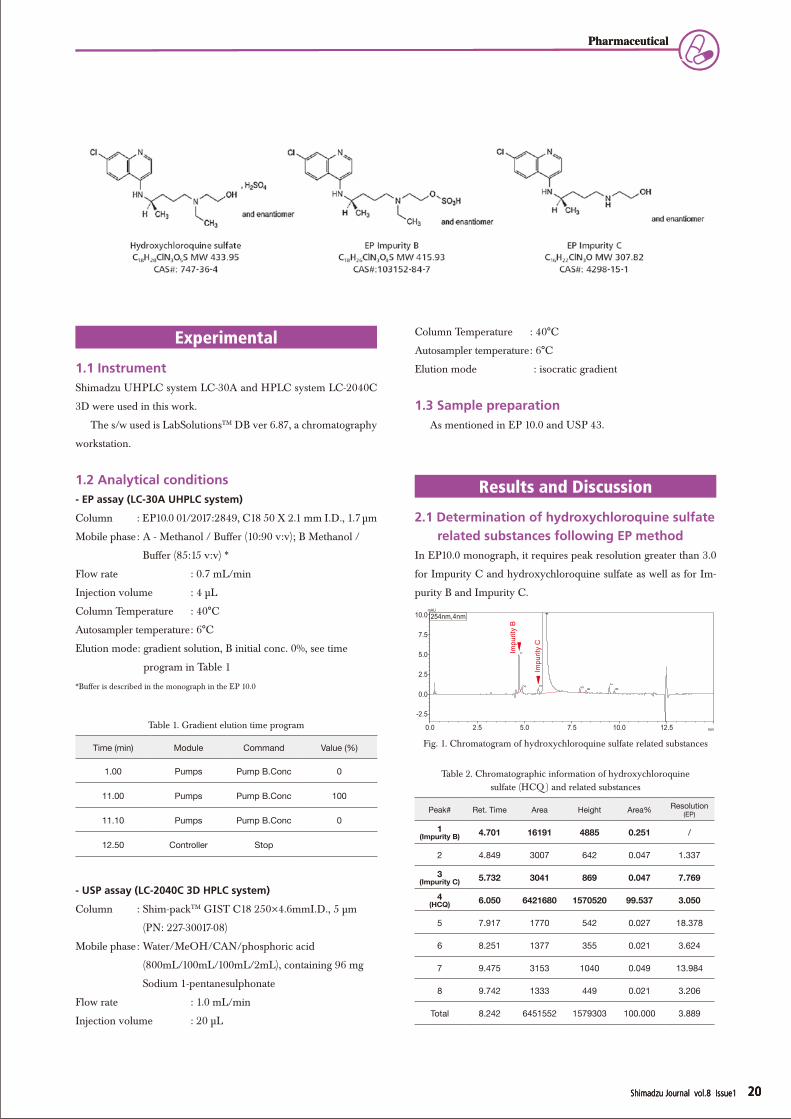
2.1 Determination of hydroxychloroquine sulfate related substances following EP method
In EP10.0 monograph, it requires peak resolution greater than 3.0
for Impurity C and hydroxychloroquine sulfate as well as for Im-
purity B and Impurity C.
0.0 2.5 5.0 7.5 10.0 12.5 min
-2.5
0.0
2.5
5.0
7.5
10.0mAU
254nm,4nm
12 3
4
5 6
78
Impu
rity
B
Impu
rity
C
Fig. 1. Chromatogram of hydroxychloroquine sulfate related substances
Table 1. Gradient elution time program
Time (min) Module Command Value (%)
1.00 Pumps Pump B.Conc 0
11.00 Pumps Pump B.Conc 100
11.10 Pumps Pump B.Conc 0
12.50 Controller Stop
Table 2. Chromatographic information of hydroxychloroquine sulfate (HCQ ) and related substances
Peak# Ret. Time Area Height Area% Resolution(EP)
1(Impurity B) 4.701 16191 4885 0.251 /
2 4.849 3007 642 0.047 1.337
3(Impurity C) 5.732 3041 869 0.047 7.769
4(HCQ) 6.050 6421680 1570520 99.537 3.050
5 7.917 1770 542 0.027 18.378
6 8.251 1377 355 0.021 3.624
7 9.475 3153 1040 0.049 13.984
8 9.742 1333 449 0.021 3.206
Total 8.242 6451552 1579303 100.000 3.889
Shimadzu Journal vol.8 Issue1 20
Pharmaceutical
Shimadzu Journal vol.8 Issue1 20
Pharmaceutical
Shimadzu Journal vol.8 Issue1 20
The result indicates that the resolutions obtained are greater
than 3.0 for hydroxychloroquine sulfate and Impurity C, as well as
for Impurity B and Impurity C. This result meets the criteria stated
in the EP monograph.
2.2 Determination of hydroxychloroquine sulfate content
in tablet following USP assay
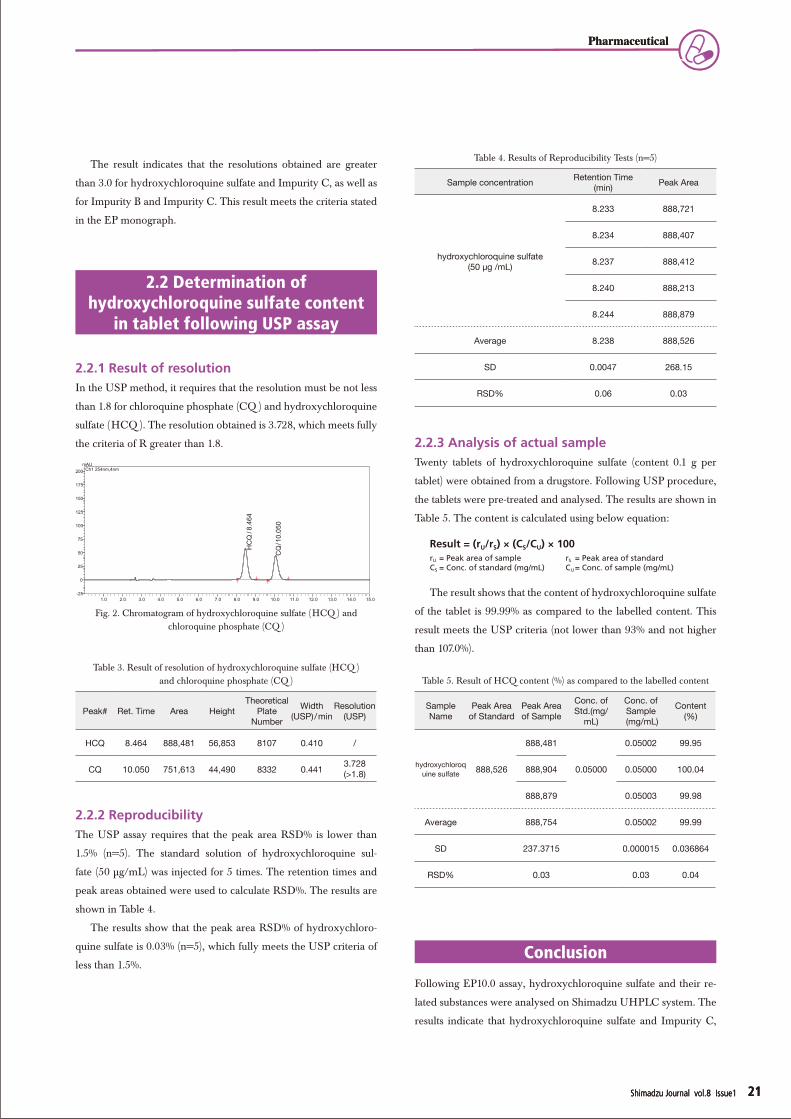
2.2.1 Result of resolutionIn the USP method, it requires that the resolution must be not less
than 1.8 for chloroquine phosphate (CQ ) and hydroxychloroquine
sulfate (HCQ ). The resolution obtained is 3.728, which meets fully
the criteria of R greater than 1.8.
2.2.2 ReproducibilityThe USP assay requires that the peak area RSD% is lower than
1.5% (n=5). The standard solution of hydroxychloroquine sul-
fate (50 μg/mL) was injected for 5 times. The retention times and
peak areas obtained were used to calculate RSD%. The results are
shown in Table 4.
The results show that the peak area RSD% of hydroxychloro-
quine sulfate is 0.03% (n=5), which fully meets the USP criteria of
less than 1.5%.
2.2.3 Analysis of actual sampleTwenty tablets of hydroxychloroquine sulfate (content 0.1 g per
tablet) were obtained from a drugstore. Following USP procedure,
the tablets were pre-treated and analysed. The results are shown in
Table 5. The content is calculated using below equation:
Result = (rU/rS) × (CS/CU) × 100rU = Peak area of sample rS = Peak area of standardCS = Conc. of standard (mg/mL) CU = Conc. of sample (mg/mL)
The result shows that the content of hydroxychloroquine sulfate
of the tablet is 99.99% as compared to the labelled content. This
result meets the USP criteria (not lower than 93% and not higher
than 107.0%).
Conclusion
Following EP10.0 assay, hydroxychloroquine sulfate and their re-
lated substances were analysed on Shimadzu UHPLC system. The
results indicate that hydroxychloroquine sulfate and Impurity C,
Table 3. Result of resolution of hydroxychloroquine sulfate (HCQ ) and chloroquine phosphate (CQ )
Peak# Ret. Time Area HeightTheoretical
Plate Number
Width(USP)/min
Resolution(USP)
HCQ 8.464 888,481 56,853 8107 0.410 /
CQ 10.050 751,613 44,490 8332 0.441 3.728 (>1.8)
1.0 2.0 3.0 4.0 5.0 6.0 7.0 8.0 9.0 10.0 11.0 12.0 13.0 14.0 15.0-25
0
25
50
75
100
125
150
175
200mAU
Ch1 254nm,4nm
HC
Q/8
.464
CQ
/10.
050
Fig. 2. Chromatogram of hydroxychloroquine sulfate (HCQ ) and chloroquine phosphate (CQ )
Table 4. Results of Reproducibility Tests (n=5)
Sample concentration Retention Time(min) Peak Area
hydroxychloroquine sulfate(50 μg /mL)
8.233 888,721
8.234 888,407
8.237 888,412
8.240 888,213
8.244 888,879
Average 8.238 888,526
SD 0.0047 268.15
RSD% 0.06 0.03
Table 5. Result of HCQ content (%) as compared to the labelled content
Sample Name
Peak Area of Standard
Peak Area of Sample
Conc. of Std.(mg/
mL)
Conc. of Sample
(mg/mL)
Content(%)
hydroxychloroquine sulfate 888,526
888,481
0.05000
0.05002 99.95
888,904 0.05000 100.04
888,879 0.05003 99.98
Average 888,754 0.05002 99.99
SD 237.3715 0.000015 0.036864
RSD% 0.03 0.03 0.04
Shimadzu Journal vol.8 Issue1 21
Pharmaceutical
Shimadzu Journal vol.8 Issue1 21
Pharmaceutical
Shimadzu Journal vol.8 Issue1 21
Impurity B and Impurity C are well separated. The resolution of
the separation measured meet the requirement desribed in the EP
monograph. Using Shimadzu HPLC, the content of hydroxychlo-
roquine sulfate in a tablet product was determined following USP
43 method. The resolution of the separation for hydroxychloro-
quine sulfate and chloroquine phosphate measured is 3.728 and
the analysis reproducibility RSD% based on peak area is 0.03%
(n=5). These results meet fully the criteria stated in the USP mon-
ograph for determination of hydroxychloroquine sulfate content
in tablet.
This article is published as Application News LC-199.
https://solutions.shimadzu.co.jp/an/n/en/hplc/hkl220025.pdf
Shimadzu Journal vol.8 Issue1 22
Pharmaceutical
Shimadzu Journal vol.8 Issue1 22
Pharmaceutical
Shimadzu Journal vol.8 Issue1 22
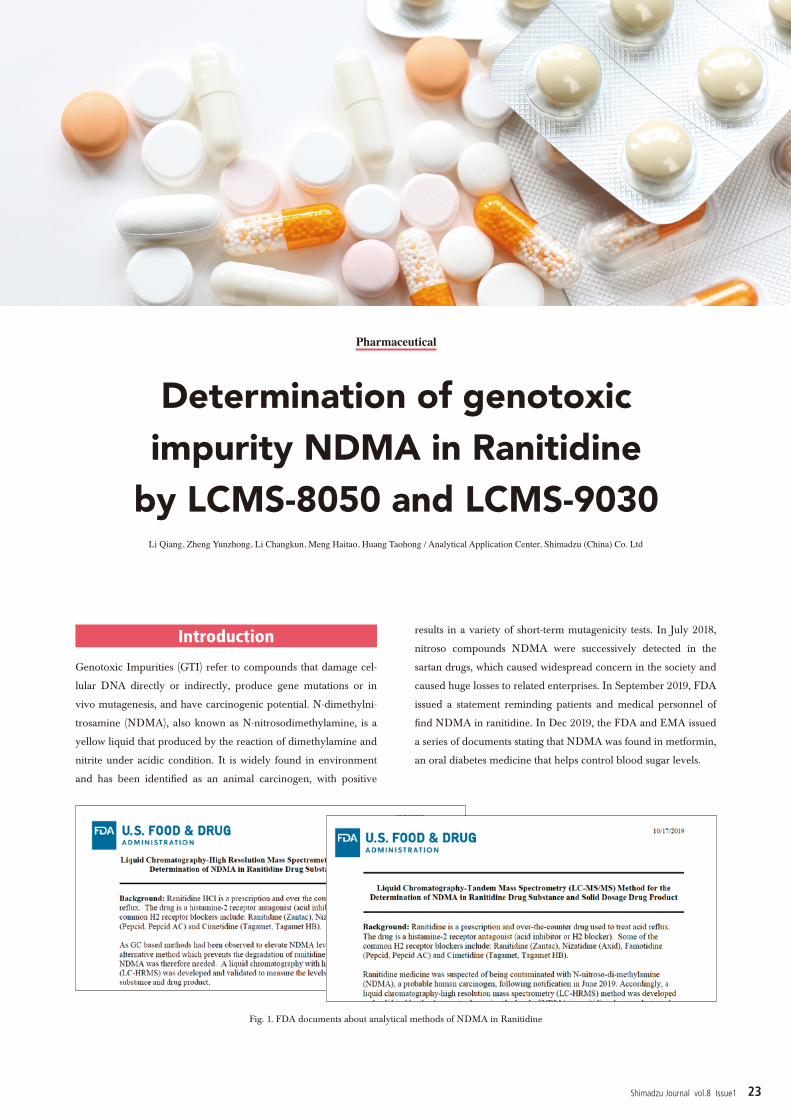
Fig. 1. FDA documents about analytical methods of NDMA in Ranitidine
Determination of genotoxicimpurity NDMA in Ranitidine
by LCMS-8050 and LCMS-9030Li Qiang, Zheng Yunzhong, Li Changkun, Meng Haitao, Huang Taohong / Analytical Application Center, Shimadzu (China) Co. Ltd
Introduction
Genotoxic Impurities (GTI) refer to compounds that damage cel-
lular DNA directly or indirectly, produce gene mutations or in
vivo mutagenesis, and have carcinogenic potential. N-dimethylni-
trosamine (NDMA), also known as N-nitrosodimethylamine, is a
yellow liquid that produced by the reaction of dimethylamine and
nitrite under acidic condition. It is widely found in environment
and has been identified as an animal carcinogen, with positive
results in a variety of short-term mutagenicity tests. In July 2018,
nitroso compounds NDMA were successively detected in the
sartan drugs, which caused widespread concern in the society and
caused huge losses to related enterprises. In September 2019, FDA
issued a statement reminding patients and medical personnel of
find NDMA in ranitidine. In Dec 2019, the FDA and EMA issued
a series of documents stating that NDMA was found in metformin,
an oral diabetes medicine that helps control blood sugar levels.
Pharmaceutical
Shimadzu Journal vol.8 Issue1 23
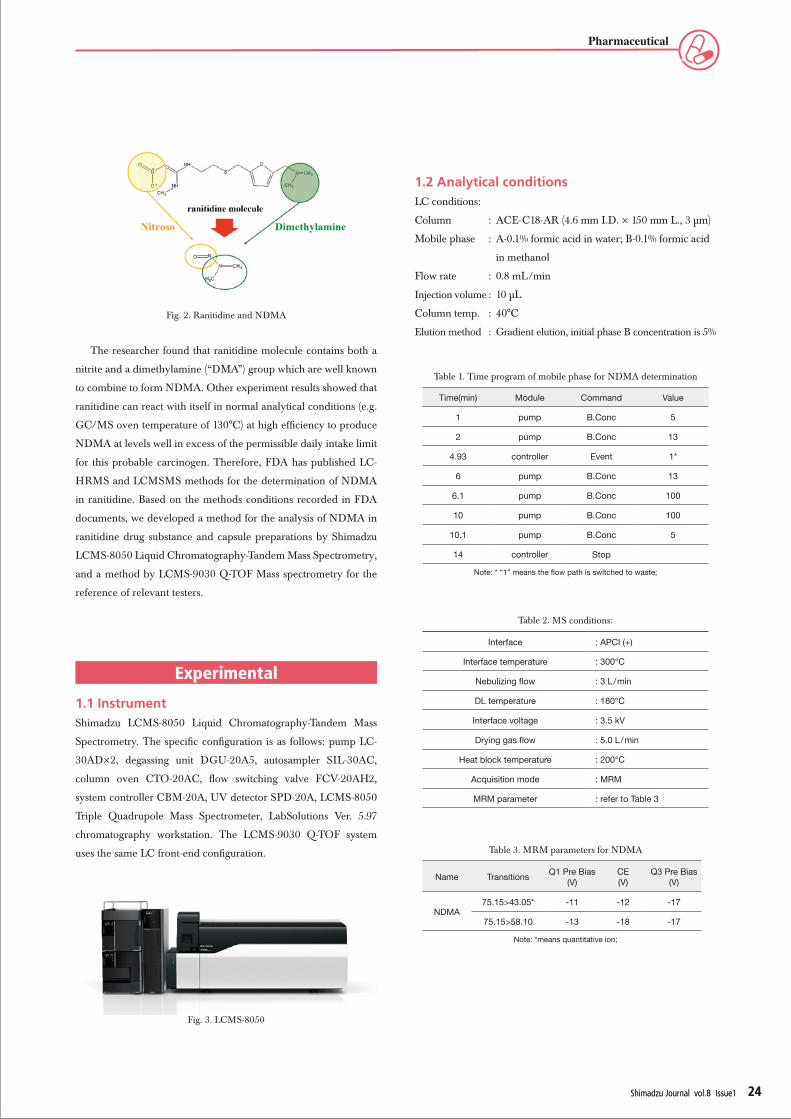
The researcher found that ranitidine molecule contains both a
nitrite and a dimethylamine (“DMA”) group which are well known
to combine to form NDMA. Other experiment results showed that
ranitidine can react with itself in normal analytical conditions (e.g.
GC/MS oven temperature of 130°C) at high efficiency to produce
NDMA at levels well in excess of the permissible daily intake limit
for this probable carcinogen. Therefore, FDA has published LC-
HRMS and LCMSMS methods for the determination of NDMA
in ranitidine. Based on the methods conditions recorded in FDA
documents, we developed a method for the analysis of NDMA in
ranitidine drug substance and capsule preparations by Shimadzu
LCMS-8050 Liquid Chromatography-Tandem Mass Spectrometry,
and a method by LCMS-9030 Q-TOF Mass spectrometry for the
reference of relevant testers.
Experimental
1.1 InstrumentShimadzu LCMS-8050 Liquid Chromatography-Tandem Mass
Spectrometry. The specific configuration is as follows: pump LC-
30AD×2, degassing unit DGU-20A5, autosampler SIL-30AC,
column oven CTO-20AC, flow switching valve FCV-20AH2,
system controller CBM-20A, UV detector SPD-20A, LCMS-8050
Triple Quadrupole Mass Spectrometer, LabSolutions Ver. 5.97
chromatography workstation. The LCMS-9030 Q-TOF system
uses the same LC front-end configuration.
1.2 Analytical conditionsLC conditions:
Column : ACE-C18-AR (4.6 mm I.D. × 150 mm L., 3 μm)
Mobile phase : A-0.1% formic acid in water; B-0.1% formic acid
in methanol
Flow rate : 0.8 mL/min
Injection volume : 10 μL
Column temp. : 40°C
Elution method : Gradient elution, initial phase B concentration is 5%
Fig. 2. Ranitidine and NDMA
Table 1. Time program of mobile phase for NDMA determination
Time(min) Module Command Value
1 pump B.Conc 5
2 pump B.Conc 13
4.93 controller Event 1*
6 pump B.Conc 13
6.1 pump B.Conc 100
10 pump B.Conc 100
10.1 pump B.Conc 5
14 controller Stop
Note: * “1” means the flow path is switched to waste;
Interface : APCI (+)
Interface temperature : 300℃
Nebulizing flow : 3 L/min
DL temperature : 180℃
Interface voltage : 3.5 kV
Drying gas flow : 5.0 L/min
Heat block temperature : 200℃
Acquisition mode : MRM
MRM parameter : refer to Table 3
Table 2. MS conditions:
Table 3. MRM parameters for NDMA
Name Transitions Q1 Pre Bias(V)
CE(V)
Q3 Pre Bias(V)
NDMA75.15>43.05* -11 -12 -17
75.15>58.10 -13 -18 -17
Note: *means quantitative ion;
Fig. 3. LCMS-8050
Shimadzu Journal vol.8 Issue1 24
Pharmaceutical
Shimadzu Journal vol.8 Issue1 24
1.3 Standard solution preparationAn 8-points calibration curve of NDMA was prepared at con-
centration of 1, 2, 5, 10, 20, 50, 100, 200 ng/mL from 100 mg/L
stocked standard solution. The diluent was water.
1.4 Sample preparationDrug substance: Accurately weigh 120 mg of drug substance into
a 15 mL glass centrifuge tube. Add 4.0 mL of water into the tube
and mix the solution using a vortex mixer until dissolved. Filter the
supernatant with a 0.22 μm filter.
Drug product: Accurately weigh the appropriate contents and dis-
solve it with water to reach the target concentration of 30 mg/mL
API. Vortex the mixture for 40 min and filter with a 0.22 μm filter.
Results and discussion
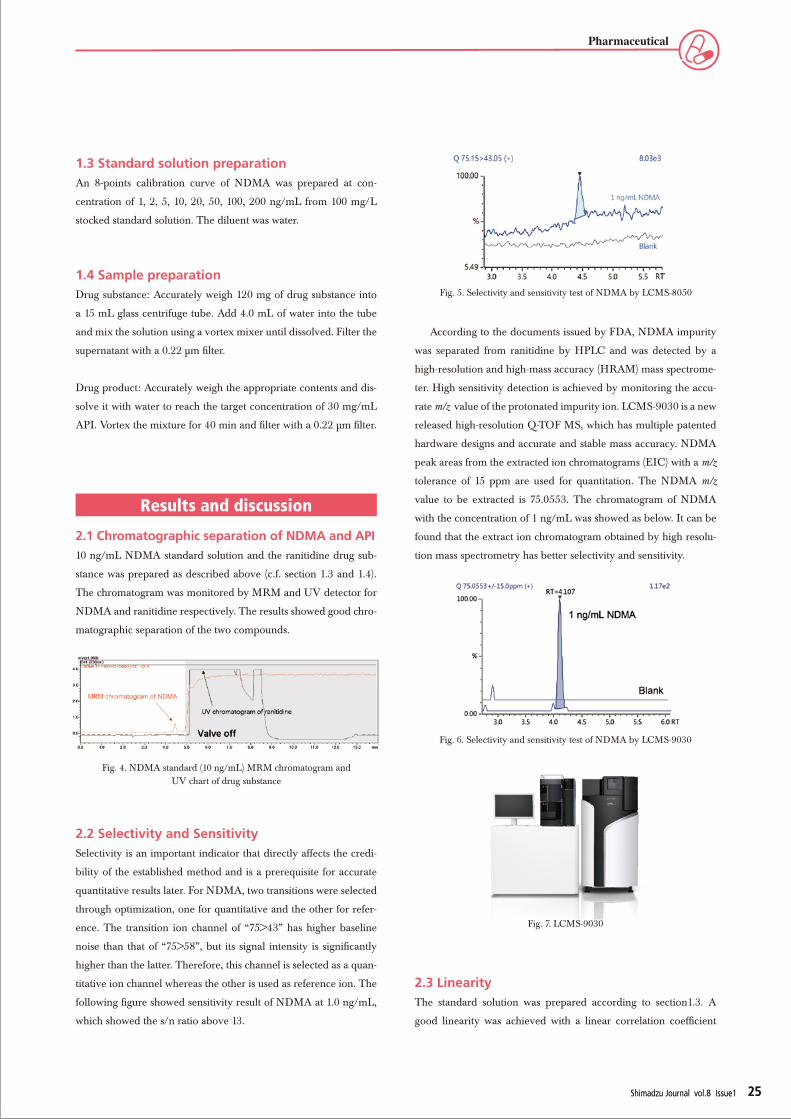
2.1 Chromatographic separation of NDMA and API10 ng/mL NDMA standard solution and the ranitidine drug sub-
stance was prepared as described above (c.f. section 1.3 and 1.4).
The chromatogram was monitored by MRM and UV detector for
NDMA and ranitidine respectively. The results showed good chro-
matographic separation of the two compounds.
2.2 Selectivity and SensitivitySelectivity is an important indicator that directly affects the credi-
bility of the established method and is a prerequisite for accurate
quantitative results later. For NDMA, two transitions were selected
through optimization, one for quantitative and the other for refer-
ence. The transition ion channel of “75>43” has higher baseline
noise than that of “75>58”, but its signal intensity is significantly
higher than the latter. Therefore, this channel is selected as a quan-
titative ion channel whereas the other is used as reference ion. The
following figure showed sensitivity result of NDMA at 1.0 ng/mL,
which showed the s/n ratio above 13.
According to the documents issued by FDA, NDMA impurity
was separated from ranitidine by HPLC and was detected by a
high-resolution and high-mass accuracy (HRAM) mass spectrome-
ter. High sensitivity detection is achieved by monitoring the accu-
rate m/z value of the protonated impurity ion. LCMS-9030 is a new
released high-resolution Q-TOF MS, which has multiple patented
hardware designs and accurate and stable mass accuracy. NDMA
peak areas from the extracted ion chromatograms (EIC) with a m/z
tolerance of 15 ppm are used for quantitation. The NDMA m/z
value to be extracted is 75.0553. The chromatogram of NDMA
with the concentration of 1 ng/mL was showed as below. It can be
found that the extract ion chromatogram obtained by high resolu-
tion mass spectrometry has better selectivity and sensitivity.
2.3 LinearityThe standard solution was prepared according to section1.3. A
good linearity was achieved with a linear correlation coefficient
Fig. 5. Selectivity and sensitivity test of NDMA by LCMS-8050
Fig. 4. NDMA standard (10 ng/mL) MRM chromatogram and UV chart of drug substance
Fig. 6. Selectivity and sensitivity test of NDMA by LCMS-9030
Fig. 7. LCMS-9030
Shimadzu Journal vol.8 Issue1 25
Pharmaceutical
Shimadzu Journal vol.8 Issue1 25
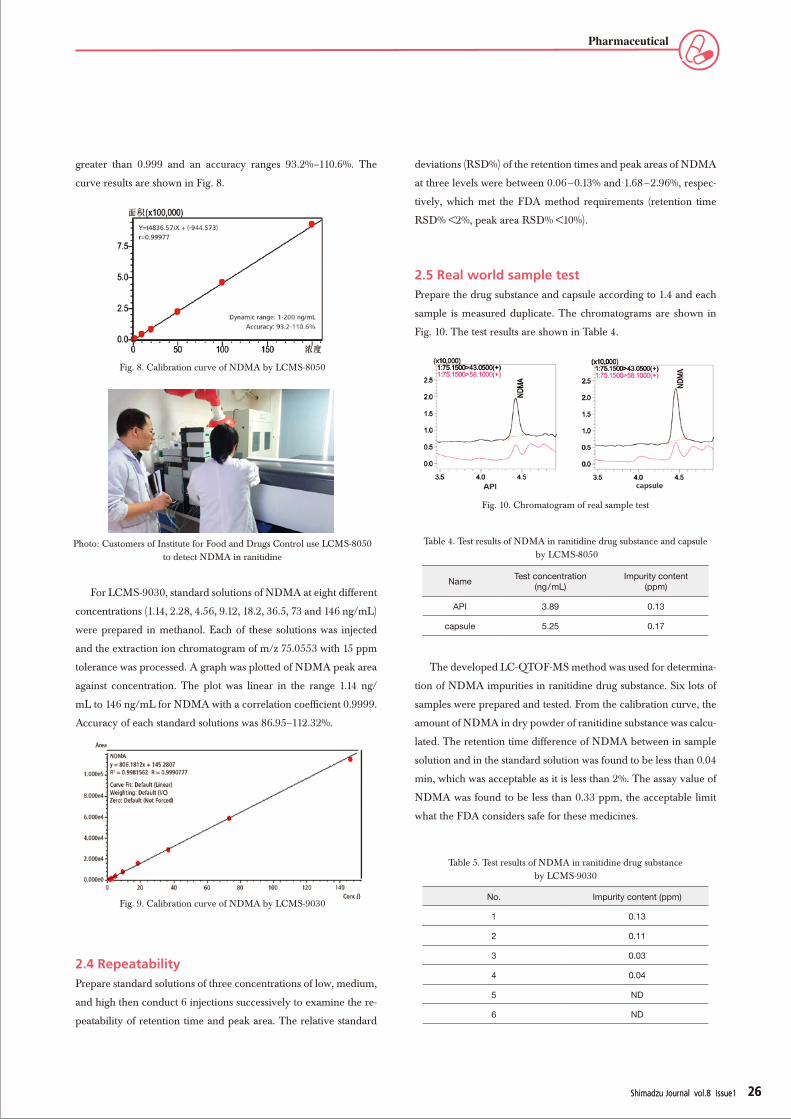
deviations (RSD%) of the retention times and peak areas of NDMA
at three levels were between 0.06–0.13% and 1.68–2.96%, respec-
tively, which met the FDA method requirements (retention time
RSD% <2%, peak area RSD% <10%).
2.5 Real world sample testPrepare the drug substance and capsule according to 1.4 and each
sample is measured duplicate. The chromatograms are shown in
Fig. 10. The test results are shown in Table 4.
The developed LC-QTOF-MS method was used for determina-
tion of NDMA impurities in ranitidine drug substance. Six lots of
samples were prepared and tested. From the calibration curve, the
amount of NDMA in dry powder of ranitidine substance was calcu-
lated. The retention time difference of NDMA between in sample
solution and in the standard solution was found to be less than 0.04
min, which was acceptable as it is less than 2%. The assay value of
NDMA was found to be less than 0.33 ppm, the acceptable limit
what the FDA considers safe for these medicines.
greater than 0.999 and an accuracy ranges 93.2%–110.6%. The
curve results are shown in Fig. 8.
For LCMS-9030, standard solutions of NDMA at eight different
concentrations (1.14, 2.28, 4.56, 9.12, 18.2, 36.5, 73 and 146 ng/mL)
were prepared in methanol. Each of these solutions was injected
and the extraction ion chromatogram of m/z 75.0553 with 15 ppm
tolerance was processed. A graph was plotted of NDMA peak area
against concentration. The plot was linear in the range 1.14 ng/
mL to 146 ng/mL for NDMA with a correlation coefficient 0.9999.
Accuracy of each standard solutions was 86.95–112.32%.
2.4 RepeatabilityPrepare standard solutions of three concentrations of low, medium,
and high,then conduct 6 injections successively to examine the re-
peatability of retention time and peak area. The relative standard
Fig. 10. Chromatogram of real sample test
Fig. 9. Calibration curve of NDMA by LCMS-9030
Fig. 8. Calibration curve of NDMA by LCMS-8050
Photo: Customers of Institute for Food and Drugs Control use LCMS-8050 to detect NDMA in ranitidine
Table 4. Test results of NDMA in ranitidine drug substance and capsule by LCMS-8050
Name Test concentration(ng/mL)
Impurity content(ppm)
API 3.89 0.13
capsule 5.25 0.17
Table 5. Test results of NDMA in ranitidine drug substance by LCMS-9030
No. Impurity content (ppm)
1 0.13
2 0.11
3 0.03
4 0.04
5 ND
6 ND
Shimadzu Journal vol.8 Issue1 26
Pharmaceutical
Shimadzu Journal vol.8 Issue1 26

2.6 Spiked recoveryThe ranitidine drug substance was prepared according to section
1.4. The standard was spiked at 80%, 100%, and 120% of the con-
centration in the drug substance, and measured triplicates. The
recoveries of the three concentrations are between 90.3% and
100.9%, and the relative standard deviations (RSD%) of three
parallel samples are between 1.77 and 4.93%, indicating that the
method is accurate and reliable.
Conclusion
For NDMA in different drugs, several instrumental methods
were developed as mentioned above. It is noted that method se-
lection is based on the chemical properties of the drug, GTI and
limit of quantification regulated by the authorities. In this study,
the triple quadrupole mass spectrometer LCMS-8050 and Q-TOF
MS LCMS-9030 were used to establish methods for determin-
ing NDMA in ranitidine drug substance and capsule. The results
for real samples showed that methods could be used for quality
control and commodity inspection for pharmaceutical companies
or Drug Inspection Agency. The method optimized by adjusting
LC parameters based on the original method can be used for the
detection of nizatidine and Bismuth ranitidine citrate. The LCMS
method for metformin is also established in the same way. It is
important to note that the retention time of metformin is weaker
than that of NDMA, and thus better separation is required to
obtain accurate results. Alternatively, GCMSMS or GCMS is also
a choice for NDMA analysis. It is applicable when the compound
is thermo stable.
Reference
1. Zantac (ranitidine): Safety Information—NDMA Found in Samples
of Some Ranitidine Medicines. https://www.fda.gov
2. Formation of NDMA from ranitidine and sumatriptan: The role of pH,
Ruqiao Shen, Susan A Andrews, Water Research, 2013(47) 802-810.
3. Structural alerts of genotoxic impurities, MA Lei et al, Chinese Jour-
nal of New Drugs 2014, 23(18)
4. FY19-177-DPA-S. Liquid Chromatography-High Resolution Mass
Spectrometry (LC-HRMS) Method for the Determination of NDMA in
Rani tidine Drug Substance and Drug Product, FDA.
5. FY19-059-DPQR-S, Review of Potential NDMA Formation from
Ranitidine HCl (July 5, 2019), FDA.
6. Statement on new testing results, including low levels of impurities
in ranitidine drugs, https://www.fda.gov
7. Questions and Answers: NDMA impurities in ranitidine (commonly
known as Zantac) https://www.fda.gov
8. Liquid Chromatography-Tandem Mass Spectrometry (LC-MS/MS)
Method for the Determination of NDMA in Ranitidine Drug Sub-
stance and Solid Dosage Drug Product, https://www.fda.gov
9. Determination of N-nitrosodimethylamine (NDMA) in metformin
products by HRAM-GCMS. Pharmaceutical Laboratory Applied Sci-
ences Group, Health Sciences Authority, Singapore.
10. NDMA impurity in valsartan and other pharmaceutical products: An-
alytical methods for the determination of N-nitrosamines, Maria
Kristina Parr, Jan Felix Joseph, Journal of Pharmaceutical and Bio-
medical Analysis, 2019 (164) 536-549
Table 6. Recovery of NDMA spiked to API at 80,100 and 120% level. Each level has triplicated samples.
NameSpiked
concentration (ng/mL)
Test concentration
(ng/mL)Recovery RSD/%
API — 7.59 — —
80% 5.6 12.75 92.1 1.77
100% 7.0 14.65 100.9 4.93
120% 8.4 15.18 90.3 4.85
Shimadzu Journal vol.8 Issue1 27
Pharmaceutical
Shimadzu Journal vol.8 Issue1 27
Determination of genotoxic impurity NDMA in Metformin by LCMS-8050
and GCMS-TQ8050 NXZheng Jia, Huang Gang, Gao Jie, Shen Lingling, Fan Jun, Huang Taohong / Analytical Application Center, Shimadzu (China) Co. Ltd
Introduction
Genotoxic Impurities (GTI) refer to one group of potential car-
cinogenic compounds which damage cellular DNA directly or
indirectly and induce gene mutations or in vivo mutagenesis. N-di-
methylnitrosamine (NDMA) is such a type of genotoxic impurity
and classified as Group 2A carcinogen by IARC; however it has
been found in some common drugs. In July 2018, the EMA an-
nounced that NDMA was detected in the anti-stress drug, valsar-
tan. After more than one year, it was detected again in ranitidine,
a drug for treating high gastric acid secretion diseases, according
to report from FDA and EMA in September 2019. Thus, we es-
tablished the complete solution for the detection of NDMA in the
drugs of valsartan and ranitidine. However, in December 2019, the
FDA and EMA reported in an official announcement that NDMA
was found in metformin, an oral diabetes medicine that helps con-
trol blood sugar levels in official documents. The pharmaceutical
matrix of metformin is different from that of valsartan and ran-
itidine. Therefore, a new method of extracting and detecting the
NDMA in metformin is extremely required.
According to FDA, the upper limit of NDMA in metformin
is 96 ng/day with the assumption of the maximum daily dosage
of metformin as 2 g, so the maximum content of NDMA in met-
formin is 48 ng/g. To meet or even superior to that detection re-
quirement from different customers, we developed three methods
to detect NDMA in metformin based on the recipe published by
National Institutes for Food and Drug Control and Health Sciences
Authority of Singapore. The first is to use the LCMS-8050 with
a LC-MS/MS protocol for the analysis of NDMA in metformin
hydrochloride tablets and active pharmaceutical ingredient (API)
besides sustained release tablets. Meanwhile, due to NDMA is a
volatile small molecule, we also built a GC-MS/MS method by
GCMS-TQ8050 NX with higher sensitivity and better anti-interfer-
ence capacity for the detection of NDMA with lower concentration
in hydrochloride metformin tablets and API. Additionally, given
that the detection cost, we also built an inexpensive method using
GCMS named GCMS-QP2020 NX to determine the concentra-
tion of NDMA in metformin according to the method published
by Health Sciences Authority of Singapore.
Pharmaceutical
Shimadzu Journal vol.8 Issue1 28
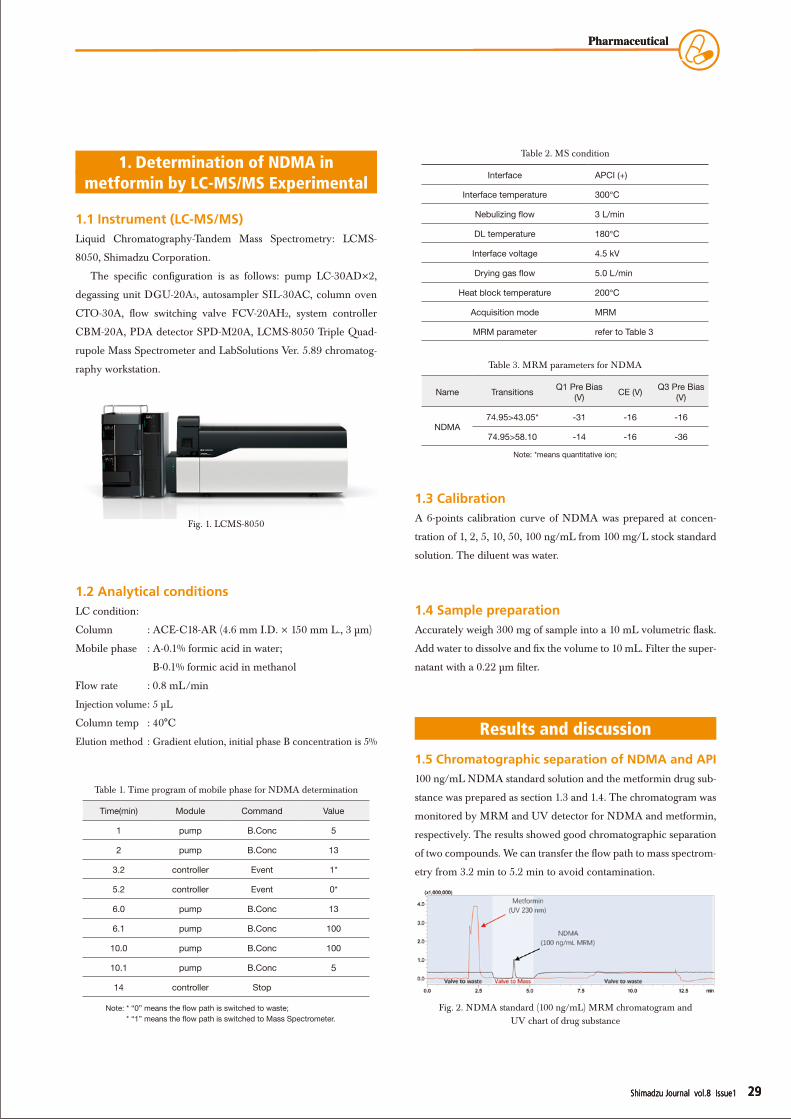
1. Determination of NDMA in metformin by LC-MS/MS Experimental
1.1 Instrument (LC-MS/MS)Liquid Chromatography-Tandem Mass Spectrometry: LCMS-
8050, Shimadzu Corporation.
The specific configuration is as follows: pump LC-30AD×2,
degassing unit DGU-20A5, autosampler SIL-30AC, column oven
CTO-30A, flow switching valve FCV-20AH2, system controller
CBM-20A, PDA detector SPD-M20A, LCMS-8050 Triple Quad-
rupole Mass Spectrometer and LabSolutions Ver. 5.89 chromatog-
raphy workstation.
1.2 Analytical conditionsLC condition:
Column : ACE-C18-AR (4.6 mm I.D. × 150 mm L., 3 μm)
Mobile phase : A-0.1% formic acid in water;
B-0.1% formic acid in methanol
Flow rate : 0.8 mL/min
Injection volume : 5 μL
Column temp : 40°C
Elution method : Gradient elution, initial phase B concentration is 5%
1.3 CalibrationA 6-points calibration curve of NDMA was prepared at concen-
tration of 1, 2, 5, 10, 50, 100 ng/mL from 100 mg/L stock standard
solution. The diluent was water.
1.4 Sample preparationAccurately weigh 300 mg of sample into a 10 mL volumetric flask.
Add water to dissolve and fix the volume to 10 mL. Filter the super-
natant with a 0.22 μm filter.
Results and discussion
1.5 Chromatographic separation of NDMA and API
100 ng/mL NDMA standard solution and the metformin drug sub-
stance was prepared as section 1.3 and 1.4. The chromatogram was
monitored by MRM and UV detector for NDMA and metformin,
respectively. The results showed good chromatographic separation
of two compounds. We can transfer the flow path to mass spectrom-
etry from 3.2 min to 5.2 min to avoid contamination.
Table 1. Time program of mobile phase for NDMA determination
Time(min) Module Command Value
1 pump B.Conc 5
2 pump B.Conc 13
3.2 controller Event 1*
5.2 controller Event 0*
6.0 pump B.Conc 13
6.1 pump B.Conc 100
10.0 pump B.Conc 100
10.1 pump B.Conc 5
14 controller Stop
Note: * “0” means the flow path is switched to waste; * “1” means the flow path is switched to Mass Spectrometer.
Interface APCI (+)
Interface temperature 300℃
Nebulizing flow 3 L/min
DL temperature 180℃
Interface voltage 4.5 kV
Drying gas flow 5.0 L/min
Heat block temperature 200℃
Acquisition mode MRM
MRM parameter refer to Table 3
Table 2. MS condition
Table 3. MRM parameters for NDMA
Name Transitions Q1 Pre Bias (V) CE (V) Q3 Pre Bias
(V)
NDMA74.95>43.05* -31 -16 -16
74.95>58.10 -14 -16 -36
Note: *means quantitative ion;
Fig. 1. LCMS-8050
Fig. 2. NDMA standard (100 ng/mL) MRM chromatogram and UV chart of drug substance
Shimadzu Journal vol.8 Issue1 29
Pharmaceutical
Shimadzu Journal vol.8 Issue1 29
Pharmaceutical
Shimadzu Journal vol.8 Issue1 29
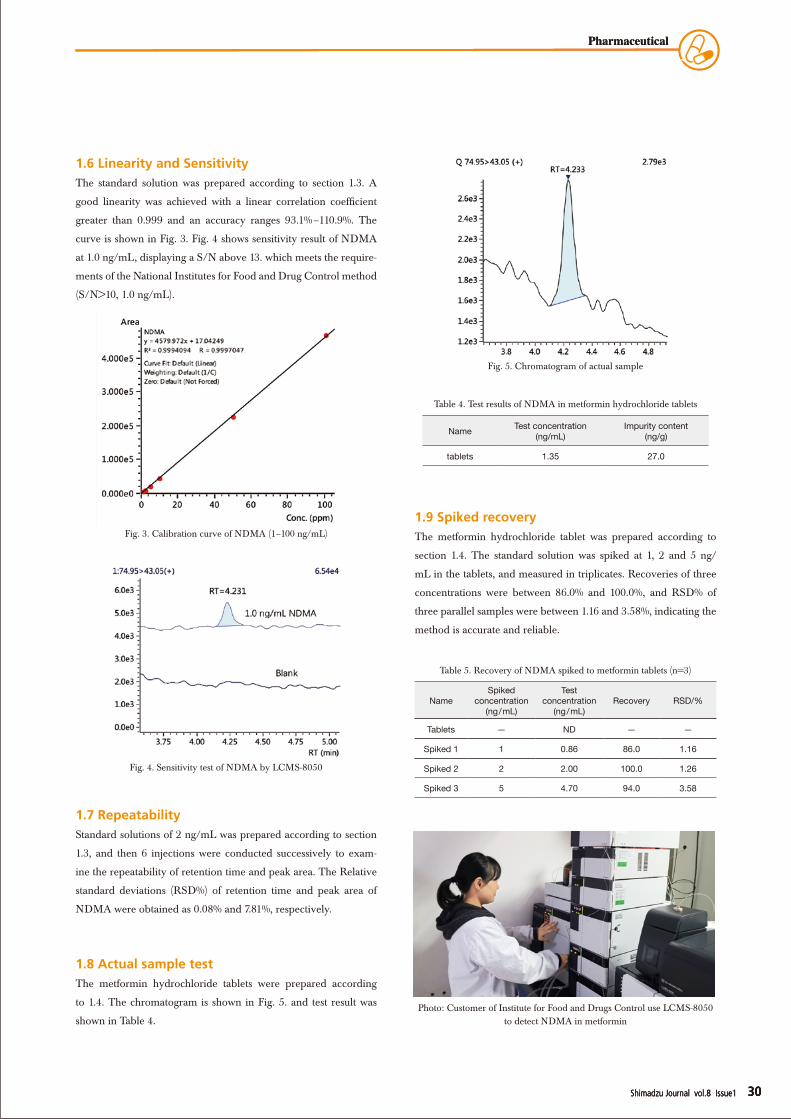
1.6 Linearity and SensitivityThe standard solution was prepared according to section 1.3. A
good linearity was achieved with a linear correlation coefficient
greater than 0.999 and an accuracy ranges 93.1%–110.9%. The
curve is shown in Fig. 3. Fig. 4 shows sensitivity result of NDMA
at 1.0 ng/mL, displaying a S/N above 13. which meets the require-
ments of the National Institutes for Food and Drug Control method
(S/N>10, 1.0 ng/mL).
1.7 RepeatabilityStandard solutions of 2 ng/mL was prepared according to section
1.3, and then 6 injections were conducted successively to exam-
ine the repeatability of retention time and peak area. The Relative
standard deviations (RSD%) of retention time and peak area of
NDMA were obtained as 0.08% and 7.81%, respectively.
1.8 Actual sample test The metformin hydrochloride tablets were prepared according
to 1.4. The chromatogram is shown in Fig. 5. and test result was
shown in Table 4.
1.9 Spiked recoveryThe metformin hydrochloride tablet was prepared according to
section 1.4. The standard solution was spiked at 1, 2 and 5 ng/
mL in the tablets, and measured in triplicates. Recoveries of three
concentrations were between 86.0% and 100.0%, and RSD% of
three parallel samples were between 1.16 and 3.58%, indicating the
method is accurate and reliable.
Fig. 4. Sensitivity test of NDMA by LCMS-8050
Fig. 5. Chromatogram of actual sample
Fig. 3. Calibration curve of NDMA (1–100 ng/mL)
Table 4. Test results of NDMA in metformin hydrochloride tablets
Name Test concentration(ng/mL)
Impurity content(ng/g)
tablets 1.35 27.0
Table 5. Recovery of NDMA spiked to metformin tablets (n=3)
NameSpiked
concentration (ng/mL)
Test concentration
(ng/mL)Recovery RSD/%
Tablets — ND — —
Spiked 1 1 0.86 86.0 1.16
Spiked 2 2 2.00 100.0 1.26
Spiked 3 5 4.70 94.0 3.58
Photo: Customer of Institute for Food and Drugs Control use LCMS-8050 to detect NDMA in metformin
Shimadzu Journal vol.8 Issue1 30
Pharmaceutical
Shimadzu Journal vol.8 Issue1 30
Pharmaceutical
Shimadzu Journal vol.8 Issue1 30
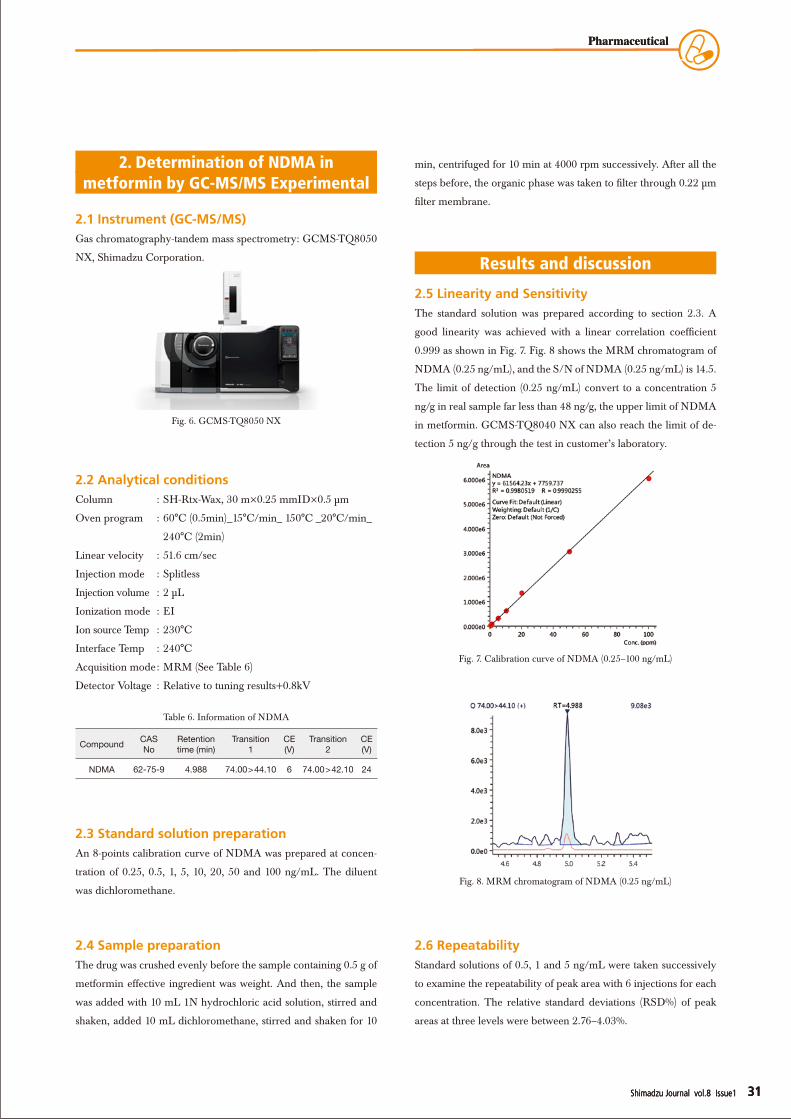
min, centrifuged for 10 min at 4000 rpm successively. After all the
steps before, the organic phase was taken to filter through 0.22 μm
filter membrane.
Results and discussion
2.5 Linearity and SensitivityThe standard solution was prepared according to section 2.3. A
good linearity was achieved with a linear correlation coefficient
0.999 as shown in Fig. 7. Fig. 8 shows the MRM chromatogram of
NDMA (0.25 ng/mL), and the S/N of NDMA (0.25 ng/mL) is 14.5.
The limit of detection (0.25 ng/mL) convert to a concentration 5
ng/g in real sample far less than 48 ng/g, the upper limit of NDMA
in metformin. GCMS-TQ8040 NX can also reach the limit of de-
tection 5 ng/g through the test in customer’s laboratory.
2.6 RepeatabilityStandard solutions of 0.5, 1 and 5 ng/mL were taken successively
to examine the repeatability of peak area with 6 injections for each
concentration. The relative standard deviations (RSD%) of peak
areas at three levels were between 2.76–4.03%.
2. Determination of NDMA in metformin by GC-MS/MS Experimental
2.1 Instrument (GC-MS/MS)Gas chromatography-tandem mass spectrometry: GCMS-TQ8050
NX, Shimadzu Corporation.
2.2 Analytical conditions Column : SH-Rtx-Wax, 30 m×0.25 mmID×0.5 μm
Oven program : 60°C (0.5min)_15°C/min_ 150°C _20°C/min_
240°C (2min)
Linear velocity : 51.6 cm/sec
Injection mode : Splitless
Injection volume : 2 μL
Ionization mode : EI
Ion source Temp : 230°C
Interface Temp : 240°C
Acquisition mode : MRM (See Table 6)
Detector Voltage : Relative to tuning results+0.8kV
2.3 Standard solution preparationAn 8-points calibration curve of NDMA was prepared at concen-
tration of 0.25, 0.5, 1, 5, 10, 20, 50 and 100 ng/mL. The diluent
was dichloromethane.
2.4 Sample preparationThe drug was crushed evenly before the sample containing 0.5 g of
metformin effective ingredient was weight. And then, the sample
was added with 10 mL 1N hydrochloric acid solution, stirred and
shaken, added 10 mL dichloromethane, stirred and shaken for 10
Table 6. Information of NDMA
Compound CAS No
Retention time (min)
Transition 1
CE(V)
Transition 2
CE(V)
NDMA 62-75-9 4.988 74.00>44.10 6 74.00>42.10 24
Fig. 7. Calibration curve of NDMA (0.25–100 ng/mL)
Fig. 8. MRM chromatogram of NDMA (0.25 ng/mL)
Fig. 6. GCMS-TQ8050 NX
Shimadzu Journal vol.8 Issue1 31
Pharmaceutical
Shimadzu Journal vol.8 Issue1 31
Pharmaceutical
Shimadzu Journal vol.8 Issue1 31
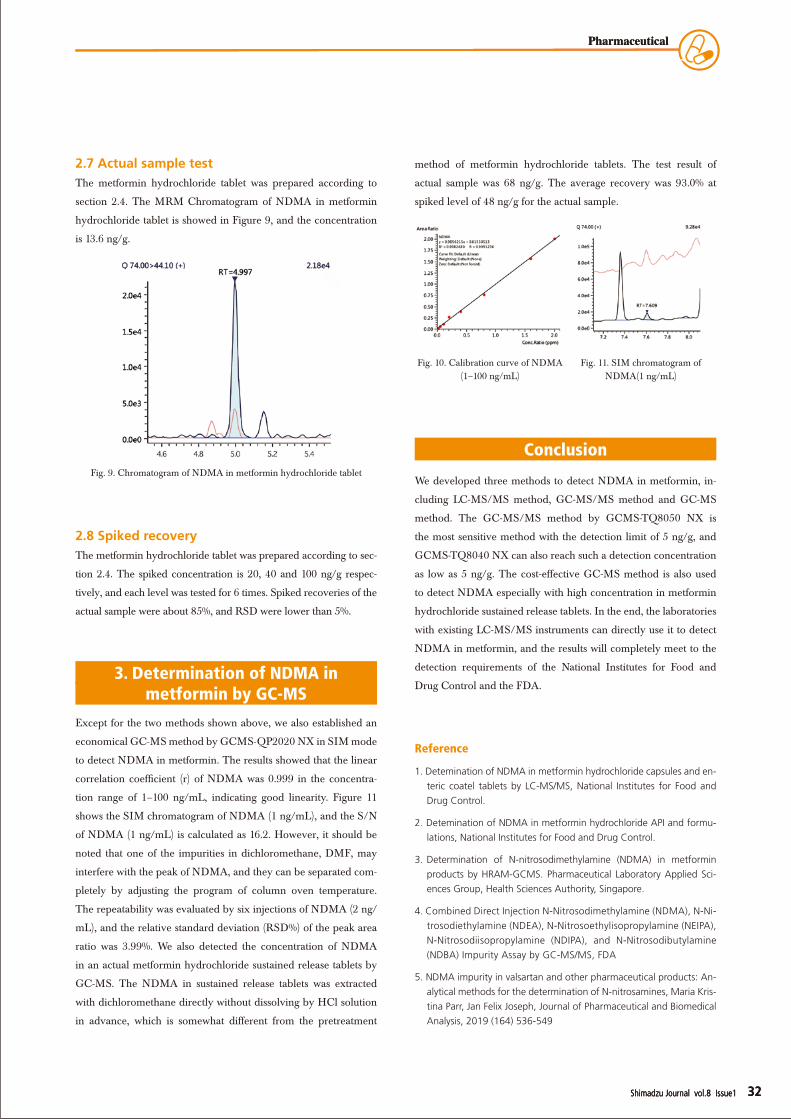
2.7 Actual sample test The metformin hydrochloride tablet was prepared according to
section 2.4. The MRM Chromatogram of NDMA in metformin
hydrochloride tablet is showed in Figure 9, and the concentration
is 13.6 ng/g.
2.8 Spiked recoveryThe metformin hydrochloride tablet was prepared according to sec-
tion 2.4. The spiked concentration is 20, 40 and 100 ng/g respec-
tively, and each level was tested for 6 times. Spiked recoveries of the
actual sample were about 85%, and RSD were lower than 5%.
3. Determination of NDMA in metformin by GC-MS
Except for the two methods shown above, we also established an
economical GC-MS method by GCMS-QP2020 NX in SIM mode
to detect NDMA in metformin. The results showed that the linear
correlation coefficient (r) of NDMA was 0.999 in the concentra-
tion range of 1–100 ng/mL, indicating good linearity. Figure 11
shows the SIM chromatogram of NDMA (1 ng/mL), and the S/N
of NDMA (1 ng/mL) is calculated as 16.2. However, it should be
noted that one of the impurities in dichloromethane, DMF, may
interfere with the peak of NDMA, and they can be separated com-
pletely by adjusting the program of column oven temperature.
The repeatability was evaluated by six injections of NDMA (2 ng/
mL), and the relative standard deviation (RSD%) of the peak area
ratio was 3.99%. We also detected the concentration of NDMA
in an actual metformin hydrochloride sustained release tablets by
GC-MS. The NDMA in sustained release tablets was extracted
with dichloromethane directly without dissolving by HCl solution
in advance, which is somewhat different from the pretreatment
method of metformin hydrochloride tablets. The test result of
actual sample was 68 ng/g. The average recovery was 93.0% at
spiked level of 48 ng/g for the actual sample.
Conclusion
We developed three methods to detect NDMA in metformin, in-
cluding LC-MS/MS method, GC-MS/MS method and GC-MS
method. The GC-MS/MS method by GCMS-TQ8050 NX is
the most sensitive method with the detection limit of 5 ng/g, and
GCMS-TQ8040 NX can also reach such a detection concentration
as low as 5 ng/g. The cost-effective GC-MS method is also used
to detect NDMA especially with high concentration in metformin
hydrochloride sustained release tablets. In the end, the laboratories
with existing LC-MS/MS instruments can directly use it to detect
NDMA in metformin, and the results will completely meet to the
detection requirements of the National Institutes for Food and
Drug Control and the FDA.
Reference
1. Detemination of NDMA in metformin hydrochloride capsules and en-
teric coatel tablets by LC-MS/MS, National Institutes for Food and
Drug Control.
2. Detemination of NDMA in metformin hydrochloride API and formu-
lations, National Institutes for Food and Drug Control.
3. Determination of N-nitrosodimethylamine (NDMA) in metformin
products by HRAM-GCMS. Pharmaceutical Laboratory Applied Sci-
ences Group, Health Sciences Authority, Singapore.
4. Combined Direct Injection N-Nitrosodimethylamine (NDMA), N-Ni-
trosodiethylamine (NDEA), N-Nitrosoethylisopropylamine (NEIPA),
N-Nitrosodiisopropylamine (NDIPA), and N-Nitrosodibutylamine
(NDBA) Impurity Assay by GC-MS/MS, FDA
5. NDMA impurity in valsartan and other pharmaceutical products: An-
alytical methods for the determination of N-nitrosamines, Maria Kris-
tina Parr, Jan Felix Joseph, Journal of Pharmaceutical and Biomedical
Analysis, 2019 (164) 536-549
Fig. 10. Calibration curve of NDMA (1–100 ng/mL)
Fig. 11. SIM chromatogram of NDMA(1 ng/mL)
Fig. 9. Chromatogram of NDMA in metformin hydrochloride tablet
Shimadzu Journal vol.8 Issue1 32
Pharmaceutical
Shimadzu Journal vol.8 Issue1 32
Pharmaceutical
Shimadzu Journal vol.8 Issue1 32
The Necessity of Analyzing Elemental Impurities in Drug products, and
Approaches to Their MeasurementTadashi Taniguchi, Shimadzu Corporation
Elemental impurities in drug products formulations consist of the
residue of catalytic components added when synthesizing the phar-
maceuticals, as well as chemicals originating through unexpected
contamination from manufacturing instruments, and chemicals
included in the structural components of the formulations. Ele-
mental impurities impede the active ingredients in Drug products,
and can have toxic effects on patients, so keeping the amount of
elemental impurities in Drug products within permitted limits is
viewed as very important. Accordingly, evaluations have long been
performed using the heavy metals test method. However, this test
method stains metallic contaminants using a reagent, and is limited
to expressing the results in terms of the amount of lead. It is not
specifically intended for elements, is lacking in quantitative ability,
and the standard values are not necessarily based on toxicity. Other
issues have also been pointed out, including the inability to eval-
uate Pd and Pt and other metallic catalysts utilized for synthesis.
Accordingly, at the International Council for Harmonisation of
Technical Requirements for Pharmaceuticals for Human Use (ICH),
the toxicity of elemental impurities was considered in Guidelines
for Elemental Impurities (Q3D), and permitted daily exposure
levels for 24 elements were configured as guideline levels. These
include the so-called big four: lead (Pb), cadmium (Cd), mercury
(Hg), and arsenic (As), as well as residual metal catalysts added
intentionally in the synthesis of the drug substances. In Europe and
the USA, the permitted daily exposure (PDE) for 24 elements, as
well as their measurement methods, are specified in the respective
Pharmacopoeia, in accordance with the ICH Q3D. These apply to
all commercially available formulations as of January 2018.
USP : USP <232> Elemental Impurities-Limits USP <233> Elemental Impurities-Procedures
EP : Ph,Eur, Chapter 5.20: Elemental Impurities in Pharmaceutical–Limits Ph Eur, Chapter 2.4.20: Determination of elemental impurities
Methods for measuring elemental impurities are indicated in the
USP <233>, and the Ph. Eur., Chapter 2.4.20, and inductively
coupled plasma-optical emission spectrometry (ICP-OES) and in-
ductively coupled plasma-mass spectrometry (ICP-MS) are noted
as the measurement instruments. For both instruments, multi-ele-
ment analysis can be performed by dissolving the samples using
devices such as a microwave sample decomposition unit. These
instruments can quickly perform analysis of the 24 elements indi-
cated in the ICH Q3D guidelines in a short time (several seconds
per sample). Further, ICP-MS is capable of high sensitivity analysis
of the concentrations in measurement sample solutions at the ppt
Pharmaceutical
Shimadzu Journal vol.8 Issue1 33
(pg/mL) level, thereby supporting the analysis of even low concen-
tration. This section will introduce examples of the analysis of drug
products utilizing these instruments.
With the ICP-OES or ICP-MS, if the sample is a solid, pretreat-
ment is required to create a sample solution. Conversely, with the
energy dispersive X-ray (EDX) method, solids, liquids, and pow-
ders can all be measured without pretreatment, which means that
this measurement method can improve productivity. This method
is adopted as a general analysis method in the USP <735> and the
European Pharmacopoeia Ph. Eur., Chapter 2.2.37. At the present
stage, there are sensitivity issues for the measured elements. How-
ever, with the specified elements, it is of interest as a measurement
method that can perform measurements without pretreatment and
in a short time.
Analysis of ICH Q3D Guideline for Elemental Impurities in Drug Products Using ICPMS-2030
https://solutions.shimadzu.co.jp/an/s/en/icp/jpb416006.pdf
Analysis of Elemental Impurities in Pharmaceutical Products Following USP <232>/<233> on ICPMS-2030
https://www.shimadzu.com/an/literature/icp/apb419001.html
Analysis by ICP Atomic Emission Spectrometry in Accordance with the ICH Q3D Guideline for Elemental Impurities Using ICPE-9820
https://www.shimadzu.com/an/literature/icp/jpb414004.html Pharmaceutical Elemental Impurities Analysis SystemEnergy Dispersive X-ray Fluorescence Spectrometer
https://www.shimadzu.com/an/elemental/edxrf/pharma_impurities/
index.html
ICH Q3D Elemental Impurities Analysis of Drug Substances by EDX
https://solutions.shimadzu.co.jp/an/n/en/edxrf/jpq219010.pdf
Shimadzu Journal vol.8 Issue1 34
Pharmaceutical
Shimadzu Journal vol.8 Issue1 34
Pharmaceutical
Shimadzu Journal vol.8 Issue1 34
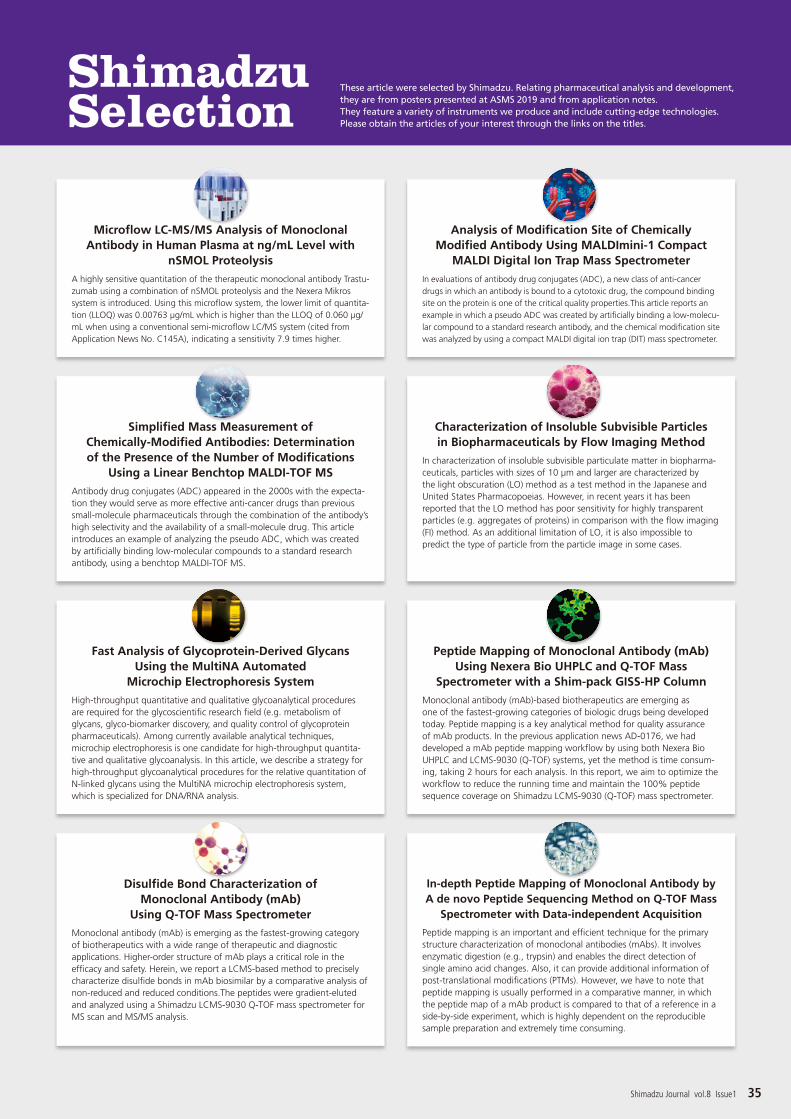
Disulfide Bond Characterization of Monoclonal Antibody (mAb)
Using Q-TOF Mass Spectrometer
Monoclonal antibody (mAb) is emerging as the fastest-growing category of biotherapeutics with a wide range of therapeutic and diagnostic applications. Higher-order structure of mAb plays a critical role in the efficacy and safety. Herein, we report a LCMS-based method to precisely characterize disulfide bonds in mAb biosimilar by a comparative analysis of non-reduced and reduced conditions.The peptides were gradient-eluted and analyzed using a Shimadzu LCMS-9030 Q-TOF mass spectrometer for MS scan and MS/MS analysis.
In-depth Peptide Mapping of Monoclonal Antibody by A de novo Peptide Sequencing Method on Q-TOF Mass
Spectrometer with Data-independent Acquisition
Peptide mapping is an important and efficient technique for the primary structure characterization of monoclonal antibodies (mAbs). It involves enzymatic digestion (e.g., trypsin) and enables the direct detection of single amino acid changes. Also, it can provide additional information of post-translational modifications (PTMs). However, we have to note that peptide mapping is usually performed in a comparative manner, in which the peptide map of a mAb product is compared to that of a reference in a side-by-side experiment, which is highly dependent on the reproducible sample preparation and extremely time consuming.
ShimadzuSelection
These article were selected by Shimadzu. Relating pharmaceutical analysis and development, they are from posters presented at ASMS 2019 and from application notes. They feature a variety of instruments we produce and include cutting-edge technologies. Please obtain the articles of your interest through the links on the titles.
Peptide Mapping of Monoclonal Antibody (mAb) Using Nexera Bio UHPLC and Q-TOF Mass
Spectrometer with a Shim-pack GISS-HP Column
Monoclonal antibody (mAb)-based biotherapeutics are emerging as one of the fastest-growing categories of biologic drugs being developed today. Peptide mapping is a key analytical method for quality assurance of mAb products. In the previous application news AD-0176, we had developed a mAb peptide mapping workflow by using both Nexera Bio UHPLC and LCMS-9030 (Q-TOF) systems, yet the method is time consum-ing, taking 2 hours for each analysis. In this report, we aim to optimize the workflow to reduce the running time and maintain the 100% peptide sequence coverage on Shimadzu LCMS-9030 (Q-TOF) mass spectrometer.
Fast Analysis of Glycoprotein-Derived Glycans Using the MultiNA Automated
Microchip Electrophoresis System
High-throughput quantitative and qualitative glycoanalytical procedures are required for the glycoscientific research field (e.g. metabolism of glycans, glyco-biomarker discovery, and quality control of glycoprotein pharmaceuticals). Among currently available analytical techniques, microchip electrophoresis is one candidate for high-throughput quantita-tive and qualitative glycoanalysis. In this article, we describe a strategy for high-throughput glycoanalytical procedures for the relative quantitation of N-linked glycans using the MultiNA microchip electrophoresis system, which is specialized for DNA/RNA analysis.
Microflow LC-MS/MS Analysis of Monoclonal Antibody in Human Plasma at ng/mL Level with
nSMOL Proteolysis
A highly sensitive quantitation of the therapeutic monoclonal antibody Trastu-zumab using a combination of nSMOL proteolysis and the Nexera Mikros system is introduced. Using this microflow system, the lower limit of quantita-tion (LLOQ) was 0.00763 μg/mL which is higher than the LLOQ of 0.060 μg/mL when using a conventional semi-microflow LC/MS system (cited from Application News No. C145A), indicating a sensitivity 7.9 times higher.
Characterization of Insoluble Subvisible Particles in Biopharmaceuticals by Flow Imaging Method
In characterization of insoluble subvisible particulate matter in biopharma-ceuticals, particles with sizes of 10 μm and larger are characterized by the light obscuration (LO) method as a test method in the Japanese and United States Pharmacopoeias. However, in recent years it has been reported that the LO method has poor sensitivity for highly transparent particles (e.g. aggregates of proteins) in comparison with the flow imaging (FI) method. As an additional limitation of LO, it is also impossible to predict the type of particle from the particle image in some cases.
Simplified Mass Measurement of Chemically-Modified Antibodies: Determination of the Presence of the Number of Modifications
Using a Linear Benchtop MALDI-TOF MS
Antibody drug conjugates (ADC) appeared in the 2000s with the expecta-tion they would serve as more effective anti-cancer drugs than previous small-molecule pharmaceuticals through the combination of the antibody’s high selectivity and the availability of a small-molecule drug. This article introduces an example of analyzing the pseudo ADC, which was created by artificially binding low-molecular compounds to a standard research antibody, using a benchtop MALDI-TOF MS.
Analysis of Modification Site of Chemically Modified Antibody Using MALDImini-1 Compact
MALDI Digital Ion Trap Mass Spectrometer
In evaluations of antibody drug conjugates (ADC), a new class of anti-cancer drugs in which an antibody is bound to a cytotoxic drug, the compound binding site on the protein is one of the critical quality properties.This article reports an example in which a pseudo ADC was created by artificially binding a low-molecu-lar compound to a standard research antibody, and the chemical modification site was analyzed by using a compact MALDI digital ion trap (DIT) mass spectrometer.
Shimadzu Journal vol.8 Issue1 35
Monoclonal Antibody Workflows on the Shimadzu Q-TOF LCMS-9030 Using
the Protein Metrics Software Suite
Accurate characterization of monoclonal antibodies is essential to develop-ment of biotherapeutics. Thorough understanding of biotherapeutic proper-ties aids in the optimization of bioprocess production, product formulation, and product dosage. In this application note, we use the new Shimadzu Q-TOF LCMS-9030 to characterize the recombinant human IgG1 NIST mAb reference standard as a model of biotherapeutic monoclonal antibodies.
Shimadzu Selection
Novel Platform for Online Sample Preparation and LC-MS/MS Analysis of Drugs in Biological Matrices
Currently, sample preparation in forensic laboratories involves using time-consuming SPE or LLE. The multi-step sample preparation can lead to more human error, irreproducible results, and endanger the analyst by exposing them to biohazardous materials. The Clinical Laboratory Automation Module (CLAM) was developed to meet these needs and offer a safer, hands-free approach to postmortem sample analysis.
High Sensitivity Identification of Drug Metabolites with Increasing Ionization Efficiency using
A Novel LC-ESI Interface and Q-TOF
Conventional LC flow rate instruments may be unable to detect minor metabolites due to the lack of sensitivity. Although nanoflow ESI helps to enhance the signal, the analytical time becomes longer and robustness is challenging. In this work, we demonstrate the ability of a micro-flow LC-ESI system with a high performance Q-TOF to detect low levels of drug metabolites.
Qualitative Characterization and Quantitative Assessment of Monoclonal Antibodies
Using Protein Metrics and nSMOL coupled with the Shimadzu LCMS-9030 QTOF
In this poster, we use the new LCMS-9030Q-ToF to qualitatively character-ize NIST mAb reference standard a s model of biotherapeutic monoclonal antibodies. Assessments of intact profile, protein subunits (heavy chain, and light chain), and peptide fragments were included in experimental design.To aid in the quantitative assessment of Bevacizumab in bio logical matrix, the Shimadzu nSMOLTM technology was utilized for increased sensitivity by selectively digesting the antibody’s FAB region and reducing matrix interference.
A Comprehensive N-Glycan Profiling Analysis of Bevacizumab Biosimilar by UHPLC with Fluorescence
Detection and Q-TOF Mass Spectrometry
Gobal biopharmaceutical market is entering a new era of biosimilars - generic copies of commercialized monoclonal antibodies (mAbs), with the aim of providing less-expensive medication options. In this work, we established a robust, sensitive and reproducible analytical system on the basis of a Nexera Bio UHPLC coupled with Fluorescence detection and Q-TOF Mass Spectrometry for N-glycan profiling analysis of a bevacizumab biosimilar sample.
High-Sensitivity Analysis of drugs in ultra-small volumes plasma samples using Micro-Flow LC-MS/MS
Drugs and other xenobiotics entering the body are generally subject to metabolism that facilitates their detoxification and elimination. The ability to predict the metabolic fate of compounds before the first doses are given to humans is highly desirable for reasons of both efficacy and safety. However, the size of the animal models usually restricts the sample volume that can be safely taken during a pharmacokinetic time study for the drug and its metabolites. This quickly results in the need for many animals and a significant amount of drug material.
Shimadzu Journal vol.8 Issue1 36

On November 14th, 2019, Shimadzu (Asia Pacific) hosted The
Global Pharma Summit in Singapore. This was seventh chapter
of the event, with theme of “Transforming the Future of Pharma”.
This technology forum reaffirmed Shimadzu’s commitment to
contribute towards growth and development of Pharma business
in Asia. The event brought 103 pharmaceutical industry leaders,
health-care providers and researchers to Singapore from twenty
countries around the world.
In his opening remarks, Shimadzu CEO Dr. Teruhisa Ueda very
eloquently framed the event and set the expectations right, stating
that “most things in the world today are powered by AI. This summit
is also harnessing what Shimadzu calls ‘Analytical Intelligence’. This
only-of-its-kind innovation in the world will be the backbone of all
future labs […] and you will experience this disruptive technology first-
hand at this summit.”
Global Trends in the Pharmaceutical IndustryIn recent years, the pharmaceutical industry has started integrating
a new intelligence, which has given rise to new demands in both
the research process and the laboratory itself. Adopting AI (artifi-
cial intelligence) to improve efficiency for various tasks, integrat-
ing a multitude of systems, improving productivity and reducing
human error through automation — all of these trends have created
a climate in which reliable, more efficient analysis in research and
development is expected.
Increasing Laboratory Efficiency: Powered by AISimilar to other industries, pharmaceutical industry has experi-
enced improvements in its processes, specifically by improving
efficiency and decreasing research time due to AI. At the confer-
ence, Dr. Jimmy Yen-Chu Lin from Insilico Medicine outlined the
company’s AI platform for drug discovery. To hear Dr. Lin say it,
“our goal in using AI is to decrease the research, discovery and
preclinical test time from 3–4 years to a few months. By focusing
on the precious time in the developmental stage as well as through
diminishing costs, we can aim to get more drugs approved.” During
his presentation he introduced real and practical application of
AI to their research. Dr. Jimmy demonstrated utilization of AI
for screening antibody drug candidates in cancer treatment or the
search process for low molecular lead compounds, which has been
called “finding a needle in a haystack”.
Latest topics 1
Global Pharma Summit 2019 Report
Dr. Jimmy Yen-Chu Lin
Shimadzu Journal vol.8 Issue1 37

Medical CannabisAnticipating the spread of medical marijuana in Thailand, Chao
Phya Abhaibhubejhr Hospital is looking at developing the culti-
vation, manufacturing and quality control of cannabis, in addition
to patient monitoring and establishing an educational system with
regards to the drug. Though research is still being performed re-
garding the safety and efficacy of cannabis for medical use, and
while it remains to be approved by the country’s regulatory insti-
tution, one of the hospital’s researchers, Dr. Pekakrong Kwankhao,
described the situation in Thailand: “In February of 2019, usage of
medical marijuana was legalized, and currently we are at the stage
where only hospitals and accredited agencies may treat with the
drug. In our hospital, we are exploring cannabis’ effect on quality
of life among cancer patients and developing medical products
to that end.”
The CEO of Front Range Biosciences Inc. USA, Dr. Jonathan
Vaught, introduced the chemical diversity and potential of the med-
ical effects of cannabis through outlining two examples of recent re-
search, one concerning the effects of THC on cancer cell biology
and another on applied research together with autistics. He stated
that “cannabis has wide applications, both for medical as well as
commercial use as wellness products. The secret to unlocking its
potential lies in understanding its make-up and chemical diversity.”
Shimadzu Analytical Intelligence and Workflow Solutions for The Pharma IndustryBy listening to the needs of researchers and other users of our
products, Shimadzu has proposed its new concept of “Analytical In-
telligence” to usher in a new intelligence for analytical instruments.
Analytical Intelligence describes automated support func-
tions utilizing digital technology, such as M2M, IoT, and Artificial
Intelligence (AI), that enable higher productivity and maximum
reliability. It consists of systems and software that simulate expert
operators automatically, determining whether conditions and results
are good or not, providing feedback to users, and solving common
problems. It increases data reliability by compensating for any dif-
ferences between users in their instrument knowledge or experience.
Including the new Nexera UHPLC series which was released in
March 2019, Shimadzu has already integrated artificial intelligence
as Analytical Intelligence for a number of instruments.
Learn more about Analytical Intelligence:https://www.shimadzu.com/an/analytical_intelligence.html
At the end of this year’s summit, key panel discussed “Trans-
forming The Future of Pharma”. Topics of discussion were wide,
and perspectives on the theme were shared from viewpoints of
manufacturing, CROs, clinical research as well as data science and
technology of tools. Irrespective of the business or workflow, panel
agreed that major trends of the pharmaceutical industry are im-
proving efficiency, increasing productivity, and integrating systems
all by digital transformation.
In addition, the development of drugs to treat incurable dis-
eases, as well as developing human resources that have expertise in
data analysis (made necessary by the stark increase in data overall),
were also cited as important questions in the industry.
Take Home Message — for Present and FutureShimadzu’s Shuzo Maruyama summed up the summit as follows:
“This year’s summit was a chance to truly feel the various changes
happening in the pharmaceutical industry stemming from new
technology aiming to improve productivity and increase efficiency.
As a provider of indispensable analytical technology, we aim to
provide solutions, supporting researchers, reducing downtime in
the lab and reducing human error through Analytical Intelligence.
This is how we will provide new value for the industry as a whole.”
The pharmaceutical industry’s aim is to support our health.
With regards to that, Shimadzu aims to not only continue to pro-
vide new products but is looking towards being a comprehensive
healthcare solution provider for its global partners through its
paradigm of Analytical Intelligence as AI technologies transform
industries, including pharma. These activities are done with the
grand goal of realizing a healthier, better lifestyle for everybody,
and Shimadzu looks forward to addressing industry challenges on
a global stage.
Dr. Jonathan Vaught
Shimadzu Journal vol.8 Issue1 38
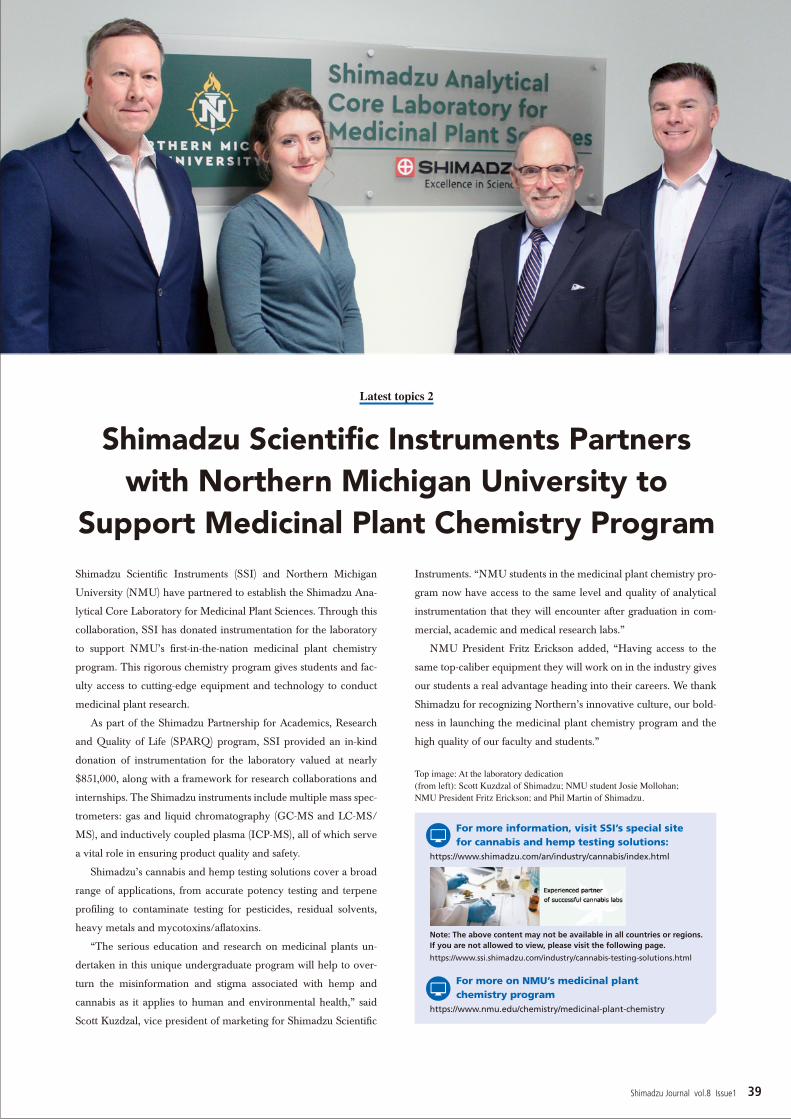
Shimadzu Scientific Instruments (SSI) and Northern Michigan
University (NMU) have partnered to establish the Shimadzu Ana-
lytical Core Laboratory for Medicinal Plant Sciences. Through this
collaboration, SSI has donated instrumentation for the laboratory
to support NMU’s first-in-the-nation medicinal plant chemistry
program. This rigorous chemistry program gives students and fac-
ulty access to cutting-edge equipment and technology to conduct
medicinal plant research.
As part of the Shimadzu Partnership for Academics, Research
and Quality of Life (SPARQ) program, SSI provided an in-kind
donation of instrumentation for the laboratory valued at nearly
$851,000, along with a framework for research collaborations and
internships. The Shimadzu instruments include multiple mass spec-
trometers: gas and liquid chromatography (GC-MS and LC-MS/
MS), and inductively coupled plasma (ICP-MS), all of which serve
a vital role in ensuring product quality and safety.
Shimadzu’s cannabis and hemp testing solutions cover a broad
range of applications, from accurate potency testing and terpene
profiling to contaminate testing for pesticides, residual solvents,
heavy metals and mycotoxins/aflatoxins.
“The serious education and research on medicinal plants un-
dertaken in this unique undergraduate program will help to over-
turn the misinformation and stigma associated with hemp and
cannabis as it applies to human and environmental health,” said
Scott Kuzdzal, vice president of marketing for Shimadzu Scientific
Instruments. “NMU students in the medicinal plant chemistry pro-
gram now have access to the same level and quality of analytical
instrumentation that they will encounter after graduation in com-
mercial, academic and medical research labs.”
NMU President Fritz Erickson added, “Having access to the
same top-caliber equipment they will work on in the industry gives
our students a real advantage heading into their careers. We thank
Shimadzu for recognizing Northern’s innovative culture, our bold-
ness in launching the medicinal plant chemistry program and the
high quality of our faculty and students.”
Latest topics 2
Top image: At the laboratory dedication (from left): Scott Kuzdzal of Shimadzu; NMU student Josie Mollohan; NMU President Fritz Erickson; and Phil Martin of Shimadzu.
Latest topics 2
Shimadzu Scientific Instruments Partners with Northern Michigan University to
Support Medicinal Plant Chemistry Program
For more information, visit SSI’s special site for cannabis and hemp testing solutions:
https://www.shimadzu.com/an/industry/cannabis/index.html
Note: The above content may not be available in all countries or regions. If you are not allowed to view, please visit the following page.
https://www.ssi.shimadzu.com/industry/cannabis-testing-solutions.html
For more on NMU’s medicinal plant chemistry program
https://www.nmu.edu/chemistry/medicinal-plant-chemistry
Shimadzu Journal vol.8 Issue1 39
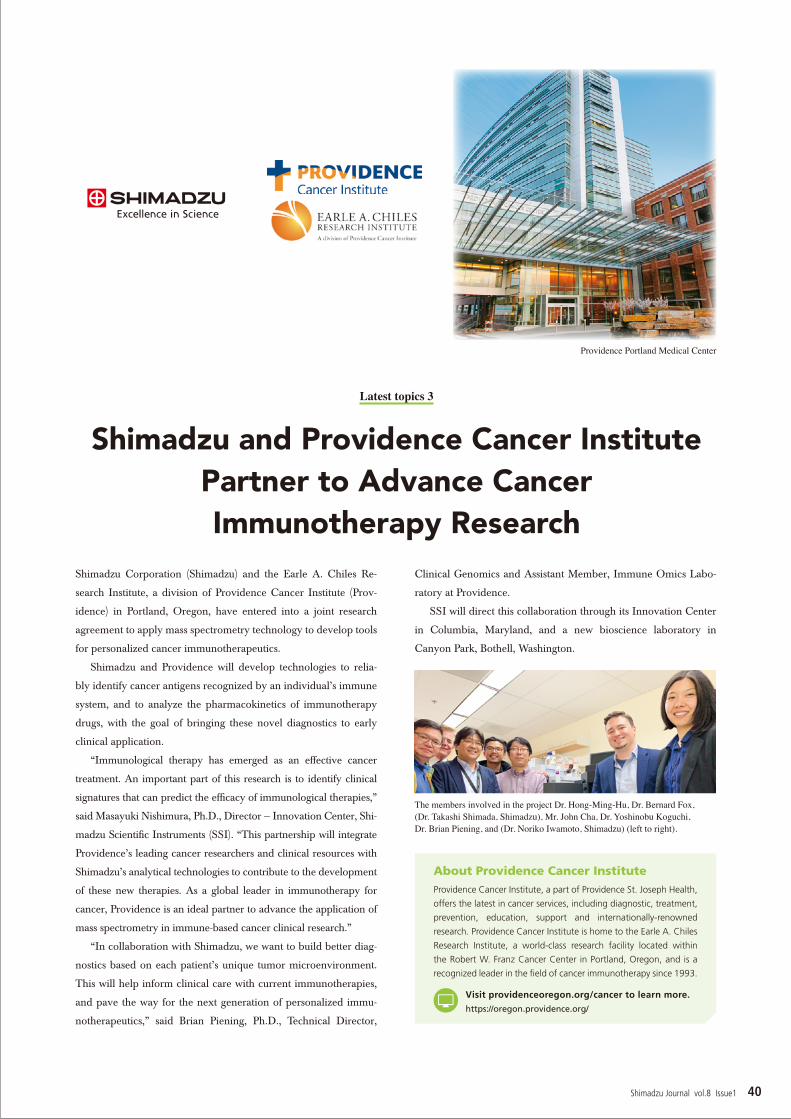
Shimadzu Corporation (Shimadzu) and the Earle A. Chiles Re-
search Institute, a division of Providence Cancer Institute (Prov-
idence) in Portland, Oregon, have entered into a joint research
agreement to apply mass spectrometry technology to develop tools
for personalized cancer immunotherapeutics.
Shimadzu and Providence will develop technologies to relia-
bly identify cancer antigens recognized by an individual’s immune
system, and to analyze the pharmacokinetics of immunotherapy
drugs, with the goal of bringing these novel diagnostics to early
clinical application.
“Immunological therapy has emerged as an effective cancer
treatment. An important part of this research is to identify clinical
signatures that can predict the efficacy of immunological therapies,”
said Masayuki Nishimura, Ph.D., Director — Innovation Center, Shi-
madzu Scientific Instruments (SSI). “This partnership will integrate
Providence’s leading cancer researchers and clinical resources with
Shimadzu’s analytical technologies to contribute to the development
of these new therapies. As a global leader in immunotherapy for
cancer, Providence is an ideal partner to advance the application of
mass spectrometry in immune-based cancer clinical research.”
“In collaboration with Shimadzu, we want to build better diag-
nostics based on each patient’s unique tumor microenvironment.
This will help inform clinical care with current immunotherapies,
and pave the way for the next generation of personalized immu-
notherapeutics,” said Brian Piening, Ph.D., Technical Director,
Clinical Genomics and Assistant Member, Immune Omics Labo-
ratory at Providence.
SSI will direct this collaboration through its Innovation Center
in Columbia, Maryland, and a new bioscience laboratory in
Canyon Park, Bothell, Washington.
Latest topics 3
Shimadzu and Providence Cancer Institute Partner to Advance Cancer Immunotherapy Research
About Providence Cancer Institute
Providence Cancer Institute, a part of Providence St. Joseph Health,
offers the latest in cancer services, including diagnostic, treatment,
prevention, education, support and internationally-renowned
research. Providence Cancer Institute is home to the Earle A. Chiles
Research Institute, a world-class research facility located within
the Robert W. Franz Cancer Center in Portland, Oregon, and is a
recognized leader in the field of cancer immunotherapy since 1993.
Visit providenceoregon.org/cancer to learn more.
https://oregon.providence.org/
The members involved in the project Dr. Hong-Ming-Hu, Dr. Bernard Fox, (Dr. Takashi Shimada, Shimadzu), Mr. John Cha, Dr. Yoshinobu Koguchi, Dr. Brian Piening, and (Dr. Noriko Iwamoto, Shimadzu) (left to right).
Providence Portland Medical Center
Shimadzu Journal vol.8 Issue1 40

A history of cutting-edge innovationThe LKB-9000 was released in 1970. By this time, Shimadzu had
nearly 100 years of experience in manufacturing physics and
chemistry equipment, and was well-positioned to bring Japan’s
first commercial GCMS device to market. The LKB-9000 was
produced in cooperation with the Swedish firm LKB, but it wasn’t
long before Shimadzu engineers were improving on the base
technology to develop various new GC/MS instruments such as
the GCMS-6020 and GCMSPAC-90 in the 1970s.
The world’s first MALDI device, the LAMS-50K, came in
1987. The development of technology underlying this new ioni-
zation technique netted Shimadzu’s Koichi Tanaka a share in the
2002 Nobel Prize for Chemistry.
In 2004 Shimadzu released the LCMS-IT-TOF, a world-first
hybrid LC/MS model fusing IT and TOF for structural analysis etc.
Throughout the 2010s, a number of world-class triple quadrupole
instruments were produced, for example the GCMS-TQ8050 and
LCMS-8060, which make full use of Shimadzu’s unique UFMS
(Ultra-Fast Mass Spectroscopy) technology.
The LKB-9000 in use
Latest topics 4
Celebrating 50 Years of Mass Spectrometry Innovation
The year 2020 marks 50 years since the release of Shimadzu’s first mass spectrometry device, the LKB-9000.
To celebrate this occasion, Shimadzu is planning a number of activities throughout the year.
Dedicated 50th anniversary webpage:https://www.shimadzu.com/an/news-events/celebrating_50_years/index.html
Shimadzu Journal vol.8 Issue1 41
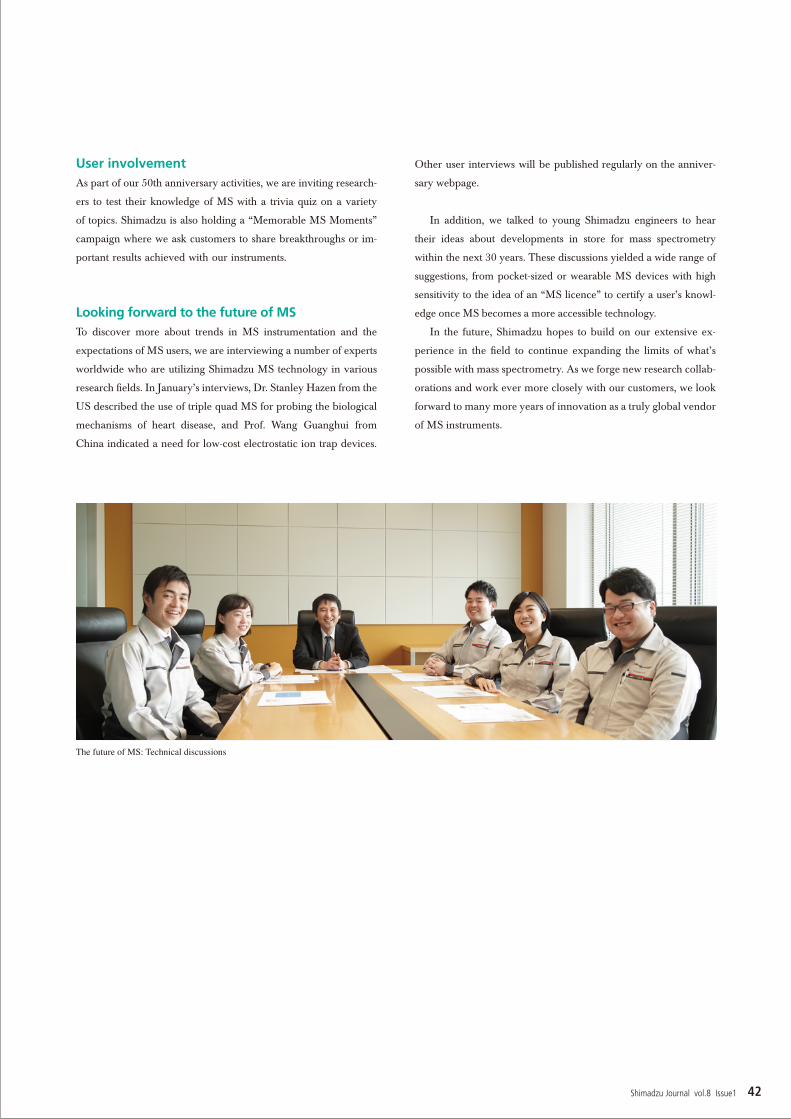
User involvementAs part of our 50th anniversary activities, we are inviting research-
ers to test their knowledge of MS with a trivia quiz on a variety
of topics. Shimadzu is also holding a “Memorable MS Moments”
campaign where we ask customers to share breakthroughs or im-
portant results achieved with our instruments.
Looking forward to the future of MSTo discover more about trends in MS instrumentation and the
expectations of MS users, we are interviewing a number of experts
worldwide who are utilizing Shimadzu MS technology in various
research fields. In January’s interviews, Dr. Stanley Hazen from the
US described the use of triple quad MS for probing the biological
mechanisms of heart disease, and Prof. Wang Guanghui from
China indicated a need for low-cost electrostatic ion trap devices.
Other user interviews will be published regularly on the anniver-
sary webpage.
In addition, we talked to young Shimadzu engineers to hear
their ideas about developments in store for mass spectrometry
within the next 30 years. These discussions yielded a wide range of
suggestions, from pocket-sized or wearable MS devices with high
sensitivity to the idea of an “MS licence” to certify a user’s knowl-
edge once MS becomes a more accessible technology.
In the future, Shimadzu hopes to build on our extensive ex-
perience in the field to continue expanding the limits of what’s
possible with mass spectrometry. As we forge new research collab-
orations and work ever more closely with our customers, we look
forward to many more years of innovation as a truly global vendor
of MS instruments.
The future of MS: Technical discussions
Shimadzu Journal vol.8 Issue1 42
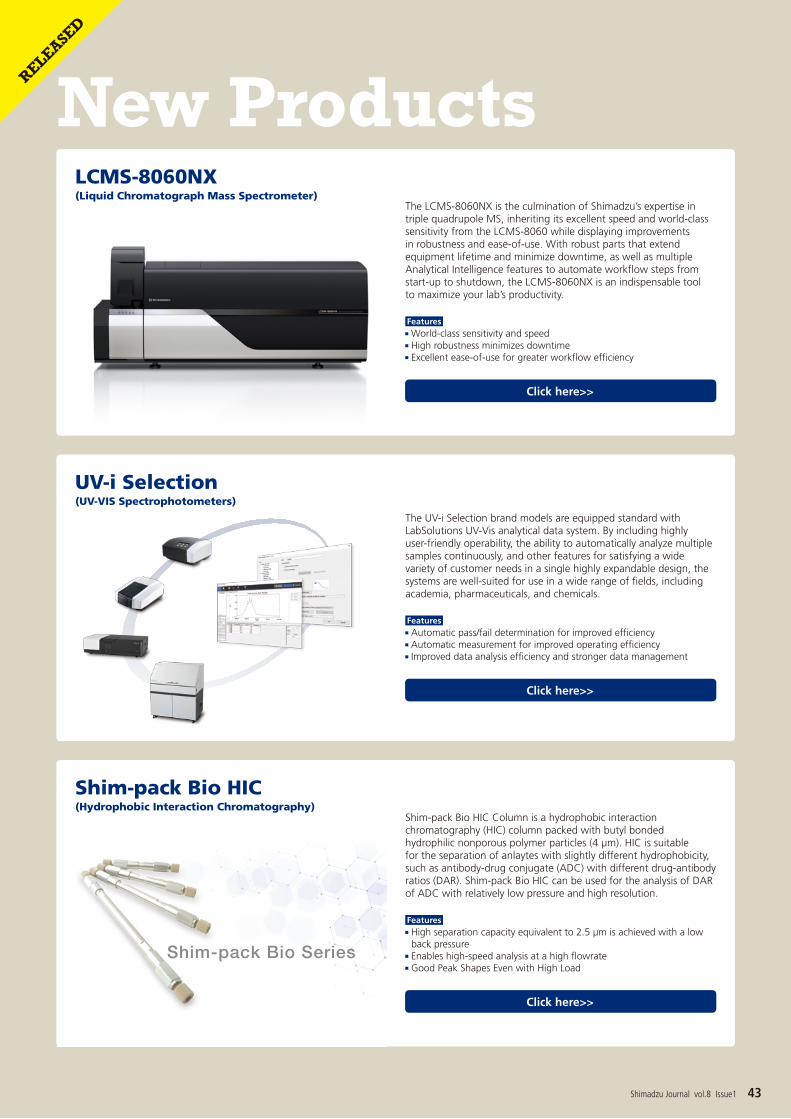
Shim-pack Bio HIC (Hydrophobic Interaction Chromatography)
Click here>>
Shim-pack Bio HIC Column is a hydrophobic interaction chromatography (HIC) column packed with butyl bonded hydrophilic nonporous polymer particles (4 µm). HIC is suitable for the separation of anlaytes with slightly different hydrophobicity, such as antibody-drug conjugate (ADC) with different drug-antibody ratios (DAR). Shim-pack Bio HIC can be used for the analysis of DAR of ADC with relatively low pressure and high resolution.
High separation capacity equivalent to 2.5 µm is achieved with a low back pressure
Enables high-speed analysis at a high flowrate Good Peak Shapes Even with High Load
Features
LCMS-8060NX(Liquid Chromatograph Mass Spectrometer)
Click here>>
The LCMS-8060NX is the culmination of Shimadzu’s expertise in triple quadrupole MS, inheriting its excellent speed and world-class sensitivity from the LCMS-8060 while displaying improvements in robustness and ease-of-use. With robust parts that extend equipment lifetime and minimize downtime, as well as multiple Analytical Intelligence features to automate workflow steps from start-up to shutdown, the LCMS-8060NX is an indispensable tool to maximize your lab’s productivity.
World-class sensitivity and speed High robustness minimizes downtime Excellent ease-of-use for greater workflow efficiency
Features
New Products
Shim-pack Bio Series
RELEASED
UV-i Selection (UV-VIS Spectrophotometers)
Click here>>
The UV-i Selection brand models are equipped standard with LabSolutions UV-Vis analytical data system. By including highly user-friendly operability, the ability to automatically analyze multiple samples continuously, and other features for satisfying a wide variety of customer needs in a single highly expandable design, the systems are well-suited for use in a wide range of fields, including academia, pharmaceuticals, and chemicals.
Automatic pass/fail determination for improved efficiency Automatic measurement for improved operating efficiency Improved data analysis efficiency and stronger data management
Features
Shimadzu Journal vol.8 Issue1 43

www.shimadzu.com/an/
For Research Use Only. Not for use in diagnostic procedures.The content of this publication shall not be reproduced, altered or sold for any commercial purpose without the written approval of Shimadzu. The information contained herein is provided to you “as is” without warranty of any kind including without limitation warranties as to its accuracy or completeness. Shimadzu does not assume any responsibility or liability for any damage, whether direct or indirect, relating to the use of this publication. This publication is based upon the information available to Shimadzu on or before the date of publication, and subject to change without notice.
© Shimadzu Corporation, 2020Printed in Japan, July, 2020