Embed Size (px)
Citation preview
6
Parameters Influencing on Sensitivities of Polycyclic Aromatic Hydrocarbons Measured
by Shimadzu GCMS-QP2010 Ultra S. Pongpiachan1,2,*, P. Hirunyatrakul3, I. Kittikoon3 and C. Khumsup3
1NIDA Center for Research and Development on Disaster Prevention and Management, School of Social and Environmental Development, National Institute of Development,
Administration (NIDA), Sereethai Road, Klong-Chan, Bangkapi, Bangkok, 2SKLLQG, Institute of Earth Environment,
Chinese Academy of Sciences (IEECAS), Xi�’an, 3Bara Scientific Co., Ltd., Bangkok,
1,3Thailand 2China
1. Introduction Throughout the decades of analytical instrument designs and developments there have been many incidents and scientific improvements, which have assisted to generate major design trend changes. A unique and innovative technology enabled analytical instrument designed to meet the needs of quantitative chemical analysis of polycyclic aromatic hydrocarbons (PAHs) in various environmental compartments. PAHs are a class of very stable organic molecules made up of only carbon and hydrogen and contain two to eight fused aromatic rings. PAHs are formed during incomplete combustion of organic materials such as fossil fuels, coke and wood. These molecules were oriented horizontal to the surface, with each carbon having three neighboring atoms much like graphite. The physicochemical properties and structures of a variety of representative PAHs can be seen in Table 1-2. Epidemiological evidence suggests that human exposures to PAHs, especially Benzo[a]pyrene are high risk factors for carcinogenic and mutagenic effects. There are hundreds of PAH compounds in the environment, but only 16 of them are included in the priority pollutants list of US EPA (EPA, 2003). Many PAHs have also been identified as cancer-inducing chemicals for animals and/or humans (IARC, 1983).
In 1775, the British surgeon, Percival Pott, was the first to consider PAHs as toxic chemicals with the high incidence of scrotal cancer in chimney sweep apprentices (IARC, 1985). Occupational exposure of workers by inhalation of PAHs, both volatile and bound to respirable particulate matter, and by dermal contact with PAH-containing materials, occurs at high levels during coke production, coal gasification, and iron and steel founding. Coke oven workers have a 3- to 7- fold risk increase for developing lung cancer (IARC, 1984 and IARC, 1987). * Corresponding Author
Advanced Gas Chromatography �– Progress in Agricultural, Biomedical and Industrial Applications
110
Congeners MW (g/mol)
MP (oC)
BP (oC) PS PL Log Kow H Log KOA
Ace 154.2 96 277.5 0.3 1.52 3.92 12.17 6.23 Ac 150.2 92 265-275 0.9 4.14 4.00 8.40 6.47 Fl 166.2 116 295 0.09 0.72; 0.79a 4.18 7.87 6.68 Ph 178.2 101 339 0.02 0.11; 0.06 4.57 3.24 7.45
1-MePh 192.3 123 359 5.14 An 178.2 216 340 1.00E-03 7.78E-02 4.54 3.96 7.34
Pyr 202.3 156 360 6.00E-04 1.19E-02; 8E-03 5.18 0.92 8.61
Flu 202.3 111 375 1.23E-03 8.72E-03 5.22 1.04 8.60 B[a]F 216.3 187 407 5.40 B[b]F 216.3 209 402 5.75
Chry 228.3 255 448 5.70E-07 1.07E-04 5.86 6.50E-02 10.44
Tri 228.3 199 438 2.30E-06 1.21E-04 5.49 1.20E-02 10.80
p-terp 230.1 213 4.86E-06 6.03 B[a]A 228.3 160 435 2.80E-05 6.06E-04 5.91 0.58 9.54
B[a]P 252.3 175 495 7.00E-07 2.13E-05 6.04 4.60E-02 10.77
B[e]P 252.3 178 7.40E-07 2.41E-05 0.02
Per 252.3 277 495 1.40E-08 6.25 3.00E-03 12.17
B[b]F 252.3 168 481 5.80 B[j]F 252.3 166 480
B[k]F 252.3 217 481 5.20E-08 4.12E-06 6.00 1.60E-02 11.19
B[g,h,i]P 268.4 277 2.25E-05 6.50 7.50E-02 11.02
D[a,h]A 278.4 267 524 3.70E-10 9.16E-08 6.75 Cor 300.4 >350 525 2.00E-10 6.75
Source: http://www.es.lancs.ac.uk/ecerg/kcjgroup/5.html MP (oC): Melting Point, Kow : Octanol-water partition coefficient, BP (oC): Boiling Point, H: Henry 's Law Constant, PS : Vapour pressure of solid substance Koa: Octanol-air partition coefficient, PL: Vapour pressure of subcooled liquid
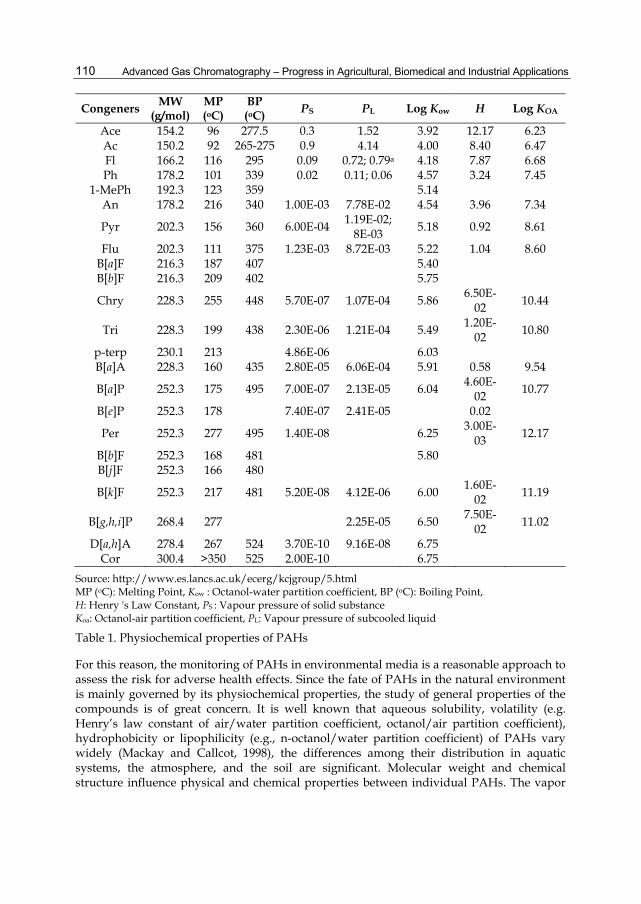
Table 1. Physiochemical properties of PAHs
For this reason, the monitoring of PAHs in environmental media is a reasonable approach to assess the risk for adverse health effects. Since the fate of PAHs in the natural environment is mainly governed by its physiochemical properties, the study of general properties of the compounds is of great concern. It is well known that aqueous solubility, volatility (e.g. Henry�’s law constant of air/water partition coefficient, octanol/air partition coefficient), hydrophobicity or lipophilicity (e.g., n-octanol/water partition coefficient) of PAHs vary widely (Mackay and Callcot, 1998), the differences among their distribution in aquatic systems, the atmosphere, and the soil are significant. Molecular weight and chemical structure influence physical and chemical properties between individual PAHs. The vapor
Parameters Influencing on Sensitivities of Polycyclic Aromatic Hydrocarbons Measured by Shimadzu GCMS-QP2010 Ultra
111
pressure and water solubility basically decrease with the increasing molecular weight. The fate of PAHs in the environment is largely determined by its physiochemical properties; as a result, high mobility of low molecular weight (LMW) species can be expected (Wild and Jones, 1995).
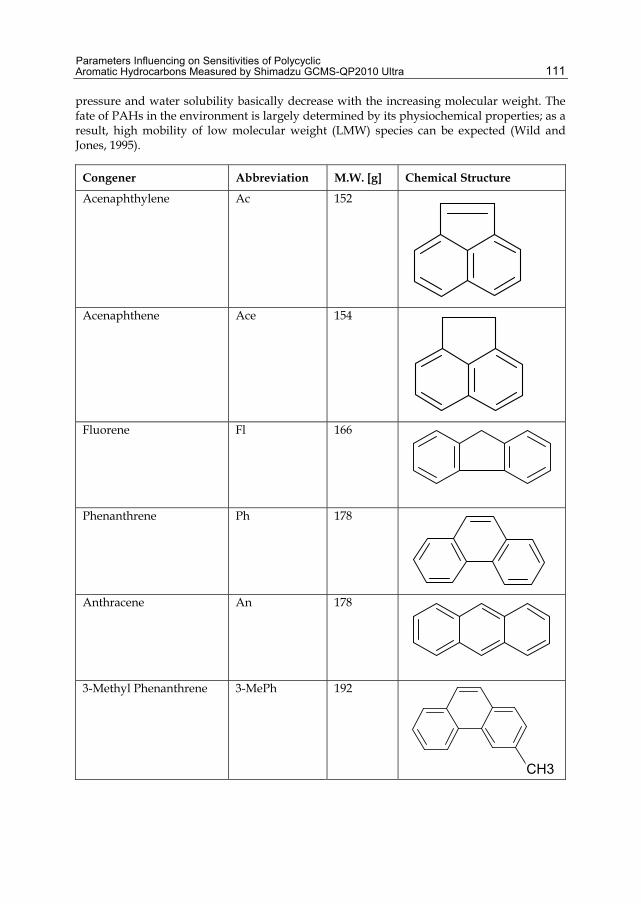
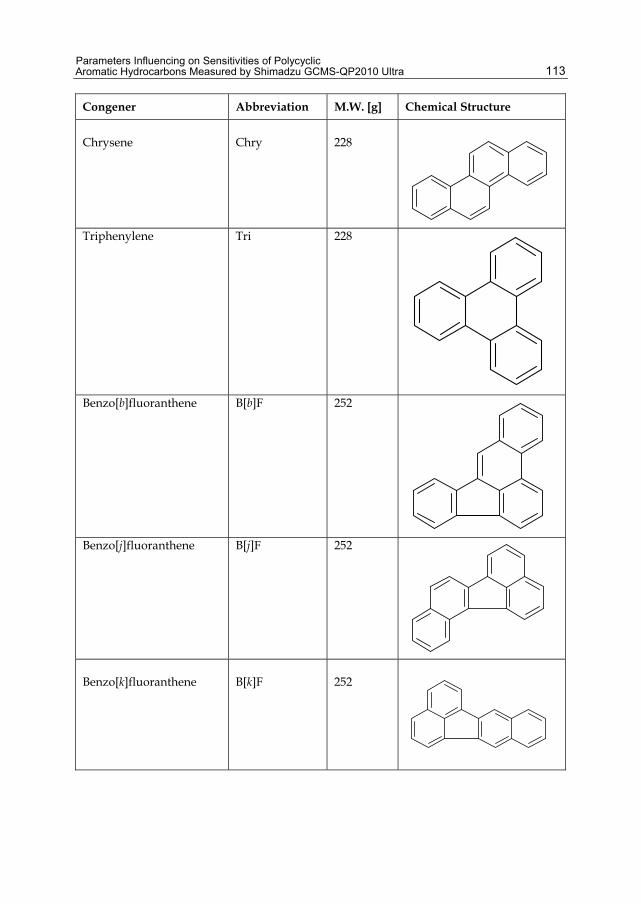
Congener Abbreviation M.W. [g] Chemical Structure
Acenaphthylene Ac 152
Acenaphthene Ace 154
Fluorene Fl 166
Phenanthrene Ph 178
Anthracene An 178
3-Methyl Phenanthrene 3-MePh 192
CH3
Advanced Gas Chromatography �– Progress in Agricultural, Biomedical and Industrial Applications
112
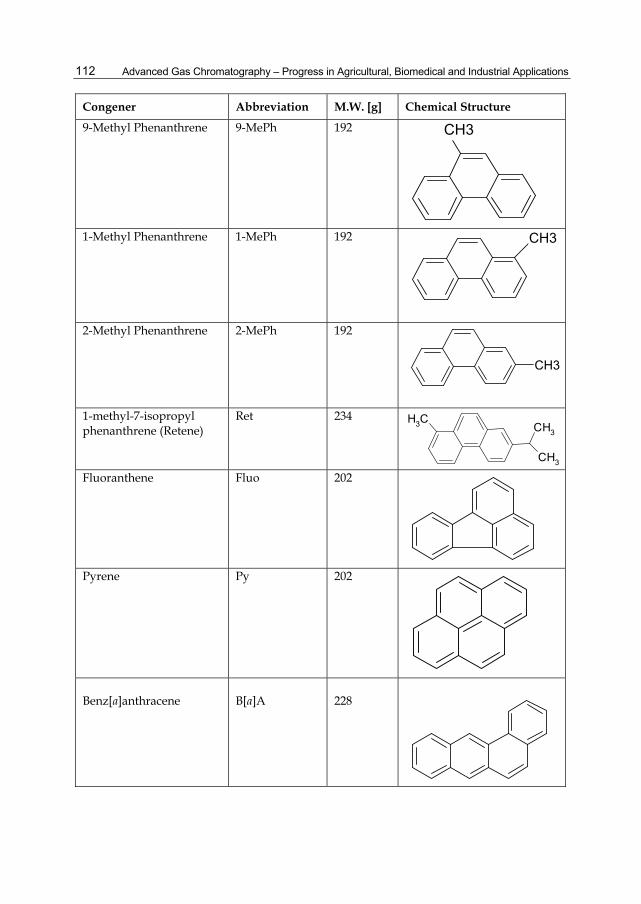
Congener Abbreviation M.W. [g] Chemical Structure
9-Methyl Phenanthrene 9-MePh 192 CH3
1-Methyl Phenanthrene 1-MePh 192 CH3
2-Methyl Phenanthrene 2-MePh 192
CH3
1-methyl-7-isopropyl phenanthrene (Retene)
Ret 234
Fluoranthene Fluo 202
Pyrene Py 202
Benz[a]anthracene
B[a]A
228
CH3 CH3
CH3
Parameters Influencing on Sensitivities of Polycyclic Aromatic Hydrocarbons Measured by Shimadzu GCMS-QP2010 Ultra
113
Congener Abbreviation M.W. [g] Chemical Structure
Chrysene
Chry
228
Triphenylene Tri 228
Benzo[b]fluoranthene B[b]F 252
Benzo[j]fluoranthene B[j]F 252
Benzo[k]fluoranthene
B[k]F
252
Advanced Gas Chromatography �– Progress in Agricultural, Biomedical and Industrial Applications
114
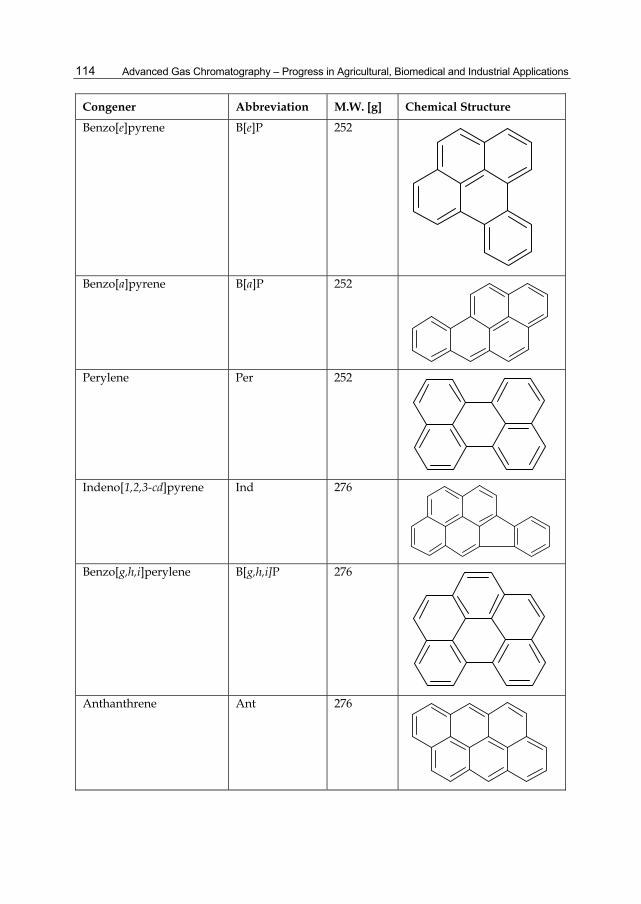
Congener Abbreviation M.W. [g] Chemical Structure
Benzo[e]pyrene B[e]P 252
Benzo[a]pyrene B[a]P 252
Perylene Per 252
Indeno[1,2,3-cd]pyrene Ind 276
Benzo[g,h,i]perylene B[g,h,i]P 276
Anthanthrene Ant 276
Parameters Influencing on Sensitivities of Polycyclic Aromatic Hydrocarbons Measured by Shimadzu GCMS-QP2010 Ultra
115
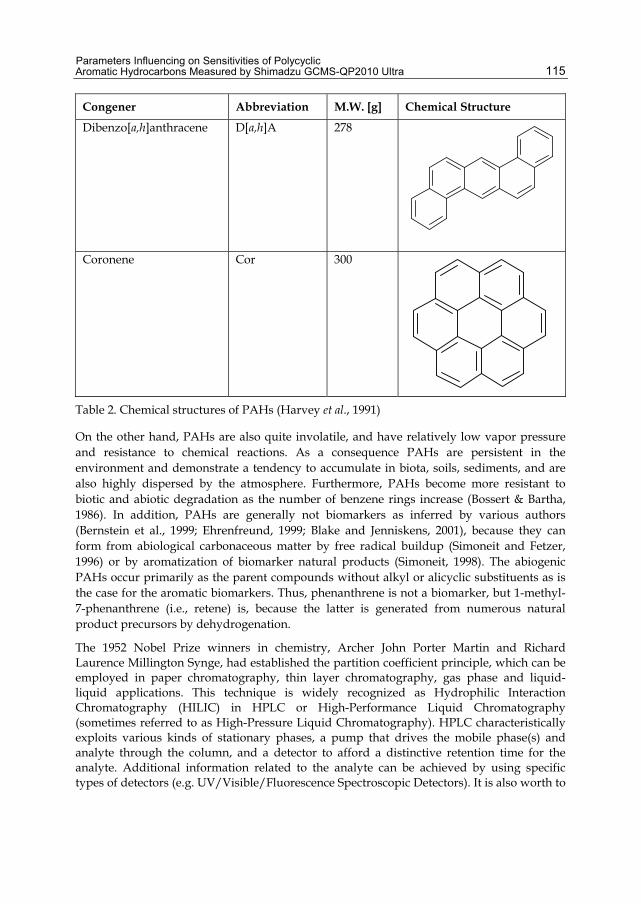
Congener Abbreviation M.W. [g] Chemical Structure
Dibenzo[a,h]anthracene D[a,h]A 278
Coronene Cor 300
Table 2. Chemical structures of PAHs (Harvey et al., 1991)
On the other hand, PAHs are also quite involatile, and have relatively low vapor pressure and resistance to chemical reactions. As a consequence PAHs are persistent in the environment and demonstrate a tendency to accumulate in biota, soils, sediments, and are also highly dispersed by the atmosphere. Furthermore, PAHs become more resistant to biotic and abiotic degradation as the number of benzene rings increase (Bossert & Bartha, 1986). In addition, PAHs are generally not biomarkers as inferred by various authors (Bernstein et al., 1999; Ehrenfreund, 1999; Blake and Jenniskens, 2001), because they can form from abiological carbonaceous matter by free radical buildup (Simoneit and Fetzer, 1996) or by aromatization of biomarker natural products (Simoneit, 1998). The abiogenic PAHs occur primarily as the parent compounds without alkyl or alicyclic substituents as is the case for the aromatic biomarkers. Thus, phenanthrene is not a biomarker, but 1-methyl-7-phenanthrene (i.e., retene) is, because the latter is generated from numerous natural product precursors by dehydrogenation.
The 1952 Nobel Prize winners in chemistry, Archer John Porter Martin and Richard Laurence Millington Synge, had established the partition coefficient principle, which can be employed in paper chromatography, thin layer chromatography, gas phase and liquid-liquid applications. This technique is widely recognized as Hydrophilic Interaction Chromatography (HILIC) in HPLC or High-Performance Liquid Chromatography (sometimes referred to as High-Pressure Liquid Chromatography). HPLC characteristically exploits various kinds of stationary phases, a pump that drives the mobile phase(s) and analyte through the column, and a detector to afford a distinctive retention time for the analyte. Additional information related to the analyte can be achieved by using specific types of detectors (e.g. UV/Visible/Fluorescence Spectroscopic Detectors). It is also worth to
Advanced Gas Chromatography �– Progress in Agricultural, Biomedical and Industrial Applications
116
mention that the analyte retention time is a function of its affinity with the stationary phase, the ratio/composition of solvents used, and the flow rate of the mobile phase. Although HPLC has the advantage of analyzing several organic compounds in a single chromatogram (e.g. analysis of PAHs), the sensitivity is not high enough to detect target compounds in part per billion (ppb) levels. To overcome the instrumental detection limit, Rolland Gohlke and Fred McLafferty had developed the application of a mass spectrometer as the detector in gas chromatography, which later on called as Gas Chromatography Mass Spectrometry (GC-MS) (Gohlke, 1959; Gohlke and Fred, 1993). In 1964, Robert E. Finnigan had extended the potential of GC-MS by developing a computer controlled quadrupole mass spectrometer under the collaboration with Electronic Associates, Inc. (EAI), a leading U.S. supplier of analog computers. By the 2000s computerized GC/MS instruments using quadrupole technology had become both essential to chemical research and one of the foremost instruments used for organic analysis. Today computerized GC/MS instruments are widely used in environmental monitoring of water, air, and soil; in the regulation of agriculture and food safety; and in the discovery and production of medicine.
Recently, GC/MS featuring ion trap systems, based on a selected parent ion and a whole mass spectrum of its daughter ions, offering the broadest selection of innovative features to expand the working mass range of typical GC/MS system to 900 amu with higher performances and specificities (Jie and Kai-Xiong, 2007). This technique minimizes the ratio between the numbers of ions from matrix background to those of target compound and thus enhances the analytical sensitivity of GC/MS system. Identifications of PAHs associated with atmospheric particulate matter, coastal and marine sediments are extremely elaborate since the congeners are generally present at trace levels in a complex mixture. Application of GC/MS featuring ion trap systems with low detection limits has allowed significant progress in characterization of organic component of particulate matter distributed in all environmental compartments. However, there are still some difficulties associated with the identification process using GC/MS featuring ion trap systems.
It is well known that the mass number of positively charged ions travelling through the quadrupole filter relies on the voltage applied to the quadrupole filter. As a consequence, the detection of a predetermined mass range can be conducted by altering (i.e. scanning) the applied voltage in a particular scope. Based on this theory, it is evident that the faster the scanning speed is, the shorter the detection time of a scanning cycle is, and the greater the number of scanning cycles within a predetermined time period can be achieved. This implies that a higher time resolution can be acquired by enhancing the scanning speed. However, the relatively fast scanning speed can lead to a major sensitivity drop due to the modification in the applied voltage while the positively charged ion is passing through the quadrupole. Assuming that a positively charged ion takes the time t1 to travel though the length L of the quadrupole filter, the kinetic energy of the ion plays an important role on the time t1 when the ion passes through the quadrupole filter. Since the voltage applied to the quadrupole while the ion passes through is positively correlated with the voltage scanning speed, the extremely high scanning speed deteriorates the instrument sensitivity as the scanning speed is enhanced.
GC-MS-QP 2010 Ultra was developed by Shimadzu engineers to resolve this problem. Advanced Scanning Speed Protocol technology (ASSP technology) was invented by using the electrical field to control the kinetic energy of the positively charged ions generated from

Parameters Influencing on Sensitivities of Polycyclic Aromatic Hydrocarbons Measured by Shimadzu GCMS-QP2010 Ultra
117
the ion source while they are passing through the quadrupole filter. ASSP technology was specially designed for adjusting the kinetic energy of positively charged ions travelling through the quadrupole filter. The shorter the travelling time is, the alteration of voltage applied to rod electrodes in the course of the passage through the quadrupole filters is smaller and thus a large number of positively charged ions can enter to the quadrupole filter. This finally leads to an improvement of instrumental sensitivity. In addition, FASST (Fast Automated Scan/SIM Type) was deliberately designed for collecting Scan data and SIM data in a single measurement. This data acquisition technique can be employed in both gathering qualitative spectral data (Scan) and analyzing quantitative data (SIM). It is also worth to note that ASSP has amended this procedure by permitting the SIM dwell times to be reduced by as much as five times without losing sensitivity, letting the user to observe more SIM channels.
Without any doubt, ASSP coupled with FASST is an innovative data acquiring technique that integrates the qualitative assessment (i.e. Scanning of spectral data) with the quantitative analysis (SIM). Despite its high speed scanning performance, little is known about the factors governing relative response factors (RRFs) detected by GC-MS-QP 2010 Ultra (Shimadzu). Since the data quality is greatly reliant on the values of RRFs, it is therefore crucial for the analyzer to know the factors affecting sensitivity and stability of RRFs. An enormous number of papers have appeared on the topic of GC/MS analysis of PAHs using single quadrupole and quadrupole ion trap, most of which have not advanced knowledge to investigate the factors influence the sensitivity of RRFs determined by ASSP and/or FASST data acquiring techniques. Although the principles of the instrumental operation and data quality control are well established and straightforward, there are some uncertainties persisted and need to be clarified. For instance, there are several factors that can significantly affect the values of RRF detected by GC-MS ion trap such as �“manifold temperature drop�”, �“glass injection port linear contamination�” and �“column degradation�” (Pongpiachan et al., 2009). However, it remained unclear to what extent other parameters such as ion source temperature (I.S.T), interface temperature (I.T) and scanning speed (S.S) could affect sensitivity of RRFs detected by using ASSP and FASST data acquiring techniques. Hence, the objectives of this study are
1. To statistically determine the effect of �“ion source temperature�” on fluctuations of RRFs of PAHs
2. To quantitatively assess the influence of �“interface temperature�” on alterations of RRFs of PAHs
3. To investigate the �“scanning speed�” effect on variations of RRFs of PAHs.
2. Materials and methods 2.1 Materials and reagents
All solvents are HPLC grade, purchased from Fisher Scientific. A cocktail of 15 PAHs Norwegian Standard (NS 9815: S-4008-100-T) (phenanthrene (Phe), anthracene (An), fluoranthene (Fluo), pyrene (Pyr), 11h-benzo[a]fluorene (11H-B[a]F), 11h-benzo[b]fluorene (11H-B[b]F), benz[a]anthracene (B[a]A), chrysene (Chry), benzo[b]fluoranthene (B[b]F), benzo[k]fluoranthene (B[k]F), benzo[a]pyrene (B[a]P), benzo[e]pyrene (B[e]P), indeno[1,2,3-cd]pyrene (Ind), dibenz[a,h]anthracene (D[a,h]A), benzo[g,h,i]perylene (B[g,h,i]P); each 100
Advanced Gas Chromatography �– Progress in Agricultural, Biomedical and Industrial Applications
118
g mL-1 in toluene: unit: 1×1 mL) and a mix of recovery Internal Standard PAHs (d12-perylene (d12-Per), d10-fluorene (d10-Fl); each 100 g mL-1 in xylene: unit: 1×1 mL) were supplied by Chiron AS (Stiklestadveine 1, N-7041 Trondheim, Norway). Standard stock solutions of 4 g mL-1 of deuterated PAHs (used as internal standard) and 100 g mL-1 of native PAHs were prepared in nonane. Working solutions were obtained by appropriate dilution in n-cyclohexane. All solutions were stored in amber colored vials at -20 °C.
2.2 Analytical apparatus
A mass spectrometer is an instrument that separates ions according to the mass-to-charge ratio (m/z) and measures their relative abundance. The instrument is calibrated against ions of known m/z. All mass spectrometers operate by separating gas phase ions in a low-pressure environment by the interaction of magnetic or electrical fields on the charged particles. In this study, the analyses were performed using a Shimadzu GCMS-QP2010 Ultra system comprising a high-speed performance system with ASSP function (i.e. achieving maximum scan speed of 20,000 u sec-1) and an ultra-fast data acquisition speed for comprehensive two-dimensional gas chromatography (GC × GC). The rod bias voltage is automatically optimized during ultra high-speed data acquisition, thereby minimizing the drop in sensitivity that would otherwise occur above 10,000 u sec-1. The GCMS-QP2010 Ultra achieves a level of sensitivity better than five times that of conventional instruments, and is particularly effective for scan measurement in applications related to fast-GC/MS and comprehensive GC/MS (Patent: US6610979).
The target compounds were separated on a 60 m length × 0.25 mm i.d. capillary column coated with a 0.25 m film thickness (phase composition: cross-linked/surface bonded 5% phenyl, 95% methylpolysiloxane. Specified in EPA methods 207, 508, 515, 515.2, 524.2, 525, 548.1, 680, 1625, 1653, 8081, 8141, 8270 and 8280) stationary phase (Agilent JW Scientific DB-5 GC columns). Helium (99.999%) was employed as carrier gas at a constant column flow of 1.0 mL min-1 and a pressure pulse of 25 psi with a duration of 0.50 min. All injections (1 L) were performed through a universal injector in the splitless mode and the standards were introduced using a 10 L Hamilton syringe. The GC oven temperature was programmed as follows: 1 min at at 40 ºC, heated at 8 ºC min-1 to 300 ºC and held for 45 min. By employing these chromatographic conditions it was possible to qualitatively distinguish between Ph/An, B[a]A/Chry and 11H-B[a]F/11H-B[b]F, three pairs of isomers that are commonly co-eluted by gas chromatographic systems.
2.3 Compound identification and quantification
In order to quantify PAHs in environmental samples, all the detected compounds are normally identified by comparing the retention time and mass spectra of the authentic standards. Appropriately selected quantification ions can be beneficial to distinguish a particular mass spectrum of an individual compound from the co-eluted complex. In general, the most abundant ion serves as the quantification ion, which is the case for PAHs in this study. The molecular markers are identified by comparing first the retention times with authentic standards within a range of ± 0.2 min, secondly the quantification ions.
Quantification of the compounds is based upon the Internal Standard (IS) method. One of the fundamental requirements of using an IS is that it displays similar physiochemical
Parameters Influencing on Sensitivities of Polycyclic Aromatic Hydrocarbons Measured by Shimadzu GCMS-QP2010 Ultra
119
properties or the same type of substitution as the analytes because be similar to each other. A relative response factor (RRF) for each native analyte was first determined. This is used for quantification, as the relative response between the internal standard (IS) and the native analyte should remain constant. It is a convenient method because recovery losses of the compound during extraction and analysis are assumed to match those of the IS. It is calculated employing the appropriate IS using the following equation: The calculation of relative response factor (RRF) is described as follows;
nat is
is nat
A CFA C
(1)
Where Anat = Peak area of the native compound in the standard; Cnat = Concentration of the native compound in the standard; Ais = Peak area of internal standard; Cis = Concentration of the internal standard. The RRFSTD used for quantifying samples are the mean of those calculated for the two quantification standards run on the same day. Concentration (C) of analytes in sample extracts is calculated using the following formula:
1nat s
is STD is
A WCA RRF W
(2)
Where Wis = weight of IS added to the sample, Ws = weight or volume of the sample analyzed. A recovery determination standard (RDS) was used for the calculation of both internal standards (IS) and the sampling efficiency standard (SES) of recoveries during sample preparation and extraction/purification. A known amount of RDS was added at the final stage prior to GC/MS analysis and was assumed to suffer zero loss.
100%is RDS is RDS
RDS is RDS isS STD STD S
A A C CA A C C
(3)
Where ARDS = Peak area of recovery determination standard; CRDS: = Concentration of the recovery determination standard. Recoveries of IS were used as an indication of the anlyte losses during extraction, pre-concentration, cleanup/fractionation and blow down stages. The calculation of the sampling efficiency by using the sampling efficiency standard (SES) is described as follows:
100%is SES is SES
SES is SES isSTD S S STD
A A C CA A C C
(4)
Where ASES = Peak area of the sampling efficiency standard, CSES = Concentration of the sampling efficiency standard. Recoveries of SES were used as an indication of analyte losses during sampling as opposed to the analysis. In this study, the IS d10-Fl and d12-Per were employed to calculate the values of RRFs of Group 1 PAHs (i.e. Phe, An, Fluo, Pyr, 11H-B[a]F, 11H-B[b]F, B[a]A, Chry) and Group 2 PAHs (i.e. B[b]F, B[k]F, Benzo[a]pyrene, B[e]P, Ind, D[a,h]A, B[g,h,i]P) respectively. In addition, the factors governing variations of RRFSTD of 15 PAHs Norwegian Standard (NS 9815: S-4008-100-T) as illustrated in Equation 1 had been carefully investigated. The results and details will be discussed in a later part of this chapter.
Advanced Gas Chromatography �– Progress in Agricultural, Biomedical and Industrial Applications
120
2.4 Statistical analysis
In this chapter, Pearson correlation analysis, multiple linear regression analysis (MLRA), hierarchical cluster analysis (HCA) and principal component analysis (PCA) were conducted by using SPSS version 13.
3. Results and discussion Ion source temperature (I. S. T), interface temperature (I. T) and scanning speed (S. S) were set at five different levels (i.e. 200 °C, 225 °C, 250 °C, 275 °C, 300 °C), four distinctive stages (i.e. 250 °C, 275 °C, 300 °C, 325 °C) and five altered points (500 u sec-1, 1,000 u sec-1, 5,000 u sec-1, 10,000 u sec-1, 20,000 u sec-1). Therefore, there are 100 combinations of I.S.T, I.T and S.S (i.e. 4×5×5 = 100) included in the statistical analysis.
3.1 Pearson correlation analysis
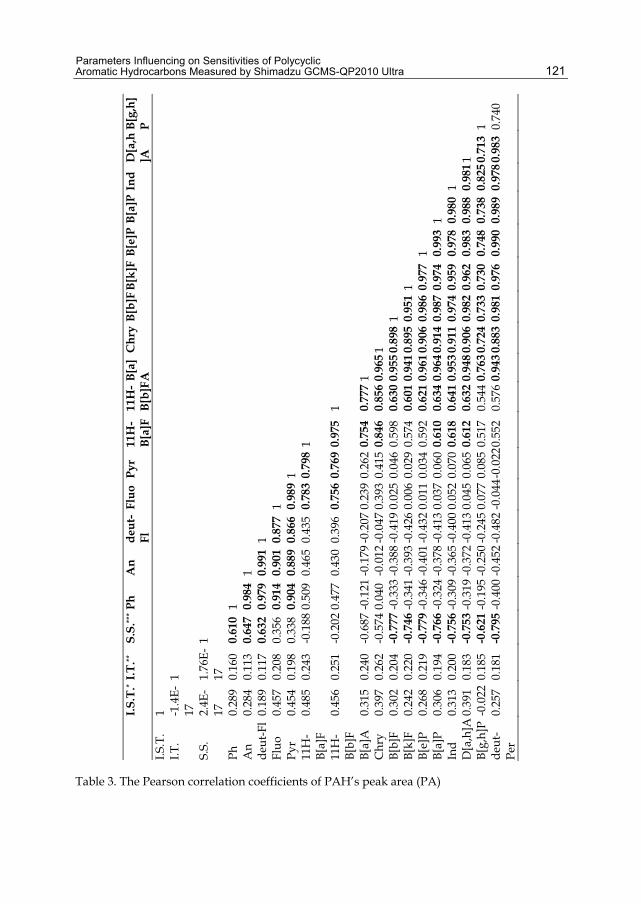
To find the relationship between peak area of PAHs and GC-MS tuning parameters (i.e. I.S.T, I.T and S.S), the Pearson correlation coefficients were computed and displayed in Table 3. Some comparatively strong negative correlations were observed between two continuous variables, namely S.S. and high molecular weight (HMW) PAHs. For instance, R-values of S.S. vs Benzo[a]pyrene, S.S. vs Ind, S.S. vs D[a,h]A were -0.77, -0.76, -0.75 respectively. As discussed earlier in Section 1, the relatively fast scanning speed can dramatically cause a significant drop of instrumental sensitivity. Therefore, ASSP and FASST were developed for resolving this technical problem. By carefully controlling the kinetic energy of positively charged ions travelling inside the mass spectrometry, one can reduce its passing time and thus allowing more ions to enter the quadrupole filter. However, if the kinetic energy is not high enough to shorten the passing time of positively charged ions inside the quadrupole, a major drop of instrumental sensitivity can be detected as previously mentioned. Some positive correlations between S.S. vs Phe (R = 0.61), An (R = 0.65), deut-Fl (R = 0.63) proved that ASSP and FASST seem to work fairly well on LMW PAHs (see Table 3). This can be explained through a competition between the kinetic energy of positively charged ions and the voltage scanning speed. It appears that ASSP and FASST successfully resolved the sensitivity drop problems for LMW PAHs. In addition, neither I.S.T. nor I.T. play a significant role on the variation of PAHs�’ sensitivities.
3.2 Cluster analysis
Cluster analysis (CA), also called segmentation analysis or taxonomy analysis, seeks to identify homogeneous subgroups of cases in a population. That is, cluster analysis seeks to identify a set of groups, which both minimize within-group variation and maximize between-group variation. In this study, CA was conducted using SPSS 13.0 for Windows. CA techniques may be hierarchical (i.e. the resultant classification has an increasing number of nested classes) or non-hierarchical (i.e. k-means clustering). Hierarchical clustering allows users to select a definition of distance, then select a linking method of forming clusters, then determine how many clusters best suit the data. Hierarchical clustering methods do not require pre-set knowledge of the number of groups.
Parameters Influencing on Sensitivities of Polycyclic Aromatic Hydrocarbons Measured by Shimadzu GCMS-QP2010 Ultra
121
Table 3. The Pearson correlation coefficients of PAH�’s peak area (PA)
Advanced Gas Chromatography �– Progress in Agricultural, Biomedical and Industrial Applications
122
There are three general approaches to clustering groups of data, namely �“Hierarchical Cluster Analysis�”, �“K-means Cluster Analysis�” and �“Two-Step Cluster Analysis�”. In both K-means clustering and two-step clustering, researchers have to specify the number of clusters in advance then calculate how to assign cases to the K clusters. Furthermore, these two clustering techniques require a very large scale of data set (e.g. n > 1,000). On the contrary, Hierarchical Cluster Analysis (HCA) is appropriate for smaller samples (e.g. n < 200) and can be carried out without any data pre-treatment. It is also important to note that there are two types of Hierarchical Clustering namely Agglomerative Hierarchical Clustering and Divisive Hierarchical Clustering.
In agglomerative hierarchical clustering every case is initially considered as a cluster then the two cases with the lowest distance (i.e. highest similarity) are combined into a cluster. The case with the lowest distance to either of the first two is considered next. If that third case is closer to a fourth case than it is to either of the first two, the third and fourth cases become the second two-case cluster, if not, the third case is added to the first cluster. The process is repeated, adding cases to existing clusters, creating new clusters, or combining clusters to get to the desired final number of clusters. In contrast, the divisive clustering works in the opposite direction, starting with all cases in one large cluster. Since the
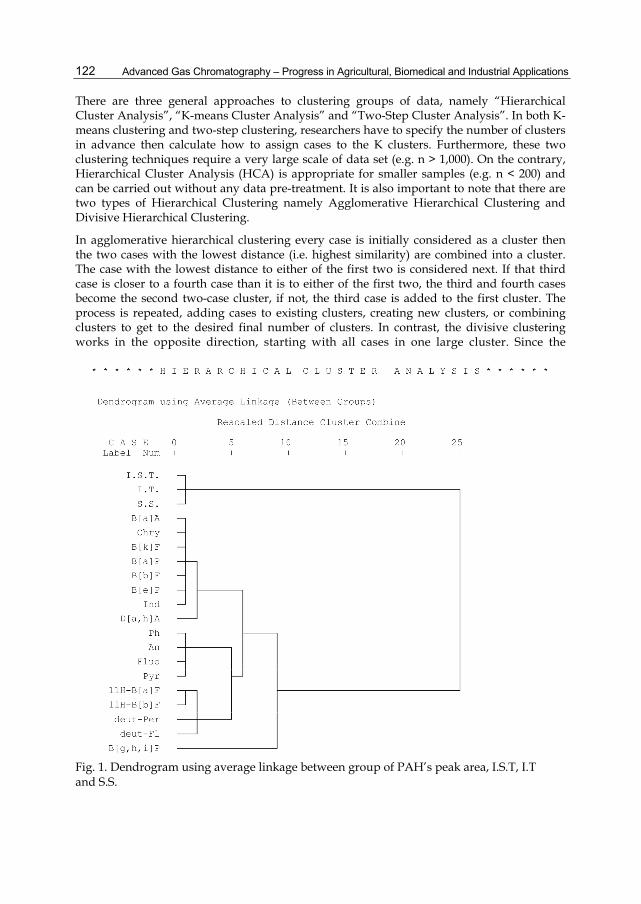
Fig. 1. Dendrogram using average linkage between group of PAH�’s peak area, I.S.T, I.T and S.S.
Parameters Influencing on Sensitivities of Polycyclic Aromatic Hydrocarbons Measured by Shimadzu GCMS-QP2010 Ultra
123
objective of this section is to clusterize the wide range of GC-MS tuning parameters coupled with RRFs of PAHs with relatively small sample numbers, the agglomerative hierarchical cluster analysis is probably the most suitable for this purpose. HCA was carried out using the multivariate data analysis software �“SPSS version 13�”. To obtain more information on the affinities of GC-MS tuning parameters and PAHs�’ peak area, HCA had been conducted on the 20 variables (i.e. 17 PAHs and 3 GC-MS tuning parameters). The results demonstrated in the dendrogram (Fig. 1) distinguished the 20 individual parameters into two major clusters. The first cluster consists mainly of I.S.T, I.T and S.S, which can be considered as a domination of GC-MS tuning parameters.
The second major cluster can be subdivided into three sub-clusters. The first sub-cluster consists of B[a]A, Chry, B[k]F, Benzo[a]pyrene, B[b]F, B[e]P, Ind, D[a,h]A, which were all composed of four to five benzene rings. Therefore, this sub-cluster represents the typical marks of HMW PAHs. The second sub-cluster contains LMW PAHs (Ph, An, Fluo, Pyr). The third sub-cluster composed of 11H-B[a]F, 11H-B[b]F, deut-Per and deut-Fl. It is interesting to note that these congeners have different chemical structures from those of other PAHs. Therefore, the third cluster can be considered as an indicative of mixing of unique structures of PAHs.
Since dendrogram provides a visual accounting of how closely connected one parameter is to another, the more properties of two parameters have in common, the closer they are associated. Figure 1 demonstrates that, for this dendrogram of four clusters, there is a fairly close-knit group in the first major cluster (i.e. I.S.T, I.T and S.S) and the first sub-cluster of second major cluster (i.e. B[a]A, Chry, B[k]F, Benzo[a]pyrene, B[b]F, B[e]P, Ind, D[a,h]A). B[g,h,i]P is the outsider in this dendrogram, while the second sub-cluster of second major cluster (i.e. Ph, An, Fluo, Pyr) takes an intermediary position. Similar to previous results obtained by using Pearson correlation analysis, S.S. is still the most influential GC-MS tuning parameters governing the instrumental sensitivity of PAHs. Apart from B[g,h,i]P, the four-to-five aromatic ring PAHs are closely associated with the fluctuations of S.S. emphasizing that one should carefully select the suitable scanning speed in order to minimize the sacrifice of instrumental sensitivity.
3.3 Multiple linear regression analysis
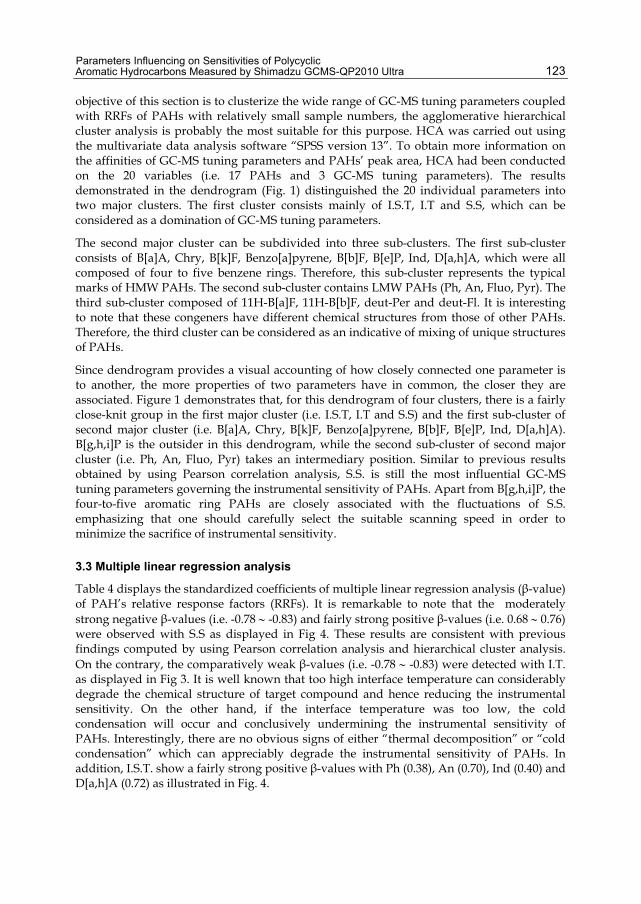
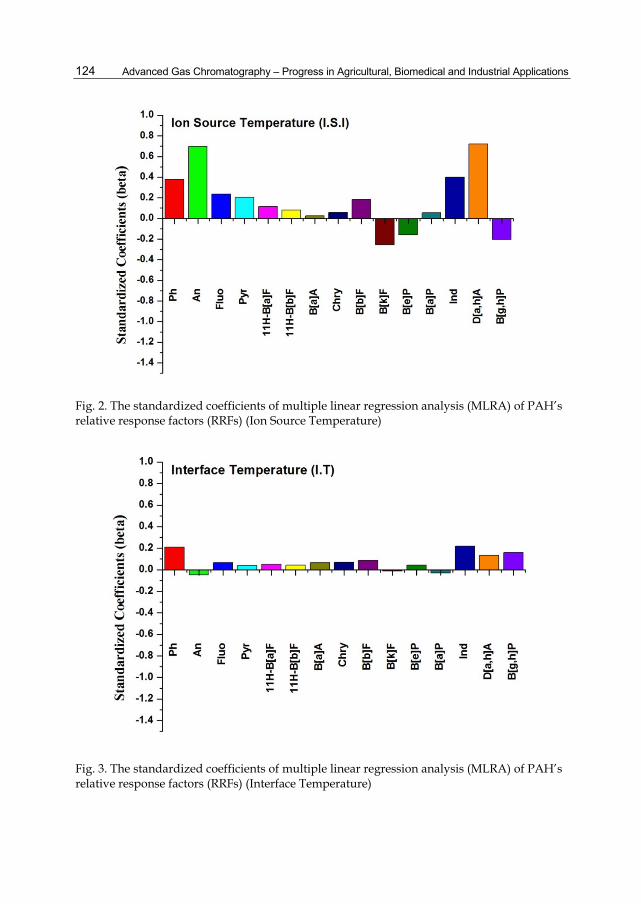
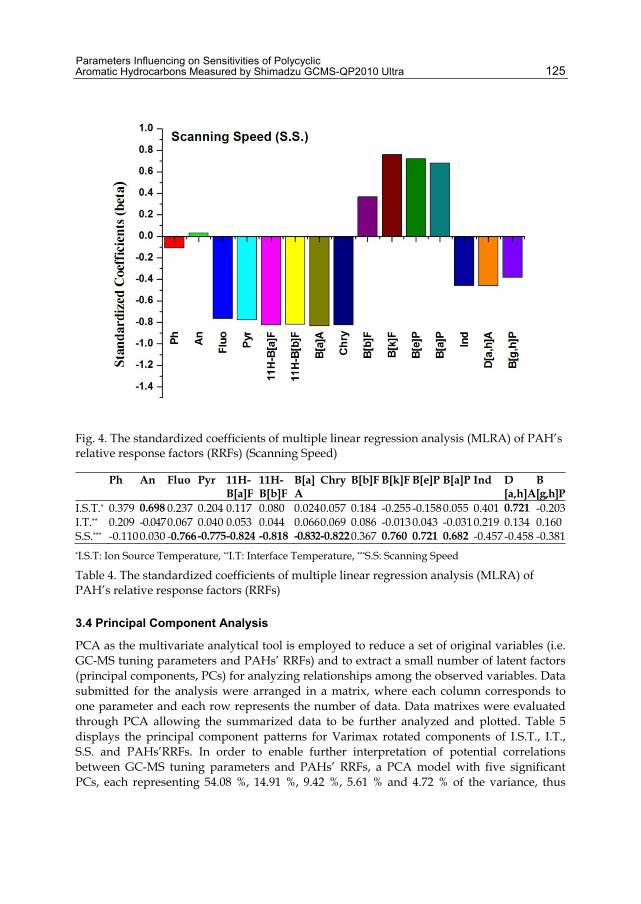
Table 4 displays the standardized coefficients of multiple linear regression analysis ( -value) of PAH�’s relative response factors (RRFs). It is remarkable to note that the moderately strong negative -values (i.e. -0.78 -0.83) and fairly strong positive -values (i.e. 0.68 0.76) were observed with S.S as displayed in Fig 4. These results are consistent with previous findings computed by using Pearson correlation analysis and hierarchical cluster analysis. On the contrary, the comparatively weak -values (i.e. -0.78 -0.83) were detected with I.T. as displayed in Fig 3. It is well known that too high interface temperature can considerably degrade the chemical structure of target compound and hence reducing the instrumental sensitivity. On the other hand, if the interface temperature was too low, the cold condensation will occur and conclusively undermining the instrumental sensitivity of PAHs. Interestingly, there are no obvious signs of either �“thermal decomposition�” or �“cold condensation�” which can appreciably degrade the instrumental sensitivity of PAHs. In addition, I.S.T. show a fairly strong positive -values with Ph (0.38), An (0.70), Ind (0.40) and D[a,h]A (0.72) as illustrated in Fig. 4.
Advanced Gas Chromatography �– Progress in Agricultural, Biomedical and Industrial Applications
124
Fig. 2. The standardized coefficients of multiple linear regression analysis (MLRA) of PAH�’s relative response factors (RRFs) (Ion Source Temperature)
Fig. 3. The standardized coefficients of multiple linear regression analysis (MLRA) of PAH�’s relative response factors (RRFs) (Interface Temperature)
Parameters Influencing on Sensitivities of Polycyclic Aromatic Hydrocarbons Measured by Shimadzu GCMS-QP2010 Ultra
125
Fig. 4. The standardized coefficients of multiple linear regression analysis (MLRA) of PAH�’s relative response factors (RRFs) (Scanning Speed)
Ph An Fluo Pyr 11H-B[a]F
11H-B[b]F
B[a]A
Chry B[b]F B[k]F B[e]P B[a]P Ind D [a,h]A
B [g,h]P
I.S.T.* 0.379 0.698 0.237 0.204 0.117 0.080 0.0240.057 0.184 -0.255 -0.1580.055 0.401 0.721 -0.203 I.T.** 0.209 -0.0470.067 0.040 0.053 0.044 0.0660.069 0.086 -0.013 0.043 -0.0310.219 0.134 0.160 S.S.*** -0.110 0.030 -0.766-0.775-0.824 -0.818 -0.832-0.8220.367 0.760 0.721 0.682 -0.457 -0.458 -0.381 *I.S.T: Ion Source Temperature, **I.T: Interface Temperature, ***S.S: Scanning Speed
Table 4. The standardized coefficients of multiple linear regression analysis (MLRA) of PAH�’s relative response factors (RRFs)
3.4 Principal Component Analysis
PCA as the multivariate analytical tool is employed to reduce a set of original variables (i.e. GC-MS tuning parameters and PAHs�’ RRFs) and to extract a small number of latent factors (principal components, PCs) for analyzing relationships among the observed variables. Data submitted for the analysis were arranged in a matrix, where each column corresponds to one parameter and each row represents the number of data. Data matrixes were evaluated through PCA allowing the summarized data to be further analyzed and plotted. Table 5 displays the principal component patterns for Varimax rotated components of I.S.T., I.T., S.S. and PAHs�’RRFs. In order to enable further interpretation of potential correlations between GC-MS tuning parameters and PAHs�’ RRFs, a PCA model with five significant PCs, each representing 54.08 %, 14.91 %, 9.42 %, 5.61 % and 4.72 % of the variance, thus
Advanced Gas Chromatography �– Progress in Agricultural, Biomedical and Industrial Applications
126
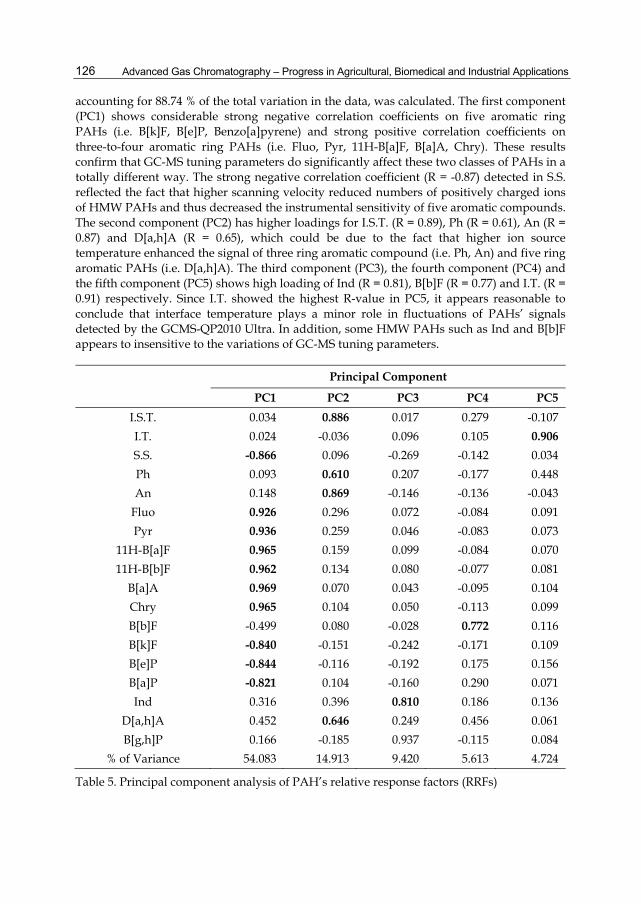
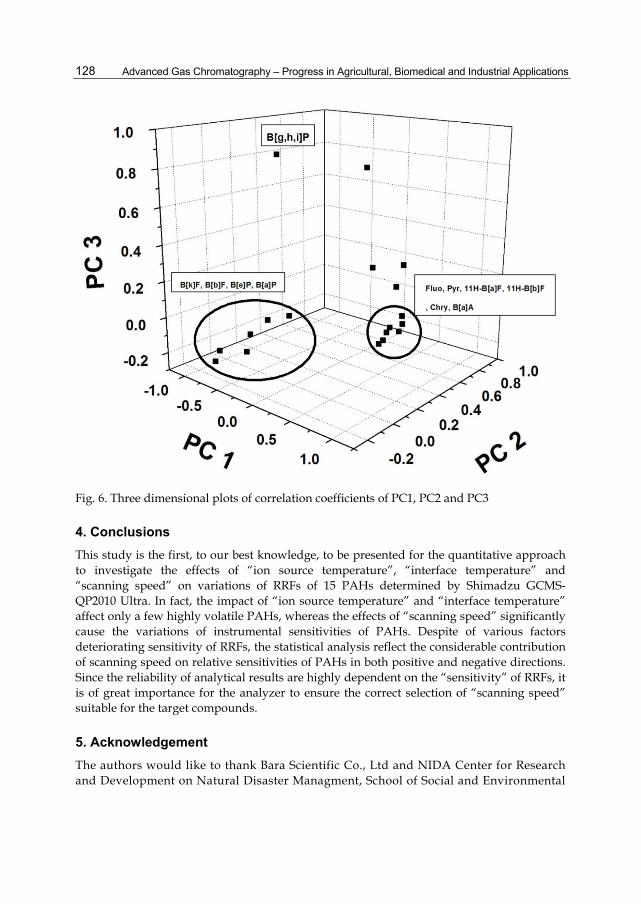
accounting for 88.74 % of the total variation in the data, was calculated. The first component (PC1) shows considerable strong negative correlation coefficients on five aromatic ring PAHs (i.e. B[k]F, B[e]P, Benzo[a]pyrene) and strong positive correlation coefficients on three-to-four aromatic ring PAHs (i.e. Fluo, Pyr, 11H-B[a]F, B[a]A, Chry). These results confirm that GC-MS tuning parameters do significantly affect these two classes of PAHs in a totally different way. The strong negative correlation coefficient (R = -0.87) detected in S.S. reflected the fact that higher scanning velocity reduced numbers of positively charged ions of HMW PAHs and thus decreased the instrumental sensitivity of five aromatic compounds. The second component (PC2) has higher loadings for I.S.T. (R = 0.89), Ph (R = 0.61), An (R = 0.87) and D[a,h]A (R = 0.65), which could be due to the fact that higher ion source temperature enhanced the signal of three ring aromatic compound (i.e. Ph, An) and five ring aromatic PAHs (i.e. D[a,h]A). The third component (PC3), the fourth component (PC4) and the fifth component (PC5) shows high loading of Ind (R = 0.81), B[b]F (R = 0.77) and I.T. (R = 0.91) respectively. Since I.T. showed the highest R-value in PC5, it appears reasonable to conclude that interface temperature plays a minor role in fluctuations of PAHs�’ signals detected by the GCMS-QP2010 Ultra. In addition, some HMW PAHs such as Ind and B[b]F appears to insensitive to the variations of GC-MS tuning parameters.
Principal Component
PC1 PC2 PC3 PC4 PC5 I.S.T. 0.034 0.886 0.017 0.279 -0.107 I.T. 0.024 -0.036 0.096 0.105 0.906 S.S. -0.866 0.096 -0.269 -0.142 0.034 Ph 0.093 0.610 0.207 -0.177 0.448 An 0.148 0.869 -0.146 -0.136 -0.043
Fluo 0.926 0.296 0.072 -0.084 0.091 Pyr 0.936 0.259 0.046 -0.083 0.073
11H-B[a]F 0.965 0.159 0.099 -0.084 0.070 11H-B[b]F 0.962 0.134 0.080 -0.077 0.081
B[a]A 0.969 0.070 0.043 -0.095 0.104 Chry 0.965 0.104 0.050 -0.113 0.099 B[b]F -0.499 0.080 -0.028 0.772 0.116 B[k]F -0.840 -0.151 -0.242 -0.171 0.109 B[e]P -0.844 -0.116 -0.192 0.175 0.156 B[a]P -0.821 0.104 -0.160 0.290 0.071 Ind 0.316 0.396 0.810 0.186 0.136
D[a,h]A 0.452 0.646 0.249 0.456 0.061 B[g,h]P 0.166 -0.185 0.937 -0.115 0.084
% of Variance 54.083 14.913 9.420 5.613 4.724
Table 5. Principal component analysis of PAH�’s relative response factors (RRFs)
Parameters Influencing on Sensitivities of Polycyclic Aromatic Hydrocarbons Measured by Shimadzu GCMS-QP2010 Ultra
127
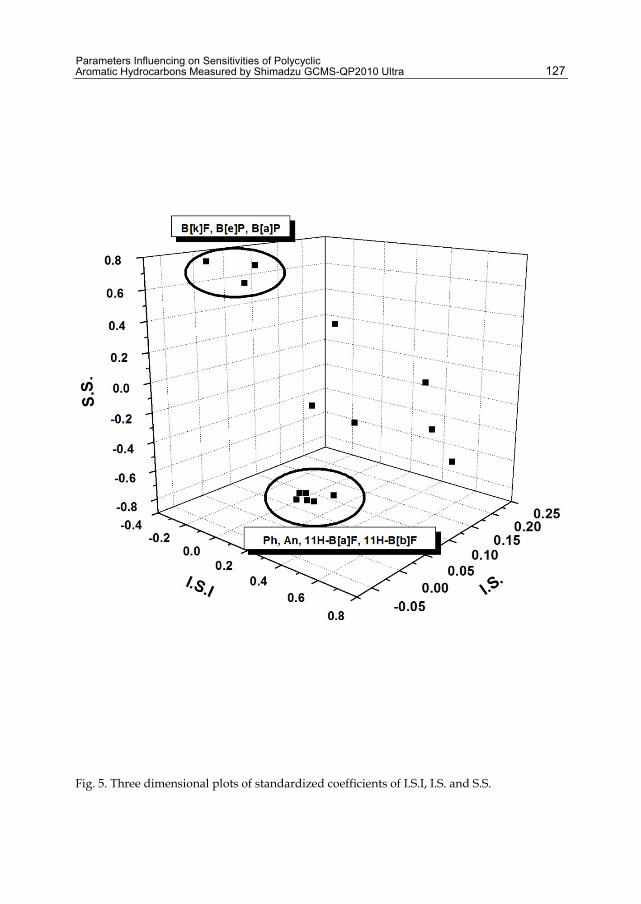
Fig. 5. Three dimensional plots of standardized coefficients of I.S.I, I.S. and S.S.
Advanced Gas Chromatography �– Progress in Agricultural, Biomedical and Industrial Applications
128
Fig. 6. Three dimensional plots of correlation coefficients of PC1, PC2 and PC3
4. Conclusions
This study is the first, to our best knowledge, to be presented for the quantitative approach to investigate the effects of �“ion source temperature�”, �“interface temperature�” and �“scanning speed�” on variations of RRFs of 15 PAHs determined by Shimadzu GCMS-QP2010 Ultra. In fact, the impact of �“ion source temperature�” and �“interface temperature�” affect only a few highly volatile PAHs, whereas the effects of �“scanning speed�” significantly cause the variations of instrumental sensitivities of PAHs. Despite of various factors deteriorating sensitivity of RRFs, the statistical analysis reflect the considerable contribution of scanning speed on relative sensitivities of PAHs in both positive and negative directions. Since the reliability of analytical results are highly dependent on the �“sensitivity�” of RRFs, it is of great importance for the analyzer to ensure the correct selection of �“scanning speed�” suitable for the target compounds.
5. Acknowledgement
The authors would like to thank Bara Scientific Co., Ltd and NIDA Center for Research and Development on Natural Disaster Managment, School of Social and Environmental
Parameters Influencing on Sensitivities of Polycyclic Aromatic Hydrocarbons Measured by Shimadzu GCMS-QP2010 Ultra
129
Development, National Institute of Development Administration (NIDA) for the continued financial support of this work.
6. References
Bernstein, M.P., Sandford, S.A. and Allamandola, L.J. (1999). Life�’s far-flung raw materials. Sci. Amer. 281 1, pp. 42�–49.
Blake, D.F. and Jenniskens, P. (2001). The ice of life. Sci. Amer. 285 (2): 44�–50. Bossert, I.P. and Bartha, R. (1986). Bull. Environ. Contam. Toxicol., 37: 490-495. Ehrenfreund, P (1999) Molecules on a space odyssey. Science 283: 1123�–1124. EPA Appendix A to 40 CFR, Part 423�–126 Priority Pollutants Available from: http://
www.epa.gov/region01/npdes/permits/generic/prioritypollutants.pdf, (2003). Gohlke, R. S. (1959). Time-of-Flight Mass Spectrometry and Gas-Liquid Partition
Chromatography. Analytical Chemistry 31 (4): 535. doi:10.1021/ac50164a024. Gohlke, R and McLafferty, F. W. (1993). Early gas chromatography/mass spectrometry.
Journal of the American Society for Mass Spectrometry 4 (5): 367. doi:10.1016/1044-0305(93)85001-E.
Harvey, G. R (1991) Polycyclic aromatic hydrocarbons, Cambridge University Press, Cambridge, USA.
International Agency for Research on Cancer (1983) IARC Monographs on the evaluation of the carcinogenic risk of chemicals to man, Vol.32: Polycyclic aromatic hydrocarbons, Part 1: Chemical, environmental and experimental data. IARC, Lyon, France.
International Agency for Research on Cancer (1984) IARC Monographs on the evaluation of the carcinogenic risk of chemicals to man, Vol.34: Polycyclic aromatic hydrocarbons, Part 3: Industrial exposures in aluminium production, coal gasification, coke production, and iron and steel founding. IARC, Lyon, France.
International Agency for Research on Cancer (1985) IARC Monographs on the evaluation of the carcinogenic risk of chemicals to man, Bitumens, coal-tars and derived products, shale-oils and soots. Monnograph No 35, IARC, Lyon, France.
International Agency for Research on Cancer (1987) IARC Monographs on the evaluation of the carcinogenic risk of chemicals to man, Supplement, IARC, Lyon, France.
Jie, F and Kai-Xiong, W. (2007). Multiresidual Analysis of Organochlorine Pesticides, Polychlorinated Biphenyls and Polycyclic Aromatic Hydrocarbons in Marine Shellfishes by Gas Chromatography-Ion Trap Mass Spectrometry. Chinese J Anal Chem 35 (11): 1607-1613.
Mackay, D., Callcot, D (1998) Partitioning and physical properties of PAHs. In: Neilson, A.H. (Ed.), The Handbook of Environmental Chemistry, vol. 3, Part J. PAHs and Related Compounds. Springer, Berlin, pp. 325�–346.
Pongpiachan, S., Bualert, S., Sompongchaiyakul, P and Kositanont, C. (2009). Factors affecting sensitivity and stability of polycyclic aromatic hydrocarbons. Journal of Analytical Letters 42 (13): 2106-2130.
Simoneit, B.R.T. and Fetzer, J.C (1996) High molecular weight polycyclic aromatic hydrocarbons in hydrothermal petroleums from the Gulf of California and Northeast Pacific Ocean. Org. Geochem 24: 1065�–1077.

Advanced Gas Chromatography �– Progress in Agricultural, Biomedical and Industrial Applications
130
Simoneit, B.R.T. (1998). Biomarker PAHs in the environment. In: Neilson, A. and Hutzinger, O., Editors, The Handbook of Environmental Chemistry, Springer Verlag, Berlin: 175�–221.
Wild, S.R. and Jones, K.C. (1995) Polynuclear Aromatic Hydrocarbons in the United Kingdon Environment: A Preliminary Source Inventory and Budget. Environ. Pollut. 88: 91-108.


