Embed Size (px)
Citation preview
Citation Mazanec J The Impact of
Working Capital Management on
Corporate Performance in
SmallndashMedium Enterprises in the
Visegrad Group Mathematics 2022
10 951 httpsdoiorg103390
math10060951
Academic Editors
Ionescu-Feleaga Liliana and Monica
Aureliana Petcu
Received 13 February 2022
Accepted 14 March 2022
Published 16 March 2022
Publisherrsquos Note MDPI stays neutral
with regard to jurisdictional claims in
published maps and institutional affil-
iations
Copyright copy 2022 by the author
Licensee MDPI Basel Switzerland
This article is an open access article
distributed under the terms and
conditions of the Creative Commons
Attribution (CC BY) license (https
creativecommonsorglicensesby
40)
mathematics
Article
The Impact of Working Capital Management on CorporatePerformance in SmallndashMedium Enterprises in theVisegrad GroupJaroslav Mazanec
Department of Quantitative Methods and Economic Informatics The Faculty of Operation and Economics ofTransport and Communications University of Zilina 010 26 Zilina Slovakia jaroslavmazanecfpedasunizask
Abstract Working capital management is a crucial pillar in corporate finance The performance oftransport companies can be improved by efficient working capital management through cash man-agement inventory management and receivables management This approach aims at sustainablegrowth of transport companies in international competition The main aim of the article is to identifystatistically significant variables from working capital management describing liquidity and activitywith a focus on corporate performance in the Visegrad Group countries We designed models forsmall and medium-sized enterprises for each member state of the Visegrad Group and a universalmodel for the entire region We applied a comprehensive model design process using multi-criterialinear regression mainly on indicators from the Amadea financial statements in IBM SPSS 25 Wedescribed the overall sample using descriptive statistics identify outliers identify multicollinearityand design models and compared with other models describing return on assets The added valueis the explanation of the impact of working capital management on the performance of small andmedium-sized transport companies in the Visegrad Group which make up most companies in thissector These findings help identify key aspects of working capital management that contributeto business performance The paper presents a detailed output for future research into the role ofworking capital in corporate management
Keywords company corporate performance transport sector working capital management
1 Introduction
Transport is extremely important for citizens and the economy Citizens use transportdaily to go to work or school travel go shopping etc The transport sector is one of the mostimportant industries of the European Union (EU) members According to Eurostat (2018) [1]transportation and storage services represented 53 of the total number of enterprisesin the EU in 2018 Moreover Statista (2022) [2] demonstrates that the annual turnover ofthe transportation and storage industry in EU 28 increased from 2011 to 2018 The sectorproduced a turnover of more than 16 trillion euros As one of the areas of corporate financewe believe that working capital management is extremely important in improving theperformance of transport companies in Central Europe Working capital management is acrucial pillar in corporate finance The main idea of this special management is the abilityto satisfy the short-term debt and operational expenses The paper aims to model theprofitability of transport companies in the Visegrad Group (V4) based on selected variablesof working capital management and using multiple regression analysis in IBM SPSS 25
We find a scientific gap in examining the impact of working capital management onthe business performance of transport companies in contrast to previous studies on thetourism manufacturing automotive and other industries with relatively low adjusted R2probably as a result of the wrong combination of independent factors but also other aspectsof working capital management itself We set a scientific question ldquoWhich working capitalmanagement variables affect business performance in the transport sector in Central Europerdquo on
Mathematics 2022 10 951 httpsdoiorg103390math10060951 httpswwwmdpicomjournalmathematics
Mathematics 2022 10 951 2 of 19
which the hypotheses on the statistical significance of selected indicators of working capitalmanagement are based One of the key motives is the creation of a statistically significantmodel composed of significant variables for modeling profitability for transport companiesin Central Europe especially for increasing the efficiency of working capital managementin companies operating or entering this region In other words we analyze various kindsof financial and non-financial variables of working capital management with profitabilityin Central Europe
The article is divided into five main parts the introduction literature review researchmethodology results discussion and conclusion First the literature review summarizescurrent theoretical and empirical knowledge about working capital management in theVisegrad Group We primarily focus on identifying potential variables describing workingcapital management with a potentially significant impact on the performance of transportcompanies These findings are applied to designing the research methodology Secondthe methodology describes the sample variable identification based on previous researchand professional experience in corporate governance Finally we explain the complexprocedure for designing a multicriteria linear model in IBM SPSS 25 Third the resultsshow models for each member state in the V4 and a universal model for the entire regionFourth we compare the proposed model with other regional models for modeling businessperformance based on indicators from working capital management in the discussion Fifththe conclusion briefly summarizes important findings for academics and practitioners
Our study contributes to the existing scientific research in three ways First we summa-rize a wide range of theoretical and empirical findings from previous research that representthe basic pillar for modeling return on assets for the Visegrad Group member states Secondwe present five models with statistically significant variables modeling return on assetsusing indicators from working capital management for small and medium-sized transportenterprises These models show specific aspects of working capital management in selectedcountries Third we compare our universal model for the Visegrad Group with othermodels describing corporate performance Finally we highlight key findings for academicsand practitioners
The added value of the paper is a comprehensive assessment of the impact of workingcapital management on business performance for a specific sector in Central Europe Theseresults present the application of different ways of managing current assets We find thatthe gap in the scientific research is in industries such as transport These findings provide amotive for research in this area We offer models based on a comprehensive procedure forall countries including a universal model for all countries of the Visegrad Group Theseresults point to a suitable way of managing short-term assets in this region especially forinternational companies entering the region Transport companies are an important pillarfor the whole European area with low costs compared to Western countries Some modelscan explain almost 50 of variability according to adjusted R2 compared to other existingmodels but in different areas Interestingly we find that liquidity does not affect corporateperformance in Polish transport companies unlike others In addition small transportcompanies are at a disadvantage compared to medium-sized companies in the Czech andSlovak Republics In conclusion the universal model shows that medium-sized transportcompanies from Slovakia have a higher corporate performance than other companiesThese findings may affect the choice of effective working capital management strategies forCentral Europe
2 Literature Review
We focused on key aspects namely the relevance of modeling business performanceusing selected indicators of working capital management We found that the issue ofworking capital management is underdeveloped in Central European countries comparedto other European and non-European countries The literature review summarized currentknowledge on working capital management for business performance in various industriesfocusing on methods and results Mielcarz et al (2018) [3] demonstrate that working
Mathematics 2022 10 951 3 of 19
capital management is very important in optimizing corporate profitability Karabay(2013) [4] argues that working capital management plays an important role mainly in theperformance of manufacturing companies The correlation and regression analysis wereapplied based on financial indicators from the Turkish Central Bank from 1996 to 2011The results show that companies must shorten the days payable outstanding and cashconversion cycle to create a balance between liquidity and profitability to survive andincrease profits Likewise Khan (2017) [5] claims that working capital management is avery important part of corporate finance especially in the manufacturing sector due toits direct impact on the companyrsquos liquidity and profitability Moreover Venkatachalam(2017) [6] argues that large working capital can lead to increased costs and reduced profitsTheir paper examines the relationship between profitability and various components ofcurrent assets based on the Pearson correlation Shajar and Farooqi (2016) [7] demonstratethat effective working capital management is the most important factor in maintaininga companyrsquos survival liquidity solvency and profitability Optimal working capitalmanagement contributes positively to the companyrsquos value Prsa (2020) [8] explains thatworking capital management has an impact on a companyrsquos wealth Businesses investingmore in working capital can expect lower business risk but adverse effects on profitabilityand vice versa However Akbulut (2011) [9] explains the relationship between workingcapital management and the profitability of manufacturing companies listed on the IstanbulStock Exchange from 2000 to 2008 According to the results there is a negative relationshipbetween working capital management as a cash conversion cycle and the companyrsquosprofitability In addition the ANOVA shows that there is a statistically significant differencebetween the cash conversion cycle and the subsectors of the manufacturing industry
Prasad et al (2019) [10] present the working capital efficiency multiplier (WCEM) asa direct profitability measurement in working capital management WCEM representsfinancial performance variables such as return on assets invested capital equity returngross operating income and net operating income WCEM reflects the part of WACC thatthe company invests in working capital management As mentioned above the lowerWCEM indicates higher efficiency of working capital Similarly Zabolotnyy and Sipilaumlinen(2020) [11] expand current knowledge on working capital management These authors eval-uate the working capital management strategies of 12 Northern European food companiesusing fuzzy logic from 2005 to 2015 Their purpose is to propose an aggregate indicatorbased on a set of financial indicators reflecting the relationships between the structureof current assets and liabilities in the company This indicator identifies four types ofworking capital management strategies based on several independent variables accordingto risk preference and return Individual variables include current assets to total assetsinventories to current assets receivables to current assets cash and cash equivalents tocurrent liabilities current liabilities to current liabilities and current liabilities to equityThe results show that some companies focus on liquidity within working capital man-agement strategies Most companies have a passive working capital management policyRasyid (2017) [12] examines the impact of an aggressive working capital managementpolicy on the profitability and non-financial company value on the stock exchange basedon 393 Indonesian listed companies in 2014 Rasyid (2017) [12] determines the return onassets and the companyrsquos value as dependent variables Independent variables include anaggressive working capital management policy in the form of an aggressive investmentpolicy and an aggressive financing policy as well as control variables such as the debtratio and the size of the company The aggressive working capital management policy hasa significant impact on the companyrsquos profitability However this policy does not affectthe companyrsquos market value when using linear regression analysis The results show thatan aggressive investment policy has a positive relationship with profitability while anaggressive financing policy harms the return on assets or Tobinrsquos Q
Naumoski (2019) [13] analyzed the impact of effective working capital managementon corporate profitability The total sample consists of 720 companies from south-easternEurope such as Bosnia and Herzegovina Bulgaria Montenegro Croatia Northern Mace-
Mathematics 2022 10 951 4 of 19
donia Romania Slovenia Serbia and Turkey Naumoski (2019) [13] defines the dependentvariable as the operating profit ratio Independent variables include inventory turnoverdays receivable outstanding days payable outstanding and cash conversion cycle as themost comprehensive indicators in working capital management as well as other controlvariables The results show that the days payable outstanding and the cash conversioncycle have a statistically significant negative impact on the companyrsquos profitability On theother hand the days receivable outstanding has a statistically significant positive impacton profitability The results of the research show that south-eastern companies increaseoperating profitability by shortening days receivable outstanding and the cash conversioncycle but also by delaying days payable outstanding in good business relations Korentand Orsag (2018) [14] examine the impact of working capital management on profitabilityin Croatian software companies using descriptive statistics correlation and regressionanalysis The results suggest that there is a nonlinear concave relationship between networking capital and return on assets These results indicate that there is an optimal levelof net working capital According to Vukovic and Jakšic (2019) [15] working capital man-agement is one of the key areas in financial management Vukovic and Jakšic (2019) [15]apply multiple regression analysis to determine the impact of independent variables suchas current ratio current liabilitiestotal assets and total liabilitiestotal capital on returnon assets in the food industry in the Republic of Serbia in 2014 The results show that mostof the analyzed variables significantly affect profitability Agha (2014) [16] determines howthe return on assets is affected by receivable turnover creditor turnover inventory turnoverand the current ratio in working capital management The results reveal that workingcapital management has a significant impact on corporate profitability Agha (2014) [16]recommends minimizing inventory turnover the account receivables ratio and creditorturnover but current liquidity does not have a statistically significant impact on profitabil-ity This study is beneficial for pharmaceutical companies in the field of working capitalmanagement Vukovic and Jakšic (2019) [15] expand previous research on working capitalmanagement Their research examines how working capital management affected theprofitability of 9883 companies in the food industry in Southeast Europe in 2010ndash2014 usingprobit regression analysis The dependent variable is the return on assets Independentvariables include current liquidity current assets to total assets current liabilities to totalassets indebtedness and the size of the enterprise The empirical results show that allindependent variables except the debt ratio have an impact on profitability
Seth et al (2021) [17] determine how working capital management affects the perfor-mance of 212 Indian manufacturing companies in 2008ndash2019 using data envelope analysisand a structural equation model Independent variables include human capital structuralcapital external financing costs interest coverage leverage the share of net workingcapital in total assets asset turnover and productivity The results show that the aver-age Indian manufacturing company achieves approximately 60 of efficiency in workingcapital management These findings indicate significant problems in the working capitalmanagement of Indian manufacturing companies Independent variables such as interestcoverage leverage the ratio of net non-current assets to total assets and asset turnoverhave a direct impact on the working capital management but also an indirect impact oncorporate performance On the other hand external financing costs have a direct impact onworking capital management Seth et al (2021) [17] argue that human capital structuralcapital and productivity do not affect the efficiency of working capital management andbusiness performance These findings contribute to effective solutions in working capitalmanagement Seth et al (2020) [18] examined the relationship between working capitalmanagement and the exogenous variables of the Indian manufacturing sector The totalsample consisted of 563 Indian manufacturing companies from 2008 to 2018 Seth et al(2020) [18] examined how the cash conversion cycle is dependent on independent variablesIndependent variables included debt ratio the share of net non-current assets in total assetssize of enterprise profitability age of enterprise the growth rate of total assets the growthrate of sales interest rate productivity and exports The results show that the leverage
Mathematics 2022 10 951 5 of 19
effect the net share of non-current assets profitability asset turnover the growth rate oftotal assets and productivity have a significant impact on the cash conversion cycle
3 Research Methodology
The methodology explains the total sample dependent and independent variablesand methods The article aims to determine the impact of working capital managementon the performance of transport companies in the Visegrad Group We focus specificallyon selected independent variables describing working capital management as indicatorsof liquidity and activity ratios First we determine the association between independentvariables and the business performance in the Czech Republic Hungary Slovakia Polandand the Visegrad Group Second we compare significant variables based on selectedindicators of working capital management according to theoretical and empirical findingsfrom relevant authors from previous research around the world and statistical metrics ofall models using multiple linear regression
The overall process includes identifying independent variables based on theoreticaland empirical knowledge from previous research as well as professional experience de-scribing the initial sample using descriptive statistics analyzing the correlation amongindependent variables using correlation analysis removing outliers and modeling busi-ness performance based on independent variables using multiple linear regression (seeFigure A1 in Appendix A) These models are proposed based on complex processes inIBM SPSS 25 We identify a model consisting of statistically significant quantitative andqualitative variables In addition we focus on the R square which measures the proportionof the variability in the dependent variable about the origin explained by the regression
The total sample consists of 3828 transport companies in the Visegrad Group in 2019Table 1 shows the initial sample broken down by country and enterprise size accordingto the European classification As can be seen more than 75 of the enterprises are smalland medium-sized enterprises and the sample consists of mainly Hungarian and Polishenterprises These data are drawn from a comprehensive database of European companiesfrom the Bureau van DijkmdashA Moodyrsquos Analytics Company [19]
Table 1 Total sample
TypeTotal
Small Medium-Sized
Country
CZ 138 432 570HU 228 1022 1250PL 85 1222 1307SK 143 558 701
Total 594 3234 3828
Table 2 shows companies classified by the three criteria of sales total assets and thenumber of employees
Table 2 The classification of enterprises
Sales [Mil euro] Total Assets [Mil euro] Employees
Small company [0 1) [0 2) [0 15)
Medium-sized company [1 10) [2 20) [15 150)Source author according to Bureau van DijkMoodyrsquos Analytics (2021) [19]
The dependent variable is the return on assets of earnings before interest tax depreci-ation and amortization (EBITDA) calculated by EBITDA to total assets as a performanceindicator according to Arnaldi et al (2021) [20] We set the scientific question ldquoWhichworking capital management variables affect business performance in the transport sector in Central
Mathematics 2022 10 951 6 of 19
Europerdquo on which the hypotheses on the statistical significance of selected indicators ofworking capital management are based Table 3 reveals 14 financial indicators in workingcapital management such as liquidity ratios and activity ratios Moreover independentvariables include two qualitative variables country and company type The country indi-cator includes four countries of the Visegrad Group namely the Czech Republic HungaryPoland and Slovakia The company type indicator divides enterprises by size into smalland medium companies according to the classification in Table 2 These indicators areselected based on a wide range of theoretical and empirical findings from previous researchon the impact of working capital management on business performance regardless ofindustry and country from leading authors such as Arnaldi et al (2021) [20] Yousafand Bris (2021) [21] Yousaf et al (2021) [22] Zimon and Tarighi (2021) [23] Anton andAfloarei Nucu (2020) [24] Golas (2020b) [25] Golas (2020a) [26] Heryaacuten (2020) [27] Vukovicand Jakšic (2019) [15] Otola and Grabowska [28] Ren et al (2019) [29] Goncalves et al(2018) [30] Botoc and Anton (2017) [31] Okyere-Kwakye et al (2015) [32] Madhou et al(2015) [33] and Bieniasz and Golas (2011) [34] but also our professional experience incorporate finance Table 3 reveals the formula for calculating independent variables withexpected impact on corporate performance We expect that liquidity ratios such as cashratio quick ratio and current ratio should harm the return on assets compared to theoperating cash flow ratio We assume that the operating cash flow ratio has a positiveimpact on corporate performance because cash flow is calculated as the sum of profit aftertax and depreciation In addition we believe that turnover indicators such as inventoryturnover accounts receivable turnover and current liabilities turnover increase the returnon assets Furthermore we expect asset indicators describing period turnover to reducecorporate profitability including the conversation cycle and the cash conversion cycleHowever we think that the indicator expressing the share of current assets in total assetswill have a positive impact on increasing profitability because a higher share of currentassets in total assets should have a significant impact on corporate governance Dummyvariables such as country and enterprise size cannot be accurately estimated based onprevious research experience as country as a dummy variable has not been used in any ofthe previous research In addition the size of the Amadeus classification was not used inanother research The size of the business is determined in different ways by the naturallogarithm of the total assets according to Anton and Afloarei Nucu (2020) [24] Ren et al(2019) [29] Okyere-Kwakye et al (2015) [32] and Madhou et al (2015) [33] On the otherhand Yousaf and Bris (2021) [21] Yousaf et al (2021) [22] and Houmlgerle et al (2020) [35]use the logarithm of operating revenues Vukovic and Jakšic (2019) [15] classify companiesby size according to the number of employees assets and income We describe the sectorof transport companies using descriptive statistics Descriptive statistics make up meanmedian standard deviation skewness kurtosis minimum maximum and percentiles forselected variables of working capital management (see Table 4)
Table 3 Independent variables
No
Inde
pend
ent
Var
iabl
e
Acr
onym
Form
ula
Expe
cted
Impa
ct
Sour
ce
1 operating cash-flow ratio OPF cash-flowcurrent liabilities +
2 cash ratio CAR (cash and cashequivalent)current liabilities minus
3 quick ratio QUR (current assetsmdashstock)currentliabilities minus
Zimon and Tarighi (2021) [23]Otola amp Grabowska (2020) [28]
Heryaacuten (2020) [27]Bieniasz and Gołas (2011) [34]
Mathematics 2022 10 951 7 of 19
Table 3 Cont
No
Inde
pend
ent
Var
iabl
e
Acr
onym
Form
ula
Expe
cted
Impa
ct
Sour
ce
4 current ratio CUR current assetscurrent liabilities minus
Yousaf et al (2021) [22]Yousaf and Bris (2021) [21]
Otola amp Grabowska (2020) [28]Gołas (2020b) [25]Gołas (2020a) [26]
Vukovic and Jakšic (2019) [15]Gonccedilalves et al (2018) [30]Madhou et al (2015) [33]
Bieniasz and Gołas (2011) [34]
5 inventory turnover INT salesstock +
6 accounts receivable turnover ART salesreceivables +
7 current liabilities turnover CLT salescurrent liabilities +
8 days inventory outstanding DIO (stocksales) times 365 minusZimon and Tarighi (2021) [23]
Arnaldi et al (2021) [20]Bieniasz and Gołas (2011) [34]
9 days current assets outstanding DCA (current assetssales) times 365 minus
10 days receivable outstanding DRO (receivablessales) times 365 minus
Zimon and Tarighi (2021) [23]Arnaldi et al (2021) [20]
Gołas (2020a) [25]Gołas (2020b) [26]
Gonccedilalves et al (2018) [30]Bieniasz and Gołas (2011) [34]
11 days payable outstanding DPO (current liabilitiessales) times 365 minus Zimon and Tarighi (2021) [23]
12 conversation cycle COC DIO + DRO minus
13 cash conversion cycle CCC COC minus DPO minus
Zimon and Tarighi (2021) [23]Arnaldi et al (2021) [20]
Gołas (2020b) [25]Gołas (2020a) [26]
Ren et al (2019) [29]Bieniasz and Gołas (2011) [34]
Okyere-Kwakye et al(2015) [32]
14 current assets on total assets CATA current assetstotal assets +
15 country COU Czech Republic HungarySlovakia Poland +minus
16 company size COM small andmedium-sized company +minus
We set a scientific question ldquoWhich working capital management variables affect businessperformance in the transport sector in Central Europerdquo on which the hypotheses on thestatistical significance of selected indicators of working capital management are based
Mathematics 2022 10 951 8 of 19
Table 4 Descriptive statistics
N
Mea
n
SE
ofM
ean
Med
ian
SD
Skew
ness
Kur
tosi
s
Min
imum
Max
imum
Percentiles
Val
id
Mis
sing
25 50 75
ROA 3518 310 014 000 012 017 minus413 15990 minus440 221 005 012 021OPF 3239 589 101 019 038 1067 5294 294359 minus5725 59400 014 038 088CAR 3480 348 305 097 024 5714 4996 269906 minus549 315900 006 024 089QUR 3036 792 500 113 139 6236 4467 219654 minus571 316400 082 139 263CUR 3544 284 744 217 147 12902 4583 228944 minus571 681400 091 147 282INT 2209 1619 133425 18076 10981 849583 1377 23601 minus10042 20388331 3380 10981 33821ART 2385 1443 3111 1198 581 58505 3585 140577 000 2468723 410 581 873CLT 3522 306 886 195 480 11591 5792 340493 minus002 682750 263 480 783DIO 2925 903 5133 2752 148 148827 4999 260066 minus497 7814237 000 148 627DCA 3425 403 117141 32888 11369 1924744 3330 130901 139 86304250 8236 11369 18972DRO 2447 1381 60660 28491 6026 1409393 3482 126098 000 55443500 3812 6026 8453DPO 3415 413 383148 213238 7384 12461223 5081 276710 minus2033845 690388375 4551 7384 12888COC 3427 401 47694 20490 4946 1199501 4047 172071 000 55470875 549 4946 8016CCC 3415 413 minus347960 197661 minus3008 11550938 minus4988 268500 minus634917500 4849466 minus8199 minus3008 1107
CATA 3823 5 052 000 051 031 minus002 minus106 000 148 028 051 078
Table 4 shows the descriptive statistics of the total sample consisting of transportcompanies in the Visegrad Group We find that average European companies from CentralEurope can pay their short-term liabilities according to the operating cash flow ratio(OPF) In particular the average business has sufficient cash flow to cover short-termliabilities Although this indicator ranges widely from (minus) 5725 to 594 However themedian shows that many transport companies cannot pay their short-term liabilities ontime On the other hand the solvency of companies in the transport sector is better basedon the cash ratio (CAR) according to which the company has three times more cash and itsequivalents than current liabilities As can be seen there is a significant difference betweenthe mean and the median The median shows that many transportation companies areinsolvent to pay their trade payables CAR quick ratio (QUR) and current ratio (CUR)are traditional liquidity ratios These indicators vary depending on the selected itemsof current assets The results show that the average enterprise has more inventory andreceivables as cash and cash equivalents Although the average values of liquidity ratiosare relatively favorable transport companies most often achieve less favorable solvencyratios Other relevant indicators describing working capital management include turnoverindicators such as inventory turnover (INT) accounts receivable turnover (ART) andcurrent liabilities turnover (CLT) According to descriptive statistics enterprises achieve arapid INT and ART as opposed to CLT due to high sales and low volumes of inventoriesand receivables In addition we focus on days inventory outstanding (DIO) days currentassets outstanding (DCA) days receivable outstanding (DRO) days payable outstanding(DPO) conversation cycle (COC) and cash conversion cycle (CCC) The company primarilycompares DRO and DPO for solvency The results show that the median of DRO is lowerthan the median of DPO by more than 13 days The company can settle its liabilities bycollecting trade receivables COC is the sum of inventory and receivables turnover witha median of almost 50 days Furthermore the median of CCC is more than (minus) 30 daysIn other words the period of payment of liabilities is longer than the period from storageto collection of trade receivables In conclusion we find that companies in the transportsector achieve a very low average profitability (014) with a range from (minus) 440 to 221 Upto 75 of companies achieve profitability of less than 021 We find that most indicatorsreach a positive skewness except for ROA CCC and CATA These results show that thesample is not symmetrically distributed depending on the selected indicators because themedian mean and mode are not equal to 0 In addition the descriptive statistics showthat the kurtosis of most indicators is more than 1000 compared to ROA INT and CATAIn other words we find that the sample has a leptokurtic distribution for most workingcapital management indicators except for the platykurtic distribution for the shares ofcurrent assets in total assets Table 4 shows a detailed overview of all important indicatorsof descriptive statistics to achieve an overall overview of the transport sector in the V4member countries In addition we find that the initial sample contains potential outliersbased on many indicatorsrsquo descriptive statistics Based on these results we exclude outliers
Mathematics 2022 10 951 9 of 19
to create a regression model describing the companyrsquos performance in the V4 countriesusing the working capital management indicator We remove outliers using Cookrsquos distanceWe arrange observations according to Cookrsquos distance from the highest to the lowest valueThose observations reaching a Cook distance of more than 1 are excluded from the samplein IBM SPSS 25
Table 5 shows the final sample for all regression models in selected countries Somedata were used to examine the impact of working capital on the business performanceof transport companies The final sample is divided into three parts namely the numberof observations the number of extreme values and the number of incomplete data Thesum of these three components represents the initial sample We excluded three to eightoutliers depending on the sample such as companies in the Czech Republic HungaryPoland Slovak Republic and V4 because they were identified as extreme values basedon Cookrsquos distance However most observations were excluded for incomplete data onindependent variables Regression analysis requires that observations take on values for allindependent variables
Table 5 Final sample
CZ HU PL SK V4
Number of observations 207 124 633 437 1394Number of outliers 3 3 5 6 8
Number of incomplete data 360 1123 669 258 2426Total 570 1250 1307 701 3828
Table 6 demonstrates the correlation among the independent variables for the trans-port companies in the Visegrad Group The results show that liquidity ratios such as CARQUR and CUR are significantly correlated with each other including OPF The correlationbetween liquidity ratios is more than 09 except for CAR and CUR For turnover indicatorswe find that CLT is significantly correlated with all liquidity indicators and inventoryturnover However a strong correlation is identified for OPF QUR and CUR The correla-tion between INT and CLT is statistically significant but this correlation is very weak Inaddition the correlation matrix reveals that among DIO DCA DRO DPO COC and CCCthere are significant correlation statistics except for DIO and DRO As can be seen CCC isnegatively statistically significantly correlated Finally CATA is statistically significantlycorrelated with several independent variables such as INT CLT DCA and COC Thecorrelation between CATA and selected variables is very low Very high correlation andhigh correlation are highlighted in red and orange in Table 6
Table 6 Correlation matrix
OPF CAR QUR CUR INT ART CLT DIO DCA DRO DPO COC CCC CATAOPF 1 0968 0966 0951 minus0020 0010 0859 minus0003 minus0003 minus0002 minus0003 minus0002 0003 minus0016CAR 1 0990 0665 minus0008 0003 0371 minus0001 0003 minus0001 minus0002 minus0001 0002 0012QUR 1 1000 minus0005 0003 0746 minus0002 0007 0006 minus0002 0006 0003 0012CUR 1 minus0007 0000 0926 minus0001 0003 0002 minus0002 0002 0002 0032INT 1 minus0006 0043 minus0006 minus0007 minus0004 minus0005 minus0005 0005 0088 ART 1 0000 minus0002 minus0003 minus0002 minus0002 minus0002 0002 0005CLT 1 minus0012 minus0003 minus0002 minus0002 minus0002 0002 0036 DIO 1 0216 0015 0045 0118 minus0037 0027DCA 1 0880 0897 0879 minus0894 0043 DRO 1 0940 1000 minus0930 0038DPO 1 0936 minus1000 0020COC 1 minus0925 0039 CCC 1 minus0018CATA 1
Correlation is significant at the 001 level (two-tailed) Correlation is significant at the 005 level (two-tailed)
For the successful selection of independent variables we use the VIF and collinearityindex to eliminate multicollinearity between predictors We calculate the collinearity index
Mathematics 2022 10 951 10 of 19
and VIF for all samples We exclude mainly liquidity indicators QUR is excluded from allsamples together with the current ratio except for Czech companies
We propose a comprehensive model for assessing the return on assets using selectedindicators of working capital management in individual samples We estimate a regressionequation to examine the association between corporate performance and working capitalmanagement using a multiple regression model The regression model is a statisticalmodel that estimates the relationship between one dependent variable and one or moreindependent variables We apply the stepwise method to select statistically significantindicators in a regression model to create the best model as opposed to the forward method
ROA =prop +β1x1 + β2x2 + β3x3βixi (1)
whereROA dependent variableprop interceptβi coefficients of the independent variablesxi independent variableThe linear regression model is based on a linear relationship between the dependency
and the independent variables One of the important statistical metrics is the coefficient ofdetermination (R-squared) measuring how much of the variation in the outcome can beexplained by the variation in the independent variables On the other hand we prefer ad-justed R-squared which compares the explanatory power of regression models containingdifferent numbers of predictors Before applying multiple regression analysis we removeoutliers using Cookrsquos distance
Di =sumn
jprime=1
(Yj minus Yj(i)
)2
(p + 1) σ2 (2)
whereYJ j-th fitted response valueYJ j-th fitted response value where the fit does not include observation ip number of regression coefficientsσ estimated variance from the fit based on all observations (mean squared error)Moreover we verify multicollinearity using correlation matrix VIF and Condition
Index Variance inflation factor (VIF) detects multicollinearity in the regression modelMulticollinearity represents a high intercorrelation between a set of independent variablesIt leads to an unreliable and inaccurate output
VIF =1
1minus R2 (3)
whereR2 coefficient of determinationThe Condition index is used to identify the dependency between several independent
variables If the indicator exceeds the recommended values these variables are excludedThe condition index is calculated from the eigenvalues It is derived from the square root ofthe ratio of the largest eigenvalue to the eigenvalue of the dimension If the value is above15 it indicates multicollinearity for example 30 means very strong multicollinearity
CIi =
radicλmax
λi(4)
whereλ conventional symbol for an eigenvalue
Mathematics 2022 10 951 11 of 19
On the other hand Durbin Watsonrsquos statistics tests autocorrelation in the residualsfrom a regression model It has a value ranging between zero and four one to threeindicates there is no autocorrelation detected in the sample If the value is below one itindicates a positive autocorrelation On other hand if the value is above three it indicatesa negative autocorrelation [36]
d =sumn
i=2(ei minus eiminus1)2
sumni=1 e2
i(5)
whereei residualsn number elements in the samplek number of independent variablesFinally we validate normal distribution homoscedasticity and linear relationship
using scatterplots and partial regression plots in IBM SPSS 25
4 Results
Table 7 shows all models demonstrate that OPF is a statistically significant indicator inall Central European countries SMEs should monitor cash flow to pay their short-termliabilities The results show that the model recommends that funds exceed total currentliabilities As can be seen this indicator has a positive effect on the growth of the companyrsquosperformance especially in Hungarian (0150) and Slovak (0118) small and medium-sizedenterprises in contrast to other companies from other member states of the Visegrad GroupOn the other hand CAR harms corporate profitability because all three regression modelsreduce the profitability the most for Hungarian small and medium-sized enterprises Inaddition Slovak profitability is reduced not only by the cash ratio but also by the currentratio including inventories and receivables We find that no liquidity indicator has astatistically significant impact on Polish companies Other indicators such as ART CLTDPO and CCC have minimal impact on business performance However the current assetsto total assets have the greatest impact on profitability compared to other coefficients forCzech companies The results show that the company size is a decisive indicator for Czechand Slovak companies We find that a small business achieves lower business performancethan a medium-sized business The variable is also significant in the universal model forthe whole region As can be seen small businesses are unlikely to exploit the potential ofworking capital management probably due to limited work capacity We expected thatthe higher the share of current assets in total assets the greater the role that current assetsplay in working capital management to corporate performance CATA plays a statisticallysignificant role in the Czech Republic This coefficient has the greatest impact on theperformance of Czech companies
Table 7 Coefficients
Acronym Variable CZ HU PL SK V4
- intercept 0082 0076 0133 0155 0177
OPF cash flowcurrentliabilities 0082 0150 0044 0118 0049
CAR(cash and cash
equivalent)currentliabilities
minus0035 minus0012 minus0011
QUR(current
assetsmdashstock)currentliabilities
CUR current assetscurrentliabilities minus0021 minus0018
INT salesstock
Mathematics 2022 10 951 12 of 19
Table 7 Cont
Acronym Variable CZ HU PL SK V4
ART salesreceivables 0001
CLT salescurrent liabilities minus0002
DIO (stocksales) times 365
DCA (current assetssales)times 365
DRO (receivablessales)times 365
DPO (currentliabilitiessales) times 365 minus0000144 minus0000020
COCdays inventory
outstanding + daysreceivable outstanding
CCCconversationcyclemdashdays
payable outstanding0000016
CATA current assetstotalassets 0099
CZ Czech Republic
HU Hungary
SK Slovakia 0050
S_code Small company minus0061 minus0059 minus0071Note All coefficients are statistically significant (p lt 005)
As can be seen Table 8 shows the key metrics describing the individual regressionmodels Regression models are statistically significant In addition these models express areturn on assets of more than 30 according to adjusted R square except for the sampleconsisting of small and medium-sized enterprises in Poland and the universal modelfor V4
Table 8 Model summary
CZ HU PL SK V4
R 0582 0712 0373 0666 0428Adjusted R Square 0322 0499 0135 0437 0180
DurbinndashWatsonStatistics 1880 2012 1937 1164 1454
Condition Index 7470 3224 3197 5376 2600
Excluded Variablesfor CI
CARQURCATA
QURCURCLT
CARQURCURDCA
QURCUR
QURCUR
F 20567 62173 33980 69091 62277p-value 0000 0000 0000 0000 0000
Normality X X X X XHomoscedasticity X X X X X
Table 8 demonstrates that models achieve different results in the studied countriesbased on adjusted R square We excluded several independent variables to eliminate multi-collinearity based on the Condition Index The results show that the selected predictorsachieve multicollinearity below the recommended value of 15 The results indicate thatthe variables are correctly selected The four independent variables CAR QUR CUR and
Mathematics 2022 10 951 13 of 19
DCA were excluded in designing the regression model for Polish SMEs As can be seenwe excluded QUR in all prediction models We most often excluded liquidity ratios such asquick ratio and current ratio These indicators were removed from all samples except forthe sample of Czech companies In this sample we excluded CAR and the share of currentassets in total assets DurbinndashWatson statistics showed that residues are not autocorrelatedIn some samples this statistic was slightly above the recommended value of one
Significant indicators are selected using the stepwise method These models achievethe recommended values of Condition Index and DurbinndashWatson Statistics On the otherhand the profitability of Polish transport companies is explained by less than 15 In thiscase we find that working capital management indicators are not suitable for estimatingcorporate performance unlike in Hungarian companies Selected indicators of workingcapital management explain the almost 45 variability of corporate profitability in Slovaksmall and medium-sized enterprises All presented models are statistically significant Inaddition we do not detect multicollinearity between statistically significant variables Weexclude the most common liquidity indicators specifically the quick and current ratio inall presented models except the regression model for small and medium-sized enterprisesin the Czech Republic In some cases we exclude some indicators of activity
5 Discussion
The added value of the research lies in the development of current theoretical andempirical knowledge on working capital management in Central Europe The currentresearch on working capital management is focused mainly on the Polish and Czech busi-ness environment in various sectors of the national economy such as manufacturing theautomotive industry construction tourism and the food sector Zimon (2019) [37] analyzedthe strategy of working capital management in LOT Polish Airlines Zimon and Zimon(2020) [38] analyzed the effect of quality working systems on working capital based on102 small trading companies in Poland in 2017ndash2019 The results demonstrate that effectivemanagement is typical for large companies for economies of scale and joint purchases basedon liability turnover ratio in days Zimon and Zimon (2020) [38] recommend applyingquality management systems for optimizing working capital Anton and Afloarei Nucu(2020) [24] examined the association between working capital management and the prof-itability of 719 Polish companies on the stock exchange from 2007 to 2016 The empiricalresults show that the U-shape reversed the level of working capital and profitability Inother words working capital has a positive effect on the profitability of Polish companiesto the breaking point After the turning point working capital begins to harm profitabilityAnton and Afloarei Nucu (2020) [24] disseminate new knowledge expressing the nonlinearrelationship between working capital management and business performance in PolandRef [39] determines corporate strategies of working capital management in the constructionsector in 2009ndash2014 Zimon and Gosik (2017) [40] argue that transport costs have an impacton various kinds of sectors in Poland Gołas (2020) [26] examines the efficiency of workingcapital management on return on assets based on days sales of inventory (DSI) days salesoutstanding (DSO) days payable outstanding (DPO) and the cash conversion cycle (CCC)The results show that an increase in independent variables such as DSI DSO DPO andCCC harm return on assets in dairy companies
Our research focuses on transport companies which are an important pillar for thefree movement of people goods and services in the European Union Transport is alsoan important pillar for other sectors We expand previous research to include transportcompanies from the Visegrad Group We aimed to design a statistically significant modelto explain the return on assets using significant independent variables describing workingcapital management as a comprehensive tool for managing current assets such as cash-flowmanagement inventory and receivables management The results show that the modelsstatistically significantly explain the return on assets We use the return on assets (calculatedby EBITDAtotal assets) unlike other research because this indicator is appropriate to usein several countries with different tax and depreciation policies The return on assets (of
Mathematics 2022 10 951 14 of 19
EBITDA) is a dependent variable because this indicator considers different interest ratestax and depreciation policies as opposed to EAT or EBIT Bieniasz and Gołas (2011) [34]examine the impact of working capital management on business performance in variouscompanies classified by size as a small medium and large companies in the food sectoracross several European countries especially Western Europe for the period 2005ndash2009These models achieve different values of selected statistical metrics However we findthat the return on assets as a dependent variable is best explained for small enterprises asopposed to large enterprises according to R square
Ugurlu and Jindrichovska (2017) [41] model profitability ratios using independentvariables of working capital management based on smallndashmedium companies in the CzechRepublic during the economic crisis Yousaf et al (2021) [22] explain that working capitalmanagement is one of the crucial parts of making decisions in corporate finance for allcompanies The research determines significant variables such as days sales outstanding(DSO) days inventory outstanding (DIO) days payable outstanding (DPO) and cashconversion cycle (CCC) based on 332 companies in the Czech Republic
Table 9 compares results from previous research from major authors in the field ofworking capital management with a focus on Central Europe Our total sample is highercompared to other studies On the other hand the data are drawn from one year unlikeprevious authors However regression models explain variability better than other modelsOur models explain more than 13 of variability compared to less than 8 in researchfrom Anton and Afloarei Nucu (2020) [24] based on adjusted R2 The regression model forHungarian and Slovak small and medium-sized enterprises is better than the model forPolish enterprises and the universal model for the entire region These results show thatthe potential impacts of working capital management vary significantly depending on themember countries of the Visegrad Group
Table 9 Summary
Anton and Afloarei Nucu (2020)[24] Yousaf et al (2021) [22] Our Research
Total sample 719 332 570 1250 1307 701 3828
Industrysector na
manufacturingautomobileconstruction
transport
Country PL CZ CZ HU PL SK V4Year 2007ndash2016 2015ndash2019 2019
Method
pooledOLS re-gressionanalysis
staticpanelmodel
with fixedeffects
panel-correctedstandard
errors
pooled regression model multiple linearregression model
Dependentvariable
ROA ROA ROAnet incomeTA EBITTA EBITDATA
R2 00722 00739 00588 01215 0338 0507 0139 0444 0183Adjusted R2 na na na 01170 0322 0499 0135 0437 0180
We evaluate our proposed models with models from previous research focusing onthe Central European region In this region we find that working capital managementis a relatively new research area with enormous potential for the future We realize thatthis research is present mainly in Poland and the Czech Republic focusing on variousindustries such as food manufacturing automotive construction transport etc Thisresearch builds on current knowledge from Polish and Czech authors and provides acomprehensive assessment of working capital management at transport companies in theVisegrad Group These data are drawn from the pre-pandemic situation based on financial
Mathematics 2022 10 951 15 of 19
statements Although the independent variables are calculated based on data from 2019the initial samples consist of a larger number of enterprises than in previous studies
We find that liquidity does not affect corporate performance in Polish companiesunlike others In addition Hungarian and Slovak companies must focus their attention oncash management CAR as the only liquidity indicator reduces corporate performance Inother words businesses should have the necessary amount of money at their disposal forday-to-day operations to encourage interesting investments In addition the size of thebusiness also has a significant impact on business management The results show that smallcompanies have lower economic results than medium-sized companies especially Czechand Slovak companies However this indicator is statistically significant for all countriesin Central Europe This indicator has one of the highest coefficients in the model for theVisegrad Group This knowledge will help identify key areas of business managementsuch as cash management inventory management or receivables management
Similarly Anton and Afloarei Nucu (2020) [24] and Yousaf et al (2021) [22] deter-mine the associations between corporate performance and working capital managementHowever the return on assets is calculated differently the difference lies in the differentforms of profit We apply EBITDA as opposed to net income or EBIT because we modelcorporate performance in many countries in Central Europe Yousaf et al (2021) [22] usedifferent indicators Their results show that corporate performance is negatively affectedby the debt ratio (minus4250) the share of fixed assets in total assets (minus4524) and DPO (minus015)On the other hand the size of the company defined as the natural logarithm of totaloperating income represents (3174) in contrast to our models Anton and Afloarei Nucu(2020) [24] find that the debt ratio and working capital ratio to the square (minus00025) harmcorporate performance in the difference between working capital ratio (00117) cash ratio(00798) and sales growth (00036) using pooled OLS regression analysis Our resultsemphasize that the cash ratio as an indicator of liquidity harms corporate performanceunlike other models
Our research differs from previous research because we use different ratios such asoperating cash flow ratio cash ratio and daysrsquo current liabilities turnover based on a broadliterature search In addition we also apply non-financial indicators such as country andcompany size broken down into small and medium-sized enterprises according to theEuropean classification The results clearly show that many of these indicators have astatistically significant impact on business performance and regression models explain thegreater degree of variability according to adjusted R2 as opposed to other models [2426]We find that entrepreneurs should be pragmatic when choosing a company headquartersin V4 The results demonstrate that locating a company is a strategic decision to increasebusiness performance We assume that Slovakia as one category of the categorical variable(country) has a positive impact on performance in the universal model for the wholeregion probably for Euro area membership unlike other countries Future research onworking capital management may also consider other categorical variables such as Euroarea membership and other macroeconomic indicators Furthermore companies with ahigher amount of funds have profitability according to the model for Hungarian and Slovakcompanies Finally we indicate that the indicators used in the survey without referenceto other research confirm our expectations The results show that OPF CAR and CLThave a statistically significant impact on the performance of companies according to theresulting models Finally medium-sized companies have better business performancebased on most models except for the model for Hungarian and Polish companies Theseresults can motivate strategic mergers and headquarters decisions in the Visegrad Groupmember states
Limitations First we focus on transport companies Therefore the results may not begeneralized to all sectors Second the research is limited by data availability
Future research We see a potential research gap in measuring the effectiveness ofcompany performance Future research should focus on assessing the effectiveness of work-ing capital management on business performance using statistically significant indicators
Mathematics 2022 10 951 16 of 19
representing input variables using data envelopment analysis The results of this articlerepresent one of the potential steps in the relevant selection of input variables to the dataenvelopment analysis method with a focus on increasing output variables such as businessperformance or sales and comparing with competing companies across the region In otherwords the method identifies strengths and weaknesses to improve the management ofcurrent assets Moreover the research on working capital management can be extendedto new indicators from the previous research of Zimon and Tarighi (2021) [23] Anton andAfloarei Nucu (2020) Arnaldi et al (2021) Botoc and Anton (2017) Gołas (2020a) Gołas(2020b) Houmlgerle et al (2020) Korent and Orsag (2018) Madhou et al (2015) Mielcarz et al(2018) Okyere-Kwakye et al (2015) Ren et al (2019) Vukovic and Jakšic (2019) Yousafet al (2021) and Yousaf and Bris (2021) [3141520ndash2224ndash262931ndash3335]
6 Conclusions
The main purpose of the paper represents cross-country research in the V4 countriesThe paper extends the current scientific literature on significant factors improving workingcapital management and corporate profitability by focusing on small and medium-sizedcompanies in Central Europe The research provides a perspective on how working capitalmanagement affects corporate profitability These results could be interesting to stake-holders lenders investors and financial analysts The presented research bridges the gapbetween theoretical assumptions and practical models used for the evaluation of corporateperformance in the transport sector using variables of working capital management Wefind that the cash ratio harms corporate performance in all models except the model forCzech and Polish companies The model for Hungarian companies achieves the highestcoefficient for the cash ratio compared to others On the other hand liquidity has nostatistically significant impact on reducing asset returns In addition small businesses areat a disadvantage in working capital management compared to medium-sized companiesin the Czech and Slovak Republics This negative impact is also shown in the universalmodel for transport models in the Visegrad Group However the results show that Slovakcompanies achieve a higher return on assets than companies from other members basedon the proposed model for the whole region
Funding This research was funded by Grant System of University of Zilina No 12021 (12821)
Institutional Review Board Statement Not applicable
Informed Consent Statement Not applicable
Data Availability Statement Not applicable
Conflicts of Interest The authors declare no conflict of interest
Mathematics 2022 10 951 17 of 19
Appendix A
Mathematics 2022 10 x FOR PEER REVIEW 17 of 19
Appendix A
Figure A1 Methodology process
bullTotal sample
bullFinancial variables
bullDescriptive statistics
bullIdentifying outliers using Cook Distance
bullCorrelation analysis
bullIdentifying multicollinearity using Collinearity Index
bullElimination of Independent variables
bullVerification of assumptions such as normal distribution homoscedasticity and linear relationship using scatterpots to create regression models
bullCreating a regression model
bullModel comparison
bullInterpretation of results
Figure A1 Methodology process
References1 Eurostat Transportation and Storage Statistics-NACE Rev 2mdashStatistics Explained Available online httpseceuropaeu
eurostatstatistics-explainedindexphptitle=Transportation_and_storage_statistics_-_NACE_Rev_2 (accessed on 5 Febru-ary 2022)
2 Statista Transportation and Storage Industry Annual Turnover European Union 2011ndash2018 Statista Available online httpswwwstatistacomstatistics1175502turnover-transportation-storage-industry-european-union (accessed on 5 February 2022)
3 Mielcarz P Osiichuk D Wnuczak P Working Capital Management through the Business Cycle Evidence from the Corporate Sector inPoland Contemporary Economics Warsaw Poland 2018
4 Karabay G Working Capital Management in Turkish Clothing Industry Tekst Konfeksiyon 2013 23 168ndash1755 Khan M Z-Score Analysis on Efficiency of Working Capital Management An Evidence of Selected Indian Food Processing
Companies Listed in NSE Pac Bus Rev Int 2017 10 106ndash1136 Venkatachalam R Relationship Between Working Capital Management and Profitability A Case of Tabreed (National Central
Cooling Company PJSC) In Leadership Innovation and Entrepreneurship as Driving Forces of the Global Economy Benlamri R SparerM Eds Springer Proceedings in Business and Economics Springer International Publishing Cham Switzerland 2017 pp721ndash729 ISBN 978-3-319-43433-9
7 Shajar SN Farooqi SA Impact of Working Capital Management on the Profitability of Automobile Industry in India-AnEmpirical Study of Selected Automobile Companies Pac Bus Rev Int 2016 8 197ndash203
Mathematics 2022 10 951 18 of 19
8 Prsa D The Impact of Working Capital Management on the Profitability of Croatian Manufacturing SMEs Ekon Vjesn 202033 371ndash382
9 Akbulut R An application to measure impact of working capital management on profitability in firms in manufacture sectorquoted on ISE Istanb Univ J Sch Bus 2011 40 195ndash206
10 Prasad P Sivasankaran N Paul S Kannadhasan M Measuring Impact of Working Capital Efficiency on Financial Performanceof a Firm An Alternative Approach JIBR 2019 11 75ndash94 [CrossRef]
11 Zabolotnyy S Sipilaumlinen T A Comparison of Strategies for Working Capital Management of Listed Food Companies fromNorthern Europe Agric Food Sci 2020 29 239ndash249 [CrossRef]
12 Rasyid R Impact of the Aggressive Working Capital Management Policy on Firmrsquos Profitability and Value Study on Non-Financial Listed Firms in Indonesia Stock Exchange In Proceedings of the International Conference on Business and ManagementResearch (icbmr-17) Padang Indonesia 1ndash3 November 2017 Balqiah TE Kusumastuti RD Eds Atlantis Press Paris FranceVolume 36 pp 207ndash216
13 Naumoski A The Impact of Working Capital Management on Profitability of the Listed Companies in Emerging EuropeanCountries In Proceedings of the 13th RSEP International Conference on Business Economics amp Finance Istanbul Turkey 11ndash13June 2019 pp 374ndash381
14 Korent D Orsag S The Impact of Working Capital Management on Profitability of Croatian Software Companies Zagreb IntRev Econ Bus 2018 21 47ndash66 [CrossRef]
15 Vukovic B Jakšic D The Effect of Working Capital Management on Profitability Evidence from Southeast Europe Ekon Poljopr2019 66 159ndash172 [CrossRef]
16 Agha H Impact of Working Capital Management on Profitability Eur Sci J ESJ 2014 10 [CrossRef]17 Seth H Chadha S Sharma SK Ruparel N Exploring Predictors of Working Capital Management Efficiency and Their
Influence on Firm Performance An Integrated DEA-SEM Approach BIJ 2021 28 1120ndash1145 [CrossRef]18 Seth H Chadha S Ruparel N Arora PK Sharma SK Assessing Working Capital Management Efficiency of Indian
Manufacturing Exporters MF 2020 46 1061ndash1079 [CrossRef]19 Bureau van DijkMoodyrsquos Analytics Amadeus Database Available online httpsamadeusbvdinfocomversion-2021517
homeservproduct=AmadeusNeo (accessed on 14 June 2021)20 Arnaldi A Nowak B Roscigno R Zhang W Working Capital Management and Profitability Empirical Evidence J Bus
Manag Econ Res 2021 12 1911ndash191721 Yousaf M Bris P Effects of Working Capital Management on Firm Performance Evidence from the EFQM Certified Firms
Cogent Econ Financ 2021 9 1958504 [CrossRef]22 Yousaf M Bris P Haider I Working Capital Management and Firmrsquos Profitability Evidence from Czech Certified Firms from
the EFQM Excellence Model Cogent Econ Financ 2021 9 1954318 [CrossRef]23 Zimon G Tarighi H Effects of the COVID-19 Global Crisis on the Working Capital Management Policy Evidence from Poland
J Risk Financial Manag 2021 14 169 [CrossRef]24 Anton S Afloarei Nucu A The Impact of Working Capital Management on Firm Profitability Empirical Evidence from the
Polish Listed Firms J Risk Financ Manag 2020 14 9 [CrossRef]25 Gołas Z Impact of Working Capital Management on Business Profitability Evidence from the Polish Dairy Industry Agric
Econ-Czech 2020 66 278ndash285 [CrossRef]26 Gołas Z Working Capital Management vs Profitability of Milk Processing Companies Sci Pap Ser Manag Econ Eng Agric
Rural Dev 2020 20 827 Heryaacuten T Managers of Tourism Companies Can No Longer Expect Any Financial Support from Company Owners Different
Working Capital Management Due to the Global Financial Crisis E+M 2020 23 50ndash59 [CrossRef]28 Otola I Grabowska M Relations Strategies of Working Capital Management in European Companies from the IT Sector International
Business Information Management Association Madrid Spain 202029 Ren T Liu N Yang H Xiao Y Hu Y Working Capital Management and Firm Performance in China ARA 2019 27 546ndash562
[CrossRef]30 Gonccedilalves T Gaio C Robles F The Impact of Working Capital Management on Firm Profitability in Different Economic Cycles
Evidence from the United Kingdom Econ Bus Lett 2018 7 70 [CrossRef]31 Botoc C Anton SG Is Profitability Driven by Working Capital Management Evidence for High-Growth Firms from Emerging
Europe J Bus Econ Manag 2017 18 1135ndash1155 [CrossRef]32 Okyere-Kwakye E Assampong IE Nor K Annan EM Working Capital Management A Casual Assessment of Its Effect on
Organizations Profit J Financ 2015 3 1633 Madhou A Moosa I Ramiah V Working Capital as a Determinant of Corporate Profitability Rev Pac Basin Financ Mark Pol
2015 18 1550024 [CrossRef]34 Bieniasz AB Gołas ZG The Influence of Working Capital Management on the Food Industry Enterprises Profitability Contemp
Econ 2011 5 68 [CrossRef]35 Houmlgerle B Charifzadeh M Ferencz M Kostin K The Development of Working Capital Management and Its Impact on
Profitability and Shareholder Value Evidence from Germany Strateg Manag 2020 25 27ndash39 [CrossRef]
Mathematics 2022 10 951 19 of 19
36 Suu DS Hao NQ Van NTH The Effect of Working Capital on Firm Performance New Evidences from Seafoods Companiesin Vietnam Financ Perform Firms Sci Educ Pract 2017 747ndash759
37 Zimon G An Analysis of working capital management in the air transport company pll lot In Proceedings of the 8thCarpathian Logistics Congress (clc 2018) Prague Czech Republic 3ndash5 December 2018 Tanger Ltd Ostrava Czech Republic2019 pp 930ndash934
38 Zimon G Zimon D Quality Management Systems and Working Capital SMEs in GPOmdashA Case of Poland Adm Sci 2020 1076 [CrossRef]
39 Jedrzejczak-Gas J Net Working Capital Management Strategies in the Construction Enterprises Listed on the NewConnectMarket In Proceedings of the 7th International Conference on Engineering Project and Production Management BialystokPoland 21ndash23 September 2016 Halicka K Nazarko L Eds Elsevier Science BV Amsterdam The Netherlands 2017 Volume182 pp 306ndash313
40 Zimon G Gosik B An Analysis of Working Capital Management in Transport Companies In Proceedings of the Knowledge forMarket Use 2017 People in Economics-Decisions Behavior and Normative Models Olomouc Czech Republic 7ndash8 September2017 Slavickova P Ed Univ Palackeho V Olomouci Olomouc Czech Republic 2017 pp 470ndash476
41 Ugurlu E Jindrichovska I Profitability and working capital management of Czech SMEs Empirical evidence in the period offinancial crisis In Proceedings of the Ifrs Global Rules amp Local Use Prague Czech Republic 20 October 2017 Jindrichovska IKubickova D Eds Anglo-Amer Univ Prague Czech Republic 2017 pp 61ndash71
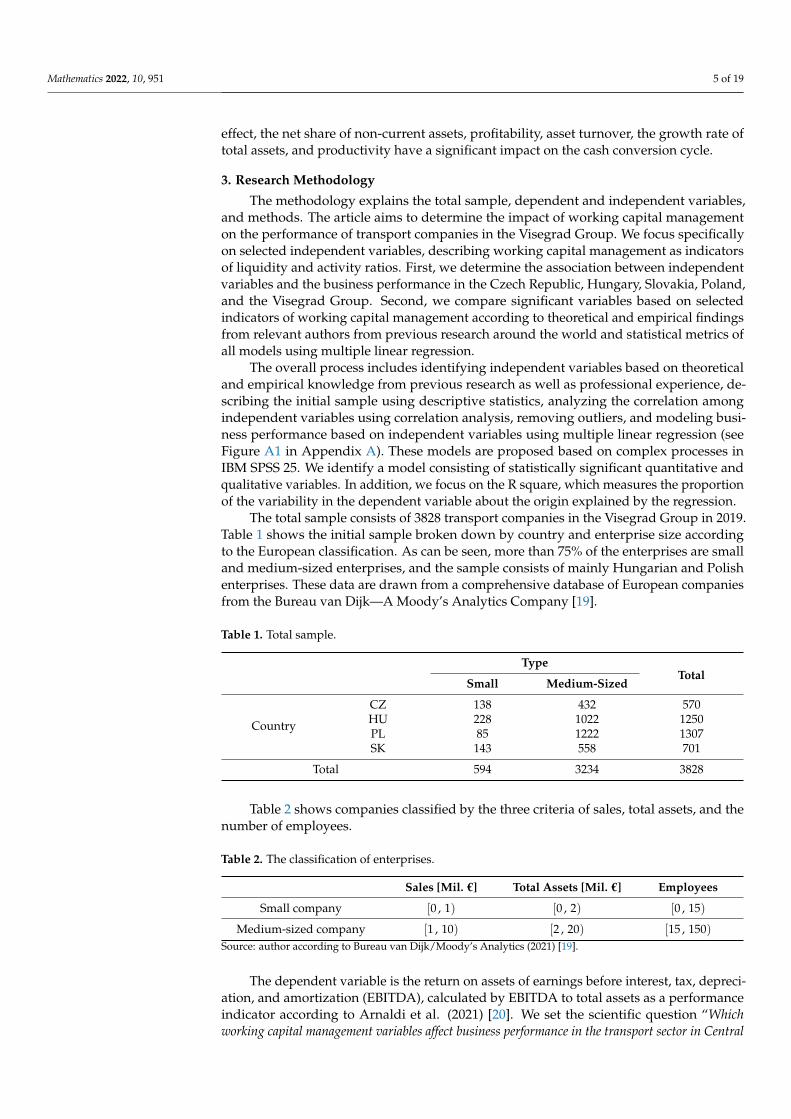
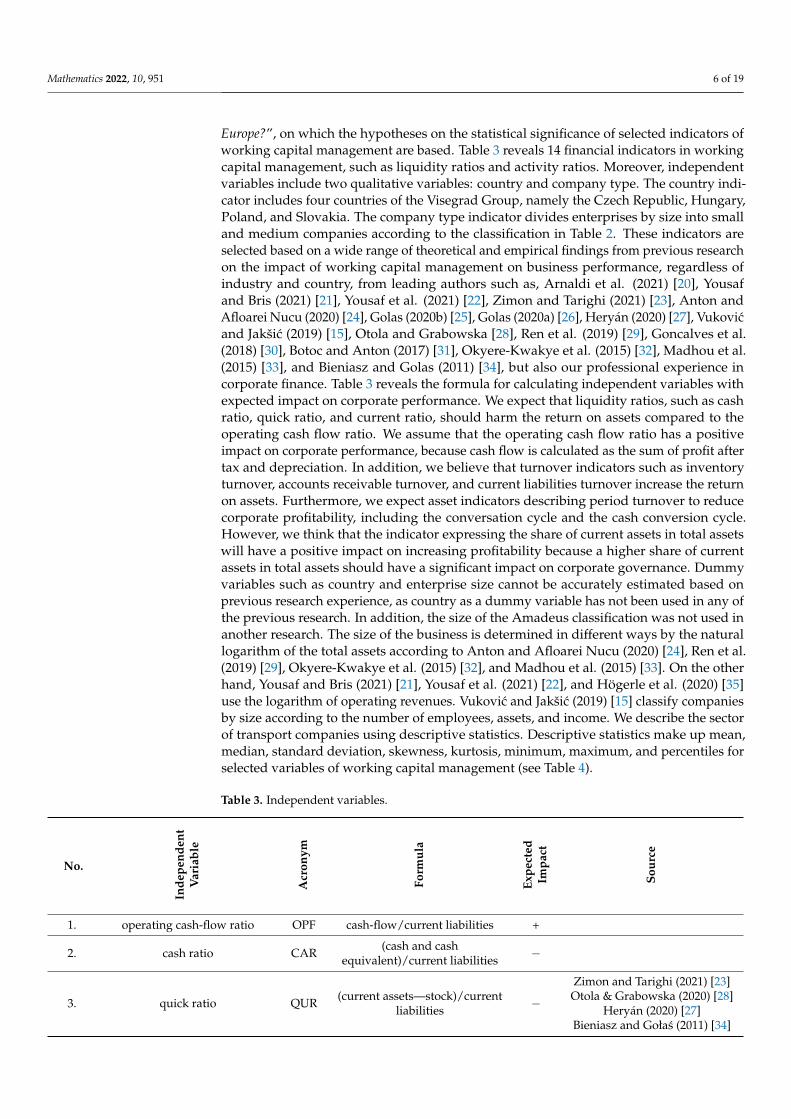
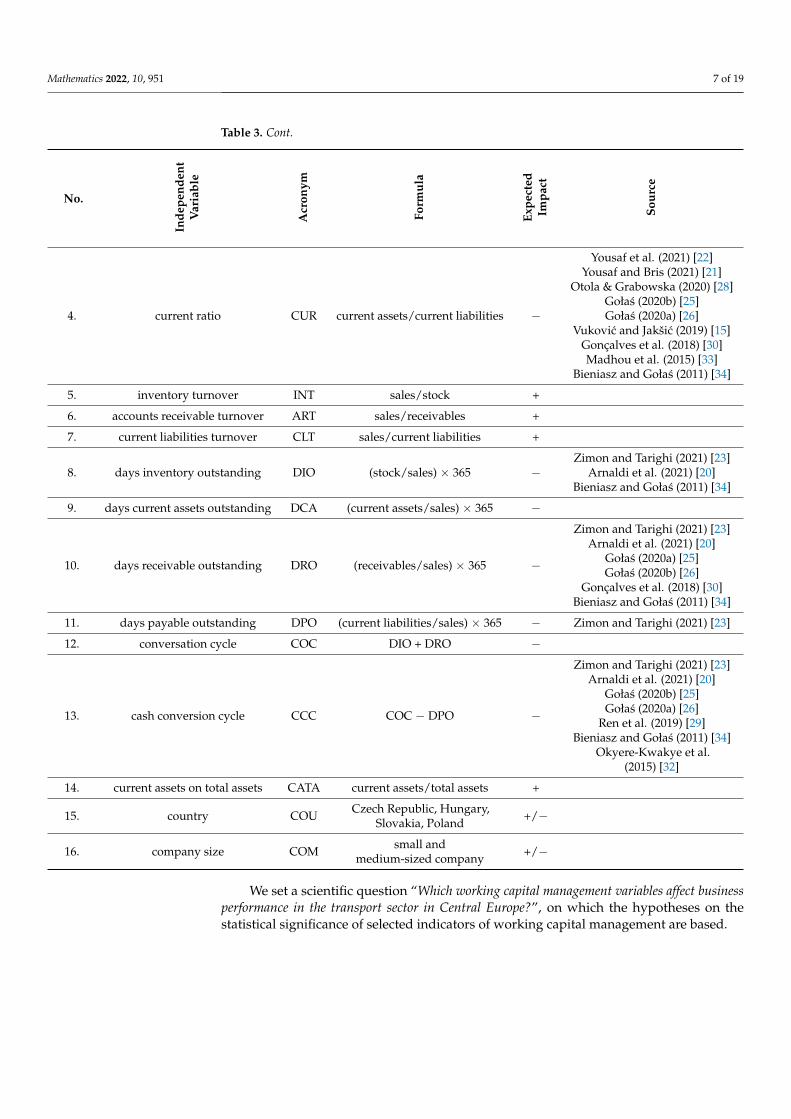
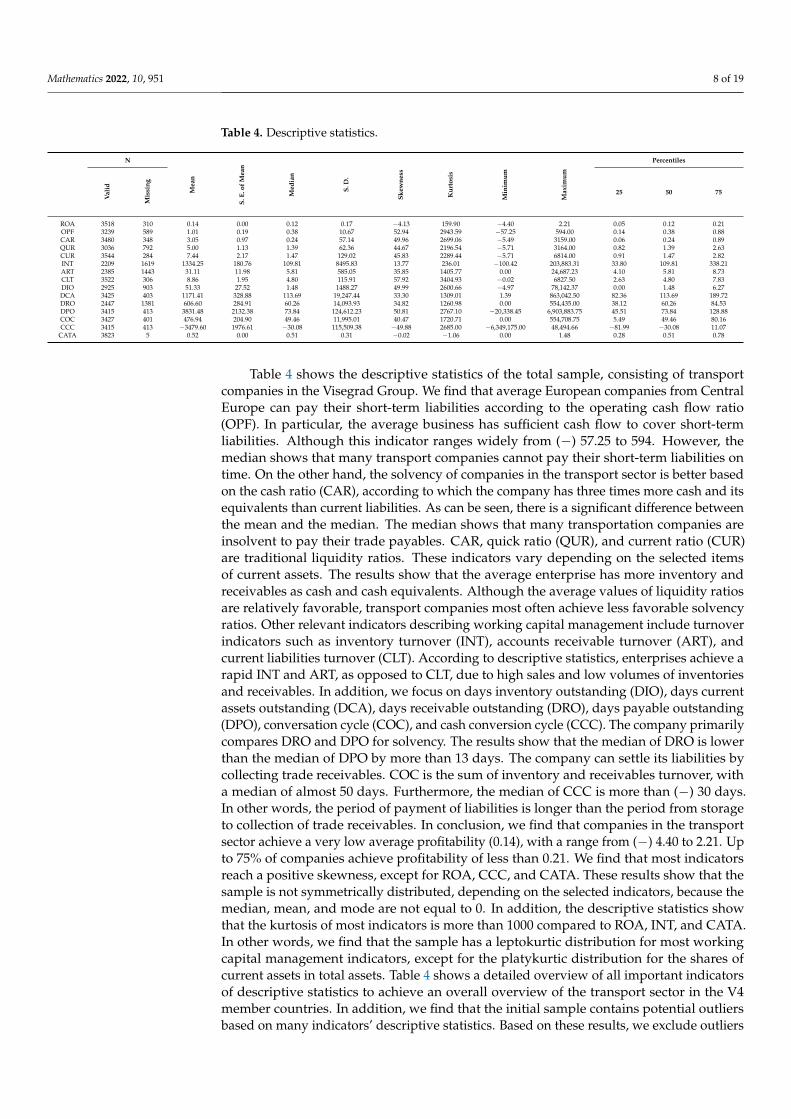
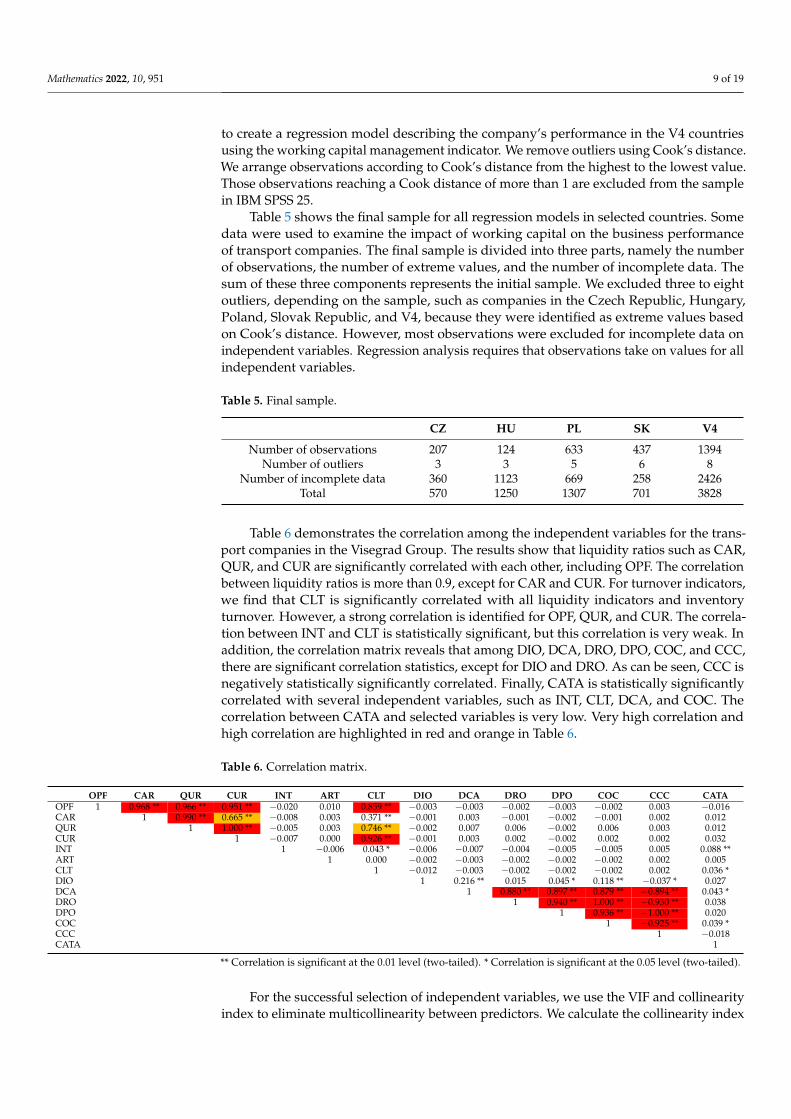
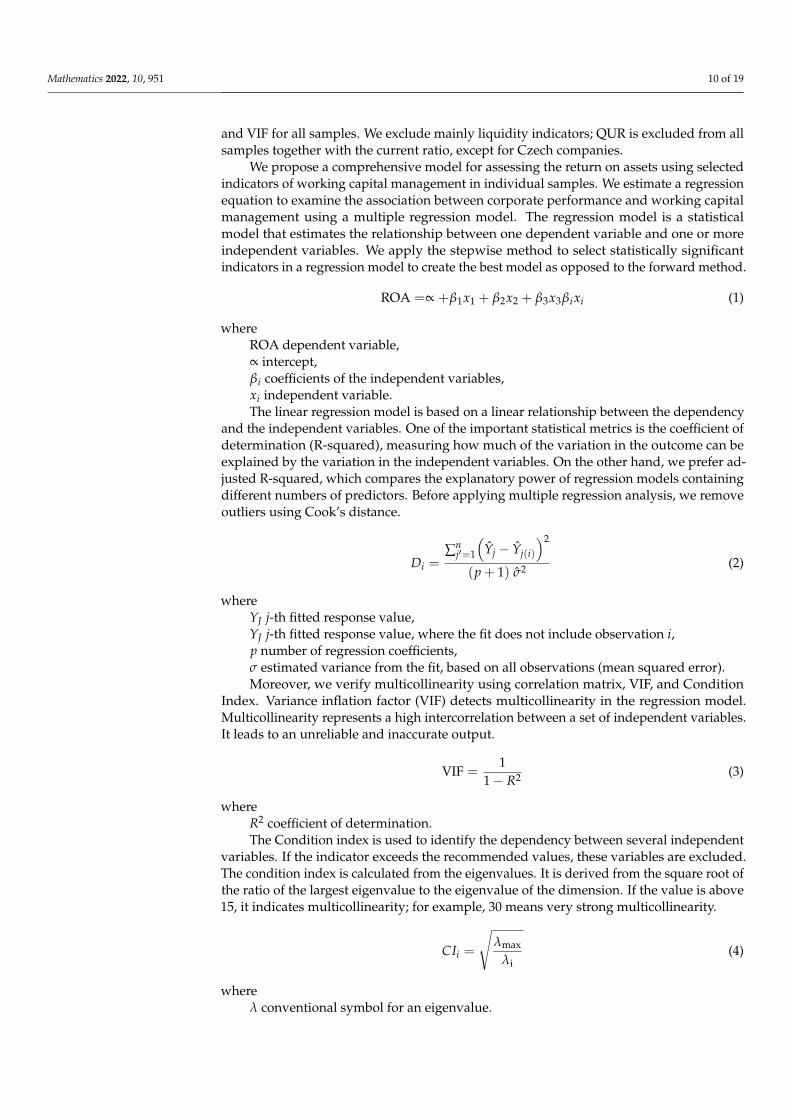
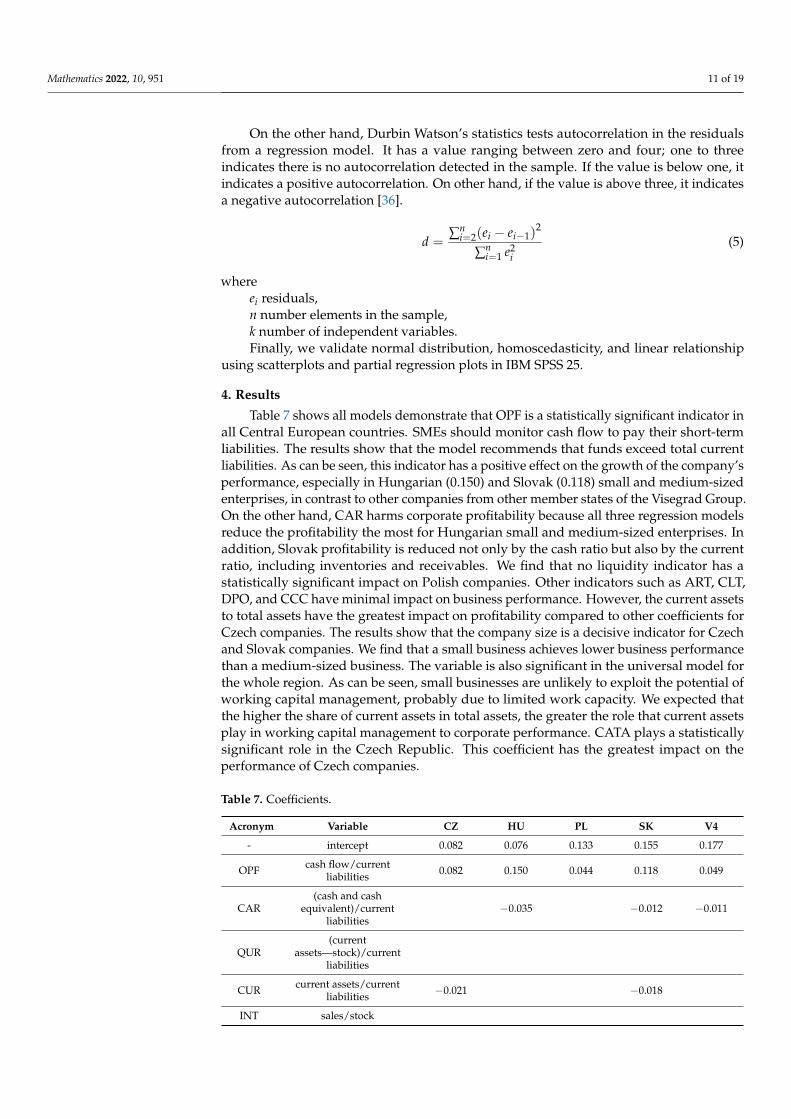
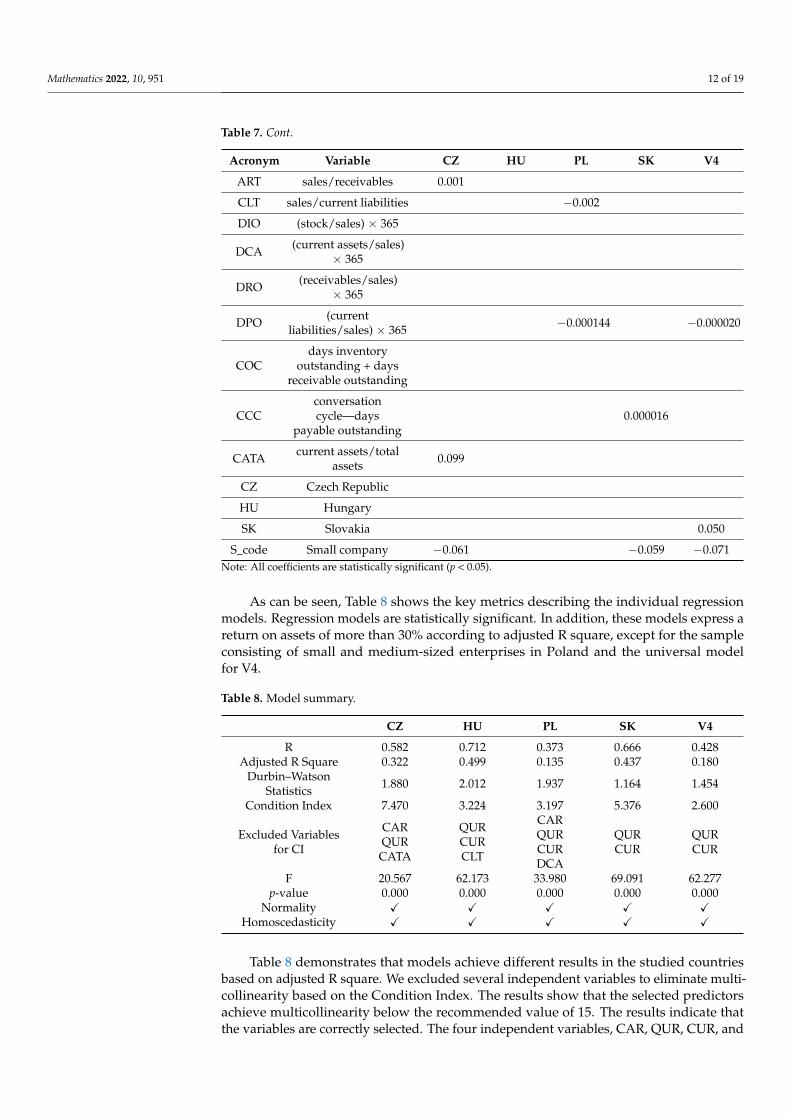
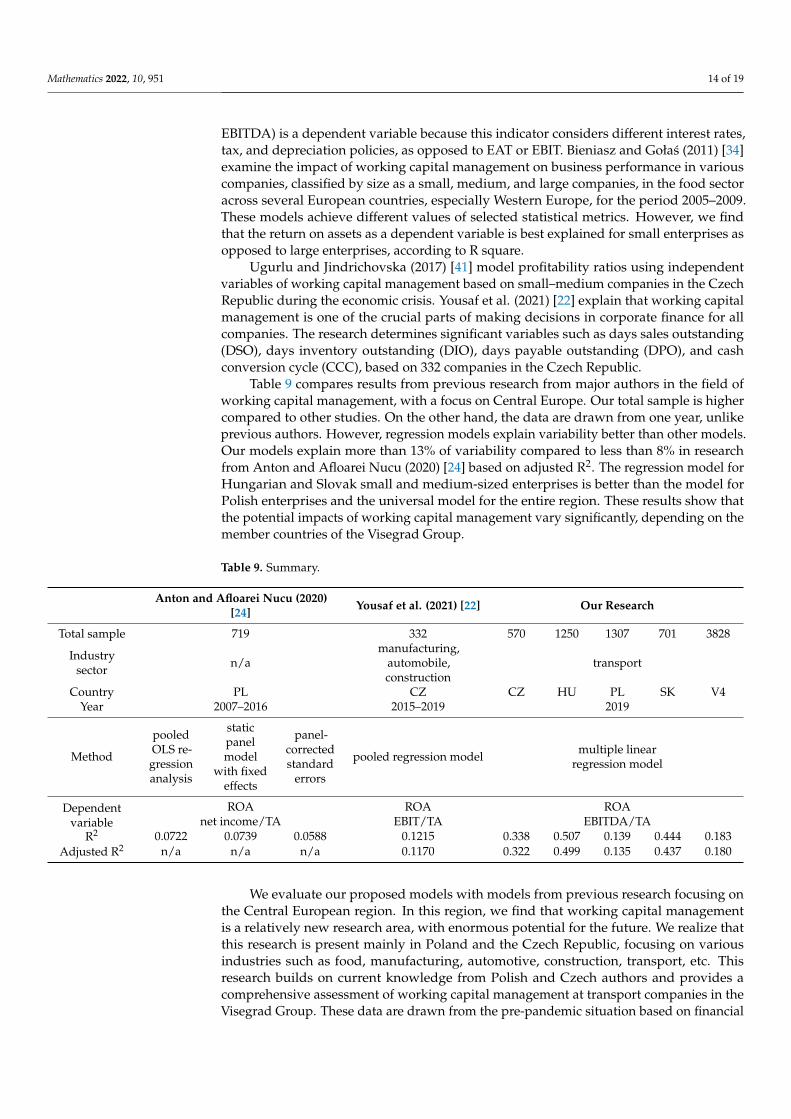
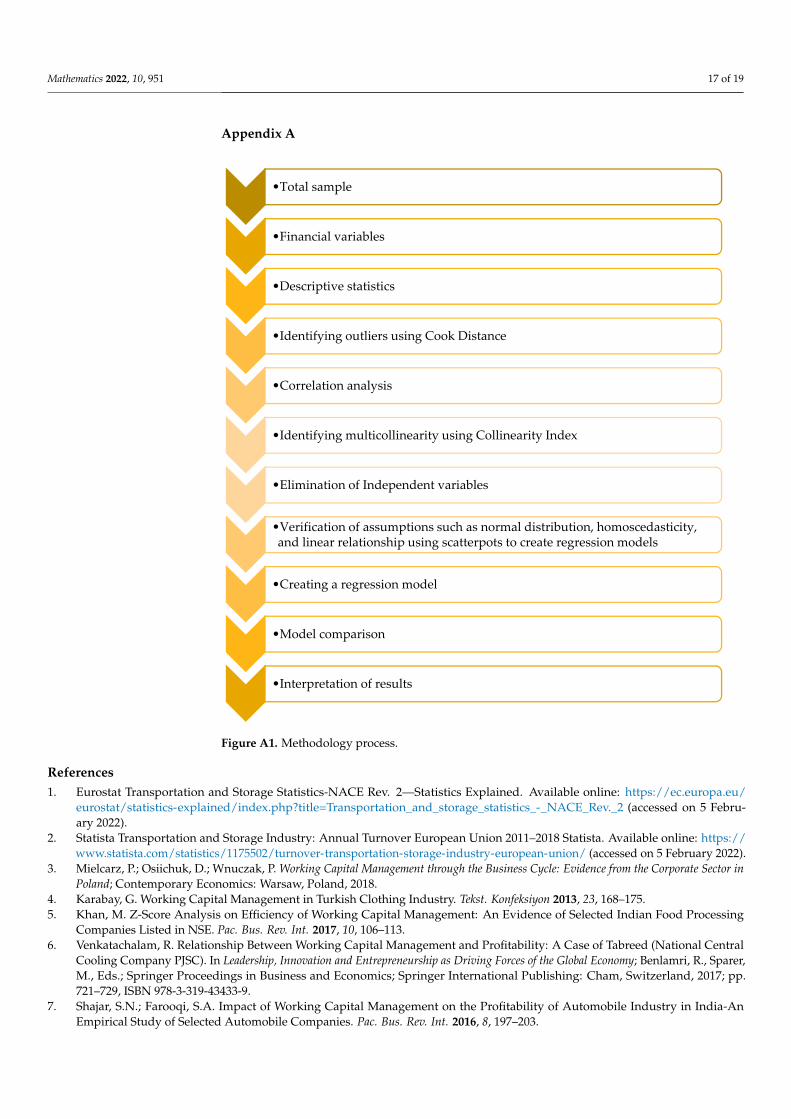