Embed Size (px)
Citation preview

Version 1.11

© 2015 RAE Systems by Honeywell.
Contents
Section 1: ProRAE Guardian 1 General Information ................................................................................................................ 8
1.1 Key Features .................................................................................................................... 8
2 Requirements .......................................................................................................................... 9
2.1 Hardware Requirements .................................................................................................. 9
2.2 Software Requirements ................................................................................................... 9
2.3 Run-Time Requirements ................................................................................................. 9
2.4 User Privilege Requirements ........................................................................................... 9
2.5 Remote Web Viewing Requirements ............................................................................ 10
2.6 SSL Certificate For HTTPS Installation ........................................................................ 10
3 ProRAE Guardian Installation .............................................................................................. 11
3.1 Installing ProRAE Guardian .......................................................................................... 12
3.2 Uninstalling An Earlier Version Of ProRAE Guardian ................................................ 12
3.3 Installation ..................................................................................................................... 14
3.4 HTTP ............................................................................................................................. 21
3.5 HTTPS ........................................................................................................................... 23
3.6 ProRAE Guardian SDK ................................................................................................. 28
4 ProRAE Guardian License Registration ............................................................................... 29
4.1 Activating A License Using A Computer With Internet Access ................................... 29
4.2 Activating A License Using A Computer Without Internet Access .............................. 30
5 Starting ProRAE Guardian ................................................................................................... 32
6 Security Features .................................................................................................................. 33
6.1 Important Security Feature: Logon And Password ....................................................... 33
7 ProRAE Guardian User Interface Overview......................................................................... 34
7.1 Resizing The Window ................................................................................................... 34
8 Global Settings...................................................................................................................... 35
8.1 Accessing Global Settings ............................................................................................. 35
8.2 Event Viewer ................................................................................................................. 37
8.3 About ProRAE Guardian ............................................................................................... 38
8.4 Quick Access Toolbar ................................................................................................... 39
8.5 System Status Bar .......................................................................................................... 42
9 Tabs ...................................................................................................................................... 43
9.1 Command Center ........................................................................................................... 44
9.1.1 System ................................................................................................................... 44
9.1.1.1 Data Sources .................................................................................................. 44
9.1.1.2 PTM ............................................................................................................... 45
9.1.1.3 Select PTM Index .......................................................................................... 45
9.1.1.4 Settings: Serial Port ....................................................................................... 46
9.1.1.5 Settings: Baud Rate ....................................................................................... 46
9.1.1.6 Settings: Unit IDs .......................................................................................... 46
9.1.1.7 Settings: Poll Master Interval(s) .................................................................... 49
9.1.1.8 Settings: Timeout (ms) .................................................................................. 49
9.1.1.9 Settings: Max Retries..................................................................................... 49
9.1.1.10 Settings: Broadcast On Alarm ....................................................................... 49
9.1.1.11 Auto Start ....................................................................................................... 50
9.1.1.12 Remote Unit Sleep/Wakeup .......................................................................... 50
9.1.1.13 Start................................................................................................................ 50
9.1.2 RCS ....................................................................................................................... 51
9.1.2.1 Listen Port (TCP Settings) ............................................................................. 52
9.1.2.2 Enable Backup Port (TCP Settings) .............................................................. 52
9.1.2.3 Max Clients (TCP Settings) ........................................................................... 52
9.1.2.4 Timeout(s) (TCP Settings)............................................................................. 52
9.1.2.5 Enable COM (Serial Port Settings) ............................................................... 52
9.1.2.6 Baud Rate (Serial Port Settings) .................................................................... 52
9.1.2.7 Auto Start ....................................................................................................... 52
9.1.2.8 Start................................................................................................................ 52
9.1.3 Modbus .................................................................................................................. 53
9.1.3.1 Communication ............................................................................................. 53
9.1.3.2 Serial Port ...................................................................................................... 53
9.1.3.3 Baud Rate ...................................................................................................... 53
9.1.3.4 Master Interval(s) .......................................................................................... 53
9.1.3.5 RTU ............................................................................................................... 54
9.1.3.6 Client ID ........................................................................................................ 54
9.1.3.7 Client Type .................................................................................................... 54
9.1.3.8 Set RTU ......................................................................................................... 54
9.1.3.9 Remove .......................................................................................................... 54
9.1.3.10 Auto Start ....................................................................................................... 54
9.1.3.11 Start................................................................................................................ 54
9.1.4 Remote Data In ...................................................................................................... 54
9.1.4.1 Viewer Mode – View data from a remote PRG PC ....................................... 55
9.1.4.2 Remote PRG PC Address (Parameters – Remote PRG) ............................... 55
9.1.4.3 Remote PRG PC Port (Parameters – Remote PRG) ...................................... 55
9.1.4.4 Cascade In Mode – Receive data from remote PCs ...................................... 56
9.1.4.5 Listen Port (Parameters – This PC) ............................................................... 56
9.1.4.6 Enable Backup Port (Parameters – This PC) ................................................. 56
9.1.4.7 Max # of remote PCs (Parameters – This PC) ............................................... 56
9.1.4.8 Enable User Authentication ........................................................................... 56
9.1.4.9 Auto Start ....................................................................................................... 56
9.1.4.10 Start................................................................................................................ 56
9.1.5 Options .................................................................................................................. 57
9.1.5.1 Data Options .................................................................................................. 57
9.1.5.2 Formats .......................................................................................................... 57
9.1.5.3 Alarm ............................................................................................................. 61
9.1.5.4 Data Forwarding ............................................................................................ 64
9.1.5.5 Remote Viewer mode .................................................................................... 65
9.1.5.6 Cascade Out mode ......................................................................................... 66
9.1.5.7 Enable Data Forwarding ................................................................................ 67
9.1.6 Web Viewer ........................................................................................................... 68
9.1.6.1 Web Viewer Location .................................................................................... 68
9.1.6.2 Max Session ................................................................................................... 68
9.1.6.3 Set The Session Timeout ............................................................................... 69
9.1.6.4 Server Port ..................................................................................................... 69
9.1.6.5 Max Concurrent User Count .......................................................................... 69
9.1.7 Care Center ............................................................................................................ 69
9.1.7.1 Care Center Device Port ................................................................................ 69
9.1.7.2 Management Service Port .............................................................................. 69
9.1.7.3 Database Service Port .................................................................................... 69
9.1.7.4 Docking Stations ........................................................................................... 69
9.1.7.5 IP Address ..................................................................................................... 69
9.1.7.6 Port ................................................................................................................ 70

9.1.7.7 Delete ............................................................................................................. 70
9.1.7.8 Add ................................................................................................................ 70
9.1.7.9 Set .................................................................................................................. 70
9.1.7.10 Cancel ............................................................................................................ 70
9.1.8 Platform ................................................................................................................. 71
9.1.8.1 Local Access .................................................................................................. 72
9.1.8.2 Remote Access .............................................................................................. 72
9.1.8.3 Platform Information ..................................................................................... 73
9.1.8.4 Add-Ons ........................................................................................................ 74
9.1.8.5 Device Templates .......................................................................................... 76
9.1.9 Status ..................................................................................................................... 78
9.1.9.1 Module ........................................................................................................... 78
9.1.9.2 Port ................................................................................................................ 78
9.1.9.3 Active ............................................................................................................ 78
9.1.9.4 Number .......................................................................................................... 79
9.1.9.5 List ................................................................................................................. 79
9.1.10 Display ................................................................................................................... 79
9.1.10.1 Reset Panes .................................................................................................... 79
9.1.10.2 View/Hide Panes ........................................................................................... 79
9.1.10.3 View/Hide Panes ........................................................................................... 80
9.1.10.4 Map Pane ....................................................................................................... 82
9.1.10.5 License ........................................................................................................... 82
9.1.11 Log View ............................................................................................................... 83
9.1.11.1 Viewing An Instrument’s Information .......................................................... 85
9.1.11.2 Compacting/Expanding/Updating The Device List ....................................... 86
9.1.11.3 Using The Query Button................................................................................ 87
9.1.11.4 Export Multiple Instruments’ Datalog ........................................................... 87
9.1.11.5 Export Current Selected Instrument’s Datalog .............................................. 88
9.1.11.6 Summary ........................................................................................................ 90
9.1.11.7 Data Grid ....................................................................................................... 90
9.1.11.8 Graph ............................................................................................................. 90
9.1.11.9 Filtered Grid .................................................................................................. 91
9.1.12 Proxy Server .......................................................................................................... 93
9.2 Google Map ................................................................................................................... 94
9.2.1 Auto Pan ................................................................................................................ 94
9.2.2 Reload .................................................................................................................... 94
9.2.3 Large Icon .............................................................................................................. 94
9.2.4 Small Icon .............................................................................................................. 96
9.3 RAE Center ................................................................................................................... 96
10 Panes ..................................................................................................................................... 97
10.1 Map Pane ................................................................................................................... 97
10.1.1 Google Map ........................................................................................................... 97
10.1.1.1 Latitude And Longitude................................................................................. 97
10.1.1.2 Set instrument GPS location manually .......................................................... 98
10.1.2 Site Maps ............................................................................................................... 99
10.1.2.1 Site Mode ....................................................................................................... 99
10.1.2.2 Tab Mode ..................................................................................................... 100
10.1.2.3 Splitter Mode ............................................................................................... 101
10.1.2.4 Add A Site ................................................................................................... 102
10.1.2.5 Location Estimation Setup........................................................................... 105
10.1.2.6 MBeacon Setup ........................................................................................... 106

10.1.2.7 Remove Site ................................................................................................. 107
10.1.2.8 Edit Site ....................................................................................................... 107
10.1.2.9 Add Device .................................................................................................. 108
10.1.2.10 Creating Zones ........................................................................................... 109
10.1.2.11 Remove Device .......................................................................................... 113
10.1.2.12 Filtering And Arranging Data .................................................................... 114
10.1.2.13 Using Groups To Filter Information .......................................................... 116
10.1.2.14 Large Icon .................................................................................................. 117
10.1.2.15 Small Icon .................................................................................................. 118
10.1.2.16 Zoom In ...................................................................................................... 118
10.1.2.17 Zoom Out ................................................................................................... 118
10.1.2.18 Export Layout ............................................................................................ 118
10.1.2.19 Import Layout ............................................................................................ 118
10.2 Device Information Pane ......................................................................................... 119
10.3 System Information Pane ........................................................................................ 120
11 Managing Panes .................................................................................................................. 121
11.1 Resizing Panes ......................................................................................................... 121
11.2 System Information Tabs Attributes ........................................................................ 121
11.3 Rearranging Panes ................................................................................................... 122
11.3.1 Resetting Panes .................................................................................................... 124
11.3.2 Consolidating System Information and Device Information Panes..................... 125
11.4 Minimizing Panes .................................................................................................... 126
12 Alarms ................................................................................................................................ 127
12.1 Main Alarm ............................................................................................................. 127
12.2 Fault Alarm .............................................................................................................. 129
12.3 Offline Alarm Feature ............................................................................................. 129
13 Device Properties ................................................................................................................ 130
14 Configuring ProRAE Guardian Data Communication ....................................................... 131
14.1 Configure ProRAE Guardian to retrieve instrument data ........................................ 131
14.1.1 PTM ..................................................................................................................... 132
14.1.2 RCS ..................................................................................................................... 132
14.1.3 Remote Data In .................................................................................................... 133
14.2 Configuring ProRAE Guardians To Share Real-Time Data .................................... 134
14.2.1 Viewer Scheme .................................................................................................... 134
14.2.1.1 Source ProRAE Guardian ............................................................................ 135
14.2.1.2 Destination ProRAE Guardian: Viewer Mode ............................................ 136
14.2.2 Cascade Scheme .................................................................................................. 136
14.2.2.1 Destination ProRAE Guardian: Cascade In Mode ...................................... 137
14.2.2.2 Source ProRAE Guardian: Cascade Out Mode ........................................... 138
15 Communications Port Configuration .................................................................................. 139
15.1 Determining The Port Number ................................................................................ 139
16 Viewing ProRAE Guardian Remotely Via Web Browser .................................................. 142
16.1 ProRAE Guardian Configuration (Host) ................................................................. 143
16.1.1 Check The Web Viewer Port ............................................................................... 143
16.1.2 Max Session......................................................................................................... 144
16.1.3 Set The Session Timeout ..................................................................................... 144
16.1.4 Server Port ........................................................................................................... 145
16.1.5 Exit Services ........................................................................................................ 145
16.1.6 Allow Remote Access Via The Internet .............................................................. 145
17 Starting ProRAE Guardian Remote Viewer ....................................................................... 149
18 Status Indicators.................................................................................................................. 150

19 General Customization ....................................................................................................... 152
19.1 Collapsing/Expanding ............................................................................................. 152
19.2 Column Management .............................................................................................. 152
20 Dashboard ........................................................................................................................... 156
20.1 Dashboard Control ................................................................................................... 157
20.2 Panels ....................................................................................................................... 158
20.3 Reordering Panels .................................................................................................... 161
20.4 Expanded Details ..................................................................................................... 163
21 Command Center ................................................................................................................ 164
21.1 BioHarness .............................................................................................................. 167
21.1.1 Views ................................................................................................................... 169
21.1.2 BioHarness Settings ............................................................................................. 171
22 Care Center ......................................................................................................................... 173
22.1 Instruments .............................................................................................................. 175
22.2 Reports ..................................................................................................................... 175
22.3 Docking Station ....................................................................................................... 176
22.3.1 Actions ................................................................................................................. 177
22.3.2 Reports ................................................................................................................. 178
22.3.3 Actions ................................................................................................................. 179
22.3.4 Pages .................................................................................................................... 179
22.3.5 Create Report ....................................................................................................... 180
22.3.6 Check Firmware Update ...................................................................................... 181
22.4 Actions ..................................................................................................................... 182
22.5 Add Instrument/Add Smartphone ............................................................................ 182
22.5.1 Add Instrument .................................................................................................... 183
22.6 Show (number) entries ............................................................................................ 185
22.7 Columns And Settings ............................................................................................. 186
22.8 Grouping .................................................................................................................. 187
22.9 Filtering ................................................................................................................... 187
22.10 Actions ..................................................................................................................... 188
22.10.1 Add Smart Phone ............................................................................................. 188
22.10.2 Create Instrument Report ................................................................................ 189
23 Control Center .................................................................................................................... 192
23.1 User Management .................................................................................................... 192
23.1.1 Add User .............................................................................................................. 193
23.1.2 Actions ................................................................................................................. 195
23.2 Action Rules ............................................................................................................ 197
23.3 Create RuleSet ......................................................................................................... 198
23.4 Attributes And Validation ....................................................................................... 202
23.5 RuleSet Log ............................................................................................................. 202
23.6 Activity Automation ................................................................................................ 202
23.6.1 Schedule Activity ................................................................................................ 203
23.6.2 General ................................................................................................................ 203
23.6.3 Triggers ............................................................................................................... 204
23.6.4 Actions ................................................................................................................. 204
23.6.5 Activity Log......................................................................................................... 205
23.6.6 Select Activity ..................................................................................................... 206
23.6.7 Select Result ........................................................................................................ 206
23.6.8 Show (number) entries ........................................................................................ 207
23.7 System Settings ....................................................................................................... 207
23.8 General Settings ....................................................................................................... 208

23.9 Warranty Expiration ................................................................................................ 209
23.10 Calibration And Bump Test Fail ............................................................................. 210
23.11 Session Timeout ...................................................................................................... 211
23.12 Command Center Settings ....................................................................................... 212
23.13 Email Settings .......................................................................................................... 213
23.13.1 Email Templates .............................................................................................. 214
23.14 Report Settings ........................................................................................................ 215
23.15 Password Policy....................................................................................................... 217
23.16 User Groups ............................................................................................................. 217
23.17 BioHarness Settings ................................................................................................. 218
23.18 Account Lockout Policy .......................................................................................... 219
24 Technical Support ............................................................................................................... 220
25 RAE Systems By Honeywell Contacts ............................................................................... 220

WARNINGS
Read Before Operating This manual must be carefully read by all individuals who have or will have the responsibility
of using, maintaining, or servicing this product. The product will perform as designed only if it
is used, maintained, and serviced in accordance with the manufacturer’s instructions.
Important Security Feature: Read Before Operating ProRAE Guardian requires user logon to change critical settings. The default username is
“administrator” and the default password for this account is “raesystems”. For security,
change the password as soon as possible. Please write down your new password and store
it in a secure place for reference, should you forget it.
The password will not reset upon installation, and you will be asked to change the default
password on startup with the following dialog:
To change/add accounts, click “Administration/Admin Panel…” under the global menu
in the upper left corner of the application.
Automatic Updates via ProRAE Update When you start ProRAE Guardian and log in, ProRAE Update automatically checks with
RAE Systems for updates to ProRAE Guardian and other RAE Systems software (this
requires an active connection with the Internet). If any updates are available, it shows
them, along with new features, version number, and release date. You can then download
any updates, or dismiss them and perform updates at a later time.

Section 1: ProRAE Guardian
1 General Information The ProRAE Guardian software program collects, stores, and displays real-time sensor
data from a variety of sensing devices to enable critical decision support for safety
applications.
One ProRAE Guardian installation can capture real-time readings from up to 64 PTM
(AreaRAE, etc.) monitors, and up to 450 RCS (Mesh-radio, such as MeshGuard)
monitors. It supports not only RAE Systems wireless products, but selected third-party
devices as well.
ProRAE Guardian collects, stores, and displays real-time data from remote monitors.
Google Maps are integrated into the interface, plus MXD and other maps and graphics
can be imported and applied. Sensor locations are overlaid on the maps or graphics,
providing direct context.
1.1 Key Features
Real-time display of device status, sensor readings, and alarms
Access security prevents tampering
User interface displays multiple simultaneous instrument readings
Reconfigurable pane sizes and locations for customized viewing
Integrated Google Maps show precise instrument locations with alarm status
Remote alarming via email
Open platform for third-party devices and systems
Image overlay option
Remote viewing with a web browser

2 Requirements
2.1 Hardware Requirements
Pentium (or compatible) CPU, 1.0 GHz or better.
Color monitor (at least 1024x768 resolution, 16-bit color)
3GB or more of RAM to support up to 500 instruments and 30 remote viewer sessions
At least 2GB (4GB recommended) of free hard disk space*
CD-ROM drive
Serial port (RS-232/USB COM port) for instrument/modem connection
Sound card (to enable local sound notifications)
LAN connection for network-connected devices.
Live Internet connection (required to view Google Maps)
*Software installation only. ProRAE Guardian may require significantly larger amounts
of disk space to store device datalog information.
2.2 Software Requirements
Operating system: Microsoft Windows (Windows 7 or Windows 8)
Adobe Acrobat Reader V5.0 or higher (to view documentation)
2.3 Run-Time Requirements
The PC’s “Energy Saving” feature should be set at “Always On.” Never turn off the hard
disk when ProRAE Guardian software is running. “Hibernate” (if available) must be
disabled.
2.4 User Privilege Requirements
During installation, you must have administrator privileges on the local PC.
Notes:
Administrator privileges are not required in order to run the program; this applies for all
operations except GPS module registration.
1. Registering the GPS module in ProRAE Guardian requires administrator privileges:
A. Right-click the ProRAE Guardian icon on the Desktop and select
“Run as administrator” (Windows 7 or Windows 8) or select “Run as…”
B. Go to “ESRI Map” to register the GPS module.
2. After the GPS module is registered, you can restart ProRAE Guardian with a normal
user account.

3. The tool “GISDataRegistration” is for registering the GIS map from RAE Systems. It
requires administrator privileges.
Start the tool by clicking the menu “Start >> Programs >> RAE Systems Inc >>
ProRAE Guardian >> ProRAEGuardian >> GISDataRegistration.”
4. “Datalog TransferTool” is for transferring the datalog in ProRAE Remote and/or
ProRAE.Net to ProRAE Guardian, if you are upgrading from ProRAE Remote or
ProRAE.Net on the PC. It requires administrator privileges.
Start the tool by clicking the menu “Start >> Programs >> RAE Systems Inc >>
ProRAE Guardian >> ProRAEGuardian >> Datalog TransferTool.”
2.5 Remote Web Viewing Requirements
Remote viewing is supported on the following operating systems and web browsers:
Windows 7, Windows 8
Internet Explorer 10 or higher
Google Chrome
Mac
Safari
iOS
Google Chrome
Safari
You must also have WAN, LAN, or Internet access, depending on the system. In some
cases, firewall issues may prevent you from connecting, so it may be necessary to consult
with your company’s I.T. department.
2.6 SSL Certificate For HTTPS Installation
The Care Center in ProRAE Guardian v1.9 supports HTTP or HTTPS installation (refer
to page 10 for the installation details). An SSL certificate is required for HTTPS
installation. The SSL certification can be purchased from a public certificate supplier
such as GoDaddy or DigiCert.

3 ProRAE Guardian Installation
Load the ProRAE Guardian software from the CD or from the Internet, and when this
window appears, follow the installation instructions:
During installation, screens prompt you to select the language for ProRAE Guardian, as
well as your locale. The locale selection automatically sets appropriate units of
measurement (such as kilometers per hour vs. miles per hour or degrees Fahrenheit vs.
Celsius), etc. The Service Port settings screen allows you to set a Viewer Port and Server
Port. (For more on port settings, refer to page 143.) Note that you can change all of these
settings once the program is installed, so you do not need to do anything at this time if
you do not want to.
When the installation is complete, click “Finish” to exit the installer program.
Click “Exit” on the initial screen to dismiss it.

3.1 Installing ProRAE Guardian Find the installer and double-click its icon to start.
3.2 Uninstalling An Earlier Version Of ProRAE Guardian
If a previous version of ProRAE Guardian is found, you should uninstall it. Select
“Uninstall ProRAE Guardian” and then click “Next.”
At this prompt, click “Next.”

Click “Next.”
Note: If you are getting rid of your computer (or replacing it), and it has an existing
ProRAE Guardian Product Key, click the box that says, “I want to deactivate and release
the ProRAE Guardian Product Key.” This removes it from the computer. Do not do this
if you plan to continue using your existing Product Key on this computer.
When uninstallation is done, the screen message says, “Uninstallation Successful.”
Click “Finish” to exit.

3.3 Installation
Whether you just removed a previous version of ProRAE Guardian or are starting fresh,
you begin here:
Click “Next” to begin.
When you see the License Agreement, read it and then click “I agree to the terms of this
license agreement.” Then click “Next.”

Select the country in which ProRAE Guardian will be operating:
Select the language you want and click “Next”:

Select “Full-Version ProRAE Guardian” to install the full version and click “Next”:
Provide the port numbers or use the default values. If you are not sure which port number
to use, check with your I.T. department to ensure there are no conflicts.
Click “Next.”

Select “Express Installation and click “Next.”
A warning message alerts you that you of the default username and password. After
following the instructions, click “Next.”

ProRAE Guardian begins installation (a progress bar is shown):
Once the procedure is complete, a Wizard for setting up Care Center is shown. Click
“Next” to start the setup.

It installs the Java Runtime Environment (JRE):

After the JRE is installed, you have a choice of HTTP or HTTPS (secure HTTP). The
procedures are different because setup for HTTPS requires obtaining an SSL certificate
from a public certificate supplier such as GoDaddy or DigiCert, etc.).

3.4 HTTP
Click “HTTP” and then click “Next.”
After the installation completes, you see this screen:
Click “Finish” to finish Carecenter’s installation.

You will see this screen next:
Click “Finish.” This confirmation message is shown:
Click “Finish” to exit. Installation of ProRAE Guardian is now complete.

3.5 HTTPS
If you select HTTPS, you will have to purchase and install an SSL Certificate.
Input the Domain Name with your SSL certificate (for example,
“*.proraeguardian.com”). Fill in your Organizational Unit, Organization, City/Locality,
State/Province, and Country Code. Then click “Next.”

You must obtain an SSL Certificate from a certification body such as Verisign,
GoDaddy, DigiCert, etc.
After entering the information, the installer generates a CSR file. This CSR file has to be
provided to a Certification Authority (CA) . The Certificate Authority provides three
certificates: Root certificate, intermediate certificate, and public certificate.
Copy these files and paste them into this folder on your computer at this location:
C:\Program Files\RAE Systems by Honeywell\ProRAE Guardian\Viewer\java\bin
Note: If the directory has the same files, copy and replace them.
Note: Certificate names can change for different Certificate Authorities, but the three
certificates (root, intermediate and public key) need to be uploaded to the folder.

Type in the Root Certificate (for example, gd_bundle.crt), Intermediate Certificate
(example: gd_intermediate.crt ), and Public Key (example: 27967d6084c3a7.crt). Then
click “Next.”
Now you will see a window that tells you a Certificate already exists in keystore. Type
“yes” and then click the “Enter” key.
You will see a success screen, telling you that the certification information has been
accepted:

Continue the installation of Care Center by clicking “Install.”
When you see this screen, click “Finish”:

You will now see a screen that says installation was successful.
Click “Finish” to complete the procedure and exit the ProRAE Guardian installer.
Your computer will need to be rebooted in order to complete the installation. You can
either do it right away or do it later. If you choose to do it later, ProRAE Guardian will
not work until you reboot.
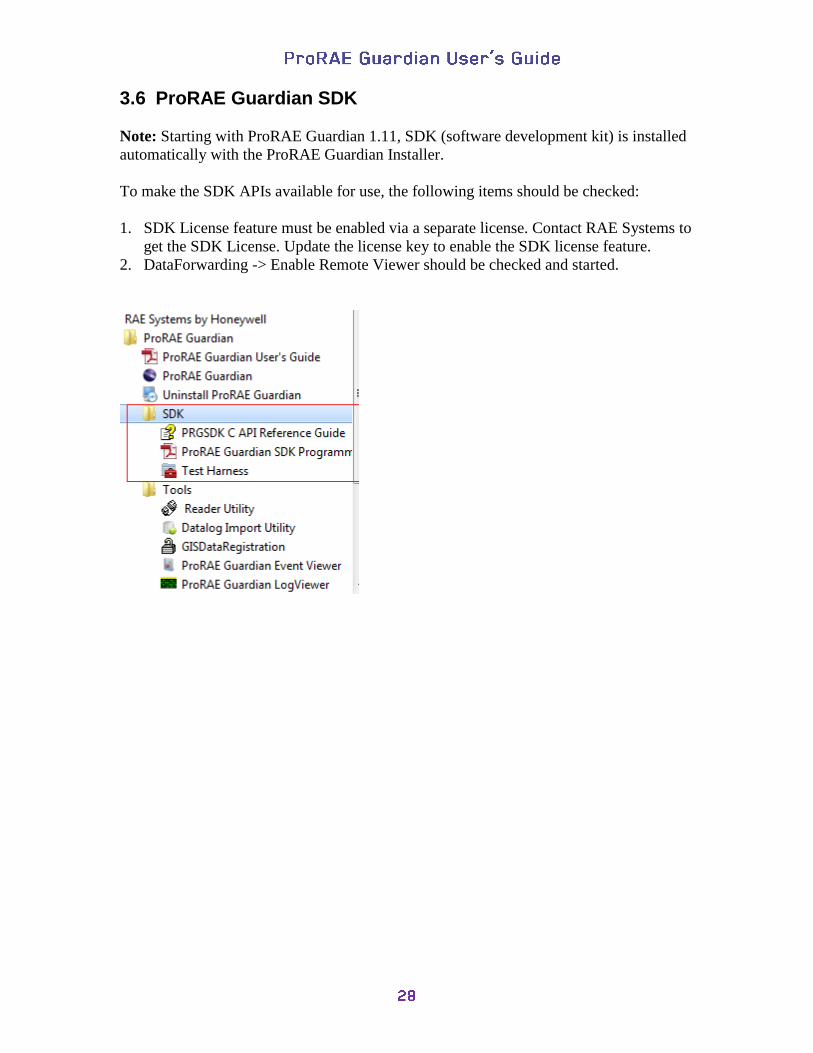
3.6 ProRAE Guardian SDK
Note: Starting with ProRAE Guardian 1.11, SDK (software development kit) is installed
automatically with the ProRAE Guardian Installer.
To make the SDK APIs available for use, the following items should be checked:
1. SDK License feature must be enabled via a separate license. Contact RAE Systems to
get the SDK License. Update the license key to enable the SDK license feature.
2. DataForwarding -> Enable Remote Viewer should be checked and started.

4 ProRAE Guardian License Registration
ProRAE Guardian requires a license that must be purchased from RAE Systems. The
license is based on the number and types (tiers) of instruments to be monitored via
ProRAE Guardian.
The license can be registered and activated two ways: With a computer connected to the
Internet or on a computer that is not connected to the Internet. The two methods are
included in the next section.
4.1 Activating A License Using A Computer With Internet Access
1. Purchase a ProRAE Guardian license from RAE Systems sales. You will receive
a license certificate that includes your Product Key and the number of Tier 1, Tier
2, and Tier 3 licenses. (Note: If you want to add more instrument tiers later to
accommodate more instruments, you can contact RAE Systems.)
2. Download ProRAE Guardian software from www.raesystems.com or install it
from a CD.
3. Install ProRAE Guardian software.
4. Once installation is complete, start ProRAE Guardian. Because your license has
not been registered and bound to your machine, you see the ProRAE Guardian
License Wizard screen.
5. Enter the 20-character Product Key and follow the steps in the Installation Wizard
to fill in Registration Information. Click “Next.”
6. Follow the steps in the next screens for registration information, including naming
your computer something memorable (or a name assigned by your IT department,
for example).
7. Click “Finish” to upload to RAE Systems and receive confirmation of
registration.
Note: If you receive an error message, make sure your computer is connected to
the Internet. If it is not, but should be, establish an Internet connection and try
again. Also, make sure that you are using a Product Key that is not already in use
on another computer.
8. If the Product Key is accepted upon retrying, then ProRAE Guardian starts.
Note: After running ProRAE Guardian for the first time and performing license
registration, you will not need to go through these steps again, unless you uninstall the
program or release the license from the computer.

4.2 Activating A License Using A Computer Without Internet Access
1. Purchase a ProRAE Guardian license from RAE Systems sales. (Note: If you
want to add more instrument tiers later, you can. Contact RAE Systems.)
2. Install ProRAE Guardian Software from the CD.
3. Once installation is complete, start ProRAE Guardian. Because your license has
not been registered and bound to your machine, you see the ProRAE Guardian
License Wizard screen. Click “Next.”
4. Enter the 20-character Product Key and follow the steps in the Installation Wizard
to fill in Registration Information. Click “Next.”
5. Follow the steps in the next screens for registration information, including naming
your computer something memorable (or a name assigned by your IT department,
for example).
6. Click “Finish” to upload to RAE Systems and receive confirmation of
registration.
You will receive an error message. Before proceeding, make sure that you are
using a Product Key that is not already in use on another computer.
7. Plug a flash drive into your computer’s USB port.
8. Select “I want to use another computer with an Internet connection.”
Note: If you typically have a problem viewing external sources, such as Google
Maps, then consult with your I.T. department so that they can configure your
Proxy Server settings. Otherwise, you likely do not need to use Proxy Server
settings.
9. Click “Next.”
10. The License Wizard now shows a screen with instructions for manually providing
the registration file.
11. Select the path to the file named request.key on your computer by clicking the
link and then selecting the file.
12. Copy “request.key” to your flash drive.
13. Unplug the flash drive and then plug it into a computer with Internet access.
14. Open a browser window and go to www.proraeguardian.com/register. You now
see the screen that says “Welcome to ProRAE Guardian Product Product Key
Management.”
15. Select “Register and activate a new Product Key,” and click “Next.”
16. You will see a screen that says “Register a new Product Key.” Select your
“request.key” file and click “Open.”
17. Click “Next.”
18. When the screen changes to “Register a new Product Key,” follow the
instructions to download a file called “activation.key” to your flash drive.
19. Remove the flash drive and plug it into the computer where you have installed
ProRAE Guardian.

20. Browse to the location where “activation.key” is stored on your flash drive and
upload the file by clicking “Next.”
21. If the Product Key is accepted, then you see a “Congratulations!” screen that
informs you that ProRAE Guardian is now registered and activated for use.
22. Click “Finish” to exit the License Wizard. ProRAE Guardian automatically starts.
Note: After running ProRAE Guardian for the first time and performing license
registration, you will not need to go through these steps again, unless you uninstall the
program or release the license from the computer.

5 Starting ProRAE Guardian
Once ProRAE Guardian has been installed on your computer, there should be an icon for
it on the desktop.
To start ProRAE Guardian, double-click the icon.
The main screen appears, and ProRAE Guardian is ready to use.
Note: If there is no ProRAE Guardian icon on your computer’s desktop, you can start it
by launching it directly by following this path:
Start >> Programs >> RAE Systems Inc >> ProRAE Guardian >> ProRAEGuardian
Note: When you start ProRAE Guardian, it checks whether any updates are available. A
“Software Update” message box tells you if your software is up to date or if a newer
version is available.
Note: Internet connectivity is required in order to check for software updates and to
download them.

6 Security Features
ProRAE Guardian has password protection for changing critical settings, plus it has an
automatic countdown that locks everyone out (requiring a password for re-entry) after 30
minutes. This does not stop or pause ProRAE Guardian operation, but it does prevent
tampering. The administrator can provide access privileges for others, plus manage them
from within ProRAE Guardian.
6.1 Important Security Feature: Logon And Password
ProRAE Guardian requires user logon to change critical settings. The default username is
“administrator” and the default password for this account is “raesystems”. For security
reasons, we recommend that you change the password as soon as possible. Please write
down your new password and store it in a secure place for reference, in case you forget it.
The password for this account is ALWAYS reset to “raesystems” upon installation. To
change/add accounts, click “Administration/Admin Panel…” under global menu in the
upper left corner of the application.
For further information, refer to section 8.1, which explains Admin access and functions.

7 ProRAE Guardian User Interface Overview
The ProRAE Guardian user interface consists of a single main window, organized into
sections by function. The Map Pane and Device List are organized as a group, and can be
collectively resized. The Device Information Pane and System Information Pane can be
resized, reorganized, or selectively hidden. The System Status Bar along the bottom can
also be selectively hidden.
7.1 Resizing The Window
The window can be changed, and standard Windows-style controls are used. The buttons
are located in the upper right corner of the window, and include (left to right):
Minimize
Restore/Maximize
Close
At the bottom right corner of the window is a place where you can grab to resize/reshape
the main window (if it is not maximized).
Click on this corner, and while holding down the left mouse button, drag it to change the
width and height of the window.
Global Settings Title Bar
Map
Pane
Tabs
Device
List
Device Information
Pane
System Information
Pane System Status
Bar
User
Quick Access Toolbar
Group
Area

8 Global Settings
All settings that pertain to the entire application are available under the Global Settings
control, located in the upper left corner of the screen. Clicking on the RAE Systems logo
reveals the Global Settings menu.
8.1 Accessing Global Settings
Click on the RAE Systems logo in the upper left corner of the window (when highlighted,
there is a yellow glow around the logo), and three main options headings are shown:
Administration
Event Viewer
About ProRAE Guardian…
When you move the mouse over “Administration,” it is highlighted, and a submenu
appears:

Note: If you have provided an administrator’s password, the submenu looks like this:
Click “Admin Panel…” will pop up web browser with below login page. After log on
the web viewer, go to “Control Center” >> “User Management” to perform operations
like add user, edit user and change password, etc.
Refer to “23.1 User Management” in “Section 2: ProRAE Guardian Remote Viewer” for
more details on user management.

8.2 Event Viewer
The Event Viewer gives you insight into what events were recorded since ProRAE
Guardian was first started after installation. The Level (of importance/severity) is listed
first in each row, along with date and time, the system’s user, the category of the
information, and a description of what occurred. In addition, the total number of events is
shown at the lower left corner of the window.
Alarms and warnings are color-coded with different icons, making it easy to scroll
through the list to find events of interest/concern.
For more details, click on the row containing any event. The bottom pane then shows
whatever details are available.
The event log stores 10,000 unique events, which should be enough for about six months
of normal use. Further, the event log incorporates a “FIFO,” or “first-in/first-out,” buffer,
which means it will always store the most-recent 10,000 events.
For security reasons, there is no way to directly edit the Event log. You may export the
event log to an Excel-readable file by using the export function. ProRAE Guardian V1.6
ships with a separate Event Viewer exe (located in the ProRAE Guardian installation
directory) that can be used to view the Event Log in the event that ProRAE Guardian is
not installed or will not start.
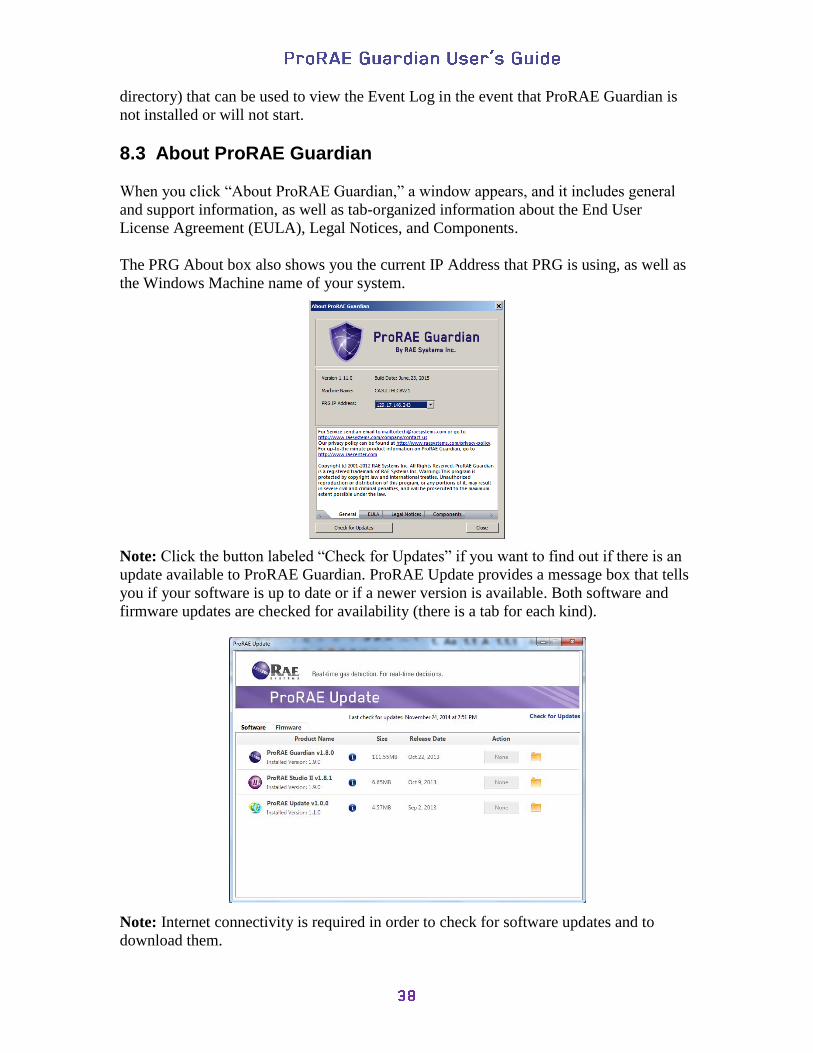
8.3 About ProRAE Guardian
When you click “About ProRAE Guardian,” a window appears, and it includes general
and support information, as well as tab-organized information about the End User
License Agreement (EULA), Legal Notices, and Components.
The PRG About box also shows you the current IP Address that PRG is using, as well as
the Windows Machine name of your system.
Note: Click the button labeled “Check for Updates” if you want to find out if there is an
update available to ProRAE Guardian. ProRAE Update provides a message box that tells
you if your software is up to date or if a newer version is available. Both software and
firmware updates are checked for availability (there is a tab for each kind).
Note: Internet connectivity is required in order to check for software updates and to
download them.

8.4 Quick Access Toolbar
The Quick Access Toolbar provides a customizable way for you to have fast access to the
functions that you use most.
You can move the Quick Access Toolbar below the Ribbon that includes the Command
Center and RAE Center.
When you mouse over any of the Quick Access Toolbar icons, a tooltip shows you what
it is. The default set is Logon, Logoff, and Reset Panes. However, you can customize the
toolbar to include other functions.
Click on the downward-facing arrow icon to the right of the Quick Access Toolbar to
access the Customize Quick Access Toolbar options.
Here you can change whether Logon, Logoff, and Reset Panes are visible, but you can
also move the Quick Access Toolbar (by clicking “Show Below the Ribbon”) or
minimize Ribbon.

Note: You can right-click on the Ribbon to access “Customize Quick Access Toolbar…”,
“Show Quick Access Toolbar Below The Ribbon,” and “Minimize the Ribbon.” Click
“More Commands…” to access a panel that allows you to customize the Quick Access
Toolbar:
The “Customize” window appears:
Click an item in the left pane and then click “Add>>” to add it to the list in the right pane.
(If something is already in the list in the right pane, ProRAE Guardian does add it again.)

To change the order in which any of the items in the right pane appear in the Quick
Access Toolbar, click on the item and then click either the up arrow or down arrow to
move it up or down in the list. The top item appears farthest to the left in the row of
icons, whereas the bottom item appears at the far right.
You can select to Show Quick Access Toolbar below the Ribbon by clicking the
checkbox. When you close this window, the change is made. (You can return it to its
original location above the Ribbon by clicking the checkbox so that it is empty.)
To remove an item from the Quick Access Toolbar, highlight the item and then click
“Remove.”
Shortcuts using keyboard commands can be created and edited by clicking the
“Customize…” button at Keyboard shortcuts.
Categories and commands can be selected by clicking them. If there are current keyboard
shortcuts, they are shown in the pane labeled Current Keys.
To create a new shortcut, click a command and then press a key (or combination of keys,
such as Control-Shift-E), and it is then shown in the Current Keys box.
You can reset the list to the originally installed set (Logon, Logoff, Reset Panes) by
clicking “Reset.” An alert pops up to make sure you really want to do this:

Click “OK” to reset the toolbar.
Click “Cancel” to not reset the toolbar and to dismiss the alert.
8.5 System Status Bar The System Status Bar, which runs along the bottom of the window, indicates whether
the system is online (green dot), as well as the number of notices, warnings, and alarms
during the session.
You can customize what is on the System Status bar. Right-click on any item in the bar.
You will see this pop-up menu:
As shown, all options are selected, and therefore these items are visible on the System Status
Bar. To turn any of the items on or off, mouse over the items, which highlights them:
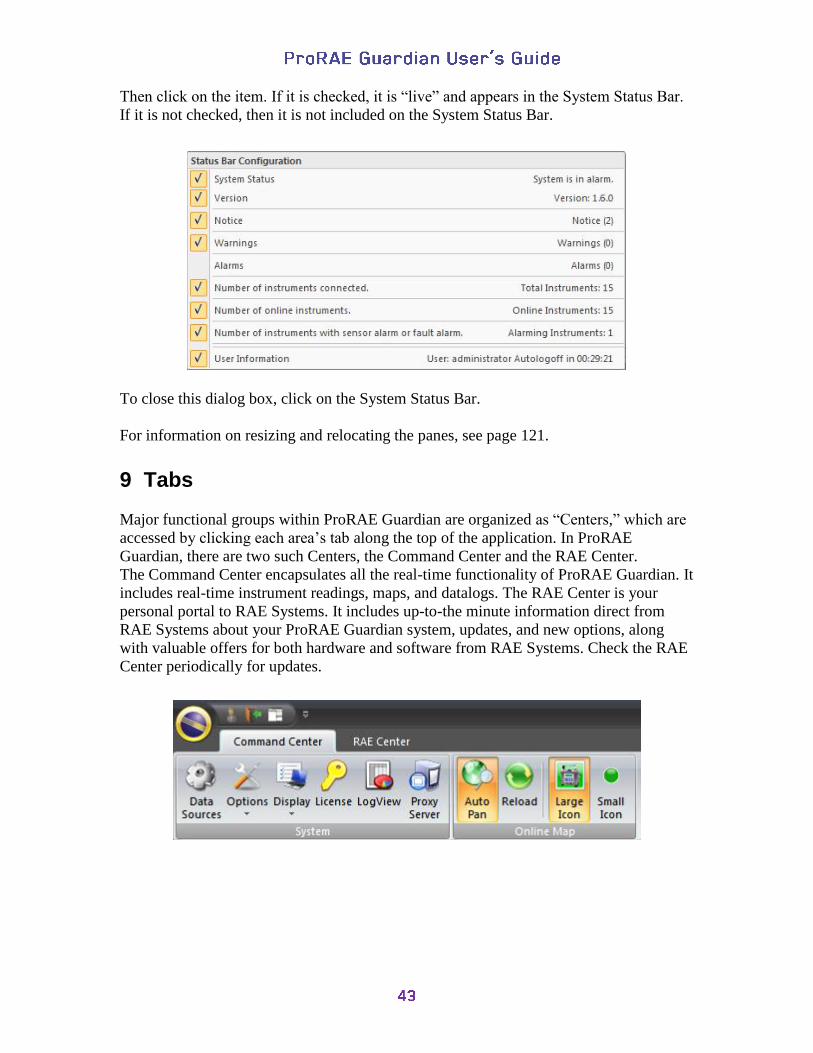
Then click on the item. If it is checked, it is “live” and appears in the System Status Bar.
If it is not checked, then it is not included on the System Status Bar.
To close this dialog box, click on the System Status Bar.
For information on resizing and relocating the panes, see page 121.
9 Tabs
Major functional groups within ProRAE Guardian are organized as “Centers,” which are
accessed by clicking each area’s tab along the top of the application. In ProRAE
Guardian, there are two such Centers, the Command Center and the RAE Center.
The Command Center encapsulates all the real-time functionality of ProRAE Guardian. It
includes real-time instrument readings, maps, and datalogs. The RAE Center is your
personal portal to RAE Systems. It includes up-to-the minute information direct from
RAE Systems about your ProRAE Guardian system, updates, and new options, along
with valuable offers for both hardware and software from RAE Systems. Check the RAE
Center periodically for updates.

9.1 Command Center
The main tab for ProRAE Guardian, Command Center, contains the most often used
functions for setting up and using the program. Clicking on any of the icons opens
windows with menus and other functional controls. The Command Center is divided into
two sections, System and Google Map.
Note: On a computer acting as a ProRAE Guardian host, there are areas for the device
type and GPS.
9.1.1 System
The System area of the Command Center provides access to the tools you need for setting
up ProRAE Guardian, setting options, and other features, all outlined in the following
sections.
9.1.1.1 Data Sources
When you click the Data Sources button, a window appears with three tabs that include
the places where you input and choose settings that help you to configure the software for
your computer running ProRAE Guardian.
Three types of data sources can be configured to match the source:
PTM Point To Multipoint, for use with RAELink3 or RAELink2 modem
RCS Remote Communication Standard, for use with RAE Systems
mesh radio-equipped devices such as MeshGuards
Modbus Data from equipment using Modbus protocol
Remote Data In Data from external sources via ProRAE Guardian’s XML interface

The general settings are described in the following section. Configuration of a system
using each of these Data Sources types is covered in the following sections.
Close the Data Sources window by clicking the “X” at the upper right corner.
9.1.1.2 PTM “PTM” stands for “point to multipoint.” This Data Sources tab allows configuration with
AreaRAEs and other monitors via a RAELink3 or RAELink2 in Host mode.
9.1.1.3 Select PTM Index Use this pull-down menu to select from as many as four different RAELink3 hosts.

9.1.1.4 Settings: Serial Port The serial port being used by a compatible modem/device is typically sensed by the
program and preselected. If you want to change the selection, make sure the “Start”
button is not on, and you should be able to select any of the COM ports available on your
system. If no port shows up, it could be because ProRAE Guardian did not detect any
available local COM ports.
Select which serial port is connected to the RAELink, RAELink2, or RAELink3 host
modem. Select a COM port from the drop-down menu. This selection should typically be
left at its default setting.
9.1.1.5 Settings: Baud Rate The baud rate is the transmission rate at which data flows between computers. The baud
rate is roughly equivalent to the number of bits per second (bps). For proper data transfer,
the baud rate must be the same at the transmitting and receiving ends of a connection.
Currently, the baud rate is fixed at 19200 bps. This setting should not be changed.
9.1.1.6 Settings: Unit IDs Clicking the “View” button under “Unit IDs” opens up the Unit IDs dialog box. This box
has two modes: Normal and Diagnostic. The default is Normal mode. In Normal mode,
ProRAE Guardian shows a check next to each PTM channel on which it has detected an
instrument. ProRAE Guardian automatically detects any instrument broadcasting on any
of the 64 available channels. (By default, channels 1 through 8 are selected.)
Alternatively, you can manually select a channel, and ProRAE Guardian scans it
regardless of whether there is a device present.
You can select the remote units if polling is not started. Click the ones you want, and then
click “OK” to dismiss this dialog box.

In Diagnostic mode, ProRAE Guardian measures the efficiency of each channel and
shows the percentage of successful transmission attempts. In this mode, ProRAE
Guardian ignores the “Max Retries” setting on the PTM tab. Instead, it retries the channel
link transfer according to the retry radio button selections in the “Diagnostics” section of
the “Channel Details” dialog.
You can start diagnostic mode after starting PTM polling begins.
Click “Start RF-Link Test” to start diagnostic mode.
Once it starts, it checks the channels one by one and provides results in the table:

You can save the results for reference or troubleshooting. Click “Export” to save the test
results to a text file.
To stop diagnostic mode, Click “Stop RF-Link Test.”
To exit, click “OK.”
Why You Shouldn’t Automatically Opt For The Maximum Number Of Channels
You might wonder, why not simply click on “select all” in the “Unit Details”
dialog box so that you don’t have to think about how many channels you will use, and let
the system “size itself.”
We strongly advise against automatically choosing the maximum number. ProRAE
Guardian can run when all 64 channels are selected, but you will most likely experience
poor updating performance with this setting, especially if you do not actually have 64
instruments connected. This is because of how ProRAE Guardian polls PTM instruments.
In order to completely understand the next section, you need to understand just how
ProRAE Guardian collects data from PTM instruments. ProRAE Guardian sends out a
request for data on a particular channel. It waits to see if an instrument responds with
data. If, after a certain period of time (Timeout), it gets no response on that channel, it
resends the request. If, after a certain number of retries (Max Retries), it still gets no
response, it then moves on to the next channel. It repeats this sequence until all selected
channels (Max Channels – selected channels only) have been covered. Then ProRAE
Guardian waits until the total polling cycle time (Poll Master Interval) is reached (since
the polling on first checked channel). Then it goes to the beginning and starts over.
Here is another way to express this sequence: On every selected channel of Max
Channels, ProRAE Guardian sends out a request for the channel. It waits for every
Timeout to get a response to that request, and if it gets no response after Max Retries, it
moves on to the next selected channel.
Therefore, if you only have two instruments, one set to Channel 1 and one set to Channel
64, you would get completely different update times depending upon:
1. If you had all 64 instruments selected under Max Channels, or just Channel 1 and
Channel 64, and
2. If you had a long or short Poll Master Interval, and
3. If you had a long or short Timeout, and
4. If you had a large or small number of Max Retries.

9.1.1.7 Settings: Poll Master Interval(s) The Poll Master Interval decides the minimum updating interval for every active remote
monitor. When ProRAE Guardian is in operation, it polls all active remote detectors in
sequence. The Poll Master Interval is the channel reading update interval. ProRAE
Guardian asks for data according to the Poll Master Interval. For example, if the Poll
Master Interval is set to 2 sec (the default setting), ProRAE Guardian sends out a request
for information every two seconds for each active channel. If there are many detectors in
the system, if you selected a large number in the Max Channels section, or if Timeout
and/or Max Retries values are set too high, the actual time for one cycle might be longer
than this number. The number range is 1 to 60 seconds, and the default is 2 seconds.
These examples illustrate how this works:
Condition: The Poll Master Interval is set to 2 seconds, and ProRAE Guardian gets a
response from the instrument in 600ms.
1. There is only one instrument in the system.
ProRAE Guardian waits 2 seconds to poll the instrument again.
Therefore, the instrument data updating interval is 2 seconds.
2. There are 64 instruments in the system.
After polling all 64 instruments, ProRAE Guardian takes about 38 seconds (which is
larger than the Poll Master Interval) to poll all the instruments. Therefore, the
instrument data upgrading interval is about 38 seconds.
9.1.1.8 Settings: Timeout (ms) Every time ProRAE Guardian sends out a request for data, it waits for a response. If there
is valid response within the Timeout time, ProRAE Guardian switches to poll other active
monitors. If there is no valid response in the Timeout interval, ProRAE Guardian resends
the request. The range is 200 to 800 ms, and the default is 600 ms.
Note: Using the default value of 600ms is highly recommended.
9.1.1.9 Settings: Max Retries Due to the nature of wireless communication, some errors may occur when an instrument
communicates with the host computer. When errors occur or when an instrument is
switched off, the host computer cannot receive valid data from it. Max Retries displays
the number of times the host computer retries communication with the instrument before
it is considered to be one failure of communication. When 10 consecutive failures of
communication occur, the status indicator for that instrument changes from green to gray,
and this monitor is then set to” inactive.” The number range is 0 to 5.
9.1.1.10 Settings: Broadcast On Alarm Checking this box enables ProRAE Guardian to send a signal that places all PTM devices
in alarm when one PTM device goes into alarm. Input the number of seconds between
alarms.

9.1.1.11 Auto Start This setting automatically commences communication with the indicated instruments
whenever ProRAE Guardian is started. If this checkbox is checked, you only need to hit
the Start button once, and thereafter ProRAE Guardian will always attempt
communication every time it starts.
9.1.1.12 Remote Unit Sleep/Wakeup Clicking the Remote Unit Sleep/Wakeup button opens this window. You can select
specific units on the network to wake or put to sleep, as well as send a message that you
type in the “Message” field. You can also click “Broadcast Message” to send the message
to the entire network. Just type any message in the “Message” text box, and click
“Broadcast message” to send to the displays of all active PTM devices attached to this
machine. Alternatively, click “Send Message” to send the message to only the display of
the selected Unit(s).
9.1.1.13 Start Clicking the Start button tells ProRAE Guardian to start communicating with the
indicated instruments. If Auto Start is not checked, you must perform this operation every
time ProRAE Guardian is started if you want communication to take place with these
instruments.

9.1.2 RCS “RCS” stands for “RAE Communication Standard.” This is the communication protocol
used by all RAE Systems mesh radios. RAE Systems mesh radios utilize a peer-to-peer,
self-configuring, self-healing radio signaling system based upon the Zigbee standard. It
provides robust communications in noisy environments, even in the presence of obstacles
that may disrupt more fragile point-to-point radio systems.
This tab has two distinct sections. One is labeled “TCP Settings,” and the other is labeled
“Serial Port Settings.” These sections are for configuring RAEMesh Readers in two
different ways, depending upon their specific connectivity to the host PC.
The “TCP Settings” section of the RCS tab allows for configuration of RAE Systems
devices that are connected on a local area network via Internet protocol. These include
the FMC2000 controller and the RAEMesh Reader (indoor version).
The “Serial Port Settings” section of the RCS tab allows you to set up a mesh-type reader
that is connected directly to the computer’s serial port via DB-9 or USB connection.

9.1.2.1 Listen Port (TCP Settings) Set the appropriate port to match your reader device (the default is 9723).
Note: If you change the port on ProRAE Guardian, you should change the TCP port with
the same value for all the FMC2000 controllers and RAEMesh Readers (indoor version)
that connect to the ProRAE Guardian.
9.1.2.2 Enable Backup Port (TCP Settings) In some installations, port 9723 is blocked and therefore communication between the
reader and the computer is also blocked. In these situations, the problem may be resolved
if you enable the backup communication port option. If you do not wish to enable a
backup port, leave the box unchecked (the default is ”Off”). Most installations will not
require this.
9.1.2.3 Max Clients (TCP Settings) ProRAE Guardian can support large numbers of mesh instruments. However, when these
instruments are connected to a mesh reader configured via Ethernet in this fashion,
serious negative network performance issues may result if large numbers of instruments
are involved. Consider this when configuring large mesh networks. The default for this
setting is 10, and the range is 1 to 64.
9.1.2.4 Timeout(s) (TCP Settings) ProRAE Guardian closes the TCP connection if there is no data communication on the
TCP connection after the Timeout interval elapses. The default is 120 seconds.
9.1.2.5 Enable COM (Serial Port Settings) Once your mesh modem is connected and operating, simply select the “Enable COM”
checkbox and use the drop-down menu to select the appropriate COM port.
9.1.2.6 Baud Rate (Serial Port Settings) The baud rate is the transmission rate at which data flows between computers. The baud
rate is roughly equivalent to the number of bits per second (bps). For proper data transfer,
the baud rate must be the same at the transmitting and receiving ends of a connection.
Currently, the baud rate is fixed to 38400 bps. This setting should not be changed.
9.1.2.7 Auto Start This setting automatically commences communication with the indicated instruments
whenever ProRAE Guardian is started. If this checkbox is checked, you only need to hit
the Start button once, and thereafter ProRAE Guardian will always attempt
communication every time it starts.
9.1.2.8 Start Clicking the Start button tells ProRAE Guardian to start communicating with the
indicated instruments. If Auto Start is not checked, you must perform this operation every
time ProRAE Guardian is started if you want communication to take place with these
instruments.

9.1.3 Modbus This Data Sources tab allows configuration the communication with RAE Systems
Modbus products.
This tab has two sections. One is labeled “Communication,” and the other is labeled
“RTU.” The “Communication” section allows for configuration of PRG parameters for
Modbus communication (serial port, baud rate and interval). The “RTU” section allows
you to set up a list of clients that connect to the computer’s serial port.
9.1.3.1 Communication Settings for communication port, speed (BaudRate), and transmission interval are set
here.
9.1.3.2 Serial Port This senses for an open port, or you can set an available port.
9.1.3.3 Baud Rate The BaudRate sets the speed at which the computer and remote device communicate.
They should match, so check with the instrument’s requirements before setting a
BaudRate. The default value is 9600.
9.1.3.4 Master Interval(s) This value (in seconds) defines the interval that ProRAE Guardian waits before
communicating with the next Modbus device. The range is 1 to 60 seconds.

9.1.3.5 RTU RTU (real-time updating) defines the details for each Modbus client. It allows you to set
which instruments are to be polled for data. Select a client ID number, then a client type
(type of instrument), and then click “Set RTU.” Add as many instruments as appropriate.
9.1.3.6 Client ID Select an ID number that you want for an instrument on the network. According to
Modbus communication, each client on the same bus must have a unique client ID. Select
the correct ID for each client. The range is 1 to 247.
9.1.3.7 Client Type Choose an instrument from the list that uses Modbus protocol. ProRAE Guardian
supports SP1003Plus, RAEGuards, RAEGuard2, RAEAlert, SP-3200, FMC-1000 and
STC103.
Note: SP1003Plus, SP3200 and STC103 are supported in China only, and STC103 needs
the configuration file before the selection.
9.1.3.8 Set RTU Click “Set RTU” to add a Modbus client to the client list. After selecting a Client ID and
Client Type, register it in the list by clicking “Set RTU.” It shows up in the list to the left.
Repeat the steps (ID, Type and Set RTU) to add more clients to the Modbus
communication.
9.1.3.9 Remove If you want to remove an instrument from the list, click on its name in the list and then
click “Remove.” It is now removed from the roster.
9.1.3.10 Auto Start This setting automatically starts communication with the indicated instruments whenever
ProRAE Guardian is started. If this checkbox is checked, you only need to hit the Start
button once, and thereafter ProRAE Guardian will always attempt communication every
time it starts.
9.1.3.11 Start Clicking the Start button tells ProRAE Guardian to start communicating with the
indicated instruments. If Auto Start is not checked, you must perform this operation every
time ProRAE Guardian is started if you want communication to take place with these
instruments.
9.1.4 Remote Data In The “Remote Data In” has settings that control how ProRAE Guardian uses instrument
and other data sent to it from other ProRAE Guardian Full Version machines. So-called
“Remote ProRAE Guardian computers” can send data to another ProRAE Guardian Full
Version machine to be used in two possible ways:

1. Remote Viewer. In “Viewer Mode,” the local ProRAE Guardian machine can
“view” instrument data from instruments that are attached to a remote machine
running ProRAE Guardian software. This is the most common way Remote Data
In is used. Viewer mode is available in all ProRAE Guardian Versions.
2. Data “Aggregator.” In “Cascade Mode” many other ProRAE Guardian machines
can forward their data to a “master” ProRAE Guardian machine for aggregation.
In this way, all data from all machines can be aggregated into one master view,
regardless of source.
Note: Cascade Mode is only available on ProRAE Guardian Full Version
installations.
9.1.4.1 Viewer Mode – View data from a remote PRG PC To set up this machine to view data from a remote computer with ProRAE Guardian,
check the checkbox labeled “Viewer Mode – View data from a Remote PRG PC.”
9.1.4.2 Remote PRG PC Address (Parameters – Remote PRG) Input the IP address of the remote ProRAE Guardian computer or URL into this field.
Note: The IP address of the remote ProRAE Guardian computer must be known and
accessible in order for Viewer mode to function properly. In this case, it is also
recommended to use a fixed IP address.
9.1.4.3 Remote PRG PC Port (Parameters – Remote PRG) Type in the port number of the remote ProRAE Guardian computer on which the viewer data
can be accessed. Note: If both machines (Viewer and host) are set to their default values, this

should work without changes, unless the specific port is blocked (possibly by a firewall). If this
occurs, change port numbers on both systems, or consult your IT department.
9.1.4.4 Cascade In Mode – Receive data from remote PCs To allow this computer to accept data from other ProRAE Guardian Full Version
computers to be aggregated into a single view, check the checkbox beside “Cascade In
Mode – Receive data from remote PCs.
.
9.1.4.5 Listen Port (Parameters – This PC) In order for Cascade Mode to operate properly, both computers (sender and receiver)
must have the same port number specified. The default is 9727.
9.1.4.6 Enable Backup Port (Parameters – This PC) Sometimes, ports may be blocked due to network configuration. If this occurs, checking
the checkbox beside “Enable Backup Port” may resolve the problem. Note: This is
typically not necessary.
9.1.4.7 Max # of remote PCs (Parameters – This PC) ProRAE Guardian can accept cascaded data from many computers, but the more
computers that send data, the more network bandwidth that is required. The default for
the setting is 10, and the range is 1 to 64.
9.1.4.8 Enable User Authentication Check this box to require authentication by any remote source (UserID and Password).
Without proper authentication, ProRAE Guardian will not accept data from remote PCs.
9.1.4.9 Auto Start This setting automatically commences communication with the indicated instruments
whenever ProRAE Guardian is started. If this checkbox is checked, you only need to hit
the Start button once, and thereafter ProRAE Guardian will always attempt
communication every time it starts.
9.1.4.10 Start Clicking the Start button tells ProRAE Guardian to start communicating with the
indicated instruments. If Auto Start is not checked, you must perform this operation every
time ProRAE Guardian is started if you want communication to take place with these
instruments. If it is already communicating, the Start button says “Stop.”

9.1.5 Options This toolbar icon opens the Options dialog box, which allows setting various display,
alarm, and other functions.
The Options Dialog/Control window has four tabs:
Data Options
Add-ons
Device Templates
Status
9.1.5.1 Data Options Data Options has five tabs and many features that set parameters and provide insight and
control for ProRAE Guardian and its data.
9.1.5.2 Formats As its name implies, Formats is where you set the way in which data is presented. There
are four sections, Data Display, Date time Format, GPS Format, and Measurement Unit:

Data Display Records In Device Information View. This sets the maximum number of records shown
in the Device Information Pane (the range can be set from 100 to 500). The larger the
setting, the more system RAM the program will use, but the more data that will be
available via this pane.
Records Per Page in Log View. This sets the maximum number of records shown in the
Log View (the range can be set from 300 to 2,000). This setting allows you to configure
how much data can be viewed on any one page of the datalog for viewing convenience.
Date time Format Date and time can be expressed in many different ways.
The date can be indicated in one of the following formats via the pull-down menu:
• mm/dd/yyyy 12/31/2010
• yyyy-mm-dd 2010-12-31
• yy-mm-dd 10-12-31
• yyyy/mm/dd 2010/12/31
• yy/mm/dd 10/12/31
• dd/mm/yyyy 31/12/2010
The time can be indicated in one of the following formats via the pull-down menu:
• HH:MM 12:15
• HH:MM:ss 12:15:27
• HH:MM:ss AM/PM 12:15:27 AM
• HH:MM AM/PM 12:15 AM
GMT/Local Time. Click either of the radio buttons to select GMT (Greenwich Mean Time) or
local time, which is shown in the time format you select via the pull-down menu.
GPS Format Click either of the radio buttons to select decimal or degree GPS coordinate data format.

Measurement Unit This section allows configuration of a custom measurement unit for some instrument
readings. An example of such a custom unit setting is pre-loaded into the program by
default to illustrate a conversion from Fahrenheit to Celsius. To see how the conversion is
programmed, select the “Temperature” line in the Measurement Unit box. Then click
“Edit”. You will then see the following dialog:
This dialog shows that an equation has been programmed into the system relating
Degrees F to Degrees C. The equation is:
Readings (°F) = 1.8 * Readings (°C) + 32
To add a new Unit of Measurement, go back to the previous dialog and click the “Add”
button. Then, in the “Unit Category” text box, type in a new Measurement Category
name of your choice. This should typically be the general category that both Units (the
original source and your new Unit of Measurement) have in common. Referring to the
example, “Temperature” is the category that both °F and °C are members of.
To illustrate this further, let’s enter a useful new Unit of Measurement for Velocity.
ProRAE Guardian has, by default, only one unit of measurement for velocity: m/sec
(meters per second). So let’s add a new unit of Velocity equal to mi/hr (miles per hour).
To do this, perform the following actions:
1. Go to the original dialog and click on “Add.”
2. Enter “Velocity” in the “Unit Category” text field.
3. Click the button labeled “New”.
Note: If you do not enter a name (such as “Velocity”) into the text field and click
“New,” an error message saying, “Please input the unit category name” will pop
up to remind you to give it a name.

You should now see another dialog box like the following:
In the text field labeled “Display Unit,” type “mph” (for “miles per hour”). This is our
new unit of measurement for velocity. For “Base Unit,” you must enter a unit of
measurement that ProRAE Guardian currently has defined. The best way to figure out
what unit ProRAE Guardian already has defined is to use the “Device Information” pane
for an instrument that you want to work with. If you have, for example, a WeatherPak
with a wind velocity monitor, then in the Device Information pane you should be able to
click on the “Device Details” tab and scroll down to see the “Spd” sensor detail. In this
detail you will see the “Unit of Measurement” of the Spd sensor for the WeatherPak is
“m/sec” (meters per second). This is what you need to type into the “Base Unit” field of
the Create Unit Conversion dialog box in our example.
After you have entered the new Display Unit name, and determined the Base Unit name
that it will be derived from, then you must enter a linear equation relating the two values
that conforms to the general form:
Output Value = Input Value * Additive Constant + Additive Constant.
If you can express the relationship between the two values with the above equation, you
can use this function to create whatever new Units of Measurement you want.
In our example above, the equation relating miles per hour to meters per second is 1
m/sec = 2.24 mph. That means
Display Value (in mph) = 2.24 * Input Value (in m/sec)

For example, the instrument’s wind speed sensor has a reading of 10 m/sec, which equals
to 22.4 mph.
So in order to program our new conversion, type 2.24 into the “Additive Percent” text
field. Leave the “Additive Constant” text field set to zero. Now the “Description” field
should read:
Readings (mph) = 2.24 * Readings (m/sec)
After this, click the “OK” button to close the dialog. You should now see your new
Measurement Unit in the Measurement Unit box. To choose between m/sec and mph,
simply select the desired Unit from the drop-down menu, and click the “Set” button.
After you do this, all m/sec readings in ProRAE Guardian will now be displayed as mph
readings.
Note: This unit conversion is only for the local computer, and does not affect the datalog.
It is for display only.
9.1.5.3 Alarm The Alarm tab provides options for local and remote notification when ProRAE Guardian
receives alarm data from its network.
Enable Off-Line Alarm Notifications. If this is checked, the Off-line Alarm feature is
activated, ensuring that you are informed in cases when remote instruments lose
connection with ProRAE Guardian.
How the Off-Line Alarm Works
ProRAE Guardian starts to check the online instrument number once the number is equal
to (or greater than) the value of “Minimum Online Devices” (refer to the next screen
image). When some instruments go offline (as a result of their power being turned off or
because of lost communication with ProRAE Guardian) and if the online instrument
number drops below the value of “Minimum Online Devices,” ProRAE Guardian
activates the Off-line Alarm.
Once the online instrument number equals or exceeds the value set in “Minimum Online
Devices,” ProRAE Guardian no longer activates the alarm.
Notes:
1. The Off-line Alarm has a lower priority than the Main Alarm. If there is a Main
Alarm, ProRAE Guardian shows the Main Alarm.
2. If the TCP connection is not stable, do not enable this the Off-Line Alarm feature on
a cascaded ProRAE Guardian.
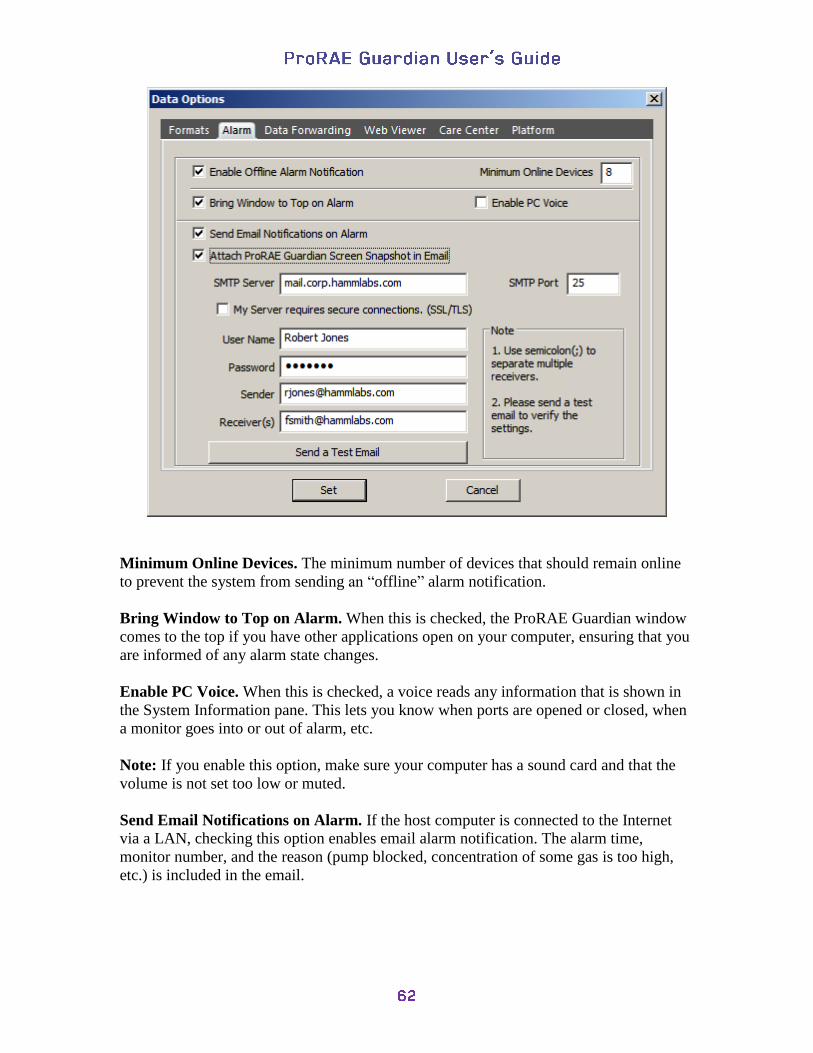
Minimum Online Devices. The minimum number of devices that should remain online
to prevent the system from sending an “offline” alarm notification.
Bring Window to Top on Alarm. When this is checked, the ProRAE Guardian window
comes to the top if you have other applications open on your computer, ensuring that you
are informed of any alarm state changes.
Enable PC Voice. When this is checked, a voice reads any information that is shown in
the System Information pane. This lets you know when ports are opened or closed, when
a monitor goes into or out of alarm, etc.
Note: If you enable this option, make sure your computer has a sound card and that the
volume is not set too low or muted.
Send Email Notifications on Alarm. If the host computer is connected to the Internet
via a LAN, checking this option enables email alarm notification. The alarm time,
monitor number, and the reason (pump blocked, concentration of some gas is too high,
etc.) is included in the email.

Attach ProRAE Guardian Screen Snapshot in Email. Enable this by checking the box.
This captures ProRAE Guardian’s image and sends it as an attachment with the email to
whoever is notified.
SMTP Server. Adding proper settings under “SMTP Server” may require that you get
this information from your I.T. department (they may also have to supply a “User Name”
and “Password” for you). Once all settings are done, use the “Send a Test Email” button
to send a test email.
SMTP Port. This controls the port for which outgoing mail connections will be
accepted.
My server requires secure connections. (SSL/TLS). You may need to set this security
option, depending on security options required by your systems administrator.
User Name. This edit box shows the username used for authentication on the SMTP server
(Extended SMTP). If the SMTP server does not require authentication, leave it blank.
Password. This edit box shows the password companion with the User Name used for
authentication on the SMTP server (Extended SMTP). If the SMTP server does not
require authentication, leave it blank.
Note: There are various authentication methods (LOGIN, CRAM-MD5, PLAIN, etc.) for
Extended SMTP. ProRAE Guardian only supports the most common “Login” method that
uses BASE64 coding. Contact your IT support for more information about your SMTP
server.
Sender. This edit box shows the originator (source of alarm) of the alarm email.
Receiver(s). In this edit box, input the destination email address of the manager who is in
charge of alarm notification circulation. If you want to send emails to multiple addresses,
separate them with a semicolon (“;”), but do not place spaces between them or in the addresses.
Send a Test Email. Clicking this button sends a test email to the destination email
address. This is to be used for testing the Internet Email configuration.
Note: It is recommended that you test the email function to make sure it works when
configuring the email parameters.

9.1.5.4 Data Forwarding After Data Forwarding is properly set and started, the remote ProRAE Guardian Full
version and/or ProRAE Guardian Viewer can connect to this ProRAE Guardian to
retrieve real-time instrument data from the ProRAE Guardian. Data forwarding must also
be properly enabled to allow Add-ons to communicate with ProRAE Guardian.
There are two modes for forwarding real-time data:
“Remote Viewer” mode
“Cascade Out” mode
In “Remote Viewer” mode, ProRAE Guardian acts as server for a remote ProRAE
Guardian to connect to. This is a common configuration.
In “Cascade Out” mode, ProRAE Guardian connects to the remote ProRAE Guardian
Full version. Use this mode in cases in which the remote ProRAE Guardian cannot
connect to the local ProRAE Guardian (for instance, if the local PC is using a dynamic IP
address).
Notes:
1. ProRAE Guardian Viewer does not support the Data Forwarding function.
2. When the local ProRAE Guardian Full version is set to “Cascade Out” mode, the
remote ProRAE Guardian must be a Full version.

To configure the settings, you must stop the Data Forwarding function by unchecking the
“Enable Data Forwarding.”
9.1.5.5 Remote Viewer mode
To configure the settings for “Remote Viewer” mode, you must check the box labeled
“Enable Remote Viewers.”
Listen Port: The TCP port on which ProRAE Guardian listens for other ProRAE
Guardian that are connected. The default is 9726. Use the default setting on both the local
ProRAE Guardian and the remote ProRAE Guardian.
Enable Backup Port: Sometimes, ports may be blocked due to the network
configuration. If this occurs, checking the box beside “Enable Backup Port” may resolve
the problem. Note: This is typically not necessary.
Max Viewers: ProRAE Guardian can accept connections from many computers, but the
more computers that are connected, the more network bandwidth that is required. The
default for the setting is 32.

9.1.5.6 Cascade Out mode To configure the settings for “Cascade Out” mode, you must check the box labeled
“Cascade Out Mode.”
Remote PC IP Address: The remote ProRAE Guardian Full version IP address (such as
215.125.12.1) or domain name (such as remoteprg.company.com).
Remote PC port: The TCP port on which the remote ProRAE Guardian Full version
listens. The default is 9727. Use the default setting on both the local ProRAE Guardian
and the remote ProRAE Guardian.
Enable User Authentication: Check the box if the remote PC is configured to require
authentication for connection. Make sure that the username and password that you enter
are correct for a user account that exists on the remote PC.
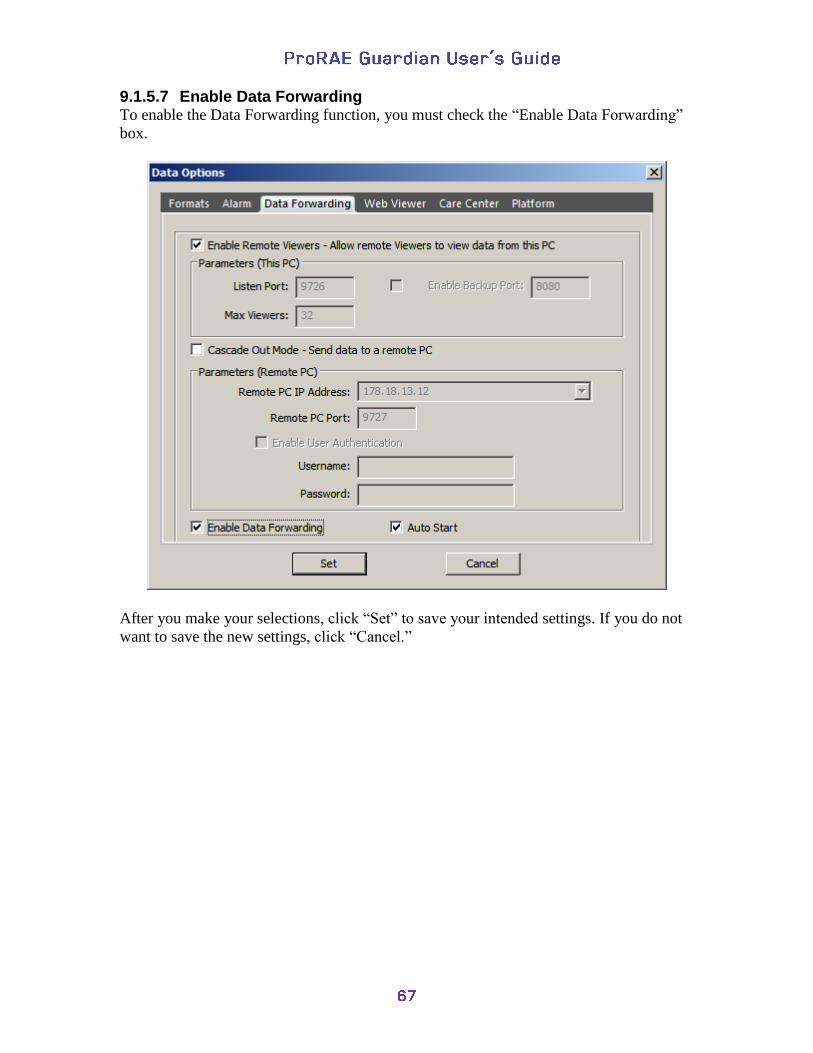
9.1.5.7 Enable Data Forwarding To enable the Data Forwarding function, you must check the “Enable Data Forwarding”
box.
After you make your selections, click “Set” to save your intended settings. If you do not
want to save the new settings, click “Cancel.”
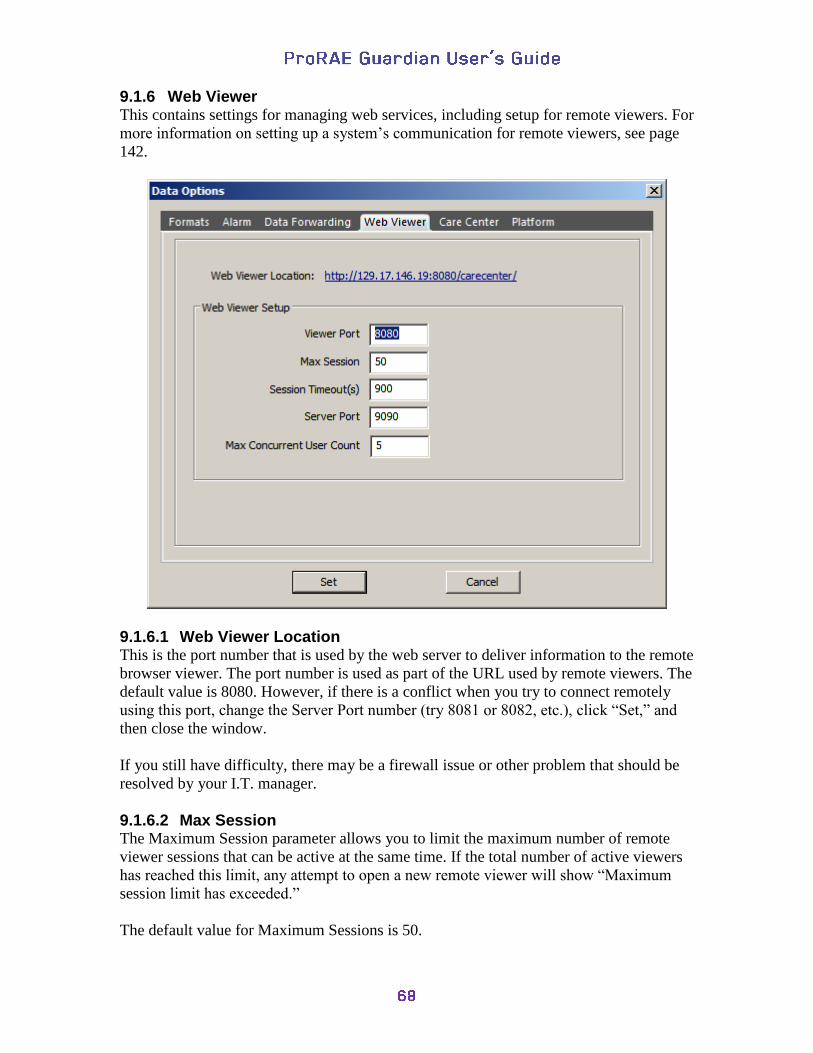
9.1.6 Web Viewer This contains settings for managing web services, including setup for remote viewers. For
more information on setting up a system’s communication for remote viewers, see page
142.
9.1.6.1 Web Viewer Location This is the port number that is used by the web server to deliver information to the remote
browser viewer. The port number is used as part of the URL used by remote viewers. The
default value is 8080. However, if there is a conflict when you try to connect remotely
using this port, change the Server Port number (try 8081 or 8082, etc.), click “Set,” and
then close the window.
If you still have difficulty, there may be a firewall issue or other problem that should be
resolved by your I.T. manager.
9.1.6.2 Max Session The Maximum Session parameter allows you to limit the maximum number of remote
viewer sessions that can be active at the same time. If the total number of active viewers
has reached this limit, any attempt to open a new remote viewer will show “Maximum
session limit has exceeded.”
The default value for Maximum Sessions is 50.

9.1.6.3 Set The Session Timeout This setting parameter allows you specify the time-out period in seconds to automatically
terminate a user session, which remains inactive for this period. Viewing time is set in
seconds. The default value is 900 seconds (15 minutes).
9.1.6.4 Server Port This port number is used internally to communicate between the ProRAE Guardian Host
and web server. The default value is 9090.
Note: Do not change this parameter unless you are certain that the port number is being
used by another program on this host computer.
9.1.6.5 Max Concurrent User Count This sets the maximum number of concurrent users.
9.1.7 Care Center This contains settings for managing ProRAE Guardian services and the AutoRAE2
docking station list for the Care Center service to communicate.
There are three services (Care Center, Management and Database service) in ProRAE
Guardian that communicates with other modules in ProRAE Guardian via TCP sockets.
Each service listens on one TCP port, so that port cannot be used by others on that
machine.
9.1.7.1 Care Center Device Port This changes the TCP port for CareCenter Service only when it is used by other
applications on the machine. The default is 9094.
9.1.7.2 Management Service Port Use this to change the TCP port for Management Service only when it is used by other
applications on the machine. The default is 9093.
9.1.7.3 Database Service Port The Database Service Port changes the TCP port for Database Service only when it is
used by other application on the machine. The default is 9092.
9.1.7.4 Docking Stations ProRAE Guardian Care center module uses UDP broadcasting to detect an online
AutoRAE2 docking station, and ProRAE Guardian supports manually adding the
AutoRAE2 docking stations that are outside the UDP broadcasting domain.
9.1.7.5 IP Address The IP address for the AutoRAE2 docking station.

9.1.7.6 Port This is the TCP port on which the AutoRAE2 docking station listens. The default is 9800.
9.1.7.7 Delete Remove the selected AutoRAE2 docking station from the list.
9.1.7.8 Add Add the AutoRAE2 docking station to the communication list with the IP address and
port.
9.1.7.9 Set Apply all the changes on all the tabs of “Data Options”
9.1.7.10 Cancel Discard all the changes on all the tabs of “Data Options”
Note: Care Center may not be accessible if an active product key license for ProRAE
Guardian host does not have the “Care Center supported” attribute enabled.

Note: If you want to verify your license, click License in the ProRAE Guardian
application (not the web version). You will see whether it is supported:
If a 20-character Product Key does not have the Care Center attribute enabled, then send
a request to RAE Systems ([email protected]). After getting
confirmation from the sales team, you can refresh the license key. The Care Center
attribute will then become active.
9.1.8 Platform This contains settings for managing the platform’s local and remote access, as well as
settings for identifying the computer running ProRAE Guardian.
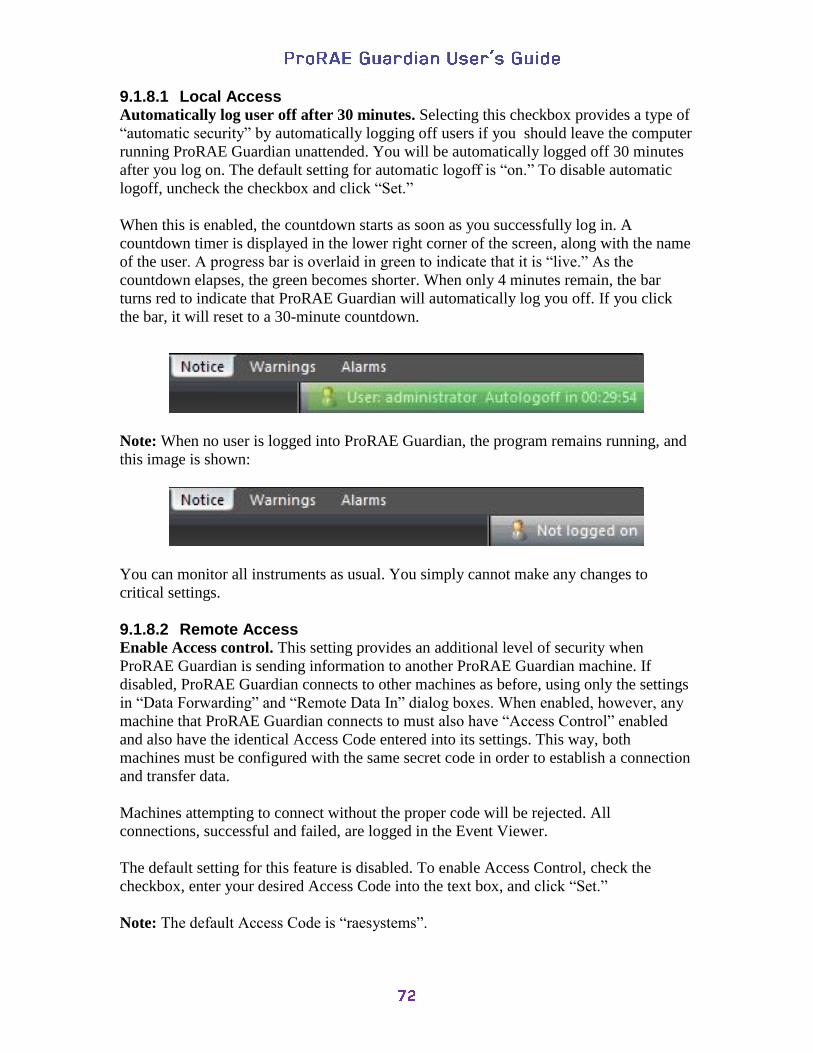
9.1.8.1 Local Access Automatically log user off after 30 minutes. Selecting this checkbox provides a type of
“automatic security” by automatically logging off users if you should leave the computer
running ProRAE Guardian unattended. You will be automatically logged off 30 minutes
after you log on. The default setting for automatic logoff is “on.” To disable automatic
logoff, uncheck the checkbox and click “Set.”
When this is enabled, the countdown starts as soon as you successfully log in. A
countdown timer is displayed in the lower right corner of the screen, along with the name
of the user. A progress bar is overlaid in green to indicate that it is “live.” As the
countdown elapses, the green becomes shorter. When only 4 minutes remain, the bar
turns red to indicate that ProRAE Guardian will automatically log you off. If you click
the bar, it will reset to a 30-minute countdown.
Note: When no user is logged into ProRAE Guardian, the program remains running, and
this image is shown:
You can monitor all instruments as usual. You simply cannot make any changes to
critical settings.
9.1.8.2 Remote Access Enable Access control. This setting provides an additional level of security when
ProRAE Guardian is sending information to another ProRAE Guardian machine. If
disabled, ProRAE Guardian connects to other machines as before, using only the settings
in “Data Forwarding” and “Remote Data In” dialog boxes. When enabled, however, any
machine that ProRAE Guardian connects to must also have “Access Control” enabled
and also have the identical Access Code entered into its settings. This way, both
machines must be configured with the same secret code in order to establish a connection
and transfer data.
Machines attempting to connect without the proper code will be rejected. All
connections, successful and failed, are logged in the Event Viewer.
The default setting for this feature is disabled. To enable Access Control, check the
checkbox, enter your desired Access Code into the text box, and click “Set.”
Note: The default Access Code is “raesystems”.

Access Code. This sets the code that any machines receiving data from this machine
must have. If the operator of the remote machine does not use the exact code, then
communication is not established.
Show Access Code. Once you have clicked “Show Access Code,” the dots in the Access
Code field change to letters or numbers, and the button says, “Hide Access Code.”
9.1.8.3 Platform Information Two columns of information are transmitted along with other data to remote machines.
Each can have its own label, which you type into the fields “User Label 1” and “User
Label 2.” A third field is called “Installation Name,” which by default takes the name of
your computer, but can be any name you choose.
Platform information refers to information from your ProRAE Guardian installation that
is transmitted along with instrument readings to all remote machines that ProRAE
Guardian connects to. This helps identify the connecting machine, as well as help the
remote user understand the context of the information they are receiving.
UserLabel1 and UserLabel2 are column headings for two user-defined columns in the
ProRAEGuardian Device list. The default column headings are “UserLabel1” and
“UserLabel2,” although you may change these headings to whatever you wish by typing
in the text boxes and clicking “Set.” As soon as you do, the corresponding column
headings in the Device List change.
If a remote machine connected to this machine is running ProRAE Guardian Viewer, its
corresponding column headings also change. This way, you can name each of these
columns with easily identifiable names that are meaningful to you, such as “Location”
and “User.”
Installation Name is used to identify the computer when it is connecting to a remote
system. This name is stored in the Event Log of the remote system for later reference. By
default, the Installation Name is set to the Windows Machine Name of the computer that
ProRAE Guardian is installed on. You can change this to any convenient name by typing
in the text box and clicking “Set.” This way, you can name each of your ProRAE
Guardian machines with easily identifiable names that are meaningful to you, such as
“PRG Installation 1.”

9.1.8.4 Add-Ons
The Add-on module(s) are to extend the ProRAE Guardian functions. Each add-on
module is a stand-alone process for customized functions that are not provided by
ProRAE Guardian as a “standard” function.
Click the Add-Ons button to show the Add-Ons Dialog/Control box to load or unload the
module, or to start or stop the module.
Click the “Started” button to stop the module and configure the setting of the module
under the“DataSwap” tab.
Uncheck the “DataSwap” box to unload the module. ProRAE Guardian V1.6 will not
load the module when restarted.
The “DataSwap” module is shipped with ProRAE Guardian. The DataSwap module is for
backward compatibility with ProRAE Remote and saves real-time instrument data to a
text file named “data.swp”. This file is used for sharing data with other software such as
PlumeRAE.

Check the box if you want to load the module automatically when ProRAE Guardian
starts.
In the module configuration window, select the folder for the output file named data.swp,
and change the “Data Forwarding Port.” The default value of 9726 is also the default
Data Forwarding port in ProRAE Guardian.
Important! Beginning with ProRAE Guardian V1.6, you can run the program without local
administrator privileges. On some windows operating systems (such as Windows 8 or
Windows 7), the OS prevents you from writing to the file in some protected folders such
as “C:\Windows” and “C:\Program Files.” During installation, do not change the
datalogging folder to a folder that requires administrator privileges, if you do not want to
run the ProRAE Guardian with administrator privileges. Choosing the default folder
provided by the installer is recommended. The default folder is typically “C:\RAE
Systems Inc\ProRAE Guardian Datalog\”.
Make sure you enable the “Data forwarding” function on the ProRAE Guardian. (Refer to
the section labeled “Data Forwarding,” page 63, on how to configure Data Forwarding on
ProRAE Guardian.)
Click “Start” to start the module processing. Check “Auto Start” to start the module
process automatically after the module is loaded.

9.1.8.5 Device Templates Devices in the network that need different alarm points for different applications, times of
day, etc., can be grouped into Templates that are stored and later used with ProRAE
Guardian.
Note: Access requires administrator privileges and a password.
Creating a Template
1. Create a Template by clicking “Save As…”
2. Name the template (do not use any of the invalid characters, which include < > / |
\ ” ’ , . ; : ~ ! @ # $ % ^ * ? = ).
3. Click “OK.”
The new template name shows up in the Templates list.
Add instruments to the Template:
1. Select one or more instruments to bind into a template by clicking on it in the
Instruments list. Select multiple instruments by using Control-Click on each one
in the list you want to bind to a template.
2. Click a Template name in the list (this directs which Template to bind to).
3. Click “Bind To Template.”

When you select a template, you can choose “Save,” “Save As…,” “Rename…” or
“Delete.” In each instance (except “Save”), a pop-up dialog will come up when you click
the button.
Note: If you delete a Template, it is permanently erased.
Note: The default template cannot be edited or deleted. However, you can edit the default
template and then save your edits to a new template using the “Save As” function.
You can edit parameters in the Template Details.
1. Click the name of a template.
2. In any of the boxes showing parameters (such as Low Limit), you can click and
highlight a number and then type a new number.
3. Save the changes to the Template by clicking “Save.”
Note: You cannot edit the Default Template or any of its settings.
Removing an instrument from a Template
You can unbind an instrument from a template very simply.
1. Click on the name of the Template so that it is highlighted.
2. Click on the instrument’s name. (Select multiple instruments by using Control-
Click.) The entire row containing the instrument and the Current Template name
is highlighted.
3. Click “Remove Binding.”

9.1.9 Status The System Status dialog box acts as a control panel to show details of your system. This
information is useful when setting up and diagnosing problems with ProRAE Guardian
systems.
The upper portion includes columns for each of the following:
Module
Port
Active
Number
List
9.1.9.1 Module Each module of the system is listed in this column. The data in the other columns is
referenced to this column.
9.1.9.2 Port This lists the data port assigned to each module.
9.1.9.3 Active This tells whether the port is active.

9.1.9.4 Number Number of connections connected to ProRAE Guardian. The connection is a logical or
physical connection from the modem to ProRAE Guardian. For example, a serial port
cable from a RAELink3 modem to ProRAE Guardian is one connection; a TCP link from
an FMC2000 controller to ProRAE Guardian is one connection.
9.1.9.5 List The IP addresses and ports for connected clients are shown here.
9.1.10 Display This group of parameters governs the number of displayed records, date and time format,
and measurement units.
When you are done making changes, click “Set” to implement them and to close the
dialog box. If you wish to exit without implementing the changes, click “Cancel.” No
changes are made, and the dialog box closes.
9.1.10.1 Reset Panes When you click “Reset Panes,” the panes are reconfigured to their default sizes and
locations.
9.1.10.2 View/Hide Panes When you click “View/Hide Panes,” you can show or hide the Device Information and/or
System Information panes.

9.1.10.3 View/Hide Panes When “Network Topology” is checked, the Network Topology pane is shown along the
left side of ProRAE Guardian:
The antenna icon shows the wireless router, with each device connected to it in a list
below it. The wireless router’s IP address and port number are shown, and each
connected device’s serial number is also indicated. If there is more than one wireless
router and instruments are wirelessly connected to it, then the other wireless routers and
their instruments are similarly displayed.
Online and offline status of instruments is shown by a colored dot (green for connected,
gray for offline, red for in-alarm status).
If you click on any of the instruments in the list, information in the Device Information
pane changes to reflect information specific to it. At the same time, the device is
highlighted in the Device List pane. (If you click another device in the Device List, the
same device is highlighted in the Network Topology pane.)
Each wireless network can be minimized or maximized by clicking the “-” or “+” to the
left of its antenna icon.
There are other options for the Network Topology pane. Right-click in the pane, and a
menu is shown with options for Floating, Docking, Auto Hide, and Hide:
Status is shown with a check box. When the Network Topology pane is included in the
main window (the default appearance), Docking is checked. If you click “Floating,” the
pane detaches and can be moved anywhere on your screen.
Included in the Network Topology heading is a small symbol that indicates “Auto Hide”:

It works the same way as choosing Auto Hide in the menu. When you click it, the
Network Topology pane is hidden, and a tab along the left side of the main window is
shown, labeled “Network Topology.” To make the Network Topology pane visible, click
the tab.
You can hide the Network Topology pane by clicking the small “X” in the upper right
corner of the heading, or by selecting “Hide” in the menu.
You can hide the Device Information or System Information panes by clicking the small
“X” in the upper right corner of the heading, or by selecting “Hide” in the menu that is
shown when you right-click either pane’s heading.
When you place your mouse over the tab while the pane is hidden, the pane appears.
In addition, in these headings is a small symbol that indicates “Auto Hide”:
It works the same way as choosing Auto Hide in the menu for each pane. When you click
it, the pane is hidden, and a tab along the right side of the main window is shown instead
of the pane.

9.1.10.4 Map Pane You can turn tooltips on and off for the Map Pane.
9.1.10.5 License
License management in ProRAE Guardian provides a way to download the latest license
information for your Product Key from the ProRAE Guardian license management
service or to deactivate your licenses and release Product Key for use on another
computer. Registration/activation is covered on page 12.
Click the “License” icon:
The license information box appears. This is where you can view your Product Key and
manage it.

Note: If your license does not have an expiration date, then the Expiration Date column is
not shown.
When you click the “Options” button, the ProRAE Guardian License Wizard appears,
and it provides two options:
I want to refresh my license
I want to deactivate and release my license for use on another computer
Except when you need to renew or move a license, you will not need to use this feature.
If you do need to renew or deactivate/release a license, follow each of the steps outlined
by the ProRAE Guardian License Wizard.
For information on which instruments are included in each tier, click “What are the
instrument tiers?” A chart shows the instruments supported in each licensed tier. When
you are done viewing the chart, click “Close.”
Important! If you deactivate your license on this computer, then ProRAE Guardian will
not run again until you reactivate it or activate it with another license number.
9.1.11 Log View
Log View provides a very detailed view of all of the sensors on the network and data
from each one.
When you click the Log View button, a window with two panes appears:
Left Pane: Navigation of the monitors/nodes
Right Pane: Query, Export (actions)
Summary, Data Grid, Graph, Filtered Grid (with controls)

When you select Log View, this is the main window that opens:

9.1.11.1 Viewing An Instrument’s Information To view information about a specific instrument, double-click on the instrument serial
number that appears below the name of the type of device:
After a few seconds, the right pane is filled with datalog information from that
instrument, which is shown in summary form under the Summary tab:
Note: If there is more than one of any device included in the left pane’s list, they are
organized by device type (MeshGuard, AreaRAE, etc.), with each individual device of
that type below it. In this example, there are many MeshGuards, so they are organized
under the “MeshGuard” heading.”
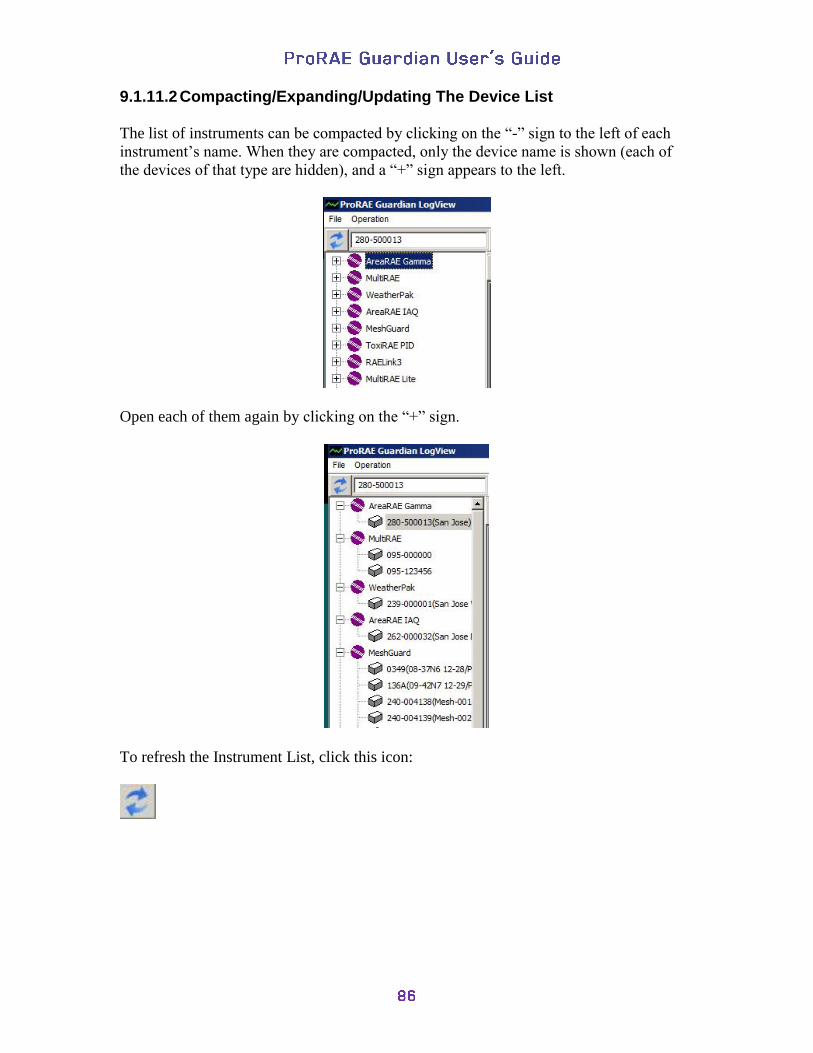
9.1.11.2 Compacting/Expanding/Updating The Device List
The list of instruments can be compacted by clicking on the “-” sign to the left of each
instrument’s name. When they are compacted, only the device name is shown (each of
the devices of that type are hidden), and a “+” sign appears to the left.
Open each of them again by clicking on the “+” sign.
To refresh the Instrument List, click this icon:

9.1.11.3 Using The Query Button
Click this button instead of double-clicking the instrument in the stack on the left side.
Either way grabs the data.
9.1.11.4 Export Multiple Instruments’ Datalog
Clicking the “Export Multiple Instruments’ Datalog” button saves saves the data from all
the instruments in the list as CSV (comma-separated value) text files. The data in the files
can then can be viewed in a spreadsheet or edited by using software such as Microsoft
Excel, etc.
By default, all logs are selected, but you can use the buttons to deselect all and/or
individually select log files. You can also set the destination where you would like all the
log files to be saved.
Once you have made the selections, click “Export.”

The progress bars show that the files are being saved. When all the files have been saved,
you see a dialog box that says, “Export datalog completed.” You may now exit from the
Export windows.
9.1.11.5 Export Current Selected Instrument’s Datalog
Clicking the “Export Current Display” button saves the currently displayed data as a CSV
(comma-separated value) text file. The data in the file can then can be viewed in a
spreadsheet or edited by using software such as Microsoft Excel, etc.

After you click the button, input the file name and then click the “Save” button to export
the data file.
Note that one “page” of the datalog is not equal to one screen on your display. Datalog
page size is set in the “Data Options/Datalog” dialog box. The default is 2,000
records/page.

9.1.11.6 Summary
The Summary tab provides a summarized view of a specific device’s data. These
summaries are organized by pages. You can navigate them by using the navigation
buttons along the bottom of the page:
9.1.11.7 Data Grid
Data Grid shows all data in a datalog as a multi-page table, showing individual sensor
readings at each interval. Use the same navigation described on the Summary tab to go
from page to page.
9.1.11.8 Graph
The Graph tab provides an interactive graph display of data and uses colors to show
individual sensor readings, with concentrations (or other values) plotted against time. Use
the same navigation described on the Summary tab to go from page to page.
Go back to first page
Go back one page
Go to last page
Go forward one page Page currently viewed or type a page number and click “Go”
Total number of pages
Go to the page you type into the field

9.1.11.9 Filtered Grid
Filtered Grid allows you to create and use “and/or” relationships and level-detection
filters to customize which data appears in the grid. It also allows you to select only
entries in which an alarm was triggered.
Here is an example of how you can use this tool to tailor what you see in your data grid.
1. Click on one of the sensors in your list.
2. Choose “AND relationship between sensors” or “OR relationship between
sensors.”
3. Now select “Below,” “Above” by clicking in the checkbox. If you select “Below”
or “Above,” you must supply a value by typing it into the box to the right of the
appropriate checkbox. Note that the units are the same as those shown in
parentheses after the name of the sensor. A choice of “Alarm Only” tells the filter
that you only want data that occurs during an alarm.
Important! When using both “Above” and “Below” values, check your values carefully.
If you are looking for values between two specific points, make sure the “AND” button is
selected and that the “Below” value and “Above” value reflects a range. For instance, if
you want to look for all entries with an H2S sensor reading between 0.3 and 0.6, select
“AND” and set the value for “Above” to 0.3 and “Below” to 0.6.
If you are looking for values outside a range, such as anything below 0.3 and higher than
0.6, select “AND” and set “Above” to 0.6 and “Below” to 0.3. This excludes any values
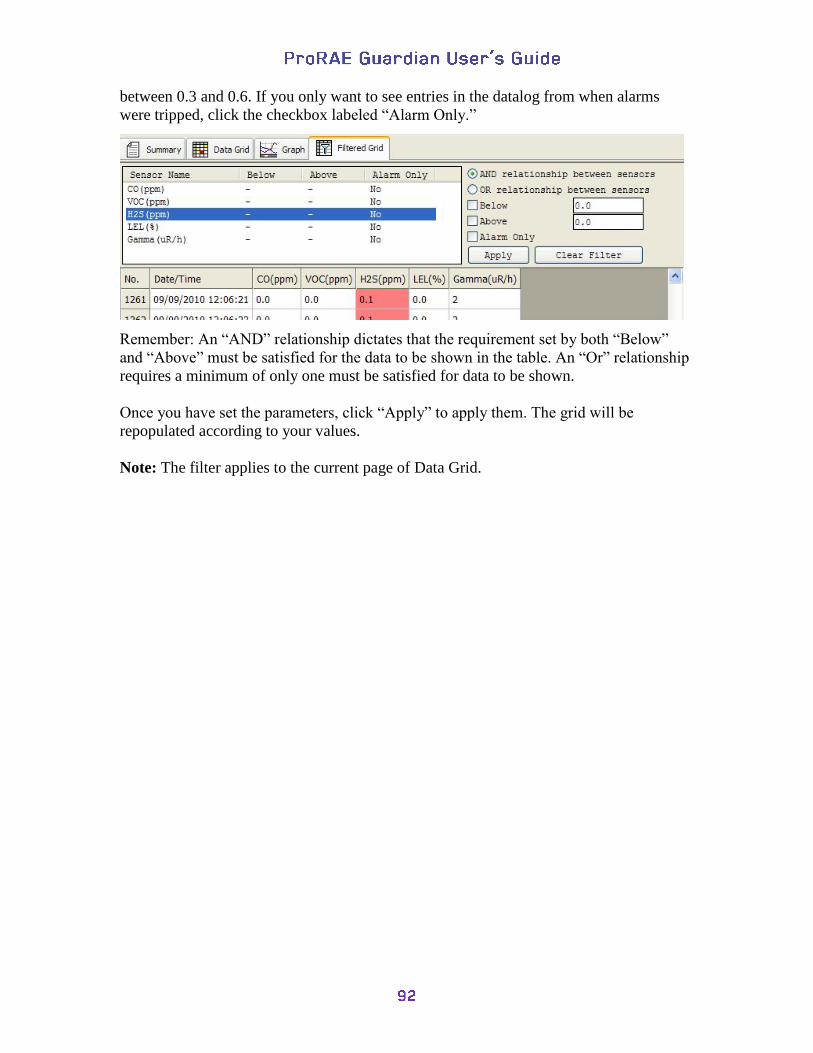
between 0.3 and 0.6. If you only want to see entries in the datalog from when alarms
were tripped, click the checkbox labeled “Alarm Only.”
Remember: An “AND” relationship dictates that the requirement set by both “Below”
and “Above” must be satisfied for the data to be shown in the table. An “Or” relationship
requires a minimum of only one must be satisfied for data to be shown.
Once you have set the parameters, click “Apply” to apply them. The grid will be
repopulated according to your values.
Note: The filter applies to the current page of Data Grid.

9.1.12 Proxy Server
Many organizations use web proxy servers to route their Internet traffic through them for
security reasons, and also for controlling Internet access. So, if your organization uses a
web proxy server, then ProRAE Guardian needs to know the server information.
Otherwise, ProRAE Guardian will not be able to access Google Maps via the Internet.
There are a few quick ways to check whether your ProRAE Guardian requires web proxy
server settings:
1. ProRAE Guardian cannot access Google maps, even when the PC is connected to
the Internet.
2. In your Internet Explorer, go to Tools > Internet Options > Connections > LAN
Settings, and look for Proxy server settings. These are shared settings that
ProRAE Guardian automatically uses if they are set here.
If you typically have a problem viewing external sources, such as Google Maps,
then consult with your I.T. department so that they can configure your Proxy
Server settings. Otherwise, you likely do not need to use Proxy Server settings.
Proxy Server Settings & Enabling Proxy Server To use a proxy server, you must provide settings and enable it.
1. Click the Proxy Server icon.
2. Click Enable Proxy Server
3. Add the IP Address and Port of the proxy server (check with your systems
administrator for these settings).

4. Check the box labeled “Enable Authentication” (this is optional, so check with
your systems administrator to determine whether it is necessary).
5. Click “OK.”
9.2 Google Map The tab labeled “Google Map” has buttons for settings that control appearance of the
Google Map and devices overlaid on it. The Maps are served on line from Google, thus to
get the map, the computer on which ProRAE Guardian is running must be connected to
the Internet.
9.2.1 Auto Pan If devices on your network are located in different places, activating Auto Pan by
clicking the Auto Pan button can save time when you want to view it on the map. When
Auto Pan is activated, it tells ProRAE Guardian to move the map and center any device
selected in the Device List.
Auto Pan
off Auto Pan
on
9.2.2 Reload Clicking this button reloads the map and refreshes the image locations of everything on
the network that is represented on the map.
9.2.3 Large Icon There are two types of representation for each physical device in the network: Large Icon
and Small Icon. The large icon is a graphic representation of the instrument, such as an
AreaRAE, which accompanies a small icon (a dot) that indicates its status.

On the map, the large icons look like this:
Note: The red flag with the black dot inside indicates the monitor selected in the Device
List (when you mouse over the red flag, a tool tip appears, saying, “Current Selected
Device”).

9.2.4 Small Icon
A Small Icon uses just a dot instead of a graphic representation.
Important! The Small Icon acts as a status indicator and is therefore color-coded. It can
be one of three colors:
Green Monitoring and communicating normally
Gray The device is offline (not communicating)
Red The device is in an alarm state
On the map, small icons look like this:
Note: Whether you have selected “Large Icons” or “Small Icons,” you can see the name
of the monitor by mousing over it:
9.3 RAE Center This takes you to the RAE Center website, which contains information about RAE
Systems software and gas-detection equipment.

10 Panes
The ProRAE Guardian window is divided into panes, which can be rearranged, resized,
minimized, or hidden from view. These, in addition to the Device List, provide the
primary user interface for ProRAE Guardian.
10.1 Map Pane
The Map Pane provides a visual reference that can be either a Google Map or a Site Map.
In addition, ESRI MXD and Tiger maps can optionally be used.
Note: As you mouse over, the latitude and longitude coordinates track the map location
as selected by the cursor.
10.1.1 Google Map Google Map is the default Map View of ProRAE Guardian. Refer to section “9.2 Google
Map” (page 94) for operation buttons on Google Map.
10.1.1.1 Latitude And Longitude When you move the mouse from one location to another, the latitude and longitude
change is reflected:
Map
Pane
Device
List
Device Information
Pane
System Information
Pane
Group
Area

10.1.1.2 Set instrument GPS location manually After clicking the instrument in the Device List, you can locate the instrument on the map
by manually setting its GPS coordinates. It is a useful feature for instruments without
GPS modules.
Note: You can only set GPS coordinates and place instruments on a map if the
instruments are locally connected.
Move the mouse on the map to the location of the instrument. Right-click on the map,
and a message box pops up. Click “Yes” to set the instrument on the map.
If you manually set the GPS coordinates (by right-clicking on the Google map or ESRI
map) for the instrument, the button “Reset GPS Setting” is enabled. Clicking the button
clears the manual GPS setting, and the instrument is then shown on the map with the GPS
coordinates from the instrument (if it is equipped with a GPS sensor). Otherwise (if it
does not have a GPS sensor), it will not show on the map.

10.1.2 Site Maps To access Site Maps, click the “Site Maps” tab:
Site Maps enables the use of a map or layout of a facility or specific region within
ProRAE Guardian. This gives you the flexibility to show locations of devices inside a
facility, or on an annotated map delineating specific hazard zones, etc.
When you click on the Site Maps tab, the Site Maps toolbar replaces the Google Maps
toolbar along the top of the screen:
The Image View toolbar acts as a control panel for configuring and monitoring
everything in the Map pane when in Site Maps.
10.1.2.1 Site Mode
There are two different modes under Site Mode: Tab Mode and Splitter Mode.

10.1.2.2 Tab Mode
Selecting Tab Mode sets the view of one site map at a time, but arranges the visible and
hidden site maps so that you can click a tab to view one and hide the others:

Click another tab, and that Site Map is shown while others are hidden:
10.1.2.3 Splitter Mode
Splitter Mode is another way to view Site Maps. Instead of tabs that allow quick
show/hide functionality, Splitter Mode allows you to show 2, 4, 6, 9, or 16 Site Maps
simultaneously in panes that are subdivisions of the main pane.
Site Maps are shown in rows and columns (this example shows 1x2 arrangement, one
row with two maps):

10.1.2.4 Add A Site
You can always add new sites for monitoring via ProRAE Guardian. Click “Add a Site,”
and a template for creating a new site is shown:
1. Name the site.
2. Set the image size. If you do not know the dimensions or if you are not going to
insert an image, leave the settings unchanged.
3. Select a background color. This is optional. You might not have a map or diagram
for a site, but want to show instruments in a pattern (such as a circle of
instruments surrounding a spill) or by relative proximity.
4. Select a background image. “Image” refers to a graphic instead of a Google map.
This means that you can import a JPEG, BMP, or PNG image such as a
photograph, a blueprint, or a scanned image of a map that suits your needs. When
you click on BG Image, the dialog box appears. You must select an image type
(PNG Files, JPEG files, etc.) and then find the image you want to use.

5. Set GPS or distance locations for your map. You can perform GPS calibration or
you can perform distance calibration.
Setting GPS locations:
A. Click “Start GPS Calibration” and then click on a position on your
map for which you know the GPS location (latitude and longitude).
The Input GPS Information dialog box appears with fields for
latitude and longitude. Fill in the data and then click “OK.”
B. Click another location on the map, again at a known location. The
Input GPS Information dialog box appears with fields for latitude
and longitude. Fill in the data and then click “OK.”
Note: If you want to remove or change the distance settings, click “Reset
Calibration.” This clears the locations.

Using Distance Calibration:
A. Click “Start Distance Calibration” and then click on a position on
your map. Drag the mouse to another location and click. Fill in the
distance (in meters). Click “OK.” The map now shows the two
points and the distance between them.
Note: If you want to remove or change the distance settings, click “Reset
Calibration.” This clears the locations.
6. Save your site by clicking “OK.”
Your site is now ready for you to add instruments and to locate them on the image.
Important! Any coordinates you provide act as reference points for instruments placed on the grid,
and their locations will only be as correct as the coordinates you use.

10.1.2.5 Location Estimation Setup Enabling location estimation requires adding devices and setting their location through
ProRAE Guardian.
1. Select “Site Map Setup.”
2. Add a site.
3. Edit “Site Properties.”
4. Set Image for the site.
5. Start Distance Calibration for the site.

6. Click on the site image for two points, and connect them using a line. Note: It
must be an oblique line. It is recommended that you use a diagonal line and then
input the width and length. This will provide the necessary information for the
distance calibration.
10.1.2.6 MBeacon Setup
If you are using MBeacons in your system, you must set their locations before using
them.
1. Click “Show” and select “MBeacon” to show MBeacons on the Site Map.
2. Click “Edit MBeacon Mode” to enter the MBeacon setup mode.
3. Place each MBeacon to the position on the site map corresponding to the real
position. For the real MBeacon position, many factors need to be considered,
including the the best positions, the placement height, and the spacing distance
between MBeacons. These factors should be referenced from Plant Safety II
system.

10.1.2.7 Remove Site
When you click on this button, a dialog box pops up. It asks if you would like to delete
the current location:
If you click “Yes,” then the location and its contents (background image and device
locations) are deleted.
If you click “No,” then the location and its content remain and the dialog box closes.
Important! If you remove the current location, the action cannot be undone.
10.1.2.8 Edit Site
When you click on this button, a dialog box pops up with fields already populated with
the information you input when you created the site. You can change the image or
background color, as well as GPS locations. When you are done editing, click “OK” to
save the changes.

10.1.2.9 Add Device
Once you have created a new site and have imported a graphic for a background (or have
selected a background color), you can place the devices on the image.
1. Click the “Add Device” button.
2. Move your mouse and locate the circle with the crosshairs in the middle exactly
where you want a device located on the image.
3. Click the mouse once to set the location.
When the dialog box comes up, you can choose the device you want by its serial number.
Then click “OK” to save your choice(s).

10.1.2.10 Creating Zones A Site Map can have instruments shown anywhere on it, but it is sometimes useful to
assign zones that delineate a relationship among different devices. For example, one zone
might be an area that processes volatile compounds, whereas another might be where
materials are stored, and each may have its own network or protocols. Zones can be
created on a Site Map before or after instruments are located on the map.
To create a zone, right-click in the image and select Add > Zone.
Name the zone, and then select a rectangle or ellipse for delineating the zone.

Select a color from the main palette or select a custom color.
Set the Opacity using the slide control. Sliding it to the left makes the zone more
transparent, while sliding to the right makes it more opaque:
Low opacity High opacity

You can add a Zone Panel to each zone, which tells you the total number of devices in
that zone, how many are online, and how many are in alarm. Right-click on the zone and
select “Show Zone Panel.”
A Zone Panel shows status and the name of the zone, providing easy at-a-glance
indication of where zones are located, which devices are in the zone, and their status.
If you want to add another zone, follow the same procedure:

If you use contrasting colors for zones, it’s easier to spot them on maps.
Add a device or gateway using the same menu box. Right-click on a zone or anywhere
else on the Site Map, and then select Add > Zone or Add > Gateway.
Once the device or gateway is shown, you can drag it anywhere on the Site Map. If you
place it inside a zone, the Zone Panel for that zone reflects that it is part of the zone and
whether it is online or offline, and whether it’s in alarm.
If you click on an instrument on the Site Map, a small flag above it indicates that it is
selected, and the corresponding row in the Device List is highlighted. Also, if you click
on a line in the Device List, the corresponding instrument in the Site Map is flagged to
show it is selected.

When a zone is clicked, points along its perimeter are highlighted in blue. If the zone has
not been locked, it can be resized by dragging these highlights. In addition, the zone can
be moved by clicking in the zone and dragging it around.
To lock a zone, right-click on the zone, and then select “Lock Zone.” The zone is now
locked and cannot be resized or moved unless you unlock it.
You can remove a zone by right-clicking on the zone and selecting “Remove Zone.” If
you select this, a confirmation alert asks if you want to do this. If you remove a zone, it
cannot be un-removed.
Finally, if you want to view information about the zone or alter its properties, right-click
on the zone and select “Zone Properties.” You can change the zone’s name, position,
color, and opacity. If you want to lock the zone so that it cannot be altered, click “Lock.”
When you are done, click “OK” to close Zone Properties.
10.1.2.11 Remove Device
If you want to remove one or more devices, click “Remove Device.” Then click the
check box(es) in the list that you want to remove. Click “OK.” You will be asked to
confirm this action. Click “Yes” to delete the device(s) and “No” to exit the action
without deleting.

Note: You can select all devices for deleting by clicking the “Select All” box instead of
each individual box.
10.1.2.12 Filtering And Arranging Data If you are monitoring many instruments/devices but want to concentrate on some specific
ones, or exclude all but a specific type, you can easily do this. You can also reverse the
order of the lists.
Reversing the list order is easy. Click the heading (Status, Fault, etc.), and it
automatically reverses the order. For example, here is the standard order:
After you click the header, the order changes. In addition, an arrow appears to the right of
the pull-down triangle to indicate sort direction:
You can also click on the triangle in a header to open a menu of options that includes
setting whether the sort order is ascending or decending. If you have already set the sort
order to ascending or descending, a check box indicates the direction.
In addition, filters can be set for excluding or including instruments and their data. Pull
down the menu and select “Set Filter…”

Check boxes in the dialog box indicates which instruments are showing. Click on the
ones you don’t want to see so that they are no longer selected. Then click “OK.”
Alternatively, deselect all of them and just select the one(s) you want to see.
In this case, only MeshGuard has been selected, so only data pertaining to MeshGuards
are shown:

If you want to show all instrument data again, simply pull down the menu and click
“Clear Filter…”
When the filter is cleared, all columns are again visible:
10.1.2.13 Using Groups To Filter Information Another way to filter your information is to produce hierarchies built from the labels (the
headings above the Device List). Drag a label into the Group Area to begin building a
hierarchy:
When you drag a label into the Group Area, red arrows above and below point to where it
can be located:
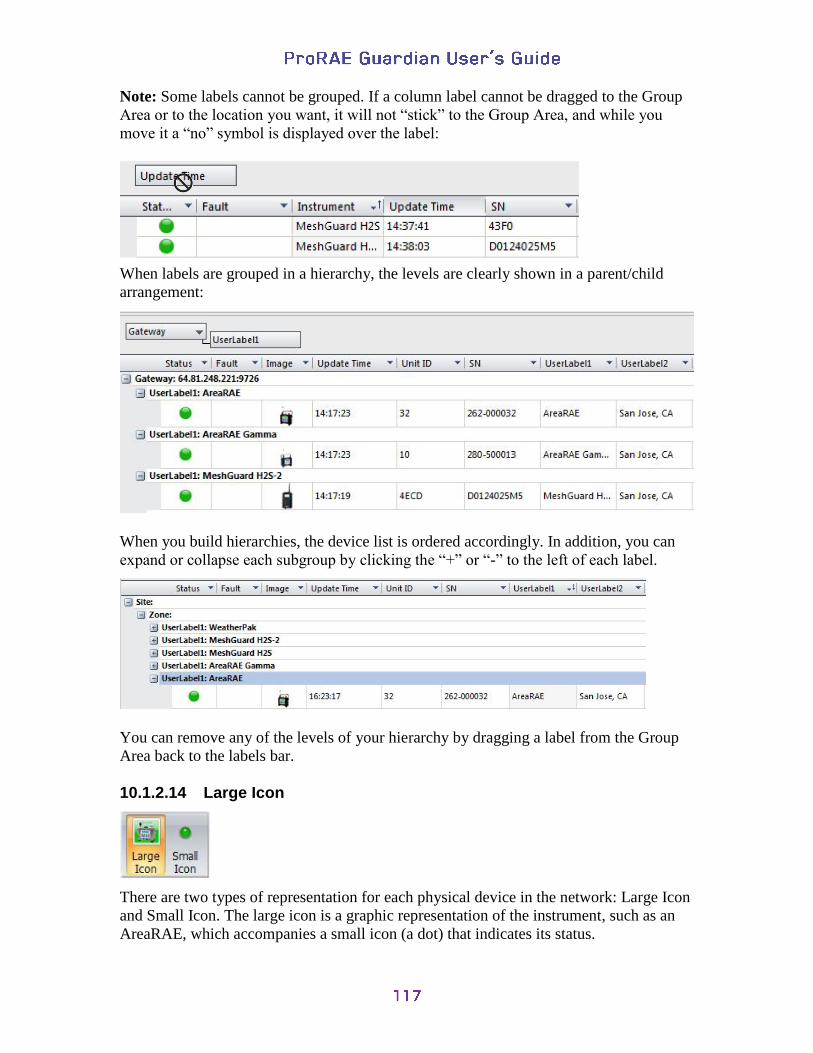
Note: Some labels cannot be grouped. If a column label cannot be dragged to the Group
Area or to the location you want, it will not “stick” to the Group Area, and while you
move it a “no” symbol is displayed over the label:
When labels are grouped in a hierarchy, the levels are clearly shown in a parent/child
arrangement:
When you build hierarchies, the device list is ordered accordingly. In addition, you can
expand or collapse each subgroup by clicking the “+” or “-” to the left of each label.
You can remove any of the levels of your hierarchy by dragging a label from the Group
Area back to the labels bar.
10.1.2.14 Large Icon
There are two types of representation for each physical device in the network: Large Icon
and Small Icon. The large icon is a graphic representation of the instrument, such as an
AreaRAE, which accompanies a small icon (a dot) that indicates its status.
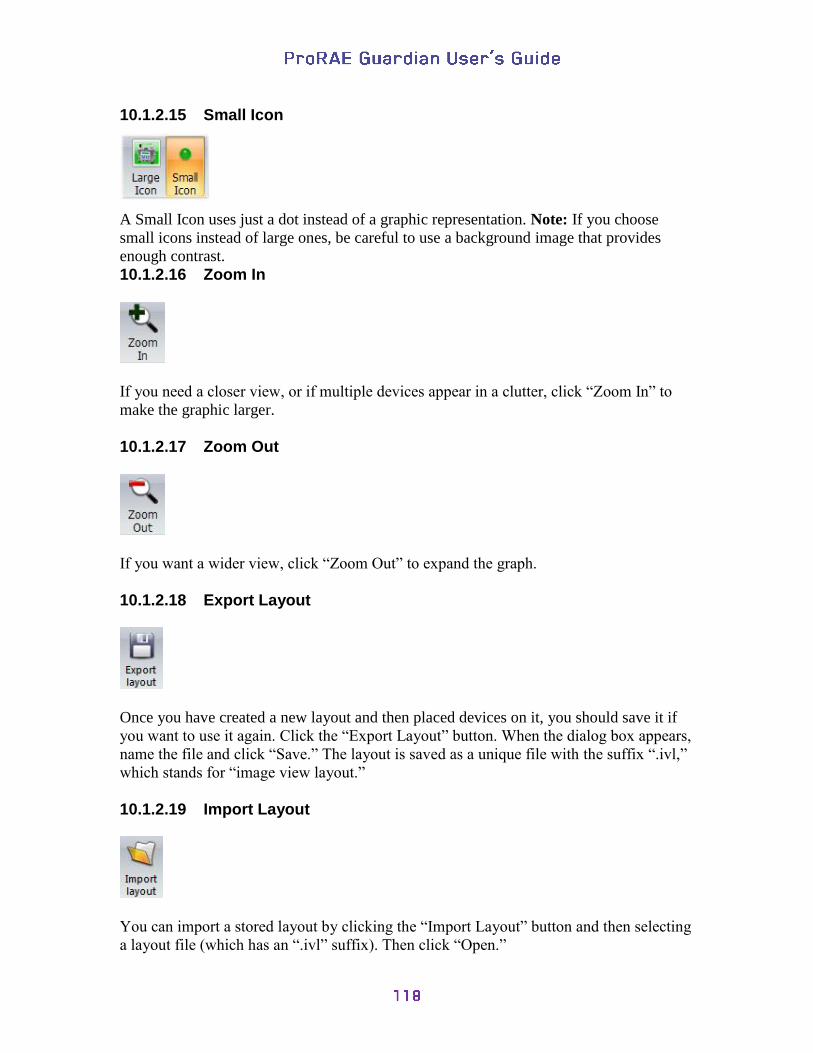
10.1.2.15 Small Icon
A Small Icon uses just a dot instead of a graphic representation. Note: If you choose
small icons instead of large ones, be careful to use a background image that provides
enough contrast.
10.1.2.16 Zoom In
If you need a closer view, or if multiple devices appear in a clutter, click “Zoom In” to
make the graphic larger.
10.1.2.17 Zoom Out
If you want a wider view, click “Zoom Out” to expand the graph.
10.1.2.18 Export Layout
Once you have created a new layout and then placed devices on it, you should save it if
you want to use it again. Click the “Export Layout” button. When the dialog box appears,
name the file and click “Save.” The layout is saved as a unique file with the suffix “.ivl,”
which stands for “image view layout.”
10.1.2.19 Import Layout
You can import a stored layout by clicking the “Import Layout” button and then selecting
a layout file (which has an “.ivl” suffix). Then click “Open.”

10.2 Device Information Pane
Device Information has tabs along the bottom for showing Data Records, Data Graph,
and Device Details. Below that set of tabs is another that is generated when you click on
the devices listed in the Device List pane. These tabs are identified by the SN (serial
number) of each device in the Device List. Any of these tabs (and its data) can be
removed from this display area by clicking the “X” on the upper right corner of the tab.
To include data (and produce a tab) again, click the device in the Device List pane.
Note: The order of all tabs (left to right) can be changed. Simply click and hold the left
mouse button to select a tab, and then drag it right or left to reposition it.
Data Records consists of time and sensor readings in a chart.
Data Graph shows the sensor readings on a graph, with colors indicating the different
sensors.
Device Details can be compacted by clicking on the “-” to the left of each major item
(Device, GPS, or Sensor) or sub-item (each sensor has information and can be
compacted, too.).
Note: The order of all tabs (left to right) can be changed. Simply click and hold the left
mouse button to select a tab, and then drag it right or left to reposition it.

10.3 System Information Pane
System Information, as its name implies, monitors activities at the system level, such as
the opening and closing of ports, establishment of connections and so forth.
There are 3 tabs in the System Information Pane
Notice
Warnings
Alarms
The “Notice” tab logs the event of normal system operations, such as open or closed ports,
etc.
The “Warnings” tab logs the event of system operation errors, such as failures to open a
port.
The “Alarms” tab logs the instrument alarm history (for example, a sensor low alarm).
Notes:
1. Each tab is limited to 500 events. If the event number in the tab exceeds the limit,
the first event is removed from the tab, and the latest event is added to the last line
of the tab. This rule applies separately to each of the three tabs.
2. Right-click in the tab to show a pop-up menu (Copy, Clear All, Log To File) to
copy the information in the tab, or clear the information, or log to a text file. This
operation applies to the selected tab, not all three tabs.

11 Managing Panes
The Device Information Pane and System Information panes on ProRAE Guardian are
detachable from the main user interface, making it possible to “park” them anywhere on
your computer desktop. In addition, ProRAE Guardian supports multiple displays, so you
can, for example, have the main window on one display and locate one or both of the
detachable panes on another display.
11.1 Resizing Panes
To resize the panes, move your mouse over the “seam” between two panes. This sizing
icon appears:
Press and hold the left button on your mouse and move the “seam” to resize the panes.
When you are done, release the button.
11.2 System Information Tabs Attributes When you right-click over “Notice,” “Warnings,” or “Alarms,” a menu of options is
shown. Whether the pane is floating or docking is indicated. You can change the pane
from Floating to Docking by clicking one or the other. In addition, you can tell the pane
to Auto Hide or to Hide (disappear). If you want a hidden pane to be shown, go to the top
of the window and click “Reset Panes.” This brings back any hidden panes.

11.3 Rearranging Panes
You can change the arrangement of the panes by using a “drag and drop.” Point to the top
of a pane and then click the left mouse button. While holding down the button, drag the
pane away from the main window or to another part of the window.
Note: You can also break out a pane by double-clicking on the top gray bar of that pane.
If it is docked, then it breaks away when you double-click. If it is undocked, it redocks
itself when you double-click the gray bar.
As you move the pane, small “navigators” appear. Drag the pane to the blue block at the
outer edge of any of these navigators to dock the pane on that portion of the main window.
Otherwise, just drag it off the main window to your desktop. Then release the button.
Grab the top of the pane and pull it away
from its “dock.”
As you move the pane, “navigators”
appear.
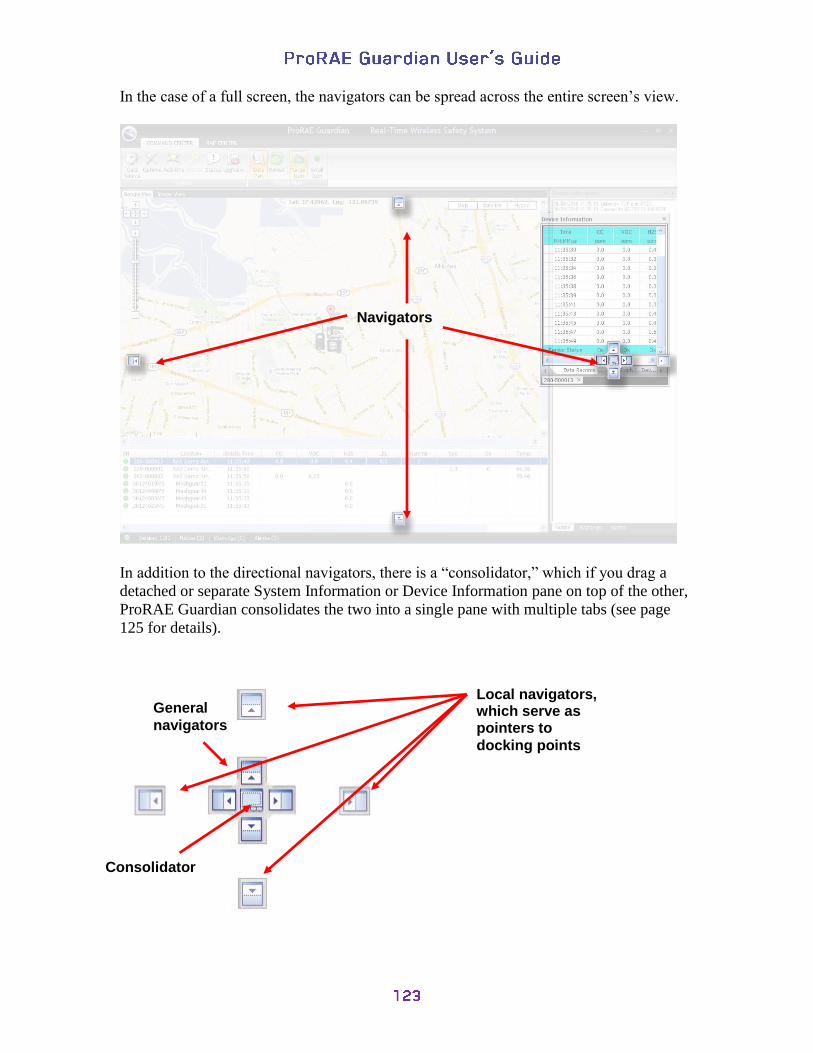
In the case of a full screen, the navigators can be spread across the entire screen’s view.
In addition to the directional navigators, there is a “consolidator,” which if you drag a
detached or separate System Information or Device Information pane on top of the other,
ProRAE Guardian consolidates the two into a single pane with multiple tabs (see page
125 for details).
Navigators
General
navigators
Local navigators, which serve as pointers to
docking points
Consolidator

As you move a pane by pointing to one of the navigators, the area where it will dock is
highlighted with a blue overlay.
Again, when you are satisfied with the placement, release the mouse button.
Note: Once you relocate a pane, it will remain there, even when you close the program
and open it again. The exception is if you removed the pane from the main window.
When you reopen the program, the pane floats over the main window.
11.3.1 Resetting Panes If you have relocated the panes and want to set them back in the same locations (and
sizes) as they appeared when the program was installed, click the “Reset Panes” icon in
the Quick Access Toolbar.

11.3.2 Consolidating System Information and Device Information Panes If the Device Information pane or System Information pane is detached or shown as a
separate pane, you can drag it on top of the other pane and consolidate the two into a
single pane with multiple tabs.
The pane you dragged disappears and tabs appear along the bottom, representing the
System Information and Device Information panes, which can be toggled for viewing.
Note: The order of all tabs (left to right) can be changed. Simply click and hold the left
mouse button to select a tab, and then drag it right or left to reposition it.
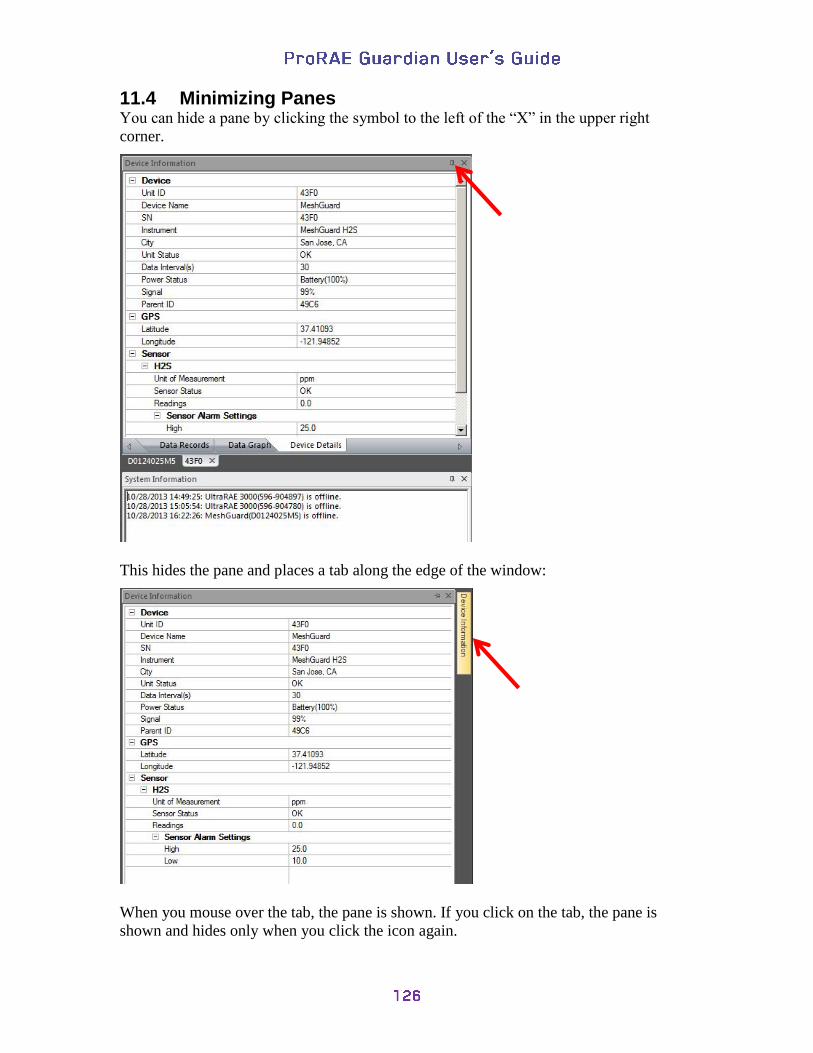
11.4 Minimizing Panes You can hide a pane by clicking the symbol to the left of the “X” in the upper right
corner.
This hides the pane and places a tab along the edge of the window:
When you mouse over the tab, the pane is shown. If you click on the tab, the pane is
shown and hides only when you click the icon again.

12 Alarms
12.1 Main Alarm When any sensor on the network exceeds its alarm trigger point, or if a device goes
offline or a port or connection closes, ProRAE Guardian alerts you with a loud alarm and
a dialog box with a flashing beacon.
ProRAE Guardian gives you the option of suppressing the alarm sound. If it is set to
“Alarm sounds ON,” then anytime an alarm state is triggered, the alarm sounds
immediately. You can select to disable the audible alarm for 1 minute, 15 minutes, or 30
minutes. This can be useful if you are performing maintenance and testing and do not
want to set off the audible alarm each time you make a change.
If you choose to silence an alarm for a period, you see different flashing-light image that
indicates the sound is turned off:
In addition, while the alarm sound is off, the System Status bar has a message that tells
you it is off, plus it has a countdown that tells how long the sound will be off:
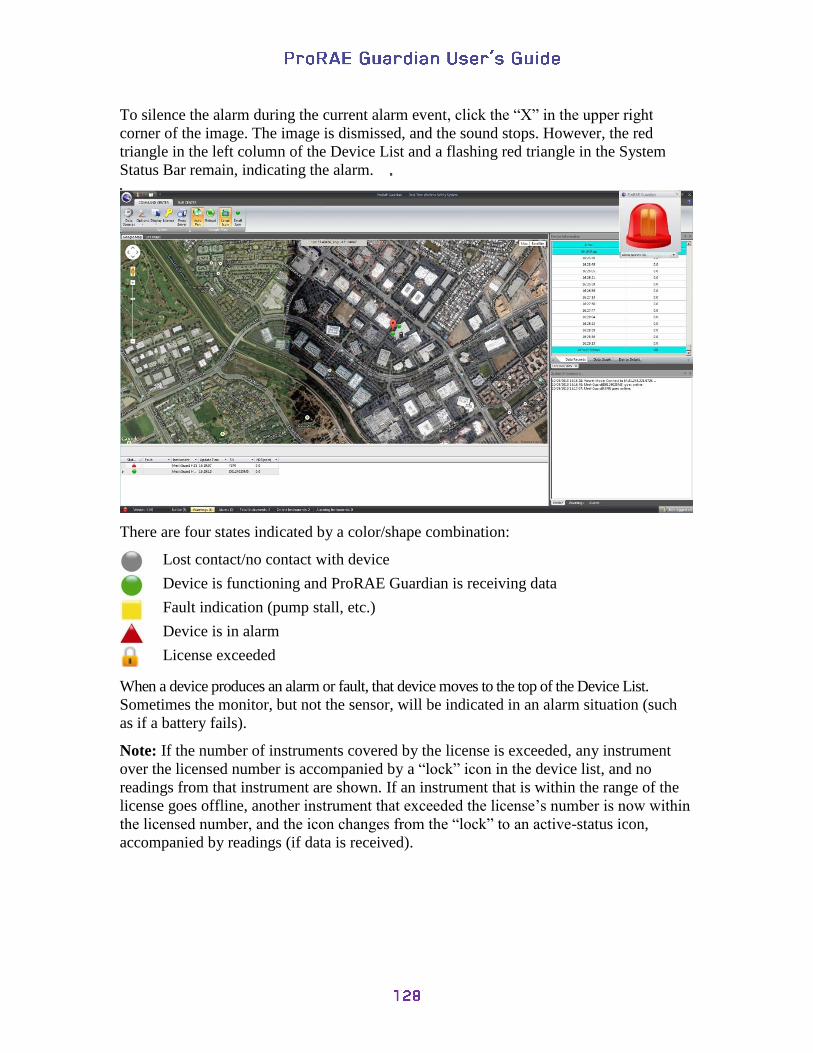
To silence the alarm during the current alarm event, click the “X” in the upper right
corner of the image. The image is dismissed, and the sound stops. However, the red
triangle in the left column of the Device List and a flashing red triangle in the System
Status Bar remain, indicating the alarm.
There are four states indicated by a color/shape combination:
Lost contact/no contact with device
Device is functioning and ProRAE Guardian is receiving data
Fault indication (pump stall, etc.)
Device is in alarm
License exceeded
When a device produces an alarm or fault, that device moves to the top of the Device List.
Sometimes the monitor, but not the sensor, will be indicated in an alarm situation (such
as if a battery fails).
Note: If the number of instruments covered by the license is exceeded, any instrument
over the licensed number is accompanied by a “lock” icon in the device list, and no
readings from that instrument are shown. If an instrument that is within the range of the
license goes offline, another instrument that exceeded the license’s number is now within
the licensed number, and the icon changes from the “lock” to an active-status icon,
accompanied by readings (if data is received).

12.2 Fault Alarm A second alarm type, a fault alarm, has been added. Like the standard alarm, it pops up a
small window with a flashing icon. The icon looks like this:
It indicates a fault, such as a pump stall, dead battery, etc. Its sound is different than the
main alarm, providing secondary audio cueing. Like the main alarm, the window can be
dismissed and the sound silenced or set to intervals. When the fault alarm is present, the
icon in the Device List and the “Alarms” text in the System Status Bar blink, as well.
12.3 Offline Alarm Feature There is also an “Offline Alarm” feature. It can be configured to be enabled/disabled,
plus its threshold set. If ProRAE Guardian detects an “Offline Alarm” status, it shows the
“Fault Alarm” icon and makes the corresponding alarm sound.

13 Device Properties
If you double-click on any instrument’s row in the Device List, a Device Properties
window opens, with details of readings (if any). This can be done at anytime (not just
when there is an alarm state). If you are logged in as an administrator, the fields’
backgrounds are white, and depending on the type of device, there are settings you can
edit. If you are not logged in, then the fields and their text are grey, indicating that you
cannot edit them.
If the device is a locally attached PTM instrument, you see a second tab called “Actions.”
Like the “Settings,” your options are determined by the device’s capabilities and editable
functions:

In some cases, such as with a BioHarness, you can select a template, or make other
changes. In addition, if your ProRAE Guardian is in a network with another ProRAE
Guardian, it shows the device is connected to a remote system, as well as identification
information about the device (its name and serial number). In such cases, all the settings
on the device property dialog are greyed out. You need to the ProRAE Guardian that the
device is attached locally to change the settings for that device.
14 Configuring ProRAE Guardian Data Communication
Before starting ProRAE Guardian to monitor your network, make sure that the network’s
controller and monitors are communicating properly and that each is uniquely identified.
Check the controller’s display to ensure that all monitors are reporting data.
It is necessary to configure the software before operation on the host PC. Before the first
operation, have the following information available:
• The serial port number (COM1, COM2, COM3, etc.) for the modem cable connected
between your computer and the wireless modem (RAELink3 or RAEMesh Reader).
• For Email alarm notification, make sure the host PC is connected to the Internet via a
LAN. Also make sure the IP address of the mail server (SMTP) is correct. If your
SMTP server requires authentication, check that your username and password are
valid before inputting them into ProRAE Guardian. (For example, install e-mail client
software such as Outlook Express, Foxmail, etc., on your PC and test the username
and password for the SMTP server).
14.1 Configure ProRAE Guardian to retrieve instrument data All communication settings for ProRAE Guardian to get instrument data are in the “Data
Sources” dialog:

14.1.1 PTM This tab is for communication with AreaRAE instruments.
For most of the applications, you must configure the COM port and select the channels:
Note: You can configure up to four COM ports. Select these through “Select PTM Index.”
Then click “Start” to start the PTM function. Checking “Auto Start” is recommended.
If you do not have RCS instruments or retrieve data from remote systems, click “X” to
close the “Data Sources” dialog box. The PTM instruments should show on the ProRAE
Guardian.
14.1.2 RCS This tab is for communication with MeshGuard instruments.
For most of the applications, you must:
1. Select whether to enable the COM port.
2. Select the COM port if enabled.

Click “Start” to start the RCS function. Checking “Auto Start” is recommended.
If you do not retrieve data from a remote ProRAE Guardian, click “X” to close the “Data
Sources” dialog box. The RCS instruments should show on the ProRAE Guardian.
14.1.3 Remote Data In This tab is for communication with remote ProRAE Guardian Full Version (and other
software with the same interface).
For most of applications, what you must:
1. Check “Viewer Mode.”
2. Input the “Remote PRG PC Address.”
Note: You must start “Data Forwarding” in the remote ProRAE Guardian Full Version.
Check “Enable Data Forwarding” and click “Set.” Checking “Auto Start” is
recommended.
Check the computer with the Source ProRAE Guardian for its IP address. If there are
several IP addresses, choose the one that can communicate with the Destination ProRAE
Guardian. Alternatively, you can get the computer’s domain name if it is available.

14.2 Configuring ProRAE Guardians To Share Real-Time Data
ProRAE Guardians can share real-time device data via the network interface. However,
you must configure both ProRAE Guardians to allow them to work together.
There are two schemes to share real-time data between ProRAE Guardians. To simply the
explanation, we will call the ProRAE Guardian Full version with instrument data as the
“Source” ProRAE Guardian, and call the other end of ProRAE Guardian the “Destination”
ProRAE Guardian.
The Viewer scheme sets the Source ProRAE Guardian as a TCP server and sets the
Destination ProRAE Guardian as TCP client. In this scheme, the Source ProRAE
Guardian must be the Full version, the Destination ProRAE Guardian can be Full version
or Viewer.
The Cascade scheme sets the Destination ProRAE Guardian as a TCP server and sets the
Source ProRAE Guardian as TCP client. This scheme is for special cases that the
Destination ProRAE Guardian cannot connect to the Source ProRAE Guardian, but they
can do it in the reverse. For example, the Source ProRAE Guardian has a GPRS modem
to which the IP address is dynamically assigned, and the Destination ProRAE Guardian is
with a fixed IP address.
In this scheme, both ProRAE Guardians must be Full Version installations.
The following are two schemes for configuring both ProRAE Guardians.
14.2.1 Viewer Scheme You must configure both on the Source ProRAE Guardian and Destination ProRAE
Guardian properly to let them work together.
Note: If the “source” ProRAE Guardian has “Remote Access Control” enabled, the
“destination” ProRAE Guardian must have “Remote Access Control” enabled and be set
to use the same access code.

14.2.1.1 Source ProRAE Guardian Configure “Data Forwarding” on the Source ProRAE Guardian to enable “Remote
Viewer” mode:
Check “Enable Remote Viewers” and click “Set.” Checking “Auto Start” is
recommended.
Check the computer with the Source ProRAE Guardian for its IP address. If there are
several IP addresses, choose the one that can communicate with the Destination ProRAE
Guardian. Alternatively, you can get the computer’s domain name if it is available.

14.2.1.2 Destination ProRAE Guardian: Viewer Mode
Configure the “Remote Data In” on the Destination ProRAE Guardian to enable the
“Viewer” mode:
Input the IP address of the domain name of the Source ProRAE Guardian.
Make sure the “Remote PRG PC Port” is the same as the “Listen Port” of Source
ProRAE Guardian (or the “Backup Port” if enabled).
Click “Start” to start connection. Checking “Auto Start” is recommended.
14.2.2 Cascade Scheme
You must configure the Source ProRAE Guardian and Destination ProRAE Guardian
properly so that they can work together.

14.2.2.1 Destination ProRAE Guardian: Cascade In Mode
Configure the “Remote Data In” on the Destination ProRAE Guardian to enable the
“Cascade In” mode:
Click “Start” to start the connection. Checking “Auto Start” is recommended.
Check the PC with the Destination ProRAE Guardian for its IP address. If there are
several IP addresses, choose the one that can communicate with the Source ProRAE
Guardian. Or you can get the computer’s domain name if it is available.

14.2.2.2 Source ProRAE Guardian: Cascade Out Mode
Configure the “Data Forwarding” on the Source ProRAE Guardian to enable “Cascade
Out” mode as shown here:
Input the IP address of domain name of the Destination ProRAE Guardian in the
“Remote PC IP Address” field.
Make sure the “Remote PC port” is the same as the “Listen Port” of the Destination
ProRAE Guardian (or the “Backup Port” if enabled).
Check “Enable Data Forwarding” and click “Set.” Checking “Auto Start” is
recommended.

15 Communications Port Configuration It is unlikely that you will need to configure your computer’s communication (COM)
port, but if it is necessary, follow the instructions below.
15.1 Determining The Port Number
In order for the computer and a host modem to communicate via the serial port (or virtual
serial port, in the case of a USB connection), you must supply the port number to the
terminal emulation program. The port number is not obvious, so you must find it in the
computer. Follow this procedure:
1. With the mouse, right-click the “My Computer” icon.
2. Select “Manage.”

3. Under “System Tools,” select “Device Manager.”
4. Click “Device Manager.” A list appears in the right pane, including “Ports (COM
& LPT).”

5. In the right pane, select “Ports (COM & LPT).”
If the computer has built-in serial ports, they are listed as “Communications Port
(COM1)”, or are similarly named.
If a Serial-To-USB controller is used, its entry looks similar to this:
Prolific Serial-To-USB Comm Port (COM10)
Note: If you want more details about the Serial-To-USB converter, double-click
on its name. This pops up a dialog box with details. The “General” tab gives an
overview, and the Port Settings tab tells you the details of the port configuration.
You will need the port number later, so write it down. Also, if you unplug the Serial-To-
USB converter and plug it in again, it is possible that the computer will assign a different
port number to it. Therefore, each time you plug it in, check the port number.

16 Viewing ProRAE Guardian Remotely Via Web Browser
ProRAE Guardian allows remote viewing via a web browser. Once the host ProRAE
Guardian is configured, it is easy to connect to it and view its data from a computer
running a web browser. Viewing via a remote computer’s browser require a username
and login (default values are “administrator” and “raesystems”, respectively). The host
computer runs ProRAE Guardian and its own web server.
This diagram shows a typical network configuration for local and remote viewing of data
via ProRAE Guardian and remote computers:
You must also have WAN, LAN, or Internet access, depending on the system. In some
cases, firewall issues may prevent you from connecting, so it may be necessary to consult
with your company’s I.T. department.
There are two steps to the process of remotely viewing ProRAE Guardian. You must first
configure the computer with ProRAE Guardian to allow remote viewing. Then you must
connect remotely via a web Browser to view (this requires a Username, and a Password).

16.1 ProRAE Guardian Configuration (Host) 1. Install the latest version of ProRAE Guardian.
2. Start ProRAE Guardian.
16.1.1 Check The Web Viewer Port This parameter setting specifies the port number that is used by the web server to deliver
information to the remote browser viewer. The port number is used as part of the URL
used by remote viewers. See Remote Viewer URL. The default value is 8080.
1. Click “Options.”
The Options Dialog/Control window has four tabs:
Data Options
Add-ons
Device Templates
Status
3. Click “Data Options.”
4. Select “Web Viewer.” Now look at the Viewer Port.
5. The default value is 80. However, if there is a conflict when you try to connect
remotely using this port, change the Server Port number (or the value used during
installation), click “Set,” and then close the window.

If you still have difficulty, there may be a firewall issue or other problem that should
be resolved by your I.T. manager.
16.1.2 Max Session This parameter allows you to limit the maximum number of remote viewer sessions that
can be active at the same time. If the total number of active viewers has reached this
limit, any attempt to open a new remote viewer will show “Maximum session limit has
exceeded.”
The default value for Maximum Sessions is 50.
16.1.3 Set The Session Timeout This setting parameter allows you specify the time-out period in seconds to automatically
terminate a user session, which remains inactive for this period. Viewing time is set in
seconds. The default value is 900 seconds (15 minutes).

16.1.4 Server Port This port number is used internally to communicate between the ProRAE Guardian Host
and web server. The default value is 9090.
Note: Do not change this parameter unless you are certain that the port number is being
used by another program on this host computer.
16.1.5 Exit Services Close the window to exit.
16.1.6 Allow Remote Access Via The Internet 1. Click on the RAE Systems logo in the upper left corner of the window (when
highlighted, there is a yellow glow around the logo.
Three main options headings are shown:
Administration
Event Viewer
About ProRAE Guardian…

When you move the mouse over “Administration,” it is highlighted, and a submenu
appears:
Note: If you have provided an administrator’s password, the submenu looks like this:
Access to the Admin Panel requires that you provide a password. It opens ProRAE
Guardian Remote Viewer. You will have to provide your User Name and Password
there.
Click on the RAE Systems logo in the upper left corner of the window.

Three main options headings are shown:
Move the mouse over “About ProRAE Guardian…,” and click it.
The “About ProRAE Guardian” window includes the “PRG IP Address.” Copy this
address. You will need it when you access ProRAE Guardian remotely via a browser.

The IP address also shows up on the Data Options’ “Web Viewer” tab as “Web Viewer
Location. You can click it to test it locally, or copy it and send it via email.

Section 2: ProRAE Guardian Remote Viewer
ProRAE Guardian Remote Viewer takes data from a network that is monitored by
ProRAE Guardian and provides a browser-based view.
Refer to the “Section 1: ProRAE Guardian” for information on configuring ProRAE
Guardian, as well as its functions and capabilities.
17 Starting ProRAE Guardian Remote Viewer
If your ProRAE Guardian host is set to broadcast, then you can view it remotely through
a web browser via ProRAE Guardian Remote Viewer. The administrator must provide
you with the IP address of the ProRAEGuardian host, as well as a user name and
password.
1. Open your web browser.
2. Type the IP address into your web browser, and you should see this login screen:
3. Fill in your Username and Password, and then click “Login.”

If the connection is successful, the ProRAE Guardian main screen is shown, and the
“Dashboard” tab is pre-selected. This central location is also where you access the
Command Center, Care Center, and Control Center, plus it provides you with a button for
instantly logging out.
Notes:
The logout time is set in the “Session Timeout” portion of Control Center >>
System Settings.
To restart the logout countdown in the web-based viewer, reload the page.
18 Status Indicators
ProRAE Guardian Remote Viewer uses colors and shapes to provide status information.
Some are identical to those used on ProRAE Guardian, but others are unique to ProRAE
Guardian Remote Viewer.
Device List. There are four states indicated by a color/shape combination:
Lost contact/no contact with device
Device is functioning and ProRAE Guardian is receiving data
Fault indication (pump stall, etc.)
Device is in alarm
License exceeded

Alarm Status. The colors indicate the alarm status:
Threat Alarms: Total number of instruments in threat alarm in the past 24 hours.
Fault Alarms: Total number of instruments with a fault alarm in the past 24 hours.
Offline Alarms: Total number of instruments that went offline in the past 24 hours.
Online Alarms: Total number of instruments that came back online in the past 24
hours.
Bump Test Status. The colors indicate the calibration status:
Overdue: Total count of instruments that are overdue for bump testing.
Failed: Total count of instruments that failed a bump test.
Unknown: Total count of instruments without last bump test information recorded.
Up-To-Date: Total count of instruments with up-to-date bump test.
Bump Test overdue in < 2 Days: Total count of instruments that will be overdue
for bump testing in less than two days.
Calibration Status. The colors indicate the calibration status:
Overdue: Total count of instruments that are overdue for calibration.
Failed: Total count of instruments that failed calibration.
Unknown: Total count of instruments without last calibration information
recorded.
Up-To-Date: Total count of instruments with up-to-date calibration.
Calibration overdue in < 1 Week: Total count of instruments that will be overdue
for calibration in less than one week.
Warranty Status. The colors indicate the warranty status of instruments:
Expired: Total count of instruments with expired warranties.
Unknown: Total count of instruments without warranty information.
Expiring in < 2 Weeks: Total count of instruments weeks.
Note : Details can also be viewed by mousing over the bar and viewing a Tool Tip, as
shown below:

Instrument Total, Online, And Alarm Status. The total number of instruments is
indicated, along with the number of them that are currently online, and the number that
are in alarm.
Total instruments registered as part of the network.
Number of online instruments.
Number of instruments in alarm.
In addition, an alarm status indicator is included in the Command Center button. This
alerts you to open the Command Center and view an instrument (or instruments) in
alarm.
Command Center button when no alarms are present.
When alarms are present, the Command Center button “pulses”
between its blue state and bright orange state to alert you.
19 General Customization
If your ProRAE Guardian host is set to broadcast, then you can view it remotely through
a web.
19.1 Collapsing/Expanding
You can collapse (minimize) or expand (maximize) a display panel, map, etc., when you
see this symbol:
For example, a map can be minimized by clicking the arrow along the navigation bar:
When a display panel, map, etc., is collapsed, you can expand it by clicking this symbol:
19.2 Column Management
Columns in the Device List or other lists in the lower pane can be reordered, hidden,
filtered, and grouped.
Columns (and their contents) can be rearranged by dragging a heading to another location.

Click on a column heading and drag:
The columns are now reordered:
You can change the sort order (ascending or descending), set filters, group columns (or
clear groups), and select columns for display.
Note: Change the sort order from ascending to descending, and vice versa, by clicking on
a heading. “Ascending” and “descending” are indicated by the up-facing and down-
facing arrows, respectively.
When filtering is active, the Filter icon is shown:
When you choose a filter, you can select which rows show or are hidden. If a checkbox is
checked, then its related rows will show.
Once you have chosen which filters to apply, click “Set.”

When a Group is active, the Group icon is shown:
Here is an example of what you see when you Group by Image (note the “Group” icon to
the left of the word “Image”):
To save screen space, click the “-” symbol to the left of the item that defines the group.
This collapses the group, and only the type and number of the items in that group is
shown.
This example shows grouping by image, with all collapsed:
This shows grouping by Status, all collapsed:

To exit Group view, click “Clear Group.”
The option labeled “Select Columns” lets you choose which columns are shown or
hidden. This is particularly useful if you want to hide some data that isn’t necessary to
monitor all the time (for example, “Site,” if you only have one site, or “Gateway”).
Scroll down the list to view and select/deselect other columns.
Once you have selected the columns, click “Set” (or “Cancel” to return without changes).
Check/uncheck this box to select/deselect all columns.
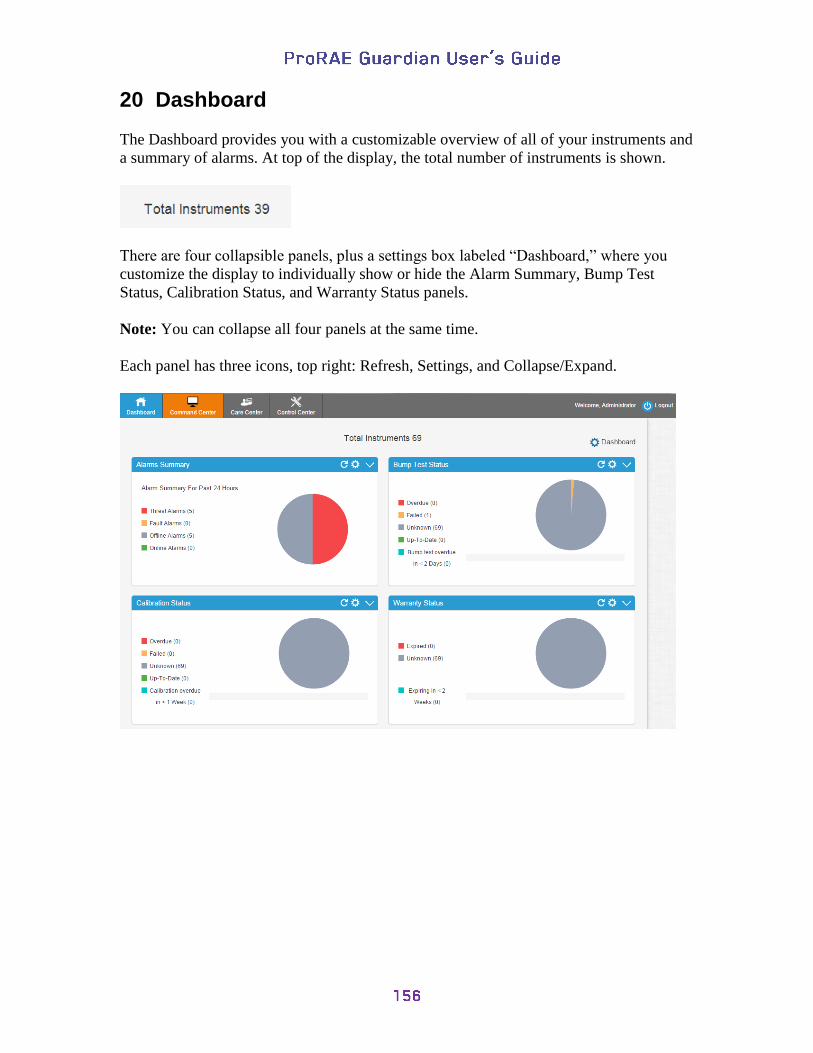
20 Dashboard
The Dashboard provides you with a customizable overview of all of your instruments and
a summary of alarms. At top of the display, the total number of instruments is shown.
There are four collapsible panels, plus a settings box labeled “Dashboard,” where you
customize the display to individually show or hide the Alarm Summary, Bump Test
Status, Calibration Status, and Warranty Status panels.
Note: You can collapse all four panels at the same time.
Each panel has three icons, top right: Refresh, Settings, and Collapse/Expand.
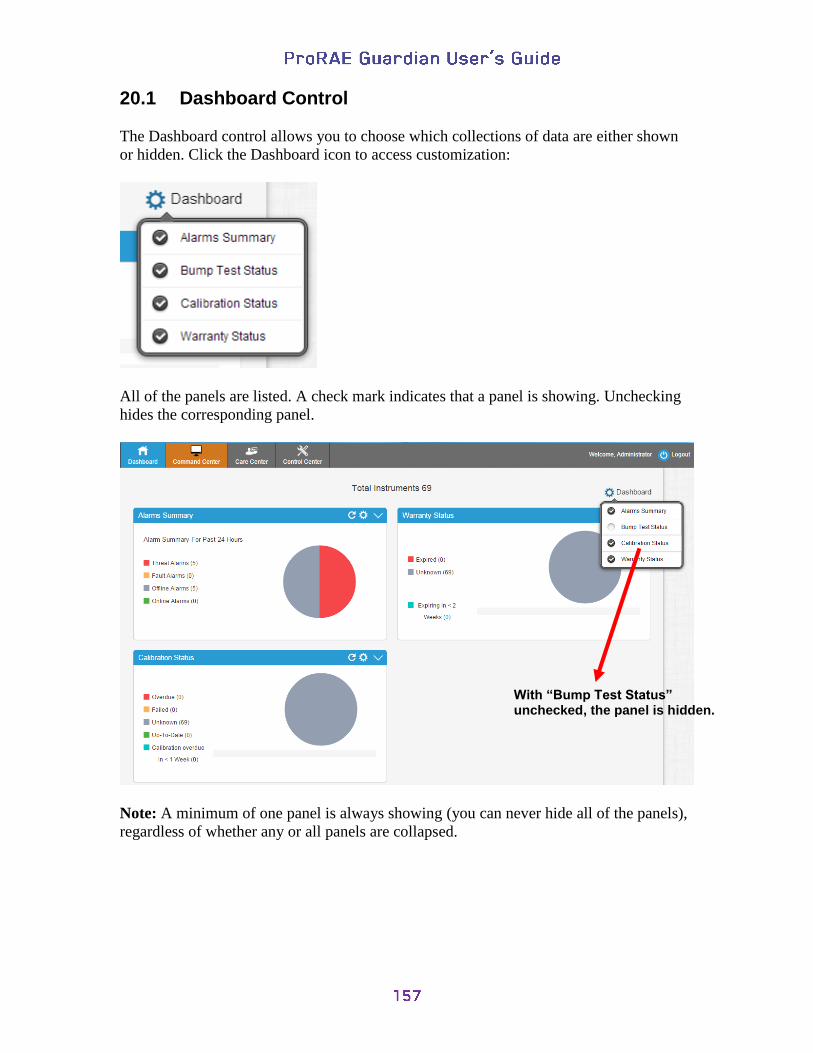
20.1 Dashboard Control
The Dashboard control allows you to choose which collections of data are either shown
or hidden. Click the Dashboard icon to access customization:
All of the panels are listed. A check mark indicates that a panel is showing. Unchecking
hides the corresponding panel.
Note: A minimum of one panel is always showing (you can never hide all of the panels),
regardless of whether any or all panels are collapsed.
With “Bump Test Status” unchecked, the panel is hidden.

20.2 Panels
Each status/summary panel has controls for Refresh, Settings, and Expand/Collapse:
Refresh
Settings
Collapse
Expand
Refresh. Click the “Refresh” icon to update the information in the panel.
Settings expands to a menu of settings. These settings act as filters to refine the ranges of
the summary or status. When you mouse over the icon, a menu for Alarms Summary is
presented, where you set summary interval.
Click the downward-facing arrow in the menu items and then select an option by clicking
it.

When you make a selection, the panel is updated and shows your choice.
Selection Updated panel
Expand/Collapse. The Collapse/Expand control allows you to minimize a panel or
expand a panel to its full size again.
Collapse
Expand

The “Bump Test Status” panel has been collapsed here:
Note: All panels can be collapsed.
The names and controls for collapsed panels are always shown, even when collapsed:

20.3 Reordering Panels Panels can be reordered in any way you choose. Simply drag a pane from one location to
another, and the two panes switch places:
1. Panels in their initial locations:
2. Dragging a panel to another location:
3. The panels’ locations are now switched:

Panels can be dragged to any location, including diagonally.
1. Original locations:
2. Moving one panel diagonally:

3. Panels are now relocated:
20.4 Expanded Details When you mouse over the graphs or their legends, greater detail is shown. For example,
mouse over any part of a graph, and a higher level of detail appears:
In addition, if you mouse over any of the legends, you get more details:

21 Command Center
Command Center gives you an overview of your system and its instruments, including
smartphones.
IMPORTANT! Whenever one or more devices on the ProRAE Guardian-monitored network are in
alarm, the Command Center button fades between the normal blue or gray color and
bright orange. This provides an attention-getting visible cue, even if the computer’s
sound is turned down or the alarm sound is silenced:
The total instruments in the roster, as well as the number of online instruments and
instruments in alarm, are shown for quick reference.
If the alarm’s sounds are on and an instrument is in alarm, the alarm icon is shown along
with the text “Alarm sounds ON.”
If the alarm’s sounds are off, the muted alarm is shown along with the selected period
until it sounds again.
In addition, you can choose to view with Google Maps, Site Maps (if they are
configured), and BioHarness (if one or more BioHarnesses are in use and if you have
access to BioHarness data) by clicking the appropriate tab.
Note: The current selection is indicated by a small triangle at the bottom of the selected
tab.

An example of a Google Map (with instruments/status indicated):
An example of a Site Map:

Note: You can set the default map in Control Center under “System Settings.”
Whether you are using a Google Map or Sitemap, you can resize the map so that you can
either view more of the map or more of the instrument data by clicking and dragging the
bar separating the two panes up or down.

21.1 BioHarness
If BioHarnesses are used on a network, special permissions must be given in order to
view details about them, in order to comply with regulations regarding medical privacy
contained in HIPAA (the U.S. Health Insurance Portability and Accountability Act).
If you log in as a BioHarness Supervisor or as a BioHarness Medical Professional, you
have enhanced access to information about users wearing BioHarnesses. This access must
be set via Control Center’s User Management tab.
To give a user this enhanced access:
1. Click an existing User ID’s “Edit User Information” icon or click “Add User” to
create a new user profile.
2. Select the role of BioHarness Medical Professional or BioHarness Supervisor.
3. Make any other changes to the user profile and then click “Save.”
Anyone logging in as a BioHarness Supervisor or as a BioHarness Medical Professional
sees a BioHarness tab under Command Center, as well as the number of BioHarnesses
online, a view selector, total instruments count, and a button labeled “Track Users.”

A BioHarness Supervisor or as a BioHarness Medical Professional can view the
BioHarness users, but only those with a BioHarness Medical Professional role can see the
individual BioHarness users’ details.
A BioHarness Supervisor or as a BioHarness Medical Professional can view the
BioHarness users, but only those with a BioHarness Medical Professional role can view
details of the BioHarness users in the roster. Mousing over one of the BioHarness users in
the roster brings up a “View Details” tip.
Click the block, and details are shown:

If you click “Locate,” a map appears, showing the BioHarness user’s location:
The status is shown on the location flag, and if you use your mouse to point to it, data
about that BioHarness is shown in a window.
Click “Previous” to see the previous user record, and “Next” to see the next one.
Click “Close” to close the window and return to the main BioHarness view.
21.1.1 Views You can view BioHarness users using two different views, Standard and Group.
Metro (Standard) View Metro View arranges all of the BioHarness users in rows, each color-coded to match its
status.
Group View Selector Metro View Selector

BioHarness Status. Each individual using a BioHarness on the network is represented by
a color-coded Icon with the instrument’s ID. The color coding indicates status.
One or more High Alarm or Low Alarm levels has been exceeded.
Some or all components being monitored have exceeded Low Warning
threshold settings.
No alarms.
Note: These are automatically arranged by status, in order of alarm severity:
Group View Click “Group View” to see BioHarness users organized into tabbed broups. Click on a
tab to view the users in that group.
Note: User Groups are created and managed under System Settings.
Track Users If you have access as a BioHarness Medical Professional or BioHarness Supervisor, you
can click a button labeled “Track Users” to bring up a map showing the locations of users
with BioHarnesses. Note: “Track Users” is not available to other roles.

Mousing over any of the BioHarness users’ locations brings up information about the
BioHarness and its user:
When the map is showing, the “Track Users” button changes to “Dashboard.” Click this
button to dismiss the map and return to the BioHarness dashboard.
21.1.2 BioHarness Settings
You can view and change BioHarness settings, including thresholds for low and high
alarms and low and high warnings:

In “User Settings,” you can input or edit alarm settings, set the user age, and activity
profile:
In “Communication Settings,” you can set time values for various parameters, plus set the
temperature unit (Fahrenheit or Celsius) used while monitoring the BioHarness in
ProRAE Guardian:
After making the settings changes, click “Update.”

22 Care Center The Care Center module is used to manage instruments in a fleet and docking stations, as
well as to create reports. It provides the following details and all common attributes of the
instrument, docking station, and reports. You can view all reports generated by the
system either manually or automatically. In addition:
a. It provides a way to see all instruments, along with their attributes in a fleet.
b. It provides a way to manually add, modify, and remove instruments from the
fleet.
c. It displays all common attributes of the instruments and can export fleet details
in PDF format.
d. It provides a way to perform the following operations on each instrument in the
fleet:
1. View data log
2. View setup log
3. View calibration log
4. View bump test log
5. View product documentation
6. Edit attributes
7. Check firmware update
When you mouse over the Care Center tab, you see its options:
Note: Care Center may not be accessible if an active product key license for the ProRAE
Guardian host does not have the “Care Center supported” attribute enabled.
Note: If you want to verify your license, click on the License toolbar in the ProRAE
Guardian application (not the web version). You will see whether it is supported:
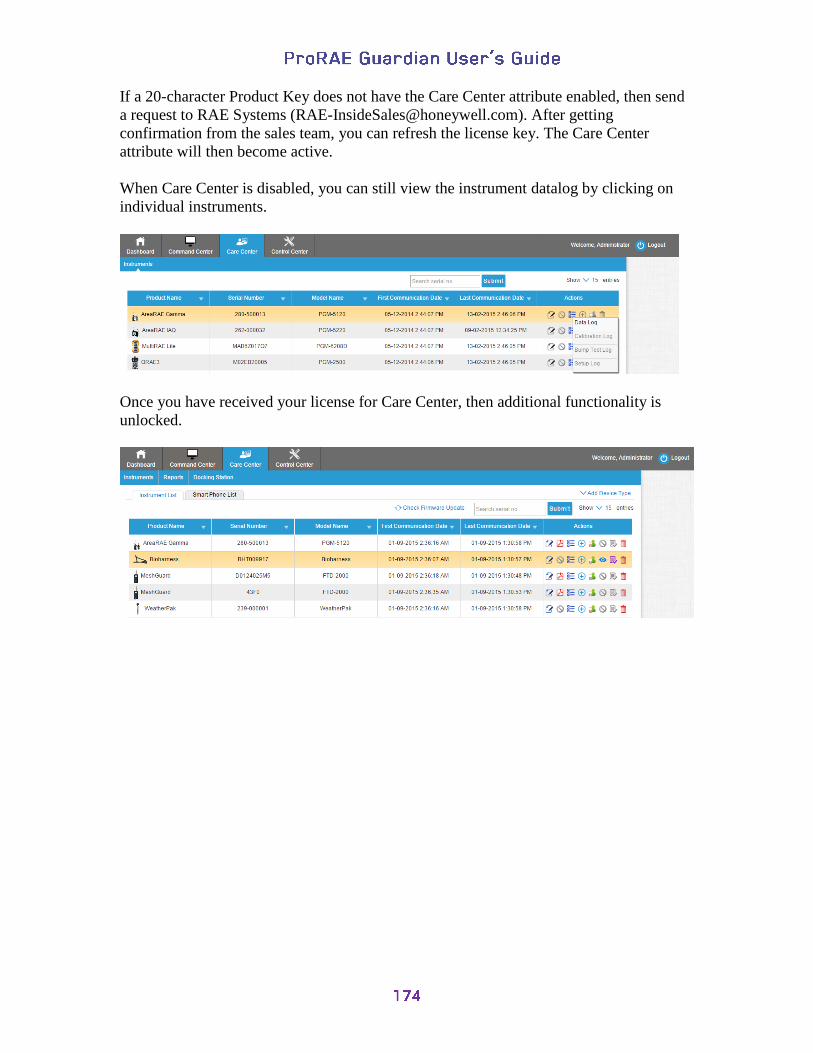
If a 20-character Product Key does not have the Care Center attribute enabled, then send
a request to RAE Systems ([email protected]). After getting
confirmation from the sales team, you can refresh the license key. The Care Center
attribute will then become active.
When Care Center is disabled, you can still view the instrument datalog by clicking on
individual instruments.
Once you have received your license for Care Center, then additional functionality is
unlocked.

22.1 Instruments All of the instruments associated with the ProRAE Guardian network are shown here.
There are two tabs, one labeled “Instrument List” and one labeled “Smart Phone List.”
22.2 Reports Care Center provides the option to generate and view reports. These support the
following:
Manually add and delete reports
Navigate through the reports list
Sort reports based on the attributes in the view
Filter reports based on the attributes in the view
Query reports-based attributes
Calibration Summary Report. This report shows the calibration summary and details of
instruments for a week, a month, or a custom date range spanning more than a week.
Bump Test Summary Report. This report shows a bump test summary and details of
instruments. It provides the option to generate a report for a week, a month, or a custom
date range spanning more than a week. In addition, it includes a summary of calibration
status for all active instruments in the system. The summary details the total number of
active instruments in use, instruments overdue for a bump test, those that will be due for a
bump test in the next five days, those that are up to date, the number of instruments with
no bump test information, etc. The Bump Test Summary Report also includes list of
instruments (with details) for which there is no calibration information available.
BioHarness Report
A BioHarness Report can be viewed/downloaded by anyone with a role of BioHarness
Medical Professional. Others can see that there is a BioHarness report, but cannot view or
download it.
Instrument Data Log Report. This report shows data log for an instrument. It provides
the option of generating a report for a day, week, month, or custom date range spanning
more than an hour.

The report has a summary section showing minimum and maximum values for each
sensor, averages, STEL, number of alarms of each type, etc. In addition, there is a log of
all data log records for the report’s duration, in descending order of their timestamp.
BioHarness Reports. The following BioHarness reports are provided, as well. Only users
registered with a "BioHarness Medical Professional" role can create or view BioHarness
reports.
Group Report. This report shows graphs for BioHarness users associated with a
particular group. A Group Report shows mininum and maximum results of sensors
for the group.
System Report. This report shows BioHarness users who are associated with groups.
A System Report shows minumum and maximum results of sensors for the system.
Individual Compared To Group Report. This report shows a comparison of
individual BioHarness users and the group. The report shows minimums and
maximums of sensors for the individual and the group.
Individual Compared to System Report.This report shows a comparison of
individual BioHarness users and overall system data. It shows minimums and
maximums of sensors for an individual and the system.
Group Compared To System Report. This report shows a comparison of a
particular group and the overall system. It includes minimum and maximum sensor
values for the group and the system.
At the upper right of the page are options that include:
Check Firmware Update. Click here to check whether a newer version of the
firmware is available for a particular instrument.
Add Instrument. Click this to manually add an instrument by entering relevant
information.
Show (number) entries. This provides the option to change the number of
instruments displayed on the grid.
22.3 Docking Station
This displays the docking stations being monitored and instruments docked in them.

Click “Search Docking Station” to search for a docking station on the network. When one
is found, it is added to the roster.
Docking stations on the network are shown, with their instruments currently in the dock,
in a hierarchy below them. You can hide the instruments’ sensor information individually
by clicking the “-” to the left of each name. You can hide all instruments by clicking the
“-” to the left of the docking station’s name. To show the instruments or sensors, click the
appropriate “+” symbol.
22.3.1 Actions
Do Calibration
Do Bump Test
Download Test Report

22.3.2 Reports
Care Center provides a way to create reports (Calibration Summary and Bump Test
summary) of the whole system. You can sort/change the order of columns by dragging a
heading. It provides all reports generated by the system, manually as well as
automatically. The report repository has the following attributes:
Report ID
Report Name
Report Type
Date Created
PDF Report
Event Type (there are two types):
a. Automatic – Generated and added by the system
b. Manual – Manually added in the system
Click on the heading you want to move, and drag it to another location:

You can also change the sort order (ascending or descending) and other attributes.
Global options for Reports include Create Report, Search, and Show (number of) entries.
You can show 15, 50, 100, or 200 entries.
22.3.3 Actions
Under “Actions,” you can select “View Report,” and “Delete Report.”
View Report
Delete Report
22.3.4 Pages When more than one page of reports is available, a navigator lets you move to the next or
previous page, as well as to each specific page (by number):

22.3.5 Create Report
This report displays system statistics showing overall health of instruments within a
specified date range with regards to calibration (for example, overdue or calibration
within 30 days) or bump test (last bump test date).
You can select either a Calibration Summary Report or Bump Test Summary Report.
Select the start date (“Date From”) and ending date (“Date To”) and type any note you
would like to add. Then click “Create.” (Click “Cancel” if you do not want to create the
report.)
In addition, you can create BioHarness Group, System, Individual Compared To Group
Report, Individual Compared to System, Group Compared To System reports, as well.
Note: Only someone with a role of "BioHarness Medical Professional" user can create or
view BioHarness reports.
The report is created (if there is no data, then the report will be blank). Once a report is
created, you can click “Save” to save it, or “Cancel” to delete it.

22.3.6 Check Firmware Update
Type in an instrument’s serial number and then click “Submit.”
ProRAE Guardian Remote searches for firmware updates.
If firmware updates are not found, then you see this:
If a firmware update is found, then you see details about it.

22.4 Actions You can choose from the Actions to customize, view logs, etc. Icon buttons are located at
the right side of the screen for each row that corresponds to an instrument.
Instrument List Actions:
Edit instrument
or No product documentation or view PDF of product documentation
View logs
Generate report
Assign to logged in user
Set/unset Qualified (unqualified is indicated by gray icon) Non-BioHarness
instruments are indicated by
Use log
Remove instrument
Smart Phone List Actions:
Edit Smart Phone
Qualified Smart Phone (unqualified is indicated by gray icon)
Remove instrument
22.5 Add Instrument/Add Smartphone
Add an instrument or smartphone (for use with BioHarness only) to your roster by
clicking “Add Instrument” and selecting either “Add Instrument” or “Add Smartphone”
and then following the instructions on the new page for adding it.

22.5.1 Add Instrument
Not all fields have to be filled, but it is mandatory to select a Product Name and Serial
Number. When you select a Product Name, the Model Name is automatically provided.
Product Name. Select an instrument from the drop-down list. If you want to add a
custom instrument, the system allows manually typing the instrument name.
Zone. Care Center displays all zones available in ProRAE Guardian.
Last Calibration Result. Options include Success, Partial Success, and Fail. The default
is “Unknown.” Note: Partial Success occurs when some sensors are not calibrated or
bump tested. This typically happens when the calibration gas is not present. If any
calibration fails, the result is “Fail.”
Last Bump Test Result. Options include Success, Partial Success, and Fail. The default
is “Unknown.” Note: Partial Success occurs when some sensors are not calibrated or
bump tested. This typically happens when the calibration gas is not present. If any bump
test fails, the result is “Fail.”
Firmware Version. These fields provide a way to enter major, minor, and patch version
information for the instrument. (Example: 11.11.a)
Note: The Major and Minor fields accept only two digits. The Patch field accepts only
alphabet letters.

You can also add sensors to each instrument.
Click “Add Sensor” to add one or more sensors for a particular instrument. This helps to
add instrument data log and sensor details in reports. You have the option to delete
sensors, as well.
Note: You can choose any sensor in any instrument. Use caution to ensure the correct
sensor and corresponding measurement unit are selected.
Select the sensor type, measurement unit, and precision. Then click “Add” to include it or
“Delete” to remove it.

Precision signifies the number of decimal places to which the reading is to be displayed.
When you are done adding sensors, click the “X” at the top right corner of the window to
close it. Your choices are automatically saved.
When you are done filling in the instrument information, click “Save” to save it or
“Cancel” to dismiss it without saving.
22.6 Show (number) entries
Use the pull-down menu to select how many entries you want to see at one time:

22.7 Columns And Settings
Each column has selections for setting the view order (ascending/descending), filtering,
grouping, and selecting columns. The submenu provides access to the options.
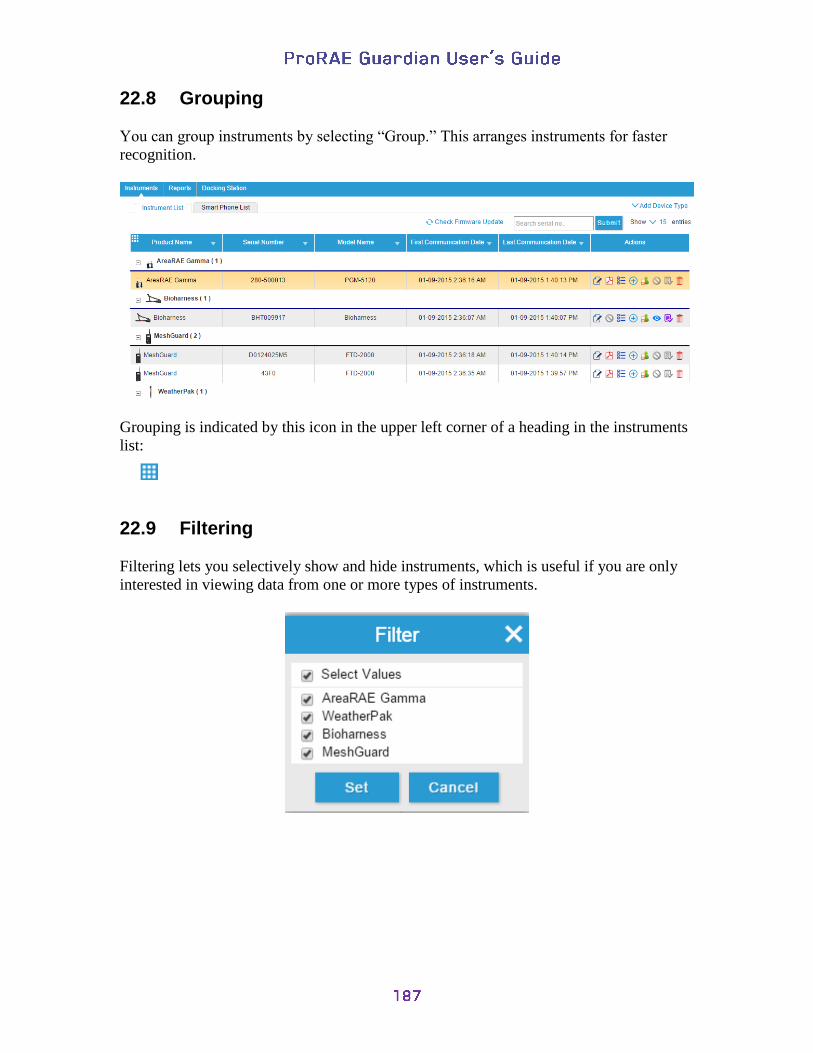
22.8 Grouping
You can group instruments by selecting “Group.” This arranges instruments for faster
recognition.
Grouping is indicated by this icon in the upper left corner of a heading in the instruments
list:
22.9 Filtering
Filtering lets you selectively show and hide instruments, which is useful if you are only
interested in viewing data from one or more types of instruments.

22.10 Actions You can choose from the Actions to customize, view logs, etc. Icon buttons are located at
the right side of the screen for each row that corresponds to an instrument.
Edit instrument
or No product documentation or view PDF of product documentation
View logs
Generate report
Assign to logged in user
Set/unset Qualified (unqualified is indicated by gray icon) Non-BioHarness
instruments are indicated by .
Use log
Remove instrument
22.10.1 Add Smart Phone
BioHarnesses operate with a smart phone, so you can add a smart phone to your roster.
Note: Not all fields have to be filled, but it is mandatory to select a Phone ID.
When you are done, click “Save.”
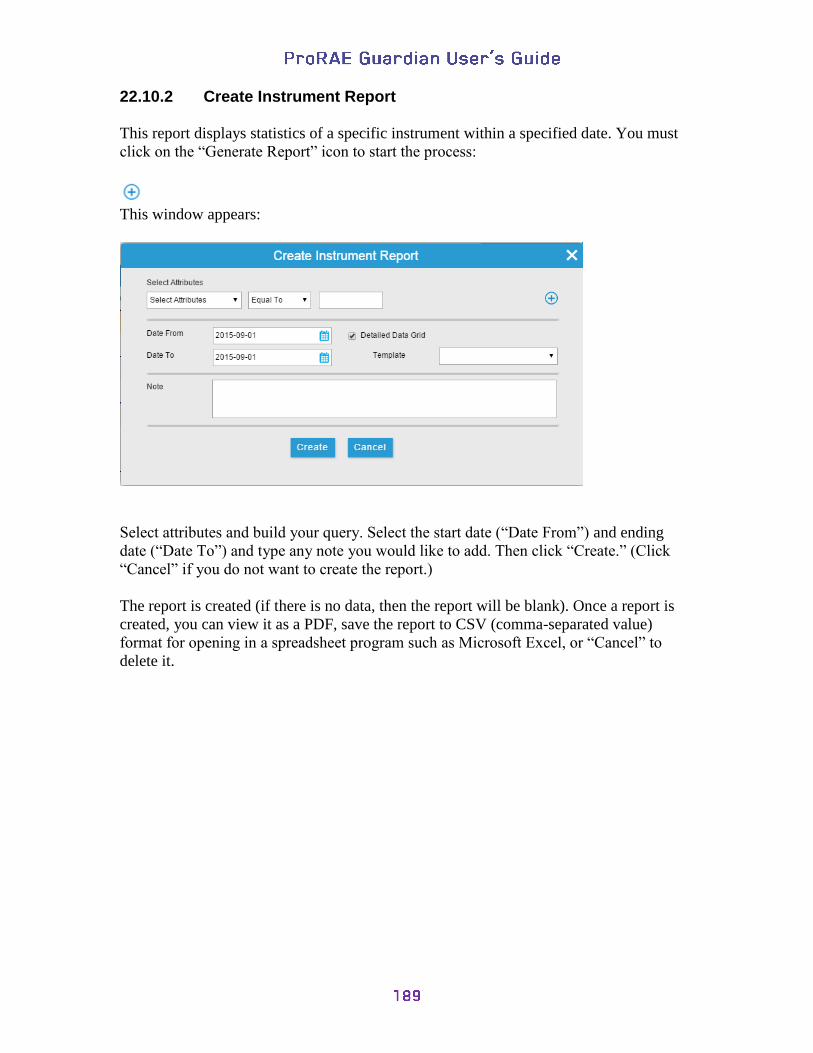
22.10.2 Create Instrument Report
This report displays statistics of a specific instrument within a specified date. You must
click on the “Generate Report” icon to start the process:
This window appears:
Select attributes and build your query. Select the start date (“Date From”) and ending
date (“Date To”) and type any note you would like to add. Then click “Create.” (Click
“Cancel” if you do not want to create the report.)
The report is created (if there is no data, then the report will be blank). Once a report is
created, you can view it as a PDF, save the report to CSV (comma-separated value)
format for opening in a spreadsheet program such as Microsoft Excel, or “Cancel” to
delete it.

If you choose the PDF option, a PDF is generated, and you see this message:
Click the link to view the PDF.
If you choose Save Report To CSV, a progress box is shown as it creates the CSV file:
When it is done, this message appears:

Click the link and then you see the save dialog, populated with the system’s name of the
file. You can rename it anything you want. When you are satisfied with the name, click
“Save.”

23 Control Center
Control Center provides a way to control the access through user management, Action
rules, Activity Automation, and Systems Settings.
Control Center has tabs that provide access to functions within Control Center.
Note: You can set the default view in Control Center under “System Settings.” Your
options are “User Management,” “Action Rules,” “Activity Automation,” and “Systems
Settings.”
23.1 User Management
In User Management, you can control access to the system to add another user and to edit
user information, as well as assign different instruments to a user. It provides an option to
change the password, as well.

23.1.1 Add User
Add User. You can add a new user to your roster or edit user information and provide
comments, a password, contact information, etc. When you are done editing the
information, click “Save” to save the changes, or “Cancel” to abandon them.
Check Availability. Input a name into UserID and click “Check Availability.” This
checks whether the UserID is already being used. If the UserID is not already in use, then
you receive this message:
Upload Image. Click the “pencil” icon in the lower-right corner of the image. You can
then upload an image to represent the person. Once the image is uploaded, click “Save
Image.” If you do not want to save the image, click the “X” in the upper right corner.
Email. Provide an email address using the format shown.
Password. Input a password that meets the criteria outlined here. The combination of
letters/symbols/numbers required depends on the requirements set in ProRAE Guardian
Remote Viewer’s Password Policy (under Control Center>>System Settings>>Password
Policy).
Confirm Password. Once you have input a password into the Password field, retype it exactly
into the Confirm Password field. If they do not match, the password will be rejected.

The administrative section below the required section is for a name, phone, etc. One of
the most important features here is Group. A user can be assigned to a group that already
exists. Pull down “Select group” and choose one. (This is optional.)
Export Profile. You can export one or more (or all) profiles. Click on a box in a user’s
line in the list and then click “Export Profile.” If you want to select all profiles, click
“Select All” at the top of the list (to de-select all, click it again to clear them).
When one or more users is selected, the “Export Profile” button changes from gray to
blue. Click “Export Profile,” and you will see this alert:
Click “here,” and a “Save As” box appears with a pre-formatted file name, with a “.csv”
extension (the file is in “comma-separated value” format, which is easily opened in
programs such as Microsoft Excel). You can change the filename and/or select a location.
Click “Save,” and the file is saved.
Personal information should be provided in the lower half of the page. In addition to a
profile name, it is helpful to select a group, if the user is part of one. That way, the group
can be referenced later, saving time in sorting records.

23.1.2 Actions
Select actions from the icon buttons under “Actions” to work with the data in the grid.
Edit User Information
Change Password
Assign Instrument
Generate Report
Delete User
Note: If any icon is gray, it is not available.
Edit User Information. Make changes to a profile. When you are done, click “Save” to
retain the changes.
Change Password. To change a password, you must provide the current password and
then type the new password. Then type the password again in “Confirm Password.” If the
two do not match exactly, the new password will not be accepted.
Assign Instrument. You can assign any instrument(s) to a person.
1. Find the person you want to assign one or more instruments to and click the
“Assign Instrument” icon under “Actions.”
2. Click one or more checkboxes in the rightmost column to select one or more
instruments, or click Select All at the top of the column.
3. Click “Assign” to assign the instrument(s) to the selected person.

Create Individual BioHarness Report
Click on the "Generate Individual BioHarness Report" icon to create an individual report for
a BioHarness user. The report shows minimum and maximum sensor values from the
BioHarness for an individual.
You can select either a sensor type or continue without selecting sensors. If you continue
without selecting any sensors, then by default all sensors are selected. Select the start date
(“Date From”) and end date (“Date To”) and type any note you would like to add. Then click
“Create.” (Click “Cancel” if you do not want to create the report.)
The report is created (if there is no data, then the report will be blank). Once a report is
created, you can click “Save” to save it, or “Cancel” to delete it.
Note: Individual report of BioHarness user can be created only by someone with the user role
of "BioHarness Medical Professional.” To get data for individual report, assign a BioHarness
instrument to a BioHarness user, so that data will appear according to selected sensors.
Delete User. Click the “Delete User” icon to delete a user from the roster.

23.2 Action Rules
ProRAE Guardian allows creation of Action Rules so that you can have notifications sent
or external applications invoked whenever the conditions are met.

23.3 Create RuleSet
You can create a RuleSet, which supports flexible and customizable rules to trigger email
notifications or invoke external applications. Define, add, modify, and delete alert
notifications and action rules so that ProRAE Guardian uses the following attributes to
define rule conditions and logical operators such as “And” and “Or” or “Equal To” for
each rule condition.
Product Name
Site Name
Instrument Alarm Type
Alarms Count
Sensor Reading
Sensor Alarm Type
Then select an Action:
Email Notification
Invoke External Application
Finally, select an Action interval (number of minutes).
Note: You can generate as many different RuleSets as you want. You can also add
attributes and rules.
There is a limitation on the supported attributes of the Product (Instrument). Validation of
conditions is checked by the system. If the RuleSet condition is not correct, then it will
not allow successfully creating a RuleSet. You can define add, modify and delete alert
notifications.
You can expand a rule to suit the level of detail of the information you need by adding
conditions. In the “Description” box, the rule appears with all of its details. Here is an
example:

In case of a RuleSet Conflict: If there is a RuleSet Conflict in action rules, ProRAE
Guardian tests and validates the rules. As a result, it will not allow you to proceed. An
alert message pops up to tell you that there is a problem:
For a rule to be valid, it must comply with at least one of the following RuleSet configurations:
Continued on next page

Continued from previous page

When RuleSets are active and actions are triggered, they are logged and in the dashboard
the Last Triggered date and time is shown along with the action that was triggered in the
Last Triggered Action column:

23.4 Attributes And Validation
When you build a RuleSet, you can validate the rule to ensure that you have created a
rule that works with the available parameters and data.
23.5 RuleSet Log
A RuleSet Log displays a history of rule sets that were triggered in a given time range. It
provides the Rule Set Name, Trigger Date, Result (successful or fail), Details (of the
action performed), and their corresponding Actions.
23.6 Activity Automation
You can create automated activities that run at specific times and on specific days at
specific intervals. You name the activity, select whether it should be active, and set start
and end dates.
Actions
Edit Activity
Delete Activity
Remove
attributes Add more
attributes
Add more
actions
Validate rule
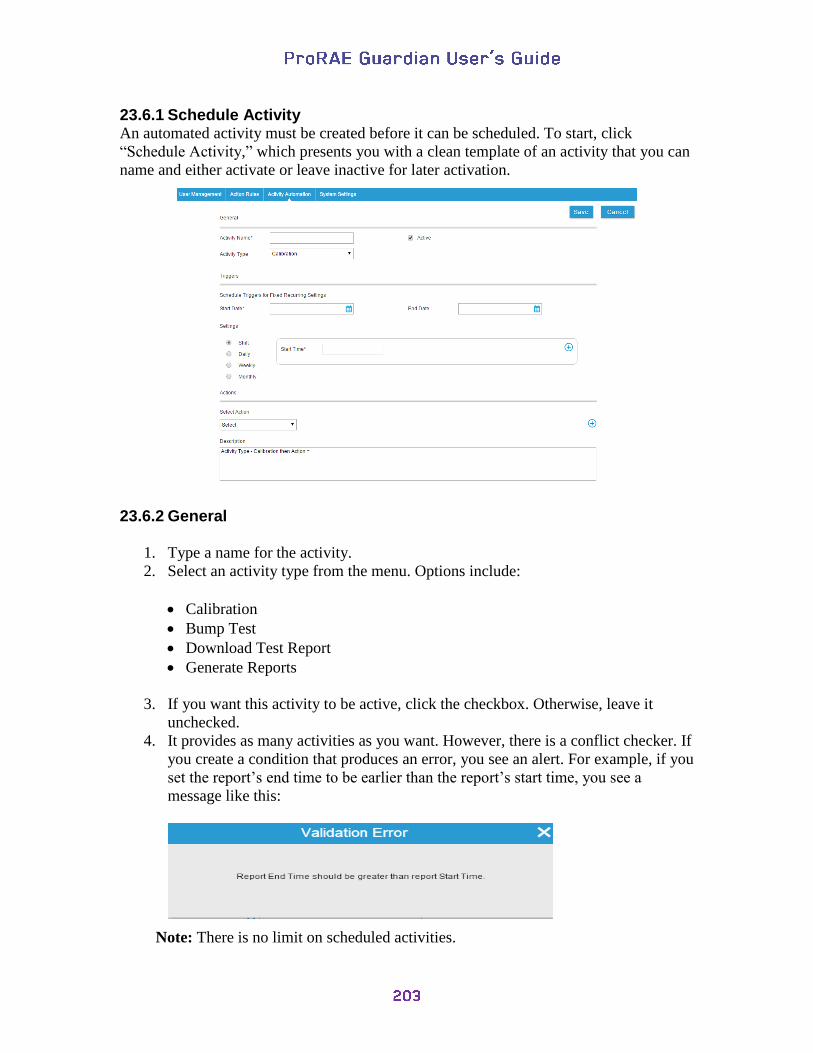
23.6.1 Schedule Activity An automated activity must be created before it can be scheduled. To start, click
“Schedule Activity,” which presents you with a clean template of an activity that you can
name and either activate or leave inactive for later activation.
23.6.2 General
1. Type a name for the activity.
2. Select an activity type from the menu. Options include:
Calibration
Bump Test
Download Test Report
Generate Reports
3. If you want this activity to be active, click the checkbox. Otherwise, leave it
unchecked.
4. It provides as many activities as you want. However, there is a conflict checker. If
you create a condition that produces an error, you see an alert. For example, if you
set the report’s end time to be earlier than the report’s start time, you see a
message like this:
Note: There is no limit on scheduled activities.

23.6.3 Triggers In this area, you set the parameters that define when the activity takes place.
1. Set the Start Date and End Date. Note: The start date is mandatory to schedule
the activity, but the end date can be left open.
2. Select Settings for when the activity should occur. Your options are:
Shift
Daily
Weekly
Monthly
When you select any of these, different sub-parameters are shown for you to select.
Anytime you see the “+” in a circle, you can click it to add another sub-parameter (for
example, with Shift selected, you can have multiple start times).
23.6.4 Actions Here is where you select the action(s) you want performed at the times and intervals you
select in Triggers.
Under “Select Action,” you can choose “Email Notifications” or “Invoke External
Applications.” If you select “Email Notifications” ProRAE Guardian can send an email
to one or more recipients (separate them with a comma), using a template of your choice.
Note: If your account does not have a template, then you can create a template from:
Control Center>>System Settings>>Email settings
If you select “Invoke External Applications” as your action, then you can use it to invoke
an external application (such as an executable, web service, etc.) with parameters.

For example:
Like Path = “C:\Program Files (x86) \XYZ.exe ” and arguments = “C:\ProgramData\RAE
Systems Inc\ProRAE Guardian\XYZ.xyz ”
Under “Description,” you can see the details as entered in required fields.
When you are satisfied with the activity’s parameters, click “Save” to save the activity, or
“Cancel” to cancel it and exit the page.
23.6.5 Activity Log Activity log provides an option to collect and retrieve data across different sets of
activities.
ProRAE Guardian allows for execution of activities by automating those that are
important for the proper functioning of a gas-detection system. You can choose the
activities for automatic execution and also specify the triggers or schedule that starts the
automatic execution of those activities.
The view has the following attributes:
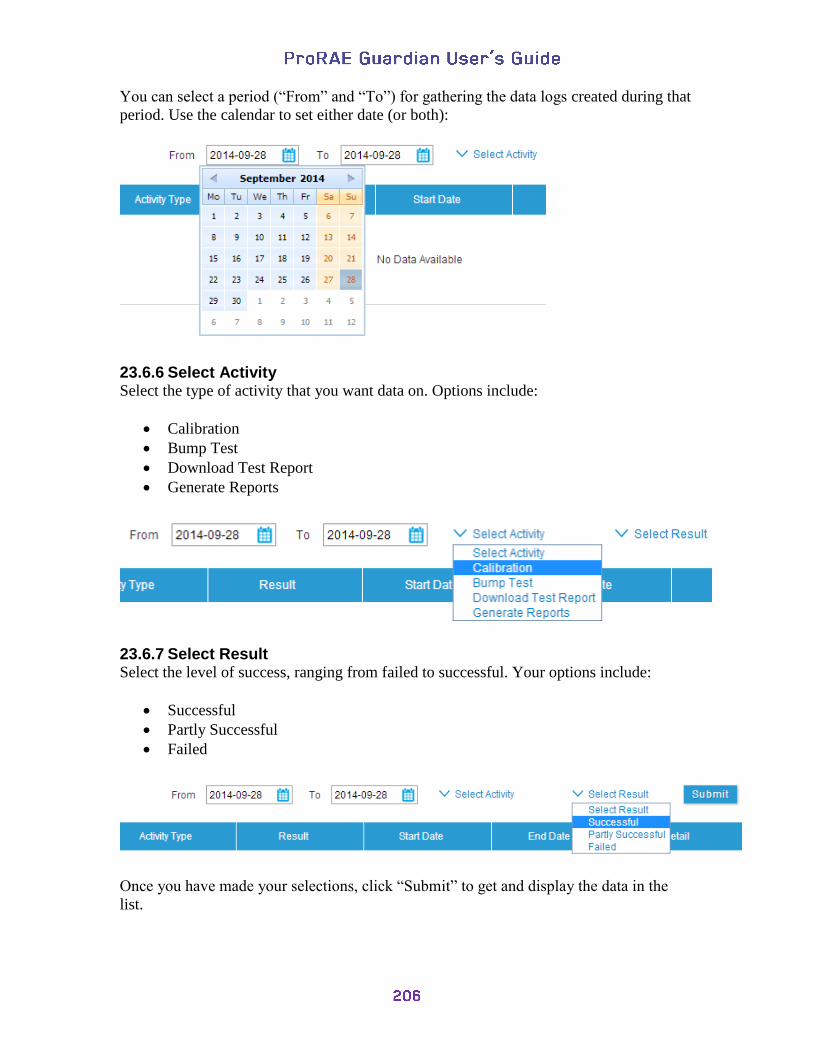
You can select a period (“From” and “To”) for gathering the data logs created during that
period. Use the calendar to set either date (or both):
23.6.6 Select Activity Select the type of activity that you want data on. Options include:
Calibration
Bump Test
Download Test Report
Generate Reports
23.6.7 Select Result Select the level of success, ranging from failed to successful. Your options include:
Successful
Partly Successful
Failed
Once you have made your selections, click “Submit” to get and display the data in the
list.

23.6.8 Show (number) entries
Select the number of entries that you want to have showing in the list.
23.7 System Settings
System Settings govern parameters that affect all of ProRAE Guardian Remote Viewer.
Select from the menu along the left side of the screen which settings you want to examine
or change. The parameters are shown to the right.

23.8 General Settings
Use the pull-down menus to set what appears as the default view in your ProRAE
Guardian panes when you select “Command Center,” “Care Center,” and “Control
Center”:
Default view when clicked on Command Center:
Site Map
Google Map
Default page when clicked on Care Center:
Instruments
Docking Stations
Reports
Default page when clicked on Control Center:
User Management
Action Rules
Activity Automation
System Settings
When you are done making changes, click “Update” to activate them.

23.9 Warranty Expiration
You can set a reminder to let you know in advance of a warranty expiration, allowing you
to plan for warranty extension to avoid gaps in service.
Notification Advance Days: Set the number of days in advance of warranty expiration
for ProRAE Guardian to send you a notification.
Reminder Frequency (how often to repeat the notification):
Daily
Weekly
Monthly
Notify To: Input the person’s name and email address that you want notified via email.
When you are done making changes, click “Update” to activate them.

23.10 Calibration And Bump Test Fail
This provides customizable advance notification of the date when a calibration or bump
test will be due.
Notification Advance Days: Notify the user via email that Calibration and Bump Test
are due in the next few days.
Reminder Frequency (how often to repeat the notification):
Daily
Weekly
Monthly
Notify To: Input the person’s name and email address that you want notified via email.
When you are done making changes, click “Update” to activate them.

23.11 Session Timeout
Set the default time at which ProRAE Guardian Remote Viewer times out and requires
you to input your Username and Password to log in again.
Select Global Session Timeout:
Never
5m
15m
30m
60m
After you have made your selection, click “Update” to activate it.

23.12 Command Center Settings
Set parameters that determine how many records are shown, date and time format, GPS
format, and measurement units.
When you are done making changes, click “Update” to activate them.

23.13 Email Settings
You can create preset email messages and information such as your service provider and
SMTP server settings. In addition, you can create two email templates, complete with
formatting.
If you select “Other” for email, more options are available:

23.13.1 Email Templates There are two templates that you can fill out in order to have premade messages that are
sent via emails. Formatting, type attributes, and other features can be set and saved.
When you are done making changes, click “Update” to activate them.

23.14 Report Settings
Like your email templates, you can create templates for your report header (top of each
page) and footer (bottom of each page). This includes formatting. Start by creating a
Report Header and a Report Footer:
When you are done making changes, click “Update” to activate them.

You can also set which reports are saved onto the server. Click “Save report on server”
and then check or uncheck the types of reports you want to include or exclude:
When you are done making changes, click “Update” to activate them.

23.15 Password Policy
You can set your password policy to be weak, medium-strength, or strong. The rules for
each level are explained when you click one of the choices:
When you are done making your selection, click “Update” to activate it.
23.16 User Groups
You can create groups of users here. To create a group, click on “Add Group” and then
provide a name and a description. To save the group name, click “Add.”
Click “Add Group” to create a new group. Provide a group name and a brief description
(optional), and then click “Add.” You have created a group that shows up in the User
Groups roster.

23.17 BioHarness Settings
Set alarm thresholds, as well as personal age and activity profile values under “User
Settings.” When you are done, click “Update.”
Click the checkboxes to allow individual users to override default values, enable smart
phone authentication, and enable and BioHarness3 authentication.
Set communication parameters such as reporting intervals under the “Communication
Settings” tab. When you are done, click “Update.”

23.18 Account Lockout Policy
You can manage the way ProRAE Guardian locks out unauthorized people by limiting
the number of times they can attempt to use an incorrect password before they are locked
out for an interval you set.
1.Set the number of attempts:
2.Set the lockout duration:
3.When you are done making your selection, click “Update” to activate it.

24 Technical Support
To contact RAE Systems Technical Support:
Monday through Friday, 7:00AM to 5:00PM Pacific (US) Time
Phone (toll-free): +1 877-723-2878
Phone: +1 408-952-8200
Fax: +1 408-952-8480 Email: [email protected]
25 RAE Systems By Honeywell Contacts
RAE Systems by Honeywell World Headquarters
3775 N. First St.
San Jose, CA 95134-1708 USA
Phone: +1 888-723-4800
E-mail: [email protected]
Web Site: www.raesystems.com
Training
Phone: +1 408-952-8260
Email: [email protected]