Embed Size (px)
Citation preview
OBDScope User's Guide 1
OBDScope User's Guide
Version 1.20
© Copyright 2010 Tmi OBDScope www.obdscope.com
OBDScope User's Guide 2
Table of Contents 1 Introduction...........................................................................3 2 Installation and activation.....................................................4 3 Connecting to the vehicle.....................................................5 4 Diagnosing the vehicle.........................................................5 5 Managing diagnoses............................................................7 6 Using gauges........................................................................8 7 Data logging........................................................................21 8 Settings...............................................................................25 9 Calibrating the Fuel Economy reading...............................27 10 Advanced features............................................................28
© Copyright 2010 Tmi OBDScope www.obdscope.com
OBDScope User's Guide 3
1 IntroductionOBDScope is a vehicle On-Board diagnostics software for S60 smartphones. The software uses Bluetooth to connect to an OBD-II interface which is connected to a vehicle. The software then uses the OBD-II interface to access the data available on the ECU of the vehicle. The data can be monitored in real-time or it can be logged to a file for further analysis.
System requirements● Symbian S60 3rd or 5th edition smartphone.
○ Most of the recent Nokia handsets.
● Bluetooth OBD-II interface.○ ELM327 Bluetooth OBD-II Wireless Transceiver Dongle.
○ DIAMEX DX70 Bluetooth.
○ OBDKey Bluetooth.
○ OBDLink Bluetooth
○ ElmCanII-Bluetooth-Interface
○ Any Bluetooth OBD-II interface with ELM compliant chip will operate.
● Vehicle supporting OBD-II.○ Most of the passenger cars model 2001 -> with petrol engine.
○ Most of the passenger cars model 2005 -> with diesel engine.
Warning:Never use OBDScope while driving!You should never attempt to use OBDScope while operating a moving vehicle. If you need to monitor sensor information while driving, it is strongly recommended that you have a passenger to operate OBDScope. If you don’t have a helping passenger, use OBDScope's Data logging feature so that you can analyse the collected data once you have safely parked your vehicle.
© Copyright 2010 Tmi OBDScope www.obdscope.com
OBDScope User's Guide 4
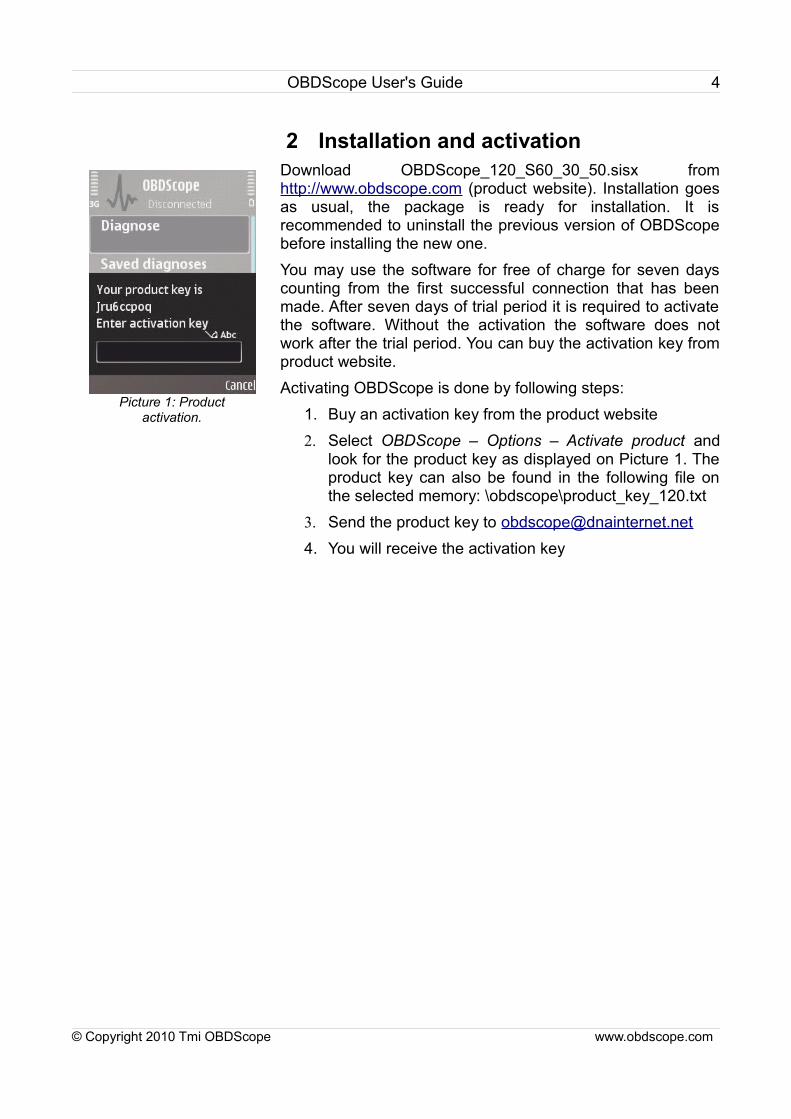
2 Installation and activationDownload OBDScope_120_S60_30_50.sisx from http://www.obdscope.com (product website). Installation goes as usual, the package is ready for installation. It is recommended to uninstall the previous version of OBDScope before installing the new one.You may use the software for free of charge for seven days counting from the first successful connection that has been made. After seven days of trial period it is required to activate the software. Without the activation the software does not work after the trial period. You can buy the activation key from product website.Activating OBDScope is done by following steps:
1. Buy an activation key from the product website2. Select OBDScope – Options – Activate product and
look for the product key as displayed on Picture 1. The product key can also be found in the following file on the selected memory: \obdscope\product_key_120.txt
3. Send the product key to [email protected]. You will receive the activation key
© Copyright 2010 Tmi OBDScope www.obdscope.com
Picture 1: Product activation.
OBDScope User's Guide 5
3 Connecting to the vehicleTo obtain full functionality of OBDScope, connection to the vehicle must be successfully established. Following steps are required for connecting to the vehicle:
● Plug the Bluetooth OBD-II interface in the OBD-II port of the vehicle.
● Start the vehicle. Only switching on the ignition may be enough to enable some functionality. For full functionality the engine must be running.
● Pair the Bluetooth OBD-II interface with your phone and set the interface as authorized. This step is required only once.
● Start the OBDScope application.● Select Options → Connect● Bluetooth device selection dialog is displayed. Search
for and select the OBD-II interface. This step is required only once.
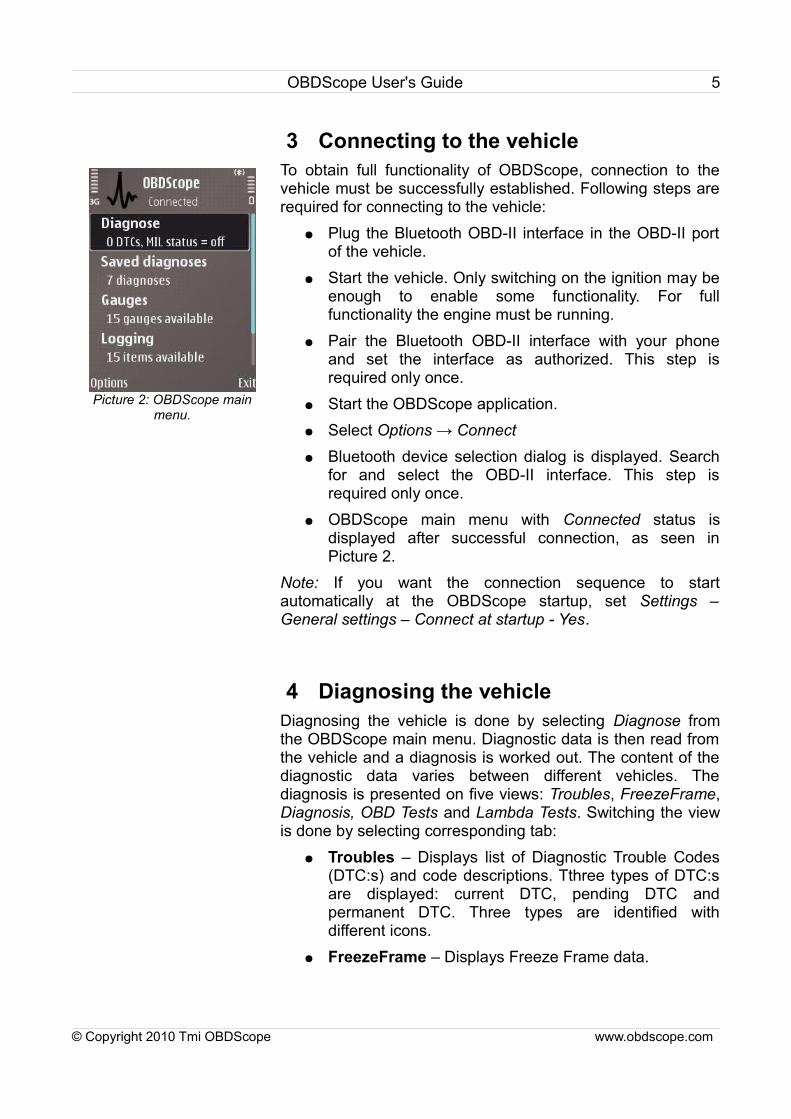
● OBDScope main menu with Connected status is displayed after successful connection, as seen in Picture 2.
Note: If you want the connection sequence to start automatically at the OBDScope startup, set Settings – General settings – Connect at startup - Yes.
4 Diagnosing the vehicleDiagnosing the vehicle is done by selecting Diagnose from the OBDScope main menu. Diagnostic data is then read from the vehicle and a diagnosis is worked out. The content of the diagnostic data varies between different vehicles. The diagnosis is presented on five views: Troubles, FreezeFrame, Diagnosis, OBD Tests and Lambda Tests. Switching the view is done by selecting corresponding tab:
● Troubles – Displays list of Diagnostic Trouble Codes (DTC:s) and code descriptions. Tthree types of DTC:s are displayed: current DTC, pending DTC and permanent DTC. Three types are identified with different icons.
● FreezeFrame – Displays Freeze Frame data.
© Copyright 2010 Tmi OBDScope www.obdscope.com
Picture 2: OBDScope main menu.
OBDScope User's Guide 6
● Diagnosis – Displays various diagnosis parameters and meta data of the diagnosis. Includes e.g. the time and the location of the diagnosis and the Malfunction Indicator Lamp (MIL) status. Also the Vehicle Identification Number (VIN) is displayed if it is available. Inspection status is shown according to the Table 1.
MIL on no no no yes/no yes
DTC:s found no no no yes yes/no
OBD Tests incomplete no yes yes yes/no yes/no
Variance in Lambda Tests yes/no yes no yes/no yes/no
Inspection status passed passed failed failed failed
Table 1: Inspection statuses.
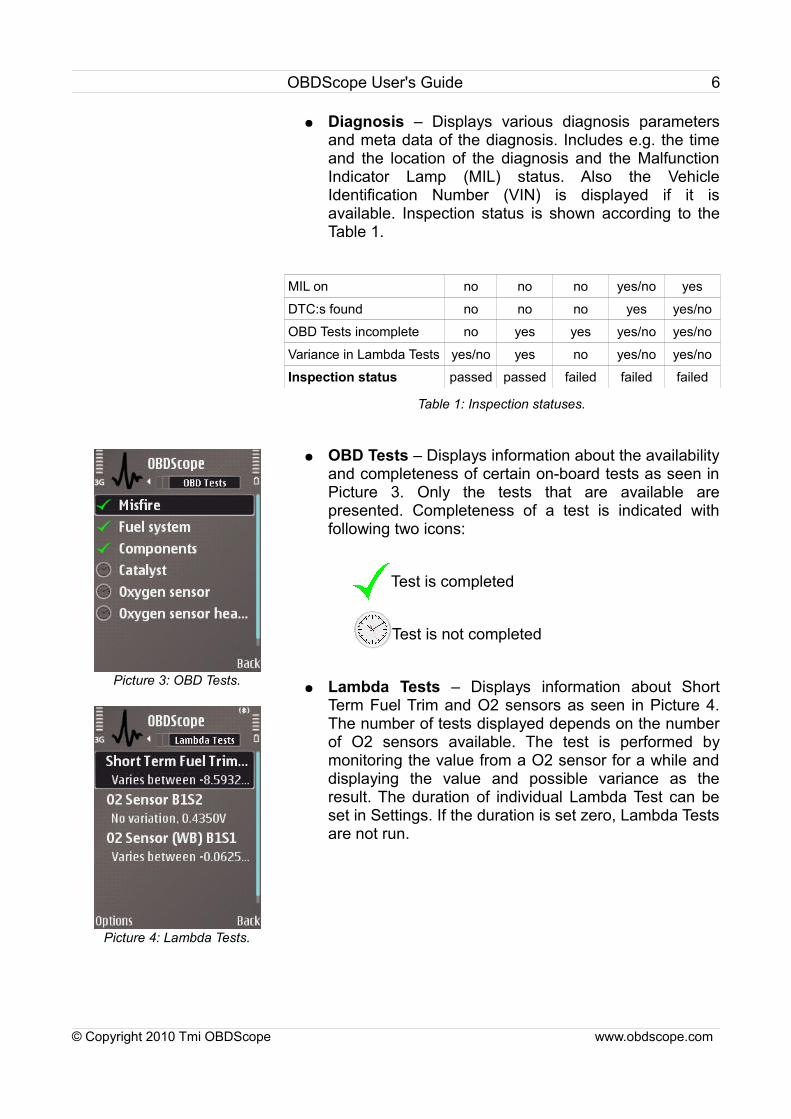
● OBD Tests – Displays information about the availability and completeness of certain on-board tests as seen in Picture 3. Only the tests that are available are presented. Completeness of a test is indicated with following two icons:
Test is completed
Test is not completed
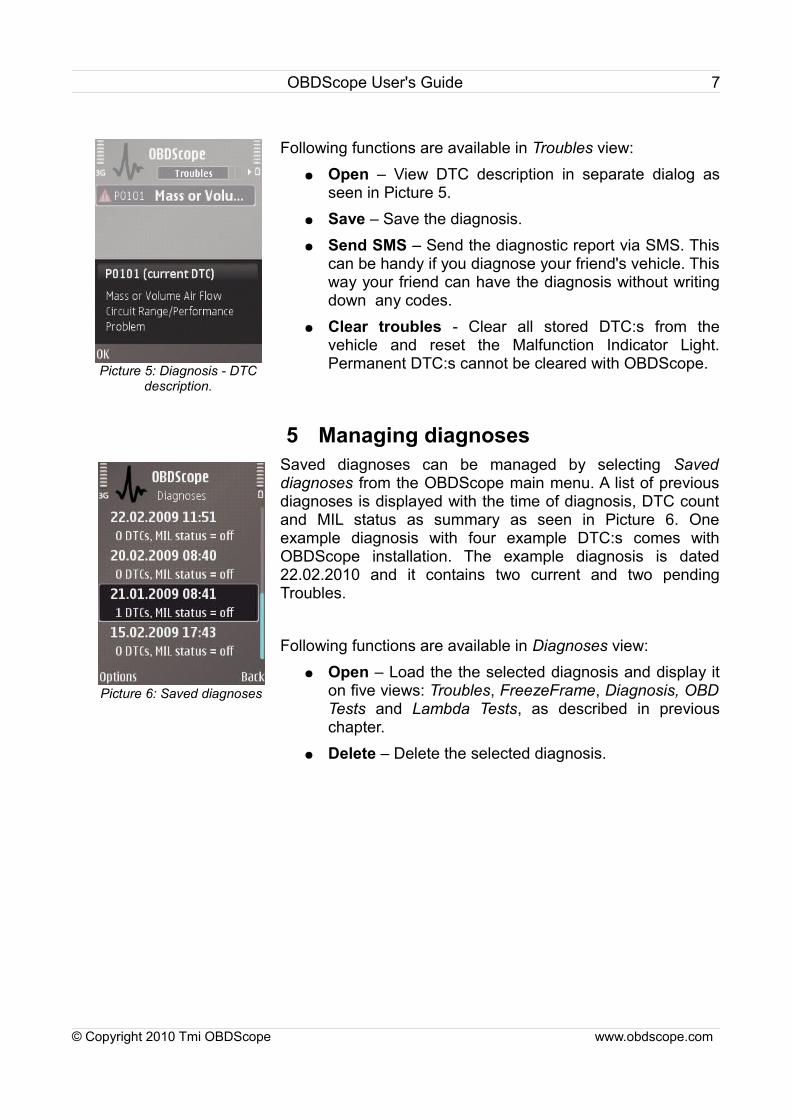
● Lambda Tests – Displays information about Short Term Fuel Trim and O2 sensors as seen in Picture 4. The number of tests displayed depends on the number of O2 sensors available. The test is performed by monitoring the value from a O2 sensor for a while and displaying the value and possible variance as the result. The duration of individual Lambda Test can be set in Settings. If the duration is set zero, Lambda Tests are not run.
© Copyright 2010 Tmi OBDScope www.obdscope.com
Picture 3: OBD Tests.
Picture 4: Lambda Tests.
OBDScope User's Guide 7
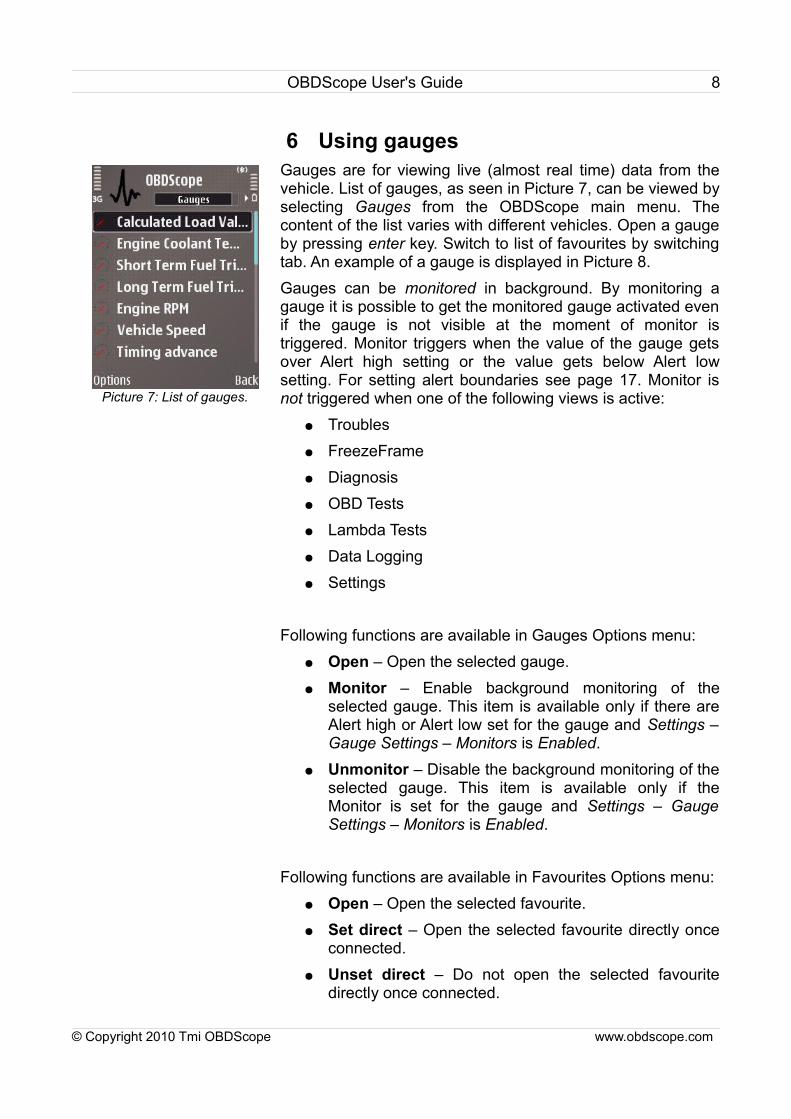
Following functions are available in Troubles view:● Open – View DTC description in separate dialog as
seen in Picture 5.● Save – Save the diagnosis.● Send SMS – Send the diagnostic report via SMS. This
can be handy if you diagnose your friend's vehicle. This way your friend can have the diagnosis without writing down any codes.
● Clear troubles - Clear all stored DTC:s from the vehicle and reset the Malfunction Indicator Light. Permanent DTC:s cannot be cleared with OBDScope.
5 Managing diagnosesSaved diagnoses can be managed by selecting Saved diagnoses from the OBDScope main menu. A list of previous diagnoses is displayed with the time of diagnosis, DTC count and MIL status as summary as seen in Picture 6. One example diagnosis with four example DTC:s comes with OBDScope installation. The example diagnosis is dated 22.02.2010 and it contains two current and two pending Troubles.
Following functions are available in Diagnoses view:● Open – Load the the selected diagnosis and display it
on five views: Troubles, FreezeFrame, Diagnosis, OBD Tests and Lambda Tests, as described in previous chapter.
● Delete – Delete the selected diagnosis.
© Copyright 2010 Tmi OBDScope www.obdscope.com
Picture 5: Diagnosis - DTC description.
Picture 6: Saved diagnoses
OBDScope User's Guide 8
6 Using gaugesGauges are for viewing live (almost real time) data from the vehicle. List of gauges, as seen in Picture 7, can be viewed by selecting Gauges from the OBDScope main menu. The content of the list varies with different vehicles. Open a gauge by pressing enter key. Switch to list of favourites by switching tab. An example of a gauge is displayed in Picture 8.Gauges can be monitored in background. By monitoring a gauge it is possible to get the monitored gauge activated even if the gauge is not visible at the moment of monitor is triggered. Monitor triggers when the value of the gauge gets over Alert high setting or the value gets below Alert low setting. For setting alert boundaries see page 17. Monitor is not triggered when one of the following views is active:
● Troubles● FreezeFrame● Diagnosis● OBD Tests● Lambda Tests● Data Logging● Settings
Following functions are available in Gauges Options menu:● Open – Open the selected gauge.● Monitor – Enable background monitoring of the
selected gauge. This item is available only if there are Alert high or Alert low set for the gauge and Settings – Gauge Settings – Monitors is Enabled.
● Unmonitor – Disable the background monitoring of the selected gauge. This item is available only if the Monitor is set for the gauge and Settings – Gauge Settings – Monitors is Enabled.
Following functions are available in Favourites Options menu:● Open – Open the selected favourite.● Set direct – Open the selected favourite directly once
connected.● Unset direct – Do not open the selected favourite
directly once connected.
© Copyright 2010 Tmi OBDScope www.obdscope.com
Picture 7: List of gauges.
OBDScope User's Guide 9
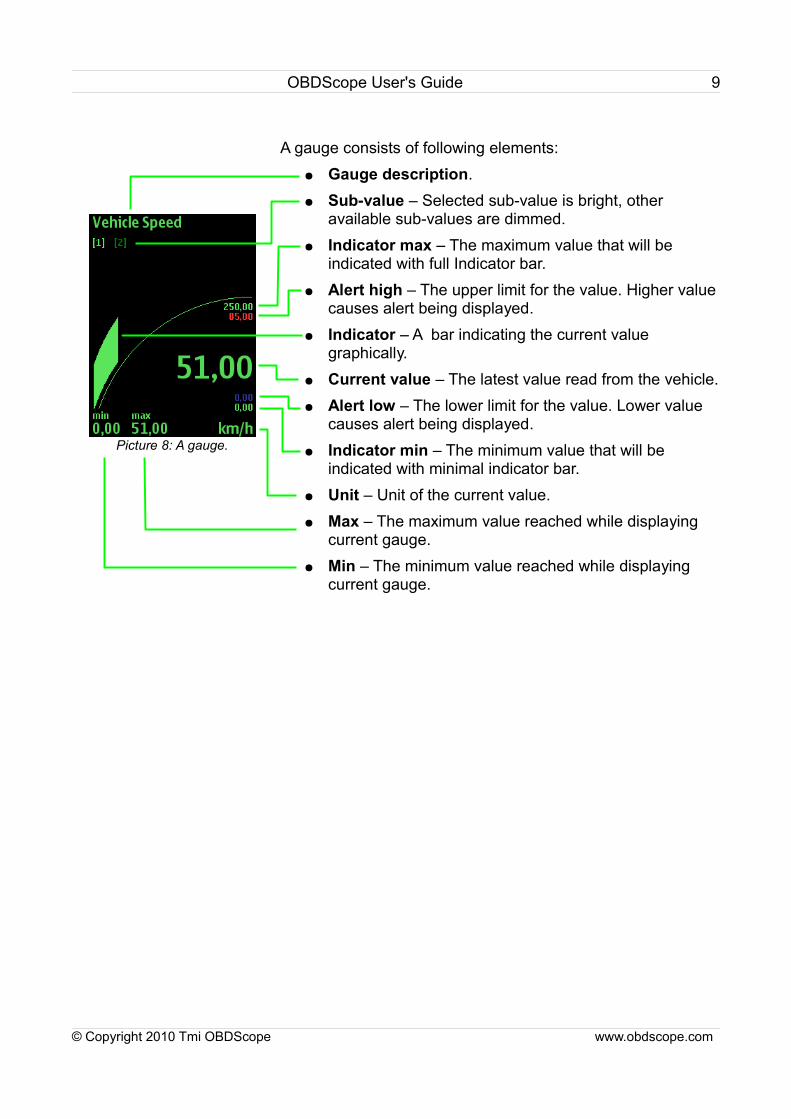
A gauge consists of following elements:● Gauge description.● Sub-value – Selected sub-value is bright, other
available sub-values are dimmed.● Indicator max – The maximum value that will be
indicated with full Indicator bar.● Alert high – The upper limit for the value. Higher value
causes alert being displayed.● Indicator – A bar indicating the current value
graphically.● Current value – The latest value read from the vehicle.● Alert low – The lower limit for the value. Lower value
causes alert being displayed. ● Indicator min – The minimum value that will be
indicated with minimal indicator bar.● Unit – Unit of the current value.● Max – The maximum value reached while displaying
current gauge.● Min – The minimum value reached while displaying
current gauge.
© Copyright 2010 Tmi OBDScope www.obdscope.com
Picture 8: A gauge.
OBDScope User's Guide 10
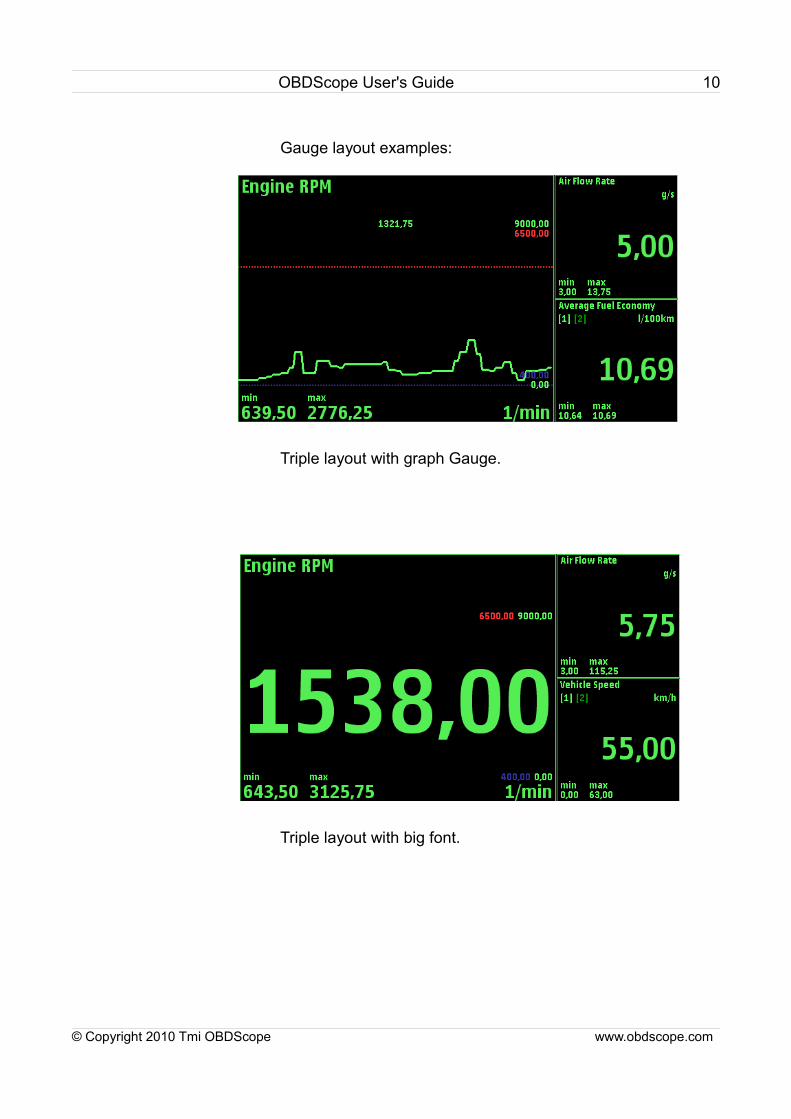
Gauge layout examples:
Triple layout with graph Gauge.
Triple layout with big font.
© Copyright 2010 Tmi OBDScope www.obdscope.com
OBDScope User's Guide 11
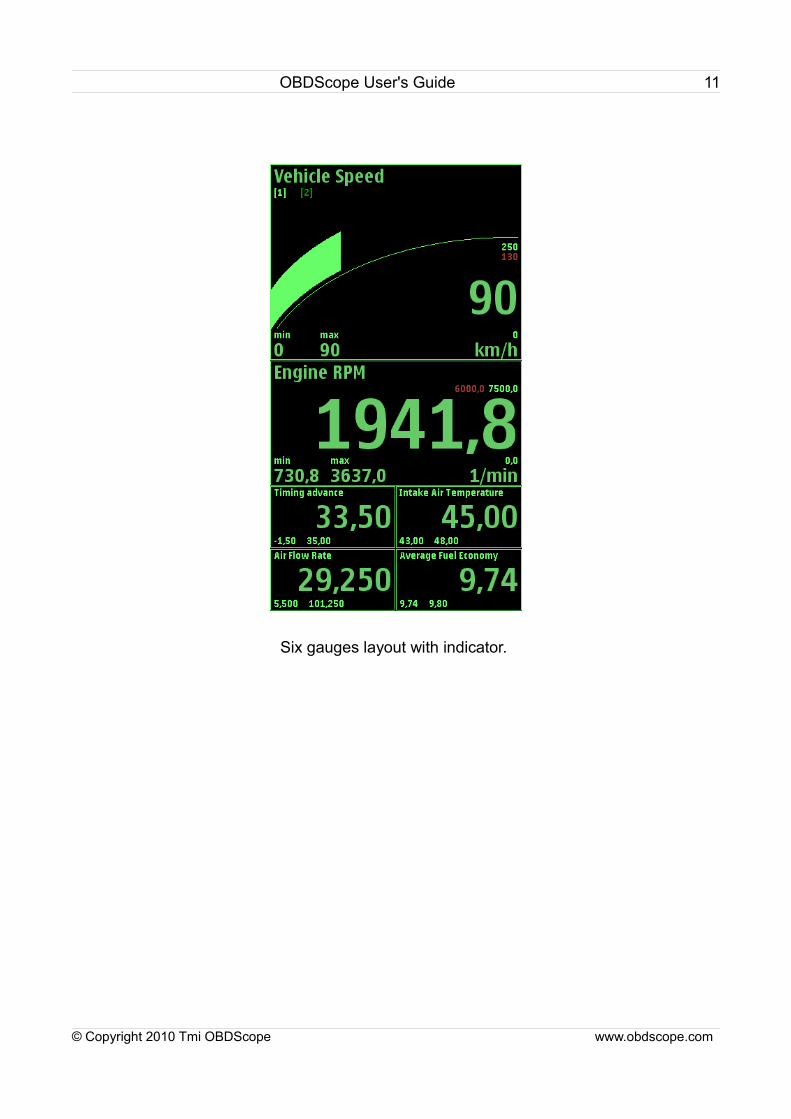
Six gauges layout with indicator.
© Copyright 2010 Tmi OBDScope www.obdscope.com
OBDScope User's Guide 12
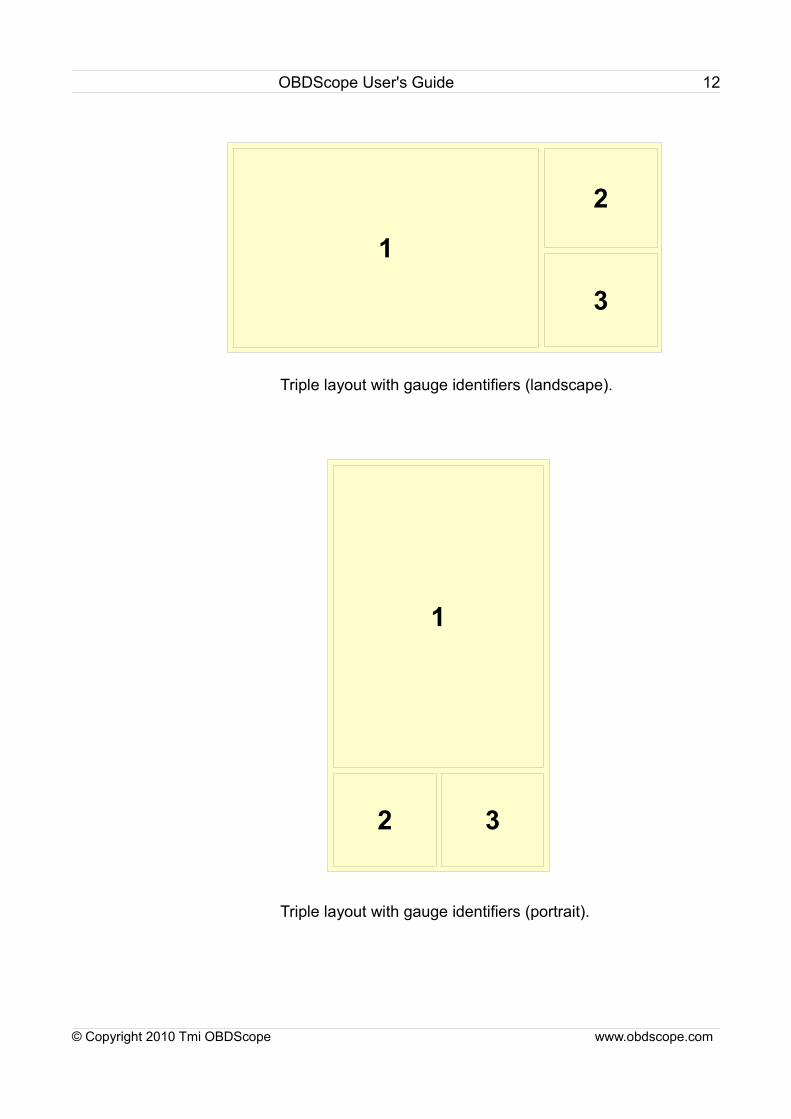
Triple layout with gauge identifiers (landscape).
Triple layout with gauge identifiers (portrait).
© Copyright 2010 Tmi OBDScope www.obdscope.com
2
3
1
32
1
OBDScope User's Guide 13
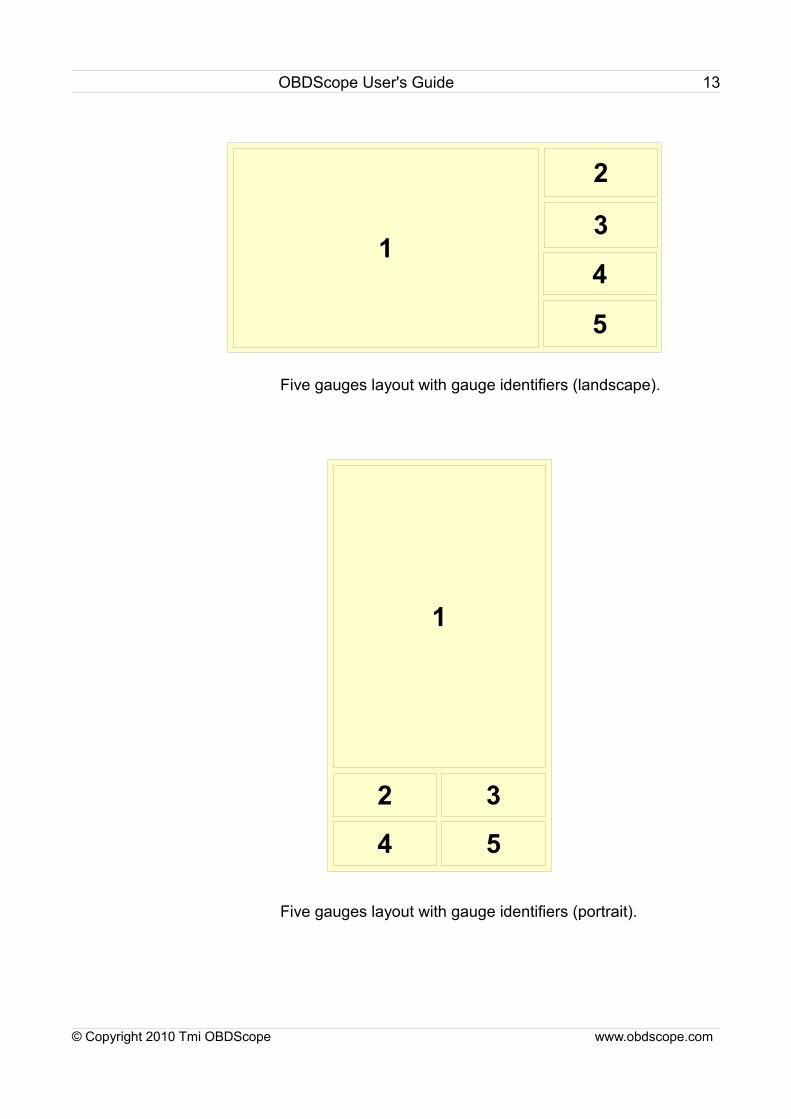
Five gauges layout with gauge identifiers (landscape).
Five gauges layout with gauge identifiers (portrait).
© Copyright 2010 Tmi OBDScope www.obdscope.com
2
31
2
1
5
4
4
3
5
OBDScope User's Guide 14
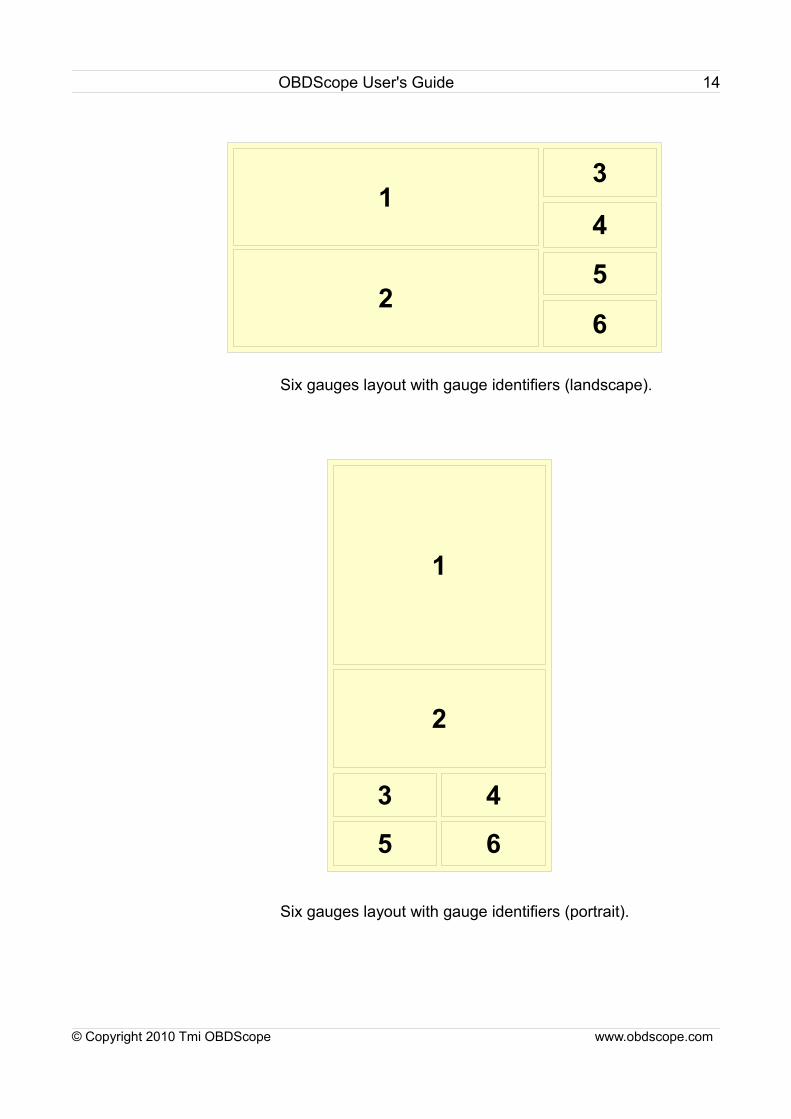
Six gauges layout with gauge identifiers (landscape).
Six gauges layout with gauge identifiers (portrait).
© Copyright 2010 Tmi OBDScope www.obdscope.com
3
41
3
1
6
5
5
4
6
2
2
OBDScope User's Guide 15
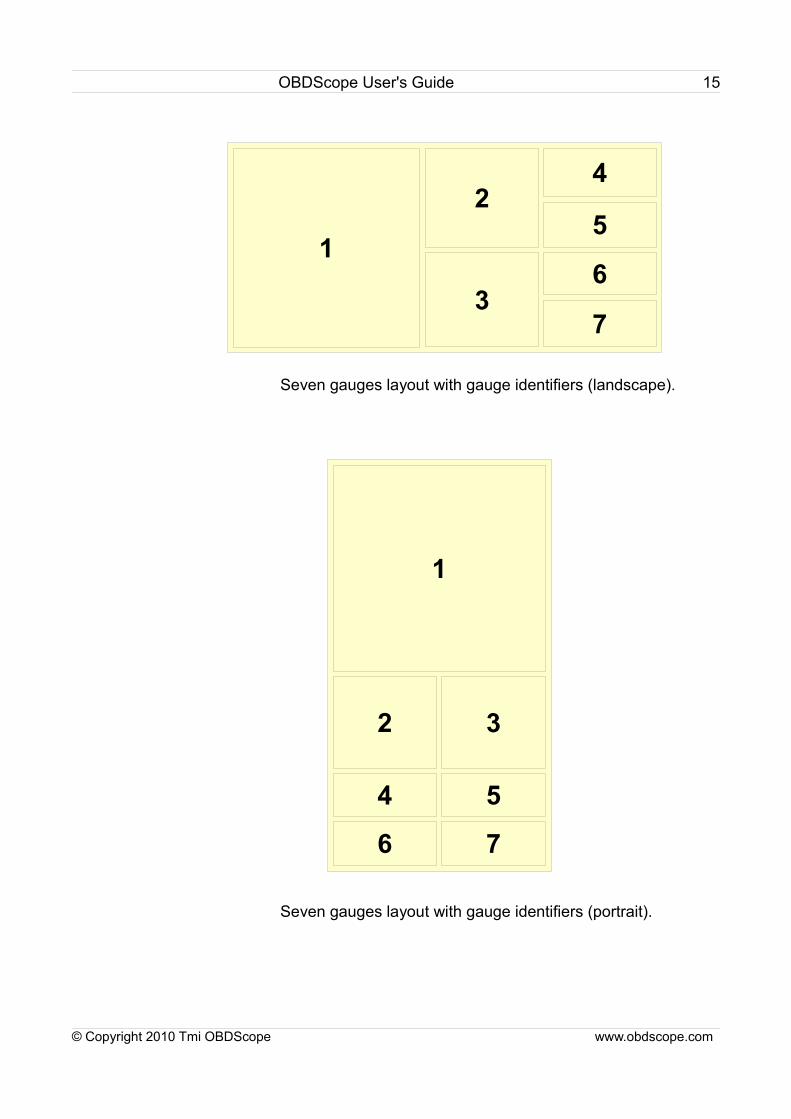
Seven gauges layout with gauge identifiers (landscape).
Seven gauges layout with gauge identifiers (portrait).
© Copyright 2010 Tmi OBDScope www.obdscope.com
4
51
4
1
7
6
6
5
7
2
3
32
OBDScope User's Guide 16
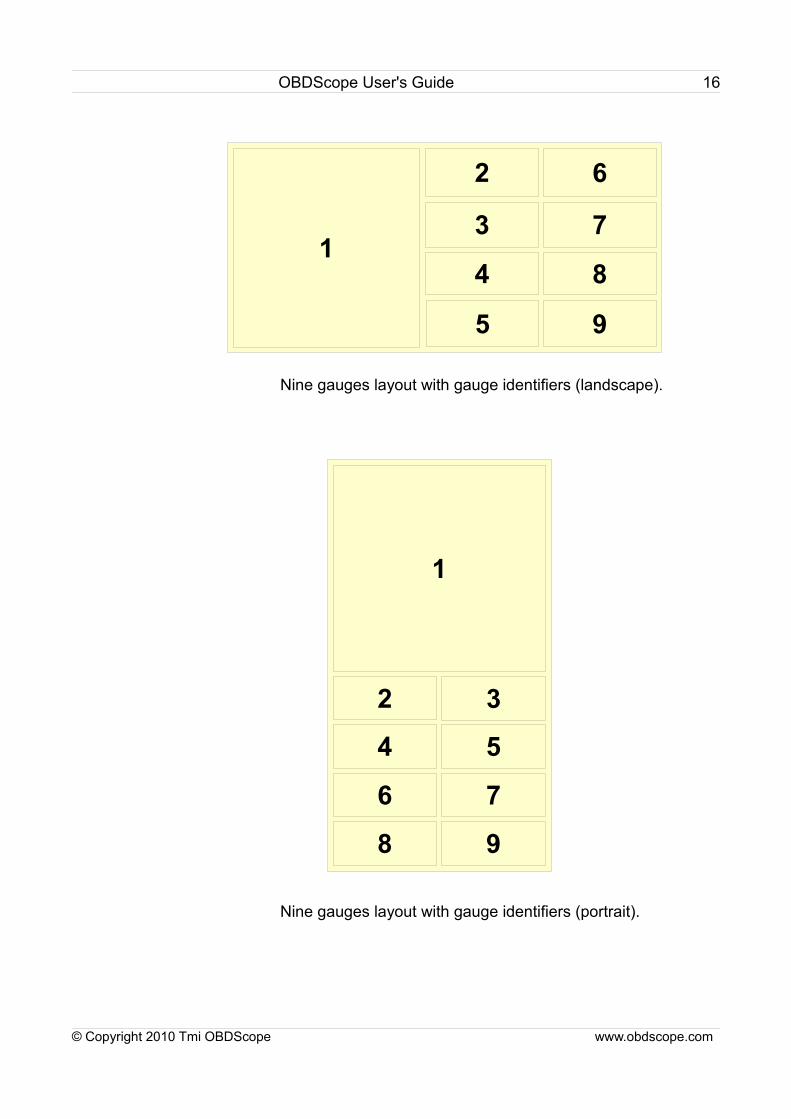
Nine gauges layout with gauge identifiers (landscape).
Nine gauges layout with gauge identifiers (portrait).
© Copyright 2010 Tmi OBDScope www.obdscope.com
6
71
6
1
9
8
8
7
9
2
3
4
5
54
2 3
OBDScope User's Guide 17
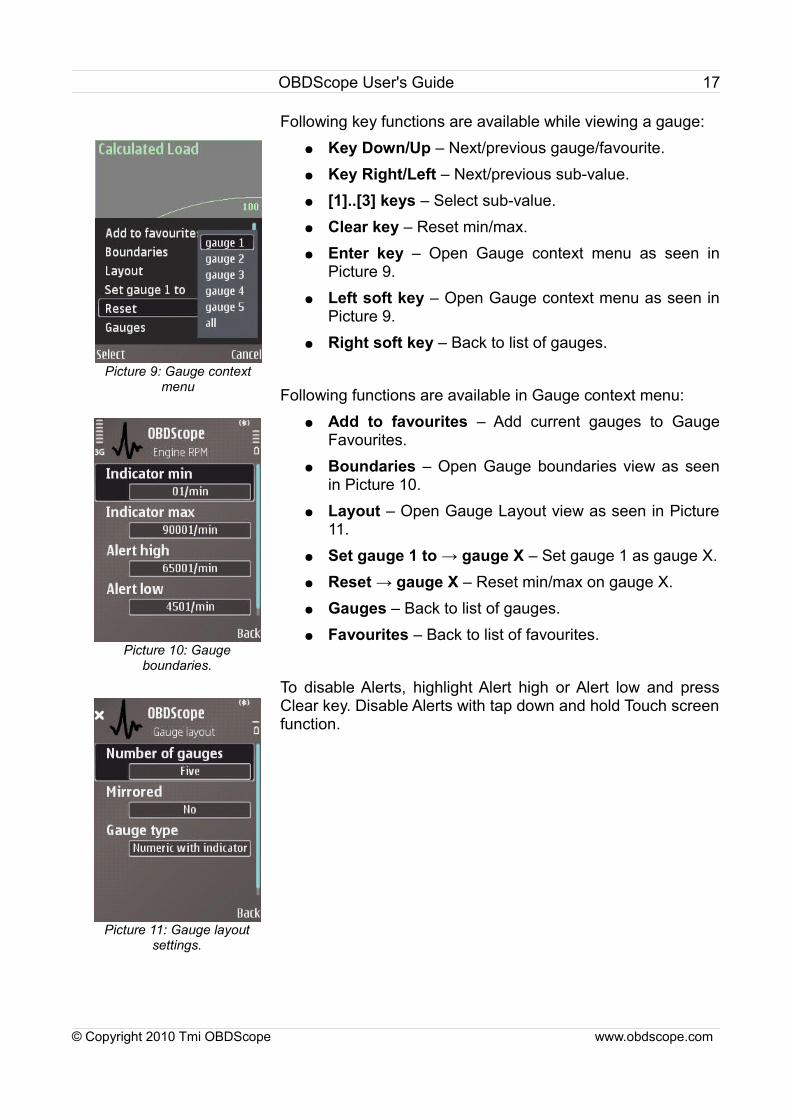
Following key functions are available while viewing a gauge:● Key Down/Up – Next/previous gauge/favourite.● Key Right/Left – Next/previous sub-value.● [1]..[3] keys – Select sub-value.● Clear key – Reset min/max.● Enter key – Open Gauge context menu as seen in
Picture 9.● Left soft key – Open Gauge context menu as seen in
Picture 9.● Right soft key – Back to list of gauges.
Following functions are available in Gauge context menu:● Add to favourites – Add current gauges to Gauge
Favourites.● Boundaries – Open Gauge boundaries view as seen
in Picture 10.● Layout – Open Gauge Layout view as seen in Picture
11.● Set gauge 1 to → gauge X – Set gauge 1 as gauge X. ● Reset → gauge X – Reset min/max on gauge X.● Gauges – Back to list of gauges.● Favourites – Back to list of favourites.
To disable Alerts, highlight Alert high or Alert low and press Clear key. Disable Alerts with tap down and hold Touch screen function.
© Copyright 2010 Tmi OBDScope www.obdscope.com
Picture 10: Gauge boundaries.
Picture 9: Gauge context menu
Picture 11: Gauge layout settings.
OBDScope User's Guide 18
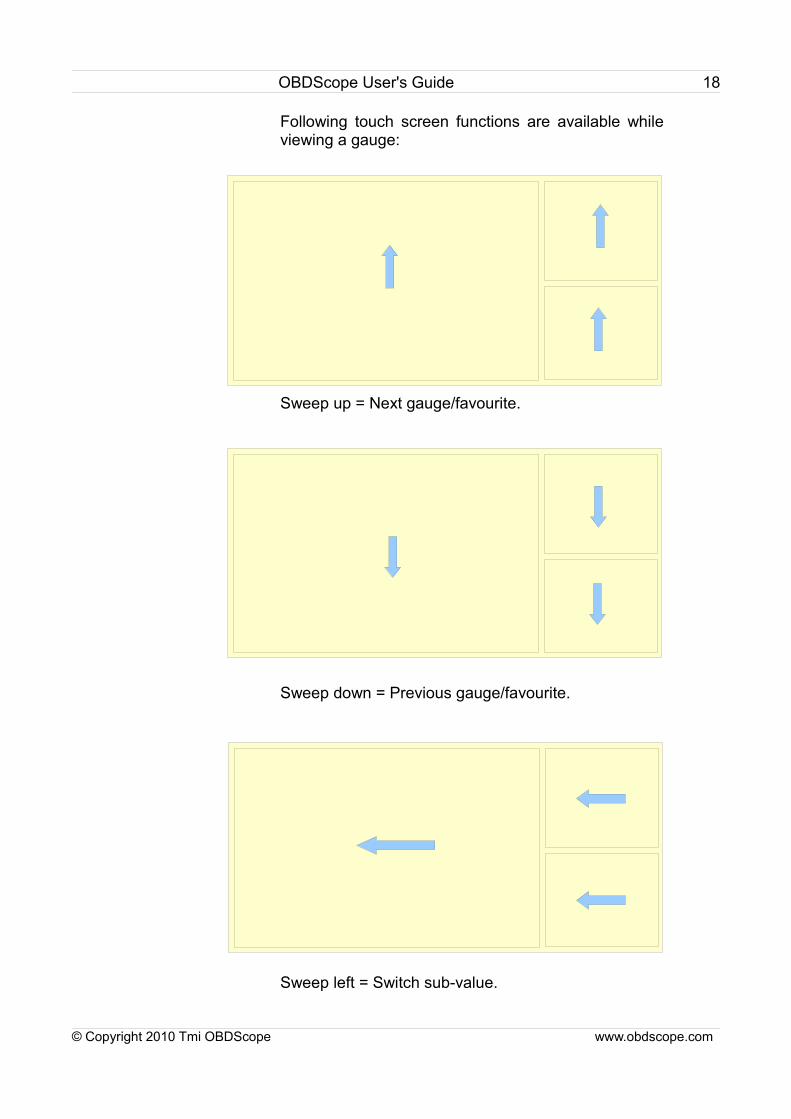
Following touch screen functions are available while viewing a gauge:
Sweep up = Next gauge/favourite.
Sweep down = Previous gauge/favourite.
Sweep left = Switch sub-value.
© Copyright 2010 Tmi OBDScope www.obdscope.com
OBDScope User's Guide 19
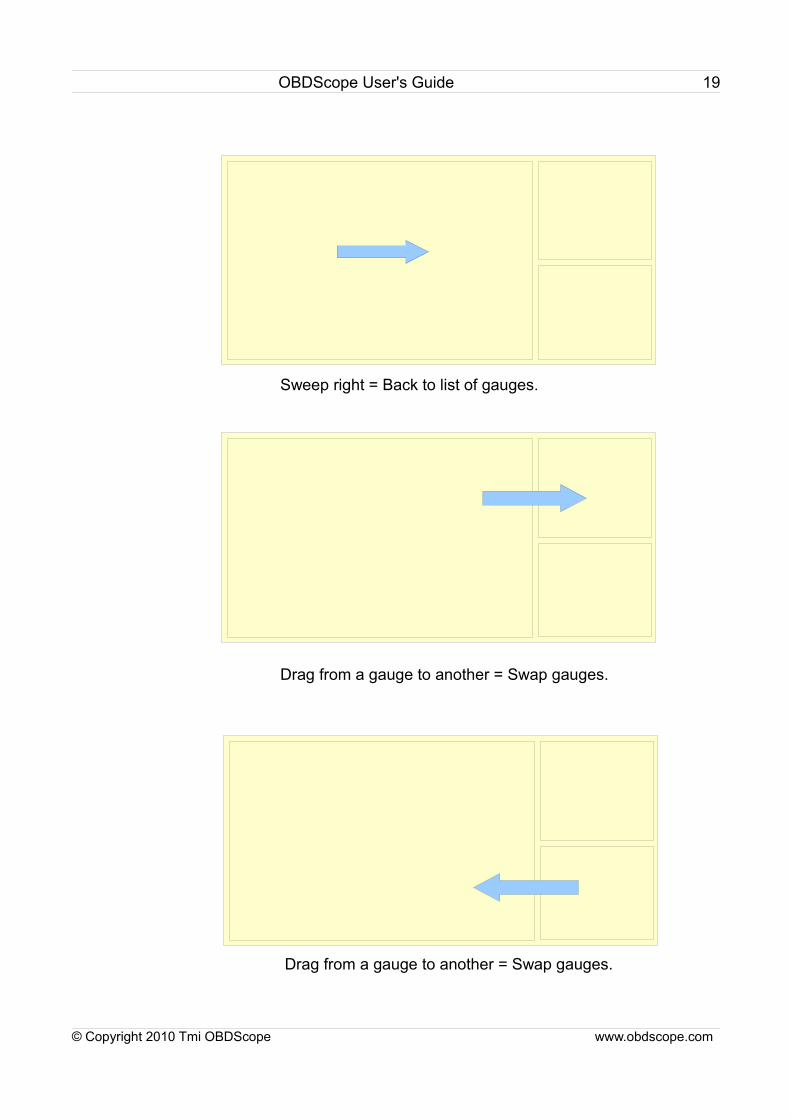
Sweep right = Back to list of gauges.
Drag from a gauge to another = Swap gauges.
Drag from a gauge to another = Swap gauges.
© Copyright 2010 Tmi OBDScope www.obdscope.com
OBDScope User's Guide 20
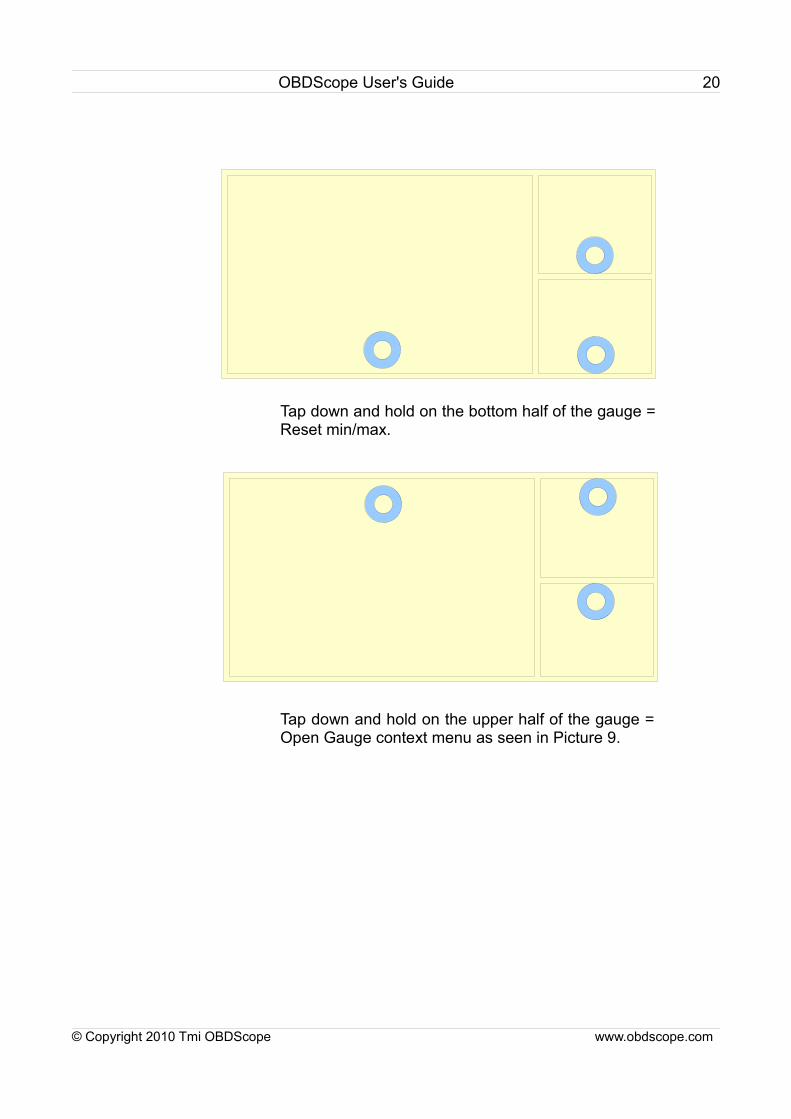
Tap down and hold on the bottom half of the gauge = Reset min/max.
Tap down and hold on the upper half of the gauge = Open Gauge context menu as seen in Picture 9.
© Copyright 2010 Tmi OBDScope www.obdscope.com
OBDScope User's Guide 21
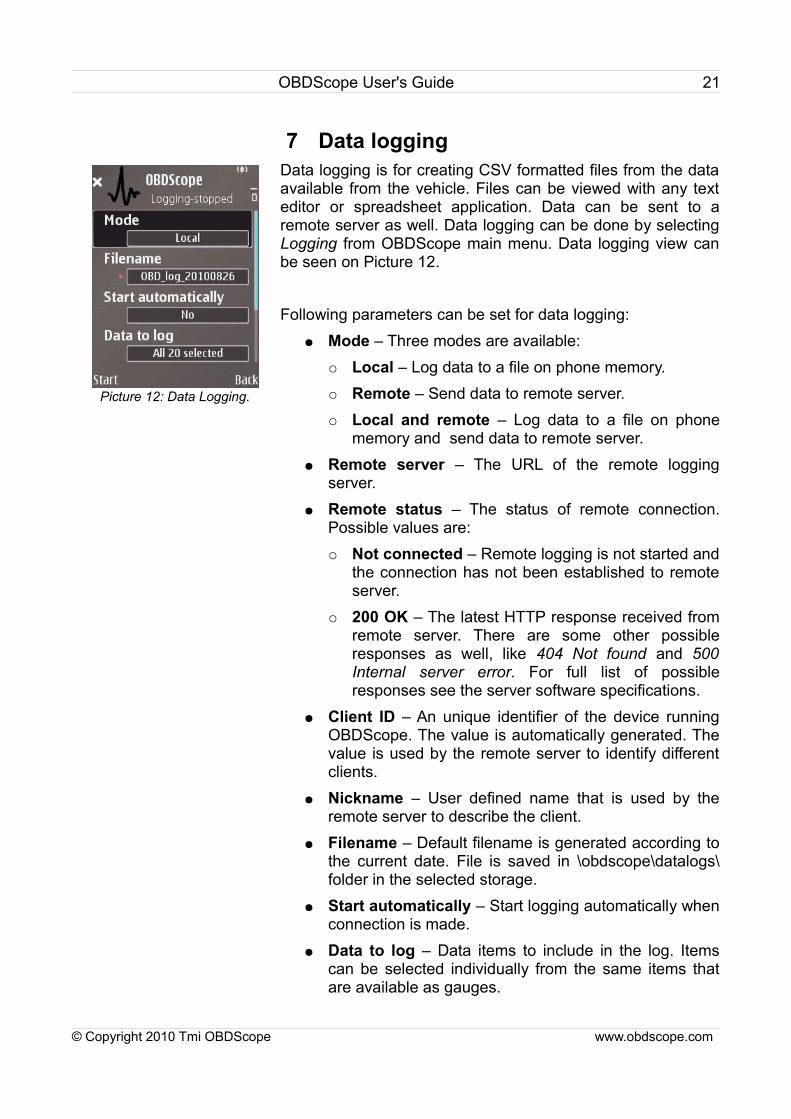
7 Data loggingData logging is for creating CSV formatted files from the data available from the vehicle. Files can be viewed with any text editor or spreadsheet application. Data can be sent to a remote server as well. Data logging can be done by selecting Logging from OBDScope main menu. Data logging view can be seen on Picture 12.
Following parameters can be set for data logging:● Mode – Three modes are available:
○ Local – Log data to a file on phone memory.○ Remote – Send data to remote server.○ Local and remote – Log data to a file on phone
memory and send data to remote server.● Remote server – The URL of the remote logging
server.● Remote status – The status of remote connection.
Possible values are:○ Not connected – Remote logging is not started and
the connection has not been established to remote server.
○ 200 OK – The latest HTTP response received from remote server. There are some other possible responses as well, like 404 Not found and 500 Internal server error. For full list of possible responses see the server software specifications.
● Client ID – An unique identifier of the device running OBDScope. The value is automatically generated. The value is used by the remote server to identify different clients.
● Nickname – User defined name that is used by the remote server to describe the client.
● Filename – Default filename is generated according to the current date. File is saved in \obdscope\datalogs\ folder in the selected storage.
● Start automatically – Start logging automatically when connection is made.
● Data to log – Data items to include in the log. Items can be selected individually from the same items that are available as gauges.
© Copyright 2010 Tmi OBDScope www.obdscope.com
Picture 12: Data Logging.
OBDScope User's Guide 22
● Sample rate – The frequency of the log rows. Note that there may be limitations with interface/vehicle data rate, the values of the log items may not update as frequent as defined with Sample rate setting. The number of selected data items affects to the actual update frequency of individual data items: The more selected data items, the lower the actual update frequency. So select only the items you really need.
● CSV separator – The character used in output to separate values.
Starting the data logging with defined parameters:● Start – Left soft key.
Stopping the data logging:● Stop – Left soft key.
© Copyright 2010 Tmi OBDScope www.obdscope.com
OBDScope User's Guide 23
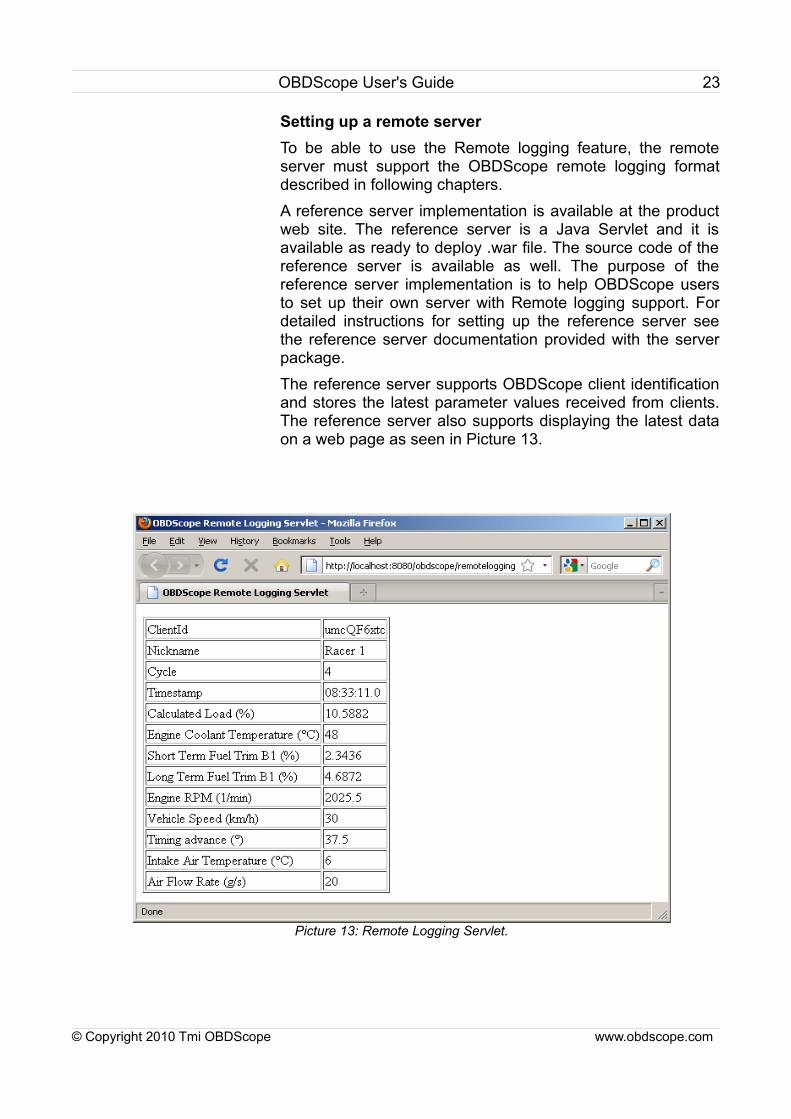
Setting up a remote serverTo be able to use the Remote logging feature, the remote server must support the OBDScope remote logging format described in following chapters.A reference server implementation is available at the product web site. The reference server is a Java Servlet and it is available as ready to deploy .war file. The source code of the reference server is available as well. The purpose of the reference server implementation is to help OBDScope users to set up their own server with Remote logging support. For detailed instructions for setting up the reference server see the reference server documentation provided with the server package.The reference server supports OBDScope client identification and stores the latest parameter values received from clients. The reference server also supports displaying the latest data on a web page as seen in Picture 13.
© Copyright 2010 Tmi OBDScope www.obdscope.com
Picture 13: Remote Logging Servlet.
OBDScope User's Guide 24
Remote logging data formatOBDScope uses HTTP POST method to send data to remote server. OBDScope sends three types of messages to the remote server:
● Initialization message – Sent once data logging is started by the client.Format:OBDScope [version][CSV separator][decimal separator][Client ID][CSV separator][Nickname]
Example:OBDScope 1.20;,e8hW3H;Racer 1
● Data message – Sent as defined in Data Logging settings. The format of the data message is almost the same as the format of the data logging file. Only the Client ID is added to the beginning of the data. The first data message contains parameter identifiers. The second data message contains parameter descriptions, just like in data logging file.Format[Client ID][CSV separator][data]
Examples:e8hW3H;;;0x0c;0x0d
e8hW3H;Cycle;Timestamp;Engine RPM;Vehicle speed
e8hW3H;0;15:14:34,25;2025,5;30
● Stop message – Sent when data logging is stopped by the client. Format:[Client ID][CSV separator]BYE
Example:e8hW3H;BYE
© Copyright 2010 Tmi OBDScope www.obdscope.com
OBDScope User's Guide 25
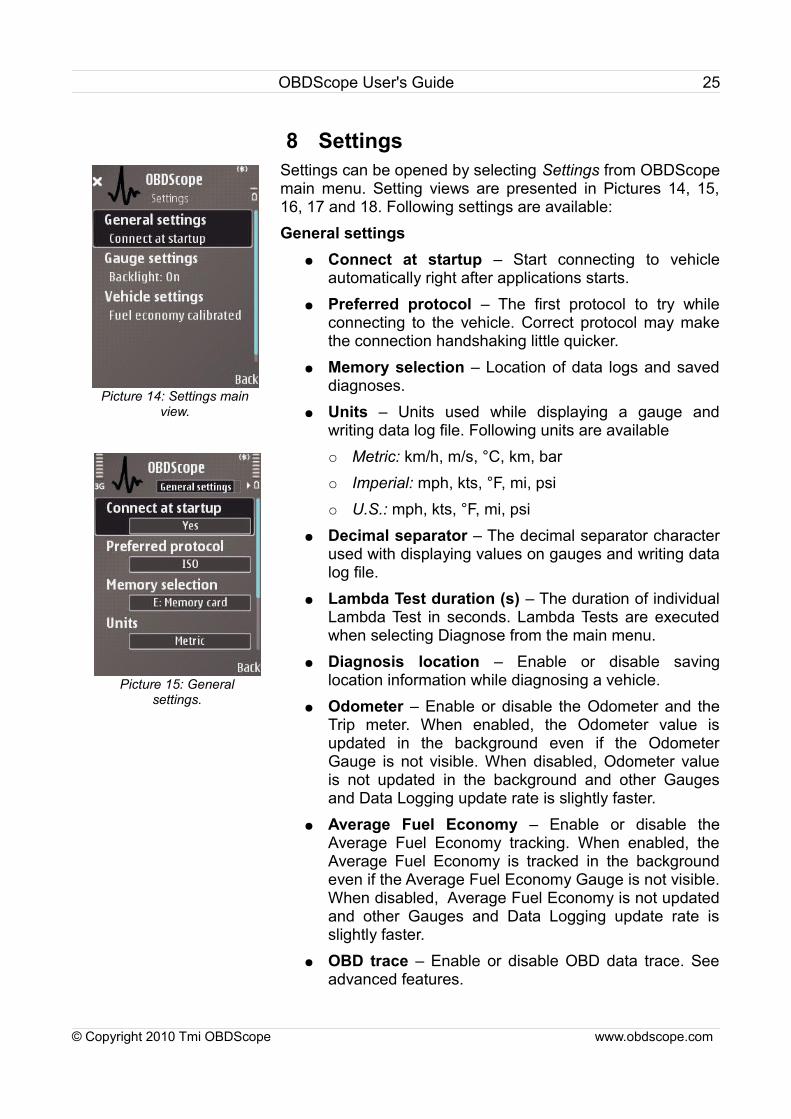
8 SettingsSettings can be opened by selecting Settings from OBDScope main menu. Setting views are presented in Pictures 14, 15, 16, 17 and 18. Following settings are available:General settings
● Connect at startup – Start connecting to vehicle automatically right after applications starts.
● Preferred protocol – The first protocol to try while connecting to the vehicle. Correct protocol may make the connection handshaking little quicker.
● Memory selection – Location of data logs and saved diagnoses.
● Units – Units used while displaying a gauge and writing data log file. Following units are available○ Metric: km/h, m/s, °C, km, bar○ Imperial: mph, kts, °F, mi, psi○ U.S.: mph, kts, °F, mi, psi
● Decimal separator – The decimal separator character used with displaying values on gauges and writing data log file.
● Lambda Test duration (s) – The duration of individual Lambda Test in seconds. Lambda Tests are executed when selecting Diagnose from the main menu.
● Diagnosis location – Enable or disable saving location information while diagnosing a vehicle.
● Odometer – Enable or disable the Odometer and the Trip meter. When enabled, the Odometer value is updated in the background even if the Odometer Gauge is not visible. When disabled, Odometer value is not updated in the background and other Gauges and Data Logging update rate is slightly faster.
● Average Fuel Economy – Enable or disable the Average Fuel Economy tracking. When enabled, the Average Fuel Economy is tracked in the background even if the Average Fuel Economy Gauge is not visible. When disabled, Average Fuel Economy is not updated and other Gauges and Data Logging update rate is slightly faster.
● OBD trace – Enable or disable OBD data trace. See advanced features.
© Copyright 2010 Tmi OBDScope www.obdscope.com
Picture 15: General settings.
Picture 14: Settings main view.
OBDScope User's Guide 26
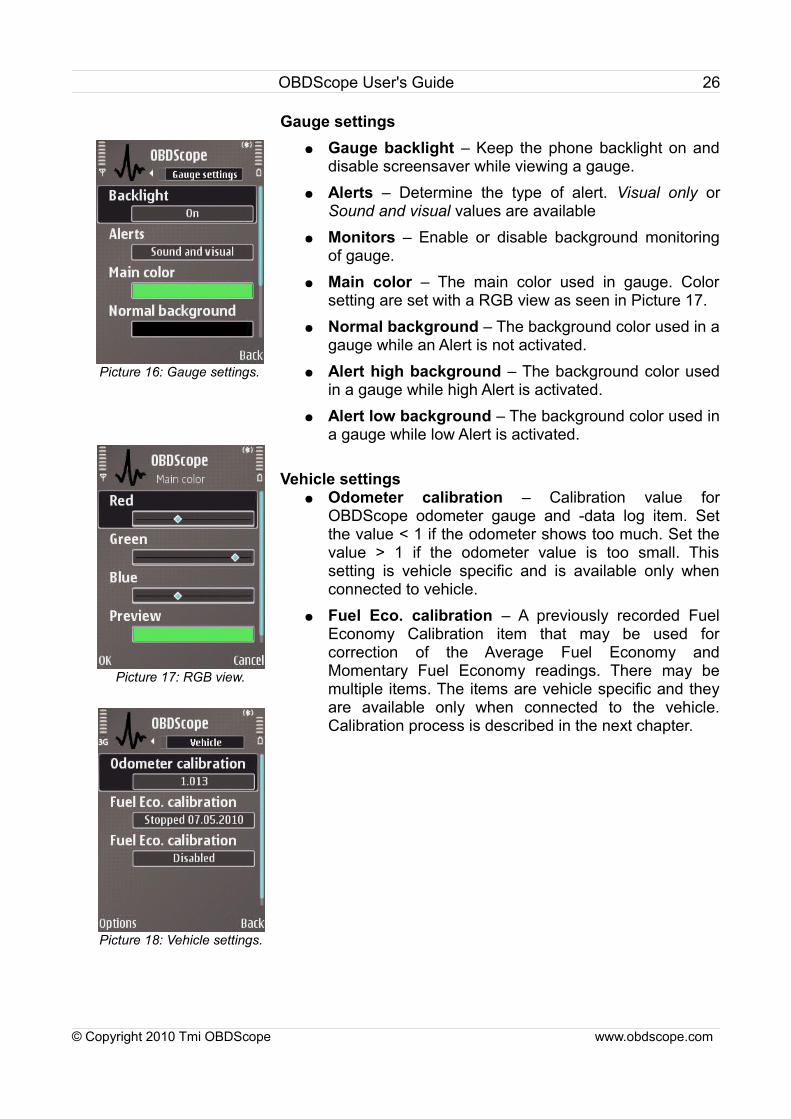
Gauge settings● Gauge backlight – Keep the phone backlight on and
disable screensaver while viewing a gauge.● Alerts – Determine the type of alert. Visual only or
Sound and visual values are available● Monitors – Enable or disable background monitoring
of gauge.● Main color – The main color used in gauge. Color
setting are set with a RGB view as seen in Picture 17.● Normal background – The background color used in a
gauge while an Alert is not activated.● Alert high background – The background color used
in a gauge while high Alert is activated.● Alert low background – The background color used in
a gauge while low Alert is activated.
Vehicle settings● Odometer calibration – Calibration value for
OBDScope odometer gauge and -data log item. Set the value < 1 if the odometer shows too much. Set the value > 1 if the odometer value is too small. This setting is vehicle specific and is available only when connected to vehicle.
● Fuel Eco. calibration – A previously recorded Fuel Economy Calibration item that may be used for correction of the Average Fuel Economy and Momentary Fuel Economy readings. There may be multiple items. The items are vehicle specific and they are available only when connected to the vehicle. Calibration process is described in the next chapter.
© Copyright 2010 Tmi OBDScope www.obdscope.com
Picture 16: Gauge settings.
Picture 17: RGB view.
Picture 18: Vehicle settings.
OBDScope User's Guide 27
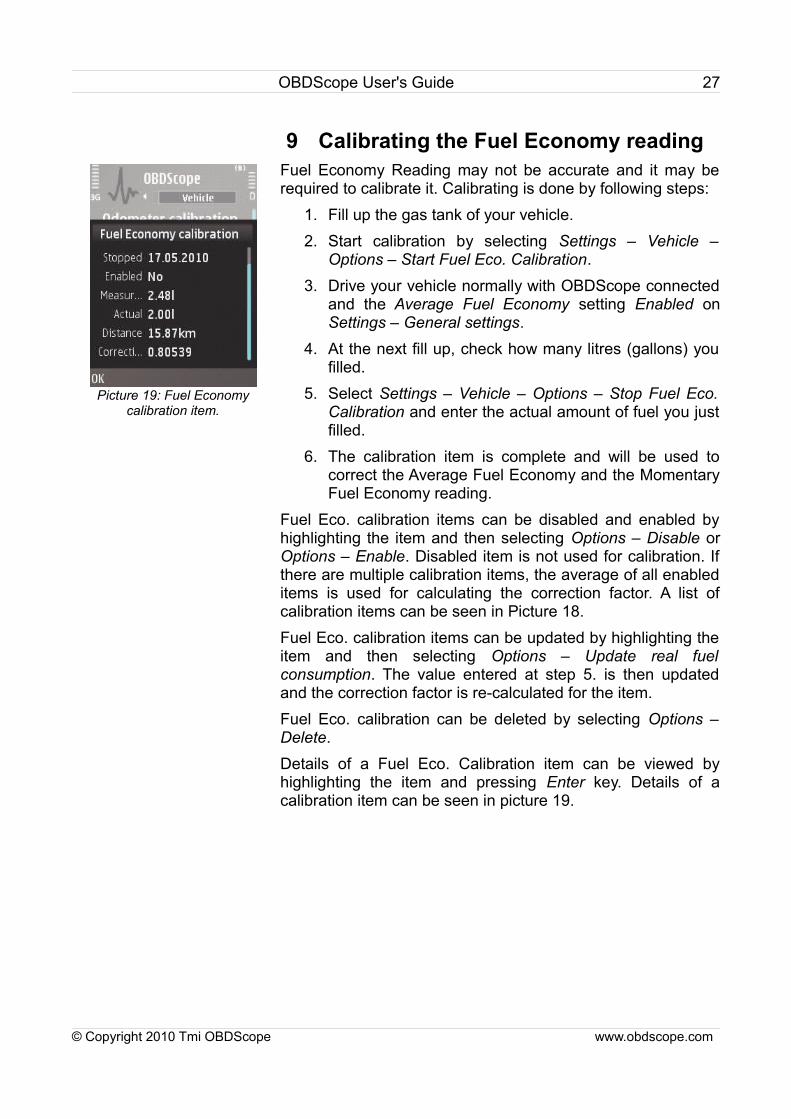
9 Calibrating the Fuel Economy readingFuel Economy Reading may not be accurate and it may be required to calibrate it. Calibrating is done by following steps:
1. Fill up the gas tank of your vehicle.2. Start calibration by selecting Settings – Vehicle –
Options – Start Fuel Eco. Calibration.3. Drive your vehicle normally with OBDScope connected
and the Average Fuel Economy setting Enabled on Settings – General settings.
4. At the next fill up, check how many litres (gallons) you filled.
5. Select Settings – Vehicle – Options – Stop Fuel Eco. Calibration and enter the actual amount of fuel you just filled.
6. The calibration item is complete and will be used to correct the Average Fuel Economy and the Momentary Fuel Economy reading.
Fuel Eco. calibration items can be disabled and enabled by highlighting the item and then selecting Options – Disable or Options – Enable. Disabled item is not used for calibration. If there are multiple calibration items, the average of all enabled items is used for calculating the correction factor. A list of calibration items can be seen in Picture 18.Fuel Eco. calibration items can be updated by highlighting the item and then selecting Options – Update real fuel consumption. The value entered at step 5. is then updated and the correction factor is re-calculated for the item.Fuel Eco. calibration can be deleted by selecting Options – Delete.Details of a Fuel Eco. Calibration item can be viewed by highlighting the item and pressing Enter key. Details of a calibration item can be seen in picture 19.
© Copyright 2010 Tmi OBDScope www.obdscope.com
Picture 19: Fuel Economy calibration item.
OBDScope User's Guide 28
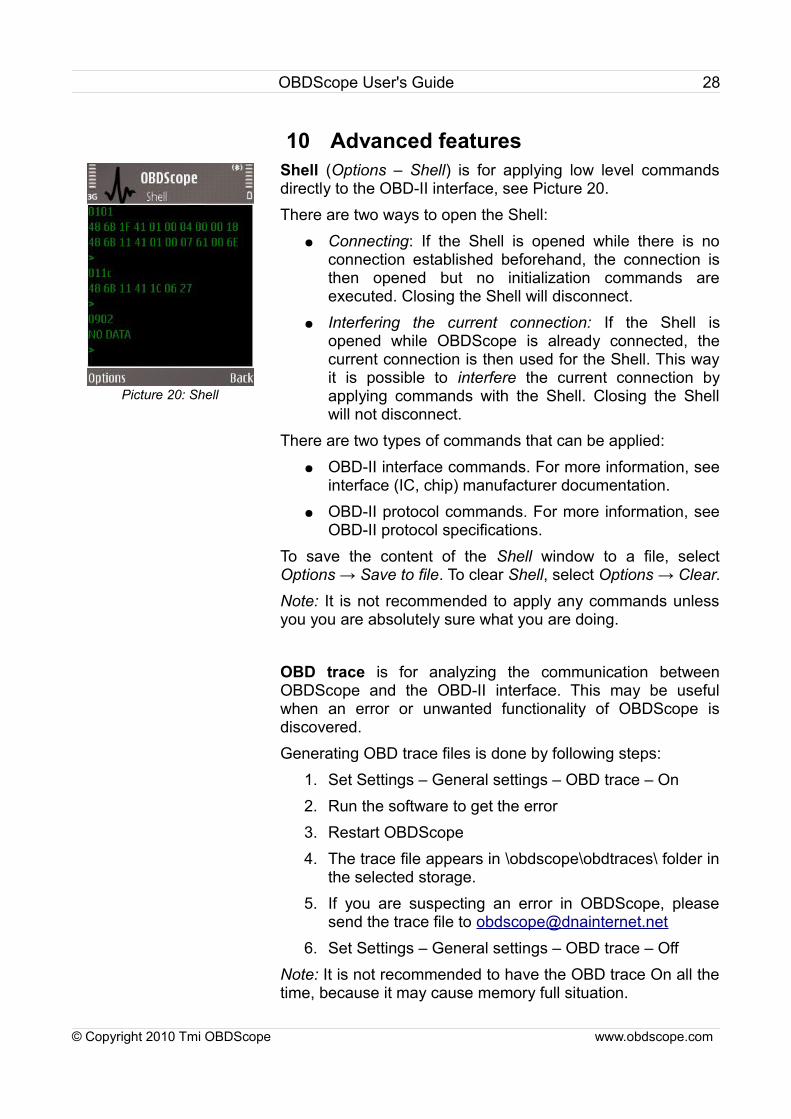
10 Advanced featuresShell (Options – Shell) is for applying low level commands directly to the OBD-II interface, see Picture 20. There are two ways to open the Shell:
● Connecting: If the Shell is opened while there is no connection established beforehand, the connection is then opened but no initialization commands are executed. Closing the Shell will disconnect.
● Interfering the current connection: If the Shell is opened while OBDScope is already connected, the current connection is then used for the Shell. This way it is possible to interfere the current connection by applying commands with the Shell. Closing the Shell will not disconnect.
There are two types of commands that can be applied:● OBD-II interface commands. For more information, see
interface (IC, chip) manufacturer documentation.● OBD-II protocol commands. For more information, see
OBD-II protocol specifications.To save the content of the Shell window to a file, select Options → Save to file. To clear Shell, select Options → Clear.Note: It is not recommended to apply any commands unless you you are absolutely sure what you are doing.
OBD trace is for analyzing the communication between OBDScope and the OBD-II interface. This may be useful when an error or unwanted functionality of OBDScope is discovered.Generating OBD trace files is done by following steps:
1. Set Settings – General settings – OBD trace – On2. Run the software to get the error3. Restart OBDScope4. The trace file appears in \obdscope\obdtraces\ folder in
the selected storage. 5. If you are suspecting an error in OBDScope, please
send the trace file to [email protected]. Set Settings – General settings – OBD trace – Off
Note: It is not recommended to have the OBD trace On all the time, because it may cause memory full situation.
© Copyright 2010 Tmi OBDScope www.obdscope.com
Picture 20: Shell