Embed Size (px)
Citation preview
POPULATION DYNAMICS OF THE PRIBILOF ISLANDS
NORTH PACIFIC FUR SEAL (CALLORHINUS URSINUS)
by
ANDREW W. TRITES
. B . S c , M c G i l l U n i v e r s i t y , Montreal, 1980.
A THESIS SUBMITTED IN PARTIAL FULFILLMENT OF THE REQUIREMENTS FOR THE DEGREE OF
MASTER OF SCIENCE in
THE FACULTY OF GRADUATE STUDIES (Department of Zoology)
We accept t h i s t h e s i s as conforming to the re q u i r e d standard
THE UNIVERSITY OF BRITISH COLUMBIA November 1984
© Andrew W. Trites,•1984

In p r e s e n t i n g t h i s t h e s i s i n p a r t i a l f u l f i l m e n t of the requirements f o r an advanced degree a t the U n i v e r s i t y o f B r i t i s h Columbia, I agree t h a t the L i b r a r y s h a l l make i t f r e e l y a v a i l a b l e f o r r e f e r e n c e and study. I f u r t h e r agree t h a t p e r m i s s i o n f o r e x t e n s i v e copying of t h i s t h e s i s f o r s c h o l a r l y purposes may be granted by the head o f my department or by h i s o r her r e p r e s e n t a t i v e s . I t i s understood t h a t copying or p u b l i c a t i o n of t h i s t h e s i s f o r f i n a n c i a l gain s h a l l not be allowed without my w r i t t e n p e r m i s s i o n .
Department of " Z o o l o g y
The U n i v e r s i t y of B r i t i s h Columbia 1956 Main Mall Vancouver, Canada V6T 1Y3
Date
DE-6 (3/81)
ABSTRACT
A conceptual model i s proposed that d e s c r i b e s the dynamics
of the P r i b i l o f Islands North P a c i f i c fur s e a l
( C a l l o r h i n u s u r s i n u s ) . It i s suggested that fur s e a l s are
regulated most s t r o n g l y at p o p u l a t i o n l e v e l s c l o s e to the l i m i t s
set by the a v a i l a b i l i t i e s of food and breeding space.
Population growth appears to be p r i m a r i l y r e g u l a t e d by changes
in the r a t e s of s u r v i v a l , r e p r o d u c t i o n , and d i s p e r s a l of young
animals. The proposed conceptual model i s used to shape a
mathematical formulation that i n c o r p o r a t e s b a s i c fur s e a l l i f e
h i s t o r y f e a t u r e s . The s i m u l a t i o n a n a l y s i s i s able to e x p l a i n
the d e c l i n e of the P r i b i l o f Islands p o p u l a t i o n by r e c o n s t r u c t i n g
pup estimates and counts of adult males over the p e r i o d 1950 to
1980. Simulation r e s u l t s show that commercial female
h a r v e s t i n g and a s e r i e s of poor j u v e n i l e s u r v i v a l r a t e s were
r e s p o n s i b l e f o r the observed d e c l i n e i n pup production on S a i n t
Paul I s l a n d . The lower number of b u l l s counted during the l a s t
two decades can be accounted for i f a d u l t male s u r v i v a l was
higher during the 1950s. The d e c l i n e i n a d u l t male s u r v i v a l ,
p o s s i b l y due to d e b r i s entanglement, does not appear to be
e q u a l l y true of females. The major d r i v i n g v a r i a b l e of the fur
s e a l system and the key f a c t o r that accounts f o r the o v e r a l l
d e c l i n e of the P r i b i l o f herd i s the s u r v i v a l of j u v e n i l e s . In
t h i s regard, the continued p o p u l a t i o n d e c l i n e through the 1980s
appears to be maintained by exogenous f a c t o r s that are
independent of current management p r a c t i c e s . Model r e s u l t s are

considered r e l i a b l e i f s i m u l a t i o n parameters ( p a r t i c u l a r l y a d u l t
s u r v i v a l ) c o n t a i n l i t t l e e r r o r . A d e t a i l e d procedure f o r
a n a l y s i n g the s e n s i t i v i t y of model output to e r r o r s i n
s i m u l a t i o n parameters i s d e s c r i b e d in an a d j o i n i n g appendix as
i s a r e v i s e d procedure for e s t i m a t i n g the s u r v i v a l of j u v e n i l e
fur s e a l s . The t h e s i s concludes with recommendations f o r
f u t u r e research.
TABLE OF CONTENTS
ABSTRACT . . i i
LIST OF TABLES v i
LIST OF FIGURES v i i
ACKNOWLEDGEMENTS x
CHAPTER 1 INTRODUCTION . 1
CHAPTER 2 BIOLOGY OF THE NORTHERN FUR SEAL .5
CHAPTER 3 THE FUR SEAL DATA BASE . 8
CHAPTER 4 A FUR SEAL CONCEPTUAL MODEL .11
4.1 L i m i t i n g Resources 12
4.2 Pop u l a t i o n Regulation 16
4.3 Conceptual Model ......... 23
4.4 D i s c u s s i o n 27
CHAPTER 5 A FUR SEAL MATHEMATICAL MODEL 29
5.1 Methods 29
5.2 Model 31
5.3 R e s u l t s 34
5.4 D i s c u s s i o n 40
CHAPTER 6 SENSITIVITY ANALYSIS OF A FUR SEAL POPULATION
MODEL 46
6.1 R e l a t i v e S e n s i t i v i t i e s 47
6.2 A n a l y t i c Model V a l i d a t i o n 52
6.2.1 Independence and l i n e a r i t y 52
6.2.2 Model v a l i d a t i o n ...54
CHAPTER 7 CONCLUSIONS 61
V
REFERENCES CITED 66
APPENDIX A FUR SEAL COMPUTER SIMULATION PROGRAM :.. 74
APPENDIX B ESTIMATING THE SURVIVAL OF JUVENILES 86
B.1 D e t a i l s of the Methods of E s t i m a t i n g J u v e n i l e
S u r v i v a l 91
B.2 E v a l u a t i o n of the Methods of Es t i m a t i n g J u v e n i l e
S u r v i v a l 96
B.3 Revised Methods of E s t i m a t i n g J u v e n i l e S u r v i v a l ...104
B. 4 Revised Estimates of J u v e n i l e S u r v i v a l 106
APPENDIX C MODEL VALIDATION BY SENSITIVITY ANALYSIS 115
C. 1 R e l a t i v e S e n s i t i v i t i e s 115
C.2 Numerical Model V a l i d a t i o n 116
C.3 A n a l y t i c a l Model V a l i d a t i o n 117
C.3.1 Determining Dt 117
C.3.2 D i s t r i b u t i o n of Dt 120
C.3.3 V a l i d a t i o n 122

LIST OF TABLES
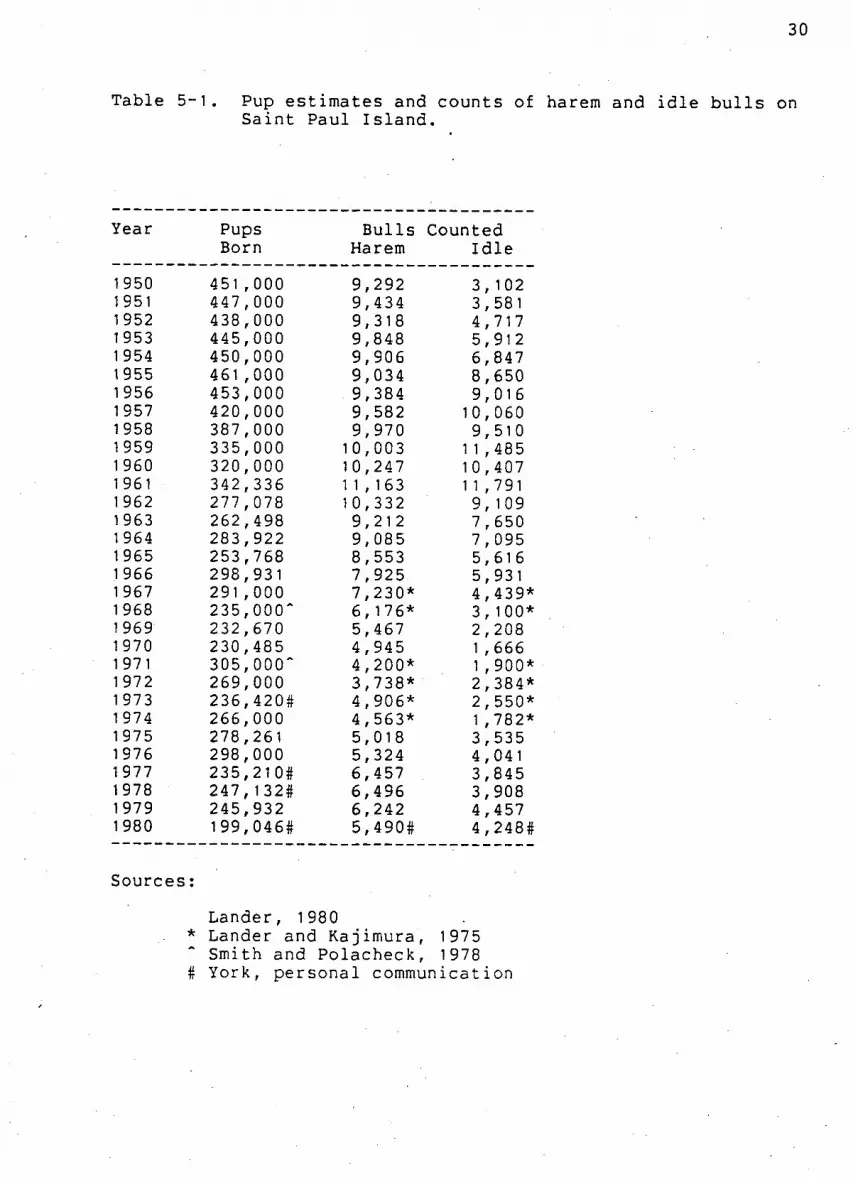
Table 5-1. Pup estimates and counts of harem and i d l e b u l l s
on Saint Paul I s l a n d 30
Table 5-2. Estimates of male j u v e n i l e fur s e a l s u r v i v a l f o r
Saint Paul I s l a n d used to simulate pups born and b u l l s
counted. 35
Table 5-3. Three measures of f i t used to determine which of
three simulated pup productions best reproduced the
observed numbers of pups born on Saint Paul Isla n d 39
Table 6-1. The r e l a t i v e s e n s i t i v i t i e s of model output (pups
born) to 1% e r r o r s i n input parameters 55
Table A-1. Number of females k i l l e d by age on Saint Paul
I s l a n d from 1956 to 1968 80
. 81
Table A-2. Number of females k i l l e d p e l a g i c a l l y from 1958
to 1974 82
83
.84
Table A-3. Number of males k i l l e d by age on Saint Paul
I s l a n d from 1950 to 1979. 85
Table B-1. T o t a l pup estimates and age s p e c i f i c male k i l l
by year c l a s s on Sa i n t Paul I s l a n d 87
Table B^2. Counts of harem and i d l e b u l l s on Saint Paul
I s l a n d 88
Table B-3. C a l c u l a t e d male j u v e n i l e fur s e a l s u r v i v a l on
v i i
Saint . Paul I s l a n d . The Chapman and Smith & Polacheck
estimates have been reduced to b i r t h to age two by
assuming a constant s u r v i v a l at age three of 0.80 89
Table B-4. Some h y p o t h e t i c a l e x p l o i t a t i o n r a t e s used in the
the s i m u l a t i o n model developed to t e s t the Lander
estimator of j u v e n i l e s u r v i v a l 98
Table B-5. Revised estimates of j u v e n i l e f ur s e a l s u r v i v a l
f o r Saint Paul I s l a n d 114

v i i i
LIST OF FIGURES
F i g u r e 4-1. T r a j e c t o r i e s showing p o p u l a t i o n growth of the
h y p o t h e t i c a l home rookery and neighboring rookery over
t ime .25
Figu r e 5-1. Male j u v e n i l e s u r v i v a l from b i r t h to age 2
years 36
Figu r e 5-2. Estimated and simulated pup p r o d u c t i o n f o r
Saint Paul I s l a n d 38
Fi g u r e 5-3. Observed and simulated b u l l counts on Sa i n t
Paul I s l a n d 41
Fi g u r e 6-1. S e n s i t i v i t y of model output to percent changes
i n model input b i r t h r a t e s ...48
Fi g u r e 6-2. A comparison of model output s e n s i t i v i t i e s to
percent changes in 9 input parameters measured by
deviance Dt at times 1954, 1959, 1964, 1969, 1974, and
1979. 51
Fi g u r e 6-3. U n c e r t a i n t y i n model output as measured by pups
born i f input parameters c o n t a i n e r r o r s of 1 to 5% 57
Fi g u r e 6-4. Model output u n c e r t a i n t y expressed as a
c o e f f i c i e n t of v a r i a t i o n 58
Fi g u r e 6-5. C o n t r i b u t i o n of input parameter e r r o r s to
u n c e r t a i n t y in output expressed as a percentage 59
Figu r e B-1. R e l a t i v e e r r o r in p r e d i c t i n g the j u v e n i l e
s u r v i v a l rate of h y p o t h e t i c a l p o p u l a t i o n s using the
Lander estimator ...100

F i g u r e B-2. P r e d i c t i o n s f o r the j u v e n i l e and subadult
s u r v i v a l r a t e s of h y p o t h e t i c a l p o p u l a t i o n s using the
Lander estimator . . 101
F i g u r e B-3. Upper and lower estimates f o r the j u v e n i l e and
subadult s u r v i v a l rates of h y p o t h e t i c a l p o p u l a t i o n s
using the Lander estimator 103
F i g u r e B-4. Upper and lower j u v e n i l e s u r v i v a l estimates
assuming pup s u r v i v a l over the f i r s t year of l i f e
remains constant over time 108
F i g u r e B-5. Upper and lower j u v e n i l e s u r v i v a l estimates
assuming the annual s u r v i v a l of subadult males i s 80%. .109
F i g u r e B-6. Upper and lower j u v e n i l e s u r v i v a l estimates
assuming that the annual s u r v i v a l of subadult males i s
80% and that changing b u l l counts are r e p r e s e n t a t i v e of
year c l a s s s t r e n g t h . 110
F i g u r e B-7. The mean of the upper and lower j u v e n i l e
s u r v i v a l bounds d e s c r i b e d i n f i g u r e B-6 are c o n t r a s t e d
with the Lander estimates 112

X
ACKNOWLEDGEMENTS
I am g r a t e f u l to Peter L a r k i n for h i s continued support and
a s s i s t a n c e throughout the course of t h i s study. He has been
p a r t i c u l a r l y h e l p f u l i n c l a r i f y i n g my thoughts and ex p r e s s i o n of
ideas. Thanks must a l s o be extended to Andreas F i s c h l i n , Jim
Spain, Jay Hestbeck, J u s t i n Cooke, Mike Bigg, and Bob Lander f o r
t h e i r comments and suggestions on improving and extending
v a r i o u s s e c t i o n s of the work. Charles Fowler and Anne York of
the N a t i o n a l Marine Mammal Laboratory were e s p e c i a l l y h e l p f u l i n
shar i n g ideas and information on fur s e a l p o p u l a t i o n dynamics.
Moira Greaven a s s i s t e d in preparing the f i g u r e s . S p e c i a l thanks
are extended to Helen Hahn for t a k i n g care of the numerous
d e t a i l s which ensured completion of t h i s work. F i n a l l y I wish
to acknowledge the never ending support of my wife and f a m i l y .

1
CHAPTER 1 INTRODUCTION
Variou s themes have been used over the past two c e n t u r i e s
fo r managing the p o p u l a t i o n of the P r i b i l o f I s l a n d s North
P a c i f i c fur s e a l ( C a l l o r h i n u s u r s i n u s ) . Management d e c i s i o n s
have l a r g e l y depended on how p o p u l a t i o n numbers were p e r c e i v e d
to change with time. Beginning i n 1799 the Russian American
Company t r i e d to increase the s i z e of the herds by
e x p e r i m e n t a l l y imposing hunting c l o s u r e s and l a t e r , i n 1837, by
e x c l u d i n g females from the k i l l (Martin, 1946: 94). P r o t e c t i n g
females was considered c r i t i c a l to p o p u l a t i o n growth, but
polygamous males were excess and c o u l d be harvested. Soon a f t e r
the purchase of Alaska the same conceptual model was used by
U n i t e d S t a t e s managers to r e b u i l d the herd that had at that time
been decimated by p e l a g i c s e a l i n g (Andrews 1931: 230). Such a
simple model of the fur s e a l system was used s u c c e s s f u l l y u n t i l
the 1950s.
During the 1940s the growth trend of the p o p u l a t i o n (and
commercial k i l l ) began to approach some kind of c e i l i n g (Kenyon
et a l . , 1954). Evidence was presented suggesting that the
apparent lack of p r o d u c t i v i t y of the fur s e a l herd was due to
reduced r a t e s of r e p r o d u c t i o n (Kenyon et a l . , 1954) and j u v e n i l e
s u r v i v a l (Chapman, 1961) a r i s i n g from competition f o r a l i m i t e d
food supply around the P r i b i l o f I s l a n d s . At the same time
Chapman questioned managing with the male-only-harvest
conceptual model. Such thoughts were independently t r a n s l a t e d
2
i n t o mathematical models by Nagasaki (1961) and Chapman (1961)
to produce r e s u l t s i n d i c a t i n g that greater p r o d u c t i v i t y c o u l d be
achieved from a smaller p o p u l a t i o n . As a r e s u l t , between 1956
and 1963 the herd was reduced by 270,000 females in a d d i t i o n to
the continued male k i l l . The new model with i t s d e n s i t y
dependent r e g u l a t o r y concepts switched the management emphasis
from r e g u l a t i n g herd growth to a c h i e v i n g maximum s u s t a i n a b l e
y i e l d (NPFSC, 1962).
The p r o j e c t e d maximum s u s t a i n a b l e y i e l d has not been
a t t a i n e d . Annual pup production and recruitment of h a r v e s t a b l e
males d e c l i n e d during the herd reduction program and continued
a f t e r i t s completion, f a l l i n g f a r short of p r e d i c t e d l e v e l s
(Chapman, 1981). Lowering herd s i z e was supposed to have
inc r e a s e d p r o d u c t i v i t y through d e n s i t y dependent changes i n
p o p u l a t i o n v i t a l r a t e s . I t s f a i l u r e to do so suggests that, the
conceptual model needs r e e v a l u a t i o n .
There i s no s a t i s f a c t o r y e x p l a n a t i o n f o r the continued
d e c l i n e of the P r i b i l o f p o p u l a t i o n (Anonymous, 1983). There i s
no i n d i c a t i o n that the sustained harvest of males has a l t e r e d
pregnancy r a t e s or the s u r v i v a l of pups on l a n d . S i m i l a r l y
there i s no evidence of g e n e t i c changes i n the s i z e of
reproducing males because of harvest s e l e c t i o n . P r e d a t i o n ,
d i s e a s e , p a r a s i t e s , and heavy metal contaminants are not
s i g n i f i c a n t sources of m o r t a l i t y . I t i s s p e c u l a t e d that the
herd d e c l i n e might be due to a high incidence of s e a l s becoming
3
entangled in f i s h i n g d e b r i s ; however, t h i s has not been
r e s o l v e d . Other p o s s i b i l i t i e s that have been examined and
r e j e c t e d are emigration to other areas, human dist u r b a n c e on
r o o k e r i e s , and i n c i d e n t a l take i n f i s h i n g gear.
The herd d e c l i n e might be due to commercial o v e r f i s h i n g of
major f ur s e a l food resources, p o l l o c k and h e r r i n g , about the
P r i b i l o f I s l a n d s . However, t h i s view i s i n c o n s i s t e n t with
o b s e r v a t i o n s that the len g t h of feeding t r i p s by l a c t a t i n g
female has decreased since the 1960s (Gentry et a l . , 1977) and
that s u r v i v a l of pups on land, a d u l t growth r a t e s , and weight at
b i r t h have increased in recent years (Fowler, 1982a). L i k e l y
e x p l a n a t i o n s for the signs of w e l l being of the fur s e a l
p o p u l a t i o n are that fur s e a l s are switching to other abundant
prey s p e c i e s (stomach samples i n d i c a t e a d i e t of over 35 common
prey s p e c i e s , Kajimura 1981) , or that the food base of the s e a l
has been incr e a s e d . I t appears that fur s e a l s and commercial
f i s h e r i e s s e l e c t f i s h of d i f f e r e n t s i z e s (Salveson and A l t o n ,
1976) such that i n the case of p o l l o c k , the numbers of
c a n n i b a l i s t i c a d u l t s are reduced by f i s h i n g which inc r e a s e s the
number of p o l l o c k j u v e n i l e s that can be eaten by fur s e a l s
(Swartzman and Haar, 1980). However, the a v a i l a b i l i t y of f i s h
to s e a l s of d i f f e r e n t age c l a s s e s at times of the year other
than the breeding season i s s t i l l unresolved. In general i t
must be concluded that no e x p l a n a t i o n for the d e c l i n e of the
P r i b i l o f p o p u l a t i o n can be c l e a r l y demonstrated.
4
The major focus of t h i s study i s the a n a l y s i s of why fur
s e a l numbers have changed as they have. The a v a i l a b l e
information on l i f e h i s t o r y of northern f u r s e a l s and b i o l o g y of
r e l a t e d pinnipeds i s reviewed, and the r e s u l t s and c o n c l u s i o n s
summarized in a r e v i s e d conceptual model. A mathematical model
i s subsequently proposed to r e c o n s t r u c t h i s t o r i c a l o b s e r v a t i o n s
of b u l l counts and pup estimates over the p e r i o d 1950 to 1980.
The r e l i a b i l i t y of p r e d i c t i o n s and the impact upon herd dynamics
of a l t e r e d p o p u l a t i o n parameters are i n v e s t i g a t e d using
techniques of s e n s i t i v i t y a n a l y s i s . Model r e s u l t s are shown to
o f f e r e xplanations for past herd dynamics and suggest d i r e c t i o n s
for future management and research.
5
CHAPTER 2 BIOLOGY OF THE NORTHERN FUR SEAL
The northern fur s e a l i s a polygamous, g r e g a r i o u s ,
o p p o r t u n i s t i c , c a r n i v o r o u s , and migratory p e l a g i c mammal. Two
t h i r d s of i t s l i f e are spent i n a p e l a g i c e x i s t e n c e while the
remaining one t h i r d i s occupied with breeding upon land.
In the case of the P r i b i l o f herd a l l breeding occurs i n
ro o k e r i e s and i s d i v i d e d between the Bering Sea i s l a n d s of S a i n t
Paul (80%) and Saint George (20%). These two t i n y grass covered
i s l a n d s produced by v o l c a n i c e r u p t i o n s of black b a s a l t l i e
barren from November u n t i l May when the f i r s t l a r g e males haul
themselves onto the rookery. Weighing an average of 600 pounds
and standing 7 feet t a l l , the mature b u l l s s e l e c t and secure a
rep r o d u c t i v e t e r r i t o r y by b a t t l e , and wait f o r the a r r i v a l of
the much smaller 90 to 120 pound females.
Adult males t y p i c a l l y double t h e i r body weight between the
ages of 7 and 8 years (Lander, 1981) and are c l a s s i f i e d as being
e i t h e r harem or i d l e b u l l s . The harem masters maintain a
t e r r i t o r y with one or more females f o r an average of one and a
h a l f years. S u c c e s s f u l harem masters w i l l not leave t h e i r
p o s i t i o n s during the breeding season. I d l e b u l l s , that are
u n s u c c e s s f u l l in defending or h o l d i n g a t e r r i t o r y , o f t e n r i s k
i n j u r y and death as they c r o s s imaginary harem boundaries. Such
l o s e r s w i l l tend to l i v e on the f r i n g e s of the rookery or on the
ha u l i n g grounds.
6
From June u n t i l mid-August young males haul out i n
decreasing order of age and s i z e . These immature b u l l s , which
are u s u a l l y l e s s than eight years o l d , band together in seperate
hauling grounds because of t h e i r i n a b i l i t y to enter the rookery.
It i s from t h i s c l a s s of animals that k i l l i n g s are made. The
s e l e c t e d congregation of immature fur s e a l s makes i t p o s s i b l e to
d r i v e and k i l l p r i m a r i l y the v a l u a b l e 3 and 4 year olds without
i n t e r f e r i n g with the breeding animals. The j u v e n i l e s (0-2
years) are not found on the h a u l i n g grounds nor are t h e i r
whereabouts known during the summer f o l l o w i n g t h e i r birth."-*-.
As the mature females (S^Sijryea r s ; arid o l d e r ) a r r i v e i n order
of decreasing age during June and July",'- they are greeted by
p r o s p e c t i v e harem masters that are anxious to include them i n
t h e i r harems. The process of h a u l i n g out on l a n d and the s o c i a l
contact i s b e l i e v e d to s t i m u l a t e b i r t h (NPFSC, 1981) which
occurs w i t h i n two weeks of"the female's harem c a p t i v i t y . W i thin
hours of g i v i n g b i r t h to a s i n g l e 12 pound pup, the female i s
again impregnated and fr e e to feed and n o u r i s h her newborn pup.
Without i n c l u d i n g the p e r i o d of delayed i m p l a n t a t i o n , the
g e s t a t i o n p e r i o d i s about s i x months. The remainder of the
female's time in the Bering Sea i s spent weaning the pup and
s t o r i n g f a t reserves for the 5,000 kilometer m i g r a t i o n south.
Pups tend to group together to a v o i d being trampled to death and
re c e i v e no care from the harem masters. Throughout the course
of the mating season the f a s t i n g b u l l s become thinn e r as t h e i r
7
s t o r e d f a t reserves are used up.
Soon a f t e r breeding i s completed in August the r i g i d harem
s t r u c t u r e q u i c k l y breaks down. Many s e a l s begin t h e i r s o l i t a r y
southward m i g r a t i o n along the west coast of North America by
November. T h e i r migratory range i s from the Bering Sea to
southern C a l i f o r n i a as f i r s t i n d i c a t e d by Townsend (1899) and
confirmed by the more recent p e l a g i c surveys from 1958 to 1974
(Lander 1980b). The extent of i n t e r m i n g l i n g of American and
Asian herds i s not w e l l understood. I t i s b e l i e v e d that a few
P r i b i l o f s e a l s t r a v e l along the A s i a t i c c oast, but no western
herds migrate along North America. Peak d e n s i t i e s occur at
d i f f e r e n t times and areas as summarized by Zeusler (1936). The
age d i s t r i b u t i o n with r e s p e c t to geography c o n s i s t s
predominately of older males w i n t e r i n g i n the Bering Sea
followed by more southern c o n c e n t r a t i o n s of young males and
young females, and f i n a l l y o l d e r females towards C a l i f o r n i a .
The s e a l s r e t u r n to breed i n the s p r i n g in order of age with the
o l d e s t b u l l s l e a d i n g the way, followed by pregnant females,
nonpregnant females, and immatures by decreasing age.

8
CHAPTER 3 THE FUR SEAL DATA BASE
The purpose of t h i s chapter i s to d e s c r i b e b r i e f l y the
nature of the fur s e a l data base. Most of the a v a i l a b l e
information i s on computer f i l e at the Marine Mammal Laboratory
in S e a t t l e , Washington and has r e c e n t l y been p u b l i s h e d (Lander
1980a,b). It c o n t a i n s :
A. Commercial K i l l of Males, 1918-83. The numbers of male
s e a l s k i l l e d on S a i n t Paul and S a i n t George I s l a n d s are
a v a i l a b l e by year, date, and rookery of k i l l . A f t e r 1956 a
tooth aging process was developed and used to break the numbers
k i l l e d i n t o age c l a s s e s . P r i o r to 1956 the lengths of the s e a l s
harvested was recorded and c o u l d have been used to e x t r a p o l a t e
ages k i l l e d , i f i t had not been l o s t . For the e n t i r e 1918-83
pe r i o d r e s t r i c t i o n s on l e n g t h of season and hunting r e s t r i c t i o n s
are well documented. Since 1972 no males have been harvested on
Saint George. Estimates are. a v a i l a b l e f o r t o t a l land and
p e l a g i c k i l l s ince d i s c o v e r y of the P r i b i l o f s .
B. Commercial K i l l of Females, 1956-68. For each day of
h a r v e s t i n g the k i l l of females has been recorded i n numbers per
rookery by age (determined from teeth) f o r both I s l a n d s .
C. Counts of Adult Males, 1911-83. Counts of harem males
(defend t e r r i t o r y c o n t a i n i n g one or more females) and i d l e males
(7 years and older with no t e r r i t o r y ) have been made every year
9
with few exceptions s i n c e 1911 and are recorded f o r each rookery
on both I s l a n d s . Because harem b u l l s are c o n s p i c i o u s , the data
i s c o n sidered a c c u r a t e .
D. Approximation of Pup Numbers, 1912-83. On each rookery
from J u l y to mid August over the p e r i o d 1912-83, newborn pups
have been completely (1912-16, 1922) and p a r t i a l l y counted
(1917-21), assumed to increase at f i x e d r a t e s (1923-40), tagged
and recaptured in harvest (1941, 1947-68), and most r e c e n t l y ,
sheared and counts made of marked/unmarked r a t i o s in subsamples
(1968-83). No data on l i v e pups were c o l l e c t e d during the 1925-
46 p e r i o d of r a p i d i n c r e a s e and apparent herd s t a b i l i z a t i o n .
Counts of dead pup have been taken i n mid to l a t e August a f t e r
most of the land m o r t a l i t y has o c c u r r e d .
E. C o l l e c t i o n of M o r t a l i t y Data from Newborn Fur S e a l s .
Three d i f f e r e n t 2,000 square yard study areas on Saint Paul
I s l a n d have been followed s i n c e 1964,1966, and 1967 f o r p e r i o d s
of 10, 8, and 8 years r e s p e c t i v e l y . Autopsies were performed on
a l l dead pups in these areas to determine the cause of death and
the c o n d i t i o n of pups before going to sea f o r the f i r s t time.
Beginning i n 1976 a two year study was conducted on Saint George
I s l a n d .
F. Fur Seals Entangled in F i s h i n g Debris and Other M a t e r i a l s .
During the p e r i o d 1967-83 records were kept of d e b r i s entangled
10
fur s e a l s among those d r i v e n from the h a u l i n g grounds f o r
harvest i n g .
G. P e l a g i c Data, 1958-74. Each year f o r 2-4 months,
s e l e c t e d areas of the migratory range from C a l i f o r n i a to the
Bering Sea were surveyed. The area was s p l i t i n t o seven
regions. Records were made of time spent l o o k i n g for s e a l s ,
numbers seen, p r e v a i l i n g environmental c o n d i t i o n s , age and sex
of those c o l l e c t e d , pregnancy r a t e s , r e p r o d u c t i v e c o n d i t i o n ,
length and weight, and food s p e c i e s consumed. A t o t a l of 13,845
seal s was taken during the study p e r i o d .
1 1
CHAPTER 4 A FUR SEAL CONCEPTUAL MODEL
The aim of t h i s chapter i s to put forward a general theory
that w i l l e x p l a i n how the l e v e l of fur s e a l p o p u l a t i o n s i s
determined and maintained. The proposed fur. s e a l conceptual
model i s developed from the general p r i n c i p l e s of p o p u l a t i o n
dynamics and. from p o p u l a t i o n s t u d i e s of fur s e a l s and other
pinnipeds. I t i s b u i l t upon concepts of resource l i m i t a t i o n and
r e g u l a t i o n of numbers, that are common to a l l p o p u l a t i o n models
(see Tamarin, 1978). The c e n t r a l s u p p o s i t i o n i s that p o p u l a t i o n
growth i s l i m i t e d by p h y s i c a l c o n d i t i o n s and r e g u l a t e d by the
processes of b i r t h , death, immigration, and emig r a t i o n ; where
the processes that r e g u l a t e growth are f u n c t i o n s of the l i m i t i n g
resources.
The chapter begins by i d e n t i f y i n g the resources that l i m i t
the s i z e of northern f u r s e a l p o p u l a t i o n s . I t proceeds by
d i s c u s s i n g the mechanisms that regulate p o p u l a t i o n growth with
respect to resource shortages. Note that a d i s t i n c t i o n i s made
between the concepts of l i m i t a t i o n and r e g u l a t i o n . A
comprehensive conceptual model of fur s e a l b i o l o g y i s proposed
and the v a l i d i t y of the model assumptions are d i s c u s s e d .

12
4_.J_ L i m i t i n g Resources
Food and space are p h y s i c a l c o n d i t i o n s thought to set
l i m i t s on northern f u r s e a l p o p u l a t i o n abundance. Food i s
g e n e r a l l y c o n s i d e r e d to be the most important f a c t o r l i m i t i n g
the s i z e of most animal p o p u l a t i o n s (Lack, 1954, 1966). But i n
some cases a shortage of breeding space i s c o n s i d e r e d to be more
important than food (Duffy, 1983) while other p o p u l a t i o n s appear
to be l i m i t e d by two or more f a c t o r s a c t i n g simultaneously
(Watson and Moss, 1970).
I b e l i e v e the maximum s i z e of northern fur s e a l p o p u l a t i o n s
i s determined by shortages of land and food resources needed
during the breeding season to produce young. I base t h i s upon
the o b s e r v a t i o n that each year the fur seal completes a s o l i t a r y
m i gration c o v e r i n g as much as 5000 kilometers i n the P a c i f i c
Ocean. In such circumstances competition f o r resources i s
i m p l a u s i b l e . Instead, resource shortages should be apparent as
the fur s e a l s congregate i n the Bering Sea and upon the breeding
grounds.
Fur s e a l s , l i k e a l l pinnipeds, are p e l a g i c mammals that
need to r e t u r n to land to produce young. They choose breeding
s i t e s that meet two important c r i t e r i a (Payne, 1977). The f i r s t
i s the s u i t a b i l i t y of the breeding s i t e f o r r e p r o d u c t i o n and
p r o t e c t i o n of the pups. Rookeries must be e a s i l y a c c e s s i b l e
from the water and p r o t e c t pups from storm m o r t a l i t y . The

13
second c o n d i t i o n i s the a v a i l a b i l i t y of food needed by l a c t a t i n g
females to produce milk f o r t h e i r pups. Optimum feeding
c o n d i t i o n s appear to be "near sea v a l l e y s , canyons, seamounts,
and along the c o n t i n e n t a l s h e l f where there are abrupt changes
in depth and upwelling of n u t r i e n t r i c h bottom water" (Lander
and Kajimura, 1982; see a l s o L l o y d et a l , 1980; David, 1984;
Perez and Bigg, 1980; Kajimura, 1984; Payne, 1977). S a t i s f y i n g
both c o n d i t i o n s apparently r e s t r i c t s the geographic d i s t r i b u t i o n
of northern fur s e a l s . Thus, some fur s e a l p o p u l a t i o n s may be
l i m i t e d by e i t h e r the l e v e l of marine p r o d u c t i v i t y or the
presence of breeding s i t e s , or perhaps by both f a c t o r s
simultaneously.
H i s t o r i c a l records from some fur s e a l p o p u l a t i o n s c o n f i r m
that the a v a i l a b i l i t i e s of food and t e r r i t o r i a l breeding space
can set l i m i t s on abundance. For example, the A n t a r c t i c fur
s e a l (Arctocephalus g a z e l l a ) breeding in South Georgia i s
b e l i e v e d to be food l i m i t e d . T h i s i s because a l l of the
apparently s u i t a b l e breeding s i t e s have never been occupied
(Payne, 1977). The Cape fur s e a l (Arctocephalus p u s i l u s
p u s i l u s ) i s an a l t e r n a t i v e example of a p o p u l a t i o n b e l i e v e d to
have been h i s t o r i c a l l y l i m i t e d by the amount of s u i t a b l e
breeding space found on s e v e r a l small i s l a n d s o f f the coast of
South A f r i c a and Namibia (David, 1984). The t o t a l p o p u l a t i o n
d i d not increase u n t i l the e a r l y part of t h i s century when the
s e a l s began to c o l o n i z e the mainland beaches. The mainland
c o l o n i e s have grown r a p i d l y compared to the i s l a n d c o l o n i e s
14
(Butterworth er a l , 1984), apparently due to the presence of
u n l i m i t e d breeding space. In general, i t seems that both food
and breeding space r e s t r i c t fur s e a l p o p u l a t i o n growth depending
upon which f a c t o r i s most l i m i t i n g .
The P r i b i l o f p o p u l a t i o n i s f a r below what i s b e l i e v e d to be
i t s p o t e n t i a l s i z e (Lander and Kajimura, 1982). T h i s makes i t
d i f f i c u l t to i d e n t i f y the resources that c o u l d l i m i t growth.
Observations of p o p u l a t i o n abundance and d i s t r i b u t i o n were
recorded by Townsend (1899) and E l l i o t (1884), when the
populat i o n was near i t s apparent c a r r y i n g c a p a c i t y .
Reexamination of these s t u d i e s may provide u s e f u l i n f o r m a t i o n
about p o s s i b l e shortages of food and breeding space.
At present, there i s an apparent abundance of food i n the
Bering Sea (Swartzman and Haar, 1980) and p l e n t y of a v a i l a b l e
breeding space on the P r i b i l o f Islands (personal o b s e r v a t i o n ) .
This does not mean that food and space are not p r e s e n t l y
l i m i t i n g the p o p u l a t i o n .
In terms of food, the c r i t i c a l f a c t o r s are a c c e s s i b i l i t y
(Andrewarth and B i r c h , 1954) and q u a l i t y (White, 1978); not only
abundance. An abundant Bering Sea food base does not ensure
popula t i o n growth i f the fur s e a l s are unable to use the
resource. During the most recent E l Nino year, s e a l food
dissappeared from around San Miguel I s l a n d o f f the coas t of
C a l i f o r n i a . Many female northern fur s e a l s from t h i s i s l a n d

15
f a i l e d to reproduce and others were unable to f i n d s u f f i c i e n t
food to produce enough milk' to p r o p e r l y n o u r i s h t h e i r pups
(DeLong, personal communication). Oceanographic phenomenon,
such as E l Nino, can a l t e r the d i s t r i b u t i o n and p r o d u c t i v i t y of
prey s p e c i e s a v a i l a b l e to the fur seals.' The v a r i a b i l i t y of
supply means, for example, that food may be a v a i l a b l e to
l a c t a t i n g females dur i n g the summer but i n a c c e s s i b l e to r e c e n t l y
weaned pups in f a l l . Thus food could be p r e s e n t l y l i m i t i n g the
e n t i r e P r i b i l o f p o p u l a t i o n by r e s t r i c t i n g the number of young
fur s e a l s that s u r v i v e to reproduce.
It i s p o s s i b l e f o r space to set a ' l o c a l ' c a r r y i n g c a p a c i t y
that i s s p e c i f i c to a given rookery and r e s t r i c t s the growth of
part of the t o t a l i s l a n d p o p u l a t i o n . I t seems that fur s e a l s
choose t h e i r breeding s i t e s based upon 'past experience'.
Females, f o r example, give b i r t h i n the approximate l o c a t i o n
where they suckled as pups (Kenyon and Wilke, 1953). Adult
males are a l s o f a i t h f u l to breeding s i t e s and f r e q u e n t l y r e t u r n
to the same spot year a f t e r year (Gentry, 1980). T h i s s i t e
f i d e l i t y of northern fur s e a l s means that areas where males arid
females are r e p r o d u c t i v e l y s u c c e s s f u l w i l l i n c r e a s e i n d e n s i t y
while neighboring areas might remain empty. Such s p e c u l a t i o n
seems confirmed by the impact of h a r v e s t i n g females that has
l e f t p o r t i o n s of the e x p l o i t e d r o o k e r i e s empty t i l l the present
day (Lander, 1980a pgs. 95, 157). The i n c r e a s i n g numbers of
s u c c e s s f u l l y reproducing fur s e a l s i n any given area w i l l be
e v e n t u a l l y c o n s t r a i n e d by the p h y s i c a l l i m i t i n g f a c t o r s such as
16
presence of c l i f f s , d i s t a n c e from water, p r o t e c t i o n from storms,
and so on. In t h i s way, the growth of some c o l o n i e s or
ro o k e r i e s c o u l d temporarily stop, even i n the presence of
u n l i m i t e d food.
In summary, the optimum fur s e a l environment r e q u i r e s
breeding s i t e s to'be near food. Population growth i s l i m i t e d by
the a v a i l a b i l i t i e s of these two resources. The number of
breeding s i t e s i s a r e l a t i v e l y constant f a c t o r u n l i k e the
v a r i a b l e a v a i l a b i l i t y of food. I suspect that food i n the North
P a c i f i c and Bering Sea i s the u l t i m a t e f a c t o r l i m i t i n g the s i z e
of the t o t a l P r i b i l o f p o p u l a t i o n and that l i m i t e d space i s a
secondary f a c t o r that could prevent c e r t a i n P r i b i l o f r o o k e r i e s
from tem p o r a r i l y growing.
_4.2_ Population Regulat ion
Regulated p o p u l a t i o n s r e g u l a r l y tend towards a d e n s i t y that
can be s u s t a i n e d by the environment (Murdoch, 1970; R i c k l e f s ,
1973). P o p u l a t i o n d e n s i t i e s are determined by the l i m i t e d and
v a r i a b l e a v a i l a b i l i t i e s of food, s h e l t e r , l i v i n g space, and
other resources; but are maintained by changes i n r e p r o d u c t i v e ,
s u r v i v a l , and d i s p e r s a l r a t e s . Many d i f f e r e n t r e g u l a t o r y
mechanisms e x i s t to prevent a po p u l a t i o n from exceeding the
l i m i t s set by environmental resources. Some po p u l a t i o n s are
regu l a t e d by m o r t a l i t y induced from c l i m a t e , d i s e a s e , p r e d a t i o n ,
and c o m p e t i t i o n . Other popu l a t i o n s r e g u l a t e t h e i r s i z e by
17
a l t e r i n g f e c u n d i t y and d i s p e r s a l p a t t e r n s by means of changing
i n d i v i d u a l p h y s i o l o g i e s and behaviour. The r e l a t i v e importance
of each r e g u l a t o r y mechanism appears to depend upon the l i f e
h i s t o r y c h a r a c t e r i s t i c s of the p o p u l a t i o n (Watt, 1973; Fowler,
1981, 1983b).
Fowler (1981) p r e d i c t s that l a r g e mammals are not s t r o n g l y
r e g u l a t e d u n t i l p o p u l a t i o n d e n s i t y i s c l o s e to c a r r y i n g
c a p a c i t y . He suggests that d e n s i t y dependent mechanisms do not
s i g n i f i c a n t l y i n c rease p o p u l a t i o n growth at low p o p u l a t i o n
l e v e l s . Instead, r e g u l a t i n g f a c t o r s are b e l i e v e d to r e s t r i c t
p o p u l a t i o n i n c r e a s e s at high d e n s i t i e s r e l a t i v e to c a r r y i n g
c a p a c i t y . There i s a wide range of p o p u l a t i o n l e v e l s over which
no r e g u l a t i n g changes are expected.
P r e d i c t i o n s made by Fowler (1981 ) , about the r e g u l a t i o n of
la r g e mammal po p u l a t i o n s i z e s , appear to be supported by
northern fur se a l s t u d i e s . P o p u l a t i o n s t u d i e s during the years
of P r i b i l o f herd d e c l i n e i n d i c a t e no p o s i t i v e changes i n v i t a l
r a t e s at low po p u l a t i o n l e v e l s . York and H a r t l e y (1981)
compared a d u l t female s u r v i v a l r a t e s between 1958 and 1965 with
the p e r i o d 1966 to 1974 and c o u l d f i n d no s i g n i f i c a n t
d i f f e r e n c e . S i m i l a r l y , Smith and Polacheck (1980) were unable
to f i n d any change in pregnancy ra t e s over the p e r i o d 1958 to
1972. The age of f i r s t r e p r o d u c t i o n i s another p o p u l a t i o n
parameter that does not c o r r e l a t e with fur s e a l d e n s i t y (York,
1983). The same i s true f o r estimates of j u v e n i l e s u r v i v a l

18
(Fowler, 1982b). In general, there seems to be a lack of
evidence that s i g n i f i c a n t d e n s i t y dependent r e g u l a t i o n i s or has
ever been o p e r a t i o n a l during the years the P r i b i l o f f ur s e a l
p o p u l a t i o n has been d e c l i n i n g .
There are a few examples of p o s i t i v e p o p u l a t i o n changes
o c c u r r i n g in the fur s e a l herd (Fowler, 1982a). Three examples
of growth changes are (1) pup weights at b i r t h from 1958-74 were
10% higher than those through the 1950s, (2) male and female
growth ra t e s i n c r e a s e d a f t e r pup d e c l i n e , and (3) a d u l t t o o t h
weight increased from 1948-79 r e f l e c t i n g an i n c r e a s e in body
s i z e . A d d i t i o n a l examples of s i m i l a r d e n s i t y dependent
responses to low herd numbers are that l a c t a t i n g mothers have
been spending l e s s time f o r a g i n g and land pup m o r t a l i t y has
decreased as abundance dropped.
The shorter female feeding t r i p s , the p o s i t i v e changes i n
growth and i n body s i z e , and the lack of changes in p o p u l a t i o n
v i t a l r a t e s , are c o n s i s t e n t with p r e d i c t i o n s drawn from
Eberhardt (1977) for marine mammal p o p u l a t i o n s t h a t are below
t h e i r c a r r y i n g c a p a c i t y . Eberhardt suggests a p r o g r e s s i o n of
p o p u l a t i o n changes that might be observed as d e n s i t i e s change i n
respect to c a r r y i n g c a p a c i t y . Behavioural m o d i f i c a t i o n ( f e e d i n g
time, a g g r e s s i v e behaviour) i s speculated to be very s e n s i t i v e
to changes in d e n s i t y , followed by i n d i v i d u a l c h a r a c t e r i s t i c s
(growth, i n c i d e n c e of diseases and p a r a s i t e s ) , r e p r o d u c t i v e
e f f e c t s ( b i r t h r a t e s , age of f i r s t r e p r o d u c t i o n ) , and p o p u l a t i o n
19
aspects ( s u r v i v a l r a t e s , d i s t r i b u t i o n ) . I t seems that the
changes in the P r i b i l o f p o p u l a t i o n conform only to the f i r s t two
c a t e g o r i e s , behavioural m o d i f i c a t i o n and i n d i v i d u a l changes.
I suspect that changes i n s u r v i v a l and r e p r o d u c t i v e r a t e s
may only be observed at fur s e a l p o p u l a t i o n l e v e l s near c a r r y i n g
c a p a c i t y . The amount of v a r i a t i o n i n i n d i v i d u a l r a t e s probably
decreases as the age of the animal i n c r e a s e s . T h i s assumes that
the adult s e a l s are l e s s v u l n e r a b l e and more r e s i s t a n t to harsh
environmental c o n d i t i o n s than the youngest age c l a s s e s . A
p r o g r e s s i v e ' expression of parameter changes co u l d account for
the v a r i a b l e j u v e n i l e s u r v i v a l r a t e s and the s t a b i l i t y of
reproductive r a t e s and . a d u l t s u r v i v a l r a t e s that have been
observed for the P r i b i l o f f ur s e a l p o p u l a t i o n .
J u v e n i l e s u r v i v a l i s thought to be the "proximate f a c t o r "
r e g u l a t i n g the abundance of most l a r g e mammal p o p u l a t i o n s
(Eberhardt, 1981). Poor s u r v i v a l over the f i r s t few years of
l i f e means that fewer w i l l reproduce. I t a l s o suggests a delay
in growth r a t e s and the age of f i r s t r e production (Eberhardt,
1977b, 1981). T h i s view appears s u b s t a n t i a t e d by the negative
c o r r e l a t i o n that has r e c e n t l y been shown to e x i s t between the
age of f i r s t r e p r o d u c t i o n and estimates of j u v e n i l e fur s e a l
s u r v i v a l (York, 1983). The higher the s u r v i v a l (0.15 to 0.45)
the younger the P r i b i l o f females reproduced (ages 6.2 to 5.2
y e a r s ) . R e s t r i c t i n g the age and numbers of reproducing female
fur s e a l s can e f f e c t i v e l y r e g u l a t e p o p u l a t i o n s i z e .
20
The l a r g e v a r i a t i o n i n P r i b i l o f j u v e n i l e fur s e a l s u r v i v a l
suggests that there may have been times when the po p u l a t i o n
l e v e l was near c a r r y i n g c a p a c i t y . The most l i k e l y l i m i t i n g
f a c t o r i s the a v a i l a b i l i t y of food f o r the j u v e n i l e s . White
(1978) b e l i e v e s that the abundance of most animal populations i s
l i m i t e d by the r e l a t i v e shortage of nitrogenous foods f o r the
very young. T h i s c o u l d w e l l be true of the northern fur s e a l
p o p u l a t i o n . I t i s p o s s i b l e that there have been times when an
i n s u f f i c i e n t q u a l i t y and q u a n t i t y of food has been a v a i l a b l e t o
r e c e n t l y weaned pups i n the Bering Sea.
I have p r e v i o u s l y suggested that the s i z e of northern f u r
s e a l p o p u l a t i o n s i s r e s t r i c t e d by the a v a i l a b i l i t i e s of both
food and breeding space. I t seems that a v a r i a b l e a v a i l a b i l i t y
of s e a l food near the breeding i s l a n d s would have the g r e a t e s t
impact upon the growth and s u r v i v a l of a l l young fur s e a l s . In
c o n t r a s t to food l i m i t a t i o n , I have speculated that space i s a
secondary f a c t o r that prevents c e r t a i n r o o k e r i e s from growing.
I n s i g h t s i n t o the fur s e a l p o p u l a t i o n changes that might occur
as rookery d e n s i t i e s became i n c r e a s i n g l y high can be gained from
knowledge of other p i n n i p e d s p e c i e s .
Northern elephant s e a l s (Mirounga a n q u s t i r o s t r i s ) show the
same s i t e f i d e l i t y to t h e i r rookery of b i r t h as northern fur
s e a l s . R e i t e r et a l (1981) report that the reproductive success
and pup m o r t a l i t y of elephant s e a l s appears to be d e n s i t y
21
dependent. As rookery d e n s i t i e s i n c r e a s e , the young females are
l e s s able to s u c c e s s f u l l y compete with o l d e r females that are
l a r g e r and more experienced at r a i s i n g pups. The females that
f a i l to s u c c e s s f u l l y reproduce are apt to give b i r t h at a
d i f f e r e n t s i t e the f o l l o w i n g season and subsequently remain
f a i t h f u l to t h e i r new l o c a t i o n . Thus the emigration and
formation of new c o l o n i e s seems to occur when a rookery i s f u l l .
The formation and growth of fur s e a l c o l o n i e s a l s o seems to
depend upon rookery d e n s i t i e s . T h i s appears to be the case f o r
A n t a r c t i c fur s e a l s (Doidge et a l , 1984b) and Cape fur s e a l s
(Butterworth et a l , 1984). It i s speculated that emigration of
young A n t a r c t i c fur s e a l s accounts fo r the expansion of low
d e n s i t y r o o k e r i e s (Payne, 1977). Older females remain on the
higher d e n s i t y r o o k e r i e s where they p r e v i o u s l y pupped. The same
reg u l a t o r y mechanism accounts f o r the r e c o l o n i z a t i o n of
Commander Island northern fur s e a l r o o k e r i e s a f t e r they were
decimated by p e l a g i c s e a l i n g in 1910. The s e a l s were i n i t i a l l y
s t i mulated to go to the higher d e n s i t y r o o k e r i e s u n t i l pup
production stopped i n c r e a s i n g . At t h i s p o i n t young females
began to emigrate to the lower d e n s i t y r o o k e r i e s (Vladimorov,
personal communication). Po p u l a t i o n growth now appears to have
slowed and s t a b l i z e d due in part to a s e r i e s of poor j u v e n i l e
s u r v i v a l r a t e s (Vladimorov, 1984).
There i s evidence of a d d i t i o n a l r e g u l a t o r y mechanisms being
invoked i n pinniped p o p u l a t i o n s that are l i m i t e d by space dur i n g
22
the b r e e d i n g season. For example, S t i r l i n g (1971) found t h a t
younger female Weddell s e a l s ( L e p t o n y c h u t e s w e d d e l l i ) are
e x c l u d e d from b r e e d i n g when crowding t a k e s p l a c e and t h a t the
s o c i a l s t r e s s e s p r e s e n t a t h i g h d e n s i t i e s d e l a y m a t u r i t y . In
comparing f o u r b r e e d i n g i s l a n d s of grey s e a l s ( H a l i c h o e r u s
g r y p u s ) , Coulson and H i c k l i n g (1964) note t h a t pup growth and
s u r v i v a l are reduced under crowded c o n d i t i o n s . These responses
t o i n c r e a s i n g b r e e d i n g d e n s i t i e s c o u l d w e l l o ccur i n the f u r
s e a l p o p u l a t i o n .
A l l a v a i l a b l e evidence suggests t h a t n o r t h e r n f u r s e a l l a n d
pup m o r t a l i t y i s d e n s i t y dependent (Lander and K a j i m u r a , 1982;
F o w l e r , 1982a). The c o n c l u s i o n s are based upon average i s l a n d
d e n s i t i e s and s u r v i v a l e s t i m a t e s but c o u l d p r o b a b l y be a p p l i e d
t o i n d i v i d u a l r o o k e r i e s . For example the 1950 v a r i a t i o n i n pup
m o r t a l i t y (3-39%) among S a i n t P a u l I s l a n d r o o k e r i e s (Kenyon et
a l , 1954) might be e x p l a i n e d by r o o k e r y b r e e d i n g d e n s i t i e s .
D e n s i t y dependent m o r t a l i t y has been o b s e r v e d f o r A n t a r c t i c f u r
s e a l ( A r c t o c e p h a l u s g a z e l l a ) by Doidge et a l (1984a). More pups
s t a r v e d on h i g h d e n s i t y beaches because mother-pup bonds f a i l e d
t o form. There was a l s o h i g h e r i n c i d e n c e s of pups b e i n g
t r a m p l e d by b u l l s and b i t t e n by cows.
In summary, i t seems l i k e l y t h a t f u r s e a l s are r e g u l a t e d
most s t r o n g l y at p o p u l a t i o n l e v e l s c l o s e t o the l i m i t s s e t by
the a v a i l a b i l i t i e s of food and b r e e d i n g space. P o p u l a t i o n
growth appears to be p r i m a r i l y r e g u l a t e d by changes i n the r a t e s
23
of s u r v i v a l , r e p r o d u c t i o n , and d i s p e r s a l f o r young a n i m a l s .
4.3_ C o n c e p t u a l Model
Based upon t h e a v a i l a b l e i n f o r m a t i o n on t h e p o p u l a t i o n
d y namics o f f u r s e a l s and o t h e r p i n n i p e d s , I p r o p o s e a
c o n c e p t u a l model t h a t d e s c r i b e s t h e dynamics of t h e P r i b i l o f
I s l a n d s n o r t h e r n f u r s e a l .
To s i m p l i f y d i s c u s s i o n , o n l y two p h y s i c a l l y i d e n t i c a l
r o o k e r y s i t e s a r e assumed t o be near a s i n g l e f o o d s u p p l y . The
maximum p o p u l a t i o n s i z e or e q u i l i b r i u m d e n s i t y f o r e a c h r o o k e r y
i s r e s t r i c t e d by t h e amounts o f a v a i l a b l e f o o d , b r e e d i n g s p a c e ,
and o t h e r r e s o u r c e s . These c o n d i t i o n s d e t e r m i n e a ' l o c a l '
c a r r y i n g c a p a c i t y t h a t c an v a r y and i s s p e c i f i c f o r e a c h o f t h e
two r o o k e r i e s . The f i r s t r o o k e r y i s r e f e r r e d t o as t h e 'home'
r o o k e r y and c o n t a i n s a s m a l l p o p u l a t i o n t h a t i s below i t s l o c a l
c a r r y i n g c a p a c i t y . The s e c o n d i s t h e ' n e i g h b o r i n g ' r o o k e r y . I t
has t h e same p o t e n t i a l c a r r y i n g c a p a c i t y a s t h e home r o o k e r y ,
but i s p r e s e n t l y empty. The h y p o t h e t i c a l p o p u l a t i o n i s not
h a r v e s t e d and i s o n l y s u b j e c t t o n a t u r a l s o u r c e s of m o r t a l i t y .
F u r s e a l s r e t u r n e a c h summer t o t h e i r r o o k e r y of b i r t h .
T h e i r s i t e f i d e l i t y t o t h e home r o o k e r y i s r e i n f o r c e d e a c h y e a r
t h e y s u c c e s s f u l l y r e p r o d u c e . D e n s i t y d ependent mechanisms b e g i n
t o a f f e c t p r e g n a n c y r a t e s and l a n d pup s u r v i v a l as t h e a n n u a l
number of a n i m a l s c o n g r e g a t i n g on t h e b r e e d i n g g r o unds
24
approaches the l o c a l c a r r y i n g c a p a c i t y . Some young females are
excluded from reproducing, while other young inexperienced
females f a i l to form a mother-pup bond and are unable to
pro p e r l y care for t h e i r pups. Many of the pups become separated
from t h e i r mothers and subsequently starve to death. Others are
trampled by b u l l s , b i t t e n by mature females, or d i e from disease
as the population d e n s i t y approaches the rookery c a r r y i n g
c a p a c i t y .
The young females that f a i l to s u c c e s s f u l l y reproduce are
l e s s f a i t h f u l to the home rookery than the o l d e r females and are
th e r e f o r e l i k e l y to emigrate to the neighboring rookery the
f o l l o w i n g breeding season. B u l l s that were p r e v i o u s l y excluded
from breeding on the high d e n s i t y rookery can s u c c e s s f u l l y
defend a t e r r i t o r y and maintain a harem on the neighboring
rookery. S u c c e s s f u l r e p r o d u c t i o n and s u r v i v a l of the pups
ensures continued c o l o n i z a t i o n of the neighboring rookery u n t i l
both home and neighboring r o o k e r i e s approach t h e i r l o c a l
c a r r y i n g c a p a c i t i e s .
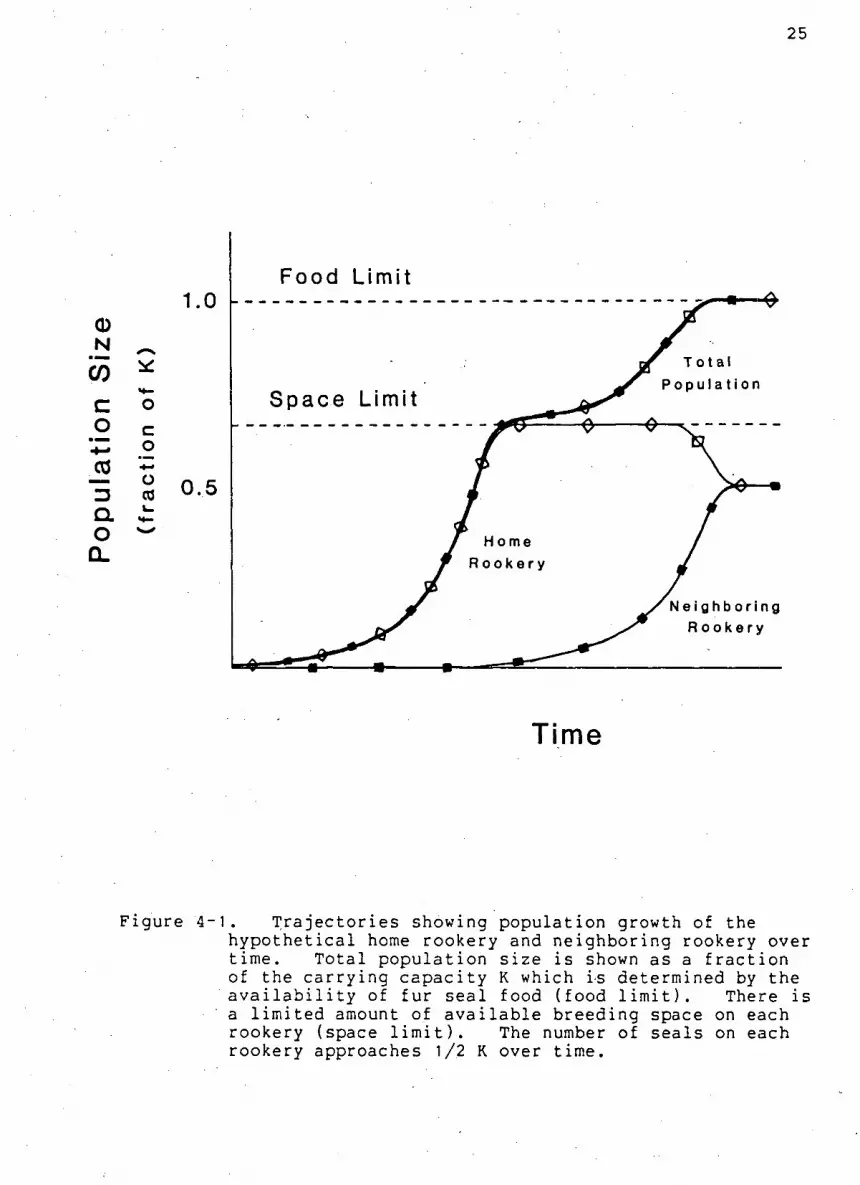
The population growth t r a j e c t o r i e s are shown for the home
rookery and neighboring rookery i n Figure 4-1. The t o t a l
p o p u l a t i o n s i z e for both r o o k e r i e s i s u l t i m a t e l y l i m i t e d by the
a v a i l a b i l i t y of food. Rookery d e n s i t i e s e v e n t u a l l y approach
l e v e l s that are one h a l f the i s l a n d c a r r y i n g c a p a c i t y and are
below the l i m i t s set by breeding space.
2 5
Figure 4-1. T r a j e c t o r i e s showing population growth of the h y p o t h e t i c a l home rookery and neighboring rookery over time. T o t a l p o p u l a t i o n s i z e i s shown as a f r a c t i o n of the c a r r y i n g c a p a c i t y K which is determined by the a v a i l a b i l i t y of fur s e a l food (food l i m i t ) . There i s a l i m i t e d amount of a v a i l a b l e breeding space on each rookery (space l i m i t ) . The number of s e a l s on each rookery approaches 1/2 K over time.
26
The t o t a l f ur s e a l p o p u l a t i o n (home and neighboring
r o o k e r i e s ) i s never at a true numeric e q u i l i b r i u m but i s
c o n t i n u a l l y f l u c t u a t i n g . The major cause of f l u c t u a t i o n s i n the
s i z e of the p o p u l a t i o n i s high and v a r i a b l e j u v e n i l e m o r t a l i t y
rates over the f i r s t two years of l i f e . Poor environmental
c o n d i t i o n s reduce the number of fur s e a l s that s u r v i v e to
reproduce and increase the time needed to grow and become
se x u a l l y mature. Good environmental c o n d i t i o n s enhance
populat i o n growth.
Oceanographic c o n d i t i o n s can i n f l u e n c e annual p r o d u c t i v i t y
and d i s t r i b u t i o n of fur s e a l prey s p e c i e s that are near
ro o k e r i e s and that are needed by l a c t a t i n g mothers to produce
enough milk to ensure s u r v i v a l of pups. S i m i l a r l y : the
t r a n s i t i o n from recent weaning to s o l i d foods i n the wintry
Bering Sea w i l l be u n s u c c e s s f u l i f prey species are not
a v a i l a b l e at t h i s c r i t i c a l p e r i o d . Adult fur s e a l s are not as
v u l n e r a b l e as j u v e n i l e s to poor weather c o n d i t i o n s , p r e d a t i o n ,
d i s e a s e , and s t a r v a t i o n , unless c o n d i t i o n s are extreme.
Growth of fur s e a l p o p u l a t i o n s i s thus l i m i t e d by the
abundance of breeding space and the a v a i l a b i l i t y of food near
these breeding l o c a t i o n s . Regulation of the numbers becomes
apparent as the s e a l s congregate in the Bering Sea and upon the
breeding grounds. Changes in v i t a l r a t e s occur at p o p u l a t i o n
l e v e l s near c a r r y i n g c a p a c i t y and are more apparent in young age
c l a s s e s . Food i s the u l t i m a t e c o n d i t i o n l i m i t i n g p o p u l a t i o n
27
s i z e . However, the l o c a l c a r r y i n g c a p a c i t i e s of some r o o k e r i e s
could well be determined by a shortage of breeding space before
food becomes l i m i t i n g . T o t a l numbers of fur s e a l s w i l l be
rookery s p e c i f i c and w i l l depend p r i m a r i l y upon the q u a l i t y and
a c c e s s i b i l i t y of both food and breeding space.
4.4 D i s c u s s i o n
The proposed general theory d e s c r i b i n g f ur s e a l p o p u l a t i o n
dynamics i s based upon s e v e r a l assumptions about resources that
l i m i t d e n s i t y and mechanisms that r e g u l a t e growth. Two major
assumptions are that l i m i t e d amounts of food are a v a i l a b l e near
the breeding i s l a n d s and that p o p u l a t i o n growth i s p r i m a r i l y
r e g u l a t e d by the numbers of young that s u r v i v e to reproduce.
Acceptance of the conceptual model depends upon the v a l i d i t y of
assumptions such as these.
C e r t a i n assumptions and p r e d i c t i o n s can be t e s t e d using a
mathematical model that i n c o r p o r a t e s the major f e a t u r e s of the.
fur s e a l conceptual model. The mathematical model can t e s t such
assumptions as that v a r i a b l e j u v e n i l e s u r v i v a l r a t e s r e g u l a t e
herd dynamics, and adult v i t a l r ates remain r e l a t i v e l y constant
at low p o p u l a t i o n d e n s i t i e s . U n f o r t u n a t e l y , there i s
i n s u f f i c i e n t information a t ' present to t e s t a l l of the
conceptual model assumptions. For example, the l o c a l c a r r y i n g
c a p a c i t y hypothesis cannot be t e s t e d because the p h y s i c a l
c a p a c i t i e s of r o o k e r i e s has never been q u a n t i f i e d .
28
Nevertheless, the mathematical model can t e s t the soundness of
c e r t a i n hypothesised r e g u l a t o r y mechanisms and may perhaps
provide f u r t h e r i n s i g h t i n t o fur s e a l p o p u l a t i o n dynamics.
A mathematical model can be c o n s t r u c t e d to reproduce
h i s t o r i c o b s e r v a t i o n s recorded during the years of P r i b i l o f herd
d e c l i n e , 1950 to 1980, by extending the conceptual model to
include the impact upon p o p u l a t i o n dynamics of h a r v e s t i n g males
and females. The hypothesis that changes in v i t a l r a t e s are
grea t e s t at popula t i o n l e v e l s near c a r r y i n g c a p a c i t y , suggests
that c u l l i n g females at low d e n s i t i e s would reduce herd
p r o d u c t i v i t y and produce no compensentary response . i n
reproductive r a t e s . Fur s e a l b i o l o g y suggests that many
nonbreeding males are excess and may be harvested without
adversely a f f e c t i n g the p o p u l a t i o n . T h i s seems to be
s u b s t a n t i a t e d by the constancy in pregnancy rate over the p e r i o d
1958 to 1972 when la r g e f l u c t u a t i o n s were recorded i n the number
of subadult males harvested and harem b u l l s counted (Smith and
Polacheck, 1978). T h i s view a l s o appears to be supported by the
comparative b e h a v i o r a l s t u d i e s conducted on the P r i b i l o f I s l a n d s
sin c e the c e s s a t i o n of . the Sa i n t George harvest i n 1972
(Anonymous, 1983).
29
CHAPTER 5 A FUR SEAL MATHEMATICAL MODEL
An approach to understanding fur s e a l dynamics and why the
P r i b i l o f I s l a n d p o p u l a t i o n has been d e c l i n i n g s i n c e the mid
1950s i s to r e c o n s t r u c t h i s t o r i c a l o b s e r v a t i o n s during the years
of herd d e c l i n e . Along with o f f e r i n g p o s s i b l e e x p l a n a t i o n s f o r
the d e c l i n e , s i m u l a t i o n r e s u l t s may a l s o suggest i m p l i c a t i o n s
f o r f u t u r e management and r e s e a r c h . A s i m u l a t i o n model was
t h e r e f o r e developed that attempted to reproduce data sets
spanning the p e r i o d 1950 to 1980.
5.1 Methods
Two s e t s of fur s e a l data can be r e c o n s t r u c t e d with a model
(Table 5-1). The f i r s t set of estimates p e r t a i n s to pup
production c a l c u l a t e d using two e s t i m a t i o n procedures over the
p e r i o d 1950 to 1980. From 1950 to 1960, Chapman (1964)
estimated the numbers of pups born using assumptions about
d i f f e r e n t i a l s u r v i v a l of j u v e n i l e males and females, s i z e of the
female p o p u l a t i o n , and pregnancy r a t e s . Since 1961, pup
estimates have been based on a mark recapture program w i t h i n the
summer of b i r t h (Chapman and Johnson, 1968). The estimates have
been widely accepted, although there e x i s t s some con t r o v e r s y
over the 1950 to 1960 estimates (Smith and Polacheck, 1978).
J u l y estimates of a d u l t male abundance on Saint Paul I s l a n d
comprise the second set of f i e l d o b s e r v a t i o n s . The male s e a l s
30
Table 5-1. Pup estimates and counts of harem and i d l e b u l l s on Saint Paul I s l a n d .
Year Pups B u l l s Counted Born Harem I d l e
1 950 451 000 9 292 3 102 1951 447 000 9 434 3 581 1952 438 ,000 9 318 4 717 1953 445 000 9 848 5 912 1 954 450 000 9 906 6 847 1955 461 ,000 9 034 8 650 1956 453 ,000 9 384 9 016 1 957 420 000 9 582 10 060 1958 387 000 9 970 9 510 1959 335 000 10 003 1 1 485 1960 320 000 10 247 10 407 1961 342 336 1 1 163 1 1 791 1 962 277 078 10 332 9 109 1963 262 ,498 9 212 7 650 1964 283 922 9 085 7 095 1965 253 ,768 8 553 5 616 1 966 298 931 7 925 5 931 1 967 291 000 7, 230* 4 439* 1968 235 000~ 6 1 76* 3 100* 1 969 232 670 5, 467 2 208 1 970 230 485 4, 945 1 , 666 1971 305 000~ 4 200* 1 900* 1 972 269 000 3 738* 2 384* 1 973 236 420# 4 906* 2 550* 1 974 266 000 4, 563* 1 782* 1 975 278 261 5, 018 3 535 1976 298, 000 5, 324 4 041 1977 235, 210# 6, 457 3 845 1978 247, 1 32# 6, 496 3, 908 1979 245, 932 6 242 4 457 1 980 199, 046# 5, 490# 4 248#
Sources:
Lander, 1980 * Lander and Kajimura, 1975
Smith and Polacheck, 1978 # York, personal communication

31
of a d u l t s i z e ( a t t a i n e d at about age 7) are c l a s s i f i e d as being
e i t h e r harem masters or i d l e males. Harem masters maintain a
t e r r i t o r y with one or more females for an average of one and a
h a l f y e a r s . Both p r i o r to and a f t e r t h i s p e r i o d of breeding
a d u l t males c o n t r i b u t e to the i d l e b u l l count. In c o n t r a s t to
the accuracy of the harem b u l l counts, there i s a great deal of
u n c e r t a i n t y about the t o t a l number of i d l e males aged 6, 7, and
8 years o l d , for some may remain at sea (Chapman, 1964; Smith
and Polacheck, 1978). A second area of u n c e r t a i n t y i s the age
s t r u c t u r e of the harem b u l l p o p u l a t i o n and how i t has,changed
over time. Despite these shortcomings, the b u l l counts are
c o n s i d e r e d to be adequate and r e l i a b l e i n d i c a t o r s of the fur
s e a l p o p u l a t i o n trend.
5.2 Model
A simple s i n g l e s p e c i e s age s t r u c t u r e d model was developed
for the Saint Paul p o p u l a t i o n that c o n s t i t u t e s about 80% of the
P r i b i l o f group of northern fur s e a l s (Appendix A). The modelled
p o p u l a t i o n was considered as , s p a t i a l l y homogeneous and was
s t r a t i f i e d by sex and 25 age c l a s s e s . No d e n s i t y dependent
r e g u l a t o r y mechanisms were assumed to be o p e r a t i o n a l .
The number of fur s e a l s at age x was designated as N x ^ f o r
males and N x p for females. The annual c y c l e of the model f i r s t
determined the number of i n d i v i d u a l s that s u r v i v e d from one year
to the next (age i n t e r v a l x to x+1) and l a t e r removed the males
32
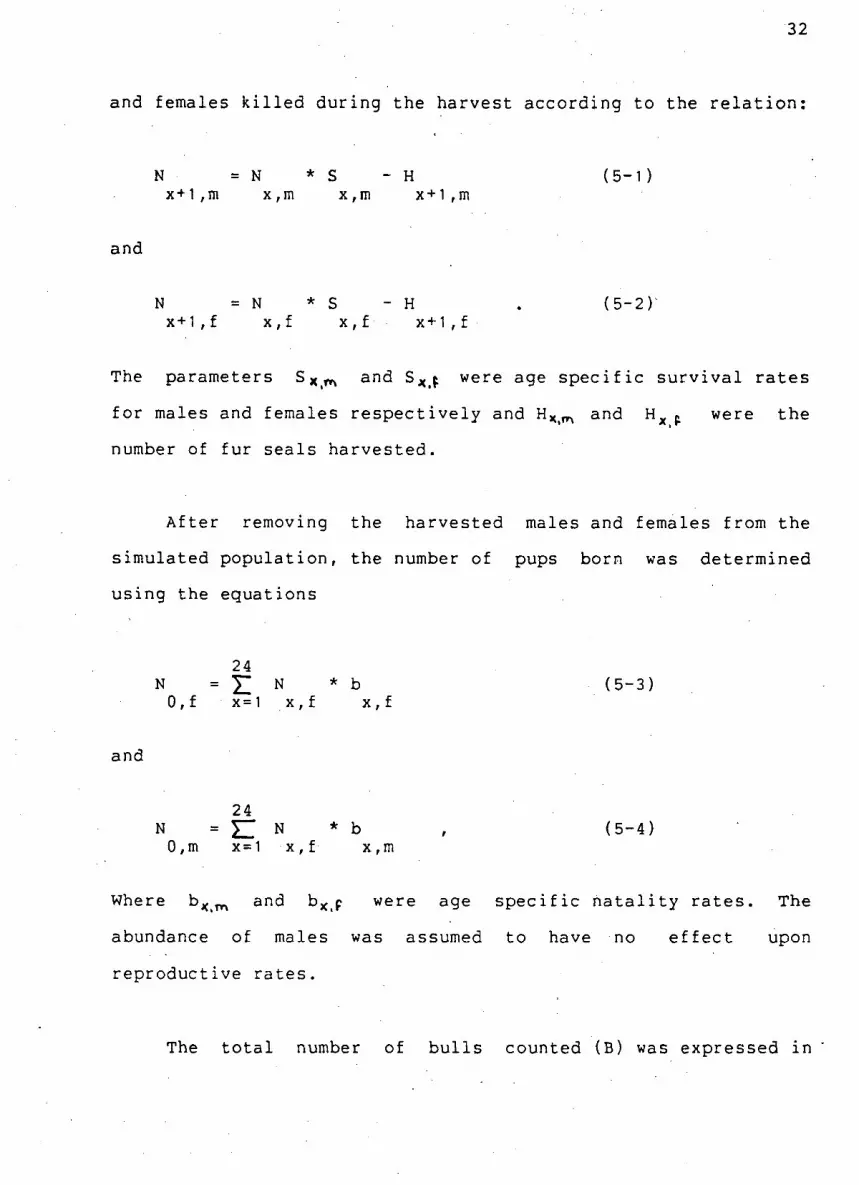
and females k i l l e d during the harvest according to the r e l a t i o n :
N = N * S - H (5-1) x+1,m x,m x,m x+1 ,m
and
N = N * S - H . (5-2)' x+1,f x,f x,f x+1,f
The parameters S X r n and S^f were age s p e c i f i c s u r v i v a l r a t e s
f o r males and females r e s p e c t i v e l y and H x > m and H x were the
number of fur s e a l s harvested.
A f t e r removing the harvested males and females from the
simulated p o p u l a t i o n , the number of pups born was determined
using the equations
24 N = £ N * b (5-3) 0 , f x= 1 x , f x,f
and
24 N = ET N * b
> (5-4) 0,m x=1 x, f x,m
Where b X m and b x p were age s p e c i f i c n a t a l i t y r a t e s . The
abundance of males was assumed to have no e f f e c t upon
rep r o d u c t i v e r a t e s .
The t o t a l number of b u l l s counted (B) was expressed i n
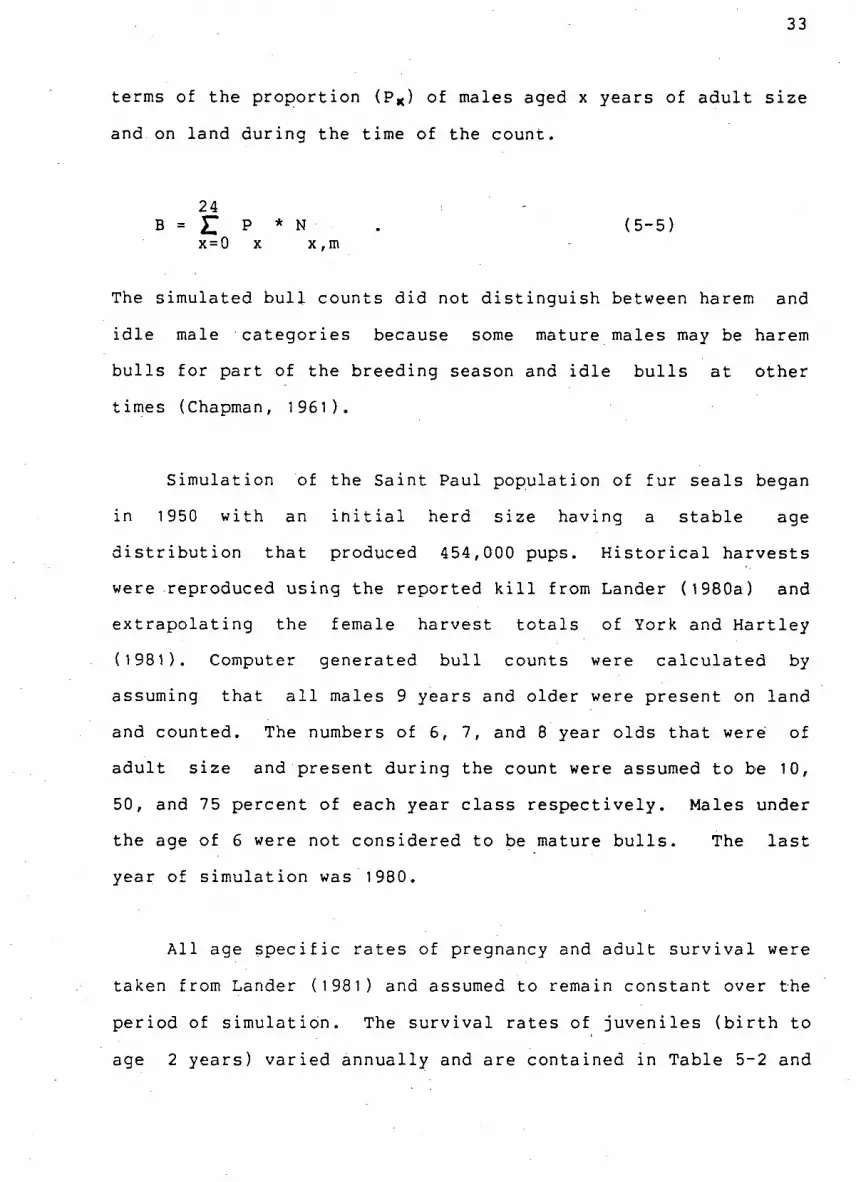
33
terms of the p r o p o r t i o n (P*) of males aged x years of a d u l t s i z e
and on land during the time of the count.
24 -B = £ P * N . (5-5)
x=0 x x,m
The simulated b u l l counts d i d not d i s t i n g u i s h between harem and
i d l e male c a t e g o r i e s because some mature males may be harem
b u l l s for part of the breeding season and i d l e b u l l s at other
times (Chapman, 1961).
Simulation of the Saint Paul population of fur s e a l s began
in 1950 with an i n i t i a l herd s i z e having a s t a b l e age
d i s t r i b u t i o n that produced 454,000 pups. H i s t o r i c a l h a r v e s t s
were reproduced using the reported k i l l from Lander (1980a) and
e x t r a p o l a t i n g the female harvest t o t a l s of York and H a r t l e y
(1981). Computer generated b u l l counts were c a l c u l a t e d by
assuming that a l l males 9 years and older were present on land
and counted. The numbers of 6, 7, and 8 year olds that were of
a d u l t s i z e and present during the count were assumed to be 10,
50, and 75 percent of each year c l a s s r e s p e c t i v e l y . Males under
the age of 6 were not c o n s i d e r e d to be mature b u l l s . The l a s t
year of s i m u l a t i o n was 1980.
A l l age s p e c i f i c r a t e s of pregnancy and a d u l t s u r v i v a l were
taken from Lander (1981) and assumed to remain constant over the
p e r i o d of s i m u l a t i o n . The s u r v i v a l rates of j u v e n i l e s ( b i r t h to
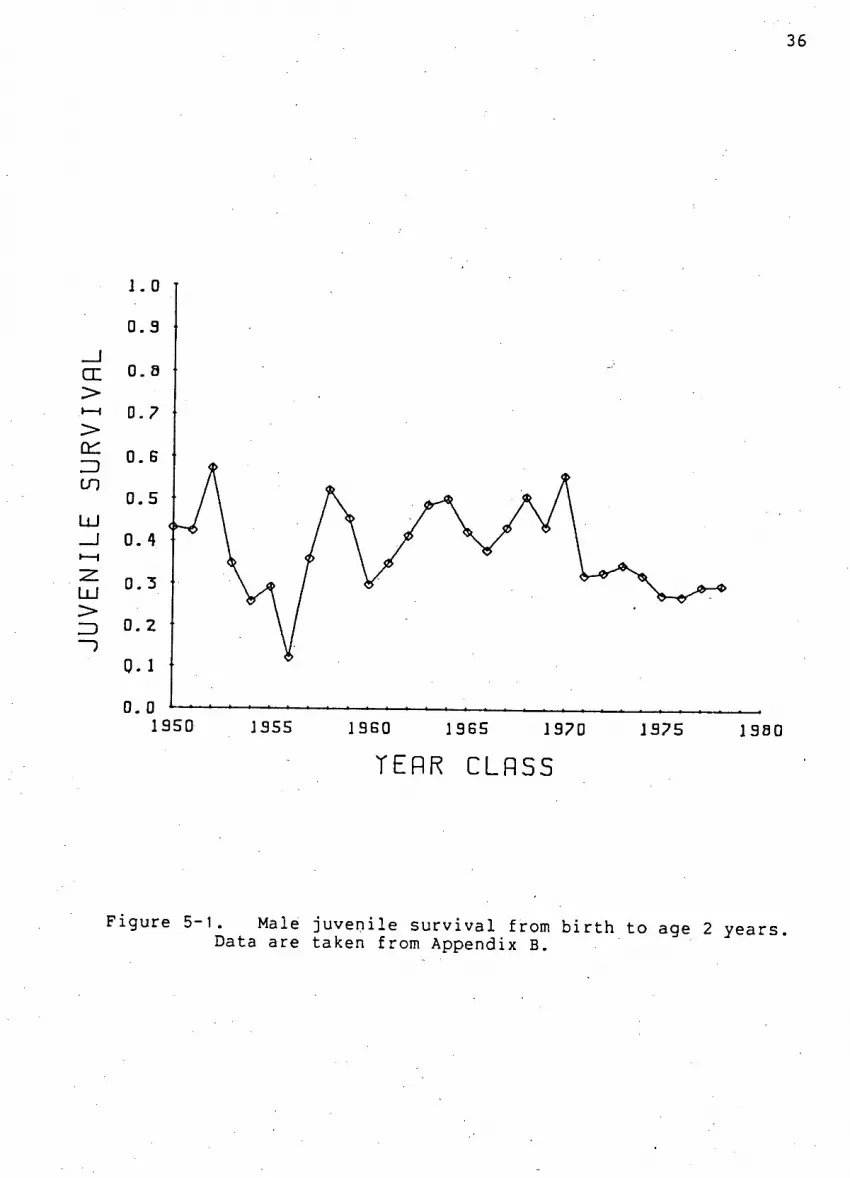
age 2 years) v a r i e d a n n u a l l y and are contained i n Table 5-2 and

34
F i g u r e 5-1. These values were c a l c u l a t e d using estimates of
numbers of pups born and counts of s e a l s k i l l e d a c c o r d i n g to age
(Appendix B).
The annual j u v e n i l e s u r v i v a l r a t e s are f o r males o n l y . I t
has been a common p r a c t i c e to assume that the s u r v i v a l of
j u v e n i l e females exceeds that of males by a constant f a c t o r
ranging from 1.05 to 1.10 (see Chapman 1961, 1964, 1973; York
and H a r t l e y , 1981; Eberhardt, 1981). This has been based on the
hypothesis that females experience b e t t e r environmental
c o n d i t i o n s during t h e i r p e l a g i c l i f e than males. However there
has been no evidence to support such an assumption. For t h i s
reason the model was run with both equal (1.0) and sex
d i f f e r e n t i a t e d (1.1) j u v e n i l e s u r v i v a l rates f o r ages 0 to 2
years.
5.3_ R e s u l t s
Computer generated pup production i s compared with the
f i e l d estimates of Saint Paul f o r the p e r i o d 1950 to 1980. The
r e s u l t s of three s i m u l a t i o n runs are summarized i n F i g u r e 5-2.
Curves 1 and 2 reproduced the female commercial harvest and
assumed male-female d i f f e r e n t i a l j u v e n i l e s u r v i v a l values of
1.00 and 1.10 r e s p e c t i v e l y . Pup production in the absence of a
female harvest with a p o p u l a t i o n that experienced e q u i v a l e n t
male and female j u v e n i l e s u r v i v a l r a t e s i s represented by curve
3. Overlayed on the s i m u l a t i o n r e s u l t s , are the a c t u a l
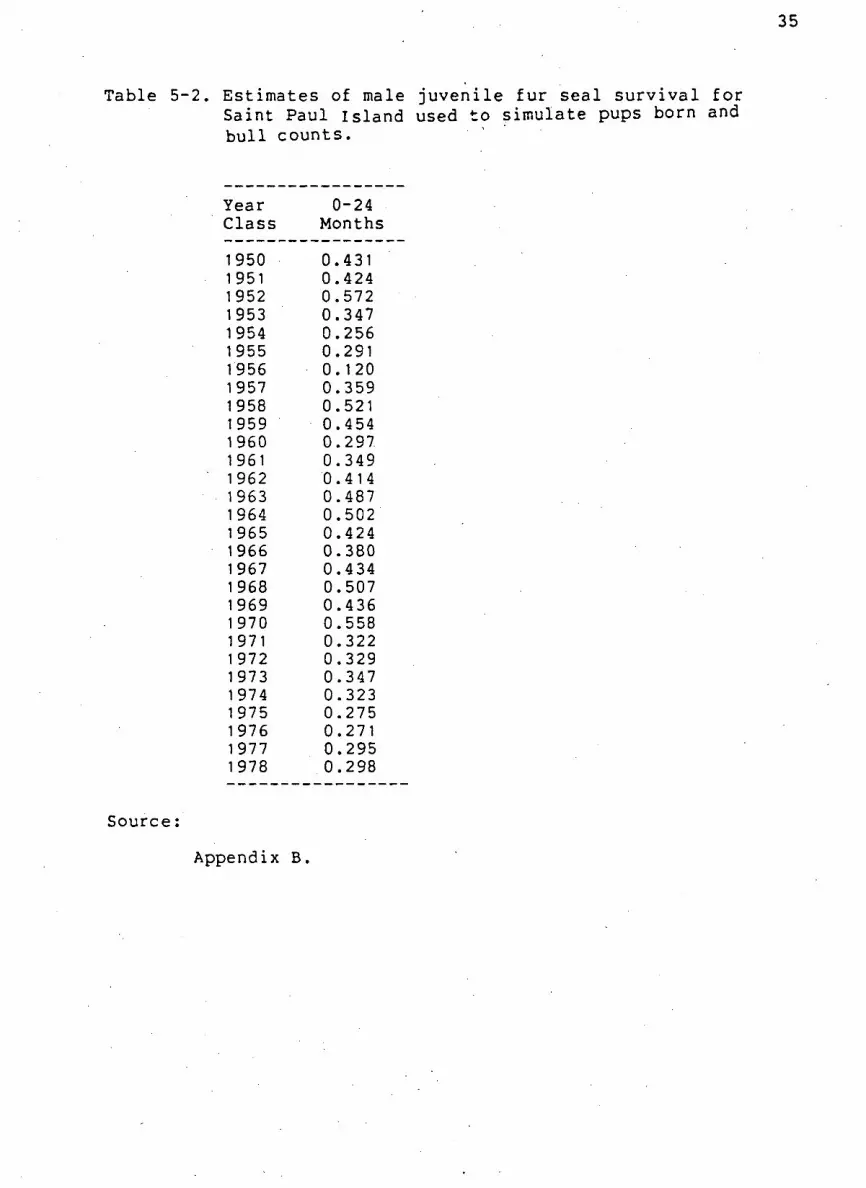
Table 5-2. Estimates of male j u v e n i l e f u r s e a l s u r v i v a l f o r Saint Paul Island used to simulate pups born and b u l l counts.
Year 0-24 Clas s Months
1950 0.431 1951 0.424 1952 0.572 1953 0.347 1954 0.256 1955 0.291 1956 0. 120 1957 0.359 1958 0.521 1959 0.454 1960 0.297 1961 0.349 1962 0.414 1963 0.487 1964 0.502 1965 0.424 1966 0.380 1967 0.434 1968 0.507 1969 0.436 1 970 0.558 1 971 0.322 1972 0.329 1973 0.347 1974 0.323 1 975 0.275 1 976 0.271 1977 0.295 1978 0.298
Source:
Appendix B.
36
1 . 0
0 . 3
C E 0 . 8 > ' ' 0.7
0 . 0 1
1 9 5 0 J 3 5 5 1 9 G 0 1 3 G 5 1 9 7 0 1 3 7 5 1 3 8 0
TERR CLASS
F i g u r e 5-1. Male j u v e n i l e s u r v i v a l from b i r t h to age 2 y e a r s . Data are taken from Appendix B.
37
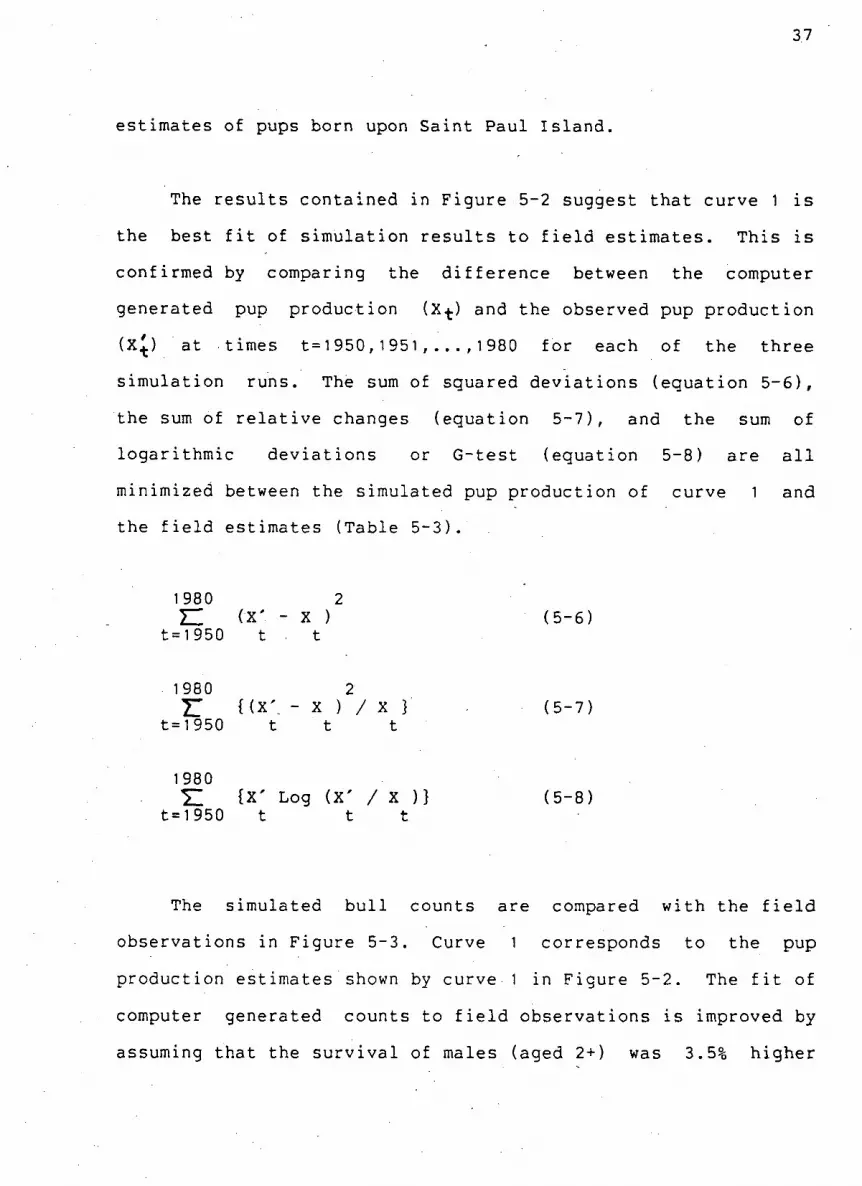
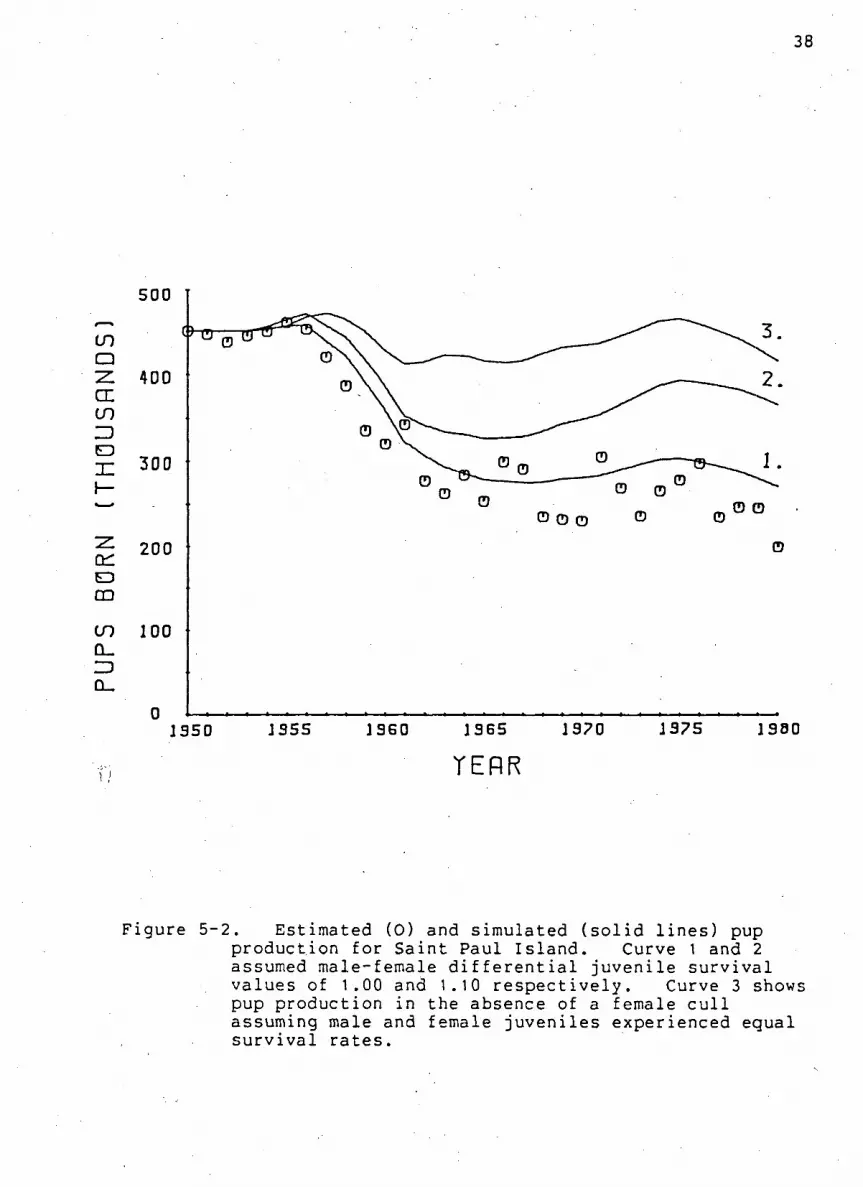
estimates of pups born upon Saint Paul I s l a n d .
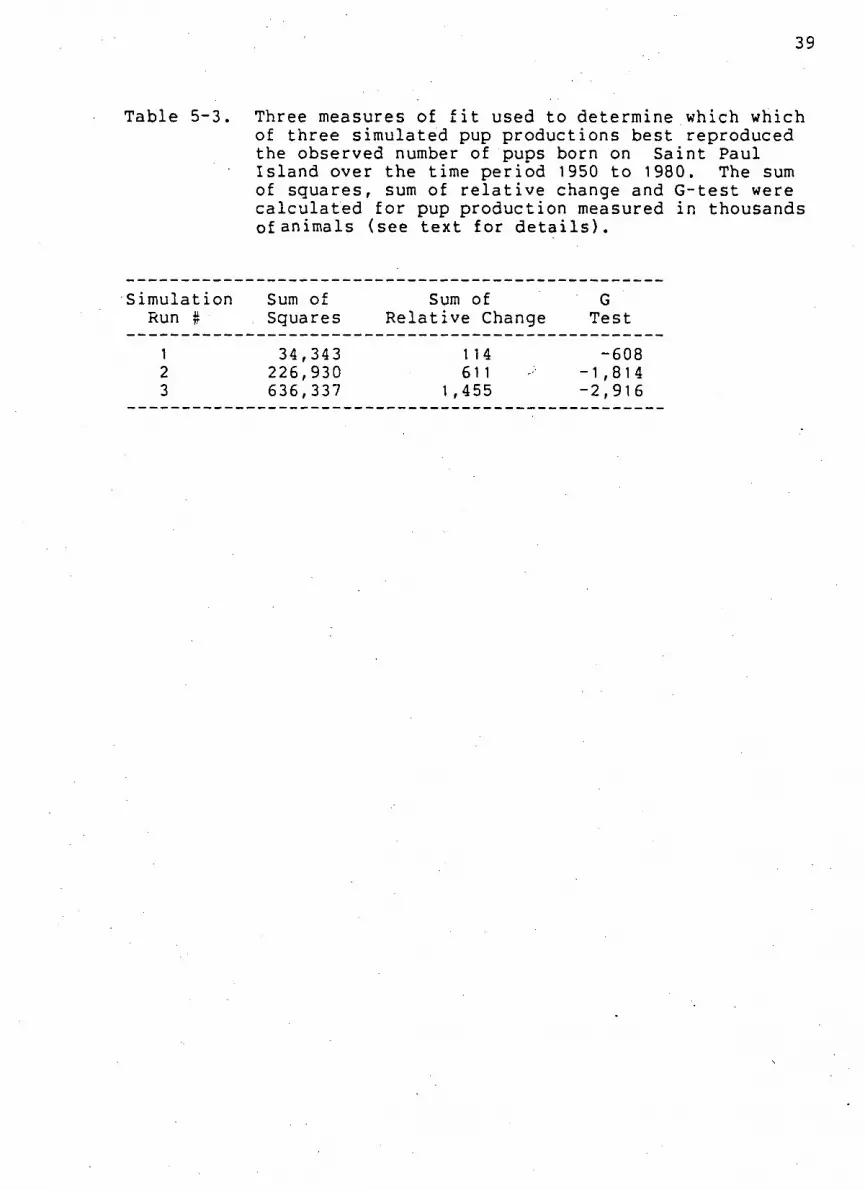
The r e s u l t s contained in F i g u r e 5-2 suggest that curve 1 i s
the best f i t of s i m u l a t i o n r e s u l t s to f i e l d e s t i m a t e s . T h i s i s
confirmed by comparing the d i f f e r e n c e between the computer
generated pup production (X^) and the observed pup p r o d u c t i o n
(X^) at times t=1950,1951,...,1980 f o r each of the three
s i m u l a t i o n runs. The sum of squared d e v i a t i o n s (equation 5-6),
the sum of r e l a t i v e changes (equation 5-7), and the sum of
l o g a r i t h m i c d e v i a t i o n s or G-test (equation 5-8) are a l l
minimized between the simulated pup production of curve 1 and
the f i e l d estimates (Table 5-3).
1980 2 TZ <X' " X ) (5-6)
t=l950 t t
1980 2 IT HX'. - X ) / X } (5-7)
t=l950 t t t
1980 TL U ' Log (X' / X )} (5-8)
t=!950 t t t
The simulated b u l l counts are compared with the f i e l d
o bservations in F i g u r e 5-3. Curve 1 corresponds to the pup
production estimates shown by curve I in Figure 5-2. The f i t of
computer generated counts to f i e l d o b s e r v a t i o n s i s improved by
assuming that the s u r v i v a l of males (aged 2+) was 3.5% higher
38
500
0 I 1 9 5 0 1 3 5 5 I 9 6 0 1 9 6 5 1 9 7 0 1 3 7 5 1 3 8 0
T E R R
Figure 5-2. Estimated (0) and simulated ( s o l i d l i n e s ) pup production for Sa i n t Paul I s l a n d . Curve 1 and 2 assumed male-female d i f f e r e n t i a l j u v e n i l e s u r v i v a l values of 1.00 and 1.10 r e s p e c t i v e l y . Curve 3 shows pup production i n the absence of a female c u l l assuming male and female j u v e n i l e s experienced equal s u r v i v a l r a t e s .
39
Table 5-3. Three measures of f i t used to determine which which of three simulated pup productions best reproduced the observed number of pups born on Saint Paul Isla n d over the time p e r i o d 1950 to 1980. The sum of squares, sum of r e l a t i v e change and G-test were c a l c u l a t e d f o r pup production measured i n thousands of animals (see text for d e t a i l s ) .
Simulation Sum of Sum of G Run # Squares R e l a t i v e Change Test
1 34,343 1 14 -608 2 226,930 61 1 -1,814 3 636,337 1 ,455 -2,916
40
from 1950 to 1960 than p r e s e n t l y accepted values (Figure 5-3,
curve 2). I t could be f u r t h e r improved by a l t e r i n g the assumed
p r o p o r t i o n s of young i d l e males present during the simulated
count or by decreasing s u r v i v a l i n a d i f f e r e n t manner than the
k n i f e edge approach employed. S i m i l a r l y , the f i r s t 8 years of
s i m u l a t i o n are l a r g e l y a r e s u l t of the i n i t i a l age s t r u c t u r e ,
but a l l subsequent year counts are d r i v e n by the modelled pup
b i r t h s . Regardless of the f i d d l i n g that may be done to model
input parameters the trend of the simulated b u l l counts remains
c o n s i s t e n t with those observed on Saint Paul.
5_.4_ D i s c u s s i o n
The two f a c t o r s that account for the d e c l i n e of pup
production on Saint Paul I s l a n d are the commercial h a r v e s t i n g of
females and a s e r i e s of poor j u v e n i l e s u r v i v a l r a t e s .
Simulation r e s u l t s summarized in curve 1 of F i g u r e 5-2 support
the c o n c l u s i o n of York and H a r t l e y (1981) that female h a r v e s t i n g
accounts f o r 70% of the observed d e c l i n e . The remaining 30% and
the present d e c l i n e can be e x p l a i n e d by poor j u v e n i l e s u r v i v a l .
Running the s i m u l a t i o n model with no female k i l l ( Figure 5-2,
curve 3) revealed two p e r i o d s of sharp decrease i n pup
production d u r i n g the years 1957-1961 and 1975-1980, with a
smaller d e c l i n e from 1964-1966. These p e r i o d s of d e c l i n e are
lagged by approximately 3 years and correspond to the low
j u v e n i l e s u r v i v a l estimates of 1954-1956, 1960, and 1972-1976.
The poor s u r v i v a l of females from these cohorts reduced the

41
CD Q I — — — 1950 1355 13G0 1SG5 1370 1375 1380
TERR
F i g u r e 5-3. Observed (0) and simulated ( s o l i d l i n e ) b u l l counts on Saint Paul I s l a n d . Adult male s u r v i v a l was assumed constant as determined by Lander (1981) in curve 1. Curve 2 was produced by assuming that a d u l t male s u r v i v a l was 3.5% higher from 1950 to 1960.
42
numbers of reproducing females.
The observed b u l l d e c l i n e of the 1960s can be e x p l a i n e d i f ,
i n a d d i t i o n to poor j u v e n i l e s u r v i v a l and a heavy female
harvest, the male s u r v i v a l schedules were higher d u r i n g the
1950s than for the l a t t e r two decades (Figure 5-3, curve 2).
The increase in m o r t a l i t y in recent times appears to be r e l a t e d
to a high incidence of seal- entanglement i n f i s h i n g d e b r i s .
Extraneous sources of m o r t a l i t y , such as the entanglement of
male sea l s in net fragments, p l a s t i c bands, and other d e b r i s ,
has been a recognized problem s i n c e the e a r l y 1960s (Scordino
and F i s h e r , 1 983.) .
Major Bering Sea f i s h e r i e s began in 1954, 1960, and 1964
for y e l l o w f i n s o l e , h e r r i n g , and p o l l o c k r e s p e c t i v e l y ( F a v o r i t e
et a l . , 1979). Along with the development of the f i s h e r i e s in
the e a r l y 1960s, the i n d u s t r y switched to s y n t h e t i c f i b e r s that
d i d not sink or r o t . I n c r e a s i n g numbers of entangled males
began appearing on the h a u l i n g grounds of S a i n t Paul I s l a n d .
From 1967 to 1981 an average of 0.40% of the males harvested
were entangled (NPFSC, 1982). The m o r t a l i t y a s s o c i a t e d with
entanglement has been c a l c u l a t e d by comparing the d e b r i s
contained on beaches with that found on the harvested males and
i s estimated to range from 2 to 5% (Fowler 1982b, 1983a).
The male s u r v i v a l schedule used w i t h i n the model was
c a l c u l a t e d f o r the p e r i o d during which entanglement m o r t a l i t y i s

43
b e l i e v e d to have been of s i g n i f i c a n c e . These values were
c a l c u l a t e d by Lander (1981) u s i n g data c o l l e c t e d d u r i n g the
1960s and 1970s, implying that the l i f e t a b l e s f o r males r e f l e c t
t h i s added source of m o r t a l i t y . Based on entanglement m o r t a l i t y
estimates of Fowler, the argument can be extended to suggest
that the s u r v i v a l of males was on average 3.5% higher d u r i n g the
1950s than during the subsequent two decades.
It i s a p p r o p r i a t e to ask whether the apparent d e c r e a s i n g
trend i n male s u r v i v a l was e q u a l l y true of females. Given that
the source of increased m o r t a l i t y was d e b r i s entanglement i t
appears u n l i k e l y . Observations of fur s e a l s on the P r i b i l o f s
suggest l e s s entanglement of breeding females than males i n the
harvest (Bigg, 1979). It i s suspected that much of the d e b r i s
c a r r i e d by the s e a l s comes from the Bering Sea (Fowler, 1982;
M e r r e l l , 1980) where males spend p r o p o r t i o n a l l y more time than
females. In c a p t i v i t y , males spend more time being p l a y f u l
(Bigg, pers comm.) and are a p p a r e n t l y more l i k e l y to become
entangled.
The e f f e c t of female entanglement m o r t a l i t y does not appear
to be l a r g e enough to be d i s t i n g u i s h e d . York and H a r t l e y (1981)
compared female s u r v i v a l rates between 1958 to 1965 with the
p e r i o d 1966 to 1974 and could f i n d no s i g n i f i c a n t d i f f e r e n c e .
Computer si m u l a t i o n supports the view that a d u l t female s u r v i v a l
r a t e s could have remained r e l a t i v e l y constant s i n c e the 1950s.
44
Increased m o r t a l i t y due to entanglement i n f i s h i n g d e b r i s
during the 1960s and 1970s appears to have s i g n i f i c a n t l y reduced
the male p o r t i o n of the fur s e a l herd. The u l t i m a t e e f f e c t has
been a reduction i n t o t a l number of males a v a i l a b l e f o r
h a r v e s t i n g . Fewer b u l l s c o u l d mean that males are now h o l d i n g
harems for longer periods of time because competition may have
decreased for breeding space w i t h i n the r o o k e r i e s . There i s no
i n d i c a t i o n that the r e p r o d u c t i v e p o t e n t i a l of the herd has been
s i g n i f i c a n t l y i n f l u e n c e d by a r e d u c t i o n i n male abundance.
Indeed, pregnancy r a t e s show no change over the p e r i o d 1958 to
1972 (Smith and Polacheck, 1978).
The key f a c t o r that accounts for the o v e r a l l d e c l i n e and
lack of p r o d u c t i v i t y of the P r i b i l o f herd i s n e i t h e r a d u l t net
entanglement nor commercial h a r v e s t i n g of females, but p e r i o d s
of poor j u v e n i l e s u r v i v a l (Figure 5-2, curve 1). It should be
noted that even i f no mature females were removed from the
p o p u l a t i o n , pup production would have d e c l i n e d from 1957 to 1961
and from 1975 to 1980 (Figure 5-2, curve 3). At best, the t o t a l
p o p u l a t i o n would have remained at a r e l a t i v e l y constant l e v e l
although f a r below what i s b e l i e v e d to be i t s p o t e n t i a l n a t u r a l
upper l i m i t of between 2-2.5 m i l l i o n (Lander and Kajimura,
1982). J u v e n i l e s u r v i v a l r a t e s are important to ensuing
p o p u l a t i o n demography. Only i f the s u r v i v a l of j u v e n i l e s was to
r i s e above 40% for s e v e r a l years would the pup production
reverse i t s downward trend.

45
I t i s not c l e a r which sources of m o r t a l i t y e x p l a i n the low
j u v e n i l e s u r v i v a l r a t e s . One p o s s i b i l i t y i s that j u v e n i l e s are
becoming entangled i n f i s h i n g d e b r i s . Other known sources of
m o r t a l i t y that occur during the f i r s t two years of p e l a g i c
e x i s t e n c e are p r e d a t i o n by k i l l e r whales (Orcinus orca) and
white sharks (Carcharodon c a r c h a r i o s ) , s t a r v a t i o n , weather,
p a r a s i t i s m , food p o i s o n i n g , and i n f e c t i o u s d i s e a s e s (Keyes,
1965). Of the n a t u r a l causes of m o r t a l i t y , s t a r v a t i o n and
weather are thought to be the most important ( S c h e f f e r , 1950;
Ic h i h a r a , 1974). In the Bering Sea and Gulf of Alaska, the
c r i t i c a l p eriod f o r pups i s l i k e l y during the t r a n s i t i o n from
recent weaning to p e l a g i c f o r a g i n g in the winter.
The model does not support the c o n v i c t i o n that female
j u v e n i l e s u r v i v a l exceeds that of males. A l l s i m u l a t i o n r e s u l t s
i n d i c a t e that males and females l i k e l y experience s i m i l a r
s u r v i v a l rates over the f i r s t two years of l i f e . As the d e t a i l s
of p e l a g i c migration d u r i n g the f i r s t two years of l i f e are not
known i t i s not p o s s i b l e to say whether the sexes are subject to
s i m i l a r sources of m o r t a l i t y . There c o u l d be years when male
s u r v i v a l could s l i g h t l y exceed that of females. Such a
p o s s i b i l i t y could improve the f i t of simulated pup production to
f i e l d estimates.
46
CHAPTER 6 SENSITIVITY ANALYSIS OF A FUR SEAL POPULATION MODEL
The usefulness of the i n f o r m a t i o n obtained from the
simula t i o n model depends upon how w e l l the model corresponds to
the r e a l fur s e a l system. The present i n d i c a t i o n , from model
r e s u l t s and observed pups born, i s that there i s a good f i t . I t
can be argued that such a c o n c l u s i o n i s e s s e n t i a l l y only
d e s c r i p t i v e and l i m i t e d to the p e r i o d examined. A b e t t e r t e s t
would perhaps be the behaviour of the model under a v a r i e t y of
p o s t u l a t e d c o n d i t i o n s . The method of s e n s i t i v i t y a n a l y s i s can
be used for t h i s purpose and in a d d i t i o n , may r e v e a l important
information about the model system.
Two procedures are used to determine the responsiveness of
model output to changes or e r r o r s i n input parameters. The
f i r s t procedure c a l c u l a t e s r e l a t i v e s e n s i t i v i t i e s , to i d e n t i f y
which input parameters produce e i t h e r a strong or a weak e f f e c t
upon model output. The second procedure, a n a l y t i c model
v a l i d a t i o n , determines how the combined presence of e r r o r s i n
a l l input parameters a f f e c t s the model output. Both procedures
are adapted from the works of Majkowski (1981), M i l l e r (1974),
M i l l e r et a l . (1976), and Mohn (1979), and are e l u c i d a t e d i n
Appendix C.
The s e n s i t i v i t y a n a l y s i s was conducted on a s i m u l a t i o n run
which d i f f e r s s l i g h t l y from the model o u t l i n e d i n the previous
chapter. P r i o r to d i s c o v e r i n g e r r o r s i n the Lander (1975, 1979)

47
estimates of j u v e n i l e s u r v i v a l (see Appendix B), the best f i t of
simulated pup production to f i e l d estimates r e q u i r e d that
females experience b e t t e r c o n d i t i o n s than males. S p e c i f i c a l l y
t h i s meant that the sex r a t i o at b i r t h was skewed in favor of
females and t h e i r s u r v i v a l u n t i l age two exceeded that of males
by a constant f a c t o r of 1.1. The s e n s i t i v i t y a n a l y s i s i n v o l v e d
9 s i m u l a t i o n parameters ( a d u l t s u r v i v a l , b i r t h r a t e s , j u v e n i l e
s u r v i v a l , male-female j u v e n i l e s u r v i v a l r a t i o , sex r a t i o at
b i r t h , i n i t i a l p o p u l a t i o n s i z e , land female k i l l , p e l a g i c female
k i l l , and male h a r v e s t ) . The s i g n i f i c a n c e of conducting a
s e n s i t i v i t y a n a l y s i s on t h i s model as opposed to using the one
developed in Chapter 5 i s d i s c u s s e d at the end of t h i s chapter.
6.1 R e l a t i v e S e n s i t i v i t i e s
The a n a l y s i s i n i t i a l l y examined the r e l a t i v e s e n s i t i v i t y of
model output to changes i n input. Each of the 9 model
parameters ( P i ; i=1..9) was i n d i v i d u a l l y a l t e r e d by a
p r o p o r t i o n a l change ( U i ; i=1..9) v a r y i n g from -25.0% to +25.0%.
The perturbed model output was c o n t r a s t e d with . unperturbed
values using a measure of deviance. Measures of de.viance Dt
([perturbed - unperturbed]/[unperturbed]) were c a l c u l a t e d f o r
each model parameter, f o r f i v e year i n t e r v a l s at times
t=l954,1959,1964,1969,1974,1979 using t o t a l numbers of pups born
as the output v a r i a b l e . As an example, the s e n s i t i v i t y of model
output to e r r o r s in estimated b i r t h rates i s shown in F i g u r e 6-
1 .
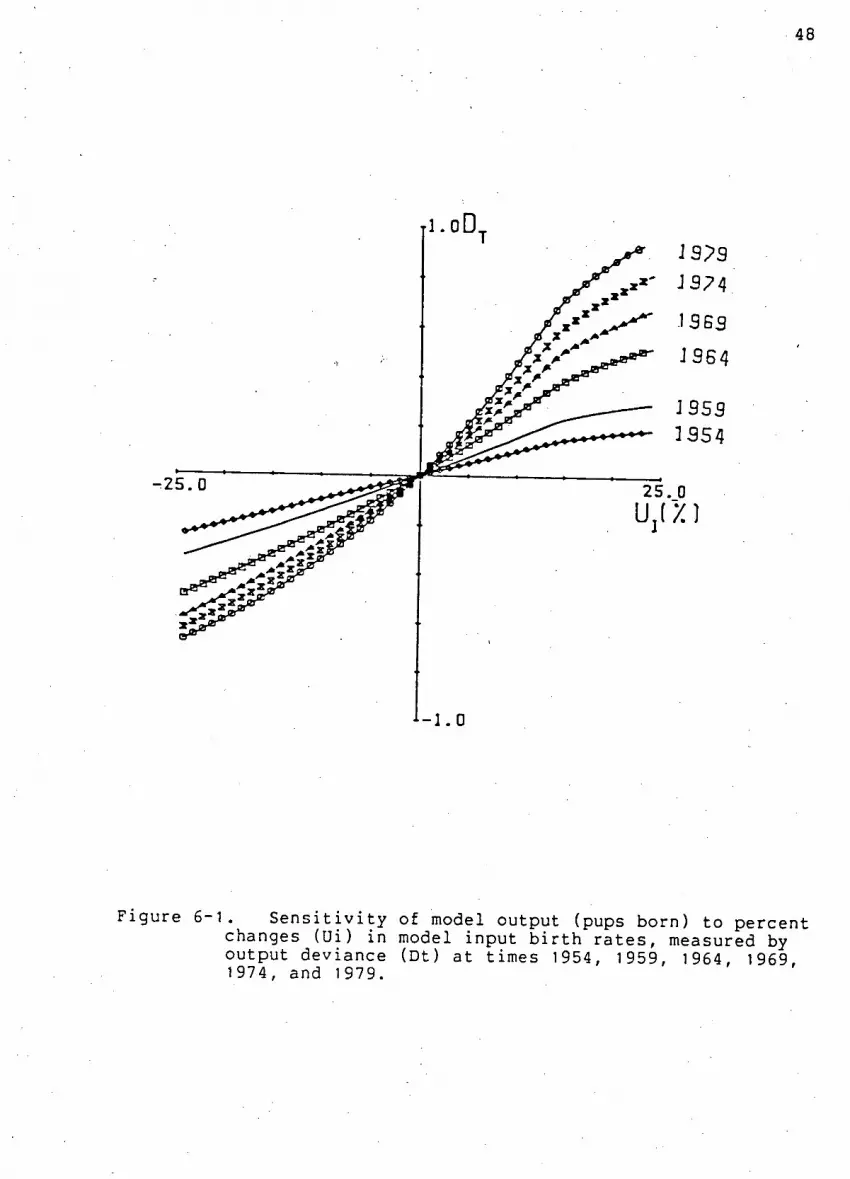
48
-1 .0
Figure 6-1. S e n s i t i v i t y of model output (pups born) to percent changes (Ui) in model input b i r t h r a t e s , measured by output deviance (Dt) at times 1954, 1959, 1964, 1969 1974, and 1979.
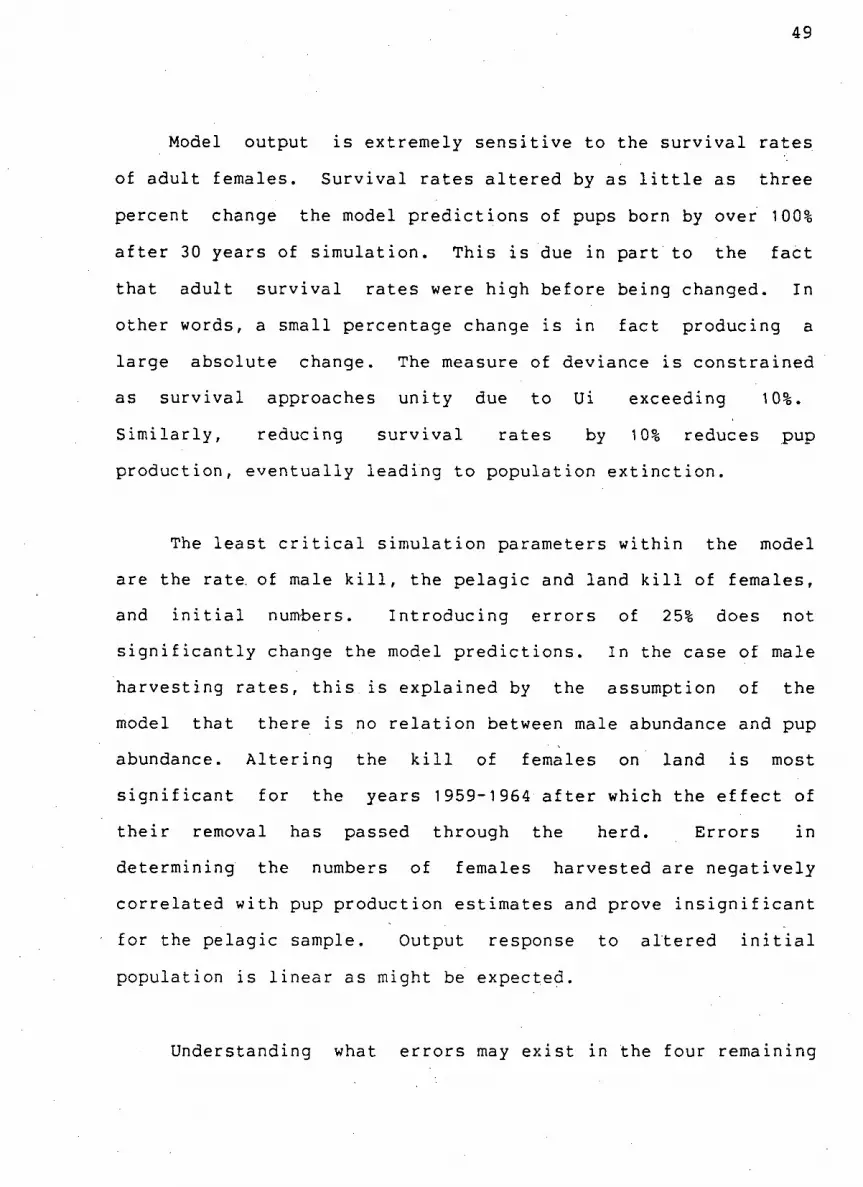
49
Model output i s extremely s e n s i t i v e to the s u r v i v a l r a t e s
of a d u l t females. S u r v i v a l r a t e s a l t e r e d by as l i t t l e as three
percent change the model p r e d i c t i o n s of pups born by over 100%
a f t e r 30 years of s i m u l a t i o n . T h i s i s due i n part to the f a c t
that adult s u r v i v a l r a t e s were high before being changed. In
other words, a small percentage change i s i n f a c t producing a
la r g e absolute change. The measure of deviance i s c o n s t r a i n e d
as s u r v i v a l approaches u n i t y due to Ui exceeding 10%.
S i m i l a r l y , reducing s u r v i v a l r a t e s by 10% reduces pup
production, e v e n t u a l l y l e a d i n g to p o p u l a t i o n e x t i n c t i o n .
The l e a s t c r i t i c a l s i m u l a t i o n parameters w i t h i n the model
are the rate, of male k i l l , the p e l a g i c and land k i l l of females,
and i n i t i a l numbers. I n t r o d u c i n g e r r o r s of 25% does not
s i g n i f i c a n t l y change the model p r e d i c t i o n s . In the case of male
ha r v e s t i n g r a t e s , t h i s i s e x p l a i n e d by the assumption of the
model that there i s no r e l a t i o n between male abundance and pup
abundance. A l t e r i n g the k i l l of females on land i s most
s i g n i f i c a n t f o r the years 1959-1964 a f t e r which the e f f e c t of
t h e i r removal has passed through the herd. E r r o r s i n
determining the numbers of females harvested are n e g a t i v e l y
c o r r e l a t e d with pup production estimates and prove i n s i g n i f i c a n t
for the p e l a g i c sample. Output response to a l t e r e d i n i t i a l
p opulation i s l i n e a r as might be expected.
Understanding what e r r o r s may e x i s t in the four remaining

50
parameters i s c r u c i a l to i n t e r p r e t i n g the s i m u l a t i o n r e s u l t s .
I n - p a r t i c u l a r , small changes in b i r t h rates s i g n i f i c a n t l y a f f e c t
model pup production e s t i m a t e s . Extreme p o s i t i v e changes have a
s a t u r a t i n g a f f e c t as the b i r t h rate approaches one. A l t e r i n g
j u v e n i l e s u r v i v a l r a t e s and r a t i o s produces i d e n t i c a l
s e n s i t i v i t y p l o t s . T h i s would not be true i f another output
v a r i a b l e such as male abundance was used to c a l c u l a t e model
deviance.
P l o t t i n g model output deviances according to year c o n t r a s t s
the r e l a t i v e importance of e r r o r s i n each i n i t i a l input
parameter and c o n d i t i o n (Figure 6-2). S i m i l a r l y , the behavior
of the model in response to such e r r o r s i s e a s i l y analysed. For
example, sex r a t i o at b i r t h appears to e x h i b i t the same behavior
as a l t e r e d j u v e n i l e s u r v i v a l f a c t o r s , a geometric i n c r e a s e as
the rates are p o s i t i v e l y increased and a slower d e c l i n e to zero
pup production as they are decreased. Both a d u l t s u r v i v a l and
b i r t h r a t e s approach e q u i l i b r i u m i n response to high percentage
parameter changes. The greatest change between years occurs
from 1959 to 1964 and i s presumably due to the combined a f f e c t s
of poor j u v e n i l e s u r v i v a l and the high female k i l l i n c o r p o r a t e d
in the model s t r u c t u r e .
51
Figure 6-2. A comparison of model output s e n s i t i v i t i e s to percent changes (Ui) in 9 input parameters measured by deviance Dt at times 1954, 1959, 1964, 1969, 1974, and 1979. The model parameters are numbered as f o l l o w s :
1. Adult s u r v i v a l 2. B i r t h r a t e s 3. J u v e n i l e s u r v i v a l
Male/female j u v e n i l e s u r v i v a l r a t i o 4. Sex r a t i o at b i r t h 5. I n i t i a l p opulation s i z e 6. Land female k i l l
Model output was not s i g n i f i c a n t l y a f f e c t e d by the p e l a g i c female k i l l , and d i d not change due to a l t e r e d male h a r v e s t s .

52
6.2 A n a l y t i c Model V a l i d a t i o n
The a n a l y t i c a l model v a l i d a t i o n procedure determines the
r e l i a b i l i t y of model p r e d i c t i o n s based upon known e r r o r s i n
input parameters. A d i s t r i b u t i o n of deviants (Dt) with a mean
zero and a s s o c i a t e d v a r i a n c e are a n a l y t i c a l l y c o n s t r u c t e d by
simultaneously i n c l u d i n g a l l parameter e r r o r s i n the model
s t r u c t u r e . The procedure r e q u i r e s that input parameters a c t
upon output v a r i a b l e s in an independent manner and that a l i n e a r
r e l a t i o n s h i p e x i s t between parameter percent e r r o r (Ui) and the
measure of output deviance ( D t , i ) . The a s s o c i a t e d v a r i a n c e of
the measure of deviance must be l e s s than a predetermined l e v e l
i f the model i s to be considered v a l i d .
§_.2.]_ Independence and l i n e a r i t y
The a n a l y t i c c a l c u l a t i o n of the d i s t r i b u t i o n of deviances
r e q u i r e s the presence of both independence and l i n e a r i t y w i t h i n
the model. The assumption that input parameters a c t upon the
output v a r i a b l e i n an independent manner i s v e r i f i e d by
c o n t r a s t i n g the measure of deviances (Dt) c a l c u l a t e d from
simultaneously changing a l l model parameters with those
determined by summing i n d i v i d u a l p e r t u r b a t i o n s corresponding to
each parameter change (E D t , i ) . The procedure f o l l o w e d i s
s i m i l a r to that f o r r e l a t i v e s e n s i t i v i t y a n a l y s i s in that
measures of deviance Dt are c a l c u l a t e d at times
t=l954,1959,1964,1969,1974,1979 using t o t a l numbers of pups born

53
as the output v a r i a b l e .
One hundred and twenty s i m u l a t i o n runs were conducted using
Ui values s e l e c t e d at random from normal d i s t r i b u t i o n s of mean
0.0 and standard d e v i a t i o n s 0.02, 0.01, and 0.005.. Two measures
of deviance were c a l c u l a t e d with the same sets of Ui e r r o r
ranges [-6% - +6%].
The s e l e c t i o n of Ui values from normal d i s t r i b u t i o n s
produces a c l u s t e r i n g of c a l c u l a t e d deviances about the o r i g i n .
The d i s p e r s i o n of t h i s measure increases over time due to the
propagation of e r r o r s w i t h i n the si m u l a t i o n model. A good
correspondence e x i s t s between observed and p r e d i c t e d changes i n
pups born when a l l parameters and i n i t i a l c o n d i t i o n s a re
simultaneously changed by r a t e s corresponding to small standard
d e v i a t i o n s . Even for l a r g e r parameter changes the two
c a l c u l a t i o n s of output deviance maintain a one to one
r e l a t i o n s h i p . Thus i t i s reasonable to conclude that input
parameters act upon the output v a r i a b l e i n an independent
manner.
The s e n s i t i v i t y p l o t s of model output to . i n d i v i d u a l
parameter changes (Figure 6-2) i n d i c a t e a strong l i n e a r r e l a t i o n
between Ui and Dt f o r the l e a s t s e n s i t i v e parameters such as
female harvest and i n i t i a l p o p u l a t i o n s i z e . A s i m i l a r
r e l a t i o n s h i p i s seen to hold f o r the h i g h l y s e n s i t i v e parameters
of s u r v i v a l and b i r t h rates although over a much sm a l l e r Ui
54
range. In general, the measure of deviance can be p r e d i c t e d f o r
a l l parameters within the area of l i n e a r i t y (Ui<=5%).
P l o t t i n g Dt c a l c u l a t e d by simultaneously changing a l l input
parameters within the run against the same value determined by
summing (equation C~9) the products of each parameter change and
r e l a t i v e s e n s i t i v i t y c o e f i c i e n t ( P Q t i ^ a t a P a r a m e t e r change of
1% (Table 6-1) confirms the l i n e a r i t y of the r e l a t i v e
s e n s i t i v i t y p l o t s . Such a r e s u l t i s presumably due to the
s i m p l i c i t y of the model s t r u c t u r e . The smaller the parameter
p e r t u r b a t i o n s , the more l i n e a r the output deviance response. In
a d d i t i o n t h i s p a r t i c u l a r l i n e a r i t y t e s t reconfirms the p r e v i o u s
assumption of independence. The two formulations f o r p r e d i c t i n g
changes i n pups born show a good correspondence when c o n t r a s t e d .
6.2.2 Model v a l i d a t i o n
The a c t u a l e r r o r s of the i n i t i a l c o n d i t i o n s and parameters
used in the s i m u l a t i o n model remain to be c a l c u l a t e d . An
i n i t i a l i n v e s t i g a t i o n of the u n c e r t a i n t y in model p r e d i c t i o n s
was conducted by uniformly a p p l y i n g e r r o r s of one to f i v e
percent to a l l i n p u t s . Variances of Dt (equation C—11) were
c a l c u l a t e d f o r each of the assumed input e r r o r s at times
t=1950,1951,...,1980 and subsequently used to put 95 percent
confidence l i m i t s upon the model p r e d i c t i o n s (Figure 6-3).
A c t u a l number of pups born upon the P r i b i l o f s have been
superimposed. C o e f f i c i e n t s of v a r i a t i o n were determined f o r
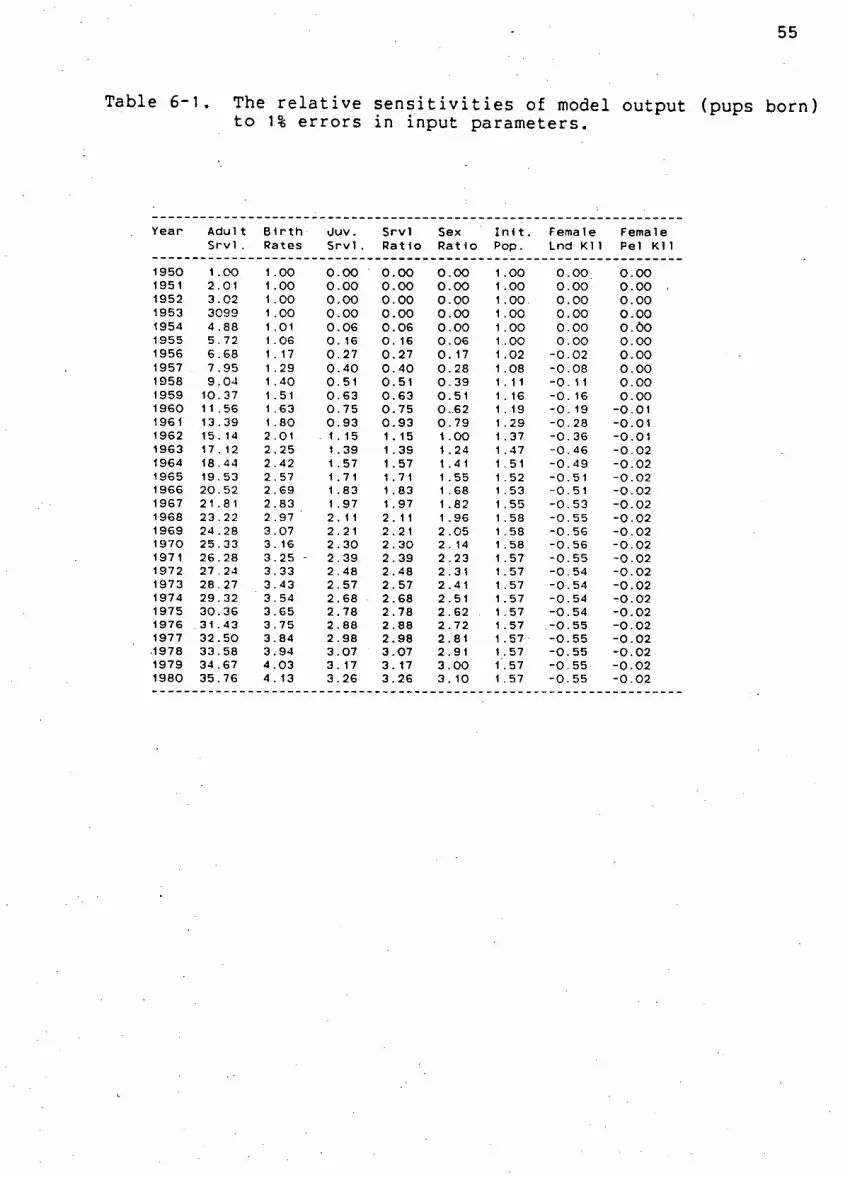
55
Table 6-1. The r e l a t i v e s e n s i t i v i t i e s of model output (pups born) to 1% e r r o r s in input parameters.
Y e a r A d u l t B i r t h Uuv. S r v l S e x I n i t . F e m a l e F e m a l e S r v l . R a t e s S r v l . R a t i o R a t i o P o p . L n d K11 P e l K I 1
1950 1 , .00 1 .00 0. .00 0. .00 0 .OO 1 .00 0. .00 0, .00 1951 2 .01 1 .00 0. .00 0. .00 0, .00 1 .00 0. .00 0. .00 1952 3 .02 1 .00 0. .00 0. .00 0, .00 1 .00. 0. ,00 0. .00 1953 3099 1 .00 0. .00 0, .00 0 .00 1 .00 0. ,00 0 .00 1954 4 .88 1 .01 0. .06 0. .06 0 .00 1 .00 0. .00 0 .00 1955 5. . 72 1 .06 0. . 16 0. , 16 0, .06 1. .00 0. ,00 0 .oo 1956 6. .68 1 . 17 0 .27 0, .27 0, . 17 1 .02 -0. .02 0. .00 1957 7 , .95 1 .29 0. .40 0. .40 0, . 28 1 .08 -0, .08 0 .00 1958 9 .04 1 .40 0. ,51 0. .51 0 . 39 1 . 1 1 -0. 11 0. .00 1959 10. . 37 1 .51 0. .63 0. .63 0, .51 1 . 16 -0. . 16 0. .00 1960 1 1 .56 1 .63 0. .75 0. .75 0, .62 1 . 19 -0. . 19 -0 .01 1961 13 . 39 1 .80 0, .93 0. .93 0 .79 1 . 29 -0, . 28 -0 .01 1962 15, . 14 2 .01 . 1 . . 15 1 , . 15 1 .00 1 . 37 -0. . 36 -0 .01 1963 17 . 12 2 .25 1 . .39 1 , . 33 1 , .24 1 .47 -0, .46 -0 .02 1964 18 .44 2 .42 1 . .57 1 . .57 1 , .41 1 .51 -0. .49 -0 .02 1965 19 .53 2 . 57 1 . .71 1 , ,71 1 , .55 1 .52 -0. .51 -0 .02 1966 20. . 52 2 .69 1 , .83 1 . ,83 1 .68 1 .53 -0. 51 -0 .02 1967 21 , .8 1 2 .83 1 . .97 1 . ,97 1 , .82 1 .55 -0. 53 -0. .02 1968 23 .22 2 .97 2 , . 1 1 2, . 1 1 1 , .96 1 .58 -0. 55 -0 .02 1969 24 . .28 3 .07 2 . .21 2. ,21 2 .05 1 .58 -0. 56 -0 .02 1970 25. . 33 3 . 16 2 . .30 2. , 30 2 . 14 1 . 58 -0. 56 -0 .02 1971 26. .28 3 .25 - 2 . . 39 2 . , 39 2 .23 1 .57 -0. .55 -0 .02 1972 27 . 24 3 . 33 2 . . 48 2 . ,48 2 .31 1 .57 -0. 54 -0. .02 1973 28 . 27 3 .43 2 . . 57 2 . , 57 2 .41 1 .57 -0. .54 -0. .02 1974 29. . 32 3 . 54 2 . .68 2 . .68 2 , .51 1 .57 -0. 54 -0. .02 1975 30, .36 3 .65 2. .78 2 . ,78 2 .62 1 .57 -0. 54 -0. .02 1976 31 . . 43 3 . 75 2 . .88 2 . 88 2 , . 72 1 .57 -o. 55 -0, ,02 1977 32. .50 3 . .84 2. .98 2. 98 2, ,81 1 .57 -0. 55 -0. .02 ,1978 33. .58 3, .94 3. .07 3. ,07 2. .91 1 .57 -0. 55 -0. ,02 1979 34 . 67 4 . .03 3 . 17 3. 17 3 . 00 1 .57 -0. 55 -0. .02 1980 35. 76 4 . . 13 3 . 26 3. 26 3. , 10 1 .57 -0. 55 -0. 02

56
each of the assumed input e r r o r s using the number of pups born
from the reference run as the mean and the corresponding
v a r i a n c e of Dt to determine standard d e v i a t i o n (Figure 6-4).
F i e l d observation c o e f f i c i e n t s of v a r i a t i o n f o r 15 and 30
percent e r r o r were superimposed upon these curves (CV = 0.05,
0.10).
The formulation of vari a n c e Dt a i d s i n i d e n t i f y i n g the
r e l a t i v e importance of input e r r o r s a f f e c t i n g output
u n c e r t a i n t y . The percent c o n t r i b u t i o n of each parameter to
o v e r a l l variance has been p l o t t e d i n Figure 6-5. Within f i v e
simulated years of the beginning of s i m u l a t i o n , a d u l t s u r v i v a l
accounts f o r approximately 96 percent of the o v e r a l l model
u n c e r t a i n t y . Other s e n s i t i v e parameters such as b i r t h r a t e s ,
j u v e n i l e s u r v i v a l , j u v e n i l e s u r v i v a l r a t i o , and sex r a t i o at
b i r t h account for the remaining 4 percent. Due to the s t r u c t u r e
of the simula t i o n model any e r r o r s i n the p r e v i o u s l y mentioned
s e n s i t i v e parameters are q u i c k l y a m p l i f i e d i n the output
v a r i a b l e , number of pups born. Figure 6-3 confirms t h a t
u n c e r t a i n t y in model p r e d i c t i o n s i n c r e a s e s over time r e g a r d l e s s
of the amount of e r r o r present in i n i t i a l c o n d i t i o n s and
parameters used.
Incrementing a l l input e r r o r s by one percent adds
aproximately 20 percent u n c e r t a i n t y to the p r e d i c t e d number of
pups born a f t e r 30 years of s i m u l a t i o n . T h i s means that u n l e s s
parameter e r r o r s are l e s s than 5 percent, the model output c o u l d
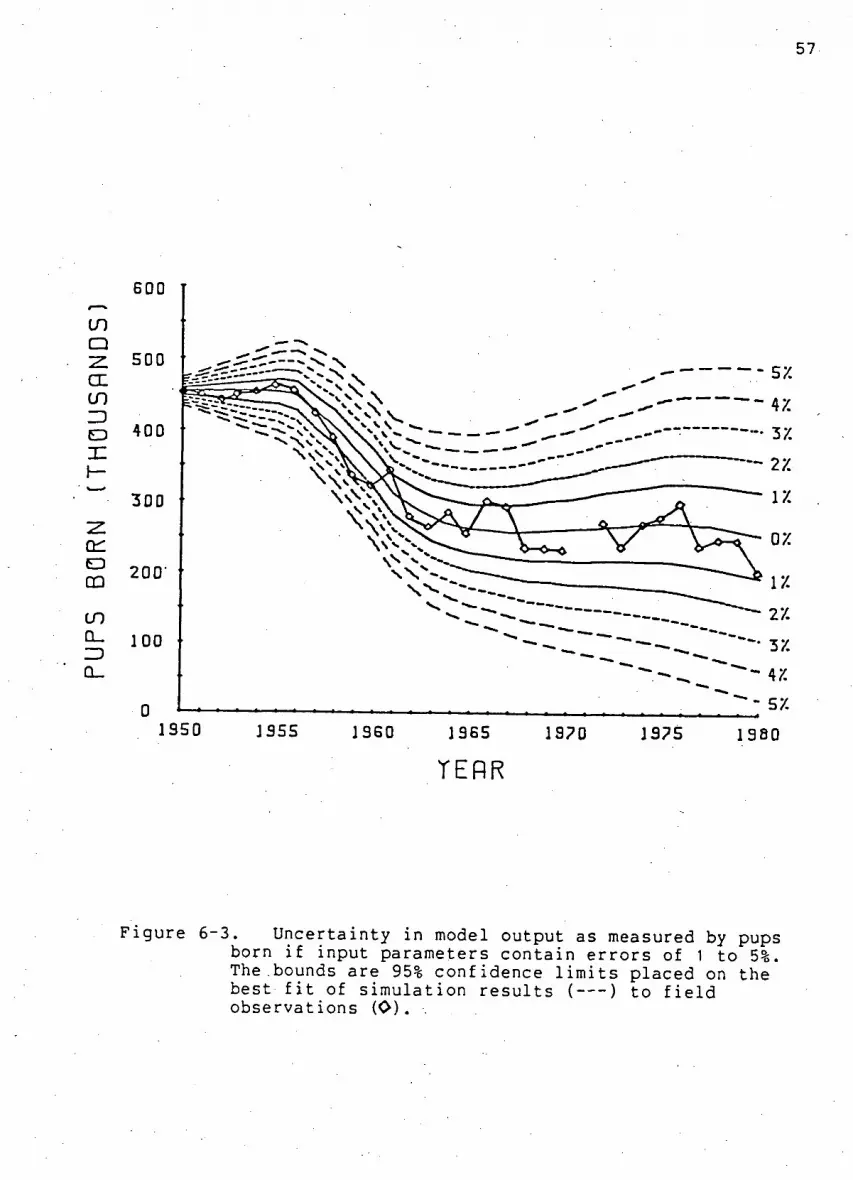
J955 I960 1965 1970 J975 1980
T E R R
3. Uncertainty i n model output as measured by pups born i f input parameters contain e r r o r s of 1 to 5%. The.bounds are 95% confidence l i m i t s placed on the best f i t of si m u l a t i o n r e s u l t s ( ) to f i e l d observations (O). .

58
O — i . 0 . 7 I — d
J350 J 3 5 S 1360 1965 1970 1375 1380
TERR
F i g u r e 6-4. Model output u n c e r t a i n t y expressed as a c o e f f i c i e n t of v a r i a t i o n . Acceptable e r r o r bounds are set at 15% (CV=0.05) and 30% (CV=0.10).

59
•
100
30
y_ 80 ZD 03 70 i — i XL GO
D C_l
LU U
LU
50
40
30
20
10
0
to
1350 1355 . ~ ~ ~ • - - - • 1360 1365 1370
TERR 1375 1380
Figure 6-5. C o n t r i b u t i o n of input parameter e r r o r s to i u n c e r t a i n t y i n output expressed as a percentage. The
most s i g n i f i c a n t parameters are a d u l t s u r v i v a l (1), b i r t h rates (2), i n i t i a l p opulation s i z e (3), and j u v e n i l e s u r v i v a l ( 4 ) .
6 0
vary by 100 percent i n e i t h e r d i r e c t i o n . These u n c e r t a i n t i e s i n
model output are extremely l a r g e given the small input e r r o r s of
one to f i v e percent. Indeed, v a l i d a t i n g the model by a l l o w i n g
constant e r r o r bounds of 15 and 30 percent r e q u i r e d input e r r o r s
to be l e s s than one percent. -At the 15 percent l e v e l the model
was only acceptable up t i l l year 1961. Given that e r r o r i s
undoubtedly present i n a l l the estimated parameters used w i t h i n
the model, the r e l i a b i l i t y of the p r e d i c t i o n s does not appear to
be high. Such a c o n c l u s i o n can be a t t r i b u t e d to the extreme
s e n s i t i v i t y of model output to any change i n a d u l t s u r v i v a l
r a t e s .
The r e s u l t s of conducting a s e n s i t i v i t y a n a l y s i s on the
model developed i n Chapter 5 would be m a r g i n a l l y d i f f e r e n t from
the above and not s i g n i f i c a n t l y a l t e r any of the previous
c o n c l u s i o n s . The a n a l y s i s has shown that sex r a t i o at b i r t h i s
not a c r i t i c a l parameter and that there i s l i t t l e d i f f e r e n c e
between the r a t i o s 0.50:0.50 and 0.49:0.51. The only other
d i f f e r e n c e between the two models i s i n terms of j u v e n i l e
s u r v i v a l ^ estimates used; but again the d i f f e r e n c e i s
i n s i g n i f i c a n t , because the r e v i s e d estimates used i n Chapter 5
approximate the Lander values m u l t i p l i e d by the d i f f e r e n t i a l
s u r v i v a l f a c t o r of 1.1 (see Appendix B). I t can thus be
concluded that the two models are p r a c t i c a l l y i d e n t i c a l i n
s t r u c t u r e .
61
CHAPTER 7 CONCLUSIONS
The mechanisms that r e g u l a t e growth of the northern f u r
s e a l p o p u l a t i o n were p o o r l y understood when management moved
from monitoring growth of the herd to o b t a i n i n g MSY i n the
1950s. The conceptual model used to j u s t i f y a female c u l l has
been improved using information c o l l e c t e d s i n c e the d e c l i n e of
the herd. This information suggests a need to r e c o n s i d e r
present concepts concerning how p i n n i p e d p o p u l a t i o n numbers
change with time. Most of the ideas presented i n Chapter 4 are
s p e c u l a t i v e and r e q u i r e f u r t h e r i n v e s t i g a t i o n to be e i t h e r
r e f u t e d or substantiated..
The hypothesis that the a v a i l a b i l i t y of rookery breeding
space i s a l i m i t i n g f a c t o r in the f u r s e a l environment i s of
p a r t i c u l a r i n t e r e s t and should be examined c l o s e r . I t c o u l d be
argued that the concept of managing the fur s e a l s should focus
upon the rookery u n i t rather than t r e a t i n g the i s l a n d p o p u l a t i o n
as being homogeneous. This idea c o u l d be extended through the
use of rookery based s i m u l a t i o n models and i m p l i e s a need to
a n n u a l l y map the i n d i v i d u a l rookery boundaries.
The mathematical model was shaped by the conceptual model.
Although simply c o n s t r u c t e d , i t i n c o r p o r a t e d the b a s i c l i f e
h i s t o r y f e a t u r e s of the fur s e a l and was able to r e c o n s t r u c t the
herd dynamics over the p e r i o d 1950 to 1980. S i m u l a t i o n r e s u l t s
i n d i c a t e d that the observed d e c l i n e i n pup p r o d u c t i o n was due to
62
ha r v e s t i n g females and a s e r i e s of poor j u v e n i l e s u r v i v a l r a t e s .
The counts of harem and i d l e b u l l s c o u l d only be accounted f o r
i f a d u l t male s u r v i v a l was greater during the 1950s than during
the l a t e r two decades. The s i g n i f i c a n t d e c l i n e i n male
s u r v i v a l , p o s s i b l y due to d e b r i s entanglement, does not appear
to be e q u a l l y true of females.
The c o n t i n u i n g d e c l i n e of the P r i b i l o f fur s e a l s i s caused
by a high m o r t a l i t y of j u v e n i l e s over t h e i r f i r s t two years of
l i f e . L i t t l e i s known about the d i s t r i b u t i o n of j u v e n i l e s in.
the P a c i f i c Ocean and the sources of m o r t a l i t y they might
encounter that c o u l d account f o r such, high r a t e s . Future
research should evaluate the d e t r i m e n t a l impact upon j u v e n i l e s
of such f a c t o r s as net entanglement and c l i m a t i c changes. The
p o s s i b i l i t y r a i s e d by the mathematical model that j u v e n i l e males
and females experience s i m i l a r s u r v i v a l r a t e s should a l s o be
f u r t h e r i n v e s t i g a t e d .
The p o s s i b i l i t y that the present herd d e c l i n e i s being
maintained by exogenous f a c t o r s implies that managers can do
l i t t l e to reverse the trend except wait f o r c o n d i t i o n s to
improve. The si m u l a t i o n s t u d i e s support the assumption that the
present harvest i s removing excess males without a f f e c t i n g the
reproductive p o t e n t i a l of the herd. The subadult harvest
provides v a l u a b l e information u s e f u l for management and
monitoring of the herd such as the j u v e n i l e s u r v i v a l rate which
i s an important i n d i c a t o r . of po p u l a t i o n s t a t u s . There i s no
63
evidence to suggest that changing harvest s t r a t e g i e s c o u l d
produce d e n s i t y dependent responses and a quick herd recovery.
It has been hypothesized that d e n s i t y dependent changes would
only be observed as land breeding space became satu r a t e d or the
Bering Sea food base became d e p l e t e d . C u l l i n g females reduces
herd p r o d u c t i v i t y and produces no compensatory responses in
r e p r o d u c t i v e r a t e s .
The r e s u l t s of the s i m u l a t i o n can be considered r e l i a b l e
only i f the assumptions that went i n t o the model are c o r r e c t .
Even then the model must be used with the s i m u l a t i o n parameters
s p e c i f i e d in Chapter 5 c o n t a i n i n g no more v a r i a t i o n than +-1%.
T h i s r e s t r i c t i v e c o n d i t i o n i s l a r g e l y based upon the extreme
s e n s i t i v i t y of model output to e r r o r i n a d u l t s u r v i v a l
e s t i m a t e s . Only s l i g h t changes i n a d u l t s u r v i v a l were shown to
have dramatic e f f e c t s upon pup p r o d u c t i o n . T h i s i m p l i e s that
any e x t r a p o l a t i o n of model output beyond the time range used
should only be done with extreme c a u t i o n and that there i s a
need for c o n t i n u a l l y monitoring the herd.
The more accurate the determination of f u r s e a l s u r v i v a l
r a t e s the more r e l i a b l e model p r e d i c t i o n s w i l l be. T h i s i s
extremely s i g n i f i c a n t i f s i m u l a t i o n models are to play an
important r o l e i n managing the fur s e a l resource. There i s a
need to reexamine the data base and s t a t i s t i c a l procedures used
to estimate adult s u r v i v a l . Attempts should be made to c o l l e c t
new data to monitor changes that may have occurred in the female

64
p o r t i o n of the herd s i n c e the p e l a g i c survey. T h i s could be
achieved through the tagging and marking of animals. In
a d d i t i o n f u r t h e r research i s r e q u i r e d to q u a n t i f y and con t r a s t
the extent of female entanglement with that of males.
Various pinniped models have been used to manage e x p l o i t e d
p o p u l a t i o n s of harp s e a l s ( L e t t et a l , 1981; Capstick et a l ,
1973), gray seals (Harwood, 1981), and ringed s e a l s (Smith,
1973). Each of the models has i n c o r p o r a t e d f u n c t i o n s of de n s i t y
dependence which, f o r the most p a r t , appear to be based upon
sporadic observations and t h e o r e t i c a l c o n s i d e r a t i o n s of
t e r r e s t r i a l mammal pop u l a t i o n dynamics. The fur s e a l a n a l y s i s
i n t h i s study has s y n t h e s i s e d r e l e v a n t information that
c h a l l e n g e s many of the t r a d i t i o n a l assumptions about pinniped
p o p u l a t i o n dynamics. The e x t e n s i v e f u r s e a l data base suggests
that d e n s i t y dependent r e g u l a t o r y changes, that occur in
pin n i p e d p o p u l a t i o n s , c o u l d w e l l be r e s t r i c t e d to c e r t a i n age
c l a s s e s (young) and that they might occur during s p e c i f i c times
of the year (breeding season). Conclusions about the
u n c e r t a i n t y of fur s e a l model p r e d i c t i o n s l i k e l y h o l d f o r most
pi n n i p e d models given species with long l i f e spans, high a d u l t
s u r v i v a l r a t e s , low f e c u n d i t y , and l a t e m a t u r i t y . In short,
many of the concepts developed by a n a l y s i n g fur s e a l dynamics
may be u s e f u l in understanding the dynamics of other pinniped
p o p u l a t i o n s .
The a n a l y s i s of fur s e a l p o p u l a t i o n dynamics has improved

65
the understanding of how fur s e a l numbers change as they do. I t
should be recognized that many of the t h e s i s c o n c l u s i o n s are
based upon assumptions r e q u i r i n g f u r t h e r e v a l u a t i o n . The
a n a l y s i s i s seen as a b a s i s f o r making much needed p r e d i c t i o n s
of future f u r s e a l p o p u l a t i o n t r e n d s .

66
REFERENCES CITED
Andrewartha, H.G., and L.C. B i r c h . 1954. The D i s t r i b u t i o n and Abundance of Animals. U. of Chicago Press, Chicago.
Andrews, C.L. 1931. The Story of Al a s k a . Lowman and Hanford Co., S e a t t l e , 258 p.
Anonymous, 1983. Workshop on the Status of the Northern Fur Sea l . N a t i o n a l Marine Mammal Laboratory, NOAA, S e a t t l e Washington, unpupblished.
Bigg, M. 1979. Incidence of a d u l t northern fur s e a l s entangled in d e b r i s on St. Paul I s l a n d , 1978. Paper submitted to the 22nd Annual Meeting ot the Standing S c i e n t i f i c Committee, North P a c i f i c Fur Seal Commission.
Butterworth, D.S., J.H.M. David, L.H. R i c k e t t , and S. Xulu. 1984. M o d e l l i n g the p o p u l a t i o n dynamics of the Cape f ur seal (Arctocephalus p u s i l l u s p u s i l l u s ) . unpublished manuscript.
Capstick, C.K., D.M. Lavigne, and K. Ronald. 1976. Population f o r e c a s t s f o r Northwest A t l a n t i c harp s e a l s (Paqophilus qroenlandicus) . ICNAF Res. D o c , No. 132. S e r i a l No. 4018.
Chapman, D.G. 1961 Population dynamics of the Alaska fur s e a l herd. Trans. North Am. W i l d l . Nat. Resour. Conf. 26:356-369.
Chapman, D.G. 1964. A c r i t i c a l study of P r i b i l o f f u r s e a l population estimates. U.S. F i s h W i l d l . Serv., F i s h . B u l l . 63:657-669.
Chapman, D.G. 1973. Spawner-recruit models and es t i m a t i o n of maximum s u s t a i n a b l e c a t c h . Rapp. P.-V. Reun. Cons. I n t . Explor. Mer. 164:325-332.
Chapman, D.G. 1981. E v a l u a t i o n of marine mammal pop u l a t i o n models. Pp. 277-296. In C.W. Fowler and T.D. Smith ( e d s . ) . Dynamics of Large Mammal Po p u l a t i o n s . John Wiley and Sons, New York.

67
Chapman, D.G. and A.M. Johnson. 1968. E s t i m a t i o n of fur s e a l pup populations by randomized sampling. Trans. Amer. F i s h . Soc. 97(3): 264-270.
Coulson, J . C , and G. H i c k e l y . 1964. The breeding b i o l o g y of the grey s e a l Halichoerus grypus (fab) on the Fame I s l a n d s , Northuberland. J . Anim. E c o l . 33(3):485-512 .
David, J.H.M. 1984. Species.summary for the cape fur s e a l Arctocephalus p u s i l l u s p u s i l l u s . Prepared f o r the I n t e r n a t i o n a l Symposium and Workshop on the B i o l o g y of Fur S e a l s , Cambridge UK, A p r i l 1984. (unpub.)
Doidge, D.W., C r o x a l l , J.P., and J.R. Baker. 1984a. Densi t y dependent pup m o r t a l i t y i n the A n t a r c t i c f u r s e a l Arctocephalus g a z e l l a at South Georgia. J . Z o o l . , Lond. 202:449-460.
Doidge, D.W., C r o x a l l , J.P., and C. R i c k e t t s . 1984b. Growth rat e s of A n t a r c t i c fur s e a l pups at South G e o r g i a . J . Zool., Lond. 203:87-93.
Duffy, D.C. 1983. Competition f o r n e s t i n g space among Peruvian guano b i r d s . Auk 100:680-688.
Eberhardt, L.L. 1977. "Optimal" management p o l i c i e s f o r marine mammals. Wild. Soc. B u l l . 5:425-428.
Eberhardt, L.L. 1981. P o p u l a t i o n Dynamics of the P r i b i l o f Fur S e a l s . Pp. 197-220. I_n C.W. Fowler and T.D. Smith ( e d s . ) . Dynamics of Large Mammal P o p u l a t i o n s . J . Wiley and Sons, New York.
Eberhardt, L.L., and D.B. S i n i f f . 1977. P o p u l a t i o n dynamics and marine mammal management p o l i c i e s . J . F i s h . Res. Board Can. 34:183-190.
E l l i o t , H.W. 1884. Report on the s e a l i s l a n d s of A l a s k a , U.S. Govt. P r i n t i n g O f f i c e , Washington, D.C. 188pp. Mort P u b l i s h e r s , P o r t l a n d , Oregon, Pp. 477.

68
F a v o r i t e , F., W.J. Ingraham, K.D. Waldron, E.A. Best, V.G. Wepestad, L.H. Barton, G.B. Smith, R.G. Bakkala, R.R. Str a t y and T. Laevastu. 1979. F i s h e r i e s Oceanography -Eastern Bering Sea S h e l f . NWAFC Processed Report 79-20. 477p.
Fowler, C.W. 1981 Density dependence as r e l a t e d to l i f e h i s t o r y s t r a t e g y . Ecology 62:602-610.
Fowler, C.W. 1982a. I n t e r a c t i o n s of northern fur s e a l s and commercial f i s h e r i e s . T r a n s a c t i o n s of the 47th North American W i l d l i f e and Na t u r a l Resources Conference, ( i n p r e s s ) .
Fowler, C.W. 1982b. Entanglement as an explanation f o r the de c l i n e i n the northern fur s e a l s of the P r i b i l o f I s l a n d s . Background paper submitted to the 25th annual meeting of the North P a c i f i c Fur Seal Commission, i n p r e s s .
Fowler, C.W. 1983a. Entanglements i n f i s h i n g d e b r i s as a c o n t r i b u t i o n f a c t o r in the d e c l i n e of fur s e a l s on the P r i b i l o f I s l a n d s , ( i n prep).
Fowler, C.W. 1983b. Po p u l a t i o n dynamics as r e l a t e d to rate of increase per generation time, (submitted).
Gentry, R.L. 1980. Set in t h e i r ways. S u r v i v a l formula of the northern fur s e a l . Oceans 13(3):34-37.
Gentry, R.L., J.H. Johnson, and J . H o l t . 1977. Behavior and biolo g y , P r i b i l o f I s l a n d s . Pp. 26-39 In Fur Seal I n v e s t i g a t i o n s , 1976. (Unpupl. r e p o r t ! - U . S . Dept. of Comm. NOAA, NFS, Marine Mammal D i v i s i o n , S e a t t l e , Wash.
Harwood, J . 1981. Managing gray s e a l p opulations f o r optimum s t a b i l i t y . Pp. 159-172. In C.W. Fowler and T.D. Smith (eds.). Dynamics of Large Mammal Po p u l a t i o n s . J . Wiley and Sons, New York.
I c h i h a r a , T. 1974. P o s s i b l e e f f e c t of surface wind f o r c e on the s e x - s p e c i f i c m o r t a l i t y of young fur s e a l s i n the eas t e r n P a c i f i c . B u l l . Far Seas F i s h . Res. Lab. (Shimizu) 11:1-8.
69
Kajimura, H. 1981. The o p p o r t u n i s t i c feeding of Northern Fur Seals o f f C a l i f o r n i a . NMML, 46p.
Kajimura, H. 1984. O p o r t u n i s t i c feeding of the northern f u r s e a l ( C a l l o r h i n u s u r s i n u s ) i n the eastern P a c i f i c Ocean and eastern Bering Sea. NOAA te c h . rep. NMFS SSRF-779.
Kenyon, K.W., V.B S c h e f f e r , and D.G. Chapman. 1954. A p o p u l a t i o n study of the Alaska fur s e a l herd. U.S. F i s h W i l d l . Serv., Spec. S c i . Rep. W i l d l . 12, 77p.
Kenyon, K.W. and F. Wilke 1953. M i g r a t i o n of the northern f u r s e a l C a l l o r h i n u s u r s i n u s . J . of Mamm. 34:86-98.
Keyes, M.C. 1965. Pathology of the nothern f u r s e a l . J . Amer. Veter. Med. Ass. 147 (10): 1090-95.
Lack, D. 1954. The Natura l Regulation of Animal Numbers. Clarendon Press, Oxford Univ. Press.
Lack, D. 1966. Population Studies of B i r d s . Oxford, Clarendon Press, Oxford Univ. Press.
Lander, R.H. 1975. Method of determining n a t u r a l m o r t a l i t y i n the northern f u r s e a l ( C a l l o r h i n u s u r s i n u s ) from known pups and k i l l by age and sex. J . F i s h . Res. Board Can. 32: 2447-2452.
Lander, R.H. 1979. Role of land and ocean m o r t a l i t y in y i e l d of male Alaskan f u r s e a l . C a l l o r i n u s u r s i n u s . F i s h . B u l l . 77: 311-314.
Lander, R.H. 1980a. Summary of northern fur s e a l data and c o l l e c t i o n procedures, volume 1, Land data of the Uni t e d States and Russia (excluding tag recovery r e c o r d s ) . U.S. Dept of Comm. NOAA Tech. Mem. NMFS F/NWC-3.
Lander, R.H. 1980b. Summary of northern fur s e a l data and c o l l e c t i o n procedures, volume 2, Eastern P a c i f i c p e l a g i c data of the United States and Canada, (excluding f u r s e a l s s i g h t e d ) . U.S. Dept. of Comm. NOAA Tech. Mem. NMFS F/NWC-4.

70
Lander, R.H. 1981. A l i f e t a b l e and biomass estimate f o r Alaskan fur s e a l s . F i s h . Res., 1:55-70.
Lander, R.H., and H. Kajimura. 1982. Status of northern fur s e a l s . S c i e n t i f i c C o n s u l t a t i o n on Marine Mammals, FAO, Bergen, Norway, 50 pp.
L e t t , P.F., R.K. Mohn, and D.F. Gray. 1981. Density-dependent processes and management s t r a t e g y f o r the Northwest A t l a n t i c harp s e a l p o p u l a t i o n s . Pp. 135-158. I_n C.W. Fowler and T.D. Smith ( e d s . ) . Dynamics of Large Mammal Popul a t i o n s . J . Wiley and Sons, New York.
Loyd, D.S., McRoy, C P . and Day, R.H. 1981. Discovery of northern fur s e a l s ( C a l l o r h i n u s ursinus) breeding on Bogoslof I s l a n d , southeastern Bering Sea. A r c t i c , 34:318-320.
Majkowski, J . 1981. S e n s i t i v i t y a n a l y s i s and i t s extensions -a p p l i c a b i l i t y and u s e f u l n e s s in a m u l t i - s p e c i e s approach for d e s i g n i n g a research program and v a l i d a t i n g the outcome of t h i s program, presented at ICLARM/CSIRO Workshop on the Theory and management of T r o p i c a l M u l t i -Species Stocks h e l d at C r o n u l l a , N.S.W. (January, 1981). 40p.
Martin, F. 1946. The Hunting of the S i l v e r F l e e c e , E p i c of the Fur S e a l . Greenberg P u b l i s h e r , New York, 328 p.
M e r r e l l , T.R. 1980. Accumulation of p l a s t i c l i t t e r on beaches of Amchitka I s l a n d , A l a s k a . Mar. environ. Res. 3:171-184.
M i l l e r , D.R. 1974. S e n s i t i v i t y a n a l y s i s and v a l i d a t i o n of s i m u l a t i o n models. J o u r n a l of t h e o r e t i c a l B i o l o g y 48: 345-360.
M i l l e r , D.R., G. B u l t e r , and L. Bramall. 1976. V a l i d a t i o n of e c o l o g i c a l systems models. J o u r n a l of Environmental Management 4: 383-401.
Mohn, R.K. 1979. S e n s i t i v i t y a n a l y s i s of two harp s e a l (Pagophilus groenlandicus) p o p u l a t i o n models. J o u r n a l of F i s h e r i e s Research Board of Canada 36: 404-410.

71
Murdoch, W.W. 1970. Population regulaton and pop u l a t i o n i n e r t i a . Ecology 51:497-502.
Nagasaki, F. 1961 po p u l a t i o n study on the fur s e a l herd. Soec. Publ. Tokai F i s h . Lab. No. 365, 60 pp.
North P a c i f i c Fur Seal Commission. 1962. North P a c i f i c Fur Sea l Commission r e p o r t on i n v e s t i g a t i o n s from 1958 to 1961. North Pac. Fur Seal Comm., Washington, D.C, 183 p.
North P a c i f i c Fur Seal Commission. 1981. Proceedings of the 25th Annual Meeting, A p r i l 13-16, 1981, Tokyo, Japan. North Pac. Fur Seal Comm., Washington, D.C, 41 p.
North P a c i f i c Fur Seal Commission. 1982. Proceedings of the 25th Annual Meeting, A p r i l 13-16, 1982, Ottawa, Canada. North Pac. Fur Seal Comm., Washington, D.C, 49 p.
Payne, M.R. 1977. Growth of a fur s e a l p o p u l a t i o n . P h i l . Trans. Roy. Soc. Lond. B279:67-79.
Perez, M.A., and M.A. Bigg. 1980. Interim report on the fe e d i n g h a b i t s of the northern f u r s e a l in the eastern P a c i f i c Ocean and eastern Bering Sea. Pp 4-172. I_n H. Kajimura, R.H. Lander, M.A. Perez, A.E. York, and M.A. Bigg. F u r t h e r a n a l y s i s of p e l a g i c fur s e a l data c o l l e c t e d by the Uni t e d Stated and Canada during 1958 to 1974, part 2. NMML, NMFS, NOAA, S e a t t l e , Washington.
Peterson, R.S., B.J. Le Boeuf, and R.L. De Long. 1968. Fur s e a l s from the Bering Sea breeding i n C a l i f o r n i a . Nature 219(5157):899-901 .
R e i t e r , J . , K.J. Panken, and B.J. LeBoeuf. 1981. Female competition and r e p r o d u c t i v e success in northern elephant s e a l s . Anim Behav., 29:670-687.
R i c k l e f s , R.E. 1973. Ecology. Cherion Press. Oregon.
Salveson, S.J., and M . S . A l t o n . 1976. P o l l o c k . Pp. 369 -391 In W. Pereyera, J . Reeves, and R. Bakkala. 1976. Demersal f i s h and s h e l l f i s h resources of the eastern Bering Sea i n the b a s e l i n e year 1975.. NWAFC Processed Report. 619 pp.
72
S c h e f f e r , V.B. 1950. Winter i n j u r y to young f u r s e a l s on the northwest c o a s t . C a l i f o r n i a F i s h and Game, 34:378-379.
Scordino, J . , and R. F i s h e r . 1983. I n v e s t i g a t i o n s on Fur Seal Entanglement i n net fragments, P l a s t i c bands and other d e b r i s i n 1981 and 1982, St. Paul I s l a n d , A laska. Background paper submitted to 26th Annual Meeting of the Standing S c i e n t i f i c Committee, North P a c i f i c Fur Seal Commission, March. 2 8 - A p r i l 8, 1983, Wash., D.C.
Smith, T., and T. Polacheck. 1978. The p o p u l a t i o n dynamics of the Alaska fur s e a l : What do we r e a l l y know? Report to up the N a t i o n a l Marine Mammal Laboratory, S e a t t l e , Washington. 69 p.
Smith, T., and T. Polacheck. 1981. Reexamination of the l i f e t a b l e for northern fur s e a l s with i m p l i c a t i o n s about population r e g u l a t o r y mechanisms. Pp. 99-120. I_n C.W. Fowler and T.D. Smith (e d s . ) . Dynamics of Large Mammal Populations. J . Wiley and Sons, New York.
Smith, T.G. 1973. Population dynamics of the r i n g e d seal- in the Canadian eastern A r c t i c . F i s h . Res. Board Can. B u l l . 181. Ottawa. 55pp.
S t i r l i n g , I. 1971. Population dynamics of the Weddell s e a l (Leptonychotes weddelli) i n McMurdo Sound, A n t a r c t i c a , 1966-1968. A n t a r c t i c Res. S e r i e s , 18:141-163.
Swartzman, G., and R. Haar 1980. E x p l o r i n g i n t e r a c t i o n s between fur s e a l populations and f i s h e r i e s i n the Bering Sea. F i n a l report to U.S. Marine Mammal Commission i n f u l f i l l m e n t of co n t r a c t MM1800969-5.
Tamarin, R.H. (ed.) 1978. Po p u l a t i o n Regulation (Benchmark papers i n ecology;7). Dowden, Hutchinson and Ross, Inc. Academic Press.
Townsend, C H . 1899. Pel a g i c s e a l i n g , with notes on the fur sea l s of Guadalupe, the Galapagos, and Lobos I s l a n d s [part 3, p. 223-274, 2 maps, 14 p i s . ] I_n the fur s e a l s and fur se a l i s l a n d s of the North P a c i f i c Ocean....U.S. Treasury Department, 1898-1899.
73
Vladimirov, V.A. 1984. Modern c o n d i t i o n of the fur se a l p o p u l a t i o n on the Commander Isl a n d s and the main p r i n c i p l e s of the s e a l i n g r e g u l a t i o n f o r the p e r i o d up to the n i n e t i e s , unpublished manuscript.
Watson, A. and R. Moss. 1970. Dominance, spacing behavior and aggression i n r e l a t i o n to p o p u l a t i o n l i m i t a t i o n i n v e r t e b r a t e s . I_n Animal Populations i n R e l a t i o n to t h e i r Food Resources (Watson A. ed.). Oxford, England. B l a c k w e l l . pp. 167-220, B l a c k w e l l S c i e n t i f i c P u b l i c a t i o n s , Oxford.
Watt, K.E.F. 1973. P r i n c i p l e s of Environmental Science. McGraw-H i l l , New York, N.Y.
White, T.C.R. 1978. The importance of a r e l a t i v e shortage of food i n animal ecology. Oecologia ( B e r l . ) 33:71-86.
York, A.E. 1983. Age at f i r s t r e p r o d u c t i o n of the northern f u r sea l ( C a l l o r h i n u s u r s i n u s ) . Can. J . F i s h . Aquat. S c i . 40: 121-127.
York, A.E. and J.R. H a r t l e y . 1981. Pup production f o l l o w i n g harvest of female northern fur s e a l s . Can. J . F i s h Aquat. S c i . 38:84-90.
Zeusler, F.A. 1936. Report of oceanographic c r u i s e United S t a t e s c u t t e r Chelan , Bering Sea and Bering S t r a i t 1934 and other r e l a t e d data. U.S. Coast Guard Headquarters, Washington, D.C, 72 p. (mimeographed).
74
APPENDIX A FUR SEAL COMPUTER SIMULATION PROGRAM
The f o l l o w i n g i s a l i s t i n g of the program used to produce
the fur s e a l p o p u l a t i o n r e s u l t s shown in Chapter 5. The
program i s w r i t t e n i n A p p l e s o f t b a s i c and runs on an Apple II+.
The three s e t s of data r e q u i r e d to run the model are contained
in Tables 1, 2 and 3.
10 REM ********************************* 20 REM * « FUR SEAL MODEL >> * 30 REM * PURPOSE: TO SIMULATE ST. PAUL * 40 REM * HERD DYNAMICS FROM 1950 * 50 REM * (TI=0) UNTIL 1980 (TI=30). * 60 REM * PROGRAM: 1. READS DATA * 70 REM * 2. SIMULATES SY YRS. * 80 REM * 3. SAVES RESULTS IN * 90 REM * SPECIFIED NUMERIC * 100 REM * DATA FILE * 1 10 REM * SIMULATION MODEL: * 1 30 REM * ALL INPUT PARAMETRS * 1 40 REM * (ADULT SRVL & FEC) ARE * 150 REM * KEPT CONSTANT THROUGHOUT * 160 REM * SIMULATION. ONLY JUVENILE * 170 REM * SRVL AND SEX RATIO AT * 180 REM * BIRTH ARE CHANGING. * 190 REM * RESULTS: CAN BE VIEWED BY * 200 REM * RUNNING 1) POKE & * 210 REM * 2) GRAPH. * 220 REM * DATA INPUT: REQUIRES THE USE * 230 REM * OF THREE NUMERIC DATA FILES * 240 REM * 1. LAND FEMALE KILL.NUM * 250 REM * 2. PELAGIC FEMALE KILL.NUM * 255 REM * 3. MALE KILL.NUM * 260 REM * ANDREW TRITES * 270 REM * SEPT. 1 , 1984. IARE. * 280 REM ********************************* 290 REM 300 REM 310 REM 320 INPUT "ENTER NUMBER OF YEARS TO BE SIMULATED: ";SY 330 FOR TI = 0 TO SY 340 IF TI > 0 THEN GO TO 1540 350 DIM N(27,2),S(27,2),B(27),JS(30),LFK(30,27),PFK(30,27),
RMK(27),Z(9,SY),BULLS(30) 360 REM
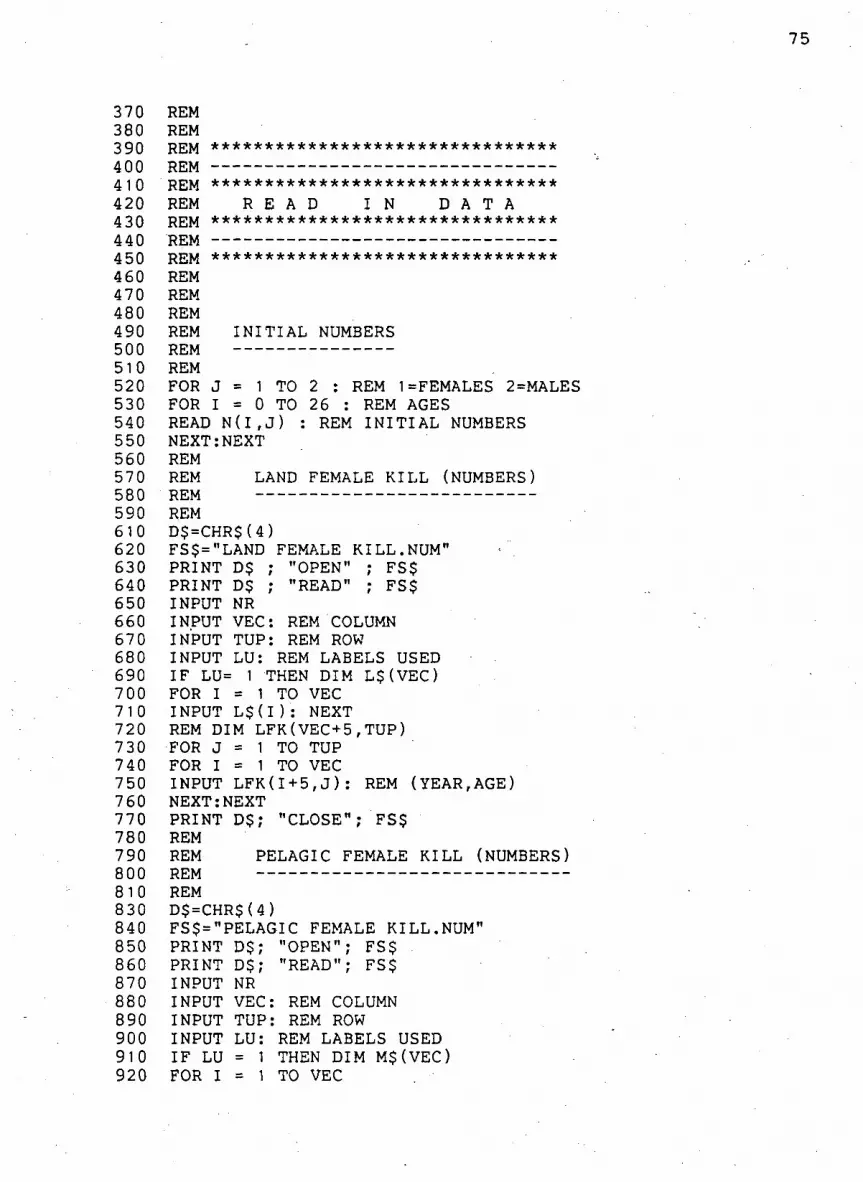
75
370 REM 380 REM 390 REM ******************************** 400 REM 410 REM ******************************** 420 REM R E A D I N D A T A 4 30 REM ******************************** 440 REM 450 REM ******************************** 460 REM 470 REM 480 REM 4 90 REM INITIAL NUMBERS 500 REM 510 REM 520 FOR J = 1 TO 2 : REM 1=FEMALES 2=MALES 530 FOR I = 0 TO 26 : REM AGES 540 READ N(I,J) : REM INITIAL NUMBERS 550 NEXT:NEXT 560 REM 57 0 REM LAND FEMALE KILL (NUMBERS) 580 REM 590 REM 610 D$=CHR$(4) 620 FS$="LAND FEMALE KILL.NUM" 630 PRINT D$ ; "OPEN" ; FS$ 640 PRINT D$ ; "READ" ; FS$ 650 INPUT NR 660 INPUT VEC: REM COLUMN 67 0 INPUT TUP: REM ROW 680 INPUT LU: REM LABELS USED 690 IF LU= 1 THEN DIM L$(VEC) 700 FOR I = 1 TO VEC 710 INPUT L $ ( I ) : NEXT 720 REM DIM LFK(VEC+5,TUP) 730 FOR J = 1 TO TUP 7 40 FOR I = 1 TO VEC 750 INPUT LFK(I+5,J): REM (YEAR,AGE) 760 NEXT:NEXT 770 PRINT D$; "CLOSE"; FS$ 780 REM 790 REM PELAGIC FEMALE KILL (NUMBERS) 800 REM 8 1 0 REM 830 D$=CHR$(4) 840 FS$="PELAGIC FEMALE KILL.NUM" 850 PRINT D$; "OPEN"; FS$ 860 PRINT D$; "READ"; FS$ 870 INPUT NR 880 INPUT VEC: REM COLUMN 890 INPUT TUP: REM ROW 900 INPUT LU: REM LABELS USED 910 IF LU = 1 THEN DIM M$(VEC) 920 FOR I = 1 TO VEC

76
930 INPUT M$(I): NEXT 940 FOR J = 1 TO TUP 950" FOR I = 1 TO VEC 960 INPUT PFK(I+7,J): REM(YEAR,AGE) 970 NEXT:NEXT 980 PRINT D$; "CLOSE"; FS$ 1010 REM 1013 REM 1081 REM LAND MALE KILL (NUMBERS) 1082 REM 1085 D$=CHR$(4) 1086 FS$ = "MALE KILL.NUM" 1087 PRINT D$; "OPEN"; FS$ 1088 PRINT D$; "READ"; FS$ 1089 INPUT NR 1090 INPUT VEC: REM COLUMNS 1091 INPUT TUP: REM ROW 1092 INPUT LU:. REM LABELS USED 1093 IF LU = 1 THEN DIM V$(VEC) 1094 FOR 1= 1 TO VEC 1095 INPUT L $ ( I ) : NEXT 1096 DIM LMK(TUP,VEC+18) 1097 FOR J = 0 TO TUP-1 1098 FOR I = 1 TO VEC 1099 INPUT LMK(J,I): REM (YEAR,AGE) 1 100 NEXT 1101 LMK(J,1)=0: LMK(J,8)=0: REM REMOVES YEAR AND YEAR KILL TOTALS 1102 NEXT 1103 PRINT D$; "CLOSE"; FS$ 1105 REM 1106 REM SURVIVAL RATES 1107 REM 1110 REM 1120 FOR J = 1 TO 2 1130 FOR I = 0 TO 26 1140 READ S ( I , J ) : REM AGE SPECIFIC SURVIVAL RATES 1150 NEXT:NEXT 1155 FOR I = 1 TO 26: S(I ,2)=S(I,2)* 1.035: NEXT 1160 REM 1170 REM BIRTH RATES 1180 REM 1190 REM 1200 FOR I = -0 TO 26 1210 READ B ( I ) : REM AGE SPECIFIC BIRTH RATES (FEMALES) 1220 NEXT 1230.REM 1240 REM JUVENILE SURVIVAL 1250 REM 1260 REM 1270 FOR I = 0 TO 28 1280 READ JS(I ) 1285 J S ( I ) = J S ( I ) / . 8 1290 NEXT 1300 FOR I = 29 TO 30
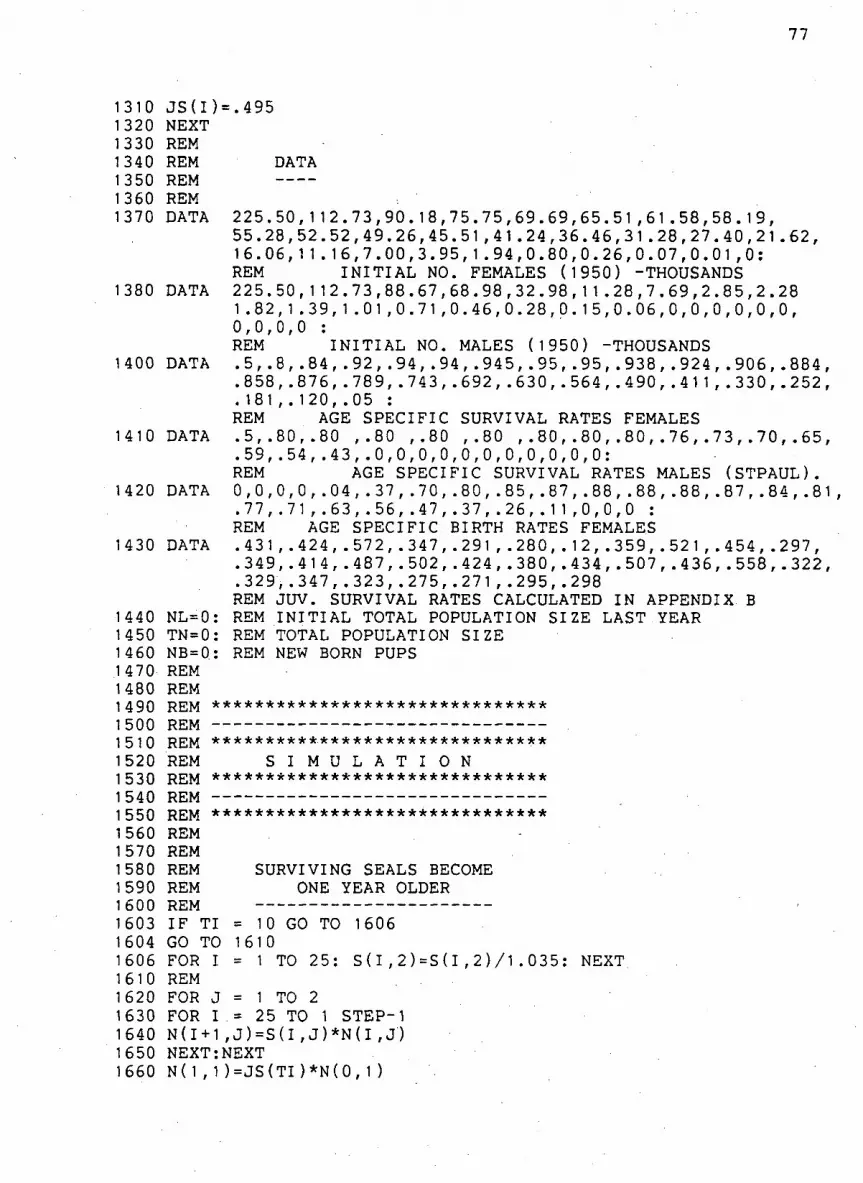
77
1310 JS(I)=.495 1320 NEXT 1330 REM 1340 REM DATA 1350 REM 1360 REM 1370 DATA 225.50,112.73,90.18,75.75,69.69,65.51,61.58,58.19,
55.28,52.52,49.26,45.51,41.24,36.46,31.28,27.40,21.62, 16.06,11.16,7.00,3.95,1.94,0.80,0.26,0.07,0.01,0: REM INITIAL NO. FEMALES (1950) -THOUSANDS 225.50,112.73,88.67,68.98,32.98,11.28,7.69,2.85,2.28 1.82,1.39,1.01,0.71,0.46,0.28,0.15,0.06,0,0,0,0,0,0, 0,0,0,0 : REM INITIAL NO. MALES (1950) -THOUSANDS .5, .8,.84,.92,.94,.94,.945,.95,.95,.938,.924,.906,.884, .858,.876,.789,.743,.692,.630,.564,.490,.411,.330,.252, .181,.120,.05 : REM AGE SPECIFIC SURVIVAL RATES FEMALES .5,.80,.80 ,.80 ,.80 ,.80 ,.80,.80,.80,.76,.73,.70,.65, .59,.54,.43,.0,0,0,0,0,0,0,0,0,0,0: REM AGE SPECIFIC SURVIVAL RATES MALES (STPAUL). 0,0,0,0,.04,.37,.70,.80,.85,.87,.88,.88,.88,.87,.84,.81, .77,.71,.63,.56,.47,.37,.26,.11,0,0,0 : REM AGE SPECIFIC BIRTH RATES FEMALES .431,.424,.572,.347,.291,.280,.12,.359,.521,.454,.297, .349,.414,.487,.502,.424,.380,.434,.507,.436,.558,.322, .329,.347,.323,.275,.271,.295,.298 REM JUV. SURVIVAL RATES CALCULATED IN APPENDIX B
NL=0: REM INITIAL TOTAL POPULATION SIZE LAST YEAR TN=0: REM TOTAL POPULATION SIZE NB=0: REM NEW BORN PUPS REM REM REM ******************************* REM REM ******************************* REM S I M U L A T I O N REM ******************************* REM REM ******************************* REM REM REM REM REM IF TI = 10 GO TO 1606 GO TO 1610
1 TO 25: S(I,2)=S(I,2)/l.035: NEXT
1380 DATA
1400 DATA
1410 DATA
1420 DATA
1430 DATA
1 440 1 450 1460 1 470 1 480 1 490 1500 1510 1 520 1530 1540 1 550 1560 1570 1 580 1590 1600 1603 1604 1606 1610 1620 1630 1640 1650 1660
SURVIVING SEALS BECOME ONE YEAR OLDER
FOR I REM FOR J FOR I
= 1 TO 2 = 25 TO 1 STEP-1
N(I + 1 , J)=S(I,J)*N(I,J) NEXT:NEXT N(1,1)=JS(TI)*N(0,1)

78
1670 N(1,2)=JS(TI)*N(0,2) 1680 REM 1690 REM MALE/FEMALE HARVEST 1700 REM '• 1710 REM 1720 TMK=0: TFK=0: REM TOTAL (MALE/FEMALE) KILL 1730 FOR I = 0 TO 26 1740 FK=(LFK(TI,I)+PFK(TI,I)*.8)/1000:
REM LAND/PELAGIC FEMALE KILL. 80% OF PELAGIC IS ST.PAUL SEALS (ACTUAL NUMBERS)
1750 MK=LMK(TI,I)/1000: REM LAND MALE KILL 1760 TFK=TFK+FK: REM TOTAL FEMALE KILL 1770 TMK=TMK+MK: REM TOTAL MALE KILL 1780 N(I,1)=N(I,1)-FK:
REM NO. EACH AGE GROUP SURVIVING HARVEST (FEMALES) 1785 PRINT"AGE "; I; " "; N(I,2); " "; MK 1790 N(I,2)=N(I,2)-MK 1795 IF N(I,2) < 0 THEN N(l,2)=0 1800 NEXT 1810 REM 1820 REM FEMALES GIVE BIRTH 1830 REM 1840 REM 1850 NB=0: REM NO. BORN 1860 FOR I = 1 TO 26 1870 NB=NB+B(I)*N(I,1) 1880 NEXT 1890 N(0,1)=NB*.50: REM FEMALE PUPS 1900 N(0,2)=NB*.50: REM MALE PUPS 1910 REM 1920 REM TOTAL POPULATION SIZE 1930 REM 1940 REM 1950 TN=0: REM TOTAL NO. 1960 FOR I = 0 TO 26 1970 TN=TN+N(I,1)+N(1,2) 1980 NEXT 1 990 BULLS (TI )=0~ 1991 BULLS(TI)=BULLS(TI)+N(6,2 ) * . 2 1992 BULLS(TI)=BULLS(TI)+N(7,2)*.50 1993 BULLS(TI)=BULLS(TI)+N(8,2)*.75 2000 FOR I = 9 TO 16 2010 BULLS(TI)=BULLS(TI)+N(I,2) 2020 NEXT 2030 NT(1)=0: NT(2)=0 2040 FOR J = 1 TO 2 2050 FOR I = 0 TO 25 -2060 NT(J)=NT(J)+N(I,J) 2070 NEXT I: NEXT J 2080 REM 2090 REM RATE OF POP CHANGE 2100 REM 2110 REM 2120 R= (TN-ND/NL+1
2130 2140 2150 2160 2170 2180 .2190 2200 221 0 2220 2230 2240 2250 2260 2270 2280 2290 2300 2310 2320 2330 2340 2350 2360 2370 2380 2390 2400 241 0 .2420 2430 2440 2450 2460 2470 2480 2490 2500 2510 2520 2530 2540 2550 2560 2570 2580 2590 2600 261 0 2620
NL=TN: REM REM REM REM Z(1,TI Z(2,TI Z(3,TI Z(4,TI Z(5,TI Z(6,TI Z(7,TI Z(8,TI Z(9,TI
REM NL = NO. LAST YEAR
SAVE OUTPUT VARIABLES
)=TN )=NB )=R )=TFK )=TMK )=JS(TI) )=NT(1) )=NT(2) )=BULLS(TI)
PRINTTI,R,TN,TFK,TMK,JS(TI),NB,BULLS(TI) PRINT" " NEXT REM REM REM* ***************************** REM REM* ***************************** REM S T O R E O U T P U T REM* ***************************** REM REM* ***************************** REM REM INPUT PRINT PRINT PRINT PRINT PRINT PRINT PRINT PRINT PRINT PRINT PRINT PRINT PRINT PRINT PRINT FOR J FOR I PRINT NEXT:NEXT PRINT D$; END
"NUMERIC MODEL DATA" FILE NAME= ";FT$ D$; "OPEN"; FT$ D$; "WRITE"; FT$ 10003+8*(TI+1+1) »g» TI n ^ n
"TN" "NB" "R" "TFK" "TMK" "JS" "# FEMALES" "# MALES" "BULLS 7+" = 0 TO = 1 TO Z (I , J )
TI 9
"CLOSE' FT$
80
Table A-1. The number of females harvested on S a i n t Paul I s l a n d from 1956 to 1968. The data are e x t r a p l o a t e d from York and H a r t l e y (1981). The Table corresponds to the computer program data f i l e "land female k i l l . n u m " .
Age 1956 1957 1958 1959 1960 1961 1962
1 0 0 0 0 0 0 0 2 1 32 0 477 215 1 9 360 320 •3 2018 953 9762 1769 258 3624 3438 4 5470 4551 6736 6379 466 5447 6434 5 3497 9373 2719 3098 763 3547 4951 6 2149 4747 2387 2414 478 3868 2689 7 1599 3201 649 2847 296 231 5 231 6 8 1 248 2880 293 1 495 271 2183 2267 9 738 2599 292 913 222 2408 1849 10 482 1389 430 849 1 35 1 605 1 328 1 1 661 1 454 40 787 73 1810 1751 1 2 601 1321 36 715 67 1 644 1 591 1 3 530 1 1 65 32 630 59 1 450 1410 1 4 455 1000 27 541 50 1245 1215 1 5 398 875 24 474 44 1090 1 054 1 6 313 688 19 372 35 " 856 828 1 7 231 508 . 14 275 26 632 612 1 8 160 352 10 1 90 18 438 422 '19 1 03 227 6 1 23 1 1 282 273 20 57 1 25 3 68 6 1 56 1 50 21 25 55 1 30 3 68 66 22 1 1 23 1 1 3 1 29 28 23 10 23 0 1 2 1 29 1 1 24 0 0 0 0 0 0 0 25 0 0 0 0 0 0 0 26 0 0 0 0 0 0 0 1-26 20888 37509 23958 24209 3302 35086 35003
81
Table A-1 continued
Age 1 963 1964 1965 1966 1967 1968 1956-68
1 0 0 0 0 ' 0 0 0 2 502 298 284 3 18 38 2666 3 2090 2506 1870 29 571 744 29632 4 5947 2672 3327 103 1 109 2572 51213 5 6994 2756 1 167 50 1204 1749 41868 6 3170 1619 387 39 955 1 453 26355 7 1415 484 286 45 459 993 16905 8 2060 235 29 24 437 828 14250 9 1955 223 27 1 5 416 658 1231 5 10 1835 209 25 1 4 390 478 9169 1 1 1686 192 23 1 3 361 1 92 9043 1 2 1538 175 21 1 1 328 174 8222 1 3 1358 1 54 1 9 1 0 288 1 54 7259 1 4 1 1 64 1 32 1 6 9 248 1 32 6234 15 1015 1 15 1 4 8 219 1 16 5446 16 806 92 1 2 7 171 91 4290 1 7 597 68 9 6 128 68 3174 18 403 46 6 3 87 46 2181 1 9 254 29 4 1 55 29 1 397 20 1 49 1 7 2 1 29 1 6 779 21 60 7 1 0 15 7 338 22 30 3 1 0 1 4 6 160 23 15 - 2 0 0 0 0 103 24 0 0 0 0 0 0 0 25 0 0 0 0 0 0 0 26 0 0 0 0 0 0 0 0-26 35043 12034 7530 391 7502 1 0544 . 252999

Table A-2. The number of females k i l l e d p e l a g i c a l l y from 1958 to 1974. The data are e x t r a p o l a t e d from York and H a r t l e y (1981). Note that 80% of the k i l l i s assumed to be from S a i n t Paul I s l a n d . The Table corresponds to the computer program data f i l e " p e l a g i c female k i l l . n u m " .
Age 1958 1 959 1960 1961 1962 1 963
1 150 89 27 121 38 7 2 29 64 56 52 38 25 3 75 56 68 1 18 1 1 3 61 4 73 120 52 1 38 183 131 5 95 141 85 81 1 65 181 6 121 160 79 79 90 1 1 1 7 1 28 193 1 12 1 1 2 1 18 87 8 118 208 1 49 1 33 1 33 98 9 97 143 179 136 120 69
10 105 1 19 159 131 1 30 88 1 1 130 112 1 49 95 1 1 1 107 12 147 88 1 16 83 111 1 1 9 13 121 66 1 28 86 75 90 14 101 78 1 1 4 75 77 74 15 78 94 73 74 64 90 16 62 74 55 60 55 59 17 39 40 49 28 49 32 18 25 30 25 27 29 1 7 19 16 18 20 1 2 17 7 20 4 6 8 8 1 2 1 3 21 2 8 7 3 4 5 22 1 5 0 0 3 1 23 0 1 1 1 0 3 24 0 1 1 1 1 0 25 0 0 0 0 0~ 0 26 0 0 0 0 0 0 1-26 1717 1914 1712 1654 1736 1475
Table A-2 continued
Age 1964 1 965 1966 1967 1968 1969 1 27 12 58 10 80 55 2 44 10 13 12 27 23 3 79 56 45 28 81 55 4 84 78 92 18 168 66 5 83 26 86 19 71 56 6 93 44 46 27 87 38 7 74 26 56 17 88 38 8 42 33 58 12 58 31 9 34 18 23 19 62 1 1
10 51 1 3 21 13 65 31 1 1 43 20 28 6 51 34 12 53 1 6 17 6 49 34 13 34 8 16 4 27 1 4 1 4 39 10 19 1 32 1 0 15 41 1 4 1 6 3 32 5 16 23 12 7 7 34 8 17 21 10 6 2 23 8 18 20 8 1 0 1 5 4 19 7 2 3 0 12 6 20 10 2 3 1 8 4 21 0 1 1 0 5 1 22 0 •0 0 1 4 0 23 1 1 0 0 1 0 24 0 0 0 0 0 1 25 0 0 0 0 0 0 26 0 0 0 0 0 0 1-26 903 420 615 206 1 080 533
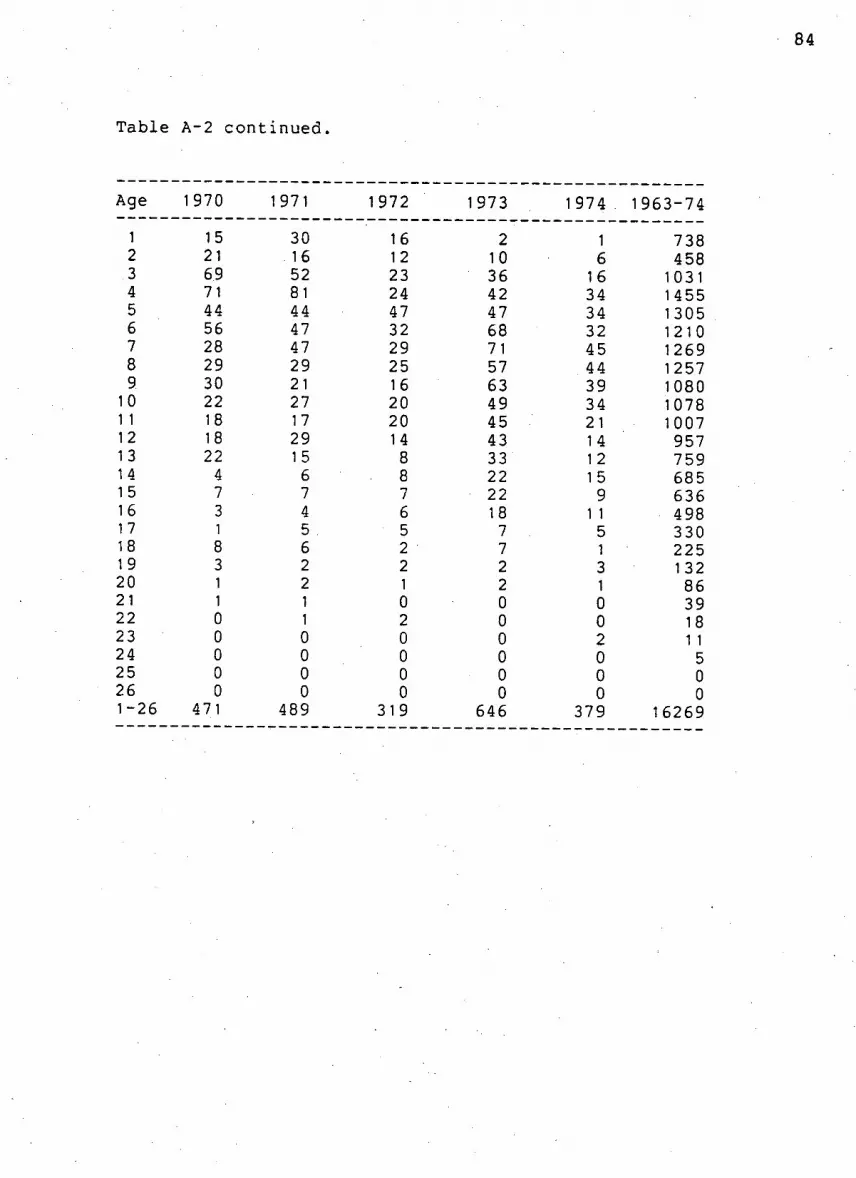
Table A-2 continued.
Age 1970 1971 1972 1973 1974 1963-74
1 15 30 16 2 1 738 2 21 16 12 10 6 458 .3 69 52 23 36 1 6 1031 4 71 81 24 42 34 1455 5 44 44 47 47 34 1305 6 56 47 32 68 32 1210 7 28 47 29 71 45 1269 8 29 29 25 57 44 1257 9 30 21 16 63 39 1080 10 22 27 20 49 34 1078 1 1 18 17 20 45 21 1007 1 2 18 29 14 43 1 4 957 13 22 1 5 8 33 1 2 759 1 4 4 6 8 22 1 5 685 1 5 7 7 7 22 9 636 1 6 3 4 6 18 1 1 498 1 7 1 5 5 7 5 330 18 8 6 2 7 1 225 19 3 2 2 2 3 1 32 20 1 2 1 2 1 86 21 1 1 0 0 0 39 22 0 1 2 0 0 18 23 0 0 0 0 2 1 1 24 0 0 0 0 0 5 25 0 0 0 0 0 0 26 0 0 0 0 0 0 1-26 471 489 319 646 379 1 6269
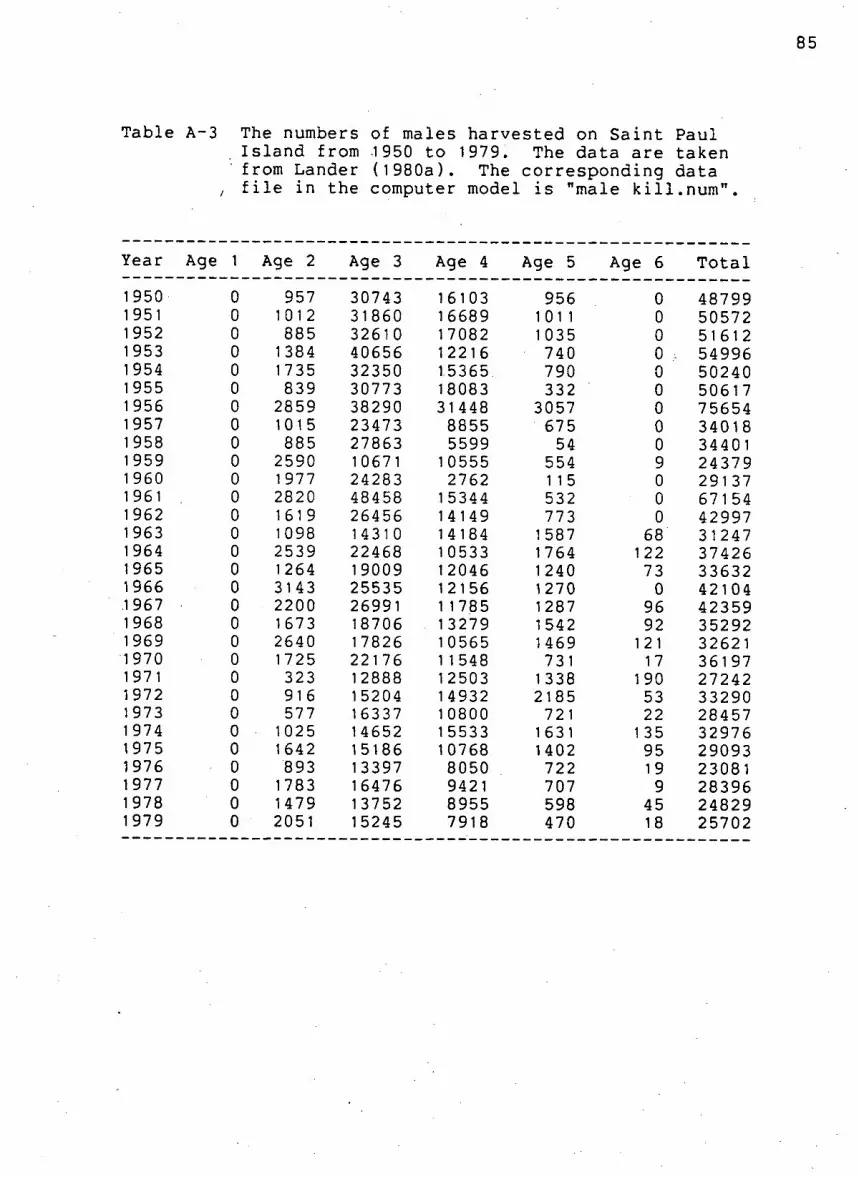
Table A-3 The numbers of males harvested on Sa i n t Paul I s l a n d : from 1950 to 1979. The data are taken from Lander (1980a). The corresponding data f i l e i n the computer model i s "male k i l l .num".
Year Age 1 Age 2 Age 3 Age 4 Age 5 Age 6 T o t a l
1950 0 957 30743 16103 956 0 48799 1951 0 1012 31860 16689 1011 0 50572 1952 0 885 32610 17082 1035 0 51612 1953 0 1 384 40656 12216 740 0 , 54996 1954 0 1735 32350 15365 790 0 50240 1955 0 839 30773 18083 332 0 5061 7 1956 0 2859 38290 31 448 3057 0 75654 1957 0 1015 23473 8855 675 0 34018 1958 0 885 27863 5599 54 0 34401 1959 0 2590 10671 1 0555 554 9 24379 1960 0 1 977 24283 2762 1 1 5 0 291 37 1961 0 2820 48458 1 5344 532 0 67154 1962 0 1619 26456 1 4149 773 0 42997 1963 0 1098 14310 14184 1 587 68 31247 1 964 0 2539 22468 1 0533 1764 1 22 37426 1965 0 1264 19009 12046 1240 73 33632 1966 0 3143 25535 12156 1270 0 421 04 1967 0 2200 26991 1 1785 1287 96 42359 1968 0 1673 18706 1 3279 1542 92 35292 1969 0 2640 17826 1 0565 1 469 121 32621 1970 0 1725 221 76 1 1 548 731 17 361 97 1971 0 323 12888 12503 1338 1 90 27242 1 972 0 916 15204 14932 2185 53 33290 1973 0 577 16337 10800 721 22 28457 1974 0 1025 14652 1 5533 1631 1 35 32976 1975 0 1642 15186 10768 1402 95 29093 1976 0 893 13397 8050 722 19 23081 1977 0 1783 16476 9421 707 9 28396 1978 0 1479 1 3752 8955 598 45 24829 1979 0 2051 15245 7918 470 18 25702
86
APPENDIX B ESTIMATING THE SURVIVAL OF JUVENILES
Fur s e a l j u v e n i l e s u r v i v a l rates ( b i r t h to age 2) can be
c a l c u l a t e d for the male component of the P r i b i l o f p o p u l a t i o n
( C a l l o r h i n u s u r s i n u s ) • The a v a i l a b l e data cover the p e r i o d
1950 to 1980 and c o n s i s t of annual age s p e c i f i c k i l l s , counts of
i d l e and harem b u l l s , and counts and estimates of l i v e and dead
pups. Subadult males aged 2 to 5 are commercially harvested i n
J u l y on Saint Paul I s l a n d . The Saint George harvest was
stopped in 1972. Mature males are d e f i n e d as harem b u l l s i f
they defend t e r r i t o r y c o n t a i n i n g one or more females and as i d l e
b u l l s i f they hold a t e r r i t o r y with no females. The most
complete set of data i s from Saint Paul I s l a n d where
approximately 80% of the P r i b i l o f herd breeds (Table B-1 and B-
2). The r e l i a b i l i t y of the data has been p r e v i o u s l y reviewed
in Chapters 3 and 5.
There are c u r r e n t l y three sets of p u b l i s h e d estimates f o r
j u v e n i l e males born on Saint Paul I s l a n d (Table B-3). The
three e s t i m a t i o n procedures are s i m i l a r i n that each t r i e s t o
r e c o n s t r u c t the number of j u v e n i l e s which s u r v i v e d the f i r s t few
years of l i f e .
The f i r s t set of estimates i s d e r i v e d by Chapman
(1961,1964,1973) using the t o t a l k i l l of males p l u s estimates of
the number of pups born w i t h i n the p a r t i c u l a r year c l a s s .
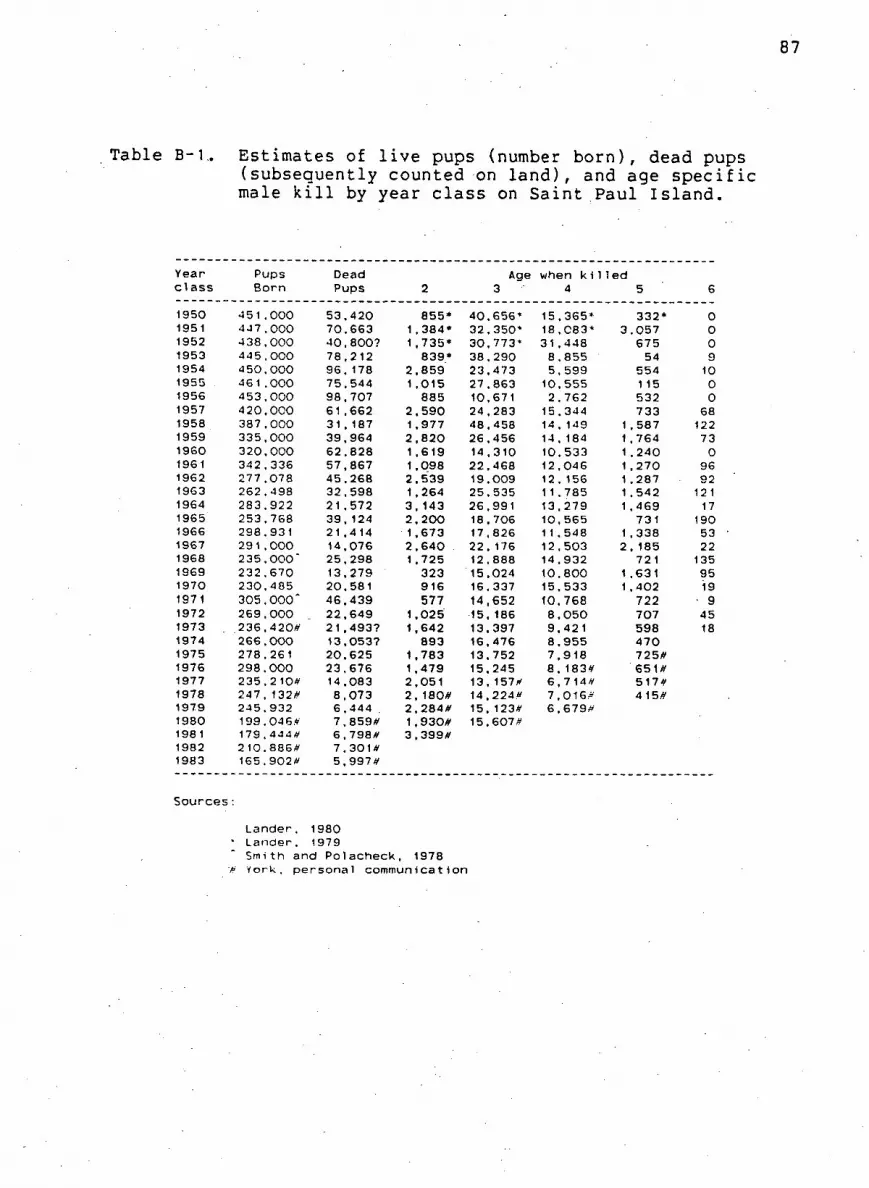
87
Table B-1.. Estimates of l i v e pups (number born), dead pups (subsequently counted on l a n d ) , and age s p e c i f i c male k i l l by year c l a s s on Saint Paul I s l a n d .
Year Pups Dead Age when k i11ed c l ass Born Pups 2 3 4 5 6
1950 451.000 53.420 855* 40.656* 15.365* 332* 0 1951 447.000 70,663 1 ,384* 32,350* 18.C83* 3.057 0 1952 4 38,000 40,800? 1 ,735* 30,773* 31 ,448 675 0 1953 44 5.000 78,212 839* 38.290 8.855 54 9 1954 450.000 96,178 2,859 23,473 5, 599 554 10 1955 461.000 75.544 1 ,015 27.863 10.555 1 15 0 1956 453,000 98,707 885 10,671 2.762 532 0 1957 4 20.000 61,662 2,590 24.283 15.344 733 68 1958 387.000 31.187 1 ,977 48.458 14,149 1 , 587 122 1959 335,000 39,964 2,820 26,456 14.184 1 , 764 73 1960 320,000 62.828 1,619 14,310 10,533 1 . 240 0 1961 342 , 336 57,867 1 ,098 22.468 12,046 1 , 270 96 1962 277.078 45.268 2,539 19.009 12,156 1 . 287 92 1963 262.498 32.598 1 ,264 25.535 1 1.785 1 , 542 12 1 1964 283.922 21.572 3. 143 26.991 13.279 1 , 469 17 1965 253,768 39,124 2.200 18,706 10,565 731 190 1966 298.931 21,414 1 .673 17,826 11,548 1 . 338 53 1967 291.000 14,076 2,640 22. 176 12.503 2, 185 22 1968 235.000' 25,298 1 .725 12,888 14.932 721 135 1969 232.670 13,279 323 15,024 10.800 1 , 631 95 1970 230,485 20,581 916 16.337 15,533 1 , 402 19 1971 305.000" 46,439 577 14.652 10,768 722 • 9 1972 269,000 22,649 1 ,025 15,186 8,050 707 45 1973 236,420* 2 1 ,493? 1 ,642 13,397 9,421 598 18 1974 266.OOO 13,053? 893 16,476 8.955 470 1975 278.261 20.625 1 ,783 13.752 7,918 725* 1976 298.000 23,676 1 ,479 15,245 8,183* 651* 1977 235,210* 14,083 2,051 13,157* 6,7 14* 517* 1978 247,132* 8,073 2,180* 14.224* 7.016.* 4 15* 1979 245.932 6,444 . 2,284* 15,123* 6,679* 1980 199.046* 7,859* 1,930* 15,607* 198 1 179.444* 6,798* 3,399* 1982 210.886* 7,301* 1983 165.902* 5,997*
Sources:
Lander. 1980 • Lander. 1979
Smith and Polacheck, 1978 '* Y o r k , p e r s o n a l communication
88
Table B-2. Counts of harem and i d l e b u l l s on Sa i n t Paul I s l a n d .
Year Harem I d l e
1950 9 292 3 102 1951 9 434 3 581 1 952 9 318 4 717 1 953 9 848 5 912 1 954 9 906 6 847 1955 9 034 8 650 #956 9 384 9 016 1957 9 582 10 060 1958 9 970 9 510 1 959 1 0 003 1 1 485 1960 10 247 1 0 407 1 961 1 1 1 63 1 1 791 1 962 10 332 9 109 1 963 9 212 7 650 1964 9 085 7 095 1 965 8 553 5 616 1966 7 925 5 931 1 967 7, 230* 4, 439* 1968 6 176* 3 100* 1 969 5 467 2 208 1970 4 945 1 666 1 971 4 , 200* 1 900* 1972 3, 738* 2, 384* 1973 4 , 906* 2, 550* 1974 4 563* 1 782* 1 975 5 018 3 535 1976 5, 324 4, 041 1 977 6, 457 3, 845 1 978 6, 496 3, 908 1979 6, 242 4, 457 1980 5, 490# 4, 248#
Sources:
Lander, 1980 * Lander and Kajimura, 1975 # York, personal communication
89
Table B-3. C a l c u l a t e d male j u v e n i l e fur s e a l s u r v i v a l on S a i n t Paul I s l a n d . The Chapman and the Smith and Polacheck estimates are c a l c u l a t e d from b i r t h to age 3. T h e i r values are reduced to b i r t h to age 2, f o r the purpose of comparison with the Lander estimates, by assuming a constant s u r v i v a l at age 3 of 0.80.
Year Chapman Smith & Polacheck Lander c l a s s b i r t h - age 2 b i r t h - age 2 b i r t h - age 2
1 950 0.444 0.364 1 951 0.430 0.360 1 952 0.515 0.414 1 953 0.398 0.320 ' 1 954 0.243 0.237 1955 0.288 0.274 1 956 0.110 0.139 1957 0.346 0.314 1958 0.525 0.451 1 959 0.450 0.383 1 960 0.334 0.281 1961 0.385 0.274 0.327 1962 0.377 0.315 0.366 1 963 0.445 0.380 0.329 1964 0.454 0.394 0.385 1965 0.374 0.301 0.375 1 966 0.274 0.355 1967 0.348 0.416 1 968 0.323 0.284 1969 0.296 0.293 1 970 0.371 0.323 1971 0.214 1 972 0.293 1973 0.323 1 974 0.311 1 975 0.278 1976 0.276 1977 0.296
Sources:.
Chapman, 1973 Smith and Polacheck, 1978 Lander, 1979
90
The second set by Smith and Polacheck (1978) improved the
Chapman procedure by i n c o r p o r a t i n g age s p e c i f i c k i l l s ,
assumptions about a d u l t s u r v i v a l , and by using the counts of
harem and i d l e b u l l s . They p u b l i s h e d only lower bound
estimates obtained by d i v i d i n g t o t a l k i l l by pups born (Smith
and Polacheck, 1981). Both the Chapman and the Smith and
Polacheck sets of estimates c a l c u l a t e d s u r v i v a l of young from
b i r t h to age 3 even though a s u b s t a n t i a l harvest begins at age
2. T h i s may be because at the time of the o r i g i n a l Chapman
work, the age of k i l l was not known.
The t h i r d set of j u v e n i l e s u r v i v a l estimates ( b i r t h to age
2) i s c a l c u l a t e d by Lander (1975,1979) using upper and lower
parameter bounds. With pup estimates and age s p e c i f i c k i l l
data he estimated the s u r v i v a l of subadult and j u v e n i l e males.
J u v e n i l e s u r v i v a l i s a key component of population dynamics
and a p o t e n t i a l i n d i c a t o r of p o p u l a t i o n s t a t u s (Eberhardt,
1981). Fur s e a l j u v e n i l e s u r v i v a l estimates have been given
wide use, such as i n p r e d i c t i n g maximum s u s t a i n a b l e y i e l d
(Eberhardt, 1981), i n t e r p r e t i n g changing ages of f i r s t
r e p roduction (York, 1983), and i d e n t i f y i n g p o s s i b l e years of
heavy net entanglement m o r t a l i t y (Fowler, 1982). Eberhardt and
S i n i f f (1977) have shown how the s u r v i v a l over the f i r s t two
years of l i f e can account f o r increases and decreases i n
pinni p e d herd s i z e f o r fur s e a l s ( C a l l o r h i n u s u r s i n u s ) , harp

91
s e a l s (Paqophilus q r o e n l a n d i c u s ) , ringed s e a l s (Phoca h i s p i d a ) ,
and Weddel s e a l s (Leptonychotes w e d d e l l i ) . J u v e n i l e s u r v i v a l
rates must be high to ensure p o p u l a t i o n growth given present
estimates of a d u l t s u r v i v a l . The importance of j u v e n i l e
s u r v i v a l to ensuing p o p u l a t i o n demography i s confirmed by the
model developed in Chapter 5.
The r e l i a b i l i t y of the p u b l i s h e d fur s e a l estimates of
j u v e n i l e s u r v i v a l has never been c r i t i c a l l y examined d e s p i t e
t h e i r wide use and t h e i r importance in i n t e r p r e t i n g p o p u l a t i o n
dynamics. T h i s has prompted the f o l l o w i n g review. I t s
purpose i s to d i s c u s s the strengths and weaknesses of the
procedures that have been used to estimate male j u v e n i l e fur
s e a l s u r v i v a l and to improve the estimates i f need be.
B.J_ D e t a i l s of the Methods of E s t i m a t i n g J u v e n i l e S u r v i v a l
For a l l three s e t s of e s t i m a t o r s , j u v e n i l e s u r v i v a l r a t e s
are d e r i v e d from the d i v i s i o n of the number of two or three year
olds by the number of pups born (No). The number of j u v e n i l e s
that s u r v i v e i s r e c o n s t r u c t e d by back c a l c u l a t i o n , using the
number of male s e a l s k i l l e d by age i ( K i ; i=2,3,4,5) and some
assumption concerning s u r v i v a l of subadult animals from the end
of the j u v e n i l e stage u n t i l age 5. The b a s i c d i f f e r e n c e i n the
methods i s the treatment of escapement and whether the estimated

92
number s u r v i v i n g i s an upper, lower, or mean val u e .
The simplest estimate of j u v e n i l e s u r v i v a l , by Chapman
(1961,1964,1973), determines the minimum number of three year
olds i n the absence of a k i l l at age 2 by summing the t o t a l year
c l a s s k i l l and adding a measure of escapement. S u r v i v a l over
the f i r s t three years of l i f e i s thus estimated from
S = { K + K + K + K + E ( K + K + K + K ) } / N o . (B-1) 0,3 2 3 4 5 2 3 4 5
The percent escapement (E) i s set at 40% but v a r i e s s l i g h t l y
depending upon the length of the harvest season.
Smith and Polacheck (1978) modify the Chapman c a l c u l a t i o n
by i n c l u d i n g age s p e c i f i c s u r v i v a l rates ( S i ; i=2,3,4,5) and
determining escapement (E 5) i n t o the breeding reserve using
harem (H) and i d l e (I) b u l l counts. Thus
S = { S K +K + K / S + K /(S S ) + E /(S S S )} / NO (B-2) 0,3 2 2 3 4 3 5 3 4 5 3 4 5
where
E = {(H + I ) - S (H + 1 )} . (B-3) 5 t t a t-1 t-1
The d i f f e r e n c e between the t o t a l number of b u l l s corresponding
to year c l a s s t and the number s u r v i v i n g from previous cohorts
determines escapement. Adult s u r v i v a l (Sa) i s assumed to be
constant.
Lander (1975,1979) combines male k i l l records with pup

93
estimates to determine the s u r v i v a l rates of j u v e n i l e s (S* c ^ )
and subadults (S). Given the known numbers at b i r t h , the b a s i c
approach i s to i d e n t i f y the upper and lower extremes of s u r v i v a l
r a t e s which c o u l d account f o r the observed male k i l l . Best
parameter estimates are taken to be wi t h i n these l i m i t s .
The Lander estimator i s the l e a s t i n t u i t i v e of the three
procedures and r e q u i r e s more e x p l a n a t i o n . The f i r s t s tep i n
h i s method, i s to place lower and upper bounds upon j u v e n i l e
s u r v i v a l such that
* - 1 - 2 - 3 S u = { K + K S + K S + K S } / N o (B~4) '0,2 2 3 4 5
and
* -1 - 2 - 3 Sj. = {K + K S + K S + (K + K )S } / No . (B-5)
0,2 2 3 4 4 5
Lander c o n s i d e r s the mean of these two l i m i t s to be a good
estimate of j u v e n i l e s u r v i v a l . T h i s i s presumably because the
e r r o r i n using a p o i n t estimate i s minimized. The upper l i m i t
S* depends upon the important assumption that e x p l o i t a t i o n of
four year olds exceeds 50%.
The process of s e t t i n g upper and lower parameter l i m i t s i s
a l s o used to f i x subadult s u r v i v a l . In t h i s case the upper
l i m i t i s a r b i t r a r i l y set at u n i t y (Su = 1.0) while the lower
bound i s w r i t t e n as a f u n c t i o n of j u v e n i l e s u r v i v a l . D e f i n i n g
annual s u r v i v a l r a t e s i n terms of average monthly m o r t a l i t i e s
94
c l a r i f i e s the c a l c u l a t i o n of S^.
Fur s e a l m o r t a l i t y from 1 b i r t h to age 5 i s broken i n t o a
j u v e n i l e ( b i r t h - age 2) and subadult (ages 3-5) component.
Average monthly m o r t a l i t y over the f i r s t 24 months of l i f e (M*)
i s expressed as a f u n c t i o n of j u v e n i l e s u r v i v a l S* where
* * M = (-In S ) / 24 (B-6)
0,2
Subadult monthly m o r t a l i t y (M) i s assumed to remain constant f o r
ages 3, 4, and 5 and i s c a l c u l a t e d f o r 11 months given
i n s i g n i f i c a n t n a t u r a l m o r t a l i t y during the p e r i o d of l a n d
harvest.
M = (-In S) / 11 . (B-7)
Combining j u v e n i l e and subadult m o r t a l i t y produces an average
value from b i r t h to age 5,
T * 3 M = (-In S S ) / 57 (B-8)
0,2
which i s r e l a t e d to the previous stages by the assumption t h a t
* T M >= M >= M (B-9) 0,2
It i s from t h i s r e l a t i o n s h i p that S L may be determined.
The l e f t hand sid e of equation B-9 sets a lower l i m i t on
subadult s u r v i v a l which can account for the observed p a t t e r n of
male k i l l . If

95
* T M = M (B-10) 0,2
then * * 3
)/24 = (-In S, S )/57 0,2 L
(-In S U
(B-11 ) 0,2
S u b s t i t u t i n g i n equations B-4 and B-5 leaves one unknown, S L,
which can be solved n u m e r i c a l l y . Note that i n s u b s t i t u t i n g the
equations f o r j u v e n i l e s u r v i v a l , one must use a p p r o p r i a t e l y
i n c o r r e c t i n using S u i n s t e a d of S u ( p r e v i o u s l y set to one) to
w i l l have the u l t i m a t e e f f e c t of producing a f i n a l estimate of
j u v e n i l e s u r v i v a l which i s too high.
Rather than t a k i n g the mean of the upper and lower subadult
s u r v i v a l l i m i t s , k i l l f i g u r e s and s u r v i v a l l i m i t s may be used to
produce a r a t i o of four year o l d s e a l s before the k i l l to three
year o l d s a f t e r the k i l l the previous year. Three and four
year olds account f o r about 90% of the k i l l and are taken i n
s u f f i c i e n t numbers to provide t i g h t l i m i t s on the numbers that
must have been present. T h i s i s to say that the mean of upper
and lower estimates of three and four year o l d s may be used to
c a l c u l a t e subadult s u r v i v a l (S) such that
bounded subadult s u r v i v a l r a t e s . In t h i s regard, Lander i s
determine S* The Lander estimated S _ w i l l be too low and
S
-1 -1 {[(K .+ K )S ] + [(K + K )S + K ]} / 2
4 5 U 4 5 L 4
-1 -2 -1 {[(K + K )S ] + [(K + K )S + K S ]} / 2
4 5 U 4 5 L 4 L
(B-12)

96
or - 1 - 1 -1
S + S + K (K + K ) U L 4 4 5
s = t (B-1.3) -1 -2 -1 -1
S + S + K ( K + K ) S U L 4 4 5 L
The upper and lower j u v e n i l e s u r v i v a l bounds can be determined
using t h i s estimate of subadult s u r v i v a l . Taking the mean of
these l i m i t s gives the best estimate of subadult s u r v i v a l :
* * ^ + S L U * U 0,2 U0,2
s = (B-14) 0,2 2
Thus the Lander procedure has estimated j u v e n i l e and subadult
s u r v i v a l r a t e s by p l a c i n g bounds on these parameters to account
for the observed b i r t h of male pups and the subsequent k i l l of
the p a r t i c u l a r cohort.
B.2 E v a l u a t i o n of the Methods of E s t i m a t i n g J u v e n i l e S u r v i v a l
J u v e n i l e s u r v i v a l estimates of Chapman can only be
considered as lower parameter bounds. T h e i r o v e r a l l
a c c e p t a b i l i t y depends l a r g e l y upon the assumption of a f i x e d
rate of recruitment. Recent work by Smith and Polacheck (1978)
suggests that escapement has probably v a r i e d c o n s i d e r a b l y over
time. I t i s t h e r e f o r e more reasonable to estimate escapement
97
based on a c t u a l counts of b u l l s rather than assuming i t to be a
constant f u n c t i o n of t o t a l k i l l . In t h i s regard the a n a l y s i s
of Smith and Polacheck i s s u p e r i o r to that of Chapman.
The major weakness of the Smith and Polacheck procedure
a r i s e s from d i f f i c u l t i e s i n a c c u r a t e l y p a r a m e t e r i z i n g subadult
and a d u l t s u r v i v a l r a t e s . T h i s may be why no f i r m estimates
have been p u b l i s h e d f o r t h i s e s timator. Instead these authors
have r e s t r i c t e d themselves to producing a lower j u v e n i l e
s u r v i v a l bound determined by d i v i d i n g t o t a l year c l a s s k i l l by
pups born (Smith and Polacheck, 1981).
The a l g e b r a i c manipulations of the Lander procedure
complicate a simple a n a l y t i c e v a l u a t i o n ; t h e r e f o r e , I conducted
a numerical a n a l y s i s using s i m u l a t i o n models. The technique
was to c o n s t r u c t h y p o t h e t i c a l populations with known s u r v i v a l
and e x p l o i t a t i o n r a t e s . The simulated numbers at b i r t h and
subsequent male k i l l were used to p r e d i c t the j u v e n i l e and
subadult s u r v i v a l r a t e s of the simulated p o p u l a t i o n .
A l l s i m u l a t i o n runs used a constant pup p r o d u c t i o n of
100,000 males and 100 d i f f e r e n t combinations of j u v e n i l e
(S*=0.1,0.2,...1.0) and subadult (S=0.1,0.2,...1.0) s u r v i v a l
r a t e s . The runs d i f f e r e d by v a r i o u s age s p e c i f i c e x p l o i t a t i o n
rates ( U i ; i=2,3,..,5) some of which are shown i n Table B-4.
Here for example U =0.70 means a harvest of 70 percent of 3 year 3
o l d males.
Table B-4. Some h y p o t h e t i c a l e x p l o i t a t i o n r a t e s used i n the the s i m u l a t i o n model developed to t e s t the Lander estimator of j u v e n i l e s u r v i v a l .
Age Simulation Run # E x p l o i t e d A B C D
2 0.05 0.05 0.05 0.05 3 0.70 0.70 0.70 0.50 4 0.40 0.50 0.90 0.70 5 0.20 0.20 0.20 0.20
99
A t y p i c a l s i m u l a t i o n e x h i b i t i n g the behaviour of the Lander
estimator i n c o r p o r a t e d e x p l o i t a t i o n rates of 0.05, 0.50, 0.70,
0.20 (run #D, Table B-4). These were the same values used by
Lander (1975) to i l l u s t r a t e the small bias in c a l c u l a t i n g S* and
S. E r r o r in model p r e d i c t i o n was recorded as percent
d i f f e r e n c e between estimate and a c t u a l j u v e n i l e s u r v i v a l r a t e s
( [ a c t u a l - e s t i m a t e ] / a c t u a l * 1 0 0 % ) and g r a p h i c a l l y represented by
10 percent e r r o r i s o c l i n e s (Figure B-1).
The zero e r r o r i s o c l i n e i n d i c a t e s unique combinations of S
and S* which when a s s o c i a t e d with a given set of e x p l o i t a t i o n
r a t e s , produce an estimate of-S* c o n t a i n i n g no e r r o r . For any
given set of s u r v i v a l r a t e s the Lander estimate s e l e c t s
parameter estimates from t h i s f i x e d l i n e . T h i s i s i l l u s t r a t e d
by v e c t o r s (Figure B-2) i n d i c a t i n g the true p o p u l a t i o n
parameters and t h e i r corresponding estimates (arrow head).
There i s a unique l i n e of estimates corresponding to any given
set of t e s t e d e x p l o i t a t i o n r a t e s , U -U . 2 5
The Lander estimator, performs w e l l only f o r some
combinations of e x p l o i t a t i o n and po p u l a t i o n v i t a l r a t e s .
Whether the method w i l l produce accurate estimates of the
P r i b i l o f I s l a n d f u r s e a l v i t a l r a t e s depends upon the
r e l a t i o n s h i p between s u r v i v a l and e x p l o i t a t i o n . A p o p u l a t i o n
e x p e r i e n c i n g given r a t e s of S* and S would have to be e x p l o i t e d
at p r e c i s e age s p e c i f i c r a t e s i n order f o r the e s t i m a t i o n
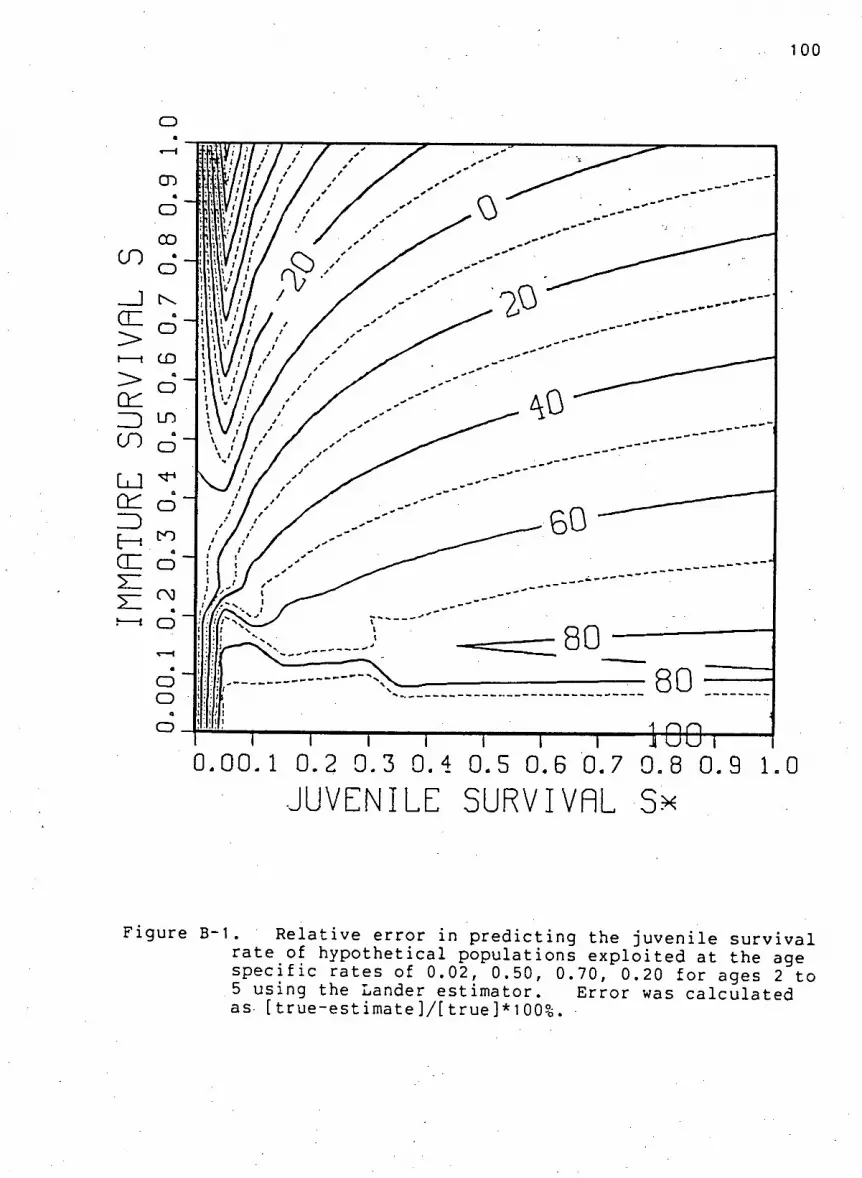
100
R e l a t i v e e r r o r i n p r e d i c t i n g the j u v e n i l e s u r v i v a l r a t e of h y p o t h e t i c a l populations e x p l o i t e d at the age s p e c i f i c r a t e s of 0.02, 0.50, 0.70, 0.20 for ages 2 to 5 using the Lander estimator. E r r o r was c a l c u l a t e d as [ t r u e - e s t i m a t e ] / [ t r u e ] * ! 0 0 % .
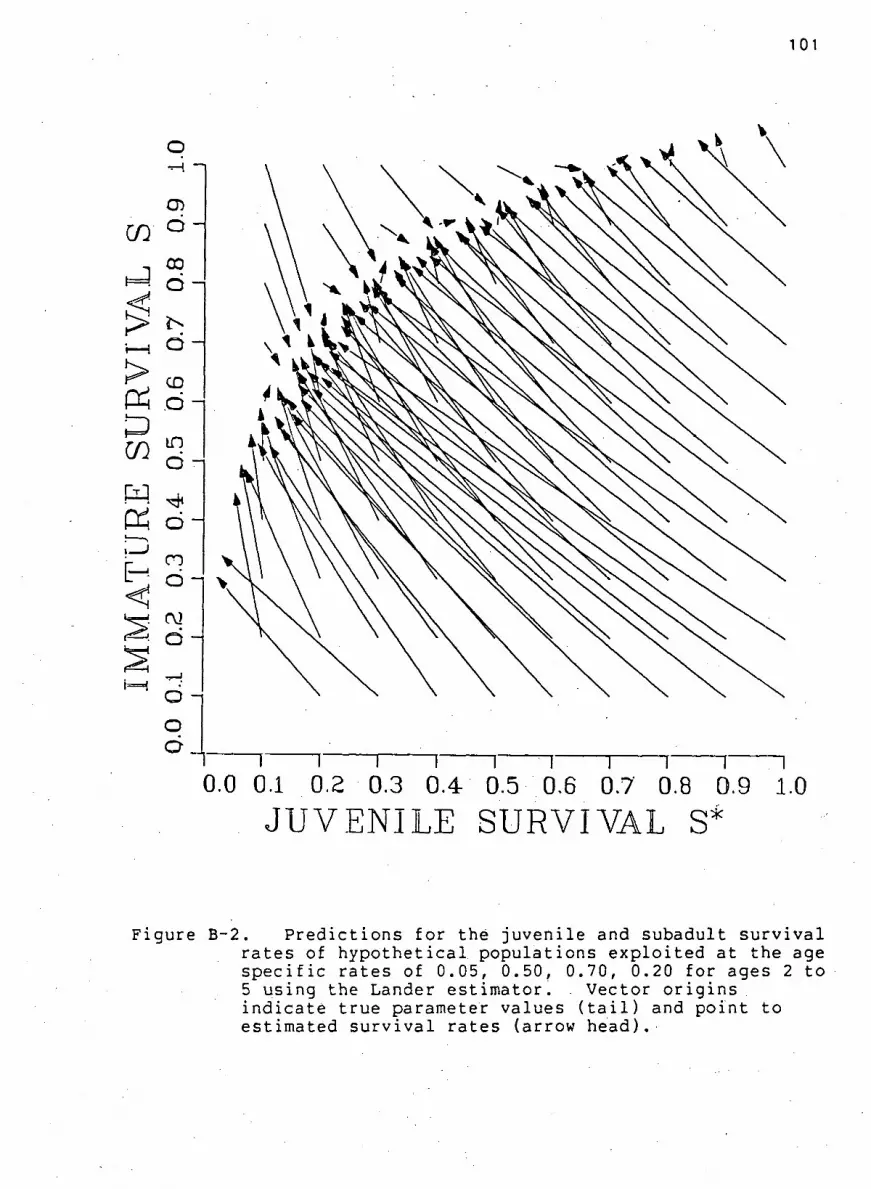
101
Figure B-2. P r e d i c t i o n s f o r the j u v e n i l e and subadult s u r v i v a l r a t e s of h y p o t h e t i c a l populations e x p l o i t e d at the age s p e c i f i c rates of 0.05, 0.50, 0.70, 0.20 for ages 2 to 5 using the Lander estimator. . Vector o r i g i n s i n d i c a t e true parameter values ( t a i l ) and p o i n t to estimated s u r v i v a l rates (arrow head).
102
technique to produce zero e r r o r . U n f o r t u n a t e l y a l l zero
i s o c l i n e s examined i n ' t h i s a n a l y s i s suggest no obvious
dependence between these two f a c t o r s , thereby p u t t i n g the
v a l i d i t y of the es t i m a t i o n procedure i n t o q u e s t i o n .
Examination of the upper and lower estimate bounds c a s t s
f u r t h e r doubt upon the v a l i d i t y of the Lander procedure.
P r e d i c t i o n s of the lower subadult s u r v i v a l bound exceed the
upper l i m i t for populations e x p e r i e n c i n g j u v e n i l e r a t e s i n
excess of 0.60 (Figure B-3). This i n c o n s i s t e n c y a r i s e s from
the i n c o r r e c t manipulation of upper and lower s u r v i v a l bounds as
a l g e b r a i c symbols i n equation B—11. The e r r o r i s analagous to
assuming a>b, then erroneously p e r m i t t i n g -a>-b. The same
equation i s r e s p o n s i b l e f o r the q u a d r a t i c shape of the lower
bound and u l t i m a t e l y the l i n e of best e s t i m a t e s .
' I conclude from t h i s study that the Lander procedure does
not estimate j u v e n i l e s u r v i v a l but rather s e l e c t s parameter
values from a l i n e determined by unique s e t s of e x p l o i t a t i o n
r a t e s . I t i s important to recognize that the area bounded by
reasonable upper and lower s u r v i v a l estimates i s q u i t e
r e s t r i c t i v e . Within t h i s region the Lander estimator g e n e r a l l y
p r e d i c t s high s u r v i v a l a s s o c i a t e d with a l a r g e k i l l and low
s u r v i v a l for small h a r v e s t s . It i s thus p o s s i b l e f o r the k i l l
schedule to produce s u r v i v a l estimates from the Lander procedure
which appear to be " i n the r i g h t b a l l park", d e s p i t e the e r r o r
in c a l c u l a t i n g subadult s u r v i v a l r a t e s and the i n c o r r e c t use of

103
O
1 i n i 1 n r 1 — — I — : — i 1
0.0 0.1 0.2 0.3 0.4 0.5 0.6 0.7 0.8 0.9 1.0
J U V E N I L E S U R V I V A L S*
F i g u r e B-3. Upper and lower estimates for the j u v e n i l e and subadult s u r v i v a l r a t e s of h y p o t h e t i c a l populations e x p l o i t e d at the age s p e c i f i c rates of 0.05, 0.50, 0.70, 0.20 for ages 2 to 5 using the Lander estimator. Vector o r i g i n s i n d i c a t e true parameter values ( t a i l ) and point to estimated s u r v i v a l rates (arrow head). A l l upper estimates f a l l on the l i n e [ s * , 1 . 0 ] .
104
parameter bounds.
In summary, the p u b l i s h e d estimates of j u v e n i l e s u r v i v a l
contained in Table B-3 are inaccurate and do not adequately
represent the Saint Paul fur s e a l p o p u l a t i o n . The Chapman
estimates which have s i n c e been used by Eberhardt (1981) must be
d i s c a r d e d . The estimates of Smith and Polacheck represent
minimal values which should be r e f i n e d . The Lander method
contains some l o g i c a l e r r o r s .
B.3_ Revised Methods of E s t i m a t i n g J u v e n i l e S u r v i v a l
Improved estimates of j u v e n i l e s u r v i v a l can be obtained by
modifying v a r i o u s components of the p r e v i o u s l y d i s c u s s e d
e s t i m a t o r s . The process of b u i l d i n g a new estimator begins by
e s t a b l i s h i n g sound upper and lower j u v e n i l e s u r v i v a l bounds.
The range of estimates may be r e f i n e d by i n t r o d u c i n g v a r i o u s
assumptions with regard to the k i l l process and dynamics of the
fur s e a l p o p u l a t i o n .
The s u r v i v a l of j u v e n i l e s (S*) i s determined over the f i r s t
two years of l i f e . Upper and lower j u v e n i l e s u r v i v a l bounds
are determined from the numbers of subadult males k i l l e d .
Using the method of Lander (1975,1979) maximal and minimal
numbers of s e a l s at age 2 are estimated through back

105
c a l c u l a t i o n s . The lower l i m i t assumes no s e a l s escaped the
harvest while the upper l i m i t i s c o n s t r a i n e d by the assumption
that at l e a s t 50% of the 4 year o l d males are k i l l e d under
present management p o l i c i e s (Lander, 1975). Thus
-1 -2 -3 S* ={K + K S + K S + K S } / N 0 (B-15)
L0,2 2 3 4 5
and
-1 -2 S* = {K + K S + 2K S } / NO . (B-16)
v0,2 2 3 4
The exact range of j u v e n i l e s u r v i v a l estimates depends upon
the assumptions invoked to account for the subadult r a t e s (S).
The s a f e s t lower l i m i t i s obtained by assuming that maximal
subadult s u r v i v a l occurred (S=1.0). A reasonable upper bound
may be based upon the assumption that annual s u r v i v a l from b i r t h
to age 2 i s l e s s than f o r subsequent ages. Thus the k i l l data
would i n d i c a t e high j u v e n i l e s u r v i v a l i f S= ^ S* . Equations
B-15 and B-16 are r e w r i t t e n to r e f l e c t these assumptions such
that
S* = {K + K + K + K.} / NO (B-17) 0,2 2 3 4 5
and
-0.5 -1 S* = {K + K S* + 2K S* } / NO . (B-18)
U 0 , 2 2 3 4
The j u v e n i l e s u r v i v a l bounds can be t i g h t e n e d c o n s i d e r a b l y
106
i f more p r e c i s e subadult s u r v i v a l estimates were used. Fur
s e a l l i f e t a b l e s i n d i c a t e annual*male s u r v i v a l over the ages 2
to 6 i s r e l a t i v e l y constant at 0.80 (Lander 1980). T h i s v a l u e
can be s u b s t i t u t e d i n t o equations B-15 and B-16.
A second way of improving the lower bounded estimate of
j u v e n i l e s u r v i v a l i s to include i n f o r m a t i o n on the abundance of
harem and i d l e b u l l s i n the c a l c u l a t i o n s f o r numbers of two year
o l d s . The Lander l i f e t a b l e s i n d i c a t e that males become b u l l s
at about age 7 (based upon average male weight per age) and t h a t
the p r o p o r t i o n of t o t a l b u l l s s u r v i v i n g from one year to the
next i s 0.74. Thus the lower estimate of j u v e n i l e s u r v i v a l may
be w r i t t e n f o r year c l a s s t as
-1 -2 -3 -5 S* = {K + K S + K S + K S + B u l l s S } / NO (B-19)
L0,2 2 3 4 5
where
B u l l s = (Harem + I d l e ) - 0.74 (Harem + I d l e ) . (B-20) t t t-1 t-1
B.4 Revised Estimates of J u v e n i l e S u r v i v a l
Three s e t s of j u v e n i l e s u r v i v a l estimates are produced by
p r o g r e s s i v e l y r e f i n i n g the assumptions concerning subadult
s u r v i v a l and the i n c l u s i o n of b u l l counts. Each i s obtained
using the pup estimates and k i l l data of Table B-1. The range
of the o r i g i n a l l i m i t s (equations B-15 and B-16) p l o t t e d i n
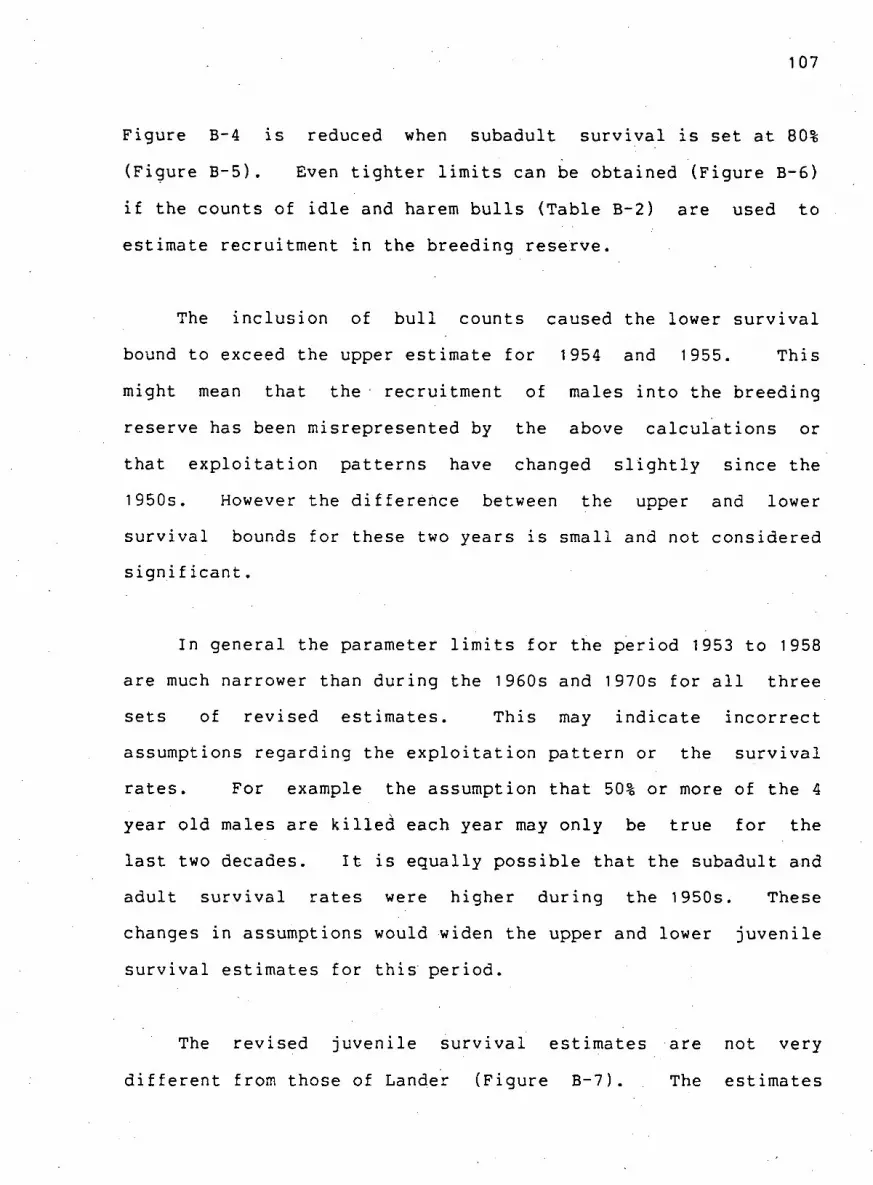
107
Figure B-4 i s reduced when subadult s u r v i v a l i s set at 80%
(Figure B-5). Even t i g h t e r l i m i t s can be obtained (Figure B-6)
i f the counts of i d l e and harem b u l l s (Table B-2) are used to
estimate recruitment i n the breeding r e s e r v e .
The i n c l u s i o n of b u l l counts caused the lower s u r v i v a l
bound to exceed the upper estimate f o r 1954 and 1955. T h i s
might mean that the recruitment of males i n t o the breeding
reserve has been misrepresented by the above c a l c u l a t i o n s or
that e x p l o i t a t i o n p a t t e r n s have changed s l i g h t l y s i n c e the
1950s. However the d i f f e r e n c e between the upper and lower
s u r v i v a l bounds for these two years i s small and not c o n s i d e r e d
s i g n i f i c a n t .
In general the parameter l i m i t s f o r the p e r i o d 1953 to 1958
are much narrower than during the 1960s and 1970s for a l l three
sets of r e v i s e d estimates. T h i s may i n d i c a t e i n c o r r e c t
assumptions regarding the e x p l o i t a t i o n p a t t e r n or the s u r v i v a l
r a t e s . For example the assumption that 50% or more of the 4
year o l d males are k i l l e d each year may only be true f o r the
l a s t two decades. I t i s e q u a l l y p o s s i b l e that the subadult and
adul t s u r v i v a l r a t e s were higher during the 1950s. These
changes in assumptions would widen the upper and lower j u v e n i l e
s u r v i v a l estimates for t h i s p e r i o d .
The r e v i s e d j u v e n i l e s u r v i v a l estimates are not very
d i f f e r e n t from those of Lander (Figure B-7). The estimates
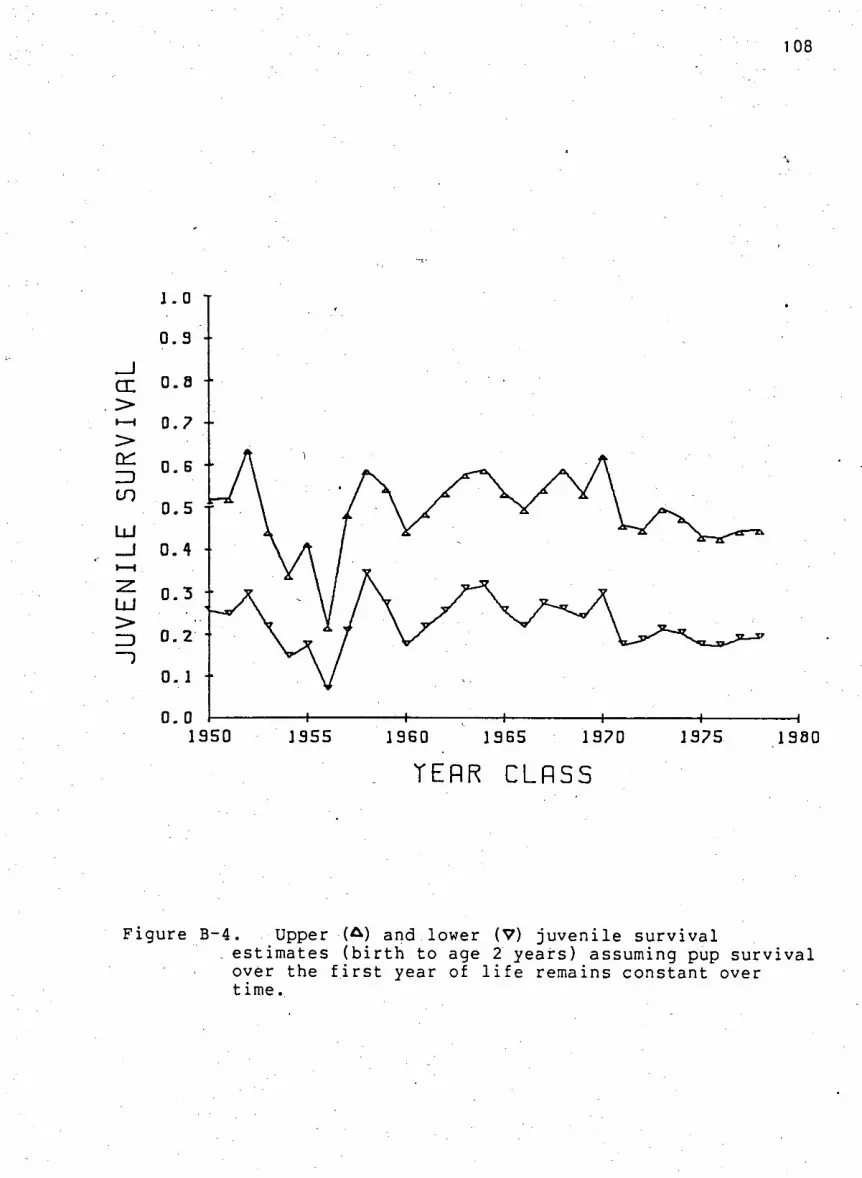
108
Figure B-4. .-Upper -(A) and lower (V) j u v e n i l e s u r v i v a l . estimates ( b i r t h to age 2 years) assuming pup s u r v i v a l over the f i r s t year of l i f e remains constant over time.

109
F i g u r e B-5. Upper (A) and lower ( V ) j u v e n i l e s u r v i v a l estimates ( b i r t h to age 2 years) assuming the annual s u r v i v a l of subadult males i s 80%.

1 10
Figure B-6. Upper (A) and lower {V) j u v e n i l e s u r v i v a l estimates ( b i r t h to age 2 years) assuming that the annual s u r v i v a l of subadult males i s 80% and that changing b u l l counts are r e p r e s e n t a t i v e of year c l a s s s t r e ngth. Males were assumed to become b u l l s at age 7 and experience an annual s u r v i v a l rate of 0.74.

111
d e r i v e d from the b u l l counts exceed the Lander estimates by a
f a c t o r of 1.1 and vary f o r only a few years. The c o n s i s t e n c y
of the Lander estimates i s i n t r i g u i n g , c o n s i d e r i n g the
shortcomings of the method. The s i m i l a r i t y i n r e s u l t s can be
explained by the v a r i a t i o n i n the magnitude of the k i l l . The
r a t i o of t o t a l k i l l to pups born e x h i b i t s the same trends as the
Lander estimates.
It i s i n e v i t a b l e that s u r v i v a l w i l l be c l o s e to or
p r o p o r t i o n a l to the r a t i o of k i l l to pups born i f k i l l m o r t a l i t y
i s l a r g e compared t o n a t u r a l m o r t a l i t y . T h i s enables the
Lander procedure to produce estimates which are p r o p o r t i o n a l l y
c o r r e c t d e s p i t e the l o g i c a l e r r o r s inherent i n the method. The
f a c t that the Lander estimates appear to be reasonable does not
v a l i d a t e the procedure.
The r e v i s e d methods of e s t i m a t i o n show that the s u r v i v a l of
j u v e n i l e males i s a c t u a l l y higher than has been acknowledged i n
the past. T h i s has bearing upon the s u r v i v a l of j u v e n i l e
females which has been p r e v i o u s l y assumed to exceed that of
males by a constant f a c t o r ranging from 1.05 to 1.10 (Chapman
1961,1964,1973; York and H a r t l e y , 1981; Eberhardt, 1981).
Higher male s u r v i v a l estimates mean that the fur s e a l l i f e t a b l e
can be balanced by assuming that males and females experience
r e l a t i v e l y s i m i l a r r a t e s of j u v e n i l e s u r v i v a l . It i s c e r t a i n l y
not unreasonable to expect that j u v e n i l e males and females are
subject to s i m i l a r s o r t s of m o r t a l i t y .
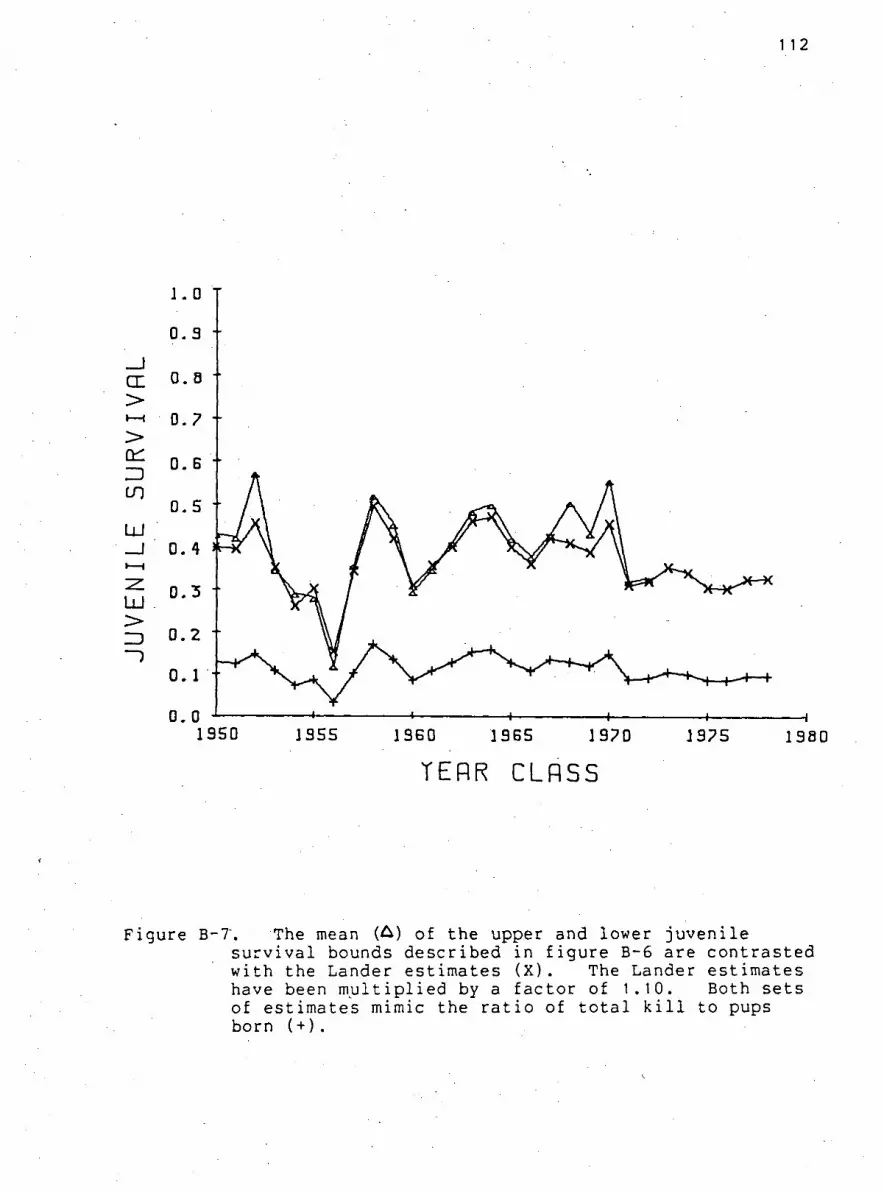
1 12
1950 1355 19G0 1365 1970 1375 1980
TERR CLRSS
Figure B-7. The mean (A) of the upper and lower j u v e n i l e s u r v i v a l bounds des c r i b e d in f i g u r e B-6 are c o n t r a s t e d with the Lander estimates (X). The Lander estimates have been m u l t i p l i e d by a f a c t o r of 1.10. Both sets of estimates mimic the r a t i o of t o t a l k i l l to pups born (+).

113
Table B-5 c o n t a i n s estimates of pup land s u r v i v a l (0-4
months) and t o t a l j u v e n i l e s u r v i v a l (0-24 months). Pup
s u r v i v a l was determined by d i v i d i n g the d i f f e r e n c e between pup
production and the number of dead pups, by the number of pups
born. Three sets of t o t a l j u v e n i l e s u r v i v a l are presented.
Each corresponds to the mean of the upper and lower s u r v i v a l
bounds of F i g u r e s B-4, B-5 and B-6. The estimates are r e f i n e d
as more information about the male component of the herd i s
i n c o r p o r a t e d i n t o the e s t i m a t i o n procedure.
The major weakness of the methods for e s t i m a t i n g j u v e n i l e
s u r v i v a l l i e s in the many years of data r e q u i r e d to - r e c o n s t r u c t
the h i s t o r i c a l p o p u l a t i o n . Future e f f o r t s should be d i r e c t e d
toward an a l t e r n a t i v e and more immediate means of e s t i m a t i n g
j u v e n i l e s u r v i v a l . Monitoring sources of j u v e n i l e m o r t a l i t i y
(net d e b r i s , weather c o n d i t i o n s ) and examining the dynamics of
other species that share the same ecosystem (sea b i r d s ) may
i n d i c a t e annual s u r v i v a l r a t e s . These p o s s i b i l i t i e s should be
i n v e s t i g a t e d c o n s i d e r i n g the importance of j u v e n i l e s u r v i v a l to
ensuing fur s e a l p o p u l a t i o n demographies.

114
Table B-5. Revised estimates of j u v e n i l e fur s e a l s u r v i v a l f o r Saint Paul I s l a n d . Land s u r v i v a l (0-4 months) i s determined by d i v i d i n g the d i f f e r e n c e between pups born and dead pups counted by the t o t a l number of pups born. T o t a l s u r v i v a l (0-24 months) are mean values f o r the l i m i t s produced by r e f i n i n g assumptions concerning subadult s u r v i v a l and the i n c l u s i o n of b u l l counts (see text for d e t a i l s ) .
Year 0-4 0-24 Months Class Months #1 #2 '•' #3
1950 0.882 0.386 0.390 0.431 1 951 0.842 0.382 0.390 0.424 1952 0.907 0.465 0.523 0.572 1953 0.824 0.329 0.313 0.347* 1954 0.786 0.242 0.204 0.256 1955 0.836 0.293 0.263 0.291* 1956 0.782 0.141 0.094 0.120* 1957 0.853 0.343 0.332 0.359 1958 0.919 0.464 0.503 0.521 1959 0.881 0.407 0.423 0.454 1960 0.804 0.308 0.284 0.297 1961 0.831 0.350 0.343 0.349 1962 0.837 0.393 0.405 0.414 1963 0.876 0.441 0.475 0.487 1964 0.924 0.452 0.489 0.502 1965 0.846 0.393 0.402 0.424 1966 0.928 0.355 0.350 0.380 1967 0.952 0.407 0.425 0.434 1968 0.892 0.423 0.456 0.507 1969 0.943 0.385 0.395 0.436 1970 0.911 0.459 0.513 0.558 1971 0.848 0.316 0.294 0.322 1972 0.916 0.316 0.294 0.329 1973 0.909 0.354 0.347 1974 0.951 0.337 0.323 1975 0.926 0.301 0.275 1976 0.921 0.298 0.271 1977 0.940 0.317 0.295 1978 0.967 v 0.319 0.298 1979 0.974
#1 S= > IT*" (equations B-15 and B-16) #2 S=0.80 #3 S=0.80; include b u l l counts with Sa=0.74 and age
of maturity 7 years
* lower bound exceeded upper l i m i t .
115
APPENDIX C MODEL VALIDATION BY SENSITIVITY ANALYSIS
The purpose of t h i s s e c t i o n i s to e l u c i d a t e the s e n s i t i v i t y
a n a l y s i s procedures developed and used by M i l l e r (1974), M i l l e r
et a l . (1976), and Mohn (1978). The methods of r e l a t i v e
s e n s i t i v i t i e s and model v a l i d a t i o n have been a p p l i e d i n Chapter
6. In the case of model v a l i d a t i o n , I have t r i e d to improve
the c r i t e r i o n used to accept or r e j e c t a model. The d e t a i l e d
o u t l i n e of methodology i s u s e f u l to those who wish to apply the
technique of s e n s i t v i t y a n a l y s i s .
C.J_ R e l a t i v e S e n s i t i v i t i e s
S e n s i t i v i t y a n a l y s i s determines the responsiveness of model
output to changes or e r r o r s i n i n i t i a l c o n d i t i o n s and input
parameters (Majkowski 1981; M i l l e r 1974; M i l l e r et a l . 1976).
T h i s technique i s a p p l i e d to the set of parameter estimates P*
(i=1..m) which produces the best f i t of s i m u l a t i o n output x£ to
observed data. - Each of the m parameters i s a l t e r e d by a
p r o p o r t i o n a l change Ui such that
P-i = Pt (1 + Ui) . (C-1 )
The a l t e r e d input parameters P; (i=1..m) determine perturbed
model output X^ over time t . A f u n c t i o n D measures the
deviance between perturbed X^ and unperturbed X^ v a l u e s .
116
Dt = (C-2)
T h i s p a r t i c u l a r f u n c t i o n or D-measure s e l e c t e d from Majkowski
(1982) has the property of d i s a p p e a r i n g when a l l equal zero
c a l c u l a t e d f o r any parameter i at any given time t . A l l o w i n g
Ui to vary fo r each parameter independently and then p l o t t i n g
i t s value against the r e s u l t i n g D t provides a u s e f u l p i c t u r e of
the r e l a t i v e s e n s i t i v i t y of model output to changes i n i n p u t .
The r e l a t i v e s e n s i t i v i t y a n a l y s i s r e v e a l s the r e l a t i v e
importance of v a r y i n g input parameter " e r r o r s " and i n i t i a l
c o n d i t i o n s i n terms of t h e i r e f f e c t upon model p r e d i c t i o n s .
T h i s information i s of l i m i t e d value unless a c t u a l e r r o r s are
known. Even then the combined e f f e c t of i n t r o d u c i n g such e r r o r
i n t o a l l parameters simultaneously i s not p r e d i c t a b l e . Thus a
methodology i s r e q u i r e d which combines known parameter e r r o r
with model s t r u c t u r e and allows an. e v a l u a t i o n of the r e l i a b i l i t y
or v a l i d i t y of model p r e d i c t i o n s .
and s i m p l i f i e s c a l c u l a t i o n s . P a r t i a l deviances D t j may be
C.2 Numerical Model V a l i d a t i o n
U n c e r t a i n t i e s i n model output can be determined from
estimated input e r r o r s . Depending upon the amount of output
u n c e r t a i n t y the s i m u l a t i o n model may be e i t h e r v a l i d or i n v a l i d .

117
A numerical approach to making such a d e c i s i o n begins by
choosing model input parameters from d i s t r i b u t i o n s corresponding
to known d i s t r i b u t i o n of input e r r o r s . Running these v a l u e s
simultaneously in the model produces output which i s compared to
unperturbed output using the D-measure. Conducting numerous
Monte C a r l o s i m u l a t i o n runs produces a d i s t r i b u t i o n of deviances
with mean zero and a s s o c i a t e d v a r i a n c e which must be l e s s than a
predetermined l e v e l i f the model i s to be con s i d e r e d v a l i d . In
other words, model output must not be c r i t i c a l l y a f f e c t e d by the
i n c l u s i o n of r e a l i s t i c input e r r o r s .
Numerical model v a l i d a t i o n i s c o s t l y i n terms of computer
time and provides l i t t l e i n f ormation concerning the c o n t r i b u t i o n
of input u n c e r t a i n t i e s to e r r o r s i n model p r e d i c t i o n . These
problems are overcome i f the d i s t r i b u t i o n of deviance i s
c a l c u l a t e d a n a l y t i c a l l y .
C._3 A n a l y t i c a l Model V a l i d a t i o n
C._3.J_ Determining Dt
A n a l y t i c model v a l i d a t i o n has been, formulated by M i l l e r
(1974) and M i l l e r et a l (1976); and a p p l i e d by Mohn (1979).
T h e i r approach i s to a n a l y t i c a l l y determine the d i s t r i b u t i o n of
deviances f o r estimated input parameter e r r o r s . They begin by
c o n s i d e r i n g the measure of deviance D^ as a l i n e a r f u n c t i o n of
the r e l a t i v e s e n s i t i v i t y c o e f f i c i e n t R B . and i n d i v i d u a l

118
parameter percent changes U\, where
m o D + = D£ +5T R D u L (C-3)
i=1 t , i
and
R N = (C-4) t , i am .
EquationC-4 i s replaced with a numerical approximation f o r the
d e r i v a t i v e ( f i r s t term of the T a y l o r expansion) should the
s i m u l a t i o n model c o n t a i n no e a s i l y d i f f e r e n t i a t e d a n a l y t i c
e x p ression. From t h i s i t f o l l o w s that
R D = (C-5) t , i U\
or
R D = (C-6) t , i U C
s i n c e Dx_ was chosen to equal zero. S u b s t i t u t i n g equation C-6
i n t o C-3 y i e l d s
m D - t ; Dx = Dj + £ — - - U; (C-7)
i = 1 Ui or
m = E Dt.i (C-8)
i= 1

119
Summing the e f f e c t of i n d i v i d u a l parameter e r r o r s upon
model output as shown i n equation C-8 i s a. simple means of
determining the deviance. In order to sum input
parameters must act upon the output v a r i a b l e i n an independent
manner. Independence can be v a r i f i e d by comparing two
c a l c u l a t e d values obtained by summing i n d i v i d u a l
p e r t u r b a t i o n s and i n c l u d i n g a l l parameter e r r o r s simultaneously
in the s i m u l a t i o n model.
A drawback to equation C-8 i s the amount of computing time
s t i l l r e q u i r e d to determine the d i s t r i b u t i o n of a c c o r d i n g to
known parameter e r r o r s . An a l t e r n a t i v e c a l c u l a t i o n of D - .
depends upon a l i n e a r r e l a t i o n s h i p between input e r r o r and
p r e d i c t e d output.
and hence D. may be p r e d i c t e d for any given U; based
upon a l i n e a r r e l a t i o n s h i p between parameter percent e r r o r and
the measure of output deviance. Model output can be p r e d i c t e d
for any given U\ by simply m u l t i p l y i n g t h i s value with
determined at U^=1%. Rewriting equation C-7 as
m D t = £ {U-v * R D . (Ui = .01 )} (C-9)
i = 1 t,(-
a l s o means the r e l a t i v e importance of parameter c o n t r i b u t i o n s to
o v e r a l l model e r r o r can be e a s i l y i d e n t i f i e d .
The extent of l i n e a r i t y w i t h i n i n d i v i d u a l model parameters
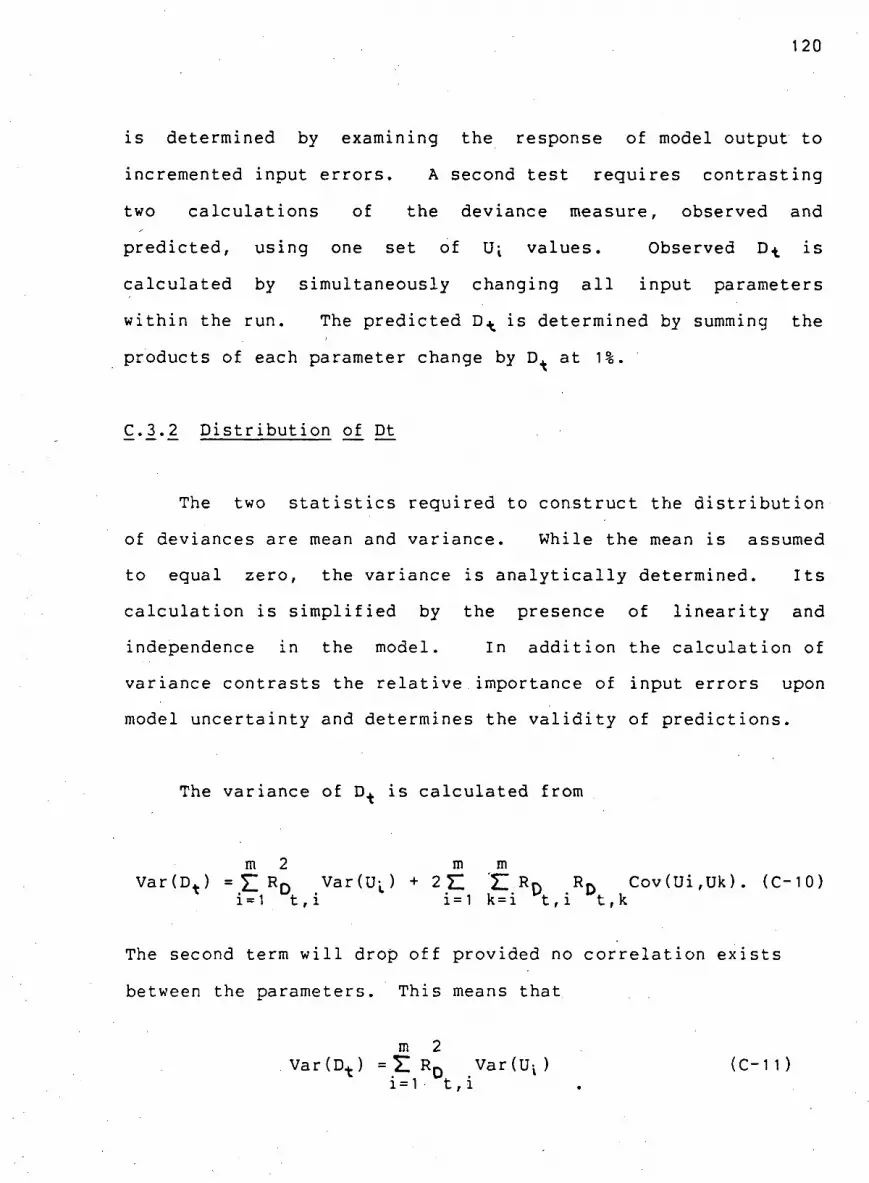
120
i s determined by examining the response of model output to
incremented input e r r o r s . A second t e s t r e q u i r e s c o n t r a s t i n g
two c a l c u l a t i o n s of the deviance measure, observed and
p r e d i c t e d , using one set of Ui v a l u e s . Observed i s
c a l c u l a t e d by simultaneously changing a l l input parameters
w i t h i n the run. The p r e d i c t e d i s determined by summing the
products of each parameter change by at 1%.
C.3.2 D i s t r i b u t i o n of Dt
The two s t a t i s t i c s r e q u i r e d to c o n s t r u c t the d i s t r i b u t i o n
of deviances are mean and v a r i a n c e . While the mean i s assumed
to equal zero, the varia n c e i s a n a l y t i c a l l y determined. I t s
c a l c u l a t i o n i s s i m p l i f i e d by the presence of l i n e a r i t y and
independence in the model. In a d d i t i o n the c a l c u l a t i o n of
varian c e c o n t r a s t s the r e l a t i v e importance of input e r r o r s upon
model u n c e r t a i n t y and determines the v a l i d i t y of p r e d i c t i o n s .
The v a r i a n c e of D^ i s c a l c u l a t e d from
m 2 m m Var(D t) = E R D Var(U- L) + 2E I R D R D Cov(Ui,Uk). (C-10)
i=1 t , i i=1 k=i t , i t,k
The second term w i l l drop o f f provided no c o r r e l a t i o n e x i s t s
between the parameters. T h i s means that
m 2 Var (D t) = l R D Var (U-V )
i=1 t , i (C-11)
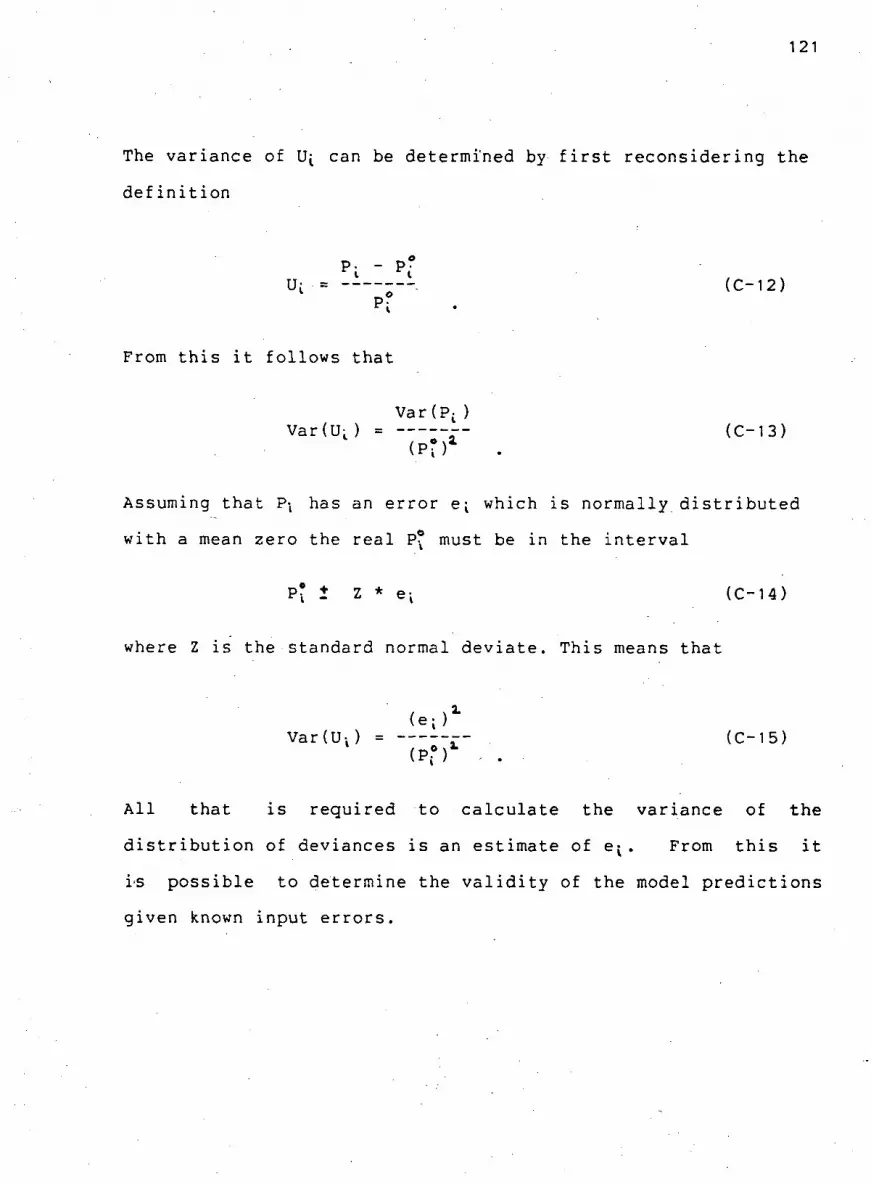
121
The varia n c e of u\ can be determined by f i r s t r e c o n s i d e r i n g the
d e f i n i t i o n
p. - pf U = (C-12)
p?
From t h i s i t f o l l o w s that
Var (p. ) Var(U^) = (C-13)
( P D 4
Assuming that P\ has an e r r o r e^ which i s n o r m a l l y . d i s t r i b u t e d
with a mean zero the r e a l P° must be in the i n t e r v a l
P? ± Z * eK (C-14)
where Z i s the standard normal d e v i a t e . T h i s means that
<e ;> 1
Var(U v) = (C-15) ( P i ° ) •
A l l that i s r e q u i r e d to c a l c u l a t e the varia n c e of the
d i s t r i b u t i o n of deviances i s an estimate of e^. From t h i s i t
i'S p o s s i b l e to determine the v a l i d i t y of the model p r e d i c t i o n s
given known input e r r o r s .

122
C._3..3 V a l i d a t i o n
The u n c e r t a i n t i e s i n s i m u l a t i o n model output are q u a n t i f i e d
by the mean and va r i a n c e of D^. T h i s d i s t r i b u t i o n of output
e r r o r s i s c o n t r a s t e d with a p r e v i o u s l y d e f i n e d i n t e r v a l of
a c c e p t a b i l i t y w i t h i n which the model i s co n s i d e r e d v a l i d .
D i f f e r e n t approaches can be taken to d e f i n e the c r i t i c a l
i n t e r v a l .
The common method of d e f i n i n g D^ c r i t i c a l , i s to ask
observers f a m i l i a r with the modelled system f o r t h e i r i n t u i t i v e
judgement ( M i l l e r , 1974; M i l l e r et a l , 1976). In t h i s case
observers are shown p l o t s of the base output superimposed upon
perturbed output, produced using d i f f e r e n t D^ v a l u e s . They are
asked i f they c o u l d d i s t i n g u i s h between the two; thereby
i d e n t i f y i n g the c r i t i c a l D t value. Mohn (1979) circumvents
t h i s procedure by f i r s t c a l c u l a t i n g the v a r i a n c e of D^, then
i n t u i t i v e l y d e c i d i n g unacceptable excessive l i m i t s would be
r e q u i r e d to v a l i d a t e the model. In both cases model v a l i d a t i o n
d e c i s i o n s are based upon i n t u i t i v e judgements which may not
r e f l e c t the r e a l system.
A second approach to model v a l i d a t i o n r e l i e s upon f i e l d
o b s e r v a t i o n e r r o r s rather than i n t u i t i v e judgements to c o n s t r u c t
acc e p t a b l e l i m i t s on model output e r r o r s . D i s t r i b u t i o n s of
output deviances exceeding f i e l d o bservation confidence l i m i t s
deem the s i m u l a t i o n model i n v a l i d . Confidence l i m i t s can be

123
placed upon the model p r e d i c t i o n s and c o n t r a s t e d with those of
expected output. In a d d i t i o n , c o e f f i c i e n t s of v a r i a t i o n may be
used to v i s u a l i z e the range over time where the model may be
considered v a l i d or i n v a l i d .


![FUR, fr. 18a [---]astoris: una lettura alternativa ?](https://img.dokumen.tips/doc/110x75/6362c1270bc31e3c170553bf/fur-fr-18a-astoris-una-lettura-alternativa-.jpg)


