Embed Size (px)
Citation preview

Seasonal oscillation in shore attendance andtransience of New Zealand fur sealsCorey J.A. Bradshaw, Chris Lalas, Lyndon Perriman, Robert G. Harcourt,Hugh Best, and Lloyd S. Davis
Abstract: The New Zealand fur seal (Arctocephalus forsteri) appears to show regular shore attendance in the form ofseasonal oscillations. This phenomenon should be quantified to properly interpret counts of fur seals >1 year old (i.e.,non-pups). Here we test the predictability of peaks in the annual shore-attendance oscillation on Otago Peninsula usingan autoregressive sine model and >2 years of intensive survey data. We predicted that the peak in fur seal numbersashore would lie between 14 January – 4 April (1996) and 8 January – 2 April (1997), although this low predictabilityis undesirable when attempts are made to monitor population trends. Estimating population size from counts of non-pups also requires knowledge of the rate of turnover of individuals. Therefore, we tested the hypothesis that taggedanimals from other colonies are immigrants to Otago Peninsula. With sightings on Otago Peninsula of fur seals taggedelsewhere in New Zealand, we used a Monte Carlo approach to simulate the expected frequency of single and multiplesightings of individuals. We found that the observed frequency of multiple sightings was significantly less thanpredicted by the model (P < 0.0001), indicating that tagged animals were transients. We also discovered that the sexratio of tagged animals varied with breeding colony of origin (G1 = 52.07,P < 0.0001), suggesting that the impetus foremigration differs among colonies. We concur with the view that counting pups is the only way to estimate the relativeabundance of New Zealand fur seals. In addition, we showed that counts of non-pups cannot be used to estimatepopulation size because an unknown proportion of individuals is transient. However, counting of pups does not addressthe issue of estimating relative abundance for locations with large numbers of nonbreeding individuals and few or nobreeders. With few or no pups it is impossible to estimate relative abundance using counts of pups.
Résumé: L’Otarie d’Australie (Arctocephalus forsteri) gagne régulièrement les côtes de Nouvelle-Zélande selon desoscillations saisonnières. Ce phénomène doit être quantifié pour permettre une interprétation juste du nombred’animaux >1 an (i.e. les non juvéniles) dans les rookeries. Nous examinons ici la possibilité de prédire les picsd’abondance dans l’oscillation annuelle sur la côte de la péninsule d’Otago au moyen d’un modèle autorégressif deforme sinusoïdale et de données d’un inventaire intensif d’une durée de plus de 2 ans. Nous avions fait la prédictionque l’abondance maximale du nombre d’otaries à terre se produirait entre le 14 janvier et le 4 avril 1996 et entre le 8janvier et le 2 avril 1997, mais la faible prédictibilité reliée à ces dates ne permet pas de statuer sur les tendances dela population. L’estimation de la population à partir du nombre d’individus de plus de 1 an requiert également deconnaître le taux de remplacement des individus dans la population. Pour cette raison, nous avons éprouvé l’hypothèseselon laquelle des animaux marqués d’autres colonies sont des immigrants dans la péninsule d’Otago. En nous servantdes données obtenues par observation d’otaries marquées ailleurs en Nouvelle-Zélande, nous avons utilisé une approcheMonte Carlo pour simuler la fréquence attendue de groupes ou d’individus isolés. Nous avons constaté que la fréquencedes groupes était significativement plus faible que ne le laissait croire le modèle (P < 0,0001), ce qui indique que lesotaries marquées étaient des animaux de passage. Nous avons également constaté que le rapport mâles : femelles chezles animaux marqués variait d’une colonie d’origine à l’autre (G1 = 52,07;P < 0,0001), ce qui signifie que l’impulsiond’émigrer varie d’une colonie à l’autre. Nous concluons que le dénombrement des jeunes est la seule façon d’évaluerl’abondance relative des Otaries d’Australie. De plus, nous démontrons que le dénombrement des adultes ne permet pasd’évaluer la taille de la population parce que les individus de passage constituent une proportion inconnue de lapopulation. Cependant, le dénombrement des jeunes <1 an ne permet pas d’évaluer l’abondance relative aux endroitsoù se retrouvent de nombreux individus non reproducteurs et où les reproducteurs sont absents ou peu nombreux. Siles jeunes sont peu nombreux ou absents, il devient impossible d’estimer l’abondance relative des otaries d’après leurnombre.
[Traduit par la Rédaction] Bradshaw et al. 823
Can. J. Zool.77: 814–823 (1999) © 1999 NRC Canada
814
Received August 11, 1998. Accepted January 28, 1999.
C.J.A. Bradshaw.1 University of Otago, Department of Zoology, P.O. Box 56, Dunedin, New Zealand.C. Lalas. Box 31, Portobello, Dunedin, New Zealand.L. Perriman. Department of Conservation, P.O. Box 5244, Dunedin, New Zealand.R.G. Harcourt. Macquarie University, Graduate School of the Environment, Sydney, NSW 2109, Australia.H. Best. Department of Conservation, Conservation Sciences Centre, P.O. Box 10420, Wellington, New Zealand.L.S. Davis. University of Otago, Department of Zoology, P.O. Box 56, Dunedin, New Zealand.
1Author to whom all correspondence should be addressed (e-mail: [email protected]).
J:\cjz\cjz77\cjz-05\Z99-033.vpWednesday, September 29, 1999 9:45:31 AM
Color profile: DisabledComposite Default screen

Introduction
New Zealand fur seals (Arctocephalus forsteri) are distrib-uted throughout New Zealand, southern Australia, and theAustralasian temperate and subantarctic islands (Crawley1990; Shaughnessy et al. 1994). Although no systematic sur-veys have been carried out over their entire range, fur sealsare increasing in number in the New Zealand region (Taylor1982, 1992, 1996; Lalas and Harcourt 1995; Taylor et al.1995), expanding northward, and spreading into parts oftheir prehistoric range (Dix 1993; Lalas and Harcourt 1995;Taylor et al. 1995).
At breeding colonies, adult male New Zealand fur sealsbegin to come ashore to defend territories as early as lateOctober (Stirling 1971a; Miller 1975a, 1975b; Goldsworthyand Shaughnessy 1994). Pregnant females begin to arriveand give birth in late November (Miller 1975a; Lalas andHarcourt 1995), and the median pupping date in New Zea-land varies from mid to late December (Miller 1971; Mattlin1978b; Lalas and Harcourt 1995). Most adult males vacatebreeding territories in mid-January (Miller 1975a; Crawleyand Wilson 1976), but pups remain ashore during the wean-ing period of approximately 7–10 months (Crawley and Wil-son 1976; Crawley 1990). During this time lactating femalesregularly alternate between feeding at sea and comingashore to suckle their pup (Crawley and Wilson 1976; Har-court et al. 1995). Outside of the breeding season, adultmales and prebreeders tend to move among various non-breeding colonies around New Zealand (Stirling 1970; Crawleyand Wilson 1976).
There have been recent attempts to quantify the distribu-tion, population trends, and dynamics of New Zealand furseals (Lalas and Harcourt 1995; Shaughnessy et al. 1995;Taylor et al. 1995; Taylor 1996; Carey 1998) because reli-able abundance estimates are needed in order to determinethe numerical and functional relationships between fur sealsand commercial fish stocks (Taylor et al. 1995). The diffi-culty with using total counts of pinnipeds ashore as an indexof abundance is that they are highly variable (Eberhardt etal. 1979; Wilson 1981; Thompson et al. 1997). Counts varyaccording to number of surveys, weather, sea conditions,visibility, terrain, time of day, season, and distance betweenthe observer and the colony (Stirling 1968; Crawley 1972,1990; Wilson 1981; Taylor et al. 1995). Counting pups ap-pears to be the most precise method of estimating relativeabundance (Chapman and Johnson 1968; Shaughnessy et al.1994, 1995; Lalas and Harcourt 1995; Taylor et al. 1995;Taylor 1996); however, fur seal abundance at nonbreedingcolonies cannot be estimating using this technique. Largepopulations of nonbreeding fur seals can be found where lit-tle or no breeding occurs (Taylor et al. 1995; Irvine et al.1997; Stamation et al. 1997).
The number of New Zealand fur seals hauled out at non-breeding colonies appears to oscillate seasonally (Stirling1970; Crawley 1990; Taylor 1992; Taylor et al. 1995), butthe characteristics of this oscillation appear to vary geo-graphically (Stirling 1968; Crawley and Wilson 1976; Wil-son 1981; Hawke 1991; Dix 1993; Taylor et al. 1995).Quantifying annual oscillations in order to identify seasonalpeaks in numbers ashore is necessary to allow annual andseasonal surveys of non-pups (individuals >1 year old) to be
properly interpreted (e.g., Taylor 1982, 1992, 1996; Carey1998).
Taylor et al. (1995) called for a “nation-wide census ofNew Zealand fur seals,” and Carey (1998) urged that furseals should continue to be monitored in order to understandfuture population trends. Even commercial fishers in NewZealand continue to demand precise population estimatesthrough counts (Anonymous 1997). To effectively countnon-pup fur seals in nonbreeding colonies around the NewZealand coastline requires detailed knowledge of the localshore attendance pattern over time, and the rate of turnoverof transient individuals (Taylor 1992). Individuals that breedat one colony may regularly attend another nonbreeding col-ony during the rest of the year to exploit local accumulationof prey species (Irvine et al. 1997). When animals are tran-sient, the potential for double-counting individuals that at-tend more than one colony during the year increases. Thisphenomenon could lead to upward biases in population esti-mates over time.
Using the first intensive survey data set for New Zealandfur seals at several breeding and nonbreeding colonies onOtago Peninsula, New Zealand (Fig. 1), we test whetherthere are oscillations in numbers ashore at nonbreeding colo-nies, and if so, whether there is a predictable annual peak.We determine the precision of estimating peak times bymodelling shore attendance during >2 years. We also deter-mine whether tagged individuals from other colonies aretransients or immigrants to Otago Peninsula by modellingthe likelihood of resighting known individuals. Our aim is totest whether annual censuses of non-pup fur seals are appro-priate for measuring relative abundance.
Methods
Aggregations of fur seals ashore are known as colonies. We ar-bitrarily define a breeding colony as one where more than 10 pupsare born each year. Colonies with <10 pups are defined as non-breeding colonies.
Study siteWe made all observations at four New Zealand fur seal colonies
situated at Taiaroa Head, Otago Peninsula, New Zealand (45°47′S,170°43′E; Fig. 1). Taiaroa Head is surrounded by rocky coastlineand cliffs and is used by both breeding and nonbreeding New Zea-land fur seals (Lalas and Harcourt 1995).
Intensive surveysFrom early March 1995 to early August 1997 we counted the
fur seals present at two nonbreeding colonies on the western sideof Taiaroa Head (Fig. 1). We also counted fur seals from two smallbreeding colonies on the eastern side of Taiaroa Head (Fig. 1). Wemade counts with binoculars from a 17 m long boat approximately20 m offshore from the colonies. The observer was about 5 mabove sea level when counting. We made all counts between 14:00and 16:30 approximately 2 or 3 times per week.
We classified seals up to 1 year old as pups, distinguishable bytheir relatively small size and dark pelage, obtuse snout, and dis-tinctive vocalisation (Shaughnessy et al. 1995), and other animalsas non-pups.
Tag identificationFrom early March 1995 until early August 1997 we identified
from the boat all animals marked with round Allflex® (Allflex
© 1999 NRC Canada
Bradshaw et al. 815
J:\cjz\cjz77\cjz-05\Z99-033.vpWednesday, September 29, 1999 9:45:33 AM
Color profile: DisabledComposite Default screen

New Zealand Ltd., Palmerston North) plastic “button” tags approx-imately 3 cm in diameter. The tags were attached to fur seal pupsfrom 4 breeding colonies (Open Bay Islands, Cape Foulwind,Wekakura Point, and Tonga Island) on the west and north coasts ofSouth Island, New Zealand, from 1991 to 1996 (Taylor et al. 1995;K. Barton, unpublished data; H. Best, unpublished data) (Fig. 1).Tag colour indicated colony of origin and the sex of the seal.When we spotted a tag and identified its colour, we went ashoreafter the census and attempted to identify the tagged individualwith a scope (Nikon 20×) to determine the identification numberwhen possible. Tags IDs consisted of four 8 mm high numericcharacters.
Analysis
Interpolation of missing survey datesBecause we could not always survey seals at regular intervals
throughout the study, we used a linear interpolation for days wherecounts were missing. Time-series analysis (see below) requirescounts at regular intervals, so we used every third day in the inter-
polated series to estimate model fit (i.e., approximating 2–3 countsper week). This maintained maximum degrees of freedom (i.e.,number of survey days) while avoiding pseudoreplication (i.e.,adding interpolated counts to the original data).
Time-series analysis of intensive surveysUpon inspection of a ln transformation of the intensive survey
data we found an oscillating pattern that resembled a sine wave. Ifwe assume that the number of seals ashore follows a regular oscil-lation, and that some stochastic process accounts for the variabilityin this cycle, then the following differential equation should ac-count for the observed pattern:
[1] & cos ( )x x i ax u= + +ω
where &x is the net rate of arrival on shore,x is the population size,cos (ωi) is an extrinsic oscillating term,ax is a first-order auto-regressive term, andu is a random error. The integral of this equa-tion provides a model to fit the oscillating pattern of the transformeddata (modified from Bulmer 1974):
© 1999 NRC Canada
816 Can. J. Zool. Vol. 77, 1999
Fig. 1. Study area (Taiaroa Head) and breeding colonies of origin for tagged fur seals sighted at Otago Peninsula.
J:\cjz\cjz77\cjz-05\Z99-033.vpWednesday, September 29, 1999 9:45:41 AM
Color profile: DisabledComposite Default screen

[2] x i rt k= + + +µ α πω εsin [ ( )]2
where xt is the natural logarithm of the number of seals countedashore,i is the day of the count,µ is the mean of the ln counts,αis the amplitude of the oscillation,ω−1 is the period of the oscilla-tion, ε is the phase lag, andrk is an autoregressive term of thekthorder. We estimated fiverk models (k = 1–5) of the form
[3] r a r a r a r uk k k n k n k= + + +− − −1 1 2 2 ...
wherean is the coefficient of thenth term, anduk is a random term.We then calculated the residuals between the ln of the original
count data and the sine equation and built a stochastic model of theresidual with the same order autocorrelation structure. Running10 000 iterations of the model of the sine equation and the simu-lated residual allowed us to calculate a distribution of peak time(days) for the oscillation.
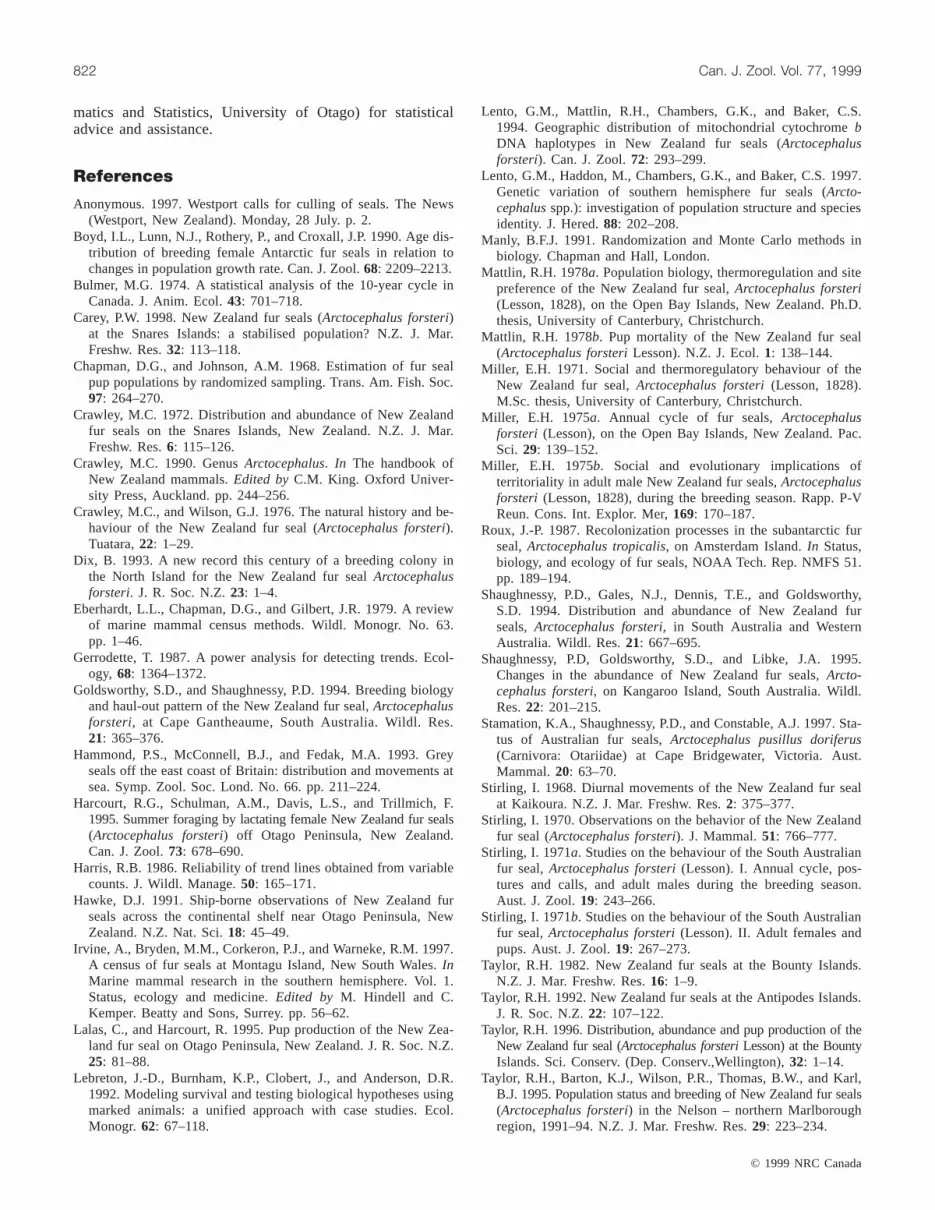
We selected the most parsimonious autoregressive order (k) us-ing Akaike’s Information Criterion (AIC) (Lebreton et al. 1992).Models with the lowest AIC fit the data reasonably well with thefewest parameters (Lebreton et al. 1992). We calculated a 95%confidence interval for peak time by removing the 2.5 and 97.5percentiles of the simulated distribution.
Immigration of tagged animalsTo determine whether a colony of fur seals comprised local (i.e.,
born in or adjacent to that colony) or foreign (i.e., born in someother colony) individuals we estimated the probability of sightingtagged individuals. The term colony in this sense refers to individ-uals that regularly attend a given area of coastline. If a certain un-known proportion of the foreign individuals in a colony is marked(i.e., tagged), and foreign individuals remain permanently (i.e., im-migrate), then the probability that a particular marked individual ishauled out during any census period is inversely proportional tothe number of individuals in that colony. If foreign individuals aretransients, then the probability of sighting these animals would besmaller. If foreigners immigrate, we can express the probabilitythat a particular tagged individual is sighted (p) as
[4] p X N nii
t
ii
t
=
= =
−∑ ∑1 1
1
whereXi is the number of tagged animals seen on survey dayi, Niis the number of animals counted on survey dayi, t is the totalnumber of survey days, andn is the total number of tagged indi-viduals seen overt days. To test the hypothesis that foreign indi-viduals immigrate we used a Monte Carlo approach (Manly 1991),which involved simulating 5 sets of 10 000 sighting data over eachobservation day of the survey period forn = 39 individuals (i.e.,the number that were observed). The probability of a tagged indi-vidual being hauled out and sighted by the observer on a particularday i was taken to be
[5] p piNi= − −1 1( )
By analogy with theχ2 statistic, we calculated a goodness-of-fitstatistic (C) using the formula
[6] [ ]C s s sgh h hg
a
= − −
=∑ ( ) ( )2 1
1
wheresgh is the number of tagged individuals sightedg times (1, 2,3, or >3) for thehth simulation, andsh is the mean value ofs forthe hth simulation. The mean proportion ofC statistics in 5 distri-butions of 10 000 simulated (expected)C statistics (Manly 1991)at least as extreme asCobs is the probability of rejecting the nullhypothesis when it is true that foreign individuals immigrate
(Type I error). We also computed the probability of making Type Ierrors for each sighting class to show which classes were most re-sponsible for the probability of making a Type I error forC. Foreach of theg sighting classes we calculated 5 sets of 10 000 simu-lations ofsgh. The mean proportion of allsgh values at least as ex-treme as the observed number of tagged individuals sightedgtimes, multiplied by 2, is the two-tailed probability of making aType I error for thegth sighting class.
It is possible that the probability of an observer seeing a taggedseal if it is hauled out decreases with an increasing number of sealshauled out at the colony. Crowding at high-density colonies can re-sult in some individuals obscuring the flippers of tagged seals. Todetermine this effect on the sighting-class model, we estimated ahypothetical sightability (q) decay model of the form
[7] qiNi= − −1 ( )αβ
whereα andβ are constants. We arbitrarily setα = 0.04 andβ =0.985 to produce a model whereq (i.e., the probability of sightinga tagged individual if it is present) decreases rapidly whenNi ex-ceeds 100 fur seals hauled out (Fig. 2). In addition to tag conceal-ment due to crowding, the time an observer spends searching eachindividual for tags tends to decrease as seal density increases. Al-though we have no data with which to construct a true sightabilitydecay, we believe that the above model is a conservative estimate,given thatq would probably not be as low (i.e., <0.20) at >200 furseals hauled out (Fig. 2). For the new model with estimated sight-ability, the probability of a tagged individual being hauled out (pi)and being sighted by the observer (qi) on day i becomespi qi.
We also tested the hypothesis that the mean ages of observed in-dividuals in the different sighting classes were not significantlydifferent. Older animals may have potentially accounted for moreof the multiple resightings because they had lived longer and there-fore the probability of resighting them was higher. We tested thenull hypothesis with a single-factor ANOVA general linear modelusing age at first sighting = sighting class + error (assumingGaussian error) as the model. We rejected all null hypotheses whenthe probability of making a Type I error (α) was >0.05.
Breeding colony of originThe assumption that males and females migrate independently
of their breeding colony of origin may bias future estimates of lo-cal dispersal rate and population composition. To test this hypothe-sis we used a 2 × 2 (2sexes, 2 colonies) test of independence usingthe G statistic (Model II with Yates’ correction for continuity) forsightings of animals tagged at Open Bay Islands and WekakuraPoint (Fig. 1). To avoid bias in the test of independence due to lowcell counts we omitted tag data from Cape Foulwind (n = 3). Weused the number of tags where only colour (indicating colony oforigin and sex) was seen plus the number of tags where the ID wasseen as the data set for this analysis. We calculated expected sexratios from the number of pups tagged at each natal breeding col-ony (Table 1).
Results
Intensive surveysIn total, we carried out 332 separate surveys between
March 1995 and August 1997 and used 296 interpolatedcounts for the time-series analysis. The combined counts ofnon-pup seals at the selected Taiaroa Head nonbreeding col-onies followed a regular pattern through the 2.4 years ofstudy (Fig. 3). Numbers of non-pups ashore at the non-breeding colonies fluctuated from 1 (26 August 1995) to 274(15 February 1996), corresponding to seasonal minima nearthe end of August and maxima in early to mid-February in
© 1999 NRC Canada
Bradshaw et al. 817
J:\cjz\cjz77\cjz-05\Z99-033.vpWednesday, September 29, 1999 9:45:44 AM
Color profile: DisabledComposite Default screen

all years studied. The pattern at the breeding colonies fol-lowed similar a trend. Numbers of non-pups in these colo-nies ranged from 45 (30 September 1996) to 252 (26January 1997), with seasonal minima ranging from June toSeptember and maxima near the end of January.
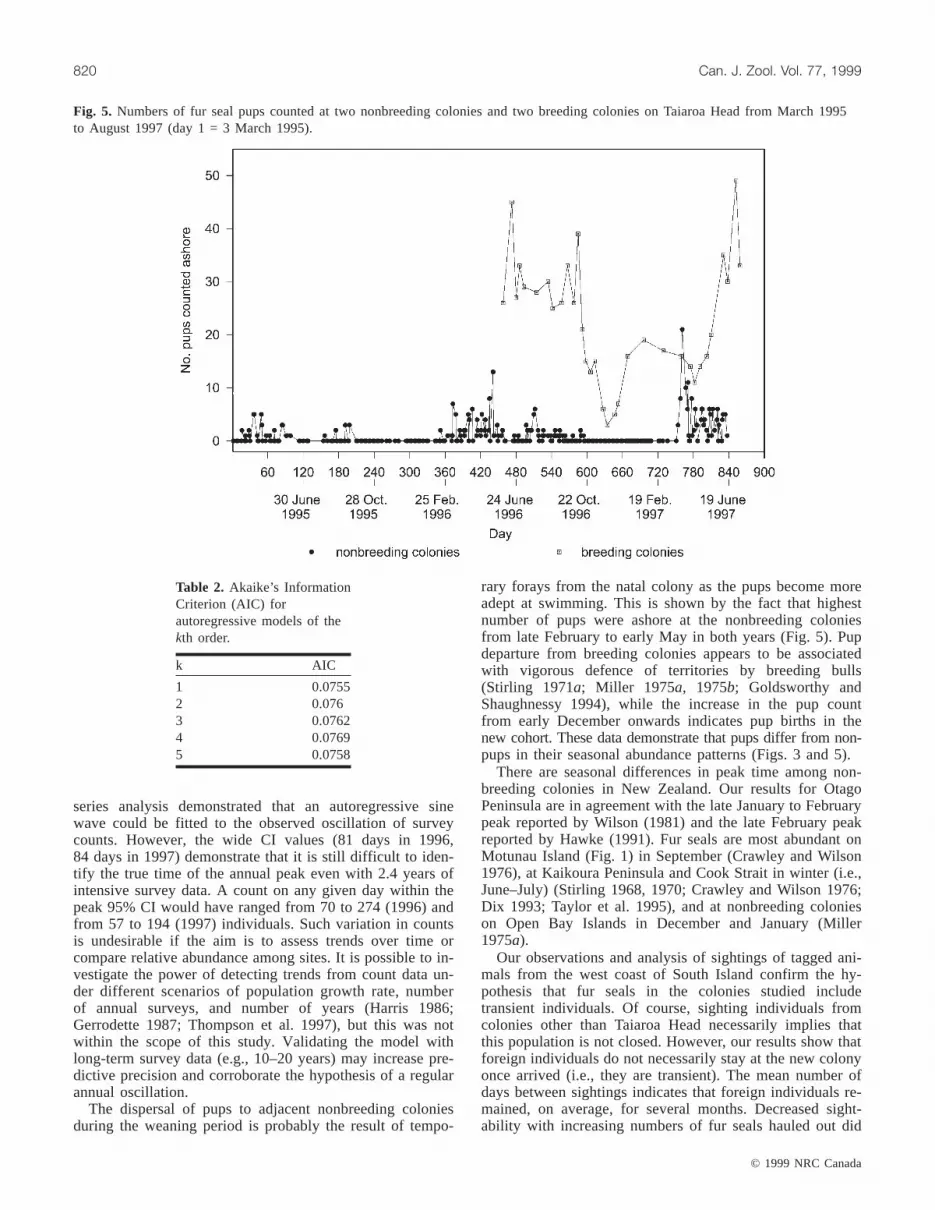
In breeding colonies most pups remained until late No-vember, but some appeared to disperse to adjacent non-breeding colonies throughout the weaning period (Februaryto October; Fig. 5). Pup numbers at breeding colonies in-creased from early December onwards (Fig. 5).
Time-series analysisThe best fit sine wave model (Fig. 4) to the ln-transformed
survey data was
[8] x i rt = + + +3 298 1 474 2 0 00276 95633 1. . sin [ . ( . )]π
The first-order autoregressive model showed the lowestAIC and was the most parsimonious (Table 2). The meanpeak dates were 23 February 1996 (95% confidence interval(CI) = 14 January to 4 April) and 19 February 1997 (95%CI = 8 January to 2 April) (Fig. 4).
Immigration of tagged animalsWe observed a total of 39 tagged individuals (ID seen)
during the survey (Table 3). The time between sightings was92 ± 56 days (mean ± SE) for individuals sighted twice and69 ± 28 days for animals sighted 3 times. The probability ofsighting a particular tagged individual (p) was 9.37 × 10⁻⁵,and the Monte Carlo simulation demonstrated that the prob-ability of rejecting the null hypothesis when it is true (Type Ierror) that foreign individuals are immigrants was <0.0001(Cobs = 34.2). More tagged individuals were sighted onlyonce than was predicted by the model, and fewer tagged in-dividuals were sighted twice than predicted (Table 3). Theobserved frequencies of individuals sighted 3 and >3 timesdid not differ significantly from those predicted (Table 3).
Incorporating the sightability decay model (q) succeededin increasing the probability of making a Type I error to0.003, although this did not modify the rejection of the nullhypothesis that foreign individuals are immigrants. Althoughthere was no change in the conclusions pertaining to taggedanimals sighted once or >3 times (Table 3), reduction insightability with increasing numbers of fur seals hauled outresulted in more tagged individuals sighted 3 times than waspredicted by the model. The number of tagged seals seentwice was no longer significantly different from that pre-dicted by the new model, although the lowP value still sug-gests a difference (Table 3).
The ANOVA general linear model revealed no significantdifference in mean age among sighting classes (F[2,36] =0.89, P = 0.42). Therefore, we failed to reject the null hy-pothesis that older animals were not accounting for the ma-jority of multiple sightings of individual tagged fur sealsduring the term of the study.
Tag identificationWe observed most tagged animals from late summer to
early winter in both years. All tagged animals originatedfrom the west coast of South Island (Wekakura Point, CapeFoulwind, and Open Bay Islands) (Fig. 1 and Table 1). Weexcluded tagged animals from Tonga Island from all analy-
© 1999 NRC Canada
818 Can. J. Zool. Vol. 77, 1999
Fig. 2. Sightability (i.e., the probability of seeing a tagged fur seal if it is hauled out) decay model whereqiNi= − × −1 0 01 0 985( . . ).
CapeFoulwind
WekakuraPoint
Open BayIslands
Males + ID 2 9 1Males + no ID 1 20 0Males tagged at natal
colony (1991–1996)600 1962 2233
Females + ID seen 0 3 24Females + no ID seen 0 4 11Females tagged at natal
colony (1991–1996)595 1947 2159
Total 3 36 36
Note: “ID” indicates that the tag number was seen and “no ID” that thetag number was not seen.
Table 1. Origin and sex of tagged animals observed on TaiaroaHead and originally tagged at natal colonies that were used inthe analysis of immigration and breeding colony of origin.
J:\cjz\cjz77\cjz-05\Z99-033.vpWednesday, September 29, 1999 9:45:47 AM
Color profile: DisabledComposite Default screen

ses because we did not identify tag IDs, nor do tags fromTonga Island indicate sex by colour.
Breeding colony of originWe saw 75 tagged animals throughout the breeding and
nonbreeding colonies on Taiaroa Head. Of these, 39 individ-uals were identifiable by both colour and a readable ID. Forthe other 36 we could positively identify colour only. The
origin of tagged animals was not random with respect to sex.More females came from Open Bay Islands, while moremales came from Wekakura Point (G1 = 52.07,P < 0.0001).
Discussion
We found that it is possible to predict oscillation in shoreattendance with the use of intensive survey data. The time-
© 1999 NRC Canada
Bradshaw et al. 819
Fig. 3. Numbers of non-pup fur seals counted at two nonbreeding colonies and two breeding colonies on Taiaroa Head from March1995 to August 1997 (day 1 = 3 March 1995).
Fig. 4. Interpolated 1:3-day ln-transformed fur seal counts (nonbreeding colonies) and fitted autoregressive sine wave model (with 95%CI for peak time in 1996 and 1997) (day 1 = 3 March 1995).
J:\cjz\cjz77\cjz-05\Z99-033.vpTuesday, October 05, 1999 2:29:46 PM
Color profile: DisabledComposite Default screen
series analysis demonstrated that an autoregressive sinewave could be fitted to the observed oscillation of surveycounts. However, the wide CI values (81 days in 1996,84 days in 1997) demonstrate that it is still difficult to iden-tify the true time of the annual peak even with 2.4 years ofintensive survey data. A count on any given day within thepeak 95% CI would have ranged from 70 to 274 (1996) andfrom 57 to 194 (1997) individuals. Such variation in countsis undesirable if the aim is to assess trends over time orcompare relative abundance among sites. It is possible to in-vestigate the power of detecting trends from count data un-der different scenarios of population growth rate, numberof annual surveys, and number of years (Harris 1986;Gerrodette 1987; Thompson et al. 1997), but this was notwithin the scope of this study. Validating the model withlong-term survey data (e.g., 10–20 years) may increase pre-dictive precision and corroborate the hypothesis of a regularannual oscillation.
The dispersal of pups to adjacent nonbreeding coloniesduring the weaning period is probably the result of tempo-
rary forays from the natal colony as the pups become moreadept at swimming. This is shown by the fact that highestnumber of pups were ashore at the nonbreeding coloniesfrom late February to early May in both years (Fig. 5). Pupdeparture from breeding colonies appears to be associatedwith vigorous defence of territories by breeding bulls(Stirling 1971a; Miller 1975a, 1975b; Goldsworthy andShaughnessy 1994), while the increase in the pup countfrom early December onwards indicates pup births in thenew cohort. These data demonstrate that pups differ from non-pups in their seasonal abundance patterns (Figs. 3 and 5).
There are seasonal differences in peak time among non-breeding colonies in New Zealand. Our results for OtagoPeninsula are in agreement with the late January to Februarypeak reported by Wilson (1981) and the late February peakreported by Hawke (1991). Fur seals are most abundant onMotunau Island (Fig. 1) in September (Crawley and Wilson1976), at Kaikoura Peninsula and Cook Strait in winter (i.e.,June–July) (Stirling 1968, 1970; Crawley and Wilson 1976;Dix 1993; Taylor et al. 1995), and at nonbreeding colonieson Open Bay Islands in December and January (Miller1975a).
Our observations and analysis of sightings of tagged ani-mals from the west coast of South Island confirm the hy-pothesis that fur seals in the colonies studied includetransient individuals. Of course, sighting individuals fromcolonies other than Taiaroa Head necessarily implies thatthis population is not closed. However, our results show thatforeign individuals do not necessarily stay at the new colonyonce arrived (i.e., they are transient). The mean number ofdays between sightings indicates that foreign individuals re-mained, on average, for several months. Decreased sight-ability with increasing numbers of fur seals hauled out did
© 1999 NRC Canada
820 Can. J. Zool. Vol. 77, 1999
Fig. 5. Numbers of fur seal pups counted at two nonbreeding colonies and two breeding colonies on Taiaroa Head from March 1995to August 1997 (day 1 = 3 March 1995).
k AIC
1 0.07552 0.0763 0.07624 0.07695 0.0758
Table 2. Akaike’s InformationCriterion (AIC) forautoregressive models of thekth order.
J:\cjz\cjz77\cjz-05\Z99-033.vpWednesday, September 29, 1999 9:45:54 AM
Color profile: DisabledComposite Default screen

not affect the conclusion that foreign individuals were tran-sient; however, the number of tagged individuals seen 3times was significantly higher than that predicted by themodel. This suggests that although most foreign individualsare transients, some may immigrate, or at least stay longerthan several months.
Some femaleArctocephalussp. can breed as young as3 years of age (Wickens and York 1997). Many of the taggedfemales we observed were older than 3 years, suggestingthat they were potential breeders. However, a female mustremain longer than several months at the breeding colony tosuccessfully raise a pup, therefore we assume that most tran-sient females were not breeding at Taiaroa Head. Nonethe-less, the breeding status of foreign individuals should beconfirmed in order to corroborate the hypothesis of a highturnover rate.
If colonies in other areas of New Zealand are as unstableas those on Taiaroa Head, multiple counts of colonies overtime may be upwardly biased, owing to the possibility ofcounting transient individuals more than once as they travelfrom colony to colony. The population of fur seals on OtagoPeninsula appears to include a non-negligible proportion oftransients and possible immigrants, considering the highrates of annual increase (Lalas and Harcourt 1995). Largenumbers of transient fur seals add another source of varia-tion to counts of non-pups. If the local “population” at onecolony is, in fact, a mixture of local and transient individu-als, then even intensive surveys of non-pups will be up-wardly biased.
We sighted animals from every colony (i.e., Open Bay Is-lands, Cape Foulwind, Wekakura Point, and Tonga Island)where fur seals are known to have been tagged in New Zea-land (apart from a new tagging program begun in early 1996by C. Bradshaw (unpublished data)). This suggests that thereis a mixing of animals from mainland New Zealand. We hy-pothesise that fur seals from colonies in mainland New Zea-land comprise a single population unit, as did Hammond etal. (1993) for grey seals off the east coast of Britain. To testthis hypothesis, tagged seals would have to be seen breedingaway from their natal colony. Although there is high geneticdiversity within A. forsteri (Lento et al. 1994, 1997), thereappear to be no significant genetic divisions betweenA. forsteri populations on the eastern and western coasts ofNew Zealand (Lento et al. 1994).
The dependence of the sex of a tagged fur seal sighted atTaiaroa Head on its breeding colony of origin suggests dif-ferences in stimuli for dispersal in different regions of NewZealand. The majority of foreign females originated from
Open Bay Islands, whereas most foreign males came fromWekakura Point (Table 1). The annual production of pups atOpen Bay Islands does not appear to have been increasingsignificantly since the mid-1970s (Mattlin 1978a; H. Best,unpublished data), whereas the colonies at Wekakura Pointappear to have shown increases from the late 1970s (Wilson1981; H. Best, unpublished data). It is possible that the OpenBay Islands population is large enough to induce density-dependent emigration, causing females, which normally showhigh fidelity to a particular pupping site (Stirling 1971b), toseek new colonies for eventual breeding (Roux 1987; Boydet al. 1990).
Counts of fur seals >1 year old (non-pups) comparedamong years and sites should be accompanied by estimatesof the turnover of foreign individuals and the predictabilityof annual peaks in numbers ashore. Without these estimates,annual or infrequent counts of non-pups may be too variableto allow population trends to be assessed (Harris 1986) un-less they occur over many years or the population growthrate is high (Gerrodette 1987; Thompson et al. 1997). Esti-mates of maximum relative abundance at different coloniesmay also overestimate fur seal numbers because of mixingof individuals among colonies. Consequently, we concur thatestimating pup numbers is the best way to compare the rela-tive abundance of fur seals in New Zealand (Chapman andJohnson 1968; Shaughnessy et al. 1994, 1995; Lalas andHarcourt 1995; Taylor et al. 1995; Taylor 1996), providedannual and geographic variation in pregnancy rates is low.However, this method does not address the problem of esti-mating relative abundance for locations with large numbersof nonbreeding individuals and few or no breeders. With fewor no pups it is impossible to estimate relative abundance onthe basis of pup counts. Understanding population energybudgets and interactions with fisheries requires accurate esti-mates of total population size, so quantifying oscillations ofnon-pup numbers in order to estimate population size is im-portant. With more data it may still be possible to accuratelypredict peaks in shore attendance and population turnoverrate for nonbreeding populations.
Acknowledgements
We thank Otago Harbour Cruises (Dunedin) for use oftheir boat (Monarch) for observations. We also thank alllandowners for allowing access to certain fur seal colonies.C. Lalas was sponsored by Sanford South Island Ltd. We of-fer particular thanks to M. Paulin (Department of Zoology,University of Otago) and D. Fletcher (Department of Mathe-
© 1999 NRC Canada
Bradshaw et al. 821
P
No. of timesindividual resighted
Mean age(years)
Observedfrequency
Mean simulatedfrequency
Type Ierror
Type I errorwith q
1 3.5 (1.43) 28 13.3 <0.0001 <0.00012 3.0 (1.39) 4 9.7 0.01 0.083 2.7 (1.09) 7 4.7 0.18 0.01
>3 — 0 2.3 0.19 0.82
Note: Numbers in parentheses show the standard deviation.
Table 3. Observed and mean simulated frequencies of sighting tagged fur seals (n = 39) and the correspondingmean individual age and probabilities of making a Type I error for each sighting class (i.e., the number of times anindividual was resighted), with and without sightability (q).
J:\cjz\cjz77\cjz-05\Z99-033.vpWednesday, September 29, 1999 9:45:57 AM
Color profile: DisabledComposite Default screen
matics and Statistics, University of Otago) for statisticaladvice and assistance.
References
Anonymous. 1997. Westport calls for culling of seals. The News(Westport, New Zealand). Monday, 28 July. p. 2.
Boyd, I.L., Lunn, N.J., Rothery, P., and Croxall, J.P. 1990. Age dis-tribution of breeding female Antarctic fur seals in relation tochanges in population growth rate. Can. J. Zool.68: 2209–2213.
Bulmer, M.G. 1974. A statistical analysis of the 10-year cycle inCanada. J. Anim. Ecol.43: 701–718.
Carey, P.W. 1998. New Zealand fur seals (Arctocephalus forsteri)at the Snares Islands: a stabilised population? N.Z. J. Mar.Freshw. Res.32: 113–118.
Chapman, D.G., and Johnson, A.M. 1968. Estimation of fur sealpup populations by randomized sampling. Trans. Am. Fish. Soc.97: 264–270.
Crawley, M.C. 1972. Distribution and abundance of New Zealandfur seals on the Snares Islands, New Zealand. N.Z. J. Mar.Freshw. Res.6: 115–126.
Crawley, M.C. 1990. GenusArctocephalus. In The handbook ofNew Zealand mammals.Edited byC.M. King. Oxford Univer-sity Press, Auckland. pp. 244–256.
Crawley, M.C., and Wilson, G.J. 1976. The natural history and be-haviour of the New Zealand fur seal (Arctocephalus forsteri).Tuatara,22: 1–29.
Dix, B. 1993. A new record this century of a breeding colony inthe North Island for the New Zealand fur sealArctocephalusforsteri. J. R. Soc. N.Z.23: 1–4.
Eberhardt, L.L., Chapman, D.G., and Gilbert, J.R. 1979. A reviewof marine mammal census methods. Wildl. Monogr. No. 63.pp. 1–46.
Gerrodette, T. 1987. A power analysis for detecting trends. Ecol-ogy, 68: 1364–1372.
Goldsworthy, S.D., and Shaughnessy, P.D. 1994. Breeding biologyand haul-out pattern of the New Zealand fur seal,Arctocephalusforsteri, at Cape Gantheaume, South Australia. Wildl. Res.21: 365–376.
Hammond, P.S., McConnell, B.J., and Fedak, M.A. 1993. Greyseals off the east coast of Britain: distribution and movements atsea. Symp. Zool. Soc. Lond. No. 66. pp. 211–224.
Harcourt, R.G., Schulman, A.M., Davis, L.S., and Trillmich, F.1995. Summer foraging by lactating female New Zealand fur seals(Arctocephalus forsteri) off Otago Peninsula, New Zealand.Can. J. Zool.73: 678–690.
Harris, R.B. 1986. Reliability of trend lines obtained from variablecounts. J. Wildl. Manage.50: 165–171.
Hawke, D.J. 1991. Ship-borne observations of New Zealand furseals across the continental shelf near Otago Peninsula, NewZealand. N.Z. Nat. Sci.18: 45–49.
Irvine, A., Bryden, M.M., Corkeron, P.J., and Warneke, R.M. 1997.A census of fur seals at Montagu Island, New South Wales.InMarine mammal research in the southern hemisphere. Vol. 1.Status, ecology and medicine.Edited by M. Hindell and C.Kemper. Beatty and Sons, Surrey. pp. 56–62.
Lalas, C., and Harcourt, R. 1995. Pup production of the New Zea-land fur seal on Otago Peninsula, New Zealand. J. R. Soc. N.Z.25: 81–88.
Lebreton, J.-D., Burnham, K.P., Clobert, J., and Anderson, D.R.1992. Modeling survival and testing biological hypotheses usingmarked animals: a unified approach with case studies. Ecol.Monogr. 62: 67–118.
Lento, G.M., Mattlin, R.H., Chambers, G.K., and Baker, C.S.1994. Geographic distribution of mitochondrial cytochromebDNA haplotypes in New Zealand fur seals (Arctocephalusforsteri). Can. J. Zool.72: 293–299.
Lento, G.M., Haddon, M., Chambers, G.K., and Baker, C.S. 1997.Genetic variation of southern hemisphere fur seals (Arcto-cephalusspp.): investigation of population structure and speciesidentity. J. Hered.88: 202–208.
Manly, B.F.J. 1991. Randomization and Monte Carlo methods inbiology. Chapman and Hall, London.
Mattlin, R.H. 1978a. Population biology, thermoregulation and sitepreference of the New Zealand fur seal,Arctocephalus forsteri(Lesson, 1828), on the Open Bay Islands, New Zealand. Ph.D.thesis, University of Canterbury, Christchurch.
Mattlin, R.H. 1978b. Pup mortality of the New Zealand fur seal(Arctocephalus forsteriLesson). N.Z. J. Ecol.1: 138–144.
Miller, E.H. 1971. Social and thermoregulatory behaviour of theNew Zealand fur seal,Arctocephalus forsteri(Lesson, 1828).M.Sc. thesis, University of Canterbury, Christchurch.
Miller, E.H. 1975a. Annual cycle of fur seals,Arctocephalusforsteri (Lesson), on the Open Bay Islands, New Zealand. Pac.Sci. 29: 139–152.
Miller, E.H. 1975b. Social and evolutionary implications ofterritoriality in adult male New Zealand fur seals,Arctocephalusforsteri (Lesson, 1828), during the breeding season. Rapp. P-VReun. Cons. Int. Explor. Mer,169: 170–187.
Roux, J.-P. 1987. Recolonization processes in the subantarctic furseal,Arctocephalus tropicalis, on Amsterdam Island.In Status,biology, and ecology of fur seals, NOAA Tech. Rep. NMFS 51.pp. 189–194.
Shaughnessy, P.D., Gales, N.J., Dennis, T.E., and Goldsworthy,S.D. 1994. Distribution and abundance of New Zealand furseals,Arctocephalus forsteri, in South Australia and WesternAustralia. Wildl. Res.21: 667–695.
Shaughnessy, P.D, Goldsworthy, S.D., and Libke, J.A. 1995.Changes in the abundance of New Zealand fur seals,Arcto-cephalus forsteri, on Kangaroo Island, South Australia. Wildl.Res.22: 201–215.
Stamation, K.A., Shaughnessy, P.D., and Constable, A.J. 1997. Sta-tus of Australian fur seals,Arctocephalus pusillus doriferus(Carnivora: Otariidae) at Cape Bridgewater, Victoria. Aust.Mammal.20: 63–70.
Stirling, I. 1968. Diurnal movements of the New Zealand fur sealat Kaikoura. N.Z. J. Mar. Freshw. Res.2: 375–377.
Stirling, I. 1970. Observations on the behavior of the New Zealandfur seal (Arctocephalus forsteri). J. Mammal.51: 766–777.
Stirling, I. 1971a. Studies on the behaviour of the South Australianfur seal,Arctocephalus forsteri(Lesson). I. Annual cycle, pos-tures and calls, and adult males during the breeding season.Aust. J. Zool.19: 243–266.
Stirling, I. 1971b. Studies on the behaviour of the South Australianfur seal,Arctocephalus forsteri(Lesson). II. Adult females andpups. Aust. J. Zool.19: 267–273.
Taylor, R.H. 1982. New Zealand fur seals at the Bounty Islands.N.Z. J. Mar. Freshw. Res.16: 1–9.
Taylor, R.H. 1992. New Zealand fur seals at the Antipodes Islands.J. R. Soc. N.Z.22: 107–122.
Taylor, R.H. 1996. Distribution, abundance and pup production of theNew Zealand fur seal (Arctocephalus forsteriLesson) at the BountyIslands. Sci. Conserv. (Dep. Conserv.,Wellington),32: 1–14.
Taylor, R.H., Barton, K.J., Wilson, P.R., Thomas, B.W., and Karl,B.J. 1995. Population status and breeding of New Zealand fur seals(Arctocephalus forsteri) in the Nelson – northern Marlboroughregion, 1991–94. N.Z. J. Mar. Freshw. Res.29: 223–234.
© 1999 NRC Canada
822 Can. J. Zool. Vol. 77, 1999
J:\cjz\cjz77\cjz-05\Z99-033.vpWednesday, September 29, 1999 9:45:59 AM
Color profile: DisabledComposite Default screen

© 1999 NRC Canada
Bradshaw et al. 823
Thompson, P.M., Tollit, D.J., Wood, D., Corpe, H.M., Hammond,P.S., and MacKay, A. 1997. Estimating harbour seal abundanceand status in an estuarine habitat in north-east Scotland. J. Appl.Ecol. 34: 43–52.
Wickens, P.A., and York, A.E. 1997. Comparative population dy-namics of fur seals. Mar. Mammal Sci.13: 241–292.
Wilson, G.J. 1981. Distribution and abundance of the New Zealandfur seal,Arctocephalus forsteri. Occas. Publ., Vol. 20, FisheriesResearch Division, New Zealand Ministry of Agriculture andFisheries, Wellington. pp. 1–3.
J:\cjz\cjz77\cjz-05\Z99-033.vpWednesday, September 29, 1999 9:45:59 AM
Color profile: DisabledComposite Default screen