Embed Size (px)
Citation preview
ami ORNL/TM-10071/R3
OAK RIDGE NATIONAL LABORATORY
Cost Estimate Guidelines for Advanced Q Q X K S Q E Q E S Q Nuclear Power Technologies
J. G. Delene C. R. Hudson II
MANAGED BY MARTIN MARIETTA ENERGY SYSTEMS, INC. FOR THE UNITED STATES DEPARTMENT OF ENERGY • c* ; . it- u h i e l .
This report has been reproduced directly from the best available copy.
Available to DOE and DOE contractors from the Office of Scientific and Techni-cal Information, P.O. Box 62, Oak Ridge, TN 37831; prices available from (615) 576-8401, FTS 626-8401.
Available to the public from the National Technical Information Service, U.S. Department of Commerce, 5285 Port Royal Rd., Springfield, VA 22161.
This report was prepared as an account of work sponsored by an agency of the United States Government. Neither the United States Government nor any agency thereof, nor any of their employees, makes any warranty, express or implied, or assumes any legal liability or responsibility for the accuracy, com-pleteness, or usefulness of any information, apparatus, product, or process dis-closed, or represents that its use would not infringe privately owned rights. Reference herein to any specific commercial product, process, or service by trade name, trademark, manufacturer, or otherwise, does not necessarily consti-tute or imply its endorsement, recommendation, or favoring by the United States Government or any agency thereof. The views and opinions of authors expressed herein do not necessarily state or reflect those of the United States Government or any agency thereof.
ORNL/TM-10071/R3 Dist. Category UC-520
Engineering Technology Division
COST ESTIMATE GUIDELINES FOR ADVANCED NUCLEAR POWER TECHNOLOGIES
This document contains information of a preliminary nature. It is subject to revision or correction and therefore does not represent a final report.
Prepared by the OAK RIDGE NATIONAL LABORATORY
Oak Ridge, Tennessee 37831 managed by
MARTIN MARIETTA ENERGY SYSTEMS, INC for the
U.S. DEPARTMENT OF ENERGY under Contract No. DE-A005-840R21400
i-i.S f Of i>u» DOCUMENT « UNLIMIT
J. G. Delene C. R. Hudson II
Date Published - May 1993

iii
CONTENTS
Page
ABSTRACT 1
1. INTRODUCTION 1
1.1 OBJECTIVE 2
1.2 DEFINITION OF TERMS 3
2. BASE CONSTRUCTION CAPITAL COST GROUND RULES 9
2.1 COST CATEGORIES 9
2.2 GENERAL GROUND RULES 10
2.3 SPECIFIC COST-ESTIMATING ASSUMPTIONS 12
2.4 EEDB COST ACCOUNT DEFINITIONS 23
2.5 BASE CONSTRUCTION CAPITAL COST DOCUMENTATION 28
2.6 DEVELOPMENT AND PROTOTYPE COST DOCUMENTATION . . . 34
3. TOTAL CAPITAL COST 36
3.1 CONTINGENCY 36
3.2 CASH FLOW 37
3.3 ESCALATION 37
3.4 INTEREST DURING CONSTRUCTION 38
3.5 TOTAL CAPITAL COST 41
4. BUSBAR GENERATION COST 43
4.1 GENERAL ASSUMPTIONS AND METHODOLOGY 43 4.2 CAPITAL COST 46
4.3 O&M COSTS 48
4.4 FUEL COSTS 54
4.5 DECOMMISSIONING 57
4.6 TOTAL BUSBAR COST 58
5. EXAMPLE CALCULATIONS 60
5.1 COST DATA 60
5.2 COST CALCULATION FOR A 600-MWe PULVERIZED COAL (PC) PLANT 63
iv
Page
5.3 COST CALCULATION FOR A 500-MWe COMBINED CYCLE COMBUSTION TURBINE PLANT 67
5.4 COST CALCULATION FOR A TWO UNIT 600-MWe PC PLANT 71
REFERENCES 75
ABBREVIATIONS AND ACRONYMS 76
LIST OF SYMBOLS 78
APPENDIX A EEDB CODE OF ACCOUNTS FOR LIQUID-METAL REACTOR (LMR) CONCEPT 80
APPENDIX B. EEDB CODE OF ACCOUNTS FOR HIGH-TEMPERATURE GAS-COOLED REACTOR (HTGR) CONCEPT 105
APPENDIX C. EEDB CODE OF ACCOUNTS FOR AN ADVANCED LIGHT WATER REACTOR (ALWR) CONCEPT I l l
APPENDIX D. LISTING OF SAMPLE FOAK TASKS 133
APPENDIX E SITE-RELATED ENGINEERING AND MANAGEMENT TASKS 135
APPENDIX F. EEDB PROGRAM DESCRIPTION OF A STANDARD HYPOTHETICAL EAST/WEST CENTRAL SITE FOR NUCLEAR POWER PLANTS 136
APPENDIX G. CONVERSION FROM NOMINAL TO CONSTANT DOLLARS 142
APPENDIX H. MOST LIKELY, EXPECTED AND CONTINGENCY COSTS 153
1
COST ESTIMATE GUIDELINES FOR ADVANCED NUCLEAR POWER TECHNOLOGIES
ABSTRACT
To make comparative assessments of competing technologies, consistent ground rules must be applied when developing cost estimates. This document provides a uniform set of assumptions, ground rules, and requirements that can be used in developing cost estimates for advanced nuclear power technologies.
1. INTRODUCTION
Several advanced power plant concepts are currently under development. These
include the Modular High Temperature Gas Cooled Reactors (MHTGR), the Advanced
Liquid Metal Reactor (ALMR) and the Advanced Light Water Reactors (ALWR). One
measure of the attractiveness of a new concept is ils cost. Invariably, the cost of a new type
of power plant will be compared with other alternative forms of electrical generation. This
report provides a common starting point, whereby the cost estimates for the various power
plants to be considered are developed with common assumptions and ground rules.
Comparisons can then be made on a consistent basis.
This is the second update of these cost estimate guidelines.1,2 Changes have been
made to make the guidelines more current (January 1,1992) and in response to suggestions
made as a result of the use of the previous report.2 The principal changes are that the
reference site has been changed from a generic Northeast (Middletown) site to a more
central site (EPRI's East/West Central site) and that reference bulk commodity prices and
labor productivity rates have been added.
This report is designed to provide a framework for the preparation and reporting of
costs. The cost estimates will consist of the overnight construction cost, the total plant capital
cost, the operation and maintenance (O&M) costs, the fuel costs, decommissioning costs and
the power production or busbar generation cost. While providing a generic set of assumptions
and ground rules, this document does not provide scenarios or assumptions specific to the
2
individual concepts, nor does it provide reporting requirements. Thus, these guidelines may
be used in a variety of studies when supplemented with concept specific data.
Power plant capital costs in this report will be developed using the U.S. Department
of Energy (DOE) Energy Economic Data Base3 (EEDB) Program Code of Accounts that has
evolved from the NUS Corporation Code of Accounts4 through modification and expansion
over two decades.
The utilization of the EEDB Code of Accounts will allow for comparisons between
the advanced concept cost estimate and costs of other plants reported in the EEDB format.
The levelized busbar generation costs will be developed using the methodology presented in
the U.S. DOE N u c l e a r E n e r g y C o s t D a t a B a s e (NECDB).5 All costs will be developed using
the methods and tax provisions in the Tax Reform Act of 1986.
These ground rules will be updated as necessary to provide and maintain a common
and consistent cost basis. The DOE Office of Nuclear Energy (NE) is responsible for
approving changes to this document. Requested changes should be made in writing to
Department of Energy Assistant Secretary for Nuclear Energy, Office of Advanced Reactor
Programs, Washington, D.C. 20545.
1.1 OBJECTIVE
Cost estimates for the development, design, construction and operation costs of future
power plants involve a great deal of uncertainty. In order to manage the cost estimating task
for the advanced nuclear power plant concepts, a number of simplifying assumptions should
be made. These include:
• Nuclear plant licensing reform, recently enacted, allows one-step licensing and certification
of a standard plant design.
• The Nth-of-a-kind (NOAK) plant is assumed to be built by the same vendor/architect-
engineer team as the first commercial plant and is identical to the first commercial plant.
The plants will be deployed on separate sites.
• An adequate site exists to build a plant (See Appendix F.)
• Adequate project financing is available for all phases of the development, design,
construction and operation of the subject plant.
• No provision should be made for acts of God, war, or labor strikes.
3
The cost estimate Guidelines are intended to provide a consistent comparison between
the advanced reactor technologies. The cost estimates are intended to be reasonable
estimates rather than to envelope the ultimate cost in an uncertain environment The total
capital cost estimate should represent the median cost, based on the guideline assumptions
where there is an equal probability of the ultimate cost being higher or lower than that cost.
12 DEFINITION OF TERMS
The following definition of terms will provide the background necessary for
understanding and interpreting the present guidelines.
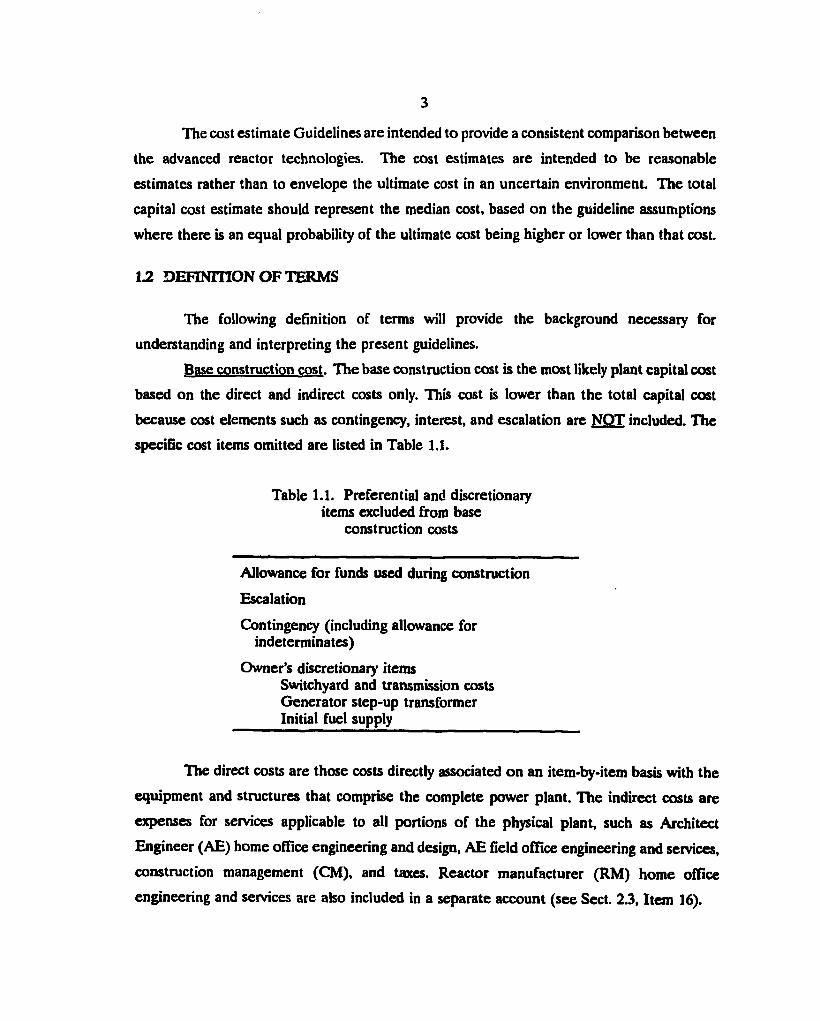
Base construction cost. The base construction cost is the most likely plant capital cost
based on the direct and indirect costs only. This cost is lower than the total capital cost
because cost elements such as contingency, interest, and escalation are NOT included. The
specific cost items omitted are listed in Table 1.1.
Table 1.1. Preferential and discretionary items excluded from base
construction costs
Allowance for funds used during construction
Escalation
Contingency (including allowance for indeterminates)
Owner's discretionary items Switchyard and transmission costs Generator step-up transformer Initial fuel supply
The direct costs are those costs directly associated on an item-by-item basis with the
equipment and structures that comprise the complete power plant. The indirect costs are
expenses for services applicable to all portions of the physical plant, such as Architect
Engineer (AE) home office engineering and design, AE field office engineering and services,
construction management (CM), and taxes. Reactor manufacturer (RM) home office
engineering and services are also included in a separate account (see Sect. 2.3, Item 16).
4
Building block. A building block is a combination of one or more reactor modules
and associated electrical generation equipment and structures that represent the smallest unit
for commercial electrical generation. Building blocks may be duplicated for capacity
expansion.
Busbar costs. Total levelized power generation costs for electricity produced by a
power plant. It includes costs associated with the capital investment, operation and
maintenance of the power plant, fuel costs, and the cost of decommissioning the plant at the
end of life.
Common plant facilities. Common plant facilities are those systems, structures, and
components that are required to support the operation of a first building block at a new plant
site and include such facilities as administration building, provisions for refueling, general
warehouse, watei supply, general fire systems, etc. These common plant facilities may be
sized sufficiently so as to be shared by other building blocks added subsequently.
Constant dollars. Constant dollar cost is defined as the cost for an item measured in
dollars that have a general purchasing power as of some reference date. As inflation is
generally associated with the erosion of the general purchasing power of the dollar, constant
dollar analysis factors out inflation.
Construction Module. A construction module is a free standing, transportable
preassembly of a portion of the plant. A construction module may be a preassembly of a
single system or portion thereof or may contain elements of all the systems that exist in a
given location in the plant. A construction module may contain parts of the building
structure. A construction module would typically be assembled in a factory, shipped to the
plant site and installed in the plant.
Contingency Allowance. The contingency allowance is an adder to the base
construction cost to obtain a median cost estimate (see Appendix H). Contingency provides
an allowance for cost uncertainties. It includes an allowance for indeterminents and should
be related to the level of design, degree of technological advance, and the quality/reliability
level of given components (see Sect. 3.1). Contingency cost does not include any allowance
for potential changes from external factors such as changing government regulations, major
design changes, catastrophic events, labor strikes, extreme weather conditions, varying site
conditions, or project funding (financial) limitations.
5
Escalation rate. The rate of change of a cost. This rate can be greater or less than
the general inflation rate as measured by the Gross Domestic Product Implicit Price Deflator.
Equipment. Generally, equipment includes all manufactured items ordered by RM
or AE. Such items may be procured on a design and build contract from qualified vendors,
wherein design responsibility belongs to the seller (vendor) or is maintained by the buyer
(RM or AE) on a "build-to-print" basis. All piping 2-1/2-in. and larger nominal pipe size is an
equipment item with the exception of galvanized pipe; storm, roof, and floor drainage; and
sanitary piping, which are site material.
Equipment module. An equipment module is a skid-mounted, factory assembled
package which includes (but is not limited to) equipment, piping, instrumentation, controls,
structural components, and electrical items. Module types include Box Modules, Equipment
Modules, Structural Modules, Connection Modules, Electrical Modules, Control System
Modules and Dressed Equipment Modules. These Modules are applicable to ; .ih the Nuclear
Island and Balance of Plant.
Factory (manufacturing facility") FOAK costs. These first of a kind (FOAK) costs
include the development of manufacturing specifications, factory equipment, facilities, startup,
tooling and setup of factories that are used for manufacturing specific equipment for the
concept. These costs may be minimized if existing facilities are used for module production,
which might not be dedicated or even its primary use application (e.g. a shipyard or other
factory which builds modules for other industries).
First commercial plant costs. The first commercial plant is the first plant of that type
that is sold to an entity for the purpose of commercial production of electricity. The costs
include all engineering, equipment, construction, testing, tooling, project management, and
any other costs that are repetitive in nature. Any costs unique to the first commercial plant
which will not be incurred for subsequent plants of the identical design will be identified and
broken out separately as FOAK plant costs. The learning for this first plant will reflect its first
commercial plant status and not be the average over a larger number of plants.
FOAK plant costs. First-of-a-kind costs necessary to put a first commercial plant in
place which will not be reproduced for subsequent plants. Such costs include R&D, standard
plant design, NRC certification of standard design and any prototype and other such FOAK
costs.
6
Force account. Force account involves the direct hiring and supervision of craftsmen
to perform a construction activity by a prime contractor as opposed to the prime contractor
hiring a subcontractor to perform these functions.
Industrial grade construction. Industrial grade construction means construction
practices which conform to generally accepted commercial requirements such as those
required for fossil-fired plant construction.
Inflation rate. The rate of change in the general price level as measured by the Gross
Domestic Product Implicit Price Deflator.
Large monolithic plant. A large monolithic plant is defined as a power plant
consisting of a single, large nuclear steam supply system (NSSS) having a power output at
least two and possibly four times as large as a typical modular building block. In some
instances, a plant of this size is referred to as an integrated plant.
Materials. Basically, materials include field-purchased (site material) and/or bulk items
such as lumber, concrete, structural steel, and plumbing items. Prefabricated pipe is an
equipment item. All other piping, less than 2-1/2-in. nominal pipe size, is a materials item with
the exception of pipe for cryogenic fluids, which is an equipment item. Also all wire and cable
and raceways are material items, including those in building service power systems.
Multi-block plant. A power plant consisting of multiple building blocks is referred to
as a multi-block plant.
Nominal dollars. Nominal dollar cost is defined as the cost for an item measured in
as-spent dollars and includes inflation. Nominal dollars are sometimes referred to as "current"
dollars, "year of expenditure" dollars, or "as spent" dollars in the literature.
Nominal cost of money. The nominal cost of money is the percentage rate used in
calculations involving the time value of money containing an inflation component. It explicitly
provides for part of the return on an investment to be solely for the purpose of keeping up
with inflation.
Nth-of-a-kind (NOAK1 plant costs. The NOAK plant is the nth-of-a-kind or
equilibrium commercial plant of identical design to the first commercial plant. NOAK plant
costs include all engineering, equipment, construction, testing, tooling, project management,
and any other costs that are repetitive in nature and would be incurred if an identical plant
7
were built. The NOAK plant also reflects the experience of prior plants leading to the NOAK
plant (see Sect 2.3, Item 6).
Nuclear safety grade. Nuclear-safety grade construction means construction practices
which satisfy the requirments of 10CFR50, Appendix B.
Prototype facility and test costs. Costs specific to any prototype plant required. These
include prototype-specific design, development, licensing, construction, testing, and operation
of the prototype to support the standard plant design certification.
R&D costs. Costs associated with material, component, system, process and fuel
development and testing performed specifically for the particular advanced concept.
Reactor module. A reactor module is a single reactor and that portion of the nuclear
island which is duplicated with the addition of each reactor, able to generate thermal heat as
an integral part of a building block of power production.
Real cost of money. The real cost of money is the percentage rate used in
calculations involving the time value of money when the inflation component has been
removed. Calculations using the real cost of money assume that the dollar maintains a
constant value in terms of purchasing power, and, thus, no return on an investment is needed
for inflation.
Single-block plant A stand-alone commercial power plant consisting of a single
building block and all necessary common plant facilities is referred to as a single-block plant
This is the smallest unit of capacity normally sold to a customer.
Standard plant design costs. Costs associated with the engineering and engineering
support functions for the design of the standard plant.
Standard plant NRC certification costs. Costs associated with licensing related
activities performed to establish the design or licensability of the standard plant, including the
design and analysis of prototype tests necessaiy for certification, coordination with NRC and
preparation of documents required to obtain NRC certification of the standard plant design.
Standard fuel facility design costs. These costs include the design and engineering of
facility and equipment, proof testing of equipment and licensing for any concept. Standard
fuel facilities may be either integral to the power plant, central or both.
Technology development costs. See R&D costs.
8
Transition period. The period starting with the first commercial plant and extending
to the NOAK plant
Transition period plant-specific capital costs. The capital costs for the transition
plants. These costs exclude any FOAK costs and include costs for manufacturing of factory
equipment, site construction, site-specific engineering, and home office construction support.
The transition in costs from the first to NOAK commercial plant and the effects of serial
manufacturing and construction should be documented.
Total capital cost. The total capital cost is an all inclusive plant capital cost developed
for the purpose of calculating the plant busbar electricity cost. This cost is the base
construction cost plus contingency, escalation, and interest-related costs.
Total overnight cost. The total overnight cost is the base construction cost plus
applicable contingency costs. It is referred to as an overnight cost in the sense that time value
costs (interest during construction and escalation) are not included. Total overnight cost is
expressed as a constant dollar amount in reference year dollars.
9
2. BASE CONSTRUCTION CAPITAL COST GROUND RULES
2.1 COST CATEGORIES
The estimated costs will be reported in eight independent categories as defined in
Sect. 1. These are:
1. Technology Development (R&D) costs
2. Standard plant design costs
3. Prototype facility and test costs
4. Standard plant NRC certification costs
5. Standard fuel facility R&D, design, test and certification costs
6. Factory FOAK costs
7. First commercial plant costs
8. NOAK plant costs
If desired, the costs for plants in the transition from the first commercial to the
NOAK plant can be given also. In any event, the transition in costs from the first commercial
to NOAK commercial plant and the effects of serial manufacturing and construction should
be documented.
Costs are to be expressed in constant reference year dollars. All Technology
Development (R&D), standard plant design, and NRC certification, prototype and other one-
time costs necessary before the first commercial plant can be built, and any one-time costs for
the first commercial plant are included in categories 1—6. All categories may not be
applicable for a given concept (e.g. a prototype plant may not be needed for all advanced
concepts). A sample listing of these first plant tasks is given in Appendix D. All costs in
categories 1—6 should be reported in only one category and should not be amortized into the
first commercial or subsequent plants except as reflected in site-delivered equipment costs
from a dedicated factory (see Sect. 2.2, Item 8). The timing of all expenditures should be
identified. Fuel cycle facility construction and operating costs are discussed in Sect. 4.4.
The specification of the costs into categories 1—7 and their time distributions allows
these estimates to be combined as appropriate and allows the total expenditures for a concept
up through the first commercial plant to be shown as a function of time. If the transition
plant costs and NOAK plant costs are included, the costs and time distributions may be
1 0
combined as appropriate for a given plan of commercialization and allows the total
expenditures for a concept to be shown as a function of time.
Distributions of costs in each category are to be presented in a way which is consistent
with the way they were estimated. Power plant capital costs must be given in the EEDB
format.
All values in the eight categories are defined as costs to the buyer and include
supplier profit margins. Representative margins (markup) of 15% for 'NSSS equipment
suppliers and 7% for BOP suppliers are to be used. Vendor prices are to be based on
quotations or margins consistent with the economic parameters for industrial organizations
given later in the guidelines.
22 GENERAL GROUND RULES
This section describes the ground rules to be followed in developing the base
construction capital cost for the advanced concepts.
1. The EEDB Code of Accounts will be the structure used for cost estimates and cost
accumulation. The EEDB Code of Accounts is an evolutionary expansion and
modification of the NUS 531 Code of Accounts. Sample EEDB Code of Accounts for
the advanced liquid metal reactor (ALMR), the modular high-temperature gas-cooled
reactor (MHTGR), and a light water reactor are given in Appendices A, B, and C,
respectively.
2. Detailed cost estimates will be reported in constant January 1 dollars for the year
specified by DOE-NE. Current studies should be reported in constant January 1, 1992
dollars.
3. The cost estimates will reflect the plant requirements and design as detailed in the Design
Requirements, System Design Descriptions (SDDs), and other formal design
documentation. Individual system boundaries will be as defined in the SDDs.
4. The base construction cost estimates will be developed so that they are the most likely
cost for a particular EEDB cost entiy without any allowance for funds used during
construction (AFUDC) (interest), escalation, or contingency allowance as defined in
Sect 3. The cost estimates shall be based on quantities of commodities/materials and
11
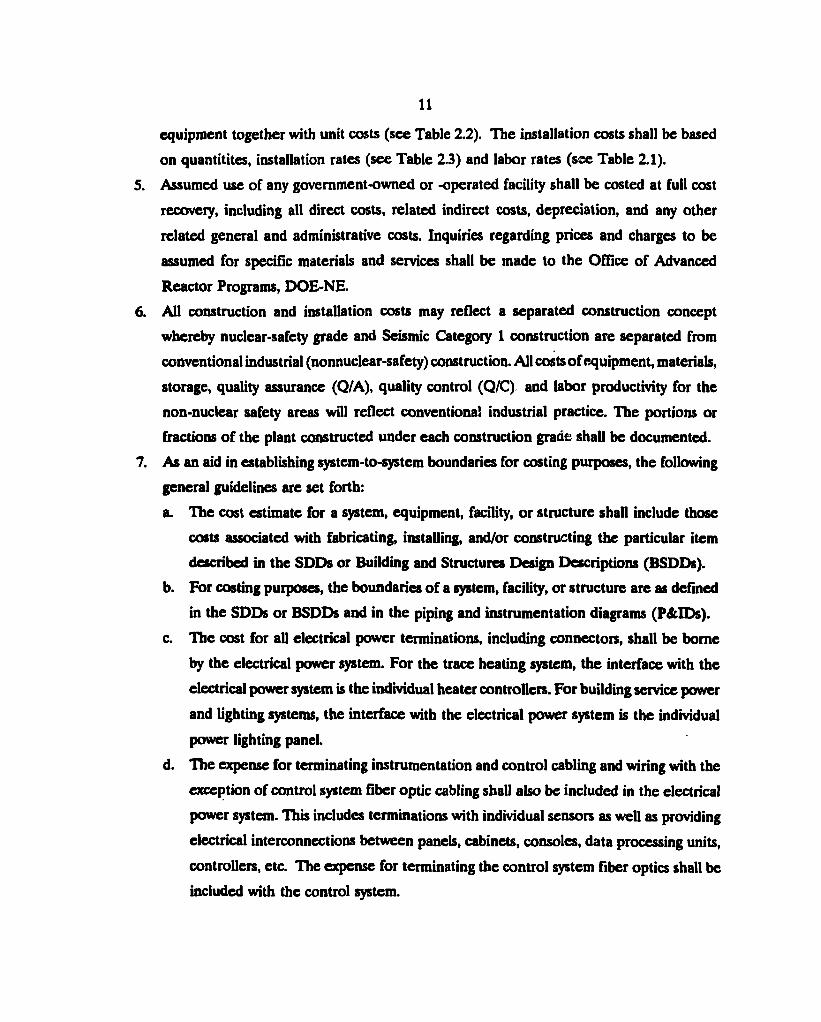
equipment together with unit costs (see Table 2.2). The installation costs shall be based
on quantitites, installation rates (see Table 2.3) and labor rates (see Table 2.1).
5. Assumed use of any government-owned or -operated facility shall be costed at full cost
recovery, including all direct costs, related indirect costs, depreciation, and any other
related general and administrative costs. Inquiries regarding prices and charges to be
assumed for specific materials and services shall be made to the Office of Advanced
Reactor Programs, DOE-NE.
6. All construction and installation costs may reflect a separated construction concept
whereby nuclear-safety grade and Seismic Category 1 construction are separated from
conventional industrial (nonnuclear-safety) construction. All costs of equipment, materials,
storage, quality assurance (Q/A), quality control (Q/C) and labor productivity for the
non-nuclear safety areas will reflect conventional industrial practice. The portions or
fractions of the plant constructed under each construction grade shall be documented.
7. As an aid in establishing system-to-system boundaries for costing purposes, the following
general guidelines are set forth:
a. The cost estimate for a system, equipment, facility, or structure shall include those
costs associated with fabricating, installing, and/or constructing the particular item
described in the SDDs or Building and Structures Design Descriptions (BSDDs).
b. For costing purposes, the boundaries of a system, facility, or structure are as defined
in the SDDs or BSDDs and in the piping and instrumentation diagrams (P&IDs).
c. The cost for all electrical power terminations, including connectors, shall be borne
by the electrical power system. For the trace heating system, the interface with the
electrical power system is the individual heater controllers. For building service power
and lighting systems, the interface with the electrical power system is the individual
power lighting panel.
d. The expense for terminating instrumentation and control cabling and wiring with the
exception of control system fiber optic cabling shall also be included in the electrical
power system. This includes terminations with individual sensors as well as providing
electrical interconnections between panels, cabinets, consoles, data processing units,
controllers, etc. The expense for terminating the control system fiber optics shall be
included with the control system.
12
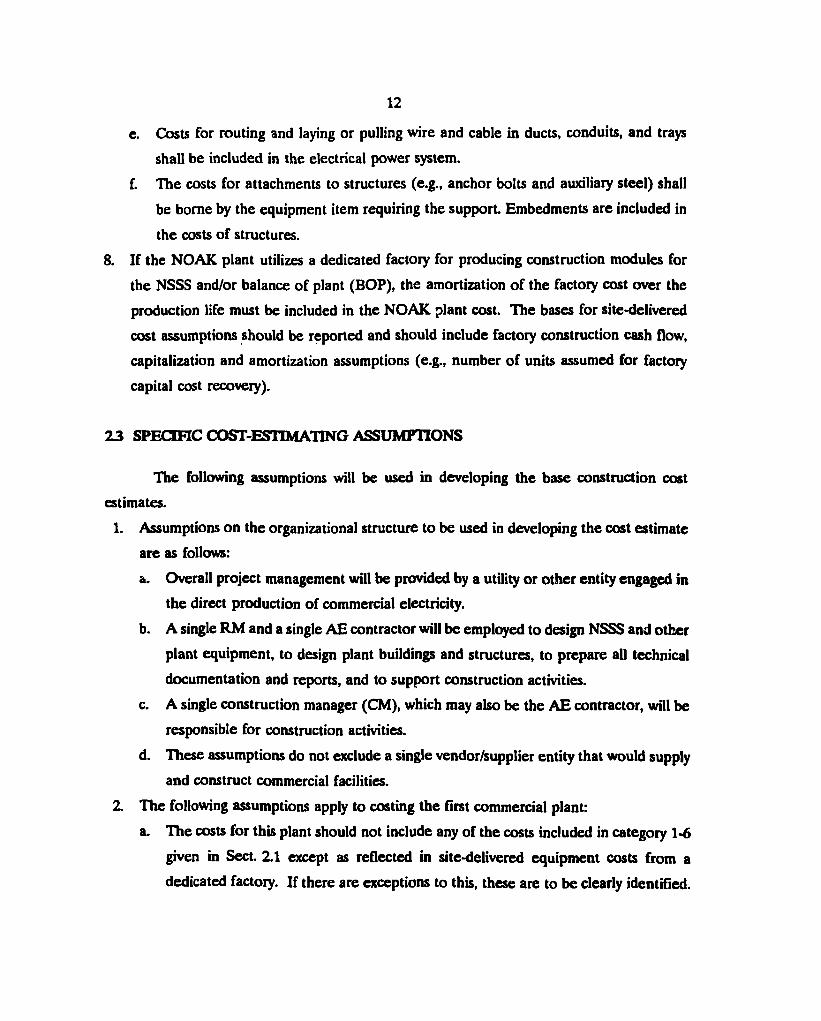
e. Costs for routing and laying or pulling wire and cable in ducts, conduits, and trays
shall be included in the electrical power system.
f. The costs for attachments to structures (e.g., anchor bolts and auxiliary steel) shall
be borne by the equipment item requiring the support. Embedments are included in
the costs of structures.
8. If the NOAK plant utilizes a dedicated factory for producing construction modules for
the NSSS and/or balance of plant (BOP), the amortization of the factory cost over the
production life must be included in the NOAK plant cost. The bases for site-delivered
cost assumptions should be reported and should include factory construction cash flow,
capitalization and amortization assumptions (e.g., number of units assumed for factory
capital cost recovery).
2 3 SPECIFIC COST-ESTIMATING ASSUMPTIONS
The following assumptions will be used in developing the base construction cost
estimates.
1. Assumptions on the organizational structure to be used in developing the cost estimate
are as follows:
a. Overall project management will be provided by a utility or other entity engaged in
the direct production of commercial electricity.
b. A single RM and a single AE contractor will be employed to design NSSS and other
plant equipment, to design plant buildings and structures, to prepare all technical
documentation and reports, and to support construction activities.
c. A single construction manager (CM), which may also be the AE contractor, will be
responsible for construction activities.
d. These assumptions do not exclude a single vendor/supplier entity that would supply
and construct commercial facilities.
2. The following assumptions apply to costing the first commercial plant:
a. The costs for this plant should not include any of the costs included in category 1-6
given in Sect. 2.1 except as reflected in site-delivered equipment costs from a
dedicated factory. If there are exceptions to this, these are to be clearly identified.
13
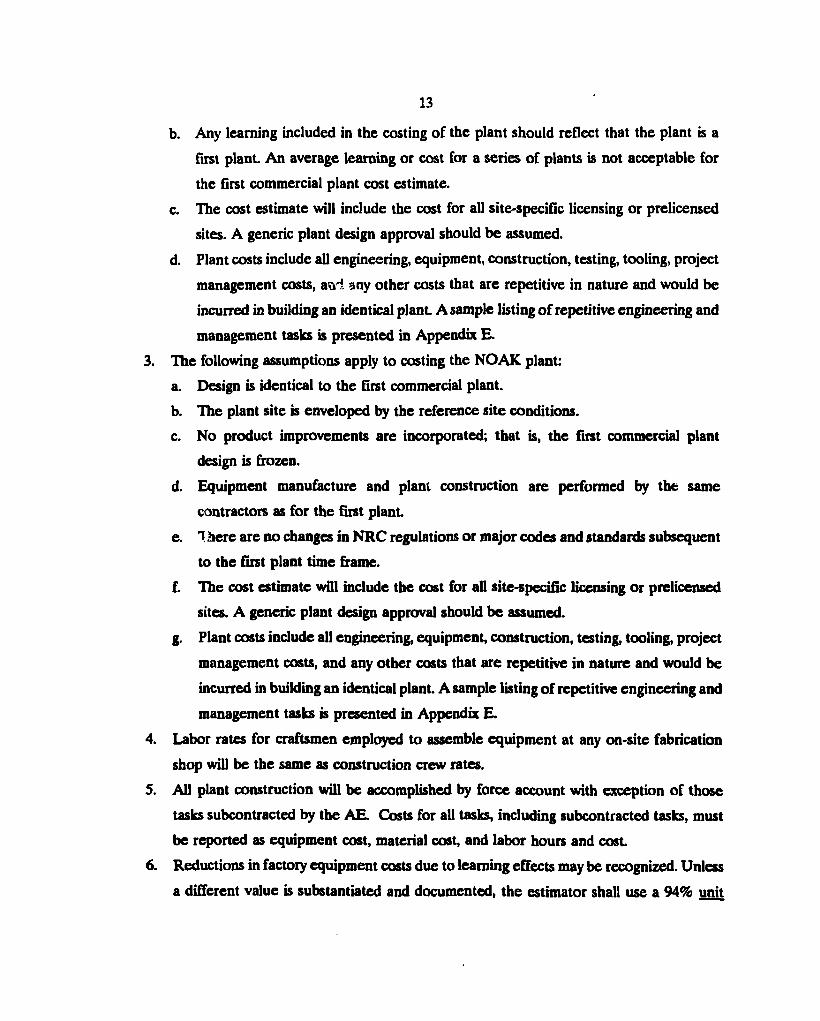
b. Any learning included in the costing of the plant should reflect that the plant is a
first plant. An average learning or cost for a series of plants is not acceptable for
the first commercial plant cost estimate.
c. The cost estimate will include the cost for all site-specific licensing or prelicensed
sites. A generic plant design approval should be assumed.
d. Plant costs include all engineering, equipment, construction, testing, tooling, project
management costs, and any other costs that are repetitive in nature and would be
incurred in building an identical plant. A sample listing of repetitive engineering and
management tasks is presented in Appendix E.
The following assumptions apply to costing the NOAK plant:
a. Design is identical to the first commercial plant
b. The plant site is enveloped by the reference site conditions.
c. No product improvements are incorporated; that is, the first commercial plant
design is frozen.
d. Equipment manufacture and plant construction are performed by the same
contractors as for the first plant
e. 1. here are no changes in NRC regulations or major codes and standards subsequent
to the first plant time frame.
f. The cost estimate will include the cost for all site-specific licensing or prelicensed
sites. A generic plant design approval should be assumed.
g. Plant costs include all engineering, equipment construction, testing, tooling, project
management costs, and any other costs that are repetitive in nature and would be
incurred in building an identical plant. A sample listing of repetitive engineering and
management tasks is presented in Appendix E.
Labor rates for craftsmen employed to assemble equipment at any on-site fabrication
shop will be the same as construction crew rates.
All plant construction will be accomplished by force account with exception of those
tasks subcontracted by the AE. Costs for all tasks, including subcontracted tasks, must
be reported as equipment cost, material cost, and labor hours and cost.
Reductions in factory equipment costs due to learning effects may be recognized. Unless
a different value is substantiated and documented, the estimator shall use a 94% unit
14
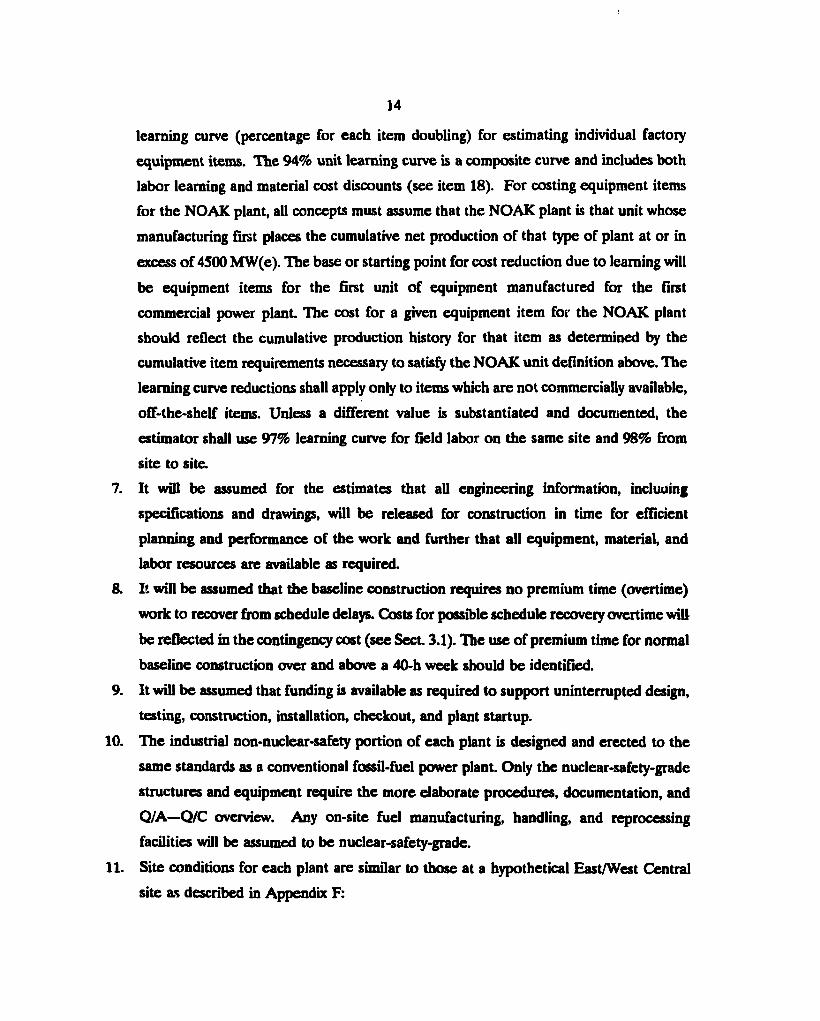
learning curve (percentage for each item doubling) for estimating individual factory
equipment items. The 94% unit learning curve is a composite curve and includes both
labor learning and material cost discounts (see item 18). For costing equipment items
for the NOAK plant, all concepts must assume that the NOAK plant is that unit whose
manufacturing first places the cumulative net production of that type of plant at or in
excess of 4500 MW(e). The base or starting point for cost reduction due to learning will
be equipment items for the first unit of equipment manufactured for the first
commercial power plant The cost for a given equipment item for the NOAK plant
should reflect the cumulative production history for that item as determined by the
cumulative item requirements necessary to satisfy the NOAK unit definition above. The
learning curve reductions shall apply only to items which are not commercially available,
off-the-shelf items. Unless a different value is substantiated and documented, the
estimator shall use 97% learning curve for field labor on the same site and 98% from
site to site.
7. It will be assumed for the estimates that all engineering information, including
specifications and drawings, will be released for construction in time for efficient
planning and performance of the work and further that all equipment, material, and
labor resources are available as required.
8. It will be assumed that the baseline construction requires no premium time (overtime)
work to recover from schedule delays. Costs for possible schedule recovery overtime will
be reflected in the contingency cost (see Sect. 3.1). The use of premium time for normal
baseline construction over and above a 40-h week should be identified.
9. It will be assumed that funding is available as required to support uninterrupted design,
testing, construction, installation, checkout, and plant startup.
10. The industrial non-nuclear-safety portion of each plant is designed and erected to the
same standards as a conventional fossil-fuel power plant. Only the nuclear-safety-grade
structures and equipment require the more elaborate procedures, documentation, and
Q / A — Q / C overview. Any on-site fuel manufacturing, handling, and reprocessing
facilities will be assumed to be nuclear-safety-grade.
11. Site conditions for each plant are similar to those at a hypothetical East/West Central
site as described in Appendix F:
15
a. An adequate pool of qualified craft labor is available.
b. There are no unique nuclear or conventional licensing restrictions that would affect
plant design, construction, or operation.
c. Estimates cover work within the plant security fence and include the water intake
systems and structures.
d. Soil and subsurface conditions are such that no unusual problems are associated
with soil-bearing capacity or rock removal, major cut and Gil operations, and
dewatering.
12. Site land (Account 20) shall be based on the estimated site area, including any buffer
zones (500 acre minimum) and a cost of $10,000/acre. It is to be assumed that the total
land cost is incurred at the same time as the decision is made to build a plant.
13. Cost items to be excluded from the base construction cost estimate were listed in
Table 1.1.
14. The assumptions to be used for the estimates of the Engineering and Home Office
Services for all plants are defined in Appendices D and E
15. Engineering and Home Office Services includes the AE costs for design, engineering,
procurement, cost engineering, Q/A—Q/C, reproduction services, etc. (Account 92). Any
module fabricator costs for engineering, Q/A etc should be separately shown.
16. Nonrecurring engineering and home office services costs of the RM are assumed to be
zero for the first commercial and NOAK plant. Any applicable recurring RM
engineering costs should be identified.
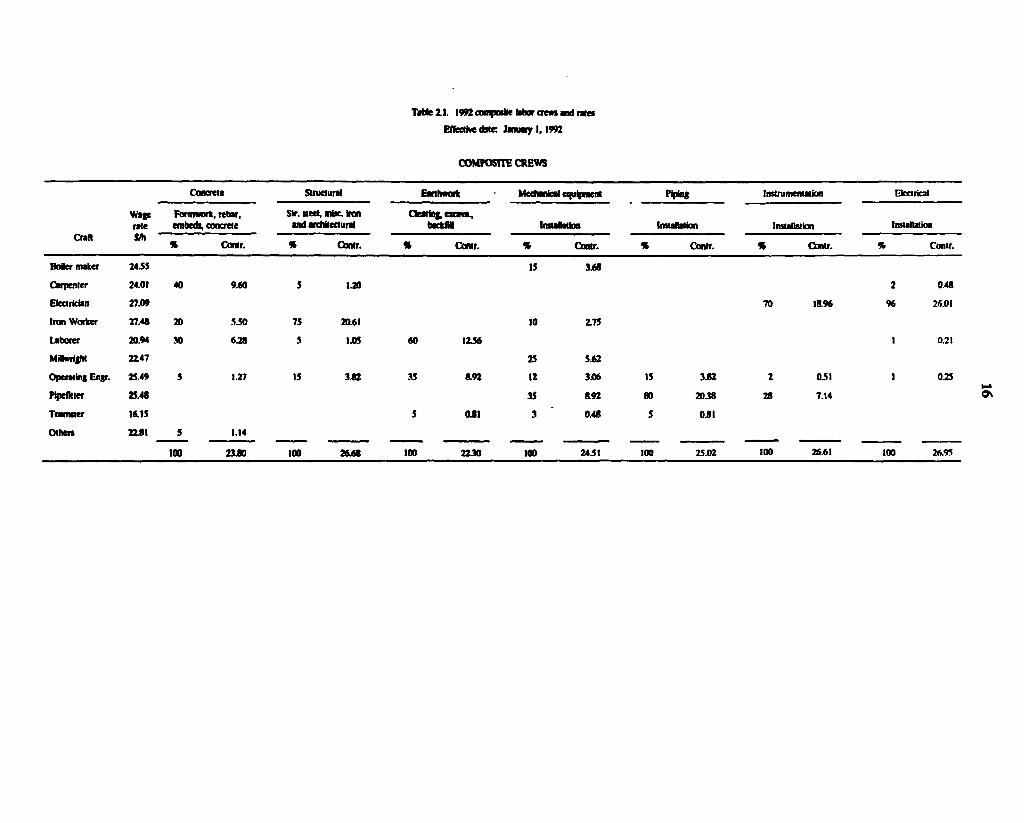
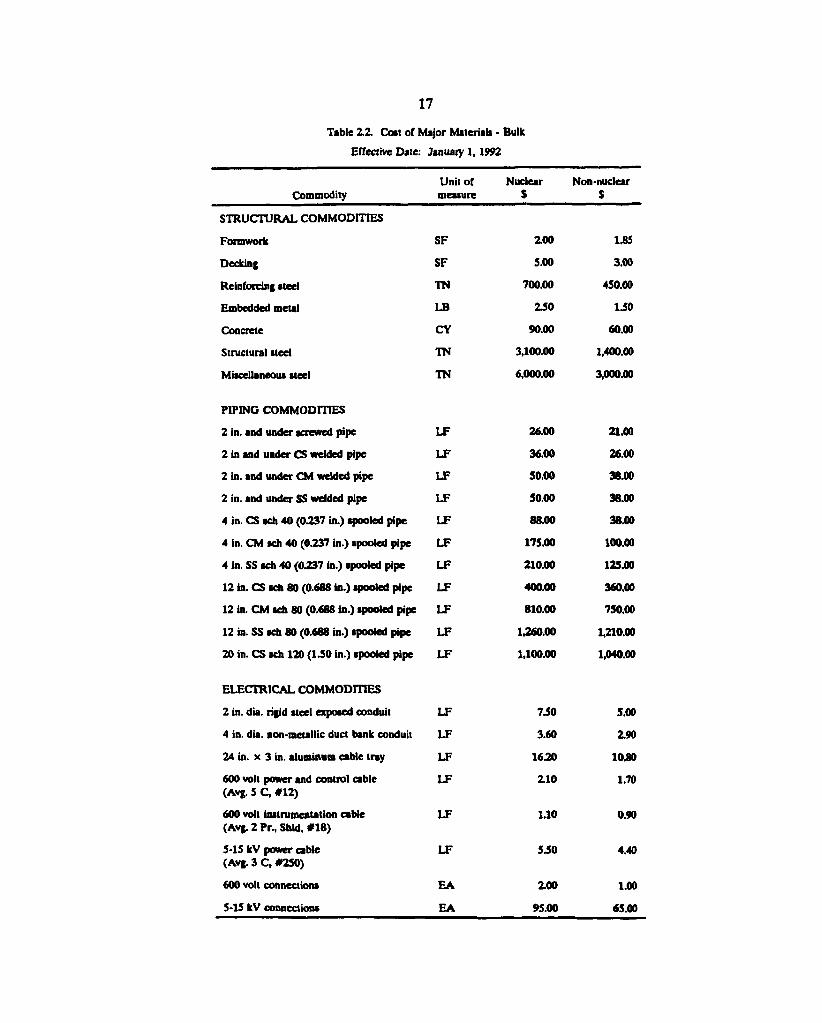
17. Composite wage rates (base rate plus fringes) to be used for the site in 1992 dollars are
given in Table 2.1 and the cost of major materials is given in Table 2.2.
18. There should be no reduction in field material prices based on quantity discounts. For
factory produced modules, an equipment learning curve of 94% was specified (see
item 6). The 94% factor includes provision for volume discounts on materials. If labor
and material learning is estimated separately, the material price discounts for high
volume items should be limited to 10% for NOAK plants. There should be no such
discounts for first commercial plants.
T M e Z I . 1992 composite labor crewi and rates
Effective dMC Jnu*y 1,1992
COMPOSITE CREWS
Craft
Concrete Structural Eart hawk Mecft mical equipment Piping Instrumentation Electrical
Craft
Wage rate
Farmwort, re bar, embeth, concrete
Sir. Med, misc. (ran and architectural
CteJring, cxcivl, tecftJM Instalation Installation Installation Installation
Craft l/h " * Gontr. * Contr. % Contr. % Contr. % Ctmtr. * Contr. * Contr.
Boiler maker 24.55 15 3.68
Carpenter 24.01 40 9.60 5 1.20 2 0.48
Electrician 27.09 70 18.96 96 26.01
Ironworker 27.48 20 5.50 75 20.61 10 2.75
Laborer 20.94 30 6.28 5 1.05 <0 12.56 1 0.21
MilKnifht 22.47 25 5.62
Operating Engr. 25.49 S 1.27 15 3.82 35 8.92 12 3X16 IS 3.82 2 0-51 1 0.25
Pipefitter 25.48 35 8.92 80 2038 28 7.14
Teamster 16.15 5 0J I 3 0.48 5 0.81
Other* 22.81 5 1.14
100 23.80 100 26.68 100 22J0 100 24.51 100 25.02 100 26.61 100 26.95
17
Table 2.2. Cent of Major Materials - Bulk
Effective Date: Januaiy 1,1992
Commodity Unit of measure
Nuclear $ Non-nuclear S
STRUCTURAL COMMODITIES
Formwork SF
Decking SF
Reinforcing steel TN
Embedded metal LB
Concrete CY
Structural steel TN
Miscellaneous steel TN
PIPING COMMODITIES
2 in. and under screwed pipe LF
2 in and under CS welded pipe LF
2 in. and under CM welded pipe LF
2 in. and under SS welded pipe LF
4 in. CS sch 40 (0.237 in.) spooled pipe LF
4 in. CM sch 40 (0.237 in.) spooled pipe LF
4 in. SS sch 40 (0237 in.) spooled pipe LF
12 in. CS sch 80 (0.688 in.) spooled pipe LF
12 in. CM sch 80 (0.688 in.) spooled pipe LF
12 in. SS sch 80 (0.688 in.) spooled pipe LF
20 in. CS sch 120 (1.50 in.) spooled pipe LF
ELECTRICAL COMMODITIES
2 in. dia. rigid steel exposed conduit LF
4 in. dia. non-metallic duct bank conduit LF
24 in. x 3 in. aluminum cable tray LF
600 volt power and control cable LF (Avg. 5 C, #12)
600 volt instrumentation cable LF (Avg. 2 Pr., Shld, #18)
5-15 kV power cable LF (Avg. 3 C, #250)
600 volt connections EA
5-15 kV connections EA
ZOO
5.00
700.00
2.50
90.00
3,100.00
6,000.00
26.00
36.00
S0.00
50.00
88.00
175.00
210.00
400.00
810.00
1,260.00
1,100.00
7.50
3.60
16.20
Z10
1.10
5.50
2.00
95.00
1.85
3.00
450.00
1.50
60.00
1,400.00
3,000.00
21.00
26.00
38.00
38.00
38.00
100.00
125.00
360.00
750.00
1,210.00
1,040.00
5.00
2.90
10.80
1.70
0.90
4.40
1.00
65.00
18
Table 2.3. Bulk Commodity Unit Hour Installation Rates (man hours/unit)
Commodity
STRUCTURAL COMMODITIES
Form work - substructure
Fonnwork - superstructure
Decking
Reinforcing steel - substructure
Reinforcing steel - superstructure
Embedded metal
Concrete - substructure
Concrete - superstructure
Structural steel
Miscellaneous steel
PIPING COMMODITIES
2 in. and under screwed pipe
2 in. and under CS welded pipe
2 in. and under CM welded pipe
2 in. and under SS welded pipe
4 in. CS sch 40 (0.237 in.) spooled pipe
4 in. CM sch 40 (0.237 in.) spooled pipe
4 in. SS sch 40 (0.237 in.) spooled pipe
12 in. CS sch 80 (0.688 in.) spooled pipe
12 in. CM sch 80 (0.688 in.) spooled pipe
12 in. SS sch 80 (0.688 in.) spooled pipe
20 in. CS sch 120 (1.30 in.) spooled pipe
ELECTRICAL COMMODITIES
2 in. dia. rigid steel exposed conduit
4 in. dia. non-metallic duct bank conduit
24 in. x 3 in. aluminum cable t n y
600 volt power and control cable
Unit of measure Nuclear Non-nuclear
SF 0.64 0.48
SF 1.12 0.84
SF 0.16 0.12
TN 32.00 24.00
TN 40.00 30.00
LB 0.11 0.08
CY ZOO 1.50
CY 4.00 3.00
TN 64.00 14.40
TN 120.00 72.00
LF 3.46 1.30
LF 5.18 1.94
LF 8.06 3.02
LF 10.37 3.89
LF 5.70 2.14
LF 13.71 5.14
LF 11.40 4.28
LF 13.41 5.03
LF 29.02 10.88
LF 26.82 10.06
LF 42.62 15.98
LF 1.26 0.58
LF 0 3 5 0.16
LF 2 8 8 1 3 2
LF 0.13 0.06
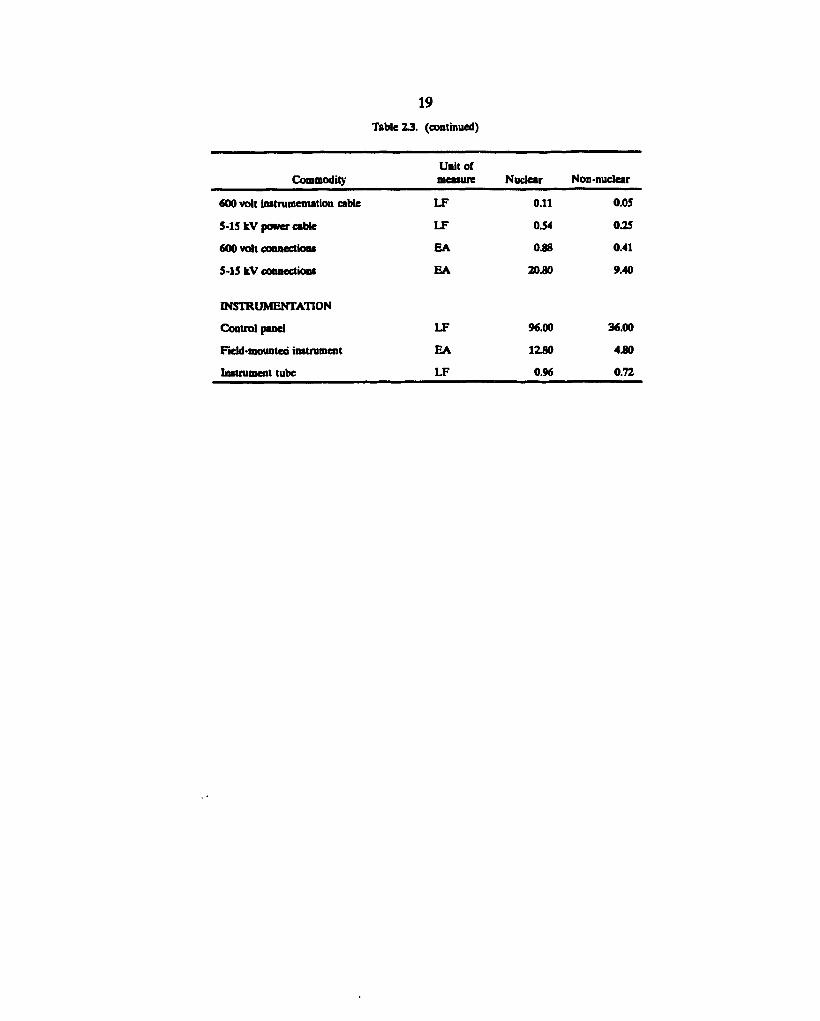
19 Table 23. (continued)
Commodity Unit of measure Nuclear Non-nuclear
600 volt instrumentation cable LF 0.11 0.05
5-15 kV power cable LF 0.54 0.25
600 volt connections EA 0.88 0.41
5-15 kV connections EA 20.80 9.40
INSTRUMENTATION
Control panel LF 96.00 36.00
Field-mounteci instrument EA 1Z80 4.80
Instrument tube LF 0.96 0.72
2 0
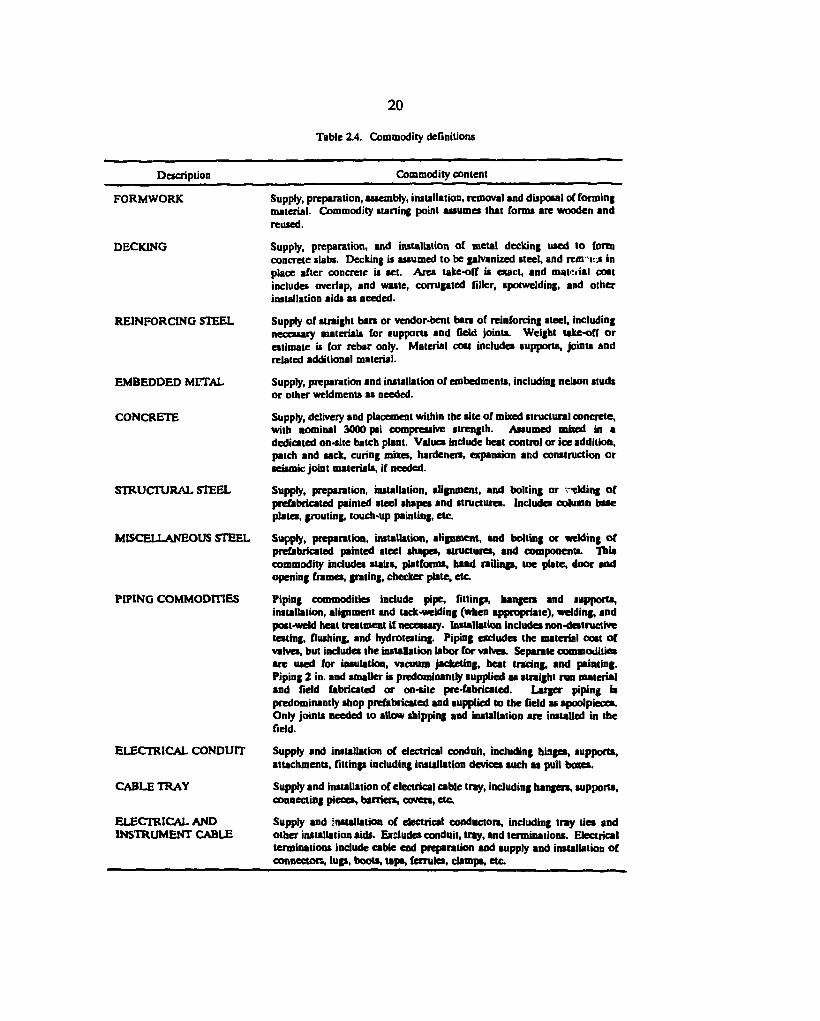
Table 2.4. Commodity definitions
Description Commodity content
FORMWORK
DECKING
REINFORCING STEEL
EMBEDDED METAL
CONCRETE
STRUCTURAL STEEL
MISCELLANEOUS STEEL
PIPING COMMODITIES
ELECTRICAL CONDUIT
CABLE TRAY
ELECTRICAL AND INSTRUMENT CABLE
Supply, preparation, assembly, installation, removal and disposal of forming material. Commodity starting point assumes that forms are wooden and reused.
Supply, preparation, and installation of metal decking used to form concrete slabs. Decking is assumed to be galvanized steel, and rem" u j in place after concrete is set. Area take-off is exact, and mattiial coat includes overlap, and waste, corrugated filler, spotwelding, and other installation aids as needed.
Supply of straight b a n or vendor-bent b a n of reinforcing steel, including necessary materials for supports and field joints. Weight take-off o r estimate is for re bar only. Material cost includes supports, joints and related additional material.
Supply, preparation and installation of embedments, including nelson studs or other weldments as needed.
Supply, delivery and placement within the site of mixed structural concrete, with nominal 3000 psi compressive strength. Assumed mixed in a dedicated on-site batch plant. Values include heat control or ice addition, patch and sack, curing mixes, hardeners, expansion and construction or seismic joint materials, if needed.
Supply, preparation, installation, alignment, and bolting or "tiding of prefabricated painted steel shapes and structures. Includes column base plates, grouting, touch-up painting, etc.
Supply, preparation, installation, alignment, and bolting or welding of prefabricated painted steel shapes, structures, and components. This commodity includes stain, platforms, hand railings, toe plate, door and opening frames, grating, checker plate, etc.
Piping commodities include pipe, fittinp, hangers and supports, installation, alignment and tack-welding (when appropriate), welding, and post-weld heat treatment if neceasaiy. Installation includes non-destructive testing, flushing, and hydrotating. Piping excludes the material cost of valves, but includes the installation labor for valves. Separate commodities are used for insulation, vacuum jacketing, heat tracing, and painting. Piping 2 in. and smaller is predominantly supplied as straight run material and field fabricated or on-site pre-fabricated. Larger piping is predominantly shop prefabricated and supplied to the field as apoolpieces. Only joints needed to allow shipping and installation are installed in the field.
Supply and installation of electrical conduit, including hinges, supports, attachments, fittings including installation devices such as pull boxes.
Supply and installation of electrical cable tray, including hangers, supports, connecting pieces, barriers, coven, etc.
Supply and installation of electrical conductors, including tray lies and other installation aids. Excludes conduit, tray, and terminations. Electrical terminations include cable end preparation and aupply and installation of connccton, lugs, boots, taps, ferrules, damps, etc.
21
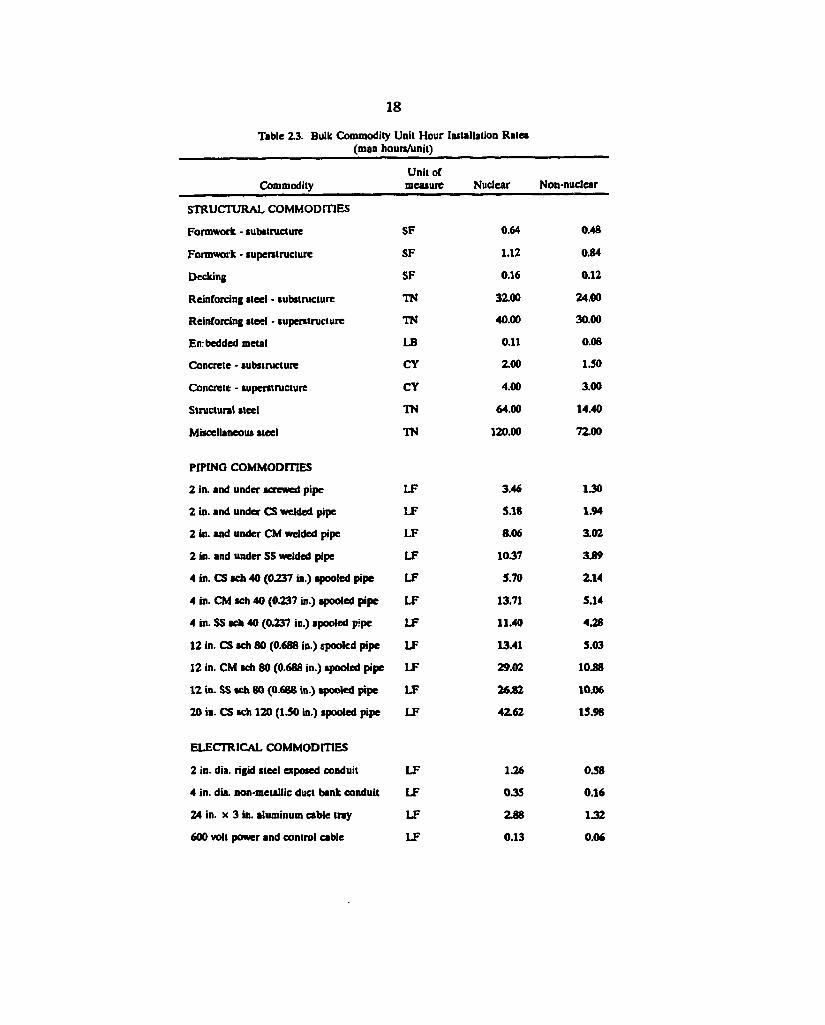
19. Bulk commodity unit hour installation rates are given in Table 2.3 for nuclear and
non-nuclear construction practices. Bulk commodity definitions are given in Table 2.4.
The data in Tables 2.2-2.4 were obtained from actual architect/engineer cost experience.6
Material unit rates were obtained from an aggregate of current commodity vendor data.
Labor installation rates were developed by applying a productivity factor to estimating
standard rates. Nuclear productivity factors were developed from a set of early nuclear
projects, which did not undergo the upset and turmoil of the post-TMI backfitting
experience. Non-nuclear installation rates were developed from current fossil power
project experience. While these data values may not be the absolute best that can be
achieved under the licensing and construction environment described by these
groundrules, they represent a data set sufficient for the preparation of consistent
conceptual cost estimates. The bulk commodity unit costs (Table 2.2) and installation
rates (Table 2.3) do not comprise the complete set of such information needed to cost
a plant design. Any exception to the labor rates, commodity prices and installation
manhours shown on Tables 2.1, 2.2, and 2.3 shall be justified.
20. Capital costs shall be separated into two categories related to whether the
equipment/construction is nuclear-safety-grade or industrial non-nuclear-safety-grade.
The plant design contractor (RM's and AE's) shall determine the boundaries of the
nuclear-safety-grade and industrial non-nuclear-safety grade areas. Costs within each
category will be reported in EEDB format as illustrated in Appendices A, B, and C.
21. Although included and reported in the overall plant estimate, costs of common plant
facilities will, in addition, be identified at the two digit account level and listed separately
in EEDB tormat as discussed above.
22. In cases where equipment items or piping are combined with structural members to
produce a factory-assembled equipment module, a work sheet documenting each module
should be prepared. The work sheet will identify by three-digit EEDB account the
applicable items and costs that comprise the module. For each three-digit account, the
work sheet will provide the equipment and material costs, shop and field labor hours
and costs, factory overhead and profit, freight, and total module cost. In addition, the
text must describe the approach used to estimate each of the cost items. In regard to
the total plant cost estimate, three-digit level costs for items that are part of a factory
2 2
module must remain in the EEDB account that represents that particular item i.e., costs
for structural portions of a module should be reported in Account 21 and equipment/
piping costs should be reported in the relevant system account (Accounts 22-26).3 The
total factory cost, including shop labor and materials, should be recorded as factory
equipment costs in the EEDB cost estimate format. Field labor to install a module
should be recorded as site labor in the EEDB estimate format. Labor costs to produce
and/or install a module may be prorated among the related three-digit EEDB accounts,
if necessary. The basis for cost-related assumptions regarding the module factory must
be documented. Such assumptions include factory location, factory labor rates, labor
unit productivity, factory overhead, and module shipping cost assumptions. The wage
rates for factory craft workers should be based on the field craft labor data for the
factory site. Any adjustments to the labor rates to reflect the factory environment must
be fully supported in the cost estimate report
23. For large equipment items and modules, the site delivered transportation costs are to
be identified as a line item.
24. For large factory equipment items such as the reactor vessel and internals, steam
generators, heat exchangers, etc., supporting cost data by component must be available
for review. The supporting data will include factory material cost, material weights,
factory man-hours, recurring cost, and total cost for each equipment item.
25. The heat rejection system will be designed for the site conditions as described in
Appendix F such that the turbine exhaust pressure will be at or below the design value
91% of the time.
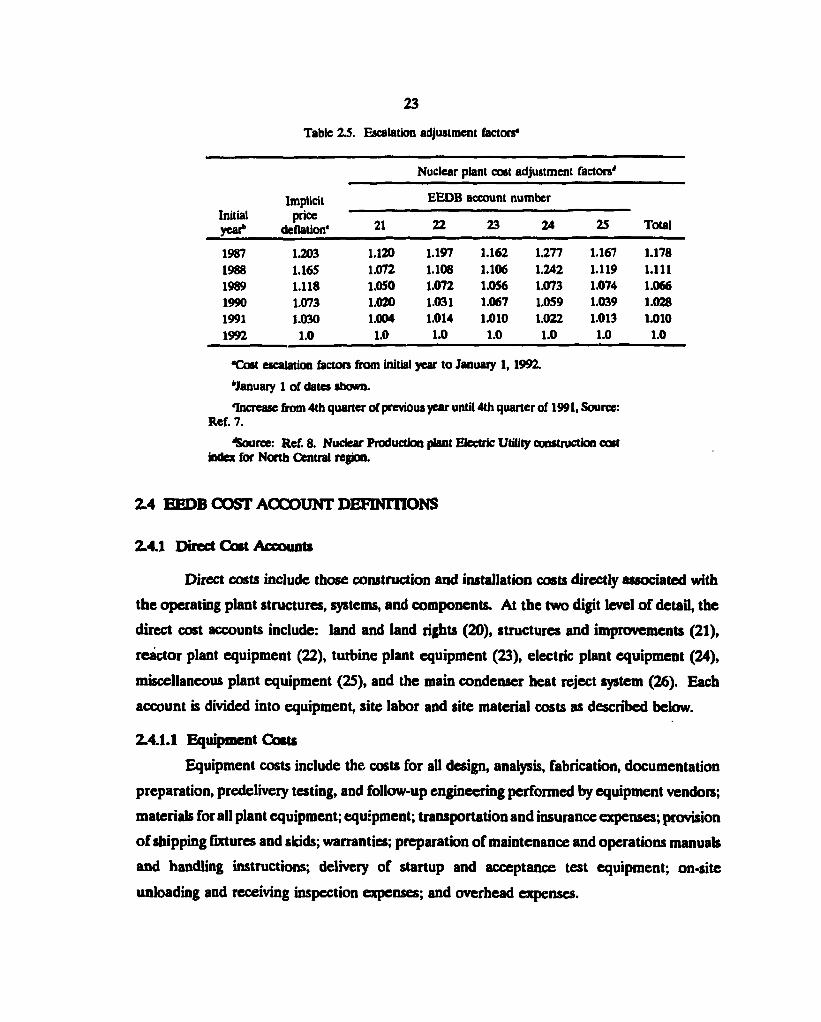
26. The estimator will use cost information relevant to the reference date (January 1,1992
for current studies) where possible. If such information is not available, costs in terms
of another reference year may be adjusted, where applicable, using appropriate cost
indices. Examples of such adjustment factors using both the Gross Domestic Product
Implicit price deflator7 and the Handy-Whitman cost index* for Nuclear Production
Plant Electric Utility construction costs (North Central region) are given in Table 2.5.
23
Table Z5. Escalation adjustment factors*
Nuclear plant cost adjustment factors'
Implicit EEDB account number Initial year*
price deflation* 21 22 23 24 25 Total
1987 1.203 1.120 1.197 1.162 1.277 1.167 1.178 1988 1.165 1.072 1.106 1.106 1.242 1.119 1.111 1969 1.118 1.050 1.072 1.056 1.073 1.074 1.066 1990 1.073 1.020 1.031 1.067 1.059 1.039 1.028 1991 1.030 1.004 1.014 1.010 1.022 1.013 1.010 1992 1.0 1.0 1.0 1.0 1.0 1.0 1.0
•Cost escalation factors from initial year to January 1,1992.
'January 1 of dates shown.
Increase from 4th quarter of previous year until 4th quarter of 1991, Source: Ref. 7.
^Source: Ref. 8. Nuclear Production plant Electric Utility construction cost index for North Central region.
2.4 EEDB COST ACCOUNT DEFINITIONS
2.4.1 Direct Coat Accounts
Direct costs include those construction and installation costs directly associated with
the operating plant structures, systems, and components. At the two digit level of detail, the
direct cost accounts include: land and land rights (20), structures and improvements (21),
reactor plant equipment (22), turbine plant equipment (23), electric plant equipment (24),
miscellaneous plant equipment (25), and the main condenser heat reject system (26). Each
account is divided into equipment, site labor and site material costs as described below.
2.4.1.1 Equipment Coats
Equipment costs include the costs for all design, analysis, fabrication, documentation
preparation, predelivery testing, and follow-up engineering performed by equipment vendors;
materials for all plant equipment; equipment; transportation and insurance expenses; provision
of shipping fixtures and skids; warranties; preparation of maintenance and operations manuals
and handling instructions; delivery of startup and acceptance test equipment; on-site
unloading and receiving inspection expenses; and overhead expenses.
2 4
All plant equipment items, whether directly associated with the power generation
systems or the facility systems, such as heating and ventilation, are included in this category.
For the equipment fabricated and/or assembled at an on-site fabrication facility, all
the associated costs are included as equipment costs, including the fabrication and/or assembly
costs and the costs to move the equipment within the facility to its on-site receiving or storage
point. The on-site labor related to installation of shop fabricated modules should be included
in the field labor and not as factory equipment. Field labor rates should be used for any on-
site fabrication facility.
2.4.1.2 Site Labor Coat
The site labor portion of the construction and equipment installation costs includes
all on-site activities related to permanent plant structures, systems, and equipment required
for all aspects of power plant operation.
The direct costs of all work crews and foremen to excavate, backfill, erect, and finish
structures and to place and install equipment, piping, wiring, modules, etc. are included.
Labor rates for this work include base rates, fringe benefits, and any travel or
subsistence allowances.
All direct construction and installation costs are on a force account basis (see
Sect. 1.2).
For this estimate, the costs associated with installing equipment items for both NSSS
and BOP systems include the labor to transport the equipment from on-site storage or the
on-site fabrication facility to the final resting place as well as the labor to align the equipment,
physically attach it to the supporting structure and test it. In addition, the labor costs for
providing mechanical hookups and electrical connections between interfacing systems will be
included.
2.4.13 Site Materials Cost
Site materials include all materials purchased in the field and/or bulk items such as
paint, concrete, rebar, welding rod, formwork, etc. All piping, less than 2-1/2-in. nominal pipe
size, is a materials item with the exception of pipe for cryogenic fluids. Also all wire, cable,
and raceways except the control system fiber optic cabling are material items, including those
in building service power systems. The control system fiber optic cabling shall be included
with the control system equipment.
25
2.42. Indirect Cost Accounts
The indirect cost accounts include those construction support activities required to
design and build the structures and systems described in the direct cost accounts. At the two-
digit account level of detail, the indirect cost accounts collect the costs for construction
services, home office engineering and services, field office engineering and services and
owner's cost. A bottoms up estimate for indirect costs is recommended. The cost estimate
procedure should be fully documented by the estimator.
The following subsections provide a description of the indirect costs by three-digit
EEDB accounts.
2.4.2.1 Construction Services Coats (Account 91)
Construction services (Account 91) includes costs for CM-related activities associated
with construction as indicated below:
Temporary construction facilities (Account 911'). This subaccount includes temporary
structures and facilities, janitorial services, maintenance of temporary facilities, guards and
security, roads, parking lots, laydown areas, and temporary electrical, heat, air, steam and
water systems, general cleanup, etc.
Construction tools and equipment (Account 912V Construction tools and equipment
include rental and/or purchase of construction equipment, small tools and consumables (fuel,
lubricants, etc.), as well as maintenance of construction equipment.
Payroll insurance and taxes (Account 913V These expenses include insurance and
taxes related to craft labor (direct and indirect including guards and janitors), such as social
security taxes and state unemployment taxes, workmen's compensation insurance, and public
liability and property damage insurance.
Permits, insurance and local taxes (Account 914V Consistent with other EEDB-type
estimates, builders all-risk insurance will be the only cost included in Account 914. Payments
to federal, state, and local governments for taxes, fees, and permits are to be included in
Account 942 because they are plant specific.
2.4.22 Engineering and Home Office Services Costs (Account 92)
Engineering and home office services are site specific and include all AE management,
engineering design, licensing and associated support activities. The costs for these services
2 6
include salaries, direct payroll-related costs (DPC), overhead loading expenses, and fees for
these services. This cost element includes activities as given below.
Reactor Module Engineering and Services (Account 920V These costs include site
specific reactor module engineering and licensing (both field and home office), procurement
and expediting activities, estimating and cost control, engineering planning and scheduling,
reproduction services, and expenses associated with the above functions. These costs may be
included in the cost of the NSSS package but should be broken out separately.
AE Engineering and home office expenses (Account 921). These costs include AE
engineering and design (both field and home office), procurement and expediting activities,
estimating and cost control, engineering planning and scheduling, reproduction services, and
expenses associated with performance of the above functions (i.e., telephone, postage, com-
puter use, travel, etc.).
AE Home office quality assurance (Account 922). This account includes the services
of home office QA engineers and staff personnel engaged in work on the project. Services
include reviews, audits, vendor surveillance, etc. as required for design and construction of
the nuclear safety-related portion of the facility.
AE Home office project management (Account 923). These services include those
of the construction manager and his assistants. Services of construction planning and
scheduling, construction methods, labor relations, safety, and security personnel are utilized
as required.
2.4.23 Field Supervision and Field Office Services Costs (Account 93)
Field Supervision and Field Office Services (Account 93) includes costs for CM-
related activities associated with on-site management of construction, site Q/A, startup and
test, and the supporting costs for these functions as indicated below. Costs of these services
include salaries, DPC, overhead loading, relocation costs of key personnel, and fees.
Field office expenses (Account 931V These expenses include costs associated with
purchase and/or rental of furniture and equipment (including reproduction), communication
charges, postage, stationery, other office supplies, first aid, and medical expenses.
Field job supervision (Account 932V This management function includes the resident
construction superintendent and his assistants; craft labor supervisors; field accounting,
27
payroll, and administrative personnel; field construction schedulers; field purchasing
personnel; warehousemen; survey parties; stenographers; and clerical personnel.
Field QA/QC (Account 933V These services include those of personnel located at
the job site engaged in equipment inspection, required documentation of safety-related
equipment, inspection of construction activities, and construction training meetings.
Plant startup and test (Account 934V These services are associated with preparation
of startup and plant operation manuals and test procedures, direction and supervision of
testing of equipment and systems as the plant nears completion, and direction of startup of
the facility. Costs of any craft labor required for startup and testing activities are included in
the appropriate direct-cost line items.
2.4.2.4 Owner*' Cost (Account 94)
Owners' cost (Account 94) includes the costs of the owner for activities associated
with the overall management and integration of the project and other costs not included in
the direct capital costs incurred prior to start of commercial operations as follows:
Management, engineering, integration, and OA/OC (Account 941V These expenses
include cost of owner's staff for project management, engineering, integration, licensing,
control, and QA/QC It also includes supporting home office services such as estimating,
planning and scheduling, and purchasing, as well as payment for outside supporting service
directly associated with siting, building and startup of the plant.
Taxes and insurance (Account 942V These expenses cover all owner's nuclear and
other insurance premiums, state and local taxes and sales taxes on purchased materials and
equipment incurred during the course of the project, and permits, licenses, and fees. Builder's
all risk insurance is included in Account 914.
Spare parts and initial supplies (Account 943V This account includes the initial stock
of supplies, consumables and spare parts needed for testing and startup operations and the
plant inventories of fluids (water, lub oils), fuels (excluding nuclear fuel) and chemicals. Office
furniture, communication equipment, transportation vehicles, laboratory equipment, house
keeping gear, and other utility specific equipment are also part of this account A good
Reliability Centered Maintenance (RCM) program should be assumed and spare parts costs
should reflect standard plants and modular plants and use of spare parts pools as applicable.
Special coolants are not included here but in account 946.
2 8
Staff Training and Startup (Account 944V The costs of the initial staffing and training
of maintenance, operating, supervisory and administrative personnel are included in this
account. This includes the preparation of all training materials and instruction costs, the
salaries of the operating and the maintenance staff assigned to the plant prior to the plant
acceptance, and their associated material and service expenses.
General and Administrative (G&A1 (Account 945V This includes administrative and
general salaries plus related expenses, labor and certain regulatory expenses, outside services
not applicable to other owner accounts, and public relation activities.
Capital equipment (Account 946V This item includes costs for any special coolants
such as sodium, helium or heavy water for the initial loading of the plant systems.
It is preferred that owner's cost be estimated directly by consideration of the contents
of each subaccount. If such an estimate is not possible, it is recommended that total owner's
cost (Account 94) be estimated as 15% of the sum of the total direct and other indirect costs
plus the cost of any special coolants.
2.4.23 RM Home Office Engineering and Services (Account 95)
This account includes all the costs of RM services and support that are over and
above the normal charges included in the cost of an NSSS package (EEDB Account 220A).
2 5 BASE CONSTRUCTION CAPITAL COST DOCUMENTATION
Specific reporting requirements will be determined by DOE Program Management.
The following documentation guidelines represent possible reporting requirements.
23.1 Cost Reports
As determined by DOE, separate cost estimates for the first commercial and NOAK
plant may be required. Each separate cost set will be documented, separating the nuclear
island costs from the balance of plant costs, using the EEDB tabular format and Code of
Accounts according to the format in Table 2.6. Typical Code of Accounts for the ALMR,
MHTGR and LWRs are provided in Appendices A—C. In addition to tabular cost data, a
complete text description of the methods and assumptions used in developing the costs shall
be submitted with the cost data. As discussed in Sect. 2.3, documentation on factory-produced
2 9
equipment modules should include a work sheet for each different module. Examples of how
the factory module costs fit into the EEDB code of accounts should be given. A suggested
work sheet format is provided in Table 2.7.
Z 5 2 Plan.: Bulk Commodities Data
To make commodity comparisons with competing plant concepts, the commodities
listed below shall be reported as indicated at the two-digit EEDB level. Additional account
detailed breakdowns should be retained by the proponent for review by DOE.
• Formwork [square feet (SF)] — Both wooden and metal forms are included.
• Structural steel [tons (TN)] — All structural steel is included regardless of whether it is
used in modules or is field erected for both safety or nonsafety class structures.
• Reinforcing steel [tons (TN)] — The quantities for cadwelds and wire fabric are not *
included.
• Embedded steel [tons (TN)] — All embedded steel is included regardless of whether it
is used in safety or nonsafety class structures.
• Structural concrete [cubic yards (CY)] — The costs for removable concrete plugs and for
curbs and walks are not included. All structural concrete is included regardless of whether
it is used in safety-class or non-safety-class structures, whether it is in internal or external
walls, or whether it is in floor or elevated slabs.
• Concrete fill [cubic yards (CY)] — All fill concrete is included regardless of its location
or purpose except when included as part of a module.
• Piping [linear ft (LF)] — The following subcategories are required:
CS, SC, <2 1/2-in. pipe
SS, SC, < 2 1/2-in. pipe
CS, SC, ^ 2 1/2-in. pipe
SS, SC, Ttl 1/2-in. pipe
CM, SC, 1/2-in. pipe
CS, NNS, <2 1/2-in. pipe
SS, NNS, <2 1/2-in. pipe
CS, NNS, 2:2 1/2-in. pipe
SS, NNS, 2s 2 1/2-in. pipe
CM, NNS, 1/2-in. pipe
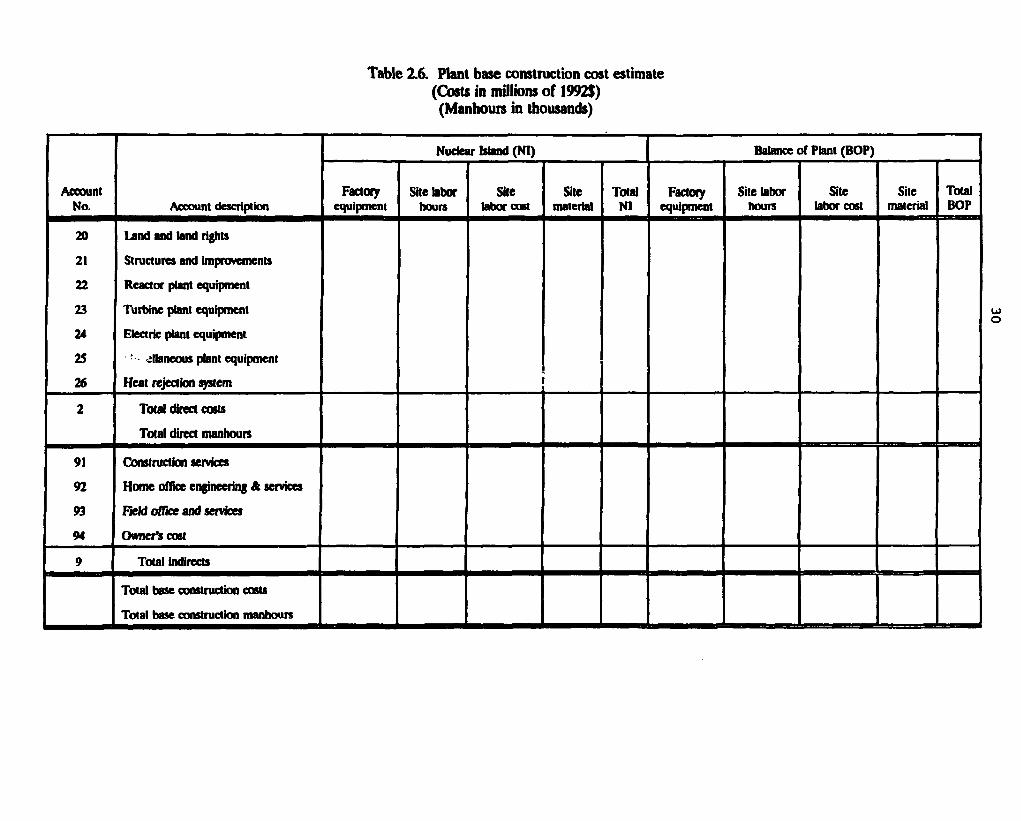
Table 2.6. Plant base construction cost estimate (Costs in millions of 1992$) (Manhours in thousands)
Account No. Account description
Nuclear Island (NI) Balance of Plant (BOP)
Account No. Account description
Factory equipment
Site labor hours
Site labor cost
Site material
Total NI
Factory equipment
Site labor hours
Site labor cost
Site material
Total BOP
20
21
22
23
24
25
26
Land and land rights
Structures and improvements
Reactor plant equipment
Turbine plant equipment
Electric plant equipment
• • dlaneous plant equipment
Heat rejection system
2 Total direct costs
Total direct manhours
91
92
93
94
Construction services
Home office engineering & services
Field office and services
Owner's cost
9 Total indirects
Total base construction costs
Total base construction manhours
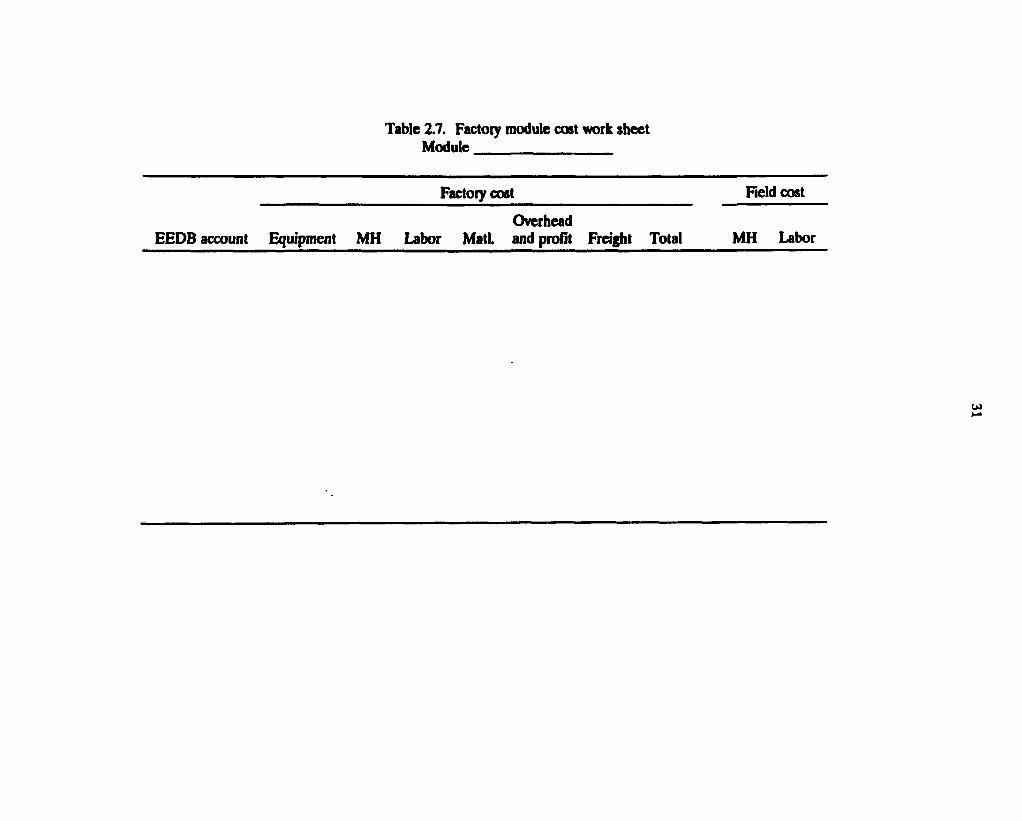
Table 2.7. Factory module cost work sheet Module
Factory cost Field cost
Overhead EEDB account Equipment MH Labor Mat), and profit Freight Total MH Labor
3 2
where
CS = carbon steel,
SS = stainless steel,
CM = chrome moly steel,
SC = safety class,
NNS = non-nuclear-safety class.
These ten categories of piping do not include the following:
1. concrete, copper, cast iron, and galvanized pipe;
2. roof and floor drains piping;
3. sprinkler systems piping; and
4. sanitary facilities piping.
• Power cable [linear feet (LF)]
This categoiy should exclude lighting, cathodic protection, communication and heat tracing
cable.
• Control cable and instrumentation cable.
• Wire and cable duct runs and containers [linear feet (LF)]—This account includes:
1. underground and above ground,
2. metallic and nonmetallic ducts, conduit, and
3. cable trays.
This categoiy should exclude lighting, cathodic protection, communication and heat tracing
cable.
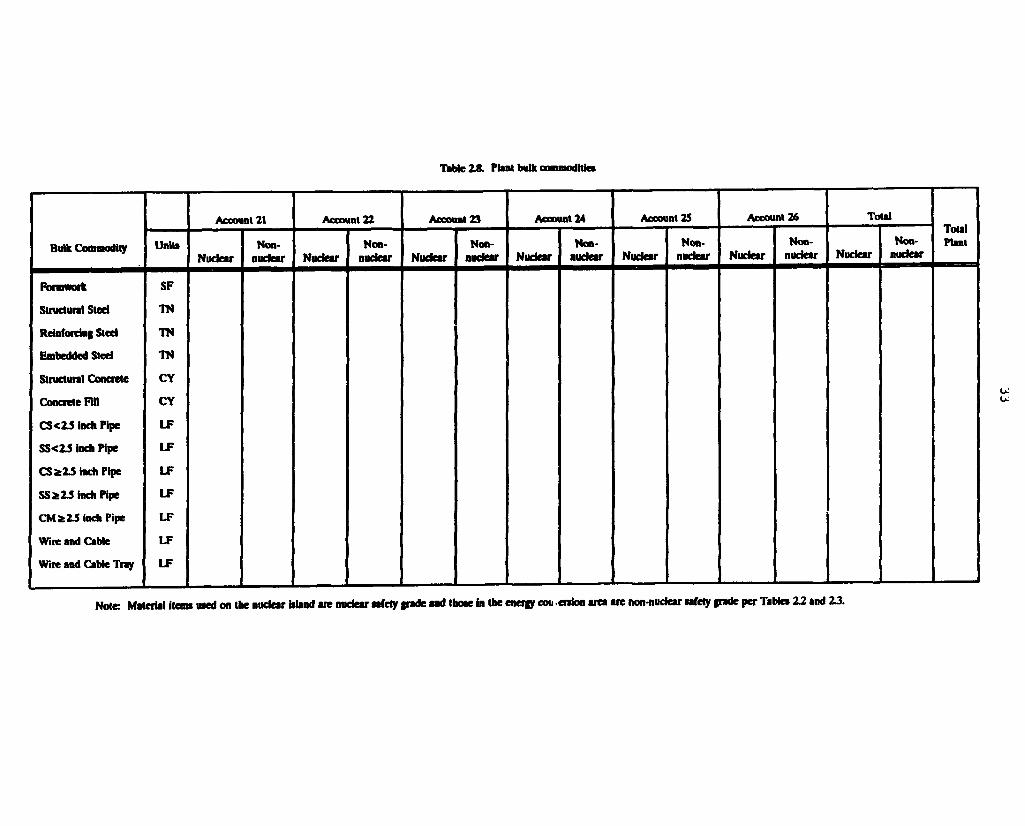
Bulk commodities should be reported by EEDB Code of Accounts as shown in
Table 2.8.
253 Plant Labor Requirements Data
Craft and engineering labor requirements will be summarized by two-digit direct and
indirect cost accounts as well as by total plant. Three-digit detail should be retained by the
Tible £8. Plant bulk commodities
Bulk Commodity
Account 21 Account 22 Account 23 Account 24 Account 2S Account 26 To tal Total Plant Bulk Commodity Units
Nuclear Non-
nuclear Nuclear Non-
nuclear Nuclear Non-
nudear Nudear Non-
nuclear Nuclear Non-
nuclear Nuclear Non-
nuclear Nuclear Non-
nuclear
Total Plant
Fonnwork
Structural Steel
Reinforcing Steel
Embedded Sted
Structural Concrete
Concrete Fill
CS<2.5 Inch Pipe
SS<Z5 inch Pipe
CS2ZS inch Pipe
S S i 2 J inch Pipe
CM a 2.5 inch Pipe
Wire and Cable
Wire and Cable Tray
SF
TN
TN
TN
CY
CY
LF
LF
LF
LF
LF
LF
LF
Non-nuclear
Note: Material items used on the nuclear island are nuclear safety grade and those in the energy cou enfon area are non-nuclear safety grade per Tables 22 and 23.
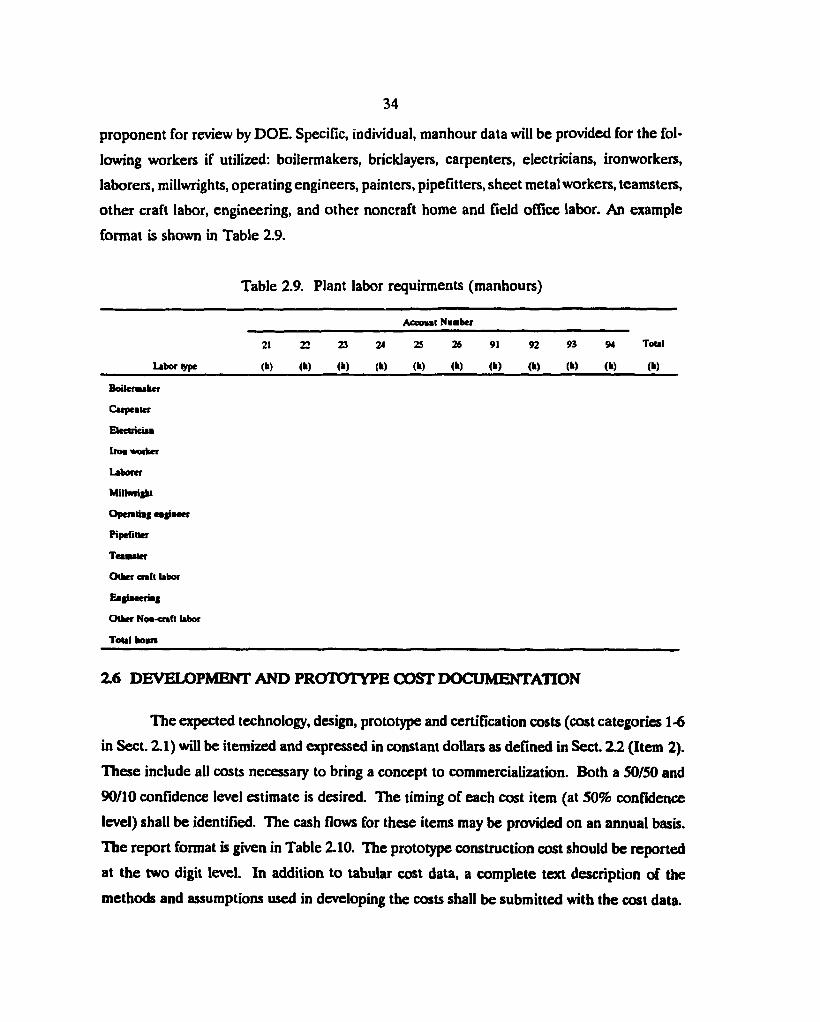
3 4
proponent for review by DOE. Specific, individual, manhour data will be provided for the fol-
lowing workers if utilized: boilermakers, bricklayers, carpenters, electricians, ironworkers,
laborers, millwrights, operating engineers, painters, pipefitters, sheet metalworkers, teamsters,
other craft labor, engineering, and other noncraft home and field office labor. An example
format is shown in Table 2.9.
Table 2.9. Plant labor requirments (manhours)
Acconal N f b e r
21 22 23 24 25 26 91 92 93 94 Total
Labor type (h) (h) (h) (h) (h) (h) (h) (fc) (h) (h) (h)
Boilermaker
Carpeater
Electricua
Iroa worker
Laborer
Millwright
Operating eajiaeer
Pipefitler
Tea alter
Other craft labor
Eagiaeeriag
Other Noa-ctaft labor
Toul boars
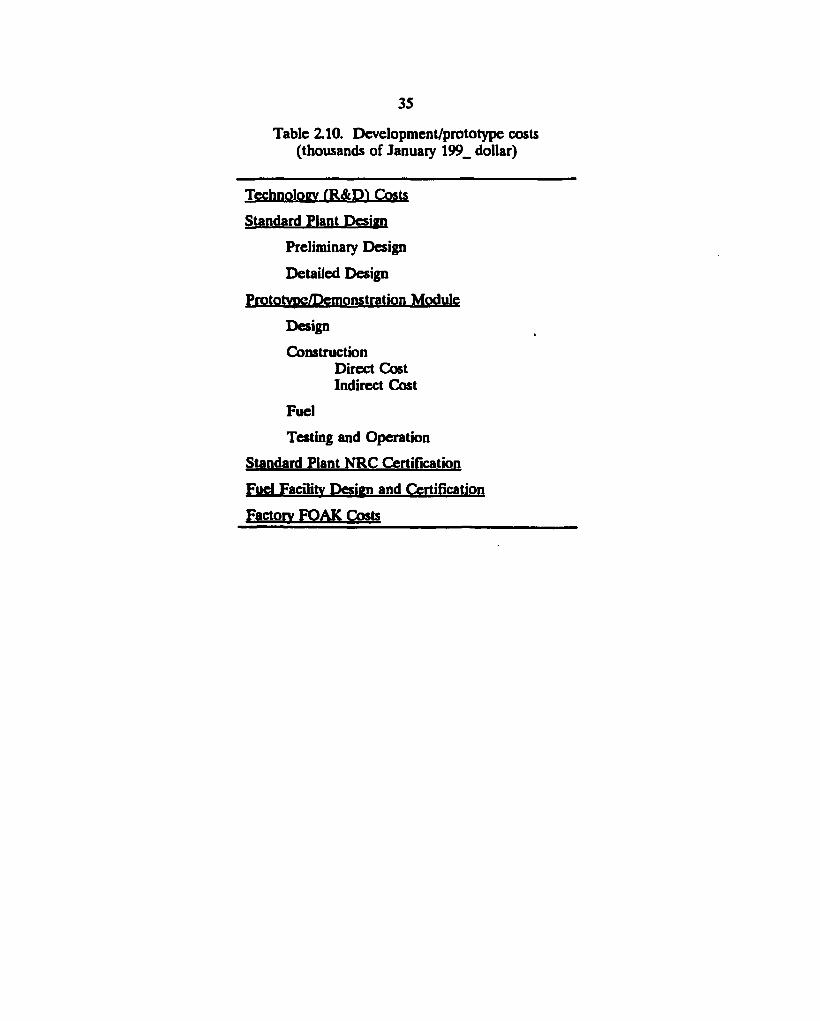
2.6 DEVELOPMENT AND PROTOTYPE CX)ST DOCUMENTATION
The expected technology, design, prototype and certification costs (cost categories 1-6
in Sect. 2.1) will be itemized and expressed in constant dollars as defined in Sect. 2.2 (Item 2).
These include all costs necessary to bring a concept to commercialization. Both a 50/50 and
90/10 confidence level estimate is desired. The timing of each cost item (at 50% confidence
level) shall be identified. The cash flows for these items may be provided on an annual basis.
The report format is given in Table 2.10. The prototype construction cost should be reported
at the two digit level. In addition to tabular cost data, a complete text description of the
methods and assumptions used in developing the costs shall be submitted with the cost data.
3 5
Table 2.10. Development/prototype costs (thousands of January 199_ dollar)
Technology fR&DI Costs
Standard Plant Design
Preliminary Design
Detailed Design
Prototype/Demonstration Module
Design
Construction Direct Cost Indirect Cost
Fuel
Testing and Operation
Standard Plant NRC Certification
Fuel Facility Design and Certification
Factory FOAK Costs
3. TOTAL CAPITAL COST
This section provides the ground rules for preparing an estir ,c total capital
cost of a power plant. The base construction capital cost as descr ibed hi ih£ previous section
is the starting point for costs developed in this section. The total capital cost shall be
calculated in nominal dollars (including inflation) to the operation date and then adjusted to
the reference years dollars.
3.1 CONTINGENCY
Contingency is a judgement adder to the base construction cost estimate to obtain a
median cost estimate where there is equal probability that the true cost will be higher or
lower than that cost (see Appendix H). It includes an allowance for indeterminates and shall
be calculated as a percentage of base construction cost. However, different percentages
should be used for different systems or components in a plant because the amount of the con-
tingency cost should be related to the stage or current level of design, the degree of
technological advance represented by the design, and the quality/reliability level of the given
system/component. As an example, it should be possible to estimate the cost for a standard
mechanical draft cooling tower system more accurately (therefore requiring less contingency)
than the cost for a new, innovative NSSS. To obtain consistency between various cost
estimates, the percentages and requirements for their use are defined as follows.
A contingency cost of 25% of the applicable base cost shall be calculated for those
systems that are innovative, that represent a substantial departure from previously built
designs, or that require a high assurance of quality in construction and operation (e.g.,
nuclear-safety grade systems). For systems or components that are standard, current, off-the-
shelf technology items that are being applied in a normal, industrial non-nuclear-safety grade
application, a contingency cost of 15% of the applicable base cost shall be calculated.
In cases where the scope and level of design provide for accurate quantity takeoffs
and material and labor pricing, a lower contingency may be justified. Where design margins
are substantial (for example, if a turbine-generator has a capability far higher than design
output), a lower contingency may also be justified. In other cases where design definition is
limited and prices are uncertain, a higher contingency value may be justified. The estimators
3 7
may assess individual contingency amounts at the detailed account level. In those cases that
the estimator departs from the basic 15% and 25% contingency rates, the details and reasons
for the deviation shall be shown. The total contingency cost to be reported will be the sum
of the contributions from each system or component category, and will include the expected
value of cost items not explicitly covered in the detailed estimate (allowance for
indeterminates). Contingency amounts for indirect base costs shall be calculated as above,
based on an estimation of the proportion of the contingency reflected in that particular
indirect cost. The assumptions used in classifying the direct and indirect base costs according
to the two categories must be fully documented by the estimator in detail.
The contingency estimate will be expressed in the same year's dollars as the base
construction costs.
3 2 CASHFLOW
The cash flow requirements during the design and construction period will be
determined on a quarterly basis for the prototype, first commercial and NOAK plants as
required. The cash flow should be expressed in the same year's dollars as the overnight costs
and should indicate whether contingency costs are included. Contingency costs must be
explicitly included in the cash flow data if it is not assumed that contingency cash flow is
proportional to base cost cash flow. Time effects such as escalation/inflation and interest
should not be included in this cash flow data. As a result of the exclusion of escalation, the
dates of cash flow may be expressed as either a relative or absolute date with respect to
commercial operation. In addition, cash flows may be provided which include inflation.
3 3 ESCALATION
It is to be assumed that escalation during the design and construction period is
occurring at the same rate as inflation; that is, there is no real escalation during this period.
Costs will escalate between the reference year given in Sect. 2.2 (item 2) and the time the
money is spent. It will be assumed that the money spent during any quarterly period will be
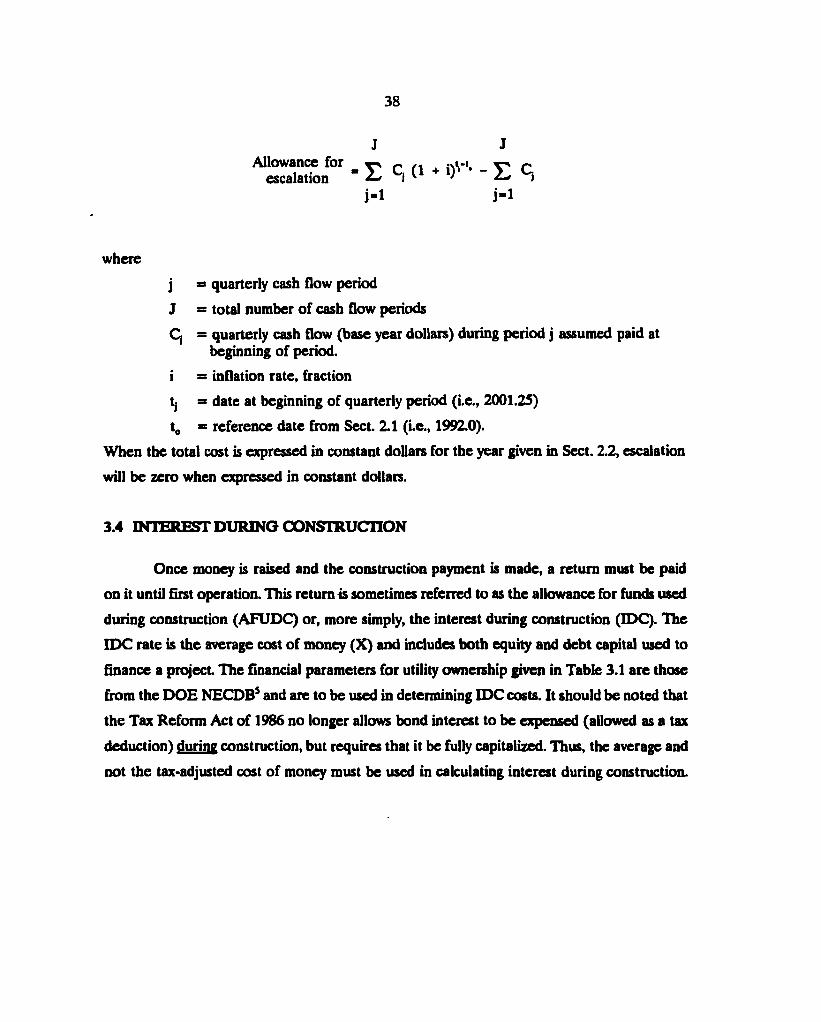
paid at the beginning of the period. Total escalation during construction may be computed
using the following formula
3 8
J J >r _ i
escalation Allowance for , £ C j (1 • i)''"- - £ C }
j -1 i - i
where
j = quarterly cash flow period
J = total number of cash flow periods
Cj = quarterly cash flow (base year dollars) during period j assumed paid at beginning of period.
i = inflation rate, fraction
tj = date at beginning of quarterly period (i.e., 2001.25)
t0 = reference date from Sect. 2.1 (i.e., 1992.0).
When the total cost is expressed in constant dollars for the year given in Sect. 2.2, escalation
will be zero when expressed in constant dollars.
3.4 INTEREST DURING CONSTRUCTION
Once money is raised and the construction payment is made, a return must be paid
on it until first operation. This return is sometimes referred to as the allowance for funds used
during construction (AFUDC) or, more simply, the interest during construction (IDC). The
IDC rate is the average cost of money (X) and includes both equity and debt capital used to
finance a project. The financial parameters for utility ownership given in Table 3.1 are those
from the DOE NECDBS and are to be used in determining IDC costs. It should be noted that
the Tax Reform Act of 1986 no longer allows bond interest to be expensed (allowed as a tax
deduction) during construction, but requires that it be fully capitalized. Thus, the average and
not the tax-adjusted cost of money must be used in calculating interest during construction.
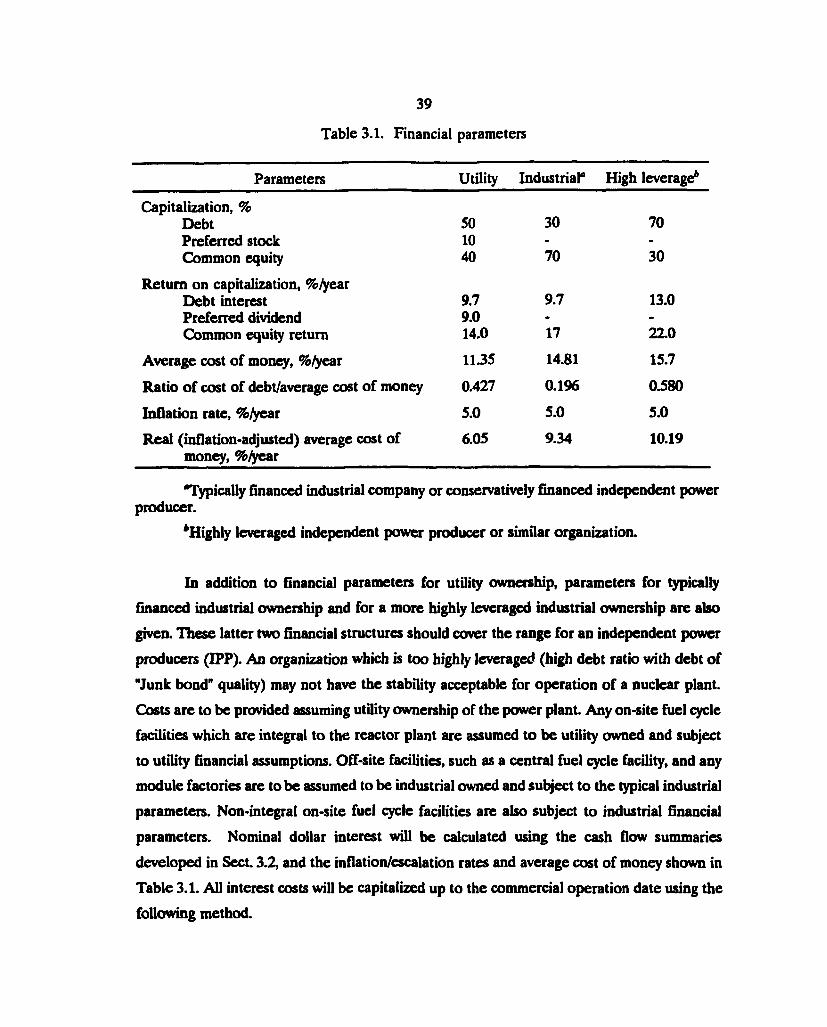
3 9
Table 3.1. Financial parameters
Parameters Utility Industrial" High leverage6
Capitalization, % Debt 50 30 70 Preferred stock 10 - -
Common equity 40 70 30
Return on capitalization, %/year Debt interest 9.7 9.7 13.0 Preferred dividend 9.0 - -
Common equity return 14.0 17 22.0
Average cost of money, %/year 11.35 14.81 15.7
Ratio of cost of debt/average cost of money 0.427 0.196 0.580
Inflation rate, %/yeat 5.0 5.0 5.0
Real (inflation-adjusted) average cost of 6.05 9.34 10.19 money, %/year
"Typically financed industrial company or conservatively financed independent power producer.
'Highly leveraged independent power producer or similar organization.
In addition to financial parameters for utility ownership, parameters for typically
financed industrial ownership and for a more highly leveraged industrial ownership are also
given. These latter two financial structures should cover the range for an independent power
producers (IPP). An organization which is too highly leveraged (high debt ratio with debt of
"Junk bond" quality) may not have the stability acceptable for operation of a nuclear plant.
Costs are to be provided assuming utility ownership of the power plant. Any on-site fuel cycle
facilities which are integral to the reactor plant are assumed to be utility owned and subject
to utility financial assumptions. Off-site facilities, such as a central fuel cycle facility, and any
module factories are to be assumed to be industrial owned and subject to the typical industrial
parameters. Non-integral on-site fuel cycle facilities are also subject to industrial financial
parameters. Nominal dollar interest will be calculated using the cash flow summaries
developed in Sect 3.2, and the inflation/escalation rates and average cost of money shown in
Table 3.1. All interest costs will be capitalized up to the commercial operation date using the
following method.
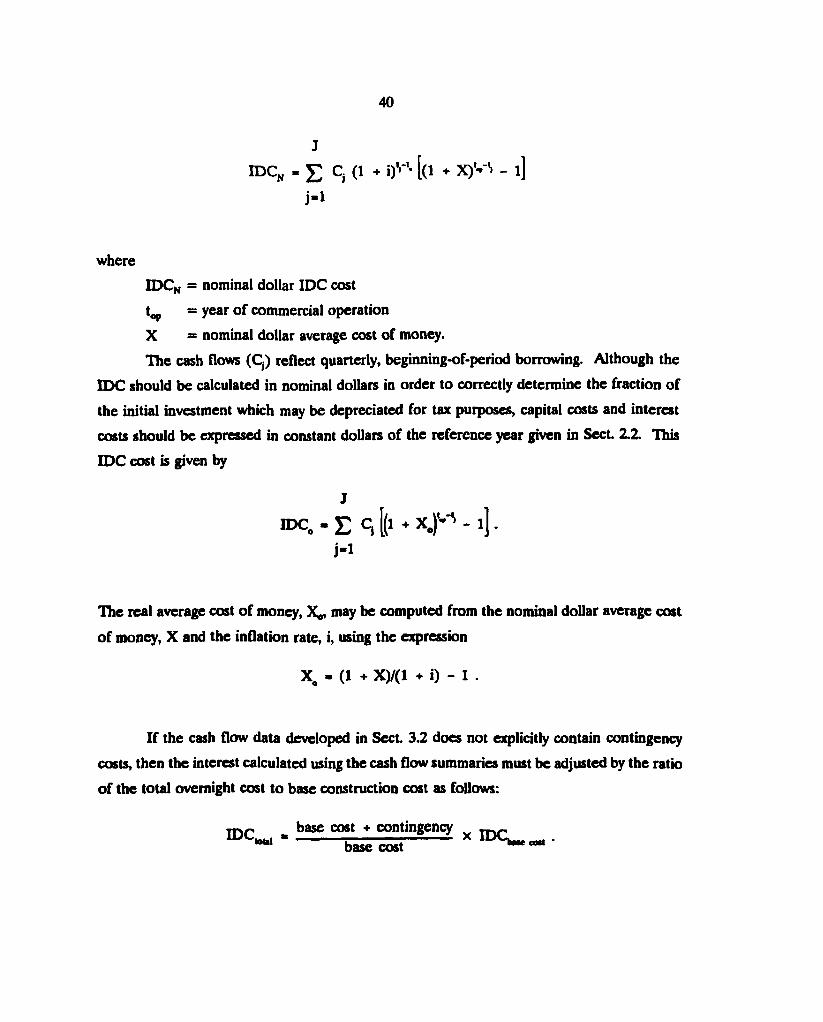
40
J
i d c n - £ q (1 • i)''"- [(1 • X)VS - i ]
j - i
where
IDCn = nominal dollar IDC cost
t^ = year of commercial operation
X = nominal dollar average cost of money.
The cash flows (Cj) reflect quarterly, beginning-of-period borrowing. Although the
IDC should be calculated in nominal dollars in order to correctly determine the fraction of
the initial investment which may be depreciated for tax purposes, capital costs and interest
costs should be expressed in constant dollars of the reference year given in Sect 2.2. This
IDC cost is given by
J
roq-E q [ ( i • x j ^ - i ] . j - i
The real average cost of money, Xo, may be computed from the nominal dollar average cost
of money, X and the inflation rate, i, using the expression
X - (1 • X)/(l + i) - 1 .
If the cash flow data developed in Sect 3.2 does not explicitly contain contingency
costs, then the interest calculated using the cash flow summaries must be adjusted by the ratio
of the total overnight cost to base construction cost as follows:
IDC , - base cost • contingency x Wtol base cost c0"
3 JS TOTAL CAPITAL COST
41
Total capital cost (TCC) will consist of the base construction cost as developed in
Sect 2, contingency, escalation, and interest during construction. All costs will be expressed
in constant dollars in the year defined in Sect. 2.2 and separated into nuclear-safety grade,
nonnuclear-safety grade, and total cost. Table 3.2 provides the format to be used in reporting
total capita] cost. In addition to constant dollars, costs may be expressed in nominal dollars.
The total capital cost in nominal dollars differs from that in constant dollars by the total
inflation between the reference year and year of startup,
TCC N - TCC 0 (1 + i)1-"-
where
TCQ* = nominal dollar total capital cost
TCC0 = constant dollar total capital cost
i = inflation rate.
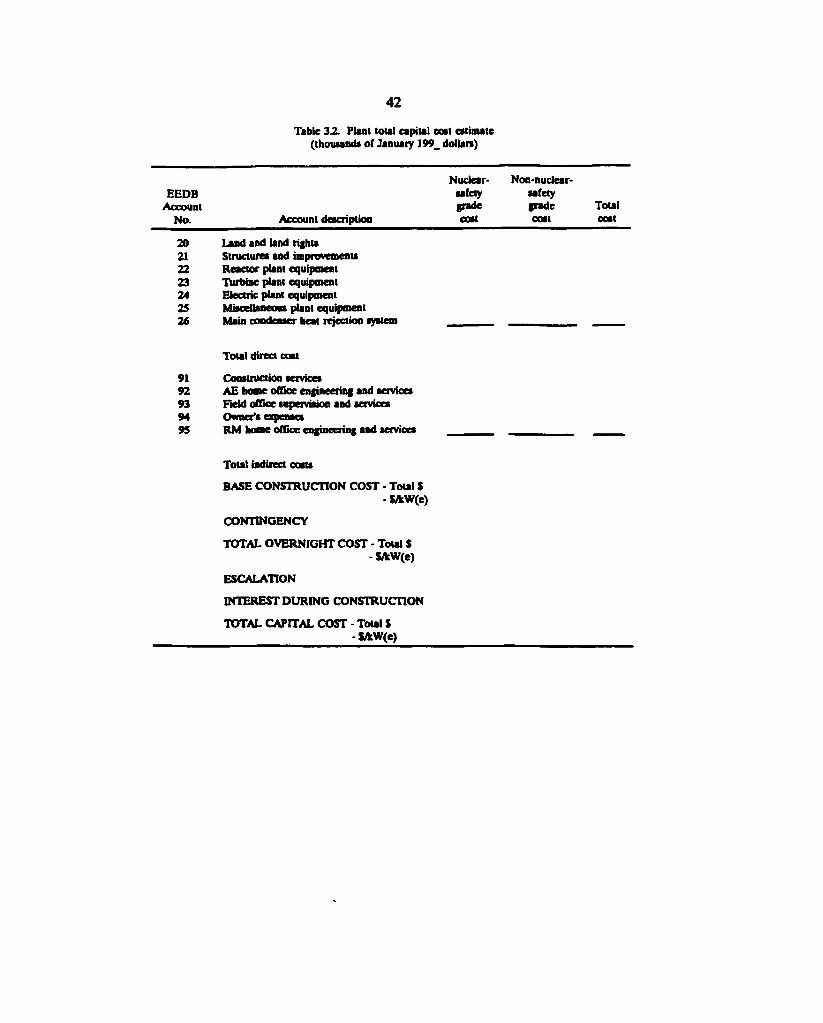
4 2
Table 32. Plant tout capital coat estimate (thousands of January 199_ dollars)
Nuclear- Non-nuclear-EEDB aafety safety
Account grade grade Total No. Account description cost cost cost
20 Land and land rights 21 Structures and improvements 22 Reactor plant equipment 23 Turbine plant equipment 24 Electric plant equipment 25 Miscellaneous plant equipment 26 Main condenser heat rejection system
Total direct cost
91 Construction services 92 AE home office engineering and services 93 Field office supervision and services 94 Owner's expenses 95 RM home office engineering and services
Total indirect costs
BASE CONSTRUCTION COST - Total S
- $/kW(e)
CONTINGENCY
TOTAL OVERNIGHT COST • Total S
- S/kW(e)
ESCALATION
INTEREST DURING CONSTRUCTION TOTAL CAPITAL COST - Total S
•S/kW(e)
4 3
4. BUSBAR GENERATION COST
This section provides guidance for developing the total leveiized generation or busbar
cost for a power plant consisting of one or more building blocks. The method is equally
applicable to a large monolithic plant.
4.1 GENERAL ASSUMPTIONS AND METHODOLOGY
A total plant energy generation cost or busbar cost includes the capital, nonfuel
operation and maintenance (O&M), fuel and decommissioning costs and is generally
expressed as a cost per unit energy. The general methodology to be followed in computing
these levelized power generation costs can be found in the U.S. DOE document NECDB.5
The methodology uses year-by-year revenue requirements procedures together with
levelization over the economic life of the plant The levelized costs can either be expressed
in dollars indexed to a reference year's buying power (constant dollar levelized cost) or in
terms of a levelized cost which remains constant over the life of the plant (nominal dollar
levelized cost). In the constant dollar levelized approach, the year-by-year unit cost of
electricity is assumed to rise in nominal dollar terms at the rate of inflation. The method used
to determine this unit cost is to calculate the present value of all the plant revenue require-
ments (costs) and divide that amount by the present value of the energy generated over the
life of the plant Although either constant dollar or nominal dollar levelized costs will give an
accurate comparison using the NECDB methodology, baseline results will be expressed in
constant dollars of the reference year given in Sect 2.2. Since the effect of taxes on the
levelized cost depends on the inflation rate, the actual calculation should be done in nominal
dollars including the projected inflation, and then adjusted to constant dollars.
Constant and nominal dollar levelized costs as defined with the NECDB methodology
are directly related by the relation,
LCo - LCN x CNCF
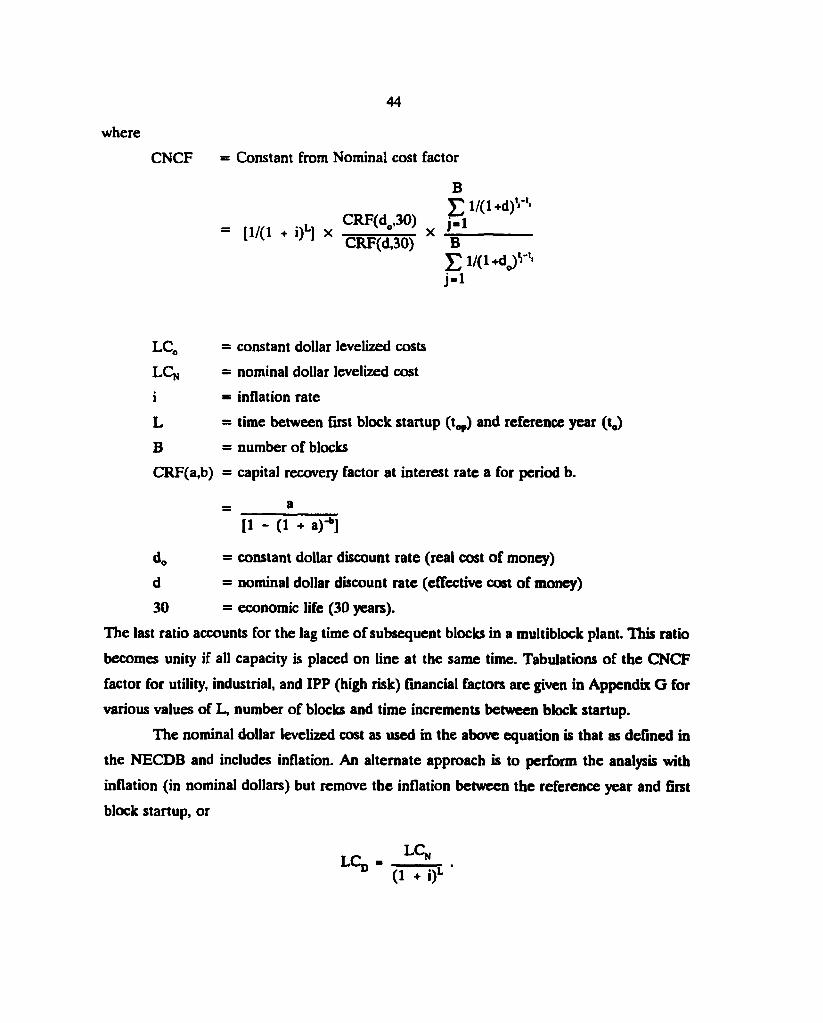
44
where
CNCF = Constant from Nominal cost factor
B E 1/(1 +d)
CRF(d ,30) fri = [1/C1 - 0 1 X ' ° X J-I CRF(d,30) B
E1/(1 + do) , ," , ,
j - i
LCC = constant dollar levelized costs
LCn = nominal dollar levelized cost
i = inflation rate
L = time between first block startup (t^) and reference year (t0)
B = number of blocks
CRF(a,b) = capital recoveiy factor at interest rate a for period b.
[1 - (1 • a)"*]
dc = constant dollar discount rate (real cost of money)
d = nominal dollar discount rate (effective cost of money)
30 = economic life (30 years).
The last ratio accounts for the lag time of subsequent blocks in a multiblock plant. This ratio
becomes unity if all capacity is placed on line at the same time. Tabulations of the CNCF
factor for utility, industrial, and IPP (high risk) financial factors are given in Appendix G for
various values of L, number of blocks and time increments between block startup.
The nominal dollar levelized cost as used in the above equation is that as defined in
the NECDB and includes inflation. An alternate approach is to perform the analysis with
inflation (in nominal dollars) but remove the inflation between the reference year and first
block startup, or
L C d - l c » (i • Ol
45
This "deflated nominal dollar" approach is simple and may promote better acceptance in some
sectors than either the pure nominal dollar or constant dollar figures.
Following some general requirements below, the treatment of each cost component
will be discussed, and in Chap. 5, examples of the method with alternative plants will be given.
1. The power plant will be assumed to be utility owned and operated. Other applications
may be shown in addition.
2. The levelized busbar cost will be expressed in constant dollars in the year defined in
Sect. 2.2, Item 2. Nominal dollar or deflated nominal dollar levelized cost may also be
shown.
3. The economic operating life of each unit (block) is assumed to be 30-years for cost-
estimating purposes. It is realized that plant lives of greater than 30-years are probable
and that these longer plant lives will be of potential economic benefit. However, the
ability to predict costs as well as technological changes into the distant future is
questionable. An economic life of 30-years is consistent with the maturity of long-term
bonds.
4. The default capacity factor to be assumed is 80%. A concept-specific capacity factor may
be used if it is properly substantiated.
5. The present-worth discount rates using the financial parameters given in Table 3.1 are
9.57%/yr (nominal) and 4.35%/yr (real) for utility applications (see Table 4.1). Discount
rates for typical industrial ownership are 13.74%/yr nominal and 8.32%/yr real. Discount
rates for the more risky, highly leveraged IPP are 12.37%/yr nominal and 7.02%/yr real.
These latter rates are less than those for the typical industrial ownership because of the
large interest expense tax deduction received in the more highly leveraged IPP case. The
general inflation rate is 5%/yr.
6. Assumed use of any government-owned or -operated facility shall be costed at full cost
recovery, including all direct costs, related indirect costs, depreciation, and any other
related general and administrative costs. Inquiries regarding prices and charges to be
assumed for specific materials and services shall be made to the Office of Advanced
Reactor Programs, DOE-NE.
7. Costs will be calculated in a manner consistent with the Tax Reform Act of 1986.

4 6
Table 4.1. Fixed charge rate input parameters
Parameters Utility Industrial" IPP*
Effective (tax-adjusted) cost of money, %/yr 9.57 13.74 12.37
Real cost of money, %/yr 4.35 8.32 7.02
Inflation rate, %/yr 5
Federal income tax rate, %/yr 34
State income tax rate, %fyr 4
Combined state and federal tax rate, % 36.64
Property tax rate, % of capital investment^ 2
Interim replacement rate, % of investment^ 0.5
Book/analysis life, yr 30
Tax depreciation duration, yr 15
Tax depreciation method' 150% declining balance
Accounting method Normalized
"Typically financed industrial company or conservatively financed Independent Power Producer.
^Highly leveraged independent power producer or similar organization.
*See Table 2.5, p. 21 of Ref. 5 for details.
4J2 CAPITAL COST
Under the assumption of equal annual energy generation, the equation for calculating
the nominal dollar levelized capital cost can be expressed as
FCR x E CAP/(1 + d)^'
LCC L
E x £ 1 / ( 1 +
J
4 7
where
LCC = levelized capital cost in nominal dollars,
FCR = nominal dollar fixed charge rate,
CAPj = total capital cost for unit j in nominal dollars as determined in Sect. 3,
tj = commercial operation date for unit 1,
tj = commercial operation date for unit j,
E = annual energy generation for single unit
For a single-unit (block) plant, the previous equation reduces to
LCC = (FCR x CAP)/E .
A fixed charge rate is used to properly account for return on capital, depreciation,
interim replacements, property tax, and income tax effects. The fixed charge rate is discussed
in detail in Sect 3.3 and Appendix B of Ref. 5. The fixed charge rate is dependent upon the
fraction of the total plant investment that is eligible for tax depreciation (tax depreciation may
not be taken on equity financing costs). The fixed charge rate can be calculated using the
NECDB methodology as implemented in an IBM type PC code.9 However, if this code is not
available the relationships given below can be used to determine the applicable fixed charge
rate for utility and industrial applications (see Tables 3.1 and 4.1 for financial structure). The
fixed charge rate varies depending on the ratio of total interest during construction (including
equity financing) to total capital cost (all expressed in nominal dollar terms) as follows,
Utility. FCR = 0.01795 x (IDC/TCC) + 0.15862
Industrial: FCR = 0.02783 x (IDC/TCC) + 0.21460
IPP: FCR = 0.01416 x (IDC/TCC) + 0.019548
where
IDC — nominal dollar interest during construction,
TCC = nominal dollar total capital cost.
The input parameters given in Table 4.1 were used to develop the above relationship.
Constant dollar fixed charge rates may be determined from the nominal dollar rates
by multiplying by the ratio of the constant to nominal dollar capital recovery factors (0.590
for utilities, 0.652 for industrials, and 0.633 for IPPs).
4 8
CRF(d .30) FCR. ° x FCR
CRF(d,30) o
where
FCR,, = constant dollar fixed charge rate.
The capital recovery factor ratio is given in Appendix G (Table G.10) for various
nominal dollar discount rates and inflation rates.
4 3 O&M COSTS
This section provides guidance on the development of the nonfuel O&M costs. The
O&M costs are incurred from commercial operation and throughout the operating life of the
plant. For these studies only the first 30 years of operation will be considered.
Certain O&M costs, such as those for materials and supplies, can be at least partially
dependent upon the amount of energy generated by the plant. These variable costs should
be added to the fixed costs, which are independent of generation, to arrive at a total annual
O&M cost
The O&M cost estimate should provide, as a minimum, the detail shown in Tables 4.2
and 4 3 for fixed, variable, and total O&M costs as applicable. Site staff requirements data
should also be reported as shown in Table 4.4. For multi-block plants, the annual O&M costs
and staffing requirements are to be specified by block as well as for the total plant.
The O&M cost estimate should be the expected costs and expressed in constant
dollars for the year defined in Sect. 2.2. It is to be assumed that the escalation rate for O&M
costs is equal to the rate of inflation, such that there is no real escalation for O&M costs.
Certain O&M cost factors are design independent and/or owner related. Data for these
factors are provided below and should be used in the development of the annual O&M costs.
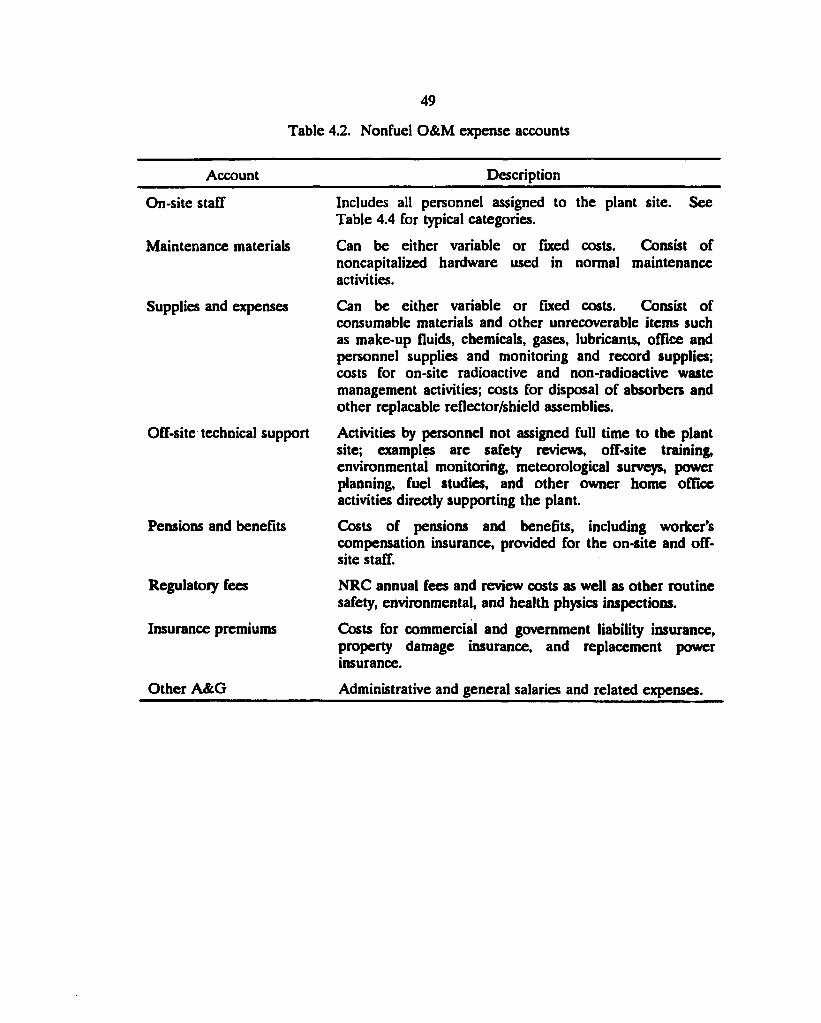
4 9
Table 4.2. Nonfuel O&M expense accounts
Account Description
On-site staff
Maintenance materials
Supplies and expenses
Off-site technical support
Pensions and benefits
Regulatory fees
Insurance premiums
Includes all personnel assigned to the plant site. Table 4.4 for typical categories.
See
Can be either variable or fixed costs. Consist of noncapitalized hardware used in normal maintenance activities.
Can be either variable or fixed costs. Consist of consumable materials and other unrecoverable items such as make-up fluids, chemicals, gases, lubricants, office and personnel supplies and monitoring and record supplies; costs for on-site radioactive and non-radioactive waste management activities; costs for disposal of absorbers and other replacable reflector/shield assemblies.
Activities by personnel not assigned full time to the plant site; examples are safety reviews, off-site training, environmental monitoring, meteorological surveys, power planning, fuel studies, and other owner home office activities directly supporting the plant.
Costs of pensions and benefits, including worker's compensation insurance, provided for the on-site and off-site staff.
NRC annual fees and review costs as well as other routine safety, environmental, and health physics inspections.
Costs for commercial and government liability insurance, property damage insurance, and replacement power insurance.
Other A&G Administrative and general salaries and related expenses.
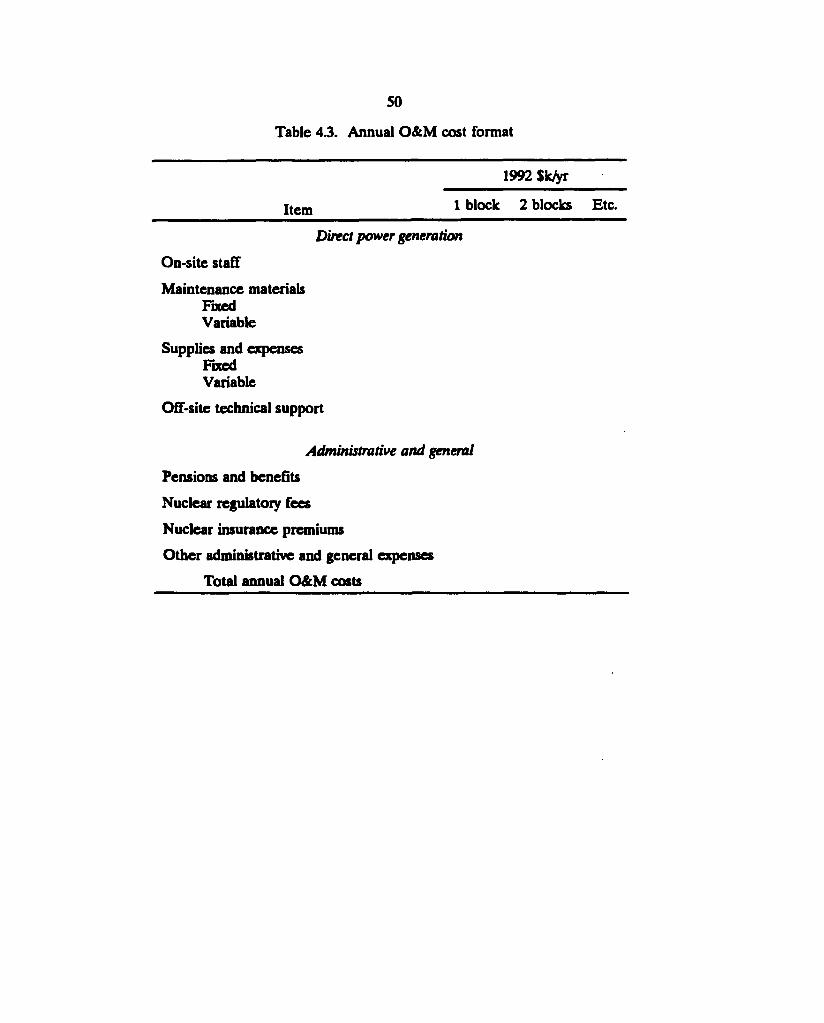
5 0
Table 4.3. Annual O&M cost format
1992 $k/yr
j t e m 1 block 2 blocks Etc.
D i r e c t p o w e r g e n e r a t i o n
On-site staff
Maintenance materials Fixed Variable
Supplies and expenses Fixed Variable
Off-site technical support
Administrative and general Pensions and benefits
Nuclear regulatoiy fees
Nuclear insurance premiums
Other administrative and general expenses
Total annual O&M costs
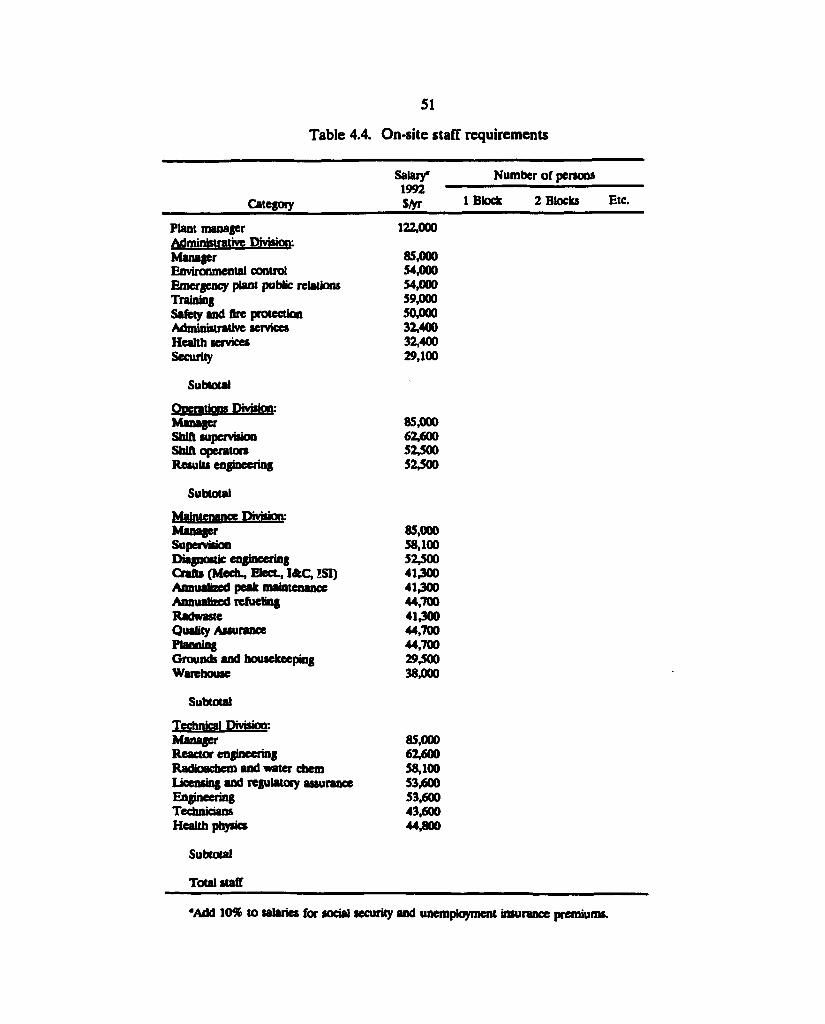
51
Table 4.4. On-site staff requirements
Salary* Number of persons 1992
Category S/yr 1 Block 2 Blocks Etc.
Plant manager 122,000 Administrative Division: Manager 85,000 Environmental control 54,000 Emergency plant public relations 54,000 Training 59,000 Safety and fire protection 50,000 Administrative services 32,400 Health services 32,400 Security 29,100
Subtotal
Onentkms Division: Manager 85,000 Shift supervision 62,600 Shift operators 52300 Results engineering 52300
Subtotal
Maintenance Division: Manager 85,000 Supervision 58,100 Diagnostic engineering 52,500 Crafts (MectL, Elect, I&C, ISI) 41300 Annualized peak maintenance 41,300 Annualized refueling 44,700 Radwaste 41300 Quality Assurance 44,700 Planning 44,700 Grounds and housekeeping 29,500 Warehouse 38,000
Subtotal
Technical Division: Manager 85,000 Reactor engineering 62,600 Radioachem and water chem 58,100 Licensing and regulatory assurance 53^00 Engineering 53,600 Technician* 43,600 Health physics 44,800
Subtotal
Tout staff
•Add 10% to salaries for social security and unemployment insurance premiums.
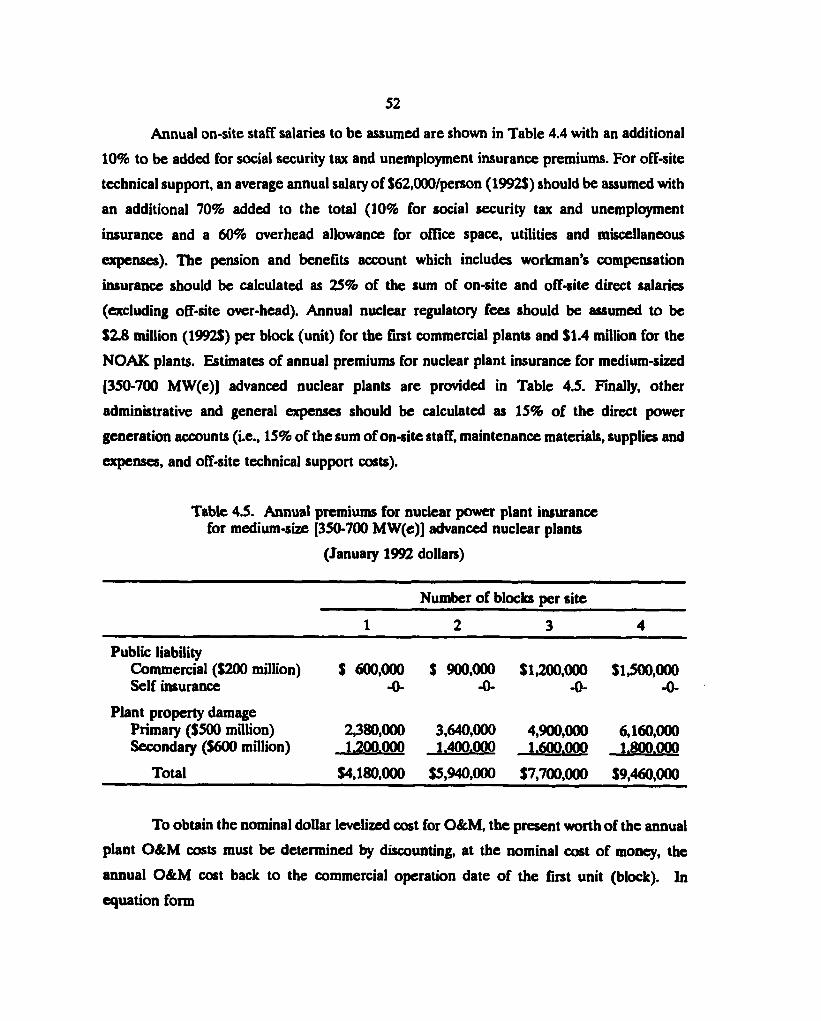
52
Annual on-site staff salaries to be assumed are shown in Table 4.4 with an additional
10% to be added for social security tax and unemployment insurance premiums. For off-site
technical support, an average annual salary of $62,000/person (1992$) should be assumed with
an additional 70% added to the total (10% for social security tax and unemployment
insurance and a 60% overhead allowance for office space, utilities and miscellaneous
expenses). The pension and benefits account which includes workman's compensation
insurance should be calculated as 25% of the sum of on-site and off-site direct salaries
(excluding off-site over-head). Annual nuclear regulatory fees should be assumed to be
$2.8 million (1992$) per block (unit) for the first commercial plants and $1.4 million for the
NOAK plants. Estimates of annual premiums for nuclear plant insurance for medium-sized
[350-700 MW(e)] advanced nuclear plants are provided in Table 4.5. Finally, other
administrative and general expenses should be calculated as 15% of the direct power
generation accounts (i.e., 15% of the sum of on-site staff, maintenance materials, supplies and
expenses, and off-site technical support costs).
Table 4.5. Annual premiums for nuclear power plant insurance for medium-size [350-700 MW(e)] advanced nuclear plants
(January 1992 dollars)
Number of blocks per site
1 2 3 4
Public liability Commercial ($200 million) $ 600,000 $ 900,000 $1,200,000 $1,500,000 Self insurance -0- -0- -0- -0-
Plant property damage Primary ($500 million) 2,380,000 3,640,000 4,900,000 6,160,000 Secondary ($600 million) 1.200.000 1.400.000 1.600.000 1.800.000
Total $4,180,000 $5,940,000 $7,700,000 $9,460,000
To obtain the nominal dollar levelized cost for O&M, the present worth of the annual
plant O&M costs must be determined by discounting, at the nominal cost of money, the
annual O&M cost back to the commercial operation date of the first unit (block). In
equation form
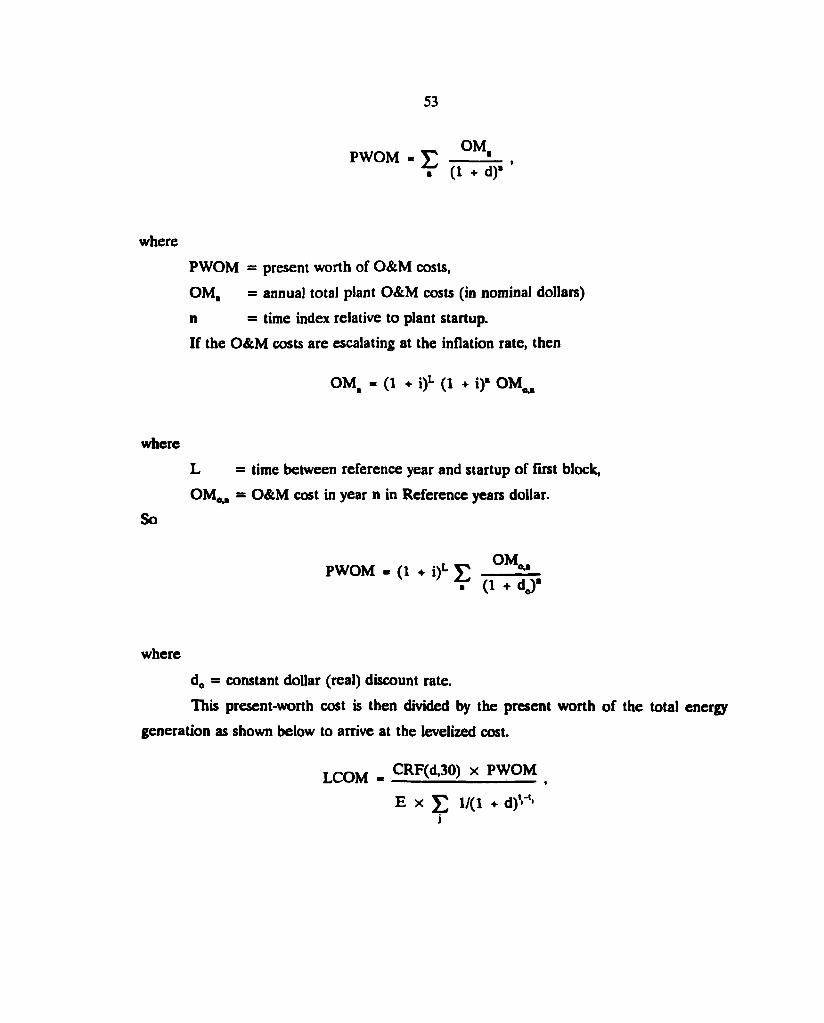
53
PWOM - £ O M " - (1 + d)'
where
PWOM = present worth of O&M costs,
OMa = annua] total plant O&M costs (in nominal dollars)
n = time index relative to plant startup.
If the O&M costs are escalating at the inflation rate, then
OM - (1 + i)L (1 + i)« OM, o,"
where
L = time between reference year and startup of first block,
O M w = O&M cost in year n in Reference years dollar.
So
OM PWOM - (1 + i)L £
• (1 - d j '
where
d0 = constant dollar (real) discount rate.
This present-worth cost is then divided by the present worth of the total energy
generation as shown below to arrive at the levelized cost.
L C Q M _ CRF(d,30) x PWOM
E x J 1/(1 + d)'1"1'
5 4
where
LCOM = levelized O&M cost in nominal dollars,
PWOM = present worth of annual O&M costs,
CRF = capital recovery factor
Examples using this methodology are presented in Sect. 5.
4.4 FUEL COSTS
The expected fuel cycle costs for the first 30 years of a power plant's operation shall
be estimated. The fuel cycle will be subdivided into its components, such as uranium, thorium
or plutonium purchase, conversion, enrichment, fabrication, reprocessing, and waste disposal.
Costs and quantities will be reported for each component over the assumed operating period.
All assumptions, such as unit costs, processing losses, mass balance data, and lead and lag
times for costs, shall be reported. A complete description of the fuel cycle cost analysis shall
be prepared. Additional requirements are listed below.
1. Fuel management plans including mass flows and their timing into and out of the
reactor must be provided for all fuel, blanket, and absorber elements.
2. The capital and O&M costs for the initial and subsequent fuel cycle facilities assumed
to support the operation of the first commercial through NOAK plants, must be
estimated following the procedures given in Sects. 3 and 4 of this document. This
includes, but is not limited to, documenting the direct and indirect costs, the
contingency cost, cash flow, and interest during construction in the capital cost of the
fuel cycle facilities. Such fuel cycle facilities include fuel reprocessing plants and fuel
fabrication plants which are not currently commercially available. The AFUDC and
fixed charge rate for non-government owned facilities should be calculated using
industrial rates. If the facility is an on-site facility and is utility owned and a physical
part of the power plant (part of utility rate-base), utility financial rates may be used.
An allowance for equipment replacement will be included if the equipment has a
design life of less than the 30-year facility operating life.
3. A deployment plan for the fuel cycle facilities should be developed and coordinated
with fuel delivery requirements of the plants to be supplied by the facility. Capital
and operating cash flows during the deployment period should be developed.
55
4. The economic lifetime of any co-located, integral fuel recycle facility shall not be in
the excess of the time necessary to service fuel from a specific power plant site over
its assumed economic life. (It is to be assumed that each power block has a 30 year
economic operating life.)
5. The costs for absorber and other replaceable reflector/shield elements must be
included in the fuel cycle cost estimates.
6. The levelized cost for an equilibrium cycle fuel, blanket, shield, and absorber
assembly shall be reported in {/assembly and $/kg HM if applicable. The costs must
be further subdivided into components related to fissile material procurement, facility
capital amortization, fuel facility O&M costs, hardware costs, fresh heavy metal and
transportation, as applicable.
7. It shall be assumed that spent fuel leaving the reactor (including the final core
discharge) has no economic value in that state. The value of any fissile plutonium
or uranium-233 from spent fuel is to be based on the cost of its recovery. The cost
basis/purchase price for recycled fissile material shall be a levelized average cost
based on the cost to reprocess (including related facility capital amortization) and the
total fissile output of the fuel cycle facility.
8. The source, availability, and cost of the reactor fuel needs to be documented if a fuel
other than U-235 used. For example, if fissile plutonium is the reactor fuel, then the
method and cost of obtaining this fuel needs to be shown. If the NOAK plant is to
use excess fissile material from other plants of its type for its start-up fuel, then the
time and extent of this recycle fuel availability needs to be shown for representative
scenarios.
9. Consistent with the 1986 Tax Reform Act, no investment tax credits may be taken.
10. The cost of each batch of fuel will be capitalized and depreciated for tax purposes
by either a 200% declining balance method over five years using the IRS half-year
convention (see Table 2.6, page 21, Ref. 5) or a units-of-production (energy pro-
ration) basis.
11. The combined federal and state tax rate to be assumed is 36.64%.
The following unit costs should be assumed in developing fuel cycle costs:
1. Uranium ore price shall be $25.00/lb (1992 $). This price is assumed to escalate at the
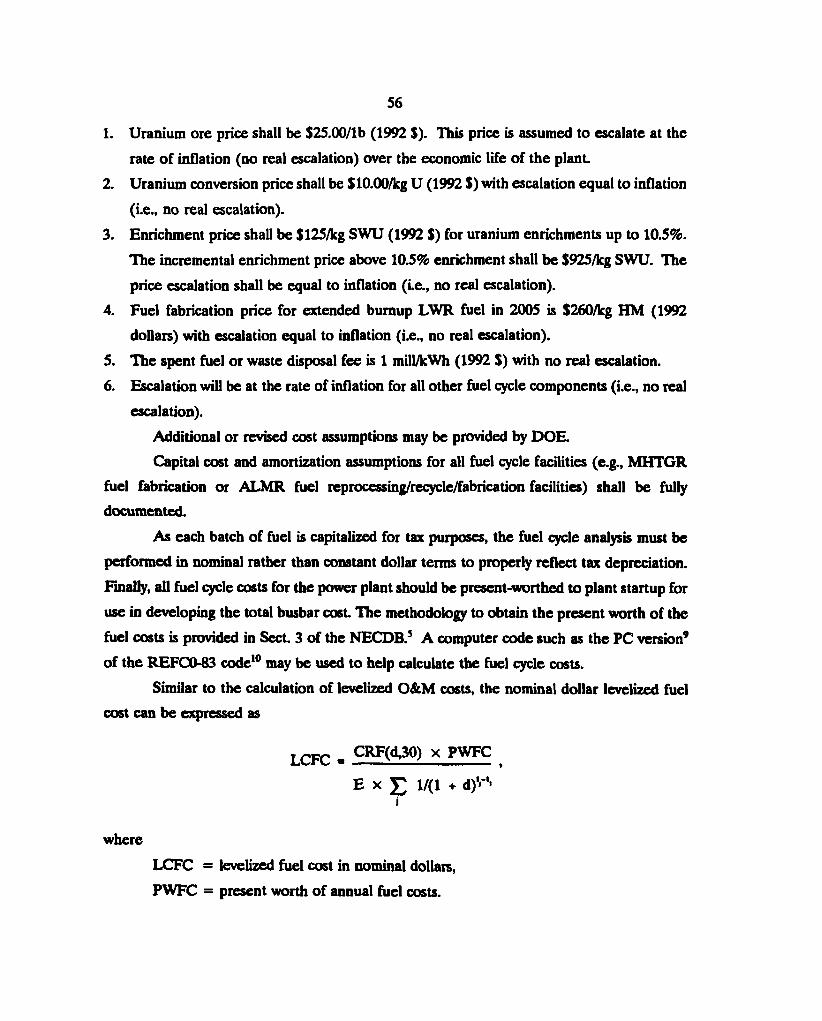
5 6
1. Uranium ore price shall be $25.00/lb (1992 $). This price is assumed to escalate at the
rate of inflation (no real escalation) over the economic life of the plant.
2. Uranium conversion price shall be $10.00/kg U (1992 $) with escalation equal to inflation
(i.e., no real escalation).
3. Enrichment price shall be $125/kg SWU (1992 $) for uranium enrichments up to 10.5%.
The incremental enrichment price above 10.5% enrichment shall be $925/kg SWU. The
price escalation shall be equal to inflation (i.e., no real escalation).
4. Fuel fabrication price for extended burnup LWR fuel in 2005 is $260/kg HM (1992
dollars) with escalation equal to inflation (i.e., no real escalation).
5. The spent fuel or waste disposal fee is 1 mill/kWh (1992 $) with no real escalation.
6. Escalation will be at the rate of inflation for all other fuel cycle components (i.e., no real
escalation).
Additional or revised cost assumptions may be provided by D O E
Capital cost and amortization assumptions for all fuel cycle facilities (e.g., MHTGR
fuel fabrication or ALMR fuel reprocessing/recycle/fabrication facilities) shall be fully
documented.
As each batch of fuel is capitalized for tax purposes, the fuel cycle analysis must be
performed in nominal rather than constant dollar terms to properly reflect tax depreciation.
Finally, all fuel cycle costs for the power plant should be present-worthed to plant startup for
use in developing the total busbar cost The methodology to obtain the present worth of the
fuel costs is provided in Sect 3 of the NECDB.5 A computer code such as the PC version9
of the REFCO-83 code10 may be used to help calculate the fuel cycle costs.
Similar to the calculation of levelized O&M costs, the nominal dollar levelized fuel
cost can be expressed as
LCFC - C R F(d>30) x PWFC
E x J 1/(1 + d)1'"' j
where
LCFC — levelized fuel cost in nominal dollars,
PWFC = present worth of annual fuel costs.
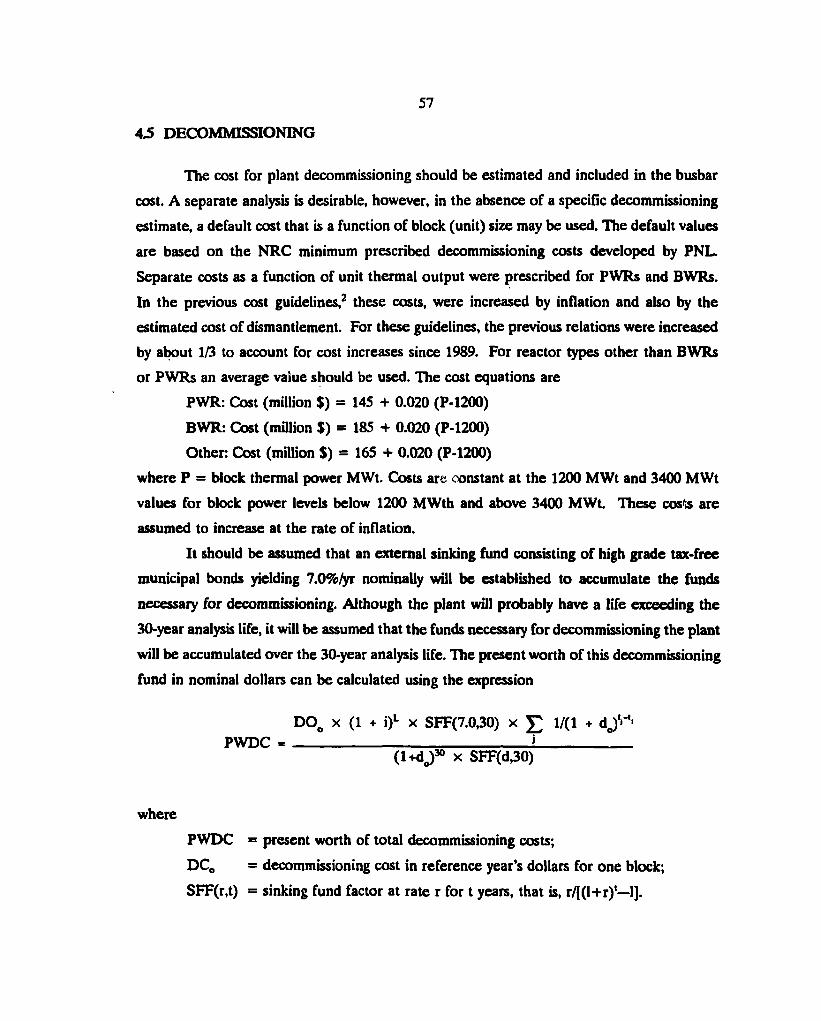
4.5 DECOMMISSIONING
57
The cost for plant decommissioning should be estimated and included in the busbar
cost. A separate analysis is desirable, however, in the absence of a specific decommissioning
estimate, a default cost that is a function of block (unit) size may be used. The default values
are based on the NRC minimum prescribed decommissioning costs developed by PNL.
Separate costs as a function of unit thermal output were prescribed for PWRs and BWRs.
In the previous cost guidelines,2 these costs, were increased by inflation and also by the
estimated cost of dismantlement. For these guidelines, the previous relations were increased
by about 1/3 to account for cost increases since 1989. For reactor types other than BWRs
or PWRs an average value should be used. The cost equations are
PWR: Cost (million $) = 145 + 0.020 (P-1200)
BWR: Cost (million $) = 185 + 0.020 (P-1200)
Other: Cost (million S) = 165 + 0.020 (P-1200)
where P = block thermal power MWt. Costs are constant at the 1200 MWt and 3400 MWt
values for block power levels below 1200 MWth and above 3400 MWt. These cos's are
assumed to increase at the rate of inflation.
It should be assumed that an external sinking fund consisting of high grade tax-free
municipal bonds yielding 7.0%/yr nominally will be established to accumulate the funds
necessary for decommissioning. Although the plant will probably have a life exceeding the
30-year analysis life, it will be assumed that the funds necessary for decommissioning the plant
will be accumulated over the 30-year analysis life. The present worth of this decommissioning
fund in nominal dollars can be calculated using the expression
DOo x (1 + i)L x SFF(7.0,30) x £ 1/(1 + dj1'"'1
PWDC « ! (1 +do)30 x SFF(d,30)
where
PWDC = present worth of total decommissioning costs;
DC0 = decommissioning cost in reference year's dollars for one block;
SFF(r,t) = sinking fund factor at rate r for t years, that is, r/[(l+r)'—1].
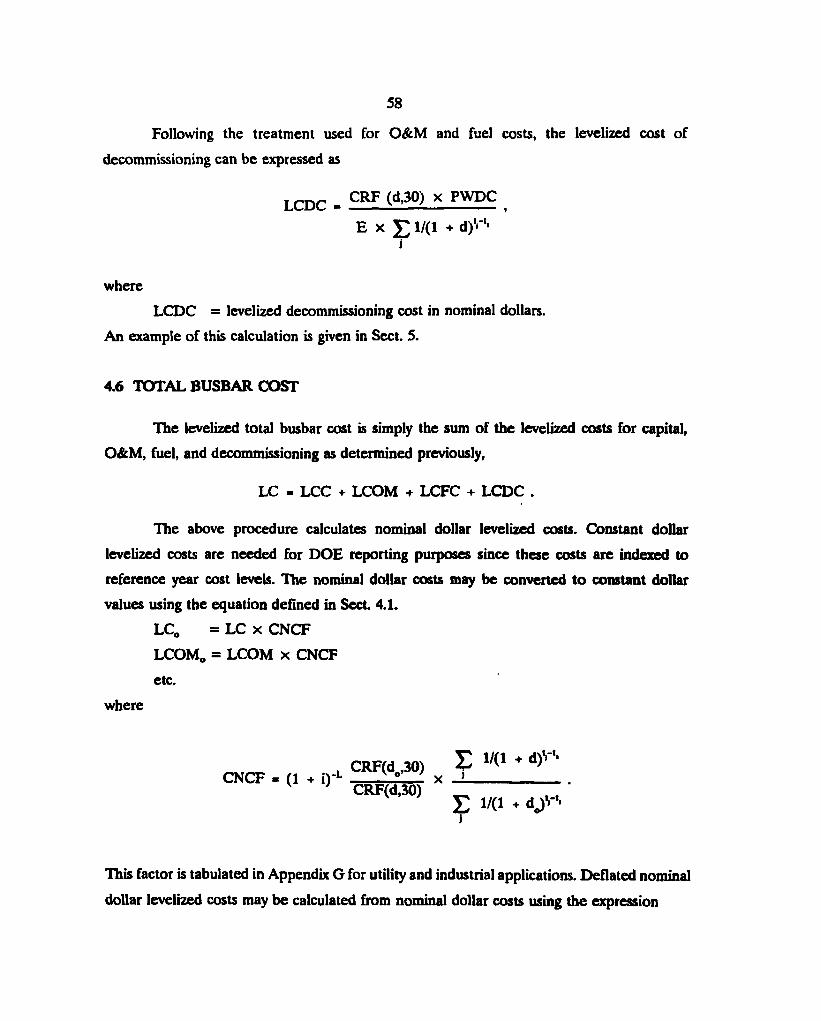
5 8
Following the treatment used for O&M and fuel costs, the levelized cost of
decommissioning can be expressed as
LCDC - CRF (d,30) x PWDC
E x £ 1 / ( 1 + d)1'"1' j
where
LCDC - levelized decommissioning cost in nominal dollars.
An example of this calculation is given in Sect. 5.
4.6 TOTAL BUSBAR COST
The levelized total busbar cost is simply the sum of the levelized costs for capital,
O&M, fuel, and decommissioning as determined previously,
LC « LCC + LCOM + LCFC + LCDC .
The above procedure calculates nominal dollar levelized costs. Constant dollar
levelized costs are needed for DOE reporting purposes since these costs are indexed to
reference year cost levels. The nominal dollar costs may be converted to constant dollar
values using the equation defined in Sect. 4.1.
LC0 = LC x CNCF
LCOM0 = LCOM x CNCF
etc.
where
CRFrd 30) £ 1 / ( 1 + d ) " CNCF - (1 • i)-i- C R F ( ° ' 3 ) x J V ' CRF(d,30) ^
E W1 + do) r '
This factor is tabulated in Appendix G for utility and industrial applications. Deflated nominal
dollar levelized costs may be calculated from nominal dollar costs using the expression
5 9
LCjj • (1 + i)"L x L C .
Examples of the development of total busbar costs for alternative plants are provided in the
next chapter.
t
6 0
5. EXAMPLE CALCULATIONS
This chapter provides examples of the method used to estimate the busbar costs for
alternative power plant configurations. Costs are provided for fossil-fired generation and are
for reference purposes only. Comparisons of advanced reactor concept costs with those for
alternatives are not required. To further understand how the levelized costs are obtained,
a description of the calculational procedure is provided below for example configurations.
Other configurations can be determined in a similar manner. The alternative plants used for
the example calculations are for coal- and gas-fired generation starting commercial operation
in the year 2010. The plants include a pulverized coal-fired (PC) plant, and a combined cycle
combustion turbine (CCCT) plant:
600-MW(e) PC plant
500-MW(e) CCCT plant
2 x 600-MW(e) PC plant
The following general assumptions apply to the development of the levelized busbar
generation costs for the alternative power plants:
1. The levelized busbar cost will be expressed in constant 1992 dollars. In addition, costs
may be expressed in nominal dollars or deflated nominal dollars.
2. The capacity factor for all alternative plants is assumed to be 80%.
3. The operating life of each unit is assumed to be 30 years for cost estimating purposes.
4. The present-worth discount rate is the utility ownership rates of 9.57%/yr (nominal) and
4.35%/yr (real). The general inflation rate is 5%/yr.
5.1 COST DATA
The capital and operating costs for these plants were taken from a recent USCEA
study.11 The basis for these costs may not be consistent with the groundrules presented in
these guidelines. The levelized costs calculated in this section therefore may not be directly
comparable to costs estimated using these groundrules and absolute comparisons with these
plants should be avoided.
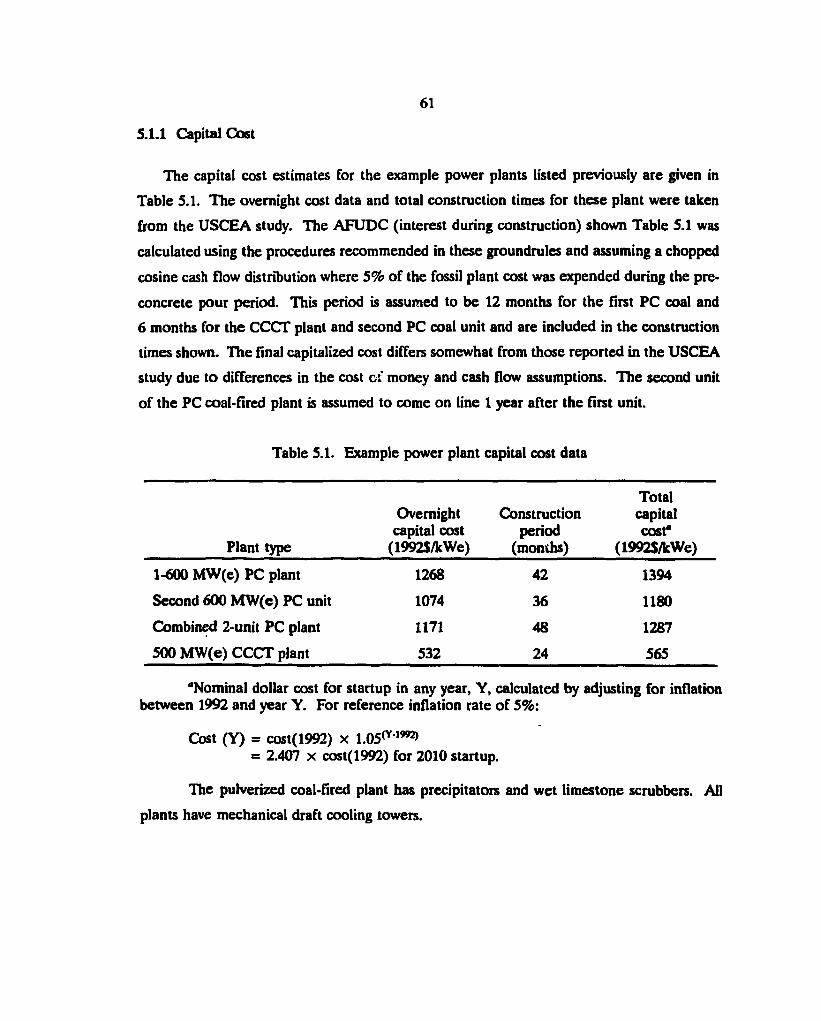
5.1.1 Capital Cost
61
The capital cost estimates for the example power plants listed previously are given in
Table 5.1. The overnight cost data and total construction times for these plant were taken
from the USCEA study. The AFUDC (interest during construction) shown Table 5.1 was
calculated using the procedures recommended in these groundrules and assuming a chopped
cosine cash flow distribution where 5% of the fossil plant cost was expended during the pre-
concrete pour period. This period is assumed to be 12 months for the first PC coal and
6 months for the CCCT plant and second PC coal unit and are included in the construction
times shown. The final capitalized cost differs somewhat from those reported in the USCEA
study due to differences in the cost of money and cash flow assumptions. The second unit
of the PC coal-fired plant is assumed to come on line 1 year after the first unit.
Table 5.1. Example power plant capital cost data
Plant type
Overnight capital cost
(1992$/kWe)
Construction period
(months)
Total capital cost"
(1992$/kWe)
1-600 MW(e) PC plant 1268 42 1394
Second 600 MW(e) PC unit 1074 36 1180
Combined 2-unit PC plant 1171 48 1287
500 MW(e) CCCT plant 532 24 565
"Nominal dollar cost for startup in any year, Y, calculated by adjusting for inflation between 1992 and year Y. For reference inflation rate of 5%:
Cost (Y) = cost(1992) x 1.05(Y1992)
= 2.407 x cost(1992) for 2010 startup.
The pulverized coal-fired plant has precipitators and wet limestone scrubbers. All
plants have mechanical draft cooling towers.
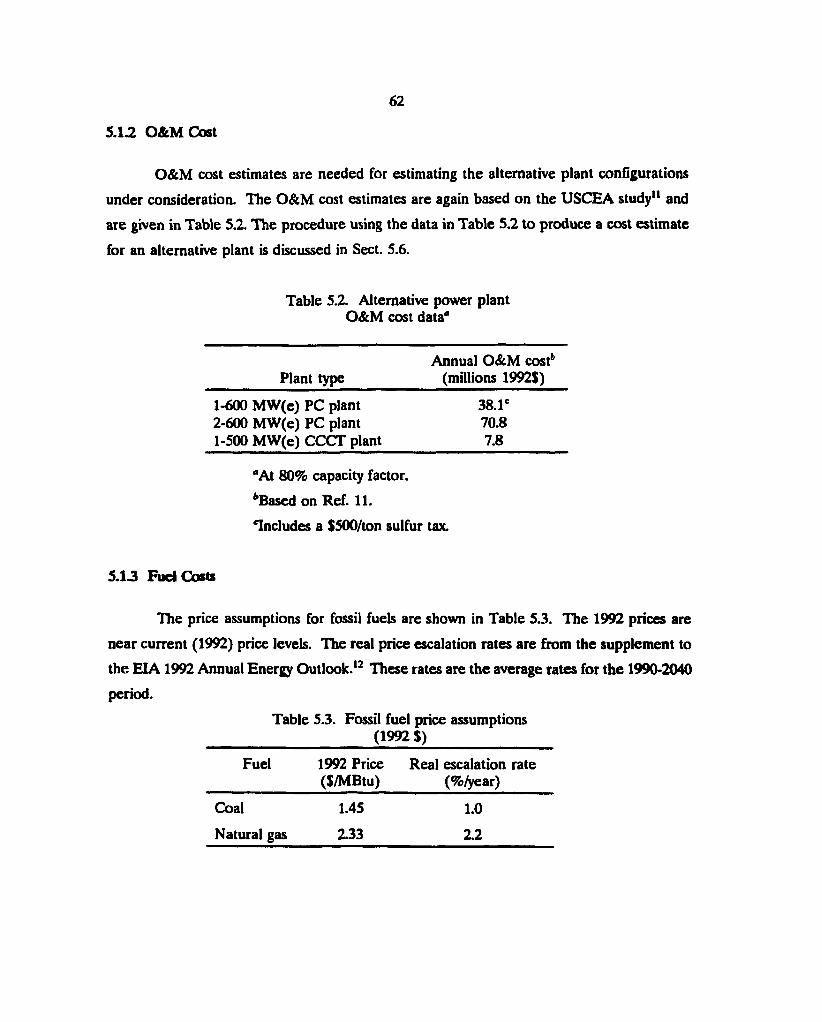
5 . 1 2 O&M Cost
6 2
O&M cost estimates are needed for estimating the alternative plant configurations
under consideration. The O&M cost estimates are again based on the USCEA study11 and
are given in Table 5.2. The procedure using the data in Table 5.2 to produce a cost estimate
for an alternative plant is discussed in Sect. 5.6.
Table 5.2. Alternative power plant O&M cost data"
Annual O&M cost6
Plant type (millions 1992$)
1-600 MW(e) PC plant 38. l c
2-600 MW(e) PC plant 70.8 1-500 MW(e) CCCT plant 7.8
"At 80% capacity factor.
'Based on Ref. 11.
Includes a $500/ton sulfur tax.
5.13 Fuel Costs
The price assumptions for fossil fuels are shown in Table 5.3. The 1992 prices are
near current (1992) price levels. The real price escalation rates are from the supplement to
the EIA1992 Annual Energy Outlook.13 These rates are the average rates for the 1990-2040
period.
Table 5.3. Fossil fuel price assumptions (1992 $)
Fuel 1992 Price Real escalation rate ($/MBtu) (%/year)
Coal 1.45 1.0
Natural gas 2.33 2.2
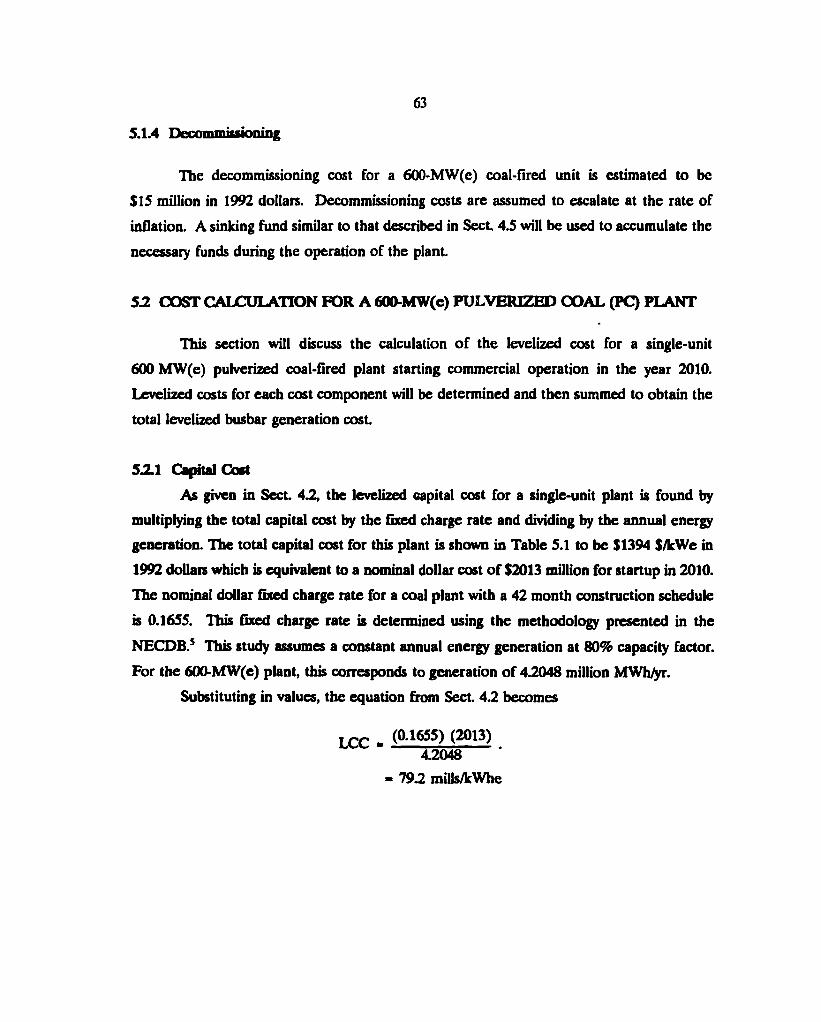
5.1.4 Decommissioning
63
The decommissioning cost for a 600-MW(e) coal-fired unit is estimated to be
$15 million in 1992 dollars. Decommissioning costs are assumed to escalate at the rate of
inflation. A sinking fund similar to that described in Sect. 4.5 will be used to accumulate the
necessary funds during the operation of the plant.
5.2 COST CALCULATION FOR A 600-MW(e) PULVERIZED COAL (PC) PLANT
This section will discuss the calculation of the levelized cost for a single-unit
600MW(e) pulverized coal-fired plant starting commercial operation in the year 2010.
Levelized costs for each cost component will be determined and then summed to obtain the
total levelized busbar generation cost
5.2.1 Capital Cost
As given in Sect 4.2, the levelized capital cost for a single-unit plant is found by
multiplying the total capital cost by the fixed charge rate and dividing by the annual energy
generation. The total capital cost for this plant is shown in Table 5.1 to be $1394 $/kWe in
1992 dollars which is equivalent to a nominal dollar cost of $2013 million for startup in 2010.
The nominal dollar fixed charge rate for a coal plant with a 42 month construction schedule
is 0.1655. This fixed charge rate is determined using the methodology presented in the
NECDB.5 This study assumes a constant annual energy generation at 80% capacity factor.
For the 600-MW(e) plant, this corresponds to generation of 4.2048 million MWh/yr.
Substituting in values, the equation from Sect. 4.2 becomes
L C C . (01655H2013) 4.2048
- 79.2 mills/kWhe
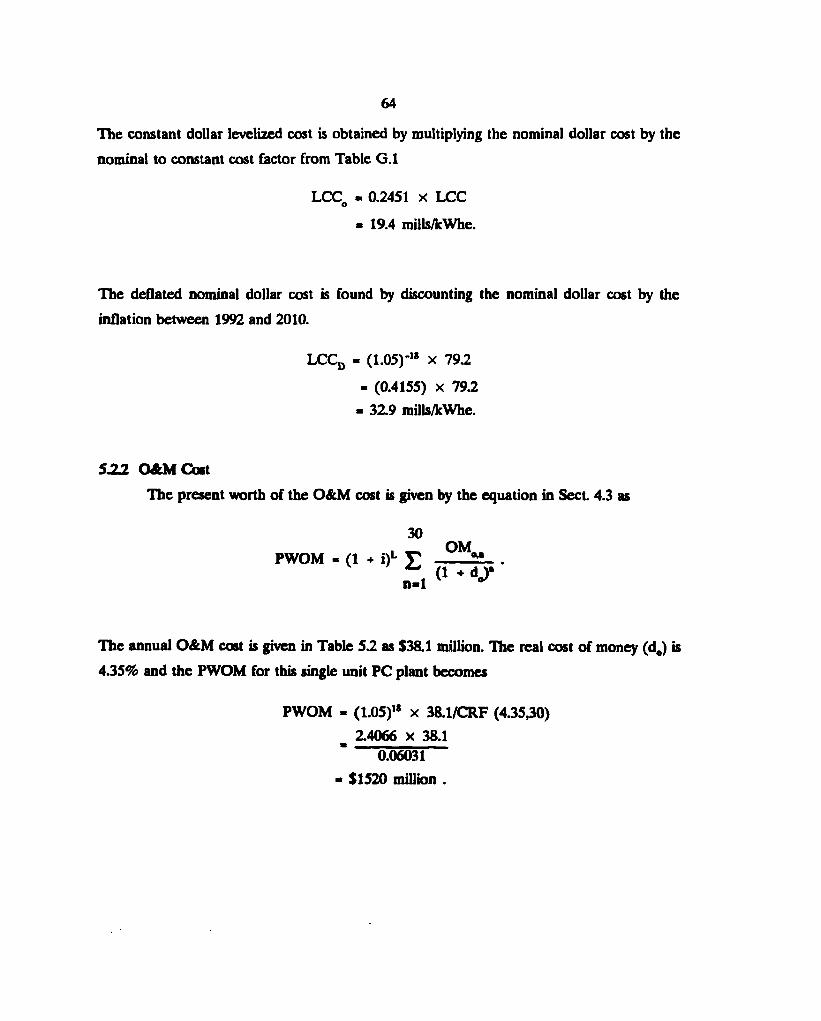
6 4
The constant dollar levelized cost is obtained by multiplying the nominal dollar cost by the
nominal to constant cost factor from Table G.l
LCC « 0.2451 x LCC O - 19.4 mills/kWhe.
The deflated nominal dollar cost is found by discounting the nominal dollar cost by the
inflation between 1992 and 2010.
LCCD - (1.05)-" x 79.2
- (0.4155) x 79.2 - 32.9 mills/kWhe.
5 J 2 2 O&M Cost
The present worth of the O&M cost is given by the equation in Sect. 4.3 as
30
PWOM - (1 + i)L £ ° M on (1 + <U* n-1 v ^
The annual O&M cost is given in Table 5.2 as $38.1 million. The real cost of money (d0) is
4.35% and the PWOM for this single unit PC plant becomes
PWOM - (1.05)1* x 38.1/CRF (4.35,30) _ 2.4066 x 38.1
0.06031 « $1520 million .
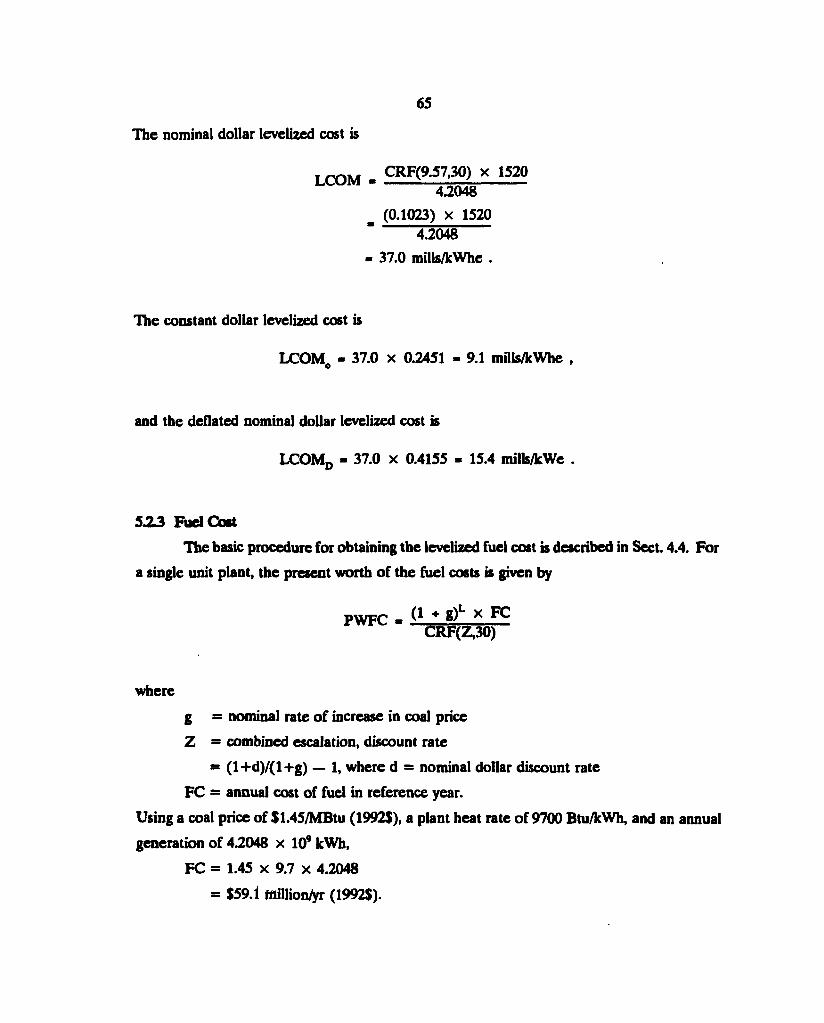
65
The nominal dollar levelized cost is
Q ^ CRF(9.57,30) x 1520 4.2048
_ (0.1023) x 1520 4.2048
- 37.0 mills/kWhe .
The constant dollar levelized cost is
LCOMc - 37.0 x 0.2451 - 9.1 mills/kWhe ,
and the deflated nominal dollar levelized cost is
LCOMd - 37.0 x 0.4155 - 15.4 mills/kWe .
523 Fuel Cost
The basic procedure for obtaining the levelized fuel cost is described in Sect. 4.4. For
a single unit plant, the present worth of the fuel costs is given by
PWFC « 0 +_g)L x ^ CRF(Z,30)
where
g = nominal rate of increase in coal price
Z = combined escalation, discount rate
= ( l+d) / ( l+g) — 1, where d = nominal dollar discount rate
FC = annual cost of fuel in reference year.
Using a coal price of $1.45/MBtu (1992$), a plant heat rate of 9700 Btu/kWh, and an annual
generation of 4.2048 x 10⁹ kWh,
FC = 1.45 x 9.7 x 4.2048
= $59.1 fflillion/yr (1992$).
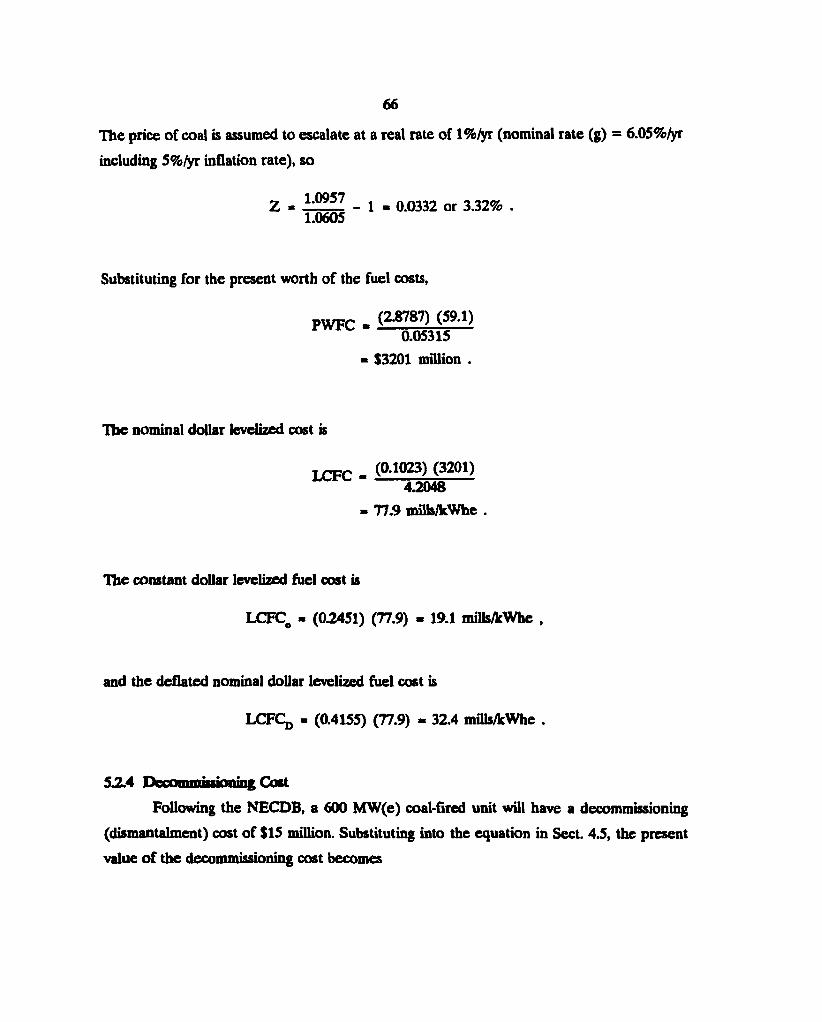
6 6
The price of coal is assumed to escalate at a real rate of 1%/yr (nominal rate (g) = 6.05%/yr
including 5%/yr inflation rate), so
Z - 1 0 9 5 7 - 1 - 0 . 0 3 3 2 o r 3 . 3 2 % . 1 . 0 6 0 5
Substituting for the present worth of the fuel costs,
i m r e n - ( 2 - 8 7 8 7 ) ( 5 9 . 1 ) P W F C 0 . 0 5 3 1 5
- $3201 million .
The nominal dollar levelized cost is
L C F C (0.1023) (3201) 4.2048
- 77.9 mffls/kWhe
The constant dollar levelized fuel cost is
LCFCo - (0.2451) (77.9) - 19.1 mills/kWhe ,
and the deflated nominal dollar levelized fuel cost is
LCFC,, - (0.4155) (77.9) - 32.4 mills/kWhe .
5.2.4 Decommissioning Cost
Following the NECDB, a 600 MW(e) coal-fired unit will have a decommissioning
(dismantalment) cost of $15 million. Substituting into the equation in Sect. 4.5, the present
value of the decommissioning cost becomes
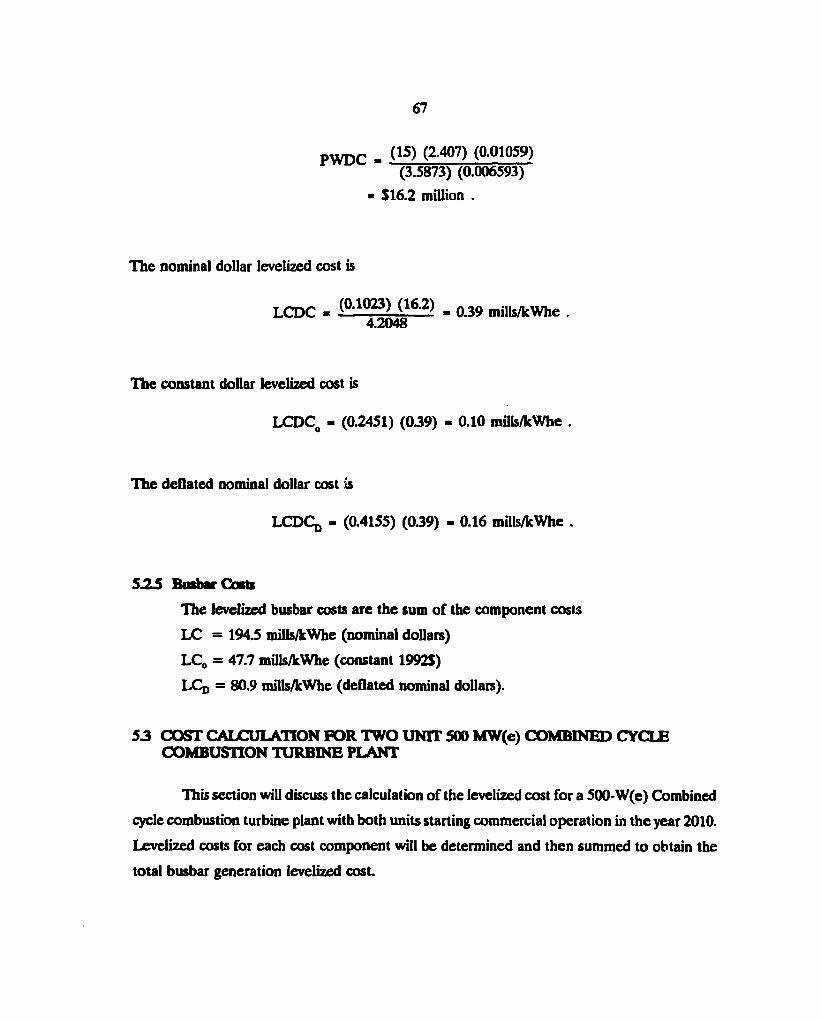
67
p W D C . (15) (2.407) (0.01059) (3.5873) (0.006593)
« $16.2 million .
The nominal dollar levelized cost is
LCDC -(0.1023) (16.2) . „ 3 9 m i | b / k w b e .
4.2048
The constant dollar levelized cost is
LCDCo - (0.2451) (039) - 0.10 mills/kWhe .
The deflated nominal dollar cost is
LCDCjj « (0.4155) (0.39) - 0.16 mills/kWhe .
5.23 Busbar Costs
The levelized busbar costs are the sum of the component costs
LC = 194.5 mills/kWhe (nominal dollars)
LC0 = 47.7 mills/kWhe (constant 1992$)
LCD = 80.9 mills/kWhe (deflated nominal dollars).
5 3 COST CALCULATION FOR TWO UNIT 500 MW(e) COMBINED CYCLE COMBUSTION TURBINE PLANT
This section will discuss the calculation of the levelized cost for a 500-W(e) Combined
cycle combustion turbine plant with both units starting commercial operation in the year 2010.
Levelized costs for each cost component will be determined and then summed to obtain the
total busbar generation levelized cost.
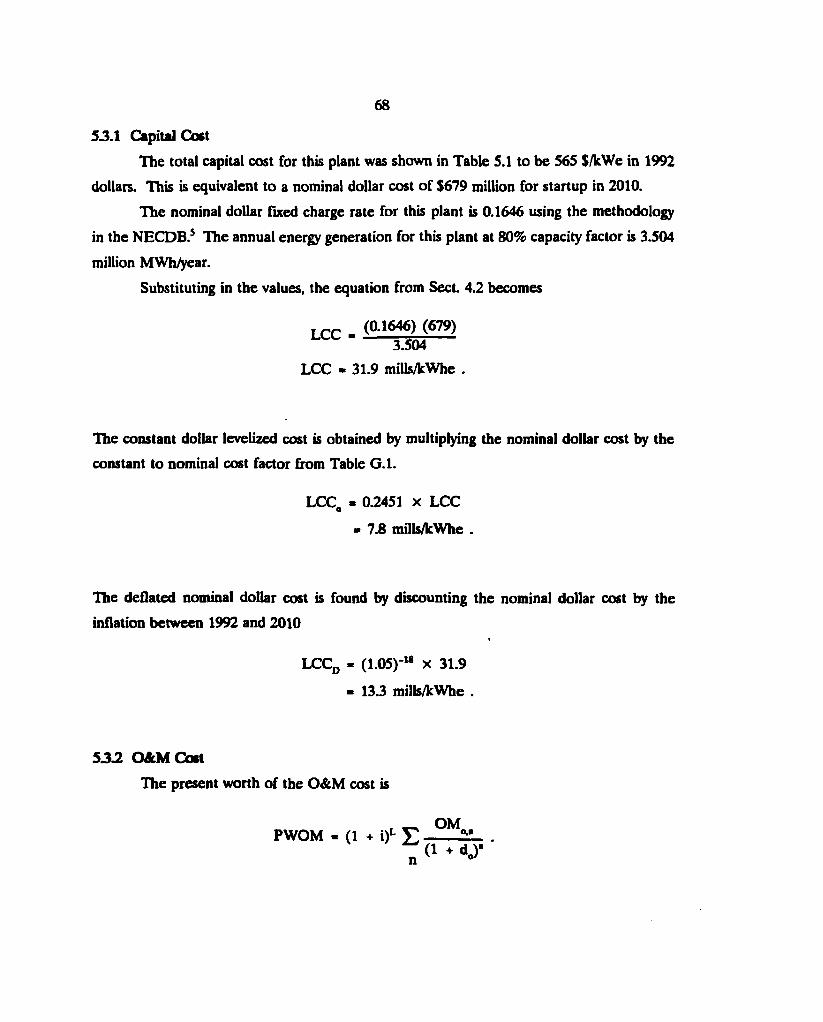
6 8
53.1 Capital Cost
The total capital cost for this plant was shown in Table 5.1 to be 565 $/kWe in 1992
dollars. This is equivalent to a nominal dollar cost of $679 million for startup in 2010.
The nominal dollar fixed charge rate for this plant is 0.1646 using the methodology
in the NECDB.5 The annual energy generation for this plant at 80% capacity factor is 3.504
million MWh/year.
Substituting in the values, the equation from Sect 4.2 becomes
LCC (0-1646) (679) 3304
LCC - 31.9 mills/kWhe .
The constant dollar levelized cost is obtained by multiplying the nominal dollar cost by the
constant to nominal cost factor from Table G.l.
LCC - 0.2451 x LCC O « 7.8 mills/kWhe .
The deflated nominal dollar cost is found by discounting the nominal dollar cost by the
inflation between 1992 and 2010
LCC d - (1.05)"w x 31.9
- 13.3 mills/kWhe .
532 O&M Cost
The present worth of the O&M cost is
PWOM - (1 + i)L T , — t(1
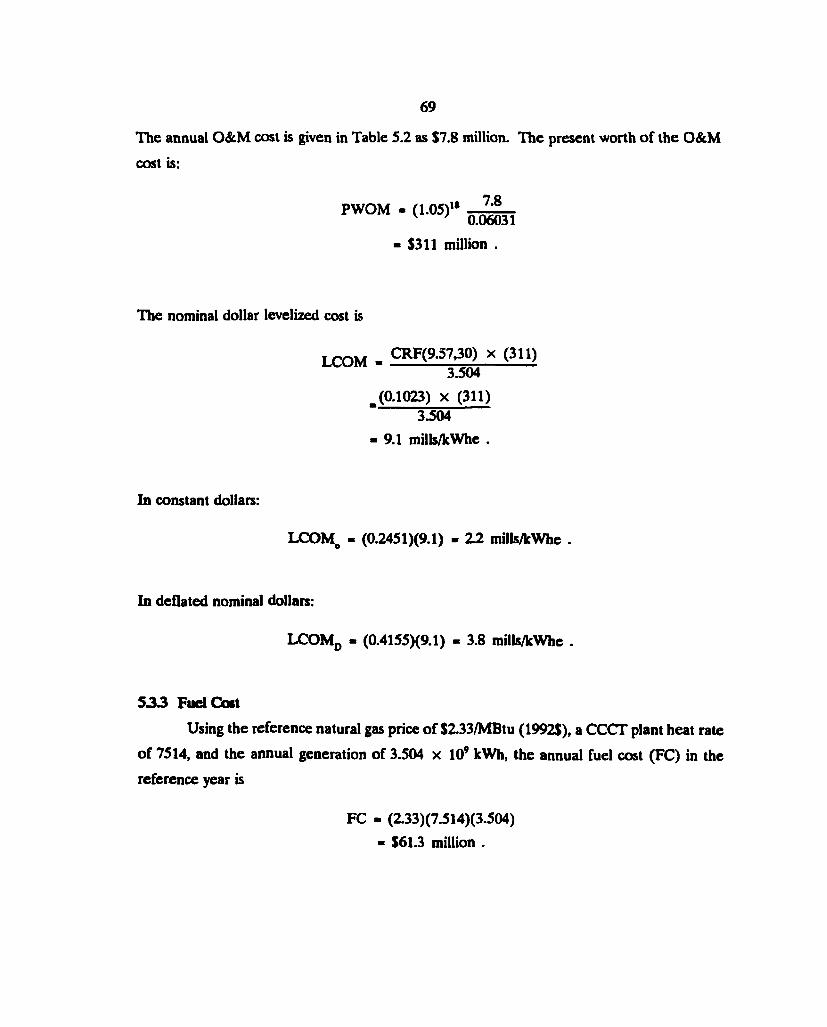
6 9
The annual O&M cost is given in Table 5.2 as $7.8 million. The present worth of the O&M
cost is:
PWOM - (1.05)1' 7 , 8
0.06031 $311 million .
The nominal dollar levelized cost is
LCOM - CRF(9.57,30) x (311) 3304
_ (0.1023) x (311) 3.504
- 9.1 mills/kWhe .
In constant dollars:
LCOMO - (0.2451)(9.1) - 2.2 mills/kWhe .
In deflated nominal dollars:
LCOMd - (0.4155)(9.1) - 3.8 mills/kWhe .
5 3 3 Fuel Cost
Using the reference natural gas price of $2.33/MBtu (1992$), a CCCT plant heat rate
of 7514, and the annual generation of 3.504 x 10⁹ kWh, the annual fuel cost (FC) in the
reference year is
FC - (2.33)(7.514)(3.504) • $61.3 million .
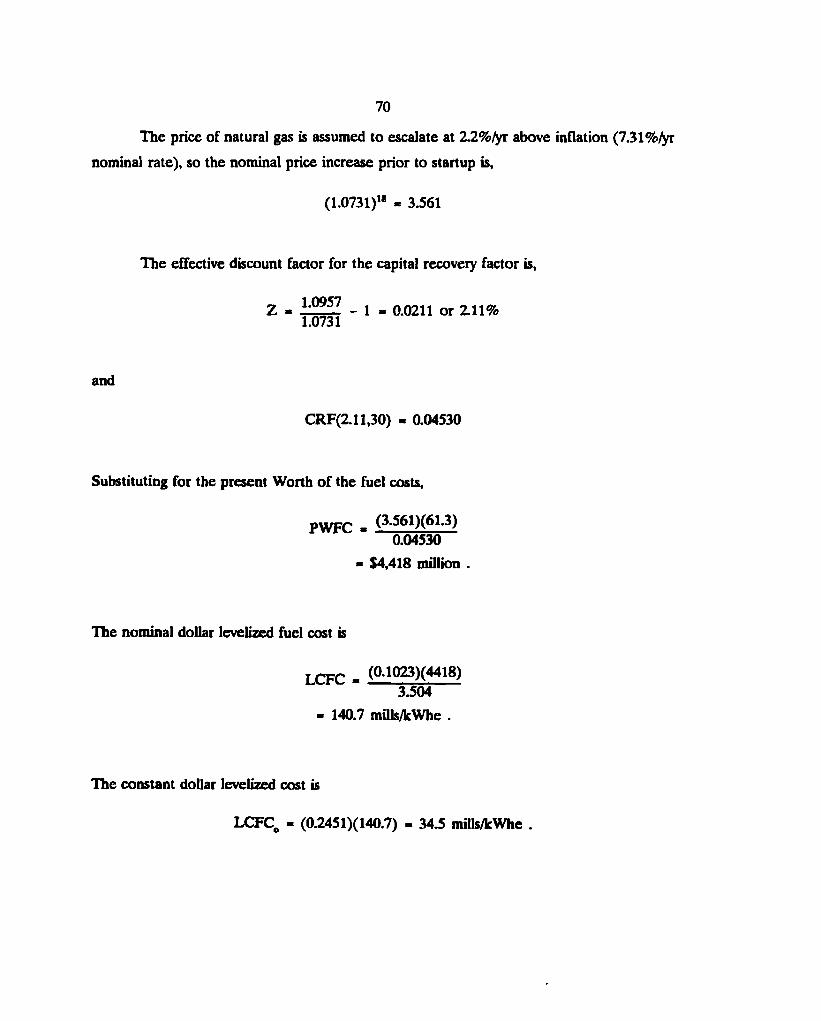
7 0
The price of natural gas is assumed to escalate at 2.2%/yr above inflation (7.31%/yr
nominal rate), so the nominal price increase prior to startup is,
(1.0731)18 - 3.561
The effective discount factor for the capital recovery factor is,
Z « 1 , 0 9 5 7 - 1 - 0.0211 or 2.11% 1.0731
and
CRF(2.11,30) - 0.04530
Substituting for the present Worth of the fuel costs,
PWFC . (3-561X61.3) 0.04530
« $4,418 million
The nominal dollar levelized fuel cost is
T rrrr - (0-1023)(4418) 3.504
- 140.7 mills/kWhe .
The constant dollar levelized cost is
LCFCo - (0.2451)(140.7) - 34.5 mills/kWhe .
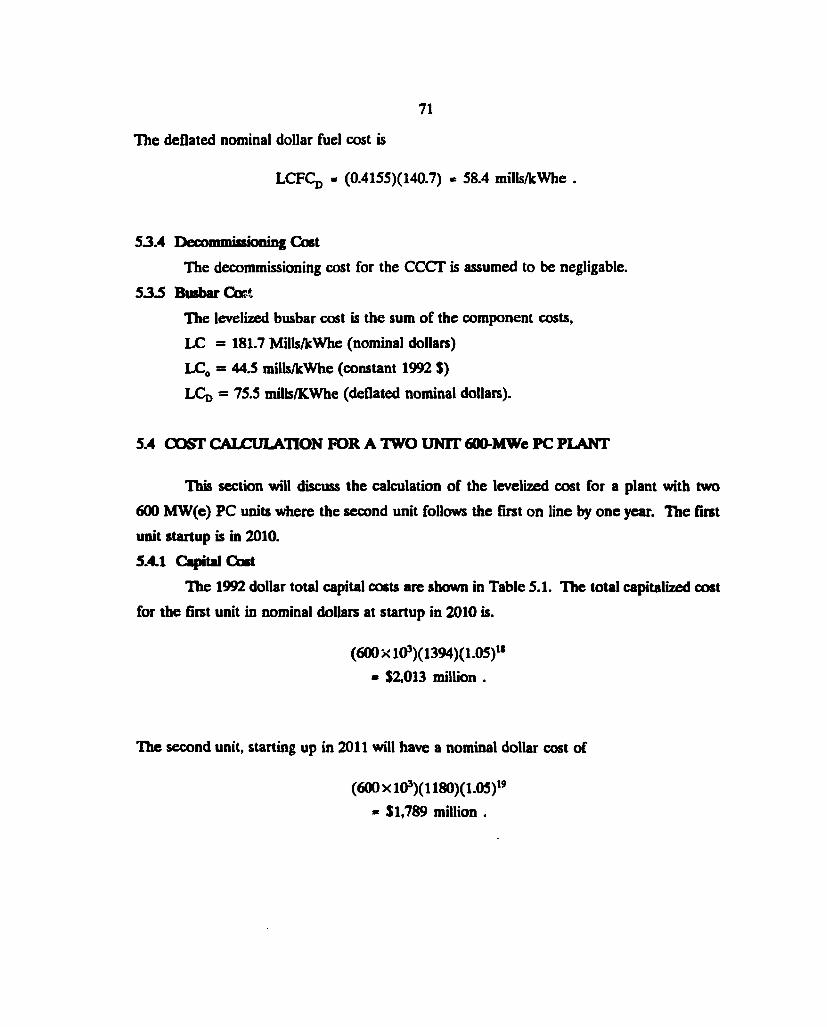
71
The deflated nominal dollar fuel cost is
LCFCJJ - (0.4155)(140.7) « 58.4 mills/kWhe .
53.4 Decommissioning Cost
The decommissioning cost for the CCCT is assumed to be negligable.
5 3 3 Busbar G r t
The levelized busbar cost is the sum of the component costs,
LC - 181.7 Mills/kWhe (nominal dollars)
LC0 = 44.5 mills/kWhe (constant 1992 S)
LQ j = 75.5 mills/KWhe (deflated nominal dollars).
5.4 COST CALCULATION FOR A TWO UNIT 600-MWe PC PLANT
This section will discuss the calculation of the levelized cost for a plant with two
600 MW(e) PC units where the second unit follows the first on line by one year. The first
unit startup is in 2010.
5.4.1 Capital Q*t
The 1992 dollar total capital costs are shown in Table 5.1. The total capitalized cost
for the first unit in nominal dollars at startup in 2010 is.
(600 x 103)(1394)(1.05)18
- $2,013 million .
The second unit, starting up in 2011 will have a nominal dollar cost of
(600x 103)(1180)(1.05)19
- $1,789 million .
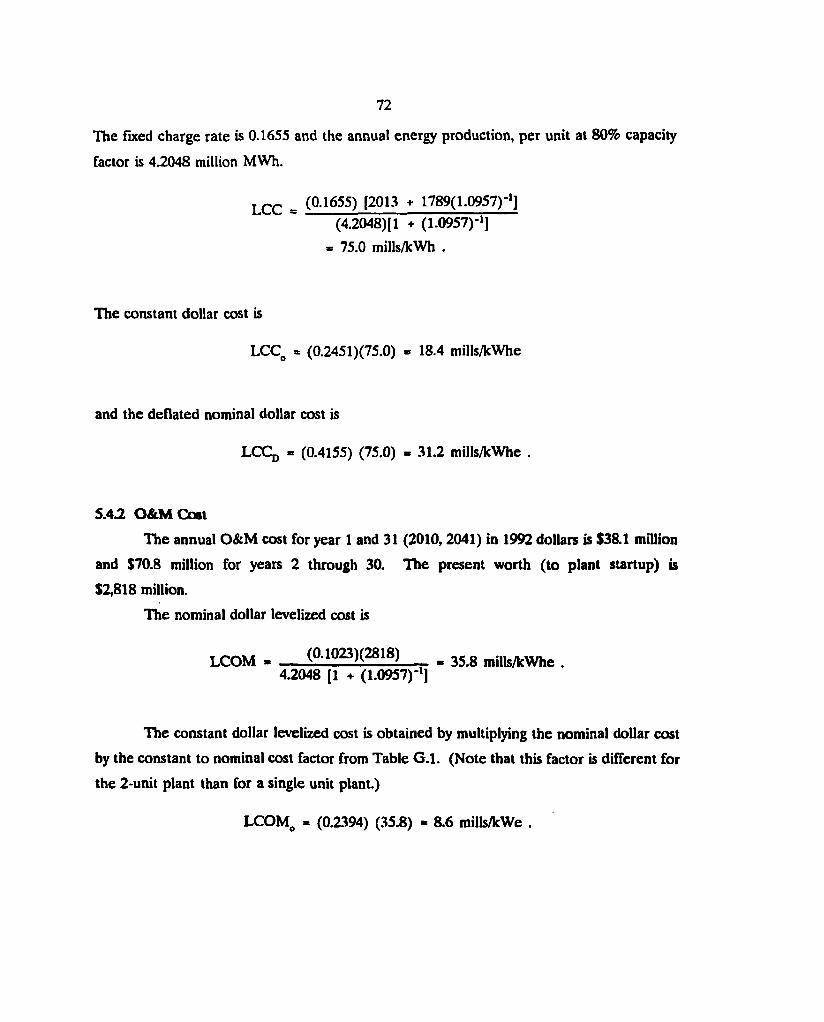
7 2
The Fixed charge rate is 0.1655 and the annual energy production, per unit at 80% capacity
factor is 4.2048 million MWh.
L C C = (0.1655) [2013 + 1789(1.0957)-'] (4.2048) [1 + (1.0957)"1]
= 75.0 mills/kWh .
The constant dollar cost is
LCCo = (0.2451)(75.0) « 18.4 mills/kWhe
and the deflated nominal dollar cost is
L C C D « (0.4155) (75.0) - 31.2 mills/kWhe .
5.4.2 O&M Cost
The annual O&M cost for year 1 and 31 (2010, 2041) in 1992 dollars is $38.1 million
and $70.8 million for years 2 through 30. The present worth (to plant startup) is
$2,818 million.
The nominal dollar levelized cost is
LCOM - (0.1023X2818) - 35.8 mills/kWhe . 4.2048 [1 + (1.0957)-']
The constant dollar levelized cost is obtained by multiplying the nominal dollar cost
by the constant to nominal cost factor from Table G.l. (Note that this factor is different for
the 2-unit plant than for a single unit plant.)
LCOM0 = (0.2394) (35.8) « 8.6 mills/kWe .
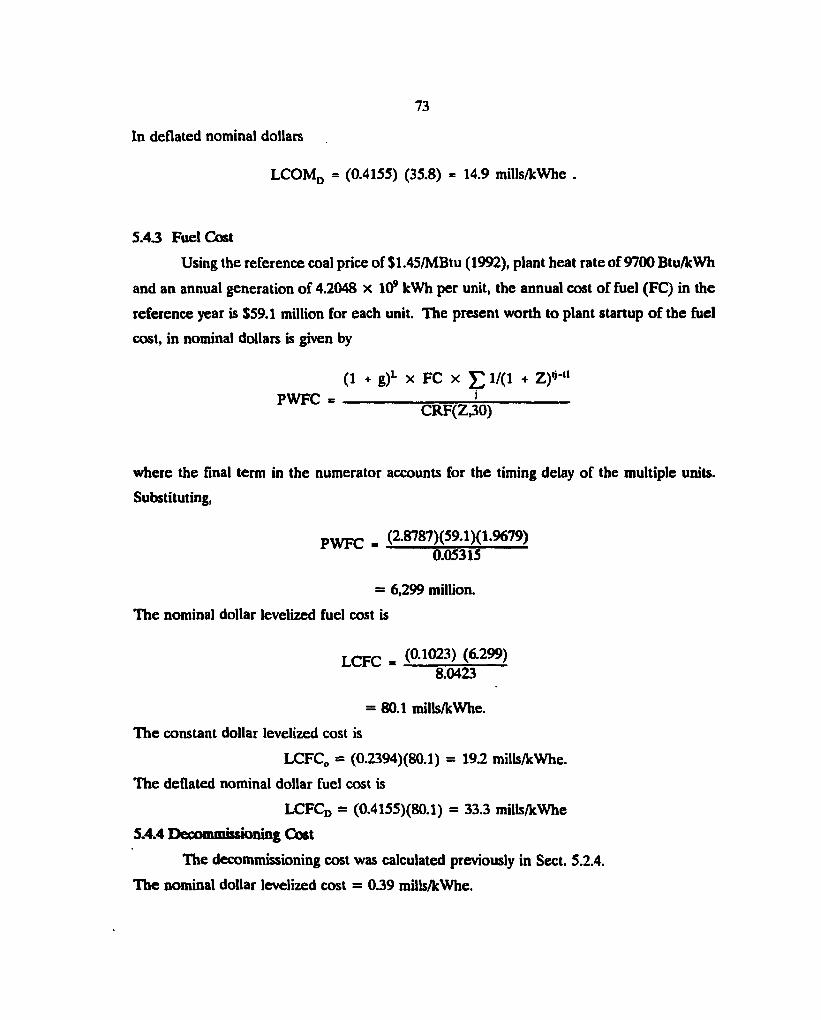
In deflated nominal dollars
73
L C O M D = (0.4155) (35.8) - 14.9 mills/kWhe .
5.43 Fuel Cost
Using the reference coal price of $1.45/MBtu (1992), plant heat rate of 9700 Btu/kWh
and an annual generation of 4.2048 x 10⁹ kWh per unit, the annual cost of fuel (FC) in the
reference year is $59.1 million for each unit. The present worth to plant startup of the fuel
cost, in nominal dollars is given by
(1 + g) L x F C x J 1/(1 + Z f ' x X
PWFC - ! CRF(Z,30)
where the final term in the numerator accounts for the timing delay of the multiple units.
Substituting,
p W F C , (2.8787)(59.1)(1.9679) 0.05315
= 6,299 million.
The nominal dollar levelized fuel cost is
t rer - ( ° 1 0 2 3 ) (6-299) 8.0423
= 80.1 mills/kWhe.
The constant dollar levelized cost is
LCFC0 = (0.2394)(8Q.l) = 19.2 mills/kWhe.
The deflated nominal dollar fuel cost is
LCFCd = (0.4155)(80.1) = 33.3 mills/kWhe
5.4.4 Decommissioning Cost
The decommissioning cost was calculated previously in Sect. 5.2.4.
The nominal dollar levelized cost = 0.39 mills/kWhe.
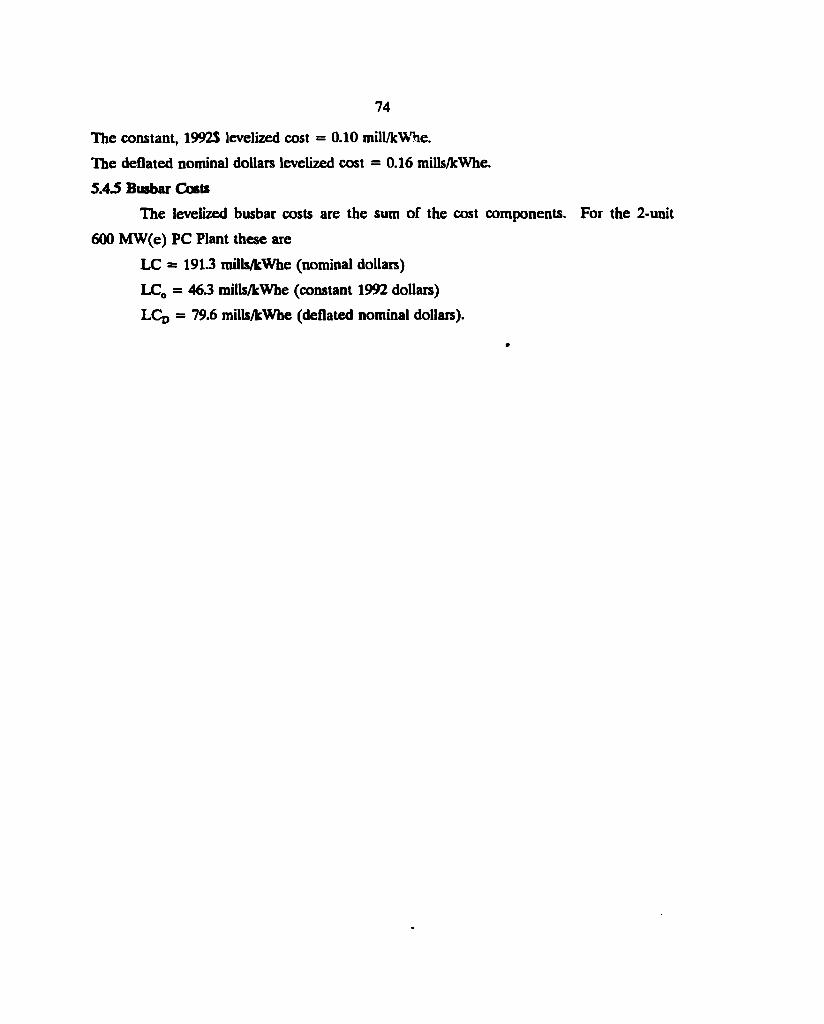
7 4
The constant, 1992$ levelized cost = 0.10 mill/kWhe.
The deflated nominal dollars levelized cost = 0.16 mills/kWhe.
5.4.5 Busbar Costs
The levelized busbar costs are the sum of the cost components. For the 2-unit
600 MW(e) PC Plant these are
LC - 1913 mills/kWhe (nominal dollars)
LC0 = 463 mills/kWhe (constant 1992 dollars)
LCq = 79.6 mills/kWhe (deflated nominal dollars).
75
REFERENCES
1. C. R. Hudson II, Cost E s t i m a t e G u i d e l i n e s f o r A d v a n c e d N u c l e a r P o w e r T e c h n o l o g i e s , ORNL/TM-10071/R1, Martin Marietta Energy Systems, Inc., Oak Ridge National Laboratoiy, July 1987.
2. J. G. Delene and C. R. Hudson II, C o s t E s t i m a t e G u i d e l i n e s f o r A d v a n c e d N u c l e a r P o w e r Technologies, ORNL/IM-1P071/R2, Martin Marietta Energy Systems, Inc., Oak Ridge National Laboratory, Mavci. 1990.
3. Technical Refeience Book for the Energy Economic Data Base Program EEDB Phase IX (1987), DOE/NE-f>092, U.S. Department of Energy, Office of Nuclear Energy, September 1988.
4. G u i d e f o r t h e E c o n o m i c E v a l u a t i o n o f N u c l e a r R e a c t o r P l a n t D e s i g n s , NUS-531, prepared for U.S. Atomic Energy Commission by NUS Corporation (January 1969).
5. N u c l e a r E n e r g y C o s t D a t a B a s e — A R e f e r e n c e D a t a B a s e f o r N u c l e a r a n d C o a l - F i r e d P o w e r P l a n t G e n e r a t i o n Cost A n a l y s i s , DOE/NE-0095, September 1988.
6. Bechtel National, Inc. letter, D. A. Dilling to Jerry Delene, BNI/GCRA: 93-663, January 22, 1993.
7. National Economic Trends, Prepared by The Federal Reserve Bank of St. Louis, April 1992 and previous issues.
8. T h e H a n d y - W h i t m a n I n d e x o f P u b l i c U t i l i t y C o n s t r u c t i o n C o s t s , Whitman, Requardt and Associates, Baltimore, Maryland 21202.
9. J. J. Coen and J. G. Delene, User I n s t r u c t i o n s f o r L e v e l i z e d P o w e r G e n e r a t i o n C o s t C o d e s U s i n g a n I B M - T y p e - P C , ORNLTM-10997, Martin Marietta Energy Systems, Inc., Oak Ridge National Laboratory, January 1989.
10. J. G. Delene and O. W. Hermann, R E F C O - 8 3 U s e r ' s M a n u a l , ORNL/TM-9186, Martin Marietta Energy Systems, Inc., Oak Ridge Natl. Lab., June 1984.
11. Advanced Design Nuclear Power Plants: Competitive, Economical Electricity, U.S. Council for Energy Awareness, June 1992.
12. Supplement to the Annual Energy Outlook 1992, Energy Information Administration, USDOE, DOE/EIA-0554(92), February 1992.
13. MHTGR Cost Estimating Groundrules and Procedures, Gas-Cooled Reactor Associates, HP10701 (to be published).
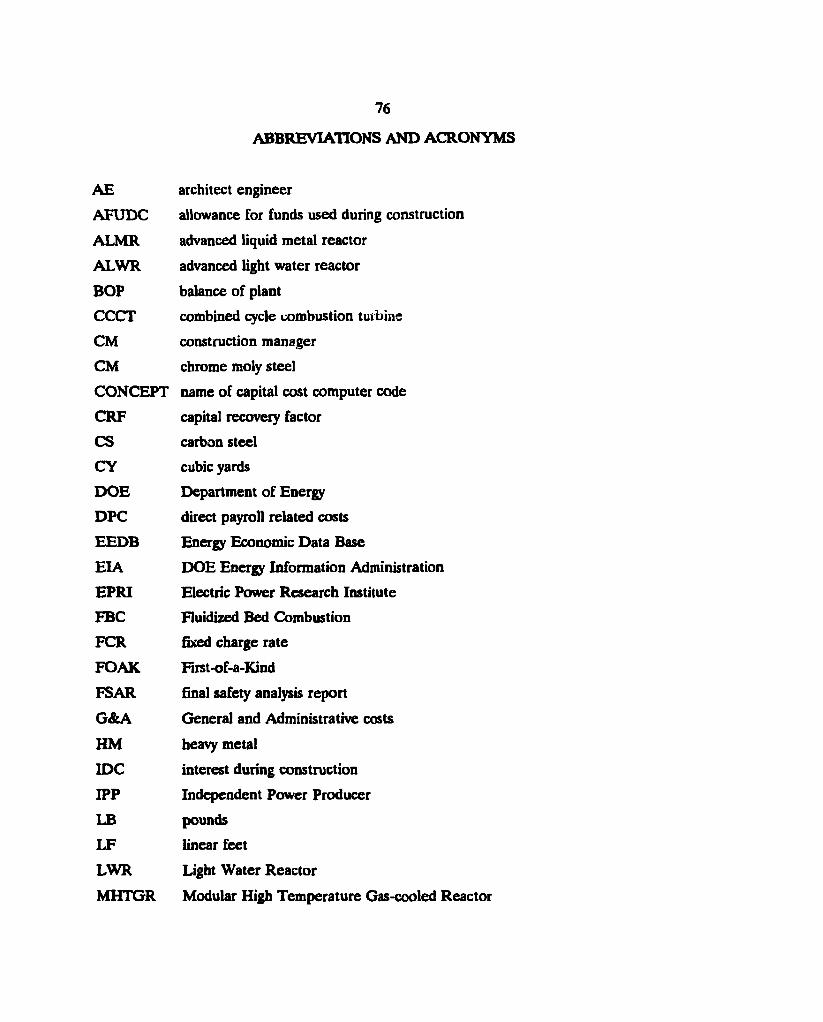
7 6
ABBREVIATIONS AND ACRONYMS
AE architect engineer
AFUDC allowance for funds used during construction
ALMR advanced liquid metal reactor
ALWR advanced light water reactor
BOP balance of plant
CCCT combined cycle combustion turbine
CM construction manager
CM chrome moly steel
CONCEPT name of capital cost computer code
CRF capital recovery factor
CS carbon steel
CY cubic yards
DOE Department of Energy
DPC direct payroll related costs
EEDB Energy Economic Data Base
EIA DOE Energy Information Administration
EPRI Electric Power Research Institute
FBC Fluidized Bed Combustion
FCR fixed charge rate
FOAK First-of-a-Kind
FSAR final safety analysis report
G&A General and Administrative costs
HM heavy metal
IDC interest during construction
IPP Independent Power Producer
LB pounds
LF linear feet
LWR Light Water Reactor
MHTGR Modular High Temperature Gas-cooled Reactor
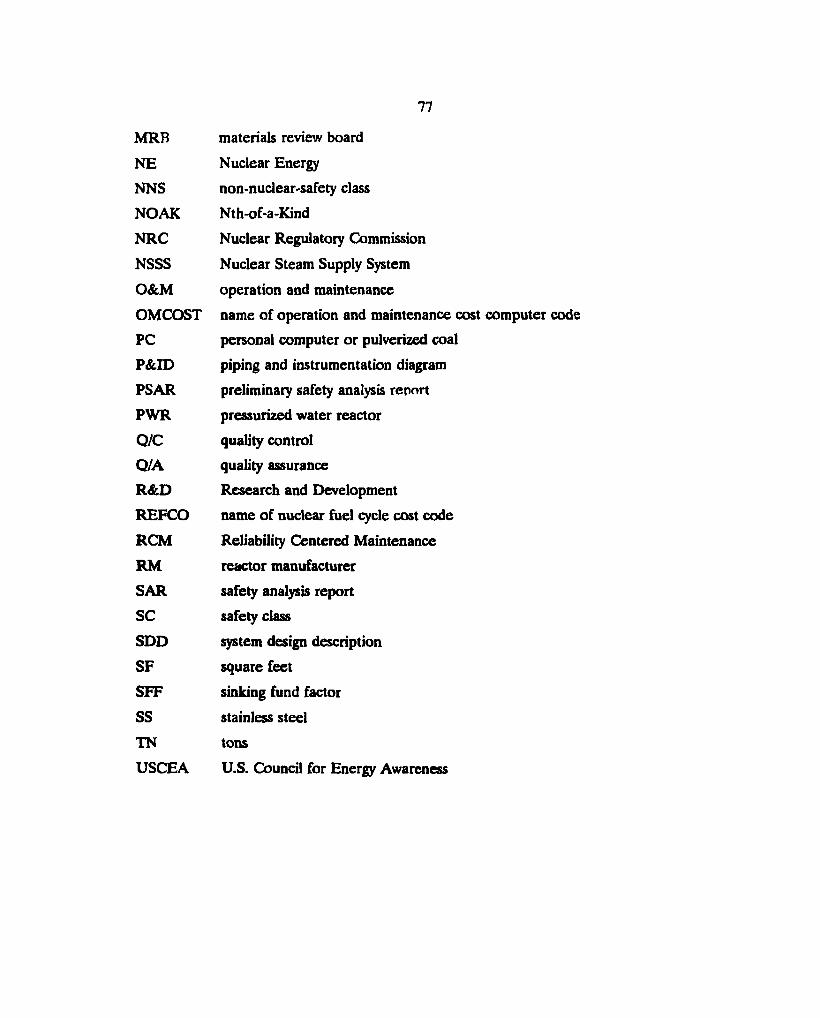
77
MRB materials review board
NE Nuclear Energy
NNS non-nuclear-safety class
NOAK Nth-of-a-Kind
NRC Nuclear Regulatory Commission
NSSS Nuclear Steam Supply System
O&M operation and maintenance
OMCOST name of operation and maintenance cost computer code
PC personal computer or pulverized coal
P&ID piping and instrumentation diagram
PSAR preliminary safety analysis report
PWR pressurized water reactor
Q/C quality control
Q/A quality assurance
R&D Research and Development
REFCO name of nuclear fuel cycle cost code
RCM Reliability Centered Maintenance
RM reactor manufacturer
SAR safety analysis report
SC safety class
SDD system design description
SF square feet
SFF sinking fund factor
SS stainless steel
TN tons
USCEA U.S. Council for Energy Awareness
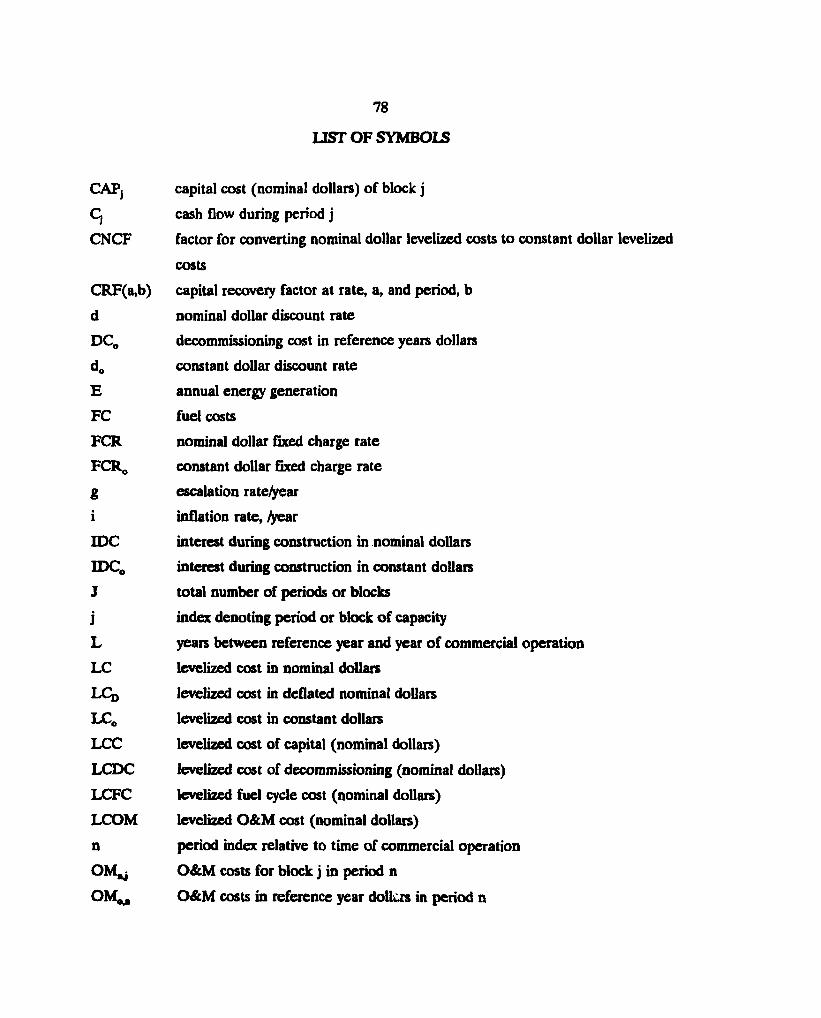
CAPJ
q C N C F
CRF(a,b)
d
DCe
d0
E
F C
F C R
F C R C g
i
roc
roc0 j
j L
L C
LCo
LCo
L C C
L C D C
L C F C
L C O M
n
OM^
7 8
LEST O F S Y M B O L S
capital cost (nominal dollars) of block j
cash flow during period j
factor for converting nominal dollar levelized costs to constant dollar levelized
costs
capital recoveiy factor at rate, a, and period, b
nominal dollar discount rate
decommissioning cost in reference years dollars
constant dollar discount rate
annual energy generation
fuel costs
nominal dollar fixed charge rate
constant dollar fixed charge rate
escalation rate/year
inflation rate, /year
interest during construction in nominal dollars
interest during construction in constant dollars
total number of periods or blocks
index denoting period or block of capacity
years between reference year and year of commercial operation
levelized cost in nominal dollars
levelized cost in deflated nominal dollars
levelized cost in constant dollars
levelized cost of capital (nominal dollars)
levelized cost of decommissioning (nominal dollars)
levelized fuel cycle cost (nominal dollars)
levelized O&M cost (nominal dollars)
period index relative to time of commercial operation
O&M costs for block j in period n
O&M costs in reference year dolkrs in period n
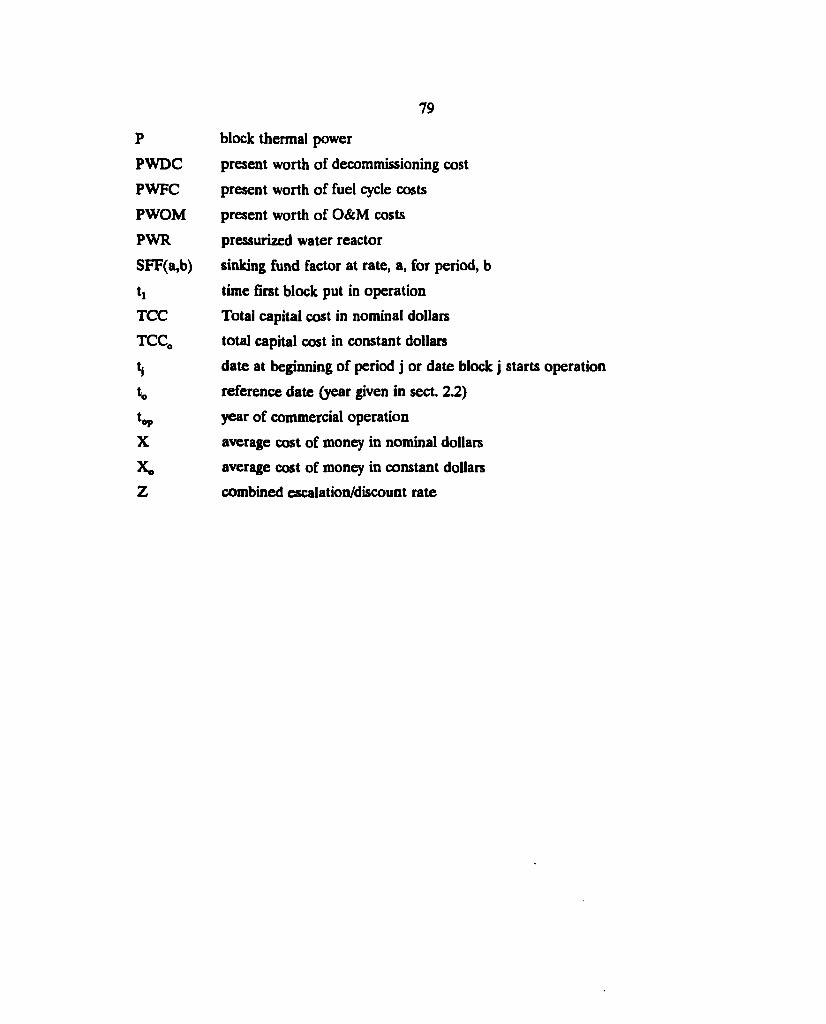
7 9
P block thermal power
PWDC present worth of decommissioning cost
PWFC present worth of fuel cycle costs
PWOM present worth of O&M costs
PWR pressurized water reactor
SFF(a,b) sinking fund factor at rate, a, for period, b
t, time first block put in operation
TCC Total capital cost in nominal dollars
TCC0 total capital cost in constant dollars
tj date at beginning of period j or date block j starts operation
tc reference date (year given in sect. 2.2)
t^ year of commercial operation
X average cost of money in nominal dollars
Xe average cost of money in constant dollars
Z combined escalation/discount rate
8 0
Appendix A
EEDB CODE OF ACCOUNTS FOR ADVANCED LIQUID-METAL REACTOR (ALMR) CONCEPT
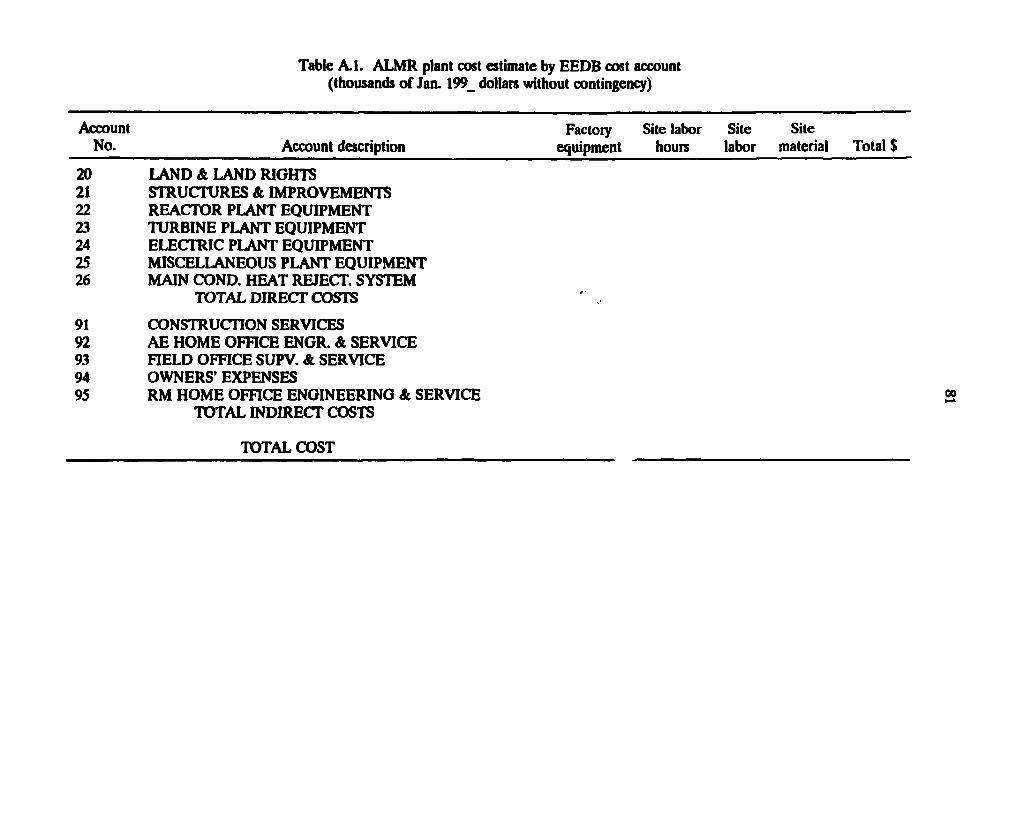
Table B.l. MHTGR plant cost estimate by E E D B cost account (thousands o f Jan. 199_ dollars without contingency)
Account No. Account description
20 LAND ALAND RIGHTS 21 STRUCTURES & IMPROVEMENTS 22 REACTOR PLANT EQUIPMENT 23 TURBINE PLANT EQUIPMENT 24 ELECTRIC PLANT EQUIPMENT 25 MISCELLANEOUS PLANT EQUIPMENT 26 MAIN COND. HEAT REJECT. SYSTEM
TOTAL DIRECT COSTS
91 CONSTRUCTION SERVICES 92 AE HOME OFFICE ENGR. & SERVICE 93 HELD OFFICE SUPV. & SERVICE 94 OWNERS' EXPENSES 95 RM HOME OFFICE ENGINEERING & SERVICE 2
TOTAL INDIRECT COSTS
Factory Site labor Site Site equipment hours labor material Total $
TOTAL COST
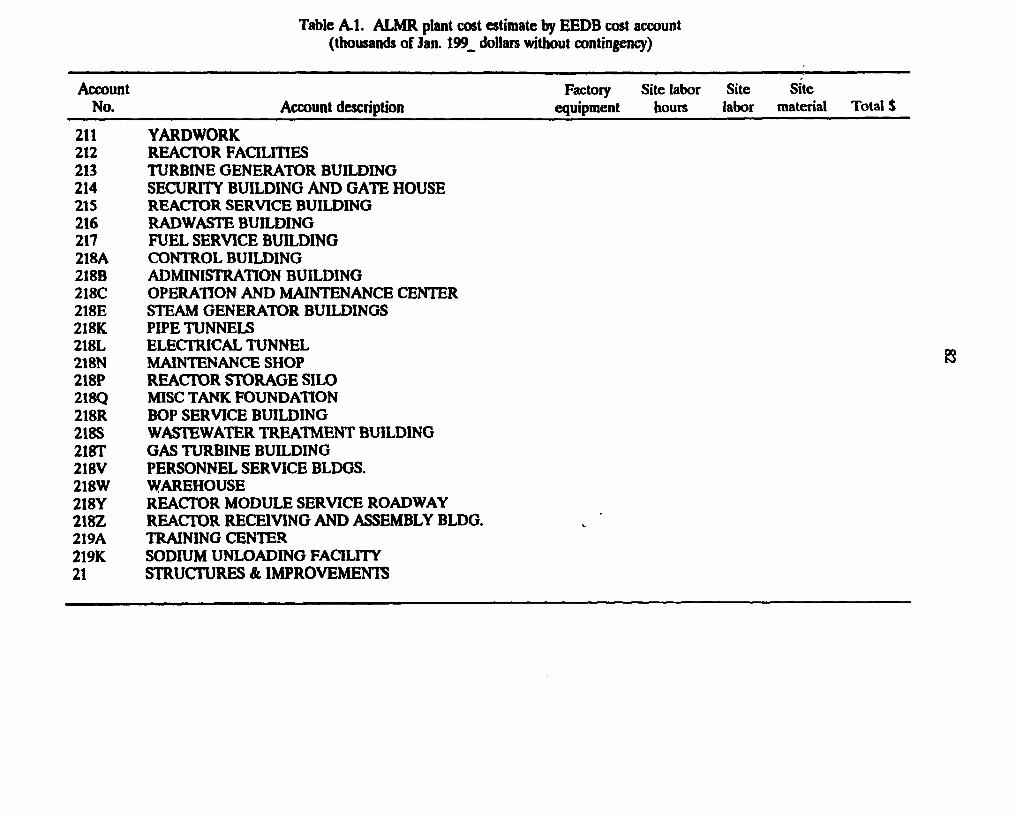
Table B.l. MHTGR plant cost estimate by E E D B cost account (thousands o f Jan. 199_ dollars without contingency)
Account No. Account description
Factory Site labor Site Site equipment hours labor material Total $
211 YARDWORK 212 REACTOR FACILITIES 213 TURBINE GENERATOR BUILDING 214 SECURITY BUILDING AND GATE HOUSE
216 RADWASTE BUILDING 217 FUEL SERVICE BUILDING 218A CONTROL BUILDING 218B ADMINISTRATION BUILDING 218C OPERATION AND MAINTENANCE CENTER 218E STEAM GENERATOR BUILDINGS 218K PIPE TUNNELS 218L ELECTRICAL TUNNEL 218N MAINTENANCE SHOP 218P REACTOR STORAGE SILO 218Q MISC TANK FOUNDATION 218R BOP SERVICE BUILDING 218S WASTEWATER TREATMENT BUILDING 218T GAS TURBINE BUILDING 218V PERSONNEL SERVICE BLDGS. 218W WAREHOUSE 218Y REACTOR MODULE SERVICE ROADWAY 218Z REACTOR RECEIVING AND ASSEMBLY BLDG. 219A TRAINING CENTER 219K SODIUM UNLOADING FACILITY 21 STRUCTURES & IMPROVEMENTS
215 REACTOR SERVICE BUILDING
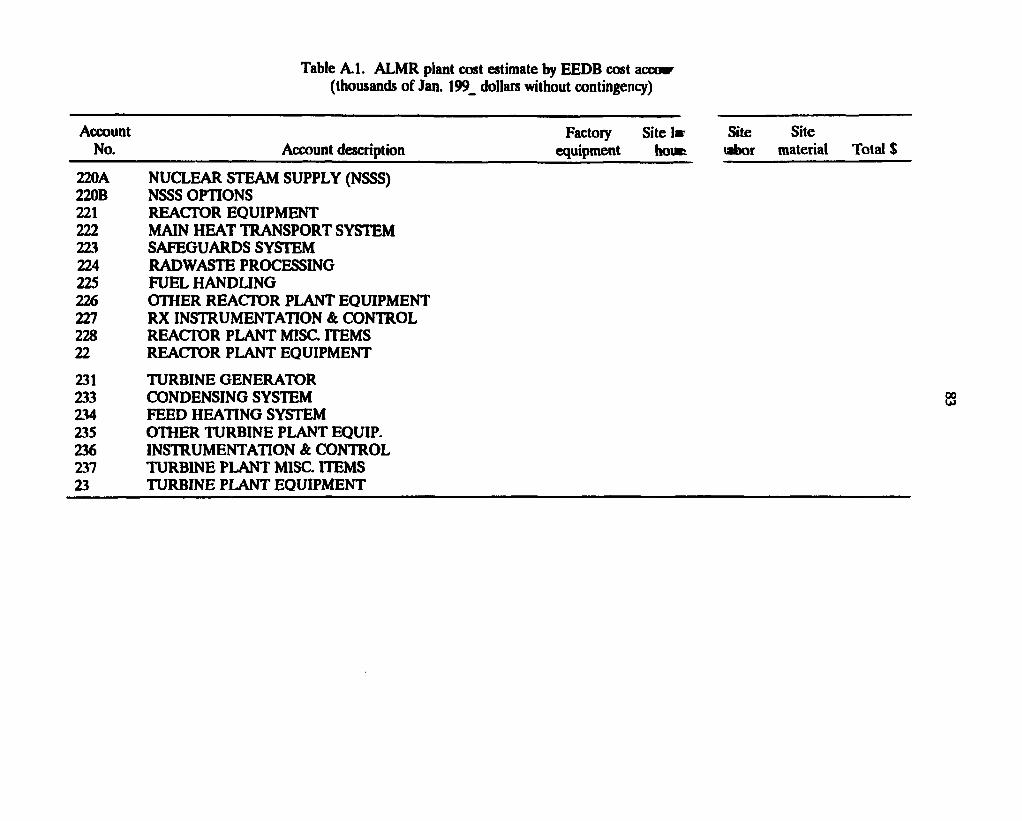
Table B.l. MHTGR plant cost estimate by E E D B cost account (thousands o f Jan. 199_ dollars without contingency)
Factory Site la? Site Site equipment houfe tabor material Total $
220A NUCLEAR STEAM SUPPLY (NSSS) 220B NSSS OPTIONS 221 REACTOR EQUIPMENT 222 MAIN HEAT TRANSPORT SYSTEM 223 SAFEGUARDS SYSTEM 224 RADWASTE PROCESSING 225 FUEL HANDLING 226 OTHER REACTOR PLANT EQUIPMENT 227 RX INSTRUMENTATION & CONTROL 228 REACTOR PLANT MISC. ITEMS 22 REACTOR PLANT EQUIPMENT
231 TURBINE GENERATOR 233 CONDENSING SYSTEM 234 FEED HEATING SYSTEM 235 OTHER TURBINE PLANT EQUIP. 236 INSTRUMENTATION & CONTROL 237 TURBINE PLANT MISC. ITEMS 23 TURBINE PLANT EQUIPMENT
Account No. Account description
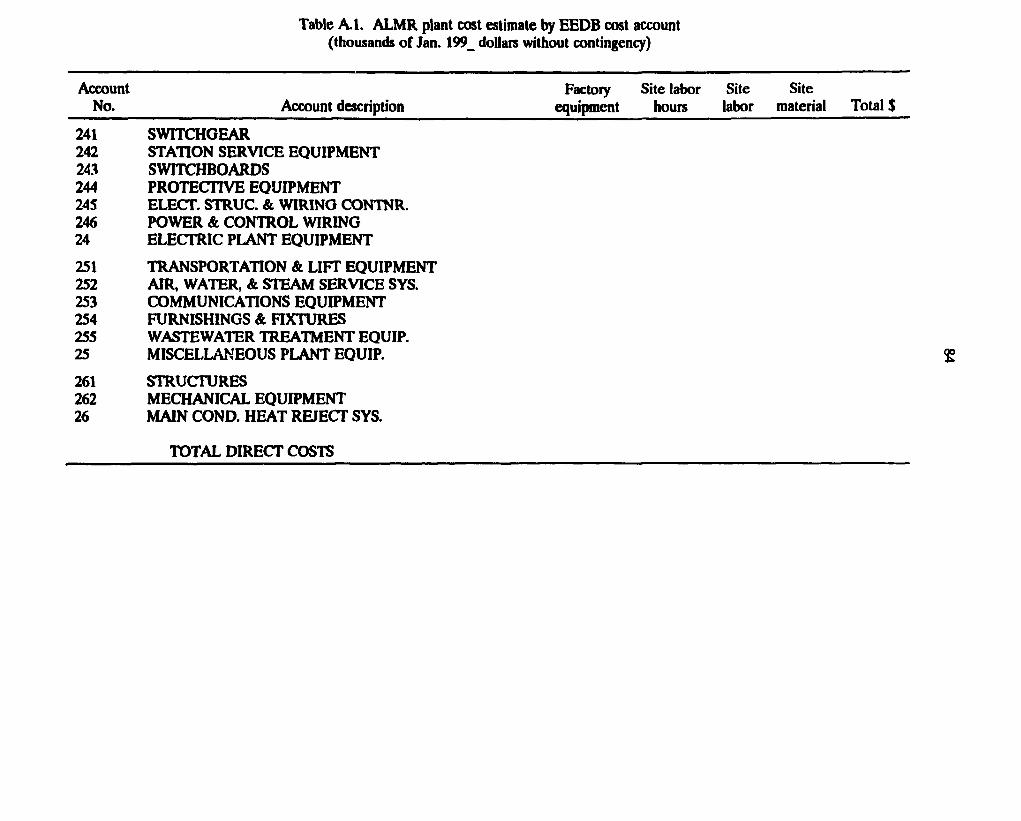
Table B.l. MHTGR plant cost estimate by E E D B cost account (thousands o f Jan. 199_ dollars without contingency)
Factory Site labor Site Site equipment hours labor material Total $
241 SWITCHGEAR 242 STATION SERVICE EQUIPMENT 243 SWITCHBOARDS 244 PROTECTIVE EQUIPMENT 245 ELECT. STRUC. & WIRING CONTNR. 246 POWER & CONTROL WIRING 24 ELECTRIC PLANT EQUIPMENT
251 TRANSPORTATION & LIFT EQUIPMENT 252 AIR, WATER, & STEAM SERVICE SYS. 253 COMMUNICATIONS EQUIPMENT 254 FURNISHINGS & FIXTURES 255 WASTEWATER TREATMENT EQUIP. 25 MISCELLANEOUS PLANT EQUIP.
261 STRUCTURES 262 MECHANICAL EQUIPMENT 26 MAIN COND. HEAT REJECT SYS.
Account No. Account description
TOTAL DIRECT COSTS
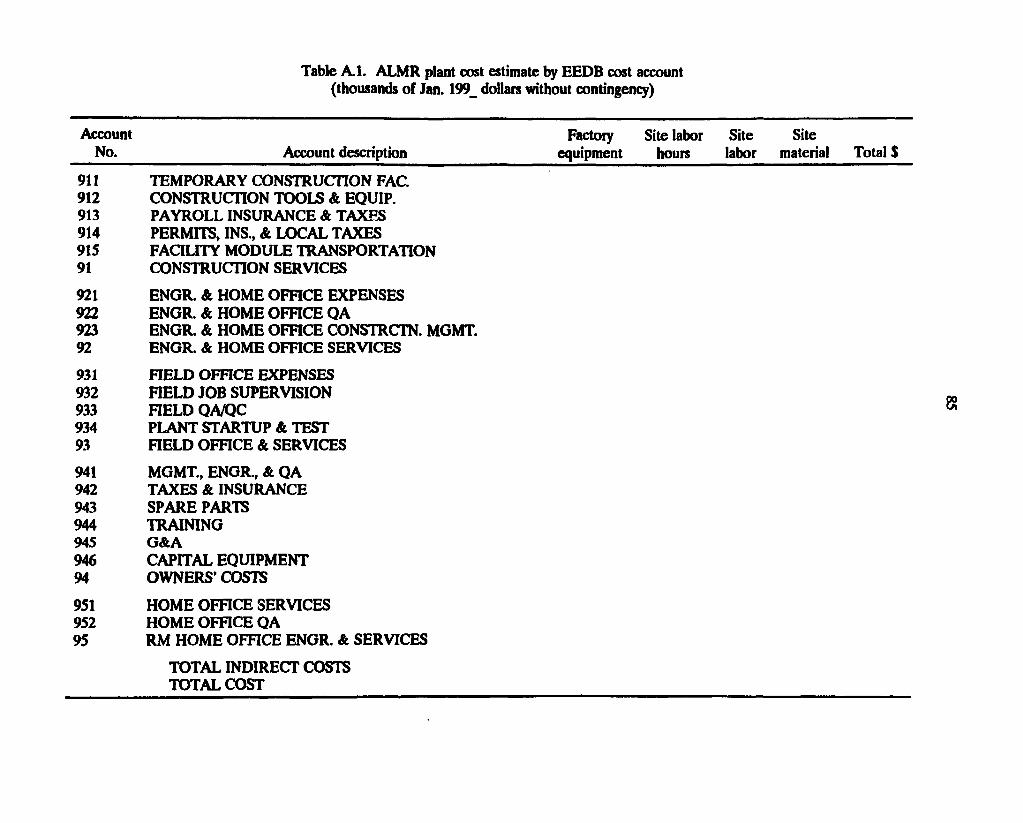
Table B.l. MHTGR plant cost estimate by E E D B cost account (thousands o f Jan. 199_ dollars without contingency)
Factory Site labor Site Site equipment hours labor material Total $
911 TEMPORARY CONSTRUCTION FAC. 912 CONSTRUCTION TOOLS & EQUIP. 913 PAYROLL INSURANCE & TAXES 914 PERMITS, INS., & LOCAL TAXES 915 FACILITY MODULE TRANSPORTATION 91 CONSTRUCTION SERVICES
921 ENGR. & HOME OFFICE EXPENSES 922 ENGR. & HOME OFFICE QA 923 ENGR. & HOME OFFICE CONSTRCTN. MGMT. 92 ENGR. & HOME OFFICE SERVICES
931 HELD OFFICE EXPENSES 932 FIELD JOB SUPERVISION 933 HELD QA/QC 934 PLANT STARTUP & TEST 93 FIELD OFFICE & SERVICES
941 MGMT., ENGR., & QA 942 TAXES & INSURANCE 943 SPARE PARTS 944 TRAINING 945 G&A 946 CAPITAL EQUIPMENT 94 OWNERS' COSTS
951 HOME OFFICE SERVICES 952 HOME OFFICE QA 95 RM HOME OFFICE ENGR. & SERVICES
Account No. Account description
TOTAL INDIRECT COSTS TOTAL COST
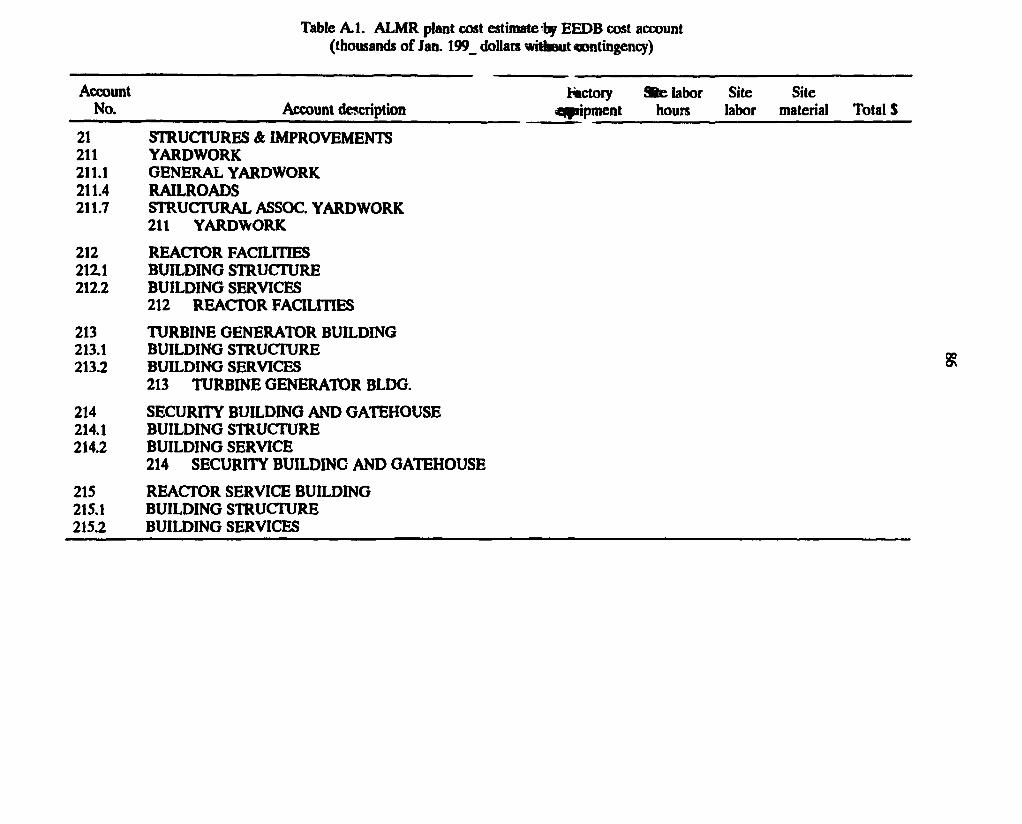
Table B.l. MHTGR plant cost estimate by E E D B cost account (thousands o f Jan. 199_ dollars without contingency)
Account factory 9 t e labor Site Site No. Account description <qpripment hours labor material Total $
21 STRUCTURES & IMPROVEMENTS 211 YARDWORK 211.1 GENERAL YARDWORK 211.4 RAILROADS 211.7 STRUCTURAL ASSOC. YARDWORK
211 YARDWORK
212 REACTOR FACILITIES 212.1 BUILDING STRUCTURE 212.2 BUILDING SERVICES
212 REACTOR FACILITIES
213 TURBINE GENERATOR BUILDING 213.1 BUILDING STRUCTURE 213.2 BUILDING SERVICES
213 TURBINE GENERATOR BLDG.
214 SECURITY BUILDING AND GATEHOUSE 214.1 BUILDING STRUCTURE 214.2 BUILDING SERVICE
214 SECURITY BUILDING AND GATEHOUSE
215 REACTOR SERVICE BUILDING 215.1 BUILDING STRUCTURE 215.2 BUILDING SERVICES
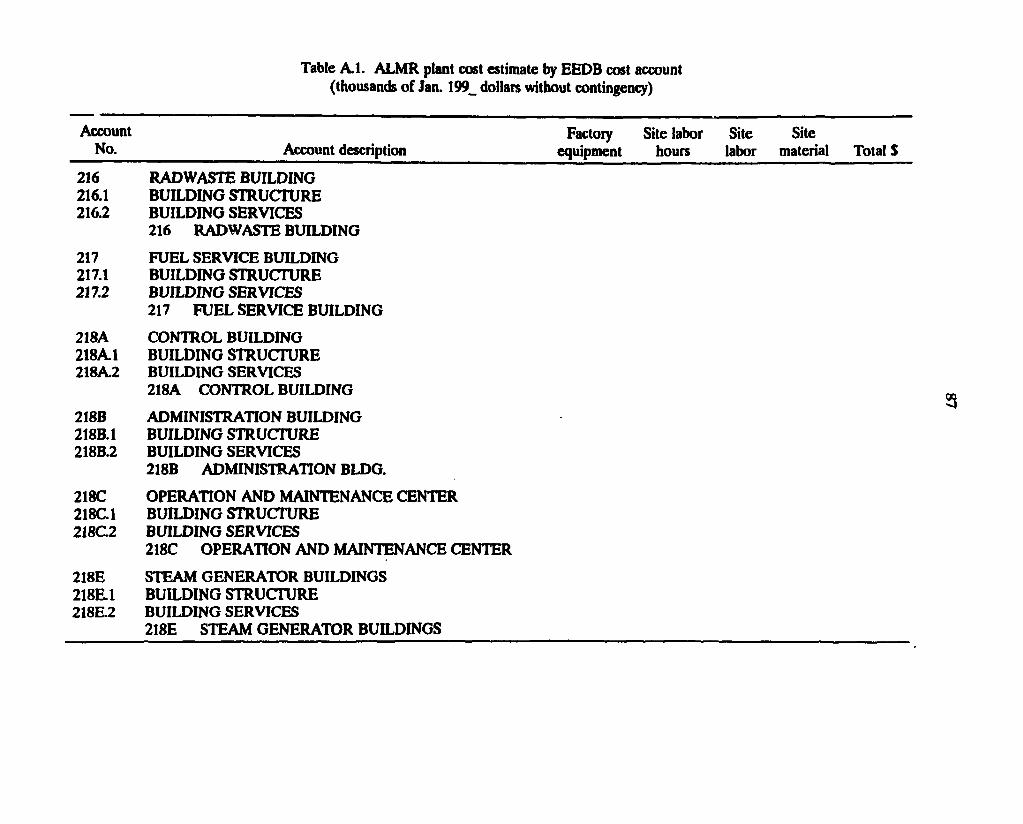
Table B.l. MHTGR plant cost estimate by E E D B cost account (thousands o f Jan. 199_ dollars without contingency)
Account No. Account description
Factory Site labor Site Site equipment hours labor material Total $
216 216.1 216.2
RADWASTE BUILDING BUILDING STRUCTURE BUILDING SERVICES 216 RADWASTE BUILDING
217 FUEL SERVICE BUILDING 217.1 BUILDING STRUCTURE 217.2 BUILDING SERVICES
217 FUEL SERVICE BUILDING
218A CONTROL BUILDING 218A1 BUILDING STRUCTURE 218A2 BUILDING SERVICES
218A CONTROL BUILDING
218B ADMINISTRATION BUILDING 218B.1 BUILDING STRUCTURE 218B.2 BUILDING SERVICES
218B ADMINISTRATION BLDG.
218C OPERATION AND MAINTENANCE CENTER 218C.1 BUILDING STRUCTURE 218C.2 BUILDING SERVICES
218C OPERATION AND MAINTENANCE CENTER
218E STEAM GENERATOR BUILDINGS 218E.1 BUILDING STRUCTURE 218E2 BUILDING SERVICES
218E STEAM GENERATOR BUILDINGS
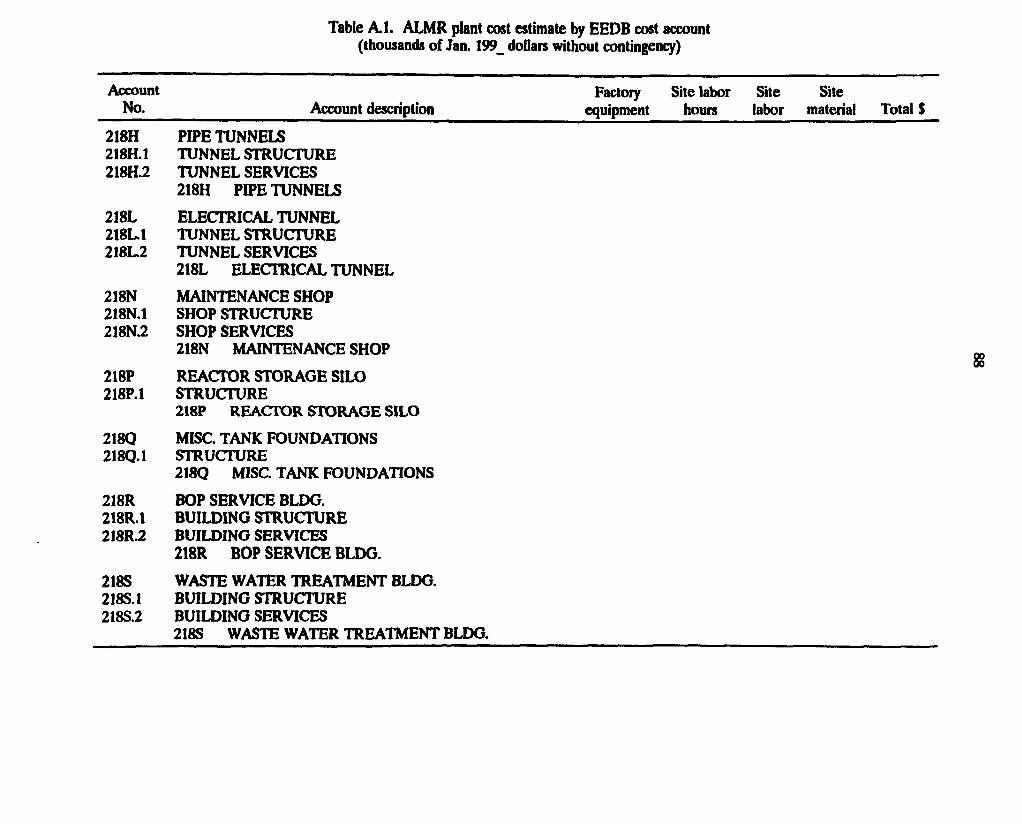
Table A.1. ALMR plant cost estimate by EEDB cost account (thousands of Jan. 199_ dollars without contingency)
Account No.
Factory Site labor Site Account description equipment hours labor
Site material Total $
218H 218H.1 218H.2
PIPE TUNNELS TUNNEL STRUCTURE TUNNEL SERVICES 218H PIPE TUNNELS
218L 218L.1 218L2
ELECTRICAL TUNNEL TUNNEL STRUCTURE TUNNEL SERVICES 218L ELECTRICAL TUNNEL
218N 218N.1 218N.2
MAINTENANCE SHOP SHOP STRUCTURE SHOP SERVICES 218N MAINTENANCE SHOP
218P 218P.1
REACTOR STORAGE SILO STRUCTURE 218P REACTOR STORAGE SILO
218Q 218Q.1
MISC. TANK FOUNDATIONS STRUCTURE 218Q MISC. TANK FOUNDATIONS
218R 218R.1 218R.2
BOP SERVICE BLDG. BUILDING STRUCTURE BUILDING SERVICES 218R BOP SERVICE BLDG.
218S 2185.1 2185.2
WASTE WATER TREATMENT BLDG. BUILDING STRUCTURE BUILDING SERVICES 218S WASTE WATER TREATMENT BLDG.
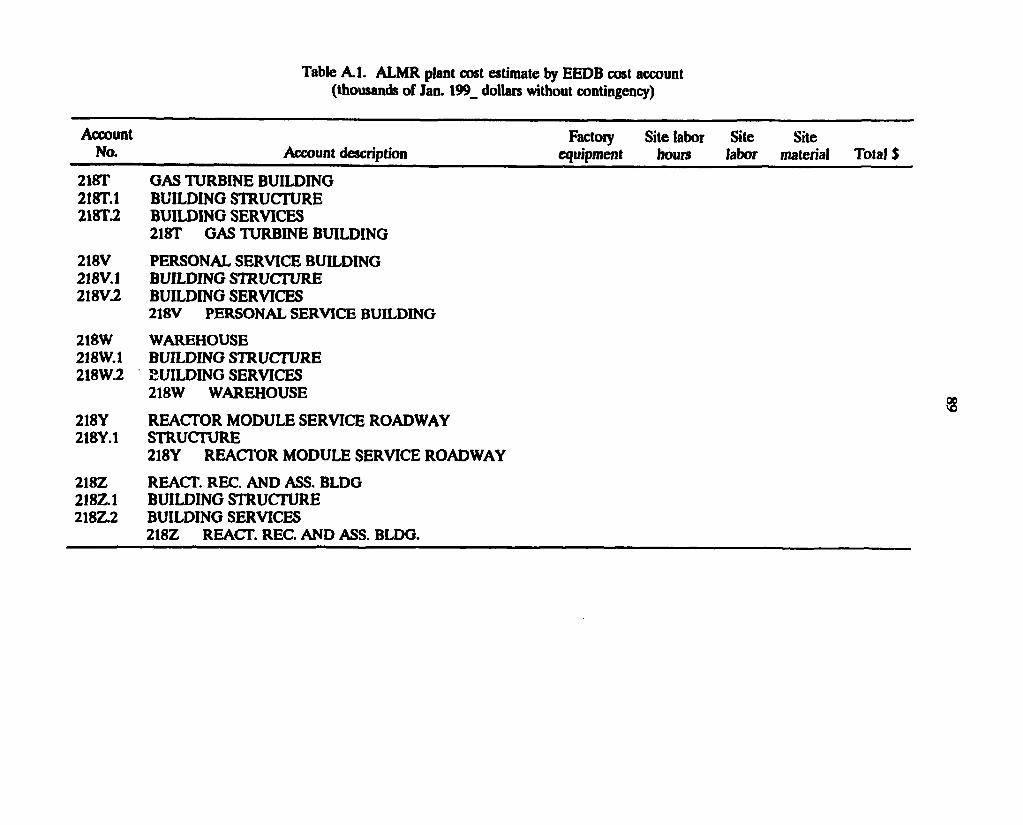
Table B.l. MHTGR plant cost estimate by E E D B cost account (thousands of Jan. 199_ dollars without contingency)
Account Factoiy Site labor Site Site No. Account description e q u i p m e n t h o u r s l a b o r m a t e r i a l T o t a l $
218T GAS TURBINE BUILDING 218T.1 BUILDING STRUCTURE 218T.2 BUILDING SERVICES
218T GAS TURBINE BUILDING
218V PERSONAL SERVICE BUILDING 218V. 1 BUILDING STRUCTURE 218V.2 BUILDING SERVICES
218V PERSONAL SERVICE BUILDING
218W WAREHOUSE 2I8W.1 BUILDING STRUCTURE 218W.2 SUILDING SERVICES
218W WAREHOUSE
218Y REACTOR MODULE SERVICE ROADWAY 218Y.1 STRUCTURE
218Y REACTOR MODULE SERVICE ROADWAY
218Z REACT. REC. AND ASS. BLDG 218Z.1 BUILDING STRUCTURE 218Z.2 BUILDING SERVICES
218Z REACT. REC. AND ASS. BLDG.
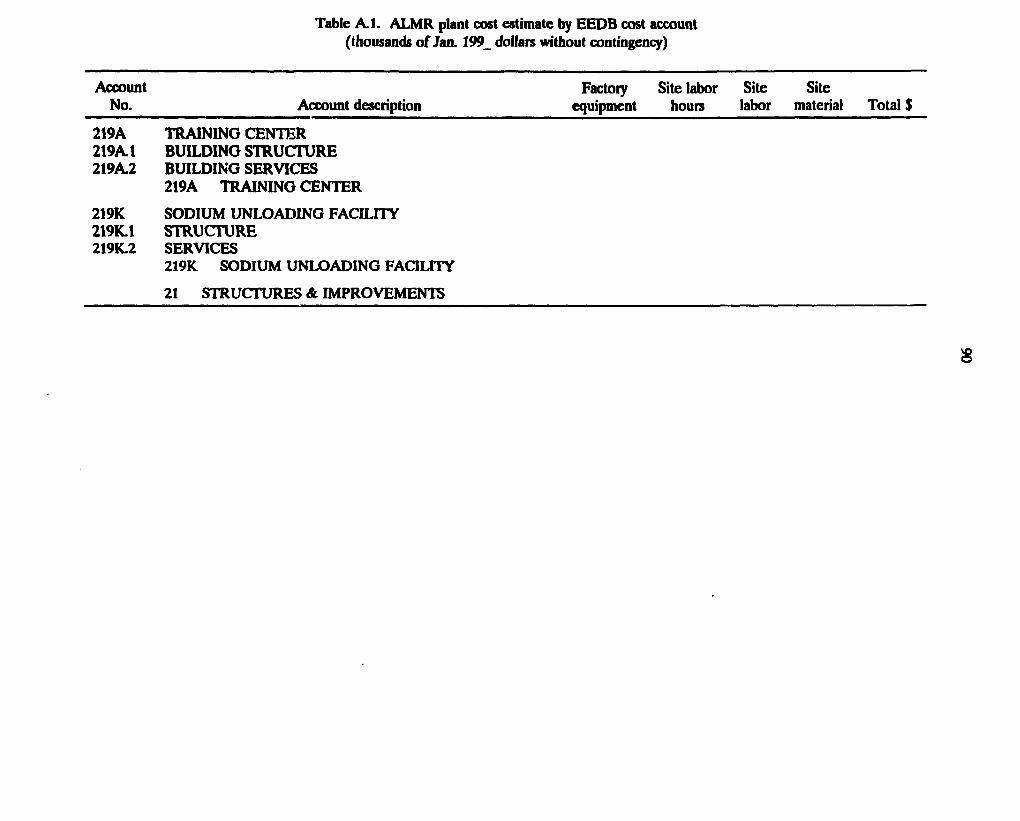
Table B.l. MHTGR plant cost estimate by E E D B cost account (thousands o f Jan. 199_ dollars without contingency)
Factory Site labor Site Site equipment hours labor material Total $
219A TRAINING CENTER 219A.1 BUILDING STRUCTURE 219A.2 BUILDING SERVICES
219A TRAINING CENTER
219K SODIUM UNLOADING FACILITY 219K.1 STRUCTURE 219K.2 SERVICES
219K SODIUM UNLOADING FACILITY
Account No. Account description
21 STRUCTURES & IMPROVEMENTS
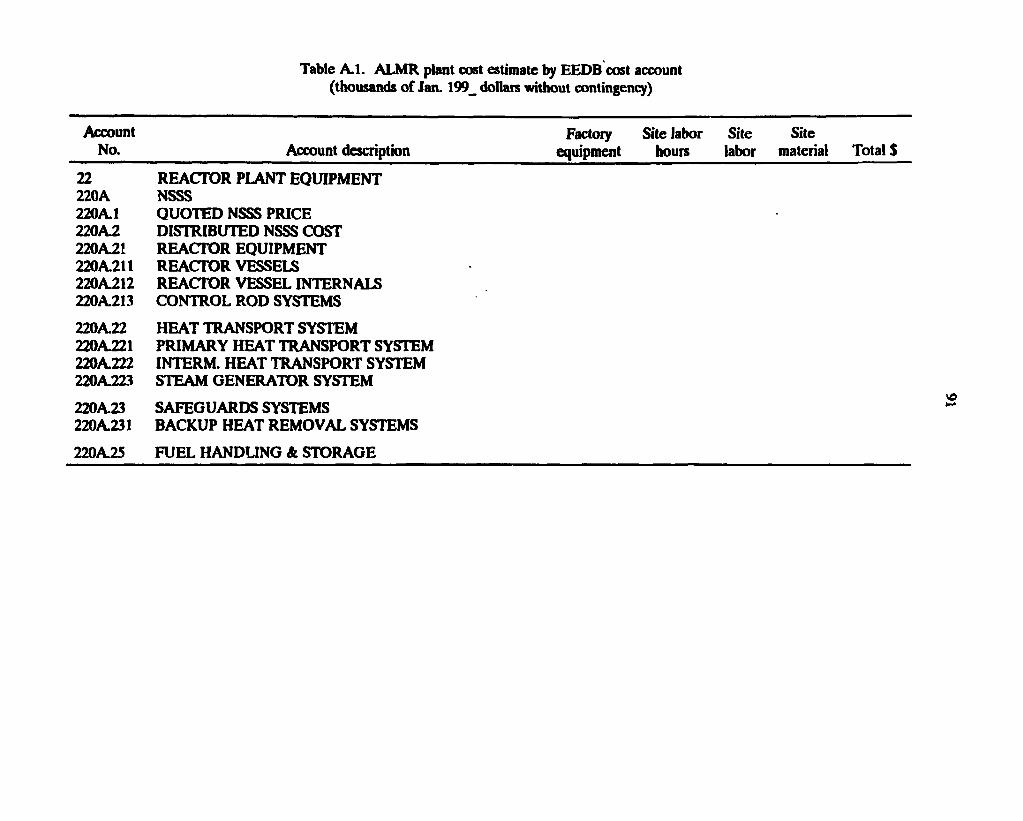
Table B.l. MHTGR plant cost estimate by E E D B cost account (thousands o f Jan. 199_ dollars without contingency)
Account Factoiy Site labor Site Site No. Account description equipment hours labor material Total $
22 REACTOR PLANT EQUIPMENT 220A NSSS 220A1 QUOTED NSSS PRICE 220A2 DISTRIBUTED NSSS COST 220A2! REACTOR EQUIPMENT 220A211 REACTOR VESSELS 220A212 REACTOR VESSEL INTERNALS 220A213 CONTROL ROD SYSTEMS
220A22 HEAT TRANSPORT SYSTEM 220A221 PRIMARY HEAT TRANSPORT SYSTEM 220A222 INTERM. HEAT TRANSPORT SYSTEM 220A223 STEAM GENERATOR SYSTEM
220A23 SAFEGUARDS SYSTEMS 220A231 BACKUP HEAT REMOVAL SYSTEMS
220A25 FUEL HANDLING & STORAGE
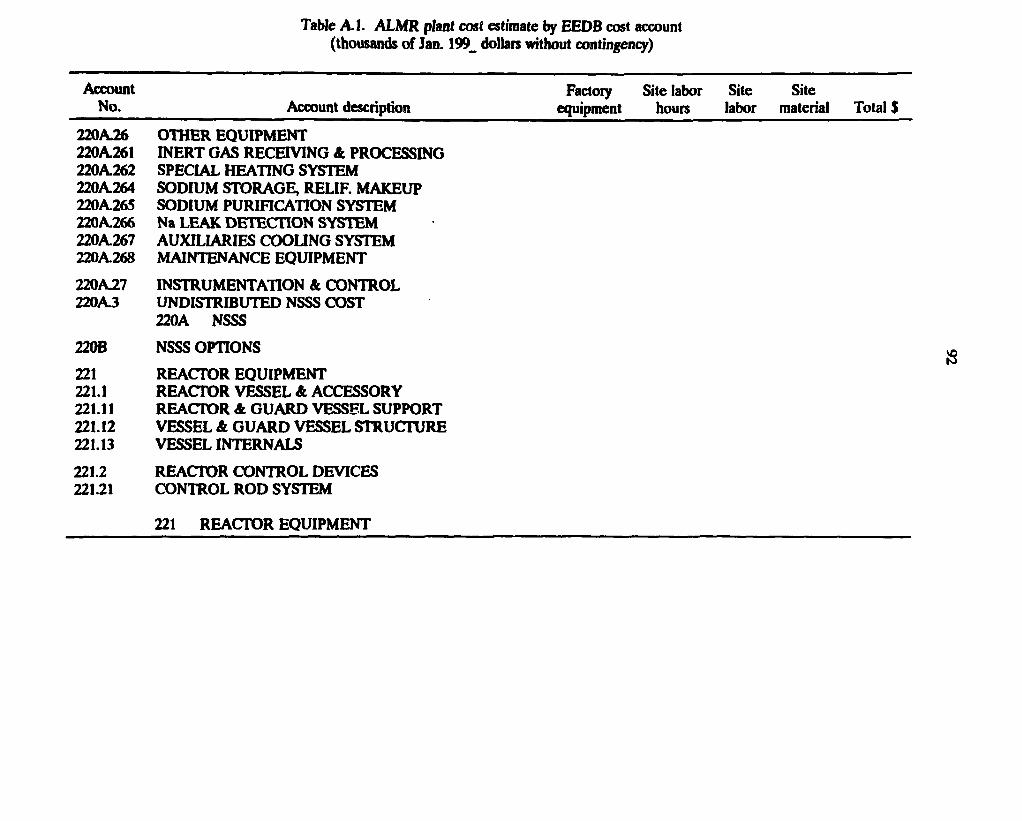
Table B.l. MHTGR plant cost estimate by EEDB cost account (thousands o f Jan. 199_ dollars without contingency)
Account Factory Site labor Site Site No. Account description equipment hours labor material Total $
220A26 OTHER EQUIPMENT 220A.261 INERT GAS RECEIVING A PROCESSING 220A.262 SPECIAL HEATING SYSTEM 220A264 SODIUM STORAGE, RELIF. MAKEUP 220A265 SODIUM PURIFICATION SYSTEM 220A266 Na LEAK DETECTION SYSTEM 220A267 AUXILIARIES COOLING SYSTEM 220A.268 MAINTENANCE EQUIPMENT
220A.27 INSTRUMENTATION A CONTROL 220A.3 UNDISTRIBUTED NSSS COST
220A NSSS 220B NSSS OPTIONS
221 REACTOR EQUIPMENT 221.1 REACTOR VESSEL A ACCESSORY 221.11 REACTOR A GUARD VESSEL SUPPORT 221.12 VESSEL A GUARD VESSEL STRUCTURE 221.13 VESSEL INTERNALS
221.2 REACTOR CONTROL DEVICES 221.21 CONTROL ROD SYSTEM
221 REACTOR EQUIPMENT
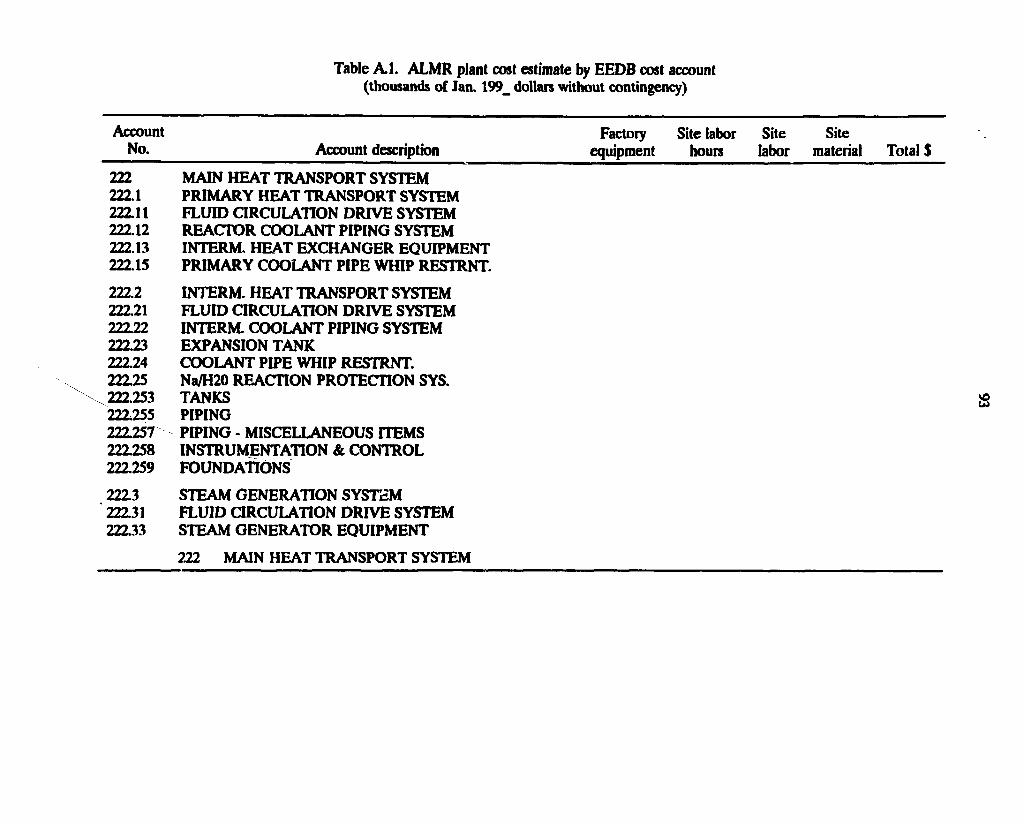
Table B.l. MHTGR plant cost estimate by E E D B cost account (thousands of Jan. 199_ dollars without contingency)
Account No. Account description
222 MAIN HEAT TRANSPORT SYSTEM 222.1 PRIMARY HEAT TRANSPORT SYSTEM 222.11 FLUID CIRCULATION DRIVE SYSTEM 222.12 REACTOR COOLANT PIPING SYSTEM 222.13 INTERM. HEAT EXCHANGER EQUIPMENT 222.15 PRIMARY COOLANT PIPE WHIP RESTRNT.
222.2 INTERM. HEAT TRANSPORT SYSTEM 222.21 FLUID CIRCULATION DRIVE SYSTEM 222.22 INTERM. COOLANT PIPING SYSTEM 222.23 EXPANSION TANK 222.24 COOLANT PIPE WHIP RESTRNT. 222.25 Na/H20 REACTION PROTECTION SYS. 222.253 TANKS 222,255 PIPING 222.257 PIPING - MISCELLANEOUS ITEMS 222.258 INSTRUMENTATION & CONTROL 222.259 FOUNDATIONS
222.3 STEAM GENERATION SYSTEM 222.31 FLUID CIRCULATION DRIVE SYSTEM 222.33 STEAM GENERATOR EQUIPMENT
Factory Site labor Site Site equipment hours labor material Total $
222 MAIN HEAT TRANSPORT SYSTEM
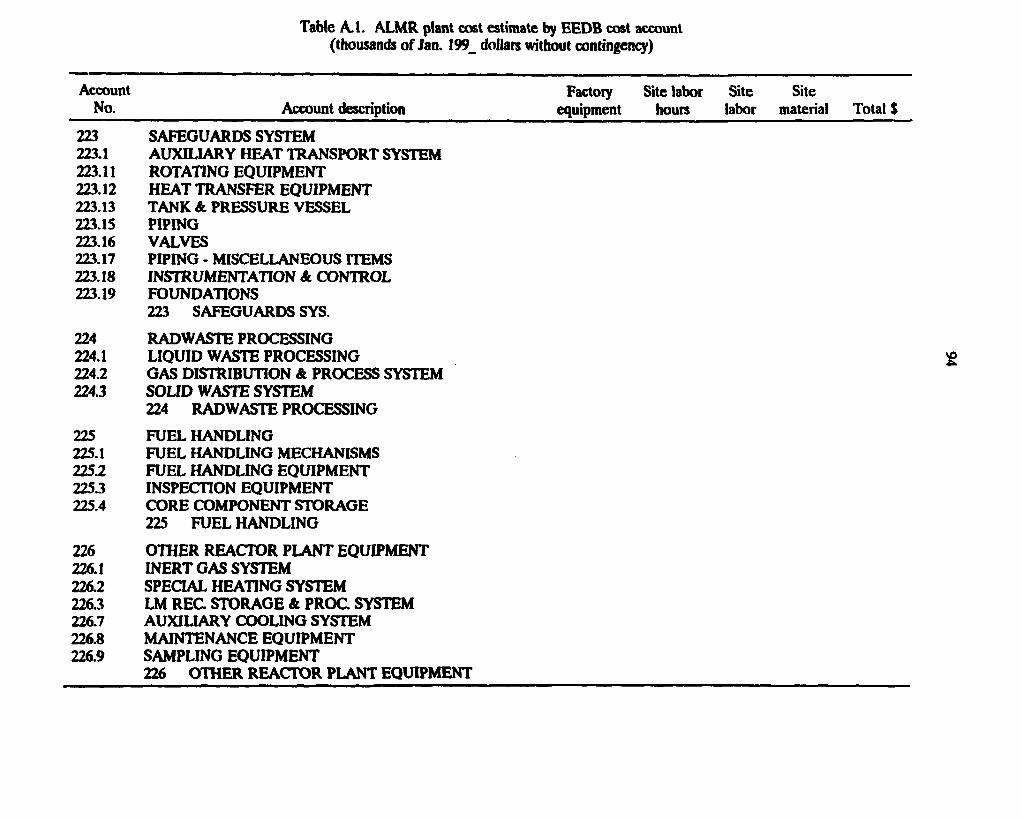
Table A l . ALMR plant cost estimate by GEDB cost account (thousands of Jan. 199_ dollars without contingency)
Account Factory Site labor Site Site No. Account description equipment hours labor material Total $
223 SAFEGUARDS SYSTEM 223.1 AUXILIARY HEAT TRANSPORT SYSTEM 223.11 ROTATING EQUIPMENT 223.12 HEAT TRANSFER EQUIPMENT 223.13 TANK & PRESSURE VESSEL 223.15 PIPING 223.16 VALVES 223.17 PIPING - MISCELLANEOUS ITEMS 223.18 INSTRUMENTATION A CONTROL 223.19 FOUNDATIONS
223 SAFEGUARDS SYS.
224 RADWASTE PROCESSING 224.1 LIQUID WASTE PROCESSING 224.2 GAS DISTRIBUTION & PROCESS SYSTEM 224.3 SOLID WASTE SYSTEM
224 RADWASTE PROCESSING
225 FUEL HANDLING 225.1 FUEL HANDLING MECHANISMS 225.2 FUEL HANDLING EQUIPMENT 225.3 INSPECTION EQUIPMENT 225.4 CORE COMPONENT STORAGE
225 FUEL HANDLING
226 OTHER REACTOR PLANT EQUIPMENT 226.1 INERT GAS SYSTEM 226.2 SPECIAL HEATING SYSTEM 226.3 LM REC. STORAGE & PROG SYSTEM 226.7 AUXILIARY COOLING SYSTEM 226.8 MAINTENANCE EQUIPMENT 226.9 SAMPLING EQUIPMENT
226 OTHER REACTOR PLANT EQUIPMENT
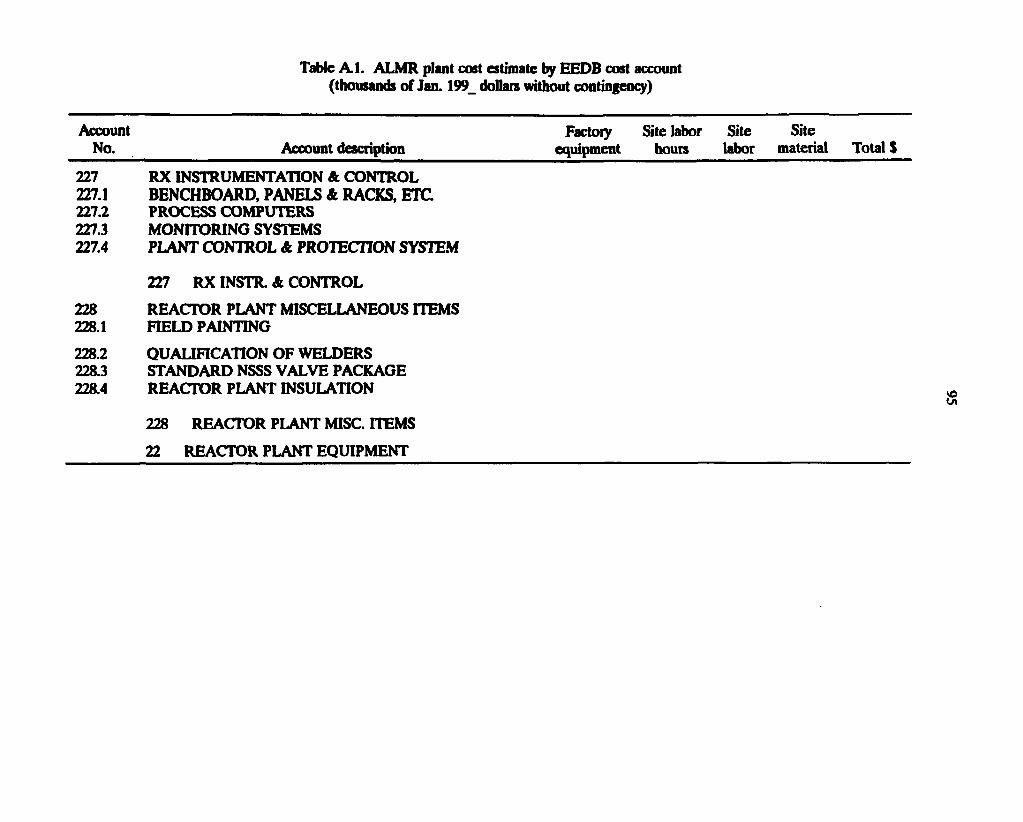
Table B.l. MHTGR plant cost estimate by E E D B cost account (thousands o f Jan. 199_ dollars without contingency)
Factory Site labor Site Site equipment hours labor material Total $
227 RX INSTRUMENTATION A CONTROL 227.1 BENCHBOARD, PANELS A RACKS, ETC. 227.2 PROCESS COMPUTERS 227.3 MONITORING SYSTEMS 227.4 PLANT CONTROL A PROTECTION SYSTEM
227 RX INSTR. A CONTROL
228 REACTOR PLANT MISCELLANEOUS ITEMS 228.1 FIELD PAINTING
228.2 QUALIFICATION OF WELDERS 228.3 STANDARD NSSS VALVE PACKAGE 228.4 REACTOR PLANT INSULATION
228 REACTOR PLANT MISC. ITEMS
Account No. Account description
22 REACTOR PLANT EQUIPMENT
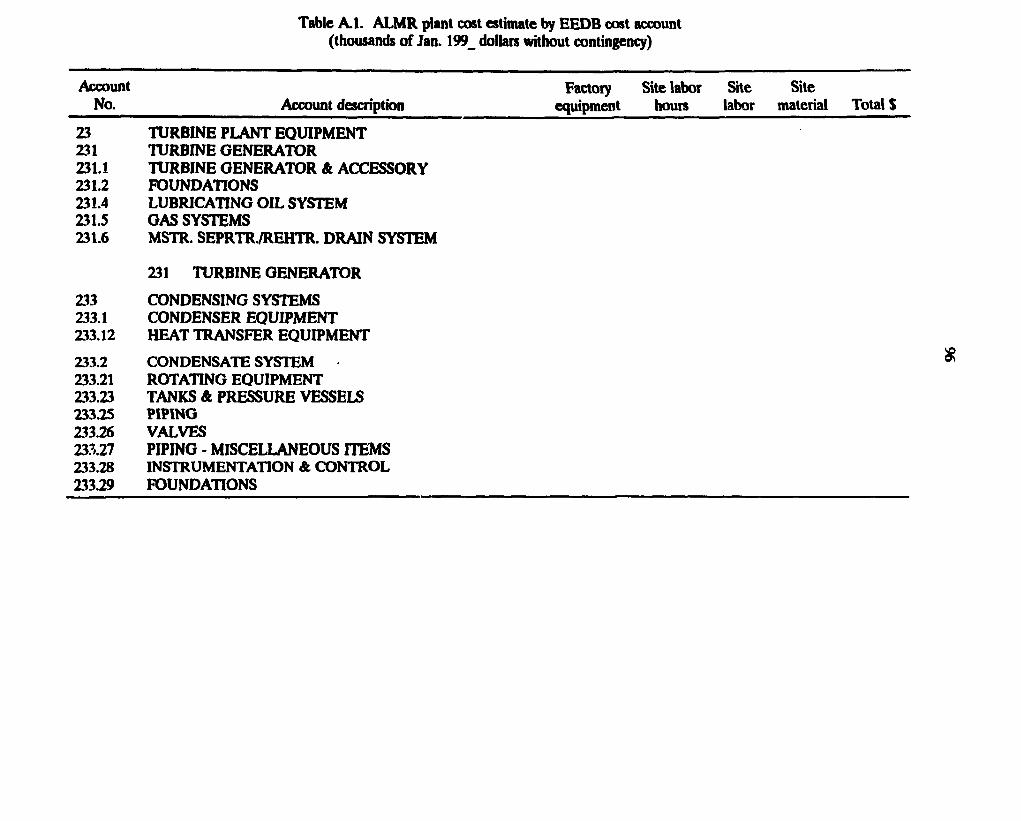
Table B.l. MHTGR plant cost estimate by E E D B cost account (thousands o f Jan. 199_ dollars without contingency)
Account Factory Site labor Site Site No. Account description equipment hours labor material Total $
23 TURBINE PLANT EQUIPMENT 231 TURBINE GENERATOR 231.1 TURBINE GENERATOR & ACCESSORY 231.2 FOUNDATIONS 231.4 LUBRICATING OIL SYSTEM 231.5 GAS SYSTEMS 231.6 MSTR. SEPRTR./REHTR. DRAIN SYSTEM
231 TURBINE GENERATOR
233 CONDENSING SYSTEMS 233.1 CONDENSER EQUIPMENT 233.12 HEAT TRANSFER EQUIPMENT
233.2 CONDENSATE SYSTEM 233.21 ROTATING EQUIPMENT 233.23 TANKS & PRESSURE VESSELS 233.25 PIPING 233.26 VALVES 233.27 PIPING - MISCELLANEOUS ITEMS 233.28 INSTRUMENTATION & CONTROL 233.29 FOUNDATIONS
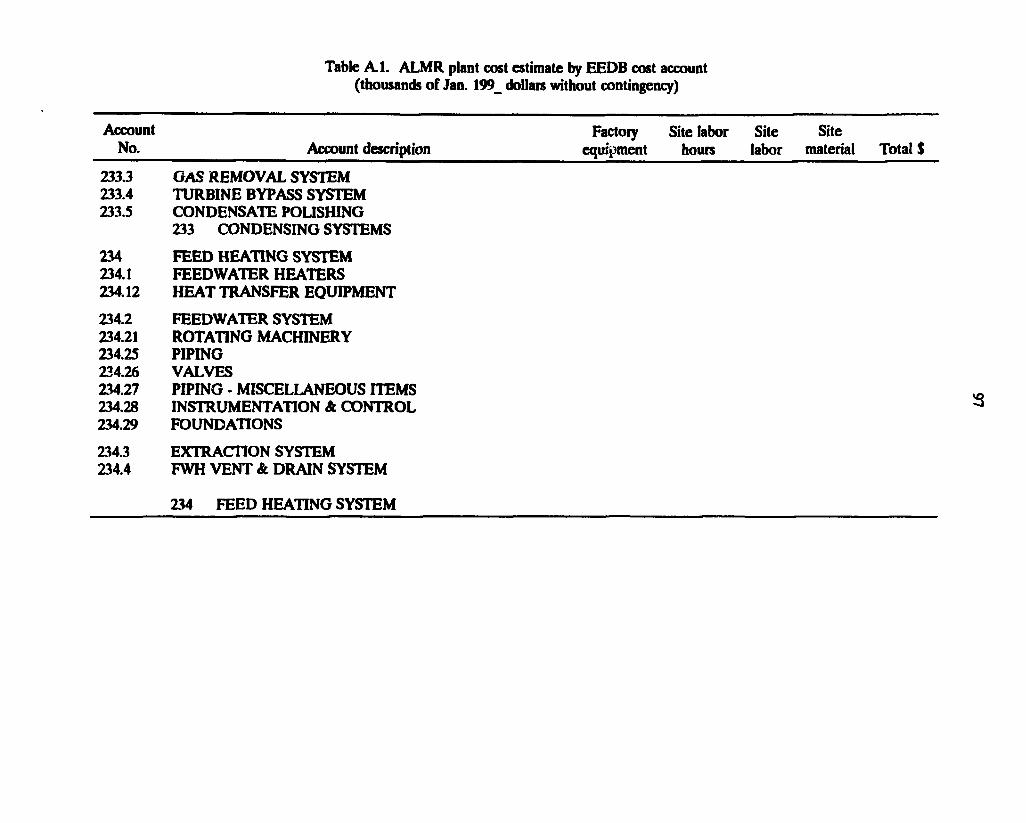
Table B.l. MHTGR plant cost estimate by E E D B cost account (thousands o f Jan. 199_ dollars without contingency)
Factory Site labor Site Site equipment hours labor material Total $
233.3 GAS REMOVAL SYSTEM 233.4 TURBINE BYPASS SYSTEM 233.5 CONDENSATE POLISHING
233 CONDENSING SYSTEMS
234 FEED HEATING SYSTEM 234.1 FEEDWATER HEATERS 234.12 HEAT TRANSFER EQUIPMENT
234.2 FEEDWATER SYSTEM 234.21 ROTATING MACHINERY 234.25 PIPING 234.26 VALVES 234.27 PIPING - MISCELLANEOUS ITEMS 234.28 INSTRUMENTATION A CONTROL 234.29 FOUNDATIONS
234.3 EXTRACTION SYSTEM 234.4 FWH VENT A DRAIN SYSTEM
Account No. Account description
234 FEED HEATING SYSTEM
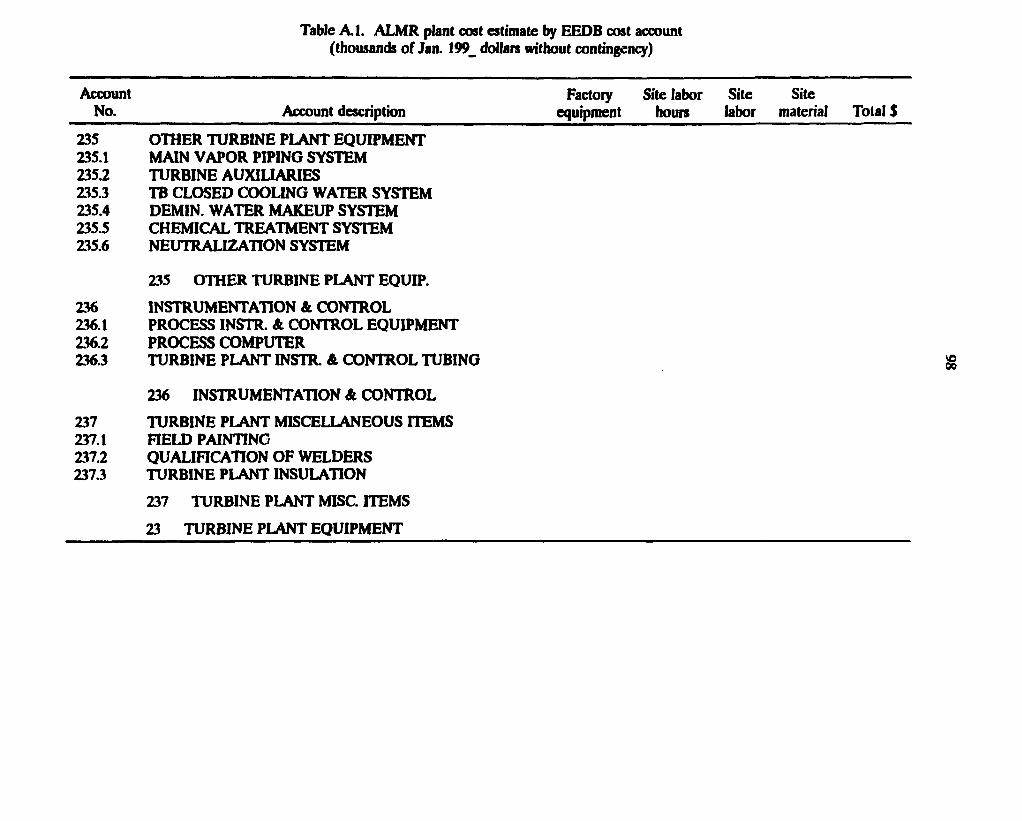
Table B.l. MHTGR plant cost estimate by E E D B cost account (thousands o f Jan. 199_ dollars without contingency)
Account Factoiy Site labor Site Site No. Account description equipment hours labor material Total $
235 OTHER TURBINE PLANT EQUIPMENT 235.1 MAIN VAPOR PIPING SYSTEM 235.2 TURBINE AUXILIARIES 235.3 TB CLOSED COOLING WATER SYSTEM 235.4 DEMIN. WATER MAKEUP SYSTEM 235.5 CHEMICAL TREATMENT SYSTEM 235.6 NEUTRALIZATION SYSTEM
235 OTHER TURBINE PLANT EQUIP.
236 INSTRUMENTATION A CONTROL 236.1 PROCESS INSTR. A CONTROL EQUIPMENT 236.2 PROCESS COMPUTER 236.3 TURBINE PLANT INSTR. A CONTROL TUBING
236 INSTRUMENTATION A CONTROL
237 TURBINE PLANT MISCELLANEOUS ITEMS 237.1 FIELD PAINTING 237.2 QUALIFICATION OF WELDERS 237.3 TURBINE PLANT INSULATION
237 TURBINE PLANT MISC. ITEMS
23 TURBINE PLANT EQUIPMENT
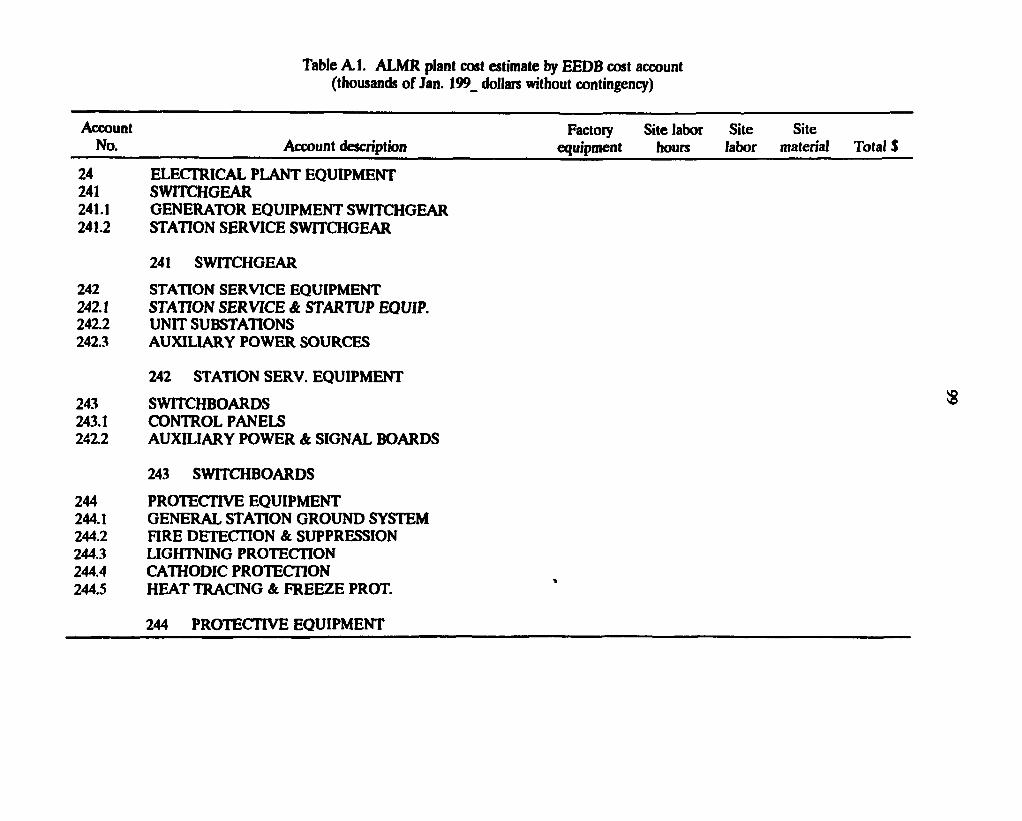
Table B.l. MHTGR plant cost estimate by E E D B cost account (thousands o f Jan. 199_ dollars without contingency)
Factory Site labor Site Site equipment hours labor m a t e r i a l Total $
24 ELECTRICAL PLANT EQUIPMENT 241 SWITCHGEAR 241.1 GENERATOR EQUIPMENT SWITCHGEAR 241.2 STATION SERVICE SWITCHGEAR
241 SWITCHGEAR
242 STATION SERVICE EQUIPMENT 242.1 STATION SERVICE & STARTUP EQUIP. 242.2 UNIT SUBSTATIONS 242.3 AUXILIARY POWER SOURCES
242 STATION SERV. EQUIPMENT
243 SWITCHBOARDS 243.1 CONTROL PANELS 242.2 AUXILIARY POWER & SIGNAL BOARDS
243 SWITCHBOARDS
244 PROTECTIVE EQUIPMENT 244.1 GENERAL STATION GROUND SYSTEM 244.2 FIRE DETECTION & SUPPRESSION 244.3 LIGHTNING PROTECTION 244.4 CATHODIC PROTECTION 244.5 HEAT TRACING & FREEZE PROT.
Account No. Account description
244 PROTECTIVE EQUIPMENT
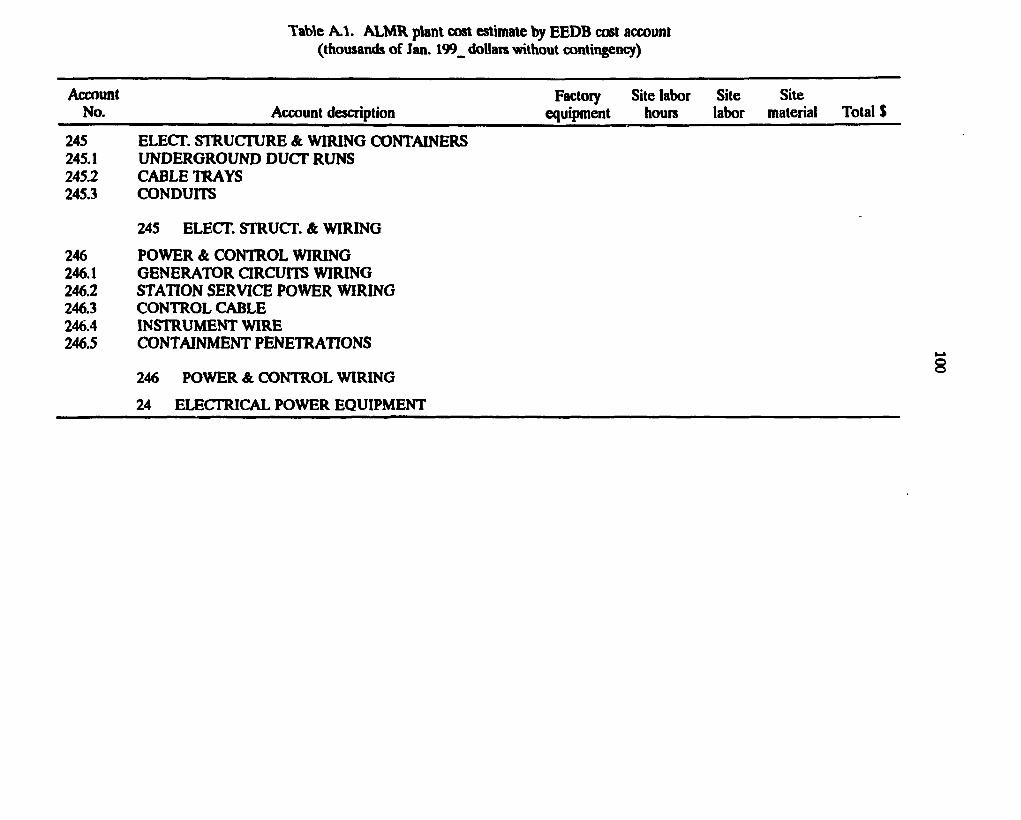
Table B.l. MHTGR plant cost estimate by E E D B cost account (thousands o f Jan. 199_ dollars without contingency)
Account Factory Site labor Site Site No. Account description equipment hours labor material Total $
245 ELECT. STRUCTURE & WIRING CONTAINERS 245.1 UNDERGROUND DUCT RUNS 245.2 CABLE TRAYS 245.3 CONDUITS
245 ELECT. STRUCT. & WIRING
246 POWER & CONTROL WIRING 246.1 GENERATOR CIRCUITS WIRING 246.2 STATION SERVICE POWER WIRING 246.3 CONTROL CABLE 246.4 INSTRUMENT WIRE 246.5 CONTAINMENT PENETRATIONS
246 POWER & CONTROL WIRING
24 ELECTRICAL POWER EQUIPMENT
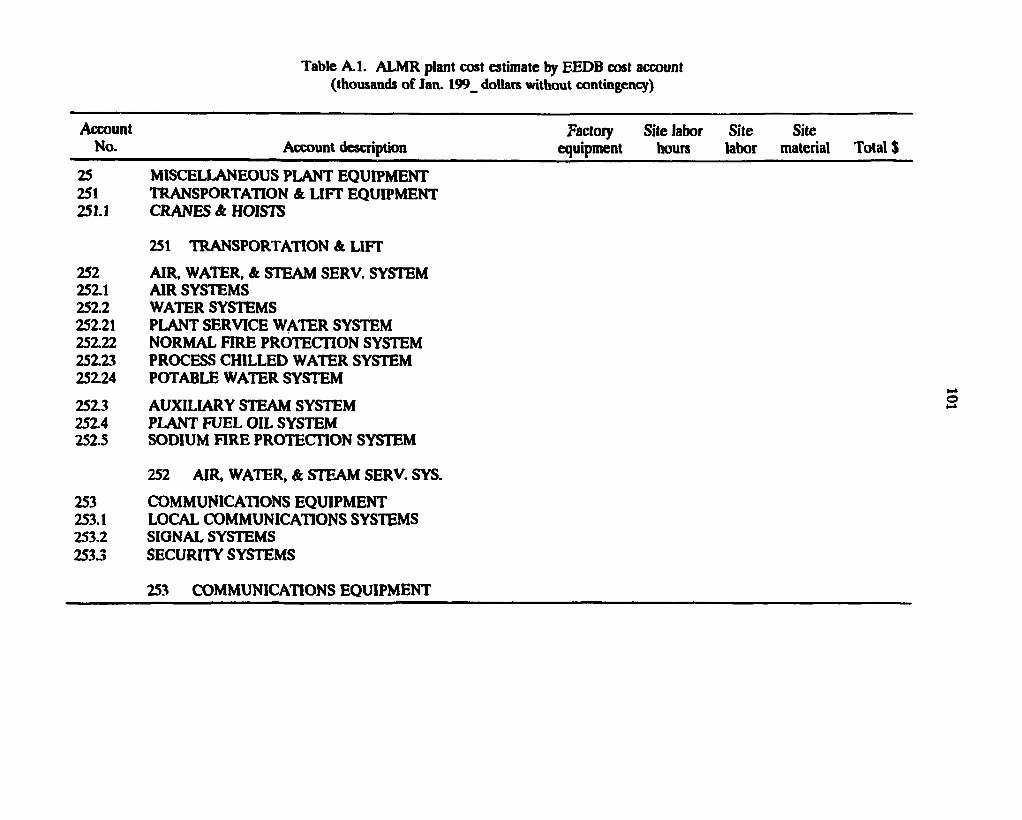
Table B.l. MHTGR plant cost estimate by E E D B cost account (thousands o f Jan. 199_ dollars without contingency)
Account Factory Site labor Site Site No. Account description equipment hours labor material Total $
25 MISCELLANEOUS PLANT EQUIPMENT 251 TRANSPORTATION A LIFT EQUIPMENT 251.1 C R A N E S A HOISTS
251 TRANSPORTATION A LIFT
252 AIR, WATER, A STEAM SERV. SYSTEM 252.1 AIR SYSTEMS 252.2 WATER SYSTEMS 252.21 PLANT SERVICE WATER SYSTEM 252.22 NORMAL FIRE PROTECTION SYSTEM 252.23 PROCESS CHILLED WATER SYSTEM 252.24 POTABLE WATER SYSTEM
252.3 AUXILIARY STEAM SYSTEM 252.4 PLANT FUEL OIL SYSTEM 252.5 SODIUM FIRE PROTECTION SYSTEM
252 AIR, WATER, A STEAM SERV. SYS.
253 COMMUNICATIONS EQUIPMENT 253.1 LOCAL COMMUNICATIONS SYSTEMS 253.2 SIGNAL SYSTEMS 253.3 SECURITY SYSTEMS
253 COMMUNICATIONS EQUIPMENT
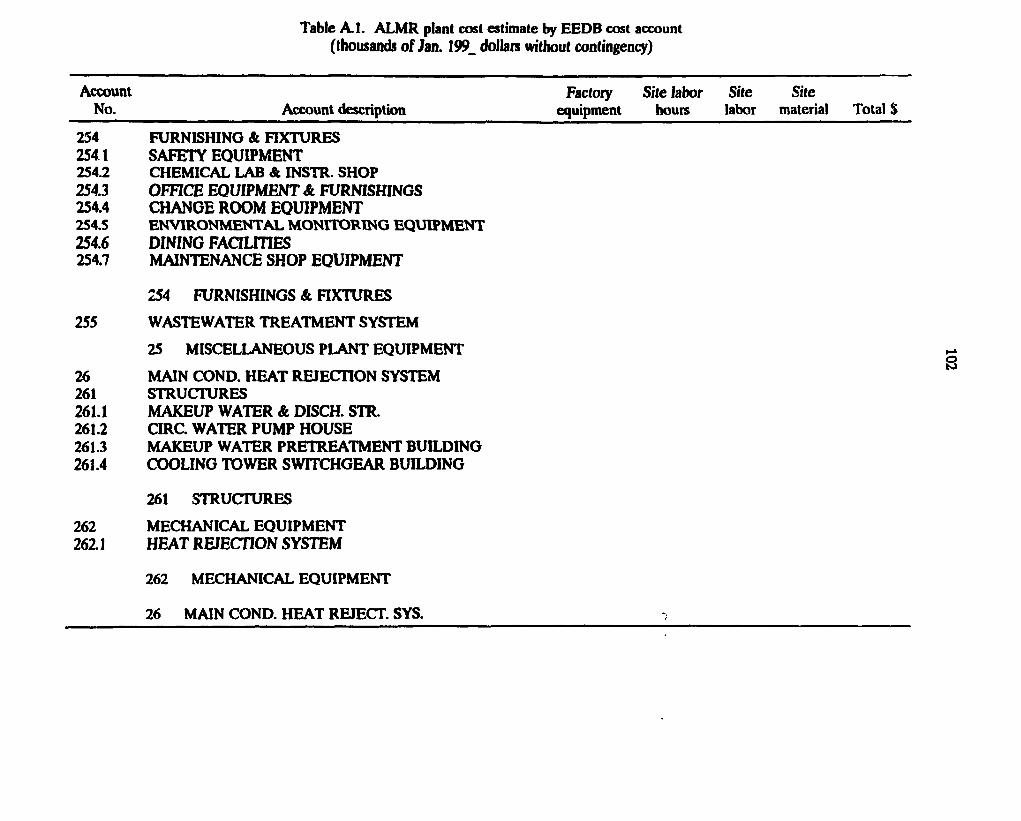
Table B.l. MHTGR plant cost estimate by E E D B cost account (thousands o f Jan. 199_ dollars without contingency)
F a c t o r y S i t e l a b o r S i t e S i t e equipment hours labor material Total $
234 FURNISHING & FIXTURES 2541 SAFETY EQUIPMENT 254.2 CHEMICAL LAB & INSTR. SHOP 254.3 O F F I C E E Q U I P M E N T & FURNISHINGS 254.4 CHANGE ROOM EQUIPMENT 254.5 E N V I R O N M E N T A L M O N I T O R I N G E Q U I P M E N T 254.6 DINING FACILITIES 254.7 MAINTENANCE SHOP EQUIPMENT
254 FURNISHINGS & FIXTURES
255 WASTEWATER TREATMENT SYSTEM
25 MISCELLANEOUS PLANT EQUIPMENT
26 MAIN COND. HEAT REJECTION SYSTEM 261 STRUCTURES 261.1 MAKEUP WATER & DISCH. STR. 261.2 CIRC. WATER PUMP HOUSE 261.3 MAKEUP WATER PRETREATMENT BUILDING 261.4 COOLING TOWER SWITCHGEAR BUILDING
261 STRUCTURES
262 MECHANICAL EQUIPMENT 262.1 HEAT REJECTION SYSTEM
262 MECHANICAL EQUIPMENT
Account No. Account description
26 MAIN COND. HEAT REJECT. SYS.
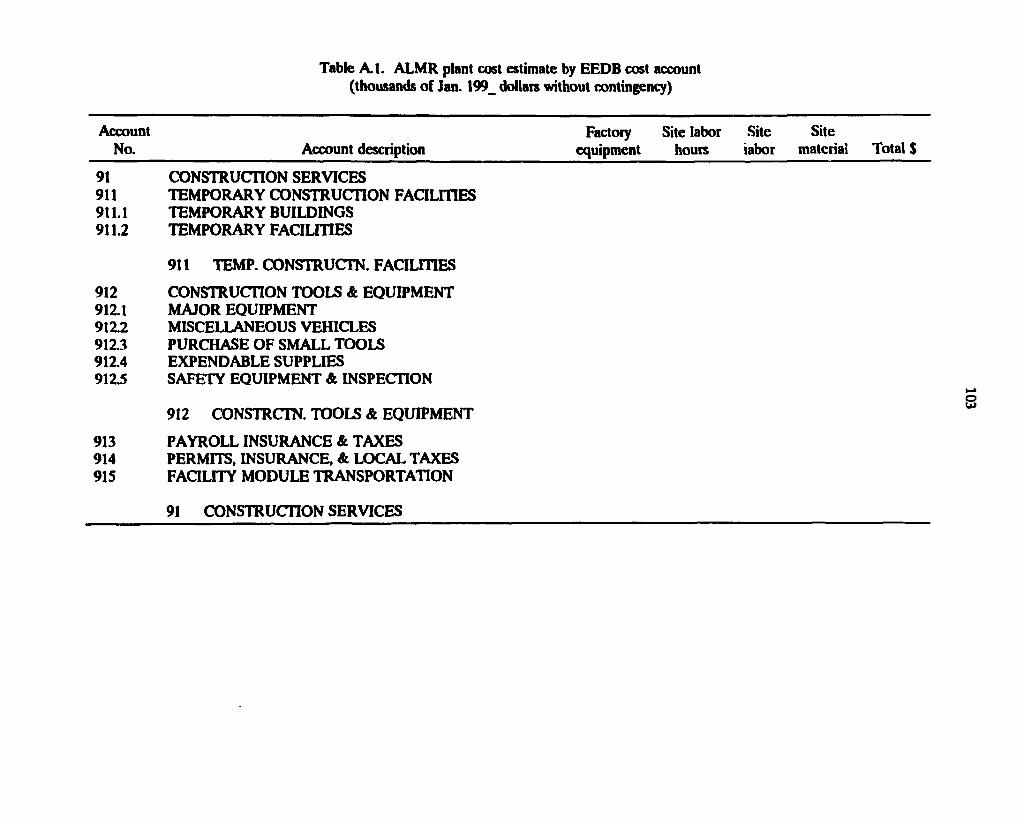
Table B.l. MHTGR plant cost estimate by E E D B cost account (thousands o f Jan. 199_ dollars without contingency)
Factory Site labor Site Site equipment hours iabor material Total $
91 CONSTRUCTION SERVICES 911 TEMPORARY CONSTRUCTION FACILITIES 911.1 TEMPORARY BUILDINGS 911.2 TEMPORARY FACILITIES
911 TEMP. CONSTRUCTS FACILITIES
912 CONSTRUCTION TOOLS & EQUIPMENT 912.1 MAJOR EQUIPMENT 912.2 MISCELLANEOUS VEHICLES 912.3 PURCHASE OF SMALL TOOLS 912.4 EXPENDABLE SUPPLIES 912.5 SAFETY EQUIPMENT & INSPECTION
912 CONSTRCTN. TOOLS & EQUIPMENT
913 PAYROLL INSURANCE & TAXES 914 PERMITS, INSURANCE, & LOCAL TAXES 915 FACILITY MODULE TRANSPORTATION
Account No. Account description
91 CONSTRUCTION SERVICES
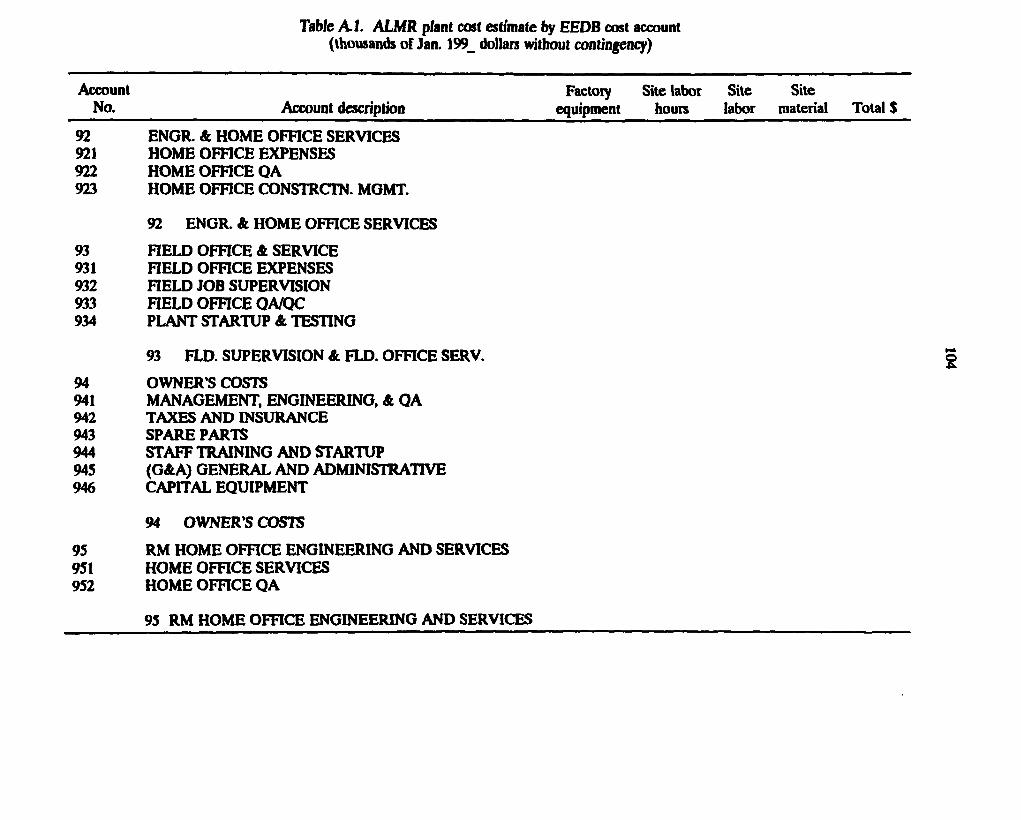
Table B.l. MHTGR plant cost estimate by E E D B cost account (thousands of Jan. 199_ dollars without contingency)
Factory Site labor Site Site equipment hours labor material Total $
92 ENGR. & HOME OFFICE SERVICES 921 HOME OFFICE EXPENSES 922 HOME OFFICE QA 923 HOME OFFICE CONSTRCTN. MGMT.
92 ENGR. A HOME OFFICE SERVICES
93 FIELD OFFICE A SERVICE 931 HELD OFFICE EXPENSES 932 FIELD JOB SUPERVISION 933 HELD OFFICE QA/QC 934 PLANT STARTUP & TESTING
93 FLD. SUPERVISION A FLD. OFFICE SERV.
94 OWNER'S COSTS 941 MANAGEMENT, ENGINEERING, A QA 942 TAXES AND INSURANCE 943 SPARE PARTS 944 STAFF TRAINING AND STARTUP 945 (G&A) GENERAL AND ADMINISTRATIVE 946 CAPITAL EQUIPMENT
94 OWNER S C O S T S
95 RM HOME OFFICE ENGINEERING AND SERVICES 951 HOME OFFICE SERVICES 952 HOME OFFICE QA
Account No. Account description
95 RM HOME OFFICE ENGINEERING AND SERVICES
105
Appendix B
EEDB CODE OF ACCOUNTS FOR MODULAR HIGH-TEMPERATURE GAS-COOLED REACTOR (MHTGR) CONCEPT
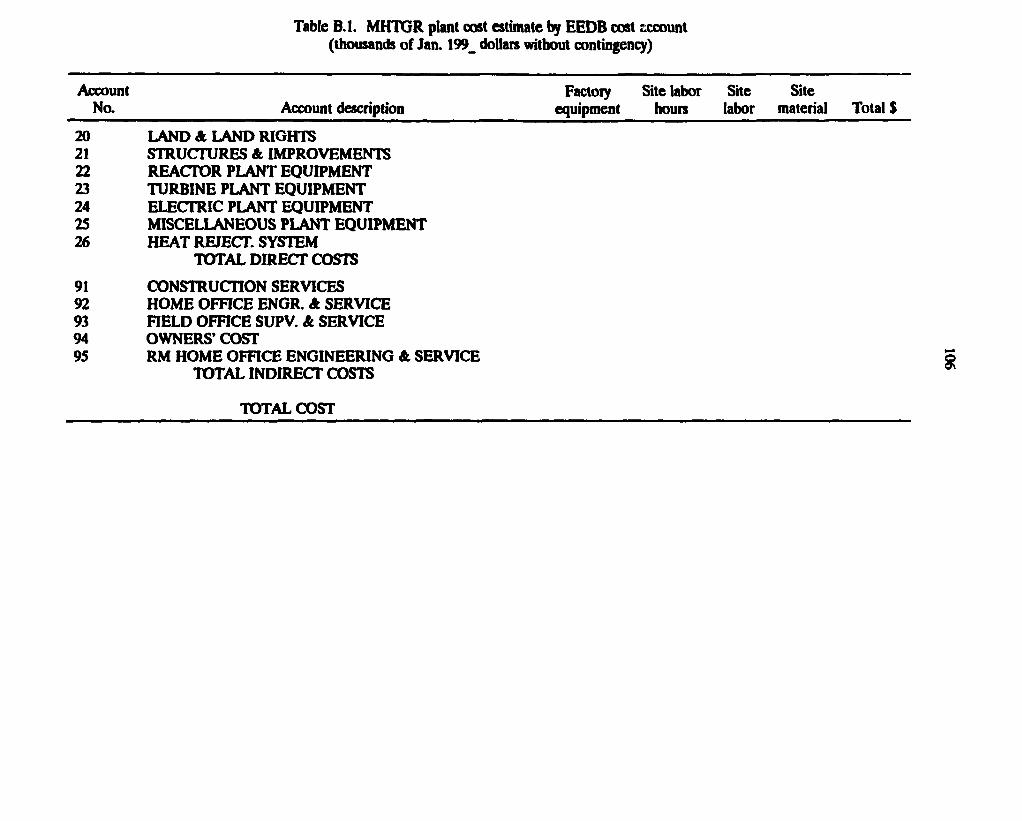
Table B . l . M H T G R plant cost estimate by E E D B cost account (thousands o f Jan. 199_ dollars without contingency)
Account Factory Site labor Site Site No. Account description equipment hours labor material Total $
20 LAND A LAND RIGHTS 21 STRUCTURES A IMPROVEMENTS 22 REACTOR PLANT EQUIPMENT 23 TURBINE PLANT EQUIPMENT 24 ELECTRIC PLANT EQUIPMENT 25 MISCELLANEOUS PLANT EQUIPMENT 26 HEAT REJECT. SYSTEM
TOTAL DIRECT COSTS
91 CONSTRUCTION SERVICES 92 HOME OFFICE ENGR. A SERVICE 93 FIELD OFFICE SUPV. A SERVICE 94 OWNERS' COST 95 RM HOME OFFICE ENGINEERING A SERVICE
TOTAL INDIRECT COSTS
TOTAL COST
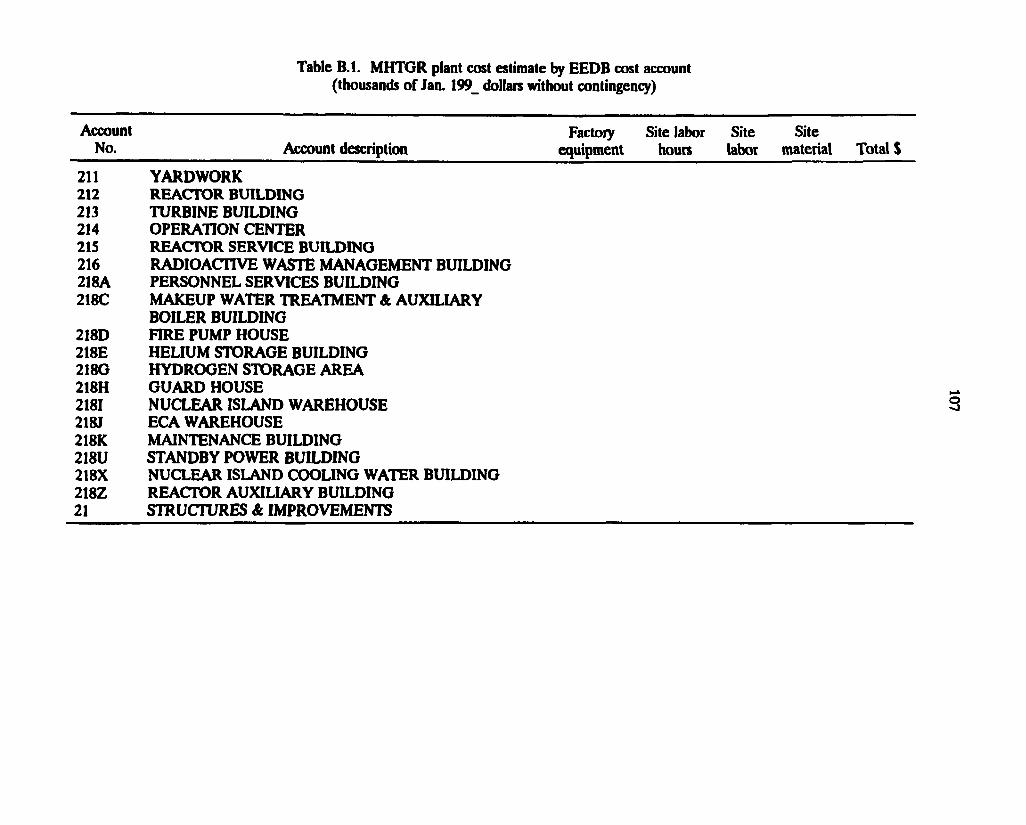
Table B . l . M H T G R plant cost estimate by E E D B cost account (thousands o f Jan. 199_ dollars without contingency)
Factory Site labor Site Site equipment hours labor material Total $
211 YARDWORK 212 REACTOR BUILDING 213 TURBINE BUILDING 214 OPERATION CENTER 215 REACTOR SERVICE BUILDING 216 RADIOACTIVE WASTE MANAGEMENT BUILDING 218A PERSONNEL SERVICES BUILDING 218C MAKEUP WATER TREATMENT A AUXILIARY
BOILER BUILDING 218D FIRE PUMP HOUSE 218E HELIUM STORAGE BUILDING 218G HYDROGEN STORAGE AREA 218H GUARD HOUSE 2181 NUCLEAR ISLAND WAREHOUSE 218J ECA WAREHOUSE 218K MAINTENANCE BUILDING 218U STANDBY POWER BUILDING 218X NUCLEAR ISLAND COOLING WATER BUILDING 218Z REACTOR AUXILIARY BUILDING 21 STRUCTURES & IMPROVEMENTS
Account No. Account description
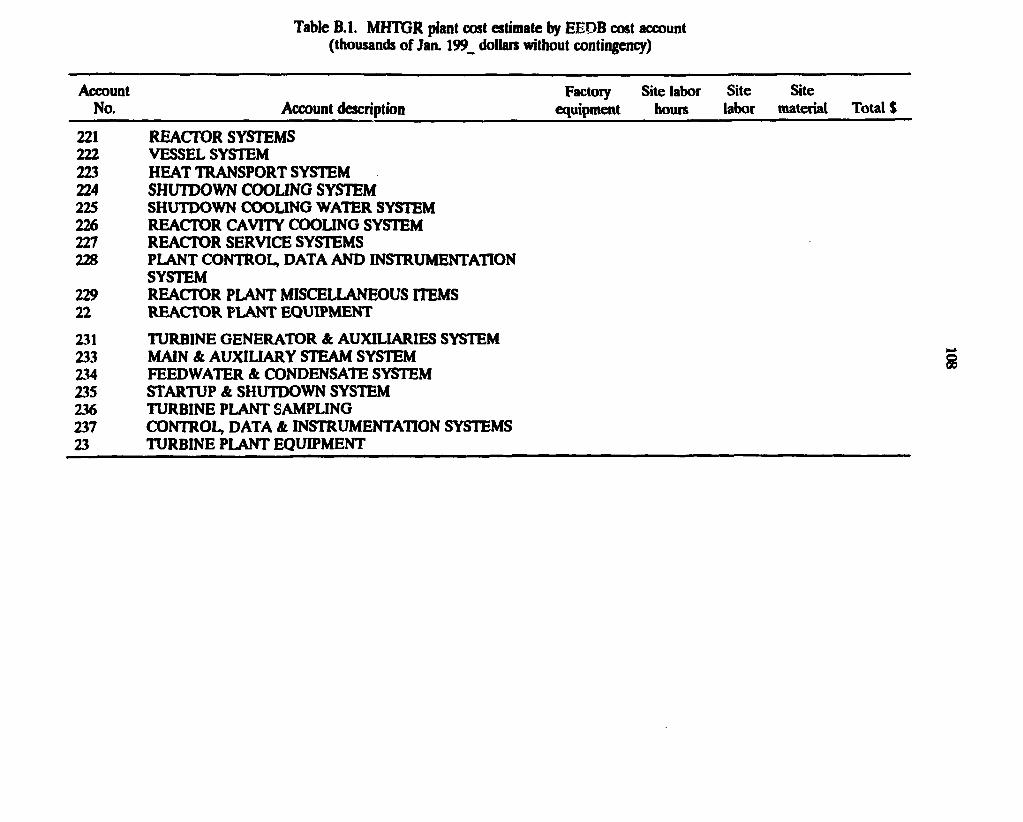
Table B . l . M H T G R plant cost estimate by E E D B cost account (thousands o f Jan. 199_ dollars without contingency)
Account Factory Site labor Site Site No. Account description equipment hours labor material Total $
221 REACTOR SYSTEMS 222 VESSEL SYSTEM 223 HEAT TRANSPORT SYSTEM 224 SHUTDOWN COOLING SYSTEM 225 SHUTDOWN COOLING WATER SYSTEM 226 REACTOR CAVITY COOLING SYSTEM 227 REACTOR SERVICE SYSTEMS 228 PLANT CONTROL, DATA AND INSTRUMENTATION
SYSTEM 229 REACTOR PLANT MISCELLANEOUS ITEMS 22 REACTOR PLANT EQUIPMENT
231 TURBINE GENERATOR & AUXILIARIES SYSTEM 233 MAIN & AUXILIARY STEAM SYSTEM 234 FEEDWATER & CONDENSATE SYSTEM 235 STARTUP & SHUTDOWN SYSTEM 236 TURBINE PLANT SAMPLING 237 CONTROL, DATA & INSTRUMENTATION SYSTEMS 23 TURBINE PLANT EQUIPMENT
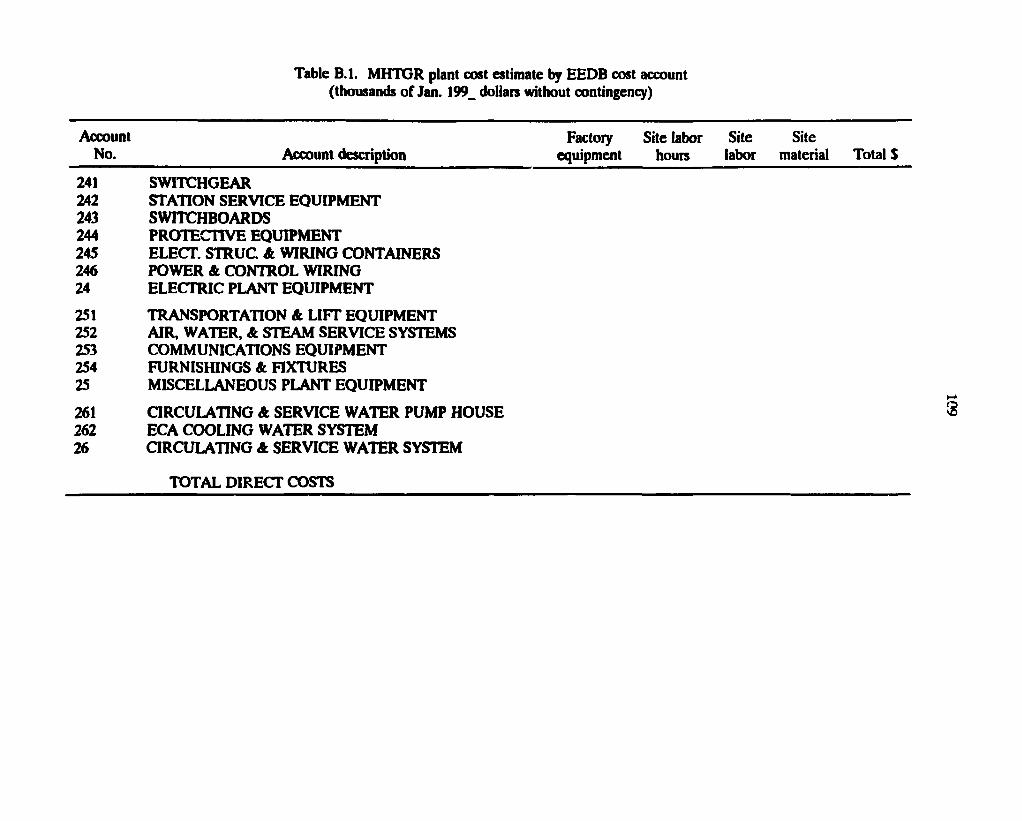
Table B . l . M H T G R plant cost estimate by E E D B cost account (thousands o f Jan. 199_ dollars without contingency)
Factoiy Site labor Site Site equipment hours labor material Total $
241 SWITCHGEAR 242 STATION SERVICE EQUIPMENT 243 SWITCHBOARDS 244 PROTECTIVE EQUIPMENT 245 ELECT. STRUC. A WIRING CONTAINERS 246 POWER A CONTROL WIRING 24 ELECTRIC PLANT EQUIPMENT
251 TRANSPORTATION A LIFT EQUIPMENT 252 AIR, WATER, A STEAM SERVICE SYSTEMS 253 COMMUNICATIONS EQUIPMENT 254 FURNISHINGS A FIXTURES 25 MISCELLANEOUS PLANT EQUIPMENT
261 CIRCULATING A SERVICE WATER PUMP HOUSE 262 ECA COOLING WATER SYSTEM 26 CIRCULATING A SERVICE WATER SYSTEM
TOTAL DIRECT COSTS
Account No. Account description
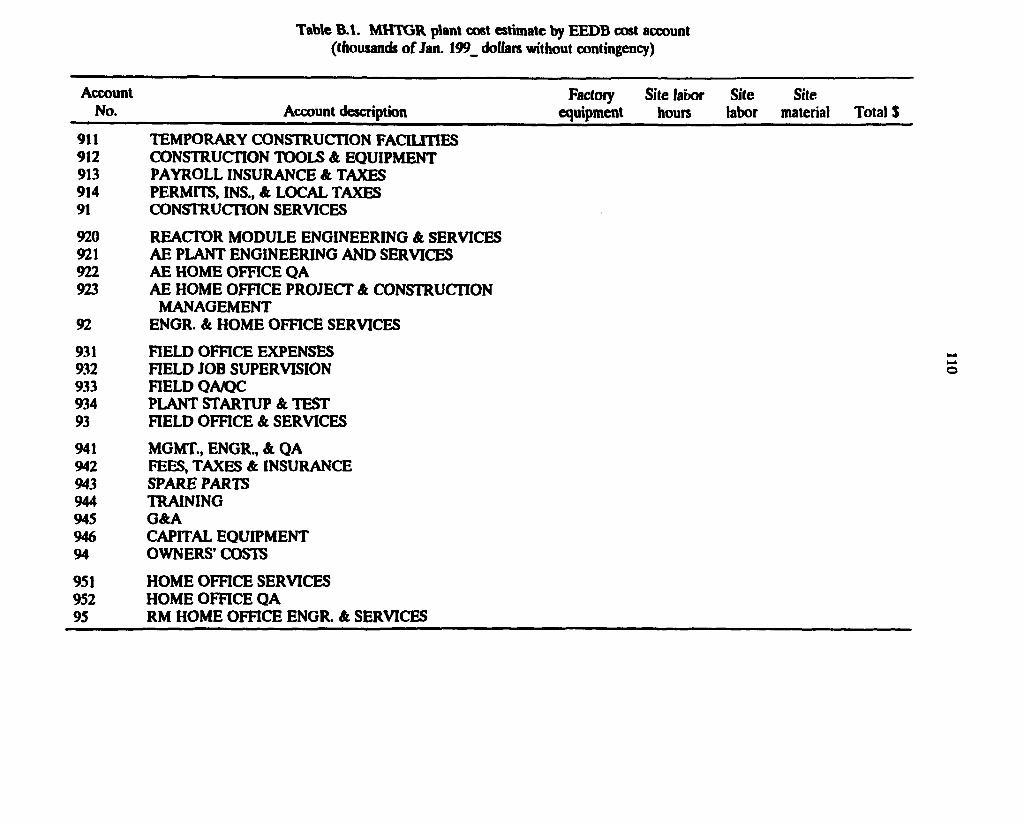
Table B . l . M H T G R plant cost estimate by E E D B cost account (thousands o f Jan. 199_ dollars without contingency)
Account Factoiy Site labor Site Site No. Account description equipment hours labor material Total $
911 TEMPORARY CONSTRUCTION FACILITIES 912 CONSTRUCTION TOOLS A EQUIPMENT 913 PAYROLL INSURANCE A TAXES 914 PERMITS, INS., & LOCAL TAXES 91 CONSTRUCTION SERVICES
920 REACTOR MODULE ENGINEERING A SERVICES 921 AE PLANT ENGINEERING AND SERVICES 922 AE HOME OFFICE QA 923 AE HOME OFFICE PROJECT A CONSTRUCTION
MANAGEMENT 92 ENGR. A HOME OFFICE SERVICES
931 FIELD OFFICE EXPENSES 932 HELD JOB SUPERVISION 933 FIELD QA/QC 934 PLANT STARTUP A TEST 93 FIELD OFFICE A SERVICES
941 MGMT., ENGR., A QA 942 FEES, TAXES A INSURANCE 943 SPARE PARTS 944 TRAINING 945 GAA 946 CAPITAL EQUIPMENT 94 OWNERS' COSTS
951 HOME OFFICE SERVICES 952 HOME OFFICE QA 95 RM HOME OFFICE ENGR. A SERVICES
Ill
Appendix C
EEDB CODE OF ACCOUNTS FOR THE REFERENCE PRESSURIZED WATER REACTOR (PWR)
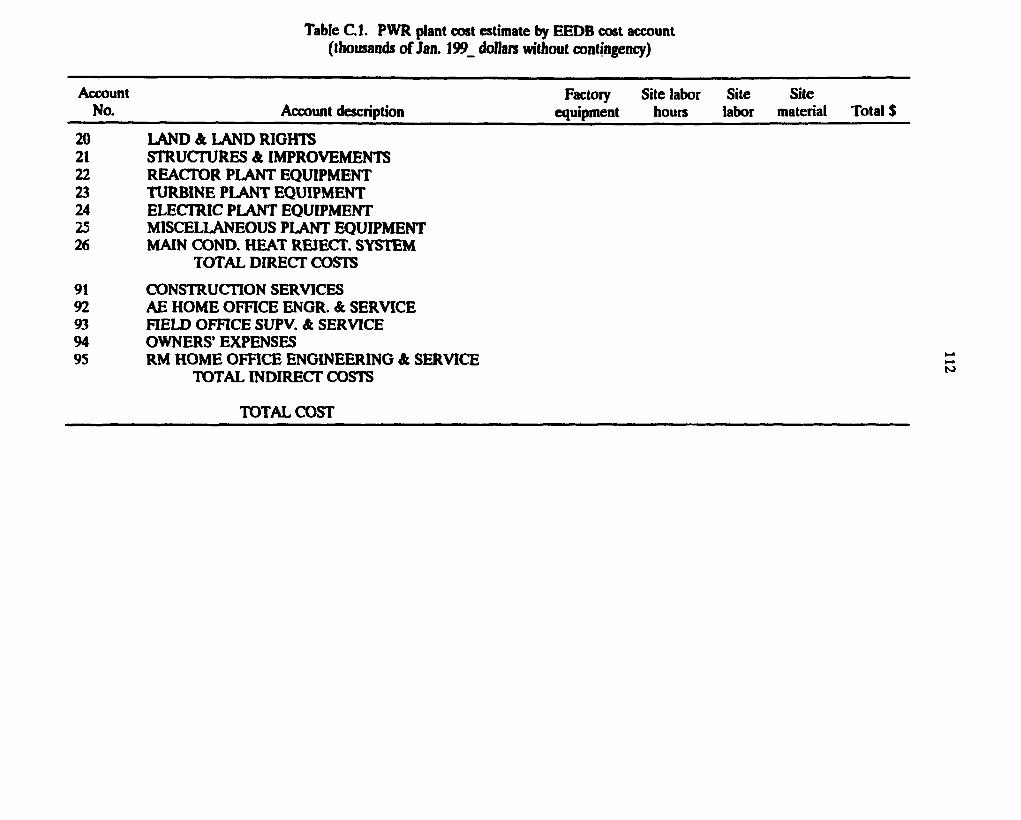
Table B . l . MHTGR plant cost estimate by E E D B cost account (thousands o f Jan. 199_ dollars without contingency)
Factory Site labor Site Site equipment hours labor material Total $
20 LAND A LAND RIGHTS 21 STRUCTURES A IMPROVEMENTS 22 REACTOR PLANT EQUIPMENT 23 TURBINE PLANT EQUIPMENT 24 ELECTRIC PLANT EQUIPMENT 25 MISCELLANEOUS PLANT EQUIPMENT 26 MAIN COND. HEAT REJECT. SYSTEM
TOTAL DIRECT COSTS
91 CONSTRUCTION SERVICES 92 AE HOME OFFICE ENGR. & SERVICE 93 FIELD OFFICE SUPV. A SERVICE 94 OWNERS' EXPENSES 95 RM HOME OFFICE ENGINEERING A SERVICE
TOTAL INDIRECT COSTS
Account No. Account description
TOTAL COST
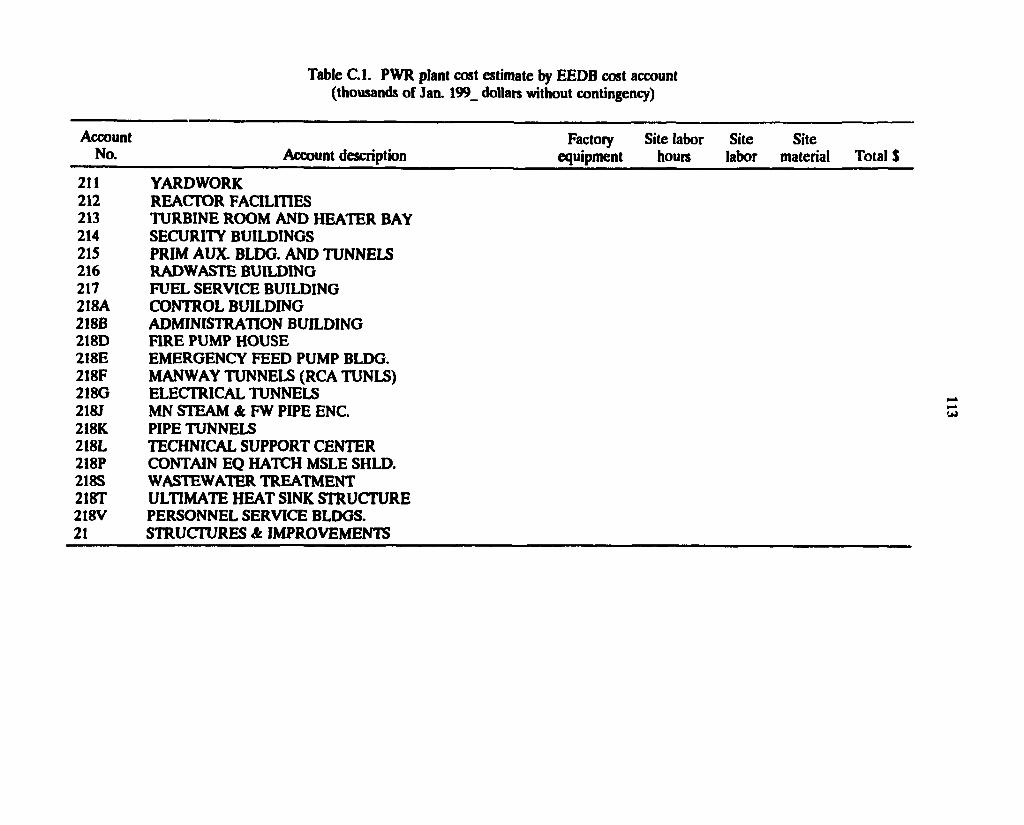
Table B . l . MHTGR plant cost estimate by E E D B cost account (thousands o f Jan. 199_ dollars without contingency)
Account Factory Site labor Site Site No. Account description equipment hours labor material Total $
211 YARDWORK 212 REACTOR FACILITIES 213 TURBINE ROOM AND HEATER BAY 214 SECURITY BUILDINGS 215 PRIM AUX. BLDG. AND TUNNELS 216 RADWASTE BUILDING 217 FUEL SERVICE BUILDING 218A CONTROL BUILDING 218B ADMINISTRATION BUILDING 218D FIRE PUMP HOUSE 218E EMERGENCY FEED PUMP BLDG. 218F MANWAY TUNNELS (RCA TUNLS) 218G ELECTRICAL TUNNELS 218J MN STEAM & FW PIPE ENC. 218K PIPE TUNNELS 218L TECHNICAL SUPPORT CENTER 218P CONTAIN EQ HATCH MSLE SHLD. 218S WASTEWATER TREATMENT 218T ULTIMATE HEAT SINK STRUCTURE 218V PERSONNEL SERVICE BLDGS. 21 STRUCTURES A IMPROVEMENTS
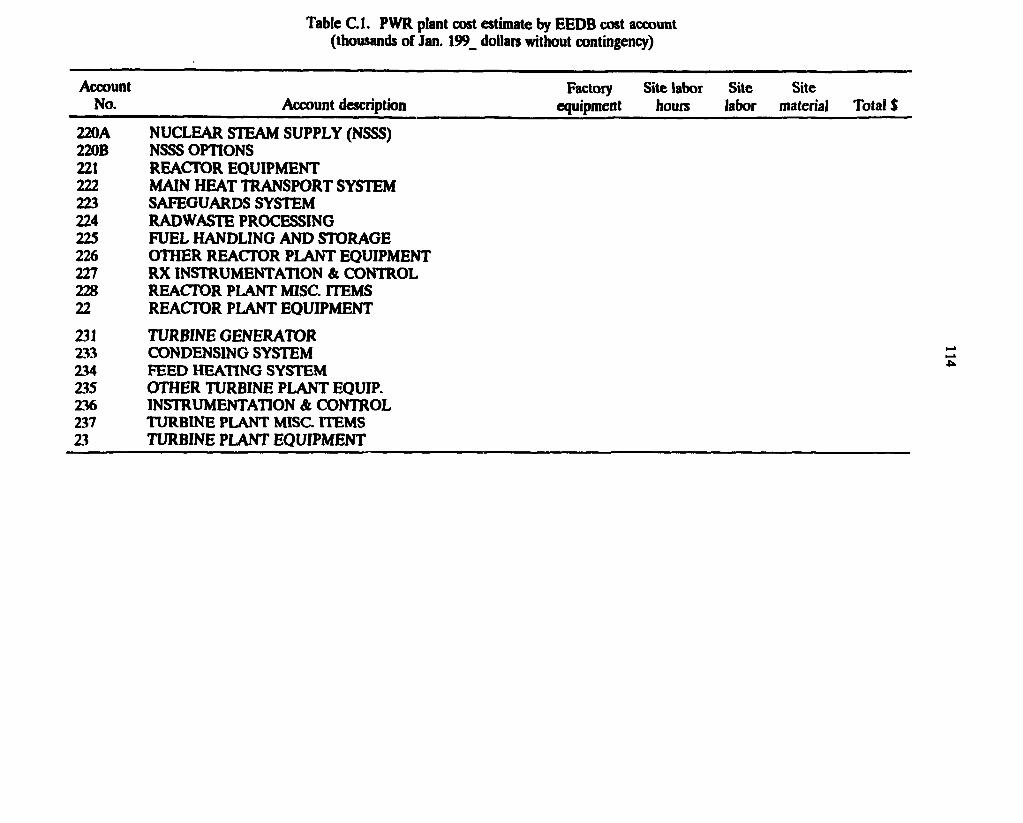
Table B . l . MHTGR plant cost estimate by EEDB cost account (thousands of Jan. 199_ dollars without contingency)
Factory Site labor Site Site equipment hours labor material Total $
220A NUCLEAR STEAM SUPPLY (NSSS) 220B NSSS OPTIONS 221 REACTOR EQUIPMENT 222 MAIN HEAT TRANSPORT SYSTEM 223 SAFEGUARDS SYSTEM 224 RADWASTE PROCESSING 225 FUEL HANDLING AND STORAGE 226 OTHER REACTOR PLANT EQUIPMENT 227 RX INSTRUMENTATION & CONTROL 228 REACTOR PLANT MISC. ITEMS 22 REACTOR PLANT EQUIPMENT
211 T U R B I N E GENERATOR 233 CONDENSING SYSTEM 234 FEED HEATING SYSTEM 235 OTHER TURBINE PLANT EQUIP. 236 INSTRUMENTATION & CONTROL 237 TURBINE PLANT MISC. ITEMS 23 TURBINE PLANT EQUIPMENT
Account No. Account description
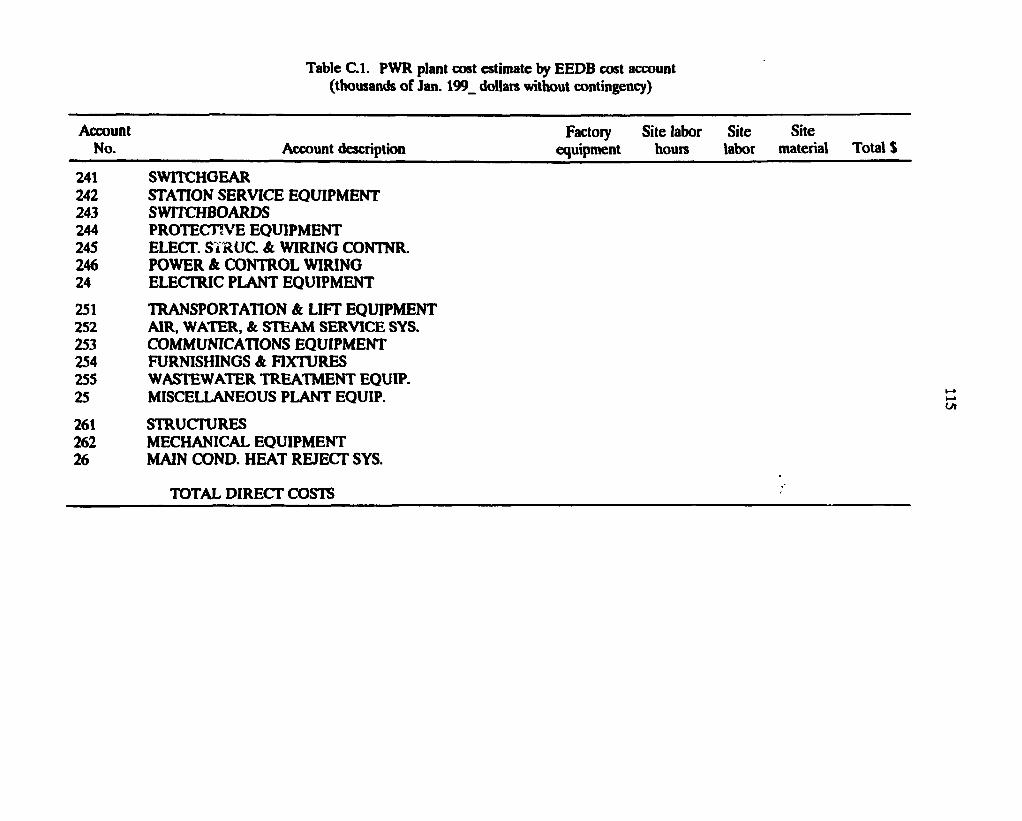
Table B . l . MHTGR plant cost estimate by E E D B cost account (thousands o f Jan. 199_ dollars without contingency)
Factory Site labor Site Site equipment hours labor material Total $
241 SWITCHGEAR 242 STATION SERVICE EQUIPMENT 243 SWITCHBOARDS 244 PROTECTIVE EQUIPMENT 245 ELECT. SiRUC. & WIRING CONTNR. 246 POWER & CONTROL WIRING 24 ELECTRIC PLANT EQUIPMENT
251 TRANSPORTATION & LIFT EQUIPMENT 252 AIR, WATER, & STEAM SERVICE SYS. 253 COMMUNICATIONS EQUIPMENT 254 FURNISHINGS & FIXTURES 255 WASTEWATER TREATMENT EQUIP. 25 MISCELLANEOUS PLANT EQUIP.
261 STRUCTURES 262 MECHANICAL EQUIPMENT 26 MAIN COND. HEAT REJECT SYS.
Account No. Account description
TOTAL DIRECT COSTS
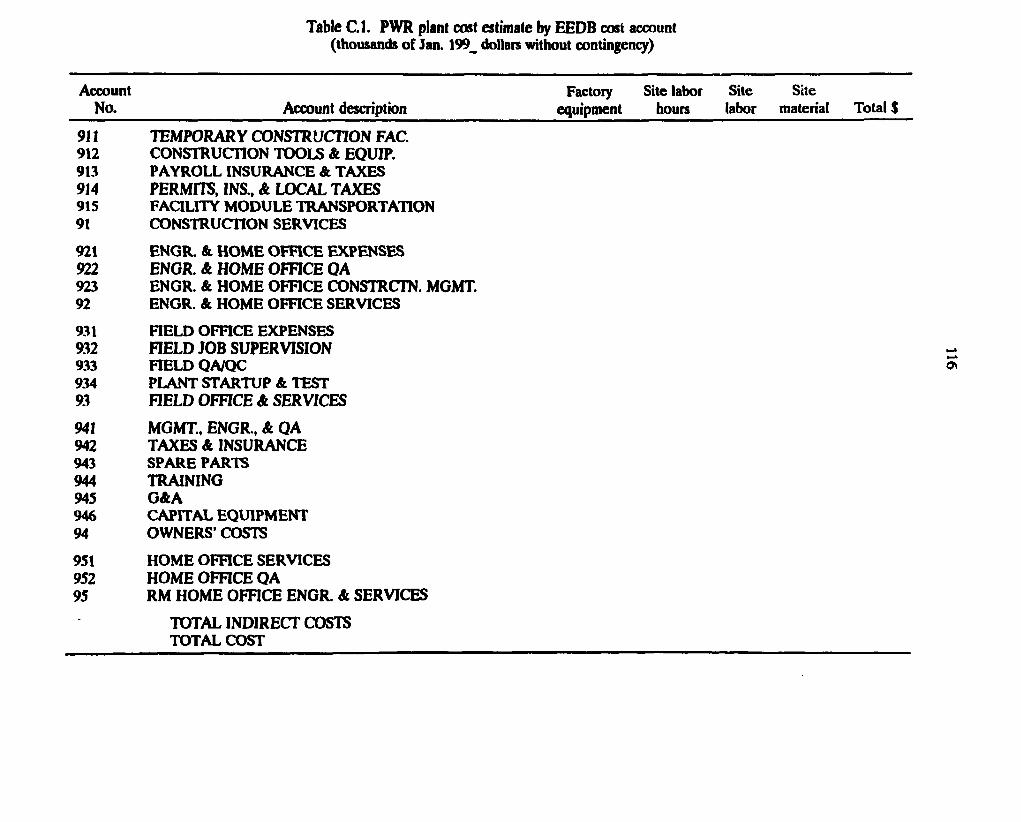
Table B . l . MHTGR plant cost estimate by EEDB cost account (thousands o f Jan. 199_ dollars without contingency)
Factory Site labor Site Site equipment hours labor material Total S
9 1 1 TEMPORARY C O N S T R U C T I O N FAC. 912 CONSTRUCTION TOOLS & EQUIP. 913 PAYROLL INSURANCE A TAXES 914 PERMITS, INS., A LOCAL TAXES 915 FACILITY MODULE TRANSPORTATION 91 CONSTRUCTION SERVICES
921 ENGR. & HOME OFFICE EXPENSES 922 ENGR. A HOME OFFICE QA 923 ENGR. & HOME OFFICE CONSTRCTN. MGMT. 92 ENGR. A HOME OFFICE SERVICES
931 HELD OFFICE EXPENSES 932 FIELD JOB SUPERVISION 933 FIELD QA/QC 934 PLANT STARTUP A TEST 93 F I E L D O F F I C E A S E R V I C E S
9 4 1 M G M T . , E N G R . , A Q A 942 TAXES A INSURANCE 943 SPARE PARTS 944 TRAINING 945 G&A 946 CAPITAL EQUIPMENT 94 OWNERS' COSTS
951 HOME OFFICE SERVICES 952 HOME OFFICE QA 95 RM HOME OFFICE ENGR. A SERVICES
TOTAL INDIRECT COSTS TOTAL COST
Account No. Account description
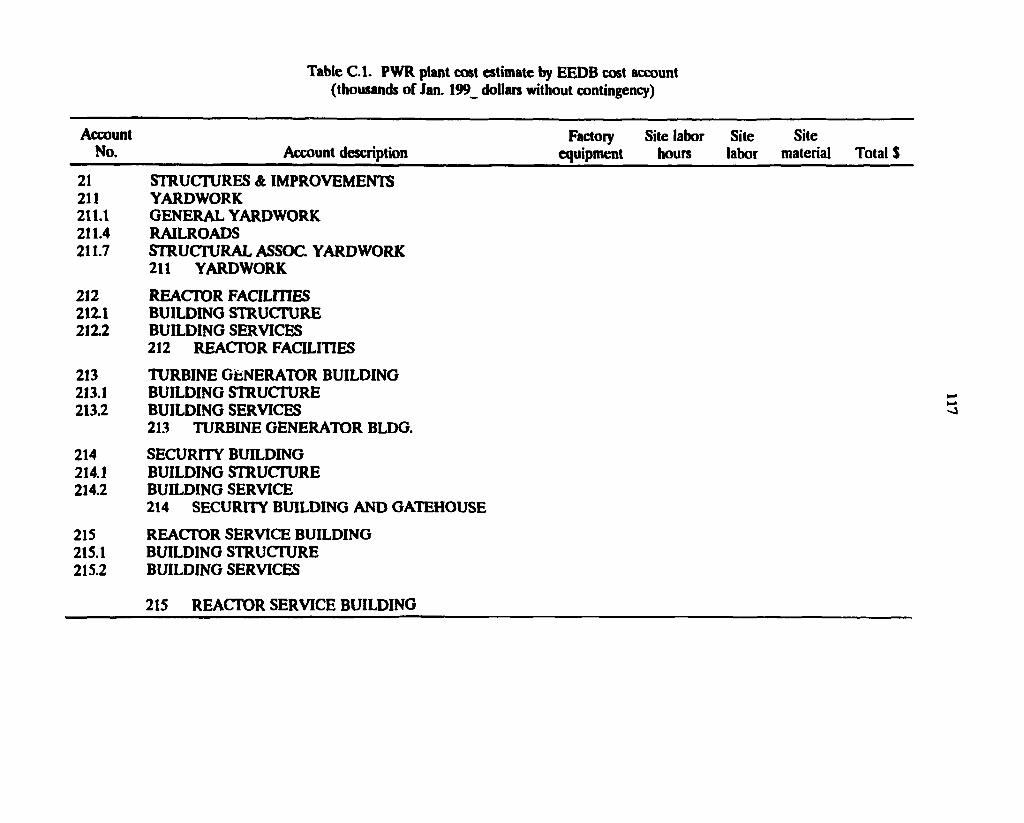
Table B . l . MHTGR plant cost est imate by E E D B cost account (thousands o f Jan. 199_ dollars without contingency)
Factory Site labor Site Site equipment hours labor material Total $
21 STRUCTURES A IMPROVEMENTS 211 YARDWORK 211.1 GENERAL YARDWORK 211.4 RAILROADS 211.7 STRUCTURAL ASSOC. YARDWORK
211 YARDWORK
212 REACTOR FACILITIES 2111 BUILDING STRUCTURE 212.2 BUILDING SERVICES
212 REACTOR FACILITIES
213 TURBINE GENERATOR BUILDING 213.1 BUILDING STRUCTURE 213.2 BUILDING SERVICES
213 TURBINE GENERATOR BLDG.
214 SECURITY BUILDING 214.1 BUILDING STRUCTURE 214.2 BUILDING SERVICE
214 SECURITY BUILDING AND GATEHOUSE
215 REACTOR SERVICE BUILDING 215.1 BUILDING STRUCTURE 215.2 BUILDING SERVICES
Account No. Account description
215 REACTOR SERVICE BUILDING
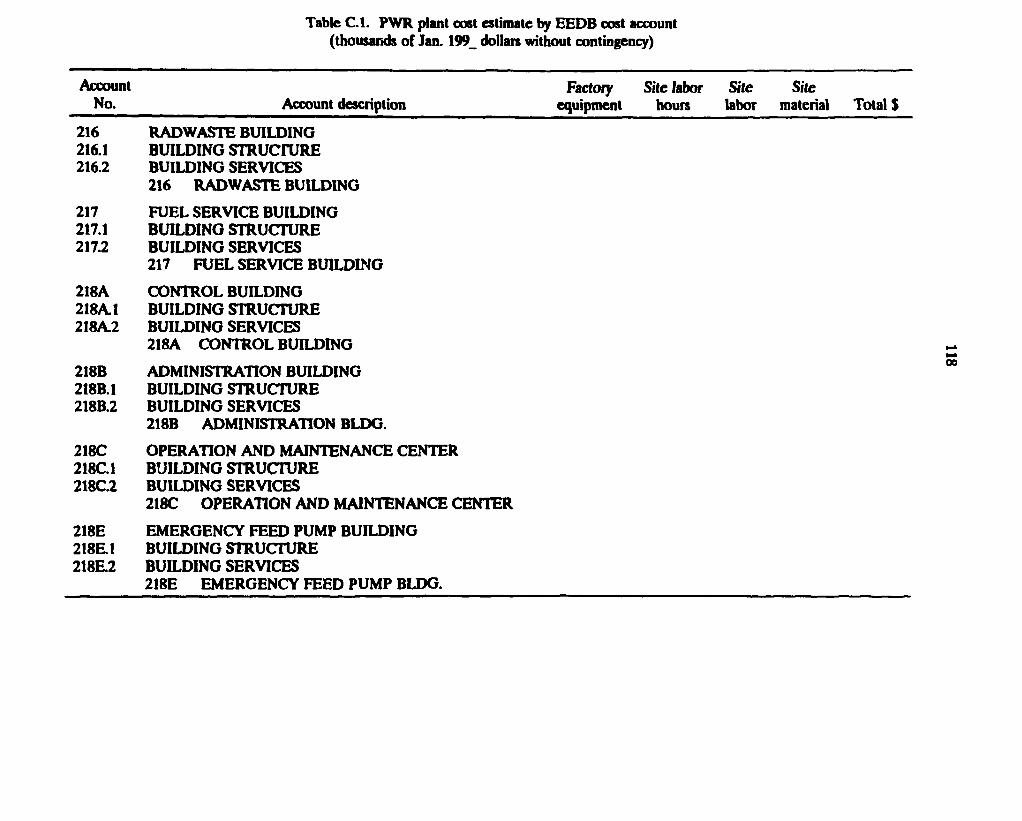
Table C.l. PWR plant cost estimate by EEDB cost account (thousands of Jan. 199_ dollars without contingency)
Account No.
F a c t o r y S i t e l a b o r S i t e Account description equipment hours labor
S i t e material Total $
216 216.1 216.2
RADWASTE BUILDING BUILDING STRUCTURE BUILDING SERVICES 216 RADWASTE BUILDING
217 217.1 217.2
FUEL SERVICE BUILDING BUILDING STRUCTURE BUILDING SERVICES 217 FUEL SERVICE BUILDING
218A 218A.1 218A.2
CONTROL BUILDING BUILDING STRUCTURE BUILDING SERVICES 218A CONTROL BUILDING
218B 218B.1 218B.2
ADMINISTRATION BUILDING BUILDING STRUCTURE BUILDING SERVICES 218B ADMINISTRATION BLDG.
218C 218C.1 218C.2
OPERATION AND MAINTENANCE CENTER BUILDING STRUCTURE BUILDING SERVICES 218C OPERATION AND MAINTENANCE CENTER
218E 218E1 218E2
EMERGENCY FEED PUMP BUILDING BUILDING STRUCTURE BUILDING SERVICES 218E EMERGENCY FEED PUMP BLDG.
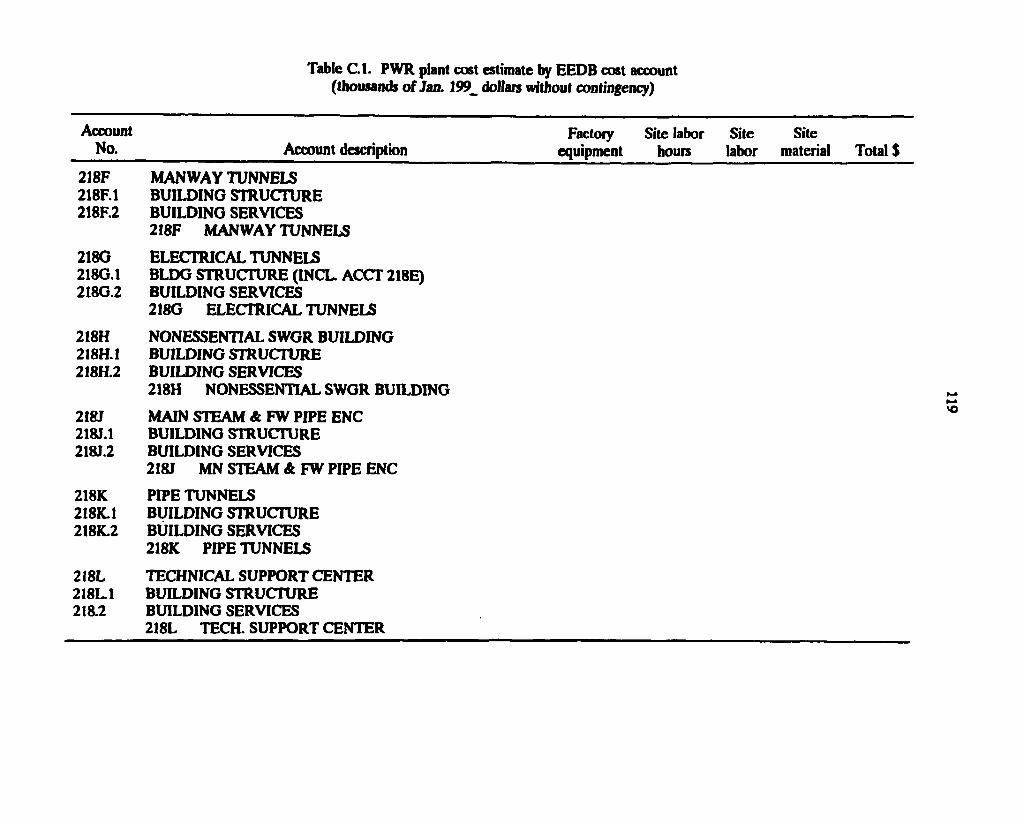
Table C.l. PWR plant cost estimate by EEDB cost account (thousands of Jan. 199_ dollars without contingency)
Account No.
Factoiy Site labor Account description equipment hours
Site labor
Site material Total $
218F 218F.1 218F.2
MANWAY TUNNELS BUILDING STRUCTURE BUILDING SERVICES 218F MANWAY TUNNELS
218G 218G.1 218G.2
ELECTRICAL TUNNELS BLDG STRUCTURE (INCL. ACCT 218E) BUILDING SERVICES 218G ELECTRICAL TUNNELS
218H 218H.1 218H.2
NONESSENTIAL SWGR BUILDING BUILDING STRUCTURE BUILDING SERVICES 218H NONESSENTIAL SWGR BUILDING
218J 218J.1 218J.2
MAIN STEAM A FW PIPE ENC BUILDING STRUCTURE BUILDING SERVICES 218J MN STEAM A FW PIPE ENC
218K 218K.1 218K.2
PIPE TUNNELS BUILDING STRUCTURE BUILDING SERVICES 218K PIPE TUNNELS
218L 218L.1 218.2
TECHNICAL SUPPORT CENTER BUILDING STRUCTURE BUILDING SERVICES 218L TECH. SUPPORT CENTER
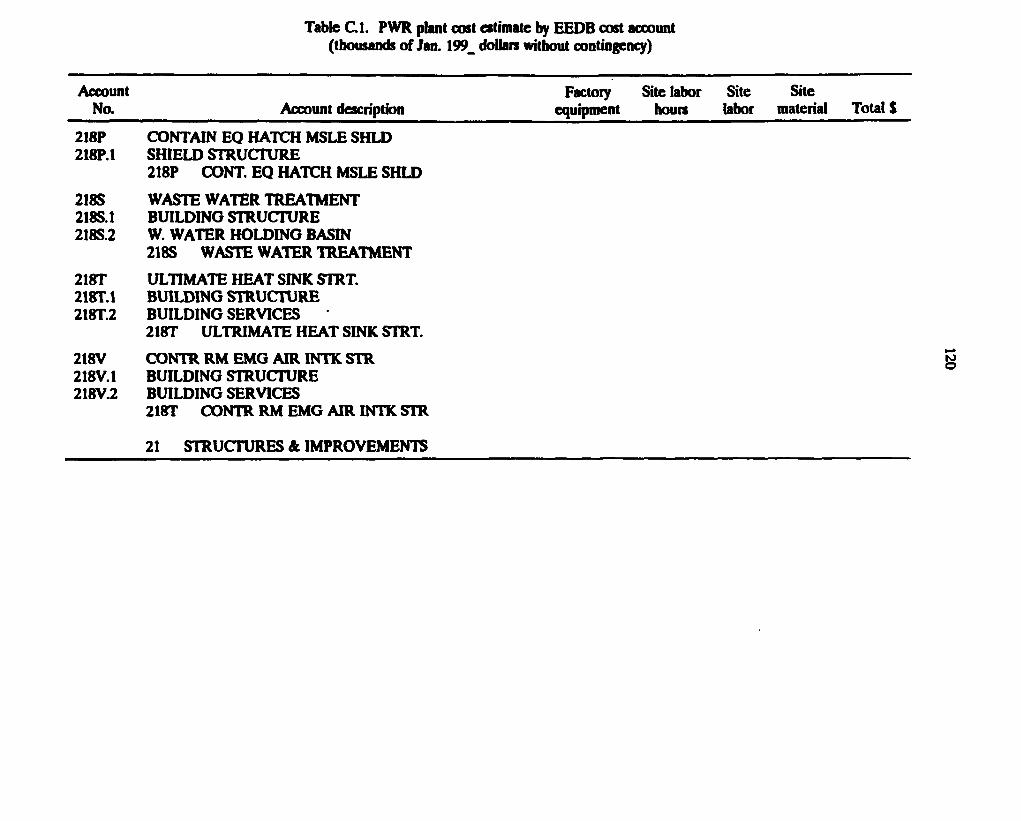
Table B.l. MHTGR plant cost estimate by E E D B cost account (thousands o f Jan. 199_ dollars without contingency)
Account Factory Site labor Site Site No. Account description equipment hours labor material Total $
218P CONTAIN EQ HATCH MSLE SHLD 218P.1 SHIELD STRUCTURE
218P CONT. EQ HATCH MSLE SHLD
218S WASTE WATER TREATMENT 2185.1 BUILDING STRUCTURE 2185.2 W. WATER HOLDING BASIN
218S WASTE WATER TREATMENT
218T ULTIMATE HEAT SINK STRT. 218T.1 BUILDING STRUCTURE 218T.2 BUILDING SERVICES
218T ULTRIMATE HEAT SINK STRT.
218V CONTR RM EMG AIR INTK STR 218V. 1 BUILDING STRUCTURE 218V.2 BUILDING SERVICES
218T CONTR RM EMG AIR INTK STR
21 STRUCTURES & IMPROVEMENTS
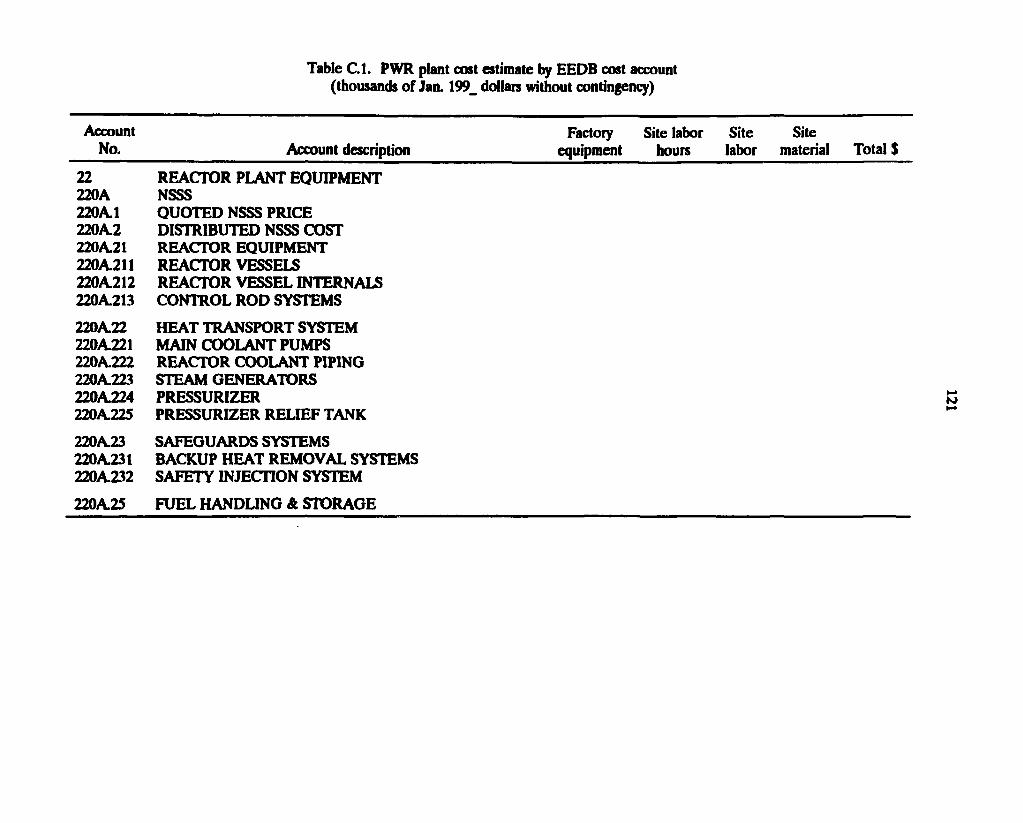
Table B . l . MHTGR plant cost estimate by E E D B cost account (thousands o f Jan. 199_ dollars without contingency)
Factory Site labor Site Site equipment hours labor material Total $
22 REACTOR PLANT EQUIPMENT 220A NSSS 220A1 QUOTED NSSS PRICE 220A.2 DISTRIBUTED NSSS COST 220A.21 REACTOR EQUIPMENT 220A.211 REACTOR VESSELS 220A212 REACTOR VESSEL INTERNALS 220A.213 CONTROL ROD SYSTEMS
220A.22 HEAT TRANSPORT SYSTEM 220A221 MAIN COOLANT PUMPS 220A222 REACTOR COOLANT PIPING 220A223 STEAM GENERATORS 220A.224 PRESSURIZER 220A225 PRESSURIZER RELIEF TANK
220A23 SAFEGUARDS SYSTEMS 220A.231 BACKUP HEAT REMOVAL SYSTEMS 220A.232 SAFETY INJECTION SYSTEM
220A.25 FUEL HANDLING A STORAGE
Account No. Account description
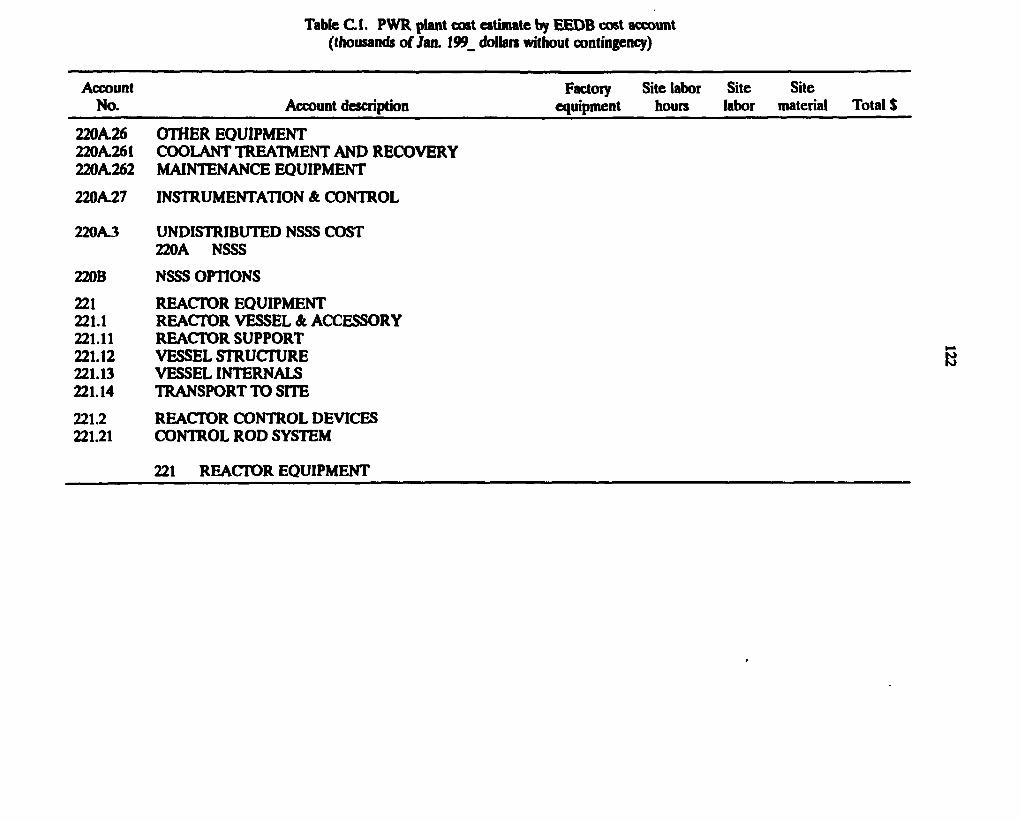
Table B.l. MHTGR plant cost estimate by E E D B cost account (thousands o f Jan. 199_ dollars without contingency)
Factory Site labor Site Site equipment hours labor material Total $
220A.26 OTHER EQUIPMENT 220A261 COOLANT TREATMENT AND RECOVERY 220A262 MAINTENANCE EQUIPMENT
220A27 INSTRUMENTATION A CONTROL
220A3 UNDISTRIBUTED NSSS COST 220A NSSS
220B NSSS OPTIONS
221 REACTOR EQUIPMENT 221.1 REACTOR VESSEL A ACCESSORY 221.11 REACTOR SUPPORT 221.12 VESSEL STRUCTURE 221.13 VESSEL INTERNALS 221.14 TRANSPORT TO SITE
221.2 REACTOR CONTROL DEVICES 221.21 CONTROL ROD SYSTEM
Account No. Account description
221 REACTOR EQUIPMENT
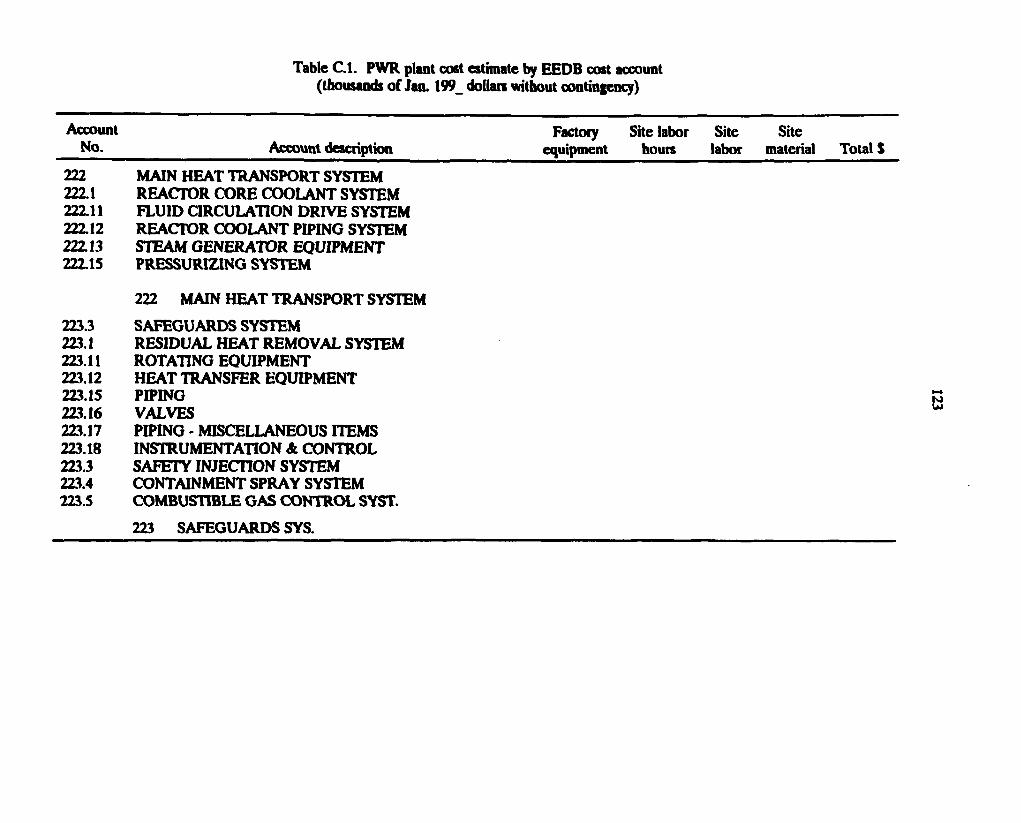
Table B . l . MHTGR plant cost estimate by E E D B cost account (thousands o f Jan. 199_ dollars without contingency)
Account No. Account description
222 MAIN HEAT TRANSPORT SYSTEM 222.1 REACTOR CORE COOLANT SYSTEM 222.11 FLUID CIRCULATION DRIVE SYSTEM 222.12 REACTOR COOLANT PIPING SYSTEM 222.13 STEAM GENERATOR EQUIPMENT 222.15 PRESSURIZING SYSTEM
222 MAIN HEAT TRANSPORT SYSTEM
223.3 SAFEGUARDS SYSTEM 223.1 RESIDUAL HEAT REMOVAL SYSTEM 223.11 ROTATING EQUIPMENT 223.12 HEAT TRANSFER EQUIPMENT 223.15 PIPING 223.16 VALVES 223.17 PIPING - MISCELLANEOUS ITEMS 223.18 INSTRUMENTATION & CONTROL 213.3 SAFETY INJECTION SYSTEM 223.4 CONTAINMENT SPRAY SYSTEM 223.5 COMBUSTIBLE GAS CONTROL SYST.
Factory Site labor Site Site equipment hours labor material Total $
223 SAFEGUARDS SYS.
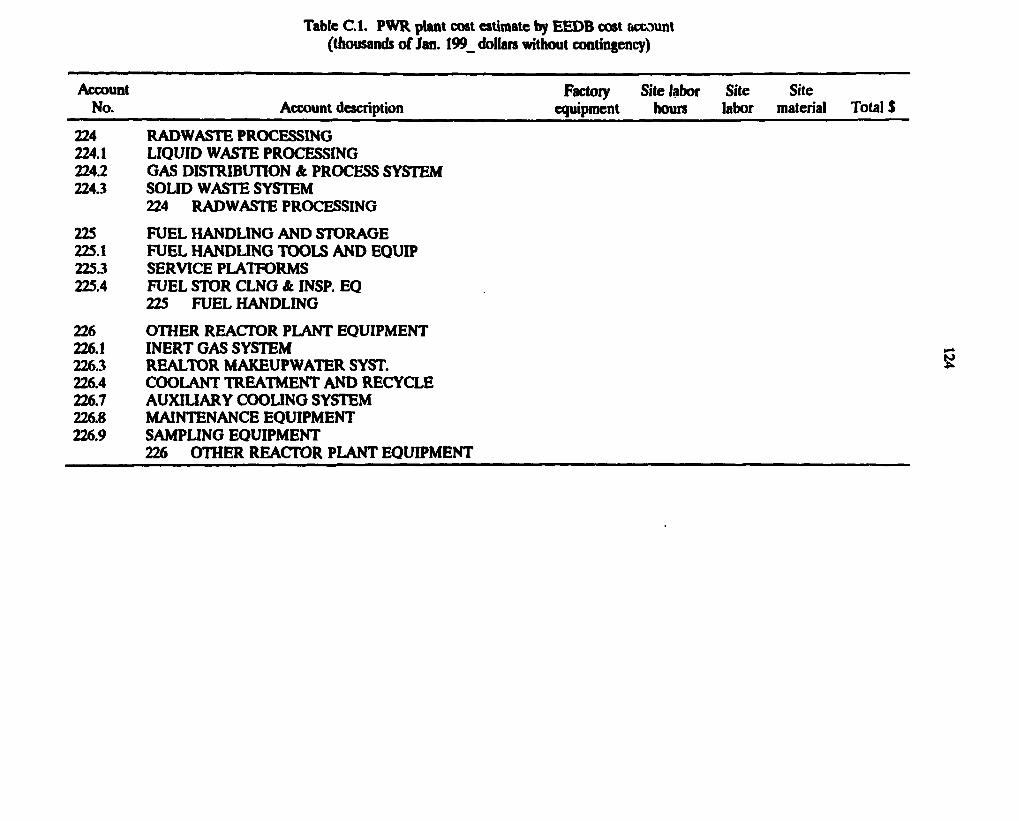
Table B . l . MHTGR plant cost estimate by E E D B cost account (thousands o f Jan. 199_ dollars without contingency)
Account Factoiy Site labor Site Site No. Account description equipment hours labor material Total $
224 RADWASTE PROCESSING 224.1 LIQUID WASTE PROCESSING 224.2 GAS DISTRIBUTION & PROCESS SYSTEM 224.3 SOLID WASTE SYSTEM
224 RADWASTE PROCESSING
225 FUEL HANDLING AND STORAGE 225.1 FUEL HANDLING TOOLS AND EQUIP 225.3 SERVICE PLATFORMS 225.4 FUEL STOR CLNG Sc INSP. EQ
225 FUEL HANDLING
226 OTHER REACTOR PLANT EQUIPMENT 226.1 INERT GAS SYSTEM 226.3 REALTOR MAKEUPWATER SYST. 226.4 COOLANT TREATMENT AND RECYCLE 226.7 AUXILIARY COOLING SYSTEM 226.8 MAINTENANCE EQUIPMENT 226.9 SAMPLING EQUIPMENT
226 OTHER REACTOR PLANT EQUIPMENT
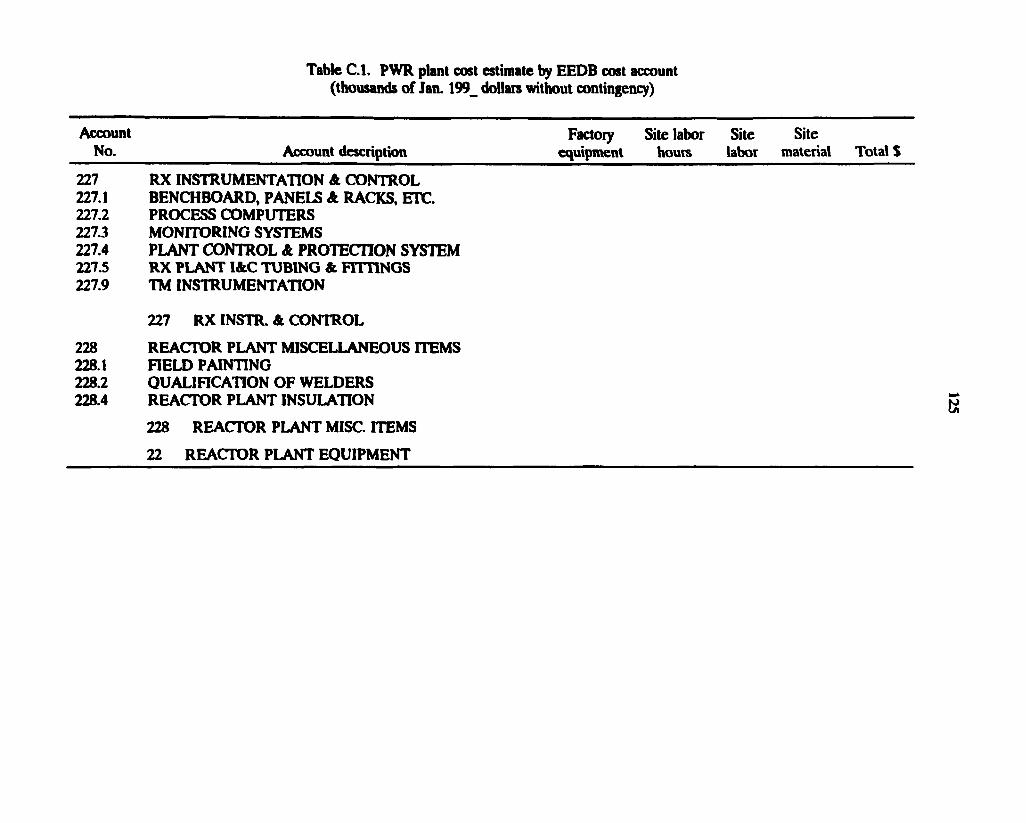
Table B . l . MHTGR plant cost estimate by E E D B cost account (thousands o f Jan. 199_ dollars without contingency)
Factory Site labor Site Site equipment hours labor material Total $
227 RX INSTRUMENTATION A CONTROL 227.1 BENCHBOARD, PANELS & RACKS, ETC. 227.2 PROCESS COMPUTERS 227.3 MONITORING SYSTEMS 227.4 PLANT CONTROL A PROTECTION SYSTEM 227.5 RX PLANT I&C TUBING & FITTINGS 227.9 TM INSTRUMENTATION
227 RX INSTR. & CONTROL
228 REACTOR PLANT MISCELLANEOUS ITEMS 228.1 FIELD PAINTING 228.2 QUALIFICATION OF WELDERS 228.4 REACTOR PLANT INSULATION
228 REACTOR PLANT MISC. ITEMS
Account No. Account description
22 REACTOR PLANT EQUIPMENT
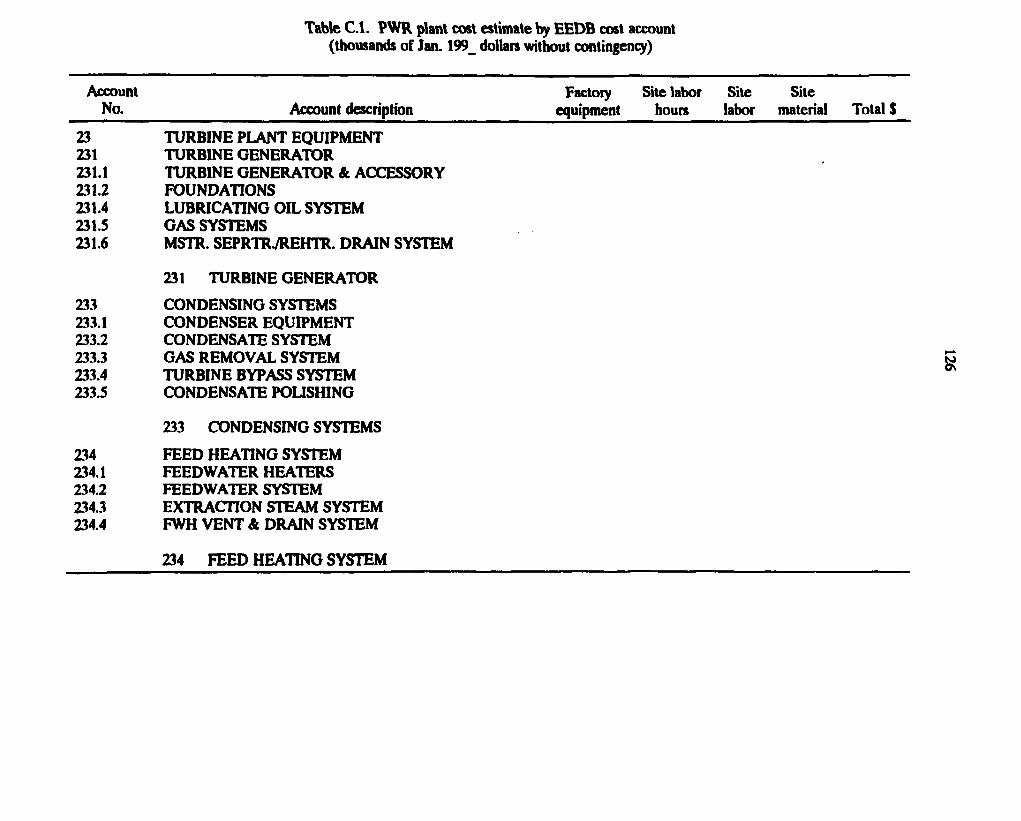
Table B . l . MHTGR plant cost estimate by E E D B cost account (thousands o f Jan. 199_ dollars without contingency)
Account Factory Site labor Site Site No. Account description equipment hours labor material Total S
23 TURBINE PLANT EQUIPMENT 231 TURBINE GENERATOR 231.1 TURBINE GENERATOR & ACCESSORY 231.2 FOUNDATIONS 231.4 LUBRICATING OIL SYSTEM 231.5 GAS SYSTEMS 231.6 MSTR. SEPRTR./REHTR. DRAIN SYSTEM
231 TURBINE GENERATOR
233 CONDENSING SYSTEMS 233.1 CONDENSER EQUIPMENT 233.2 CONDENSATE SYSTEM 233.3 GAS REMOVAL SYSTEM 233.4 TURBINE BYPASS SYSTEM 233.5 CONDENSATE POLISHING
233 CONDENSING SYSTEMS
234 FEED HEATING SYSTEM 234.1 FEEDWATER HEATERS 234.2 FEEDWATER SYSTEM 234.3 EXTRACTION STEAM SYSTEM 234.4 FWH VENT & DRAIN SYSTEM
234 FEED HEATING SYSTEM
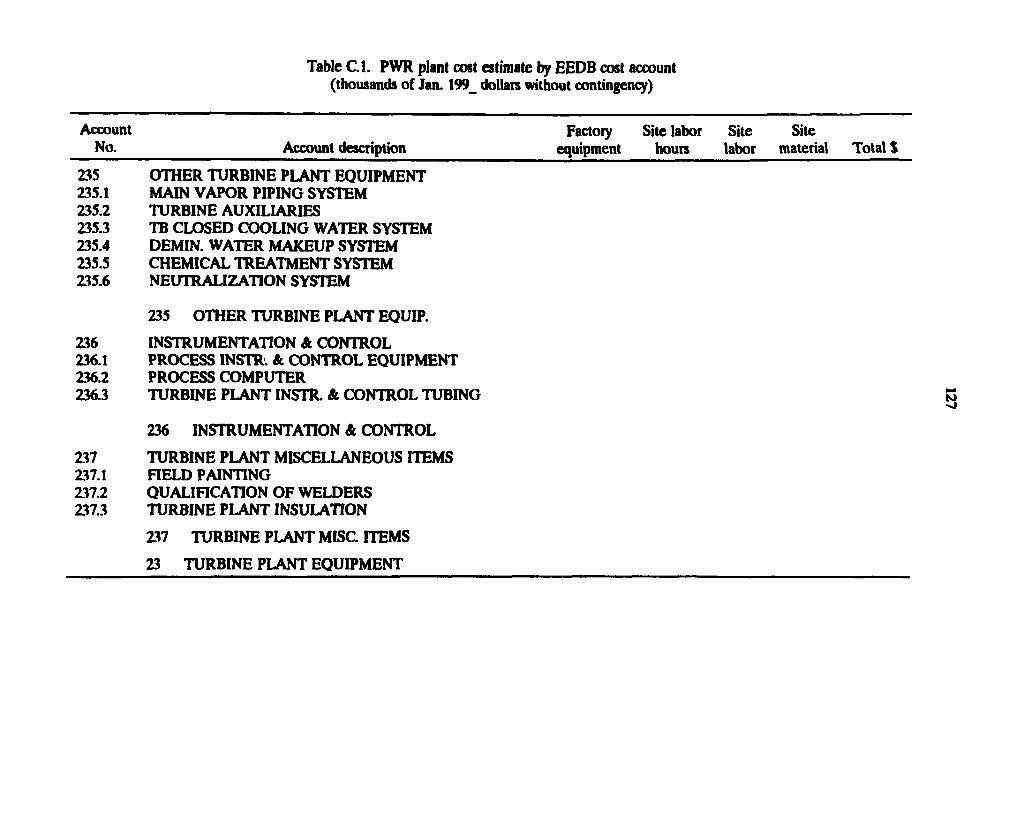
Table B . l . MHTGR plant cost estimate by E E D B cost account (thousands o f Jan. 199_ dollars without contingency)
Factory Site labor Site Site equipment hours labor material Total $
235 OTHER TURBINE PLANT EQUIPMENT 235.1 MAIN VAPOR PIPING SYSTEM 235.2 TURBINE AUXILIARIES 235.3 TB CLOSED COOLING WATER SYSTEM 235.4 DEMIN. WATER MAKEUP SYSTEM 235.5 CHEMICAL TREATMENT SYSTEM 235.6 NEUTRALIZATION SYSTEM
235 OTHER TURBINE PLANT EQUIP.
236 INSTRUMENTATION & CONTROL 236.1 PROCESS INSTR. & CONTROL EQUIPMENT 236.2 PROCESS COMPUTER 236.3 TURBINE PLANT INSTR. & CONTROL TUBING
236 INSTRUMENTATION & CONTROL
237 TURBINE PLANT MISCELLANEOUS ITEMS 237.1 FIELD PAINTING 237.2 QUALIFICATION OF WELDERS 237.3 TURBINE PLANT INSULATION
237 TURBINE PLANT MISC. ITEMS
Account No. Account description
23 TURBINE PLANT EQUIPMENT
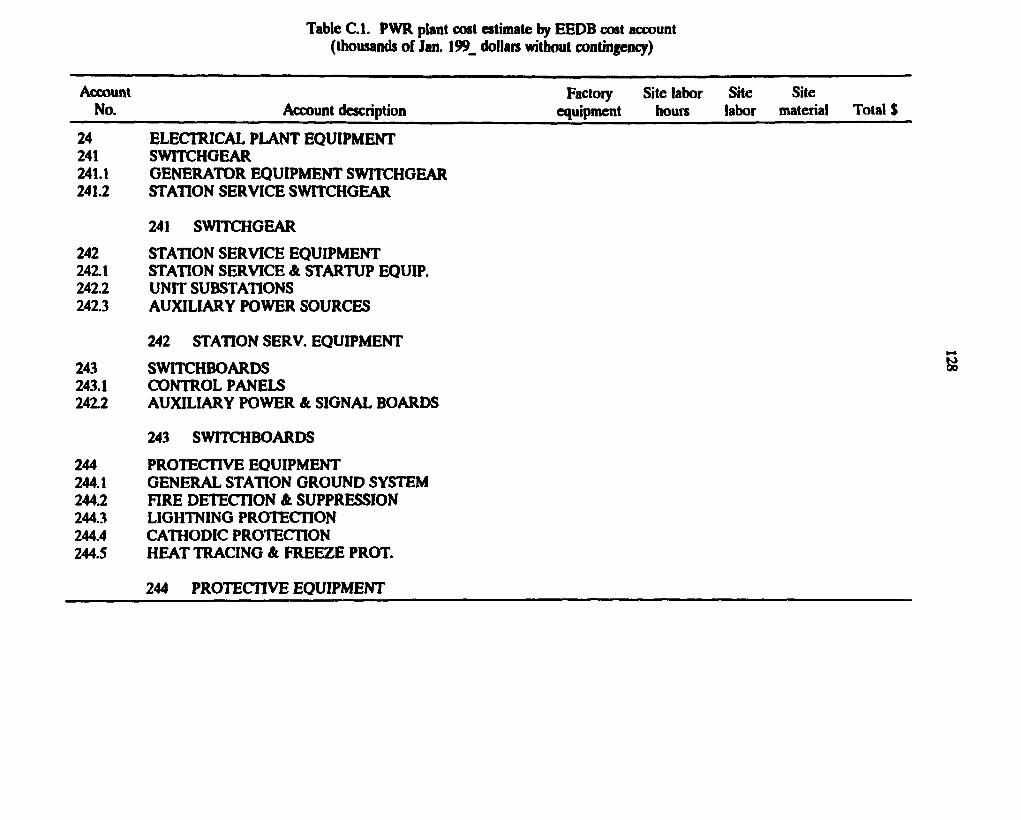
Table B . l . MHTGR plant cost estimate by E E D B cost account (thousands o f Jan. 199_ dollars without contingency)
Factory Site labor Site Site equipment hours labor material Total $
24 ELECTRICAL PLANT EQUIPMENT 241 SWITCHGEAR 241.1 GENERATOR EQUIPMENT SWITCHGEAR 241.2 STATION SERVICE SWITCHGEAR
241 SWITCHGEAR
242 STATION SERVICE EQUIPMENT 242.1 STATION SERVICE A STARTUP EQUIP. 242.2 UNIT SUBSTATIONS 242.3 AUXILIARY POWER SOURCES
242 STATION SERV. EQUIPMENT
243 SWITCHBOARDS 243.1 CONTROL PANELS 242.2 AUXILIARY POWER A SIGNAL BOARDS
243 SWITCHBOARDS
244 PROTECTIVE EQUIPMENT 244.1 GENERAL STATION GROUND SYSTEM 244.2 FIRE DETECTION A SUPPRESSION 244.3 LIGHTNING PROTECTION 244.4 CATHODIC PROTECTION 244.5 HEAT TRACING A FREEZE PROT.
Account No. Account description
244 PROTECTIVE EQUIPMENT
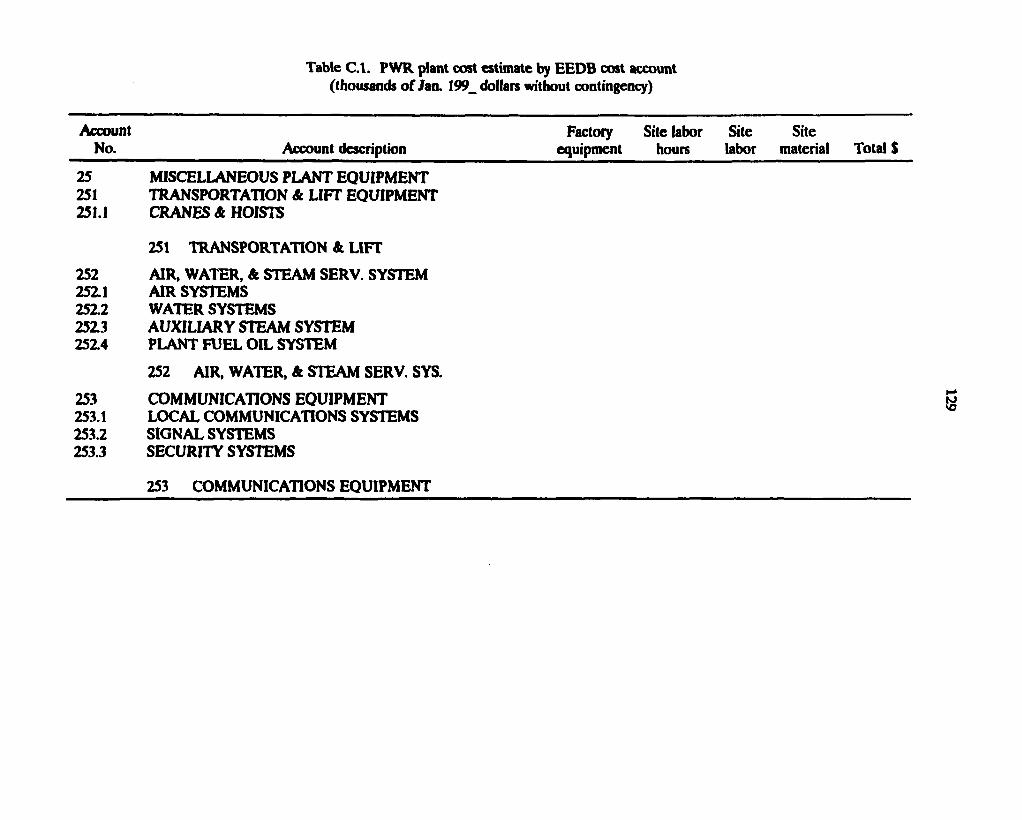
Table B . l . MHTGR plant cost estimate by EEDB cost account (thousands o f Jan. 199_ dollars without contingency)
Factory Site labor Site Site equipment hours labor material Total $
25 MISCELLANEOUS PLANT EQUIPMENT 251 TRANSPORTATION & LIFT EQUIPMENT 251.1 CRANES A HOISTS
251 TRANSPORTATION & LIFT
252 AIR, WATER, A STEAM SERV. SYSTEM 252.1 AIR SYSTEMS 252.2 WATER SYSTEMS 2523 AUXILIARY STEAM SYSTEM 252.4 PLANT FUEL OIL SYSTEM
252 AIR, WATER, & STEAM SERV. SYS.
253 COMMUNICATIONS EQUIPMENT 253.1 LOCAL COMMUNICATIONS SYSTEMS 253.2 SIGNAL SYSTEMS 253.3 SECURITY SYSTEMS
Account No. Account description
253 COMMUNICATIONS EQUIPMENT
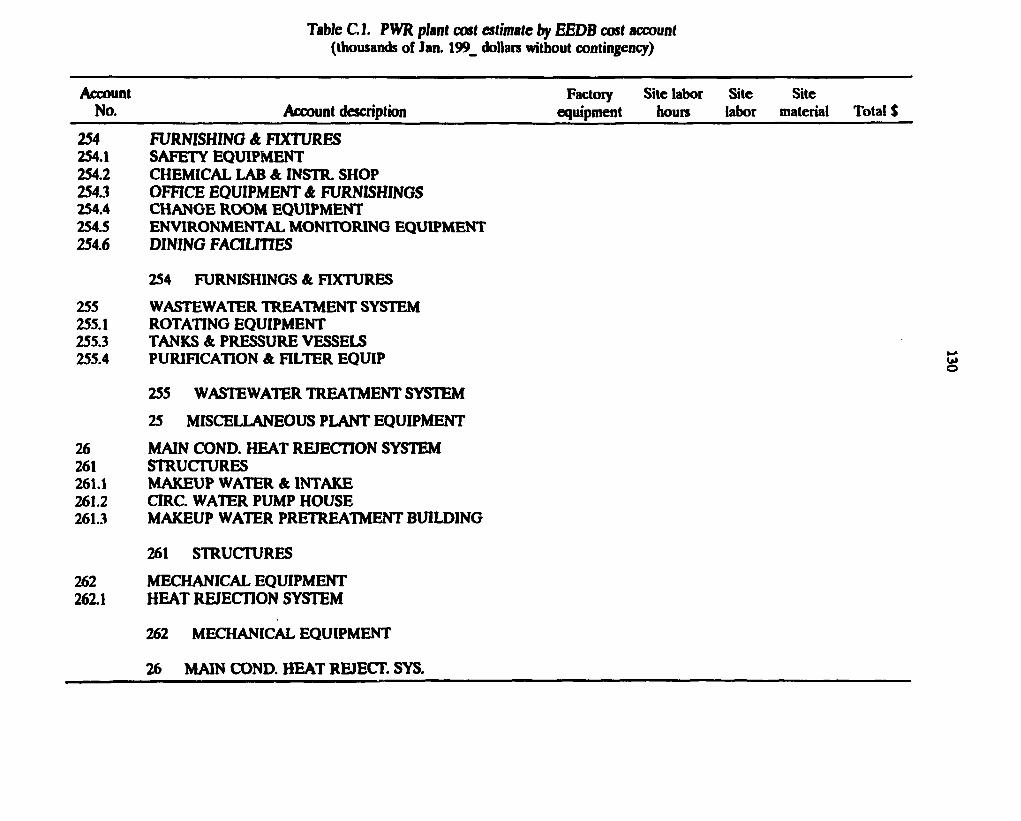
Table B.l. MHTGR plant cost estimate by EEDB cost account (thousands of Jan. 199_ dollars without contingency)
Account Factory Site labor Site Site No. Account description equipment hours labor material Total S
254 F U R N I S H I N G A FIXTURES 254.1 SAFETY EQUIPMENT 254.2 CHEMICAL LAB A INSTR. SHOP 254.3 OFFICE EQUIPMENT A F U R N I S H I N G S 254.4 CHANGE ROOM EQUIPMENT 254.5 ENVIRONMENTAL MONITORING EQUIPMENT 2 5 4 . 6 D I N I N G F A C I L I T I E S
254 FURNISHINGS A FIXTURES
255 WASTEWATER TREATMENT SYSTEM 255.1 ROTATING EQUIPMENT 255.3 TANKS A PRESSURE VESSELS 255.4 PURIFICATION A FILTER EQUIP
255 WASTEWATER TREATMENT SYSTEM
25 MISCELLANEOUS PLANT EQUIPMENT
26 MAIN COND. HEAT REJECTION SYSTEM 261 STRUCTURES 261.1 MAKEUP WATER A INTAKE 261.2 CIRC. WATER PUMP HOUSE 261.3 MAKEUP WATER PRETREATMENT BUILDING
261 STRUCTURES
262 MECHANICAL EQUIPMENT 262.1 HEAT REJECTION SYSTEM
262 MECHANICAL EQUIPMENT
26 MAIN COND. HEAT REJECT. SYS.
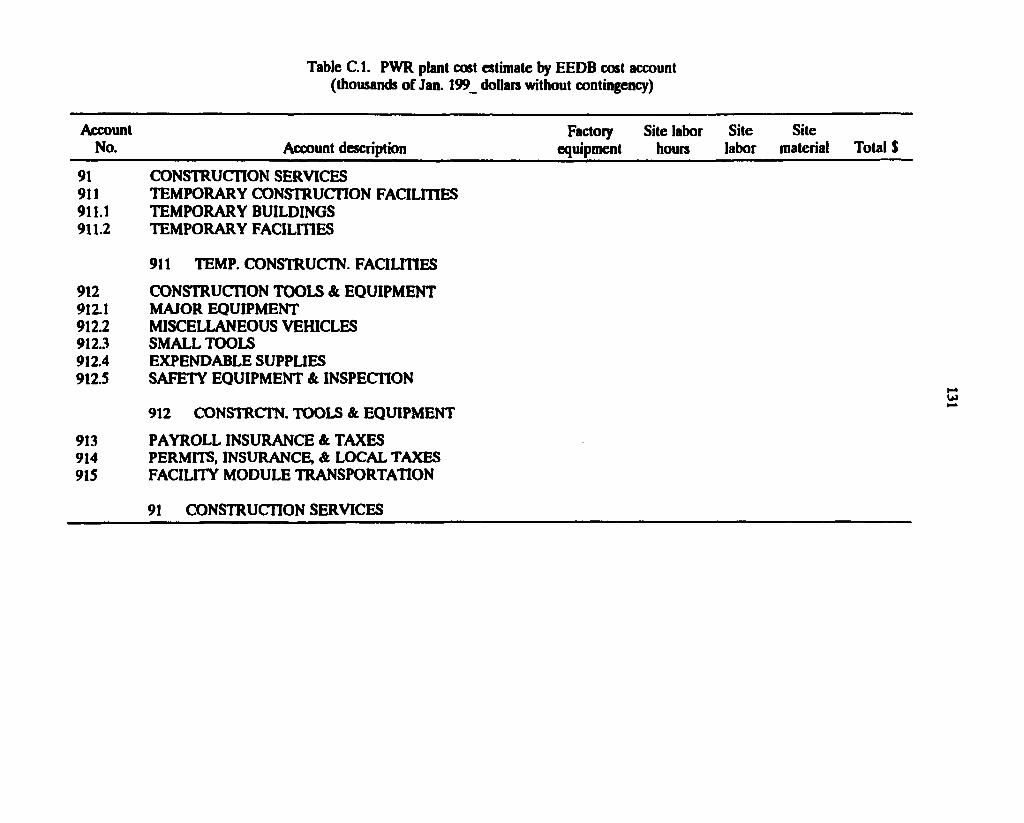
Table B . l . MHTGR plant cost estimate by E E D B cost account (thousands o f Jan. 199_ dollars without contingency)
Account Factoiy Site labor Site Site No. Account description equipment hours labor material Total $
91 CONSTRUCTION SERVICES 911 TEMPORARY CONSTRUCTION FACILITIES 911.1 TEMPORARY BUILDINGS 911.2 TEMPORARY FACILITIES
911 TEMP. CONSTRUCTS FACILITIES
912 CONSTRUCTION TOOLS & EQUIPMENT 912.1 MAJOR EQUIPMENT 912.2 MISCELLANEOUS VEHICLES 912.3 SMALL TOOLS 912.4 EXPENDABLE SUPPLIES 912.5 SAFETY EQUIPMENT & INSPECTION
912 CONSTRCTN. TOOLS & EQUIPMENT
913 PAYROLL INSURANCE & TAXES 914 PERMITS, INSURANCE, & LOCAL TAXES 915 FACILITY MODULE TRANSPORTATION
91 CONSTRUCTION SERVICES
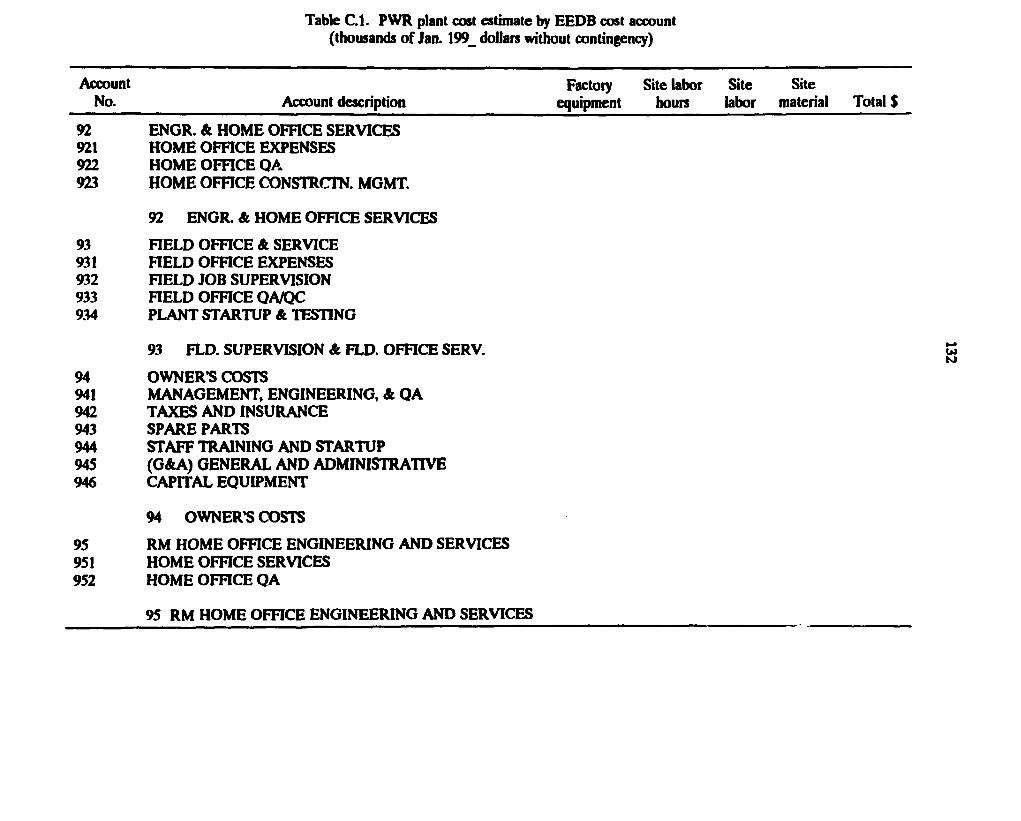
Table B . l . MHTGR plant cost estimate by E E D B cost account (thousands o f Jan. 199_ dollars without contingency)
Account Factory Site labor Site Site No. Account description equipment hours labor material Total $
92 ENGR. A HOME OFFICE SERVICES 921 HOME OFFICE EXPENSES 922 HOME OFFICE QA 923 HOME OFFICE CONSTRCTN. MGMT.
92 ENGR. A HOME OFFICE SERVICES
93 HELD OFFICE A SERVICE 931 FIELD OFFICE EXPENSES 932 HELD JOB SUPERVISION 933 HELD OFFICE QA/QC 934 PLANT STARTUP A TESTING
93 FLD. SUPERVISION A FLD. OFFICE SERV.
94 OWNER'S COSTS 941 MANAGEMENT, ENGINEERING, A QA 942 TAXES AND INSURANCE 943 SPARE PARTS 944 STAFF TRAINING AND STARTUP 945 (G&A) GENERAL AND ADMINISTRATIVE 946 CAPITAL EQUIPMENT
94 OWNER'S COSTS
95 RM HOME OFFICE ENGINEERING AND SERVICES 951 HOME OFFICE SERVICES 952 HOME OFFICE QA
95 RM HOME OFFICE ENGINEERING AND SERVICES
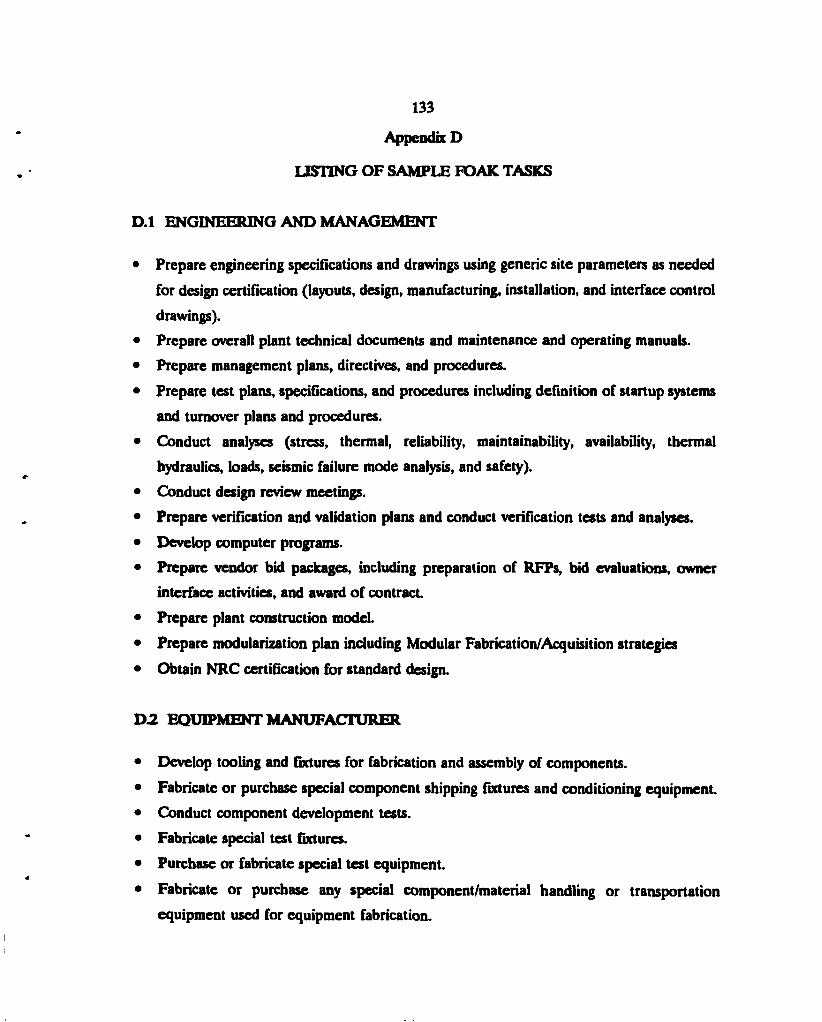
133
Appendix D
LISTING OF SAMPLE FOAK TASKS
D.l ENGINEERING AND MANAGEMENT
• Prepare engineering specifications and drawings using generic site parameters as needed
for design certification (layouts, design, manufacturing, installation, and interface control
drawings).
• Prepare overall plant technical documents and maintenance and operating manuals.
• Prepare management plans, directives, and procedures.
• Prepare test plans, specifications, and procedures including definition of startup systems
and turnover plans and procedures.
• Conduct analyses (stress, thermal, reliability, maintainability, availability, thermal
hydraulics, loads, seismic failure mode analysis, and safety).
• Conduct design review meetings.
• Prepare verification and validation plans and conduct verification tests and analyses.
• Develop computer programs.
• Prepare vendor bid packages, including preparation of RFPs, bid evaluations, owner
interface activities, and award of contract.
• Prepare plant construction model.
• Prepare modularization plan including Modular Fabrication/Acquisition strategies
• Obtain NRC certification for standard design.
D 2 . EQUIPMENT MANUFACTURER
• Develop tooling and fixtures for fabrication and assembly of components.
• Fabricate or purchase special component shipping fixtures and conditioning equipment
• Conduct component development tests.
• Fabricate special test fixtures.
• Purchase or fabricate special test equipment.
• Fabricate or purchase any special component/material handling or transportation
equipment used for equipment fabrication.
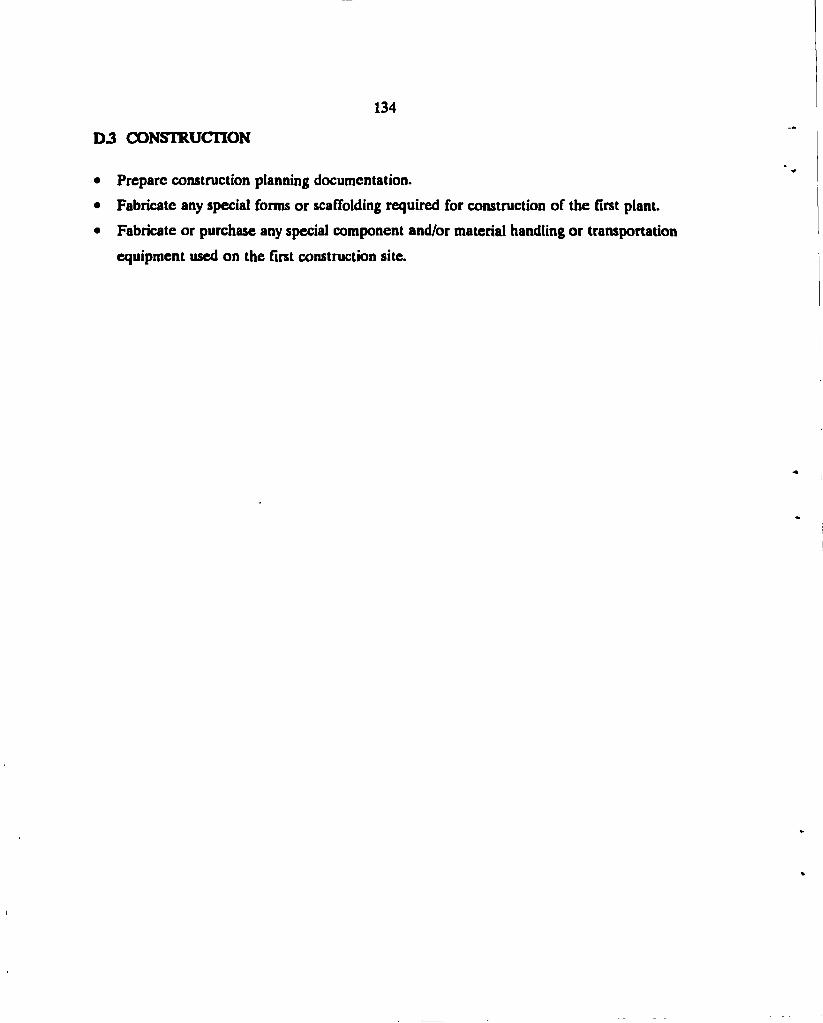
D 3 CONSTRUCTION
134
• Prepare construction planning documentation.
• Fabricate any special forms or scaffolding required for construction of the first plant.
• Fabricate or purchase any special component and/or material handling or transportation
equipment used on the first construction site.
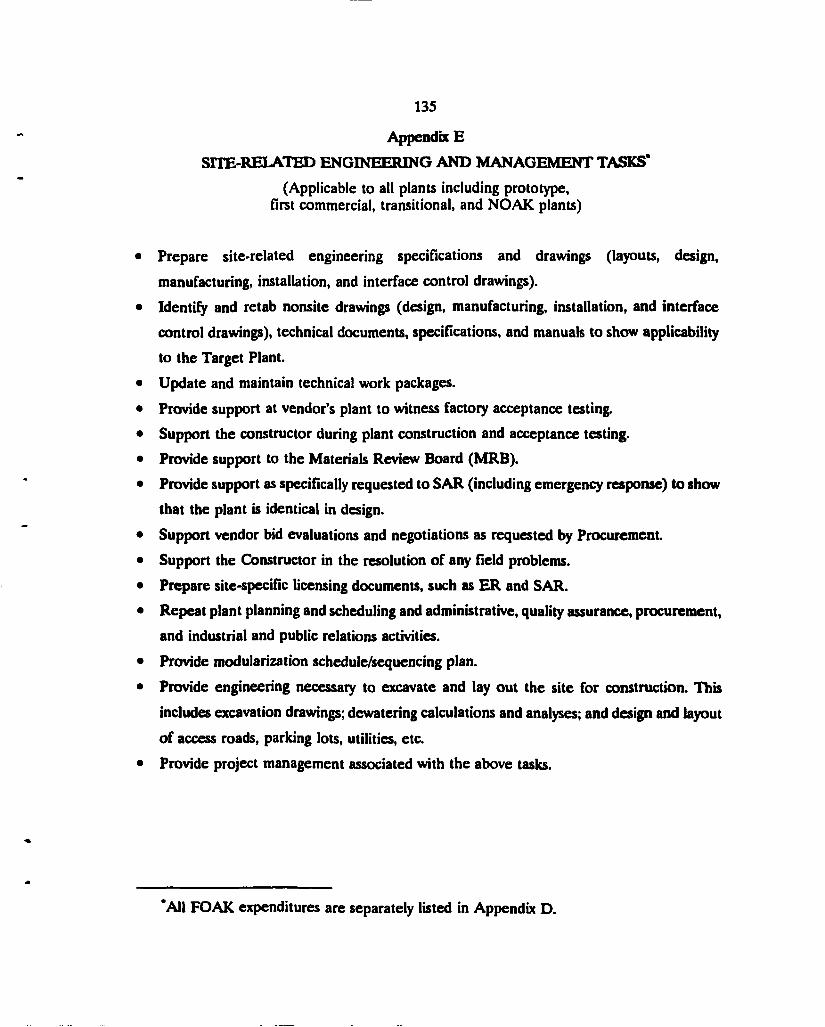
135
Appendix E
SITE-RELATED ENGINEERING AND MANAGEMENT TASKS'
(Applicable to all plants including prototype, first commercial, transitional, and NOAK plants)
• Prepare site-related engineering specifications and drawings (layouts, design,
manufacturing, installation, and interface control drawings).
• Identify and retab nonsite drawings (design, manufacturing, installation, and interface
control drawings), technical documents, specifications, and manuals to show applicability
to the Target Plant.
• Update and maintain technical work packages.
• Provide support at vendor's plant to witness factory acceptance testing.
• Support the constructor during plant construction and acceptance testing.
• Provide support to the Materials Review Board (MRB).
• Provide support as specifically requested to SAR (including emergency response) to show
that the plant is identical in design.
• Support vendor bid evaluations and negotiations as requested by Procurement.
• Support the Constructor in the resolution of any field problems.
• Prepare site-specific licensing documents, such as ER and SAR.
• Repeat plant planning and scheduling and administrative, quality assurance, procurement,
and industrial and public relations activities.
• Provide modularization schedule/sequencing plan.
• Provide engineering necessary to excavate and lay out the site for construction. This
includes excavation drawings; dewatering calculations and analyses; and design and layout
of access roads, parking lots, utilities, etc.
• Provide project management associated with the above tasks.
'All FOAK expenditures are separately listed in Appendix D.
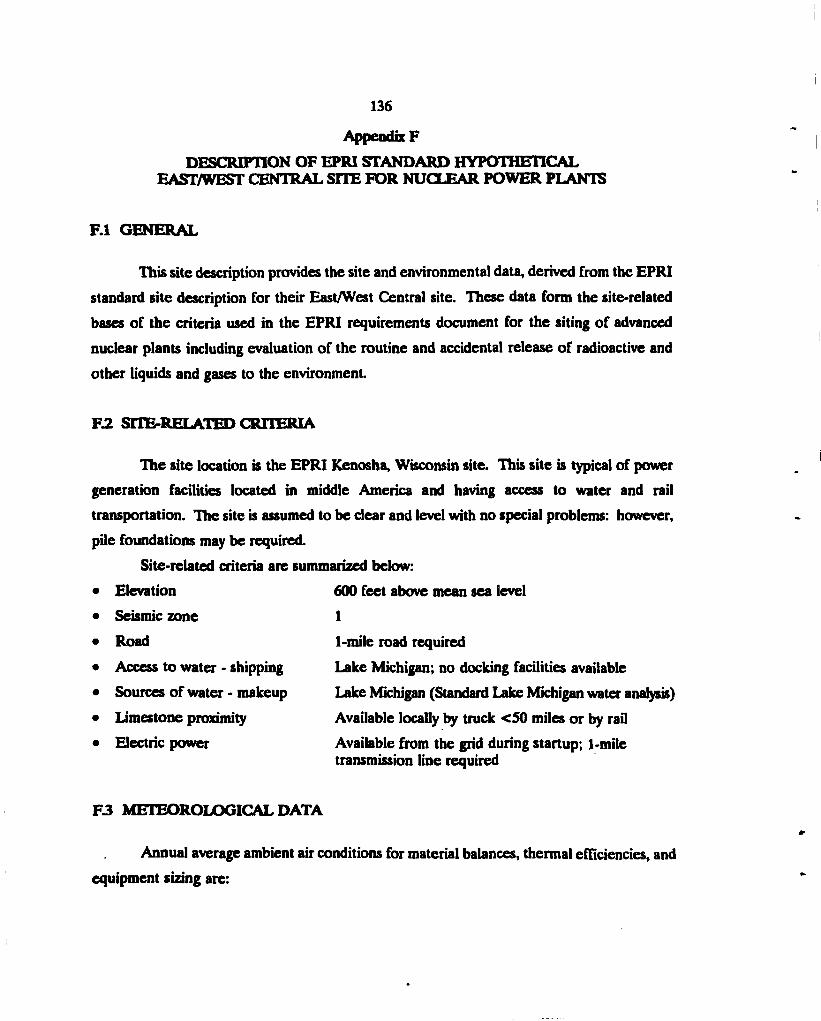
136
Appendix F
DESCRIPTION OF EPRI STANDARD HYPOTHETICAL EAST/WEST CENTRAL SITE FOR NUCLEAR POWER PLANTS
F.l GENERAL
This site description provides the site and environmental data, derived from the EPRI
standard site description for their East/West Central site. These data form the site-related
bases of the criteria used in the EPRI requirements document for the siting of advanced
nuclear plants including evaluation of the routine and accidental release of radioactive and
other liquids and gases to the environment.
F.2 SITE-RELATED CRITERIA
The site location is the EPRI Kenosha, Wisconsin site. This site is typical of power
generation facilities located in middle America and having access to water and rail
transportation. The site is assumed to be clear and level with no special problems: however,
pile foundations may be required.
Site-related criteria are summarized below:
• Elevation
• Seismic zone
• Road
• Access to water - shipping
• Sources of water - makeup
• Limestone proximity
• Electric power
600 feet above mean sea level
1
1-mile road required
Lake Michigan; no docking facilities available
Lake Michigan (Standard Lake Michigan water analysis)
Available locally by truck <50 miles or by rail
Available from the grid during startup; 1-mile transmission line required
F 3 METEOROLOGICAL DATA
Annual average ambient air conditions for material balances, thermal efficiencies, and
equipment sizing are:
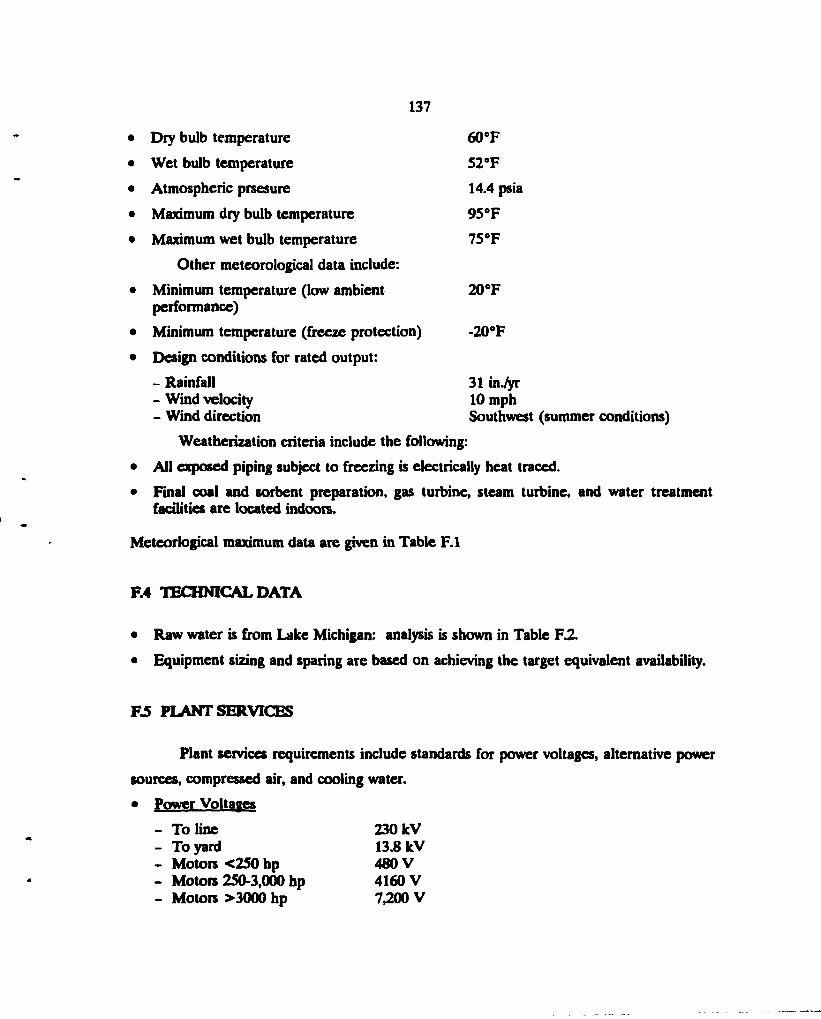
137
• Dry bulb temperature 60°F
• Wet bulb temperature S2°F
• Atmospheric prsesure 14.4 psia
• Maximum dry bulb temperature 95 °F
• Maximum wet bulb temperature 75 °F
Other meteorological data include:
• Minimum temperature (low ambient 20°F performance)
• Minimum temperature (freeze protection) -20°F
• Design conditions for rated output:
- Rainfall 31 in./yr - Wind velocity 10 mph - Wind direction Southwest (summer conditions)
Weatherization criteria include the following:
• All exposed piping subject to freezing is electrically heat traced. • Final coal and sorbent preparation, gas turbine, steam turbine, and water treatment
facilities are located indoors.
Meteorlogical maximum data are given in Table F.l
F.4 TECHNICAL DATA
• Raw water is from Lake Michigan: analysis is shown in Table F.2.
• Equipment sizing and sparing are based on achieving the target equivalent availability.
ES PLANT SERVICES
Plant services requirements include standards for power voltages, alternative power
sources, compressed air, and cooling water.
• Power Voltages
- To line 230 kV - To yard 13.8 kV - Motors <250 hp 480 V - Motors 250-3,000 hp 4160 V - Motors >3000 hp 7,200 V
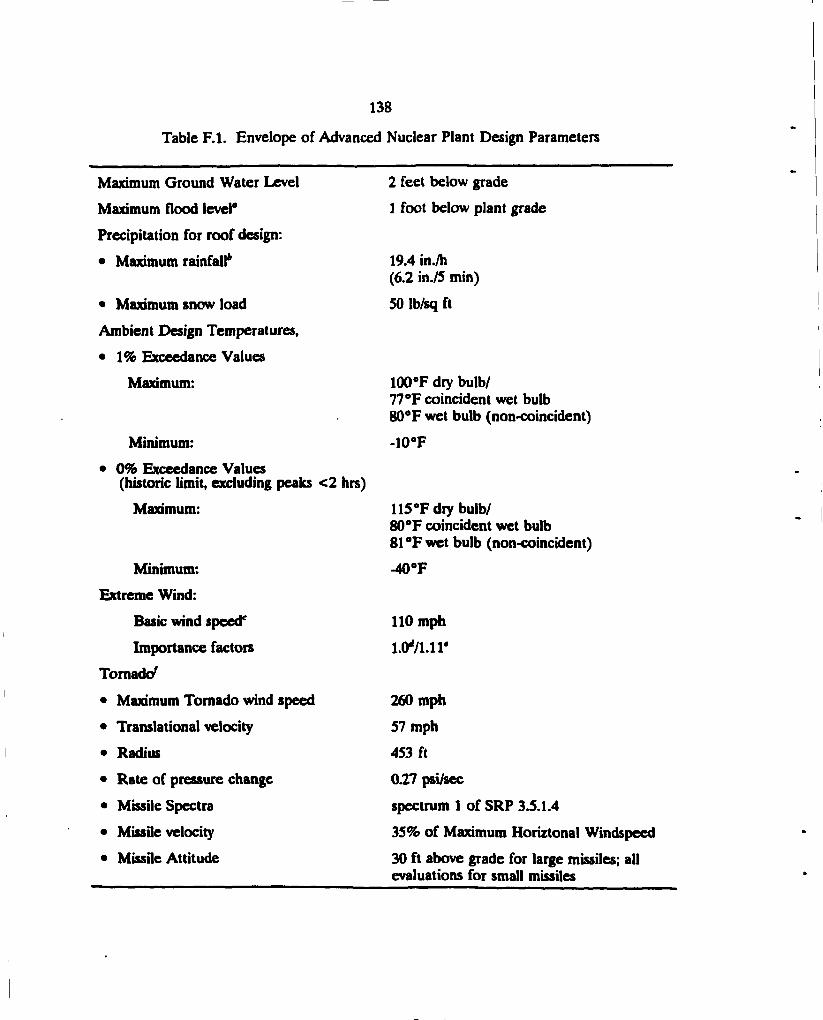
138
Table F.l. Envelope of Advanced Nuclear Plant Design Parameters
Maximum Ground Water Level
Maximum flood level"
Precipitation for roof design:
• Maximum rainfall6
• Maximum snow load
Ambient Design Temperatures,
• 1% Exceedance Values
Maximum:
Minimum:
• 0% Exceedance Values (historic limit, excluding peaks <2 hrs)
Maximum:
Minimum:
Extreme Wind:
Basic wind speed*
Importance factors
Tornadc/
• Maximum Tornado wind speed
• Translational velocity
• Radius
• Rate of pressure change
• Missile Spectra
• Missile velocity
• Missile Attitude
2 feet below grade
1 foot below plant grade
19.4 in./h (6.2 in./5 min)
50 Ib/sq ft
100°F dry bulb/ 77 °F coincident wet bulb 80°F wet bulb (non-coincident)
-10°F
115°F diy bulb/ 80°F coincident wet bulb 81°Fwet bulb (non-coincident)
-40°F
110 mph
1.0d!\AY
260 mph
57 mph
453 ft
0.27 psi/sec
spectrum 1 of SRP 3.5.1.4
35% of Maximum Horiztonal Windspeed
30 ft above grade for large missiles; all evaluations for small missiles
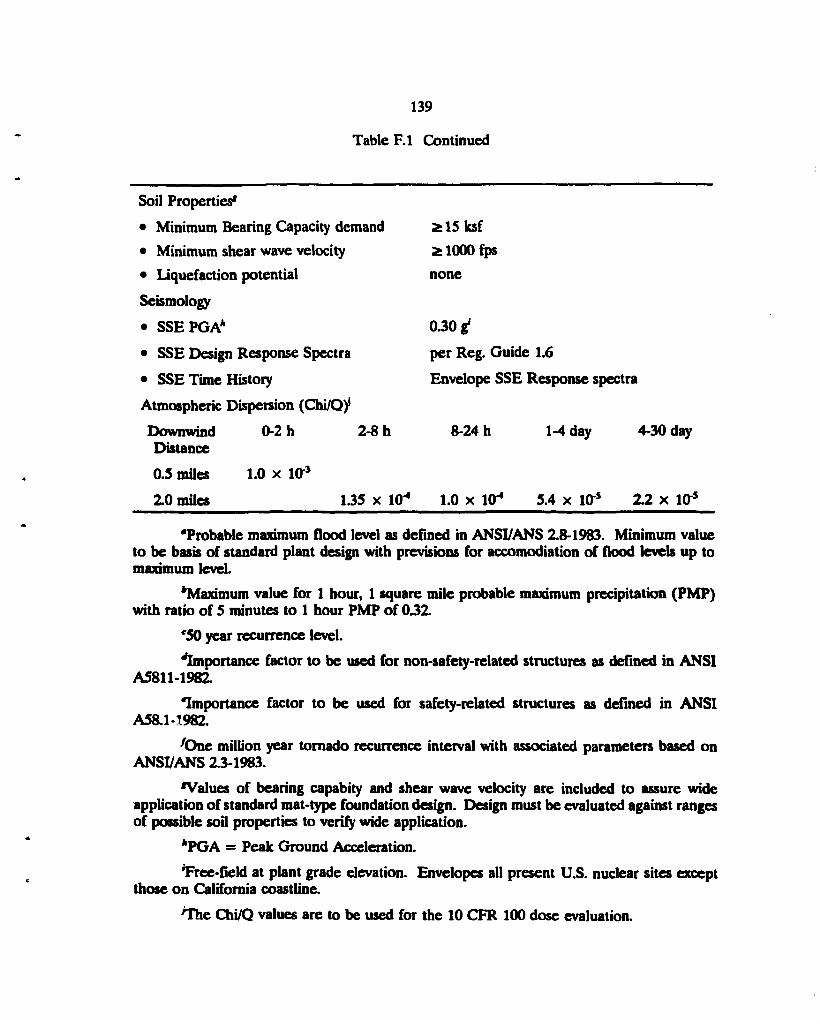
139
Tab le F . l Cont inued
Soil Properties'
• Minimum Bearing Capacity demand • Minimum shear wave velocity • Liquefaction potential
Seismology
• SSE PGA*
• SSE Design Response Spectra
• SSE Time History
Atmospheric Dispersion (Chi/Q)>
Downwind 0-2 h 2-8 h
0.30 i
per Reg. Guide 1.6
Envelope SSE Response spectra
none
2*15 ksf 21000 fps
8-24 h 1-4 day 4-30 day Distance
0.5 miles 1.0 x 10*
2.0 miles 1 . 3 5 x 10** 1 . 0 x 1CT* 5 . 4 x 1 0 * 2 . 2 x 1 0 *
"Probable maximum flood level as defined in ANSI/ANS 2.8-1983. Minimum value to be basis of standard plant design with previsions for accomodiation of flood levels up to maximum level.
^Maximum value for 1 hour, 1 square mile probable maximum precipitation (PMP) with ratio of 5 minutes to 1 hour PMP of 0.32.
'50 year recurrence level.
'Importance factor to be used for non-safety-related structures as defined in ANSI A5811-1982.
Importance factor to be used for safety-related structures as defined in ANSI A58.1-1982.
'One million year tornado recurrence interval with associated parameters based on ANSI/ANS 2.3-1983.
'Values of bearing capabity and shear wave velocity are included to assure wide application of standard mat-type foundation design. Design must be evaluated against ranges of possible soil properties to verify wide application.
*PGA = Peak Ground Acceleration.
Tree-field at plant grade elevation. Envelopes all present U.S. nuclear sites except those on California coastline.
' T h e Chi /Q values are to b e used for the 10 C F R 100 d o s e evaluation.
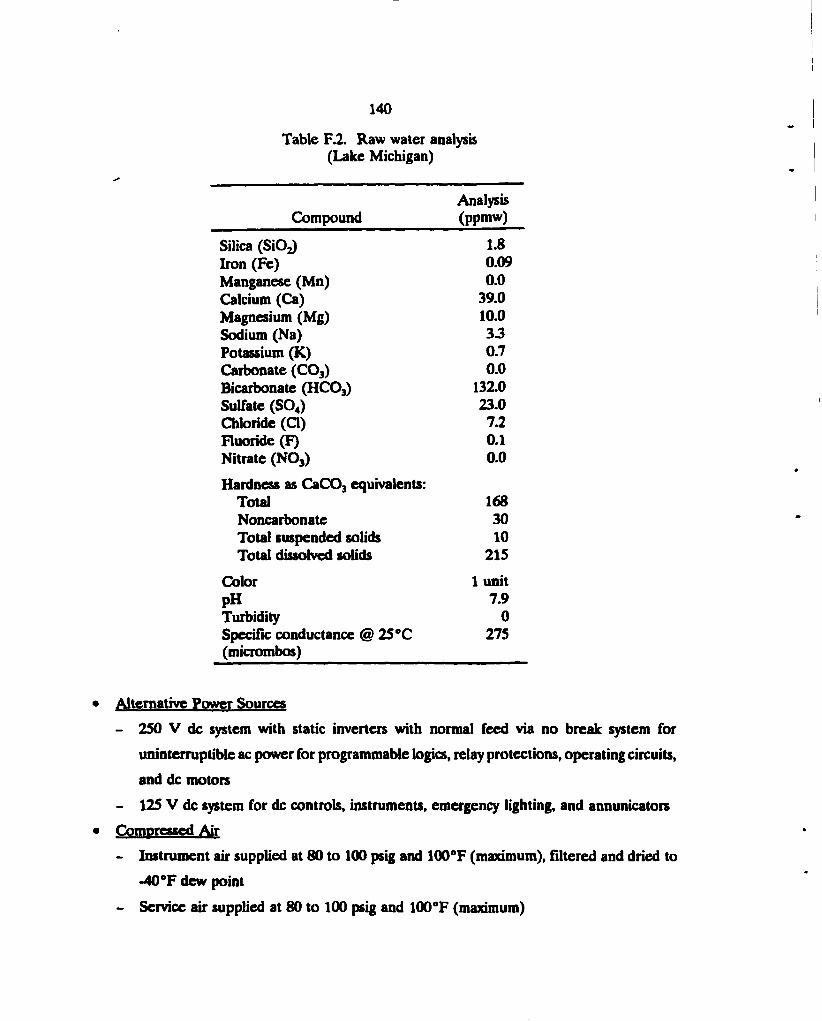
1 4 0
T a b l e F.2. R a w water analysis (Lake Michigan)
Analysis Compound (ppmw)
Silica (SiOs) 1.8 Iron (Fe) 0.09 Manganese (Mn) 0.0 Calcium (Ca) 39.0 Magnesium (Mg) 10.0 Sodium (Na) 3.3 Potassium (K) 0.7 Carbonate (C03) 0.0 Bicaibonate (HCOa) 132.0 Sulfate (S04) 23.0 Chloride (CI) 7.2 Fluoride (F) 0.1 Nitrate (NOa) 0.0
Hardness as CaC03 equivalents: Total 168 Noncarbonate 30 Total suspended solids 10 Total dissolved solids 21S
Color 1 unit pH 7.9 Turbidity 0 Specific conductance @ 25 "C 275 (micrombos)
Alternative Power Sources
- 250 V dc system with static inverters with normal feed via no break system for
uninterruptible ac power for programmable logics, relay protections, operating circuits,
and dc motors
- 125 V dc system for dc controls, instruments, emergency lighting, and annunicators
Compressed Air
- Instrument air supplied at 80 to 100 psig and 100°F (maximum), filtered and dried to
-40 °F dew point
- Service air supplied at 80 to 100 psig and 100°F (maximum)
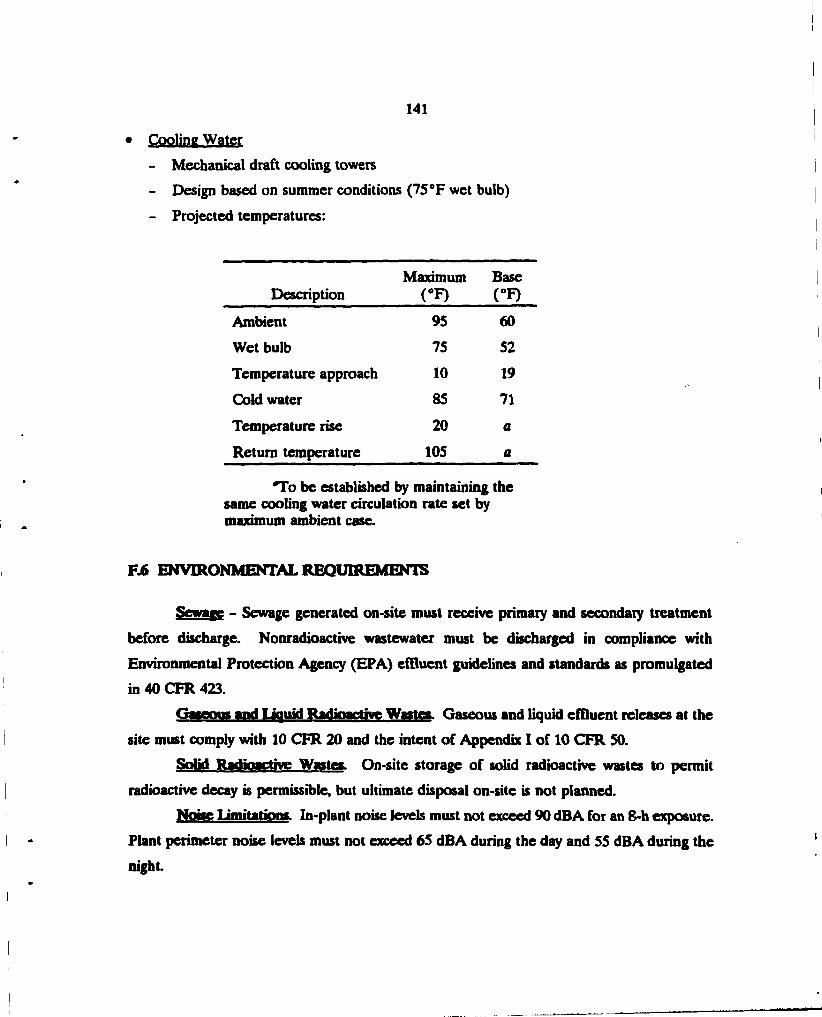
141
• Cooling Water
- Mechanical draft cooling towers
- Design based on summer conditions (75 °F wet bulb)
- Projected temperatures:
Description Maximum
(°F) Base (°F)
Ambient 95 60
Wet bulb 75 52
Temperature approach 10 19
Cold water 85 71
Temperature rise 20 a Return temperature 105 a
*To be established by maintaining the same cooling water circulation rate set by maximum ambient case.
R 6 ENVIRONMENTAL REQUIREMENTS
Sewage - Sewage generated on-site must receive primary and secondary treatment
before discharge. Nonradioactive wastewater must be discharged in compliance with
Environmental Protection Agency (EPA) effluent guidelines and standards as promulgated
in 40 CFR 423.
Gaseous and Liquid Radioactive Waste*. Gaseous and liquid effluent releases at the
site must comply with 10 CFR 20 and the intent of Appendix I of 10 CFR 50.
Solid Radioactive Wastes. On-site storage of solid radioactive wastes to permit
radioactive decay is permissible, but ultimate disposal on-site is not planned.
Noise Limitations. In-plant noise levels must not exceed 90 dBA for an 8-h exposure.
Plant perimeter noise levels must not exceed 65 dBA during the day and 55 dBA during the
night
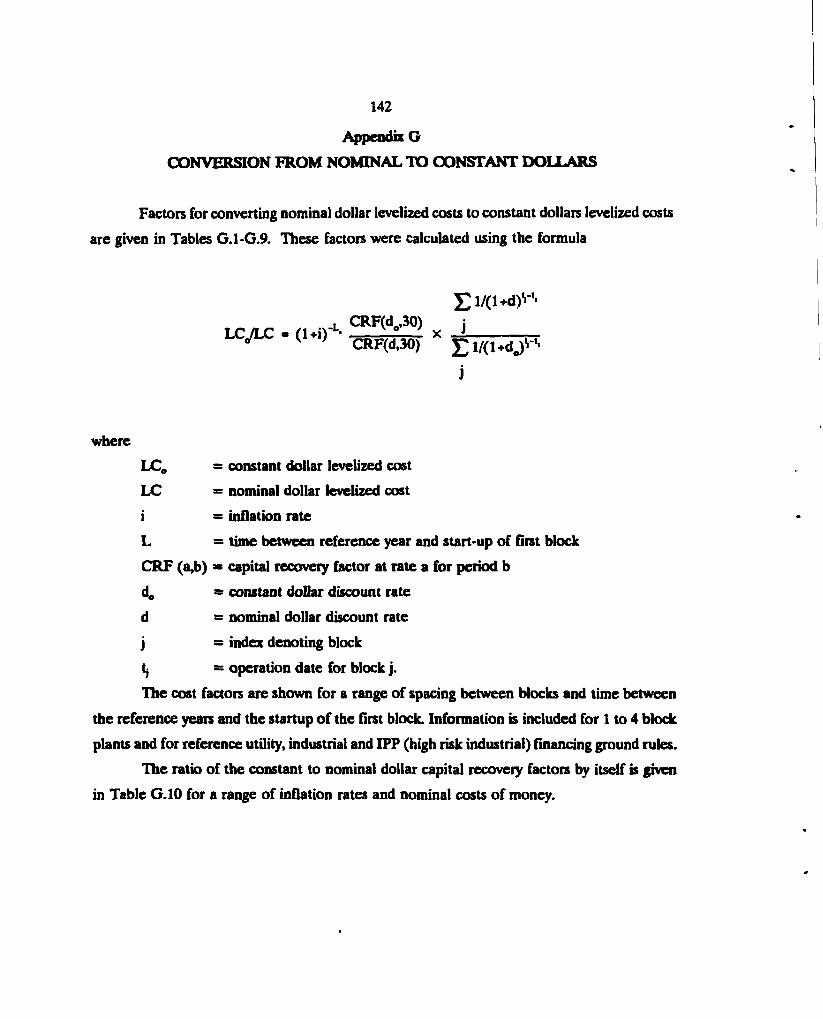
142
Appendix G
CONVERSION FROM NOMINAL TO CONSTANT DOLLARS
Factors for converting nominal dollar levelized costs to constant dollars levelized costs
are given in Tables G.1-G.9. These factors were calculated using the formula
, CRF(d ,30) ; U C J L C - ( 1+ i ) • „ V * ' x J
CRF(d,30) £ 1/(1+d0)^' j
where
LC0 = constant dollar levelized cost
LC = nominal dollar levelized cost
i = inflation rate
L = time between reference year and start-up of first block
CRF (a,b) = capital recovery factor at rate a for period b
d0 = constant dollar discount rate
d = nominal dollar discount rate
j = index denoting block
tj = operation date for block j.
The cost factors are shown for a range of spacing between blocks and time between
the reference years and the startup of the first block. Information is included for 1 to 4 block
plants and for reference utility, industrial and IPP (high risk industrial) financing ground rules.
The ratio of the constant to nominal dollar capital recovery factors by itself is given
in Table G.10 for a range of inflation rates and nominal costs of money.

143
Table G . l . Level ized cost ratios" Utility economics , 2-Block plant
Time until Spacing between blocks, yr
startup years o.(r 0.5 1.0 1.5 2.0 2.5 3.0
0.00 0.5898 0.5827 0.5760 0.5696 0.5635 0.5577 0.5522 1.00 0.5617 0.5550 0.5486 0.5425 0.5367 03312 0.5259 2.00 0.5349 0.5286 03225 0.5167 0.5111 0.5059 0.5008 3.00 0.5095 0.5034 0.4976 0.4921 0.4868 0.4818 0.4770 4.00 0.4852 0.4794 0.4739 0.4686 0.4636 0.4588 0.4543 5.00 0.4621 0.4566 0.4513 0.4463 0.4415 0.4370 0.4326 6.00 0.4401 0.4349 0.4298 0.4251 0.4205 0.4162 0.4120 7.00 0.4191 0.4141 0.4094 0.4048 0.4005 0.3964 0.3924 8.00 0.3992 0.3944 0.3899 03855 0.3814 0.3775 0.3737 9.00 0.3802 03756 0.3713 0.3672 03633 0.3595 03559
10.00 03621 0.3578 03536 03497 0.3460 0.3424 03390 11.00 03448 03407 0.3368 03330 03295 03261 03228 12.00 03284 03245 0.3208 0.3172 0.3138 0.3106 0.3075 13.00 0.3128 03090 03055 03021 0.2988 02958 02928 14.00 0.2979 02943 02909 0.2877 0.2846 0.2817 02789 15.00 0.2837 0.2803 0.2771 02740 02711 02683 02625 16.00 0.2702 02670 02639 02610 02582 02555 0.2530 17.00 0.2573 0.2542 0.2513 02485 02459 02433 02409 1R00 0.2451 02421 02394 02367 0.2342 0.2317 02294 19.00 0.2334 0.2306 0.2280 0.2254 02230 0.2207 02185 20.00 0.2223 52196 0.2171 02147 02124 0.2102 0.2081 21.00 0.2117 0.2092 02068 0.2045 0.2023 0.2002 0.1982 22.00 02016 0.1992 0.1969 0.1947 0.1926 0.1907 0.1888 23.00 0.1920 0.1897 0.1875 0.1855 0.1835 2.1816 0.1798 24.00 0.1829 0.1807 0.1786 0.1766 0.1747 0.1729 0.1712 25.00 0.1742 0.1721 0.1701 0.1682 0.1664 0.1647 0.1631 26.00 0.1659 0.1639 0.1620 0.1602 0.1585 0.1569 0.1553 27.00 0.1580 0.1561 0.1543 0.1526 0.1509 0.1494 0.1479 28.00 0.1504 0.1487 0.1469 0.1453 0.1438 0.1423 0.1409 29.00 0.1433 0.1416 0.1399 0.1384 0.1369 0.1355 0.1342 30.00 0.1365 0.1348 0.1333 0.1318 0.1304 0.1290 0.1278
"Ratio o f constant to nominal dollar levelized costs. f c T i m e be tween reference year and year o f commercial operat ion o f first block.
'Single block plant ratio is the s a m e as zero lag time.
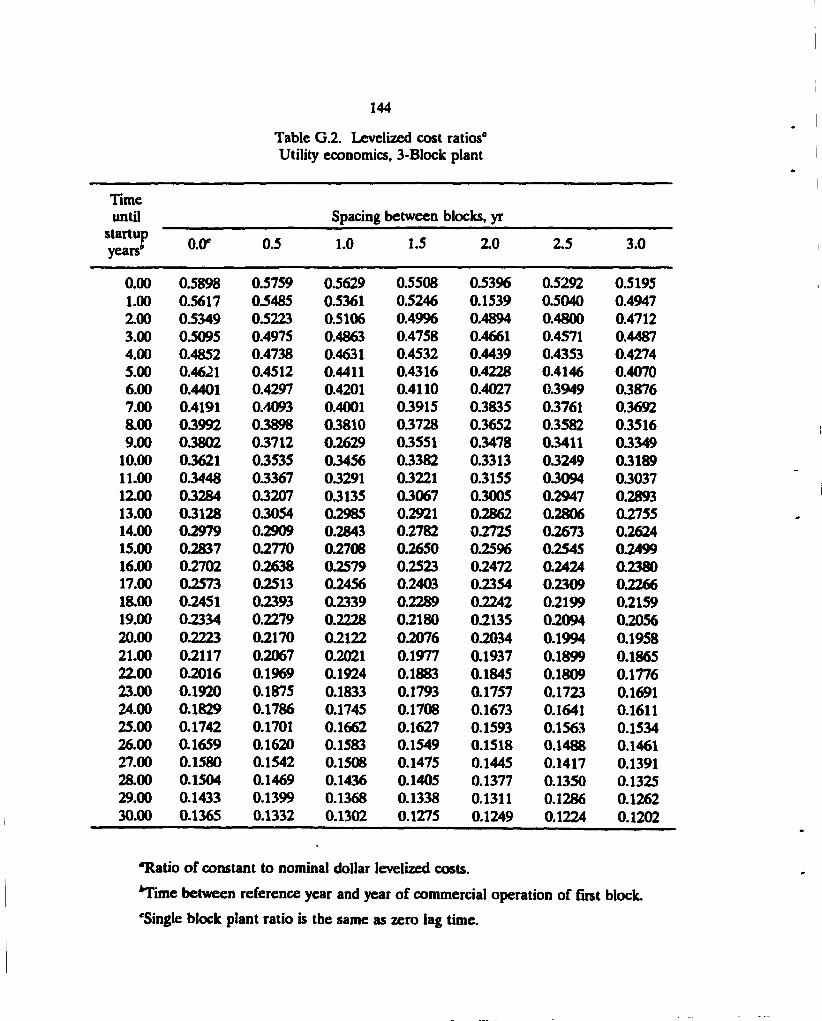
144
Table G . l . Level ized cost ratios" Utility economics, 2-Block plant
Time until Spacing between blocks, yr
startup years 0.0* 0.5 1.0 1.5 2.0 2.5 3.0
0.00 0.5898 0.5759 0.5629 0.5508 0.5396 0.5292 0.5195 1.00 0.5617 0.5485 0.5361 0.5246 0.1539 0.5040 0.4947 2.00 0.5349 0.5223 0.5106 0.4996 0.4894 0.4800 0.4712 3.00 0.5095 0.4975 0.4863 0.4758 0.4661 0.4571 0.4487 4.00 0.4852 0.4738 0.4631 0.4532 0.4439 0.4353 0.4274 5.00 0.4621 0.4512 0.4411 0.4316 0.4228 0.4146 0.4070 6.00 0.4401 0.4297 0.4201 0.4110 0.4027 0.3949 0.3876 7.00 0.4191 0.4093 0.4001 0.3915 0.3835 0.3761 0.3692 8.00 03992 03898 0.3810 0.3728 0.3652 0.3582 0.3516 9.00 03802 03712 0.2629 0.3551 0.3478 0.3411 0.3349
10.00 0.3621 03535 0.3456 0.3382 0.3313 0.3249 0.3189 11.00 03448 03367 0.3291 0.3221 0.3155 0.3094 0.3037 12.00 03284 03207 0.3135 0.3067 0.3005 0.2947 0.2893 13.00 03128 03054 0.2985 0.2921 0.2862 0.2806 0.2755 14.00 0.2979 0.2909 0.2843 0.2782 0.2725 0.2673 0.2624 15.00 0.2837 0.2770 0.2708 0.2650 0.2596 0.2545 0.2499 16.00 0.2702 0.2638 02579 0.2523 0.2472 0.2424 0.2380 17.00 0.2573 0.2513 0.2456 0.2403 0.2354 0.2309 0.2266 18.00 0.2451 0.2393 0.2339 0.2289 0.2242 0.2199 0.2159 19.00 0.2334 0.2279 0.2228 0.2180 0.2135 0.2094 0.2056 20.00 0.2223 0.2170 0.2122 0.2076 0.2034 0.1994 0.1958 21.00 0.2117 0.2067 0.2021 0.1977 0.1937 0.1899 0.1865 22.00 0.2016 0.1969 0.1924 0.1883 0.1845 0.1809 0.1776 23.00 0.1920 0.1875 0.1833 0.1793 0.1757 0.1723 0.1691 24.00 0.1829 0.1786 0.1745 0.1708 0.1673 0.1641 0.1611 25.00 0.1742 0.1701 0.1662 0.1627 0.1593 0.1563 0.1534 26.00 0.1659 0.1620 0.1583 0.1549 0.1518 0.1488 0.1461 27.00 0.1580 0.1542 0.1508 0.1475 0.1445 0.1417 0.1391 28.00 0.1504 0.1469 0.1436 0.1405 0.1377 0.1350 0.1325 29.00 0.1433 0.1399 0.1368 0.1338 0.1311 0.1286 0.1262 30.00 0.1365 0.1332 0.1302 0.1275 0.1249 0.1224 0.1202
"Rat io o f constant to nominal dollar levelized costs. f c T ime be tween reference year and year o f commercial operation o f first block.
'Single block plant ratio is the same as zero lag time.
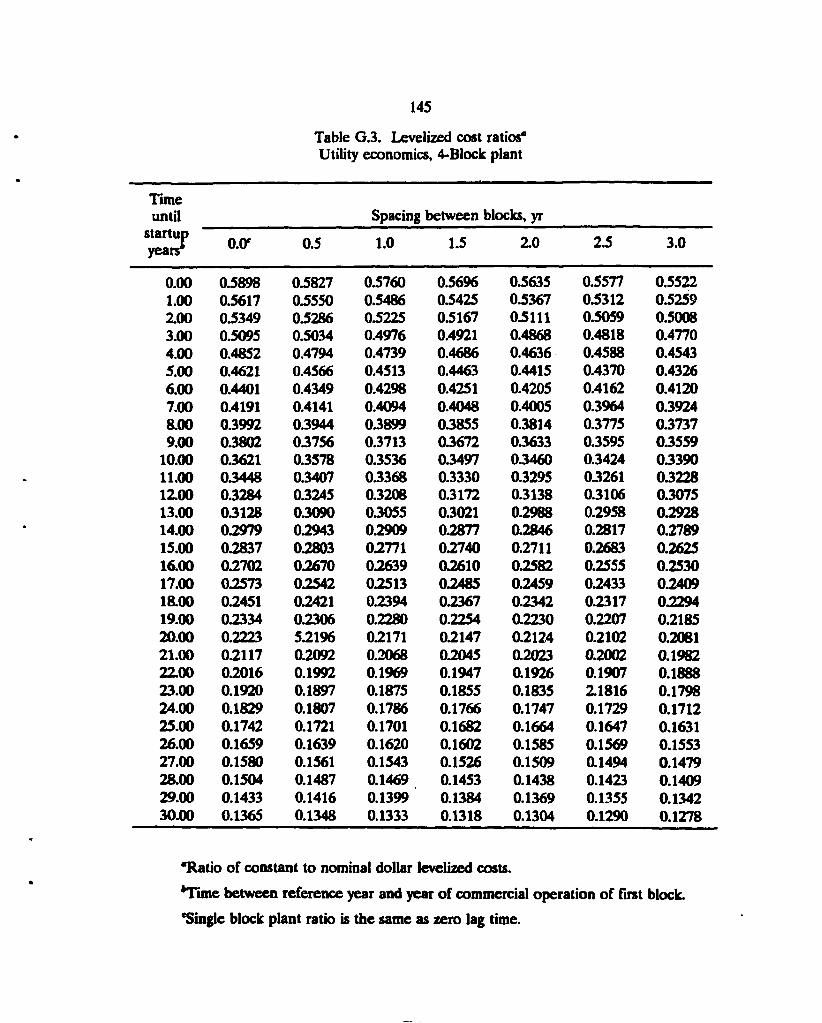
145
Table G . l . Level ized cost ratios" Utility economics, 2-Block plant
Time until Spacing between blocks, yr
startup years 0.0* 0.5 1.0 1.5 2.0 2.5 3.0
0.00 0.5898 0.5827 0.5760 0.5696 0.5635 0.5577 0.5522 1.00 0.5617 0.5550 0.5486 0.5425 0.5367 0.5312 0.5259 2.00 0.5349 0.5286 03225 0.5167 0.5111 0.5059 0.5008 3.00 0.5095 0.5034 0.4976 0.4921 0.4868 0.4818 0.4770 4.00 0.4852 0.4794 0.4739 0.4686 0.4636 0.4588 0.4543 5.00 0.4621 0.4566 0.4513 0.4463 0.4415 0.4370 0.4326 6.00 0.4401 0.4349 0.4298 0.4251 0.4205 0.4162 0.4120 7.00 0.4191 0.4141 0.4094 0.4048 0.4005 0.3964 0.3924 8.00 0.3992 03944 0.3899 0.3855 0.3814 0.3775 0.3737 9.00 0.3802 0.3756 0.3713 03672 0.3633 0.3595 0.3559
10.00 0.3621 0.3578 0.3536 0.3497 0.3460 0.3424 0.3390 11.00 0.3448 0.3407 03368 0.3330 0.3295 0.3261 0.3228 12.00 0.3284 03245 0.3208 0.3172 0.3138 0.3106 0.3075 13.00 0.3128 03090 0.3055 0.3021 0.2988 0.2958 0.2928 14.00 0.2979 0.2943 0.2909 02877 0.2846 0.2817 0.2789 15.00 0.2837 02803 0.2771 0.2740 0.2711 0.2683 02625 16.00 0.2702 02670 02639 0.2610 02582 0.2555 0.2530 17.00 0.2573 02542 02513 02485 0.2459 02433 0.2409 18.00 0.2451 02421 0.2394 0.2367 0.2342 0.2317 0.2294 19.00 0.2334 0.2306 0.2280 0.2254 0.2230 0.2207 0.2185 20.00 0.2223 52196 02171 0.2147 0.2124 0.2102 0.2081 21.00 0.2117 0.2092 0.2068 02045 0.2023 0.2002 0.1982 22.00 0.2016 0.1992 0.1969 0.1947 0.1926 0.1907 0.1888 23.00 0.1920 0.1897 0.1875 0.1855 0.1835 2.1816 0.1798 24.00 0.1829 0.1807 0.1786 0.1766 0.1747 0.1729 0.1712 25.00 0.1742 0.1721 0.1701 0.1682 0.1664 0.1647 0.1631 26.00 0.1659 0.1639 0.1620 0.1602 0.1585 0.1569 0.1553 27.00 0.1580 0.1561 0.1543 0.1526 0.1509 0.1494 0.1479 28.00 0.1504 0.1487 0.1469 0.1453 0.1438 0.1423 0.1409 29.00 0.1433 0.1416 0.1399 0.1384 0.1369 0.1355 0.1342 30.00 0.1365 0.1348 0.1333 0.1318 0.1304 0.1290 0.1278
"Ratio o f constant to nominal dollar levelized costs. f c T ime b e t w e e n reference year and year o f commercial operat ion o f first block.
'Single block plant ratio is the same as zero lag time.
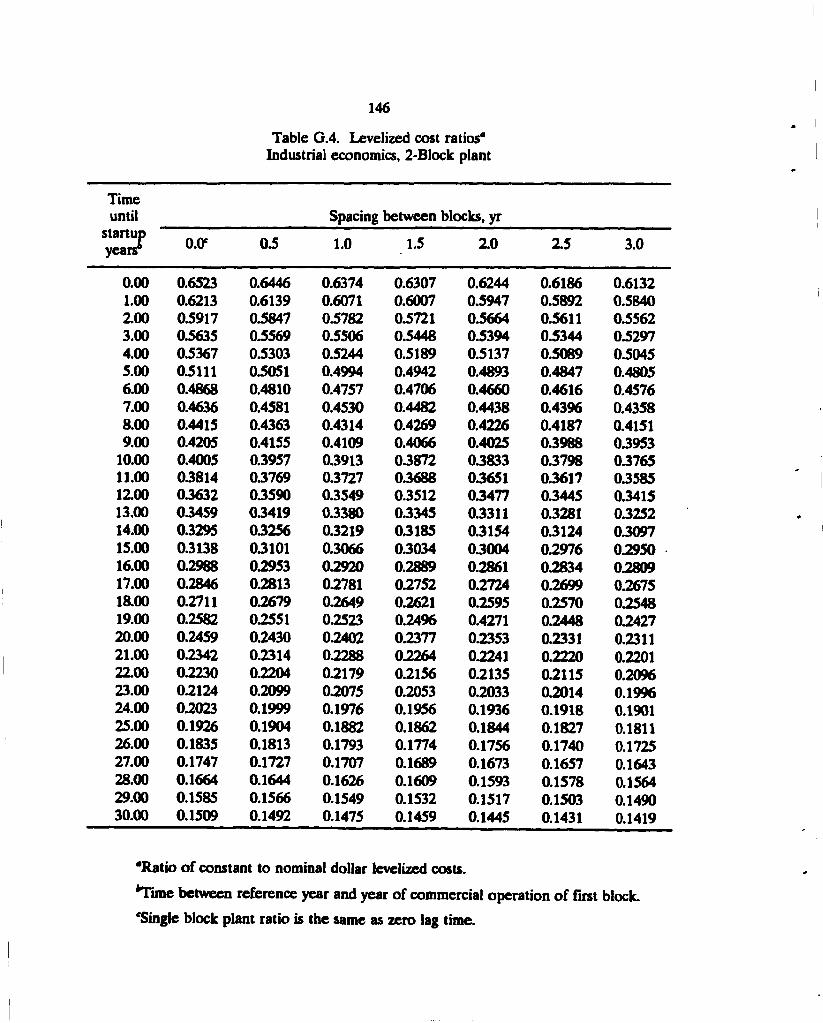
146
Table G.4. Leve l ized cost ratios" Industrial economics , 2 -Block plant
Time until Spacing between blocks, yr
startup years 0.CF 0 3 1.0 1.5 2.0 2.5 3.0
0.00 0.6523 0.6446 0.6374 0.6307 0.6244 0.6186 0.6132 1.00 0.6213 0.6139 0.6071 0.6007 0.5947 0.5892 0.5840 2.00 0.5917 03847 0.5782 0.5721 0.5664 0.5611 0.5562 3.00 0.5635 03569 0.5506 0.5448 0.5394 0.5344 0.5297 4.00 0.5367 0.5303 0.5244 0.5189 0.5137 0.5089 0.5045 5.00 0.5111 03051 0.4994 0.4942 0.4893 0.4847 0.4805 6.00 0.4868 0.4810 0.4757 0.4706 0.4660 0.4616 0.4576 7.00 0.4636 0.4581 0.4530 0.4482 0.4438 0.4396 0.4358 8.00 0.4415 0.4363 0.4314 0.4269 0.4226 0.4187 0.4151 9.00 0.4205 0.4155 0.4109 0.4066 0.4025 0.3988 0.3953
10.00 0.4005 0.3957 0.3913 0.3872 0.3833 0.3798 0.3765 11.00 0.3814 03769 0.3727 0.3688 03651 0.3617 0.3585 12.00 0.3632 03590 0.3549 0.3512 0.3477 0.3445 0.3415 13.00 0.3459 0.3419 0.3380 0.3345 0.3311 0.3281 0.3252 14.00 03295 03256 0.3219 0.3185 0.3154 0.3124 0.3097 15.00 03138 03101 0.3066 0.3034 03004 0.2976 0.2950 16.00 0.2988 0.2953 02920 0.2889 0.2861 02834 0.2809 17.00 0.2846 0.2813 02781 02752 0.2724 0.2699 0.2675 18.00 0.2711 0.2679 02649 0.2621 0.2595 0.2570 0.2548 19.00 0.2582 0.2551 0.2523 0.2496 0.4271 0.2448 0.2427 20.00 0.2459 0.2430 0.2402 0.2377 0.2353 0.2331 0.2311 21.00 0.2342 0.2314 0.2288 0.2264 02241 0.2220 0.2201 22.00 0.2230 0.2204 0.2179 0.2156 0.2135 0.2115 0.2096 23.00 0.2124 0.2099 0.2075 0.2053 0.2033 0.2014 0.1996 24.00 0.2023 0.1999 0.1976 0.1956 0.1936 0.1918 0.1901 25.00 0.1926 0.1904 0.1882 0.1862 0.1844 0.1827 0.1811 26.00 0.1835 0.1813 0.1793 0.1774 0.1756 0.1740 0.1725 27.00 0.1747 0.1727 0.1707 0.1689 0.1673 0.1657 0.1643 28.00 0.1664 0.1644 0.1626 0.1609 0.1593 0.1578 0.1564 29.00 0.1585 0.1566 0.1549 0.1532 0.1517 0.1503 0.1490 30.00 0.1509 0.1492 0.1475 0.1459 0.1445 0.1431 0.1419
'Ratio of constant to nominal dollar levelized costs.
*Time b e t w e e n re ference year and year o f commercial operat ion o f first block.
'Single block plant ratio is t h e s a m e as z e r o lag t ime.
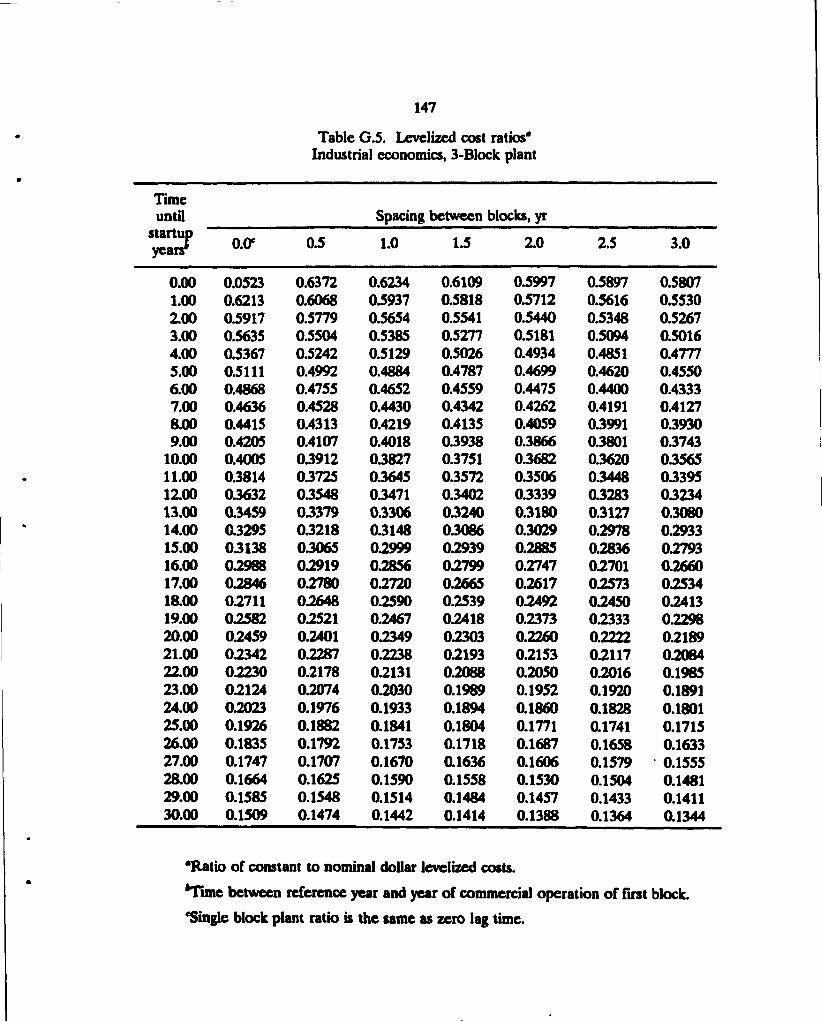
147
T a b l e G.4 . Level ized cost ratios" Industrial economics , 2-Block plant
Time until Spacing between blocks, yr
startup years' o.<r 0.5 1.0 13 2.0 2.5 3.0
0.00 0.0523 0.6372 0.6234 0.6109 0.5997 0.5897 0.5807 1.00 0.6213 0.6068 0.5937 0.5818 0.5712 0.5616 03530 2.00 0.5917 0.5779 0.5654 0.5541 0.5440 0.5348 0.5267 3.00 0.5635 0.5504 0.5385 0.5277 0.5181 0.5094 0.5016 4.00 0.5367 0.5242 0.5129 0.5026 0.4934 0.4851 0.4777 5.00 0.5111 0.4992 0.4884 0.4787 0.4699 0.4620 0.4550 6.00 0.4868 0.4755 0.4652 0.4559 0.4475 0.4400 0.4333 7.00 0.4636 0.4528 0.4430 0.4342 0.4262 0.4191 0.4127 8.00 0.4415 0.4313 0.4219 0.4135 0.4059 0.3991 0.3930 9.00 0.4205 0.4107 0.4018 0.3938 0.3866 0.3801 0.3743
10.00 0.4005 03912 03827 0.3751 0.3682 0.3620 0.3565 11.00 03814 0.3725 0.3645 03572 0.3506 0.3448 0.3395 12.00 0.3632 03548 0.3471 0.3402 0.3339 0.3283 0.3234 13.00 0.3459 0.3379 0.3306 0.3240 0.3180 0.3127 0.3080 14.00 0.3295 03218 0.3148 03086 0.3029 0.2978 0.2933 15.00 03138 03065 02999 0.2939 0.2885 0.2836 02793 16.00 02988 02919 02856 02799 0.2747 0.2701 0.2660 17.00 02846 02780 02720 02665 0.2617 0.2573 02534 18.00 02711 02648 02590 0.2539 0.2492 0.2450 02413 19.00 02582 0.2521 0.2467 02418 0.2373 0.2333 0.2298 20.00 02459 0.2401 0.2349 02303 0.2260 0.2222 0.2189 21.00 02342 02287 0.2238 0.2193 0.2153 0.2117 0.2084 22.00 02230 0.2178 0.2131 0.2088 0.2050 0.2016 0.1985 23.00 0.2124 02074 0.2030 0.1989 0.1952 0.1920 0.1891 24.00 02023 0.1976 0.1933 0.1894 0.1860 0.1828 0.1801 25.00 0.1926 0.1882 0.1841 0.1804 0.1771 0.1741 0.1715 26.00 0.1835 0.1792 0.1753 0.1718 0.1687 0.1658 0.1633 27.00 0.1747 0.1707 0.1670 0.1636 0.1606 0.1579 0.1555 28.00 0.1664 0.1625 0.1590 0.1558 0.1530 0.1504 0.1481 29.00 0.1585 0.1548 0.1514 0.1484 0.1457 0.1433 0.1411 30.00 0.1509 0.1474 0.1442 0.1414 0.1388 0.1364 0.1344
"Ratio of constant to nominal dollar levelized costs.
* T i m e b e t w e e n re ference year and year o f commercial operat ion o f first block.
'Single block plant ratio is t h e s a m e as z e r o lag t ime.
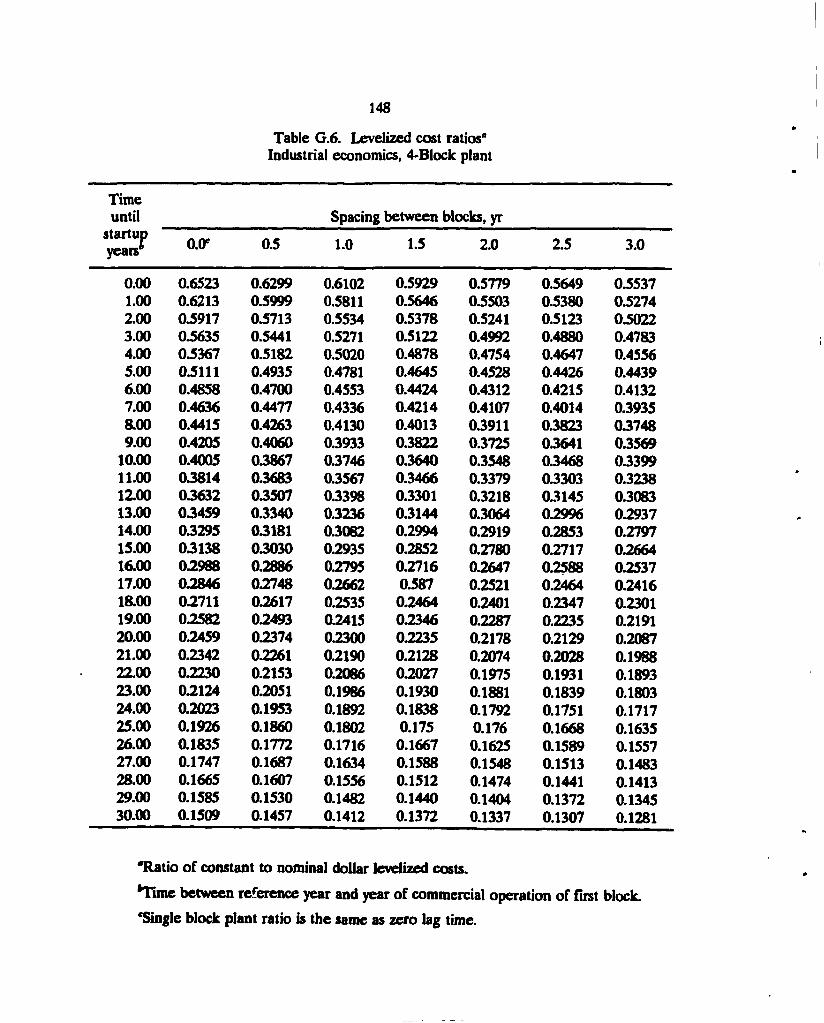
148
Table G.4. Level ized cost ratios" Industrial economics , 2 -Block plant
Time until Spacing between blocks, yr
startup years o.<r 0.5 1.0 1.5 2.0 2.5 3.0
0.00 0.6523 0.6299 0.6102 0.5929 0.5779 0.5649 0.5537 1.00 0.6213 03999 0.5811 0.5646 0.5503 0.5380 0.5274 2.00 0.5917 03713 0.5534 0.5378 0.5241 0.5123 0.5022 3.00 0.5635 0.5441 0.5271 0.5122 0.4992 0.4880 0.4783 4.00 0.5367 0.5182 0.5020 0.4878 0.4754 0.4647 0.4556 5.00 0.5111 0.4935 0.4781 0.4645 0.4528 0.4426 0.4439 6.00 0.4858 0.4700 0.4553 0.4424 0.4312 0.4215 0.4132 7.00 0.4636 0.4477 0.4336 0.4214 0.4107 0.4014 0.3935 8.00 0.4415 0.4263 0.4130 0.4013 0.3911 0.3823 0.3748 9.00 0.4205 0.4060 0.3933 0.3822 0.3725 0.3641 0.3569
10.00 0.4005 03867 0.3746 0.3640 0.3548 0.3468 0.3399 11.00 03814 03683 0.3567 0.3466 0.3379 0.3303 0.3238 12.00 0.3632 03507 0.3398 0.3301 0.3218 0.3145 0.3083 13.00 0.3459 0.3340 0.3236 0.3144 0.3064 0.2996 0.2937 14.00 0.3295 03181 0.3082 0.2994 0.2919 0.2853 0.2797 15.00 03138 03030 0.2935 0.2852 0.2780 02717 0.2664 16.00 0.2988 0.2886 02795 0.2716 0.2647 0.2588 0.2537 17.00 02846 02748 02662 0.587 0.2521 0.2464 0.2416 18.00 02711 0.2617 0.2535 0.2464 0.2401 0.2347 0.2301 19.00 0.2582 02493 0.2415 0.2346 0.2287 0.2235 0.2191 20.00 0.2459 02374 02300 0.2235 0.2178 0.2129 0.2087 21.00 0.2342 02261 0.2190 0.2128 0.2074 0.2028 0.1988 22.00 0.2230 0.2153 0.2086 0.2027 0.1975 0.1931 0.1893 23.00 02124 02051 0.1986 0.1930 0.1881 0.1839 0.1803 24.00 02023 0.1953 0.1892 0.1838 0.1792 0.1751 0.1717 25.00 0.1926 0.1860 0.1802 0.175 0.176 0.1668 0.1635 26.00 0.1835 0.1772 0.1716 0.1667 0.1625 0.1589 0.1557 27.00 0.1747 0.1687 0.1634 0.1588 0.1548 0.1513 0.1483 28.00 0.1665 0.1607 0.1556 0.1512 0.1474 0.1441 0.1413 29.00 0.1585 0.1530 0.1482 0.1440 0.1404 0.1372 0.1345 30.00 0.1509 0.1457 0.1412 0.1372 0.1337 0.1307 0.1281
"Ratio of constant to nominal dollar levelized costs.
*Time b e t w e e n re ference year and year o f commercial operat ion o f first block.
'Single block plant ratio is t h e s a m e as z e r o lag time.
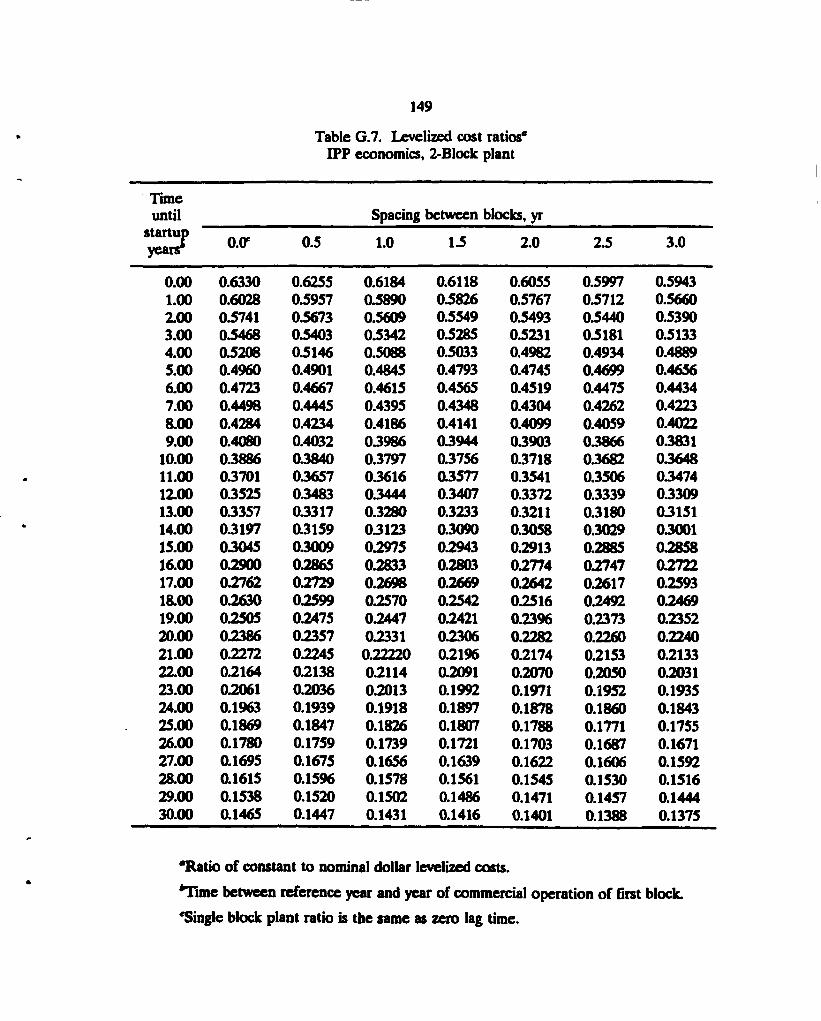
149
Table G . l . Level ized cost ratios" Utility economics, 2-Block plant
Time until Spacing between blocks, yr
startup years 0.(T 0.5 1.0 1.5 2.0 2.5 3.0
0.00 0.6330 0.6255 0.6184 0.6118 0.6055 0.5997 0.5943 1.00 0.6028 0.5957 0.5890 0.5826 0.5767 0.5712 0.5660 2.00 0.5741 0.5673 0.5609 0.5549 0.5493 0.5440 0.5390 3.00 0.5468 0.5403 0.5342 0.5285 0.5231 0.5181 0.5133 4.00 0.5208 0.5146 0.5088 0.5033 0.4982 0.4934 0.4889 5.00 0.4960 0.4901 0.4845 0.4793 0.4745 0.4699 0.4656 6.00 0.4723 0.4667 0.4615 0.4565 0.4519 0.4475 0.4434 7.00 0.4498 0.4445 0.4395 0.4348 0.4304 0.4262 0.4223 8.00 0.4284 0.4234 0.4186 0.4141 0.4099 0.4059 0.4022 9.00 0.4080 0.4032 0.3986 03944 0.3903 03866 0.3831
10.00 03886 03840 0.3797 03756 03718 0.3682 03648 11.00 03701 03657 0.3616 03577 0.3541 0.3506 0.3474 12.00 03525 03483 03444 0.3407 03372 0.3339 03309 13.00 03357 03317 0.3280 0.3233 0.3211 0.3180 0.3151 14.00 03197 03159 03123 0.3090 03058 0.3029 03001 15.00 03045 03009 0.2975 02943 0.2913 02885 02858 16.00 0.2900 02865 02833 02803 02774 02747 02722 17.00 0.2762 02729 02696 0.2669 0.2642 02617 0.2593 18.00 0.2630 02599 02570 0.2542 0.2516 02492 0.2469 19.00 0.2505 02475 02447 02421 0.2396 0.2373 0.2352 20.00 02386 02357 02331 02306 0.2282 0.2260 0.2240 21.00 0.2272 02245 0.22220 0.2196 0.2174 0.2153 0.2133 22.00 02164 02138 02114 0.2091 02070 0.2050 02031 23.00 02061 02036 0.2013 0.1992 0.1971 0.1952 0.1935 24.00 0.1963 0.1939 0.1918 0.1897 0.1878 0.1860 0.1843 25.00 0.1869 0.1847 0.1826 0.1807 0.1788 0.1771 0.1755 26.00 0.1780 0.1759 0.1739 0.1721 0.1703 0.1687 0.1671 27.00 0.1695 0.1675 0.1656 0.1639 0.1622 0.1606 0.1592 28.00 0.1615 0.1596 0.1578 0.1561 0.1545 0.1530 0.1516 29.00 0.1538 0.1520 0.1502 0.1486 0.1471 0.1457 0.1444 30.00 0.1465 0.1447 0.1431 0.1416 0.1401 0.1388 0.1375
"Rat io o f constant to nominal dollar levelized costs.
f c T ime b e t w e e n reference year and year o f commercial operat ion o f first block.
'Single block plant ratio is the same as zero lag time.
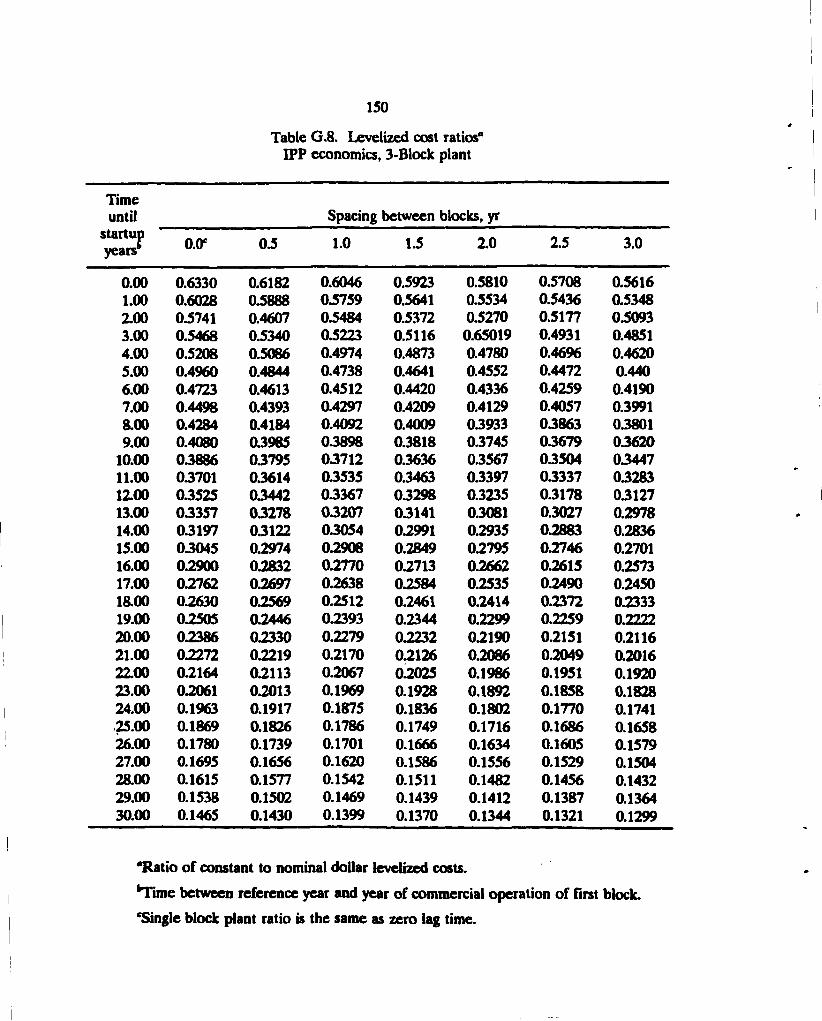
150
Table G . l . Level ized cost ratios" Utility economics , 2-Block plant
Time until Spacing between blocks, yr
startup years o.<r 0.5 1.0 1.5 2.0 2.5 3.0
0.00 0.6330 0.6182 0.6046 0.5923 0.5810 0.5708 0.5616 1.00 0.6028 0.5888 0.5759 0.5641 0.5534 0.5436 0.5348 2.00 0.5741 0.4607 0.5484 0.5372 0.5270 0.5177 0.5093 3.00 0.5468 0.5340 0.5223 0.5116 0.65019 0.4931 0.4851 4.00 0.5208 0.5086 0.4974 0.4873 0.4780 0.4696 0.4620 5.00 0.4960 0.4844 0.4738 0.4641 0.4552 0.4472 0.440 6.00 0.4723 0.4613 0.4512 0.4420 0.4336 0.4259 0.4190 7.00 0.4498 0.4393 0.4297 0.4209 0.4129 0.4057 0.3991 8.00 0.4284 0.4184 0.4092 0.4009 0.3933 03863 0.3801 9.00 0.4080 0.3985 03898 0.3818 0.3745 0.3679 0.3620
10.00 0.3886 03795 0.3712 0.3636 0.3567 0.3504 0.3447 11.00 03701 03614 0.3535 0.3463 0.3397 03337 0.3283 12.00 03525 0.3442 03367 0.3298 0.3235 0.3178 0.3127 13.00 03357 03278 0.3207 03141 0.3081 0.3027 0.2978 14.00 03197 03122 0.3054 0.2991 0.2935 0.2883 0.2836 15.00 03045 0.2974 02908 0.2849 0.2795 0.2746 0.2701 16.00 02900 02832 02770 0.2713 0.2662 0.2615 0.2573 17.00 02762 02697 0.2638 02584 0.2535 0.2490 0.2450 18.00 02630 02569 0.2512 0.2461 0.2414 0.2372 0.2333 19.00 02505 0.2446 02393 0.2344 0.2299 0.2259 0.2222 20.00 0.2386 02330 0.2279 02232 02190 0.2151 0.2116 21.00 0.2272 02219 0.2170 02126 0.2086 0.2049 0.2016 2100 02164 02113 0.2067 0.2025 0.1986 0.1951 0.1920 23.00 02061 02013 0.1969 0.1928 0.1892 0.1858 0.1828 24.00 0.1963 0.1917 0.1875 0.1836 0.1802 0.1770 0.1741 25.00 0.1869 0.1826 0.1786 0.1749 0.1716 0.1686 0.1658 26.00 0.1780 0.1739 0.1701 0.1666 0.1634 0.1605 0.1579 27.00 0.1695 0.1656 0.1620 0.1586 0.1556 0.1529 0.1504 28.00 0.1615 0.1577 0.1542 0.1511 0.1482 0.1456 0.1432 29.00 0.1538 0.1502 0.1469 0.1439 0.1412 0.1387 0.1364 30.00 0.1465 0.1430 0.1399 0.1370 0.1344 0.1321 0.1299
"Ratio o f constant to nominal dollar levelized costs.
f c T i m e b e t w e e n reference year and year o f commercial operation o f first block.
'Single block plant ratio is the same as zero lag time.
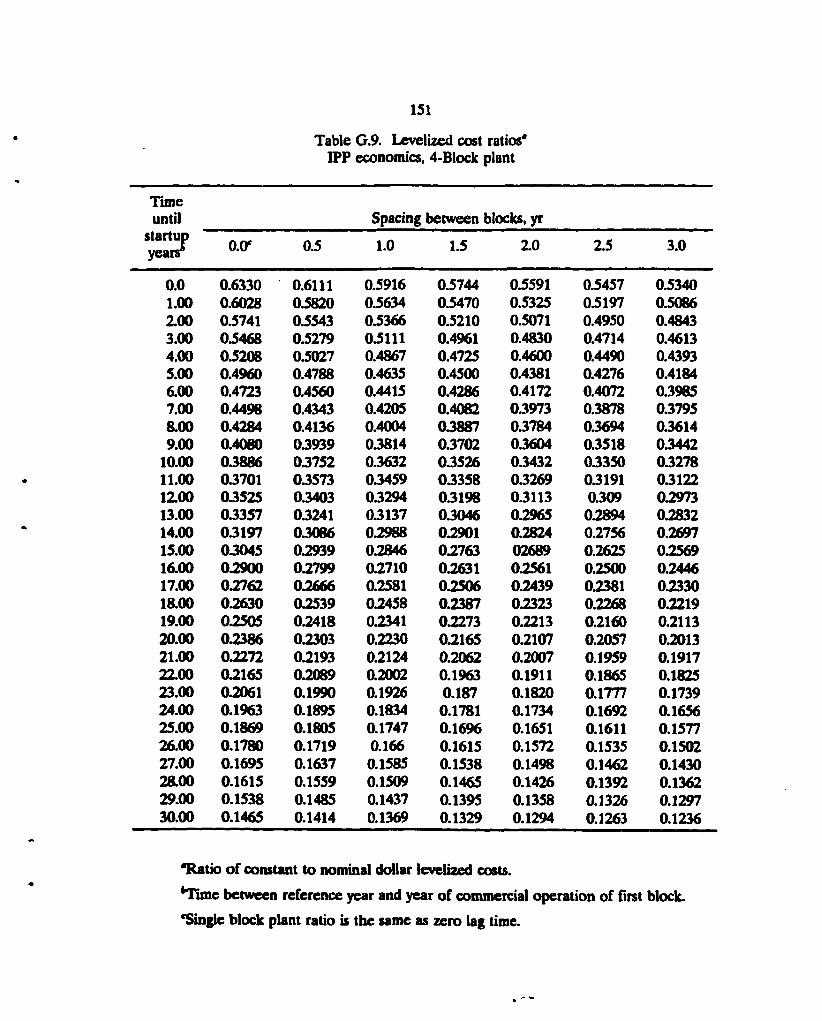
151
Tab le G . l . Leve l i zed cost ratios" Utility economics , 2-Block plant
Time until Spacing between blocks, yr
startup years' o.tr 0.5 1.0 1.5 2.0 2.5 3.0
0.0 0.6330 0.6111 0.5916 0.5744 0.5591 0.5457 0.5340 1.00 0.6028 0.5820 0.5634 0.5470 0.5325 0.5197 0.5086 2.00 0.5741 0.5543 0.5366 0.5210 0.5071 0.4950 0.4843 3.00 0.5468 0.5279 03111 0.4961 0.4830 0.4714 0.4613 4.00 0.5208 0.5027 0.4867 0.4725 0.4600 0.4490 0.4393 5.00 0.4960 0.4788 0.4635 0.4500 0.4381 0.4276 0.4184 6.00 0.4723 0.4560 0.4415 0.4286 0.4172 0.4072 0.3985 7.00 0.4498 0.4343 0.4205 0.4082 0.3973 0.3878 0.3795 8.00 0.4284 0.4136 0.4004 03887 0.3784 0.3694 0.3614 9.00 0.4080 03939 0.3814 0.3702 0.3604 0.3518 03442
10.00 03886 03752 0.3632 0.3526 0.3432 0.3350 0.3278 11.00 03701 03573 0.3459 0.3358 03269 0.3191 0.3122 12.00 03525 03403 03294 03198 0.3113 0.309 02973 13.00 03357 03241 03137 0.3046 02965 0.2894 02832 14.00 03197 03086 02988 0.2901 0.2824 0.2756 0.2697 15.00 03045 0.2939 02846 02763 02689 0.2625 02569 16.00 0.2900 02799 0.2710 02631 02561 0.2500 0.2446 17.00 0.2762 02666 0.2581 02506 0.2439 0.2381 02330 18.00 0.2630 02539 0.2458 0.2387 02323 0.2268 02219 19.00 0.2505 02418 02341 0.2273 0.2213 0.2160 0.2113 20.00 0.2386 02303 0.2230 0.2165 0.2107 0.2057 0.2013 21.00 0.2272 02193 0.2124 0.2062 0.2007 0.1959 0.1917 22.00 0.2165 02089 0.2002 0.1963 0.1911 0.1865 0.1825 23.00 0.2061 0.1990 0.1926 0.187 0.1820 0.1777 0.1739 24.00 0.1963 0.1895 0.1834 0.1781 0.1734 0.1692 0.1656 25.00 0.1869 0.1805 0.1747 0.1696 0.1651 0.1611 0.1577 26.00 0.1780 0.1719 0.166 0.1615 0.1572 0.1535 0.1502 27.00 0.1695 0.1637 0.1585 0.1538 0.1498 0.1462 0.1430 28.00 0.1615 0.1559 0.1509 0.1465 0.1426 0.1392 0.1362 29.00 0.1538 0.1485 0.1437 0.1395 0.1358 0.1326 0.1297 30.00 0.1465 0.1414 0.1369 0.1329 0.1294 0.1263 0.1236
"Ratio o f constant t o nominal dollar leve l ized costs. fcTime b e t w e e n re ference year and year o f commercial operat ion o f first block.
'S ingle b lock plant ratio is t h e s a m e as z e r o lag time.
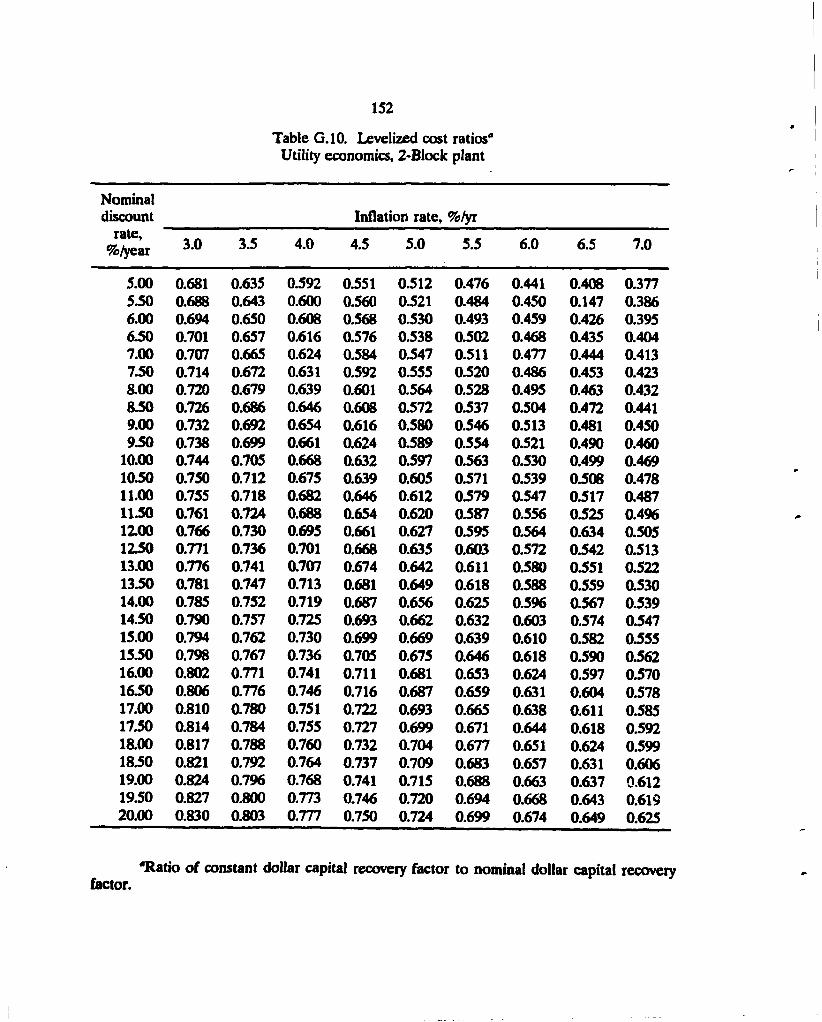
152
Tab le G.10. Leve l ized cost ratios" Utility economics , 2 - B l o c k plant
Nominal discount Inflation rate, %fyt
rate, %/year 3.0 3.5 4.0 4.5 5.0 5.5 6.0 6.5 7.0
5.00 0.681 0.635 0.592 0.551 0.512 0.476 0.441 0.408 0.377 5.50 0.688 0.643 0.600 0.560 0.521 0.484 0.450 0.147 0.386 6.00 0.694 0.650 0.608 0.568 0330 0.493 0.459 0.426 0.395 6.50 0.701 0.657 0.616 0.576 0338 0.502 0.468 0.435 0.404 7.00 0.707 0.665 0.624 0.584 0.547 0.511 0.477 0.444 0.413 7.50 0.714 0.672 0.631 0.592 0.555 0.520 0.486 0.453 0.423 8.00 0.720 0.679 0.639 0.601 0.564 0.528 0.495 0.463 0.432 830 0.726 0.686 0.646 0.608 0.572 0.537 0.504 0.472 0.441 9.00 0.732 0.692 0.654 0.616 0380 0.546 0.513 0.481 0.450 9.50 0.738 0.699 0.661 0.624 0389 0.554 0.521 0.490 0.460
10.00 0.744 0.705 0.668 0.632 0.597 0.563 0.530 0.499 0.469 10.50 0.750 0.712 0.675 0.639 0.605 0.571 0.539 0.508 0.478 11.00 0.755 0.718 0.682 0.646 0.612 0.579 0.547 0.517 0.487 1130 0.761 0.724 0.688 0.654 0.620 0.587 0.556 0.525 0.496 12.00 0.766 0.730 0.695 0.661 0.627 0.595 0.564 0.634 0.505 1230 0.771 0.736 0.701 0.668 0.635 0.603 0.572 0342 0.513 13.00 0.776 0.741 0.707 0.674 0.642 0.611 0.580 0351 0.522 1330 0.781 0.747 0.713 0.681 0.649 0.618 0.588 0.559 0.530 14.00 0.785 0.752 0.719 0.687 0.656 0.625 0.596 0.567 0339 14.50 0.790 0.757 0.725 0.693 0.662 0.632 0.603 0.574 0.547 15.00 0.794 0.762 0.730 0.699 0.669 0.639 0.610 0.582 0.555 1530 0.798 0.767 0.736 0.705 0.675 0.646 0.618 0.590 0.562 16.00 0.802 0.771 0.741 0.711 0.681 0.653 0.624 0.597 0.570 1630 0.806 0.776 0.746 0.716 0.687 0.659 0.631 0.604 0.578 17.00 0.810 0.780 0.751 0.722 0.693 0.665 0.638 0.611 0.585 17.50 0.814 0.784 0.755 0.727 0.699 0.671 0.644 0.618 0.592 18.00 0.817 0.788 0.760 0.732 0.704 0.677 0.651 0.624 0.599 1830 0.821 0.792 0.764 0.737 0.709 0.683 0.657 0.631 0.606 19.00 0.824 0.796 0.768 0.741 0.715 0.688 0.663 0.637 0.612 19.50 0.827 0.800 0.773 0.746 0.720 0.694 0.668 0.643 0.619 20.00 0.830 0.803 0.777 0.750 0.724 0.699 0.674 0.649 0.625
' R a t i o o f constant dollar capital recovery factor t o nominal dollar capital recovery factor.
153
A P P E N D I X H
MOST LIKELY, EXPECTED, AND CONTINGENCY COSTS'
Base construction cost is defined in Sect. 1.2 to be the "most likely" plant capital cost
based on the direct and indirect costs only. Contingency, defined in Sect. 3, is a percentage
of base construction cost when added results in the median cost estimate. The relevance of
these terms and their interrelationship is described in this Appendix. The overall contingency
factor will include an allowance for indeterminates.
H.1 MOST LIKELY COST
If there were several cost estimates for a given item, where the item has uncertainties
and complexities associated with it, experience indicates that the distribution of the estimated
costs would be typically like that shown in Fig. H.1 with a characteristically skewed to-the-
right shape. The highest point on the distribution corresponds to the estimate value for
which there are the largest number of estimates. This value, known in statistics as the mode,
is the most likely value (i.e., the most probable value or value with the highest probability).
For estimates determined in accordance with these guidelines, the base construction
cost estimates are to represent the most likely cost value.
K 2 EXPECTED COST AND CONTINGENCY
Referring again to Fig. H.1, the median estimate value (estimate where there is an
equal probability of actual costs being higher or lower) is greater than the most likely value.
For the skewed distribution such as that shown in Fig. H.l, the median is where the area
under the curve on both sides of the point is equal. The median is shown in Fig. H.2 to be
the point were the cumulative probability is 50%. For a normal distribution of costs (not
skewed) the median cost = the mode cost and a "0%" contingency for that item would be
assigned.
Based o n R e f . 13.
154
The total contingency cost for a power plant is the sum of the contributions for each
system or component category and will also include the expected value of cost items not
explicitly covered in the detailed estimate (allowance for indeterminates).
Thus, base cost plus contingency is intended to be a projected cost for which there
is an equal probability of the actual cost being higher or lower. The greater the uncertainty,
the higher the contingency assigned to develop a 50% confidence level estimate. Obviously,
if a 90% confidence level estimate is desired (90% probability that the actual cost will be
lower), a much higher contingency factor will be required to be applied to the "most likely"
cost (1.85 vs. 1.2 in the Figs. H.l and H.2 example).
Figures H.1 and H.2 were generated using a simple beta function with a "most likely"
estimate of 100, an optimistic estimate of 50, and a pessimistic estimate of 270. This data set
results in an median value of 120 and a 20% contingency.
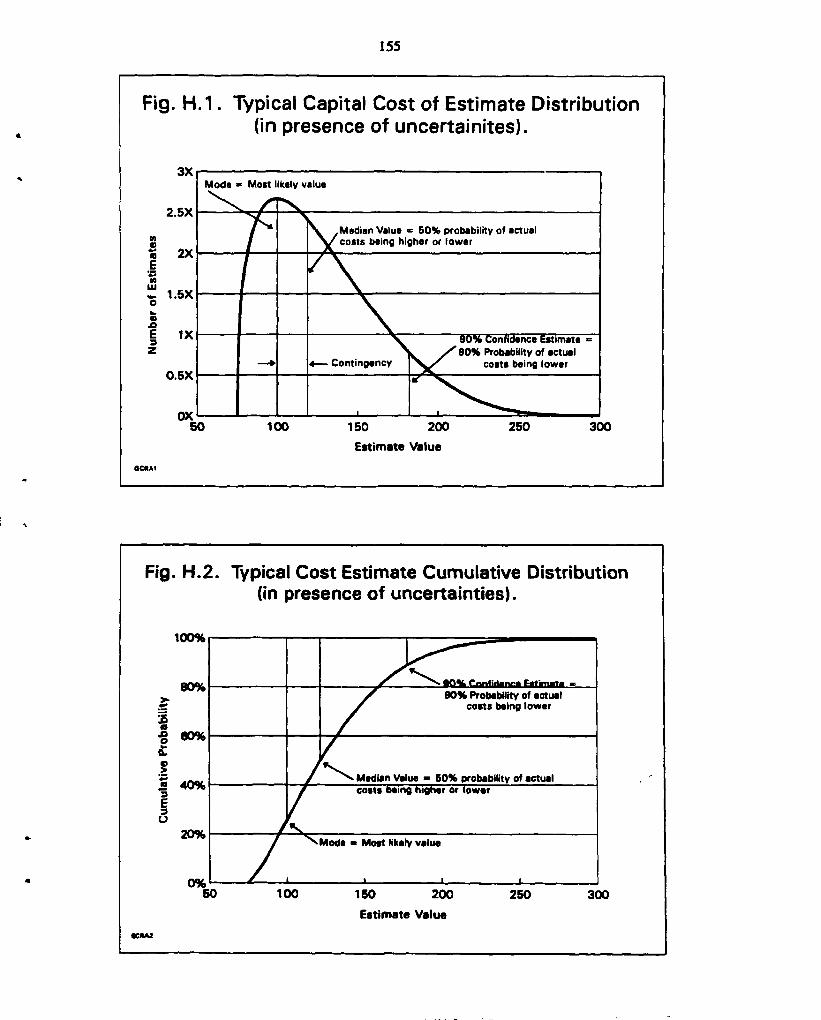
155
Fig. H.1. Typical Capital Cost of Estimate Distribution (in presence of uncertainites).
Fig. H.2. Typical Cost Estimate Cumulative Distribution (in presence of uncertainties).
100%
80%
x> m X) o
o >
60%
S 40%
20%
0%
/ ^ a o * rnnlManra Fatimata • / 90% Probability of actual
/ costs baing lower
Median Value • 50% probability of actuel i costs being higher or lower
V / "N Mod* « Most likaly value
— i > 1 i 50 100 ISO 200
Estimate Value 250 300
157
ORNL/TM-10071/R3 Dist. Categoiy UC-520
Internal Distribution
1-5. J. G. Delene 20. P. L. Rittenhouse 6. C. A Forsberg 21. J. O. Steigler 7. E.C. Fox 22. C. L. Wagner 8. L. C. Fuller 23. J. D. White 9. W. J. Fulkerson 24. K. A. Williams
10. F. J. Homan 25. ORNL Patent Office 11-15. C. R. Hudson n 26. Central Research Library
16. H. Jones 27. Document Reference Section 17. J. E Jones Jr. 28-29. Laboratory Records Department 18. D .L . Moses 30. Laboratory Records (RC) 19. R. L. Reid
External Distribution
31. R. E. Allen, United Engineers & Constructors Inc., P.O. Box 8223, Philadelphia, PA 19101
32. R. C. Berglund, General Electric Company, P.O. Box 530954, San Jose, CA 95153 33. L. F. Blankner, DOE-OR, P.O. Box 2001, Oak Ridge, TN 37831-8600. 34. G. C Brambkitt, General Atomics, P.O. Box 85608, San Diego, CA 92138 35. E C. Brolic, U.S. Department of Energy, NE-2, Washington, DC 20545 36. H. Brusche, Westinghouse Electric Corporation, P.O. Box 355, Pittsburgh, PA
15230 37. J. Caldwell, Gilbert/Commonwealth, Inc., P.O. Box 1498, Reading, PA 19603-1498 38. Sten Caspersson, ABB/CENP(M/S 9354-0422) 1000 Prospect Hill Road, Windsor,
CT 06095-0500 39. Y. I. Chang, Bldg. 208, Argonne National Laboratory, 9700 S. Cass Ave., Argonne,
IL 60439 40. R. Clausen, United Engineers and Constructors, 4500 Cherry Creek Drive, Box
5888, Denver, CO 80217 41. E. Cutting, Stone and Webster, 245 Summer St, Boston, MA 02107. 42. G. A. Davis, Combustion Engineering, Inc., P.O. Box 500, Windsor, CT 06095 43. David Dilling, Bechtel National Incorporated, P.O. Box 3965, San Francisco, CA
94119 44. E. J. Domaieski, Babcock & Wilcox, P.O. Box 10935, Lynchburg, VA 24506-0935 45. C. S. Ehrman, Burns and Roe Company, Inc., 700 Kinderkamack Road, Oradell, NJ
07649. 46. S . E l Safwany, U . S . D e p a r t m e n t o f Energy, S a n Francsico Operat ions Of f i ce , 1333
Broadway, Oakland, C A 9 4 6 1 2 47 . G . P . E y s y m o n t t AutEx , Inc., 7213 Chestnut S t , Chevy Chase , M D 2 0 8 1 5
158
48. L. K. Fletcher, DOE-Oak Ridge Operations, Oak Ridge, TN 37831 49. S. M. Franks, U.S. Department of Energy, NP-61, Washington, DC 20545 50. Mark Gielecki, U.S. Department of Energy EI-821, Washington, DC 20545 51. S. Golan, Bechtel National Incorporated, P.O. Box 3965, San Francisco, CA 94119 52. F. J. Goldner, U.S. Department of Energy, NE-45, Washington, DC 20545 53. J. N. Gonzaga, AutEx, Inc., 130 W. 67 St., Suite 1C, New York, NY 10023 54. J. Griffith, U.S. Department of Energy, NE-40, Washington, DC 20545 55. N. Grossman, U.S. Department of Energy, NE-45, Washington, DC 20545 56. C. O. Gruber, Gilbert/Commonwealth, Inc., P.O. Box 1498, Reading, PA
19603-1498 57. P. B. Hemmig, U.S. Department of Energy, NE-462, Washington, DC 20545 58. B. A. Hutchins, General Electric Company, P.O. Box 530954, San Jose, CA 95153 59. M. P. LaBar, General Atomics, P.O. Box 85608, San Diego, CA 92138 60. E. G. Lazur, U.S. Department of Energy, DP-66, Washington, DC 20545 61. D. J. McGoff, U.S. Department of Energy, NE-40, Washington, DC 20545 62. L. D. Mears, Gas-Cooled Reactor Associates, 10240 Sorrento Valley Rd., San
Diego, CA 92121 63. Ray R. Mills, MHTGR-PDCO-East, MEREX, Inc., 3206 Tower Oak Blvd., Ste.
300, Rockville, MD 20852 64. James Mottley, Westinghouse Electric Corporation, P.O. Box 355, Pittsburgh, PA
15230 65. J. D. Nulton, U.S. Department of Energy, NE-40, Washington, DC 20545 66. P. Overholt, U.S. Department of Energy, NE-44, Washington, DC 20545 67. Walter Parker, Stone and Webster, 245 Summer St., Boston, MA 02107 68. G. R. Pause, Gas-Cooled Reactor Associates, 10240 Sorrento Valley Rd.,
San Diego, CA 92121 69. G. Pavlenco, United Engineers & Constructors Inc., P.O. Box 8223, Philadelphia,
PA 19101 70. J. E. Quinn, General Electric Company, P.O. Box 530954, San Jose, CA 95153 71. E. Rodwell, Electric Power Research Institute, P.O. Box 10412, Palo Alto, CA
94303 72. H. H. Rohm, U.S. Department of Energy, NE-40, Washington, DC 20545 73. S. Rosen, U.S. Department of Energy, NE-45, Washington, DC 20545 74. L. N. Salerno, General Electric Company, P.O. Box 530954, San Jose, CA 95153 75. C. R. Snyder, Bechtel National Incorporated, P.O. Box 3965, San Francisco, CA
94119 76. John Stamos, U.S. Department of Energy, NE-44, Washington, DC 20545 77. I. Taylor, General Electric Company, P.O. Box 530954, San Jose, CA 95153 78. M. L. Thompson, General Electric Company, P.O. Box 530954, San Jose, CA
95153 79. T. A. Werner, U.S. Department of Energy, NE-44, Washington, DC 20545 80. John Williams, U.S. Department of Energy, NE-40, Washington, DC 20545 81. P. M. Williams, U.S Department of Energy, NE-45, Washington, DC 20545 82. R. S. Wood, U.S. Nuclear Regulatory Commission, 11555 Rockville Pike, Rockville,
MD 20852
159
83. Office of Assistant Manager for Energy Research and Development, DOE-Oak Ridge Operations, Oak Ridge, TN 37831
84-152. Given distribution as shown in DOE/OST1-4500-R75 under category UC-520 (General Reactor Technology)