Embed Size (px)
Citation preview
ORN L-4145
Contract No. W-7405-en g -2 6
CHEMICAL TECHNOLOGY DIVISION
ANNUAL PROGRESS REPORT
for Period Ending May 31, 1967
D. E. Ferguson K. B. Brown R. G. Wyrner
R. E. Blanco
M. E. Whatley H. E. Goel ler R. E. Brooksbank - P i l o t P l a n t Sect ion Ch ie f
- D i v i s i o n Di rector - A s s i s t a n t D i v i s i o n D i rec tor - Chemica l Development
- Chemica l Development
- U n i t Opera t ions Section Ch ie f - Process Des ign Section Ch ie f
Sect ion A Ch ie f
Sect ion B Chief
OCTOBER 1967
OAK RIDGE NATlONAL LABORATORY Oak Ridge, Tennessee
operated by UNION CARBIDE CORPORATION
for the U. 5. ATOMIC ENERGY COMMISSION
Reports previously issued in th is series ore os follows:
0 R N L-239 2 0 R N L - 2576 ORNL-2788 ORNL-2993 ORN L-3 153 ORNL-3314 ORNL-3452 ORNL-3627 ORN L-3830 ORNL-3945
Per iod Ending August 31, 1957 Per iod Ending August 31, 1958 P e r i o d Ending August 31, 1959 Per iod Ending August 31, 1960 Per iod Ending May 31, 1961 P e r i o d End ing May 31, 1962 Per iod Ending May 31, 1963 Per iod Ending May 31, 1964 Period Ending May 31, 1965 Per iod Ending May 31, 1966
Contents
... . . .
......
SUMMARY ............................................. ..........................................................................................
1. POWER REACTOR F U E L PROCESSING ................................................................................................
1.1 1.2
1.3 1.4 Solvent Extraction Studies ..............................................................................................................
1.5
Development of Mechanical P r o c e s s e s ........................................................................................
Development of Burn-Leach P r o c e s s for Graphite-Base F u e l s ................................................
Development of Grind-Leach P r o c e s s for Graphite-Base F u e l s _ . _ . _ .
Development of P r o c e s s e s for Heavy-Water-Moderated Organic-Cooled Reactor F u e l s ................................................................................................................................
1.6 Development of Processes for Fast-Breeder-Reactor Fue l s ......................
2. FLUORIDE-VOLATILITY PROCESSING ................................................................................................
2.1 Sta tus of Fluidized-Bed Volatility Pilot P lan t ..........................................................................
L A B O R A T O R Y - S C A L E S T U D I E S ..............................................................................................................
2.2
2.3
2.4
2.5
2.6
2.7
2.8
2.9
1
29 30
35 39 47
51 53
58 59
71 New Decladding and Oxidation Method for Zircaloy-Clad UO, F u e l s Using
Par t ic le S ize and Filtration of U,O, During Oxidation ...................................................
Effects of F ive P r o c e s s Variables on Retention of Uranium by Alumina After
Rela t ive Effec t iveness of Fluorine, BrF,, and BrF, in Minimizing Retention of
Fluorine Calorimetric Reactor for Determining Bromine and BrF, Contents of
L i F and Fluorine as a Sorption-Desorption System for P u F , ....................................................
Hydrogen, Oxygen, and €IF-0, i n Sequence _ . _ _ ........................................................... 71
Treatment with Fluorine .......... ....................................................................... 75
Uranium by Alumina ...................................................................................................................... 76
Primary Reactor Off-Gas ............................................................................................................. 76 78
Sorption-Desorption Systems for NpF, ...................... .................................. 81 Corrosion in Volatility Processes .................................... ....................... 8 2
2.10 Leach ing of Uranium and Plutonium from Primary Reactor Waste Solids, and Rela ted Corrosion Studies ............................................................................................................ 85
SMALL-SCALE E N G I N E E R I N G S T U D I E S .........................................................................
2.11 P r o c e s s Flowsheet Tests .......................................................................................
2.12 Sampling of Solids from a Fluidized-Red Reactor ...................................................................... 92 2.13 Continuous In-Line Monitoring of P r o c e s s G a s Stre ............................. 9 2
2.14 Estimation of Cr i t ica l Cons tan ts for NbF, .._. .................................................... 94
... 111
i v
3 . MOLTEN-SALT REACTOR PROCESSING ........ ...............................................................................
Continuous Fluorination of Molten Fluoride Mixtures in 1-in.-diam Colunins ........................ 3.1
3.2
3.3
3.4 Vaporization Ra te s in Fluoride Salt Distillation ...................................................................
3.5 3.6 Demonstration of Fuel-Salt Disti l lat ion a t t he MSRE ................................................................
3.7 Alternative Process ing Methods ................................ ...........................................................
3.8 Preparation of 233U F u e l for the MSR E: ........................................................................................
4 . WASTE TREATMENT AND DISPOSAL .............................................. ...............................................
Corrosion Control by Use of a Frozen Wall ..................................................................................
Relative Volati l i t ies of Rare-Earth Fluorides in MSBR Sa l t s ..................
Prevention of t h e Buildup of Low-Volatility Materials a t a Vaporization Surface ................
4.1 High-Level Radioactive Waste ......................................................................................
4.2 Intermediate-Level Radioactive Waste ................................ ..............................................
4.3 Low-Level Radioactive Waste .. .......................................................................................
4.4 Engineering, Economic, and Safety Evaluation ................ .......................................
4.5
4.6
Separation of Noble Gases f rom Air Using Permselective Membranes ....................................
Computer Code for Calcu la t ing Nuclear Properties of Accumulated Wastes. ..........................
5 . TRANSUIIANIUM-ELEMENT PROCESSING ...... .............................................................................
5.1 TRU Operations .............................................................................................................
5.2 Transplutonium Element Isolation from 'l'ramex Products .... ...............................................
5.3 Development of Chemical Processes ...................................................................... .........
5.5 HFIR Target Rod Fa i lures .................................................................................... ...........
5.4 Development of P rocess Equipment .................... .................................................................
6 . DEVELOPMENT O F THE THORIUM F U E L CYCLE ............................................................................
6.1
6.2 Sol-Gel P rocess : Further Development and New Applications ................................................
6.3 Development of Methods for Producing Microspheres ................ ...........................................
6.4 Thorium-Uranium Recycle Fac i l i ty ...... ...................................................................................
6.5
Sol Preparation by Solvent Extraction ..........................................................
233U Storage and Distribution Fac i l i ty ........................................................................
7 . SOL-GEL PROCESSES FOR T H E URANIUM F U E L CYCLE .................. .........................................
7.1 Urania ...... ...............................................................................................................
7.2 Plutonia ............................................................................................................................................
7.3 Oxides of Controlled Porosity ................................................................................
8 . SEPARATIONS CHEMISTRY RESEARCH ................................................................................................
8.1 Extraction of Metal Sulfates and Nitrates by Amines ................................................................
8.2 New Separations Agents ...................................................................................................................
8.3 Selectivity of Polyacrylamide Gels for Certain Cations and Anions ........................................
8.4 Performance of Degraded Reagents and Diluents ........................................................................
8.5 Recovery of Beryllium from Ores ..................................................................................................
95
95
97
98
99
99
101
101
102
104
104
111 122 125
125
129
130
130
136
144
151
152
151
154
159
169
175 179
180
180
195 206
208
208
209
211 213
214
V
... . . . . . . .
8.6
8.7
8.8 8.9 Comparative Chemistry of Lanthanides and Trivalent Actinides .....................
8.10 Transplutonium Element Compound Preparation and X-Ray Characterization ........................
Beryllium Purification by Solvent Extraction .............................................................................
Separation of Zirconium and Hafnium with Amines ....................................................................
Separation of Rare Ear ths ..............................................................................................................
8.11 Aminopolycarboxylic Acid Complexes of Trivalent Actinides .......................... ...............
8.12 Lanthanide and Actinide Sulfate Complexes .. .............................................................
8.13 Equilibria and Mechanisms of Extractions ....................................................................
8.14 Kinetics of Metal-Ion Extractions by Di(2-ethy1hexyl)phosphoric Acid (HDEHP) ..................
8.15 Aggregation and Activity Coefficients in Solvent P h a s e s ........................................................
9 . CHEMICAL APPLICATIONS O F NUCLEAR EXPLOSIONS ..................................................................
9.1 Copper Ores ......................................................................................................................................
9.2 Stimulation of Natural Gas Wells ..................................................................................................
9.3 Recovery of Oil from Shale ...................................... ................................................................
9.4 Development of Hypervelocity J e t Samplers ................................................................................
10 . RECOVERY O F FISSION PRODUCTS BY SOLVENT EXTRACTION ..................
10.1
.........
New Flowsheet for Recovering Strontium, Rare Ear ths , and Cesium ......................................
11 . BIOCHEMICAL SEPARATIONS ................................................................................................................
Development of Processes for Macromolecular Separations ......................................................
Scaleup of Processes for Macromolecular Separations ..............................................................
Molecular Weights of Transfer Ribonucleic Acids ......................................................................
Behavior of Transfer Ribonucleic Acids on Polyacrylamide Gel Columns . .
11.1 11.2
11.3
11.4 11.5 Body Fluid Analys is ........................................................................................................................
12 . CHEMISTRY O F PROTACTINIUM .............................................. ..............................
12.1 Chemical Behavior of Protactinium in Sulfuric Acid So ..............................
12.2 Absorption Spectra of Protactinium in Sulfuric Acid Solutions ................................................
12.3 Anion Exchange Behavior of Protactinium in Hydrochloric Acid Solutions ............................
13 . IRRADIATION E F F E C T S ON HETEROGENEOUS SYSTEMS ................................ .........
Radio lys is of Water in the Adsorbed State ..................................................................................
14 . SPECTROPHOTOMETKIC STUDIES O F SOLUTIONS OF ALPHA-ACTIVE MATERIALS ....
Spectral Studies of Uranium Solutions ..........................................................................................
Installation and Tes t ing of the Spectrophotometer System for High Alpha Leve l s ................
15 . CHEMICAL ENGINEERING RESEARCH .................. .............................................
13.1
14.1
14.2
15.1
15.2
15.3
15.4
Performance of a Prototype Stacked-Clone Contactor with Integral Pumps
Sca leup of the Stacked-Clone Contactor ......................................................................................
Mass Transfer of Water from Sol Droplets During Microsphere Gelation ..................................
Hyperfiltration of Spent Sulfite Liquor with a Self-Rejecting Membrane .................................
215
217
218 220
223
223
225 226
229
230
234
234
237
237
239
240
240
243
243
246
250
251
252
260
260
260
261
262
262
266
266
268
269
269
271
272
273
vi
16 .
17 .
18 .
19 . 20 . 21 .
22 .
REACTOR EVALUATION STUDIES ........................................ ........................................................
16.1 16.2
16.3
16.4
Studies of the Cost of Shipping Reactor F u e l s ............................................................................
Computer Code for Studies of Overall Power Cos t s .... ...........................................................
PHOEBE Fiss ion Product Code ..........................................................................................
Cost Studies of Fue l Preparation and Process ing for New AEC Civilian Nuclear Power Evaluation ............................................................................................................
16.5 Optimization of the S izes , Da te s of Construction, and Locat ions of P rocess ing P lan t s in a n Expanding Economy ................................................................................................
PIiEPAHATION AND PROPERTIES OF ACTINIDE-ELEMENT OXIDES ....................................
17.1 Fundamental Studies of Thoria Sols and Gels ............................................................................
17.2 Surface and Sintering Properties. of Sol-Gel-Derived Thoria .... .............................................
17.3 Studies of Urania Sols and Gels ....................................................................................................
ASSISTANCE PROGRAMS ...................................................................... ...............................................
18.1 Eurochemic Ass is tance Program ...............................................................................................
18.2 Evaluation of t h e Radiation Res i s t ance of Selected Protective Coatings and Other Materials ................................................................................................................
WATER RESEARCH PROGRAM .............................................. ...............................................
CHEMISTRY O F CARBIDES AND NITRIDES ..........................................................................................
INDUSTRIAL APPLICATIONS OF NUCLEAR ENERGY ..................................................
21.1 21.2
SAFETY STUDIES O F FUEL TRANSPORT ..........................
22.1 Cask Transport Studies ....................................................................................................
Survey of P rocess Applications in a Desalination Complex .....................................................
Production of Hydrogen by the Elec t ro lys i s of Water .............................
.............................................
275
275
276
277
277
278
282
282
285
287
289
289
289
292
293
297
297
298
303
303
PUBLICATIONS. SPEECHES. AND SEMINARS .............................................................................................. 309
Summary
1 . POWER REACTOR F U E L PROCESSING
1 . 1 Development of Mechanical Processes
Several reactor and reactor fuel manufacturers were v is i ted to obtain the most recent de ta i led des igns for third-generation PWR and BWR fuel (and proposed F B R fuel) a s sembl i e s . Evaluation of t h e s e da ta indicated tha t fuel element d isas - sembly and shear - leach methods and equipment were su i t ab le for handling the newer des igns . Leaching of shea red Zircaloy-clad ThO,-UOL in Thorex d isso lvent [13 M I-INO,-0.05 M HF-0.05 rM Al(NO,),] resulted in the d isso lu t ion of about 99.8% of the uranium and thorium and 1.5% of the Zircaloy. Most of the zirconium precipitated during feed ad- justment; however, subsequen t so lvent extraction processing of the unclarified solution was satis- factory. Operability of t he full-sized delayed- neutron leached-hull monitor was evaluated; even in the presence of a n 830-r/hr gamma f ie ld as li t t le as 0.01 g of 2 3 5 U was s t i l l de tec tab le . Further refinement of t h i s monitoring technique, which we be l ieve is the most s ens i t i ve and ac- curate for s t a i n l e s s steel cladding, is now i n progress. Mechanical process ing s tud ie s of graphite-base HTGR fuels were begun. T e s t s were made of the rough-breaking of la rge graphite fuel blocks with the ORNL 250-ton s h e a r and of a 6L pile-driver’’ technique to provide feed for a jaw crusher; neither method was sa t i s fac tory . USC of a high-pressure (1000-psi) multinozzle water j e t for removing coa ted fue l par t ic les embedded in a s in te red binder from ho les in prototype graphite fuel s t i c k s (Publ ic Service of Colorado Reactor) was success fu l ; the removal rate was 0.2 to 0.3 in . / sec . A l a rge fraction of the par- t i c le coa t ings were broken; however, t h i s did not interfere with t h e almost quantitative separa t ion of simulated fuel (- 40 mesh) from ferti le (+ 30 mesh) particles. Further development of t h i s technique is i n progress .
1.2 Development of Burn-Leach Process for Graphite-Base F u e l s
T h e burn-leach p rocess for graphite-base HTGR fuels was successfu l ly demonstrated in hot-cell t e s t s us ing General Atomic GAIL-3A and GAIL- 3B compacts; t h e s e were composed of pyrolytic- carbon-coated (Th,U)C, par t ic les i n a graphite matrix and had been irradiated t o (U -1. Th) butnups of 8800 and 41,500 Mwd/ton sespectively. T h e broken compacts were burned in a fluidized bed of alumina a t temperatures up to 750°C. Ilecon- tamination fac tors up to about IO7 (based on the f i ss ion product activity in the bed and that in the discharged off-gas) were obtained after p a s s i n g the off-gas through a 20-p-porosity sintered metal filter held a t 2300°C. Further filtration of the off-gas through ordinary fiber-glass m a t s removed a l l t he radioactive particulate matter. Nearly quantitative recovery of the thorium and uranium (:.99%) w a s obtained when t h e (Th,U)02 a s h was leached with boiling 13 M HNO,-0.05 M HF-0.1 M Al(NO,),; however, small quantit ies of insoluble fission products contaminated the leached alumina slightly. A system was developed for separa t ing the bulk of the Th0 , -U30 , f rom the alumina by screening, thus allowing par t of t h e alumina bed to b e recycled to t h e burner without leaching.
1.3 Development of Grind-Leach Process for Graphite-Base F u e l s
Although laboratory experiments with unirra- diated HTGR fuel s amples [carbon-coated (Th,U)C, particles] indicated that the grind-leach process is feas ib le , hot-cell t e s t s were disappoint- ing because of the high (/ 1%) thorium and uranium l o s s e s and f i ss ion product retention (10 to 20%) by the leached graphite. T h e new ORNL roll crusher, which u s e s two 4-in. by 12-in.-diam rolls,
1
2
was tes ted ; crushing of all fuels having fue l par- t icle diameters of > 150 p to - 140 mesh was c o m - pletely successfu l . Single-step leaching with 13 i l I IINO 3-0 .OS M HF-0 .OS M Al(NO,), of un- irradiated ground P e a c h Bottom and UHTREX fuel, even for extended t imes, was unsuccessful; results indicated uranium and thorium l o s s e s of 2 0 25 and 0.75% respectively. Two-step leach- ings were satisfactory, however, and resulted i n uranium and thorium l o s s e s of 5 0.1%. Leaching t e s t s with crushed carbon-coated sol-gel T h o , were very sa t i s fac tory , result ing in thorium l o s s e s of only 0.01%. All l each solutions contained about 1% of the carbon from the fuel as so luble organic compounds. Washing the graphite residue first with nitric ac id and then with water was shown to give the highest fuel recovery for a miiiimurn of wash volume. Hot-cell s tud ie s with irradiated Peach Bottom [GAIL-3A, irradiated to a (U + "Th) burnup of 8850 Mwd/ton, and GAIL-3H, irradiated to a (U + T h j burnup of 41,500 Mwd/ton] fuel compacts and AVK fuel sphe res [irradiated to a (U + Th) burnup of 23,000 Mwd/ton] were disappointing. Uranium and thorium l o s s e s varied from 1 to 5% and 2.5 to 7% respectively; i n all experiments 10 to 20% of t h e f i ss ion products, principally Io6Ru , 137Cs, and ' 4 4 C e were retained in the leached and washed graphite residues.
1.4 Solvent Extraction Studies
T h e fuel so lu t ions prepared in the grind-leach head-end experiments were used t o eva lua te a high-acid T B P extraction flowsheet that is capable of handling feeds containing 1% soluble organic compounds. T h e thorium-uranium s t r ip product from the process h a s only low concentrations of organic material and f i ss ion products, and t e s t s have demonstrated that i t is a su i t ab le feed for the standard Acid Thorex process . Preliminary results indicate that uranium and thorium can be leached directly f rom acidified HTGR fuel with TBD in n-dodecane. In other solvent extraction s tudies , we measured the solubili ty of (1) uranyl nitrate i n di-sec-butyl phenylphosphonate-diethyl- benzene and (2) thorium nitrate i n T B P (diluted with benzene, diethylbenzene, or various straight- and branched-chain a l ipha t ic compounds).
1.5 Development of Processes for Heavy-Wafer- Moderated Organic-Cooled Reactor Fuels
Development of head-end methods for heavy-water- moderated organic-cooled (HWOCR) fuels was con- tinued. Studies were made of UC, (Th,UjC, and (Th,UjO, fue ls c l ad in Zircaloy and i n SAP (a dispersion of 5 to 15% A1,0, i n aluminum). S ince the shear - leach process appears t o b e adequate for Zircaloy-clad fue ls , the major development effort WRS devoted to SA?-clad fuels (particularly SAP- c lad UC), for which the shear-leach process seems inadequate because of t h e high solubili ty of t h e aluhinum (in the SAP) i n HNO,. T h e most prom- i s ing process ing mcthod for t h i s fuel appears t o b e dissolution of the cladding in 2 M NaOH-2 M N a N 0 3 , dissolution of the residual UC in nitric ac id , and decontamination and recovery of the uranium and plutonium by so lvent extraction or ion exchange. Alternatively, t he aluminum in the SAP can b e volati l ized as AlC1, a t 300 t o 350OC with anhy- drous IICI, and the residue c a n be processed further.
1.6 Development of Processes for Fast- Breeder- Reactor Fuels
Mechanical fuel d i sassembly and shear-leach s tud ie s were made on the b a s i s of da ta recently obtained from a number of reactor and reactor fuel manufacturers relative to their proposed fast-reactor fuel assembly des igns . T h e eva lua t ions ind ica te that, mechanically, p rocess ing problems, while similar to those for LWK fuels, a r e more s e v e r e in degree. For ins tance , based on computer calcu- la t ions , f i s s ion product hea t d i ss ipa t ion for short- cooled (30 days), highly irradiated (burnup, 100,000 Mwd/ton) fuels will be quite difficult . Laboratory s tudies were made to find safe methods for d i s - posal of t h e residual sodium coolant and 'mnd tha t are a s soc ia t ed with fast-breeder-reactor (FBR) fuels. External coolant can be reacted t o form oxide and oxygen and/or water-vapor-inert-gas mixtures a t room temperatures. Destruction of t h e sodium bonding material after fuel rod shea r ing is more difficult. T h e bes t method appears t o b e ex- posure to 3% Hz0-97% He at 3OOOC. Exposure a t 3OOOC in a i r gave e r ra t ic reaction rates. The re- action with COz to form N a z C 0 3 w a s too slow at temperatures below 600°C to b e useful. Because the quantit ies of plutonium are quite large (10 to
3
20% plutonium in uranium), i t i s undesirable to u s e ferrous sulfamate or U(1V) as a reagent for reducing the Pu(IV) t o Pu(1II) for the so lvent extraction par- titioning of plutonium and uranium; therefore, an alternative method us ing hydrogen and a platinized- alumina ca t a lys t was studied. When 4% H, in argon was used, quantitative reduction w a s obtained; i n so lu t ions containing only uranium, 1% reduction of U(V1) to U(1V) w a s observed.
In init ial s tud ie s of amine extractants as poten- tial a l te tna t ives to T B P , coefficients for the ex- traction of Pu(IV) from 1 M U0,(N03)2-3 W HNO, were obtained for a number of amines of different types and a lkyl s t ruc tures . A branched secondary amine, di(tridecyl)amine, which showed the desired degree of plutonium extraction power to a l low com- plete recovery and s t i l l permit stripping of the plu- tonium with d i lu te acid, was se lec ted for more in- tensive study.
oxide fuel containing 10% plutonium, a conceptual plant study was made to determine what additions to the Nuclear Fue l Services (NFS) plant would be required to permit t he process ing of this type of fuel. A process ing rate of 0.52 ton of U i- Pu (50 kg of Pu) per day was found to be compatible with present NFS operating l i cense restrictions; how- ever, l .4 tons/day is technically feasible. T h e latter capacity i s commensurate with the d ischarge rate from s ix teen 1000-Mw (electrical) reactors a n d would result in a process ing charge of 0.09 mill/ kwhr for a core-plus-blanket burnup of 38,500 Mwd/ton. In any case, a new, shielded plutonium ion exchange sys t em, cos t ing up to $5 million, would have to be added t o the ex i s t ing NFS p lan t . Computations made in th i s s tudy indicated that t he processing of F B R fuel decayed as shor t a t i m e as 30 days would not be limited by the radiation degradation of the solvent.
In order to obtain a unit p rocess ing cos t for FRK
2. FLUOR1 DE-VOLATIL I TY PROCESSING
The present investigation of fluoride-volatility processing at ORNL is par t of an intersite effort to develop a n alternative to the aqueous method for recovering valuable components that a re present in spen t UO, fuel from power reactors. Our main contribution will be t h e installation and operation of a “hot” pilot plant i n Building 3019. The in- stallation of head-end process equipment and t h e design of t h e d is t i l l a t ion sys tem for purifying U F , have be gun.
We continued laboratory-scale and small-scale engineering s tud ie s in support of t he fluidized-bed volatility process . Laboratory efforts were centered on (1) gaining a better understanding of the recently adopted BrFS f lowsheet and (2) attempting t o de- velop a sorption method for separa t ing and purify- i ng plutonium. Hot-cell s tud ie s of the process were initiated. The smal l - sca le engineering s tud ie s a re simulating head-end s t e p s that a re planned for t h e pilot plant; spec ia l emphas is is being placed on in-line instrumentation and sampling of so l id s from a fluidized-bed reactor.
2.1 Status of Fluidized-Bed Volatility Pilot Plant
The Fluidized-Bed Volatility P i lo t P l an t (FBVPP) is being designed for installation in Building 3019 to study the process ing of Zircaloy-clad UO, power reactor fue ls at high irradiation leve ls . La ter , t h e processing of s ta in less -s tee l -c lad UO, may a l s o h e studied.
U s e of BrF, a s the fluorinatrng agent for uranium was agreed upon during the year. P l ans to ins ta l l leaching equipment in the F B V P P were abandoned.
Nearly a l l the equipment required in the declad- ding, oxidation, and fluorination of “cold” uranium fuel h a s been fabricated. Structural s t e e l and much of t he shielding have been installed in cell 3 for head-end equipment, and installation of process equipment h a s begun. Purchas ing and fabrication a re progressing on mechanical handling equipment and instrumentation (including a computer-based data acquisit ion system). Electrical gear and ven- tilation components a r e being ins ta l led .
Design of t he d is t i l l a t ion system for separa t ing and purifying UF, was begun, and cell 2 was pre- pared for installation of that equipment. A s a t i s - factory method for purifying P u F b is not ye t avail- able.
LABORATORY-SCALE STUDIES
2.2 New Decladding and Oxidotion Method for Zircaloy-Clod UO , Fue l s Using Hydrogen,
Oxygen, and H F - 0 , in Sequence
In laboratory s tud ie s an alternative decladding and oxidation scheme was developed for UOz fue ls clad in Zircaloy. It cons i s t s in: (1) reacting the
4
zirconium wit!. ::‘ drogen (“hydriding”) t o fracture the cladding, (2) converting the UO, to U,O, by reaction with oxygen, (3) pulverizing the cladding by expos ing i t to HF-0, , and ( I ) fluorinating to volati l ize the uranium and plutonium. Use of t h i s method should eliminate difficult ies now being ex- perienced with fi l tering ZrC1, that is obtained from the HC1-Zr reaction. Also, compared with the HF- 0, process , the ratio of fuel charged to bed volume is about four times greater. T h e hydriding reaction proceeds very rapidly, making th i s method advan- tageous for thick Zircaloy p i eces . However, be- fore the process could b e ser ious ly considered for large-scale application, p rocess t e s t s to study plu- toniuin retention would b e required.
2.3 Part ic le Size and Fi l t rat ion of U,O, During Oxidation
Members of an MIT practice school team studied the s i z e distribution of U,08 par t ic les formed by t h e oxidation of UO, pellets. Of the two d is t inc t classes of U,O, par t ic les formed, the larger par- t i c l e s were irregular in shape and had a number- average diameter of 4.2 p; the other c l a s s con- s i s t ed of spher ica l par t ic les with a number-average diameter of about 0.6 p. Fi l t e r s made of sintered nickel f ibers (10-p rating) sa t i s fac tor i ly removed U,Os from the exit gases from fluidized beds dur- ing the t e s t s .
2.4 Effects of F i v e Process Variableson Retention of Uranium by Alumina After
Treatment with Fluorine
T h e fluorination s t e p was s t id i ed , in the ab- s e n c e of plutonium, in both a 0.94-in.-ID fluidized- bed reactor and in a ?,-in.-ID rotating-bed reactor. A s ta t i s t ica l ly designed experiment w a s conducted to determine the e f fec ts of t he following var iab les on the final uranil;i.) conc.1. itration iii t he a l u 7 i n a bed: temperature, fluorinating g a s concentration, reaction time, and the init ial concentration of uranium in the bed. The resu l t s of th i s experi- ment indicated that, over the ranges s tud ied , t h e s e five variables had no e f fec t o n the amount of ura- nium retained by the alumina bed.
2.5 Relat ive Effectiveness of Fluorine, B r F 5,
Uranium by Alumina and BrF in Minimizing Retention of
In other experiments us ing the 5/,-in.-ID rotating- bed reactor, some evidence w a s found that fluorine leaves less residual uranium than does BrF5 , par- ticularly a t temperatures above 3OOOC. Treatment of the alumina with BrF, between the BrFs and the fluorine s t e p s may b e required to reduce the carry-over of uranium during the fluorination of plutonium with fluorine. In severa l experiments with a 0.94-in.-IU fluidized-bed reactor, BrF, w a s used successfu l ly a s a cleanup agent for the dis- engaging sec t ion , f i l ter , and l ines . After fluori- nation a t 60O0C, with e i ther fluorine or BrF,, the final fluoride content of the alumina bed was twice that after fluorination a t 500OC.
2.5 Fluorine Calorimetric Reactor for Determining Bromine and B r F Contents of Primary
Reactor Off-Gas
An experimental fluorine calorimetric reactor was built and tes ted . T h e concentration of bromine or HrF, in a g a s stream c a n b e determined by mixing fluorine with the stream in the reactor and measur- ing the r i se in temperature. Such a device should be ab le to measure as l i t t i e as 5% utilization of BrFS in the off-gas from the fluidized-bed reactor and thus provide a n indirect measurement of the IJE’, concentration in the off-gas product stream. Consideration is being given to us ing t h i s dev ice as a means of maintaining the reqilired e x c e s s fluorine in the UF,-BrFS-N2-F, g a s stream from the BrF5 regenerator and to t he 400°C NaF bed. In th i s ins tance , the gas of unknown fluorine con- tent would b e reacted with bromine to hold t h e fluorine concentration constant.
2.7 L i F and Fluorine as a Sorption-Desorption System for PuF,
The investigation of LiF for u s e in a sorption- desorption method of purifying PuF6 was extended during th i s report period.
L a s t year, 31 metal fluorides were tes ted for pos- s ib l e u s e as sorbents; LiF was the only one f rom which PuFs could b e desorbed a t reasonable ra tes . The chemical equilibrium between PuF,, fluorine,
5
and the PuF,-LiF complex was found, by the transpiration method, to b e defined by the relation- ship: l og K 2047/T (OK) -t- 0.827, where K is t h e F, : PuF, equilibrium cons tan t i n terms of m o l e ratio.
b e dependent on the sorption temperature and t h e sur face a rea of the LiF. When LiF having a spe- cific sur face area of 1 to 3 m 2 / g w a s used, t h e sorption reaction with PuF , w a s abou t 99% com- plete in 0.04 min at 275°C. High-surface-area LiF (20 to 37 m2/g) w a s similarly effective a t 175°C. Satisfactory separa t ion of PuF, was demonstrated by t h e select . ive sorption of PuF, by low-surface- a rea L i F (1 to 3 m2/g) at 275°C; however, separa- t ion was incomplete with the high-surface-area LiF (20 t o 37 m2/g ) at 175°C owing to the partial cosorption of LTF,.
Desorption of PuF, from low-sur facearea LiF was about 98% complete in 5 hr i n t he presence of fluorine a t 5OOOC. Desorption from t h e high-sur- face-area LiF w a s only 93% complete a f te r 3.5 hr at 475°C. T h e high-surface-area LiF degenerated, during desorption, to a spec i f i c sur face area of about 1 m2//g.
T h e l imitations of an LiF sorption process were confirmed in p rocess application t e s t s i n which a n LiF bed w a s used to recover PuF, tha t had been volati l ized from a 0.94-in.-ID fluidized-bed reactor. A reasonable degree of PuF , sorption (96.1%) w a s obtained only by us ing a high-surface-area LiF bed that was relatively la rge in proportion to the amount of plutonium involved. Fluorine flow rate and F,: PuF, mole ratio, as well as sorption bed tempera- ture and spec i f ic sur face a rea , were shown to b e important variables. Under p rocess conditions the undesirable thermal decomposition of PuF, to PuF4 within the sorption bed was found to occur during the sorption reaction.
h a s been terminated in favor of the u s e of N a F as a sorbent for PuF, .
T h e sorption rate for PuF, by LiF was shown to
Further work on the L i F system for PuF, sorption
2.8 Sorption-Desorption Systems for NpF,
T h e separa t ion and recovery of NpF, from both PuF, and U F , product s t r eams may be required i n volatility processing. T h e separation from PuF, may b e sa t i s f i ed by the current BrF, flowsheet, but the problem of separa t ion from UF, remains. T h e sorption of NpFB by NgF2 h a s been used pre- viously to co l lec t NpF, a t low concentrations from
UFh p rocess streams; however, this sorbent re- quires a retention time of more than 0.8 min, and the NpF, is not recoverable from the sorbent by refluorination. T h e compounds LiF, CaF2, and BaF, appear unsuitable as sorbents for NpF6. However, NaF h a s been found to sorb NpF, ef- fectively at temperatures from 200 to 450°C, producing a violet-colored complex. T h e NpF6 may b e desorbed e i ther with nitrogen or fluorine. The d issoc ia t ion pressure of the NpF6 complex with NaF appears to be about one one-hundredth of tha t found for t h e comparable UFB-NaF complex.
2.9 Corrosion in Volatility Processes
Because of the highly reac t ive reagents and t h e elevated temperatures required in volatility proc- ess ing , corrosion of equipment and piping must be given careful consideration. In addition to cor- rosion s tud ie s at each of the participating s i t e s , we have had a subcontract with Bat te l le Memorial Insti tute - Columbus Laboratories (BMI) to s tudy corrosion problems, particularly those relating to the FBVPP. T h i s subcontract was continued, and their resu l t s a r e presented.
A major portion of the BMI work during th i s period was a continuation of the study of inter- granular corrosion of nickel 200 and 201, and of high-nickel a l loys . T h e additional da ta from th i s study tended to support the earlier conclusion tha t the contaminant sulfur is a factor in s u c h corro- sion. During the last part of th i s period, severa l failures by corrosion of nickel pipe at the engineer- ing-scale tes t reactor led to a renewed and inten- s i v e study of the problem; th i s study is nearing completion, and , aga in , resu l t s a r e indicating tha t sulfur is t h e principal contributor t o corrosion.
T h e second major a rea of BMI work concetned the determination of corrosion charac te r i s t ics of nickel and nickel a l loys upon exposure to bromine and to bromine and oxygen a t 3OO0C, the normal maximum temperature expected in the processing s t e p s where bromine is present. Corrosion of nickel and m o s t nickel a l loys was not of signifi- cant proportions at 300°C; in other t e s t s a t 5OO0C, corrosion ra tes were about tenfold higher. Monel was more rapidly a t tacked , apparently because of the copper content, and copper i tself dissolved quickly. Monel, when exposed in the s a m e sys tem with nickel, acce le ra ted the nickel corrosion by a factor of more than 5 - apparently from deposit ion
6
of CuBr, (formed by reactions with the copper in the Monel). A laboratory-scale system is being in- s ta l led at RMI to study corrosion under fluidized- bed conditions.
2.10 Leaching of Uranium and Plutonium from Primary Reactor Waste Solids, and
Related Corrosion Studies
Leaching of was te so l id s from the primary re- actor, and possibly other sources , is k i n g con- sidered mainly as a means of supplementing accountability and ana ly t ica l da ta . Laboratory s tud ie s have demonstrated that uranium and plu- tonium recoveries a r e 85% or greater when the initial uranium or plutonium concentration in the was te so l id s i s 0.03% or higher; recoveries de- c rease tapidly for concentrations below t h e 0.03% level. Reproducibility of da ta in the lower ranges is poor. However, t h e proposed leaching of entire beds of reactor was te s o l i d s would b e useful for detecting “pockets” or agglomerates of plutonium or uranium that might e s c a p e detection by other analytical means. T h e most effective leachant is 13 M HNO, up to 0.1 M in HF; Al(NO,), a t about the s a m e concentration as the WF is effective in reducing fluoride corrosion and may b e addc ‘. if required. Small-scale engineering work h a s dem- onstrated operating feasibil i ty. Corrosion s tud ie s have been concluded; they indicated HAPO-20 alloy (50% Ni-25% Cr-16% Fe-6% Mo--l% Cu) to be the bes t choice for equipment construction. In view of ;1 decision not to ins ta l l t he leaching sys tem ir! t h e FBVP?. engineer;ng des ign progressed only
ves se l des igns , and of equipment layout. ‘.*ough preliminary vers ions of a flowsh,et, of
SMALL-SCALE ENGINE E RING ST LID I ES
2.11 Process Flowsheet Tests
T e s t s of process f lowshee ts have been continued in the small-scale engineering t e s t facility t o ob- tain experience with remotely operated fluidized- bed equipment. T h e s e t e s t s , using uniriadiated U 0 2 fuel c lad in s t a i n l e s s s t ee l or Zircaloy-2, were performed in a 2-in.-ID fluidized-bed reactor. Instruments and controls duplicated a s c lose ly a s possible those proposed for installation in the FBVPP. No process s t e p s involving plutonium were tested.
Evaluation of the HF-oxygen flowsheet for de- cladding UO, fuel was completed. S ta in less steel cladding was completely destroyed and the UO, was oxidized to U,O, by us ing 40% IIF-60% oxygen to init iate t h e reaction and 20% HF-80% oxygen t o complete it. Although massive p i eces of s t a in l e s s s t e e l , s u c h as end plugs, were only partially reacted, operation of the flui.dized bed appeared to be unaffected, and subsequent treat- ment of the bed with fluorine resulted in uranium losses cons is ten t ly l e s s than 0.2%. Zircaloy-2 cladding can also be destroyed and t h e UOz oxi- dized by use of similarly programmed HF-oxygen reagent flows. T h e massive sha rds of Zr02 pro- duced a re not detrimental to bed fluidization; how- ever, their conversion to ZrF4 in t h e subsequent fluorination s t e p would b e slow.
During preliminary experiments in decladding Zircaloy-2-clad U 0 2 fuel elements with HCl, un- s teady flow conditions ex i s t ed in the pyrohydro- lyzer a s a consequence of a high gas velocity, which resulted from t h e increased volume of g a s produced during the pyrohydrolysis of 2rC1 to Zr0 , . Operating difficult ies with the pyrohydro- lyzer c a n b e minimized by keeping t h e superficial velocity of the HC1 reagent in the primary reactor a t or below 1 fps. aec l add ing t imes of 2 hr or less were obtained when using 60% HC1-40% oxygen, a 450°C reactor temperature, and a U 0 2 : A1,03 ratio of 1 : 1.6. Uranium losses to the pyrohydrolyzer were about b.2%, and 1 to 2% of the zirconium re- mained in the primary reactor bed. T h e U 0 2 pellei:, from t he HCl decladding t e s t were oxidized to U,O, by air without sintering. T h e chloride con- tent i n the bed after oxidation was about 0.1%.
2.12 Sampling of Solids from a F lu id ized- Bed Reactor
A sys tem is being developed for sampling bed material in fluidized-bed reactors. It u s e s a gas- powered je t to transfer par t ic les f rom the fluidized bed through a n external loop and back into the re- actor. After numerous t e s t s a j e t was designed; t hese j e t s will b e integral par t s of the sample takeoff nozzles installed on the primary reactor in the F B V P P . A prototype unit was built and will b e tested to determine the correlntiori be- tween the amount of uranium i n the sample and the to ta l amount i n the bed.
7 ...
2.13 Continuous In -L ine Monitoring of Process Gas Streams
Proper control of the various s t e p s in the fluo- ride volatility process depends on developing in- line monitoring devices that measure, preferably continuously, some component in the off-gas stream whose concentration varies directly with the reaction rate. The HCI-Zircaloy-2 reaction can be followed by measuring the hydrogen con- centration in t h e pyrohydrolyzer off-gas s t r e a m with a thermal conductivity cell. In the oxidation s t ep , the oxygen concentration c a n be measured by taking advantage of its high magnetic suscep- tibility. At present, a gas chromatograph that measures e i ther the bromine-BrF3 or the U F 6 concentration appears t.o be a promising method for monitoring the B r F j fluorination step; how- ever, further development effort is needed. Fluorine concentrations in the off-gas from the plutonium fluorination s t ep can b e monitored with an ultraviolet spectrophotometer.
2.14 Estimation of Cr i t ica l Constants for NLF
As an extension of ear l ie r experiments to de- termine vapor-liquid equilibria of the UF,-NbF5 system, the pressure-density-temperature relation- sh ips of the liquid and vapor phases of NbFS w e r e detenn ined.
3. M O L T E N - S A L T REACTOR PROCESSING
3.1 Continuous Fluorination of Molten Fluoride Mixtures in 1-in.-diam Columns
Process ing of the fuel s t ream of a molten-salt breeder reactor (MSBR) requires complete removal of uranium from the s a l t by continuous fluorination. A high uranium recovery can be obtained by us ing a tower in which molten s a l t and fluorine a r e con- tacted countercurrently, with the molten s a l t as the continuous phase . Experimental data indicate that the fluorination rate is sa t i s fac tory and tha t the required ax ia l concentration gradient will not be destroyed by the inherent ax ia l mixing result- ing from rising bubbles of fluorine. The e f fec ts of salt throughput, operating temperature, and init ial U F 4 concentration on uranium removal during s teady-s ta te operation were studied in fluorinators having a s a l t depth of 48 in. Re-
moval of the uranium fed t o the fluorinator ranged from 97.4 to 99.9%, with removal i n most of t he runs being greater than 99%.
3.2 Corrosion Control by Use of Q Frozen Wall
Corrosion of a cont inuous fluorinator can be con- trolled by maintaining a layer of frozen s a l t on the fluorinator wall. W e a re making preparations for the demonstration of frozen-wall protection. In these forthcoming experiments, the molten s a l t will contact an inert gas countercurrently in equip- ment of a design su i t ab le for continuous fluorina- tion.
3 .3 Relat ive Vo la t i l i t i es of Rare-Earth Fluorides in MSBR Salts
The method currently proposed for p tocess ing the fuel stream of a n MSRR includes a disti l lat ion s t ep in which the major components of the stream, L i F and B e F 2 , a re vaporized and separated from less-volati le f i ss ion products, primarily rare-earth fluorides (REF). Relative volati l i t ies of a number uf REF’S with respec t t o LiF’ have been measured in a recirculating equilibrium s t i l l , using the binary system L i F - R E F and the ternary system IAF-BeF,- REF. The s t i l l w a s operated at 1000°C in all in- s tances ; the operating pressures were 0.5 and 1.5 mm Hg with the binary and t h e ternary sys t ems re- spectively. Relative volati l i t ies of the trifluotides of La, Pr, Nd, Ce, and Sm ranged from 2 x to 2 x l ow3 , with C e and Pr showing the highest values. T h e s e values ind ica te that t he required R E F removal efficiencies can be obtained in s t i l l s of simple design without rectification.
3.4 Vaporization Rates in Fluoride Salt Di s ti I l a t i on
Data on the variation of vaporization rate with total pressure a re necessary t o predict vaporiza- tion rates in equipment that is su i tab le for MSBK fuel processing and to assess errors in relative volati l i t ies t ha t a r e measured in recirculating equilibrium stills. T h e rate of vaporization of a mixture of LiF and PrF, was measured a t severa l condenser pressures in the range 0.1 to 1 .O mm Hg in a n inverted-U-shaped disti l lat ion unit constructed from 1-in. nickel tubing. The vapor pressure of t he
8
s a l t mixture was 0 5 0 mm 1-11: a t t h e vaporization temperature of 10oO°C.
Salt vaporization rates a t condenser pressures of 1.0 and 0.1 m m Hg were 7.8 x g sec- * c m ~ ~ . respectively. The vaporization rate for a condenser pressure of 1.0 mm Hg is compa- rable with the ca lcu la ted rate of diffusion of s a l t vapor through stationary argon, which was present between the vaporization and condensation sur- faces, Viscous drag in the p a s s a g e between t h e vaporization and condensation sur faces limits t h e vaporization rate when condenser pressure- a a r e lower than the vapor pressure of t h e s a l t at t he vaporization sur face .
and 2 .4 x
3.5 Preveqtion of the Buildup of Low-Volat i l i ty Materials a t a Vaporization Surface
During the vaporization of a multicomponent mix- ture, materials that a r e less volati le than the bulk of the mixture tend to remain in the liquid phase and are mnoved from the surface of the liquid by -snvection and molecular diffusion. Low-pressure vaporization does not generate deeply submerged bubbles and therefore provides l i t t l e convective mixing in the liquid. T h e concentration of ma- t e r ia l s of low volati l i ty a t t he vaporization sur - face may b e appreciably higher than the average liquid concentration if t h e s e materials a r e removed by diffusion a lone . T h e increased surf2 con- centration will resiil’ :n the vaporizatiu. *,f a greater quantity of low-volatility material . n ~ . would occur iAi J comparable system having a miform liquid-phase concentration and will de-
c r ease the separation efficiency of t h e s t i l l . T h e effect of the sur face buildup of materials
having low volati l i t ies h a s been considered for both transient and s teady-s ta te operation of sev - eral s t i l l types. Liquid-phase mixing by liquid circulation i s a necessary charac te r i s t ic of molten- sa I t s t i l l s .
3.6 Demonstration of Fuel-Salt Dist i l lat ion a t the MSRE
Equipment h a s been designed and fabricated for a Iarge-scale demonstration of the disti l lat ion of molten-salt reactor fuel. T h e system cons i s t s of a 48-liter feed tank, a 12-liter s t i l l pot, a condenser, a 48-liter condensa te ieceiver, ana assoc ia ted aux- i l iaries required for removing condensa te samples
during operation and for maintaining desired op- erating conditions.
The sys tem will b e operated for 500 to 700 hr c ing nonradioactive s a l t having the MSRE fuel currier composition (65-30-5 mole % LiF-BeF2- ZrF4) and containing smal l quant i t ies of rare- earth fluorides. T h e system will be used in early 1968 to d i s t i l l approximately 48 l i ters of radioactive MSRE fuel s a l t from which the ura- nium h a s been removed by fluorination.
3.7 Alternative Processing Methods
The stabil i ty of lanthanum beryllide (LaBe l 3 ) i n contact with liquid bismuth was s tudied in connec- ‘:on with poss ib l e reductive precipitation and re- aiictive extraction inethods for process ing MSBR fuel. Over the temperature range investigated, 318 to 832”C, the beryllide was decomposed by the bismuth, the extent of decomposition being poverned mainly by the solubili ty of lanthanum
can, therefore, probably be avoided in t h e reduc- tive extraction method if enough bismuth is present ’ \ sa t i s fy the so lubi l i t i es of the rare-earth metals.
.. bismuth. Formation of insoluble beryll ides
3.8 Preparation of 233M Fuel for the MSRE
Approximately 71 k g of UF4 7 L i F eu tec t ic s a l t will be prepared for refueling the MSRE in early 1968. T h e s ta r t ing material will cons i s t of 2331J03 containing 240 ppm of 232U, which is presently ava i lab le a t the Laboratory. The chem- ical. flowsheet involves simultaneous reduction and hydrofluorination in the presence of lithium fluoride. Equipment h a s been designed and is being installed in the TUFCDF.
4, WASTE: TREATMENT AND DiSPOSAL
4.1 High-Level Radioactive Waste
Development work on the d isposa l of aqueous high-level was te by t h e Po t Calcination p rocess i s now complete except for the pilot-plant demon- stration of this p rocess a t the Pac i f i c Northwest Laboratories. Currently, t h e m a j o r ob jec t ipes in high-level was te development a re to develop and to demonstrate, on a pilot-plant s c a l e , p rocesses for putting the was te powders from the Fluidized-
9
Bed Volatility P r o c e s s (FBVP) into a form su i t ab le for permanent d i sposa l . P r o c e s s e s a re be ing de- veloped concurrently at Oak Ridge National Labora- tory (ORNL) and Brookhaven National Laboratory (BNL); ORNL's primary responsibil i ty is t o deter- mine the problems assoc ia ted with the s torage of the was te as a powder and BNL's to develop an economical process for d i spers ing the was te in a g l a s s matrix.
Studies at ORNL o n the thermal s tab i l i ty of un- treated w a s t e s have shown tha t f luorides s u c h a s those of aluminum and c e s i u m have subs tan t ia l vapor pressures a t temperaiures of about 500°C. Further, t hese s tud ie s have shown tha t t h e pres- ence of trace quant i t ies of water on the untreated was te s c a u s e s r e l ease of corrosive hydrogen fluo- ride during t h e hea t ing cyc le . Thermochemical ca l - cu la t ions indicate tha t alkaline-earth oxides shou ld s t ab i l i ze these sys t ems by reacting with the vola- t i l e f luorides to y ie ld a more-stable fluoride and a s t ab le oxide. Laboratory experiments with calcium oxide as a "fluoride getter" confirm t h e s e calcula- t ions. T h e 1 to 3% weight loss observed when t h e untreated powder is held a t 550°C for 74 hr can b e reduced to e s sen t i a l ly zero i f calcium oxide is added to t h e was te powder in a 1 : 9 weight ratio prior to heating. Thermal conductivity measure- ments made on t h e alumina powders used as fluid- izing media in the FBVP gave va lues ranging from 0.26 Btu hr-' ft-' O F - . ' a t 327°F to 0.42 Btu hr-.'
at 1680'F. Leach ing tests with water f t - 1 OF.-' showed that in one week e s sen t i a l ly a l l the 137Cs tracer, about 30% of t h e fluoride, and 3% of t h e alu- minum a r e removed from these powders. L e a d borosil icate and lead silicate g l a s s e s have been tes ted at ORNI, i n a n attempt to find a commercial g l a s s frit for u s e as a g l a s s matrix in t h e disper- sion process . Dense, void-free products have been obtained using Pemco 716 (nominally 67.6% PbO, 26.8% S O , , and 5.6% CaO) in a g l a s s : powder was te weight ratio of about 1.7: 1. T h e measured thermal conductivity of this d ispers ion is about 1.22 Btu hr-I ft-' "F-' at 140"F, which is about five t imes tha t of the w a s t e powder alone. Leach- ing s tud ie s on was te d i spe r sed i n g l a s s have shown tha t 0.002% of t h e cesium and 0.07% of t h e fluoride and aluminum a re leached from t h e d is - persion in 21 days .
The pilot-plant demonstration of t h e ORNL and BNL was te d i sposa l p rocesses , which will be carried out simultaneously with t h e fluidized-bed volatility p rocess demonstration, will b e loca ted
in cell I of Building 3019. T h e necessary equip- ment i s being designed to b e compatible with both processes . P r o c e s s operations will be performed remotely with a c rane and manipulators.
4.2 lntermedia te- L e v e l Radioactive Waste
A process for incorporating a l l t ypes of inter- mediate-level w a s t e s in asphal t is be ing developed. The was te types s tud ied include a lka l ine evaporator residues, an aluminum c ladding solution, and a second-cycle solvent extraction raffinate with added caus t ic . In t h i s process , the was te s a re mixed with emulsified asphal t (.1,35% H,O), the water is volatilized, and the product is heated to 160'C. The l each r a t e s of cesium from the a spha l t products were reduced by fac tors of 2 t o 10 by adding 2 wt 7% Grundite c l ay and 2 wt % water g l a s s t o t h e original was t e s . These addi t ives a l s o increased the igni- tion temperatures of t h e products by at l e a s t 65°C. The effect of radiation on the products is being studied us ing samples that contain 60 wt 7% salts and 2 to 52 cur ies of mixed radionuclides per gallon of asphal t product. After s e v e n months and an absorbed d o s e of 4 Y lo7 rads, no swelling, g a s evolution, or increase in l each rates of salts have been observed. A nonradioactive p i lo t plant was constructed to determine the feasibil i ty of using a wiped-film evaporator for t h e incorporation of intermediate-level was t e s in asphal t . T h e equip- ment operated for 62 hr at r a t e s up to 11 gal o f was t e solution pe r hour yielding product contain- ing up to 64 wt % was te s a l t s . No ser ious op- erating difficult ies were encountered, and wiper- blade wear w a s negligible. T h e water d i s t i l l a te was decontaminated from sodium by a factor greater than 4000 as compared with the original was t e solution. T h e estimated capi ta l cost of a n asphal t plant for annually treating 400,000 gal of TLW containing 5 cur ies /ga l w a s $330,500; t h e estimated unit operating cos t , including amottiza- tion and burial a t ORNL, w a s 37q per gallon.
4.3 Low-Level Radioactive Waste
A process is being developed to decontaminate low-level radioactive was te to the degree required to permit recycle and r euse of the was te s . T h i s would b e a n improvement on the current prac t ice of par t ia l decontamination and t h e dependence on discharge to s t reams and dilution to m e e t t he
10
maximum permissible concentration l imits for ra- dionuclides. Micro-pilot-plant experiments in- cluded flocculation and clarification by alum, demineralization hy ion exchange, and final cleanup by activated carbon. Overall decon- tamination factors of 1000 to 10,000 were ob- tained for a l l major radioactive spec ie s for up to 2400 voluines of low-salt-content recycle was te water treated per bed volume of cation resin. Wastes with the same concentration of dissolved so l id s but containing different amounts of s u s - pended so l id s require the s a m e amount of the co- agulant alum. Wastes containing tripolyphosphate and alkylbenzenesulfonate (synthetic detergents) may require treatment with a n organic polyelec- trolyte in addition to alum. With polyphosphate in solution, a calcium : phosphate ratio of 1 or higher i s needed for floc formation to minimize the amount of alum required.
4.4 Engineering, Econo Evaluation
The management of was te s produced a t nuclear power plants will become increasingly significant in ari economy that is expected t o grow to 50 times i t s p resent size within t h e next 13 years. As a pre- liminaey s t e p in a s s e s s i n g future implications, t h e operating experience in was te management at Dres- den-I, Big Rock Poin t , Humboldt Bay, Elk River, Yankee, and Indian K’oint-I h a s been reviewed. In th i s study, to bL published as ORNL-4070, t he sources and charac te r i s t ics of the was te s a r e re- viewed, t he was te management sys tems and tech- niques in use a t the power s t a t ions a re described, and t h e operating exper ience is ana lyzed from the standpoint of the radioactivity released to the en- vironment.
4.5 Separation of Noble Gases from Air Using Permse lec t ive Mem branes
A thin (“ 1 mil) dimethyl s i l i cone rubber mem- brane was used to sepa ra t e noble g a s e s from air. The permeability fac tors of krypton, oxygen, and nitrogen a t 1.50 ps ig were 45, 16, and 10 respec- tively. Preliminary es t imates indicate tha t the cos t for removing noble gases from a reactor con- tainment she l l following a reactor acc ident by using a c a s c a d e of permselective membranes com- pares fivorably with other p rocesses that have been proposed.
4.6 Computer Code for Calculating Nuclear Properties of Accumulated Wastes
‘Three computer programs have been written to ca lcu la te the buildup and decay of gross f i s s ion product activity and heat in was te tanks and s y s - tems. Steady or variable w a s t e addition rates may be considered.
5. TRANSURANIUM- EL E
T h e Transuranium Process ing P lan t (THU) and ine High Flux Isotope Reactor (HFIR) were built a t ORNL to produce la rge quantit ies of the heavy actinide elements as par t of the USAEC Heavy Ele- ment Production Program. T h e s e materials will b e used in bas i c research i n laboratories throughout the country. During tht pas t year ’TKU began “hot” operations, * 2 P u 0 2 target irradiation was s ta r ted in the HFIK, and isotopic enrichment of 244Pu was carried out in t h e Isotopes Division. More than 40 shipments of transuranium elements were made to fulfill reques ts from national labora- tories, universit ies, and industry in th i s country and i n three foreign countries. T h e phases of t h e program tha t a r e under the direction of the Chem- ical ‘Technology Division a re reported here; t h e s e include operation of THU, final isolation and puri- fication of the transuranium elements, and develop- ment of chemical separa t ion p rocesses and equip- ment.
Design and development work on the target e le - ments, which a r e to ‘-e remotely fabricated in TRU, is under +he direction of the Metals and Ceramics Division and is reported e l sewhere . However, t h e premature failure of ta rge ts during irradiation i.n t he HFIR and t h e poss ib l e e f fec t on the Transuranium Element Production Program a re d iscussed .
5.1 PRU Operations
’The purpose of the Transuranium Process ing ”lant is to recover transuranium e lements from ir- radiated ta rge ts for distribution to research workers and to refabricate targets from some of the inter- mediate i so topes , espec ia l ly americium and curium, to produce heavier elements. Complete process ing is expected t o include:
1. dissolution of irradiated targets;
2. recovery of unburned plutonium;
11
3.
4.
5.
6.
7. 8.
separa t ion of the transplutonium e lements from f i s s ion products (Tramex);
separa t ion of transcurium e lements from ameri- cium and curium;
separa t ion of berkelium from californium, ein- steinium, and fermium;
i so la t ion of californium, einsteinium, and fer- mium;
preparation of ox ides of some of t h e ac t in ides ;
remote fabrication of ta rge ts for reirradiation of some of the ac t in ides in the HFIR.
T h e first three process ing s t e p s were performed successfu l ly th i s year in ‘I‘RU, at full l eve l s of solution power density and a lpha and beta-gamma radioactivity. Operation i n TRU of equipment for the main-line p rocess s t e p s tha t a r e t o follow Tramex h a s been held up by flowsheet problems in the next s t ep , separa t ion of transcurium e lements from t h e americium and curium. In t h e meantime, subsequent ac t in ide separa t ions have been done using laboratory-type equipment and alternative flowsheets.
Eighteen targets, which had been irradiated a t the Savannah River P l a n t for a yeat, were inspec ted and repaired in TRU and then transferred to HFIR for continued irradiation. Four HFIR prototype ta rge ts and s i x SRP reactor s l u g s were processed . When laboratory-scale i so la t ion and purification of the result ing so lu t ions (now in the f ina l s t ages ) a r e completed, w e will have produced 50 g of 2 4 2 P u , 10 mg of 244Pu, 25 g of L43Am, 80 g of 2 4 4 C m , 200 pg of 249Bk , and 2 mg of zszCf .
aluminum (jacket and matrix) i n 6 M NaOH - 3 M NaNOj and decanting t h e aluminum-bearing solu- tion through a filter and centrifuge, leaving t h e un- dissolved par t ic les of ac t in ide oxides. Less than 0.2% of the ac t in ides h a s been lost during aluminum removal, and no difficulty h a s been encountered in fi l tering the so lu t ions . T h e ac t in ides a r e then d is - so lved in e i ther 6 M HC1 or 15.8 M H N 0 3 (with or without fluoride catalyst) . If fluoride is used , a fluoride-removal s t e p is required to prevent ex- c e s s i v e corrosion of Zircaloy-2 and tantalum equip- ment.
nitrate-based anion exchange p rocess and a new batch solvent extraction p rocess were used suc- cessfully. A chloride-based anion exchange process, which worked well in glass equipment,
Targe t dissolution i s done by f i r s t d i sso lv ing the
Plutonium is removed initially. The well-known
was unsatisfactory for u s e with metal equipment in TRU. T h e plutonium w a s apparently reduced to Pu(III), which will not load on the resin; oxidants that a r e s t rong enough to keep the plutonium oxi- dized caused e x c e s s i v e corrosion of equipment.
After only cursory t e s t s , w e obtained sa t i s fac tory resu l t s with a batch so lvent extraction p rocess that u s e s di-terf-butylhydroquinone to reduce t h e ex- tracted plutonium in t h e organic phase and to c a u s e i t t o be stripped into concentrated HCl. T h e plu- tonium product was decontaminated from gross gamma activity by a factor of 150, which is ap- proximately equal to tha t ach ieved with nitrate- based anion exchange. Separation between plu- tonium and transplutonium ac t in ides w a s very sharp, and losses were low. Zirconium, which is introduced into p rocess so lu t ions by corrosion and which c a u s e s equipment operating problems during subsequent process ing s t e p s , was completely re- moved from t h e ac t in ides and d iscarded with the was te solvent. T h i s feature (zirconium removal) is a key advantage of t h e extraction flowsheet.
tinuous separa t ion of f i ss ion products from t h e transplutonium ac t in ides , is operational in TRU. Equipment operability s t i l l needs to b e improved, and t h e flowsheet parameters need to be optimized. Nevertheless, p rocess operation is routine, and product recovery i s good. T h e transplutonium ele- ments a re decontaminated from gross gamma activity by a factor of 75, which i s adequate s i n c e remote fabrication techniques will b e used t o m a k e re- cyc le targets.
TRU was shut down for an ex tens ive program of equipment repair and modification in February 1967, a f te r about seven months of operation. No s ing le problem was se r ious enough to have forced a shut - down, but the combined e f f ec t s had made plant op- eration inefficient. Eventually, remote maintenance techniques will be required i n the tank p i t s , but thus far direct maintenance h a s been possible. A to ta l of 28 en t r ies by personnel were made into the tank pits; the radiation d o s e received per en t ry (about 20 min average duration) ranged up to 150 mil l i - rems; no weekly d o s e s exceeded 300 millirems. Although sur face contamination in the p i t s was in e x c e s s of lo5 alpha disintegrations per second per 100 cm2 and a number of internally contaminated l i nes were d isconnec ted in t h e p i t s , the level of airborne contamination in t h e “limited access” area, into which t h e p i t s were opened, never ex - ceeded normal tolerance.
The Tramex so lvent extraction process , for con-
12
Two computer programs, which a re operational, were written to allow t h e prediction of compositions of targets irradiated in the IIFIR. Such predictions a re required in order to determine ta rge t composi- t ions that can b e sa fe ly irradiated in the reactor, to plan irradiation and process ing schedu les , and to forecas t t h e availabil i ty of various i so topes of the transuranium elements. One of the computer programs, which is used to ca lcu la te production rates of various i so topes during neutron irradiation, is an extension of earlier programs tha t a re based on the CRUNCH code . T h i s expanded version con- pu tes explicit contributions from epithermal neu- trons and makes a n approximation of resonance self-shielding effects. T h e second program is used to interpolate and weigh the resu l t s from the f i r s t program, by the method of l e a s t squa res , to deter- mine the s e t of cioss sec t ions that most nearly re- su l t s in the observed target compositions. T h e prediction of HFIR effective cross sec t ions for 2 4 2 P u and 243Am, which w a s based on t h e anal- y s i s of SRP irradiations, was found to be within 10% of the values determined by the aiialysis of irradiations in the HFJR. T h i s ind ica tes that no gross def ic ienc ies ex i s t in the mathematical models. As larger quantit ies of transuranium elements a re produced, t hese programs will be used repeatedly to reevaluate c ross -sec t ion da ta and to more ac- curately predict the availabil i ty of various iso- topes.
5 . 2 Transplutonium Element Isolation from Tramex Products
Generally accepted processes for i so la t ing ac t in ides from small-scalc ta rge ts of highly ir- radiated plutonium, americium; and curium were satisfactorily sca led up for processing Tramex product f r o m TRU operations. The success fu l processing of Tramex product h a s demonstrated the feasibil i ty of us ing t h e s e laboratory-type isolation methods to sepa ra t e significantly larger amounts of transplutonium elements than was previously con- sidered possible.
Four major process ing s t e p s were required for isolation of the ac t in ides . Following adjustment of the feed a n LiC1-anion exchange process was used t o provide additional decontamination from fission products and ion ic contaminants and to separa te the ac t in ides into three fractions that could be subsequently processed for final ac t in ide isolation. Most of the americium and curium was eluted us ing 9 M LiC1; continued elution with S M
LiCl provided a second fraction, which contained thc remainder of t he curium and about 60% of t h e berkelium; final elution with 8 il.I HC1 gave a third fraction, which contained t h e remainder of t h e berkelium, a l l of the californium, and about 0.5% of the original americium-curium. Highly pure californium was recovered by chromatographic elution from ca t ion exchange res in with ammonium a-hydroxyisobutyrate. T h e americium-curium- berkelium fractions from both columns were com- bined, and berkelium was recovered by extraction of Bk(1V) with di(2-ethylhexy1)phosphoric ac id from 8 M HNO,. When the separa t ion of americium and curium was required, americium was precipitated from potassium carbonate solution as a double potassium americium(Vr) carbonate.
5.3 Development of Chemical Processes
1Lahoratory support was provided to inves t iga te chemical problems tha t a rose during init ial high- activity-level process ing i n TRU. P r o c e s s de- velopment was continued in the a r e a s of plutonium recovery by a n HC1-anion exchange process , ac- tinide partitioning by so lvent extraction, Cf-Es-Fm separations, and americium-curium oxide prepara- tion.
We studied methods for removing fluorides from dissolver solutions when IIN0,-HF was used to ensure complete d isso lu t ion of oxide target ma- terials of low burnup. with main-line TRU process equipment.) Hydroxide precipitation was determined to b e the s imples t method readily ava i lab le , and process parameters for t h i s procedure were evaluated. It w a s found that un less t he hydroxide precipitate is washed very thoroughly, two or more precipitation-filtration cyc le s a re required for complete fluoride removal; when appreciable amounts of aluminum a re present, complete fluoride removal in a s ingle cyc le is im- possible.
so lved in HCI. media and s i n c e i t is convenient to have t h e transplutonium elements in HC1 solution following plutonium removal, development of a p rocess to recover plutonium by an I-ICI-anion ex- change system w a s continued. Laboratory s tud ie s were made to determine t h e e f f ec t s of severa l variables on plutonium loading for three different resins. Distribution coefficients for Pu(1V) were determined as a function of HC1 and L iCl concen- tration; a l so , t he e f fec t of t h e addition of ethanol on plutonium sorption was investigated.
(Fluoride is not compatible
Since highly burned plutonium ta rge ts c a n b e dis-
13 ...
... .....
In recent s t u d i e s of the Pharex p rocess , in which the heavy ac t in ides a re separa ted from americium and curium by preferential extraction into 2-ethyl- hexyl phenylphosphonic ac id (HEH[+PI) from di lu te hydrochloric ac id , w e found tha t the presence of smal l amounts of zirconium significantly reduces available curium-berkelium separa t ion factors; for example, 100 ppm of zirconium in the feed c a u s e s a fourfold reduction. T h i s reduction i s explained by t.he fact tha t berkelium and californium distri- bution coef f ic ien ts a r e not affected by zirconium, while t he americium-curium distribution coefficients increase with increas ing zirconium concentration. Since feed so lu t ions for th i s separation s t ep will probably contain enough zirconium to preclude Pharex , other separa t ion methods were sought. It was found that, by us ing di(2-ethylhexy1)phosphoric ac id (I-IDEHP) as the extractant, t he de le te r ious effect of zirconium c a n b e avoided and a berkelium- curium separation factor of 12 to 14 c a n b e ob- tained. Laboratory s tud ie s of t h i s process (named Hepex) a re presently under way; de t a i l s a r e re- ported in Sect. 8.9.
Chromatographic elution from ca t ion exchange resin with a-hydroxyisobutyrate so lu t ions will b e used for t h e separa t ion of Cf-Es-Fm and t h e purifi- cation of s o m e final products. Column scale-up s tud ie s to high activity leve ls , us ing 242Cm as a stand-in, confirmed tha t t h i s method c a n probably be used t o p rocess 100-mg quant i t ies of "'Cf in conventional equipment; however, very careful control of conditions, and rapid processing, a r e required to l i m i t radiolytic g a s formation and ra- diation damage to the resin.
We a r e developing a new ion exchange technique that improves control and dec reases process ing t-ime. F e e d is pumped rapidly at high pressure through a long bed of very f ine par t ic les of ion ex- change resin. T h e u s e oE fine-mesh res in inc reases the k ine t ics of ion exchange , and the high pressure permits greater freedom in the se l ec t ion of operating parameters. Tests with neodymium and praseodym- ium indicated tha t t h i s technique is promising for the separation of ac t in ides . Systems have been in- s t a l l ed i n glove boxes , and testing with actinide tracers is in progress.
Pa r t i c l e s of dense americium-curium oxide in t h e range of 20 to 100 11 diameter a r e required for in- corporation into HFIR targets. T h e sol-gel method has severa l advantages over alternative p rocesses for preparing s u c h par t ic les . Two techniques tha t a re potentially appl icable to in-cell preparation of
10-g ba tches of sol were investigated: (1) filtra- tion and washing in a jacke ted fi l ter funnel that can b e heated to convert the hydroxide pas t e to a so l , arid (2) filtration and washing in a sintered- metal bowl centrifuge, which c a n also b e heated. After conversion, t he s o l c a n b e separa ted from unconverted hydroxide p a s t e by applying pressure ac ross the porous material, ei ther by centrifuging or by applying vacuum; the fluid sol p a s s e s through to a collection vesse l , and t h e unconverted pas t e remains. ing init ial evaluations in which europium hydroxide sols were prepared. T h e fi l ter w a s used to prepare S g ba tches of americium-241 hydroxide sol; the behavior of americium c lose ly paralleled tha t of europium.
Both techniques appeared ptomising dur-
5.4 Development of Pracess Equipment
W e continued the development of equipment for use with so lvent extraction p rocesses for t he sep - aration of americium and curium from other trans- plutonium elements. Last year i t was found tha t s eve re p la te wetting by the so lvent precluded op- eration of the Pharex p rocess in TRU solvent ex- traction equipment with the aqueous phase con- tinuous, as designed. Two alternative so lu t ions were investigated: operation with the organic phase continuous, or the u s e of ceramic s i eve p la tes , which a re preferentially wetted by the aqueous phase . Both so lu t ions a re workable. IIowever, Pharex w a s found to b e unsatisfactory for u s e in TRU because the presence of zirconium in the feed, which is introduced by corrosion of TRU equipment, reduced separa t ion fac tors to in- tolerably low va lues . W e a r e developing a new process, Hepex, which employs a chemical system that is insens i t ive to zirconium; however, Hepex exhibits hydraulic behavior that i s similar to Pharex. It must b e operated with t h e organic phase continuous, o r ceramlc s i e v e p l a t e s must be used. At present ou r development work indi- ca t e s that operatlon with t h e organic phase con- tinuous is t h e preferred method. Only Itmited da ta on s t a g e heights have h e n obtained as yet.
5.5 HFIR Target Rod Failures
In February 1967, it w a s observed tha t severa l TRU target rods had ruptured during irradiation in the HFIR. process ing of t h e s e ta rge ts had been scheduled. When the fa i lures were de tec ted , t h e target i s land
T h i s was s i x to e ight months before the
14
in the HFIR flux trap contained 14 t a rge ts that had been irradiated only in the HFIR and 17 ta rge ts that had been previously irradiated about one year at the Savannah River P lan t . Both groups of ta rge ts had received the same amount of irradiation in the HFIR. Examination of the SRP-irradiated ta rge ts showed cracked cladding on five. T h e 14 ta rge ts that had been irradiated only in t h e HFIR apparently remained intact . I t was concluded tha t the failures occurred because the ducti l i ty of t h e cladding was reduced by the e f f ec t s of irradiation, t o the extent that t h e cladding was unable to deform to accom- modate the normal swel l ing of the target pe l l e t s and the fission-gas pressures generated within the pellets. The Metals and Ceramics Division h a s begun an ex tens ive program to determine t h e mechanisms tha t caused the failures and t o de- velop an improved des ign for t he targets; th i s work will be reported elsewhere.
'The transuranium-element production program should not b e seriously affected a s a result of these prema- ture target failures. On t h e other hand, t he failures will have a rather important effect on production in the coming year, s ince process ing the failed targets and recycling the americium and curium to the HFIR will require s i x months. S ince contamination prob- lems in HFIR have not been severe , t h e remaining S R P targets will be irradiated either until they fa i l or until they have been irradiated as originally planned; the ac tua l reduction in product. availability will depend on how long these targets a r e irradiated.
6. DEVELOPMENT OF THE THORIUM FUEL CYCLE
During the pas t year notable advances were made in the 'Thorium Utilization Program. traction process for preparing mixed Tho,-UO, s o l s was developed i n the laboratory and was demon- strated in engineering equipment on the scale that will be required in t h e Thorium-Uranium Recycle Fac i l i ty (TURF). Conditions were determined for producing thoriiim dicarbide microspheres at greater than 90% of theoretical dens i ty , with acceptably low oxygen and free carbon. A sphere-forming pilot plant was built and operated on the s c a l e that will be required in the TURF. T h e T U R F building, procurement of major equipment, and the design of process ing equipment aie nearly complete.
A solvent ex-
6.1 Sol Preparation by Solvent Extraction A simple solvent extraction process h a s been
developed for preparing mixed Tho,-UO, sols di-
rectly f rom an aqueous solution of thorium and uranyl nitrates. T h e solution is denitrated by u s e of a multistage solvent extraction process ; t he nitrate extractant is a long-chain amine, d i sso lved in an n-paraffin dilucnt. Digestion of t he partially denitrated aqueous phase , after the first s t age of extraction, forms the sol and r e l eases more nitrate, which is extracted in the additional s t a g e s to produce the des i red nitrate content. T h e sol may be evaporated to a concentrate that is su i tab le for u se in forming microspheres, or it may be dried to form gel fragments. Laboratory s tud ie s have de- fined the important chemical variables for t he preparation of sols containing up t o 68 mole % uranium. Engineering s tud ie s have demonstrated the feasibil i ty of thc continuous production of s o l s at t he rate of 1 kg of oxide per hour. Kepresenta- t ive ba tches of sol have been concentrated to 1.5 M by continuous evaporation. Good-quality Tho,-UO, microspheres have been formed by firing gel micro- spheres that were prepared from t h e s e so ls .
6.2 Sol-Gel Process: Further Development and New Applications
Continued s tud ie s of the preparation of thorium dicarbide par t ic les showed that the major problem is gross porosity. T h e method of firing Tho,-C gel to ThC, involves a cri t ical balance between grain growth, sintering, and chemical conversion. An argon atmosphere and the presence of CO a id in controlling the conversion at a temperature where grain growth is optimized and high-density (> 90% of theoretical) microspheres a r e obtained. Typica l microspheres had the composition ThC, . 8 - ,9,
and contained 0.1 to 0.2% free carbon and 0.03 to 0.1% oxygen. 'They were characterized by a n open porosity of 1% and a c losed porosity of 6 t o 8%. They res i s ted crushing loads of 700 to 900 g. Electron micrographs and electrophoretic and vis- cos i ty measurements of the ThO,-C so l s showed strong assoc ia t ion between the particles. Thoria (and urania) d i spersed and s tab i l ized carbon b lacks , the quantity of carbon depending on the spec i f ic surface of the thoria.
T h o , sols accurately at any des i red ratio of tho- rium to uranium, with emphas is on a ratio of =3. Uranium dioxide-thorium dioxide c a n b e prepared by coprecipitating and peptizing t h e hydroxides or by mixing the separately prepared so ls . Control of the thorium:uranium ratio proved to b e precise, and
We have been studying methods for preparing U0,-
15
the products were of exce l len t chemical and physical quality. A coprecipitation-peptization method was developed for preparing U0,-Tho, sols and was demonstrated through calcination to dense U0,-Tho, microspheres having a thorium: uranium ratio of 3.
W e studied t h e chemistry of gel microsphere formation in the 2-ethyl-1-hexanol column, em- phasizing control of surfactant concentrations and poss ib le e f f ec t s of long-term operation. Conduc- t ivity measurements proved useful for monitoring the concentration of Ethomeen S/15. Little, if any, surfactant was sorbed on T h o , s o l or gel. Some oxidation of 2-ethyl-1-hexanol by air and/or nitrate during d is t i l l a t ion was indicated.
6.3 Devefopment of Methods for Producing Microspheres
A pilot plant for preparing microspheres was built and operated as a part of the ORNL Coated Par t ic le Development Laboratory. T h i s pilot plan1 opera tes at t he rate of 2.5 cc of thoria s o l feed per minute, or about 1 kg of product per hour. T h i s system has demonstrated long-term, s tab le opera- tion with respec t t o the water extractant (2-ethyl- 1 - h e x a d , 2EH) and sur fac tan ts . Several problems of remote operation were solved; however, we s t i l l need s imple remote techniques for monitoring t h e operation of the gel-forming column and the quali ty of t h e gel spheres .
W e have continued the study of sol-dispersing equipment in a n effort to a t ta in higher throughputs and a c lose r control of drop sizes. Resu l t s a r e reported for s ing le and multiple two-fluid nozz les , mechanically vibrated nozz les , and free-fall o r i f ices (for large sol droplets only). T h e two-fluid nozz le s have been the most useful; a t optimum operating conditions, t h e mechanically vibrated nozz les produced the .most uniform droplets. The choice of equipment that is most su i tab le for gelation by ex- traction of water with 2EIi depends on the des i red droplet s i z e ; a Eluidized bed in a tapered column is b e s t for larger s i z e s (e.g., to produce thoria microspheres 1.50 p, or larger, i n diameter); d i rec t agitation produces (nonuniform) sphe res 80 IL, or less, in diameter; a long “fall-through” column i s promising for intermediate- and small-sized sphe res .
T h e key s t e p - extraction of water by 2EH .- i s being studied by observing the resultant shrinkage of s ingle suspended sol droplets. T h e m a s s trans- fer charac te r i s t ics during gelation appear to b e
different f r o m any that have been reported in the literature.
Empirical observations of the drying and firing of thoria ge l rnicrospheres indicate tha t , in general , the conditions that will prevent cracking a re t h o s e that minimize concentration gradients within the spheres . T h e desirable conditions (most stringent in the case of the la rges t microspheres) include relatively s low drying in argon and superheated s team at temperatures reaching 200°C, before fir- ing in air. A new gel dryer for removing water and alcohol from the gel sphe res was installed and successfu l ly operated in the Coated Par t ic le De- velopment Laboratory.
6.4 Thorium-Uranium Recycle F a c i l i t y
T h e Thorium-Uranium Recycle Fac i l i t y (TURF) is being built to provide adequate shielded s p a c e for the development of p rocesses and equipment for remotely processing and fabricating ‘l‘h-2 ’U fue ls of various types. The building and the procurement of spec ia l materials (exclusive of process equipment) a r e virtually complete. Con- tracted work yet to be completed c o n s i s t s mainly in installation of the in-cell c rane and manipulator system, cell access plugs, and viewing windows.
During the pas t year, various i tems of p rocess equipment t o b e used by the development groups were designed. T h e s e include equipment for continuous uranium reduction by hydrogen at atmospheric pressure, a bench-scale solvent ex- traction unit for sol production by nitric acid ex- traction, equipment for continuous s o l production by precipitation, an evaporator t o concentrate d i lu te sol, a se t t l e r to remove gel f ines from the gel- forming 2EN stream, and a furnace for ba tch ge l drying and firing. Most of these have been fab- ricated; some have been tes ted . T h e original sphere-forming equipment flowsheet h a s been simplified; t he number of equipment i tems, a s well as the s p a c e required, h a s been reduced. Equip- ment design is scheduled for completion by June 30, 1967.
6.5 233U Storage and Distribution F a c i l i t y
Oak Ridge National Laboratory se rves as a storage, purification, and d ispens ing center for 2 3 3 U . During the pas t year, the 2 3 3 U handling facil i ty received 180 kg of 2 3 3 U (31 shipments) and
16
transferred out 190 kg of Most of th i s material contained less than 5 ppm of 232U. F i v e solvent extraction runs were made to purify 46 kg of 2 3 3 U ,
T h e new 5-kg/day dissolver-leacher performs satisfactorily; it h a s proved very efficient in d is - solving high-fired sol-gel Tho,-UO 2. A study of the stabil i ty of uranyl nitrate solutions contain- ing rare-earth neutron poisons for criticality con- trol, i n anticipation of semipermanent s torage of a large amount of mixed 2 3 - 2 3 5 UO,(NO,),, indi- ca ted that the use of these poisons i s feasible.
(54 shipments).
7. SOLGEL PROCESSES FOR THE URAHIUM FUEL CYCLE
T h e uranium fuel cyc le , espec ia l ly a s it re la tes t o fas t reactors, occupies an important place in the reactor development program of the IJnited States. Fue l preparation i s an e s sen t i a l part of the uranium fuel cyc le , and the investigations re- ported in th i s sec t ion cons t i tu te part of our effort to apply sol-gel techniques to the uranium cycle. Emphasis was on the preparation of urania and plutonia s o l s , which can he readily converted into UOz-PuOz mixtures. Zirconia (and UO,-%rOz) s o l preparation i s a l so being investigated s i n c e ZrO, is used a s a n inert diluent in oxide fuels.
7.1 Usania
A flowsheet for the engineering-scale prepara- tion of urania sol was developed. T h e hydrous oxide is first precipitated at pH 9 from a U(1V) nitrate-formate solution (NO,-~/U mole ratio : 2.0; H C O W / U mole ratio = 0.5 to 1.0). The precipi- t a t e is then washed free of electrolyte by d, ncan- tation. To form the sol, the washed precipitate is iesuspended, HNO, and HCOOH are added, and the suspens ion i s stirred at 60 to 63OC until pep- tized. Init ial s tud ies of the engineering flowsheet and the u s e of FINO, as the s o l e peptizing agent indicated that peptization was not always achieved and sol y ie lds were not good. The u s e of hydrazine in the precipitation and washing s t a g e s and of formic acid in the peptizing s t e p s made the process inore reproducible and increased s o l y ie lds to m o r e than 90%.
Kilogram quant i t ies of wan ia microspheres, con- taining both natural and highly enriched uranium, for u se in various applications were made from
batch-prepared uiania sol; however, the desirabil i ty of continuous preparation methods for the engineer- ing s c a l e was recognized. Therefore, a continuous urania s o l preparation sys tem for remote, large- s ca l e , cri t ically safe operation with enriched uranium was designed and fabricated. Sol products prepared in the init ial t e s t s were dilute and had to he concentrated before they were su i tab le for use in the preparation of microspheres. Opera.. tional experience indicated the need for additional equipment development to make the sys tem su i t - able for remote operations. Countercurrent wash- ing of the uranous hydroxide precipitate in a s imple column was demonstrated as a poss ib le means of removing electrolyte on an engineering scale,
A process for t he preparation of urania sol by solvent extraction was developed. In th i s process , NO,- is extracted from a dilute U(1V) nitrate- formate solution (aqueous phase) into an immiscible organic phase containing Amberlite LA-2, a long- chain secondary amine. 'This removal of t he nitrate ion c a u s e s the U(1V) t o hydrolyze and form a so l . The process c o n s i s t s of a reduction s t e p , for preparation of t he U(1V) solution; nitrate extrac- tion in two s t ages , with an intervening digestion s t ep to produce a dilute so l ; and concentration of the dilute sol by evaporation at reduced pressure.
microspheres a re being made in order to e s t ab l i sh firing conditions that will provide products of low carbon content (<50 ppm) and near-theoretical density. Although the u s e of a CO, atmosphere has , i n many t e s t s , yielded adequate products, t h e most effective atmosphere for attaining low carbon content and high density has been Ax-4% H, saturated with water vapor at 90OC. The shrink- age rate, c rys ta l l i t e growth, and decrease in sur face area during firing were studied. Analyses of t he evolved g a s e s by chemical, thermogravimetric and differential-thermal methods were used to s tudy phenomena tha t occur during the firing, in various atmospheres, of UOz gels.
s o l by precipitation-peptization or solvent extrac- tion is the preparation of a U(1V) solution. Work on the preparation of such solutions included the development of a redox-potential measurement to determine t h e completeness of reduction, a n in- vestigation of slurry ca t a lys t s , and s tud ie s of t h e nature of the hydrogen reduction process. A com- mercially ava i lab le platinized-alumina powder containing 5 wt % P t appeared to b e the most suit- ab le ca ta lys t for the reduction reaction.
Drying and firing s tud ie s of sol-gel urania
A necessary first s t e p in the production of urariia
17
A urania sol preparation method involving the direct reduction of U(V1) suspens ions was de- veloped on a laboratory sca l e ; however, i n con- sidering engineering sca leup , i t was set a s i d e in favor of the two sol preparation methods descr ibed above.
Urania s o l s were analyzed by means of chemical methods, pH and conductivity measurements, vis- cometry, electron microscopy, and x-ray diffraction techniques.
Concentrated zirconia sols (?3.4 M ) were pre- pared by autoclaving zirconyl nitrate so lu t ions a t 2 0 0 T to promote hydrolysis and grow zirconia c rys ta l l i t es . T h e result ing s lur r ies were peptized by s u c c e s s i v e decantation-washing procedures to give nitrate-rich zirconia sols. The nitrate con- t en t s were decreased to acceptab le l eve l s by sol- vent extraction with a long-chain amine d isso lved in a hydrocarbon solvent. Gel microspheres were prepared in the usua l manner and fired in a i r at llOO°C to yield dense porcelain-white zirconia spheres.
0.3 were prepared by an adaptation of the laboratory method for preparing urania sol. Zirconyl n i t ra te or zirconia sol was added to U(1V) solution, t h e mixed hydrous oxides were precipitated at p1-I 7, and the filtered, washed precipitate was heated a t 60 to 63°C to form the sol. Strong, dense micro- sphe res of urania-zirconia were prepared from t h e sols.
<
Urania-zirconia sols with a Zr/U mole ratio of
7.2 Plutonia
L.aboratory s t u d i e s and engineering sca l eup of the plutonia sol-gel process were continued during th i s report period. T h e objective of th i s work w a s to develop p rocesses for preparing plutonia sols that (1) could b e used to prepare d e n s e PuO,, (2) would be compatible with other oxide sols so that mixed ox ides could b e prepared, and (3 ) would have the same versati l i ty with regard to forming techniques as the sols already developed a t ORNL. T h e sols produced by t h i s procedure axe 1 to 3 11.1 i n plutonium and have NO,-/Pu mole ra t ios of 0.1 to 0.15. They a re stable €or seve ra l months and are compatible with thoria or utania sols tha t a r e produced by the ORNL sol-gel process. T h e ability t o produce d e n s e plutonia microspheres, as well as homogeneous plutonia-urania or plutonia- thoria microspheres at desired heavy-metal mole
ratios, h a s now been demonstrated on an engineer- ing scale.
T h e plutonia sol is prepared by precipitating t h e hydrous oxide from a nitrate solution with ammonium hydroxide. After it i s washed, the oxide is peptized by the addition of nitric ac id to give a nitrate-rich plutonia sol having a n NO,-/Pu ratio greater than , or equal to, 1. T h e nitrate concentration is reduced by drying and baking t.he sol. T h e residue i s t hen resuspended in water to give a d i lu te so l , which is concentrated by evaporation to the desired plutonium concentration.
T h e operabili ty and the reproducibility oE t h e b a s i c flowsheet were demonstrated by the produc- tion of 20 ba tches of sol (50 to 150 g of plutonium per batch) containing over 1500 g of plutonium. During sol preparation, engineering efforts were concentrated on the development of e s s e n t i a l equipment components having increased reliability and ease of operation. Oxide microspheres from plutonia sols and mixed sols were successfu l ly prepared,
Laboratory efforts were continued i n a n effort t o optimize variables in the plutonia sol process , t o investigate the b a s i c nature of colloidal plutonia particles, to examine alternative procedures €or preparing plutonia s o l , and to def ine character- i s t i c s of ox ide microsphere products. A subs tan t ia l improvement in sol charac te r i s t ics was obtained by the simple flowsheet modification of boiling the washed precipitate of plutonium hydroxide prior to peptization with d i lu te HNO, . Several laboratory preparations employing t h i s technique were charac- terized by high yields, improved s tab i l i ty , and good handling and sphere-forming charac te r i s t ics .
P lu tonia and Pu0,-UO, microspheres ca lc ined a t 1150°C are characterized by high density, low sur face area, and high res i s tance to crushing. Density determinations by mercury porosimetry indicate dens i t i e s of 95 t o 99% of t h e theore t ica l c rys ta l density €or typical products. Surface a r e a s of 0.02 m2/g a re obtained for 30C- to 600-p-diam microspheres. The c rush r e s i s t ances of 250- and 500-p-diam microspheres calcined at 1 150°C aver- age about 550 g and more than 1 kg respectively. Calcined PuO sphe res were water-washed, dried in air , and smeared. Extens ive contac t with 50 t o 100 sphe res produced smears that demonstrated a very low leve l of transferable alpha activity (20 dis/min per smear). T h e homogeneity of utania- plutonia microspheres was investigated by electron microprobe techniques. Examination of micro-
18
spheres containing 20 wt 7% PuO, indicated a homogeneous mixture with a uniform distribution of urania.
actinide compounds of interest t o transplutonium element production by use of thermonuclear de- v i ces i s in progress. Equipment for thermogravi- metric and differential thermal ana lyses was in- s ta l led in a glove-box facility, cold-tested with europia gels, and used to analyze plutonia sol- gel materials. Weight changes in europia ge l s a re (tentatively) attributed to water loss below 300OC (1 m o l e of H,O per mole of Eu, 250 to 300°C) and to nitrate decomposition between 350 and 500°C. Plutonia ge l s l o se weight in two merging s t eps ; the first involves the l o s s of water and nitrogen oxides, while the second corresponds to the measured l o s s in nitrate. Analyses of gel micro- spheres are complicated by the presence of organic res idues that are introduced during the micro- sphere forming process.
An investigation of the thermal s tab i l i ty of various
7.3 Oxides of Controlled Porosity
Methods of producing sol-gel oxide (Tho , and UO,) microspheres having controlled porosity were investigated by incorporating, in the oxide s o l s , materials that volati l ize during t h e firing of gel spheres. In the preparation of porous T h o , , carbon black was dispersed in the T h o z sols, gels were then prepared from the sols, and, f inally, t he car- bon was removed by firing the ge l s in air. Porous UO, was prepared by volati l izing either chloride or molybdic oxide (MOO,) from the urania gel.
8. SEPARATIQNS CHEMlSTRY RESEA
New separations methods and reagents are be ing developed, principally for uses in radiochemical processing but a l so for other purposes extending from ext rac t ive metallurgy to biochemical separa- tions. Solvent extraction technology retains t h e principal emphasis, although increasing attention is being given to other separation methods. Re- agents developed in the former ORNL raw-materials program and in subsequent s tud ie s continue to show extended ntility. T h e program in separations chemistry can b e divided into three interdependent types of research activity: (1) descriptive chemi- cal s tud ie s (Sects. 8.1-8.4, 8.9) of the reactions of subs t ances to b e separated and of separations
reagents, of t he controlling variables in particular separa t ions , and of new compounds that may b e potential reagents; (2) development (Sects. 8.5- 8.8) of se lec ted separations into spcc i f ic complete processes , both where no workable process h a s yet been devised and where existing processes c a n b e improved, car r ied where warranted to the point that large-scale performance c a n b e predicted; (3) fundamental chemical s tud ie s (Sects. 8.10-8.15) of the spec ie s , equilibria, and reaction mechanisms involved in separation sys t ems , both to increase knowledge and t o help define potential applications.
8.1 Extraction af Metal Sulfates and Nitrates by Amines
A s part of the program surveying the extraction charac te r i s t ics of many metals from various s y s - terns, da t a were obtained for extractions from acidified lithium nitrate (0.5-10 N NO,-) and lithium su l fa te (0.3-0.5 N SO, *-) solutions with representative primary, secondary, tert iary, and quaternary amines. Data a re presented for extrac- tion of 16 meta ls in the nitrate sys tem and 12 metals in the su l fa te system. Relatively high ex- traction coefficients were found for Tc(V1I) from both su l f a t e and nitrate solutions with a l l classes of amines , and for Sc, Fe(lII), and Y from su l fa te solutions with primary amine.
8.2 New Separations Agents
W e a re continuing to investigate, for potential utility in solvent extraction or other separations methods, compounds that are: (1) newly ava i lab le commercially, (2) submitted by manufacturers for testing, or ( 3 ) spec ia l ly procured for t e s t ing of class or structure.
ac id (HDDNS) w a s prepared and used to extract strontium and europium from concentrated acid solutions. Two new carboxylic ac ids of relatively high molecular weight were obtained for testing: a mixed “neo” acid K-C(CH,),-CO,H (15 to 19 carbon atoms) and 3,7,11,15-tetramethylhexadecan~c acid.
Three aminopolycarboxylic ac ids , needed for t h e investigation of the e f f ec t s of structure on complex- ing of the tr ivalent ac t in ides , were synthesized by reaction of sodium chloroacetate with polyamines. After the ac ids were purified by multiple recrystal-
A supply of 3,7-di-n-dodecylnaphthalenesulfonic
19
.. .
l ization from aqueous alcohol, the success ive pKe’s were determined by t i tration to be 2.46, 2.52, 4.00, 5.95, 9.35, and 10.33 for triethylenetetraamine- hexaace t ic ac id ; 1.99, 2.19, 2.55, 3.19, 5.80, 9.46, and 11.11 for tetraethylenepentaamineheptaacetic ac id ; and r’ 1.60, 2.65, 6.98, and 9.50 for 2-hydroxy- 1,3-diaminopropanetetraacetic acid.
Reported complexing of lithium by low-molecular- weight s te r ica l ly hindered /%diketones sugges ted that higher-weight ana logs might b e effective lithium extractants. By u s e of a new method, 2,2,6,6-tet ramethylpent adecanedioiie-3,j was synthes ized; t h i s compound h a s been shown to ex t rac t lithium from concentrated potassium hy- droxide solutions.
T h e previous observation that severa l symmetri- c a l dialkyl su l foxides extracted only metals likely to coordinate with sulfur rather than with oxygen was confirmed with s e v e n different sym- metrical sulfoxides. In contrast , the unsymmetri- cal met.liy1 2-ethylhexyl sulfoxide extracted meta ls thai. a re more l ikely t o coordinate with t h e su l - finyl oxygen than with the sulfur, for example, uranium as U0,CI2 and UO,(NO,), and iron as chloride, but not iron, s i lver , and coba l t as n i t ra tes or cobalt , copper, z inc , and rare ea r ths as chlorides.
A supply of 1-(3-ethylpentyl)-4-ethyloctylamine (3,9-diethylttidecyl-6-amine, “heptadecylamine,” “HDA,” “Amine 2 lF81”> , which was obtained on spec ia l order, a s s a y s 93.8% primary amine, 4.8% secondary and tertiary amines, and 1.4% inert ma- terial . Previously, t h i s amine had not been avail- ab le from any commercial source.
8.3 Selectivity of Polyacrylamide G e l s for Certain Cations and Anions
Polyacrylamide ge ls , used primarily for separa t - ing macromolecules, a l so show se lec t iv i ty for certain smal l ca t ions and anions; t h i s ind ica tes a separation mechanism other t han that based on matching the size of the so lu te s p e c i e s to the size of t h e ge l pores. In chromatographic elution with water from Bio-Gel P-2 (macromolecule exclusion above a molecular weight of 1600), t h e order of elution was: (chlorides) K , Na, Li, Mg, Ca; (nitrates) Cs-Na, Mn-TI, Ag; (sodium sa l t s ) I?, SO,, C1, NO,.
8.4 Performance of Degraded Reagents and Diluents
We have begun a study of the role of iodine in solvent extraction processing. T h e objectives a re t o determine the t y p e s of organic iodine compounds formed and the e f fec ts of the i r presence on t h e ex- traction process , and to e s t ab l i sh methods for separating them from t h e so lvent phase , if neces- sary. Init ial tests showed that oxidation of iodide ion by nitric acid is rapid when the aqueous phase is stirred with TBP in a hydrocarbon diluent. Ir- radiation of the sys tem to an absorbed dose of 100 whr/liter apparently iodinated about 2% of t h e diluent molecules.
8.5 Recovery of Beryllium from Ores
In further s tud ie s of the primary amine extraction process for recovermg beryllium from low-grade ore su l fa te liquors, optimum conditions were es- tablished for str ipping t h e beryllium from t h e sol- vent with sulfuric acid and for recovering a beryl- lium oxide product from the strip solution. Develop- ment work on th i s process is now complete. A brief study of beryllium extraction with di(2- ethylhexy1)phosphoric ac id showed that extractions of beryllium with this reagent, which a re usually very s low, c a n b e accomplished rapidly under certain conditions.
8.6 Beryll ium Purif ication by Solvent Extraction
In the study of new and potentially less-ex- pens ive methods for preparing high-purity beryl- lium compounds, effective extraction of beryllium from sodium and ammonium carbonate solutions was obtained with quaternary ammonium extract- ants. T h e beryllium extraction coefficients in- c r ease with increas ing pH and have a strong in- verse dependence on to ta l carbonate concentration in the range of about 0.5 to 1.5 M. The beryllium is stripped readily from 0.1 M Adogen 464 in diethylbenzene with 2 M NH,HCO,.
8.7 Separation of Zirconium and Hafnium with Amines
Preliminary resu l t s obtained in t h e separation of zirconium from hafnium by extraction with amines
20
in the su l fa te system were promising. The Zr/Hf separation fac tors are strongly dependent on the amine type and alkyl structure. The highest separation fac tors (6 to 10) were obtained with an cxtensively branched secondary amine and with certain tert iary amines.
8.8 Separation of Rare Earths
T h e potential usefu lness of di(2-ethylhexy1)- phosphoric ac id (D2EHPA) extractant for large- scale separa t ion of rare ear ths is be ing studied. Efficient separations of small quantit ies of rare ear ths can b e obtained by extraction chromatography (sequential elution of the rare ear ths from a column containing DZEHPA on diatomaceous earth sup- port material), but whether t h i s method can b e sca l ed up successfu l ly is questionable. T h e com- parison of resu l t s from runs i n 0.9-, 2.5-, and 5.0- cm-diam columns indicated a partial loss of resolution in the largest column compared with the smaller columns. Preliminary t e s t s i n a mixer- se t t le r sys tem with a s t a t i c organic phase , 0.5 bl D2EHPA in Amsco 125-82, were encouraging.
8.9 Comparative Chemistry of Lanthanides and Trivalent Actinides
In the extraction of lanthanides from minepal acid solutions by di(2-ethy1hexyl)phosphoric ac id (HDEHP) and 2-ethylhexyl phenylphosphonic acid (I-IEH[$P]), t he increase of the extraction coef- f ic ien ts with increasing a ton ic number is not uni- form for s u c c e s s i v e pairs of these elements. In extractions from carboxylic acid solutions the ir- regularities increase until neodymium, instead of lanthanum, i s t h e l ea s t extractable. The addition of aqueous aminopolyacetic acid complexers de- c reases and further a l te rs t he extractions s o tha t , with diethylenetrianinepentaacetic acid (DTPA), lanthanum is the most extractable of the light lanthanides. Extraction coefficients for americium and californium are inversely proportional to DTPA concentrations above t ionship e x i s t s above lanthanides.
tion and on (inverse) ac id concentration are not simply third-power, and they vary between ele- ments. The practicable separation factors are about the s a m e with e i ther HEHrSP] or HDEHP.
M; a comparable rela- t o lo--’ M for t he
Extraction dependences on extractant concentra-
Fo r the separa t ion of greatest interest , berkelium from curium, the factor is around 12 in extraction from I1Cl solution,
from HCl and espec ia l ly from HNO, solutions, are enhanced by the presence of smal l concentrations of s o m e ca t ions of the type M02+. The enhance- ment dec reases with increasing atomic number in both series, thus impairing or eliminating inter- group separa t ions with HEHr$P]. T h i s synergism h a s not been found with HDEHP.
Trace amounts of berkelium a rc quantitatively carried with cerium in iodate precipitation after bromate oxidation.
Lanthanide and actinide ex t rac t ions by EIEH[@’I,
8.10 Transplutonium Element Compound Preparation and X-Ray Characterization
A coherent particle of berkelium oxide was pre- pared by saturating a s ingle bead of ion exchange resin with purified berkelium and then calcining it. Activation ana lys i s of the resultant oxide de tec ted only C e (<1.3%), Nd (<0.5%), La (O.OOSX) , and Eu (<0.005%). X-ray diffraction measurements showed that the air-stable oxide is BkO, (face-centered cubic , l a t t i ce parameter a = 5.334 5 0.005 A) and that t h e hydrogen-reduced form is Bk,O, (body- centered cubic , l a t t i ce parameter a = 10.880 t 0.005 A).
8.11 Arninopslycarboxylic Acid COrPlpleXc5 of Tr iva lent Actinides
To a id in the theore t ica l understanding of stabil i ty t rends and to permit enhanced separations, we are determining the stabil i ty cons tan ts of a variety of transplutonium ac t in ide che la te com- pounds. Complexing with a se r i e s of aminopoly- carboxylic ac ids was studied by both spectro- photometric and cation exchange techniques. T h e stabil i ty cons tan ts found for four different l igands with americium were: Imidodiacetic acid: 1:1, pKs :- 6.1 (two additional conp lexes detected). I-Iydroxyethylimidodiacetic acid: 1:1, pKs = 10.44; 1:2, pKs = 7.1. Ethylenediaminetetraacetic acid (EIITA): 1:1, pKs = 18.15 (one additional com- plex detected). Diethylenetriaminepentaacetic acid: 1:1, pKs 24.6. Stability cons tan ts (pKs) for 1:l complexes with 2-hydroxy-l,3-d iaminopropanetetra- acetic acid were: Am, 12.14 k 0.05; Cm, 12.30 + 0.05; Cf, 13.18 _i_ 0.05; and Eu, 12.21 i 0.05. T h e
21
CHOH group caused a larger dec rease in the pKs (as compared with EDTA) than was expected. Also, the difference between americium and californium w a s greater than with other l igands tested.
8.12 Lanthanide and Actinide Sulfate Complexes
A primary amine, 1-n-nonyl-n-decylamirie ( a s sulfate), was found to have sufficiently high solubility in benzene , low distribution to aqueous phases , and high extraction coefficients f o r europium su l fa te that i t could be used in a so lvent extraction study of the aqueous su l f a t e complexes of europium. T h e extraction se r i e s that were Completed at cons tan t sulfuric acid activity l eve l s of 3.58 7. lo-' ' M 3 (pH .-: 3 ) and 6.4.5 x M 3 (pf-l -- 1) (ionic strength varying) ind ica te quali ta- tively that posit ive s p e c i e s ( E u 3 + and EuSO, ') preponderate over negative s p e c i e s [Eu(SO,),-, etc.] a t a to ta l su l fa te concentration of about 1 M. T h e quantitative r e su l t s (formation cons tan ts ) a re being calculated.
traLted metals occurred, in contrast t o t he exten- s i v e additional coordination in the case of organo- phosphorus ac ids . Thus , ex tens ive synergism by added organic-phase complexers may b e expected.
Extraction coefficients of strontium and barium with seve ra l carboxylic acid-sodium carboxylate mixtures were a n order O E magnitude higher than those with HDEHP a t the same N a A / r A ratios. Pos i t i ons of maxima in the E v s pH curves indi- ca ted coordination of the strontium and barium carboxylates with differing amounts of additional carboxylic acid.
activity in the equilibria of uranyl extraction by amine su l fa te , extractions were measured from saturated (NH,),SO, (a, = 0.80) and saturated Na2S0, (aw - 0.93) and compared with those from 1 M Na2SQ, (aw - 0.96). 'The log E v s log [aminel plots were parallel a t a given pH, with a s lope near 1; t h i s eliminated any possibil i ty that t h e deviations from the mass action law in this sys tem involve some abrupt change at high water ac t iv i t ies .
In a t e s t of the poss ib le c r i t i ca l eEfects of water
5.14 Kinetics of Metal-Ion Extraction by Di(2-ethylhexyl)phosphoric Acid (HDEHP)
8.13 Equilibria and Mechanisms of Extroctions
T h e study of t h e synerg is t ic extraction of strontium by HDEHP-THP was completed with a continuous-variations examination of i.he eEfect of h e TBP:DEHP ratio, and a brief direct t e s t of poss ib le 'I'HP-H,O aggregation (in n-octane) tha t is sugges ted by the extraction results. W e con- cluded that changing d i luents (or additives) h a s two sepa ra t e effects: (1) shift of the Esr v s pH curve a long the pH axis , reflecting changes in the apparent acidity of HDEHD, and (2) synerg is t ic enhancement or antagon i s t ic depress ion of ,Esf, due, respectively, t o direct assoc ia t ion of the addi- t ive with the extracted strontium s p e c i e s or t o competitive assoc ia t ion of the additive with DEHP. TBP replaces HDEHP = MA in coordination with SrA,, probably to give SrA2.2HA.TBP when l i t t l e sodium s a l t (NaA) is present and SrA2.4TBP when NaA/XA ? 0.2.
Extractions of strontium and europium by di- dodecylnaphthalenesulfonic acid (HDDNS) con- firmed the expectation that t h i s s t rong acid should a c t a s a liquid ca t ion exchanger for metals i n con- centrated ac id solutions. They also indicated that no coordination of additional ac id with the ex-
In the continued study of the k ine t ics of the s low extraction of iron(II1) from acid perchlorate solu- t ions by HDEHP (?HA), a n explanation was found €or the increase in extraction ra te with decreas ing acidity. It is analogous to a published mechanism for the formation of aqueous iron complexes and a s sumes that two s t e p s occur at t he interface:
FeA(t120)52+ -t H,O , . . . . . . . . . . . followed by further fast reactions to yield FeA,. 3HA. T h i s l eads to the prediction that the addi- t ion of aqueous proton-accepting complexers should speed up the extraction. Resu l t s obtained b y add- ing severa l complexers at 0.1 M to a solution tha t was 0.002 rM in Fe3+ and 2 M i n ClO,--, pH 1, showed that the rafe of extraction by 0.1 M HDEHP was increased by fac tors of up to 18.
In contrast to the iron extraction, the rate of beryllium extraction from acid perchlorate solu- t ion by HDEIIP does not fit wel l t o a n equation of any order, integral or fractional. T h i s could re- su l t f r o m rate control by two s low extraction re-
22
actions in parallel , or more likely f rom a slow first-order extract ion of a particular beryllium s p e c i e s accornpanicd by s low reequilibration t o replenish that s p e c i e s from other aqueous beryl- lium spec ies .
8.15 Aggregatian and Activity Coefficients in Solvent Phases
I sopies t ic measurement of average aggregations in TBP-HDEHP-NaDEHP-n-hexane confirmed t h e previous quali tative evidence from dielectric m e a s - urements that T B P is assoc ia ted with DEHP and suggested that the principal adduct may be NaA. 2IIA.TBP.
T e s t s of the usefu lness of a commercial matched- thermistor osmometer for measurements of aggrega- tion numbers and activity coefficients showed tha t it is usable to lower concentrations (0.005 m) than is our i sopies t ic sys tem but that i t s reproducibility above 0.01 rn (with the solutions t e s t ed ) was not as good as is desired for calculation of activity coefficients. Brief t e s t s of a new principle for osmometry gave promising results: we equilibrated a solution with pure diluent through the vapor phase in a sea l ed container, as in i sopies t ic balancing, but with a pressure gradient es tab l i shed by holding the solution at a measured elevation above the solvent. T h i s method would give abso- lu te measurements, in contrast to the comparison measurements of i sopies t ic balancing and matched- thermistor osmometry, at much lower pressure dif- ferences than can be measured by our direct dif- ferential manometer system.
W e measured the solubili ty of water in eight common organic d i luents by liquid-liquid equili- bration, with tr i t iated water as analytical tracer. T h e precision of the resu l t s is better than we have been ab le t o obtain by Karl F i sche r titra- tion or to find in the literature. F i v e of t hese diluents, t e s t ed over a range of water ac t iv i t ies , conformed to Henry’s law throughout, with con- s t an t s varying from 3.00 x l o p 4 for cyclohexane to 3.05 x I O p 3 for benzene (mole fraction sca le ) . Previous i sopies t ic measurements of water d i s - tribution and T B P ac t iv i t ies in the TEP-H,O system were confirmed and extended to the T B P - D,O sys t em by liquid-liquid equilibration, with tritium as analytical tracer. The Henry’s law cons tan ts found were 2.09 i- 0.04 a t aH < 0.7 and 2.03 k 0.06 a t a < 0.06 ( m o l e fraction
2 0
scale). 2 O
T h e previously reported aggregation numbers for dry tri-11-octylamine bisulfate i n benzene were fitted up to 0.4 m by a model involving monomers, tetramers, and s o m e dimers:
2T13NH.HSQ4~(R3N~I.I-IS04),, Q , - 11.7 ; ~(R,NH.HSO,),<-’(R,NM.HSO~)~, Q,, = 2.99 io5 . With the aid of th i s model, improved extrapolation of osmotic coef f ic ien ts to infinite dilution gave a more coinplete evaluation of t h e stoichiometric activity coef f ic ien ts than was previously reported.
Infrared absorption spec t ra i n the system water- tri-n-octylamine-H2S04-diluent indicated that t he water is as soc ia t ed with the su l fa te and not with the alkylammoniutn ion.
9. CHEMICAL APPLICATIONS OF NUCLEAR EXPLOSIONS
9 .1 Copper Ores
Recent s tud ie s continued to show that ‘06Ru would probably b e t h e only significant radiocon- taminant of cement copper produced by nuclear fracturing of a copper ore body, in-situ leaching, and recovery of copper from solution by cementa- tion on scrap iron. In laboratory t e s t s effective separation of coppcr from ruthenium was obtained in upgrading the cement copper to electrolytic copper. T h e final copper product, therefore, should not be hazardous to the user.
9.2 Stimulation af Natural Gas Wel ls
Laboratory measurements of tritium-hydrogen cx- change i n water-methane sys tems indicate tha t t h e rate of exchange will probably be low during methane production from a natural g a s well that h a s been stimulated under the conditions of t he proposed Gasbuggy experimpnt. The rate a t room tempera- ture and atmospheric pressure i n a I-liter g l a s s ves se l is
H ̂u 2.3 x lo--’ [HTOI’ m c liter-’ day-’
when the tritium concentration is i n the range of 10 to 50 mc/liter.
23
9.3 Recovery of Oil from Shale
T h e use of a nuclear device to crush oil s h a l e in p lace h a s been proposed. The recovery of oil from the c rushed s h a l e in the nuclear chimney would then involve in-situ retorting. T h e proposed demonstration experiment i s called Pro jec t Bronco. ORNL is ass i s t i ng in th i s project by studying the
/ potential contamination of t h e product sha le oil by radionuclides and potential problems involved in producing and handling the oil. In a s m a l l lab- oratory retort, s h a l e moistened with tr i t iated water produced o i l that was sl ightly contaminated with tritium. When s h a l e oil was heated with radioac- t ive debr i s from an underground t e s t shot, srnall amounts of radionuclides (predominantly “Ru) were de tec ted in the oil.
9.4 Development of Hypervelocity Jet Samplers
In final t e s t s to demonstrate a jet-sampler method for recovering a target irradiated about a meter from a detonating nuclear device , five highly symmetrical copper cones containing gold ta rge ts were jetted. T h e gold will b e recovered from t h e wood used to ca tch the jetted ta rge ts to determine t h e efficiency with which the j e t s were focused within t h e flight chamber.
10. RECOVERY OF FISSION PRODUCTS BY SOLVENT EXT RACTl ON
A new p rocess flowsheet for i so la t ing f i ss ion product rare ear ths , strontium, and cesium from Purex was te was demonstrated on a bench s c a l e a t tracer level. T h e rare ear ths and bulk metal contaminants a re extracted from unadjusted was te solution wj.th the sodium sa l t of di(2-ethylhexy1)- phosphoric ac id , and the rare ear ths a r e se lec t ive ly stripped from the extract . T h e raffinate from t h i s operation is adjusted to a pH of about 6 to precipi- t a t e residual metal contaminants, and the result- ing solution is contac ted first with di(2-ethyl- hexy1)phosphoric acid to recover strontium and then with a substi tuted phenol :o recover cesium. The p rocess y i e lds less-pure concent ra tes t han processes developed previously, but i t is simpler and does not require t.he u s e of large amounts of aqueous-phase complexing agents.
11. BIOCHEMICAL SEPARATIONS
11.1 Development of Processes for Macromolecu lor Sepora t ions
W e have developed a new reversed-phase chroma- tographic system that g ives superior resolution of E . coli transfer ribonucleic a c i d s (tRNA’s). The sys tem employs a quaternary ammonium extractant i n a Freon diluent, which i s immobilized as a film on a hydrophobic diatomaceous earth support. T h e chromatograms a re developed by elution with a sodium chloride solution of increasing concen- tration.
quantit ies of phenylalanyl-RNA syn the ta se has been devised . In the f i r s t t e s t of t h e complete flowsheet, 22.4 mg of highly purified phenylalanyl- RNA syn the ta se was obtained from 4.3 kg of E. coli ce l l s .
A revised procedure for the preparation of larger
11.2 Scaleup of Processes far Macromolecu la t Separations
Engineering-scale research and development have provided informat ion on scaled-up procedures for the preparation of purified tRNA’s. During the latter half of th i s report period an intensified de- velopment campaign was undertakcn to prepare a gram-sized sample of phenylalanine tRNA.
E . coli B cells were grown by ba tch fermenta- t ion techniques; 390 kg of cells were obtained after four weeks of intermittent three-shift opera- tion. These cells yielded approximatc>ly 500 g of crude tRNA, which was fractionated by reversed- phase chromatography on large coupled columns. T h e eluted phenylalanine tRNA product was pooled, desa l ted on Sephadex G-25 columns, concentrated in a wiped-film evaporator, and separa ted from high-molecular-weight components by g e l filtra- t ion on Sephadex (2-100 columns.
T h e ptoduct, which represented about a 23% overall recovery, was accumulated in two purity grades: approximately 1 g that a s sayed 64% ac t ive phenylalanine tRNA, and 0.5 g that a s sayed 51% phenylalanine tRNA.
11.3 Molecular Weights of Transfer Ribonucleic Acids
Molecular weight va lues obtained by membrane osmometry ranged from 41,300 to 46,200 for crude,
24
mixed tRNA. After purification of the tRNA by parison of uv spec t ra l data. Other techniques gel permeation chroiiiatography, the molecular weight va lues ranged from 30,100 to 32,800 (pH 7) and f rom 35,200 to 38,400 (pII 4) a t 10 to 50'C.
being developed for a more complete identifica- tion include thin-layer Chromatography, spot t e s t s , other physical comparisons, and computer resolu- t ion of complex uv spectra.
put of the spectrnphotometer column monitor has been designed.
A data acquisit ion sys tem for digit izing the out- 11.4 Behavior of Transfer Ribonucleic Acids
on Polyacrylamide Gel Columns
Transfer ribonucleic ac ids c a n be partially separated into groups on a Bio-Gel P-100 column by means of polyacrylamide ge l chromatography. The tRNA's a re eluted with a buffered solution containing NaCl and MgC1,. The position of the tRNA's on thc chromatogran1 i s affected by tem- perature, pH, and NaCl and Mg2+ concentrations.
11.5 Body-Fluid Analysis
We are developing automatic high-resolution analyzers that a re capable of quantifying t h e molecular cons t i tuents of human body fluids, Currently, emphasis is centered on the develop- ment of a chromatographic analyzer for t he low- molecular-weight (less than 1000) uv-absorbing cons t i tuents of human urine. Several pathological and normal samples have been analyzed by a proto- type system, and differences between normal urine chromatograms and those from lymphocytic leukemic and schizophrenics have been observed.
A search of the literature, for a two-year period (1964-65), dealing with molecular consti tuents of urine h a s resulted in the accumulation of more than 800 references to more than 300 low-molecular- weight consti tuents.
clude: collection of a refrigerated 24-hr composite sample; filtration through a membrane filter; pH adjustment to 4.4; and, i n some c a s e s , pressure filtration through d ia lys i s tubing. A 1- to 2-ml sample i s injected into the ana ly t ica l system for ana lys i s .
Several different separa t ions media have been tes ted for chromatographically separating the ab- sorbing consti tuents. Biorad AG-l-X8 (purified Dowex 1-X8) provided the highest resolution.
A uv photometer with solid-state detectors is being developed for u s e in the continuous monitor- ing of the chromatographic column effluent.
identified by cochromatography; the identit ies of five of these have been further verified by com-
Urine collection and processing procedures in-
F i f teen urinary components have been tentatively
S
12, CHEMISTRY OF PROTACTINIUM
In the continued study of the chemistry of protactinium in aqucous su l fa te sys tems, a so l id protactinium sulfate was prepared by precipitation from fuming sulfuric acid. It w a s hoped that more reproducible solutions could be prepared from t h i s compound than have been obtained by dissolving protactinium oxide or hydroxide in sulfuric acid. IIowever, i t s apparent solubility in sulfuric ac id varied with the amount of solid present, sugges t - ing heterogeneity. Absorption spec t ra of t h e re- sult ing solutions were, in general, similar t o those previously obtained from protactinium hydroxide d isso lved in sulfuric acid. band near 2000 A that i s shown by the protactinium remaining in the fuming sulfuric ac id from which the protactinium su l f a t e was precipitated. Resolu- tion of t hese spectra awaits computer analysis.
A novel protactinium purification procedure was demonstrated, i n which fired Pa,O,, together with anion exchange resin, was contacted in a c losed circuit with 10 M HC1 solution. T h e slowly d is - solving protactinium was sorbed by the resin. After two months, elution with I-IC1-HF solution gave 15 mg of highly pure protactinium (from an init ial 100 rng of Pa,O,).
They did not show the
T h e study of the rad io lys i s of adsorbed water was continued in an effort to determine the mechanism by which the adsorbent influences t h e yield of molecular hydrogen. Several molecular s i eves with different sur face ca t ions were tes ted , and the resu l t s were compared with those previously found for silica ge l s of varying spec i f ic sur face area. T h e s e s tud ie s indicate n highly efficient transfer of energy from the adsorbent to the ad- sorbate, probably in the form of inelastically scat- tered electrons. These electrons become hydrated
25
... ....
at the sur face and then react with water or hydro- nium ions to give H atoms and hence molecular hydrogen. T h e efficiency of this latter process depends on the nature of t he surface, t he to ta l amount of water present, and the to t a l irradiation dose received by the system. Competing reactions with radiation-induced rad ica ls in the e x c e s s water and with accumulated positively charged s p e c i e s reduce the hydrogen yields.
14. SPECTROPHOTOMETRIC STUDIES OF SOLUTIONS OF ALPHA-ACTIVE MATERIALS
14.1 Spectral Studies of Uranium Solutions
The ultraviolet (1795 to 3565 A) and v is ib le spec t ra of the uranyl ion in perchlorate solution were resolved into 24 absorption bands , which were subsequent ly grouped into 7 major bands with an average spac ing of 6137 and progres- sively increasing oscil lator s t rengths or transi- tion probabilities. The relative energy leve ls for the complete ultraviolet and visible absorption spec t ra and fluorescence emission spectra, a s determined from the resolved bands, are presented in at1 energy-level diagram.
The spectrum (2000 t o 13,000 A) of U(1V) in perchloric acid solution contains 23 overlapping bands, which have not yet been ass igned t o particular transit ions. The resolved spec t ra at various s t a g e s of U(1V) hydrolysis can b e as- soc ia ted with the changes in the nature of t h e U(1V) spec ie s . Further progress is contingent on our ability to prepare and maintain a pure U(CIO,), solution, completely f r ee of higher oxidation s t a t e s of uranium.
14.2 Installation and Testing of the Spectrophotometer System for High
Alpha Levels
The spectrophotometer sys tem is mounted in a “cold” laboratory for testing. The spectrophotom- e te r is operating sa t i s fac tor i ly and is showing a resolution e s sen t i a l ly twice that of a standard Cary model 14 spectrophotometer. Initial check- out of the a s soc ia t ed equipment is nearly complete. The sys tem is being operated with dummy cells a t high temperature prior to ac tua l operation with uranium and lanthanide solutions.
15. CHEMICAL ENGINEERING RESEARCH
15.1 Performance of a Prototype Stacked-Clone Contactor with Integral Pumps
The 14-stage prototype stacked-clone contactor h a s been t e s t ed , by using the Purex and other flowsheets, and found t o be equal in performance t o i t s experimental predecessor. It is currently being evaluated for u se in “hot” 2 3 3 U recovery operations in the Chemical Technology Division P i lo t Plant. Operability with the light (organic) phase continuous and with an internal interface h a s been demonstrated; th i s will greatly increase the range of usefu lness of the device.
15.2 Scaleup of the Stacked-Clone Contactor
A study of the sca l eup of the stacked-clone contactor has been completed. Experimental un i t s 0.5 and 1.4 t imes the s i z e of the standaid contac- tor were t e s t ed . T h e smaller unit provides seve ra l advantages, including flow capacil ies 60% higher than expected, m a s s transfer efficiencies 20% higher than those obtained with the standard con- tactor, and solution residcncc times of only 1 sec per s tage ; thus the most effective sca leup can b e provided by the manifolding of severa l small c lones in each s tage .
15.3 Mass Transfer of Water from Sol Droplets During Microsphere Gelation
The m a s s transfer of water from s ingle thoria s o l droplets into 2-ethyl-1-hexanot is being in- vestigated by optically measuring t h e diameters of s ing le fluidized drops, at magnifications of 20 to 4Ox. A smel l tapered P lex ig las column that will s tab i l ize the droplets for t h i s purpose h a s been developed. The experimental data are cor- related with a model that assumes that the con- trolling r e s i s t ance to m a s s transfer is the organic- phase f i l m surrounding the drops.
115.4 Hyperfiltration of Spent Sulfite Liquor with a Self-Rejecting Membrane
Hyperfiltration using a dynamically c a s t mem- brane is a new technique that is potentially use- ful for various radiochemical applications such as
26
concentration of low- and intermediate-level wastes. We have been participating in i t s develop- ment by a s s i s t i ng in programs with similar appli- ca t ions , for example, the concentration of d isso lved so l id s in paper-mill was tes . Work h a s deinonstrated the recovery and recycle of 90% of t h e water from spent sulfi te liquor and the collection of so l id s in concentrations that a re sufficiently high t o make evaporation and burning feasible. We have obtained 95% rejection of dissolved s a l t s with high production rates (35 gal day-. ft-2) a t moderate pressures (400 psig) by hyperfiltration with a self-rejecting membrane. Our technique cons i s t s in pumping the spent liquor through a porous cerarnic or carbon tube under pressure and allowing the spent liquor to form its own membrane.
to environmental e f fec ts such as changes in pH or ionic strength.
Studies of the shrinkage and of the sintering of thoria g e l s with and without addi t ives have also been completed; reports summarizing th i s work are being prepared.
Attention i s now being focused on urania sols, and a few measurements of their v i scos i t i e s and electrophoretic mobilities have been made. The most remarkable effect observed to da te is t h e sharp dec rease in the viscosity of concentrated (6.2 to 6.4 M ) chloride-stabil ized UO, sols upon the addition of a small amount of UO,. A dec rease from IO4 t o 100 cent ipoises was observed as t h e ca lcu la ted oxygen:uraninm atom ratio was in- c reased from 2.00 to 2.07.
15. REACTOR EVALUATION STU
T h i s program, sponsored jointly by the Reactor Division and the Chemical Technology Division, cons i s t s of s tud ie s of various proposed advanced reactor and fuel-cycle sys tems to evaluate their t echnica l and economic feasibil i ty. Currently, t h e bulk of th i s work is being done in support of t h e USAEC Fue l Recycle T a s k Force and the Systems Analysis T a s k Force. Evaluations completed dur- ing the pas t year included estimations of t he costs of fuel-material preparation (conversion), p rocess ing spent fuel, and shipping fresh and spent fuel. for advanced converter reactors (HWOCR, HWBLWR, and HTGR), f a s t breeder reactors, and various proposed desalination reactors. In addition, com- puter codes were developed for the ana lys i s of t h e overall cos t of nuclear power and for calculation of the decay properties of mixed f i ss ion products resulting from the f i ss ion of 2 3 5 U . The optimiza- tion of the s i z e of fuel processing plants in a growing economy was also studied.
17. PREPARATICP AND PROPERTIES 0% ACTINIDE-ELEMENT OXIDES
Studies of the electrophoretic behavior of thoria s o l s have essent ia l ly been completed. 'The mul- t iple boundaries observed in the T i se l iu s type of apparatus were shown t o b e caused by the presence of smal l amounts (- 10W4 M ) of Th' + in the inter- m i c e l l a r fluid. T h e method of preparation of t h e sol is not an important variable, and the electro- phoretic mobility, in general, is not very sens i t i ve
18.1 Eurochemic Assistance Program
T h e Laboratory continued t o coordinate t h e ex- change of technica l information between Eurochemic and the AEC production sites and national lab- oratories for the AEC Division of International Affairs. E. M. Shank completed h i s fifth year a t Mol, Belgium, as U.S. Technica l Advisor t o Eurochemic during the construction and s ta r tup of the Eurochemic fuel-processing plant. Con- struction of the plant and i t s auxiliary fac i l i t i es and s ta r tup operations a re complete. Discharged fue ls from seve ra l European reactors havr now been processed.
18.2 Evaluation af the Radiation Selected Protective Coatings end Other Materials
In a continuing piogram the radiation res i s tance of a number of protective coatings, lubricants, gasket materials, s ea l an t s , e lec t r ica l insulation materials, and g l a s s e s were t e s t ed in a 6oCo gamma field having a radiation intensity of 8 x lo5 r/hr. Epoxy and polyurethane coa t ings were sa t i s fac tory for t o t a l doses , in air, of up to 10" rads; failure of epoxy and modified phenolic coat- ings exposed in deionized water occurred at d o s e s between 1 x lo8 and 3 x lo9 rads. The other ma- t e r ia l s t e s t ed failed a t to ta l d o s e s between 5 x 10' and 5 x l o 9 rads.
?
... ..... . . - .
27
19. WATER RESEARCH PROGRAM
Oak Ridge National Laboratory is carrying out a program of bas i c research on the properties of water and i t s so lu t ions under t h e ausp ices of t h e Office of Saline Water, Department of t h e Interior. This program has as its long-range goal the de- velopment of methods for the economical purifica- t ion of water i n such amounts and of such purity that i t may be used for irrigation and for drinking. Work in th i s interdivisional program i s under the direction of K. A. Kraus. It is reported in part i n a s e r i e s of reports i s sued annually by t h e Depart- ment of t h e Interior. T h e most recent report i n t h e s e r i e s is Saline Water Conversion Report, 1966. Because the work is reported formally in t h e above ser ies , only th i s abs t rac t of the work carried out by Chemical Technology Division personnel is presented in t h i s report.
Studies carried out i n the Chemical Technology Division have followed severa l l ines . In one, w e have measured thermodynamic properties of water- organic liquid mixtures, in order tha t such mix- tures can serve as models for salt-excluding organic membranes. T h i s part of t h e program h a s now been t e rmna ted ; resu l t s will b e published that show the correlation of ac t iv i ty coefficients and miscibility gaps with class and structure of the organic l iquids, d ie lec t r ic constants, and thermodynamic activity of water.
In another l ine of study, methods a re be ing sought t o alter t h e hydrodynamic conditions near a so l id sur face to promote higher r a t e s of trans- fer of a so lu t e between t h e sur face and the circulat- ing fluid. (This study is under t h e direct super- vision of D. G. Thomas, Reactor Ilivision, ORNL.) This research is spec i f ica l ly intended to reduce the concentration polarization problems encountered in reverse osmos i s and e lec t rodia lys i s of brackish waters; the effort is focused upon s tudying t h e e f fec ts of cylindrical obstructions supported slightly above the transfer surface. Earlier, we reported that m a s s transfer r a t e s a t a given point c a n be increased eightfold through the u s e of s u c h promoters and tha t a threefold increase c a n b e achieved over a la rge transfer surface. T h e s e in- c reased mass transfer r a t e s are accompanied by higher pressure losses or pumping power require- ments. IIowever, the pumping power required t o achieve given m a s s transfer r a t e s with de tached promoters has now been shown to be less than tha t required to obtain t h e same r a t e s in c lear , or
unpromoted,” channels. T h e investigation h a s included s tud ie s of the e f f ec t s of promoters on loca l velocity and mass transfer ra te fluctuations a t t h e wall; th i s h a s provided insight into t h e manner in which velocity disturbances near t he wall a f fec t ins tan taneous and time-averaged mass transfer rates. An ana ly t ica l model describing many fea tures of t h e s e e f fec ts h a s been developed.
In a third l ine of s tudy , hyperfiltration (reverse osmosis) i s be ing t e s t ed as a means of treating was te water. One of t h e principal wood-pulping p rocesses i s the calcium-base sulfi te process , which produces a spent liquor containing mostly calcium lignosulfonate. T h e recovery and recycle of 90% of the water would concentrate t he liquor s o that evaporation and burning would be feas ib le , and thus would eliminate a water pollution prob- lem. We have obtained 95% rejection of d i sso lved so l id s with high product r a t e s (35 ga l day-’ ft-’) at moderate pressures (400 psig) by hyperfiltra- t ion with a self-forming membrane. Our technique involves pumping the spent liquor through a porous ceramic or carbon tube under pressure and allow- ing the spen t liquor that forms a concentrated layer at the porous sur face to a c t as i t s own mem- brane. ’rubes with a uniform pore size distribution of 1 p in diameter gave highest rejection and product fluxes.
I <
20. CHEMISTRY OF CARBIDES AND NITRIDES
Fundamental s tud ie s of t he reac t ions of metal carb ides with aqueous solutions were continued. T h e reactions of high-purity uramurn and thorium carbides with 3 t o 9 M HC1 and 6 M H,SO, were found to b e hydrolysis reactions, yielding hydro- carbons, with no oxidation of the U(IV) or forma- tion of C-S, C-0-S, or C-C1 bonds. In 2 to 18 M NaOH some of the tetravalent uranium in uranium monocarbide was oxidized to a higher va lence s t a t e , with the accompanying evolution of hydro- gen; the carbide carbon was hydrolyzed to methane. Other s tud ie s showed that the rate-determining s t e p in the hydrolysis of the uranium and thorium carb ides probably does not involve c leavage of the H-0 bond in the water, s i n c e the reaction with D,O a t 80°C was identical t o the corresponding reaction with Ii,O except that deuterium was sub- st i tuted for hydrogen in the products.
Pronounced differences in chemical behavior between t h e alkaline-earth dicarbides and the
28
actinide dicarbides were found. T h e reactions of calcium dicarbide with 0 to 16 M HNO, and of barium dicarbide with 0 to 8 M I-INO, yielded acetylene as the only carbon-containing product. In contrast , the uranium and thorium dicarbides yielded complex aliphatic hydrocarbon mixtures when hydrolyzed, and complex aromatic compounds when oxidized by nitric acid.
21. INDUSTRIAL APPLICATIONS OF NUCLEAR ENERGY
21.1 Survey of Process Applications in a Desal ination Complex
A survey of the chemical and metallurgical industries was made to ascer ta in which p rocesses should b e given priority for further de ta i led study as possible components of a nuclear industrial- desalination complex. Investigated factors in- cluded market potential, demand for large quant i t ies of power or s team, shipping cos t s , production cos t s , and economics expressed as turnover ratios.
A comparison of 20 industrial p rocesses showed that nitrogenous and phosphatic fertilizer produc- tion should b e given first priority, after which chlorine and caus t ic production should b e con- sidered. T h e production of metals such a s iron, s t ee l , aluminum, ferroalloys, and magnesium fa l l s next i n priority. The production of acetylene v ia calcium carbide and the e lec t r ic arc furnace a l s o appeared promising.
21.2. Production of Hydrogen by the Electro lys is of Water
A recent survey indicated that the production of ammonia for fert i l izer using electrolytic hydrogen i s economically feas ib le if newly developed elec- trolytic ce l l s prove successfu l in industrial appli-
cations. One of the new ce l l s is be ing studied on a laboratory scale.
Galvanic corrosion was found to b e a problem in a bimetallic electrolytic system exposed to aqueous KOH a t temperatures in excess of 80°C. Mechani- cal coupling of t y p e s 316 and 304 s t a in l e s s s t e e l s increased the corrosion of the former by 75% when exposed to 34% KO11 a t 116OC:; nickel, however, did not corrode under t h e s e conditions. Evalua- t ions of severa l different types of membranes showed that type 1 0 Quinterra a sbes tos produced significantly lower internal r e s i s t ance losses without sacrificing any g a s separation quali t ies. An 82-hr laboratory t e s t was performed a t 90°C and at a current density of 1860 amp/ft2. T h e resu l t s showed no measurable degradation of cell performance during th i s period. Ultrahigh c u r - rent dens i t ies , up t o about 4600 amp/ft2, had no apparent effect on electrodes and membranes a t temperatures up to 90OC.
22. SAFETY STUDIES OF FUEL TWA
A new program has been organized to develop an acceptance Criteria for c a s k s tha t a re designed for transporting irradiated fuel. The intent of t h e Criteria is to provide a uniform engineering b a s i s for c a s k des ign and fabrication that will ensure compliance with the performance specifications imposed by AEC regulations as s ta ted in chapter 0529 of the AEC Manual.
for the des ign , fabrication, testing, and ana lys i s of shipping c a s k s for irradiated fuel. It will pro- vide a uniform b a s i s for a s s e s s i n g design adequacy without inhibiting the ingenuity or technical ag- gress iveness of the designer.
Data and information are presented on c a s k structural design, materials and fabrication, shielding, cri t icali ty, and heat transfer.
T h e Criteria will consider engineering s tandards
1. Power Reactor Fuel Processing
Laboratory- and engineering-scale development of p rocesses for recovering f i s s ionab le and fert i le material from spen t power-reactor fue ls is con- tinuing. T h i s work h a s included b a s i c chemical s tud ie s on unirradiated samples of new types of fuel and cladding materials, chemical and engineer- ing development of mechanical and aqueous chem- ical p rocesses for present-day and advanced fue ls , and hot-cell t es t ing of new p rocesses to determine the e f fec ts of radiation and f i ss ion products on t h e chemical reactions. T h e major p rocesses s tud ied th i s year included a burn-leach process and a grind-leach process for uranium-thorium-graphite HTGR (high-temperature gas-cooled reactor) fuel, mechanical methods applicable to HTGR and metal-clad oxide fue ls , and c a u s t i c decladding and high-temperature HC1 decladding methods for SAP-clad UC fue l for a heavy-water-moderated, organic-cooled reactor (H!VOCR). Work on fuel recovery p rocesses for liquid-metal fas t breeder reactor (LMFBR) fuel w a s begun. A limited num- ber of so lvent extraction s t u d i e s were also made.
Various reactor and fuel manufacturers were v is i ted to obtain the most up-to-date information on ex is t ing and proposed third-generation PWR’s and HWR’s and on proposed f a s t breeder reactor (FBR) fuel element des igns ; such information was needed to determine whether ex is t ing fue l disassembly and shear-leach methods and equip- ment c a n b e satisfactorily used to process t h e s e fuels. Evaluation of t h e accumulated da ta indi- c a t e s that t h e new fuel des igns c a n b e adequately handled; however, computer ca lcu la t ions show that f i s s ion product heat removal from short-cooled (30 days), highly irradiated (burnup, 100,000 Mwd/ton) FBR fue l s will b e a very difficult problem. T h e safe d isposa l of res idua l sodium coolant and bond- ing (on and i n F B R fue l rods) was eva lua ted in laboratory t e s t s . Res idua l sodium on t h e fuel rod exteriors c a n b e destroyed e a s i l y by controlled reaction with oxygen and/or water-vapor-inert-gas
atmospheres. Destruction of t he sodium bond at 3OO0C with 3% H,O-97% He is satisfactory; sub- sequent pyrohydrolysis at 75OOC adequately con- ver t s PuC-UC to the more des i rab le Pu02-UO,. Treatment with a i r and with CO, was less sat- isfactory for destroying sodium. Leaching of sheared Zircaloy-clad Tho,-UO, with 13 M HNO,-0.05 ,1.3 H F resu l ted in t h e dissolution of 1.5% of t h e cladding, part of which precipitated during feed adjustment; however, solvent extrac- tion process ing (employing T B P or amines) of the result ing feed solution was satisfactory. T h e development and evaluation of a full-sized delayed- neutron leached-hull monitor was continued. T h e detection of 0.01 g of 235U in an 830-r/hr gamma field w a s demonstrated.
p rocesses for carbon- and Sic-coa ted (Th,U)C , and (Th,U)O, fuel par t ic les in graphite was continued. Mechanical process ing t e s t s indicated that both shearing and breaking the large compacts by a “pile-driver” technique were unsatisfactory. T h e removal of coated-particle compacts from the holes i n unirradiated Publ ic Service of Colorado Reactor prototype graphite fuel s t i c k s with a high-pressure water je t was success fu l ; sc reening of the removed material provided adequate separation of f i s s i l e and fert i le par t ic les of different sizes. A s e r i e s of hot- cell demonstrations of the burn-leach process showed th is process t o b e sa t i s fac tory for HTGK fuels that had been irradiated to exposures a s high as 50,000 Mwd/ton. Burning r a t e s were adequate, and decontamination of off-gases by a factor of l o6 with a sintered-metal filter a t 53OO0C was con- s i s ten t ly achieved. T h e dissolution of t he Tho,- U,O, burner a s h was 299 .7% complete in 5 t o 7 hr i n boiling 13 M HN0,-0.05 M HF-0.01 11.1 A i 3 + .
HTGR fuel s amples [carbon-coated (Th,U)C, par- ticles] indicated that t h e grind-leach process is feas ib le , hot-cell t e s t s were disappointing be-
T h e development of the burn-leach and grind-leach
Although laboratory experiments with unirradiated
29
30
c a u s e of the high (> 1%) thorium and uranium losses and fission product retention (10 to 20%) by the leached graphite, T h e development of t h e method is continuing, however, s ince it may b e e s sen t i a l for t h e process ing of fuels composed of S ic-coa ted particles. T h e demonstration of the new ORNL- designed roll c rusher showed that t h i s device i s adequate for all fue ls containing par t ic les with diameters 2 150 p. Leaching t e s t s with unir- radiated Peach I3ottom and UHTREX fuel samples showed tha t a two-step leaching procedure and a thorough washing of the leached graphite are re- quired to achieve > 99.5% fuel dissolution. 'The leaching of ground carbon-coated sol-gel T h o resulted in a thorium loss of only 0.01%. All l eacha tes contained about 1% of t h e carbon from the fuels as so luble organic compounds. An improved equation for calculating the filtration and washing charac te r i s t ics of the graphite res idue was formulated; a l so , an acid recycle flowsheet, which u s e s the first acid wash as the d isso lvent for the next ba tch , was developed.
mit t he processing of grind--leach so lu t ions con- taining s m a l l amounts of so luble organic com- pounds. T h e recovery of thorium and uranium was adequate, and a f i ss ion product decontamina- tion factor of 1100 was obtained in a system con- taining five extraction and three scrub s t eps . T h e leaching of ground fuel (after treatment with HNO, and drying) with acidified 30% TBP in n-dodecane gave satisfactory thorium and uranium recoveries; a two-step stripping flowsheet, in which relatively good uranium-thorium separation was achieved, was also demonstrated.
Other solvent extraction s tud ie s included deter- minations of the solubili ty of UO,(NO,), in di- sec-butyl phenylphosphonate-diethylbenzene inixtures and of the solubili ty of Th(N0,)4 i n 30% TBP with various diluent.s, including severa l nor- mal and branched saturated hydrocarbons, benzene, and diethylbenzene. Measurements were a l so made of the adsorhability of 0.1 M H F on Dowex 50W ion exchange resin sa tura ted with 'Th(NO,),. Further demonstrations of t he reduction of Pu(IV) to Pu(II1) with hydrogen and a platinized-alumina ca t a lys t were made; t h i s method will b e used for the par- titioning of plutonium and uranium from FBR fuels.
T h e development of head-end p rocesses for t he most promising HWOCR fuel candidate, UC c lad in SAP (a dispersion of A1,0, in aluminum), w a s continued. Decladding i n NaOH-NaNO, solutions,
T h e Acid-Thorex flowsheet was modified to per-
followed by dissolution i n nitric acid and solvent extraction or anion exchange, appears t o b e t h e most satisfactory process. Another method in- vestigated involves volati l ization of t h e aluminum (as AlC1,) i n t he cladding by reaction with HC1 a t 3OO0C, pyrohydrolysis t o remove t h e residual I K 1 and to convert UC1, t o U,O,, and, finally, dissolution of the U,O, in HNO,; alternatively, the U,O, may h e processed subsequently by fluidized-bed volatility methods. Process ing of th i s fuel by the shear-leach process appears t o b e an unlikely choice because a significant amount of the aluminum from the SAP cladding d isso lves in HNO 3 .
1.1 DEVELOPMENT OF MECHANICAL PROCESSES
T h e engineering-scale development of the bas i c technology of the shear-leach process (with full- size unirradiated first- and second-generation stainless-steel-clad and Zircaloy-clad UO , and Tho,-UO, power reactor f u e l elements) h a s been completed. T h e process is now being used by Nuclear Fue l Services, Inc., in their reactor fuel processing plant near Buffalo, New York.
Work th i s year included s tud ie s and mechanical t e s t s of t h e applicability of the shear-leach proc- ess t o third-generation LWR fuels, leaching s tud ie s of Z i r ca loyc lad urania-thoria fue ls , and continued developinent of t h e delayed-neutron leached-hull monitor. In addition, we began mechanical proc- e s s ing s tud ie s of HTGR fue ls [coated (Th,U)C, or (Th,U)O, fuel par t ic les incorporated in a graphite matrix or cemented in ho le s in a graphite block] and LMFBR fue ls ( U 0 2 - P u 0 , and UC-PuC).
Fuel Disassembly and Shearing Studies
T h e la rge number of thermal power reactors (LWR's) that a r e expected to begin operation during the period 1969-72 prompted 3 detailed study of t he des igns of third-generation fuel assembl ies t o determine if t h e latter could b e satisfactorily processed by conventional fuel disassembly and shear-leach methods.
of t he principal producers of power reactors and power reactor fuels. Based on de ta i led da t a ob- tained during these v i s i t s , a typical third-genera-
T h e study was preceded by on-site v i s i t s t o most
31
tion assembly will be comprised of 49 to 173 Zircaloy-2 or -4 t ubes containing UO, (235U enrichment -, 3%) and having s t a in l e s s steel ends . It w i l l b e about 7 % or 8 k in. square in c ros s sec- tion and wi l l have 12 ft of ac t ive length. Grids will b e made from either brazed Zircaloy with Inconel or s t a i n l e s s s t ee l i n se r t s or from shee t metal with wire inser t s . A l l fuel t ubes will con- tain spr ings t o hold the fuel pe l le t s i n place during handling and transport. T h e s e springs will vary in length f rom 3 to 16 in. and will usually be made of Inconel or carbon s t ee l ; however, other materials, including Zircaloy, are being tes ted for t h i s ap- plication. In general, Zircaloy-4 appears t o be the most popular alloy for u s e in fabricating the as- semblies.
T h e resu l t s of the subsequent study indicated that all third-generation fue l s now in ex is tence or currently proposed can b e processed by a shear- leach head-end method. T h e inert end hardware holding the multitubular assembly together can eas i ly b e removed by a s imple t ransverse sawing operation or the removal of nu ts from threaded tie rods. Then , all assembl ies can be completely taken apart by withdrawing the individual fuel tubes or rows of tubes i n a tube puller. T h e re- maining part of the assembly, which becomes a solid was te , cons i s t s of grids held together by severa l empty tubes (formerly containing control rods) or by severa l solid-metal, small-diameter t i e rods. Cas ings and shea ths no longer present a problem in disassembly operations s i n c e they either a re not u sed or are removed by the reactor operator prior to the shipping of fuel to the processor. A cropped assembly can b e sheared intact or, if d isassembled, a s individual fuel tubes, rows of tubes , or a reassembled bundle of loose tubes. However, when assembl ies are sheared intact , grids used t o align and support f u e l tubes and to t i e an assembly together c a n be troublesome in the shearing operation. For ex- ample, if a shear cu t is made immediately before and after a grid, or directly on one, chunks are produced which may c log the shea r discharge chute or the fue l baske ts . If continuous leachers , such a s vibratory conveyors, a r e used , portions of such chunks may protrude above the sur face of t h e leach acid, caus ing incomplete leaching of core material. There i s no obvious practical answet to th i s problem a t present.
In order to eva lua te the shearing of third-genera- tion fuel assembl ies , t h e ORNL 250-ton prototype
shear was modified so that prototypes as large a s 10 in. square could b e accommodated. T h e shear stroke was increased from 9 t o in., and the gag stroke was increased from 258 t o 4”/8 in. New gag guides, fixed and moving blades to shear 10- by 10-in. shapes ac ross flats, and a new feed envelope and co l laps ib le pusher head were installed. The shea r ram was a l s o equipped with new V-2 gibs and Stell i te 6-B liners.
For the tests, two prototype assembl ies (one of which is shown in F ig . 1.1) were fabricated from two Consolidated Edison core B fuel assemblies. One of t he reconstituted prototypes was a 9%?- in.-square, 24- by 24-tube array cons is t ing of576 lead-filled tubes 0.300 in. in diameter by 21 in. long on $;-in. cen ters ; t he other was a 10-in.- square, 22- by 22-tube array cons is t ing of 484 porcelain-filled tubes 0.340 in. in diameter by 21 in . long on 0.425-in. centers. Each assembly contained two leaf-spring grids fabricated by welding together s ec t ions of prototype Consolidated Edison core B grids.
Leaching of Zi rcaloy-Clad Tho ,-UO
Leaching tests of sheared Zircaloy-clad urania- thoria were made to determine the extent to which the cladding and cladding f ines are dissolved by fluoride-catalyzed Thorex dissolvent (13 M IiNO,- 0.05 M F- -0.05 M A13+) and t o determine whether the dissolved zirconium interferes in the sub- sequent Acid-Thorex solvent-extraction s tep . About 99.8% of the thorium and the uranium were leached from unirradiated sol-gel Tho,-UO, in 24 hr by the dissolvent; during th i s t i m e about 15% of the Zircaloy cladding was a l s o dissolved. T h e product solution contained 264 g of thorium per liter, 8.3 g of uranium per l i ter , and 1.5 g of zirconium per l i ter . Several experiments showed tha t only -0.05 and -0.01% of the Zircaloy were present i n t h e potentially hazardous size range (-40 mesh) after 7 and 24 hr, respectively, of leaching. Preliminary solvent extraction tests indicated that about 70% of the zirconium in solution is precipitated when t h e leacha te is made ac id deficient. It was concluded that the shear-leach process can b e used satisfactorily with th i s type of fuel desp i te t h e disadvantage of having some dissolved Zircaloy in the waste s t ream.
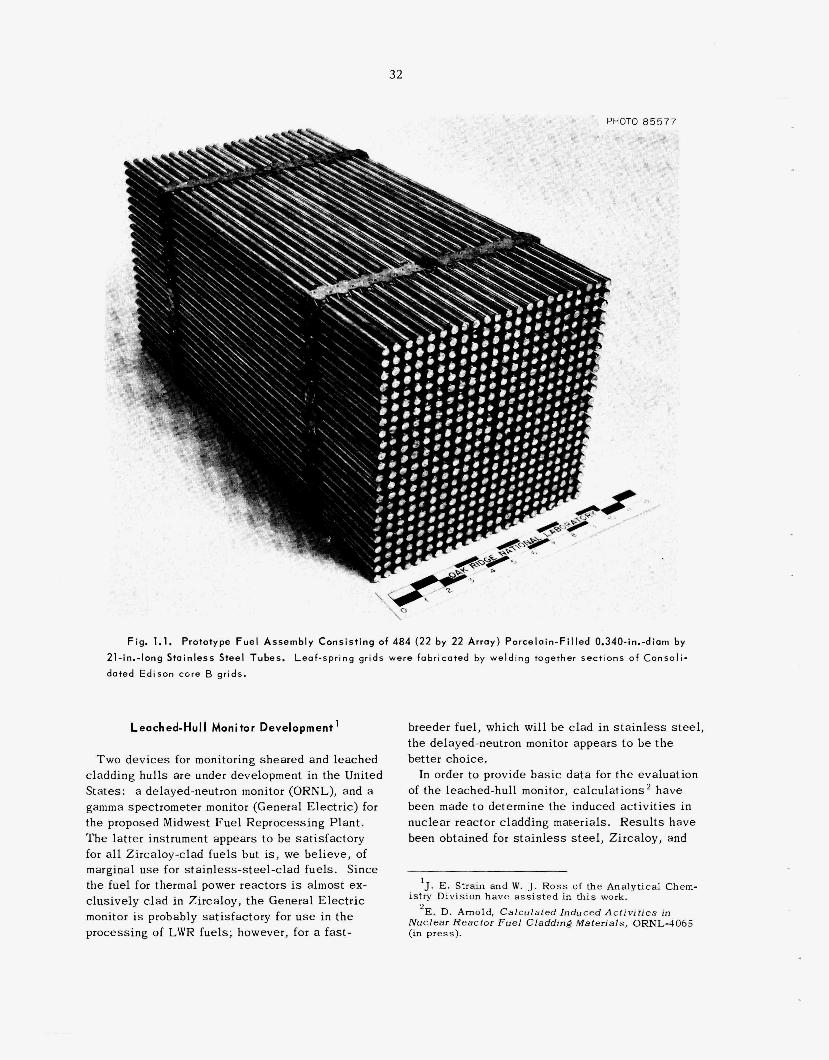
32
Fig. 1.1. Prototype Fuel Assembly Consisting of 484 (22 by 22 Array) Porcelain-Filled 0.340-in.-diam by 2l-in.-long Stainless Steel Tubes. Leaf-spring grids were fabricated by welding together sections of Consoli- dated Edison core B grids.
Leached-Hull Monitor Development’
Two devices for monitoring sheared and leached cladding hul ls a re under development in the United States: a delayed-neutron monitor (ORNL), and a gamma spectrometer monitor (General Electr ic) for the proposed Midwest F u e l Reprocessing Plant . T h e la t te r instrument appears to be sat isfactory for all Zircaloy-clad fue ls but i s , we believe, of marginal u s e for s ta inless-s teel-clad fue ls . Since the fuel for thermal power reactors is almost ex- clusively c lad in Zircaloy, the General Elec t r ic monitor is probably sat isfactory for u s e in t h e processing of LWR fuels ; however, for a fas t -
breeder fuel, which will b e c lad in s t a i n l e s s steel, the delayed-neutron monitor appears to b e t h e better choice.
of the leached-hull monitor, calculat ions have been made t o determine the induced ac t iv i t ies in nuclear reactor cladding maberials. R e s u l t s have been obtained for s t a i n l e s s steel, Zircaloy, and
In order to provide b a s i c data for t h e evaluation
‘J. E. Strain and W. J. Ross of the Analyacal Chem-
‘E. D. Arnold, Calculated Induced Activzties in istry Divislon h a v e ass i s ted in this work.
Nuclear Reactor Fuel Claddrng Matenals, ORNL-4065 (in press).
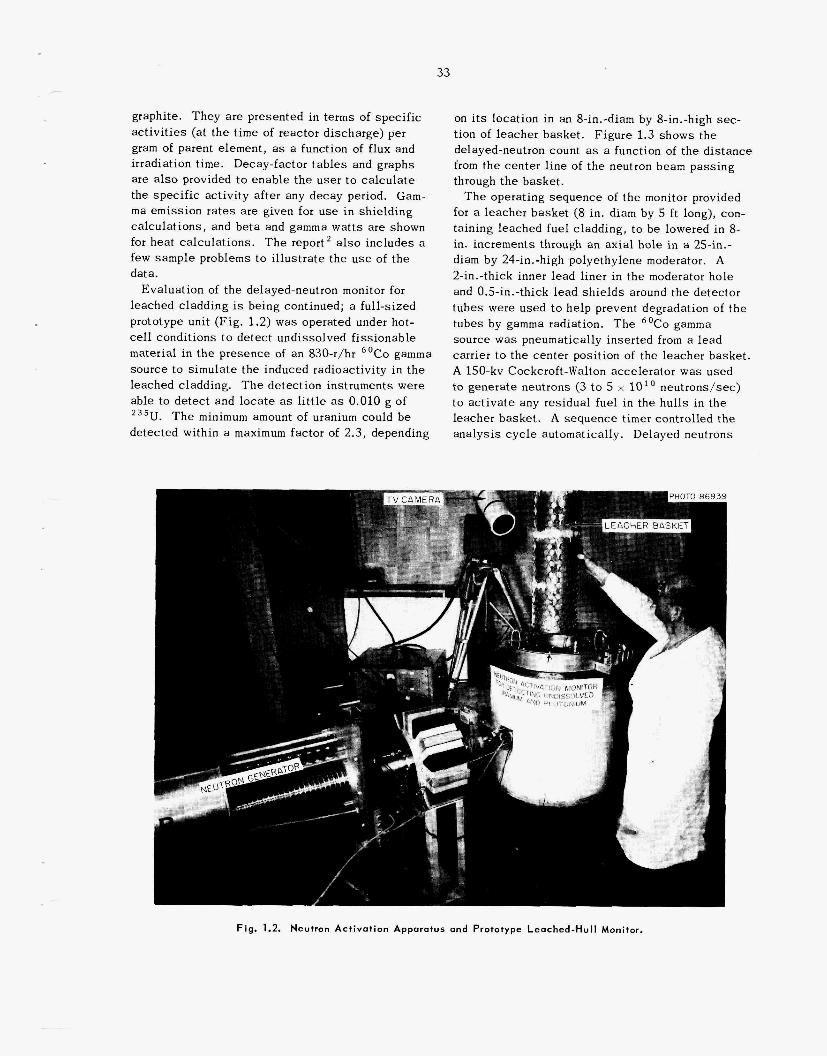
33 -F-
. graphite. They are presented in terms of spec i f ic ac t iv i t ies (at the time of reactor discharge) per gram of parent element, as a function of flux and irradiation t ime. Decay-factor tab les and graphs are a l s o provided to enable t h e user to ca lcu la te the spec i f ic activity after any decay period. Gam- m a emission r a t e s are given for use in shielding calculat ions, and beta and gamma wat t s are shown for hea t calculat ions. T h e report' also includes a few sample problems to i l lustrate the u s e of t h e data.
Evaluat ion of the delayed-neutron monitor for leached cladding is being continued; a full-sized prototype unit (Fig. 1.2) was operated under hot- cell conditions to detect undissolved f iss ionable material in t h e presence of an 830-r/hr 6 o C o gamma source to s imulate the induced radioactivity in t h e leached cladding. T h e detect ion instruments were able to detect and loca te as l i t t l e as 0.010 g of 235U. T h e minimum amount of uranium could be detected within a maximum factor of 2.3, depending
on its location in an 8-in.-diam by 8-in.-high sec- tion of leacher basket . Figure 1.3 shows the delayed-neutron count as a function of t h e d is tance from the center l ine of t h e neutron beam pass ing through t h e basket.
T h e operating sequence of t h e monitor provided for a leacher baske t (8 in. diam by 5 ft long), con- taining leached fue l cladding, t o b e lowered in 8- in. increments through an axial hole in a 25-in.- diam by 24-im-high polyethylene moderator. A 2-in.-thick inner lead liner i n t h e moderator hole and OS-in.-thick lead s h i e l d s around the detector tubes were used to help prevent degradation of the tubes by gamma radiation. T h e 6oCo gamma source w a s pneumatically inserted from a lead c a r i e r t o t h e center posit ion of the leacher basket . A 150-kv Cockcroft-Walton accelerator was used to generate neutrons (3 t o 5 x 10'' neutrons/sec) to ac t iva te any residual fuel in the hul l s i n the leacher basket. A sequence t imer controlled t h e analysis cyc le automatically. Delayed neutrons
Fig. 1.2. Neutron Activation Apparatus and Prototype Leached-Hull Monitor.
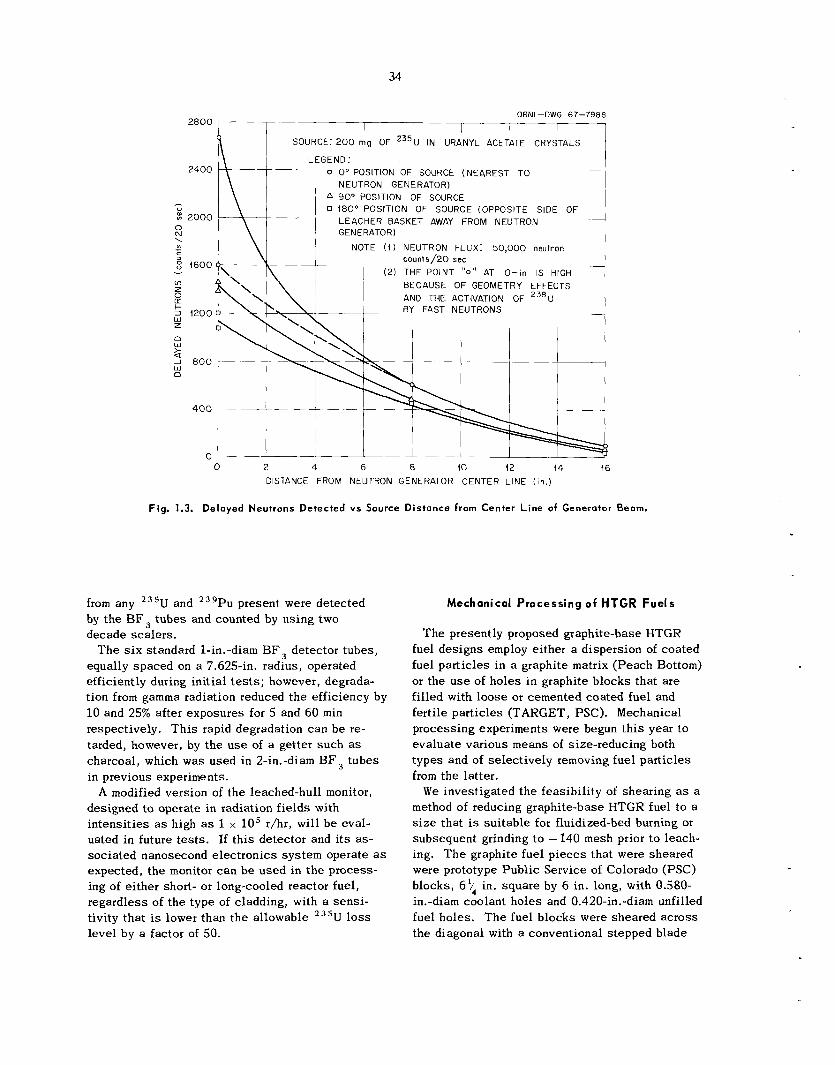
34
2800
2400
..-. 0 : 2000 0 N \ v)
c &
$ 1600 - v) z $ 5 !200 W z 0 w 2 1 800 n W
400
0
ORNL-DWG 67-7988
I 1 r I I I
I SOURCE: 200 mg OF 235u IN URANYL ACETATE CRYSTALS
LEGEND:
-7--- I
0 Oo POSITION OF SOURCE (NEAREST TO NEUTRON GENERATOR)
a 90' POSITION OF SOURCE 0 180" POSITION OF SOURCE (OPPOSITE SIDE OF
LEACHER BASKET AWAY FROM NEUTRON GENE RAT0 R )
NOTE ( 4 ) NEUTRON FLUX: 50,000 neutron ~ counis/20 sec
(2) THE POINT " 0 " AT 0 - i n IS HIGH BECAUSE OF GEOMETRY EFFECTS AND THE ACTIVATION OF 238U BY FAST NEUTRONS ~-
I I I I
0 2 4 6 0 10 12 14 16 DISTANCE FROM NEUTRON GENERATOR CENTER LINE ( i n . )
Fig. 1.3. Delayed Neutrons Detected vs Source Distance from Center Line of Generator Beam.
from any 235U and 2 3 9 P u present were detected by t h e BF, tubes and counted by using two decade sca le rs .
T h e s i x standard 1-in.-diam BF , detector tubes , equally spaced on a 7.625-in. radius, operated efficiently during ini t ia l t e s t s ; however, degrada- tion from gamma radiation reduced the efficiency by 1 0 and 25% after exposures for 5 and 60 min respectively. T h i s rapid degradation can b e re- tarded, however, by the u s e of a getter such as charcoal, which was used in 2-in.-diam B F 3 tubes in previous experiments.
A modified version of the leached-hull monitor, designed to operate in radiation f ie lds with in tens i t ies a s high as 1 x l o5 r/hr, will b e eval- uated in future tes t s . If th i s detector and i t s as- sociated nanosecond electronics system operate as expected, the monitor c a n be used in t h e process- ing of ei ther short- or long-cooled reactor fuel, regardless of the type of cladding, with a s e n s i - tivity tha t is lower than the allowable 235U loss level by a factor of 50.
Mechanical Processing o f HTGR F u e l s
T h e presently proposed graphite-base HTGR fuel des igns employ either a dispersion of coated fuel par t ic les in a graphite matrix (Peach Bottom) or the u s e of holes in graphite blocks that are filled with loose or cemented coated fuel and fertile par t ic les (TARGET, PSC). Mechanical processing experiments were begun th i s year to evaluate various means of size-reducing both types and of se lec t ive ly removing fue l par t ic les from the latter.
W e invest igated the feasibi l i ty of shear ing as a method of reducing graphite-base HTGR fuel t o a size that is sui tab le for fluidized-bed burning or subsequent grinding to - 140 mesh prior t o leach- ing. T h e graphite fuel p ieces that were sheared were prototype Publ ic Service of Colorado (PSC) blocks, 65, in. square by 6 in. long, with 0.580- in.-diam coolant ho les and 0.420-in.-diam unfilled fuel holes . T h e fuel blocks were sheared across the diagonal with a conventional s tepped blade
35
..... . .
to 3;- and 1-in. lengths and across the f la t s , us ing a straight blade, to Y2-in. lengths. In both c a s e s , the fuel did not shea r evenly but fractured into random-shaped and -sized chunks varying from fine dus t to wedge-shaped p i eces 2 t o 3 in. on a s i d e and of a th ickness equal t o the length of cut. T h e fuel sheared in an acceptab le fashion for approximately 50% of the cross-sectional area, but la rge irregular p i eces were dislodged from the remainder of t he c r o s s sec t ion . T h e force required t o shear t he prototypes was insignificant. It was concluded f rom t h e s e t e s t s tha t t he non- uniformity of product and the uncertainty of holding and feeding b locks of graphite that break randomly makes s i z e reduction by shear ing an unattractive operation.
blocks were mechanically broken t o determine whether such an approach would ptoduce su i tab le feed for a hammer m i l l or roll crusher. The t e s t specimens were 6-in.-thick sec t ions of prototype PSC graphite fue l blocks (hexagons measuring 14 in. ac ross the f l a t s , with coolant and unfilled fuel holes). In these t e s t s a fue l block was placed on edge in an open-top m e t a l box, and a 500-lb cylindrical weight was dropped axially from heights of 5, 7, and 10 ft . In each case, approximately 30% of the graphite s ec t ion was broken into various- s i zed p i eces ranging from sp l in te rs 6 in. long to fine powder; the remainder of the sec t ion was broken into four or five large wedge-shaped p ieces . The resu l t s of t h e s e t e s t s indicate tha t breaking PSC graphite fuel blocks by the “pile-driving” technique is not practical and does not warrant further investigation.
Several methods of removing the coa ted fuel particles from ho les in PSC type fuel blocks have been suggested: (1) pressing t h e cylindrical compact of cemented fuel particles (beads) from the channel, (2) burning out the low-density binder holding t h e beads together, and ( 3 ) using a high-velocity water flow t o erode t h e binder and thus dislodge the beads from the channel. T h e beads might then b e screened into two size frac- t ions in order t o separa te t h e fissile beads from the fert i le beads for further processing in separa te chemical sys tems.
methods for removing the fuel beads was encourag- ing. A three-hole nozzle, which delivered water a t 1000 psi, eroded the cemented fuel beads from a 0.45-in.-diam graphite hole a t a penetration of
In other t e s t s , the unirradiated prototype PSC fuel
T h e init ial t es t ing of hydraulic or jet erosion
about 0.2 t o 0.3 in./sec. Unfortunately, many of t he pyrolytic carbon coatings were fractured. T h e irregular coatings of carbonized phenolic binder did not interfere with s iev ing of the beads in to two fractions in the proper proportions. The original charge of coa ted beads was 60% t30 mesh and 40% -40 mesh.
Addition of 15% carbon-black filler to t h e phe- nolic binder, followed by carbonization, resulted i n a fuel compact that was very res i s tan t t o j e t erosion. T h e ra te of bead dislodgment was only about 5% of tha t found in the previous t e s t s . Modifications to the t e s t equipment a re being made t o increase the operating pressure t o about 6000 psi.
1.2 DEVELOPMENT OF BURN-LEACH PROCESS FOR GRAPHITE-BASE FUELS
T h e prime contender in the United S ta tes for a high-temperature gas-cooled reactor fuel cons i s t s of coa ted (Th,U)C2 or (Th,U)O, fuel particles incorporated in a graphite matrix (Peach Bottom) or cemented in to holes in a graphite block (TARGET, PSC). Several p rocesses a re being developed for t h i s fuel. T h e burn-leach process is described below, and the grind-leach process is d i scussed in t h e following section. Work on a pressurized aqueous combustion (PAC) process was abandoned because it appeared to b e inferior to the first two methods. Mechanical pteprocess- ing is a l s o being investigated (see Sect . 1.1).
T h e burn-leach process is the preferred process for fue ls containing carbon-coated fue l particles; however, for Sic-coated fuel par t ic les , grind-leach, or a modified grind-burn-leach process , must b e employed.
of the graphite fuel t o - 4 mesh, burning in a i r or oxygen a t 600 t o 75OOC in a fluidized bed of alumina, and leaching of the thorium and uranium oxide a s h with fluoride-catalyzed nitric acid for subsequent solvent extraction. Development of the process, using unirtadiated carbon-coated- particle fue l samples , w a s completed previously; work during th i s period h a s cons is ted of the hot- ce l l demonstration of t he process. T h e two major unsolved problems in the “cold” t e s t s were: the
T h e burn-leach process involves rough crushing
3Chern. Tedinol . Div . Ann. Progr. Rept . May 31, 1965, ORNL-3830, pp. 34-36.
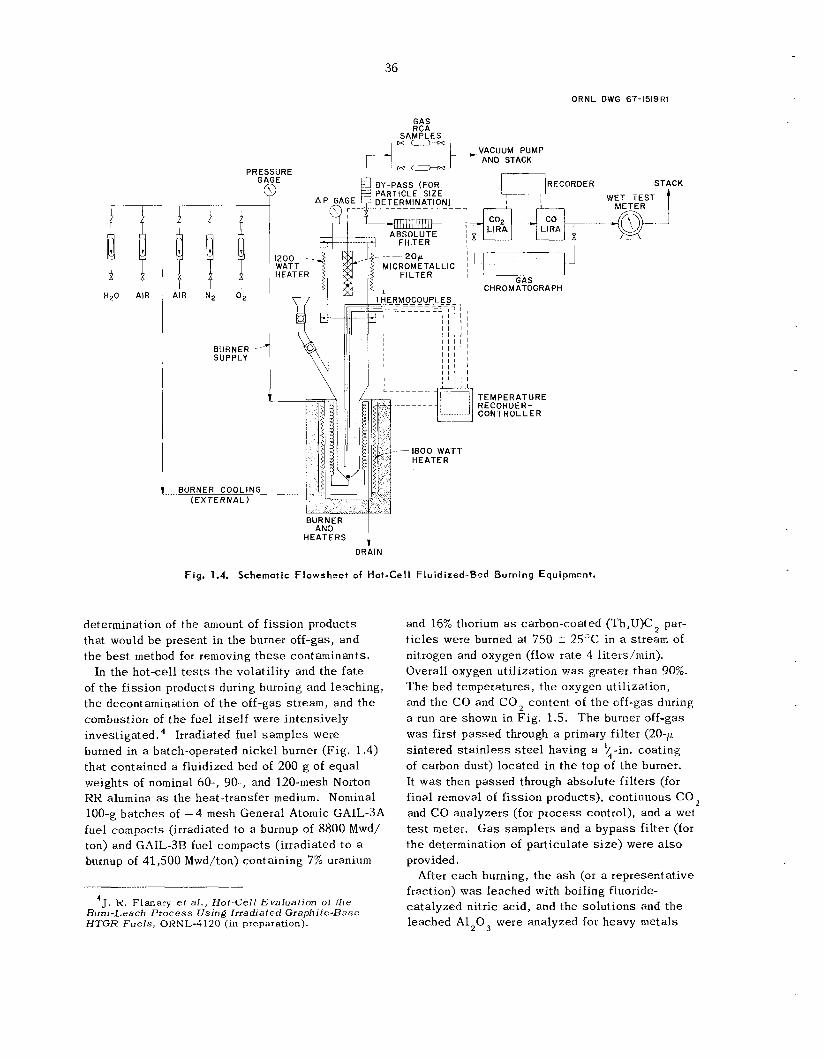
36
O R N L DWG 67-1519R1
PREI G I
(
BURNER - - SUPPLY
i BURNER COOLING ( E X T E R N A L )
DRAIN
Fig. 1.4. Schematic Flowsheet of Hot-Cell Fluidized-Bed Burning Equipment.
determination of the amount of f i ss ion products that would b e present in t h e burner off-gas, and the bes t method for removing t h e s e contaminants.
In t h e hot-cell t e s t s t h e volati l i ty and the fate of t h e f i ss ion products during burning and leaching, t he decontamination of t h e off-gas stream, and t h e combustion of t h e fuel i tself were intensively investigated. Irradiated fuel samples were burned in a batch-operated nickel burner (Fig. 1.4) that contained a fluidized bed of 200 g of equal weights of nominal 60-, 90-, and 120-mesh Norton KR alumina as the heat-transfer medium. Nominal 100-g ba tches of - 4 mesh General Atomic GAIL-3A fuel compacts (irradiated to a burnup of 8800 Mwd/ ton) and GAIL-3B fuel compacts (irradiated to a burnup of 41,500 Mwd/ton) containing 7% uranium
4J. K. F i a n a r y et al., Hot-Cell Evaluation of the Buni-Leach Process Using Irradiated Graphite-Rase HTGR Fue l s , ORNL-4120 (in preparation).
STACK
t WET TEST
and 16% thorium as carbon-coated (Th,U)C, par- t i c l e s were burned at 750 t 25°C in a stream of nitrogen and oxygen (flow rate 4 liters/min). Overall oxygen uti l ization vias greater than 90%. T h e bed temperatures, t h e oxygen uti l ization, and the CO and CO, content of t h e off-gas during a run a r e shown in F ig . 1.5. T h e burner off-gas was first pas sed through a primary fi l ter (20-11 sintered s t a i n l e s s s t e e l having a t - i n . coating of carbon dust) located in t h e top of t h e burner. It was then passed through absolu te f i l t e rs (for final removal of f i ss ion products), continuous CO,
and CO analyzers (for process control), and a wet t e s t meter. G a s samplers and a bypass filter (for t h e determination of particulate size) were also provided.
fraction) was leached with boiling fluoride- ca ta lyzed nitric acid, and the so lu t ions and the leached A120, were analyzed for heavy meta ls
After each burning, t h e a s h (or a representative
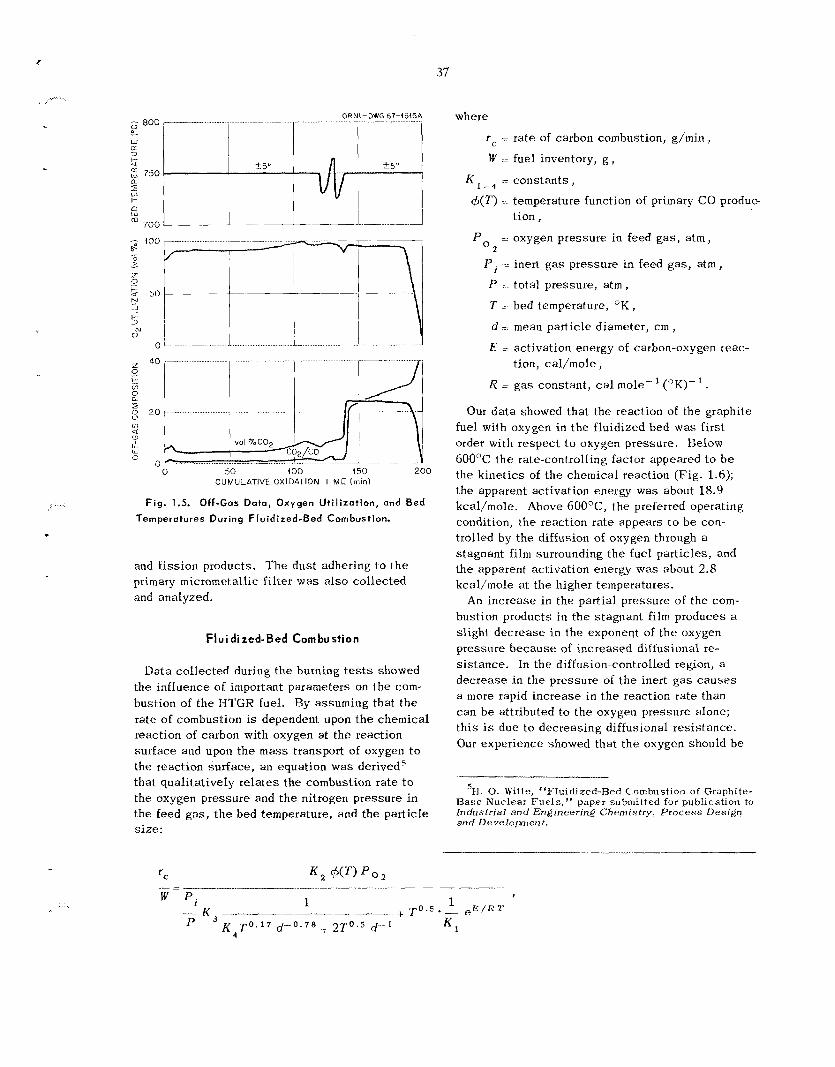
I
37
ORNL-OWG 67-l5l5 ............... ~
.̂... 1 ..
2 401- P 71
CUMULATIVE OXIDATION TIME (rninl
Fig. 1.5. Off-Gas Data, Oxygen Ut i l izat ion, and Bed
Temperotures During F luidired-Bed Combustion.
and f i ss ion products. T h e dus t adhering t o t h e primary micrometallic filter was a l so collected and analyzed.
Fluidized-Bed Combustion
Data co l lec ted during the burning tests showed the influence of important parameters on the com- bustion of the HTGR fuel. By assuming that t he rate of combustion is dependent upon t h e chemical reaction of carbon with oxygen a t the reaction surface and upon the mass transport of oxygen to the reaction surface, an equation was deriveds that quali tatively relates the combustion rate to the oxygen pressure and the nitrogen pressure in the feed gas, t he bed temperature, and the particle size:
where
rc = rate of carbon combustion, g/min , I = fuel inventory, g ,
K = cons tan t s , 1 - 4
$ ( T ) = temperature function of primary CO produc t i on ,
= oxygen pressure in feed g a s , a tm,
Pi = inert gas pressure in feed gas , atm, 2
P : total pressure, a tm,
T = bed temperature, O K ,
d = mean particle diameter, c m , E = activation energy of carbon-oxygen reac-
R = gas constant, c a l mole-’ (OK)-’.
t ion, ca l /mole ,
Our da t a showed that the reaction of the graphite fuel with oxygen in the fluidized bed was first order with respec t t o oxygen pressure. Below 600°C t he rate-controlling factor appeared to b e the k ine t ics of the chemical reaction (Fig. 1.6); the apparent activation energy was about 18.9 kcal/mole. Above 6OO0C, the preferred operating condition, t he reaction ra te appears to be con- trolled by the diffusion of oxygen through a stagnant f i l m surrounding the fuel particles, and the apparent activation energy was about 2.8 kcal/mole at the higher temperatures.
An increase in the partial p ressure of the com- bustion products in the stagnant film produces a slight decrease in the exponent of the oxygen pressure because of increased diffusional re- s i s tance . In the diffusion-controlled region, a decrease in the pressure of t h e inert g a s causes a more rapid increase in the reaction rate than can b e attributed t o the oxygen pressure alone; th i s is due t o decreasing diffusional res i s tance . Our experience showed that t he oxygen should b e
€1. 0. W i t t e , “Fluidized-Bed Combustion of Graphite- Base N u c l e a r Fuels,” paper submi t ted f o r publication to Industrial and Engineering Cheniistty, Process Design and Development.
5
r c
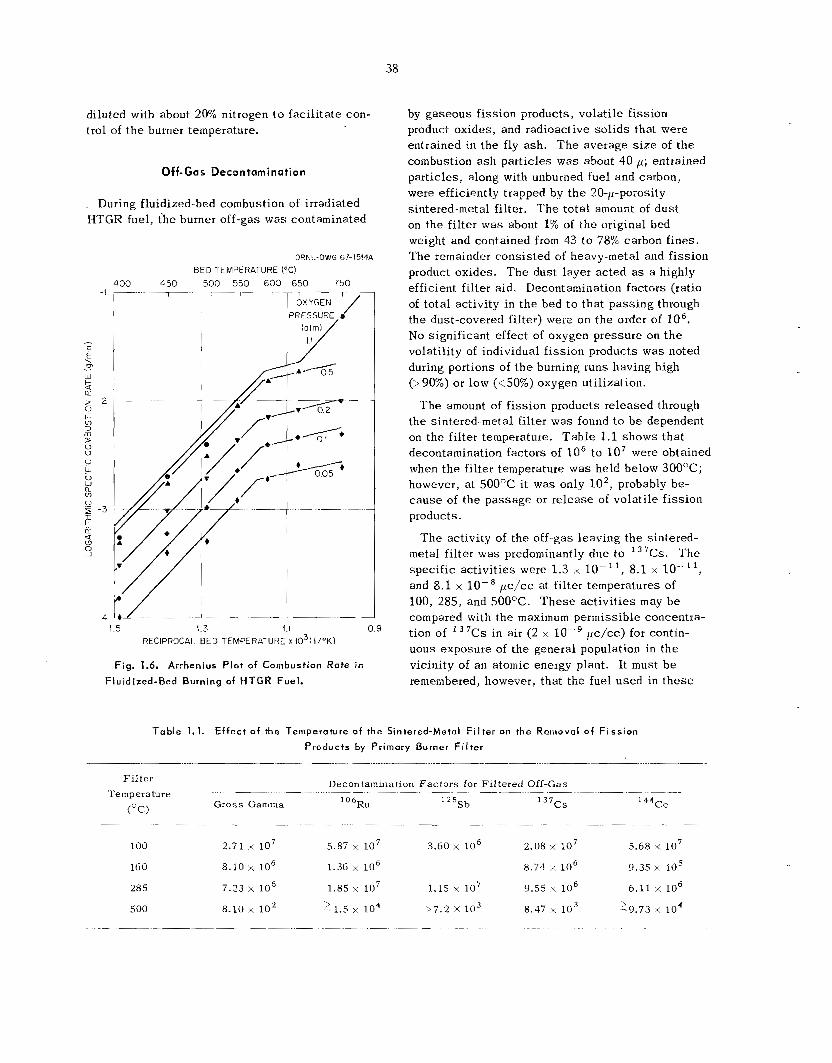
38
diluted with about 20% nitrogen t o fac i l i t a te con- trol of t h e burner temperature.
Off-Gas Decontami nation
During fluidized-bed combustion of irradiated HTGR fuel, t h e burner off-gas was contaminated
U f - 3
E
-4
400 r
-
ORNL-DWG 67-1514A
BED 1 EMPERATURE ("C) 450 500 550 600 650 750 7
PRESSURE a
1 5 1.3 f.! RECIPROCAL BED TEWER4TURE x lo3( I P K I
0.9
Fig. 1.6. Arrhenius Plot of Combusfion Rote in
Fluidized-Bed Burning of HTGR Fuel.
by gaseous fission products, volati le f i ss ion product ox ides , and radioactive so l id s that were entrained in the fly ash . T h e average size of t h e combustion a sh paeticles was about 40 p; entrained particles, along with unburned fuel and carbon, were efficiently trapped by t h e 20-11-porosity sintered-metal filter. 'The to t a l amount of dus t on t h e f i l t e r was about 1% of the original bed weight and contained from 43 t o 78% carbon f ines . T h e remainder cons is ted of heavy-metal and f i ss ion product oxides. T h e dus t layer ac ted as a highly efficient filter aid. Decontamination factors (ratio of to t a l activity in t h e bed t o tha t pas s ing through the dust-covered filter} were on t h e order of lo6. N o significant effect of oxygen pressure on t h e volatility of individual f i s s ion products was noted during portions of t h e burning runs having high (> 90%) or low (<50%) oxygen utilization.
T h e amount of f i ss ion products re leased through the sintered-metal filter was found to b e dependent on the fi l tet temperature. T a b l e 1 .1 shows tha t decontamination factors of lo6 to l o 7 were obtained when t h e fi l ter temperature was held below 300OC; however, a t 500°C it was only lo2 , probably be- c a u s e of t h e pas sage or r e l ease of volati le f i ss ion products.
T h e activity of the off-gas leaving t h e sintered- metal f i l ter was predominantly due to ' 7Cs. The spec i f ic ac t iv i t ies were 1.3 x lo -" , 8 .1 x lo-"', and 8.1 x lo-* pc/cc at filter temperatures of 100, 285, and 500°C. T h e s e ac t iv i t ies may b e compared with t h e maximum permissible concentra- tion of l 3 7 ~ s i n air (2 x uous exposure of the general population in t h e vicinity of an atomic energy plant. It must b e remembered, however, tha t t he fuel u sed in t h e s e
pc/cc} for contin-
Table 1.1. Effect of the Temperature of the Sintered-Metal F i l te r on the Removal o f F iss ion
Products by Primary Burner F i l te r
Decontamination Fac tors for Fil tered Off-Gas Filter l'ernperature _ _ ~ __ ~ -~ -~ ~
Gross G a m m a O 6Ru l Z 5 S b l37CS l44Ce ( O C )
- ~~~~ _ _ ~ ~- ~ ~ ~ ___ _ _ _ _ _ _ _ _ _ _
5.68 x l o 7 160 8.10 x lo6 1.36 x l o 6 8.71 x lo6 9.35 x los
500 8.10 x 10² ?1.5 i o 4 b 7 . 2 x i o 3 8 47 x l o 3 29 .73 x 10'
100 2.71 l o 7 5.87 lo7 3.60 x l o 6 2.08 l o 7
28 5 7.23 x l o 6 1.85 l o 7 1.15 i o 7 9.55 x 10⁶ 6.11 x lo6
~ ~ - ~ _ _ ~ _ _ ~ ~- ~
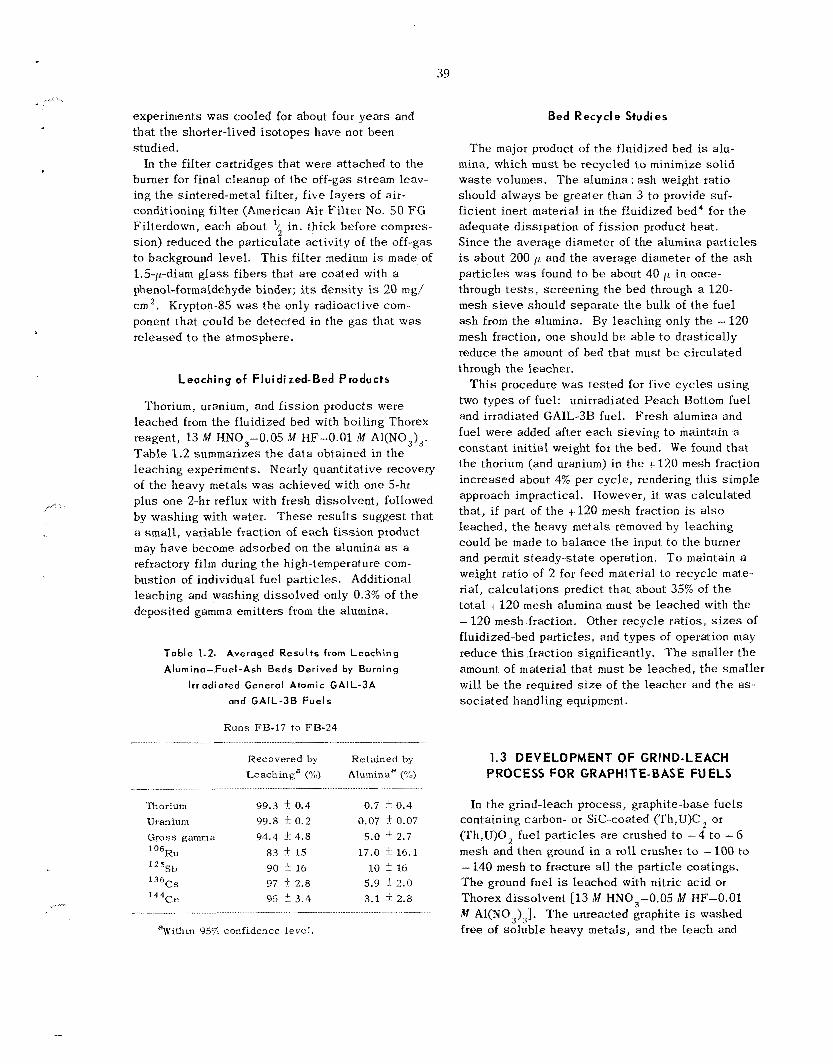
39
experiments was cooled for about four years and tha t t h e shorter-lived i so topes have not been studied.
In t h e fi l ter cartridges that were a t tached to the burner for final cleanup of t he off-gas stream leav- ing t h e sintered-metal filter, f ive l aye r s of air- conditioning f i l t e r (American Air F i l t e r No. 50 F G Filterdown, each about '/2 in. thick before compres- s ion) reduced t h e particulate activity of the off-gas to background level. T h i s filter medium is made of 1.5-p-diam g l a s s fibers that a r e coa ted with a phenol-formaldehyde binder; its density is 20 mg/ c m 2 . Krypton-85 was t h e only radioactive com- ponent t ha t could b e detected in t h e g a s that was re leased to t h e atmosphere.
Leaching of Fluidized-Bed Products
Thorium, uranium, and f i ss ion products were leached from t h e fluidized bed with boiling l'horex reagent, 13 M HN0,-0.05 11.I HF-0.01 M Al(NO,),. Table 1.2 summarizes t h e d a t a obtained in t h e leaching experiments. Neatly quantitative recovery of t he heavy metals was achieved with one 5-hr p lus one 2-hr reflux with fresh dissolvent, followed by washing with water. T h e s e resu l t s sugges t tha t a smal l , variable fraction of e a c h f i ss ion product may h a v e become adsorbed on t h e alumina as a refractory film during t h e high-temperature com- bustion of individual fuel particles. Additional leaching and washing d isso lved only 0.3% of t h e deposited gamma emitters from the alumina.
Table 1.2. Averaged R e s u l t s from Leaching
Alumina-Fuel-Ash Beds Derived by Burning
Irradiated General Atomic G A I L - 3 A
and G A I L - 3 8 Fuels
R u n s FB-17 to FB-24
Bed Recycle Studies
T h e major product of t h e fluidized bed is alu- mina, which must be recycled to minimize so l id was te volumes. T h e alumina : a s h weight ratio should a lways b e greater than 3 t o provide suf- f icient inert material in t h e fluidized bed4 for t h e adequate d iss ipa t ion of f i ss ion product heat. Since t h e average diameter of t h e alumina par t ic les is about 200 p and the average diameter of t he a s h par t ic les was found t o b e about 40 p in once- through tests, screening t h e bed through a 120- mesh s i e v e should sepa ra t e t h e bulk of t he fuel a s h from the alumina. By leaching only the - 120 mesh fraction, one should b e ab le t o drastically reduce t h e amount of bed that must b e circulated through the leacher.
T h i s procedure was tes ted for f ive cyc le s us ing two types of fuel: unirradiated Peach Bottom fuel and irradiated GAIL-3B fuel. F r e s h alumina and fuel were added after each s iev ing t o maintain a cons tan t in i t ia l weight for t h e bed. W e found that t h e thorium (and uranium) in t h e .+- 120 mesh fraction increased about 4% per cyc le , rendering th i s simple approach impractical. However, i t was ca lcu la ted that, if part of t he + 120 mesh fraction is also leached , the heavy meta ls removed by leaching could b e made t o ba lance the input t o t h e burner and permit steady-state operation. To maintain a weight ratio of 2 for feed material to recycle mate- rial, ca lcu la t ions predict that about 35% of t h e to ta l -6 120 mesh alumina must b e leached with t h e - 120 mesh fraction. Other recycle ratios, sizes of fluidized-bed particles, and types of operation may reduce this fraction significantly. T h e smaller t h e amount of material that must b e leached, t h e smaller will b e t h e required size of t h e leacher and t h e a s - soc ia ted handling equipment.
~~
Recovered by Retained by LeachinEd ('%) Aluminaa (%)
1.3 DEVELOPMENT OF GRIND-LEACH PROCESS FOR GRAPHITE-BASE FUELS
'I% o rium 99.3 k 0.4 0.7 k 0.4 Uranium 99.8 k 0.2 0.07 k 0.07 Gross gamma 91.4 ir 4.8 5.0 ? 2.7 106R11 83 k 15 17.0 i 16.1 125sb 90 k 16 10 16 13CiCs
'44Ce 96 2 3.4 3.1 2 2.8
97 i 2.8 5.9 t 2.0
"Within 9571 confidence level.
In t h e grind-leach process, graphite-base fue ls containing carbon- or S ic -coa ted (Th,U)C, or (Th,U)O, fuel par t ic les a re crushed t o - 4 to - 6 mesh and then ground in a roll crusher to - 100 to - 140 mesh to fracture all t h e particle coatings. T h e ground fuel is leached with nitric acid or Thorex d isso lvent [13 A4 HN0,-0.05 M HF-0.01 M A1(N03),]. T h e unreacted graphite is washed free of so luble heavy metals, and the leach and
40
wash solutions a r e combined for feed adjustment prior to solvent extraction.
designed and built l a s t year6 was evaluated with broken (- 6 mesh) HTCR fuel; additional laboratory leaching t e s t s werc made with ground unirradiated I3TGK and UHTREX fuel samples and with pyro- lytic-carbon-coated T h o sol-gel fuel beads ; further engineering-scale graphite residue filtration t e s t s were performed, and a hot-cell evaluation of the grind-leach process was made with irradiated I-ITGR (General Atomic GAIL compacts and AVR) fuel. samples.
T h e new experimental roll crusher tha t was
Roll Crusher Evaluation Tests
Quantitative recovery of uranium and thorium from coated-particle fue ls requircs that the coa t ing of every fuel particle be broken prior t o leaching. Previously reported work6 with a small commercial double-roll crusher demonstrated its applicability to the Peach Bottom type of HTGR fuel [carbon- coated (Th,U)C, fuel par t ic les i n a graphite matrix] and led t o the fabrication of a much im- proved ORNL-designed roll crusher. T h i s machine h a s severa l notable fea tures tha t have not been incorporated in commercially ava i lab le units:
1.
2.
3.
4.
5.
a preloading mechanism between shaf t s , which minimizes undesirable deflections that would othcrwise result in a significant increase in t h e spac ing between rolls during operation;
hardening of the two 4-in. by 12-in.-diam rolls t o Rockwell 60 (C scale) for maximum res i s tance to abrasion and indentation;
a c learance of only 0.003 in. between the ends of t h e rolls and t h e heavy (1 f/,-in.-thick) s i d e p l a t e s t o ensure that t he material fed to t h e crusher will not bypass t h e two roll faces;
a pivoting yoke tha t supports one roll to permit rapid and prec ise adjustment of t h e roll-to-roll spacing;
horizontal gage rods (riding on t h e shaf t of the adjustable roll) to provide a means of contin- uously monitoring t h e shaf t posit ion to de tec t translational movement tha t would indicate a change in the preset roll-to-roll spac ing under load.
The performance of t h e new roll crusher w a s not accurately predicted from earlier measurements of
nip angle that were made with the smal l commercial machine; in general, t h e new rolls can accommodate larger par t ic les than expected. Three of t h e s e roll c rushers in s e r i e s would provide a capacity of about 0.25 metric ton (U F Th) of Hl'GR fucl per day.
A typical size distribution of P e a c h Bottom compacts crushed t o about -6 mesh in a 15- by %in. hammer mill is shown i n the lower clirve of Fig. 1.7 (a Rosin-Rammler distribution diagram); the upper curve descr ibes t h e size distribution of the final product from t h e roll crusher, us ing t h e optimum sequence of three roll spac ings : 0.030, 0.004, and 0.002 in.
crushing in fracturing t h e coa t ings of the fuel particles was evaluated by leaching t e s t s . T h e s e t e s t s showed that about 30% of the coa t ings of Peach Bottom fuel par t ic les [150- t o 200-p-diam ('rh,IJ)C, coated with a 50- t o 60-p-thick layer of pyrolytic carbon] were broken during rough crushing to - 6 mesh i n t h e hammer mill. Three p a s s e s of the hammer m i l l product through the roll crusher were required to increase the proportion of fractured coa t ings t o 299.8%. ing of 75-p-diam UC, particles was crushed and leached under s i m i l a r conditions, t h e uranium recovery was only 99.0%. T h i s sugges t s that coated-particle fuel containing - 150-p (Th,U)C kernels may define t h e lower limit for fully ef- fective grinding in the 12- by 4-in. double-roll crusher.
T h e rate of roll wear was not well es tab l i shed because the limited quantity of fuel (35 kp,) that was crushed produced a barely measurable change (- 0.0005 in.) i n roll radius; t h e sur face finish was unchanged a t 12 to 15 pin.
T h e e f fec t iveness of hammer milling and roll
When graphite fuel cons is t -
Leaching Experiments with Unirradiated Fuel
Laboratory-scale s tud ie s of t h e leaching of unirradiated HTGR fue l s (Peach Bottom and catbon-coated sol-gel T h o ,) and UHTREX fue ls have been made us ing samples that were rough- crushed t o - 6 mesh and then roll-crushed to - 140 mesh6 t o ensure ruptute of the coated particles.
6Chern. Technol. Div. Ann. Progr. R e p t . M a y 31, 1966,
7L. M. F-r r i s , Grind-Leach Process for Graphite-Base
ORNL-3945, PP. 28-32.
Reactor Fuels That Contain Coated Particles: Lah- oratory Development, ORNL-4110 (June 1967).
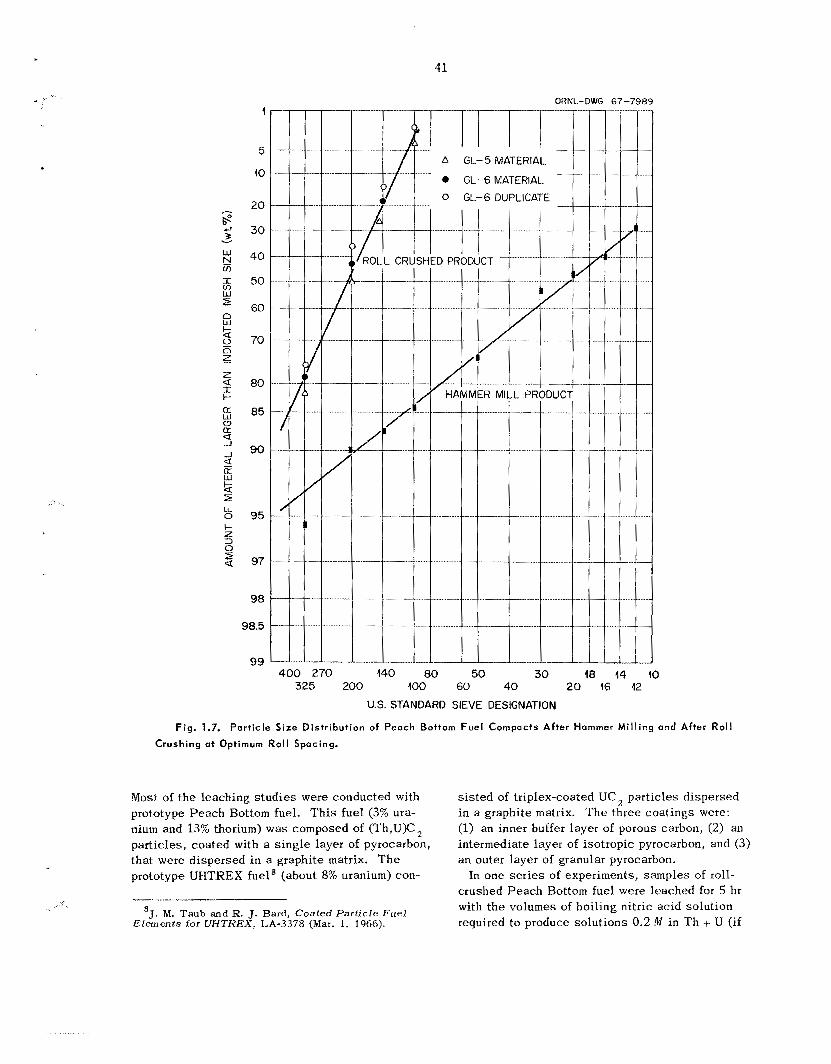
...
41
.... .. ...
30 18 14 10
U.S. STANDARD SIEVE DESIGNATION
Fig. 1.7. Part ic le Size Distr ibut ion of Peach Bottom F u e l Compacts After Hammer Mi l l ing and After Ro l l Crushing a t Optimum Roll Spacing.
Most of t h e leaching s tud ie s were conducted with prototype Peach Bottom fuel. T h i s fue l (3% ura- nium and 13% thorium) was composed of (Th,U)C, particles, coa ted with a s ingle layer of pyrocarbon, that were dispersed in a graphite matrix. T h e prototype UHTREX fuel8 (about 8% uranium) con-
s i s t ed of triplex-coated UC, particles dispersed in a graphite matrix. T h e three coa t ings were: (1) an inner buffer layer of porous carbon, (2) an intermediate layer of isotropic pyrocarbon, and (3 ) an outer layer of granular pyrocarbon.
In one series of experiments, samples of roll- crushed Peach Bottom fuel were leached for 5 hr with t h e volumes of boiling nitric acid solution required to produce so lu t ions 0.2 M in T h + U (if
I_
*J. M. Taub and R. J. Bard, Coated Particle Fuel Elements for VHTKEX, LA-3378 (Mar. 1, 1966).
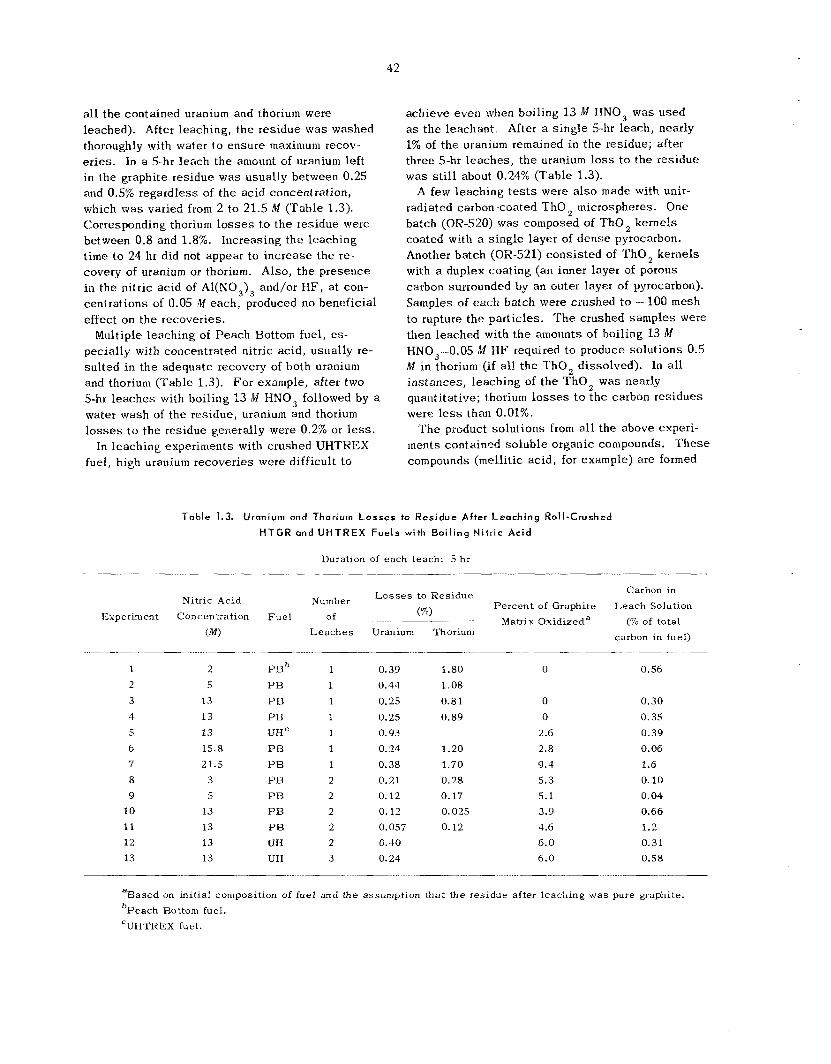
42
all the contained uranium and thorium were leached). After leaching, t he residue w a s washed thoroughly with water t o ensure maximum recov- e r ies . In a 5-hr leach the amount of uranium left i n t h e graphite residue w a s usually between 0.25 and 0.5% regardless of the acid concentration, which was varied from 2 to 21.5 M (Table 1.3). Corresponding thorium losses to t h e residue were between 0.8 and 1.8%. Increasing t h e leaching t i m e to 24 hr did not appear to increase the re- covery of uranium or thorium. Also, t h e presence in the nitric ac id of Al(NO,), and/or HF , a t con- centrations of 0.05 1l.I each , produced no beneficial effect on t h e recoveries.
Multiple leaching of P e a c h Bottom fuel, es- pecially with concentrated nitric acid, usually re- su l ted in t h e adequate recovery of both uranium and thorium (Table 1.3). Fo r example, after two 5-hr l eaches with boiling 13 M IINO, followed by a water wash of t h e residue, uranium and thorium losses to the residue generally were 0.2% or less.
In leaching experiments with crushed UHTREX fuel, high uranium recoveries were difficult t o
achieve even when boiling 13 M IINO, was used as t h e leachant. After a s ingle 5-hr leach , nearly 1% of t h e uranium remained in t h e residue; after three 5-hr leaches, t h e uranium loss to the residue was s t i l l about 0.24% (Table 1.3).
A few leaching t e s t s were also made with unir- radiated carbon-coated T h o microspheres. One batch (OR-520) was composed of T h o , kernels coated with a s ingle layer of d e n s e pyrocarbon. Another ba tch (OR-521) cons is ted of ‘ r h o kernels with a duplex coa t ing (an inner layer of porous carbon surrounded by an outer layer of pyrocarbon). Samples of each batch were crushed to - 100 mesh to rupture t h e particles. The crushed samples were then leached with t h e amounts of boiling 13 M HN0,-0.05 iM IIF required t o produce so lu t ions 0.5 M i n thorium (if all t h e T h o , dissolved). In all ins tances , leaching of t h e Tho, was nearly quantitative; thorium losses to t h e carbon res idues were l e s s than 0.01%.
T h e product so lu t ions from all the above experi- ments contained so luble organic compounds. T h e s e compounds (mellitic ac id , for example) a re formed
Table 1.3. Uranium and Thorium L o s s e s PO Residue After Leoching Roll-Crushed H T G R a n d U H T R E X Fuels with B o i l i n g N i t r i c Acid
Duration of each leach: 5 hr
Nitric Acid Experiment Concentration
( M )
Fue l Number
of Leach e s
1 2 2 5 3 13 4 13 5 13 6 15.8 7 21.5 8 3 9 5
10 13 11 13 12 13 13 13
P H b P B PI3 PI3 UH PI3 P B P H P R P B P B UH UH
1 1 1 1
1
1
1 2 2 2 2 2 3
L o s s e s to Residue
( 7 0 ) ___ Uranium Thorium
~ ~ _ _
0.39 1.80 0.44 1.08 0.25 0.81 0.25 0.89 0.93 0.24 1.20 0.38 1.70 0.21 0.28 0.12 0.17 0.12 0.025 0.057 0.12 0.40 0.24
Percent of Graphite Matrix Oxidizeda
0
0 0
2.6 2.8
9.4 5.3 5.1 3.9 4.6 6.0 6.0
Carbon in Leach Solution
(% of total carbon in fuel)
0.56
0.30 0.35 0.39 0.06
1.6 0.10 0.04 0.66 1.2 0.31 0.58
aBased on initial composition of fuel and the assumption that the residue after leaching was pure graphite. bPeach Bottom fuel. ‘UHTREX fuel.
43
.. . . ..
by reaction of ni t r ic acid with carbon9 (graphite and/or par t ic le coat ings) and/or uranium and thorium carbides . l o - * In s ing le 5-hr l e a c h e s of crushed HTGR fue ls with boiling 2 to 5 M HNO,, no measurable oxidation of the graphite matrix occurred; however, about 3 t o 9% was oxidized as the HNO, concentration was increased from 13 to 21.5 M (Table 1.3). In two 5-hr leaches with boiling 3 to 13 M HNO,, 4 to 6% was oxidized. Less than 1% of the total carbon from t h e fuel was generally found in the leach solution as soluble organic compounds, even when t h e amount of graphite matrix oxidized was s ignif icant (Table 1.3). T h i s amount of carbon corresponded to 30 to 50% of t h e carbide carbon from t h e ThC,-UC, or UC particles. T h e s e resu l t s indicate tha t oxidation of t h e graphite matrix and/or the carbide par t ic les g ives CO, and CO as the main products and that t h e soluble organic compounds s t e m principally f r o m the carbide carbon. Some oxidation of t h e carbon w a s also noted in t h e leaching experiments with the carbon-coated T h o microspheres; consequently, soluble organic com- pounds c a n be expected in t h e solut ions resul t ing from t h e leaching of practically all t y p e s of graphite-b ase reactor fuels.
Grophite Residue Fi l t rat ion Tests
Previous filtration experiments have confirmed that t h e maximum recovery of uranium and thorium requires ex tens ive washing of t h e graphite res i - due.6 In order t o measure t h e effects of acid con- centration and acid temperature, a series of s m a l l engineering-scale washing experiments were made using -2-ft-deep beds, each of which was con- ta ined in a 1 '/,-in.-diam g l a s s column; the latter was maintained at a constant temperature by heated mineral oil c i rculat ing through a g l a s s jacket . A perforated s t a i n l e s s s t e e l p la te covered with graded A1,0, ( - 6 +30 mesh) was used to support a bed of previously leached - 140 mesh HTGR fuel. Preheated wash solution w a s metered into the filter a t a rate sufficient t o maintain a shallow pool over t h e flooded bed. Air overpressure in
'L. M. Ferris, J . Chern. Eng. Data 9, 387 (1964). L. M. Fer r i s and M. J. Bradley, J. Am. Chern. I O
P. L. Pausen , J. McLean, and W. J. Clelland,
H. Imai and S. Uruno, Nature 206, 691 (19bS).
S O C . 87, 1710 (1965).
Nature 197, 1200 (1963). 1 1
12
the vapor s p a c e a t t h e top of the column provided the driving force to push the wash downward through t h e bed.
T h e resu l t s of s even such experiments are summarized in Tab le 1.4. T h e da ta indicate that acid washing, followed by a short water wash, resu l t s in lower thorium and uranium l o s s e s than extended water washing (compare all other runs with GL-SA). L o s s e s were a l so reduced by increasing the temperature of the wash. A moder- ate reduction in acid concentration (13 to 10 M ) and temperature (90 t o 75OC) resulted in a s m a l l increase in uranium loss and no change in thorium loss.
Figure 1.8 shows t h e amount of soluble thorium remaining i n the bed as a function of the volume of f i l t ra te col lected. When t h e normal ratio of filtrate volume to fuel weight (about 2 l i ters/kg) is used, approximately 75% of the soluble thorium is removed in t h e filtered leachate before the addition of wash liquid t o the column is begun. About 5 liters of wash solution per kilogram of residue is required for essent ia l ly complete re- moval of the soluble thorium (lower curve). Wash- ing is less efficient a t t h e higher flow rate (upper curve) in t e r m s of wash volume required.
only dilution with water t o achieve Einal adjust- ment, a recycle acid flowsheet was developed (Fig. 1.9) in which the bulk of the wash acid is returned to the head end of the process for leach- ing a subsequent batch of ground fuel . T h e leacha te and the water wash are combined and diluted to obtain a f inal HNO, concentration of about 4 M ; t h i s treatment produces a solution that is su i tab le for an acid-feed thorium extraction flowsheet, l 3 despi te the presence of a small amount of dissolved organic compounds formed during leaching.
Previous experiments showed that a deep bed of graphite residue permits more efficient utiliza- tion of acid and water washes than a shallow bed but that i t h a s the disadvantage of a greater pres- sure drop. In order t o develop an improved per- meability correlation, permeabili t ies for typical res idues were measured a s functions of pressure drop (AI'), bed depth (L) , and liquid viscosi ty (p). Fil t ra t ion rate ( V ) plotted v s the product of pressure gradient and reciprocal viscosi ty showed
To provide a solvent extraction feed that requires
R. €1. Rainey, Oak Ridge National Laboratory, 13
personal communication (May 1967).
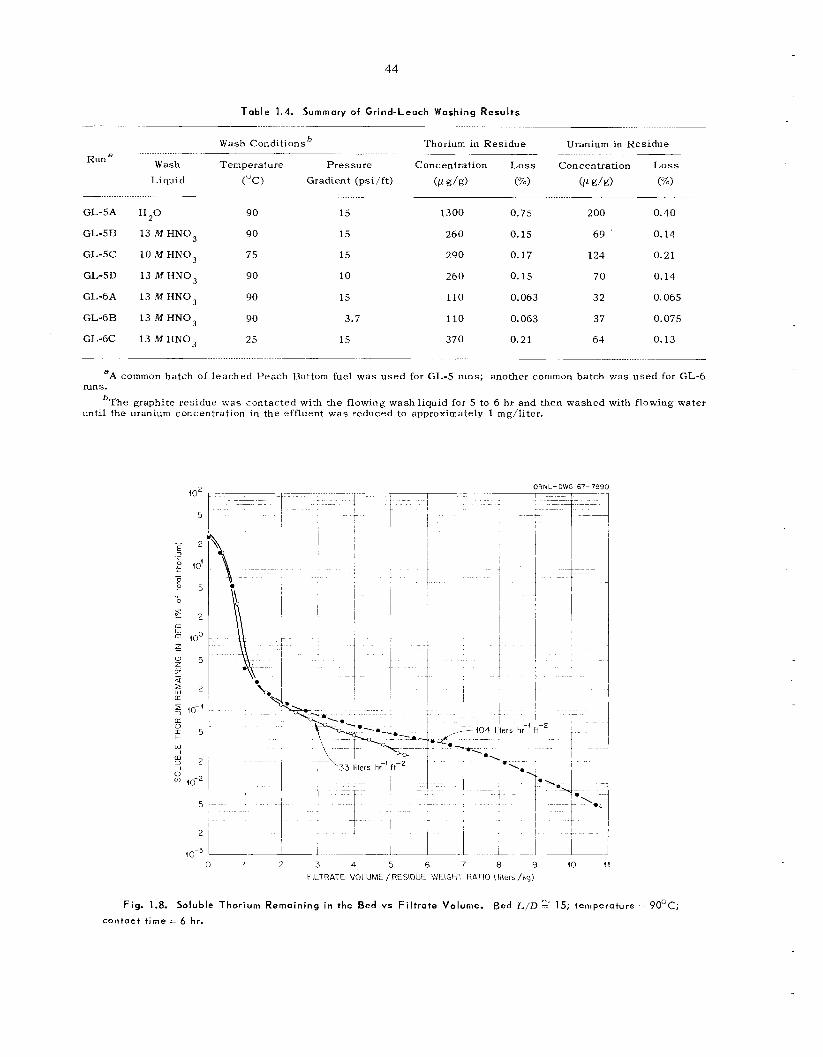
44
Table 1.4. Summary of Grind-Leach Washing Results -
Run a
- GL-5A
GL-5R
GL-5C
GL-5D
GL-6A
GL-6B
GL-6C
Wash Conditionsb Thorium in Residue
Wash Temperature Pressure Liquid ("C) Gradient (psi/f t)
Concentration Loss
(p P/%) (a)
13 2o 90 15
13 M HNO, 90 15
10 M IINO, 75 15
13 M HNO, 90 10
13 M IINO, 90 15
13 M HNO, 90 3.7
13 M IINO, 25 15
1300 0.75
260 0.15
290 0.17
260 0.15
110 0.063
110 0.063
370 0.21
Uranium in Residue
Concentration J.,oss - . . . .. . .______
(/L g / 9) ("lo)
2 00 0.40
69 ' 0.14
124 0.21
70 0.14
32 0.065
37 0.075
64 0.13
aA common hatch of leached Peach Bottom fuel was used for GL-5 runs; another coriunon batch was used for GL-6
bThe graphite residue was contacted with the flowing wash liquid for 5 to 6 hr and then washed with flowing water runs.
until the uranium concentration in the effluent was reduced to approximately 1 mg/liter.
Fig. 1.8. contact t ime :
1 0
10-2
5
2
10.~
ORNL- DWG 67- 7990
Soluble Thorium Remaining in the Bed vs F i l t ra te Volume. Bed L / D 2' 15; temperature 7
= 6 hr.
9OoC;
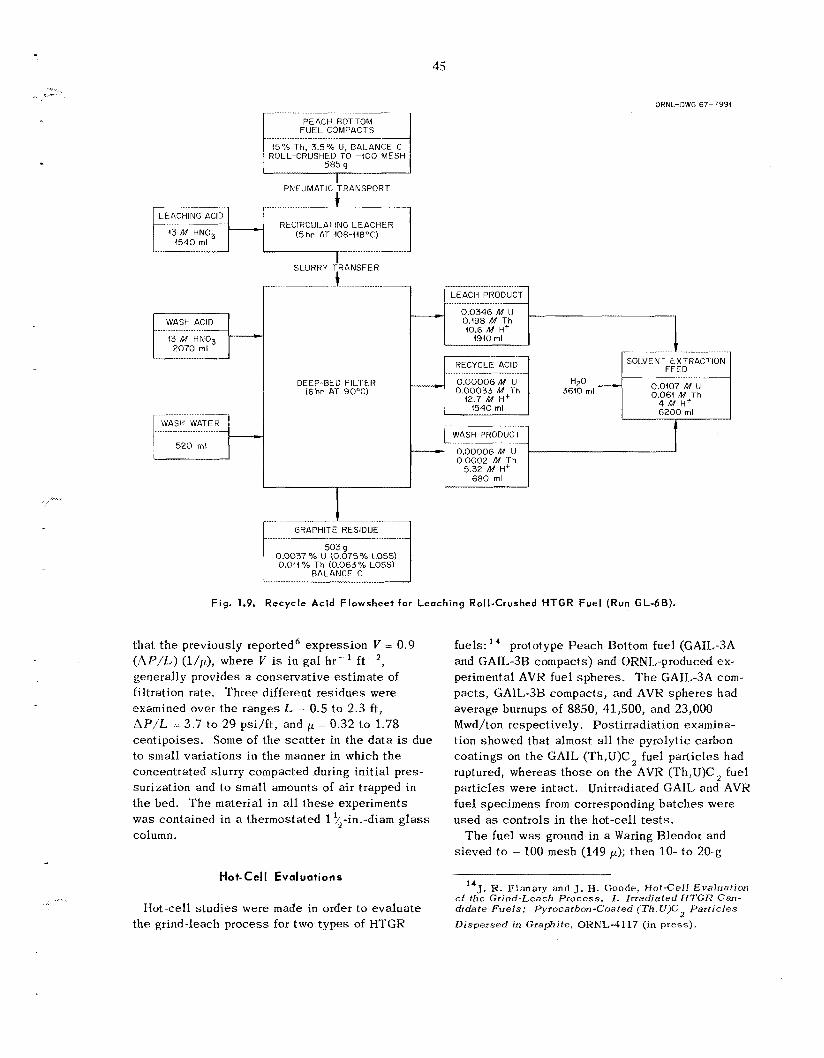
45
PEACH BOTTOM FUEL COMPACTS
.........
ROLL-CRUSHED TO -100 MESH 585 g
ORLI.-DWG 67-7994
...... <.-..
I PNEUMATIC TRANSPORT
.................
RECIRCUILATING LEACHER (5 hr AT .108-41R°C) 43 M HN03
SLURRY TRANSFER
t
.....
2070 ml
................... __ WASH WATER ........................ 1 520 ml
I ............. (......GRAPHITE RESIDUE 1
[email protected] FILTER (6hr AT 90°C)
I- 503 g
0.0037 YO U (0.075% LOSS) 0.01i% Th (0.063% LOSS)
BAL.ANCE C
LEACH PRODUCT .......................
0.498 M Th i0.6 M H+
SOLVENT EXTRACTION I FEED I 0.00006M U 0.00033 M+Th 0.064 M+Th 42.7 M ti
6 2 0 0 ml
WASH PRODUCT
----) 0.00006M U . 0.0002 M Th
5.32 M H+ 680 ml
Fig. 1.9. Recycle Acid Flowsheet for Leaching Roll-Crushed HTGR Fuel ( R u n GL-6B).
tha t t h e previously reportedfi expression V = 0.9 ( / Z P / L ) (l/p), where V is in ga l hr- ' ft-', generally provides a conserva t ive es t imate of filtration rate. Three different res idues were examined over t h e ranges L : 0.5 to 2 .3 ft, AP/L - 3.7 to 29 ps i j f t , and p - 0.32 to 1.78 cent ipoises . Some of t h e sca t t e r i n t h e da t a is due to small variations in t h e manner in which t h e concentrated slurry compacted during init ial p tes - surization and t o smal l amounts of a i r trapped i n t h e bed. T h e material i n all t h e s e experiments was contained i n a thermostated 1 j/2-in.-diam glass column.
Hot-Cel I Eva1 uotion s
Hot-cell s tud ie s were made in order t o eva lua te the grind-leach process for two types of HTGR
fuels: l 4 prototype P e a c h Bottom fue l (GAIL3A and G A I L 3 B compacts) and ORNL-produced ex- perimental AVR fuel spheres . T h e G A I L 3 A com- pac ts , G A I L 3 B compacts, and AVR sphe res had average burnups of 8850, 41,500, and 23,000 Mwd/ton respectively. Postirradiation examina- tion showed tha t almost all the pyrolytic carbon coa t ings on t h e GAIL (Th,U)C, fuel par t ic les had ruptured, whereas those on t h e AVR (Th,U)C, fuel par t ic les were intact . Unirradiated GAIL and AVR fuel specimens from corresponding ba tches were used a s controls i n t h e hot-cell t e s t s .
The fuel w a s ground in a Waring Blendor and s ieved to - 100 mesh (149 p); then 10- to 20-g
14J. R. Flanary and J. H. Goode, Hot-CcIl Evalriafion of the Grind-Leach Process. I . Irradiated HTGR Cam- didate Fuels : Pyrocarbon-Coated (Th, U)C2 Particles
Dispersed zri Graphite, ORNL-4117 (in press).
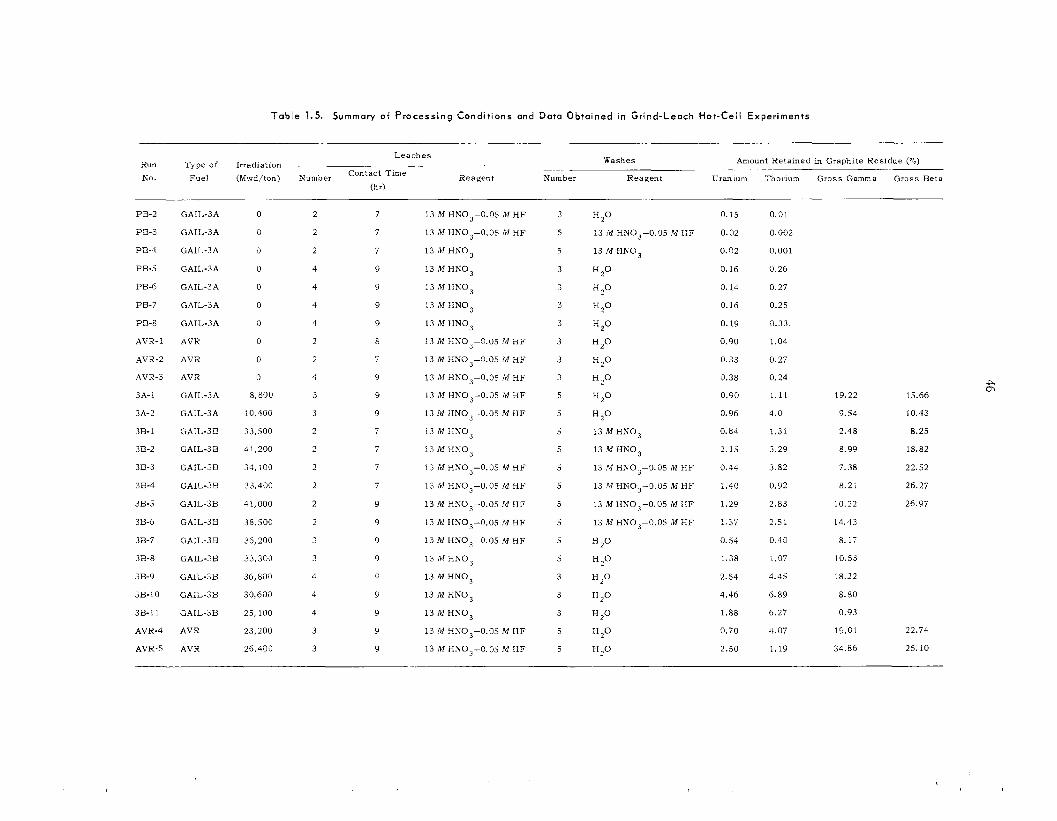
T a b l e 1.5. Summary o i P r o c e s s i n g C o n d i t i o n s a n d Data O b t a i n e d i n f r : n d - L e a c h H o t - C e l l E x p e r i m e n l s
Washes Amount Re ta ined in Graphi te Res idue (%) L e a c h e s __ ~- D....
N O . Fue l (Mwd/ton) Sumber Lun'acl l lrne Reagent Number Reagen t Uranium Thorium Gross Gamma G r o s s Be ta (hr)
PB-2
?E-3
PB-4
PB-5
PB-6
PB-7
?E-6
AVR-I
AVR-2
AVR-3
3A-1
3A-2
3B-1
3B-2
3B-3
3B-4
3B-5
3B-6
3 3 7
3B-8
3B-9
3B-10
3B-11
AVR-4
AVR-5
GAIL-3A
GAIL-3A
GAIL-3A
GAlL-3A
GAIL-3A
GAIL-3A
GAIL-3A
AVR
AVR
AVR
GAIL-3A
GAIL-3A
GAIL-3B
GAIL-3B
GA!L-3B
GAIL-3B
GAIL-3B
GAIL-3B
G A L - 3 B
GAIL-3B
GAIL-3B
GAIL-3B
GAIL-3B
AVR
AVR
0
il
il
0
0
0
0
0
0
0
8,800
i 0,400
33,500
4 1,200
34,100
33,400
4 1,000
35,500
35,200
33,300
36,600
30,600
25,100
23,200
26,400
2 7
2 7
2 7
4 9
4 9
4 9
4 9
2 6
2 7
4 9
3 9
3 9
2 7
2 7
2 7
2 7
2 9
2 9
3 9
3 9
4 9
4 9
4 9
3 9
3 9
13 M HN0,-0.05 M H F
13 M HNOJ-0.05 M H F
13 M HNO,
13 M HKO,
13 M FINO,
13 M H N 0 3
13 M HNO,
13 M €iNO3-0.05 M H F
I 3 M HNO3-0.05 M H F
1 3 M HN0,-0.05 M H F
13 M HN03-0.0S M HF
13 M HNOJ-0.05 M H F
13 M HXO,
13 M H N 0 3
13 M HNO.-0.05 M H F
13 M HN03-0.05 M H F
13 M HNO,-O.OS M H F
13 M HNO3-0.0S M H F
13 M HN03--0.05 IM H F
13 iYI HNO,
13 M HNO,
13 M HNO,
13 M HNO,
13 M HN0,-0.05 M H F
13 M HNO3-0.05 M 2%
3
5
5
3
3
3
3
3
3
3
5
5
5
5
5
5
5
5
5
5
3
3
3
S
S
H ? 0 13 M HN03-0.05 M H F
13 M H N 0 3
H P
H 2 0 €1 2O
H 2 0
H2O
H ?O
€I 2O
H2O
H 2O
i 3 M H N 0 3
13 M HKO,
13 M HNO3-0.05 M €IF
13 M HN03-0.0S M H F
13 M HNO,-O.OS M H F
13 M HN03-0.05 /M H F
H ?O
H 2 0
H 2 0
H?O
H ? 0
H P
* 2 0
0.15
0.02
0.02
0. 16
0.14
0.16
0.19
0.90
0.33
0.38
0.90
0.95
0.84
2.15
0.44
i .40
1.29
1.37
0.54
1.38
2.54
4.46
1.88
3.70
2.50
0.01
0.002
0.001
0.26
0.27
0.2s
0.33
1.04
0.27
0.24
1.11
4.0
1 .3 i
3.29
3.82
0.92
2.83
2 .5 i
0.40
1.07
4.45
6.89
6.27
4.07
1.19
19.22
9.54
2.48
8.99
7.38
8.21
10.22
14.43
8. i i
10.53
18.22
8.80
0.93
19.01
34.66
15.66
10.43
8.25
18.82
21.52
26.27
25.97
22.74
25.10
47
...
samples of t he pulverized fuel were leached and washed severa l t imes with boiling 13 M HNO, or 13 M HN0,-0.05 M H F and f resh d isso lvent or water respectively. Finally, the graphite residues were dried and submitted for chemical and radiochemical ana lys i s . Tab le 1.5 summarizes the da t a obtained in t h e s e grind-leach experiments.
T e s t s with t h e unirradiated control samples gave cons is ten t recoveries of ? 99.7% of t h e thorium and uranium; the nonleachable fraction is probably as- soc ia ted with the pyrocarbon coa t ings and pre- sumably resu l t s from diffusion during t h e fuel fabrication process. T h e irradiated G A I L 3 A samples yielded residues containing an average of about 1% of t h e to ta l uranium, 2.5% of the thorium, 15% of the gross gamma activity, and 13% of the gross be ta activity in each sample. T h e residues from t h e more highly irradiated G A I L 3 B samples , leached under optimum conditions, contained up to 4.5% of the uranium, 6.9% of the thorium, and 18.2% of t h e gross gamma activity in t h e samples . Unsatisfactory resu l t s were a l s o obtained with t h e irradiated AVR material (Table 1.5).
As many as four l eaches for to ta l contact t i m e s up t o 9 hr resulted in no significant additional recovery after t he first leach. From t h e s e resu l t s i t was concluded that, a t most, two l eaches (total contact t i m e 7 hr) will recover a l l t he readily acid-soluble (Th,U)C 2 . T h e recovery of the heavy metals from the dicarbide was not enhanced by t h e presence of 0.05 M H F in the leachant Lfluoride is necessary , however, for leaching (Th,U)O, fuel particles]. Water was found to b e as effective as fresh acid for washing the leached graphite; furthermore, a boiling water wash could be filtered about th ree t imes as fas t as an ac id wash. T h e use of fluoride in the wash solution did not improve the recovery of t h e heavy metals or f i ss ion products.
T h e presence of significant amounts of uranium and thorium, along with major quant i t ies of f i ss ion products (particularly lo6Ru , 137Cs , and 144Ce), in t he leached and washed res idues f t o m t h e grind- leach head-end process makes t h i s method appear unattractive for t he reprocessing of HTGR fue ls that contain pyrolytic-carbon-coated (Th,U)C particles dispersed in a graphite matrix.
Additional t e s t s wil l b e made with irradiated samples of ORNL carbon-coated sol-gel T h o , and (Th,U)O , fuel microspheres and General Atomic Sic-coated (Th,U)C to determine t h e applicability of t he grind-leach process t o these fuels. T h e
latter work is quite important s ince process cannot b e used directly for particle fuels.
1.4 SOLVENT EXTRACTION
the burn-leach SiC-coated-
STUD1 ES
Aqueous so lu t ions obtained from the head-end processes tha t a re being developed for various reactor fuel types will b e treated by solvent ex- traction (or anion exchange) to effect the required recovery and decontamination of uranium, thorium, and plutonium from radioactive f i ss ion products. To demonstrate tha t such separa t ions processes are adequate, experiments a re performed, first with solutions of unirradiated fuel to es tab l i sh flowsheet conditions and later with so lu t ions of fully irra- diated fuel, in hot-cell t e s t s , t o determine decon- tamination factors and t o verify that t he separa- t ions sys t ems are valid for u se with irradiated material. During th i s report period, the inajor effort involved the development of a solvent ex- traction process for treating grind-leach fuel solu- t ions. T h e new process was then demonstrated in hot-cell t e s t s . In addition, some survey s tudies of alternative so lvents and d i luents were made.
Solvent Extraction Studies with HTGR Grind-Leach Solutions
Solutions from the grind-leach head-end process for graphite-base HTGR fue ls contain s m a l l amounts of soluble organic materials (mellitic and oxalic acids); during the subsequent extraction process, t h e s e materials c a u s e troublesome emul- s ions when t h e standard Acid-Thorex flowsheet ' is used for fuel recovery. W e have found, however, tha t t he thorium and uranium can be extracted from the solution by T B P without formation of an emul- sion i f t he acid concentration of t he aqueous phase is high. T h e thorium-uranium s t r ip product solu- tion from t h i s head-end extraction cyc le contains only s m a l l amounts of organic material and f i ss ion products; it i s a su i tab le feed solution (after heat- ing and evaporating t o effect concentration and conversion t o an acid-deficient condition) for t h e
I5R. 13. Rainey and J. G. Moore, Nucl . S c i . Eng. 10, 367 (1961).
48
standard Acid-Thorex process . Flowsheet condi- t ions for t h e new process a re as follows:
Feed
Solvent
Scrub solution
Strip solution
Stages
41 g of Th per liter, 7.7 g of U per liter, 4.6 N 11N03; 1 volume
30% TBP in n-dodecane (NDD); 1.5 volumes
Water; 0.3 volume
0.002 N H N 0 3 ; 1.5 volumes
F ive extraction, three scrub, five s t r ip
In a batch countercurrent demonstration run a t tracer level, no difficult ies were encountered with emulsions or crud formations. T h e gross gamma decontamination factor (DF) from f i ss ion products was 400; t h e fission product t ha t limited the decon- tamination was ruthenium. T h e uranium loss t o t h e aqueous raffinate was < 0.01%, but t h e thorium loss was about 5%; however, t h e latter loss could have been decreased by t h e use of additional extractioii s t a g e s or a smal l increase in t h e volume of t h e solvent. T h i s head-end solvent extraction treat- ment h a s advantages over other proposed head-end treatments (e.g., treatment of the aqueous feed solution with permanganate t o destroy the organic material) in that it (1) effectively sepa ra t e s ura- nium and thorium from t h e f i ss ion products and (2) does not add chemical reagents t o the feed that would complicate subsequent was te treatment.
Using the organic extract from t h e above t e s t s , we then obtained sepa ra t e thorium and uranium products by u s e of a compound s t r ip column. Nearly a l l t h e thorium and nitric acid and 6% of the ura- nium were first str ipped from the extract (composi- tion: 0.14 M in thorium, 0.03 11.1 in uranium, and 0.12 N in HNO,) with 0.4 volume of water, us ing a five-stage countercurrent contactor. T h e remain- ing uranium was then stripped, i n a second five- s t a g e contactor, with 0.5 volume of 0.01 M NIi,N03. T h e column separation factors of thorium from ura- nium and of uranium from thorium were 16 and 4 5 respectively. A similar experiment employing an organic feed that did not contain any free acid produced similar results; however, t h e separation factors were about 12 and 300 respectively. Be- s i d e s providing sepa ra t e uranium and thorium products, t he compound s t r ip sys tem h a s t h e ad- vantage of yielding products a t concentrations about twice those that a r e obtainable from a co- stripping system.
Subsequently, hot-cell experiments were per- formed with feeds derived from t h e burn-leach and the grind-leach head-end hot-cell t e s t s (Sects. 1.2 and 1.3) with irradiated GAIL3B fuel compacts and pyrolytic-carbon-coated thorium oxide particles. Based on extraction isotherms, f ive idea l extrac- tion s t a g e s should provide greater than 99.9% recovery of uranium and thorium from t h e s e feeds . In a s e r i e s of batch t e s t s t h e aqueous feeds (of varying f i ss ion product conten ts ranging from 9.4 to 37 beta-plus-gamma curies/l i ter) were equili- brated with the organic solvent for periods ranging from 3 min t o 24 hr t o eva lua te t h e effects of radia- tion or chemical damage to t h e organic solvent. T h e ex t rac ts were then scrubbed, in three suc - c e s s i v e s t eps , with water or nitric acid; each was finally stripped, in five success ive s t e p s , with very dilute acid. Tab le 1.6 sumniarizes t h e da t a obtained in t h e s e t e s t s . In equilibrations with f eeds containing long-decayed (4 years and 19 months respectively) fuel tha t was derived irom mixed burn-leach and grind-leach t e s t s , thorium and uranium losses were low and decontamination factors (g ioss g a m m a D F = 750) were essent ia l ly constant. T h e radiation d o s e absorbed by t h e organic solvent ranged up to 0.35 whr/liter. Ruthenium was the principal Contaminant in t h e product. Tests with so lu t ions containing shorter- decayed (10 months) fuel, derived from the grind- leach process , showed that losses of uranium during stripping increased from less than 0.01 to 0.17% as t h e absorbed d o s e increased from 0.006 to 1.49 whr/liter. T h e "Nb decontamination factor decreased as the absorbed d o s e w a s in- creased; t h e gross gamma D F decreased from 180 t o less than 100. T h e effect of t h e ac id concen- tration of t h e scrub solution was also evident; low acid concentrations gave greater decontamination from zirconium-niobium, whereas higher concentra- t ions removed more ruthenium. More recent so lvent extraction t e s t s show that t h e retention of f i ss ion products by the solvent is principally assoc ia ted with t h e presence of d i sso lved organic materials contained in so lu t ions from t h e griiid-leach proc- ess ing . In t h e s e t e s t s t h e loss of decontamination efficiency and t h e increase in uranium retention by the solvent with increased solvent radiation ex- posure a re due t o t h e combined e f f ec t s of t h e organic materials in t h e feed and of t h e radiation damage to t h e process solvent (and should not b e attributed entirely to the latter).
A 12-stage modified Eurochemic mixer-settler with f ive extraction, three scrub, and four s t r ip
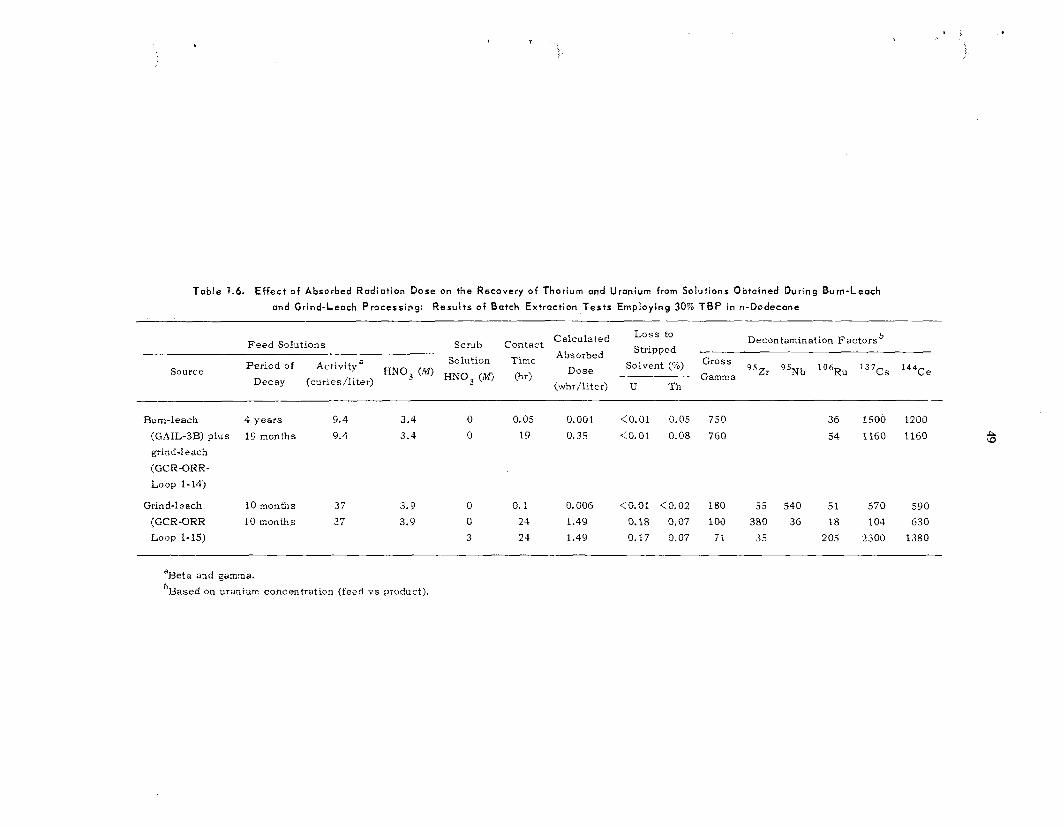
Table 4.6. E f fec t of Absorbed Radiation Dose on the Recovery of Thorium and Uranium from Solutions Obtoined During Bum-Leach
and Grind-Leach Processing: Resu l ts of Batch Extraction T e s t s Employing 30% TEP in n-Dodecane
Bum-leach 4 years 9.4 3.4 0 0.05 0.001 (0.01 0.05 750 (GAIL-3B) plus 19 months 9.4 3.4 0 19 0.35 (0.01 0.08 760 grind-leach
(GCR-ORR- LOOP 1-14)
36 1500 1200 54 1160 1160
Grind-leach 10 months 37 3.9 0 0.1 0.006 <0.01 <0.02 180 55 540 51 570 590 (GCR-ORR 10 months 37 3.9 0 24 1.49 0.18 0.07 100 380 36 18 104 630 LOOP 1-15) 3 24 1.49 0.17 0.07 7 1 35 205 2300 1380
aBeta and gamxa. bBased on uranium concentration (feed v s product).
50
s t a g e s w a s used t o t e s t t he new flowsheet. A s ingle 1-liter batch of solvent was continuously recir- culated without cleanup during runs with aqueous feeds having two different ac id concentrations. T h e aqueous feeds cons is ted of 3400 m l of mixed burn-leach and grind-leach fuel so lu t ions and 480 m l of grind-leach so lu t ions containing short- decayed fuel; t h e latter feed analyzed 9.4 be ta- plus-gamma curies/l i ter . T h e nitric acid concen- tration of the feed used i n t h e first mixer-settler run was 2.5 M ; t h i s was increased to 5.4 M i n t h e second run. Phys ica l operation of t h e mixer- se t t le r sys tem was sa t i s fac tory ; no problems were experienced with phase separation or crud forma- tion. Extraction l o s s e s (about 40%) of t h e thorium and uranium and stripping l o s s e s (up t o 4%) of the uranium, however, were high because of t he poor s t age efficiency of t h e contactor; for example, t h e five mechanical extraction s t a g e s were found to b e equivalent t o sl ightly less than two idea l s t ages .
Direct Leaching of Acidif ied HTGR Fuel with TBP
Scouting t e s t s were performed to determine t h e feasibil i ty of leaching crushed graphite fue l with TBP. T h e ground, unirradiated P e a c h Bottom graphite fuel was wetted with 13 M HNO, and heated; t he amount of acid used w a s only s l igh t ly in e x c e s s of t h e stoichiometric amount required for reaction with the thorium and uranium. T h e resultant material was then dried, loaded in a column, and finally leached by pass ing acidified 30% TBP-NDD through the column. Major frac- t ions of t h e thorium and uranium were readily d is - solved i n t h e solvent phase; however, t he run was too short t o accurately define the recoveries that may b e obtainable by th i s procedure. It is expected that most of t h e f i ss ion products would b e retained by the graphite, but t h i s expectation needs t o b e verified in t e s t s with irradiated fuels.
General Solvent Extraction Studies
It h a s been shown that a solvent composed of di-sec-butyl phenylphosphonate in diethylbenzene (DSBPP in DEB) h a s some advantages over TUP- NDD for u s e in the extraction of uranium (especially
2 3 3 U ) hecause of its greater stabil i ty at high ir- radiation l eve l s and because of the higher ratio of t he uranium distribution coefficient t o t h e thorium distribution coefficient. Studies with DSBPP in DEB s h o w a l that t h e complexed uranium s p e c i e s i s UO,(NO,), * 2DSBPP. T h e limit of solubili ty of t h i s complex in DEB a t about 25OC is 0.37 M ; therefore, 20 vol % DSBPP (-0.75 M ) i n DEB is the maximum concentration tha t c a n b e used a t t h i s temperature in t h e presence of high concentrations of uranium without precipitation of t h e complex.
In other experiments t h e solubili ty of thoriuiii nitrate i n 30% 'TBP (1.06 M ) i n various d i luents w a s found to b e strongly influenced by t h e diluent; how- ever, t h e solubili ty of uranyl. nitrate in a l l t h e t e s t ed d i luents was about 0.50 M . T h e so lubi l i t i es of the thorium nitrate-TBP complexes were deter- mined by equilibrating Th(N0,)4 * 4H,O c rys t a l s with various so lven t s containing TBP (dissolved in t h e normal aliphatic hydrocarbons from hexane to tetradecane, in severa l branched isomers of t h e s e compounds, and in benzene and diethyl- benzene). T h e solubili ty of t h e thorium nitrate- T B P complex i n the aliphatic hydrocarbons WRS
limited by the formation of a second organic phase. T h e solubili ty varied l inearly from 0.33 M in hexane to 0.15 kJ in te t radecane and c a n b e approximately represented by: thorium concentration ( M ) = 0.48 - O.O25C, where C is t h e number of carbon atoms in the diluent molecule. Throughout t h i s s e r i e s , t h e hydrocarbon :thorium mole ratio at saturation had a nearly constant va lue of about 20. T h e T B P :tho- rium mole ratio observed a t t h e beginning of t h e formation of a second organic phase did not change as the concentration of TBP in the diluent w a s varied. If addition of thorium nitrate t o the solu- tion was continued unt i l so l id c rys t a l s remained undissolved, t h e TBP :thorium mole ratio was found to b e approximately 2.6 in t h e heavy organic phase and 2.9 in t h e light phase . T h e solubili ty of t h e TBP-thorium complex in branched aliphatic d i luents was as much as 10% greater than in t h e corresponding normal aliphatic compound. In benzene and diethylbenzetie, indicated maximum thorium so lubi l i t i es were 0.39 and 0.38 M respec- t ively; n o second organic phase formed.
. . . .. ....
16C. A. Blake, J r . , A. T. G r e s k y , J. M. Schmit t , and I?. G. Mansfield, Comparison of Dialkyl Phenyl Phos- phonates with Tri-n-butyl Phosphate in Nitrate Sys t ems: Extraction Properties, Stabili ty, and E f f e c t o f Diluent on the Recovery o f Uranium and Thorium from Spent Fue l s , ORNL-3374 (Jan. 8 , 1963).
51
1.5 DEVELOPMENT OF PROCESSES FOR H EAVY - WATE R-MODER AT ED
ORGANIC-COOLED REACTOR FUELS
Several conceptual reactor des igns are being considered by the Atomic Energy Commission in connection with i t s heavy-water-reactor program. Uranium monocarbide (UC) c lad in SAP (a disper- s ion of 5 t o 15% A1203 in an aluminum matrix) h a s emerged a s the leading candidate for a heavy-water- moderated organic-cooled reactor (HWOCR) fuel. Other types of fuel considered were: (1) SAP-clad UO 2, (2) Zircaloy-clad UC, (3) Zircaloy-clad UO,, (4) SAP-clad (Th,U)C (thorium : uranium atom ratio of about 40), (5) SAP-clad (Th,U)O,, and (6) Zircaloy-clad thorium-uranium alloy (alloy and cladding coextruded). Possible methods for proc- e s s i n g t h e s e fue ls were s tudied on a laboratory scale. ' * * ' Shearing followed by leaching with nitric acid solution appeared to b e the most promising head-end method for fue ls c lad in zirconium. F a r the SAP-clad fuels , decladding either with c a u s t i c solut ion or with gaseous HC1 appeared attractive. Since SAP s e e m s to be the leading candidate for t h e cladding material for HWOCR fuels , only t h e development work on the processing of SAP-clad fue ls is reviewed here.
Caustic Decladding Process Development
Previous work 1 8 * 2 0 h a s shown that t h e aluminum matrix of SAP d i s s o l v e s readily in boiling NaOH and NaOH-NaNO, solut ions, leaving t h e A120, as a residue. It is also well known that both UO, and Tho,-UO, are almost total ly insoluble in c a u s t i c and sodium aluminate solutions. Con- sequently, t h e chemistry of aqueous decladding processes for SAP-clad oxide fue ls is straight- forward, and processes for t h e s e fue ls can probably be devised utilizing ex is t ing technology. On t h e other hand, c a u s t i c decladding processes for SAP- clad carbide fue ls will probably have to b e devel-
17P. R. Kasten et al., An Evaluation of Heavy-Water- Moderated, Organic-Cooled Reactors, ORNL-3921 (January 1967).
"L. M. Ferris, Poss ih le Head-End Processes for H e o vy-Water-Moderated Organic-CooIed Reactor (fiWOCR) Fuels, ORNL-4109 (July 1967).
"Chern. Technol. Div . Ann. Pro&. Rept . May 31 ,
'OG. Beone, Dissolution of Fuel-Element Jacke t s of Alumiriuni and S . A . P . in a Recirculating Dissolver, RT/CHI(65)1 (January 1965).
1966, ORNL-3945, p p . 40-42.
oped by using irradiated fuel samples . Formula- tion of such processes utilizing exis t ing da ta is difficult because of t h e unpredictable behavior of the heavy-metal carbides in aqueous systems. Examples of t h e errat ic behavior of uranium and thorium carbides in aqueous sys tems are numerous. Unirradiated UC is inert in boiling 2 M NaOH-2 M NaNO, (a desirable decladding reagent), but ThC reac ts rapidly. Unirradiated UC and ThC are both hydrolyzed by boiling water and nitrate-free sodium hydroxide solut ions; however, UC irradiated to burnups of 0.6 at. % or higher is inert to both water and 6 M NaOH. '' T h e behavior of itradiated ThC in aqueous sys t ems h a s not yet been studied.
Conceptual c a u s t i c decladding f lowsheets for SAP-clad carbide fue ls have been devised" in which irradiated UC is assumed to b e inert to the decladding solution. Consequently, the first s t e p in the conceptual process for SAP-clad UC (Fig. 1.10) would cons is t in dissolut ion of the SAP in boiling NaOH-NaNO solution (to minimize hydro- gen formation); UC and the A1,0, from t h e SAP would comprise the residue. T h e UC and mos t of the Al,O, would then be dissolved i n concentrated nitric acid. T h e product solution would contain 20 to 50% of t h e carbide carbon as soluble organic compounds, ab le as a feed for a conventional Purex solvent extraction purification process. Several alternative procedures appear feas ib le for recovering t h e ura- nium, and espec ia l ly the plutonium, from the product solution. In o n e methodz2 t h e organic compounds would b e oxidized to CO, and CO after adding KMnO, (or another su i tab le oxidant) t o the system. After removal of the sol id MnO, that would b e formed, the result ing solution could be used as a feed for the Purex extraction process. An oxidation s t e p to remove t h e organic compounds does not appear necessary, however. Data from severa l s o u r c e s 1 0 , 2 3 - 2 5 show that t h e uranium
and would therefore not b e su i t -
M. J. Bradley, J. 11. Guode, L. M. Ferris, J. R. 21
Flanary, and J. W . Ullmann, Nucl. Sc i . Eng. 21, 159 ( 1965).
"J. R. Flanary, J . IT. Goode, M. J. Bradley, L. M . Ferris, and J. W. Ullmann, Nucl. AppI . 1, 219 (1965).
A. M . Simpson and B. A. Heath, Products of the Reaction Uranium Monocarhide-Nitric Acid , IG Memo- randum 464(D) (June 19.59).
240RNL Status and Pro&. Rept . Sept. 1966, ORNL- 4026 (Oct . 6 , 1966) (of f ic ia l use only).
25F. Mannone, C . Stoppa, and G. Sauso, Separation with Solvents of the Products of Nitric Ac id Dissolution of Uranium Carbide, EUR-1913-1 (1964).
2 3
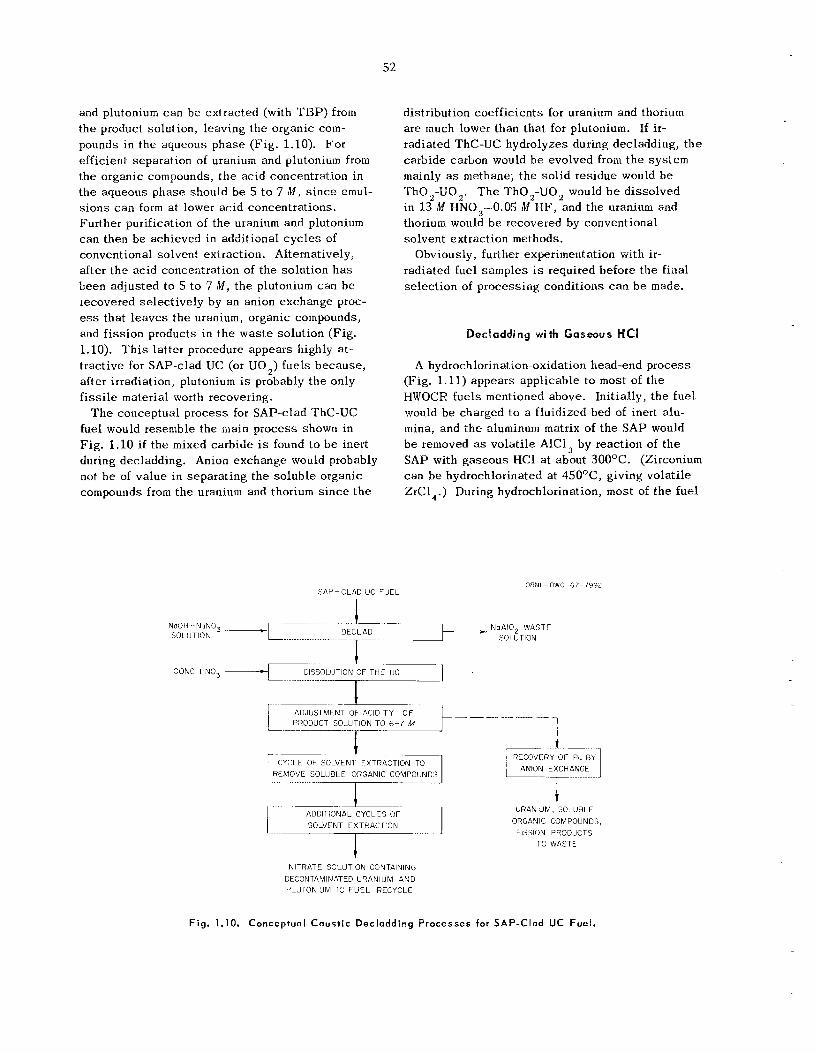
52
and plutonium can b e extracted (with T B P ) from the product solution, leaving the organic com- pounds in the aqueous phase (Fig. 1.10). For efficient separation of uranium and plutonium from the organic compounds, t h e acid concentration in the aqueous phase should be 5 t o 7 M , s ince emul- s ions c a n form a t lower acid concentrations. Further purification of t he uranium and plutonium can then be achieved in additional cyc le s of conventional solvent extraction. Alternatively, after t h e acid concentration of the solution h a s been adjusted t o 5 t o 7 M , t h e plutonium can b e recovered se lec t ive ly by an anion exchange proc- ess that l eaves the uranium, organic compounds, and f i ss ion products in t h e was te solution (Fig. 1.10). T h i s latter procedure appears highly a t - tractive for SAP-clad UC (or UO,) fue ls because , after irradiation, plutonium is probably the only fissile material worth recovering.
T h e conceptual process for SAP-clad ThC-UC fuel would resemble the main process shown in F ig . 1.10 i f the mixed carbide is found t o b e inert during decladding. Anion exchange would probably not b e of va lue in separating the so luble organic compounds from the uranium and thorium s ince t h e
distribution coefficients for uranium and thorium are much lower than tha t for plutonium. If ir- radiated ThC-UC hydrolyzes during decladdiag, t h e carbide carbon would b e evolved from the sys tem mainly as methane; t he so l id residue would b e ’ r h o ,-UO ,. T h e ThO ,-UO would b e dissolved in 13 M NNO,--0.05 M H F , and the uranium and thorium would b e recovered by conventional solvent extraction methods.
radiated fuel samples i s required before the f ina l se lec t ion of processing conditions c a n b e made.
Obviously, further experimentation with ir-
Dedadding with Gaseous MCI
A hydrochlorination-oxidation head-end process (Fig. 1.11) appears applicable t o most of t he HWOCR fue ls mentioned above. Init ially, t he fuel would b e charged to a fluidized bed of inert alu- mina, and the aluminum matrix of the SAP would b e removed as volati le AlCl, by reaction of t he SAP with gaseous HCl at about 300OC. (Zirconium can be hydrochlorinated a t 45OoC, giving volati le ZrCl,.) During hydrochlorination, most of t h e fuel
ORUL-DWG 67-7992 SAP-CLAD UC FUEL
NaOli NoN03 - NoAIO, WASTE SOLUTION <=-
I
CONC HU03 - ~ I S S O L ~ J T I O N OF r H t uc
-1 ~~
CYCLE OF SOLVENT FXTR4CTION TO REMOVC SOLUBLE ORGANIC COMPOUNDS
1 -_I-
ADDITIONAL CYCl FS OF i SOLVENT EX rt?ALl ION
t NITRATE SOLUTION CONTAINING
DECONTAMINATED URANIUM AND PLUTONIUM TO F U E L RECYCLE
-1 ...-
I
~ RECOVERY OF Pu BY i -- ANION EYCHANGE... ‘ - 1 URANIUM, SOLUBLE
ORGANIC COMPOUNDS, FISSION PRODUCTS
TO WASTE
Fig. 1.10. Conceptual Caustic Decladding Processes for SAP-Clad UC Fuel.
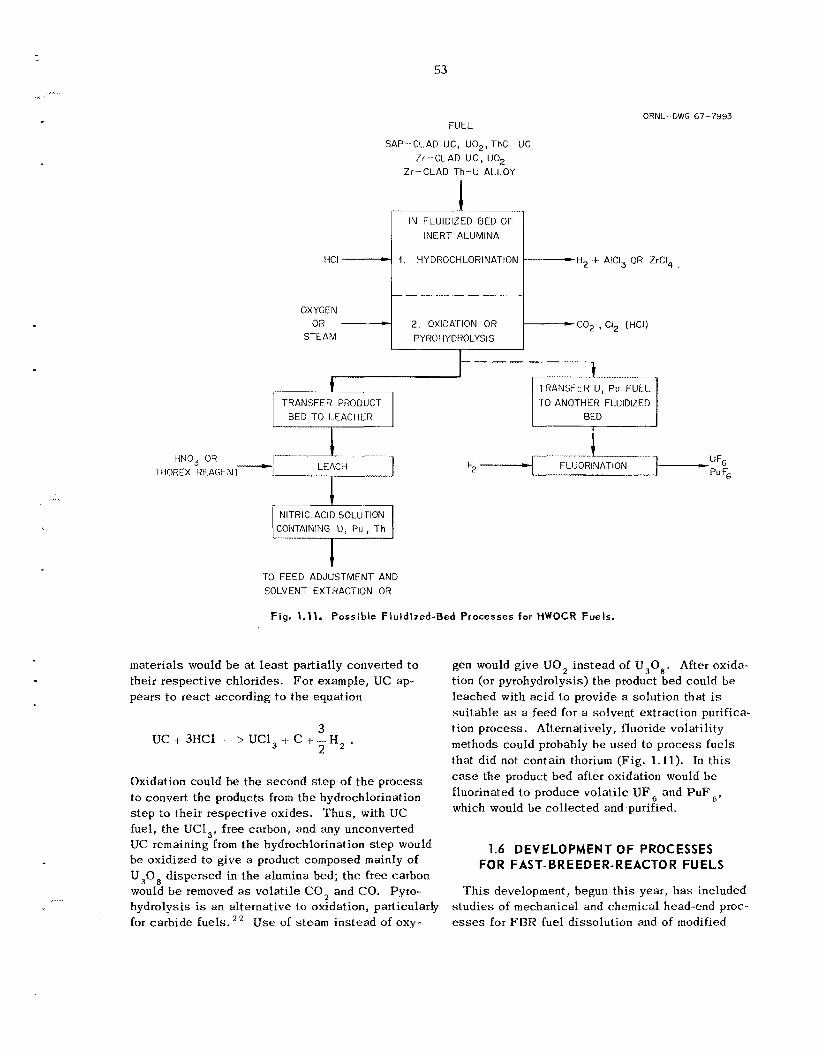
... . .
HCI =-
OXYGEN
STEAM OR -
53
IN FLUIDIZED BED OF INERT ALUMINA
I . HYDROCHLORINATION )H2 + AIClj OR ZrCI, ,
- - ......... - - - - -
2. OXIDATION OR PYROHYDROLYSIS
-co2 , CI, (HCl)
ORNL-DWG 67-7993 FUEL
SAP-CLAD UC, U02, ThC -UC Zr -CLAD UC, U 0 2
Zr-CLAD Th-U ALLOY
...
Fig. 1.11. Possible Fluidized-Bed Processes for HWOCR Fuels.
materials would b e at least partially converted t o their respect ive chlorides. Fo r example, UC ap- pears t o react according to t h e equation
gen would give UO, ins tead of U,O,. After oxida- tion (or pyrohydrolysis) the product bed could b e leached with acid to provide a solution that is su i tab le as a feed for a solvent extraction purifica-
3 2
UC -t- 3IICl -+ UC1, + C + - H , . tion process . Alternatively, fluoride volatility methods could probably b e used to process fue ls that did not contain thorium (Fig. 1.11). In th i s
Oxidation could be the second s t e p of the process the product bed after Oxidation be
to convert the products from t h e hydrochlorination s t e p to their respect ive oxides . Thus , with UC fuel, the UCI,, f ree carbon, and any unconverted UC remaining f rom t h e hydrochlorination s t e p would be oxidized to give a product composed mainly of U,O, dispersed in t h e alumina bed; t h e free carbon would b e removed as volat i le CO, and CO. Pyro- hydrolysis is an al ternat ive to oxidation, particularly for carbide fuels . 2 2 U s e of s t e a m ins tead of oxy-
‘luorinated to produce which would be col lected and purified.
UFs and P u F b f
1.6 DEVELOPMENT OF PROCESSES FOR FAST- BR E ED E R- R E ACTO R FU EL S
T h i s development, begun th i s year, h a s included s t u d i e s of mechanical and chemical head-end proc- esses for FBR fuel dissolution and of modified
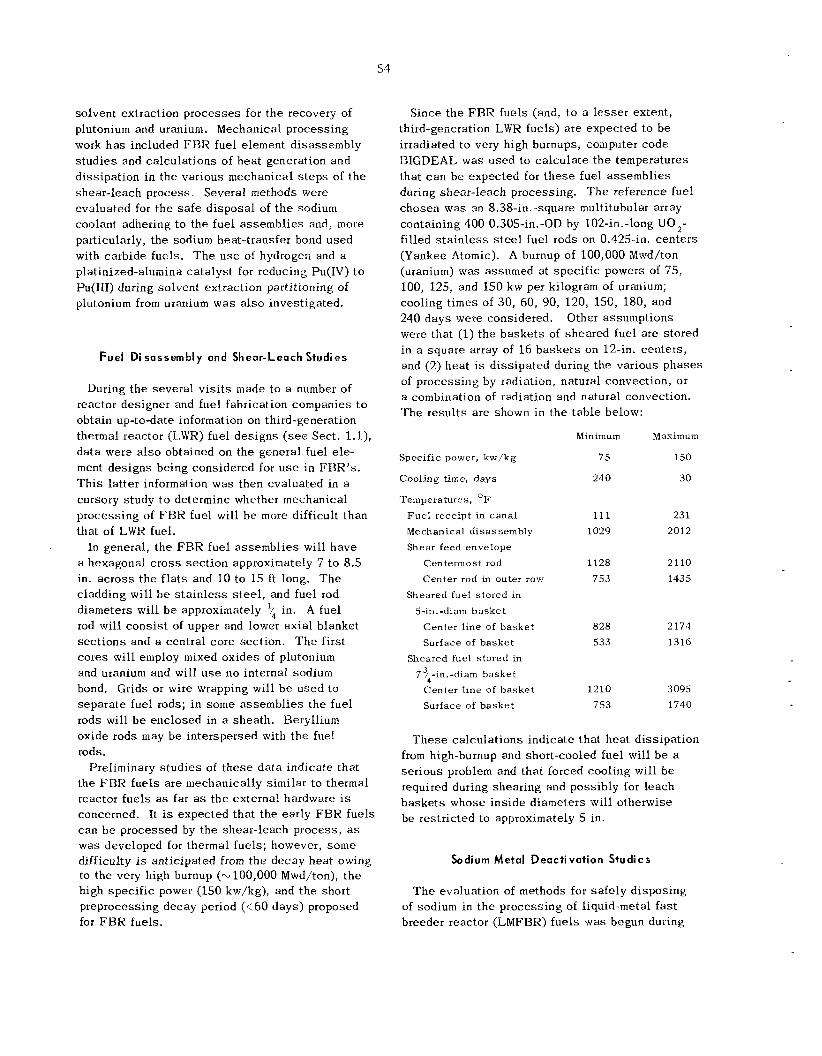
solvent extraction p rocesses for t h e recovery of plutonium and uranium. Mechanical processing work h a s included F B R fuel element disassembly s tud ie s and ca lcu la t ions of hea t generation and dissipation in t h e various mechanical s t eps of t h e shear-leach process , Several methods were evaluated for t h e safe d isposa l of t h e sodium coolant adhering to the fuel assembl ies and, more particularly, t he sodium heat-transfer bond used with carbide fuels. T h e u s e of hydrogen and a platinized-alumina ca ta lys t for reducing Pu(1V) to Pu(II1) during solvent extraction partitioning of plutonium from uranium w a s a l so investigated.
Fuel Disassembly and Shear-Leach Studies
During t h e severa l v i s i t s made to a number of reactor designer and fuel fabrication companies to obtain up- toda te information on third-generation thermal reactor (LWR) fuel des igns (see Sect. 1.1), da ta were also obtained on the general fuel ele- ment des igns being considered for u s e i n FBR’s. T h i s latter information was then evaluated in a cursory study t o determine whether mechanical processing of F R R fuel will b e more difficult than that of LWR fuel.
In general , t h e FBR fuel assembl ies will have a hexagonal cross sec t ion approximately 7 t o 8.5 in. across t h e f l a t s and 10 to 15 ft long. T h e cladding will b e s t a i n l e s s s t e e l , and fuel rod diameters will b e approximately in. A fuel rod will cons i s t of upper and lower ax ia l blanket s ec t ions and a central core section. T h e first cores will employ mixed oxides of plutonium and uranium and will u s e no internal sodium bond. Grids or wire wrapping will b e used to separa te fuel rods; i n s o m e assembl ies t he fuel rods will b e enclosed in a shea th . 13eryllium oxide rods may b e interspersed with t h e fuel rods.
Preliminary s tud ie s of t h e s e da ta ind ica te that the F B R fue ls a r e mechanically similar t o thermal reactor fue ls as far as the external hardware is concerned. It is expected that t he early FER fue ls can b e processed by the shear-leach process , as was developed for thermal fuels; however, s o m e difficulty is anticipated from the decay heat owing to the very high burnup (- 100,000 Mwd/ton), t h e high spec i f ic power (150 kw/kg), and t h e short preprocessing decay period (<60 days) proposed for FBR fuels.
S ince t h e FBR fue ls (and, t o a l e s se r extent, third-generation LWR fuels) a r e expected to b e irradiated t o very high burnups, computer code BIGDEAL was used to ca lcu la te t h e temperatures that c a n b e expected for t h e s e fuel assembl ies during shear-leach processing. T h e reference fuel chosen was an 8 .38- in . square multitubular array containing 400 0.305-in.-OD by 102-in.-long UO 2-
filled s t a i n l e s s s t e e l fuel rods on 0.425-in. cen te r s (Yankee Atomic). A burnup of 100,000 Mwd/ton (uranium) was assumed a t spec i f ic powers of 75, 100, 125, and 150 kw per kilogram of uranium; cooling t imes of 30 , 60, 90, 120, 150, 180, and 240 days were considered. Other assumptions were tha t (1) t h e baske t s of sheared fuel a r e stored in a square array of 16 b a s k e t s on 12-in. cen ters , and (2) hea t is d iss ipa ted during t h e various phases of process ing by radiation, natural convection, or a combination of radiation and natural convection. T h e resu l t s a r e shown in t h e t ab le below:
Maximum Minimum
Specific power, kw/kg 75 150
Cooling t i m e , days 210 30
Temperatures, O F
Fue l receipt in cana l Mechanical disassembly Shear feed envelope
Centeimost rod Center rod in outer row
Sheared fuel storcd i n
5-in. -di am baske t Center l ine of basket Surface of basket
Sheared fuel stored in 7%-in.-diam basket
Center line of baske t Surface of baske t
111 1029
1128 753
828 533
1210 7 53
231 2012
2110 1435
2174 1316
3095 1740
T h e s e ca lcu la t ions ind ica te that hea t d i ss ipa t ion from high-burnup and short-cooled fuel will b e a ser ious problem and tha t forced cooling will b e required during shearing and possibly for leach baske t s whose in s ide diameters will otherwise b e restricted to approximately 5 in.
Sodium Metal Deactivation Studies
T h e evaluation of methods for s a fe ly d ispos ing of sodium i n t h e processing of liquid-metal f a s t breeder reactor (LMFBR) fue ls was begun during
....
the pas t year. Sodium will be used a s t h e coolant and, possibly, as a heat-transfer bond in fas t - reactor fue ls . In the case of unbonded s t a in l e s s - s tee l -c lad U0,-PuO, fue ls , only sodium adhering to the external sur faces of t h e fuel e lements poses a poss ib le chemical problem during processing. T h i s sodium can , however, probably b e safe ly converted to oxide by a method s i m i l a r to tha t used at the EBR-I1 F u e l Process ing Facil i ty. 2 6
T h e b a s i s of t h i s method is the controlled reaction of t h e sodium with oxygen and/or water vapor present at low concentrations in an inert gas such a s helium.
Sodium disposa l poses a major problem, however, in the processing of more advanced sodium-bonded UC-PuC fuels. To avoid the possibil i ty of explo- s i v e vapor-phase reactions between hydrogen and nitrogen oxides, or removed before the carbide can b e d isso lved in nitric acid. A poss ib le head-end process tha t would circumvent t h i s problem would involve shear- ing of the fue l in a n inert atmosphere, followed by the s imultaneous oxidation or pyrohydrolysis of the carbide and the sodium. In th i s connection, cursory s tud ie s were made of the reaction of sodium with air and water vapor. Thermobalance t e s t s of the reaction of sodium (Baker Analyzed Reagent) with dry air gave inconclusive results. In some experiments t he sodium w a s relatively inert i n dry air at temperatures up t o about 275OC, with con- trolled oxidation being achieved at about 300°C; in others, however, t h e sodium ignited a t about 295OC and reacted very rapidly. Based on the weight change, t he product of t he reaction in a l l i n s t ances appeared to b e Na,O,.
Sodium was nearly inert i n a s t ream of 3% H,O- 97% He (H,O partial p ressure about 24 torrs) at temperatures up t o about 275°C. At about 300°C, t he sodium reacted at a controlled r a t e of about 2 mg/min, giving NaOH as the product. T h e resu l t s of t h e s e experiments sugges t tha t t he sodium bond could b e safe ly destroyed at low temperatures; after reaction of the sodium, pure s t e a m could be ad- mitted to t h e system and could b e allowed t o reac t with t h e UC-PuC at about 75OOC to give a U0 , - PuO , product.
t he sodium must b e destroyed
Other experiments showed tha t reaction with CO, was not an attractive method for t he chemical destruction of sodium. Sodium was practically inert t o CO, a t temperatures below about 600’C; above 62SoC, the sodium reacted rapidly, giving Na,CO, and free carbon as the products.
PI u toni urn Reduction Studi es
One of t he principal problems that will emerge in the processing of FBR f u e l s is t h e partitioning of high concentrations of plutonium from uranium i n an increased radiation field. Ferrous sulfamate h a s been used successfu l ly to reduce plutonium t o Pu(II1) i n the Purex process ; however, t h i s method was not satisfactory with FHR fue ls (i.e., a t Dounreay ’). In severa l other laboratories, uranous nitrate is being studied as a reductant. W e are de- veloping a new partitioning process tha t u s e s hy- drogen g a s as the reductant for plutonium. In demonstrating th i s process, 4% I-l,-argon and an organic solution tha t was 0.1 N in RNO, and con- tained about 80 g of uranium and 16 g of plutonium per liter were passed , cocurrent with an aqueous solution tha t was 0.5 N in HNO, and 0.02 M in hydrazine hydrate, through a column packed with 0.5% platinum on alumina pe l le t s . T h e sys tem operated satisfactorily a t f lows of 2 t o 10 m l of to ta l liquid flow and 100 to 600 m l of g a s flow per minute through a 1-cm-diam, 22-cm-long column. When t h e organic extract did not contain plutonium, about 1% of the uranium was reduced to U(1V). Analytical problems have prevented the determina- tion of uranium and plutonium va lences when both plutonium and uranium were present; however, both the color of the solutions and t h e ana lyses for total uranium and plutonium have indicated sat- isfactory plutonium reduction and partitioning from uranium.
Extraction of Plutonium with Amines
W e (and Brit ish workersz9) are studying the u s e of amines as potential alternatives t o T B P for u s e
26J. C. Hesson, M. J. Feldmnn, and L. Burris, Description and Proposed Operation of the Fuel Cycle Faci l i ty for the Second Experimental Breeder Reactor (EBR-II), ANL-6605 (April 1963).
27K. S. Warren, Survey of Potent ia l Vapor-Phase Explosioris in Darex and Sulfex Processes , ORNt-2937 (Dec. 27, 1960).
28D. M. Donaldson, K. Hartley, P. Lees, a n d N . Parkinson, “Reprocessing of F a s t Reactor Fuels a t Dounreay,” paper given at AIME meeting, Oct. 25, 1961; published in Transactions.
Reprocessing rvi th Amine-E ther S y s tems, AERE-R4440, Parts I, 11, and 111 (1965).
29E. S. Lane, A. Pilbeam, smd J. M. Fletcher,
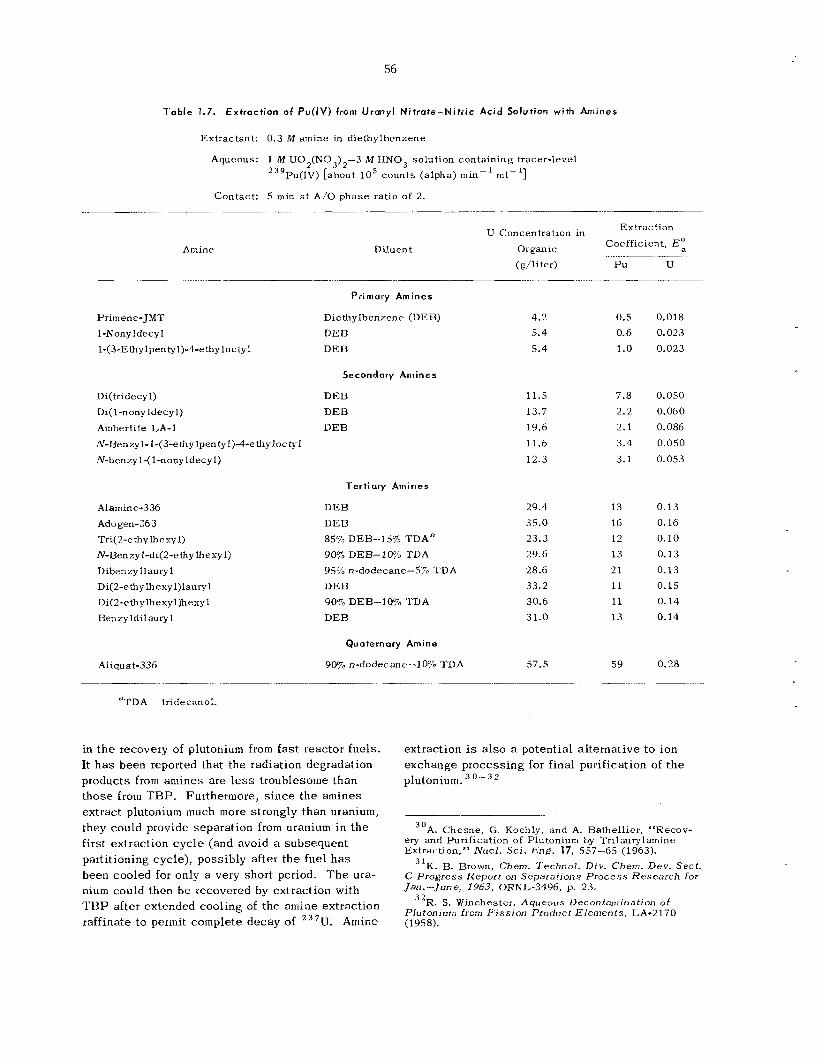
Table 1.7. Extraction of Po(lV) from Uranyl Nitrate-Nitr ic A r i d Solution w i h Amines
Extractant:
Aqueous:
0.3 M amine in diethylbenzene
1 M U02(N03) , -3 in HNO, solution containing tracer-level 2 3 9 Pu(1V) [about lo5 counts (alpha) min-‘ ml-l]
Contact: 5 rrrin a t A/O phase ratio of 2. ~
Amine
Primene-JMT 1-Nony ldecy 1
1-(3-Ethylpenty1)-4-ethyloctyl
Di(tridecy 1) Di( 1-nonyldecyl) Arnberlite LA-1 N-Benzy l- 1-(3-e thy Ipen ty1)4-e thy Soc ty 1
N-benzy 1-( 1-nonyldecyl)
Alamine-336 Adogen-363 Tri( 2-ethy lhesy I) N-Benzyl-di(2-ethylhexyl)
Dibenzyllauryl Di(2-ethylhexyl)laurj~l Di(2-ethylhexy1)hexyl Benzy ldilaury 1
Aliquat-336 ~~ -
aTDA ~ tridecanol.
Diluent
Extraction U Concentration in Organic (g/liter)
Piirnary Amines
Diethylbenzene (DEB) DEB DEB
Secondary Amines
DEB DEB DEB
Tertiary Amines
DEB DEB 85% DEB--lS% TDAa 90% DEB--10% TDA 95% n-dodecane--5% T D A DEB 9070 DEB-10% ’l’DA DEB
Quaternary Amine
90% n-dodecane--10% TDA
4.2 5.4 5.4
11.5 13.7 19.6 11.6 12.3
29.4 35.0 23.3 29.6 28.6 33.2 30.6 31.0
57.5
in t h e recovery of plutonium from fas t reactor fuels. It h a s been reported that t he radiation degradation products from amines are less troublesome than those from TBP. Furthermore, s ince t h e amines extract plutonium much more strongly than uranium, they could provide separation from uranium i n t h e first extraction cyc le (and avoid a subsequent partitioning cycle), possibly after t h e fuel h a s been cooled for only a very short period. T h e ura- nium could then be recovered by extraction with T H P after extended cooling of the amine extraction raffinate to permit complete decay of 2 3 7 U . Amine
Coefficient, E:
Pu U
0.5 0.6 1.0
7.8 2.2 2.1 3.4 3.1
13 16 12 13 21 11 11 13
59 ....
0.018 0.023 0.023
0.050 0.060 0.086 0.050 0.053
0.13 0.16 0.10 0.13 0.13 0.15 0.14 0.14
0.28
extraction is also a potential alternative to ion exchange processing for final purification of t h e plutonium. 3 0 - 3 2
A. Chesne, G. Koehly, and A. Bathell ier, “Recov- 3 0
ery and Purification of Plutonium by ‘I’rilaurylamine Extraction,” N u c l . Sci. Eng. 17, 557-65 (1963).
, l K . B. Brown, Chem. ’l‘echnol. Div. Chem. Dev. Sect. C Progress Report on Separations P r o c e s s Research f o r Jan.-June, 1963, ORNL-3496, p. 23.
32R. S. Winchester, Aqueous Decontamination of Plutonium from Fission Product Elements , LA-2170 (1958).
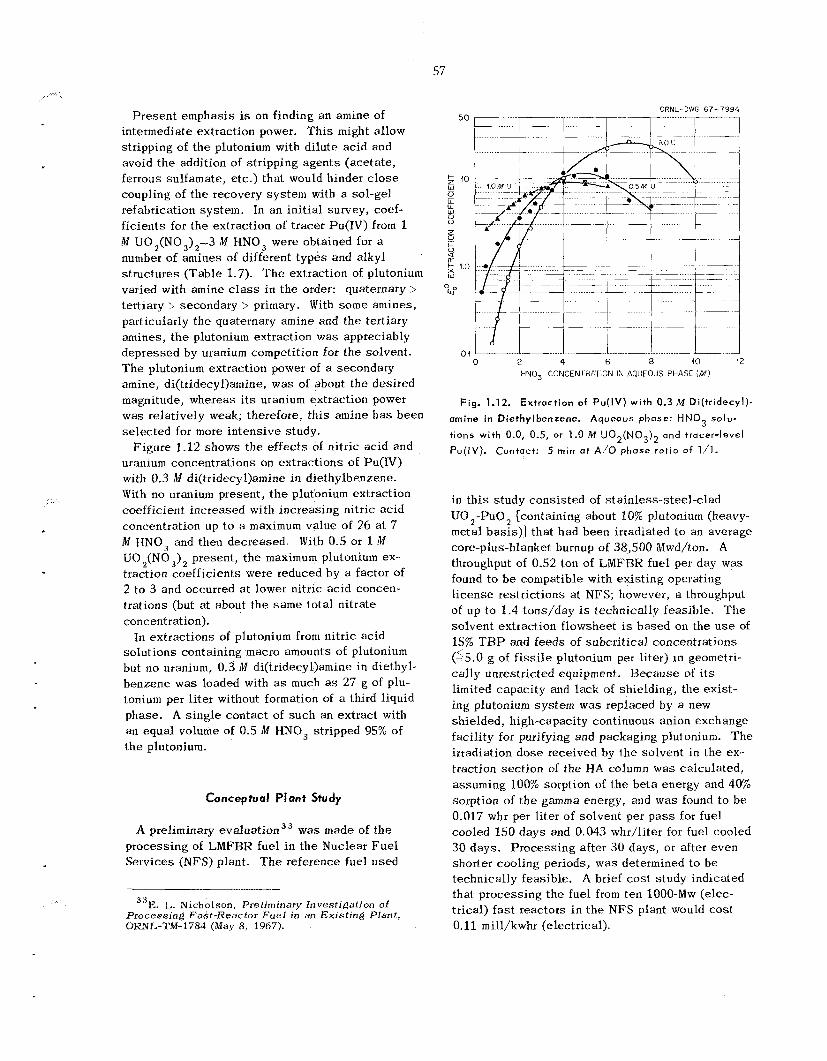
57
Presen t emphas is is on finding an amine of intermediate extraction power. T h i s might allow stripping of the plutonium with dilute acid and avoid t h e addition of stripping agents (acetate, ferrous sulfamate, etc.) tha t would hinder c l o s e coupling of t h e recovery sys tem with a sol-gel refabrication system. In an in i t ia l survey, coef- f ic ien ts for t he extraction of tracer Pu(1V) from 1 M U0,(N03),-3 IV HNO, were obtained for a number of amines of different types and alkyl s t ruc tures (Table 1.7). T h e extraction of plutonium varied with amine class in the order: quaternary > tertiary i secondary > primary. With s o m e amines, particularly the quaternary amine and the tertiary amines, t h e plutonium extraction was appreciably depressed by uranium competition for t he solvent. T h e plutonium extraction power of a secondaty amine, di(tridecyl)amine, w a s of about the desired magnitude, whereas its uranium extraction power was relatively weak; therefore, th i s amine h a s been se lec ted for more in tens ive study.
Figure 1.12 shows the e f f ec t s of nitric acid and uranium concentrations on extractions of Pu(1V) with 0.3 M di(tridecy1)amine i n diethylbenzene. With no uranium present, t h e plutonium extraction coefficient increased with increas ing nitric acid concentration up to a maximum value of 26 a t 7 M HNO, and then decreased. With 0.5 or 1 fM UO ,(NO 3)2 present, t he maximum plutonium ex- traction coefficients were reduced by a factor of 2 to 3 and occurred a t lower nitric ac id concen- trations (but at about t he same to ta l nitrate concentration).
so lu t ions containing macro amounts of plutonium but no uranium, 0.3 M di(tridecy1)amine in diethyl- benzene was loaded with as much as 27 g of plu- ionium per liter without formation of a third liquid phase. A s ingle contact of such an extract with an equal volume of 0.5 M HNO, stripped 95% of t h e plutonium.
In extractions of plutonium from nitric ac id
Conceptual PJant Study
A preliminary eva lua t ion33 was made of t h e processing of LMFBR fuel i n the Nuclear F u e l Services (NFS) plant. T h e reference fuel used
E. L. Nicholson, Preliminary Investigation of 3 3
Processing Fast-Reactor Fuel in at] Exis t ing Plant, OWL-TM-1784 (May 8, 1967).
5 10 w 0 LL LL W 0 0
z
0 d
5 1.0 W
CRNL-DWG 67-7994 50
12 Of 0 2 4 E 8 10
HNOJ CGNCENIHArlON IN AQLJEOLJS PHASE ( M )
Fig. 1.12. Extroction of Pu(IV) with 0.3 M Di(tridecy1)-
amine in Diethylbenrene. Aqueous phase: H N 0 3 solu- tions with 0.0, 0.5, or 1.0 M U02(N03)2 and tracer-level
Pu(tV) . Contact: 5 min at A/O phase rat io o f 1/1.
in t h i s s tudy cons is ted of stainless-steel-clad UO ,-PuO , [containing about 10% plutonium (heavy- metal bas i s ) ] tha t had been irradiated to an average core-plus-blanket burnup of 38,500 Mwd/ton. A throughput of 0.52 ton of LMFBR fuel per day was found to be compatible with existing operating l i cense restrictions a t NFS; however, a throughput of up to 1.4 tons/day is technically feasible. T h e solvent extraction flowsheet is based on the u s e of 15% T B P and feeds of subcrit ical concentrations (55.0 g of fissile plutonium per liter) in geometri- ca l ly unrestricted equipment. Because of its limited capacity and lack of shielding, t he ex is t - ing plutonium sys tem w a s replaced by a new shielded, high-capacity continuous anion exchange facil i ty for purifying and packaging plutonium. T h e irradiation dose received by the solvent in the ex- traction sec t ion of the H A column was calculated, assuming 100% sorption of t he be ta energy and 40% sorption of t h e gamma energy, and was found io b e 0.017 whr per liter of solvent per p a s s for fuel cooled 150 days and 0.043 whr/liter for fuel cooled 30 days. Process ing after 30 days , or after even shorter cooling periods, was determined t o be technically feasible. A brief cos t study indicated that processing the fue l from ten 1000-kIw (elec- trical) fast reactors i n the NFS plant would cos t 0.11 mill/kwhr (electrical).
2. Fluoride-Volatility Processing
The present investigation of fluoride-volatility processing a t ORNL i s part of an intersite program; the aim of th i s program i s to develop an alternative to the aqueous method for recovering valuable com- ponents that a r e present in spent UO, fuel f rom power reactors. T h e AEC’s goals for t h i s work, t he responsibil i t ies of other s i t e s , and the poss ib le ad- vantages of volatility methods have been d i scussed in earlier progress reports. Our main contribution will be the installation and operation of a “hot” pilot plant (Fluidized-Red Volatility P i lo t P l an t - FBVPFj) in two of t h e sh ie lded cells in Building 3019.
During t h i s report period, t he BrF,-F, reference flowsheet was adopted for the F B V P P , thus elimi- nating the codisti l lat ion of U F O and PuF,. P l a n s to ins ta l l equipment for leaching was te so l ids from the primary reactor were abandoned. Nearly all the head-end equipment was fabricated, structural s t e e l and much of t he head-end shielding was installed, and installation of p rocess equipment was init iated. Design of the d is t i l l a t ion sys tem for separating and purifying UF, was begun, and ce l l 2 was cleaned out in preparation for t h i s equipment. A satisfactory method for purifying DuF, i s not yet available.
W e continued laboratory- and small-engineering- scale s tudies in support of the fluidized-bed vola- tility process. Laboratory work emphasized problems that a r e expected in conjunction with the u s e of bromine fluorides and sorption-desorption methods for purifying PuF,. We developed a new laboratory method for decladding and oxidizing Zircaloy-clad UO, fue ls by the u s e of hydrogen, oxygen, and I-IF- 0, in sequence. T h i s method h a s a very rapid ra te of reaction; a l so , it would eliminate difficulties recently experienced with fi l tering ZrCl,, which is produced in the HC1 decladding s tep , and would tolerate higher fuel: alumina weight ratios than t h e HI;-0, process. T h e effect on plutonium retention remains to b e studied. par t ic les formed during the oxidation of UO, w a s
T h e s i z e range of U,O,
determined, and problems of filtering U,O, were studied. T h e e f fec ts of f ive process variables on the retention of uranium by alumina after treatment with fluorine were eva lua ted in a s ta t i s t ica l ly de- signed experiment. Rela ted s tud ie s indicated that fluorine apparently l e a v e s less residual uranium with the alumina bed than BrF, does , particularly at temperatures above 30OOC. A fluorine calorimet- ric reactor (FCR) was developed for determining concentrations of bromine and BrF, in the primary reactor off-gas by mixing the off-gas with fluorine and measuring t h e temperature rise.
Following further transpiration-type s tud ie s and siiiiulated p rocess flow shee t s tud ies , attempts to purify P u F , by sorption-desorption us ing L i C were terminated in favor of the u s e of NaF as a sorbent. Low-surface-area LiF was found to have satisfactory sorption and desorption charac te r i s t ics for PuF,, and i t satisfactorily separa ted UF, and PuF,. I-Iowever, low-surface-area LiF would require an excess ive ly high bed volume. High-surface-area L i F , which could be used in reasonably low volumes, had satisfactory sorption charac te r i s t ics but unsa t - isfactory desorption and disintegration prope-t’ I ies. Separation of UF, from YuF, was inadequate a t 175OC:. Therefore the sorption of PuF, by NaF , and the subsequent d i sso lu t ion of the NaF, was proposed as an al.ternative separation and purifi- cation method. Unfortunately, purification of t he plutonium from the ruthenium and niobium f i ss ion products has , so far, been inadequate, and further s tud ies have been abandoned.
More attempts were made to find a satisfactory metal fluoride sorption-desorption system for NpF,. The sorbents MgF,, J.,iF, C a F 2 , and BaF2 appear unsuitable; however, N a F sorbs NpF, effectively from 200 to 45OoC, and the NpF, may b e d, -sorbed either with nitrogen o r fluorine.
cell t e s t s of t he fluoride-volatility process. Em- phas i s will b e on the e f fec t iveness of the 4OOOC
Equipment was ins ta l led in Building 4507 for hot-
58

,::. . . .. .
59
N a F trap in decontaminating UF, during fluorination with BrF5 and in developing purification methods for PuF, . A scrubber w a s developed for the removal and d isposa l of gaseous fluorides and fluorine; the effectiveness of adding 0.2 N KI to 2 N KOH was demonstrated.
Columbus Labora tor ies (BMI) for corrosion s tud ie s was maintained. Workers at BMI reported da ta on intergranular modifications of nickel, examined specimens exposed during ear l ie r HF-0, s tud ies , exposed severa l meta ls to bromine at 30OoC, and began assembl ing smal l - sca le equipment for studying corrosion under fluidized-bed conditions. In addition, they determined the relative r e s i s t ances of certain meta ls and a l l o y s to HNO,-HF so lu t ions and subsequently recommended IIAPO-20 as t h e most su i tab le material for leaching equipment.
T h e dec is ion not to in s t a l l equipment in the F B V P P for leaching was te so l id s from the primary reactor was based on r e su l t s of laboratory s tudies . T h e s e s tud ie s ind ica ted tha t a 13 M HN0,-0.1 M H F solution is t h e most e f fec t ive leachant. Ura- nium and plutonium recover ies were 85% or greater wheri the init ial uranium or plutonium concentrations in the was te s o l i d s were 0.03% or higher; recoveries decreased rapidly below t h e 0.03% level, and repro- ducibility of da t a in t h i s range was poor.
In small-scale engineering s tudies , work on the decladding and fluorination of s ta in less -s tee l -c lad UO, was terminated; however, similar tests with Zircaloy-clad UO, were made. U s e of HF-0, left relatively massive s h a r d s of ZrO,, but the UO, pe l le t s were apparently oxidized completely. Re- moval of Zircaloy c ladding with HC1 and subsequent conversion of t h e ZrC1, to ZrO, was studied by operating the primary reactor and pyrohydrolyzer in ser ies . Difficult ies were experienced with unsteady flows in the pyrohydrolyzer and plugging of e i ther t he primary reactor f i l t e rs or t h e off-gas l i ne between the primary reactor and t h e pyrohydrolyzer. T h e s e runs were interrupted by an accidental contamination of the equipment from an external source of radio- activity. Oxidation t e s t s us ing untreated, as- received U 0 2 pe l l e t s required a gradual increase in oxygen content of the oxidizing g a s to avoid sintering. P e l l e t s exposed to HC1 were success - fully oxidized with a i r .
We continued to inves t iga te t h e problems involved in sampling so l id s from a fluidized-bed reactor. T h e design and the location of t he gas-powered je t , which i s used to withdraw so l id s from the fluidized
T h e subcontract with Ba t t e l l e Memorial Ins t i tu te -
bed for d i scharge into the external sample loop, were optimized during the period. A j e t was de- signed for u s e in t h e FBVPP.
analyzing the hydrogen content of the pyrohydrolyzer off-gas stream, e x c e s s oxygen from t h e oxidation step, and the concentration of fluorine during the plutonium fluorination s t ep . Work continues on the u s e of a g a s chromatograph for analyzing off-gas from the BrF, fluorination s tep .
In-line instrumentation i s now available for
2.1 STATUS OF FLUIDIZED-BED VOLATILITY PILOT PLANT
T h e Fluidized-Bed Volatility P i lo t P l an t (FBVPP) is being des igned for installation in Building 3019. Initial emphas is will b e o n the study of the process- i ng of Zircaloy-clad UO, power reactor fue ls a t ir- radiation l eve l s to about 30,000 Mwd/ton with 140- day cooling. La ter , p rocess ing of s ta in less -s tee l - clad UO, may b e s tudied .
needed in the des ign of a full-scale commercial plant. Specific benef i t s t o be derived were l i s ted previously.
In accordance with an agreement with project workers a t ANL and ORGDP, and with the AEC, the flowsheet for t h e F B V P P was modified during the year, as described under “ P r o c e s s Description.” P l a n s to ins ta l l l eaching equipment i n the F B V P P were discontinued.
Nearly all t he equipment required i n the declad- ding, oxidation, and fluorination of cold uranium fuel h a s been fabricated. of t h e shielding were ins ta l led in cell 3 , where head-end p rocess equipment will be located, and installation of equipment w a s begun. Purchas ing and fabrication of mechanical handling equipment and instrumentation (including a computer-based da ta acquisit ion sys tem) a re progressing. Elec- trical gear and ventilation components a re being installed.
T h e design of d is t i l l a t ion equipment and traps for separating and purifying UF, was begun, and ce l l 2 was prepared for installation of that equipment. A satisfactory method for purifying P u F , is not yet available.
In t h e s e s tud ie s we hope to develop data that a r e
Structural s t ee l and much
‘Chern. Technol. Div . Ann. Pro@. R s p t . May 3 1 , 1966, ORNL-3915, p. 54.
6 0
Studies of cri t icali ty problems and hazards evalu- ation were continued. A report on problems of handling plutonium in the FBVPP was i ssued .
(except nonirradiated Pu02) that is needed for s tud ies of Zircaloy-clad fuel processing.
Arrangements were made to obtain a l l of the fuel
Process Description
T h e FBVPP flowsheet init ially cons is ted of the following d iscre te operations: decladding, oxidation, fluorination, and disti l lat ion for separating and purifying uranium and plutonium. Workers at ANL, however, had difficulty in obtaining high recoveries of plutonium from t h e fluidized-bed reactor during the fluorination s tep . Also , the likelihood of ex- ces s ive thermal and radioactive decomposition of the P u F , in the s t i l l during rectification was recogtiized. T h e flowsheet was , therefore, changed from that described l a s t year, hopefully to so lve both problems.' A simplified version of the overall flowsheet as of May 31 , 1967, is shown in Fig. 2.1.
In the revised flowsheet, as in the initial one, t h e Zircaloy cladding i s removed from t h e fuel element by reaction with anhydrous HC1 a t a bed temperature of 4OOOC to form volati le ZrC1,. T h e unreactive UO, pe l le t s remain in the bed. T h e ZrC1, flows to a separa te ves se l and i s converted to ZrO, by re- action with steam at 35OOC in a fluidized bed of alumina.
Whereas previously UO 2 - P u 0 , was oxidized to U,O,-PuO, in the lower part of t h e primary reactor while t he oxides were being converted to the hexa- fluorides with fluorine in a higher zone, the new flowsheet inc ludes an oxidation s t ep followed by fluorination - first with HrF, at 35OOC to form UF, and PuF, and then with fluorine a t 350 to 5SOOC to produce PuF, . T h i s modification resu l t s i n a com- p le te and early separation of the uranium from plutonium, thus permitting simplification of t he uranium decontamination process.
After decladding and pulverization of the UO, pe l le t s by reaction with oxygen in nitrogen at 45OOC to form U,O,, t he uranium i s converted to UF, by reaction with BrF, a t o r below 350OC. The Pn02 i s simultaneously converted to nonvolatile PuF , and remains in the reactor. T h e volati le UF,, ex- cess BrF,, some volati le f i ss ion product fluorides, and the bromine or BrF, reaction byproducts p a s s
2F. W. Miles, Plutonium-Related S a f e t y A s p e c t s in De- signing the Fluidized-Bed Volat i l i ty Pilot Plant, OKNL- TM-1593 (November 1966).
out of the reactor to t h e recombiner, in which the bromine and BrF, a r e reac ted with fluorine a t about 700OC to re-form BrF,. Then the gases , including an e x c e s s of fluorine, p a s s through a 40OOC N a F trap for removal of much of t h e ',Nb and l o 3 R u fluorides. T h e remaining g a s e s a re cooled to about 6OoC and a r e partially condensed in a cold trap at about -60°C. T h e UF,, BrF,, and volati le f ission product fluorides in t h e cold t rap are melted, weighed, sampled, and drained to a batch disti l la- tion column, where the UF , and BrF, a re separa ted from each other and from most of t he accompanying fission product f luorides. T h e s t i l l sys tem opera tes a t a pressure of 3 atm (abs) and a temperature of about 86OC, sufficiently above the WF, triple point (64°C) to prevent solidification of t he LJF,. T h e low-boiling f i ss ion products a r e vented from the s t i l l overhead to the off-gas scrubber. T h e BrF, overhead, t he init ial s t i l l product, is held for reuse in subsequent runs. T h e BrF5-free UF,, the final s t i l l product, is col lec ted separa te ly and is subse- quently vaporized through sorbent t raps for final purification and then condensed i n a product con- tainer. T h e high-boiling f i ss ion products remain in the s t i l l reboiler; they a re eventually volatilized to sorbent traps and discarded.
Upon completion of t h e uranium volatilization s tep , the plutonium in the primary reactor i s con- tacted with fluorine (at l e a s t 50 vol '% in nitrogen) a t temperatures tha t a r e progressively increased from 350 to 550OC; i t is volati l ized from the reactor as P u F , and collected. To da te , however, the collection method and the purification flowsheet for the PriF, have not been se l ec t ed .
Several additional i t ems of equipment were re- quired to accommodate the flowsheet changes, and some added safe ty precautions, such as the u s e of Monel pans under a l l equipment containing liquid BrF,, were necessary to protect operating personnel and equipment. T h e following i tems of equipment were either modified o r added: t he BrF, vaporizer, the BrF, regenerator, the 4OOOC N a F trap, the cooler following the N a F trap, and the cold-trap sump. T h e system for withdrawing product from the disti l lat ion column was extensively revised.
T h e processing capac i ty of the facility was not changed. T h e pilot plant is s i zed to process a charge of about 40 kg of UO, and up to 2 k g of plutonium. T h e primary reactor will be 8 in. in inner diameter and about 1 2 ft high, and will ac- commodate a fuel element 60 in. high with a 5.4- in.-square c ros s sec t ion .
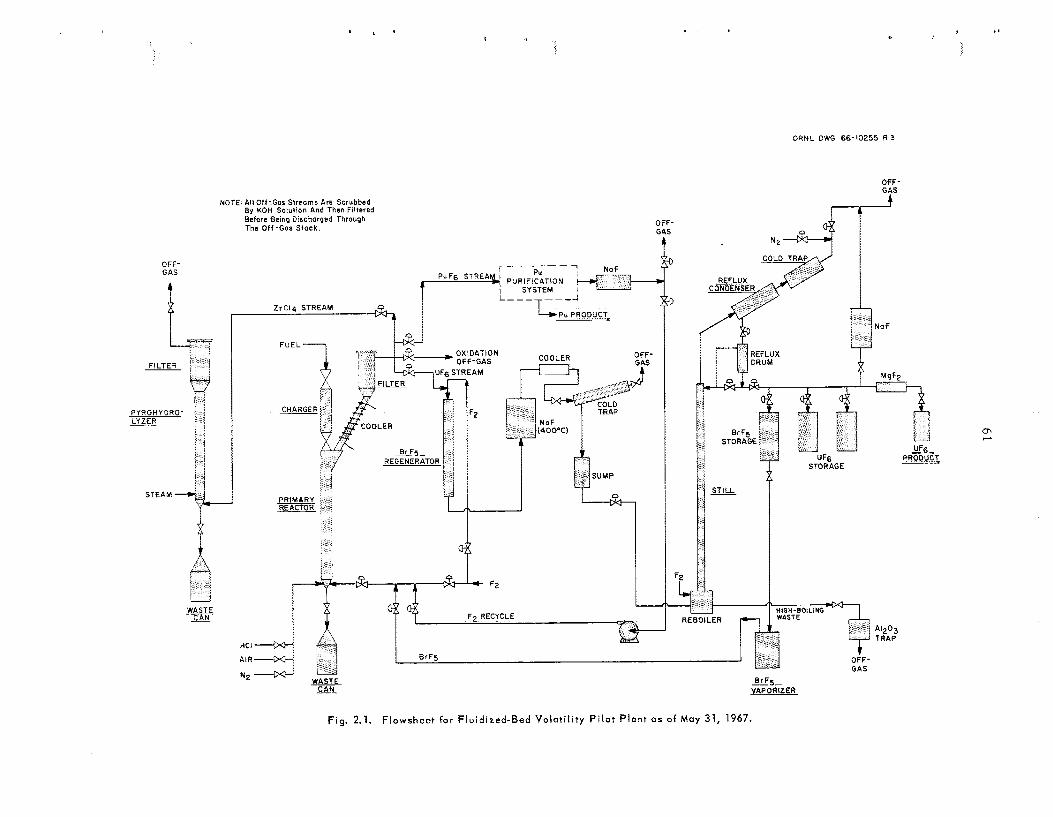
L '
ORNL OWG 66-10255 R 3
OFF- GAS
PYROHY DRO-
NOTE. All Off-Gas Streams Are Scrubbed By KOH Solution And Thsn Filtered Before Being Discharqed Through The O f i - G a s Stack. OFF-
G
F- S
OFF-
4 NZ 41
NaF
*'2O3 TRAP
B r F 5 - VAPORIZER
Fig. 2.1. F lowsheet for Fluidized-Bed Vola t i l i ty P i lot P lant a s of May 31, 1967.
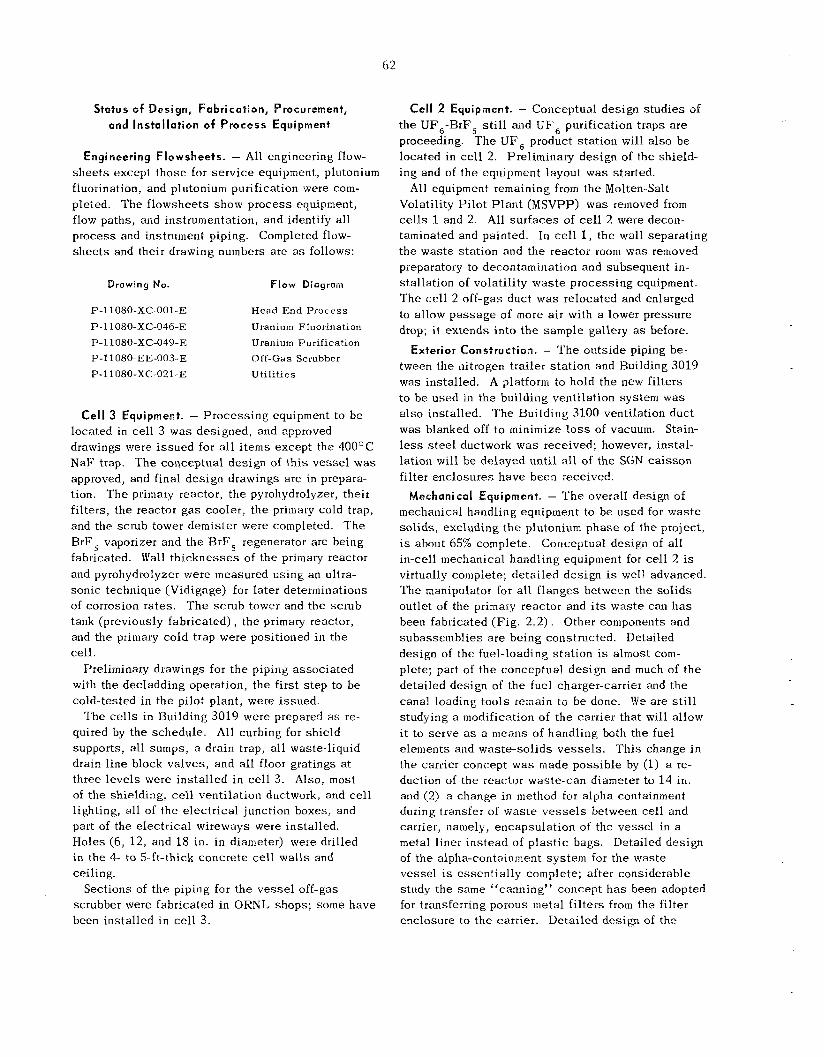
62
Status of Design, Fabrication, Procurement, and Instal lat ion of Process Equipment
Engineering Flowsheets. - All engineering flow- s h e e t s except t hose for s e rv i ce equipment, plutonium fluorination, and plutonium purification were com- pleted. T h e flowsheets show process equipment, flow paths, and instrumentation, and identify a l l p rocess and instrument piping. Completed flow- s h e e t s and their drawing numbers are a s follows:
Drawing No. Flow Diagram
P-1 P-1 P-1 P-1 P-1
080-XC-001-E
080-XC-046-E 080-XC-049-F: 080-EE-003-E 080-XC-021-E
Head End Process Uranium Fluorination Uranium Purification Off-Gas Scrubber Util i t ies
Cell 3 Equipment. - Process ing equipment to b e located in ce l l 3 was designed, and approved drawings were i s sued for a l l i t ems except the 40OOC NaF trap. T h e coqceptual des ign of t h i s ves se l was approved, and final design drawings a re in prepara- tion. T h e primary reactor, the pyrohydrolyzer, their f i l ters, the reactor g a s cooler, t he primary cold trap, and the scrub tower demister were completed. T h e BrFS vaporizer and the &F5 regenerator are being fabricated. Wall th i cknesses of the primary reactor and pyrohydrolyzer were measured using an ultra- sonic technique (Vidigage) for la te r determinations of corrosion rates. T h e scrub tower and the scrub tank (previously fabr ica ted) , t he primary reactor, and the primary cold trap were positioned in the ce l l .
Preliminary drawings for t he piping assoc ia ted with the decladding operation, t he first s t e p to b e cold-tested in the pilot plant, were i ssued .
The cells in Building 3019 were prepared as re- quired by the schedule . All curbing for shield supports, a l l sumps, a drain trap, a l l waste-liquid drain l ine block va lves , and all floor gratings at three leve ls were ins ta l led i n ce l l 3. Also, most of the shielding, cell ventilation ductwork, and cell lighting, all of the e lec t r ica l junction boxes, and part of the electrical wireways were installed. Holes (6, 12, and 18 in. in diameter) were drilled in the I - to 5-ft-thick concre te cell wal l s and ceiling.
scrubber were fabricated in ORNL shops; some have been installed in ce l l 3.
Sections of the piping for t h e ves se l off-gas
Cell 2 Equipment. - Conceptual design s tudies of the UF,-BrF, s t i l l and UF, purification traps a r e proceeding. T h e UF, product s ta t ion will also b e located in cell 2. Preliminary design of the shield- ing and of the equipment layout was started.
All equipment remaining from t h e Molten-Salt Volatility P i lo t P l a n t (MSVPP) was removed f rom cells 1 and 2. All su r f aces of cell 2 were decon- taminated and painted. In cell 1 , t he wall separating the was te s ta t ion and the reactor room was removed preparatory to decontamination and subsequent in- stallation of volatility was te process ing equipment. T h e cell 2 off-gas duct was relocated and enlarged to allow passage of more a i r with a lower pressure drop; it ex tends into t h e sample gallery as before.
Exterior Construction. - T h e outs ide piping be- tween the nitrogen trailer s ta t ion and Building 3019 was installed. A platform to hold the new fil ters to b e used in the building ventilation system was also installed. T h e Building 3100 ventilation duct was blanked off to minimize lo s s of vacuum. Stain- less s t ee l ductwork w a s received; however, instal- lation will be de layed unt i l all of the SGN ca i s son filter enc losures have been received.
Mechanical Equipment. - T h e overall design of mechanical handling equipment to b e used for was te so l ids , excluding t h e plutonium phase of the project, i s about 65% complete. Conceptual design of a l l in-cell mechanical handling equipment for cell 2 is virtually complete; de ta i led des ign is well advanced. The manipulator for all f langes between the so l id s outlet of the primary reactor and i t s was t e can h a s been fabricated (Fig. 2 .2) . Other components and subassembl ies are being constructed. Detailed design of the fuel-loading, s ta t ion is almost com- plete; part of the conceptual design and much of t he detailed design of t he fuel charger-carrier and the canal loading tools remain to be done. We a re s t i l l studying a modification of the carrier that will al low i t to se rve as a means of handling both the fuel elements and waste-solids ves se l s . T h i s change in the carrier concept w a s made poss ib le by (1) a re- duction of the reactor waste-can diameter to 14 in. and (2) a change in method for alpha containment during transfer of was te v e s s e l s between cell and carrier, namely, encapsulation of the vessel in a metal liner ins tead of p l a s t i c bags. of t he alpha-containment sys tem for the was te vesse l is essent ia l ly complete; after considerable study the s a m e “canning” concept h a s been adopted for transferring porous metal f i l t e rs f rom the filter enclosure to the carrier. Detailed design of the
Detailed design
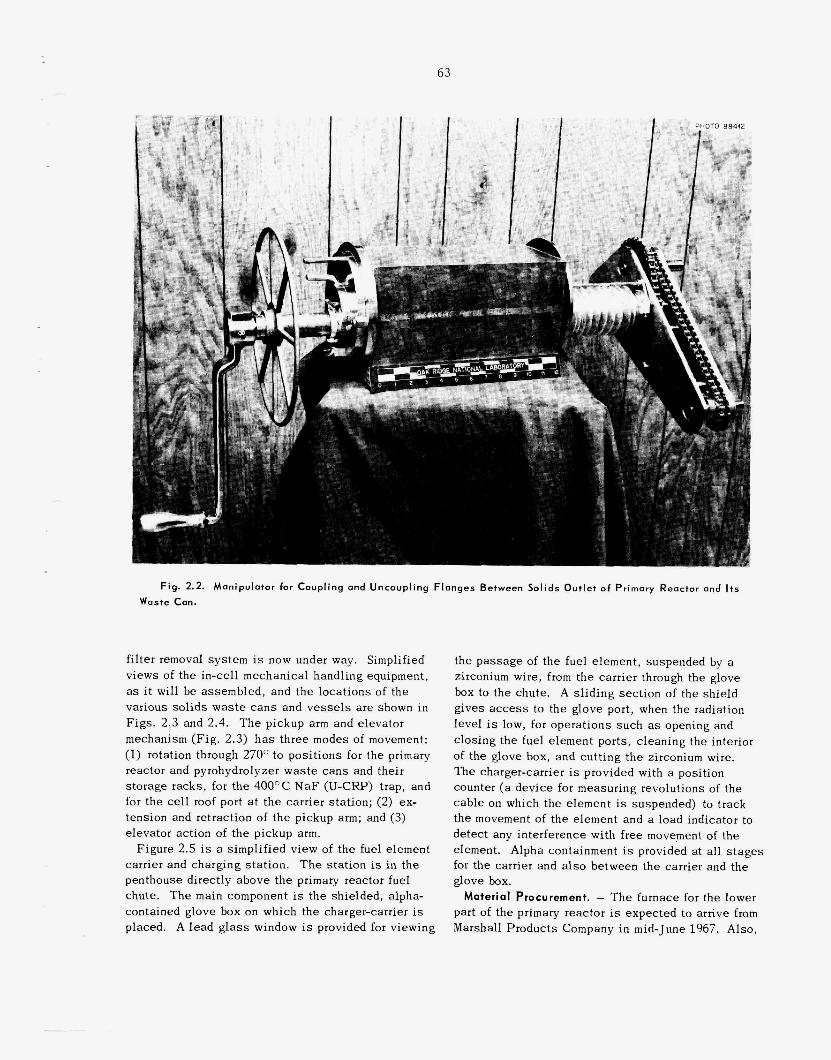
63
Fig. 2.2. Manipulator for Coupling and Uncoupling Flanges Between Solids Outlet o f Primary Reactor and I t s
Waste Can.
filter removal system is now under way. Simplified views of the in-cell mechanical handling equipment, a s it will be assembled, and the locat ions of the various s o l i d s w a s t e c a n s and v e s s e l s a re shown in F igs . 2.3 and 2.4. The pickup arm and elevator mechanism (Fig. 2.3) h a s three modes of movement: (1) rotation through 270' to posi t ions for the primary reactor and pyrohydrolyzer was te c a n s and their s torage racks, for the 40OOC N a F (U-CRP) trap, and for the cell roof port at the carrier station; (2) ex- tension and retraction of the pickup arm; and (3) elevator action of the pickup arm.
carrier and charging s ta t ion. T h e s ta t ion is in the penthouse directly above the primary reactor fuel chute. T h e main component is the shielded, alpha- contained glove box on which t h e charger-carrier is placed. A lead glass window is provided for viewing
Figure 2.5 is a simplified view of the fuel element
the p a s s a g e of the fuel element, suspended by a zirconium wire, from the carrier through the glove box to the chute. A s l id ing sec t ion of the shield gives access to the glove port, when the radiation level is low, for operat ions such as opening and closing the fuel element ports, c leaning the interior of the glove box, and cut t ing t h e zirconium wire. The charger-carrier is provided with a position counter (a device for measuring revolutions of the cable on which the element is suspended) to track the movement of the element and a load indicator to detect any interference with free movement of the element. Alpha containment is provided a t all s t a g e s for the carrier and a l s o between the carrier and the glove box.
Material Procurement. - T h e furnace for the lower part of the primary reactor is expected to arrive from Marshall Products Company in mid-June 1967. Also,
64
ORNL DWG 67-5252
Fig. 2.3. Equipment for Handling Waste Solids in Ce l l 3 (Elevat ion V iew) .
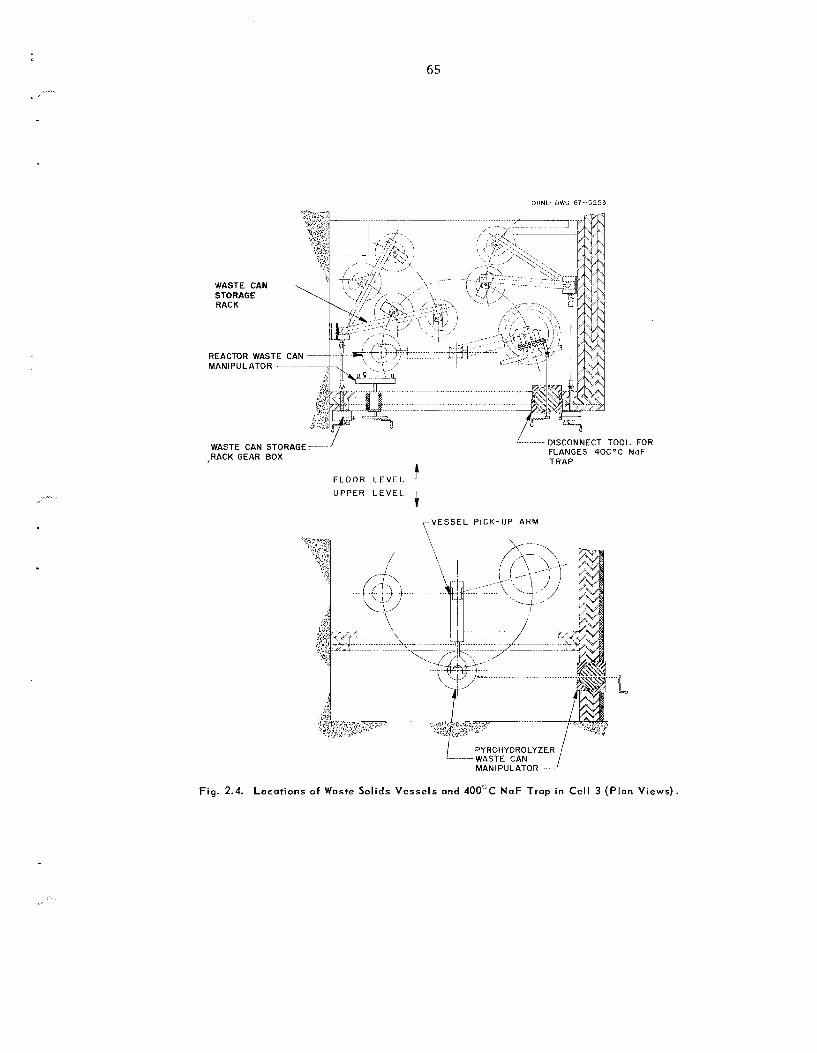
65 .... .. .
OflNL-~GWG 67--5253
WASTE CAN STORAGE -- ---f RACK GEAR BOX
F L O O R L E V E L U P P E R L E V E L
i. .. DISCONNECT TOOL FOR FLANGES-400 'C NaF T R A P
\ - V E S S E L P I C K - U P A R M
PYROHYDROLYZER WASTE CAN MANIPULATOR -..-.
Fig. 2.4. Locat ions o f Waste Solids Vessels and 400°C N a F Trap in Cell 3 ( P l a n V iews) .
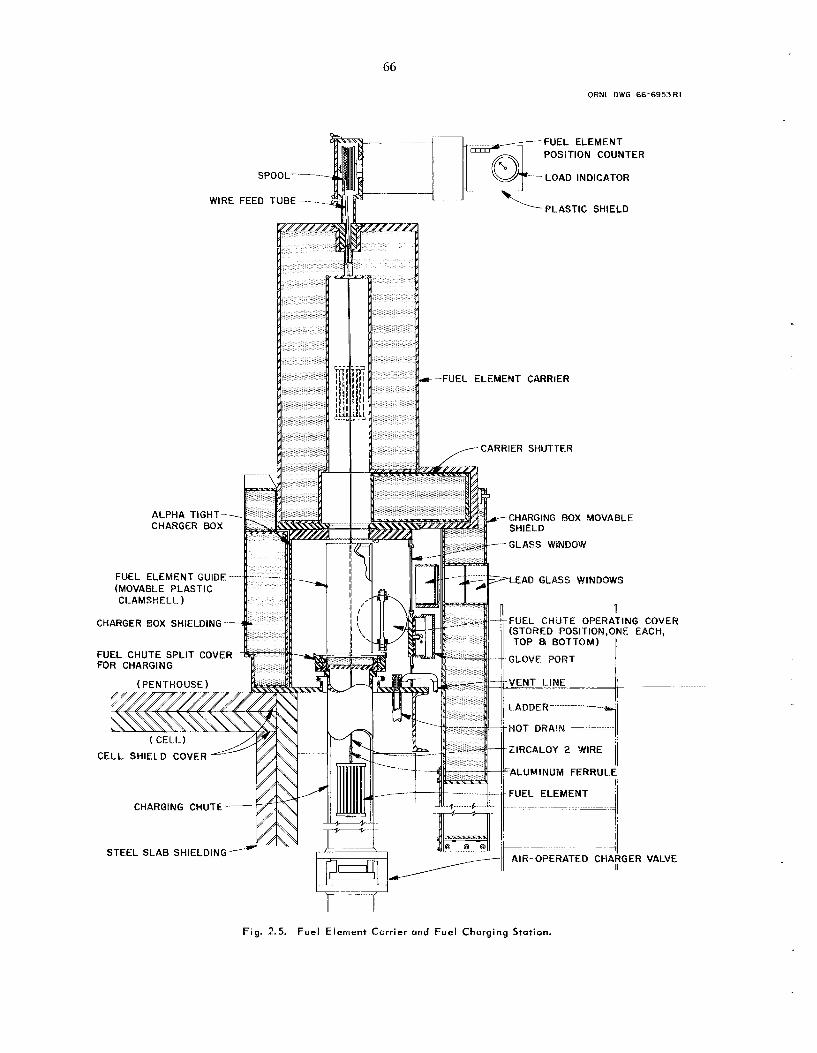
66
ORNL DWG 66-6953Rl
SPOOL- - WIRE FEED l U B E ---
-FUEL ELEMENT POSITION COUNTER
-- LOAD INDICATOR
PLASTIC SHIELD
FUEL ELEMENT CARRIER
ALPHA TIGHT- CHARGING BOX MOVABLE CHARGER BOX
- - G L A S S WiNDOW
FUEL ELEMENT GUIDE -- (MOVABLE PLASTIC CLAMSHELL)
LEAD GLASS WINDOWS
CHARGER BOX SHIELDING FUEL CHUTE OPERATING (STORED POSITION,ONE €
GLOVE PORT
TOP 8 BOTTOM) FUEL CHUTE SPLIT COVER FOR CHARGING
HOT DRAIN
ZIRCALOY 2 WIRE
EL ELEMENT CHARGING CHUTE ~
STEEL SLAB SHIELDING --
Fig. 2.5. Fuel Element Carrier ond Fuel Charging Stotion.
COVER ACH,
~. . .. . . . .. . .-
VALVE
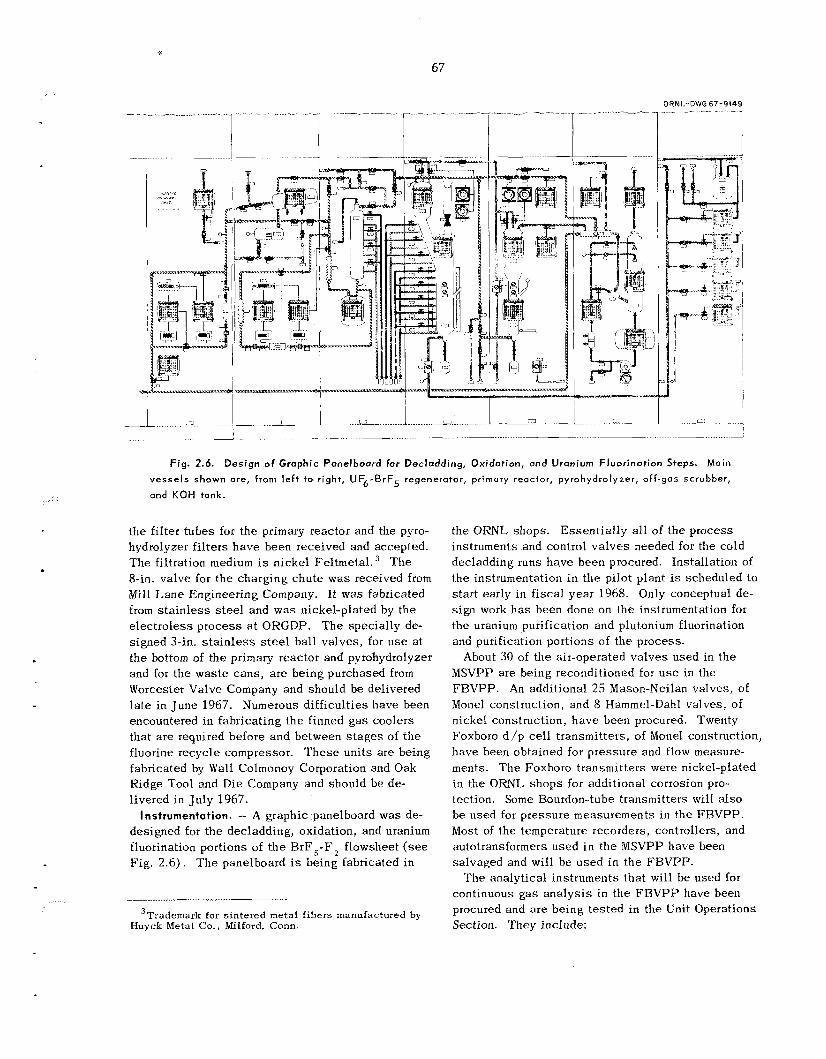
/I
i
i
6*16-L9 OMO-1MtlO
. ... .
1.
2.
3.
4.
5 .
68
a Gow-Mac thermal conductivity g a s analyzer to measure the hydrogen content of the off-gas during the HC1 decladding s tep ,
a Hays model 625 analyzer for measuring oxygen concentration during the oxidation and uranium fluorination s t eps ,
a I h Pont photometric analyzer for fluorine ana lys i s ,
a Gow-Mac g a s density detector to estimate the density (and possibly the uranium content) of the g a s stream from the primary reactor during uranium fluorination,
an MSA Billionaire to de t ec t chlorides and fluorides in the ce l l ventilation a i r ,
The fluorine calorimetric reactor (FCR) , developed by Chemical Development Section B and described in Sect. 2.6, will b e used to give a continuous indi- cation of the brornine-BrF3 content of the primary reactor off-gas. Development work is also being done in the Unit Operations Section on a gas chromatograph that may b e used to analyze the off- gas from the primary reactor.
transmitter rack in the penthouse and for the ana- lytical instruments to be loca ted in the ce l l 3 gallery. A mechanism was designed that will permit the transmitters and purges to b e adjusted from out- s i d e the enclosure.
The number and types of radiation monitoring in- struments that will be required for t he FBVPP have been investigated. At present, we plan to u s e a gamma-ray spectrometer, cons is t ing of an NaI scintillation c rys ta l and multichannel analyzer, to identify fission products a t various locations in the system. Ionization chambers (about ten) and elec- trometers will De used to measure the radiation level. Preliminary design work h a s been done on the shielding and the collimator for the gamma-ray spectrometer. Currently, w e plan to u s e about four detectors for the gamma-ray spectrometer. Detection of neutrons from the (a, n ) reactions with fluorine will be used as a means of determining the location of plutonium in the sys tem.
The data handling requirements of the F R V P P have been reviewed, and a survey h a s been made of the commercially ava i lab le equipment that might be used. A s a result of t h i s study we now plan to u s e a computer-based da ta acquisit ion system that will sample up to 298 e lec t r ica l s igna ls and 128 pneumatic s igna l s a t a rate of about 1 0 signals/sec. 'The system will convert raw da ta into engineering
Enclosures were designed for the main instrument
units for printout upon demand, limit check each signal, and write a ziagnetic tape f o r later ana lys i s on an ORNL central computer. In addition, alarms will be actuated upon s igna l deviations, and periodic alarm summaries and LIP to s i x trend logs will b e printed. T h e PDP-8 computer (Digital Equipment Corporation) and other components of the system are being purchased separately; they will be as- sembled a t ORNL,.
and threshold detector units) to provide adequate radiation protection for personnel will be installed at strategic locations.
Instruments (e . g., air monitors, personnel monitors,
Electrical. - Electrical i t e m s for which the design is essent ia l ly complete include the junction boxes, wireways, and l ighting for ce l l 3 ; and the wire and cable layouts, main v e s s e l hea te rs , and process piping heaters. for the head end of the FBVPP. Items for which the design i s partially complete in- clude the power distribution center and the bill of materials. Very l i t t l e progress h a s been made on the design of ce l l 2 equipment.
used in the MSVPP. Three differences a re ex- pected, however, to result in improved utility of power, plant operation, and safe ty for the FBVPP. F i rs t , a 10/2O-v e lec t r ica l sys tem is being used to heat short pipelines to temperatures of 15OOC or l e s s . Use of th i s sys tem is expected to result i n a lower power requirement for t h e s e l i nes and, conse- quently, l e s s overheating of t he l ines . Second, each 230- and 480-v compartment in the distribution center will obtain i t s control-circuit power from i t s own power leads , ins tead of f rom one of two control circuits as in the MSVPP. T h i s arrangement will b e safer, s ince activating the d isconnec t switch for a compartment will turn off both the control circuit and the load circuit. In addition, difficulty with any particular control circuit will affect only one com- partment, ins tead of half of the compartments, as in the MSVPP. F ina l ly , for increased safety 440-v autotransformers will be placed on a separa te panel- board having an expanded-metal guard.
Ventilation and Containment. - T h e ductwork, f i l ters, and an off-gas scrubber are the major compo- nents of the ventilation and containment system for the FWVPP. To vent i la te t he primary containment a reas , 1500 c f m of a i r will be drawn from the pent- house, an ex is t ing secondary containment area in Building 3019, to both c e l l s 2 and 3. T h e exhaus t air s t reams from these cells will join and p a s s in se r i e s through an aqueous KOH scrubber and two
In general, electrical des igns are similar to those
69
- banks of high-efficiency particulate a i r f i l ters (HEPA) Then th is stream of a i r (3000 cfm) will mix with that (1500 cfm) from c e l l 1. T h e combined stream (4500 cfm) will flow through a second aqueous KOII scrubber and an HEPA fil ter bank (currently being modified) before joining the ventilation stream from other operations i n Building 3019. T h i s total venti- lation stream will then flow through an exhaust fan and out of the Building 3020 s tack . T h e first scrubber and the two banks of HEPA fil ters will b e located in cell 2, while t he o ther p i eces of equip- ment mentioned will b e s i t ua t ed outs ide the build- ing. T h e outs ide ventilation scrubber was ins ta l led during the operation of t he MSVPP to protect t he downstream f i l te rs from damage by corrosive fluoride gases ; th i s scrubber will remain in service.
A new filter system will al low a i r to b e drawn through cells 1 , 2, and 3 at t h e rate of 4500 cfm. Previously, t h e ventilation a i r from all of Building 3019 passed through only o n e s e t of filters. T h e new system will cons i s t of three enclosures, each containing three 24 x 24 x 111/, in. HEPA fil ters. T h e s t a tus of th i s ins ta l la t ion is described under “Exterior Construction” above.
filter enc losures j u s t mentioned and the ventilation system for cell 3 . Design i s partially complete for the ventilation system for cell 2 and the in-cell scrubber and fi l ter ins ta l la t ion in ce l l 2, which will c lean the ventilation a i r f rom both c e l l s 2 and 3 .
Special fea tures of the F B V P P ventilation system include i t s abil i ty to:
I tems for which the des ign is complete a re the new
1. Humidify the a i r s t r eams in cells 2 and 3 to a dew point of 5O0F to effect t he removal of ac- cidentally re leased P u F , and UF, as particles on HEPA filters.’
2. Provide sh ie lded compartments i n cells 2 and 3 for main equipment i t ems and u s e enclosures and glove boxes i n o ther a r e a s to contain radioac- tivity in the event of an acc identa l release. All of these compartments a r e airtight and have ventilation sys t ems equipped with fi l ters and back-pressure dampers. Examples of enc losures are those used for t he transmitter rack in the penthouse and the ana ly t ica l sampling s ta t ions in the operating gallery oppos i te cell 3 .
3. Scrub the ventilation a i r t o prevent accidentally released fluoride g a s e s from damaging the HEPA filter installations.
Some method is required for protecting the two- bank filter ins ta l la t ion that is planned for cell 2.
Before deciding to u s e an aqueous KOH scrubber, we made a study to determine whether a scrubber or a so l id sorbent bed would b e more s ~ i t a b l e . ~ Resul t s of the study showed the scrubber to b e the obvious choice. T h e so l id sorbent bed had some advantages, but i t seemed m o r e appl icable to smaller-scale in- stallations.
T h e above fea tures a re sa l i en t par t s of the con- tainment policy recommended for the design of the FBVPP‘ and were felt to b e necessary to provide the degree of containment needed to safe ly handle plutonium iso topes and their daughters. Two of t hese measures a r e ident ica l to two of t he tentative ORNL containment c r i te r ia for processing ceI l s5 - item 2 is identical to criterion h and item 3 to criterion i of the reference.
The HEPA f i l te rs i n cell 2 will b e held within side-loading enc losures of spec ia l design. With t h e s e enclosures, f i l t e rs can be changed without contaminating the surroundings or interrupting operations. T h i s capabili ty i s thought to be e s sen - t ial in a reas where plutonium is handled, in order to prevent the spread of radioactivity, t he exposure of personnel to radioactivity, o r both. Other filter en- c losures in which plutonium may be collected will b e of a similar design.
Project Planning, Schedul ing , and Reporting. - Deta i l s of the cos t reporting sys tem and the cri t ical path scheduling method used with th i s project were published during the year.
T h e project plan w a s modified twice during this period. T h e first modification cons is ted in rec- onciling the plan with the schedule to November 1966. During March 1967, the project plan was com- pletely revised as a result of t h e adoption of the BrF, flowsheet. T h e scope of each activity was reestimated, and the sequence of ac t iv i t ies was , i n many ins tances , changed. At that time, the project was reorganized along the l i nes of t he major engi- neering flowsheets: head-end process , fluorination of uranium, purification of uranium, and processing of plutonium.
54% complete, based on an e s t ima te of labor and As of May 31, 1967, t h e project i s estimated to b e
4F. W. M i l e s a n d E. L. Youngblood, personal com-
’Radiation S a f e t y and Control Manual, sect. 6.2, Oak
%. W. Goolsby and F. T . Snyder, Crit ical Path Time-
munication, May 22, 1967.
Ridge National Laboratory, 1961.
Cost Scheduling for Management of Xesearch and De- velopment Prolects, ORNL-4112 (May 1967).
70
materials c o s t s that include an assumed value for the processing of plutonium.
Miscellaneous Des ign Studies
Crit icatity. - From t h e standpoint of criticality, the only i so topes that will b e present i n sufficient quantit ies in the F B V P P to be important are 2 3 9 P u and 235U. Tentative l imits of f i ss ionable elements per run a re 2 kg for plutonium (more than 40 wt '% * 'Pu) and 10 kg of uraniiim ( l e s s than 2 wt % 235U). The total allowable plant inventory for plutonium i s , a t present, considered to be 10 kg; the corresponding value for uranium is 200 kg.
Uranium-2.35 and plutonium-239 will coexis t only in the primary reactor during decladding, oxidation, and uranium fluorination. S ince t h e s e s t e p s are performed in the absence of moderating materials, no cri t icali ty problem will ex i s t for t he per-run quantity of 2 3 9 P u or 2 3 5 U or the combination of t he two. In addition, no cri t icali ty problem will ex i s t for a combination of t he total-inventory quantity of 239Pu and the per-run quantity of 235U. However, t he accumulation of 2 3 5 U in t he primary reactor combined with the total inventory of 2 3 y P u could produce a criticality problem. Further investigation of the likelihood of such accumulations i s needed to determine situations that are not cri t ically safe .
No work relative to crit icali ty h a s been done for any of the process v e s s e l s except t he scrubber tank. In general, however, t he absence of moderating materials in most of t he other F B V P P v e s s e l s will el iminate the likelihood of a c r i t i ca l incident. Vesse l s that may contain moderators (and the poss ib le moderators) are the uranium cold trap (€IF) , t he N a F trap (HF) , and the p rocess and ventilation scrubber tanks (H20) .
A su i tab le plan h a s beea devised to prevent a c r i t i ca l incident in the p rocess scrubber tank. It cons i s t s of the use of: (1) a so luble poison ( B 3 + ) in the scrubber solution (4 M KOH) , (2) a neutron absorptiometer, (3) a two-persons-per-batch-card makeup system, and ( 3 ) periodic boron ana lyses . Calculations indicated that a B3' concentration of 20 g/ l i ter i s sufficient to ensu re the cri t ical safety of 10 kg of 2 3 y P u ( the F B V P P inventory limit) in th i s tank. other measures will b e used as additional iiieans for avoiding criticality. T h e absorptiometer will
The neutron absorptiometer and the
' J. P. Nichols, personal communication, July 29, 1966.
monitor t he scrubber solution continuously to indi- ca t e any decrease in the B3 concentration of t he solution. The value of restricted solution makeup and periodic boron ana lyses is obvious.
Trivalent boron is added to t h e solution in the form of H 3 B 0 3 . Since the reported solubility of B 3 + in water i s on the order of that needed for adequate Criticality protection, solubili ty t e s t s in 1 M KOH were made. T h e s e t e s t s indicated tha t t he solu- bility of B 3 + in 4 M KOH is about SO d l i t e r . Other t e s t s in initial and spent scrubber solutions have indicated that va lues of 22 to 23 d l i t e r could be obtained a t room temperature; no attempt was made to determine the saturation value.
Because precipitation of R 3 + occurred in some of the simulated scrubber so lu t ions when uranium was added as UO,F,, a difficulty in using the soluble poison appeared to ex is t . Prec ip i ta t ion occurred primarily in solutions containing free KOH and having uranium contents equal t o or greater than 10 g/liter. Further t e s t s indicated, however, that no precipitation occurred when an amount of uranium equivalent to 10 kg of plutonium was added to the solution. If plutonium behaves l i ke uranium ( a s would b e expec ted) , protection aga ins t criticality is assured for 10 kg of plutonium. S ince both uranium and plutonium are not expec ted to migrate to the scrubber solution a t the same time, protection for all credible acc idents in the pilot plant is felt t o be adequate. In the event t h i s unlikely migration does take place, however, adequate warning will be given by the neutron absorptiometer.
Hazards Evaluation. - T h e hazards evaluation of the F B V P P cons i s t s of two parts: (1) the prepara- tion of a hazards evaluation report that will be presented to the OMNL Radiochemical P l a n t s Com- mittee for review and (2) t he review of the system, as i t is being designed, t o ensure tha t desirable safe ty features are included. Preparation of the hazards evaluation report i s in progress. A pre- liminary review of the F B V P P w a s made in October 1966 by the Chemical Technology Division Radiation Control Officer and severa l members of the Radio- chemical P l a n t s Committee. T h e purpose of the review was to acquaint the Committee with the layout, equipment, p rocess , potential hazards, and safe ty features of the F B V P P .
Many factors are being considered in the hazards ana lys i s of the F K V P P ; t hose of primary importance are the containment of plutonium, f i ss ion products, and uranium; criticality control; and t h e hazards assoc ia ted with the handling of highly reactive
7 1
chemica ls such as fluorine and BrF,. Safety fea tures a re being included in t h e sys tem to elimi- na t e potential hazards and to contain any material that may b e accidentally re leased . In addition, written run shee t s , which are checked during “cold” operation, will be followed during t h e runs with radioactive material. Some of t h e safe ty features being included in the system a r e d i scussed below.
Essent ia l ly a l l of t he F B V P P p rocess equipment tha t will contain radioactive material will b e located in c e l l s 2 and 3 of Building 3019. T h e s e ce l l s a r e primary containment areas. Equipment that may be- come highly radioactive or may have external con- tamination will be located in sh ie lded a lpha en- c losu res within these cells. Equipment that may have internal contamination but tha t requires maintenance, such as va lves , is being located i n access ib l e a reas i n the ce l l s . Air s u i t s will b e worn for maintenance operations; a change station h a s been installed a t the lower en t rance of cell 3 for washing down and changing t h e s e su i t s . Ventilation air f rom the F B V P P a rea p a s s e s through two caus t i c scrubbers and three s e t s of HEPA f i l te rs before being discharged to the 3020 s tack . T h e caus t i c scrubbers s e rve t o protect t he fi l ters from damage by corrosive g a s e s , s u c h as fluorine and BrF,. They also ensure tha t any gaseous U F , or P u F , accidentally re leased i s hydrolyzed to so l id UO,F, and PuO,F,, which can b e effectively removed by the filters.
T r a y s will be placed under equipment, such as the HrF, vaporizer, that will contain large quantit ies of liquid BrF,. Combustible mater ia l s will b e ex- cluded f rom the area. A sa t i s fac tory method for handling poss ib le BrF5 l e a k s in the F B V P P appears to b e to co l lec t t he B r F j i n t rays and to allow i t to evaporate and b e neutralized in the ventilation scrubber. Consideration is also being given to the u s e of dry chemicals for neutralizing BrF T e s t s a r e scheduled a t OKGDP during the summer of 1967 to determine e f fec t ive methods for handling such leaks .
Instruments attached to p r o c e s s equipment but loca ted in secondary containment a r e a s a re being located in enc losures as a precaution aga ins t the spread of contamination during maintenance opeta- t ions or i n case l e a k s should occur i n the instru- ments. Alpha-tight conta iners end bagging tech- niques will b e used to provide continuous alpha containment during such operations as fuel charging, was t e removal and burial, and fi l ter replacement. Interlocks are being used to prevent the inadvertent
leaks .
mixing of incompatible p rocess g a s e s , such as oxygen or fluorine, with hydrogen; they are also being employed to automatically c l o s e valves to prevent backup of process material into supply l i nes in t h e event that t he sys tem pressure should exceed the g a s supply pressure. A leak detection system i s being used on important f langes in the system. In addition to detecting l eaks , t h i s sys tem will maintain nitrogen pressure on the f langes to prevent external leakage of process material. Double valves, with nitrogen buffering, are being used i n l ines where valve s e a t leakage is particularly undesirable.
T h e safety of the F B V P P during emergencies such as power failures o r abnormal operating condi- t ions is being considered. Remotely operated va lves will fail safe in the event of a power failure or l o s s of compressed air. T h e ventilation sys tem for Building 3019 and the F B V P P a rea will switch to a steam-driven fan in the event of an e lec t r ica l power failure; a study was made that recommends placing additional equipment on t h e ex is t ing system for supplying emergency power and providing additional generating capacity. W e also plan to ins ta l l a
s c r a m ” swilch similar t o t h e one now i n u s e in the MSVPP. Actuating only one swi tch a t the panelboard or a t t he en t rance of the building will p l ace the FHVPP in a s a f e standby condition during an emergency.
( <
La boratory-Scale Studies
2.2 NEW OECLADDING AND OXIDATION METHOD FOR ZIRCALOY-CLAD UO, FUELS
USING HYDROGEN, OXYGEN, AND HF-0, IN SEQUENCE
T h e two current methods for process ing Zircaloy- c l ad UO, have disadvantages. T h e better of t h e s e u s e s €IC1 to form volati le ZrC1,. Recently, trouble- some plugging of Feltmetal f i l t e rs occurred when ZrC1, was being filtered a t about 300°C. T h e second process u s e s I-IF-0 , mixtures to form ZrO, in the primary fluidized-bed reactor. Here the ac- ceptable fue l load is qui te smal l because of lumping of t he UO, when it is constricted in t h e presence of I IF-0 , mixtures. W e have es t imated that the fuel- to-bed a rea ratio should not exceed 0.1. s Since
‘Chem. Teciinol. Div. Ann. Pro&. K e p t . May 31, 1966, OKNL-3945, p. 49.
72
neither of these processes is idea l , al ternative methods of processing have been investigated.
One such alternative method c o n s i s t s in reacting zirconium with dilute hydrogen (“hydriding”) a t about 6OOOC in the presence of Z r F , to fracture the cladding, oxidizing a t about 45OOC to d i sperse the UO, as U,O,, completely pulverizing the cladding by treatment a t 450°C with diluted HF-0 , mixtures, and fluorinating with fluorine a t 450 to 55OOc to volati l ize the uranium and plutonium. ’The u s e of BrF,, BrF,, or C lF , a t lower temperatures would also be feas ib le for removing the uranium. T h e hydriding reaction is exothermic, and effective penetration rates of 80 to 160 mils/hr are attain- able. ‘The oxidation s t ep , in which the UO, i s oxidized t o a fine U,O, powder, h a s only a slight physical effect on the zirconium hydride. T h e subsequent reaction of zirconium hydride with an H F - 0 , mixture i s very vigorous and exothermic but can b e controlled by diluting the g a s with nitrogen and by using only 5 to 10% H F in the mixture. T h e presence of ZrF, in the bed does not result i n l o s s e s of uranium greater than those observed with an alumina bed. T h i s method h a s been tested, using a 0.94-in.-ID fluidized-bed reactor, without se r ious difficulty.
T h e poss ib le d isadvantages of th i s method are those assoc ia ted with plutonium retention and with the poss ib le hazards of zirconium hydride. amount of plutonium retention in the %r F, produced by the hydride process h a s not been determined but would need to b e defined before such a scheme cod d be seriously considered. Although zirconium hydride was handled successfu l ly in t h e s e small- scale experiments, i t should b e recognized that, under some conditions, i t could ignite during the oxidation s t ep of t he process . For example, a high radiation field might in i t ia te t h e reaction. Further experiments, including hot-cell t e s t s , would need to be made either to eliminate th i s possibil i ty or to find ways to control and to t ake advantage of it.
T h e
2.3 PARTICLE SIZE AND f lLTRATlO U,O, DURING OXIDATION
During the oxidation s t e p of t h e fluidized-bed volatility process the UO a f ine U,O, powder. Photographic s tud ies , using an electron microscope, revealed two distinct classes of U,O, particles (F igs . 2.7 and 2.8). The larger particles were irregular i n shape , with a
pe l l e t s are converted to
number-average diameter of about 4 .2 p. The m a s s - average diameter of th i s group is estimated to be about 6 p. T h e other class of par t ic les cons is ted of spherical particles having a number-average diameter of about 0.6 p . T h e mass-average diameter of th i s group is possibly 1 . 4 p . Work done by an M I T practice school team gave further evidence about t he size distribution of t h e U,O, particles. By us ing photomicrographs taken through an optical microscope a t a magnification of lOOOx, sizes of more than 900 particles w e r e measured with a Z e i s s particle analyzer; a log-probability plot of distribution i s shown in F ig . 2.9. S ince th i s plot shows only the number of par t ic les determined by optical methods, most of the spher ica l par t ic les were not included because they were too small to be counted. However, t he plotted da ta agree well with the earlier approximations of average diameter. Since most of the par t ic les are l e s s than 10 p in diameter, a distinct possibil i ty e x i s t s that some of th i s U,O, can p a s s through t h e process g a s fi l ters, which are rated to remove 100% of a l l 10-p particles.
Experiments with a 0.94-in.-ID fluidized-bed ie- actor equipped with two fi l ters, each with separa te blowback pulsing, allowed appioximately 1% of a U,O, charge to p a s s through the f i l t e rs during a 4- to 5-hr fluidization. Each of t h e s e f i l t e rs cons is ted of a 1- by 4-in. f lat p iece of nickel Feltmetal , rated for 10 p, that was edge-welded into a holder. Some welding damage to the fi l ters w a s found i n t e s t s that were conducted after t he completion of the MIT filtration s tudies described below. Because of the magnitude of the U,O, l o s s , t he MIT practice team studied U,O, filtration. Thei r da t a showed that the Feltmetal f i l ters, when operated properly, are capable of filtering out e s sen t i a l ly a l l t he U,O,. In fact , with a l’/,-in.-ID Pyrex column, a 3-in.-ID disengaging section, and a 3-in.-diam filter, less than 0.0002% of the U,O, p a s s e d through the filter in 4 hr of fluidization. After obtaining these re- su l t s , we made further t e s t s with the 0.94-in.-ID reactor. W e then found that, i f the f i l t e rs were operated without blowback, l o s s of U,0, did not occur. Further, no loss of U,O, was obtained by changing the temperature a t which the UO, was oxidized f rom 450 to 525°C or by varying the tem- perature of the filter i n the range of 50 to 275OC. T h u s we conclude that the l o s s e s experienced earlier can be attributed either to welding damage
‘D. D. Wilson and P. A. ’romlinson, Fil tration of U 0 from a G a s Stream, ORNL-MIT-5 (Nov. 9, 1966). a
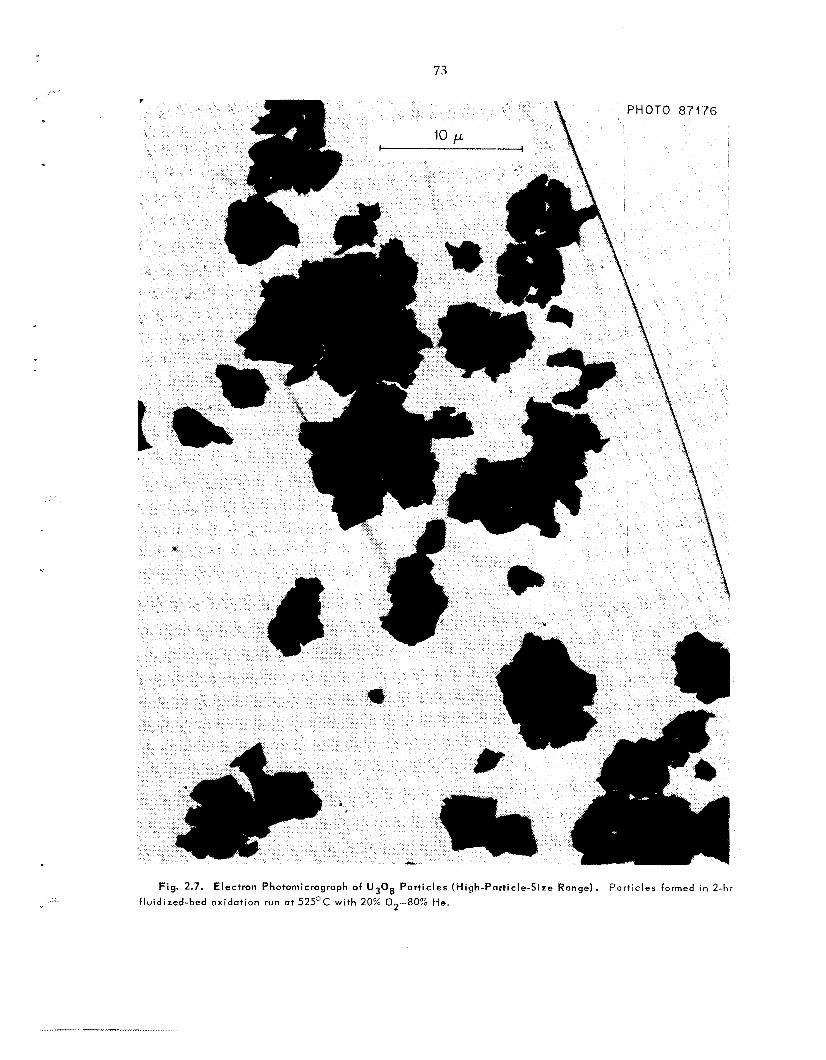
73 .....
Fig. 2.7. Electron Photomicrograph of U308 Par t ic les (High-Part ic le-Size Range) . Part ic les formed in 2-hr fluidized-bed oxidation run ot 525°C with 20% 0 2 - 8 0 % He.
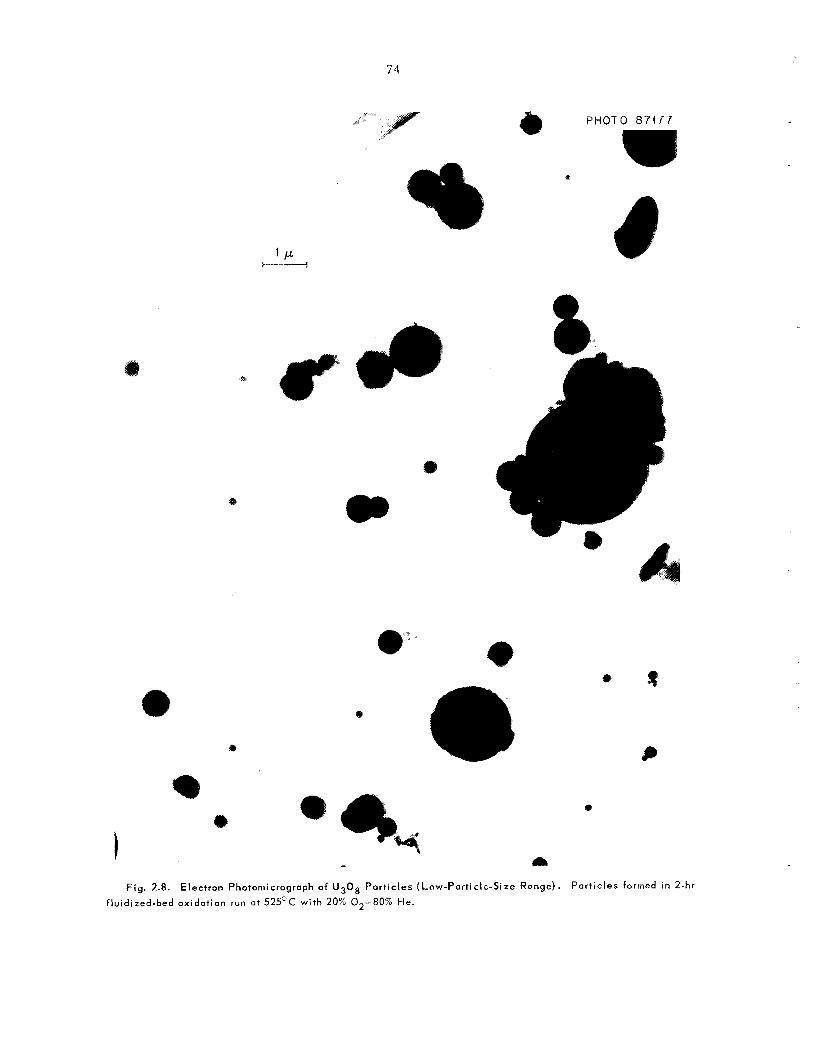
7 4
e
e
Fig. 2.8. Electron Photanlicrograph of U308 Part ic les (Low-Part ic le-Size Rangc). Part ic les formed in 2-hr fluidized-bed oxidation run a t 525OC with 20% 02-80% H e .
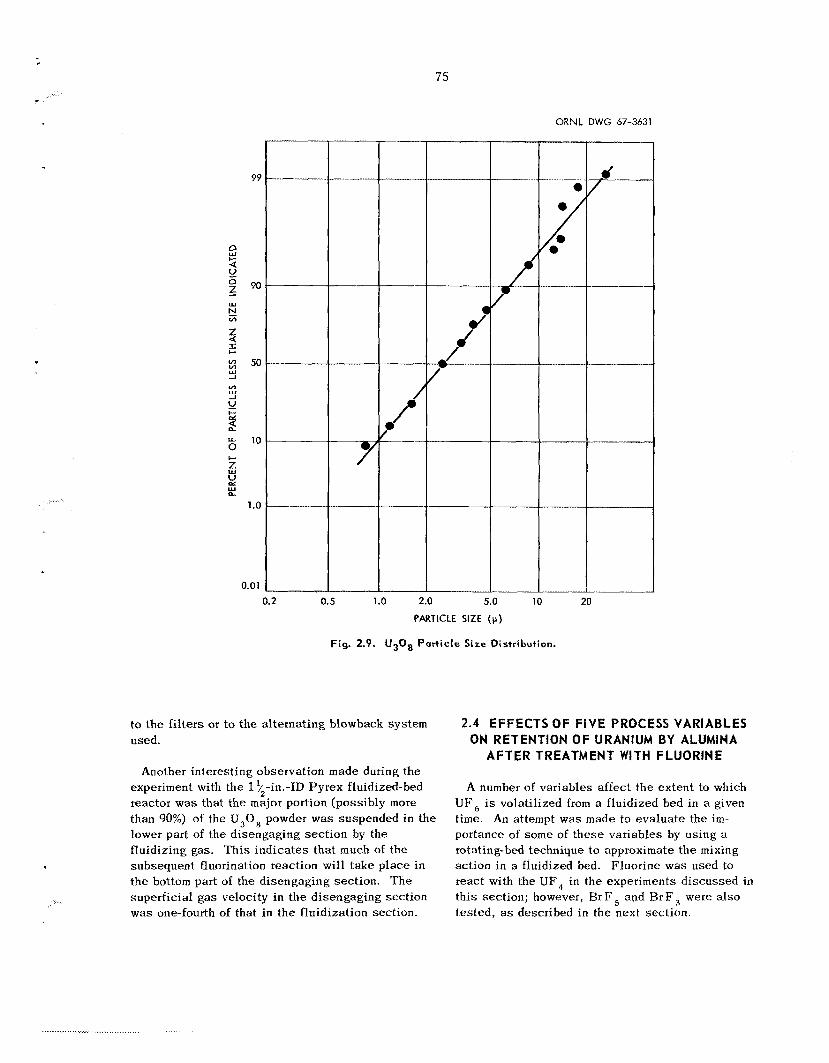
ORNL DWG 67-3631
75
0.2 0.5 1.0 2.0 5.0 10 20 PARTICLE SIZE (p )
Fig. 2.9. U308 Particle Size Distribution.
to the f i l ters or to the al ternat ing blowback system used.
Another interest ing observation made during the experiment with the 1 '/-in.-ID Pyrex fluidized-bed reactor w a s that the major portion (possibly more than 90%) of the U,O, powder was suspended in the lower part of the disengaging sec t ion by the fluidizing gas. T h i s ind ica tes tha t much of the subsequent fluorination reaction will t ake p lace in t h e bottom part of the disengaging sect ion. The superf ic ia l gas velocity in the disengaging sect ion was one-fourth of that in the fluidization section.
2.4 EFFECTS OF FIVE PROCESS VARIABLES ON RETENTION OF URANIUM BY ALUMINA
AFTER TREATMENT WITH FLUORINE
A number of var iables affect the extent to which UF , is volati l ized from a fluidized bed in a given time. An attempt was made to evalua te the im- portance of some of t h e s e var iables by using a rotating-bed technique to approximate the mixing act ion in a fluidized bed. Fluorine was used to react with the UF, in the experiments d i scussed in th i s sect ion; however, Br F and Bt F were also t es ted , as described in the next sect ion.
76
T h e alumina and U F , charged to t h e reactor weighed about 2'4 g; of tha t amount, about 0.2 g
was uranium (as UF,) . T h e flow ra te of g a s into the reactor was usually 200 ml/min (STP) , which was sufficient to keep a nearly cons tan t g a s con- centration in the reactor. T h e quantity of reacting uranium was insufficient to c a u s e any significant variation in the temperature of t h e rotating reactor.
Of interest in t hese experiments were the e f fec ts of the following variables on final uranium concen- tration: the particle: diameter of t h e alumina (Norton RR grade), the fluorination temperature, the con- centration of the fluorinating gas , t h e time of reac- tion, and the init ial concentration of uranium in the bed. A s ta t i s t ica l ly designed experiment was per- formed to eva lua te the e f f ec t s of t h e s e variables. '' A central composite des ign was used that consisted of the following 31 points: 16 poin ts comprising one-half of a 2' factorial ( the b a s e des ign) , 10 axial points, and 5 points all a t t he cen te r of the design.
Resu l t s of the ana lys i s ind ica ted tha t , based on the first 16 experiments, t he f ive variables, over t he range studied, have no effect on uranium retention by the alumina. ' Also, t he expec ted retention of uranium over the range of var iab les s tud ied is 0.010 wt %, with only o n e run in 40 expected to exceed 0.021 wt %.
2.5 RELATIVE EFFECTIVENESS OF FLUORINE, $rF5, AND BrF, IN MlNlMlLlNG
N OF URANIUM BY ALUMINA
I f uranium and plutonium are to b e volatilized separa te ly with BrF, and fluorine, respectively, as shown in the current f lowsheet for t he FBVPP, the quantity of uranium remaining i n t he bed after t he BrF, s t e p i s of interest . If fluorine should vola- t i l i ze some of th i s residual uranium in the subse- quent s tep , then the plutonium stream will contain both uranium and plutonium, and further separation will be necessary. Experiments supplementing those described in the previous sec t ion were made to compare the relative e f fec t iveness of fluorine,
"Experiment designed by D. A. Gardiner, Mathematics
11.. l h i s analysis by I,. B. Koppel, Associate Professor Division, ORNL.
of Chemical Engineering, Purdue University, and con- sultant to the Chemical Engineering Division, Argonne National Laboratory. A siimmary of another analysis by W. Blot, Mathematics Division, ORNL, is presented in Fluoride Volatility Processing Semiannual Progress Re- port for Per iod ending November 30, 1966, OKNL-TM- 1849, p. 27.
BrF,, and BrF, i n removing uranium from the alumina in the bed. T h e rotating-bed reactor was used.
that a t all temperatures above 3OOOC fluorine l eaves less residual uranium than WrF,. For example, after 65 min of fluorination at 40Q°C with 15 vol % concentration of fluorinating agent, t h e residual uranium with BrF, fluorination w a s about 0.015 wt %, while with fluorine i t was only about 0.007 wt %. More de ta i l s have been reported elsewhere. ' A poss ib le solution is to t rea t t he alumina with BrF, between the BrFS and fluorine s t eps . Treat- ment of a bed for 65 min with 16 vol % BrF, a t 100°C resulted in a residual uranium content of only 0.0037 wt %. Treatment with RrF, could also se rve as a method for completely reinoving uranium from disengaging sec t ion , f i l t e rs , and l ines ; i n severa l experiments, us ing a 0.94-in.-ID fluidized- bed reactor, BrF, was used success fu l ly for t h i s purpose.
J u s t as the residual uranium in the bed increases when t h e fluorination temperature is increased, the final fluoride content of t h e bed i s higher a t higher temperatures. T h e final fluoride content after fluorination at 60OOC (1 .5 wt 7%) i s more than twice tha t after fluorination at 5OOOC (0.7 wt %) . Fluorine and BrF, gave similar results. Minimizing the fluoride content of the d iscarded alumina could b e important for subsequent d i sposa l operations.
Resu l t s of t hese experiments showed evidence
LORIMETRIC REACTOR FOR DETERMINlNG SROMIHE AND BrF, CONTENTS
OF PRIMARY REACTOR OFF-GAS
In the FBVPP, continuous measurements of t he BrF , utilization during the uranium volatilization would b e desirable, both to allow periodic addition of the proper amount of makeup fluorine to the off- gas stream and to determine when the reaction i s complete. One poss ib le way to provide such a measurement involves the u s e of a fluorine calori- nietric reactor (FCR) , which i s descr ibed below.
Description and Test Resul ts
T h e FCR operates by reacting the ex i t gas stream, which cons i s t s of bromine, BrF,, and BrF,, with
' 2R. P. Milford et al., Fluoride Volatility Processing Semiannrial Progress Report for Period ending November 30, 1966, OKNL-TM-1819, p. 29.
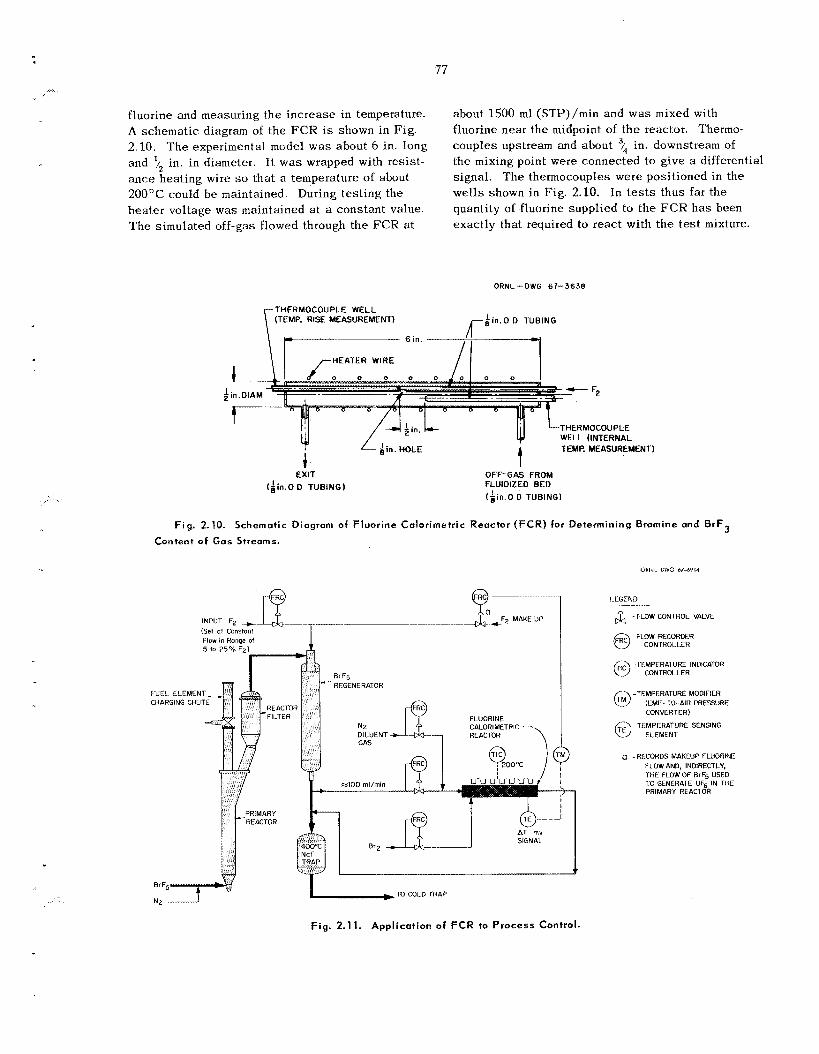
77
fluorine and measuring the increase in temperature. A schematic diagram of t h e F C R is shown in Fig. 2.10. 'The experimental model was about 6 in. long and v2 in. i n diameter. I t w a s wrapped with resist- ance heating wire so tha t a temperature of about 200"C could be maintained. During tes t ing the hea ter voltage was maintained at a cons tan t value. T h e simulated off-gas flowed through the FCR at
about 1500 m l (STP)/min and w a s mixed with fluorine near the midpoint of the reactor. Thermo- couples upstream and about "/4 in. downstream of the mixing point were connected to give a differential signal. The thermocouples were positioned i n the wel l s shown in Fig. 2.10. In tests thus far the quantity of fluorine supplied to the F C R h a s been exactly tha t required to react with the t e s t mixture.
ORNL-DWG 67-3638
THERMOCOUPLE WELL (TEMP. RISE MEASUREMENT)
I F2 z
THERMOCOUPLE WELL (INTERNAL TEMP. MEASUREMENT1
EXIT OFF-GAS FROM FLUIDIZED BED ( $ 1 " 0 D TUBING1
(bin o D TUBING)
Fig. 2.10. Schematic Diagram of Fluorine Colorimetric Reactor (FCR) for Determining Bromine and B r F 3
Content of Gas S t r e a m s .
INPUT Fz .+Lk ~ ............... (Sei ut Canstont Flow in Ronm of
.....
............
FUEL ELEMENT CHARGING CHUTE
BrF5
FLUORINE CALORIMETRIC --- REACTOR
QOOT
... I & -FLOW CON-rROL VALVE
@ -FLOW HECORDER CONTROLLER
. EMPERATURE INDICATOR CONTROLLER
fj -TEMPERATURE MODiFlER (EMF-TO-AIR PRESSURE CONVERTER)
@-TEMPERATURE SENSING ELEMENT
0 -RECORDS MAKEUP FLUORINE FLOW AND. INDIRECTLY.
I >TO COLD TRAP
THE FLOW OF BrFg USE0 1.0 GENERATE UFg IN THE PRIMARY REACTOR
NZ - Fig. 2.11. Application of FCR to Process Control.
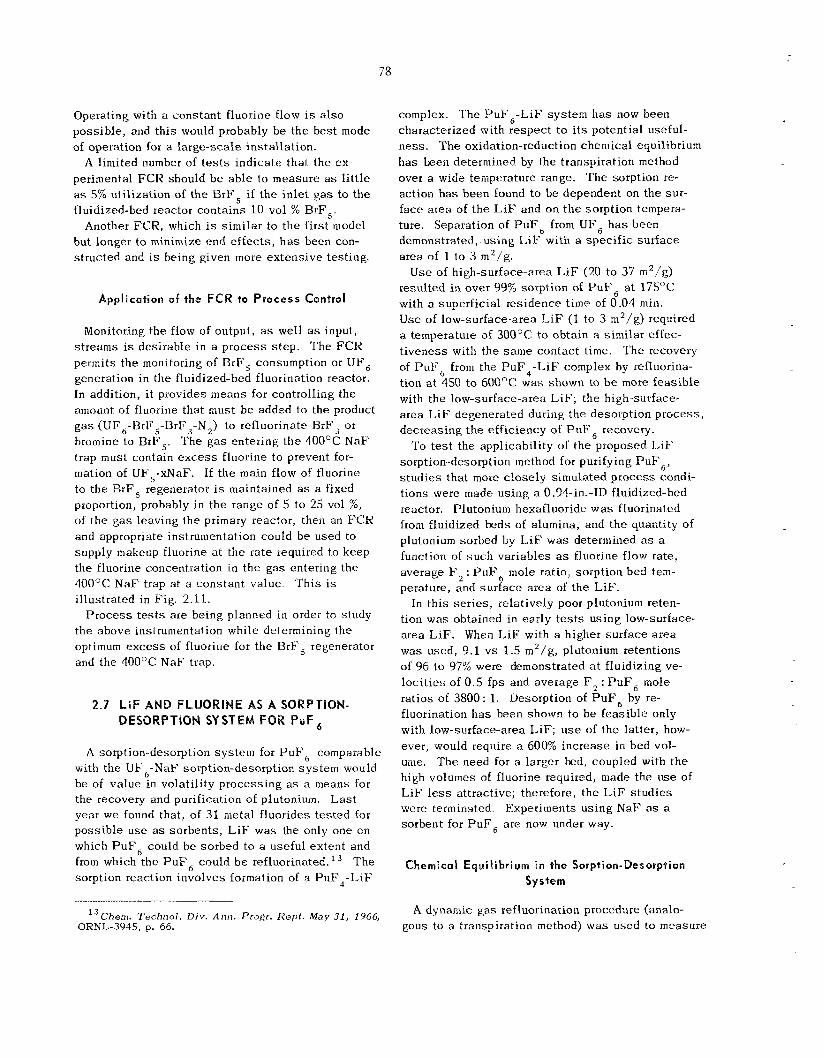
78
Operating with a constant fluorine flow i s also poss ib le , and th i s would probably b e the bes t mode of operation for a la rge-sca le installation.
A limited number of t e s t s ind ica te tha t the ex- perimental FCR should b e ab le to measure as l i t t l e as 5% util ization of the BrF , if t h e in le t gas to the fluidized-bed reactor conta ins 10 vol % BrF,.
Another FCR, which is similar t o t h e first model but longer to minimize end ef fec ts , has been con- structed and is being given more ex tens ive testing.
Application of the FCR to P r o c e s s Control
Monitoring the flow of output, as well a s input, s t reams i s desirable in a p rocess s tep . T h e FCR permits t he monitoring of BrF, consumption or UF, generation in the fluidized-bed fluorination reactor. In addition, i t provides means for controlling the amount of fluorine that must b e added to the product g a s (UF,-RrF5-8rF,-N2) to refluorinate MrFj or bromine to BrF,. T h e g a s entering t h e 400°C N a F trap must contain e x c e s s fluorine to prevent for- mation of UF;xNaF. If the main flow of fluorine to the BrF, regenerator i s maintained as a fixed proportion, probably in the range of 5 to 25 vol %, of the g a s leaving the primary reactor, then an FCR and appropriate instrumentation could be used to supply makeup fluorine a t t he rate required to keep the fluorine concentration in t h e g a s entering the 400°C N a F trap a t a cons tan t value. T h i s is il lustrated in Fig. 2.11.
Process t e s t s are being planned i n order to study the above instrumentation while determining the optimum e x c e s s of fluorine for t he BrF, regenerator and the 4OOOC NaF trap.
2.7 LiF AND FLUOR1 E AS A SORPTION- DESORPTION SYSTEM FOR P u F ,
A sorption-desorption sys tem for PuF, comparable with the UF,-NaF sorption-desorption system would be of value in volatility process ing as a means for the recovery and purification of plutonium. year we found that, of 31 metal fluorides t e s t ed for poss ib le use as sorbents , LiF was the only one on which P u F , could be sorbed to a useful extent and from which the PuF , could b e refluorinated. ' T h e sorption reaction involves formation of a PiiF4-IdiF
L a s t
13Chern. Techno]. Div . Ann. Pro&. R e p t . May 31, 1966, ORNL-3945, p. 66.
complex. The PuF,-LiF sys tem h a s now been characterized with respec t t o i t s potential useful- nes s . The oxidation-reduction chemical equilibrium h a s t e e n determined by the transpiration method over a wide temperature range. T h e sorption re- action h a s been found to be dependent on t h e sur- face area of the LiF and on t h e sorption tempera- ture. Separation of PuF, from UF, h a s been demonstrated, using LiF with a spec i f i c sur face area of 1 to 3 m2/g.
Use of high-surface-area LiF (20 to 37 m2/g) resulted in over 99% sorption of P u F , at 175°C with a superficial residence t i m e of 0.04 min. Use of low-surface-area L i F (1 to 3 m2/g) required a temperature of 300°C to obtain a similar effec- t iveness with the s a m e contac t time. T h e recovery of P u r , from the P u F 4 - C i F complex by refluorina- tion at 450 to 6OO0C was shown to b e more feas ib le with the low-surface-area LiF; the high-surface- a rea LIE' degenerated during the desorption p rocess , decreasing t h e efficiency of P u F , recovery.
To t e s t the applicabili ty of the proposed Id? sorption-desorption method for purifying PuF,, s tud ie s that more c lose ly simulated process condi- t ions were mad:: us ing a 0.94-in.-ID fluidized-bed reactor. Plutonium hexafluoride w a s fluorinated from fluidized beds of alumina, and the quantity of plutonium sorbed by L iF was determined as a function of s u c h variables a s fluorine flow rate, average F2 : PuF, mole ratio, sorption bed tem- perature, and sur face a rea of t h e LiF.
In th i s s e r i e s , relatively poor plutonium reten- tion w a s obtained in early t e s t s us ing low-surface- area LiF. When 1,iF with a higher sur face a rea was used, 9 .1 v s 1.5 m2/g, plutonium retentions of 96 to 97% were demonstrated at fluidizing ve- loc i t ies of 0.5 fps and average F2 : PuF, mole ratios of 3800: 1. Desorption of PuF, by re- fluorination h a s been shown to b e feas ib le only with low-surface-area L iF ; u s e of the latter, how- ever, would require a 600% increase in bed vol- ume. The need for a larger bed, coupled with t h e high volumes of fluorine required, made the use of L i F l e s s attractive; therefore, t he LiF s tud ie s were terminated. Experiments us ing N a F as a sorbent for PuF, a re now under way.
Chemical Equil ibrium i n the Sorption-Desorption System
A dynamic g a s refluorination procedure (analo- gous to a transpiration method) was used to measure
79
. .
the equilibrium between PuF, , fluorine, and t h e sorbed plutonium complex (probably L i4PuF8) over the temperature range 100 to 600°C. The t e s t bed, cons is t ing of about 300 mg of plutonium sorbed by 7.8 g of L iF , was used at different temperatures and fluorine flow ra tes to determine the desorption rate as measured by the amount of volati l ized PuF, collected in an N a F trap at 30OOC. The K value w a s found to be unchanged when the g a s flow rate was varied by a factor of 2; t h i s indicated that an equilibrium value w a s actually being measured. Similar r e su l t s were obtained in sorp- tion t e s t s , that is, when t h e equilibrium w a s ap- proached from the excess P u F , s i d e of t h e re- action:
L i 4 P u F 8 + F, PuF, t 4 L i F .
The da ta were found t o be defined by the relation- ship
log K = 2047/T(OK) 1- 0.827 ,
where K = F, : P u F , mole ratio. The d a t a and the l ine representing the above equation a re plotted in Fig. 17 in ref. 12. From th i s , the free energy- temperature relationship for the above reaction ap- pears to be AF0- 9360 + 3.74T("K) cal/mole.
Variables Affecting the Sorption of PuF , by LiF
T h e ef fec ts of gas flow rate, temperature, and su r face a rea of LiF on P u F 6 sorption were in- vestigated. The valence s t a t e of the sorbed plu- tonium was determined, and the manner in which sorption e f fec t iveness varied with plutonium load- ing was studied.
Tests with g a s flow ra t e s of 10, 30, 60, and 250 ml/min (STP) demonstrated that sorption is only slightly affected by flow ra tes below 60 ml/min and tha t the effect at 250 ml/min is not large. For the low-surface-area L i F , a temperature of 2 7 5 T is required t o achieve a P u F , retention comparable with that achieved with high-surface- area L i F at 175°C. Furthermore, partial sorption occurs at temperatures of 35 to 175°C with the high-surface-area L i F , i n cont ras t to almost no sorption at temperatures up to 200OC for the low- surface-area LiF (see Table 3, ref. 12).
T h e plutonium tha t is sorbed by low-surface- area L i F at 300OC has previously been shown to be tetravalent, by u s e of the iodine liberation
method. l 3 Also, the x-ray pattern is similar in most respec ts to that of L i4UF8 . The plutonium that was sorbed a t 175 and 100°C by high-surface- area LiF was found by the iodine liberation method to have average valences of 4.21 and 4.55 respec- tively.
The sorption capacity of L i F for P u F s was studied in a series of 15 success ive experiments involving cumulative sorptions on a s ing le 7.8-g batch of low-surface-area LiF a t 300OC. For each of the 15 sorptions, about 50 mg of plutonium a s PuOz was added to the P u F , generator, and the NaF backup trap was renewed. A total of 0.76 g of plutonium as P u F , was p a s s e d into t h e sorbent bed; 0.71 g was retained. T h e spec i f ic loadings observed at the end of the s e r i e s of t e s t s varied from 0.1225 g of plutonium per gram of LiF near the en t rance t o 0.0309 g per gram of LiF at the exit.
Desorption of PuF, from L i F
Desorption t e s t s with low-surface-area LiF pro- vided resu l t s that were cons is ten t with the equi- librium da ta presented i n a previous section. T h e desorption ra te increases with temperature up to approximately 550°C; here the relationship re- verses, possibly as a resu l t of sintering.
using the low-surface-area L i F , t h e quantity of residual plutonium on t h e LiF did not increase above that noted for one c y c l e (see Table 5 , ref. 12).
In a s e r i e s of five cyc les of sorption-desorption
The init ial desorption from high-surface-area L i F appears comparable with tha t found with low-surface- area LiF . However, the tailing-out effect appears to b e extended, and, at least a t t h e relatively high desorption temperature of 475OC, it appears that some of t he plutonium is not desorbable (see Table 6, ref. 12). Reduction of the sur face area to about 3 m2/g after attempts to desorb at 4 7 5 T indicated partial sintering of t he sorbent. The u s e of high- surface-area LiF therefore appears to be limited to one cyc le .
Separation of PuF from UF , T h e separa t ion of plutonium and uranium hexa-
fluorides was demonstrated in dupl ica te sorption tests in which both PuF, and UF, were produced in the P u F b generator and two t raps containing
80
low-surface-area LiF a t 30OOC were subs t i tu ted for t he s ing le L i F trap ( a s described in ref . 12); g a s e s from the LiF t raps were finally p a s s e d through a n NaF trap. No uranium was detected in the LiF traps, while 4.9 and 17.6 mg of ura- nium were found in t h e NaF traps. In the f i r s t t es t , the two LiF t raps and t h e NaE' trap con- tained 61.4, 3.0, and 0.3 mg of plutonium re- spectively; i n t he second t e s t , corresponding va lues were 61.9, 4.5, and 0 .4 m g of plutonium.
In similar experiments with t h e high-surface- area LiF as the sorbent a t 17SoC, a significant part of the UF, was cosorbed with the P u F , by the LiF bed. Independent t e s t s confirmed t h e sorption of significant quant i t ies of U F 6 by t h e high-surface-area LiF a t 175OC.
process Application Tests of PuF Sorption by biF
Process application t e s t s of P u F 6 sorption by LiF were conducted, using a 0.94-in.-ID fluidized- bed reactor and two 25-g beds of L i F in se r i e s . T h e first two t e s t s contained 7-g charges of 5.4% PuQz -UOz (sol-gel-derived microspheres with di- ameters of about 300 to 450 p)> one with and one without the presence of s t a i n l e s s s t e e l cladding. Fluorinations in each t e s t were made at 55OoC, using gas fluidization ve loc i t ies of 0.55 fps [1200 ml/min (STP)]. T h e product gas s t reams of P u F 6 - U F 6 - F z (some CrQ2F2-CrF5 was present in the t e s t that included s t a i n l e s s s t e e l claddinF, were passed through the LiF beds a t 300OC. T h e re- spec t ive overall sorptions of PuF , were 7 and 34%. The appreciable difference in retentions in the two tests was a t f i r s t thought to b e attribut- ab le to the presence of chromium fluorides; how- ever, subsequent s t u d i e s d isc losed significant differences in the sur face a r e a s of various LiF batches tha t had been prepared under similar con- dit ions. For ba tches tha t were prepared from fused Li2C03 by reaction with fluorine a t 4OO0C, the sur face areas ranged from 1.3 to 3.4 m2/g; at 2OO0C, 5.9 to 17.7 m2/g; at 25OoC, 6.5 to 36.8 m 2 / g ; and at 100°C, 3.5 to 9.1 m2/g.
p ressure of t he PuF,-LiF complex, described earlier in th i s sec t ion , a dec is ion to lower t h e temperature of the LiF sorption beds from 300 to 25OOC was made. In a t e s t with the bed tem- perature a t 250°C and with other conditions
Based on determinations of the decomposition
similar to those used previously, a n overall PuF', sorption of 56% w a s achieved. T h i s represents a definite improvement over the 34% that was obtained in the 3OOOC sorption t e s t but is s t i l l not adequate for our purposes.
T h e importance of res idence time and of the F2 : PuF , riiole ratio on the sorption of PuF, was demonstrated i n a s t a t i c bed tes t ; a subfluidization velocity of 0.1 fps [240 ml/min (STP)] for 3 hr at 550°C was used. An overall sorption of 99.4% was achieved by a 50-g bed of LiF at 300°C. T h e low material balance for plutonium in th i s t e s t (57.8% as compared with previous va lues of about 90 to loo%), in addition to the unusually high re- tention by the bed, sugges ted the possibil i ty of some thermal decomposition. (The Fz : PuF6 mole ratio below which thermal decomposition occurs h a s been reported to b e 396 1 1 a t 30OOC.' 4, In th i s t e s t t h e mole ratio was 1270: 1, based on a con- tinuous evolution of P u F , over t h e 3-hr period. T h e ac tua l m o l e ratio was determined in a s i m i l a r t e s t in which a neutron counting device , calibrated with a known amount of plutonium, was posit ioned ad jacent to the L i F sorption bed. T h e neutron count during fluorination indicated tha t essen- t ially a l l of the plutonium w a s removed from the fluidized bed within a period of about 30 min and that about 50 to 60% of i t reached the sorption bed during that time ( s e e F ig . 2.12). On th i s b a s i s t he actual F2 : P u F , m o l e ratio w a s below t h e required value of 396:l for a s igni f icant length of time. T h i s ev idence supports t he previous tentative conclu- sion that thermal decomposition of P u F 6 was caus- ing low material ba lances and high sorption.
T h e amount of P u F 6 not sorbed by LiF at the proposed sorption temperature w a s determined. Plutonium hexafluoride was forined by fluorination and sorbed by a 50-g bed of L,iF at 300°C. Then fluorine was p a s s e d through the bed for 1 2 hr a t a rate of 240 ml/min (STP). collected in a 10-g N a F backup trap a t 300°C in- dicated a n equilibrium cons tan t of about 5 x l o 5 for Fz : Pup6.
A batch of LiF having a high sur face a rea (9.1 m2/g) w a s prepared by fluorination of L i 2 C 0 3 a t 100°C and w a s used for sorbing P u F , (ba tches of lithium fluoride with sur face a reas between 1 and 2 m2/g had been used previously in application
T h e amount of plutonium
' 4M. J. Steindler, Laboratory Investigations in Support of Fluid B e d Fluoride Volat i l i ty Process . Part I I . T h e Properties of Plutonium Hexafluoride, ANL-6753, p. 40 (August 1963).
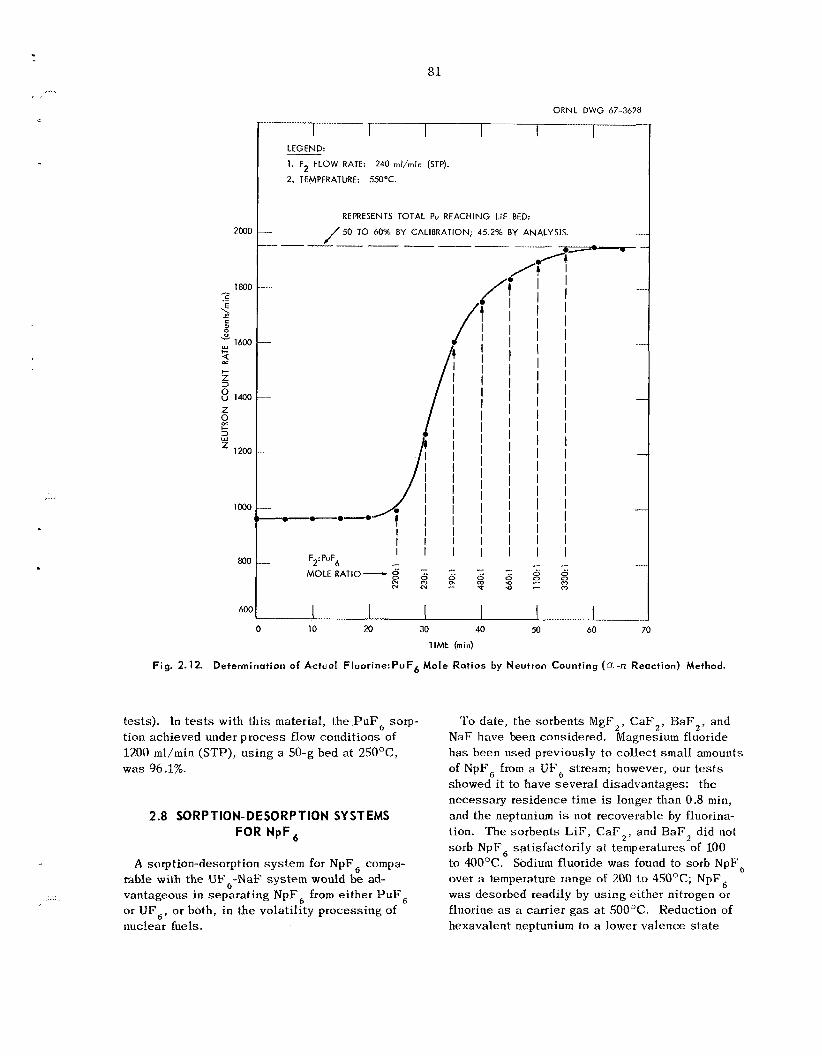
81
600
2000
ORNL DWG 67-3678
-- LEGEND 1. F2 FLOW RATE:
2. TEMPERATURE: 550°C.
240 rnl/min (STP).
REPRESENTS TOTAL Pu REACHING LiF BED:
- /SO T O 60% BY CALISRATION; 45.2% BY ANALYSIS. -
/i /! I
I I I I I I I I I I I I I I I I I I I
MOLE RATIO- 7. - N
I I I I I I I I I I I I I I I I I I I I I - 3
i I I I I I I I I I I I I I I I I I I I I I ,.. 3 -
i I I I I I I I I I I I I I I I I I
-
-
-
-
- I I
- c
$j (7 (7
0 10 20 30 40 50 60 70 TIME (min)
Fig. 2.12. Determination of Actual Fluorine:PuF6 Mole Rat ios by Neutron Counting (0,-n Reaction) Method.
tests). In t e s t s with th i s material , the P u F , sorp- tion achieved under process flow condi t ions of 1200 ml/min (STP), us ing a 50-g bed at 250°C, was 96.1%.
2.8 SORPTION- DES0 RP TlON SYSTEMS FOR NpF,
A sorption-desorption sys t em for NpF, compa- rable with the UF,-NaF sys t em would be ad- vantageous in separa t ing NpF, from ei ther P u F , or UF,, or both, in the volat i l i ty processing of nuclear fuels.
To date , the sorbents MgF,, CaF , , BaF, , and N a F have been considered. Magnesium fluoride h a s been used previously to collect s m a l l amounts of NpF, from a UF, stream; however, our t e s t s showed i t to have several disadvantages: t h e necessary residence t i m e is longer than 0.8 min, and the neptunium is not recoverable by fluorina- tion. The sorbents L i F , CaF , , and BaF, did not sorb NpF, sat isfactor i ly at temperatures of 100 to 400°C. Sodium fluoride was found to sorb NpF, over a temperature range of 200 to 4S0°C; NpF, was desorbed readily by us ing ei ther nitrogen or fluorine as a carr ier g a s at 500°C. Reduction of hexavalent neptunium to a lower valence state
8 2
occurs when the NpF,-NaF complex is maintained at 4OOOC for 6 hr under nitrogen. pressure of th i s complex appears to be about one one-hundredth of tha t for the comparable UF,-NaF complex.
The d issoc ia t ion
Sorption of NpF , by M g F and Desorption wi th Fluorine
Only a partial sorption of NpF, by MgF, was achieved, even after long residence times. For the short residence time of 0.04 min, 15 t o 20% of the NpF, in fluorine carrier gas was sorbed by MgFz at a bed temperature of 100 or 230OC. For longer residence t i m e s of 0.13 and 0.80 min, i t w a s found that 23 and 79%, respectively, of the NpF, entering MgF, beds a t 100°C w a s sorbed.
In 30-min desorption tests a t temperatures of 235, 470, and 525OC and a t a fluorine flow rate of 50 ml/min (STP), the amounts of neptunium de- sorbed, respectively, from an MgF, bed were 1.42, 0.81, and 0.78 mg; 21 .3 mg (86%) remained on the bed.
Sorption of N p F , by LiF, CaF2, and BaF2
The sorption of NpF, varied from 20 to 35% over the temperature range of 100 to 4OOOC for both L i F and CaF, for 0.OCmin residence t imes. In s i m i l a r tests with B a F 2 , amounts sorbed were about 35 and 60% a t 125 and 23OOC respectively.
Sorption of NpF by N a F and Desorption wi th Fluorine or Nitrogen
Sorptions of NpF, by N a F were 17 , 47, 94, 96, 86, and 9% for N a F bed temperatures of 100, 150, 250, 275, 300, and 450°C, respectively, a t residence times of 0.04 min. The product was violet in color. The desorption of NpF, from a freshly prepared bed of NpF,-NaF complex was accomplished with either fluorine or nitrogen; with fluorine, 21.1 mg (97%) of the neptunium was desorbed from the 500°C N a F bed in 1 hr, using a g a s flow of 50 ml/min (STP); 0.57 rng was left on the NaF bed. With nitrogen, 21.60 m g (99%) of the neptunium w a s desorbed from the 5OOOC NaF bed in 4 hr, us ing a gas flow of 100 ml/min (STP); 0.19 m g remained on the bed. Pre- liminary dissociation pressure measurements in- dicated that t he NpFs pressure over t he NpF,-NaF
complex is about one one-hundredth of t h e observed value for the UF, pressure over t he UF,-NaF com- plex. Reduction of the hexavalent neptunium caused difficult ies in d i ssoc ia t ion pressure m e a s - urements when nitrogen w a s used a s the ca r r i e r gas.
2.9 CORROSION IN VOLATILITY PROCESSES
The highly reactive nature of t he principal re- agents and the high temperatures (up to 55OoC> that are used in fluidized-bed volati l i ty processes could result in se r ious corrosion problems. rosion s tudies have had a n immediate objective that is related to construction and operation of the F B V P F and a longer-range objective that is con- cerned with future commercial application. A s part of the volatility development work, corrosion da ta have k e n gathered at each of the participating s i t e s ; during th i s period most of the OKNL work w a s performed a t Bat te l le Memorial Insti tute - Columbus Laboratories (BMI) under a coritinuing subcontract.
Workers a t BMI have completed their s tudy of intergranular modifications of nickel exposed to alumina. Toward the end of t he reporting period, the failures of severa l nickel p ipes a t tached to the primary reactor in the small-scale engineering t e s t facility (Unit Operations Section, ORNI,) instigated more intensive s tud ie s of intergranular modifica- tions; t h i s work is nearing completion.
Nickel, severa l nickel a l loys , and copper were exposed to gaseous bromine at 300 and 500°C. Corrosion of the nickel was insignificant, Monel corroded at rates of a f e w mils per month, and copper disintegrated rapidly.
Laboratory-scale fluidized-bed equipment is now being installed at BMI to study corrosion under dy- namic conditions. In the f i r s t experiments with th i s unit, w e sha l l attempt t o determine t h e reason for the observed plugging of nickel Fe l tmeta l f i l ters during recent hydrochlorination runs.
Cor-
Intergranular Modif ication of Nickel in the Fluidized- Bed Volat i l i ty Program
L a s t year we reported resu l t s of m o s t of t h e work done a t BMI to determine the c a u s e of inter- granular modifications sometimes found in nickel that had been exposed under conditions ex i s t ing i n the head-end s t e p of the fluidized-bed volatility
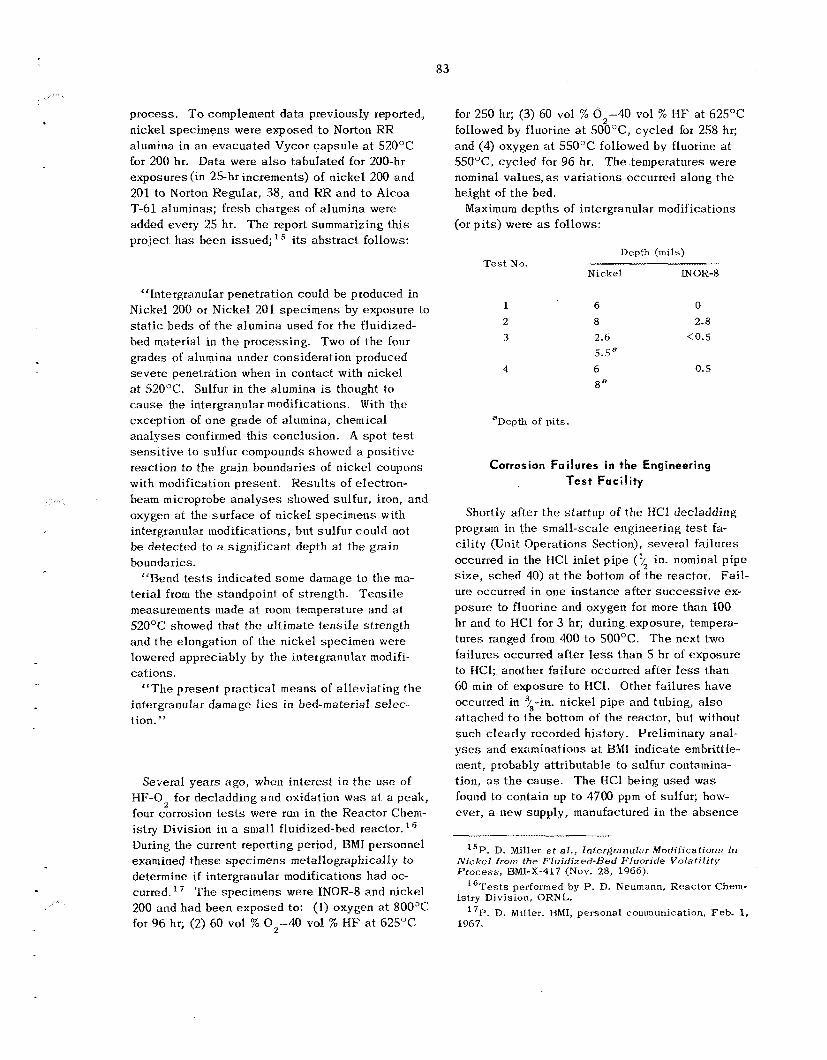
83
....
t
....
process . To complement da ta previously reported, nickel spec imens were exposed to Norton RR alumina in a n evacuated Vycor capsu le at 5 2 0 T for 200 hr. Data were also tabulated for 200-hr exposures (in 2 5 h r increments) of nickel 200 and 201 to Norton Regular, 38, and RR and t o Alcoa T-61 aluminas; fresh charges of alumina were added every 25 hr. T h e report summarizing th i s project has been issued; its abs t rac t follows:
“Intergranular penetration could be produced in Nickel 200 or Nickel 201 spec imens by exposure to s t a t i c beds of t he alumina used for t he fluidized- bed material in the processing. Two of the four grades of alumina under consideration produced severe penetration when in contac t with nickel at 520°C. Sulfur in t h e alumina is thought to cause the intergranular modifications. With the exception of one grade of alumina, chemical ana lyses confirmed this conclusion. A spot t e s t s ens i t i ve t o sulfur compounds showed a posit ive reaction to t h e grain boundaries of nickel coupons with modification present . Resul t s of electron- beam microprobe ana lyses showed sulfur, iron, and oxygen at the sur face of nickel spec imens with intergranular modifications, but su l fur could not be detected to a significant depth a t t he grain boundaries.
terial from the standpoint of strength. Tens i l e measurements made at room temperature and a t 52OoC showed that the ultimate t ens i l e strength and t h e elongation of the nickel specimen were lowered appreciably by the intergranular modifi- cations.
intergranular damage l i e s in bed-material selec- tion. ”
“Bend tests indicated some damage to the ma-
“ T h e present prac t ica l means of alleviating t h e
Several years ago, when in te res t in t h e use of H F - 0 2 for decladding and oxidation was at a peak, four corrosion t e s t s were run in the Reactor Chem- istry Division in a small fluidized-bed reactor.I6 During the current reporting period, BMI personnel examined these specimens metallographically to determine i f intergranular modifications had oc- curred. 200 and had been exposed to: (1) oxygen at 8 0 0 T for 96 hr; (2) 60 vol % 02-40 vol % H F a t 625°C
T h e spec imens were INOR-8 and nickel
for 250 hr; (3) 60 vol % 02-40 vol % HF a t 625°C followed by fluorine a t 5OO0C, cycled for 258 hr; and (4) oxygen a t 5 5 0 T followed by fluorine a t 55OoC, cycled for 96 hr. The temperatures were nominal values, as variations occurred along the height of the bed.
Maximum depths of intergranular modifications (or p i t s ) were as follows:
Depth (mils)
Nickel INOR-8 Test No.
1
2 3
4
6 0
8 2.8 2.6 <0.5 5.5* 6 0.5
8”
aDepth of pits.
Corrosion Failures in the Engineering Test Facility
Shortly after t h e s ta r tup of the HCl decladding program in the smal l - sca le engineering t e s t fa- cil i ty (Unit Operations Section), severa l failures occurred in the tICt in le t p ipe ($2 in. nominal p ipe s i z e , sched 40) at the bottom of the reactor. Fail- ure occurred in one ins tance after s u c c e s s i v e ex- posure to fluorine and oxygen for more than 100 hr and to HCl for 3 hr; during exposure, tempera- tures ranged from 400 to 500°C. The next two failures occurred after less than 5 hr of exposure to IICI; another failure occurred after less than 60 min of exposure t o HCI. Othet fa i lures have occurred in ”/,in. nickel pipe and tubing, also attached t o the bottom of the reactor, but without such clearly recorded history. Preliminary anal- y s e s and examinations at BMI indicate embrittle- ment, probably attr ibutable to sulfur contamina- tion, as t h e cause . The HC1 being used was found to contain up to 4700 ppm of sulfur; how- ever, a new supply, manufactured i n the absence
“P. D. Miller et af., Intergranular Modifications in Nickel from the Fluidized-Bed Fluoride Volatility Process, UMI-X-417 (Nov. 28, 1966).
is try Division, ORNL.
1967.
lGTests performed by P. n. Neumann, Reactor Chem-
* 7P. D. Miller, BMI, personal communication, Feb. 1,
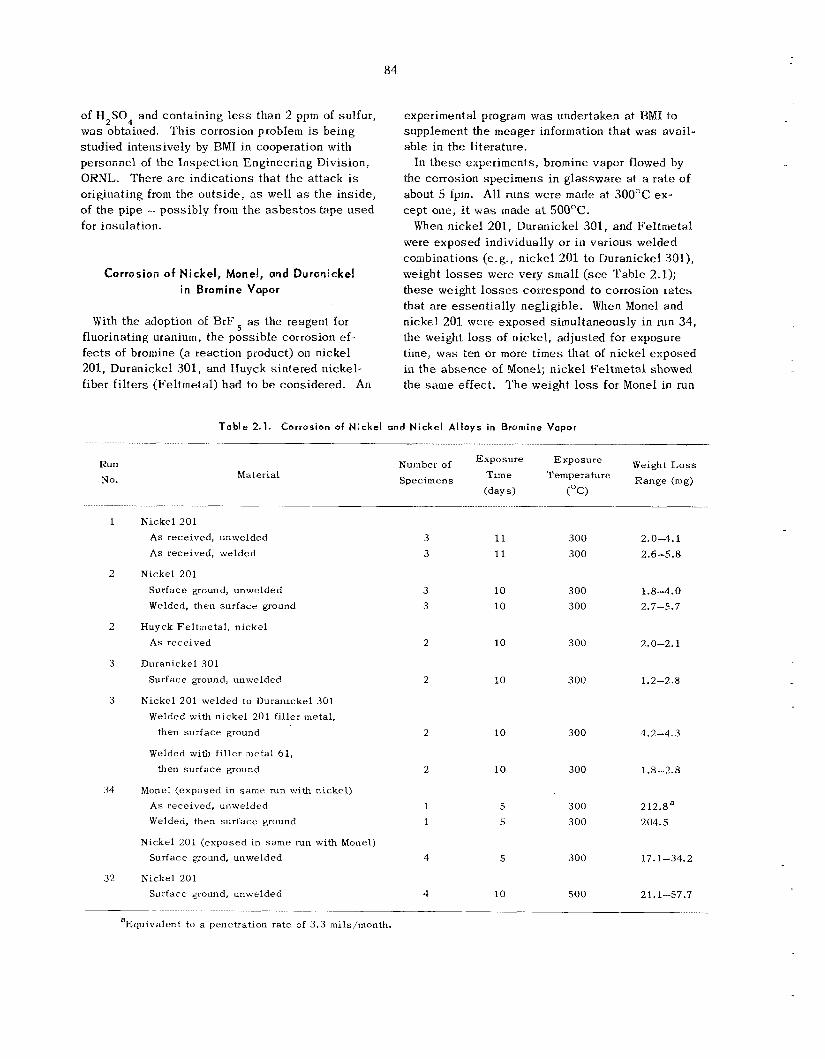
84
of H,S04 and containing l e s s than 2 ppm of sulfur, was obtained. Th i s corrosion problem is being studied intensively by BMI in cooperation with personnel of the Inspection Engineering Division, ORNL. There are indications that the a t tack is originating from the outs ide , as well as the inside, of t he pipe - possibly from t h e a s b e s t o s tape u s e d for insulation.
Corrosion o f Nickel, Monel, and Duranickel in Bromine Vapor
With the adoption of B r F 5 as the reagent for fluorinating uranium, the poss ib le corrosion ef- fec ts of bromine (a reaction product) on nickel 201, Duranickel 301, and Huyck s in te red nickel- fiber f i l t e rs (Feltmetal) had to b e considered. An
. .~ .......
Run No.
1
2
2
3
3
34
32
experimental program w a s undertaken at 1ZMI to supplement the meager information tha t was avail- able in the literature.
In t h e s e experiments, bromine vapor flowed by the corrosion specimens in g lassware a t a r a t e of about 5 fpm. All runs were made at 300°C ex- cept one, it w a s made at 500OC.
When nickel 201, Duranickel 301, and Fe l tmeta l were exposed individually or i n various welded combinations (e.g., nicke l 201 to Duranickel 301), weight losses were very smal l (see Tab le 2.1); these weight losses correspond to corrosion r a t e s that a re essent ia l ly negligible. When Monel and nickel 201 were exposed simultaneously in run 34, the weight loss of nickel, adjusted for exposure time, was ten or more t imes that of n icke l exposed in the absence of Monel; nickel Fe l tmeta l showed the s a m e effect. T h e weight loss for Monel in run
Table 2.1. Corrosion of N i c k e l and N i c k e l Al loys in B r o m i n e Vapor
Material Weizht Loss Nu,nber of Exposure Exposure - Range (mg) Time Temperature Specimens
(days) ("C)
Nickel 201 As received, unwelded As received, welded
Nickel 201 Surface grourid, unwelded Welded, then surface ground
Huyck Feltmetal , nickel As received
Duranickel 301 Surface ground, unwelded
Nickel 201 welded to Duranickel 301 Welded with nickel 201 filler metal,
then surface ground
Welded with filler metal 61, then surface ground
Monel (exposed in s a m e run with nickel) A s received, unwelded Welded, then surface ground
Nickel 201 (exposed in same run with Monel) Surface ground, unwelded
Nickel 201 Surface ground, unweldeci
3 3
3 3
2
2
2
2
1 1
4
4
11 11
10 10
10
10
10
10
5 5
5
10
300 300
300 300
300
300
300
300
300 300
300
500
2.0-4.1 2.6-5.8
1.8-4.0 2.7-5.7
2.0-2.1
1.2-2.8
4.2-4.3
1.8-2.8
212.8a 204.5
17.1-34.2
2 1.1-57.7
aEquivalent to a penetration rate of 3.3 mils/month.
85 ... ... .
34 was very high compared with nickel, indicating that Monel is not su i t ab le €or bromine service. T h e acce lera ted corrosion of nickel in the presence of Monel is believed to be caused by CuBrz tha t is formed by the reaction of bromine with copper from the Monel. Copper exposed alone d isso lved rapidly in the bromine atmosphere.
Resu l t s of run 32 (Table 2.1) show tha t corro- sion of nickel 201 at 500°C is higher than at 3 0 0 T by a factor of 10 or more; the s a m e is true for Duranickel. However, t h i s is not se r ious s ince the higher temperature conditions are not expected to be encountered in the F B V P P when bromine i s present.
and bromine at 300OC for 11 days showed only a slight tarnish and negligible weight l o s s e s .
Nickel spec imens exposed to a mixture of oxygen
2.10 LEACHING OF URANIUM AND PLUTONIUM FROM PRIMARY
REACTOR WASTE SOLIDS, AND RELATED CORROSION STUDIES
One of t he objec t ives of the F B V P P is the demonstration of reliable accountabili ty procedures for uranium and plutonium. Efficient so l ids - sampling methods will b e required not only to meet this goal but a l s o t o determine the fate of f i ss ion products in the process and t o provide other da t a necessary for t h e complete evaluation of t he proc- ess. An accura te ana lys i s of t he was te so l id s from the primary reactor is of particular in te res t s ince it would give a direct measure of the amounts of uranium and plutonium tha t are not volati l ized during the fluorination s tep . After each F B V P P run a smal l and, hopefully, representative sample of the fluorinator was te so l id s will b e obtained and then analyzed for uranium and plutonium by s l an - dard procedures.
entire residue from each run would be leached; then the leachant would be sampled and analyzed, and the r e su l t s would be compared with those ob- tained by ana lys i s of the so l id s sample. T h e usefu lness of such a procedure would depend upon our abil i ty to quantitatively leach uranium and plutonium from the bed residue.
laboratory and small-scale engineering s tud ie s to es tab l i sh a flowsheet, (2) engineering flowsheet development and equipment design, and (3) corro-
T o test the e f fec t iveness of so l id s sampling, the
T h e program cons is ted of three phases : (1)
sion s tud ie s (under subcontract with Bat te l le Memorial Insti tute - Columbus Laboratories) to aid in choosing a material of construction for the leacher and its assoc ia ted piping. The design and the layout have been arranged, so far, t o handle only fluidizable so l id s from the primary reactor or the pyrohydrolyzer; some alterations would b e required i f i t w e r e necessary to leach other solid was tes , such as N a F pe l le t s . Lab- oratory s tud ie s of the chemistry of leaching were made, preliminaty des igns of the engineering flow- shee t and equipment were prepared, and the corro- s ion experiments were concluded.
decision tha t leaching equipment will not be included in the F B V P P .
No further work is being done in view of our
Description of Leacher Flowsheet
T h e leaching equipment (Fig. 2.13) is composed basically of an upflow leacher vesse l , an overflow cooler, an air lift, and an elevated head-and-surge tank; t he usua l circulating l ines , hea te rs , con- densers , and off-gas separa tors are indicated. 'The direction of flow is indicated by the order in which the major v e s s e l s a re l i s ted above; circulation is obtained by means of the air l if t and gravity flow to and from the head tank. Thz head tank h a s a nominal capacity of only 317 gal (1200 li ters) because of s p a c e l imitations and might require one or m o r e solution changes during a run to maintain desired concentrations. T h e leacher is composed of a permanent top sec t ion and an interchangeable bottom section. The bottom sec t ion is actually a waste-solids can; i t c a n b e remotely disconnected from either the primary reac- tor or pyrohydrolyzer and clamped to the bottom of the leacher. Most of the leaching action t akes place in the was te can , and any so l id s that are carried up into the top sec t lon return to the can when circulation s tops . After draining and drying, the waste can is used a s the burial container for the so l ids . T h e can and the part of the leacher immediately above it have inner diameters of 14 in.; circulation rates of about 5 gpm per square foot of c r o s s sec t ion will be used.
L a b ra tory and Engineering- Scal e Studies
Laboratory Studies. - Studies wete conducted to determine how efficiently uranium and plutonium
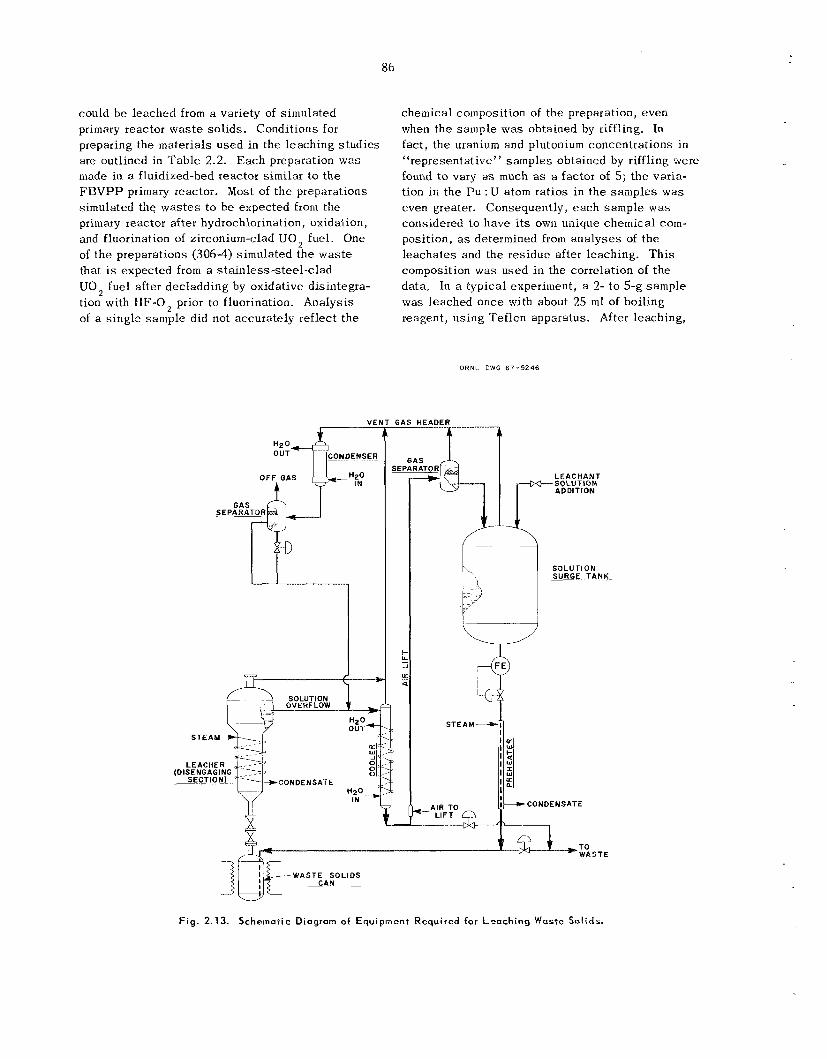
could b e leached from a variety of simulated primary reactor was te solids. Conditions for preparing the materials used in the leaching s tud ie s are outlined in Tab le 2.2. Each preparation was made in a fluidized-bed reactor similar to the FBVPP primary reactor. Most of the preparations simulated the was te s to be expected from the primary reactor after hydrochlorination, oxidation, and fluorination of zirconium-clad UO, fuel. One of t h e preparations (306-4) simulated the was te that is expected from a stainless-steel-clad U02 fuel after decladding by oxidative disintegra- tion with € I F - 0 prior to fluorination. Analysis of a s ingle sample did not accurately reflect t he
V E I
.UTION
.RFLOW
STEAM
*CONDENSATE
chemical composition of the preparation, even when the sample was obtained by riffling. In fact , t h e uranium and plutonium concentrations in (1 representative" samples obtained by riffling were found to vary a s much as a factor of 5; the varia- tion in the P u : U atom ratios in the samples was even greater. Consequently, each sample was considered to have its own unique chemical c o m - position, a s determined from ana lyses of the leacha tes and the res idue after leaching. T h i s composition w a s used in the correlation of t h e data, In a typical experiment, a 2- to 5-g sample was leached once with about 25 ml of boiling reagent, us ing Teflon apparatus. After leaching,
ORNL. OWG 6 7 - 5 2 4 6
LEACHANT SOLUTION AD DI TlON
S O L U r l O N SURGE TANK
Fig. 2.13. Schetnatic Diagram of Equipment Required for Leaching Waste Solids.
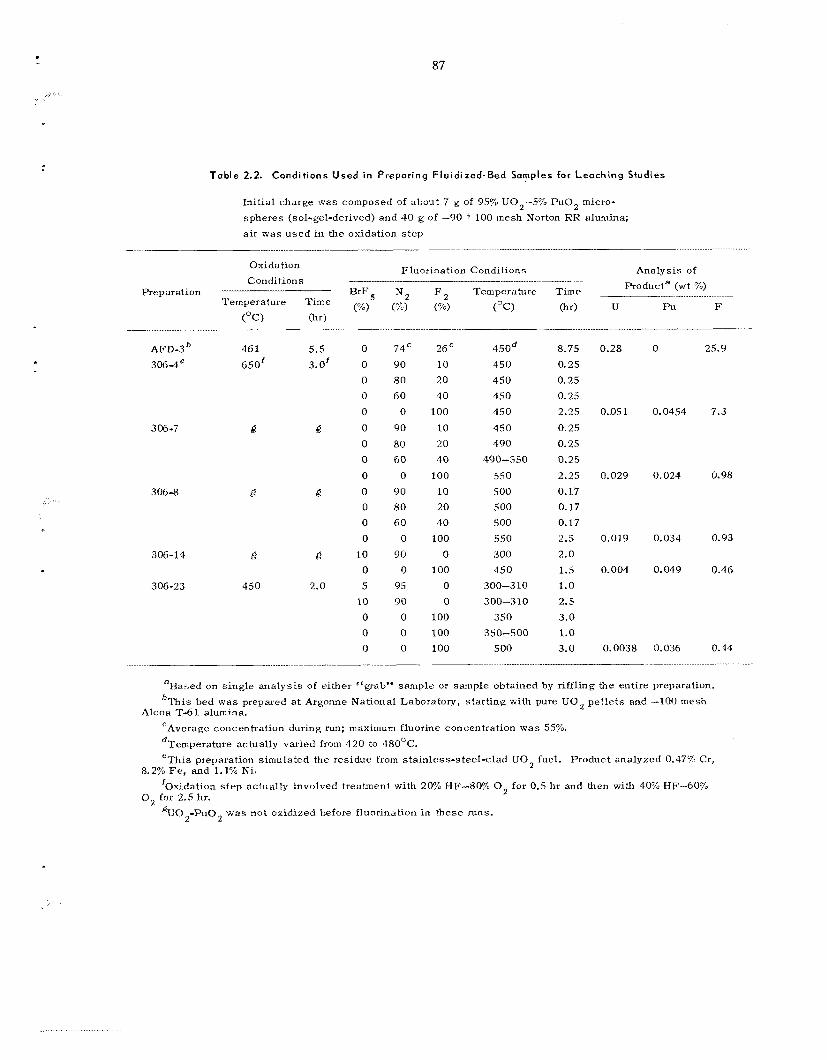
87
....
Table 2.2. Conditions Used in Preparing Fluidized-Bed Samples for Leaching Studies
Init ial charge was composed of about 7 g of 95% UO,-5% pUOz micro- spheres (sol-gel-derived) and 40 g of -90 + 100 mesh Norton RR alumina;
-
air was used in the oxidation s tep
Fluorination Conditions Oxidation Conditions
Temperature Time
-. . . . .
Preparation BrF5 N 2 F, Temperature Time
(70) (%) (%) (OC) Old ( O C ) (hr)
AFD-3‘ 46 1 5.5 0 306-4“ 650‘ 3.0‘ 0
0 0 0
306-7 42 62 0 0 0
0 306-8 g 8 0
0
0
0
g 10 0
2.0 5 10 0 0 0
306-14 g
306-23 450
74“ 90 80 60 0
90 80 60
0 YO 80 60
0
90
0
95
90 0
0 0
26 10 20 40
100 10 20 40
100 10 20 40
I O 0 0
100
0
0 100 100 100
450d 450 450 4.50 450 450 490
490--550 550 500 500 500 550 300 450
300-310 300-310
350 350-500
5 00
8.75 0.25 0.25 0.25 2.25 0.25 0.25 0.25 2.25 0.17 0.17 0.17 2.5 2.0 1.5 1.0 2.5 3.0 1.0 3.0
..... . .. . . . ..
Analysis of Producta (wt 70)
U PU F
0.28
0..05 1
0.029
0.019
0.004
0.0038
0
0.0451
0.024
0.031
0.049
0.036
25.9
7.3
0.98
0.93
0.46
0.44
aBahed on s ingle ana lys i s of either “grab” sample or sample obtained by riffling the entire preparation. bThis bed was prepared a t Argonne National Laboratory, start ing with pure UO, petlets and -100 mesh
‘Average concentration during run; maximum fluorine concentration was 55%. dTemperature actually varied frmn 420 to 480OC.
Alcoa T-61 alumma.
“Th i s preparation simulated the residue from stainless-steel-clad UO, fuel. Product analyzed 0.47% Cr, 8.2% Fe, and 1.1% Ni.
foxidation s t ep actually involved treatment with 20% HF-8m 0, for 0.5 h r and then wi th 40% NF--60%
‘ U 0 2 - P u 0 2 was not oxidized before fluorination in these runs. 0, for 2.5 hr.
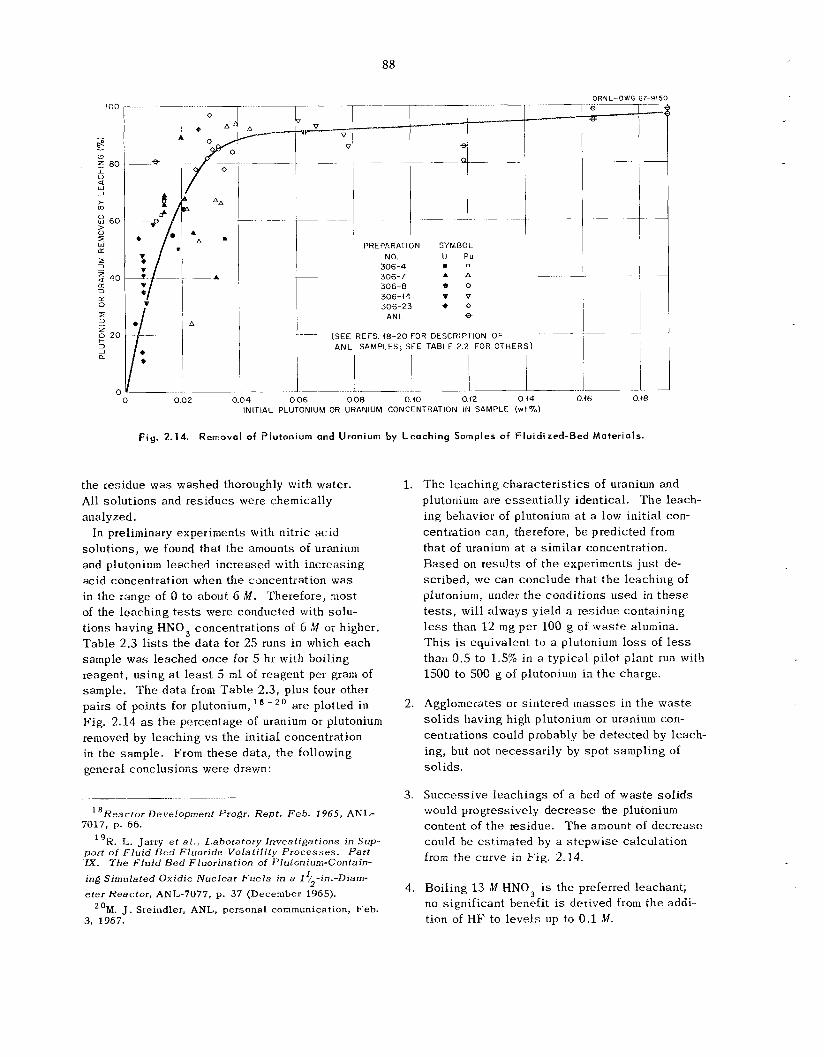
88
400
- e 0
1 u W J
>
c 80
a
m
2 60 > 0
I w n 5 2 5 40 n 3
n 0
I 3 __ 6 20 t- 3 1 Q
C
I A
~
b 5-----pv v
PREPARATION NO.
306-4 306-7 306-8 306-44 306-23
ANL
SYMBOL u Pu m u
A A e o Q V 0 0
0
ORNL-OWG 67-915' v-
I I
I I I I
f ~- (SEE REFS. 18-20 FOR DESCRIPTION O F
I ANL SAMPLES; SEE TABLE 2.2 FOR OTHERS)
___. . . 0.02 0.04 0.06 0.08 0.40 0.12 0.14 0.48
INITIAL PLUTONIUM OR URANIUM CONCENTRATION IN SAMPLE ( w t % )
F iy . 2.14. Removol of plutonium and Uranium by Leaching Samples of Fluidized-Bed Materials.
the residue was washed thoroughly with water. All so lu t ions and res idues were chemically analyzed.
solutions, we found that t he amounts of uranium and plutonium leached increased with increasing acid concentration when the concentration was in the range of 0 to about 6 M . Therefore, most of the leaching t e s t s were conducted with solu- t ions having HNO, concentrations of 6 M or higher. Table 2.3 l i s t s the da t a for 25 runs in which each sample was leached once for 5 hr with boiling reagent, us ing a t l e a s t 5 m l of reagent per gram of sample. T h e da ta from Tab le 2.3, plus four other pairs of points for plutonium, O are plotted in Fig. 2.14 as t h e percentage of uranium or plutonium removed by leaching v s the init ial concentration in the sample. From these da ta , t he following general conclusions were drawn:
In preliminary experiments with nitric ac id
......_____
"Reactor Development Progr. Rept . Feb. 1965, ANL-
"R. L. Jarry et at., L,aboratory Investigations in Sup-
7017, p . 66.
port of Fluid Bed Fluoride Volat i l i ty Processes . Part E. The Fluid Bed Fluorination of Plufonium-Contain-
ing Simulated Oxidic Nuclear Fuels in a l$'-in.-Diam-
eter Reactor, ANT,-7077, p. 37 (December 1965).
3, 1967. 'OM. J . Steindler, ANL, personal communication, Feb.
1.
2.
3.
4.
The leeching charac te r i s t ics of uranium and plutonium a re e s sen t i a l ly identical . T h e leach- ing behavior of plutonium at a low init ial con- centration can, therefore, be predicted from that of uranium at a similar concentration. Based on resu l t s of t h e experiments j u s t de- scribed, w e can conclude that t h e leaching of plutonium, under the conditions used in t h e s e t e s t s , will a lways y ie ld a residue containing l e s s than 12 mg per 100 g of was te alumina. T h i s is equivalent tu a plutonium loss of l e s s than 0.5 to 1.5% in a typical pilot plant run with 1500 to 500 g of plutoniurii in t h e charge.
Agglomerates o r s in te red masses in the was te s o l i d s having high plutonium or uranium con- centrations could probably b e de tec ted by leach- ing, but not necessar i ly by spot sampling of so l ids .
Success ive leachings of a bed of was te so l id s would progressively decrease the plutonium content of t h e residue. T h e amount of decrease could be estimated by a s t epwise calculation from the curve in F ig . 2.14.
Boiling 13 M HNO, is the preferred leachant; no significant benefit is derived from t h e addi- tion of H F to leve ls up to 0 .1 M.
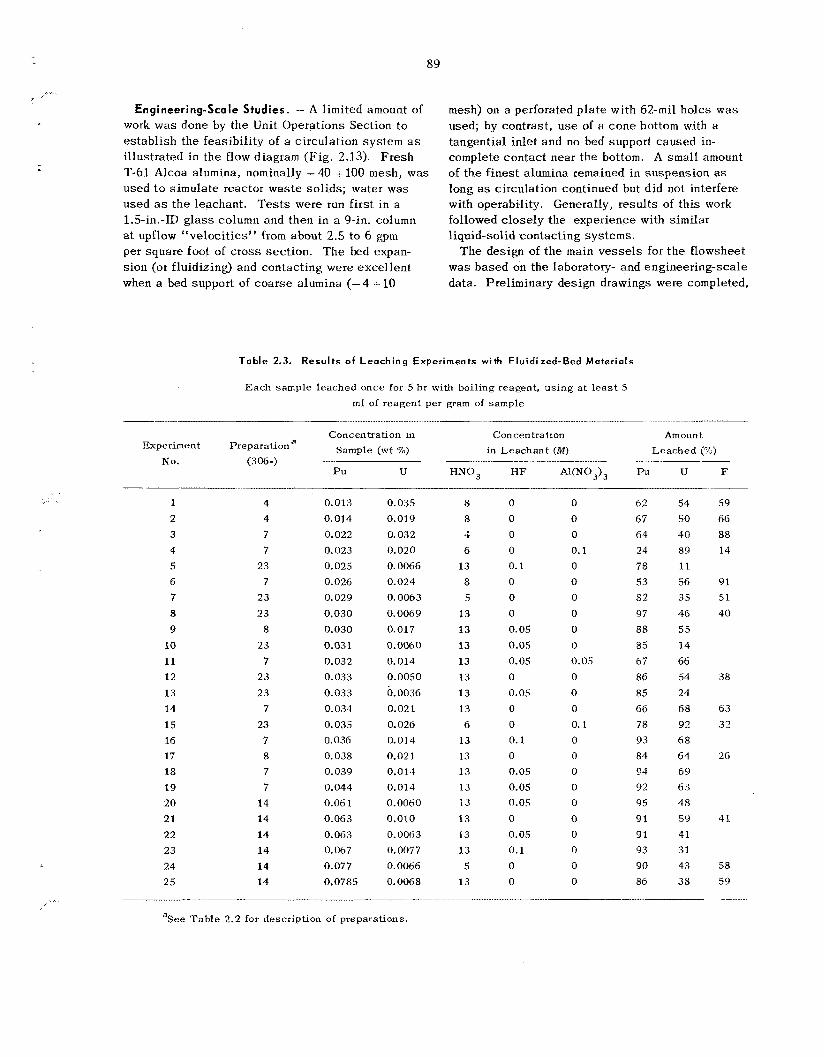
89
..... . . - : Engineering-Scale Studies. - A l imited amount of
work w a s done by the Unit Operations Section to es tab l i sh the feas ib i l i ty of a circulation sys tem as il lustrated in the flow diagram (F ig . 2.13). F resh T-61 Alcoa alumina, nominally -40 i 100 mesh, was used t o s imula te reactor was te so l ids ; water was used as t h e leachant. T e s t s were run f i r s t in a 1.5-in.-ID g l a s s column and then i n a 9-in. column at upflow “ve loc i t ies” from about 2.5 to 6 gpm per square foot of cross sec t ion . T h e bed expan- sion (or fluidizing) and contacting were exce l len t when a bed support of coa r se alumina (- 4 t 10
mesh) on a perforated p l a t e with 62-mil holes w a s used; by contrast , u s e of a c o n e bottom with a tangential in le t and no bed support caused in- complete contac t near t h e bottom. A small amount of the f ines t alumina remained in suspens ion as long as circulation continued but did not interfere with operability. Generally, resu l t s of th i s work followed c lose ly the experience with similar liquid-solid contacting sys tems.
T h e des ign of t h e main v e s s e l s for t h e flowsheet was based on the laboratory- and engineering-scale da ta . Preliminary des ign drawings were completed,
Table 2.3. Results of Leaching Experiments wi th Fluidized-Bed Mater ials
Each sample leached once for 5 hr with boiling reagent, using a t l e a s t 5 rnl of reagent per gram of sample
Concentration in Concentration Amount Sample (wt 70) in Leachant ( M ) Leached (70) Experiment Preparation a
..... ___..___.__~~..~.._.....___.__.....I ... No. (306-) P u U HNO, H F A1(N03)3 F’u U F
1 2 3 4 5 6
7 8 9
10 11 12 13 14 15 16 17 18 19 20 21 22 23 24 25
4 4 7 7
23 7
23 23
8 23
7 23 23
7 23 7 8 7 7
14 14 14 14 14 14
0.013 0.014 0.022 0.023 0.02s 0.026 0.029 0.030 0.030 0.031 0.032 0.033 0.033 0.034 0.035 0.036
0.038 0.039 0.044 0.06 1 0.063 0.063 0.067 0.077 0.0785
0.035 0.019 0.032 0.020 0.0066 0.024 0.0063 0.0069 0.017 0.0060 0.014 0.0050 0.0036 0.02 1 0.026 0.014 0.021 0.014 0.014 0.0060 0.010 0.0063 0.0077 0.0066
0.0068
8 8 4
6 13 8 5
13 13
13 13 13
13 13 6
13 13 13 13 13
13 13 13 5
13
0
0
0
0
0.1
0
0
0 0.05
0.05
0.05 0 0.05 0 0 0.1 0 0.0s 0.05 0.05
0 0.05
0.1 0
0
0
0
0
0.1 0
0
0
0
0
0
0.05 0
0 0 0.1 0 0 0 0
0
0 0
0
0
0
62
67 64 24 78 53 8 2 97 88 85 67 86 85 66 78 93 84 94 92 95 91 91 93 90 86
54 50 40 89 1 1
56 35 46 55 14 66 54 24 68 92 6 8 64 69 6 3
48 59 41 31
43 38
59 66 88 14
91 51 40
38
63 32
26
41
58 59
~ ....
“See Table 2.2 for description of preparations.
90
and a preliminary layout was made. No further de- s ign work is intended s i n c e p lans to ins ta l l a leacher in the F B V P P have been abandoned.
Corrosion Studies to Aid in Choosing an Alloy for the Leacher
A corrosion program w a s completed under sub- contract with 13attelle Memorial Insti tute - Colum- bus Laboratories (BMI). I t s purpose was to de- termine the most su i t ab le material of construction for t he leaching system. 2 1 T h i s program included a survey of work by other investigators.
Welded and unwelded coupons of candidate con- structional materials were exposed to a boiling solution (120OC) of 13 1l.I HN03-0.1 M H F for t imes up to 240 hr. T h e addition of 0.1 M A1(N03)3 to the leach solution greatly reduced the corrosion of the a l loys during a 24-hr exposure.
HAPO-20 (SO% Ni-25% Cr--16% Fe-6% Mo-1% Cu) w a s the most res i s tan t of the materials that were studied from the standpoint of durability of both the welds and t h e b a s e metal. Several other a l loys showed fairly good r e s i s t ance to the l each solution, but all were preferentially attacked near, or in, the welded areas ; they were: Corronel 230 (nickel-36% Cr-5% Fe-1% Cu-1% Mn-1% Ti), 50% Ni-50% Cr, and Haynes 25 (50% Co-20% Cr-15% W-10% Ni-3% Fe-1.5% Mn). Earlier work conducted by investigators from BMT and the Hanford Laboratories had shown HAPQ-.20 to have superior fabrication properties compared with other high-nickel alloys. An overall considera- tion of resu l t s l e a d s to HAPO-20 as the preferred material and Corronel 230 a s t h e second choice.
Small-Scale Engineering Studies
A small-scale fluidized-bed engineering t e s t fa- cil i ty, located in a cell i n Bullding 3503, conta ins a 2-in.-diam nickel fluidized--bed reactor and other process equipment tha t is required for decladding s tud ie s us ing either HCI-N, or H F - 0 2 , oxidation s tudies , and fluorination s t u d i e s with BrF5-N2 or F2-N2. Since the primary purpose of th i s facil i ty is to t e s t instrumentation, controls, and sampl ing devices and to develop operating procedures for t he F B V P P , the instruments and controls dupli- ca t e those to b e installed in the F B V P P as c lose ly as possible. T h e operations also simu-
la te t hose planQed for the F B V P P , except tha t irradiated fuel will not b e used and no process s t ep involving plutonium c a n b e tested. Evalu- ation of t h e HF-0, f lowsheet for s ta in less -s tee l - c l ad fuels was completed, and tes t ing of the flow- sheet for Zircaloy-clad UO fue ls w a s begun. Several instruments for t he continuous in-line monitoring of g a s s t reams were evaluated. The development of a gas- jet-powered sys tem to ob- tain samples of t h e bed material from fluidized-bed reactors was continued.
2
2.11 PROCESS FLOWSHEET TESTS
Results of D e c l ~ d d i n g and Fluorination Tests with Stainless-Steel-Clad UQ,
T h e difficult ies reported l a s t year in decladding and fluorinating s ta in less -s tee l -c lad U 0 2 fue ls2 have now been resolved. Caking problems with the alumina bed can be avoided by us ing Alcoa T-60 alumina, nominally --- 48 + 100 mesh, tha t contains less than 5% - 140 mesh material. Using 40% HF-60% O2 to in i t ia te t h e decladding reaction and 20% €TF-80% O 2 to complete the re- action ensured complete conversion of UO, to
U 3 0 8 . filter residue, and on the primary reactor wal l s were consistently less than 0.2% in a s e r i e s of t e s t s u s i n g programmed flows of H F - 0 2 followed by a fluorine-nitrogen mixture. Although the stain- l e s s s t e e l cladding w a s completely reacted under these conditions, massive p i e c e s of s t a i n l e s s s t ee l were only partially oxidized. Operating character- i s t i c s of t h e sintered nickel (powder) fi l ters ap- peared unchanged after s i x decladding-fluorination cyc les . T h e pressure-, temperature-, and flow- measuring equipment performed satisfactorily in all tests.
Uranium losses in the bed material, in t h e
Results of Decladding and Oxidation Tests with Zircoloy-Clad UO,
T h e major experimental effort during t h i s period was directed toward the decladding and oxidation
‘lP. D. M i l l e r e t a l . , Coriosion of Construction Mo- terials in Boiling 13 M Nitric-0.1 M Hydrofluoric Ac ids , BMI-X-434 (Mar. 30, 1967).
Develop. 2(2), 163 (1963). “R. E. Burns et al., Ind. En& Chern., Prod. Res.
23Chern. ’l’echnol. Div . Ann. Progr. Rep t . May 3 1 , 1966, ORNL-3915, p. 53.
91 ...
...
of Zircaloy-clad UO, fuel. Fue l assembl ies were simulated by loading 1-ft-long Zircaloy tubes (0.4 in. OD, .%-mil wall) with 3/s-in.-diam UO, pe l le t s . Four tubes were arranged in a square array with tubes on 0.52s-in. centers. T h e assembly was held together by two 20-mil-thick s p a c e r s made from s t a i n l e s s s t ee l , each space r being 1 in. from a n end of the assembly. Alcoa T-60 alumina (nominally - 48 + 100 mesh) was used as the bed material .
Decladding with HF-0,. - Two t e s t s using HF-OL as the decladding reagent were made with a Zir- caloy-clad fuel assembly t o determine the nature of the residues. A programmed HF-0 , flow (1 hr at 40% tIF-60% 0, followed by 2 hr at 20% HE’- 80% 0,) was used; reactor wal l temperatures were held a t 550°C. A s expected, the bed residues con- tained relatively mass ive shards of ZrO,. Although these p i eces were not detrimental to bed fluidiza- tion, they would make the operation of any bed- sampling device difficult, and the time required for their conversion to ZrF4 might be excess ive due to a low surface-to-volume ratio. T h e U 0 2 pel le t s appeared to be completely oxidized and partially fluorinated. T h e U6+: U 4 + ratio in all samples was greater than 2; one sample of oxi- dized pellets a s sayed 13.5% U4+, 65.3% U6+, and 12 3% F, with oxygen not determined.
Declodding with HCI. - T h e small-scale en- gineering test facil i ty u s e s a 2-in.-ID primary re- actor tha t is operated in series with a 2-in.-ID pyrohydrolyzer for HC1 decladding flowsheet t e s t s . In preliminary t e s t s , trouble was experienced with operation of the pyrohydrolyzer bed due to unsteady
Although the accumulation of Zr02 in t he bed, as sugges ted by ANL, might modify the fluid- izing behavior, we believe t h a t extreme spouting conditions ex i s t in t h e bed as a consequence of a high gas velocity that resu l t s from a n increased volume of g a s p a s s i n g through the reactor, as il lustrated in the Eollowing sequence of reactions:
1. Primary reactor:
Zr(s) + 413Cl(g) i 2 .66N2(g) 4 ZrC14(g)
+ 2H2(g) + 2.66N2(g)
Total moles of g a s into reactor per mole of zip- 6.66 conium reacted
Tota l moles of g a s leaving reactor per mole of 5.66 zirconium reacted
~
24R. P. M i l f o r d et n l . , Fluoride Vola t i l i t y Processing Samianriual Progress Report Period Endzng Nov. .30, 1966, ORNL-TM-1849, p. 15.
2. Pyrohydrolyzer reactor:
ZrC14(g) t 2H,(g) t 2.G6N2(g)
+ 2H,O(g) -+ZrO,(s) t 4HCl(g)
i- 2H,(g) + 2.66N2 (9)
(assuming only stoichiometric addition of s team) Minimum total moles of gas into reactor per mole of zirconium reacted Minimum total moles of g a s leaving pyrohydro- lyzer per mole of zirconium reacted
7 66
8.66
Since steam IS a lways added in e x c e s s and the utilization of HC1 is low, the volumes are actually higher than those shown above, and velocit ies greater than 2 fps c a n be expected.
contamination of the equipment from an external source of radioactivity occurred, a period of two months was required to decontaminate and rebuild the equipment. Following the cleanup, a se r i e s of t e s t s was run us ing 60% HC1-40% N 2 in the pri- mary reactor. Superficial ve loc i t ies were 0.7, 1.0, and 1.25 fps; the reactor wa l l temperature was 4S0°C; arid the UOz : AI,O, mole ratio was 1: 1.6. Although decladding was complete in 2 hr at ve- locities of l fps and above, t he conversion oE ZrC14 to ZrO, was not complete, and the ZrC1, either desublimed on t h e filters ( i f their tempera- tures were below 400°C) or pas sed through them to desublime in the cooler off-gas line; in both cases, plugs were formed. Uranium l o s s e s to t h e pyrohydrolyzer were about 0.2%; from 1 to 2% of the charged zirconium remained in the primary re- actor bed. ‘The chloride conten t of that bed (meas- ured after the oxidation s t ep ) was about 0.1%. UO, Oxidation Test. - Several oxidation t e s t s
using as-received and untreated UO, pe l le t s were made a t low fluidization ve loc i t ies (0.7 and 1.0 fps) to minimize elutriation of fine U,08 particles. The bed temperature was 450°C for t h e se r i e s , and the UO, : A120, mole ratio w a s 1 : 1.6. When air was used as t he oxidizing agent, s in te rs formed in the bed, and oxidation was incomplete after 2 hr with 20% to 50% of the uranium oxide in particles larger than 16 mesh. At the end of another test s e r i e s using varying oxygen-nitrogen mixtures, t he product beds flowed freely and contained no particles larger than SO mesh. The oxygen con- tent was init ially lo%, then success ive ly 20, 40, and 80%, followed finally by 100% oxygen for the
During t h e s e “shakedown” tests an accidental
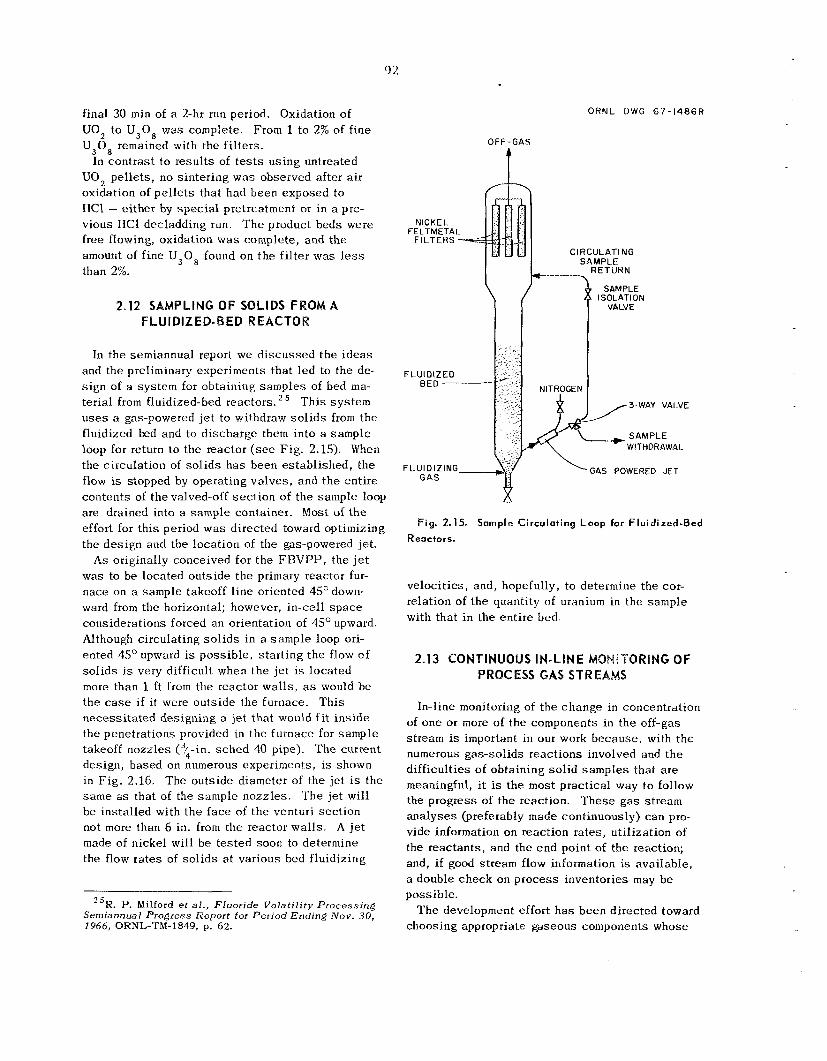
92
final 30 min of a 2-hr run period. Oxidation of U 0 2 t o U,O, was complete. From 1 t o 2% of fine U,O, remained with the fi l ters.
In cont ras t to resu l t s of tests us ing untreated UO, pe l le t s , no s in te r ing was observed after a i r oxidation of pe l l e t s that had been exposed to HCl - either by spec ia l pretreatment or in a pre- vious IICl decladding run. T h e product beds were free flowing, oxidation w a s complete, and the amount of f ine U , 0 8 found on t h e fi l ter was l e s s than 2%.
2.12 SAMPLIMG OF SOLID FLUIDIZED- 5 ED R EAC
In the semiannual report we d i scussed t h e i d e a s and the preliminary experiments that l ed to the de- s ign of a sys tem for obtaining samples of bed ma- terial from fluidized-bed reactors. Th i s sys t em u s e s a gas-powered j e t to withdraw s o l i d s from t h e fluidized k d and to discharge them into a sample loop for return to the reactor (see Fig . 2.15). When the circulation of so l id s h a s been es tab l i shed , t he flow is stopped by operating va lves , and t h e en t i re conten ts of t h e valved-off s ec t ion of t he sample loop are drained into a sample container. Most of t h e effort for th i s period was directed toward optimizing the des ign and the location of the gas-powered jet.
As originally conceived for t he F B V P P , the j e t was to b e located outside the primary reactor fur- nace on a sample takeoff l ine oriented 45' down- ward from the horizontal; however, in-cell s p a c e considerations forced an orientation of 45" upward. Although circulating s o l i d s in a sample loop ori- ented 45' upward is poss ib le , s ta r t ing t h e flow of so l id s i s very difficult when t h e je t is loca ted m o r e than 1 ft from the reactor wa l l s , as would b e t h e case if it were outs ide the furnace. Th i s necess i ta ted designing a je t t ha t would f i t i n s ide the penetrations provided in the furnace for sample takeoff nozz les (3/4-in. s c h e d 40 pipe). The current design, based on numerous experiments, is shown in F ig . 2.16. The outs ide diameter of the jet is the s a m e as that of the sample nozz les . T h e je t will be installed with t h e f ace of t h e venturi sec t ion not more than 6 in. from the reactor wa l l s . A j e t made of nickel will be tes ted soon to determine the flow ra t e s of so l id s a t various bed fluidizing
25R. P. Milford et a l . , Fluoride Volatil i ty Processing Semiannual Progress Report for Period Ending N o v . 30, 1966, ORNL-TM-1849, p. 6 2 .
NICKEL FELTMETAI.
FlLTERS -
O R N L UWG G 7 - 1 4 8 6 R
OFF-GAS
A CIRCULATING
SAMPLE RETURN
FLUIDIZING- GAS
WITHDRAW4L
GAS POWERED JET
Fig. 2.15. Sample Circulating Loop for Fluidized-Bed Reactors.
velocit ies, and, hopefully, t o determine the cor- relation of t h e quantity of uranium in the sample with that i n the en t i re bed.
2.13 CONTINUOUS IN-LINE ~ ~ ~ ~ ~ ~ R ~ ~ G OF PROCESS GAS STREAMS
In-line monitoring of t he change in concentration of one or more of t he Components in the off-gas stream is important in our work because , with the numerous gas-solids reac t ions involved and t h e difficult ies of obtaining so l id samples that a r e meaningful, it is the m o s t practical way to follow the progress of the reaction. These g a s stream ana lyses (preferably made continuously) can pro- vide information on reaction ra tes , uti l ization of the reac tan ts , and the e n d point of the reaction; and, if good stream flow information is available, a double check on p rocess inventories may b e possible.
choosing appropriate gaseous components whose T h e development effort h a s been d i rec ted toward
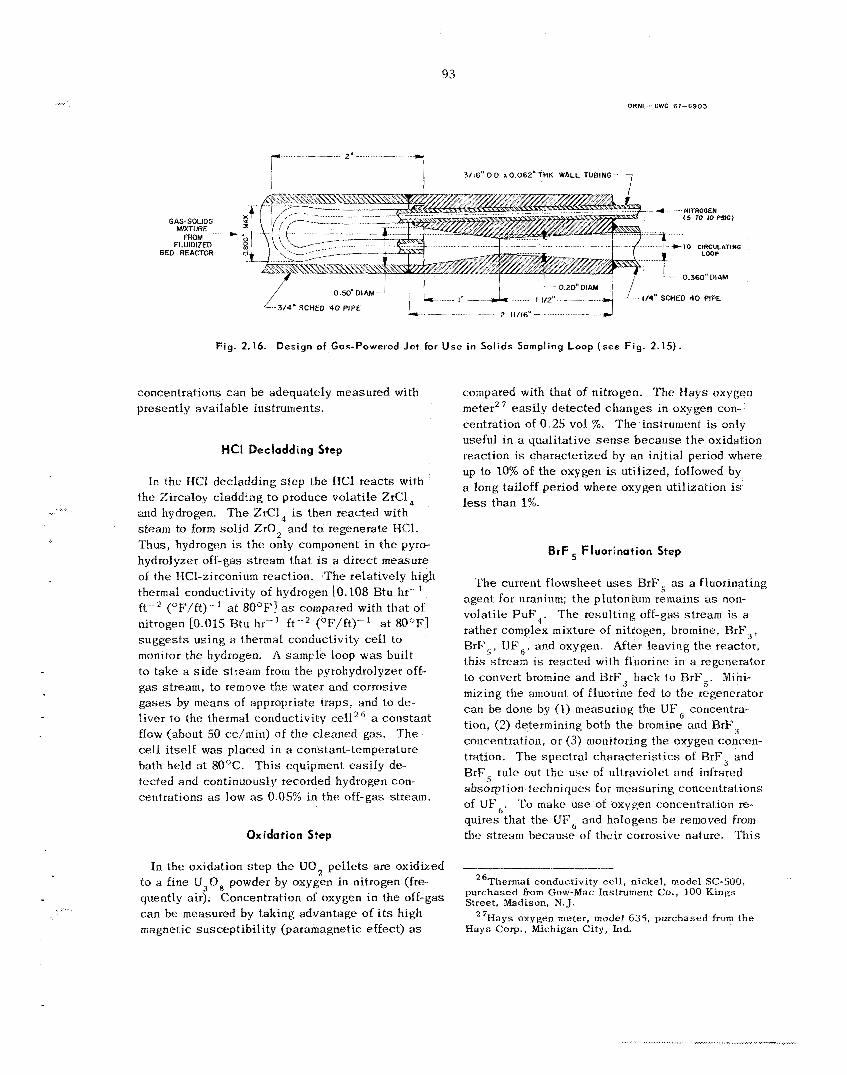
93
ORNL - DWG 67-6903
7 3/16" 0 0 x 0 062" THK WALL TUBING -
- __ 2
.......... BAS-SOLIDS a , - - I - - 4 - f - 1 C T O CIRCULATIUG
....... In I /-- 1/4" SCHED 4 0 PIPE
2 . ..... __ L--3/4" SCHED 40 PIPE
Fig. 2.16. Design of Cos-Powered Jet for U s e i n Solids Sampling Loop (see F ig . 2.15).
concentrations c a n be adequately measured with presently available instruments.
HCI Decladding Step
I r the HC1 decladding s t e p the HC1 reac ts with the Zircaloy c l a d d h g t o produce volati le ZrC14 and hydrogen. The ZrCl, is then reacted with s team to form so l id ZrO, and to regenerate HG1. Thus, hydrogen is the only component in the pyro- hydrolyzer off-gas s t ream tha t is a d i rec t measure of the HC1-zi tconium reaction. T h e relatively high thermal conductivlty of hydrogen LO. 108 Btu hr--' ft ("F/ft)-' at 80°F] as compared with tha t of nitrogen [0.015 Btu hr-' f Y 2 ( O F / f t ) - ' at 80"FI sugges t s using a thermal conductivity cell to monitor the hydrogen. A s a m p l e loop w a s built to take a s i d e s t r e a m from the pyrohydrolyzer off- gas stream, to remQve the water and corrosive g a s e s by means O E appropriate traps, and to de- liver to the thermal conductlvlty cell2 ' a cons tan t flow (about 50 cc/min) of the c leaned gas. The cell itself was placed in a constant-temperature bath held at 80°C. T h i s equipment eas i ly de- tected and continuously recorded hydrogen con- centrations as low as 0.05% in t he off-gas stream.
Oxidation Step
In the oxidation s t e p the UO, pe l l e t s are oxidized to a fine U,O, powder by oxygen in nitrogen (fre- quently air). Concentration of oxygen in the off-gas can be measured by taking advantage of i t s high magnetic suscept ib i l i ty (paramagnetic effect) as
compared with that of nitrogen. The Hays oxygen meter' centration of 0.25 vol %. useful in a qualitative s e n s e because t h e oxidation reaction i s characterized by an init ial period where up to 10% of the oxygen is util ized, followed by a long tailoff period where oxygen uti l ization is less than 1%.
eas i ly detected changes in oxygen con- The instrument is oilly
BrF Fluorination Step
T h e current f towsheet u s e s BrF, as a fluorinating agent for uranium; the plutonium remains as non- volati le PuF,. The result ing off-gas s t r e a m is a rather complex mixture of nitrogen, bromine, BrF,, f3rF5, UF',, and oxygen. After leaving the reactor, th i s stream is reacted with fluorine in a regenerator to convert bromine and B r F , back to BrF,. Mini- mizing the amount of fluorine fed to the regenerator can be done by (1) measuring the U F , concentra- tion, (2) determining both the bromine and RrF, concentration, or (3) monitoring the oxygen concen- tration. 'The spec t ra l charac te r i s t ics of RrF, and BrF 5 rule out the use of ultraviolet and infrared absorption techniques for measuring concenttations of UF,. To make use of oxygen concentration re- quires tha t the UF, and halogens be removed from the stream because of their corrosive nature. This
6Thermal conductivity cell, nickel, model SC-500, purchased from Gow-Mac Instrument Co., 100 Kings Street, Madison, N. J.
Hays C o p . , Michigan City, Ind. 27Hays oxygen meter, model 6 3 5 , purchased from the
94
removal could be accomplished, but thus fa r no ex- perimental work h a s been done toward tha t end.
G a s chromatographic techniques ate probably t h e most effective means for resolving the off-gas com- position. A sys t em tha t u s e s columns packed with Kel-F 10 on a n alumina support (Alcoa T-60, -60 +70 mesh) with Freon 114 as a carrier g a s i s cur- rently being tested. Although complete resolution h a s not yet been obtained, t h i s approach appears to offer s eve ra l advantages over t h e conventional sys tems for corrosive gases . The ta i l ing of t he peaks is improved, and with light subs t ra te load- ings (typically 5% Kel-F 10 on alumina), i t is pos- s ib l e that the ana lys i s c a n b e completed in an ac- ceptab le period of t h e . The Freon 114 carrier suppres ses the BrF, s igna l because of their com- parable dens i t ies (molecular weights of Freon 114 and BrF', a r e 171 and 175 respectively). Moreover, the u s e of the high-density carrier gas increases the sens i t iv i ty of the gas-density balance; t he U F 6 response is increased about fivefold over tha t with an argon carrier desp i te the smal le r density dif- ference. Tests a re continuing us ing other grades of alumina with various loadings and temperatures.
Plutonium Fluorination Step
After the uranium h a s been volati l ized with BrF,, fluorine a t a concentration of about 50 vol % i n nitrogen will be used to volati l ize the plutonium. No instruments have been proposed for monitoring the F ' u ~ " ~ , primarily because of i t s low concentra- tion and t h e radiation problems. Monitoring the
recycle gas stream, however, for fluorine concen- tration will b e necessary . By use of a Du Pon t photometric analyzer, ' equipped with a capillary tube to control flow through the sample ce l l , we have been ab le to measure fluorine concentrations i n the off-gas s t r eam over a range of 0 to 90% with accurac ies approaching 51.0% fluorine.
2.14 ESTIMATION OF CRITICAL CONSTANTS
As an extension .of previously reported experi- ments to determine vapor-liquid equilibria of t he UF6-NbF5 sys tem, 3 D t he pressure-density-tempera- ture relationships of the liquid and vapor p h a s e s of NbF, were determined. 3 1 From these da ta t h e critical. cons tan ts of NbF, were estimated using the law of rectilinear diameters. T h i s law s t a t e s that the orthobaric dens i t i e s are a l inear function of temperature up to the cri t ical temperature. The crit ical cons tan ts were estimated t o be: p , = 1.21 g/cm3, V c = 0.155 liter/g-mole, Tc = 737OK, and P c = 62.0 atm.
___.-...I_ -.... ____ 28Work dune hy A. S. Meyer and W. F. Peed, Analytical
Chemistry Division, ORNL. * 'Du Pont 400 split-beam photometric analyzer pur-
chased from Instrument Product Div. , E. I. du Pon t de Nemours and Co., Inc., Wilmington, Del.
30Chem. Technol. Div. Ann. Progr. Rept. May 31,
3 1 W . W. P i t t , Jr., Vapor Liquid Equilibria of the Ri- nary System Uranium Hexafluoride-Niobium Pentaflu- oride (thesis) , ORNL-TM-1683 (January 1967).
1966, ORNL-3945, p. 69.
3. Molten-Salt Reactor Processing
T h e development of a molten-salt breeder reactor (MSBR) is one of the long-range projects a t ORNL. The Chemical Technology Division is participating by developing p rocesses for continuously removing f i ss ion products from the core salt and for recover- ing the newly produced 2 3 3 U from the blanket sa l t . The reference reactor for t h i s study, a 1000-Mw (electrical) MSBR, is a two-region sys tem with an LiF-ThF, (71-29 mole %) blanket and an LiF-BeF,- UF, (about 65.5-31.2-3 mole %) fuel stream.
provide continuous removal of blanket, thereby keeping its concentration at a sufficiently low leve l to make its transmutation by neutron capture economically acceptable. The tech- nology for achieving th i s is presently being ex- plored by the Reactor Chemistry Division. T h e alternative method, removal of 2 3 3 U from the blan- ket by fluorination, is less attractive economically but is very much simpler to engineer, With th i s method, t he below 0.012 mole %, which would allow removal of f i ss ion products by a s m a l l purge stream, result ing in complete replacement of the blanket volume every 40 years.
F i s s ion products accumulate in the fuel salt a t a much higher rate than in the blanket s a l t and must be removed on about a 39-day cycle. At present, the most attractive process for removing t h e s e con- taminants cons i s t s in fluorination of t h e fuel s a l t to remove the uranium and subsequent dist i l lat ion of the carrier s a l t to separa te the valuable LiF and BeF , from the less-volati le f i ss ion products. The UFb from the fluorination is purified by sorption on NaF, desorption, and collection in a cold trap. I t is subsequent ly combined with the purified carrier s a l t by simultaneously absorbing it in molten s a l t and ad jus t ing t h e valence state of uranium by re- duction with hydrogen. T h i s processing scheme was previously descr ibedl and was subjec ted t o a preliminary c o s t es t imate that showed it to be eco-
T h e most attractive processing scheme would 3Pa from the
3U concentration could be maintained
nomically feasible. Advances in the technology this year include: the determination of the e f fec ts of operating variables on the recovery of uranium by continuous fluorination, and t h e completion of a facility to study the protection of the fluorinator walls by a layer of frozen sa l t . T h e relative vola- t i l i t ies of the rare-earth fluorides and zirconium fluoride are now known with good accuracy. Vapor- ization ra tes for the vacuum disti l lat ion of s a l t s have been studied. Experiments have been planned in which 48 liters of fuel s a l t from the MSRE w i l l be d is t i l l ed ; appropriate equipment to am omplish th i s work h a s been built. P l ans have been formu- lated to provide the MSRE with a 2 3 3 U fuel charge; a facil i ty to effect this is being provided. Alterna- tive methods for fuel reprocessing have been studied. The most promising of t h e s e is the ex- tractive reduction of the f i ss ion products.
3.1 CONTINUOUS FLUORINATION OF MOLTEN FLUORIDE MIXTURES IN 1-in.-diam COLUMNS
The recovery of uranium from molten s a l t by fluorination h a s been studied extensively in the development of the Molten-Salt Volatility Process . In th i s process, the uranium tetrafluoride in the s a l t i s converted t o volati le uranium hexafluoride by the reaction
UF, + F, -j UF, . The f i ss ion products and corrosion products tha t form volati le compounds during fluorination can be
'D. E. Ferguson, Chem. Technol. Div. Ann. Pro@. Rept. May 31 , 1965, ORNL-3830, pp. 301-2.
' C . D. Scott and W. L. Carter, Preliminary Design Study of a Continuous Fluorination-Vacuum-Distilfiltiori System for Regenerating Fuel and Fertile Streams in a Molten-Saft Breeder Reactor, ORNL-3791 (January 1966).
95
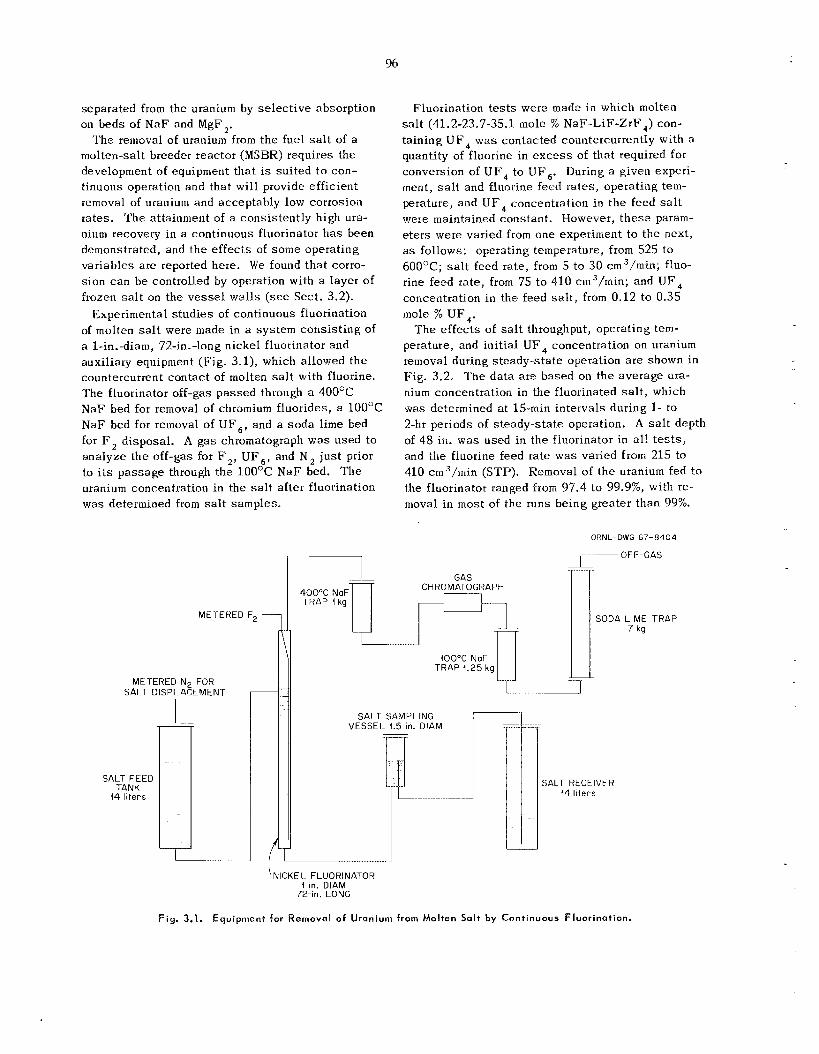
96
separated from the uranium by se l ec t ive absorption on beds of N a F and MgF,.
The removal of uranium from the fuel s a l t of a molten-salt breeder reactor (MSBR) requires the development of equipment that is su i ted t o con- tinuous operation and that will provide efficient ienioval of uranium and acceptably low corrosion rates. The attainment of a consistently high ura- nium recovery in a continuous fluorinator h a s been demonstrated, and t h e e f fec ts of some operating variables a re reported here. We found tha t corro- sion can b e controlled by operation with a layer of frozen s a l t on the ves se l wal l s (see Sect. 3.2).
Experimental s tud ie s of continuous fluorination of molten s a l t were made in a sys tem cons is t ing of a 1-in.-diam, 72-in.-long nickel fluorinator and auxiliary equipment (Fig. 3.1), which allowed the countercurrent contact of molten salt with fluorine. The fluorinator off-gas pas sed through a 4OO0C N a F bed for removal of chromium fluorides, a I O O O C N a F bed for removal of UF , , and a soda l i m e bed for F, disposal. A gas chromatograph was used to ana lyze the off-gas for F,, UF, , and N, jus t prior to its passage through the 100°C N a F bed. T h e uranium concentration in the s a l t after fluorination was determined f rom s a l t samples.
METERED F2 -
METERED N2 FOR SALT D ISPL ACE M ENT
7 400°C NaF TRAP I k g
Fluorination t e s t s were made in which molten s a l t (41.2-23.7-35.1 m o l e % NaF-LiF-ZrF,) con- taining U F , w a s contacted countercurrently with a quantity of fluorine in e x c e s s of that required for conversion of U F , to UP,. During a given experi- ment, s a l t and fluorine feed rates, operating tem- perature, and UF, concentration in the feed salt were maintained constant. However, t h e s e param- e te rs were varied from one experiment to the next, as follows: operating temperature, from 525 to 600OC; s a l t feed rate, from 5 to 30 cm3/rnin; fluo- rine feed rate, from 75 to 410 cm3/min; and 1JF, concentration in the feed s a l t , from 0.12 to 0.35 mole % UF,.
T h e e f fec ts of salt throughput, operating tem- perature, and init ial UF, concentration on uranium removal during s teady-s ta te operation a re shown in Fig. 3.2. T h e da ta a r e based on the average ura- nium concentration in the fluorinated salt, which was determined a t 15-min intervals during 1- to 2-hr periods of steady-state operation. A s a l t dcpth of 48 in. was used i n the fluorinator in a l l t e s t s , and the fluorine feed rate was varied from 215 to 410 crn3/min (STP). Removal of t he uranium fed to the fluorinator ranged f rom 97.4 to 99.9%, with re- moval i n most of the runs be ing greater than 99%.
GAS CHROMATOGRAPH
400°C NaF TRAP i . 2 5 kg
SALT SAMPLING VESSEIL 1.5-in. DIAM
~
1 ‘NICKEL FLUORINATOR
!-In. DIAM 72-in. LONG
ORNL-OWG 67-8404
~ OFF-GAS
SODA LIME TRAP 7 kg
I t . . . I
SALT RECEIVER 44 liters
Fiy . 3.1. Equipment for R e m o v a l of Uranium from Molten Salt by Continuous Fluorination.
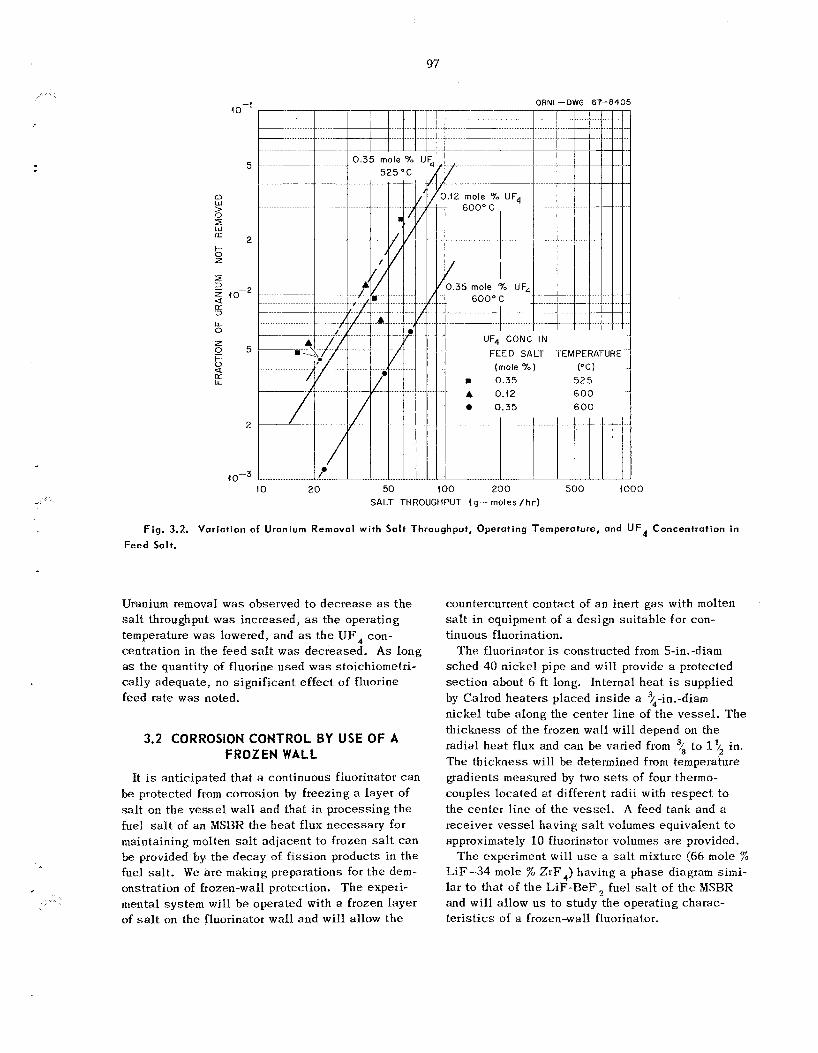
97
.....
. ....
-i to
5
0 W > 0 z W If: 2 t5
5 z to-2
z
-3 (1I 3
LL 0
z 0 5 b a LT L L
2
UF4 CONC IN FEED SALT TEMPERATURE-
m 0.35 A 0.f2
0.35
(mole %) ( " C )
52 5 600 600
10 20 50 200 500 SALT THROUGHPUT ( 4 - moles / h r )
io00
Fig. 3.2. Variation of Uranium Removal with Salt Throughput, Operating Temperature, and UF4 Concentration in
Feed Salt.
...
Uranium removal w a s observed to dec rease as t h e salt throughput w a s increased , as the operating temperature w a s lowered, and a s t h e U F , con- centration i n the feed salt was decreased . A s long as the quantity of fluorine used w a s stoichiometri- ca l ly adequate, no significant e f fec t of fluorine feed rate was noted.
3.2 CORROSION CONTROL BY USE OF A FROZEN WALL
It is anticipated tha t a continuous fluorinator can be protected ftom corrosion by freezing a layer of salt on t h e ves se l wall and that in process ing t h e fuel salt of an MSBR t h e hea t flux necessary for maintaining molten salt ad jacent to frozen s a l t c a n be provided by t h e decay of f i ss ion products i n t h e fuel sa l t . W e a r e making preparations for t he dem- onstration of frozen-wall protection. T h e experi- mental system will b e operated with a frozen layer of salt on t h e fluorinator wal l and will al low t h e
countercurrent contac t of a n inert g a s with molten s a l t i n equipment of a des ign su i tab le for con- tinuous fluorination,
T h e fluorinator is constructed from 5-in.-diam sched 40 nickel pipe and will provide a protected sec t ion about 6 ft long. Internal hea t is supplied by Calrod hea ters placed ins ide a 3/,-in.-diam nickel tube a long the center l ine of t h e vesse l . T h e th ickness of the frozen wall will depend on the radial hea t f lux and can be varied from ?i to 1% in. The th ickness will b e determined from temperature gradients measured by two sets of four thermo- couples located at different radii with respec t t o the center l i ne of the vesse l . A feed tank and a receiver ves se l having salt volumes equivalent to approximately 10 fluorinator volumes a r e provided.
T h e experiment will u s e a s a l t mixture (66 mole % LiF-34 mole % ZrF,) having a phase diagram s i m i - lar to that of t h e LiF-BeF, fuel salt of t he MSBR and wi l l al low u s to s tudy the operating charac- t e r i s t i c s of a frozen-wall fluorinator.
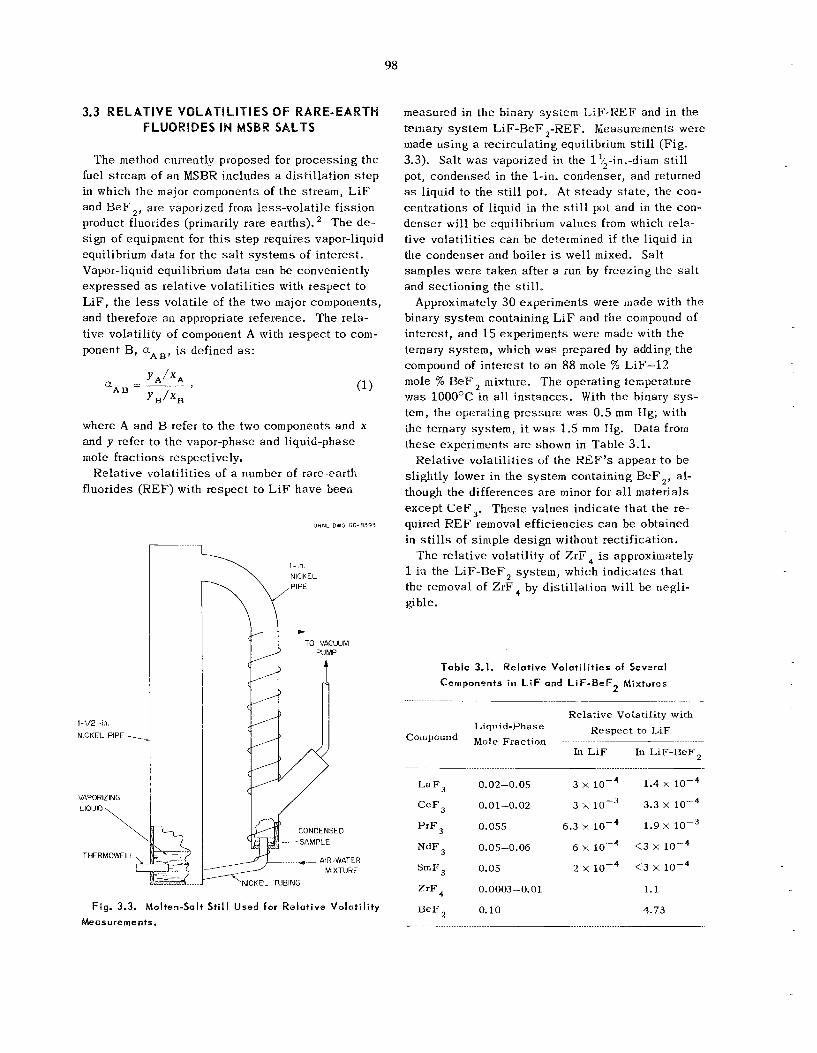
98
3.3 RELATIVE VOLATlLlTlES OF RARE-EARTH FLUORIDES IN MSBR SALTS
The method currently proposed for processing the fuel stream of an MSBR includes a disti l lat ion s t e p in which the major components of t h e stream, LiF and WeF,, are vaporized f rom less-volati le f i ss ion product fluorides (primarily rare earths). The d e - sign of equipment for t h i s s t e p requires vapor-liquid equilibrium da ta for the s a l t sys t ems of interest . Vapor-liquid equilibrium da ta can b e conveniently expressed a s relative volati l i t ics with respec t to LiF, the less volati le of the two major components, and therefore an appropriate reference. The rela- tive volatility uf component A with respec t to com- ponent B, aA,, i s defined as:
where A and B refer to the two components and x and y refer to the vapor-phase and liquid-phase m o l e fractions respectively.
Rela t ive volati l i t ies of a number of rare-earth fluorides (REF) with respec t t o LiF have been
I-1/2 -in. NICKEL PIPE-,
VAPORIZING LIQIJID \
UHNL DNG '25-8'193
Fig. 3.3. Molten-Salt Sti l l Used for Relat ive Volati l i ty
Measurements.
measured in the binary system LiF-KEF and in the ternary sys tem L iF-BeF ,-REF. Measurements were made us ing a recirculating equilibrium s t i l l (Fig. 3.3). Sal t was vaporized in the 1 '/-in.-diam s t i l l pot, condensed in the 1-in. condenser, and returned as liquid to the s t i l l pot. At s t eady s t a t e , the con- centrations of liquid in the s t i l l pot and in the con- denser will b e equilibrium va lues from which rela- tive volati l i t ies can be determined if t he liquid in the condenser and boiler is wel l mixed. Salt samples were taken after a run by f reez ing the s a l t and sec t ion ing the st i l l .
binary sys tem containing LiF and the coil1pound of interest , and 15 experiments were made with the ternary sys tem, which was prepared by adding the compound of in te res t to a n 88 mole % LiF-12 mole % BeF , mixture. T h e operating temperature was 1000°C in a l l ins tances . With t h e binary s y s - tem, the operating pressure was 0.5 mm Wg; with the ternary system, i t w a s 1.5 mm Hg. Data from these experiments a re shown in Table 3.1.
Relative volati l i t ies of the REF'S appear t o be slightly lower in the system containing BeF,, al- though the differences a r e minor for all materials except CeF,. T h e s e va lues indicate tha t the re- quired R E F removal e f f ic ienc ies can b e obtained in s t i l l s of simple design without rectification.
T h e relative volatility of Z r F 4 is approximately 1 in the LiF-BeF, sys tem, which ind ica tes t ha t the removal of ZrF, by disti l lat ion will b e negli- gible.
Approximately 30 experiments were made with the
Table 3.1. Relat ive Volat i l i t ies of Several
Components in biF and L i F - 3 e F 2 Mixtures
Relative Volatility with Hespect to LiF Liqnid-Phase
Compound Mole Fraction ~.. ~
In LiF In LiF-BeFp . . .. . . . .. ....... .... ......... ~
L a F 3 0.02-0.05 3 x lo-, 1.4 x io-, 3 x 3.3 x 10-4
P r F , 0.055 6.3 1.9 x lo-,
SmF, 0.05 2 IO-' < 3 x 1 0 - ~
ZrF , 0.0003-0.01 1.1
B"FZ 0.10 4.73
CeF, 0.01-0.02
NdF, 0.05-0.06 6 x < 3 X
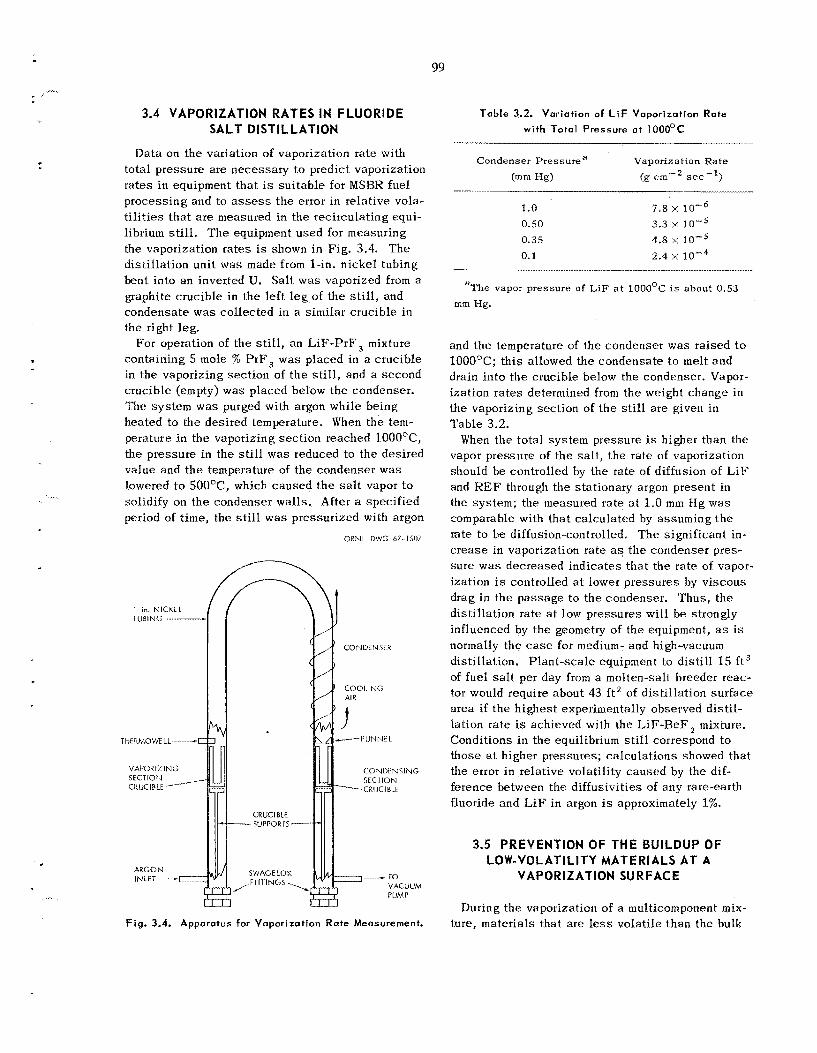
99 ....
3.4 VAPORIZATION RATES IN FLUORIDE SALT DISTILLATION
Data on t h e variation of vaporization ra te with total p ressure a re necessary to predict vaporization ra tes in equipment tha t is su i t ab le for MSBR fuel process ing and to assess t h e error in re la t ive vola- t i l i t i es tha t a r e measured in the recirculating equi- librium still. T h e equipment used for measuring the vaporization r a t e s is shown i n Fig. 3.4. T h e disti l lat ion unit was made from 1-in. n i cke l tubing bent into an inverted U. Sal t was vaporized from a graphite crucible in the left leg of the s t i l l , and condensa te w a s co l lec ted in a similar crucible in the right leg.
For operation of t he still, an L iF-PrF , mixture containing 5 mole % PrF, w a s placed in a crucible in the vaporizing sec t ion of t h e s t i l l , and a second crucible (empty) was placed below t h e condenser. The sys tem w a s purged with argon while being heated to the des i red temperature. When the t e m - perature i n the vaporizing sec t ion reached 1O0OoC, the pressure in the still w a s reduced to the des i red value and t h e temperature of t he condenser w a s lowered to 5OO0C, which caused t h e salt vapor to solidify on t h e condenser walls. After a spec i f ied period of time, the s t i l l was pressur ized with argon
ORNL DWG h7-150/
I-in. NICKEL lUYlNG --
THERMOWE L L 4
VAI'OK I% I NG
CKI.KIBLE ------ SECTION
ARGON INLET-
CONDENSER
CONDFNSING
--CRIJCIBLE
CRUCIBLE -SUPPORTS
SWASELOK VACUUM
Fig. 3.4. Apparatus for Vaporizotion Rate Measurement.
Table 3.2. Variation of LiF Vaporization Rate
with Total Pressure at 1000°C
Condenser P r e s sure a Vaporization Rate (g cm-' sec-l) (mm JW
-- I -- ~ _ _
1.0 7.8 x
0.50 3.3 x 10⁻⁵ 0.35 4.8 x 10⁻⁵ 0.1 2.4 x
~ -...... ~ _.......-_._...i__i_I_ I_
"The vapor pressure of LiF at lOO0OC is about 0.53 mm Ilg.
and t h e temperature of the condenser was raised t o 1000°C; th i s allowed the condensa te to melt and drain in to t h e crucible below the condenser. Vapor- ization r a t e s determined from the weight change in the vaporizing sec t ion of t h e s t i l l a r e given in Tab le 3.2.
When the total sys tem pressure i s higher than the vapor pressure of t he sa l t , t h e rate of vaporization should b e controlled by the rate of diffusion of L,iF and R E F through the stationary argon present i n the sys tem; the measured rate a t 1.0 mm t Ig w a s comparable with tha t ca lcu la ted by assuming t h e nte to b e diffusion-controlled. T h e significant in- c r ease in vaporization rate as t h e condenser pres- su re w a s decreased ind ica tes t ha t t he ra te of vapor- ization is controlled a t lower pressures by v iscous drag i n the pas sage to the condenser. Thus , t he disti l lat ion rate a t low pressures will be strongly influenced by the geometry of the equipment, a s is normally the case for medium- and high-vacuum disti l lat ion. P lan t -sca le equipment to d is t i l l 15 f t3 of fuel s a l t per day from a molten-salt breeder reac- tor would require about 43 f t 2 of dist i l lat ion sur face a rea if t h e h ighes t experimentally observed disti l- lation ra te is achieved with the LiF-BeF, mixture. Conditions i n the equilibrium s t i l l correspond to those at higher pressures; ca lcu la t ions showed tha t the error i n relative volatility caused by the dif- ference between the diffusivit ies of any rare-earth fluoride and LiF in argon is approximately 1%.
3.5 PREVENTION OF THE BUILDUP OF LOW-VOLATILITY MATERIALS AT A
VAPORIZATION SURFACE
During the vaporization of a multicomponent mix- ture, materials that a r e less volati le than the bulk
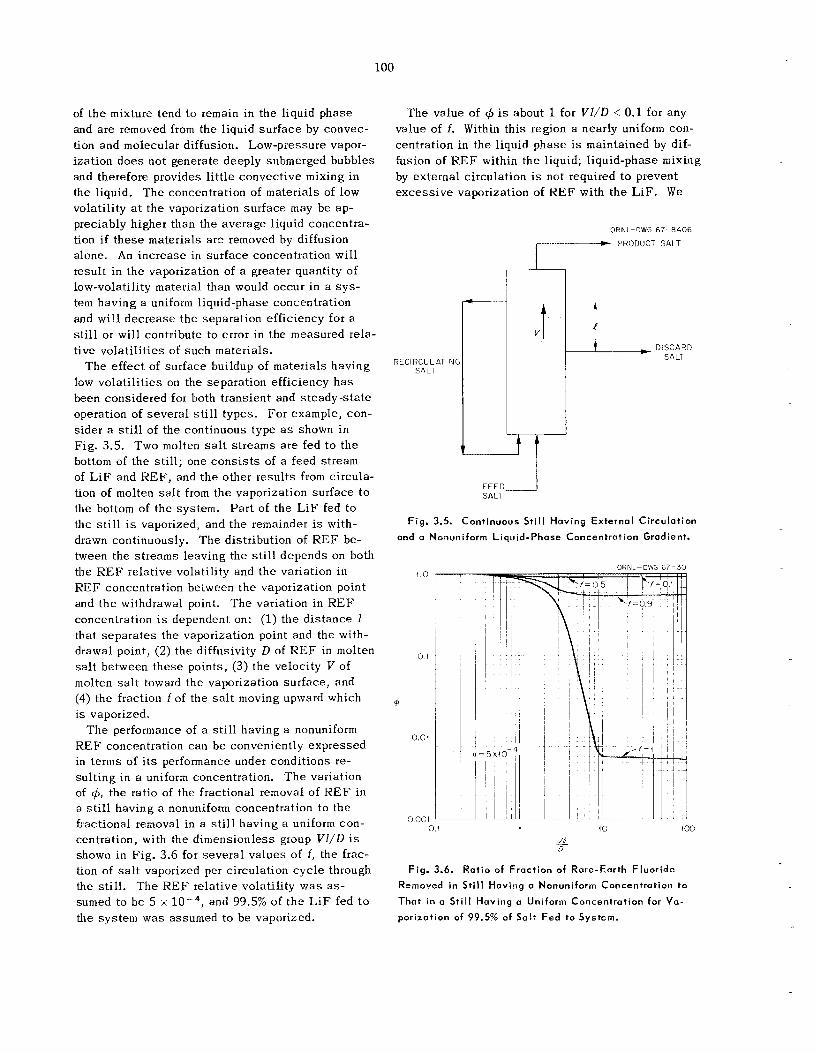
100
of t h e mixture tend to remain in the liquid phase and a re removed from the liquid sur face by convec- tion and molecular diffusion. Low-pressure vapor- ization d o e s not generate deeply submerged bubbles and therefore provides l i t t l e convective mixing in the liquid. T h e concentration of materials of low volatility a t t h e vaporization sur face may b e ap- preciably higher than the average liquid concentra- tion if t hese materials a r e removed by diffusion alone. An increase in sur face concentration will result i n the vaporization of a greater quantity of low-volatility material than would occur in a s y s - tem having a uniform liquid-phase concentration and will decrease t h e separation efficiency for a still or will contribute to error i n the measured rela- t ive Volatilities of such materials.
The effect of surface buildup of materials having low volati l i t ies on the separation efficiency h a s been considered for both transient and s teady-s ta te operation of severa l s t i l l types. For example, con- sider a s t i l l of the continuous type as shown in Fig. 3.5. Two molten salt s t reams a r e fed to the bottom of the s t i l l ; one c o n s i s t s of a feed stream of LiF and R E F , and t h e other resu l t s from circula- tion of molten s a l t f rom the vaporization sur face t o the bottom of the system. Pa r t of the LiF fed to the still i s vaporized, and the remainder is with- drawn continuously. T h e distribution of R E F be- tween the s t reams leaving the s t i l l depends on both the R E F relative volatility and the variation in R E F concentration between the vaporization point and t h e withdrawal point. T h e variation in R E F concentration is dependent on: (1) the d is tance 1 that s epa ra t e s the vaporization point and the with- drawal point, (2) the diffusivity D of R E F in molten s a l t between these points, (3) the velocity V of molten s a l t toward the vaporization sur face , and (4) the fraction f of the s a l t moving upward which i s vaporized,
T h e performance of a s t i l l having a nonuniform R E F concentration can b e conveniently expressed in terms of i t s performance under conditions re- su l t ing in a uniform concentration. The variation of $, the ratio of the fractional removal of R E F in a s t i l l having a nonuniform concentration to t h e fractional removal in a s t i l l having a uniform con- centration, with the dimensionless group V l / D is shown in Fig. 3.6 for severa l va lues of f, the frac- tion of s a l t vaporized per circulation cyc le through the sti l l . T h e R E F relative volatility w a s as- sumed to be 5 A and 99.5% of t h e L,iF fed t o the sys tem w a s assumed to be vaporized.
The value of q5 is about 1 for V l / D < 0.1 for any value of f. Within th i s region a nearly uniform con- centration in the liquid phase i s maintained by dif- fusion of K E F within the liquid; liquid-phase mixing by external circulation is not required to prevent excess ive vaporization of R E F with the LiF. W e
ORNL-DWG 6 7 - 8 4 0 6
PRODUCT SALT
R EC I RCU L AT I N ( SALT
L
v t
Fig. 3.5. Continuous Sti l l Having External Circulation
and a Nonuniform Liquid-Phase Concentrotion Gradient.
1.0
0.1
+
0.0(
0.001 0.4
ORNL-DWG 67 -30
10 vo D
100
Fig. 3.6. Ratio of Fraction of Rare-Earth Fluoride
Removed in Sti l l Having a Nonuniform Concentration to
That in o Stil l Having o Uniform Concentration for Vo-
porization of 99.5% of Salt Fed to System.
10 1
..... r
think an ac tua l s t i l l will opera te in t h e region of V l / D ‘> 1, where the disti l lat ion performance i s strongly dependent on f. Within th i s region, a nearly uniform liquid-phase concentration c a n b e maintained only if external circulation of the liquid i s provided by mechanical or thermal methods. Fo r V I / D L: 100, + h a s a va lue of 0.0055 when circula- tion is not provided and a value of 0.99 if 90% of the s a l t is returned to the bottom of t h e s t i l l . Thus, the importance of the circulation of liquid cannot be overemphasized if good separation factors and h ighes t d i s t i l l a t ion r a t e s are to b e obtained.
3.6 DEMONSTRATION OF FUEL-SALT DISTILLATION AT THE MSRE
Equipment h a s been des igned and fabricated for a large-scale demonstraiion of t h e disti l lat ion of molten-salt reactor fuel. Disti l lat ion i s carried out at %lOOO°C and 1.5 mm H g and r e su l t s i n volati l ization and separation of t he major com- ponents (LiF, BeF2, and ZrF,) from less -vola t i le f i ss ion product fluorides (primarily rare earths).
T h e system c o n s i s t s of a 48-liter feed tank, a 12-liter s t i l l pot, a condenser, a 48-liter conden- s a t e receiver, and assoc ia ted auxi l ia r ies required for removing condensa te samples during operation and for main tnining desired operating conditions. All components that contac t molten s a l t a r e fabri- ca ted from Hastelloy N. Provision i s made for batch operation; a l so , s a l t c a n be fed to the still continuously.
T h e system will b e operated for SO0 t o 700 hr us ing nonradioactive s a l t having the MSRE fuel carrier composition (65-30-5 mole % LiF-BeF,- ZrV,) and containing smal l quant i t ies of rare-earth and/or other fluorides. During th i s period, da t a will b e obtained on the variation of throughput with operating conditions and on the e f fec t ive relative volati l i t ies of components of t he s a l t mixture. Cor- rosion da ta will also be obtained from t e s t spec i - mens of candida te materials of construction for future d is t i l l a t ion systems.
The s t i l l and t h e condenser will be examined thoroughly after nonradioaci i ve operation, u s ing
on the behavior and relative vola t i l i t i es of various f i ss ion product fluorides will b e obtained.
3.7 ALTERNATIVE PROCESSlNG METHODS
Methods other than disti l lat ion a r e be ing evalu- ated for the process ing of MSBR fuel. Among these a re reductive precipitation” and reductive extrac- tion. 3-s T h e first s t e p i n both of t h e s e methods would be removal of t h e uranium from the fuel s a l t by fluorination. In the reductive precipitation method a so l id reductant such as beryllium would be added to t h e s a l t to precipitate the rare-earth f i ss ion products a s insoluble, high-melting inter- metall ic compounds (beryllides), which would then be removed by filtration. Although t h i s method appears to b e chemically feas ib le , i t s suitabil i ty for engineering-scale application is marginal be- c a u s e of the problems inherent in handling fission products i n a concentrated form. A variation of this approach involves t h e addition of solid beryl- lium to t h e fue l s a l t while it is in contact with a liquid metal s u c h as bismuth. ‘The liquid metal would a c t a s a solvent for the rare-earth f i ss ion product metals produced by the reduction reaction. Since i t is poss ib le tha t rare-earth beryll ides could be formed as reaction intermediates and inhibit t h e transfer of rare ear ths from the s a l t phase to t h e metal phase, a general study of t h e s t ab i l i t i e s of the rare-earth beryll ides in contac t with liquid bismuth w a s begun, u s ing t h e sys tem Re-La-Bi for the in i t ia l investigations,
(0.4 g), and bismuth (SO g) were heated in graphite c ruc ib les for 20 to 115 hr a t se lec ted temperatures in the range 318 to 832T . Frit ted quartz samplers were used to obtain filtered samples (0.3 to 1 g)
at temperature. ’The lanthanum and beryllium con- centrations in these samples were determined by either neutron activation or emiss ion spec t roscopic methods. T h e lanthanum betyll ide w a s prepared by s in te r ing the appropriate mixture of t he powdered elements i n a c losed tantalum crucible. Initially, the powders were sintered for about 3 hr at tem- peratures up to 1220°C under argon (pressures of
Mixtures of LaBe , (1 .OS g), beryllium powder
dimensional, radiographic, and ultrasonic methods. ___ I_
T h e system will then b e installed in a cell ad jacent to the fuel process ing ce l l a t t he MSRE s i t e and will be used to d is t i l l approximately 48 l i te rs of radioactive MSRE fuel s a l t from which the uranium h a s been removed by fluorination. Additional da t a
’D. E. Ferguson, Chern. Technol. Div. A m . Progr.
,R. E. Rriggs, MSR Program Semiann. Progr. Rept.
’W. R. Grimes, Reactor Chern. Dzv. Ann. Pro&. Rept .
R e p t . May 31, 1966, ORNL-3945.
A u ~ . 31, 1966, OKNL-4037.
D e c . 31, 1966, ORNL-4076.
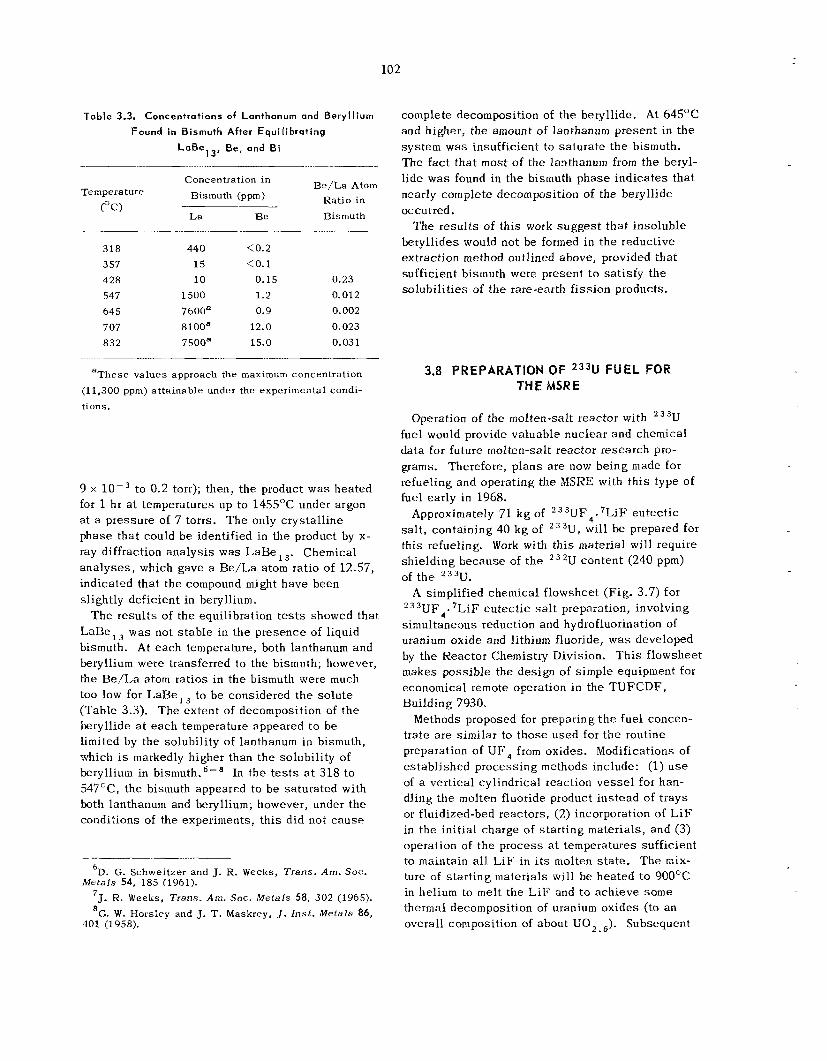
102
Table 3.3. Concentrations of Lanthanum and Beryl l ium Found in Bismuth After Equilibrating
LoBel3, Be, and Bi
Be/La Atom Ratio in
Concentration in Temperature Bismuth (ppm)
(OC) ~I
La Be Bismuth
318 440 <0.2 357 15 <0.1 428 10 0.15 0.23 547 1500 1.2 0.012 645 76OOa 0.9 0.002 707 8 1 ooa 12.0 0.023 832 7500a 15.0 0.031
aThese values approach the maximum concentration (11,300 ppm) attainable under the experimental condi- tions.
9 x lo - , to 0.2 torr); then, t he product w a s hea ted for 1 hr a t temperatures up to 14SSOC under argon a t a pressure of 7 torrs. T h e only c rys ta l l ine phase that could b e identified in the product by x- ray diffraction ana lys i s was LaBe 3. Chemical ana lyses , which gave a Be/La atom ratio of 12.57, indicated tha t the compound might have been slightly deficient in beryllium.
LaBe,, was not s t ab le in t h e presence of liquid bismuth. At each temperature, both lanthanum and beryllium were transferred to the bismuth; however, the Be/La atom ratios in the bismuth were much too low for LaBe, (Table 3.3). T h e ex ten t of decomposition of the beryllide a t each temperature appeared t o be limited by the solubility of lanthanum in bismuth, which is markedly higher than the solubility of beryllium in In the t e s t s a t 318 to 547OC, the bismuth appeared to b e saturated with both lanthanum and beryllium; however, under the conditions of the experiments, th i s did not c a u s e
T h e resu l t s of the equilibration t e s t s showed tha t
to be considered the so lu te
6D. G. Schweitzer and J. R. Weeks, Trans. A m . SOC.
J- R. Weeks, Trans . Am. S O C . Metals 58, 302 (1965). 7
'G. W. Horsley and J. T. Maskrey, J. I n s t . Metals 86,
Metals 54, 185 (1961).
401 (1958).
complete decomposition of the beryllide. At 645OC and higher, the amount of lanthanum present in the sys tem was insufficient to sa tura te the bismuth. The f ac t tha t most of the lanthanum from the beryl- l ide was found in the bismuth phase ind ica tes t ha t nearly complete decomposition of the beryllide occurred.
beryll ides would not be formed in t h e reductive extraction method outlined above, provided tha t sufficient bismuth were present to sa t i s fy t h e solubili t ies of t he rare-earth f i ss ion products.
The resu l t s of this work sugges t tha t inso luble
3.8 PREPARATION OF 233U FUEL FOR THE MSRE
Operation of the molten-salt reactor with 233U fuel would provide valuable nuclear and chemical data for future molten-salt reactor research pro- grams. Therefore, p lans a r e now be ing made for refueling and operating the MSKE with th i s type of fuel early in 1968.
s a l t , containing 40 kg of 233U, will be prepared for this refueling. Work with th i s material will require shielding because of t h e of t h e 233U.
Approximately 71 k g of 3UF,. 'LiF eutec t ic
2U content (240 ppm)
A simplified chemical f lowsheet (Fig. 3.7) for ,UF,. 'LiF eutec t ic s a l t preparation, involving
simultaneous reduction and hydrofluorination of uranium oxide and lithium fluoride, w a s developed by the Reactor Chemistry Division. T h i s flowsheet makes poss ib le the design of simple equipment for economical remote operation in the TUFCDF, Building 7930.
Methods proposed for preparing t h e fue l concen- trate a re similar to those used for t h e routine preparation of U F , from oxides. Modifications of es tab l i shed processing methods include: (1) u s e of a vertical cylindrical reaction v e s s e l for han- dling the molten fluoride product ins tead of t rays or fluidized-bed reactors, (2) incorporation of LiF in the init ial charge of s ta r t ing materials, and (3) operation of the process a t temperatures sufficient to maintain a l l LiF in i t s molten s ta te . The mix- ture of s ta r t ing materials will be heated to 900°C in helium to melt the L i F and t o achieve s o m e thermal decomposition of uranium oxides (to an overall composition of about UO, J. Subsequent
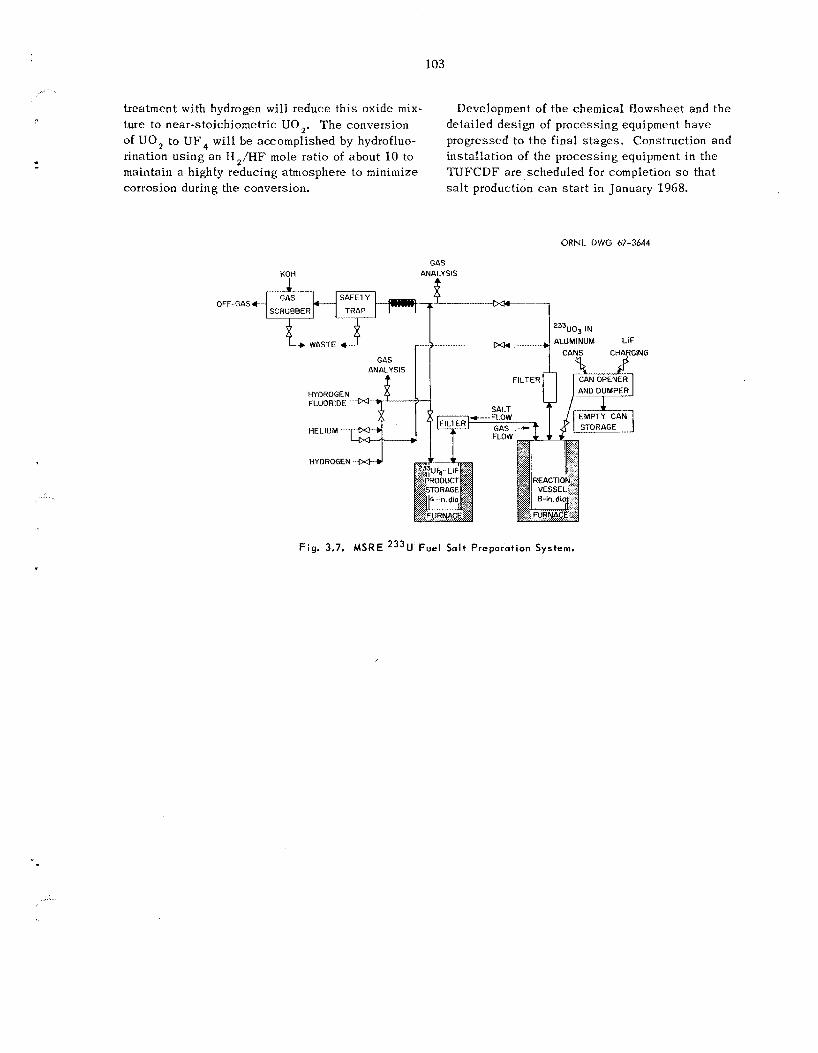
103
treatment with hydrogen will reduce th i s oxide mix- ture to near-stoichiometric UO 2. T h e conversion of L J 0 2 to U F , will b e accomplished by hydrofluo- rination us ing an H,/HF mole ratio of about 10 to maintain a highly reducing atmosphere to minimize corrosion during the conversion.
Development of the chemical f lowsheet and t h e detailed des ign of process ing equipment have progressed to the final s t ages . Construction and installation of the process ing equipment in the TUFCDF a re scheduled for completion so that salt production can s t a r t i n January 1968.
OFF-GAS+
ORNL DWG 67-3644
KOH I
GAS ANALYSIS
A
1 SAFETY
TRAP
I 1 233u03 IN
Fig. 3.7. MSRE 233U Fuel Soit Preparation System.
4. Waste Treatment and Disposal
T h e objectives of t he was te treatment and d is - posa l development program are to develop a coni- prehensive waste-management sys tem for nuclear was te s , including their final d i sposa l , and to es t imate the c o s t of th i s operation. Economical management of radioactive effluents i s a pre- requisite t o the natural growth of a nuclear power industry. A comprehensive waste-management flowsheet, which was presented previously, ’ in- c ludes the following operations: High-level radio- ac t ive was te s (HLW), which contain nearly a l l t h e fission products, a r e converted t o solids. Inter- mediate-level radioactive w a s t e s (ILW), character- ized by their generally high s a l t content, a re in- corporated in asphalt; any contained water is simultaneously volatilized. Low-level radioactive was te s (LLW) are treated t o remove the radio- nuclides, and the decontaminated water is d is - charged to the environment or recycled for reuse. The recovered so l ids a re combined with the ILW. Both the IILW and ILW sol id products c a n b e shipped to a final d i sposa l s i t e .
4.1 HIGH-LEVEL RADIOACTIVE WASTE
A process is being developed for preparing t h e was te powders from the Fluidized-Bed Volatility P rocess (P’BVP) for final storage. The so l id s c a n be: (1) simply sea l ed i n a s t a i n l e s s s t ee l pot, (2) mixed with a “getter” t o dec rease the production of volati le components, or (3) dispersed in a g l a s sy matrix. A pilot plant i s being designed for t e s t ing these processes on radioactive was te s made in the O W L Fluidized-Bed Volatility P i lo t P lan t (FBVPP, Sect. 2.0). Laboratory t e s t s with non- radioactive simulated was te s showed that t he addition of 10 wt % CaO to the fluidized-bed was te s
‘Chern. Technol. Div. Ann. Progr. Kept . May 31, 1965, ORNL-3830, p. 96.
reduced the weight l o s s a t 85OOC from 4.7 t o 1.3%, or the weight l o s s attributable t o moisture on the powder. Powders f r o m aqueous was te s (produced in a spray calciner) were successfu l ly d ispersed in a g lassy matrix in init ial t e s t s of a continuous process designed to immobilize a l l types of powdered was te products.
Chemic a I D eve I opme nt
Characterization of Wnste P o w d e r s . - T h e principal effort i n laboratory s tud ie s on the d is - posal of F B V P was te h a s involved the problems assoc ia ted with canning (i.e., s ea l ing i n a s ta in- less s t ee l pot) t h e untreated powders for long- term storage. Since the was te powders cons is t of aluminum oxide plus aluminum fluoride, s ta in- less s t e e l fluorides, and a wide variety of f i ss ion product f luorides, t h e volati l ization of fluorides presents a potential hazard a t s torage temperatures above about 25OOC. Also, if moisture is present t he hydrolysis of fluorides will c a u s e corrosion.
Two arrangements of appara tus a re used to de- termine the e f fec ts of time and temperature on t h e weight losses of was te powders and pure fluorides comprising the was te powder. In one, thermo- gravimetric methods are used to yield differential and integral weight losses of small samples (51 g) as a function of time and temperature? In t h e other, g ross integral weight losses of large s a m - p l e s (several grams) a re determined as a function of final temperature and time.
Therrnogravimetric ana lyses (TGA) of was te powders from both t h e IIF-0, and HC1 p rocesses have been made. Weight l o s s e s obtained for
2W. W. Wendlandt, Thermal Methods of Analysis , pp.
3 53---55, Interscience, New York, 1964.
J. C. Si-iddath and J. 0. Blomeke, An Economic Analysis of High Leve l Waste Management for Fluid- ized-Red Volat i l i ty Processing of Power Reactor Fue l s , ORNL-TM-1441 (April 1966).
104
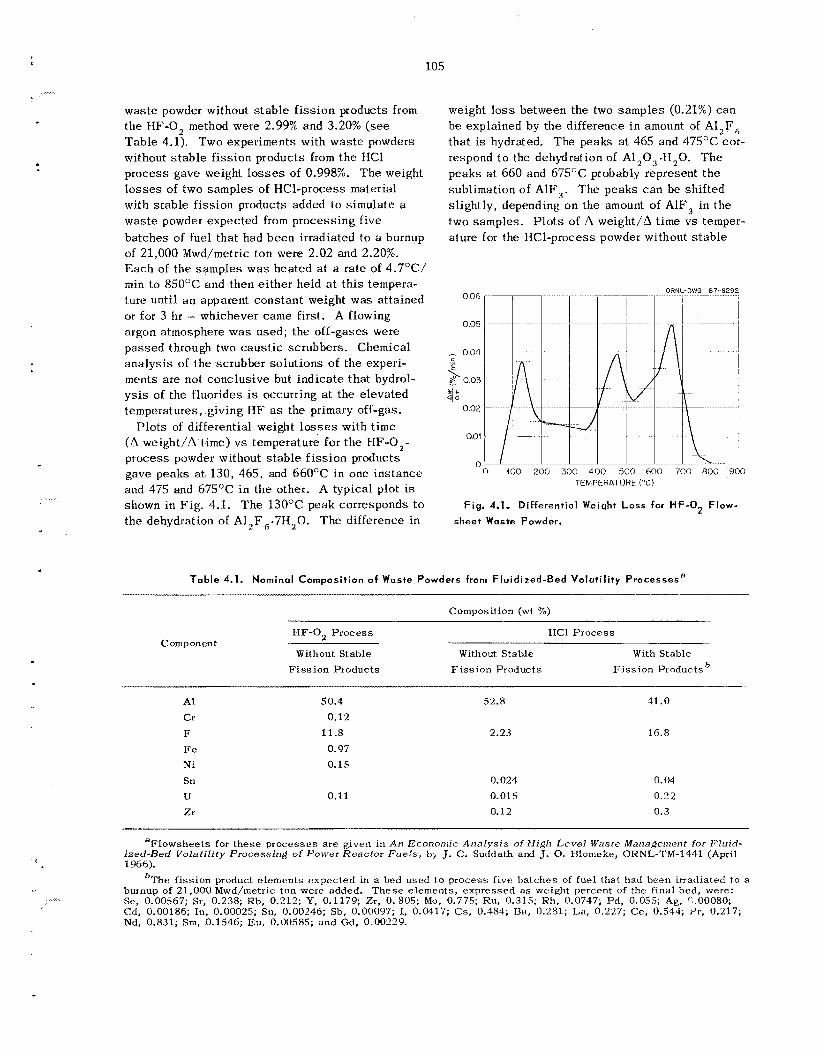
105
.... . .
.. .
waste powder without s t ab le f i s s ion products from the HF-0 , method were 2.99% and 3.20% (see Table 4.1). Two experiments with was te powders without stable f i ss ion products from t h e HC1 process gave weight l o s s e s of 0.998%. The weight l o s s e s of two samples of HC1-process material with s t ab le f i ss ion products added to simulate a was te powder expected from process ing f ive batches of fuel that had been irradiated to a burnup of 21,000 Mwd/metric ton were 2.02 and 2.20%. Each of the samples was heated a t a rate of 4.7OC/ min t o 850°C and then e i ther held at th i s tempera- ture until a n apparent cons tan t weight was attained or for 3 hr - whichever came first. A flowing argon atmosphere was used; the off-gases were pas sed through two caus t i c scrubbers. Chemical ana lys i s of the scrubber so lu t ions of the experi- ments are not conclusive but ind ica te tha t hydrol- y s i s of the fluorides is occurring a t the elevated temperatures, giving H F as the primary off-gas.
P lo t s of differential weight losses with t ime (A weight/A t ime) v s temperature for t he HF-0,- p rocess powder without s t ab le f i s s ion products gave peaks at 130, 465, and 66OOC in one ins tance and 475 and 675°C in the other. A typical plot IS shown in Fig. 4.1. T h e 1 3 0 T peak corresponds t o the dehydration of A1,F6.7II,O. The difference in
weight l o s s between the two samples (0.21%) can be explained by the difference in amount of Al,F, that is hydrated. The peaks a t 465 and 475°C cor- respond t o the dehydration of Al,O,-H,O. The peaks a t 660 and 675OC probably represent the sublimation of AlF,. The peaks c a n be shifted slightly, depending on the amount of AlF, in the two samples. P l o t s of A weight /h time v s temper- ature for the HC1-process powder without s t ab le
3
Fig. 4.1. Differentiol Weight Loss for H F - 0 2 Flow- sheet Waste Powder.
Table 4.1. Nominal Composition o f Woste Powders from Fluidized-Bed Volat i l i ty ProcessesB
Composition (wt YO)
HF-0, P rocess HCI P rocess Component
Without Stable Without Stable With Stable F i s s ion Products F i s s ion Products F i s s ion Productsb
A I 50.4 52.8 41.0 Cr 0.12 F 11.8 2.23 16.8 Fe 0.97 Ni 0.15 Sn 0.024 0.04
U 0.11 0.01 5 0.22 Zr 0.12 0.3
. ..
aFlowsheets for these processes a te given in An Economic Analysis of H i g h Level Waste Management f o r Fluid- ized-Bed Volatility Processirig of Power Reactor Fuels, bq J. C. Suddath a d J. 0. Blomeke, ORNL-TM-1441 (April 1966).
bThe f iss ion product elements expected in a bed used t o process five batches of fuel that had been irradiated to B burnup of 21,000 Mwd/metric ton were added. These elements, expressed as weight percent of the final bed, were: Se, 0.00567; St, 0.238; Kb, 0.212; Y, 0.1179; Zr, 0.805; Mo, 0.775; Ru, 0.315; Rh, 0.0747; Pd, 0.055; Ag, C.00080; Cd, 0.00186; In, 0.00025; Sn, 0.00246; Sb, 0.00097; I, 0.0417; Cs, 0.484; E a , 0.281; La, 0.227; Ce, 0.544; i'r, 0.217; Nd, 0.831; Sm, 0.1546; Eu, 0.00585; and Gd, 0.00229.
f i ss ion products gave peaks at 130 and 650°C. Again, the 13OOC peak corresponds to the dehydra- tion of A1,F6.7H,0, whereas t h e 65OoC peak probably represents sublimation of AlF,. TGA a t 85OOC of the pure anhydrous fluorides of ru- bidium, cesium, strontium, lanthanum, neodymium, aluminum, and cerium have been completed. A summary of the resu l t s i s presented in Table 4.2. T h e experiments will also be run a t intermediate temperatures (250 and 55OoC), and the information obtained will b e used to aid in interpreting t h e complex curves obtained by hea t ing was te powders containing simulated f i ss ion products.
Integral weight losses as a function of time at temperature were determined us ing approximately 2-g samples. Each sample was placed in a n alumina boat, which, i n turn, w a s inserted in a l-in.-diam nickel tube. Heating was done in a tube furnace. Flowing argon carried the off-gases into caus t i c scrubbers. In t h e s e experiments, t h e weight losses of pure anhydrous aluminum fluoride at 25OOC were zero after heating periods of up t o 74 hr. At 550°C, the weight loss of pure aluminum fluoride w a s 0.9% after 18.5 hr and 3.5% after 74 hr. Aluminum fluoride held a t 85OOC showed weight losses of 4.9 and 15.4% after hea t ing periods of
18.5 and 74 hr respectively. T h e s e resu l t s agree with the high vapor pressures recorded i n the literature for AlF, and l ead to the conclusion tha t aluminum fluoride volatility c a n be a problem when was te is s tored a t high temperatures.
Waste powder without s tab le f i ss ion products from the HC1 process (Table 4.1) was tes ted for fluoride volatility. Weight l o s s of the untreated powder was 0.91%, which agrees well with the TGA above, considering the differences in sam- p l e s , s i z e s , and experimental conditions. T h e weight loss of IKl-process powder containing s t ab le f i ss ion products (Table 4.1) w a s 7.35%. T h i s result re f lec ts t he number of volati le com- pounds contained in the f i ss ion product spectrum.
Theoretical considerations ind ica te tha t t he addition of alkaline-earth oxides should convert t he metal fluorides in was te powder to s t a b l e metal ox ides p lus the more-stable alkaline-earth fluorides. Experiments were carried out in which calcium oxide and magnesium oxide were added to inhibit t he fluoride volatility. When calcium oxide was added t o the was te f rom the H F - 0 , p rocess (Table 4.1) in 1:19 and 1:9 weight ratios, t he weight l o s s e s were 2.4 and 1.3% respectively. Calcium oxide was added to the was te powder from
Table 4.2. Summary of Data Obtained by Thermogravimetric Analysis
T i m e a t Temperature Weight L o s s Heating Rate Temperature Material
(OC /min) ( O C ) (rnin) (x)
HF-0, process powder: Without stable 4.7 f iss ion products
HC1 process powder: Without stable 4.7 f i ss ion products
With s t ab le 4.5 f iss ion products
R b F C s F SrF, LaF, NdF, AIF, CeF,
4.6 4.6 4.6 4.6 4.6 4.7 4.6
850 80 3.10
850 160 1.00
85 0 180 2.11
85 0 850 85 5 85 5 850 855 85 5
180 60
180 180 180 180 180
9.20
25.20 0.91 0.20 0.58 1.28 0.82
107
the HCI method (Table 4.1) in a 1:49 weight ratio, which resulted in a weight l o s s of 0.2%. As t he calcium oxide: was te powder weight ratio was in- c reased t o 1:33, no further reduction in weight loss occurred. When magnesium oxide was added to Lhe powder i n a 1:49 weight ratio, the integral weight loss was 0.6%. Additional amounts of magnesium oxide to a 1:9 weight ra t io did not further reduce the weight loss . T h e s e data lead to the conclusion that calcium oxide se rves a s an adequate fluoride getter. T h e weight l o s s e s ob- served, when calcium oxide is added in sufficient quantity to hold the fluoride present, correspond to the moisture content of the powders. When magnesium oxide is added t o inhibit fluoride volati l i ty, the magnesium fluoride formed probably reac ts with moisture present on the powder and forms volati le hydrogen fluoride. Thus , calcium oxide appears t o be a better s tab i l izer for t h e moi s t powders than magnesium oxide.
Samples (about 1.5 g) of HC1-process was te powder without s t ab le f i ss ion products (Table 4.1) were heated to 250, 550, and 850°C. When each had reached a s teady-s ta te temperature, i t was sea l ed in a nickel pot. Alter three months a t temperature, the gage pressures , which were re- corded continuously during th i s time, had de- c reased to -1.5, - 25, and - 60 in. M,O respectively. A s a part of the effort to understand and predict s u c h behavior of the was te powders (which re- f l ec t s the interactions between the powder, mois- ture, and the me ta l of the container), experiments to determine weight l o s s with temperature are be- ing made; the pure fluorides (for example, see Tab le 4.2) and their hydrates, which arc expected to b e cons t i tuents of the was te , a r e used in t h e s e s tud ies . Dispersion of Powders in Glass. - Laboratory
development work has indicated that some treat- ment of high-level radioactive was te powders may
Table 4.3. Summary of Laboratory Tests for Dispersion of Waste Powders i n Gloss
Time at Maxi mum Product Quality Maximum Composition (wt %)
Temperature Temperature ('70 voids) Experiment
(OC ) (hr) Waste Powder Glass
1 2 3 4 5"
6 7 8 b
9b
IOb
I l b
12b
13
35.4% Alcoa T-61 36.6% Alcoa T-61 38.5% Alcoa T-61 34.5% Norton RR 33.0% FRVE NO.
11, 3.770 CaO
33.3% Purex calcine 33.3% Purex calcine
32.9% Norton RR, 5.1% Al,F,*xH,O
32.9% Norton RR, 5.170 A I F , -xH *O
32.9% Norton RR, 5.1% AI,F,.xII,O
32.9% Norton KK, 5.1% A1,F6.xH,0
32.9% Norton RR, 5.1% A12F6-xIIZ0
34.2% Norton RR, 1.2% A l Z F 6
64.6% Corning # 8163 63.4% Corning # 846.3 61.5% Pemco P R 41 65.5% Pemco 716 63.3% P e m c o 716
66.7% Pemco 716 66.7% Pemco 716 62.07" Pemco 716
62,WZ Pemco 716
62.0% Pemco 716
62.0% Pemco 716
62.Wo Pemco 716
64.670 Pemco 716B
770 925 93 5 940 92 0
9 05 93 0
95 0
940
93 0
950
900
790
1.5 3.5 3 i
10
5.5 16
18
18
18
20
24
1.5
40-50 40-50 40-50 4-5
40-50
2-3 2-3
20-25
20-25
20-25
10-15
10-15
2 -3
V B V E No. 11 contained 1.7 wt 70 H,O, and the CaO contained 1.1 wt % H,O. bAlzF,-xH,O contained 62 wt % A12F6 and 38 wt % H,O.
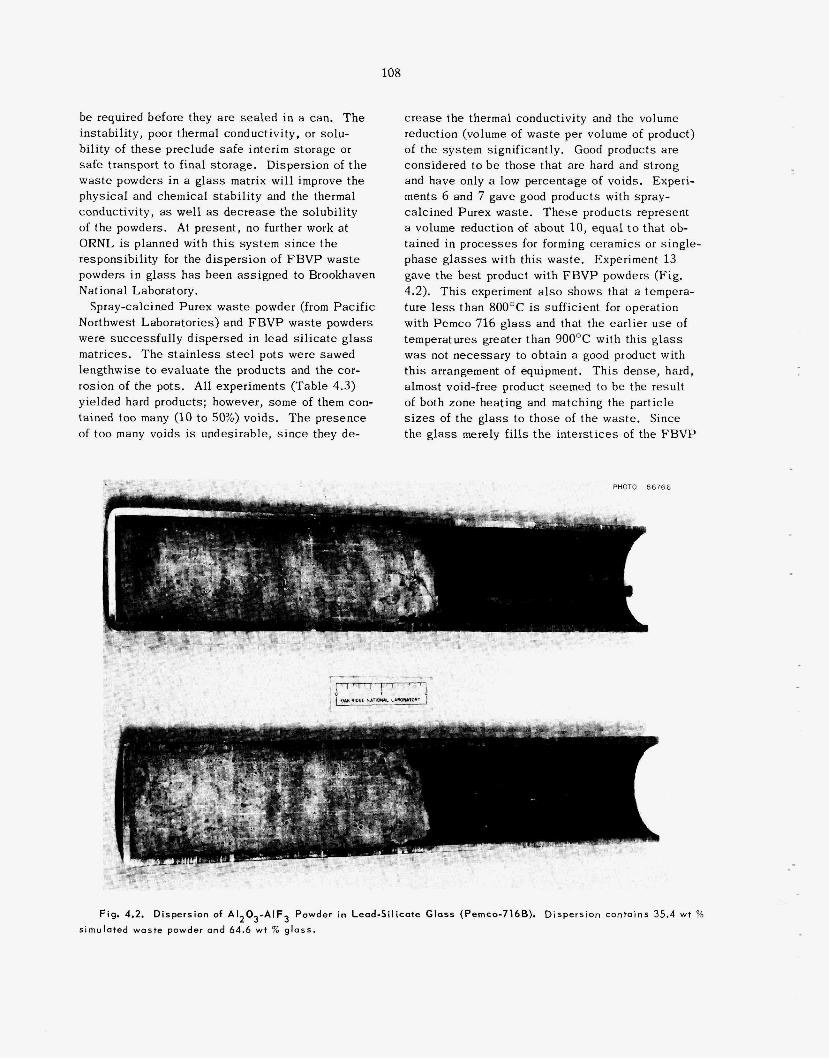
108
be required before they are sea l ed in a can. T h e instabil i ty, poor thermal conductivity, or solu- bility of t hese preclude s a f e interim storage or safe transport to final storage. Dispersion of t h e was te powders i n a g l a s s matrix will improve the physical and chemical s tabi l i ty and the thermal conductivity, as wel l as dec rease the solubili ty of the powders. At present, no further work a t ORNL is planned with th i s system s i n c e the responsibil i ty for the d ispers ion of F B V P was te powders i n g l a s s has been ass igned to Brookhaven National Laboratory.
Spray-calcined Purex was te powder (from Pacific Northwest Laboratories) and F B V P was te powders were successfu l ly d ispersed in lead silicate g l a s s matrices. The s t a i n l e s s steel pots were sawed lengthwise to eva lua te the products and the cor- rosion of the pots. All experiments (Table 4.3) yielded hard products; however, s o m e of them con- tained too many (10 to 50%) voids. T h e presence of too many voids is undesirable, s i n c e they de-
c rease the thermal conductivity and the volume reduction (volume of was te per volume of product) of the system significantly. Good products a re considered to be those that are hard and strong and have only a low percentage of voids. Experi- ments 6 and 7 gave good products with spray- calcined Purex waste. These products represent a volume reduction of about 10, equal t o that ob- tained in processes for forming ceramics or single- phase g l a s s e s with th i s waste. Experiment 13 gave the best product with F B V P powders (Fig. 4.2). This experiment a l s o shows that a tempera- ture less than 800°C is sufficient for operation with Pemco 716 glass and that the earlier u s e of temperatures greater than 900°C with this g l a s s was not necessary to obtain a good product with this arrangement of equipment. Th i s dense, hard, almost void-free product seemed to be the result of both zone heating and matching the particle sizes of the g l a s s to those of the waste. Since the g l a s s merely fills t h e in t e r s t i ce s of the FBVP
PHOTO 86766
d e r in Lead-Silicate Glass (Pemco- Dispersion contoins 35.4 wt 76
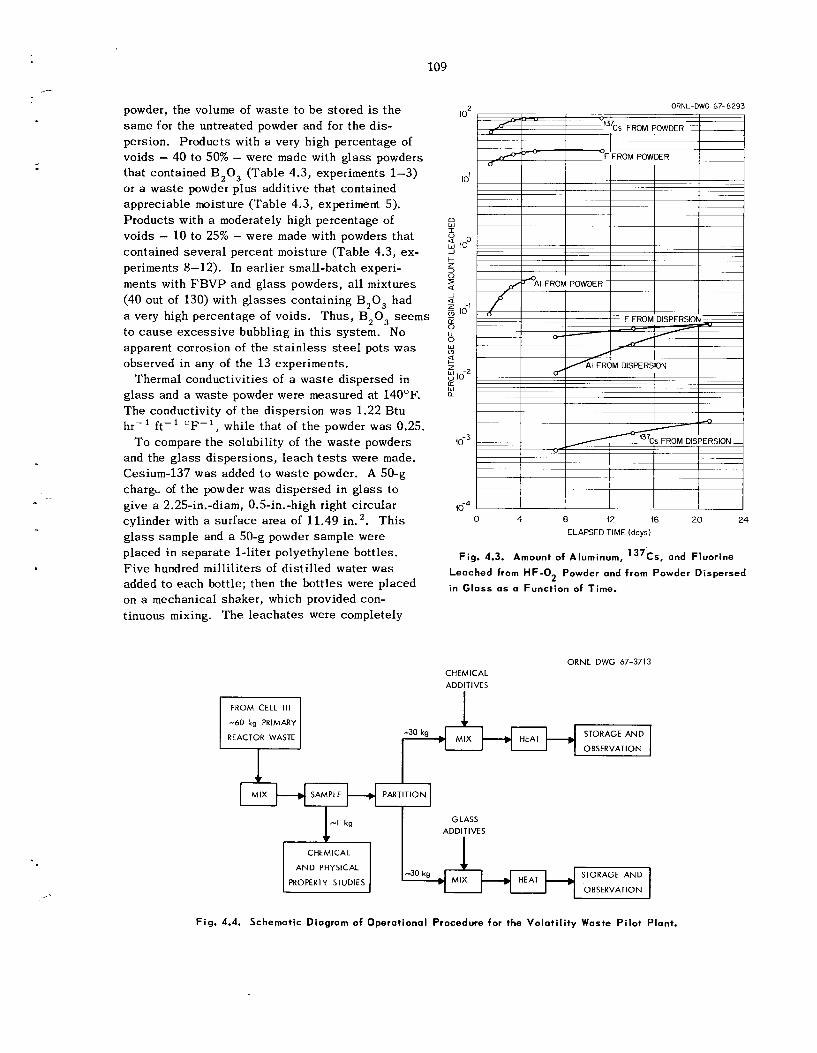
.-
CHEMICAL AND PHYSICAL
109
GLASS ADDITIVES
-30 kg STORAGE AND
powder, the volume of was te to b e stored is t h e s a m e for the untreated powder and for t he d is - persion. Products with a very high percentage of voids - 40 t o 50% - were made with g lass powders that contained B ,03 (Table 4.3, experiments 1-3) or a was te powder plus additive that contained appreciable moisture (Table 4.3, experiment 5). Products with a moderately high percentage of voids - 1 0 to 25% - were made with powders that contained severa l percent moisture (Table 4.3, ex- periments 8-12). In earlier small-batch experi- ments with F B V P and g l a s s powders, all mixtures (40 out of 130) with g l a s s e s containing B,O, had a very high percentage of voids. Thus , B'O, seems t o c a u s e excess ive bubbling in th i s system. No apparent corrosion of the s t a i n l e s s s t e e l pots was observed in any of the 13 experiments.
Thermal conductivit ies of a was te dispersed in g l a s s and a was te powder were measured at 140OF. The conductivity of the dispersion was 1.22 Btu
, while that of t he powder was 0.25. hr- 1 ft- 1 O F - 1
To compare the solubili ty of the was te powders and the g l a s s d i spers ions , l each t e s t s were made. Cesium-137 was added to was te powder. A 50-9 charg, of the powder was dispersed in glass to give a 2.25-in.-diam, 0.5-in.-high right circular cylinder with a sur face area of 11.49 in.'. T h i s g l a s s sample and a 50-g powder sample were placed in sepa ra t e 1-liter polyethylene bottles. F ive hundred milliliters of d i s t i l l ed water was added to each bottle; then the bot t les were placed on a mechanical shaker, which provided con- tinuous mixing. The l eacha te s were completely
PROPERTY STUDIES
-60 kg PRIMARY REACTOR WASTE
MIX OBSERVATION
I U I
I I
F FROM POWDER I I
IO'
0 w
0 4 8 12 16 20 24 ELAPSED TIME (days)
Fig. 4.3. Amount of Aluminum, 13'Cs, and Fluorine
Leached from HF-02 Powder and from Powder Dispersed
in Glass as o Function of Time.
CHEMICAL ADDlTl VE S
ORNL DWG 67-3713
-30 kg STORAGE AND OBSERVATION I MIX
Fig. 4.4. Schematic Diagram of Operational Procedure for the Vo la t i l i ty Waste P i lo t Plant.
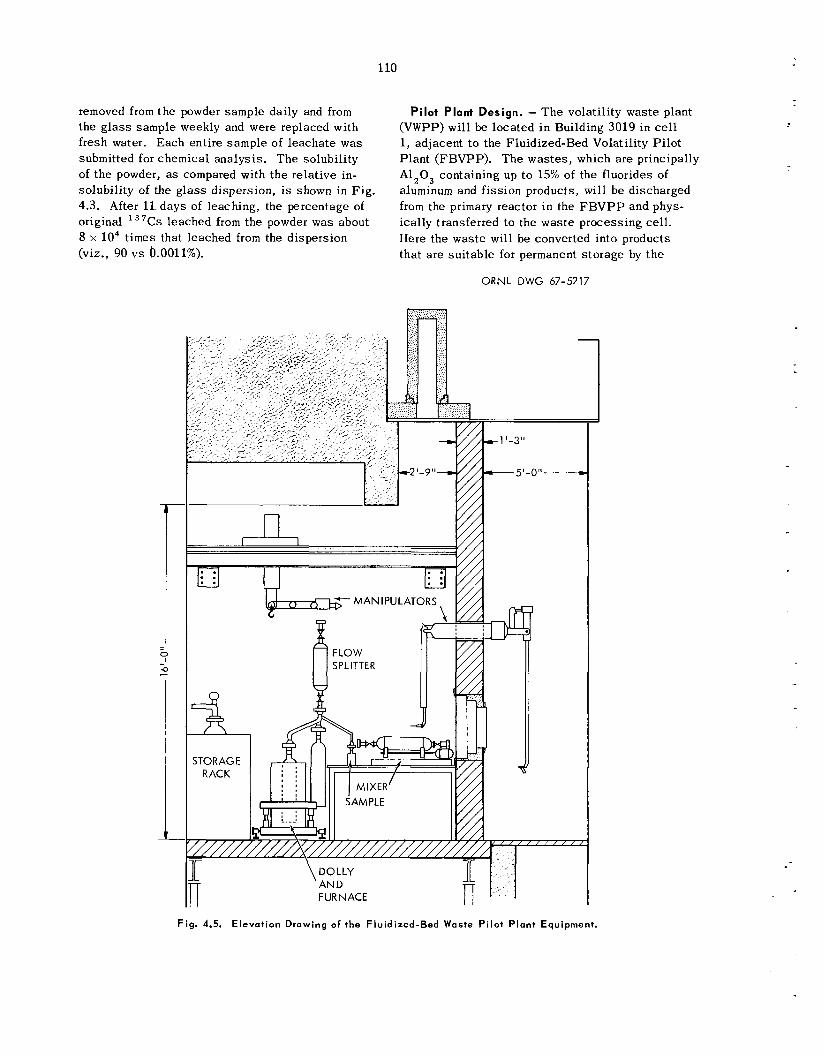
110
removed from t h e powder sample daily and from the g l a s s sample weekly and were replaced with fresh water. Each entire sample of leacha te was submitted for chemical analysis. T h e solubili ty of t h e powder, as compared with the relative in- solubili ty of the g l a s s dispersion, is shown in Fig. 4.3. After 11. days of leaching, the percentage of original 13’Cs l eached from the powder was about 8 x l o 4 times that leached from the dispersion (viz., 90 v s b.0011%).
Pilot Plant Design. - T h e volatility was te plant (VWPP) will be loca ted in Building 3019 in cell 1 , adjacent t o the Fluidized-Bed Volatility P i lo t P lan t (FBVPP). T h e w a s t e s , which a r e principally A1,0, containing up to 15% of the fluorides of aluminum and f i ss ion products, will b e discharged from the primary reactor i n the F B V P P and phys- ically transferred to the was te process ing cell. Here the was te will be converted into products tha t a r e su i tab le for permanent s torage by t h e
ORNL DWG 67-5217
STORAGE RACK
v Fig. 4.5. Elevat ion Drawing of the Fluidized-Bed Waste P i lo t Plant Equipment.
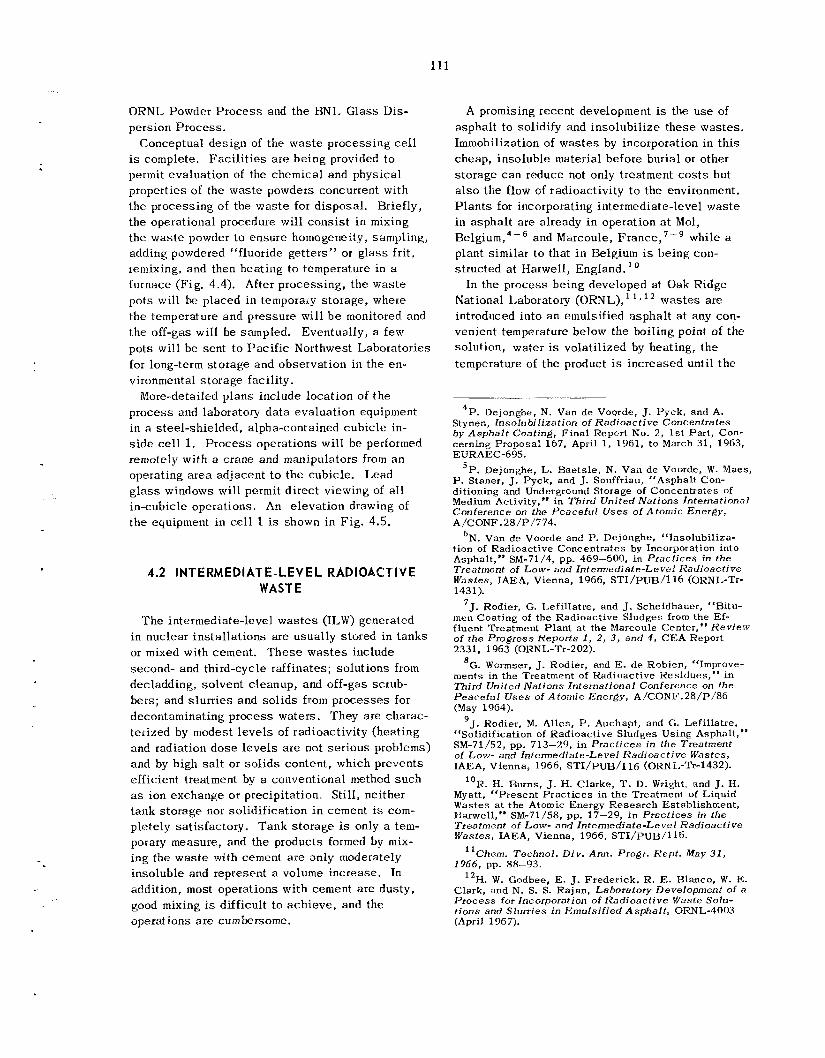
111
ORNL Powder P r o c e s s and the BNL Glass Dis- persion Process .
is complete. Facilities a r e be ing provided to permit evaluation of the chemical and physical properties of the was te powders concurrent with t h e processing of the was te for d i sposa l . Briefly, t he operational procedure will cons i s t i n mixing t h e was te powder to ensure homogeneity, sampling, adding powdered “fluoride ge t te rs” or g l a s s fri t , remixing, and then heating to temperature in a furnace (Fig. 4.4). After process ing , t he was te pots will be placed in temporaiy storage, where the temperature and pressure will b e monitored and t h e off-gas will be sampled. Eventually, a few pots wi l l b e sen t t o Pac i f i c Northwest Laboratories for long-term s torage and observation in the en- vironmental s torage facility.
More-detailed p lans include location of t h e process and laboratory da t a evaluation equipment in a steel-shielded, alpha-contained cubic le in- s i d e cell 1. P r o c e s s operations will b e performed remotely with a crane and manipulators from a n operating a rea ad jacent to t h e cubicle. Lead glass windows wi l l permit d i rec t viewing of all in-cubicle operations. An e leva t ion drawing of t h e equipment in cell 1 is shown in Fig. 4.5.
Conceptual des ign of the was te process ing cell
4.2 I NT E RM ED1 AT E- LEV E L RAD1 OACT IVE WASTE
T h e intermediate-level w a s t e s (ILW) generated in nuclear ins ta l la t ions are usually stored in tanks or mixed with cement. T h e s e w a s t e s include second- and third-cycle raffinates; solutions from decladding, solvent cleanup, and off-gas scrub- bers ; and s lur r ies and so l id s from p rocesses for decontaminating p rocess waters. They are charac- terized by modest l eve l s of radioactivity (heating and radiation d o s e l eve l s a re not se r ious problems) and by high salt or so l id s content, which prevents efficient treatment by a conventional method s u c h as ion exchange or precipitation. Still, neither tank s torage nor solidification i n cement is com- pletely satisfactory. Tank s torage is only a tem- porary measure, and the products formed by mix- ing the was te with cement a r e an ly moderately insoluble and represent a volume increase, In addition, most operations with cement are dusty, good mixing is difficult to ach ieve , and the operations a r e cumbersome.
A promising recent development is the use of asphal t to solidify and inso lubi l izc these was tes . Immobilization of was te s by incorporation in th i s cheap, insoluble material before burial or other s torage c a n reduce not only treatment costs but a l so the flow of radioactivity to the environment. P l a n t s for incorporating intermediate-level was t e in asphal t a r e already i n operation at Mol, B e l g i ~ m , ~ - ~ and Marcoule, while a plant similar t o that i n Belgium is being con- structed a t Harwell, England. l o
In the process be ing developed at Oak Ridge National Laboratory (ORNL), ‘ ‘ 8 ’’ was tes a re introduced into a n emulsified a spha l t at any con- venient temperature below the boiling point of t he solution, water is volati l ized by heating, the temperature of t he product is increased until the
4P. Dejonghe, N. Van de Voorde, J. Pyck, and A. Stynen, lnsolubilization of Radioactive Concentrates b y Asphalt Coating, F ina l Repcrt No. 2, 1 s t Part , Con- cerning Proposal 167, April 1, 1961, to March 31, 1963, EURAEC-695.
P. Staner, J. Pyck, and J. Souffriau, “Asphalt Con- ditioning and Underground Storage of Concentrates of Medium Activity, *’ in Third United Notions International Conference on the Peacefu l Uses of Atomic Energy, A/CONF.28/P/774.
6N. Van de Voorde and P. Dejonghe, “Insolubiliza- t ion of Radioactive Concentrates by Incorporation into Asphalt,” SM-71/4, pp. 469-600, in Prac t ices in the Treatment of Low- and Intermediate-Level Radioactive Wastes, IAEA, Vienna, 1966, STI /PUB/I 16 (ORNL-Tr- 1431).
7J. Rodier, G. Lefil latre, and J. Scheidhauer, “Bitu- men Coating of the Radioactive Sludges from the Ef- fluent Treatment Plant a t the Marcoule Center,” Review of the Progress Reports 1, 2, 3 , and 4 , CEA Report 2331, 1963 (ORNL-Tr-202).
ments in the Treatment of Radioactive Residues,” i n Third United Nations International Conference on the Peacefu l Uses of Atomic Energy, A/CONPT.28/P/86 (May 1964). ’ J. Kodier, M. Alles, P. Auchapt, and G. Lefillatre, “Solidification of Radioactive Sludges Using Asphalt,” SM-71/52, pp. 713-29, in P rac t i ces in the Treatment of Low- and Intermediate-Level Radioactive Wastes, IAEA, Vienna, 1966, STI/PUB/116 (ORNL-Tr-1432).
‘OR. H. Burns, J. H. Clarke, T. D. Wright, and J. H. Myatt, “Present Prac t ices in the Treatment of Liquid Wastes at the Atomic Energy Research Establishment, Harwell,” SM-71/58, pp. 17-29, i n Prac t ices in the Treatment of Low- and Intermediate-Level Radioactive Wastes, IAEA, Vienna, 1966, STI/PUB/116.
“Chem. Technol. Div. Ann. Progr. Hept. May 31, 1966, pp. 88-93.
lZH. W. Godbee, E. J. Frederick, R. E. Rlanco, W. E. Clark, and N. S . S . Rajan, Laboratory Development of a Process for Incorporation of Radioac t ive 5Vaste Solu- tions and Slurries in Emulsified Asphalt, ORNL-4003 (April 1967).
’P, Dejonghe, L. Haetsle, N. Van d e Voorde, W. Maes,
‘G. Wormser, J. Rodier, and E. d e Robien, “Improve-
112
product flows freely, and, finally, the product i s drained into a s t e e l drum for preliminary s torage and shipment. Attractive fea tures of t h e process include: u se of emulsified asphal t , which flows readily a t room temperature; evaporation a t low temperatures to minimize degradation of the asphalt; low agitation r a t e s , which provide ade- qua te mixing and keep the heated sur faces of t h e evaporator c lean; operation in either a hatch or continuous manner; and incorporation of so luble or insoluble so l ids with equal e f fec t iveness .
Incorporating ILW in a spha l t is a promising method for handling a l l was t e s in th i s c l a s s . No ser ious problems have been observed i n the in- corporation procedure in laboratory, hot-cell, and nonradioactive pilot plant s tud ie s with alkaline solutions and slurries. T h e products show ac- ceptably low leach ra tes i n water over long periods of time, with no significant increase a t radiation leve ls up to lo9 rads (with external 6oLo irradia- tion). Hot-cell t e s t s us ing samples that contained up to 52 curies of mixed radionuclides per gallon of asphal t product a re in progress. No increase in leach ra tes of s a l t s from the products, swelling of t h e product, or evolution of g a s e s from the product occurred a t d o s e s up to 4 x l o 7 rads over a seven- month period.
A nonradioactive pilot plant was constructed to determine the feasibil i ty of us ing a wiped-film evaporator for the incorporation of intermediate- level was tes in asphalt . T h e equipment operated for 62 hr a t ra tes up to 11 gal of was te solution per hour and yielded a product that contained up t o 64 wt % was te sa l t s . No ser ious operating dif- f icult ies were encountered, and no appreciable wiper-blade wear was detected. The water that w a s disti l led was decontaminated from sodium by a factor of greater than 4000 (based on comparisons with the original was t e solution). The estimated capi ta l cos t of an asphalt plant for annually treat- ing 400,000 gal of ORNL ILW containing 5 cur ies / gal was $330,500; the estimated unit operating cos t , including amortization and burial at OHNL, was $0.37/gal.
Process Description
T h e emulsified asphal t p rocess c a n be operated in either a hatch or a continuous manner. In the laboratory, t he batch process c o n s i s t s i n adding the was te directly to emulsified asphal t in an evaporator which conta ins a stirrer and a bottom
outlet , mixing a t any convenient temperature up to about 100°C (with a low s t i r r ing rate of 100 to 300 rpm), evaporating the water, increasing the tcmperature t o 130 t o 16OoC, and draining the product into a d i sposa l container. In the continuous process, t he was te and asphal t a r e introduced a t t he top of a wiped-film evaporator, and the mix- ture flows down the wal l s of t he evaporator a t about 160OC. Agitator paddles sweep the wal l s continuously a t about 300 rpm and provide good mixing and heat transfer. T h i s p rocess has been demonstrated i n the laboratory with nonradioactive waste, in hot-cell t e s t s with was te containing up to 25 cur ies of mixed f i ss ion products per gallon in a 4-in.-diam, 6'/2-in.-high evaporator, and on a pilot-plant s c a l e with nonradioactive was te in a 12-in.-diam, 16-in.-high Pfaudler wiped-film evaporator having 4 f t2 of heat-transfer surface.
T h e water vapor from the evaporator i n either mode of operation is subsequently condensed and collected in a su i tab le receiver. In practice, t h i s condensa te would b e sampled and sen t to the plant LLW treatment system. Noncondensable g a s e s from the condenser would b e heated and passed through a n absolute filter before discharge to the plant off-gas system.
Chemical Development
A s reported previously, asphal t products con- taining 10 to 80 wt % s a l t s from was te have been prepared with OKNL ILW, a n aluminum cladding solution (ACS), and a Purex second-plutonium- cyc le was te (2CW) with and without added caus t i c (Table 4.4). No apparent difference, other than hardness, was observed in the product obtained with a given was te . Products made with 2CW are harder than those made with ILW or ACS a t t he s a m e weight percent so l ids . Leaching t e s t s with disti l led water show that t he ra tes a t which strontium and ruthenium are leached from asphal t products a re sufficiently low (0.1% or l e s s leached out in 1.5 years). However, t h e l each rate of cesium is 50 to 100 times higher than this. Re- s u l t s of in i t ia l experiments with mineral addi t ives to improve cesium retention ind ica te tha t t h e addition of Grundite clay should have the desired effect. Tests were made with ORNL, T L W that contained 2 wt % Grundite clay and 2 wt % water glass (Na,SiO,). The purpose of t h e water glass is to hold or suspend t h e Grundite i n t h e waste. An asphalt product containing 60 wt % so l ids from
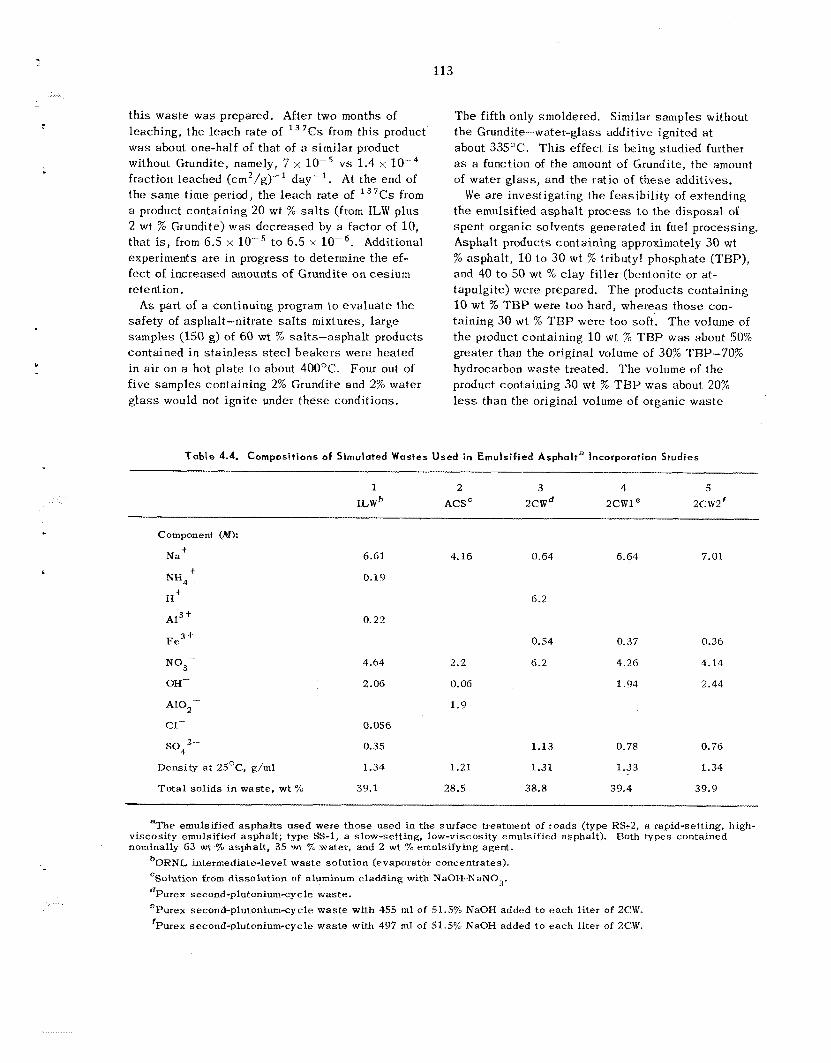
113
th is was te w a s prepared. After two months of leaching, the l each rate of 13'Cs from th is product was about one-half of that of a s imi la r product without Grundite, namely, 7 x lo-' v s 1.4 x fraction leached (cm2/g)-' day-'. At the end of the same time period, the l each rate of 137Cs from a product containing 20 wt % s a l t s (from ILW plus 2 wt % Grundite) was decreased by a factor of 10, that is, from 6.5 x t o 6.5 x Additional experiments a re in progress to determine the ef- fect of increased amounts of Grundite o n ces ium retention.
As part of a continuing program to eva lua te the safe ty of asphalt-nitrate s a l t s mixtures, large samples (150 g) of 60 wt % salts-asphalt products contained in s t a i n l e s s s t e e l beakers were heated in air o n a hot plate t o about 400°C. Four out of f i v e samples containing 2% Grundite and 2% water g l a s s would not ignite under these conditions.
The fifth only smoldered. Similar samples without t he Grundite-water-glass additive ignited a t about 335OC. T h i s effect is being studied further as a function of the amount of Grundite, the amount of water glass, and the ratio of t h e s e additives.
We a re investigating the feas ib i l i ty of extending the emulsified asphal t process t o the disposal of spent organic so lvents generated in fuel processing. Asphalt products containing approximately 30 wt 76 asphal t , 10 to 30 wt % tributyl phosphate (TBP), and 40 t o 50 wt % c lay f i l l e r (bentonite or at- tapulgite) were prepared. The products containing 10 wt 76 'rWP were too hard, whereas those con- taining 30 wt '% TBP were too soft. T h e volume of t he product containing 10 wt % TBP was about 50% greater than the original volume of 30% TRP-70% hydrocarbon was te treated. The volume of the product containing 30 wt % TBP was about 20% less than the original volume of organic was te
Table 4.4. Compositions of Simulated Wastes U s e d in Emulsi f ied Asphalta Incorporation Studies
1 2 3 4 5 I L W ~ ACSC 2CWd 2cw1 e 2cw2' -
Component (M):
+ Na 6.61 4.16 0.64 6.64 7.01
NH, + 0.19
I1 + 6.2
~1~ * 0.22
Fe3 + 0.54
NO,-- 4.64 2.2 6.2
OH- 2.06 0.06
Al0,- 1.9
c1- 0.056
so4 2.- 0.35 1.13 0.78 0.76
Density a t 2S°C, g/ml 1.34 1.21 1.31 1.33 1.34
To ta l so l ids in waste, wt % 39.1 28.5 38.8 39.4 39.9
0.37
4.26
1.94
0.36
4.14
2.44
BThe emulsified asphal t s used were those used in the surface treatment of roads (type RS-2, il rapid-setting, high- viscosity emulsified asphalt; type SS-1, a slow-setting, low-viscosity emulsified asphalt). nominally 63 wt 7'0 asphalt , 35 wt 70 water, and 2 wt % emulsifying agent.
Both types contained
b~~~~ intermediate-level was te solution (evaporator concentrates). 'Solution from dissolution of aluminum cladding with NaOH-NaNOj. dPurex second-plutonium-cycle waste. PPurex second-plutonium-cycle was te with 455 ml of 51.5% NaOH added to each l i ter o f 2CW. 'Purex second-plutonium-cycle was te with 497 ml of 51.5% NaOH added to each l i ter of 2CW.
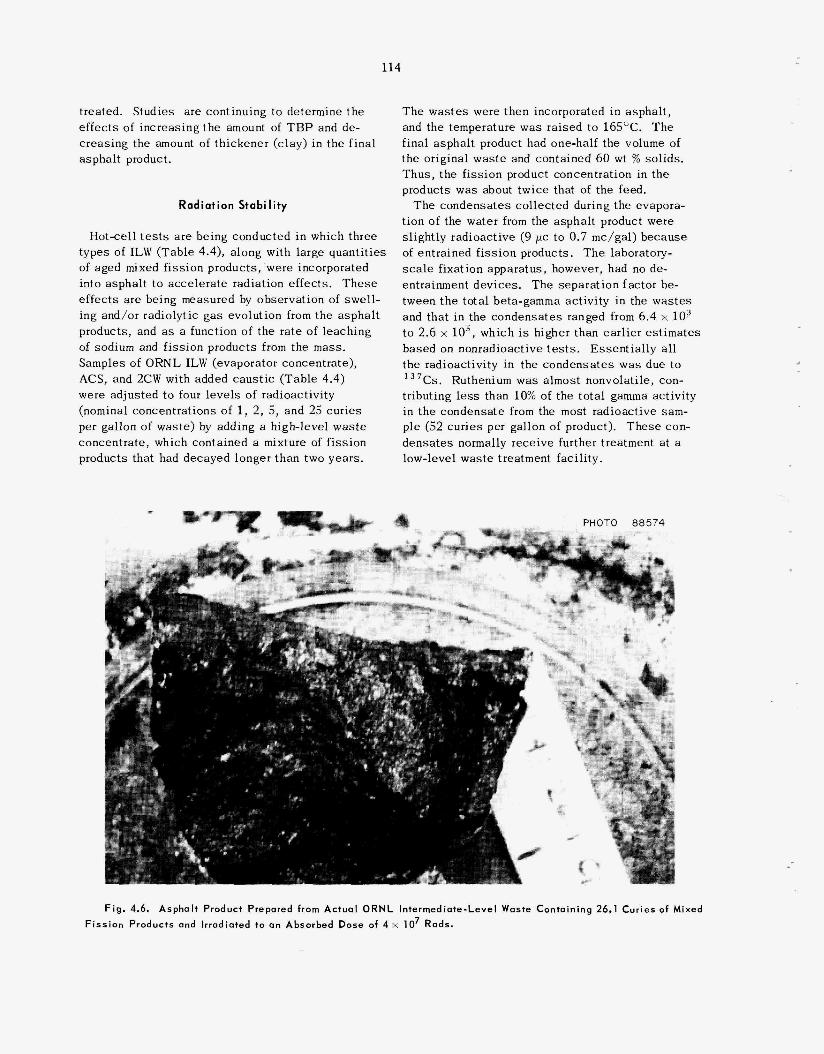
114
treated. Studies are continuing to determine the effects of increasing t h e amount of T B P and de- creasing the amount of thickener (clay) in the f inal asphal t product.
Radiation Stability
Hot-cell t e s t s a r e being conducted in which three types of ILW (Table 4.4). along with large quant i t ies of aged mixed f i ss ion products, were incorporated into asphal t to accelerate radiation effects. T h e s e effects are being measured by observation of swel l - ing and/or radiolytic gas evolution from the asphal t products, and as a function of the ra te of leaching of sodium and f iss ion products from the mass. Samples of ORNL ILW (evaporator concentrate), ACS, and 2CW with added caus t ic (Table 4.4) were adjusted t o four leve ls of radioactivity (nominal concentrations of 1, 2, 5, and 25 cur ies per gallon of waste) by adding a high-level w a s t e concentrate , which contained a mixture of f iss ion products that had decayed longer than two years .
T h e w a s t e s were then incorporated in asphalt , and the temperature was raised to 165OC. T h e final asphal t product had one-half the volume of the original was t e and contained 60 wt % sol ids . Thus, the f iss ion product concentration in the products was about twice that of the feed.
T h e condensates collected during the evapora- tion of the water from the asphal t product were slightly radioactive (9 pc to 0.7 mc/gal) because of entrained f i ss ion products. T h e laboratory- scale fixation apparatus, however, had no de- entrainment devices . The separat ion factor be- tween t h e total beta-gamma activity in the was te s and that in the condensates ranged from 6.4 x 10³ to 2.6 x lo5, which is higher than ear l ier es t imates based on nonradioactive t e s t s . Essent ia l ly all the radioactivity in the condensa tes was due to l 3 7 C s . Ruthenium was almost nonvolati le, con- tributing less than 10% of the total gamma activity in t h e condensate f rom the most radioactive sam- ple (52 cur ies per gallon of product). T h e s e con- d e n s a t e s normally receive further treatment a t a low-level waste treatment facility.
It Product Prepared from Actual ORNL Intermediate-Level Was FissEon Products and Irradiated to on Absorbed e of 4 x IO7 Rads,
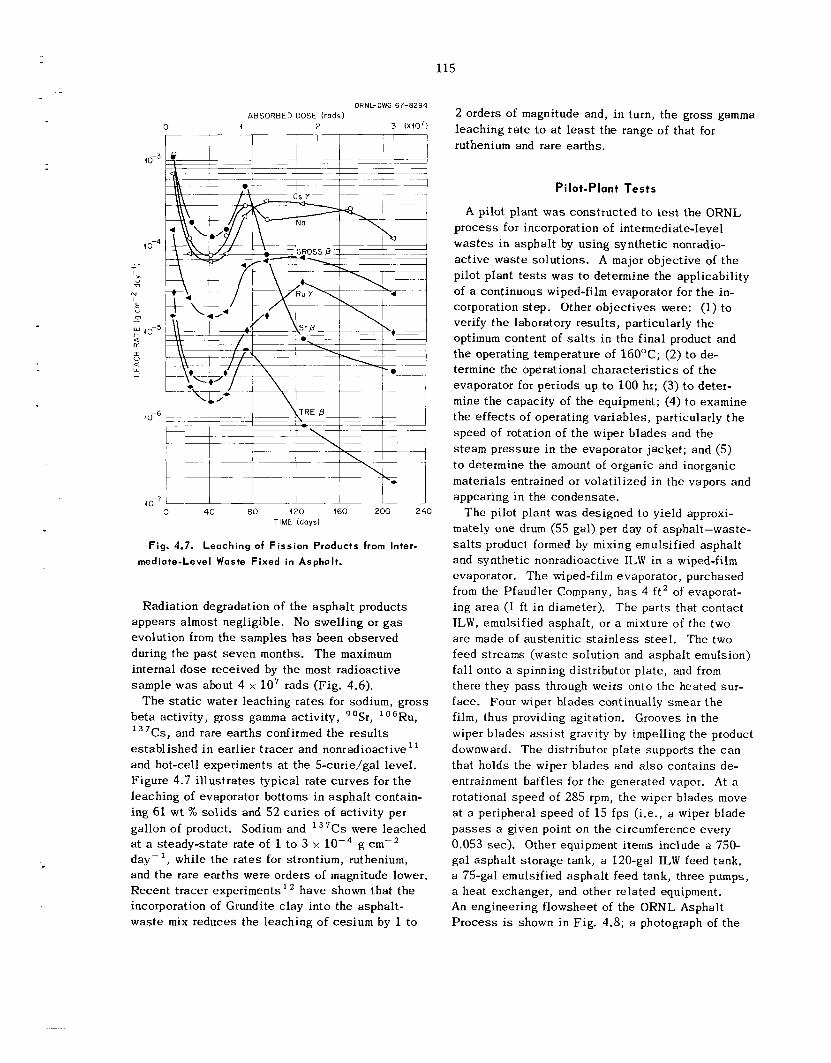
115
IO-^
40-6
ORNL-DWG 67-8294 ABSORBED DOSE (rads)
0 4 2 3 (~407)
420 160 200 240 40-? I
0 40 80 TIME (days)
Fig. 4.7. Leaching of F iss ion Products from Inter-
mediate-Level Waste F ixed i n Asphalt.
Radiation degradation of the asphal t products appears almost negligible. No swelling or g a s evolution from the samples h a s been observed during the pas t s even months. The maximum internal dose received by the most radioactive sample was about 4 x l o 7 rads (Fig. 4.6).
beta activity, gross gamma activity, "Sr, l o6Ru ,
es tab l i shed in earlier t racer and nonradioactive' and hot-cell experiments a t the 5-curie/gal level. Figure 4.7 i l lus t ra tes typical rate curves for t h e leaching of evaporator bottoms in asphal t contain- ing 61 wt % so l id s and 52 cu r i e s of activity per gallon of product. Sodium and 1 3 7 C s were leached at a s teady-s ta te rate of 1 t o 3 x day-', while the ra tes for strontium, ruthenium, and the rare ear ths were orders of magnitude lower. Recent tracer experiments ' have shown that the incorporation of Grundite clay into the asphalt- waste mix reduces the leaching of cesium by 1 to
T h e static water leaching rates for sodium, gross
7Cs , and rare earths confirmed the results
g cm-'
2 orders of magnitude and, i n turn, the gross gamma leaching r a t e to a t l ea s t the range of that for ruthenium and rare earths.
Pilot-Plant Tests
A pilot plant was constructed t o test the ORNL process for incorporation of intermediate-level was t e s in asphal t by using synthe t ic nonradio- ac t ive was te solutions. A major objective of t he pilot plant t e s t s was t o determine the applicability of a continuous wiped-film evaporator for t he in- corporation s tep . Other ob jec t ives were: (1) to verify the laboratory results, particularly the optimum content of salts in the final product and t h e operating temperature of 16OOC; (2) to de- termine the operational charac te r i s t ics of t he evaporator for periods up t o 100 hr; (3) to deter- mine the capacity of the equipment; (4) t o examine the e f fec ts of operating variables, particularly t h e speed of rotation of the wiper b lades and the s team pressure in the evaporator jacket; and (5) to determine the amount of organic and inorganic materials entrained or volati l ized in the vapors and appearing in the condensate.
The pilot plant was designed to yield approxi- mately one drum (55 gal) per day of asphalt-waste- s a l t s product formed by mixing emulsified asphalt and synthetic nonradioactive ILW in a wiped-film evaporator. The wiped-film evaporator, purchased from the Pfaudler Company, h a s 4 f t2 of evaporat- ing a rea (1 ft in diameter). T h e parts that contact ILW, emulsified asphalt , or a mixture of the two are made of aus ten i t ic s t a in l e s s steel . The two feed streams (waste solution and asphalt emulsion) fall onto a spinning distributor plate, and from there they pass through weirs onto the heated sur- face. Four wiper b lades continually smear t h e film, thus providing agitation. Grooves in the wiper b lades a s s i s t gravity by impelling the product downward. The distributor plate supports the c a n that holds the wiper blades and a l so contains de- entrainment baffles for the generated vapor. At a rotational speed of 285 rpm, the wiper blades move a t a peripheral speed of 15 fps (i.e., a wiper blade p a s s e s a given point on the circumference every 0.053 sec). Other equipment items include a 750- gal asphal t s torage tank, a 120-gal ILW feed tank, a 75-gal emulsified asphal t feed tank, three pumps, a heat exchanger, and other related equipment, An engineering flowsheet of the ORNL Asphalt P rocess is shown in Fig. 4.8; a photograph of the
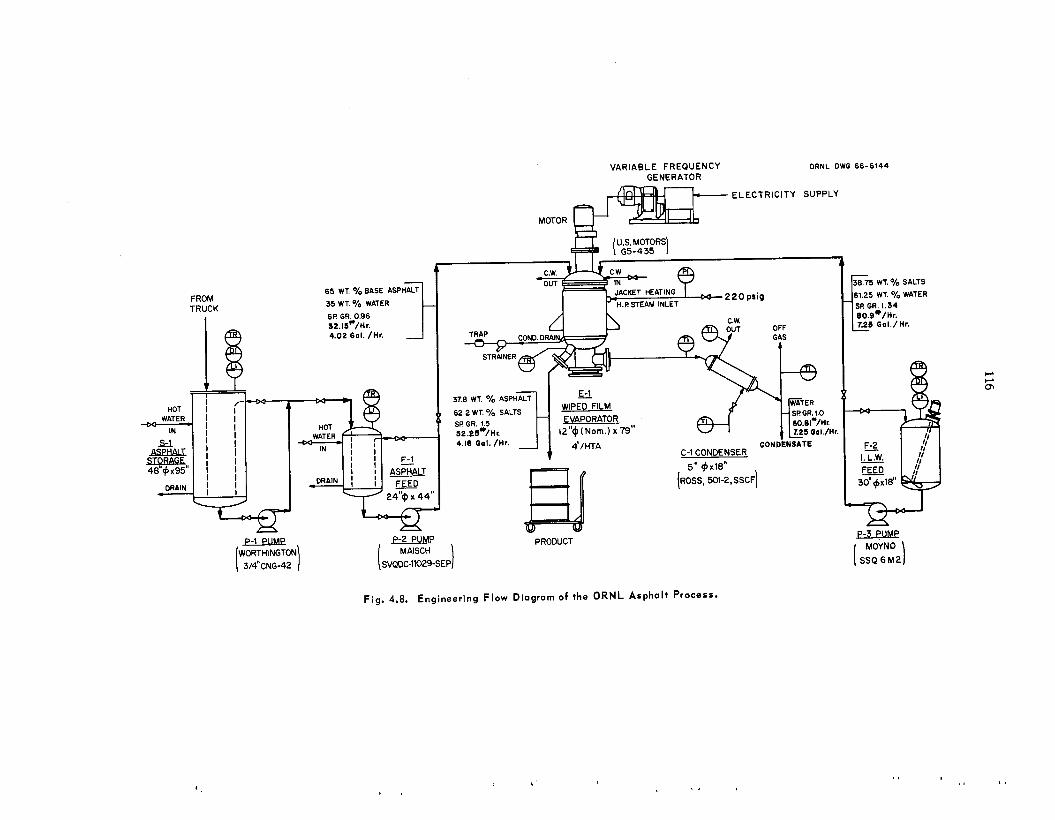
FROM TRUCK
65 WT. o/o BASE ASPHALT 35 WT. '/o WATER Si? GR. 0.96 ?,z.lS"/Hr. 4.02 Gal. /Hr.
P-1 PUMP WORTHINGTON
3/4"CNG-42
V A R I A B L E F R E Q U E N C Y ORNL OWG 66-6144 GENERATOR
E L E C T R I C I T Y SUPPLY
C-1 CONDENSER
H II PRODUCT
MAISCH
Fig. 4.8. Engineering F l o w Diagram of the ORNL Asphalt Process.
, I -
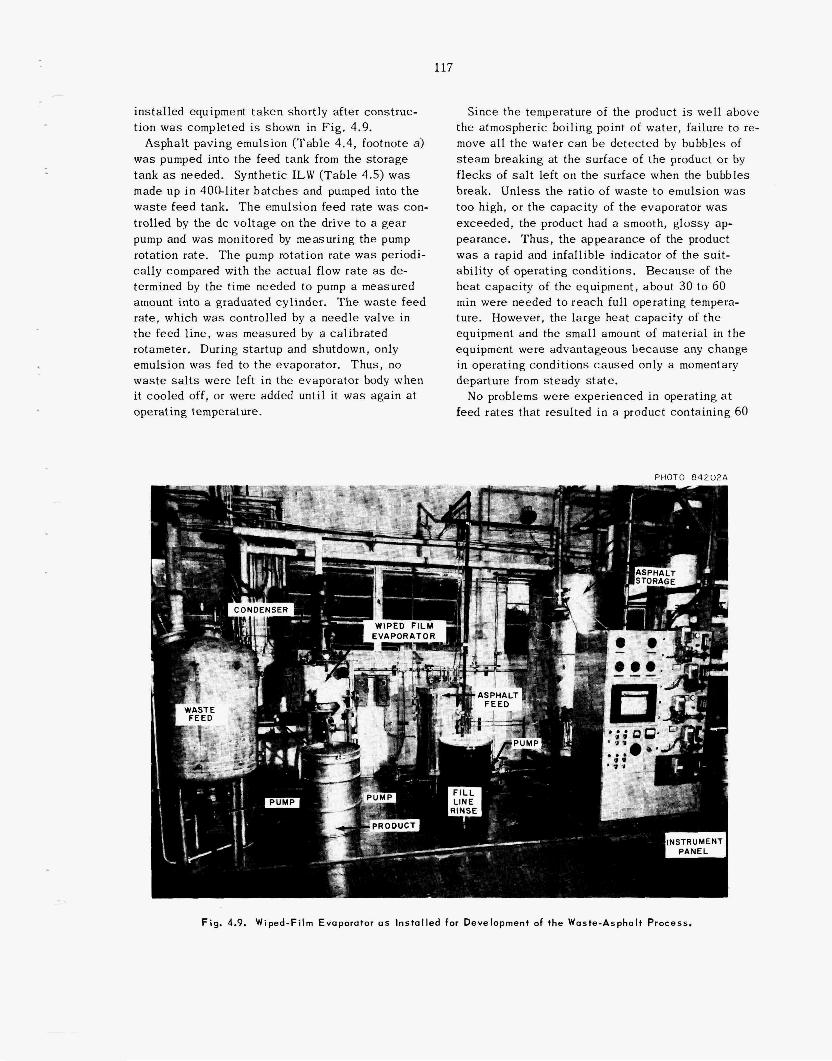
117
installed equipment taken shortly after construc- t ion w a s completed is shown in F ig , 4.9.
was pumped into the feed tank from the s torage tank as needed. Synthetic ILW (Table 4.5) was made up in 400-liter ba tches and pumped into t h e was te feed tank. T h e emulsion feed rate was con- trolled by the dc vol tage on t h e drive to a gear pump and was monitored by measuring the pump rotation rate. T h e pump rotation ra te was periodi- cal ly compared with the actual flow ra te as de- termined by the time needed to pump a measured amount into a graduated cylinder. T h e waste feed rate, which was controlled by a needle valve in the feed l ine, was measured by a calibrated rotameter. During s tar tup and shutdown, only emulsion was fed to the evaporator. Thus, no was te s a l t s were left in the evaporator body when it cooled off, or were added until i t was again at operating temperature.
Asphalt paving emulsion (Table 4.4, footnote a)
Since the temperature of the product is well above the atmospheric boiling point of water, failure to re- move all the water can b e detected by bubbles of s team breaking at the sur face of the product or by f lecks of s a l t left on the surface when the bubbles break. Un les s the ratio of was te to emulsion was too high, or the capacity of the evaporator was exceeded] the product had a smooth, glossy ap-
e. Thus, the appearance of the product was a rapid and infallible indicator of the suit- ability of operating conditions. Because of the heat capaci ty of the equipment, about 30 to 60 min were needed to reach ful l operating tempera- ture. However, the large heat capaci ty of the equipment and the small amount of material in t h e equipment were advantageous because in operating conditions caused only a departure from steady s ta te .
No problems were experienced i n op feed ra tes that resulted in a product containing 60
PHOTO 84202A
Fig. 4.9. Wiped-Film Evaporator o s Instal led for Development of the Woste-Asphalt Process.
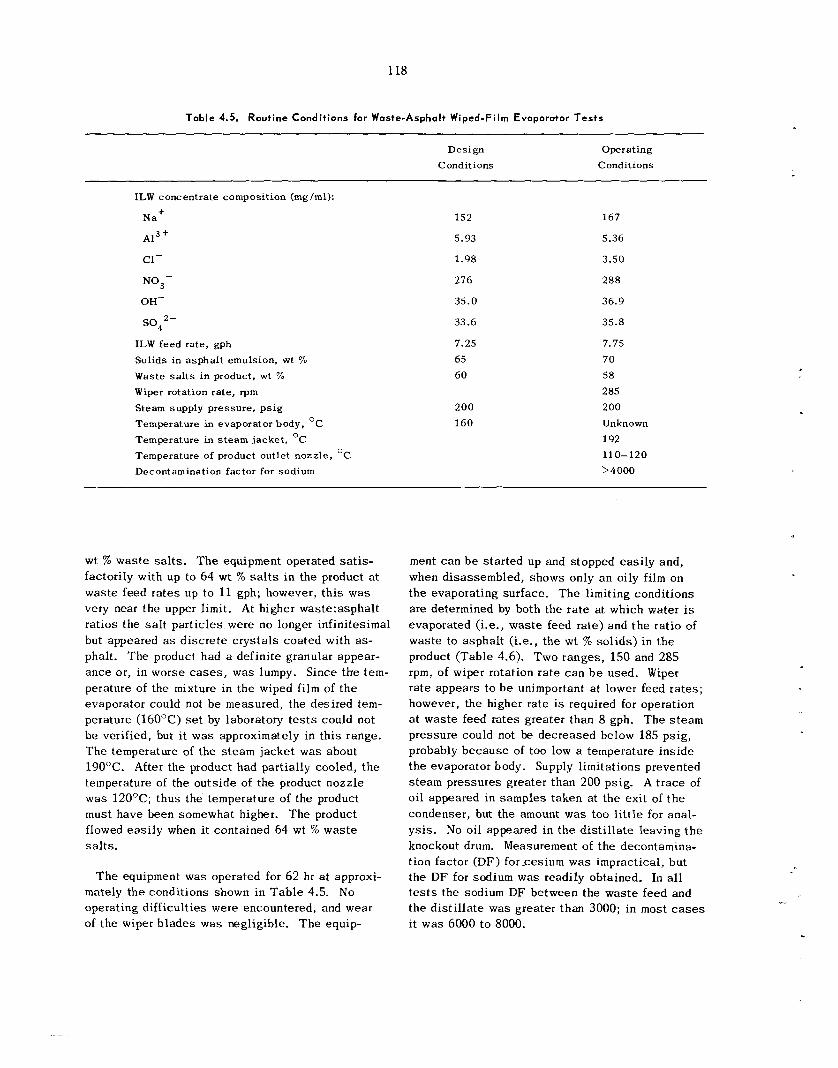
118
Table 4.5. Routine Conditions for Waste-Asphalt Wiped-Film Evaporator Tests
ILW concentrate composition (mg/ml):
Na'
~1~ +
c1-
NO,-
OH-
so,2-
ILW feed rate, gph Solids in asphalt emulsion, wt % Waste sa l ts in product, wt 70
Wiper rotation rate, rpm Steam supply pressure, ps ig Temperature in evaporator body, OC Temperature in steam jacket, OC Temperature of product outlet nozzle, OC Decontamination factor for sodium
152
5.93
1.98
276
35.0
33.6
7.25 65 6 0
200 160
167
5.36
3.50
288
36.9
35.8
7.75 70 58 2 85 200 Unknown 192 110-120 >4000
Design Conditions
Operating Conditions
wt % was te salts. T h e equipment operated satis- factorily with up to 64 wt % s a l t s i n the product at was te feed r a t e s up to 11 gph; however, t h i s was very near t he upper limit. At higher waste:asphalt ratios the s a l t par t ic les were no longer infinitesimal but appeared as d i sc re t e c rys ta l s coated with as- phalt. The product had a definite granular appear- ance or, i n worse cases, was lumpy. Since t h e tem- perature of the mixture in the wiped film of t h e evaporator could not b e measured, the desired tem- perature (16OOC) s e t by laboratory t e s t s could not be verified, but it w a s approximately in th i s range. The temperature of the s team jacke t was about 190°C. After the product had partially cooled, t h e temperature of the outs ide of the product nozzle was 120OC; thus the temperature of the product must have been somewhat higher. T h e product flowed eas i ly when i t contained 64 wt % was te sa l t s .
The equipment was operated for 62 hr a t approxi- mately t h e conditions shown in T a b l e 4.5. No operating difficult ies were encountered, and wear of the wiper b l ades was negligible. T h e equip-
ment c a n b e s ta r ted up and stopped eas i ly and, when disassembled, shows only a n oily film on t h e evaporating surface. T h e limiting conditions a re determined by both the r a t e at which water is evaporated (i.e., was te feed rate) and t h e ratio of was te to asphal t (i.e., the wt % so l id s ) i n the product (Table 4.6). Two ranges , 150 and 285 rpm, of wiper rotation r a t e c a n b e used. Wiper rate appears to b e unimportant a t lower feed r a t e s ; however, the higher rate is required for operation a t was t e feed ra tes greater than 8 gph. The s t eam pressure could not be decreased below 185 psig, probably because of too low a temperature ins ide t h e evaporator body. Supply l imitations prevented s team pressures greater than 200 psig. A t race of oil appeared in samples taken at the exit of t h e condenser, but the amount was too l i t t l e for anal- ys i s . No oil appeared in the d is t i l l a te leaving t h e knockout drum. Measurement of t h e decontamina- t ion factor (DF) for c e s i u m was impractical, but t he D F for sodium was readily obtained. In all t e s t s the sodium DF between the was te feed and t h e d is t i l l a te was greater than 3000; in most cases it was 6000 to 8000.
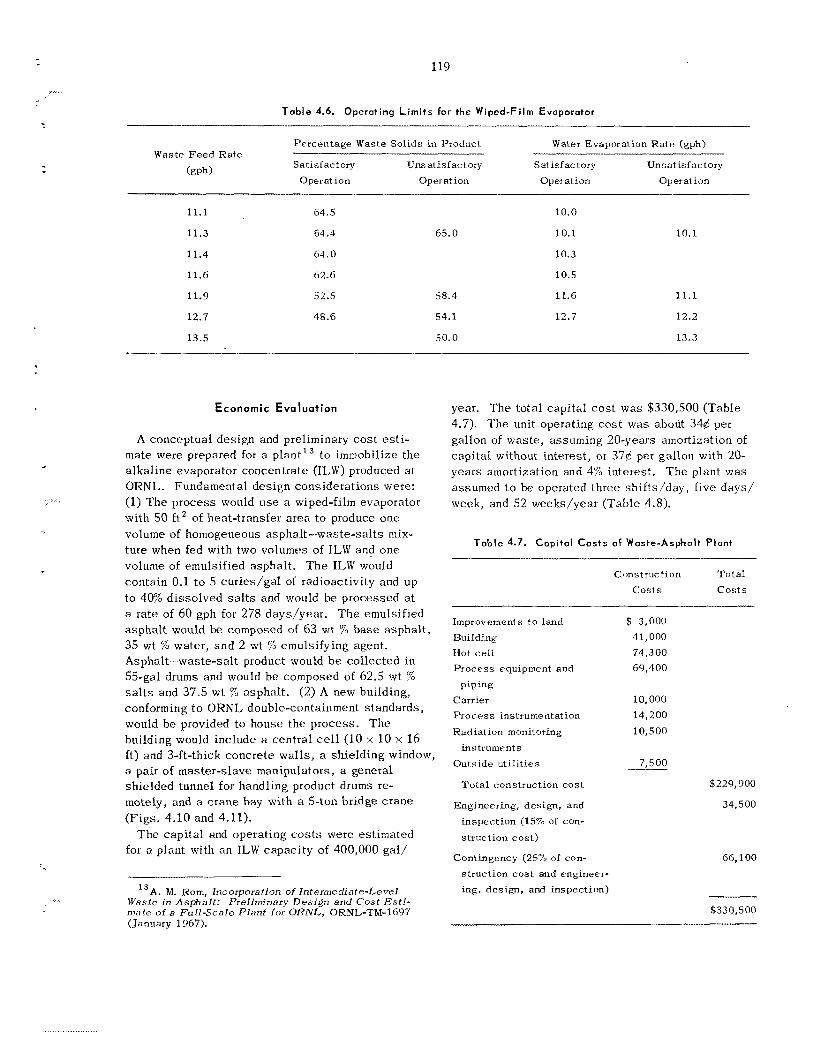
.....
119
Table 4.6. Operating L imi ts for the Wiped-Film Evoporotor
Percentage Waste Solids in Product
Satisfactory Unsatisfactory Satisfactory Unsatisfactory
Water Evaporation Rate (gph) Waste Feed Rate
( w h ) Operation Operat ion Operation Operation
11.1
11.3
11.4
11.6
11.9
12.7
13.5
64.5
64.4
64.0
62.6
52.5
48.6
65.0
58.4
54.1
50.0
10.0
10.1
10.3
10.5
11.6
12.7
10.1
11.1
12.2
13.3
Economic Evaluation
A conceptual design and preliminary c o s t e s t i - mate were prepared for a plant ' a lka l ine evaporator concentrate (ILW) produced a t ORNL. Fundamental des ign considerations were: (1) The process would u s e a wiped-film evaporator with 50 €t2 of heat-transfer a r ea t o produce one volume of homogeneous asphalt-waste-salts mix- ture when fed with two volumes of ILW and one volume of emulsified asphalt . T h e ILW would contain 0.1 to 5 curies/gal of radioactivity and up to 40% disso lved s a l t s and would be processed at a rate of 60 gph for 278 days/year. T h e emulsified asphal t would be composed of 63 wt % base asphal t , 35 wt % water, and 2 wt $5 emulsifying agent. Asphalt-waste-salt product would be collected in 55-gal drums and would be composed of 62.5 wt % s a l t s and 37.5 wt % asphalt . (2) A new building, conforming to ORNL double-containment s tandards , would bc provided to house the process . The building would include a central cell (10 x 10 x 16 ft) and 3-ft-thick concrete walls, a shielding window, a pair of master-slave manipulators, a general shielded tunnel for handling product drums re- motely, and a c rane bay with a 5-ton bridge c rane (F igs . 4.10 and 4.11).
The capi ta l and operating costs were estimated for a plant with an ILW capac i ty of 400,000 gal/
t o immobilize the
13A. M. Kom, Incorporation of Intermediate-Level Waste i n Asphalt: Preliminary Design and Cost Es t i - mate of a Full-scale Plant for ORNL, ORNL-TM-1697 (January 1967).
year. T h e total cap i ta l c o s t was $330,500 (Table 4.7). The unit operating cos t was about 344 per gallon of waste, assuming 20-years amortization of capi ta l without interest , or 37& per gallon with 20- years amortization and 4% interest . T h e plant was assumed to be operated three shifts/day, f ive days / week, and 52 weeks/year (Table 4.8).
Table 4.7. Capitol Costs of Woste-Asphalt Plont
Construction T o t a l c o s t s costs
Improvements to land $ 3,000 Building 41,000 Hot ce l l 74,300 Process equipment and 69,400
piping Carrier 10,000
Radiation monitoring 10,500 Process instrument at ion 14,200
instruments 7,500 - - ~ Outside u t i l i t i es
To ta l construction cos t $2 2 9,900
Engineering, design, and 34,500 inspection (15% of con-
struction cos t )
Contingency (2570 of con- 66,100 struction cos t and engineer- ing, design, and inspection)
$33 0,5 00
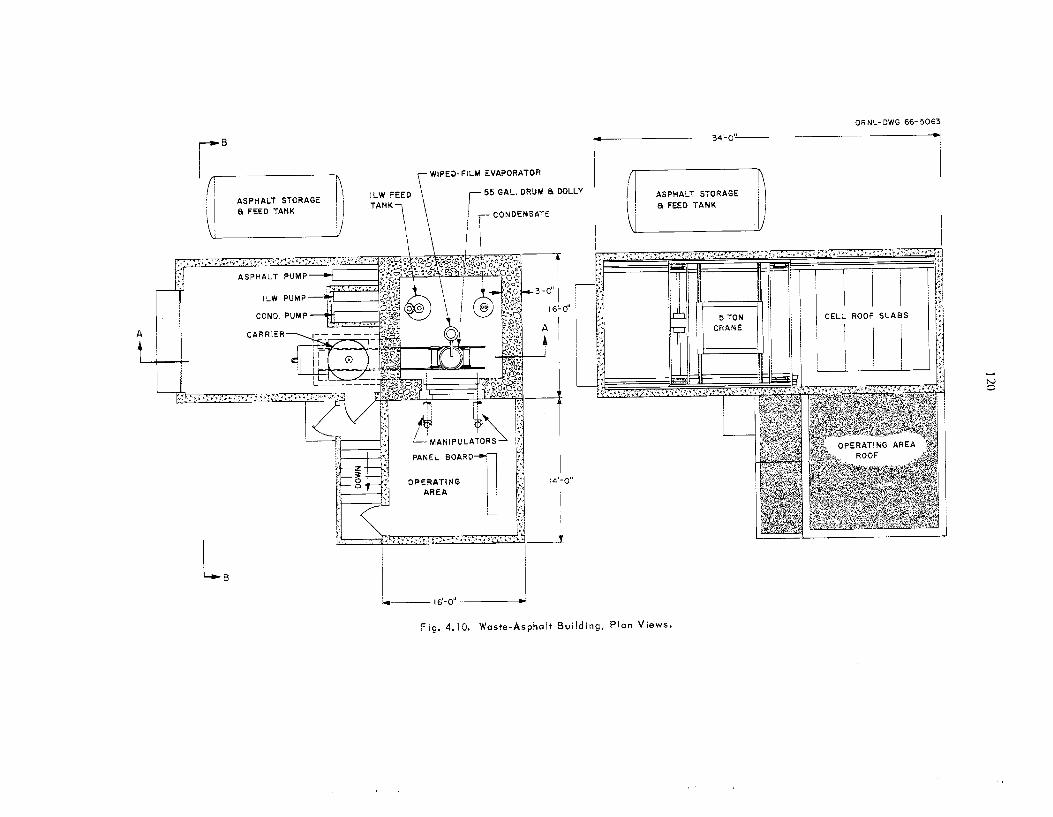
F-
W
"P
I .
1
OZ I
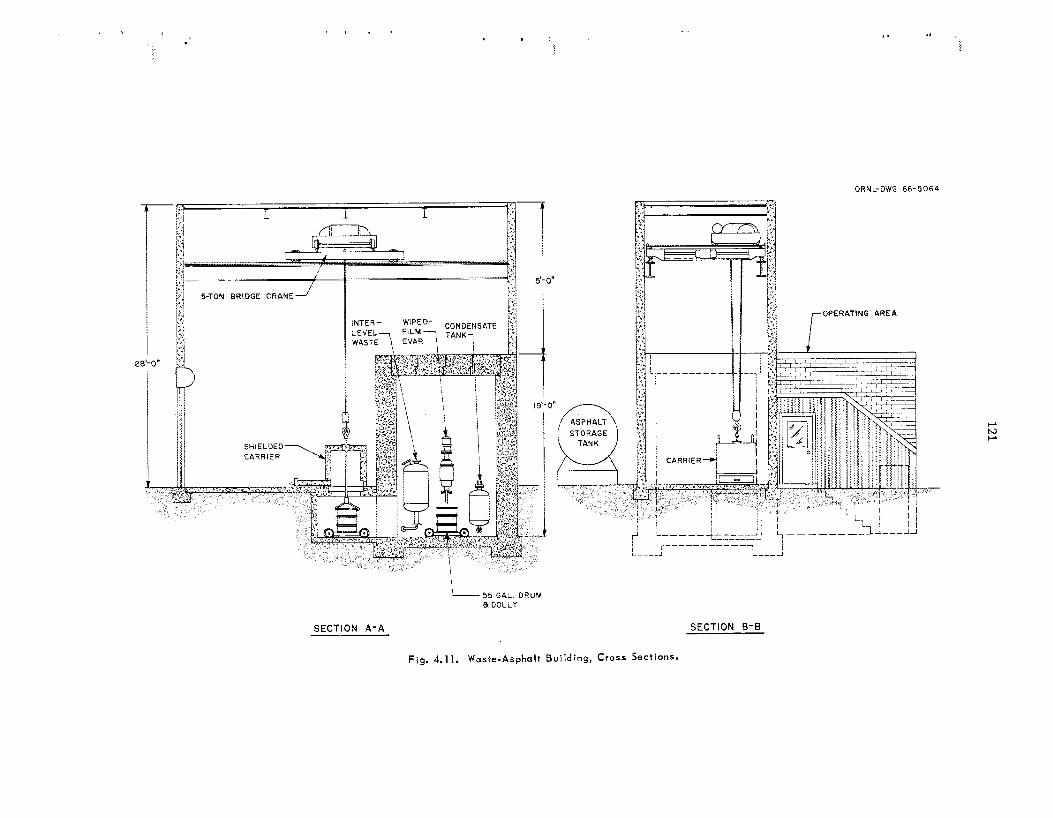
121
.... ..
.
4
W
(L
4
e
z 5 (L
w a 0
---. I I I
rJ
I I I I I I I I I I
-1 I I I
--J
cn
SI!
a c
.- .- 3
122
Table 4.8. Operating Costs of the Aspholt-Waste-Salts Plant
Annual Cos t s ~ ~~
Asphalt, 200,000 gal, at 12$/gal (delivered) Steam, 586 lb/hr, at 97q per 1000 lb Barrels, 4240, a t $3.00 each Burial ground storage space (includes transportatioii). 11.6ft3 per barrel, at 57q per cubic foot Direct labor, 1 operator per shift, 3 sh i f t s lday Overhead (including supervision), 140% of direct labor Maintenance of building, 1% of original cos t Maintenance of process equipment, 5% of original cos t Depreciation of capital by straight-line method, assuming 20-year life and no interest
$ 24,000 3,550
12,720 28,000 20,500 28,700
1,150 5,200
16,525
$140,315
4.3 LOW-LEVEL RADlQACTlVE WASTE
Introduction
Water reuse i s the objective of t he development of the Water Recycle P r o c e s s (WKP) for treating low-level radioactive was te (LLU') solutions f rom fuel reprocessing plants. Conventional treatment involves only partial decontamination of these solu- t ions and subsequent discharge to s t reams, relying on dilution t o maintain radionuclide concentrations a t l eve ls below the required MPCw; on the other hand, in the WRP, was te water containing OW con- centrations of d i sso lved so l id s is completely de- contaminated and demineralized and then returned to t h e plant for reuse, thus providing a closed cir- cuit . Also, fresh water i s demineralized before entering the circuit.
Resul t s of micro-pilot-plant t e s t s employing low- salt-content recyc le water have indicated that the WRP is a very promising process. Fo r a l l major radioactive spec ie s , overall decontamination fac tors (DF's) of 1000 t o 10,000 were obtained in t e s t s treating up t o 2400 voluines of was te per bed volume (BV) of cation resin. For t h e clarification of recycle water, it was found that samples having the s a m e concentrations of d isso lved so l ids (spe- cific conductance of 50 to 60 micromhos/cm), but having either a low IS Jackson turbidity units (JTU)] or a high (20 t o 25 JTU) concentration of suspended so l ids , required the s a m e amount of alum [2 t o 3 ppm as Al,(SO,),] and activated s i l i ca (0.2 ppm a s SiO,). Low-turbidity water a l so required the addition of a nonionic organic polyelectrolyte during flocculation. When the two
main components of synthe t ic detergents (syndets) were added in relatively high concentration [ 10 ppm each of tripolyphosphate (TP) and alkyl- benzenesulfonate (ABS)], optimum clarification re- quired a ca t ion ic organic polyelectrolyte as wel l as alum, activated s i l i ca , and a nonionic poly- electrolyte. Since the results obtained i n s m a l l - s c a l e laboratory work were verified in micro-pilot- plant t e s t s , they will be used t o predict the c o s t of processing and reusing water i n a full-scale plant.
Experimental Work and Results
T h e Water Recycle P rocess cons i s t s in: (1) coagulating by zeta-potential- (ZP-) controlled additions of coagulant and coagulant a ids , (2) clarifying by upflow through a fluidized bed of s ludge (upflow clarifier) followed by filtering through a bed of anthracite coa l and sand , ( 3 ) demineralizing by cation-anion exchange, and (4) sorbing the remaining radioactive and nonradio- ac t ive contaminants on granular activated carbon.
Laboratory work h a s included a study of im- portant parameters that could significantly affect p rocess operations i n recycle water treatment, namely, the presence of turbidity and synthetic detergents. Optimum clarification does not appear t o b e attained simply by %P control. Th i s is indicated by micro-pilot-plant runs, using the following feeds (with the indicated spec i f ic con- duc tances and suspended so l id s contents): (1) ORNL-LLW, - 15 JTU; (2) ORNI,-LLW diluted fivefold with completely decontaminated and de-
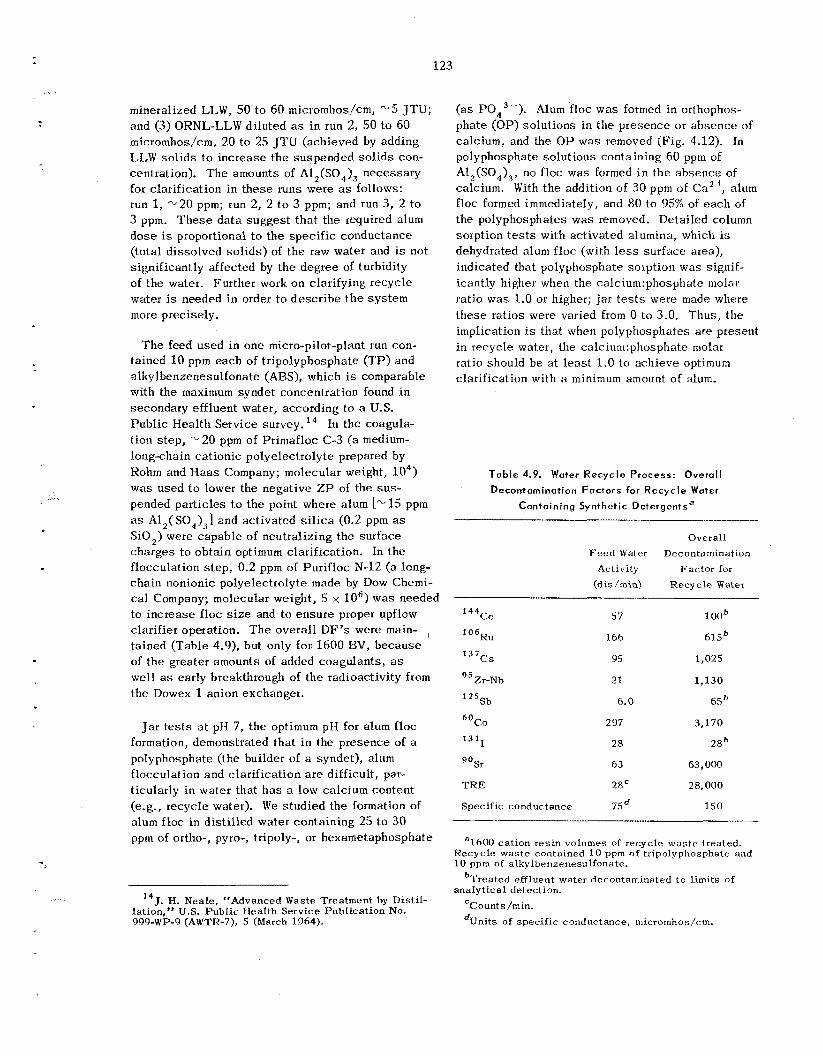
123
mineralized LLW, 50 to 60 micromhos/cm, - 5 JTU; and (3) ORNL-LLW diluted as in run 2, 50 to 60 micromhos/cm, 20 t o 25 JTU (achieved by adding LL,W so l id s to increase the suspended solids con- centration). T h e amounts of A1,(S04), necessary for clarification in these runs were a s follows: run 1, %’20 ppm; run 2, 2 to 3 ppm; and run 3 , 2 t o 3 ppm. T h e s e da t a sugges t t ha t the required alum dose is proportional to the spec i f ic conductance (total dissolved so l ids ) of t h e raw water and is not significantly affected by the degree of turbidity of the water. Further work on clarifying recycle water is needed i n order to desc r ibe t h e sys tem more precisely.
T h e feed used in one micro-pilot-plant run con- tained 10 ppm each of tripolyphosphate (TP) and alkylbenzenesulfonate (ABS), which is comparable with the maximum syndet concentration found in secondary effluent water, according to a U.S. Publ ic Heal th Service survey. l 4 In the coagula- tion s tep , -20 ppm of Priniafloc C-3 (a medium- long-chain cationic polyelectrolyte prepared by Rohm and H a a s Company; molecular weight, l o 4 ) w a s used to lower the negative ZP of the sus- pended particles to the point where alum [%* 15 ppm as Al,( SO,),] and activated silica (0.2 ppm as SiO,) were capable of neutralizing the sur face charges to obtain optimum clarification. In the flocculation s t ep , 0.2 ppm of Purifloc N-12 (a long- cha in nonionic polyelectrolyte made by Dow Chemi- cal Company; molecular weight, 5 x lo6) was needed to increase floc size and to ensure proper upflow clarifier operation. The overall DF’s were main- , tained (Table 4.9), but only for 1600 BV, because of the greater amounts of added coagulants, as well as early breakthrough of t he radioactivity from the Dowex 1 anion exchanger.
Jar t e s t s a t pI1 7, the optimum pII for alum f loc formation, demonstrated tha t i n the presence of a polyphosphate (the builder of a syndet), alum flocculation and clarification a r e difficult, par- ticularly in water that h a s a low calcium content (e.g., recycle water). We s tudied the formation of alum f loc in d is t i l l ed water containing 25 to 30 ppm of ortho-, pyro-, tripoly-, or hexametaphosphate
J. H. Neale, “Advanced Waste Treatment by Disti l- 14
lation,” U.S. Publ ic HeaIth Service Publication No. 999-WP-9 (AWTR-’I), 5 (March 1964).
(as POe3-). Alum floc w a s formed in orthophos- phate (OP) so lu t ions in the presence or absence of calcium, and the O P was removed (Fig. 4.12). In polyphosphate solutions containing 60 ppm of A1,(S04)3, no floc was formed i n t h e absence of calcium. With t h e addition of 30 ppm of Ca2+, alum floc formed immediately, and 80 to 95% of each of the polyphosphates was removed. Detailed column sorption tests with activated alumina, which is dehydrated alum f loc (with less surface area), indicated that polyphosphate sorption was signif- icantly higher when the ca l c iunqhospha te molar ratio was 1.0 or higher; jar t e s t s were made where these ra t ios were varied from 0 to 3.0. Thus, the implication IS tha t when polyphosphates are present in recycle water, the ca1cium:phosphate molar ratio should be a t l ea s t 1.0 t o achieve optimum clarification with a minimum amount of alum.
T a b l e 4.9. Water Recycle Process: Overall
Decontamination Factors for Recycle Water
Containing Synthetic Detergentsa
Overall F e e d Water Decontamination
Activity Fac tor for (dis/min) Recycle Water
144c,
Io6Ru
137cs
95Zr-Nb
”Sb
6oC0
1 3 l1
9 0 ~ r
TRE
Specific conductance
57
166
95
21
6.0
297
2 8
63
28’
75d
1 OOb
61Sh
1,025
1,130
6 5 b
3,170
2 9
63,000
28,000
150
a1600 cation resin volumes of recycle was te treated. Recycle was te contained 10 ppm of tripolyphosphate and 10 ppm of alkylbenzenesulfonate.
bTreated effluent water decontaminated t o limits of analytical detection.
cCounts /min. %nits of specific conductance, micromhos/cm.
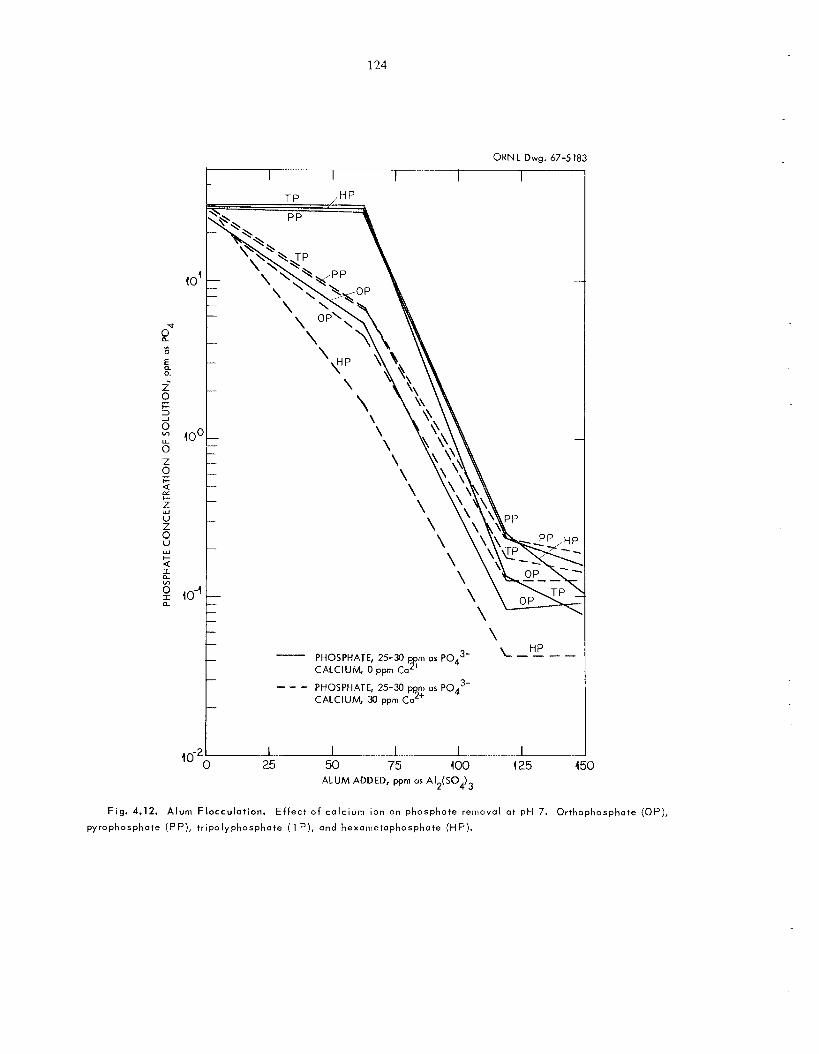
124
H P - - - - PHOSPHATE, 25-30 p m as Pod3-
- - - PHOSPHATE, 25-30 pprn as P043- CALCIUM, 30 pprn ca2+
CALCIUM, 0 pprn Co 1:
L A .___ I ___._....... 1 ...... I I_ 25 50 75 400 4 25 450
ALUM ADDED, ppm as A12(S04)3
Fig. 4.12. A l u m F l o c c u l a t i o n . E f f e c t o f c a l c i u m ion on p h o s p h a t e remova l a t p H 7. O r t h o p h o s p h a t e (OP) ,
p y r o p h o s p h a t e ( P P ) , t r i p o l y p h o s p h a t e ( T P ) , a n d hexan le tophosphote ( H P ) .
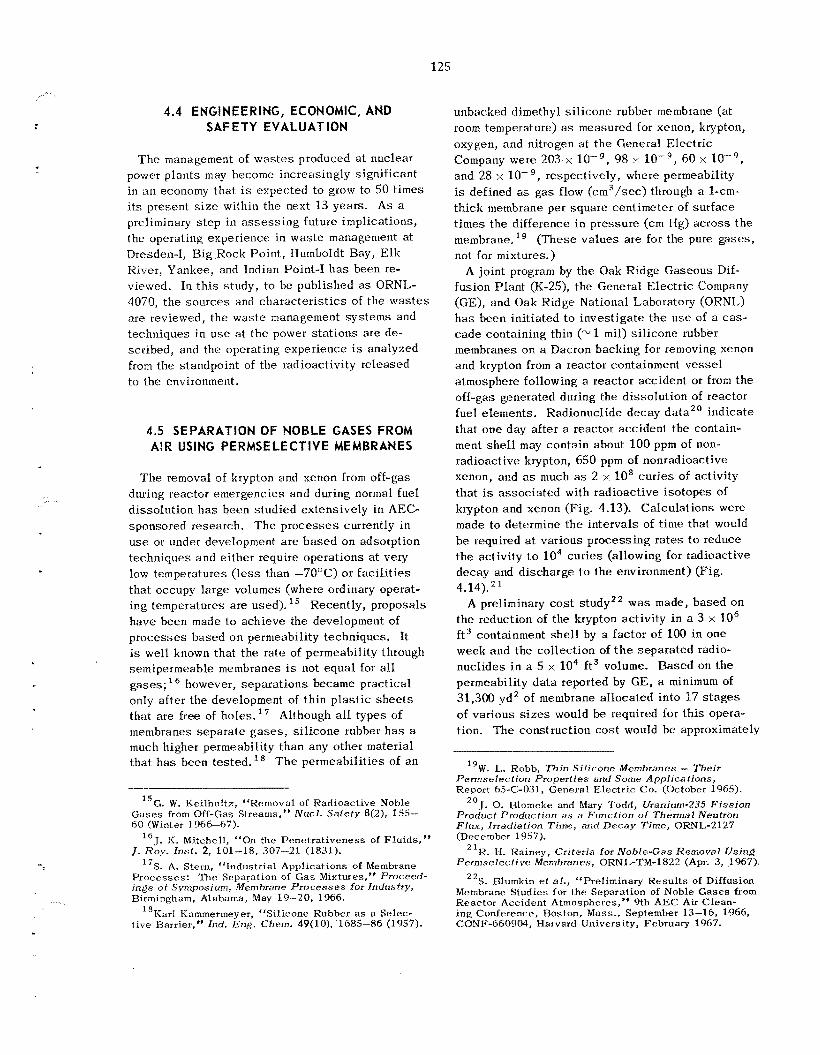
125 ....
4.4 ENGINEERING, ECONOMIC, AND SAFETY EVALUATION
T h e management of was te s produced a t nuclear power p lan ts may become increasingly significant in an economy tha t i s expected to grow to 50 t i m e s its present s i z e within the next 13 years. A s a preliminary s t e p in a s s e s s i n g future implications, the operating experiencr in was te management a t Dresden-I, Big Rock Poin t , Humboldt Bay, Elk River, Yankee, and Indian Point-I h a s been re- viewed. In th i s study, to be publ ished a s ORNL- 4070, t he sources and charac te r i s t ics o€ the was te s arc reviewed, the was te management sys tems and techniques in use a t the power s t a t ions are de- scribed, and the operating experience is analyzed from the standpoint of the radioactivity released to the environment.
4.5 SEPARATION OF NOBLE GASES FROM AIR USING PERMSELECTIVE MEMBRANES
The removal of krypton and xenon from of€-gas during reactor emergencies and during normal fuel dissolution h a s been studied extensively in AEC- sponsored research. T h e p rocesses currently in use or under development a r e based on adsorption techniques and e i ther require operations a t very low temperatures (less than -70OC) or fac i l i t i es that occupy large volumes (where ordinary operat- ing temperatures are used). have been made t o achieve the development of processes based on permeability techniques. It is well known that t he rate of permeability through semipermeable membranes is not equal for a l l gases ; however, separa t ions became practical only after the development of th in p l a s t i c s h e e t s that a re free of holes. l 7 Although all types of incmbranes separa te g a s e s , s i l i cone rubber h a s a much higher permeabilil y than any other material tha t h a s been tested. T h e permeabili t ies of an
Recently, proposals
5G. W. Keilholtz, “Removal of Radioactive Noble Gases from Off-Gas Strratns,” N u c l . Safety 8(2), 1.55- 60 (Winter 1966-67).
J . Roy. I n s t . 2, 101-18, 307-21 (1831).
Processes : ’I’he Separation of Gas Mxtures ,” Proceed- ings of Symposium, Membrane Processes for Indimtry, Birmingham, Alabama, May 19-20. 1966.
“Karl Kammermeyer, “Siliccone Rubber as a Selec- t ive Barrier,” Ind. Eng. Chrm. 49(10), 1685-86 (1957).
16J. K. Mitchell, “On the Penetrativeness of F lu ids ,”
7S. A. Stern, “Industrial Applications of Membrane
unbacked dimethyl s i l i cone rubber membrane (at room temperature) as measured for xenon, krypton, oxygen, and nitrogen at t he General Electric Company were 203 x lo-’, 98 x lo-’, 60 x loa9 , and 28 x respectively, where permeability is defined as gas flow (cm3/sec) through a l -cm- thick membrane per square centimeter of surface t i m e s t he difference in pressure (cm Hg) across t h e membrane. l 9 (These values a re for the pure gases , not for mixtures.)
A joint program by the Oak Ridge Gaseous Dif- fusion Plan t (K-25), the General Elec t r ic Company (GE), and Oak Ridge National Laboratory (ORNL) h a s been init iated t o inves t iga te the use of a cas - cade containing thin (- 1 mil) s i l i cone rubber membranes on a Dacron backing for removing xenon and krypton from a reactor containment vesse l atmosphere following a reactor accident or from t h e off-gas generated during the dissolution of reactor fuel elements. Radionuclide decay da ta2 indicate tha t one day after a reactor accident t he contain- ment she l l may contain about 1 0 0 ppm of non- radioactive krypton, 650 ppm of nonradioactive xenon, and as much a s 2 x 10’ cur ies of activity that is assoc ia ted with radioactive i so topes of krypton and xenon (Fig. 4.13). Calculations were made to determine the intervals of t i m e that would be required at various process ing ra tes to reduce the activity to lo4 cur ies (allowing for radioactive decay and discharge to the environment) (Fig. 4.14).21
the reduction of the krypton activity in a 3 x IO6 ft3 containment she l l by a factor of 100 in one week and the collection of t h e separa ted radio- nuclides i n a 5 x lo4 ft3 volume. Based on the permeability da ta reported by GE, a minimum of 31,300 yd2 of membrane allocated into 17 s t a g e s of various sizes would be required for th i s opera- tion. The construction cos t would be approximately
A preliminary cos t study” was made, based on
W. L. Kobb, Thin Silicone 1Wernhrane.s - Their Permselection Properties and Some Applications, Report 6.5-‘2-031, General Electric Co. (October 1965).
Product Production a s a Function of Therrtial Neutron Flux, Irradiation Time, and Decay T ime , ORNL,-2127 (December 195 7).
Permselective Membranes, ORNL-TM-18‘22 (Apr. 3, 1967).
19
J. 0. Blomekr and Mary Todd, Uranium-235 Fiss ion 2 0
21R. H. Rainey, Criteria f o r Noble-Gas Removal Using
’5. Blumkin et ol., “Preliminary Resul t s of Diffusion Membrane Studies for the Separation of Noble Gases from Reactor Accident Atmospheres,” 9th AEC Air Clean- ing Conference, Boston, M a s s . , September 13-16, 1966, CONF-660904, Harvard University, February 1967.
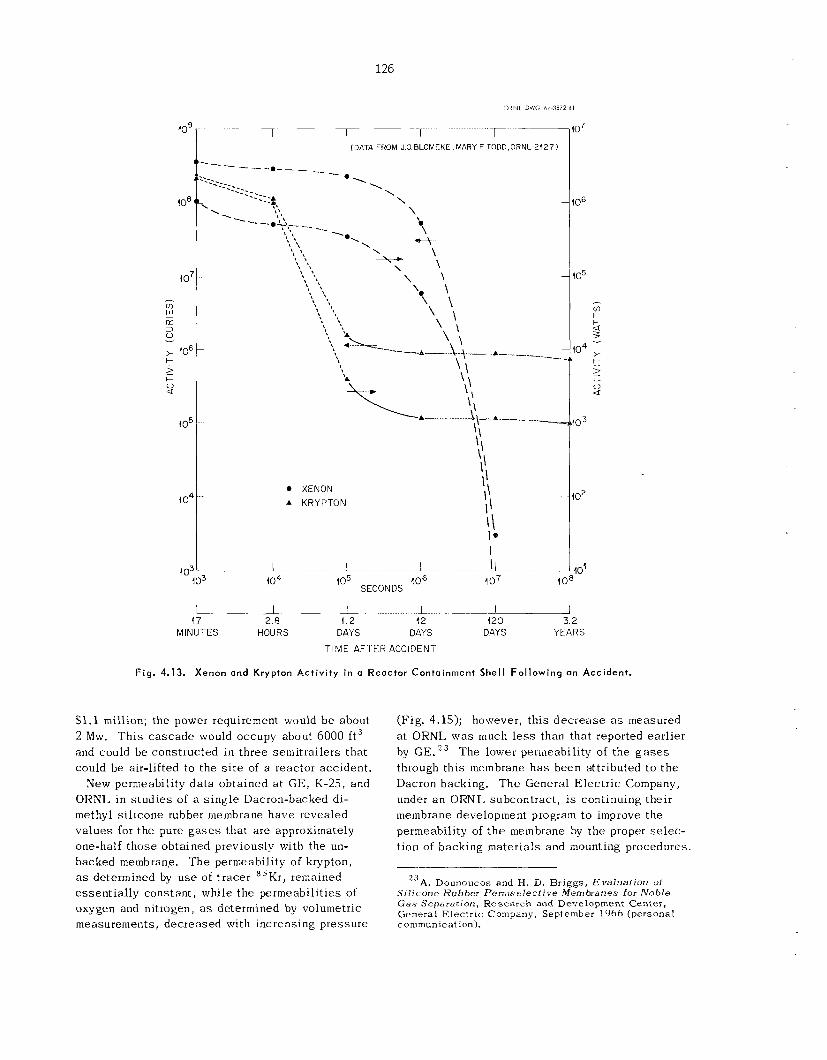
126
ORNL D*lr’G 07-3872 P I
io7 (DATA FROM JOBLOMEKE,MARY FTODD,ORNL21271
0 XENON A KRYPTON
I I 1 L -u 17 7 8 I 2 12 120 3 2
MINUTES HOURS DAYS DAYS DAYS YEARS
TIME AF rkH ACCIDENT
Fig. 4.13. Xenon and Krypton Activity in a Reactor Containment Shell Fol lowing an Accident.
$1.1 million; the power requirement would b e about 2 Mw. T h i s cascade would occupy about 6000 ft3 and could be constructed in three semitrailers that could be air-lifted to the s i t e of a reactor accident.
New permeability da ta obtained a t GE, K-25, and ORNI, in s tud ie s of a s ing le Dacron-backed di- methyl s i l i cone rubber membrane have revealed va lues for the pure g a s e s that a re approximately one-half those obtained previously with the un- backed membrane. T h e permeability of krypton, as determined by u s e of t racer 8 5 K r , remained essent ia l ly constant, while the permeabilities of oxygen and nitrogen, as determined by volumetric measurements, dccreased with increasing pressure
(Fig. 4.15); however, th i s dec rease as measured a t ORNL w a s much l e s s than that reported earlier by GE.23 The lower permeability of the g a s e s through th is membrane h a s been attributed to t h e Dacron backing. The General Elec t r ic Company, under a n ORNL subcontract, i s continuing their membrane development program to improve the permeability of t h e membrane by the proper selec- tion of backing materials and mounting procedures.
23A. Dounoucos and 13. D. Briggs, Evaluation of Silicone Rubber Perrnselecfive Membranes for Noble Gas Separa t ion , Research and Development Center, General Electric Company, September 1966 (personal communication).
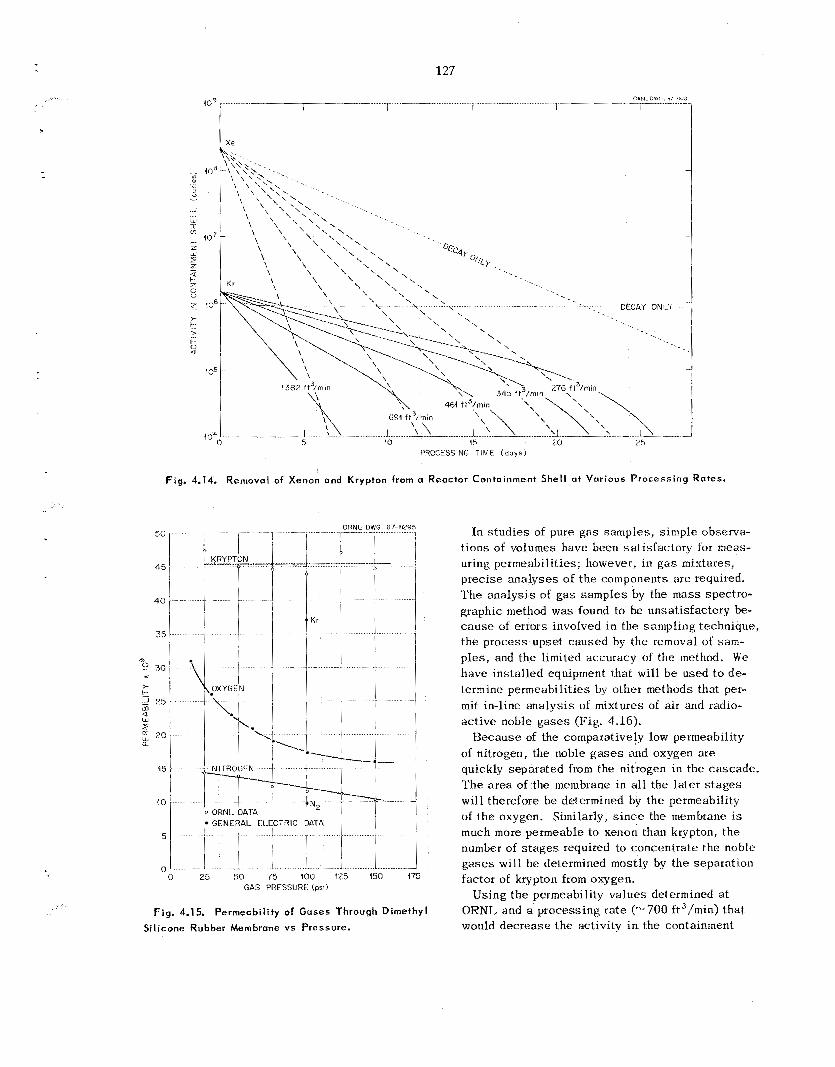
....
Fig. 4.14. Removal of Xenon and Krypton from a Reoctor Containment Shell at Various Processing Rates.
GENERAL E 1 ECTRIC DATA
0 25 50 75 100 175 150 $75 GAS PRESSURE (psi)
Fig. 4.15. Permeability of Gases Through Dimethyl
Silicone Rubber Membrane vs Pressure.
In s tud ie s of pure gas samples , s imple observa- tions of volumes have been sa t i s fac tory for meas- uring permeabilities; however, in g a s mixtures, precise ana lyses of the components a re required. The ana lys i s of g a s samples by the mass spectro- graphic method was found to be unsatisfactory be- cause of errors involved in the sampling technique, the process upset caused by the removal of sam- p l e s , and the limited accuracy of the method. We have installed equipment that will b e used to de- termine permeabilities by other methods that per- mi t in-line ana lys i s of mixtures of air and radio- ac t ive noble gases (Fig. 4.16).
Because of the comparatively low permeability of nitrogen, the noble g a s e s and oxygen are quickly separated from the nitrogen in the cascade . T h e a rea of the membrane in a l l the la te r s t a g e s w i l l therefore be determined by the permeability of the oxygen. Similarly, s i n c e the membrane is much more permeable to xenon than krypton, the number of s t a g e s required to concentrate the noble gases will be determined mostly by the separation factor of krypton from oxygen.
Using the permeability va lues determined at ORNL and a processing r a t e (?,700 ft3/min) that would decrease the activity i n the containment
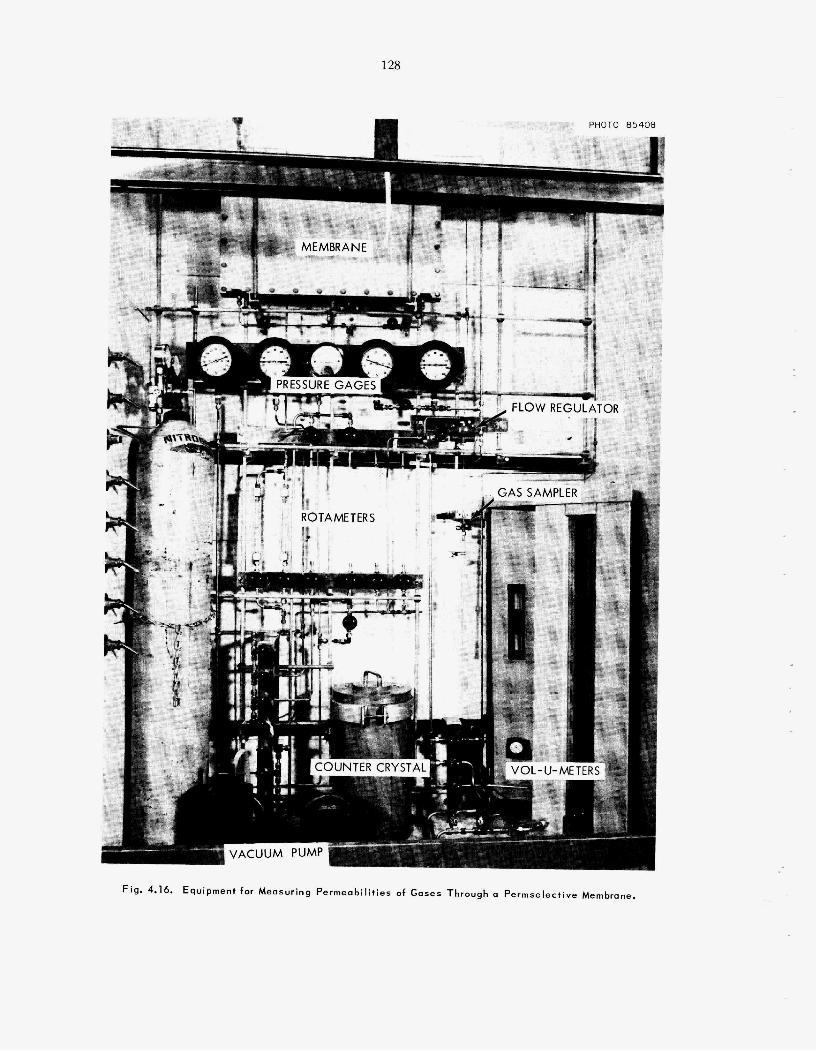
128
PHOTO 85408
3 EO~NTER CRYSTAL^
I-, V A C U U M PUMP
Fig. 4.16. Equipment for Measuring Permeabilities of Gases Through a Permselective Membrane,
129
she l l t o lo4 cur ies i n 12.5 days , the capi ta l cost of such a treatment system would b e approximately $940,000 and the power requirement would be about 1 Mw.
4.6 COMPUTER CODE FOR CALCULATING NUCLEAR PROPERTIES OF
ACCUMULATED WASTES
Three computer codes for the CDC-1604 computer were written to ca lcu la te the buildup and decay of gross activity and hea t production in a was te tank or was te system. T h e f i r s t two consider t he buildup with a s teady ra te of addition of radioactive was te , while the third code will allow the was te t o b e added according t o some programmed stepped func- t ion (such a s one that approximates t h e ra te of in- s ta l la t ion of power reactors of some given type).
T h e s e three codes were based on the activity functions tha t were used in PHOEBE (see Sect. 18.5). In fact , t he calculational part of the PHOEBE code s e r v e s as an integral part of t hese was te programs. As i n PHOEBE, a total of 14 group functions (12 gamma groups plus a be ta activity group and a be ta energy group) a re used t o descr ibe the f i ss ion product activity. However, only in the Waste Tank-1 code a re the individual
gamma groups printed a s part of the results. Codes designated a s Waste Tanks-2 and -3 print only gross totals for beta cur ies , gamma curies, be ta watts, gamma watts, to ta l wat t s , and total Btu/hr. In most cases, the summary outputs of codes 2 and 3 are those generally used in waste tank or was te sys tem calculations. Waste Tank-1 would only be used when a shielding ana lys i s is required.
Three types of output may be se l ec t ed in each case : (1) the activity and power in a s ingle batch (the b a s i c PHOEBE output); (2) the activity and power in a s ingle tank or system in which the activity is accumulated for s o m e specified fi l l ing period, followed by decay after f i l l ing (the resu l t s c a n be printed at severa l t i m e s during the fi l l ing as well a s during decay periods following the filling); and ( 3 ) the total accumulated activity and power in a was te system composed of many indi- vidual units (tanks).
Codes 1 and 2 allow accumulation and/or decay for periods up t o 10,000 years. Waste Tank-3 will only allow accumulation for 300 ba tches (100 years for all practical purposes) but will allow decay for 10,000 years.
T h e s e codes have been used in severa l economic evaluations of was te sys tems and in making an estimate of the accumulation of was te activity in a n expanding nuclear economy.
5. Transuranium-Element Processing
T h e Transuranium Process ing P l a n t (TRU) and the High Flux Isotope Reac tor (HFIR) were built a t ORNL to produce gram quant i t ies of many of t he transuranium e lements and milligram quant i t ies of some of the transcalifornium i so topes for u s e in research. T h i s part of t he USAEC Heavy Element Production Program began with t h e long-term irra- diation of 2 3 9 P u in a Savannah River production reactor. T h e init ial irradiation, subsequent irra- diation of some of the 2 4 2 P u i n a spec ia l high flux demonstration run i n one of the Savannah River production reactors, and t h e process ing of transuranium elements a t ORNL prior to the startup of TRU were descr ibed in l a s t year’s annual report.
During the p a s t year, TRU began “hot” opera- t ions; 2 4 2 P u 0 2 target irradiation was s ta r ted in the HFIR; and isotopic enrichment of 2 4 4 P u was achieved by the I so topes Division. More than 40 shipments of transuranium e lements were made to fulfill reques ts from national laboratories, univer- s i t i e s , and industry i n th i s country and in three foreign countries. Shipments included 7 .4 mg of P u (74.2% 244Pu) , 16.5 g of 243Am, 2 2 g of 244Crn, 18 p g of 249Bk, and 100 pg of ”’Cf.
In TRU t h e first three process ing s t e p s [dissolu- tion, plutonium recovery, and ac t in ide purification (Tramex process)] were performed successfu l ly , all at full l eve l s of solution power dens i ty and a lpha and beta-gamma radioactivity. T h e development of p rocesses and equipment for subsequent s t e p s was continued. T h e processing of ten irradiated ta rge ts , including laboratory-scale product cleanup and purification, is essent ia l ly complete. Products include about 50 g of 2 4 2 P u , 1 0 mg of 2 4 4 P u , 25 g of 243Am, 80 g of 244Cm, 200 p g of 249Bk, and 2 mg of ’Cf. T h i s material was recovered from four HFIR prototype ta rge ts and s i x Savannah River reactor s lugs that had been irradiated for about one year, in t he High Flux Demonstration Run, at t h e Savannah River P lan t . T h i s report summarizes the production operations and the process and equip-
ment development in the Chemical Technology Division during the pas t year. Development of procedures and equipment for remotely fabricating target rods is under the direction of t h e Metals and Ceramics Division and i s reported elsewhere.
Some of t h e TRU target rods ruptured during irra- diation in the HFIR. A general description of t h e failures and their poss ib l e effect on the program are included i n th i s report.
5.1 TRU OPERATIONS
T h e Transuranium Process ing P lan t began opera- tion t h i s year; t h e f i r s t th ree process ing s t e p s - dissolution, plutonium recovery, and actinide puri- fication - were performed successfu l ly in plant equipment. Isolation and final purification of t he ac t in ide elements were accomplished in g l a s s equipment tha t w a s ins ta l led temporarily in cell 5 of TRU (see Sect. 5.2).
Status and Progress
T h e HFIR became operational i n June 1966. After being inspec ted and repaired in TRU, 18 targe ts tha t had been irradiated at t h e Savannah River P lan t (SRP) for a year were transferred to HFIR for continued irradiation. Tracer-level runs were made in TRU process equipment in July; t he first production runs were made in August. Four HFIR prototype ta rge ts were processed i n the pe- riod from August through November. Six Savannah River reactor s lugs were processed in t h e period from December 1966 through May 1967. T h e power dens i t i e s of t he so lu t ions and t h e a lpha and beta- gamma activity l eve l s were as high as any we expec t to handle. F e e d preparation, plutonium recovery, and decontamination of transplutonium e lements from f i ss ion products (Tramex) have been demonstrated in TRU.
130
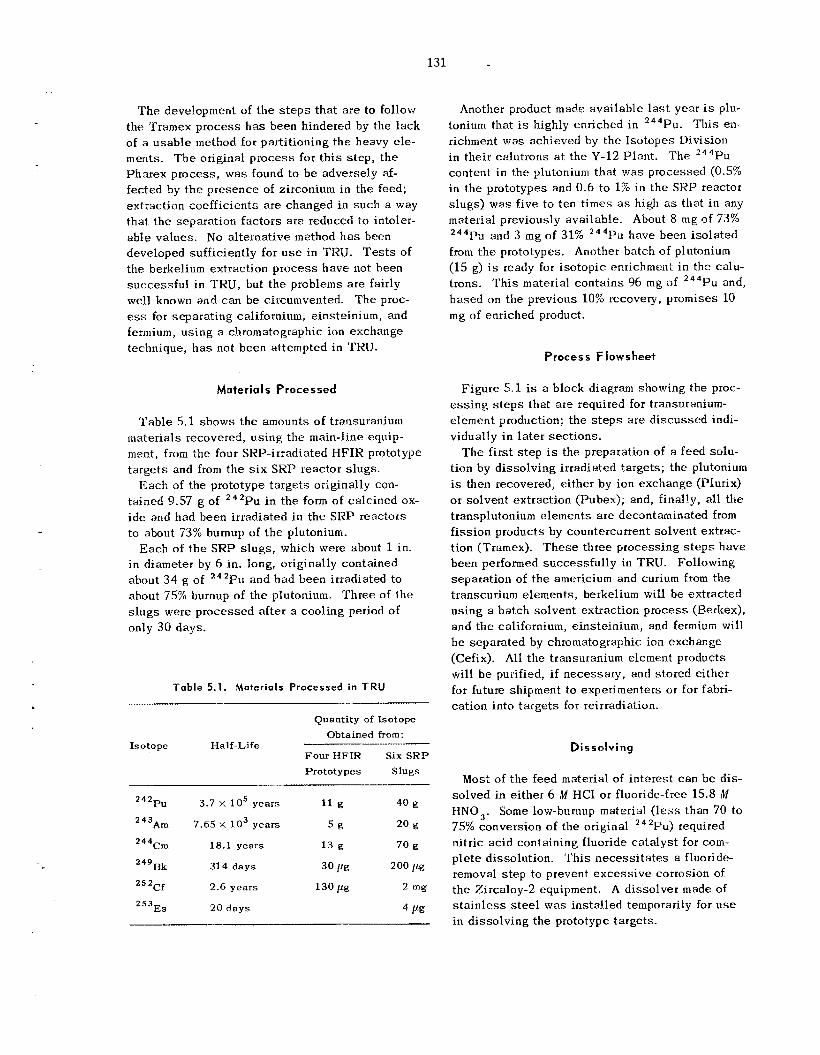
131
T h e development of t h e s t e p s tha t are to follow the Tramex p rocess h a s been hindered by the lack of a usab le method for parti t ioning the heavy e le - ments. T h e original process for t h i s s tep , t h e Pharex process , was found to b e adversely af- fected by t h e presence of zirconium in the feed; extraction coefficients a r e changed in such a way tha t t he separation fac tors a re reduced to intoler- ab le values. No alternative method h a s been developed sufficiently for u s e in TRU. T e s t s of t he berkelium extraction process have not been success fu l in TRU, but the problems a re fairly well known and can be circumvented. The proc- ess for separa t ing californium, einsteinium, and fermium, us ing a chromatographic ion exchange technique, h a s not been attempted in TRU.
Materia I s Processed
Tab le 5.1 shows the amounts of transuranium materials recovered, us ing the main-line equip- ment, from the four SRP-irradiated HFIR prototype ta rge ts and from the s i x SRP reactor s lugs .
Each of the prototype ta rge ts originally con- tained 9.57 g of 2 4 2 P u in the form of ca lc ined ox- ide and had been irradiated in the SRP reactors to about 73% bumup of t h e plutonium.
in diameter by 6 in. long, originally contained about 34 g of 242Pu and had been irradiated to about 75% burnup of the plutonium. Three of the s lugs were processed after a cooling period of only 30 days.
Each of the S R P s lugs , which were about 1 in.
Table 5.1. Materials Processed in TRU
Quantity of Isotope Obtained from:
Four HFIR Six S R P Prototypes Slugs
--I_--__- Isotope Half-Life
2 4 2 ~ u 3.7 x 10⁵ years 11 g 40 g
243Am 7.65 x l o3 years 5 g 20 g
244cm 18.1 years 13 g 70 g
249Bk 314 days 30 /.'E 200 pg
252Cf 2.6 years 130 pg 2 mg
,Es 2 0 days 4 I&
Another product madc avai lab le l a s t year is plu- tonium that is highly enriched in 2 4 4 P u . Th i s cn- richment was achieved by t h e I so topes Division in their calutrons at the Y-12 Plant . T h e 2 4 4 P u contcnt i n the plutonium tha t was processed (0~5% in the prototypes and 0.6 to 1% in t h e S K P reactor s lugs) was five to ten t i m e s as high as tha t in any material previously available. About 8 mg of 7.3% 2 4 4 P u and 3 mg of 31% 244Pu have been i so la ted from the prototypes. Another batch of plutonium (15 g) is ready for i so topic enrichment in the calu- trons. T h i s material conta ins 96 mg of 2 4 4 P u and, based on the previous 10% recovery, promises 10 mg of enriched product.
Process Flow sheet
Figure 5.1 is a block diagram showing the proc- e s s i n g s t e p s that are required for transuranium- element production; t he s t e p s a re d i scussed indi- vidually in l a t e r sec t ions .
The f i r s t s t e p is the preparation of a feed S d U -
tion by d isso lv ing irradiated targets; the plutonium is then recovered, e i ther by ion exchange (Plurix) or solvent extraction (Pubex); and, finally, all the transplutonium elements are decontaminated from f i ss ion products by countercurrent so lvent extrac- tion (Tramex). T h e s e three processing s t e p s have been performed successfu l ly in TRU. Following separation of the americium and curium from the transcurium elements, berkelium will be extracted us ing a batch solvent extraction process (Berkex), and the californium, einsteinium, and fermium will b e separa ted by chromatographic ion exchange (Cefix). All t he transuranium element products will b e purified, i f necessary , and s tored either for future shipment to experimenters or for fabri- cation in to ta rge ts for reirradiation.
Dissolving
Most of t h e feed material of in te res t can b e dis- so lved in either 6 M HC1 or fluoride-free 15.8 M HNO,. Some low-bumup material (less than 70 to 75% conversion of the original 242Pu3 required nitric ac id containing fluoride ca ta lys t for com- p l e t e dissolution. T h i s necess i t a t e s a fluoride- removal s t ep to prevent excess ive corrosion of t he Zircaloy-2 equipment. A disso lver made of s t a i n l e s s s t e e l was ins ta l led temporarily for u s e in d isso lv ing the prototype targets.
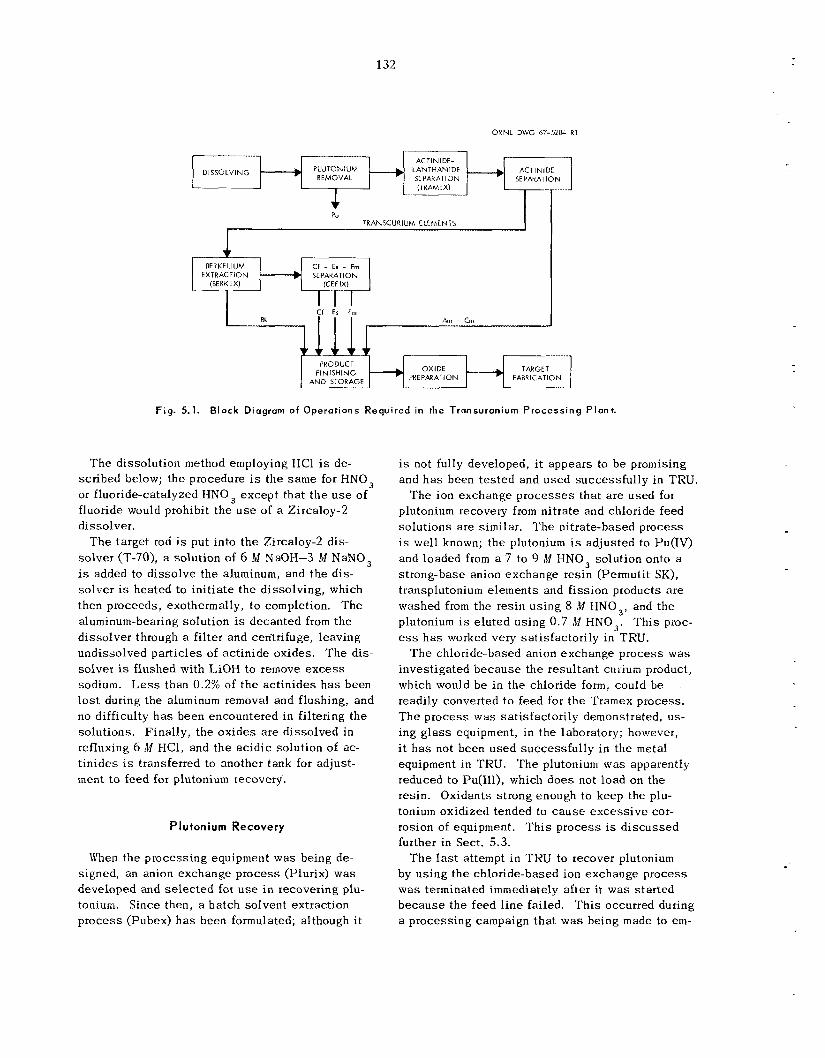
132
ORNL DWG 67-5283 R 1
ACT IN1 DE SEPARATION
ACTINIDE- LANTHANIDE SEPARATION (iRAMEX)
__+ DISSOLVING
P” .TRANSCURIUM ELEMENTS I
BERKELllJM Cf - Er - Frn EXTRACTION SEPARATION
I Cf E, Fm Bk Am - Crn
v 7 - - - - - - - - 1
OXIDE TARGET PREPARATION FAaRlCATlON
PRODUCI FINISHING
A N D STORAGE
Fig. 5.1. Block Diagram of Operations Required in the Transuranium Processing Plant.
T h e dissolution method employing HC1 is de- scribed below; the procedure i s t he s a m e for HNO, or fluoride-catalyzed HNO , excep t that t h e u s e of fluoride would prohibit t he u s e of a Zircaloy-2 dissolver.
T h e target rod is put into t h e Zircaloy-2 dis- so lver (T-70), a solution of 6 M NaOH-3 M NaNO, is added to d isso lve the aluminum, and t h e dis- so lver is heated to in i t ia te t he dissolving, which then proceeds, exothermally, t o completion. The aluminum-bearing solution is decanted from t h e d isso lver through a filter and centrifuge, leaving undissolved par t ic les of actinide oxides. T h e dis- solver is flushed with LiOH to remove e x c e s s sodium. Less than 0.2% of t h e ac t in ides h a s been l o s t during the aluminum removal and flushing, and no difficulty h a s been encountered in filtering the solutions. Finally, t he ox ides a re d isso lved in refluxing 6 M HCl, and t h e ac id ic solution of ac- t in ides is transferred to another tank for adjust- ment to feed for plutonium recovery.
Plutonium Recovery
When the process ing equipment was being de- signed, an anion exchange p rocess (Plurix) was developed and se l ec t ed for u s e in recovering plu- tonium. Since then, a ba tch solvent extraction p rocess (Pubex) h a s been formulated; although i t
is not fully developed, it appears to b e promising and h a s been t e s t ed and used successfu l ly in TRU.
T h e ion exchange p rocesses that a r e used for plutonium recovery from nitrate and chloride feed so lu t ions a re similar. T h e nitrate-based process i s well known; t h e plutonium i s adjusted to Pu(1V) and loaded from a 7 to 9 M HNO, solution onto a strong-base anion exchange resin (Permutit SK), transplutonium elements and f i ss ion products a r e washed from the resin us ing 8 iM I-INO,, and the plutonium is e lu ted using 0.7 W HNO,. T h i s proc- ess h a s worked very satisfactorily in TRU.
T h e chloride-based anion exchange process was investigated because the resultant curium product, which would b e in the chloride form, could be readily converted to feed for t h e Tramex process. T h e p rocess was satisfactorily demonstrated, us- ing g l a s s equipment, in t he laboratory; however, i t h a s not been used successfu l ly in the metal equipment in TKU. T h e plutonium was apparently reduced to Pu(III), which d o e s not load on the resin. Oxidants strong enough to keep the plu- tonium oxidized tended to c a u s e excess ive cor- rosion of equipment. T h i s p rocess is d i scussed further in Sect. 5.3.
T h e l a s t attempt in T R U to recover plutonium by us ing the chloride-based ion exchange process w a s terminated immediately after it was s ta r ted because the feed l i ne failed. T h i s occurred during a process ing campaign tha t w a s being made to e m -
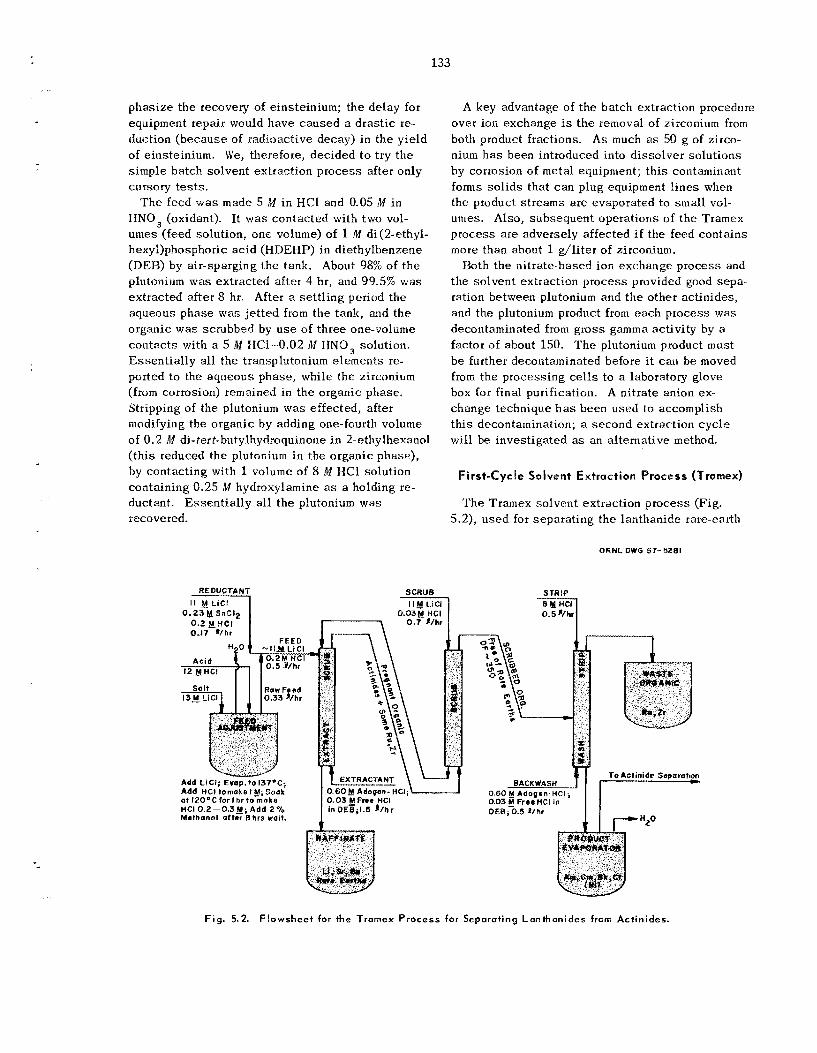
133
phas i ze t h e recovery of einsteinium; t h e de lay for equipment repair would have caused a dras t ic re- duction (because of radioactive decay) in t h e y ie ld of einsteinium. We, therefore, dec ided t o try t h e s imple ba tch so lvent extraction p rocess after only cursory tests.
HNQ, (oxidant). It wa., contac ted with two vol- umes (feed solution, one volume) of 1 M di(Zethy1- hexy1)phosphoric ac id (HDEIIP) in diethylbenzene (DF:N) by air-sparging t h e tank. About 98% of t h e plutonium was extracted a f te r 4 hr, and 99.5% was extracted a f te r 9 hr. After a se t t l ing period the aqueous phase was j e t t ed from t h e tank, and t h e organic w a s scrubbed by u s e of th ree one-volume contac ts with a 5 M HCl-8.02 M HNO, solution. Essen t i a l ly all the transplutonium e lements re- ported to the aqueous phase , while t he zirconium (from corrosion) remained in t h e organic phase. Stripping of the plutonium w a s effected, after modifying the organic by adding one-fourth volume of 0 .2 M di-tert-butylhydroquinorie i n 2-ethylhexanol ( th i s reduced the plutonium in the organic phase), by contacting with 1 volume of 8 M HC1 solution containing 0.25 M hydroxylamine as a holding re- ductant. Essen t i a l ly all t h e plutonium w a s recovered.
T h e feed w a s made 5 iM i n €IC1 and 0.05 M i n
SCRUB m REDUCTANT
A key advantage of the ba tch extraction procedure over ion exchange is the removal of zirconium from both product fractions. As much as SO g of zirco- nium h a s been introduced into d isso lver so lu t ions by corrosion of metal equipment; t h i s contaminant forms so l id s tha t c a n plug equipment l i nes when the product s t reams a re evaporated to s m a l l vol- umes. Also, subsequent operations of t h e Tramex process a r e adversely affected i f the f e d conta ins more than about 1 g/ l i te r of zirconium.
Both the n i t ra te -hased ion exchange p rocess and the so lvent extraction p rocess provided good sepa - ration between plutonium and t h e o ther ac t in ides , and the plutonium product from each p rocess was decontaminated from gross gamma activity by a factor of about 150. T h e plutonium product must b e further decontaminated before i t can b e moved from t h e process ing c e l l s to a laboratory glove box for final purification. A nitrate anion ex- change technique h a s been used to accomplish t h i s decontamination; a second extraction c y c l e will be inves t iga ted as an alternative method.
First-Cycle Solvent Extraction Process (Tramex)
T h e Tramex so lvent extraction p rocess (Fig. 5.2), u s e d for separa t ing the lanthanide care-earth
ORNL DWC 67- 5281
STRIP B M HCI 0.5R/hr --1
Fig. 5.2. Flowsheet for the Tramex Process for Separating Lanthanides from Actinides,
134
elements and other major fission products from the ac t in ides or transuranium elements, is operational in TRU. Equipment operability s t i l l needs to b e improved, and the flowsheet parameters need to be optimized. However, operation of the process is routine. Recovery of product i s good, and the transplutonium elements a r e decontaminated from gamma activity by a factor of about 75, which i s satisfactory.
adjusted so that i t i s 11 M in LiC1 and 0.2 M i n HCI, methanol is added to prevent loss of ac id by radiolysis, and then t h i s solution is fed to the Tramex process a t the rate of '/3 liter/hr. A solu- tion of 11 iM LiC1-0.2 M HC1 containing s tannous chloride, which prevents oxidation of cerium to an ex t rac tab le form, i s added continuously to the feed stream a t a rate sufficient to maintain an SnClz concentration of 0.075 M . The total flow rate of 11 M LiC1-0.2 M HC1 solution is 0.5 liter/hr. T h e transuranium e lements are extracted into a solution of 0.6 1l.I Adogen 364-HP (high-purity tertiary amine) - 0.03 M HC1, in DEB. T h e flow rate of the extractant is 1.5 liters/hr. Small amounts of extracted lanthanides a re scrubbed out of the or- ganic phase us ing a solution of 11 M LiC1-0.03 M HC1 (flow rate, 0.7 liter/hr). The ac t in ides a r e stripped from the solvent us ing 8 M HC1 (flow rate, 0.5 liter/hr), and the aqueous solution containing the actinide product i s backwashed with extractant t o reduce the zirconium content.
The curium and the americium in t h e Tramex product will b e su i tab le for recycle to the HFIK without further decontamination from fission prod- u c t s because remote refabrication techniques will b e used in preparing the targets.
T h e raffinate from the plutonium recovery s t e p is
Treatment Subsequent to Tramex Processing
T h e first three process ing s t e p s - dissolution, plutonium recovery, and decontamination of acti- n ides (by the Tramex process) - have been ac- complished in TRU. P r o c e s s e s for subsequent s t e p s have not been demonstrated in plant equip- ment. T h i s year, t he isolation and the final puri- f ication of actinide e lements were accomplished in g l a s s equipment that was ins ta l led temporarily in ce l l 5 in TRU ( s e e Sect. 5.2).
T h e next s t e p required in TRU is actinide parti- tioning, or t he separation of americium and curium (which will b e recycled to HFIR for reirradiation)
from t h e heavier actinides. T h e la t te r will b e separa ted from each other and recovered a s puri- f ied products. T h e original f lowsheet (Pharex) for t h i s s t e p c a n perform t h e required separation under ideal conditions; however, it was discovered th i s year that t he presence of 100 ppm of zirconium in the feed reduced the separation fac tors to in- tolerably low values. Thus , Pharex is not a sa t i s - factory p rocess for u s e i n TRU because much of t he equipment is made of Zircaloy-2. W e are de- veloping a new process , Hepex, which is insens i - t ive to the presence of corrosion products.
In t e s t s of the berkelium extraction p rocess in TRU, only about 30% of the berkelium was recov- ered. Apparently, t he berkelium was rapidly re- duced to Bk(II1) i n the concentrated nitrate system. If t he entire extraction and stripping could b e done in a few hours, t he process would probably work; however, i f i t requires 1 6 hr, as in t h e t e s t s i n TRU, the reduction to Rk(II1) will occur and the recovery of berkelium will b e greatly decreased. T h e problem should b e readily so lved by shorten- ing the process ing time.
Demonstration of t he Cefix process for t h e sepa- ration and purification of californium, einsteinium, and fermium h a s not been attempted in TRU.
T h e p rocesses for ox ide preparation have not been developed sufficiently for demonstration in TRU. T h e equipment to b e used for remote target fabrication is now being ins ta l led in the process- ing cells.
Plant Shutdown and Maintenonce Experience
TRU was shu t down for an ex tens ive program of equipment repair and replacement in February 1967, after about seven months of operation. Although severa l equipment problems had ar i sen during the seven months, none had been se r ious enough per se to force a plant shutdown; a l l of them had been circumvented or the equipment had been temporar- i ly repaired. However, t h e combined ef fec ts had made plant operation inefficient. In addition to t h e s e repairs, severa l equipment modifications were made during t h i s period.
T h e major repairs involved: (1) replacement of a bundle of p rocess l i nes that connect equipment i t ems located in cubic le 7 to tanks in the cell 7 tank pit, (2) replacement of t h e Plurix process ion exchange column, and ( 3 ) general overhaul of t he cubic le 7 sampler station. T e n Zircaloy-2 l i nes in
135
t h e l i ne bundle had corroded severely on t h e out- s ide . Apparently, mixtures of HCI and HNO, had been allowed to s t and i n t h e d isconnec t well i n which the l i n e s terminated. T h e ion exchange col- umn had co l lapsed , apparently because of exces - s i v e pressure tha t w a s applied to the water jacket.
Major equipment modifications included: (1) ad- dition of a second tantalum-lined evaporator to the feed preparation system to provide for concentration of feed solutions, (2) ins ta l la t ion of larger top sec- t ions on the Tramex so lvent extraction columns to provide better venting and to improve the hydrau- lics of t h e system, and (3) installation of a new vacuum sys tem for the plant.
The b a s i c maintenance concept i n TRU opera- t i ons and des ign is tha t remote techniques will be required eventually; however, i t h a s been poss ib le thus fa r to u s e direct maintenance techniques in the cell tank p i t s . A to ta l of 28 en t r i e s by person- ne l were made in to tank p i t s 6 and 7 during t h i s extended period of maintenance; t he maximum radn- ation dose received per entry (average duration, about 20 min) was 150 millirems. No weekly d o s e s exceeded 300 millirems. Although sur face contam- ination in the tank p i t s w a s i n e x c e s s of l o5 a lpha disintegrations per s econd per 100 cm2 and a num- ber of internally contaminated p rocess l i nes were d isconnec ted i n the p i t s , t h e l eve l of airborne con- tamination in the “limited access” area, into which the p i t s were opened, never exceeded noma1 tolerances. One entry (duration, 10 min) was made by an individual into cub ic l e 7. A d o s e of only about 100 millirems was received; very l i t t l e con- tamination w a s found on the sur face of t he p l a s t i c s u i t worn.
Prediction of Heavy-Element Production in the HFIR
Accurate predictions of the compositions of HFIR ta rge ts , during and following irradiation, a re vital to the transuranium-element production program. Such predictions a r e required to determine cornpo- s i t i ons tha t c a n be sa fe ly irradiated in t h e reactor, to plan irradiation and process ing schedules , and to forecas t t h e availabil i ty of various i so topes of the transuranium elements.
Two computer programs are u s e d i n making pre- d ic t ions of compositions of t a rge t s irradiatcd i n the HFIR. T h e first of t h e s e is used to ca lcu la te production r a t e s of t h e various i so topes during neu- tron irradiation. I t is an ex tens ion of ear l ie r pro-
grams that a re based on the CRUNCH code. Two fea tures distinguish it: i t inc ludes explicit con- tributions from epithermal neutron reactions, and it makes an approximate calculation of resonance self-shielding e f fec ts , which c a u s e t h e effective neutron c r o s s sec t ions for particular nuc l ides to vary during irradiation as t h e concentrations of t h e s e nuc l ides change. Two 242Pu t a rge ts , which were irradiated at the SRP to about 4.5% burnup and subsequently analyzed for heavy-element con- tent, se rved a s t h e first s u b j e c t s for t h i s code. Numerous ca lcu la t ions were made tha t involved t h e known irradiation h is tor ies of t hese ta rge ts and various assumed va lues for thermal-neutron c r o s s sec t ions .
lyzed, us ing the second computer program, which in te rpola tes and weighs the resu l t s by t h e leas t - squa res method, to obtain the set of c r o s s sec t ions tha t most nearly resu l t s in . the composition ob- se rved a t t h e end of irradiation. T h i s second pro- gram is capable of simultaneously considering t h e da t a for ten different targets.
In t h e ana lys i s to da te , resonance absorption h a s been based on l i terature va lues of infini te-dilution resonance in tegra ls (1280 and 1500 barns for 242Pu and 243Amr respectively). For the purpose of e s t i - mating resonance self-shielding, a mathematical model. that is appropriate to a s ingle narrow reso- nance was assumed. T h e va lues for thermal. c ros s sec t ions (2200 m / s e c ) result ing from th i s ana lys i s agree with t h e lower end of t h e range of va lues reported in the l i terature (see T a b l e 5.2).
T h e resu l t s of t he ana lys i s of t h e SRP irradia- t ions were u s e d to predict t h e HFIR effective c ros s sec t ions of 242Pu and 243A111, t h e first two mem- be r s of t he transuranium-element production chain (Table 5.3). Reactor e f fec t ive c r o s s sec t ions vary during irradiation a s target compositions change; t h i s ana lys i s was based on the ta rge t compositions a t the end of one reactor-core l ifetime in the HFIR.
HFIR target D-3Q was irradiated for one reactor- core cyc le at 90 Mw and d isso lved , and the result- i ng solution w a s analyzed for transuranium ele- ments; t h e sesu l t s were then subjec ted to numerical ana lys i s . Es t ima tes of IIFXR effective c r o s s sec- t ions for 242Pu and 243Am are within 10% of the va lues previously ca lcu la ted (see T a b l e 5.3) . T h i s agreement is encouraging, indicating that there a re no gross def ic ienc ies i n t he mathematical model u sed to allow for resonance self-shielding for t h e s e two i so topes .
T h e resu l t s of t h e s e ca lcu la t ions were then ana-
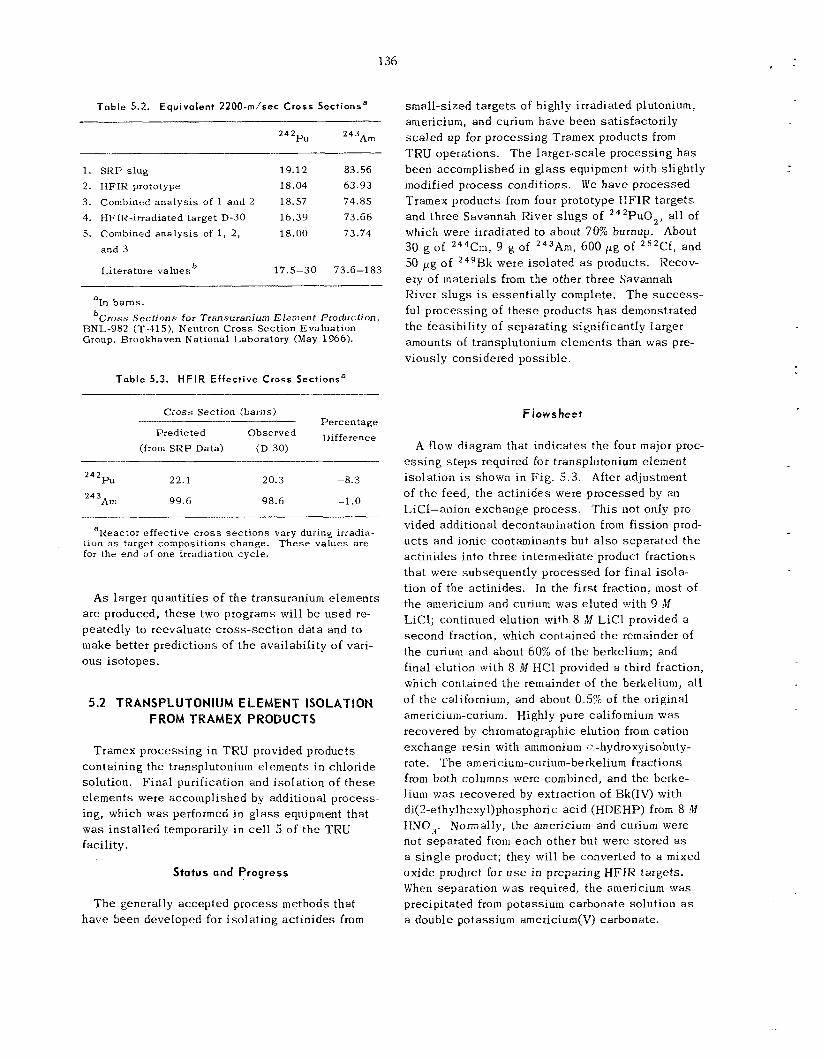
136
Toble 5.2. Equivalent 2200-m/sec Cross Sectionsa -- -_
24ZPu 243Am
1. 2. 3. 4. 5.
SRP slug 19.12 83.56
HFIK prototype 18.04 63.93 Combined analysis of 1 and 2 18.57 74.85 HFIR-irradiated target D-30 16.39 73.66 Combined analysis of 1, 2, 18.00 73.74 and 3
Literature values 17.5-30 73.6-183
barns. bCros s S ec ti on s for Tran swan ium E [ern en t Produc ti on,
BNL-982 (T-415), Neutron Cross Section Evaluation Group, Brookhaven National Laboratory (May 1966).
Toble 5.3. H F I R Effect ive Cross Sectionsa -_I__
Cross Section (barns) .-- Percentage
Observed Difference Predicted (from S R P Data) (D-30)
P u 22.1 20.3 -8.3 242
99.6 98.6 -1.0 2 4 3 Am
aReactor effective c ros s sect ions vary during irradia tion as target compositions change. These values are for the end of one irradiation cycle.
A s larger quantit ies of t h e transuranium elements a re produced, t h e s e two programs will b e used re- peatedly to reevaluate cross-section d a t a and to make better predictions of t h e availabil i ty of vari- o u s isotopes.
5.2 TRANSPLUTONIUM ELEMENT ISQLATION FROM TRAMEX PRODUCTS
Tramex process ing in TRU provided products containing the transplutonium elements i n chloride solution. F ina l purification and i so la t ion of t h e s e elements were accomplished by additional process- ing, which w a s performed in g l a s s equipment that was ins ta l led temporarily in ce l l 5 of t he TRU facility.
Status and Progress
T h e generally accepted p rocess methods that have been developed for i so la t ing ac t in ides from
small-sized ta rge ts of highly irradiated plutonium, americium, and curium have been satisfactorily sca l ed up for process ing Tramex products from TRU operations. T h e la rger -sca le processing h a s been accomplished in g l a s s equipment with sl ightly modified p rocess conditions. We have processed Tramex products from four prototype HFIR ta rge ts and three Savannah River s lugs of 242Pu02, all of which were irradiated to about 70% burnup. About 30 g of 244Cm, 9 g of 243Am, 600 pg of 252Cf, and 50 pg of 249Hk were i so la ted as products. Recov- ery of tnaterials from the other three Savannah River s lugs i s essent ia l ly complete. T h e success - ful p rocess ing of t h e s e products h a s demonstrated the feasibil i ty of separa t ing significantly larger amounts of transplutonium e lements than was pre- viously considered poss ib le .
Flows heet
A flow diagram that ind ica tes the four major proc- e s s i n g s t e p s required for transplutonium element isolation i s shown in F ig . 5.3. After adjustment of t he feed, t he ac t in ides were processed by an LiCl-anion exchange process. Th i s not only pro- vided additional decontamination from fission prod- uc t s and ionic contaminants but also separa ted t h e ac t in ides into three intermediate product fractions that were subsequently processed for final i so la - tion of the actinides. In the first fraction, most of the americium and curium was e lu ted with 9 M LiC1; continued elution with 8 M LiCl provided a second fraction, which contained the remainder of the curium and about 60% of the berkelium; and final elution with 8 M IICl provided a third fraction, which contained the remainder of t he berkelium, all of the californium, and about 0.5% of the original americium-curium. Highly pure californium was recovered by chromatographic elution from cation exchange resin with ammonium a-hydroxyisnbuty- rate. T h e am eri ciuni-cu rium- berkelium fractions from both columns were combined, and the berke- lium was recovered by extraction of Bk(1V) with di(2-ethylhexy1)phosphoric ac id (HDEHP) from 8 M HNO,. Normally, t he americium and curium were not separa ted from each other but were stored as a s ingle product; they will b e converted to a mixed oxide product for u s e i n preparing HFIR targets. When separation w a s required, t he americium was precipitated from potassium carbonate solution as a double potassium americium(V) carbonate.
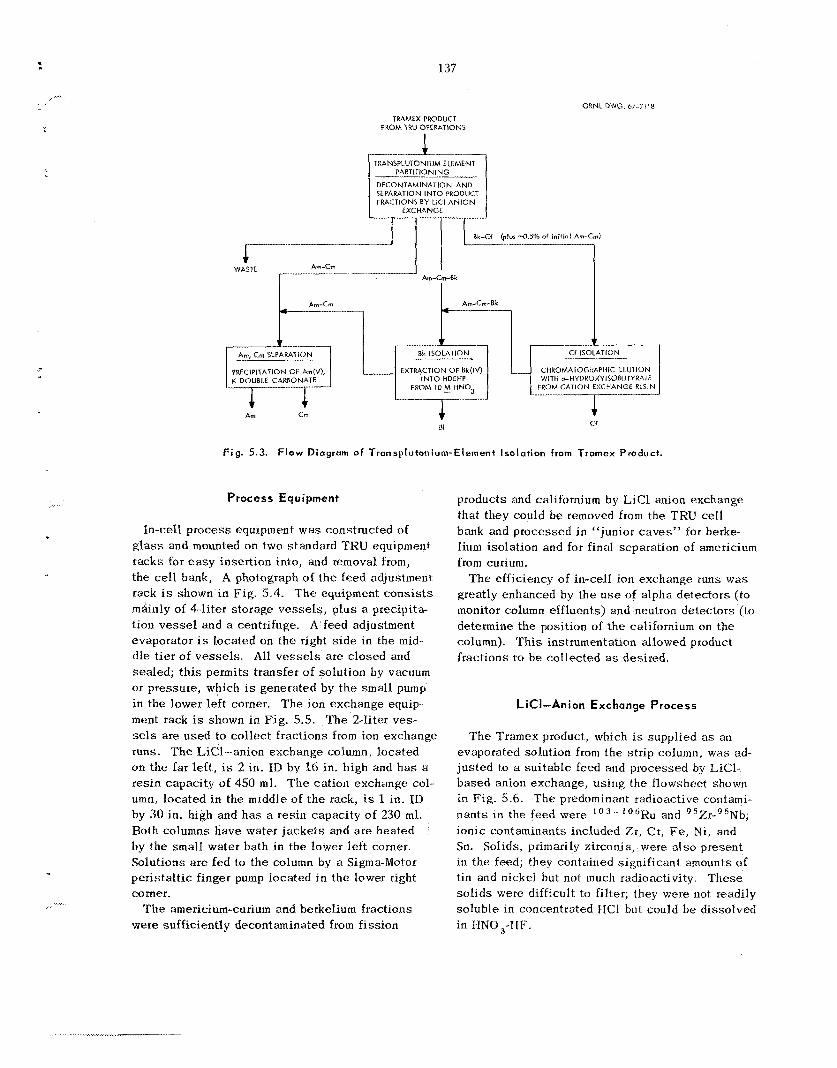
137
TRAMEX PRODUCT FROM TRU OPERATIONS
L_ TRANSPLUTONIUM ELEMENT
PARTITIONING
DECONTAMINATION AND SEPARATION INTO PRODUCT FRACTIONS BY LiCl A N I O N
EXCHANGE
ORNL DWG. 67-71ia
Am-Crn I------
- .... ...
PRECIPITATION OF Arn(V),
Am Cm
Am-Cm-Bk
[- Bk ISOLATION
FXTRACTION OF Bk(lV) INTO HDEHP
FROM 10M H N 0 3
CHKOMATOGXAPHIC ELUTION WITH J-HYDROXYlSOBlJTYRATE
FROM CATION EXCHANGE R E S I N
+ 0k
+ Cf
F ig . 5.3. F l o w Diagram of Tronsplutonium-Element Isolation from Tromex Product.
Process Equipment
In-cell p rocess equipment w a s constructed o f glass and mounted on two s tandard TRU equipment racks for e a s y insertion into, and removal from, the cell bank, A photograph of the feed adjustment rack is shown in Fig. 5.4. T h e equipment c o n s i s t s mdinly of 4-Iiter storage v e s s e l s , plus a precipita- tion v e s s e l and a centrifuge. A feed adjustment evaporator is located on the right s i d e in the mid- d le t i e r of vessels. All v e s s e l s are c losed and sea led ; t h i s permits transfer of solution by vacuum or pressure, which is generated by t h e s m a l l pump in the lower le f t corner. T h e ion exchange equip- tnent rack is shown in F ig . 5.5. T h e 2-liter ves- sels are used to co l lec t fractions from ion exchange runs. T h e LiCl-anion exchange column, located o n the far le f t , is 2 in. ID by 16 in. high and h a s a resin capacity of 450 ml. The cation exchange col- umn, loca ted in the middle of the rack, is 1 in. ID by 30 in. high and h a s a res in capac i ty of 230 ml. Both columns have water j a c k e t s and are heated by the small water bath i n the lower left corner. Solutions a r e fed to the column by a Sigma-Motor per i s ta l t ic finger pump located in the lower right corner.
T h e americium-curium and berkelium fractions were sufficiently decontaminated from f i ss ion
products and californium by LiCl anion exchange tha t they could b e removed from the TRU cell bank and processed i n “junior caves” for berke- lium isolation and for final separation of americium from curium.
T h e efficiency of in-cell ion exchange tuns w a s greatly enhanced by the u s e of a lpha de tec tors (to monitor column effluents) and neutron detectors (to determine the position of t h e californium on the column). T h i s instrumentation allowed product fractions to b e co l lec ted as desired.
LiC1-Anion Exchange Process
T h e Tramex product, which is supplied as an evaporated solution from the s t r ip column, was ad- jus ted to a su i tab le feed and processed by LiC1- based anion exchange, us ing the flowsheet shown in Fig. 5.6. T h e predominant radioactive contami- nants in the feed were l o 3 - - l o 6 R u and Zr- 5Nb; ion ic contaminants included %x, Cr, Fe, Ni, and Sn. Solids, primarily zirconia, were also present i n t he feed; they contained significant amounts of tin and nickel but not much radioactivity. T h e s e so l id s were difficult t o filter; they were not readily so luble in concentrated €IC1 but could b e dissolved in HN0,-€IF.
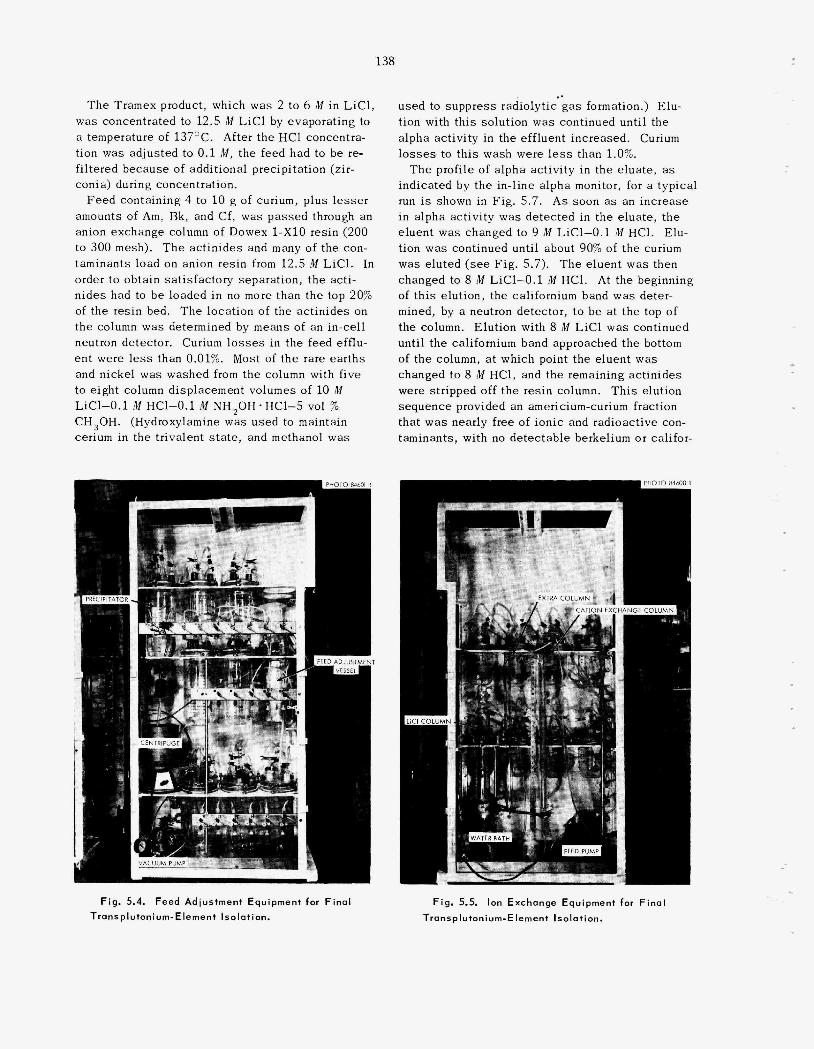
138
.. used to suppress radiolytic g a s formation.) Elu- tion with th i s solution was continued until the a lpha act ivi ty in the effluent increased. Curium losses to th i s wash were less than 1.0%.
indicated by t h e in-line alpha monitor, for a typical run is shown in Fig. 5.7. A s soon as an increase in alpha activity was detected in the eluate , t h e eluent w a s changed to 9 M LiC1-0.1 M HC1- Elu- tion w a s continued until about 90% of the curium was eluted ( s e e Fig. 5.7). T h e eluent was then changed to 8 M LiC1-0.1 M HCI. At the beginning of th i s elution, the californium band w a s deter- mined, by a neutron detector, t o b e at the top of the column. Elution with 8 M L i C l w a s continued until t h e californium band approached t h e bottom of t h e column, a t which point the eluent was changed to 8 M HCI, and the remaining ac t in ides were s t r ipped off the resin column. T h i s elution sequence provided an americium-curium fraction that was nearly f ree of ionic and radioactive con- taminants, with no detectable berkelium or califor-
T h e profile of a lpha activity in the eluate , a s
T h e Tramex prod which was 2 to 6 M in LiCI, was concentrated t .5 M L i C l by evaporating to a temperature of 137OC. After t h e HC1 concentra- tion was adjusted to 0 .1 M , the feed filtered because of additional precip conia) during concentration.
Feed containing 4 to 10 g of curium, plus lesser amounts of Am, Bk, and Cf, was pas sed through an anion exchange column of Dowex 1-X10 resin (200
mesh). T h e ac t in ides and many of the con- n t s load on anion resin from 12.5 M LiC1. In
order to obtain sat isfactory separation, t h e acti- n i d e s had to b e loaded i n no more than t h e top 20% of the resin bed. T h e location of the act inides on the column was determined by means of an in-cell neutron detector. Curium l o s s e s in t h e feed efflu- en t were less than 0.01%. Most of the rare ear ths and nickel w a s washed from the column with five to e ight column displacement volumes of 10 M LiC1-0.1 M HC1-0.1 M NH,OH - HC1-5 vol % CH,OH. (Hydroxylamine was cerium in the trivalent s ta te , and methanol was
XIR" COL-MrV i D ADJUSTMENT
1 U V E S S E L
t
Fig. 5.4. Feed Adiustment Equipment for F i n a l Transplutoniurn-Element Isolat ion.
F ig . 5.5. Ion Exchange Equipment for Fino1
Transplutonium-Element Isolation.
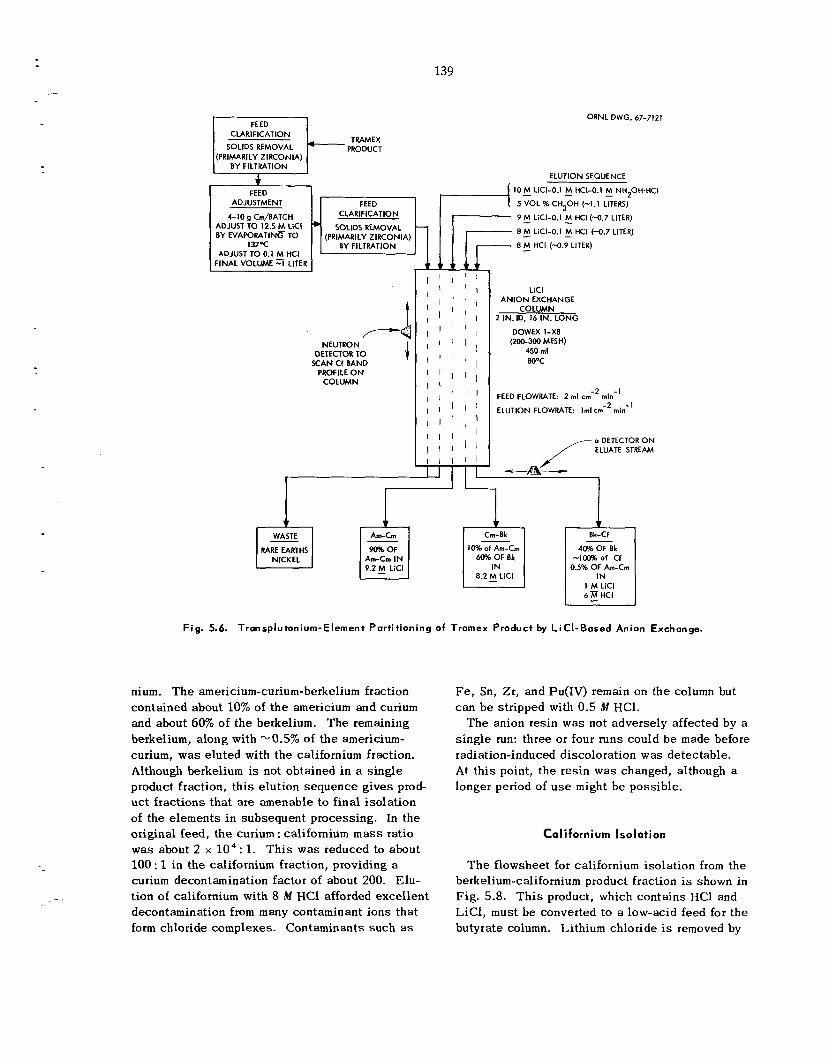
139
ORNL DWG. 67-7121
CLARIFICATION SOLIDS REMOVAL
(PRIMARILY ZIRCONIA) BY FILTRATION
FEED ADJUSTMENT FEED
4- IO g Cm/BATCH CLARIFICATION ADJUST TO 12.5 M LiCl SOLIDS REMOVAL - * BY EVAPoRATlNc TO (PRIMARILY ZIRCONIA)
ADJUST TO 0.1 M HCI FINAL VOLUME -? LITER
137-c BY FILTRATION -
NEUTRON
SCAN Cf BAND PROFILE ON
COLUMN
DETECTORTO 1
Am-Cm IN 9 . 2 M LiCl
1 ELUTION SEQUENCE
IO! LiCI-0.1 HCI-0.1 M NH20H 5 VOL % CH30H (-1 . I LITERS) 9 M LiCI-0.1 HCI (-0.7 LITER) 8 LiCI-0.1 M HCl (-0.7 LITER) 8M HCI (-0.9 LITER)
.HCl
LiCl ANION EXCHANGE
COLUMN 2 IN. ID, 16 IN. LONG
DOWEX I-X8 (20&300 MESH)
450 rnl 8OOC
I I I I I
I
RARE EARTHS 10% of Am-Cm 60% OF Bk
8.2 LiCl
I Bk-Cf
40% OF Bk -100% of Cf
0.5% OF Am-Cm IN
I M LiCl 6z HCI
Fig. 5.6. Transplutonium-Element Partit ioning of Tromex Product by L iCI -Based Anion Exchange.
nium. T h e americium-curium-berkelium fraction contained about 10% of t h e americium and curium and about 60% of the berkelium. T h e remaining berkelium, along with -0.5% of t h e americium- curium, w a s eluted with the californium fraction. Although berkelium is not obtained in a s ingle product fraction, t h i s e lut ion sequence g ives pmd- u c t f ract ions tha t are amenable to f inal isolat ion of the elements in subsequent processing. In the original feed, the curium : californium m a s s ratio was about 2 x lo4: 1. T h i s was reduced to about 100 : 1 in the californium fraction, providing a curium decontamination factor of about 200. Elu- t ion of californium with 8 M HC1 afforded excel lent decontamination from many contaminant ions tha t form chloride complexes. Contaminants such as
Fe, Sn, Zr, and Pu(1V) remain on the column but can be stripped with 0.5 M HC1.
T h e anion resin was not adversely affected by a s ingle run: three or four runs could b e made before radi ation-induced discoloration was detectable. At t h i s point, the resin was changed, although a longer period of u s e might b e possible.
Cali forni urn I solation
T h e flowsheet for californium isolat ion from the berkelium-californium product fraction is shown in Fig. 5.8. T h i s product, which contains HC1 and LiC1, must be converted to a low-acid feed for the butyrate column. Lithium chloride is removed by
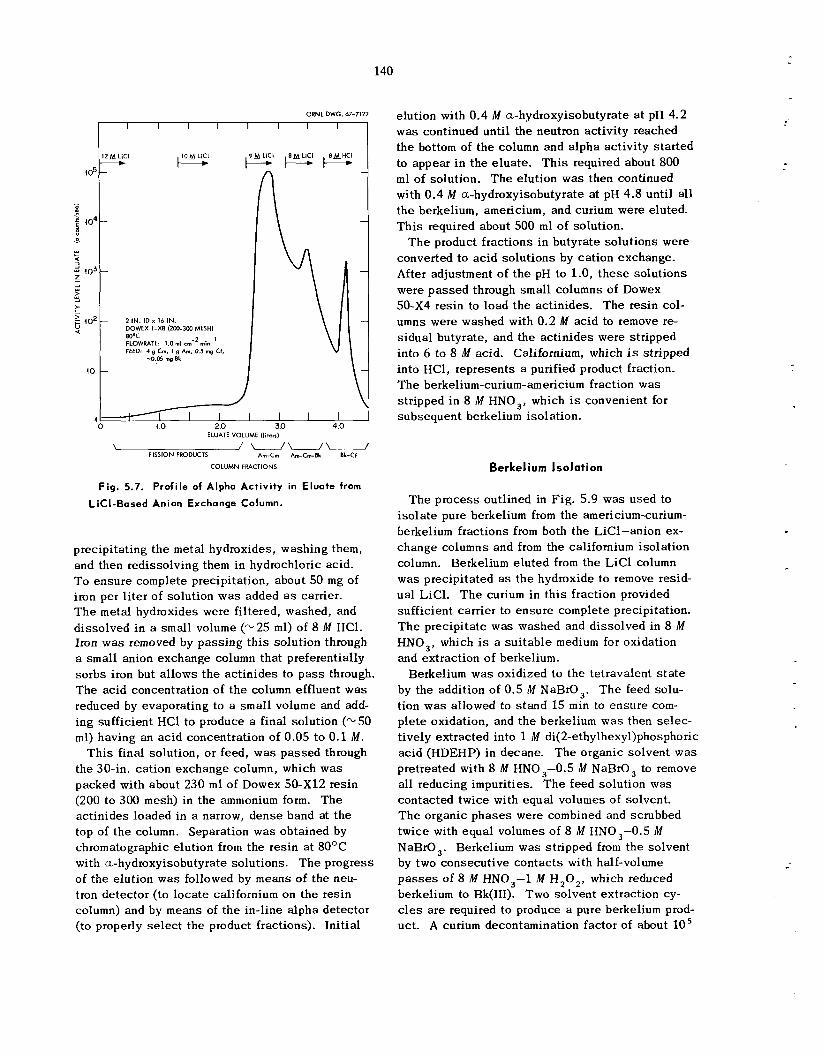
ORNL DWG. 67-712
I 1 I I I I I I
\uuu FISSION PRODUCTS Am-Cm AmCmBk Ik-Cf
COLUMN FRACTIONS
F ig . 5.7. Profile of Alpha Act ivi ty in Eluate from
LiCI -Based Anion Exchange Column.
precipitating the metal hydroxides, washing them, and then redissolving them in hydrochloric acid. T o ensure complete precipitation, about 50 mg of iron per l i ter of solution w a s added as carrier. T h e metal hydroxides were filtered, washed, and dissolved in a s m a l l volume (-25 ml) of 8 M HC1. Iron was removed by pass ing th i s solution through a s m a l l anion exchange column tha t preferentially sorbs iron but allows t h e ac t in ides to p a s s through. T h e acid concentration of t h e column effluent w a s reduced by evaporating to a s m a l l volume and add- ing sufficient HC1 to produce a final solution (-50 ml) having an ac id concentration of 0.05 to 0.1 M.
T h i s final solution, o r feed, w a s pas sed through the 30-in. cation exchange column, which was packed with about 230 m l of Dowex 5O-Xl2 resin (200 to 300 mesh) in the ammonium form. T h e ac t in ides loaded in a narrow, dense band at the top of t h e column. Separation was obtained by chromatographic elution from the resin a t 8OoC with a-hydroxyisobutyrate solutions. T h e progress of t he elution was followed by means of the neu- tron detector (to locate californium on the resin column) and by means of t he in-line alpha detector (to properly select the product fractions). Init ial
40
elution with 0.4 M a-hydroxyisobutyrate at pH 4.2 was continued until the neutron activity reached t h e bottom of the column and a lpha activity s ta r ted to appear i n the eluate. T h i s required about 800 ml of solution. T h e elution was then continued with 0.4 M a-hydroxyisobutyrate at pH 4.8 until all the berkelium, americium, and curium were eluted. Th i s required about 500 m l of solution.
T h e product fractions in butyrate so lu t ions were converted to ac id so lu t ions by cation exchange. After adjustment of t h e pH to 1.0, t h e s e so lu t ions were pas sed through small columns of Dowex 50-X4 resin to load the actinides. T h e resin col- umns were washed with 0.2 M ac id to remove re- s idua l butyrate, and the ac t in ides were stripped into 6 to 8 M acid. Californium, which is stripped in to HC1, represents a purified product fraction. T h e berkelium-curium-americium fraction was stripped in 8 M HNO,, which is convenient for subsequent berkelium isolation.
Berkelium Isolation
T h e process outlined in Fig. 5.9 was used to i so l a t e pure berkelium from the americium-curium- berkelium fractions from both the LiC1-anion ex- change columns and from the californium isolation column. Berkelium e lu ted from the LiCl column was precipitated as t h e hydroxide t o remove resid- ual LiC1. T h e curium in th i s fraction provided sufficient carrier to ensure complete precipitation. T h e precipitate was washed and d isso lved in 8 M HNO,, which is a su i t ab le medium for oxidation and extraction of berkelium.
Berkelium was oxidized to the tetravalent s t a t e by the addition of 0.5 M NaBrO,. T h e feed solu- tion w a s allowed to s tand 15 min to ensure com- p le te oxidation, and the berkelium was then selec- tively extracted into 1 M di(2-ethylhexy1)phosphoric ac id (HDEHP) in decane. T h e organic solvent was pretreated with 8 M HN0,-0.5 M NaBrO, to remove all reducing impurities. T h e feed solution was contacted twice with equal volumes of solvent. T h e organic p h a s e s were combined and scrubbed twice with equal volumes of 8 M HN0,-0.5 M NaBrO,. Berkelium was stripped from the solvent by two consecut ive contac ts with half-volume p a s s e s of 8 M HNO,-l M H,O,, which reduced berkelium to Bk(II1). Two solvent extraction cy- cles a re required to produce a pure berkelium prod- uct. A curium decontamination factor of about l o 5
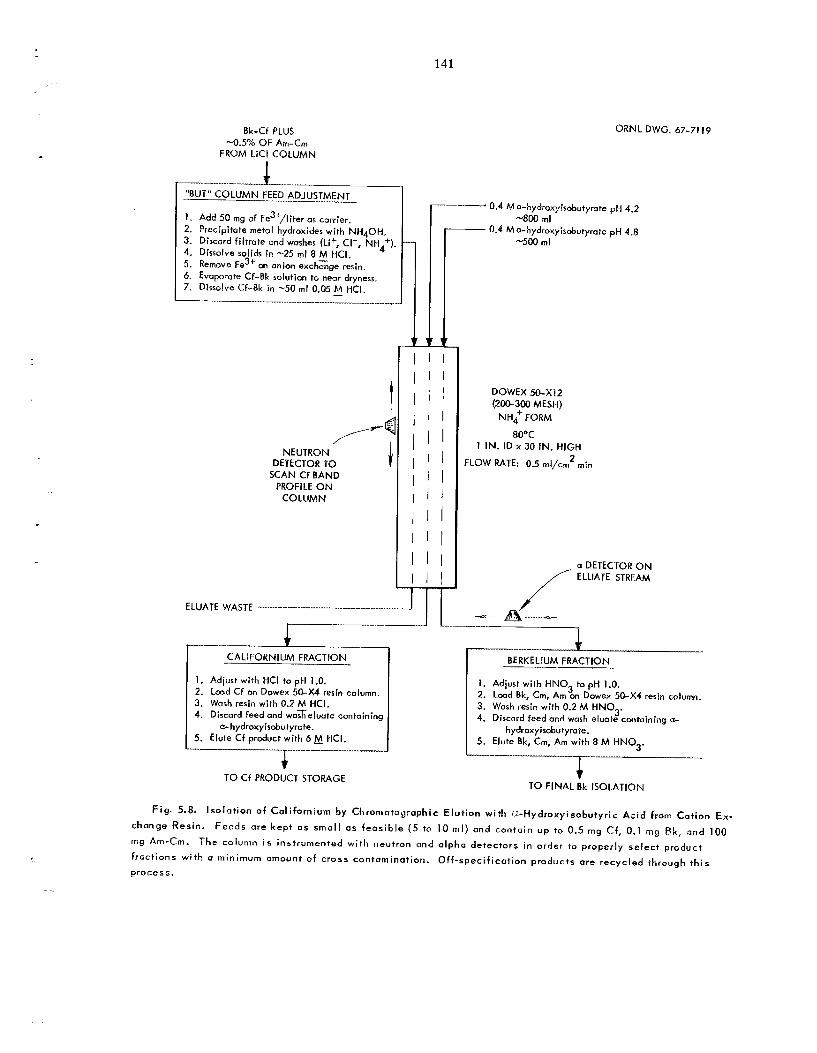
Bk-Cf PLUS -0.5% OF Am-Cm
FROM LiCl COLUMN
141
ORNL DWG. 67-71 19
......__ "BUT" COLUMN FEEDADJUSTMENT
I . Add 50 mg of Fe3+/liter as carrier. 2. Precipitate metal hydroxides with NH4OH. 3. Discord fi l trate ond washes (Li+, CI-, NH4+). 4. Dissolve solids in -25 ml 8 M HCI. 5. Remove Fe3'- on onion exchzge resin. 6. Evaporate Cf-Bk solution to near dryness. 7. Dissolve Cf-Bk in -50 ml 0.05 HCI.
___..-- I_-._
ELUATE WASTE
1 1 ' 1 1 1 1 ' 1
1 ' 1 1 ' 1
NEUTRON DETECTOR TO
SCAN Cf BAND PROFILE ON
COLUMN
II
.-.___
CALIFORNIUM FRACTION
1 . Adjust with HCI to pH 1 .O. 2. L a d Cf on Dowex 5 G X 4 resin column. 3. Wash resin with 0.2 M HCI. 4. Discord feed and wazeluate containing
a- hydroxyisabu tym te. 5. Elute Cf product with 6 M HCI.
TO Cf PRODUCT STORAGE
v.7 IVI u-nyoruxytaoouryrate pU 4.2
- 0.4 Ma-hydroxyisobutyrate pH 4.8 -800 rnl
-500 ml
BOWEX 50-Xl2 (200-300 MESH)
NH; FORM
aooc 1 IN. ID x 30 IN. HIGH
FLOW RATE: 0.5 ml/crn 2 min
a DETECTOR ON ELUATE STREAM
r---- BERKELIUM FRACTION
1. Adjust wi th H N 0 3 to pH 1.0. 2. Load Bk, Cm, Am on Dowex 50-X4 resin column.
3' 3. Wash resin with 0.2 M H N O 4. Discord feed and wash eluate cmtaining a-
5. Elute Bk, Cm, Am with 8 M H N 0 3 . h ydroxyirobutyrate.
I- _I___r__--- - + TO FINAL Bk ISOLATION
F i g . 5.8. Isolation of C a l i f o r n i u m by Chromatog raph ic E l u t i o n w i t h a , - H y d r o x y i s o b u t y r i c A c i d from C a t i o n E x -
change R e s i n . F e e d s a r e k e p t as s m a l l as f e a s i b l e (5 to 10 m l ) and contain up to 0.5 rng Cf, 0.1 rng Bk, and 100 mg Am-Cm. T h e column i s i n s t r u m e n t e d w i t h neutron and a l p h a d e t e c t o r s i n o rde r to p r o p e r l y s e l e c t p r o d u c t
f r a c t i o n s w i t h a m i n i m u m amount of c r o s s c o n t a m i n a t i o n . O f f - s p e c i f i c a t i o n p r o d u c t s are r e c y c l e d th rough t h i s
p rocess .
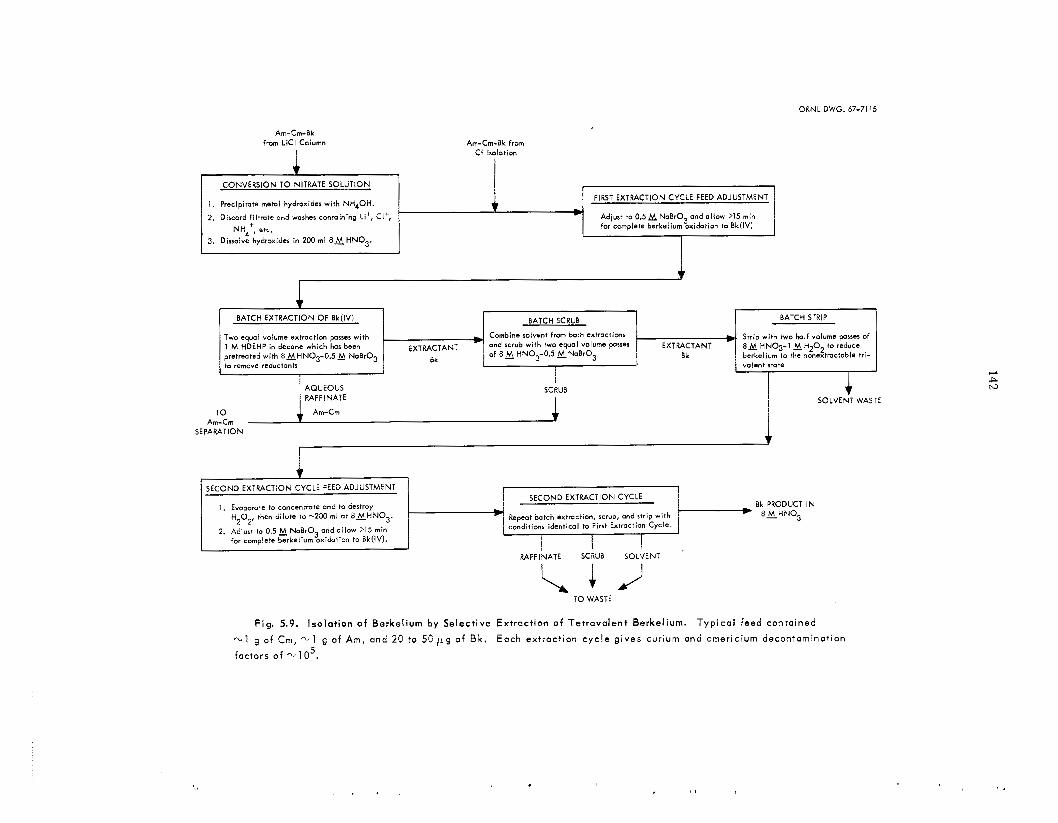
ORNL DWG. 67-71 15
Precipitate metal hydroxides w i t h N H 4 0 H .
Discord f i l t m t e and washes conraining LI',
Dissolve hydroxides i n 200 ml B & H N 0 3 . NH~+, etc.
- CI+.
FIRST EXTRACTION CYCLE FEED ADJUSTMENT
Adjust to 0 . 5 M NaBrO for complete berkel ium%xidation to Bk(IV)
and al low >I5 min
Am-Cm-ak from C f Isolation
Two equal volume extraction passes wi th 1 M HDEHP in decane which has been pretreated wi th 8 M H N 0 3 - 0 . 5 M N&03 to remove reductonts
Combine solvent from both extractions Strip wi th two half volume posses of
of 8 1 HN03-0.5 &NaBr03 Bk berkelium to the nonextmctable t r i - EXTRACT AN^
Bk
* and scrub wi th two equal volume parses EXTRACTANT * 8M HNOg-l M H 2 0 2 to reduce
valent state
I I I
SECOND EXTRACTION CYCLE FEED ADJUSTMENT
I , Evoporo*e to concenrrate and to cestroy H,O,, then d i lu te to -230 ml a t 6 M H N 0 3 .
SECOND EXTRACTION CYCLE ak P R O D K T IN
Qpeat botch extraction, scrub, and strip wi th @ 8 M H N 0 3
1 BATCH STRIP BATCH SCRUB
SCRUB
I TO Am-Cm
Am-Cm SEPARATION
7 RAFFINATE SCRUB SOLVENT
6'.
2. Adjust IO 0.5 E NoBrO ond a l low > I 5 min for complete berke i iumtx ida t ion to Bk(lV).
F i g . 5.9. Iso la t ion o f B e r k e l i u m b y S e l e c t i v e
- 1 g o f Cm, - 1 g o f Am, and 20 to 5 0 p g o f Bk. 5 fac to rs o f - 10 .
Extrcction o f T e t r a v a l e n t Be rke l i um.
Each e x t r a c t i o n c y c l e g i v e s cu r ium and c m e r i c i u m decon tamina t ion
T y p i c a l f eed conyained
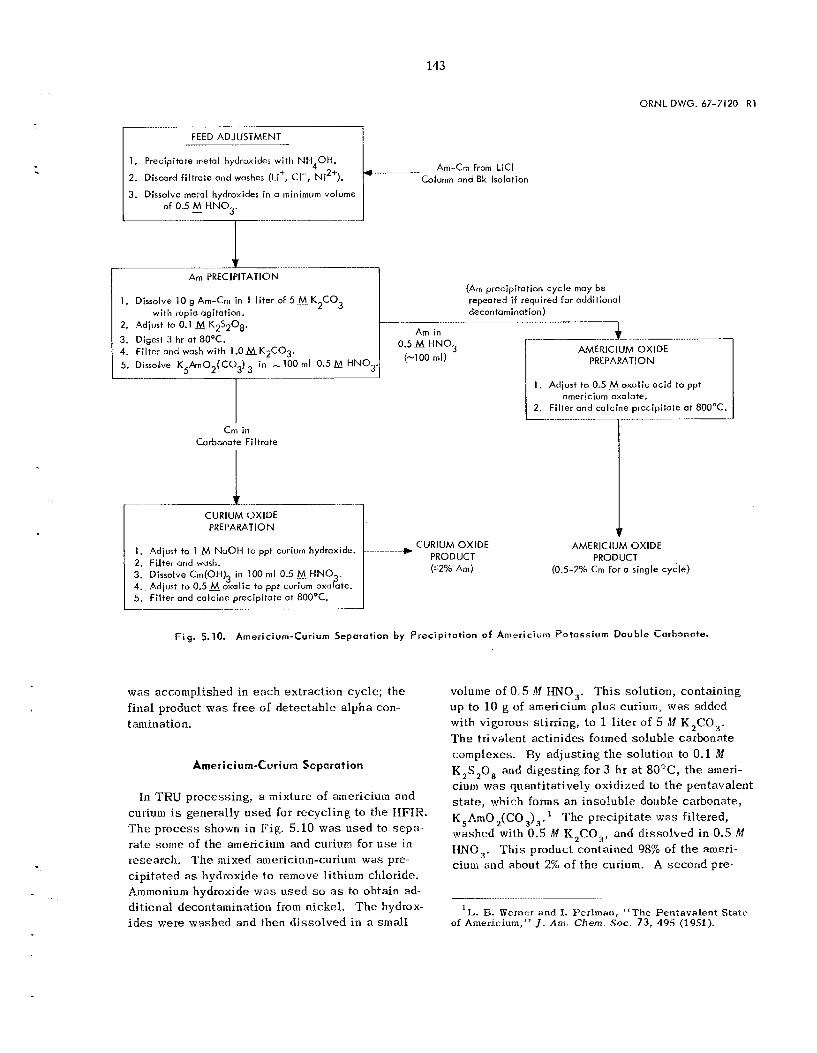
143
CURIUM OXIDE PREPARATION
1. Adjust to 1 .& N o O H to ppt curium hydroxide. 2. Fi l ter and wash. 3. Dissolve Cin(OH)3 in 100 m l 0.5 .MWNO . 4. Adjust 10 0 . 5 M o x a I i c to ppt curium axa6te. 5. Fi l ter and calcine precipitate at 8OOOC.
ORNL DWG. 67-7120 R1
------
I FEED ADJUSTMENT
Am-Cm from LiCl Column and Bk Isolation
1. Precipitate inetol hydroxides w i th NH40H.
2. Discord f i l t ra te ond washes (Li', CI-, Ni2+).
3. Dissolve metal hydroxides in a minimum volume of 0.5 M H N 0 3 . -
Am PRECIPITATION
Dissolve 10 g Am-Cm in 1 l iter of 5 .?n_ K 2 C 0 3
Adjust to 0.1 & K25208. Digest 3 hr a t 8OOC.
wi th rapid agitation.
, F i l ter and wash w i th I . O M K 2 C 0 3 . , Dissolve K 5 h 0 2 ( C 0 3 ) i n - 100 rnl 0.5 M H N 0 3
(Am precipitation cyc le may be repeated if required for additional decontamination)
Am in 0.5M H N 0 3
(-100 ml)
...* CURIUM OXIDE PRODUCT ('2% Amj
...__... + _l.._l___ AMERICIUM OXIDE
PREPARATION
1 . Adiust to 0.5-M-oxaIic acid to ppt
2. Fi l ter and calcine precipitate at 800OC. americium oxalate.
I
AMERlCllJM OXIDE PRODUCT
(0.5-2% Cm for a single cycle)
F i g . 5.10. A m e r i c i u m - C u r i u m S e p a r a t i o n b y P r e c i p i t a t i o n of A m e r i c i u m Potassium D o u b l e Carbonate.
was accomplished in each extraction cycle; t he final product w a s f ree of de tec tab le a lpha con-- t amination.
Americium-Curium Separation
In TRU processing, a mixture of americium and curium is generally used for recycling to the HFIR. T h e process shown in Fig. 5.10 was used to sepa- ra te some of the americium and curium for u s e in research. T h e mixed ameiicium-curium was pre- cipitated as hydroxide to remove lithium chloride. Ammonium hydroxide w a s used so a s to obtain ad- ditional decontamination from nickel. The hydrox- i d e s were washed and then d isso lved in a small
volume of 0.5 M HNO,. T h i s solution, containing up to 1 0 g of americium plus curium, w a s added with vigorous stirring, t o 1 liter of 5 M K2C0, . T h e trivalent ac t in ides formed so luble carbonate complexes. By adjusting the solution to 0.1 M K,S,O, and digesting for 3 hr at 80°@, the atneri- ciuui was quantitatively oxidized to t h e pentavalent s ta te , which forms an insoluble double carbonate, K,AmO,(CO,),.l The precipitate was filtered, washed with 0.5 M K,CO,, and dissolved in 0.5 M WNQ,. This product contained 98% of the amer i - cium and about 2% of the curium. A second pre-
.... ~ ............
'J.,. R. Werner and I. Perlmarr, "The Pentavalent State of Americium," J. A n . Chem. SOC. 73, 495 (1951).
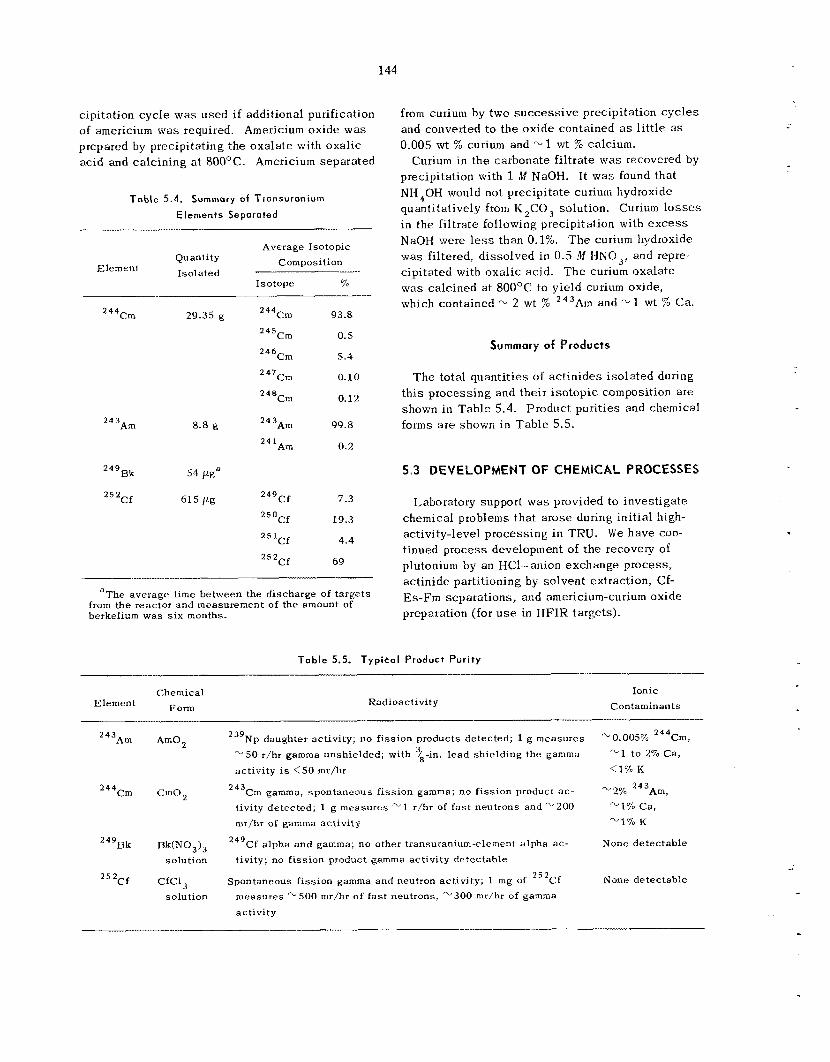
144
cipitation cyc le w a s used i f additional purification of americium was required. prepared by precipitating the oxa la te with oxa l ic acid and calcining at 8OOOC. Americium separated
Americium oxide was
Toble 5.4. Summary of Transuranium
Elements Separated -___. ~
Average Isotopic Composition Quantity
Isolated Element Isotope Cib
2 4 4 ~ m 29.35 g 2 4 4 C m 93.8
0.5
5.4
245
246
Cm
Cm
Cm 0.10 2 4 7
248Cm 0.12
8.8 g 243Am 99.8
0.2
2 4 3 Am
24 1 Am
249Bk 54 lLga
from curium by two s u c c e s s i v e precipitation Cycles and converted to the oxide contained as l i t t l e RS
0.005 wt 76 curium and '" 1 wt '% calcium.
precipitation with 1 M NaOH. It w a s found that NI140H would not precipitate curium hydroxide quantitatively from K 2 C 0 3 solution. Curium l o s s e s in the fi l trate following precipitation with e x c e s s NaOH were less than 0.1%. T h e curium hydroxide was filtered, d i sso lved in 0.5 M I-INO,, and repre- cipitated with oxa l ic acid. T h e curium oxala te was calcined at 8OO0C to yield curium oxide, which contained '" 2 wt % 243A~n and " 1 wt % Ca.
Curium i n the carbonate fi l trate was recovered by
Summary of Products
T h e total quant i t ies of ac t in ides i so la ted during th i s process ing and their i so topic composition are shown in Tab le 5.4. Product purit ies and chemical forms a r e shown i n Tab le 5.5.
5.3 DEVELOPMENT OF CHEMICAL PROCESSES
2 4 9 c f 7.3 Laboratory support w a s provided to inves t iga te 250Cf 19.3 chemical problems tha t a rose during init ial high-
activity-level process ing in TRU. We have con- tinued process developiiient of t h e recovery of plutonium by an HC1-anion exchange process, ac t in ide partitioning by so lvent extraction, Cf-
2 5 i C f 4.4
252Cf 69 . .__._._
aThe average time between the discharge of targets E ~ - F ~ separations, and americium-curium oxide preparation (for u s e in HFIR targets).
from the reactor and measurement of the amount of berkelium was s ix months.
Table 5.5. Typical Product Purity
Chemical Ionic
Contaminants
'"0.005% 244Cm, '"1 to 2% Ca, < l % K
Element Form Radioactivity
239Np daughter activity; no fission products detected; 1 g measures "SO r/hr gamma unshielded; with %-in. l ead shielding the gamma activity is ( 5 0 mr/hr
2 4 3 Am Am02
2 4 4 ~ m Cm02 243Cm gamma, spontaneous fission gamma; no f i ss ion product ac - '"2% 243Am, tivity detected; 1 g measures '"1 r/hr of f a s t neutrons and "'200 '"1% Ca, mr/hr of gamma activity "1% K
None detectable 249Bk 13k(N03)3 solution
249Cf alpha and gamma; no other transuranium-clement alpha ac - tivity; no f i ss ion product gamma activity detectable
None detectable 25 2 25 2Cf CfCI, Spontaneous fission gamma and neutron act-ivity; 1 mg of Cf
solution measures '"500 mr/hr of fas t neutrons, '"300 mr/hr of gamma activity
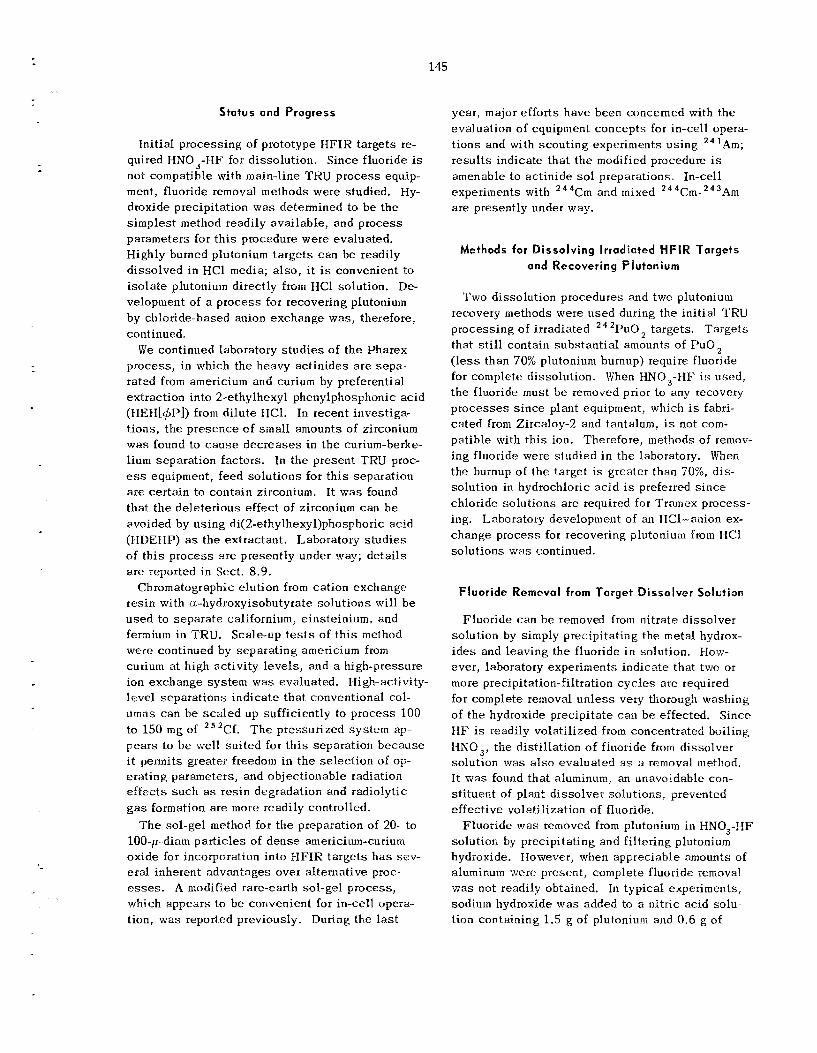
145
Status and Progress
Init ial processing of prototype HFIR targets re- quired HN0,-HF for dissolution. Since fluoride is not compatible with main-line TKU process equip- ment, fluoride removal methods were studied. Hy- droxide precipitation was determined to b e t h e s imples t method readily ava i lab le , and process parameters for t h i s procedure were evaluated. Highly burned plutonium ta rge ts can be readily d isso lved in HC1 media; a l so , i t is convenient to i so la te plutonium directly from HC1 solution. De- velopment of a process for recovering plutonium by chloride-based anion exchange was , therefore, continued.
We continued laboratory s tud ie s of the Pharex process , in which the heavy ac t in ides are sepa- rated from americium and curium by preferential extraction into 2-ethylhexyl phenylphosphonic acid (HIEH[$P]) from di lu te HC1. In recent investiga- t ions, t h e presence of sinall amounts of zirconium was found to c a u s e dec reases in the curium-berke- lium separation factors. In the present TRU proc- ess equipment, feed so lu t ions for t h i s separation a re certain to contain zirconium. It w a s found tha t t h e deleterious effect of zirconium can b e avoided by us ing di(2-ethy1hexyl)phosphoric acid (HX)EIIP) as the extractant. Laboratory s tud ie s of th i s process a re presently under way; de ta i l s are reported in Sect. 8.9.
Chromatographic elution from cation exchange res in with a-hydroxyisobutyrate so lu t ions will be used to separa te californium, einsteinium, and fermium in TRU. Scale-up tests of t h i s method were continued by separa t ing americium from curium at high activity leve ls , and a high-pressure ion exchange sys tem was evaluated. Nigh-activity- leve l separa t ions ind ica te tha t conventional col- umns can b e sca l ed up sufficiently to process 100 to 150 mg of ' 2Cf. T h e pressurized sys tem ap- pea r s to b e well su i ted for t h i s separation because i t permits greater freedom in t he se lec t ion of op- erating parameters, and objectionable radiation e f fec ts such a s res in degradation and radiolytic g a s formation a re more readily controlled.
T h e sol-gel method for t he preparation of 20- to 100-p-diam par t ic les of dense americium-curium oxide for incorporation in to I-IFIR ta rge ts h a s sev- eral inherent advantages over alternative proc- esses. A modified rare-earth sol-gel process, which appears to be Convenient for in-cell opera- tion, was reported previously. During the last
year, major efforts have been concerned with the evaluation of equipment concepts for in-cell opera- t ions and with scout ing experiments us ing 2 4 'Am; resu l t s indicate tha t the modified procedure is amenable t o ac t in ide sol preparations. In-cell experiments with 244Cm and mixed 244Cm-243Am are presently under way.
Methods for Dissolving Irradiated HFIR Targets and Recovering Plutonium
Two dissolution procedures and two plutonium recovery methods were used during the init ial TRU process ing of irradiated 2 4 %O2 targets. Targe ts that s t i l l contain subs tan t ia l amounts of P u O ( l e s s than 70% plutonium burnup) require fluoride for complete dissolution. When HN0,-HF i s used, t he fluoride must be removed prior to any recovery p rocesses s ince plant equipment, which is fabri- ca ted from Zircaloy-2 and tantalum, is not com- patible with t h i s ion. Therefore, methods of remov- ing fluoride were s tud ied in the laboratory. When the burnup of the target is greater than 7076, dis- solution in hydrochloric ac id i s preferred s ince chloridc so lu t ions a re required for Tramex process- ing. Laboratory development of an NC1-anion ex- change process for recovering plutonium from IIC1 so lu t ions was continued.
Fluoride Removal from Target Dissolver Solution
Fluoride can he removed from nitrate dissolver solution by simply precipitating the m e t a l hydrox- i d e s and leaving the fluoride in solution. How- ever, laboratory experiments indicate tha t two or more precipitation-filtration c y c l e s a re required for complete removal un le s s very thorough washing of t he hydroxide precipitate can b e effected. Since H F is readily volati l ized from concentrated boiling IINO,, the disti l lat ion of fluoride from dissolver solution was also evaluated as a removal method. It was found tha t aluminum, an unavoidable con- s t i tuent of plant d i sso lver solutions, prevented effective volatilization of fluoride.
solution by precipitating and filtering plutonium hydroxide. However, when apprcciable amounts of aluminum were present, complete fluoride removal was not readily obtained. In typical experiments, sodium hydroxide was added to a nitric acid solu- tion containing 1.5 g of plutonium arid 0.6 g of
Fluoride was removed from plutonium in HN0,-HF
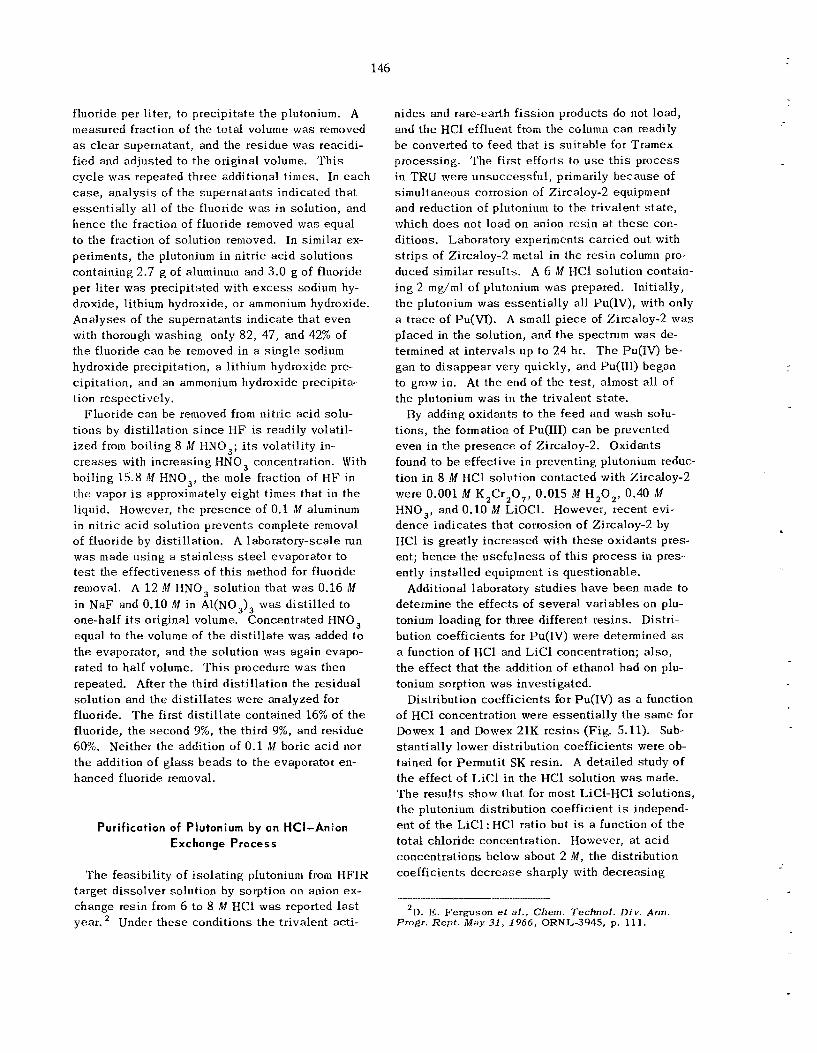
146
fluoride per liter, to precipitate t he plutonium. A measured fraction of the to ta l volume was removed a s c lear supernatant, and the residue w a s reacidi- f ied and adjusted to t h e original volume. 'This c y c l e w a s repeated three additional t imes. In each case, ana lys i s of t he superna tan ts indicated that essent ia l ly a l l of the fluoride was in solution, and hence the fraction of fluoride removed was equal to t h e fraction of solution removed. In similar ex- periments, the plutonium i n nitric ac id so lu t ions containing 2.7 g of aluminum and 3.0 g of fluoride per l i ter was precipitated with e x c e s s sodium hy- droxide, lithium hydroxide, o r ammonium hydroxide. Analyses of the superna tan ts ind ica te tha t even with thorough washing only 82, 47, and 42% of the fluoride c a n be removed in a s ing le sodium hydroxide precipitation, a lithium hydroxide pre- cipitation, and an ammonium hydroxide precipita- tion respectively.
Fluoride c a n be removed from nitric ac id solu- t ions by disti l lat ion s i n c e H F is readily volatil- i zed from boiling 8 M HNO,; i t s volatility in- c r e a s e s with increas ing HNO , concentration. With boiling 15.8 M HNO,, t he mole fraction of H F in the vapor i s approximately e ight t imes that i n the liquid. However, t he presence of 0.1 M aluminum in nitric ac id solution prevents complete removal of fluoride by distillation. A laboratory-scale run was made us ing a s t a i n l e s s steel evaporator to t e s t the e f fec t iveness of t h i s method for fluoride removal. A 1 2 M HNO, solution that was 0.16 M in N a F and 0.10 M in Al(NO,), was d is t i l l ed to one-half i t s original volume. Concentrated HNO, equal to the volume of t h e d i s t i l l a t e w a s added t o t h e evaporator, and the solution was again evapo- rated to half volume. 'This procedure w a s then repeated. After t h e third d is t i l l a t ion the residual solution and the d i s t i l l a t e s were analyzed for fluoride. T h e first d i s t i l l a te contained 16% of the fluoride, t he second 9%, t h e third 9%, and residue 60%. Neither the addition of 0 .1 M boric ac id nor the addition of g l a s s beads to the evaporator en- hanced fluoride removal.
Purif ication of Plutonium by an HCI-Anion Exchange Process
T h e feasibil i ty of i so la t ing plutonium from HFIR target d i sso lver solution by sorption on anion ex- change resin from 6 to 8 M HC1 was reported l a s t year. Under t h e s e conditions t h e tr ivalent acti-
n ides and rare--earth f i ss ion products do not load, and t h e HC1 effluent from the column c a n readily b e converted to feed tha t is su i tab le for Tramex processing. The first efforts to u s e th i s process in TRU were unsuccessfu l , primarily because of simultaneous corrosion of Zircaloy-2 equipment and reduction of plutonium to the tr ivalent s t a t e , which d o e s not load on anion res in a t t hese con- ditions. Laboratory experiments carried out with s t r ip s of Zircaloy-2 metal in the res in column pro- duced similar results. A 6 M HCl solution contain- ing 2 rng/ml of plutonium was prepared. Initially, t he plutonium was essent ia l ly all Pu(lV), with only a t race of Pu(V1). A s m a l l p i ece of Zircaloy-2 w a s p laced in the solution, and t h e spectrum was de- termined at in te rva ls up to 24 hr. T h e Pu(1V) be- gan to d isappear very quickly, and Pu(l1I) began to grow in. At t he end of the t e s t , almost all of the plritonium w a s i n the tr ivalent state.
By adding oxidants to t h e feed and wash solu- t ions , the formation of Pu(II1) c a n b e prevented even in t h e presence of Zircaloy-2. Oxidants found to b e e f fec t ive i n preventing plutonium reduc- t ion i n 8 M HC1 solution contacted with Zircaloy-2 were 0.001 IN K2Cr,0, , 0.015 M H,O,, 0.40 M HNO,, and 0.10 M LiOCI. However, recent evi- dence ind ica tes tha t corrosion of Zircaloy-2 by HC1 is greatly increased with these oxidants pres- ent; hence t h e use fu lness of t h i s p rocess in pres- ently ins ta l led equipment is questionable.
Additional laboratory s t u d i e s have been made to determine the effects of severa l var iab les on plu- tonium loading for three different resins. Distri- bution coefficients for Pu(1V) were determined as a function of HC1 and L iCl concentration; a l so , t h e e f fec t tha t t he addition of ethanol had on plu- tonium sorption w a s investigated.
Distribution coefficients for Pu(IV) a s a function of HC1 concentration were e s sen t i a l ly t h e same for Dowex 1 and Dowex 21K res ins (Fig. 5.11). Sub- s tan t ia l ly lower distribution coefficients were ob- tained for Permutit SK resin. A detailed study of t he effect of L iC l i n the HCI solution was made. 'The r e su l t s show tha t for most LiCI-HC1 solutions, t he plutonium distribution coefficient is independ- en t of t h e LiCl : HC1 ratio but is a function of t he to ta l chloride concentration. However, at ac id concentrations below about 2 M , t he distribution coefficients dec rease sharply with decreas ing
'D. E. Ferguson et a l . , Chem. Technol. Div. Ann Progr. Rept . May 3 1 , 1966, ORNL-3945, p. 111.
147
U X N L DWG 67-6&52
0. I oL...
m DorfL.x I-XII
A DOWEX Z I K
I-- 6 8 10 12
MOLARITY OF !XI
F i g . 5.11. Adsorption of Pu( IV) by Anion Exchange
Resins Dowex 1 and Dowex 21K from Various Concen- trutions of Hydrochloric Acid .
mesh nnd in the chloride form.
Resin was 50 to 100
acid concentration even at high LiCl concentra- t ions (Fig. 5.12). Observat ions made during t h e s e s tud ie s show, quali tatively, tha t increasing the ac id concentration of t he feed while simultaneously decreas ing the concentration of LiCl to maintain the same chloride concentration inc reases the ki- n e t i c s for both loading and elution. T h e addition of a so luble alcohol, such as methanol o r ethanol, to relatively low-acid feeds greatly inc reases t h e plutonium distribution coefficients. For example, t he Pu(lV) distribution coefficient between Dowex 21K res in and 5 M HC1 in water is 30; however, when the aqueous phase contained 40 vol % etha- nol, t he distribution coefficient was greater than 1000.
Plutonium elution from the anion exchange resin column can b e accomplished e i ther with dilute HC1 or with concentrated HC1 containing sufficient re- ductant to convert t h e plutonium from the tetra-
valent to the tr ivalent s t a t e . T h e la t te r method is des i rab le s i n c e the u se of concentrated acid pro- v ides subs tan t ia l decontamination from ruthenium and zirconium. Satisfactory elution of plutonium h a s been demonstrated with four to five column volumes of 5 to 8 M HC1 containing 0.8% NH,I, 0.1 M FeCl,, or 0.5 to 1.5% ascorbic acid. At- tempts tu reduce t h e plutonium to the trivalent s t a t e in 5 to 8 M I-IC1 by the addition of 1% NH,OH, formic acid, or formaldehyde were unsuccessful. Although ammonium iodide satisfactorily reduces the plutonium, i t s u s e is not rccommended un le s s the resin is discarded after each run, s i n c e the resin can not b e satisfactorily regenerated.
When plutonium was eluted with 8 M HCl con- taining either 0.1 M FeC1, or 0.5 to 1.5% ascorbic acid, significant decontamination from both zir- conium and ruthenium was obtained. Laboratory runs were made i n which plutonium feeds contained macro amounts of t h e s e contaminants. Par t ia l de- contamination of both the curium fraction (which does not load) and the plutonium product was ob- tained. T h e resu l t s of severa l runs gave zirconium- niobium decontamination fac tors of 5 to 8 and xu-
ORNL DWG 47-6881
i
I L - L I 1 2 0 I 2 3 4 5 h
MOLARITY OF HCl
Fig. 5.12. Adsorption of Pu(IV) by the Anion Ex- change Resin Dowex 21K from H C I - L i C I Mixtures.
148
thenium decontamination factors of 2.5 to 3 for t he curium fraction. Decontamination fac tors of > 100 for zirconium-niobium and 5 to 7 for ruthenium were obtained for t he plutonium product.
Cf - E s - F m Separations
Since the separation of Cf-Es-Fm and purifica- tion of s o m e final products will b e effected by ion exchange, column sca le -up s tud ie s to high activity l eve l s of 242Cm were continued. T h e resu l t s con- firm that t h i s method c a n probably be used to proc- ess up to 100-mg ba tches of 252Cf in conventional equipment. Very careful control of conditions and rapid processing a re required in order to obtain satisfactory results. A new ion exchange tech- nique tha t improves t h e control and dec reases proc- e s s i n g t i m e h a s been t e s t ed with s t ab le rare earths: Ion exchange resin of a very fine mesh size is used to increase the k ine t ics of ion exchange. A high- pressure feed pump makes i t poss ib le to maintain a constant, rapid flow through a long bed of t h i s resin. T h e shorter process ing time required with th i s system will dec rease radiation damage to the resin, as well as the amount of radiolytic g a s formed during processing.
Ian Exchange Separations a t High Act iv i ty L e v e l s
Several additional t e s t s were made with macro quant i t ies of 241Am and 242Cm to t e s t t he feas i - bility of chromatographic ion exchange separa t ions at high activity leve ls . A g l a s s column 1 in. i n diameter and 2 8 in. long w a s packed with about 260 m l of Dowex 50\V-X12 resin (200 mesh) in the ammonium form. F e e d so lu t ions that contained 125 to 250 mg of 242Cm, 900 to 1700 mg of 241Am, smal l amounts of Ni, Cu, Li, and Ca, and t race amounts of lo6Ru, 95Zr-Nb, and rare-earth f i ss ion products in 0.1 M I-IC1 were pas sed through t h e column at a flow rate of 3 ml cm-' min-I. Chro- matographic elution was done at 80°C with 0.4 M a-hydroxyisobutyrate that had been adjusted to pH 4.6 with ammonium hydroxide.
T h e s e runs conclusively demonstrated that col- umn design and flow rate charac te r i s t ics a re ex- tremely important for sa t i s fac tory separations. In the f i r s t several runs the resin bed was compressed with a spring-loaded g l a s s frit. Separations were adversely affected in t h e s e runs because of e r ra t ic flow rates; t h i s behavior was due to partial plug-
ging and apparent disintegration of t he g l a s s frit. In some runs t h e flow ra te was reduced to s u c h a low value that t h e resin charred; 15 t o 20% of t h e curium was retained in the charred resin. T h e curium was recovered from t h i s resin by leaching with 6 M HNO, for about 24 hr.
After t he glass-fri t retainer was replaced with a platinum screen , constant flow ra tes could b e maintained during t h e elution. In a test us ing 125 mg of 242Cm, resin degradation was not s e - vere, even though t h e activity leve l of t he loaded resin was -1200 w/liter. T h e b e s t separation demonstrated at t h i s activity leve l gave one prod- uc t fraction containing 80% of the 242Cm and 10% of t h e 241Am; the other fraction contained 90% of the 241Am and 20% of the 242Cm.
Evaluation of High-Pressure Ion Exchange Columns
We evalua ted a high-pressure ion exchange sys - tem by determining i t s abil i ty to sepa ra t e Nd from Dr (a problem representative of those presented by the separation of trivalent ac t in ides) by chromato- graphic elution with a-hydroxyisobutyric ac id from Dowex 50 resin. A high-pressure pump was used to force so lu t ions a t a high flow rate through a column containing resin of s m a l l mesh size. T h e high-pressure feature permits greater freedom i n the se lec t ion of operating parameters such as resin particle s i z e , column length, and flow rate. T h e capabi l i t i es of t h i s sys tem are identical to those of a conventional ion exchange sys tem, except tha t with t h e higher flow ra tes , resu l t s a r e obtained much more rapidly. Deleterious e f fec ts of radiation damage from high-activity-level materials are ac- cordingly minimized. Operation h a s been unusually smooth, and essent ia l ly no problems have arisen.
tinely with flow rates up to 25 m l c m - 2 min- '. T h e experiments were done with % 100-mg quanti- t i e s of rare earths. T h e degree of separation could b e controlled from s o m e overlap of the elution bands to complete separation, by regulating the eluent concentration. In one c a s e , s even column volumes between the neodymium and praseodymium bands contained no de tec tab le rare earths. With greater rare-earth loadings, a more-dilute eluent was re- quired to yield the same degree of separation; al- ternatively, a larger column could b e used with larger loadings. Operation a t e leva ted temperature i s generally des i rab le because the pressure drop
Quantitative separa t ions have been obtained rou-
149
is less a t a givcn flow rate, but temperature ap- pears to have only a minor e f fec t on k ine t ics over the range of conditions investigated.
In th i s sys tem the resin column, 0.34 c m 2 in cross sec t ion and 150 c m long, was constructed from standard 3/-in. s t a i n l e s s s t ee l tubing with a water jacke t for temperature control. T h e column was packed with 50 m l of resin, which was retained a t the bottom with a C-porosity s t a i n l e s s s tee l frit. It was used without difficulty a t p ressure drops in e x c e s s of 2000 psi, which were provided by a Beckman posit ive displaccment pump. Connecting l i n e s in the sys tem were constructed of )8-in. s t a i n l e s s s t ee l (wall th ickness , 35 mils).
and flow rate were studied with th i s column. In general, decreas ing the isobutyrate concentration of t he eluent i nc reases both the number of column volumes necessary to e lu t e the sorbed ions and the separation between elements; decreas ing the temperature during elution dec reases both the quantity of elutrient required and t h e separa t ions obtained. The ef fec t of varying the flow rate w a s s m a l l over the range of 0.5 to 25 m l cm-’ min-’.
T h e e f fec ts of eluent concentration, temperature,
80
An example of the exce l len t separation obtaiti- able between neodymium and praseodymium a t high flow ra t e s is shown in Fig. 5.13. Figure 5.14 il- lus t ra tes the increased separa t ions obtained by decreasing the concentration of t he eluent from 0.43 t o 0.3 kl. In th i s run, which was made a t 8OoC, about 26 column volumes of e luent were re- quired before neodymium began to elute; t h i s was reduced to s i x volumes by decreas ing the tempera- ture to 25°C. Complete separation of rare ear ths was still obtained.
boxes, and t e s t ing with actinide t racers is in progress.
Systems of t h i s type have been ins ta l led in glove
Preparation of Actinide Oxides for HFlR Targets
High F lux Isotope Reactor ta rge ts a r e made from pressed pe l le t s of aluminum powder and actinide oxides, with the aluminum phase continuous to en- sure sa t i s fac tory hea t transfer during irradiation. To da te , only 2 4 ’PuO targets. Pa r t i c l e s of the proper s i z e were obtained
h a s been used in these
ORNL DWG 67-3656
25 mg Nd
17.5 mg Pr
0.43M, pH 4.4-Bdfrr 1450-1650 PSI
8 ml/min 80°C
0.34 cm2 x 150 cm Column
20-40p Dowex SO-X12
120 160 200 240
VOLUME OF ELUENT (ml)
280 320
Fig. 5.13. Quantitative Nd-Pr Separation I s Obtained a t High F l o w Rate (23.5 m l cm-’ rnin-’).
0.
c
-E m 5 z 0 d
Z
Z 0 U
8 I- P(
t
0.
3
$
d w zx
0.
N d
150
ORNL DWG 67-3661 R I
25 rng N d 0.34 c m L x 150 Column
18 mg Pr
0.3M, pH 4.4-Buffer 900-1050 PSI
15-2Op Dowex 50-X12
2 mI/min 50T
I 7- DISPLACEMENT
VOLUME -
I -1- I I
-I- I I
540 700 760 829 850 940 1000
VOLUME OF ELUENT (ml)
Pr i I I
- t I \ \
Fig. 5.14. Lower Eluent Concentration Y ie lds Elution Bands That Are Sharp and Widely Separated.
by grinding and screening oxide prepared by a hy- droxide precipitation method. A sol-gel method that d o e s not require grinding and screening ap- pears to b e su i tab le for t he preparation of 20- to 200-p-diam par t ic les of dense americium-curium oxide. L a s t year4 we reported t h e preparation of ox ide microspheres of controlled particle s i z e from rare ear ths (as s tand- ins for americium and curium) by a modified procedure that is amenable to in-cell preparations. During the pas t year, two methods for preparing 10-g ba tches of sol were evaluated, and the modified sol procedure was tes ted with '' 'Am.
The rare-earth s o l p rocess c o n s i s t s i n precipitat- ing the metal hydroxide by adding a dilute solu- tion of rare-earth nitrate to a 20-fold e x c e s s of 8 M
3F. L. Culler, Jr . , e l a l . , Chern. Technol. Div. Ann Progr. Rept. M a y 31, 1964, ORNL-3452, p p . 114-15.
4D. E. Ferguson et al., Chem. Technol . Div. Ann. Progr. Rept. May 31, 1966, ORNL-3945, p p . 111-16.
NH40H with st irring a t 2S°C, centrifuging the pre- c ip i ta te and washing it with water f ive or s ix t imes (the precipitate i s reslurried and centrifuged, and the wash liquor i s decanted, during each wash cy- cle), and hea t ing the hydroxide for about 1 hr a t 8OoC (heating is not required for the l ight rare earths). During heating, the pas t e converts t o a fluid sol that is about 0.5 M in metal; t h i s sol c a n be formed into microspheres by standard procedures.
T h e two techniques inves t iga ted for t h e prepara- tion of 10-g ba tches of sol are: filtration and washing in a jacke ted fi l ter funnel (which c a n be hea ted to convert t he hydroxide p a s t e to a sol) , and filtration and washing in a sintered-metal bowl centrifuge (which c a n also b e heated). Both pro- cedures allow s o l to b e prepared in a s ing le ves se l and avoid handling and transfer of t h e hydroxide pas te . After conversion t o the sol, i t c a n b e col- l ec ted by filtration through the fi l ter medium.
init ial evaluations i n which europium hydroxide Both these techniques appeared promising during
1.51
sols were prepared; however, additional develop- ment will b e required before e i ther c a n be consid- ered operational. The optimum method for prepar- ing sol requires efficient n i t ra te removal and a minimum of aqueous contact t ime during washing. T o date, t h i s h a s been bes t accomplished with the water-jacketed filter. Nitrate ra t ios of the product obtained with the centrifuge method have been somewhat high; a su i t ab le method for heating the centrifuge cake without partially drying the hy- droxide h a s not ye t been developed.
ba tches of 241Am hydroxide so l . In a typical ex- periment, 5 g of americium in dilute HNO, solution was precipitated with e x c e s s NH,OH and filtered through a jacke ted fri t ted-glass funnel. After water washing, the e x c e s s water was vacuumed through the fi l ter , t he fi l ter was covered, and the moist f i l ter cake w a s hea ted to about 85OC. T h e hydrox- ide pas t e was converted to a fluid sol in about 1.5 hr. T h i s so l f i l tered readily; americium losses on the fi l ter were estimated to b e very low (1 to 2%). T h e final s o l was 0.36 M in 241Am, and the NO,- : Am mole ratio was 0.21. The sol was formed into microspheres by us ing standard tapered- column techniques, and the gel spheres were ca l - cined to oxide sphe res at 1150°C. T h e s e sphe res were extremely uniform in par t ic le s i z e and would be su i t ab le for incorporation into IIFIR targets; however, sur face blemishes, charac te r i s t ic of microspheres prepared frotn dilute s o l s , were evident.
in-cell preparation of CmO microspheres us ing t h e s e procedures.
T h e fi l ter procedure w a s used t o prepare 5-g
Preparations a re presently under way for the and mixed CmO 2-Am0
5.4 DEVELOPMENT OF PROCESS EQUIPMENT
Engineering s tud ie s in support of TRU are being continued. Emphasis h a s been on developing and t e s t ing so lvent extraction f lowsheets to b e used in pulsed columns; t e s t s were made both in proto- type and in full-scale columns.
Hydraulic Testing of Pulsed Columns
“Cold” tes t ing of proposed chemical f lowsheets €or separa t ion of the heavy ac t in ides from ameri- cium and curium h a s been continued in pulsed col-
umns. Previously it had been shown tha t the Pharex flowsheet could not b e operated in the TRU pulsed columns with the aqueous phase continu- ous. Severe wetting by the solvent of either tan- talum o r Zircaloy s i eve p la tes caused flooding even at very low throughputs. Two alternative so- lutions to the problem a re being investigated. One solution i s to operate with the organic phase con- tinuous; the other is to u s e c e r a m i c s i e v e p la tes , which a re preferentially wet by the aqueous phase. The f i r s t method was t e s t ed , us ing the Pharex flowsheet, with fu l l - sca le Zircaloy and tantalum TRU columns modified for operation with the or- ganic phase continuous; sa t i s fac tory operation w a s achieved. In t e s t s with ceramic pulse p l a t e s i n a g l a s s column and with t h e Pharex flowsheet, more than 400 hr of success fu l operation were ob- tained with the aqueous p h a s e continuous. N o wetting of the p l a t e s with organic was detected, even after the p l a t e s had been immersed in or- ganic for 30 hr.
p rocess were made, it was discovered that the presence of t race amounts of zirconium in t h e feed h a s a marked effect on the extraction coeffi- c i en t s for the ac t in ides and reduces the separation factors to intolerably low values. A new process, Hepex, is being developed which uses di(2-ethyl- hexy1)phosphoric acid (HDEHP) as the extractant, ins tead of the 2-ethylhexyl phenylphosphonic acid (HEH(+P]) which is the Pharex solvent. IIepex is insens i t ive to the metall ic impurities that ad- versely affect Pharex. However, Hepex exhibits s i m i l a r hydraulic problems; i t can be operated with the aqueous phase continuous with Zircaloy s i e v e p l a t e s (the extraction and scrub columns in the TRU equipment) but not with tantalum pla tes (the TRU stripping column) because of p la te wet- ting. As with the Pharex process, operation with the organic phase continuous, or with the u s e of ceramic s i eve plates, resu l t s in satisfactory opera- tion of the Hepex process . One failure, due to organic wetting of the ceramic p l a t e s by the Hepex solvent, occurred when an aqueous feed containing hydrolyzed zirconium w a s tes ted ; however, t h e p l a t e s were restored to good condition by cleaning with chromic acid.
T h e Tramex flowsheet was a l s o operated suc- cess fu l ly , with the organic phase continuous, i n the prototype equipment tha t had ceramic p la tes . T h i s showed tha t equipment for e i ther mode of op- eration of the ac t in ide separa t ion s t e p will b e use- ful a s s tandby equipment for t he Tramex process.
After t hese t e s t s of equipment for t he Pharex
152
From t h e s e s tud ies it appears tha t operation with the organic phase continuous is the prefetred method. If other aspects of the flowsheet are found to be favorable, the second-cycle equipment will b e modified for th i s type of operation.
5.5 HFIR TARGET ROD FAILURES
In February 1967, it was observed tha t several TRU target rods had ruptured during t h e HFIR. T h i s w a s s i x to eight months before the processing of t h e s e ta rge ts had been scheduled. T h e Transuranium Element Production Program will not b e ser iously affected as a resul t of t h e s e pre- mature target failures. It will be necessary to
and refabricate more targets than was
made in the est imated amounts of transuranium elements tha t will b e made avai lable next
l y planned; also, s o m e reduction must be
The Fai lures
When t h e fai lures were de tec ted , the target i s land in the HFIR flux trap contained 17 ta rge ts that had been irradiated for about a year in a Savannah River P l a n t and 1 4 ta rge ts irradiated only in the HFIR; e a c h of the targets had been irradiated about 125 d a y s in t h e HFIR. T h e total exposure to thermal neutrons (nvt) w a s 3.7 x 10” neutrons/cm2 a t SRP and 2.6 x 10” neutrons/cm2 in the HFIR. The exposu neutrons ( 1 x 10 neutrons/cm 2, w a s e t h e same for a l l the targets b e c a u s e t h e S R P reac- tor h a s a very low fast-neutron flux.
T h e SRP-irradiated ta rge ts had been inspected and repaired in TRU prior to being put into the HFIR. Some of the ta rge ts had been damaged in
the Savannah River reactor. Apparently the flow of coolant had caused the ta rge ts to flutter, and the spacer f i n s had beaten against t h e outer can, which d i rec ts coolant p a s t the rod. T h i s action of the f ins had caused holes to form in some of the cans . New c a n s had been placed on nine of t h e targets, and a spacer (a put in e a c h of t h e targets , n the target rod in the can. Dimensional inspect ions and leak checks had assured the integrity of the targets prior to irradiation in the HFIR.
When the fai lures were detected, all rods were tes ted in the HFIR pool in flow loops with f i l t e rs and ion exchange resin, which picked up residual activity. Suspect targets were transferred to TRU for further inspection. T h e cladding was found to b e cracked on 5 of the 17 SRP-irradiated ta T h e 14 t a rge ts that h been irradiated only in the HFIR have given
near t h e centers of the target i s a photograph of the most s get. I t was concluded tha t t because the duct by the e f fec ts of cladding was un normal swel l ing of t h e target sion-gas pressures that target pellet. T h e mech
indication of leaking. T h e fai lures cons is ted of cracks in t h e cladding
the cladding was reduced tion, to the extent that the deform to accommo
not ye t been determined.
Effect on the Production Program
I t is impossible to accurately predict t h e life of the targets that have not failed. T h e following analysis , which includes a considerable amount of conjecture, is considered conservative.
-1 -
Fig. 5.15. SRP-Irradiated Target 56A Showing Crack in the Cladding. The hex can has been removed.
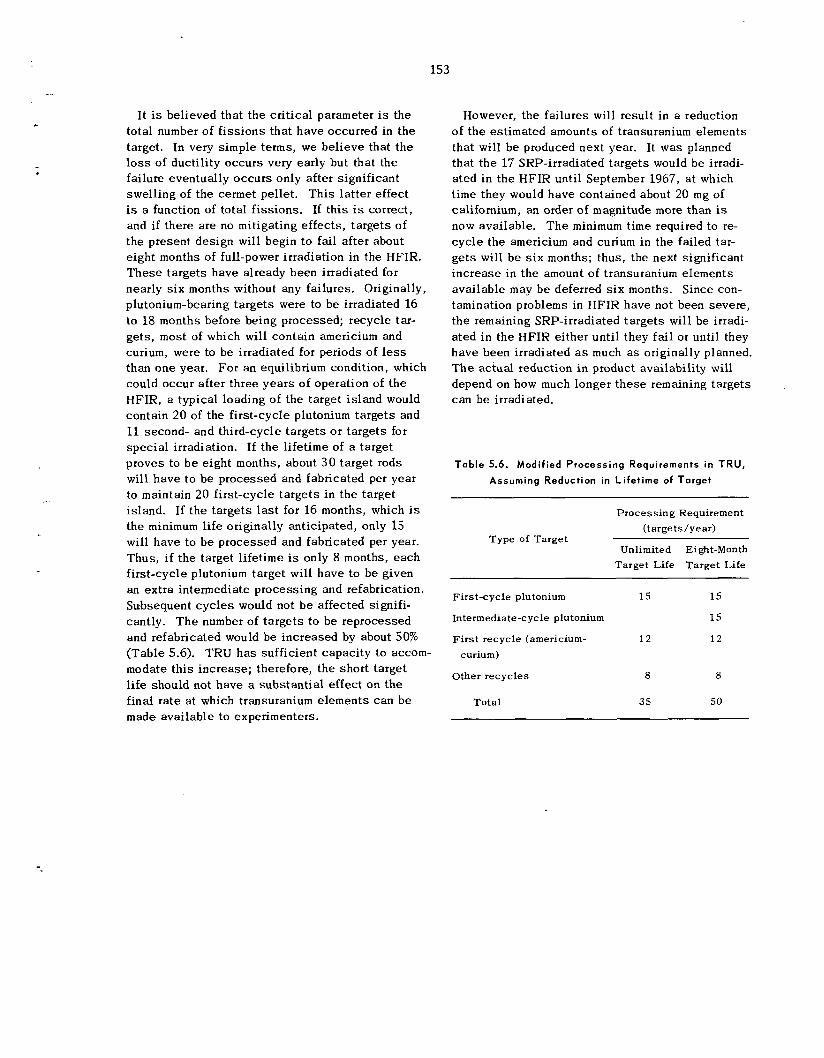
153
It is believed that t he c r i t i ca l parameter is the total number of f i s s ions tha t have occurred in the target. In very s imple terms, we be l ieve that t he l o s s of ductil i ty occur s very early but that the failure eventually occur s only after significant swelling of t he cermet pellet. T h i s la t te r effect is a function of total f i ss ions . If t h i s is correct, and if there a re no mitigating e f fec ts , t a rge ts of the present des ign will begin to fail after about eight months of full-power irradiation in the HFIR. T h e s e ta rge ts have already been irradiated for nearly s i x months without any failures. Originally, plutonium-bearing ta rge ts were to b e irradiated 16 to 18 months before being processed; recycle tar- ge ts , most of which will contain americium and curium, were to be irradiated for periods of less than o n e year. For an equilibrium condition, which could occur after th ree yea r s of operation of t h e HFIR, a typical loading of the target i s land would contain 20 of the first-cycle plutonium ta rge ts and 11 second- and third-cycle ta rge ts o r ta rge ts for spec ia l irradiation. If t he lifetime of a target proves to b e eight months, about 30 target rods will have t o be processed and fabricated per year to maintain 20 first-cycle ta rge ts i n t h e target island. If t he ta rge ts l a s t for 16 months, which is the minimum life originally anticipated, only 15 will have t o b e processed and fabricated per year. Thus, if t he target l i f e t i m e is only 8 months, each first-cycle plutonium target will have to b e given an ex t ra intermediate process ing and refabrication. Subsequent c y c l e s would not b e affected signifi- cantly. T h e number of ta rge ts to be reprocessed and refabricated would b e increased by about 50% (Table 5.6). TRU h a s sufficient capac i ty to accom- modate th i s increase ; therefore, the short target life should not have a subs tan t ia l effect on t h e final ra te at which transuranium e lements can b e made ava i lab le to experimenters.
However, t he failures will result in a reduction of the estimated amounts of transuranium elements tha t will be produced next year. It was planned that t he 17 SRP-irradiated ta rge ts would be irradi- a ted in the HFIR until September 1967, a t which time they would have contained about 20 mg of californium, an order of magnitude more than is now available. T h e minimum time required to re- cyc le the americium and curium in the failed tar- ge t s will b e s i x months; thus , the next significant i nc rease in t h e amount of transuranium elements ava i lab le may b e deferred s i x months. Since con- tamination problems in HFIR have not been severe, t he remaining SRP-irradiated ta rge ts will be irradi- a ted in the HFIR either unti l they fail or until they have been irradiated as much a s originally planned. T h e ac tua l reduction in product availability will depend on how much longer t h e s e remaining ta rge ts can b e irradiated.
Table 5.6. Modified Processing Requirements i n TRU, Assuming Reduction in L i fe t ime of Target
Process ing Requirement (targe ts/year)
Type of Target Unlimited Eight-Month
Target Life Targe t Life
First-cycle plutonium 1 5 1s Intermediate -c yc le plutonium
F i r s t recycle (americium- 1 2 12
Other recyc les 8 8
Total 35 50
1s
curium)
6. Development of the Thorium Fuel Cycle 6.1 SOL PREPARATION
BY SOLVENT EXTRACTION
A simple two- or three-stage extraction process was developed for the preparation of mixed Tho, - UO, sols directly from solutions containing tho- rium and uranyl nitrates. ' The nitrate (as nitric acid) is removed from the aqueous solution by extraction into a n organic phase cons is t ing of a long-chain amine extractant in a n inert organic diluent. About 80 to 90% of the nitrate is ex- tracted in the first s t age . Subsequent heating of the aqueous phase converts it to s o l and releases additional nitrate, which is extracted by amine in the second s t age . Th i s sol may be dried to gel fragments or evaporated to a concentration that is su i tab le for forming microspheres. In laboratory s tudies , sols were prepared from aqueous thorium nitrate solutions containing up t o 68 mole % ura- nyl nitrate. Sols having compositions that are currently of in te res t for reactor fuels (22 t o 25 mole % uranium) have been made in the engineering s tudies at the rate of 1 kg of oxide per hour.
Laboratory Studies
Typical flowsheet conditions used in preparing the s o l (and, subsequently, oxide microspheres having a thorium : uranium atom ratio of about 3.5) are presented in Fig. 6.1. One volume of an aque- ous solution about 0.21 M in Th(NO,), and 0.06 M in UO,(NO,), is contacted in g l a s s mixer-settler equipment for a t l ea s t 2 min with about 1.9 vol- umes of an organic phase composed of 0.75 M Amberlite LA-2 (an extensively branched second- ary amine, N-lauryltrialkylmethylamine) in n-par- affin, the commercial equivalent of n-dodecane.
'J. G. Moore, An Amine Solvent Extraction Sol-Gel Process for Preparing Tho,-UO, Sols from Nitrate So- lutions, ORNL-4095 (in press) .
To ensure rapid phase separation the extraction is made, with the organic phase continuous, at 50 t o 6OoC. The phases are separated, and the aque- ous phase is heated for a t l ea s t 1 0 min a t 95 t o 100°C. The aqueous phase changes from a yellow solution t o a dark-red so l , indicating the further hydrolytic re lease of nitrate ions. Th i s nitrate is then extracted when the aqueous phase is again contacted with the amine extractant in the second s tage . Although the flowsheet in Fig. 6.1 is based on cocurrent flow, countercurrent or c ross - current flows are equally effective. More than 98% of the extractable nitrate is removed in two s t ages , yielding a s o l with a nitrate : metal mole ratio of about 0.2. The organic so lvent containing amine nitrate from the second s t a g e is scrubbed with water to remove entrained sol; the amine nitrate is then converted to free amine by con- tacting the organic phase with a n aqueous phase containing sodium carbonate (at l ea s t 1 .OS moles per mole of amine nitrate).
In th i s particular example, water was evaporated from the aqueous phase t o provide a final s o l hav- ing the following composition: 1 .10 M in thorium, 0.32 M in uranium, 0.30 M in nitrate, and 0.01 M in carbon of a n unspecified form. The crystall i te s i z e , according to x-ray ana lys i s , was 35 to 40 A. Spheres were formed by injecting droplets of t h i s s o l into 2-ethyl-1-hexanol (2EH) containing 0.5 vol % H ,O and su i tab le surfactants. The gelled spheres were dried overnight a t 100°C, held at 170 t o 18OoC for about 5 hr, and then calcined in a i r a t 1150°C. Finally, the uranium was partially reduced by contacting the calcined spheres with Ar-4% H , for 4 hr a t 115OoC. T h e result ing spheres were shiny black and had a n oxygen : ura- nium atom ra t io of 2.003. T h e measured porosity was less than 1%, and the density was equivalent t o >95% of the theoretical density of the oxide solid solution. in diameter res i s ted crushing forces of 940 t o
Individual spheres 150 to 350 p
2000 g.
154
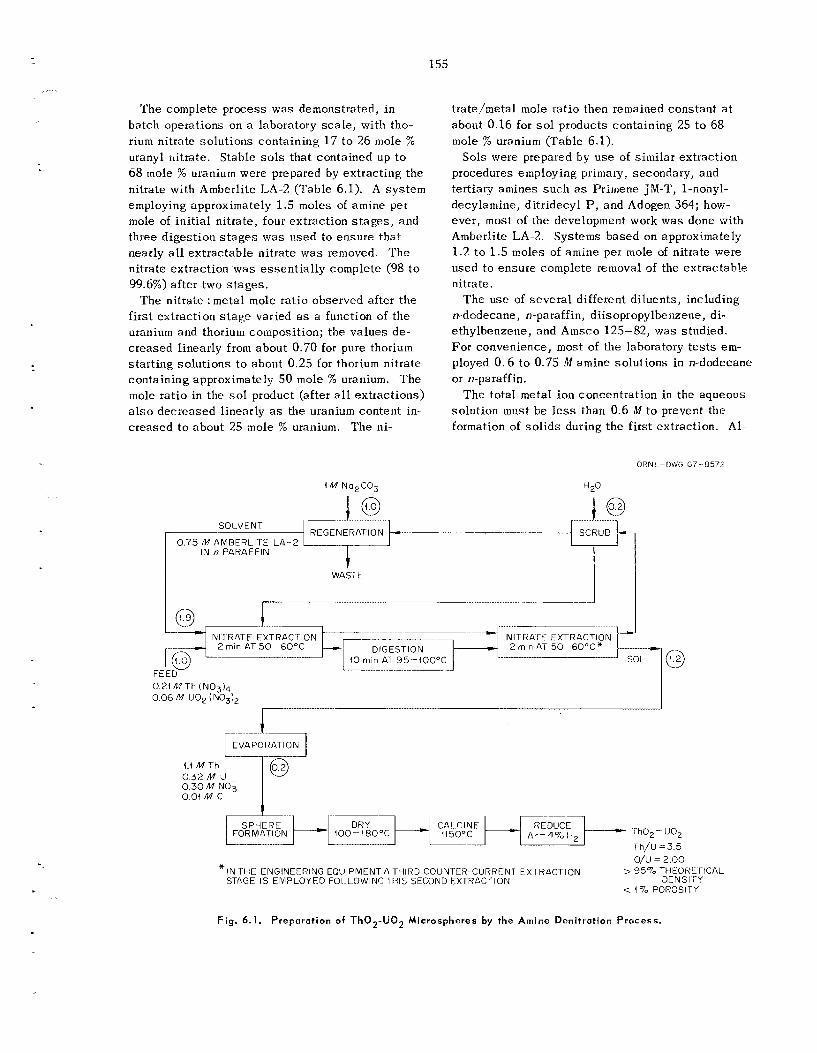
155
The complete process was demonstrated, in batch operations on a laboratory sca l e , with tho- rium nitrate solutions containing 17 t o 26 mole % uranyl nitrate. Stable s o l s that contained up t o 6% mole 76 uranium were prepared by extracting the nitrate with Amberlite LA-2 (Table 6.1). A sys tem employing approximately 1.5 moles of amine per mole of in i t ia l nitrate, four extraction s t ages , and three digestion s t a g e s was used to ensure tha t nearly all extractable nitrate was removed. The nitrate extraction was essent ia l ly complete (98 to 99.6%) after two s t ages .
The nitrate : metal mole ra t io observed after the first extraction s t a g e varied a s a function of the uranium and thorium composition; the values de- creased linearly from about 0.70 for pure thorium start ing so lu t ions t o about 0 .25 for thorium nitrate containing approximately 50 mole 76 uranium. The mole ra t io in the sol product (after a l l extractions) a l s o decreased linearly a s the uranium content in- c reased t o about 25 mole % uranium. The ni-
SOLVENT
IN n PARAFFIN i
i M Na2C03
I @
trate/metal mole ratio then remained constant a t about 0.16 for s o l products containing 25 t o 68 m o l e % uranium (Table 6.1).
procedures employing primary, secondary, and tertiary amines such as Primene JM-T, l-nonyl- decylamine, ditr idecyl P, and Adogen 364; how- ever, most of the development work was done with Amberlite LA-2. Systems based on approximately 1.2 to 1.5 moles of amine per mole of nitrate were used to ensure complete removal of the extractable nitrate.
The use of s eve ra l different diluents, including n-dodecane , n-pa raff in, diisopr opylbe nzene, di- ethylbenzene, and Amsco 12.5-82, was studied. For convenience, most of the laboratory t e s t s em- ployed 0 .6 t o 0.75 M amine solutions in n-dodecane or ti-paraffin.
The total metal ion concentration in the aqueous solution must be less than 0.6 M t o prevent the formation of so l id s during the first extraction. Al-
Sols were prepared by u s e of similar extraction
H20
..... . .. .. . ... . . SOLVENT
REGENERA-TION = SCRUB
IN n PARAFFIN I ..... . .. .. . ... . .
SCRUB
ORNL-DWG E7--857?
J WASTE
I_..___._
. .. . . . . . ... . . . ... .. .
DIGESTION
_.__.___.__I.
0.21 M Th (NO,), 0.06 /M UOe ( N 0 3 ) Z
EVAPORATION
- -
1 I M T h 0 3 2 M U - 0 30 lw NO3 O 0 1 M C
- REDUCE - I h0,- UO,
l h / U = 3 . 5 A r - 4 % H2
o/u = 2 00 * IN THE ENGINEERING EQUIPMENT A THIRD COUNTER-CURRFNT EXTRACTION > 95% T H E O W I ICAL
< 1 '% POROSITY STAGE I S EMPLOYFD FOLLOWING 1 HIS SECOND EXTRACTION DENS11 Y
Fig. 6.1. Preparation af Th02-U02 Microspheres by the Amine Denitration Process.
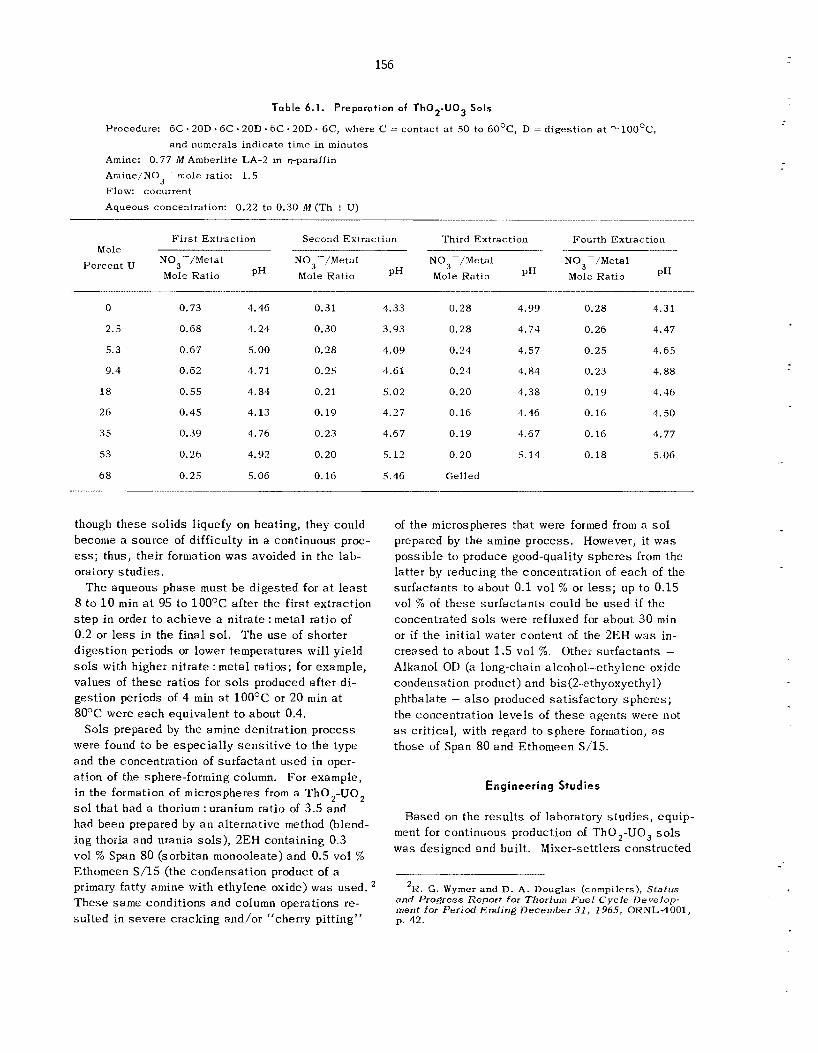
156
Table 6.1. Preparation of Th02-U03 Sols
Procedure: 6C 20D. 6 C - 20D - 6C 20D 6C, where C = contact a t SO to 60°C, D = digestion a t 100°C, and numerals indicate t ime in minutes
Amine: 0.77 M Amberlite LA-2 i n n-paraffin Amine/N03- mole ratio: 1.5 Flow: cocurrent Aqueous concentration: 0.22 to 0.30 M (Th + U)
F i r s t Extraction Second Extraction Third Extraction Fourth Extraction Mole - _. __I- - - .~
Percent U NO 3 -/Metal N03-/Metal N03-/Metal N03-/Metal Mole Ratio pH Mole Ratio pH Mole Ratio pH Mole Ratio pH
0
2.5
5.3
9.4
18
26
35
53
6 8
0.73
0.68
0.67
0.62
0.55
0.45
0.39
0.26
0.25
4.46
4.24
5.00
4.71
4.81
4.13
4.76
4.92
5.06
0.31
0.30
0.28
0.25
0.21
0.19
0.23
0.20
0.16
4.33
3.93
4.09
4.61
5.02
4.27
4.67
5.12
5.46
0.28
0.28
0.24
0.24
0.20
0.16
0.19
0.20
Gelled
4.99
4.74
4.57
4.84
4.38
4.46
4.67
5.14
0.28
0.26
0.25
0.23
0.19
0.16
0.16
0.18
4.31
4.47
4.65
4.88
4.46
4.50
4.77
5.06
though these so l id s liquefy on heating, they could become a source of difficulty in a continuous proc- e s s ; thus, their formation was avoided in the lab- oratory s tudies .
The aqueous phase must b e d iges ted for at l e a s t 8 t o 10 min at 95 to 100°C after the first extraction s t e p in order to achieve a nitrate : metal ratio of 0.2 or less in the final sol. T h e u s e of shorter digestion periods or lower temperatures will yield sols with higher nitrate :me ta l ratios; for example, values of t hese ratios for sols produced after di- gestion periods of 4 min a t 100°C or 20 min at 80°C were each equivalent t o about 0.4.
Sols prepared by the amine denitration process were found to be espec ia l ly sens i t i ve t o the type and the concentration of surfactant used in oper- ation of the sphere-forming column. For example, i n the formation of microspheres from a Tho,-UO, s o l that had a thorium : uranium ratio of 3.5 and had been prepared by a n alternative method (blend- ing thoria and urania so ls ) , 2EH containing 0.3 vol % Span 80 (sorbitan monooleate) and 0.5 vol % Ethomeen S/15 (the condensation product of a primary fatty amine with ethylene oxide) was used. These same conditions and column operations re- su l ted in seve re cracking and/or “cherry pitting”
of the microspheres that were formed from a sol prepared by the amine process. However, i t was poss ib le to produce good-quality sphe res from the latter by reducing the concentration of each of the surfactants to about 0.1 vol % or l e s s ; up to 0.15 vol % of these sur fac tan ts could b e used if t he concentrated s o l s were refluxed for about 30 min or if the init ial water content of the 2EH was in- c reased to about 1.5 vol %. Other surfactants - Alkanol OD (a long-chain alcohol-ethylene oxide condensation product) and bis(2-ethyoxyethyl) phthalate - also produced sa t i s fac tory spheres ; the concentration leve ls of these agents were not as crit ical , with regard to sphere formation, a s those of Span 80 and Ethomeen S/15.
Engineering Studies
Based on the resu l t s of laboratory s tud ie s , equip- ment for continuous production of Tho,-UO, sols was designed and built. Mixer-settlers constructed
’R. G. Wymcr and D. A. Douglas (compilers), Status and Progress Report for Thorium F u e l Cycle Develop- ment for Per iod Ending Deceniber 3 1 , 1965, ORNL-4001, p. 42.
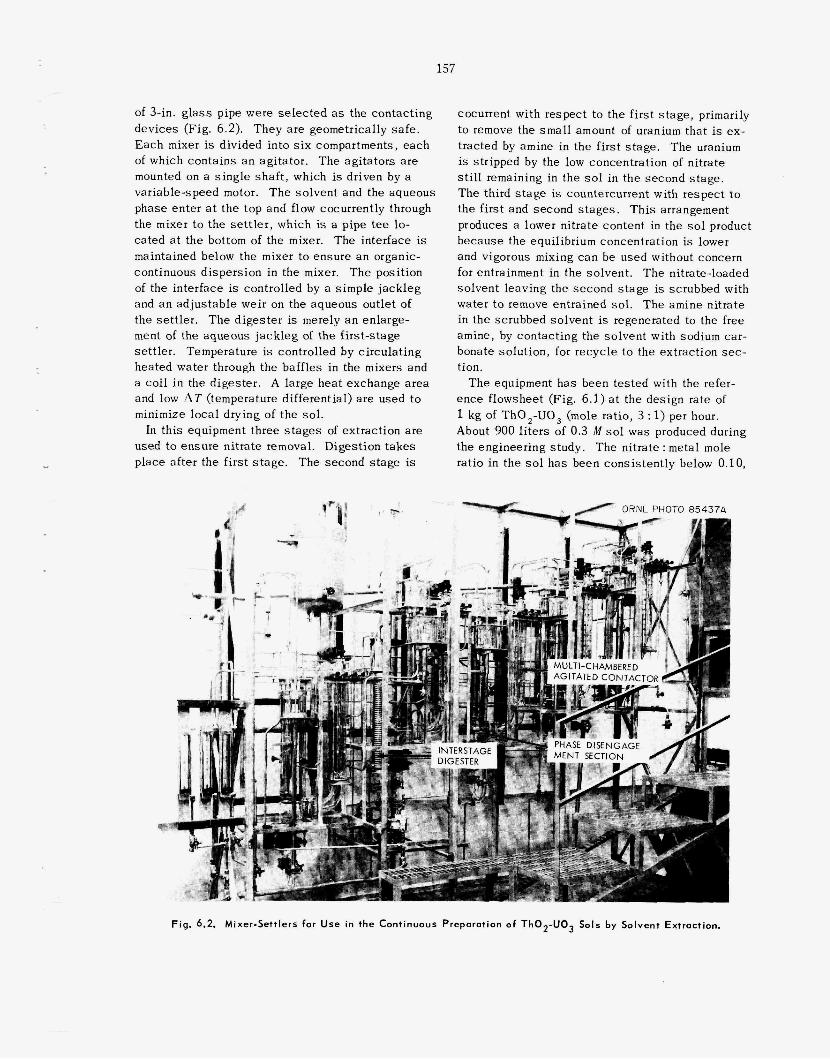
157
of %in. glass pipe were se lec ted as the contact ing devices (Fig. 6.2). They are geometrically safe. E a c h mixer is divided into s i x compartments, each of which contains a n agitator. The agi ta tors a r e mounted on a s ingle shaf t , which is driven by a variable-speed motor. T h e solvent and the aqueous phase enter a t the top and flow cocurrently through the mixer to the se t t le r , which is a pipe tee lo- cated at the bottom of the mixer. The interface is maintained below the mixer to ensure a n organic- continuous dispers ion in the mixer. T h e posit ion of the interface i s controlled by a s imple jack leg and a n ad jus tab le weir on the aqueous outlet of the settler. The d iges te r is merely a n enlarge- ment of the aqueous jackleg of the f i rs t -s tage settler. Temperature is controlled by circulat ing heated water through the baffles in the mixers and a co i l i n the digester . A large heat exchange area and low A T (temperature differential) are used to minimize loca l drying of the sol.
In th i s equipment three s t a g e s of extraction are used to ensure ni t ra te removal. Digest ion takes place after the f i r s t s t a g e . The second s tage is
cocurrent with respect to the f i rs t s tage , primarily to remove the small amount of uranium that is ex- tracted by amine in the f i rs t s tage . T h e uranium is stripped by the low concentration of nitrate still remaining in the sol in the second s tage . The third s t a g e is countercurrent with respect t o the f i rs t and second s t a g e s . T h i s arrangement produces a lower nitrate content in the sol product because the equilibrium concentration is lower and vigorous mixing c a n be used without concern for entrainment in the solvent . The nitrate-loaded solvent leaving the second s tage is scrubbed with water t o remove entrained sol. The amine nitrate in the scrubbed so lvent is regenerated to the free amine, by contact ing the solvent with sodium car- bonate solution, for recycle to the extraction sec- tion.
The equipment h a s been tes ted with the refer- ence flowsheet (Fig. 6.1) a t the design rate of 1 kg of Tho,-UO, (mole ratio, 3 : 1) per hour. About 900 l i te rs of 0.3 M sol was produced during the engineering study. The nitrate : metal mole ratio in the sol h a s been consis tent ly below 0.10,
Fig. 6.2. Mixer-Settlers for Use in the Continuous Preparation of Th02-U03 Sols by Solvent Extroction.
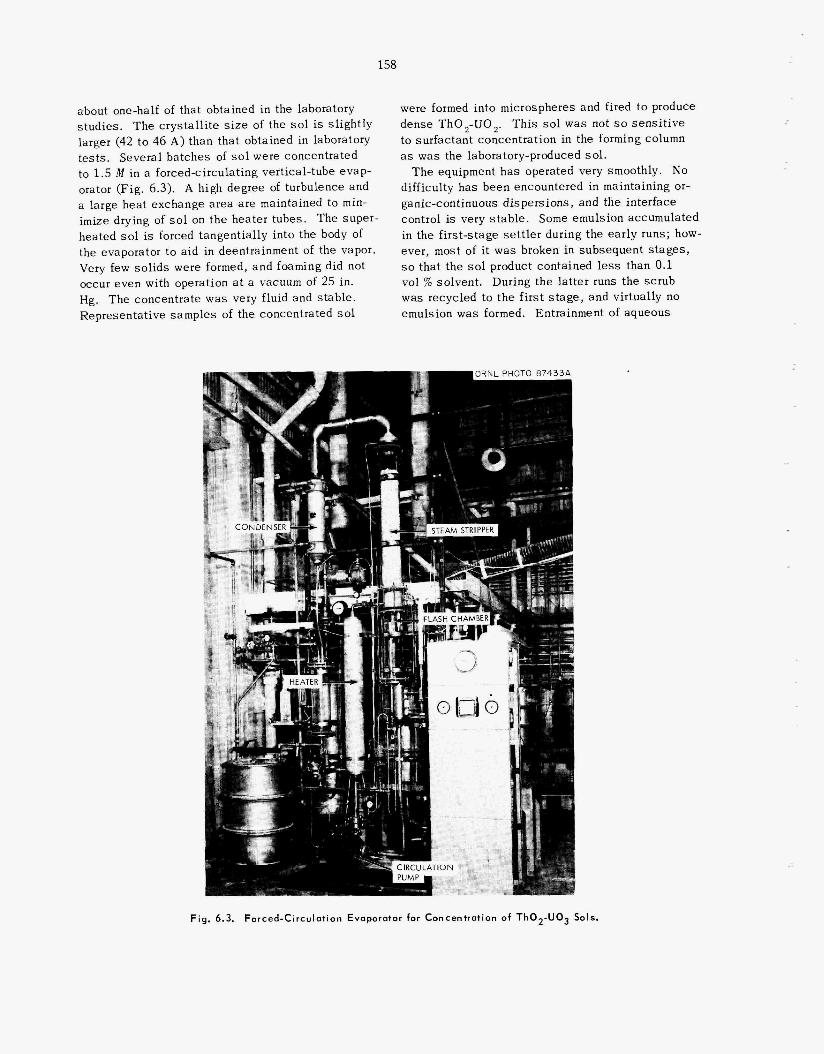
158
about one-half of that obtained in the laboratory s tudies . The crystal l i te size of the s o l is sl ight ly larger (42 to 46 A) than tha t obtained in laboratory tes ts . Several batches of s o l were concentrated to 1.5 M in a forcedcirculat ing vertical-tube evap- orator (Fig, 6.3). A high degree of turbulence and a large heat exchange area are maintained to min- imize drying of s o l on the heater tubes. The super- heated sol is forced tangentially into the body of the evaporator to aid in deentrainment of the vapor. Very few so l ids were formed, and foaming did not occur even with operation at a vacuum of 25 in. Hg. The concentrate w a s very fluid and s table . Representative samples of the concentrated sol
were formed into microspheres and fired to produce dense Tho,-UO,. This s o l was not so s e n s i t i v e to surfactant concentration in the forming column as was the laboratory-produced so l .
T h e equipment h a s operated very smoothly. N o difficulty h a s been encountered in maintaining or- ganic-continuous dispers ions, and the interface control is very s tab le . Some emulsion accumulated in the first-stage se t t l e r during the ear ly runs; how- ever, most of it was broken in subsequent s t a g e s , s o tha t the sol product contained less than 0.1 vol % solvent. During the la t ter runs the scrub was recycled to the f i r s t s t a g e , and virtually no emulsion was formed. Entrainment of aqueous
Y
P
Fig. 6.3. Forced-Circulation Evaporator for Concentration of Th02-U03 Sols.
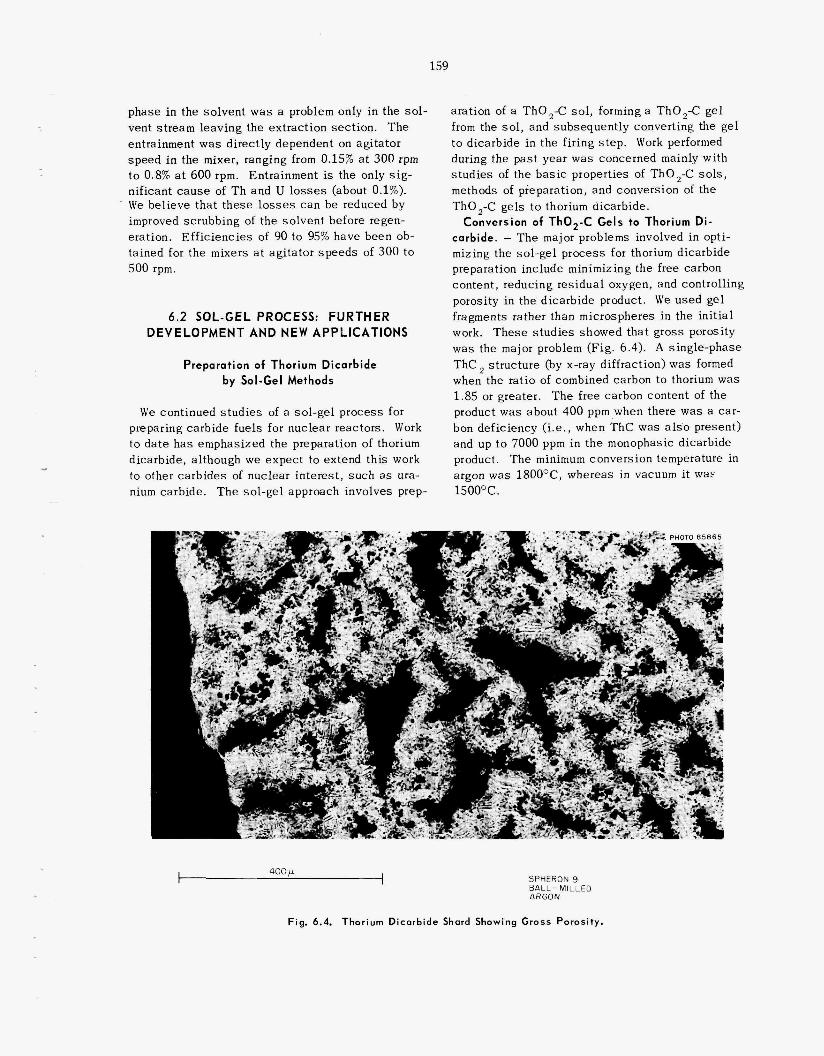
159
phase in the solvent w a s a problem only in the sol- vent stream leaving the extraction sect ion. The entrainment was directly dependent on agitator speed i n the mixer, ranging from 0.15% a t 300 rpm to 0.8% at 600 rpm. Entrainment is the only s i g - nificant c a u s e of T h and U losses (about 0.1%). We believe tha t these 1 es can be reduced by improved scrubbing of the solvent before regen- eration. Eff ic iencies of 90 to 95% have been ob- tained for the mixers at agi ta tor s p e e d s of 300 to 500 rpm.
6.2 SOL-GEL PROCESS: FURTHER DEVELOPMENT AND NEW APPLICATIONS
Preparation of Thorium Dicarbide by Sol-Gel Methods
We continued s tudies of a sol-gel process for preparing carbide fue ls for nuclear reactors. Work to d a t e h a s emphasized the preparation of thorium dicarbide, although we expect to extend this work to other carbides of nuclear interest , s u c h as ura- nium carbide. The sol-gel approach involves prep- -
8
aration of a Tho,-C so1, forming a Tho,-C ge l from the sol, and subsequently converting the ge l to dicarbide in the firi s tep . Work performed during the pas t year w concerned mainly with s tud ies of the basic properties of Tho,-C s o l s , methods of preparation, and conversion of the Tho,-C ge ls to thorium dicarbide.
Conversion of Tho,-C Gels to Thorium Di- carbide. - T h e major problems involved in opti- mizing the sol-gel process for thorium dicarbide preparation include minimizing the free carbon content, reducing residual oxygen, and controll ing porosity in the dicarbide product. We used ge l fragments rather than microspheres in the ini t ia l work. T h e s e s tudies showed that gross porosity w a s the major problem (Fig. 6.4). A single-phase ThC , st ructure (by x-ray diffraction) was formed when the rat io of combined carbon to thorium was 1.85 or greater. The free carbon content of the product was about 400 ppm when there w a s a car- bon deficiency (i.e., when ThC was also present) and up to 7000 ppm in the monophasic d product. The minimum conversion temperature in argon was 18OO0C, whereas in vacuum i t waE 15OO0C.
, "3
E
1 400 p SPHERON 9 BALL-MILLED ARGON
Fig. 6.4. Thorium Dicorbide Shord Showing Gross Porosity.
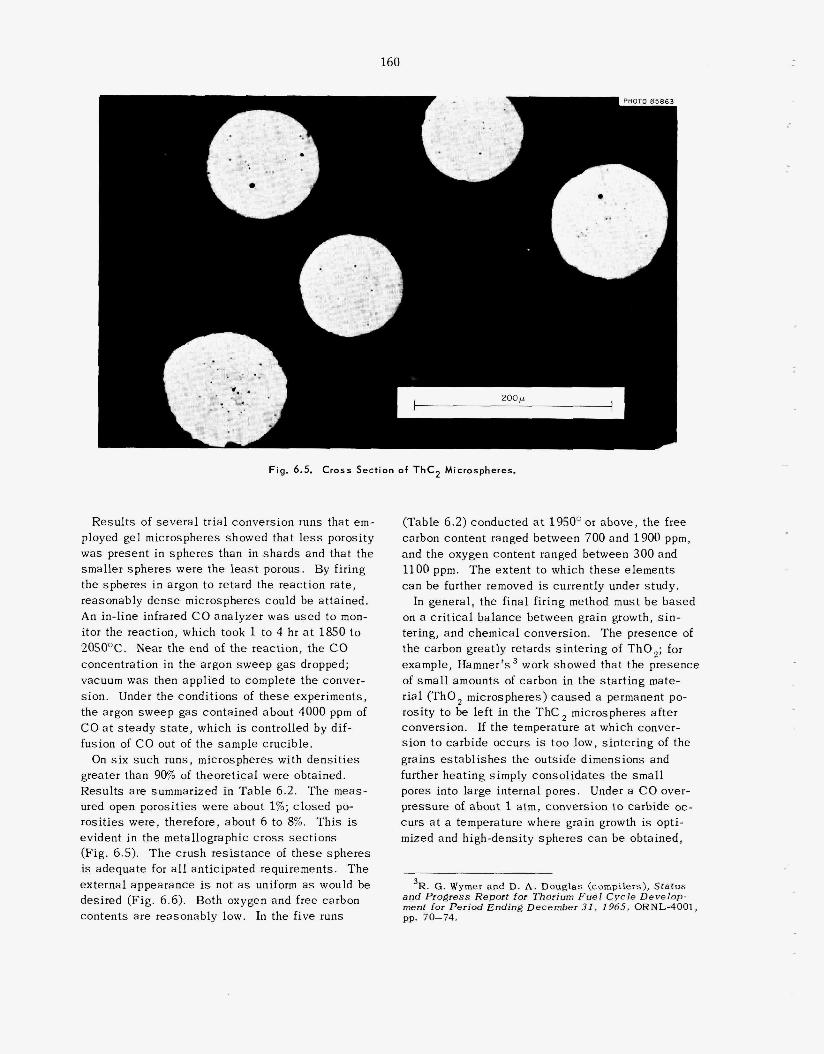
160
V
L
A h
L ‘*-
Fig. 6.5. Cross Section of ThC2 Microspheres.
Resul ts of severa l t r ia l conversion runs that em- ployed gel microspheres showed that 1 was present in spheres than i n shards smaller spheres were the l e a s t porous. By firing the spheres i n argon to retard the reaction rate, reasonably dense microspheres could be attained. An in-line infrared CO analyzer was used to mon- itor the reaction, which took 1 to 4 hr a t 1850 to 20SOOC. Near the end of the reaction, the CO concentration in the argon sweep gas dropped; vacuum was then applied to complete the conver- s ion. Under the conditions of these experiments, the argon sweep gas contained about 4000 ppm of CO at s teady s t a t e , which is controlled by dif- fusion of CO out of the sample crucible.
greater than 90% of theoretical were obtained. Resul ts are summarized in Table 6.2. The meas- ured open porosit ies were about 1%; closed po- rosi t ies were, therefore, about 6 to 8%. This is evident in the metallographic c r o s s sec t ions (Fig. 6.5). T h e crush resis tance of t h e s e spheres is adequate for all anti requirements. The external appearance is uniform a s would be
contents are reasonably low. In the f ive runs
On s i x such runs, microspheres with dens i t ies
d (Fig. 6 6). Both oxygen and free carbon
(Table 6.2) conducted at 1950’ or above, the free carbon content ranged between 700 and 1900 ppm, and the oxygen content ranged between 300 and 1100 ppm. The extent to which th c a n be further removed is currently under study. In general , the final firing method must b e based
on a cr i t ica l balance between grain growth, s i n - tering, and chemical conversion. The presence of the carbon greatly re tards s inter ing of Tho, ; for example, Hamner’s work showed that the presence of small amounts of carbon in the s ta r t ing mate- r ia l (Tho , microspheres) caused a permanent po- rosity to be left in the ThC, microspheres af ter conversion. If the temperature a t which conver- s ion t o carbide occurs is too low, s inter ing of the grains es tab l i shes the outside dimensions and further heat ing simply consol idates the small pores into large internal pores. Under a CO over- pressure of about 1 atm, conversion to carbide oc- curs a t a temperature where grain growth is opti- mized and high-de ’ e r e s c a n b e obtained,
~ ~ ~
mer and D. A . Douglas (cornpi s Report for Thorium Fuel C y
ment for Period Ending December 31, 1965, ORNL-4001, pp. 70-74.
16 1
provided the shrinkage path is not too long. The presence of CO during th i s process may also faci l - i t a te grain growth by enhancing diffusion on the sol id surfaces .
Preparation and Properties of Thoria-Carbon Sols. - In order t o bet ter understand the problems assoc ia ted with the preparation of thoria-carbon s o l s , it was necessary to s tudy the properties of these mixed sols. Electron microscopic tech- niques and viscosi ty and electrophoretic meas- urements were used in s tudying the interactions between thoria sols and carbon blacks. Exami- nation of carbon-rich mixed sols by electron mi- croscopy showed that the carbon black par t ic les were coated by thoria par t ic les ; on the other hand, electron micrographs of thoria-rich sols suggested that the carbon blacks were dispersed to the in-
dividual crystal l i tes . Other evidence of a carbon- thoria interaction is obtained from measured ze ta potentials. The ze ta potential of the Tho,-C sol is +55 mv, which is about the same a s that of a pure T h o , s o l (+67 mv). In contrast , conventional aqueous carbon s o l s have a negative zeta poten- tial.
and chemical ac t iv i t ies have been tes ted; all are dispersed by Tho , . T o date , extension of this dispers ion s tudy t o other oxide-type s o l s h a s shown that only urania s o l s behave like thoria sols; the behavior of s i l i ca , zirconia, europium hydroxide, and boehmite (A100H) s o l s is not s i m - ilar.
Electron micrographs give no visual evidence of a well-defined “interaction ratio” between T h o
Carbon blacks with widely varying surface a r e a s
Table 6.2. Properties of Thorium Carbide Microspheres
Run No.
Maximum temperature, OC
T i m e a t temperature, hr
X-ray diffractionb Tho , ThC ThC,
Thorium, %
Total carbon, 7‘0
Oxygen, %
2 (material balance)
F r e e carbon, 7’0
ThCx (value of x )
Density, g/cm3 Part iculate Hg intrusion Helium
Open porosity, %
Res i s t ance to crushing,d g
11-146
2050
1
? v. wk. P
90.93
9.09
0.096
100.12
0.12
1.92
>8.75 8.84
<1
700
11-148
1950
2.5
ND ND P
91.25
8.74
0.045
100.04
0.12
1.83
8.83 8.95
1.3
790
11-150
1850
4
? wk. P
90.88
8.85
0.360
100.09
0.47
1.83
8.75 8.87
1.4
940
111-14
1975
2.5
ND v. wk. P
91.23
8.57
0.033
99.83
0.066
1.81
> 8.91 9.00 9.04
<1
800
111-16
1975
2.5
ND v. wk. P
91.23
8.52
0.032
99.78
0.106
1.79
> 8.76 8.84 8.77
<1
70 0
111- 1 8
2030
4a
ND v. wk. P
91.45
8.65
0.106
100.21
0.186
1.80
>8.97 9.06 9.10
<1
aTemperature was gradually increased from 1700 to 203OoC during the 4 hr. bP indicates phase present; v. wk., very weak; ?, may be present; ND, not detected. C‘‘Particulate*’ density means the bulk density of single spheres; “Hg intrusion” density is the density after sub-
tracting the volume occupied by Hg a t 15,000 psi . for pores >120 A.
ameter.
The difference between these two values gives the “open porosity” The helium density subtracts a l l open pore volumes, including those <120 A.
dCorrected to 240-p-diam sphere by assuming that res is tance to crushing is proportional to the square of the di-
16 2
E . I 2 L A Fig. 6.6. External V i e w of ThC2 Microspheres
and carbon sols, but “v iscos i ty t i t ra t ions” indicate that there is a limiting value beyond which a given thoria sol wil l not suspend any addi t ional carbon black. T h i s value appears to b e a function of sur- face area. A s increasing amounts of carbon black a re blended into thoria sol, the viscosi ty increases slowly from a few cent ipoises to about 50 cent i - poises . Beyond that value, additional carbon c a u s e s a very rapid increase in v iscos i ty (up to hundreds of cent ipoises) , thus providing a sor t of titration end point. A s the total avai lable thoria surface is varied, e i ther by changing the thoria concentration or by using a thoria sol of different crystal l i te size (i.e., different spec i f ic surface area), the carbon capac i ty a t the end point changes in direct proportion to the surface area of the tho- ria. Thoria concentrations of 250 to 500 g/liter were used in these viscosi ty experiments. T h e carbon content a t the end point was as high as 350 g/liter, depending on the surface-area relation- ships .
Although both acid and alkal ine carbons a re d is - persed by thoria, the former yield a more permanent
mixed so l . Preparat ions f rom acid carbons have been s tored for one year without evidence of in- s tabi l i ty , whereas a lkal ine carbons give mixed sols that tend to gel and become lumpy within about a week. T h e surface a rea of the carbon black is important. If i t is too high (> 1000 m2/g), the mixed sol is too viscous; if it is too low (<30 m2/g), carbon d ispersa l is slow and difficult. Fo r handling convenience, pelletized carbon black is much preferred over the fluffy form. Spheron 9 (Cabot Corporation) carbon black appears to be optimum for Tho,-C sol preparation. T h i s channel black h a s a spec i f ic sur face a rea of 105 m2/g, a volat i les content of about 5%, and a pH of 4.5 in water. Sols with good fluidity character is t ics c a n be prepared eas i ly , over the range of carbon : thoria ratios of interest, with th i s carbon black.
In the blending process the pel le t ized carbon black must be broken into its b a s i c aggregates; after it is separa ted to th i s degree, the thoria sol itself acts as a dispers ing and s tabi l iz ing agent . W e have investigated ba l l milling, recirculation through a centrifugal pump recycle loop, and ultra-
163
-- Table 6.3. Properties of U02-Th02 Microspheres Prepared by Mixing U02 and Tho2 Sols
Microsphere diameters: 250-297 fl; firing temperature: 12OO0C
Gas Re lease Uranium Enrichment Density
Desired Measured g/cm3 Theoretical (m2/g)
Surface Carbon to 120OOC Percen t of Area (ppm) in Vacuum
(% 2 3 5 u ) Preparation Th/U Weight Ratio Code
(cm3/g)
OL-2 0.3333 0.3337 43.5 43.3 10.34 96.5 0.004 <20 0.02
OL-3 1.000 1.005 65.3 65.04 10.31 98.3 0.006 30 0.01
OL-4 1.857 1.886 93.18 10.08 97.5 0.005 20 0.011
aThe desired percentages of UO, (by weight) for OL-2, OL-3, and OL-4 were 75, 50, and 35 respectively.
sonic agitation as methods of preparation. Ultra- sonic agitation was the most success fu l method tried.
Preparation of Mixed Oxide Sols
During the pas t year we have been studying methods whereby Tho,-UO, sols may be prepared in any desired thorium :uranium atom ratio with good control of composition. Emphasis is being placed on a t ta in ing a thorium : uranium ratio of about 3 in the final oxide, s ince the most useful fuel for reactors uti l izing thorium wi l l probably have th i s thorium :uranium ratio. T h e original ORNL sol-gel process 4 , 5 is limited to s o l s having uranium contents of less than about 1%.
W e have studied two approaches t o the prepa- ration of U0, -Tho, s o l s . One method involves simply mixing UO, sols prepared by the formate method6 with T h o , s o l s prepared from steam- denitrated thoria. 4 ’ 5 The other method involves s o l preparation by coprecipitating thorium-ura- nium(1V) hydroxides and then peptizing the hy- droxides to a s t ab le sol. The latter approach was not s tud ied beyond preparation of the sols. W e
4J. P. McBride (compiler), Preparation of UO, Micro- spheres by a Sol-Gel Technique, ORNL-3784 (February 1966). 5D. E. Ferguson (compiler), Status and Progress Re-
port for Thorium F u e l Cycle Development for Period Ending December 31, 1962, ORNL-3385.
%. C. Haws, J. L. Matherne, F. W. Miles, and J. E. Van Cleve, Summary of Kilorod Project - a Semiremote 10 kg/day Demonstration of 233U02-Th02 F u e l Element Fabrication by the ORNL Sol-Gel Vibratory Compaction Method, ORNL-3681 (August 1965).
have demonstrated the mixed-sol method through final product microsphere evaluation, and irradi- ation t e s t spec imens have been prepared from these materials.
It was previously thought that one of the major problems with the mixed-sol method would b e close control of the thorium : uranium ratio. However, th i s was not t he case (Table 6.3). Large (150-g) batches of mixed s o l were prepared. Mixing of the s o l s was accomplished volumetrically by using calibrated glassware. Since the potential u s e s of these s o l s required different degrees of 235U en- richment, the UO, sols t o be mixed with the thoria sol were prepared by mixing a 93.18%enriched UO, sol with a natural UO, sol. The mixed s o l s were formed into ge l microspheres under standard oper- a t ing conditions; about 4 0 to 60% of these micro- spheres were in the des i red 210- to 297-pdiam range (after calcination) and were of exce l len t quality. Also, they were characterized by high dens i t ies and low carbon contents.
U0, -Tho, microspheres in which the thorium : ura- nium a t o m ratios were 4 . 8 and 3.4. T h e s e micro- spheres were prepared from fully enriched uranium and were used for irradiation t e s t s of coated par- ticles. T h e spheres were characterized by very high density, good res i s tance t o crushing, and es- sent ia l ly “geometric” surface area (Table 6.4). X-ray diffraction measurements showed that solid solution was achieved. The spheres produced by
W e have prepared kilogram-sized batches of
7W. D. Bond e t al . , Preparation of 235U02-Th02 Mi- crospheres by a Sol-Gel Method, ORNL-TM-1601 (August 1966).
164
Table 6.4. Analyses of U 0 2 - T h 0 2 Microspheres (97.69% 235U) After F i r ing
Firs t firing - fired to llOO°C and reduced for 2 hr in Ar-4% H2; cooled to 25OC in Ar Second firing - the 210- to 297-p-diam fraction from the f i r s t firing was fired to 140OoC
and reduced 4 hr in H ; cooled to 25OC in Ar 2
Sol preparation No.
Th/U atom ratio‘
u, %
Th, 7’0
Hg porosimetry Density, g/cm3 Density, % of theoretical Porosity, %
Resis tance to crushing, g
Surface area, m2/g
X-ray crystall i te s ize , A
Lat t ice parameter
Carbon, ppm
Aluminum, ppm
Gas re lease to 12OO0C in vacuum Tota l volume, cm3/g Composition, vol Yo
H Z
H2° N 2 +co
c02
O2
Ar
Weight of 210- to 297-p-diam fraction, g
Screen analysis, e wt % >297 p 249-297 p 210-249 ~1 <210 p
Samule NO.^
3371-78-1400’ 33 7 1-80- 1400 3371-82-1400 ~
47-27-97 47-27-97 47-49A-97
3.41 3.41 4.79
10.95 10.95 8.18
37.3 37.3 39.2
10.13 99.3 <1
1152
0.004
1537
5.5679
< 10
100
10.17 99.7 <1
1008
0.003
1280
5.5680
<10
110
10.11 99.6 <1
90 7
0.004
1348
5.5679
< 10
110
0.011 0.007 0.007
91.4 0.69 7.92
439.2
68.8 5.24 13.4 0.26 12.0 0.26
539.3
81.1 2.16 16.2 0.27 0.27
1295.1
20.6 9.2 15.5 65.9 74.9 69.0 0.6 1.7 3.2 12.9 14.2 12.2
aAll ana lyses on 140O0C-fired material except a s indicated. ‘Contained some “cherry-pitted” spheres. ‘Analysis on coated particles. %alculated geometric surface area of 210- to 297-p-diam spheres is 2.0-2.8 x lop3 m2/g .
eAfter llOO°C firing.
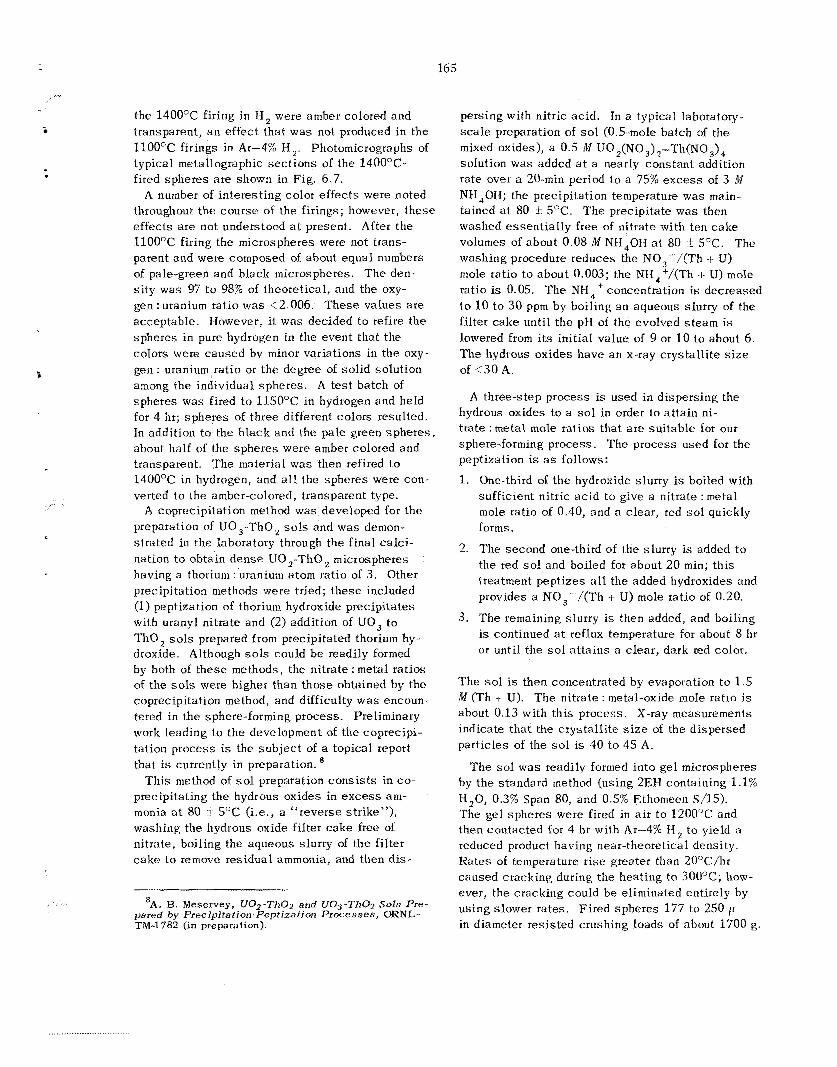
165
.. .
the 1400'C firing in 11, were amber colored and transparent, a n effect that was not produced in the 1100°C firings in Ar-4% H,. Photomicrographs of typical metallographic sec t ions of the 1400OC- fired sphe res are shown i n Fig. 6.7.
A number of interesting color e f f ec t s were noted throughout t he course of the firings; however, t hese effects a re not understood a t present. After the 1100°C firing the microspheres were not trans- parent and were composed of about equal numbers of pale-green and black microspheres. The den- s i t y was 97 t o 98% of theoretical , and the oxy- gen : uranium ratio was <2.006. T h e s e values a re acceptable. However, i t was decided t o ref i re the spheres in pure hydrogen in the event that the colors were caused by minor variations in the oxy- gen : uranium ra t io or the degree of so l id solution among the individual spheres . A t e s t batch of spheres was fired to 1150°C in hydrogen and held for 4 hr; spheres of three different colors resulted. In addition t o the b lack and the pa le green sphe res , about half of the spheres were amber colored and transparent. The material was then refired t o 1400°C in hydrogen, and a l l the spheres were con- verted to the amber-colored, transparent type.
A coprecipitation method was developed for the preparation of U0 , -Tho , s o l s and was demon- s t ra ted in the laboratory through the final ca lc i - nation t o obtain dense U0, -Tho, microspheres having a thorium : uranium atom ratio of 3. Other precipitation methods were tried; t hese included (1) peptization of thorium hydroxide precipitates with uranyl nitrate and (2) addition of UO, t o T h o , sols prepared from precipitated thorium hy- droxide. Although s o l s could be readily formed by both of t hese methods, the nitrate : metal ratios of the sols were higher than those obtained by the coprecipitation method, and difficulty w a s encoun- tered in the sphere-forming process. Preliminary work leading to the development of the coprecipi- tation process is the sub jec t of a topical report that is currently in preparation.
precipitating the hydrous oxides in e x c e s s am- monia at 80 i 5OC (i.e., a "reverse strike"), washing the hydrous oxide fi l ter cake free of nitrate, boiling the aqueous slurry of t he fi l ter c a k e to remove residual ammonia, and then d i s -
Th i s method of sol preparation cons i s t s in co-
'A. B, Meservey, UOg-ThOZ and UO,-ThOZ Sols Pre- pared by Precipitation-Peptjzafion Processes , ORNL- TM-1782 (in preparation).
persing with nitric ac id . In a typical laboratory- scale preparation of sol (0 5-mole batch of the mixed oxides), a 0.5 M UO2(NO3)?-Th(NO,), solution was added a t a nearly constant addition rate over a 20-min period to a 75% e x c e s s of 3 ll.I NW,OH; the precipitation temperature was main- tained a t 80 _t 5°C. The precipitate was then washed essent ia l ly free of nitrate with ten cake volumes of about 0 08 M N€f,OH at 80 4. SOC. The washing procedure reduces the NO,-/(Th t U) mole ratio t o about 0.003; the NH,+/(Th + U) mole ratio is 0.05. The NH,' concentration is decreased to 10 t o 30 ppm by boiling a n aqueous slurry of the fi l ter cake until the pH of the evolved s t eam i s lowered from i t s init ial value of 9 or 10 to about 6. The hydrous oxides have a n x-ray c rys ta l l i t e s i z e of <30 A.
A three-step process is used in dispersing the hydrous oxides to a sol in order to a t ta in ni- t ra te : metal mole ratios tha t are su i tab le for our sphere-forming process . The process used for the peptization is a s follows:
1. One-third of t he hydroxide slurry is boiled with sufficient nitric ac id to give a nitrate : metal mole ratio of 0.40, and a c lear , red s o l quickly forms.
2. The second one-third of the slurry i s added t o the red sol and boiled for about 20 min; th i s treatment pept izes all the added hydroxides and provides a NO,-/(Th
3. The remaining slurry is then added, and boiling is continued a t reflux temperature for about 8 hr or until the sol a t t a ins a c lear , dark red color.
U) mole ratio of 0.20.
T h e sol is then concentrated by evaporation to 1.5 M (Th t U). The nitrate : metal-oxide mole ratio is about 0.13 with th i s process . X-ray measurements indicate tha t the c rys ta l l i t e s i z e of the dispersed particles of the sol is 40 to 45 A.
The sol was readily formed into gel micrcspheres by the standard method (using 2EH containing 1 .l% H,O, 0.3% Span 80, and 0.5% Ethomeen S/15). The gel spheres were fired i n air to 1200°C and then contacted for 4 hr with Ar-4% H, to yield a reduced product having near-theoretical density. Rates of temperature rise greater than 20"C/hr caused cracking during the heating to 300°C; how- ever, the cracking could be eliminated entirely by us ing s lower rates. F i red spheres 177 to 250 f L in diameter res i s ted crushing loads of about 1700 g.
~....I_ .......
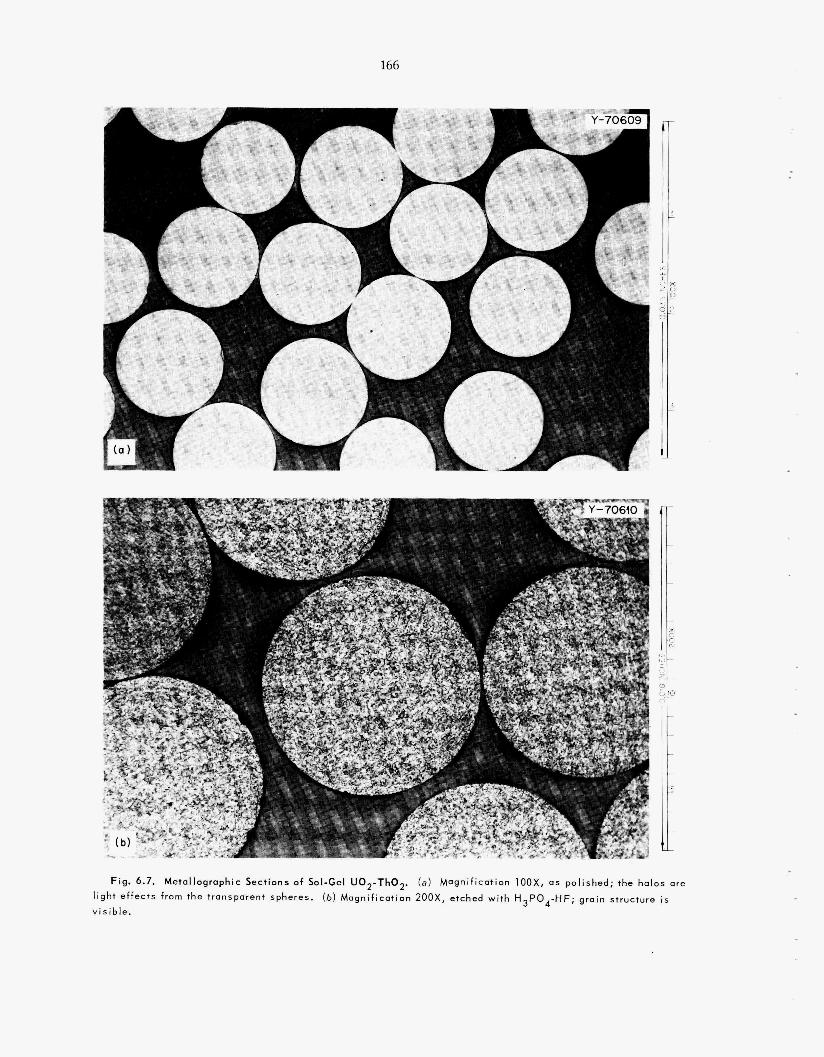
166
Fig. 6.7. Metallographic Sections of Sol-Gel U02-Th02. ( a ) Magnification lOOX, O S polished; the halos are l ight effects from the transparent spheres. (b) Magnification 2OOX, etched with H3P04-HF; grain structure i s
visible.
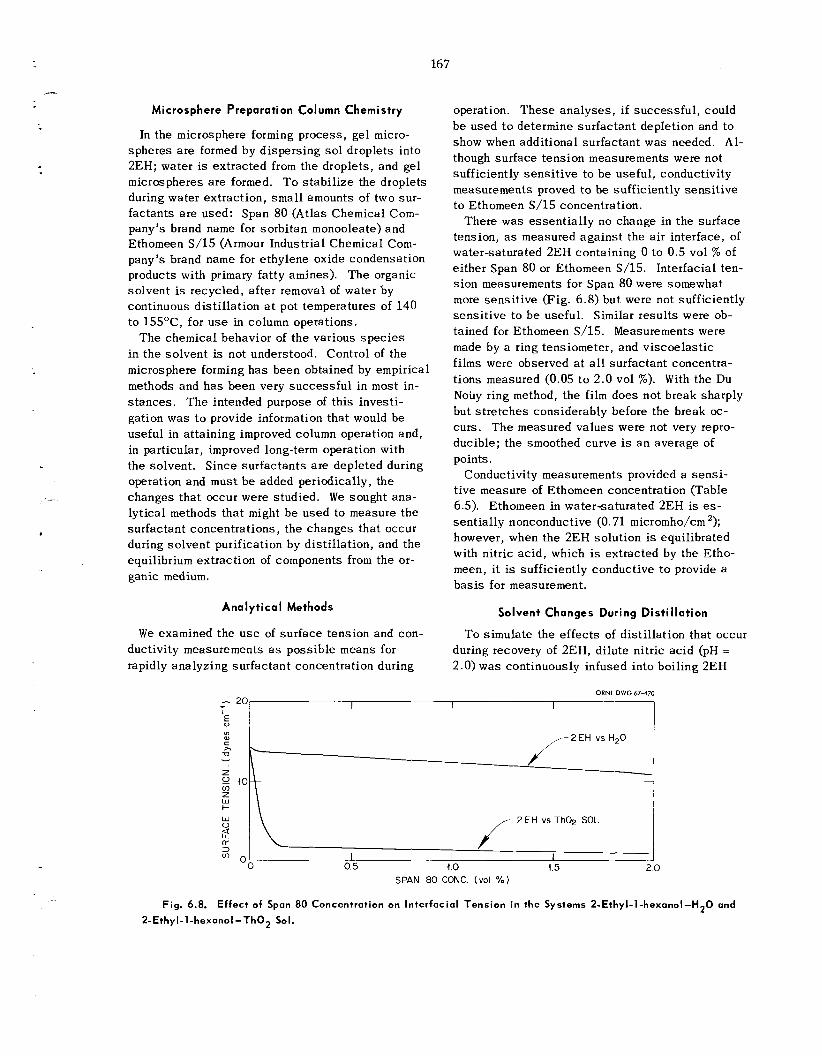
167
Microsphere Preparation Column Chemistry
In the microsphere forming process, gel micro- spheres are formed by dispersing s o l droplets into 2EH; water is extracted from the droplets, and gel microspheres a re formed. T o s t ab i l i ze the droplets during water extraction, smal l amounts of two sur- factants a r e used: Span 80 (Atlas Chemical Com- pany’s brand name for sorbitan monooleate) and Ethomeen S / l 5 (Armour Industrial Chemical Com- pany’s brand name for ethylene oxide condensation products with primary fa t ty amines). The organic solvent is recycled, after removal of water by continuous d is t i l l a t ion a t pot temperatures of 140 to 15SoC, for u s e in column operations.
The chemical behavior of t he various s p e c i e s in the so lvent is not understood. Control of the microsphere forming h a s been obtained by empirical methods and h a s been very success fu l in most in- s t ances . The intended purpose of th i s investi- gation was to provide information that would be useful in attaining improved column operation and, in particular, improved long-term operation with the solvent. Since sur fac tan ts are depleted during operation and must be added periodically, the changes tha t occur were studied. W e sought ana- lytical methods tha t might b e used to measure the surfactant concentrations, the changes tha t occur during so lvent purification by disti l lat ion, and the equilibrium extraction of components f rom the or- ganic medium.
Analyt ica l Methods
W e examined the u s e of sur face tension and con- ductivity measurements a s poss ib le means for rapidly analyzing surfactant concentration during
operation. These ana lyses , if successfu l , could b e used t o determine surfactant depletion and to show when additional surfactant was needed. A l - though surface tension measurements were not sufficiently sens i t i ve to b e useful, conductivity measurements proved to be sufficiently sens i t ive to Ethomeen S/15 concentration.
There was e s sen t i a l ly no change in the surface tension, a s measured aga ins t the air interface, of water-saturated 2EH containing 0 to 0.5 vol % of either Span 80 or Ethomeen S/15. Interfacial ten- s ion measurements for Span 80 were somewhat more sens i t i ve (Fig. 6.8) but were not sufficiently sens i t ive to be useful. Similar resu l t s were ob- tained for Ethomeen S/15. Measurements were made by a ring tensiometer, and v iscoe las t ic f i lms were observed at all surfactant concentra- t ions measured (0.05 t o 2 . 0 vol %). With the Du Nouy ring method, the f i l m does not break sharply but s t r e t ches considerably before the break oc- curs . The measured va lues were not very repro- ducible; the smoothed curve is a n average of points.
Conductivity measurements provided a sens i - t ive measure of Ethomeen concentration (Table 6.5). Ethomeen in water-saturated 2EH is es- sent ia l ly nonconductive (0.71 micromho/cm ’); however, when the 2EH solution is equilibrated with nitric ac id , which is extracted by the Etho- meen, it is sufficiently conductive t o provide a bas i s for measurement.
Solvent Changes During Dist i l la t ion
T o simulate the effects of disti l lat ion that occur during recovery of 2EH, dilute nitric ac id (PH = 2.0) was continuously infused into boiling 2EH
ORNL DWG 67-470
SPAN 80 CONC. (VOI % I
Fig. 6.8. Effect of Span 80 Concentration on Interfacial Tension in the Systems 2 - E t h y l - l - h e ~ a n o l - H ~ O and
2-Ethyl - l -hexanol -Th02 Sol.
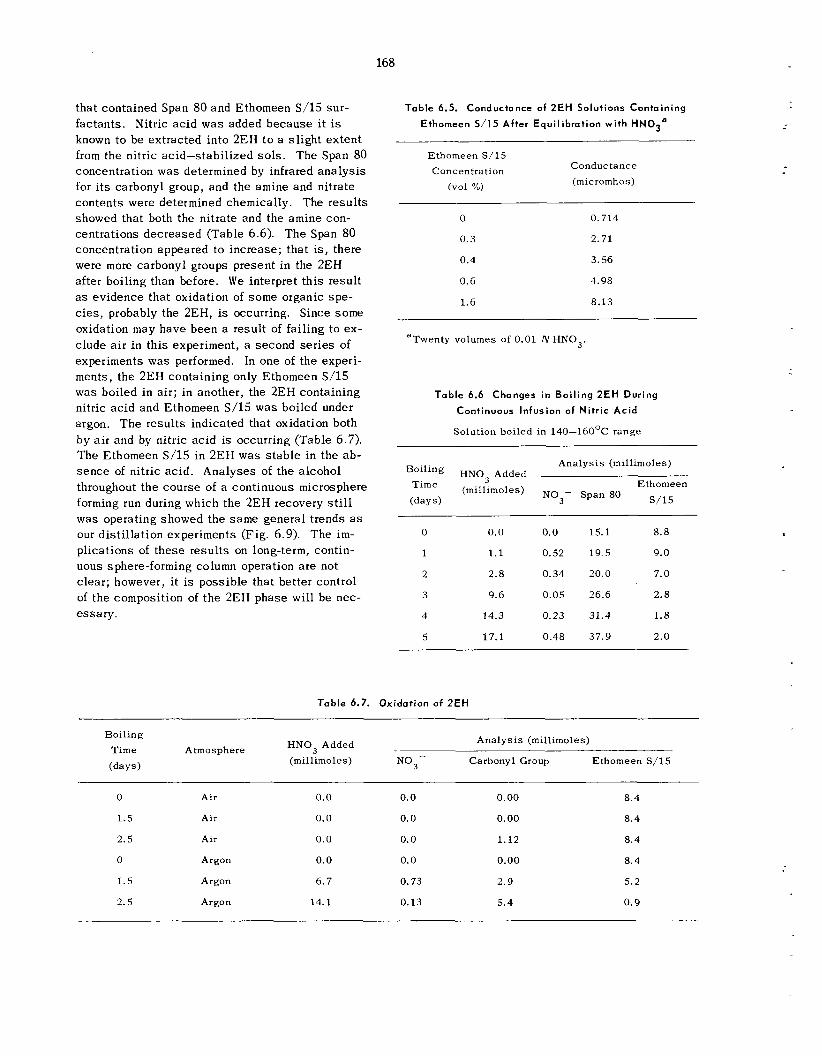
168
that contained Span 80 and Ethomeen S/15 sur- factants. Nitric ac id w a s added because i t is known to b e extracted into 2EH t o a s l igh t ex ten t from the nitric acid-stabil ized sols. The Span 80 concentration was determined by infrared ana lys i s for i t s carbonyl group, and the amine and nitrate contents were determined chemically. The resu l t s showed that both the nitrate and the amine con- centrations decreased (Table 6.6). T h e Span 80 concentration appeared to increase ; tha t is, there were more carbonyl groups present i n the 2EH after boiling than before. W e interpret th i s result as ev idence that oxidation of some organic spe - cies, probably the 2EH, is occurring. Since some oxidation may have been a result of fail ing to ex- clude a i r i n th i s experiment, a second se r i e s of experiments was performed. In one of the experi- ments, the 2EH containing only Ethomeen S/15 was boiled in a i r ; in another, the 2EH containing nitric ac id and Ethomeen S/15 was boiled under
Table 6.5. Conductance of 2EH Solutions Containing Ethorneen 5/15 After Equilibration with HN03a
Ethomeen S/15 Concentration Conductance
(micromhos) (vol 70)
0
0.3
0.4
0.6
1.6
0.714
2.71
3.56
4.98
8.13
aTwenty volumes of 0.01 N HNO,.
Table 6.6 Changes in Boiling 2EH During Continuous Infusion of Nitric Acid
argon. The results indicated that oxidation both by a i r and by nitric ac id is occurring (Table 6.7). The Ethomeen S/15 in 2EH was s tab le in the ab- s e n c e of nitric ac id . throughout t he course of a continuous microsphere Time (millimoles) N03- Span 8o Ethomeen forming run during which the 2EH recovery still (days) S/15
was operating showed the same general trends a s our disti l lat ion experiments (Fig. 6.9). The im- 0 0.0 0.0 15.1 8.8
uous sphere-forming column operation a r e not 2 2.8 0.34 20.0 7.0 c lear ; however, it is poss ib le that better control
of the composition of the 2EH phase will b e nec- 3 9.6 0.05 26.6 2.8
e s sa ry . 4 14.3 0.23 31.4 1 .8
5 17.1 0.48 37.9 2.0
Solution boiled in 140-160°C range
Analysis (millimoles) Analyses of the alcohol HNO, Added
plications of these resu l t s on long-term, contin- 1 1.1 0.52 19.5 9.0
Table 6.7. Oxidation of 2EH
Analysis (millimoles) Boiling H N 0 3 Added (millimoles) NO3- Carbonyl Group Ethomeen S/15
Time Atmosphere
(days)
0 Air
1.5 Air
2.5 Air
0 Argon
1.5 Argon
2.5 Argon
0.0 0.0
0.0 0.0
0.0 0.0
0.0 0.0
6.7 0.73
14.1 0.13
0.00
0.00
1 .12
0.00
2.9
5.4
8.4
8.4
8.4
8.4
5.2
0.9
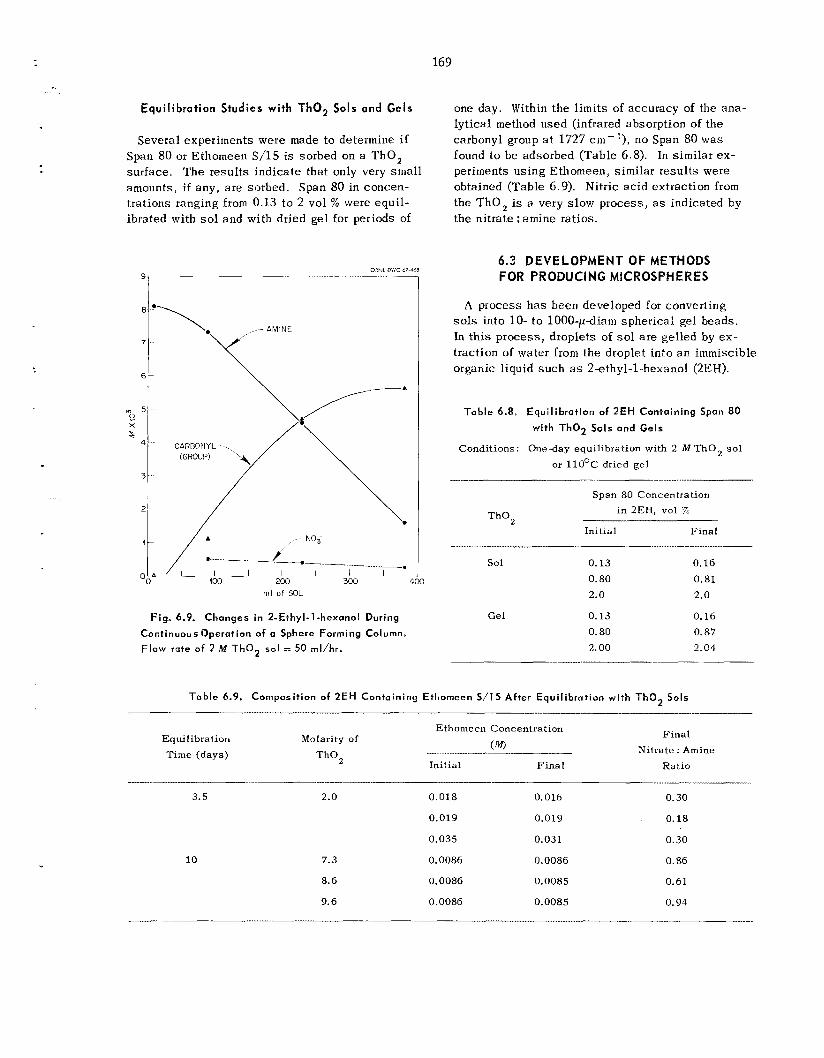
169
Equilibration Studies with Tho, Sols and Gels
Several experiments were made to determine if Span 80 or Ethomeen S/15 i s sorbed on a Tho, surface. The resu l t s indicate that only very smal l amounts, if any, are sorbed. Span 80 in concen- trations ranging from 0.13 to 2 vol % were equil- ibrated with sol and with dried gel for periods of
9 r 1
one day. Within the l imits of accuracy of the ana- lytical method used (infrared absorption of the carbonyl group a t 1727 cm-'), no Span 80 was found to be adsorbed (Table 6.8). In similar ex- periments using Ethomeen, similar resul ts were obtained (Table 6.9). Nitric ac id extraction from the T h o , is a very slow process , a s indicated by the nitrate :amine ratios.
6.3 DEVELOPMENT OF METHODS FOR PRODUCING MICROSPHERES
A process h a s been developed for converting sols into 10- to 1000-p-cliam spher ica l gel beads. In this process, droplets of s o l a r e gelled by ex - traction of water from the droplet into a n immiscible organic liquid such as 2ethyl-1-hexanol (2EH).
Table 6.8. Equilibration of 2EH Containing Span 80 with ThOZ Sols and Gels
Conditions: One-day equilibration with 2 T h o , sol or llO°C dried ge l
____I .
Span 80 Concentration i n 2EH, vol %
Initial Final T h o ,
__ Sol 0.13 0.16
200 300 0.80 0.81
------..-. rnl of SOL. 2.0 2.0
Gel 0.13 0.16 0.80 0.87
2.00 2.04
m 5 . ~ 0 8 X
400
Fig. 6.9. Changes in 2-Ethyl-1-hcxonol During
Continuous Operation of a Sphere Forming Column.
F low rate of 2 M Tho, s o l = 50 rnl/hr.
Table 6.9. Composition of 2EH Containing Ethomeen 5/15 After Equilibration with Tho, Sols
Final Ethomeen Concentration
(M) Nitrate : Amine Equi Iibra tion Molarity of T i m e (days) T h o ,
Initial F ina l Ratio ~ ~ -
3.5 2.0 0.018 0.016 0.30
0.019 0.019 0.18
0.035 0.031 0.30
10 7.3 0.0086 0.0086 0.86
8.6 0.0086 0.0085 0.61
9.6 0.0086 0.0085 0.94
.____I .-
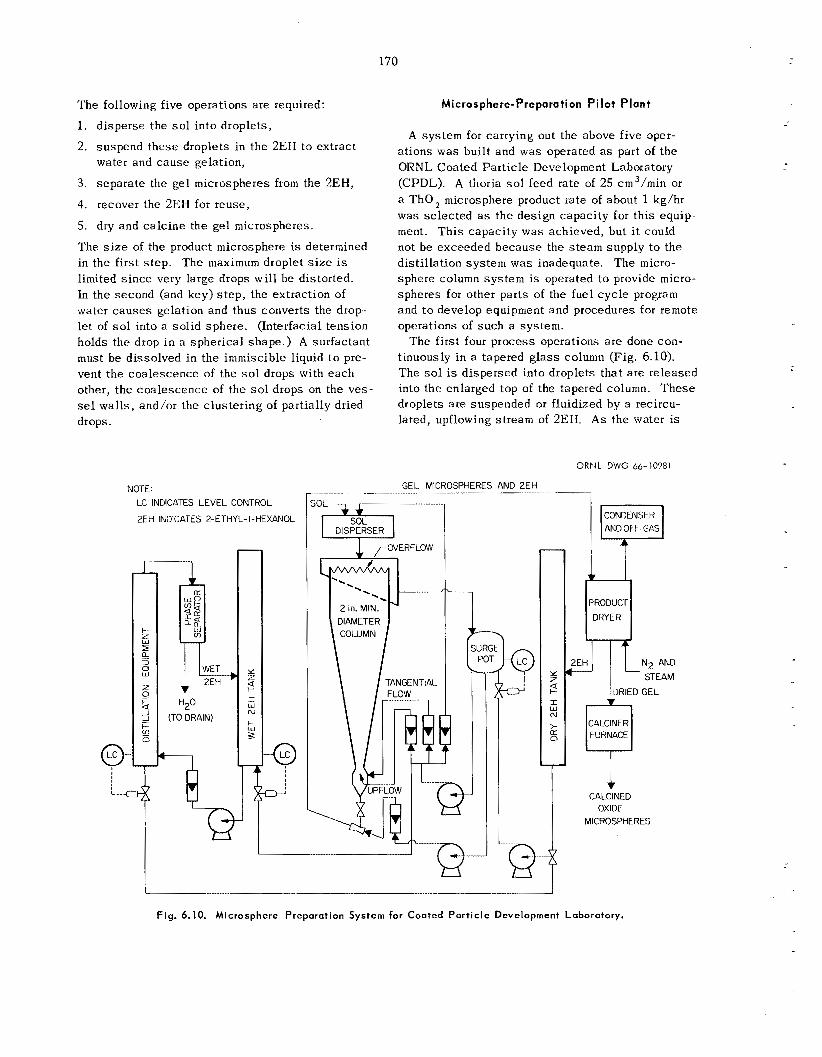
170
The following five operations a re required:
1. d isperse the s o l into droplets,
2. suspend these droplets in the 2EH to extract water and c a u s e gelation,
3. separa te the ge l microspheres from the 2EH,
4. recover the 2EI-I for reuse ,
5. dry and ca l c ine the ge l microspheres.
The size of the product microsphere is determined in the first s t e p . The maximum droplet s i z e is limited s ince very large drops wi l l be distorted. In the second (and key) s t e p , the extraction of water c a u s e s gelation and thus converts the drop- let of sol into a solid sphere . (Interfacial tension holds the drop i n a spher ica l shape . ) A surfactant must be dissolved in the immiscible liquid t o pre- vent the coa lescence of the s o l drops with each other, the coa le scence of the sol drops on the ves- sel wal l s , and/or the c lus te r ing of partially dried drops.
NOTE: LC INDICATES LEVEL CONTROL
2EH INDICATES 2-ETHYL-1-HEXANOL
H20 (TO DRAIN)
Microsphere-Preparation Pi lot Plant
A system for carrying out the above five oper- a t ions was built and was operated as part of the ORNL Coated Particle Development Laboratory (CPDL). A thoria sol feed rate of 25 cm3/rnin or a T h o , microsphere product rate of about 1 kg/hr was se lec ted as the des ign capac i ty for th i s equip- ment. T h i s capac i ty was achieved, but it could not be exceeded because the s team supply to the disti l lat ion sys t em was inadequate. The micro- sphere column system is operated to provide micro- spheres for other parts of the fuel cyc le program and t o develop equipment and procedures for remote operations of such a sys tem.
The first four process operations a r e done con- tinuously in a tapered g l a s s column (Fig. 6.10). The sol is d ispersed into droplets that a r e released into the enlarged top of the tapered column. These droplets a r e suspended or fluidized by a recircu- lated, upflowing stream of 2EH. As the water is
ORNL DWG 66--10981
GEL MICROSPHERES AND 2EH .......... .-- .........
..........
DISPERSER
t.lr SURGI
I --@ 0’
CONDENSER AND OFF -GAS
i PRODUCT DRYER
N2 AND STEAM
DRIED GEL v
CALCINER FURNACE
-c CALCINED
OXIDE MICROSPHERES
ig. 6.10. Microsphere Preparation System for Coated Par t ic le Development Laboratory.
17 1
extracted and the droplets gel into solid micro- spheres , the se t t l i ng velocity increases . The column configuration and the fluidizing flow rates are se l ec t ed t o permit the gelled particles to drop out continuously while sol droplets are being formed in the top of the column. The ge l spheres a re transferred t o a dryer, dried, and calcined batchwise. F resh or purified 2EH is continuously added t o the column and d i sp laces a s t ream of wet 2EH t o a recovery system. Water is removed from the 2EH by disti l lat ion.
We have demonstrated long-term, s t ab le oper- ation with r e spe r t t o the 2EH and surfactant in the CPDL microsphere column. Single charges of 2EH were used for periods longer than s i x months. The coa lescence and c lus te r ing problems a s s o - ciated with the thoria drops were effectively pre- vented with the u s e of about 0.3 vol 76 Ethomeen S/lS and 0.05 vol % Span 80 in the in i t ia l charge, plus 10 om3 of Ethomeen S/15 and 2.5 c m 3 of Span 80 added per l i ter of thoria sol fed to the column. When the sys t em was drained in prepa- ration for equipment changes , the only noticeable evidence of deterioration in the surfactant-2EH solution was a c loudiness , which resulted from accumulation of very sma l l ge l particles. Samples of t he 2EH that was used for preparing thoria mi- c rmpheres for a six-month period (a s ing le charge of 2EH) were analyzed for NO,-, Th, total N, and amine. T h e resu l t s , neglecting one anomalous ana lys i s for amine, for the final four months of operation were:
- NOj (1.5 to 4) x M , no trend with t i m e
T n N (2 to 5) x M , no trend wlth t lme Amine (6 t o 10) x loL4 M, no trend wi th t ime
12 to 7) x 1 0 - ~ M, increasing with t i m e
The disti l lat ion sys t em for removal of water from 2EH was t e s t ed with a new high-pressure s team supply; it is now adequate for a s o l feed rate of at l ea s t SO cm3/min . T h i s is equivalent to about 50 kg of T h o , or 15 kg of IJO, micro- spheres per 24-hr day.
ual water and alcohol from the ge l spheres , was designed, installed, and operated successfu l ly . A s t r e a m of 2EH from the column transfers the gel. spheres from the column bottom to the dryer, where the spheres a re co l lec ted on a filter of nonblinding wire cloth. Af te r batch drying, the spheres a re transferred pneumatically t o the fur- nace for batch calcining. This new arrangement
A new ge l dryer, for use in removing the resid-
permits nearly continuous collection of the gelled spheres.
The problems of remote operation (necessary with highly radioactive materials) have been only partly solved. Gel sphe res or calcined oxide spheres can be readily transferred, hydraulically or pneumatically, with 2EH or a gas. T h e inven- tory of s o l drops or gel sphe res in the column is adequately indicated by average bed -density meas - urements. However, we s t i l l need simple, remote techniques for determining the optimum fluidizing flow and for inspecting the gel spheres (to deter- mine dryness and the absence of clustering and distortion).
Sol Disperser Development
Many column operating difficult ies would be minimized if uniformly s i z e d s o l drops were formed; therefore, a variety of sol dispersion devices have been tes ted . Sol drops c a n be formed from a larger m a s s of sol by applying one or more forces, such a s gravity, shear , ineit ia, interfacial tension, e l ec - trostatic repulsion, and centrifugal force. T o ob- tain uniform drops and controlled diameters, the force, as well as the configuration of the s o l where the force is applied, must be uniform; in addition, one or both of t hese factors m u s t be con- trollable. For a l l the d ispersers that were tes ted , a uniform configuration was obtained by feeding the s o l through orifices or cap i l la r ies 0.004 t o 0.030 in. in diameter.
Two-fluid nozz les have proved to b r the most useful s o l dispersion devices . They are reliable, give a uniform product, and are eas i ly controlled for pioducing sol drops over the s i z e range of interest (200 t o 2000 p diameter). In every c a s e , 90 wt % of the product obtained from s ingle two- fluid nozz les had diameters tha t were within +1S% of the mean diameter (Table 6.10). Since the capacity of s ingle two-fluid nozzles was un- acceptably low for pilot plant operations, iiiultiple arrays of two-fluid nozzles, arranged in parallel , were tes ted . Two of t hese arrays consisted of 6 and 11 two-fluid nozzles, respectively, arranged in parallel. In these arrays the s o l and the 2EH were fed to their feed locations from s ingle pumps. Operations, over extended periods, with the 6- nozzle and the 11-nozzle arrangempnts provided acceptable products, of which 70 and SO wt %, respectively, had diameters tha t were within t 1 0 % of the mean diameter. Attempts to improve these yields will continue
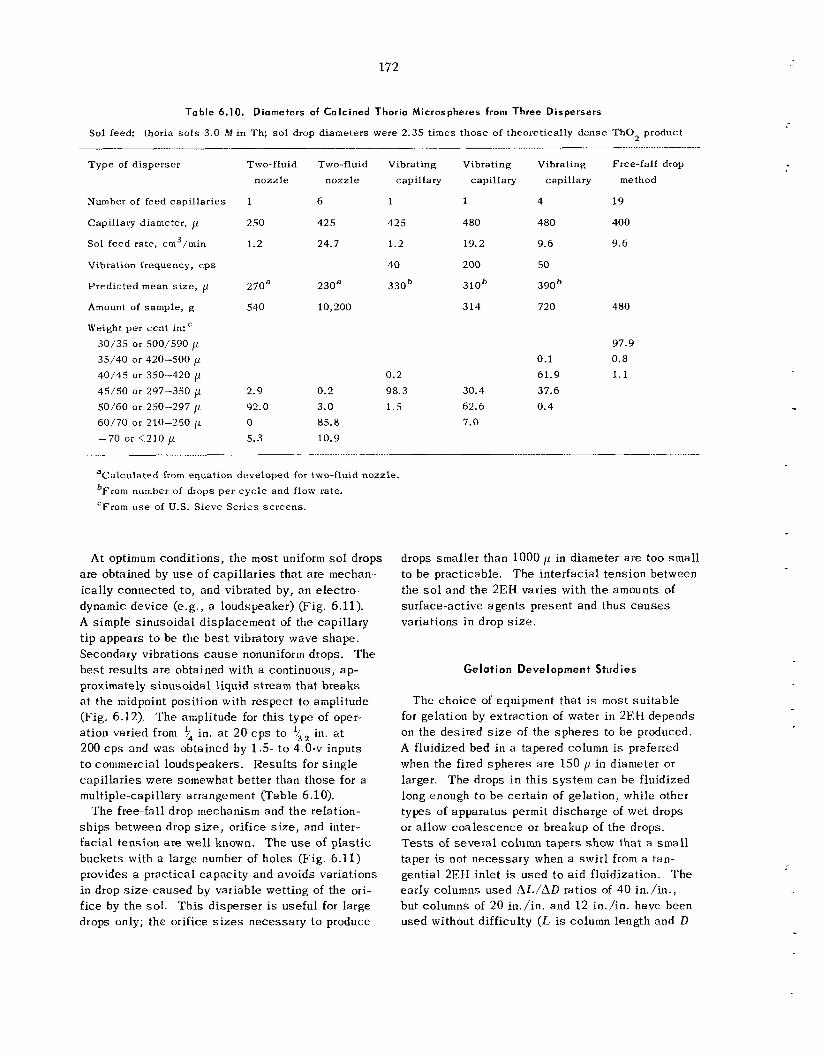
172
Table 6.10. Diameters of Calcined Thoria Microspheres from Three Dispersers
Sol feed: thoria sols 3.0 M i n Th; so l drop diameters were 2.35 times those of theoretically dense T h o z product
Type of disperser
Number of feed capillaries
Capillary diameter, p
Sol feed rate, crn3/min
Vibration frequency, c p s
Predicted mean s ize , p
Amount of sample, g
Weight per cent in: 30/35 or 500/590 p 35/40 or 420-500 p 40/45 or 350-420 p 45/50 or 297-350 p 50/60 or 250-297 p 60/70 or 210-250 p -70 or <210 p
Two-fluid nozzle
1
250
1.2
270a
540
2.9 92.0 0
5.3
Two-fluid nozzle
6
425
24.7
230a
10,200
0.2 3.0 85.8 10.9
Vibrating capillary
1
425
1.2
40
330'
0.2 98.3 1.5
Vibrating capillary
1
480
19.2
200
310'
314
30.4 62.6 7.0
Vibrating capillary
4
480
9.6
50
390 ' 720
0.1 61.9 37.6 0.4
Free-fall drop method
19
400
9.6
480
97.9 0. 8 1.1
aCalculated from equation developed for two-fluid nozzle. bFrom number of drops per cyc le and flow rate. 'From use of U.S. Sieve Series sc reens .
At optimum conditions, t he most uniform sol drops a re obtained by u s e of capi l la r ies that a r e mechan- ically connected to, and vibrated by, a n electro- dynamic device (e.g., a loudspeaker) (Fig. 6.11). A simple s inusoida l displacement of the capillary t ip appears to be the b e s t vibratory wave shape . Secondary vibrations c a u s e nonuniform drops. The bes t resu l t s a r e obtained with a continuous, ap- proximately s inusoida l liquid s t ream tha t breaks a t the midpoint position with respect to amplitude (Fig. 6.12). T h e amplitude for t h i s type of oper- ation varied from $4 in. a t 20 cps to $32 in. at 200 c p s and was obtained by 1.5- t o 4.0-v inputs t o commercial loudspeakers. Resul t s for s ing le capi l la r ies were somewhat better than those for a multiple-capillary arrangement (Table 6.10).
The free-fall drop mechanism and the relation- sh ips between drop size, orifice s i z e , and inter- facial tension a r e wel l known. T h e u s e of p l a s t i c buckets with a large number of holes (Fig. 6 .11) provides a practical capac i ty and avoids variations in drop size caused by variable wetting of the ori- f ice by the sol. Th i s d i sperser is useful for large drops only; the orifice s i z e s necessary to produce
drops smaller than 1000 p in diameter a r e too smal l to b e practicable. The interfacial tension between the sol and the 2EH varies with the amounts of surface-active agents present and thus c a u s e s variations in drop size.
Gelat i on Deve I opmen t Stud ies
The cho ice of equipment that is most su i tab le for gelation by extraction of water i n 2EH depends on the desired size of the sphe res to b e produced. A fluidized bed in a tapered column i s preferred when the fired sphe res a r e 150 p in diameter or larger. T h e drops i n th i s sys t em can b e fluidized long enough t o b e certain of gelation, while other types of apparatus permit discharge of wet drops or allow coa le scence or breakup of the drops. Tests of seve ra l column tapers show tha t a sma l l taper i s not necessary when a swir l from a tan- gential 2EI-I inlet is used to a id fluidization. The early columns used A L / A D ratios of 40 in./in., but columns of 20 in./in. and 1 2 in./in. have been used without difficulty ( L is column length and D
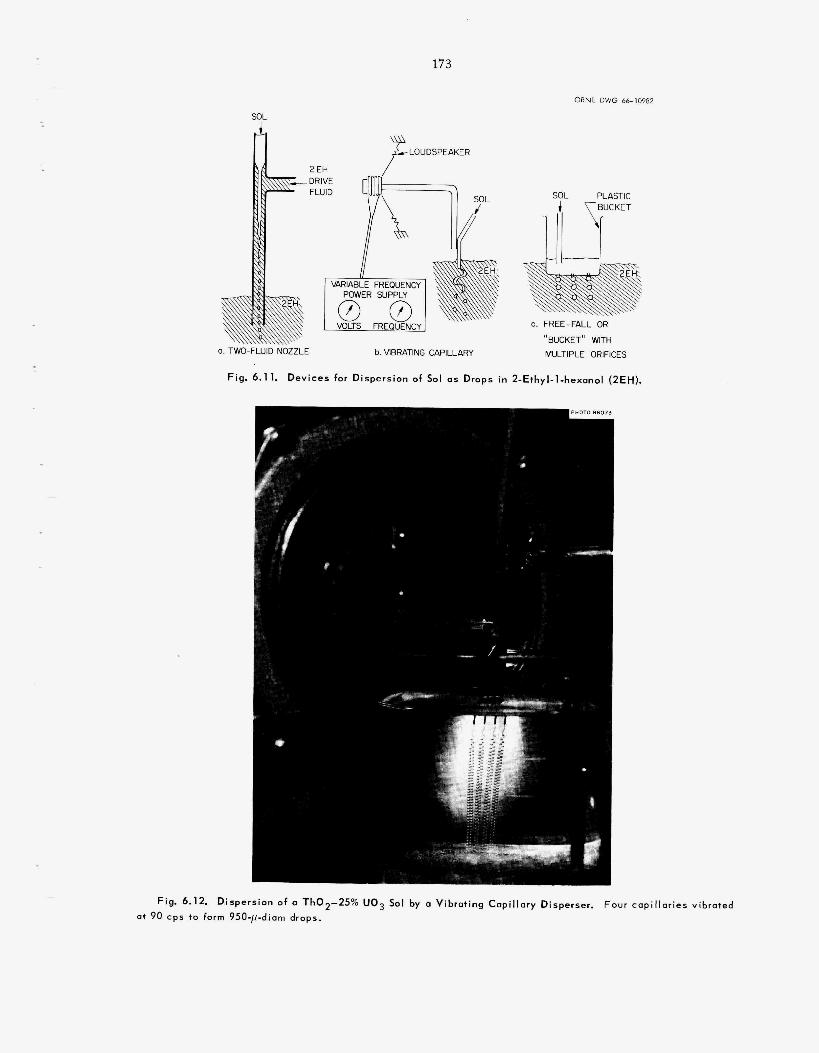
173
ORNL DWG 66-10982
SOL
LOUDSPEAKER
SOL PLASTIC
c. FREE-FALL OR
“BUCKET“ WITH MULTIPLE ORIFICES 0. TWO-FLUID NOZZLE b. VIBRATING CAPILLARY
Fig. 6.1 1. Dev ices for Dispersion of Sol a s Drops i n 2-Ethyl-1-hexanol (2EH).
b
*
--.L, - 1 .
Fig. 6.12. Dispersion of o Th02-25% UO3 Sa1 by a Vibrating Capi l lary Disperser. Four capi l lar ies vibrated a t 90 cps to form 950-p-diam drops.
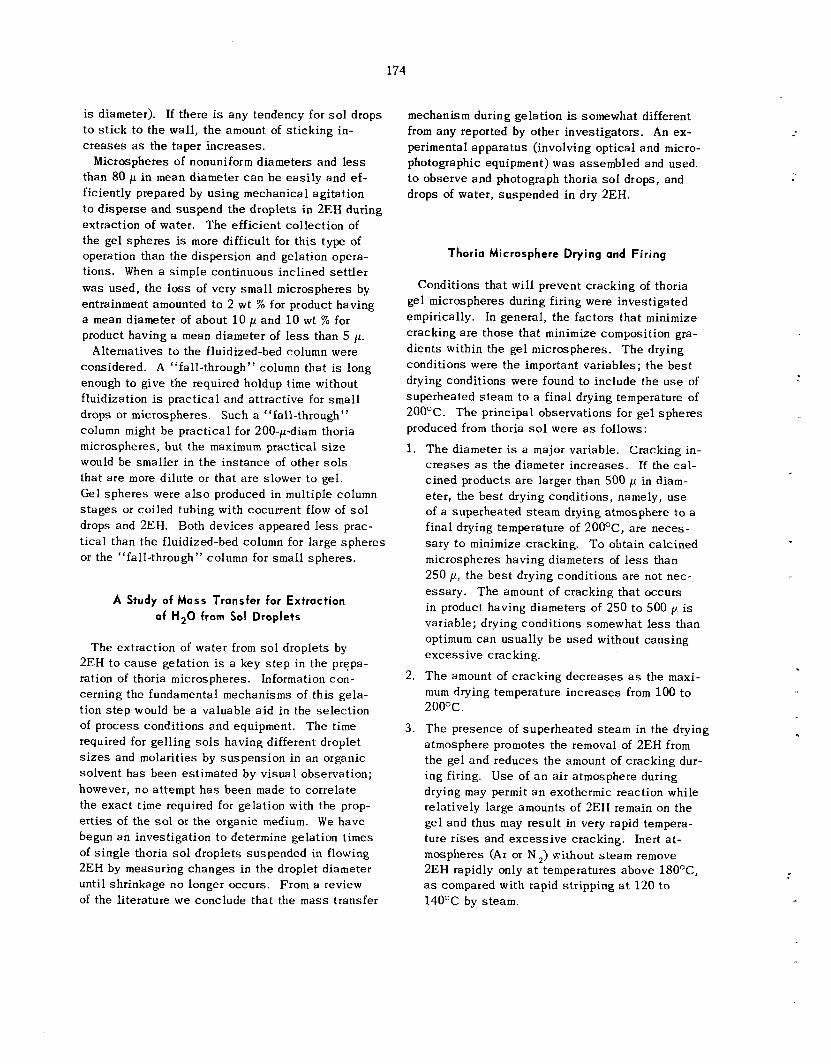
174
is diameter). If there is any tendency for s o l drops to s t ick t o the wall, t he amount of s t ick ing in- c r eases as the taper increases .
Microspheres of nonuniform diameters and less than 80 p in mean diameter can b e eas i ly and ef- ficiently prepared by us ing mechanical agitation to d isperse and suspend the droplets in 2EH during extraction of water. The efficient collection of the gel spheres is more difficult for t h i s type of operation than the dispersion and gelation opera- tions. When a simple continuous inclined se t t l e r was used, the l o s s of very s m a l l microspheres by entrainment amounted t o 2 wt % for product having a mean diameter of about 10 p and 1 0 wt % for product having a mean diameter of less than 5 p.
Alternatives t o the fluidized-bed column were considered. A “fall-through” column tha t is long enough to give the required holdup time without fluidization is prac t ica l and attractive for s m a l l drops or microspheres. Such a “fall-through” column might be prac t ica l for 200-pdiam thoria microspheres, but the maximum practical s i z e would be smaller in the ins tance of other s o l s that a re more dilute or that a r e s lower t o gel. Gel spheres were a l s o produced in multiple column s t a g e s or coiled tubing with cocurrent flow of s o l drops and 2EH. Both dev ices appeared less prac- t i ca l than the fluidized-bed column for large spheres or the “fall-through” column for s m a l l spheres.
A Study of Mass Transfer for Extraction of H 2 0 from Sol Droplets
The extraction of water from s o l droplets by 2EH t o cause gelation is a key s t e p in the prepa- ration of thoria microspheres. Information con- cerning the fundamental mechanisms of th i s gela- tion s t e p would be a valuable a id in the se lec t ion of process conditions and equipment. T h e time required for gell ing sols having different droplet sizes and molarities by suspens ion in an organic solvent has been estimated by v isua l observation; however, n o attempt h a s been made to correlate the exac t t i m e required for gelation with the prop- e r t i e s of the sol or the organic medium. W e have begun an investigation t o determine gelation times of s ingle thoria s o l droplets suspended in flowing 2EH by measuring changes in the droplet diameter until shrinkage no longer occurs. From a review of the literature we conclude tha t the mass transfer
mechanism during gelation is somewhat different from any reported by other investigators. An ex- perimental apparatus (involving optical and micro- photographic equipment) w a s assembled and used. t o observe and photograph thoria sol drops, and drops of water, suspended in dry 2EH.
Thoria Microsphere Drying and F i r ing
Conditions tha t will prevent cracking of thoria gel microspheres during firing were investigated empirically. In general, the factors tha t minimize cracking a re those that minimize composition gra- d ien ts within the gel microspheres. The drying conditions were the important variables; the bes t drying conditions were found to include the use of superheated s team t o a final drying temperature of 200°C. T h e principal observations for gel spheres produced from thoria s o l were a s follows:
1.
2.
3.
T h e diameter is a major variable. Cracking in- c r eases as the diameter increases . If the cal- cined products a r e larger than 500 p in diam- e te r , the bes t drying conditions, namely, use of a superheated s team drying atmosphere t o a final drying temperature of 200°C, a re neces- sa ry t o minimize cracking. To obtain ca lc ined microspheres having diameters of less than 250 p, the bes t drying conditions are not nec- essary . The amount of cracking that occurs in product having diameters of 250 t o 500 I/ is variable; drying conditions somewhat less than optimum can usually b e used without caus ing excess ive cracking.
T h e amount of cracking decreases as the maxi- mum drying temperature increases from 100 t o 200oc .
The presence of superheated s team in the drying atmosphere promotes the removal of 2EH from the gel and reduces the amount of cracking dur- ing firing. Use of a n a i r atmosphere during drying may permit a n exothermic reaction while relatively large amounts of 2EH remain on the gel and thus may resu l t in very rapid tempera- ture r i s e s and excess ive cracking. Inert a t - mospheres (Ar or N2) without s team remove 2EH rapidly only at temperatures above 18OoC, a s compared with rapid stripping at 120 t o 14OOC by steam.
175
The currently preferred drying and firing con- dit ions for Tho:! microspheres a re as follows:
Drying Ar atmosphere 25 to 110°C i n 1 hr
Ar and s team atmosphere
110 to 2OOoC in 6 hr
F i r ing Air atmosphere 100 to 5OO0C at 100°C/hr Air atmosphere Air atmosphere
500 to 1150°C a t 300°C/hr A t 1150°C for 4 hr
6.4 T H O R I U M - U R A N I U M RECYCLE FACILITY
Design and Construction
A contract for the construction of the Thorium- Uranium Recycle Fac i l i ty was signed with Blount Brothers Construction Company of Montgomery, Alabama, on May 6, 1965, One year later the building (which was estimated to be 60% complete) was enc losed , and the ce l l wal l s had been erected up t o a point between the first- and second-floor levels.
During the pas t year, the portion of the work t o be accomplished by the fixed-price contractor has been virtually completed. The procurement of special materials and equipment (exclusive of process equipment) to be installed in the building has been completed. An amount of work estimated to cost approximately $90,000 remains to be done by a cost-plus-fixed-fee contractor. Th i s work cons is t s mainly in ins ta l l ing the in-cell crane and manipulator sys tem, plugs for the many points of cell a c c e s s , and the viewing windows.
about $1,764,000 for the building. Except for three s t e e l sh ie ld ing doors, e a c h item was re- ceived by the t ime it was needed. T h e doors, which with their housings weigh well in e x c e s s of 100 tons, arrived about three months later than specified by the contract. Excess ive wear ra te has been observed in the square-threaded jack- screw assembl ies used to r a i se the two 25-ton doors. We have s i n c e learned that, in this type of application, ba l l s c rews have a life expectancy that is approximately 100 times that of square- threaded jackscrews.
The in-cell c rane and manipulator system con- st i tuted the la rges t s ing le procurement package; it involved intricate problems in both mechanical des ign and fabrication. In contrast to the expe- rience mentioned above with the sh ie ld ing doors,
The Laboratory has procured equipment cos t ing
the c tane and manipulator design proceeded smoothly and quite satisfactorily. Operational t e s t s in the manufacturer's plant were successfu l .
Process Equipment Design
The main design effort during this report period was directed toward the des ign , fabrication, and, in some c a s e s , t es t ing of various items or assem- blies of process equipment to be used by the de - velopment groups. In addition, sphere forming equipment tha t would be su i tab le for installation in TURF was designed.
Uranium Reduction. - Our evaluation and ob- servation of the uranium reduction s t e p have led to the conclusion that neither the atmospheric- pressure reduction procedure (as used by the chemical development group) nor the high-pressure reduction procedure (used in engineering develop- ment work t o make significant quantit ies of re- duced uranium) is su i tab le for use in a hot cell. The first procedure contains a difficult so l ids separation s t ep , whereas mechanical and safe ty problems assoc ia ted with high pressure make the latter method undesirable. W e have proposed operation at atmospheric pressure, using a suf- ficiently large quantity of ca ta lys t on a fixed, but removable, bed to accomplish the reduction. A tr ickle column sys t em was designed and con- structed; it i s now undergoing tes t s . It cons i s t s of three water-cooled 1-in.-diam by 3-ft-long tubes filled with j',-in.-diam by %s-in -long alumina cyl- inders coated with platinum. Sol Preparation. - A bench-scale batch extrac-
tion unit was designed and constructed for Iab- oratory use in the development of the amine ex- traction process as a method for producing urania s o l (see Fig . 6.13). Also, a continuous extraction sys tem was designed and constructed for the de- velopment of amine extraction a s a means for pro- ducing both urania and urania-thoria sols. Th i s latter unit was designed to have a capacity of a t least 1 0 k g of mixed metal pet day (see Fig . 6.2). T e s t s by the development groups have shown this process to b e the method of choice for producing s o l in the TURF.
Ass i s t ance was a l s o provided in the operational t e s t s and redesign of continuous process equip- ment that will be used for producing urania sol by precipitation. The gas-operated pumps were re- designed to handle the so l ids stream from the bot-
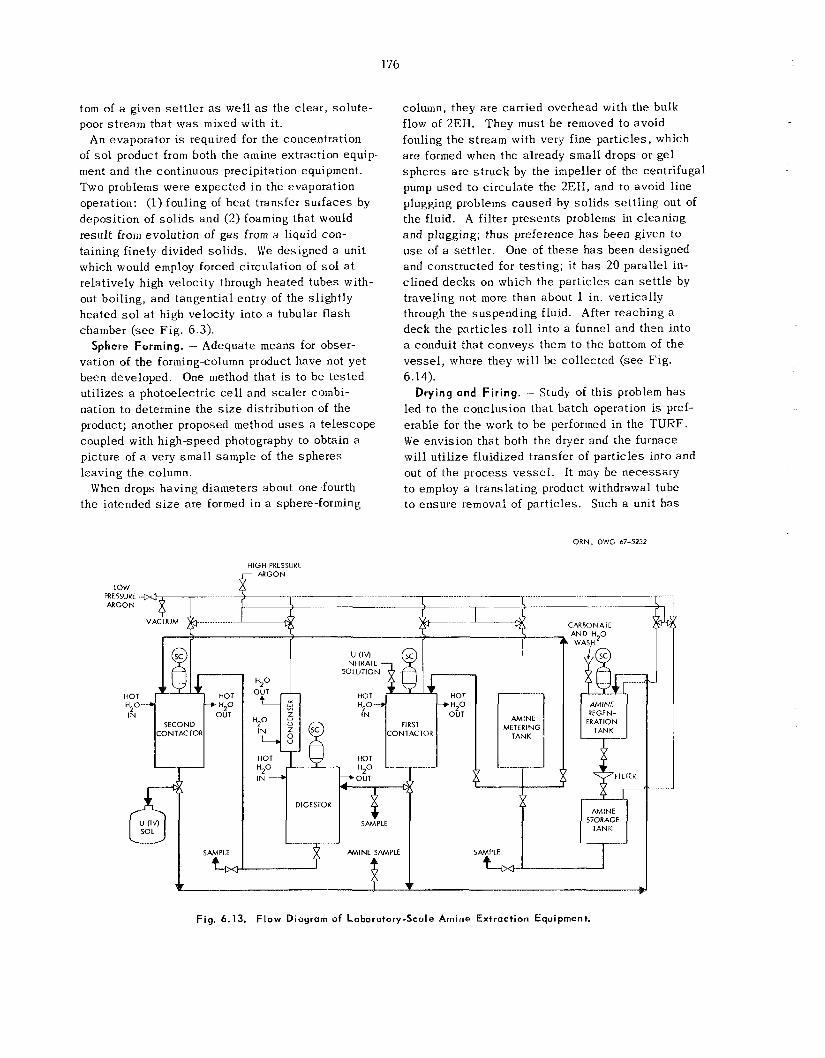
176
tom of a given se t t l e r as well a s the c lear , so lu te - poor stream that was mixed with i t .
An evaporator is required for the concentration of sol product from both the amine extraction equip- ment and the continuous precipitation equipment. Two problems were expected in the evaporation operation: (1) fouling of hea t transfer sur faces by deposit ion of so l id s and (2) foaming that would result from evolution of gas from a liquid con- taining finely divided so l ids . We designed a unit which would employ forced circulation of sol a t relatively high velocity through heated tubes with- out boiling, and tangential entry of the sl ightly heated sol a t high velocity into a tubular f lash chamber ( see F ig . 6.3).
Sphere Forming. - Adequate means for obser- vation of the forming-column product have not yet been developed. One method tha t is to b e t e s t ed uti l izes a photoelectric cell and scaler combi- nation to determine the s i z e distribution of the product; another proposed method u s e s a te lescope coupled with high-speed photography to obtain a picture of a very smal l sample of the spheres leaving the column.
When drops having diameters about one-fourth the intended size are formed in a sphere-forming
column, they a re carried overhead with the bulk flow of 2EH. They must b e removed t o avoid fouling the stream with very fine par t ic les , which a re formed when the already sma l l drops or ge l spheres a re s t ruck by the impeller of the centrifugal pump used to circulate the 2EH, and to avoid l ine plugging problems caused by so l id s sett l i t ig out of the fluid. A fi l ter p resents problems in c leaning and plugging; thus preference h a s been given to use of a se t t le r . One of t hese h a s been designed and constructed for testing; i t h a s 20 parallel in- clined decks on which the particles c a n se t t l e by traveling not more than about 1 in. vertically through the suspending fluid. After reaching a deck the particles roll into a funnel and then into a conduit that conveys them to the bottom of the ves se l , where they will be collected ( see Fig. 6.14).
Drying and Fir ing. - Study of th i s problem h a s led to the conclusion tha t batch operation is pref- erable for t he work to be performed in the TURF. W e envision that both the dryer and the furnace will uti l ize fluidized transfer of particles into and out of the process ves se l . It may be necessary to employ a translating product withdrawal tube to ensure removal of particles. Such a unit has
ORNL DWC 67-5232
HIGH PRESSIJRE
.......... ....... .... ....... ........ ~
.............. ....... CARBON ATE
tow
ARGON
VACUUM
HOT H20--- IN
7
8AMPI.E
L . 4
SOLUTION
HOT
IN OUT FIRST
CONTACTOR
AMINE METERING
TANK
Fig. 6.13. F l o w Diagram of Laboratory-Scale Amine Extraction Equipment.
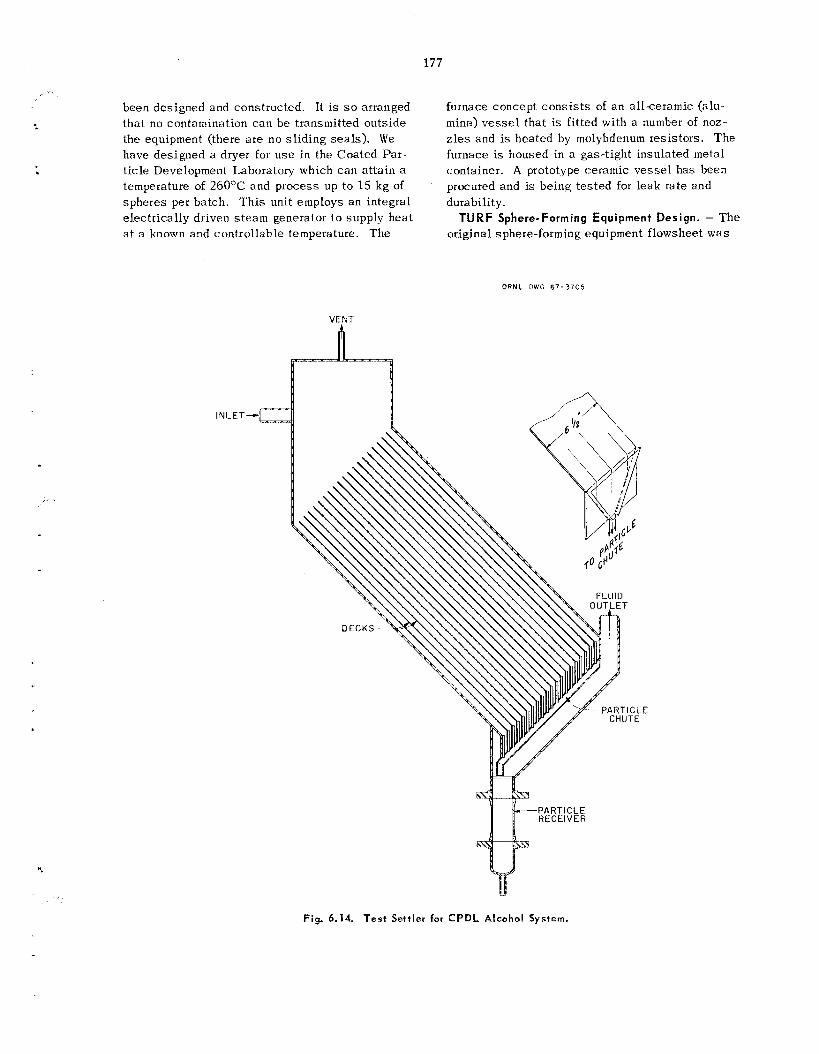
177
....
been designed and constructed. It is so arranged that no contamination can be transmitted outside the equipment (there a re no s l id ing sea ls ) . We have designed a dryer for u se in the Coated Par - ticle Development Laboratory which can a t ta in a temperature of 2 6 0 T and process up t o 15 kg of spheres per batch. T h i s unit employs an integral electrically driven steam generator t o supply hea t a t a known and controllable temperature. The
furnace concept cons i s t s of a n all-ceramic (alu- mina) v e s s e l tha t is fitted with a number of noz- z l e s and is heated by molybdenum resistors. The furnace is housed in a gas-tight insulated metal container. A prototype ceramic vesse l has been procured and is being tes ted for leak rate and durability.
original sphere-forming equipment flawsheet w a s TURF Sphere-Forming Equipment Design. - The
ORNL DWC 67-3705
VENT
INLET-
Fig. 6.14. Test Settler for CPDL Alcohol System.
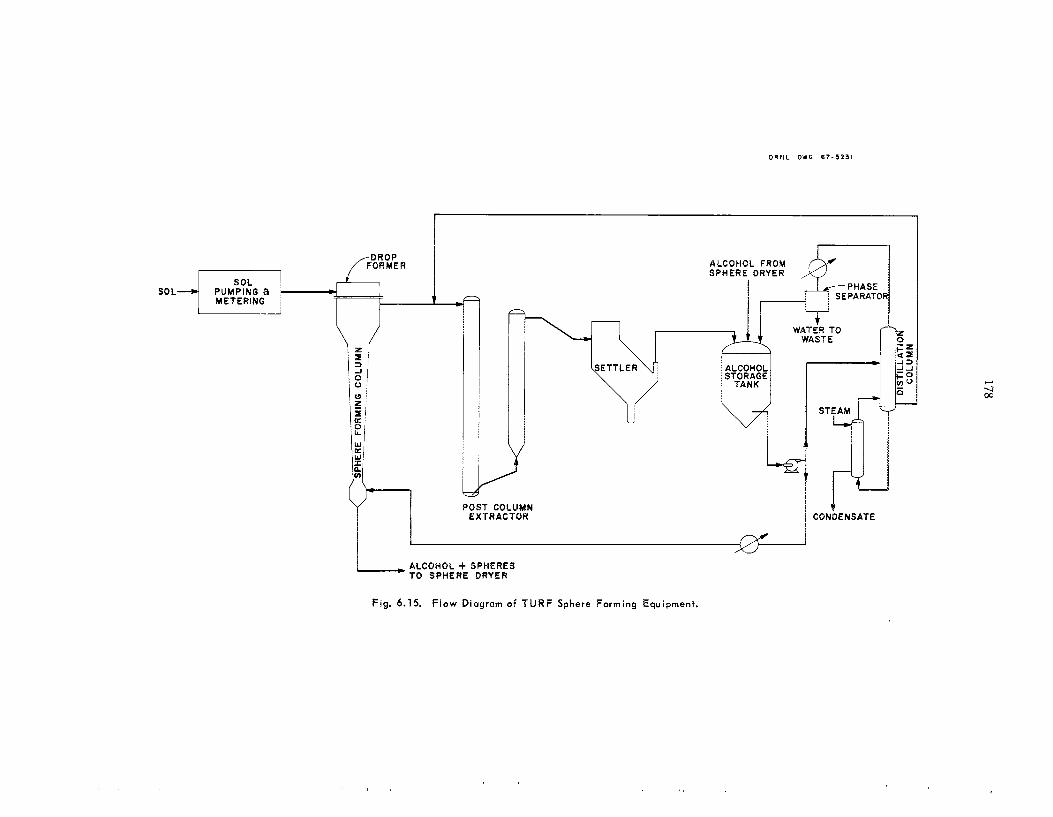
178
- n N n I- - J
z
L
0
. .
179 ... .. .
simplified t o minimize the number of equipment items and t o reduce the s p a c e occupied by th i s process s t e p ( see F ig . 6.15). Only one mechanical pump is used t o c i rcu la te alcohol for the entire system. Th i s equipment is to be fitted within a framework which is 6 x 6 x 9 ft high. The bulk of the equipment is considered nonvulnerable and will not be readily removable from the frame. Con- trol va lves , flowmeters, and the mechanical pump will be readily removable. Equipment design is under way and is scheduled for completion by June 30, 1967.
6.5 233U STORAGE AND DISTRIBUTION FACILITY
Oak Ridge National Laboratory se rves a s a storage, purification, and dispensing center for
U. Operations during the year, including uranium purification and transfers to and from the center, a r e summarized below. A study was made of the s tab i l i ty of uranyl nitrate so lu t ions con- taining neutron poisons; the resu l t s of the s tudy , indicating tha t the u s e of rare ear ths for criti- ca l i ty control in s torage i s feas ib le , a r e also presented.
2 3 3
F o c i I i ty Operations Summary
During the pas t year, approximately 180 kg of 23*3U (31 shipments) was received and 190 kg of
3U (54 shipments) was transferred from the center. The bulk of the material had a low (t5 ppm) 232U a s s a y and was freshly purified a t t he production s i t e . Approximately 73 kg of this material was exchanged with Nuclear F u e l s Ser- v i ces (NFS), Erwin, Tennessee , for material of sl ightly lower purity (NFS is the fuel fabrication contractor for the Bet t i s Light Water Breeder Pro- gram). In addition, another 75 kg was transferred to the ORNL Neutron Phys ic s Division for cri t i- cali ty experiments; th i s material will b e returned t o the center for s torage .
Forty-six kilograms of 233U was purified in five solvent extraction runs during the year.
The dissolver-leacher, described l a s t year, w a s placed in operation; performance during the year was sa t i s fac tory . T h e unit proved very efficient in the dissolution of high-fired Th0,-UO sol-gel material, a t ta in ing a dissolution rate approximately five times that observed in the batch dissolver. The dissolution ra te of aluminum-canned UO, pow- der is limited t o approximately 3 kg of 2 3 3 U per day.
Criticality Control in Storage
Fac i l i t i e s will b e built for semipermanent s tor- age of a large amount of mixed 2 3 3 - - 2 3 5 UO 2(N 0 ,) 2.
Since geometrically s a f e fac i l i t i es would be very expensive, ca lcu la t ions were made of the concen- trations of samarium and gadolinium that would be required for cri t icali ty control. A solution tha t contains 150 g of U per liter and is 3 .9 M in HNO,, 0.05 M in Sm(N03),, and 0.05 ill in Gd(NO,), would be both safe and s tab le . Stability w a s determined by s torage in a s t a in l e s s s t e e l v e s s e l at room t e m - perature and a t 90°C, by cooling until c rys ta l s formed, and by evaporation a t room temperature until a precipitate formed.
temperature or a t 90°C in s t a in l e s s s t e e l during a two-week period. Upon evaporation a precipitate was not formed until the solution w a s concentrated t o 323 g of U per l i ter (a concentration factor greater than 2).
and -3OOC (-13 and -22OF) before c rys ta l s formed (they redissolved a t about -18OC). A sample of the c rys ta l s was filtered from the solution. On heating, they liquefied, giving a solution of nearly the same composition as the supernatant liquid: supernatant - U, 121.6 mg/ml; IINO,, 3.92 N ; Sm, 8.2 mg/ml; Gd, 7.9 mg/ml; c rys ta l solution - U, 165.5 mg/ml; I-INO,, 3 .77 N ; S m , 7.9 mg/ml; Gd, 7.6 mg/ml.
No change was observed in the solutions a t room
The solution could be cooled t o between -25
9Chem. Technol. Div. Ann. Progr. R e p t . May 31 , 1966, ORNL-3945, pp. 141-42.
recesses far the Uranium Fuel Cycle
7.1 URANIA
Chemical development of a urania sol-gel proc- ess w a s continued; further work was done to make the precipitation-peptization method of preparing urania sol more amenable to engineering sca leup . h addition, a laboratory-scale so lvent extraction method for making urania sol was developed. Dry- ing and firing conditions were es tab l i shed for pre- paring urania microspheres of near-theoretical den- s i t y and low carbon content.
Work on the preparation of uranium(1V) so lu t ions by ca ta ly t ic reduction of uranyl(V1) nitrate with H, - a necessary first s t e p in both urania sol preparation methods -- included the development of a redox-potential measurement to determine the completeness of reduction, a n investigation of poss ib le slurry ca t a lys t s , and s tud ie s of the nature of the reduction process. A urania sol preparation method involving the direct reduction of U(V1) sus - pensions was developed on a laboratory scale; however, in considering engineering sca leup , t h i s method was set a s i d e in favor of the two sol prep- aration methods mentioned above. The urania sols were analyzed by means of chemical methods, pH and conductivity measurements, viscometry, e lec- tron microscopy, and x-ray diffraction techniques. Chemical development of zirconia sol preparation methods, the goal of which is the preparation of sols tha t a re su i tab le for mixing with urania sols to prepare the mixed oxides , was continued. Ura- nia-zirconia sols with a Zr/U m o l e ratio of 0.3 were prepared by an adaptation of the precipitation- peptization method of preparing urania so l s .
Preparation of Urania Sols by Preci pitotian- Peptization
Chemical Development. - In the laboratory prep- aration of urania s o l , t he hydrous oxide was pre-
cipitated at pH 7.5 from a U(1V) nitrate-formate solution (NO,-/U mole ratio = 4.6; H C O W / U mole ratio - 0.6), collected by filtration, and washed in p lace unt i l t h e NQ,-/U mole ratio w a s at the leve l required for sol formation. The re- su l t ing filter cake was then heated at 60 to 6SoC t o produce a s t ab le , fluid sol. ' 8 ' For engineering sca l eup it was des i rab le to eliminate the filtration s t ep , wash the precipitate completely free of e l ec - trolyte by decantation, and peptize the washed so l id s by the addition of peptizing electrolyte and heating. A tentative flowsheet for th i s procedure is shown in F ig . 7.1. A U(IV) solution i s prepared by the ca ta ly t ic reduction with hydrogen of a 0.5 M I J0 ,2+so lu t ion 1 M in NO,- and 0.25 M in HC00-. After reduction and ca t a lys t removal, concentrated formic ac id is added to the reduced solution to give a n HCOO-/U m o l e ratio of 0.6 t o 1.0. (This adjustment i s necessary because part of the original. HCOO- is destroyed in the reduc- tion s t ep . ) T h e hydrous oxide is then precipitated by the addition of 3.5 M NH,OI-I or 3 . 0 M NH,OH--- 0.5 M N,II,- M,O t o pll 9.0. T h e result ing pre- c ip i ta te is washed free of electrolyte by decan- tation, us ing either H,O or 0.01 M N,H; H20. The washed precipitate is resuspended, HNO, and HCOOH are added, and the suspens ion is stirred a t 60 to 63OC until peptized.
The use of a U(XV) feed solution containing a much lower NO,-/U mole ratio than tha t used in the laboratory p rocess w a s prompted by devel- opment s tud ie s which indicated that a s t ab le U(1V) solution containing a n NO,-/U mole ratio of 2 could be prepared if a sma l l amount of formic ac id were added prior to reduction. It should be
' J. P. McBride et al., Preparation of UO, Microspheres
'Chern. Techno[. Div. Ann. Pro&. Rept. M a y 31, 1966,
by a Sol-Gel Technique, ORNL-3874 (February 1966).
ORNL-3915, p. 157.
180
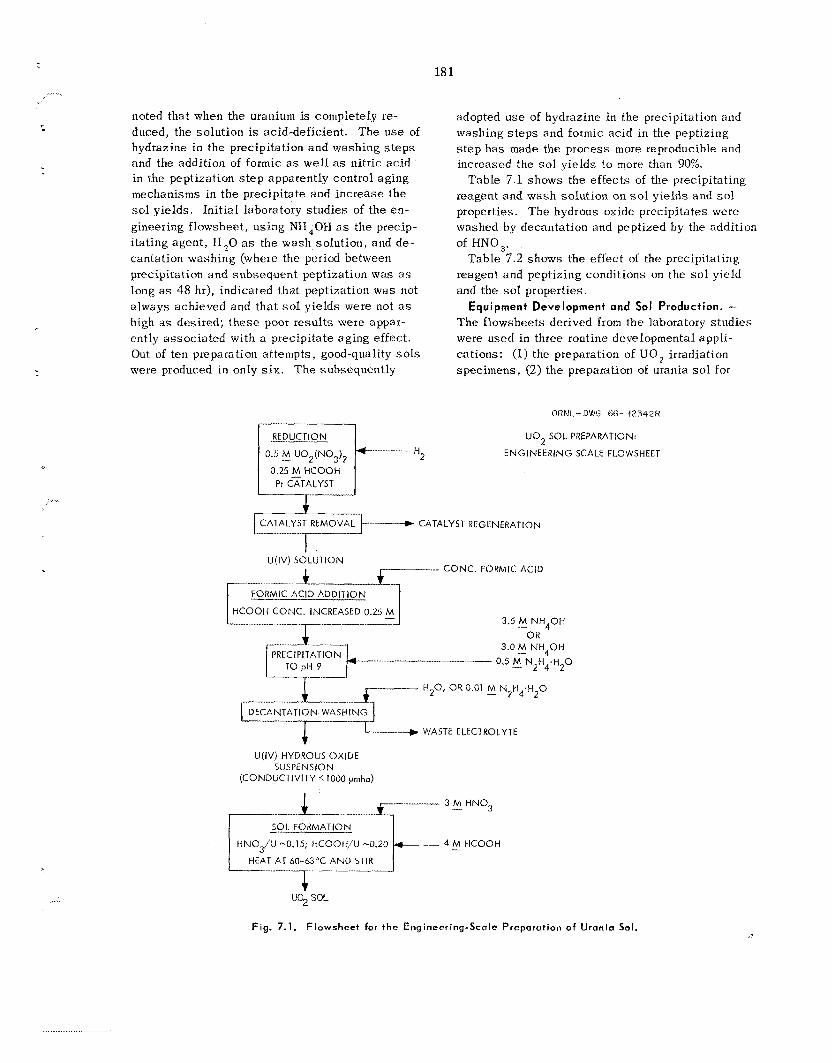
18 1
noted that when the uranium is completely re- duced, the so lu t ion is acid-deficient. The u s e of hydrazine in the precipitation and washing s t e p s and the addition of formic as wel l as nitric ac id in the peptization s t e p apparently control aging mechanisms in the precipitate and increase the sol yie lds . Init ial laboratory s tud ie s of the en- gineering flowsheet, us ing NH ,OH as the precip- i tat ing agent , H,O as the wash solution, and de- cantation washing (where the period between precipitation and subsequent peptization was a s long as 48 hr), indicated that peptization was not always achieved and tha t sol y ie lds were not as high as des i red ; t hese poor resu l t s were appar- ently a s soc ia t ed with a precipitate aging effect . Out of ten preparation attempts, good-quality sols were produced in only s i x . T h e subsequently
RED UC TI 0 N
P i CATALYST
adopted u s e of hydrazine in the precipitation and washing s t e p s and formic ac id in the peptizing s t e p h a s made the process more reproducible and increased the sol y ie lds to more than 90%.
reagent and wash solution on so l y ie lds and sol properties. The hydrous oxide precipitates were washed by decantation and peptized by the addition of FINO,.
Tab le 7.2 shows the e f fec t of the precipitating reagent and peptizing conditions on the so l yield and the sol properties.
Equipment Development and Sol Production. - T h e flowsheets derived from the laboratory s tud ie s were used in three routine developmental appli- cations: (1) the preparation of UO, irradiation spec imens , ( 2 ) t h e preparation of urania sol f o r
Table 7.1 shows the e f fec ts of the precipitating
ORNL- DWG 66- 1234PR
U 0 2 SOL PREPARATION:
ENGINEERING SCALE FLOWSHEEl
CATALYST REMOVAL I_) CATALYST REGENERATION
L-.---T---k- U(IV) SOLUTION - CONC. FORMIC ACID
HCOOH CONC. INCREASED 0.25 M 3.5 3 N H 4 0 H
OR 3.0 3 N H 4 0 H
._I 0.5 E N2H4.H20 PRECIPITATION
H20, OR 0.01 M N H .H 0 - 2 4 2
WASTE ELEClROLYTE
U(1V) HYDROUS OXIDE SUSPENSION
(CONDUCTIVITY 1000 yrnho)
SOL FORMATION
HNOJU -0.15; HCOOH/U -0.20 4 M HCOOH
HEAT AT 60-63’C AND STIR
c U% SOL
Fig. 7.1. Flowsheet for t h e Engineering-Scale Preparation of Urania Sol.
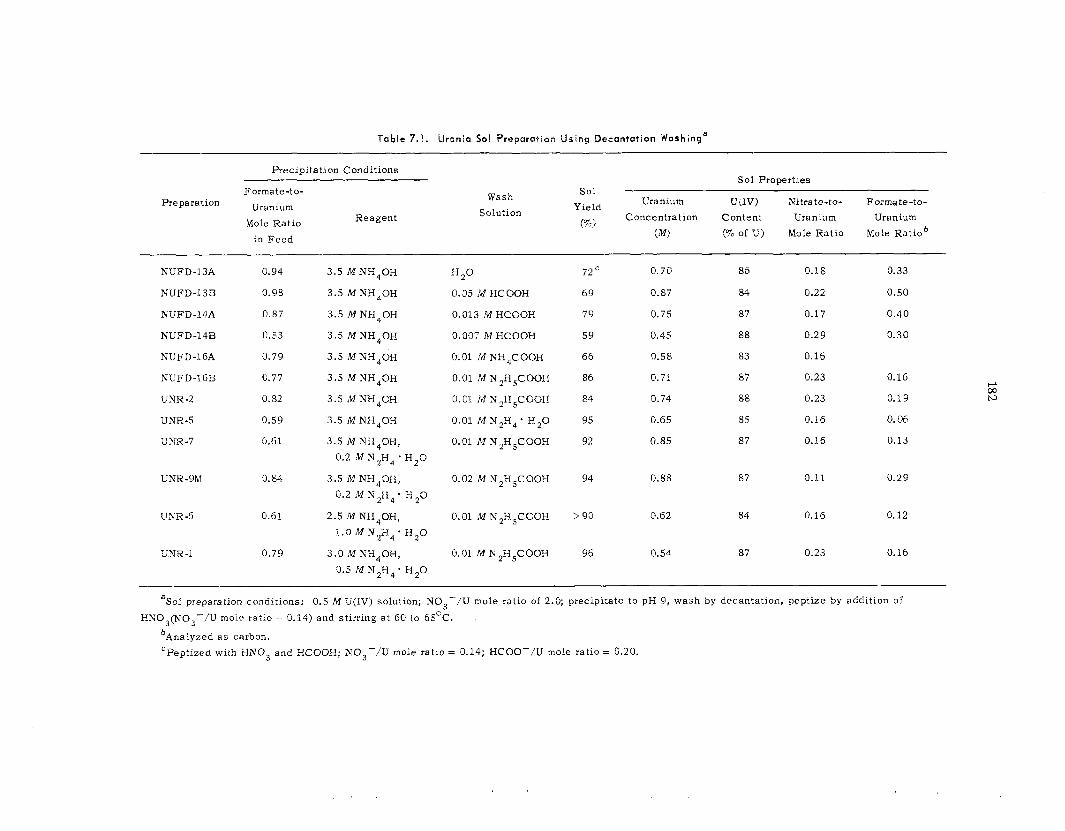
Table 7.3. Vrania Sol Preparation Us ing Decantation Washinga
Precipitation Conditions Sol Properties
Sol Y ie Id Uranium W(IV) Nitrate-to- Formate-to-
(.V) (70 of V ) Mole Ratio Mole Rat iob
Wash Solution
Formate-to-
Concentration Content Uranium Uranium Prepara:ion Uranium
Reagent Mole Rat io in Feed
KUFD-13A
NUFD-13B
NUFD-14A
NUFD-14B
NUFD-16A
KUFD-:6B
UNR-2
UNR-5
VXR-7 7 , T
LKR-9M
UNR-6
UNR -1
0.94
0.98
0.67
0.53
0.79
0.77
0.82
0.59
0.61
0. a4
0.61
0.79
3.5 M NH,OH
3.5 hI NH,OH
3.5 M NH,OH
3.5 M NH,OH
3.5 M Ii^tl,OH
3.5 M NH,OH
3.5 M NH,OH
3.5 M NH,OH
3.5 M NH,GH, 0.2 M N,H, * H 2 3
3.5 M NH,OH, 0.2 M K 2 H ; H,O
2.5 M NW,OH, 1 . 0 M N 2 H 4 - H 2 0
3.0 M IiX,OH, 0.5 M N,W; W 2 0
20
0.05 M WCOOH
0.013 M HCOOH
0.007 M HCOOH
0.01 /M NH,COOH
0.01 M N,M,CGOH
0.01 MN2H5COOH
0.01 MN,H, ' H,O
0.01 MN,H,COOH
72
69
79
59
66
86
84
95
92
0.02 i%I 'N,H5C30H 94
0.01 ,91N,K,COOH >90
0.01 M N2H,COOH 96
0.70
0.87
0.75
0.45
0.58
0.75
0.74
0.65
0.85
0.88
0.62
0.54
85
84
87
88
83
87
68
85
87
87
84
87
0.16
0.22
0.17
0.29
0.15
G.23
0.23
0.16
0.16
3.11
0.16
0.23
0.33
0.50
0.40
0.30
0.16
0.19
0. Q6
0.13
0.29
0.12
0.16
~~~ ~~ ~~ ~~
aSol preparation condirions: 0.5 M U(1V) solution; NO,-/LJ mole ratio of 2.0; precipirate to pH 9, wash by decantation, peprize by addition of
bAnalyzed a s carbon. 'Peptized with WNO, and HCOGW; NO,-/U mole ratio = 0.14; HCOO-/U mole ratio = 0.20.
KKO,(NO,-/U mole ratio = 0.14) and st irring a t 60 to 65°C.
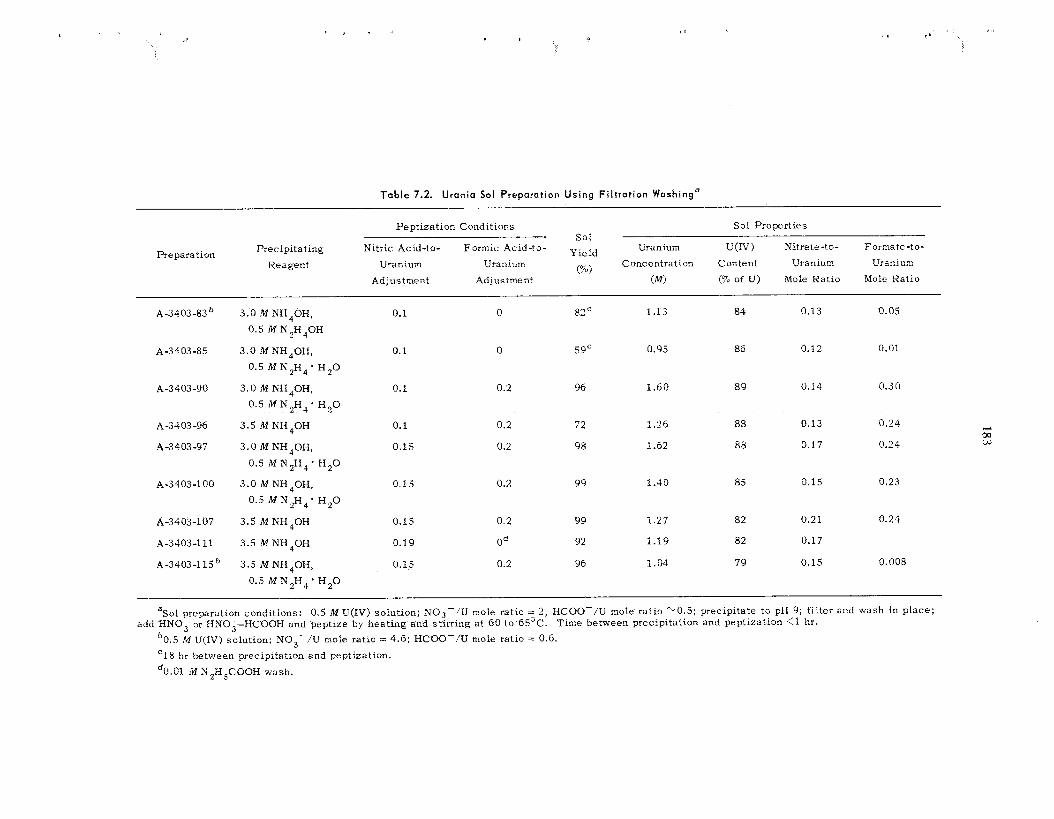
I t
9
Table 7.2. Uranio Sol Preparation Using Fi l t rat ion Washing"
Peptization Conditions Sol Properties s 01
Precipitating Nitric Acid-to- Formic Acid-to- Yield Uranium U(1V) Nitrate-to- Formate-to-
Reagent Uranium Uranium (%)
Concentration C o n k tit Uranium Uranium Preparation
Adjustment Adjustment (W (70 of U) Mole Ratio Mole Ratio
A-3403-83b 3.0 M NH,OH, 0.1
A -34 03 -85 3.0 MNH40H, 0.1
A -3 403-90 3 . 0 M N H 4 0 H , 0.1
A -3403 -96 3.5 M NH,OH 0.1
0.5 M N,H,OH
0.5 M N,H, * H 2 0
0.5 M N 2 H 4 ' H 2 0
0 82 1.13 84 0.13 0.05
0 59= 0.95 86 0.12 0.01
0.2 96 1.60 8 9 0.14 0.3 0
0.2 72 1.26 88 0.13 0.24
A -34 03 -97 3.0 M NH40H, 0.15 0.2 98 1.62 88 0.17 0.24
0.5 iMN2H4'H,O
A-3403-100 3.0 M NH,OH, 0.15 0.2 99 1.40 85 0.15 0.23
0.5 M N 2 H 4 ' H 2 0
A-3403-107 3.5 M NH40H 0.15 0 2 99 1.2: 82 0.21 0.24
A-3403-111 3.5 M NH,OH 0.19 O* 92 1.19 82 0.17
A-3403-l l jb 3.5 MNH4011, 0.15 0.2 96 1.04 79 0.15 0.008
0.5 M N 2 H 4 ' H,O
aSol preparation conditions: 0.5 M U(IV) solution; N 0 3 - / U mole ratio 2 2, HCOO-/U mole ratlo '"0 5; preclpltate to pH 9, filter and wash In place;
b0.5 M U i l V ) solution; NO,-/U m o l e ratro = 4.6, HCOO-/U mole ratlo = 0.6. '1 8 ht between precipitation and peptlzation.
add HNO, or HN0,-HCOOH and peptize by heating and stirring a t 60 to 65°C. Tune between preclpltatlon and peptlzation <I hr.
do.^^ M N ~ H ~ C O O H wash.
184
u s c in the development of processes for forming microspheres, and (3) the development of remotely operated equipment for poss ib le u s e in the prep- aration of urania sols in TURF. T h e flowsheets had to be modified somewhat for each of t h e s e applications.
One of the flowsheets for urania sol preparation was used in the preparation of microspheres for irradiation specimens; over 10 kg of enriched ura- nia was used to form microspheres. Crit icali ty control was maintained by limiting the batch size to 300 g of uranium. Hence, the enriched urania used in irradiation specimens was made in lab- oratory batch apparatus, using the flowsheet for precipitation a t pH 7 to 7.5.
Most of the natural urania s o l s tha t were formed into microspheres during the year were prepared in a batch apparatus (1 k g of UO, per batch) us ing the engineering-scale flowsheet with precipitation a t pH 9. T h e precipitation, washing, and disper- s ion were done in a s ingle v e s s e l that had a 12- in.-diam porous s t a i n l e s s steel plate a s the bottom; i t was equipped with a slow-speed paddle-type agitator. T h e supernatant was removed by filtra- tion a f te r precipitation and after each of four washing s t e p s . The washing involved stirring 10 l i te rs of H,O with the 5 l i t e rs of filter cake . Peptization to sol was achieved by adding HNO, and I-ICOOH to the washed precipitate, and s t i r - ring and hea t ing a t -60°C. Compositions typical of these sols a re given for two of the last ba tches , F-31 and F-32, in Table 7.3.
A continuous urania sol preparation sys tem (Fig. 7 . 2 ) w a s designed and fabricated to meet the re- quirements for both remote operation and large- s c a l e cri t ically safe operation with enriched ura- nium. T h i s system c o n s i s t s of two continuous precipitators, s i x countercurrent mixer-decanter s t ages , and two continuous peptizers. T h e wash water flows by gravity, and the so l id s a r e trans- ferred by gas-operated pumps. The initially in- s ta l led precipitators, gas-operated pumps, and peptizers were inadequate for the transfer of pre- c ip i ta tes and were replaced by units of modified design.
Two 70-hr runs, us ing the engineering-scale flowsheet and a natural-uranium feed rate of 0.5 mole/hr, were made i n th i s sys tem, which is called the P 'C 'D system (Precipitation-pep- tization Counter-Current Decantation). T h e slurry pumped from the final s e t t l e r was 0.2 to 0.4 M in U for most operating conditions. T h e s o l products
weie dilute and had t o be concentrated before they were su i tab le for the preparation of niicrospheres (Table 7.3). The operational data indicated tha t the P '@ *@ system sa t i s f ied the chemical flow- shee t requirements. The mechanical operation of the sys t em was marginalj with transfer of so l ids between s t a g e s and metering of flows in to the peptizers being the principal problems. T h e resu l t s indicate that t he P 2C: '0 system as pres- ently consti tuted would be acceptab le for direct operation but not for remote operation. To obtain a sys tem su i tab le for remote operation, more equip- ment development would be required.
A 12-ft-high, 4-in.-ID column was tes ted for countercurrent washing of the uranous hydroxide precipitate. Such a column might replace the mixer- decanters and solids-transfer pumps in the P 'C 'D sys tem. T h e wash column t e s t s showed good nie- chanica l operation and adequately sa t i s f ied the washing requirements for either a batch precipi- tator or the P'C'D precipitators. The problems for peptization are approximately the same a s those for the P2C 'D sys tem; however, the wash column h a s a shorter residence time and thus l e s s holdup of precipitate. The wash column products were dewatered and peptized in the batch ag i ta ted filter apparatus. T h e sol compositions in Table 7.3 show the resu l t s tha t a r e poss ib le with continuous operation of the wash column (LKT-1) and with a batch type of operation that is presently planned for the preparation of enriched uranium s o l s (WCT- 8, -9, -10).
Preparation sf Aqueous Uranio Sols by Solvent Extraction
The preparation of aqueous urania s o l s by sol- vent extraction is heing studied. Jn th i s process, sufficient nitrate ion is extracted in a s tagewise fashion from a n aqueous 0.2 A! U(IV)--O.1 M NO,-- HCOO'-- solution t o c a u s e hydrolysis of the U(1V) and the production of a sol. T h e nitrate ion ex- traction is accomplished in mixer-settler equip- ment by contacting the aqueous phase with a n immiscible organic phase containing 0.1 M Amber- l i te LA-2, , a long-chain secondary aliphatic amine, N-la ury Itr ia Iky lme thy la m ine, i n n-para f f in. The final NO,-/U m o l e ratio in the aqueous phase is
- .. _.
3Rohm and Haas, Philadelphia, Pa. 4South Haiiipton Co., Houston , Tex.
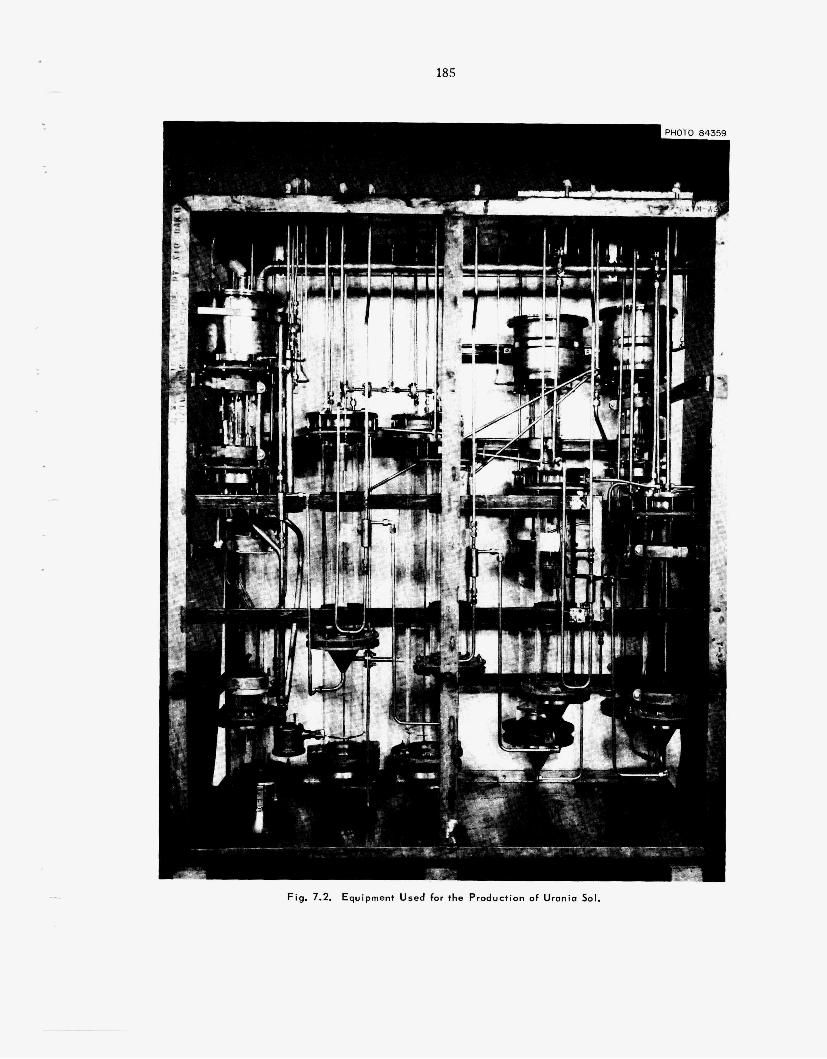
185
-_-
A
Fig. 7.2. Equipment Used for the Production of Uronia Sol.
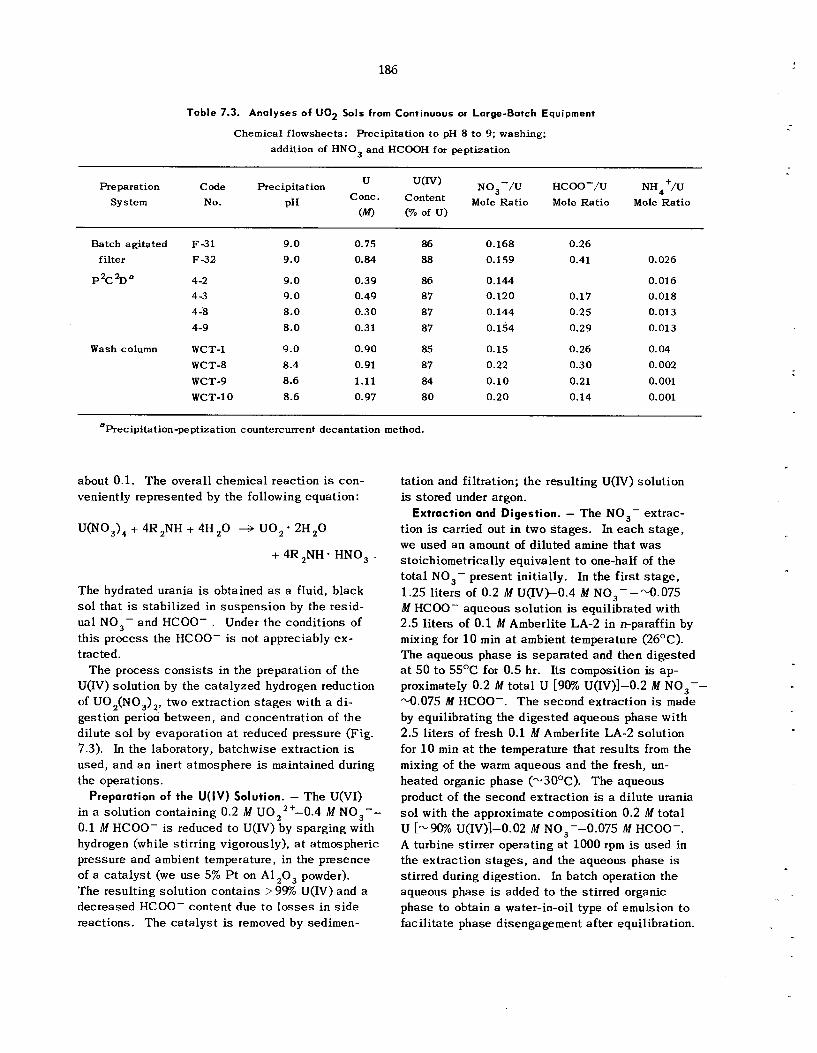
186
Table 7.3. Analyses o f UOP Sols from Continuous or Large-Batch Equipment
Chemical flowsheets: Precipitation to pH 8 to 9; washing; addition of HNO, and HCOOH for peptization
Reparation Code Precipitation u(lv) NO,-/U HCOO-/U NH +/u U
System No. PH Cone. 'Ontent Mole Ratio Mole Ratio Mole Ratio (M) (% of U)
Batch agitated F 3 1 filter F 3 2
PzC2Da 4-2 4 -3 4-8 4-9
Wash column WCT-1 WCT-8 WCT-9 WCT-10
9 .0 9 . 0
9 .0 9.0 8 .0 8 .0
9 .0 8.4 8.6 8.6
0.75 86 0.84 88
0.39 86 0.49 87 0.30 87 0.31 87
0.90 85 0.91 87 1.11 84 0.97 80
0.168 0.159
0.144 0.120 0.144 0.154
0.15 0.22 0.10 0.20
0.26 0.41
0.17 0.25 0.29
0.26 0.30 0.21 0.14
0.026
0.016 0.018 0.01 3 0.013
0.04 0.002 0.001 0.001
aPrecipitation-peptization countercurrent decantation method.
about 0.1. The overall chemical reaction is con- veniently represented by the following equation:
U(N03)4 + 4R,NH + 4H ,O -+ UO, 2H,O
+ 4R ,NH - HNO, .
The hydrated urania is obtained as a fluid, black sol that is stabi l ized in suspens ion by the resid- ua l NO,- and HCOO- . Under the conditions of this process the HCOO- is not appreciably ex- tracted.
T h e process c o n s i s t s in the preparation of the U(1V) solut ion by the catalyzed hydrogen reduction of UO,(NO,),, two extraction s t a g e s with a di- gestion perioa between, and concentration of the dilute sol by evaporation at reduced pressure (Fig. 7.3). In the laboratory, batchwise extraction is used, and a n inert atmosphere is maintained during the operations.
Preparation of the U(IV) Solution. - T h e U(V1) in a solution containing 0.2 M U0,2+-0.4 M NO,-- 0.1 M HCOO- is reduced to U(1V) by sparging with hydrogen (while s t i r r ing vigorously), at atmospheric pressure and ambient temperature, in the presence of a ca ta lys t (we u s e 5% Pt on A1,0, powder). The result ing solut ion contains > 9% U(1V) and a decreased HCOO- content due to l o s s e s in s i d e reactions. The ca ta lys t is removed by sedimen-
tation and filtration; the resul t ing U(1V) solut ion is stored under argon.
Extraction and Digestion. - The NO,- extrac- tion is carried out in two s tages . In e a c h s t a g e , we used a n amount of diluted amine that was stoichiometrically equivalent to one-half of the total NO,- present initially. In the f i r s t s tage , 1 .25 l i t e rs of 0.2 M U ( I V t 0 . 4 M NO,- - -0.075 M HCOO- aqueous solut ion is equilibrated with 2.5 l i te rs of 0.1 M Amberlite LA-2 in n-paraffin by mixing for 10 min at ambient temperature (26OC). The aqueous phase is separated and then digested at 50 to 55OC for 0.5 hr. Its composition is ap- proximately 0.2 M total U [go% U(IV)]-O.2 M NO,-- -0.075 M HCOO-. T h e second extraction is made by equilibrating the d iges ted aqueous phase with 2.5 l i te rs of fresh 0.1 M Amberlite LA-2 solut ion for 10 min at the temperature that resu l t s from the mixing of the warm aqueous and the fresh, un- heated organic phase (-30OC). The aqueous product of the second extract ion is a di lute urania sol with the approximate composition 0.2 M total
A turbine s t i r rer operating a t 1000 rpm is used in the extraction s t a g e s , and the aqueous phase is stirred during digest ion. In batch operation the aqueous phase is added to the stirred organic phase to obtain a water-in-oil type of emulsion to faci l i ta te phase disengagement after equilibration.
U 1- 9% U(IV)]-o.o2 M NO,--0.075 M HCOO-.
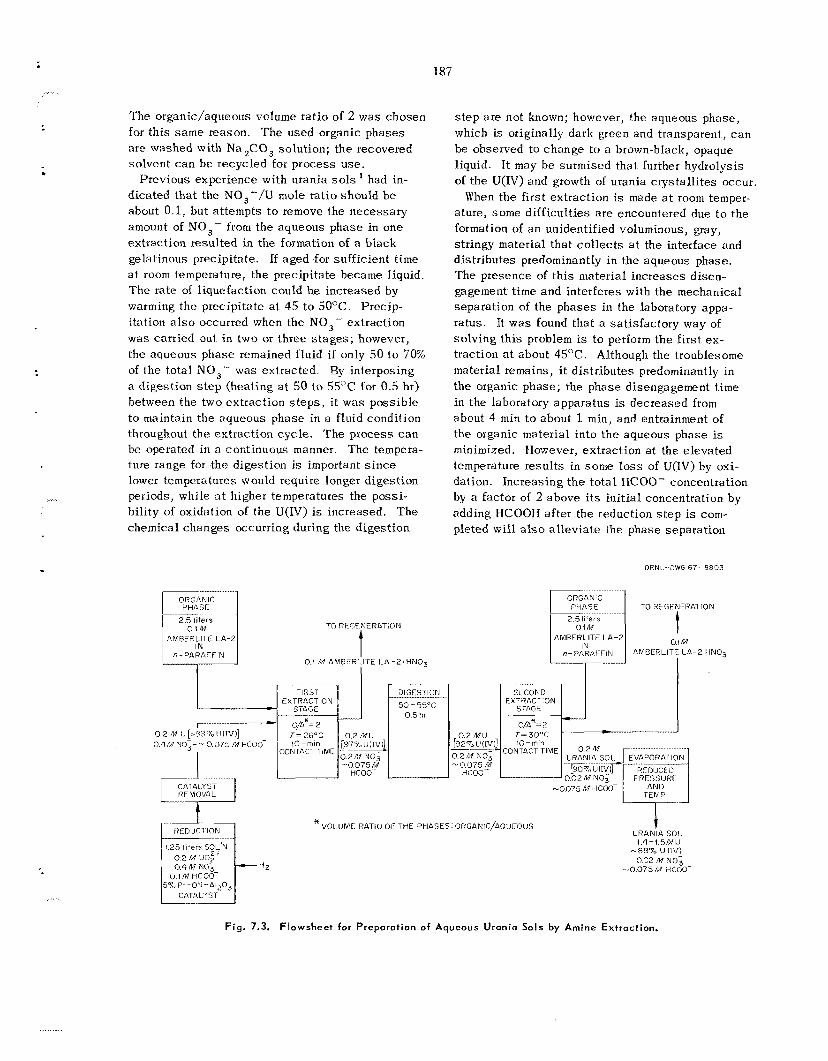
187
The organic/aqueous volume rat io of 2 w a s chosen for this same reason. The used organic phases a re washed with Na 2 C 0 3 solution; the recovered solvent can be recycled for process use.
Previous experience with urania sols had in- dicated that the N 0 3 - / U mole ratio should be about 0.1, but attempts t o remove the necessary amount of NO,- from the aqueous phase in one extraction resulted in the formation of a black gelatinous precipitate. If aged for sufficient time a t room temperature, the precipitate became liquid. The rate of l iquefaction could b e increased by warming the precipitate at 45 to 5 0 T . Precip- itation also occurred when the NO,- extraction w a s carried out in two or three s t a g e s ; however, the aqueous phase remained fluid if only 50 to 70% of the total NO,'- was extracted. By interposing a digestion s t e p (heating a t SO to S V C for 0.5 hr) between the two extract ion s t e p s , i t was possible to maintain the aqueous phase in a fluid condition throughout the extraction cycle. The process c a n be operated in a continuous manner. The tempera- ture range for the digestion is important s i n c e lower temperatures would require longer digest ion periods, while a t higher temperatures the possi- bility of oxidation of the U(1V) is increased. The chemical changes occurring during the digest ion
s t e p are not known; however, the aqueous phase, which is originally dark green and transparent, can be observed to change to a brown-black, opaque liquid. It may be surmised that further hydrolysis of the U(1V) and growth of urania crystal l i tes occur.
When the first extract ion is made at room temper- ature, some diff icul t ies are encountered due t o the formation of a n unidentified voluminous, gray, stringy material that co l lec ts a t the interface and dis t r ibutes predominantly in the aqueous phase. The presence of this material increases disen- gagement t i m e and interferes with the mechanical separation of the phases in the laboratory appa- ratus. It was found that a sat isfactory way of solving this problem is to perform the f i rs t ex- traction at about 4 5 T . Although the troublesome material remains, i t d is t r ibutes predominantly in the organic phase; the phase disengagement time in the laboratory apparatus is decreased from about 4 min to about 1 min, and entrainment of the organic material into the aqueous phase is minimized. However, extraction a t the elevated temperature resul ts in some loss of U(IV) by oxi- dation. Increasing the to ta l I-ICOO-' concentration by a factor of 2 above i t s ini t ia l concentration by adding HCOOH after the reduction s t e p i s com- pleted wil l a l s o a l lev ia te the phase separation
ORNI: DWCi 67- R R 0 3
I ORGANIC PIiASC I 0.1 iw
n - PAR A F F IN
TO RCGENERDTION
t 01 M AMOERLITE L A - 2 . H N 0 3
CRGANIC
2.5i i ters 1 5'1;; TO REGENERATION
t 0.1IL1 AMBERLITE L A - ?
AMBERLITE L A - 2 HN03
I .... ~.~ .................
* voL.orx RATIO OF THE PHASES: OKGANIC/AQ~JEOLJS I i? tDlJCTlON URANIA SOL
1.4- !.5M LJ -ER% U (1V) 1.25 l i ters SOL'N
0.02 M NO; - 0 2 M IJO;' --O.O75M +COO
0.1 M HCOO-
. .. . . . . .
Fig. 7.3. Flowsheet for Preparation of Aqueous Urania Sols by Amine Extraction.
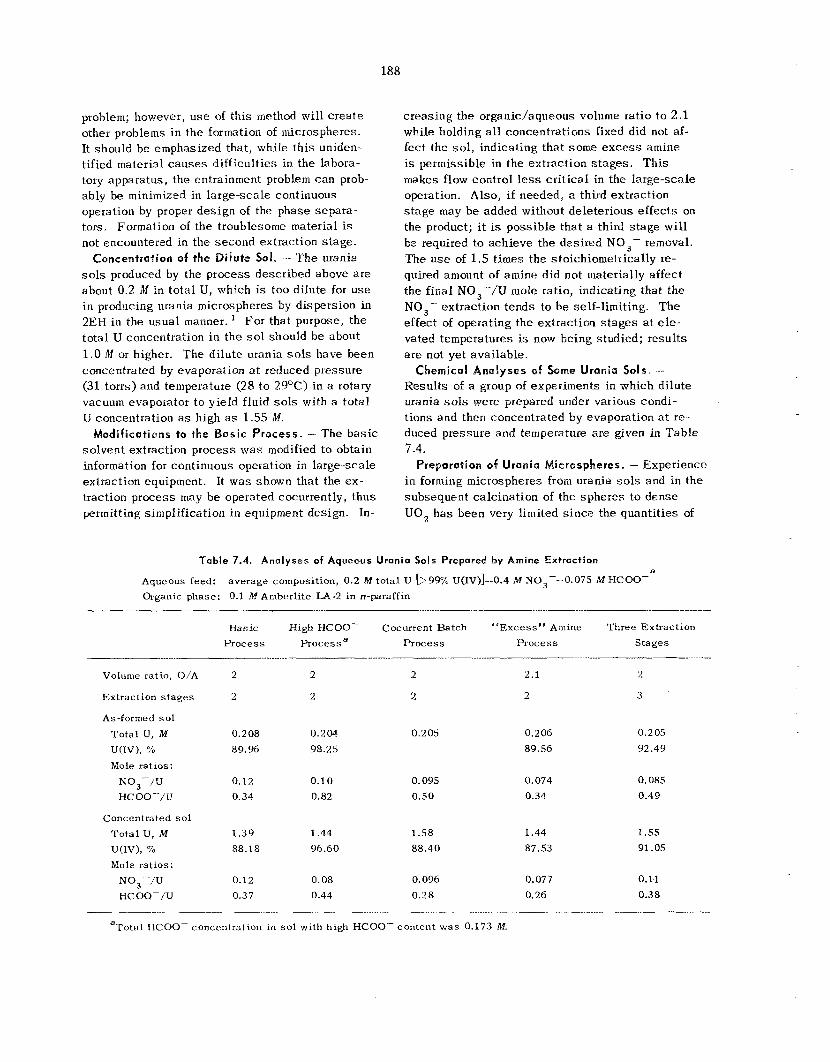
188
problem; however, u se of th i s method will c rea te other problems in the formation of microspheres. It should be emphasized that, while t h i s uniden- tified material c a u s e s difficult ies in the labora- tory apparatus, the entrainment problem can prob- ably be minimized in large-scale continuous operation by proper des ign of the phase separa- tors. Formation of the troublesome material is not encountered in the second extraction s tage .
Concentration of the Dilute Sol. ..- T h e urania sols produced by the process described above are about 0.2 M in to ta l U, which is too dilute for u se in producing urania microspheres by dispersion in 2EH in the usual manner. total U concentration in the sol should b e about 1.0 M Qi higher. The dilute urania s o l s have been concentrated by evaporation a t reduced pressure (31 torrs) and temperature (28 t o 23OC) in a rotary vacuum evaporator to yield fluid s o l s with a total IJ concentration a s high a s 1.55 M .
Modifications to the Basic Process. - The bas i c so lvent extraction process w a s modified to obtain information for continuous operation in large-scale extraction equipment. It was shown tha t the ex - traction process may be operated cocurrently, thus permitting simplification in equipment design. In-
For that purpose, the
c reas ing the organic/aqueous volume ratio t o 2 .1 while holding all concentrations fixed did not af- fect the s o l , indicating that s o m e e x c e s s amine is permissible in the extraction s t ages . Th i s makes flow control less cr i t ica l in the large-scale operation. Also, i f needed, a third extraction s t age may be added without deleterious effects on the product; it is poss ib le tha t a third s t age wi l l be required to achieve the desired NO,- removal. The use of 1.5 times t he stoichiometrically re- quired amount of amine did not materially affect the final NO, .-/U mole ratio, indicating that the NO,- extraction tends to b e self-limiting. The effect of operating the extraction s t a g e s at eIe- vated temperatures is now being studied; resu l t s a r e not yet available.
Chemical Analyses of Some Urania Sols. - Resul t s of a group of experiments in which dilute urania sols were prepared under various condi- tions and then concentrated by evaporation a t r e - duced pressure and temperature a re given in Table 7.4.
icraspheres. - Experience in forming microspheres from urania s o l s and in the subsequent calcination of the spheres to dense UQ, h a s been very limited s ince the quantit ies of
Preparation of Urania
Table 7.4. Analyses of Aqueous Urania SOIS Prepared by Amine Extraction
Aqueous feed: average composition, 0.2 M to ta l IJ [>99% U(XV)]-O.4 M NO,--O.075 IM I-ICOO-a Organic phase: 0.1 M Aiiiberlite LA-2 in n-paraffin
Bas i c High IICOO- Cocurrent Batch “ Excess” Amine Three Extraction P rocess Processa Process Process Stages
.... ._... _.... ......... . -.
Volume ratio, O/A 2 2 2 2.1 2
Extraction s t ages 2 2 2 2 3
As-formed s o l To ta l U, M 0.208 0.204 0.205 U(IV), 70 89.96 98.25
Mole ratios: NO,-/U 0.12 0.10 0.095 HCOO--/LT 0.34 0.82 0.50
Concentrated so l To ta l U, M 1.39 1.44 1.58 U(IV), % 88.18 96.60 88.40
Mole ratios: NO,-/U 0.12 0.08 0.096 HCOO-/U 0.37 0.44 0.28
0.206 89.56
0.074 0.31
1.44 87.53
0.077 0.26
0.205 92.49
0.085 0.49
1.55 91.05
0.11 0.38
aTotal HCOO- concentration in so l with high HCOO- content w a s 0.173 M.
189
- .. ...
urania s o l s produced in the laboratory have been too smal l t o permit ex tens ive investigation. With urania s o l s prepared by the bas i c procedure as the s ta r t ing material, large batches of microspheres have now been formed in the sphere-forming col- umn using 2EH tha t conta ins 0.58 vol % Ethomeen S/15 and 0.48 vol % Span 80. These spheres were dried in s team and argon and then calcined t o dense UO, by heating t o 125OoC in Ar-4% H2. The microspheres had the composition UO,, o o 6 and contained 0.091% carbon; measurements a t 210 ps i (Hg displacement method) showed the den- s i t y to be 98% of the theoretical value.
Drying and F i r ing Studies on Sol-Gel Urania Microspheres
Drying and firing s t u d i e s on sol-gel UO, micro- spheres a re being made ' to e s t ab l i sh firing con- ditions that will yield products of low carbon con- ten ts (.:SO ppm) and near-theoretical density. The major problem in fir ing UO , gel microspheres is the removal of carbon tha t is introduced during the microsphere-forming s t e p a s sorbed 2EH and surfactant. ' 9 Low-temperature drying methods such a s s team drying t o 200°C or washing a t room temperature with acetone or methanol were unsuc- ces s fu l in removing carbon to acceptably low lev- els. To remove carbon and t o achieve high den- si ty, a mildly oxidizing gaseous atmosphere is necessary during the firing. Also, i t appears tha t chemical reaction with e i ther H,O or CO, is re- quired for removing the final traces of carbon compounds. Firing in an H,O atmosphere h a s been far more success fu l than firing in a CO, atmosphere, although in many c a s e s the latter h a s yielded adequate resu l t s . The difficulty in re- moving carbon with the CO, or H,O atmosphere stems from the fac t tha t the maximum shrinkage rate and pore c losure occur between 400 and 600°C - the temperature range where carbon is oxidized. Carbon dioxide is more effective than H,O in promoting sintering; th i s may be a d is - advantage s ince i t l eads t o trapping of the carbon compounds before they are oxidized, thus tending t o inhibit densification. The enhancement of sintering may be due to oxidation of the UO, by CO, or H,O. Thermogravimetric ana lyses (TGA) show tha t oxidation of the UO, fX by CO, or I1,O occurs a t temperatures below those where carbon is oxidized. T h i s resu l t is in agreement with thermodynamic calculations.
The most effective atmosphere used t o da t e for attaining low carbon content and high density has been Ar-4% H, saturated with water vapor a t 90°C ( H 2 0 / W , mole ratio, -40) have not as ye t been investigated. Thermodynamic calculations show that the composition of H,-H,O presently used is reducing with respect to U O z t x up to 100D"C a t a l l values of x of 0.05 or greater (x in our UOz+x gels ranges from 0.1 to 0.35) but is oxidizing t o carbon or hydrocarbons. On the other hand, Ar-H,O or CO, atmospheres are oxi- dizing t o the U 0 2 + x under the same conditions. Current work involves es tab l i sh ing the optimum kinetics for both carbon removal and densification using Ar-H 2-H ,O atmospheres .
In the pas t year, b a s i c s tud ies of the effect of various atmospheres on the sintering of UO,+x gels were made in an attempt t o gain information on both carbon removal and densification. Studies of shrinkage rate, c rys ta l l i t e growth, and sur face area decrease were made. Differential thermal ana lys i s (DTA), thermogravimetric ana lys i s (TGA), and ana lyses of evolved gases were used to in- vestigate phenomena tha t occur during the firing of UO, ge ls in various atmospheres . Low-tempera- ture d y i n g conditions were examined for their ef- fec t iveness in carbon removal. Firing procedures us ing a variety of atmospheres and soaking con- dit ions were evaluated for their e f fec t iveness in carbon removal and densification on a 10- to 300-g sca l e .
Other compositions
Low-Temperature Drying Studies
Low-temperature drying s tud ie s in Ar or in Ar- s team show ' that carbon i s not effectively removed by these atmospheres. Even after drying t o 350 to 40O0C, the gels still contained about ?,% carbon. Argon-steam was slightly more effective than a r - gon. T h e measured NO,-/U mole ratios indicate that nitrate removal is nearly complete a t 180 t o 200°C. The NO,-/U mole ratios were about 0.15 in the original so l . T h e O/U atom ratios were not affected by the drying. Amounts of s t eam above 2 g per gram of UO, ge l did not significantly in- c r ease the rate of carbon removal below 200nC. The drying resu l t s indicate tha t the carbon-bearing materials a r e very strongly sorbed.
Oxidat ion Stud; e s Using Thermogravimetric Techniques
Experiments in which oxidation was studied using TGA methods were reported previously. '
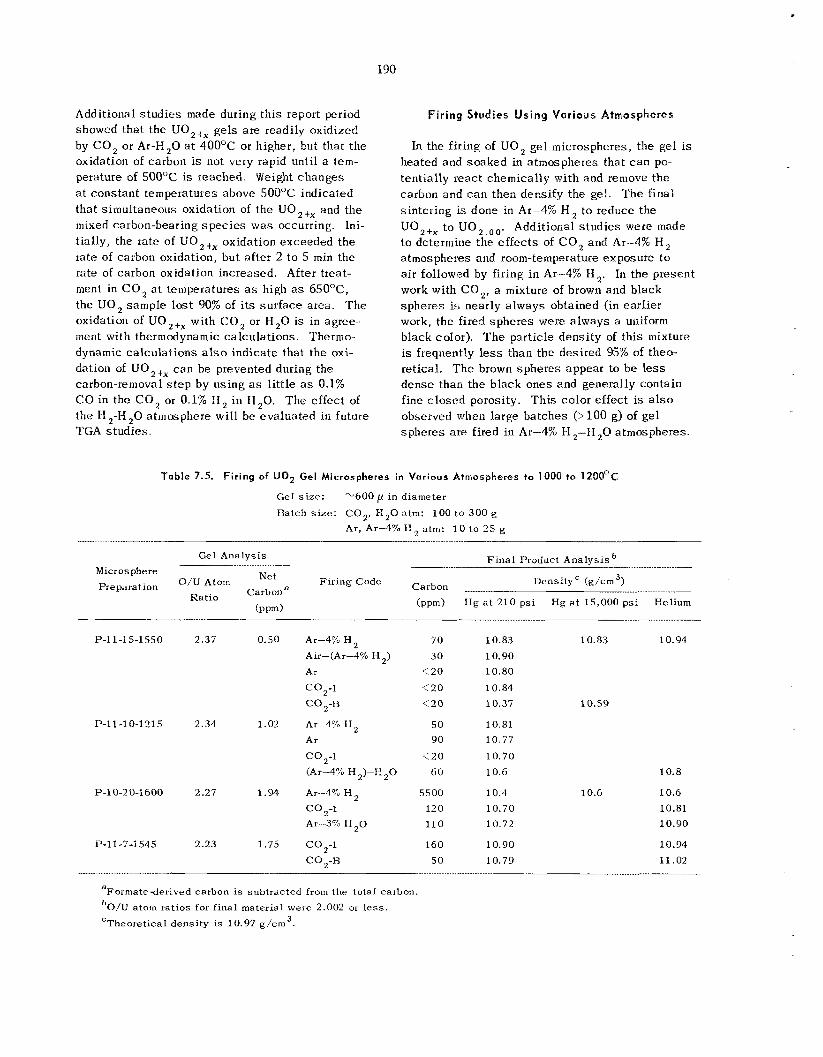
190
Additional s tud ie s made during th i s report period showed that the U 0 2 , x ge l s a re readily oxidized by CO, or Ar-H,O at 4OOOC or higher, but that t he oxidation of carbon is not very rapid until a tem- perature of 500°C is reached. Weight changes at constant temperatures above 50Q°C indicated that simultaneous oxidation of the UOz+x and the mixed carbon-bearing s p e c i e s w a s occurring, Ini- t ial ly, the rate of UO, +x oxidation exceeded the rate of carbon oxidation, but after 2 to 5 min the rate of carbon oxidation increased. After treat- ment in CO, a t temperatures as high as 65OoC, the U o , sample lo s t 90% of i t s sur face area. T h e oxidation of UOz+x with CO, or H,O i s in agree- ment with thermodynamic calculations. Thermo- dynamic ca lcu la t ions also indicate tha t t he oxi- dation of UO,+x c a n be prevented during the carbon-removal s t e p by us ing a s l i t t le as 0.1% CO in the CO, or 0.1% H, in H,O. The effect of t he 11,-I-I,O atmosphere will be evaluated in future TGA s tudies .
Fir ing Studies Using Voriorrs Atmospheres
In the fir ing of UO, ge l microspheres, the ge l is heated and soaked in atmospheres that c a n po- tentially reac t chemically with and remove the carbon and c a n then densify the gel. T h e f ina l sintering is done in Ar-4% H, to reduce the UOz+x t o UO,,,,. Additional s tud ie s were made to determine the e f f ec t s of CO, and Ar-4% H, atmospheres and room-temperature exposure tQ a i r followed by firing in Ar-4% 13,. In the present work with CO,, a mixture of brown and black sphe res i s nearly a lways obtained (in earlier work, the fired sphe res were a lways a uniform black color). T h e particle dens i ty of th i s mixture is frequently less than the des i red 95% of theo- retical . T h e brown sphe res appear to b e less dense than the black ones and generally contain fine c losed porosity. Th i s color effect is also observed when large ba tches (>lo0 g) of gel sphe res are fired in Ar-4% 1-1 ,-H,O atmospheres.
Table 7.5. Firing of Ut32 Gel Microspheres in Various Atmospheres to 1000 to 120QnC
Gel size:
Batch size: CO,, H,O atm: 100 to 300 g ‘“600 / I in diameter
Ar, Ar-4% H Z atm: 1 0 to 25 g
-. .- .. Gel Analys is Final Product Analys isb
Preparation O” *torn Fir ing Code Carbon Density‘ (g/cm3) Microsphere Net
................. Ratio Carbona (ppm) I I g a t 2 1 0 psi H g at 15,000 p s i Helium
(PPd
P-11-15-1550 2.37 0.50
P-11-10-1215 2.34 1.02
P-10-2 0-1600 2.27 1.94
P-11-7-i545 2.23 1.75
Ar-4% H 2 Air-(Ar-4% H,) Ar CO,-l CO,-B
Ar-4% H, Ar CO,-l (Ar-4% H 2 )-13,O
Ar---.l% H , Ar---3% 13 ,O co2-1
co,-1 CO243
70 30
< 2 0
< 2 0 < 2 0
50 90
< 2 0 60
5500 120 110
160 50
10.83 10.83 10.94 10.90 10.80 10.84 10.37
10.81 10.77 10.70 10.6 10.8
10.4 10.6 10.70 10.81 10.72 10.90
10.90 10.94 10.79 11.02
10.59
1 O . G
aFormate-derived carbon is subtracted from the total carbon b ~ / ~ atom rat ios for f ina l material were 2.002 or less.
‘Theoretical density is 10.97 g/cm3.
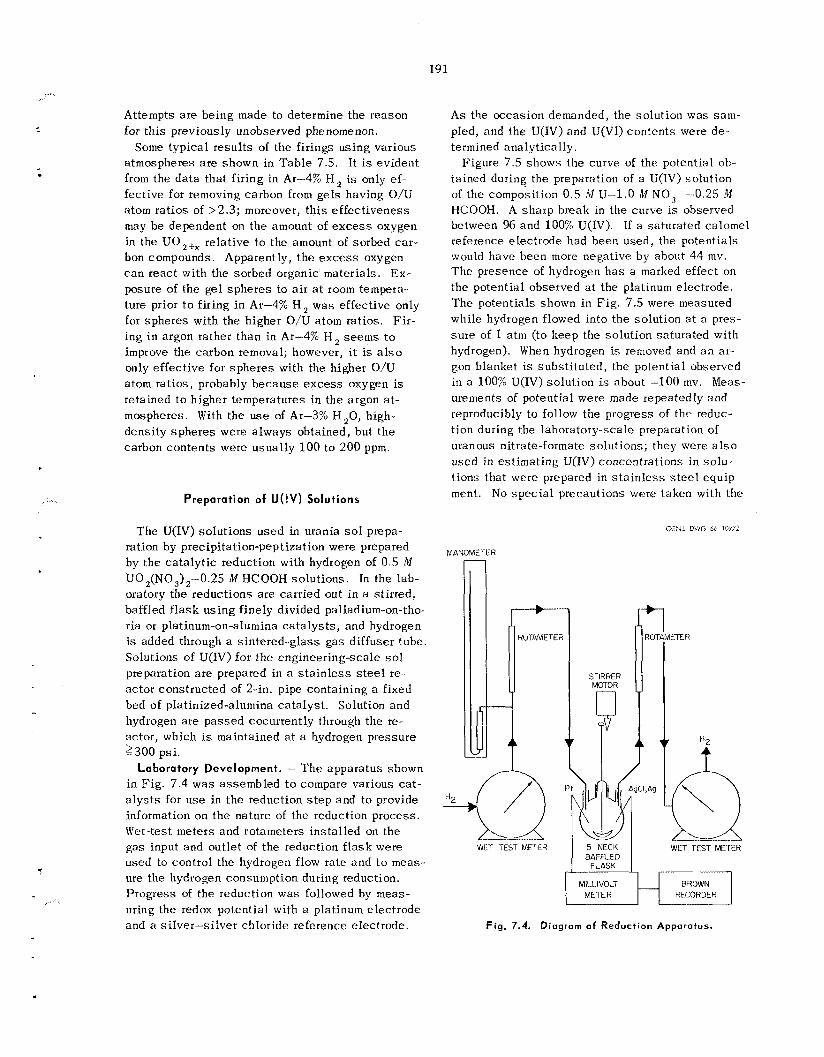
191
... .. .
Attempts a re be ing made to determine the reason for th i s previously unobserved phenomenon.
Some typical resu l t s of the firings us ing various atmospheres a r e shown in Tab le 7.5. It is evident from the da t a that firing in Ar-4% I?, is only ef- fective for removing carbon from ge l s having O/U atom ra t ios of > 2.3; moreover, t h i s e f fec t iveness may be dependent on the amount of e x c e s s oxygen in the U 0 2 + x relative to the amount of sorbed car- bon compounds. Apparently, t h e e x c e s s oxygen c a n reac t with the sorbed organic materials. Ex- posure of the ge l sphe res to a i r a t room tempera- ture prior t o firing in Ar-4% H , was effective only for spheres with the higher O/U atom ratios. F i r - ing in argon rather than in Ar-4% H, seems to improve the carbon removal; however, it is also only e f fec t ive for sphe res with the higher O/U atom ratios, probably because e x c e s s oxygen is retained to higher temperatures in t h e argon at- mospheres. With the use of Ar-3% H 2 0 , high- density sphe res were a lways obtained, but t he carbon contents were usua l ly 100 to 200 ppm.
Preparation of U ( 1 V) Solutions
The U(1V) so lu t ions u s e d in urania sol prepa- ration by precipitation-peptization were prepared by the ca ta ly t ic reduction with hydrogen of 0.5 M UO,(NO,),-0.25 W HCOOH solu t ions . In the lab- oratory the reductions a re carried out i n a stirred, baffled f lask us ing finely divided palladium-on-tho- ria or platinum-on-alumina ca t a lys t s , and hydrogen is added through a s in te red-g lass gas diffuser tube. Solutions of U(1V) for t h e engineering-scale sol preparation a r e prepared in a s t a i n l e s s s t e e l re- actor constructed of 2-in. pipe containing a fixed bed of platinized-alumina ca ta lys t . Solution and hydrogen a r e pas sed cocurrently through the re- actor, which is maintained at a hydrogen pressure 2300 psi.
Laboratory Development. - T h e apparatus shown in F ig . 7.4 w a s assembled to compare various cat- a l y s t s for u s e in the reduction s t e p and to provide information on the nature of the reduction process. Wet-test meters and rotameters ins ta l led on the gas input and outlet of the reduction f l a sk were used to control the hydrogen flow rate and to meas- ure the hydrogen consumption during reduction. Progress of the reduction was followed by meas- uring the redox potential with a platinum e lec t rode and a siIver-silver chIoride reference electrode.
A s the occas ion demanded, the solution was sam- pled, and the U(IV) and U(V1) conten ts were de- termined analytically.
Figure 7.5 shows the curve of the potential ob- tained during the preparation of a U(IV) solution of the composition 0.5 AI U-1.0 M NO,--0.25 M HCOOH. A sha rp break in the curve is observed between 96 and 100% U(1V). If a saturated calomel reference electrode had been used, the potentials would have been more negative by about 44 mv. The presence of hydrogen h a s a marked effect on the potential observed a t the platinum electrode. The potentials shown in Fig. 7.5 were measured while hydrogen flowed into the solution a t a pres- su re of 1 atm (to keep the solution saturated with hydrogen). When hydrogen is removed and a n ar- gon blanket i s subs t i tu ted , the potential observed in a 100% U(1V) solution is about -100 mv. Meas- urements of potential were made repeatedly and reproducibly to follow the progress of the reduc- t ion during the laboratory-scale preparation of uranous nitrate-formate solutions; they were a l s o used in es t imat ing U(1V) concentrations in so lu- t ions that were prepared in s t a i n l e s s s t e e l equip- ment. No s p e c i a l precautions were taken with the
MANOMETER
I
STIRRER MOTOR
OPNL DWG 66 10971
T E R
RECORDER
Fig. 7.4. Diagram o f Reduction Apparatus.
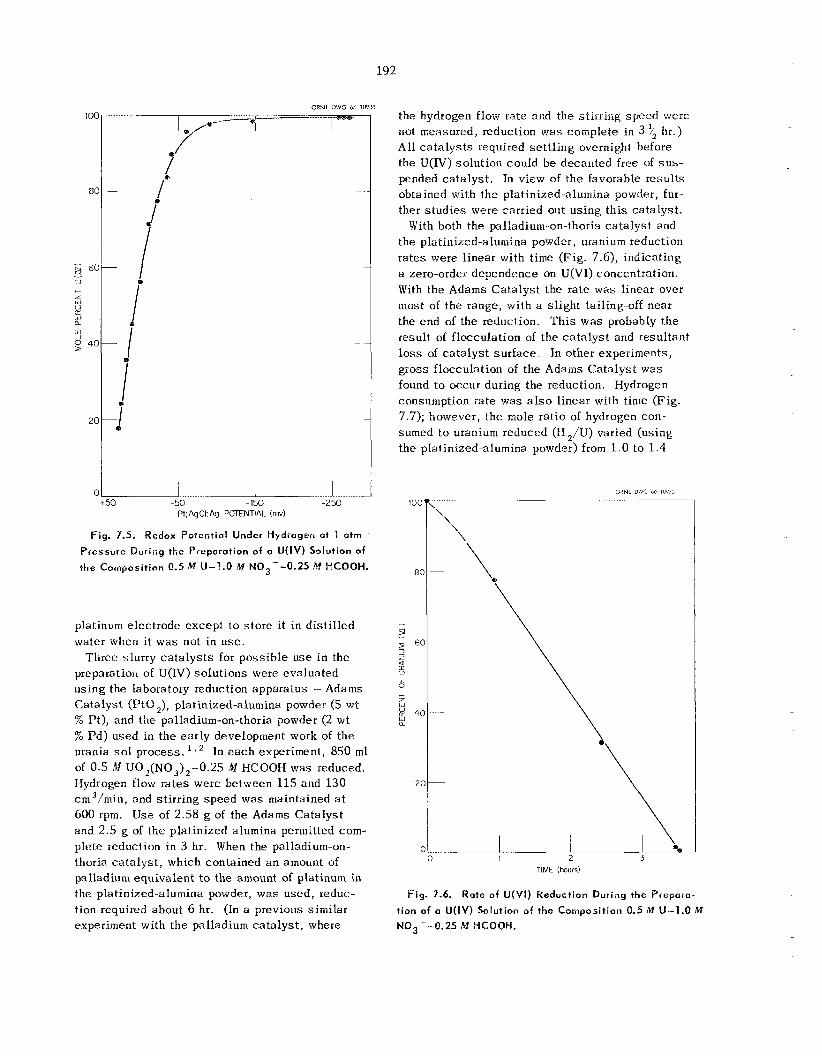
192
ORNL DWG 66 109PR
i i I i
-j
- 50
i - I J -50 -150 -250
Pt,AgCl Ag POTFNTIAL (rnv)
Fig. 7.5. Redox Potential Under Hydrogen at 1 atm
Pressure During the Preparation of a U( IV) Solution of the Cornposition 0.5 M U-1.0 N N03--0.25 M HCOBH.
platinum electrode except to s tore it in d i s t i l l ed water when it was not in use .
Three slurry ca t a lys t s for poss ib le use in the preparation of U(1V) so lu t ions were evaluated using the laboratory reduction apparatus - A d a m Cata lys t (PtO,), platinized-alumina powder (5 wt % Pt), and the palladium-on-thoria powder (2 wt % P d ) used in the e a ~ l y development work of the urania sol process. ' e 2 In e a c h experiment, 850 rnl of 0.5 M U02(N0,),--0.2S M IICOOH was reduced. Hydrogen flow ra tes were between 115 and 130 cm3/min, and stirring speed w a s maintained at 600 rpm. Use of 2.58 g of the Adams Cata lys t and 2 .5 g of the platinized alumina permitted com- plete reduction in 3 hr. When the palladium-on- thoria ca ta lys t , which contained a n amount of palladium equiva len t to the amount of platinum in the platinized-alumina powder, was used, reduc- tion required about 6 hr. (In a previous similar experiment with the palladium ca ta lys t , where
the hydrogen flow rate and the st irring speed were not measured, reduction was complete in 3 ?2 hr.) All ca t a lys t s required se t t l ing overnight before the U(1V) solution could b e decanted free of s u s - Lwnded ca ta lys t . In view of t h e favorable resul ts obtained with the platinized-alumina powder, fur- ther s tud ie s were carried out us ing th i s ca ta lys t .
With both the palladium-on-thoria ca t a lys t and the platinized-alumina powder, uranium reduction ra tes were l inear with time (Fig. 7.6), indicating a zero-order dependence on U(V1) concentration. With the Adams Cata lys t the rate w a s l inear over most of the range, with a s l igh t tailing-off near the end of the reduction. 'This w a s probably the result of f locculation of the ca t a lys t and resultant loss of ca t a lys t surface. In other experiments, gross flocculation of the A d a m Cata lys t was found to occur during the reduction. IHydrogen consumption rate was a lso linear with time (Fig. 7.7); however, t he mole ratio of hydrogen con- sumed t o uranium reduced (H ,/U) varied (using the platinized-alumina powder) from 1.0 to 1.4
Fig. 7.6. Rate o f U(VI ) Reduction During the Prepara-
tion of a U ( I V ) Solution of the Composition 0.5 iM U-1.0 M NQ3--Q.25 M HCOCJH.
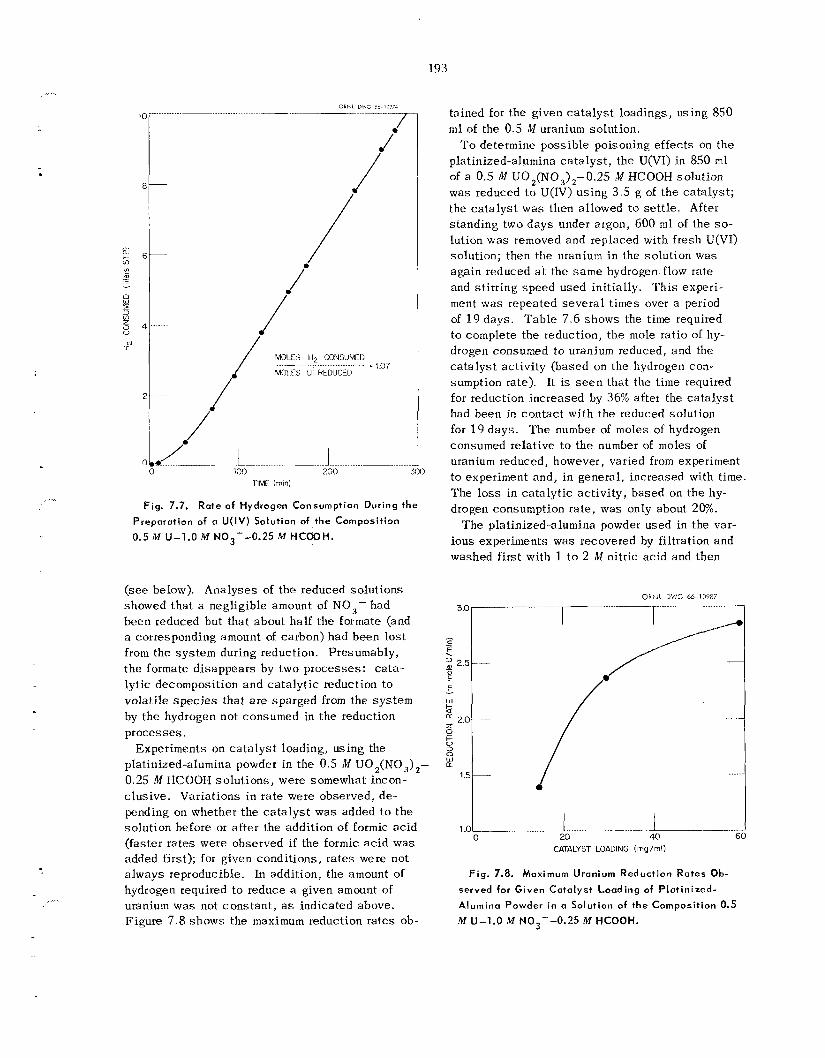
193
...
ORNL DsVG M - I O P I I
TIME !mid
Fig. 7.7. Rate of Hydrogen Consumption During the
Preparation of a U( IV) Solution of the Cornpasition
0.5 M U-1 .0 M N03--0.25 M HCOOH.
(see below). Analyses of the reduced so lu t ions showed that a negligible amount of NO,- had been reduced but that about half the formate (and a corresponding amount of carbon) had been lo s t from the sys t em during reduction. Presumably, the formate d isappears by two processes : cata- lytic decomposition and ca ta ly t ic reduction to volati le species that a r e sparged from the sys t em by the hydrogen not consumed in the reduction processes .
Experiments on ca ta lys t loading, us ing the platinized-alumina powder in the 0.5 M UO,(NO,),- 0.25 M HCOOH solu t ions , were somewhat incon- c lus ive . Variations in ra te were observed, dc- pending on whether t he ca t a lys t w a s added to the solution before or after the addition of formic ac id (faster r a t e s were observed if the formic ac id was added first); for given conditions, ra tes were not a lways reproducible. In addition, the amount of hydrogen required to reduce a given amount of uranium was not cons tan t , as indicated above. Figure 7.8 shows the maximum reduction ra tes oh-
tained for the given ca t a lys t loadings, using 850 m l of the 0.5 M uranium solution.
To determine poss ib le poisoning ef fec ts on the platinized-alumina ca t a lys t , the U(VX) in 850 ml of a 0.5 111 U0,(NO3),-0.25 ill HCOOH solution was reduced to U(IV) us ing 3 . 5 g of the ca ta lys t ; the ca t a lys t was then allowed to se t t le . After standing two days under argon, 600 m l of the so- lution was removed and replaced with fresh U(V1) solution; then the uranium in the solution was again reduced a t the s a m e hydrogen flow rate and stirring speed used init ially. T h i s experi- ment was repeated severa l t imes over a period of 19 days . Tab le 7.6 shows the time required to complete the reduction, t he mole ratio of hy- drogen consumed t o uranjum reduced, and the ca t a lys t activity (based on the hydrogen con- sumption rate). It is s e e n that the time required for reduction increased by 36% after the ca t a lys t had been in contac t with the reduced solution for 19 days . The number of moles of hydrogen consumed relative to the number of moles of uranium reduced, however, varied f rom experiment to experiment and, i n general , increased with time. The loss in ca ta ly t ic ac t iv i ty , based on t h e hy- drogen consumption rate, was only about 20%.
T h e platinized-alumina powder used in the var- ious experiments was recovered by filtration and washed first with 1 t o 2 hl nitric ac id and then
OKNL D ’ S G 66.10987 ....... ,
...... 40 60
1 .0 ~
0 20 CATALYST L0aDING (my/ml)
Fig. 7.8. Moximum Uranium Reduction Rates Ob- served for Given Catalyst Loading of Plat inized-
Alumina Powder in a Solution of the Composition 0.5 IVZ U-1.0 M N03--0.25 M HCOOH.
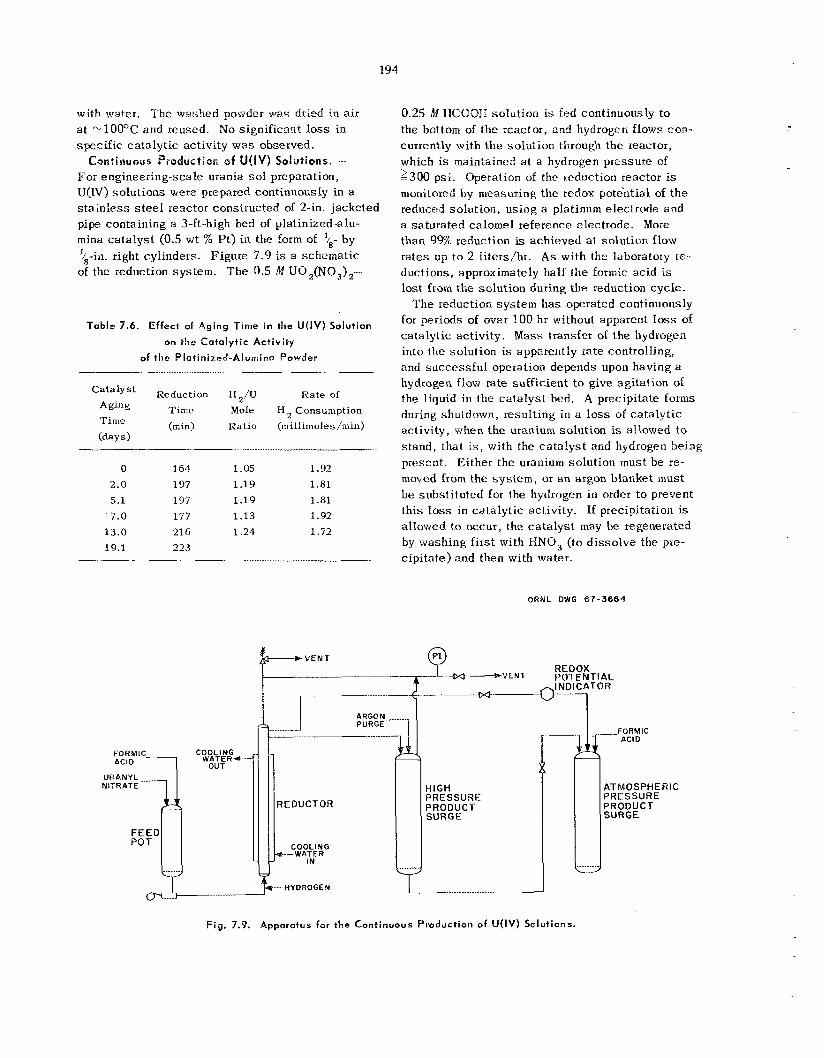
194
with water. ' rhe washed powder was dried in a i r a t -10Oo@: and reused. N o significant loss in spec i f ic ca ta ly t ic activity was observed.
Continuous Production of U(IV) Solutions. - For engineering-scale urania sol preparation, U ( N ) so lu t ions were prepared continuously in a s t a in l e s s s t e e l reactor constructed of 2-in. jacketed pipe containing a 3-ft-high bed of platinized-alu- mina ca t a lys t (0.5 wt % Pt) in the form of $8- by $-in. right cylinders. Figure 7.9 is a schemat ic of the reduction sys tem. The 0.5 M UO,(NQ,),-
Tabla 7.6. Effect of Aging Time in the U(IV) Solution
on t h e Catalyt ic Act ivi ty
of the Platinized-Alumina Powder
Reduction H2/U Rate of ' r ime Mole H , Consumption (min) Ratio (millimoles /min)
Aging T i m e (days)
0 164 1.05 1.92 2.0 197 1.19 1.81
5.1 197 1.19 1.81 ' 7.0 177 1.13 1.92
13.0 216 1.24 1.72
19.1 223
FORMIC COOLING *cID 7 WATER+----
OUT
0.25 M MCOOW solution is fed continuously t o the bottom of the reactor, and hydrogen flows csa- currently with t h e so lu t ion through the reactor, which is maintained a t a hydrogen pressure of 2300 psi. Operation of the reduction reactor is monitoEd by measuring the redox potc'ntial of t h e reduced solution, us ing a platinum electrode and a sa tura ted calomel reference electrode. More than 99% reduction is achieved at solution. flow ra tes up to 2 iiters/hr. As with the laboratory re- ductions, approximately half t he formic ac id i s lost from the so lu t ion during the reduction cycle.
T h e reduction sys t em has operated continuously for periods of over 100 hr without apparent loss of ca ta ly t ic activity. Mass transfer of the hydrogen into the solution is apparently rate controlling, and success fu l operation depends upon having a hydrogen flow rate suf f ic ien t to give agitation of the liquid in the ca t a lys t bed. A precipitate forms during shutdown, result ing iin a loss of ca t a ly t i c activity, when the uranium solution is allowed to s tand , tha t is, with the ca t a lys t and hydrogen being present. Either t he uranium solution must be re- moved from the sys t em, or a n argon blanket must b e subs t i tu ted for the hydrogen in order to prevent th i s loss in ca t a ly t i c activity. If precipitation is allowed to occur, the ca t a lys t may he, regenerated by washing f i r s t with MNO, (to d i s so lve the pre- c ip i ta te ) and then with water.
ORNL DWG 67-3664
I
HIGH PRESSURE PRODUCT SURGE
L ..+-HYDROGEN
Fig. 7.9. Apparatus for the Continuous Production of U(IV) Solutions.
195 ...
Preparation of Urania Sols by the Direct Reduction of UO, Suspensions
Although the major effort is now concentrated on the precipitation-peptization and the solvent ex- traction methods of UO, sol preparation, we have developed a method of UO, sol preparation that in- volves direct reduction of UO, suspens ions in ni t r ic acid-formic acid solut ions in which the ni t ra tehranium and formate/uranium mole rat ios a re comparable with t h o s e obtained in the final s o l s prepared by the other methods. In the ini t ia l work, UO, was added directly to a well-st irred nitric acid-formic ac id solution in a baffled f lask, palladium-on-thoria c a t a l y s t w a s added, and hydrogen was bubbled through the s u s - pension by means of a gas-diffuser tube. Using 2.0 M UO, suspens ions and NO,-/U and HCOO-/U mole ra t ios of 0 .2 and 1.0, respect ively, more than 90% conversion to sol was achieved in about 20 hr at 30 to 4OOC. In some experiments the suspens ion was then heated to 45 to 75°C for 1 to 3 hr to en- hance the catalyt ic destruction of formate, but t h i s treatment w a s not effective. L a t e r invest igat ion showed tha t converting the UO, to a b a s i c formate by s t i r r ing it in the formic acid solut ion prior t o the addition of nitric acid and ca ta lys t and the hydrogen treatment shortened sol formation t i m e and, in gener- al, produced higher yields of so l . Such a procedure necess i ta ted the u s e of a higher nitric acid concen- tration (NO,-/U mole ratio 1 0 . 2 5 ) to produce a fluid sol. In the l inal development work, i t w a s demonstrated that a uranyl nitrate solut ion could b e converted to a di lute uranyl formate solut ion by an ion exchange method, and the resul t ing solut ion could b e concentrated by heat ing to give a “creamy” suspens ion of the bas ic formate. N i t r i c acid and ca ta lys t were then added, and the system w a s treated with hydrogen as before.
Zirconia and Uronia-Zirconia Sol Preparations
Development of methods for preparing Concentrated zirconia sols of low electrolyte content continued. T h e objec t ive is to produce zirconia sols that can be mixed with urania s o l s in a l l proportions and to form t h e s e mixed sols into dense microspheres.
pare zirconia sols: destruction of t h e ni t ra te in zirconyl ni t ra te solution with formaldehyde, and precipitation of hydrous zirconia and subsequent pept izat ion with nitric acid.
r Two methods were used in previous at tempts to pre-
Neither approach w a s
successfu l in producing concentrated s o l s of low ni t ra te content. During th i s report period we at- tempted sol preparation by removal of ni t ra te ion from an aqueous zirconyl nitrate solution by multi- s t a g e solvent extraction, employing an amine ex- t ractant in an inert organic diluent; the aqueous p h a s e was digested at 100°C between extraction stages. Satisfactory sols were not produced. How- ever , it was possible to prepare concentrated zir- conia sols having low nitrate content by autoclaving zirconyl nitrate so lu t ions at 20O0C t o promote crys- ta l l i t e growth and zirconia precipitation, removing the bulk of the ni t ra te by centrifugation and decan- tation, peptizing the recovered sol ids by addition of water, and finally decreasing the nitrate content of the zirconia sol to the desired leve l by a sol- vent extraction technique.
Urania-zirconia sols with a Zr/U m o l e ratio of 0.3 were made by an adaptation of the laboratory method for preparing urania sol by precipitation-peptization. Strong, d e n s e microspheres of urania-zirconia were prepared from the sols on a laboratory scale. In the sol preparation, zirconyl nitrate or zirconia s o l i s added to the uranium solution prior to the precipita- tion of the hydrous oxide.
7.2 PLUTONIA
A plutonia sol-gel process for the preparation of d e n s e forms of PuOz and homogeneous mixtures of Pu0,-UO, and Pu0 , -Tho , was reported l a s t year.’ T h e object ive of th i s work w a s to develop processes for preparing plutonia sols which (1) could be used to prepare d e n s e PuO,, (2) would be compatible with other oxide sols, and ( 3 ) would afford versatility in forming techniques already developed at ORNL. To meet t h e s e requirements, a s t a b l e plutonium colloid with a low nitrate content i s required T h e current process u t i l i zes the polymerization behavior of te t ravalent plutonium to maintain valence s tabi l i ty and to produce colloidal par t ic les of PuO,. The sols produced by this procedure are 1 to 3 M in plutonium and have NO,-/Pu mole rat ios of 0 .1 to 0.15. They are s tab le for several months and are compatible with both the thoria and urania sols that a r e produced at ORNL. T h e ability to produce dense plutonia microspheres as well as homogeneous plutonia-urania or plutonia-thoria microspheres a t desired heavy-metal ratios h a s now been demonstrated on an engineering sca le . Equipment for thermo- gravimetric and differential thermal a n a l y s e s was
196
installed in a glove-box facility, cold-tested with europia gel, and used to analyze plutonia sol-gel materials.
S t a t ~ s and Progress
T h e success fu l processing of 560 g of plutonium into plutonia s o l in small equipment was reported l a s t year. and the reproducibility of the bas i c flowsheet were further demonstrated by the production of 20 addi- tional sol ba tches (SO to 150 g of P u per batch) containing over 1500 g of plutoniuin. During so l preparation, engineering efforts were concentrated on developing essential equipment components with increased reliability arid ease of operation. Engi- neering-scale equipment (installed last year) to produce oxide microspheres from plutonia sols and mixed s o l s w a s successfully used to prepare 865 g of P u 0 2 , 4 kg of Pu02-U0, containing 5 to 20 wt % PuO,, and 1.5 kg of P u 0 2 - T h 0 2 containing 5 wt % PuO,. Dens i t ies were generally greater than 95% of the theoretical crystal density.
We contiriued laboratory efforts to optimize vari- ab l e s in the plutonia sol process , to de l inea te the nature of the colloidal plutonia par t ic les , to examine alternative piocedures for preparing plutonia sol, and to charac te r ize microsphere products. During th i s work, plutonia sols, so l intermediates, and sol-gel products were studied by u s e of spectrophotometry, x-ray l ine broadening, powder camera techniques, electron microscopy, metallography, mercury porosimetry, electron microprobe ana lys i s , and sur- face area measurements. Several. c r i t i ca l parameters in the plutonia sol process were elucidated. Gel microspheres of europia and plutonia and gel products formed by drying the oxide sols were examined using thermogravimetric arid differential thermal ana lyses .
During th i s report period the operability
Sol Process
T h e flowsheet for the plutonia s o l process is showii in F ig . 7.10. Hydrous plutonia is precipitated from a plutonium nitrate solution that is 1 to 3 M in e x c e s s HNO, by s low addition of the plutonium solution to a 100% e x c e s s of NH,OI-I, with s imultaneous rapid stirring. filter c a k e i s resuspended in water, and the sus- pension i s filtered. Three washings are usually sufficient to reduce the pH of the fi l trate to less than 8.0, which indicates satisfactory removal of
T h e plutonia is recovered by filtration, the
contaminant ions. The freshly precipitated plutonia i s then aged by refluxing in water for 1 to 2 hr. I t is peptized by digestion with d i lu te HNO,. Com- p le te peptization, which is characterized by a change from an opaque light-green slurry to a nearly transparent dark-green suspens ion , requires a minimum NO,--/Pu mole ratio of 1. At th i s HNO,-/Pu ratio, a digestion time of about 4 hr a t 80° C is necessary. Higher nitrate concentrations, however, can be used to reduce the digestion time and temperature; for example, at NO,'- /Pu mole ra t ios of 2 or more, digestion requires only 10 to 15 min a t room temperature.
The plutonia sol produced during digestion is a s t ab le colloidal dispersion but is not su i t ab le for fuel-particle preparation until t h e NO ,- / P u mole ratio h a s been reduced. This is accomplished by evaporating the sol to produce a gel and then baking the gel a t 250°C for about 2 br. Nitrate removal i s a function of both t i m e and temperature, and ex- c e s s i v e baking will result in material tha t cannot b e redispersed. For th i s reason, very uniform hea t ing of plutonia so l id s is required during nitrate removal. T h e final sol is prepared by resuspending the baked gel in water and evaporating t o the desired plutonium concentration. Sols with plutonium concentrations in e x c e s s of 2 M and with NO;-/Pu m o l e ra t ios be- tween 0. l and 0.15 are obtained.
Demonstration of the Process OW on Engineering Scale
sol Preparation. - Twenty plutonia s o l s (50 to 150 g of P u per batch) containing IIIOTE than 1500 g of P u were prepared using the flowsheet described above except that the hydroxide w a s not aged prior to peptization. These preparations deinonstrated the operability of newly developed equipment and the reproducibility of the standard flowsheet (Fig. 7.10) and provided sol for the preparation of microspheres of plutonia, plutonia-urania, and plutonia-thoria. were made in recently developed engineering-scale equipment, a re presented in Tab le 7.7.
Thermal denitration continues to be the s t e p of major concern. There appears to be some correlation between the iiiolarity of nitric acid used in peptiza- tion and the baking time required. A s ac id concen- tration increased from 0.4 to 0.9 M (runs PS-23-25, Tab le 7.7) , the total baking time required to produce comparable NO,- / P u mole ratios in the final sol. decreased from 2 to < 1 hr.
Data for the l a s t s i x runs, which
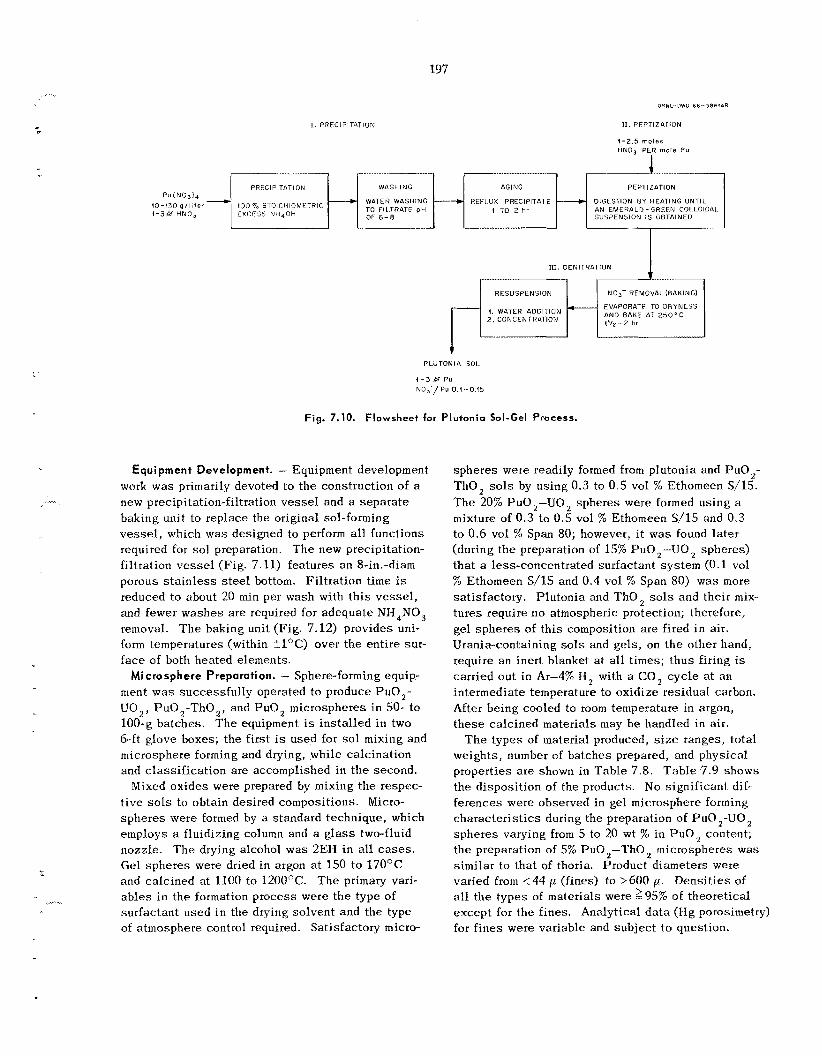
... . .
PRECIPITATION
------) 100% STDlCWlOMETRlt EXCESS NHIOH
197
............ ~ ...... ....
WASHING AGING PEPTIZATION
WATER W4SHING REFLUX PRECIPITATE __C DIGESTION a y HEATING U N ~ I L TO FILTRATE p H OF 6 - R SUSPENSION I S OBTAINED
AN EMERALD-GREEN CO!~LOIOAL. 1 TO 2 tlr -
I . PRECIPITATION
-
ORNC-OWG 6 6 - 3 8 6 1 A R
EV4PORATE TO DRYNESS AN0 BAKE AT 2 5 0 ° C 1Vz - 2 hr
1. WATER ADDITION 4----- 2. CGNCEN TRATION
11. PEPTIZATION
4-2.5 m o l e s HN03 PER mole Pu
I
Pu(ND314 10-130 g / l i t c r 1-3M HN03
I Ill. OENITRATION
I RESUSPENSION I I NO3- REMOVAL(B4XINGl
+ PLUTONIA SOL
1 - 3 M P u NO,-/PU 0.4 --0.(5
Fig. 7.10. Flowsheet for Plutonia Sol-Gel Process.
Equipment Development. - Equipment development work was primarily devoted io the construction of a new precipitation-filtration v e s s e l and a sepa ra t e baking unit to replace the original sol-forming v e s s e l , which was designed to perform all functions required for so l preparation. The new precipitation- filtration v e s s e l (Fig. 7.11) features an 8-in.-diam porous s t a i n l e s s steel bottom. Fil tration time is reduced t o about 20 miri per wash with t h i s ves se l , and fewer washes a re required for adequate NH,NO, removal. T h e baking unit (Fig. 7.12) provides uni- form temperatures (within t l ° C ) over the entire sur- face of both heated elements.
Mi crosphere Preparation. - Sphere-forming equip- ment w a s successfu l ly operated to produce P u 0 , - UO,, P u 0 2 - T h 0 , , and PuO, microspheres in 50- to 100-g batches. The equipment is ins ta l led in two 6-ft glove boxes; the first is used for s o l mixing and microsphere forming and drying, while calcination and c lass i f ica t ion are accomplished in the second.
Mixed oxides were prepared by mixing the respec- t ive sols to obtain desired compositions. Micro- sphe res were formed by a standard technique, which employs a fluidizing column and a g l a s s two-fluid nozzle. T h e drying alcohol was 2EH in all cases. Gel spheres were dried in argon a t 150 to 17OOC and calcined at 1100 to 1200*C. T h e primary vari- ab l e s in the formation process were the type of surfactant used in the drying so lvent and the type of atmosphere control required. Satisfactory micro-
spheres were readily formed from plutonia and Pu0,- T h o , sols by using 0.3 to 0 .5 vol % Ethomeen S/15. T h e 20% Pu0,-UO, spheres were formed using a mixture of 0.3 to 0.5 vol % Ethomeen S/15 and 0.3 to 0.G vol % Span 80; however, it was found later (during the preparation of 15% Pu0,-WO, spheres) tha t a less-concentrated surfactant sys tem (0.1 vol % Ethomeen S/15 and 0.4 vol % Span 80) was more satisfactory. Plutonia and T h o , sols and their mix tures require no atmospheric protection; therefore, gel sphe res of th i s composition are fired i n air. Urania-containing sols and ge ls , on t h e other hand, require an inert blanket at all times; t hus firing is carried out i n Ar-4% H 2 with a CO, cyc le at an intermediate temperature to oxidize residual carbon. After being cooled to room temperature in argon, t hese calcined materials may b e handled in air.
T h e types of material produced, size ranges, total weights, number of batches prepared, and physical properties a re shown in Tab le 7 .8 . Tab le 7.9 shows the disposit ion of the products. No significant dif- fe rences were observed in gel microsphere forming charac te r i s t ics during the preparation of PuO ,-UO spheres varying from 5 to 20 wt % in PuO, content; the preparation of 5% Pu0,-Tho, microspheres was similar to tha t of thoria. Product diameters were varied from < 4 4 p (fines) to ;600 p. Densi t ies of a l l the types of materials were 95% of theoretical except for the for f i nes were
fines. Analytical da t a (Hg porosimetry) variable and subjec t t o question.
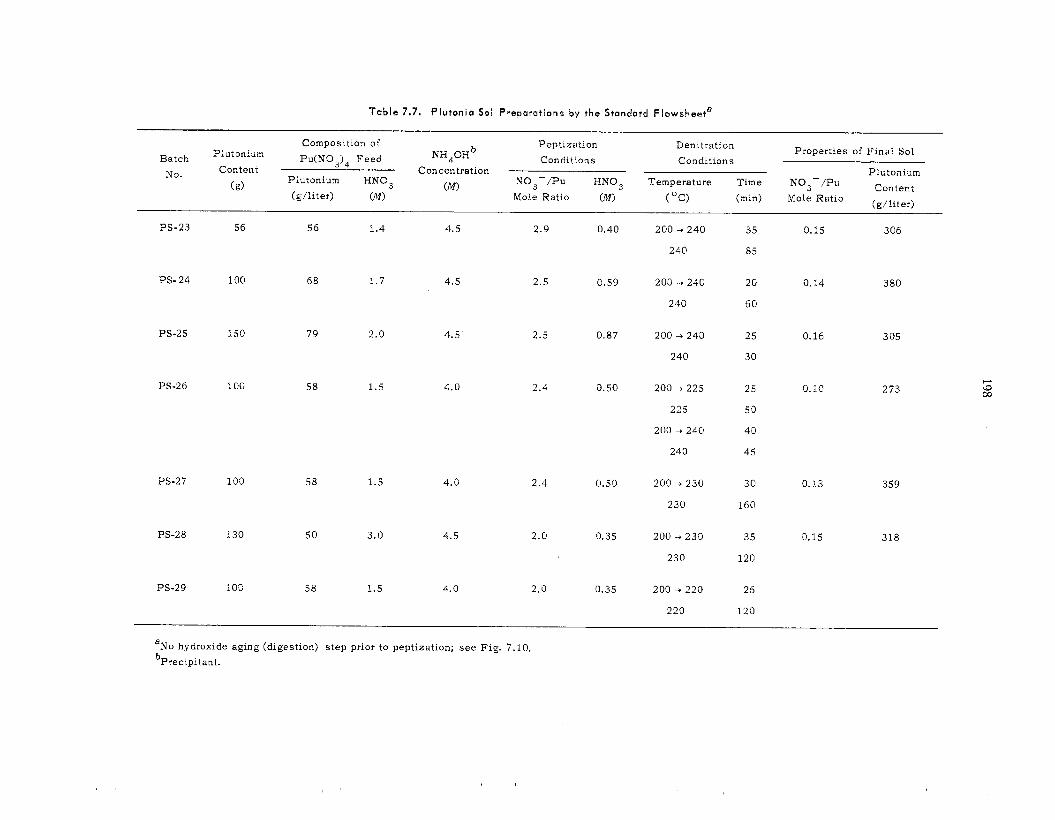
198
M
0
-4 m
i;, m C
c 0
m m a, a
.* L
2 a
W
0
m
m
F.
d
m
m
0
d
N
T 0
0
N
0
0 t
9
N
v! d
7
r(
W
Lo
u3 10
m
a
a 7
0
m
m
m
0
t.
m
m
N
m
m
m
m
A
m
d
r-l
0'
0
N
0
\f N
T 0
0
N
m
2
W
4
0
m
N
0
d
N
T 0
0
N
t.
0
09
W
4
d
m
N
m
c.I N
T 0 0
N
3
:
m
,., 0'
0
m
G
m
N
t 0
0
N
0
2
Lo r-
d
m
m
0
W
N 7 0
0
PI
m
2
(0
N
0
N
N
T 0
0
N
m
2 ?
N
:
v! d
m
Lo
0
0
7-
m
7
a"
"1 v!
N
N
Y N
d: N
3. N
6
bb
.-. t. i;: a, 0
m 9
w
0
.s .. C m N
a
a, a
-3
+A
"-i
c
0
0
a a
m
C
u
I-.
.3
Y
h
.4
c
m
m M
4 v M
C
M
.4
9
t.
d
N
Lo 4
"1 F.
00
W
m
t.
00
m
00
m
0
m
0
0
7-
0
0
4
0
m
r(
0
0
,+ 0
10 r-
W
VI
7
a
t.
v)
7
a
00
z a d
N
m
m
7
a,
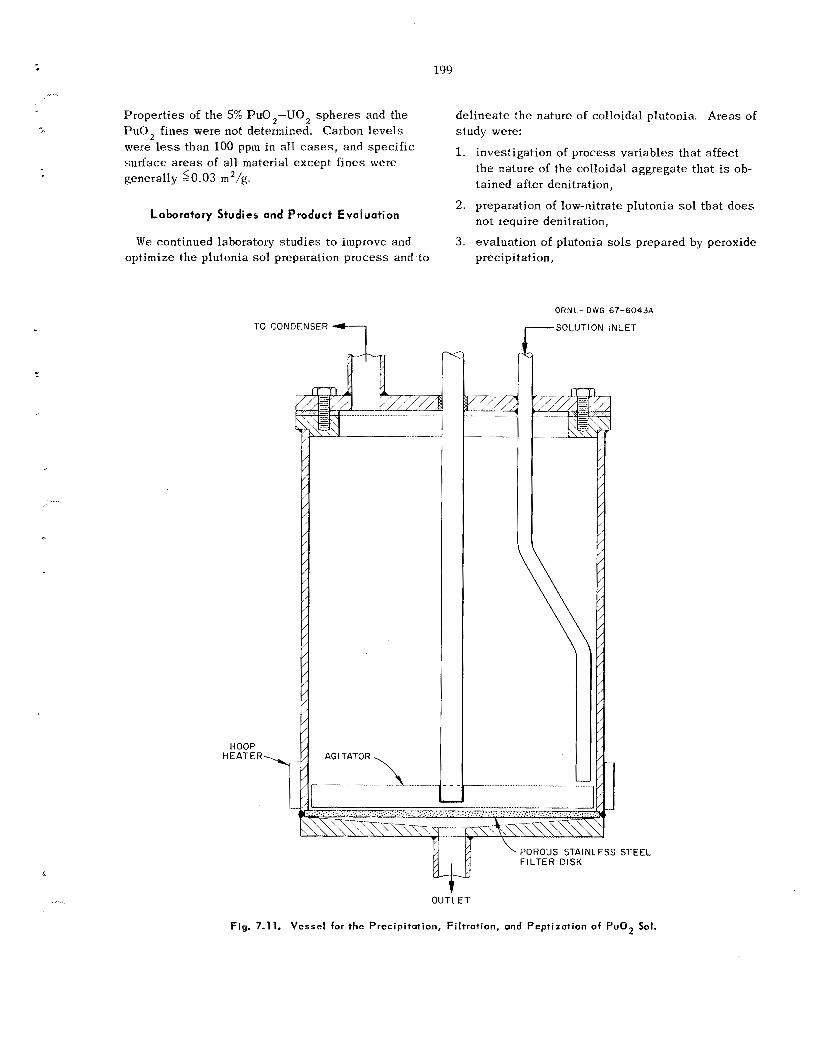
199
Proper t ies of the 5% Pu02-U0, sphe res and the PuC), f ines were not determined. Carbon l eve l s were less than 100 ppm in all c a s e s , and spec i f ic sur face a reas of all material except f ines were generally 50.03 m2/g.
Laboratory Studies and Product Evaluation
W e continued laboratory s tud ie s to improve and optimize the plutonia sol preparation process and to
-7 ro CONDENSER
HOOP HEAT E R h
.. .
del inea te the nature of colloidal ptutonia. Areas of study were:
1. investigation of process variables that affect the nature of the colloidal aggregate tha t is ob- tained after denitration,
2. preparation of low-nitrate plutoriia sol that does not require denitration,
3. evaluation of plutonia sols prepared by peroxide precipitation,
ORNL-DWG 67-6043A
SOLUTION INLET
STEEL
t OUTLET
Fig. 7.11. Vessel for the Precipitation, Filtration, and Peptizution of PuOz Sot.
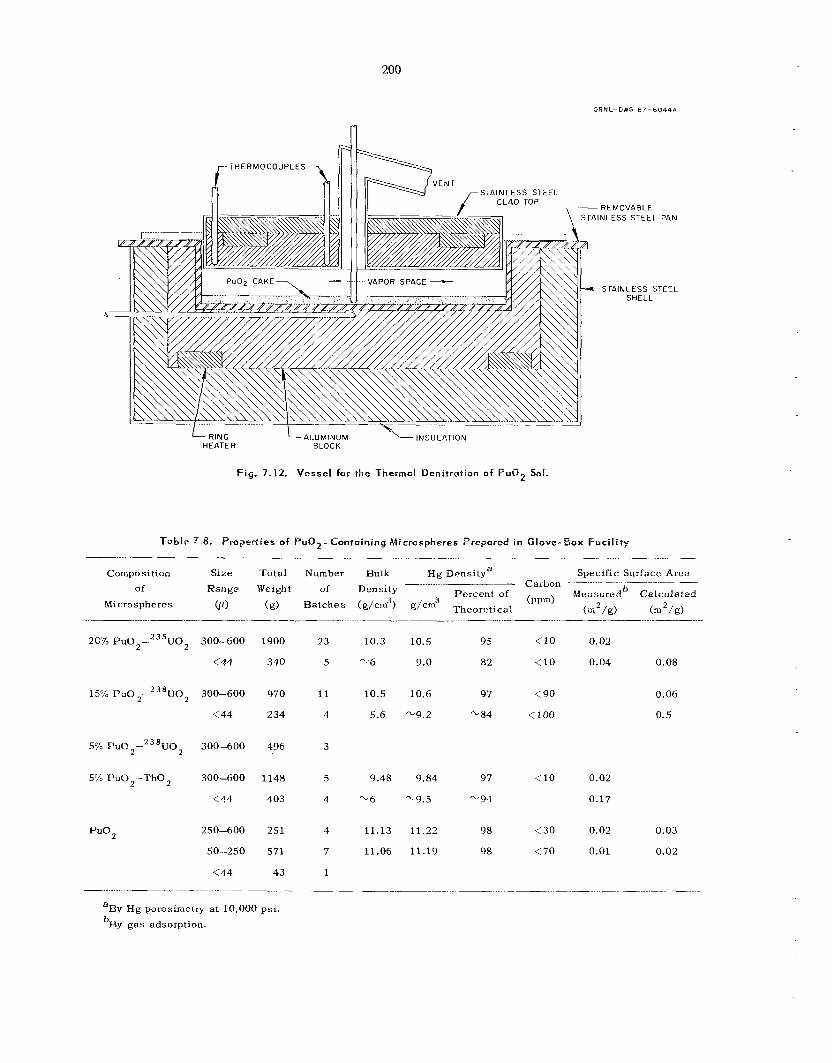
200
ORNL-DWS 6 7 - 6 0 4 4 ~
RING AILUMINUM I N S U L A T I O N HEATER BLOCK
Fig. 7.12. Vessel for the Thermal Denitration o f PuQ2 Sol.
Table 3.8. Properties of Pu02- Containing Microspheres P r e p o r e d in Glove- BQX Facil i ty
Composition Size Tota l Number Bulk H g Densitya Specific Surface Area ^_.._______ Carbon __-
~ e n s u r e d ~ Calculated
(m /P) (m2/g)
Range Weight of Density Percent of of (win) Microspheres w (9) Batches (g/cn13) g/cx3 Theoretical
20'70 Pud,-2"U02 300-600
< 44
15% P U O , - ~ ~ ~ U O ~ 300-600
< 44
5% P U O , - ~ ~ ~ L J O ~ 300-600
5% PuO,-ThO, 300-600
<44
PUO, 250-600
50-250
<44
1900
340
970
234
496
1148
403
251
571
43
23
5
11
4
3
5
4
4
7
1
10.3 10.5 95 (10 0.02
-G 9.0 82 .: 10 0.04 0.08
10.5 10.6 97 <90
5.6 -9.2 -84 < loo 0.06
0.5
9.48 9.84 97 <10 0.02
'"6 -9.5 -L 94 0.17
11.13 11.22 98 < 30 0.02 0.03
11.06 11.19 98 < 70 0.01 0.02
a ~ y ~g porosirnetry a t ~ O , O O O psi. bBy gas adsorption.
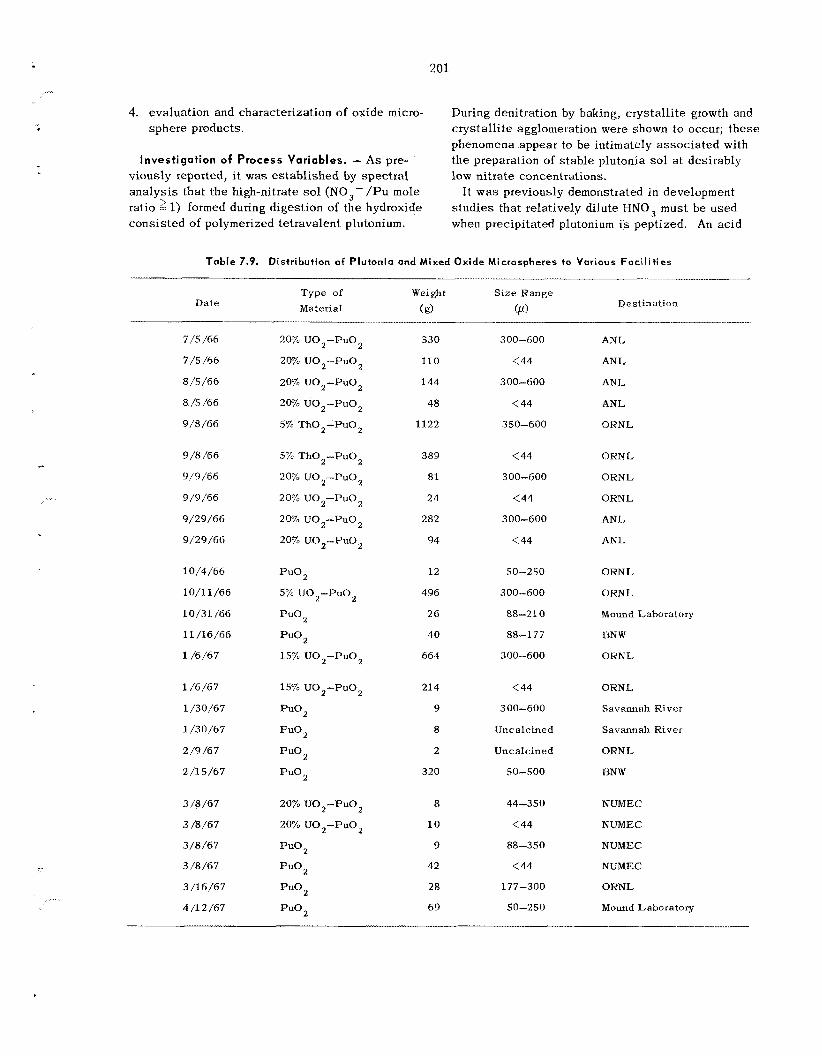
201
4. evaluation and characterization of oxide micro- sphere products.
During denitration by baking, c rys ta l l i t e growth and crys ta l l i t e agglomeration were shown to occur; t hese phenomena appear to be intimately assoc ia ted with the preparation of s t ab le plutonia so l a t desirably low nitrate concentrations.
I t w a s previously demonstrated in development s tud ie s that relatively dilute HNO, must be used when precipitated plutonium is peptized. An ac id
investigation of Process Variables. - As pre- viously reported, it was es tab l i shed by spec t r a l ana lys i s that t he high-nitrate sol (NO,- /Pu mole ratio 2 1) formed during digestion of the hydroxide cons is ted of polymerized tetravalent plutonium.
Table 7.9. Distribution of Plutonia and Mixed Oxide Microspheres to Various Fac i l i t i es
Type of Weight Size Range Destination
( 9) W) Date Material
- ... .
7 /S/66
7/5 /66
8/5/66
8 /S /66
9/8/66
9/8/66
9 /9 /66
9/9/66
9/29/66
9/29/66
10/4/66
10/11/66
10/31/66
11 /16/66
1 /b/67
1 /6/67
1/30/67
1 /30/67
2/9/67
2/15/67
3/8/67
3 /8/67
3/8/67
3/8/67
3/16/67
4 /12 /67
20% U02-Pu02
2% U02-Pu02
20% UO2-PUO,
20% U 0 2 - P u 0 2
5% ThOz-Pu02
5% ThOz-PuOz
20% UO2-PUO,
20% U02-Pu02
20% UO2-Pu0 2
20% UO2-PUO2
PUO,
5% UOz-Pu02
P U O ,
PUO,
15% UO2-PUO2
15% U02-Pu0 2
PUO2
Pu02
p u o 2
PuO , 20% U02-Pu02
20% UO2-Pu0,
PUO
PUO
PUO2
PUOz
330
110
144
48
1122
389
81
24
282
94
12
496
26
40
664
214
9
8
2
320
8
10
9
42
28
69
300-600
< 44
300-600
< 44
350-600
< 44
300-600
< 44
300-600
< 44
so-250
300-600
88-21 0
88-177
300-600
< 44
300-600
Uncalcined
Unc alcine d
50-500
44-350
< 44
88-350
< 44
177-300
50-250
ANL
ANL
ANL
ANL
ORNL
ORNL
ORNL,
OKNL
ANL
ANL
ORNL
ORNL
Mound Laboratory
BNW
ORNL
OKNL
Savannah River
Savannah River
ORNL
BNW
NUMEC
NUMEC
NUMEC
NUMEC
OKNL
Mound Laboratory
2 02
concentration i n e x c e s s of 1 M resulted in product with undesirable characterist ics. s tud ie s es tab l i shed that the acid concentration of t he plutonium feed and the molarity of the NII,OH used for precipitation a re also crit ical . electrolyte concentration in either s t e p (precipitation or peptization) appears to result i n a rapid nitrate loss during baking and high product losses due to material that will not resuspend. pared in th i s way are very opaque, a r e l ight green i n appearance, and show so l id s separation. T‘ney are very difficult to form into sa t i s fac to ly micro- sphe res (in extreme c a s e s , microspheres cannot b e formed a t all).
One factor that is a t l ea s t partly responsible for t h i s behavior was indicated by the spectrophoto- metric ana lys i s of high-nitrate sols prepared from plutonium s tock containing excess ive amounts of FINO,. Depolymerization of P u (IV) polymer QC-
curred during evaporation, giving r i s e to ionic forms of P u ( 1 v j and Pu(V1) [Pu(VI j resu l t s froiii t h e oxidation of ionic I’u(IV) under t h e s e conditions]. On evaporation to dryness and subsequent baking, both the ion ic Pu(IV) and Pu(V1) yield an un- des i rab le form of plutonium. Although exac t l imits have not been established, it was shown tha t precipitation from feed solution with an MNO, con- centration a s high as 8 M , us ing 5 M NH,OH, re- s u l t s in gieater depolymerization during concentra- tion of t h e high-nitrate sol than when t h e plutonium feed solution was less than 3 M i n HNO,. T h e present indication is that a high nitrate content promotes a polymer form that is less res i s tan t to depolymerization. Th i s si tuation is further com- plicated by indications that t he prec ip i ta tes of plutonium tha t are immediately peptized in d i lu te HNO,, rather than stored for short periods i n water, a l s o exhibit a greater degree of depolymerization during subsequent evaporation and baking s t eps .
A recent extension of these observa t ions gave r i s e to a simple process modification tha t appears to result in improved sol product. I t involves “aging” precipitated washed hydroxide by boiling for 1 to 2 hr in water prior to peptization. Several product sols prepared in the laboratoiy by us ing t h i s technique were characterized by high y ie lds , itti-
proved colloidal stabil i ty, and good handling and sphere-forming characterist ics. T h i s modification will b e additionally evaluated on a n engineering scale.
Kesu l t s of recent
A high
F ina l s o l s pre-
Direct Preparation ob Low-Nitrate Piwtonia Sol. - Previous efforts to make pliitonia sols by methods
not requiring a denitration s t e p were reported l a s t year; however, i n t hese c a s e s , i t was found that a n NO,- /Pu mole ratio of 1 or greater was required to form a s t a b l e so l . Recently, by u s e of a modified procedure, plutonium sols having intermediate NO,- /Pu mole ratios have been obtained directly from plutonium precipitates. T h e procedure involves forming plutonium polymer prior t o precipitation by adding plutonium nitrate solution to NH,OH to a se l ec t ed pH in t h e range of 1.5 to 2. T h e polymer i s aged by digestion a t an e leva ted temperature until it prec ip i ta tes (pH above 3.5). T h e prec ip i ta te forms a sol when sufficient NH,NQ, and NM,QM have been removed by washing. Two types of sol - a translucent emerald-green sol and an opaque light-green sol - can b e obtained by th i s procedure, depending primarily on the final pH se l ec t ed for precipitation. T h e first type appears to b e superior hut requires more careful control during its forma- tion. Both types of sol a re characterized by a very s m a l l c rys ta l l i t e size (20 to 30 A o r less) NQ,- /Pu mole ra t ios ranging from 0.4 to 0.8. If e x c e s s NI-I,OH is used, a precipitate is obtained tha t requires t h e addition of approximately 1 inole of nitrate per m o l e of plutonium to a t ta in a s t a b l e sol. This behavior is cons is ten t with that of sols studied last year.
Evaluation of these sols is presently under way. I t is fe l t that , while t hese sols might have spec ia l application because of simplified equipment re- quirements, sols produced by the s tandard flowsheet a r e superior and have a more universal applicabili ty. T h e relatively high nitrate content of t h e s e spec ia l sols enhances instabil i ty and resultant precipitation when they a r e mixed with low-nitrate thoria and urania sols. Also, t hese sols are not reversible (i .e. , they cannot b e evaporated to d ryness and then re-formed to sol by resuspension in water). Micro- sphe res not only a re more difficult to form from t h e s e sols but also have a strong tendency to crack and d is in tegra te during calcination.
and
Characterization of Calcined Mi crsspheaes. - Plutonia and Pu0,-UO, microspheres that have been ca lc ined at 1150°@ are characterized by high den- s i ty , low surface a rea , and high res i s tance to crushing. Photograplis of po l i shed metallographic sec t ions of PUB), and Pu02-U02 microspheres a re shown in Fig. 7.13. Mercury porosimetry measure- ments indicate dens i t i e s of 95 to 99% of the theo- retical crystal density for typ ica l products. Specific sur face a reas of 0.02 m 2 / g were obtained for 300- t o 600-p-diam microspheres. Calc ined (at 1150°C:
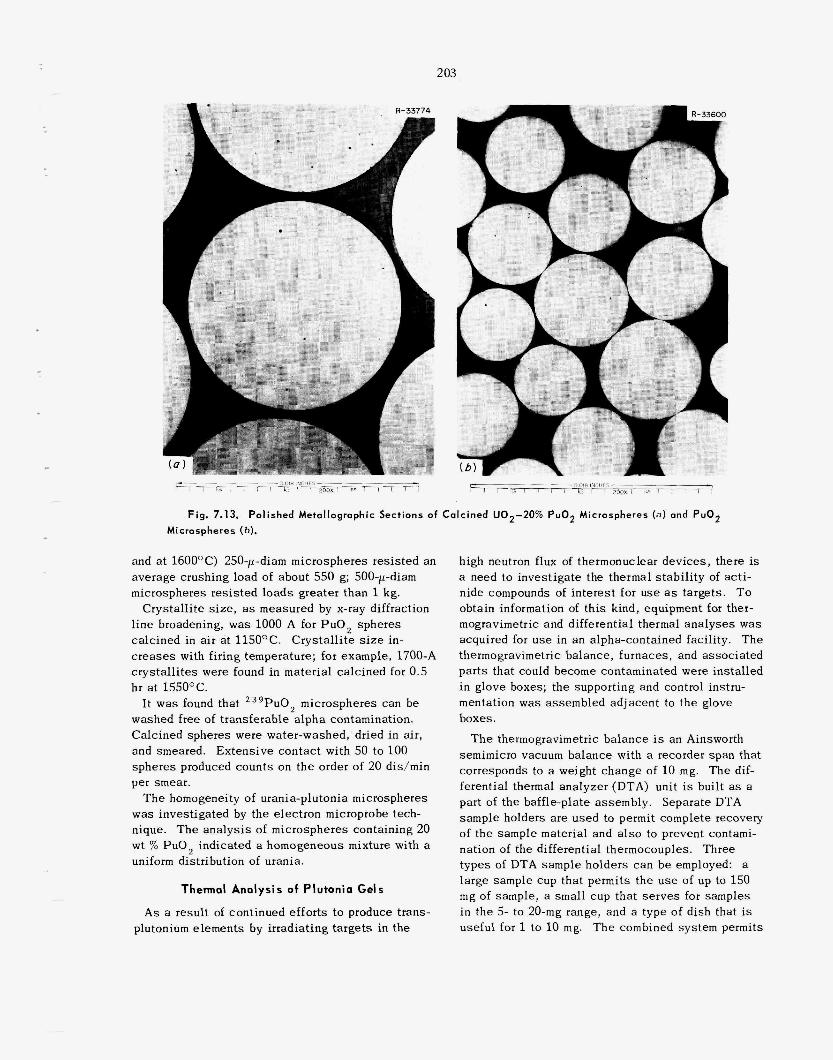
203
Fig. 7.13. Pol Metallographic Sections of Calcined UO2-2O% PuOz Micros ) and P Microspheres (b).
ut 550 g; 500-p-diam
Thermal Analysis of Plutonia Gels
As a result of con ued efforts to produce tra urn elements by irradiating targets in the
boxes.
with a recorde
unit i s built as a
204
simultaneous thermogravimetric and differential thermal ana lyses of alpha-active materials up to 16OO0C in vacuum, air , or various atmospheres up to pressures sl ightly above atmospheric. Baffle- p l a t e assembly uni t s can b e interchanged to optimize conditions for a particular temperature range. In ad- dition, the existing baffle-plate assembly design can b e temporarily removed, and other assembl ies or des igns can b e used for spec ia l experiments or applications.
Thermal Analysis of Europia Sol-Gel Material . - T h e equipment described above w a s cold-tested with europia gel because of the known similarity between lanthanides and ac t in ides and the related interest i n t he actinide and rare-earth sol-gel processes . T h e TGA-DTA study of europia gel was limited to tem- peratures below 1100' C by the construction material used for prototype baffle-plate assembl ies .
Two types of colloidally d ispersed hydrous oxides (sols) can be made with rare earths: o n e crystall ine and one amorphous (which s lowly c rys ta l l izes upon aging in aqueous media). T h e thermal ana lys i s of gel microspheres prepared from both types of sol sugges t s a difference in chemical forms. Thermo- grams for europia gel microspheres prepared from crystall ine sol exhibit a rapid weight loss, ac- companied by a sharp endothermic DTA peak, at 250 to 300OC. T h e weight change corresponds to a l o s s of 1 mole of water per mole of europium, indi- ca t ing the empirical formula Eu20,.2H20. Thermo- grams of microspheres made from an amorphous sol show only a gradual weight loss, with no detectable endothermic DTA peak in t h e 250 to 3OOOC region.
Analys is of the thermograms of microspheres is complicated by the presence of organic residues from the drying solvent used in forming the gel microspheres. Oxidation of t h i s carbon residue either by residual nitrate and/or oxygen from the a i r resu l t s in an exothermic DTA peak in the region of 300OC. Material from amorphous and crystall ine so l that gelled by evaporation ( ins tead of by u s e of solvents) was examined to a id t h e interpretation. Thermograms for ge l s made by evaporating both amorphous and crystall ine s o l s at 60'C were iden- t ica l , indicating that t he amorphous sol was con- verted to the crystall ine form during evaporation. Ge l s obtained by vacuum evaporation (at 25OC) of an amorphous sol gave a thermogram tha t appeared
'C. J. Hardy, S. R. Buxton, and M. H. Lloyd, Prepara- tion of Lanthanide Oxide Microspheres by Sol-Gel Methods, ORNL-4000 (Aug. 8 , 1967).
to b e a mixture of the amorphous and crystall ine ma- terials. Thermograms of evaporated ge l s were the same in oxygen, argon, or vacuum, but thermograms of microspheres were different in different atmo- spheres. T h e height of t h e exothermic DTA peak a t 300'C was greatly enhanced by an oxygen atmo- sphere and the weight change in t h i s region was more abrupt. T h i s is as expected i f t h e s e e f fec ts result from t h e oxidation of organic material in the micro- spheres.
The weight changes and the endothermic DTA peaks a re tentatively considered t o resu l t from l o s s of water below 300' and nitrate decomposi- tion in the 350 to 500' region. T h e sharp weight change and the endothermic peak at approximately 250 to 3OOOC correspond to a loss of 1 mole of water per mole of europium. Further work is planned to completely define the system.
Thermal Analysis of Plutonia Sol-Gel Materials. - After alpha containment of t he TGA-DTA system was complete, t h e equipment was used to examine sev- e ra l plutonia sol-gel compounds. In the plutonia sol-gel process there a re two s t e p s that involve solid-state reactions at temperatures above ambient: (1) denitration of high-nitrate plutonia gel, which is then redispersed into plutonia so l ; and (2) calci- nation of gel microspheres formed from such a sol.
High-nitrate plutonium gel w a s studied by TGA and DTA methods in vacuum, argon, and oxygen atmospheres up to 1600OC. T h e decomposition re- action of th i s material (Fig. 7.14a) did not vary with atmosphere and cons is ted of two weight loss s t e p s (total l o s s , 32%) accompanied by corresponding endothermic DTA peaks. T h e decomposition mecha- nism h a s not been completely elucidated, but nitrate is los t in both s t eps . Decomposition products in the first s t e p appear to cons i s t of water and oxides of nitrogen, while the second weight l o s s corresponds t o the measured loss i n nitrate.
Thermograms for plutonia gel microspheres and for gel prepared by drying plutonia so l are shown in Figs. 7.14b and 7 . 1 4 ~ . T h e thermogram for plutonia micro- spheres was again complicated by the presence of organic residue, as evidenced by an exothermic DTA peak a t about 230OC. T h e TGA plot for gel micro- spheres shows severa l inflections rather than well- defined weight loss regions; evaporated gel not ex- posed to organic so lvents produced a thermogram similar to that for high-nitrate gel, except that the two weight loss s t e p s extended to higher tempera- tures. The total weight loss was 6.5% (constant after 700OC) for evaporated gel and 7.5% for micro-
..
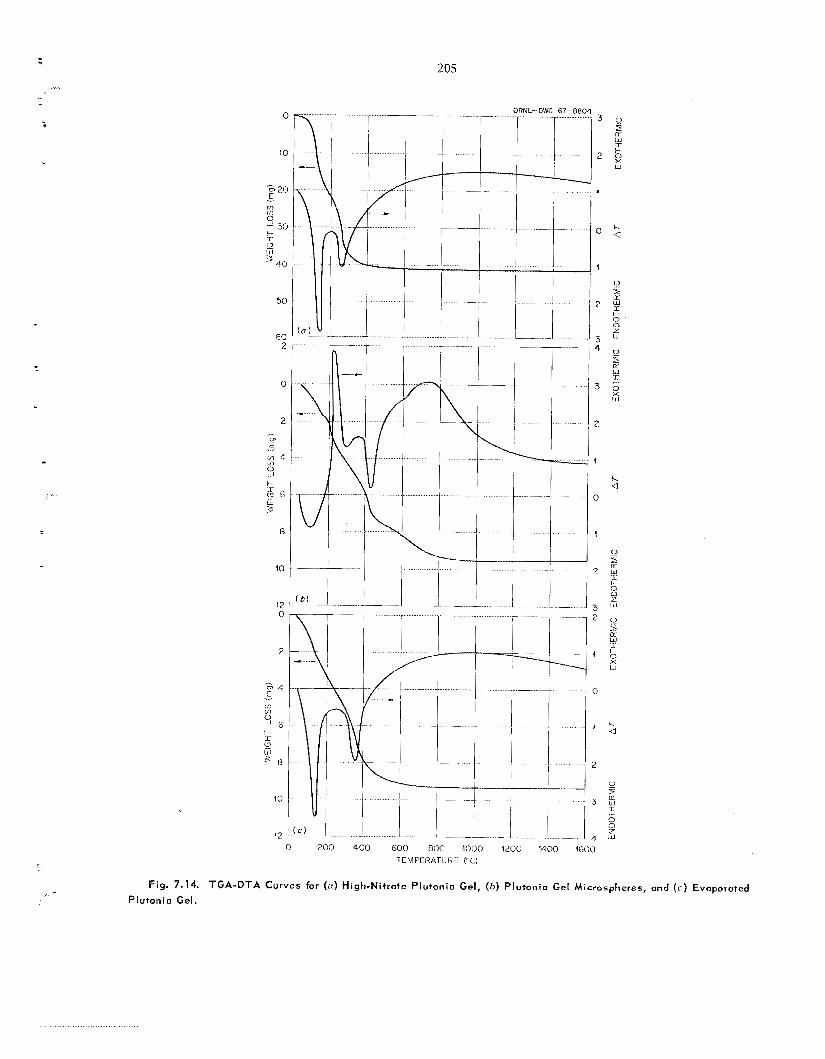
205 ....
Fig. 7.14. TGA-DTA Curves for ( a ) High-Ni t rate Plutonio Gel, ( b ) Plutonio Gel Microspheres, and (c) Evaporated
Plutonio Gel.
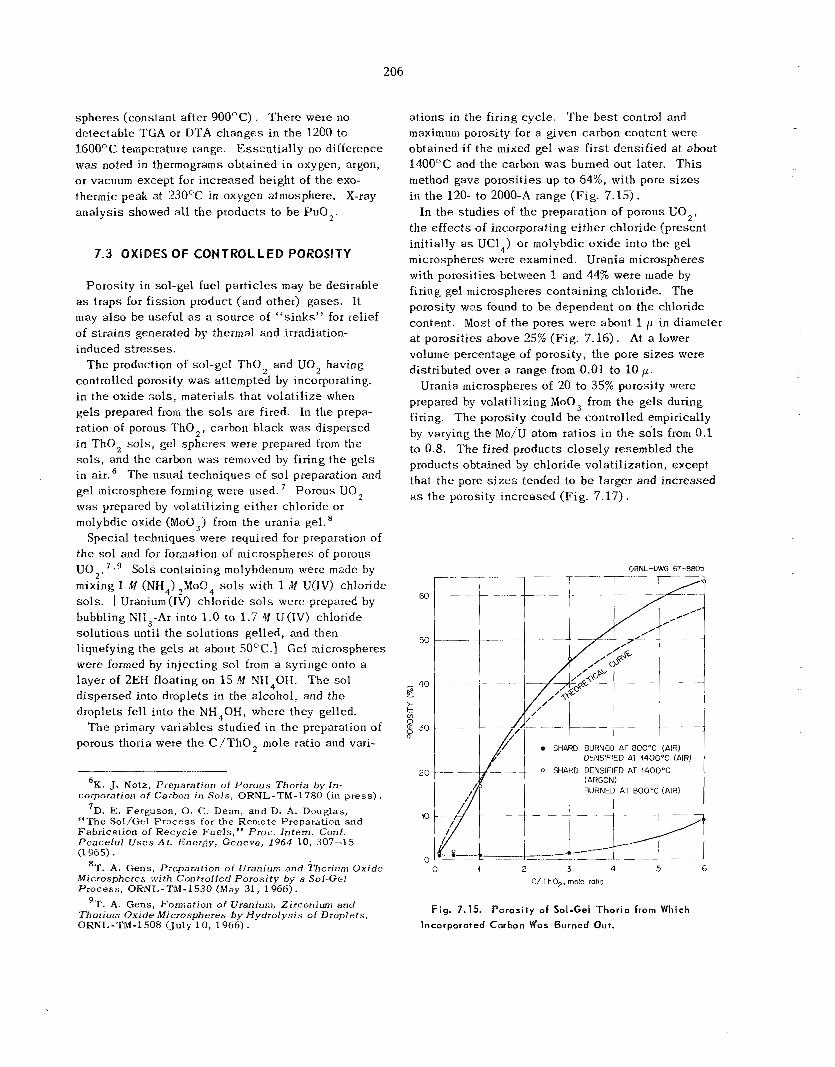
206
spheres (constant after 9OOOC). There were no detectable TGA or DTA changes in the 1200 to 1600°C temperature range. Essent ia l ly no difference was noted in thermograms obtained in oxygen, argon, or vacuum except for increased height of the exo- thermic peak at 230°C in oxygen atmosphere. X-ray ana lys i s showed all the products to b e PuQ,.
7.3 OXIDES OF CONTROLLED POROSITY
Porosity in sol-gel fuel par t ic les may be desirable a s traps for fission product (and other) gases . It may a l so be useful a s a source of “ s inks” for relief of s t ra ins generated by thermal and irradiation- induced s t r e s ses .
The production of sol-gel T h o , and UO, having controlled porosity was attempted by incorporating, in the oxide so l s , materials that volati l ize when ge l s prepared from the s o l s a r e fired. In the prepa- ration of porous ‘ThO,, carbon black was dispersed in T h o , sols, gel spheres were prepared from the so l s , and the carbon was removed by firing the ge ls in air .6 The usual techniques of sol preparation and gel microsphere forming were used. was prepared by volatilizing either chloride or molybdic oxide (MOO,) from the urania gel.
the sol and for formation of microspheres of porous UO,. 7 , 9 Sols containing molybdenum were made by mixing 1 M (NH,) ,MoQ, sols with 1 M U(IV) chloride sols. [ Uranium (IV) chloride s o l s were prepared by bubbling NH3-Ar into 1 .0 to 1.7 ?/I U(1V) chloride solutions until the solutions gelled, and then liquefying the ge ls a t about 50°C.] Gel microspheres were formed by injecting sal from a syringe onto a layer of 2EH floating on 15 M N H 4 0 H . The so l dispersed into droplets in the alcohol, and the droplets fell into the NH,OH, where they gelled.
porous thoria were the C / T h O , mole ratio and vari-
Porous UO,
Special techniques were required for preparation of
T h e primary variables s tud ied in the preparation of
%. J. Notz, Preparation of Porous ‘Thoria b y l n - corporation o f Carbon in Sols , ORNL-TM-1780 ( in p r e s s ) .
7D. E. Ferguson, 0. C . Dean, and D. A. Douglas, “The Sol/Gel P rocess for the Remote Preparation and Fabrication o f Recyc le Fue l s , ” Proc. Intern. Conf . Peaceful Uses At . Energy, Geneva, 1964 10, 307-15 (1 965).
Microspheres with Controlled Porosity b y a Sol-Gel Process , ORNL-TM-1530 (May 31, 1 9 G G ) . 9T. A. Gens, Formation of Uranium, Zirconium and
Thorium Oxide Microspheres b y Hydrolysis o f Droplets,
‘T. A. Gens, Preparation of Uranium and Thorium Oxide
ORNL-TM-1508 (July 10, 1966).
a t ions in the firing cyc le . maximum porosity for a given carbon content were obtained i f the mixed gel was first densified a t about 1400°C and the carbon was burned out later. T h i s method gave porosit ies up to 64%, with pore s i z e s in the 120- to 2000-A range (Fig. 7.15).
In the s tud ies of the preparation of porous UO,, the e f fec ts of incorporating e i ther chloride (present initially as UC1,) or molybdic oxide into the gel microspheres were examined. Urania microspheres with porosit ies between 1 and 44% were made by firing gel microspheres containing chloride. The porosity was found to b e dependent on the chloride content. Most of the pores were about 1 p in diameter a t porosit ies above 25% (Fig . 7.16), At a lower volume percentage of porosity, t he pore s i z e s were distributed over a range from 0.01 to 10 F .
Urania microspheres of 20 to 35% porosity were prepared by volatilizing MOO, from the ge ls during firing. The porosity could b e controlled empirically by varying the Mo/U atom ra t ios in the so’ls from 0.1 to 0.8. T h e fired products c lose ly resembled the products obtained by chloride volati l ization, except that the pore s i z e s tended to b e larger and increased as the porosity increased (F ig . 7 .17) .
T h e bes t control and
60
50
I 40 - Fs > k ul 0
a 30 B
2 0
10
0
ORNL-OWG 67-8805
SHARD BURNED AT 800°C (AIR) DENSIFIED AT f4OO0C (AIR)
.- DENSIFIED AT 4400°C (ARGON) BURNED AT 800°C (AIR)
I I
0 4 2 3 4 5 6 C/ i.hO2, mole ratlo
Fig. 7.15. Porosity of Sol-Gel Thoria from Which
Incorporated Carbon Was Burned Out.
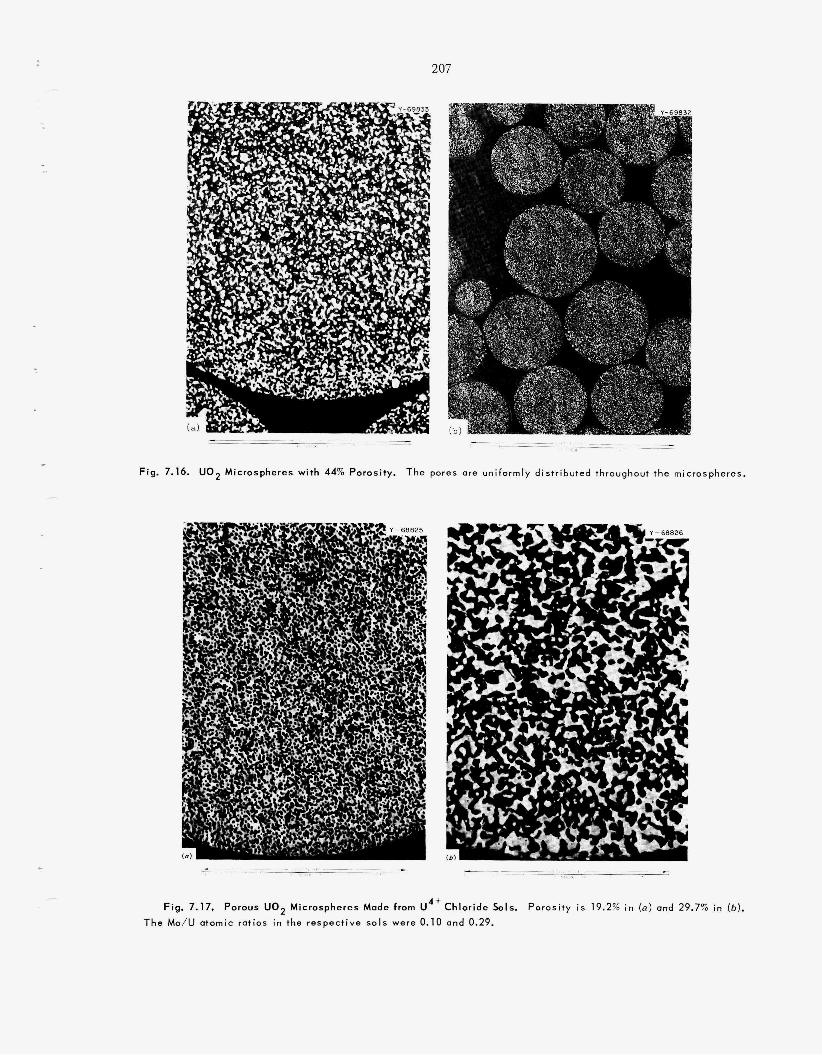
,- 207
Fig. 7.16. U 0 2 Microspheres with 44% Porosity. The pores are uniformly distributed throughout the microspheres.
10.:
Fig, 7.17. Porous U02 Microspheres Made from U 4 + C h l o r i d e Sols. Porosity i s 19.2% in (a) and 29.7% in (b) .
T h e Mo/U atomic ratios in the respective so ls were 0.10 and 0.29.
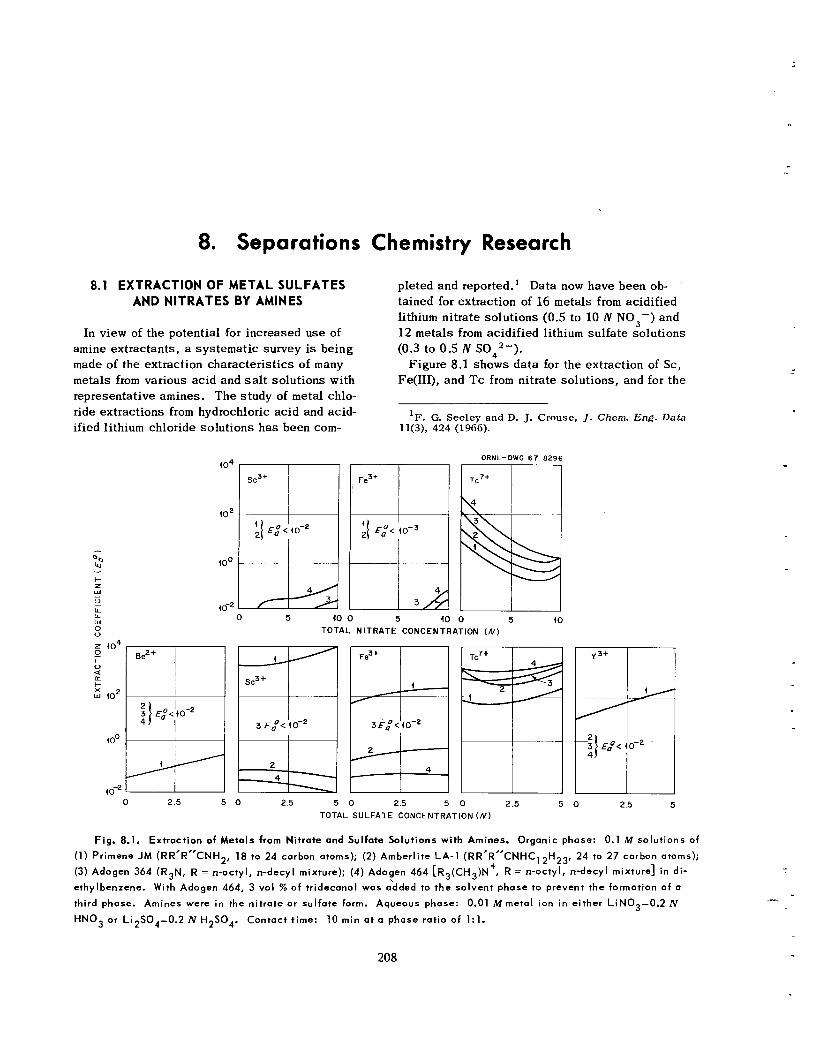
0. Separations
8.1 EXTRACTION OF METAL SULFATES AND NITRATES BY AMINES
In view of the potential fo r increased use of amine extractants , a sys temat ic survey is being made of the extraction character is t ics of many metals from various acid and salt solut ions with representative amines. T h e s tudy of m e t a l chlo- ride extractions from hydrochloric ac id and acid- ified lithium chloride so lu t ions h a s been com-
404
402
400
10-2
sc3+
Chemistry Research
pleted and reported.’ Data now have been ob- tained for extraction of 16 metals from acidified lithium ni t ra te so lu t ions (0.5 to 10 N NO,-) and 12 m e t a l s from acidif ied lithium su l fa te solut ions (0.3 to 0.5 N S042- ) .
Figure 8.1 shows d a t a for the extraction of Sc, Fe(III), and Tc from ni t ra te solut ions, and for the
‘F. G. Seeley and D. J. Crouse, J . Chern. Eng. Data 11(3), 424 (1966).
ORNL-DWG 67-8296
0 5 40 0 5 40 0 5 40 TOTAL NITRATE CONCENTRATION ( N ) -1 3 €,O<ro-‘
0 2.5 5 0 2.5 5 0 2.5 5 0 2.5 5 0 2.5 5 TOTAL SULFATE CONCENTRATION ( N )
Fig. 8.1. Extraction of Metals from Nitrate and Sulfate Solutions with Amines. Organic phase: 0.1 M solutions of (1) Pr imem JM (RR’R”CNH2, 18 to 24 carbon atoms); (2) Amberlite LA-1 (RR’R’’CNHC,2H23, 24 to 27 carbon atoms); (3) Adogen 364 (R3N, R = n-octyl, n-decyl mixture); (4) Adogen 464 [R,(CH,)N+, R = n-octyl, n-decyl mixture] in di- ethylbenzene. With Adogen 464, 3 vol % o f tridecanol was abded to the solvent phase to prevent the formation o f a
third phase. Amines were in the nitrate or sulfate form. Aqueous phase: 0.01 M metal ion in either LiN03-0.2 N HNO3 or Li2S04-0.2 N H2S04. Contact t ime: 10 min at o phase ratio of 1:l.
208
extraction of Sc , Fe(III), T c , Be, and Y from sul- fa te so lu t ions with 0.1 M so lu t ions of representa- t ive primary, secondary, tertiary, and quaternary amines in diethylbenzene. In the sulfate sys tem, the primary amine ex t rac ted Sc, Fe(III), and Y strongly, and B e weakly, the extraction coeffi- c ien ts i n a l l cases increas ing with increasing su l fa te concentration. Very slight, or negligible, extraction of t h e s e e lements was obtained with the other types of amines in the su l f a t e sys tem and with all types of amines in the nitrate sys t em. Technetium w a s ex t rac ted strongly in both s y s - tems. Bes ides t h e resu l t s shown in Fig. 8.1, ex- traction coefficients were less than 0.05 over t h e total range of salt concentrations for L i , Na, K, Rb, Cs, Be, Mg, Ca , Sr, Ba , AI, Y , and Zn from nitrate so lu t ions , and for Li, Na, K, Rb, Cs, Al, and Zn from su l f a t e so lu t ions .
8.2 NEW SEPARATIONS AGENTS
- ....
II . ..
We are continuing to investigate, for potential utility i n so lvent extraction or other separa t ions methods, compounds that are: (1) newly ava i lab le commercially, (2) submitted by manufacturers for testing, or (3 ) spec ia l ly procured fo r t e s t ing of class or structure.
Sulfonic and Carboxylic Acids
A supply of didodecylnaphthalenesulfonic ac id (HDDNS) w a s prepared for u s e in cation exchange and synerg is t ic extraction tests. T h i s compound is 298% pure and h a s a neutral equivalent of 534 (theoretical, 545); we assume, from t h e method used for its syn thes i s , that t h e material h a s only one s tmcture, 3,7-di-n-dodecylnaphthalene-l-sul- fonic acid. A s expec ted , it is a s t rong ac id and is effective as a ca t ion exchanger for metals from concentrated ac id (aqueous) solutions. It is 30% converted from t h e hydrogen to the sodium form (0.05 M DDNS) by contac t with 2 izI HN03--1 M NaNO . , while more than 50% conversion is
tion being observed. T h i s is cons is ten t with the earlier observation tha t adding phosphoryl com- pounds to a sulfonic ac id (dinonylnaphthalene- sulfonic ac id p lus phosphonate e s t e r or phosphine oxide) synerg izes the extraction of various metal ions.’ In preliminary t e s t s with HDDNS, europium extraction w a s synergized by trioctylphosphine oxide (TOPO) but not by TBP; strontium extraction was not synergized by TOPO.
Two new branched carboxylic ac ids , of higher molecular weight than those previously available, have been obtained for t e s t ing solubility and ex- traction properties. They are a “neo” ac id mix- ture, R-C(CH3)2-C02H, containing 15 to 19 carbon atoms, and 3,7,11,15-tetramethylhexadecanoic ac id .
Aminopoiycarboxylic Acids
Three aminopolycarboxylic ac ids , needed i n the investigation of the effects of s t ruc ture on their formation of complexes with trivalent ac t in ides (Sect. 8.11), were synthes ized by reaction of sodium chloroacetate with the ap- propriate polyamine under reflux. T h e arnino- polycarboxylic a c i d s were liberated from the re- su l tan t s a l t s by hydrochloric ac id (pH 1 .O), pre- c ip i ta ted by adding a n equal volume of ethanol, and purified by s u c c e s s i v e recrystall izations from water-ethanol mixtures. T h e purit ies were veri- fied by elemental ana lys i s , and t h e success ive pK,’s of each were determined by potentiometric titration (Table 8.1).
p-Di ketones
Sterically hindered P-diketones have been re- ported a s complexers for lithium i ~ n . ~ - ~ Iiow- ever, t he li+hium complexes with the reagents used in those s tud ie s (dipivaloylrnethane, di- benzoylmethane) had either s ign i f icant solubili ty in the a lka l ine aqueous solution or low solubili ty in common organic diluents. T h e da ta sugges t
achie:ed by contac t with 1 M HN03-2 M NaN03. Extraction coef f ic ien ts for strontium and europium (cf. Sect. 8.13) a r e much lower than with dialkyl-
2Cherri. Teclinol. Div. Cheni. D e v . Sect. C Pro&. Rept. for October, 1959, CF-59-10-101, pp. 22-24.
3G. A. Cuter and G. S. Hammond, J. Am. Chem. Soc. 78. 5166 (1956). . ,
phosphoric or carboxylic acids and l ack the prom- inent maxima in t h e E vs pH curves tha t a r e charac te r i s t ic of those cornplexing ac ids . T h e s e da ta sugges t tha t t h e extractions occur through cation exchange a lone , with l i t t l e or no coordina-
4T. V. Healy, Chern. Div. Pro&. R e p t . fdr 1 Nov. 1964 to 30 Apr. 1965, AEKE-PR/Chem 8, p. 13 (May 1965).
5D. A. Lee, Abstracts of Papers , 153rd Meeting Am. Cbem. S O C . , April 10-14, 1967, Div. Nucl. Chem. and Technology.
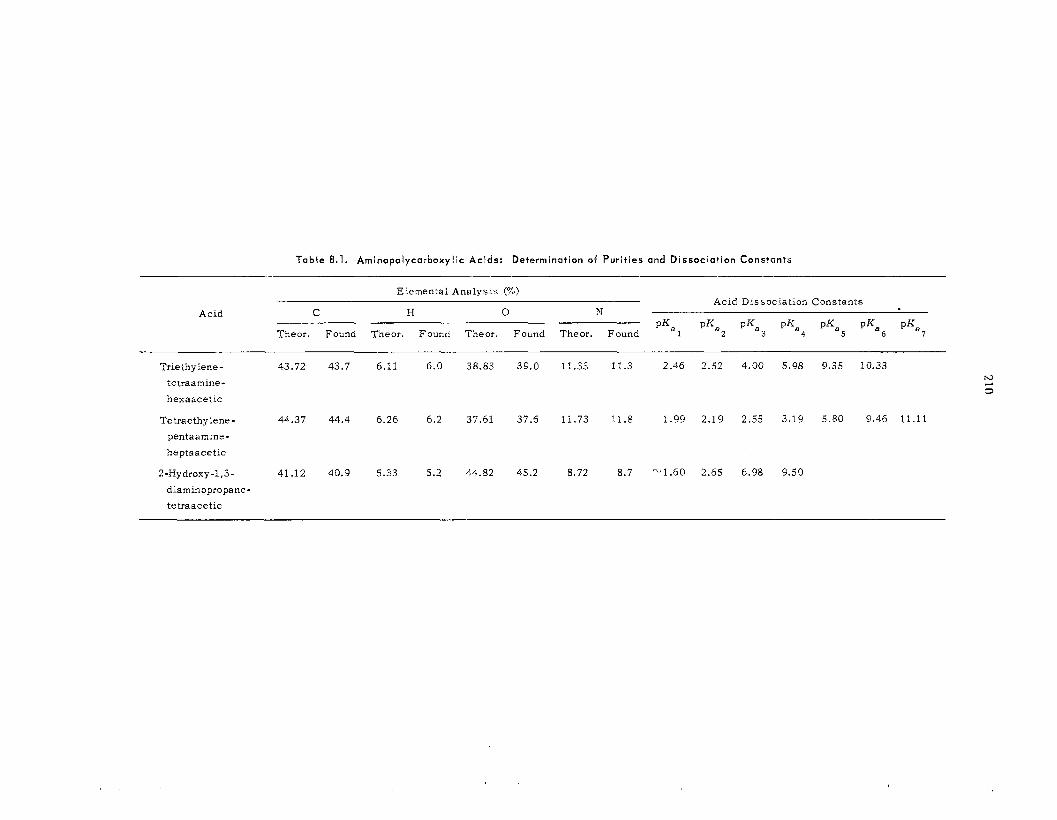
Table 8.1. Aminopolycarboxylic Acids : Determinaiian of Puri t ies and Dissocia?ion Constants
Elemental Analysis (%) Acid Dissociation Constants
Acid C H 0 N PK, PK, PK, pKa pKa PK, PK,
Theor. Fonnd Theor. Found Theor. Found Theor. Found 1 2 3 4 5 6 7
Trieihylene - 43.72 43.7 6.11 6.0 38.53 39.0 11.33 11.3 2.46 2.52 4.00 5.98 '3.35 10.33
tecraamine- hcxaece:ic
Te traethylene - 44.37 44.4 6.26 6.2 37.61 37.6 11.73 11.8 1.99 2.19 2.55 3.19 5.80 9.46 11.11
pentaamine- heptaacetic
2-Hydioxy-l,3- 41.12 40.9 5.33 5.2 44.82 45.2 8.72 8.7 h.l.SG 2.05 6.98 9.50 diaminopropane- tetraacetic
N CI 0
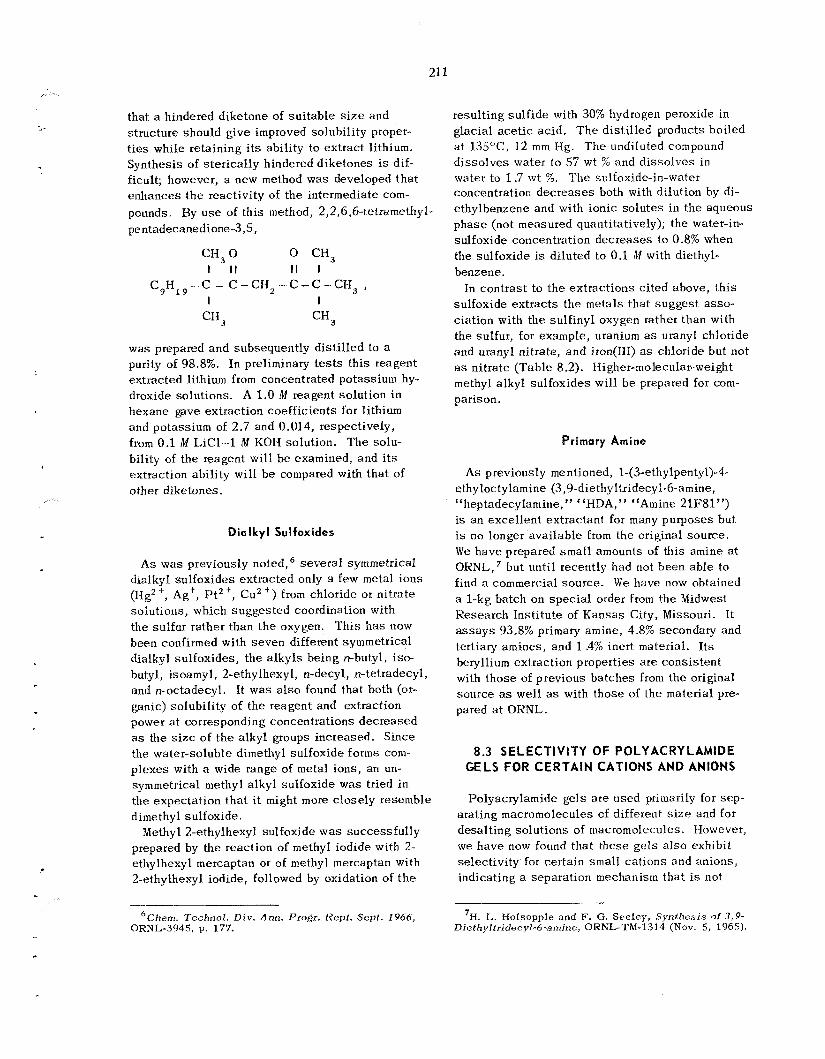
21 1
that a hindered diketone of su i tab le size and structure should give improved solubili ty proper- t i e s while retaining i t s ability to ex t rac t lithium. Synthesis of s te r ica l ly hindered diketones is dif- ficult; however, a new method was developed tha t enhances t h e reactivity of the intermediate c o m - pounds. By use of this method, 2,2,6,6-tetramethyl- pentadecanedione-3,5,
CH, 0 0 CH, I I1 II I
I I C,H1,-C - C - C H , - C - C - C H , ,
CN
was prepared and subsequent ly d is t i l l ed to a purity of 98.8%. In preliminary tests th is reagent extracted lithium from concentrated potassium hy- droxide solutions. A 1 .0 M reagent solution in hexane gave extraction coefficients for lithium and potassium of 2.7 and 0.014, respectively, from 0.1 M LiC1-1 M KOH solution. T h e solu- bility of the reagent will be examined, and its extraction abil i ty will be compared with tha t of other diketones.
Dia lkyl Sulfoxides
As was previously noted, s eve ra l symmetrical dialkyl sulfoxides ex t rac ted only a few metal ions (Hg2 +, Ag’, Pt2 +, Cu2 + ) from chloride or nitrate solutions, which sugges ted coordination with the sulfur rather than t h e oxygen. T h i s h a s now been confirmed with seven different symmetrical dialkyl sulfoxides, the a lkyls being n-butyl, iso- butyl, is oa my 1, 2-ethyl hex y 1, n-decy I, n-tetradec yl , and n-octadecyl. It was also found that both (or- ganic) solubili ty of the reagent and extraction power at corresponding concentrations decreased as the size of the alkyl groups increased. Since the water-soluble dimethyl sulfoxide forms com- p lexes with a wide range of m e t a l ions, an un- symmetrical methyl a lkyl sulfoxide was tried in the expectation tha t it might more c lose ly resemble dimethyl sulfoxide.
Methyl 2-ethylhexyl sulfoxide w a s successfu l ly prepared by the reaction of methyl iodide with 2- ethylhexyl mercaptan or of methyl mercaptan with 2-ethylhexyl iodide, followed by oxidation of t h e
‘Chem. Technol. Div. Ann. Pro&. Rept. Sept. 1966, ORNL-3945, p. 177.
result ing su l f ide with 30% hydrogen peroxide in glacial acetic ac id . T h e d is t i l l ed products boiled a t 135OC, 1 2 mm Hg. T h e undiluted compound d isso lves water to 57 wt % and d isso lves in water to 1.7 wt %. The sulfoxide-in-water concentration dec reases both with dilution by di- e thylbenzene and with ionic so lu tes in the aqueous phase (not measured quantitatively); the water-in- sulfoxide concentration decreases to 0.8% when the sulfoxide is diluted to 0.1 M with diethyl- benzene.
In contrast to t he ex t rac t ions c i ted above, t h i s sulfoxide ex t rac ts the metals tha t sugges t asso- ciation with the sulfinyl oxygen rather than with the sulfur, for example, uranium as uranyl chloride and uranyl nitrate, and iron(II1) as chloride but not as nitrate (Table 8.2). Higher-molecular-weight methyl alkyl su l foxides will b e prepared for com- parison.
Primary Amine
A s previously mentioned, 1-(3-ethylpentyl)-4- ethyloctylamine (3,9-diethyXtridecyl-6-amine, “heptadecylamine,” “HDA,” “Amine 21F81”) is an exce l len t extractant for many purposes but is no longer available from the original source . We have prepared s m a l l amounts of this amine at ORNL,’ but until recently had not been ab le to find a commercial source. We have now obtained a 1-kg batch on spec ia l order f rom the Midwest Research Insti tute of Kansas City, Missouri. It a s s a y s 93.8% primary amine, 4.8% secondary and tertiary amines, and 1.4% inert material. Its beryllium extraction properties a re cons is ten t with those of previous ba tches from the original source as well as with those of the material pre- pared at ORNL.
8.3 SELECTIVITY OF POLYACRYLAMIDE GELS FOR CERTAIN CATIONS AND ANIONS
Polyacrylamide gels are used primarily for sep- arating macromolecules of different s i z e and for desa l t ing so lu t ions of macromolecules. However, we have now found tha t these ge l s also exhibit selectivity for certain small cations and anions, indicating a separation mechanism tha t is not
’H. I,. Holsopple and F. G. Seefey, Syntheais of 3,9- Diethyffr idecyl-6-aminc, ORNL-TM-1.314 (Nov. 5 , 1965).
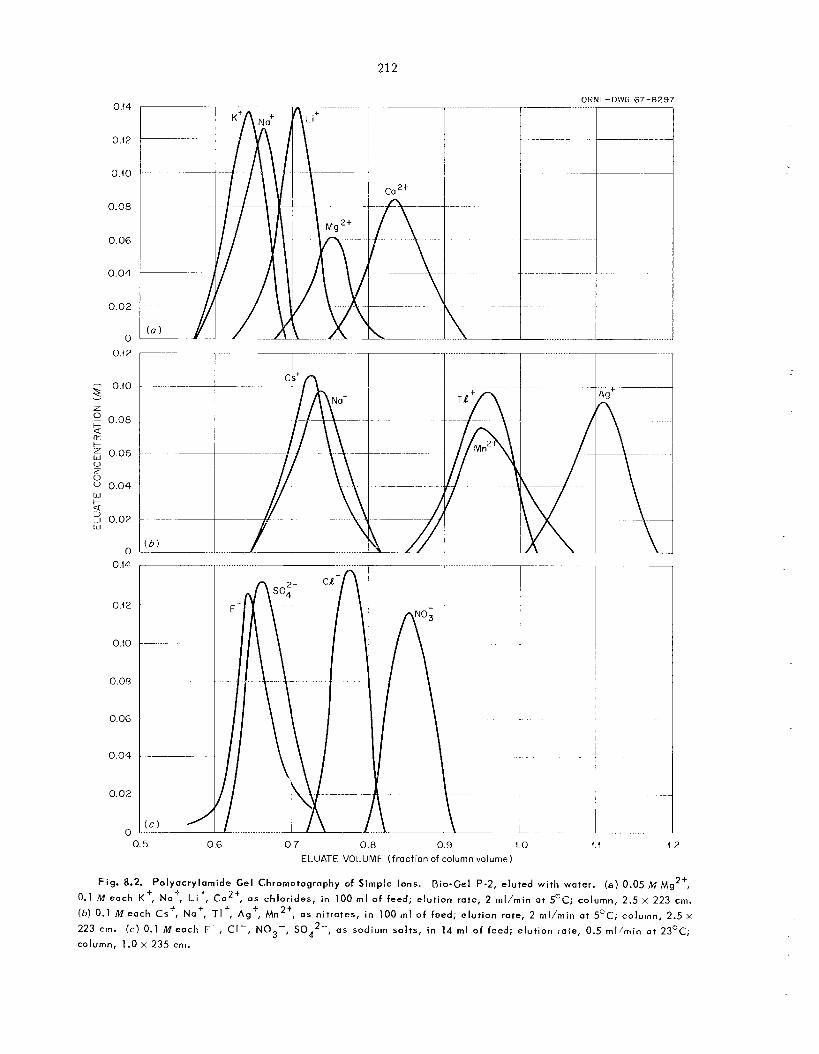
212
OKNL-UIVG t7--8297 0.i4
0.12
0.40
0.08
0.06
0.04
0.02
0
0.(2
- 0.10 8 - Z p 0.08
w & U 3 J 0.02 w
0
0.14
0.12
0.10
0.08
0.06
0.04
0.02
0 C ) "/ ...
0.5 0.6 0 7 0.8 0.9 I O i.i 12 EILUATE VOLLUME (fraction of column volume)
Fig. 8.2. Polyacrylamide Gel Chromatography of Simple Ions. Rio-Gel P-2, eluted with water. (a) 0.05 M Mg2*, 0.1 1?4 eoch K', Na', Lit, Ca2', a s chlorides, in 100 m l of feed; elution rate, 2 rnl/min a t 5OC; column, 2.5 x 223 cm.
( b ) 0.1 M each CS', NO', TI*, Ag', Mn2+, as nitrates, in 100 m l o f feed; elution rate, 2 ml/min a t 5OC; column, 2.5 x 223 cm. ( c ) 0.1 M e a c h F-, CI-, NOg-, .SOA2.-, as sodium salts, i n 14 m l o f feed; elution rate, 0.5 ml/rnin a t 23OC; column, 1 .O x 235 cm.
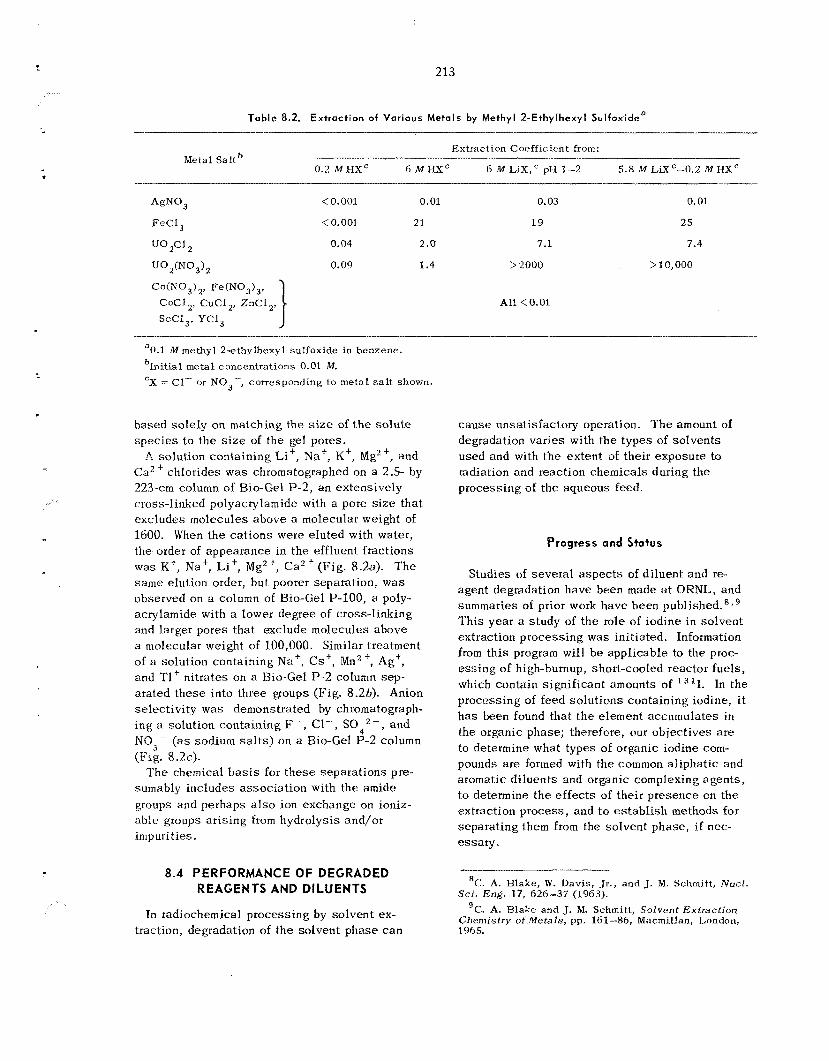
213
Table 8.2. Extraction of Various Metals by Methyl 2-Ethylhexyl Sulfoxidea
Extraction Coefficient from: __ Metal S a l t b 0.2 M H X ~ 6 M €EC 6 M LiX, ' pH 1-2 5 . 8 M LaC-0.2 M HXC
&NO3 < 0.001 0.01 0. OB 0.01
FeC1, < 0.001 21 19 25
U 0 2 C l , 0.04 2.0 7.1
u 0 (rm ,) 0.09 1.4 > 2000
7.4
> l O , O O O
A l l <0.01 Co(N03)2 , Fe(N03)3,
CoCl 2, CuCl 2, ZnCl 2 ,
ScC13, YC1,
"0.1 M methyl 2-ethylhexyl sulfoxide i n benzene. b . . Initial metal concentrations 0.01 M. cX = C1- or NO,-, corresponding to metal salt shown.
based so le ly on matching the s i z e of t h e so lu t e spec ie s to the s i z e of the gel pores.
A solution containing Li', Na', K', Mg2', and Ca2 ' chlorides was chromatographed on a 2.5- by 223-cm column of Bio-Gel P-2, an extensively cross-linked polyacrylamide with a pore s i z e tha t excludes molecules above a molecular weight of 1600. When the ca t ions were eluted with water, the order of appearance in the effluent fractions was K', Na', Li', Mg2', Ca2 ' (F ig . 8.2aj. The same elution order, but poorer separation, w a s observed on a column of Bio-Gel P-100, a poly- acrylamide with a lower degree of cross-linking and larger pores that exclude molecules above a molecular weight of 100,000. Similar treatment of a solution containing Na', Cs', Mn2', Ag', and Tl' nitrates on a Bio-Gel P-2 column sep- arated these into three groups (Fig. 8.20). Anion se lec t iv i ty was demonstrated by chromatograph- ing G solution containing I?, Cl-, SO4'-, and NO3- ( a s sodium s a l t s ) on a Bio-Gel P-2 column
T h e chemical b a s i s for these separa t ions pre- sumably includes assoc ia t ion with the amide groups and perhaps a l s o ion exchange on ioniz- ab le groups a r i s ing from hydrolysis and/or impurities.
(Fig. 8.2c).
8.4 PERFORMANCE OF DEGRADED REAGENTS AND DILUENTS
In radiochemical processing by so lvent ex- traction, degradation of the solvent phase c a n
cause unsatisfactory operation. T h e amount of degradation var ies with the types of so lvents used and with the extent of their exposure to radiation and reaction chemicals during the processing of the aqueous feed.
Progress and Status
Studies of severa l a s p e c t s of diluent and re- agent degradation have been made a t ORNL, and summaries of prior work have been published.'*' Th i s year a s tudy of the role of iodine i n solvent extraction process ing was init iated. Information from t h i s program will b e applicable to the proc- e s s ing of high-hurnup, short-cooled reactor fuels, which contain significant amounts of '"I. In the processing of feed so lu t ions containing iodine, it h a s been found that t h e element accumulates in the organic phase; therefore, our objectives a re to determine what types of organic iodine com- pounds a re fwmed with the common a l ipha t ic and aromatic d i luents and organic cornplexing agents , t o determine the e f fec ts of their p resence on the extraction process , and to e s t ab l i sh methods for separating them from the solvent phase , if nec- essary .
'C. A. Blake, W. Davis, Jr., and J. M. Schmit t , N u c t . Sci. Eng. 17, 626-37 (1963).
' C . A. Blake and J. M. Schmitt, Solvent Exfract ion Cliemistry of Metals, pp. 161-86, Macmillnn, London, 1965.
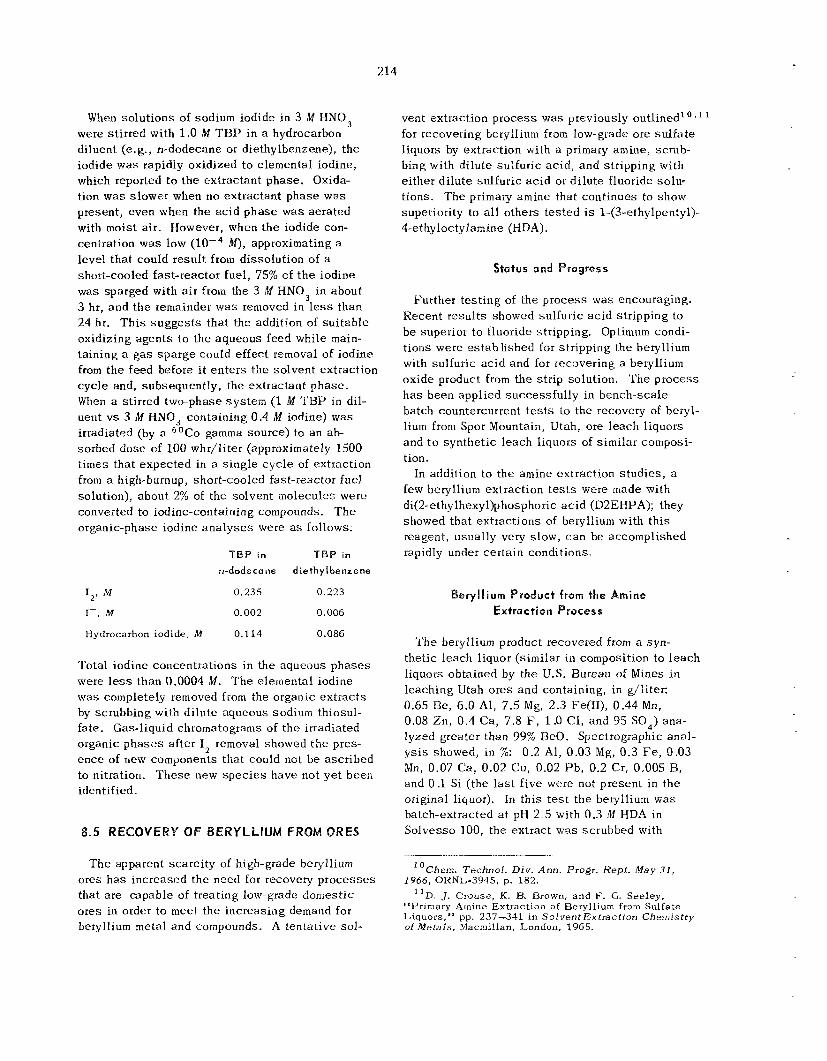
214
When so lu t ions of sodium iodide in 3 M HNQ, were s t i r red with 1.0 M TBP in a hydrocarbon diluent (e .g . , n-dodecane or diethylbenzene), t he iodide was rapidly oxidized to elemental iodine, which repoited to the extractant phase . Oxida- tion was s lower when no extractant phase w a s present, even when the ac id phase w a s aerated with m o i s t air . However, when t h e iodide con- centration was low level that could resu l t from dissolution of a short-cooled fast-reactor fuel, 75% of t h e iodine was sparged with a i r from the 3 M HNQ3 in about 3 hr, and t h e remainder was removed in l e s s than 24 hr. T h i s sugges t s tha t the addition of su i t ab le oxidizing agents to the aqueous feed while main- taining a g a s spa rge could effect removal of iodine from t h e feed before i t en te rs t he so lvent extraction cyc le and, subsequently, the extractant phase . When a stirred two-phase sys t em (1 M TBP in dil- uent v s 3 M HNO, containing 0.4 ,11 iodine) was irradiated (by a 6oCo gamma source) to an ab- sorbed dose of 100 whr/liter (approximately 1500 times that expec ted in a s ingle cyc le of extraction from a high-burnup, short-cooled fast-reactor fuel solution), about 2% of the solvent molecules were converted to iodine-containing compounds. T h e organic-phase iodine a n a l y s e s were as follows:
M ) , approximating a
TBP in TBP in n-dodecane diethyl benzene
12' M 0.235 0.223
I-, M 0.002 0.006
Hydrocarbon iodide, M 0.114 0.086
Total iodine concentrations in the aqueous phases were less than 0.0004 M . T h e elemental iodine was completely removed from the organic ex t rac ts by scrubbing with d i lu te aqueous sodium thiosul- fate. Gas-liquid chromatograms of t h e irradiated organic p h a s e s after I2 removal showed the pres- e n c e of new components tha t could not be ascr ibed to nitration. T h e s e new s p e c i e s have not ye t been identified.
T h e apparent scarc i ty of high-grade beryllium ores h a s increased the need for recovery p rocesses that a r e capable of treating low-grade domestic o re s in order to m e e t the increasing demand for beryllium metal and compounds. A tentative sol-
vent extraction p rocess was previously outlined' o ,' ' for recovering beryllium from low-grade ore su l f a t e liquors by extraction with a primary amine, scrub- bing with dilute sulfuric ac id , and stripping with either d i lu te sulfuric ac id or d i lu te fluoride solu- tions. T h e primary amine that continues to s h o w superiority to all others tes ted is 1-(3-ethylpentyl)- 4-ethyloctylamine (HDA).
Staters and Progress
Further tes t ing of the process was encouraging. Recent resu l t s showed sulfuric ac id stripping to b e superior t o fluoride stripping. Optimum condi- t ions were es tab l i shed for stripping the beryllium with sulfuric ac id and for recovering a beryllium oxide product from the s t r ip solution. The p rocess h a s been applied successfu l ly in bench-scale batch countercurrent tests to the recovery of beryl- lium from Spor Mountain, Utah, ore leach liquors and to synthe t ic leach liquors of similar composi- tion.
In addition to the amine extraction s tud ie s , a few beryllium extraction t e s t s were made with di(2-ethylhexy1)phosphoric ac id (D2EHPA); they showed that extractions of beryllium with th i s reagent, usually very s low, c a n be accomplished rapidly under certain conditions.
Beryll ium Product from the Amine Extraction Proces s
T h e beiyllirim product recovered from a syn- thetic leach liquor (similar in composition to l each liquors obtained by the U.S. Bureau of Mines in leaching Utah o res and containing, in g/liter: 0.65 Be, 6.0 Al, 7.5 Mg, 2.3 Fe(II), 0.44 Mn, 0.08 Zn, 0.4 Ca, 7.8 F, 1 .O C1, and 95 SO4) ana- lyzed greater than 99% B e 0 . Spectrographic anal- y s i s showed, i n %: 0.2 Al, 0.03 Mg, 0.3 F e , 0.03 Mn, 0.07 C a , 0.02 Cu, 0.02 P b , 0.2 Cr, 0,005 B, and 0.1 Si (the l a s t f ive were not present in t he original liquor). In th i s t e s t t he beryllium was batch-extracted a t pH 2.5 with 0.3 ,I.I HDA in Solvesso 100, the extract was scriubbed with
"Chem. Technol. Div. Ann. Progr. Hept. May 31,
"D. J. Crouse, K. B. Brown, and F. G. Seeley, "Prlmary Atnine Extraction of Beryllium from Sulfate Liquors," pp. 237-341 in Solvent Extraction Chemistry of M e t a l s , Macmillan, London, 1965.
1966 , ORNL-3945, p. 182.
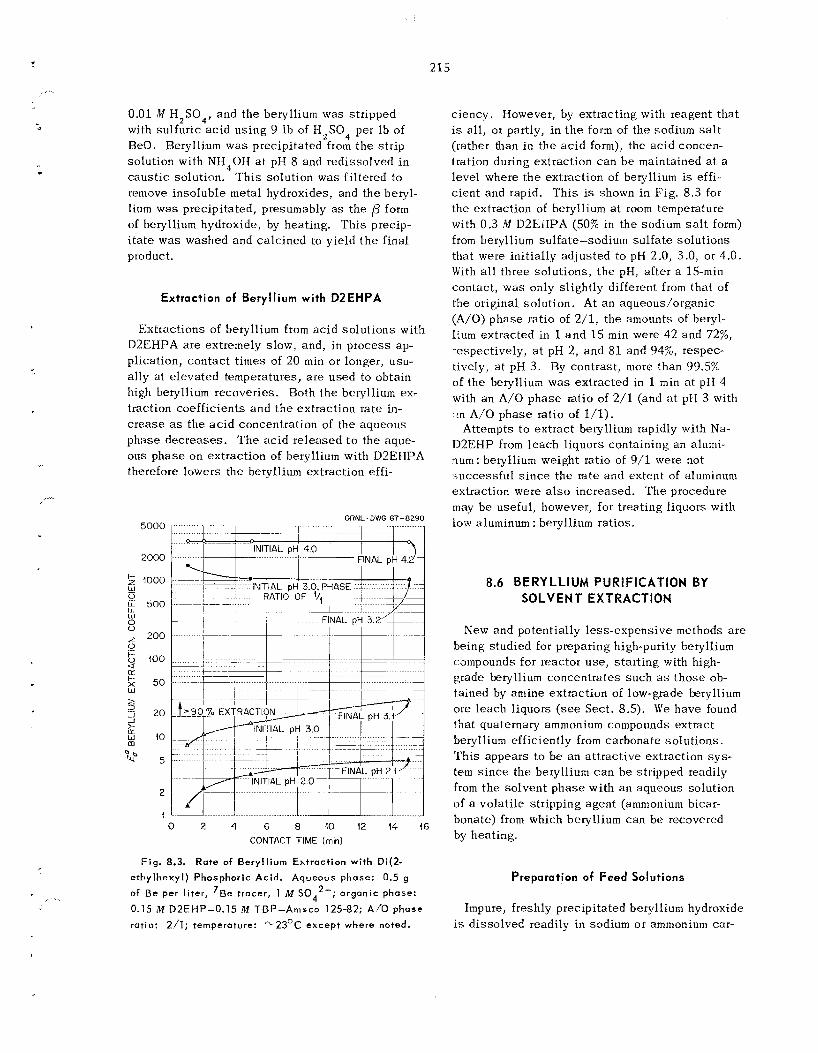
... . .
215
....
. .
0.01 iM H 2 S 0 4 , and t h e beryllium was stripped with su l fur ic ac id us ing 9 lb of H 2 S 0 4 per Ib of BeO. Beryllium w a s precipitated f rom t h e s t r ip solution with NH40H a t pH 8 and redissolved in caus t i c solution. T h i s solution was fi l tered to remove inso luble metal hydroxides, and the beryl- lium was precipitated, presumably as the @ form of beryllium hydroxide, by heating. T h i s precip- i t a t e w a s washed and ca lc ined to yield t h e final product.
Extraction of Beryllium with DZEHPA
Exttactions of beryllium from ac id so lu t ions with Il2EHPA a re extremely slow, and, in process ap- plication, contac t times of 20 min or longer, usu- ally a t e leva ted temperatures, a r e used to obtain high beryllium recoveries. Both the beryllium ex- traction coefficients and t h e extraction rate in- c r ease as the a c i d concentration of the aqueous phase dec reases . T h e ac id re leased t o the aque- ous phase o n extraction of beryllium with D2EHPA therefore lowers the beryllium extraction effi-
ORNL-DWG 67-8298
7 T-7- __ 1 - - 1 5000 --
2000 l o ! , I ^ ! , I FINAL pH 4 2 ~-
i I ~~ -1 ~ INI'TIAL pH: 40 ~
2 1000
8
t, 100
L g
i;: 500 0
LL W
200 0
K
w 5 50
I I3
J t- n 3 20
w 10 rn
2 5
2
I 0 2 4 6 8 10 12 14 16
CONTACT TIME (min)
Rate of Beryll ium Extraction with Di(2- Fig. 8.3. cthylhexyl) Phosphoric Acid. Aqueous phase: 0.5 g
of Be per l i ter, 7Be tracer, 1 Iw SOA2-; organic phase:
0.15 M D2EHP-0.15 M TBP-Amsco 125-82; A/O phase
ratio: 21'1; temperature: -23OC except where noted.
ciency. However, by extracting with reagent tha t is a l l , or partly, i n t h e form of the sodium s a l t (rather than in the a c i d form), the ac id concen- tration during extraction c a n b e maintained a t a level where t h e extraction of beryllium is effi- c ien t and rapid. T h i s is shown in F ig . 8.3 for the extraction of beryllium at room temperature with 0.3 M D2ErIPA (50% in the sodium s a l t form) from beryllium sulfate-sodium su l fa te so lu t ions that were init ially ad jus ted to pH 2.0, 3.0, or 4.0. With all three so lu t ions , t h e pH, after a 15-min contact, was only sl ightly different f rom tha t of the original solution. At a n aqueous/organic (A/O) phase ratio of 2/1, the amounts of beryl- lium extracted in 1 a n d 15 min were 42 and 72%, espec t ive ly , at pH 2, and 81 and 94%, respec-
tively, a t pH 3 . By contrast , more than 99.5% of t h e beryllium w a s ex t rac ted in 1 min at pH 4 with a n A/O phase ratio of 2/1 (and at pH 3 with in A/O phase ratio of l/l).
Attempts to extract beryllium rapidly with Na- D2EHP from l each l iquors containing an alumi- Turn: beryllium weight ratio of 9/1 were not L,uccessful s i n c e t h e rate and extent of aluminum extraction were a l s o increased. T h e procedure may b c useful, however, for treating liquors with low aluminum : beryllium ratios.
8.6 BERYLLIUM PURIFICATION BY SOLVENT EXTRACTION
New and potentially less-expensi ve methods a r e being studied for preparing high-purity beryllium csmpounds for reactor u se , s ta r t ing with high- grade beryllium concent ra tes such a s those ob- tained by amine extraction of low-grade beryllium ore leach liquors (see Sect . 8.5). W e have found that quaternary ammonium compounds extract beryllium efficiently from carbonate so lu t ions . T h i s appears to b e an a t t rac t ive extraction sys - tem s i n c e the beryllium c a n b e stripped readily from t h e so lvent phase with an aqueous solution of a vola t i le stripping agent (ammonium bicar- bonate) from which beryllium c a n b e recovered by heating.
Preparation of Feed Solutions
Impure, freshly precipitated beryllium hydroxide is disso lved readily in sodium or ammonium car-
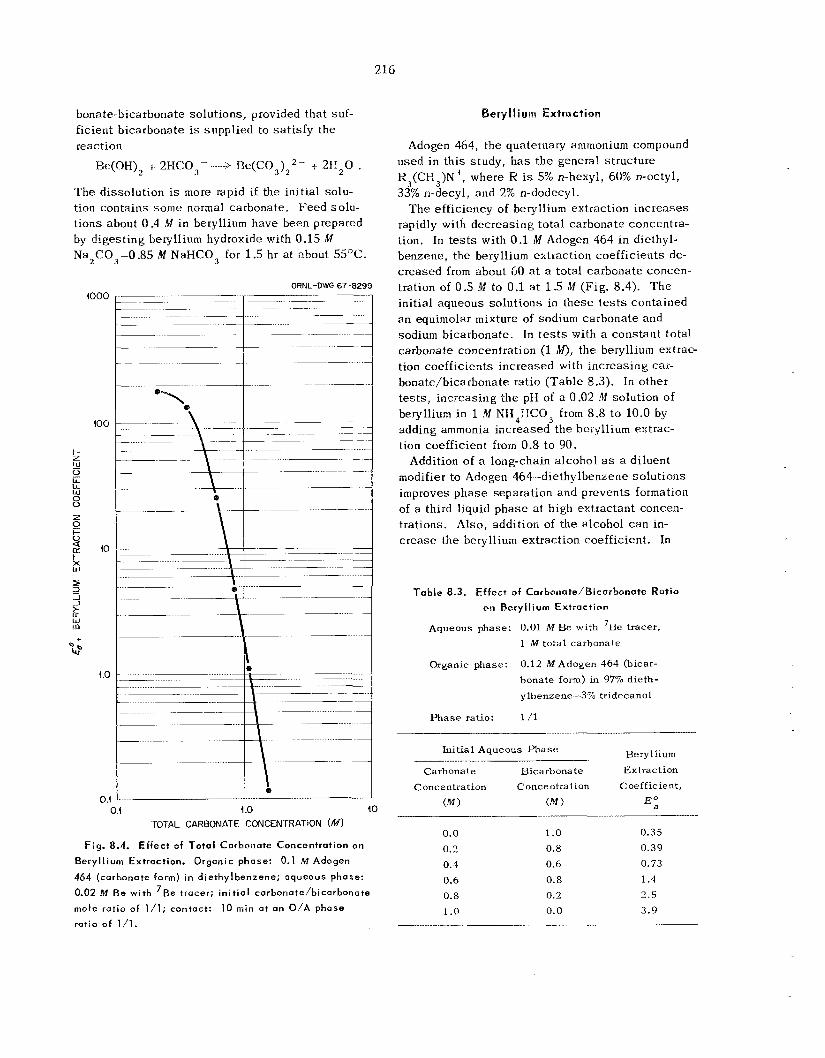
21 6
bonate-bicarbonate solutions, provided tha t suf- ficient bicarbonate i s suppl ied to sa t i s fy the reaction
Bc(OH)~ + 2HC03- ---+ Be(C03)22- + 2 H 2 0 . The dissolution i s more rapid if the initial solu- tion contains s o m e normal carbonate, Feed so lu- t ions about 0.4 M i n beryllium have been prepared by digesting beryllium hydroxide with 0.15 M Na2C03-0.85 M NaHC03 for 1.5 hr a t about 5S°C.
ORNL-DWG 67 8299 ~~ 1- ~~~
io00 I--- ~
t- z w 0 LL Lc W
8 Z
t- 0
[r
ILI
0
a
k 5 J J
W m &
Q
400
O.! 4 .O 40 'TOTAL CARBONATE CONCENTRATlON (M)
Fig. 8.4. Effect of Total Carbonate Concentration on
Beryllium Extraction. Organic phase: 0.1 M Adogen
464 (carhonate form) in diethylbenzene; aqueous phase:
0.02 M Be with 7Ee tracer; ini t ia l carbonate/bicarbonote
mole ratio of 1/1; contact:
ratio o f 1/1. 10 m i n a t an O/A phose
Beryl I i urn Extraction
Adogen 464, the quaternary ammonium compound used i n th i s s tudy , h a s t h e general structure R3(CH3)N+, where R is 5% n-hexyl, 60% n-octyl, 33% n-decyl, and 2% n-dodecyl.
T h e efficiency of beryllium extraction inc reases rapidly with decreas ing to ta l carbonate concentra- tion. In t e s t s with 0.1 M Adogen 464 i n diethyl- benzene, the beryllium extraction coefficients de- c reased from about 60 at a total carbonate concen- tration of 0.5 M to 0.1 a t 1.5 M (Fig. 8.4). T h e init ial aqueous so lu t ions in these t e s t s contained a n equimolar mixture of sodium carbonate arid sodium bicarbonate. In tests with a cons tan t total carbonate concentration (1 M), the beryllium extrac- tion coef f ic ien ts increased with increas ing car- bonate/bicarbonate ratio (Table 8.3). In other t e s t s , increasing the pI-1 of a 0.02 M solution of beryllium in 1 M N H 4 H C 0 3 from 8.8 to 10.0 by adding ammonia increased the beryllium extrac- tion coefficient from 0.8 to 90.
Addition of a long-chain a lcohol as a diluent modifier to Adogen 464---diethylbenzene so lu t ions improves phase separation and prevents formation of a third liquid phase a t high extractant concen- trations. Also, addition of the a!cohol can in- c r ease the beryllium extraction coefficient. In
Table 8.3. Effect of Corbonote/Bicarbonote Ratio on Beryll ium Extraction
Aqueous phase: 0.01 MBe with 7Be tracer, 1 M total carbonate
Organic phase: 0.12 MAdogen 454 (bicar- bonate form) in 97% dieth- ylbenzene-3% tridecanol
Phase ratio: 1/1 ..........
Initial Aqueous Phase Beryllium Carbonate Bicarbonate Extraction
Concentration Concentration Coefficient,
__. ..... ._
(M ) (bf ) E:: ____ .......
0.0 1 .o 0.35 0.2 0.8 0.39 0.4 0.5 0.73 0.5 0.8 1.4 0.8 0.2 2.5
1.0 0.0 3.9 .......... ~ .... ~ _. .........
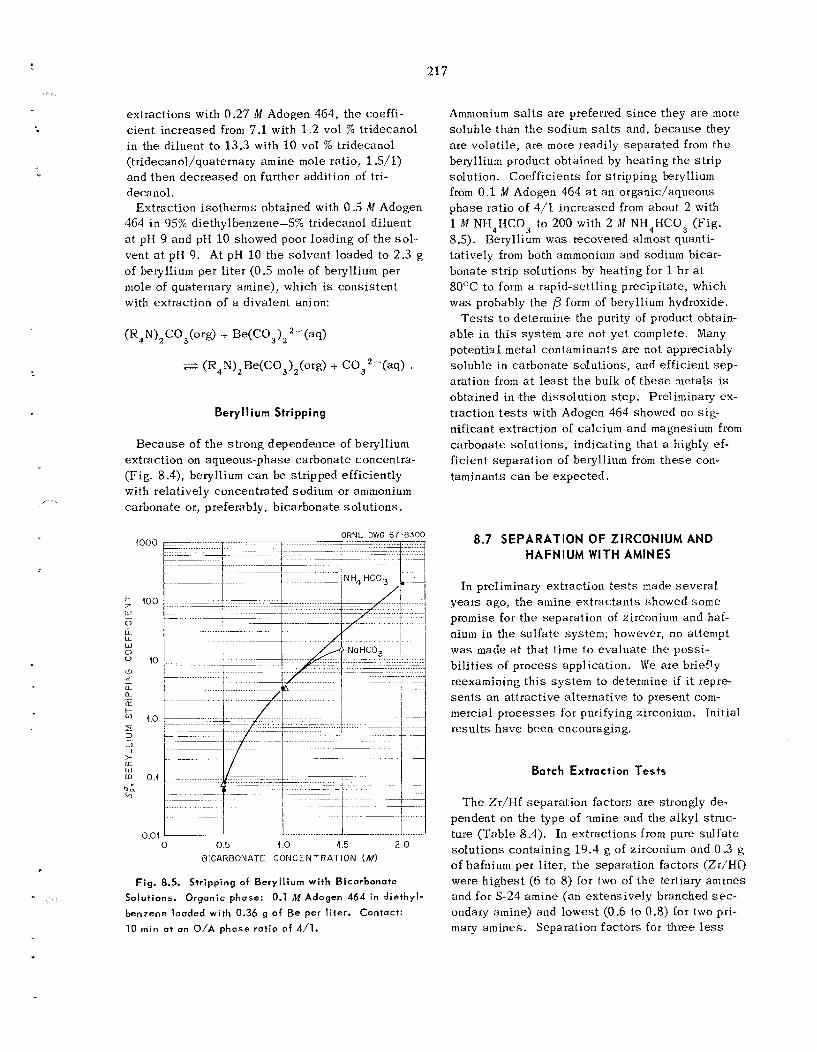
217
extractions with 0.27 I!! Adogen 464, t he coeffi- c ien t increased from 7.1 with 1.2 vol % tr idecanol in the diluent to 13.3 with 10 vol % tridecanol (tridecanol/quaternary amine mole ratio, 1 S/l) and then dec reased on further addition of tri- decanol.
464 in 95% diethylbenzene-5% tridecanol diluent a t pH 9 and pH 10 showed poor loading of t h e so l - vent at pH 9. At pH 10 the so lvent loaded to 2.3 g of beryllium per l i t e r (0.5 mole of beryllium per mole of quaternary amine), which is cons is ten t with extraction of a d iva len t anion:
Extraction isotherms obtained with 0.5 M Adogen
Beryl I ium Stripping
Because of t h e s t rong dependence of beryllium extraction on aqueous-phase carbonate concentra- (Fig. 8.4), beryllium c a n be stripped efficiently with relatively concentrated sodium or ammonium carbonate or, preferably, bicarbonate so lu t ions .
ORNL-DWG 67-8300
0 0.5 10 1 5 2 0
BICARBONATE C O N C E N T R A T I O N (MI
Fig. 8.5. Stripping of Beryllium with Bicarbonate Solutions. Organic phase: 0.1 M Adogen 464 in diethyl- benzene loaded with 0.36 g of Be per liter. Contact: 10 m i n at an O/A phase ratio of 4/1.
Ammonium s a l t s a r e preferred s ince they are more so luble than t h e sodium s a l t s and, because they a r e volati le, are more readily separa ted from t h e beryllium product obtained by hea t ing the s t r ip solution. Coefficients for stripping beryllium from 0.1 M Adogen 464 at an organic/aqueous phase ratio of 4 /1 increased from about 2 with 1 ilf NH4HC03 to 200 with 2 M NH,HC03 (Fig. 8.5). Beryllium was recovered almost quanti- tat ively from both ammonium and sodium bicar- bonate s t r ip so lu t ions by hea t ing for 1 hr a t 80°C t o form a rapid-sett l ing precipitate, which was probably the /3 form of beryllium hydroxide.
ab le i n th i s sys tem are not ye t complete. Many potential metal contaminants a re not appreciably so luble in carbonate solutions, and efficient sep- aration from a t least t h e bulk of t h e s e metals is obtained in the d isso lu t ion s t ep . Preliminary ex- traction tests with Adogen 464 showed no s ig - nificant extraction of calcium and magnesium from carbonate solutions, indicating that a highly ef- ficient separa t ion of beryllium from t h e s e con- taminants c a n b e expec ted .
Tests t o determine the purity of product obtain-
8.7 SEPARATION O F ZIRCONIUM AND HAFNIUM WITH AMINES
In preliminary extraction t e s t s made seve ra l years ago, t he amine ex t rac tan ts showed s o m e promise for t h e separa t ion of zirconium and haf- nium i n the su l fa te system; however, no attempt was made a t tha t time to eva lua te the poss i - b i l i t i es of p rocess application. We a re brieCly reexamining t h i s system to determine if i t repre- s e n t s a n a t t rac t ive a l te rna t ive to present com- mercial p rocesses for purifying zirconium. Init ial results have been encouraging.
Batch Extraction Tests
T h e Zr/Hf separa t ion factors a re strongly de- pendent on t h e type of .Imine and the alkyl struc- ture (Table 8.4). In ex t rac t ions from pure su l fa te solutions containing 19.4 g of zirconium and 0.3 g of hafnium per l i ter , t he separation factors (Zr/Hf) were h ighes t (6 to 8) for two of t h e tertiary amines and for S-24 amine (an extensively branched sec- ondary amine) and lowest (0.6 to 0.8) for two pri- mary amines. Separation fac tors for three less
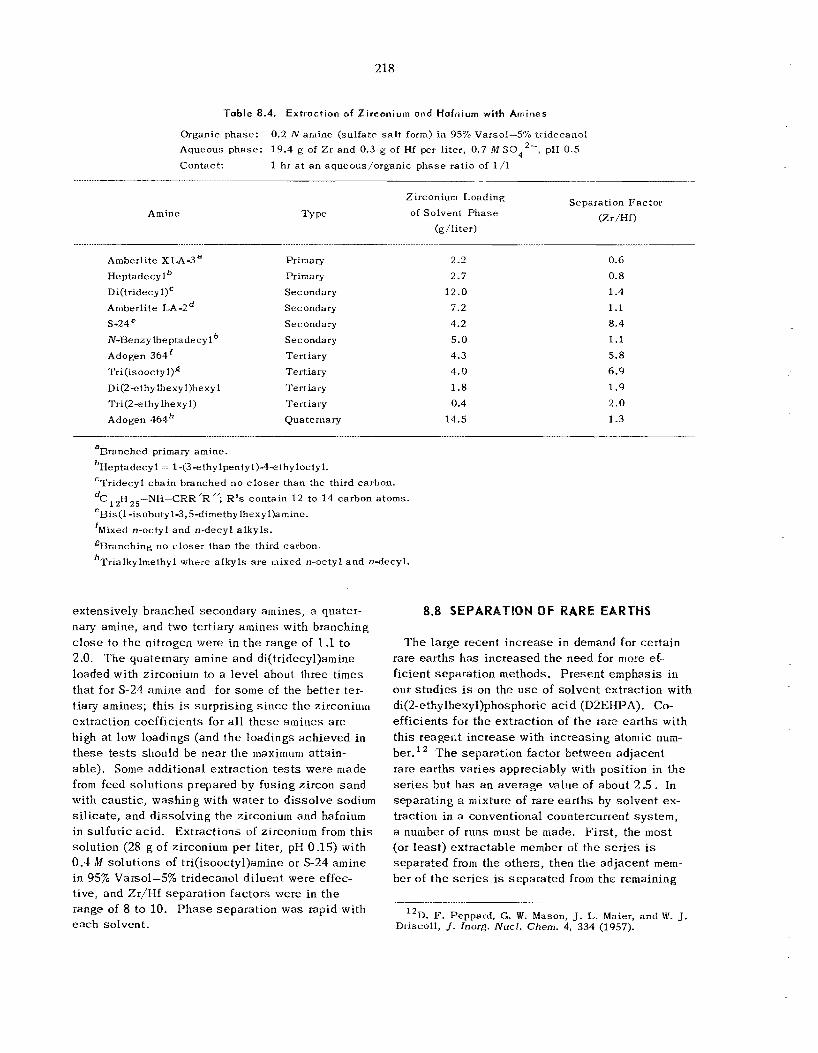
2 18
Table 8.4. Extraction af Zirceniut1.r and H a f n i u m with Amines
Organic phase: Aqueous phase: 19.4 g of Zr and 0.3 g of Hf per liter, 0.7 IC1 SO,’-, p1-I 0.5 Contact:
0.2 N amine (sulfate sa l t form) in 95% Varsol--570 tridecanol
1 hr a t a n aqueous/organic phase ratio of 1/1
Amine Type
. . . . . . . . . . . . . . . . . . . . . . . . . . . . . .-
Amberlite XLA-3a Primary Heptadecylb Primary Di(tridecyl)c Secondary Ainberlite LA-2 Secondary S-24= Secondary N-Benzy Ihe ptadecy 1 Secondary Adogen 364‘ Tertiary Tri(isoocty1)g Tertiary D i(2 -e thy lhex y 1)hexy 1 Tertiary
Tri(2 e thylhexy 1) Tertiary Adogen 464h Qua ternary
Separation Factor (Zr/Hf)
Zirconium Loading of Solvent Phase
(g/liter)
2.2 2.7
12.0 7.2 4.2 5.0 4.3 4.0 1.8
0.4 14.5
0.6 0.8 1 .4 1.1 8.4 1 .I 5.8 6 .9 1 .9 2.0
1.3
aBranched primary amine. bIIeptadecyl ~ 143 -ethylpentyl)-4ethylocty 1. ‘Tridecyl chain branched n o c loser than the third carbon. dC121125-NI-~--CRR’R’’; R’s contain 12 to 14 carbon atoms. eBis(1-isobuty13,5-dimethylhexyl)amine.
fMixed n-octyl and n-decyl alkyls. ‘Branching no closer than the third carbon. hTrialkylrnethyl where alkyls a re mixed n-octyl and n-decyl.
extensively branched secondary amines, a quater- nary amine, and two tertiary amines with branching close to the nitrogen were in t h e range of 1.1 t o 2.0. T h e quaternary amine and di(tridecy1)amine loaded with zirconium to a level about three times that for S-24 amine and for s o m e of the better ter- tiary amines; th i s i s surprising s i n c e t h e zirconium extraction coefficients for a l l t hese amities a r e high at low loadings (and t h e loadings achieved in these t e s t s should be near the maximum attain- able). Some additional extraction t e s t s were made from feed so lu t ions prepared by fusing zircon s a n d with caus t ic , washing with water t o d isso lve sodium s i l ica te , and d isso lv ing the zirconium and hafnium in su l fur ic ac id . Extractions of zirconium from t h i s solution (28 g of zirconium per l i ter , pH 0.15) with 0.4 M solutions of tri(isoocty1)amine or S-24 amine in 95% Varsol-5% tridecanol diluent were effec- tive, and Zr/Hf separa t ion fac tors were in t h e range of 8 to 10. P h a s e separa t ion was rapid with each solvent.
8.8 SEPARATION OF RARE EART
T h e la rge recent increase in demand for certain rare ear ths h a s increased t h e need for more ef- f icient separa t ion methods. P resen t emphas is in our s tud ie s is on the u s e of solvent extraction with di(2-ethylhexyl)phosphoric a c i d (D2EHPA). Co- efficients for the extraction of t h e rare ear ths with th i s reagent increase with increasing atomic nurn- ber. ’’ T h e separa t ion factor between ad jacent rare ear ths var ies appreciably with position in the se r i e s but h a s a n average value of about 2 .5 . In separa t ing a mixture of rare ea r ths by so lvent ex- traction in a conventional countercurrent system, a number of runs must be made. F i r s t , the m o s t (or leas t ) ex t rac tab le member of the s e r i e s is separa ted from the others, then the ad jacent m e m ber of t h e s e r i e s is separa ted from t h e remaining
”D. F. Peppard, G. W. Mason, J. L. Maier, and W. Driscoll, J . Inorg. Nucl. Chem. 4, 334 (1957).
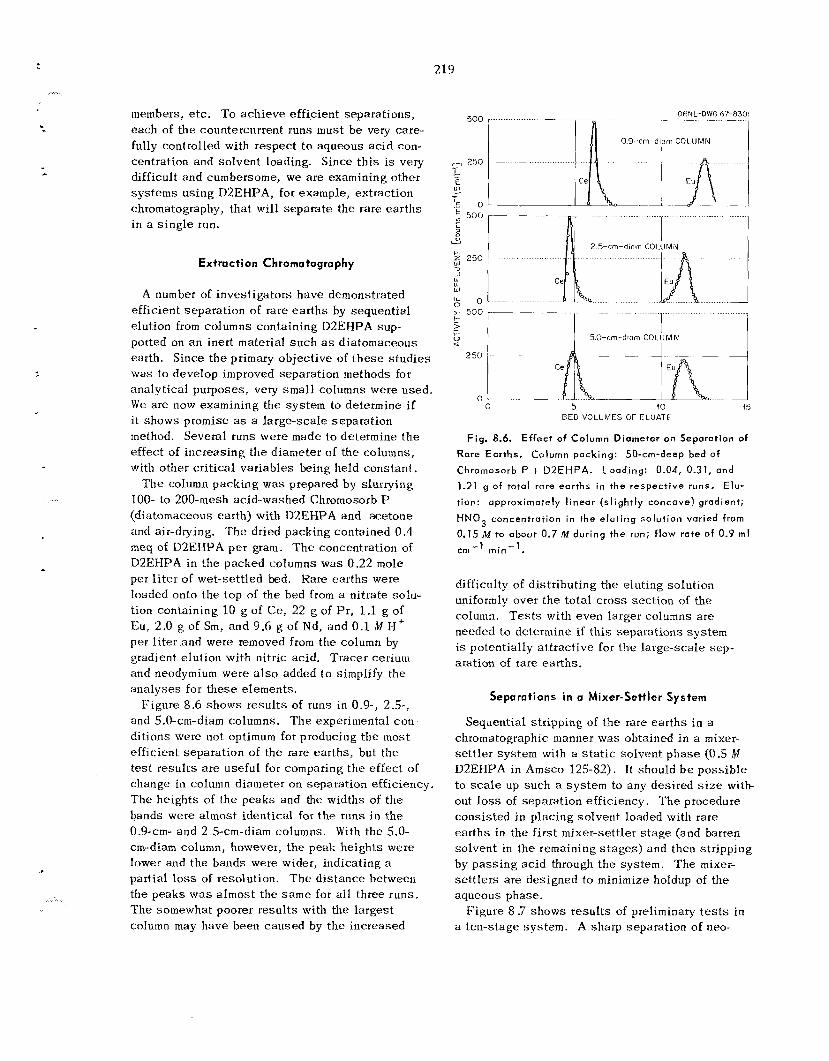
219
...
members, e t c . To achieve efficient separations, each of the countercurrent runs must b e very care- fully controlled with respec t t o aqueous ac id con- centration and so lvent loading. Since t h i s is very difficult and cumbersome, w e a re examining other sys t ems using D2EHPA, for example, extraction chromatography, tha t will separa te the rare ea r ths in a s ing le run.
Extraction Chromatography
A number of investigators have demonstrated efficient separation of rare ea r ths by sequential elution from columns containing D2EHPA sup- ported on an inert material s u c h as diatomaceous earth. Since the primary objective of t h e s e s tud ie s was to develop improved separation methods for analytical purposes, v e y small columns were used. W e are now examining the system to determine if it shows promise as a large-scale separa t ion method. Several runs were made to determine the effect of increas ing the diameter of t he columns, with other cri t ical variables being held cons tan t .
T h e column packing w a s prepared by slurrying 100- to 200-mesh acid-washed Chromosorb P (diatomaceous earth) with D2EHPA and acetone and air-drying. T h e dried packing contained 0.4 meq of D2EHPA pe r gram. T h e concentration of D2EHPA in the packed columns w a s 0.22 mole pe t liter of wet-sett led bed. Rare ear ths were loaded onto the top of the bed from a nitrate solu- tion containing 10 g of Ce, 22 g of P r , 1.1 g of Eu, 2.0 g of Sm, and 9.6 g of Nd, and 0.1 M H + per l i t e r and were removed from the column by gradient elution with nitric acid. Tracer cerium and neodymium were a l s o added to simplify the ana lyses for these elements.
Figure 8.6 shows r e su l t s of runs in 0.9-, 2.5-, and 5.0-cm-diam columns. T h e experimental con- dit ions were not optimum for producing the most efficient separa t ion of the rare ear ths , but t he t e s t resu l t s a re usefu l for comparing t h e effect of change in column diameter on separation efficiency, The heights of the peaks and the widths of the bands were a l m o s t identical for t h e runs i n t h e 0.9-cm- and 2.5-cm-diam columns. With the 5.0- cm-diam column, however, t he peak he ights w e r e lower and the bands were wider, indicating a partial loss of resolution. T h e d is tance between the peaks w a s a lmost the s a m e for a l l three runs. The somewhat poorer resu l t s with the largest column may have been caused by the increased
500 GHNL-DWG fi7-8301
I
0 5 1 ‘1 13 BED VOLUMFS OF CLIJATE
F ig . 8.6. Effect of Column D i a m e t e r on S e p a r a t i o n of Rare E a r t h s . C o l u m n p a c k i n g : 50 -cm-deep bed of
Chromosorb P c D2EHPA. L o a d i n g : 0.04, 0.31, a n d
1.21 g of t o t a l ra re e a r t h s in t h e r e s p e c t i v e runs. E l u -
t ion: a p p r o x i m a t e l y l i n e a r ( s l i g h t l y c o n c a v e ) gradient ,
H N 0 3 c o n c e n t r a t i o n in the e l u t i n g s o l u t i o n v a r i e d f rom
0.15 M t o a b o u t 0.7 M d u r i n g t h e run; f low r a t e of 0.9 m l
cm -1 m i n -’. difficulty of distributing the eluting solution uniformly over the to ta l c ros s sec t ion of the column. T e s t s with even larger columns ate needed t o determine if t h i s separa t ions sys tem is potentially a t t rac t ive for t h e large-scale sep- aration of rare earths.
Separations in o Mixer-Settler System
Sequential str ipping of the rare ear ths in a chromatographic manner was obtained in a mixer- se t t le r system with a static solvent phase (0.5 M D2EHPA in Amsco 125-82). It should b e poss ib le to scale up such a sys tem to any desired s i z e wi th out loss of separation efficiency. The procedure cons is ted in placing so lvent loaded with rare ear ths i n the f i r s t mixer-settler s t age (and barren solvent in the remaining s t a g e s ) and then stripping by pass ing ac id through the system. The mixer- s e t t l e r s are designed to minimize holdup of the aqueous phase.
a ten-stage sys tem. A sharp separation of neo- Figure 8.7 shows resu l t s of preliminary t e s t s in
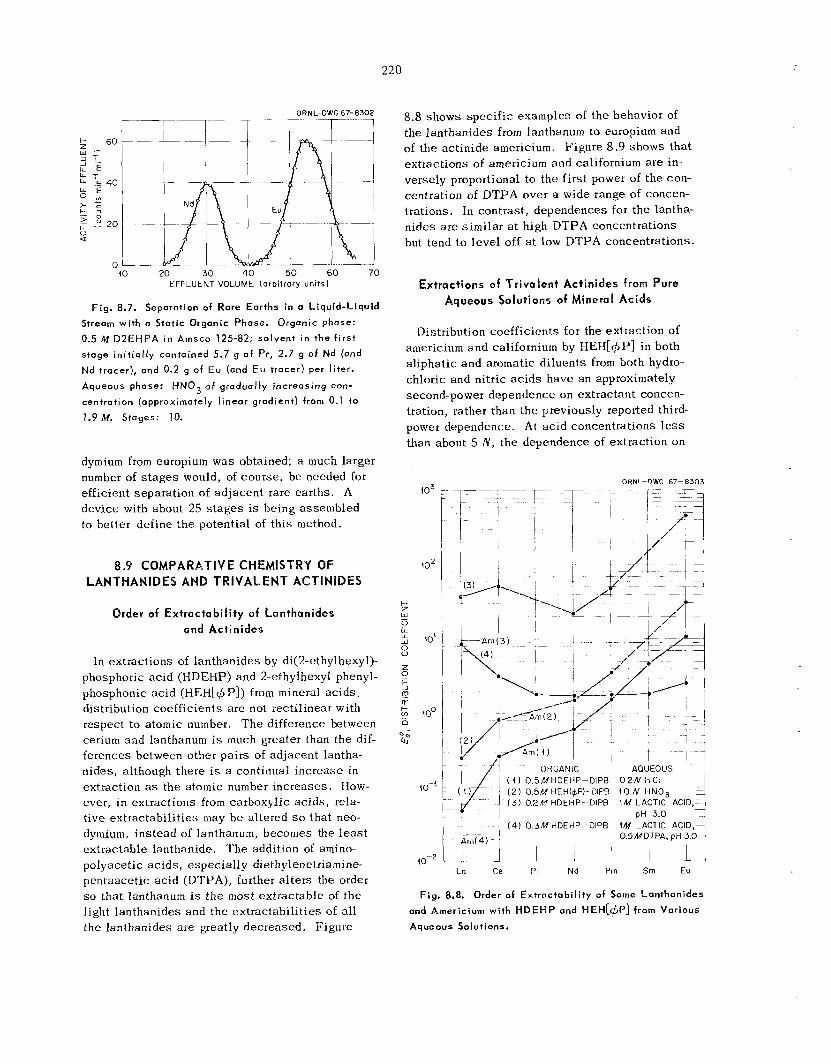
220
ORNL-DUG 67-8302
r - r i - 7 11
10 20 30 40 50 60 70 EFFLUENT VOLUME (arbitrary u n i t s )
Fig. 8.7. Separation of Rare Earths in o Liquid-Liquid
Stream with a Static Organic Phase. Organic phase:
0.5 M D2EHPA i n Arnsco 125-82; solvent in the f irst
stage init ial ly contained 5.7 g of Pr, 2.7 g o f Nd (and
Nd tracer), and 0.2 g of E u (and E u tracer) per liter.
Aqueous phase: H N 0 3 of gradually increasing con-
centration (approximately l inear gradient) from 0.1 to
1.9M. Stages: 10.
dymium from europium was obtained; a much larger number of s t a g e s would, of course , be needed for efficient separa t ion of ad jacent rare earths. A device with about 25 s t a g e s is being assembled to better define the potential of th i s method.
8.9 COMPARATIVE CHEMISTRY OF LANTHANIDES AND TRIVALENT ACTINIDES
Order of Extractability of Lanthanides and Actinides
In extractions of lanthanides by di(Zethylhexy1)- phosphoric ac id (I-IDEHP) and 2-ethylhexyl phenyl- phosphonic ac id (HEHI+ PI) from mineral ac ids , distribution coefficients a r e not recti l inear with respect t o atomic number. T h e difference between cerium and lanthanum is much greater than the dif- ferences between other pa i r s of ad jacent lantha- nides, although there is a continual increase in extraction as the atomic number increases . How- ever, i n extractions from carboxylic ac ids , rela- t ive extractabil i t ies may b e altered so tha t neo- dymium, ins tead of lanthanum, becomes the l e a s t extractable lanthanide. 'The addition of amino- polyacetic ac ids , espec ia l ly diethylenetriamine- pentaacetic ac id (DTPA), further a l te rs the order s o that lanthanum is t h e most ex t rac tab le of t h e light lanthanides and the ex t rac tab i l i t i es of a l l the lanthanides a re greatly decreased . F igure
8.8 shows spec i f ic examples of the behavior of the lanthanides from lanthanum to europium and of the ac t in ide americium. F igure 8.9 shows that extractions of americium and californium a r e in- versely proportional to the f i r s t power of the con- centration of DTPA over a wide range of concen- trations. In contrast , dependences for t he lantha- n ides a r e s imi la r a t high DTPA concentrations but tend t o leve l off a t low DTPA concentrations.
Extractions of Trivalent Actinides from Pure Aqueous Solutions of Mineral Acids
Distribution coefficients for the extraction of americium and californium by HEH[+P] in both aliphatic and aromatic d i luents from both hydro- chloric and nitric a c i d s have an approximately second-power dependence on extractant concen- tration, rather than t h e previously reported third- power dependence. At ac id concentrations less than about 5 N , t he dependence of extraction on
ORNL-DWG 57-8303
I 10'
! doo 1
{ O - j
OflGANIC AQUEOUS
(3) 0 2 M HDEHP-DIP6 IM LACTIC ACID,-
( 4 ) 0 5MHDEHP-DIPB 0 2 N HCI ( 2 ) 0.5M HEH(+P)-DlPB
(4) 0 3 M HDEHP-DIPB 1M LACTIC ACID,
LFy 05MDTPA,pH30 1 10 N HNO,
pH 3 0
10-2 ~ '1 LL-L. La C e Pr Nd Pm Sm Eu
Fig. 8.8. Order of Extractabil i ty of Some Lanthanides
and Americium with HDEHP and HEH[r$P] from Various
Aqueous Solutions.
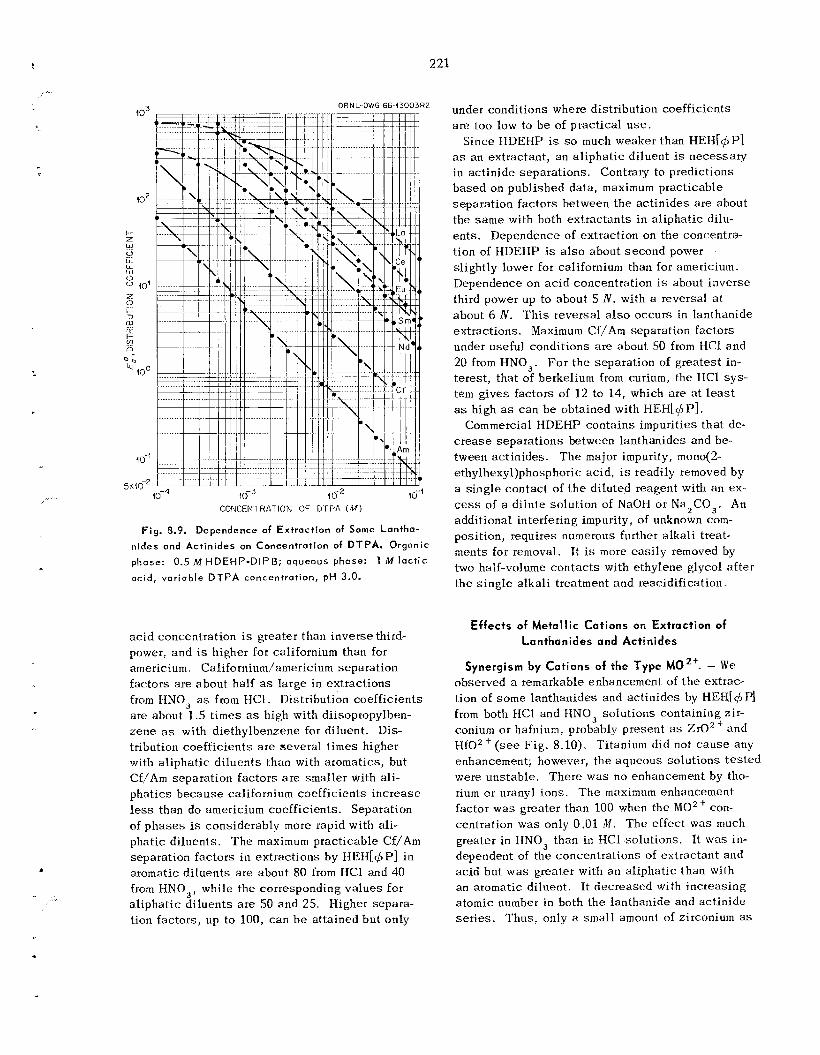
221
.
ORNL-DWG 66-(3003RE
Fig. 8.9. Dependence of Extraction of Some Lantha-
nides and Actinides on Concentration of DTPA. Organic
phose: 0.5 M HDEHP-DIPB; aqueous phase: 1 M lact ic
acid, variable DTPA concentration, pH 3.0.
ac id concentration i s greater than inve r se third- power, and is higher for californium than for americium. Californium/americium separation fac tors a re about half as la rge in extractions from FINO, as from HCl. Distribution coefficients are about 1.5 t imes as high with diisopropylben- zene as with diethylbenzene for diluent. Dis- tribution coef f ic ien ts a r e severa l t imes higher with a l ipha t ic d i luents than with aromatics, but Cf/Am separa t ion fac tors a r e smaller with ali- pha t ics because californium coefficients i nc rease less than do americium coefficients. Separation of p h a s e s is considerably more rapid with ali- phatic diluents. T h e maximum practicable Cf/Am separation fac tors i n extractions by HEH[+P] i n aromatic d i luents a re about 80 from HC1 and 40 from HNO,, while t he corresponding va lues for a l ipha t ic d i luents a re 50 and 25. Higher separa- tion factors, up to 100, c a n b e attained but only
under conditions where distribution coefficients are too low to b e of p tac t ica l u s e .
S ince IiDEHP is so much weaker than NEI-I[+P] as a n extractant, an a l ipha t ic diluent is necessary in ac t in ide separa t ions . Contrary to predictions based on publ i shed data, maximum practicable separa t ion fac tors between t h e ac t in ides a re about the s a m e with both ex t rac tan ts i n a l ipha t ic dilu- en ts . Dependence of extraction on t h e concentra- tion of HDEI-IP is also about s econd power - slightly lower for californium than for americium. Dependence on a c i d concentration i s about inverse third power up to about 5 N, with a reversal at about 6 N . T h i s reversal also occurs in lanthanide extractions. Maximum Cf/Am separation fac tors under useful conditions a re about SO from HCl and 20 from HNO,. For t h e separation of grea tes t in- terest , that of berkelium from curium, the HC1 sys - tem gives factors of 1 2 to 14, which a r e at l e a s t as high as c a n b e obtained with HEH[+P].
c r e a s e separa t ions between lanthanides and be- tween ac t in ides . T h e major impurity, mono(2- ethylhexy1)phosphoric ac id , is readily removed by a s ingle contac t of t h e diluted reagent with an ex- cess of a d i lu te so lu t ion of NaOH or Na2CO3. An additional interfering impurity, of unknown com- posit ion, requires numerous further a lka l i tteat- ments for removal. It is more eas i ly removed by two half-volume contac ts with e thylene glycol a f te r the s ing le a lka l i treatment and reacidification.
Commercial HDEHP conta ins impurities t ha t de-
Effects of Metal l ic Cations on Extraction of Lanthanides and Actinides
Synergism by Cations of the Type M02+. - We observed a remarkable enhancemeni of t h e extrac- tion of some lanthanides and ac t in ides by HEII[+ P] from both €IC1 and HNO, solutions containing zir- conium or hafnium, probably present as Zr02' and H f 0 2 + (see Fig. 8.10). Titanium did not c a u s e any enhancement; however, t he aqueous solutions tes ted were unstable. There was no enhancement by tho- rium or uranyl ions. T h e maximum enhancement factor w a s greater than 100 when the M 0 2 + con- centration was only 0.01 M . T h e effect was much greater in HNO, than in €IC1 solutions. I t w a s in- dependent of the concentrations of extractant and acid but w a s greater with a n aliphatic: than with a n aromatic diluent. It decreased with increas ing atomic number in both the lanthanide and ac t in ide se r i e s . Thus , only a small amount of zirconium as
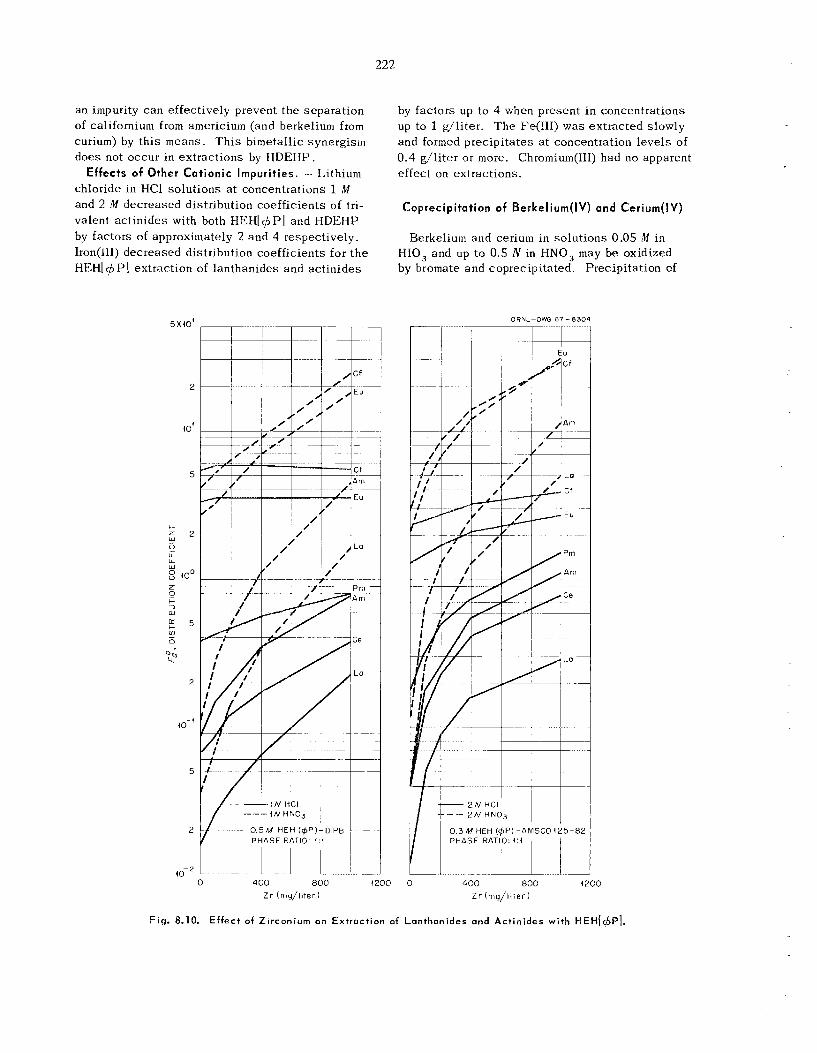
222
an impurity can effectively prevent t he separa t ion of californium from americium (and berkelium from curium) by th i s means. T h i s bimetallic synergism does not occur in ex t rac t ions by HDEHP.
Effects of Other Cat ionic Impurities. .-- Lithium chloride in HC1 so lu t ions a t concentrations 1 M and 2 M decreased distribution coefficients of tri- valent ac t in ides with both HEH[+P] and HDEf-IP by factors of approximately 2 and 4 respectively. Iron(1II) decreased distribution coefficients for t h e HEH[$ PI extraction of lanthanides and ac t in ides
IN H N O j I I__ r -
0 5EA HEH (@P)-DIPEJ PHASE RATIO f 1 1
rn-‘ -
by fac tors up to 4 when present i n concentrations up to 1 dl i ter . T h e Fe(II1) w a s ex t rac ted slowly and formed prec ip i ta tes a t concentration l eve l s of 0.4 g/li ter o r more. Chroinium(II1) had no apparent effect on extractions.
Coprecipitation of Berkeliurn(1V) and Cerium(1V)
Berkelium and cerium in so lu t ions 0.05 M in HIO, and LIP to 0.5 N in HNO, may be oxidized by bromate and coprecipitated. Precipitation of
ORNL-DWG 5 7 - 8 3 0 4
I 1 -- I
.- 0 400 800 1200 0 400 800 1200
Z r (rng/iiter I Z r [ mg/ i i t e r 1
Fig. 8.10. Ef fect of Zirconium on Extraction of Lanthanides and Actinides wi th HEH[+P].
. ..
223
1
. .
trace amounts of berkelium with 1 mg of cerium in 10 ml was '>99.8% complete when precipitation of the cerium carrier w a s only 95 to 99% complete.
8.10 TRANSPLUTONIUM ELEMENT COMPOUND PREPARATION AND X-RAY
CHARACTERIZATION
Preliminary preparations of various oxides of berkelium were made as a part of t h e program to prepare and charac te r ize compounds of the trans- plutonium elements. We were a b l e to prepare these oxides from only microgram quant i t ies of the element by us ing t h e s ing le ion exchange bead technique of Cunningham and Green. ' 3 - ' technique c o n s i s t s i n loading a s ing le ion ex- change resin bead to saturation (using a highly purified solution of berkelium) and then destroy- ing t h e res in matrix by calcination. A coherent particle of t h e e lement oxide remains.
T h e berkelium w a s purified by a s e r i e s of sol- vent extraction and ion exchange techniques . Analys is of the berkelium oxide .by the neutron activation method showed 51.3% Ce, < O S % Nd, 0.008% L a , and <0.005% Eu. No other impurities were detected.
T h e air-stable form of berkelium oxide is Bk02, which h a s a face-centered cubic s t ruc ture with l a t t i ce parameter a = 5.334 + 0.005 A . T h e hy- drogen-reduced oxide is B k z 0 3 , which h a s a body- centered cub ic s t ruc ture wi th a = 10,880 -i 0.005 A .
W e a re planning additional work on the oxide sys tem and on berkelium ha l ide preparations and characterizations; a l s o , w e plan to extend the u s e of these techniques to s imi la r s t u d i e s o f
T h i s
9Cf.
8.11 AMINOPOLYCARBOXYLIC ACID COMPLEXES OF TRIVALENT ACTINIDES
It is anticipated tha t t he determination of s t a - bility cons tan ts of a variety of transplutonium ac t in ide che la t e compounds will contribute to formulation of a theory regarding s tab i l i ty trends
13B. B. Cunningham, Microchem. J . , Symp. Ser. 1
' 4B. B. Cunningham, Proceedings of the Robert A . Welch Foundation Conferences on Chemical Research. VI. Topics in Modern Inorganic Chemistry, 1962.
15J. 1,. Green, The Absorption Spectrum of Cf+3 and Crystallography of Ca I i fornium Sesquioxide and Cali- fornium Trichloride, UCRL-16516 (November 1965).
(196 1).
and will l ead to improved separa t ion methods. Ion exchange and spectrophotometric techniques are being used. Init ial work h a s been centered on complexes with aminopolycarboxylic a c i d s , which a re already important i n processing. In addition to s tab i l i ty cons tan ts , t he type of complexes formed and the e f fec ts of structural changes on their formation a r e be ing determined.
Spectrophotometric Determination of Americium Complexing with Aminopolyacetic Acids
T h e complexing of americium with aminopoly- acetic a c i d s w a s s tudied by absorption spectro- photometric ana lys i s i n a n effort to ascer ta in the type of complexes formed, and also to provide an a1 ternative method for determining s tab i l i ty con- s t an t s . T h e presence of complcxing agents d i s - p l aces the absorption spec t r a of americium to longer wavelengths. With s u c c e s s i v e complexing, new absorption bands a r e formed, which makes i t poss ib le to s tudy t h e complexes in solution and the conditions under which they a r e formed.
T h e aminopolyacetic a c i d s examined have two to seven carboxylic ac id groups. T h e experiments were carried out in series a t constant Am3' (0.001 M) and ligand (0.005 M ) concentrations. T h e ionic strength was he ld cons tan t with 0.1 M NII[,C104, while the pH was varied from 1 to 9 by smal l addi- t ions of HClO, or Nf€40€I. T h e optical dens i t ies were measured with a Gary 14 spectrophotometer. A second isomolar s e r i e s of experiments at con- s t a n t pI-1 and varying metal-to-ligand ratios was used to determine the composition of the com- plexes. An example of the spec t ra l sh i f t of the americium complex with diethylenetriaminepenta- ace t i c ac id (DTPA) i s shown in F ig . 8.11. With increasing pH, the band at 502.7 mp d isappears and a new absorption band at 507.6 mp is formed. A s ingle complex w a s found with th i s ligand; the iso- molar series showed it to be a 1 : 1 complex. Two or three complexes were found between e a c h of the other l igands and americium (Table 8.5).
Ion Exchange Behavior with 2-Hydroxy-1,3- diaminopropanetetraacetic Acid (HPDTA)
HPDTA differs from t h e foregoing aminopoly- carboxylic a c i d s in having a hydroxy group. T h e effect of t h i s hydroxy group on aminopolycarboxylic ac id complexing of the transplutonium elements i s
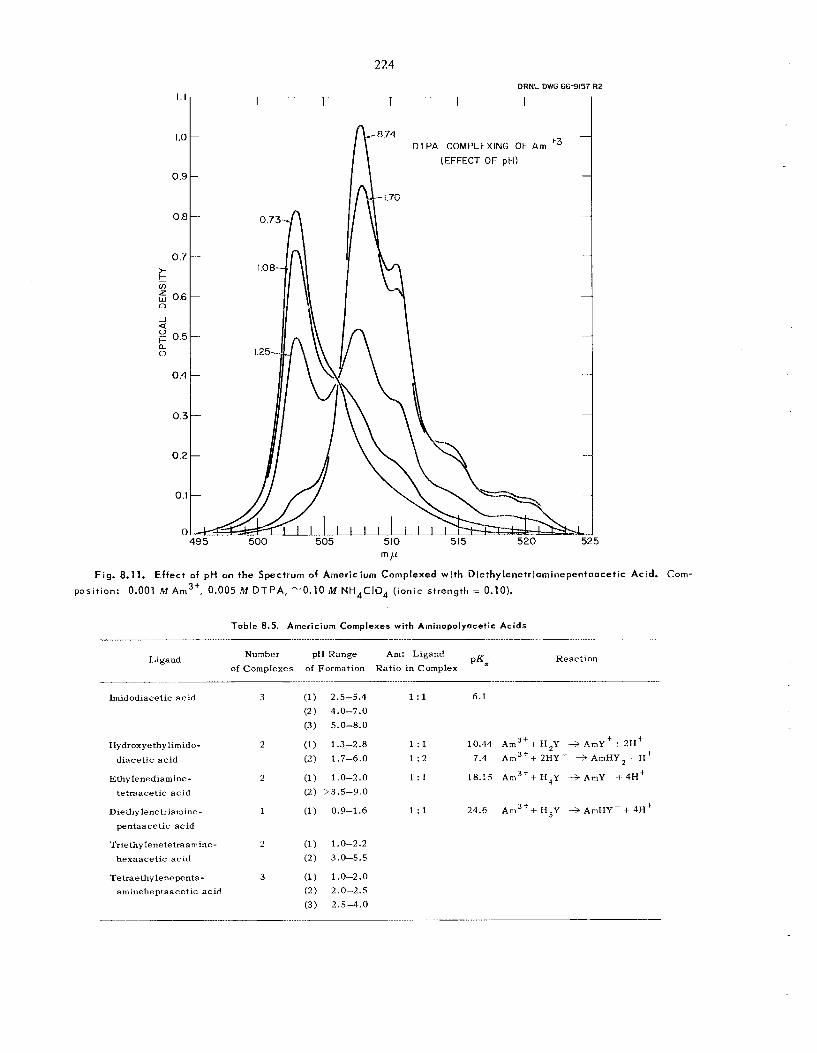
1 . 1
1.0
0.9
0 .e
0.7 > v) k
5 0.6 c1
_1 :: 0.5
a 0
0.4
0.3
0.2
0.1
C
224 ORNL DWG 66-9157 R2
I I 1 1 1
DTPA COMPLEXING OF Am +3 (EFFECT OF pH)
5
t L
Fig. 8.11. Effect of p H on t h e S p e c t r u m of A m e r i c i u m C o m p l e x e d w i t h Diethylenetriominepentaocetic Acid. Com-
position: 0.001 M Am3', 0.005 M DTPA, "0.10 M NH4C104 (ionic s t r e n g t h = 0.10).
T a b l e 8.5. Americium C o m p l e x e s wi th Aminopo lyoce t i c A c i d s
R e a c t i o n Number pH R a n g e Am: L i g a n d
of C o m p l e x e s of F o r m a t i o n R a t i o i n Complex L i g a n d pKs
- . . . .. . _.. . . .. ... .. . . .-.. ... ..
I m i d o d i a c e t i c a c i d 3
Hydroxye thy l imido- 2
E t b y l s n e d i a m i n e - 2
D i e t h y l e n e t r i amine - 1
T r i e t h y l e n e t e t r a a mine - 2
T e t r a e t h y l e n e p e n t a - 3
d i a c e t i c a c i d
t e t raa ce t i c a c i d
p e n t a a c e t i c a c i d
h e x a a c e t i c a c i d
a m i n e h e p t a a c e t i c a c i d
(1) 2.5-5.4 1:1 6.1
(2) 4.0-7.0 (3) 5.0-8.0
(1) 1.3-2.8 (2) 1.7-6.0
(1) 1.0-2.0 (2) >3.5--9.0
(1) 0.9-1.6
1:1 1 : 2
1:1
1:1
10.44 A m 3 + 4- I I zY + A m y + + - 213'
7.4 Am3' + 2HY- -3 A m H Y z + H +
18.15 Am3'+ H A Y - + A m Y - - I 4H+
24.6 Am3'+ H 5 Y + Am€IY-+ 4H'
(1) 1.0-2.2
(2) 3.0-5.5
(1) 1.0-2.0 (2) 2.0-2.5 (3) 2.5-4.0
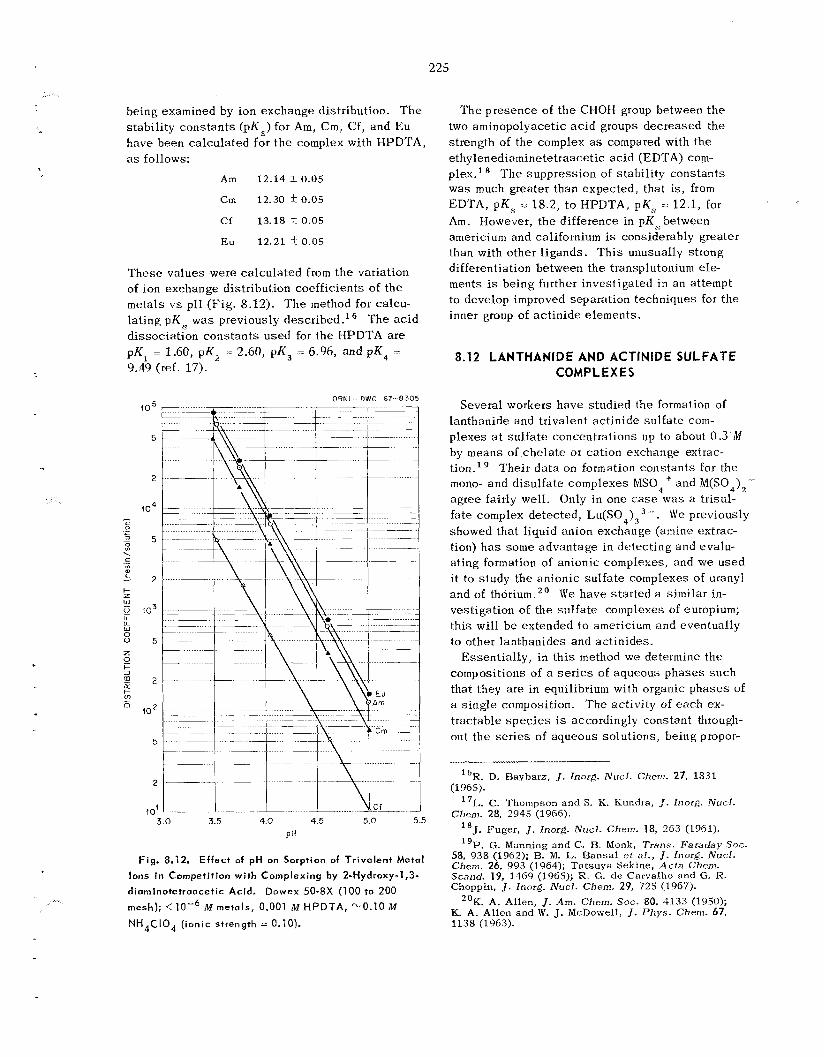
225
being examined by ion exchange distribution. T h e stabil i ty cons t an t s (pKs) for Am, Cm, Cf, and Eu have been ca lcu la ted for t he complex with HPDTA, as follows:
Am 12.14 5 0.05
C m 12.30 k 0.05
Cf 13.18 fr 0.05
E u 12.21 k 0.05
'These va lues were ca lcu la ted from t h e variation of ion exchange distribution coef f ic ien ts of the metals v s pH (Fig. 8.12). T h e method for calcu- lating pKs w a s previously described. ' d i ssoc ia t ion cons tan ts used for t h e HPDTA a r e pK1 = 1.60, pK, - 2.60, pK, = 6.96, and pK4 7 9.49 (ref. 17).
T h e a c i d
ORNL-DWG 67 8305
3 0 3 5 40 4 5 5 0 5 5 pH
Fig. 8.12. Effect of pH on Sorption of Trivalent Metol Ions i n Competition with Complexing by 2-Hydroxy-1,3- diaminotetroacetic Acid. Dowex 50-8X (100 to 200 mesh); < l o u 6 M metals, 0.001 M HPDTA, -0.10 M NH4C104 (ionic strength = 0.10).
T h e p te sence of t h e CHOH group between t h e two aminopolyacetic a c i d groups decreased the strength of the complex as compared with t h e ethylenediaminetetraacetic ac id (EDTA) com- plex." T h e suppress ion of stabil i ty cons tan ts was much greater than expec ted , that i s , from EDTA, pKs = 18.2, to HPDTA, pKs -. 12.1, for Am. However, t h e difference in pKs between americium and californium is considerably greater than with other l igands . T h i s unusually strong differentiation between the transplutonium ele- ments is being further investigated i n an attempt to develop improved separation techniques for the inner group of ac t in ide e lements .
8.12 LANTHANIDE AND ACTINIDE SULFATE COMPLEXES
Several workers have studied the formation of lanthanide and trivalent ac t in ide su l fa te com- plexes a t su l f a t e concentrations up to about 0.3 M by means of che la t e or cation exchange extrac- tion.' Thei r da t a on formation cons tan ts for the mono- and disulfate complexes MS04 + and M(S04)2- agree fairly well. Only in one case was a trisul- fate complex de tec ted , L U ( S O ~ ) ~ ~ --. We previously showed tha t l iquid anion exchange (amine extrac- tion) has some advantage in de tec t ing and evalu- ating formation of anionic complexes, and w e used it to study t h e an ionic su l fa te complexes of utanyl and of thorium." We have s ta r ted a similar in- vestigation of the su l f a t e complexes of europium; th i s will b e extended to americium and eventually to other lanthanides and ac t in ides .
Essent ia l ly , in t h i s method we determine t h e compositions of a s e r i e s of aqueous p h a s e s s u c h that they a re in equilibrium with organic phases of a s ingle composition. T h e activity of e a c h ex- t rac tab le s p e c i e s i s accordingly constant through- out t h e s e r i e s of aqueous solutions, being propor-
16R. D. Rayharz, J. lnorg. Nucf. Cherti. 27, 1831
"1,. C. Thompson and S. K. Kundra, J. l norg . Nucf.
'*J. Pugzr, J . Inorg. Nix[. ~ h c m . 18, 263 (1961). "E'. C;. Manning and C. R. Monk, Trana. Faraday Soc
58, 978 (1962); R. M. L. Bansal et al., J . h x g . N u c f . Chem. 26, 993 (1964); Tatsuya Sekine, Acta Chem. Scand. 19, 1469 (1965); R. G. d e CarvaIho and G. K. Choppin, J. lnorg. Nucf. Chem. 29, 725 (1967).
2"K. A. Allen, J . Am. Chern. SOC. 80, 4133 (1950); K. A. Allen and W. J. McDowell, J . Pliys. Chem. 67, 1138 (1963).
(1965).
Chem. 28, 2945 (1966).
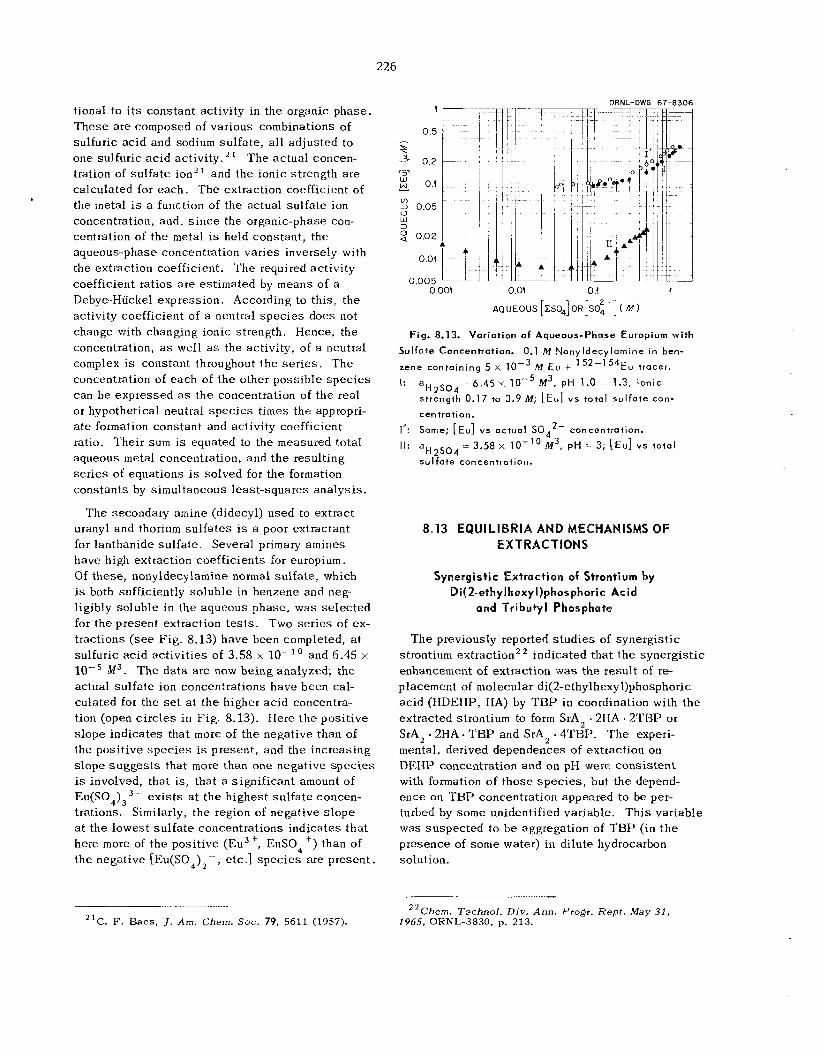
226
tional to i t s constant activity in the organic phase . T h e s e a r e composed of various combinations of sulfuric ac id and sodiiim su l fa te , all ad jus ted to one sulfuric a c i d activity." The ac tua l concen- tration of su l fa te ion' and the ionic strength a re calculated for each. T h e extraction coefficient of the metal is a function of the actual su l fa te ion concentration, and , s i n c e the organic-phase con- centration of the metal i s held cons tan t , the aqueous-phase concentration var ies inversely with the extraction coefficient. T h e required ac t iv i ty coefficient ratios a r e estimated by means of a Debye-Huckel express ion . According to th i s , t he activity coefficient of a neutral s p e c i e s does not change with changing ionic strength. Hence, the concentration, as well as the activity, of a neutral complex i s constant throughout t h e s e r i e s . T h e concentration of each of t he other poss ib le s p e c i e s can b e expressed as the concentration of the real or hypothetical neutral s p e c i e s t imes the appropri- a t e formation cons tan t and activity coefficient ratio. Their sum is equated to the measured total aqueous metal concentration, and t h e result ing se r i e s of equations i s solved for the formation cons tan ts by simultaneous leas t - squares ana lys i s .
The secondary amine (didecyl) used to extract uranyl and thorium su l f a t e s is a poor extractant for lanthanide su l fa te . Several primary amines have high extraction coefficients for europium. Of these , nonyldecylamine normal su l fa te , which is both sufficiently so luble in benzene and neg- ligibly so luble in the aqueous phase , was se l ec t ed for t he present extraction t e s t s . Two se r i e s of ex- tractions (see Fig . 8.13) h a v e been completed, a t sulfuric ac id ac t iv i t ies of 3.58 x lo-'' and 5.45 x lo-' M 3 . T h e da ta a re now be ing analyzed; t he actual su l fa te ion concentrations have been cal- culated for the s e t a t t he higher ac id concentra- tion (open c i r c l e s i n Fig. 8.13). Here the pos i t ive s lope ind ica tes that more of the negative than of the pos i t ive s p e c i e s is present , and the increasing s lope s u g g e s t s that more than one negative s p e c i e s is involved, that i s , that a s igni f icant amount of E u ( S O , ) ~ ~ - e x i s t s at t h e h ighes t su l f a t e concen- trations. Similarly, the region of negative s lope a t t he lowes t su l f a t e concentrations ind ica tes tha t here more of t h e posit ive (Eu3 +, EuS0, +) than of the negative [ E U ( S O ~ ) ~ - , etc.] s p e c i e s a re present .
t
0.5
O.O! 0 .i t
AQUEOUS [XSO4]OR[S0;-]( M )
Fig. 8.13. Variation of Aqueous-Phase Europium with Sulfate Concentration.
zene containing 5 x I: a H 2 S 0 4 = 6.45 x
0.1 M Nonyldecylarnine in ben-
M ~u + '52-15'~u tracer.
M 3 , pH 1.0 - 1.3, ionic
strength 0.17 to 3.9 M ; [E"] v s total sulfate con-
cen tration.
1': Some; [Eu] v s actual S042- concentration.
II: = 3.58 x 10-l' M3, pH = 3; [Eu] v s total
sulfate concentration.
8.13 EQUlLlBRlA AND MECHANISMS OF EX TRACTIONS
Synergistic Extraction of Strontium by Di(2-ethylhexyl)phospbo~ic Acid
and Tr ibugl Phosphate
T h e previously reported s t u d i e s of synerg is t ic strontium extraction' ' indicated that t h e syne ig is t ic enhancement of extraction w a s the resu l t of re- placement of molecular di(2-ethy1hexyl)phosphoric ac id (IIDEHP, HA) by T B P in coordination with the extracted strontium to form SrAz . 2 H A - 2TI-3P or SrA, - 2HA T B P and S t A z 4TBP. T h e experi- mental, derived dependences of extraction on DEHP concentration and on pH were cons i s t en t with formation of those s p e c i e s , but the depend- ence on TBP concentration appeared to be per- turbed by s o m e unidentified variable. T h i s var iab le was suspec ted to be aggregation of T B P (in t h e presence of s o m e water) i n dilute hydrocarbon solution.
. .. .. . . . . .. ........
'lC. F. Baes, J. Am. Chem. S O C . 79, 5611 (1957). ''Chern. Techno]. Div. Ann. Progr. Rept . May 3 1 ,
1965, ORNL-3830, p. 213.
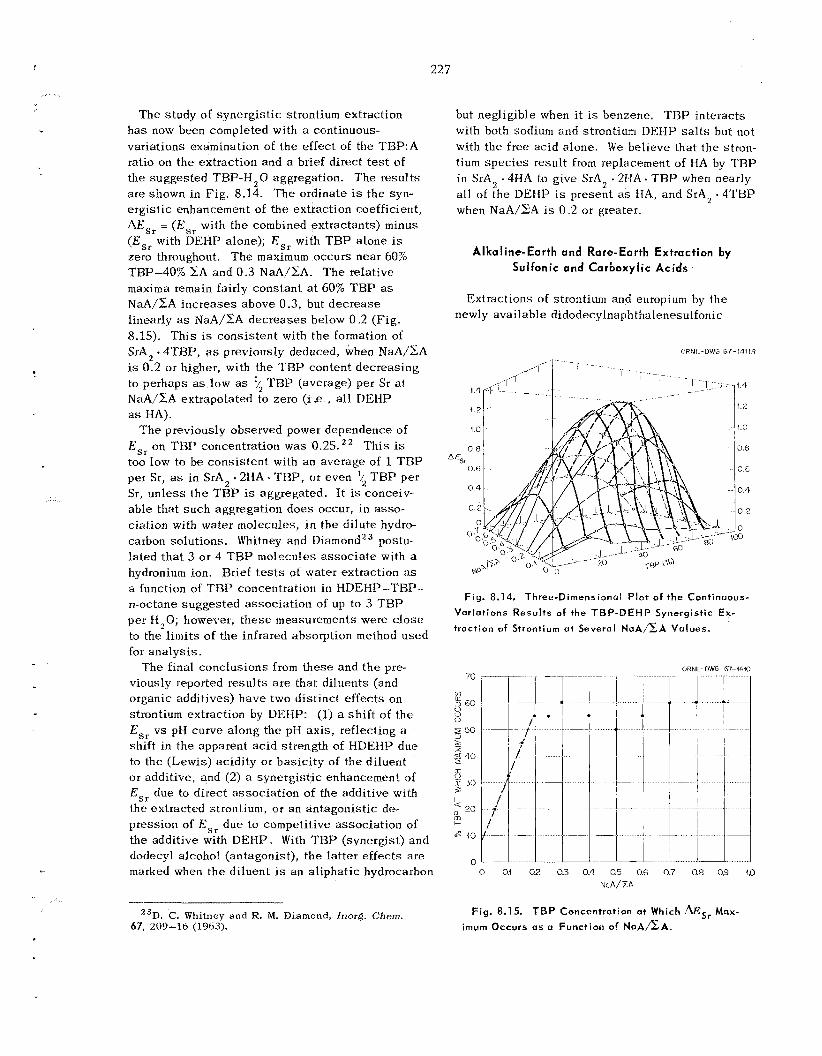
....
227
...
- ....
T h e s tudy of synerg is t ic strontium extraction h a s now been completed with a continuous- variations examination of t h e effect of the TBP:A ratio on the extraction and a brief direct test of the sugges ted TBP-H,O aggregation. The resu l t s a r e shown in F ig . 8.14. T h e ordinate is t h e syn- e rg is t ic enhancement of the extraction coefficient, AEsr = ( E s , with the combined extractants) minus ( E s , with DEIlP alone); Esr with TBP a lone is zero throughout. T h e maximum occurs near 60% TBP-40% CA and 0.3 NaA/CA. T h e relative maxima remain fairly cons tan t at 60% T B P as NaA/CA inc reases above 0.3, but dec rease linearly as NaA/)3A dec reases below 0.2 (Fig. 8.15). T h i s is cons i s t en t with t h e formation o f SrA, - 4TNP, as previously deduced, when NaA/xA is 0.2 o r higher, with the T B P content decreas ing to perhaps as low as '4 T B P (average) per Si a t NaA/xA extrapolated to zero (1 .e., a l l DEHP as HA).
T h e previously observed power dependence of ESr on TBP concentration was 0.25. T h i s is too low to b e cons i s t en t with an average of 1 T B P per Sr, as in SrA, - 2HA. 'l'BP, or even '4 T B P per Sr, un le s s t h e TBP is aggregated. I t is conceiv- ab le tha t s u c h aggregation d o e s occur, i n asso- ciation with water molecules, in t h e d i lu te hydro- carbon solutions. Whitney and Diamond' postu- la ted tha t 3 o r 4 TBP molecules a s soc ia t e with a hydronium ion. Brief t e s t s ~t water extraction as a function of TBP concentration in HDEHP-TBP- n-octane sugges t ed assoc ia t ion of up to 3 TBP per H, 0; however, t h e s e measurements were close to the l i m i t s of the infrared absorption method used for ana lys i s .
viously reported resu l t s a r e that diluents (and organic additives) h a v e two d is t inc t e f f ec t s on strontium extraction by DEHP: (1) a sh i f t of t he E S r v s pH curve a long the pH a x i s , reflecting a shift i n t he apparent ac id strength of HDEHP due to the (Lewis) ac id i ty or bas i c i ty of t h e d i luent or additive, and (2) a synerg is t ic enhancement of EST due to d i rec t assoc ia t ion of the additive with the ex t rac ted strontium, o r a n an tagonis t ic de- pression of Esr due to competit ive assoc ia t ion of t h e additive with DEHP . With TBP (synergist) and dodecyl alcohol (antagonist), t h e la t te r e f fec ts a r e marked when the diluent is a n a l ipha t ic hydrocarbon
T h e final conclus ions from these and t h e pre-
23D. C. Whitney a n d K. M. Diamond, iriorg. Chern. 67, 209-16 (1963).
but negligible when it is benzene. T B P in te rac ts with both sodium and strontium IIEX-IP s a l t s but not with t h e f ree ac id alone. W e believe that t he stron- tium s p e c i e s result from replacement of HA by T B P in SrA, . 4 H A to give SrA' v2HA - TBP when nearly all of t he DEHP is present as HA, and S A z - 4 T B P when NaA/%A i s 0.2 or greater.
Alkaline-Earth and Rare-Earth Extraction by Sulfonic and Carboxylic A c i d s .
Extractions of strontium and europium by t h e newly ava i lab le didodecylnaphthalenesulfonic
ORNL -DWG 61-1'31 It7
1.4
1.2
1.0
0.8
0.6
0.4
0 2
0 0
Fig. 8.14. Three-Dimensional Plot of the Continuaus-
Variotions Results of the TBP-DEHP Synergistic Ex- traction of Strontium a t Several N ~ A / Z A Values.
0 0.4 02 0.3 0.4 0.5 0.6 0.7 0.8 0.9 1.0 NaA/XA
Fig. 8.15. TBP Concentration at Which hs, Max. imum Occurs o s CI Functiori of N o A / x A .
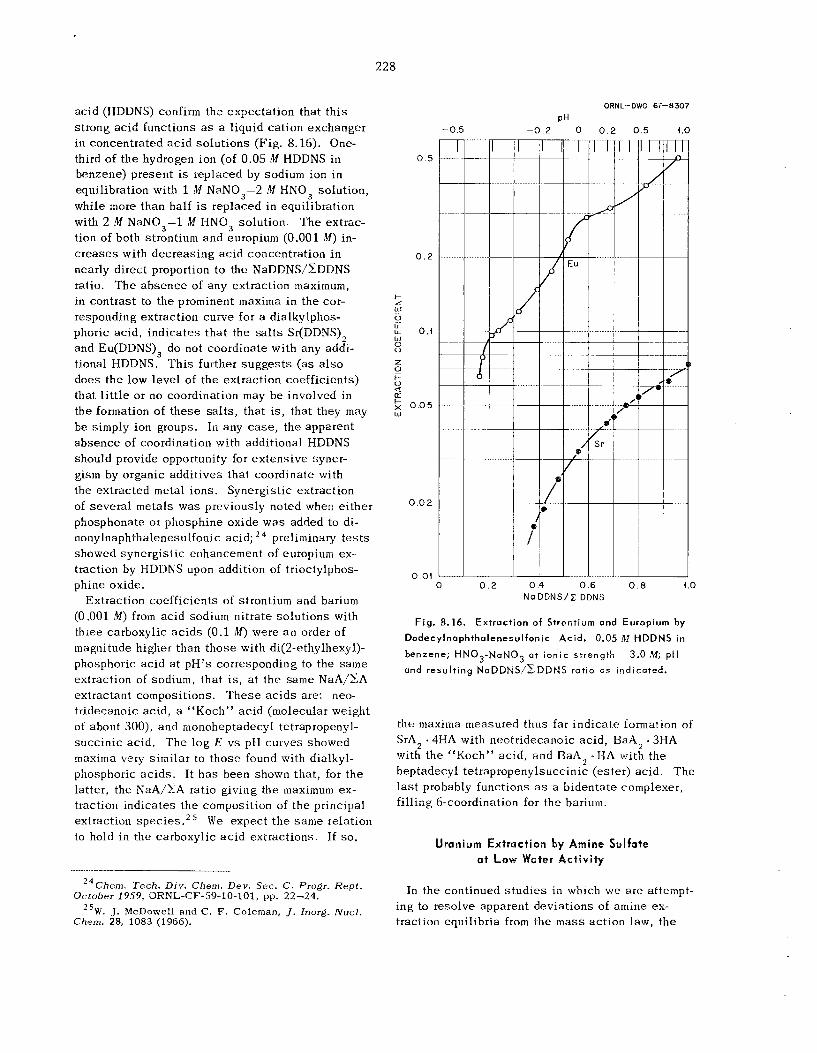
228
ac id (I-IDDNS) confirm the expectation that t h i s s t rong ac id functions as a liquid ca t ion exchanger in concentrated ac id so lu t ions (Fig. 8.16). One- third of t he hydrogen ion (of 0.05 M HDDNS in benzene) present is replaced by sodium ion in equilibration with 1 M NaN03-2 M HNQ3 solution, while more than half is replaced in equilibration with 2 M NaN03-1 M NNQ3 solution. ‘The extrac- tion of both strontium and europium (0.001 M) in- c r e a s e s with decreas ing ac id concentration i n nearly direct proportion to the NaDDNS/CDDNS ratio. T h e absence of any extraction maximum, in contrast to the prominent maxima in the cor- responding extraction curve for a dialkylphos- phoric acid, ind ica tes t ha t the s a l t s Sr(DDNS)2 and Eu(DDNS)~ do not coordinate with any addi- tional HDDMS. T h i s further sugges t s ( a s also does the low leve l of the extraction coefficients) that l i t t l e or no coordination may be involved in the formation of t hese sa l t s , that i s , that they may b e simply ion groups. In any c a s e , the apparent. absence of coordination with additional HDDNS should provide opportunity for ex tens ive syner- gism by organic addi t ives tha t coordinate with the extracted metal ions . Synergistic extraction of severa l metals was previously noted when e i ther phosphonate or phosphine oxide was added to di- nanylnaphthalenesulfonic acid; preliminary t e s t s showed synerg is t ic enhancement of europium ex- traction by HDDNS upon addition of trioctylphos- phine oxide.
Extraction coefficients of strontium and barium (0.001 11.1) from acid sodium nitrate so lu t ions with three carboxylic a c i d s (0.1 M ) were a n order of magnitude higher than those with di(2-ethylhexy1)- phosphoric ac id a t pH’s corresponding to the same extraction of sodium, that is, at the s a m e NaA/CA extractant compositions. T h e s e ac ids are: neo- tr idecanoic acid, a “Koch” ac id (molecular weight of about 300), and monoheptadecyl tetrapropenyl- succ in ic ac id . The log E v s pH curves showed maxima very similar to those found with dialkyl- phosphoric ac ids . It h a s been shown tha t , for t h e latter, the NaA/CA ratio giving the maximum ex- traction indicates t he composition of t h e principal extraction spec ie s .25 W e expect t h e s a m e relation to hold in the carboxylic a c i d extractions. If so,
-0.5
0 . 2
ORNL-DWG 67-8307
PH -0 .2 0 0.2 0.5
0.4 0 .6 N a D D N S / X DDNS
0 8
i.0
i.0
F i g . 8.16, Extraction of Strontium and Europium by
Dodecylnaphthalenesulfonic Acid. 0.05 M HDDNS in
benzene; H N 0 3 - N a N 0 3 a t i o n i c s t reng th = 3.0 M ; pH and r e s u l t i n g N o D D N S / z D D N S r a t i o Q S i n d i c a t e d .
the maxima measured thus far ind ica te formation of SrA, e4HA with neotridecanoic ac id , BaA2 3HA with the “Koch” ac id , and RaA2 HA with the heptadecyl tetrapropenylsuccinic (ester) acid. The l a s t probably functions as a bidentate complexer, filling 6-coordination for t he barium.
Uranium Extractian by Amine Sulfate a t L a w Water Act ivi ty
24Chem. Tech. DIV. Chem. Dev. Sec. C . Pro&. Rept.
2 5 W . J. McDowell and C . F. Coleman, J . Inorg. Nucl.
October 1959, ORNL-CF-59-10-101, pp. 22-24.
Chem. 28, 1083 (1966).
In the continued s t u d i e s in which we are attempt- ing to resolve apparent deviations of ainine ex- traction equilibria from the m a s s ac t ion law, t h e
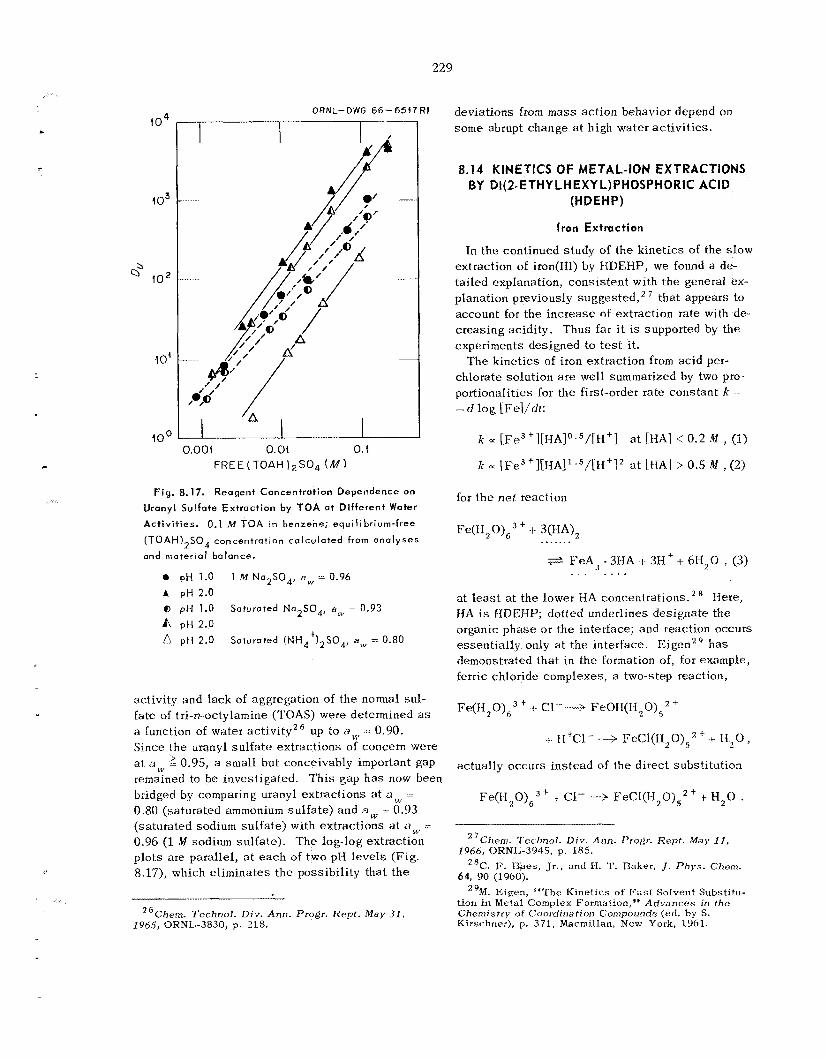
229
ORNL-DWG 66- 6547 R1
I O 0 0.001 0. O'I 0.t
FREE ( TOAH ) z ~ o , ( M )
Fig. 8.17. Reagent Concentration Dependence on
Uranyl Sulfote Extraction by TOA at Different Water
Activit ies. 0.1 hf TOA in benzene; equilibrium-free
(TOAH)2S04 concentration calculated from analyses
and material balance.
e pH 1.0 1 M N a 2 S 0 4 , uw 0.96 A pH 2.0 @ pH 1.0 Saturated Na2S04, aw = 0.93
0 pH 2.0 A pH 2.0 1-
Saturated ( N H 4 I2SO4, aw = 0.80
activity and lack of aggregation of t h e normal su l - €ate of tri-n-octylamine (TOAS) were determined as a function of water ac t iv i tyz6 up to aw - 0.90. Since the uranyl su l f a t e extractions of concern were a t an, 2 0.95, a s m a l l but conceivably important gap remained to be investigated. Th i s gap h a s now been bridged by comparing uranyl extractions at aw - 0.80 (saturated ammonium sul fa te ) and aw - 0.93 (saturated sodium su l fa te ) with extractions a t aw - 0.96 (1 M sodium sulfate). T h e log-log extraction p lo ts are parallel , a t e a c h of two pII leve ls (Fig. 8.17), which e l imina tes t h e possibil i ty that t h e
"Chem. Technul. Div. Ann. Pro&. K e p t . May 31, 196.5, ORNL-3830, p. 218.
deviations from mass ac t ion behavior depend on some abrupt change at high water ac t iv i t ies .
8.14 KINETICS OF METAL-ION EXTRACTIONS BY Dl(2-ETHY LHEXY L)PHOSPHORIC ACID
(HDEHP)
Iron Extraction
In the continued s tudy of the k ine t ics of the s low extraction o f iron(II1) by HDEIIP, we found a de- tailed explanation, cons is ten t with the general ex- planation previously suggested, ' that appears to account for t he inc rease of extraction rate with de- c reas ing acidity. Thus fa r i t is supported by the experiments designed to test it.
The kine t ics of iron extraction from ac id per- chlorate solution a r e well summarized by two pro- portionali t ies for t h e first-order ra te cons tan t k =
- d log LFel/rlf:
k Q [Fe3 'l[HA]o.5/[tI+] at [HA] < 0.2 iM , (1)
k 0: ~ F ~ ~ ~ ] [ E I A ] ' . ~ / [ H ~ ] ' at [HA] > 0.5 M , (2)
for t h e net reaction
Fe(H2 ' - I - 3(HA)? . . . . . . . FeA3. 3IHA i 3H' + 6H,O , (3 ) " . . I . . .
at least at the lower HA concentrations. ' HA is HDEHP; dotted underlines des igna te the organic phase or the interface; and teaction occurs essent ia l ly only at the interface. I':igenZ9 h a s demonstrated tha t in the formation of, for example, ferric chloride complexes, a two-step reaction,
Here,
Fe(I-I,0)63t + C 1 - 4 FeOH(H,0)5''
actually occurs ins tead of the direct substi tution
Fe(H20)63 ' + Cl-- -? FeC1(HZ0)52t t H,O
2 7 ~ t x e m . ~ecl inol . ~ i v . tlnn. Progr. Rept. lvay 1 1 ,
"C. F. Raes, Jr., and H. T. Baker, J . Phys. Chom.
29M. Eigen, "The Kinet ics of Fast Solvent Substitu-
1966, ORNL,-3945, p. 185.
6.1, 90 (1960).
tion in Metal Complex Formation," Advances in the Chemistry of Coordiriafiun Compounds (ed. by S. Kirschner), p. 371, Nlacmillan, New York, 1961.
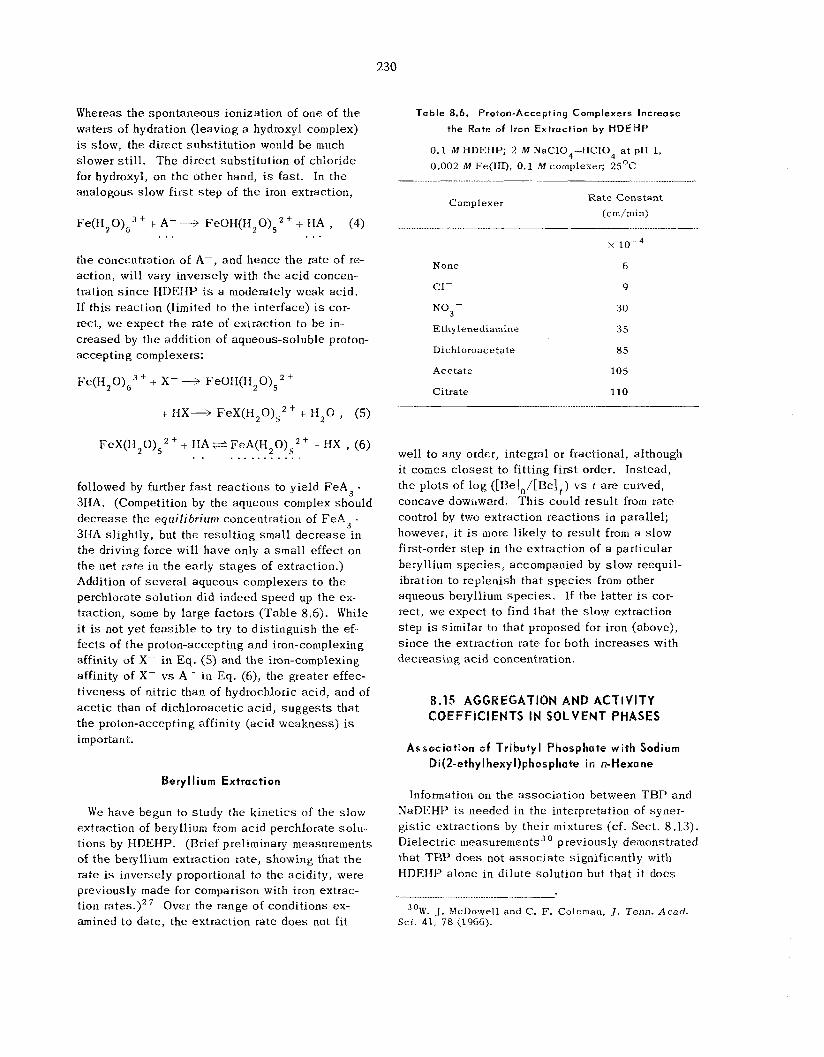
230
Whereas the spontaneous ionization of one of t he waters of hydration (leaving a hydroxyl complex) is s low, the direct substi tution would be much slower s t i l l . T h c direct substi tution of chloride for hydroxyl, on the other hand, is fast . In the analogous slow f i r s t s t e p of the iron extraction,
Fe(1120)63 + + A- ---a FeOII(H20)5z + + HA , (4) . . . . . . the concentration of A-, and hence the rate of re- action, will vary inversely with the a c i d concen- tration s i n c e I-IDEHP is a moderately weak ac id . If th i s reaction (limited to the interface) i s cor- rect, we expec t t h e rate of extraction to b e in- c reased by the addition of aqueous-soluble proton- accepting complexers:
F ~ ( H , O ) , ~ + + X-+ FeOH(H,0)52'
+ I-IX- FeX(H20)52 + + H z O , (5)
F e X ( H 2 0 ) 5 2 + + HA*FeA(Hz0)52+ t HX , (6)
followed by further f a s t reac t ions to yield FeA3 . 3HA. (Competition by the aqueous complex should decrease the equilibrium concentration of FeA3 ~
3HA slightly, but the result ing small decrease in the driving force will have only a smal l effect on the net rate in t he early s t a g e s of extraction.) Addition of severa l aqueous complexers t o the perchlorate solution did indeed speed up the ex- traction, some by large fac tors (Table 8.6). While i t is not ye t feas ib le to try to d is t inguish the ef- fects of the proton-accepting and iron-complexing affinity of X- i n Eq. (S) and t h e iron-complexing affinity of X- v s A- i n Eq. (6), the greater effec- t iveness of nitric than of hydrochloric acid, and of acetic than of dichloroacetic ac id , sugges t s that t he proton-accepting affinity (acid weakness) is important.
Sesyllium Extraction
W e have begun to study the k ine t ics of the s low extraction of beryllium from ac id perchlorate solu- t ions by HDEHP. (Brief preliminary measurements of t h e beiyllium extraction rate, showing that t h e rate is inversely proportional to the acidity, were previously made for comparison with iron extrac- tion rates.)2 Over the range of conditions ex- amined to date, the extraction rate does not f i t
Table 8.6. Proton-Accepting Camplexers Increase
the Rate of Iron Extraction by HDEWP
0.1 M HDEHP; 2 M NaC104-HC104 a t pII 1, 0.002 M Fe(III), 0.1 M complexer; ZSOC
__I_ I_........ ~...~.
Complexer R a t e Constant (c m/min)
None
c1-
NO3-
Ethylenediamine
Dichloroacetate
Acetate
Citrate
x
6
9
30
35
85
105
110
well to any order, integral or fractional, although i t comes c loses t to fi t t ing f i r s t order. Instead, the p lo ts of l og ([Be]o/[Be],) v s t a r e curved, concave downward. T h i s could resu l t from rate control by two extraction reactions in parallel; however, i t is more likely to result from a s low first-order s t ep in the extraction of a particular beryllium spec ie s , accompanied by s low reequil- ibration to replenish that s p e c i e s from other aqueous beiyllium spec ie s . If the la t te r is cor- rect, we expec t to find that the s low extraction s t ep is similar to that proposed for iron (above), s ince the extraction rate for both inc reases with decreas ing ac id concentration.
8.15 AGGREGATION AND A C T l V l f Y COEFFICIENTS IN SQLVENT PHASES
Association of f r i b u t y l Phosphate with Sodium Di(2-ethylh%xyl)phosphate in n-Hexane
Information on the assoc ia t ion between TBP and NaDEHP is needed in the interpretation of syner- gist ic extractions by their mixtures (cf. Sect. 8.13). Dielectric measurements3 previously demonstrated that TBP does not a s s o c i a t e significantly with HDEHP a lone in dilute solution but that it does
30W. J. McDowell and C. F. Coleman, J. Tenn. A c a d . Sei. 41, 78 (1966).
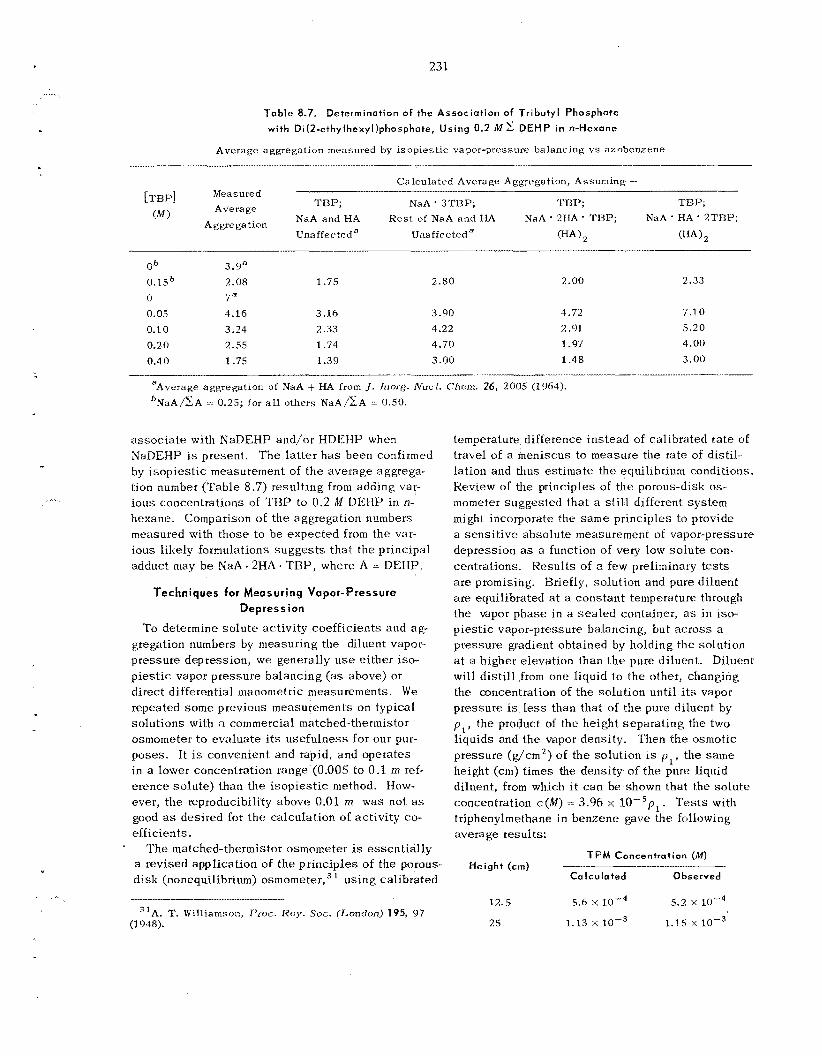
, 231
Table 8.7. Determination o f the Association of Tributyl Phosphate
with Di(2-ethylhexyl)phosphate, Using 0.2 Iw 2 DEHP in n-Hexane
Average aggregation measured by i sopies t ic vapor-pressure balancing vs azobenzene
Calculated Average Aggregation, Assuming - - Measured Average
A ggre pa t i on
[TBP] TBP; NaA 3TBP; TRP; TBP;
Unaffected a una ffe cteda (HA ) (HA), l M ) NaA and HA R e s t of NaA and HA NaA 2HA. TBP; NaA HA 2TBP;
O b 3.ga 0.15b 2.08 1.75 2.80 2.00 2.33
0 0.05 4.16 3.16 3.90 4.72 7.1.0
0.10 3.24 2.33 4.22 2.91 5.20 0.2 0 2.55 1.74 4.70 1.97 4.00
0.40 1.75 1.39 3.00 1.48 3.00
,a
- aAverage aggregation of NaA + HA from J . Inorg. NucI. Chetn. 26, 2005 (1964). bNaA/sA = 0.25; for a l l others N a A / x A = 0.50.
a s soc ia t e with NaDEHP and/or HDEfW when NaDEHP is present. The la t te r has been confirmed by i sopies t ic measurement of the average aggrega- lion number (Table 8.7) result ing from adding var- ious concentrations of TBP to 0.2 il.I DEHP in n- hexane. Comparison o€ the aggregation numbers measured with those to be expec ted from the var- ious l ikely formulations sugges t s t ha t the principal adduct may b e NaA .2I-IA. T R P , where A - DEHP.
Techniques for Measuring Vapor- Pressure Depression
To determine so lu t e ac t iv i ty coefficients and ag- gregation numbers by measuring the diluent vapor- pressure depression, w e generally u s e either iso- p i e s t i c vapor pressure ba lanc ing (as above) or direct differential manometric measurements. We repeated some previous measurements on typical solutions with a commercial matched-thermistor osmometer t o eva lua te its usefu lness for our pur- poses . It is convenient and rapid, and operates in a lower concentration range (0.005 to 0.1 zn ref- e rence so lu te ) than the i sopies t ic method. How- ever, the reproducibility above 0.01 m w a s not as good as desired for the calculation of ac t iv i ty co- efficients.
The matched-thermistor osmometer is essent ia l ly a revised application of the pr inc ip les of the porous- disk (nonequilibrium) osmometer, ' using calibrated
.
"A. T. Williamson, Proc. Roy. Soc. (London) 195, 97
temperature difference ins tead of calibrated rate of travel of a meniscus to measure the rate of distil- lation and thus estimate the equilibrium conditions. Review of the principles of the porous-disk os- mometer sugges ted tha t a s t i l l different system might incorporate the same principles to provide a sens i t i ve absolute measurement of vapor-pressure depression as a function of very low so lu t e con- centrations. Kesults of a few preliminary t e s t s are promising. Briefly, solution and pure diluent are equilibrated at a cons tan t temperature through the vapor phase in a sea l ed container, a s i n iso- p ies t ic vapor-pressure balancing, brit ac ross a pressure gradient obtained by holding the solution at a higher elevation than t h e pure diluent. Diluent will d i s t i l l from one liquid to the other, changing the concentration of the solution until i t s vapor pressure is l e s s than tha t of the pure diluent by pl, the product of the height separa t ing the two liquids and the vapor density. Then the osmotic pressure ( d c m ' ) of the solution is pl, the same height (cm) t i m e s the density of the pure liquid diluent, from which i t can be shown tha t the so lu te concentration c(M) = 3.96 x 10-spl. Tests with triphenylmethane in benzene gave the fcsllowing average results:
TPM Concentration (M)
Calculated 0 bserved I______ I.__. Height (cm)
12.5 5.6 x 5.2 X
(1948). 25 1.13 X IO-" 1.15 X
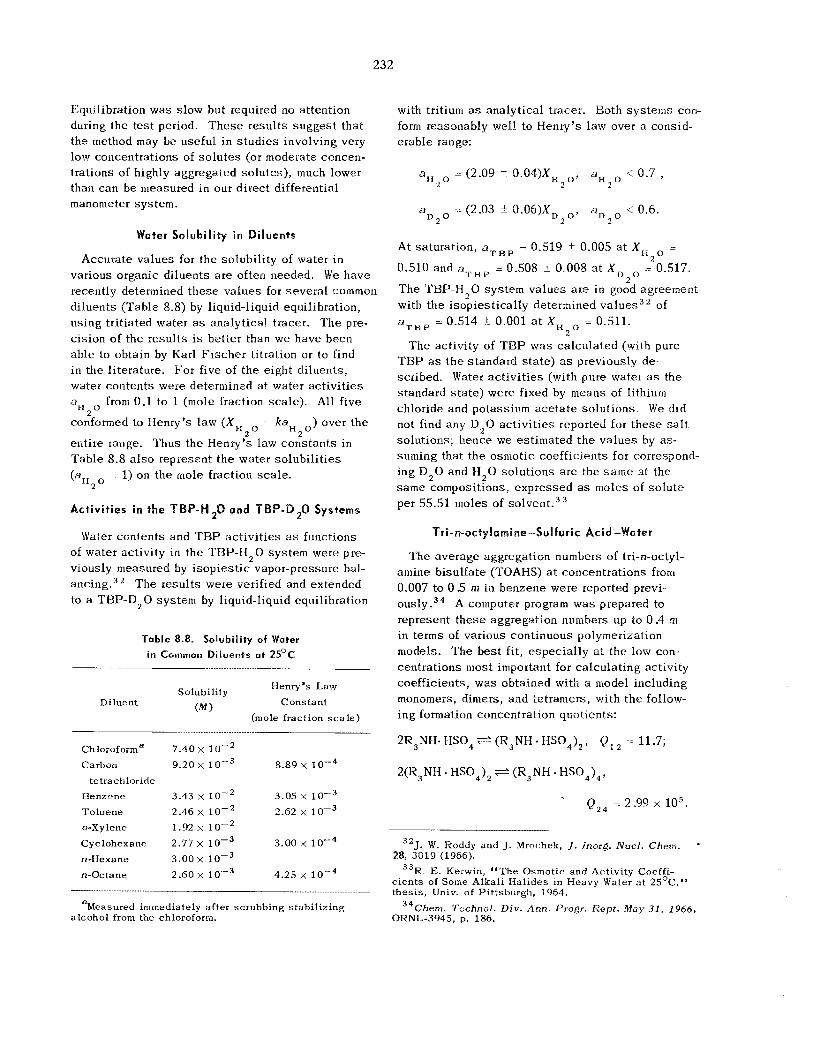
232
Equilibration was slow but required no attention during the t e s t period. T h e s e resu l t s sugges t that the method may be useful i n s tud ie s involving very low concentrations of so lu t e s (or moderate concen- trations of highly aggregated solutes), much lower than can be measured in our direct differential manometer system.
Water Salubil i ty in Diluents
Accurate va lues for the solubili ty of water i n various organic diluents a r e often needed. W e have recently determined t h e s e va lues for severa l common diluents (Table 8.8) by liquid-liquid equilibration, using tritiated water as analytica! tracer. ‘The pre- c i s ion of the resu l t s is be t te r than w e have been ab le to obtain by Karl Fischer titration or to find in the literature. Fo r five of t he eight diluents, water contents were determined at water ac t iv i t ies aEI from 0.1 to 1 (mole fraction scale). All f ive
conformed to Henry’s law ( X H Z 0 - k a H z 0 ) over the
entire iaage. Thus the Henry’s law cons tan ts in Table 8.8 a l s o represent t he water so lubi l i t i es ( a H z o = 1) on the mole fraction sca l e .
Activit ies in the %BP-M,Q and TBP-D,Q Systems
Water contents and TBP ac t iv i t ies as functions of water activity in the THP-H,O sys tem were pre- viously measured by i sop ie s t i c vapor-pressure bal- ancing.32 T h e resu l t s were verified and extended to a THP-D2 0 sys tem by liquid-liquid equilibration
2
Table 8.8. Solubility of Water
in Common Diluents at 25OC .....................
Henry’s Law Constant
(mole fraction sca l e )
Solubility ( M )
Diluent
....................
Chloroforma 7.40 x lo-’ Carbon 9.20 x 8.89 x
Benzene 3.43 x 10⁻² 3.05 x 1 0 - ~ Toluene 2.46 x lo-’ 2.62
Cyclohexane 2.77 x 3.00 x 1 0 - ~ n-Hexane 3.00 x 10⁻³ n-Oc ta ne 2.60 x 4.25
tetrachloride
o-Xylene 1.92 x IO--’
aMeasured immediately af ter scrubbing stabil izing alcohol from the chloroform.
with tritium a s analytical tracer. Both sys tems COR-
form reasonably well to Henry’s law over a consid- erable range:
a = (2.09 + O.O4)XHz0, aH < 0.7 , H Z o 2
a = (2.03 k 0.06)XD2,, a < 0.6. D 2 O D 2 °
At saturation, aTBP = 0.519 f 0.005 a t X
0.510 and aTHl, 0.508 i 0.008 a t X 0.517. The TBP-H20 sys tem va lues a r e in good agreement with the i sopies t ica l ly determined va lues3
= H 2 °
D 2 °
of = 0.514 + 0.001 a t X = 0.511.
H 2 ° aTBP
T h e activity of TBP w a s ca lcu la ted (with pure TBP as t h e s tandard s ta te ) as previously de- scribed. Water ac t iv i t ies (with pure watei as the standard s ta te ) were fixed by means of lithium chloride and potassium ace ta t e so lu t ions . We did not find any D 2 0 ac t iv i t ies reported for t h e s e salt solutions; hence we estimated t h e va lues by as- suming that t he osmotic coefficients for correspond- ing D,O and H 2 0 so lu t ions a r e the same a t the same compositions, expressed as moles of so lu t e per 55.51 moles of solvent.33
Tri-n-ostylcsmine-Sulfuric Acid-Water
T h e average aggregation numbers of tri-n-octyl- amine bisulfate (TOAHS) a t concentrations from 0.007 to 0.5 m in benzene were reported previ- 0 u s 1 y . ~ ~ A computer program was prepared to represent t hese aggregation numbers up to 0.4 rn in terms of various continuous polymerization models. T h e bes t fit, espec ia l ly a t the low con- centrations most important for calculating activity coefficients, w a s obtained with a model including monomers, dimers, and tetramers, with t h e follow- ing formation concentration quotients:
2R3NH. I-ISO, ~ (R3NH * I-IS04), , Q, , = 11.7;
2(R3NH * HSO,), e (R3NH - HS04)4 ,
* Q,, = 2-99 105.
32J. W. Roddy and J. Mrochek, J . inorg. Nucl. Chem. 28, 3019 (1966).
33R. E. Kerwin, #‘The Osmotic and Activity Coeffi- c ien ts of Some Alkali Halides in Heavy Water a t 25OC,” thesis, Univ. of Pittsburgh, 1961.
ORNL-3945, p. 186. 34Chen~ . Tc-chnol. Div. Ann. Pro&. R e p t . May 31, 1966,
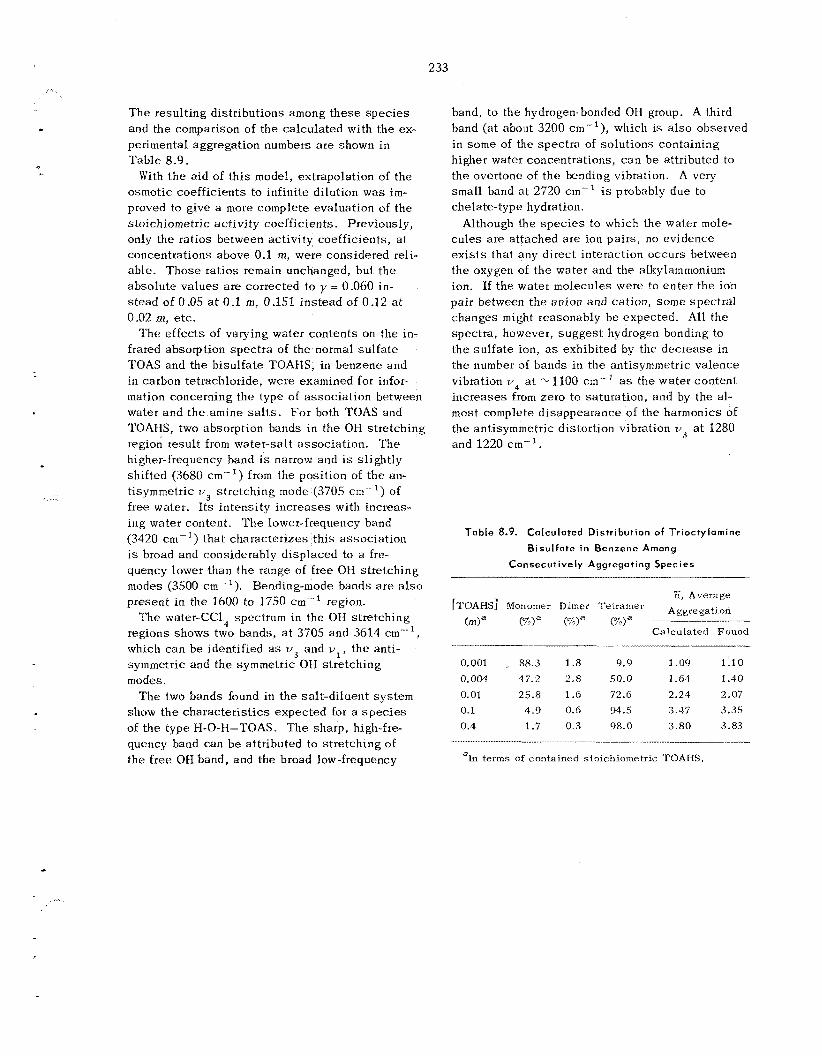
233
The result ing distributions among these s p e c i e s and the comparison of t h e ca lcu la ted with the ex- perimental aggregation numbers a r e shown i n Table 8.9.
With t h e a id of th i s model, extrapolation of t h e osmotic coef f ic ien ts to infinite dilution was im- proved to give a more complete evaluation of the stoichiometric ac t iv i ty coefficients. Previously, only the ratios between ac t iv i ty coefficients, a t concentrations above 0.1 m, were considered reli- able. Those ratios remain unchanged, but t h e absolu te va lues a re corrected to y = 0.060 in- s t ead of 0.05 at 0.1 m, 0.151 ins t ead of 0.12 a t 0.02 in, etc.
frared absorption spec t r a o l the normal su l€a te TOAS and the b isu l fa te TOAHS, in benzene and in carbon tetrachloride, were examined for infor- mation concerning the type of assoc ia t ion between water and the amine salts. For both TOAS and TOAHS, two absorption bands in the OH stretching region result from water-salt assoc ia t ion . T h e higher-frequency band is narrow and is s l igh t ly shifted (3680 cm-') from the posit ion of t he an- tisymmetric v 3 s t re tch ing mode (3705 cm-.') of free water. I t s in tens i ty inc reases with increas- ing water content. T h e lower-frequency band (3420 cm- ' ) t ha t charac te r izes th i s assoc ia t ion is broad and considerably d isp laced to a fre- quency lower than the range of f ree OH s t re tch ing modes (3500 cm- '). Bending-mode bands a r e also present in the 1600 to 1750 cm-' region.
T h e water-CCI4 spectrum in the OH s t re tch ing regions shows two bands, at 3705 and 3614 cm-', which can b e identified as vj and vl, t he anti- symmetric and the symmet ric 011 s t re tch ing modes.
show t h e charac te r i s t ics expec ted for a s p e c i e s of t h e type 11-0-H-TOAS. T h e sharp, high-fre- quency band can b e attr ibuted to s t re tch ing of the f ree OH band, and the broad low-frequency
T h e ef fec ts of varying water conten ts on the in-
T h e two bands found in t h e salt-diluent system
band, to the hydrogen-bonded OH group. A third band (at about 3200 cm-I), which is also observed in s o m e of the spec t r a of so lu t ions containing higher water concentrations, c a n b e attributed to the overtone of t h e bending vibration. A very small band a t 2720 cm-' is probably d u e to chelate-type hydration.
Although the s p e c i e s to which the water mole- cu le s a r e a t tached are ion pa i r s , no evidence e x i s t s tha t any direct interaction occurs between the oxygen of the water and the alkylammonium ion. If t he water molecules were to en ter t he ion pa i r between t h e anion and ca t ion , some spectrial changes might reasonably b e expected. All t he spectra, however, sugges t hydrogen bonding to t h e su l f a t e ion, a s exhibited by the dzc rease in t h e number of bands i n the antisymmetric va lence vibration vq at * 1100 cm--l as the water conten t i nc reases from zero to saturation, and by the al- m o s t complete d isappearance of the harmonics ol the antisymmetric distortion vibration i l j a t 1280 and 1220 c m - '.
Table 8.9. Calculated Distribution of Trioctylamine
Bisulfate in Benzene Among
Consecutively Aggregating Species
- 11, A v e r a g e
rTClRHS1 Monomer Dimer Tetramer Aggregation wa (%)* (%)" ph)a Calculated Found
0.001 , 88.3 1.8 9.g 1 .or) 1.10 0.004 47.2 2.8 50.0 1.64 1.40 0.01 25.8 1.G 72.6 2.24 2.07 0.1 4.9 0.6 94.5 3.47 3.3s
0.4 1.7 0.3 98.0 3.80 3.83 --_iil-__ .--..___.-_...___.III___
=In t e r m s of contained stoichiometric TOAHS.
...
9. plications of
The purpose of th i s program i s to provide re - s ea rch and development in se l ec t ed a r e a s of the Plowshare Program, espec ia l ly those a r e a s re- quiring knowledge of chemistry or metallurgical engineering to determine feasibil i ty. Areas in which research was performed last year included:
1. s t u d i e s of the distribution and poss ib le fate of radionuclides formed during the u s e of nu- c l ea r d w i c e s t o a id i n the recovery of copper from ore depos i t s ;
2. measurement of the ra te of exchange of tritium and hydrogen in water and natural gas undei conditions tha t may be encountered in the st imulation of g a s production from wel l s by nuclear explos ives ;
3. s tud ie s of the distribution and poss ib le fa te of radionuclides formed during the u s e of nuclear dev ices to a id in the recovery of oil from sha le s ;
4. hypervelocity j e t samplirig as a means of re- moving a specimen after irradiation i n t h e neutron flux of a detonation, hut ahead of the detonation shock wave.
Knowledge of the thermal s tab i l i ty and high- temperature reactions of actinide compounds is pertinent t o their poss ib le production through the u s e of thermonuclear devices . h description of related s tud ie s to determine some of t hese da ta by differential thermal ana lys i s and thermogravi- metric ana lys i s techniques appears in Sect. 7 of th i s repoit.
Laboratory is cooperating in th i s program by s tudying potential problems tha t might arise from the presence of radioactive contaminants i n thc process ing cyc le . T h e proposed flowsheet for recovering copper includes percolating a leaching solution of d i lu te su l fur ic a c i d down through the nuclear-broken o re to d isso lve the copper, col- lec t ing the leach liquor at the bottom of the ore body and pumping it to the surface, recovering a copper concentrate from the solution by cemen- tation on iron, and returning the barren solution, after fortifying i t with ac id , for r euse in the leaching s tep .
Status and Progress
Recent s t u d i e s continued to support the ear l ie r observation’ tha t ‘“Ru is probably the only radio- isotope of impoitance with respec t to radiocon- tamination of the cement copper. Ruthenium and copper a re not separa ted when the cement copper is smelted in to a consumable anode, but they a r e separa ted efficiently during electrolytic purifi- ca t ion of the anode. T h e final copper product should contain only t race amounts of radiocon- taminants and t h u s should riot be hazardous to the user. Some method for decreas ing ruthenium contarnination of the cement copper would be desirable, however, in order to minimize contami- nation of the electrolytic process ing facility. Several potential methods have been s tudied , but none of t hese have been acceptable.
Factors Affecting Ruthenium Cementation
Of the var iab les tha t a f fec t t he amount of rutbe- 9.1 COPPER (PRES
Fracturing of copper o re s with nuclear explo- s i v e s , followed by leaching in place, is being studied for the AEC by Lawrence Radiation Lab- oratory (LRL) and by the U.S. Bureau of Mines
nium cemented with the copper, t he init ial ruthe- nium concentration in the liquor w a s the most
‘Chern. Technol. Div. Ann. Pro&. R e p t . May 31, 1966, a t Tucson , Arizona. The Oak Ridge National ORNL-3945, p. 189.
234
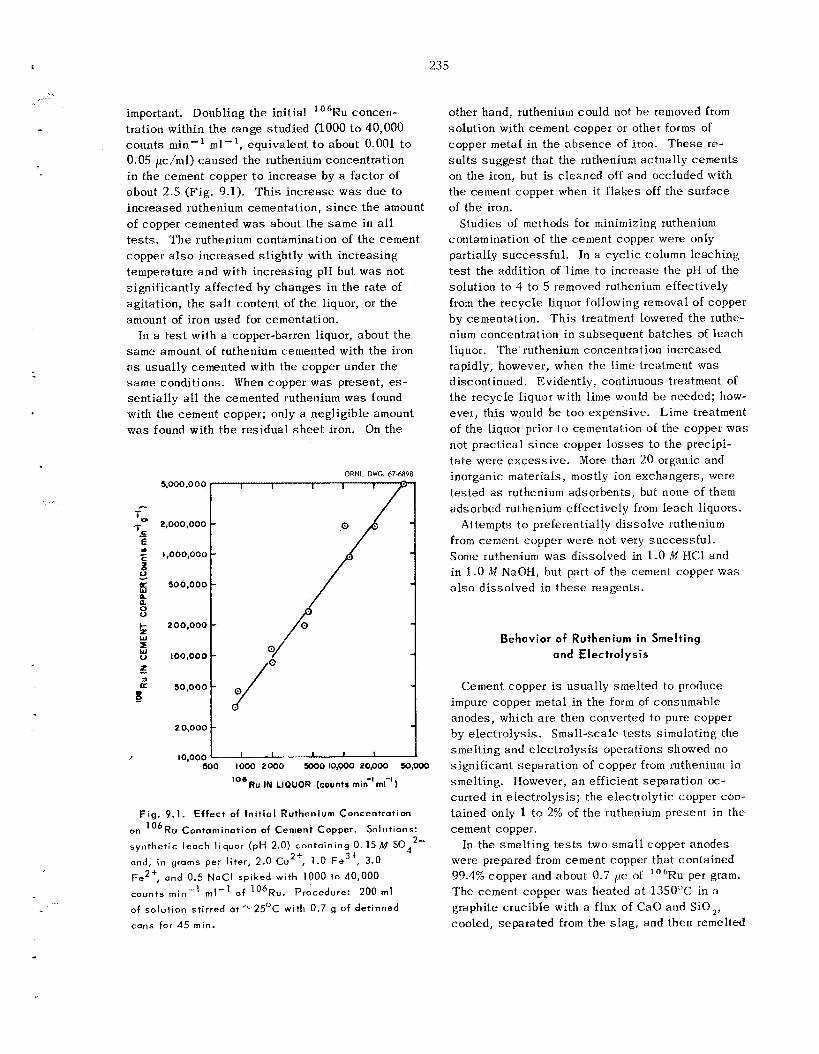
235
. .. ., ...
- important. Doubling the init ial 6 R ~ concen- tration within the range s tudied (1000 t o 40,000 counts min” ml-‘, equivalent to about 0.001 t o 0.05 ,uc/ml) caused the ruthenium concentration in the cement copper to increase by a factor of about 2.5 (Fig. 9.1). T h i s increase w a s due to increased ruthenium cementation, s i n c e the amount of copper cemented w a s about the s a m e in all t e s t s . T h e ruthenium contamination of the cement copper also increased slightly with increasing temperature and with increasing pH but was not significantly affected by changes in the rate of agitation, the salt content of the liquor, or the amount of iron used for cementation.
In a t e s t with a copper-barren liquor, about the same amount of ruthenium cemented with the iron as usually cemented with the copper under the s a m e conditions. When copper was present, es- sent ia l ly all the cemented ruthenium was found with the cement copper; only a negligible amount was found with the residual s h e e t iron. On the
b- z W
u 3
...
ORNL DWG. 67.6898 qooo .o 0 0 I I I 1 I
2.000,000 - 1,000,000 -
500,000 -
200,000 - 100,000 - 50,000 -
I
20,000
10,000 500 1000 2000 woo l0,gOO 20,000 so,oO0
RU +N LIPUOR (counts rnin’rnl- ’) 106
F i g . 9.1. E f f e c t of I n i t i a l R u t h e n i u m C o n c e n t r a t i o n
on ’ O ‘ R ~ C o n t a m i n a t i o n of Cement Capper .
s y n t h e t i c l e a c h l i q u o r ( p H 2.0) c o n t a i n i n g 0.15M Sod2- and, in grams per l i t e r , 2.0 Cu2’, 1.0 F e 3 + , 3.0 Fe2+, ond 0.5 N a C l s p i k e d w i t h 1000 t o 40,000 c o u n t s m i n - ’ m i - ’ of l o 6 R u . Procedure : 200 ml
of s o l u t i o n s t i r r e d a t ‘“25OC w i t h 0.7 g of d e t i n n e d
cans for 45 min .
So lu t ions :
other hand, ruthenium could not b e removed from solution with cement copper or other forms of copper metal in the absence of iron. These re- s u l t s sugges t that the ruthenium actually cements on the iron, but is cleaned off and occluded with the cement copper when i t flakes off the surface of the iron.
Studies of methods for minimizing ruthenium contamination of the cement copper were only partially success fu l . In a cyc l ic column leaching test the addition of l i m e t o increase the pH of the solution to 4 t o 5 removed ruthenium effectively from the recyc le liquor following removal of copper by cementation. Th i s treatment lowered the ruthe- nium concentration in subsequent batches of leach liquor. The ruthenium concentration increased rapidly, however, when the lime treatment was discontinued. Evidently, continuous treatment of the recycle liquor with l i m e would be needed; how- ever, th i s would be too expensive. Lime treatment of the liquor prior t o cementation of the copper was not practical s ince copper l o s s e s t o the precipi- t a t e were excess ive . More than 20 organic and inorganic materials, mostly ion exchangers, were tested as ruthenium adsorbents, but none of them adsorbed ruthenium effectively from leach liquors.
Attempts to preferentially d isso lve ruthenium from cement copper were not very successfu l . Some ruthenium was dissolved in 1.0 ill €IC1 and in 1.0 151 NaOH, but part of the cement copper was a l s o d isso lved in these reagents.
Behavior of Ruthenium i n Smelting and Electrolysis
Cement copper is usually smelted to produce impure copper metal in the form of consumable anodes, which are then converted to pure copper by e lec t ro lys i s . Small-scale tests simulating the smelting and e lec t ro lys i s operations showed no significant separa t ion of copper from ruthenium in smelting. However, a n efficient separation OC-
curred in e lec t ro lys i s ; the electrolytic copper con- tained only 1 to 2% of the ruthenium present in tho cement copper.
In the smelting t e s t s two smal l copper anodes were prepared from cement copper tha t contained 99.4% copper and about 0.7 pc of ‘“Ru per gram. The cement copper w a s heated a t 1350T in a graphite crucible with a flux of CaO and SiO,, cooled, separated from the s l ag , and then remelted
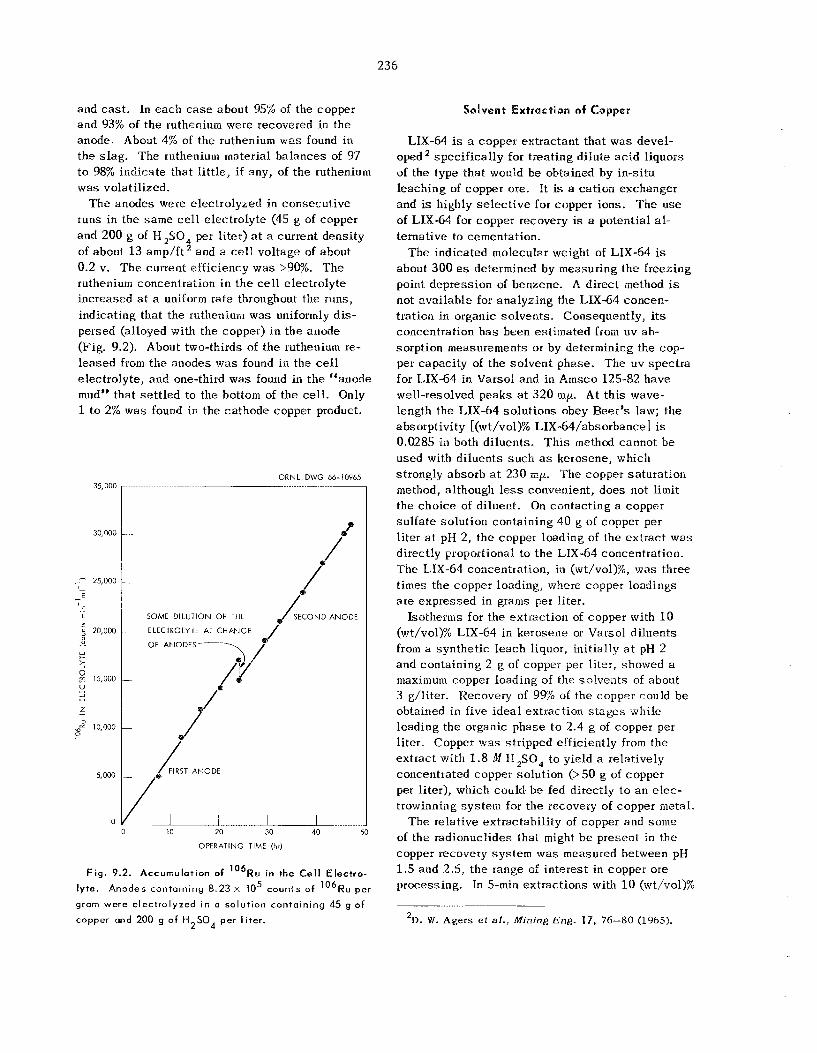
236
and cas t . In each c a s e about 95% of the copper and 93% of the ruthenium were recovered in the anode. About 4% of the ruthenium was found in the s l ag . The ruthenium material ba lances of 97 t o 98% indicate that l i t t le, i f any, of the ruthenium was volatilized.
The anodes were electrolyzed in consecut ive runs in the same ce l l electrolyte (45 g of copper and 200 g of H,SO per l i ter) a t a current density
0.2 v. The current efficiency w a s >go%. The ruthenium concentration in the cell electrolyte increased a t a uniform rate throughout the runs, indicating that the ruthenium was uniformly d is - persed (alloyed with the copper) i n the anode (Fig. 9.2). About two-thirds of the ruthenium re- leased from the anodes was found in the cell electrolyte, and one-third was found in the "anode mud" that s e t t l ed to the bottom of the cell. Only 1 to 2% was found in the cathode copper product.
of about 13 amp/ft 4 and a cell voltage of about
ORN L . DWG 66- 10965 35,000
30,030
-- 25,000 - E - E
< 20,000
t,
:
0 - w *-.
15,000
L,J
L - -2 10,000 2
5,000
0
i' /*
SOME DILUTION OF THE
~ ELECTROLYTE AT CHAI'IGE
OF ANODES---->/*
- /?
- i/'
OPERATING TIME (hr)
F i g . 9.2. A c c u m u l a t i o n of l o 6 R u in the Cell E l e c t r o -
l y t e .
grom were e l e c t r o l y z e d i n a s o l u t i o n c o n t a i n i n g 45 g of copper and 200 g of H SO per l i t e r .
Anodes c o n t a i n i n g 8.23 X lo5 c o u n t s of ' 06Ru per
2 4
Sallvent Extraction of copper
LIX-64 is a copper extractant tha t w a s devel- oped of the type tha t would be obtained by in-situ leaching of copper ore. It is a cation exchanger and is highly se l ec t ive for copper ions. The use of LIX-64 for copper recovery is a potential al- ternative to cementation.
The indicated molecular weight of LIX-64 is about 300 a s determined by measuring the freezing point depression of benzene. A direct method is not available for analyzing the LIX-64 concen- tration in organic solvents. Consequently, i t s concentration h a s been estimated from uv ab- sorption measurements or by determining the cop- per capacity of the so lvent phase. The uv spec t ra for LIX-64 in Varsol and in Amsco 125-82 have well-resolved peaks at 320 nip. At t h i s wave- length the LIX-64 solutions obey Beer's law; the absorptivity [(wt/vol)% LIX-6l/absorbance] i s 0.0285 in both diluents. T h i s method cannot b e used with diluents such a s kerosene, which strongly absorb a t 230 mp. The copper saturation method, although l e s s cotivetiient, does not limit the choice of diluent. On contacting a copper su l fa te solution containing 40 g of copper per liter a t pH 2, the copper loading of the ex t rac t was directly proportional to the LIX-64 concentration. The LIX-61 concentration, in (wt/vol)%, was three times the copper loading, where copper loadings a re expressed in grams per liter.
Isotherms for the extraction of copper with 10 (wt/vol)% LIX-64 in kerosene or Varsol diluents from a synthe t ic leach liqiior, initially a t pH 2 and containing 2 g of copper per l i ter , showed a maximum copper loading of thc so!vents of about 3 g/liter. Recovery of 9% of the copper could be obtained in five idea l extraction s t a g e s while loading the organic phase t o 2.4 g of copper per liter. Copper was stripped efficiently from the extract with 1.8 M I1,SO, to yield a relatively concentrated copper solution (>SO g of copper per liter), which could, b e fed directly to a n elec- trowinning sys tem for the recovery of copper metal.
The relative extractabil i ty of copper and soiiie of the radionuclides that might b e present in the copper recovery sys tem was measured between pH 1.5 and 2.5, the range of in te res t i n copper ore processing. In 5-min extractions with 1 0 (wt/vol)%
spec i f ica l ly for treating dilute ac id liquors
'1). VI. Agers et a l . , Mining Eng. 17, 76-80 (1965).
237
LIX-64 in Varsol from a synthe t ic leach liquor containing 0.2 g of copper per l i ter and tracer amounts of t he radiocontaminants, the extraction ccefficients for copper were 10 at pH 1.6 and greater than 50 at pH 1 . 9 and above. Ruthenium- 106 (the most troublesome contaminant i n the ce- mentation process), 1 3 4 ~ s , *%r, 6 0 ~ o , 4 6 S ~ , 65Zn, and I4'Ce each had a n extraction coefficient of less than 0.005 over the pH range studied. Mow- ever, significant amounts of 95Zr-Nb, 59Fe , and ' "Ag were extracted; extractions of the first two
were strongly rate dependent. In 5-min contac ts t he "Zr-Nb extraction coefficients were 1.4 and 0.7 at pH 1 . 5 and 2.5 respectively. At either pH the coef f ic ien ts were more than SO for a contac t time of 1 hr. There was no extraction of 59Fe a t pH 1.5 in 1 hr, but a t pH 2 .0 the extraction co- efficient increased from 0.05 at 5 min t o 0.16 a t 1 hr. Extraction coef f ic ien ts for loAg were 0.2 and 0.6 at pH 1.5 and 2.4 respectively. Essen - t ially a l l the 59Fe but only about 300% of the ' l oAg and 20% of the 95Zr-Nb were stripped from the ex t rac ts with 2 A! H,SO, in 10-min contac ts a t a phase ratio of 1 : 1. Fortunately, it is anticipated tha t the concentrations of "Zr-Nb, 59Fe, and
loAg in the leach liquors will be very low. Sol- vent extraction with LIX-64, therefore, should produce a copper product solution that is nearly free of radionuclides.
9.2 STIMULATION OF NATURAL GAS WELLS
In feasibiliky s tud ie s of the st imulation of gas production from wel l s by nuclear devices (Project Gasbuggy), it is important t o consider the relative distributions of tritium gas (produced by the de- vice) to the groundwater, to the natural gas (e.g., methane) init ially present in the cavity, and t o the gas that en ters the wel l after gas production has started. Because of the extreme temperatures and pressures at the ins tan t of detonation and shortly thereafter, t he tritium distribution occurring during this phase c a n be measured realist ically only in a n ac tua l nuclear tes t . However, laboratory meas - urements have been made tha t provide an indication of the tritium exchange t o be expected during the gas-production phase.
Such t e s t s have shown tha t the formation of tri- t iated methane from contac t with tr i t iated water will be low, provided tha t the tritium concentration in the gas phase is low and provided that there is
no ca ta ly t ic effect from the cavity medium. Specif- ically, the rate of tritium exchange with hydrogen in methane-water-vapor mixtures a t room tempera- ture and atmospheric pressure in a 1-liter g l a s s ves se l is
R -., 2.3 x l om8 [HTOI2 ,
where R is the rate of exchange in m c liter" day-' and the tritium (as HTO) concentration is in the range of 10 t o 50 mc/ l i te r . In a test per- formed l a s t year a t 100°C the exchange rate was equal to, or less than, 2.2 x m c li ter- ' day- ' when the tritium concentration w a s 1 mc/ l i ter .
It i s poss ib le that the exchange ra tes within the nuclear cavity c a n be different from those reported above a s a result of e f fec ts from the large sur face area of the crushed rock within the cavity. Lab- oratory experiments with crushed sha le (from the gas-producing geological formation) in the ex- change v e s s e l were inconclusive. Although the s h a l e had been exposed t o water vapor for severa l days prior to its addition to the tritiated-water- methane mixture, a large portion of the tritiated water was absorbed by the s h a l e as the experiment progressed. Within 3 0 days , for example, the gas- phase tritium concentration decreased from 2 0 to 2 mc/liter. The measured exchange of tritium with hydrogen in the methane during the same period was about equal to tha t which would have been observed i f a l l the tritium had remained in the gas phase.
9.3 RECOVERY OF OIL FROM SHALE
The AEC and its contractors, along with the U.S. Bureau of Mines and a private company named CER Geonuclear, a r e studying the feasibil i ty of using nuclear explosives t o fracture oil s h a l e for an in- s i t u retorting process (Project Bronco). ORNL has been asked to a s s i s t in the project by studying the poss ib le fate of radionuclides in the process oper- ations. It is known from earlier Plowshare experi- ence tha t most of the f i ss ion products and radio- nuclides formed by neutron activation during the nuclear b l a s t will be trapped fairly efficiently in the fused rock (Fuddle g lass ) that accumulates a t the bottom of the nuclear chimney. The crushed sha le , however, w i l l b e contaminated with fusion product tritium (presumably as tritiated water) and fission products having gaseous precursors, for
238
example, ”Sr and 137Cs , and volati le radionu- c l ides , for example, ‘“KU. In addition, the void space in the chimney will contain krypton and tritium (assumed to be mostly tritiated water vapor). Without actually performing a nuclear t e s t , it is impossible to assess accurately the potential prob- l e m s involved in producing and handling the oil. Conceivably, t he product s h a l e oil c a n b e con- taminated with radionuclides a t s eve ra l points in the process, for example:
1. exchange of tritium and hydrogen between water and s h a l e oil during the retorting phase ,
2, dissolution of oil-soluble f i ss ion product coin- pounds present i n the sha le rubble and puddle g l a s s ,
3 . inclusion of tr i t iated hydrocarbons that may b e produced in the fireball and that will b e d is - persed i n the chimney.
Also, t he g a s e s emerging from the retort will b e contaminated with krypton and tritium. T h e rela- t ive amounts of the various f i ss ion products and tritium in the sys t em will depend on the type of device used and the e l apsed t i m e following the shot. Assuming the u s e of a predominantly fusion device and a de lay of at l e a s t a year prior t o the s t a r t of retorting, tritium will be, by far, the pre- dominant radionuclide present.
The nuclear b l a s t will produce an underground chimney that is severa l hundred feet high and filled with seve ra l million tons of broken sha le . The proposed in-situ retorting process is designed t o operate a s follows: Air is forced down through the broken s h a l e , and the top is ignited. As the combustion front moves very slowly down through the chimney, t he g a s (CO 2, N 2, I1 20) from the combustion transports hea t from the combustion front t o the s h a l e below. This maintains a tem- perature gradient that moves with the combustion front i n a fixed relationship. The temperature l imits of this gradient a r e the temperature of t h e f l a m e at the top and that of the much cooler s h a l e at the bottom of the chimney. When the sha le temperature i s about 4OO0C, the kerogen destruc- tively d i s t i l l s , producing natural g a s (CH,, C $I6) and oil vapor. T h e s e products a r e swept down by the hot gas stream, thereby leaving depleted sha le , which is similar to charcoal and se rves as the fuel when the cornbustion front reaches it. T h e oil condenses i n the lower range of the gradient and drains to the bottom of the chimney, where i t is
collected and withdrawn a s product. It is hoped that 50 to 70% of the oil c a n b e recovered from sha le by th i s method. Recoveries of about 70% have been obtained by mining and burning the sha le in disti l lat ion retorts a t ground level.
Laboratory-Scale Retorting Stwdies
To obtain some understanding of the type and degree of radiocontamination of the oil that may occur, we a r e retorting sha le sp iked with radio- nuclides in smal l - sca le equipment and a re leaching nuclear-test-shot debris with s h a l e oil.
Green River oil s h a l e from the P iceance Bas in , Colorado, was c rushed and s i z e d as follows:
Percentage
Sample Size Range (in.) of Total Sample
Coarse -0.31 +0.19 71
Medium -0.19 +0.05 20 F ine -0.05 9
Samples of each of the fractions were analyzed by the U.S. Bureau of Mines a t Larainie, Wyoming. They varied only s l igh t ly in composition (‘T’able 9.1). T h e coa r se fraction was used in our experi- ments.
severa l of the s t e p s in the sequence of in-situ oil recovery c a n be simulated. Essen t i a l features of the system a r e a heated s h a l e furnace (to which
A laboratory retort w a s constructed in which
Table 9.1. Ana lys is of Sired Oil Shale
Fractions of Shale Sninple
Fine Medium Coarse Analysis ~-
Oil, w t % 10.7 11.8 12.1 Water, wt 70 1.0 1.2 1 .o Spent shale,, 85.8 84.5 84.1
w t 70
Gas + loss , 2.5 2.5 2.5 v r t 70
Specific gravity 0.919 0.918 0.914 of oil
Oil, gali ton 28.0 30.8 31.7
Water, ga l l ton 2.2 2.6 2.5
23 9
CO,, N,, W,O, oil , CH,, and a i r c a n b e added in sequence or i n a mixture), a n oil condenser a t 38”C, and a water condenser at OOC. By con- trolling the composition of the inlet gases and the temperatures, the s h a l e c a n b e first retorted and then burned.
fully in th i s unit. Disti l lat ion of the oil began when the s h a l e temperature was about 300°C and was e s sen t i a l ly complete a t about 430°C. T h e oil yield was 12 to 13 g, the approximate amount present in t h e sample a s determined by F i sche r ana lys i s ( s ee Tab le 9.1).
When the s h a l e was wetted with tritiated water prior t o retorting, t he product oil contained tritium compounds that were not removed by washing the oil with water. T h e shale had been moistened with 4.5 mc of 3H per ton of sha le ; t h i s is about ten t imes the maximum leve l anticipated in Pro jec t Bronco, assuming uniform distribution throughout the rubble and the u s e of a predominantly fusion device. T h e washed oil contained about 1 mc of 3W per gallon of oil, which is equivalent t o about 0.5% of the tritium originally added to the sys tem.
In other t e s t s , s amples of s h a l e oil were heated with test-shot debr i s i n the form of rubble (broken rock from up i n the chimney) and puddle g l a s s (material from the bottom of the chimney which w a s melted by t h e b l a s t and then cooled into a glass). After being heated a t 2 2 O T for 4 hr, the oil con- tained about 0.2% of the gross gamma activity
Samples (100 g ) of s h a l e were retorted s u c c e s s -
initially present i n t h e rubble and about 0.02% of that originally present in the puddle g lass . More than 85% of the to ta l radioactivity of the oil that was heated with the rubble was due to Io6Ru; about 10% was due to I3’Cs. The gamma activity of the oil sample from the t e s t with the puddle g l a s s w a s mostly due t o ‘06Ru (56%) and 6oCo
(42%). Only 1.5% of the ”Sr w a s d isso lved from the rubble; less than 0.01% was dissolved f rom the g lass .
9.4 DEVELOPMENT OF HYPERVELOCITY JET SAMPLERS
T e s t s t o demonstrate a jet-sampler method for recovering a target loca ted and irradiated a t about 1 m from a detonating nuclear device were com- pleted. T h e t e s t s were conducted a t the Frankford Arsenal, Vincentown, New Jersey, in a n evacuated (1 mm Hg) flight chamber tha t is 18 in. in diameter and 55 ft long. In the final t e s t s f ive copper cones were machined to provide a high degree of sym- metry, and gold, simulating transplutonium targets, was plated in the cones . T h e s e were jetted a t t he t e s t range. The wood that was used to ca tch the jetted targets h a s been received a t ORNL, where the gold wi l l be recovered from the wood t o de- termine the efficiency with which the je t ted target w a s focused within the fl ight chamber.
TI 0. of: Fission w t
240
T h e objective of the f i ss ion product recovery program is to develop processes that a r e applicable to large-scale rccovery and purification of f i ss ion products from reactor-fuel-reprocessing waster;. Since the inception of th i s program the principal emphasis h a s bcen on the development of so lvent extraction methods, because they are particularly versati le and readily adaptable to lapge-scale operations. A solvent extraction process us ing di(2-ethyhexy1)phosphoric acid (D2EHPA) h a s been successfully developed for recovering 'Sr and mixed rare earths. A modification of th i s process has been developed and operated on a plant scale at Hanford. New processes have also been de- veloped in the laboratory for recovering cesium with substi tuted phenols and for recovering zirconium-niobium and ruthenium. The combina- tion of these p rocesses with previous methods for separating rare ear ths and recovering technetium, neptunium, and plutonium affords a possible integrated solvent extraction flowsheet for re- covering nearly all the valuable components from was te solutions.
The experimcntal work planned for t h i s program is nearly complete. Recent s tud ies have included the bench-scale demonstration of a simplified flowsheet for i so la t ing strontium, mixed rare earths, and cesium from each other and from other f i ss ion products and bulk contaminants.
10.1 NEW FLOWSHEET FOR ~ ~ ~ O V ~ ~ l ~ ~ STRONTIUM, RARE EARTHS, AND CESIUM
The proposed process (Fig. 10.1) provides l e s s - pure rare ear ths and strontium Concentrates than processes developed earlier; however, it requires less equipment and does not u s e large amounts of aqueous-phase cornplexing agents (e. g., tartrate or citrate). In th i s f lowsheet the rare ear ths , as
well as nearly all the iron and "Zr-Nb and most of the aluminum, a re extracted in a s ing le s t age from Purex sugar-treated was te (STW) solution with the sodium s a l t of di(2-ethy1hexyl)phosphoric acid (Na-W?EI-IP) in normal paraffin hydrocarbon (NPH)-tribatyl phosphate. The amount of Na- D2EHF fed to the system is regulated to provide a final extraction pM of 2 to 2.5. Iron extraction, which is very slow at higher acid concentrations, is rapid under these conditions. The rare ear ths are selectively stripped from the extract with dilute nitric acid, after which the solvent is prepared for recycle by a single-stage contac t with d i lu te NaOH. The raffinate from the rare- ear ths recovery operation is adjusted with NaOH to a pH of about 6, where the bulk of the con- taminant metals, but only a small fraction of the strontium and essent ia l ly none of t he cesium, precipitates. T h e resulting supernatant solution cons t i tu tes a feed from which t h e recovery of strontium with D2EHPA, and then the recovery of cesium (at pH 12) with a substi tuted phenol, can be eas i ly accomplished.
Es t imates of the distribution of the more im- portant f i s s ion products and bulk metal contami- nants in the various process streams a re given in F ig . 10.1, and estimates of the decontamination factors obtainable by the process are given in Table 10.1. T h e s e va lues should be considered as tentative s ince they were made on the b a s i s of very limited process tes t ing with simulated Purex STW feeds at tracer level. Recoveries of more than 90% of the rare earths, strontium, and cesium are indi- cated, with each of the concentrates being rela- tively free of contaminants.
The first-cycle extraction of r a re ear ths and metal contaminants was demonstrated successfu l ly in continuous runs in equipment tha t included two cocurrent mixers (to improve the s t a g e efficiency) and a sett ler. T h e residence time of the phases i n the mixers, which were operated at 50 to 6OoC,
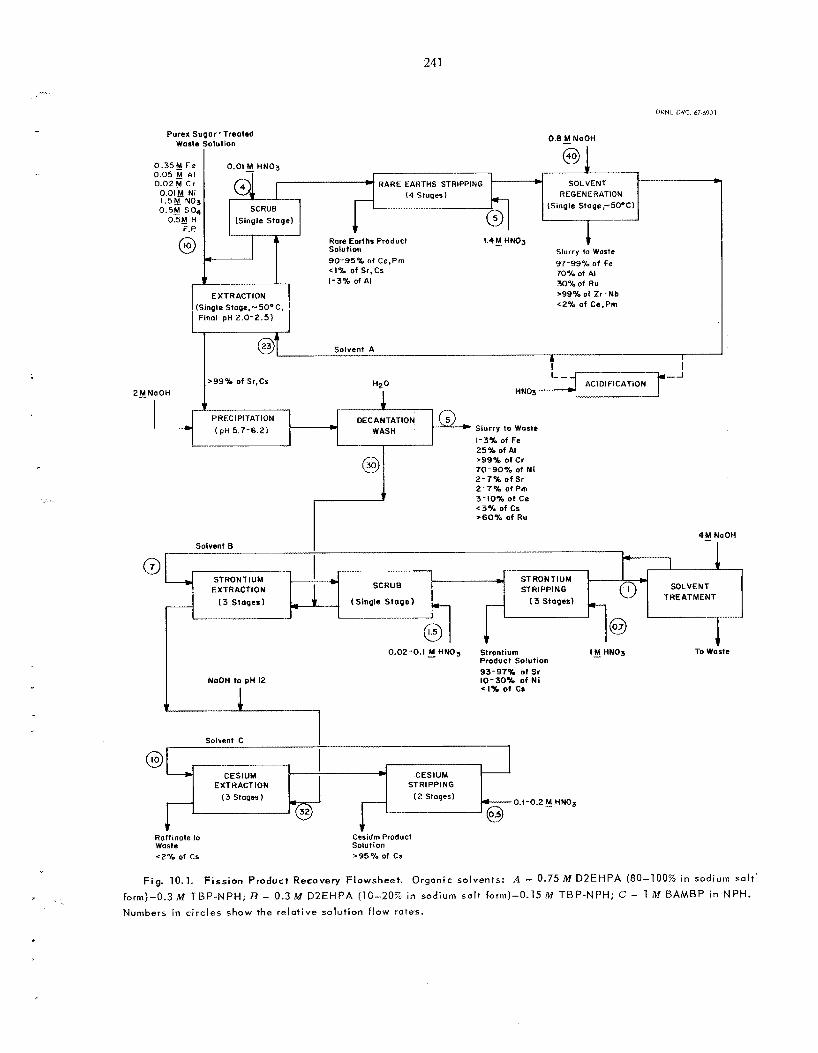
24 1
~
69
ORNI. DWG. 67-5901
25% of AI >99% of Cr 70-90% of Ni 2-7% o f Sr 2-7% of Pm
... . .
-
r
...
- - * STRONTIUM
SCRUB STRIPPING SOLVENT
(Single Stoge) .t- - I 3 Stages) (3 Stages)
...
@ 1 To Waste IhJ HNO3 0.02-0.1 HN03 Strontium
Product Solution 93-97s of Sr IO-30% of Ni C l X Of C.
NaOH to pH 12
Purex Sugar-Treated Waste Solution
0.0ly Ni (4 Stoges) 1.5M NO3
Rare Eorths Product Solution 90-95% of Ce,Prn < I % of Sr,C5 I - 3% of AI
1.4 fi HNO3
EXTRACTION
0.B NaOH
I REGENERATION (Single Stoge,-SWC) I 7.- +
Slurry to Woste 97-99% of Fe 70% of AI 3096of Ru >99%of Zr-Nb <2% o f Ce,Pm
Solvent A I k I
"20 I
I
H N O ~
Solvent C
CESIUM CESIUM EXTRACTION STRIPPING
0.1-0.2 E HNOs @@e (3 Stages) (2 Stages)
Raffinote to Waste <2% of cs
Cesidrn Product Solution >95% of cs
Fig. 10.1. Fission P r o d u c t Recovery Flowsheet . O r g a n i c solvents: A - 0.75 M DZEHPA (80-100% in s o d i u m salt
form)-0.3 M TBP-NPH; B - 0.3 M D2EHPA (10-2070 in s o d i u m s a l t f o r m ) - 0 . 1 5 M TBP-NPH; C - 1 M BAMBP in NPH. Numbers in circles show the re la t i ve s o l u t i o n f l o w ra tes .
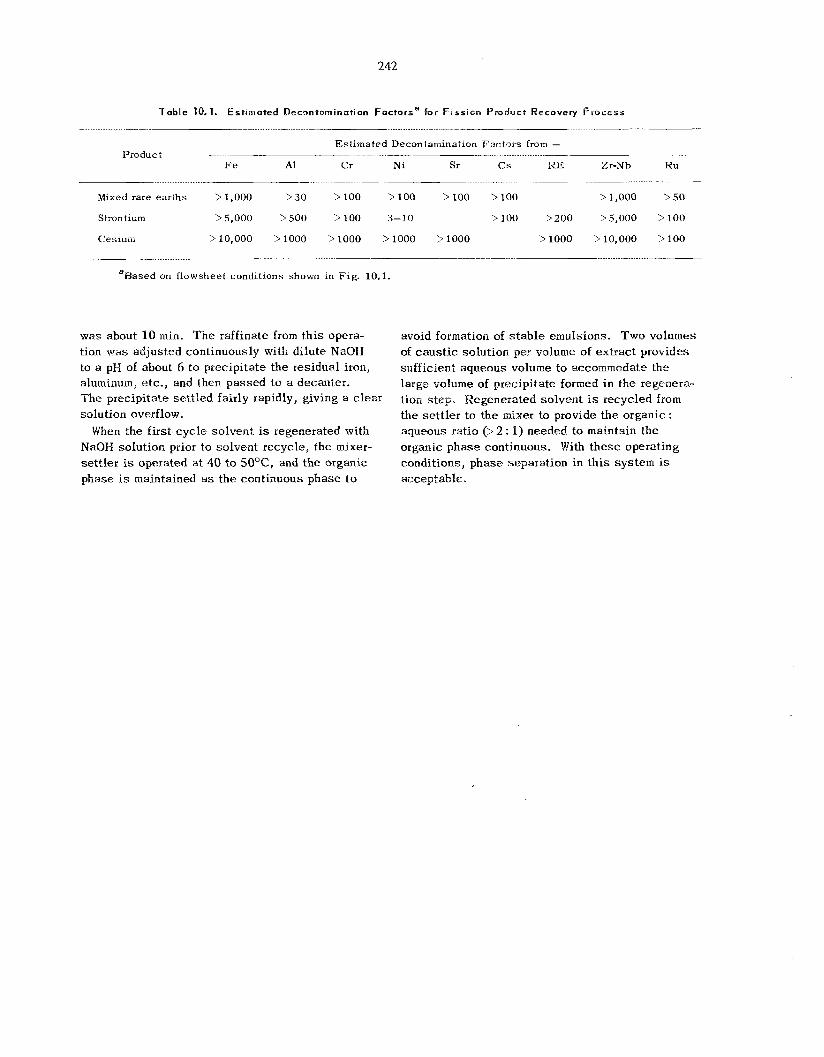
242
Table 10.1. Estimated Decontcrnination Factorse for Fission Product Recovery Pvocess .......... __ . ._ ........ ............... .. -. . ......
Estimated Decontamination Factors from - .................... ._ - .................. __ Product
Fe A1 Cr Ni Sr CS R E Zr-N b Ru
Mixed rare earths > 1,000 > 3 0 > L O O > I O 0 >IO0 > l o 0 >1,000 > 5 0
Strontium >5,000 >500 >IO0 3-19 >IO0 >200 >5,000 >IO0
Cesium >10,000 >loo0 >IO00 >IO00 >IO00 >loo0 >10,000 > I O 0
aHased on flowsheet conditions shown in Fig. 10.1.
was about 10 min. T h e raffinate from th i s opera- tion mas adjusted continuously with di lute NaQW to a pH of about 6 to precipitate the residual iron, aluminum, etc., and then passed to a decanter. T h c precipitate settled fairly rapidly, giving a c l e a t solution overflow.
When the first-cycle solvent is regenerated with NaQH solution prior to solvent recycle, the n' I ixer- settler is operated at 40 to 5OoC, and the organic phase i s maintained a s the continuous phase to
avoid formation of s t a b l e emulsions. Two volumes of c a u s t i c solution per volume of extract provides sufficient aqueous volume to accommodate the large volume of precipitate formed in the regenera- tion s tep. Regenerated solvent is recycled from the se t t le r to the mixer to provide the organic : aqueous ratio Q> 2 : 1) needed to maintain the organic phase continuous. W i t h t h e s e operating conditions, phase separation in this system is acceptable.
11. Biochemical Separations
11.1 DEVELOPMENT OF PROCESSES FOR MACROMOLECULAR SEPARATIONS
Separation of Transfer Ribonucleic Acids
In the last annual report we descr ibed a reversed- phase chromatographic system that employed a quaternary ammonium extractant dissolved in a n isoamyl a c e t a t e diluent. It was useful for the preparation of highly purified samples of phenyl- alanine t ransfer r ibonucleic acid (tRNA) and a leucine tRNA from E . coli. During th i s report period w e developed a new reversed-phase chro- matographic system that yields superior chro- matographic resolution of E. coli transfer nucleic ac ids (tRNA’s). T h e system is similar in principle to the previous reversed-phase chromatographic system; however, u s e of a new diluent and a dif- ferent quaternary amine, as well as a concave- gradient elution method, produced sharper tRNA chromatographic peaks and better separat ion of the tRNA’s in t h e front region of the chromatogram. In th i s separat ion method a solution of tricaprylyl- methylammonium chloride in a water-insoluble Freon, tetrafluorotetrachloropropane, is immobilized as a f i lm on a hydrophobic diatomaceous earth sup- port. After the treated sol id (an organic anion ex- changer) h a s been packed in a g l a s s column, the crude tRNA is absorbed on the exchanger from a di lute sodium chloride solution. Chromatograms are then developed by u s e of the sodium chloride gradient elution technique.
T h e e f fec ts of flow rate, temperature, and the shape of the gradient elution curve (concave or linear) were investigated; t h e s e conditions were then optimized for the b e s t distribution of E. coli B tRNA’s throughout the chromatogram. Chroma- tograms were run at two pH leve ls , 4.5 (Fig. 11.1) and 7.0 (Fig. 11.2)’ to invest igate the distribution, the posit ions, and the heterogeneity of 14 tRNA’s. T h e s e experiments, employing the NaCl gradient,
were performed a t 37OC with the additional presence of 0.01 M MgClz (and ei ther 0.05 M T r i s buffer at pH 7.0 or 0.01 IW sodium ace ta te buffer at pH 4.5). An elution flow rate of 0.5 ml/min and a concave gradient were employed.
heterogeneous (i.e., they had multiple elution peaks). For example, at pH 7.0, five leucine tRNA’s were found, while at pH 4.5, three peaks were detected for each of the following: alanine, arginine, phenylalanine, and methionine tRNA’s. A greater degree of heterogeneity for many tRNA’s was obtained with t h e Freon diluent reversed-phase system than with the previous system using isoamyl acetate. Heterogeneous tRNA’s could result from subt le differences in chemical composition and/or physical conformation.
reversed-phase chromatographic system lies in the sharpness of the individual tRNA e l u t i o i peaks that a re obtained and in t h e capabili ty of the s y s - t e m with regard to separation of tRNA’s from sources (other than E . coli) for which methods have not previously been available. For example, this system h a s been used by invest igators i n the Biology Division to fract ionate tRNA’s from rat liver, mouse liver, and two different types of mouse plasma cell tumors.
Twelve of the fourteen tRNA’s were found to b e
T h e s p e c i a l advantage or usefu lness of the Freon
I sol ation of Phenylalanyl- RNA Synthetase from E. coli 8
To invest igate the interaction between tRNA’s and the enzymes that recognize the tRNA’s and ca ta lyze the attachment of the correct amino acid (RNA synthetases) , it is desirable to be able to prepare purified synthe tases that correspond to the purified tRNA’s. A method for the preparation oE s m a l l amounts of highly purified phenylalanyl-RNA synthetase from E. coli B h a s been developed by
243
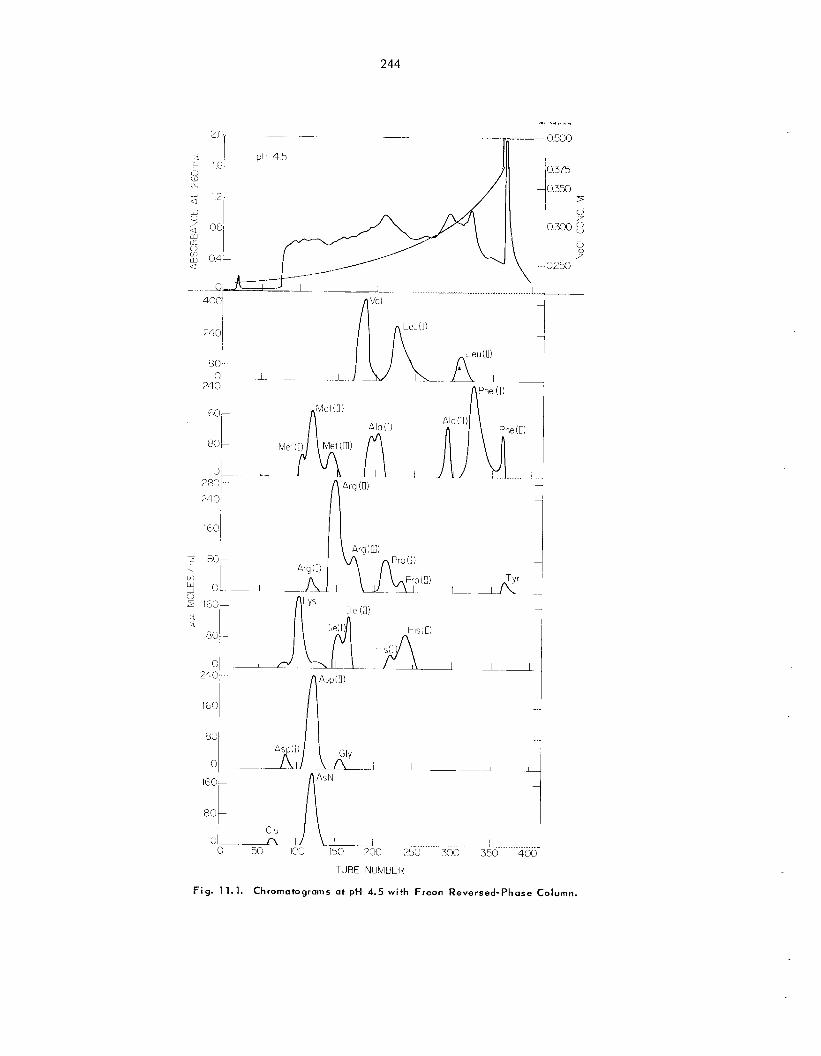
244
C C IEC-
0- 0
1 .. . .1....J 350 400
TUBE NUMBEH
Fig. 11 .1 . Chromotograms at pH 4.5 with Freon Reversed-Phase Column.
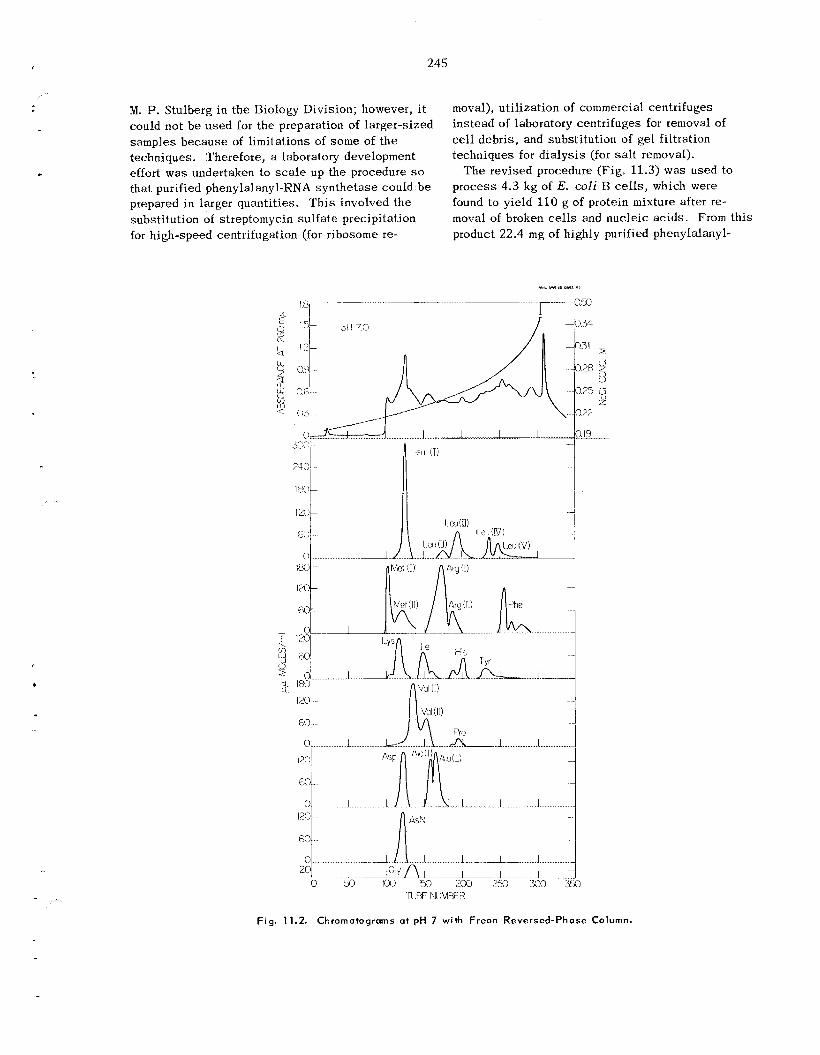
245
...
... . . .
M. P. Stulberg in the Biology Division; however, i t could not b e used for the preparation of larger-sized samples because of l imitations of some of t h e techniques. Therefore, a laboratory development effort was undertaken to scale up the procedure so that purified phenylalanyl-RNA synthe tase could b e prepared in larger quant i t ies . T h i s involved the subst i tut ion of streptomycin su l fa te precipitation for high-speed centrifugation (for ribosome re-
moval), utilization of commercial centrifuges instead of laboratory centrifuges for removal of cell debris , and subst i tut ion of gel filtration techniques for d ia lys i s (for salt removal).
p rocess 4.3 kg of E. coli R cells, which were found to yield 110 g of protein mixture after re- moval of broken cells and nucleic ac ids . From th is product 22.4 mg of highly purified phenylalanyl-
T h e revised procedure (Fig. 11.3) was used to
TI!= NIJMER
Fig. 11.2. Chromatograms a t pH 7 with Freon Reversed-Phase Column.
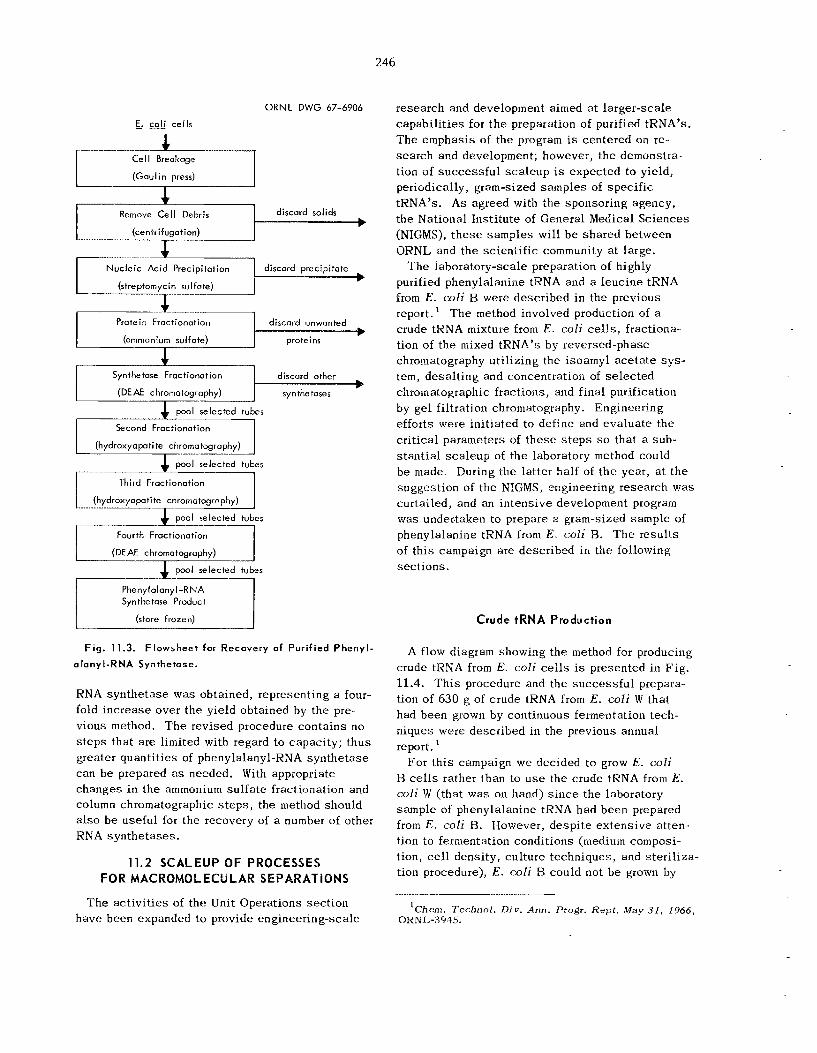
246
ORNL DWG 67-6906
E. coli cells
(Gaulin press)
I Nucleic Acid Precipitation
(streptomycin sulfate)
Fig. 11.3. Flowsheet for Recovery of Purif ied Phenyl- a lanyl -RNA Synthetase.
RNA synthe tase was obtained, representing a four- fold inc rease over t h e yield obtained by the pre- vious method. T h e revised procedure conta ins no s t e p s that a re limited with regard to capacity; t hus greater quantit ies of phenylalanyl-RNA synthe tase can b e prepared as needed. With appropriate changes in the ammonium sul fa te fractionation and column chromatographic s t e p s , the method should also b e useful for the recovery of a number of other RNA synthe tases .
11.2 SCALEUP OF PROCESSES FOR MACROMOL ECU L AR SEP ARAT 1 ONS
T h e ac t iv i t ies of the Unit Operations sec t ion have been expanded to provide engineering-scale
research and development aimed at larger-scale capabi l i t i es for t h e preparation of purified tRNA’s. The emphasis of the program is centered on re- search and development; however, t he demonstra- tion of success fu l s ca l eup is expected to yield, periodically, gram-sized samples of spec i f ic tRNA’s. A s agreed with the sponsoring agency, the National Insti tute of General Medical. Sc iences (NIGMS), t h e s e samples will b e shared between ORNL and the sc ien t i f ic community a t large.
T h e laboratory-scale preparation of highly purified phenylalanine tRNA and a leuc ine tRNA from E . coli B were described in the previous report. T h e method involved production of a crude tRNA mixture from E . coli ce l l s , fractiona- tion of the mixed tRNA’s by reversed-phase chroiuatography uti l izing the isoamyl ace t a t e sys - tem, desa l t ing and concentration of se l ec t ed chromatographic fractions, and final purification by ge l filtration chromatography. Engineering efforts were init iated to define and eva lua te t h e cri t ical parameters of t h e s e s t e p s so tha t a sub- s tan t ia l s ca l eup of the laboratory method could be made. During the latter half of t h e year, at t h e suggestion of the NIGMS, engineering research w a s curtailed, and an intensive development program was undertaken to prepare a gram-sized sample of phenylalanine tRNA from E. coli R. T h e resu l t s of th i s campaign a re described in the following sec t ions .
Crude tRNA Production
A flow diagram showing the method for producing crude tRNA from E. coli cells is presented in F ig . 11.4. T h i s procedure and the success fu l prepara- tion of 630 g of crude tRNA from E. coli W that had been grown by continuous fermentation tech- niques were described in the previous annual report. *
For th i s campaign we decided to grow E. coli B cells rather than to u s e the crude tRNA from E. coli W (that was on hand) s i n c e the laboratory sample of phenylalanine tRNA had been prepared from E . coli B. However, desp i te ex tens ive atten- tion to fermentation conditions (medium composi- tion, cell density, culture techniques, and s te r i l i za- tion procedure), E. coli B could not b e grown by
‘Chern. Technol. Di v. Ann. Progr. I?ept. May 31, 1966, ORNL-3915.
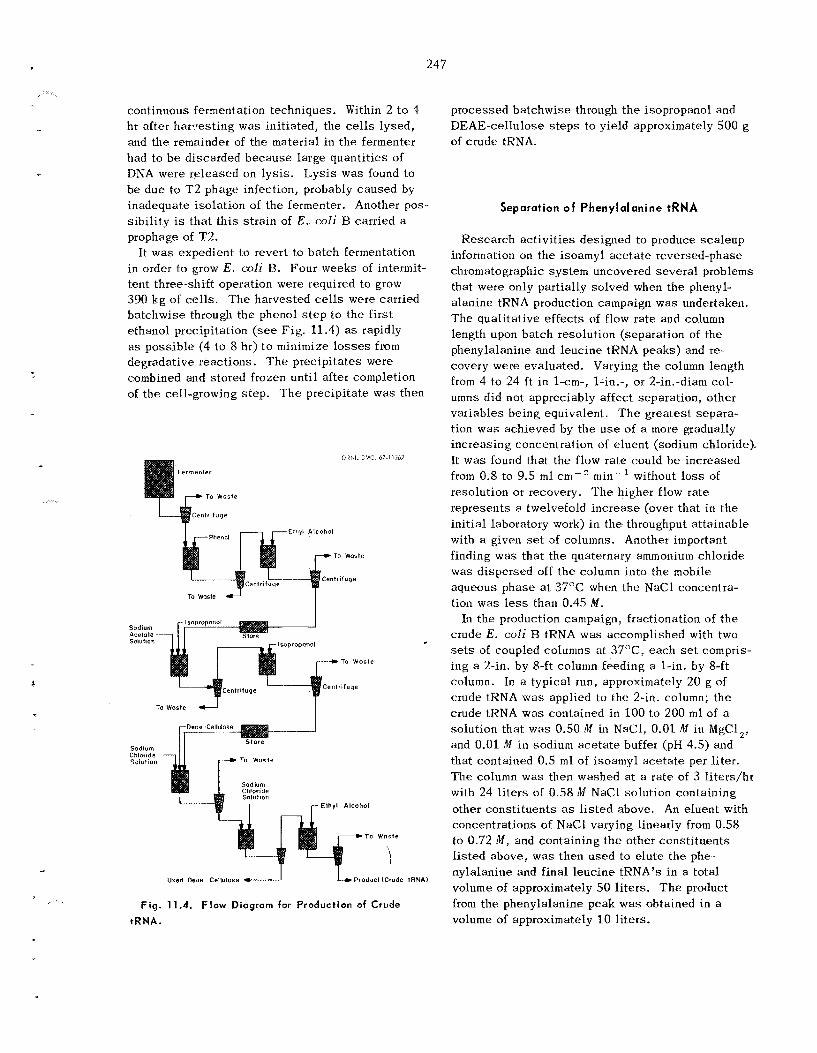
247
r
continuous fermentation techniques. Within 2 to I hr after harvesting was init iated, the cells lysed, and the remainder of the material in t he fermenter had to be discarded because large quantit ies of DNA were re leased on lys i s . L y s i s was found to be due to T 2 phage infection, probably caused by inadequate isolation of the fermenter. Another pos- sibil i ty is tha t t h i s s t ra in of E. coli B carried a prophage of T2.
in order to grow E . cvli B. Four weeks of intermit- tent three-shift operation were required to grow 390 kg of cells. T h e harvested cells were carried batchwise through the phenol s t e p t o the first ethanol precipitation (see Fig. 11.4) a s rapidly as poss ib le (4 to 8 hr) t o minimize l o s s e s from degradative reactions. T h e precipitates were combined and stored frozen until after completion of the cell-growing s t ep . T h e precipitate was then
It w a s expedient to revert to batch fermentation
processed batchwise through the isopropanol and DEAE-cel lulose s t e p s to yield approximately 500 g of crude tRNA.
Separation of Phenylalanine tRNA
Research ac t iv i t ies designed to produce sca leup information on the isoamyl ace ta te reversed-phase chromatographic system uncovered severa l problems that were only partially solved when the phenyl- alanine tRNA production campaign was undertaken. The qualitative effects of flow rate and column length upon batch resolution (separation of the phenylalanine and leucine tRNA peaks) and re- covery were evaluated. Varying the column length from 4 to 24 Et in 1-cm-, l-in.-, or 2-in.-diam col- umns did not appreciably affect separation, other variables being equivalent. T h e grea tes t separa- tion was achieved by the use of a m o r e gradually increas ing concentration of eluent (sodium chloride). It w a s found that the flow rate could be increased from 0.8 to 9.5 m l cm-' min-' without loss of resolution or recovery. T h e higher flow rate represents a twelvefold increase (over tha t in the in i t ia l laboratory work) in the throughput attainable with a given set of columns. Another important finding was tha t the quaternary ammonium chloride was dispersed off the column into the mobile aqueous phase at 37OC when the NaCl concentta- tion was less than 0.45 M.
In t h e production campaign, fractionation of t he crude E . coli I3 tRNA was accomplished with two s e t s of coupled columns a t 3 7 T , each set compris- ing a 2-in. by 8-ft column feeding a 1-in. by 8-ft column. In a typical run, approximately 20 g of crude tRNA w a s applied to the 2-in. column; the crude tRNA was contained i n 100 to 200 m l of a solution that was 0.50 M in NaC1, 0.01 M in MgCl,, and 0.01 M in sodium ace ta t e buffer (pH 4.5) and that contained 0.5 m l of isoamyl ace ta te per liter. The column was then washed at a ra te of 3 li ters/hr with 24 l i t e rs of 0.58 M NaCl solution containing other cons t i tuents as l i s ted above. An eluent with concentrations of NaCl varying linearly from 0.58 to 0.72 M , and containing t h e other cons t i tuents l i s ted above, was then used to e lu te the phe- nylalanine and final leuc ine tRNA's in a total volume of approximately 5 0 l i t e rs . T h e product from the phenylalanine peak was obtained in a volume of approximately 10 li ters.
Used Lkae -Cellulase Producl (Crude I R N A )
Fig. 11.4. Flow Diagram for Production of Crude tRNA.
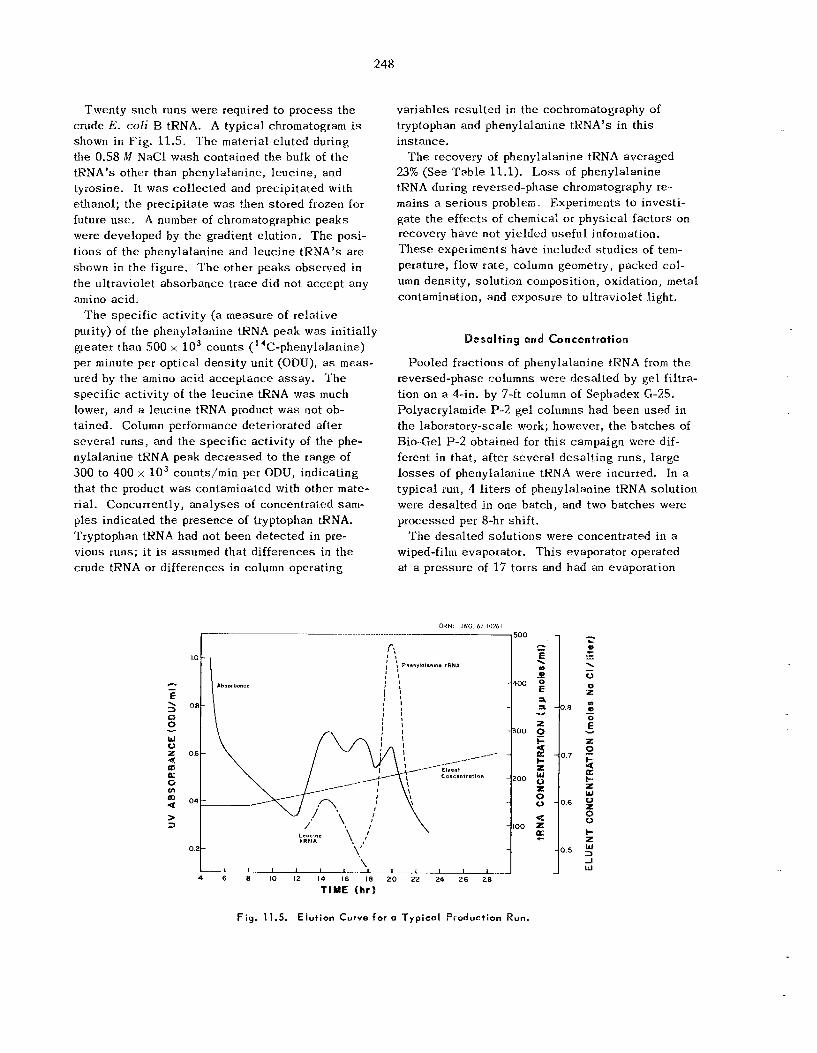
248
- - - E ea \
E a a.
z t- 2 I- X w 0 x
- s
e Z
55 - -
Twenty such runs were required to process t h e crude E. coli B tRNA. A typical chromatogram is shown in Fig. 11.5. T h e material eluted during the 0.58 M NaCl wash contained the bulk of t h e tRNA’s other than phenylalanine, leucine, and tyrosine. It was collected and precipitated with ethanol; t he precipitate was then stored frozen for future use . A number of chromatographic peaks were developed by the gradient elution. T h e posi- t ions of the phenylalanine and leucine tRNA’s a re shown in the figure. T h e other peaks observed in the ultraviolet absorbance t race did not accept any amino acid.
purity) of the phenylalanine tRNA peak was init ially greater than 500 x l o3 counts (“C-phenylalanine) per minute per optical dens i ty unit (ODU), as m e a s - ured by t h e amino acid acceptance a s say . T h e spec i f ic activity of the leuc ine tRNA was much lower, and a leucine tRNA product w a s not ob- tained. Column performance deteriorated after severa l runs, and the spec i f i c activity of the phe- nylalanine tRNA peak decreased to the range of 300 to 400 x l o 3 counts/min per ODU, indicating that the product was contaminated with other mate- rial. Concurrently, ana lyses of concentrated s a m - ples indicated the presence of tryptophan tRNA. Tryptophan tHNA had not been detected in pre- vious runs; i t is assumed tha t differences in the crude tRNA or differences in column operating
T h e spec i f ic activity (a measure of relative
-0.u
-0 .7
-0.6
0.5
w 0 X 4 m LL 0 ul
a m
> 3
variables resulted in t h e cochromatography of tryptophan and phenylalanine tRNA’s i n th i s instance.
T h e recovery of phenylalanine tRNA averaged 23% (See Tab le 11.1). Loss of phenylalanine tRNA during reversed-phase chromatography re- mains a ser ious problem. Experiments t o investi- ga te the e f f ec t s of chemical or physical factors on recovery have not yielded usefu l information. T h e s e experiments have included s tud ie s of tem- perature, flow rate, column geometry, packed col- umn density, solution composition, oxidation, m e t a l contamination, and exposure to ultraviolet light.
Desalting and Concentration
Pooled fractions of phenylalanine tRNA from t h e reversed-phase columns were desa l ted by gel filtra- tion on a 4-in. by 7-ft column of Sephadex G-25. Polyacrylamide P-2 ge l columns had been used i n the laboratory-scale work; however, t he ba tches of Bio-Gel P-2 obtained for th i s campaign were dif- ferent in tha t , after severa l desa l t ing runs, large losses of Phenylalanine tRNA were incurred. In a typical run, 1 l i t e rs of phenylalanine tRNA solution were desa l ted in one ba tch , and two ba tches were processed per 8-hr shift .
T h e desa l ted so lu t ions were concentrated in a wiped-film evaporator. T h i s evaporator operated at a pressure of 17 torrs and had an evaporation
OeNL DWG 67~10241
0 X
Fig. 11.5. Elution Curve for a Typical Production Run.
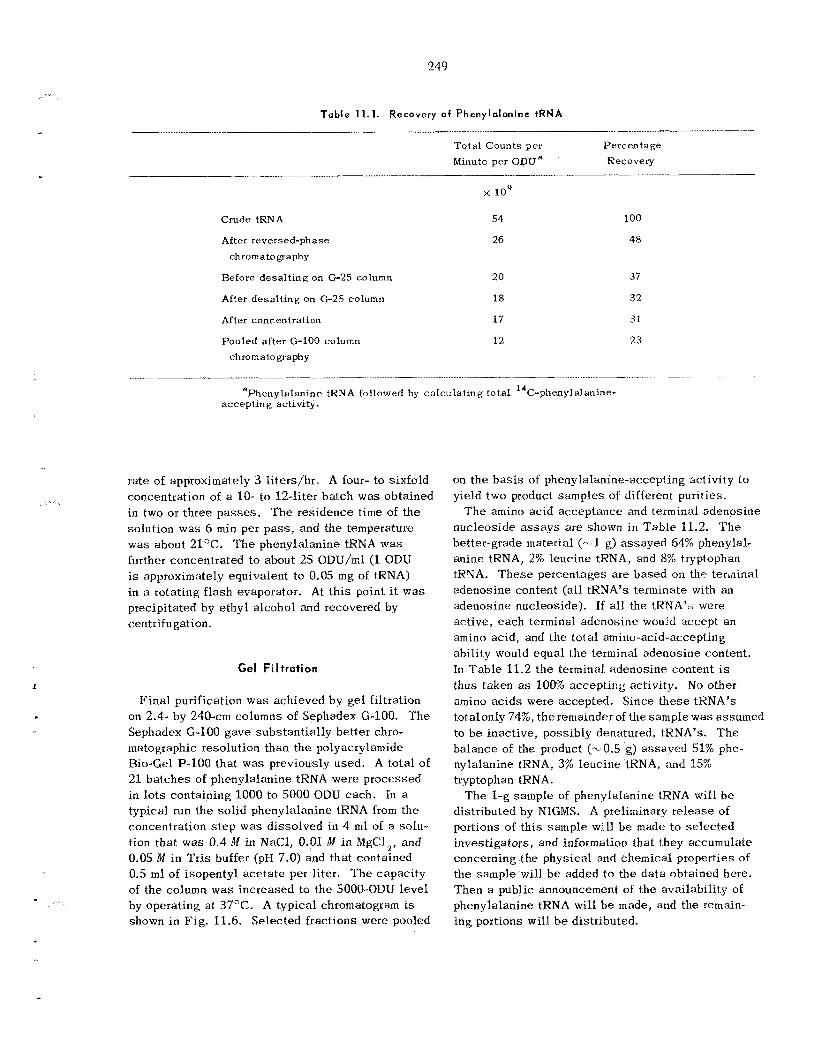
249
....
-
.. .
Table 11.1. Recovery o f Phenylalanine tRNA
Tota l Counts per Percentage Minute per ODUe Recovery
Crude tRNA
After reversed-phase chrornato graphy
Before desalt ing on G-25 column
After desalt ing on (3-25 column
After concentration
Pooled after G-100 column chromatography
109
54
26
20
18
17
12
100
48
37
32
31
23
aPhenylalanine tRNA followed by calculating total “C-phenyl alanine- accepting activity.
rate of approximately 3 l i ters/hr. A four- to sixfold concentration of a 10- to 12-liter batch was obtained in two or three pas ses . The res idence t i m e of the solution was 6 min per pas s , and the temperature was about 21OC. T h e phenylalanine tRNA w a s further concentrated to about 25 ODU/ml (1 ODU is approximately equivalent to 0.05 mg of tRNA) in a rotating f l a sh evaporator. At t h i s point it w a s precipitated by e thyl alcohol and recovered by ceritrif u gat ion.
Gel Filtration
F i n a l purification was achieved by ge l filtration on 2.4- by 240-cm columns of Sephadex G-100. T h e Sephadex G-100 gave subs tan t ia l ly better chro- matographic resolution than the polyacrylamide Bio-Gel P-100 tha t was previously used. A to ta l of 21 ba tches of phenylalanine tRNA were processed in lots containing 1000 to 5000 ODU each . In a typical tun the solid phenylalanine tRNA from the concentration s t e p w a s dissolved in 4 m l of a solu- tion tha t w a s 0.4 M in NaC1, 0.01 A4 i n MgCl,, and 0.05 M i n Tris buffer (pH 7.0) and that contained 0.S m l of isopentyl ace t a t e per liter. T h e capacity of the column was increased to the 5000-ODU level by operating at 37OC. A typical chromatogram i s shown in Fig. 11.6. Selected f rac t ions were pooled
on the b a s i s of phenylalanine-accepting activity to yield two product samples of different purities.
nucleoside a s s a y s a re shown in Tab le 11.2. T h e better-grade material (,I- 1 g) as sayed 64% phenylal- anine tRNA, 2% leucine tRNA, and 8% tryptophan tRNA. T h e s e percentages a re based on the terkninal adenosine content (all tRNA’s terminate with an adenosine nucleoside). If a l l the tRNA’.; were active, each terminal adenosine would xccept an amino acid, and the to ta l amino-acid-accepting abil i ty would equal the terminal adenosine content. In Tab le 11.2 the terminal adenosine content is thus taken a s 100% a c c e p t h g activity. No other amino ac ids were accepted. Since these tRNA’s totalonly 7470, t he remainder of the sample was assumed to be inactive, possibly denatured, tRNA’s. T h e balance of the product (-0.5 g) assaved 51% phe- nylalanine tRNA, 3% leucine tRNA, and 15% tryptophan tRNA.
T h e 1-g sample of phenyIaIanine tRNA will be distributed by NIGMS. A preliminary release of portions of t h i s sample will b e made to se lec ted investigators, and information that they accumulate concerning the physical and chemical properties of the sample will b e added to the da t a obtained here. Then a public announcement of the availabil i ty of phenylalanine tRNA will be made, and the remain- ing portions will be distributed.
T h e amino acid acceptance and terminal adenosine
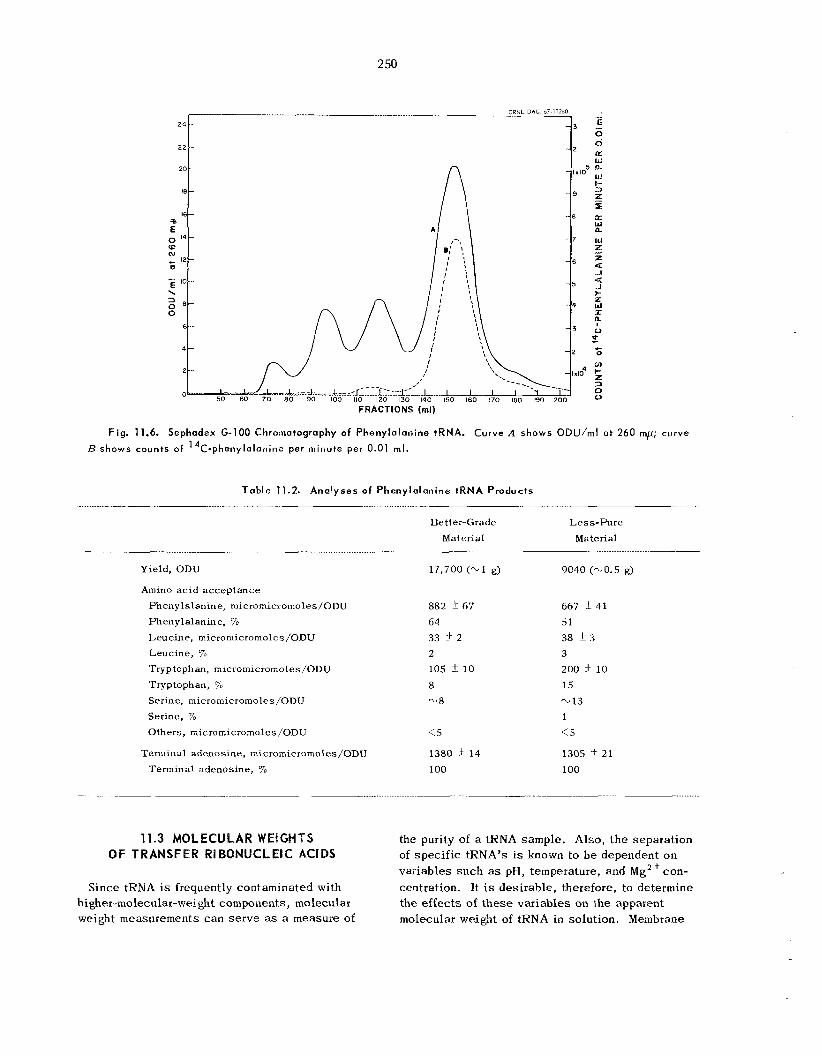
2 58
FRACTIONS (ml)
Fig. 11.6. Scphodex G-100 Chromatography of Phenylalanine tRNA. Curve A s h o w s ODU/ml a t 260 mp; c u r v e
R shows counts o f 14C-phenylolanine per minute per 0.01 rnl.
Table 11.2. Analyses of Phenylalanine tRNA Products
Be tter-Grade Less-Pure Material Material
Yield, ODU
Amino acid acceptance Phenylalanine, micromicromoles/ODU Phenylalanine, 70
Leucine, micromicromoles/ODU Leucine, 7‘0
Tryptophan, micromicromoles/ODU Tryptophan, 70
Serine, micromicromoles /OnU Serine, % Others, micromicromoles/ODIJ
Terminal adenosine, micromicromoles/ODU Terminal. adenosine, 7%
....
11.3 MOLECULAR WEfGHTS OF TRANSFER RIBONUCLEIC ACIDS
Since tRNA is frequently contaminated with higher-molecular-weight components, molecular weight measurements c a n se rve as a measure of
17,700 (-1 g)
882 167
64
33 1 2 2 105 + 10 8 -8
<5
1380 14
100
9040 (-0.5 g)
667 i 41 51 38 + 3
3 200 rf- 10 15 - 13 1
<5
1305 k 21 100
the purity of a tKNA sample. Also, t h e separation of spec i f ic tRNA’s is known to b e dependent o n variables such as pH, temperature, and MgZ + con- centration. It is desirable, therefore, to determine the e f f ec t s of these var iab les on the apparent molecular weight of tRNA in solution. Membrane
251
-
. ..:. .
osmometry h a s proved to b e a very usefu l method for t h i s purpose.
For a given set of conditions, osmotic pressure measurements were made at seve ra l tRNA con- centrations. T h e resu l t s were extrapolated t o zero concentration from a plot of v / c (osmotic pressure divided by concentration) v s c. T h e molecular weight w a s calculated from th i s limiting value of rr/c by us ing the van't Hoff equation.
T h e molecular weight of crude, mixed tRNA ob- tained from the General Biochemicals Company was compared with that of a sample prepared at ORNL (Table 11.3). T h e samples were dried in a vacuum desiccator over P,05 and were used without furthei purification. T h e so lu t ions were 0.1 M in NaCl, 0.01 M i n MgCI 2, and 0.05 M in Tris-HC1 buffet (pH 7.0, measured at 25OC). T h e molecular weight of the crude tRNA from General Biochemicals was also determined at 25OC with no MgC1, added; a value of 41,800 was obtained.
The tRNA mixture obtained from t h e General Biochemicals Company w a s further purified by ge l permeation chromatography, us ing a column of Bio-Gel P-100 polyacrylamide gel. A high- molecular-weight component eluted separately ahead of the tRNA. T h e fractions containing t h e tRNA were pooled, desa l ted on a Bio-Gel P-2 column, concentrated by evaporation at 37OC, and dried in a vacuum des icca tor over P20,. T h e molecular weights of t h i s purified, mixed tRNA under various conditions a re summarized in Tab le 11.4.
Purification of the crude tRNA by the method just outlined significantly reduced the apparent molecular weight to va lues tha t a re cons is ten t with those obtained by investigators u s ing
Table 11.3. Apparent Molecular Weights
of Crude, Mixed t R N A
T e m p e r a t u r e *Pparernt M o l e c u l a r
Weighta (OC)
Source
General B i o c h e m i c a l s 10 45,600 Company ( l o t 642574) 25 46,200
OKNL (RGBB) 25 41,300 GO 44,100
aAll tRNA s a m p l e s w e r e in the sodium s a l t form.
f o b l e 11.4* Appurent Molecular Weights
of Purif ied, Mixed tRNA
T e m p e r a t u r e
("C) M o l e c u l a r
W e i g h t a S o l u t i o n
-.
0.1 M N a C l ; 0.05 IM 1s 3 1,500 Tris-HC1, pH 7.0 (2S°C) 25 30,800
35 30,700
0.1 IM N a C I ; 0.05 M 10 32,800 Tris-HC1, p H 7.0 (25OC) ; 15 32,800 0.01 M M&1, 25 31,700
0.1 M N a C 2 H , 0 , ; 0.01 IM 25 38,400 W ( C 2 H 3 0 2 ) 2 ; HC2H302 I 50 35,200 pH 4.1 (2SGC)
35 30,100
"All tRNA s a m p l e s w e r e in the sodium salt form.
nucleotide and end-group analyses. T h e higher values obtained a t lower pI-1'~ sugges t aggregation or assoc ia t ion of tRNA, probably involving hy- drogen bonding.
The addition of 0.01 M MgZt to the purified tRNA solu t ions under the conditions studied does not significantly affect t he apparent molecular weight. T h e extent of the effect of varying t h e temperature is difficult to assess because of s imultaneous pf-f change. T h e p1-I of the buffers is temperature-dependent, decreasing with increas- ing temperature. Nevertheless, the apparent molecular weight appears to decrease slightly with increasing temperature.
11.4 BEHAVIOR OF TRANSFER RIBONUCLEIC ACIDS ON POLYACRYLAMIDE
GELCOLUMNS
Polyacrylamide gel Chromatography is a tech- nique used for purifying tRNA by removal of higher-molecular-weight components (Sect. 11.3). Th i s technique Blso resu l t s in partial separation of certain spec i f ic tRNA's.
A 250-mg sample of crude tRNA was chroma- tographed on a 2.5- by 238-cm column of Bio-Gel P-100 at 5°C and eluted with a solution tha t was 0.4 M in NaC1, 0.01 M in MgCI,, and 0.05 M in Tris-HC1 (pH 7.0). T h e effluent fractions were
2 52
assayed for amino-acid-accepting ability. There appeared to be two tRNA’s for each of t he follow- ing: arginine, alanine, glycine, lys ine , proline, phenylalanine, valine, and serine. The tRNA’s were separated into two major groups, with a minor group between. Overlapping of the peaks was fairly extensive. The group near the front of the tRNA peak contained 10 tRNA’s - phenylalanine, glutamic acid, alanine, asparagine, lysine, pro- line, tyrosine, valine, tryptophan, and ser ine - plus s m a l l amounts of arginine and glycine tRNA’s. T h e middle group contained isoleucine, hist idine, and ser ine tRNA’s. T h e group near the end of the chromatogram contained alanine, glycine, arginine, methionine, proline, and valine tRNA’s plus a s m a l l amount of lysine tRNA. Leucine tRNA gave a broad peak covering all groups.
On a 2.3- by 118-cm P-100 column, five samples of crude tRNA were chromatographed under the following conditions:
tRNA Run Load
(m g )
1 49
2 50
3 20
4 20
5 25
Temperature
PH (OC) Eluent
0.4 M NaCl 7.1 5
0.01 M MgC12 0.05 M Tris-HC1
0.4 M NaCl 4.3 5
0.01 M MpClz
0.01 M MgCl2 7.1 5
0.01 M NaCZH3Oz
0.05 M Tris-IIC1
0.05 M Tris-HC1 7.2 5
0.4 M NaCl 7.0 37 0.01 M M&lz 0.05 M Tris-HC1
Run 3 gave the bes t separation of tRNA’s from high-molecular-weight components, as measured by the absorbance of the fractions at 260 mp. T h e fractions were assayed for phenylalanine tRNA and leucine tRNA. Runs 1 and 3 gave the b e s t separa- tion of t hese tRNA’s. T h e relative amounts of tRNA and high-molecular-weight components a l s o changed under the different conditions.
In another experiment, 250 mg of crude tRNA was chromatographed on a 2.5- by 237-cm P-100 column a t 5OC and was eluted by gradient elution; the NaCl concentration was decreased continuously from 0.1 M to zero, while the MgCl, concentration
was increased from zero to 0.01 M. T h e buffer concentration was maintained at 0.05 M Tris-MCl, pH 7.0. T h e fractions were a s sayed for accepting ability with 17 amino acids. T h e phenylalanine tRNA was eluted at the front of the tRNA peak and was partially separated from the other specific tRNA’s.
Separations on a gel column are generally con- sidered to occur on the basis of s i z e differences of t he so lu tes ; however, charge effects cannot b e ruled out (see Sect. 8.3).
11.5 BODY FLUID ANALYSIS
Over 400 molecular cons t i tuents of human urine have been reported. ’-‘ T h e s e include inorganic compounds, organic ac ids and amino ac ids , sugars , purines and related compounds, hormones, vitamins, estrogens, enzymes and other proteins, and many others. Knowledge of t he quantit ies of many of t hese cons t i tuents of urine represents a wealth of information that can be used to evaluate body function. T h i s is particularly true of many of the organic chemicals of low molecular weight (less than 1000) s i n c e more than 200 such cons t i tuents have been reported to have pathological signifi- cance.
is being developed to quantitatively determine many of the low-molecular-weight consti tuents in human urine. The present approach is t o modify and expand the capabi l i t i es of an ex is t ing nucleo- t ide analyzer7 for t h i s use. Initial resu l t s indicate that t h i s concept is feasible; that is, a high- pressure, high-resolution modification of the nucle- otide analyzer h a s resolved over 100 chromato- graphic peaks of uv-absorbing consti tuents from a 2-m1 urine sample.
An automatic, high-resolution analytical system
’P. L. Altnian and D. S. D i t h e r , Blood and Other Body Fluids, Federation of American Societies for Experimental Biology, Washington, D.C., 1961.
Federation of American 5oc ie t ies for Experimental Biology, Washington. D.C., 1964.
Data, The Chemical Rubber Co., Cleveland, 1965.
Spon, Ltd., London, 1961.
unpublished data, 1966.
3P. L. Altman and D. S. Dittnler, Biology Data Book,
‘H. C. Damm (ed.), Handbook of Clinical Laboratory
5C. Long (ed.), Biochemists’ Handbook, E. and F. N.
%. A. McKee, Oak Ridge National Laboratory,
7N. G. Anderson e t al . , Anal. Biochem. 6 , 153 (1963). *C. D. Scott, J. E. Attrill, and N. G. Anderson, Proc.
S O C . Exptl. Biol. Med. 125, 181 (1967).
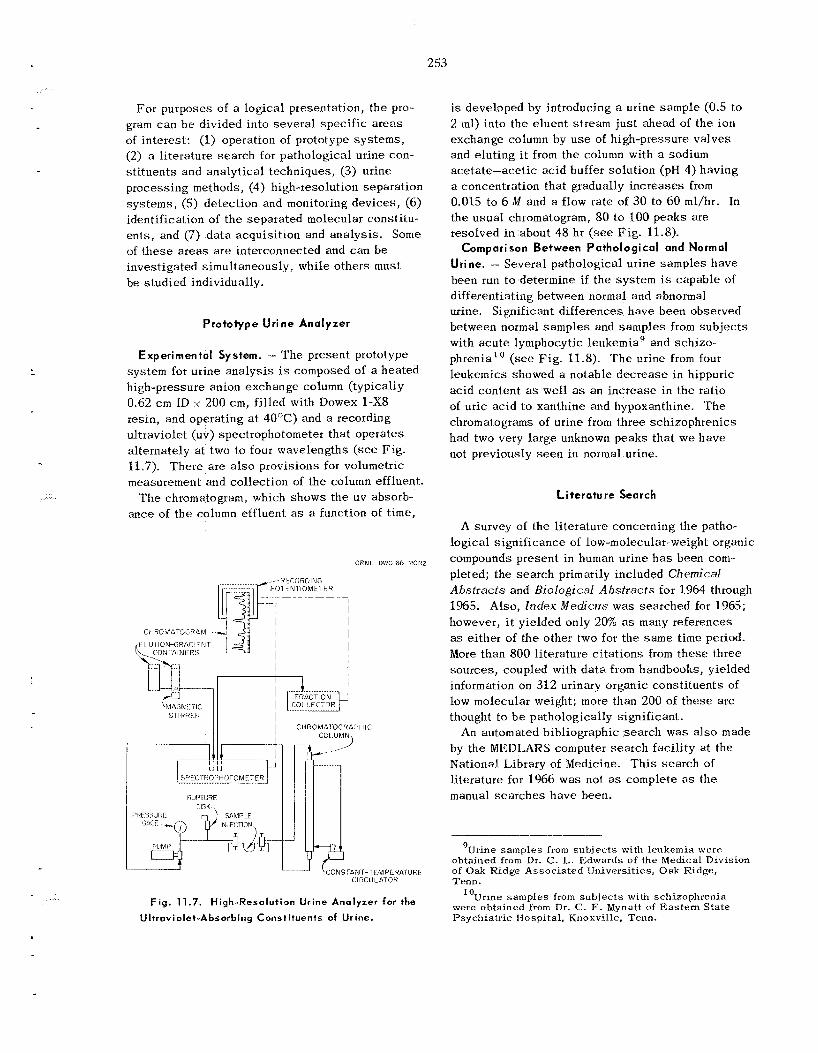
2 53
... . .
For purposes of a logical presentation, the pro- gram can b e divided into severa l spec i f ic a reas of interest: (1) operation of prototype sys tems, (2) a l i terature search for pathological urine con- s t i tuents and analytical techniques, ( 3 ) urine processing methods, (4) high-resolution separation sys tems, (5) detection and monitoring devices, (6) identification of the separa ted molecular constitu- en ts , and (7) d a t a acquisit ion and ana lys i s . Some of t hese a reas a re interconnected and can b e investigated simultaneously, while o thers must be s tud ied individually.
Prototype Urine Analyzer
Experimental System. - T h e present prototype system for urine ana lys i s is composed of a hea ted high-pressure anion exchange column (typically 0.62 c m ID Y 200 cm, f i l led with Dowex 1-X8 resin, and operating at 4 0 T ) and a recording ultraviolet (uv) spectrophotometer tha t operates alternately a t two to four wavelengths (see Fig. 11.7). There are a l s o provisions for volumetric measurement and collection of t he column effluent.
T h e chromatogram, which shows the uv absorb- ance of t he column effluent as a function of t ime ,
ORNL-DWG G ~ - % O H Z
C I i R O M A l O G R A P h l i CDL.UMN\
F i g . 11.7. High-Resolution Urine Analyzer for the
Ultraviolet-Absorbing Constituents of Urine.
is developed by introducing a urine sample (0.5 to 2 ml) into the eluent s t r e a m jus t ahead of t he ion exchange column by u s e of high-pressure va lves and eluting i t from the column with a sodium acetate-acetic acid buffer solution (pH 4) having a concentration that gradually increases from 0.015 to 6 M and a flow rate of 30 to 6 0 ml/hr. In the usua l chromatogram, 8 0 to 100 peaks are resolved in about 48 hr (see F ig . 11.8).
Comparison Between Pathological and Normal Urine. - Several pathological urine samples have been run to determine i f the sys tem is capable of differentiating between normal and abnormal urine. Significant differences have been observed between normal samples and samples from sub jec t s with acute lymphocytic leukemia' and schizo- phrenia" (see Fig . 11.8). T h e urine from four leukemics showed a notable dec rease in hippuric acid content as well a s an increase in the ratio of uric acid to xanthine and hypoxanthine. T h e chromatograms of urine from three schizophrenics had two very large unknown peaks tha t w e have not previously s e e n in normal urine.
Literature Search
A survey of the l i terature concerning the patho- logical significance of low-molecular-weight organic compounds present in human urine h a s been com- pleted; the sea rch primarily included Chemical Abstracts and Biological Abstracts for 1964 through 1965. Also, Index Medicus was searched for 1965; however, it yielded only 20% as many references as either of the other two for the s a m e time period. More than 800 li terature c i ta t ions from these three sources, coupled with da t a from handbooks, yielded information on 312 urinary organic consti tuents of low molecular weight; more than 200 of t hese are thought to b e pathologically significant.
by the MEDLARS computer search facil i ty at the National Library of Medicine. T h i s search of literature for 1966 was not as complete as the manual s ea rches have been.
An automated bibliographic search w a s a l so made
'Urine samples from subjec ts with leukemia were obtained from Dr. C. L. Edwards of the Medical Division of Oak Ridge Associated IJniversities, Oak Ridge, Tenn.
were obtained from Dr. C . F. Mynatt of Eas te rn State Psychiatric Hospital , Knoxville, Tenn.
"Urine samples from subjec ts with schizophrenia
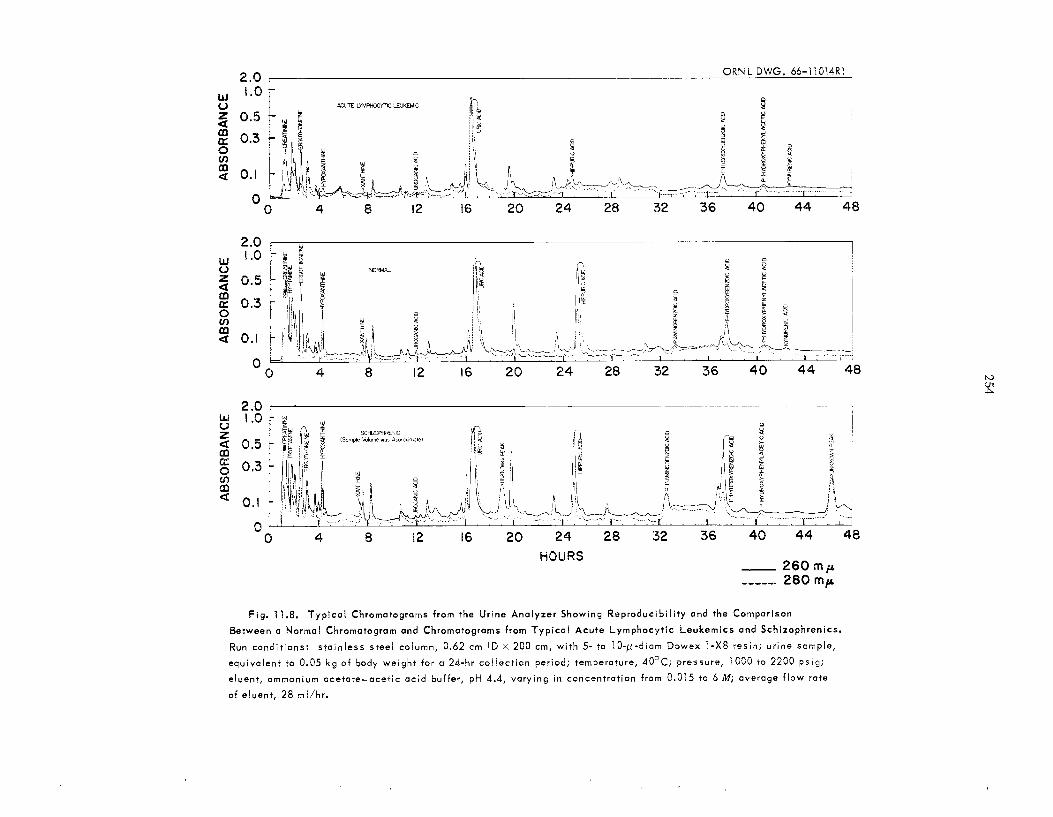
0 -0 0
--
R)
0-
w
UI bo
0
ABSO
RBAN
CE
0
0
0
.-"
0:
&
v, 00
PS Z
25
Urine Processing Methods
Until additional t e s t s can b e made, i t has been assumed that, s i n c e many components vary as a function of the daily cycle , quantitative evaluation of urinary components requires a sample from a composite of urine that h a s been col lected over a period of a t l e a s t 24 hr. For example, urines from diabet ics character is t ical ly show the highest con- centration of glucose after meals , etc. It may b e possible that a s ingle sample, such a s that col- lected on ar is ing in the morning following a prescribed regimen of intake, can eventually b e considered as acceptable for a screening tes t .
chemical reaction, prompt refrigeration of the urine specimen is desirable . If t h i s is impractical , an ant ibacter ia l agent may b e added to the col lec- tion v e s s e l . Of the agents considered, formaldehyde appears to b e the most useful. After col lect ion, filtration of the specimen through a membrane filter having a pore s i z e of less than 0.5 p sat- isfactorily removes bacteria.
Urine specimens often contain a fairly heavy sediment even in the absence of s ignif icant bacter ia l growth. T h i s sediment is apparently composed of material that has precipitated due to decreased solubility a t lower temperatures. In acid urines the precipi ta tes cons is t of organic compounds such as uric acid, tyrosine, hippuric acid, etc., while a lkal ine precipi ta tes a re likely to b e inorganic. T h e s e can probably be dis- solved by heat ing to above 37.5OC and diluting with dis t i l led water. Our present procedure includes diluting the urine with d is t i l l ed water, buffering to the pII of the chromatographic s y s - t e m (4.4), heat ing the urine sample to approximately 4O0C, and filtering through a 0.5-p membrane filter. After processing, the urine samples a re frozen to - 20OC.
mucopolysaccharides and proteins probably will not b e eluted from the chromatographic column and may tend to foul the ion exchange resin. T o cir- cumvent th i s problem, pressure filtration of the urine sample through d ia lys i s tubing h a s proved to be effective.
To prevent b a c t e r i d action and degradation by
High-molecular-weight compounds such as
Separations S y s t e m s
A large number of separat ions media have been evaluated by scout ing tests for u s e in separat ing
the uv-absorbing const i tuents of urine. T h e s e included inorganic materials, activated charcoal, various organic anion and cation exchange resins , and a polyacrylamide gel (Table 11.5). Resolution was defined as the number of separa te uv chro- matographic peaks detected in the column effluent. T h e s e scout ing tests were made a t conditions that produced good resul ts for a Dowex 1 type of ion exchange resin; therefore, they may not have utilized the b e s t conditions for each particular medium.
T h e b e s t separat ions media were found to be organic ion exchange resins , of which Dowex 1 resin was the m o s t sa t isfactory. A s reported earlier, ' ' resolution of the Dowex 1 resin is very dependent on par t ic le s i ze ; for example, 5- to 10- p-diam resin provides 50% more chromatographic peaks than 20- to 40-p-diam resin.
T h e effect of nominal degree of cross- l inkage of Dowex 1 resin h a s a l so been investigated. (Dowex 1 res ins are formed from styrene polymers that are cross-linked with divinylbenzene; the degree of cross-l inkage is indicated by the percent of divinylbenzene used.) Res in of low cross- l inkage (2 to 4%) gives bet ter separat ion in the beginning of the chromatogram, whereas resin of high cross-linkage (10 t o 12%) gives better separation in the la t ter part of the chromatogram. A resin of medium (8%) cross-linkage is superior in overall performance. Initial tests where res ins of varying cross- l inkage were used ei ther mixed or in s e r i e s gave resu l t s inferior to those from any of the separa te tes t s . Additional t e s t s will be made with both anion and cat ion exchange resins .
Although it is possible to operate a s ingle ion exchange column with reasonable reproducibility, i t is difficult t o obtain reproducible resu l t s from multiple columns packed with the s a m e type (even from the s a m e batch) of resin. Moreover, if different ba tches of res in ( s a m e nominal type) ate used, the experimental da ta are frequently very different. Some of t h i s difference c a n be attributed to varying par t ic le s i z e s or degrees of cross- linkage; however, some of the more fundamental properties of the resin, such as the amount and type of porosity or the type and quantity of charged functional groups, a re also probably important. In the future, an attempt will be made to more fully character ize the ion exchange res ins
"Chem. Teclmol. Div. Ann. Pro&. Rept. May 31, 1966, ORNL-3945, p. 206.
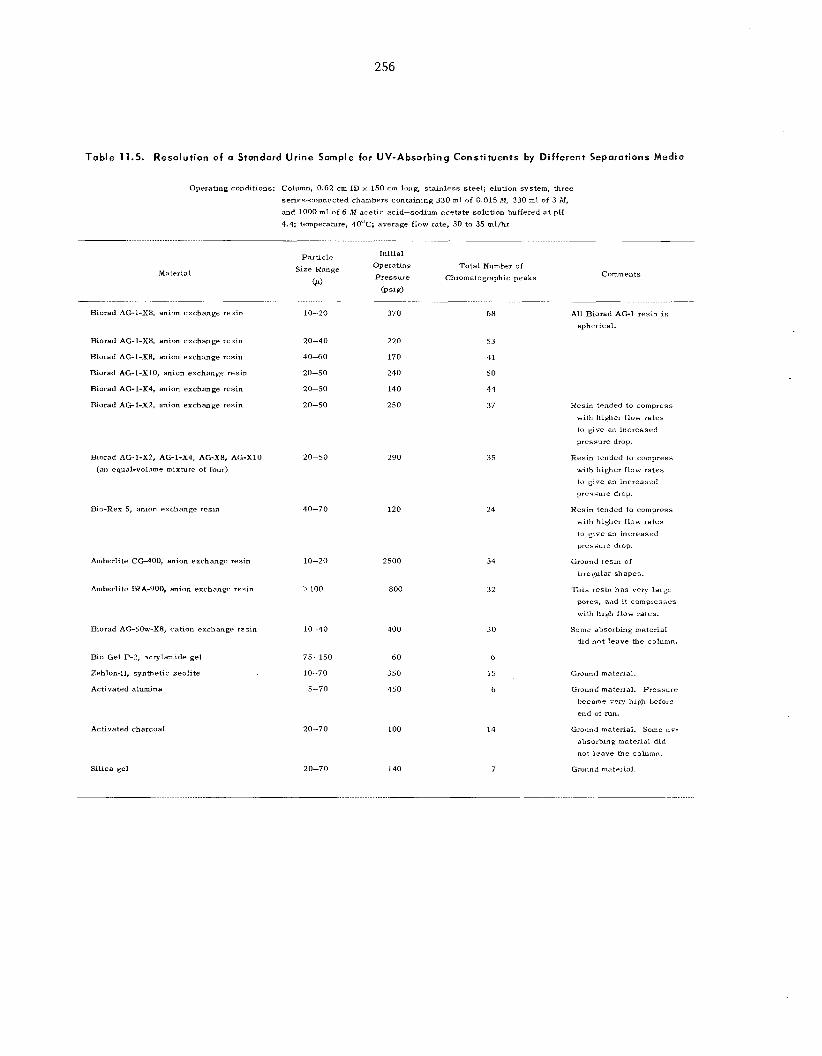
256
Table 11.5. Resolution of a Stondard Urine Sample far UV-Absorbing Constituents by Dif ferent Separations Medio
Opsrating conditions: Column, 0.62 cm ID x 150 cm long, stainless steel; elution system, three series-connected chambers containing 330 ml of 0.015 M, 330 ml of 3 M,
and I000 ml of 6 M acr t i r acid-sodium acetate solution buffered a t pH 4.4; temperature, 40°C; average flow rate, 30 to 35 mlihr
Material
Biorad AG-I-X8. anion exchange resin
Biornd AG-1-X8, anion exchange resin
Riorad AG-1-XII, anion exchange resin
Biorad AC-1-XIO, anion exchange resin
Biorad AGI-X4. anion exchange resin
Biorad AGI-X2, anion exchange resin
Biorad AG1-X2. AG-l-X4, AGX8, AG-XI0 (an equal-volume mixture of four)
Bio-Rex 5, anion exrhanee r c s m
P a r t d e Size Range
W) -
10-20
20-40
40-60
20-50
20-50
20-50
20-50
40-70
Amherlite CG400. anion exchangr resin
Arnherlitc IRA-900, anion exchange resin
10-20
100
Bmmd AG-SOW-XU, cation exchange resin 10-40
Bio Gel P-2, acrylamide gel
Zehlon-€3, synthe lc zeolite
Activated alumina
75-150
10-70
5-70
Activated charcoal 20-70
Initial Operatine Pressure
(P..d
Total Number of Chromatographic peaks Comments
370
220
170
240
140
250
290
120
2500
so0
400
60
350
450
100
68
53
41
50
44
37
35
24
34
32
30
6
l5
6
14
All Biorad A G I resin is spherical.
Resin tended to compress with higher flow rates to give an increased pressure dmp.
Resin tended to compress with higbfier f low rates to give an incrcased greqsure drop.
Resin tended to compress with hiu$ier flow rates to give an increased pressure drop.
Ground resm of
~ r r e ~ l a r shapes.
This resin has very laree pores, and i t compresses with high flow rates.
Some absorbing matcrial did not leave the column.
Ground material.
Ground matenal. Pressure became very high before end of run.
Ground matenal. Some uv-
absorhing material did not leave the colunm.
Ground matp:ial Silica gel 20-70 140 7
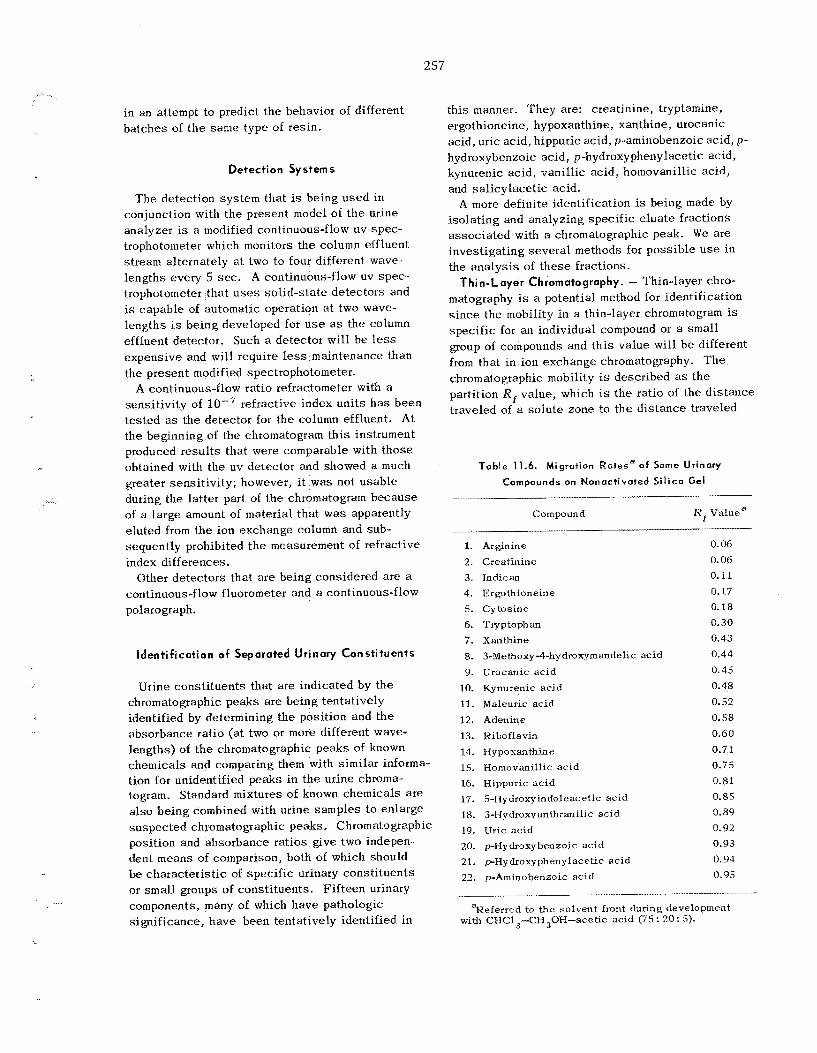
257
in an attempt to predict the behavior of different batches of t h e s a m e type of resin.
Detection Systems
T h e detection sys tem that is being used in conjunction with the present model of t h e urine analyzer is a modified continuous-flow uv spec- trophotometer which monitors t he column effluent stream alternately at two to four different wave- lengths every 5 sec. A continuous-flow uv spec- trophotometer tha t u s e s solid-state detectors and is capable of automatic operation at two wave- lengths IS being developed for u s e as the column effluent detector. Such a detector will be less expensive and will require less maintenance than the present modified spectrophotometer.
A continuous-flow ratio refractometer with a sensit ivity of l o v 7 refractive index uni t s h a s been tested as the detector for t he column effluent. At the beginning of the chromatogram th i s instrument produced resu l t s tha t were comparable with those obtained with the uv detector and showed a much greater sensit ivity; however, i t was not usable during the latter part of the chromatogram because of a la rge amount of material tha t was apparently eluted f rom the ion exchange column and sub- sequently prohibited t h e measurement of refractive index differences.
Other detectors tha t a r e being considered a re a continuous-flow fluorometer and a continuous-flow polarograph.
identif ication of Separated Urinary Constituents
Urine cons t i tuents that are indicated by the chromatographic peaks a re being tentatively identified by determining the posit ion and the absorbance ratio (at two or more different wave- lengths) of the chromatographic peaks of known chemicals and comparing them with similar informa- tion for unidentified peaks in t h e urine chroma- togram. Standard mixtures of known chemicals a re a l so be ing combined with urine samples t o enlarge suspec ted chromatographic peaks. Chromatographic position and absorbance ratios give two indepen- dent means of comparison, both of which should be charac te r i s t ic of spec i f i c urinary cons t i tuents or smal l groups of consti tuents. F i f teen urinary components, many of which have pathologic significance, have been tentatively identified in
th i s manner. They are: creatinine, tryptamine, ergothioneine, hypoxanthine, xanthine, urocanic acid, uric acid, hippuric acid, p-aminobenzoic acid, p- hydroxybenzoic acid, p-hydroxyphenylacetic acid, kynurenic acid, vanill ic acid, homovanillic acid, and sa l icy lace t ic acid.
A more definite identification is being made by isolating and analyzing spec i f ic e lua te fractions assoc ia ted with a chromatographic peak. W e are investigating severa l methods for poss ib le u s e in the ana lys i s of t hese fractions.
Thin-Layer Chromatography. - Thin-layer chro- matography is a potential method for identification s ince the mobility in a thin-layer chromatogram is spec i f ic for an individual compound or a s m a l l group of compounds and th i s value will b e different from tha t i n ion exchange chromatography. T h e chromatographic mobility is described as the partition R , value, which is the ratio of the d i s t ance traveled of a so lu te zone to the d is tance traveled
Table 11.6. Migration Rotese of S o m e Urinary
Compounds on Nonactivated Sil ica Gel -
Compound I ? ~ Valuea -. ...__
1.
2. 3. 4. 5. 6. 7. 8. 9.
10. 11. 12. 13. 14. 1s. 16. 17. 18. 19. 20. 21. 22.
Arginine Creatinine Indican Ergothioneine Cytosine Tryptophan Xanthine 3-Methoxy-4-hydroxymandelic acid Urocanic ac id Kynurenic ac id Maleuric acid Adenine Riboflavin Hypoxanthine Nomovanillic ac id Hippuric ac id 5-Hydroxyindoleacetic ac id 3-Hydroxyanthranilic acid Uric ac id p H y droxybenzoic ac id p-Hydroxyphenylacetic acid p-Aminobenzoic acid
....... . . .. .
0.06 0.06 0.1 1 0.17 0.18 0.30 0.43 0.44 0.45 0.48 0.52 0.58 0.60
0.7 1 0.75 0.81 0.85 0.89 0.92 0.93 0.94 0.95
=Referred to the solvent front during development with CHC13-CH30H--acetic acid (75: 20: 5).
258
of t.he solvent front; Rf values for 22 different urinary consti tuents that a r e present in urine in relatively large amounts have been determined for a chloroform-methanol-acetic acid (75 : 20 : 5) solvent on thin layers of unactivated silica gel (Table 11.6). T h e s e compounds were visualized on the developed chromatogram by using either uv light or iodine vapor.
analytical sys tems u s e a uv spectrophotometer as a detector, comparison of t he uv spec t ra of known urinary consti tuents with those of t he components of the e lua te fractions will b e useful i n identifying the peaks.
A large number of the organic compounds reported to b e present in urine have been obtained from commercial sources , and the uv spec t ra (220 to 340 mp) of standard buffered solutions (pH 4.4) of t hese compounds have been determined. The location of inflection points in the spec t ra , as well a s t he general shapes of t h e curves, will b e useful in identification. Maxima and minima have been tabulated for 60 compounds. Thus the maxima and minima of the e lua t e fraction representing a chrornatographic peak can be compared with the tabulated values. F ive of the chromatographic peaks have been further identified in th i s manner. T h e s e are: creatinine, hypoxanthine, xanthine, uric acid, and hippuric acid.
Changes i n the shape of the uv spec t ra l curve with varying pH have been used by Cohn" and others to es tab l i sh the identity of unknown bio- chemicals; it is poss ib le that t h i s technique may a l so b e applicable to th i s program.
Campwter Resolution of Complex UV Spectra. - A significant development in the field of radio- chemical ana lyses cons i s t s in us ing computers to resolve the spectrum of a mixture of ten or more gamma-ray-emitting nuclides to determine the quantity of each nuclide present. l 3 - I 5 T h e spectra of individual components s e rve as a library in the linear least-squares resolution performed by a high-speed digital computer. T h i s technique
UV Spectrophotometry. - Since the present
"W. E. Cohn, J . Biol. Chem. 235, 1490 (1960). 13E. Schonfeld, A. H. Kibbey, and W. Davis, Jr.,
14 Nucl. Instr. Methods 45, 1 (1966).
J. S. Eldridge and A. A. Brooks, Nucleonics 24(4), 54 (196G).
to Nuclear and Radio-Chemistry, Proceedings of a Symposium, Gatlinburg, Tennessee, October 17-19, 1962, NAS-NS 3107.
"G. D. O'Kelley (ed.), Applications of Coniplters
is being extended for u s e in the resolution of t he uv spec t ra of aqueous mixtures of biochemicals. It may ultimately b e a valuable means of identify- ing unknown urinary compounds i n the column effluent, espec ia l ly when the e lua te fractions contain more than one compound.
The e f fec ts of the number of s p e c i e s present and their individual concentrations on the ac- curacy of this method of uv-spectrum resolution are currently being studied. In investigations of simulated spec t ra , each of which is composed of the summation of two bands having a Gaussian distribution about t he wavelength of maximum absorption, a spectrum composed of s i x to e ight separa te spec t r a can be resolved (that i s , t he concentrations of s i x to eight separa te chemicals can b e determined).
When the wavelength region of spec t ra determined for standard biochemicals in solution was extended from 220-340 mp to 190-400 mp, 16 of the 17 mate- r ia l s tes ted showed structure (in the region 190 to 220 mp) that h a s not been reported previously. For example, vanill ic acid h a s two absorption maxima between 250 and 300 mp and an additional two maxima between 200 and 220 mp. T h e presence of t hese additional maxima in the extended spec- tral range means that more than the s i x to eight components can b e resolved by the computer resolution technique.
For th i s techniquc to be generally useful, identification of all of the uv-absorbing urinary consti tuents in a particular column e lua te fraction would b e necessary . Since th i s information is not currently available, t he identification problem may have to b e solved by another method. Thus the computer resolving technique is not expected to b e advantageous in the in i t ia l identification problem; however, it should have utility in analyzing chro- matograms after peak identification is completed.
niques may aid in the identification of unknown chromatographic peaks. l 6 T o a limited extent, spot tes t ing may be conducted directly on the e lua te fractions or concentrated portions of them. The following reagents identify classes or groups of compounds: periodic acid, phosphomolybdic acid, diazotized sulfanil ic a r i d (Ehrlich), HC1 + KClO (Colmant), thio-Michler's ketone, dimethyl oxalate, and hexamethylene tetramine.
Other Ident i f icot ian Methads. - Many other tech-
16K. S. Warren, Oak Ridge National Laboratory, unpublished data, 1967.
259
Additional techniques include melting point determination after purification of the so lu te in the column eluate , x-ray powder diffraction, infrared spectroscopy, m a s s spectroscopy, and nuclear magnetic resonance spectroscopy.
Data Acquisition
A d a t a acquisit ion sys t em for digi t iz ing the out- put of the recording spectrophotometer that monitors
the column effluent h a s been designed and should be avai lable by the summer of 1967. T h i s system includes a digi ta l voltmeter (that digi t izes the analog s igna l from the spectrophotometer), a paper- tape punch and a typewriter printer (that record the digit ized data), and the necessary control circuitry. The result ing punched tape will be used as the input to a computer program that will analyze the urine chromatogram to quantify the separated urinary const i tuents .
12. Chemistry of Protactinium
T h e purpose of th i s program is to study the chemistry of protactinium, particularly in sys tems that a r e potentially applicable to separa t ions processing, and to e luc ida te the relationship of t he properties of protactinium to those of t h e other actinides. In most aqueous sys tems, protactinium does not behave in a simple or reproducible man- ner; its chemistry, therefore, cannot b e predicted with certainty. During the p a s t year t h i s program was extended to the study of heavier ac t in ides and to the development of new experimental techniques for u s e i n th i s study.
poss ib le that so l id protactinium compounds (oxide or sulfate, for example) develop a sur face layer that differs from the bulk of t h e material and is substantially more soluble. T h e first addition of hydrochloric or sulfuric acid to a given sample of so l id h a s repeatedly been observed t o d isso lve much more material than did subsequent additions, even after prolonged mixing. T h e resu l t s , which sugges t that more than one s p e c i e s is present in these so lu t ions and that equilibrium between t h e s e spec ie s is extremely slow, even in very high ac id concentrations and after hea t ing to about 2OO0C, are in agreement with t h e conclus ions previously reached on t h e b a s i s of spec t ra l measurements. It is very doubtful that any useful thermodynamic da ta can b e obtained from s tud ie s of the solubility
12. ' lBEHAV'OR OF PRoTACT'N'UM IN SULFURIC ACID SOLUTIONS
T h e study of t he preparation and properties of solid protactinium su l f a t e was continued, in the hope of obtaining a more definite and re- producible s ta r t ing material than the oxide or hydroxide for preparation of protactinium su l fa te solutions. However, attempts to measure the solubility of the solid protactinium su l f a t e in sulfuric acid continued to give resu l t s that vary with the conditions. In one experiment w e observed reasonably constant so lubi l i t i es unti l a fresh por- tion of so l id protactinium su l fa te w a s added to t h e mixture; th i s caused an increase in the concentra- tion of d i sso lved protactinium. Two more additions were made, each of which caused a further increase in t h e apparent solubili ty. T h e solubili ty remained fairly constant after each addition and was relatively unaffected by heating to about 200OC.
Since the apparent solubili ty depends on t h e amount and the nature of the solid equilibrated with the solution, we have not been ab le to obtain meaningful solubility da t a for th i s system. It is
partly
of protactinium in sulfuric ac id so lu t ions because of t h e complexity and t h e nonreproducibility of t h e system. If more than o n e s p e c i e s e x i s t s in t h e s e solutions and i f t he s p e c i e s a re not i n equilibrium with each other (as indicated by a l l work to date), then thermodynamic da ta can b e obtained only if some means is found to distinguish between t h e different spec ie s .
12.2 ABSORPTION SPECTRA
ACID SOLUTIONS QF PROTACTIN1
Absorption spec t ra were measured for sulfuric acid so lu t ions of t h e protactinium sulfate. In general, they were similar to spec t ra previously obtained for protactinium hydroxide dissolved in sulfuric acid. T h e relatively sharp band near 2000 A, observed in so lu t ions tha t had been heated to fuming, * was not obtained when t h e protactinium su l fa te was d isso lved in either concentrated or
'Chern. Technol. Div, Ann. Progr. Rept . May 31, 2Chen~. Technol. Div. Ann. Progr. Rept . Mdy 31, 1966, OKNL-3945, p. 209. 1966, ORNL-3945, p. 211.
260
261
....
di lu te sulfuric acid. T h i s ind ica tes tha t the species remaining in solution when t h e solid protactinium su l fa te is prepared by precipitation from fuming sulfuric acid are different from those obtained by redissolving t h e so l id and provides additional evidence that severa l spec ie s , a l l quite persistent, are present in t h e s e solutions.
Unambiguous, quantitative information is clearly difficult to obtain from such a complex system, but thcre is some hope tha t t he spec t ra c a n b e resolved into individual bands by computer methods. POS- sibly, each individual band could b e assoc ia ted with a particular s p e c i e s in solution. T h i s ap- proach h a s been postponed until a newly purchased digital output can b e ins ta l led on the Cary model 14 spectrophotometer. Conversion of da t a from strip chart t o digital form was not only t i m e consuming but also somewhat inaccurate.
12.3 ANION EXCHANGE BEHAVIOR O F PROTACTINIUM IN HYDROCHLORIC
ACID SOLUTIONS
W e have demonstrated a novel anion exchange protactinium purification procedure tha t , although slow, works well on a s m a l l scale. Although
protactinium oxide is soluble (about 30 mg/ml) i n 10 M HC1, dissolution is slow. Protactinium wi l l load on anion exchange resin from 10 M HCI with a very high distribution coefficient. In these s tud ies , so l id p i eces of fired Pa,05 and of Dowex 1 resin were placed in a bottle of 10 M HCI so lu- tion and tumbled continuously. Samples of the resin were removed a t intervals and analyzed to determine the amount of sorbed protactinium. At room temperature t h e amount increased uniformly for 35 d a y s until the sys tem was loaded t o the extent of approximately 1 g of protactinium per l i ter of resin. Subsequently, t h e rate slowed, and in the next 31 d a y s the amount sorbed increased only 10%.
T h e same scheme was t e s t ed in a c losed loop in which 10 iW HC1 w a s pumped slowly through ii
bed of 100 mg of impure, ignited Pa,O, and then through a 20-ml Dowex I anion exchange column. After one month t h e column w a s removed and eluted with HC1-HF solution. A to ta l of 15 mg of highly pure protactinium was recovered.
T h e s e observations support t he previous con- c lus ions from dissolutions in sulfuric acid, namely, that the dissolution of protactinium from a solid is fairly rapid init ially but subsequent ly becomes very slow.
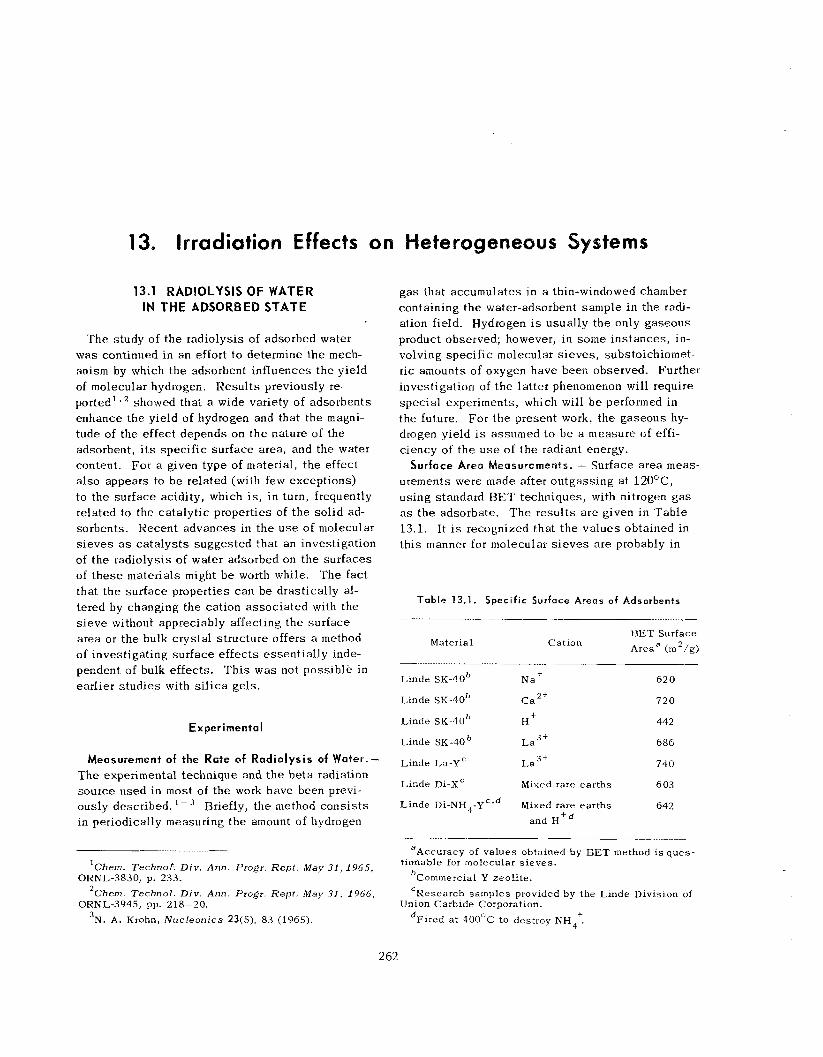
13. Irradiation Effects on Heterogeneous
13.1 RAQlOLYSlS OF WATER IN T H E ADSORBED STATE
T h e study of t he radiolysis of adsorbed water was continued i n an effort t o determine the mcch- anism by which the adsorbent influences the yield of molecular hydrogen. Resu l t s previously re- ported' v 2 showed that a wide variety of adsorbents enhance the yield of hydrogen and that t he magni- tude of the effect depends on the nature of the adsorbent, i t s spec i f ic sur face area, and the water content. For a given type of material, t h e effect also appears to b e related (with few exceptions) to t h e sur face acidity, which i s , in turn, frequently related to the ca ta ly t ic properties of t he so l id ad- sorbents. Recent advances in t h e u s e of molecular s i e v e s a s ca ta lys t s sugges ted that an investigation of the radiolysis of water adsorbed on the sur faces of t h e s e inaterials might b e worth while. T h e f ac t that t h e sur face properties c a n b e drastically al- tered by changing the cation a s soc ia t ed with the s i e v e without appreciably affecting the sur face area or t he bulk c rys ta l structure offers a method of investigating sur face e f f ec t s essent ia l ly inde- pendent of bulk effects. T h i s w a s not poss ib le in earlier s tud ie s with s i l i ca ge ls .
E x per imenta I
Measurement of the Rate of Radiolysis of Water. - T h e experimental technique and t h e be t a radiation source used in most of the work have been previ- ously described. '-' Briefly, t he method cons i s t s in periodically measuring the amount of hydrogen
'Chern. Technol. Div. Ann. Progr. Rept. May 31,1965, ORNL-3830, p. 233.
'Chern. Technol. Div. Ann. Progr. Rept. May 3 1 , 1966,
3N. A. Krohn, Nucleonics 23(5), 83 (1965). ORNL-3945, pp. 218-20.
g a s that accumulates in a thin-windowed chamber containing t h e water-adsorbent sample i n the radi- ation field. Hydrogen is usually the only gaseous product observed; however, in some ins t ances , in- volving spec i f i c molecular s i eves , substoichiomet- ric amounts of oxygen havc been observed. Further investigation of t h e la t te r phenomenon will require spec ia l experiments, which will b e performed in the future. For the present work, t he gaseous hy- drogen yield i s assumed to b e a measure of effi- ciency of t h e u s e of t h e radiant energy.
urements were made after ou tgass ing at 12OoC, us ing standard BET techniques, with nitrogen g a s as the adsorbate. T h e resu l t s a r e given in Tab le 13.1. It i s recognized that t h e va lues obtained in th i s manner for molecular s i e v e s a re probably in
Surface Area Measuremen~s. - Surface area m e a s -
Table 13.1. Specif ic Surface Areas of Adsorbents
BET Surface Area" (rn'/g) Cation Material
Linde SK-40' Na' 62 0
Linde SK-40' C a 2 + 720
Linde SK-40' H f 442
Linde SK-40' ~ a ~ + 686
740 Linde La-YC L a
Linde Di-XC Mixcd rare ear ths 6 03
Linde Di-NH4-YCzd Mixed rare ear ths 642
3 +
and H t d
aAccuracy of values obtained by BET method is ques-
'Commercial Y zeolite. 'Research samples provided by the Linde Division of
Union Carbide Corporation. dFired a t 400°C to destroy NH,'.
tionable for molecular s ieves .
2 62
263
error; however, in t he absence of a be t t e r tech- nique, they at l e a s t provide g ross comparisons among the various materials.
Determination of Surface Acid i ty . - Previously reported resu l t s indicated a relationship between sur face acidity and t h e efficiency of uti l ization of t h e radiant energy for the decomposition of ad- sorbed water. Attempts were made to quantita- tively measure the su r face acidity of some of the t e s t ed adsorbents; t h e method involved titration of t h e sur face with n-butylamine in dry benzene, using butter yellow (N,N-dimethyl-pphenylazo- ‘aniline) as t h e indicator, according to t h e method described by Johnson.
Preparation of Materials. - All t he adsorbents were pretreated by soaking in d is t i l l ed water and drying a t 150OC in a i r overnight; the residual water content w a s es t imated by determining weight loss on ignition to 1000°C. Samples of varying water conten ts were prepared by absorbing water vapor a t room temperature. F o r experiments in which i t was des i red to u s e materials containing less water than that remaining after t h e 15OOC treatment, t he given adsorbent was hea ted to 300 to 4OOOC for a su i t ab le period of t ime and t h e additional water loss was obtained by weight change. All subse- quent opera t ions on t h e s e samples were performed in a dry argon atmosphere to prevent readsorption of water. T h e different forms of t h e Y zeolite (Linde SK-40) were obtained by ion exchange methods; t h e original sodium form w a s treated with aqueous so lu t ions (- 1 M ) containing CaCl 2 ,
La(N0,)3, or NH,C,H,02. After ex tens ive wash- ing with d is t i l l ed water, they were dried overnight. The ammonium-exchanged s i e v e w a s then fired a t q’300°C to drive off NH, and thereby convert t he s i e v e to the hydrogen form. B E T sur face a rea measurements ind ica ted a partial co l l apse of t h e s i e v e structure as a result of th i s treatment.
T h e ex ten t of exchange w a s found, by a n a l y s e s for sodium, calcium, and lanthanum, to b e 75% for the C a 2 + form and 69% for the L a 3 + form. T h e ex- t.ent of exchange for t h e hydrogen form w a s calcu- la ted to b e 72% from sodium a n a l y s e s before and after treatment; no nitrogen w a s found by a spec ia l micro-Kjeldahl ana lys i s of t h e fired material.
Results and Discussion
T h e resu l t s a r e shown in F i g s . 13.1 and 13.2. T h e ind ica ted va lues a re maximum observed hydro-
gen y ie lds per 100 e v of energy absorbed by the water-adsorbent system. T h e y ie lds varied with total radiation dose , as noted in ear l ie r s tud ie s of silica gel and o ther tes ted adsorbents. Figure 13.3 shows some examples of t h i s behavior for t h e Linde SK-40 s i eve after exchange with various ca t ions . T h e electron fraction of water in the SK-40 molecular s i e v e s w a s ca lcu la ted by us ing a nominal formula of Na, 6(A102)5 ,(Si0 ,) 3 6 for the Y zeol i te and making appropriate corrections for the ion exchanged materials. T h e electron fractions of water for t h e research samples ob- tained from the Linde Division of Union Carbide Corporation were ca lcu la ted from ac tua l analytical da t a supplied with the samples. T h e water con- t en t s for t he C a Z f form of the SK-40 s i e v e in Fig. 13.1 are different from those presented in a pre- liminary report because of an error found in the measurement of t h e residual water content of t he stock m ateri a1.
T h e da ta in F ig . 13 .2 ind ica te reasonable agree- ment in behavior between t h e La-Y zeo l i t e sample obtained from L inde and the lanthanum form of the Linde SK-40 s i e v e that was prepared in ou r labo- ratory. Nothing can b e s a i d about t he didymium-X s i eve s i n c e no da ta were obtained on X-type s i e v e s exchanged with other cations. Why the Ili-NII,-Y material did not show a larger effect is not known. I t might have been anticipated that its behavior would b e similar t o that of the hydrogen and lan- thanum forms of t h e SK-40 material; i t s unusually high SiO, : A1,0, mole ratio (5.1) compared with tha t for SK-40 material (‘-2.4) may be a factor.
T h e da ta shown in Fig. 13.1 reveal t h e effect of t h e nature of t h e sur face on t h e hydrogen yield. S ince the c rys ta l l ine structure and the sur face a rea oE t he SK-40 molecular s i e v e a re common to all t h e s e cases, except for t h e hydrogen form (where a partial co l l apse of t he s i e v e structure apparently occurred), the amount of absorbed be ta energy transferred from the adsorbent to the adsorbed water should b e about t h e same. Yet, t h e hydro- gen y i e lds vary greatly, indicating tha t t he nature of t h e sur face (i.e., t h e ca t ion present i n th i s ca se ) a f fec ts t he efficiency of the conversion of t he reac t ive s p e c i e s to molecular hydrogen. if correction is made for t h e differences found in sur face a rea by the B E T method, t he efficiency is inversely related to t h e charge-to-ionic-radius ratio. However, t he BET method for obtaining the l____l__.~_.____i_
,O. Jvhnson, J . P h y s . Chern. 59, 827 (1955).
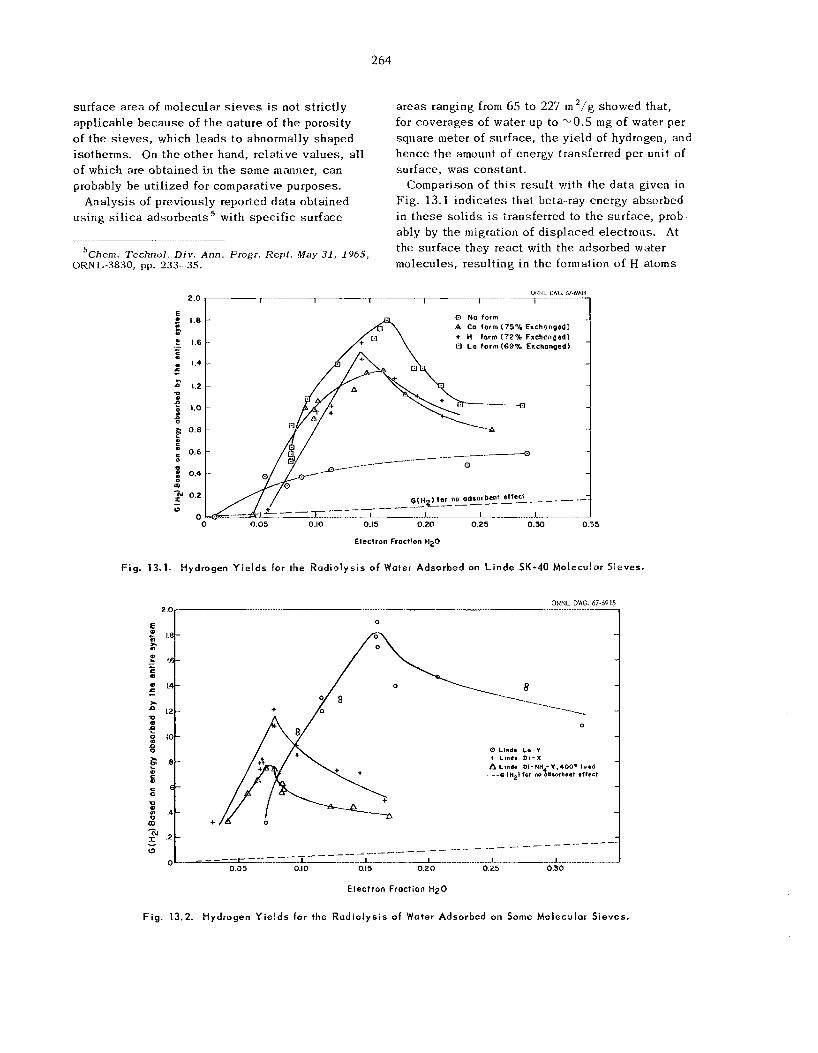
2 64
surface a rea of molecular s i e v e s is not s t r ic t ly applicable because of t h e nature of t he porosity of t he s i eves , which l e a d s to abnormally shaped isotherms. On t h e other hand, relative va lues , all of which a re obtained i n t he same manner, can probably b e uti l ized for comparative purposes.
us ing s i l i c a adsorbents5 with spec i f ic sur face Analys is of previously reported da ta obtained
5Chern. Technul. D i v . Ann. Progr. Rept . May 31 , 1965, ORNL-3830, pp. 233-35.
a r eas ranging from 65 to 227 m2/g showed that, for coverages of water up to -0.5 mg of water per square meter of sur face , t he yield of hydrogen, and hence the amount of energy transferred per unit of surface, was constant.
Comparison of t h i s result with the da t a given in Fig. 13.1 indica tes that beta-ray energy absorbed i n t h e s e so l id s i s transferred to t h e surface, prob- ably by the migration of d i sp laced electrons. At t he surface they reac t with t h e adsorbed water molecules, result ing i n t h e formation of H atoms
ORhL CWG. 67-6908
1 ,....... -.~ ..... ~ ...." ...-................
E t 1.8 h .)
E 1.6 - c . 1.4 I h
0 1.2
; 1.0 3 6 0.8 0
0.6
0 Na f o r m A Co f o r m (75% Exchanged) + H f n r m (72% Exchangedl d L O form (69% Exchangedl
/---------
) f o r no adsorbent effect 2 -_-------~
0 0.05 0.10 0.15 0.20 0.25 0.30 0.35
Electron Fraction M2Q
F ig . 13.1. Hydrogen Yie lds for the Radiolysis o f Water Adsorbed on L inde SK-40 Molecular Sieves.
Electron Froction HzO
F ig . 13.2. Hydrogen Yie lds for the Radia lys is of Water Adsorbed on Some Molecwlar Sieves.
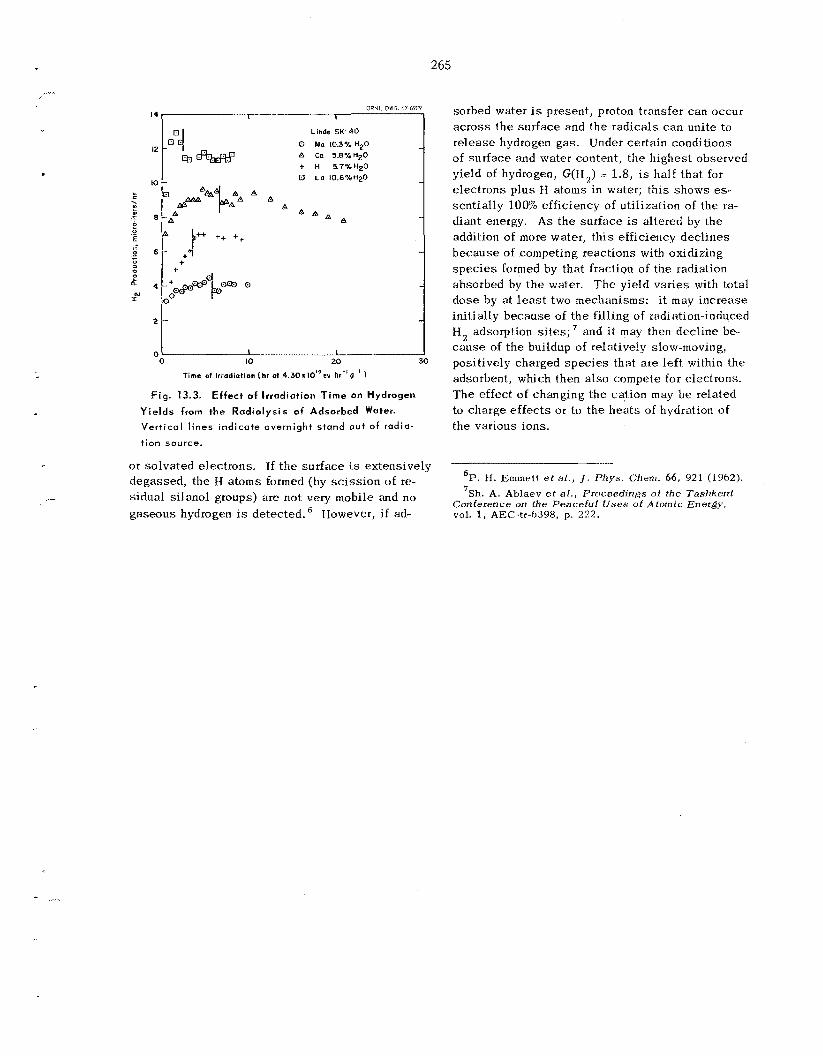
14
12
10 L
z . 07
f 8 0 E
.g 6 .- 0 = ,a 0 a 4 N
2
0
OQNL DWG. 67.69'29
Linde 5K-40
0 No 10.3% H20
5.7% HZO I3 L o 10.6%H20
f l+ ++ ++ +
A
I ..-.___I_*__-- .1 10 20 30
Time of Irradiation[kr ol 4 . 3 0 x I O ' * e v h r - ' q ' )
Fig. 13.3. Effect o f irradiation T ime on Hydrogen
Yie lds from the Radiolysis o f Adsorbed Water.
Vertical l ines indicate overnight stand out o f radia-
tion source.
o r so lva ted electrons. If t h e sur face is extensively degassed , t he fJ atoms formed (by s c i s s i o n of re- s idua l si lanol groups) a re not very mobile and no gaseous hydrogen is detected.6 However, if ad-
sorbed water i s present, proton transfer can occur a c r o s s the sur face and the rad ica ls c a n unite to r e l ease hydrogen gas . Under certain conditions of sur face and water content, t he h ighes t observed yield of hydrogen, G(H,) - 1.8, is half that for e lec t rons p lus H atoms in water; th i s shows es- sent ia l ly 100% efficiency of uti l ization of t he ra- diant energy. A s t h e sur face is altered by the addition of more water, t h i s efficiency dec l ines because of competing reac t ions with oxidizing s p e c i e s formed by tha t fraction of t h e radiation absorbed by t h e water. T h e yield var ies with total d o s e by at least two mechanisms: i t may inc rease init ially because of t h e fi l l ing of radiation-induced H2 adsorption s i t e s ; 7 and it may then dec l ine be- c a u s e of t he buildup of relatively slow-moving, posit ively charged s p e c i e s tha t ate le f t within t h e adsorbent, which then also compete for electrons. T h e effect of changing the cation may b e related to charge e f f ec t s or to t h e h e a t s of hydration o f t he various ions.
P. H. Emmett e t a l . , J. Phys . Chern. 6 6 , 921 (1962). 6
'Sh. A. Ablaev e t al. , Proceedings of the Tashkent Conference on the Peaceful IJses of Atomic Energy, vol. 1, AEC-tr-6398, p. 222.
. Spectrophotometric Studies of
of Alpha-Active Mat
T h e objective of th i s program is to develop spec - trophotometric techniques for the study of the prop- e r t ies of aqueous so lu t ions of the ac t in ide and lan- thanide elements over wide ranges of experimental conditions. Efforts thus far have been concentrated principally on the uranyl ion; some preliminary work h a s a l s o been done on U(1V) i n perchlorate media. To permit the s tudy of the more highly alpha-active actinides, a specially modified Cary model 14 spec- trophotometer sys tem ’ -’ h a s been built and is being tested. In addition to providing s a f e containment for highly radioactive materials, t h i s sys tem i s de- signed to operate a t temperatures up to the c r i t i ca l point of water (372O) and at pressures up to 10,000 psi.
14.1 SPECTRAL STUDIES OF URANIUM SOLUTIONS
A comprehensive theory of the uranyl ion with re- spec t to its spectroscopic properties h a s not y e t been fully developed. Until t he new spectrophotom- e t e r sys tem (see Sect. 14.2) is ava i lab le for high- temperature work, experiments a t temperatures up to about 95OC a r e being performed with other spectro- photometric equipment. We have developed ancil lary equipment to a id in t h e s e s tud ies . Several computer techniques and programs have been developed and evaluated specifically for the ana lyses of cer ta in types of spectroscopic data. We plan s i m i l a r s tud ie s with the lanthanides for comparison with the ac t i - nides.
‘Chem. Technol. Div. Ann. Progr. Rept. May 31, 1966,
2Chem. Technol. Div. Ann. Progr. Rept. May 3 1 , 1965.
3R. E. Biggers and R. G. Wymer, Design and Develop- ment of a High-Teniperature, High-pressure Spectrophoto- metric System: Status Report, ORNT.XF-60-11-96 (Nov. 12, 1960).
ORNL-3945, pp. 221-27.
OKNL-3830, pp. 236-47.
Absorption Spectra of the Uranyl Ion i n Perchlorate Media
Descriptions and resu l t s of most of the work in
therefore, this part of t h e program have been recently pub- l ished4e5 or submitted for publication; only a brief summary is presented here.
uranyl ion in a perchlorate medium have been re- solved into 24 absorption bands of Gaussian char- ac te r ; t h i s resolution included the f i r s t detailed ana lys i s of the complete ultraviolet spectrum (1795 to 3565 A) for any ac t iny l type of ion in an aqueous ( I noncomplexing” medium. T h e 24 bands have been grouped into 7 major absorption bands with a n av- e rage spac ing of 6137 c m - ’ and progressively in- c reas ing oscil lator s t rengths or transit ion prob- ab i l i t i es (Table 14.1). A l inear relationship between the band ene rg ie s and the logarithms of the osc i l - lator s t rengths was noted.
T h e f i r s t two major bands a re in agreement with the two triplet exc i ted s t a t e s proposed by other authors. T h e lower-lying triplet i s composed of 12 vibrationally perturbed bands and h a s a center at 24,107 cm-I; the second triplet, which h a s not been previously observed, is located a t 31,367 c m - ’ and is composed of 7 vibrationally perturbed bands. We be l i eve that the f ive remaining bands represent e lec t ron transit ions from t h e ground s t a t e
T h e ultraviolet and v i s ib l e spec t r a of the aqueous
J. T. Bell and K. E . Biggers, J. M o l . Spectry. 18, 247
’J. T. Bell and R. E. Biggers, J. M o l . Spectry. 22, 262
J. T. Bell and R. E. Biggers, ‘‘The Absorption Spec- 6
e Con-
4
(1965).
(1967).
trum of the Uranyl Ion in Perchlorate Media. Part 111. Resolution of the Ultraviolet Band Structure; S o clusions Concerning the Excited State of UO 2.F]”.* J. Mol. Spectry. (in press). 7S. P. McGlynn and J . K. Smith, J . M o f . Spectry. 6 ,
2
164-87 (1961).
266
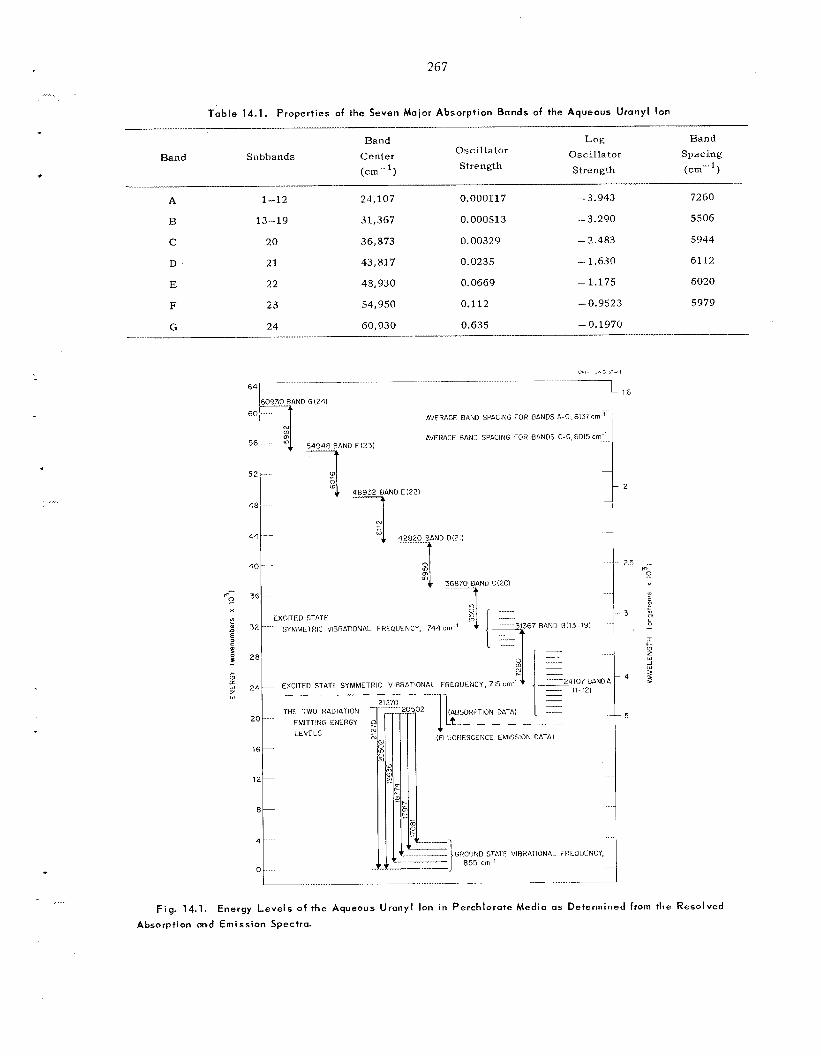
. . .....
267
Table 14.1. Properties of the Seven Moior Absorption Bands of the Aqueous Uranyl Ion
Band Log Rand Subbands Center Oscil lator Spacing Oscillator
(cm-') Strength Strength (cm-l) Band
A 1-12 24,107 0.0001 17 - 3.943 7260
E3 13-19 31,367 0.000513 -3.290 5506
C 20 36,873 0.00329 - 2.483 5944
D 21 43,817 0.0235 - 1.630 6112
E 22 48,930 0.0669 - 1.175 5020
F 23 54,950 0.112 - 0.9523 5979
G 24 60,930 0.635 - 0.1970
AVERAGE GAND SPACiNG FOR BfiNDS A-G,6137sm
AVERAGli BAND SPACING FOR BANDS C-G, 6015 cn
r
a " z w
12 : 0 -
(i - 121 21270
_ - - _ _ - LEVELS
Fig. 14.1. Energy Leve ls o f the Aqueous Uranyl Ion in Perchlorate Media os Determined from the Resolved
Absorption ond Emission Spectra.
268
to five excited s t a t e s t ha t a r e characterized by regular energy increments.
T h e fluorescence emiss ion spectrum is shown to result from two excited leve ls t o five vibrational leve ls in the ground s t a t e ; however, only 4.66% of the emitted energy is from t h e higher of the two excited levels. An energy-level diagram in Fig. 14.1 depic t s t h e relative energy leve ls for t he com- plete ultraviolet and v i s ib l e absorption spec t ra and fluorescence emiss ion spec t ra , as determined from resolution of the bands.
Studies of U(IV) i n Perchlorate Media
T h i s work i s complicated by the oxidation of U(1V) to U(V1); thus far we have iiot becn a b l e t o so lve th i s oxidation problem.
T h e spectrum (2000 to 13,000 A) of U(IV), i n perchloric ac id solution is composed of 23 ab- sorption bands of varying in tens i t ies and widths. Most of the bands seriously overlap with two or more adjacent bands, and the changes in the ob- se rved spectrum cannot b e directly a s soc ia t ed with particular transit ions. T h e resolved spec t ra of U(IV) a t various s t a g e s of hydrolysis can b e related to changes in the nature of the U(1V) s p e c i e s that occur a s a direct result of hydrolysis. Also, the assoc ia t ion between U(1V) and U(V1) c a n bc determined at these s t ages .
We a r e trying to obtain a pure U(C104)4 solution from which the hydrolyzed samples can be prepared.
Preliminary resu l t s show very marked changes in the absorption bands when the HC10, concentration of a 0.006 M U(1V) solution is reduced from 1.2 M to 0.045 M.
14.2 INSTALLA TESTING OF T H E SPECTROPH R SYSTEM FOR
HIGH ALPHA LEVELS
T h e modified spectrophotometer, which is in- s ta l led in a “cold” laboratory for testing, i s now operating satisfactorily. Th i s instrument, with its larger scale and spec ia l ly designed optics, provides about twice t h e resolution of a standard Cary modcl 14 spectrophotometer.
Spec ia l cell c rad les , which have been fabricated for the large cell supports in the cell compartment, permit the placement of standard absorption cells in-beam in the spectrophotometer. T h e s e dev ices allow servicing, calibration, and standard spec t ro- photometric operations t o be carried out. Automatic programmer operations have been checked out, and a Sun-Gun l igh t source unit , Variacs, and lapsed- time meters were added to the ultraviolet and in- frared source sys tems. Init ial checkout of the equipment i s more than 90% complete. T h e sys t em i s undergoing thermally hot operations with dummy cells prior to operation with uranium and lantha- nides. After sufficient tes t ing with t h e latter, i t will b e relocated in a high-level alpha laboratory for work with t h e transuranium elements.
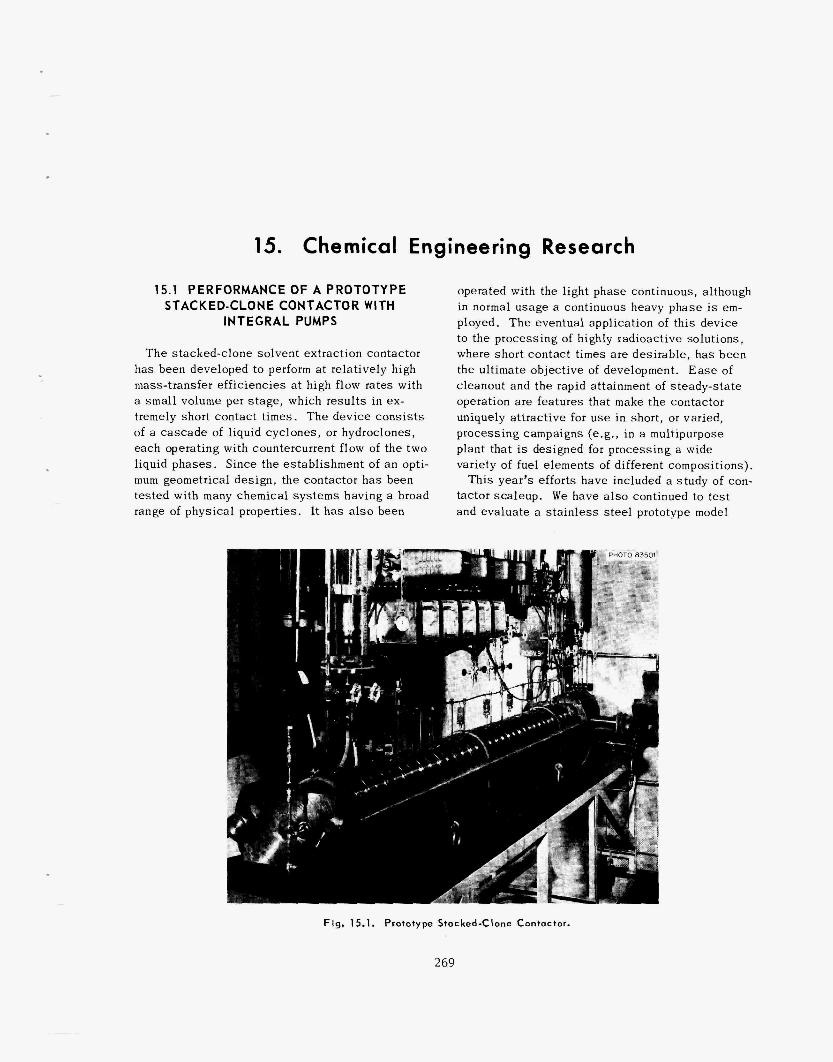
15. Chemical Engineering Research
15.1 PERFORMANCE OF A PROTOTYPE STACKED-CLONE CONTACTOR WITH
INTEGRAL PUMPS
T h e stacked-clone solvent extraction contactor has been developed to perform a t relatively high mass-transfer eff ic iencies a t high flow rates with a small volume per s t a g e , which resu l t s in ex- tremely short contact t . The device c o n s i s t s of a c a s c a d e of liquid cyclones, or hydroclones, each operating with countercurrent flow of the two liquid phases . Since the establ ishment of an opti- mum geometrical design, the contactor has been tes ted with many chemical sys t ems having a broad range of physical properties. It h a s also been
operated with the light phase continuous, although in normal usage a continuous heavy phase is em- ployed. T h e eventual application of th i s device to the processing of highly radioactive solutions, where short contact times a re desirable , has been the ultimate objective of development. E a s e of cleanout and the rapid attainment of s t eady- s t a t e operation a r e features that make the contactor uniquely at t ract ive for u s e in short, or varied, processing campaigns (e.g., in a multipurpose plant that is designed for processing a wide variety of fuel elements of different compositions).
This year’s effor ts have included a s tudy of con- tactor scaleup. W e have a l s o continued to t e s t and evaluate a s t a i n l e s s s t e e l prototype model
Fig . 15.1. Prototype Stacked-Clone Contactor.
2 69
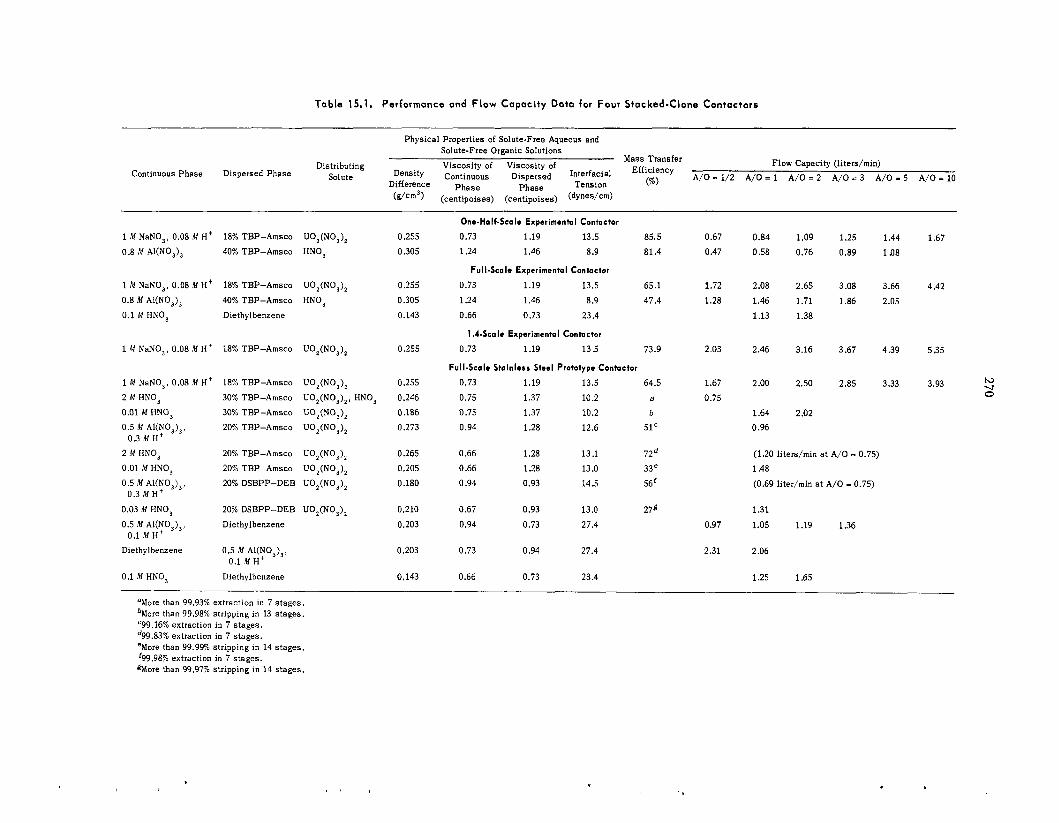
Table 15.1. P e r f o r m a n c e ond Flow C a p o c i t y Data f o r F o u r S t o c k e d - C l o n e C o n t o c t a r r
Physical Properties of Solute-Free Aqueous and Solute-Free Organic Solutions
Flow Capacity ( l i t e d m i n ) Mass Transfer Distributing Viscosity of Viscosity of
Density Continuous Dispersed Interfacial Efficiency
(dcm') (centipoises) (centipoises) ( d y n ~ c m )
Solute (%) A/O= 1/2 A/O= 1 A/O= 2 A/O= 3 A/O= 5 A/O= 10 Continuous Phase Dispersed Phase Difference phase phase Tension
1 M NaNO,, 0.08 M Hi 18% TBP-Amsco UO,(NO,),
0.8 M AKNO,), 40% TBP-Amsco HNO,
1 M NaNO,, 0.08 M Ht 18% TBP-Amsco UO,(NO,), 0.8 M Al(NO,), 40% TBP-Amsco HNO,
0.1 M HNO, Diethylbenzene
1 M NaNO,, 0.08 M Ht 18% TBP-Amsco UO,(NO,),
1 M NaNO,, 0.08 M Ht 18% TBP-Amsco UO,(NO,), 2 M HNQ, 30% TBP-Amsco UO,(NO,),, HNO,
0.01 M HNO, 30% TBP-Amsco UO,(NO,), 0.5 M Al(NO,),, 20% TBP-Amsco UO,(NO,),
2 M HNO, 20% TBP-Amsco UO,(NO,),
0.01 M HNO, 20% TBP-Amsco UO,(NO,),
0.5 M Al(NO,),, 20% DSBPP-DEB U02(N0,),
0.03 M HNO, 20% DSBPP-DEB UO,(NO,),
03 M H~
0.3 M Ht
0.5 M Al(;O,),, Diethylbenzene
Diethylbenzene 0.5 M Al(NO,),,
0.1 M H
0.1 M Ht 0.1 M HNO, Diethylbenzene
~~
aMore than 99.93% extraction in 7 s tages . bMore than 99.98% stripping in 13 stages. '99.16% extraction in 7 stages. d99.83% extraction in 7 stages. eMore than 99.9% stripping i n 14 s tages , '99.98% extraction in 7 stages. gMore than 99.97% stripping in 14 stages.
0.255 0.305
0.255 0.305 0.143
0.255
0.255 0.246 0.186 0.273
0.265 0,205 0.180
0.210
0.203
0.203
0.143 __
One-Half-Scale Experimental Contactor
0.73 1.19 13.5 85.5 1.24 1.46 8.9 81.4
Ful I-Sca le Experiment0 I Contactor
0.73 1.19 13.5 65.1 1.24 1.46 8.9 47.4 0.66 0.73 23.4
1.4-Scale Experimental Contactor
0.73 1.19 13 5 73.9
Full-Scale Stainless Steel Prototype Contactor
0.73 1.19 13.5 64.5 0.75 1.37 10.2 a
0.75 1.37 10.2 b
0.94 1.28 12.6 51'
0.66 1.28 13.1 72 0 6 6 1.28 13 .O 33e 0.94 0.93 14.5 56'
0.67 0.93 13.0 278 0.94 0.73 27.4
0.73 0.94 27.4
0.66 0.73 23.4
0.67 0.84 1.09 1.25 1.44 1.67 0.47 0.58 0.76 0.89 1 0 8
1.72 2.08 2.65 3.08 3.66 4.42
1.28 1.46 1.71 1.86 2.05 1.13 1.38
2.03 2.46 3.16 3.67 4.39 5.35
1.67 2.00 2.50 2.85 3.33 3.93 0.75
1.64 2.02 0.96
(1.20 liters/min a t A/O = 0.75) 1.48
(0.69 liter/min a t A/O = 0.75)
1.31
0.97 1.05 1.19 1.36
2.31 2.06
1.25 1.65
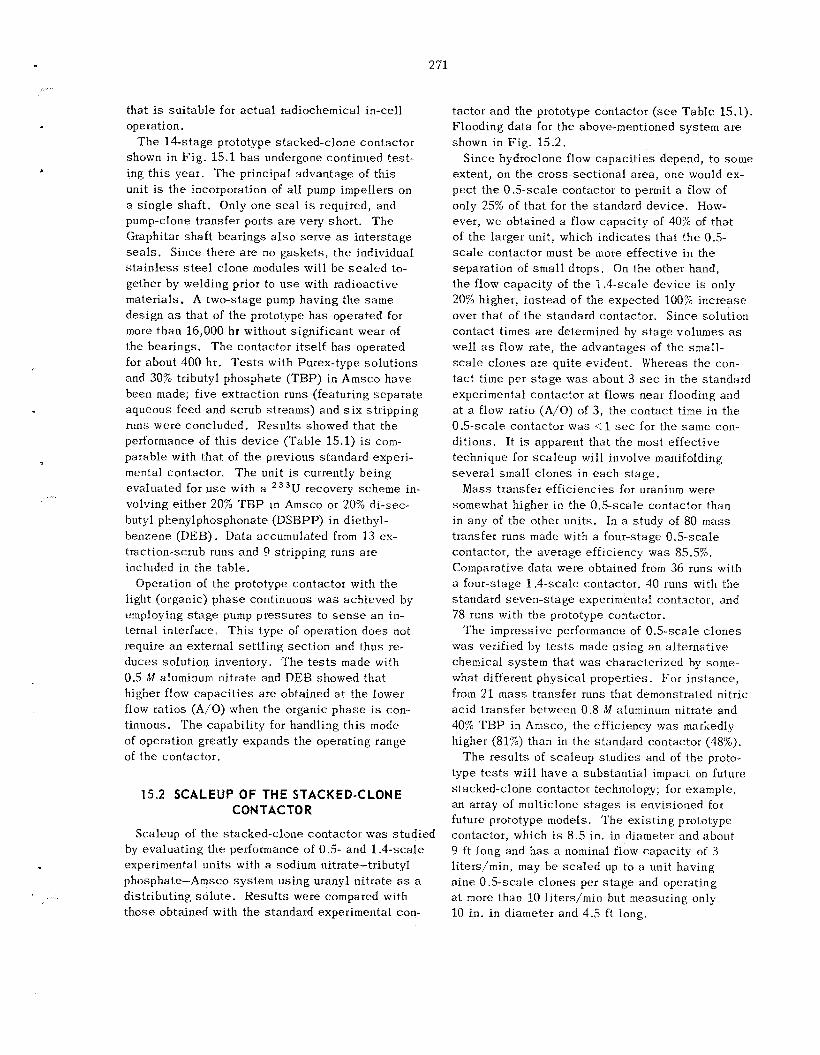
.....
2 71
that is su i tab le for ac tua l radiochemical in-cell operation.
T h e 14-stage prototype stacked-clone contac tor shown in F ig . 15.1 h a s undergone continued t e s t - ing t h i s year . T h e principal advantage of th i s unit is the incorporation of all pump impellers on a s ing le shaf t . Only one s e a l is required, and pump-clone transfer ports a r e very short . T h e Graphitar shaf t bearings also se rve as in te rs tage seals, Since there are no gaske ts , t h e individual s t a i n l e s s s t e e l c lone modules will be s e a l e d to- gether by welding prior to u s e with radioactive materials. A two-stage pump having the same design as that of t he prototype h a s operated for more than 16,000 hr without s ign i f icant wear of the bearings. T h e contactor i tself h a s operated for about 400 hr. Tests with Purex-type so lu t ions and 30% tributyl phosphate (TBP) in Amsco have been made; five extraction runs (featuring sepa ra t e aqueous feed and sc rub streams) and s i x s t r ipp ing runs were concluded. Resul t s showed tha t the performance of t h i s device (Table 15.1) is com- parable with that of the previous standard experi- mental contactor. T h e unit i s currently be ing evaluated for u s e with a volving e i ther 20% TBP in Amsco or 20% di-sec- butyl phenylphosphonate (DSBPP) in diethyl- benzene (DEB). Data accumulated from 13 ex- traction-scrub runs and 9 stripping runs a r e included in the table.
Operation of the prototype contactor with the light (organic) phase continuous was achieved by employing s t a g e pump pressures to s e n s e a n in- ternal interface. T h i s type of operation does not require a n external s e t t l i ng sec t ion and thus re- duces solution inventory. T h e tests made with 0.5 iz1 aluminum nitrate and DEB showed tha t higher flow capac i t i e s a re obtained at the lower flow ra t ios (A/O) when the organic p h a s e i s con- tinuous. T h e capabili ty for handling th i s mode of operation greatly expands the operating range of the contactor.
'U recovery scheme in-
15.2 SCALEUP OF THE STACKED-CLONE CONTACTOR
Scaleup of t he stacked-clone contactor was s tudied by eva lua t ing the performance of 0.5- and 1.4-scale experimental un i t s with a sodium nitrate-tributyl phosphate-Amsco system us ing uranyl nitrate as a distributing so lu te . Resu l t s were compared with those obtained with the standard experimental con-
tactor and the prototype contactor ( s e e Table 15.1). Flooding da ta for the above-mentioned sys tem a re shown in F ig . 15.2.
extent, on the cross-sectional a rea , one would ex- pec t t he 0 .5-sca le contac!.or to permit a flow of only 25% of that for the standard device. How- ever, we obtained a flow capac i ty of 40% of tha t of the larger unit, which ind ica tes that t h e 0.5- scale contactor must b e more effective in the separation of smal l drops. On the other hand, the flow capac i ty of t h e 1 .4-sca le device is only 20% higher, ins tead of the expected 100% increase over that of the standard contactor. Since solution contac t times a re determined by s t a g e volumes as well a s flow rate, the advantages of the small- s c a l e c lones a r e qui te evident. Whereas the con- tac t time per s t age was ahout 3 sec in the standard experimental contactor a t flows near flooding and at a flow ratio (A/O) of 3, the contac t time in the 0.5-scale contactor was < 1 sec for the s a m e con- ditions. It i s apparent that the most effective technique for s ca l eup will involve manifolding severa l small c lones in each s t age .
Mass transfer e f f ic ienc ies for uranium were somewhat higher i n t he 0.5-scale contactor than in any of the other units. In a study of 80 m a s s transfer runs made with a four-stage 0.5-scale contactor, the average efficiency was 85.5%. Comparative da ta were obtained from 36 runs with a four-stage 1.4-scale contactor, 40 runs with the standard seven-stage experimental contactor, and 78 runs with the prototype contactor.
T h e impressive performance of 0.5-scale c lones was verified by t e s t s made using a n alternative chemical sys tem that was characterized by some- what different phys ica l properties. Fo r ins tance , from 21 m a s s transfer runs that demonstrated nitric ac id transfer between 0.8 M aluminum nitrate and 40% T H P in Amsco, the e f f ic iency was markedly higher (81'%) than in the standard contactor (38%).
T h e resu l t s of s ca l eup s tud ie s and of the proto- type t e s t s wi l l have a subs tan t ia l impact on future stacked-clone contactor technology; for example, an array of multiclone s t a g e s is envisioned for future prototype models. T h e ex is t ing prototype contactor, which i s 8.5 i n . in diameter and about 9 ft long and h a s a nominal flow capacity of 3 liters/min, may b e sca l ed up to I unit having nine 0.5-scale c lones per s t a g e and operating a t more than 10 liters/min but measuring only 10 in. i n diameter and 4.5 ft long.
S ince hydroclone flow capac i t i e s depend, t o some
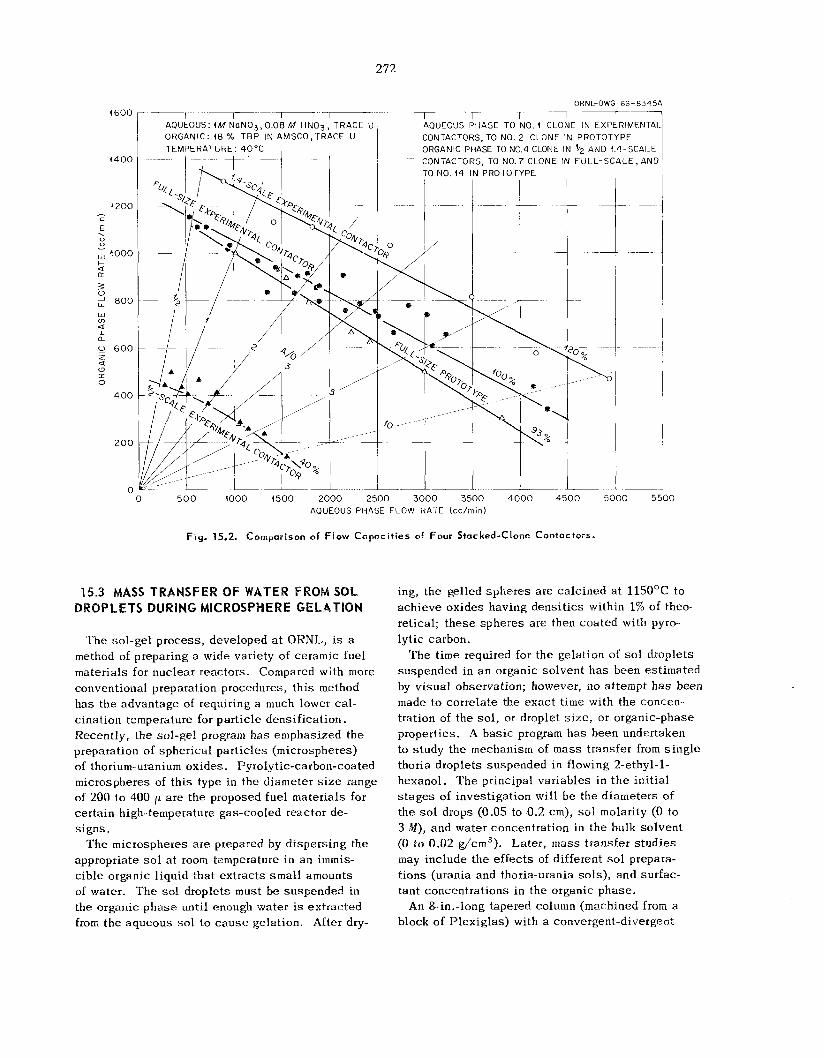
I 7-71
272
OXNL--DWG 66-83450
AQUEOUS: 1M NaN03, 0.08 M HN03, TRACE U ORGANIC: 48% TBP IN AMSC0,TRACE U TEMPERATURE: 40°C ,
AQUEOUS PHASE TO NO 4 CLONE IN EXPERIMFNTAI CONTACTORS, TO NO. 2 CLONE IN PROTOTYPE ORGANIC PHASE TO N0.4 CLONt IN '12 AND 1 4 - S C A l E
+ ' - - 1 1 ~ t CONTACTORS TO NO 7 CLONE IN FULL-SCALE. AND
0 5 0 0 4000 1500 2000 2500 3000 3500 4000 4500 5000 5500 AQUEOUS PIiASE FLOW RATE (cc/min)
Fig. 15.2. Comparison of Flow Capacities of Four Stocked-Clone Contactors,
15.3 MASS TRANSFER OF WATER FROM SOL DROPLETS DURING MICROSPHERE GELATION
T h e sol-gel process , developed at ORNL, is a method of preparing a wide variety of ceramic fuel materials for nuclear reactors. Compared with more conventional preparation procedures, th i s method h a s the advantage of requiring a much lower cal- cination temperature for particle densification. Recently, t he sol-gel program h a s emphasized the preparation of spher ica l par t ic les (microspheres) of thorium-uranium oxides. Pyrolytic-carbon-coated microspheres of t h i s type in the diameter size range of 200 to 400 p a r e the proposed fue l materials for certain high-temperature gas-cooled reactor de- s igns .
appropriate s o l at room temperature i n a n immis- c ib le organic liquid that extracts s m a l l amounts of water. T h e sol droplets must be suspended in the organic p h a s e until enough water is ext rac ted from t h e aqueous sol to c a u s e gelation. After dry-
T h e microspheres are prepared by d ispers ing the
ing, t he gelled sphe res a re calcined a t 115OoC to achieve oxides having dens i t ies within 1% of theo- retical; t h e s e sphe res a re then coa ted with pyru- lytic carbon.
T h e time required for t he gelation of sol droplets suspended in an organic so lvent h a s been es t imated by v isua l observation; however, no attempt h a s been made to correlate the exac t time with the concen- tration of the sol, or droplet s i z e , or organic-phase properties. A bas i c program h a s been undertaken to study t h e mechanism of m a s s transfer from s ing le thoria droplets suspended i n flowing 2-ethyl-l- hexanol. T h e principal variables in t h e in i t ia l s t a g e s of investigation will b e the diameters of the sol drops (0.05 to 0.2 cm), sol molarity (0 to 3 M ) , and water concentration in the bulk so lvent (0 to 0.02 s/cm3). La ter , mass teansfer s tud ie s may include the effects of different sol prepara- t ions (urania and thoria-urania sols), and surfac- tant concentrations i n the organic phase .
An 8-in.-long tapered column (machined from a block of P lex ig las ) with a convergent-divergent
2 73
c
flow channel h a s been employed in t h e s e s t u d i e s . In experimental operation a vertical velocity pro- file is developed and held stationary a long the central a x i s of the flowing divergent channel; the sol droplets that form a r e observed to main- ta in near-spherical s h a p e s during the gelation process , and they exhibit no de tec tab le horizontal motion. Observation of the forming p rocess with photographic equipment and with opt ica l magnifica- t ions of 20 to 40x i s feasible; thus, through the use of photographs, t he amount of water trans- ferred from t h e s o l droplet to the organic phase can b e determined by measuring changes in drop diameters with time. (The reverse process , transfer of 2-ethyl-1-hexanol into the sol droplet, will b e neglected s i n c e t h e solubili ty of organic in water is a n order of magnitude l e s s than the solubili ty of water in organic.) As the droplet shr inks and dens i f ies , the fluidizing flow i s s teadi ly increased to maintain horizontal alignment between t h e drop- l e t and t h e optical system.
From the dec rease of droplet diameter with time, mass transfer coefficients c a n b e ca lcu la ted for bulk so lven t s with varied water conten ts . It h a s been shown that t he experimental da t a c a n b e correlated by a model which a s sumes tha t t he mass transfer r a t e is controlled by the diffusion of water through a n organic film surrounding the drop. At some s t a g e s of the gelation process the diffusion of water within the drop i t se l f may con- tribute a significant res i s tance to mass transfer; however, t h e relative e f fec t of t h e s e different mechanisms c a n b e ana lyzed by s tudying sep- arately the ra tes of water extraction from so l droplets and from pure-water droplets.
15.4 HYPERFILTRATION OF SPENT SULFITE LiQUOR WITH A SELF-REJECTING
MEMBRANE ’ Hyperfiltration us ing dynamically cast m e m -
branes is a new technique that is potentially useful for various radiochemical appl ica t ions such as concentration of low- and intermediate- leve l was t e s . We have been participating in its development by a s s i s t i n g in programs with similar applications, for example, t he concentration of dis- so lved s o l i d s in paper-mill w a s t e s .
.... ‘Members of the Director’s and Chemistry Divisions, the MIT Prac t i ce School, and F i d a Butt, guest sc i en t i s t from Pakis tan, a lso participated in th i s work.
In the pulp and paper industry one of the prin- cipal chemical pulping p rocesses is t h e su l f i te process , in which the wood is cooked in sulfurous ac id and a s a l t (usually the calcium salt.) of th i s ac id . If t h e d isso lved subs t ances could be sep- arated from the s p e n t su l f i t e liquor, t h e water could b e recycled and the concentrated liquor could b e prepared for d i sposa l by evaporation and burning, thereby eliminating one industrial sou rce of water pollution.
Hyperfiltration experiments by the Pu lp Manu- facturers Research League , us ing spen t su l f i te liquor and ce l lu lose ace t a t e membranes, resulted in exce l len t separation of dissolved s o l i d s (mostly lignin) and water, with a so l id s rejection of 97.5 to 99%. However, product f luxes were rather low.‘
Dynamically formed “membranes,” under study at OKNI,,3 have t h e potential advantage of high production rates. Usually t h e s e a re formed by forcing f eeds containing addi t ives of a colloidal nature through porous bodies. Ins tances have been observed where no additive was required to obtain rejection. Examples of such self-rejecting sys tems a r e Th(iV), Fe(III), and humic a c i d in aqueous so lu t ions
A self-rejecting membrane w a s formed with calcium-base spen t su l f i te liquors suppl ied for this s tudy by A . J. Wiley and B. F. Lueck of the Pu lp Manufacturers Research League . T h e con- centration range of interest is 1 to 10 wt % dis- so lved so l id s . T h e porous support s t ruc tures used were two different types of carbon tubes , which were manufactured for u s e as e lec t rodes , and three grades of ceramic tubes , which a r e so ld commercially as polishing fi l ters.
When the type 03 ceramic tube (median pure di- ameter 0.9 p) and type 6 C carbon tube (median pore diameter 0.4 p ) were operated continuously with 1% liquor for 340 hr, permeabili t ies decreased and re- jec t ions increased significantly. For t h e ceramic tube, the permeability and the rejection were 6.5 x
c m min-’ atm-’ and 86% (400 psig and 35’C) a t the beginning; after 300 hr they had leveled off a t 1,8 x cm min-’ a tm-’ and
-- *A. J. Wiley, A. C. F. Ammerlaan, and G. A. Dubey,
“Application o f Reverse Osmosis to Processing of Spent Liquors from the Pulp and Paper Industry,@’ Re- search Conference on Reverse O s m o s i s , sponsored by the Office o f Salina Water, San Diego, Calif., Feb. 13-15, 1967.
3K. A. Kraus , H. 0. Phill ips, A. E. Marcinkowsky, J. S. Johnson, and A. J. Shor, Desalination 1, 225 (1966).
274
96% respectively. Corresponding va lues for t h e carbon tube were 2.7 x 70%, and . l . 2 x l o w 3 c m min-' a h - ' and 90% a t the same pressure and temperature. During th i s period, conditions were not held constant; pres- sure, temperature, and feed circulation rate were varied. T h e s e final permeabili t ies correspond to Rejections were not affected.
product r a t e s of 19.5 gal day-' ft-* for t h e ceramic tube and 12 gal day-' ft-' for t h e carbon tube at 480 psig. After 300 hr of operation, t he tempera- ture was increased to 6O0C, and product ra tes in- c reased to 29 and 19 gal day.-' ft-' for t h e ceramic tube and the carbon tube, respectively, at 400 ps ig .
cm min-' atm-' and
16. Reactor Evaluation Studies
...
T h i s program, supported jointly by the Reactor Division and the Chemical Technology Division, cons i s t s of s tud ie s of various advanced reactor and fuel-cycle sys tems t o determine engineering and economic feasibil i ty. T h e work in th i s Divi- s ion during the pas t year included c o s t s tud ie s of shipping fresh and spent nuclear fuel, processing spen t fue l (including final was te disposal) , and preparing various virgin and recycle fue l mate- rials (oxides, metals, f luorides, etc.). In addition, computer c o d e s were developed for estimating and ana lyz ing the overall cost of nuclear power, for ca lcu la t ing decay charac te r i s t ics of f i s s ion prod- uc ts in spen t nuclear fuel, and for optimizing the s i z e , da t e of construction, and location of process- ing plants in an expanding nuclear economy. W e have prepared formal c o s t es t imates in conjunction with evaluations of the HWOCR (Heavy-Water- Moderated, Organic-Cooled Reactors) and severa l desalination reactor proposals, ‘ y 2 and in support of the evaluation programs ass igned to the USAEC F u e l Recycle T a s k Force and the Systems Analy- sis T a s k Force.’
16.1 STUDIES OF THE COST OF SHIPPING REACTOR FUELS
Shipping costs for various fresh, spent , and re- cycled reactor fue ls were estimated during the year. Th i s was done as part of a continuing e f - fort t o develop fuel cyc le c o s t e s t ima tes for re- ac tor evaluation purposes. The estimating meth-
....
‘P. R. Kasten e t al . , A n Evaluation of Heavy-Water- Moderated, OrganicCooled Reactors , ORNL-3921 (Jan- uary 1967) and ORNL-3’321 Supplement (to be i s sued) .
Annual Progress Report for Period Ending October 3 1 , 1966, ORNL-4087 (March 1967).
3Civil ian Nuclear Power - the 1967 Supplement to fhe 1962 Report t o the President, USAEC (February 1 96 7).
2R. P. Hammond at a t . , Nuclear Desalinatiori Program
ods used , based on computer programs MYRA and NORA, have been described in previous reports. 4 * 5
Bas ic changes in the AEC shipping regulations took place in July 1%6.6 The new regulations a re generally more lenient with regard to the “ l o s s of coolant” condition and the se t t i ng of temperature restrictions on the cask ; this has eased the prob- l e m of hea t removal from the c a s k for some irradi- ated fuels, notably fast-breeder fuels. For most other fuels, the change in shipping c o s t result ing from the new regulations is negligible when com- pared with the uncertainties in the es t imate .
Summary of Est imates of Shipping C o s t s
Tab le 16.1 summarizes some of the shipping c o s t s that were estimated for some of the reactors that are being evaluated in the current AEC reac- tor sys t ems ana lys i s study.
Tab le 16.2 shows the shipping c o s t s tha t were estimated for irradiated MTGR fuel e lements of the hexagonal block type, 31.2 in. long and 14.2 in. across flats.
A shipping c o s t of about $11 per kilogram of ura- nium plus plutonium was estimated for the spent f u e l from a l iqu id-meta l too led fas t breeder reactor of the type designed by the General Elec t r ic Com- pany. Th i s c o s t is based on the assumption that the fuel e lements a re disassembled prior t o
4R. Salmon, A Computer Code for Calculating the Cost of Shipping Spent Reactor Fuels a s a Function o f Burnup, Spec i f ic Power, Cooling Time, Fuel Composition, and Other Variables, ORNL-3648 (August 1964).
5R. Salmon, Estimation o f Fuel-shipping C o s t s for Nuc lear Power Cos t-E va Iuat ion Purposes, ORNL-3 943 (March 1966).
‘Ti t le 10, Part 71 ui Federal Register, July 22, 1966. 7M. J. McNelly, Liquid Metal Fas t Breeder Desigri
Study (1,000 W e U 0 2 - P u o , Fueled Plant), GEA P-4418. 8K. P. Cohen and ti. L. O’Neill, Proceedings of the
Conference on Safe ty , Fuels, and Core Design in Large Fast Power Reactors, October 11 -14 , 1965, ANL-7120, pp. 185-20.1.
2 75
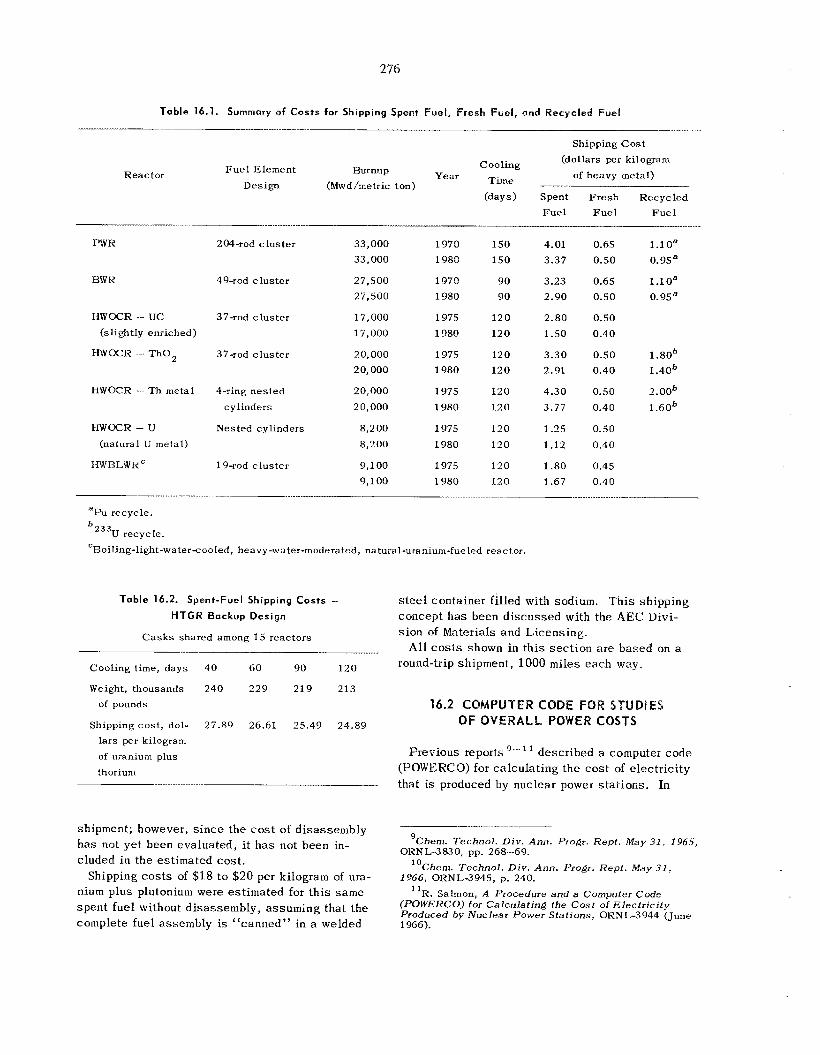
276
Table 16.1. Summary of Costs far Shipping Spent Fuel, Fresh Fuel, and Recycled Fuel
Shipping Cos t (dollars per kilogram
of heavy metal) Cooling
F u e l Element Burniip Year Tittle Reactor
Design (Mwd/metric ton) (days) Spent F resh Recycled
Fue l F u e l F u e l ~~~ ~~~~~ ~~~~~~~~
W R 204-rod cluster 33,000 1970 150 4.01 0.6.5 l . l O B
BWK 49-rod cluster 27,500 1970 90 3.23 0.65 l . loa 33,000 1980 150 3.37 0.50 O.9Sa
27,500 1980 90 2.90 0.50 0.95
I-IWOCR --- UC 37-rod cluster 17,000 1975 120 2.80 0.50 (slightly enriched) 17,000 1980 120 1.50 0.40
H W W R - T h o , 37-rod cluster 2 0,000 1975 120 3.30 0.50 1 .80‘ 20,000 1980 120 2.91 0.40 1.40‘
HWOCR - Th metal 4-ring nested 20,000 1975 120 4.30 0.50 2. OOb
cylinders 2 0,000 1980 120 3.77 0.40 1.60’
IIWOCR - U Nested cylinders 8,200 1975 120 1.35 0.50 (natural U metal) 8,200 1980 120 1.12 0.40
IIWRIdWRC 19-rod cluster 9,100 1975 120 1.80 0.45 9,100 1980 120 1.67 0.40
. .___ .................. ._ ..........._I_
*PU recycle.
‘233U recycle. CRoiling-light-watercooled, heavy-water-moderated, natural-uranium-fueled reactor.
Table 16.2. Spent-Fuel Shipping Costs - HTGR Bockvp Design
C a s k s shared among 15 reactors
Cooling time, days 40 60 90 120
Weight, thousands 240 229 219 213 of pounds
Shipping cos t , dol- 27.89 26.61 25.49 24.89 la rs per kilogram of uranium plus thorium
shipment; however, s i n c e the c o s t of d isassembly h a s not ye t been evaluated, i t h a s not been in- cluded in the estimated cos t .
Shipping c o s t s of $18 to $20 per kilogram of ura- nium plus plutonium were estimated for th i s same spen t fue l without d i sassembly , assuming that t he complete fuel assembly i s ‘‘canned” in a welded
s t e e l container filled with sodium. T h i s shipping concept h a s been d i scussed with the AEC Divi- s ion of Materials and Licensing.
All c o s t s shown i n th i s s ec t ion are based on a round-trip shipment, 1000 m i l e s each way.
15.2 COMPUTER CODE FOR STUDIES OF OVERALL POWER COSTS
Previous reports ’’-” described a computer code (POWERCQ) for ca lcu la t ing the cos t of electricity that is produced by nuclear power s ta t ions . In
’Chem. Technol. Div. Ann. Progr. Rept. May 31, 1965,
“Chem. Technol. Div. Ann. Progr. Rept . May 31 ,
ORNL-3830, pp. 268-69.
1966, ORNL-3945, p. 240. “R. Salmon, A Procedure a n d a Computer Code
(POWERCO) for Calculating the Cos t of Electr ic i ty Produced by Nuclear Power Stations, ORNL-3944 (June 1’366).
,. . . ..
277
C
writing th i s code i t was assumed that all t he c a s h expenditures of t he project were known, except for the Fede ra l income tax , which w a s ca lcu la ted by the code. Annual c a s h expenditures for s t a t e and local taxes , interim replacements, and property insurance were required as input. T h e code also ca lcu la ted fixed charge r a t e s on depreciable and nondepreciable capi ta l ; t hese were defined in ac- cordance with the Oyster Creek report l 2 to include only recovery of investment, return on investment, and Fede ra l income tax. S ta te and local taxes , interim replacements, and insurance were accounted for as expenses in t h e ca lcu la t ion of the power c o s t but were not included in the fixed charge ra tes . However, because fixed charge r a t e s given in various sou rces frequently include t h e s e i tems, it was felt tha t POWERCO should b e a b l e to d is - play fixed charge ra tes ca lcu la ted on th i s bas i s . T h i s capabi l i ty h a s now been incorporated into t h e code. T h e revised code (POWERCO-35) wi l l permit a c r i t i ca l evaluation of the breakdown of fixed charge ra tes into their components and wi l l fac i l i t a te t he se t t i ng of appropriate fixed charge ra tes for evaluation s tud ie s .
As a n example of t he results observed thus far, t he 3 .0 t o 3.4% that is conventionally charged to Fede ra l income tax for investor-owned power com- panies l 3 was found to b e too high for new proj- ec t s ; t he proper value, using sum of the years ' d ig i t s depreciation, is about 1.0 to 1.8%, depending on the r a t e s of return, debt s t ruc ture , and other fac- tors.
A report covering th i s work is in preparation.
16.3 PHOEBE FISSION PRODUCT CODE
A computer code , PHOEBE, w a s written t o cal- cu la te the decay properties of mixed f i s s ion prod- uc t s result ing from the f i s s ion of 235U. '' Fis s ion product be ta and g a m m a activity and spec t r a a r e ca lcu la ted for t hese f i ss ion products as a function
of power, irradiation time, and decay time. Either cons tan t or variable power may b e spec i f ied for the reactor operation period.
descr ibe the gamma spec t ra . T h e computer output is in terms of gamma photon emiss ion r a t e s for each group, gamma energy emiss ion ra tes for each group, total gamma emiss ion rate, to ta l gamma energy emiss ion rate, be ta particle emission rate, to ta l average beta energy emiss ion rate, and to ta l energy re lease rate.
descr ibes the re lease ra tes a s a function of t i m e after f ission. T h e report l 5 presents a d iscuss ion of these da t a functions and descr ibes how they were obtained, how they a r e used , and how they may b e modified for u s e in spec i f i c ins tances . It also presents other detailed d iscuss ions tha t in- clude: gamma photon and energy re lease ; beta particle and energy re lease ; the fission rate func- tion for variable power operation; the da t a library; input preparation, operation, and output; sample problems; and a FORTRAN list of the code.
An earlier version of th i s code w a s re leased on a temporary, unpublished b a s i s s eve ra l y e a r s ago. However, the variable-power sec t ion h a s been completely rewritten, and those who have been us ing the old form of the code should either re- p lace their old decks with the new version or re- compile a n y programs that u s e PHOEBE as a sub- routine.
A to ta l of 12 gamma energy groups are used to
T h e code conta ins a permanent da t a sec t ion that
16.4 COST STUDIES OF FUEL PREPARATION AND PROCESSING FOR NEW AEC CIVILIAN
NUCLEAR POWER EVALUATION
Cost e s t ima tes for fuel-material preparation (chemical conversion) and for spent-fuel process- ing were made in support of the Fue l Recycle T a s k Force , the Systems Analys is Task Force , and the various reactor t a sk forces taking part in
1962 asses smen t of c iv i l ian nuclear power and to
"Report on Economic Analys i s for Oyster Creek Nu- clear Electric Generating Station, Jersey Central Power the USAEC study whose purpose is to update the and Light Company (February 1964).
13Costs of Nticlear Power, USAEC Report TID-8531
"R. Salmon, A Revis ion of Computer code
extend i t beyond the year 2000.3 Our previous e s t ima tes of fuel cyc le c o s t s for advanced con- verter reactors 1 , 9 , 1 0 , 1 6 were revised to reflect the change from a ground rule which spec i f ied the u s e
(Rev.) (January 1961).
(POWERCO) (Calculation of Cos t of E l e c f r i c i f y Pro- duced b y Nuclear Power Stations), ORNL4116 (April 1967).
Beta and Gainma Act i v i t y and Spectra for 235U Fiss ion Products, ORNL-3931 (July 1966).
"E. D. Arnold, PHOEBE - a Code f o r Calculating .-
16M. W. Rosenthal et a l . , A Comparative Evaluation of Advanced Converters, ORNL-3GSG (January 1965).
2 78
of single-purpose plants that a re designed t o match a n economy of 15,000 Mw (electrical) of the par- t icular reactor type being evaluated; under the new rule it is necessary t o consider tha t the size of the nuclear economy, as wel l as the relative number of various reactor types, changes with time. Th i s new b a s i s ca l l s for prediction of fuel-cycle c o s t s a s a function of time, and thus presents a complex and controversial t ask . We have made es t imates of capi ta l and operating c o s t s for single-purpose plants with daily processing capac i t ies of up t o 30 metric tons/day for HWOCR-U and HWBLWR fuels, up to 15 metric tons/day for BWR-PWR and H W K R fuels, and up to 10 metric tons/day for HTGR and FBR (mixed core -plus-blanket) fuels.
Linear-Growth-Rate Model
For the present we are using a simplified linear- growth-rate model of the spent-nuclear-fuel process- ing economy to guide our thinking on plant s i z ing and timing. Th i s model, a n improvement of the one described in l a s t year’s report, l o a s sumes that fuel is backlogged for y years (incurring s torage and in- ventory cos ts ) , a t which time a plant of capacity mx comes on stream. The cyc le is repetitive, with plants of size mx coming on stream every x years s ta r t ing a t y. For th is model the total present- worth-levelized processing cost, including fuel inventory cos t s , per unit amount of fuel is given by Eq. (1):
, \ (1 - e - - r X )
Thus the largest-size processing plants would serv ice the equivalent of 60,000 t o 120,000 Mw (electrical) of a given reactor type. These e s t i - m a t e s must b e converted in to predictions of c o s t s vs t ime by making assumptions concerning: how the fuel loads will increase with time; bow the preparation and processing industries will expand with time (whether many smal l plants or fewer large plants); and what t he costs of investment capi ta l will be for t hese industries. T h i s work i s not ye t complete; however, i t is expected that the resu l t s will be published a s a report of the AEC Fue l Recycle T a s k Force by the end of 1967. Our cos t optimization s tud ie s in support of t h i s work a re reported in Sect. 16.5.
16.5 OPTlMlZATlON OF THE SIZES, DATES OF CONSTRUCTION, AND LOCATIONS
OF PROCESSING PLANTS IN AN EX PAN DI N G ECONOMY
T h e projected growth of nuclear electric power production t o a very large sca l e , 150,000 Mw (elec- trical) Ey 1980 and on the order of l o 6 Mw (elec- trical) by 2000, c rea t e s a need for a mathematical model t o eva lua te growth patterns for nuclear fuel- cyc le sys t ems in the interest of cos t minimization. W e a re currently using a simplified mathematical model and a re developing more sophisticated mod- els, as described below.
where
C = total processing c o s t per unit of production, P
g - that part of unit processing c o s t which i s constant (e.g., expendable materials pro- portional t o production rate),
k = capitalized cos t of building and operating a fuel-receipt-and-storage (backlogging) facil i ty of unit capacity, such that k ( 1 n y ~ / 2 ) ~ i s the capitalized c o s t of building and oper- a t ing (indefinitely) a backlogging facil i ty that accumulates fuel for y years before processing begins,
rate of growth of spent-fuel production, units pcr year per year,
r = cos t of money, the effective discount (con- tinuous) interest rate for the present-worth calculation, fraction per year,
rn
b = cos t - sca l ing factor for backlogging facil i ty, dimensionless fraction,
K - capitalized cost of building and operating a processing plant of unit annual capacity, such that K(mx)” is the capitalized c o s t of building, operating, and replacing (indef- initely) a processing plant of throughput capacity m x ,
a = cos t - sca l ing factor for processing plant,
V s - unit sale value of recovered fuel.
279
T a b l e 16.3. Processing Costs,a in Dollars per Kilogram, for Selected Values of Backlogging T ime ( y ) and Plant Size (mx)
... _ - Y
X
X 0 0.05 0.10 0.15 0.20 0.25 0.50 (years)
1
2
3
5 10 15 16
17 18
19
20
25
30.42
2C.71
16.94 13.67
11.34
10.96 10.96
10.98 11.02 11.06
11.12 11.49
31.04 21.16 17.29
13.90
11.37
10.81 10.78 10.76
10.76
10.77 10.78
10.96
31.37 21.35
17.41 13.93 11.24
10.60
10.56
10.54 10.54
10.55 10.57
10.51
31.62
21.49
17.49 13.92
11.19 10.64 10.64 10.66 10.71
10.77
10.85 11.51
31.83
21 .GO 17.54
13.93 11.26
11.00 11.09 11.20 11.35
11.53
11.74 13.14
32.02 21.69
17.59 13.96 11.49
11.73 11.95
12.21 12.51 12.85
13.23
15.64
32.75 22.12
18.01 14.84
15.43 20.64 22.00
23.44 24.95 26.53
28.16
36.90
aBasis: a r 0.35; h
k-= 2.6G x l o 6 $/(metric K = 9.58 x l o 6 $/(metr ic ton/year)0.35.
0.35; r -= 0.12/year; rn -- 300 met r i c tons/(year)’;
V s = $100,00O/metric ton; g = $.5OO/metric ton;
Table 16.3 shows the resu l t s of a typical ca lcu- lation. I t is based on light-water-reactor fuel value and processing-cost es t imates , with a growth rate of 300 metric tons/(year)2 (predicted for the 1970’s), and a discount rate of 12%/year (appli- cab le to common ownership of fuel, backlogging facil i ty, and processing plant by a fuel-cycle corporation with a “medium” c o s t of money). T h i s growth rate is approximately equivalent t o 1 . 0 m e t - r ic ton per day per year, so tha t in th i s case x is equal to the processing plant capacity in metric tons/day. In th i s model the value of y cannot ex- ceed 0 . 5 ~ . T h e c o s t drops from about $3 l /kg in a 1 .O-metric ton/day plant (relatively independent of backlogging time) t o less than one-half of that in a 5.0-metric ton/day plant (still relatively in- sens i t ive t o backlogging time in th i s c a s e ) and t o l i t t le more than one-third of the 1-metric ton/day cos t a t t he optimal conditions of y - 1.7 to 1.8 years and x = 17 to 18 years (= 17- t o 18-metric ton/day plant). The optimum is qui te “flat”; for example, a 10.0-metric ton/day plant with 1.0 year of backlogging g ives a levelized unit c o s t only 6% higher than the minimum, and might b e preferable from the risk point of view.
Linear and Dynamic Programming Models
W e are developing a linear-programming model that will a l loca te spent fuel from H sources t o reprocessing plants to be constructed at K po- tential s i t e s so a s t o minimize present-worth ex- pense, if the following are specified:
1. a forecast over T t i m e periods of the power demands t o b e placed on the reactors that generate the spen t fuels,
2. the processing and capi ta l economies that resu l t from the construction of fewer and larger reprocessing p lan ts ,
3 . the transportation economies that result from construction of numerous reprocessing plants.
‘The bas i c information to be obtained from t h e model cons i s t s of the optimal s i z e s , da t e s of con- struction, and locations of reprocessing plants.
In considering the trade-off between the s i z e s of plants and the number of plants necessary to meet demand, the model will:
1. recognize the nonlinearity between the capi ta l required t o construct a plant and the s i z e of the plant;
2 80
2.
3 .
4.
5 .
6 .
7.
recognize the individual unit costs for shipping fuel between each of the H sources and the K potential plant s i t e s ;
allow fuel t o b e inventoried, as optimal, a t sou rces and reprocessing sites; th i s , of conrse, a l lows plant construction to be deferred until a larger and more efficient plant c a n be used a t a n economical percentage of capac i ty ;
accep t t he ex i s t ence of init ial and final inven- tories;
readily permit a respecification of t h e number of spen t fuel sou rces , t h e number of potential reprocess ing sites, and the numbei of time periods in the planning horizon;
be liinited, in at l e a s t its in i t ia l formulation, t o regarding all spen t fue ls as a homogeneous en t i ty no matter what types of reactor might ac tua l ly be in serv ice ;
t rea t unit direct p rocess ing costs and unit in- ventorying c o s t s a s independent of volume but not necessar i ly independent of location. It is probable that th i s restriction will be eliminated after some u s e of the model.
There a r e a number of optimization techniques tha t could have been used as the b a s i s of the model. One of t hese is dynamic programming, which is particularly vrell su i ted to a problem, s u c h a s th i s , containing nonlinearit ies and even discon- t inuit ies. ular, have made ex tens ive use of dynamic pro- gramming in the ana lys i s of fue l reprocessing plants in France. ming suf fers from two disadvantages: (1) any problem except t he smallest requires the u s e of a computer for solution, which in turn requires the writing of a custom program for e a c h type of problem, and (2) the dimensionalit ies of “real- world” problems often exceed the memory capac- ity of even the la rges t computers. T h e U.S. spent-fuel problem falls in the latter category; moreover, t he resu l t s a r e needed quickly. For
L. Thiriet and c o a u t h o r s , in partic-
However, dynamic program-
these reasons , dynamic programming was not chosen as the b a s i s of the present model.
Another technique that could have been used a s the b a s i s of the optimization is the simulation of the fue l reprocess ing fac i l i t i es as a s tochas t i c system. Such simulations have become very ex- tensively used i n recent years because they allow sys tems to b e treated on a probabilist ic, rather than a deterministic, bas i s . Certainly the prob- ab i l i s t ic assignment of demands, sh ipping c o s t s , cap i ta l costs, process ing c o s t s , and inventorying costs would b e appropriate amidst al l the uncer- ta in t ies i n the spent-fuels problem. Again, how- ever , t he development of a c u s t o m simulation algorithm for th i s problem might well b e prohibi- t ive with respec t to e l apsed time, computer hard- ware, and programming and execution time.
T h e third optimization technique considered (the method chosen) w a s l inear programming. A major fa r tor in the dec is ion for i t s s e l ec t ion was the present ex is tence of computer programs that would handle problems of the magnitude of the spent-fuels problem. A second factor w a s that, in any event , t h e technique used would have to conta in a n embedded transportation l inear program (LP) to handle the fuel movements between sources and reprocessing s i t e s . A conventional LP will not, however, handle the nonlinearit ies tha t must b e recognized between plant cap i ta l and s i ze . Two modifications of a convcntional LP a r e pos- sible in order t o cope with nonlinearit ies. One of t hese is separable programming, which inter- po la tes on l ine segments that approximate the nonlinear function. The other modification in- volves so lv ing a conventional LP where capi ta l c o s t coefficients a r c ass igned init ially, based on g u e s s e s as to what t h e plant s i z e s will be. T h e resultant plant sizes are used to determine new capi ta l c o s t coefficients from the cos t - s ize func- tion, and the new coefficients a r e used in the LP to get revised va lues for plant size, e t c . , unti l the plant sizes a re identical i n two s u c c e s s i v e l inear programming so lu t ions ,
T h e l inear programming model conta ins three types of constraints: inatcrial ba l ances a t spent -
~~
___ ___ fuel sou rces , material ba lances a t reprocessing 1 7 ~ . E. ~ ~ l l ~ ~ ~ and S . E. nreyfus, ~ ~ ~ ~ i ~ d ~~~~~i~ s i t e s , and reprocessing capac i t i e s a t sites T h e
Programming, Princeton University Press, Princeton, N.J., 1962.
18L. Thiriet and J. Gaussens , “A Method for the Choice of Allocations and Capital Investments,” paper presented a t Fourth Operational Research Conference, Massachusetts Institute of Technology, Boston, Mass., Aug. 29-Sept. 2, 1966.
_____...____
C . E. Miller, T h e Simplex Method for Local Sep- 19
arable Programming, ed. by Graves and Wolfe, McGraw- Hill, New York, 1963.
model h a s five types of activity vectors: (round- trip) shipments between sources and s i t e s , amounts of fuel inventoried a t sou rces , amounts of fuel in- ventoried at s i t e s , reprocessing rates a t sites, and capac i ty increases at s i t e s . Our reference runs of the LP will be made using eight spent-fuel sources , e ight potential reprocessing s i t e s , and a planning horizon of 60 one-year time periods. T h e s e pa- xameters a re se lec ted to f i t a 60-year projection of power demand made by the USAEC and the Federa l
Power Commission which a s sumes that the United S ta tes is comprised of eight regions. The model wil l consider each region as a s ingle source and allow no more than one reprocessing site per re- gion. T h e s e parameters, i n conjunction with the use of three line segments in the plant capital- cost-size function, lead to a model having 1920 row constraints and 7184 column vectors. W e a r e us ing the IBM-MPS package for the IBM-360 com- puter, with a capabili ty of 4000 constraints.
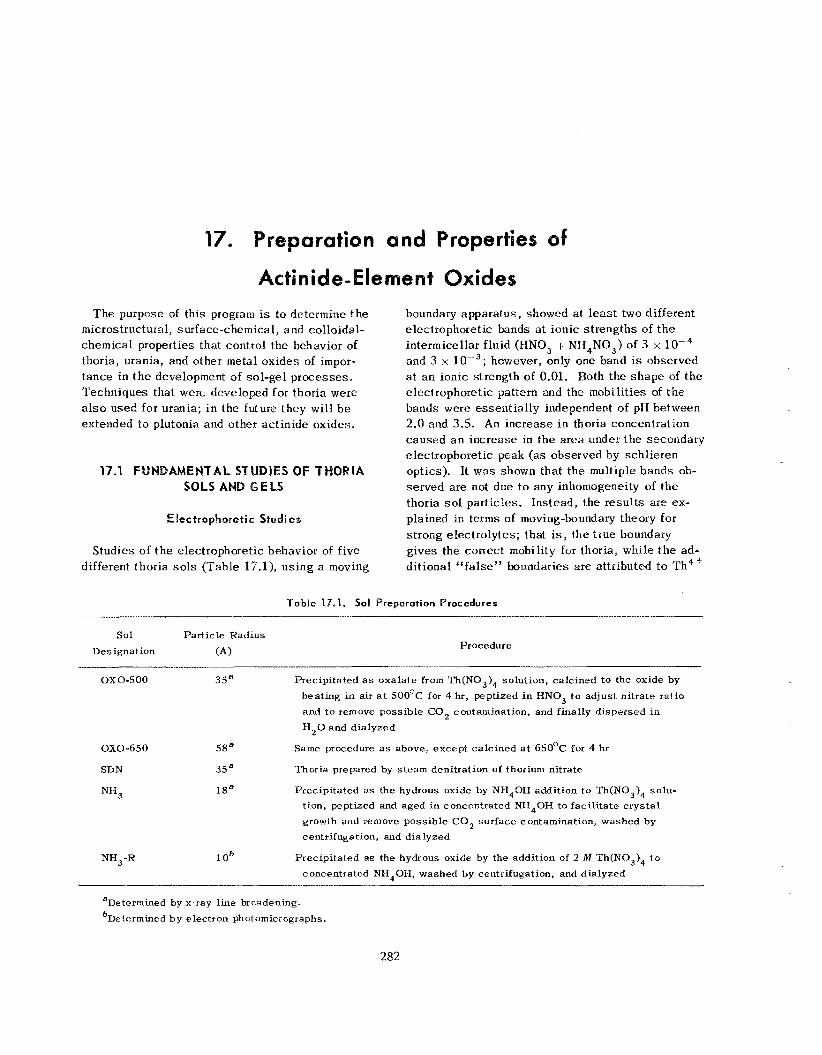
reparation and raperties sf
T h e purpose of this program is to determine t h e microstructural, surface-chemical, and colloidal- chemical properties that control the behavior of thoria, urania, and other rnetal ox ides of impor- t ance in t h e development of sol-gel processes , Techniques that were d e v e l q x d for thoria were also used for urania; i n the future they will. b e extended to plutonia and other ac t in ide oxides.
Eiectrophoretic Studies
Studies of t h e electrophoretic behavior of f ive different thoria sols (Table 17.1), us ing a moving
boundary apparatus, showed at l e a s t two different electrophoretic bands at ion ic s t rengths of t h e intermicellar f luid (HNO, ! NII,NO,) of 3 x lo-’ and 3 x lo-,; however, only one band is observed a t a n ionic strength of 0.01. Both the s h a p e of t h e electrophoretic pattern and the mobilities of t h e bands were essent ia l ly independent of pII between 2.0 and 3.5. An increase i n thoria concentration caused a n increase in the a rea under t h e secondary electrophoretic peak (as observed by sch l ie ren optics). It was shown tha t t he multiple bands ob- served a re not due to any inhomogeneity of t h e thoria sol particles. Ins tead , t he resu l t s a r e ex- plained in terms of moving-boundary theory for s t rong electrolytes; that is, the t rue boundary g ives the correct mobility for thoria, while t h e ad- dit ional “false” boundaries arc attributed t o T h 4 +
Table 17.1. Sol Preparation Procedures
Sol Par t ic le Radius Procedure
Designation (A) _I.__ ... -... . .. . -. . .
oxo*5oo 3 s a Precipitated as oxalate from Th(NO,), solution, calcined to the oxide by heating in air a t 5OO0C for 4 hr, peptized i n HNO, t o adjust nitrate ra t io and t o remove possible CO H,O and dialyzed
contamination, and finally dispersed in 2
OXO-650
SDN
NIX,
5 s a
3 s a
1 sa
Same procedure a s above, except calcined a t 65OoC for 4 hr
Thoria prepared by s t e a m denitration of thorium nitrate
Precipitated as the hydrous oxide by NH40H addition to Th(NO,), solu- tion, peptized and aged in concentrated M 4 0 H to faci l i ta te crystal. growth and remove possible C 0 2 surface contamination, washed by centrifugation, and dialyzed
NH,-R 1 O b Precipitated as the hydrous oxide by the addition of 2 M Th(NO,), t o concentrated NH401-I, washed by centrifugation, and dialyzed
aDetermined by x-ray line broadening. %etermined by electron photomicicgraphs.
282
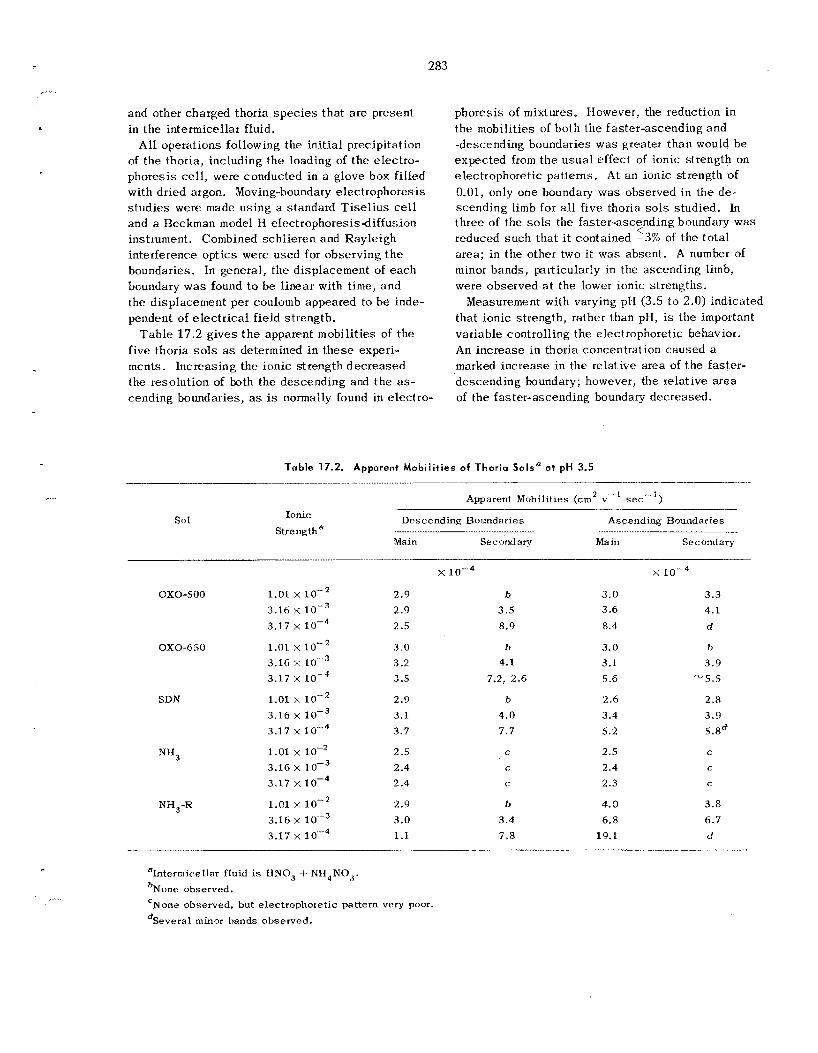
...
283
and other charged thoria s p e c i e s tha t a re present in the intermicellar fluid.
All operations following the ini t ia l precipitation of the thoria, including the loading of the electro- phoresis ce l l , were conducted in a glove box filled with dried argon. Moving-boundary electrophoresis s tud ies were made using a standard T i s e l i u s cell and a Beckman model 1% electrophoresisdiffusion instrument. Combined schl ieren and Rayleigh interference opt ics were used for observing t h e boundaries. In general , the displacement of each boundary was found t o be l inear with t ime, and the displacement per coulomb appeared to b e inde- pendent of e lec t r ica l field strength.
T a b l e 17.2 gives t h e apparent mobilities of the five thoria sols as determined in t h e s e experi- ments. Increasing the ionic strength dec reased the resolution of both the descending and t h e as- cending boundaries, as is normally found in electro-
phoresis of mixtures. However, the reduction in the mobilities of both the faster-ascending and -descending boundaries was greater than would be expected from the usua l effect of ionic strength on electrophoretic patterns. At an ionic strength of 0.01, only one boundary was observed in t h e de- scending limb for all f ive thoria sols studied. In three of the s o l s the faster-ascending boundary was reduced such that it contained =3% of the to ta l area; in the other two it was absent . A number of minor bands, particularly in the ascending limb, were observed a t the lower ionic s t rengths .
that ionic strength, rather than pH, is the important variable controll ing t h e electrophoretic behavior. An increase in thoria concentration caused a marked increase in the relative area of the faster- descending boundary; however, the relative area of t h e faster-ascending boundary decreased.
<
Measurement with varying pH (3.5 to 2.0) indicated
Table 17.2. Apparent Mobil i t ies of Thoria Solsa at pH 3.5
Apparent Mobilities (cmZ v-' s e c - ' )
Descending Boundaries Ascending Boundaries
Main Secondary Ma in Secondary
Ionic Sol Strengtha ~ l_l__
x 1 0 - ~
o x o - 5 0 0 1.01 x 3.16 3.17 x
OXO-GSO 1.01 x 3.16 X
3.17 x
SDN 1.01 x lo-* 3.16 x io-, 3.17 x 1.01 x 3.16 1 o-, 3.17
3.16 x 1 0 - ~ 3.17 x
NH3
NH,-R 1.01 x lo-*
2.9 2.9
2.5
3.0 3.2 3.5
2.9
3.1 3.7
2.5 2.4 2.4
2.9
3.0 1.1
b
3.5 8.9
h
4.1
7.2, 2.6
b 4.0 7.7
C
c c
b
3.4 7.8
x 10-4
3.0
3.6
8.4
3.3 4.1
d
3.0 b
3.1 3.9 5.6 '"5.5
'2.6 2.8
3.4 3.9 5.2 5.8d
2.5 2.4
2.3
4.0 6.8
19.1
C
C
c
3.8
6.7
d
*Intermicellar fluid is HNO, 4- NH,NO,. bNone observed. 'None observed, but electrophoretic pattern very poor. dSeveral minor hands observed.
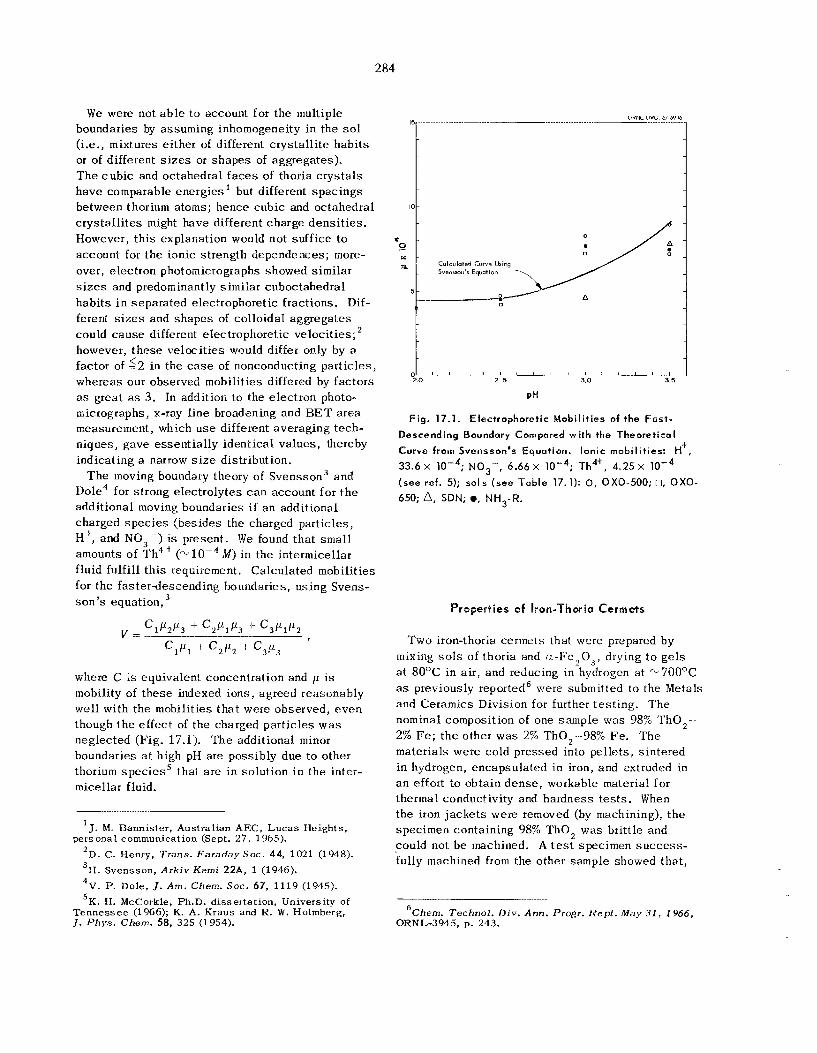
284
15
10
W e were not a b l e t o account for the multiple boundaries by assuming inhomogeneity i n the sol (i.e., mixtures e i ther of different c rys ta l l i t e habi t s or of different sizes or s h a p e s of aggregates). T h e c u b i c and octahedral f a c e s of thoria c rys ta l s have comparable energ ies but different s p a c i n g s between t horium atoms; hence cubic and octahedral c rys ta l l i t es might have different charge dens i t ies . However, t h i s explanat ion would not suff ice to account for t h e ionic s t rength dependences; more- over, e lectron photomicrographs showed s imilar sizes and predominantly s imilar cuboctahedral habi t s i n separa ted electrophoretic f ract ions. Dif- ferent sizes and s h a p e s of col loidal aggregates could c a u s e different e lectrophoret ic veloci t ies ; however, t h e s e ve loc i t ies would differ only by a factor of = 2 in the case of nonconducting par t ic les , whereas our observed mobilities differed by fac tors as great as 3. In addition t o the e lec t ron photo- micrographs, x-ray l ine broadening and BET area measurement, which u s e different averaging tech- niques, gave essent ia l ly ident ica l values , thereby indicat ing a narrow size distribution.
T h e moving boundary theory of Svensson, and Dole4 for s t rong electrolytes c a n account for t h e addi t ional moving boundaries i f a n addi t ional charged s p e c i e s cbesides the charged par t ic les , H', and NO, --) i s present. W e found tha t small amounts of T h 4 ' (-lo-" M ) i n t h e intermicellar fluid fulfill t h i s requirement. Calculated mobilities for the f a s t e r d e s c e n d i n g boundaries, us ing Svens- son ' s e q ~ a t i o n , ~
<
. . . . . . . . . . . . . . . . . . . . . . .. . ... .
-
where C is equivalent concentrat ion and p is mobility of t h e s e indexed ions, agreed reasonably wel l with t h e mobilities t h a t were observed, e v e n though t h e e f fec t of the charged par t ic les w a s neglected (Fig. 17.1). The additional minor boundaries at high pH are possibly due to other thorium s p e c i e s ' tha t a r e in solut ion i n t h e inter- micellar fluid.
J. M. Bannis te r , Austral ian AEC, L u c a s Heights ,
'D. C. Henry, Trans . F a r a d a y SOC. 44, 1021 (1918). 3H. Svensson , Arkiv Kerni 22A, 1 (1946). 4V. P. Dole, J. Am. Chem. SOC. 67. 1119 (1945). 'K. H. McCorkle, Ph.D. d i sser ta t ion , Universi ty of
T e n n e s s e e (1966); K. A. Kraiis and R. W. Holmberg, J. P h y s . Chem. 58, 325 (1954).
personal communication (Sept. 27, 1965).
PH
Fig . 17.1. Electrophoretic Mobilities of the F a s t -
Descending Boundary Compared with the Theoreticol
Curve from Svensson's Equation. Ionic mobilities: H+, 33.6 x (see ref. 5); s o l s (see Table 17.1): 0, OXO-500; 0, QXO- 650; A, SDN; e, NH3-R.
NOg-, 6.66 x lom4; Th4+, 4.25 x
Properties of Iron-Thoria Cermets
T w o iron-thoria cermets that were prepared b y mixing sols of thoria and a-lJe2Q3, diying t o gels a t 8OoC in a i r , and reducing in hydrogen a t -7OOOC as previously reported6 were submitted t o the Metals and Ceramics Division for further tes t ing . T h e nominal composition of one sample w a s 98% ' r h o 2 - 2% Fc; t h e other w a s 2% Th0,-98% Fe. T h e mater ia ls were cold pressed into pe l le t s , s in te red in hydrogen, encapsula ted in iron, and extruded in a n effort to obtain d e n s e , workable material for thermal conductivity and hardness t e s t s . When the iron jacke ts were removed (by machining), t h e specimen containing 98% T h o , w a s brittle and could not b e machined. A t e s t specimen s u c c e s s - fully machined from the other sample showed tha t ,
6Chern. Technol. Div. Ann. Progr. R e p t . May 31, 1966, ORNL-3915, p. 243.
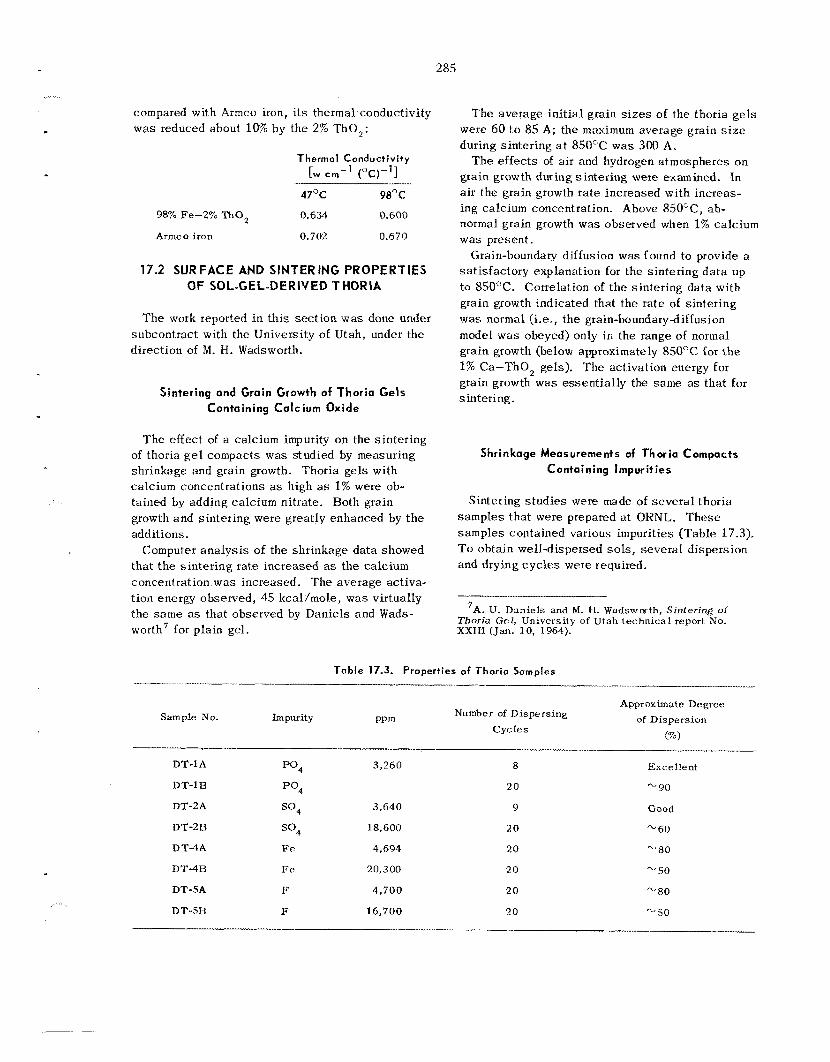
285
compared with Armco iron, i ts thermal conductivity was reduced about 10% by the 2% Tho,:
Thermal Conductivity rw cm-' ("c)-'l -
47OC 9a0c
98% Fe-2% Tho, 0.634 0.600
Armco iron 0.702 0.670
17.2 SURFACE AND SINTERING PROPERTIES OF SOL-GEL-DERIVED THORIA
The work reported in this section was done under subcontract with the University of Utah, under the direction of M. H. Wadsworth.
Sintering and Grain Growth of Thoria Gels Containing Calcium Oxide
The effect of a calcium impurity on the sintering of thoria g e l compacts was studied by measuring shrinkage and grain growth. Thoria gels with calcium concentrations as high a s 1% were ob- tained by adding calcium nitrate. Both grain growth and sintering were greatly enhanced by the additions.
Computer analysis of the shrinkage data showed that the sintering rate increased as the calcium concentration was increased. The average activa- tion energy observed, 45 kcal/mole, was virtually the same a s that observed by Daniels and Wads- worth7 for plain gel.
The average initial grain s i z e s of the thoria ge ls were 60 to 85 A; the maximum average grain size during sintering a t 850OC was 300 A.
The effects of air and hydrogen atmospheres on grain growth during sintering wete examined. In air the grain growth rate increased with increas- ing calcium concentration. Above 850"C, ab- normal grain growth was observed when 1% calcium was present.
Grain-boundary diffusion was found to provide a satisfactory explanation for the sintering data up to 850°C. Correlation of the sintering data with grain growth indicated that the rate of sintering was normal (i.e., the grain-boundarydiffusion model was obeyed) only in the range of normal grain growth (below approximately 85OOC for the 1% Ca-Tho, gels). The activation energy for grain growth was essentially the same as that for sintering.
Shrinkage Measurements of Thoria Compacts Containing Impurities
Sintering studies were made of severa l thoria samples that were prepared at ORNI,. These samples contained various impurities (Table 17.3). To obtain well-dispersed sols, several dispersion and drying cycles were required.
7A. U. Daniels and M. €1. Wadswath, Sintering of Thoria Gel, Univers i ty of Utah t e c h n i c a l report No. XXIII (Jan. 10, 1964).
T a b l e 17.3. Properties of Thoria Samples ____.__._I __ ___
Approximate Degree Number of Dispersing
PP m of Dispersion Sample No. Impurity
("I.) C y c l e s
DT-1A Po, 3,260 8 Ex r elle nt
DT-1B po4 2 0 -, 90
DT-2A so, 3,640 9 Good
DT-2B so4 18,600 2 0 * 60
DT-4A FP 4,694 20 "' 80
DT-4B Fe 20,300 2 0 -50
DT-SA F 4,700 2 0 ,.., 80
DT-SB F 16,700 20 -., 50
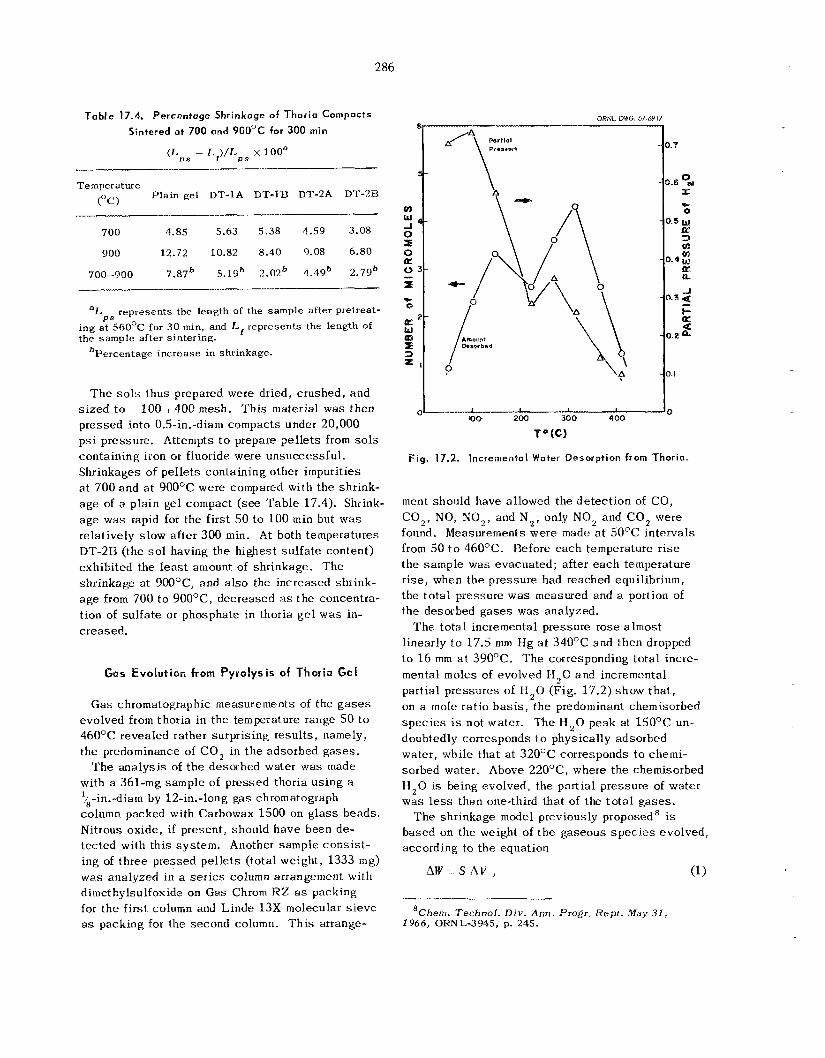
286
Table 17.4. Percentage Shrinkage of Thoria Compacts
Sintered at 700 and 9OO0C for 300 min
( L p s - L f ) / L p s x looa
Temperature Plain gel DT-1A DT-1B DT-2A
("C) D'1'-2B
.-
700 4.85 5.63 5.38 1.59 3.08
900 12.72 10.82 8.40 9.08 6.80
700-900 7.87' 5.19' 2 . 0 2 b 4.49' 2.79'
aL represents the length of the sample after pretreat- P S
ing at 56OoC for 30 min, and Lf represents the length of the sample after sintering.
bPercentage increase in shrinkage.
T h e sols thus prepared were dried, crushed, and s ized to - 100 + 400 mesh. This material was then pressed into 0.5-in.-diam compacts under 20,000 psi pressure. Attempts t o prepare pellets from s o l s containing iron or fluoride were unsuccessful. Shrinkages of pellets containing other impurities at 700 and a t 900°C were compared with the shrink- age of a plain gel compact (see Table 17.4). Shrink- age was rapid for the first 50 to 100 min but was relatively slow after 300 min. At both temperatures DT-2B (the s o l having the highest sulfate content) exhibited the leas t amount of shrinkage. The shrinkage a t 9W°C, and also the increased shrink- age from 700 to 900°C, decreased as the concentra- tion of sulfate or phosphate in thoria ge l was in- creased.
Gas Evolution from Pyrolysis of Thoria Gel
Gas chromatographic measurements of the g a s e s evolved from thoria in the temperature range 50 to 46OOC revealed rather surprising results, namely, the predominance of CO, in the adsorbed gases.
The analysis of the desorbed water was made with a 361-mg sample of pressed thoria using a ?'-in.-diam by 12-in.-long gas chromatograph column packcd with Carbowax 1500 on g lass beads. Nitrous oxide, if present, should have been de- tected with this system. Another sample consist- ing of three pressed pellets (total weight, 1333 mg) was analyzed in a se r ies column arrangement with dimethylsulfoxide on Gas Chrom RZ a s packing for the first column and Linde 1 3 X molecular s ieve a s packing for the second column. This arrange-
ORNL DWG. 67-6917
TQ (C)
Fig. 17.2. Incremental Water Desorption from Thoria.
ment should have allowed the detection of CO, CO,, NO, NO,, and N,; only NO, and CO, were found. Measurements were made a t 5OoC intervals from 50 t o 46OOC. Before each temperatute r i s e the sample was evacuated; after each temperature rise, when the pressure had reached equilibrium, the total pressure w a s measured and a portion of the desorbed gases was analyzed.
linearly to 17.5 mm Hg a t 340°@ and then dropped to 16 mm a t 390OC. The corresponding total incre- mental moles of evolved I-I,O and incremental partial pressures of H,Q (Fig. 17.2) show tha t , on a m o l e ratio bas i s , the predominant chemisorbed spec ies is not water. The H,O peak at 150°C un- doubtedly corresponds to physically adsorbed water, while that a t 32OOC corresponds to chemi- sorbed water. Above 22OoC, where the chemisorbed H,Q is being evolved, the partial pressure of water was less than one-third that of the to ta l gases.
The shrinkage model previously proposed' is based on the weight of the gaseous spec ies evolved, according to the equation
The total incremental pressure rose almost
'Chern. Technol. D i v . Ann. Progr. Rep t . May 3 1 , 1966, QKNL-3945, p. 245.
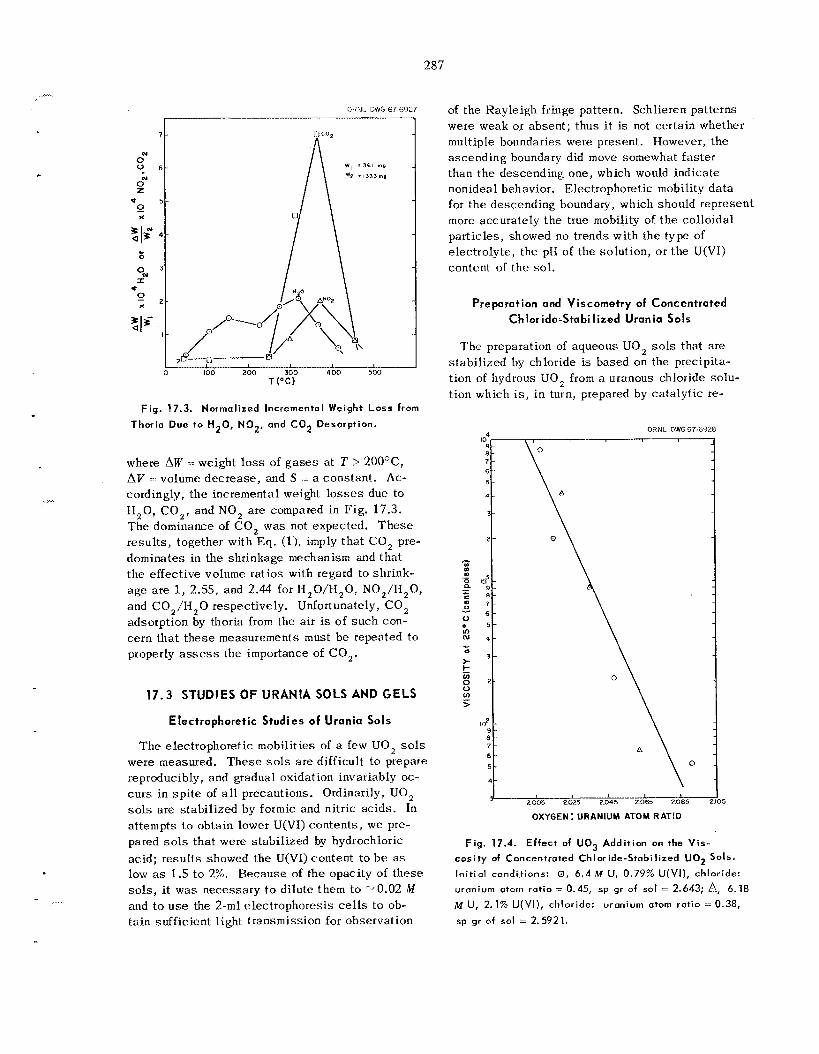
287
ORNL GWG 67-6927
Fig. 17.3. Normalized Incremental Weight Loss from Thoria Due to H20, NOZ, and C02 Desorption.
where 88 = weight loss of g a s e s a t T > 2OO0C, AT' volume d e c r e a s e , and S : a cons tan t . Ac- cordingly, t h e incremental weight losses due to H,O, CO,, and NO, a r e compared in Fig. 17.3. T h e dominance of CO, w a s not expected. T h e s e resu l t s , together with Eq. (11, imply t h a t CO, pre- dominates in the shr inkage mechanism and t h a t t h e effect ive volume rat ios with regard t o shr ink- a g e a r e 1, 2.55, and 2.44 for H,O/H,O, NO,/H,O, and CO,/H,O respect ively. Unfortunately, CO, adsorpt ion by thoria from the air is of s u c h con- cern t h a t t h e s e measurements must b e repeated to properly assess the importance of CO,.
17.3 STUDIES OF URANIA SOLS AND GELS
Electrophoretic Studies of Urania Sols
T h e electrophoret ic mobil i t ies of a few UO, sols were measured. T h e s e sols are difficult to prepare reproducibly, and gradual oxidation invariably oc- c u r s in s p i t e of a l l precautions. Ordinarily, UO, sols a r e s tab i l ized by formic and nitric ac ids . In a t tempts to obtain lower U(V1) contents , w e pre- pared sols tha t were s tab i l ized by hydrochloric acid; r e s u l t s showed t h e U(V1) content to b e as low as 1.5 t o 2%. B e c a u s e of t h e opaci ty of t h e s e sols, it w a s necessary t o di lute them t o -2 0.02 M and to u s e the 2-ml e lec t rophores i s cells to ob- ta in suff ic ient l ight t ransmission €or observat ion
of the Rayleigh fringe pattern. Schl ieren pat terns were weak or absent ; thus i t is not cer ta in whether multiple boundaries were present. However, the ascending boundary did move somewhat fas te r than t h e descending one , which would indicate nonideal behavior. Electrophoretic mobility d a t a for t h e descending boundary, which should represent more accurately the true mobility of t h e col loidal par t ic les , showed no t rends with the type of electrolyte , the pII of the solut ion, or t h e U(V1) content of t h e sol.
Preparation and Viscometry of Concentrated Chloride-Stabilized Urania Sols
T h e preparation of aqueous UO, sols tha t a re s tab i l ized by chloride is based on the precipita- t ion of hydrous UO, from a uranous chloride solu- t ion which i s , i n turn, prepared by ca ta ly t ic re-
1
%
: '.
._
.- s 0:; c E 8 '
v
0 0 5 Lo N 4 c 0
3 * e 0 0 2 0 !!? >
6 - 7 - 6 - 5 -
4-
102 -
! 2005 2025 2.045 2065 2085 2J05
OXYGEN: URANIUM ATOM RATIO
F ig . 17.4. Effect of UOj Addition on the Vis- cosity of Concentrated Chloride-Stabilized U02 Sols. Init ial conditions: 0, 6.4M U, 0.79% U(VI) , chloride: uranium atom ratio = 0.45, sp gr of 501 = 2.643; b?, 6.18 M U, 2.1% U(VI) , chloride: sp gr of sol = 2.5921.
uranium atom rat io =- 0.38,
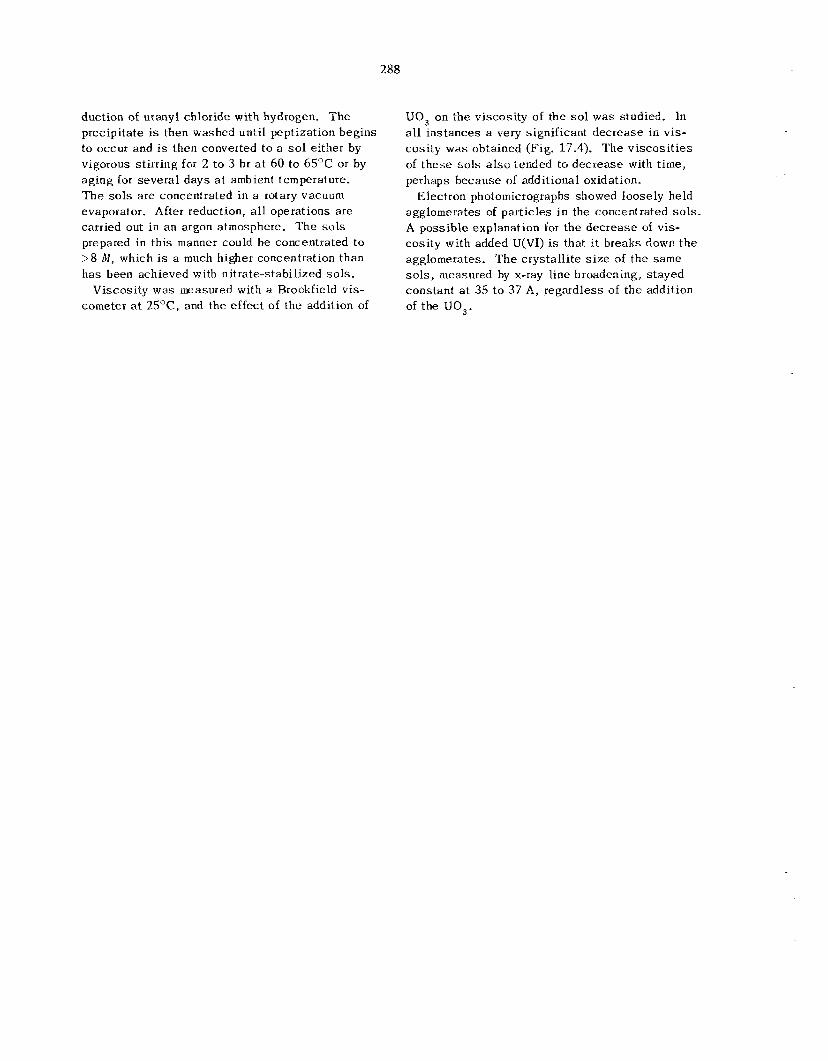
288
duct ion of uranyl chlor ide with hydrogen. T h e precipi ta te is then washed unt i l pept izat ion begins t o occur and is then converted t o a sol ei ther by vigorous s t i r r ing for 2 to 3 hr a t 60 to 65OC or by ag ing for severa l d a y s a t ambient temperature. T h e sols a r e concentrated i n a rotary vacuum evaporator. After reduction, a l l operat ions a r e carried out i n a n argon atmosphere. T h e sols prepared in th i s manner could b e concentrated t o >8 hI, which is a much higher concentration than h a s been achieved with ni t ra te-s tabi l ized s o l s .
Viscos i ty w a s measured with a Brookfield vis- cometcr at 2S°C, and t h e e f fec t of the addition of
UO, on t h e viscosi ty of the sol w a s studied. In a l l ins tances a very s ignif icant decrease i n vis- cos i ty w a s obtained (Fig. 17.4). T h e v i s c o s i t i e s of t h e s e s o l s also tended to d e c r e a s e with time, perhaps because of addi t ional oxidation.
Electron photomicrographs showed loosely held agglomerates of par t ic les i n the concentrated sols. A poss ib le explanat ion for the d e c r e a s e of vis- cos i ty with added U(V1) is that it breaks down t h e agglomerates. T h e c rys ta l l i t e size of t h e same sols, measured by x-ray line broadening, s tayed cons tan t at 35 t o 37 A, regardless of t h e addition of the UO,.
18. Assistance Programs
The Division provided a s s i s t ance to others on several projects, principally the Eurochemic As- s i s tance Program and a program in which the radi- ation resistance of a number of se lec ted materials is being determined. The latter effort involves the exposure of protective coatings, lubricants, gasket materials, sea lan ts , electrical insulations, and g l a s ses to a 6 0 ~ o gamma source (intensity, 8 x l o 5 r/hr) until failure is observed or until a total dose of 10 rads is received.
18.1 EUROCHEMIC ASSISTANCE PROGRAM
The Laboratory continued to coordinate t h e Euro- chemic Ass is tance Program for the exchange of information between Eurochemic and the several AEC sites included in the program. In addition, the Laboratory is supplying the serv ices of the U.S. Technical Advisor, E. M. Shank, who wil l remain at Mol, Belgium, during the construction and startup phases of the Eurochemic plant.
During the pas t year, 390 USAEC-originated documents and 32 drawings and miscellaneous i t e m s of information were sen t to Eurochemic. Twenty-four Eurochemic documents written in English were received, reproduced, and distrib- uted. In addition, one Eurochemic report (French) was translated for distribution in English.
Construction and ‘ ‘cold” startup operation of the Eurochemic facil i ty were completed, and the proc- e s s ing of fuels f rom several European reactors h a s now been successfully accomplished.
18.2 EVALUATION OF THE RADIATION RESISTANCE OF SELECTED PROTECTIVE
COATINGS AND OTHER MATERIALS
In a continuing evaluation program for determin- ing the radiation resistance of protective coatings for radiochemical plant u ses , ’-‘ a total of 30 coating specimens (from five different manufac- turers) and 13 miscellaneous materials a re cur-
rently being evaluated. The results for coatings that were exposed to a ‘OCo gamma source a t an intensity of 8 x l o s r/hr and a temperature of 40 to
1.
2.
3.
4.
5.
50°C are a s follows:
Two specimens, one epoxy and one polyure- thane, showed excellent radiation resistance (had not failed after exposure to 1 x l o l o rads i n air).
Eight specimens, seven epoxy and one polyu- rethane, failed by embrittlement or cracking at exposure to 1 x l o l o rads in air.
Seven epoxy specimens failed at exposures to between 3 and 9 x l o 9 rads in air.
Seventeen specimens, 3 epoxy and 14 modified phenolic, submerged in deionized water, failed a t exposures to 1 x 10’ to 2.6 )i l o 9 rads.
Thirteen specimens, 1 phenolic and 12 modified phenolic, exposed to 1.5 to 4.0 x l o 9 rads in air, showed excellent resistance. T e s t s will be continued with these coatings until they have failed or until they have received a dose of 1 x 10” rads.
‘Chem. Technol. Div. Arm. Pro&. Rept. May 31, 19hG,
‘C. D. Watson and G . A. West, “Protective Coatings (Paints),” chap. 1 2 in Deconfamination of Nciclear Ke- actors and Equipment (ed. by J. A. Ayres), sponsored by Division o f Technical Information, USAEC, Washing- ton, D.C. (in press).
C . D. Watson, “Buildings and Laboratories,” sect. 20-3 of chap. 20 in Decontarniriafion of Nuclear Reactors and Equipment (ed. by J . A. Ayres), sponsored by Di- vision of Technical Information, USAEC, Washington, D.C. (in press).
4C. D. Watson e t aI., United States Standard, “Pro- tective Coatings (Paints) for the Nuclear Industry,” United States Standards Institute, 1967.
’C. D. Watson and 6. A. West, “A Ten-Year Look at Protective Coatings (Paints) in the Nuclear Industry,” presented a t the National Association of Corrosion Engineers, 22d Annual NACE Conference and 1966 Cor- rosion Show, Miami Beach, Fla., Apr. 18-22, 19G6.
C . D. Watson and G. A. West, “Radiation Effects on Paints,” Mater. Protect. 6(2), 44-49 (February 1967).
ORNL-3945, pp. 250-55.
3
6
289
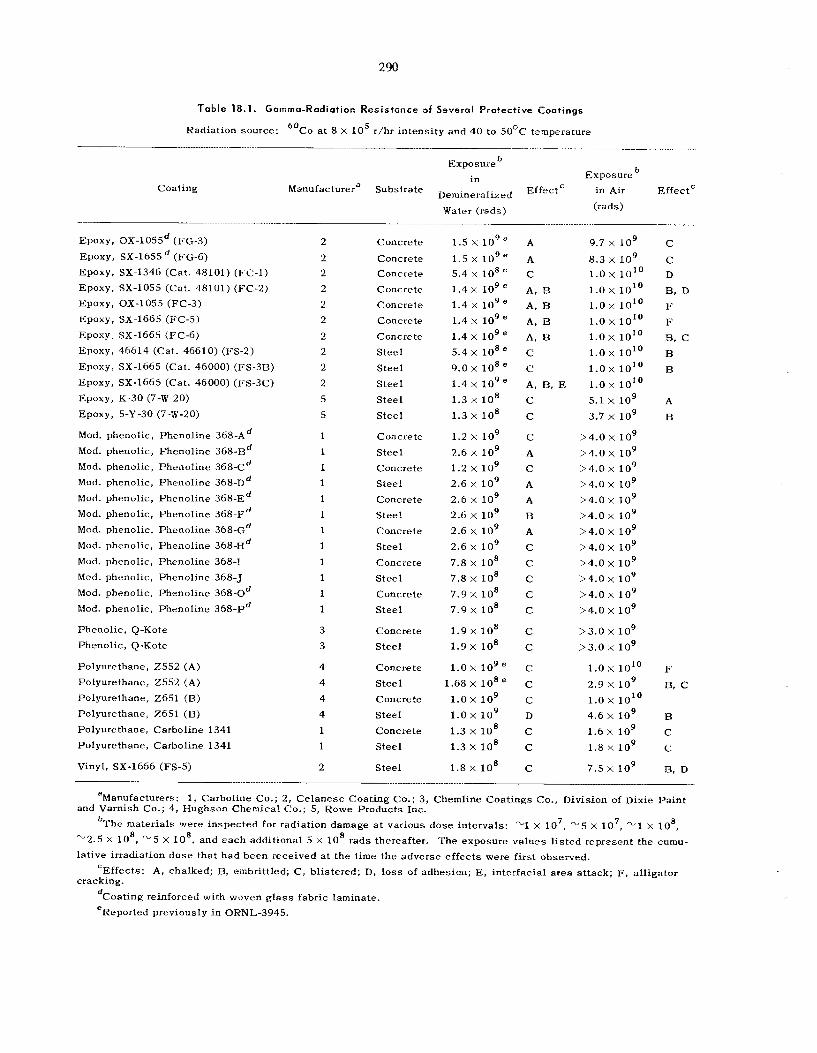
Table 18.1. Gamma-Radiation Resislance of Several Protective Coatings
Radia t ion source : 6oCo a t 8 X IO5 r /hr in tens i ty a n d 40 to 5OoC temperature .... ..... ..... ... ........ ._
Coat ing Manufacturera Subs t ra te
Epoxy, OX-1055d (FG-3) Epoxy, SX-1655 (FG-6) Epoxy, SX-1346 (Cat . 48101) (FC-1) Epoxy, SX-1055 (Cat . 48101) (FC-2) Epoxy, OX-1055 (FC-3) Epoxy, SX-1665 (FC-5) EPOXY, SX-1665 (FC-6) Epoxy, 46614 (Cat . 46610) (FS-2) Epoxy, SX-1665 (Cat. 46000) (FS-3B) Epoxy, SX-1665 (Cat. 46000) (FS-3C) EPOXY, K-30 (7-V-20) EPOXY, 5-Y-30 (7-W-20)
Mod. phenol ic , Phenol ine 368-Ad Mod. phenol ic , Phenol ine 368-Bd Mod. phenol ic , Phenol ine 368-Cd Mod. phenol ic , Phenol inc 368-Dd Mod. phenol ic , Phenol ine 368-Ed Mod. phenol ic , Phenol ine 368-Fd Mod. phenol ic , Pinenoline 368-Gd Mod. phenol ic , Phenol ine 368-Hd Mod. phenol ic , Phenol ine 368-1 Mod. phenol ic , Phenol ine 368-5 Mod. phenol ic , Phenol ine 368-Od
Mod. phenol ic , Phenol ine 368-Pd
Phenol ic , Q-Kote Phenol ic , Q-Kote
Polyurethane, 2552 (A) Polyurethane, 2552 ( A ) Polyurethane, 2651 (B) Polyurethane, 2651 (B) Polyurethane, Carbol ine 1341 Polyurethane, Carbol ine 1341
Vinyl, SX-1666 (FS-5)
2 2 2 2 2 2 2 2 2 2 5 5
1
1 1 1 1 1 1 1 1
1
1 1
3 3
4 4 4 4 1 1
2
Concre te
Concre te Concre te Concre te Concre te Concrete Concre te S t e e l S t e e l S t e e l S t e e l S t e e l
Concre te S t e e l Concre te S t e e l Concre te S t e e l Concre te S t e e l Concre te S t e e l Concre te S t e e l
Concre te S t e e l
Concre te S t e e l Concre te S t e e l Concre te S t e e l
S t e e l
Exposureb i n
Deiiiineralized
Exposure i n Air Effec t '
Water (rads) ( rads) ....
1.5 x i o g c 1.5 x l o g e 5.4 x 10⁸ e 1.4 x lo9 e 1.4 x i o g e
1.4 x lo9 e 1.4 x i o g e 5.4 x 1 0 8 e
9.0 x 1 0 8 e
1.4 x i o 9 e
1.3 x IO8 1.3 x lo8 1.2 x lo9
1.2 x l o 9 2.6 x i o9 2.6 x i o 9 2.6 l o 9 2.6 lo9 2.6 x i o9
2.6 x I O 9
7.8 x 10' 7.8 x 10' 7.9 x 10⁸ 7.9 x l o8 1.9 x 10⁸ 1.9 x 10⁸
1.0 x io9 e
1.0 x lo9 1.0 x i o 9
1.68 x I O E e
1.3 X lo8 1.3 X l o 8 1.8 x IO8
A A C
A, R A, R A, B A, B C c A, R, E C C
C A C A A R A C
c C C C
C C
C C C D C C
C
9.7 x 10⁹
8.3 x i o 9 1.0 x 1 o ' O 1.0 x 1 o ' O 1.0 x 10'0 1.0 x 10'O 1.0 x 10'0 1.0 x 10¹⁰
1.0 x 10¹⁰ 1.0 x 10'O 5.1 x i o 9 3.7 x lo9
>4.0 x i o 9 >4.0x io9 OX io9 >4.0 x 1.0~ >4.0 x i o 9 >4.0x i o 9 >4.0 x l o9 >4.0 x i o 9 >4.0 x i o 9 >4.0 x 10⁹
OX i o 9 >.a.o x i o 9 >3.0 x i o 9 >3.0 x i o 9
1.0 x 10¹⁰ 2.9 x l o9 1.0 x 1 o ' O 4.6 x i o9 1.6 x io9 1.8 x l o 9 7.5 x 10⁹
C
C D B. D F F E, c B R
A B
F B, c
B C C
B, D
"Manufacturers: 1, Carbol ine Co.; 2 , C e l a n e s o Coat ing Co.; 3, Chemline Coat ings Co., Division of Dixie P a i n t
bThc mater ia l s were i n s p e c t e d for radiat ion damage a t var ious d o s e in te rva ls : -1 x IO7, "5 x lo7 , -1 x lo8, and Varnish Co.; 4, Hughson Chemical Co.; 5, Rowe Products Inc.
"2.5 x IO8, "5 X lo8, and e a c h addi t iona l 5 x IO8 r a d s thereaf ter . T h e exposure v a l u e s l i s t e d represent t h e curnu- l a t i v e i r radiat ion d o s e t h a t h a d b e e n rece ived a t t h e t ime t h e a d v e r s e e f f e c t s were f i r s t observed.
cracking. 'Effects : A, chalked; R, embri t t led; C , b l i s te red ; D, loss of adhes ion; E, in te r fac ia l a r e a a t tack ; F, a l l iga tor
dCoat ing reinforced with woven g l a s s fabr ic laminate . eReported previously i n ORNL-3945.
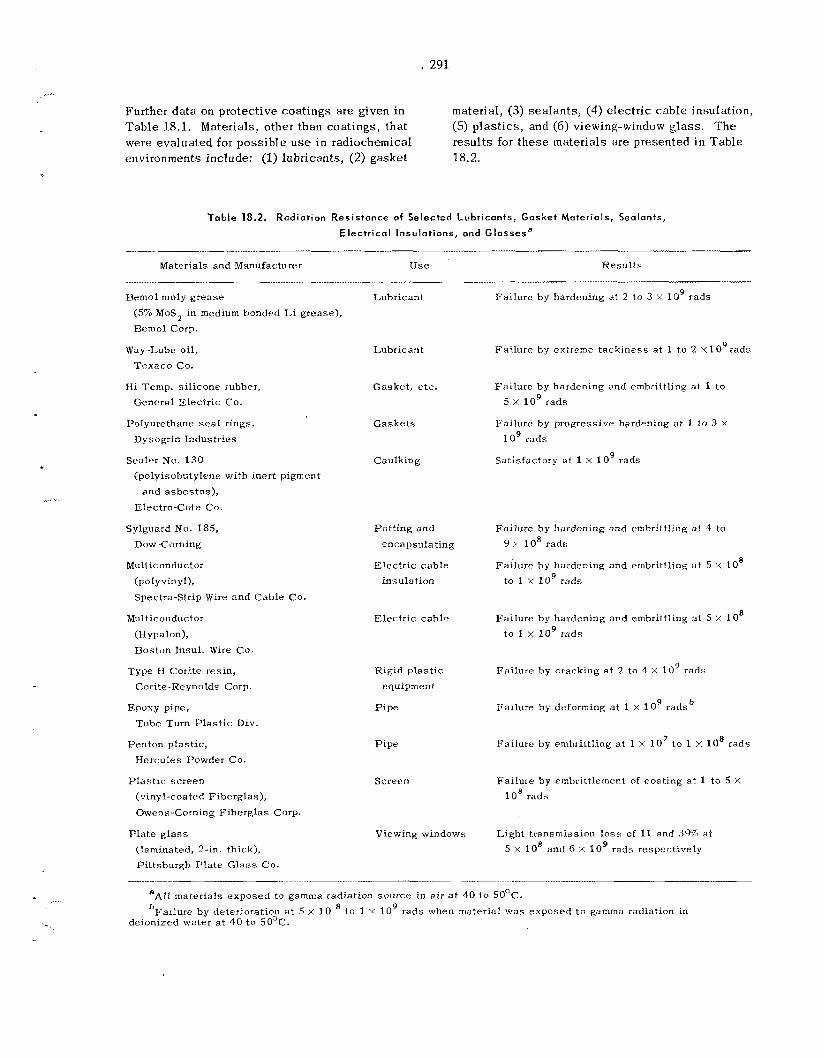
. 291
..A\
Further data on protective coatings are given in Table 18.1. Materials, other than coatings, that (5) plastics, and (6) viewing-window glass. The were evaluated for possible u s e in radiochemical environments include: (1) lubricants, (2) gasket 18.2.
material, (3 ) sealants, ( 4 ) electric cable insulation,
results for these materials are presented in Table
Table 18.2. Radiation Resistance of Selected Lubricants, Gasket Materials, Sealants,
E lec t r ica l Insulations, and Glasses-
- Materials and Manufacturer Use Resul t s
.....-
Bemol moly grease Lubricant Failure by hardening at 2 to 3 >: lo9 rads (5% MoSz in medium bonded Li grease), Bemol Corp.
Way -Lube oil , Tt-xaco Co.
Hi Temp. si l icone rubber, General Elec t r ic Co.
Polyurethane s e a l r ings, Dysogrin Industries
Sealer No. 130 (polyisobutylene with inert pigment
and asbes tos) , Electro-Cote Co.
Sylguard No. 185, Dow-Corning
Multiconductor
(polyvinyl), Spectra-Strip Wire and Cable Co.
Mdticonduc tor
(Ebwlon) , Boston Insul. Wire Co.
'Type E i Corite resin, Corite-Reynolds Corp.
Epoxy pipe, 'rube Turn P la s t i c Div.
Panton plastic, Hercules Powder Co.
P la s t i c sc reen (vinyl-coated Fiberglas), @wens-Corning Fiberglas Corp.
P la te g l a s s (laminated, ?!-in. thick), Pit tsburgh Pla te G las s Co.
Lubricant
Gasket, etc.
Gaskets
Caulking
Potting and encapsulating
Elec t r ic cable insu la tion
Elec t r ic cable
Rigid p las t ic equipment
P ipe
P ipe
Screen
Failure by ext reme tackiness a t 1 t o 2 x 1 O9 rads
Failure by hardening and embrittling at 1 to 5 j< l o 9 rads
Failure by progressive hardening a t 1 to 3 x l o 9 rads
Satisfactory at 1 x 10' rads
Failure by hardening and embrittling a t 4 to
Y A lo8 rads 8 FailurP by hardening and embrittling a t 5 X 10
to 1 x lo9 rads
Failure by hardening and embrittling a t 5 j: 1 O8
to 1 x l o 9 rads
Failure by cracking at 2 to 4 j: IO9 rads
Failure by deforming a t 1 X lo9 redsb
7 Failure by embrittling a t 1 x 10 to 1 x 10⁸ rads
Failure by embrittlement of coating a t 1 to 5 X
10' rads
Viewing windows Light transmission loss of 11 and 39% a t 5 x 10' and 6 j< lo9 rads respectively
"All materials exposed to gamma radiation source in a i r a t 40 to SO'C. bFailure by deterioration at 5 x 10 9 to 1 jc 10 rads when material was exposed t o gamma radiation in
deionized water a t 40 to 50°C.
19. Water Research
Work by the Chemical Technology Division on the Water Research Program is reported directly to
the Office of Saline Water, and only an abstract appears i n t h i s report (see the Summary).
292
20. Chemistry of Carbides and Nitrides
T h e b a s i c chemistry of t h e carb ides of uranium, thorium, and o ther metals is being invest igated, with emphas is on react ions in aqueous sys tems. T h i s work h a s apgl icat ion to the process ing oE power reactor fue ls , reactor sa fe ty , a n d high- temperature mater ia ls development. Previous s t u d i e s were primarily concerned with the react ion of water with uranium and thorium carbide s p e c i - mens that h a d been carefully character ized by ad- vanced ana ly t ica l and metallographic techniques. Rie react ions of the uranium c a r b i d e s with ni t r ic ac id and of the thorium carb ides with sodium hydroxide have a l s o been examined. During t h e pas t year t h e react ions of t h e uranium and thorium carbides with aqueous so lu t ions of hydrochloric and sulfur ic a c i d s and of uranium monocarbide with sodium hydroxide so lu t ions were s tudied. The la t te r experiments were useful i n devis ing process ing methods for SAP-clad carb ide fuel (see Sect. 15). To gain insight into t h e mecha- nisms of t h e react ions (which a r e qui te complex), the hydrolysis of the carbides of uranium, thorium, arid aluminum i n D,O and f.he s impler react ions of the carb ides of calcium and barium with 0 to 16 il.l HNO, were also studied. Work already re- ported i n t h e open literature"-3 h a s only been briefly summarized here .
T h e react ions of t h e uranium and thorium car - bides with 3 to 9 M FIG1 and with 6 i l l H,SO, a t 80OC were found to be hydrolysis react ions, wi th no oxidation or formation of C-S, C-0-S, or C-Gl bonds occurring.' Ninety percent or more of t h e carbon in the uranium and thorium monocarbides
'M. B. Sears and L. M. Ferris, "Reactions of Uranium and Thorium Carbides with Aqueous Solutiotis of I-lydro- chloric Acid and Sulfuric Acid," to be published in the Journal of Inorganic 2nd N u c l e s r Chemistry.
111. B. Sears and L. M. F e r r i s , J . Inorg. N u c l . Chem. 29, 1255 (1967).
'M. B. Sears and L. M. Ferris, J. Inorg. N u c l . Chen7. 28, 2055 (1966).
2
w a s hydrolyzed to methane, whereas uranium sesquicarb ide , uranium dicarbide, and thorium dicarbide produced complex al iphat ic hydrocarbon mixtures s imilar t o t h o s e obt.ained with water. Hydrochloric a c i d w a s found t o affect the extent of polymerization of t h e C:, groups from the di- carb ides ; it increased wax formation with uranium dicarbide and decreased polymerization (Le*, yielded more g a s e o u s hydrocarbons) with thorium dicarbide. In t h e experiments with hydrochloric ac id more than 99% of t h e uranium w a s found a s so luble O(IVj, and .all of the thorium was found as so luble 'Th(1V). With 6 tlii H,SO, t h e products were crystal l ine U(SO,), -4H,O and crys ta l l ine Th(SO, j, xH,O, where x w a s in the range of 2.5 t o 3.5. With 12 M H,SO, t h e montxarbides yielded pri- marily methane. The react ions of uranium sesqui - carbide, uranium dicarbide, and thorium dicarbide with 12 M H,SO, a t 80°C were so slow that they were terminated af ter 16 d a y s when they were only about half completed. Tfie co l lec ted g a s con- ta ined mostly hydrogen, plus some hydrocarbons and a s m a l l amcmnt of SO,. No compounds con- ta ining C-0, C-S, or C-0-S bonds were found in t h e gas . Surprisingly, with 12 iw H,SO, 30% of t h e uranium w a s found a s UO,, and some of t h e thorium w a s found as ThO, (7% from ThC and 40% from ThC,); t h e remaining salt w a s U(s0, j, or Th(SO,), (the ex ten t of hydration could not b e determined).
There a r e pronounced differences between t h e chemical behavior of the alkal ine-ear th dicarbides and that of t h e act inide dicarbides . T h e r e x - t ions of calcium carbide with 0 to I6 M HNO, and of barium carbide with 0 t o 8 M HNO, at 25°C produced ace ty lene as t h e only c arbonconta in ing product.' With 10 to 16 M HNO,, part of t h e carbide carbon in barium carbide w a s oxidized t o f ree carbon and carbon oxides , although s o m e w a s hydrolyzed to acetylene. There w a s no pass iva- tion of ei ther carbide i n d i lu te nitric acid. In
2 93
2 94
contrast , t h e uranium and thorium dicarbides yielded coniplex a l ipha t ic hydrocarbon mixtures when hydro1yzed4n5 and complex aromatic con- pounds when oxidized by ni t r ic more, uranium dicarbide w a s p a s s i v e i n di lute (0.005 to 0.05 M ) nitric ac id , although i t reacted readily with water and with moreconcentrated (> 1 M) nit r ic acid.6 T h e alkaline-earth dicarbides and t h e act inide dicarbides all contain C, groups in t h e c rys ta l la t t ice; t h e only difference is in t h e carbon-to-carbon bond length, which is about that of a t r iple bond in calcium carbide' v s a double bond in the uranium' and thorium dicarbides. Actually, one would expec t the acetyl ide group t o polymerize more readily than the ethyl ide group. Therefore, i t s e e m s likely tha t differences in t h e ca t ions , ra ther than in the an ions , a r e responsible for observed differences i n the chemical behavior of the alkaline-earth dicarbides and t h e act inide dicarbides .
T h e rate-determining s t e p i n the hydrolysis of the uranium and thorium carb ides probably d o e s not involve c leavage of t h e H-0 bond i n the water, s i n c e the react ions with D,O a t 80°C were ident i - cal t o the corresponding reaction with H,O except that deuterium w a s subst i tuted for hydrogen in t h e p r o d u ~ c t s . ~ In cont ras t , hydrolysis of aluminum carbide at 8OoC t o produce methane w a s four t imes more rapid i n H,O than i n D,O and probably in- volved c l e a v a g e of the H-0 bond in the rate-de- termining step.3 An i so tope effect h a s also b e e n reported for t h e calcium carbide-water react ion. T h e difference in the reaction mechanisms is not surpr is ing in view of differences between t h e chemical behavior of calcium dicarbide and t h a t of the act inide dicarbides .
Further-
j 1
M. J. Bradley and L. M. Ferr i s , Znorg. Chem. 3, 189
'M. J. Bradley and L. M. Ferris, J. Inorg. NucI. Chem.
6L. M. Ferris and M. J. Bradley, J. Am. Chem. S O C .
'P. L. Pansen, J. &Lean, and W. J. Clelland, Nature
'H. Imai and S. Uruno, Nature 206, 691 (1965). '111. Atoji, J. Chem. Phys. 35, 1950 (1961). ''E. B. Hunt and R. E. Rundle, J. Am. Chem. SOC.
4
(1964).
27, 1021 (1965).
87, 1710 (1965).
197, 1200 (1963).
73. 4777 (1951). "H. L. Johnston and C. 0. Davis , J . Am. Chem. S O C .
"E. D. Hughes, C. K . Ingold, and C. L. Wilson, 64, 2613 (1942).
J . Chem. Snc., 493 (1934).
T h e hydrolysis of uranium monccarbide with 2 t o 18 M NaOH a t 80°C in g l a s s equipment produced t h e expected methane, s o ~ n e amorphous U(1V) oxide, and t r a c e s of higher hydrocarbons; in addi- tion, the amount of hydrogen formed w a s s ignif- icantly higher than that found i n the react ion with water (Table 20.1). Furthermore, some of t h e uranium w a s oxidized to a higher v a l e n c e s t a t e , which w a s not the case with water. T h e amount of f ree hydrogen increased nonlinearly from 1 1 t o 3.9 milligram-atoms per gram of carbide as t h e sodiuiii hydroxide concentration increased from 0 t o 18 M , reaching a plateau of about 2.4 milligram- atoms in t h e 2 to 6 M region. The amount of methane decreased s l ight ly with increasing sodium hydroxide concentration, while t h e small quant i ty of C,- to C,-hydrocarbons (probably from t h e t race of dicarbide impurity in the specimens) showed l i t t le variation. After the residue w a s dissolved in hydrochloric a c i d , about 1 gram-atom of U(V1) w a s found for each mole of hydrogen produced i n e x c e s s of the amount found when the specimen w a s hydrolyzed i n water (Table 20.2) in accordance with
C0H-l u 4 + + 2 ~ + - > U 6 ' + H 2 ,
where UX ' refers to the oxidation state of the uranium and does not s ignify a n ion. T h e IJ(V1) va lues a re probably s l ight ly high b e c a u s e t h e corrosion products from the g l a s s plugged t h e f i l ters , a l lowing t i n e for some oxidation by a i r during preparation of the uranium solut ions for ana lys i s . T h e a c t u a l uranium-containing products have not been identified. They were greenish, gelat inous precipi ta tes , which oxidized rapidly when exposed t o air ; x-ray s t u d i e s showed them t o be amorphous. T h e s o l i d s were contaminated with sodium s i l i c a t e s from the g lass , s o that chemical a n a l y s i s w a s of value only in determin- ing the oxidation s t a t e of t h e uranium. T h e re- act ion of uranium monocarbide with 6 M NaOH gave t h e s a m e products at 40, 80, and 99°C (Table 20.1). At 8OoC, t h e time required t o hydrolyze 95% of a 3- t o 4-g specimen increased nonlinearly from 2.3 hr with water, t o 5 hr with 2 to 6 M NaOH, and to about 4 0 hr with 18 M NaOH. T h e c o n s t a n t ra te i n the 2 to 6 M range is cons is ten t with t h e constant g a s composition noted earlier. Although varying the temperature had n o effect on t h e products, t h e ra te of reaction with 6 M NaOW de- c reased markedly from 3 hr a t 99OC for 95%
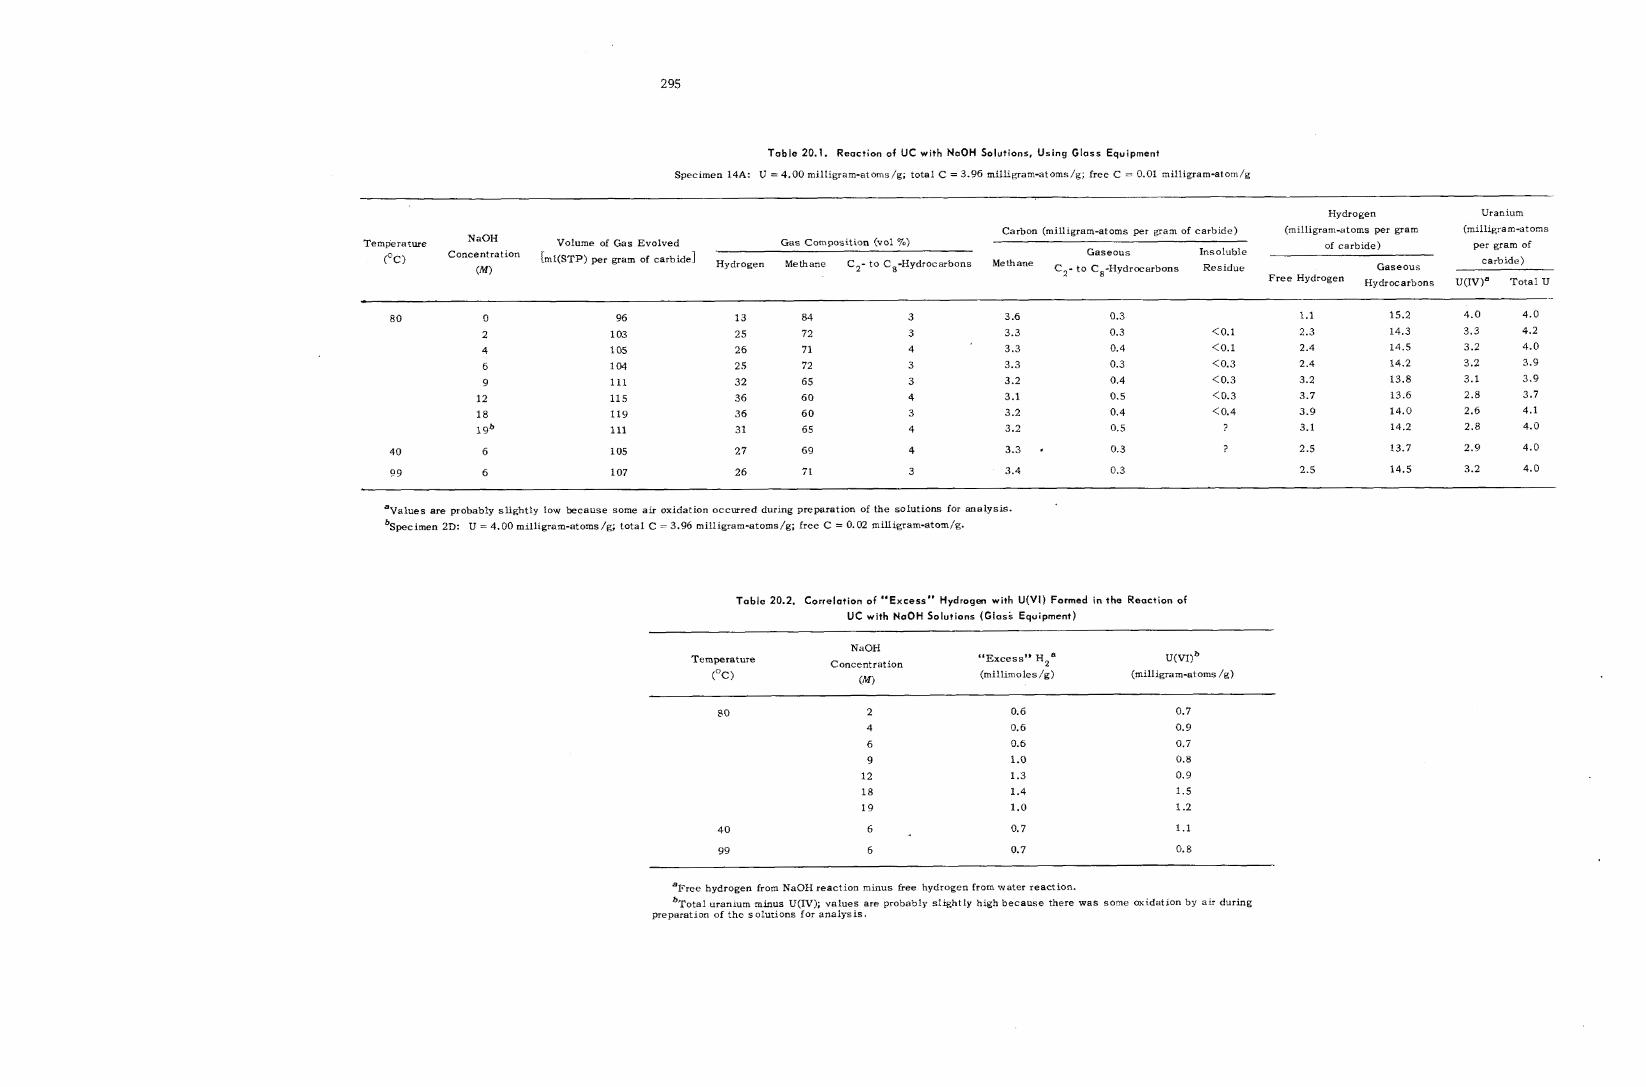
2 95
T a b l e 20.1. Reaction of UC with NaOH Solutions, Us ing Gloss Equipment
Specimen 14A: U = 4.00 milligram-atorns/g; total C = 3.96 milligram-atoms/g; free C = 0.01 milligram-atom/g
Hydrogen Uranium (milligram-atoms Carbon (milligram-atoms per gram of carbide) (milligram-atoms per gram
of carbide) per gram of carbide)
Gas Composition (vol 70) Concentration Gaseous Insoluble
(“C) 'mi(STP) per gram Of Hydrogen Methane C,- to C8-Hydrocarbons Methane C2- t o C8-Hydrocarbons Residue
Volume of Gas Evolved NaOH Temperature
Gaseous (M) Free Hydrogen Hydrocarbons U(IV)a Total U
80 0
2 4 6 9
12 18 196
96 1 03 105 104
111 115 119 111
13 84 25 72 26 71 25 72 32 65 36 60
36 60 31 65
3.6 3.3 3.3 3.3 3.2 3.1 3.2 3.2
0.3 0.3 0.4 0.3 0.4 0.5 0.4 0.5
1.1
<0.1 2.3 <0.1 2.4 <0.3 2.4 <0.3 3.2 <0.3 3.7 <0.4 3.9
? 3.1
15.2 14.3 14.5 14.2 13.8 13.6 14.0 14.2
4.0 3.3 3.2 3.2 3.1 2.8 2.6 2.8
4.0 4.2 4.0 3.9
3.9 3.7 4.1 4.0
40 6 1 05 27 69 4 3.3 9 0.3 ? 2.5 13.7 2.9 4.0
99 6 107 26 71 3 3.4 0.3 2.5 14.5 3.2 4.0
aValues are probably slightly low because some air oxidation occurred during preparation of the solutions for analysis. ’Specimen 2D: U = 4.00 milligram-atoms/g; total C = 3.96 milligram-atoms/g; free C = 0.02 milligram-atom/g.
T a b l e 20.2. Correlation of “Excess” Hydrogen with U(V I ) Formed in the Reaction of U t with N o O H Solutions (Glass Equipment)
Temperature (millimoles /g) (milligram-atoms /g)
( M ) (OC )
NaOH Concentration “Excess” H2 e U(VI)b
PO 2 4 6 9
12 18 19
0.6
0.6 0.6 1.0 1.3 1.4 1.0
0.7 0.9 0.7
0.8 0.9 1.5 1.2
40 6 0.7 1.1
99 6 0.7 0.8
=Free hydrogen from NaOH reaction minus free hydrogen from water reaction. bTotal uranium minus U(1V); values are probably slightly high because there was some oxidation by a i r during
preparation of the solutions for analysis.
96 i:
21. Industrial Applications of Nuclear Energy
U s e of low-cost power produced by a la rge nu- c lear reactor in an industr ia l -desal inat ion complex may h a v e economic advantages both i n the indus- t r ia l p r o c e s s e s and i n the production of f resh water by desaliaiation. R e c e n t estimates indica te tha t e lectr ic i ty c a n b e obtained at costs 2.5 to 3.2 mills/kwhr for 50- to 500-Mw (electr ical) b locks of incremental power and, ultimately, as low a s 1.6 mills/kwhr from 5000-Mw (electr ical) dual- purpose desal inat ion reactors. T h e cost of off- peak power may be as low as 0.5 to 0.8 mill/kwhr. However, there is s o m e quest ion concerning the abi l i ty to i1,ltilke the l a rge b l o c k s of power 13000 to 5000 Mvv (e lectr ical)) that may be produced at s u c h desa l t ing s ta t ions . Certainly, i f the area is highly industr ia l ized, the power could b e put into t h e existirig system. But s o m e regions of the world a r e n o t suff ic ient ly industr ia l ized to u s e large blocks of power. P l a n t s for producing industr ia l chemica ls a t the site of a nuclear desa l t ing s ta t ion would provide a ready market for surp lus power.
A general economic survey w a s made to deter-. mine which indus t r ies should b e loca ted a t a nu- c l e a r desal inat ion complex for their mutual bene- fit. ’ T h e production of hydrogen and fer t i l izers ranked high in this evaluat ion, and , therefore, fur- ther de ta i led s t u d i e s of the production of hydrogen, ammonia, and ammonium ni t ra te4 were made. De- ta i led s t u d i e s of phosphate o r po tash fer t i l izers are still iu progress . A chemical sys tem w a s pro- posed a n d a n in i t ia l evaluat ion w a s completed for a process for removing scale-forming e lements from seawater , u s i n g only chemicals f rom t h e sea and low-cost e lec t r ica l power. Hydrogen and chlor ine are obtained a s by-products. T h e hydrogen, a long with nitrogen from t h e a i r a n d carbon dioxide from t h e seawater , c a n b e combined io form ammonia a n d urea by s tandard industr ia l techniques. A
preliminary cost s tudy w a s prepared to show the economic feasibi l i ty of using oxygen. ins tead of air for the treatment of s e w a g e s ludge by a modi- f ied wet-air oxidation (Zimmermann) process . Final ly , a l i ferature survey w a s made to determine promising appl icat ions for nuc lear energy in the treatment of s e w a g e or industr ia l w a s t e waters. Only t h e f i r s t two of t h e s e s t u d i e s are d i s c u s s e d here.
21.1 SURVEY OF PROCESS APPLICATIONS 1N A DESALINATION COMPLEX
A survey of the chemical and metallurgical i n - dus t r ies w a s made to ascer ta in which process
‘J. M. Holmes and J. W. ullmann, Survey of Process Applications in a Desalination Complex, ORNL-‘I’M-1561 (October 1966). ’R. E. Hlanco, J . M. Holmes, R. Salmon, a n d J. W.
Ullmann, “An Economic Study of t.he Production of Rtn- motiia and Other Chemica ls with the U s e of‘ Elec t r ic i ty from a Nuclear Desal ina t ion Reactor Complex,” Cheim En$. Prngr . , Symp. Ser. 63, No. 71 (1967).
R . E. Ulanco, J. M. Holmes, R. Salmon, and J. W. Ullmann, An Ecoriornic Study of the I’rodnrtion of Am- monia Using Elec t r ic i ty from a Nuclear Desaliriation Kractor Complex, ORNL-3882 (June 1366).
“R. E. Rlanco, J. M. Holmes, R . Salmon, and J. W. Ullrnann, ’‘The Production of Ammonium Nitrate Fer t i l - i zer by Using Low-Cost Energy from a Nuclear Dcsalina- lion Reac tor ,” submitted for publication in Chemical Engineerirzg.
’R. E. Rlanco, W. C. Yep, W. E. Clark, J. M. Nolmes, and R. Salmon, A Closed-Cycle Descaling P r o c e s s for Prevent ing S c a l e Formation in Evaporators a n d ProrJuc- in& Industrial Chemicals a t a Nuclear Desa l ina t ion P l a n t , ORNL-4057 (in press) . ‘W. F. Shaffer, Jr., Cost Study of the Treafment of
Sewage Sludge by the Wet-Air Oxidation P r o c e s s , Using Oxygen Produced by Low-Cost Elec t r ic i ty from L a r g e Nuclear Reac tors , ORNL-TM-1629 (August 1966).
’1. Spiewak and W. F. Schaffer, Jr., Survey of tlw Po- tential U s e of Nuclear Derived Energy Snurces in Waste Water Treatment, ORNL-TM (in preparation).
3
297
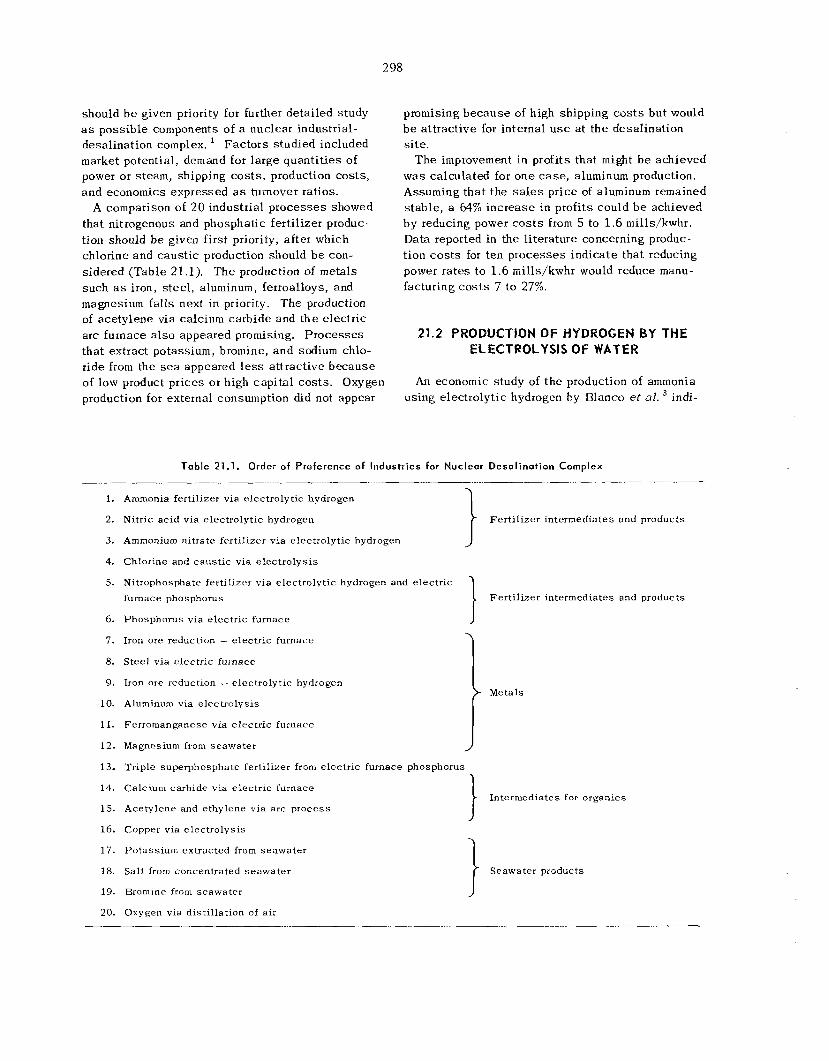
2 98
should b e given priority for further detai led s tudy a s poss ib le components of a nuclear industr ia l - desal inat ion complex. ' F a c t o r s s tudied included market potent ia l , demand for la rge quant i t ies of power or steam, shipping c o s t s , production cos ts , a n d economics expressed a s turnover ratios.
A comparison of 20 industr ia l p r o c e s s e s showed that nitrogenous and phosphat ic fer t i l izer produc- tion should b e given f i rs t priority, af ter which chlor ine and caus t ic production should b e con- s idered (Table 21.1). T h e production of metals such a s iron, s t e e l , aluminum, ferroalloys, and magnesium fa l l s next i n priority. T h e production of ace ty lene via calcium carb ide and the electr ic arc furnace a l s o appeared promising. P r o c e s s e s that extract potassium, bromine, a n d sodium chlo- r ide from the sea appeared less a t t rac t ive b e c a u s e of low product pr ices or high capi ta l c o s t s . Oxygen production for external consumption did not appear
promising b e c a u s e of high shipping c o s t s but would b e a t t rac t ive for internal u s e a t t h e desal inat ion site.
T h e improvement in profits that might b e achieved w a s ca lcu la ted for o n e c a s e , aluminum production. Assuming t h a t the s a l e s pr ice of aluminum remained s tab le , a 64% i n c r e a s e i n prof i ts could b e achieved b y reducing power c o s t s from 5 to 1.6 mills/kwlir. Data reported in the l i terature concerning produc- t ion c o s t s for t e n p r o c e s s e s ind ica te that reducing power ra tes t o 1.6 mills/kwhr would reduce manu- facturing costs 7 t o 27%.
21.2 PRODUCTION OF HYDROGEN BY THE ELECTROLXSIS OF WATER
An economic s tudy of t h e production of ammonia indi- using electrolyt ic hydrogen by Ulanco et al.
Table 21.1. Order of Preference of Industries for Nuclear Desalination Complex ___. ....... ..... ..... ______..
Fer t i l i zer intermediates and products
F e r t i l i z e r intermediates and products
I 1
1. Ammonia fer t i l izer v ia e lec t ro ly t ic hydrogen
2. Nitr ic a c i d via e lec t ro ly t ic hydrogen
3. Ammonium ni t ra te fer t i l izer v ia e lec t ro ly t ic hydrogen
4. Chlor ine and c a u s t i c v i a e l e c t r o l y s i s
5. Nitrophosphate fer t i l izer via e lec t ro ly t ic hydrogen and e lec t r ic furnace phosphorus
6. Phosphorus via e lec t r ic furnace
7. Iron ore reduction - e lec t r ic furnace
8. S t e e l via e lec t r ic furnace
9. Iron ore reduction - e lec t ro ly t ic hydrogen
10. Aluminum via e lec t ro lys i s Metals I
J 1 I.
12. Magnesium from s e a w a t e r
13. Trip le superphosphate fer t i l izer from e lec t r ic furnace phosphorus
Ferromanganese via e l e c t r i c furnace
14. Calcium carbide via e lec t r ic furnace
15. Acety lene and e thylene v ia a r c p r o c e s s Intermediates for organics I
16. Copper via e lec t ro lys i s
17. P o t a s s i u m ext rac ted from s e a w a t e r
18. Sa l t from concentrated s e a w a t e r
19. Bromine from seawater
20. Oxygen via d is t i l l a t ion of a i r
Seawater products
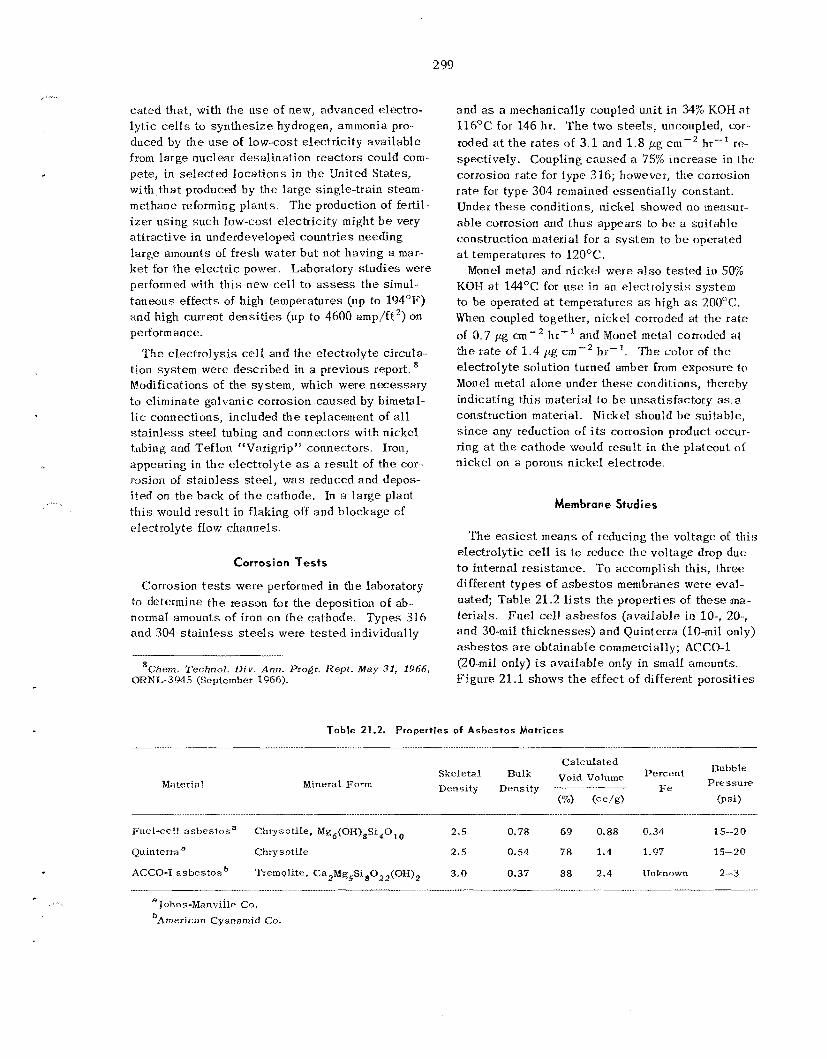
2 99
cated that, with the use of new, advanced electro- lytic cells to synthcs ize hydrogen, ammonia pro- duced by the u s e of low-cost electricity available from large nuclcar desalination reactors could com- pete, in selected locations in the United States, with that produced by the large single-train s t eam- methane reforming plants izer using such low-cost electricity might b e very attractive in underdeveloped countries needing large amounts of fresh water but not having a mar- k e t for the e lec t r ic power. Laboratory s tudies were performed with th i s new cell to assess the simul- taneous effects of high temperatures (up to 194OF) and high current dens i t ies (up to 4600 amp/ft2) on performance.
The production of fertil-
T h e electrolysis cell and the electrolyte circula tion system were described in a previous report. Modifications of the system, which were necessary to eliminate galvanic corrosion caused by bimetal- lic connections, included the replacement of all s t a in l e s s steel tubing and connectors with nickel tubing and Teflon "Varigrip" connectors. Iron, appearing in the electrolyte as a result of the cor- rosion of s ta in less steel, was reduced and depos- i ted on the back of the cathode. In a large plant t h i s would result in flaking off and blockage of electrolyte flow channels.
Corrosion Tests
Corrosion t e s t s were performed in the laboratory to determine the reason for the deposition of ab- normal amounts of iron on the cathode. Types 316 and 304 s ta in less s t e e l s were tes ted individually
*Chern. Technsl. Div. A m . Pro&. Rep t . May 31, 1966, ORNL-3945 (September 1966).
and as a mechanically coupled unit in .34% KOII at 116OC for 146 hr. T h e two steels, uncoupled, cor- roded a t t he rates of 3.1 and 1.8 pg cmW2 ht-' re spectively. Coupling caused a 75% increase in the corrosion ra te for type 316; however, the corrosion ra te for type 304 remained essentially constant. Under these conditions, nickel showed no measur- ab le corrosion and thus appears to b e a suitable construction material for a system to b e operated at temperatures to 12OOC.
Monel metal and nickel were also tested i n 50% KOH a t 144°C for use in an electrolysis system to be operated at temperatures as high as 20O0C. When coupled together, nickel corroded at the rate of 0.7 pg cm-' l it- ' and Monel metal corroded a t t he rate of 1 .4 pg cm-' h-'. T h e color of the electrolyte solution turned amber from exposure to Monel m e t a l alone under these conditions, thereby indicating this material to be unsatisfactory as a construction material. Nickel should b e suitable, s ince any reduction of its corrosion product occui- ring at the cathode would result i n the plateout o i nickel on a porous nickel elect rode.
Membrane Studies
The easiest means of reducing the voltage of th i s electrolytic cell i s to reduce the voltage drop due to internal resistance. T o accomplish this, thtw different types of asbes tos membranes were eval- uated; Table 21.2 lists the properties of these ma- terials. Fuel cell a sbes tos (available i n IO-, 20-, and 30-mil thicknesses) and Quinterra (10-mil only) a sbes tos a r e obtainable commercially; ACCO-1 (20-mil only) is available only in s m a l l amounts. Figure 21.1 shows the effect of different porosities
Table 21.2. Properties of Asbestos Matrices
Material Mineral F o r m
~ u e l - c e l ~ . asbestosa Chtysntile, Mg6(OI<)BSi,0,, 2.5 0.78 69 0.88 0,34 15---20
@interma Chrysotile 2.5 0.54 78 1.4 1.97 15-2 0
2-3 88 2.4 Unknown AGCO-I asbestosb 'rrremnlite, Ca2111g5Sig022(OH)2 3.0 0.37
*Johns-Manville Co. bAmrrican Cyanamid Co.
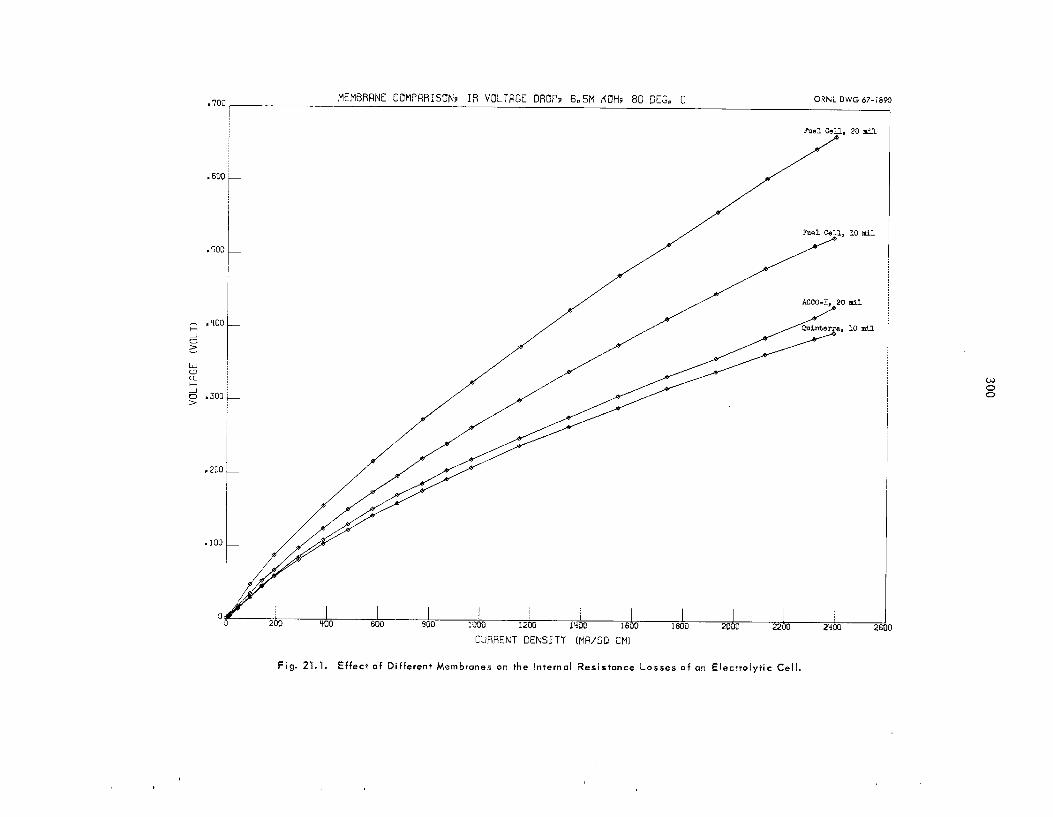
3 00
la
.. . . .
. .
. . . . . . . . . .. .
. . . . . .-
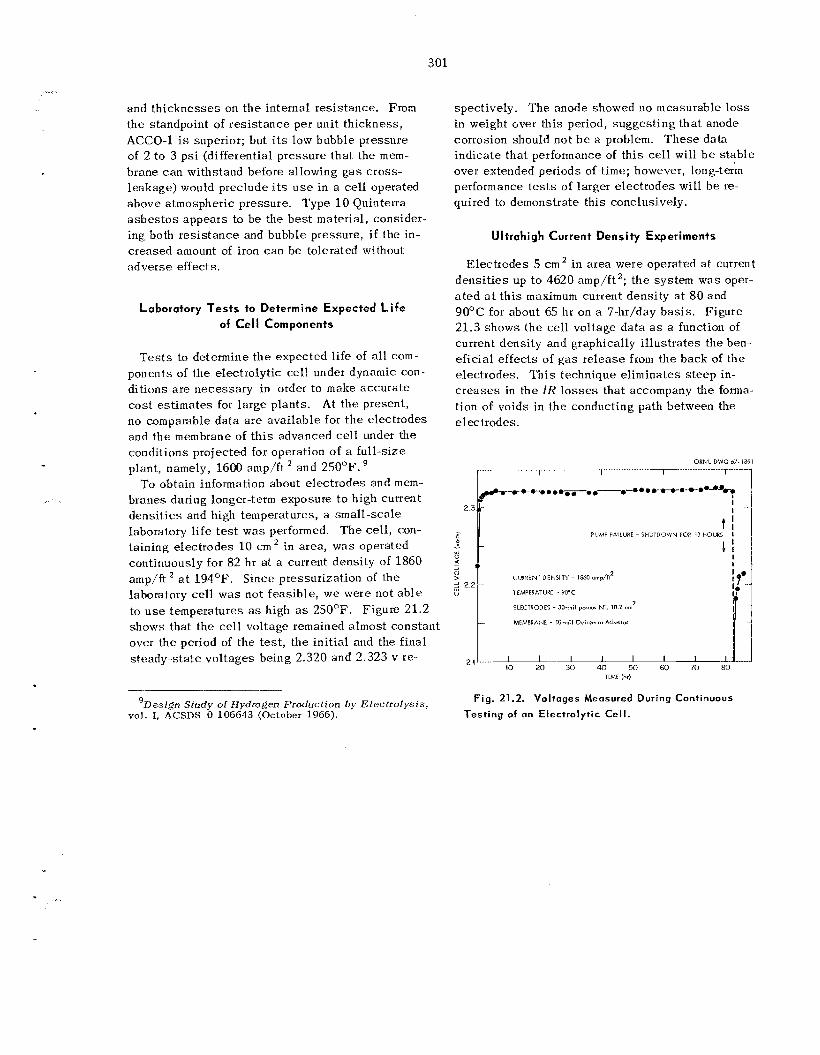
301
and thicknesses on t h e internal resistance. From the standpoint of res i s tance per unit thickness, ACCO-1 is superior; but i t s low bubble pressure of 2 to 3 psi (differential pressure that the mem- brane can withstand before allowing g a s cross- leakage) would preclude i t s u s e in a cell operated above atmospheric pressure. Type 1 0 Quinterra a sbes tos appears to be the bes t material, consider- ing both res i s tance and bubble pressure, i f the in- creased amount of iron can be tolerated without adverse effects.
Laboratory Tests to Determine Expected L i f e of Cell Components
Tests to determine the expected life of all com- ponents of the electrolytic cell under dynamic con- ditions a re necessary in order to make accurate cost estimates for large plants. At the present, no comparable data are available for t he electrodes and the membrane of th i s advanced cell under the conditions projected for operation of a full-size plant, namely, 1600 amp/ft
To obtain information about electrodes and mem- branes during longer-term exposure t o high current densit ies and high temperatures, a small-scale laboratory life t e s t was performed. The cell , con- taining electrodes 10 c m 2 in area, was operated continuously for 82 hr at a current density of 1860 amp/& a t 194OF. Since pressurization of the lahoratory cell was not feasible, we were not ab le to u s e temperatures as high as 250°F. Figure 21.2 shows that the cell voltage remained almost constant over the period of the tes t , the init ial and the final steady-state voltages being 2.320 and 2.323 v re-
and 250°F.
spectively. The anode showed no measurable loss in weight over this period, suggesting that anode corrosion should not b e a problem. These data indicate that performance of th i s cell will b e s tab le over extended periods of time; however, long-term performance t e s t s of larger electrodes will be re- quired to demonstrate this conclusively.
Ultrahigh Current Density Experiments
Electrodes 5 c m 2 in area were operated a t current dens i t ies up to 4620 amp/ft2; t he system was oper- a ted a t th i s maximum current density a t 80 and 90°C for about 65 hr on a ’i-hr/day bas is . Figure 21.3 shows the cell voltage data a s a function of current density and graphically i l lustrates the ben- eficial effects of g a s re lease from the back of the electrodes. Th i s technique eliminates s teep in- c r eases in the IR l o s s e s that accompany the forma- tion of voids in the conducting path between the electrodes.
ORNL DWG t7-i%41 I. .. . . . . . . . . ... . ..
TlMt (hr)
Fig. 21.2. Voltages Measured During Continuous 9Desiff11 Study of Hydrogen Production hy Elcctrolysis, vol. I, ACSDS 0 106643 (October 1966). Testing of an Electrolytic Cell.
- ....
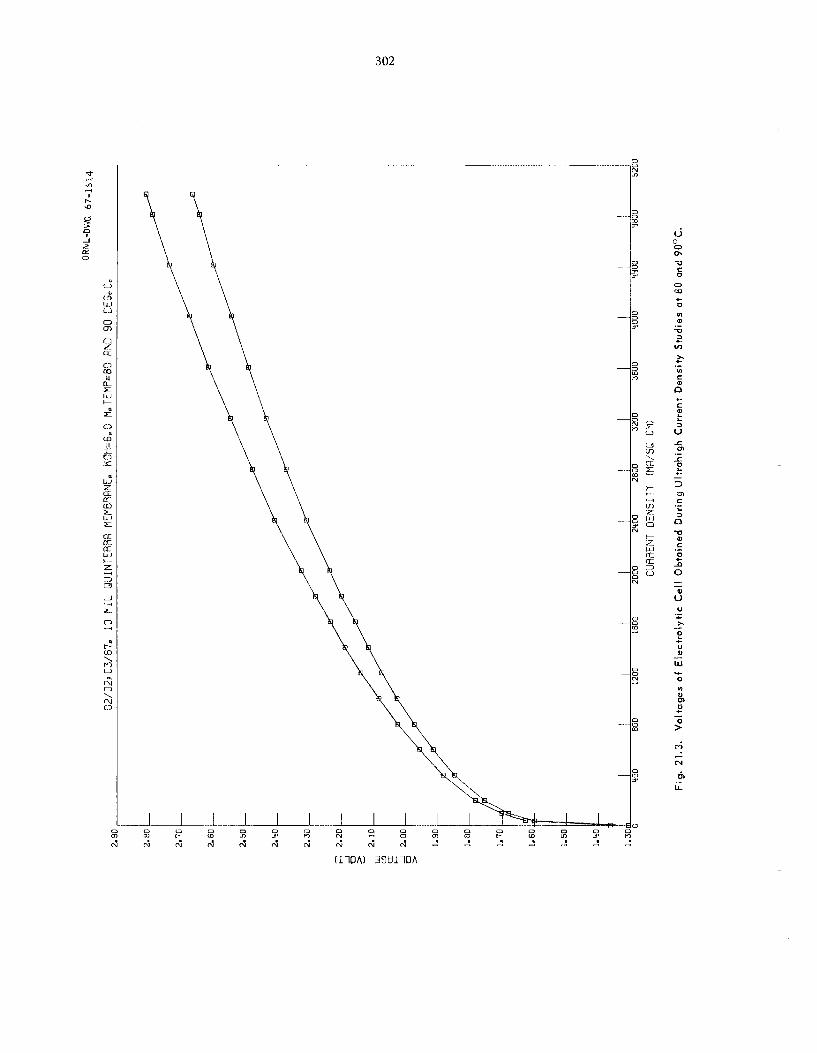
302
22. Safety Studies
22.1 CASK TRANSPORT STUDIES
A new program was organized in the early part of 1966 to develop an acceptance Criteria for casks designed for u se in shipping irradiated fuel . The Criteria is intended to provide a uniform engineer- ing bas i s for cask design and fabrication that will ensure compliance with the performance specifica- tions imposed by AEC regulations.' The program will culminate i n the issuance of two volumes; the f i r s t will contain the design and fabrication Cri- teria, and the second will consist of a technical supplement describing the engineering develop- ment on which the Criteria is based.
engineering standards for the design, fabrication, testing, inspection, and maintenance of shipping casks for irradiated fue l and thus should solve many of the designer's problems which now may include (1) determination of acceptable materials, (2) destructive testing to confirm design assump- tions, and (3 ) uncertainty of thermal and criticality analyses. The Criteria is not expected or intended to inhibit the ingenuity or the technical aggresive- ness of the designer.
The technical supplement, or second volume, will provide detailed data concerning the bas i s and the development of the Criteria and wil l indi- cate the margin of safety and relative degree of conservatism that is assumed.
The following sec t ions describe the work that has been done to date; th i s material will also be included in the Criteria.
The design and fabrication Criteria will set forth
Literature Search
Battelle Memorial Institute, working under a sub- contract, has assembled a bibliography of approxi-
1'4Safety Standards for the Packaging of Radioactive and Fissile Materials," chap. OS29 in AEC Manual.
. -
303
of Fuel Transport
mately 600 abstracts of journals, reports, patents, etc., dealing with a l l aspec ts of the transportation and the handling of radioactive materials. Each abstract h a s been key-worded and l isted on the Radiation Safety Information Center's electronic data-processing machine. The report containing these abstracts has been issued a s ORNL-NSIC- 33.
Cask Structural Design
The analysis and approval of structural integrity normally requires the development and submission of a mass of supporting data.' Consequently a large portion of the Criteria will be devoted to this problem. The cask designer will have a choice of methods for developing individual com- ponents of the cask , but in every instance a simple approach has been set forth that will permit him to design quickly though conserva- tively.
The following equations are examples of this approach; however, more-detailed analytical pro- cedures will also b e provided to enable the de- signer to reduce to some extent the high factor of conservatism afforded by the simple approach and, perhaps to achieve a more economical de- sign that will comply fully with regulations. l
Inner Shell Thickness. - The thickness of the inner cask shell , tf , must be a t l eas t as great as the largest f l computed by Eqs. (1) and (2):
10Rf (1 - V)
'L. B. Shappert and R. S . Burns, Indexed Bibliography on Transportat iori nrid Handfir@ of R a d i o a c t i v e Materials , ORNL-NSIC-33 (June 1967).
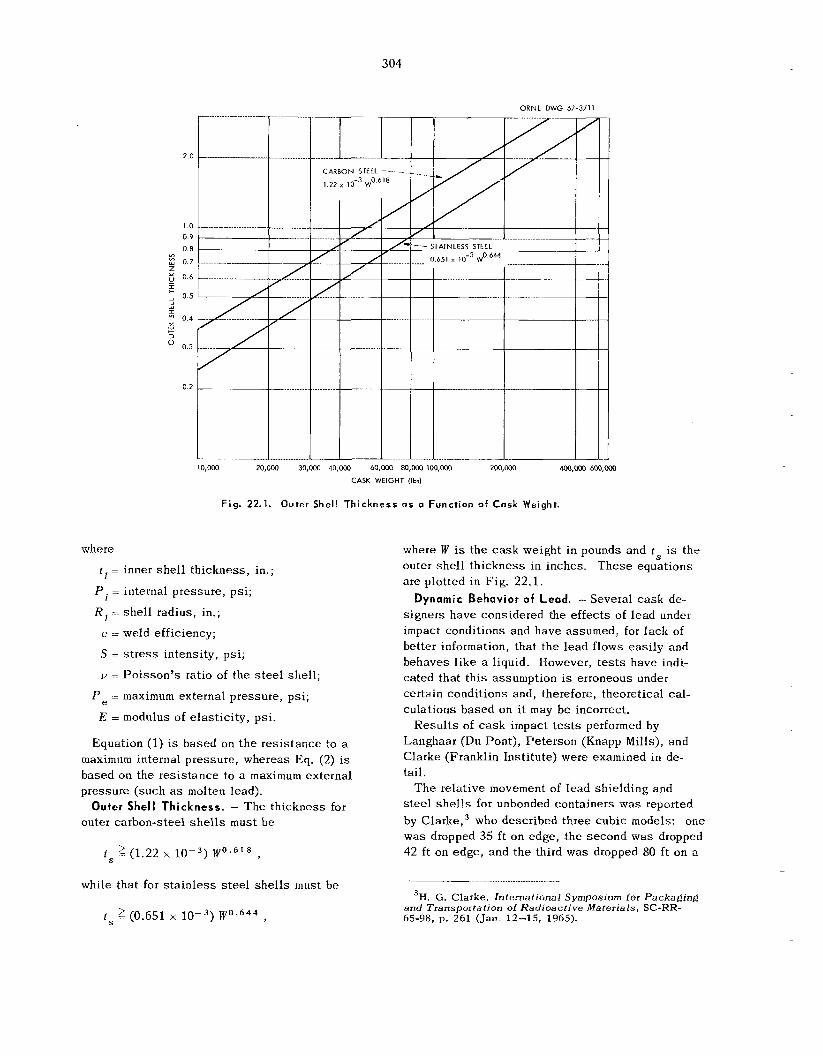
2.0
1.0 0.9
0.8
6 0.7 Z
0.6
rn
I ~ 0.5
- 0.4
2 w lr
cx w
3
0.3
0.2
10,000 20,000 30,000 40,000 60,000 80,003 IM),Mn 2W,ooO 400,oW 600,wO CASK WEIGHT (Ibr)
F ig . 22.1. Outer Shell Thickness a s a Funct ion of Cask Weight.
where
t l = inner s h e l l th ickness , in.;
P = internal pressure, p s i ;
K, - s h e l l radius , in.;
e - weld efficiency;
S = s t r e s s intensi ty , psi;
v - Poisson’s ratio of the s t e e l she l l ;
P maximum external pressure, ps i ;
E = modulus of e las t ic i ty , psi .
where W is the c a s k weight in pounds and t s is t h e outer s h e l l th ickness in inches. T h e s e equat ions a r e plotted in Fig. 22.1.
Dynamic Behavior o f Lead. - Several c a s k de- s igners have considered the effects of lead under impact condi t ions and have assumed, for lack of bet ter information, tha t t h e lead flows e a s i l y and behaves l i k e a liquid. However, t e s t s have indi- ca ted that t h i s assumption is erroneous under cer ta in condi t ions and, therefore, theoret ical cal- culat ions based on it may b e incorrect.
Kesul t s of c a s k impact t e s t s performed by Equat ion (1) i s b a s e d on t h e res i s tance to a
maximum internal pressure , whereas Eq. (2) is based on t h e res i s tance to a maximum external pressure ( such as molten lead) .
Outer Shell Thickness. - T h e th ickness for outer carbon-steel shells must b e
Langhaar (Du Pont) , Pe te rson (Knapp Mills), and Clarke (Frankl in Inst i tute) were examined in de- tail.
T h e relat ive movement of lead sh ie ld ing and s t e e l s h e l l s for unbonded containers w a s reported by C l a ~ k e , ~ who descr ibed three c u b i c models: one w a s dropped 35 ft on edge , the second w a s dropped 42 ft on edge , and t h e third w a s dropped 80 f t on a t s 2 (1.22 10-3) w 0 . 6 ~ ~ ,
304
ORNL DWG 67-3711
_l..._.._l_.__..._ while that for s t a i n l e s s s t e e l s h e l l s must b e 3H. G . Clarke, International Symposiiim for Packaging
and Transportation of Radioactive Materials, SC-HR- 65-98, p. 261 (Jan. 12-15, 1965). t s 2 (0.651 x lop3) W0.644 ,
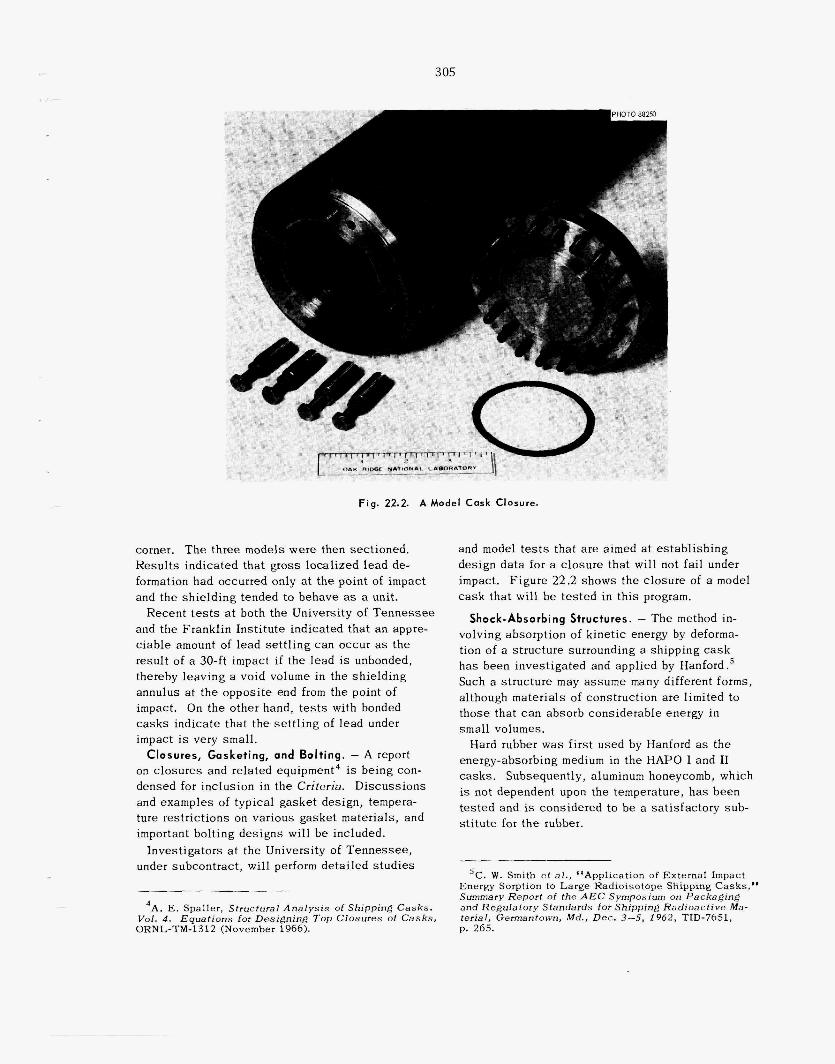
3 05
P
r
- _ - -
Fig. 22.2. A Model Cask Closure.
corner. The three models were then sectioned. Results indicated that gross localized lead de- formation had occurred only at the point of impact and the shielding tended to behave as a unit.
and the Franklin Institute indicated that an appre- ciable amount of lead sett l ing can occur as the result of a 30-ft impact if the lead is unbonded, thereby leaving a void volume in the shielding annulus at the opposite end from the point of impact. On the other hand, t e s t s with bonded casks indicate that the sett l ing of lead under impact is very sma l l .
Closures, Gasketing, and Bolting. - A report on closures and related equipment4 is being con- densed for inclusion in the Criteria. Discussions and examples of typical gasket design, tempera- ture restrictions on various gasket materials, and important bolting designs will be included.
lnvestigators at the University of Tennessee, under subcontract, will perform detailed studies
Recent t e s t s at both the University of Tennessee
4A. E. Spaller, Structural Analys l s of Shipping Casks . Vol. 4 . Equations for Designing Top Closures of Casks , ORNL-TM-1312 (November 1966).
and model t e s t s that a re aimed a t establishing design data for a closure that will not fail under impact. Figure 22.2 shows the closure of a model cask that will be tested in this program.
Shock-Absorbing Structures. - The method in- volving absorption of kinetic energy by deforma- tion of a structure surrounding a shipping cask has been investigated and applied by Hanford .5
Such a structure may assume many different forms, although materials of construction are limited to those that can absorb considerable energy i n small volumes.
Hard rubber was first used by Hanford as the energy-absorbing medium i n the H A P 0 I and I1 casks. Subsequently, aluminum honeycomb, which is not dependent upon the temperature, has been tested and is considered to be a satisfactory sub- st i tute for the rubber.
'C. W. Smi th e t a ] . , "Appllcation of External Impact Energy Sorption to Large Radioisotope Shipping Casks," Summary Report of the AEC Symposium on Packaging and Regulatory Standards for Shipping Radioactive Ma- terial, Gemantown, Md., Dec . 3-5, 1962, TID-7651, p . 265.
3 06
Materials and Fabrication
Ductility is a prime consideration in the selec- tion of structural materials for the cask because of the necessity of avoiding brittle fracture of the outer or inner shell during normal operating tem- peratures (- 40 to + 130OF). The problem centers around the ductility and impact properties of the shell material at low (- 40°F) temperatures; many grades of structural carbon steels are subjec t to brittle fracture at such temperatures.
have excellent impact properties at low tempera- tures, they a re recommended for u s e as she l l ma- terial by the Criteria. A-516 steel is essentially a normalized version of A-212; i t cos t s about the s a m e and is widely available.
In almost every impact failure, the cask she l l failed at a weld. Weld design, welder and proce- dure qualification, and weld inspection methods will therefore be described in detail in the Criteria.
The chapter on fabrication outlines cask re- quirements as set forth in the ASME Pressure Vessel Code, Sect. 111, VIII, and IX. To assure the cask purchaser, as well as the AEC, that proper fabrication practices a re followed and re- corded, the functions and the responsibility of an independent fabrication inspector are outlined.
Since fine-grained carbon steels, such as A-516,
Shielding
Even though detailed shielding ana lyses are recommended, simplified methods of ana lys i s will be presented in the Criteria so that particular shielding thicknesses may be checked with a reasonable degree of accuracy. Graphs have been developed for predicting the amount of shielding required for specified reactor irradiation and cool- ing conditions. Such a graph is expected to pre- dict the amount of necessary shielding to within 10% of the amount that would be determined from a detailed machine calculation.
Critica I i ty
The shipper of fissile materials must demonstrate to the AEC not only that h i s container has incor- porated sound engineering design and fabrication but also that the shipment will remain subcrit ical at all t i m e s during shipment, including loading and
unloading, and under hypothetical accident con- ditions.
concerned with the method of maintaining sub- criticality as it is with the proof of adherence to the requirement of subcriticality. The chapter on criticality provides a framework within which to judge the accuracy of the proof.
The criticality evaluation problem is not so much
Heat Transfer
Investigators at Battelle Memorial Institute (BMI), under subcontract, are studying the heat- transfer processes that occur inside and outside the shipping cask. Present regulations do not specify the maximum permissible fuel tempera- ture; however, it is prudent to keep temperatures as low as possible, certainly below the shea th failure temperature. Information to be reported in the Criteria will concern heat sources, internal heat transfer, and cask behavior in a fire.
Heat Sources. - BMI has developed a nomogram that shows the heat release of a spent fuel ele- ment as a function of operating power in the re- actor, operating t ime, and cooling t i m e .
A second heat source that should be considered is the sun; thus, a nomogram that will predict max- imum values to be expected from solar heating has also been developed. It should provide conserva- tive estimates of temperature responses in ship- ping casks under normal operating conditions.
is often a complex arrangement of spent fuel ele- ments, nuclear poison plates, coolants, and sup- port structures. With such an arrangement, the determination of the temperature distribution throughout the cavity becomes quite difficult.
Complex computer codes can account for all modes of heat transfer in an air-filled cavity (the situation that will impose the highest potential temperatures on the fuel during transit). Several specific cases that are typical of power reactor fuel shipments have been analyzed; these assume that any liquid coolant present at the start of the shipment is lost.
for conduction and radiation within the fuel as- sembly, as well as conduction, convection, and radiation outside it. Figure 22.3 shows the tem- perature response of a loaded cask under the con- ditions specified in the figure. Ambient air tem- perature was assumed to be 130OF.
Internal Heat Transfer. - The interior of the cask
The code used to analyze these c a s e s accounted
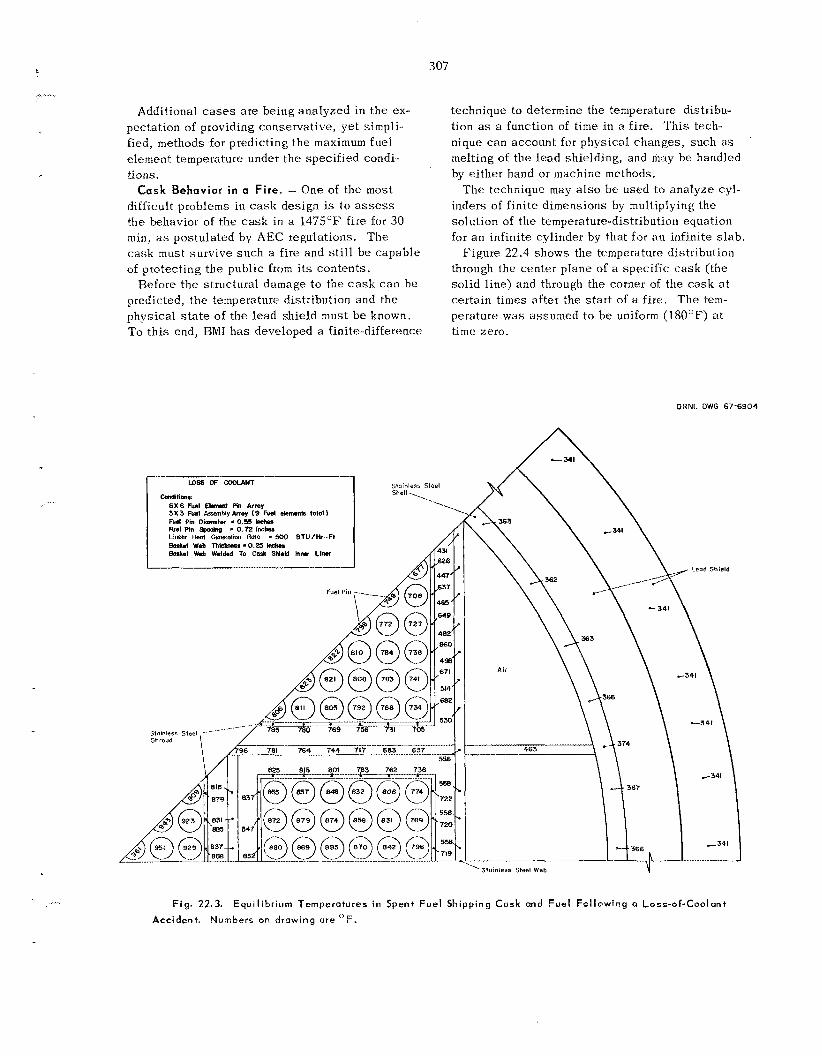
. ....
307
... . .
Additional c a s e s are being analyzed in the ex- pectation of providing conservative, yet simpli- fied, methods for predicting the maximum fuel element temperature under the specified condi- tions. Cask Behavior i n a Fire. - One of the most
difficult problems in cask design is to assess the behavior of the cask in a 1475°F fire for 30 min, a s postulated by AEC regulations. The
technique to determine the temperature distribu- tion as a function of time in a fire. This teoh- nique can account for physical changes, such as tnelting of the lead shielding, and may be handled by either hand or machine methods.
The technique may also be used to analyze cyl- inders of finite dimensions by multiplying the solution of the temperature-distribution equation for a n infinite cylinder by that f o r a n infinite s lab .
cask must survive such a fire and s t i l l be capable of protecting the public from i t s contents.
Before the structural damage to the c a s k can be predicted, the ternperature distribution arid the physical s t a t e of the lead shield must be known. To th is end, BMI h a s developed a finite-difference
Figure 22.4 shows the temperature distribution through the center plane of a specific cask (thc solid line) and through the corner of the cask at certain times after the s ta r t of a f i re . The tem- perature w a s assumed to be uniform (180°F) a t time zero.
OHNL DWG 67-6904
Stainless Steel
. .‘. ----..
F i g . 22.3. Equi l ibr ium Temperatures in Spent F u e l Shipping Cask and Fuel Fol lowing a Loss-of-Coolant
Accident. Numbers on drawing are OF.
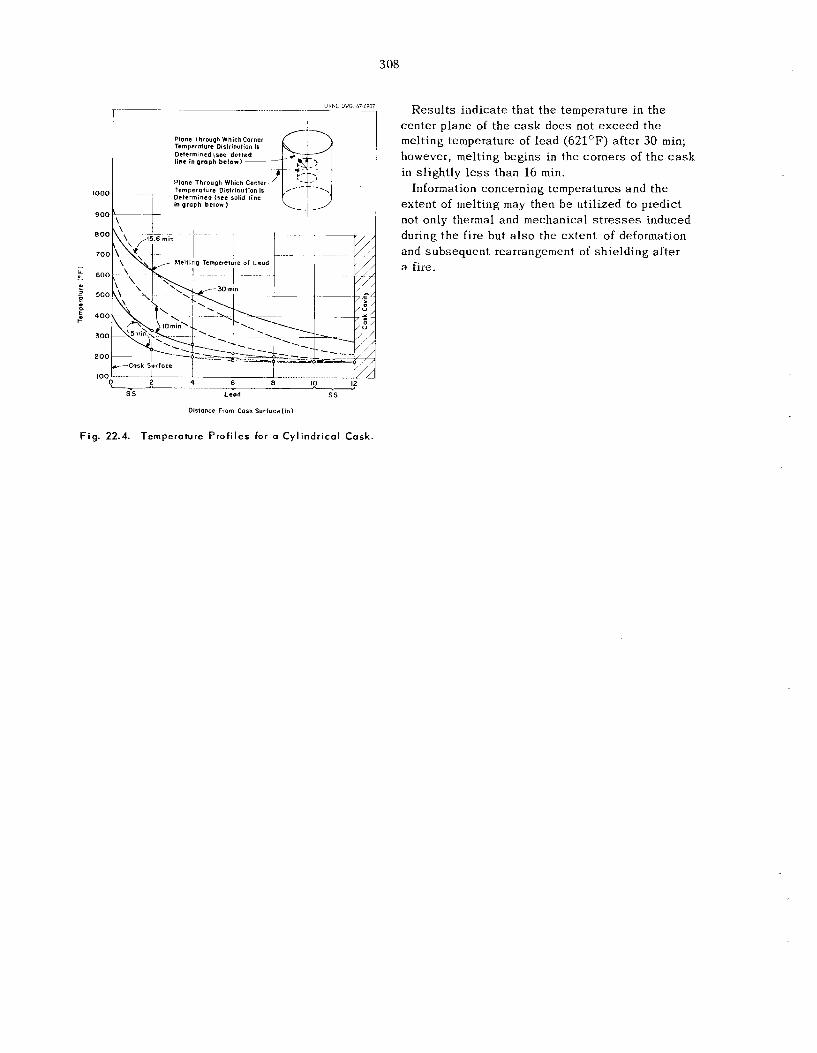
3 08
ORNL Dl lG 67 09 , ..... ~ I - - - -
Plane Through Wnich Corner
Determined (see dotted l int ingraph belaw) __
Plane Through Which Center-
Dcltirnincd (see solid line inproph below)
Temperolurc 0iSIribuI:On I L
800
700
& 600
u $ 500
:: 400
-
300
200
100 2 4 6 a 10 12
'V -- s s L t o d ss
Distance From Cask Surface ( i n )
R e s u l t s ind ica te that the temperature in t h e center p lane of t h e c a s k does not e x c e e d t h e melting temperature of lead (62l0F) af te r 30 min; however, melting begins in the corners of t h e c a s k in s l igh t ly l e s s than 16 min.
Information concerning temperatures a n d t h e extent of melting may then b e ut i l ized t o predict not only thermal and mechanical s t r e s s e s induced during t h e f i re but a l s o the extent of deformation and subsequent rearrangement of sh ie ld ing a f te r a fire.
Fig. 22.4. Temperature Prof i les for a Cyl indrical Cask.
Publications, Speeches, and Seminars
ASSISTANCE PROGRAMS
Goeller, H. E . , E. M . Shank, and W. &I. Sproule, L i s t o f Information Sent to and Received from the Eurochemic eo., January 1 , 1966 Through June 30, 1966 (Categorized), ORN1,-TM-685, suppl . 6 (Aug. 1, 1966).
Goeller, H. E., E. M. Shank, and W. M. Sproule, L i s t of Inlormation Setit to and Received [ram the Eurochemic Co., July 1, 1966 Through December 31, 1966 (Categorized), ORNL-TM-685, suppl. 7 (Feb. 15, 1967).
BIOCHEMICAL SEPARATIONS
Egan, €3. Zane , “Molecular Weights of Transfer Ribonucleic Acids ,” presented a t the ACS South-
Kelmers, A. D., “Preparat ion of a Highly Purif ied Phenyla lan ine Transfer Ribonucleic Acid,”
e a s t e r n Regional Meeting, Louisv i l le , Ky., Oct . 27-29, 1966.
J . Brol. Chem. 241, 3540-45 (August 1966).
Biophys. R e s . Cornrnun. 25(5), 562-66 (1966). Kelmers, A. D., “Preparation of a HighIy Purif ied Leucine Transfer Ribonucleic Acid,” Biochem.
Kelmers, A. D., “Separation of Transfer Ribonucleic Acids ,” presented a t t h e Gordon Research Conference on Nucle ic Acids , New Hampton, N.H. , June 19-23, 1967.
Scott, C. D., J . E. Attrill, and N. G. Anderson, “Automatic, High-Resolution Analys is of Urine for I t s Ultraviolet-Absorbing Const i tuents ,” Proc. Soc. Exptl. Biol. Med. 125, 181 (1967).
Weiss, J . F., A. D. Kelmers, and M. P. Stulberg, “A New Chromatographic System for Increased Resolut ion of Transfer RNAs,” presented a t 51st Annual Meeting, Federat ion of American Socie t ies for Experimental Biology, Chicago, Ill., Apr. 16-21, 1967,
CHEMICAL ENGINEERING RESEARCH
Finsterwalder , L. O., Geometric Scaling o f Stacketl-Clone Contactors, OKNL-4G-23 (April 1967).
CHEMICAL PROCESSING FOR THE MOLTEN-SALT EXPERIMENT
McNeese, I,. E. , Considerations of Low Pressrrrc Distillation and Its Application to Processing o f Molten-Salt Breeder Reactor Fuels, ORNL-TM-1730 (March 1967).
CLASS1 F I ED
Robinson, R. A. ( Isotopes Division), J. P. Nichols , e t al., ORNL-TM-1691 (December 1966) (c lassi f ied) .
3 09
310
DEVELOPMENTOFTHE TWORlUMFUELCYCLE
Anderson, J. W., A. R. Irvine, J . P. Jarv is , and D. M. Shepherd, Leak Testing of TUFCDF Cell Supply Ducts by Temperature compensated Differential Pressure Method, OHNL-TM-1728 (May 1967).
Bond, W. D., S. D. Clinton, P. A. H a a s , A. T. Kleinsteuber, and A. H. Meservey, Preparation of
F e r g u s m , D. E., B. A. Hannaford, and E. I,. Nicholson, “Status of P r o c e s s Development for UO,-ThO Microspheres by a Sol-Gel Method, OKNI,-TM-1601 (Aug. 8 , 1966). 2 3 5
Thorium-Wearing HTGR F u e l s , ” presented at t h e ANS Annual Meeting, Denver, Colo., June 20-23, 1966; abs t rac t publ ished in Trans. Am. Nucl. SOC. 9 , 315 (1966).
Haas , P. A., and S. D. Clinton, “Preparat ion of Thoria and Mixed-Oxide Microspheres,” Ind. Eng.
Haws, C. C., and J. W. Snider, “Development and F u l l - s c a l e T e s t i n g of P r o c e s s Equipment for t h e Thorium-Uranium Recycle Fac i l i ty ,” presented at the 13th Annual ANS Meeting, San Diego, Calif., J u n e 11-16, 1967.
Chem., Prod. Res . Develop. 5(3), 236-44 (September 1966).
Meservey, A. B., “U0, -Tho, and U0, -Tho, Sols Prepared by Precipi ta t ion-Pept izat ion Proc- e s s e s , ” presented at t h e 153d National ACS Meeting, Miami, F l a . , Apr. 9-14, 1967; also publ ished as ORNL-TM-1782 (Mar. 20, 1967).
Moore, J . G., “Preparation of Thorium-Uranium Oxide Sols by Amine Denitration, ” presented a t t h e 13th Annual ANS Meeting, San Diego, Calif., J u n e 11-15, 1967.
Notz, K . J., “Propert ies of Thoria-Carbon Sols and t h e Preparat ion of Thorium Carbides and Porous Thoria ,” presented at t h e 153d National ACS Meeting, Miami, Fla . , Apr. 9-14, 1967.
Notz, K. J . , “Dispersal of Carbon 13lacks to Individual Crys ta l l i t es ,” J. Phys. Chem. 71, 1965 (1967).
FLUORIDE VOLATILITY PROCESSlNG
Katz, Sidney, and G . I. Cathers , “A G a s Sorption-Desorption Recovery Method for Plutonium Hexafluoride,” presented a t t h e 152d Nat ional ACS Meeting, New York City, Sept. 11-16, 1966.
Mailen, J . C. , “Recovery of Uranium and Plutonium from Fal l ing Droplets of Molten Fluoride Sal t by Fluorination,” presented a t t h e 153d National ACS Meeting, Miami, F l a . , Apr. 9-14, 1967.
Plant, ORNL-TM-1593 (November 1966). Miles, F. W., Plutonium-Related Safety Aspec ts in Designing the Fluidized-Bed Volatility Pilot
Miller, P. D., W. E. Berry, W. N. Stiegelmeyer, and W. K . Boyd (employed by Bat te l le Memorial Inst i tute under subcontract No. 988), Inter&aiular Modifications in Nickel from the Fluidized- Bed Fluoride VolatiZity Process, BMI-X-417 (Nov. 28, 1966).
Miller, P. D., E. F . Stephan, W. E. Berry, and W. K. Boyd (employed by Bat te l le Memorial Insti- tu te under subcontract No. 988), Corrosion o f Construction MaterinZs in Boiling 13 M Nitric- 0.1 M Hydrofhoric Acids , BMI-X-434 (Mar. 30, 1967).
Nicol, R. G., “Engineering and Maintenance Problems i n a F u e l P r o c e s s i n g P i l o t P l a n t Using t h e Volatility Method,” presented a t t h e 14th ANS Conference on Remote Systems Technology, Pi t tsburgh, P a . , Oct. 30-Nov. 4 , 1966; publ ished i n Trans. Am. Nucl. SOC. 9 , 622 (1966).
31 1
MI SCE LLAN EOUS
Bell, J . T., and K. E. Biggers, “The Absorption Spectrum of the Uranyl Ion i n Perchlorate Media. Part 11. The Effects of Hydrolysis on the Resolved Spectral Bands,” presented a t the South- eastern Regional ACS Meeting, Louisville, Ky., Oct. 27-29, 1966.
Bell, J . T., and R. E. Biggers, “The Absorption Spectra of the Uranyl Ion i n Perchlorate Media. Par t 11. The Effects of Hydrolysis on the Resolved Spectral Bands,” J . Mol. Specfry. 22, 262-71 (1967).
Biggers, R. E., J . T. Bell, E. C. Long, and 0. W. Russ, “NIROCOS/MKOPLT - a Computer Pro- gram for the Mathematical Resolution of Complex Overlapping Spectra and Fine Structure by Nonlinear, Least-Squares Approximation Methods,” presented a t the Seminar on Automated Spectrometry, National Research Council of Canada, Ottawa, Ontario, July 6-7, 1966.
nation Infomation Meeting, ORNL, Mar . 28-29, 1967. Blanco, R. E., “Industrial Applications of Nuclear Energy,” presented a t the Water and Desali-
Blanco, R. E., “Production of Industrial Chemicals in n Nuclear DesaIination Complex,” pte- sented at the Technical University, Aachen, Germany, July 10-21, 1967.
Blanco, R. E., et a] . , Survey of R Site for a Nuclear Fuel Processing Plant and Waste Disposal Area at Oak Ridge, ORNL-TM-1748 (Jan. 13, 1967).
Blanco, R. E., J. M. Holmes, R. Salmon, and J . W. Ullmann, An Economic Stucly o f the Production o f Ammonia Using Electricity from a Nric: lear Desalination Reactor Complex, OKNL-3882 (June 1966j.
Chem. Erik. Pro&. 63(4), 46-50 (1967). Blanco, R. E., J . M . Holmes, R. Salmon, and J. W. Ullmann, “Ammonia Cos t s and Electricity,”
Blanco, R. E., J. M. Holmes, K. Salmon, and J . W. Ullmann, “An Economic Study of the Pro- duction of Ammonia and Other Chemicals Using Electricity from a Nuclear Desalination Reactor Complex,” Chem. Eng. Progr., Symp. Ser. 63(71), 18-30 (1967).
Acid Solutions a t 25”C,” J . Chem. En&. Data 1 1 , 343-46 (1966).
tween Foam Bubbles,” Ind. Eng” Chern., Fundamentals 6 , 225 (1967).
Ferris, L. M., “Solubility of Niobic Oxide and Niobium Dioxyfluoride i n Nitric Acid-Hydrofluoric
Haas, P. A., and H. F. Johnson, “Model and Experimental Results for Drainage of Solution Be-
Hannon, F. L,. , “Construction Problems in the Transuranium Facili ty,” presented at General En- \ gineering and Construction Seminar, Feb. 8, 1967.
I-lannon, F. L., “Transuranium Procurement,” presented at General Engineering and Construction Seminar, Mar. 8, 1967.
Holmes, J . M. , and J. W. Ullmann, Survey of Process Applications in a Desalination Complex, ORNL-TM-1561 (October 1966’).
presented a t ORNL Desalination Information Meeting, Mar. 28-29, 1967.
Plutoni a,” presented a t the 10th Conference on Analytical Chemistry, Gattinburg, ’I’enn., Sept. 27-29, 1966.
Johnson, J. S., K. A. Kraus, J . J . Perona, and F. H. Butt, “Hyperfiltration of Paper Mill Wastes,”
Jolley, R. L., B. J. Robinson, and J. S. Wike, “Dissolution and Analysis of Highly Irradiated
Jury, S. I<., Foam Decontamination o f Air Containing Radioactive Iodine and Particulates Follow- ing R Nuclear Incident, ORNL-TM-1589 (October 1966).
Landry, J. W., “From Weapon to Welfare - Civilian U s e s of Nuclear Explosives,” presented at the dinner meeting of the Sixth Annual United States Army Nuclear Science Seminar, Oak Ridge, ‘Tenn., July 15, 1966.
312
Landry, J. W., “Tapping Earth’s Steam Ket t le with Nuclear Explos ives ,” presented a t t h e dinner meet ing of t h e Second Annual Southeastern Seminar on Thermal Sc iences , Oak Ridge, Tenn. , July 25, 1966.
Museum of Atomic Energy, Oak Ridge, Tenn. , Aug. 1, 1966. Landry, J . W., “ T h e Benevolent Bomb,” presented to t h e Exhibit Managers of t h e American
Landry, J. W . , “Industrial and Scient i f ic U s e s of Nuclear Explos ives ,” presented a t t h e dinner meeting of the F i r s t North American Symposium on Electromagnet ic Separat ions, Oak Ridge, Tenn. , Sept. 8, 1966.
Landry, J . W., “Peacefu l Nuclear Explos ives .- Thei r U s e s and Problems,” presented a t t h e Joint Heal th P h y s i c s Society Meeting, Cumherland F a l l s , Ky., Sept. 10, 1966.
Day dinner of t h e Athens, Term., Kiwanis Club, Athens, Tenn., Nov. 11 , 1966. Landry, J. W., “ T h e Reformed Sword: Peacefu l Nuclear Explos ives ,” presented a t t h e Armistice
Landry, J. W., “Geographic Engineering with P e a c e f u l Nuclear Explos ives ,” presented at t h e Quarterly Dinner Meeting of t h e Atlanta Chapter of t h e Military Order of the World Wars, Fort McPherson, Atlanta, Ga., Nov. 16 , 1966.
Landry, J . W., “The Converted Sword,” presented to t h e Cathol ic Youth Organization, Oak Ridge,
Landry, J . W., “Nuclear Digging for C a n a l s and Harbors,” presented to t h e Annual United S ta tes
Tenn. , Nov. 27, 1966.
Navy Nuclear Sc ience Seminar, Oak Ridge, Tenn., Dec. 2 , 1966.
t h e American Society of Mechanical Engineers , Nashvi l le , Tenn. , Dec. 14, 1966. Landry, J . W., “ T h e Engineering Explosion I s Coming!” presented to t h e Nashvi l le subsec t ion of
Landry, J . W., “Engineers Are Thinking Bigger with Nuclear Explos ives ,” presented under the ORNL Travel ing Lec ture Program to t h e College of Engineering Seminar, University of South Carolina, Jan. 5, 1967.
Landry, J . W., “Projec t Earth Furnace - Industr ia l Chemicals from Peacefu l Nuclear Explos ives ,” presented under t h e ORNL Travel ing Lec ture Program to t h e Student Chapter of American In- s t i t u t e of Chemical Engineers , University of Mississ ippi , Fcb. 6 , 1967.
Landry, J. W., “ P h y s i c i s t s Provide P o t e n t P a c k a g e s of Power for P r o g r e s s - Peacefu l Nuclear Explosives ,” presented under the ORNL Travel ing Lec ture Program to t h e P h y s i c s Depart- ment Seminar, University of Southern Mississ ippi , F e b . 7, 1967.
Landry, J. W., “Scient i f ic Applicat ions of Nuclear Explos ives ,” presented under t h e ORNL Travel ing Lec ture Program to t h e P h y s i c s and Nuclear Engineer ing classes at t h e University of Southern Mississ ippi , Feb . 8, 1967.
Landry, J. W . , “Chemical Applicat ions of Nuclear Explos ives ,” presented to t h e Oak Ridge High School Chemiteers, Oak Ridge, Tenn. , Mar. 7 , 1967.
Landry, J. W., “Quick and Dirt Cheap: P r o j e c t s from Peacefu l Nuclear Explosives , ’ ’ presented to t h e dinner meeting of the QAD Seminar-Workshop conducted by t h e Radiation Shielding In- formation Center, ORNL and LASL, Oak Ridge, Tenn. , Apr. 17, 1967.
Landry, J . W., “Peacefu l U s e s of Nuclear Explos ives , or, How I Learned to Love the €I Bomb,” presented to the dinner meeting of t h e Civi l Defense Research Pro jec t Annual Information Meeting, Oak Ridge, Tenn. , Apr. 25, 1967.
Landry, J . W., “Canals and Other Colossa l Construction with Nuclear Explos ives ,” presented to t h e U.S. Navy Research Reserve Nuclear Sc ience Seminar, Oak Ridge, Tenn. , May 21, 1967.
Mrochek, J . E. , and A. H. Kibbey, Laboratory Studies of the Electrolysis of Water. The Feasibil- i ty of Electrolysis at Temperatures to 400°F, OFWL-TM-1716 (Dec. 7 , 1966).
313
Nichols, J. P., and D. R. Winkler, A Program for Calculating Optimum Dimensions o f Alpha Radio- isotope Capsules Exposed to Varying Stress and Temperature, ORNL-TM-1735 (April 1967); a l so NASA CR-72172 (April 1957).
Nichols, J. P., “Containment Potential of the HFIR Pressure Vesse l and Primary Coolant Sys- tem,” pp. 227-44 in The High Flux Isotope Reactor, Accident Analysis, ORNL-3573 (April 1967)-
presented a t Discussion a t International Symposium on Eutrophication, University of Wiscon- s in , Madison, W i s . , June 12-16, 1967.
Rainey, R. H., Criteria for Noble-Gas Removal Using Permselective Membranes, ORNL-TM-1822 (Apr. 3, 1967).
(1967).
(October 1966).
Rainey, R. H., “Application of the Mixing Equation to the Displacement of Pollution from Lakes ,”
Rainey, R. H., “Natural Displacement of Pollution from the Great Lakes , ” Science 155, 1242
Rom, A. M., Design o f a Critically Sa fe 2 3 3 U Batch Dissolver for Building 3019, ORNL-4029
Rom, A. M., Design o f a Criticality-Proof Ratch Dissolver for 2 3 3 U Located in Building 3019, ORNL-TM-1568 (Aug. 8, 1966).
Schaffer, W. F., Jr., Cost Study o f the Treatment o f Sewage Sludge by the Wet-Air Oxidation Process, Using Oxygen Produced by Low-Cost Electricity from Large Nuclear Reactors, ORNL-TM-1629 (August 1966).
Schonfeld, Ernest, “Alpha - a Computer Program for t he Determination of Radioisotopes by Least-Squares Resolution of the Gamma-Ray Spectra,” Nucl. Instr. Methods 42, 213-18 (1966).
Squares Resolution of the Gamma-Ray Spectra, ORNL-3975 (September 1966). Schonfeld, E., Alpha 1 1 1 - an improved Computer Program for Determining Radioisotopes by Least-
Schonfeld, E., “Improved Accuracy in Determination of Radionuclide Concentrations in Solutions Containing Fast-Decaying Isotopes by Least-Squares Resolution of the Gamma-Ray Spectra,” pp. 279-83 in Proceedings o f the 2d International Conference on Modern Trends in Activation Analysis, Texas A & M University, 1966.
Schonfeld, Ernest, “Computer Programs for the Analysis of Samples Containing Several Radio- isotopes,” presented a t the ACS National Meeting, M i a m i , Fla. , Apr. 11-14, 1967.
Leve l s of Radioactivity,” presented at the National ANS Meeting, San Diego, Calif., June 11-15, 1967.
Schonfeld, E., W. Davis, Jr., and A. H. Kibbey, “Rapid, Low-Cost Analyses of Isotope Mixtures,” published in Fundamental Nuclear Energy Research (USAE:C Annual Report to Congress for 1966), pp. 155-56 (December 1966).
Schonfeld, E., J . F. Emery, F. F. Dyer, and T. Alexander, “The Evaluation of Computer Programs for Gamma-Ray Spectrometry in Activation Analysis,” pp. 212-15 in Proceedings o f the 2d International Conference on Modern Trends in Activation Analysis, Texas A & M Univcrsity, 1966.
Schonfeld, E., “Pulse-Height Analysis of Gamma-Ray Spectra of Samples Containing Very Low
Schonfeld, E., A. H. Kibbey, and W. Davis, Jr., “Determination of Nuclide concentrations in Solu- tions Containing Low Levels of Radioactivity by Least-Squares Resolution of the Gamma-Ray Spectra,” Nucl. Instr. Methods 45, 1--21 (1966).
Schonfeld, E., and D. C. Stewart, “Effect of Temperature on Rare Earth Separations on Cation Resin Columns with Lactate,” Radiochim. Acta 5 , 176 (1966).
314
Sears , M. B., and I,. M. Ferr i s , “Hydrolys is of Uranium, Thorium, and Aluminum Carbides in DZO,” J . Inorg. Nucl. Chem. 28, 2055-59 (1966).
Nitric Acid,” J . Znorg. Nucl. Chem. 29, 1255 (1967). Sears , M. B., and L. M. Fer r i s , “ T h e React ion of Calcium and Barium Carbides with 0 to 16 M
Watson, C. D., and G. A. West, “Protect ive Coat ings (Pa in ts ) ,” chap. 12 in Decontamination of Nuclear Reactors and Equipment (ed. by J . A. Ayres), USAEC Division of Technica l Information.
Watson, C. D., and G. A. West, “Radiation E f f e c t s on P a i n t s , ” Mater. Protect. 5 , 44-49 (Feb- ruary 1%7).
Watson, C. D., et al. (United S t a t e s Standard), “Protect ive Coat ings (Paints) for t h e Nuclear Industry,” sponsored by t h e American Ins t i tu te of Chemical Engineers and approved by t h e United S ta tes Standards Institute.
POWER REACTOR FUEL PROCESSING
Abraham, G. E., and B. C. F inney , Calculated Maxinzum Temperatures o f Spent Yankee Atomic Type Power Reactor Fuel During Shear-Leach Processing, ORNL-3948 (November 1966).
Blanco, R. E., “Survey of Aqueous F u e l P r o c e s s i n g Methods,” presented a t t h e Technical Uni- vers i ty , Aachen, Germany, July 10-21, 1967.
Power,” presented a t t h e KFA, Juel ich, Germany, July 10-21, 1967. Ulanco, R. E., “Survey of Thoriuin Nuclear F u e l P r o c e s s i n g and Industrial U s e s of Nuclear
I-3lanc0, R. E., “Survey of Nuclear Fuel P r o c e s s i n g and Industr ia l U s e s of Nuclear Power,” pre- sen ted at the Technica l University, Aachen, Germany, July 10-21, 1967.
Blanco, R. E., “Survey of Nonaqueous Fluoride Volatility and Molten Salt Reactor F u e l P r o c e s s - ing Methods,” presented a t t h e ’Technical University, Aachen, Germany, July 10-21, 1967.
Ferr is , L. M., Experimental Survey o f Close-Coupled Processing Methods for Fuels Containing Uranium and Thorium, ORNL-3952 (June 1966).
Fer r i s , L. M., Possible Head-End Processes for Heavy-Water-Moderated Organic-Cooled Reactor (HWOCR) Fuels, ORNL-4109 (June 1967).
Ferris, L. M., Grind-Leach Process for Graphite-Base Reactor Fuels That Contain Coated Par-
Goode, J . H., Hot Cell Evaluation of the Release of Tritium and 85Krypton During Processing o f ThO,-VO, Fuels, ORNL-3956 (June 1966).
Goode, J . H., “ T h e R e l e a s e of Tritium and 85Krypton to t h e Atnosphere During Process ing of Tho,-UO, Reactor F u e l , ” presented a t t h e ANS Annual Meeting, Denver, Colo., J u n e 20-23, 1966.
ticles: Laboratory Development, ORNL-4110 (June 1967).
Goode, J . H., and J . R. Flanary, Hot Cell Evaluation of the Grind-Leach Process with Irradiated Pyrolytic-Carbon-Coated Sol-Gel Thoria-Urania Particles, ORNL-TM-1880 (May 26, 1967).
Haas , P. A., and I,. M. Fer r i s , “Dissolut ion of Graphite-Base Reactor F u e l s by Pressur ized Aqueous P r o c e s s e s , ” Ind. Eng. Chem., Process Design Develop. 5, 234-38 (1966).
Nicholson, E. L., Preliminary Investigation of Processing Fast-Reactor Fuel in an Existing Plant, ORNL-TM-1784 (April 1967).
Warren, K. S., and L . M. Fer r i s , Oxidation and Chlorination o f U0,-PuO2, OKNI,-3977 (July 1966).
Witte, H. O., Calculation of Fission Product Radioactivity in Off -Gases from a Burn-Leach Proc- e s s for Graphite-Base Fuels, ORNL-TM-1506 (Apr. 27 , 1966).
...
315
PROGRESS RE PORTS
Blake, C. A., Jr., K. B. Brown, and D. J. Crouse, Chemical Applicatioris of Nuclear Explosions
Blake, C. A., Jr., K. B. Brown, and D. J . Crouse, Chemical Apptications of Nuclear Explosions
Blake, C. A., Jr., K. B. Brown, and D. J. Crouse, Chemical Applications of Nuclear Explosions
Burch, W. D., Transuranium Quarterly Progress Report for Period Ending October 31, 1965, ORNL-
(CANE): Progress Report for October 1 to December 31, 1966, ORNL-TM-1775 (Feb. 21, 1967).
(CANE): Progress Report for July 1 to Septemher 30, 1944, ORNL-TM-I688 (Nov. 9, 1966).
(CANE): Progress Report for April 1 to June 30, 1966, ORNL-Till-1582 (July 29, 1966).
3965 (October 1966).
Ending May 31, lY66, ORNL-394.5 (September 1966). Ferguson, D. E., and staff , Chemical Technology Division Annual Progress Report for Period
Milford, R. P., G. I. Cathers, R. W. Horton, and W. H. Carr, Fluoride Volatility Processing Semi- annuaf Progress Report for Period Ending November 30, 1966, ORNL-‘I’M-1849 (July 1967).
Whatley, M. E., et al., Unit Operations Section Quarterly Progress Report, October-Decemher 1965, ORNL-3958 (July 1966).
LVhatley, M. E., et al., Unit Operations Section Quarterly Progress Report for January-March 1946, 0 RN L-3995 (September 1966).
OWL-4074 (April 1967). Whatley, M. E., et al., Unit Operations Section Quarterly Progress Report, April-June 1966,
Wymer, R. G., and D. A. Douglas, Jr., Stafrrs and Progress Report for Thorium Fuel Cycle Devel- opment for Period Ending December 31, 1964, ORNL-3831 (May 1966).
Wymer, R. G., and A. L. Lot t s , Status and Progress Report for Thorium Fuel Cycle Development for Period Ending December 31, 1965, ORNL-4001 (October 1966).
REACTOR EVALUATION STUDIES
Arnold, E. D., Individual Fission Products Produced in High-Exposure, Gas-Cooled Thorium
Arnold, E. D., “Formation of 2 3 6 P u and 2 3 2 U in Slightly Enriched Power Reactors,” presented
Reactor Fuel, ORNL-TM-1556 (June 15, 1966).
at the National ANS Meeting, Denver, Colo., June 20-23, 1966; published i n Trans. Am. Nucl. Soc. 9(1), 294 (1966).
Arnold, E. D., PHOEBE - a Code for CaIculnting Beta and Gamma Activity and Spectra for ‘ 35U Fission Products, OWL-3931 (July 1966).
Arnold, E. D., and R. 1‘. Maskewitz, SDC, ei Shie2ding-Dt.sign Calculation Code for Fuet-Handling Facilities, ORNL-3041 (March 1966).
Ilarrington, F. E., ‘‘Fuel Preparation Cost,” chap. 9 in An Evaluation o f Hec7vy-Wnter-Modcratc.d
Ilarrington, F. E., and J. T. Roberts, “Fuel Preparation Cos ts ,” sec t . 9.1 in An Evaluation of
Roberts, J. ‘I?. , “Spent-Fuel Process ing Cos ts ,” chap. 11 i n An Evaluation of Heavy-Warer-Mod-
Roberts, J. T., “Fuel Process ing Cos ts ,” sect. 9.3 in An Evaluation of Heavy-Water-lliloderated
Salmon, R., “Fuel Shipping Cos ts ,” chap. 12 in An Evaluation of Heavy-Wdter-Motlerateri Organic-
Organic-Cooled Reactors, ORNL-392 1 (January 1967).
Heavy-Water-Mocferated Organic-Cooled Reactors, ORNL-3921 suppl. (May 1967).
erated Organic-Cooled Reactors, ORNL-3921 (January 1967).
Organic-Cooled Rmctors , ORNL-3921 suppl. (May 1967).
Cooled Reactors, ORNL-3 921 (January 1967).
316
Salmon, R., “Fuel Shipping Cos ts ,” sect. 9 .4 in An Evaluat ion of Renvy-Water-r~foderclted Or- ganic-Cooled Reac tors , ORNL-3921 suppl. (May 1967).
Salmon, Royes, A Procedure a n d a Computer Code (POIVERCO) for Calculat ing the C o s t of E l e c - tricity Produced by Nuclear Power Stat ions, OKNL-3944 (June 1966).
SEPARATIONS CHEMISTRY RESEARCH
Baybarz, R. D., “Anion Exchange Behavior of t h e Transplutonium Elements with Ethylenediamine-
Blake, C. A., “Solvent Extract ion Research a t the Chemical Technology Division of t h e Oak
te t raace t ic Acid, ’’ J. Inorg. Nucl. Chem. 28, 1723-31 (1966).
Ridge National I,aboratory,” presented a t seminar at Ames Laboratory, Ames, Iowa, Dec. 8 , 1966.
Campbell, D. O., and H. D. Harmon, “Amine Extract ion of Sulfuric Acid,” presented at t h e Ten- n e s s e e Academy of Sc ience Meeting, Harrogate, Tenn., Apr. 28-29, 196‘7.
fa te ,” presented at t h e International Conference on Solvent Extract ion Chemistry, Goteborg, Sweden, Aug. 29-Sept. 1 , 1966.
Davis, W., J r . , and J . Mrochek, “Act ivi t ies of l‘ributyl P h o s p h a t e i n Tributyl Phosphate--Uranyl Nitrate---Water Solutions, ’’ presented a t t h e International Conference on Solvent Extraction Chemistry, Goteborg, Sweden, Aug. 29-Sept. 1, 1966.
Coleman, C. F . , and J. W. Roddy, “Mass Action and Non-Ideality in Extraction by Amine Sul-
Davis , W., Jr . , J. Mrochek, and C. J . Hardy, “ T h e System: Tri-n-butyl P h o s p h a t e (TBP)--Nitric Acid-Water. 1. Activi t ies of T B P in Equilibrium with Aqueous Nitric Acid and Par t ia l Molar Volumes of t h e Three Components i n t h e TBP P h a s e , ” J. Inorg. Nucl. Chem. 28, 2001-14 (1966).
McDowell, W. J. , and C. F. Coleman, “Investigation of P o s s i b l e Intermolecular Bonding in Some Mixtures of Phosphate Ext rac tan ts by U s e of Dielectr ic Measurements,” J. Tenn. Acad. Sci- e n c e 41(2), 78-80 (April 1966).
Uranium,” presented a t t h e International Conference on Solvent Extraction Chemistry, Gote- borg, Sweden, Aug. 29---Sept. 1, 1966.
Mcnowell, W. J., and C. F. Coleman, “Interface and Transferring Spec ies i n Amine Extraction of
Mcnowell, W. J . , and C. F. Coleman, “Extraction of Alkaline Ear ths from Sodium Nitrate Solu- t ions by Di(2-ethylhexy1)phosphate in Benzene: Mechanisms and Equilibria, ’’ J. Inorg. Nizcl. Chem. 28, 1083-89 (1966).
Sulfate ,” J. Inorg. Nucl. Chem. 29, 1325 (1967).
Differential Vapor P r e s s u r e s , ’’ Chem. Eng. 72(26), 120-22 (1965).
octylamine-Sulfuric Acid-Benzene System,” presented a t the 152d Annual ACS Meeting, New York, N.Y., Sept. 12-16, 1966.
Seeley, F. G., and D. J . Crouse, “Extract ion of Metals f r o m Chloride Solutions with Amines,” J . Chern. Eng. Data 11(3), 424-29 (July 196b).
Zingaro, R. A. ( T e x a s A & M University), and C. F. Coleman, “Synergism and Diluent Ef fec ts in the Extraction of Cesium by I-sec-Butyl-2-(a-methylbenzyl)phenol (BAMUP), ’’ J , Inor&. Nucl . Chem. 29, 1287 (1967).
McDowell, W. J . , and C. F. Coleman, “Interface Mechanism for Uranium Extraction by Amine
McDowell, W. J . , C. F. Coleman, and R. M. Fuoss (Yale University), “Prec is ion Manometer for
Roddy, J. W., and C. F. Coleman, “Activity Coeff ic ients and Aggregation Numbers i n t h e Tri-n-
- .... ....
317
SEPARATIONS PROCESS DEVELOPMENT
.
Arnold, W. D., and D. J. Crouse, “Radium Removal from Uranium M i l l Effluents with Inorganic Ion Exchangers,” Ind. Eng. Chem., Process Design Develop. 4, 333 (1965).
Arnold, W. D., D. J . Crouse, and K. B. Brown, “Solvent Extraction of Cesium (and Rubidium) from Ore Liquors with Substituted Phenols,” Ind. Eng. Chem., Process Design Develop. 4, 249 (1965).
Butyl-2-(tr-methylbenzyl)phenol (BAMBP),” Anal. Chem. 38, 950 (1966). Egan, B. Z. , and W. D. Arnold, “The Purity, Properties and Analytical Determination of 4-sec-
Hurst, F. J., D. J . Crouse, K. B. Brown, and A. H. Ross, Estimated Costs for Processing Granites for Recovery of Thorium and Uranium, OKNL-3988 (November 1966).
Hurst, F. J., D. J. Crouse, and K. B. Brown, Recovery of Thorium (and Uranium) from Granitic Rocks , ORNL-3987 (October 1966).
SOL-GEL STUDIES
Baybarz, R. D., “Preparation of Curium Hydroxide Sol-Gel Spheres as an Intermediate to CmO,
Buxton, S. R., C. J. Hardy, and M. H. Lloyd, “Analysis and Significance of Rare-Earth Oxides Produced by a Sol-Gel Method,” presented a t the 3d International Materials Symposium on Ceramic Microstmcture, Berkeley, Calif., June 13-16, 1966; also ORNL-TM-1682 (Sept. 7 , 1966).
by a Sol-Gel Process, ORNL-TM-1530 (May 31, 1966).
of Droplets, ORNL-TM-1508 (July 10, 1966).
Gel Method, ORNL-TM-1785 (Mar. 10, 1967).
presented a t AlChE National Meeting, Salt Lake City, Utah, May 21-24, 1967.
copy, Efectron Diffraction, and Spectrophotometry, ORNL-3963 (August 1966).
and Gels of Lanthanide Hydroxides, Thoria, Urania, and PZutonia, ORNL-TM-1592 (Aug. 12, 196G).
of Rare-Earth Hydroxides,” presented a t 6th Rare-Earth Research Conference, Gatlinburg, Tenn., May 3-7, 1967.
Hardy, C. J., S. R. Ruxton, and T. E. Willmarth, “The Structure and Properties of Europium Oxide Spheres Prepared from Sols and Gels of Colloidal Europium Hydroxide,” presented a t 6th Rare-Earth Research Conference, Gatlinburg, Tenn., May 3-7, 1967.
Baking, ORNL-TM-1558 (June 22, 1966).
search Conference, Meriden, N.H., Aug. 1-5, 1966. Wymer, R. G., and J. H. Coobs, “Preparation, Coating, Evaluation, and Irradiation Testing of
Sol-Gel Oxide Microspheres,” Proc. Brit. Ceram. Soc., No. 7, 61-79 (February 1967).
Microsphere Preparation,’’ Inorg. Nucl. Chem. Letters 2, 129-32 (1966).
Gens, T. A., Preparation o f Uranium and Thorium Oxide Microspheres with Controlled Porosity
Gens, T. A., Formation of Uranium, Zirconium, and Thorium Oxide Microspheres by Hydrolysis
Gens, T. A., Leboratory Preparation o f Several Kinds o f Nuclear Fuel Microspheres Using B Sol-
Haas, P. A., F. G. Kitts, and H. Beutler, “Preparation of Reactor Fue l s by Sol-Gel Processes ,”
Hardy, C. J., Examination of Hydrous Uranium Dioxide Precipitates and Sols by Electron Micros-
Hardy, C. J ., Sol-Gel Preparation of Lanthanide Oxide Microspheres and Characterization o f Sols
Hardy, C. J., S. R. Buxton, and T. E . Willmarth, “The Structure of Precipitates, Sols, and Gels
Lloyd, M. H., and E. J. Kosiancic, Investigation of Denitration o f High-Nitrate Plutonia Sols by
McCorkle, K. H., “Preparation and Properties of Sol-Gel Oxides,” presented at the Gordon Re-
318
THESES
McCoikle, K. H., Surface Chemistry and Viscometry o f Thoria Sols, OWL-TM-1536 (July 1966).
P i t t , W. W., Jc., Vapor-Liquid Equilibria of the Binary System Uranium Hexafluoridc-Niobiuni Pen lafluoride, ORNL,-TM- 1683 (January 1967).
Scott, (1. D., Oxidation of Hydrogen and Carbon Monoxide in a Helium Stream by Copper Oxide. Ans lys i s of Combined Film and Pore Diffusion with Kapid Irreversible Reaction for Two Com- ponents in a Fixed-Red Process, ORNL-TM-1540 (August 1966).
Baybarz, R. D., “An Alpha-Gamma-Neutron Hot Cel l for ‘I’ransplutonium Element Handling,” pie- sen ted a t the 10th Conference on Analytical Chemistry in Nuclear Technology, Gatlinburg, Tenn., Sept. 27-29, 1966.
Bigelow, J. E., “Optimizing Schedules at t h e TRU-HFIR Complex to Maximize 2 4 9 C f or 252Cf a s Alternative Products ,” presented a t t h e Annual ANS Meeting, San Diego, Cal i f . , J u n e 11---16, 1967.
b t t e n f i e l d , B. F., F. L. Hannon, R. McCarter, C. A. Hahs , and F. I>. P e i s h e l , “Remote Main- tenance Systems i n the Transuranium P r o c e s s i n g P l a n t , ” presented a t the 14th Fall Confer- e n c e of ANS Remote Systems Technology Division, Pi t tsburgh, P a , , Oct. 30-Nov. 4, 1966; published in Trans. Am. Nucl. Soc. 9 , 623-24 (1966).
Burch, W. D., F. L. P e i s h e l , and 0. 0. Yarbro, “Phi losophy of Chemical P r o c e s s i n g Equipment Design and Instal la t ion i n t h e Transuranium P r o c e s s i n g P l a n t , ” presented a t t h e 14th ANS Conference on Remote Systems Technology, Pi t tsburgh, Pa . , Oct. 30-Nov. 4, 1966; a l s o published in Trans. Am. Nucl. Soc. 9, 627 (1966).
King, L. J . , and J. L. Mathernr, “Containment of Radioact ive Material i n t h e Transuranium Proc- e s s i n g P l a n t , ” presented a t t h e 14th ANS Confererice on Remote Systems Technology, P i t t s - burgh, P a . , Oct. 30-Nov. 4, 1966; published i n Trans. Am. Nucl. Soc. 9 , 610 (1966).
URANIUM FUEL CYCLE
Haas , P. A., S. U. Clinton, and A. T. Kleinsteuber, “Preparation of Urania and Urania-Zirconia Microspheres,” Can. J. Chem. Eng. 44(6), 348-53 (1966).
Irvine, A. R., J . M. Chandler, P. A. H a a s , and K. H. McCorkle, “ T h e Design and Performance of Continuous P r o c e s s Equipment for Preparat ion of Urania Sol,” presented a t t h e 13th Annual ANS Meeting, San Diego, Calif., June 11-16, 1967; to b e published in the Transact ions.
WASTE TREATMENT AND DISPOSAL
Blanco, R. E., “Waste By-product Product ion,” presented a t Nuclear Power Briefing for the Coal
Blanco, R. E., “Solving t h e Waste Disposal Problem,” NucZeonics 25(2), 58-61 (1967).
Blanco, R. E., “Survey of Radioact ive Waste Treatment Methods,” presented a t t h e ‘Technical
Illomeke, J . O., and F. E. Ilarrington, “Power-Reactor Waste Management,” presented a t 13th
Industry Conference, Oak Ridge, Tenn., Sept. 29-30, 1966.
University, Aachen, Germany, July 10-21, 1967.
Annual ANS Meeting, San Diego, Calif., J u n e 11-15, 1967.
319
Clark, W. E., and C. L. Fitzgerald, Laboratory Development o f Processes for Fixation o f High- Level Radioactive Wastes it2 Glassy Solids. (5) Continuous Fixation o f Aqueous Wastes: The Con-Potglass Process, ORNL-4017 (January 1967).
Clark, W. E., et al., Development o f Processes for Solidification o f High Level Radioactive ’Waste: Summry for Pot Calcination and Rising Level Potglass Processes, ORNL-TM-1584 (Aug. 12, 1966).
Godbee, H. W., R. E. Blanco, E. J. Frederick, W. E. Clark, and N. S. S. Rajan, Laboratory Devel- opment o f a Process for Incorporation o f Radioactive Waste Solutions and Slurries in Emulsi- f ied Asphnlt, ORNL-4003 (April 1967).
Estimate o f a Full-Scale Plant for ORNL, ORNL-TM-1697 (December 1966).
lation of Evaporator Equipment in Building 4505, ORNL-TM-1637 (Sept. 21, 1966).
flux Foam Separation,” Nucl. A p p l . 3, 353 (1967).
Rom, A. M., Incorporation of Intermediate-Level Waste in Asphalt: Preliminary Design and Cost
Rom, A. M., Developmetit o f the Waste-Asphalt Process on a Semiworks Scale: Design and Instal-
Schonfeld, E., and A. H. Kibbey, “Improving Strontium Removal from Solution by Controlled Re-
Suddath, J . C., C. W. Hancher, and J. M. Holmes, “Engineering Development of the Pot P rocesses for Solidification of Radioactive Waste,” pp. 301-25 in Proceedings of the Symposium on the Solidification and Long-Term Storage of Highly Radioactive Wastes, Feb. 14-18, 1966, Rich- land, Washington, November 1966.
Yee, W. C., “The Influence of Calcium Ion on the Chemical Removal of Phosphates from Waste Effluents,” presented at Gordon Research Conference on Environmental Sciences and Engi- neering, New Hampton, N.N., J u n e 13-17, 1966.
1966 Feb. 1
Feb. 8
Feb. 15
Feb. 22
Feb. 25 Mar. 1
Mar. 8
Mar. 15
Mar. 22 Mar. 29
SEMINARS
Hot Flowsheet Demonstration (Talspeak, Cerex, Dapex) - Cm Recovery Facil i ty
of Equipment Project Salt Vault - Design and Demonstration
Estimated Cos t s of High-Level Waste Management
T h e Potential U s e s of Activated Carbons for the Adsorption of Metallic Ions
Project Plowshare: Application to Copper Ores
Densification of Thoria
Extraction of Alkalies and Alkaline Earths by FIDEI-IP
Activity Measurements in the Water, Sulfuric Acid,
Plowshare, Poss ib l e Applications: Stimulation of Gas Production from Wells and Recovery of Oil for Shales
Trioctylamine, Diluent System
Waste Disposal by Hydrofracture
Thermal Conductivity of Sheared Fuel Elements
F. A. Kappelmann J . E. Bigelow
W. F. Schaffer, J r .
J. 0. Blemeke
E. A. Sigworth (West Virginia Pulp and Paper
W. D. Arnold F. J . Hurst
M. E. Wadsworth
W. J. McDowell
Co., Chemicals Division)
J. W. Roddy
C. A. Blake
€1. 0. Weeren
H. W. Godbee
32 0
Apr. 1 2
Apr. 19
May 2 4
May 31
June 6
June 7 June 8
June 9
June 10 June 13 J u n e 1 4
June 15 J u n e 16
June 17 June 20
June 21
J u n e 22
June 2 3
June 24
June 27
J u n e 28
June 29
June 30
Rare Earth Sol-Gel Development and Application of Spectroscopy to t h e Study of Sol-Gel Processes
Pliitonia Sol-Gel Development
Comments on Design and Construction of T U R F
Laboratory T e s t i n g of the Fluid-Bed Volatility P r o c e s s
Tracer and Kinet ic Studies of t h e Cata ly t ic Decom- position of Hydrocarbons over Silica-Alumina C a t a l y s t s
P h y s i c a l Adsorption of G a s e s on Sol ids
Multilayer P h y s i c a l Adsorption and Surface Area Measurements on Porous Sol ids
Measurement of P o r e S ize Distribution in Sol ids
Chemical Adsorption
Reac t ions of Clean Metal Surfaces
P h y s i c a l Adsorption and t h e Poten t ia l Model
The Electr ical Double Layer
Stability of Lyophobic Colloids
Surface F i lms and Capillary Waves
Continuity in Ideal, One Dimensional Flow System
Hyperbolic Continuity
Implicit v s Expl ic i t Chromatographic Systems
T h e Theory of Dist inguishable P u l s e s i n a Per- turbed Equilibrium System
Effec ts of Dispersion (Peak-Spreading) on Equilib- rium Theory
Chemical Reac t ions in Chromatographic Systems
Generalization of Gas-Liquid Part i t ion Chromatog- raphy to Study High P r e s s u r e Vapor-Liquid Equi- l ibr ia - P a r t I
General izat ion of Gas-Liquid Part i t ion Chromatog- raphy to Study High P r e s s u r e Vapor-Liquid Equi- l ibr ia - P a r t I1
General izat ion of Gas-Solid Chromatography to Study Adsorption i n High P r e s s u r e Sys tems - P a r t I
Generalization of Gas-Solid Chromat.ography to Study Adsorption in High P r e s s u r e Systems - P a r t I1
T h e Study of Diffusion i n Dilute and Moderately Dense G a s e s by a Perturbation Technique
Ruthenium Chemistry - Coordination Chemis ts ’s Delight, P r o c e s s Chemist’s Nightmare
C. J . Hardy
R. G. Haire
A. 12. Irvine J . W. Anderson
J . C. Mailen
P a u l H. Emmett
P a u l H. Emmett
P a u l H. Emmett
P a u l H. Emmett
P a u l H. Emmett
Robert S. Hansen
Kobert S. Hansen
Robert S. I Iansen
Robert S. Hansen
Robert S. Hansen
H. A. Deans
H. A. Deans
H. A. Deans
H. A. Deans
1-1. A. Deans
R. Kobayashi
R. Kobayashi
R. Kobayashi
I<. Kobayashi
R. Kobayashi
C. J . Hardy
321
- .... .. .
Sept. 27 Oct. 2 5
S ta tus of t h e ORNL Civi l Defense Research Pro jec t
F u e l Reprocess ing Studies - Refractory Mater ia ls
An Introduction t o L i n e a r Programming and I t s Ap- pl icat ion to t h e Current Reactor Sys tems Analy- s i s P r o j e c t
and P l a s m a Technology at K-25
Nov. 22
Nov. 29 Urania Sol-Gel P r o c e s s I. Preparat ion of Urania S o l s
11. Drying and Fir ing of UO, Gel Microspheres
Dec. 6 Preparat ion of Sols by Amine Extract ion P a r t 1. Mixed Thorium-Uranium Sols P a r t 2. Urania Sols
Dec. 13 UO,-Tho, Sols and UO,-Tho, Sols Prepared by
Proper t ies of Thoria-Carbon Sols and t h e Prepara-
Precipi ta t ion-Pept izat ion Processes
t ion of Thorium Carbides and P o r o u s Thoria
1967 Jan. 10 Advantages and Disadvantages of Factor ia l
Experiments
Jan. 24 Microsphere Forming Column Engineering Studies
Chemistry of t h e Microsphere Forming Column
Product ion of Hydrogen by Elec t ro lys i s of Water
Analys is of Complex Gamma-Kay Spectra of Radio-
Feb. 21 Feb. 2 8
nuc l ides
Foam Separation with Reflux
Solvent Extract ion a t Ames Laboratory Mar. 6
Apr. 4 Apr. 11
Construct ion Problems i n t h e Transuranium Faci l i ty
P r o c e s s i n g of HWOCR F u e l s
Hot-Cell Studies of t h e Combustion-Leach P r o c e s s
“AKUFVE,” a n Automatic System for Measuring Apr. 17 Liquid-Liquid Part i t ion Data
Apr. 25 MSBR and Blanket P r o c e s s i n g
Unit Operat ions R e s u l t s i n Vacuum Dist i l la t ion of MSR S a l t s
T h e Hand Trap (safe ty f i lm)
May 2 Startup of TRU a. P r o c e s s i n g to Date b. T h e Recent Maintenance Program i n Cel l 7 c. P r e s e n t Status and Future P l a n s
May 16 HDEHP Extraction Kine t ics
J. C. B r e s e e
S. f f . Smiley
R. Salmon
J . P. McBride W. D. Bond
J. G. Moore L. E. Morse
A. B. Meservey
K. J. Notz
John T. Holmes (ANI,) Lowell E. Koppel (Purdue University)
C. C. Haws
W. D. Bond
J. E. Mrochek
E. Schonfeld
A. H. Kibbey
Morton Smutz (Ames Laboratory)
F. L. Hannon
L. M. Fer r i s
H. 0. Witte
L a r s G. Erwall (Incentive Research and De-
velopment AB, Stockholm)
W. L. Carter
L. E. McNeese
J. B. Ruch
L. J. King J. L. Matherne W. D. Burch
J. W. Roddy

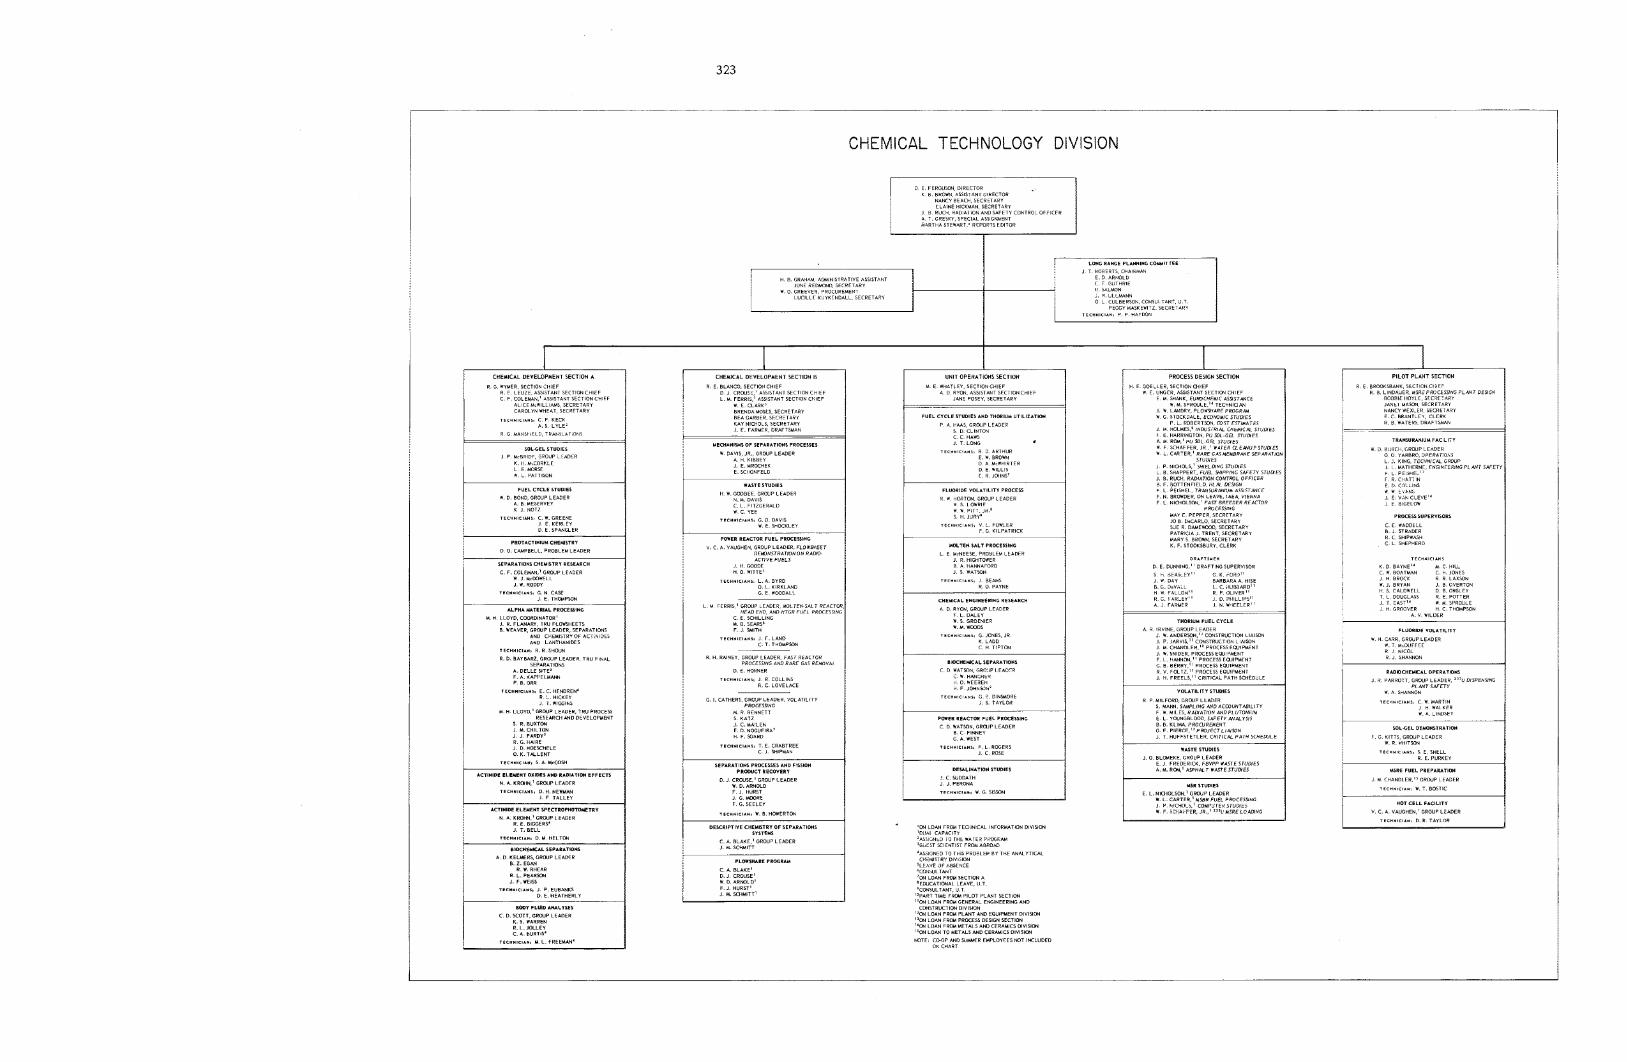
323
CH E M I CAL T EC H NO LOGY DIVISION
i( B BROWN. ASSISTANT DIRECTOR
i NANC" BEACH. I E C R E T A R " CLAlNE HICKMAN, SECRETARY
J B RULH. RbDlAi lON ANOSAFETYCONTROL OFFICFR A T GRESKY. SPECIAL ASSIGNMENT M4RTHASTEWART.' RCPORTS EDITOR
LONG RAHCE PLANNING C O M I T T E E
~ 1 lT~8?TSCHNKMAk I E. D ARYOLO C F GUTHRlE
;. w. U L L M N N 0 L CULBERSON. CONSULTANT. U T
PEGGY MASKEWITL. SECRETARY
H 8 GRAHAM. ACMINISTRATIVE ASSISTANT
W 0. GREEVER, PROCUREMENT JUNE REDMONO StCRFTARY
LUCILLE KUYKCNOALL. SECRETARY
T r C * * I L I A * , P P H*"WN
I PROCESS DESIGN SECTION
I
P I L O T P L A N T SECTION CHEMICAL DEVELOPMENT SECTION 0 CHEMICAL DEVELOPMENT SECTION A
R G WIMER, SECTION CHIEF R E LEULE. ASSISThNT SECTION CHIEF C F COLEMh. ' ASSISTANT SECTIONCHIEF
ALICE CP.ROLINWHE*T.SELlETdiRI MiWlLLlAMS. SECRETARY
A . 5 LYLE' T I c " * I c I A * I : c F K E L I
R G M A N W E L D . T R A h I L A I , O N 5
SOLGEL STUDIES J P MrSRlDF. GROUP LEADER
K. l i .LcCORKLE L E MORSE I L PATTISON
UNIT OPERATIONS SECTION
M E WHATLEY, SECTIONCHIEF A 0 RYON. ASSISTANT SFLiiONCnlEF
JANE POSE". S E C R E T M I ___
FUEL CYCLE STUDIES AND THORIUM UTILIZATION P A. H M S . G R W P LEADER
s 0 CLINTON c c HAWS J T LONG
T I C " I , C I A * l i R 0 ARTHUR E. W. BROWN 0 A MrWHIRTEP D E WILL15 c R iOllNS'
FLUOIIDE VOLATILITY PROCESS
R. E BLANCO. D J I R W S t . ' SECTION ASSlST&NT CHIEF SECTlDNCHlEF
L M. FERR1S.I ASSISTANT SECTION C i i l E F I E CLARK'
LLER, SECTION C H I t F UNGCR. AWSTANT ICCTION CHIEF E M SHbNK. EVW3CHEHIC A S Y I T W C t J. w W L b N D E " . P L O Y W d R E P R O G R ~ M. SPRWLE.'" TECHNICIAN
W G STOCKDALt. ECOMiMlC STUDIES
J M HOLMES.8 iNOUSiRliiL CntMiCi iL SIUUIES F E HARRINGTON, P U Y ) L - G B STLIUES A M Ro*l.' PU y1L 6% STUUES W F SCHAFFER. JR . ' WATER CLEIWUPSTUDIES
P. L. ROBERTSON. msi EXTIMATES
w L. CUTER,' R ~ R E G ~ ( * I E M B R W W F S E P ~ R ~ T I O STUDIES
J P NIDIOLS.' SHIELDING STUDIES L B SHAPPERT. FUEL WlPPiNC S A F E I Y S T U U E I. B a. F RUCH. BOTTENFIELO. RADIATION H L l V CONTROL DEYGN OFFICER
F L PEISHEL. TRANYIRWWIUM ASIISIWWCE F. N BRWDER, ON LEAVE, lAE4 VIENNA F I N lCHOLICI l ' FAIT B R E E D E R REACTOR
PRDCESSiNG M A Y E PEPPER.SECREIARY JO 8 OeCARLO. SECRETAHI SUER. D M E W W O . SECRETARY PATRICIAJ TRENT. SECRETARY MARY S BROWN. SECRETARY K. F. STOOKSBURY. CLERK
R E .WT DESIGN
H E GOE W t
YECHbNlYS OF SEPARATIONS PROCESSES
W DAVIS, JR.. G R W P LEADER I\ H KlBBFY J. E.MROCHEK E. SCIIONFELD
WASTE STUOlEI FUEL CYCLE STUDIES
H W . GODBEE. GRWP LEADER N.M DAVIS c L FITZGERALO W C YEE
W. 0. BOND, GROUP LEADER b. B MESERVE" K J. NO12
R W IIORTON. GROUP LEADER il 5 I OWillE
S H. JURYs w w PiT1. i H . 8
TECMYICIIHII C W. GREENE J E K E R L E I D E SPANCLER
TCCH#ICI IU I , G 0 DAYIS w t SHOCKLEI
POWER REACTOR FUEL PROCEWNG
V. C. A. VAUGHEN. GROUP LEADER. FLOWWEET "EII)NSTRI\T,ON O N RADO-
C E WADDELL 8 i STRADCR R c SHIPW*SH c L SHEPHERD
TIC*NIC l . . * I . Y L FOWLER F G KILPATRICK
MOLTEN SALT PROCESSING PROTACTINIUM CHEMISTRY
0 0 CAMPBELL. PROBLEULEkDER
SEPARATION5 CHEMISTRY I I E I E A I C H C. F. COLEMAN,' GRWP LEADER
W J MrmWELL 1 W. ROODY
TECHNICIANI I G N CASE J E THCMPSON
ALPHA W T E R I A L PROCESSING
L E McNEESt. PROBLEM LtAOER I. R HIGHTOWER B 4 HANNAFORD i s WATSON
T I C H N I C I A N I , J B E M S R 0 PAYNE
K n V E FUELS J H GOOOE H 0 W l l T t l
T E C " " I C I . * I
1 c K . w D. 80ATkAN BAYNE" M. c ".JONES C. HILL
J n BROCK R R LAXSON
H s CALDWELL 0 8.OWSLE" T L OOUGLASS R E POTTER I. T EAST" W M SPROULE
A Y WILDER
I W. I. BRYAN 1. B OVERTON
I 1 H GROWER H c THouPsnN
D. E. DUNNING," DRAFTING SUPERVISOR
s t> dE&SLEY" G K i O R 0 " J. Y 3 A Y BARBARAA HlSE 8 . G . DsVKii L C I A L I B ~ ~ R R O ~ ' H w FAILON" R P OLIVER" R 6. FARL."" J 0. PHILLIPS" A 1 FARMER J. N WHECLCR"
TECHNICIANS L.A. a m D 0 G L E KIRKLAND WOODALL
CHEMICAL ENGlNEERlHG RESEARCH
A 0 RION. GFlOUP LEADER F L DALE" 1. 5. GROENIER w u wmos
T E C I I N I C I A M I : G. JONES. 1 R I: LAOD c H T,PTON
L M FERRIS.' GROUP LCADER. MOLTEN-SALT RCACTI H F ~ D END, Awn H K R F U E L P X O C E ~
C E SCHILLING M 0. SEARSb F I SMITH
TECHNICIANIS I. F . L A N D C T THOMPSON
u n LLOYD. COORDINATOR' 1. R. FLANARY, TRU FLDWSHEETS 8 . WEAVEIl. GPDUP LEADER. SEPARAT.TIONS
AND CHEMISIRIOFACIINIDES AN0 LANTllANIDES
1 IC"* IC I . * . R . R SHOW.
THORIUM FUELCYCLE
A R IRYINE. GROUP LEADER J I ANDERSON," CONSTRUCTION LIAISON
J M CHWOLER." PROCESStCVlPMENT I W SNIDER. PROCESSEOJIPMENT
G B BERRY." PROCESS EQUIPMENT R V. FOLTZ." PROCESS EQUIPMENT J H FREELS." CRITICAL PATHSCHEDULE
J P JAR"IS.1I CONSTRUCTION LIAISON
F L HANNM." PROCESSEWlPMCNT
FLUORIDE VOLATILITY
W H CARR, G R W P LEADER w. T MIDUFFEE R J NKOL R 1 SHANNON R. D. BAIBARZ, G R W P L E A D E I I . TRU FiNAL
SEPARATIONS A. DELLE SITE' F A L A P P E L W P B ORR
R H RAINEY, GROUP LEADER, FPiSTRE*IIUR PROCESSlNG AND RARE GAS REMOVAL
D t HOKNiR
T I E H * I ' I A * I , 1 R COLLINS I C LOVELACE
I I O C I I C U K A L SEPARATIONS
C D WATSON. GRO'iP L E A O T i w HANCHtY 'i 0. WEEXEN A F JOHN%%'
T E C H * I F I * N I , G e DINWORE j S T A I L W
P W E R REACTOR FUEL PROCESSING C D WATSON. G R W P LEADER
B C FlNNEY G . A WEST
I I C M Y I C I A W I , F L ROGERS 1 ' ROSE
T I C ~ ( M I C I A N L I E.C. HENDREN' I i HlCXEY J T.WICc,NS
M H LLOYO.' GROUP LEADER. TRU PROCESS RESEUlCHANDOEVELOPMENT
S P.BUXTlW J *I CHlLTON
R P MILFORD. C R W P L t M E R 5. M A N . SMIPLING WD ACCDUNTABILIIY F W MILES. PAOIATION WDPLUTONii lM t L YOUNGBLOOD. S M E T Y Ml#LlSjS B 0. KLIMA, PROCUREMENT G E P I E R C E . " P R D J E C T L l d l Y I N i T HUFFSTETLER. CRITIClV PATH SCHEWLE
SOLGEL DIYONITIATION
F G KITTS. GROUP LEADER w R WHITSON
J 1 FARDY' R d. HAIRE J. D HOESCHELE D K. T U L E N T
TECIIYICIAYII T. E. CRABTREE C J SHIPMAN
SEPARATIONS PROCESSES AND FISSION PROWCTRECOVERY
J 0 BLCMEKE. GROUP LEAOER E.. FREDERICK. F W P P WASTESTLIDIES A M. RCM,' PIPPHIVT Y U l E S T U C f E S
TECHNICIAN, 5 A MrCOSH DESALINATION STUDIES
J C SUOOATH J 1.PERONA T ~ C " N I E I A M , W G SISYW
MSRe FUEL PREPARATION
J M CHnNOLER.'5 G R W P LE4DER
TECHNIFIAH: W. T. BOSTlC
ACTINIDE ELEMENT OXIDES AND RlDlATlOW EFFECTS N. A. K R M N . ' GROUP LEADER
T ~ C I ( N I L I A M I I 0. H. N E W M N J F T A L L E I
ACTINIDE ELEMENT IPLCTROPHOTOUETIY N A KROHN.' G R W P LEADER
R. E. BIGGERS' I. 1. B E L L
TIC** ICI . * , D M "ELTON
BKICI IEYLAL SEPAPATIONI
8. 2. E G M R W RHEAR
R L. P E A R X N 1. F. WEISS
A 0 KELUERS, GROUP LEADER
TECHNIEIAWI I J P tUB&NKS 0 E.HEATHERLI
D.1 CROUSE.' GROUP LEADER W. D. ARNOLD F I. H U M T J G MOOKE F. G. S E E L E I
E. L. NICHOLSON.' GROUP LEADER w. L. CARTER.^ MYIR FUEL PROCESYNG J P bICHOLS.' COMPUTE#STUOES W F. SChAiFER. JR..' '"CMSRELCAONG
HOT CELL FIClLlT" V. C. A. VAUGHEN.' GROUP L i A D E R
TECHNICIA" . D.11 I.4"L"R YICHMICIIIM, W B HOWCRTON
DESCRIPTIVE CHEMISTRY OF SEPARATIONS S"ITE*
C A. BLAKE.'GROUPLEADER J *I SCHUITT
'ON LOAN FROM TECHNICAL INFORMTION DIVISION ' D M 1 CAPPICIT" 'ASSILNtO 13 1Ht WAlERPROGWJd ' G u t i T SCIENTIST F R O M A S R O C
'ASSIGNED TO Ti36 PROBLtK B I THE ANI\LYTICAL CHLMISIRY D)IVIIION
iLLXVEdF*BSCNCE *COIIrnULTANT 8EDUCATIMAL 'ON LOAN FROM LEAVE. IECTION U.T. A
PCONSULTANl. U T 'DPART TIME FRCM PILOT PLANT SECTION "ON LOAN FRO*GENEP*I ENGINEERING AND
CONSTRUCTION DIVISION "ON LOAN FROM PLANT AN0 EQUiPMENT D I W S I M 'lON LOAN FROU PROCES DESIGN SECTION "ON LOAN FROM METALS AND CERAMlCS OIYISIM
NOTE. CDOP AND SUMMER EMPLOYEES NOT I K L U D E O ON CHART
"ON LOAN TO METALS bN0 C E R U l l C I DIVISIMI
c A BLAKE' D. I. CROUSE' W D A R W L O ' F J W R I T ' I. M. Y H H I T T '
Sm" FLUID ANALI IF I C D. SCOTT. GRWP LEADER
K. I. WARREN R. L. J O L L E I c. A BURT1S'
TICWNICIAN, M. L. FREEMAN'

325
O R N L-4 145 UC-10 - Chemical Separations Processes
for Plutonium and Uranium
. ,.._ ......
INTERNAL DlSTRlBUTlON
1. Biology Library
5. Laboratory Shift Supervisor 2-4. Central Research Library
6-7. ORNL - Y-12 Technical Library Document Reference Section
29. Laboratory Records, ORNL R.C. 30-31. E. L. Anderson
32. S . E. Beall 33. Arnold Berman 34. D. 5. Bill ington 35. C. A. Blake 36. R. E. Blanco 37. J. 0. Blomeke 38. C. J. Borkowski 39. R. E. Brooksbank 40. G. E. Boyd 41. J. C. Bresee 42. R. B. Briggs 43. K. B. Brown 44. F. R. Bruce 45. W. D. Burch 46. W. H. Carr 47. G. I. Cathers 48. J. M. Chandler 49. W. E. Clark 50. C. F. Coleman 51. J. A. Cox 52. D. J. Crouse 53. F. L. Culler 54. W. Davis, Jr. 55. D. A. Douglas
8-28. Laboratory Records Department
56-185. 0. E. Ferguson 186. L. M. Ferris 187. J. R. Flanary 188. J. L. Fowler 189. J. H. Frye, Jr. 190. J. H. Gillette 191. H. E. Goeller 192. A. T. Gresky 193. W. R. Grimes 194. P. A. Haas 195. Richard Hamburger 196. J. P. Hammond 197. C. S. Harri l l
198. A. Hollaender 199. R. W. Horton 200. A. R. l rv ine 201. M. A. Kastenbaum 202. W. H. Jordan 203. M. T. Kelley 204. R. F. Kimball 205. J. A. Lane 206. C. E. Larson 207. R. E. Leuze 208. M. H . Lloyd 209. 8. S. Livingston 210. H. G. MacPhersoq 211. F. C. Maienschein 212. W. J. McDowelI 213. R. A. McNees 214. R. P. Milford 215. D. R. Mil ler 216. E. C. Miller 217. K. Z. Morgan 218. E. L. Nicholson
219-220. R. B. Parker 221. R. E. Pahler 222. R. H. Rainey 223. J. T. Roberts 224. A. D. Ryon 225. A. F. Rupp 226. H. E. Seagren 227. M. J. Skinner 228. A. H. Snell 229. J. C. Suddath 230. E. H. Taylor 231. V. C. A. Vaughen 232. W. E. Unger 233. B. J , Young 234. C. D. Watson 235. 6. S. Weaver 236. A. M. Weinberg 237. M. E . Whatley 238. G. C. Wi l l iams 239. R. G. Wymer 240. J. J. Katz (consultant) 241. C. W. J. Wende (consultant)
.242. P. H. Emmett (consultant) 243. E. A. Mason (consultant)
326
EXTERNAL DISTRIBUTION
244. 245 I 246. 247. 248.
249. 250.
251.
252.
253.
254. 255.
256 257. 258. 259. 260. 261. 262.
263.
264. 265. 266.
267.
268.
269.
270. 271.
272. 273. 274. 275. 276. 277.
J. A. Swartout, 270 Park Avenue, New York 17, New York Sylvania Electr ic Products, Inc. Dr. Barendregt, Eurochemic, Mol, Belgium Giacomo Calleri , CNEN, c/o Vi t ro v ia Bacdisseras, Milano, I ta ly D. J. Carswell, Radiochemical Laboratory, The New South Wales University of Technology, P.O. Box 1, Kensington, Sydney, N.S.W., Austral ia E. Cerrai, Laboratori CISE, Casella Postale N. 3986, Milano, I taly David Dryssen, The Royal Inst i tute of Technology, Department of Inorganic Chemistry, Kernistragen 37, Stockholm 70, Sweden Syed Fareeduddin, Indian Rare Earths Ltd., Army and Navy Building, 148 Mahatma Gandhi Road, Bombay 1, India J. M. Fletcher, Uni ted Kingdom Atomic Energy Authority, Atomic Energy Research Establishment, Harwell, Berks, England W. A. Graf, Manager, Plant Design, Atomic Products Division, General Electr ic Company, Box 450, Palo Alto, Cali f . H. Irving, Deportment of Inorganic chemistry, University o f Leeds, Leeds, England T. I shihara, Div is ion of Fuel Research and Development, Tokai Research Establ i shment, JAERI, Tokai-mura, I baraki-ken, Japan A. S. Kertes, Hebrew University, Jerusalem Jorgen Klitgaard, Eurocheniic, Mol. Belgium Y . Marcus, Israel Atomic Energy Coniiiiission, ' [e l Aviv, Israel E. Glueckauf, Atomic Energy Research Establishment, Harwell, Berks, England P. Rengnaut, C.E.N. Fontenay-aux-Roses, Boi te Postale No. 6, Fontenay-aux-Roses, Seine, France R. Rometsch, Eurochemic, Mol. Belgium A. J. A. Roux, Director of Atomic Energy Research, South Afr ican Counci l for Scienti f ic and Industrial Research, Box 395, Pretoria, South Afr ica Jon Rydberg, Department of Nuclear Chemistry, Chalmers Tekniska Hogskola, Gihraltorgatan 5 ti. Goteborg, Sweden M. Show, AEC, Washington Erik Svenke, Director, Department of Chemistry, Atomic Energy Company, Stockholm 9, Sweden D. G. Tuck, Associate Professor, Department of Chemistry, Simon Fraser University, Burnaby 2, Bri t ish Columbia, Canada B. F. Warner, United Kingdom Atomic Energy Authority, Production Group, Wiiidscale and Colder Works, Sellafield, Seascale, Cumberland, England R. A. Wells, Dept. of Scienti f ic and Industrial Research, National Chemical Laboratory, Tedd i ngto n, Mi dd I esex, En g I and M. Zifferero, Comitato Nazionale per I'Energia, Nucleare, Laborntorio Trattamento Elementi Combustibili, c/o lnst i tuto di Chemica Farmaceutica e Tossicologica del l 'Universitn, Piazzale del le Scienze, 5, Rome, Italy M. Claude Jean Jouonnaud, Department Head, Plutonium Extraction Plant, Marcoule (Gard), France Prof. Lou is Gutierrez-Jadra, Director de Planta Pi lotos e Industriales, Junta de Energia Nuclear, Ciudad Universitaris, Modrid (3), Spain W. G. Belter, AEC, Washington J. A. Liebermon, AEC, Washington W. ti. Regan, AEC, Washington H. Bernard, AEC, Washington P. Schmid, Federal Inst i tute for Reactor Research, Wurenlingen, AG, Switzerland Atou Shimozato, Nuclear Reactor Design Section, Nuclear Power Plant Department, Hi tachi Ltd., Hi tachi Works, Hitachi-Shi, Ibaraki-Ken, Japon . .
278. R. S. Brodsky, D iv is ion of Naval Reactors, Atomic Energy Commission, Washington, D.C. 20545
327
279. Theodore Rockwell Ill, Chairman, AIF Safety Task Force, MPR Associates, Inc., 815 Connecticut Avenue, N.W., Washington, D.C. 20006
280. Guenther Wirths, NUKEM, Hanau, Germany 281. Rik i Kobayashi, Professor, Rice University 282. W. W. Grigarieff, Assistant to the Executive Director, Oak Ridge Associated Universities 283. G. R. Hall, Nuclear Technology Laboratories, Department of Chemical Technology, Imperial
College, Prince Consort Road, London, S.W. 7, England 284. Giuseppe Orsenigo, CNEN, Via Belisario 15, Rome, Italy 285. Laboratory and University Division, AEC, OR0
286-468. Given distribution as shown in TID-4500 under Chemical Separations Processes for Plutonium and Uranium (25 copies - CFSTI)
.