Embed Size (px)
Citation preview

OAK RIDGE
ASSESSMENT AND TESTING OF LONG-LINE INTERFACE DEVICES
n LOCKHEED MARTI
P. R. Barnes B. W. McConnell
I MANAGED AND OPERATED BY
LOCKHEED MARTIN ENERGY RESEARCH CORPORATION
FOR THE UWED BTATEB
DEPARTMENT OF ENERGY
ORNL-27 (3-96) -1

ORNL/TM-1999/93
ASSESSMENT AND TESTING OF LONG-LINE INTERFACE DEVICES
P. R. Barnes and B. W. McConnell
March 2000
Prepared by the POWER SYSTEMS TECHNOLOGY PROGRAM
OAK RIDGE NATIONAL LABORATORY Oak Ridge, Tennessee 37831
managed by LOCKHEED MARTIN ENERGY RESEARCH CORPORATION
for the U.S. DEPARTMENT OF ENERGY
under contract DE-AC05960R22464


CONTENTS
List of Figures ............................................... v List of Tables ............................................... vii Acronyms and Abbreviations ...................................... ix
1. INTRODUCTION............................................. 1
2. ELECTRIC POWER NETWORKS .................................. 3 2.1 Electric Power Systems ...................................... 3 2.2 TheU.S. Power Network .................................... 4 2.3 Foreign Power Systems ...................................... 6 2.4 Utility Grounding Systems ................................... 7
3. LIGHTNING ACTIVITY AND LIGHTNING PROTECTION ................ 11 3.1 Introduction ............................................. 11 3.2 Use of Surge Arresters in Selected Countries ........................ 11 3.3 Characteristics of Surge Arresters ............................... 12 3.4 Lightning Protection Considerations .............................. 13
4. LINE INTERFACE DEVICES ..................................... 17 4.1 Introduction ............................................. 17 4.2 Standard Dielectric Tests .................................... 17 4.3 Steep-Front Short-Duration Surge Tests ........................... 18 4.4 Transformer Insulation ...................................... 25 4.5 Fuses ................................................. 27 4.6 Cables and Wires ......................................... 28
5. SECONDARY DISTRIBUTION SYSTEMS ............................ 33 5.1 Introduction ............................................. 33 5.2 Disconnect and Transfer Switches .............................. 33 5.3 Typical Building Wiring Practice ................................ 36
..
6. RECOMMENDED EXPERIMENTS ................................. 39 6.1 El Transformer Tests ....................................... 39 6.2 El Tests on Insulators, Terminators, and Potheads .................... 40 6.3 SREMP Tests on Arresters .................................. .41 6.4 E3 Tests on Transformers .................................... 41 6.5 Summary of Recommended Tests ............................... 42
, 7. SUMMARY AND CONCLUSIONS ................................ .43
7.1 Line Interface Devices ...................................... 43 7.2 Experiments ............................................. 43 7.3 Preliminary Assessments ..................................... 43 7.4 Summary ............................................. ..4 4
. . . 111
8. REFERENCES . . . . . . . . . . . . . . . . . . . . . . . . . . . . . . . . . . . . . . . . . . . . . . 47
APPENDIX: Typical Transmission and Distribution Voltages for Selected Countries . e 49
iV
FIGURES
2.1 2.2 2.3 3.1 3.2 4.1
4.2
4.3 5.1
5.2 5.3 5.4
Simplified diagram of an electric power system ........................ 3 Electric power system control system .............................. 5 Utility grounding systems ...................................... 9 Lightning activity in the continental United States ...................... 12 Annual lightning activity in Russia ................................ 13 Results from sample basic insulation level and chopped wave tests for an electric powersystem .............................................. 18 The AT hot spot (Ths - 273 - Trise - TambienS temperature and effective life for a 65 “C rise in insulation temperature in a typical power transformer ............ 27 Comparison of various fuse-link time-current characteristics ................ 28 One-line diagram for a dual-feed facility with auxiliary generation for emergency power ................................................. ..3 3 Typical one-line diagram of a static switch ........................... 35 Diagram of a hybrid solid-state transfer switch ......................... 35 One-line diagram for typical building served from 48OY/277-V network ........ 37

TABLES
3.1
3.2 4.1 4.2
4.3 4.4
4.5 4.6 4.7 4.8 4.9
4.10
4.11 4.12 4.13 5.1 5.2 6.1 6.2 6.3 6.4 6.5 7.1
Commonly applied surge arrester voltage ratings by type of surge arrester for common system voltages ...................................... 14 Protection characteristics of metal oxide varistor surge arresters ............. 15 IEEE standard test values for transformer windings and bushings ............ 19 Maximum rated withstand voltages for transformer windings with highest voltage for equipment up to 170 kV: Series I based on European practice ............ 20 Impulse test values for dry-type (indoor) transformers .................... 20 Basic insulation levels for power circuit breakers, switchgear assemblies, and metal-enclosed buses ......................................... 21 Typical critical impulse flashover (CFO) for line insulators ................ 21 Summary of equipment strength .................................. 22 Selected results of component tests for SFSD voltage surges ................ 22 Selected results from SFSD impulse tests on insulators, cables, and arresters ..... 23 Tests on power cable terminators ................................. 24 Typical fuse link ratings for distribution transformers using the K or T fuse links and the high-surge H link .............................. 29 Typical conductor parameters ................................... 30 Maximum allowable temperature by insulation type ..................... 31 Conductor short-circuit factors, F, ................................. 31 Withstand current ratings for automatic transfer switches .................. 34 Performance and feature summary of three types of switches ............... 36 Estimated costs for El transformer tests ............................. 40 Estimated costs for El insulator tests ............................... 40 Estimated costs for SREMP tests on surge arresters ..................... 41 Estimated costs for E3 transformer tests ............................. 42 Summary of the recommended tests and estimated costs .................. 42 Postulated HEMP response of line interface devices ..................... 45
vii


ACRONYMS AND ABBREVIATIONS
ANSI BIL DOE DTRA
EMP HEMP HV HVDC IEC IEEE MOV MV NERC ORNL rms RTU SFSD SREMP wscc
American National Standards Institute basic insulation level U.S. Department of Energy Defense Threat Reduction Agency [formerly the Defense Special Weapons Agency (DSWA), formerly the Defense Nuclear Agency
@WI electromagnetic pulse high-altitude electromagnetic pulse high voltage high-voltage direct current International Electrotechnical Commission Institute of Electrical and Electronics Engineers metal oxide varistor medium voltage North American Electric Reliability Council Oak Ridge National Laboratory root mean square remote terminal unit steep-front short-duration source-region electromagnetic pulse Western States Coordinating Council
ix

1. INTRODUCTION
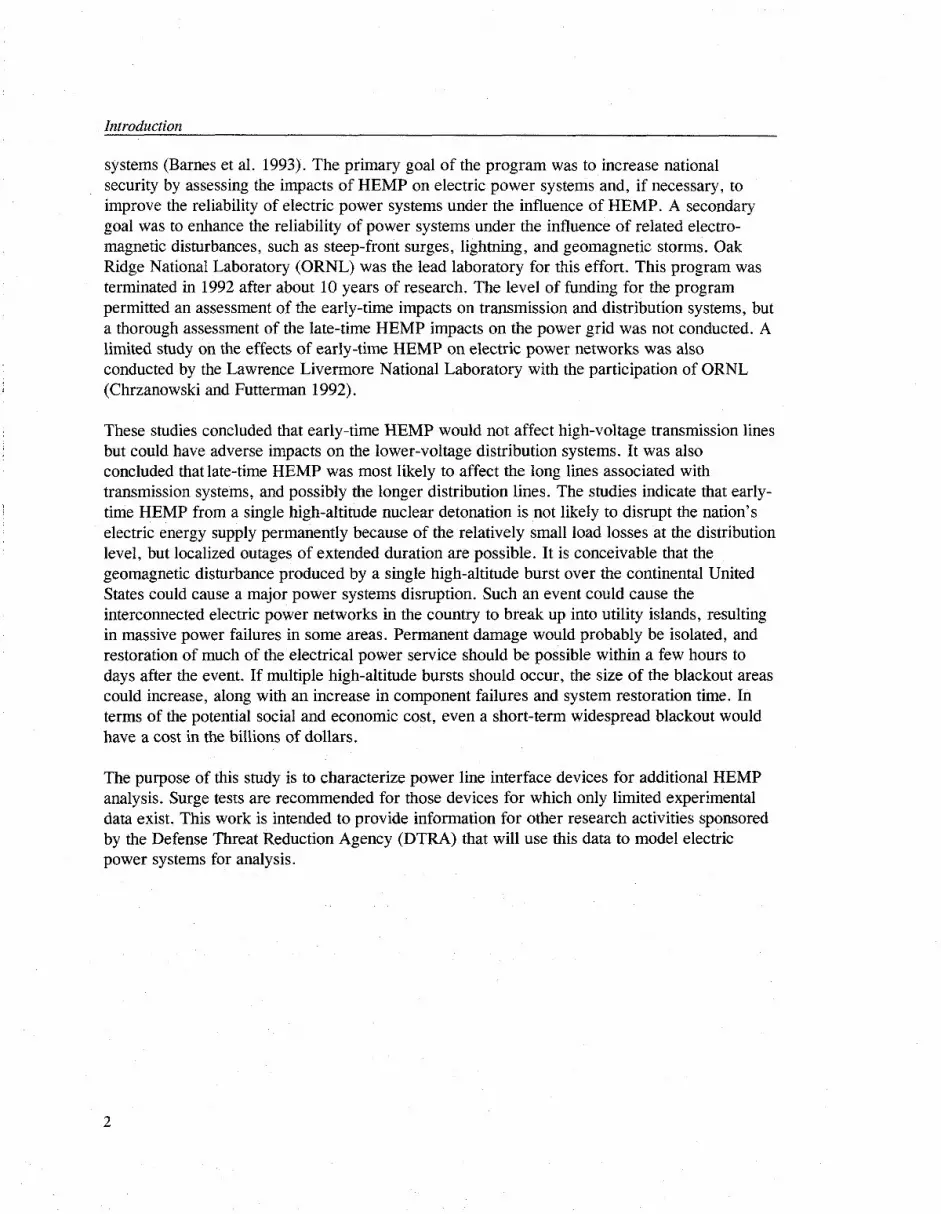
The general vulnerability of electric power systems in the United States and elsewhere to disruptive events caused by nature or man is well established. Power systems are particularly at risk in the case of multiple events that result from equipment failure, system faults, or communications and control system misoperation. The consequences range from short-term, widespread outages with little or no equipment damage to long-term, localized major outages with major damage to key equipment. The usual causes for power system disruptions are weather-related faults caused by lightning or line damage. For example, the initiating event for the widespread Western States Coordinating Council (WSCC) outages during the summer of 1996 was a simple contact between a transmission line and a tree, followed by the misoperation of a single protective relay. The increasing interconnection of power grids and their growing use of long-distance power transfers heightens the probability of regional power outages caused by single events cascading out of control. The changes proposed for restructuring the electric utility industry into a competitive market supply system will result in the loading of critical transmission lines even closer to their capacity limits. This will increase the susceptibility of our nation’s electric supply to disruptive events.
In the past, severe solar geomagnetic storms have caused a range of equipment and operating problems in electric power systems. An intense solar storm in March 1989 caused a widespread blackout of the Hydro-Quebec power system in Canada, as well as failures of several large power transformers and other less severe power disruptions in the United States. The susceptibility of electric power systems to such events has apparently increased during the last 10 to 20 years as power systems have become more interconnected, as transmission lines have increased in length and capacity, and as power systems are being operated closer to their security stability limits than in the past. The severe solar storm that caused the blackout of the Hydro-Quebec system had a peak electric field of about 5 V/km over much of the utility’s service region. It is estimated that the late-time high-altitude electromagnetic pulse (HEMP) electric field peak can be larger than that produced by the most intense solar-induced geomagnetic disturbance.
Some large power transformers, such as those that sustained insulation damage at the Salem‘ nuclear plant site in New Jersey, have been shown to be vulnerable to intense solar storms. Power transformers are special-order purchases that normally require about one year for delivery. If several major power transformers were damaged at the same time, it could take months, or even years, to restore power to some regions. The long lead-time for new transformer construction and the lack of spares contributes to this long recovery time. Heavily populated coastal regions and other areas with relatively low earth conductivity have the largest risk of a geomagnetic disturbance. Thus, given the apparent increasing vulnerability of the nation’s electric power network and the possibility of a large geomagnetic disturbance, there is reason for concern about the reliability of the electrical power system during and after a HEMP event.
In 1983, the Office of Energy Storage and Distribution of the U.S. Department of Energy (DOE) established a research program to assess the impacts of HEMP on electric power
Introduction
systems (Barnes et al. 1993). The primary goal of the program was to increase national security by assessing the impacts of HEMP on electric power systems and, if necessary, to improve the reliability of electric power systems under the influence of HEMP. A secondary goal was to enhance the reliability of power systems under the influence of related electro- magnetic disturbances, such as steep-front surges, lightning, and geomagnetic storms. Oak Ridge National Laboratory (ORNL) was the lead laboratory for this effort. This program was terminated in 1992 after about 10 years of research. The level of funding for the program permitted an assessment of the early-time impacts on transmission and distribution systems, but a thorough assessment of the late-time HEMP impacts on the power grid was not conducted. A limited study on the effects of early-time HEMP on electric power networks was also conducted by the Lawrence Livermore National Laboratory with the participation of ORNL (Chrzanowski and Futterman 1992).
These studies concluded that early-time HEMP would not affect high-voltage transmission lines but could have adverse impacts on the lower-voltage distribution systems. It was also concluded that late-time HEMP was most likely to affect the long lines associated with transmission systems, and possibly the longer distribution lines. The studies indicate that early- time HEMP from a single high-altitude nuclear detonation is not likely to disrupt the nation’s electric energy supply permanently because of the relatively small load losses at the distribution level, but localized outages of extended duration are possible. It is conceivable that the geomagnetic disturbance produced by a single high-altitude burst over the continental United States could cause a major power systems disruption. Such an event could cause the interconnected electric power networks in the country to break up into utility islands, resulting in massive power failures in some areas. Permanent damage would probably be isolated, and restoration of much of the electrical power service should be possible within a few hours to days after the event. If multiple high-altitude bursts should occur, the size of the blackout areas could increase, along with an increase in component failures and system restoration time. In terms of the potential social and economic cost, even a short-term widespread blackout would have a cost in the billions of dollars.
The purpose of this study is to characterize power line interface devices for additional HEMP analysis. Surge tests are recommended for those devices for which only limited experimental data exist. This work is intended to provide information for other research activities sponsored by the Defense Threat Reduction Agency (DTRA) that will use this data to model electric power systems for analysis.
2
2. ELECTRIC POWER NETWORKS
2.1 Electric Power Systems
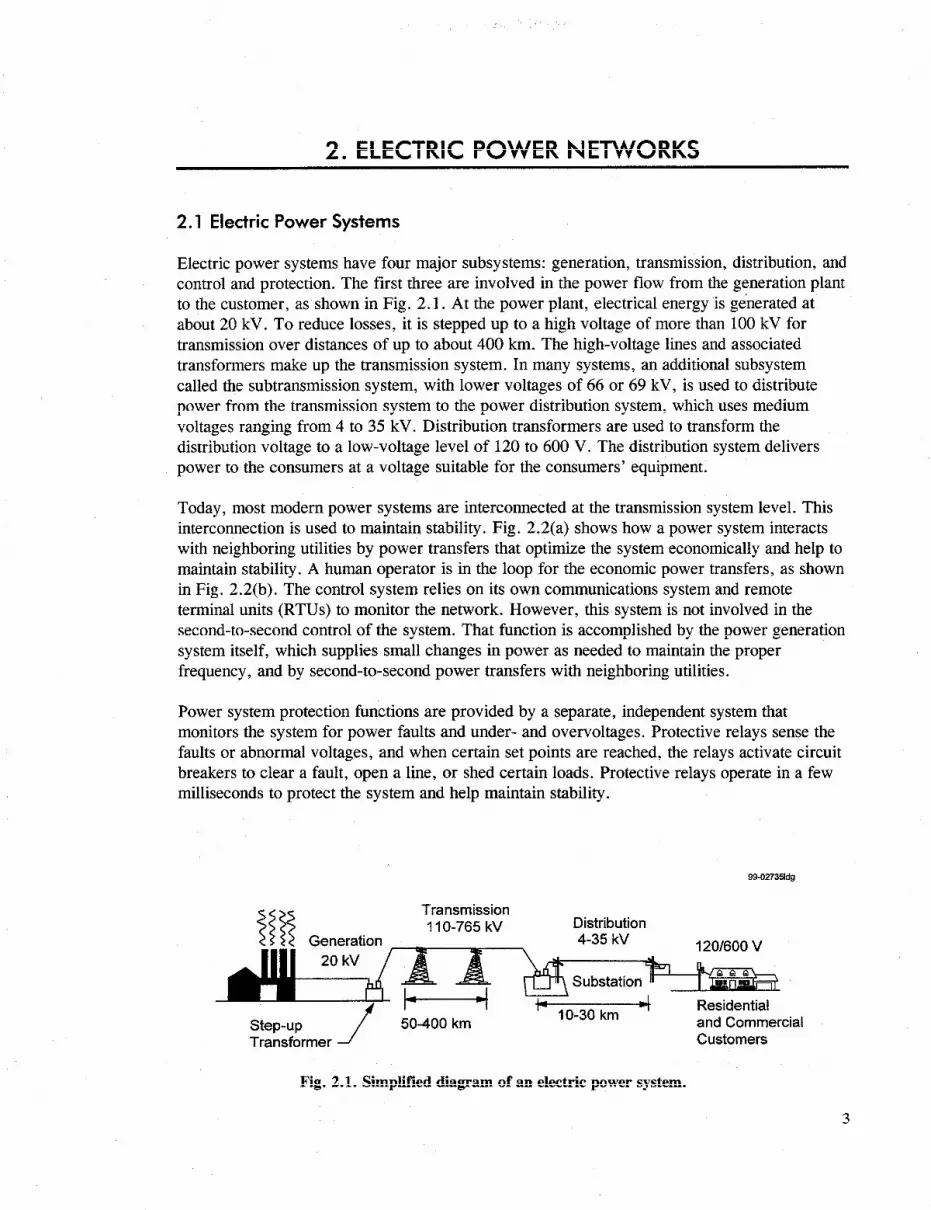
Electric power systems have four major subsystems: generation, transmission, distribution, and control and protection. The first three are involved in the power flow from the generation plant to the customer, as shown in Fig. 2.1. At the power plant, electrical energy is generated at about 20 kV. To reduce losses, it is stepped up to a high voltage of more than 100 kV for transmission over distances of up to about 400 km. The high-voltage lines and associated transformers make up the transmission system. In many systems, an additional subsystem called the subtransmission system, with lower voltages of 66 or 69 kV, is used to distribute power from the transmission system to the power distribution system, which uses medium voltages ranging from 4 to 35 kV. Distribution transformers are used to transform the distribution voltage to a low-voltage level of 120 to 600 V. The distribution system delivers power to the consumers at a voltage suitable for the consumers’ equipment.
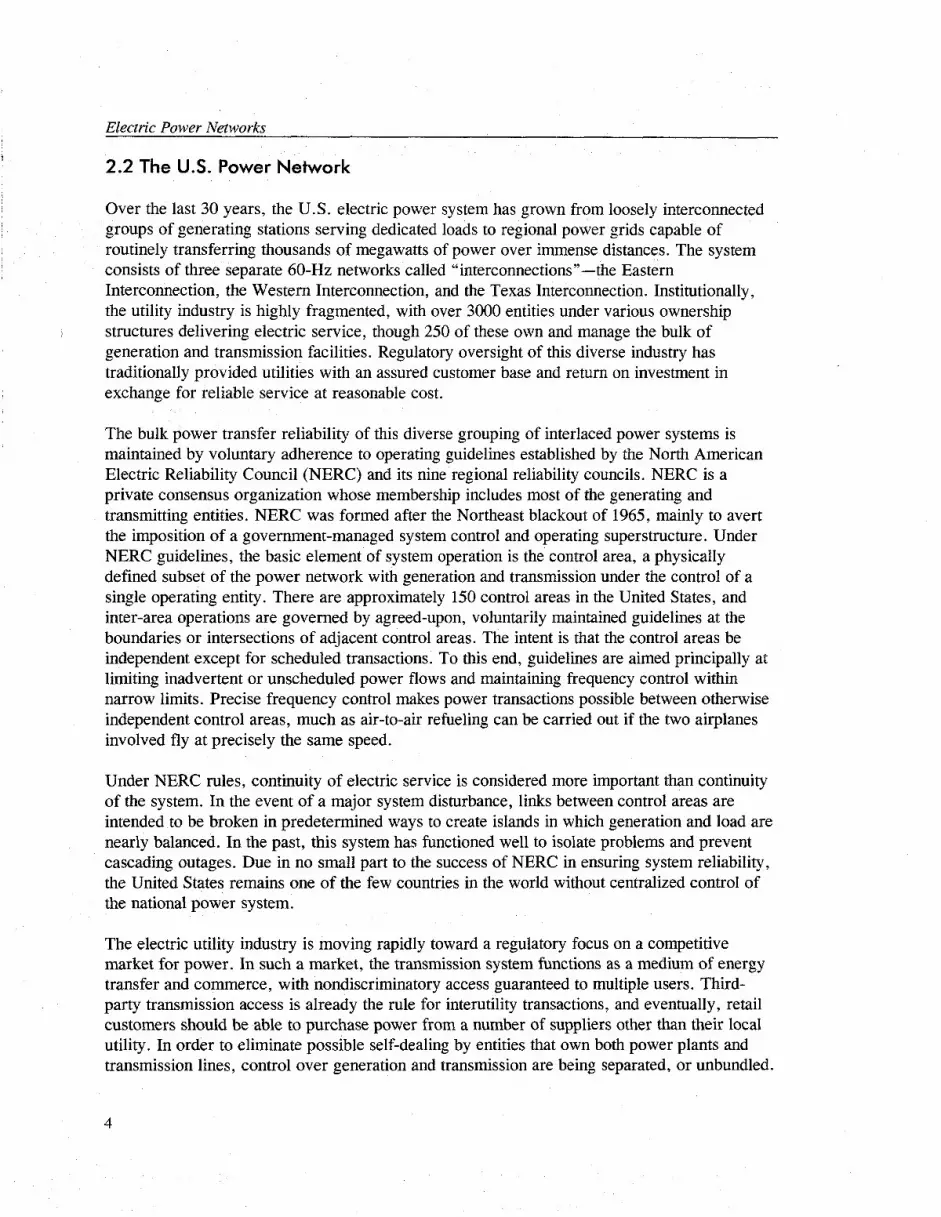
Today, most modern power systems are interconnected at the transmission system level. This interconnection is used to maintain stability. Fig. 2.2(a) shows how a power system interacts with neighboring utilities by power transfers that optimize the system economically and help to maintain stability. A human operator is in the loop for the economic power transfers, as shown in Fig. 2.2(b). The control system relies on its own communications system and remote terminal units (RTUs) to monitor the network. However, this system is not involved in the second-to-second control of the system. That function is accomplished by the power generation system itself, which supplies small changes in power as needed to maintain the proper frequency, and by second-to-second power transfers with neighboring utilities.
Power system protection functions are provided by a separate, independent system that monitors the system for power faults and under- and overvoltages. Protective relays sense the faults or abnormal voltages, and when certain set points are reached, the relays activate circuit breakers to clear a fault, open a line, or shed certain loads. Protective relays operate in a few milliseconds to protect the system and help maintain stability.
%027351dg
Transmission 11 O-765 kV
Step-up Transformer
50-400 km
Fig. 2.1. Simplified diagram of
Distribution
Customers
an electric power system.
3
Electric Power Networks
2.2 The U.S. Power Network
Over the last 30 years, the U.S. electric power system has grown from loosely interconnected 1 $ groups of generating stations serving dedicated loads to regional power grids capable of
I routinely transferring thousands of megawatts of power over immense distances. The system consists of three separate 60-Hz networks called “interconnections’‘-the Eastern Interconnection, the Western Interconnection, and the Texas Interconnection. Institutionally, the utility industry is highly fragmented, with over 3000 entities under various ownership
I structures delivering electric service, though 250 of these own and manage the bulk of generation and transmission facilities. Regulatory oversight of this diverse industry has traditionally provided utilities with an assured customer base and return on investment in exchange for reliable service at reasonable cost.
The bulk power transfer reliability of this diverse grouping of interlaced power systems is maintained by voluntary adherence to operating guidelines established by the North American Electric Reliability Council (NERC) and its nine regional reliability councils. NERC is a private consensus organization whose membership includes most of the generating and transmitting entities. NERC was formed after the Northeast blackout of 1965, mainly to avert the imposition of a government-managed system control and operating superstructure. Under NERC guidelines, the basic element of system operation is the control area, a physically defined subset of the power network with generation and transmission under the control of a single operating entity. There are approximately 150 control areas in the United States, and inter-area operations are governed by agreed-upon, voluntarily maintained guidelines at the boundaries or intersections of adjacent control areas. The intent is that the control areas be independent except for scheduled transactions. To this end, guidelines are aimed principally at limiting inadvertent or unscheduled power flows and maintaining frequency control within narrow limits. Precise frequency control makes power transactions possible between otherwise independent control areas, much as air-to-air refueling can be carried out if the two airplanes involved fly at precisely the same speed.
Under NERC rules, continuity of electric service is considered more important than continuity of the system. In the event of a major system disturbance, links between control areas are intended to be broken in predetermined ways to create islands in which generation and load are nearly balanced. In the past, this system has functioned well to isolate problems and prevent cascading outages. Due in no small part to the success of NERC in ensuring system reliability, the United States remains one of the few countries in the world without centralized control of the national power system.
The electric utility industry is moving rapidly toward a regulatory focus on a competitive market for power. In such a market, the transmission system functions as a medium of energy transfer and commerce, with nondiscriminatory access guaranteed to multiple users. Third- party transmission access is already the rule for interutility transactions, and eventually, retail customers should be able to purchase power from a number of suppliers other than their local utility. In order to eliminate possible self-dealing by entities that own both power plants and transmission lines, control over generation and transmission are being separated, or unbundled.
4
Electric Power Networks
99-02739ldg
Power Flow, Uni-directional
+ggg?zE Power Flow, Bi-directional
<-> Data/Information Exchange
(SCADA Systems)
(a) Simplified block diagram of a power system control system
Protective Relay Monitoring
I- ____--------
I I I I I I I I I L-,------------------J
(b) Control architecture
Fig. 2.2. Electric power system control system.
Separation of control authority violates the assumption underlying the functioning of the NERC control area system, while competitive power supply in general has a number of other implications for system reliability. The most significant, in terms of the large-scale vulner- ability of the system, is the tendency toward long-distance power transactions as users go farther and farther afield in an effort to fiid lower-cost resources. Long-distance transactions directly stress the transmission system, while the dynamic nature of the market, with transactions being altered hourly, makes it difficult to predict load and generation balance within any geographic area.
Failure to achieve load and generation balance during system breakup defeats the purpose of islanding schemes and increases the severity and extent of outages. Of the four islands created by the WSCC system breakup of August 10, 1996, only one actually enjoyed load and
5
Electric Power Networks
generation balance; and in that island, almost no firm customers experienced outages. In the other islands, nearly 7.3 million customers lost power as under- or over-frequency relays operated to shed over 27,000 MW of generation due to load and generation unbalance (Taylor and Erickson 1997).
In an effort to address some of the reliability issues arising out of the transition to a competitive market, NERC has converted its voluntary guidelines into binding rules and has established a system of security coordinators to oversee the actions of control area operators (now referred to as “independent system operators”). It is also expected that some control areas will be consolidated into fewer, larger units. Thus, somewhat paradoxically, the U.S. electric supply industry, in the name of increased competition, is moving toward a greater level of centralized control over power system operations. It remains to be seen whether a voluntary, consensus organization such as NERC can continue to provide the framework within which the reliability of the U.S. power system can be ensured.
2.3 Foreign Power Systems
Power system operating practices outside the United States differ significantly from U.S. practice, mainly in the use of a centralized operating authority with responsibility for power plant dispatch as well as transmission system operation. In many countries, the centralized operating authority is a government agency, but even when the system is privatized, the same model can apply. In the United Kingdom, for instance, a central pool dispatches all power based on bid-in prices, with power transactions between generators and purchasers being mainly contractual documents and not true physical sales. The effect of such an operating structure is to deemphasize the importance of frequency control as a means of enabling transactions within the country, especially if the country is essentially an isolated system, as is the case with the United Kingdom.
Transactions between countries under this scenario are handled either by transferring a portion of the receiving country’s grid to the sending country, as is done between Ukraine and Russia, or by construction of asynchronous high-voltage direct current (HVDC) transmission ties such as those that link the United Kingdom and the French (western European) grids, or those between Quebec and the U.S. eastern interconnection. Similar links are being constructed to interconnect the systems of the former Eastern Bloc countries in Central Europe to the western European grid. The western European system itself is interconnected and operated in a fashion similar to U.S. practice, if one considers each national power system as constituting a control area. While HVDC ties resolve the problem of interconnecting nonsynchronous power systems, they are often of limited capacity, which tends to limit opportunities for either electric trade or mutual system support across national boundaries.
The centralized operation model can have an effect on system reliability philosophy and practice. The transmission system of the former Soviet Union was characterized by long transmission lines that transferred large amounts of power over great distances with minimal redundant capacity reserves. Like the western U.S. grid, the system was stability-limited-that is, power transfer capacity was less than the thermal limits of the transmission line conductors.
6
Electric Power Networks
In particular, failures of system elements could trigger oscillatory disturbances, causing portions of the system to lose synchronism with other portions, effectively breaking up the grid, and terminating all power transfers. Rather than depend upon islanding schemes to supervise breakup of the transmission system and preserve electric service, as is U.S. practice, the Soviets deployed a coordinated, centralized protective system whose function was to shed load and generation as required to keep the remainder of the system in balance and the transmission system intact. After a disturbance, restoration was carried out by reconnecting load and generation in controlled steps to the intact transmission system.
The philosophy of the Soviet control system placed a higher priority on the continuity of the system than on continuity of service because the centralized authority was responsible for both. This is the opposite of practice in the United States, where independent control area operators consider their first duty to be preservation of service within the control area, with restoration of the links between control areas taking place only after the disturbance has ended. The Soviet control system was hampered by the lack of sufficiently powerful computers, by poor network monitoring, and by poor communications. Nonetheless, the concept of a coordinated systemwide automatic emergency response capability may be appealing in the restructured environment developing in the United States, in which the market players will be increasingly reluctant to share information or to voluntarily coordinate operations. A similar system architecture has reportedly been adopted by the Chubu Electric Power Company in Japan.
2.4 Utility Grounding Systems
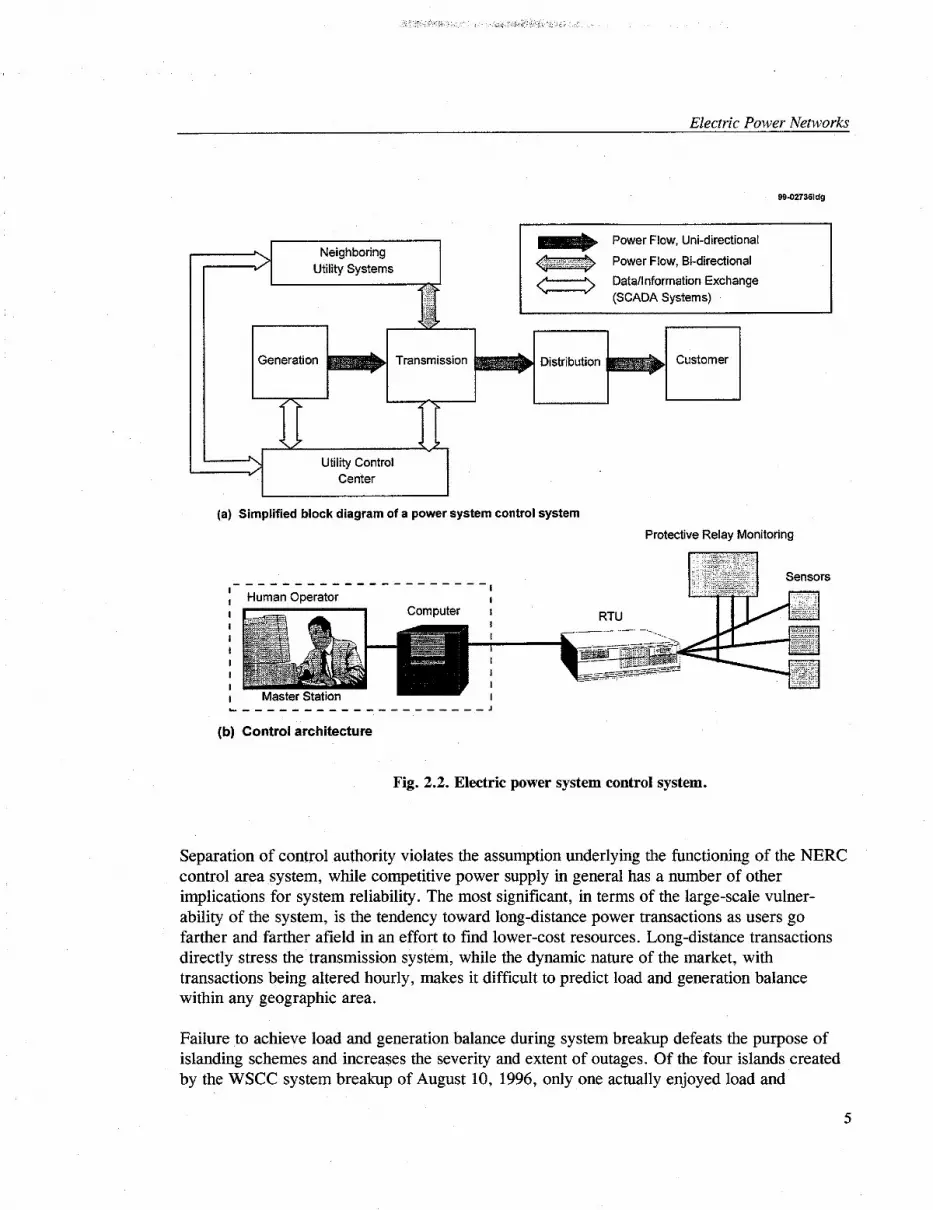
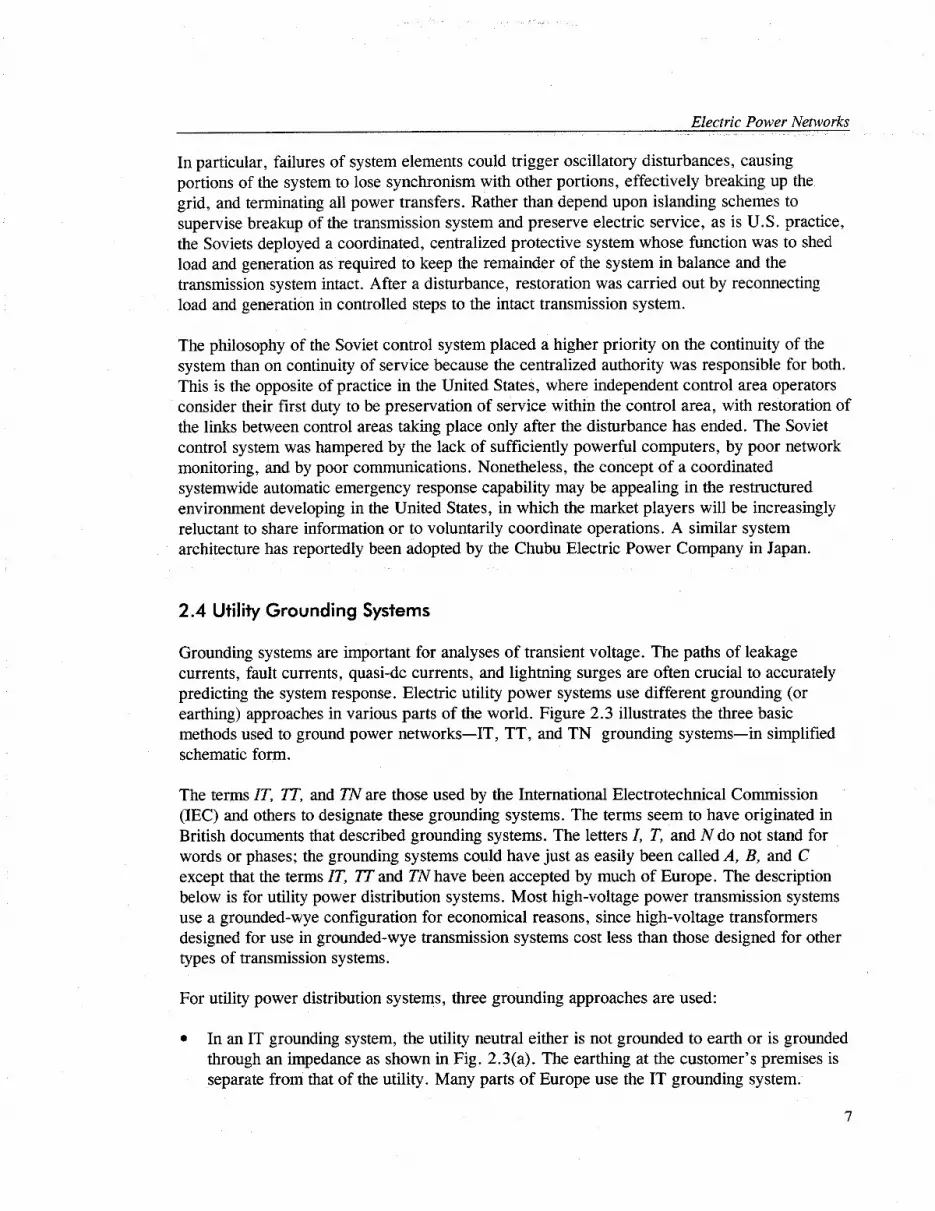
Grounding systems are important for analyses of transient voltage. The paths of leakage currents, fault currents, quasi-dc currents, and lightning surges are often crucial to accurately predicting the system response. Electric utility power systems use different grounding (or earthing) approaches in various parts of the world. Figure 2.3 illustrates the three basic methods used to ground power networks-IT, TT, and TN grounding systems-in simplified schematic form.
The terms IT, TT, and TN are those used by the International Electrotechnical Commission (IEC) and others to designate these grounding systems. The terms seem to have originated in British documents that described grounding systems. The letters 1, T, and N do not stand for words or phases; the grounding systems could have just as easily been called A, B, and C except that the terms ZT, 27 and TN have been accepted by much of Europe. The description below is for utility power distribution systems. Most high-voltage power transmission systems use a grounded-wye configuration for economical reasons, since high-voltage transformers designed for use in grounded-wye transmission systems cost less than those designed for other types of transmission systems.
For utility power distribution systems, three grounding approaches are used:
l In an IT grounding system, the utility neutral either is not grounded to earth or is grounded through an impedance as shown in Fig. 2.3(a). The earthing at the customer’s premises is separate from that of the utility. Many parts of Europe use the IT grounding system.
7
Electric Power Networks
l In a TT grounding system [Fig. 2.3(b)], the utility neutral is intentionally grounded (often quite frequently), but the grounding at the customer’s facility is separate from that of the utility. The TT grounding system is used in many parts of Asia.
l In the TN grounding system, the utility neutral is intentionally grounded throughout the network [Fig. 2.3(c)]. The earthing at the customer’s premises is tied to the protective neutral of the utility. The TN grounding system predominates throughout the United States.
From the U.S. perspective, the TN-based distribution system provides better reliability and service. The well-grounded system provides the ability to clear faults and limit voltage rise on the faulted network. It also provides a low-impedance path back to the power source and limits common-mode voltage rise during fault conditions.
8

Electric Power Networks
HV Lines
9402755ldg
A- -=
(a) IT grounding system typically used in Europe
HV Lanes
Substatmn &-
I End User
-GE=-
(b) TT grounding system typically used in Asia
HV Lines
Substation
(c) TN grounding system typically used in United States
Fig. 2.3. Utility grounding systems.
9

3. LIGHTNING ACTIVITY AND LIGHTNING PROTECTION
3.1 Introduction
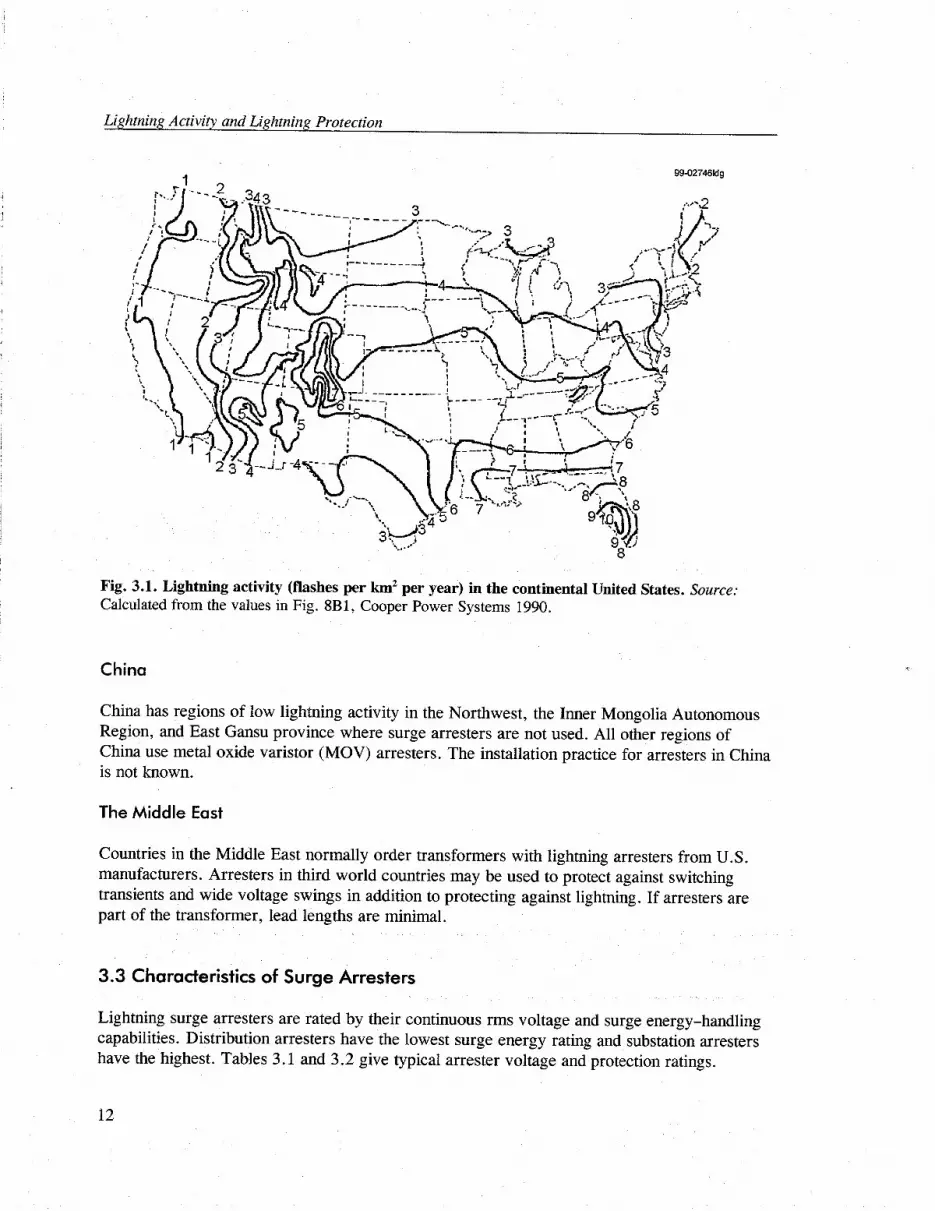
Line interface devices that are protected by surge arresters are not likely to be vulnerable to HEMP-induced surges (Barnes et al. 1993). It is general practice to use surge arresters on high-voltage (HV) power transmission lines in regions of both high and low lightning activity to protect the lines against switching transients as well as lightning. In regions with low lightning activity, however, medium-voltage (MV) power distribution and subtransmission lines may not have surge arrester protection. This issue is examined in this section for selected countries.
3.2 Use of Surge Arresters in Selected Countries
United States
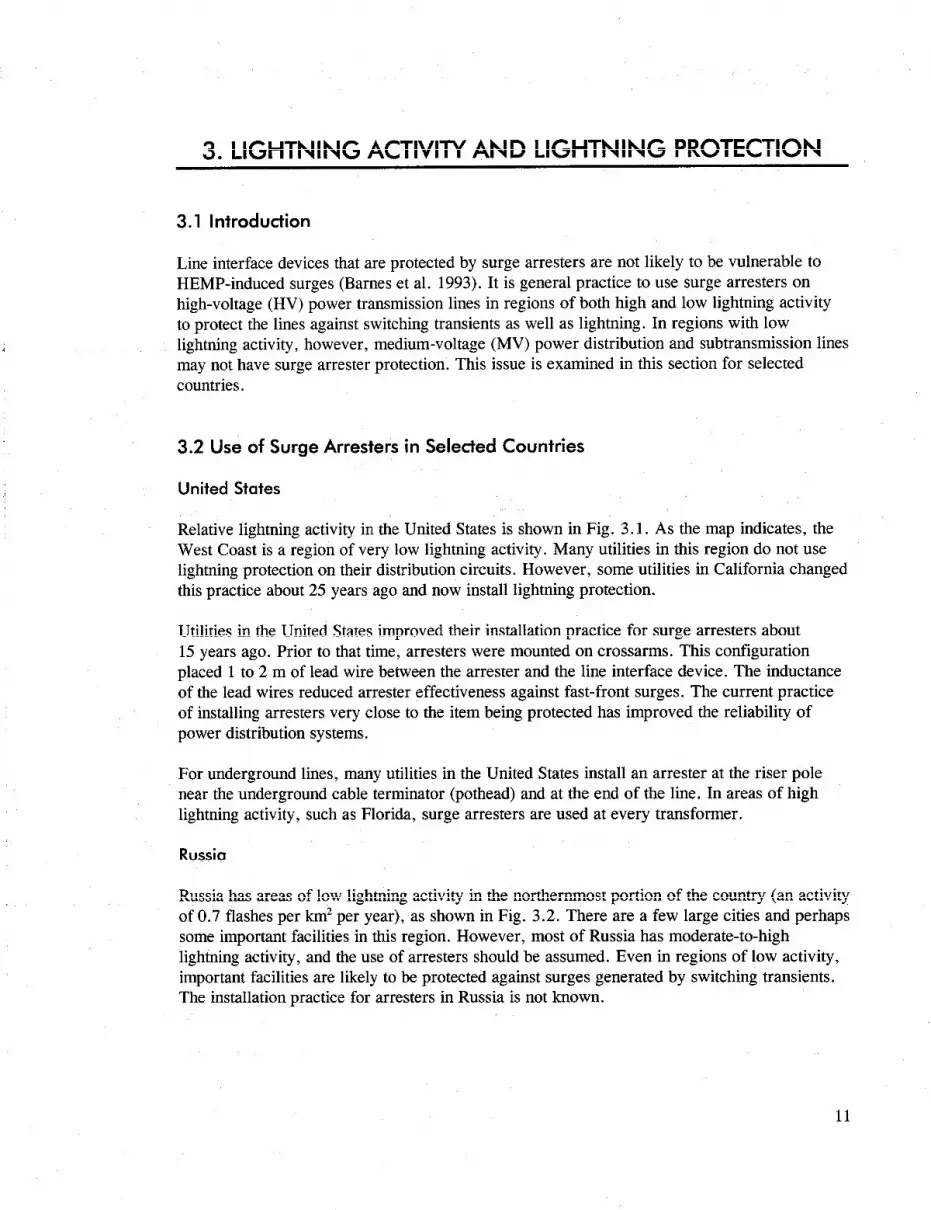
Relative lightning activity in the United States is shown in Fig. 3.1. As the map indicates, the West Coast is a region of very low lightning activity. Many utilities in this region do not use lightning protection on their distribution circuits. However, some utilities in California changed this practice about 25 years ago and now install lightning protection.
Utilities in the United States improved their installation practice for surge arresters about 15 years ago. Prior to that time, arresters were mounted on crossarms. This configuration placed 1 to 2 m of lead wire between the arrester and the line interface device. The inductance of the lead wires reduced arrester effectiveness against fast-front surges. The current practice of installing arresters very close to the item being protected has improved the reliability of power distribution systems.
For underground lines, many utilities in the United States install an arrester at the riser pole near the underground cable terminator (pothead) and at the end of the line. In areas of high lightning activity, such as Florida, surge arresters are used at every transformer.
Russia
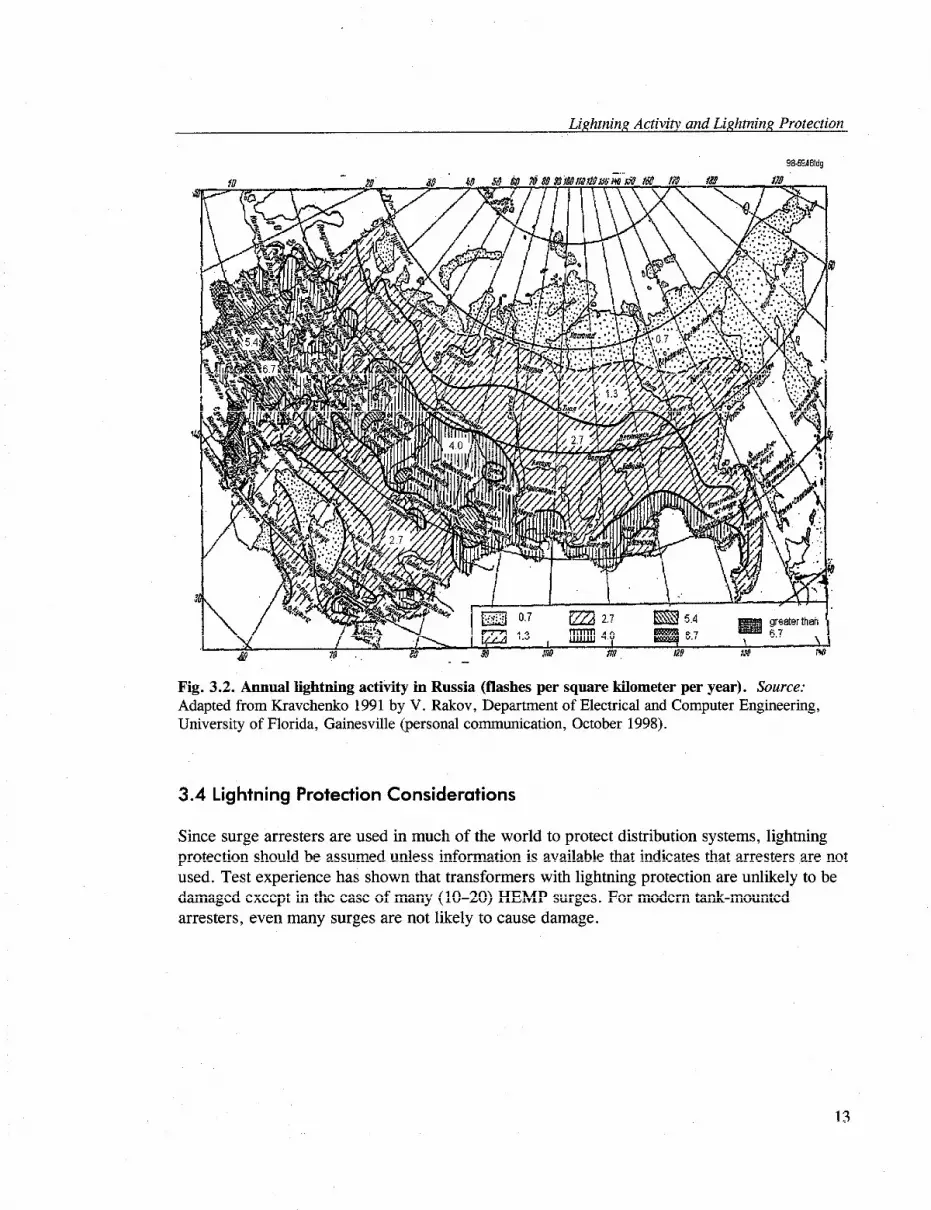
Russia has areas of low lightning activity in the northernmost portion of the country (an activity of 0.7 flashes per km* per year), as shown in Fig. 3.2. There are a few large cities and perhaps some important facilities in this region. However, most of Russia has moderate-to-high lightning activity, and the use of arresters should be assumed. Even in regions of low activity, important facilities are likely to be protected against surges generated by switching transients. The installation practice for arresters in Russia is not known.
11
Lightning Activity and Lightning Protection
99s02746169
Fig. 3.1. Lightning activity (flashes per km* per year) in the continental United States. Source: Calculated from the values in Fig. SBl, Cooper Power Systems 1990.
China
China has regions of low lightning activity in the Northwest, the Inner Mongolia Autonomous Region, and East Gansu province where surge arresters are not used. All other regions of China use metal oxide varistor (MOV) arresters. The installation practice for arresters in China is not known.
The Middle East
Countries in the Middle East normally order transformers with lightning arresters from U.S. manufacturers. Arresters in third world countries may be used to protect against switching transients and wide voltage swings in addition to protecting against lightning. If arresters are part of the transformer, lead lengths are minimal.
3.3 Characteristics of Surge Arresters
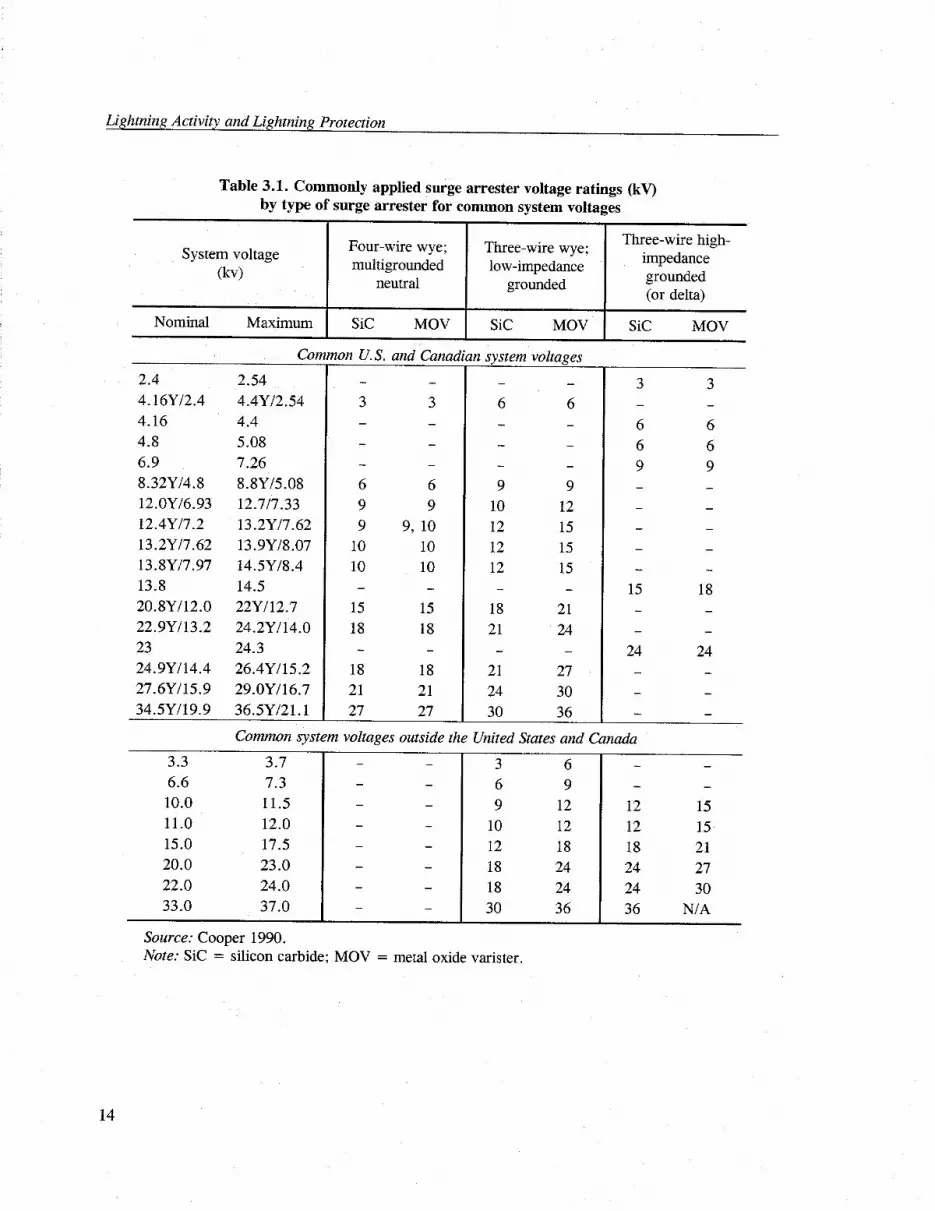
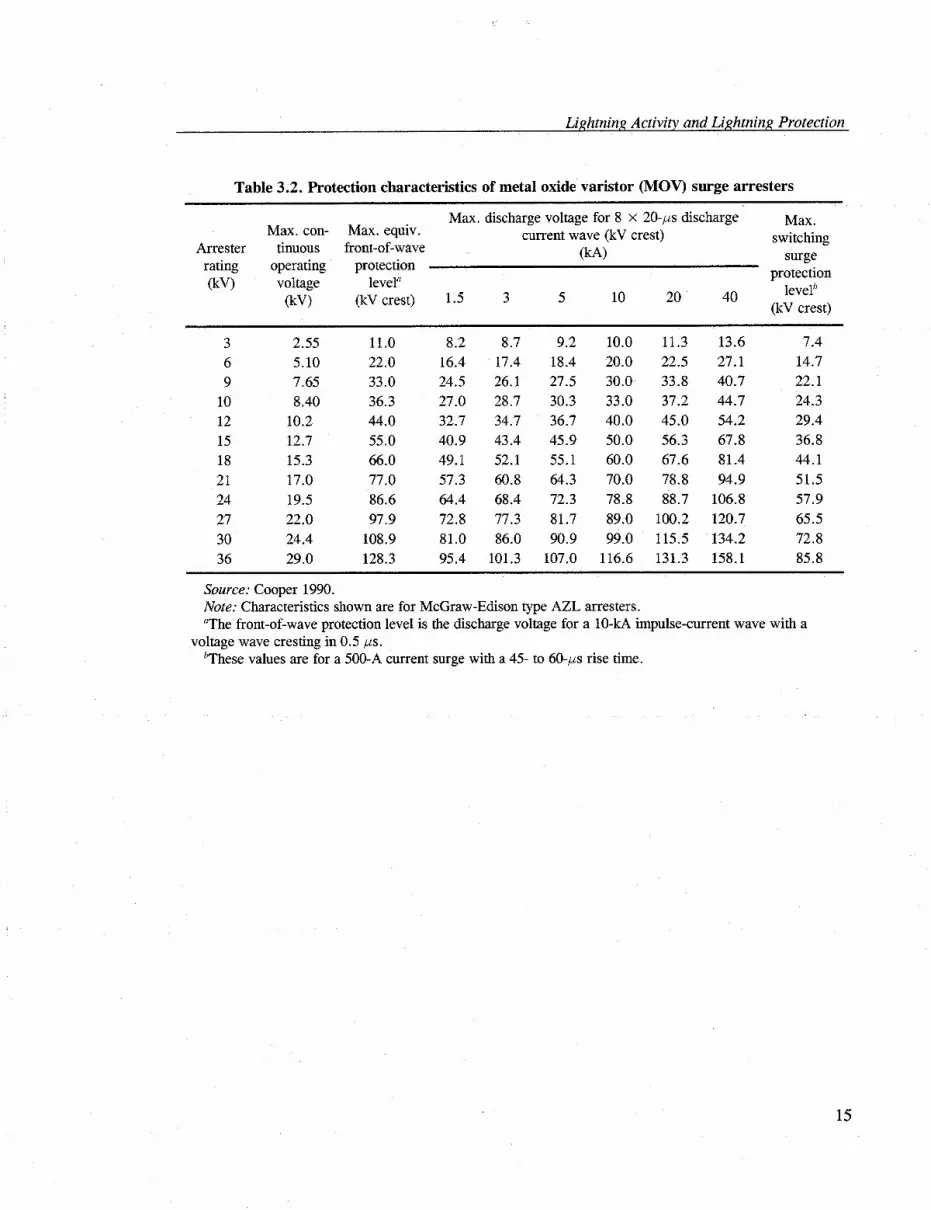
Lightning surge arresters are rated by their continuous rms voltage and surge energy-handling capabilities. Distribution arresters have the lowest surge energy rating and substation arresters have the highest. Tables 3.1 and 3.2 give typical arrester voltage and protection ratings.
12
Lightning Activity and Lightning Protection
Fig. 3.2. Annual lightning activity in Russia (flashes per square kilometer per year). Source: Adapted from Kravchenko 1991 by V. Rakov, Department of Electrical and Computer Engineering, University of Florida, Gainesville (personal communication, October 1998).
3.4 Lightning Protection Considerations
Since surge arresters are used in much of the world to protect distribution systems, lightning protection should be assumed unless information is available that indicates that arresters are not used. Test experience has shown that transformers with lightning protection are unlikely to be damaged except in the case of many (10-20) HEMP surges. For modern tank-mounted arresters, even many surges are not likely to cause damage.
13
Lightning Activity and Lightning Protection
Table 3.1. Commonly applied surge arrester voltage ratings (kv) by type of surge arrester for common system voltages
System voltage (W
Nominal Maximum
Four-wire wye; Three-wire wye; multigrounded low-impedance
neutral grounded
SIC MOV Sic MOV
Three-wire high- impedance grounded (or delta)
Sic MOV
COK
2.4 2.54 4.16Yl2.4 4.4Yl2.54 4.16 4.4 4.8 5.08 6.9 7.26 8.32Yi4.8 8.8Yl5.08 12.OYl6.93 12.717.33 12.4Yl7.2 13.2Yf7.62 13.2Yi7.62 13.9Yi8.07 13.811117.97 14.5Yl8.4 13.8 14.5 20.8Y/12.0 22Yl12.7 22.9Yl13.2 24.2Yl14.0 23 24.3 24.9Yl14.4 26.4Y115.2 27.6YI15.9 29.0Y116.7 34.5YI19.9 36.5YI21.1
3
6 9 9
10 10 -
15 18
18 21 27
3 -
-
6 9
9, 10 10 10
15 18
18 21 27
-
6 6
- -
9 9 10 12 12 15 12 15 12 15 -
18 21 21 24
-
21 27 24 30 30 36
3 3
6 6 6 6 9 9 - - -
- - -
15 18
24 24
Common system voltages outside the United States and Canada
3.3 3.7 - -
6.6 7.3 -
10.0 11.5 -
11.0 12.0 15.0 17.5 20.0 23.0 -
22.0 24.0 33.0 37.0 -
3 6 6 9 9 12
10 12 12 18 18 24 18 24 30 36
Source: Cooper 1990. Note: Sic = silicon carbide; MOV = metal oxide varister.
-
12 15 12 15 18 21 24 27 24 30 36 N/A
14
Li,ghtning Activity and Lightning Protection
Table 3.2. Protection characteristics of metal oxide varistor (MOV) surge arresters
Max. con- Max. equiv. Max. discharge voltage for 8 x 20-PS discharge Max.
tinuous front-of-wave current wave (kV crest)
Arrester switching
rating operating protection RN surge
W) voltage level” protection
tw (kv crest) 1.5 3 5 10 20 40 level” (kV crest)
3 2.55 11.0 8.2 8.7 9.2 10.0 11.3 13.6 7.4 6 5.10 22.0 16.4 17.4 18.4 20.0 22.5 27.1 14.7 9 7.65 33.0 24.5 26.1 27.5 30.0 33.8 40.7 22.1
10 8.40 36.3 27.0 28.7 30.3 33.0 37.2 44.7 24.3 12 10.2 44.0 32.7 34.7 36.7 40.0 45.0 54.2 29.4 15 12.7 55.0 40.9 43.4 45.9 50.0 56.3 67.8 36.8 18 15.3 66.0 49.1 52.1 55.1 60.0 67.6 81.4 44.1 21 17.0 77.0 57.3 60.8 64.3 70.0 78.8 94.9 51.5 24 19.5 86.6 64.4 68.4 72.3 78.8 88.7 106.8 57.9 27 22.0 97.9 72.8 77.3 81.7 89.0 100.2 120.7 65.5 30 24.4 108.9 81.0 86.0 90.9 99.0 115.5 134.2 72.8 36 29.0 128.3 95.4 101.3 107.0 116.6 131.3 158.1 85.8
Sowce: Cooper 1990. Note: Characteristics shown are for McGraw-Edison type AZL arresters. “The front-of-wave protection level is the discharge voltage for a lo-kA impulse-current wave with a
voltage wave cresting in 0.5 ys. hThese values are for a 500-A current surge with a 45- to 6O+s rise time.
15

4. LINE INTERFACE DEVICES
4.1 Introduction
Line interface devices in primary and secondary distribution systems are most likely to be damaged by electromagnetic-pulse- (EMP) induced surges because of the low and medium voltages used in distribution systems. Late-time HEMP will affect both transmission and distribution systems but will most adversely affect long transmission lines. Transformers in transmission systems have become saturated at levels of a few volts per kilometer during solar storms, and some very long distribution circuits have been affected during solar storms.
This section discusses the parameters of line interface devices that might be used to model damage by EMP. Most of these parameters are available from IEEE and IEC standards, which identify the immunity levels these devices are required to meet. The section also presents test data from the DOE EMP program.
4.2 Standard Dielectric Tests
Dielectric tests are performed on transformers, circuit breakers, switchgear, and other line interface devices in order to ensure immunity to certain lightning and switching surges. The level and type of tests are described in various standards used by utilities to specify transformers. Most U.S. utilities use IEEE standards. European and other utilities use the international standard IEC 76-3.
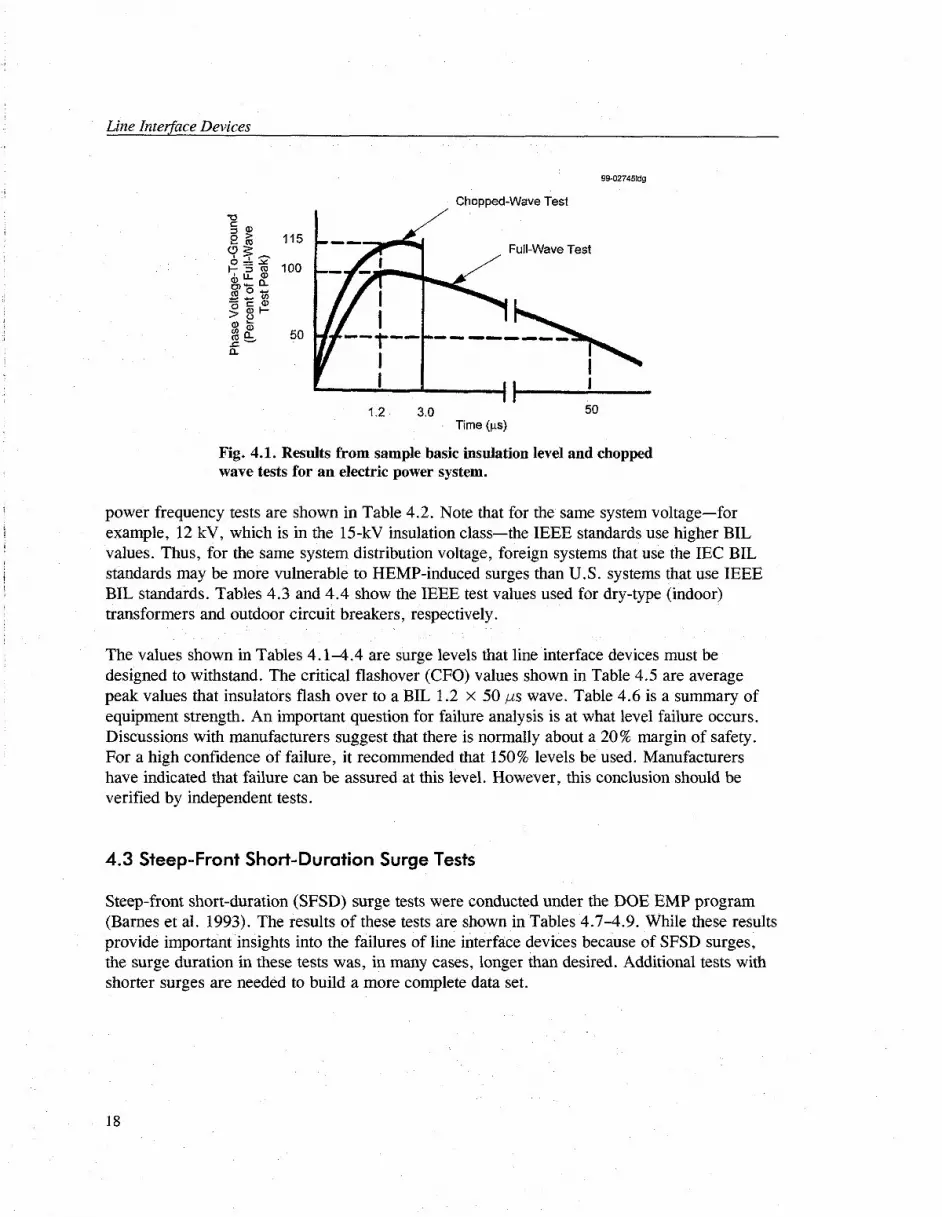
For power system transformers, IEEE C57.12.00 applies. Four tests are used for electric power systems: the basic insulation level (BIL) test, the chopped wave test, a switching surge test, and a low-frequency (power frequency) test (ANSI/IEEE 1983). The first two are intended to simulate a lightning surge.
l The BIL test uses an impulse of a 1.2 X 50 ps wave in which the rise time from 10% to 90% is 1.2 ps and the fall time from 50% of the rising slope to 50% of the falling slope is 50 pus.
l A chopped wave test is similar to the BIL test except its magnitude is 10% higher and the wave is chopped after about 3 ps.
l The switching surge test uses a slow wave to simulate a switching surge. This surge has a time to crest that exceeds 100 ,us and a fall time to the first zero crossing of more than 1000 ,us. The switching surge crest voltage is typically 83% of that of the BIL test value.
l The power frequency test is also called the high pot test. This is a 50- or 60-Hz high- potential test applied for 1 minute.
Figure 4.1 shows the results from sample BIL and chopped wave tests.
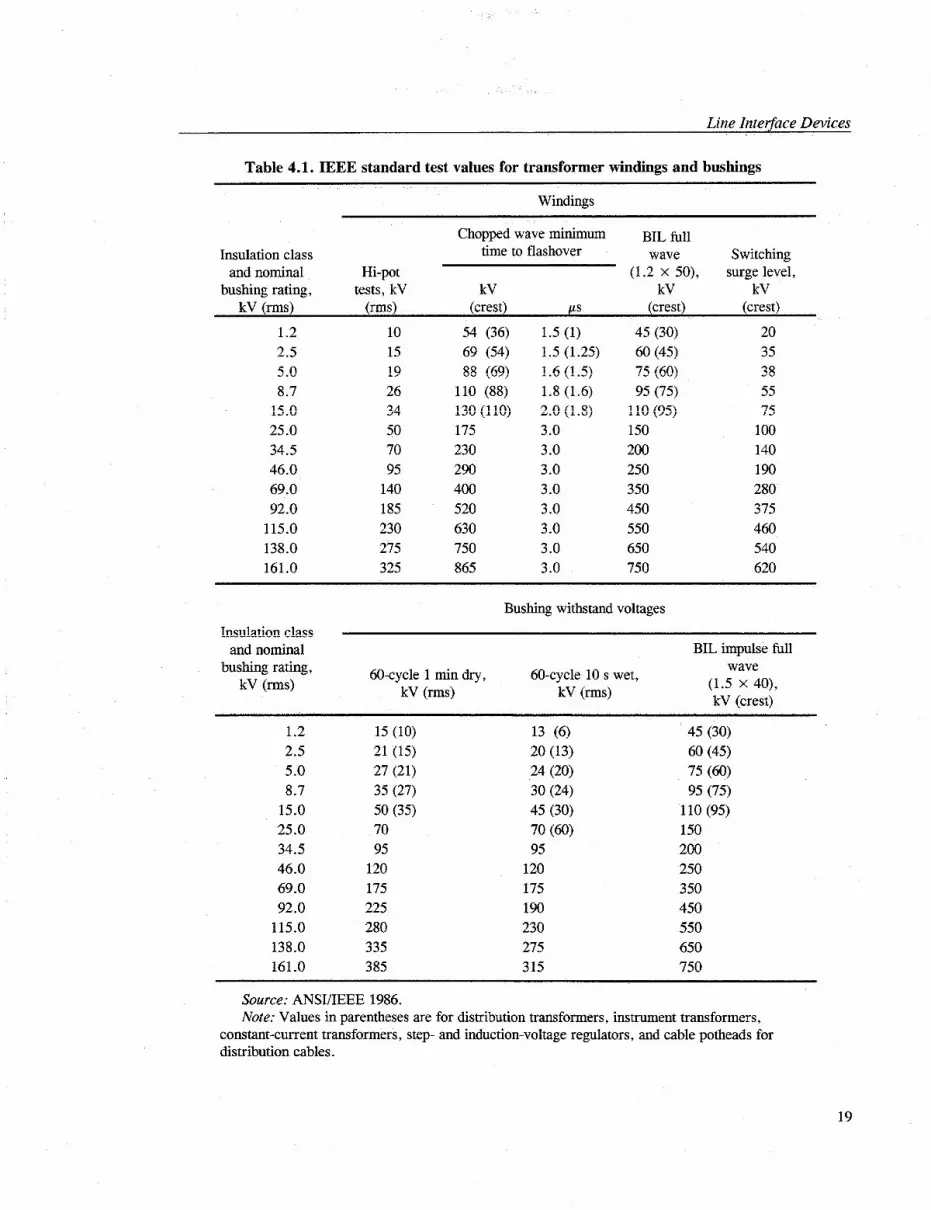
The IEEE standard voltage withstand test values for transformer windings and bushings as a function of insulation class are shown in Table 4.1. The maximum IEC values for BIL and
17
Line Inteqace Devices
99027451dg
Chopped-Wave Test
Full-Wave Test
. 1.2 3.0 50
Time (ps)
Fig. 4.1. Results from sample basic insulation level and chopped wave tests for an electric power system.
i
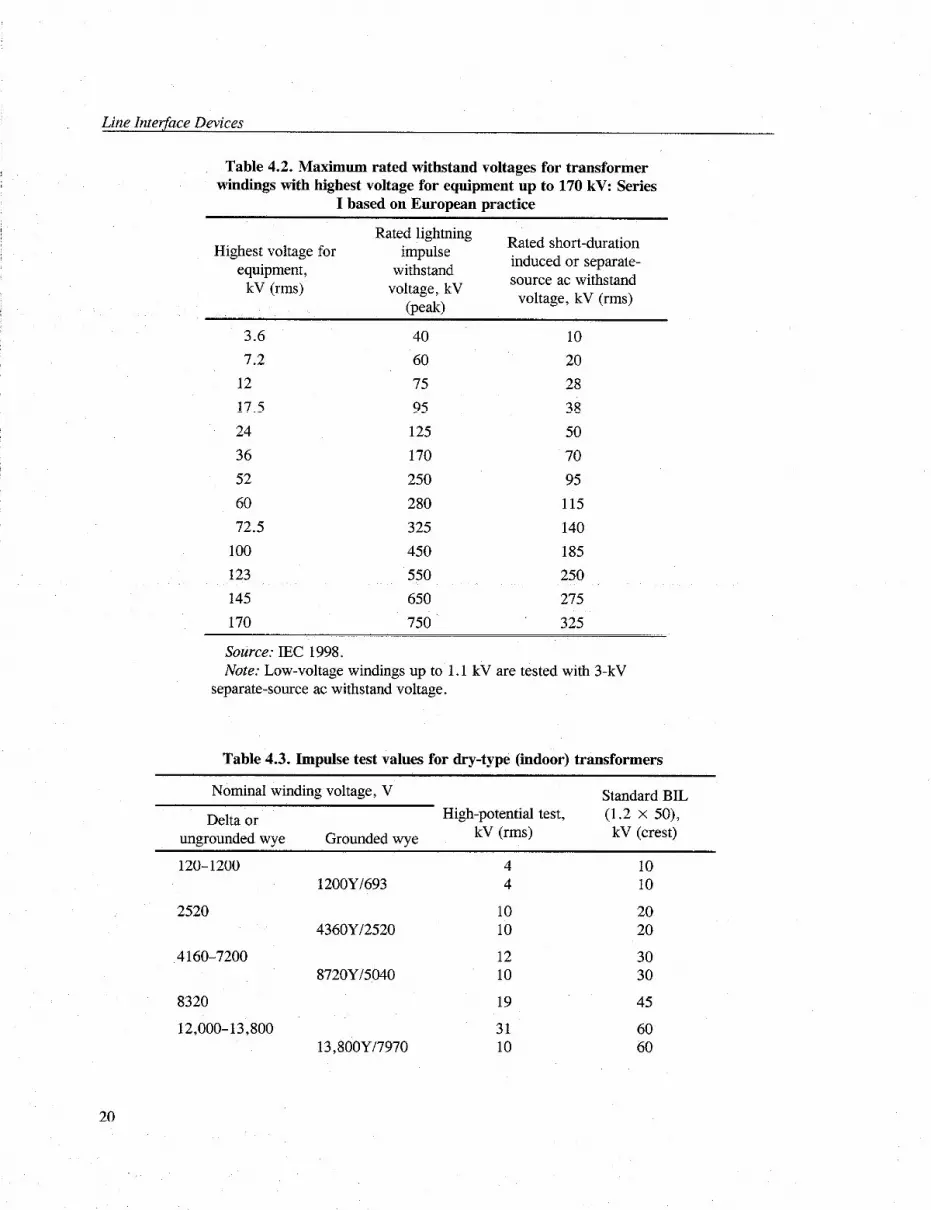
power frequency tests are shown in Table 4.2. Note that for the same system voltage-for example, 12 kV, which is in the 15-kV insulation class-the IEEE standards use higher BIL values. Thus, for the same system distribution voltage, foreign systems that use the IEC BIL standards may be more vulnerable to HEMP-induced surges than U.S. systems that use IEEE BIL standards. Tables 4.3 and 4.4 show the IEEE test values used for dry-type (indoor) transformers and outdoor circuit breakers, respectively.
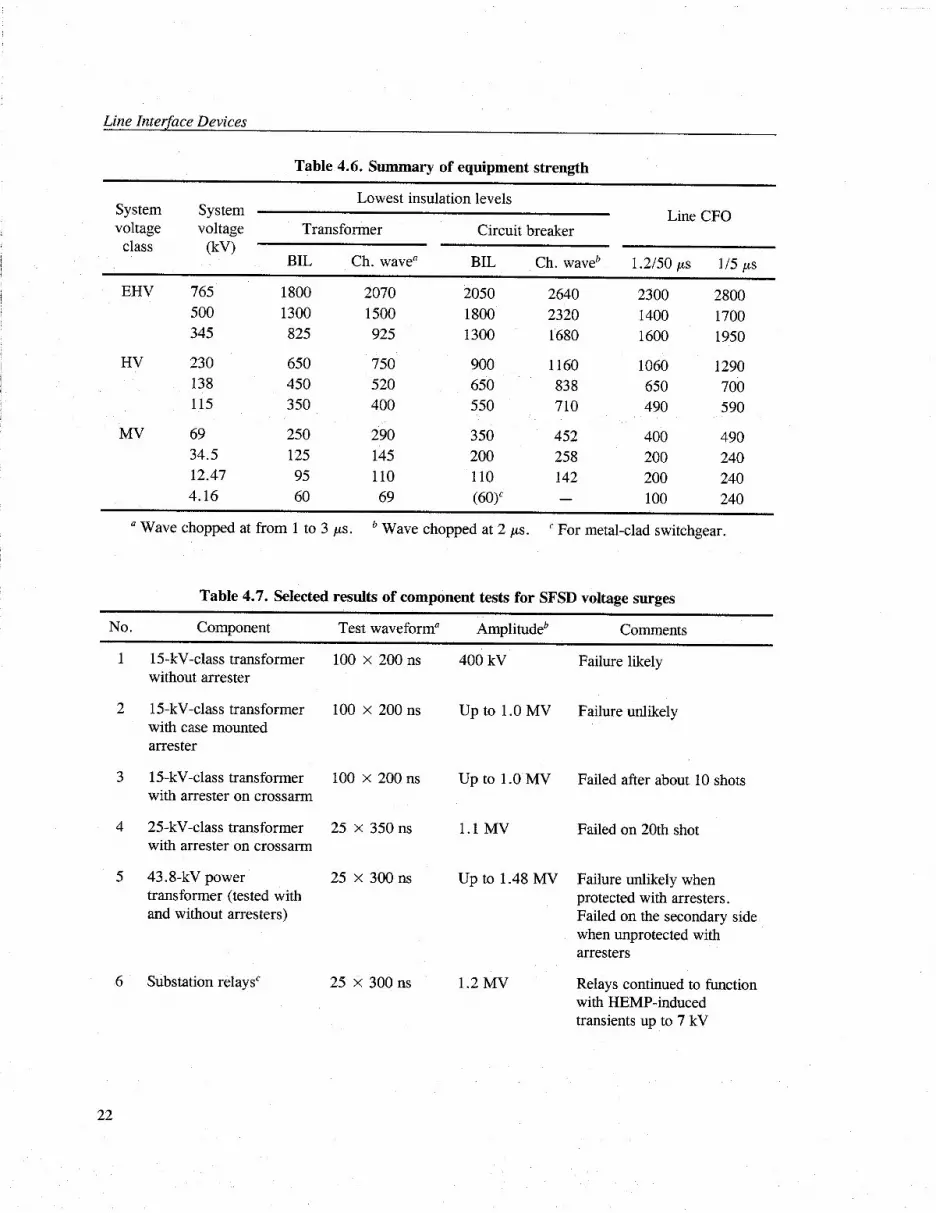
The values shown in Tables 4.1-4.4 are surge levels that line interface devices must be designed to withstand. The critical flashover (CFO) values shown in Table 4.5 are average peak values that insulators flash over to a BIL 1.2 x 50 pus wave. Table 4.6 is a summary of equipment strength An important question for failure analysis is at what level failure occurs. Discussions with manufacturers suggest that there is normally about a 20% margin of safety. For a high confidence of failure, it recommended that 150% levels be used. Manufacturers have indicated that failure can be assured at this level. However, this conclusion should be verified by independent tests.
4.3 Steep-Front Short-Duration Surge Tests
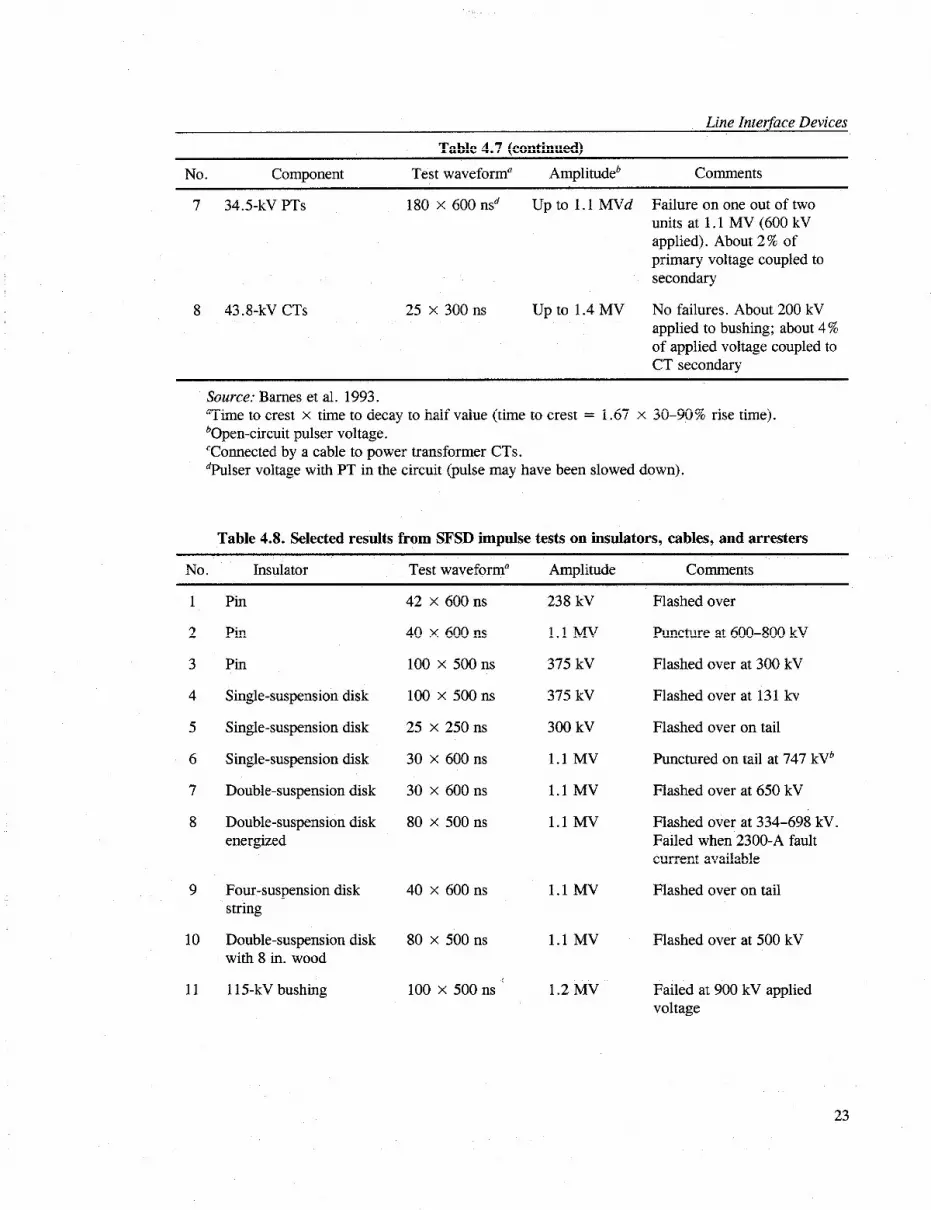
Steep-front short-duration (SFSD) surge tests were conducted under the DOE EMP program (Barnes et al. 1993). The results of these tests are shown in Tables 4.7-4.9. While these results provide important insights into the failures of line interface devices because of SFSD surges, the surge duration in these tests was, in many cases, longer than desired. Additional tests with shorter surges are needed to build a more complete data set.
18
Line Inteqface Devices
Table 4.1. IEEE standard test values for transformer windings and bushings
Windings
Insulation class and nominal
bushing rating, kV (rms)
1.2 2.5 5.0 8.7
15.0 25.0 34.5 46.0 69.0 92.0
115.0 138.0 161.0
Hi-pot tests, kV
(rms)
10 15 19 26 34 50 70 95
140 185 230 275 325
Chopped wave minimum BIL full time to flashover wave Switching
(1.2 x 50), surge level, kV kV kV
(crest) ps (crest) (crest)
54 (36) 1.5 (1) 45 (30) 20 69 (54) 1.5 (1.25) 60 (45) 35 88 (69) 1.6 (1.5) 75 (60) 38
110 (88) 1.8 (1.6) 95 (75) 55 130 (110) 2.0 (1.8) 110 (95) 75 175 3.0 150 100 230 3.0 200 140 290 3.0 250 190 400 3.0 350 280 520 3.0 450 375 630 3.0 550 460 750 3.0 650 540 865 3.0 750 620
Insulation class and nominal
Bushing withstand voltages
BIL impulse full bushing rating,
kV (rms) 60-cycle 1 min dry, 60-cycle 10 s wet,
kV (rms) kV (rms)
wave (1.5 x 40) kV (crest) . ,
1.2 15 (10) 13 (6) 45 (30) 2.5 21 (15) 20 (13) 60 (45) 5.0 27 (21) 24 (20) 75 (60) 8.7 35 (27) 30 (24) 95 (75)
15.0 50 (35) 45 (30) 110 (95) 25.0 70 70 (60) 150 34.5 95 95 200 46.0 120 120 250 69.0 175 175 350 92.0 225 190 450
115.0 280 230 550 138.0 335 275 650 161.0 385 315 750
Source: ANSI/IEEE 1986. Note: Values in parentheses are for distribution transformers, instrument transformers,
constant-current transformers, step- and induction-voltage regulators, and cable potheads for distribution cables.
19
Line InterJace Devices
Table 4.2. Maximum rated withstand voltages for transformer windings with highest voltage for equipment up to 170 kV: Series
I based on European practice
Highest voltage for equipment,
kV (rms)
Rated lightning impulse
withstand voltage, kV
@W
Rated short-duration induced or separate- source ac withstand voltage, kV (rms)
3.6 40 10 7.2 60 20
12 75 28
17.5 95 38 24 125 50
36 170 70
52 250 95
60 280 115
72.5 325 140
100 450 185
123 550 250
145 650 275
170 750 325
Source: IEC 1998. Note: Low-voltage windings up to 1.1 kV are tested with 3-kV
separate-source ac withstand voltage.
Table 4.3. Impulse test values for dry-type (indoor) transformers
Nominal winding voltage, V Standard BIL
Delta or High-potential test, (1.2 x 50),
ungrounded wve Grounded wve kV (rms) kV (crest)
120-1200
2520
4160-7200
8320
12,000-13,800
20
4 12OOY/693 4
10 436OYf2520 10
12 872OY/5040 10
19
31 13,8OOY/7970 10
10 10
20 20
30 30
45
60 60
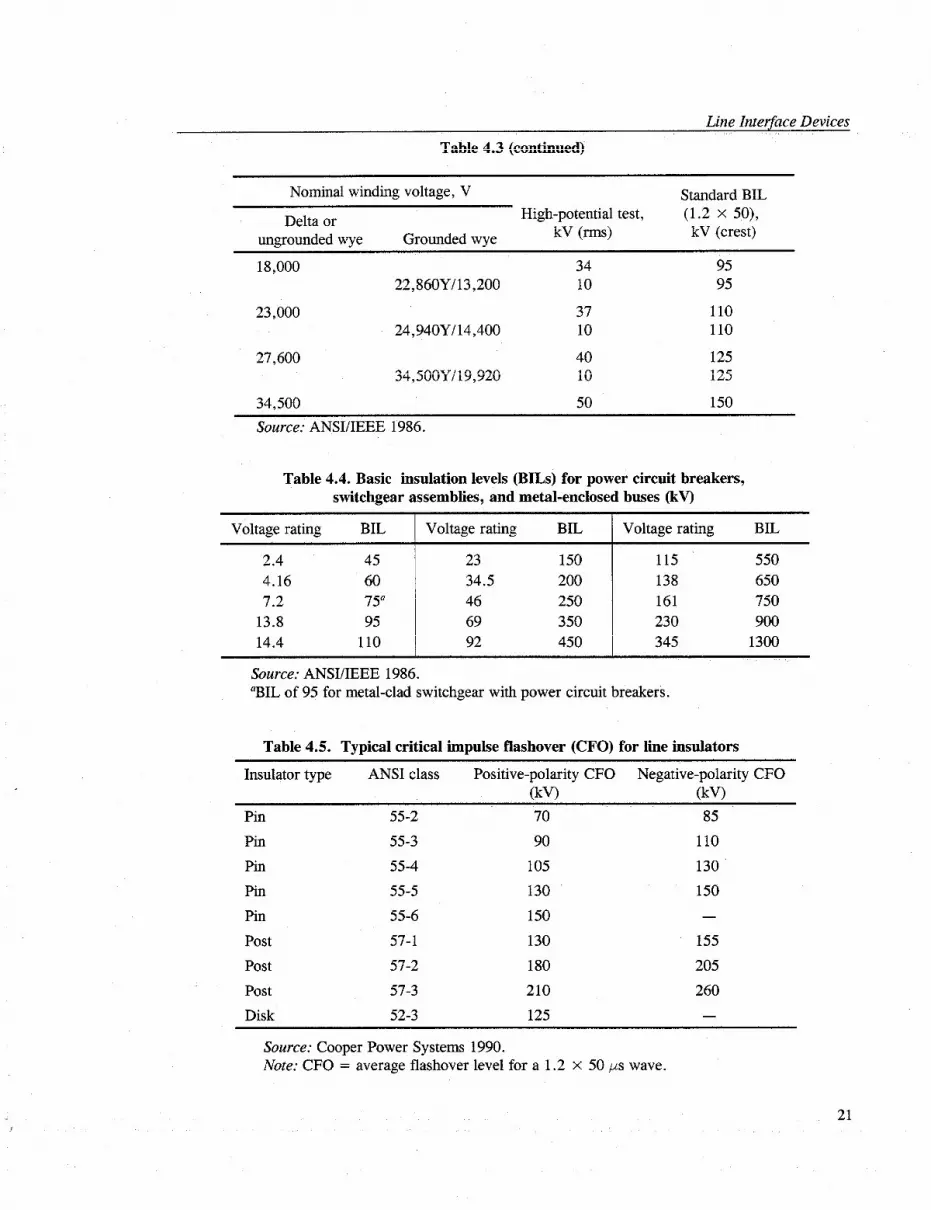
Table 4.3 (continued)
Line Inteflace Devices
Nominal winding voltage, V Standard BIL
Delta or High-potential test, (1.2 x 50),
ungrounded wye Grounded wye kV (rms) kV (crest)
18,000 34 95 22,86OY/13,200 10 95
23,000 37 110 24,94OY/14,400 10 110
27,600 40 125 34,5OOY/19,920 10 125
34,500
Source: ANSI/IEEE 1986.
50 150
Table 4.4. Basic insulation levels (BILs) for power circuit breakers, switchgear assemblies, and metal-enclosed buses (kV)
Voltage rating BIL Voltage rating BIL Voltage rating BIL
2.4 45 23 150 115 550 4.16 60 34.5 200 138 650 7.2 75” 46 250 161 750
13.8 95 69 350 230 900 14.4 110 92 450 345 1300
Source: ANSI/IEEE 1986. “BIL of 95 for metal-clad switchgear with power circuit breakers.
Table 4.5. Typical critical impulse flashover (CFO) for line insulators
Insulator type ANSI class Positive-polarity CFO Negative-polarity CFO W) W)
Pin 55-2 70 85
Pin 55-3 90 110
Pin 55-4 105 130
Pin 55-5 130 150
Pin 55-6 150 -
Post 57-l 130 155
Post 57-2 180 205
Post 57-3 210 260 Disk 52-3 125 -
Source: Cooper Power Systems 1990. Note: CFO = average flashover level for a 1.2 X 50 ps wave.
21
Line Inte@ace Devices
Table 4.6. Summary of equipment strength
System voltage
System voltage
Lowest insulation levels
Transformer Circuit breaker Line CFO
class W)
EHV 765
BIL Ch. wave” BIL Ch. waveb 1.2150 ps l/5 /Ls
1800 2070 2050 2640 2300 2800 500 345
HV 230 138 115
1 300 1500 1800 2320 1400 1700 825 925 1300 1680 1600 1950
650 750 900 1160 1060 1290 450 520 650 838 650 700 350 400 550 710 490 590
MV 69 250 290 350 452 400 490 34.5 125 145 200 258 200 240 12.47 95 110 110 142 200 240 4.16 60 69 (60)’ - 100 240
’ Wave chopped at from 1 to 3 ps. b Wave chopped at 2 ,us. ’ For metal-clad switchgear.
No.
Table 4.7. Selected results of component tests for SFSD voltage surges
Component Test waveform” Amplitudeb Comments
1 15-kV-class transformer 100 X 200 ns without arrester
2 15-kV-class transformer 100 X 200 ns with case mounted arrester
3 15-kV-class transformer 100 X 200 ns with arrester on crossarm
4 25-kV-class transformer 25 x 350 ns with arrester on crossarm
5 43.8-kV power 25 x 300 ns transformer (tested with and without arresters)
6 Substation relaysC 25 x 300 ns 1.2 MV
400 kV Failure likely
Upto l.OMV Failure unlikely
Upto l.OMV Failed after about 10 shots
1.1 MV Failed on 20th shot
Up to 1.48 MV Failure unlikely when protected with arresters. Failed on the secondary side when unprotected with arresters
Relays continued to function with HEMP-induced transients up to 7 kV
22
Line Inteqace Devices
Table 4.7 (continued)
No. Component Test waveform” Amplitudeb Comments
7 34.5-kV PTs 180 x 600 nsd Up to 1.1 MVd Failure on one out of two units at 1.1 MV (600 kV applied). About 2 % of primary voltage coupled to secondary
8 43.8-kV CTs 25 x 300 ns Upto 1.4MV No failures. About 200 kV applied to bushing; about 4% of applied voltage coupled to CT secondary
Source: Barnes et al. 1993. “Time to crest x time to decay to half value (time to crest = 1.67 X 30-90% rise time). bOpen-circuit pulser voltage. ‘Connected by a cable to power transformer CTs. dPulser voltage with PT in the circuit (pulse may have been slowed down).
Table 4.8. Selected results from SF’SD impulse tests on insulators, cables, and arresters
No. Insulator Test waveform” Amplitude Comments
Pin
Pin
Pin
Single-suspension disk
Single-suspension disk
Single-suspension disk
Double-suspension disk
Double-suspension disk energized
10
11
Four-suspension disk string
Double-suspension disk with 8 in. wood
80 x 500 ns
115-kV bushing 100 X 500 ns
42 x 600 ns
40 x 600 ns
100 X 500 ns
100 X 500 ns
25 x 250 ns
30 x 600 ns
30 x 600 ns
80 x 500 ns
40 x 600 ns
238 kV
1.1 MV
375 kV
375 kV
300 kV
1.1 MV
1.1 MV
1.1 MY
1.1 MV
1.1 MV
1.2 MV
Flashed over
Puncture at 600-800 kV
Flashed over at 300 kV
Flashed over at 13 1 kv
Flashed over on tail
Punctured on tail at 747 kVb
Flashed over at 650 kV
Flashed over at 334-698 kV. Failed when 2300-A fault current available
Flashed over on tail
Flashed over at 500 kV
Failed at 900 kV applied voltage
23

Line InterJace Devices
Table 4.8 (continued)
No. Insulator Test waveform” Amplitude Comments
12 15-kV class cables 100 X300 ns 400 kV Aged cable. New cable breaks down at 50% higher levels
13 15-kV cable terminators 100 x 300 ns Varied Punctured at 300 kV
14 lo-kV MOV arrester 100 X 300 ns Varied At 6 kA, discharge voltage was 95 kV, three times higher than for 8 x 20 us wave
Source: Miller 1992. “Time to crest x time to decay to half value. bOne sample was p unctured on the impulse front at 420 kV.
Table 4.9. Tests on power cable terminators
Terminator Rated BIL CFO’ Failure mode-voltage
E-l 15-kV porcelain 110 kV 289 kV E-2 15-kV porcelain Shattered-330 kV E-3 15-kV porcelain’ Shattered-330 kV
F-l 15-kV elastimer 95 kV Punctured-297 kV F-2 15-kV elastimer 289 kV F-3 15-kV elastimer 297 kV F-4 15-kV elastimer Punctured-300 kV
I-l 15-kV heat shrink6 110 kV 251 kV I-2 15-kV heat shrink’ 202 kV I-3 15-kV heat shrink’ Punctured-230 kV
H-l 25 kV porcelain 150 kV 397 kV H-2 25 kV porcelain Shattered-397 kV
L- 1 15-kV elastime? Punctured-222 kV L-2 15-kV elastimerb Punctured-295 kV L-3 15-kV elastime? Punctured-244 kV
M-l 15-kV elastime? 95 kV Puuctured-380 kV M-l 15-kV elastime? Punctured-408 kV M- 1 15kV elastimerb Punctured-402 kV
Source: Miller 1992. a CFO: rated critical flashover. b Steep-front pulses (60 ns x 240 ns and 125 ns x 240 ns).
24
Line Inter$ace Devices
4.4 Transformer Insulation
Ultimately, whether a power distribution apparatus fails hinges upon the performance of the insulation system(s) under abnormal or stress conditions. Power apparatus are insulated with a variety of materials. For example, air is typically used to insulate overhead lines, and oil/paper systems are used in transformers. The oil/paper systems used in transformers, cables, and some bushings have several excellent properties-high dielectric strength, low dielectric losses, a natural convective heat transfer mechanism, and “self-healing” breakdowns in some configurations. Solid insulation systems-plastics, ceramics, and glass-offer excellent performance. However, solid insulation failures are not self-healing, and heat removal through solid insulations can present significant problems. Each type of insulation offers different electrical breakdown strengths that are dependent upon the nature of the electrical stress. Arguably, the real failure mechanism can be related to thermal aging of the insulating materials, perhaps initially at a microscopic level, as in the case of partial discharge.
It is possible to use the basic model and data on transformer insulation life found in the ANSI/IEEE standards on transformer loading to obtain an estimate of the impact of thermal overload on transformer insulation. A similar procedure can be used for cables, capacitors, motors, and other apparatus. The problem in predicting failure is one of predicting thermal and electrical stress on the insulation system components. The thermal model is based upon classic Arrhenius chemical reaction rate models. Roughly speaking, a rise in temperature of 10°C results in a 50% loss in insulation life. This effect is referred by saying that the Montsinger factor is 10°C.
Of key importance to the thermal aging and failure of insulation is a determination of the “hot spot” in the insulation system. Estimates of the hot spot are often based upon empirical data for full-load steady-state operation. However, the hot spot cannot be so easily modeled for geomagnetic storms because the phenomena that occur as a result of such storms create a very nonlinear problem. DC excitation results in saturation of the iron, which forces the flux out of the normal design flux path in the core and into the surrounding tank, support structure, and elsewhere. As a result, the normal operating hot spot moves out of the windings to an initially cooler location, increasing the thermal time constant. In addition, failure of the system at this new hot spot may not have any effect on the integrity of the main winding insulation.
Furthermore, most of the ANSI/IEEE loading guides (C57.91-1981 and others) have a statement on insulation life along the following lines:
Because the cumulative effects of temperature and time in causing deterioration of transformer insulation are not thoroughly established, it is not possible to predict with any degree of accuracy the length of life of a transformer even under constant or closely controlled conditions, much less under widely varying service conditions.
Deterioration of insulation is generally characterized by a reduction in mechanical strength and in dielectric strength, but these characteristics may not necessarily be directly related. In some cases, insulation in a charred condition will have sufficient insulating qualities to withstand normal operating electrical and mechanical stresses.
25 x
Line Inter$ace Devices
[The insulation] may continue in service for many months or years, if undisturbed. On the other hand, any unusual movement of the conductors, . . . may disturb the mechanically weak insulation such that . . . a turn-turn or layer-layer failure will result.
Keeping these cautions in mind, the general relationship for transformer life expectancy based on chemical reaction rates has the following general form:
log10 (life in hours) = A + B/T , (4.1)
where T is the absolute temperature of the hot spot = 273 + Ths (Ths = Trise + Tambient) in degrees Celsius and the constants A and B are dependent upon the insulation system design temperature rise (55 or 65 “C for oil/paper insulation; 155, 185, or 220 “C for dry) and the transformer type (power or distribution transformers, either liquid-filled or dry). Typical values are as follows:
Liquid-jilled power Liquid-jilled distribution Dry-type distribution (65 “C) (65 “C) (18.5 ‘=I?)
A = - 13.391 -11.269 -7.941
B = 6972 6328.8 5907
The relationship in Eq. 4.1 can be restated in a form that calculates the percentage loss of life resulting from operating at a given temperature, T, for a give time, t (hours)
% loss of life = 100 X t X lo+ + Bnl . (4.2)
Taking % loss of life = 100 this allows an estimate of the time, t, required to essentially destroy the insulation at a temperature c viz.,
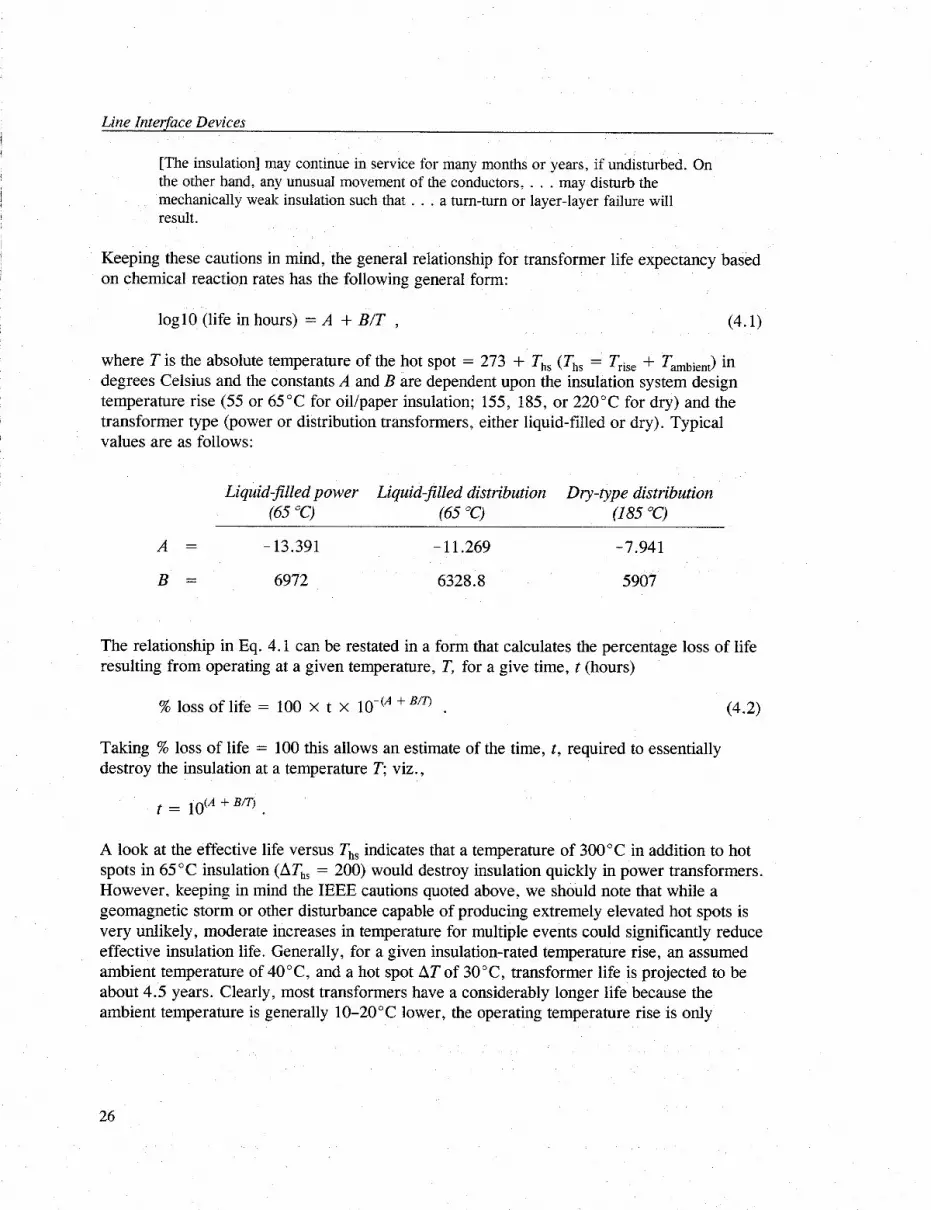
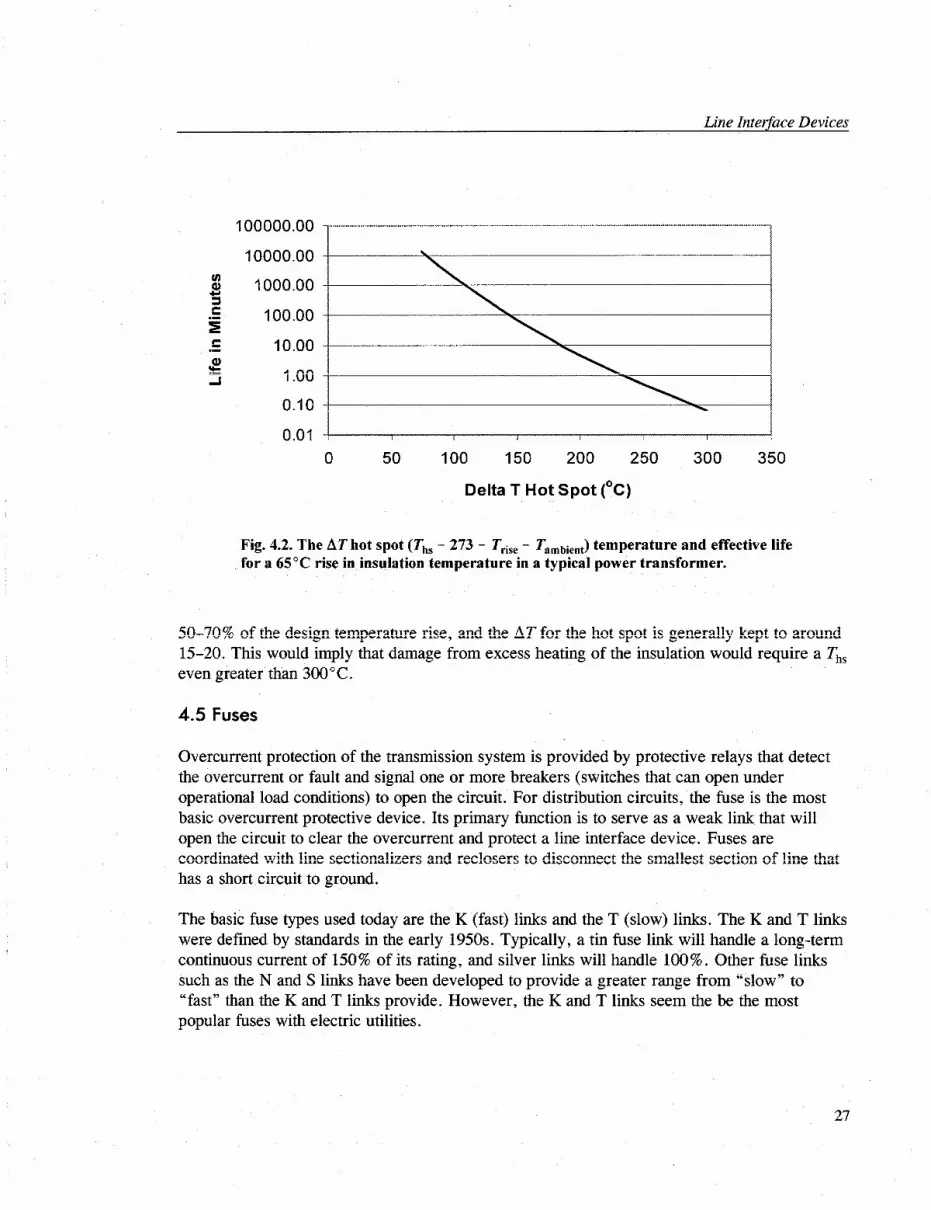
A look at the effective life versus Ths indicates that a temperature of 300°C in addition to hot spots in 65°C insulation (AThS = 200) would destroy insulation quickly in power transformers. However, keeping in mind the IEEE cautions quoted above, we should note that while a geomagnetic storm or other disturbance capable of producing extremely elevated hot spots is very unlikely, moderate increases in temperature for multiple events could significantly reduce effective insulation life. Generally, for a given insulation-rated temperature rise, an assumed ambient temperature of 40°C and a hot spot AT of 30°C transformer life is projected to be about 4.5 years. Clearly, most transformers have a considerably longer life because the ambient temperature is generally lo-20°C lower, the operating temperature rise is only
26
Line InterJace Devices
10000.00 .
3
2 1000.00
.- I 100.00
c .- 10.00
si J 1 .oo
0.10 \
0.01 I I I I I
0 50 100 150 200 250 300 350
Delta T Hot Spot (“C)
Fig. 4.2. The AT hot spot (Ths - 273 - Trise - Tambient) temperature and effective life for a 65°C rise in insulation temperature in a typical power transformer.
50-70% of the design temperature rise, and the AT for the hot spot is generally kept to around 15-20. This would imply that damage from excess heating of the insulation would require a Ths even greater than 300’ C .
4.5 Fuses
Overcurrent protection of the transmission system is provided by protective relays that detect the overcurrent or fault and signal one or more breakers (switches that can open under operational load conditions) to open the circuit. For distribution circuits, the fuse is the most basic overcurrent protective device. Its primary function is to serve as a weak link that will open the circuit to clear the overcurrent and protect a line interface device. Fuses are coordinated with line sectionalizers and reclosers to disconnect the smallest section of line that has a short circuit to ground.
The basic fuse types used today are the K (fast) links and the T (slow) links. The K and T links were defined by standards in the early 1950s. Typically, a tin fuse link will handle a long-term continuous current of 150% of its rating, and silver links will handle 100%. Other fuse links such as the N and S links have been developed to provide a greater range from “slow” to “fast” than the K and T links provide. However, the K and T links seem the be the most popular fuses with electric utilities.
27
Line Inter$ace Devices
ORNL 99-02756/ldg
Typical Time-Current Curves Types K, T. N and S Fuse Links
0.5 1 5 IO 20 40 100 200 5001000 3000 10000 Current (amps)
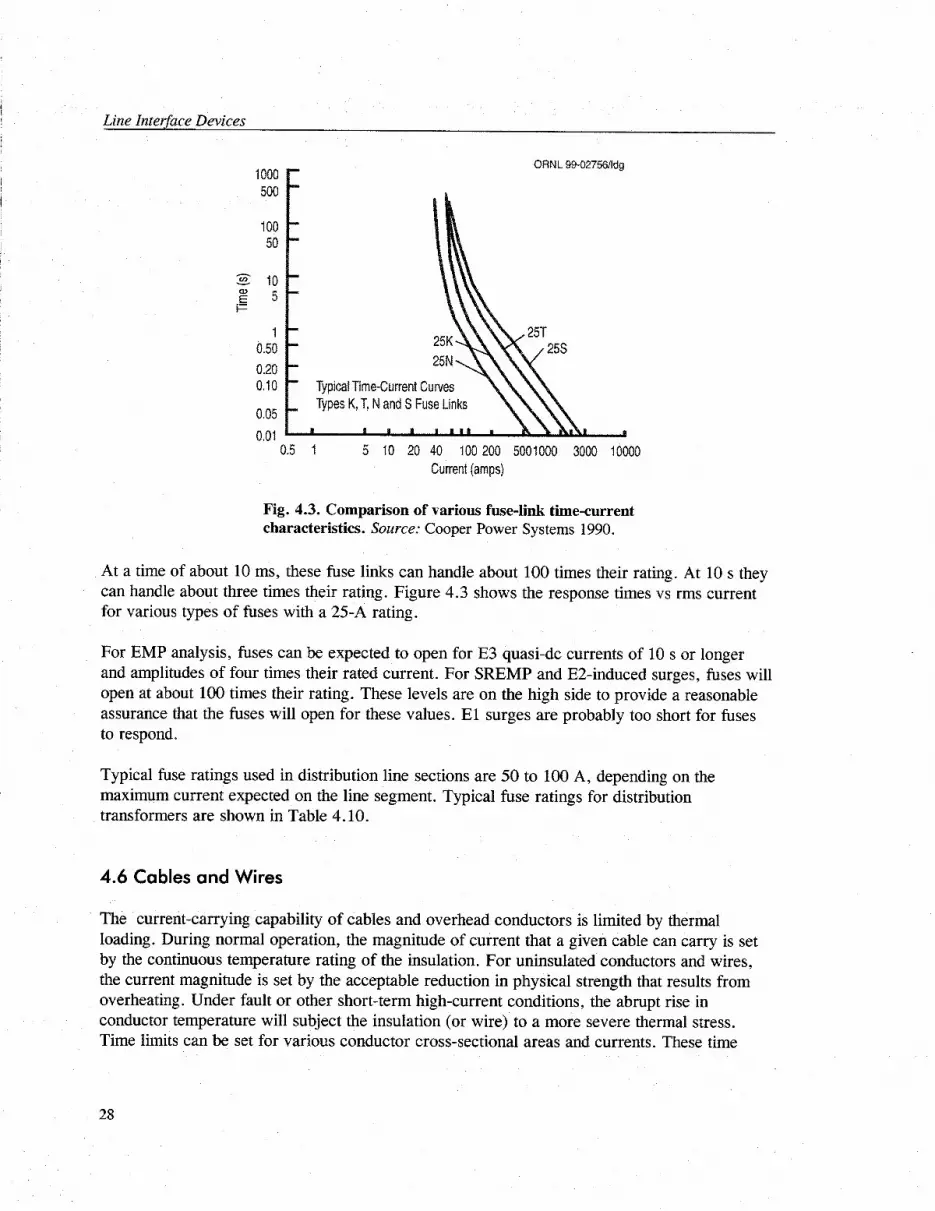
Fig. 4.3. Comparison of various fuse-link time-current characteristics. Source: Cooper Power Systems 1990.
At a time of about 10 ms, these fuse links can handle about 100 times their rating. At 10 s they can handle about three times their rating. Figure 4.3 shows the response times vs rms current for various types of fuses with a 25-A rating.
For EMP analysis, fuses can be expected to open for E3 quasi-dc currents of 10 s or longer and amplitudes of four times their rated current. For SREMP and E2-induced surges, fuses will open at about 100 times their rating. These levels are on the high side to provide a reasonable assurance that the fuses will open for these values. El surges are probably too short for fuses to respond.
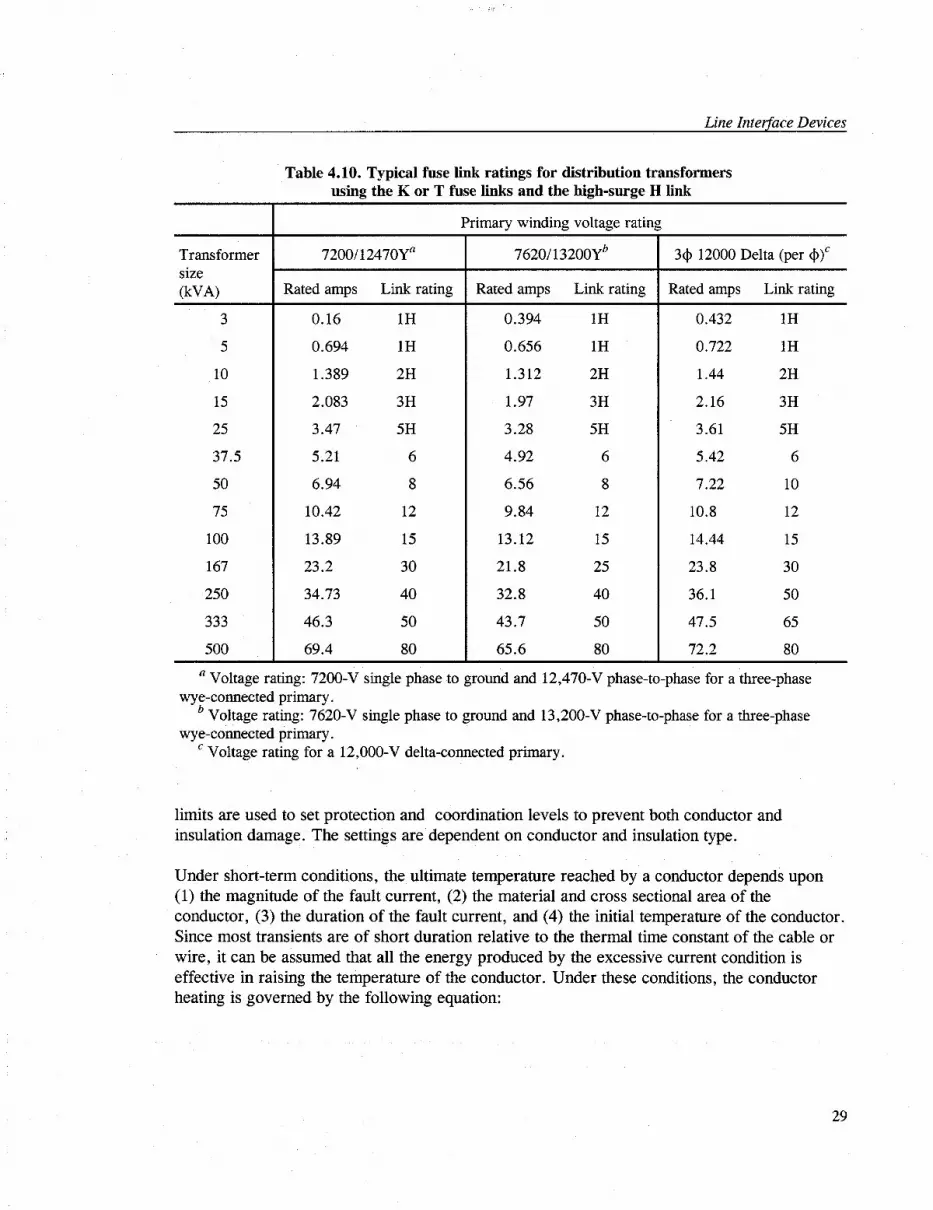
Typical fuse ratings used in distribution line sections are 50 to 100 A, depending on the maximum current expected on the line segment. Typical fuse ratings for distribution transformers are shown in Table 4.10.
4.6 Cables and Wires
The current-carrying capability of cables and overhead conductors is limited by thermal loading. During normal operation, the magnitude of current that a given cable can carry is set by the continuous temperature rating of the insulation. For uninsulated conductors and wires, the current magnitude is set by the acceptable reduction in physical strength that results from overheating. Under fault or other short-term high-current conditions, the abrupt rise in conductor temperature will subject the insulation (or wire) to a more severe thermal stress. Time limits can be set for various conductor cross-sectional areas and currents. These time
28
Line Inter$ace Devices
T Primary winding voltage rating
Transformer size WA)
3
5
10
15
25
37.5
50
75
100
167
250
333
500
Table 4.10. Typical fuse link ratings for distribution transformers using the K or T fuse links and the high-surge H link
7200/ 12470Y’ 7620/13200Yb
Rated amps Link rating Rated amps Link rating
0.16 1H 0.394 1H
0.694 1H 0.656 1H
1.389 2H 1.312 2H
2.083 3H 1.97 3H
3.47 5H 3.28 5H
5.21 6 4.92 6
6.94 8 6.56 8
10.42 12 9.84 12
13.89 15 13.12 15
23.2 30 21.8 25
34.73 40 32.8 40
46.3 50 43.7 50
69.4 80 65.6 80
34 12000 Delta (per a)”
Rated amps Link rating
0.432 1H
0.722 1H
1.44 2H
2.16 3H
3.61 5H
5.42 6
7.22 10
10.8 12
14.44 15
23.8 30
36.1 50
47.5 65
72.2 80
a Voltage rating: 7200-V single phase to ground and 12,470-V phase-to-phase for a three-phase wye-connected primary.
b Voltage rating: 7620-V single phase to ground and 13,200-V phase-to-phase for a three-phase wye-connected primary.
’ Voltage rating for a 12,000-V delta-connected primary.
limits are used to set protection and coordination levels to prevent both conductor and insulation damage. The settings are dependent on conductor and insulation type.
Under short-term conditions, the ultimate temperature reached by a conductor depends upon (1) the magnitude of the fault current, (2) the material and cross sectional area of the conductor, (3) the duration of the fault current, and (4) the initial temperature of the conductor. Since most transients are of short duration relative to the thermal time constant of the cable or wire, it can be assumed that all the energy produced by the excessive current condition is effective in raising the temperature of the conductor. Under these conditions, the conductor heating is governed by the following equation:
Line Inter$ace Devices
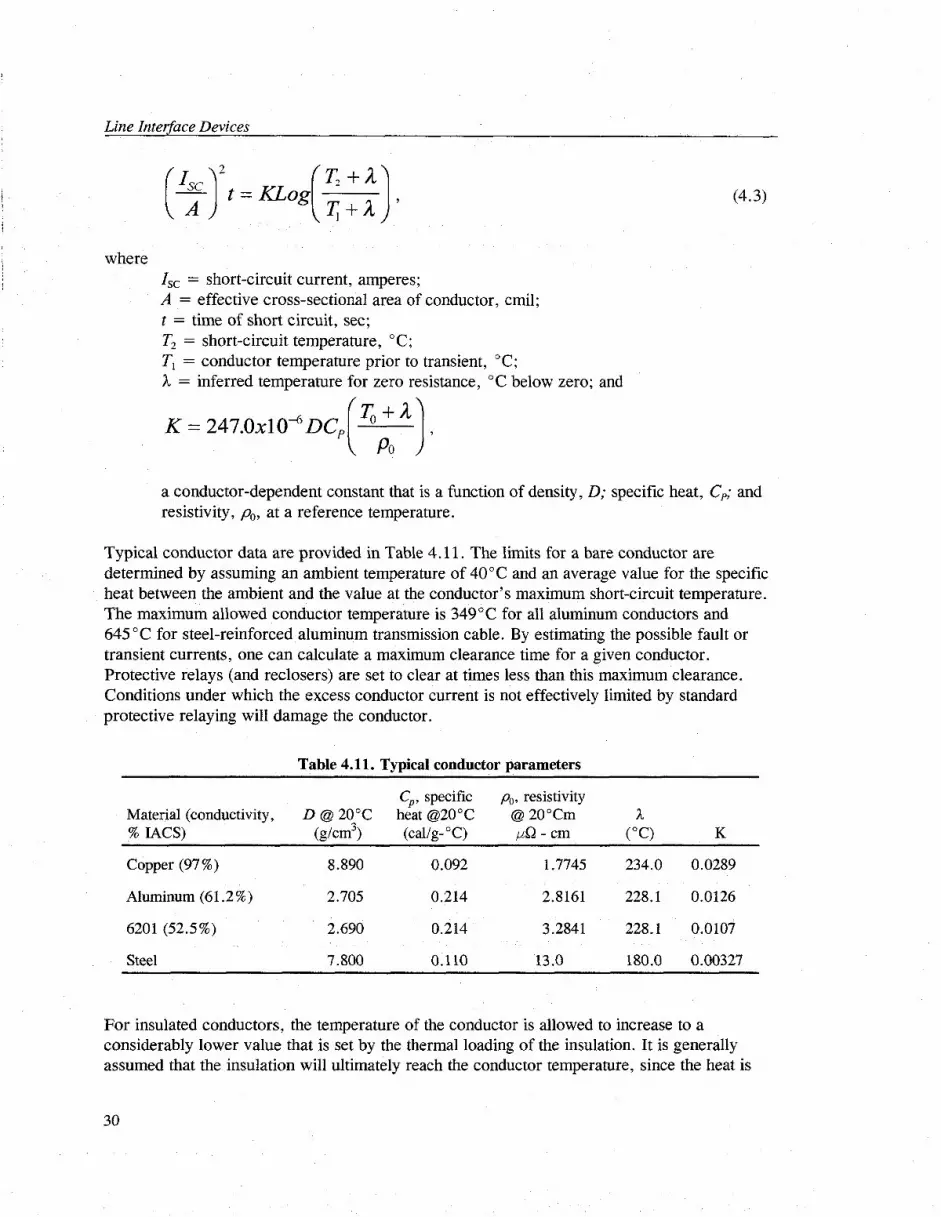
(4.3)
where I,, = short-circuit current, amperes; A = effective cross-sectional area of conductor, cmil; t = time of short circuit, set; T2 = short-circuit temperature, “C; T, = conductor temperature prior to transient, “C; h = inferred temperature for zero resistance, “C below zero; and
K = 247.0~1 OA DC,
a conductor-dependent constant that is a function of density, D; specific heat, C,; and resistivity, PO, at a reference temperature.
Typical conductor data are provided in Table 4.11. The limits for a bare conductor are determined by assuming an ambient temperature of 40°C and an average value for the specific heat between the ambient and the value at the conductor’s maximum short-circuit temperature. The maximum allowed conductor temperature is 349°C for all aluminum conductors and 645 “C for steel-reinforced aluminum transmission cable. By estimating the possible fault or transient currents, one can calculate a maximum clearance time for a given conductor. Protective relays (and reclosers) are set to clear at times less than this maximum clearance. Conditions under which the excess conductor current is not effectively limited by standard protective relaying will damage the conductor.
Table 4.11. Typical conductor parameters
Material (conductivity, % IACS)
Copper (97 %)
Aluminum (61.2 %)
6201 (52.5%)
Steel
Cp, specific PO, resistivity D @ 20°C heat @2O”C @ 20”Cm
Wm3) (Cal/g-“C) ,&-cm K
8.890 0.092 1.7745 234.0 0.0289
2.705 0.214 2.8161 228.1 0.0126
2.690 0.214 3.2841 228.1 0.0107
7.800 0.110 13.0 180.0 0.00327
For insulated conductors, the temperature of the conductor is allowed to increase to a considerably lower value that is set by the thermal loading of the insulation. It is generally assumed that the insulation will ultimately reach the conductor temperature, since the heat is
Line Inteflace Devices
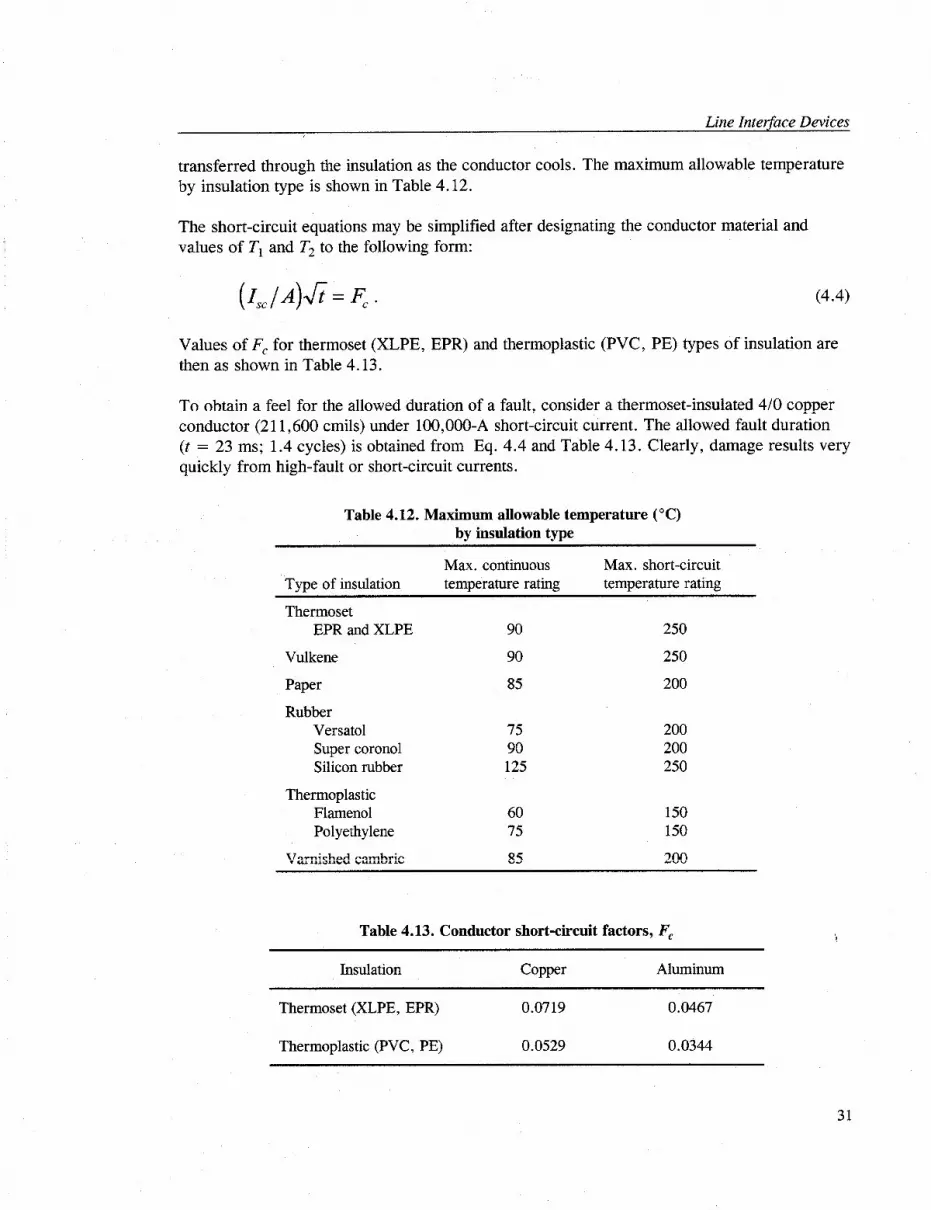
transferred through the insulation as the conductor cools. The maximum allowable temperature by insulation type is shown in Table 4.12.
The short-circuit equations may be simplified after designating the conductor material and values of Tl and T2 to the following form:
(4.4)
Values of F, for thermoset (XLPE, EPR) and thermoplastic (PVC, PE) types of insulation are then as shown in Table 4.13.
To obtain a feel for the allowed duration of a fault, consider a thermoset-insulated 4/O copper conductor (211,600 cmils) under 100,000-A short-circuit current. The allowed fault duration (t = 23 ms; 1.4 cycles) is obtained from Eq. 4.4 and Table 4.13. Clearly, damage results very quickly from high-fault or short-circuit currents.
Table 4.12. Maximum allowable temperature (“C) by insulation type
Type of insulation
Thermoset EPR and XLPE
Vulkene
Paper
Rubber Versatol Super coronal Silicon rubber
Thermoplastic Flamenol Polyethylene
Varnished cambric
Max. continuous Max. short-circuit temperature rating temperature rating
90 250
90 250
85 200
75 200 90 200 125 250
60 150 75 150
85 200
Table 4.13. Conductor short-circuit factors, F,
Insulation Copper Aluminum
Thermoset (XLPE, EPR) 0.0719 0.0467
i
Thermoplastic (PVC, PE) 0.0529 0.0344
31


5. SECONDARY DISTRIBUTION SYSTEMS
5.1 introduction
Secondary distribution systems provide electrical power at low voltages (less than 1000 V) suitable for customers’ equipment. Typical voltages for secondary distribution in the United States are 120, 240, 208, 277, and 480 V. Foreign systems typically use 220 V for single- phase loads and 440 to 600 V for three-phase loads. The typical BIL of secondary systems is about 30 kV for exterior components and 10 kV for interior components, Interior building wiring is considered to have a typical BIL of 6 to 8 kV.
5.2 Disconnect and Transfer Switches
Every facility has some form of disconnect switch. For noncritical facilities this may be either a switch or the main circuit breaker connecting the distribution system. The complexity of the disconnect is strongly dependent upon the facility’s power requirements and ranges from the simple mechanical breaker found in the typical residential panel board to the large motorized switches and breakers found in distribution substations. For critical facilities or loads a transfer switch or automatic transfer device (ATD) is required. A recent paper by Dan Scheffer (Scheffer 1999) describes the key operating functions of the transfer switch. The one-line diagram shown in Fig. 5.1, for a dual-feed facility with auxiliary generation, represents a configuration that might be typical of a facility requiring a highly reliable source of power for all operations as well as having some fraction of the load that is considered essential.
Fig. 5.1. One-line diagram for a dual- feed facility with auxiliary generation for emergency power. Source: ANSI/IEEE 1987, fig. 14.
33
Secondary Distribution Systems
The primary role of the transfer switch is to connect loads to an acceptable alternative power source such as a second redundant feed, on-site generation, or uninterruptible power supply. To accomplish this a control system must continuously sense the availability of alternative sources and provide essentially instantaneous source selection. Switching is generally required for either a planned or an unplanned transfer. The planned case allows for system maintenance and is generally accomplished manually under monitored conditions. The unplanned transfer generally results from an interruption or significant disturbance of the electrical feed. For critical facilities with alternate electrical feeds or backup power supplies, this switching function must be designed to operate quickly and automatically and may involve significant electronic controls and solid state components. This function is the most critical element in systems applications using redundant power supplies,
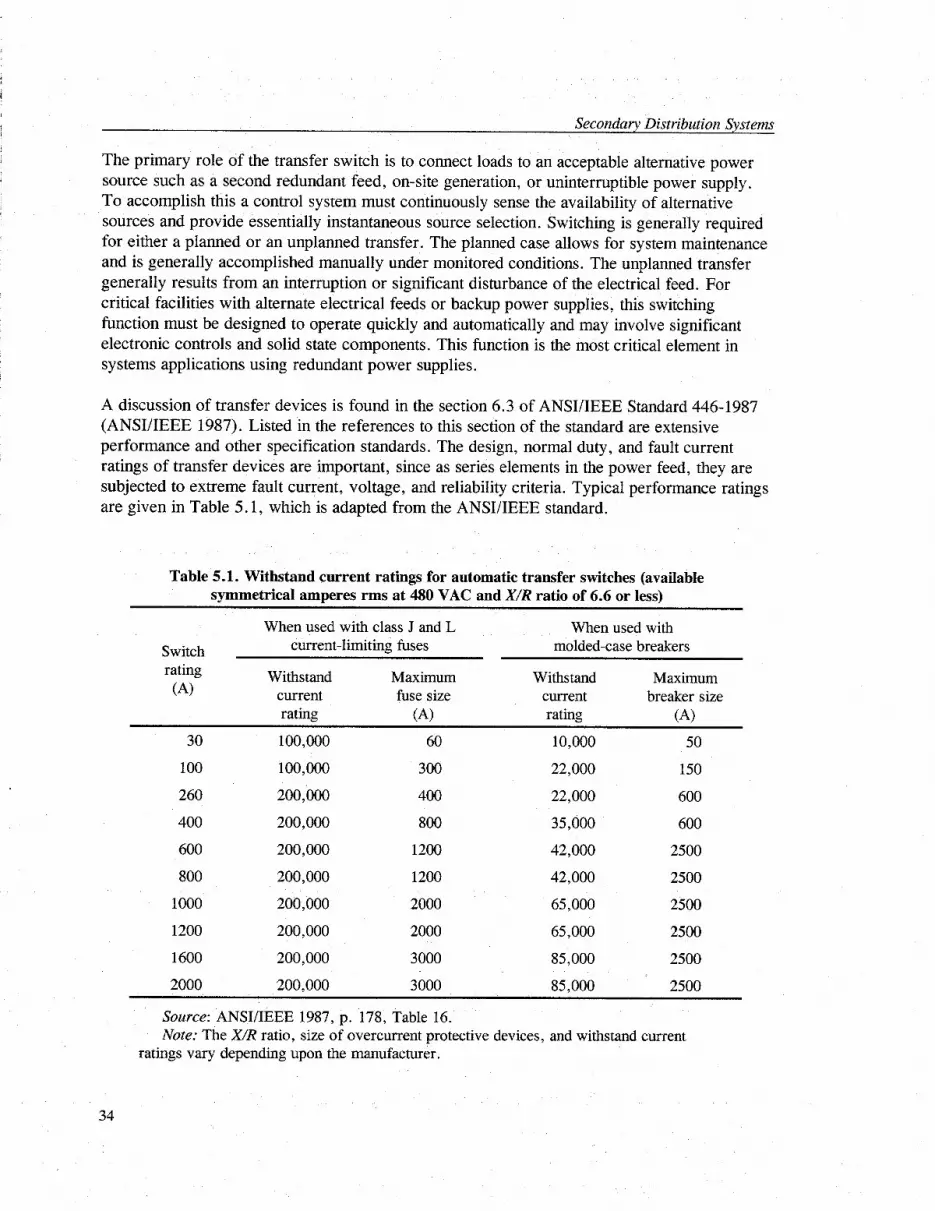
A discussion of transfer devices is found in the section 6.3 of ANSI/IEEE Standard 446-1987 (ANSI/IEEE 1987). Listed in the references to this section of the standard are extensive performance and other specification standards. The design, normal duty, and fault current ratings of transfer devices are important, since as series elements in the power feed, they are subjected to extreme fault current, voltage, and reliability criteria. Typical performance ratings are given in Table 5.1, which is adapted from the ANSI/IEEE standard.
Table 5.1. Withstand current ratings for automatic transfer switches (available symmetrical amperes rms at 480 VAC and X/R ratio of 6.6 or less)
Switch rating (4
30
100
260
400
When used with class J and L When used with current-limiting fuses molded-case breakers
Withstand Maximum Withstand Maximum current fuse size current breaker size rating (4 rating (4
100,000 60 10,000 50
100,000 300 22,000 150
200,000 400 22,000 600
200,000 800 35,000 600
600 200,000 1200 42,000 2500
800 200,000 1200 42,000 2500
1000 200,000 2000 65,000 2500
1200 200,000 2000 65,000 2500
1600 200,000 3000 85,000 2500
’ 2000 200,000 3000 85,000 2500
Source: ANSI/IEEE 1987, p. 178, Table 16. Note: The X/R ratio, size of overcurrent protective devices, and withstand current
ratings vary depending upon the manufacturer.
34
Secondary Distribution Systems
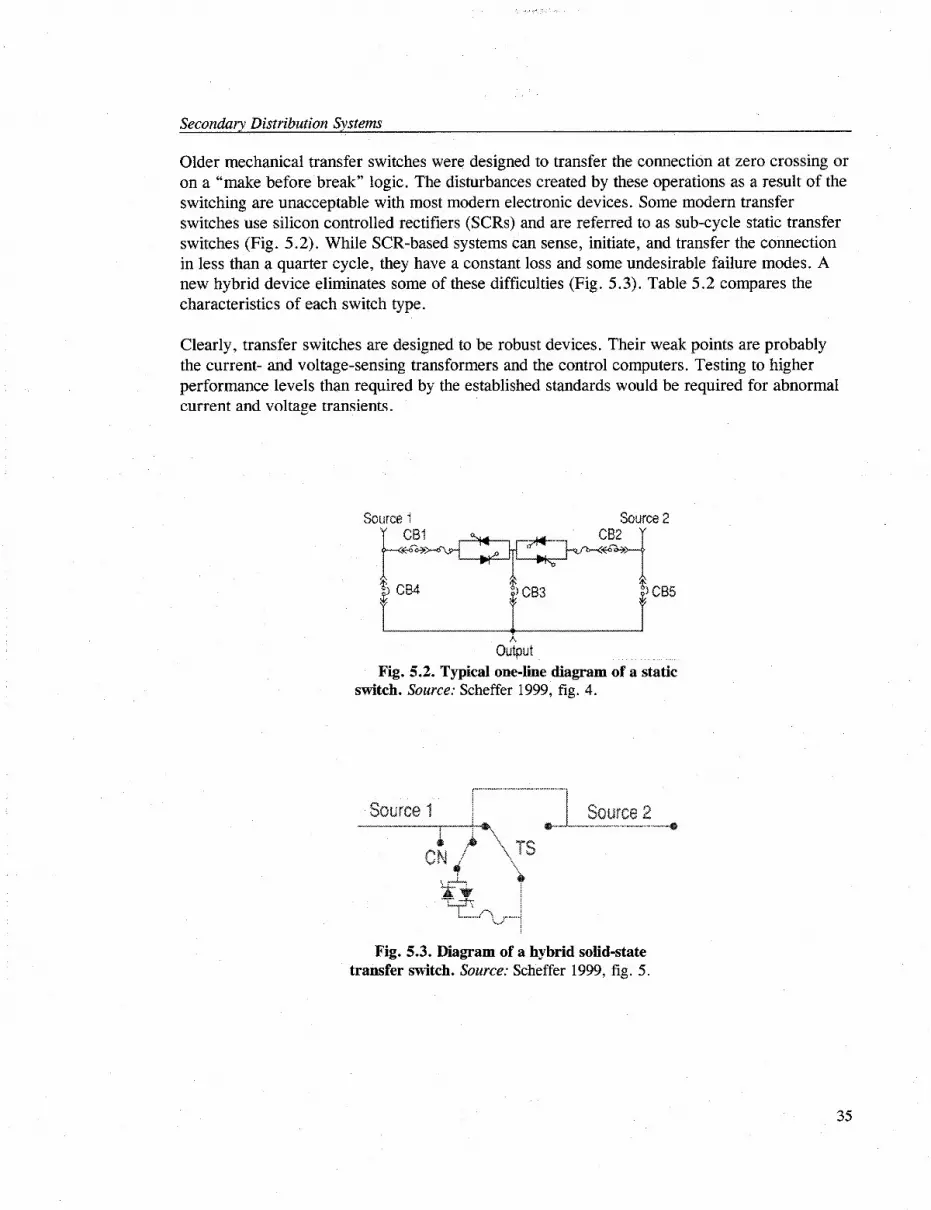
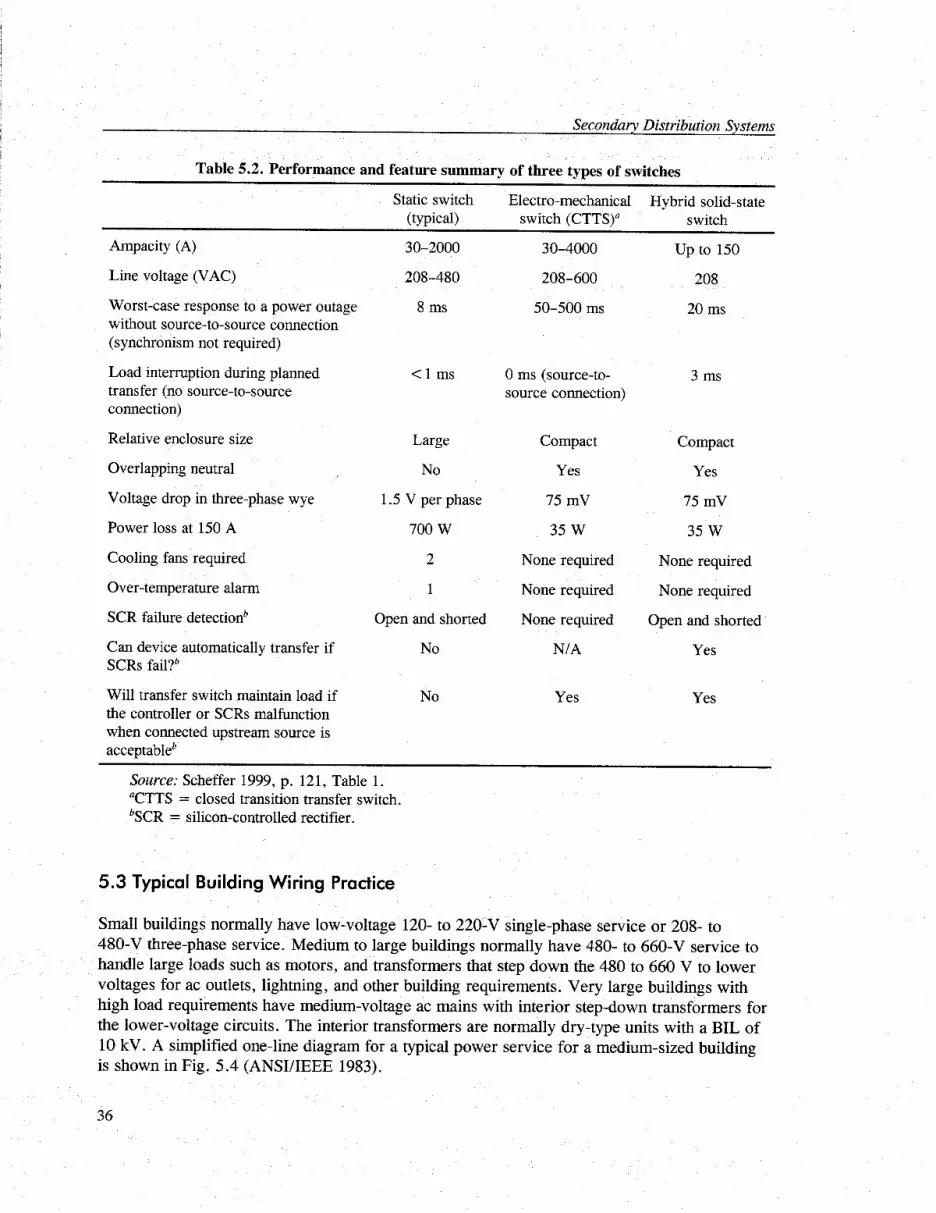
Older mechanical transfer switches were designed to transfer the connection at zero crossing or on a “make before break” logic. The disturbances created by these operations as a result of the switching are unacceptable with most modern electronic devices. Some modern transfer switches use silicon controlled rectifiers (SCRs) and are referred to as sub-cycle static transfer switches (Fig. 5.2). While SCR-based systems can sense, initiate, and transfer the connection in less than a quarter cycle, they have a constant loss and some undesirable failure modes. A new hybrid device eliminates some of these difficulties (Fig. 5.3). Table 5.2 compares the characteristics of each switch type.
Clearly, transfer switches are designed to be robust devices. Their weak points are probably the current- and voltage-sensing transformers and the control computers. Testing to higher performance levels than required by the established standards would be required for abnormal current and voltage transients.
Source i Source 2
Fig. 5.2. Typical one-line diagram of a static switch. Source: Scheffer 1999, fig. 4.
Fig. 5.3. Diagram of a hybrid solid-state transfer switch. Source: Scheffer 1999, fig. 5.
35
Secondary Distribution Systems
Table 5.2. Performance and feature summary of three types of switches
Static switch Electra-mechanical Hybrid solid-state (typical) switch (CTTS)’ switch
Ampacity (A)
Line voltage (VAC)
Worst-case response to a power outage without source-to-source connection (synchronism not required)
Load interruption during planned transfer (no source-to-source connection)
Relative enclosure size
Overlapping neutral /
Voltage drop in three-phase wye
Power loss at 150 A
Cooling fans required
Over-temperature alarm
SCR failure detectionb
Can device automatically transfer if SCRs fail?b
Will transfer switch maintain load if the controller or SCRs malfunction when connected upstream source is acceptableb
30-2000
208-480
8 ms
<lms
Large
No
1.5 V per phase
700 w
2
1
Open and shorted
No
No
30-4000
208-600
50-500 ms
0 ms (source-to- source connection)
Compact
Yes
75 mV
35 w
None required
None required
None required
N/A
Yes
up to 150
208
20 ms
3 ms
Yes
75 mV
35 w
None required
None required
Open and shorted
Yes
Yes
Source: Scheffer 1999, p. 121, Table 1. “CTTS = closed transition transfer switch. bSCR = silicon-controlled rectifier.
5.3 Typical Building Wiring Practice
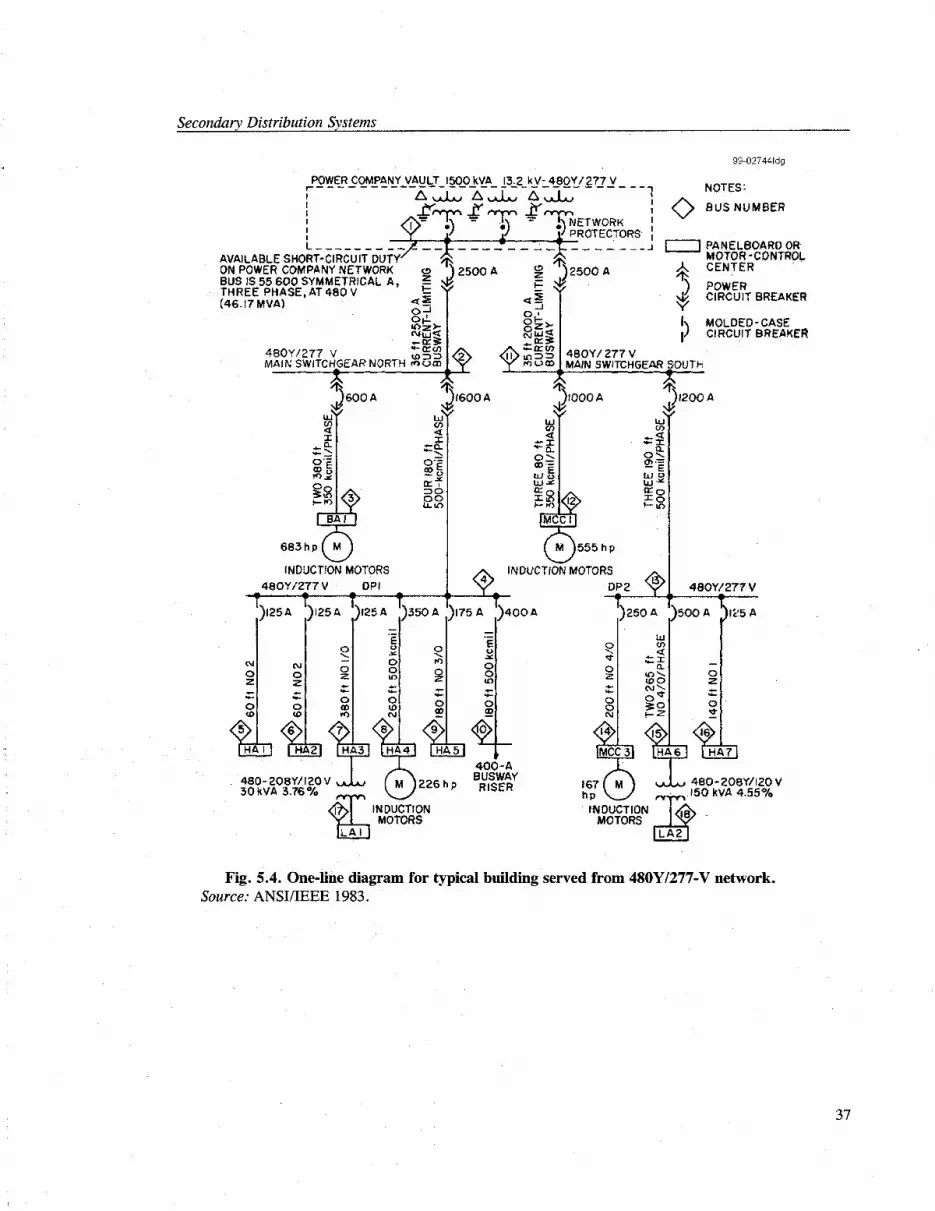
Small buildings normally have low-voltage 120- to 220-V single-phase service or 208- to 480-V three-phase service. Medium to large buildings normally have 480- to 660-V service to handle large loads such as motors, and transformers that step down the 480 to 660 V to lower voltages for ac outlets, lightning, and other building requirements. Very large buildings with high load requirements have medium-voltage ac mains with interior step-down transformers for the lower-voltage circuits. The interior transformers are normally dry-type units with a BIL of 10 kV. A simplified one-line diagram for a typical power service for a medium-sized building is shown in Fig. 5.4 (ANSI/IEEE 1983).
36
Secondary Distribution Systems
99.02744ldg
POWER COMPANY VAULT 1500 kVA 13.2 kV- 48OY/2?7 V r ________- ------- --_------- ------7 I A,,l, A& A& I I
NOTES:
BUS NUMBER
--- ------- , [ PANELBOARD OR
i: MVIVfi’C; ------ “VNTROL
J 25OOA 2500A .I
+ CENTER
+ SF7 \ I
^_...-- l-wwl- H
L - - - - - - - -+iy AVAILABLE SHORT-CIRCUIT DUTY ON POWER COMPANY NETWORK BUS IS 55 600 SYMMETRICAL A,
9
THREE PHASE, AT 480 V E:
(46.17 MVAl *z
g$ 25% +lXS
48OYl277 V ‘c&v]
MAIN SWITCHFEAR NORTH %%
A ,
INDUCTION MOT’ORS
48OYf277 V OPI
r6VOA 1200 A
INDUCTION MOTORS
Fig. 5.4. One-line diagram for typical building served from 48OY/277-V network. Source: ANSI/IEEE 1983.
37

6. RECOMMENDED EXPERIMENTS
To fill information gaps in the database for line interface device vulnerability to EMP-induced surges, additional experiments are recommended. Some selected tests are recommended in this section. El tests are designed to simulate the effects of the early portion of the EMP event, and E3 tests are designed to simulate the late time portion (also called MHD-EMP). The test costs estimated below are based on test laboratory costs of $1400 per hour for short-circuit laboratory tests and $550 per hour for high-voltage laboratory tests (Potter 1999). Test plan development and data analysis costs are very rough estimates. The tests planning, data analysis, and documentation tasks should be accomplished by a DTRA test contractor. The costs presented in this report are for planning purposes only; actual test costs could be higher.
6.1 El Transformer Tests
Existing data provide failure information for a 100 x 2000 ns pulse on unenergized transformers; this is slower and longer than the typical HEMP-induced surge. A fast surge with a rise time of lo-30 ns and a fall time of 100-200 ns is needed for the tests. In addition, it is recommended that some tests be conducted on energized transformers to determine if tests on unenergized transformers are valid. Testing energized equipment is much more complicated because the safety of the personnel and of the test facility for fire, explosions, etc., must be considered. In addition, the pulser and the ac source must be protected against the fast surges.
During previous transformer tests, damages were associated with construction details such as a conductor with a right angle bend within the tank. Thus, damages may be manufacturer- and size-dependent to some degree. It is recommended that transformers of various sizes and manufacturers be tested to the extent that funding and time permit.
The following impulse tests are recommended for transformers:
1. BIL failure tests to determine actual failure levels for five transformers each from two manufacturers. Use 25-kVA transformers and test unenergized units to failure starting with a test voltage of 0.5 BIL and increasing the voltage for each shot by 0.25 BIL until failure occurs.
2. El failure tests for five 25-kVA transformers each from two manufacturers with the transformers energized and protected by arresters. Conduct a second test with the arresters removed. The El test level will start at a BIL of 0.5, with the test voltage increased by 0.5 BIL for each shot until failure occurs.
3. El failure test for a 500-kVA transformer starting at a test voltage of 0.5 BIL and increasing the test level for each shot by 0.5 BIL until failure occurs.
An estimate of the costs for these tests are shown in Table 6.1.
39

Recommended Experiments
Table 6.1. Estimated costs for El transformer tests
Estimated cost Item
Facility setup
($ x 1000)
30
Test plan 25
Thirty 25-kVA transformers
One 500-kVA transformer
Transformer testing to determine BIL failure: 9 hours HV laboratory
Transformer testing to determine Elfailure: 25 hours energized equipment tests
Data analysis and documentation
Total estimated cost
15
3
5
50
32
160
6.2 El Tests on Insulators, Terminators, and Potheads
El tests on pin insulators, dead-end bell insulators, terminators, and potheads should he performed with the equipment energized. At least 6 units of the four line interface devices should be tested to failure starting at 0.5 BIL and increasing the level for each subsequent shot by 0.5 BIL until failure occurs. Two types of failure are possible: a flashover that causes a fault on the line, and puncture of the insulation, which may cause the device to explode.
If the transformer tests are performed first, the setup costs will already have been paid for by the previous El transformer tests. Assuming that four units could be tested per hour, then 6-8 hours of actual high-voltage and short-circuit lab time would be used. Another 8 hours of high-voltage lab time would be necessary for equipment setup. The total laboratory cost is estimated at about $20,000. The test plan and analysis would be about $30,000, for a total cost of about $50,000. Cost estimates are summarized in Table 6.2.
Table 6.2. Estimated costs for El insulator tests
Estimated cost Item ($ x 1000)
Facility setup 0
Testing to determine Elfailure: 8 hours energized insulator tests 20
Test plan, data analysis, and documentation 30
Total estimated cost 50
Note: Costs for the insulators for the tests will be small and are not shown.
40
Recommended Experiments
6.3 SREMP Tests on Arresters
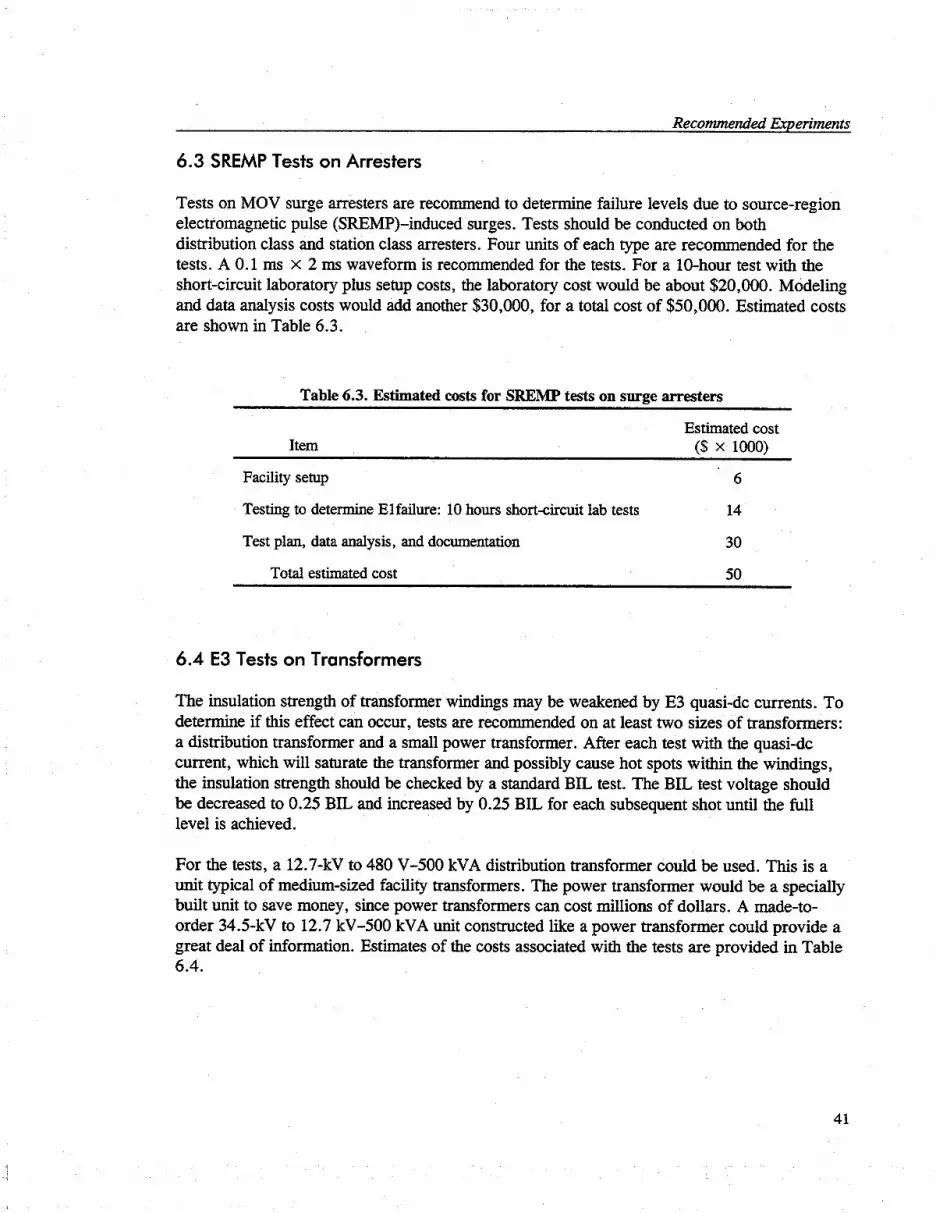
Tests on MOV surge arresters are recommend to determine failure levels due to source-region electromagnetic pulse (SREMP)-induced surges. Tests should be conducted on both distribution class and station class arresters. Four units of each type are recommended for the tests. A 0.1 ms x 2 ms waveform is recommended for the tests. For a lo-hour test with the short-circuit laboratory plus setup costs, the laboratory cost would be about $20,000. Modeling and data analysis costs would add another $30,000, for a total cost of $50,000. Estimated costs are shown in Table 6.3.
Table 6.3. Estimated costs for SREMP tests on surge arresters
Item
Facility setup
Estimated cost ($ x 1000)
6
Testing to determine Elfailure: 10 hours short-circuit lab tests 14
Test plan, data analysis, and documentation 30
Total estimated cost 50
6.4 E3 Tests on Transformers
The insulation strength of transformer windings may be weakened by E3 quasi-dc currents. To determine if this effect can occur, tests are recommended on at least two sizes of transformers: a distribution transformer and a small power transformer. After each test with the quasidc current, which will saturate the transformer and possibly cause hot spots within the windings, the insulation strength should be checked by a standard BIL test. The BIL test voltage should be decreased to 0.25 BIL and in&eased by 0.25 BIL for each subsequent shot until the full level is achieved.
For the tests, a 12.7-kV to 480 V-500 kVA distribution transformer could be used. This is a unit typical of medium-sized facility transformers. The power transformer would be a specially built unit to save money, since power transformers can cost millions of dollars. A made-to- order 34.5-kV to 12.7 kV-500 kVA unit constructed like a power transformer could provide a great deal of information. Estimates of the costs associated with the tests are provided in Table 6.4.
41
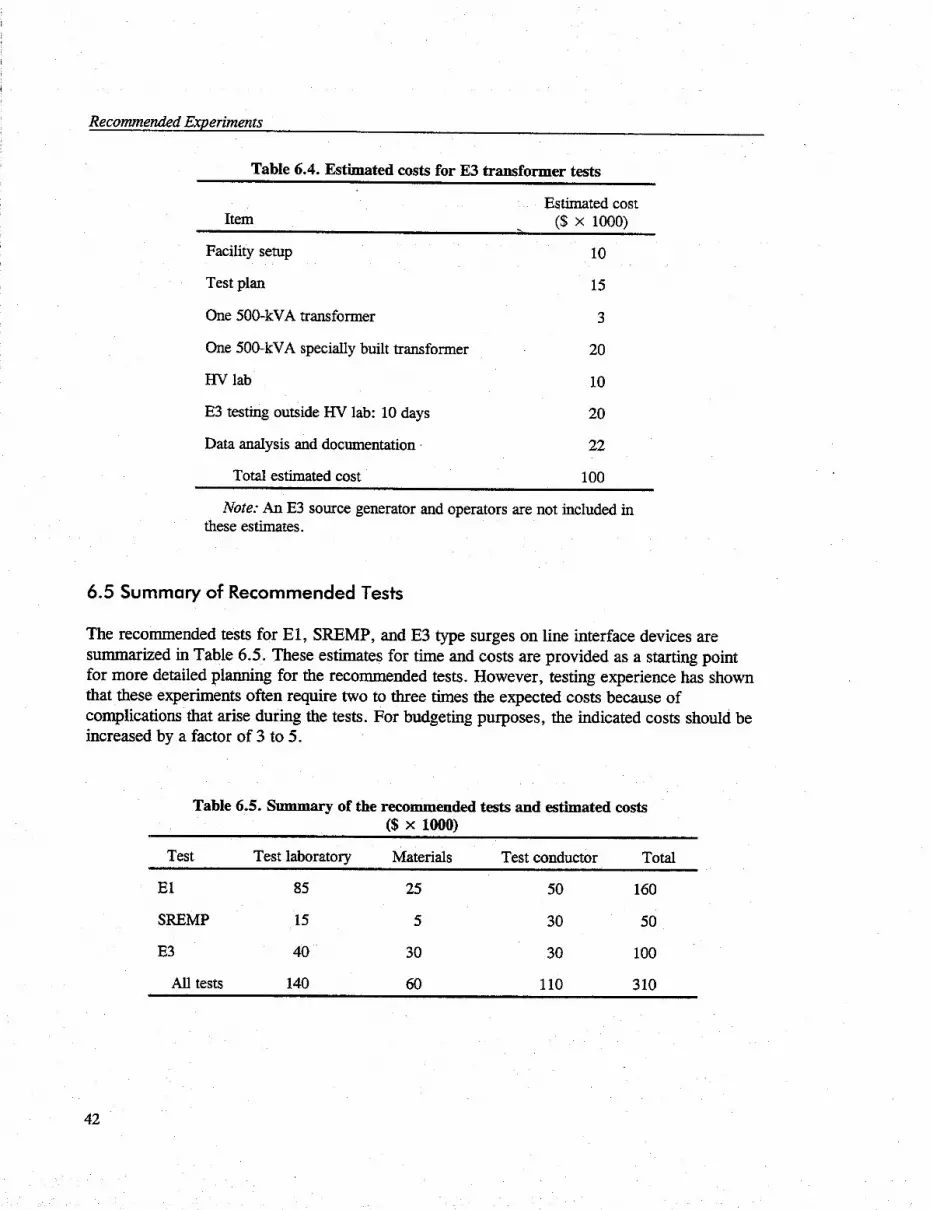
Recommended Experiments
Table 6.4. Estimated costs for E3 transformer tests
Item
Facility setup
Test plan
One 500-kVA transformer
One 500-kVA specially built transformer
Estimated cost . ($ x 1000)
10
15
3
20
HV lab 10
E3 testing outside HV lab: 10 days 20
Data analysis and documentation 22
Total estimated cost 100
Note: An E3 source generator and operators are not included in these estimates.
6.5 Summary of Recommended Tests
The recommended tests for El, SREMP, and E3 type surges on line interface devices are summarized in Table 6.5. These estimates for time and costs are provided as a starting point for more detailed Planning for the recommended tests. However, testing experience has shown that these experiments often require two to three times the expected costs because of complications that arise during the tests. For budgeting purposes, the indicated costs should be increased by a factor of 3 to 5.
Table 6.5. Summary of the recommended tests and estimated costs ($ x 1000)
Test Test laboratory Materials Test conductor Total
El 85 25 50 160
SREMP 15 5 30 50
E3
All tests
30 30 100
140 60 110 310
42

7. SUMMARY AND CONCLUSIONS
7.1 Line Interface Devices
Utility electric power systems throughout the world comply with either IEEE or IEC standards. Line interface devices can be characterized for EMP analysis by their standard IEEE and IEC withstand voltage specifications, which are based on the ac operation voltage class of the device. Most interface devices-transformers, bushings, cables, connectors, terminators, and potheads-have a basic insulation level (BIL) rating. Insulators are normally rated at critical flashover (CFO) values. The CFO is an average voltage peak at which an insulator will flash over using the 1.2 x 50 ,us BIL pulse.
A BIL test wave is much too slow, both in rise time and fall time, to represent HEMP-induced surges. Steep-front short-duration surge tests have been performed on line interface devices under a DOE program to assess the effect of HEMP on electric power systems (Barnes et al. 1993). Damage and flashovers were related to the device’s rated BIL and/or CFO. One problem with the existing experimental data is that the available surges used in the experiments were longer than most HEMP surges. Additional experiments should be performed with surges that have very steep fronts and very short durations. It is expected that the new experiments will reveal that the shorter test surges will damage line interface devices at higher amplitudes than those of the longer pulses used in the DOE program.
7.2 Experiments
Possible experiments, and estimates of their costs, have been outlined in Section 6. The estimates of the time for the experiments, the number of components needed, and the costs are based on the authors’ experience and laboratory hourly charges. However, cost estimates for experiments are risky because actual tests usually take longer and cost more than planned. Therefore, it is recommended that for budget planning purposes and until more detailed test planning is conducted, the costs budgeted for testing be increased by a factor of 3 to 5.
Tests on energized lo-kV transformers and line insulators should have the highest priority. Data from these tests would permit an El analysis of lo-kV circuits. The engineering practice of installing surge arresters should be accurately followed for these tests, since arrester application will have a large impact on the results.
7.3 Preliminary Assessments
Table 7.1 shows the postulated El effects on selected line interface devices. These postulated results are based on the assumption that an El surge similar to a 30 x 100 ns wave will damage or flash over the component at a higher amplitude than the longer test pulses. The exact failure levels for SFSD surges will have to be determined by experiments.
43
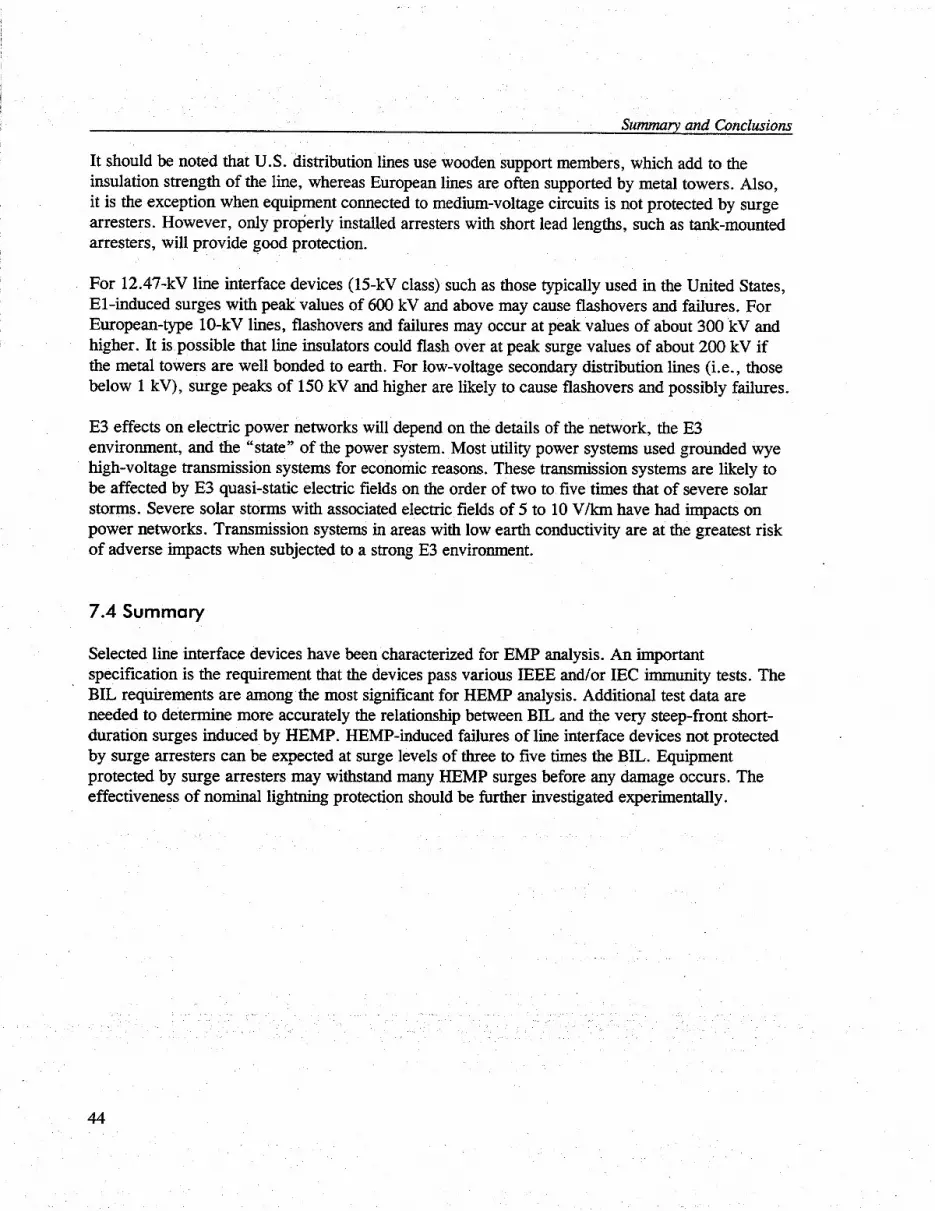
Summary and Conclusions
It should be noted that U.S. distribution lines use wooden support members, which add to the insulation strength of the line, whereas European lines are often supported by metal towers. Also, it is the exception when equipment connected to medium-voltage circuits is not protected by surge arresters. However, only properly installed arresters with short lead lengths, such as tank-mounted arresters, will provide good protection.
For 12.47-kV line interface devices (15-kV class) such as those typically used in the United States, El-induced surges with peak values of 600 kV and above may cause flashovers and failures. For European-type lo-kV lines, flashovers and failures may occur at peak values of about 300 kV and higher. It is possible that line insulators could flash over at peak surge values of about 200 kV if the metal towers are well bonded to earth. For low-voltage secondary distribution lines (i.e., those below 1 kV), surge peaks of 150 kV and higher are likely to cause flashovers and possibly failures.
E3 effects on electric power networks will depend on the details of the network, the E3 environment, and the “state” of the power system. Most utility power systems used grounded wye high-voltage transmission systems for economic reasons. These transmission systems are likely to be affected by E3 quasi-static electric fields on the order of two to five times that of severe solar storms. Severe solar storms with associated electric fields of 5 to 10 V/km have had impacts on power networks. Transmission systems in areas with low earth conductivity are at the greatest risk of adverse impacts when subjected to a strong E3 environment.
7.4 Summary
Selected line interface devices have been characterized for EMP analysis. An important specification is the requirement that the devices pass various IEEE and/or IEC immtmity tests. The BIL requirements are among the most significant for HEMP analysis. Additional test data are needed to determine more accurately the relationship between BIL and the very steep-front short- duration surges induced by HEMP. HEMP-induced failures of line interface devices not protected by surge arresters can be expected at surge levels of three to five times the BIL. Equipment protected by surge arresters may withstand many HEMP surges before any damage occurs. The effectiveness of nominal lightning protection should be further investigated experimentally.
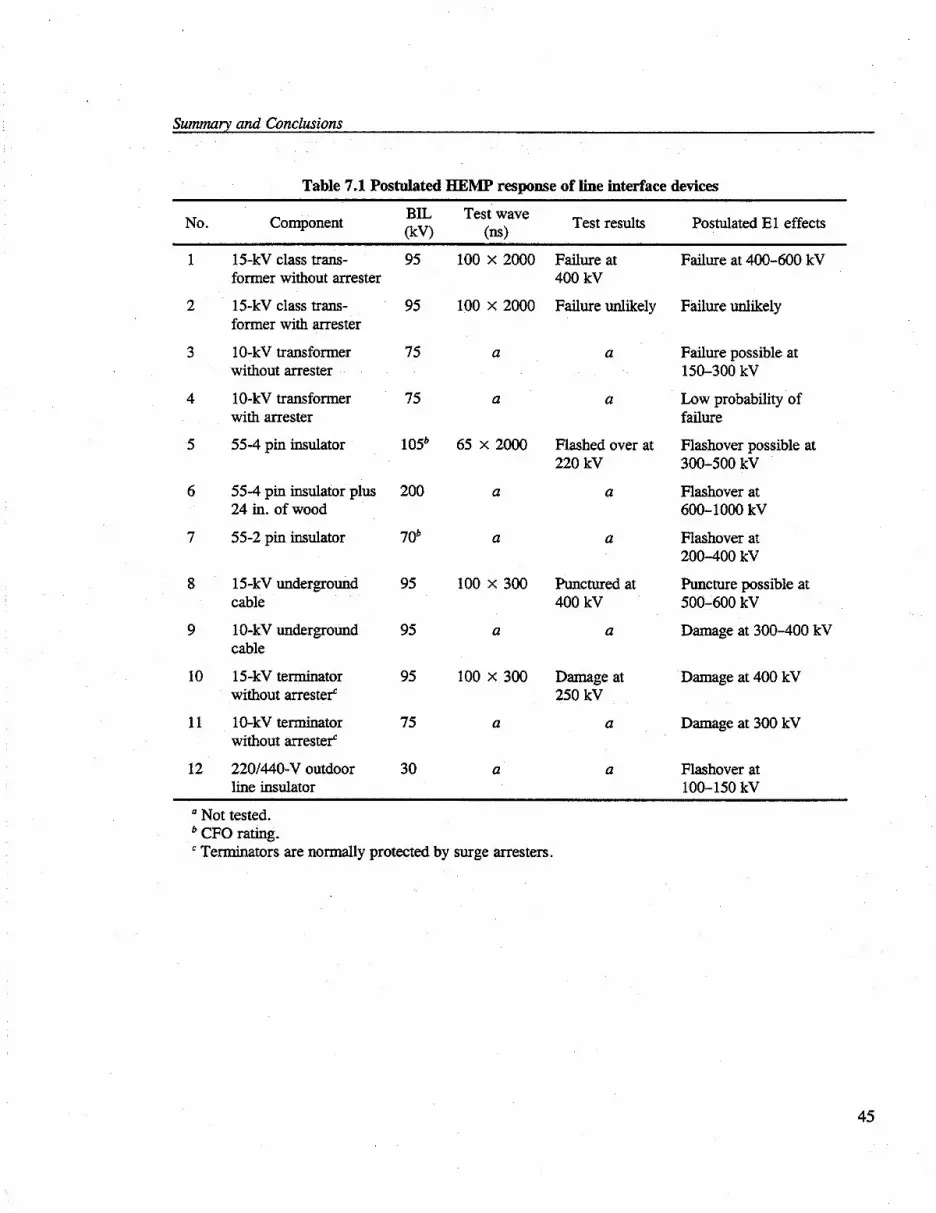
Summaiy and Conclusions
Table 7.1 Postulated HEMP response of line interface devices
No. Component BIL Test wave (kV) (IlS)
Test results Postulated El effects
1
2
3
4
5
6
7
8
9
10
11
12
15-kV class trans- former without arrester
15-kV class tmns- former with arrester
1 0-kV transformer without arrester
1 0-kV transformer with arrester
55-4 pm insulator
55-4 pin insulator plus 24 in. of wood
55-2 pm insulator
15-kV underground cable
1 O-kV underground cable
15-kV terminator without arresterC
lO-kV terminator without arrester’
220/440-V outdoor line insulator
95
95
75
75
1o5b
200
7ob
95
95
95
75
30
100 x 2000
100 x 2000
a
a
65 x 2000
a
a
100 x 300
a
100 x 300
a
a
Failure at 400 kV
Failure unlikely
a
a
Flashed over at Flashover possible at 220 kV 300-500 kV
a Flashover at 600-1000 kV
a
Punctured at Puncture possible at 400 kV 500-600 kV
a Damage at 300-400 kV
Damage at 250 kV
Damage at 400 kV
a Damage at 300 kV
a
Failure at 400-600 kV
Failure unlikely
Failure possible at 150-300 kV
Low probability of failure
Flashover at 200-400 kV
Flashover at -- loo-150 kv
a Not tested. b CFO rating. ’ Terminators are normally protected by surge arresters.
45


8. REFERENCES
ANSI/IEEE 1983. IEEE Recommended Practice for Electric Power Systems in Commercial Buildings. ANSI/IEEE Standard 241-1983. New York: Institute of Electrical and Electronics Engineers, July.
ANSI/IEEE 1987. IEEE Recommended Practices for Emergency and Standby Power for Industrial and Commercial Applications. ANSI/IEEE Standard 446-1987. New York: Institute of Electrical and Electronics Engineers.
ANSI/IEEE 1986. IEEE Recommended Practice for Electric Power Distribution for Industrial Plants. ANSI/IEEE Standard 141-1986. New York: Institute of Electrical and Electronics Engineers, June.
Barnes, P. R. et al. 1993. Electromagnetic Pulse Research on Electric Power Systems: Program Summary and Recommendations. ORNL-6708. Oak Ridge, Tenn. : Oak Ridge National Laboratory, January.
Chrzanowski, P., and J. Futterman 1992. An Assessment of the Electromagnetic Pulse (EMP) Eflects on the U.S. Civilian Infrastructure - Unclasst~ed Summary and Recommendations. CD-90-0014. Liver-more, Calif.: Lawrence Livermore National Laboratory, June.
Cooper Power Systems 1990. Electrical Distribution-System Protection. 3d ed. Bulletin 90020. Waukesha, Wis. : Cooper Power Systems, September.
Kravchenko, V. I. 1991. Lightning Protection of Radioelectronic Devices (in Russian). Moscow: Radio i Svyaz (Radio and Communications).
Miller, D. B. 1992. Experimental Investigation of Steep-Front Short Duration (SFSD) Surge E@cts on Power Systems Components. ORNL/Sub/87-91345. Oak Ridge, Term. : Oak Ridge National Laboratory, May.
Potter, M. 1999. Letter from Mike Potter, Cooper Power Systems, to P. R. Barnes, Oak Ridge National Laboratory, 11 February 1999.
Scheffer, D. 1999. “Transfer Switch Options for Critical Loads.” Power Quality Assurance 10, no. 3 (May/June): 24-31.
Taylor, C. W., and D. C. Erickson 1997. “Recording and Analyzing the July 2 Cascading Outage. n IEEE Computer Applications in Power 10, no. 1 (January).
47

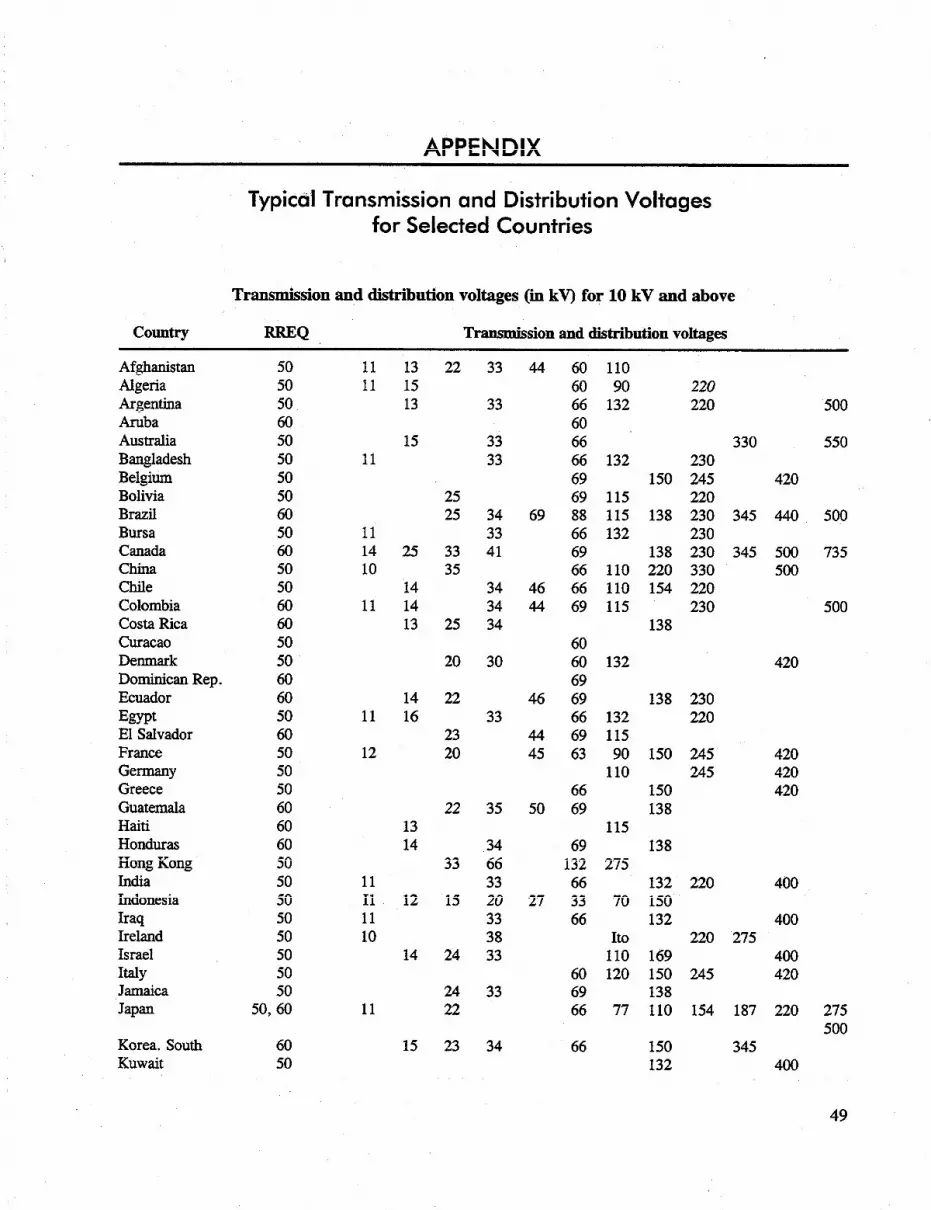
APPENDIX
Typical Transmission and Distribution Voltages - for Selected Countries
Transmission and distribution voltages (in kv) for 10 kV and above
colmtly =Q Transmission and distribution voltages
Afghanistan Algeria Argentina Aruba Australia Bangladesh Belgium Bolivia Brazil Bursa Canada China Chile Colombia Costa Rica Curacao Denmark Dominican Rep. Ecuador Egypt El Salvador France Germany Greece Guatemala Haiti Honduras Hong Kong India Indonesia Iraq Ireland Israel IdY Jamaica Japan
50 11 13 22 33 44 60 110 50 11 15 60 90 220 50 13 33 66 132 220 60 60 50 15 33 66 330 50 11 33 66 132 230 50 69 150 245 420 50 25 69 115 220 60 25 34 69 88 115 138 230 345 440 50 11 33 66 132 230 60 14 25 33 41 69 138 230 345 500 50 10 35 66 110 220 330 500 50 14 34 46 66 110 154 220 60 11 14 34 44 69 115 230 60 13 25 34 138 50 60 50 20 30 60 132 420 60 69 60 14 22 46 69 138 230 50 11 16 33 66 132 220 60 23 44 69 115 50 12 20 45 63 90 150 245 420 50 110 245 420 50 66 150 420 60 22 35 50 69 138 60 13 115 60 14 34 69 138 50 33 66 132 275 50 11 33 66 132 220 400 50 11 12 15 20 27 33 70 150 50 11 33 66 132 400 50 10 38 It0 220 275 50 14 24 33 110 169 400 50 60 120 150 245 420 50 24 33 69 138
50,60 11 22 66 77 110 154 187 220
Korea. South 60 15 23 34 66 150 345 Kuwait 50 132 400
500
550
500
735
500
275 500
49
couutry
Malaysia Mexico Morocco Nepal Netherlands Nicaragua Nigeria Pakistan Panama Pw3w Peru Philippines Russia
=Q Transmission and distribution voltages (in kV)
50 11 22 33 66 132 275 60 14 22 34 69 115 161 230 400 50 22 30 60 150 230 50 11 33 66 132 50 13 25 50 110 150 245 60 14 25 69 138 50 11 33 66 132 50 11 33 66 132 230 60 34 230 50 23 66 220 60 20 60 110 220 60 15 34 69 115 138 230 50 10 20 35 150 220
420
330
330 500 750 1150
400 Saudi Arabia 60 11 14 33 66 132 230 Singapore 50 15 34 69 230 South Africa 50 11 22 33 44 66 88 132 145 Spain 50 50 66 110 132 245 Sri Lanka 50 11 33 66 132 Sl.Uinam 60 33 Switzerland 50 245 Taiwan 50 15 27 33 44 69 110 169 230 Thailand 50 11 22 33 69 115 230 Tunisia 50 10 15 30 90 150 225 Turkey 50 15 34 66 154 U.A.E. 50 33 132 United Kingdom 50 11 22 33 66 132 275 United States 60 12 25 34 69 115 230 345 U%wY 50 60 110 150 Venezuela 60 14 34 69 115 230 Vietnam 50 15 33 66 230 Yugoslavia 50 10 34 110 245
220 330 400 420
420 345
420
420 500 765
500 420
420
50
ORNL-TM-1999193
INTERNAL DISTRIBUTION
1. J. E. Christian 12. J. VanCoevering 2. G. E. Courville 13. R. B. Wolfe 3. T. R. Curlee 14. Central Research Library 4-10. B. W. McConnell 15. Laboratory Records - RC 11. C. I. Moser 16-17. OSTI
EXTERNAL DISTRIBUTION
18. 19. 20.
21.
Paul R. Barnes, 4437 W. Rocky Lane, Beverly Hills,‘FL 34465-2 114 Phil Castillo, Lodicon RDA, P.O. Box 9377, Albuquerque, NM 87119 T. W. Kennedy, Defense Threat Reduction Agency, DSWA/WEP, 6801 Telegraph Road, Alexandria, VA 22310-3398 Mohammed Owais, Defense Threat Reduction Agency, DSWAAVEP, 6801 Telegraph Road, Alexandria, VA 22310-3398
22-24. Bah-am Prasad, Defense Threat Reduction Agency, DSWANEP, 6801 Telegraph Road, Alexandria, VA 223 lo-3398
25-29. W. Radasky, Metatech Corporation, P.O. Box 1450, Goleta, CA 93116-1450 30. W. J. Scott, Defense Threat Reduction Agency, DSWNRAEE, 6801 Telegraph Road,
Alexandria, VA 223 lo-3398 31. F. M. Tesche, Consulting Scientist, 9308 Stratford Way, Dallas, TX 75220 32. Office of Assistant Manager for Energy, Research and Development, DOE-ORO, P.O. Box
2001, Oak Ridge, TN 37831