Embed Size (px)
Citation preview
STRICTLY PRIVATE AND CONFIDENTIAL - DO NOT REPRODUCE
June 2022
As at 30 June 2022
STRICTLY PRIVATE AND CONFIDENTIAL - DO NOT REPRODUCE
Agenda
i. Introduction, Portfolio Manager Profile & Portfolio Strategy
ii. Investment Culture & Team Structure
iii. Portfolio Construction & Risk Management
iv. White Oak India Equity Fund V
v. Case Studies
vi. Summary of Terms
vii. Investment Case for Indian Equities
viii. Appendix
STRICTLY PRIVATE AND CONFIDENTIAL - DO NOT REPRODUCE
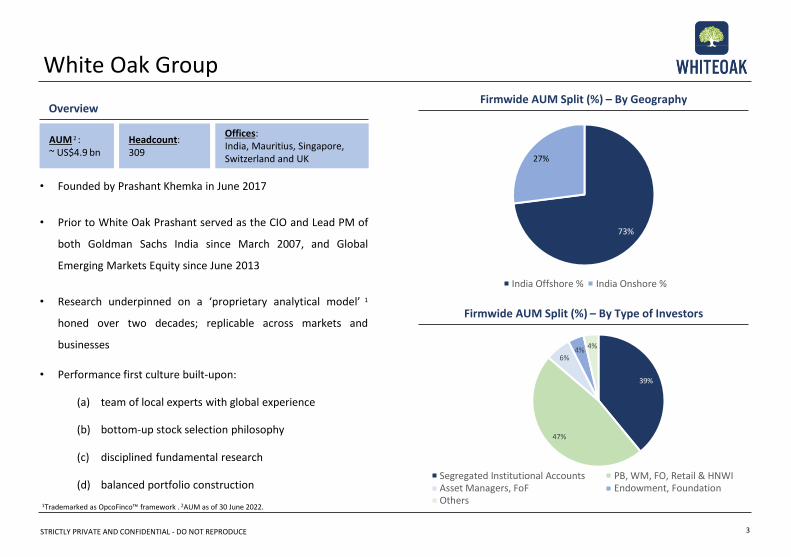
White Oak Group
3
• Founded by Prashant Khemka in June 2017
• Prior to White Oak Prashant served as the CIO and Lead PM of
both Goldman Sachs India since March 2007, and Global
Emerging Markets Equity since June 2013
• Research underpinned on a ‘proprietary analytical model’ 1
honed over two decades; replicable across markets and
businesses
• Performance first culture built-upon:
(a) team of local experts with global experience
(b) bottom-up stock selection philosophy
(c) disciplined fundamental research
(d) balanced portfolio construction
OverviewFirmwide AUM Split (%) – By Geography
Headcount:309
1Trademarked as OpcoFinco™ framework . 2AUM as of 30 June 2022.
AUM 2 :~ US$4.9 bn
Offices:India, Mauritius, Singapore, Switzerland and UK
Firmwide AUM Split (%) – By Type of Investors
73%
27%
India Offshore % India Onshore %
39%
47%
6%4%
4%
Segregated Institutional Accounts PB, WM, FO, Retail & HNWIAsset Managers, FoF Endowment, FoundationOthers
STRICTLY PRIVATE AND CONFIDENTIAL - DO NOT REPRODUCE
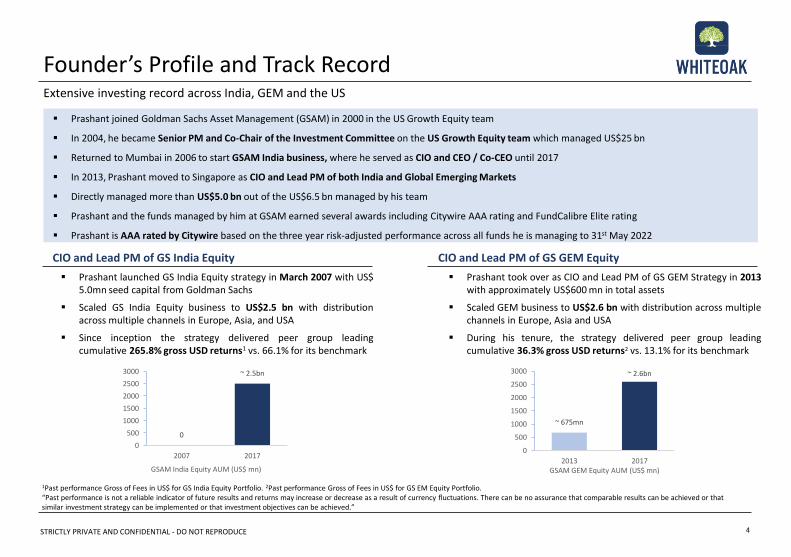
▪ Prashant took over as CIO and Lead PM of GS GEM Strategy in 2013with approximately US$600 mn in total assets
▪ Scaled GEM business to US$2.6 bn with distribution across multiplechannels in Europe, Asia and USA
▪ During his tenure, the strategy delivered peer group leadingcumulative 36.3% gross USD returns2 vs. 13.1% for its benchmark
▪ Prashant launched GS India Equity strategy in March 2007 with US$5.0mn seed capital from Goldman Sachs
▪ Scaled GS India Equity business to US$2.5 bn with distributionacross multiple channels in Europe, Asia, and USA
▪ Since inception the strategy delivered peer group leadingcumulative 265.8% gross USD returns1 vs. 66.1% for its benchmark
CIO and Lead PM of GS GEM Equity CIO and Lead PM of GS India Equity
Extensive investing record across India, GEM and the US
Founder’s Profile and Track Record
▪ Prashant joined Goldman Sachs Asset Management (GSAM) in 2000 in the US Growth Equity team
▪ In 2004, he became Senior PM and Co-Chair of the Investment Committee on the US Growth Equity team which managed US$25 bn
▪ Returned to Mumbai in 2006 to start GSAM India business, where he served as CIO and CEO / Co-CEO until 2017
▪ In 2013, Prashant moved to Singapore as CIO and Lead PM of both India and Global Emerging Markets
▪ Directly managed more than US$5.0 bn out of the US$6.5 bn managed by his team
▪ Prashant and the funds managed by him at GSAM earned several awards including Citywire AAA rating and FundCalibre Elite rating
▪ Prashant is AAA rated by Citywire based on the three year risk-adjusted performance across all funds he is managing to 31st May 2022
1Past performance Gross of Fees in US$ for GS India Equity Portfolio. 2Past performance Gross of Fees in US$ for GS EM Equity Portfolio. “Past performance is not a reliable indicator of future results and returns may increase or decrease as a result of currency fluctuations. There can be no assurance that comparable results can be achieved or that similar investment strategy can be implemented or that investment objectives can be achieved.”
4
0
~ 2.5bn
0
500
1000
1500
2000
2500
3000
2007 2017
GSAM India Equity AUM (US$ mn)
~ 675mn
~ 2.6bn
0
500
1000
1500
2000
2500
3000
2013 2017GSAM GEM Equity AUM (US$ mn)
STRICTLY PRIVATE AND CONFIDENTIAL - DO NOT REPRODUCE
Investment Culture: Team, Philosophy, Process & Portfolio Construction
STRICTLY PRIVATE AND CONFIDENTIAL - DO NOT REPRODUCE
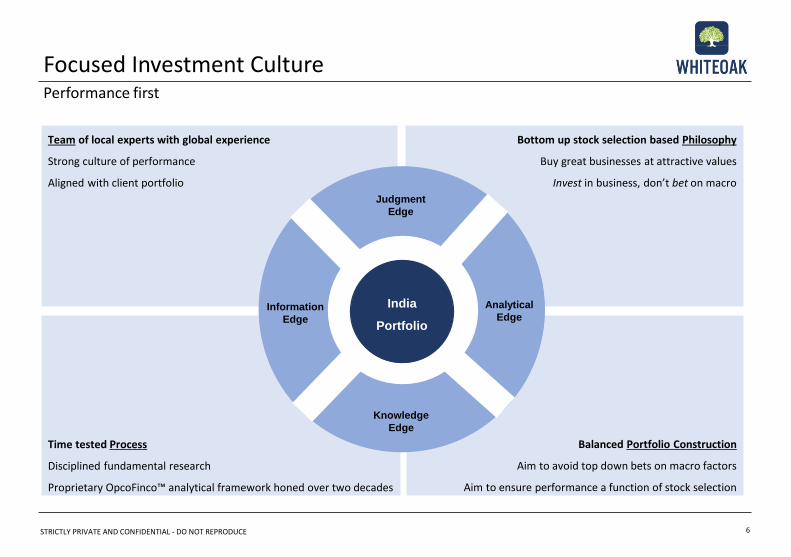
Balanced Portfolio Construction
Aim to avoid top down bets on macro factors
Aim to ensure performance a function of stock selection
Bottom up stock selection based Philosophy
Buy great businesses at attractive values
Invest in business, don’t bet on macro
Time tested Process
Disciplined fundamental research
Proprietary OpcoFinco™ analytical framework honed over two decades
Team of local experts with global experience
Strong culture of performance
Aligned with client portfolio
Information
Edge
Knowledge
Edge
Judgment
Edge
Analytical
EdgeIndia Portfolio
India
Portfolio
Focused Investment CulturePerformance first
6
STRICTLY PRIVATE AND CONFIDENTIAL - DO NOT REPRODUCE
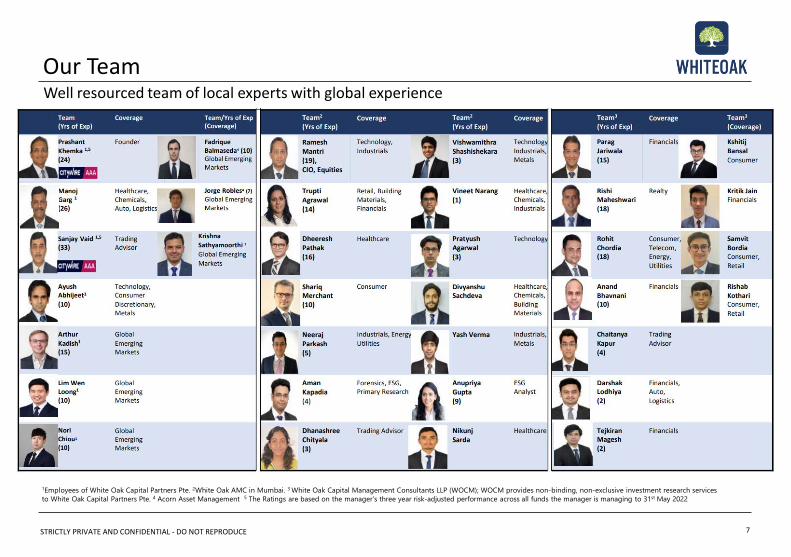
Our TeamWell resourced team of local experts with global experience
7
1Employees of White Oak Capital Partners Pte. 2White Oak AMC in Mumbai. 3 White Oak Capital Management Consultants LLP (WOCM); WOCM provides non-binding, non-exclusive investment research services
to White Oak Capital Partners Pte. 4 Acorn Asset Management 5 The Ratings are based on the manager’s three year risk-adjusted performance across all funds the manager is managing to 31st May 2022
STRICTLY PRIVATE AND CONFIDENTIAL - DO NOT REPRODUCE
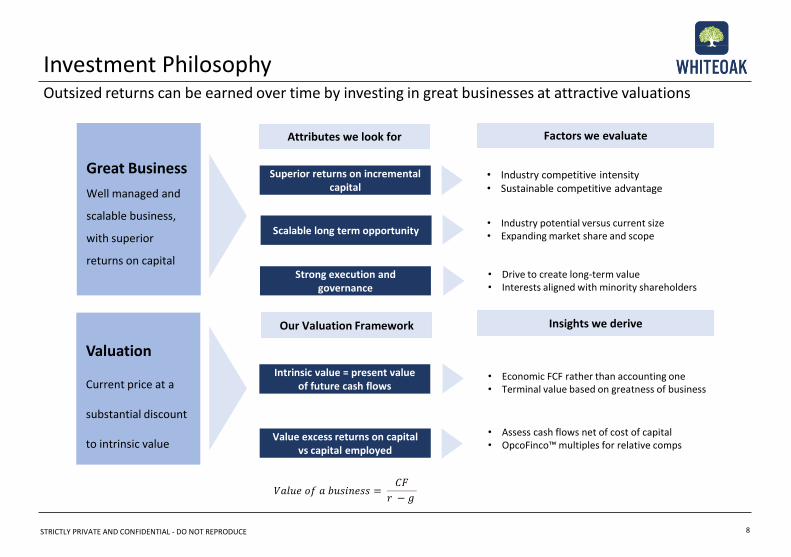
Factors we evaluate
Great Business
Well managed and
scalable business,
with superior
returns on capital
Superior returns on incremental capital
Scalable long term opportunity
Strong execution and governance
Intrinsic value = present value of future cash flows
• Industry competitive intensity• Sustainable competitive advantage
• Industry potential versus current size• Expanding market share and scope
• Drive to create long-term value• Interests aligned with minority shareholders
Attributes we look for
Our Valuation Framework
• Economic FCF rather than accounting one• Terminal value based on greatness of business
• Assess cash flows net of cost of capital• OpcoFinco™ multiples for relative comps
Value excess returns on capital vs capital employed
Insights we derive
Investment PhilosophyOutsized returns can be earned over time by investing in great businesses at attractive valuations
8
Valuation
Current price at a
substantial discount
to intrinsic value
𝑉𝑎𝑙𝑢𝑒 𝑜𝑓 𝑎 𝑏𝑢𝑠𝑖𝑛𝑒𝑠𝑠 =𝐶𝐹
𝑟 − 𝑔
STRICTLY PRIVATE AND CONFIDENTIAL - DO NOT REPRODUCE 9
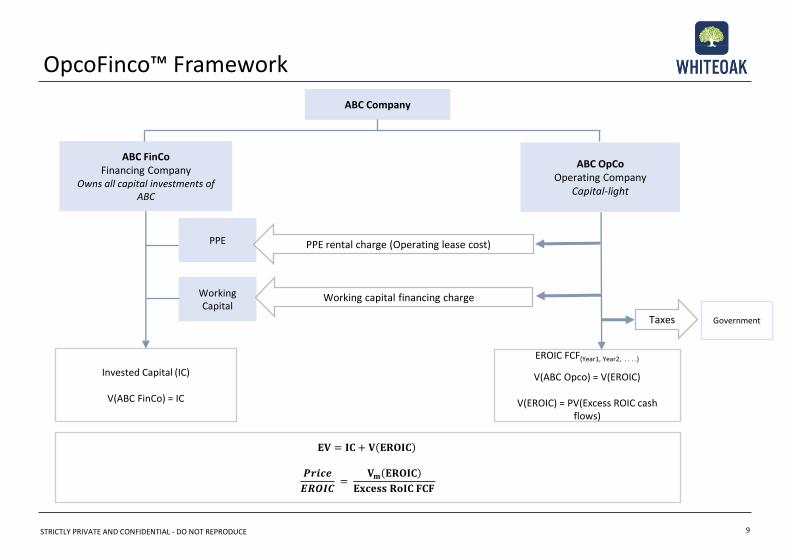
OpcoFinco™ Framework
ABC Company
ABC FinCo Financing Company
Owns all capital investments of ABC
ABC OpCoOperating Company
Capital-light
PPE
Working Capital
PPE rental charge (Operating lease cost)
Working capital financing charge
𝐄𝐕 = 𝐈𝐂 + 𝐕 𝐄𝐑𝐎𝐈𝐂
𝑷𝒓𝒊𝒄𝒆
𝑬𝑹𝑶𝑰𝑪=
𝐕𝐦 𝐄𝐑𝐎𝐈𝐂
𝐄𝐱𝐜𝐞𝐬𝐬 𝐑𝐨𝐈𝐂 𝐅𝐂𝐅
EROIC FCF(Year1, Year2, . . . .)
V(ABC Opco) = V(EROIC)
V(EROIC) = PV(Excess ROIC cash flows)
Taxes Government
Invested Capital (IC)
V(ABC FinCo) = IC
STRICTLY PRIVATE AND CONFIDENTIAL - DO NOT REPRODUCE
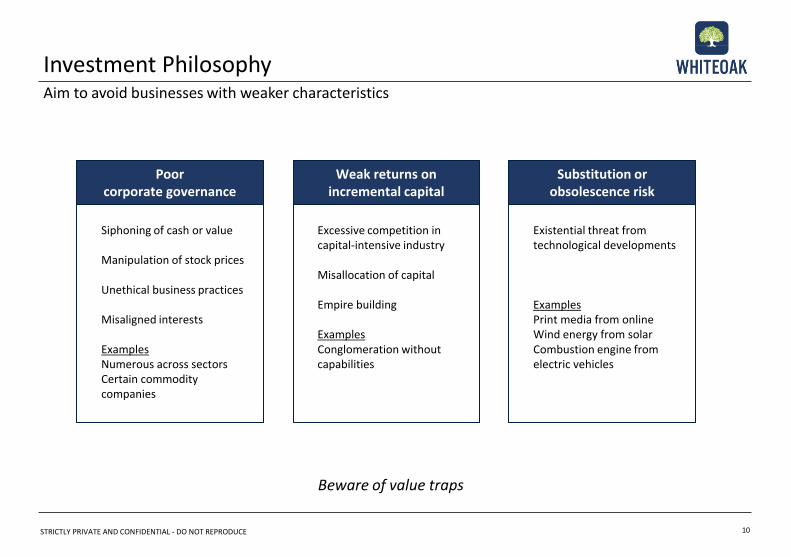
Existential threat from technological developments
ExamplesPrint media from onlineWind energy from solarCombustion engine from electric vehicles
Siphoning of cash or value
Manipulation of stock prices
Unethical business practices
Misaligned interests
ExamplesNumerous across sectorsCertain commodity companies
Beware of value traps
Excessive competition in capital-intensive industry
Misallocation of capital
Empire building
ExamplesConglomeration without capabilities
Substitution or obsolescence risk
Weak returns on incremental capital
Poor corporate governance
Investment PhilosophyAim to avoid businesses with weaker characteristics
10
STRICTLY PRIVATE AND CONFIDENTIAL - DO NOT REPRODUCE
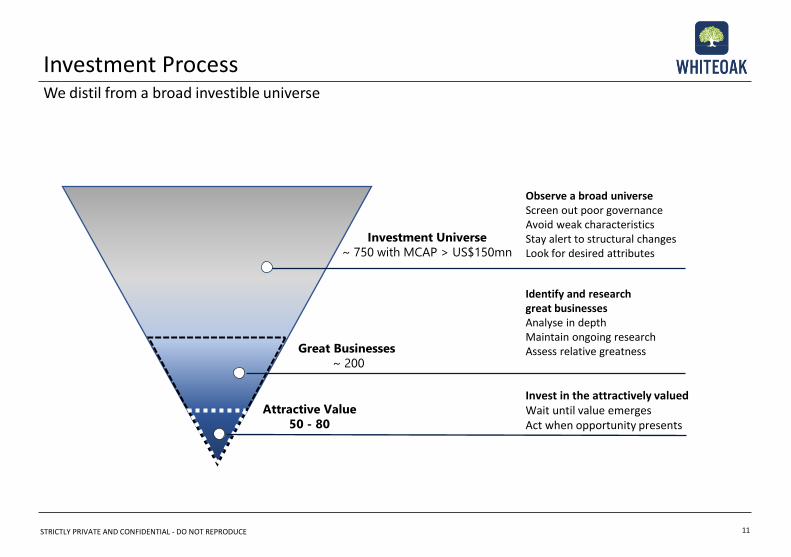
Investment ProcessWe distil from a broad investible universe
11
Observe a broad universeScreen out poor governanceAvoid weak characteristicsStay alert to structural changesLook for desired attributes
Identify and research great businessesAnalyse in depthMaintain ongoing researchAssess relative greatness
Invest in the attractively valuedWait until value emergesAct when opportunity presents
Investment Universe
~ 750 with MCAP > US$150mn
Great Businesses
~ 200
Attractive Value
50 - 80
STRICTLY PRIVATE AND CONFIDENTIAL - DO NOT REPRODUCE
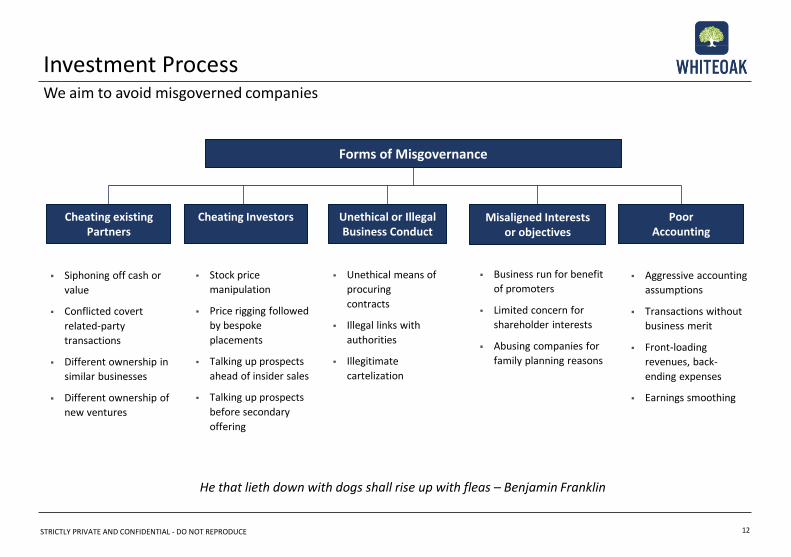
Poor Accounting
Cheating InvestorsCheating existing Partners
Misaligned Interests or objectives
Forms of Misgovernance
Unethical or Illegal Business Conduct
▪ Siphoning off cash or
value
▪ Conflicted covert
related-party
transactions
▪ Different ownership in
similar businesses
▪ Different ownership of
new ventures
▪ Stock price
manipulation
▪ Price rigging followed
by bespoke
placements
▪ Talking up prospects
ahead of insider sales
▪ Talking up prospects
before secondary
offering
▪ Aggressive accounting
assumptions
▪ Transactions without
business merit
▪ Front-loading
revenues, back-
ending expenses
▪ Earnings smoothing
▪ Business run for benefit
of promoters
▪ Limited concern for
shareholder interests
▪ Abusing companies for
family planning reasons
▪ Unethical means of
procuring
contracts
▪ Illegal links with
authorities
▪ Illegitimate
cartelization
He that lieth down with dogs shall rise up with fleas – Benjamin Franklin
Investment ProcessWe aim to avoid misgoverned companies
12
STRICTLY PRIVATE AND CONFIDENTIAL - DO NOT REPRODUCE
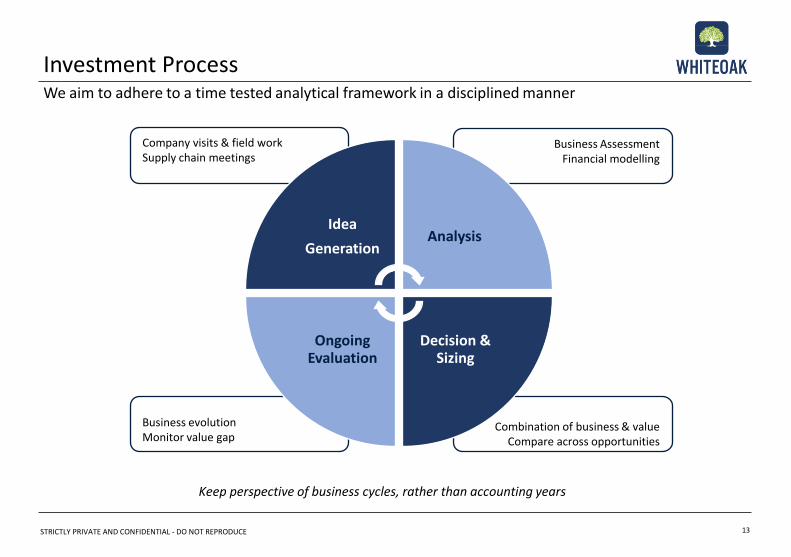
Business AssessmentFinancial modelling
Business evolutionMonitor value gap
Combination of business & valueCompare across opportunities
Keep perspective of business cycles, rather than accounting years
Company visits & field workSupply chain meetings
Investment ProcessWe aim to adhere to a time tested analytical framework in a disciplined manner
13
Idea
GenerationAnalysis
Decision & Sizing
Ongoing Evaluation
STRICTLY PRIVATE AND CONFIDENTIAL - DO NOT REPRODUCE
Portfolio Construction & Risk Management
STRICTLY PRIVATE AND CONFIDENTIAL - DO NOT REPRODUCE
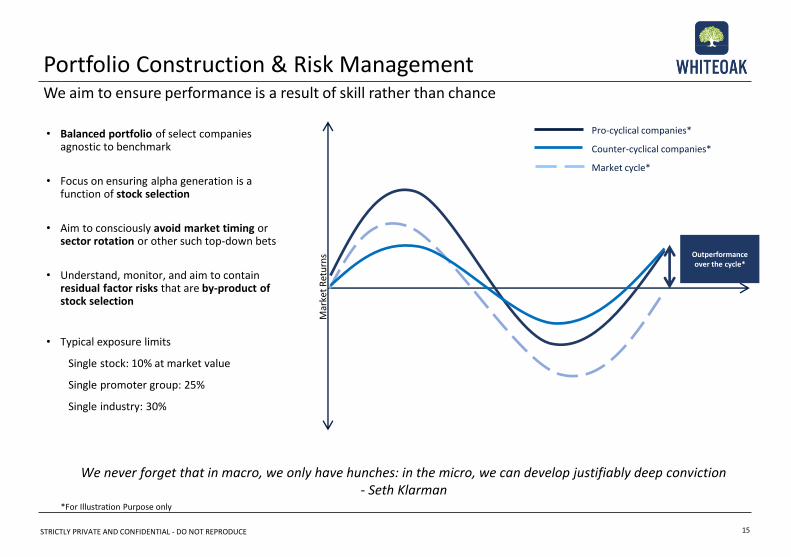
• Balanced portfolio of select companies agnostic to benchmark
• Focus on ensuring alpha generation is a function of stock selection
• Aim to consciously avoid market timing or sector rotation or other such top-down bets
• Understand, monitor, and aim to contain residual factor risks that are by-product of stock selection
• Typical exposure limits
Single stock: 10% at market value
Single promoter group: 25%
Single industry: 30%
We never forget that in macro, we only have hunches: in the micro, we can develop justifiably deep conviction- Seth Klarman
Portfolio Construction & Risk ManagementWe aim to ensure performance is a result of skill rather than chance
Outperformance over the cycle*
Pro-cyclical companies*
Counter-cyclical companies*
Market cycle*
Mar
ket
Ret
urn
s
*For Illustration Purpose only
15
STRICTLY PRIVATE AND CONFIDENTIAL - DO NOT REPRODUCE
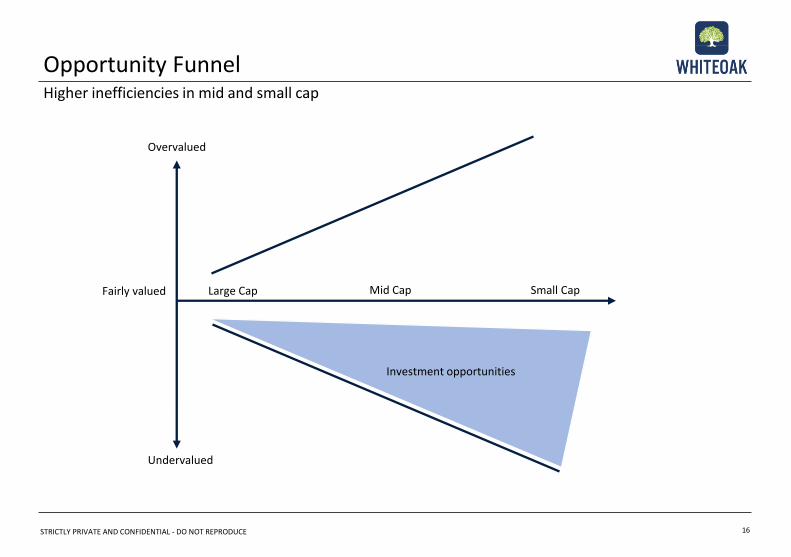
Large Cap
Investment opportunities
Small CapMid Cap
Overvalued
Undervalued
Fairly valued
Opportunity FunnelHigher inefficiencies in mid and small cap
16
STRICTLY PRIVATE AND CONFIDENTIAL - DO NOT REPRODUCE
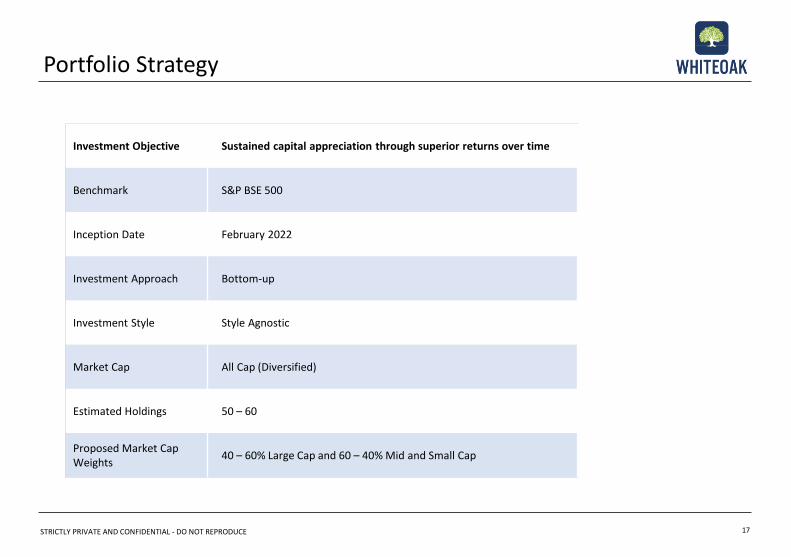
Investment Objective Sustained capital appreciation through superior returns over time
Benchmark S&P BSE 500
Inception Date February 2022
Investment Approach Bottom-up
Investment Style Style Agnostic
Market Cap All Cap (Diversified)
Estimated Holdings 50 – 60
Proposed Market Cap Weights
40 – 60% Large Cap and 60 – 40% Mid and Small Cap
Portfolio Strategy
17
STRICTLY PRIVATE AND CONFIDENTIAL - DO NOT REPRODUCE 18
White Oak India Equity Fund V
STRICTLY PRIVATE AND CONFIDENTIAL - DO NOT REPRODUCE
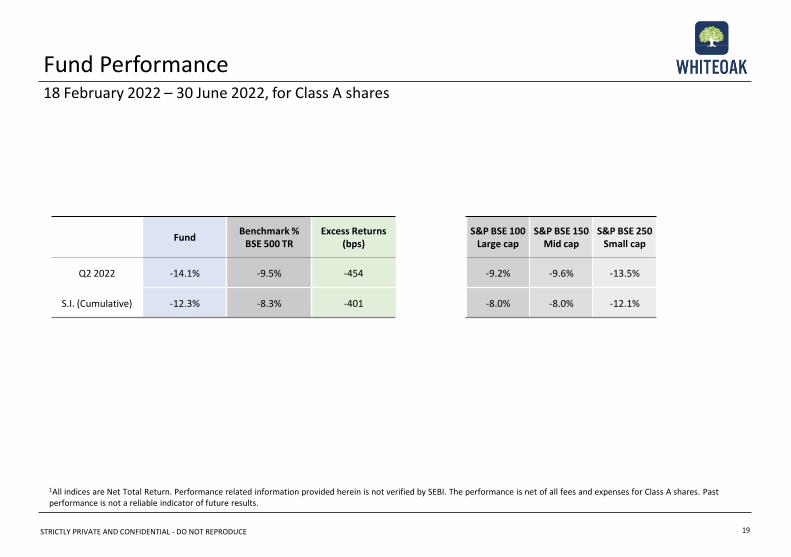
Fund Performance18 February 2022 – 30 June 2022, for Class A shares
19
` FundBenchmark %
BSE 500 TRExcess Returns
(bps)
Q2 2022 -14.1% -9.5% -454
S.I. (Cumulative) -12.3% -8.3% -401
S&P BSE 100 Large cap
S&P BSE 150 Mid cap
S&P BSE 250Small cap
-9.2% -9.6% -13.5%
-8.0% -8.0% -12.1%
1All indices are Net Total Return. Performance related information provided herein is not verified by SEBI. The performance is net of all fees and expenses for Class A shares. Past performance is not a reliable indicator of future results.
STRICTLY PRIVATE AND CONFIDENTIAL - DO NOT REPRODUCE
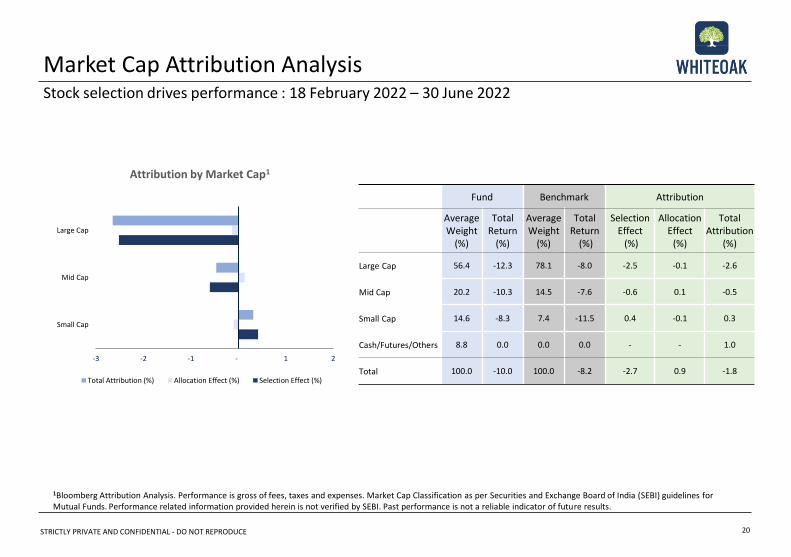
Fund Benchmark Attribution
Average Weight
(%)
Total Return
(%)
Average Weight
(%)
Total Return
(%)
Selection Effect
(%)
Allocation Effect
(%)
Total Attribution
(%)
Large Cap 56.4 -12.3 78.1 -8.0 -2.5 -0.1 -2.6
Mid Cap 20.2 -10.3 14.5 -7.6 -0.6 0.1 -0.5
Small Cap 14.6 -8.3 7.4 -11.5 0.4 -0.1 0.3
Cash/Futures/Others 8.8 0.0 0.0 0.0 - - 1.0
Total 100.0 -10.0 100.0 -8.2 -2.7 0.9 -1.8
Attribution by Market Cap1
Market Cap Attribution AnalysisStock selection drives performance : 18 February 2022 – 30 June 2022
20
1Bloomberg Attribution Analysis. Performance is gross of fees, taxes and expenses. Market Cap Classification as per Securities and Exchange Board of India (SEBI) guidelines for Mutual Funds. Performance related information provided herein is not verified by SEBI. Past performance is not a reliable indicator of future results.
-3 -2 -1 - 1 2
Small Cap
Mid Cap
Large Cap
Total Attribution (%) Allocation Effect (%) Selection Effect (%)
STRICTLY PRIVATE AND CONFIDENTIAL - DO NOT REPRODUCE
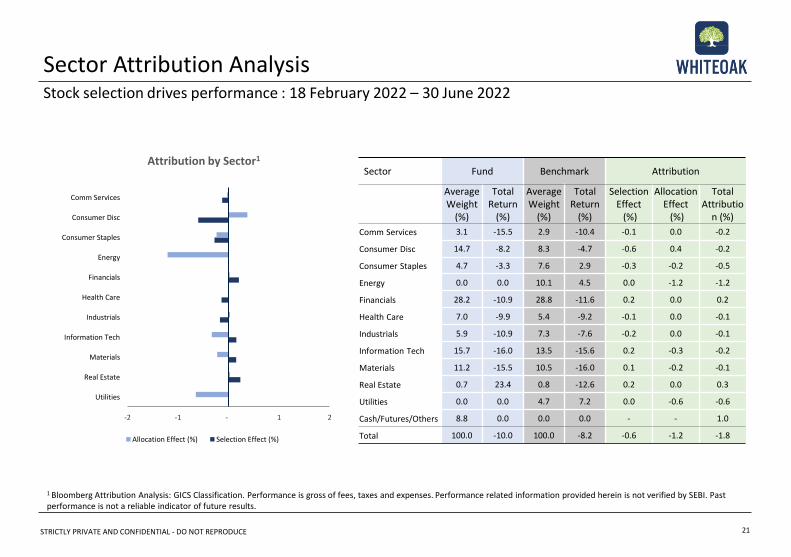
Sector Fund Benchmark Attribution
Average Weight
(%)
Total Return
(%)
Average Weight
(%)
Total Return
(%)
Selection Effect
(%)
Allocation Effect
(%)
Total Attributio
n (%)
Comm Services 3.1 -15.5 2.9 -10.4 -0.1 0.0 -0.2
Consumer Disc 14.7 -8.2 8.3 -4.7 -0.6 0.4 -0.2
Consumer Staples 4.7 -3.3 7.6 2.9 -0.3 -0.2 -0.5
Energy 0.0 0.0 10.1 4.5 0.0 -1.2 -1.2
Financials 28.2 -10.9 28.8 -11.6 0.2 0.0 0.2
Health Care 7.0 -9.9 5.4 -9.2 -0.1 0.0 -0.1
Industrials 5.9 -10.9 7.3 -7.6 -0.2 0.0 -0.1
Information Tech 15.7 -16.0 13.5 -15.6 0.2 -0.3 -0.2
Materials 11.2 -15.5 10.5 -16.0 0.1 -0.2 -0.1
Real Estate 0.7 23.4 0.8 -12.6 0.2 0.0 0.3
Utilities 0.0 0.0 4.7 7.2 0.0 -0.6 -0.6
Cash/Futures/Others 8.8 0.0 0.0 0.0 - - 1.0
Total 100.0 -10.0 100.0 -8.2 -0.6 -1.2 -1.8
Sector Attribution AnalysisStock selection drives performance : 18 February 2022 – 30 June 2022
21
Attribution by Sector1
1 Bloomberg Attribution Analysis: GICS Classification. Performance is gross of fees, taxes and expenses. Performance related information provided herein is not verified by SEBI. Past performance is not a reliable indicator of future results.
-2 -1 - 1 2
Utilities
Real Estate
Materials
Information Tech
Industrials
Health Care
Financials
Energy
Consumer Staples
Consumer Disc
Comm Services
Allocation Effect (%) Selection Effect (%)
STRICTLY PRIVATE AND CONFIDENTIAL - DO NOT REPRODUCE
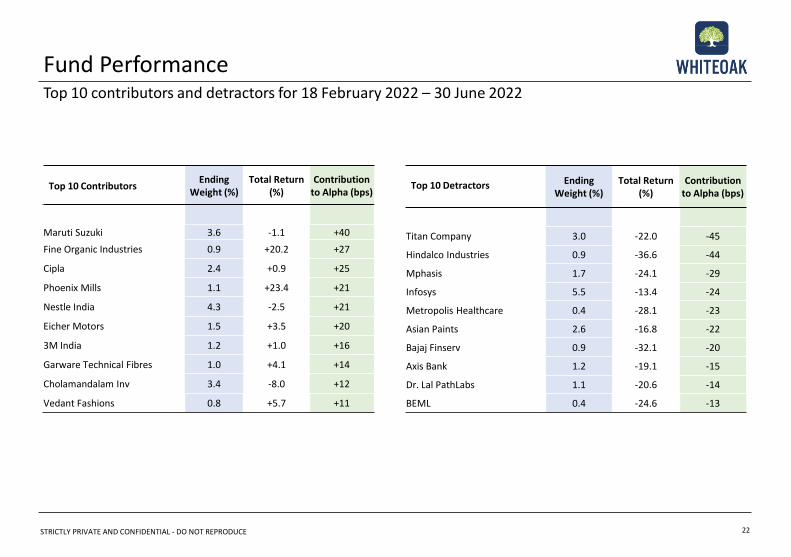
Top 10 ContributorsEnding
Weight (%) Total Return
(%)Contribution
to Alpha (bps)
Maruti Suzuki 3.6 -1.1 +40
Fine Organic Industries 0.9 +20.2 +27
Cipla 2.4 +0.9 +25
Phoenix Mills 1.1 +23.4 +21
Nestle India 4.3 -2.5 +21
Eicher Motors 1.5 +3.5 +20
3M India 1.2 +1.0 +16
Garware Technical Fibres 1.0 +4.1 +14
Cholamandalam Inv 3.4 -8.0 +12
Vedant Fashions 0.8 +5.7 +11
Top 10 Detractors EndingWeight (%)
Total Return (%)
Contribution to Alpha (bps)
Titan Company 3.0 -22.0 -45
Hindalco Industries 0.9 -36.6 -44
Mphasis 1.7 -24.1 -29
Infosys 5.5 -13.4 -24
Metropolis Healthcare 0.4 -28.1 -23
Asian Paints 2.6 -16.8 -22
Bajaj Finserv 0.9 -32.1 -20
Axis Bank 1.2 -19.1 -15
Dr. Lal PathLabs 1.1 -20.6 -14
BEML 0.4 -24.6 -13
Fund PerformanceTop 10 contributors and detractors for 18 February 2022 – 30 June 2022
22
STRICTLY PRIVATE AND CONFIDENTIAL - DO NOT REPRODUCE
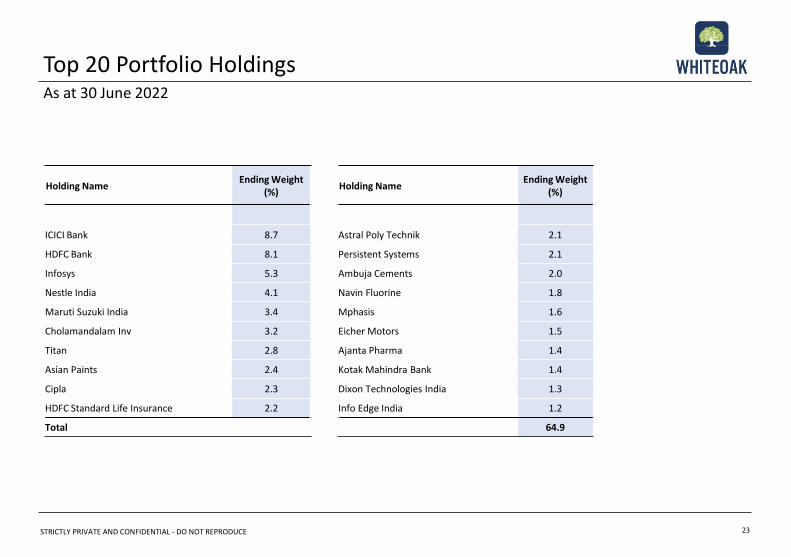
Holding NameEnding Weight
(%)
ICICI Bank 8.7
HDFC Bank 8.1
Infosys 5.3
Nestle India 4.1
Maruti Suzuki India 3.4
Cholamandalam Inv 3.2
Titan 2.8
Asian Paints 2.4
Cipla 2.3
HDFC Standard Life Insurance 2.2
Total
Top 20 Portfolio HoldingsAs at 30 June 2022
23
Holding NameEnding Weight
(%)
Astral Poly Technik 2.1
Persistent Systems 2.1
Ambuja Cements 2.0
Navin Fluorine 1.8
Mphasis 1.6
Eicher Motors 1.5
Ajanta Pharma 1.4
Kotak Mahindra Bank 1.4
Dixon Technologies India 1.3
Info Edge India 1.2
64.9
STRICTLY PRIVATE AND CONFIDENTIAL - DO NOT REPRODUCE
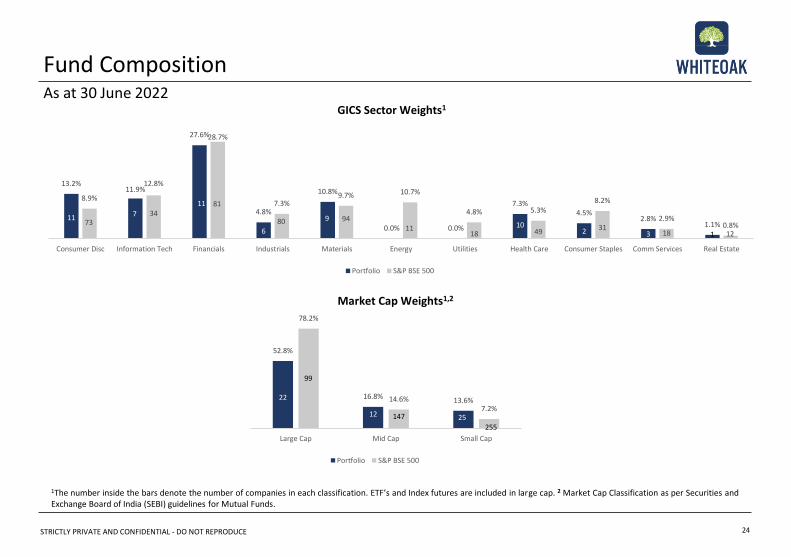
52.8%
16.8%13.6%
78.2%
14.6%7.2%
22
12 25
99
147
255
Large Cap Mid Cap Small Cap
Portfolio S&P BSE 500
13.2%11.9%
27.6%
4.8%
10.8%
0.0% 0.0%
7.3%4.5%
2.8%1.1%
8.9%
12.8%
28.7%
7.3%9.7% 10.7%
4.8% 5.3%8.2%
2.9%0.8%
11 7
11
6
9
0
0
102 3 1
7334
81
80 9411
18 4931
18 12
Consumer Disc Information Tech Financials Industrials Materials Energy Utilities Health Care Consumer Staples Comm Services Real Estate
Portfolio S&P BSE 500
Market Cap Weights1,2
GICS Sector Weights1
1The number inside the bars denote the number of companies in each classification. ETF’s and Index futures are included in large cap. 2 Market Cap Classification as per Securities and Exchange Board of India (SEBI) guidelines for Mutual Funds.
Fund Composition
24
As at 30 June 2022
STRICTLY PRIVATE AND CONFIDENTIAL - DO NOT REPRODUCE 25
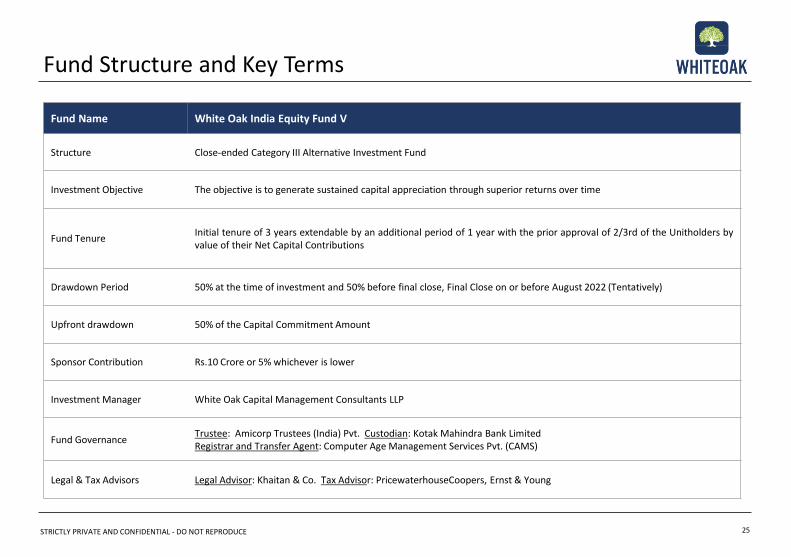
Fund Structure and Key Terms
Fund Name White Oak India Equity Fund V
Structure Close-ended Category III Alternative Investment Fund
Investment Objective The objective is to generate sustained capital appreciation through superior returns over time
Fund TenureInitial tenure of 3 years extendable by an additional period of 1 year with the prior approval of 2/3rd of the Unitholders byvalue of their Net Capital Contributions
Drawdown Period 50% at the time of investment and 50% before final close, Final Close on or before August 2022 (Tentatively)
Upfront drawdown 50% of the Capital Commitment Amount
Sponsor Contribution Rs.10 Crore or 5% whichever is lower
Investment Manager White Oak Capital Management Consultants LLP
Fund GovernanceTrustee: Amicorp Trustees (India) Pvt. Custodian: Kotak Mahindra Bank Limited Registrar and Transfer Agent: Computer Age Management Services Pvt. (CAMS)
Legal & Tax Advisors Legal Advisor: Khaitan & Co. Tax Advisor: PricewaterhouseCoopers, Ernst & Young
STRICTLY PRIVATE AND CONFIDENTIAL - DO NOT REPRODUCE
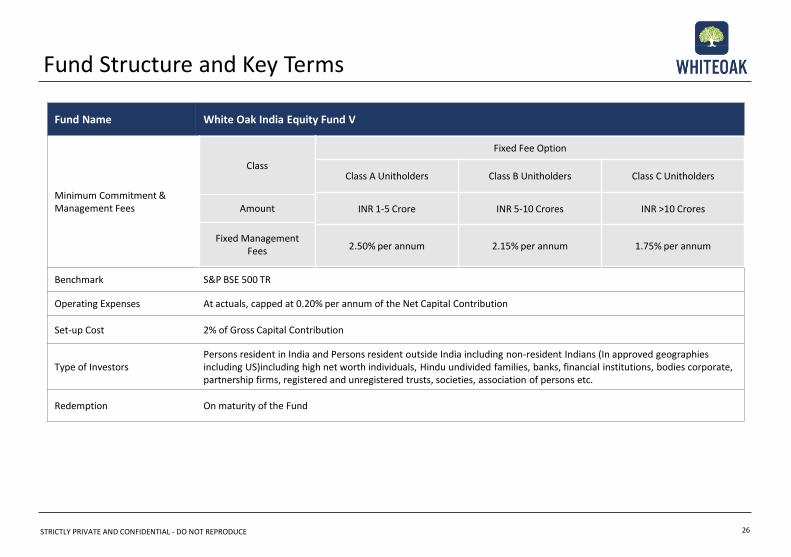
Fund Structure and Key Terms
26
Fund Name White Oak India Equity Fund V
Minimum Commitment & Management Fees
Benchmark S&P BSE 500 TR
Operating Expenses At actuals, capped at 0.20% per annum of the Net Capital Contribution
Set-up Cost 2% of Gross Capital Contribution
Type of InvestorsPersons resident in India and Persons resident outside India including non-resident Indians (In approved geographies including US)including high net worth individuals, Hindu undivided families, banks, financial institutions, bodies corporate,partnership firms, registered and unregistered trusts, societies, association of persons etc.
Redemption On maturity of the Fund
Class
Amount
Fixed Management Fees
Fixed Fee Option
Class A Unitholders Class B Unitholders Class C Unitholders
INR 1-5 Crore INR 5-10 Crores INR >10 Crores
2.50% per annum 2.15% per annum 1.75% per annum
STRICTLY PRIVATE AND CONFIDENTIAL - DO NOT REPRODUCE
Case Studies*
*The following case studies are illustrative examples only. The illustrated companies included here may or may not necessarily be held in any portfolio at any time in the past or currently.
STRICTLY PRIVATE AND CONFIDENTIAL - DO NOT REPRODUCE
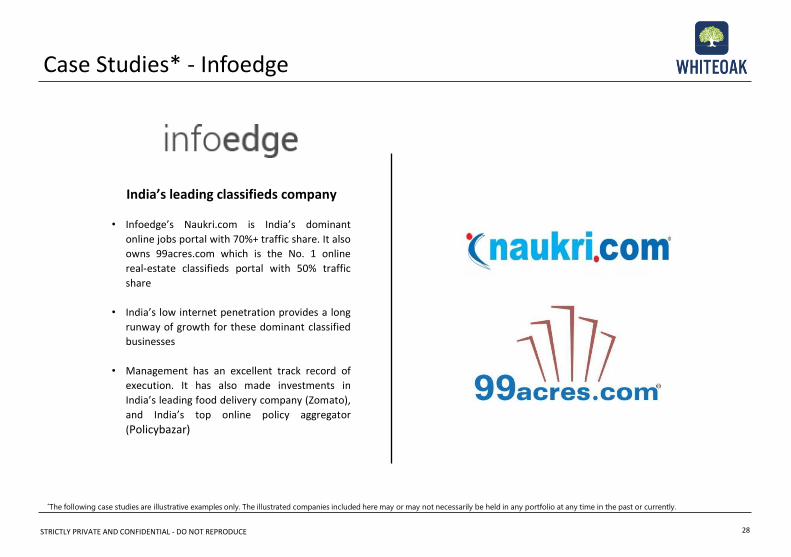
Case Studies* - Infoedge
28
*The following case studies are illustrative examples only. The illustrated companies included here may or may not necessarily be held in any portfolio at any time in the past or currently.
India’s leading classifieds company
• Infoedge’s Naukri.com is India’s dominant
online jobs portal with 70%+ traffic share. It also
owns 99acres.com which is the No. 1 online
real-estate classifieds portal with 50% traffic
share
• India’s low internet penetration provides a long
runway of growth for these dominant classified
businesses
• Management has an excellent track record of
execution. It has also made investments in
India’s leading food delivery company (Zomato),
and India’s top online policy aggregator
(Policybazar)
STRICTLY PRIVATE AND CONFIDENTIAL - DO NOT REPRODUCE
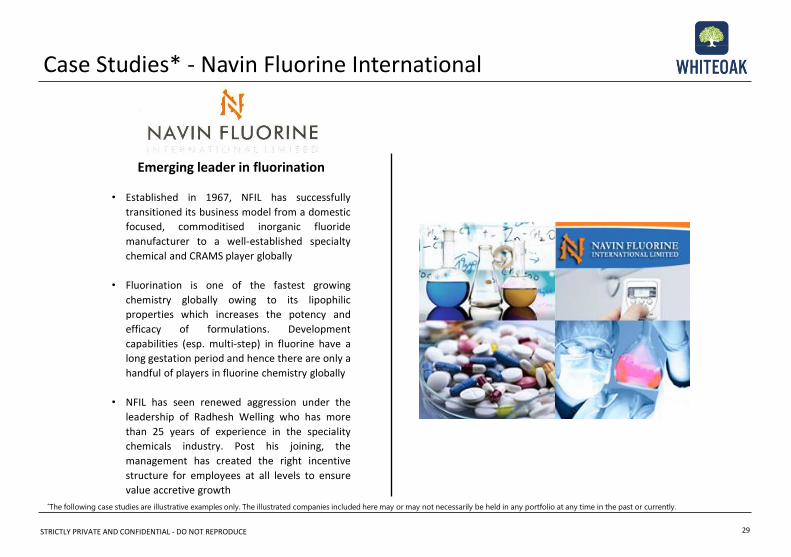
Case Studies* - Navin Fluorine International
29
*The following case studies are illustrative examples only. The illustrated companies included here may or may not necessarily be held in any portfolio at any time in the past or currently.
Emerging leader in fluorination
• Established in 1967, NFIL has successfully
transitioned its business model from a domestic
focused, commoditised inorganic fluoride
manufacturer to a well-established specialty
chemical and CRAMS player globally
• Fluorination is one of the fastest growing
chemistry globally owing to its lipophilic
properties which increases the potency and
efficacy of formulations. Development
capabilities (esp. multi-step) in fluorine have a
long gestation period and hence there are only a
handful of players in fluorine chemistry globally
• NFIL has seen renewed aggression under the
leadership of Radhesh Welling who has more
than 25 years of experience in the speciality
chemicals industry. Post his joining, the
management has created the right incentive
structure for employees at all levels to ensure
value accretive growth
STRICTLY PRIVATE AND CONFIDENTIAL - DO NOT REPRODUCE
Investment Case for Indian Equities
STRICTLY PRIVATE AND CONFIDENTIAL - DO NOT REPRODUCE
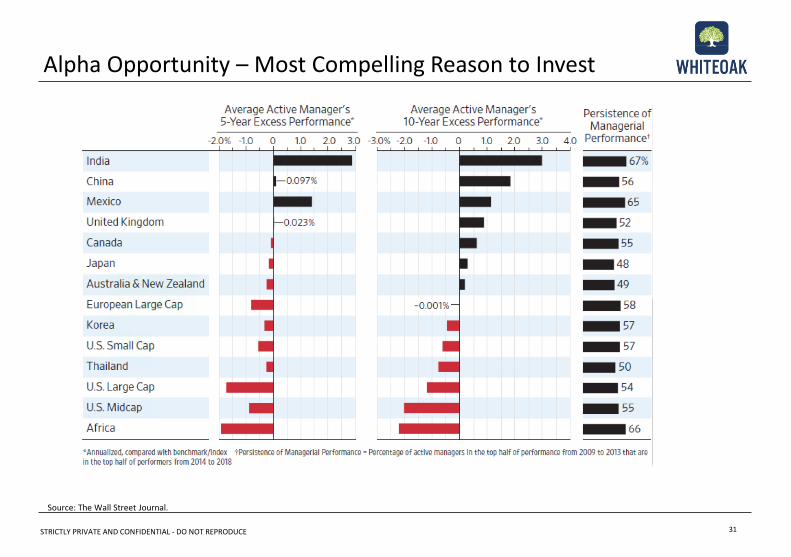
Alpha Opportunity – Most Compelling Reason to Invest
31
Source: The Wall Street Journal.
STRICTLY PRIVATE AND CONFIDENTIAL - DO NOT REPRODUCE
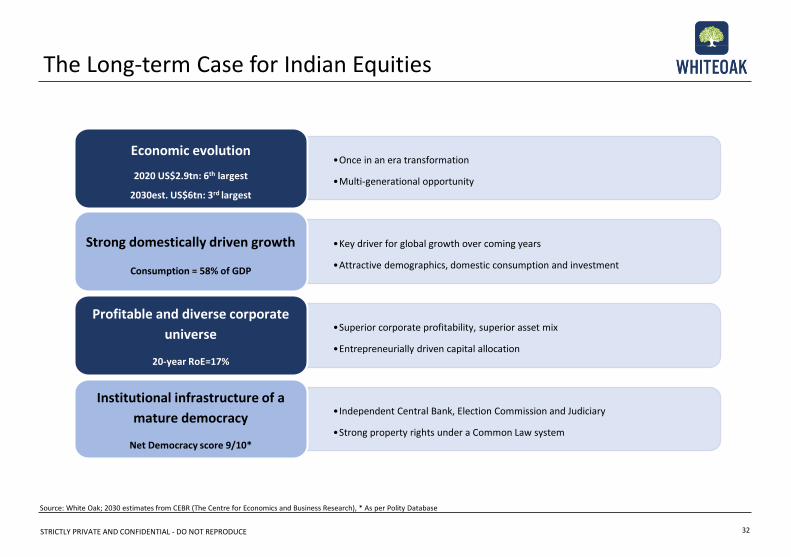
•Once in an era transformation
•Multi-generational opportunity
Economic evolution
2020 US$2.9tn: 6th largest
2030est. US$6tn: 3rd largest
•Key driver for global growth over coming years
•Attractive demographics, domestic consumption and investment
Strong domestically driven growth
Consumption = 58% of GDP
•Superior corporate profitability, superior asset mix
•Entrepreneurially driven capital allocation
Profitable and diverse corporate
universe
20-year RoE=17%
•Independent Central Bank, Election Commission and Judiciary
•Strong property rights under a Common Law system
Institutional infrastructure of a
mature democracy
Net Democracy score 9/10*
The Long-term Case for Indian Equities
32
Source: White Oak; 2030 estimates from CEBR (The Centre for Economics and Business Research), * As per Polity Database
STRICTLY PRIVATE AND CONFIDENTIAL - DO NOT REPRODUCE
FY9
3
FY9
4
FY9
5
FY9
6
FY9
7
FY9
8
FY9
9
FY0
0
FY0
1
FY0
2
FY0
3
FY0
4
FY0
5
FY0
6
FY0
7
FY0
8
FY0
9
FY1
0
FY1
1
FY1
2
FY1
3
FY1
4
FY1
5
FY1
6
FY1
7
FY1
8
FY1
9
FY2
0
FY2
1
FY2
2
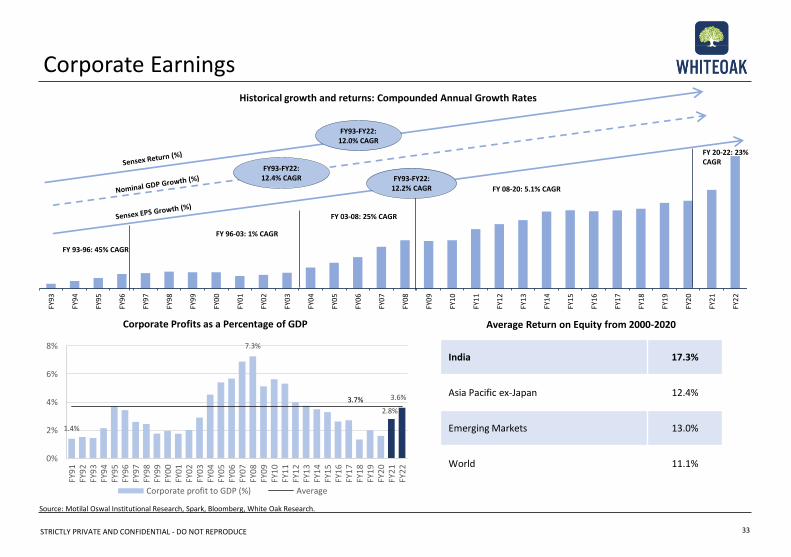
FY 93-96: 45% CAGR
FY 96-03: 1% CAGR
FY 03-08: 25% CAGR
FY 08-20: 5.1% CAGR
Historical growth and returns: Compounded Annual Growth Rates
Source: Motilal Oswal Institutional Research, Spark, Bloomberg, White Oak Research.
Corporate Profits as a Percentage of GDP Average Return on Equity from 2000-2020
India 17.3%
Asia Pacific ex-Japan 12.4%
Emerging Markets 13.0%
World 11.1%
Corporate Earnings
33
FY93-FY22: 12.2% CAGR
FY93-FY22: 12.4% CAGR
FY93-FY22: 12.0% CAGR
FY 20-22: 23% CAGR
1.4%
7.3%
2.8%
3.6%3.7%
0%
2%
4%
6%
8%
FY9
1FY
92
FY9
3FY
94
FY9
5FY
96
FY9
7FY
98
FY9
9FY
00
FY0
1FY
02
FY0
3FY
04
FY0
5FY
06
FY0
7FY
08
FY0
9FY
10
FY1
1FY
12
FY1
3FY
14
FY1
5FY
16
FY1
7FY
18
FY1
9FY
20
FY2
1FY
22
Corporate profit to GDP (%) Average
STRICTLY PRIVATE AND CONFIDENTIAL - DO NOT REPRODUCE
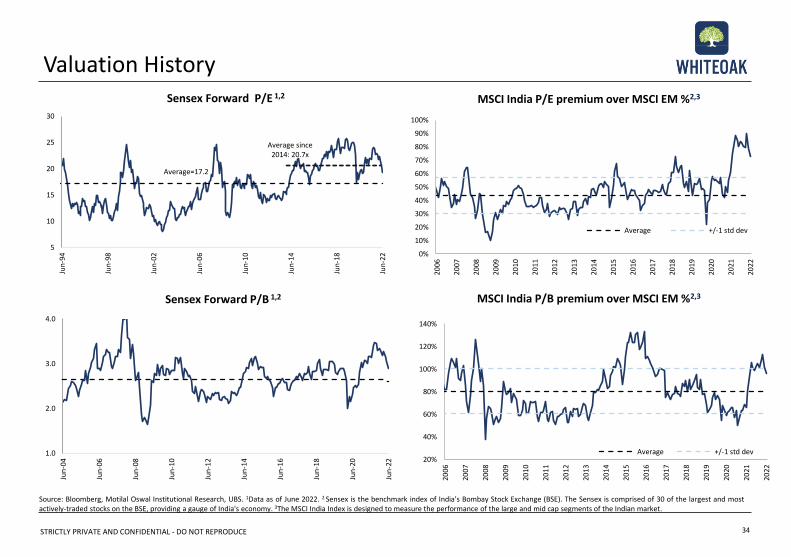
Source: Bloomberg, Motilal Oswal Institutional Research, UBS. 1Data as of June 2022. 2 Sensex is the benchmark index of India's Bombay Stock Exchange (BSE). The Sensex is comprised of 30 of the largest and mostactively-traded stocks on the BSE, providing a gauge of India's economy. 3The MSCI India Index is designed to measure the performance of the large and mid cap segments of the Indian market.
Valuation History
34
Sensex Forward P/B 1,2
Sensex Forward P/E 1,2 MSCI India P/E premium over MSCI EM %2,3
MSCI India P/B premium over MSCI EM %2,3
5
10
15
20
25
30
Jun
-94
Jun
-98
Jun
-02
Jun
-06
Jun
-10
Jun
-14
Jun
-18
Jun
-22
Average since 2014: 20.7x
Average=17.2
1.0
2.0
3.0
4.0
Jun
-04
Jun
-06
Jun
-08
Jun
-10
Jun
-12
Jun
-14
Jun
-16
Jun
-18
Jun
-20
Jun
-22
0%
10%
20%
30%
40%
50%
60%
70%
80%
90%
100%
2006
2007
2008
2009
2010
2011
2012
2013
2014
2015
2016
2017
2018
2019
2020
2021
2022
Average +/-1 std dev
20%
40%
60%
80%
100%
120%
140%
2006
2007
2008
2009
2010
2011
2012
2013
2014
2015
2016
2017
2018
2019
2020
2021
2022
Average +/-1 std dev
STRICTLY PRIVATE AND CONFIDENTIAL - DO NOT REPRODUCE
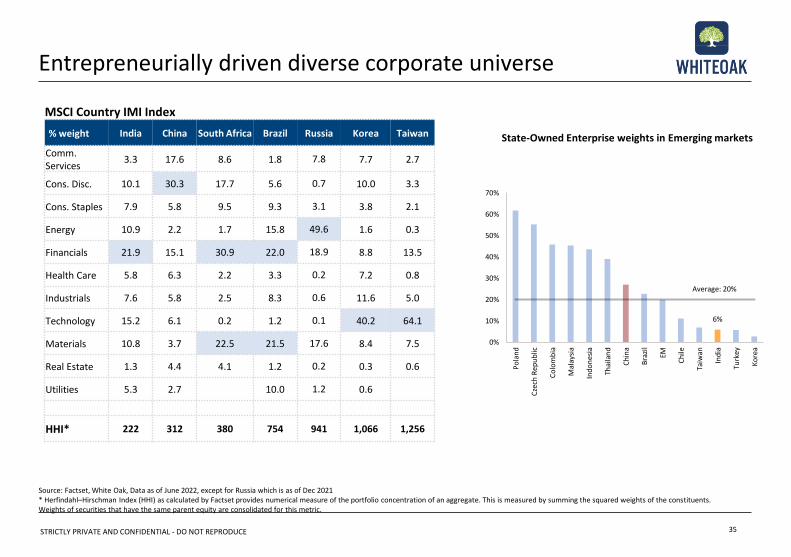
Entrepreneurially driven diverse corporate universe
35
Source: Factset, White Oak, Data as of June 2022, except for Russia which is as of Dec 2021* Herfindahl–Hirschman Index (HHI) as calculated by Factset provides numerical measure of the portfolio concentration of an aggregate. This is measured by summing the squared weights of the constituents. Weights of securities that have the same parent equity are consolidated for this metric.
State-Owned Enterprise weights in Emerging markets
MSCI Country IMI Index
% weight India China South Africa Brazil Russia Korea Taiwan
Comm. Services
3.3 17.6 8.6 1.8 7.8 7.7 2.7
Cons. Disc. 10.1 30.3 17.7 5.6 0.7 10.0 3.3
Cons. Staples 7.9 5.8 9.5 9.3 3.1 3.8 2.1
Energy 10.9 2.2 1.7 15.8 49.6 1.6 0.3
Financials 21.9 15.1 30.9 22.0 18.9 8.8 13.5
Health Care 5.8 6.3 2.2 3.3 0.2 7.2 0.8
Industrials 7.6 5.8 2.5 8.3 0.6 11.6 5.0
Technology 15.2 6.1 0.2 1.2 0.1 40.2 64.1
Materials 10.8 3.7 22.5 21.5 17.6 8.4 7.5
Real Estate 1.3 4.4 4.1 1.2 0.2 0.3 0.6
Utilities 5.3 2.7 10.0 1.2 0.6
HHI* 222 312 380 754 941 1,066 1,256
6%
Average: 20%
0%
10%
20%
30%
40%
50%
60%
70%
Po
lan
d
Cze
ch R
epu
blic
Co
lom
bia
Mal
aysi
a
Ind
on
esia
Thai
lan
d
Ch
ina
Bra
zil
EM
Ch
ile
Taiw
an
Ind
ia
Turk
ey
Ko
rea
STRICTLY PRIVATE AND CONFIDENTIAL - DO NOT REPRODUCE 36
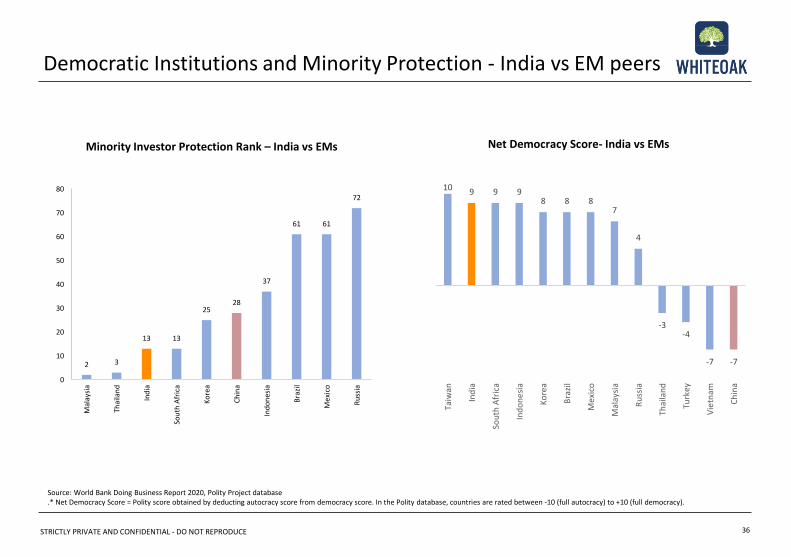
Democratic Institutions and Minority Protection - India vs EM peers
Minority Investor Protection Rank – India vs EMs
Source: World Bank Doing Business Report 2020, Polity Project database.* Net Democracy Score = Polity score obtained by deducting autocracy score from democracy score. In the Polity database, countries are rated between -10 (full autocracy) to +10 (full democracy).
2 3
13 13
2528
37
61 61
72
0
10
20
30
40
50
60
70
80
Mal
aysi
a
Thai
lan
d
Ind
ia
Sou
th A
fric
a
Ko
rea
Ch
ina
Ind
on
esia
Bra
zil
Me
xico
Ru
ssia
Net Democracy Score- India vs EMs
10 9 9 98 8 8
7
4
-3-4
-7 -7
Taiw
an
Ind
ia
Sou
th A
fric
a
Ind
on
esi
a
Ko
rea
Bra
zil
Mex
ico
Mal
aysi
a
Ru
ssia
Thai
lan
d
Turk
ey
Vie
tnam
Ch
ina
STRICTLY PRIVATE AND CONFIDENTIAL - DO NOT REPRODUCE
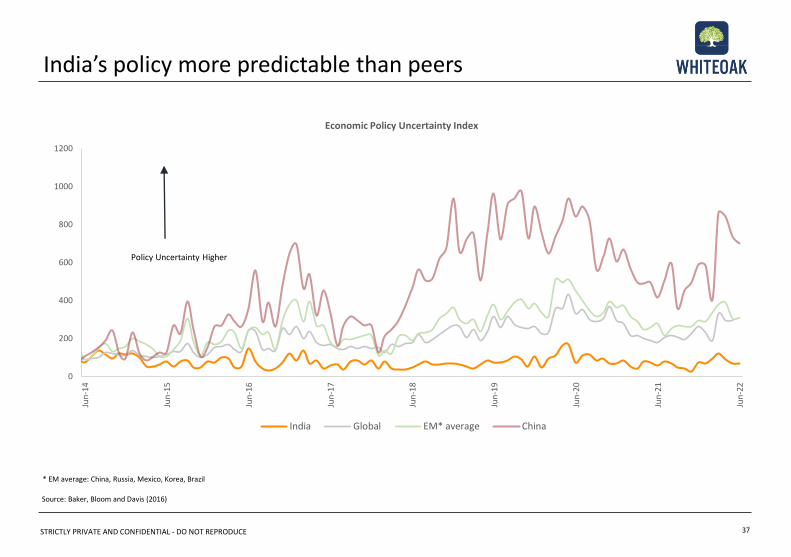
India’s policy more predictable than peers
37
Source: Baker, Bloom and Davis (2016)
* EM average: China, Russia, Mexico, Korea, Brazil
0
200
400
600
800
1000
1200
Jun
-14
Jun
-15
Jun
-16
Jun
-17
Jun
-18
Jun
-19
Jun
-20
Jun
-21
Jun
-22
Economic Policy Uncertainty Index
India Global EM* average China
Policy Uncertainty Higher
STRICTLY PRIVATE AND CONFIDENTIAL - DO NOT REPRODUCE
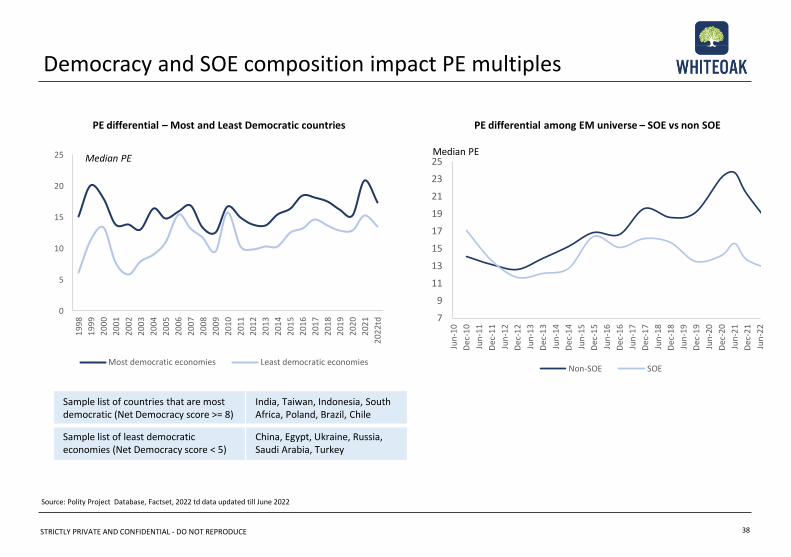
Source: Polity Project Database, Factset, 2022 td data updated till June 2022
PE differential – Most and Least Democratic countries
Democracy and SOE composition impact PE multiples
38
Sample list of countries that are most democratic (Net Democracy score >= 8)
India, Taiwan, Indonesia, South Africa, Poland, Brazil, Chile
Sample list of least democratic economies (Net Democracy score < 5)
China, Egypt, Ukraine, Russia, Saudi Arabia, Turkey
PE differential among EM universe – SOE vs non SOE
Median PE
0
5
10
15
20
25
199
8
199
9
200
0
200
1
200
2
200
3
200
4
200
5
200
6
200
7
200
8
200
9
201
0
201
1
201
2
201
3
201
4
201
5
201
6
201
7
201
8
201
9
202
0
202
1
202
2td
Most democratic economies Least democratic economies
Median PE
7
9
11
13
15
17
19
21
23
25
Jun
-10
Dec
-10
Jun
-11
Dec
-11
Jun
-12
Dec
-12
Jun
-13
Dec
-13
Jun
-14
Dec
-14
Jun
-15
Dec
-15
Jun
-16
Dec
-16
Jun
-17
Dec
-17
Jun
-18
Dec
-18
Jun
-19
Dec
-19
Jun
-20
Dec
-20
Jun
-21
Dec
-21
Jun
-22
Non-SOE SOE
STRICTLY PRIVATE AND CONFIDENTIAL - DO NOT REPRODUCE
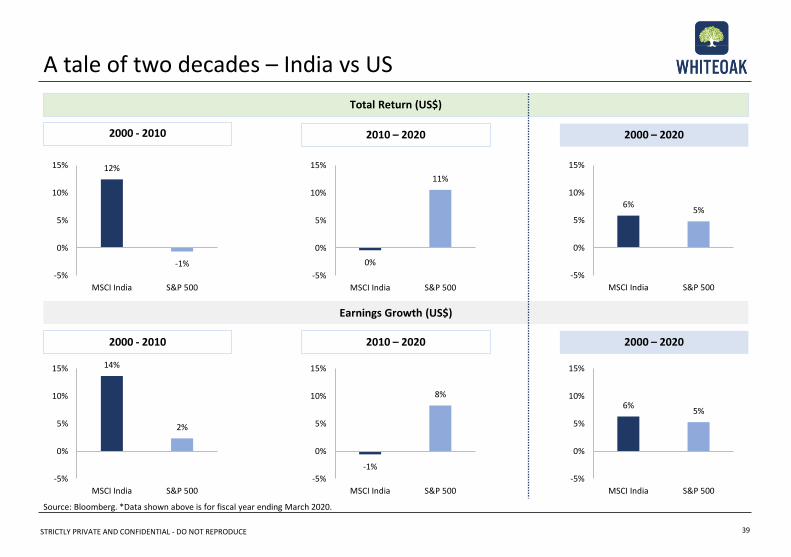
Source: Bloomberg. *Data shown above is for fiscal year ending March 2020.
A tale of two decades – India vs US
2000 - 2010
39
2010 – 2020 2000 – 2020
2000 - 2010 2010 – 2020 2000 – 2020
Earnings Growth (US$)
Total Return (US$)
12%
-1%
-5%
0%
5%
10%
15%
MSCI India S&P 500
0%
11%
-5%
0%
5%
10%
15%
MSCI India S&P 500
6%5%
-5%
0%
5%
10%
15%
MSCI India S&P 500
14%
2%
-5%
0%
5%
10%
15%
MSCI India S&P 500
-1%
8%
-5%
0%
5%
10%
15%
MSCI India S&P 500
6%5%
-5%
0%
5%
10%
15%
MSCI India S&P 500
STRICTLY PRIVATE AND CONFIDENTIAL - DO NOT REPRODUCE 40
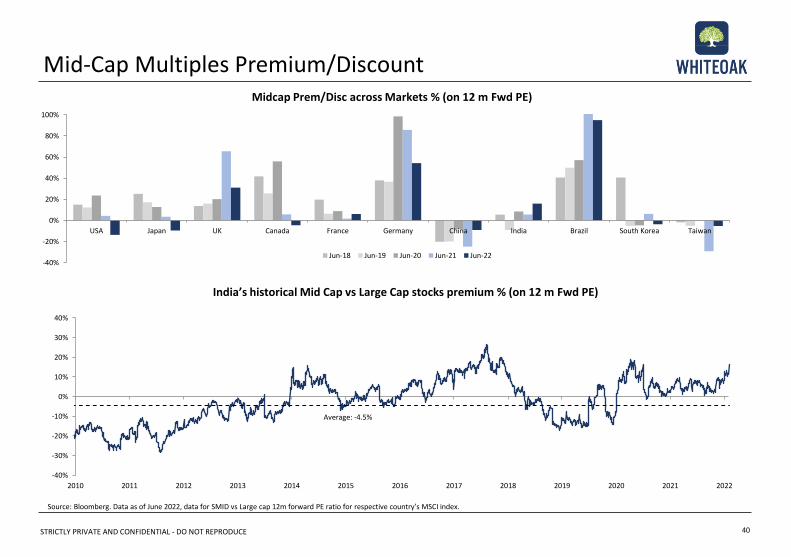
Mid-Cap Multiples Premium/Discount
India’s historical Mid Cap vs Large Cap stocks premium % (on 12 m Fwd PE)
Midcap Prem/Disc across Markets % (on 12 m Fwd PE)
Source: Bloomberg. Data as of June 2022, data for SMID vs Large cap 12m forward PE ratio for respective country’s MSCI index.
-40%
-20%
0%
20%
40%
60%
80%
100%
USA Japan UK Canada France Germany China India Brazil South Korea Taiwan
Jun-18 Jun-19 Jun-20 Jun-21 Jun-22
Average: -4.5%
-40%
-30%
-20%
-10%
0%
10%
20%
30%
40%
2010 2011 2012 2013 2014 2015 2016 2017 2018 2019 2020 2021 2022
STRICTLY PRIVATE AND CONFIDENTIAL - DO NOT REPRODUCE
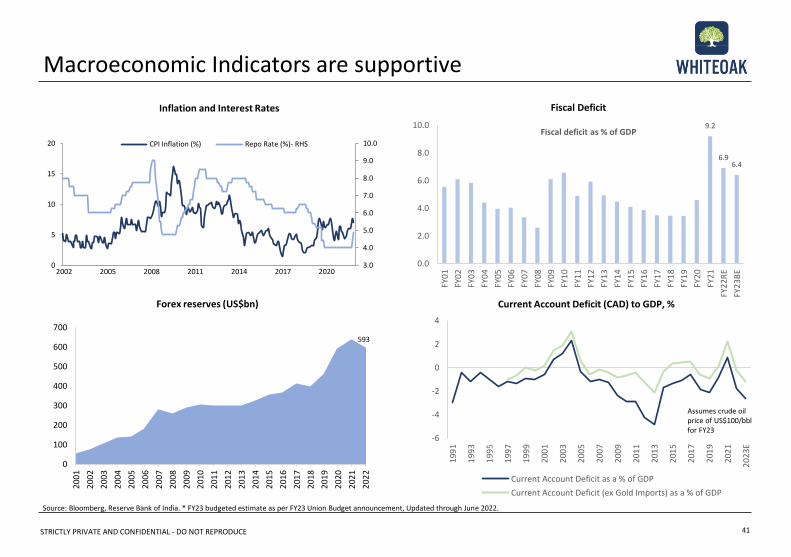
Macroeconomic Indicators are supportive
Inflation and Interest Rates
41
Forex reserves (US$bn) Current Account Deficit (CAD) to GDP, %
3.0
4.0
5.0
6.0
7.0
8.0
9.0
10.0
0
5
10
15
20
2002 2005 2008 2011 2014 2017 2020
CPI Inflation (%) Repo Rate (%)- RHS
Source: Bloomberg, Reserve Bank of India. * FY23 budgeted estimate as per FY23 Union Budget announcement, Updated through June 2022.
Fiscal Deficit
0
100
200
300
400
500
600
700
200
1
200
2
200
3
200
4
200
5
200
6
200
7
200
8
200
9
201
0
201
1
201
2
201
3
201
4
201
5
201
6
201
7
201
8
201
9
202
0
202
1
202
2
593
9.2
6.96.4
0.0
2.0
4.0
6.0
8.0
10.0
FY0
1
FY0
2
FY0
3
FY0
4
FY0
5
FY0
6
FY0
7
FY0
8
FY0
9
FY1
0
FY1
1
FY1
2
FY1
3
FY1
4
FY1
5
FY1
6
FY1
7
FY1
8
FY1
9
FY2
0
FY2
1
FY2
2RE
FY2
3BE
Fiscal deficit as % of GDP
-6
-4
-2
0
2
4
199
1
199
3
199
5
199
7
199
9
200
1
200
3
200
5
200
7
200
9
201
1
201
3
201
5
201
7
201
9
202
1
202
3E
Current Account Deficit as a % of GDP
Current Account Deficit (ex Gold Imports) as a % of GDP
Assumes crude oil price of US$100/bblfor FY23
STRICTLY PRIVATE AND CONFIDENTIAL - DO NOT REPRODUCE
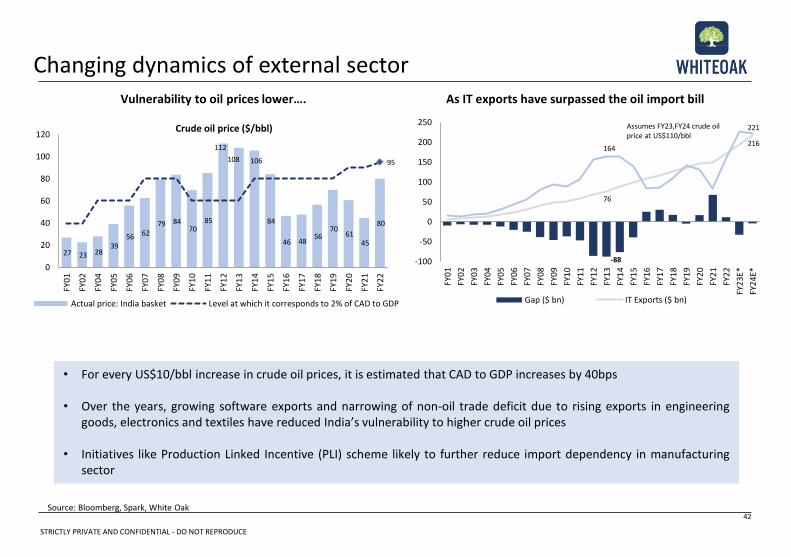
Changing dynamics of external sector
Source: Bloomberg, Spark, White Oak42
Vulnerability to oil prices lower…. As IT exports have surpassed the oil import bill
• For every US$10/bbl increase in crude oil prices, it is estimated that CAD to GDP increases by 40bps
• Over the years, growing software exports and narrowing of non-oil trade deficit due to rising exports in engineeringgoods, electronics and textiles have reduced India’s vulnerability to higher crude oil prices
• Initiatives like Production Linked Incentive (PLI) scheme likely to further reduce import dependency in manufacturingsector
27 23 28 39
56 62 79 84
70 85
112
108 106
84
46 48 56
70 61
45
80
95
0
20
40
60
80
100
120
FY0
1
FY0
2
FY0
4
FY0
5
FY0
6
FY0
7
FY0
8
FY0
9
FY1
0
FY1
1
FY1
2
FY1
3
FY1
4
FY1
5
FY1
6
FY1
7
FY1
8
FY1
9
FY2
0
FY2
1
FY2
2
Crude oil price ($/bbl)
Actual price: India basket Level at which it corresponds to 2% of CAD to GDP
Assumes FY23,FY24 crude oil price at US$110/bbl
-88
76
216164
221
-100
-50
0
50
100
150
200
250
FY0
1
FY0
2
FY0
3
FY0
4
FY0
5
FY0
6
FY0
7
FY0
8
FY0
9
FY1
0
FY1
1
FY1
2
FY1
3
FY1
4
FY1
5
FY1
6
FY1
7
FY1
8
FY1
9
FY2
0
FY2
1
FY2
2
FY2
3E*
FY2
4E*
Gap ($ bn) IT Exports ($ bn)
STRICTLY PRIVATE AND CONFIDENTIAL - DO NOT REPRODUCE
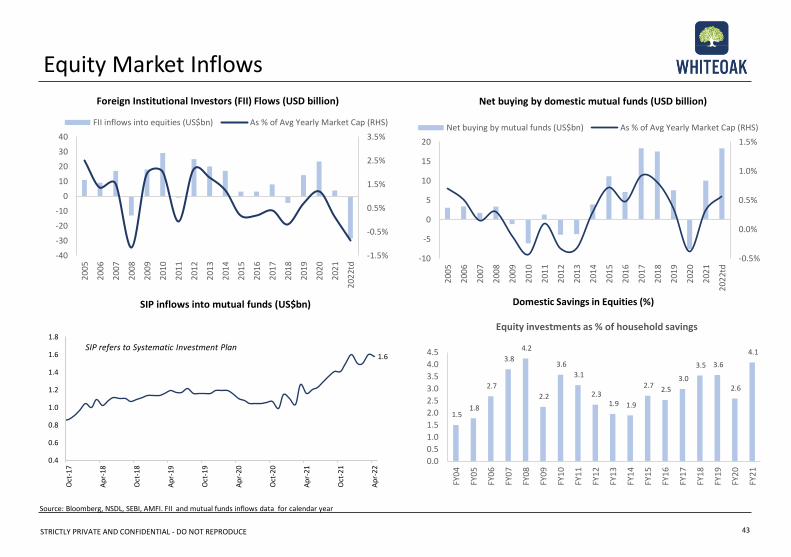
Source: Bloomberg, NSDL, SEBI, AMFI. FII and mutual funds inflows data for calendar year
Equity Market Inflows
Foreign Institutional Investors (FII) Flows (USD billion)
43
SIP inflows into mutual funds (US$bn) Domestic Savings in Equities (%)
-1.5%
-0.5%
0.5%
1.5%
2.5%
3.5%
-40
-30
-20
-10
0
10
20
30
40
200
5
200
6
200
7
200
8
200
9
201
0
201
1
201
2
201
3
201
4
201
5
201
6
201
7
201
8
201
9
202
0
202
1
202
2td
FII inflows into equities (US$bn) As % of Avg Yearly Market Cap (RHS)
1.5 1.8
2.7
3.8
4.2
2.2
3.6
3.1
2.3 1.9 1.9
2.7 2.5
3.0
3.5 3.6
2.6
4.1
0.0
0.5
1.0
1.5
2.0
2.5
3.0
3.5
4.0
4.5
FY0
4
FY0
5
FY0
6
FY0
7
FY0
8
FY0
9
FY1
0
FY1
1
FY1
2
FY1
3
FY1
4
FY1
5
FY1
6
FY1
7
FY1
8
FY1
9
FY2
0
FY2
1
Equity investments as % of household savings
-0.5%
0.0%
0.5%
1.0%
1.5%
-10
-5
0
5
10
15
20
200
5
200
6
200
7
200
8
200
9
201
0
201
1
201
2
201
3
201
4
201
5
201
6
201
7
201
8
201
9
202
0
202
1
202
2td
Net buying by mutual funds (US$bn) As % of Avg Yearly Market Cap (RHS)
Net buying by domestic mutual funds (USD billion)
1.6
0.4
0.6
0.8
1.0
1.2
1.4
1.6
1.8
Oct
-17
Ap
r-18
Oct
-18
Ap
r-19
Oct
-19
Ap
r-20
Oct
-20
Ap
r-21
Oct
-21
Ap
r-22
SIP refers to Systematic Investment Plan
STRICTLY PRIVATE AND CONFIDENTIAL - DO NOT REPRODUCE
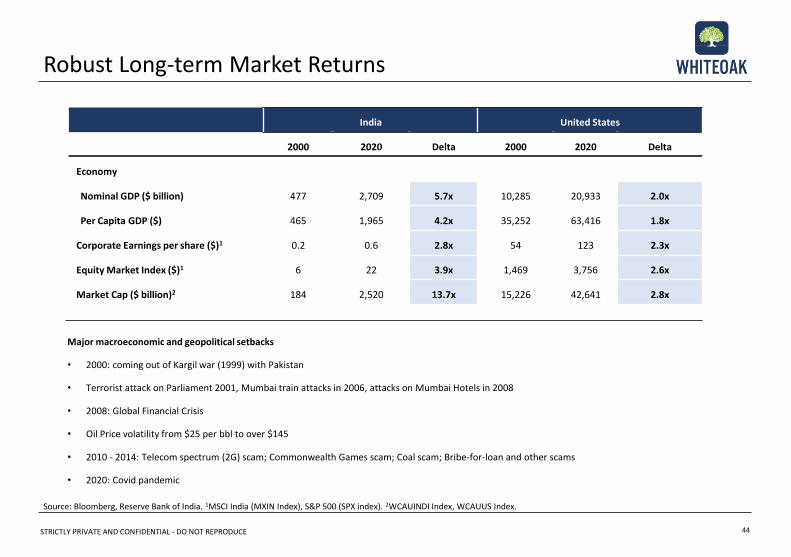
India United States
2000 2020 Delta 2000 2020 Delta
Economy
Nominal GDP ($ billion) 477 2,709 5.7x 10,285 20,933 2.0x
Per Capita GDP ($) 465 1,965 4.2x 35,252 63,416 1.8x
Corporate Earnings per share ($)1 0.2 0.6 2.8x 54 123 2.3x
Equity Market Index ($)1 6 22 3.9x 1,469 3,756 2.6x
Market Cap ($ billion)2 184 2,520 13.7x 15,226 42,641 2.8x
Major macroeconomic and geopolitical setbacks
• 2000: coming out of Kargil war (1999) with Pakistan
• Terrorist attack on Parliament 2001, Mumbai train attacks in 2006, attacks on Mumbai Hotels in 2008
• 2008: Global Financial Crisis
• Oil Price volatility from $25 per bbl to over $145
• 2010 - 2014: Telecom spectrum (2G) scam; Commonwealth Games scam; Coal scam; Bribe-for-loan and other scams
• 2020: Covid pandemic
44
Source: Bloomberg, Reserve Bank of India. 1MSCI India (MXIN Index), S&P 500 (SPX index). 2WCAUINDI Index, WCAUUS Index.
Robust Long-term Market Returns
STRICTLY PRIVATE AND CONFIDENTIAL - DO NOT REPRODUCE
Equity returns since 1985
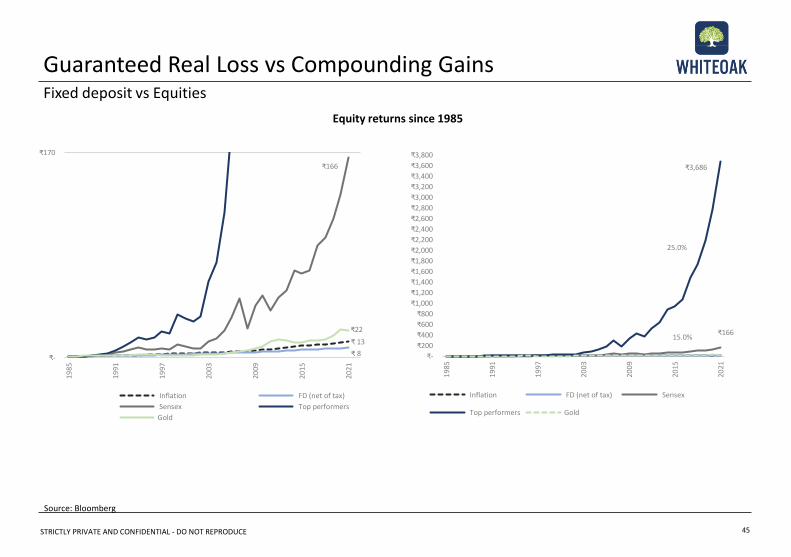
Guaranteed Real Loss vs Compounding GainsFixed deposit vs Equities
Source: Bloomberg
45
₹16615.0%
25.0%
₹3,686
₹-
₹200
₹400
₹600
₹800
₹1,000
₹1,200
₹1,400
₹1,600
₹1,800
₹2,000
₹2,200
₹2,400
₹2,600
₹2,800
₹3,000
₹3,200
₹3,400
₹3,600
₹3,800
1985
1991
1997
2003
2009
2015
2021
Inflation FD (net of tax) Sensex
Top performers Gold
₹ 13
₹ 8
₹166
₹22
₹-
₹170
1985
1991
1997
2003
2009
2015
2021
Inflation FD (net of tax)
Sensex Top performers
Gold
STRICTLY PRIVATE AND CONFIDENTIAL - DO NOT REPRODUCE
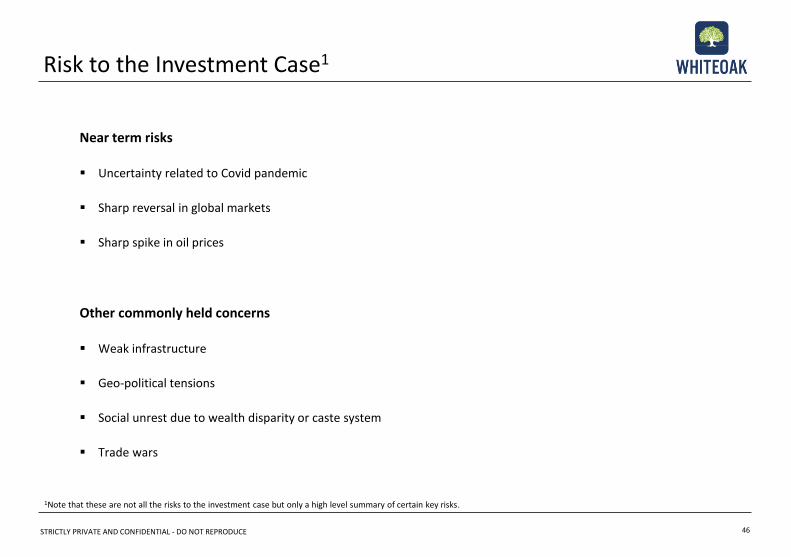
Near term risks
▪ Uncertainty related to Covid pandemic
▪ Sharp reversal in global markets
▪ Sharp spike in oil prices
Other commonly held concerns
▪ Weak infrastructure
▪ Geo-political tensions
▪ Social unrest due to wealth disparity or caste system
▪ Trade wars
46
1Note that these are not all the risks to the investment case but only a high level summary of certain key risks.
Risk to the Investment Case1
STRICTLY PRIVATE AND CONFIDENTIAL - DO NOT REPRODUCE
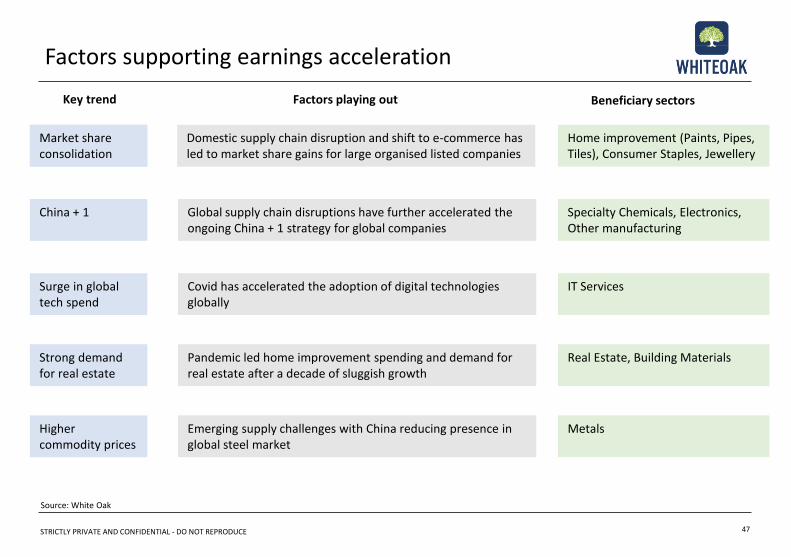
Factors supporting earnings acceleration
47
Source: White Oak
Key trend Factors playing out Beneficiary sectors
Domestic supply chain disruption and shift to e-commerce has led to market share gains for large organised listed companies
Market share consolidation
Home improvement (Paints, Pipes, Tiles), Consumer Staples, Jewellery
Global supply chain disruptions have further accelerated the ongoing China + 1 strategy for global companies
Specialty Chemicals, Electronics, Other manufacturing
Covid has accelerated the adoption of digital technologies globally
Surge in global tech spend
IT Services
Pandemic led home improvement spending and demand for real estate after a decade of sluggish growth
Strong demand for real estate
Real Estate, Building Materials
Emerging supply challenges with China reducing presence in global steel market
Higher commodity prices
Metals
Market share consolidation
China + 1
STRICTLY PRIVATE AND CONFIDENTIAL - DO NOT REPRODUCE
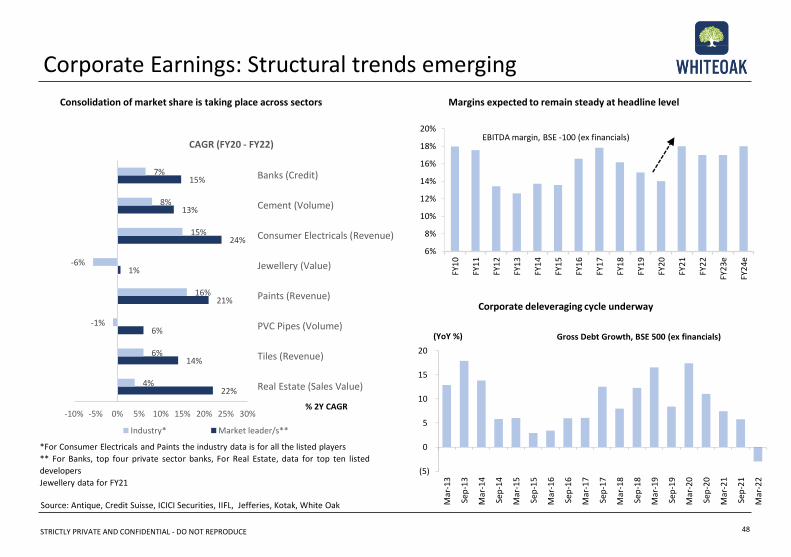
Corporate Earnings: Structural trends emerging
48
*For Consumer Electricals and Paints the industry data is for all the listed players
** For Banks, top four private sector banks, For Real Estate, data for top ten listed
developers
Jewellery data for FY21
Consolidation of market share is taking place across sectors Margins expected to remain steady at headline level
Corporate deleveraging cycle underway
Source: Antique, Credit Suisse, ICICI Securities, IIFL, Jefferies, Kotak, White Oak
6%
8%
10%
12%
14%
16%
18%
20%
FY1
0
FY1
1
FY1
2
FY1
3
FY1
4
FY1
5
FY1
6
FY1
7
FY1
8
FY1
9
FY2
0
FY2
1
FY2
2
FY2
3e
FY2
4e
EBITDA margin, BSE -100 (ex financials)
22%
14%
6%
21%
1%
24%
13%
15%
4%
6%
-1%
16%
-6%
15%
8%
7%
-10% -5% 0% 5% 10% 15% 20% 25% 30%
Real Estate (Sales Value)
Tiles (Revenue)
PVC Pipes (Volume)
Paints (Revenue)
Jewellery (Value)
Consumer Electricals (Revenue)
Cement (Volume)
Banks (Credit)
CAGR (FY20 - FY22)
Industry* Market leader/s**
% 2Y CAGR
(5)
0
5
10
15
20
Mar
-13
Sep
-13
Mar
-14
Sep
-14
Mar
-15
Sep
-15
Mar
-16
Sep
-16
Mar
-17
Sep
-17
Mar
-18
Sep
-18
Mar
-19
Sep
-19
Mar
-20
Sep
-20
Mar
-21
Sep
-21
Mar
-22
Gross Debt Growth, BSE 500 (ex financials)(YoY %)
STRICTLY PRIVATE AND CONFIDENTIAL - DO NOT REPRODUCE
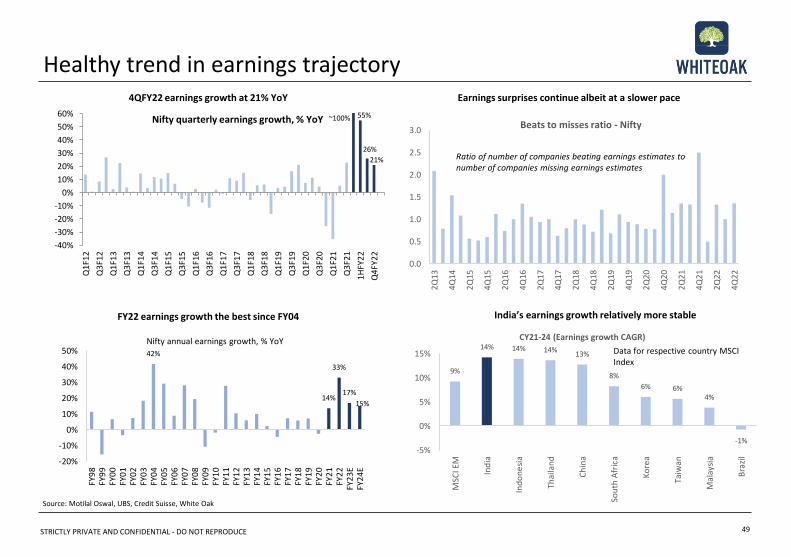
Healthy trend in earnings trajectory
49
Source: Motilal Oswal, UBS, Credit Suisse, White Oak
4QFY22 earnings growth at 21% YoY Earnings surprises continue albeit at a slower pace
FY22 earnings growth the best since FY04 India’s earnings growth relatively more stable
42%
14%
33%
17%
15%
-20%
-10%
0%
10%
20%
30%
40%
50%
FY9
8FY
99
FY0
0FY
01
FY0
2FY
03
FY0
4FY
05
FY0
6FY
07
FY0
8FY
09
FY1
0FY
11
FY1
2FY
13
FY1
4FY
15
FY1
6FY
17
FY1
8FY
19
FY2
0FY
21
FY2
2FY
23E
FY2
4E
Nifty annual earnings growth, % YoY
0.0
0.5
1.0
1.5
2.0
2.5
3.0
2Q
13
4Q
14
2Q
15
4Q
15
2Q
16
4Q
16
2Q
17
4Q
17
2Q
18
4Q
18
2Q
19
4Q
19
2Q
20
4Q
20
2Q
21
4Q
21
2Q
22
4Q
22
Beats to misses ratio - Nifty
Ratio of number of companies beating earnings estimates to number of companies missing earnings estimates
55%
26%
21%
-40%
-30%
-20%
-10%
0%
10%
20%
30%
40%
50%
60%
Q1
F12
Q3
F12
Q1
F13
Q3
F13
Q1
F14
Q3
F14
Q1
F15
Q3
F15
Q1
F16
Q3
F16
Q1
F17
Q3
F17
Q1
F18
Q3
F18
Q1
F19
Q3
F19
Q1
F20
Q3
F20
Q1
F21
Q3
F21
1H
FY2
2
Q4
FY2
2
Nifty quarterly earnings growth, % YoY ~100% 1
9%
14% 14% 14%13%
8%
6% 6%4%
-1%-5%
0%
5%
10%
15%
MSC
I EM
Ind
ia
Ind
on
esi
a
Thai
lan
d
Ch
ina
Sou
th A
fric
a
Ko
rea
Taiw
an
Mal
aysi
a
Bra
zil
CY21-24 (Earnings growth CAGR)
Data for respective country MSCI Index
STRICTLY PRIVATE AND CONFIDENTIAL - DO NOT REPRODUCE
Source: White Oak Research
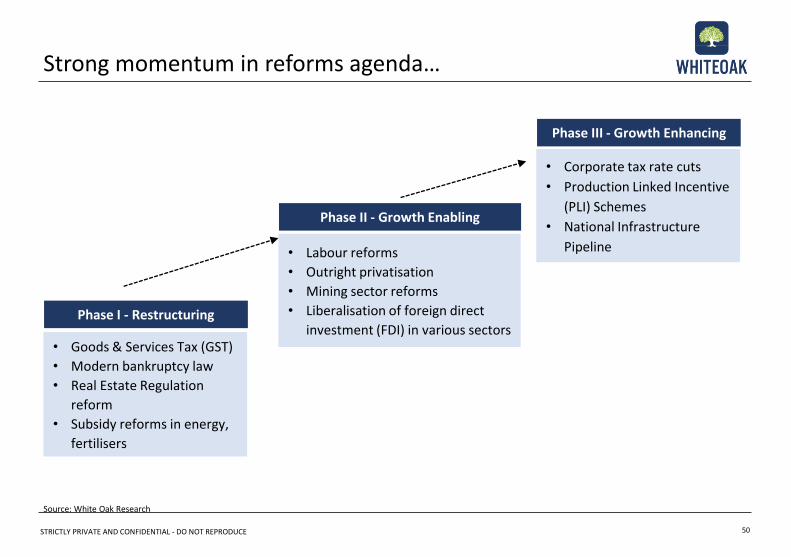
Strong momentum in reforms agenda…
50
• Goods & Services Tax (GST)
• Modern bankruptcy law
• Real Estate Regulation
reform
• Subsidy reforms in energy,
fertilisers
• Labour reforms
• Outright privatisation
• Mining sector reforms
• Liberalisation of foreign direct
investment (FDI) in various sectors
• Corporate tax rate cuts
• Production Linked Incentive
(PLI) Schemes
• National Infrastructure
Pipeline
Phase I - Restructuring
Phase II - Growth Enabling
Phase III - Growth Enhancing
STRICTLY PRIVATE AND CONFIDENTIAL - DO NOT REPRODUCE
Source: World Bank (Doing Business report 2020), White Oak Research as of end February 2021.
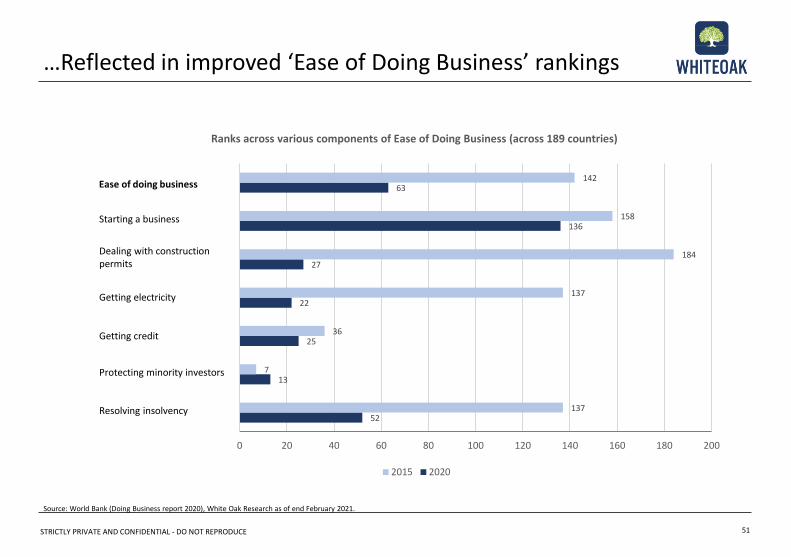
…Reflected in improved ‘Ease of Doing Business’ rankings
51
52
13
25
22
27
136
63
137
7
36
137
184
158
142
0 20 40 60 80 100 120 140 160 180 200
Ranks across various components of Ease of Doing Business (across 189 countries)
2015 2020
Ease of doing business
Starting a business
Dealing with construction permits
Getting electricity
Getting credit
Protecting minority investors
Resolving insolvency
STRICTLY PRIVATE AND CONFIDENTIAL - DO NOT REPRODUCE
Source: PIB, Credit Suisse, White Oak Research
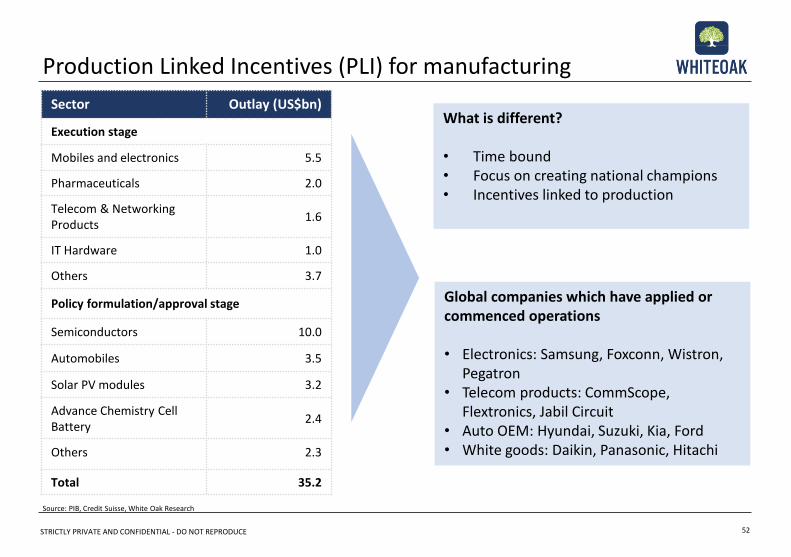
Production Linked Incentives (PLI) for manufacturing
52
Sector Outlay (US$bn)
Execution stage
Mobiles and electronics 5.5
Pharmaceuticals 2.0
Telecom & Networking Products
1.6
IT Hardware 1.0
Others 3.7
Policy formulation/approval stage
Semiconductors 10.0
Automobiles 3.5
Solar PV modules 3.2
Advance Chemistry Cell Battery
2.4
Others 2.3
Total 35.2
What is different?
• Time bound• Focus on creating national champions• Incentives linked to production
Global companies which have applied or commenced operations
• Electronics: Samsung, Foxconn, Wistron, Pegatron
• Telecom products: CommScope, Flextronics, Jabil Circuit
• Auto OEM: Hyundai, Suzuki, Kia, Ford• White goods: Daikin, Panasonic, Hitachi
STRICTLY PRIVATE AND CONFIDENTIAL - DO NOT REPRODUCE
Source: Credit Suisse, White Oak
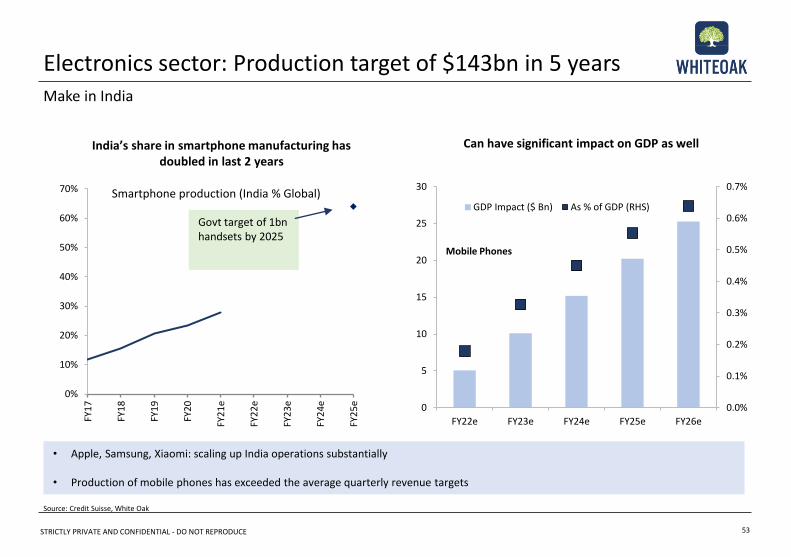
Electronics sector: Production target of $143bn in 5 years
53
India’s share in smartphone manufacturing has doubled in last 2 years
Can have significant impact on GDP as well
• Apple, Samsung, Xiaomi: scaling up India operations substantially
• Production of mobile phones has exceeded the average quarterly revenue targets
0%
10%
20%
30%
40%
50%
60%
70%
FY1
7
FY1
8
FY1
9
FY2
0
FY2
1e
FY2
2e
FY2
3e
FY2
4e
FY2
5e
Smartphone production (India % Global)
Govt target of 1bn handsets by 2025
Make in India
0.0%
0.1%
0.2%
0.3%
0.4%
0.5%
0.6%
0.7%
0
5
10
15
20
25
30
FY22e FY23e FY24e FY25e FY26e
GDP Impact ($ Bn) As % of GDP (RHS)
Mobile Phones
STRICTLY PRIVATE AND CONFIDENTIAL - DO NOT REPRODUCE
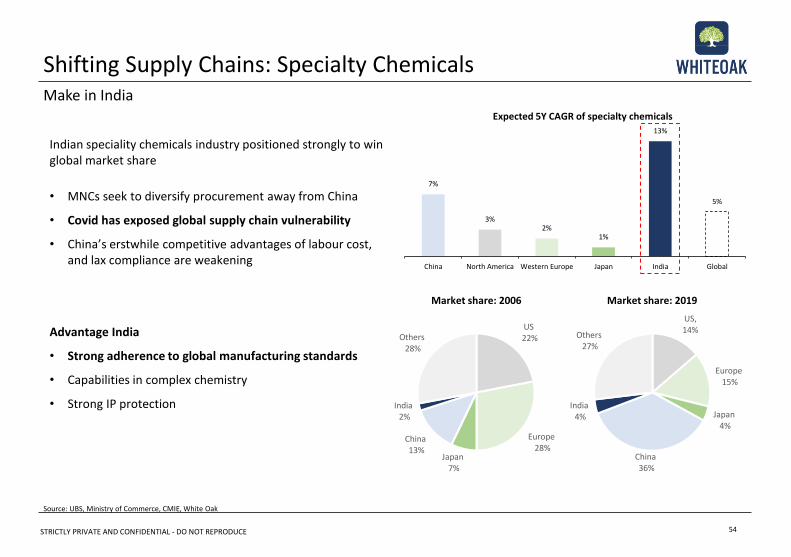
Indian speciality chemicals industry positioned strongly to win global market share
• MNCs seek to diversify procurement away from China
• Covid has exposed global supply chain vulnerability
• China’s erstwhile competitive advantages of labour cost, and lax compliance are weakening
Advantage India
• Strong adherence to global manufacturing standards
• Capabilities in complex chemistry
• Strong IP protection
Shifting Supply Chains: Specialty Chemicals
54
Source: UBS, Ministry of Commerce, CMIE, White Oak
Make in India
7%
3%2%
1%
13%
5%
China North America Western Europe Japan India Global
Expected 5Y CAGR of specialty chemicals
US22%
Europe28%
Japan7%
China13%
India2%
Others28%
Market share: 2006
US,14%
Europe15%
Japan4%
China36%
India4%
Others27%
Market share: 2019
STRICTLY PRIVATE AND CONFIDENTIAL - DO NOT REPRODUCE
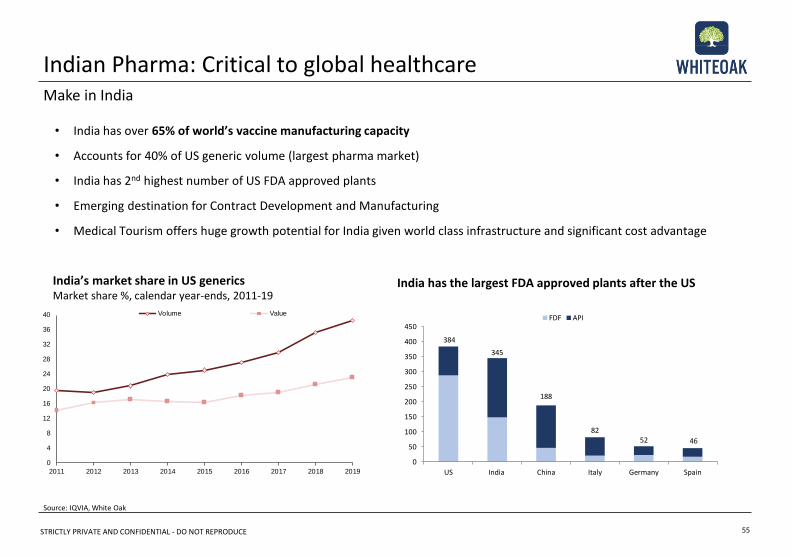
Indian Pharma: Critical to global healthcare
55
Make in India
• India has over 65% of world’s vaccine manufacturing capacity
• Accounts for 40% of US generic volume (largest pharma market)
• India has 2nd highest number of US FDA approved plants
• Emerging destination for Contract Development and Manufacturing
• Medical Tourism offers huge growth potential for India given world class infrastructure and significant cost advantage
India’s market share in US genericsMarket share %, calendar year-ends, 2011-19
Source: IQVIA, White Oak
India has the largest FDA approved plants after the US
384
345
188
8252 46
0
50
100
150
200
250
300
350
400
450
US India China Italy Germany Spain
FDF API
0
4
8
12
16
20
24
28
32
36
40
2011 2012 2013 2014 2015 2016 2017 2018 2019
Volume Value
STRICTLY PRIVATE AND CONFIDENTIAL - DO NOT REPRODUCE
Source: Nasscom, Kotak, White Oak Research as of December 2021.
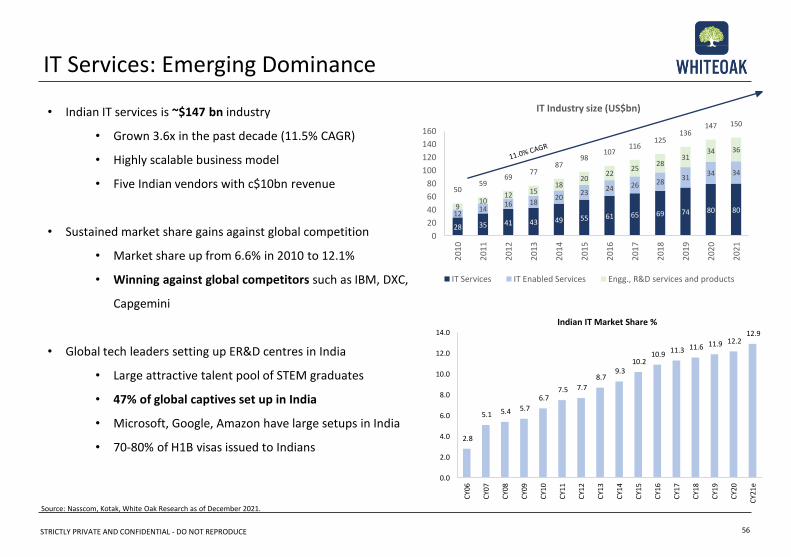
IT Services: Emerging Dominance
56
• Indian IT services is ~$147 bn industry
• Grown 3.6x in the past decade (11.5% CAGR)
• Highly scalable business model
• Five Indian vendors with c$10bn revenue
• Sustained market share gains against global competition
• Market share up from 6.6% in 2010 to 12.1%
• Winning against global competitors such as IBM, DXC,
Capgemini
• Global tech leaders setting up ER&D centres in India
• Large attractive talent pool of STEM graduates
• 47% of global captives set up in India
• Microsoft, Google, Amazon have large setups in India
• 70-80% of H1B visas issued to Indians2.8
5.1 5.4 5.7
6.7 7.5 7.7
8.7 9.3
10.2 10.9
11.3 11.6 11.9 12.2 12.9
0.0
2.0
4.0
6.0
8.0
10.0
12.0
14.0
CY0
6
CY0
7
CY0
8
CY0
9
CY1
0
CY1
1
CY1
2
CY1
3
CY1
4
CY1
5
CY1
6
CY1
7
CY1
8
CY1
9
CY2
0
CY2
1e
Indian IT Market Share %
28 35 41 43 49 55 61 65 69 74 80 801214
16 1820
2324 26 28
3134 34
910
12 1518
2022
2528
3134 36
5059
6977
8798
107116
125136
147 150
0
20
40
60
80
100
120
140
160
201
0
201
1
201
2
201
3
201
4
201
5
201
6
201
7
201
8
201
9
202
0
202
1
IT Industry size (US$bn)
IT Services IT Enabled Services Engg., R&D services and products
STRICTLY PRIVATE AND CONFIDENTIAL - DO NOT REPRODUCE
Lessons from 2020
57
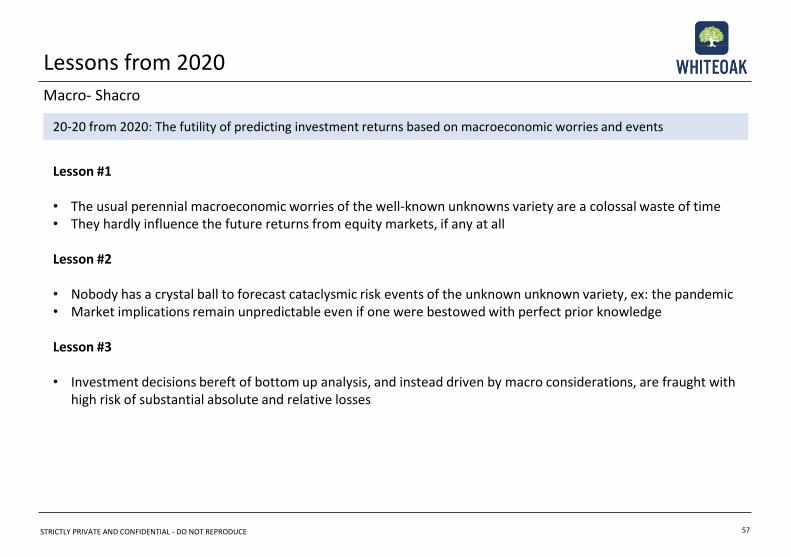
Lesson #1
• The usual perennial macroeconomic worries of the well-known unknowns variety are a colossal waste of time • They hardly influence the future returns from equity markets, if any at all
Lesson #2
• Nobody has a crystal ball to forecast cataclysmic risk events of the unknown unknown variety, ex: the pandemic• Market implications remain unpredictable even if one were bestowed with perfect prior knowledge
Lesson #3
• Investment decisions bereft of bottom up analysis, and instead driven by macro considerations, are fraught with high risk of substantial absolute and relative losses
20-20 from 2020: The futility of predicting investment returns based on macroeconomic worries and events
Macro- Shacro
STRICTLY PRIVATE AND CONFIDENTIAL - DO NOT REPRODUCE 58
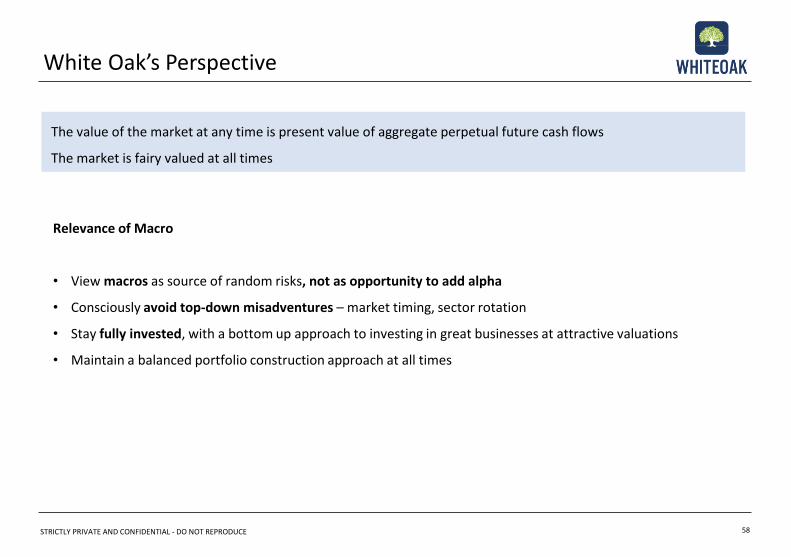
Relevance of Macro
• View macros as source of random risks, not as opportunity to add alpha
• Consciously avoid top-down misadventures – market timing, sector rotation
• Stay fully invested, with a bottom up approach to investing in great businesses at attractive valuations
• Maintain a balanced portfolio construction approach at all times
White Oak’s Perspective
The value of the market at any time is present value of aggregate perpetual future cash flows
The market is fairy valued at all times
STRICTLY PRIVATE AND CONFIDENTIAL - DO NOT REPRODUCE
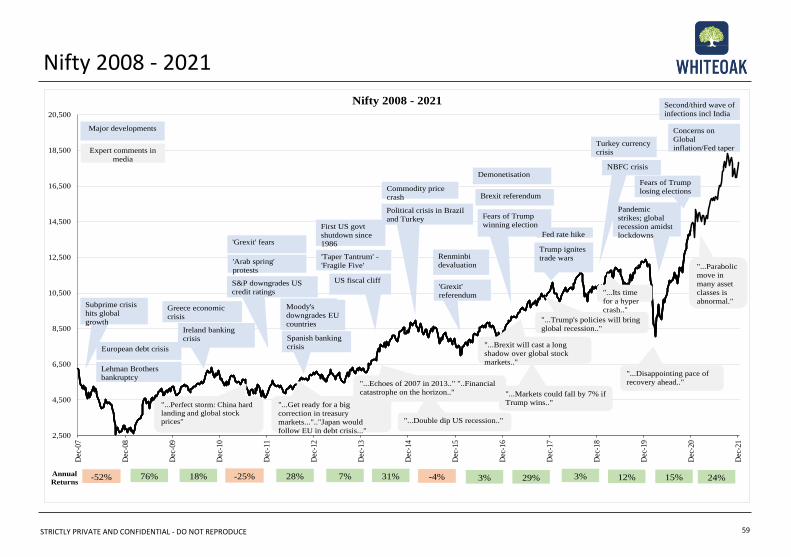
Nifty 2008 - 2021
59
2,500
4,500
6,500
8,500
10,500
12,500
14,500
16,500
18,500
20,500
Dec
-07
Dec
-08
Dec
-09
Dec
-10
Dec
-11
Dec
-12
Dec
-13
Dec
-14
Dec
-15
Dec
-16
Dec
-17
Dec
-18
Dec
-19
Dec
-20
Dec
-21
Nifty 2008 - 2021
Annual
Returns76% 18% -25%-52% 28% 7% 31% -4% 3% 29% 3% 12% 15%
"...Perfect storm: China hard
landing and global stock
prices"
"...Brexit will cast a long
shadow over global stock
markets.."
"...Echoes of 2007 in 2013.." "..Financial
catastrophe on the horizon.."
"...Get ready for a big
correction in treasury
markets...".."Japan would
follow EU in debt crisis..."
"...Double dip US recession.."
"...Markets could fall by 7% if
Trump wins.."
"...Trump's policies will bring
global recession.."
"...Its time
for a hyper
crash.."
"...Disappointing pace of
recovery ahead.."
Ireland banking
crisis
S&P downgrades US
credit ratings
Moody's
downgrades EU
countries
First US govt
shutdown since
1986
'Taper Tantrum' -
'Fragile Five'
US fiscal cliff
Political crisis in Brazil
and Turkey Fears of Trump
winning election
Turkey currency
crisis
Major developments
Expert comments in
media
Moody's
downgrades EU
countries
Commodity price
crash
Demonetisation
Brexit referendum
Fed rate hike
Trump ignites
trade wars
'Grexit' fears
'Arab spring'
protests
Moody's
downgrades EU
countries
Spanish banking
crisis
Renminbi
devaluation
'Grexit'
referendum
Greece economic
crisis
European debt crisis
Subprime crisis
hits global
growth
Lehman Brothers
bankruptcy
Pandemic
strikes; global
recession amidst
lockdowns
NBFC crisis
Second/third wave of
infections incl India
Concerns on
Global
inflation/Fed taper
Fears of Trump
losing elections
"...Parabolic
move in
many asset
classes is
abnormal."
24%
STRICTLY PRIVATE AND CONFIDENTIAL - DO NOT REPRODUCE
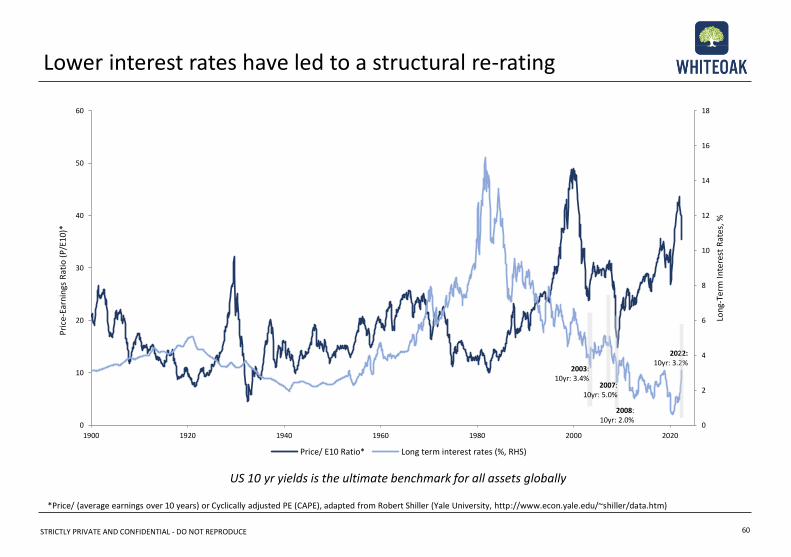
Lower interest rates have led to a structural re-rating
60
*Price/ (average earnings over 10 years) or Cyclically adjusted PE (CAPE), adapted from Robert Shiller (Yale University, http://www.econ.yale.edu/~shiller/data.htm)
US 10 yr yields is the ultimate benchmark for all assets globally
0
2
4
6
8
10
12
14
16
18
0
10
20
30
40
50
60
1900 1920 1940 1960 1980 2000 2020
Lon
g-Te
rm I
nte
rest
Rat
es, %
Pri
ce-E
arn
ings
Rat
io (
P/E
10)*
Price/ E10 Ratio* Long term interest rates (%, RHS)
2007:10yr: 5.0%
2008:10yr: 2.0%
2022:10yr: 3.2%
2003:10yr: 3.4%
STRICTLY PRIVATE AND CONFIDENTIAL - DO NOT REPRODUCE
Appendix
STRICTLY PRIVATE AND CONFIDENTIAL - DO NOT REPRODUCE
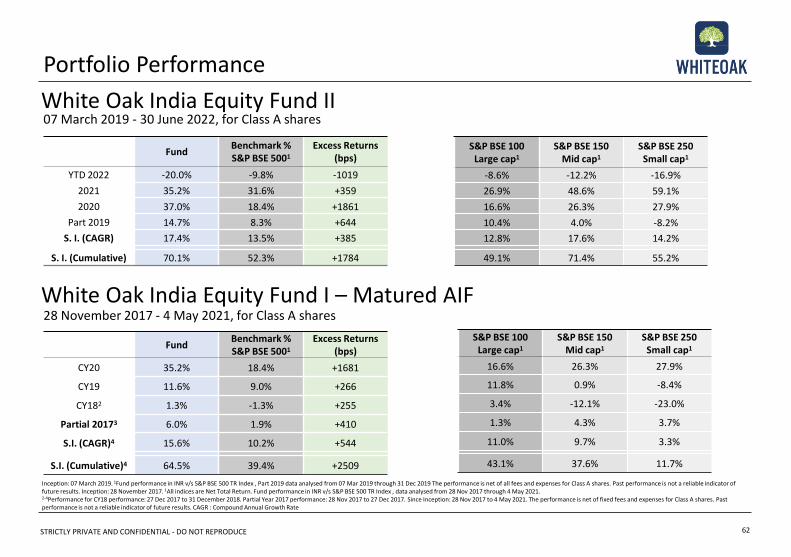
Portfolio Performance
07 March 2019 - 30 June 2022, for Class A shares
62
` FundBenchmark %S&P BSE 5001
Excess Returns (bps)
YTD 2022 -20.0% -9.8% -1019
2021 35.2% 31.6% +359
2020 37.0% 18.4% +1861
Part 2019 14.7% 8.3% +644
S. I. (CAGR) 17.4% 13.5% +385
S. I. (Cumulative) 70.1% 52.3% +1784
S&P BSE 100 Large cap1
S&P BSE 150 Mid cap1
S&P BSE 250Small cap1
-8.6% -12.2% -16.9%
26.9% 48.6% 59.1%
16.6% 26.3% 27.9%
10.4% 4.0% -8.2%
12.8% 17.6% 14.2%
49.1% 71.4% 55.2%
Inception: 07 March 2019. 1Fund performance in INR v/s S&P BSE 500 TR Index , Part 2019 data analysed from 07 Mar 2019 through 31 Dec 2019 The performance is net of all fees and expenses for Class A shares. Past performance is not a reliable indicator of future results. Inception: 28 November 2017. 1All indices are Net Total Return. Fund performance in INR v/s S&P BSE 500 TR Index , data analysed from 28 Nov 2017 through 4 May 2021. 2-4Performance for CY18 performance: 27 Dec 2017 to 31 December 2018. Partial Year 2017 performance: 28 Nov 2017 to 27 Dec 2017. Since Inception: 28 Nov 2017 to 4 May 2021. The performance is net of fixed fees and expenses for Class A shares. Past performance is not a reliable indicator of future results. CAGR : Compound Annual Growth Rate
` FundBenchmark %S&P BSE 5001
Excess Returns (bps)
CY20 35.2% 18.4% +1681
CY19 11.6% 9.0% +266
CY182 1.3% -1.3% +255
Partial 20173 6.0% 1.9% +410
S.I. (CAGR)4 15.6% 10.2% +544
S.I. (Cumulative)4 64.5% 39.4% +2509
S&P BSE 100 Large cap1
S&P BSE 150 Mid cap1
S&P BSE 250Small cap1
16.6% 26.3% 27.9%
11.8% 0.9% -8.4%
3.4% -12.1% -23.0%
1.3% 4.3% 3.7%
11.0% 9.7% 3.3%
43.1% 37.6% 11.7%
White Oak India Equity Fund II
28 November 2017 - 4 May 2021, for Class A sharesWhite Oak India Equity Fund I – Matured AIF
STRICTLY PRIVATE AND CONFIDENTIAL - DO NOT REPRODUCE
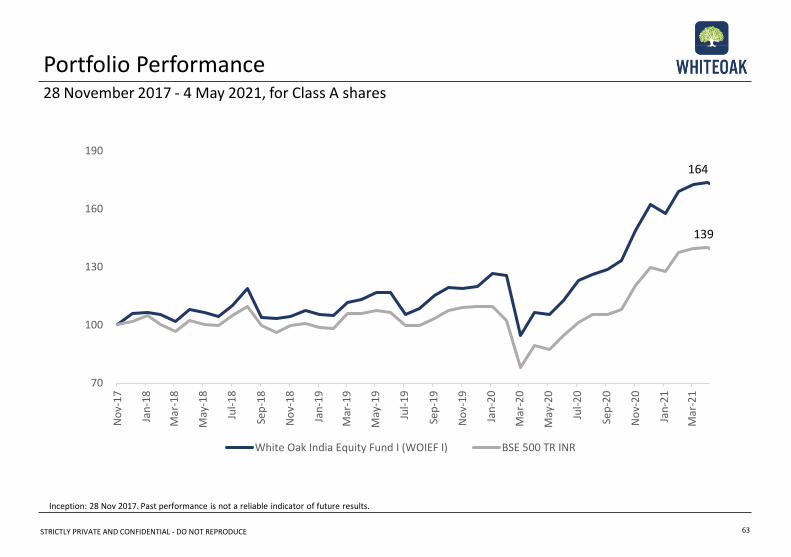
Portfolio Performance
63
28 November 2017 - 4 May 2021, for Class A shares
Inception: 28 Nov 2017. Past performance is not a reliable indicator of future results.
70
100
130
160
190
No
v-1
7
Jan
-18
Mar
-18
May
-18
Jul-
18
Sep
-18
No
v-1
8
Jan
-19
Mar
-19
May
-19
Jul-
19
Sep
-19
No
v-1
9
Jan
-20
Mar
-20
May
-20
Jul-
20
Sep
-20
No
v-2
0
Jan
-21
Mar
-21
White Oak India Equity Fund I (WOIEF I) BSE 500 TR INR
164
139
STRICTLY PRIVATE AND CONFIDENTIAL - DO NOT REPRODUCE
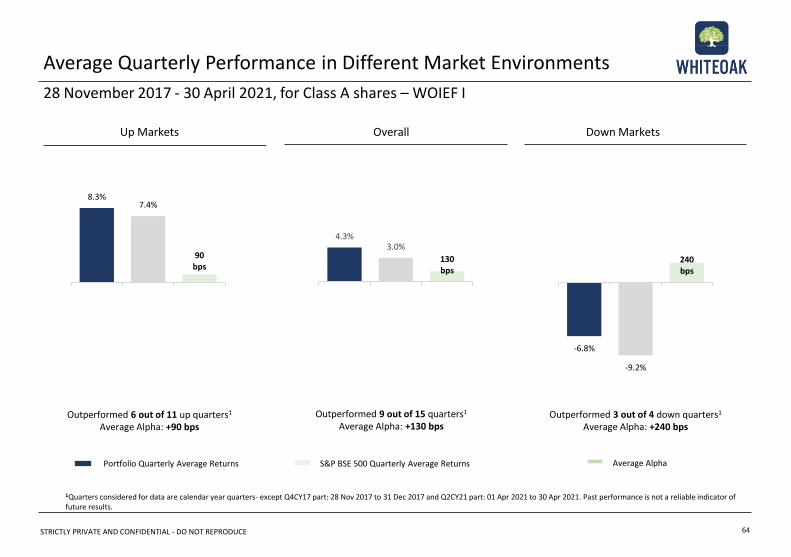
-6.8%
-9.2%
240 bps
8.3%7.4%
90 bps
64
Average Quarterly Performance in Different Market Environments
OverallUp Markets Down Markets
Outperformed 9 out of 15 quarters1
Average Alpha: +130 bpsOutperformed 6 out of 11 up quarters1
Average Alpha: +90 bps
Portfolio Quarterly Average Returns S&P BSE 500 Quarterly Average Returns Average Alpha
Outperformed 3 out of 4 down quarters1
Average Alpha: +240 bps
1Quarters considered for data are calendar year quarters- except Q4CY17 part: 28 Nov 2017 to 31 Dec 2017 and Q2CY21 part: 01 Apr 2021 to 30 Apr 2021. Past performance is not a reliable indicator of future results.
28 November 2017 - 30 April 2021, for Class A shares – WOIEF I
4.3%3.0%
130 bps
STRICTLY PRIVATE AND CONFIDENTIAL - DO NOT REPRODUCE
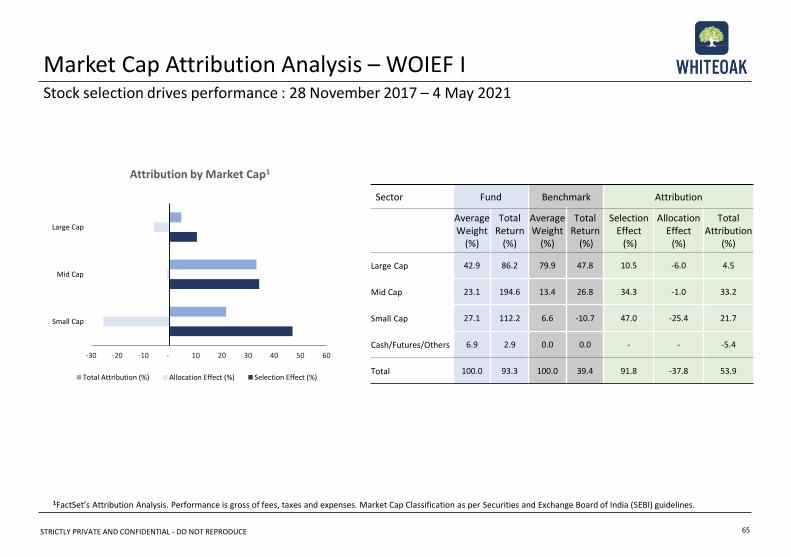
1FactSet’s Attribution Analysis. Performance is gross of fees, taxes and expenses. Market Cap Classification as per Securities and Exchange Board of India (SEBI) guidelines.
Sector Fund Benchmark Attribution
Average Weight
(%)
Total Return
(%)
Average Weight
(%)
Total Return
(%)
Selection Effect
(%)
Allocation Effect
(%)
Total Attribution
(%)
Large Cap 42.9 86.2 79.9 47.8 10.5 -6.0 4.5
Mid Cap 23.1 194.6 13.4 26.8 34.3 -1.0 33.2
Small Cap 27.1 112.2 6.6 -10.7 47.0 -25.4 21.7
Cash/Futures/Others 6.9 2.9 0.0 0.0 - - -5.4
Total 100.0 93.3 100.0 39.4 91.8 -37.8 53.9
Attribution by Market Cap1
Market Cap Attribution Analysis – WOIEF IStock selection drives performance : 28 November 2017 – 4 May 2021
65
-30 -20 -10 - 10 20 30 40 50 60
Small Cap
Mid Cap
Large Cap
Total Attribution (%) Allocation Effect (%) Selection Effect (%)
STRICTLY PRIVATE AND CONFIDENTIAL - DO NOT REPRODUCE
Sector Fund Benchmark Attribution
Average Weight
(%)
Total Return
(%)
Average Weight
(%)
Total Return
(%)
Selection Effect
(%)
Allocation Effect
(%)
Total Attributio
n (%)
Comm Services 3.7 162.2 2.6 -8.4 5.2 -0.6 4.5
Consumer Disc 15.3 66.1 9.6 -0.4 11.4 -3.3 8.1
Consumer Staples 9.3 27.2 9.6 34.3 -1.6 1.4 -0.2
Energy 0.0 0.0 9.6 51.0 0.0 -3.3 -3.3
Financials 24.3 79.0 32.2 25.2 12.6 0.6 13.2
Health Care 9.5 231.7 5.2 75.5 12.5 4.7 17.1
Industrials 8.5 87.8 7.1 19.1 7.7 -1.2 6.5
Information Tech 13.3 158.1 11.3 144.5 0.8 1.4 2.2
Materials 8.6 194.2 9.2 60.2 9.7 0.7 10.3
Real Estate 0.6 -19.4 0.6 1.9 0.3 0.1 0.4
Utilities 0.0 5.5 3.1 43.6 0.3 0.6 0.9
Cash/Futures/Others 6.9 2.9 0.0 0.0 - - -6.0
Total 100.0 93.3 100.0 39.4 58.8 -4.9 53.9
Sector Attribution Analysis – WOIEF IStock selection drives performance : 28 November 2017 - 4 May 2021
66
Attribution by Sector1
1 FactSet’s Attribution Analysis: GICS Classification. Performance is gross of fees, taxes and expenses.
-6 -3 - 3 6 9 12 15
Utilities
Real Estate
Materials
Information Tech
Industrials
Health Care
Financials
Energy
Consumer Staples
Consumer Disc
Comm Services
Allocation Effect (%) Selection Effect (%)
STRICTLY PRIVATE AND CONFIDENTIAL - DO NOT REPRODUCE
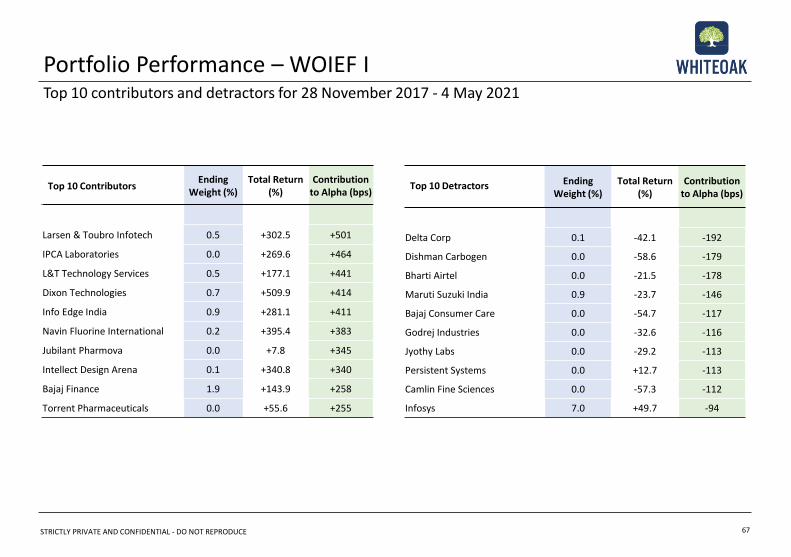
Top 10 ContributorsEnding
Weight (%) Total Return
(%)Contribution
to Alpha (bps)
Larsen & Toubro Infotech 0.5 +302.5 +501
IPCA Laboratories 0.0 +269.6 +464
L&T Technology Services 0.5 +177.1 +441
Dixon Technologies 0.7 +509.9 +414
Info Edge India 0.9 +281.1 +411
Navin Fluorine International 0.2 +395.4 +383
Jubilant Pharmova 0.0 +7.8 +345
Intellect Design Arena 0.1 +340.8 +340
Bajaj Finance 1.9 +143.9 +258
Torrent Pharmaceuticals 0.0 +55.6 +255
Top 10 Detractors EndingWeight (%)
Total Return (%)
Contribution to Alpha (bps)
Delta Corp 0.1 -42.1 -192
Dishman Carbogen 0.0 -58.6 -179
Bharti Airtel 0.0 -21.5 -178
Maruti Suzuki India 0.9 -23.7 -146
Bajaj Consumer Care 0.0 -54.7 -117
Godrej Industries 0.0 -32.6 -116
Jyothy Labs 0.0 -29.2 -113
Persistent Systems 0.0 +12.7 -113
Camlin Fine Sciences 0.0 -57.3 -112
Infosys 7.0 +49.7 -94
Portfolio Performance – WOIEF ITop 10 contributors and detractors for 28 November 2017 - 4 May 2021
67
STRICTLY PRIVATE AND CONFIDENTIAL - DO NOT REPRODUCE
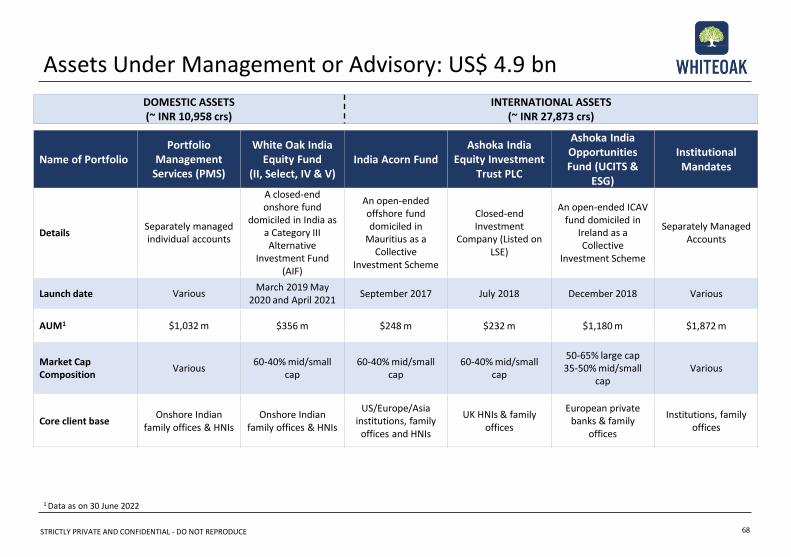
Assets Under Management or Advisory: US$ 4.9 bn
68
1 Data as on 30 June 2022
Name of PortfolioPortfolio
Management Services (PMS)
White Oak India Equity Fund
(II, Select, IV & V)India Acorn Fund
Ashoka India Equity Investment
Trust PLC
Ashoka India Opportunities Fund (UCITS &
ESG)
Institutional Mandates
DetailsSeparately managed individual accounts
A closed-end onshore fund
domiciled in India as a Category III Alternative
Investment Fund (AIF)
An open-ended offshore fund domiciled in
Mauritius as a Collective
Investment Scheme
Closed-end Investment
Company (Listed on LSE)
An open-ended ICAV fund domiciled in
Ireland as a Collective
Investment Scheme
Separately Managed Accounts
Launch date VariousMarch 2019 May
2020 and April 2021September 2017 July 2018 December 2018 Various
AUM1 $1,032 m $356 m $248 m $232 m $1,180 m $1,872 m
Market Cap Composition
Various60-40% mid/small
cap60-40% mid/small
cap60-40% mid/small
cap
50-65% large cap35-50% mid/small
capVarious
Core client baseOnshore Indian
family offices & HNIsOnshore Indian
family offices & HNIs
US/Europe/Asia institutions, family
offices and HNIs
UK HNIs & family offices
European private banks & family
offices
Institutions, family offices
DOMESTIC ASSETS(~ INR 10,958 crs)
INTERNATIONAL ASSETS(~ INR 27,873 crs)
STRICTLY PRIVATE AND CONFIDENTIAL - DO NOT REPRODUCE
Prashant Khemka, CFA
Founder, White Oak Group
Prashant founded White Oak Capital Management in June 2017. Prior to this he was the
CIO and lead portfolio manager of GS India Equity at Goldman Sachs Asset Management
(GSAM) during March 2007 to March 2017, and also for the Global Emerging Markets
(GEM) Equity during June 2013 to March 2017. As lead PM, he managed all mutual funds
and separate accounts under these strategies. Prashant started his professional investing
career in 1998 at SSGA in Boston as senior portfolio officer of Enhanced International
equity in the quant group. He started his career at GSAM in 2000 as a research analyst in
US Growth Equity, and by 2004 he rose to become Senior Portfolio Manager and Co-Chair
of the Investment Committee. Prashant returned to Mumbai in 2006 to start GSAM India
business and served as the CIO and CEO/Co-CEO of their domestic Asset Management
Company. In 2013, in addition to India he was also made the CIO and lead PM of GEM
equity. He won several accolades as the CIO and Lead PM of GS India Equity. He and his
fund won several awards including AAA rating from Citywire and Elite rating from Fund
calibre among others. Prashant graduated with honors from Mumbai University with a BE
in Mechanical Engineering and earned an MBA in Finance from Vanderbilt University,
where he received the Matt Wigginton Leadership Award for outstanding performance in
Finance. He was awarded the CFA designation in 2001 and is a fellow of the Ananta
Aspen Centre, India.
Manoj Garg
Manoj is responsible for Pharma, Auto and Chemicals sectors. He has 26 years of relevant
experience and has been in White Oak since 2017. He has a strong track record in equity
research in healthcare and pharmaceuticals over the last 11 years working as lead analyst
at leading brokerage houses in India. Prior to joining White Oak, he was with Merrill
Lynch where he was highest voted analyst by external as well as internal clients. He
ranked #1 / #2 in the All Asia Institutional Survey 2015/2016 in the Healthcare category.
He began his career in the pharmaceutical industry working with companies like Cipla
and Ipca for 10 years. He graduated as Gold medallist from Nagpur University with an
MBA in Finance.
Ramesh Mantri, CIO Equities
Ramesh is responsible for Technology, Building Materials, Industrials and Metals
sectors. He has 19 years of experience in investing and financial analysis across
sectors and joined White Oak in 2017. Ramesh had founded Ashoka Capital Advisers
that advised a fund and family offices on equity investment in South Asia. Earlier, he
was part of the two member team which invested in South Asia in equity and debt for
Alden Global Capital, a US based hedge fund for over 7 years. Prior to this he was an
analyst at CRISIL (majority owned by Standard and Poor’s), India’s leading rating
agency and covered the financial sector. Ramesh is a CFA charter holder, MBA from
Faculty of Management Studies, Delhi and passed the Chartered Accountancy course.
Parag Jariwala, CFA
Parag is responsible for the Financial Services sector. Parag completed over 13 years
in institutional equity research covering the Banking and Financial Services
Institutions (BFSI) sector and joined White Oak in 2017. Prior to joining White Oak, he
worked as a lead analyst with Religare Capital. Before that he has worked with
Macquarie and other domestic sell side firms covering BFSI sector. He was highly
rated by marquee institutional clients for his original think pieces and primary
research work in the sector. Parag is a chartered accountant and MBA from K J
Somaiya Institute of Management of Mumbai University. He also holds CFA charter
from the CFA Institute (AIMR).
Profiles of Investment Professionals
69
STRICTLY PRIVATE AND CONFIDENTIAL - DO NOT REPRODUCE
Rishi Maheshwari
Rishi is responsible for covering the Real Estate sector. He joined White Oak in 2018
and has 18 years of private equity and investment banking experience gained in the US,
India and Middle East. Prior to his current role, he served as a Managing Director of The
Abraaj Group’s deal execution team in South Asia. His responsibilities included
investment strategy development, local relationship management (including
regulators), deal sourcing & execution and portfolio monitoring (including board
participation). Prior to joining Abraaj, he worked in the Investment Banking division at
Goldman Sachs in New York & Chicago before moving to India as a part of Goldman’s
start-up team. At Goldman Sachs, he was a part of the Industrials Group and was
involved in 10+ transactions, including sell-side and buyside M&A’s, bank & bond
financings and equity offerings. Additionally, he assisted the Executive Office in various
capacities regarding India operations.
Rishi holds a Bachelor of Science degree in Finance from the Indiana University,
Bloomington.
Rohit Chordia
Rohit covers the Consumer, Telecom, Energy and Utilities sectors. He has over 18 years
of total experience with over 14 years in the investment industry having covered the
Indian Telecom, Consumers and IT services sectors as a sell-side analyst at Kotak
Institutional Equities. He joined White Oak in 2020. Rohit was consistently ranked
amongst the top analysts in both his lead coverage sectors in polls conducted by
Institutional Investor and Asia Money. Prior to his sell-side stint, Rohit spent a couple of
years working with Ameriprise Financial as a financial analyst on areas like competitive
intelligence and cost reengineering.
Rohit holds a Post Graduate Diploma in Management from IIM Calcutta and a B.E.
(Honours) degree from BITS, Pilani.
Ayush Abhijeet
Ayush is responsible for covering the Technology, Consumer discretionary and Metals
sectors. He has over 10 years of experience in investment management and trading of
structured products and complex derivatives. He joined White Oak in 2017. Prior to
joining White Oak Capital Ayush worked as an Investment Analyst at Avendus Capital in
Indian public equities. Before starting a career in Investment Management he had
stints with Deutsche Bank and Credit Suisse in macro structuring and trading in
Mumbai. He also had a short stint with UBS Investment Bank's FICC trading desk in
Singapore. He holds a B.Tech from IIT Delhi and a PGDM from IIM Ahmedabad.
Trupti Agrawal
Trupti is responsible for Retail and Building Materials sectors. She has 14 years of total
work experience and joined White Oak in 2017. She has also been an entrepreneur and
has run her own ecommerce venture prior to joining White Oak Capital. She started her
career as a statutory auditor with Ernst & Young's affiliate in India, S. R. Batliboi & Co.
She later joined the credit team at L&T Infrastructure Finance Limited where she was
responsible for evaluating credit for large projects and corporate finance deals across
Infrastructure, Resources and Capital goods.
Trupti is a Chartered Accountant and a graduate of commerce from Osmania
University.
Anand Bhavnani, CFA | FRM
Anand is responsible for covering the Financial Services sector. He has more than 10
years of experience across Equity Research, Fund Management and Derivatives. He
joined White Oak in 2021. Before joining White Oak, at Unifi Capital he assisted the CIO
in managing Blend & Deep Value Discount (DVD) funds and tracked Chemicals, Pharma
and select midcaps across sectors. Prior to Unifi Capital, he worked with Sameeksha
Capital and had a short stint with Citi Global Markets in London. He started his career
in financial markets as a Derivatives trader with Futures First. Anand has done M Sc. in
Financial Economics from University of Oxford and graduated with distinction from
Nirma Institute of Technology in Electronics & Communication engineering.
Profiles of Investment Professionals
70
STRICTLY PRIVATE AND CONFIDENTIAL - DO NOT REPRODUCE
Profiles of Investment Professionals
71
Neeraj Parkash
Neeraj is responsible for Industrials, Energy and Utilities sectors. He has five years of
experience in equity research on the buy side and joined White Oak in 2021. Prior to
joining White Oak, he worked as an investment analyst at Nepean Capital, an India
focused mid and small-cap fund, where he covered a wide range of sectors including
healthcare, chemicals, consumer, and financial services. Prior to Nepean Capital, he
was an equity research analyst at Lazard Asset Management, in New York, covering the
healthcare sector within US Equities. Neeraj has a Bachelor of Arts in Economics and
Psychology from Cornell University, New York.
Aman Kapadia
Aman is responsible for Forensic accounting, ESG and Primary research. He has over
four years of experience and joined White Oak in 2020. Prior to joining White Oak
Capital, Aman has worked as an Investigative Journalist with BloombergQuint where he
was responsible for research and reportage of corporate governance issues. Prior to
that, Aman worked as an Internal Auditor with Sharp & Tannan Associates for a total of
3 years as an articled assistant and later as employee. Aman is a Chartered Accountant
and a graduate of commerce from Veer Narmad South Gujarat University.
Anupriya Gupta
Anupriya is responsible for analysing Environmental, Social and Governance (ESG)
related risks within portfolio companies. She has around 10 years of experience in
diverse domain. Prior to joining White Oak, she was in ICICI Bank as team lead in ESG
related credit research responsible for integration of ESG risks in credit risk
management process of corporate portfolio. She began her career with Crisil Global
Research and Analytics in equity research covering US Metals and Mining (specifically
Precious Metal companies). She graduated from IIM Raipur with PGDM in Finance.
Sanjay Vaid, Trading Advisor
Sanjay has over 33 years of experience in the asset management, equity trading, and
equities broking industry. Prior to joining us he was Director & Head of Equity Sales
Trading at Religare Capital Markets. Before that he was Executive Director –
Fundamental Equity trading at Goldman Sachs Asset Management (GSAM), responsible
for trading for GS India equity fund. Before joining GSAM, he was Co-Head Equities at
SBICAP Securities. Prior to that he was responsible for trading at HSBC Asset
Management and SBI Mutual Fund, which are amongst the largest India funds. Sanjay
began his career with Unit Trust of India, working in various capacities for 15 years.
Sanjay graduated with honors in Economics from Delhi University and earned an MBA
in Finance from Faculty of Management Studies, Delhi University. He is a Certified
Associate of Indian Institute of Bankers (CAIIB).
Chaitanya Kapur, Trading Advisor
Chaitanya has four years of experience and is a Chartered Accountant and has received
a Bachelor’s degree in Commerce (Accounting and Finance) from Mumbai University.
He has worked as an Articled Assistant at Deloitte Haskins & Sells LLP where he worked
on statutory audits in the Automobile, Financial services, Pharmaceutical, Chemicals
and Industrial sectors.
STRICTLY PRIVATE AND CONFIDENTIAL - DO NOT REPRODUCE
Profiles of Investment Professionals
72
Arthur Kadish
Arthur has 15 years of experience and joins from Eastspring Investments where he was
an Asian equity analyst responsible for generating ideas and researching industries
across the region. Prior to that, Arthur was a global equity analyst at Orbis Investments
in London. Arthur is a Chartered Financial Analyst and obtained his MA in Modern
History from University of Oxford.
Nori Chiou
Nori joins from Tokio Marine Asset Management where he was an investment analyst
with expertise on Information Technology sector across Asia. Prior to that, he was also
involved in long/short strategy of the US/Asia investment and different sell-side roles in
Hong Kong/Taiwan. He joined the investment industry since 2011.
Wen Loong Lim
Loong has nine years of investment experience and currently covers semiconductors
and tech hardware at White Oak. His previous position prior to joining White Oak was
with Maitri Asset Management as a Senior Equity Analyst. Loong started his career at
M&G Investments in London where he spent 7 years on the Global Emerging Markets
team. He was a generalist across sectors and geographies but developed a deep
understanding of the tech and industrial sectors, particularly in North Asia. During his
time at M&G, Loong developed from an analyst to a deputy fund manager and finally
managing M&G’s China Strategy before leaving the company to return to Singapore.
Loong read Philosophy, Politics & Economics at the University of Warwick. He is a CFA
Charterholder.
Fadrique Balmaseda
Fadrique is responsible for covering Consumer discretionary, Industrials and Diversified
Financials. He has over 10 years of experience in investment management. Prior to
joining White Oak Capital Fadrique worked as Portfolio Manager at Chronos Global
Equity, focusing on global listed equities. Before starting Chronos Fadrique worked at
Goldman Sachs Asset Management in London, where he worked as an Equity Analyst
for Goldman’s Emerging Markets Equity Team. Prior to that he spent 18 months at
Goldman Sachs’ Fund sales team. He holds a double degree in Law and Business
administration from ICADE University in Madrid.
Dheeresh Pathak, CFA
Dheeresh is responsible for covering the Healthcare and Chemical sectors. He has over
15 years of rich experience in investment management. He joined White Oak in June
2022. Prior to joining White Oak, Dheeresh was the Executive Director at Goldman
Sachs Asset Management. During his 14 years at Goldman Sachs he covered a wide
range of sectors including Healthcare, Chemicals, Telecom & Media, Logistics, Building
Materials and Retail. At Goldman Sachs India Equity Fund , Dheeresh was among the
top rated professionals generating the highest alpha per unit of capital. He holds a B.E
in Electronics Engineering from Punjab Engineering College (Gold Medallist) and a
PGDBM from MDI Gurgaon
Shariq Merchant
Shariq is responsible for covering the Auto and Consumer (ex-retail) sectors. He has
over 11 years of experience in the financial services industry and joined White Oak in
2022. Prior to joining White Oak, Shariq worked as an Investment Analyst with Duro
Capital, covering autos, consumer and healthcare, prior to which he worked as an
analyst with Quest Investment Advisors and the Ambit Group where he worked across
multiple roles spanning sell side, strategy and investment management. He is a
Chartered Accountant and has cleared all 3 levels of the CFA program.
STRICTLY PRIVATE AND CONFIDENTIAL - DO NOT REPRODUCE
Wise Words that Reflect Our Thinking
73
▪ Investing is a marathon not a sprint - Anonymous
▪ To time the market is not merely difficult, its impossible - White Oak
Borrowed from ”Don ko pakadna mushkil hi nahin, namumkin hai ”- Bollywood movie Don, 1978
▪ Investor returns are a function of time in the market rather than timing the market - Anonymous
▪ We never forget that in macro, we only have hunches: in the micro, we can develop justifiably deep conviction -Seth Klarman, 2017
▪ Don’t miss the forest for the trees - John Heywood, 1546
▪ Don’t miss the trees for the forest - Anonymous
▪ He that lieth down with dogs shall rise up with fleas - Benjamin Franklin, 1739
▪ Stay hungry. Stay foolish - Whole Earth Catalog, 1971
▪ Far more money has been lost by investors preparing for corrections, or trying to anticipate corrections, than has been lost in corrections themselves – Peter Lynch
▪ Absent a lot of surprises, stocks are relatively predictable over twenty years. As to whether they’re going to be higher or lower in two to three years, you might as well flip a coin to decide.– Peter Lynch
▪ It is unwise to be too sure of one’s own wisdom – Mahatma Gandhi
STRICTLY PRIVATE AND CONFIDENTIAL - DO NOT REPRODUCE
Disclaimer
Terms & Conditions with respect to this Presentation:
The purpose of this presentation is to provide general information of a product structure to prospective investors in a manner to assist them in understanding the product. ThePresentation is purely for information purposes and should not be construed to be investment recommendation/advice or an offer or solicitation of an offer to buy/sell anysecurities. This Presentation is for the personal information of the authorized recipient(s) and is not for public distribution and should not be reproduced or redistributed to anyother person or in any form without prior permission of White Oak Capital Management Consultants LLP (White Oak Capital Management). While reasonable endeavors have beenmade to present reliable data in the Presentation, but White Oak Capital Management does not guarantee the accuracy or completeness of the data in the Presentation. White OakCapital Management or any of its connected persons including its subsidiaries or associates or partners or employees shall not be in any way responsible for any loss or damage thatmay arise to any person from any inadvertent error in the information contained, views and opinions expressed in this Presentation. Past performance should not be taken as anindication or guarantee of future performance, and no representation or warranty, express or implied, is made regarding future performance. Information, opinions and estimatescontained in this Presentation reflect a judgment of its original date of publication by White Oak Capital Management and are subject to change without notice. This Presentation isnot directed or intended for distribution to, or use by, any person or entity who is a citizen or resident of or located in any locality, state, country or other jurisdiction, where suchdistribution, publication, availability or use would be contrary to local law, regulation or which would subject White Oak Capital Management and its affiliates to any registration orlicensing requirement within such jurisdiction The product described herein may or may not be eligible for sale in all jurisdictions or to certain category of investors. Persons inwhose possession this Report/Presentation may come are required to inform themselves of and to observe such restrictions.
This presentation is qualified in its entirety by the Information Memorandum/PPM/Term Sheet/Contribution Agreement and other related documents, copies of which will beprovided to prospective investors. All investors must read the detailed Private Placement Memorandum (PPM) including the Risk Factors and consult their tax advisors, beforemaking any investment decision/contribution to AIF. Capitalized terms used herein shall have the meaning assigned to such terms in the PPM and other documents.
Sponsor & Manager: White Oak Capital Management Consultants LLP
Contact Details – Registered and Corporate Office - Unit 6 2B, 6th Floor, Cnergy Building, Appasaheb Marathe Marg, Prabhadevi, Mumbai - 400 025. Tel: (91-22) 62308100 / 8182
Investor Queries & Complaints: Email: [email protected] Details – IN/AIF3/21-22/0934
Direct Investment: For availing Alternative Investment Fund Services you can reach us directly without any third-party intermediation by emailing us at [email protected] by calling us on +91-22- 62308100.
74


