Embed Size (px)
Citation preview
This article appeared in a journal published by Elsevier. The attachedcopy is furnished to the author for internal non-commercial researchand education use, including for instruction at the authors institution
and sharing with colleagues.
Other uses, including reproduction and distribution, or selling orlicensing copies, or posting to personal, institutional or third party
websites are prohibited.
In most cases authors are permitted to post their version of thearticle (e.g. in Word or Tex form) to their personal website orinstitutional repository. Authors requiring further information
regarding Elsevier’s archiving and manuscript policies areencouraged to visit:
http://www.elsevier.com/copyright
Author's personal copy
Research paper
Dissolution–reprecipitation of igneous zircon in mid-ocean ridge gabbro, AtlantisBank, Southwest Indian Ridge
Joshua J. Schwartz a,⁎, Barbara E. John b, Michael J. Cheadle b, Joseph L. Wooden c, Frank Mazdab c,1,Susan Swapp b, Craig B. Grimes d
a Department of Geological Sciences, University of Alabama, Tuscaloosa, AL 35487, United Statesb Department of Geology and Geophysics, University of Wyoming, Laramie, WY 82071, United Statesc U.S.G.S.-Stanford Ion Probe Laboratory, Stanford, CA 94305, United Statesd Department of Geosciences, Mississippi State University, Mississippi State, MS 39762, United States
a b s t r a c ta r t i c l e i n f o
Article history:Received 20 November 2009Received in revised form 25 March 2010Accepted 28 March 2010
Editor: R.L. Rudnick
Keywords:Dissolution–reprecipitationU–Pb zircon geochronologyZircon geochemistryEBSDAtlantis BankMid-ocean ridge
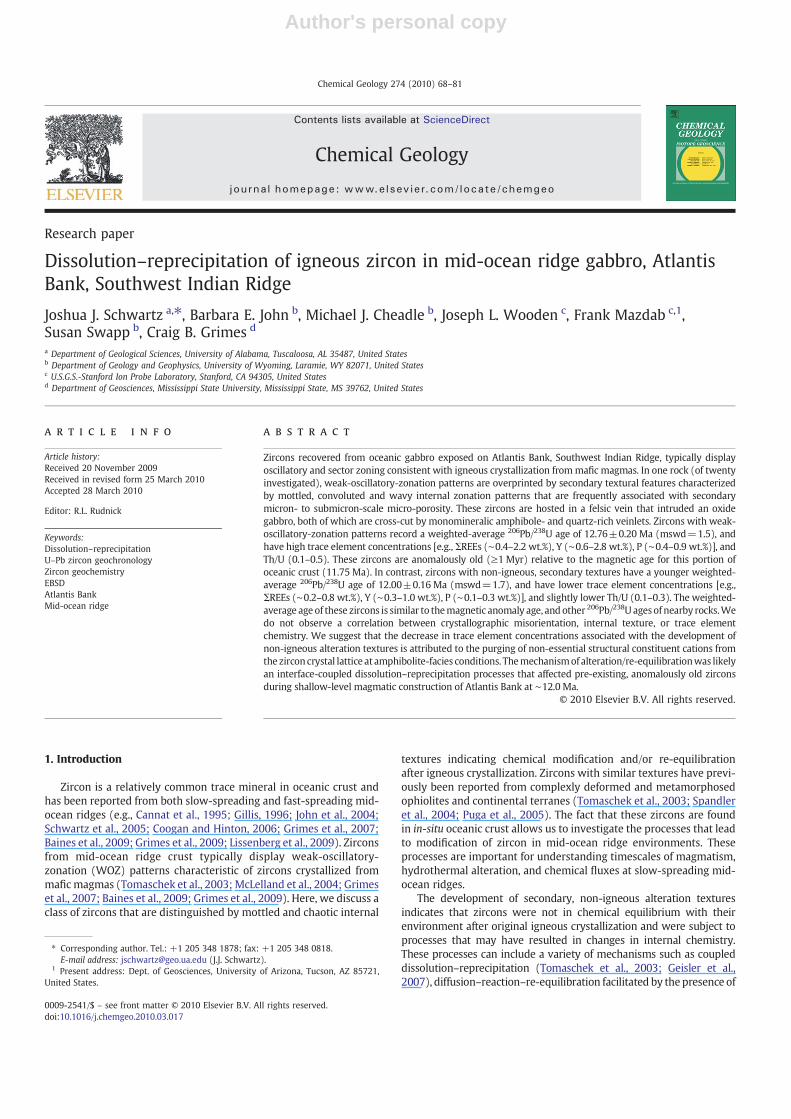
Zircons recovered from oceanic gabbro exposed on Atlantis Bank, Southwest Indian Ridge, typically displayoscillatory and sector zoning consistent with igneous crystallization frommafic magmas. In one rock (of twentyinvestigated), weak-oscillatory-zonation patterns are overprinted by secondary textural features characterizedby mottled, convoluted and wavy internal zonation patterns that are frequently associated with secondarymicron- to submicron-scale micro-porosity. These zircons are hosted in a felsic vein that intruded an oxidegabbro, both of which are cross-cut by monomineralic amphibole- and quartz-rich veinlets. Zircons with weak-oscillatory-zonation patterns record a weighted-average 206Pb/238U age of 12.76±0.20 Ma (mswd=1.5), andhave high trace element concentrations [e.g., ΣREEs (∼0.4–2.2 wt.%), Y (∼0.6–2.8 wt.%), P (∼0.4–0.9 wt.%)], andTh/U (0.1–0.5). These zircons are anomalously old (≥1 Myr) relative to the magnetic age for this portion ofoceanic crust (11.75 Ma). In contrast, zircons with non-igneous, secondary textures have a younger weighted-average 206Pb/238U age of 12.00±0.16 Ma (mswd=1.7), and have lower trace element concentrations [e.g.,ΣREEs (∼0.2–0.8 wt.%), Y (∼0.3–1.0 wt.%), P (∼0.1–0.3 wt.%)], and slightly lower Th/U (0.1–0.3). The weighted-average age of these zircons is similar to themagnetic anomaly age, and other 206Pb/238U ages of nearby rocks.Wedo not observe a correlation between crystallographic misorientation, internal texture, or trace elementchemistry. We suggest that the decrease in trace element concentrations associated with the development ofnon-igneous alteration textures is attributed to the purging of non-essential structural constituent cations fromthe zircon crystal lattice at amphibolite-facies conditions. Themechanismof alteration/re-equilibrationwas likelyan interface-coupled dissolution–reprecipitation processes that affected pre-existing, anomalously old zirconsduring shallow-level magmatic construction of Atlantis Bank at ∼12.0 Ma.
© 2010 Elsevier B.V. All rights reserved.
1. Introduction
Zircon is a relatively common trace mineral in oceanic crust andhas been reported from both slow-spreading and fast-spreading mid-ocean ridges (e.g., Cannat et al., 1995; Gillis, 1996; John et al., 2004;Schwartz et al., 2005; Coogan and Hinton, 2006; Grimes et al., 2007;Baines et al., 2009; Grimes et al., 2009; Lissenberg et al., 2009). Zirconsfrom mid-ocean ridge crust typically display weak-oscillatory-zonation (WOZ) patterns characteristic of zircons crystallized frommafic magmas (Tomaschek et al., 2003; McLelland et al., 2004; Grimeset al., 2007; Baines et al., 2009; Grimes et al., 2009). Here, we discuss aclass of zircons that are distinguished by mottled and chaotic internal
textures indicating chemical modification and/or re-equilibrationafter igneous crystallization. Zircons with similar textures have previ-ously been reported from complexly deformed and metamorphosedophiolites and continental terranes (Tomaschek et al., 2003; Spandleret al., 2004; Puga et al., 2005). The fact that these zircons are foundin in-situ oceanic crust allows us to investigate the processes that leadto modification of zircon in mid-ocean ridge environments. Theseprocesses are important for understanding timescales of magmatism,hydrothermal alteration, and chemical fluxes at slow-spreading mid-ocean ridges.
The development of secondary, non-igneous alteration texturesindicates that zircons were not in chemical equilibrium with theirenvironment after original igneous crystallization and were subject toprocesses that may have resulted in changes in internal chemistry.These processes can include a variety of mechanisms such as coupleddissolution–reprecipitation (Tomaschek et al., 2003; Geisler et al.,2007), diffusion–reaction–re-equilibration facilitated by the presence of
Chemical Geology 274 (2010) 68–81
⁎ Corresponding author. Tel.: +1 205 348 1878; fax: +1 205 348 0818.E-mail address: [email protected] (J.J. Schwartz).
1 Present address: Dept. of Geosciences, University of Arizona, Tucson, AZ 85721,United States.
0009-2541/$ – see front matter © 2010 Elsevier B.V. All rights reserved.doi:10.1016/j.chemgeo.2010.03.017
Contents lists available at ScienceDirect
Chemical Geology
j ourna l homepage: www.e lsev ie r.com/ locate /chemgeo
Author's personal copy
an aqueous fluid (Geisler et al., 2003a,b, 2007), static grain-boundaryand defect migration (e.g., Hoskin and Black, 2000), and deformation-enhanced diffusion along high diffusivity pathways (e.g., Timms et al.,2006; Reddy et al., 2006, 2007, 2009). The driving force(s) for re-equilibration can be either the reduction of lattice strain resulting fromhigh concentrations of trace element ‘impurities’ in solid solution(Hoskin and Black, 2000; Tomaschek et al., 2003), or in metamictzircons, recovery of structural damage caused by self-irradiation(Chakoumakos et al., 1987; Murakami et al., 1991; Geisler et al.,2003a). Understanding these processes and their effects on zirconcrystal chemistry is crucial for the correct interpretation of zircon geo-chronologic and geochemical data and for understanding the signifi-cance of those data in the context of the tectonic, magmatic andmetamorphic history of the sample.
The purpose of this paper is to describe in detail the internalstructures of altered/re-equilibrated zircons from one sample of oceanicgabbro collected from Atlantis Bank, Southwest Indian Ocean. In thisstudy, we link textural observations with Pb/U ages, trace elementgeochemical data and representative electron backscattered diffractionmaps from twenty-one igneous zircons, which have undergone varyingdegrees of secondary alteration/re-equilibration. Our data allow us toexamine both magmatic and alteration processes, including 1) thetiming of igneous crystallization and subsequent alteration/re-equili-bration, 2) the behavior of trace- and rare earth elements duringalteration/re-equilibration, and 3) mechanisms for chemical mobility(e.g., coupled dissolution–reprecipitation, dynamic and static re-equilibration) during alteration/re-equilibration on the seafloor. Wesuggest that decreasing trace element and REE concentrations reflectthe expulsion of non-essential structural cations (e.g., P, REEs, Y, and Pb)from originally igneous domains. The patterns we observe cannot beexplained by simple volume diffusion mechanisms, metamictization ofthe zircon lattice, nor deformation-enhanced chemical mobility. Wesuggest that coupled dissolution–reprecipitation of these zircons mayexplain many of the chemical and textural variations we observe.
2. Geology of Atlantis Bank
The Southwest Indian Ridge (SWIR) is a transitional slow- toultraslow-spreading mid-ocean ridge (Dick et al., 1991b, 2003) thatseparates the Antarctic and Indian plates (Fig. 1 inset). Atlantis Bank liesapproximately 100-km south of the SWIR rift valley where the long-term seafloor spreading half rate is estimated at 8.5 mm/yr for theAntarctic plate (Dick et al., 1991b; Hosford et al., 2003; Baines et al.,2007). Recently, Baines et al. (2008) estimated a seafloor spreading rateof 14.1 mm/yr during the creation of Atlantis Bank. Based on drilling,dredging, manned submersible and ROV observations, Atlantis Bankconsists of variably deformed and denuded lower oceanic crust anduppermantle (Cannat et al., 1991a;Dick et al., 1991a, 2000;Natland andDick, 2002). Rocks from ODP Hole 735B and from submersible dives atAtlantis Bank include olivine gabbro, olivine gabbronorite, and oxidegabbro with minor felsic veins (Dick et al., 1991a, 2000; Robinson et al.,2000; Natland and Dick, 2001, 2002). Oxide gabbros and felsic veinscompose ∼25% of core recovered from ODP Hole 735B and commonlyhost trace minerals (e.g., apatite, zircon, and titanite) suitable for geo-chronologic and thermochrologic dating (John et al., 2004). Pb/U geo-chronologic ages fromAtlantis Bank range from10.80 to 14.00 Ma (Johnet al., 2004; Schwartz et al., 2005; Baines et al., 2009). Some ages areanomalously old and may reflect assimilation of pre-existing gabbroicrocks from the mantle lithosphere (Schwartz et al., 2005).
Structurally, Atlantis Bank forms the footwall of a long-lived de-tachment fault system. Detachment faulting is thought to have occurredduring the final stages of magmatic accretion (Natland and Dick, 2002)and likely rooted in the rift valley. High-temperature (N650 °C) defor-mation fabrics including mylonites are common (Cannat et al., 1991a;Dick et al., 2000; Miranda, 2006), and are overprinted by extensivelyaltered cataclasites, locally ultracataclasites, andrare gouge. Core samples
fromODPHole 735B exhibit magmatic andmetamorphic fabrics rangingdown-temperature from submagmatic, granulite (650°–900 °C), am-phibolite (450°–650 °C), greenschist (300°–450 °C) and sub-greenschistgrades (Cannat et al., 1991b; Dick et al., 2000; Miranda, 2006).Microstructural and mineral thermometry indicate that ductile defor-mation initiated at high temperatures (N900 °C) and continued to lowertemperatures as fault rocks were denuded along the detachment faultsystem (Miranda, 2006). Semi-brittle greenschist-grade fabrics in gabbromylonites preserve the subsequent lower-temperature history attemperatures of ∼250° to 350 ° C (Miranda, 2006). Active slip on thedetachment fault system ceased as the footwall emerged at the rift valleywall, and was denuded to the seafloor, approximately 500 kyr afterformation (Baines et al., 2008).
3. Sample description and analytical methods
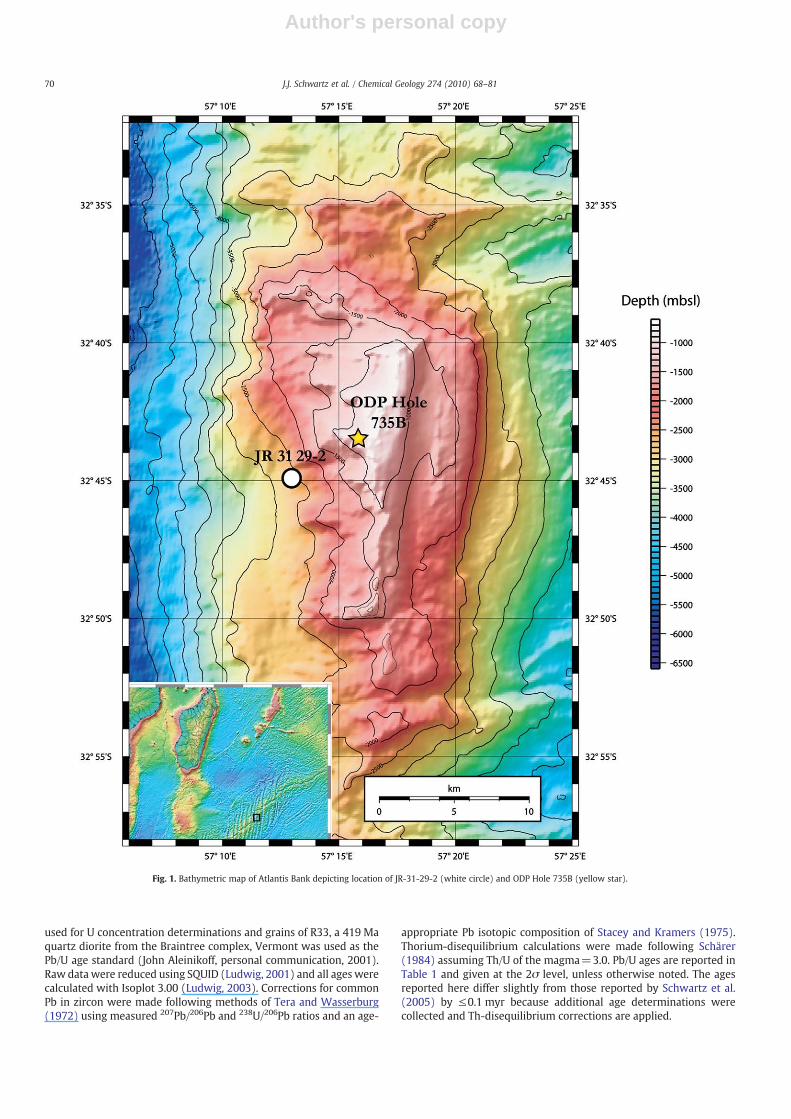
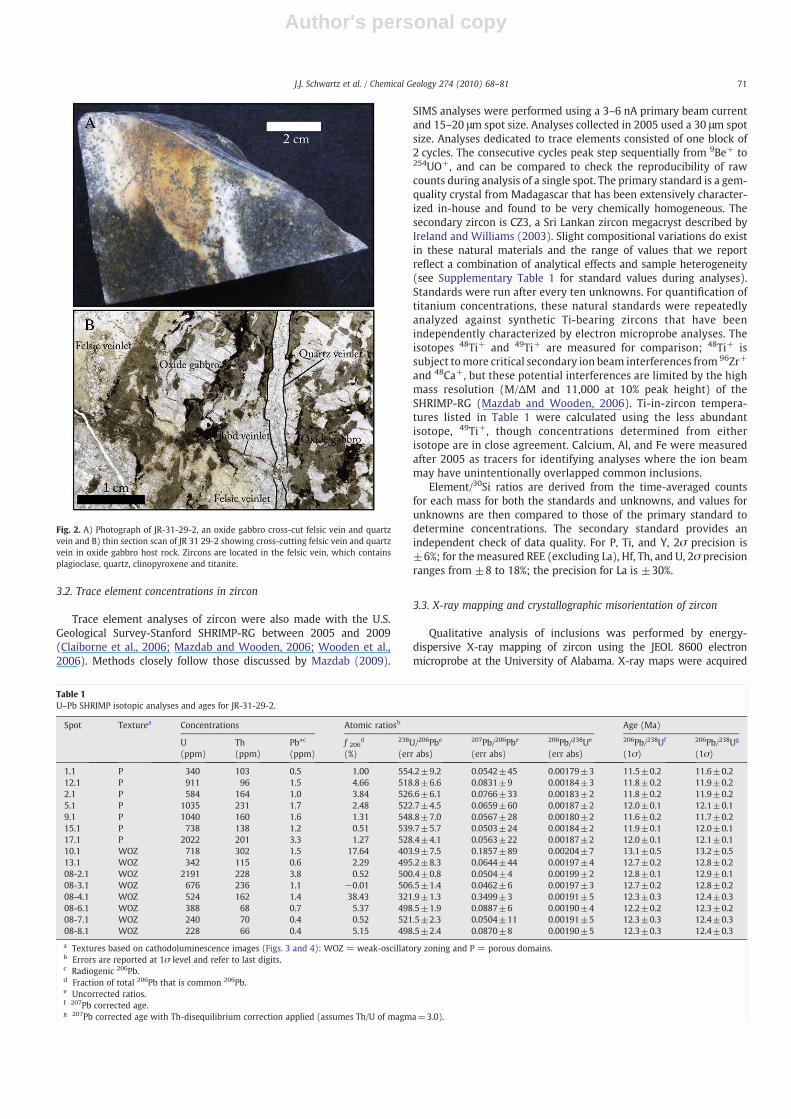
We analyzed twenty-one zircon grains from sample JR-31 29-2,collected bydredgingduringRRS JamesClark Ross Leg31 (MacLeod et al.,1998). The sample was collected along the western flank of AtlantisBank, ∼5 km SW of ODP Hole 725B (lat: 57.2018 to 57.2118; long:−32.7507 to −32.7507), between 2644 and 2895 m water depth(Fig. 1). Sample JR-31 29-2 is an oxide gabbro intruded by feldspar- andquartz-bearing felsic vein, in turn intruded by a quartz vein (Fig. 2).Mineralogy of the host oxide gabbro comprises plagioclase, clinopyrox-ene, ilmenite, green and brownhornblende, actinolite and apatite. Lathsof plagioclase occur along the right-side of the thin section in Fig. 2 andare relativelyundeformed. Inmany cases, large clinopyroxenegrains arereplaced by brown hornblende along grain boundaries. In some cases,clinopyroxene cores are retrogressed to mats of fine-grained actinolitesurrounded by rims of dark green and brown hornblende. Largeplagioclase laths are cut by anastomosing networks of albite veinletsthat sometimes parallel brown and dark green hornblende veinlets. Thefine- to medium-grained felsic vein cross-cuts the oxide gabbro anddisplays graphic and micrographic textures characterized by fine-grained intergrowths of feldspar and quartz. The felsic vein is composedof quartz, plagioclase (and possibly fine-grained alkali feldspar),clinopyroxene and titanite. Clinopyroxene in the felsic vein is anhedral,lacks exsolution textures and unlike clinopyroxenes in the oxide gabbrodoes not display evidence formultiple alteration events by retrogressionof amphibole. The felsic vein is cut by fractures and hornblende veinlets,and is intruded by a late-stage syntaxial quartz-rich vein (Fig. 2). Zircon(visible in thin section and scanning electronmicroscope) occurs in thefelsic vein.
Deformation in the oxide gabbro host rock is localized (center ofthe thin section: Fig. 2) and involved dislocation creep accompaniedby dynamic re-equilibration of plagioclase and clinopyroxene. Bothclinopyroxene and plagioclase grains have well-developed mantles ofsubgrains with porphyroclasts displaying kink-banding. The felsic andquartz veinlets are undeformed to weakly deformed with minorundulatory extinction observed in quartz.
JR-31 29-2 was hand-crushed and processed utilizing standardheavy liquid and magnetic separation techniques. Hundreds of zirconwere obtained with sizes varying from b50 to ∼100 μm in length.Individual zircons were mounted in epoxy, polished, and imaged inreflected light, backscattered light, and cathodoluminescence (CL).Sample preparation methods for ion probe analyses at the Stanford-USGS SHRIMP-RG facility follows those outlined in Schwartz et al.(2005).
3.1. U–Pb age determinations
Methods used to obtain the U–Pb analytical data closely followthose outlined by Compston et al. (1984) andWilliams (1998), and arediscussed in Schwartz et al. (2005). Samples were analyzed between2005 and 2009 in multiple analytical sessions with standards run forevery 3–4 unknowns. A gem-quality zircon, CZ3, with 550 ppm Uwas
69J.J. Schwartz et al. / Chemical Geology 274 (2010) 68–81
Author's personal copy
used for U concentration determinations and grains of R33, a 419 Maquartz diorite from the Braintree complex, Vermont was used as thePb/U age standard (John Aleinikoff, personal communication, 2001).Raw data were reduced using SQUID (Ludwig, 2001) and all ages werecalculated with Isoplot 3.00 (Ludwig, 2003). Corrections for commonPb in zircon were made following methods of Tera and Wasserburg(1972) using measured 207Pb/206Pb and 238U/206Pb ratios and an age-
appropriate Pb isotopic composition of Stacey and Kramers (1975).Thorium-disequilibrium calculations were made following Schärer(1984) assuming Th/U of the magma=3.0. Pb/U ages are reported inTable 1 and given at the 2σ level, unless otherwise noted. The agesreported here differ slightly from those reported by Schwartz et al.(2005) by ≤0.1 myr because additional age determinations werecollected and Th-disequilibrium corrections are applied.
Fig. 1. Bathymetric map of Atlantis Bank depicting location of JR-31-29-2 (white circle) and ODP Hole 735B (yellow star).
70 J.J. Schwartz et al. / Chemical Geology 274 (2010) 68–81
Author's personal copy
3.2. Trace element concentrations in zircon
Trace element analyses of zircon were also made with the U.S.Geological Survey-Stanford SHRIMP-RG between 2005 and 2009(Claiborne et al., 2006; Mazdab and Wooden, 2006; Wooden et al.,2006). Methods closely follow those discussed by Mazdab (2009).
SIMS analyses were performed using a 3–6 nA primary beam currentand 15–20 μm spot size. Analyses collected in 2005 used a 30 μm spotsize. Analyses dedicated to trace elements consisted of one block of2 cycles. The consecutive cycles peak step sequentially from 9Be+ to254UO+, and can be compared to check the reproducibility of rawcounts during analysis of a single spot. The primary standard is a gem-quality crystal from Madagascar that has been extensively character-ized in-house and found to be very chemically homogeneous. Thesecondary zircon is CZ3, a Sri Lankan zircon megacryst described byIreland and Williams (2003). Slight compositional variations do existin these natural materials and the range of values that we reportreflect a combination of analytical effects and sample heterogeneity(see Supplementary Table 1 for standard values during analyses).Standards were run after every ten unknowns. For quantification oftitanium concentrations, these natural standards were repeatedlyanalyzed against synthetic Ti-bearing zircons that have beenindependently characterized by electron microprobe analyses. Theisotopes 48Ti+ and 49Ti+ are measured for comparison; 48Ti+ issubject tomore critical secondary ion beam interferences from 96Zr+
and 48Ca+, but these potential interferences are limited by the highmass resolution (M/ΔM and 11,000 at 10% peak height) of theSHRIMP-RG (Mazdab and Wooden, 2006). Ti-in-zircon tempera-tures listed in Table 1 were calculated using the less abundantisotope, 49Ti+, though concentrations determined from eitherisotope are in close agreement. Calcium, Al, and Fe were measuredafter 2005 as tracers for identifying analyses where the ion beammay have unintentionally overlapped common inclusions.
Element/30Si ratios are derived from the time-averaged countsfor each mass for both the standards and unknowns, and values forunknowns are then compared to those of the primary standard todetermine concentrations. The secondary standard provides anindependent check of data quality. For P, Ti, and Y, 2σ precision is±6%; for the measured REE (excluding La), Hf, Th, and U, 2σ precisionranges from ±8 to 18%; the precision for La is ±30%.
3.3. X-ray mapping and crystallographic misorientation of zircon
Qualitative analysis of inclusions was performed by energy-dispersive X-ray mapping of zircon using the JEOL 8600 electronmicroprobe at the University of Alabama. X-ray maps were acquired
Fig. 2. A) Photograph of JR-31-29-2, an oxide gabbro cross-cut felsic vein and quartzvein and B) thin section scan of JR 31 29-2 showing cross-cutting felsic vein and quartzvein in oxide gabbro host rock. Zircons are located in the felsic vein, which containsplagioclase, quartz, clinopyroxene and titanite.
Table 1U–Pb SHRIMP isotopic analyses and ages for JR-31-29-2.
Spot Texturea Concentrations Atomic ratiosb Age (Ma)
U Th Pb*c f 206d 238U/206Pbe 207Pb/206Pbe 206Pb/238Ue 206Pb/238Uf 206Pb/238Ug
(ppm) (ppm) (ppm) (%) (err abs) (err abs) (err abs) (1σ) (1σ)
1.1 P 340 103 0.5 1.00 554.2±9.2 0.0542±45 0.00179±3 11.5±0.2 11.6±0.212.1 P 911 96 1.5 4.66 518.8±6.6 0.0831±9 0.00184±3 11.8±0.2 11.9±0.22.1 P 584 164 1.0 3.84 526.6±6.1 0.0766±33 0.00183±2 11.8±0.2 11.9±0.25.1 P 1035 231 1.7 2.48 522.7±4.5 0.0659±60 0.00187±2 12.0±0.1 12.1±0.19.1 P 1040 160 1.6 1.31 548.8±7.0 0.0567±28 0.00180±2 11.6±0.2 11.7±0.215.1 P 738 138 1.2 0.51 539.7±5.7 0.0503±24 0.00184±2 11.9±0.1 12.0±0.117.1 P 2022 201 3.3 1.27 528.4±4.1 0.0563±22 0.00187±2 12.0±0.1 12.1±0.110.1 WOZ 718 302 1.5 17.64 403.9±7.5 0.1857±89 0.00204±7 13.1±0.5 13.2±0.513.1 WOZ 342 115 0.6 2.29 495.2±8.3 0.0644±44 0.00197±4 12.7±0.2 12.8±0.208-2.1 WOZ 2191 228 3.8 0.52 500.4±0.8 0.0504±4 0.00199±2 12.8±0.1 12.9±0.108-3.1 WOZ 676 236 1.1 −0.01 506.5±1.4 0.0462±6 0.00197±3 12.7±0.2 12.8±0.208-4.1 WOZ 524 162 1.4 38.43 321.9±1.3 0.3499±3 0.00191±5 12.3±0.3 12.4±0.308-6.1 WOZ 388 68 0.7 5.37 498.5±1.9 0.0887±6 0.00190±4 12.2±0.2 12.3±0.208-7.1 WOZ 240 70 0.4 0.52 521.5±2.3 0.0504±11 0.00191±5 12.3±0.3 12.4±0.308-8.1 WOZ 228 66 0.4 5.15 498.5±2.4 0.0870±8 0.00190±5 12.3±0.3 12.4±0.3
a Textures based on cathodoluminescence images (Figs. 3 and 4): WOZ = weak-oscillatory zoning and P = porous domains.b Errors are reported at 1σ level and refer to last digits.c Radiogenic 206Pb.d Fraction of total 206Pb that is common 206Pb.e Uncorrected ratios.f 207Pb corrected age.g 207Pb corrected age with Th-disequilibrium correction applied (assumes Th/U of magma=3.0).
71J.J. Schwartz et al. / Chemical Geology 274 (2010) 68–81
Author's personal copy
using a 15 kV accelerating voltage and 20–50 nAbeamcurrent. Electronbackscatter diffraction patterns (EBSP) from the zircon grains werecollected at the University of Wyoming using an HKL electronbackscatter diffraction detector attached to a JEOL5800LV SEM. Sampleswere tilted70° to the incident beamandEBSPswere collectedunder lowvacuum conditions using aWDof 26 mmand an accelerating voltage of20 kV. Zircons from the original ion probe mount were mapped usingbeam scans with step sizes between 0.5 µm and 1 µm. The EBSPs wereindexed automatically to determine crystallographic orientations, usingHKL Channel 5 software. The resultant beam scans are presented asmaps of relative crystallographic misorientation.
4. Results
4.1. Textural characteristics of zircons
4.1.1. Primary texturesZircons from mafic rocks typically display sector and weak-
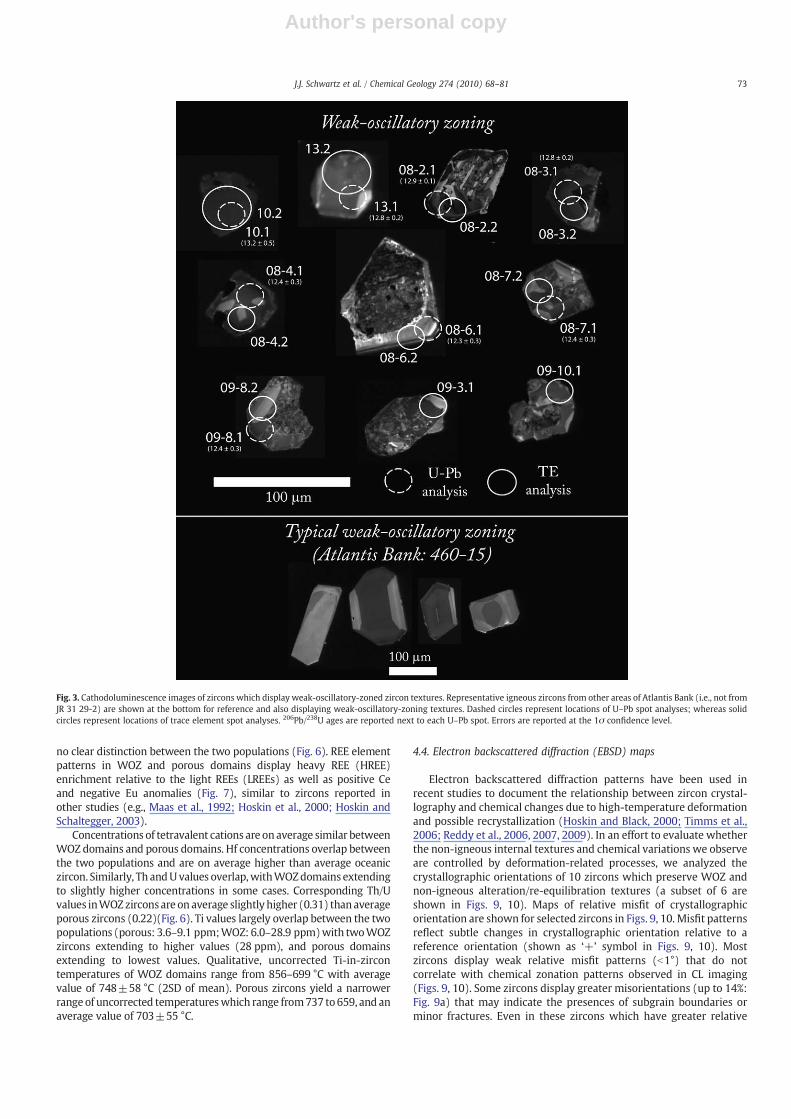
oscillatory zoning (Tomaschek et al., 2003; McLelland et al., 2004;Bea et al., 2006; Grimes et al., 2007, 2009; Baines et al., 2009).Approximately 60% of all imaged zircons from JR 31 29-2 (Figs. 3, 4)preserve subtle, WOZ domains which are commonly restricted tointerior and rim portions of zircon crystals (Fig. 3). Nearly all grainsare overprinted by secondary textures characterized by cloudy porousregions in transmitted light and chaotic internal zonation features inCL (see discussion below).
4.1.2. Secondary texturesSecondary, non-igneous textures appear brighter in CL thanWOZ
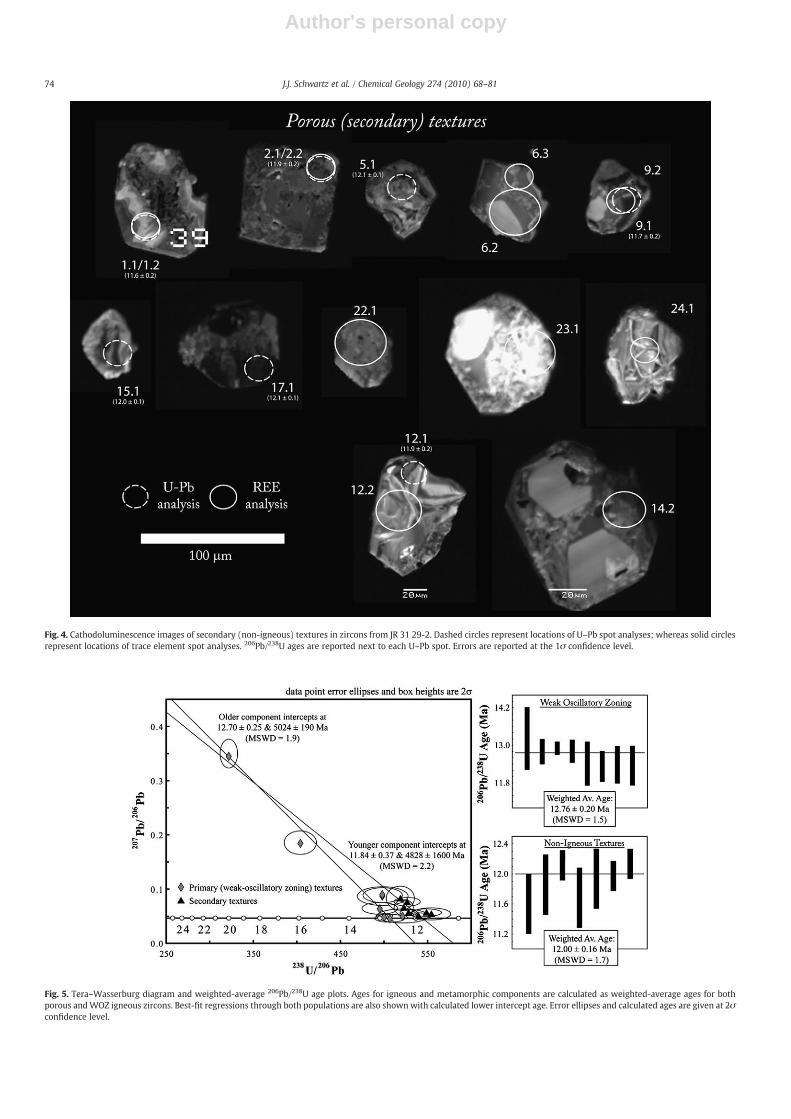
domains in the same zircon (Fig. 4). In some cases, dark and lightareas appear patchy or are randomly distributed. In these regions,there is no clear relationship to proximity to grain exteriors in the 2-Dmount sections. However, these regions are strongly correlated withporous regions in BSE images (Figs. 4, 5). These micron- tosubmicron-scale pores may be voids, fluid/melt inclusions or regionsof dissolution. In general, domains with limited or no porositypreserve oscillatory igneous zonation patterns, whereas regions withextensive porosity are characterized by chaotic patterns (c.f., Fig. 4).X-ray mapping of porous domains displays micron- to submicron-scale Y- and P-rich inclusions. Pores sometimes contain Fe-, Ca-, F-and Cl-rich inclusions. We do not observe magmatic resorptiontextures characterized by areas of embayed grain boundaries, orother evidence (e.g., luminescent rims) for the development ofyounger magmatic overgrowths.
4.2. Age relationship between primary and secondary zircons
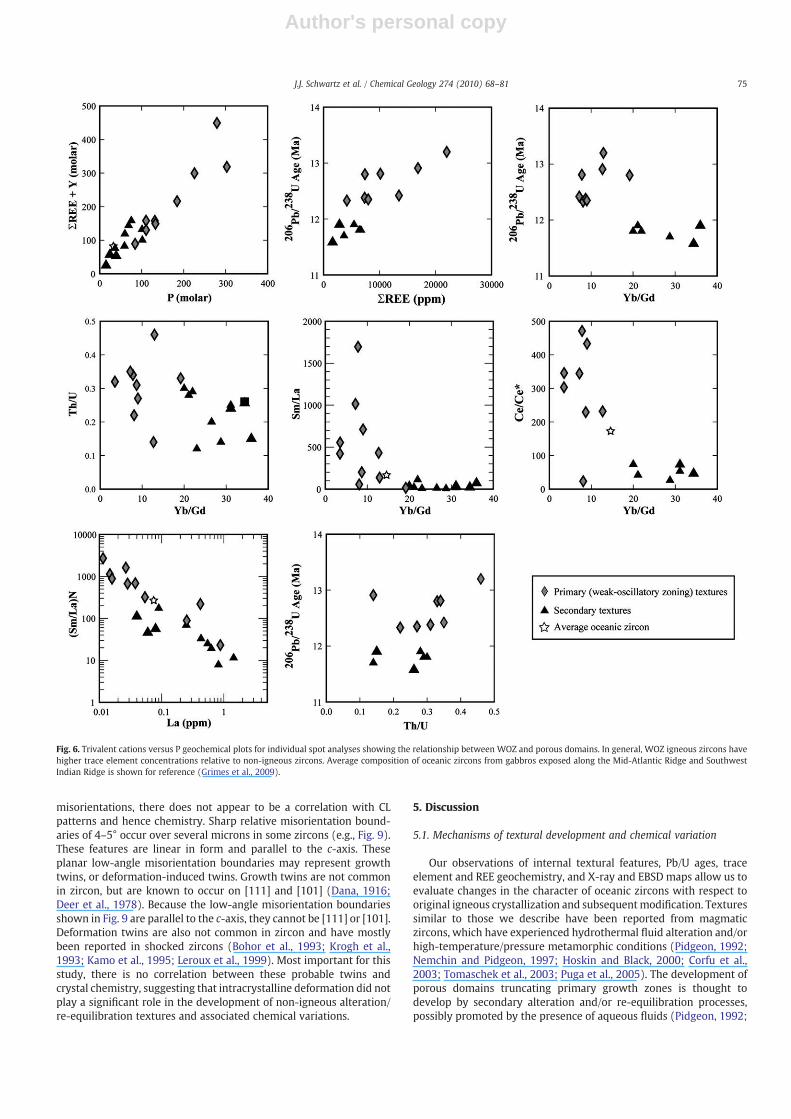
A subset of fifteen zircon grains was analyzed to quantify therelationship between zircon zonation and the timing of crystallizationand subsequent textural modification (Table 1). Individual U–Pb spotanalyses are shown on Figs. 3, 4, and data are plotted on a Concordiadiagram in Fig. 5. Based on textural information, we divide the zirconpopulations into two groups: WOZ domains which record older 206Pb/238U ages, and secondary (porous) domains which record younger ages(Figs. 3, 4, 6). WOZ domains yield a weighted-average 206Pb/238U age of12.76±0.20 Ma (n=8,mswd=1.5) (see inset in Fig. 5). This age is takenas the best estimate for the timing of igneous crystallization associatedwith the WOZ zircon population. This age also agrees with the lowerintercept age for this population which yields an age of 12.70±0.25(mswd=1.9). Theseagesdiffer slightly fromtheage reported inSchwartzet al. (2005), which used a smaller subset of data and applied theSambridge and Compston (1994) deconvolution method (previouslyreported 206Pb/238U age: 12.48±0.10). Thismethod is described below asanalternatively viable age calculationandyields a similar agewithinerror.
Porous zircon domains collectively yield a weighted-average206Pb/238U age of 12.00±0.16 Ma (n=7, mswd=1.7; inset Fig. 5).
Statistically, the weighted-average age for all non-igneous texturedzircons is younger than theWOZ zircon population, and is interpretedto date the timing of secondary textural development in these zircons.A less precise lower intercept age of 11.84±0.37 Ma also overlaps theweighted-average age. These ages are similar to the age given inSchwartz et al. (2005) based on the Sambridge and Compston (1994)deconvolution method described below (previously reported 206Pb/238U age: 11.84±0.10).
An alternative approach is to calculate ages for the WOZ and non-igneous zircon populations using the “mixture modeling” method ofSambridge and Compston (1994). The Sambridge and Compston“mixture modeling” method assumes a priori that the number ofcomponents is known (assumed here to be two: an igneous and amodified population) and the samples display a Gaussian distributionof ages. Using all analyses, the method produced 206Pb/238U ages of12.03±0.10 Ma (70% of zircon analyses) and 12.86±0.17 Ma (30% ofzircon analyses) for the two components. The age of the porous zirconpopulation calculated by this method (12.03±0.10 Ma) is identical tothe weighted-average age for these zircons (12.00±0.16 Ma). Theweak-oscillatory-zoned population in the Sambridge and Compstonmethod (12.86±0.17 Ma) is slightly older than, but within error of,the calculated weighted-average age discussed above (12.76±0.20 Ma).We prefer the weighted-average 206Pb/238U age calculationsbecause they take into account the additional constraints provided bythe textures of the grains; however bothmethods yield similar results.
4.3. Trace element characteristics
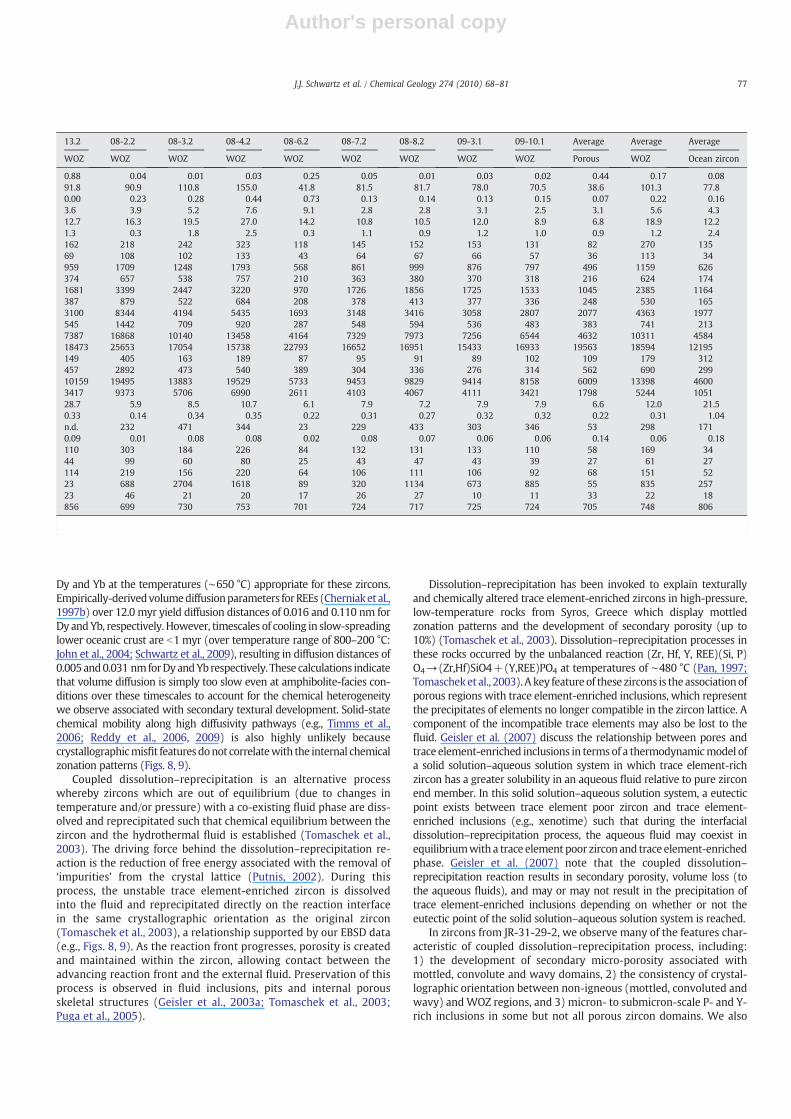
Trace element concentrations were collected to investigate therelationship between internal zonation textures, Pb/U age andchemistry (Tables 2, 3). Locations of trace element spot analyses areshownon Figs. 3, 4.We report concentrations of both trace elements (Ti,P, Y,Hf, U andTh) and rare earth elements (REEs) in Tables 2, 3. Analyseswere performed on both WOZ and porous domains (Figs. 7–9). Theaverage composition of oceanic zircons from gabbros exposed along theMid-Atlantic Ridge and Southwest Indian Ridge is shown for reference(Grimes et al., 2009).
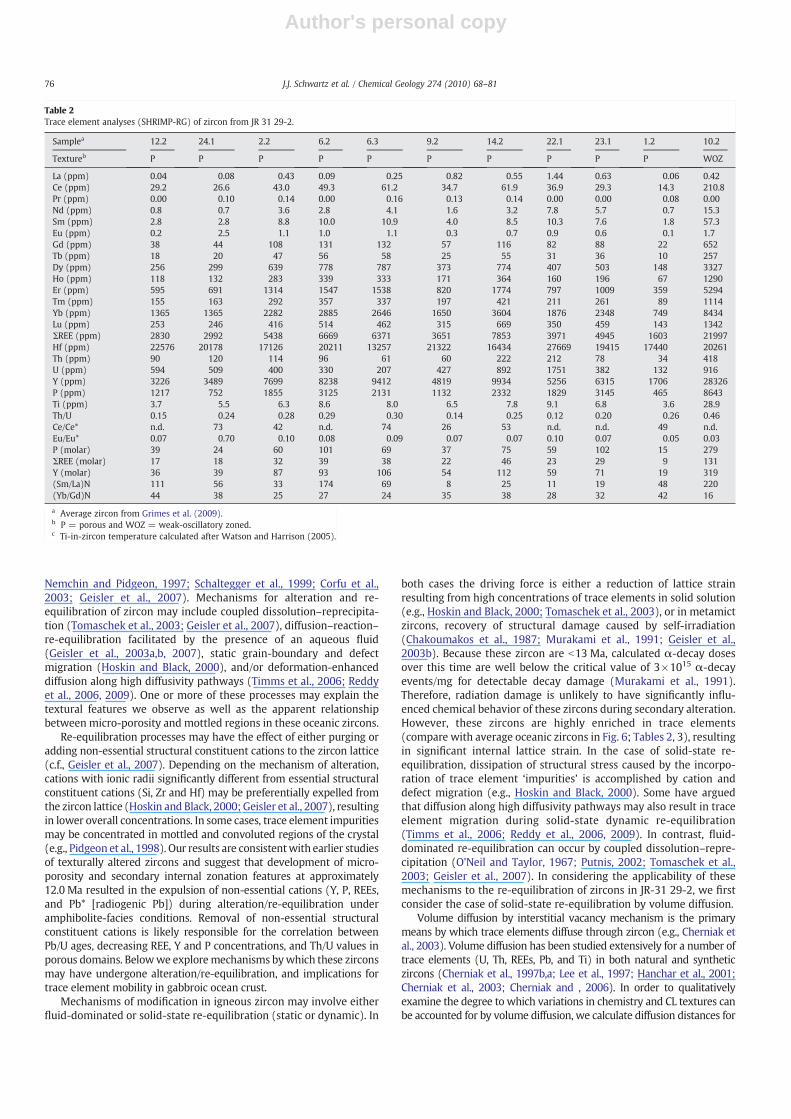
WOZ domains are characterized by extreme P (2611–9373 ppm)enrichment relative to porous domains (465–3145 ppm) andaverage oceanic zircon (∼1050 ppm)(Fig. 6). Trivalent cations (e.g.,REEs and Y) also display enrichment in WOZ domains relative toporous domains. This relationship is observed in the plot of molarΣREEs+Y vs. molar P (Fig. 6) which displays a positive correlation,suggesting that the REEs3+ and Y3+ are partially charged balanced byP5+ according to the ‘xenotime’-coupled substitution [e.g., Speer,1980b]. The best-fit array on this diagram has a slope of ∼1.2,demonstrating a slight deficiency of P relative to the trivalent cations.Previous workers have recognized that the ‘xenotime’ exchangevector is not the exclusive substitutionmechanism to account for theincorporation of trivalent cations in the zircon structure (Hinton andUpton, 1991; Maas et al., 1992; Hoskin et al., 2000; Finch et al., 2001;Hanchar et al., 2001; Finch and Hanchar, 2003; Hoskin andSchaltegger, 2003; Tomaschek et al., 2003). Other elements includingSc3+, alkali and alkaline earths (not reported in this study), varioustransition elements and hydrous species may also substitute in thezircon structure and may account for the observed trend in theseoceanic zircons (Speer, 1980b,a; Hoskin et al., 2000; Hanchar et al.,2001).
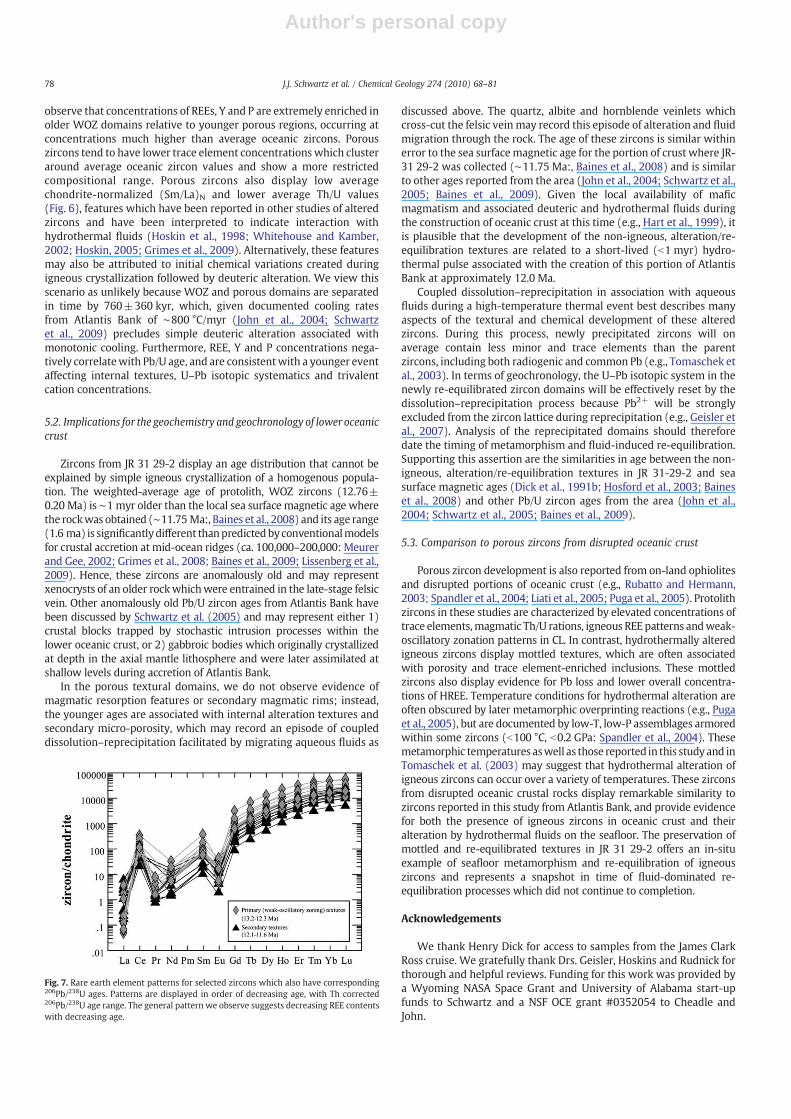
Rare earth element concentrations also decreasewith Pb/U age fromWOZ to porous domains (Fig. 6). WOZ domains are distinguished fromporous domains by lower average chondrite-normalized (Yb/Gd)Nvalues, higher chondrite-normalized (Sm/La)N values, larger Ce-anomalies, and higher average HREE concentrations (Fig. 7). Average(Sm/La)N for porous zircon domains is 55 (versus 835 in WOZ zircondomains), reflecting La enrichment in porous domains. Negative Euanomalies characterize bothWOZ and porous zircon; however, there is
72 J.J. Schwartz et al. / Chemical Geology 274 (2010) 68–81
Author's personal copy
no clear distinction between the two populations (Fig. 6). REE elementpatterns in WOZ and porous domains display heavy REE (HREE)enrichment relative to the light REEs (LREEs) as well as positive Ceand negative Eu anomalies (Fig. 7), similar to zircons reported inother studies (e.g., Maas et al., 1992; Hoskin et al., 2000; Hoskin andSchaltegger, 2003).
Concentrations of tetravalent cations are onaverage similar betweenWOZ domains and porous domains. Hf concentrations overlap betweenthe two populations and are on average higher than average oceaniczircon. Similarly, Th andUvalues overlap,withWOZdomains extendingto slightly higher concentrations in some cases. Corresponding Th/Uvalues inWOZzirconsare on average slightly higher (0.31) thanaverageporous zircons (0.22)(Fig. 6). Ti values largely overlap between the twopopulations (porous: 3.6–9.1 ppm;WOZ: 6.0–28.9 ppm)with twoWOZzircons extending to higher values (28 ppm), and porous domainsextending to lowest values. Qualitative, uncorrected Ti-in-zircontemperatures of WOZ domains range from 856–699 °C with averagevalue of 748±58 °C (2SD of mean). Porous zircons yield a narrowerrange of uncorrected temperatureswhich range from737 to659, and anaverage value of 703±55 °C.
4.4. Electron backscattered diffraction (EBSD) maps
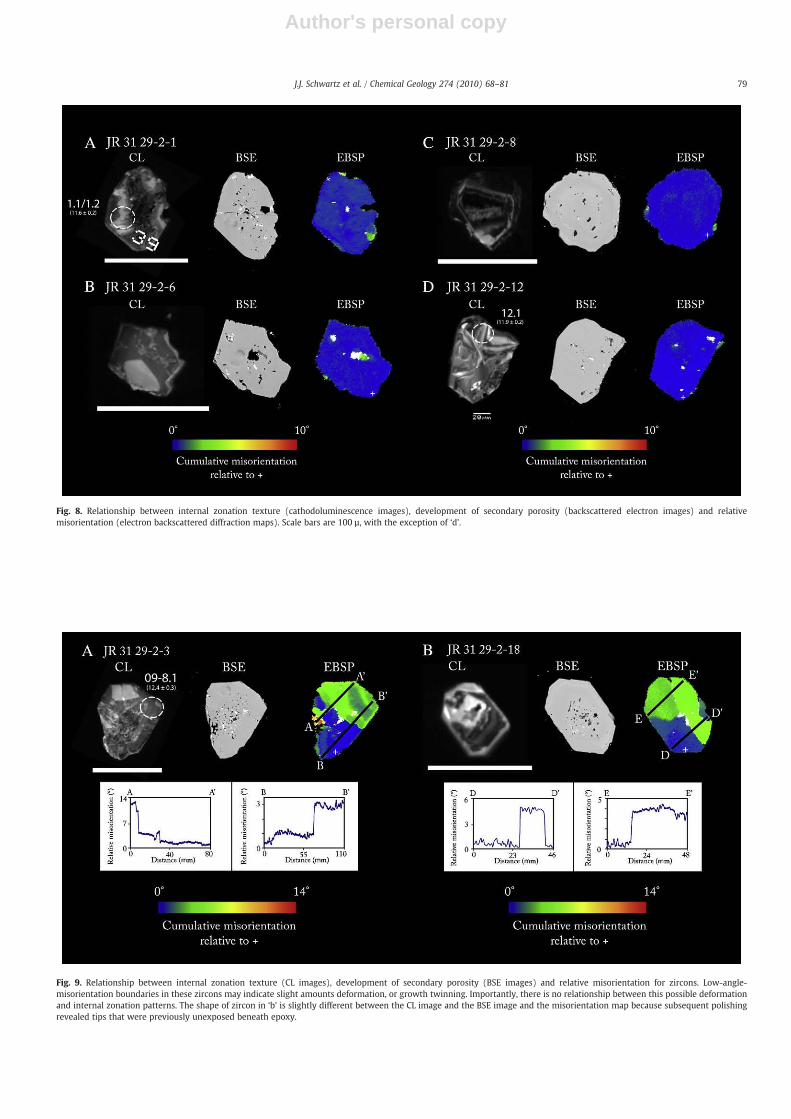
Electron backscattered diffraction patterns have been used inrecent studies to document the relationship between zircon crystal-lography and chemical changes due to high-temperature deformationand possible recrystallization (Hoskin and Black, 2000; Timms et al.,2006; Reddy et al., 2006, 2007, 2009). In an effort to evaluate whetherthe non-igneous internal textures and chemical variations we observeare controlled by deformation-related processes, we analyzed thecrystallographic orientations of 10 zircons which preserve WOZ andnon-igneous alteration/re-equilibration textures (a subset of 6 areshown in Figs. 9, 10). Maps of relative misfit of crystallographicorientation are shown for selected zircons in Figs. 9, 10. Misfit patternsreflect subtle changes in crystallographic orientation relative to areference orientation (shown as ‘+’ symbol in Figs. 9, 10). Mostzircons display weak relative misfit patterns (b1°) that do notcorrelate with chemical zonation patterns observed in CL imaging(Figs. 9, 10). Some zircons display greater misorientations (up to 14%:Fig. 9a) that may indicate the presences of subgrain boundaries orminor fractures. Even in these zircons which have greater relative
Fig. 3. Cathodoluminescence images of zircons which display weak-oscillatory-zoned zircon textures. Representative igneous zircons from other areas of Atlantis Bank (i.e., not fromJR 31 29-2) are shown at the bottom for reference and also displaying weak-oscillatory-zoning textures. Dashed circles represent locations of U–Pb spot analyses; whereas solidcircles represent locations of trace element spot analyses. 206Pb/238U ages are reported next to each U–Pb spot. Errors are reported at the 1σ confidence level.
73J.J. Schwartz et al. / Chemical Geology 274 (2010) 68–81
Author's personal copy
Fig. 4. Cathodoluminescence images of secondary (non-igneous) textures in zircons from JR 31 29-2. Dashed circles represent locations of U–Pb spot analyses; whereas solid circlesrepresent locations of trace element spot analyses. 206Pb/238U ages are reported next to each U–Pb spot. Errors are reported at the 1σ confidence level.
Fig. 5. Tera–Wasserburg diagram and weighted-average 206Pb/238U age plots. Ages for igneous and metamorphic components are calculated as weighted-average ages for bothporous andWOZ igneous zircons. Best-fit regressions through both populations are also shownwith calculated lower intercept age. Error ellipses and calculated ages are given at 2σconfidence level.
74 J.J. Schwartz et al. / Chemical Geology 274 (2010) 68–81
Author's personal copy
misorientations, there does not appear to be a correlation with CLpatterns and hence chemistry. Sharp relative misorientation bound-aries of 4–5° occur over several microns in some zircons (e.g., Fig. 9).These features are linear in form and parallel to the c-axis. Theseplanar low-angle misorientation boundaries may represent growthtwins, or deformation-induced twins. Growth twins are not commonin zircon, but are known to occur on [111] and [101] (Dana, 1916;Deer et al., 1978). Because the low-angle misorientation boundariesshown in Fig. 9 are parallel to the c-axis, they cannot be [111] or [101].Deformation twins are also not common in zircon and have mostlybeen reported in shocked zircons (Bohor et al., 1993; Krogh et al.,1993; Kamo et al., 1995; Leroux et al., 1999). Most important for thisstudy, there is no correlation between these probable twins andcrystal chemistry, suggesting that intracrystalline deformation did notplay a significant role in the development of non-igneous alteration/re-equilibration textures and associated chemical variations.
5. Discussion
5.1. Mechanisms of textural development and chemical variation
Our observations of internal textural features, Pb/U ages, traceelement and REE geochemistry, and X-ray and EBSD maps allow us toevaluate changes in the character of oceanic zircons with respect tooriginal igneous crystallization and subsequentmodification. Texturessimilar to those we describe have been reported from magmaticzircons, which have experienced hydrothermal fluid alteration and/orhigh-temperature/pressure metamorphic conditions (Pidgeon, 1992;Nemchin and Pidgeon, 1997; Hoskin and Black, 2000; Corfu et al.,2003; Tomaschek et al., 2003; Puga et al., 2005). The development ofporous domains truncating primary growth zones is thought todevelop by secondary alteration and/or re-equilibration processes,possibly promoted by the presence of aqueous fluids (Pidgeon, 1992;
Fig. 6. Trivalent cations versus P geochemical plots for individual spot analyses showing the relationship between WOZ and porous domains. In general, WOZ igneous zircons havehigher trace element concentrations relative to non-igneous zircons. Average composition of oceanic zircons from gabbros exposed along the Mid-Atlantic Ridge and SouthwestIndian Ridge is shown for reference (Grimes et al., 2009).
75J.J. Schwartz et al. / Chemical Geology 274 (2010) 68–81
Author's personal copy
Nemchin and Pidgeon, 1997; Schaltegger et al., 1999; Corfu et al.,2003; Geisler et al., 2007). Mechanisms for alteration and re-equilibration of zircon may include coupled dissolution–reprecipita-tion (Tomaschek et al., 2003; Geisler et al., 2007), diffusion–reaction–re-equilibration facilitated by the presence of an aqueous fluid(Geisler et al., 2003a,b, 2007), static grain-boundary and defectmigration (Hoskin and Black, 2000), and/or deformation-enhanceddiffusion along high diffusivity pathways (Timms et al., 2006; Reddyet al., 2006, 2009). One or more of these processes may explain thetextural features we observe as well as the apparent relationshipbetween micro-porosity and mottled regions in these oceanic zircons.
Re-equilibration processes may have the effect of either purging oradding non-essential structural constituent cations to the zircon lattice(c.f., Geisler et al., 2007). Depending on the mechanism of alteration,cations with ionic radii significantly different from essential structuralconstituent cations (Si, Zr and Hf) may be preferentially expelled fromthe zircon lattice (Hoskin and Black, 2000; Geisler et al., 2007), resultingin lower overall concentrations. In some cases, trace element impuritiesmay be concentrated in mottled and convoluted regions of the crystal(e.g., Pidgeon et al., 1998). Our results are consistentwith earlier studiesof texturally altered zircons and suggest that development of micro-porosity and secondary internal zonation features at approximately12.0 Ma resulted in the expulsion of non-essential cations (Y, P, REEs,and Pb* [radiogenic Pb]) during alteration/re-equilibration underamphibolite-facies conditions. Removal of non-essential structuralconstituent cations is likely responsible for the correlation betweenPb/U ages, decreasing REE, Y and P concentrations, and Th/U values inporous domains. Belowwe exploremechanisms bywhich these zirconsmay have undergone alteration/re-equilibration, and implications fortrace element mobility in gabbroic ocean crust.
Mechanisms of modification in igneous zircon may involve eitherfluid-dominated or solid-state re-equilibration (static or dynamic). In
both cases the driving force is either a reduction of lattice strainresulting from high concentrations of trace elements in solid solution(e.g., Hoskin and Black, 2000; Tomaschek et al., 2003), or in metamictzircons, recovery of structural damage caused by self-irradiation(Chakoumakos et al., 1987; Murakami et al., 1991; Geisler et al.,2003b). Because these zircon are b13 Ma, calculated α-decay dosesover this time are well below the critical value of 3×10¹⁵ α-decayevents/mg for detectable decay damage (Murakami et al., 1991).Therefore, radiation damage is unlikely to have significantly influ-enced chemical behavior of these zircons during secondary alteration.However, these zircons are highly enriched in trace elements(compare with average oceanic zircons in Fig. 6; Tables 2, 3), resultingin significant internal lattice strain. In the case of solid-state re-equilibration, dissipation of structural stress caused by the incorpo-ration of trace element ‘impurities’ is accomplished by cation anddefect migration (e.g., Hoskin and Black, 2000). Some have arguedthat diffusion along high diffusivity pathways may also result in traceelement migration during solid-state dynamic re-equilibration(Timms et al., 2006; Reddy et al., 2006, 2009). In contrast, fluid-dominated re-equilibration can occur by coupled dissolution–repre-cipitation (O'Neil and Taylor, 1967; Putnis, 2002; Tomaschek et al.,2003; Geisler et al., 2007). In considering the applicability of thesemechanisms to the re-equilibration of zircons in JR-31 29-2, we firstconsider the case of solid-state re-equilibration by volume diffusion.
Volume diffusion by interstitial vacancy mechanism is the primarymeans by which trace elements diffuse through zircon (e.g., Cherniak etal., 2003). Volume diffusion has been studied extensively for a number oftrace elements (U, Th, REEs, Pb, and Ti) in both natural and syntheticzircons (Cherniak et al., 1997b,a; Lee et al., 1997; Hanchar et al., 2001;Cherniak et al., 2003; Cherniak and , 2006). In order to qualitativelyexamine the degree to which variations in chemistry and CL textures canbe accounted for by volume diffusion, we calculate diffusion distances for
Table 2Trace element analyses (SHRIMP-RG) of zircon from JR 31 29-2.
Samplea 12.2 24.1 2.2 6.2 6.3 9.2 14.2 22.1 23.1 1.2 10.2
Textureb P P P P P P P P P P WOZ
La (ppm) 0.04 0.08 0.43 0.09 0.25 0.82 0.55 1.44 0.63 0.06 0.42Ce (ppm) 29.2 26.6 43.0 49.3 61.2 34.7 61.9 36.9 29.3 14.3 210.8Pr (ppm) 0.00 0.10 0.14 0.00 0.16 0.13 0.14 0.00 0.00 0.08 0.00Nd (ppm) 0.8 0.7 3.6 2.8 4.1 1.6 3.2 7.8 5.7 0.7 15.3Sm (ppm) 2.8 2.8 8.8 10.0 10.9 4.0 8.5 10.3 7.6 1.8 57.3Eu (ppm) 0.2 2.5 1.1 1.0 1.1 0.3 0.7 0.9 0.6 0.1 1.7Gd (ppm) 38 44 108 131 132 57 116 82 88 22 652Tb (ppm) 18 20 47 56 58 25 55 31 36 10 257Dy (ppm) 256 299 639 778 787 373 774 407 503 148 3327Ho (ppm) 118 132 283 339 333 171 364 160 196 67 1290Er (ppm) 595 691 1314 1547 1538 820 1774 797 1009 359 5294Tm (ppm) 155 163 292 357 337 197 421 211 261 89 1114Yb (ppm) 1365 1365 2282 2885 2646 1650 3604 1876 2348 749 8434Lu (ppm) 253 246 416 514 462 315 669 350 459 143 1342ΣREE (ppm) 2830 2992 5438 6669 6371 3651 7853 3971 4945 1603 21997Hf (ppm) 22576 20178 17126 20211 13257 21322 16434 27669 19415 17440 20261Th (ppm) 90 120 114 96 61 60 222 212 78 34 418U (ppm) 594 509 400 330 207 427 892 1751 382 132 916Y (ppm) 3226 3489 7699 8238 9412 4819 9934 5256 6315 1706 28326P (ppm) 1217 752 1855 3125 2131 1132 2332 1829 3145 465 8643Ti (ppm) 3.7 5.5 6.3 8.6 8.0 6.5 7.8 9.1 6.8 3.6 28.9Th/U 0.15 0.24 0.28 0.29 0.30 0.14 0.25 0.12 0.20 0.26 0.46Ce/Ce* n.d. 73 42 n.d. 74 26 53 n.d. n.d. 49 n.d.Eu/Eu* 0.07 0.70 0.10 0.08 0.09 0.07 0.07 0.10 0.07 0.05 0.03P (molar) 39 24 60 101 69 37 75 59 102 15 279ΣREE (molar) 17 18 32 39 38 22 46 23 29 9 131Y (molar) 36 39 87 93 106 54 112 59 71 19 319(Sm/La)N 111 56 33 174 69 8 25 11 19 48 220(Yb/Gd)N 44 38 25 27 24 35 38 28 32 42 16
a Average zircon from Grimes et al. (2009).b P = porous and WOZ = weak-oscillatory zoned.c Ti-in-zircon temperature calculated after Watson and Harrison (2005).
76 J.J. Schwartz et al. / Chemical Geology 274 (2010) 68–81
Author's personal copy
Dy and Yb at the temperatures (∼650 °C) appropriate for these zircons.Empirically-derivedvolumediffusionparameters forREEs (Cherniaket al.,1997b) over 12.0 myr yield diffusion distances of 0.016 and 0.110 nm forDy andYb, respectively. However, timescales of cooling in slow-spreadinglower oceanic crust are b1 myr (over temperature range of 800–200 °C:John et al., 2004; Schwartz et al., 2009), resulting in diffusion distances of0.005and0.031 nmforDyandYbrespectively. These calculations indicatethat volume diffusion is simply too slow even at amphibolite-facies con-ditions over these timescales to account for the chemical heterogeneitywe observe associated with secondary textural development. Solid-statechemical mobility along high diffusivity pathways (e.g., Timms et al.,2006; Reddy et al., 2006, 2009) is also highly unlikely becausecrystallographicmisfit featuresdonot correlatewith the internal chemicalzonation patterns (Figs. 8, 9).
Coupled dissolution–reprecipitation is an alternative processwhereby zircons which are out of equilibrium (due to changes intemperature and/or pressure) with a co-existing fluid phase are diss-olved and reprecipitated such that chemical equilibrium between thezircon and the hydrothermal fluid is established (Tomaschek et al.,2003). The driving force behind the dissolution–reprecipitation re-action is the reduction of free energy associated with the removal of‘impurities’ from the crystal lattice (Putnis, 2002). During thisprocess, the unstable trace element-enriched zircon is dissolvedinto the fluid and reprecipitated directly on the reaction interfacein the same crystallographic orientation as the original zircon(Tomaschek et al., 2003), a relationship supported by our EBSD data(e.g., Figs. 8, 9). As the reaction front progresses, porosity is createdand maintained within the zircon, allowing contact between theadvancing reaction front and the external fluid. Preservation of thisprocess is observed in fluid inclusions, pits and internal porousskeletal structures (Geisler et al., 2003a; Tomaschek et al., 2003;Puga et al., 2005).
Dissolution–reprecipitation has been invoked to explain texturallyand chemically altered trace element-enriched zircons in high-pressure,low-temperature rocks from Syros, Greece which display mottledzonation patterns and the development of secondary porosity (up to10%) (Tomaschek et al., 2003). Dissolution–reprecipitation processes inthese rocks occurred by the unbalanced reaction (Zr, Hf, Y, REE)(Si, P)O4→(Zr,Hf)SiO4+(Y,REE)PO4 at temperatures of ∼480 °C (Pan, 1997;Tomascheket al., 2003). A key featureof these zircons is the associationofporous regions with trace element-enriched inclusions, which representthe precipitates of elements no longer compatible in the zircon lattice. Acomponent of the incompatible trace elements may also be lost to thefluid. Geisler et al. (2007) discuss the relationship between pores andtrace element-enriched inclusions in termsof a thermodynamicmodel ofa solid solution–aqueous solution system in which trace element-richzircon has a greater solubility in an aqueous fluid relative to pure zirconend member. In this solid solution–aqueous solution system, a eutecticpoint exists between trace element poor zircon and trace element-enriched inclusions (e.g., xenotime) such that during the interfacialdissolution–reprecipitation process, the aqueous fluid may coexist inequilibriumwith a trace element poor zircon and trace element-enrichedphase. Geisler et al. (2007) note that the coupled dissolution–reprecipitation reaction results in secondary porosity, volume loss (tothe aqueous fluids), and may or may not result in the precipitation oftrace element-enriched inclusions depending on whether or not theeutectic point of the solid solution–aqueous solution system is reached.
In zircons from JR-31-29-2, we observe many of the features char-acteristic of coupled dissolution–reprecipitation process, including:1) the development of secondary micro-porosity associated withmottled, convolute and wavy domains, 2) the consistency of crystal-lographic orientation between non-igneous (mottled, convoluted andwavy) andWOZ regions, and 3) micron- to submicron-scale P- and Y-rich inclusions in some but not all porous zircon domains. We also
13.2 08-2.2 08-3.2 08-4.2 08-6.2 08-7.2 08-8.2 09-3.1 09-10.1 Average Average Average
WOZ WOZ WOZ WOZ WOZ WOZ WOZ WOZ WOZ Porous WOZ Ocean zircon
0.88 0.04 0.01 0.03 0.25 0.05 0.01 0.03 0.02 0.44 0.17 0.0891.8 90.9 110.8 155.0 41.8 81.5 81.7 78.0 70.5 38.6 101.3 77.80.00 0.23 0.28 0.44 0.73 0.13 0.14 0.13 0.15 0.07 0.22 0.163.6 3.9 5.2 7.6 9.1 2.8 2.8 3.1 2.5 3.1 5.6 4.312.7 16.3 19.5 27.0 14.2 10.8 10.5 12.0 8.9 6.8 18.9 12.21.3 0.3 1.8 2.5 0.3 1.1 0.9 1.2 1.0 0.9 1.2 2.4162 218 242 323 118 145 152 153 131 82 270 13569 108 102 133 43 64 67 66 57 36 113 34959 1709 1248 1793 568 861 999 876 797 496 1159 626374 657 538 757 210 363 380 370 318 216 624 1741681 3399 2447 3220 970 1726 1856 1725 1533 1045 2385 1164387 879 522 684 208 378 413 377 336 248 530 1653100 8344 4194 5435 1693 3148 3416 3058 2807 2077 4363 1977545 1442 709 920 287 548 594 536 483 383 741 2137387 16868 10140 13458 4164 7329 7973 7256 6544 4632 10311 458418473 25653 17054 15738 22793 16652 16951 15433 16933 19563 18594 12195149 405 163 189 87 95 91 89 102 109 179 312457 2892 473 540 389 304 336 276 314 562 690 29910159 19495 13883 19529 5733 9453 9829 9414 8158 6009 13398 46003417 9373 5706 6990 2611 4103 4067 4111 3421 1798 5244 105128.7 5.9 8.5 10.7 6.1 7.9 7.2 7.9 7.9 6.6 12.0 21.50.33 0.14 0.34 0.35 0.22 0.31 0.27 0.32 0.32 0.22 0.31 1.04n.d. 232 471 344 23 229 433 303 346 53 298 1710.09 0.01 0.08 0.08 0.02 0.08 0.07 0.06 0.06 0.14 0.06 0.18110 303 184 226 84 132 131 133 110 58 169 3444 99 60 80 25 43 47 43 39 27 61 27114 219 156 220 64 106 111 106 92 68 151 5223 688 2704 1618 89 320 1134 673 885 55 835 25723 46 21 20 17 26 27 10 11 33 22 18856 699 730 753 701 724 717 725 724 705 748 806
77J.J. Schwartz et al. / Chemical Geology 274 (2010) 68–81
Author's personal copy
observe that concentrations of REEs, Y and P are extremely enriched inolder WOZ domains relative to younger porous regions, occurring atconcentrations much higher than average oceanic zircons. Porouszircons tend to have lower trace element concentrations which clusteraround average oceanic zircon values and show a more restrictedcompositional range. Porous zircons also display low averagechondrite-normalized (Sm/La)N and lower average Th/U values(Fig. 6), features which have been reported in other studies of alteredzircons and have been interpreted to indicate interaction withhydrothermal fluids (Hoskin et al., 1998; Whitehouse and Kamber,2002; Hoskin, 2005; Grimes et al., 2009). Alternatively, these featuresmay also be attributed to initial chemical variations created duringigneous crystallization followed by deuteric alteration. We view thisscenario as unlikely because WOZ and porous domains are separatedin time by 760±360 kyr, which, given documented cooling ratesfrom Atlantis Bank of ∼800 °C/myr (John et al., 2004; Schwartzet al., 2009) precludes simple deuteric alteration associated withmonotonic cooling. Furthermore, REE, Y and P concentrations nega-tively correlatewith Pb/U age, and are consistentwith a younger eventaffecting internal textures, U–Pb isotopic systematics and trivalentcation concentrations.
5.2. Implications for the geochemistry and geochronology of lower oceaniccrust
Zircons from JR 31 29-2 display an age distribution that cannot beexplained by simple igneous crystallization of a homogenous popula-tion. The weighted-average age of protolith, WOZ zircons (12.76±0.20 Ma) is ∼1 myr older than the local sea surface magnetic age wherethe rockwas obtained (∼11.75 Ma:, Baines et al., 2008) and its age range(1.6 ma) is significantlydifferent thanpredictedbyconventionalmodelsfor crustal accretion at mid-ocean ridges (ca. 100,000–200,000: Meurerand Gee, 2002; Grimes et al., 2008; Baines et al., 2009; Lissenberg et al.,2009). Hence, these zircons are anomalously old and may representxenocrysts of an older rockwhichwere entrained in the late-stage felsicvein. Other anomalously old Pb/U zircon ages from Atlantis Bank havebeen discussed by Schwartz et al. (2005) and may represent either 1)crustal blocks trapped by stochastic intrusion processes within thelower oceanic crust, or 2) gabbroic bodies which originally crystallizedat depth in the axial mantle lithosphere and were later assimilated atshallow levels during accretion of Atlantis Bank.
In the porous textural domains, we do not observe evidence ofmagmatic resorption features or secondary magmatic rims; instead,the younger ages are associated with internal alteration textures andsecondary micro-porosity, which may record an episode of coupleddissolution–reprecipitation facilitated by migrating aqueous fluids as
discussed above. The quartz, albite and hornblende veinlets whichcross-cut the felsic vein may record this episode of alteration and fluidmigration through the rock. The age of these zircons is similar withinerror to the sea surfacemagnetic age for the portion of crust where JR-31 29-2 was collected (∼11.75 Ma:, Baines et al., 2008) and is similarto other ages reported from the area (John et al., 2004; Schwartz et al.,2005; Baines et al., 2009). Given the local availability of maficmagmatism and associated deuteric and hydrothermal fluids duringthe construction of oceanic crust at this time (e.g., Hart et al., 1999), itis plausible that the development of the non-igneous, alteration/re-equilibration textures are related to a short-lived (b1 myr) hydro-thermal pulse associated with the creation of this portion of AtlantisBank at approximately 12.0 Ma.
Coupled dissolution–reprecipitation in association with aqueousfluids during a high-temperature thermal event best describes manyaspects of the textural and chemical development of these alteredzircons. During this process, newly precipitated zircons will onaverage contain less minor and trace elements than the parentzircons, including both radiogenic and common Pb (e.g., Tomaschek etal., 2003). In terms of geochronology, the U–Pb isotopic system in thenewly re-equilibrated zircon domains will be effectively reset by thedissolution–reprecipitation process because Pb2+ will be stronglyexcluded from the zircon lattice during reprecipitation (e.g., Geisler etal., 2007). Analysis of the reprecipitated domains should thereforedate the timing of metamorphism and fluid-induced re-equilibration.Supporting this assertion are the similarities in age between the non-igneous, alteration/re-equilibration textures in JR 31-29-2 and seasurface magnetic ages (Dick et al., 1991b; Hosford et al., 2003; Baineset al., 2008) and other Pb/U zircon ages from the area (John et al.,2004; Schwartz et al., 2005; Baines et al., 2009).
5.3. Comparison to porous zircons from disrupted oceanic crust
Porous zircon development is also reported from on-land ophiolitesand disrupted portions of oceanic crust (e.g., Rubatto and Hermann,2003; Spandler et al., 2004; Liati et al., 2005; Puga et al., 2005). Protolithzircons in these studies are characterized by elevated concentrations oftrace elements,magmatic Th/U rations, igneous REE patterns andweak-oscillatory zonation patterns in CL. In contrast, hydrothermally alteredigneous zircons display mottled textures, which are often associatedwith porosity and trace element-enriched inclusions. These mottledzircons also display evidence for Pb loss and lower overall concentra-tions of HREE. Temperature conditions for hydrothermal alteration areoften obscured by later metamorphic overprinting reactions (e.g., Pugaet al., 2005), but are documented by low-T, low-P assemblages armoredwithin some zircons (b100 °C, b0.2 GPa: Spandler et al., 2004). Thesemetamorphic temperatures aswell as those reported in this studyand inTomaschek et al. (2003) may suggest that hydrothermal alteration ofigneous zircons can occur over a variety of temperatures. These zirconsfrom disrupted oceanic crustal rocks display remarkable similarity tozircons reported in this study from Atlantis Bank, and provide evidencefor both the presence of igneous zircons in oceanic crust and theiralteration by hydrothermal fluids on the seafloor. The preservation ofmottled and re-equilibrated textures in JR 31 29-2 offers an in-situexample of seafloor metamorphism and re-equilibration of igneouszircons and represents a snapshot in time of fluid-dominated re-equilibration processes which did not continue to completion.
Acknowledgements
We thank Henry Dick for access to samples from the James ClarkRoss cruise. We gratefully thank Drs. Geisler, Hoskins and Rudnick forthorough and helpful reviews. Funding for this work was provided bya Wyoming NASA Space Grant and University of Alabama start-upfunds to Schwartz and a NSF OCE grant #0352054 to Cheadle andJohn.
Fig. 7. Rare earth element patterns for selected zircons which also have corresponding206Pb/238U ages. Patterns are displayed in order of decreasing age, with Th corrected206Pb/238U age range. The general pattern we observe suggests decreasing REE contentswith decreasing age.
78 J.J. Schwartz et al. / Chemical Geology 274 (2010) 68–81
Author's personal copy
Fig. 9. Relationship between internal zonation texture (CL images), development of secondary porosity (BSE images) and relative misorientation for zircons. Low-angle-misorientation boundaries in these zircons may indicate slight amounts deformation, or growth twinning. Importantly, there is no relationship between this possible deformationand internal zonation patterns. The shape of zircon in ‘b’ is slightly different between the CL image and the BSE image and the misorientation map because subsequent polishingrevealed tips that were previously unexposed beneath epoxy.
Fig. 8. Relationship between internal zonation texture (cathodoluminescence images), development of secondary porosity (backscattered electron images) and relativemisorientation (electron backscattered diffraction maps). Scale bars are 100 µ, with the exception of ‘d’.
79J.J. Schwartz et al. / Chemical Geology 274 (2010) 68–81

Author's personal copy
Appendix A. Supplementary data
Supplementary data associated with this article can be found, inthe online version, at doi:10.1016/j.chemgeo.2010.03.017.
References
Baines, A.G., Cheadle, M.J., Dick, H.J.B., Hosford Scheirer, A., John, B.E., Kusznir, N.J.,Matsumoto, T., 2007. The evolution of the Southwest Indian Ridge from 55°45′E–62°E: changes in plate-boundary geometry since 26 Ma. Geochemistry GeophysicsGeosystems 8, Q06022. doi:10.1029/2006GC001559.
Baines, A.G., Cheadle, M.J., John, B.E., Schwartz, J.J., 2008. The rate of oceanic detachmentfaulting at Atlantis Bank, SW Indian Ridge. Earth and Planetary Science Letters 273,105–114. doi:10.1016/j.epsl.2008.06.013.
Baines, A.G., Cheadle, M.J., John, B., Grimes, C.B., Schwartz, J.J., Wooden, J.L., 2009. SHRIMPPb/U zircon ages constrain gabbroic crustal accretion at the ultraslow-spreadingSouthwest Indian Ridge. Earth and Planetary Science Letters 287, 540–550.
Bea, F., Montero, P.G., Gonzalez-Lodeiro, F., Talavera, C., Molina, J.F., Scarrow, J.H.,Whitehouse, M.J., Zinger, T., 2006. Zircon thermometry and U–Pb ion-microprobedating of the gabbros and associated migmatites of the Variscan Toledo AnatecticComplex, Central Iberia. Journal of the Geological Society 163, 847–855.
Bohor, B.F., Betterton, W.J., Krogh, T.E., 1993. Impact-shocked zircons; discovery ofshock-induced textures reflecting increasing degrees of shock metamorphism.Earth and Planetary Science Letters 119, 419–424.
Cannat, M., Mevel, C., Stakes, D.S., Von Herzen, R.P., Robinson, P.T., Adamson, A.C.,Becker, K., Bloomer, S.H., Dick, H.J.B., Emmermann, R.F.K., Gard, G., Goldberg, D.,Hebert, R., Hertogen, J.G.H., Hoskins, H., Iturrino, G., Kassenaar, J.D.C., Kempton, P.D.,Kikawa, E., Kirby, S.H., Meyer, P.S., Natland, J.H., Ozawa, K., Pariso, J., Scott, J.H.,Swift, S.A., 1991a. Normal ductile shear zones at an oceanic spreading ridge;tectonic evolution of Site 735 gabbros (Southwest Indian Ocean). Proceedings ofthe Ocean Drilling Program, Scientific Results 118, 415–429.
Cannat, M., Von Herzen, R.P., Robinson, P.T., Adamson, A.C., Becker, K., Bloomer, S.H.,Dick, H.J.B., Emmermann, R.F.K., Gard, G., Goldberg, D., Hebert, R., Hertogen, J.G.H.,Hoskins, H., Iturrino, G., Kassenaar, J.D.C., Kempton, P.D., Kikawa, E., Kirby, S.H.,Meyer, P.S., Natland, J.H., Ozawa, K., Pariso, J., Scott, J.H., Stakes, D.S., Swift, S.A.,1991b. Plastic deformation at an oceanic spreading ridge; a microstructural studyof the Site 735 gabbros (Southwest Indian Ocean). Proceedings of the OceanDrilling Program, Scientific Results 118, 399–408.
Cannat, M., Karson, J.A., Miller, D.J. (Eds.), 1995. Proceedings of the Ocean DrillingProgram Initial Reports Leg 153. Ocean Drilling Program, College Station, TX. 798 pp.
Chakoumakos, B.C., Murakami, T., Lumpkin, G.R., Ewing, R.C., 1987. Alpha-decay-induced fracturing in zircon; the transition from the crystalline to the metamictstate. Science 236, 1556–1559.
Cherniak, D.J., Watson, E.B., 2006. Ti diffusion in zircon. Fall Meeting Supplement: EosTrans. AGU, 87. V31F-02.
Cherniak, D.J., Hanchar, J.M., Watson, E.B., 1997a. Diffusion of tetravalent cations inzircon. Contributions to Mineralogy and Petrology 127, 383–390.
Cherniak, D.J., Hanchar, J.M., Watson, E.B., 1997b. Rare-earth diffusion in zircon.Chemical Geology 134, 289–301.
Cherniak, D.J., Watson, E.B., Watson, E.B., Cherniak, D.J., 2003. Diffusion in zircon.Reviews in Mineralogy and Geochemistry 53, 113–143.
Claiborne, L.L., Miller, C.F., Walker, B.A., Wooden, J.L., Mazdab, F., Bea, F., 2006. Trackingmagmatic processes through Zr/Hf ratios in rocks and Hf and Ti zoning in zircons:an example from the Spirit Mountain batholith, Nevada. Mineralogical Magazine70, 517–543.
Compston, W., Williams, I.S., Meyer, C.E., 1984. U–Pb geochronology of zircons fromlunar breccia 73217 using a sensitive high mass-resolution ion microprobe. Journalof Geophysical Research B 89 (Suppl.), 525–534.
Coogan, L.A., Hinton, R.W., 2006. Do the trace element compositions of detrital zirconsrequire Hadean continental crust? Geology 34, 633–636.
Corfu, F., Hanchar, J.M., Hoskin, P.W.O., Kinny, P., 2003. Atlas of zircon textures. Reviewsin Mineralogy and Geochemistry 53, 469–500.
Dana, E.S., 1916. A text-book of mineralogy; with an extended treatise oncrystallography and physical mineralogy. J. Wiley & Sons, New York. 593 pp.
Deer, W.A., Howie, R.A., Zussman, H.J., 1978. Rock-forming minerals: orthosilicates, 1A:orthosilicates. Longman, London.
Dick, H.J.B.,Meyer, P.S., Bloomer, S.H., Kirby, S.H., Stakes, D.S.,Mawer, C.K., VonHerzen, R.P.,Robinson, P.T., Adamson, A.C., Becker, K., Cannat, M., Emmermann, R.F.K., Gard, G.,Goldberg, D., Hebert, R., Hertogen, J.G.H., Hoskins, H., Iturrino, G., Kassenaar, J.D.C.,Kempton, P.D., Kikawa, E., Natland, J.H., Ozawa, K., Pariso, J., Scott, J.H., Swift, S.A.,1991a. Lithostratigraphic evolutionof an in-situ sectionof oceanic layer 3. Proceedingsof the Ocean Drilling Program, Scientific Results 118, 439–538.
Dick, H.J.B., Schouten, H., Meyer, P.S., Gallo, D.G., Bergh, H., Tyce, R., Patriat, P., Johnson,K.T.M., Snow, J., Fisher, A., 1991b. Tectonic evolution of the Atlantis II fracture zone.In: Von Herzen, R.P., Fox, J., Palmer-Julson, A., Robinson, P.R. (Eds.), Proceedings ofthe Ocean Drilling Program, Scientific Results 118. Ocean Drilling Program, CollegeStation, TX, pp. 359–398.
Dick, H.J.B., Natland, J.H., Alt, J.C., Bach, W., Bideau, D., Gee, J.S., Haggas, S., Hertogen, J.G.H., Hirth, G., Holm, P.M., Ildefonse, B., Iturrino, G.J., John, B.E., Kelley, D.S.,Kikawa, E., Kingdon, A., LeRoux, P.J., Maeda, J., Meyer, P.S., Miller, D.J., Naslund, H.R., Niu, Y.-L., Robinson, P.T., Snow, J., Stephen, R.A., Trimby, P.W., Worm, H.-U.,Yoshinobu, A., 2000. A long in situ section of the lower ocean crust; results of ODPLeg 176 drilling at the Southwest Indian Ridge. Earth and Planetary Science Letters179, 31–51.
Dick, H.J.B., Lin, J., Schouten, H., 2003. An ultraslow-spreading class of ocean ridge.Nature 426, 405–408.
Finch, R.J., Hanchar, J.M., 2003. Structure and chemistry of zircon and zircon-groupminerals. Reviews in Mineralogy and Geochemistry 53, 1–25.
Finch, R.J., Hanchar, J.M., Hoskin, P.W.O., Burns, P.C., 2001. Rare-earth elements insynthetic zircon: part 2. A single-crystal X-ray study of xenotime substitution.American Mineralogist 86, 681–689.
Geisler, T., Pidgeon, R.T., Kurtz, R., van Bronswijk,W., Schleicher, H., 2003a. Experimentalhydrothermal alteration of partially metamict zircon. American Mineralogist 88,1496–1513.
Geisler, T., Rashwan, A.A., Rahn, M.K.W., Poller, U., Zwingmann, H., Pidgeon, R.T.,Schleicher, H., Tomaschek, F., 2003b. Low-temperature hydrothermal alteration ofnatural metamict zircons from the Eastern Desert, Egypt. Mineralogical Magazine67, 485–508.
Geisler, T., Schaltegger, U., Tomaschek, F., 2007. Re-equilibration of zircon in aqueousfluids and melts. Elements 3, 43–50.
Gillis, K.M., 1996. Rare earth element constraints on the origin of amphibole in gabbroicrocks from Site 894, Hess Deep. In: Mevel, C., Gillis, K.M., Allan, J.F., Meyer, P.S.(Eds.), Proceedings of the Ocean Drilling Program. Scientific results. Ocean DrillingProgram, College Station, Texas, pp. 59–75.
Grimes, C.B., John, B.E., Kelemen, P.B., Mazdab, F., Wooden, J.L., Cheadle, M.J., Hanghoi,K., Schwartz, J.J., 2007. The trace element chemistry of zircons from oceanic crust: amethod for distinguishing detrital zircon provenance. Geology 35, 643–646.
Grimes, C.B., John, B.E., Cheadle, M.J., Wooden, J.L., 2008. Evolution and timescales foraccretion of slow-spreading oceanic crust: constraints from high resolution U–Pbzircondatingof a gabbroic crustal section at AtlantisMassif, 30°N,MAR. GeochemistryGeophysics Geosystems 9. doi:10.1029/2008GC002063.
Grimes, C.B., John, B.E., Cheadle, M.J., Mazdab, F.K., Wooden, J.L., Swapp, S., Schwartz, J.J.,2009. On the occurrence, trace element geochemistry, and crystallization history ofzircon from in situ ocean lithosphere. Contributions to Mineralogy and Petrology158, 757–783.
Hanchar, J.M., Finch, R.J., Hoskin, P.W.O., Watson, E.B., Cherniak, D.J., Mariano, A.N.,2001. Rare earth elements in synthetic zircon: Part 1. Synthesis, and rare earthelement and phosphorus doping. American Mineralogist 86, 667–680.
Hart, S.R., Blusztajn, J., Dick, H.J.B., Meyer, P.S., Muehlenbachs, K., 1999. The fingerprintof seawater circulation in a 500-meter section of ocean crust gabbros. Geochimicaet Cosmochimica Acta 63, 4059–4080.
Hinton, R.W., Upton, B.G.J., 1991. The chemistry of zircon; variationswithin and betweenlarge crystals from syenite and alkali basalt xenoliths. Geochimica et CosmochimicaActa 55, 3287–3302.
Hosford, A., Tivey, M.A., Matsumoto, T., Dick, H.J.B., Schouten, H., Kinoshita, H., 2003.Crustal magnetization and accretion at the Southwest Indian Ridge near theAtlantis II fracture zone, 0–25 Ma. Journal of Geophysical Research 108.doi:10.1029/2001JB00064.
Hoskin, P., 2005. Trace element composition of hydrothermal zircon and the alterationof Hadean zircon from the Jack Hills, Australia. Geochimica et Cosmichimica Acta69, 637–648.
Hoskin, P.W.O., Black, L.P., 2000. Metamorphic zircon formation by solid-state recrystal-lization of protolith igneous zircon. Journal of Metamorphic Geology 18, 423–439.
Hoskin, P.W.O., Schaltegger, U., 2003. The composition of zircon and igneous andmetamorphic petrogenesis. Reviews in Mineralogy and Geochemistry 53, 27–62.
Hoskin, P., Kinny, P., Wyborn, D., 1998. Chemistry of hydrothermal zircon: investigatingtiming and nature ofwater–rock interaction. In: Arehart, G.B., Hulston, J.R., Balkema,A.A. (Eds.), Water rock Interaction. Totterdam, pp. 545–548.
Hoskin, P.W.O., Kinny, P.D., Wyborn, D., Chappell, B.W., 2000. Identifying accessorymineral saturation during differentiation in granitoid magmas; an integratedapproach. Journal of Petrology 41, 1365–1396.
Ireland, T.R., Williams, I.S., 2001. Considerations in zircon geochronology by SIMS.Reviews in Mineralogy and Geochemistry 53, 215–241.
John, B.E., Foster, D.A., Murphy, J.M., Cheadle, M.J., Baines, A.G., Fanning, C.M., Copeland,P., 2004. Determining the cooling history of in situ lower oceanic crust-AtlantisBank, SW Indian Ridge. Earth and Planetary Science Letters 222, 145–160.
Kamo, S.L., Krogh, T.E., Krogh, T.E., Kamo, S.L., Bohor, B.F., 1995. Chicxulub Crater sourcefor shocked zircon crystals from the Cretaceous–Tertiary boundary layer,Saskatchewan; evidence from new U–Pb data fingerprinting the K/T impact siteand determining the time of impact by U–Pb dating of single shocked zircons fromdistal ejecta. Geology 23, 281–284.
Krogh, T.E., Kamo, S.L., Bohor, B.F., 1993. Fingerprinting the K/T impact site anddetermining the time of impact by U–Pb dating of single shocked zircons fromdistal ejecta. Earth and Planetary Science Letters 119, 425–429.
Lee, J.,Williams, I., Ellis,D., 1997. Pb,UandThdiffusion innatural zircon.Nature390,281–304.Leroux, H., Reimold, W.U., Koeber, L.C., Hornemann, U., Doukhan, J.C., 1999.
Experimental shock deformation in zircon: a transmission electron microscopicstudy. Earth and Planetary Science Letters 169, 291–301.
Liati, A., Froitzheim, N., Fanning, C.M., 2005. Jurassic ophiolites within the ValaisDomain of the Western and Central Alps; geochronological evidence for re-riftingof oceanic crust. Contributions to Mineralogy and Petrology 149, 446–461.
Lissenberg, C.J., Rioux, M., Shimizu, N., Bowring, S.A., Mével, C., 2009. Zircon dating ofoceanic crustal accretion. Science 323, 1017–1018.
Ludwig, K.R., 2001. SQUID 1.02. Berkeley Geochronology Center Spec. Pub. No. 2.Ludwig, K.R., 2003. Isoplot 3.00: a geochronological toolkit for Microsoft Excel. Berkeley
Geochronology Center Spec. Pub. No. 4.Maas, R., Kinny, P.D., Williams, I.S., Froude, D.O., Compston, W., 1992. The Earth's oldest
known crust; a geochronological and geochemical study of 3900–4200 Ma olddetrital zircons from Mt. Narryer and Jack Hills, Western Australia. Geochimica etCosmochimica Acta 56, 1281–1300.
80 J.J. Schwartz et al. / Chemical Geology 274 (2010) 68–81
Author's personal copy
MacLeod, C.J., Allerton, S., Dick, H.J.B., Robinson, P., Party, S.S., 1998. Geology of AtlantisBank, SW Indian Ridge: preliminary results of RRS James Clark Ross Cruise 31. Eos,Transactions AGU 79, F893.
Mazdab, F.K., 2009. Characterization of flux-grown trace element-doped titanite usingthe high-mass-resolution ion microprobe (Shrimp-Rg). Canadian Mineralogist 47,813–831.
Mazdab, F., Wooden, J.L., 2006. Trace element analysis in zircon by ion microprobe(SHRIMP-RG); technique and applications. Geochimica et Cosmochimica Acta 70,A405 (2006 Goldschmidt abstract volume).
McLelland, J.M., Bickford, M.E., Hill, B.M., Clechenko, C.C., Valley, J.W., Hamilton, M.A.,2004. Direct dating of Adirondack massif anorthosite by U–Pb SHRIMP analysis ofigneous zircon: implications for AMCG complexes. GSA Bulletin 116, 1299–1317.
Meurer, W.P., Gee, J., 2002. Evidence for the protracted construction of slow-spreadoceanic crust by small magmatic injections. Earth and Planetary Science Letters201, 45–55.
Miranda, E.A., 2006. Structural Development of the Atlantis Bank Oceanic DetachmentFault System. Southwest Indian Ridge, University of Wyoming, Laramie. 457 pp.
Murakami, T., Chakoumakos, B.C., Ewing, R.C., Lumpkin, G.R.,Weber,W.J., Lumpkin, G.R.,1991. Alpha-decay event damage in zircon rare-element mineralogy and internalevolution of the Rutherford #2 Pegmatite, Amelia County, Virginia; a classic localityrevisited. American Mineralogist 76, 1510–1532.
Natland, J.H., Dick, H.J.B., 2001. Formation of the lower ocean crust and thecrystallization of gabbroic cumulates at a very slowly spreading ridge. Journal ofVolcanology and Geothermal Research 110, 191–233.
Natland, J.H., Dick, H.J.B., 2002. Stratigraphy and composition of gabbros drilled in OceanDrilling Program Hole 735B, Southwest Indian Ridge; a synthesis of geochemicaldata. In: Natland, J.H., Dick, H.J.B., Miller, D.J., Von Herzen, R.P. (Eds.), Proceedings ofthe Ocean Drilling Program, Scientific Results (CD-Rom), p. 69.
Nemchin, A.A., Pidgeon, R.T., 1997. Evolution of the Darling Range Batholith, YilgarnCraton,Western Australia; a SHRIMP zircon study. Journal of Petrology 38, 625–649.
O'Neil, J.R., Taylor, H.P., 1967. The oxygen isotope and cation exchange chemistry offeldspars. American Mineralogist 52, 1414–1437.
Pan, Y., 1997. Zircon- and monazite-forming metamorphic reactions at Manitouwadge,Ontario. The Canadian Mineralogist 35 (Part 1), 105–118.
Pidgeon, R.T., 1992. Recrystallisation of oscillatory zoned zircon; some geochronolog-ical and petrological implications. Contributions to Mineralogy and Petrology 110,463–472.
Pidgeon, R.T., Nemchin, A.A., Hitchen, G.J., 1998. Internal structures of zircons fromArchaean granites from the Darling Range Batholith; implications for zirconstability and the interpretation of zircon U–Pb ages. Contributions to Mineralogyand Petrology 132, 288–299.
Puga, E., Fanning, C.M., Nieto, J.M., Diaz de Federico, A., Pattison, D.R.M., St-Onge, M.R.,Begin, N.J., 2005. Recrystallization textures in zircon generated by ocean floor andeclogite facies metamorphism; a cathodoluminescence and U/Pb SHRIMP study, withconstraints from REE elements. The Canadian Mineralogist 43 (Part 1), 183–202.
Putnis, A., 2002. Mineral replacement reactions: from macroscopic observations tomicroscopic mechanisms. Mineralogical Magazine 66, 689–708.
Reddy, S.M., Timms, N.E., Trimby, P., Kinny, P.D., Buchan, C., Blake, K., 2006. Crystal–plastic deformation of zircon: a defect in the assumption of chemical robustness.Geology 34, 257–260.
Reddy, S.M., Timms, N.E., Pantleon, W., Trimby, P., 2007. Quantitative characterizationof plastic deformation of zircon and geological implications. Contributions toMineralogy and Petrology 153, 625–645.
Reddy, S.M., Timms, N.E., Hamilton, P.J., Smyth, H.R., 2009. Deformation-relatedmicrostructures in magmatic zircon and implications for diffusion. Contributions toMineralogy and Petrology 157, 231–244.
Robinson, P.T., Dick, H.J.B., Natland, J.H., Alt, J.C., Bach, W., Bideau, D., Gee, J.S., Haggis, S.,Hertogen, J., Hirth, G., Holm, P.M., Ildefonse, B., Iturrino, G.J., John, B.E., Kelley, D.S.,Kikawa, E., Kingdon, A., LeRoux, P.J., Maeda, J., Meyer, P.S., Miller, D.J., Naslund, H.R.,Niu, Y.L., Snow, J., Stephen, R.A., Trimby, P.W., Worm, H.U., Yoshinobu, A., 2000.Lower oceanic crust formed at an ultra-slow-spreading ridge; Ocean DrillingProgram Hole 735B, Southwest Indian Ridge. Special Paper - Geological Society ofAmerica 349, 75–86.
Rubatto, D., Hermann, J., 2003. Zircon formation during fluid circulation in eclogites(Monviso, Western Alps); implications for Zr and Hf budget in subduction zones.Geochimica et Cosmochimica Acta 67, 2173–2187.
Sambridge, M.S., Compston, W., 1994. Mixture modeling of multi-component data setswith application to ion-probe zircon ages. Earth and Planetary Science Letters 128,373–390.
Schaltegger, U., Fanning, C.M., Guenther, D., Maurin, J.C., Schulmann, K., Gebauer, D.,1999. Growth, annealing and recrystallization of zircon and preservation ofmonazite in high-grade metamorphism; conventional and in-situ U–Pb isotope,cathodoluminescence and microchemical evidence. Contributions to Mineralogyand Petrology 134, 186–201.
Schärer, U., 1984. The effect of initial 230Th disequilibrium on young U–Pb ages: theMakalu case, Himalaya. Earth and Planetary Science Letters 67, 191–204.
Schwartz, J.J., John, B.E., Cheadle, M.J., Miranda, E.A., Grimes, C.B., Wooden, J.L., Dick, H.J.B.,2005. Dating the growth of oceanic crust at a slow-spreading ridge. Science 310,654–657.
Schwartz, J.J., John, B., Cheadle, M.J., Reiners, P.W., Baines, A.G., 2009. Cooling history ofAtlantis Bank oceanic core complex: evidence for hydrothermal activity 2.6 Ma offaxis. Geochemistry Geophysics Geosystems 10. doi:10.1029/2009GC002466.
Spandler, C., Hermann, J., Rubatto, D., 2004. Exsolution of thortveitite, yttrialite, andxenotimeduring low-temperature recrystallizationof zircon fromNewCaledonia, andtheir significance for trace element incorporation in zircon. AmericanMineralogist 89,1795–1806.
Speer, J.A., 1980a. The actinide orthosilicates. Reviews in Mineralogy and Geochemistry5, 113–135.
Speer, J.A., 1980b. Zircon. Reviews in Mineralogy and Geochemistry 5, 67–112.Stacey, J.S., Kramers, J.D., 1975. Approximation of terrestrial lead isotope evolution by a
two-stage model. Earth and Planetary Science Letters 26, 207–221.Tera, F., Wasserburg, G.J., 1972. U–Th–Pb systematics in three Apollo 14 basalts and the
problemof initial Pb in lunar rocks. Earth and Planetary Science Letters 14, 281–304.Timms, N.E., Kinny, P., Reddy, S.M., 2006. Enhanced diffusion of uranium and thorium linked
to crystal plasticity in zircon. Geochemical Transactions 7. doi:10.1186/1467-4866-7-10.Tomaschek, F., Kennedy, A.K., Villa, I.M., Lagos, M., Ballhaus, C., 2003. Zircons from
Syros, Cyclades, Greece; recrystallization and mobilization of zircon during high-pressure metamorphism. Journal of Petrology 44, 1977–2002.
Watson, E.B., Harrison, T.M., 2005. Zircon thermometer reveals minimum meltingconditions on earliest earth. Science 308, 841–844.
Whitehouse, M.J., Kamber, B.S., 2002. On the overabundance of light rare earthelements in terrestrial zircon and its implications for Earth's earliest magmaticdifferentiation. Earth and Planetary Science Letters 204, 333–346.
Williams, I.S., 1998. U–Th–Pb geochronology by ion microprobe. In: McKibben (Ed.),Applications of microanalytical techniques to understanding mineralizationprocesses: Soc. Econ. Geol. , pp. 1–35.
Wooden, J.L., Mazdab, F.K., Barth, A.P., Miller, C.F., Lowery, L.E., 2006. Temperatures (Ti)and compositional characteristics of zircon: early observations using high massresolution on the USGS-Stanford SHRIMP-RG. Geochimica et Cosmichimica Acta 70,A707 (2006 Goldschmidt abstract volume).
81J.J. Schwartz et al. / Chemical Geology 274 (2010) 68–81