Embed Size (px)
Citation preview
AN ESTIMATE OF BREEDING FEMALES AND ANALYSES OF DEMOGRAPHICS
FOR THE BATHURST HERD OF BARREN-GROUND CARIBOU:
2015 CALVING GROUND PHOTOGRAPHIC SURVEY
John Boulanger1, Bruno Croft2, Jan Adamczewski2, Dean Cluff2, Mitch Campbell3, David Lee4, Nic Larter2
1Integrated Ecological Research, Nelson, BC 2Environment and Natural Resources, Government of Northwest Territories
3Department of Environment, Government of Nunavut, Arviat, NU 4Nunavut Tunngavik Inc., Rankin Inlet, NU
2017
Manuscript Report No. 267
The contents of this paper are the sole responsibility of the authors.

ii
iii
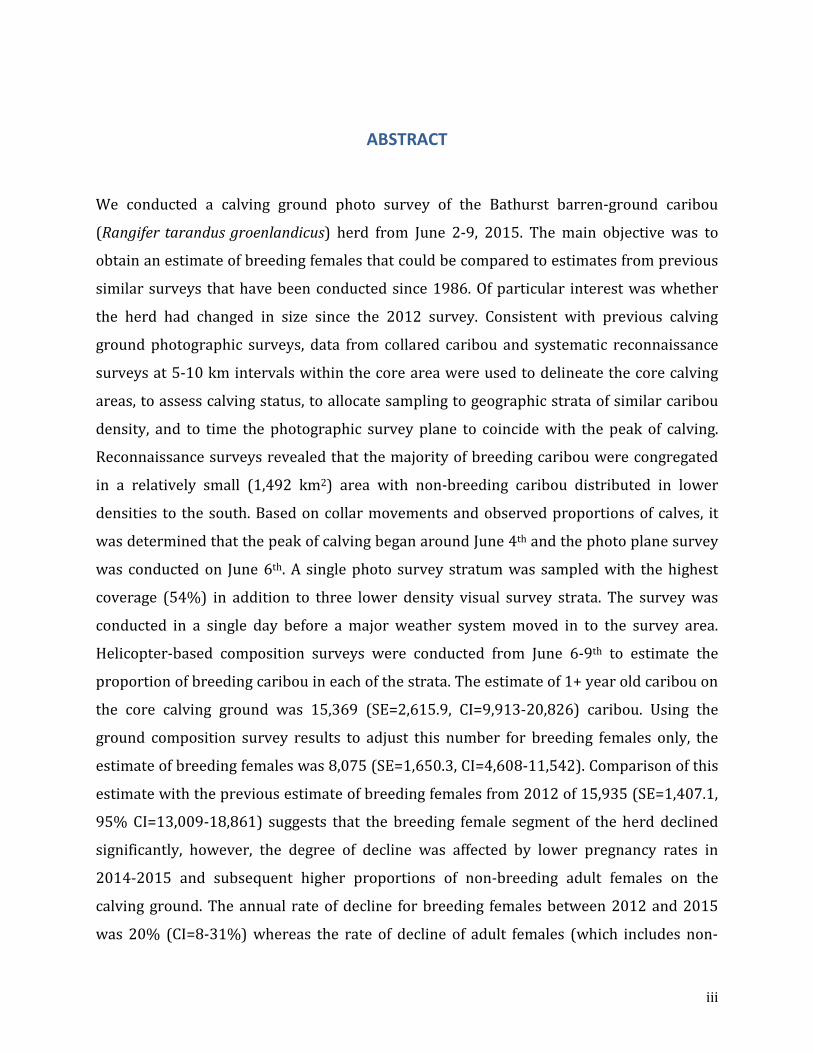
ABSTRACT
We conducted a calving ground photo survey of the Bathurst barren-ground caribou
(Rangifer tarandus groenlandicus) herd from June 2-9, 2015. The main objective was to
obtain an estimate of breeding females that could be compared to estimates from previous
similar surveys that have been conducted since 1986. Of particular interest was whether
the herd had changed in size since the 2012 survey. Consistent with previous calving
ground photographic surveys, data from collared caribou and systematic reconnaissance
surveys at 5-10 km intervals within the core area were used to delineate the core calving
areas, to assess calving status, to allocate sampling to geographic strata of similar caribou
density, and to time the photographic survey plane to coincide with the peak of calving.
Reconnaissance surveys revealed that the majority of breeding caribou were congregated
in a relatively small (1,492 km2) area with non-breeding caribou distributed in lower
densities to the south. Based on collar movements and observed proportions of calves, it
was determined that the peak of calving began around June 4th and the photo plane survey
was conducted on June 6th. A single photo survey stratum was sampled with the highest
coverage (54%) in addition to three lower density visual survey strata. The survey was
conducted in a single day before a major weather system moved in to the survey area.
Helicopter-based composition surveys were conducted from June 6-9th to estimate the
proportion of breeding caribou in each of the strata. The estimate of 1+ year old caribou on
the core calving ground was 15,369 (SE=2,615.9, CI=9,913-20,826) caribou. Using the
ground composition survey results to adjust this number for breeding females only, the
estimate of breeding females was 8,075 (SE=1,650.3, CI=4,608-11,542). Comparison of this
estimate with the previous estimate of breeding females from 2012 of 15,935 (SE=1,407.1,
95% CI=13,009-18,861) suggests that the breeding female segment of the herd declined
significantly, however, the degree of decline was affected by lower pregnancy rates in
2014-2015 and subsequent higher proportions of non-breeding adult females on the
calving ground. The annual rate of decline for breeding females between 2012 and 2015
was 20% (CI=8-31%) whereas the rate of decline of adult females (which includes non-
iv
breeding adult females) was 13% (CI=1-23%). The extrapolated herd size estimate (using
direct estimates of adult females) was 19,769 (CI=12,349-27,189) 1.5+ year old caribou.
Results from a data-driven demographic modeling exercise suggest that the adult female
survival rate was 0.78 (CI=0.76-0.80) from 2009-2015, which is still below levels needed
for a stable herd. The low adult female survival rate in addition to low productivity of the
herd (after 2011) has been the primary drivers for the observed decline in the herd.
Switching of female caribou to adjacent calving grounds has been very low and is unlikely
to account for the declining trend. Recent low calf productivity and continuing low cow
survival suggest that further decline is likely, even with no harvest, and a very careful
approach to management is needed.
v
TABLE OF CONTENTS
ABSTRACT ............................................................................................................................................................. III LIST OF FIGURES ................................................................................................................................................ VII LIST OF TABLES..................................................................................................................................................... X INTRODUCTION ..................................................................................................................................................... 1 METHODS ................................................................................................................................................................. 4
Study Areas ......................................................................................................................................................... 4 Overview of Methods ...................................................................................................................................... 5 Analysis of Collared Caribou Data ............................................................................................................. 5 Reconnaissance Surveys to Delineate Strata ......................................................................................... 6 Stratification and Allocation of Survey Effort ....................................................................................... 8 Estimation of Caribou on the Calving Ground ....................................................................................... 9
Photo Surveys ............................................................................................................................................ 9 Visual Surveys Using Double-Observer Methods .......................................................................10 Estimation of Caribou in Stratum with Varying Strip Widths ...............................................13
Composition of Breeding and Non-breeding Caribou on the Calving Ground .......................14 Estimation of Adult and Breeding Females ..........................................................................................15 Estimation of Adult Sex Ratio from Fall Composition Surveys ....................................................16 Estimation of Total Herd Size ....................................................................................................................16
Estimation of Herd Size Assuming Fixed Pregnancy Rate ......................................................16 Estimate of Herd Size Based Upon Estimates of Adult Females ...........................................16
Trends in Herd Indicators ...........................................................................................................................17 Trends in Calving Ground Size and Location ...............................................................................17 Trends in Adult and Breeding Females ..........................................................................................17 Trends in Estimates of Caribou on the Calving Ground from Reconnaissance Surveys .......................................................................................................................................................18
Exploration of Demographic Factors Influencing Population Trend .........................................19 Females Switching Calving Grounds ...............................................................................................19 Demographic Model using Multiple Data Sources .....................................................................19
RESULTS .................................................................................................................................................................24
Survey conditions...........................................................................................................................................24 Analysis of Collared Caribou Data ...........................................................................................................24 Reconnaissance Surveys to Delineate Strata .......................................................................................26 Stratification and Allocation of Survey Effort .....................................................................................29 Photo and Visual Survey ..............................................................................................................................34
Photo Survey ............................................................................................................................................34 Visual Surveys ..........................................................................................................................................35
Estimates of Caribou on the Calving Ground .......................................................................................42 Composition on Calving Ground ...............................................................................................................44 Estimation of Breeding and Adult Females. .........................................................................................48
vi
Estimation of Breeding Females .......................................................................................................48 Estimation of Adult Females ..............................................................................................................48
Fall Composition Surveys ............................................................................................................................49 Extrapolated Estimate of Total Herd Size .............................................................................................50
Using an Assumed Pregnancy Rate .................................................................................................50 Using Estimates of Adult Females ....................................................................................................51 Comparison of Estimates of Herd Size ...........................................................................................52
Trends in Indicators of Herd Status ........................................................................................................54 Trends in Calving Ground Size and Location ...............................................................................54 Trends in Adult and Breeding Females ..........................................................................................55 Weighted Regression ............................................................................................................................58 Comparison of Photo Survey to Reconnaissance-based Estimates of Trend ..................59
Exploration of Potential Reasons for Decline of the Bathurst Caribou Herd ..........................60 Analysis of Movements to Other Calving Grounds ....................................................................60 Survival Rate Estimates from Collared Caribou .........................................................................62 Analysis of Demography Using Multiple Data Sources ............................................................63
DISCUSSION...........................................................................................................................................................72 General Results ...............................................................................................................................................72 Interpretation of Breeding Female Estimates. ....................................................................................74
Estimates of Extrapolated Herd Size...............................................................................................75 Management Implications and Recommendations ...........................................................................77
ACKNOWLEDGEMENTS ...................................................................................................................................79 LITERATURE CITED ...........................................................................................................................................80 APPENDIX 1: Details on Double-Observer Estimation Methods ......................................................84 APPENDIX 2: Details on Correction of Survey Altitude of Pilatus Porter Aircraft .....................86 APPENDIX 3: Raw Transect Data From Survey Strata .........................................................................90
vii
LIST OF FIGURES
Figure 1: Calving, summer, and winter ranges of the Bathurst herd, 1996-2009, based on accumulated radio collar locations of cows. ..................................................................................... 1
Figure 2: Trends of breeding female estimates for the Bathurst herd from 1986-2012 ......... 2
Figure 3: The path of collared females from the Bluenose-East, Bathurst, and Beverly-Ahiak caribou herds to their 2015 calving grounds. ..................................................................... 4
Figure 4: The tablet data entry screen used during reconnaissance surveys. ............................. 7
Figure 5: Observer position for double-observer methods. ..............................................................11
Figure 6: Classification of breeding females used in composition surveys. ................................15
Figure 7: Underlying stage matrix life history diagram for caribou demographic model. ...20
Figure 8: Survey conditions during the June 6th visual and photo survey in the core survey area..................................................................................................................................................................24
Figure 9: Movements of collared caribou to the calving ground area from May 12 - June 6 ..........................................................................................................................................................................25
Figure 10: Movement rates (km/day) for Bathurst caribou before, during, and after the calving ground survey .............................................................................................................................26
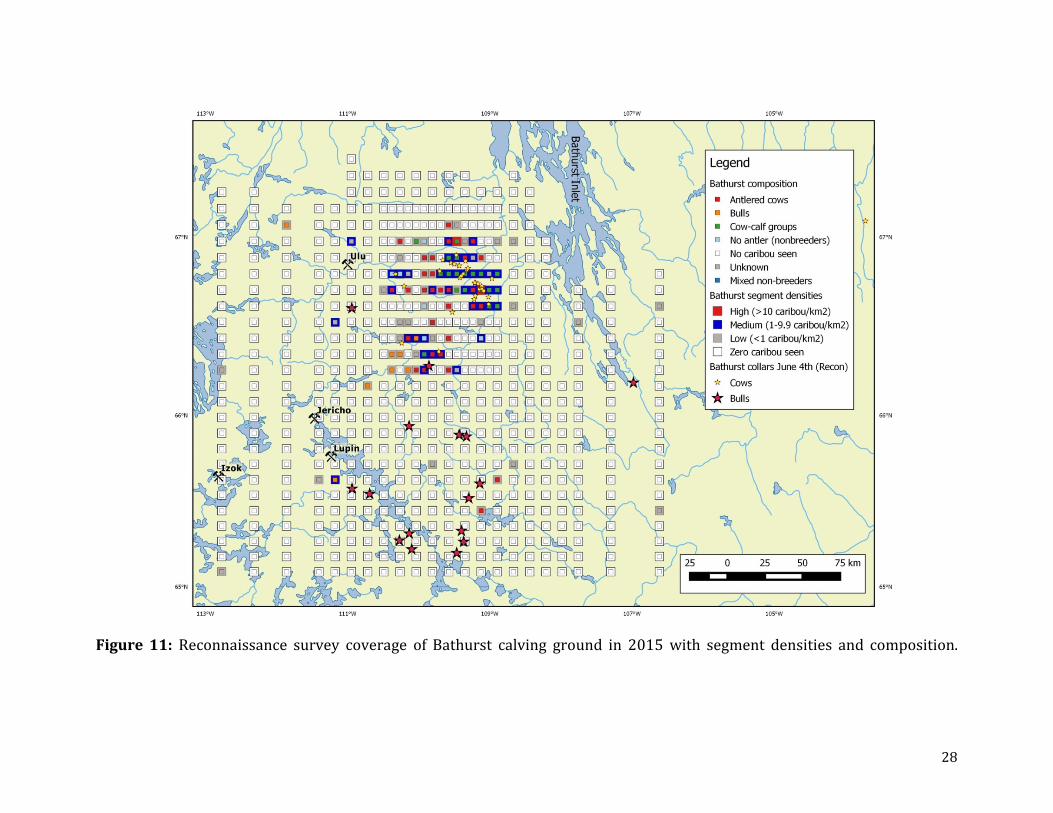
Figure 11: Reconnaissance survey coverage of Bathurst calving ground in 2015 with segment densities and composition. ..................................................................................................28
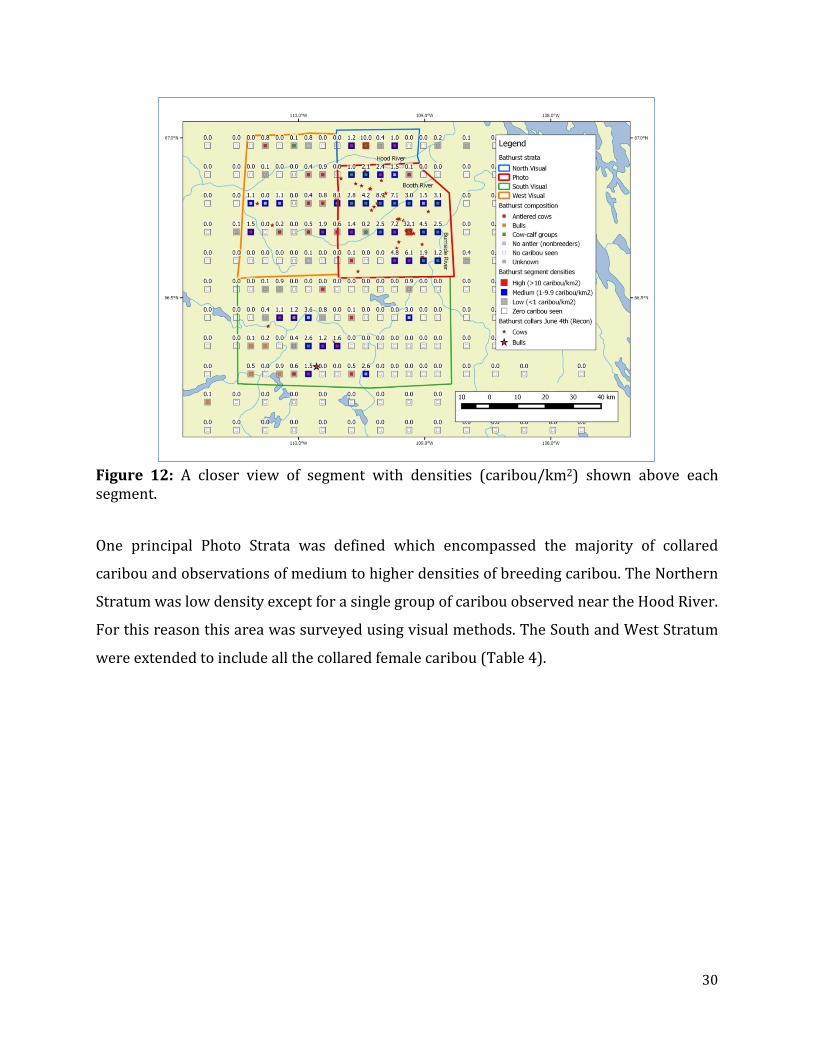
Figure 12: A closer view of segment with densities (caribou/km2) shown above each segment. ........................................................................................................................................................30
Figure 13: Final strata layout with actual transect area sampled and collared caribou locations during the visual/photo survey. .......................................................................................35
Figure 14: Group sizes of caribou observed as a function of whether observed by primary, secondary, or both observers ...............................................................................................................36
Figure 15: Snow and cloud cover in reconnaissance and visual surveys for the Bathurst herd .................................................................................................................................................................37
viii
Figure 16: Predicted single and combined (double) observer sighting probabilities for the visual phase of the survey with other covariates set at mean levels. ...................................41
Figure 17: The estimated effect of cloud and snow cover on sightability of caribou for single and both observers combined (2x observer). ...................................................................41
Figure 18: Densities of caribou on each transect line for the high Photo Stratum. .................43
Figure 19: Spatial representation of caribou counted per 1 km segment of transects. .........44
Figure 20: Movement of collared females between the primary reconnaissance survey, photo survey and visual survey and composition surveys. ......................................................45
Figure 21: Flight tracks and waypoints for the composition survey. ...........................................46
Figure 22: Fall composition survey waypoints and proportions of bulls and cows in each sample waypoint displayed as pie charts. .......................................................................................49
Figure 23: Extrapolated herd estimates using the pregnancy rate and adult female based estimation methods for 2009, 2012, and 2015. .............................................................................53
Figure 24: Location and relative size of calving grounds as defined by Photo Strata from 2009-2015 ....................................................................................................................................................54
Figure 25: Relative size of the core Bathurst calving ground area as defined by areas where breeding caribou were detected. .........................................................................................................55
Figure 26: Estimates of breeding females in the Bathurst herd from 1986-2015. ..................56
Figure 27: Comparison of 2015 breeding female estimate with estimates from the 2009 and 2012 calving ground surveys. ......................................................................................................57
Figure 28: Estimates of total adult females subdivided by breeding status for 2009, 2012, and 2015. ......................................................................................................................................................58
Figure 29: Trends in reconnaissance survey estimates of caribou on the core calving ground in comparison to the 2015 estimates.................................................................................60
Figure 30: Frequencies of caribou movement events from 2008-2015 based on locations on calving grounds. ...................................................................................................................................62
Figure 31: Estimate of demographic parameters from the most supported OLS model.. .....64
ix
Figure 32: Estimates of adult female survival, spring calf-cow ratios, proportion females breeding and breeding cow population size estimates. .............................................................66
Figure 33: Estimates of bull-cow ratios and fall calf-cow ratios from fall composition surveys from Model 1. .............................................................................................................................67
Figure 34: Estimates of abundance for each age-sex class from the most supported OLS model ..............................................................................................................................................................68
Figure 35: The estimated relative number of adult cows and bulls compared to estimated mortalities and recruitment into the bull and cow age class from the most supported OLS model .....................................................................................................................................................70
Figure 36: Estimated altitude of the Pilatus aircraft on the North Stratum based upon GPS altitude and digital elevation models. ...............................................................................................87
Figure 37: Relationship between altitude AGL and strip width using ground-based measurements for the Pilatus porter aircraft.................................................................................88
Figure 38: Sensitivity of estimates of caribou on the Northern Stratum to different survey altitudes and strip width. .......................................................................................................................89
x
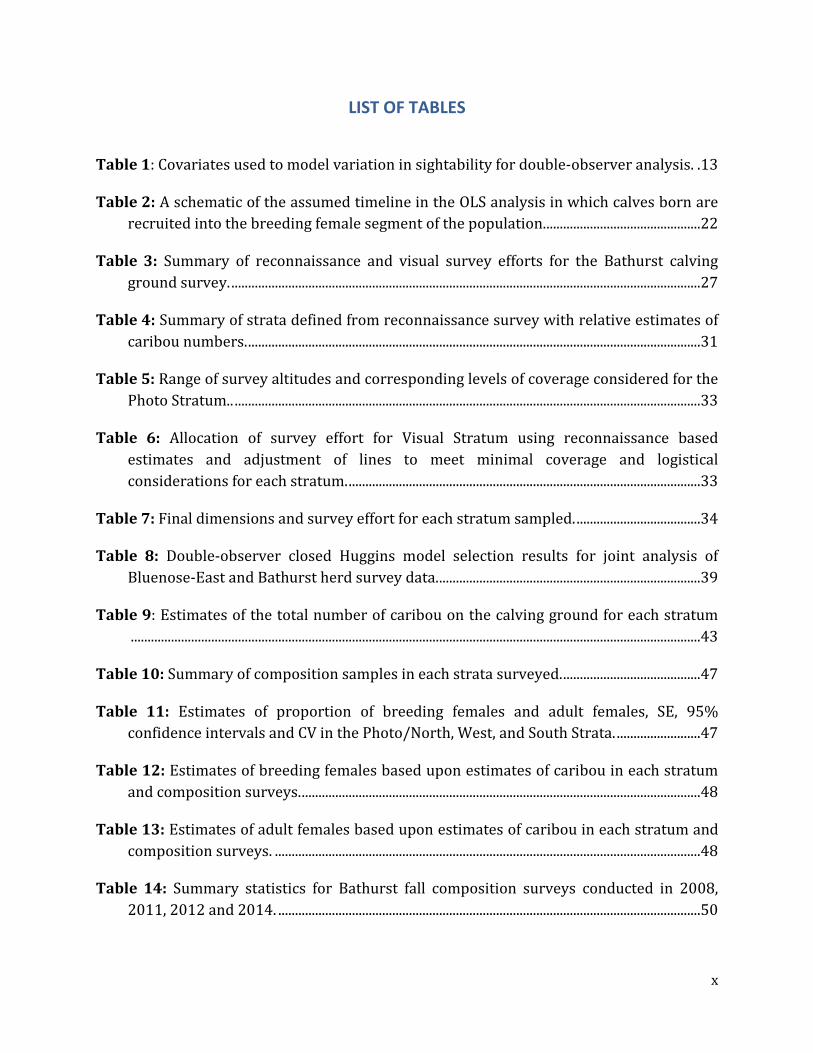
LIST OF TABLES
Table 1: Covariates used to model variation in sightability for double-observer analysis. .13
Table 2: A schematic of the assumed timeline in the OLS analysis in which calves born are recruited into the breeding female segment of the population. ..............................................22
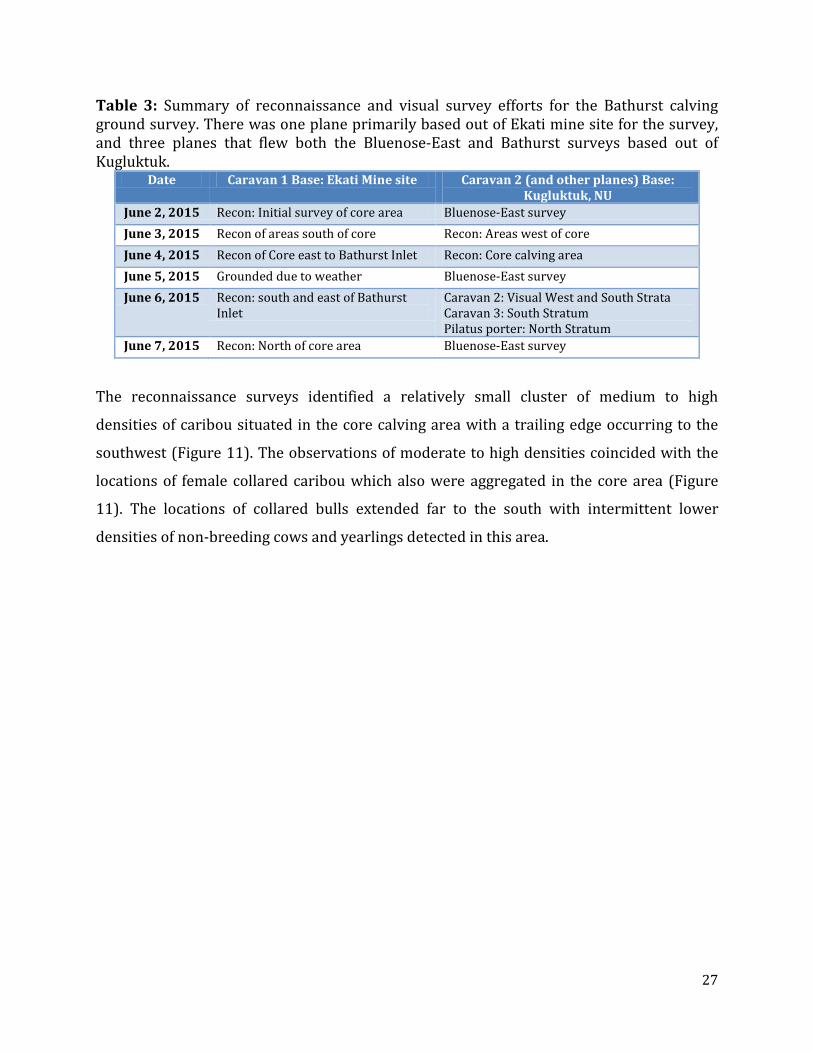
Table 3: Summary of reconnaissance and visual survey efforts for the Bathurst calving ground survey. ............................................................................................................................................27
Table 4: Summary of strata defined from reconnaissance survey with relative estimates of caribou numbers. .......................................................................................................................................31
Table 5: Range of survey altitudes and corresponding levels of coverage considered for the Photo Stratum.. ...........................................................................................................................................33
Table 6: Allocation of survey effort for Visual Stratum using reconnaissance based estimates and adjustment of lines to meet minimal coverage and logistical considerations for each stratum. .........................................................................................................33
Table 7: Final dimensions and survey effort for each stratum sampled. .....................................34
Table 8: Double-observer closed Huggins model selection results for joint analysis of Bluenose-East and Bathurst herd survey data. ..............................................................................39
Table 9: Estimates of the total number of caribou on the calving ground for each stratum ..........................................................................................................................................................................43
Table 10: Summary of composition samples in each strata surveyed. .........................................47
Table 11: Estimates of proportion of breeding females and adult females, SE, 95% confidence intervals and CV in the Photo/North, West, and South Strata. .........................47
Table 12: Estimates of breeding females based upon estimates of caribou in each stratum and composition surveys. .......................................................................................................................48
Table 13: Estimates of adult females based upon estimates of caribou in each stratum and composition surveys. ...............................................................................................................................48
Table 14: Summary statistics for Bathurst fall composition surveys conducted in 2008, 2011, 2012 and 2014. ..............................................................................................................................50
xi
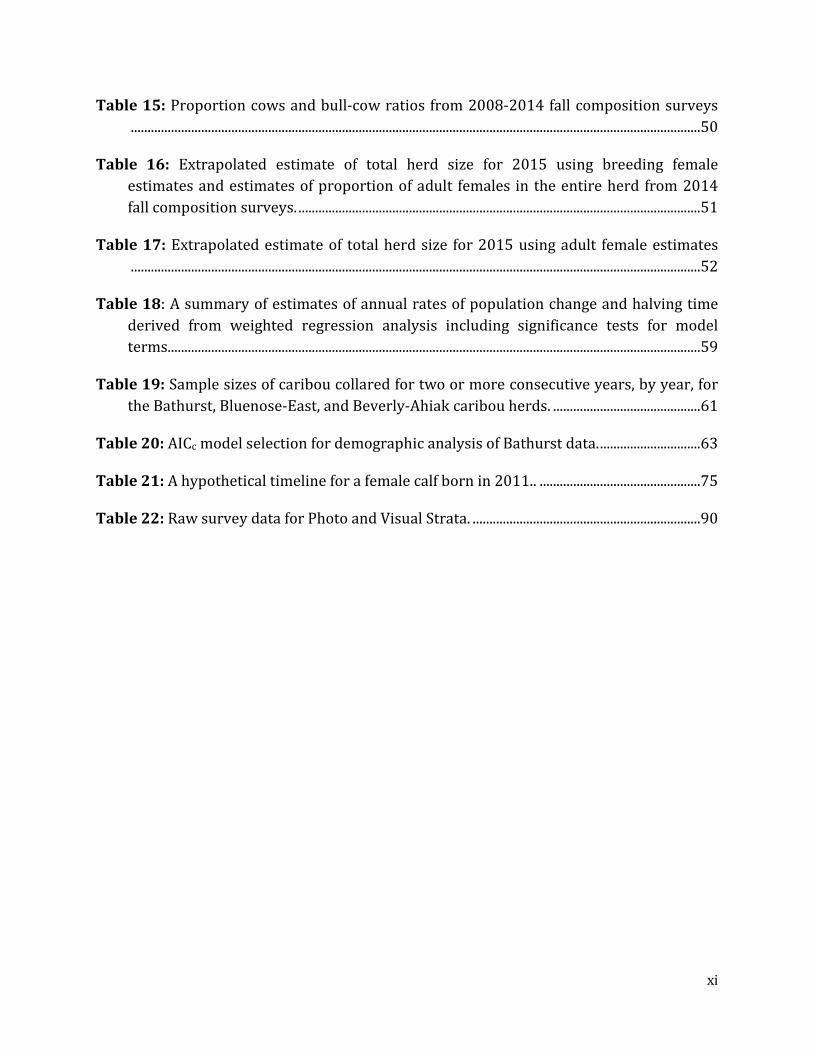
Table 15: Proportion cows and bull-cow ratios from 2008-2014 fall composition surveys ..........................................................................................................................................................................50
Table 16: Extrapolated estimate of total herd size for 2015 using breeding female estimates and estimates of proportion of adult females in the entire herd from 2014 fall composition surveys. ........................................................................................................................51
Table 17: Extrapolated estimate of total herd size for 2015 using adult female estimates ..........................................................................................................................................................................52
Table 18: A summary of estimates of annual rates of population change and halving time derived from weighted regression analysis including significance tests for model terms...............................................................................................................................................................59
Table 19: Sample sizes of caribou collared for two or more consecutive years, by year, for the Bathurst, Bluenose-East, and Beverly-Ahiak caribou herds. ............................................61
Table 20: AICc model selection for demographic analysis of Bathurst data. ..............................63
Table 21: A hypothetical timeline for a female calf born in 2011.. ................................................75
Table 22: Raw survey data for Photo and Visual Strata. ....................................................................90
1
INTRODUCTION
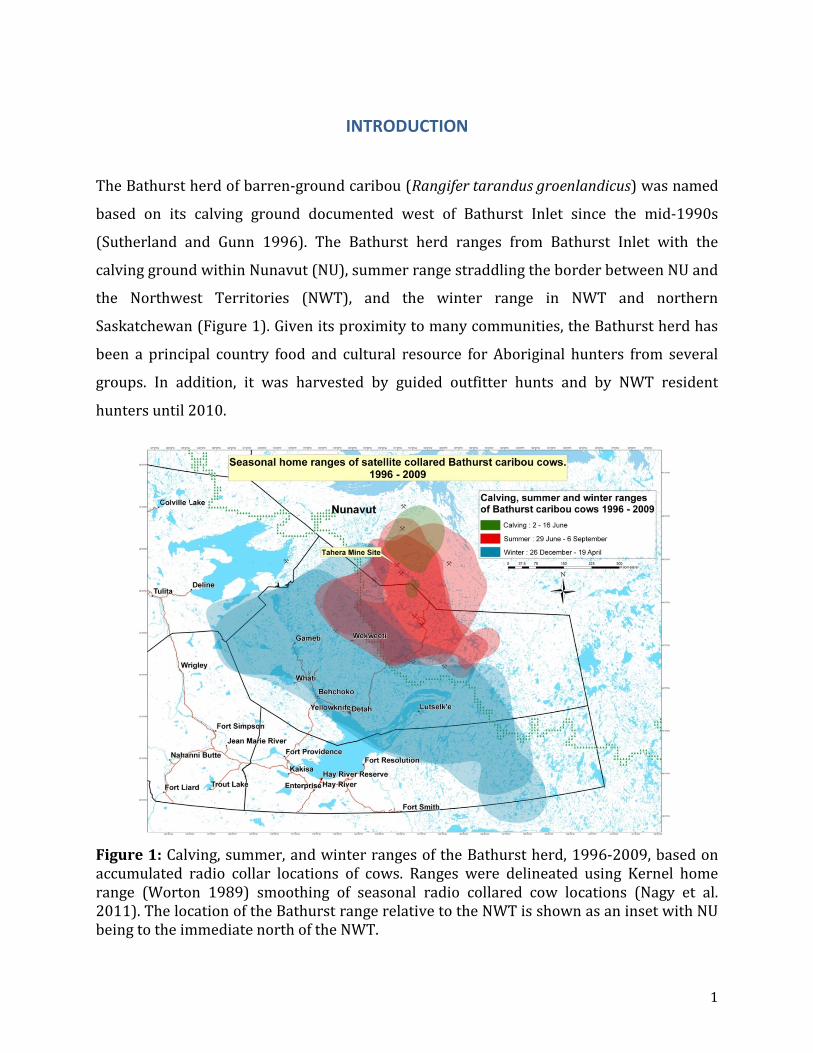
The Bathurst herd of barren-ground caribou (Rangifer tarandus groenlandicus) was named
based on its calving ground documented west of Bathurst Inlet since the mid-1990s
(Sutherland and Gunn 1996). The Bathurst herd ranges from Bathurst Inlet with the
calving ground within Nunavut (NU), summer range straddling the border between NU and
the Northwest Territories (NWT), and the winter range in NWT and northern
Saskatchewan (Figure 1). Given its proximity to many communities, the Bathurst herd has
been a principal country food and cultural resource for Aboriginal hunters from several
groups. In addition, it was harvested by guided outfitter hunts and by NWT resident
hunters until 2010.
Figure 1: Calving, summer, and winter ranges of the Bathurst herd, 1996-2009, based on accumulated radio collar locations of cows. Ranges were delineated using Kernel home range (Worton 1989) smoothing of seasonal radio collared cow locations (Nagy et al. 2011). The location of the Bathurst range relative to the NWT is shown as an inset with NU being to the immediate north of the NWT.
2
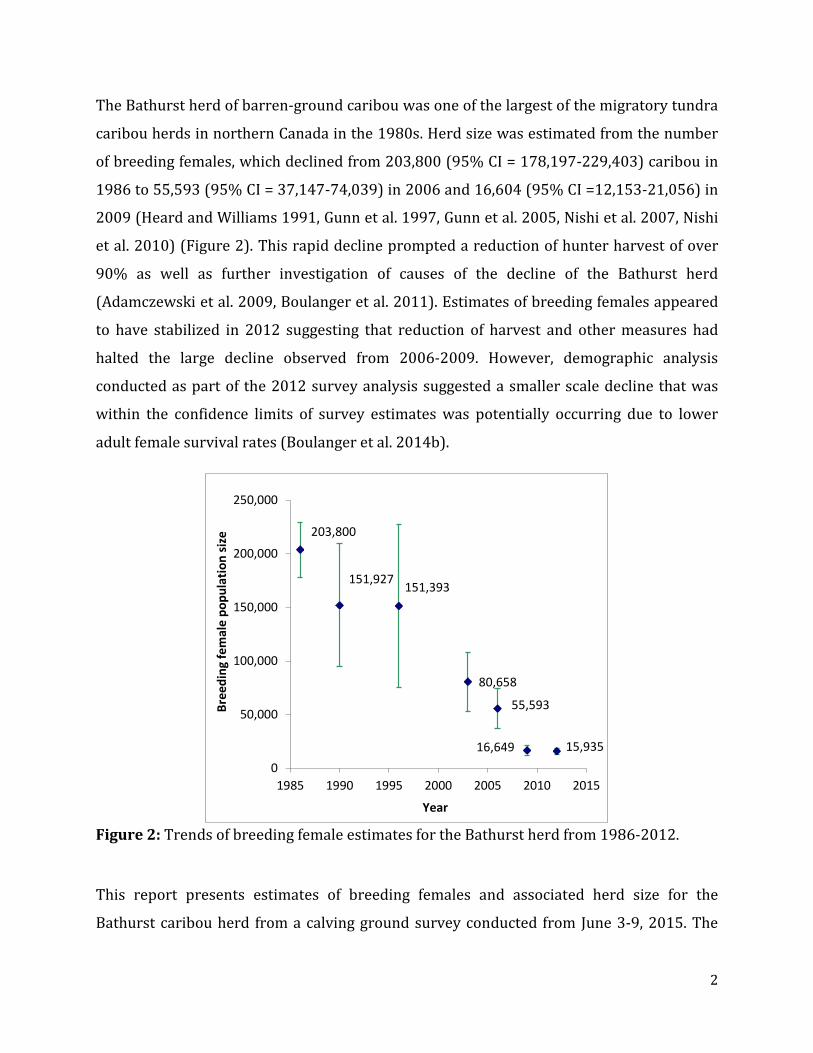
The Bathurst herd of barren-ground caribou was one of the largest of the migratory tundra
caribou herds in northern Canada in the 1980s. Herd size was estimated from the number
of breeding females, which declined from 203,800 (95% CI = 178,197-229,403) caribou in
1986 to 55,593 (95% CI = 37,147-74,039) in 2006 and 16,604 (95% CI =12,153-21,056) in
2009 (Heard and Williams 1991, Gunn et al. 1997, Gunn et al. 2005, Nishi et al. 2007, Nishi
et al. 2010) (Figure 2). This rapid decline prompted a reduction of hunter harvest of over
90% as well as further investigation of causes of the decline of the Bathurst herd
(Adamczewski et al. 2009, Boulanger et al. 2011). Estimates of breeding females appeared
to have stabilized in 2012 suggesting that reduction of harvest and other measures had
halted the large decline observed from 2006-2009. However, demographic analysis
conducted as part of the 2012 survey analysis suggested a smaller scale decline that was
within the confidence limits of survey estimates was potentially occurring due to lower
adult female survival rates (Boulanger et al. 2014b).
Figure 2: Trends of breeding female estimates for the Bathurst herd from 1986-2012.
This report presents estimates of breeding females and associated herd size for the
Bathurst caribou herd from a calving ground survey conducted from June 3-9, 2015. The
15,93516,649
55,593
80,658
151,393151,927
203,800
0
50,000
100,000
150,000
200,000
250,000
1985 1990 1995 2000 2005 2010 2015
Bree
ding
fem
ale
popu
latio
n si
ze
Year
3
Bathurst herd has been surveyed using the same calving ground methodology since 1986
(Gunn et al. 1997, Gunn et al. 2005, Nishi et al. 2007, Nishi 2010, Nishi et al. 2010,
Boulanger et al. 2014b). An additional objective was the estimation of overall trend in the
population size of the herd. The results from this survey will provide an indication of herd
status and whether stabilization or potential herd recovery has occurred since the last
survey in 2012.
4
METHODS
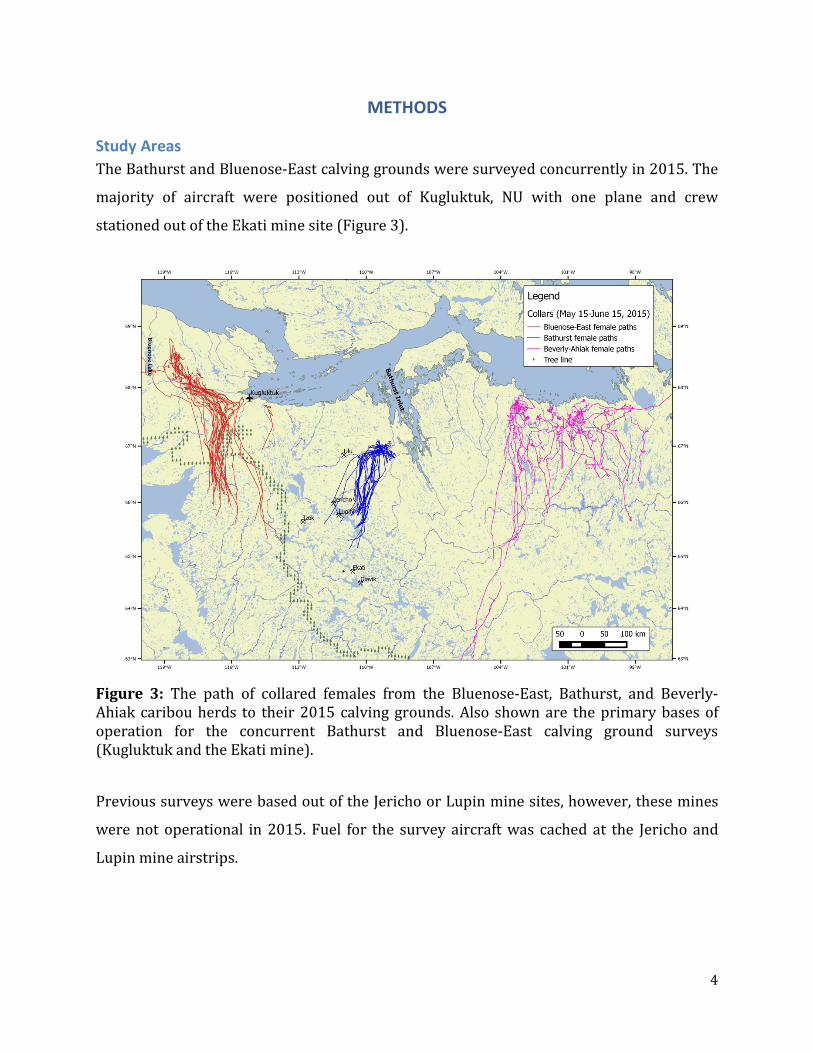
Study Areas The Bathurst and Bluenose-East calving grounds were surveyed concurrently in 2015. The
majority of aircraft were positioned out of Kugluktuk, NU with one plane and crew
stationed out of the Ekati mine site (Figure 3).
Figure 3: The path of collared females from the Bluenose-East, Bathurst, and Beverly-Ahiak caribou herds to their 2015 calving grounds. Also shown are the primary bases of operation for the concurrent Bathurst and Bluenose-East calving ground surveys (Kugluktuk and the Ekati mine).
Previous surveys were based out of the Jericho or Lupin mine sites, however, these mines
were not operational in 2015. Fuel for the survey aircraft was cached at the Jericho and
Lupin mine airstrips.
5
Overview of Methods The calving ground survey was conducted as a sequence of steps.
1. Locations from collared caribou, historic records of calving ground use, and systematic aerial reconnaissance surveys of the Bathurst calving area were conducted to identify core calving areas in the general area to the southwest of Bathurst Inlet.
2. A systematic reconnaissance survey was conducted where transects were flown in 10 km intervals to determine areas where breeding females were concentrated, as well as locations of bulls, yearlings, and non-breeding cows near the calving ground. How far calving had progressed was also assessed from the proportion of cows with newborn calves. Due to the relatively smaller size of the Bathurst calving ground, transects spaced at 5 km intervals were flown in the core calving area.
3. Using data from the reconnaissance survey, geographic areas called strata were delineated for sampling by the photo plane with the most sampling effort dedicated to areas with the highest densities of breeding female caribou.
4. A photographic survey plane was then used to sample the higher density and medium density areas while visual strip-transect surveys were used to estimate caribou in lower density strata.
5. While the photo plane conducted the aerial survey, a helicopter-based composition survey was conducted within each stratum to determine the proportion of breeding caribou.
6. An estimate of breeding females was derived using the estimate of total caribou within the strata and the estimate of proportion of breeding females within the strata.
7. The estimate of breeding females was then used to estimate the total size of the herd, and trends in breeding females (Heard 1985, Heard and Williams 1990, Gunn and Russell 2008).
Each component is next described in detail.
Analysis of Collared Caribou Data Data from collared caribou were monitored during the survey to assess relative location of
breeding females on calving ground areas. In addition, change in movement rates was
assessed to determine the timing of calving. Generally, caribou movement rates are
reduced to <5 km/day during the peak of calving and for a short interval after calving
6
(Gunn et al. 1997, Nishi et al. 2007, Gunn et al. 2008, Gunn and Russell 2008, Nishi et al.
2010). Information from collared caribou and observations during the aerial
reconnaissance surveys was used to time the photo survey near the peak of calving, when
caribou movement rates in the survey area would be lowest.
Reconnaissance Surveys to Delineate Strata Since the 2012 Bathurst survey, the core calving area, as indicated by higher densities of
breeding caribou, was surveyed with north-south transects at 5 km line spacing. This
approach allowed higher resolution in terms of defining caribou distribution, and more
precise estimates of caribou density within the core calving area. The survey ground
coverage for areas with 5 km transects was approximately 16%. Areas peripheral to the
core area were surveyed at 10 km intervals resulting in 8% coverage.
In visual surveys, caribou were counted within a 400 m strip on each side of the survey
plane (800 m total; Gunn and Russell 2008). Strip width was defined by the wheel of the
airplane on the inside, and wooden doweling defined on the wing strut. Planes were flown
at an average survey speed of 160 km/hr. at an average altitude of 120 m above the ground
to maintain a constant strip width.
Two observers were used on both sides of the survey airplane to minimize the chance of
missing caribou. Previous research (Boulanger et al. 2010) demonstrated that this
approach increases sightability compared to single observers. During the survey the two
observers on the same side of the plane communicated to ensure that groups of caribou
were not double counted.
Caribou groups were classified by whether they contained breeding caribou. Breeding
caribou were defined by female caribou with hard antlers or presence of calves. A female
7
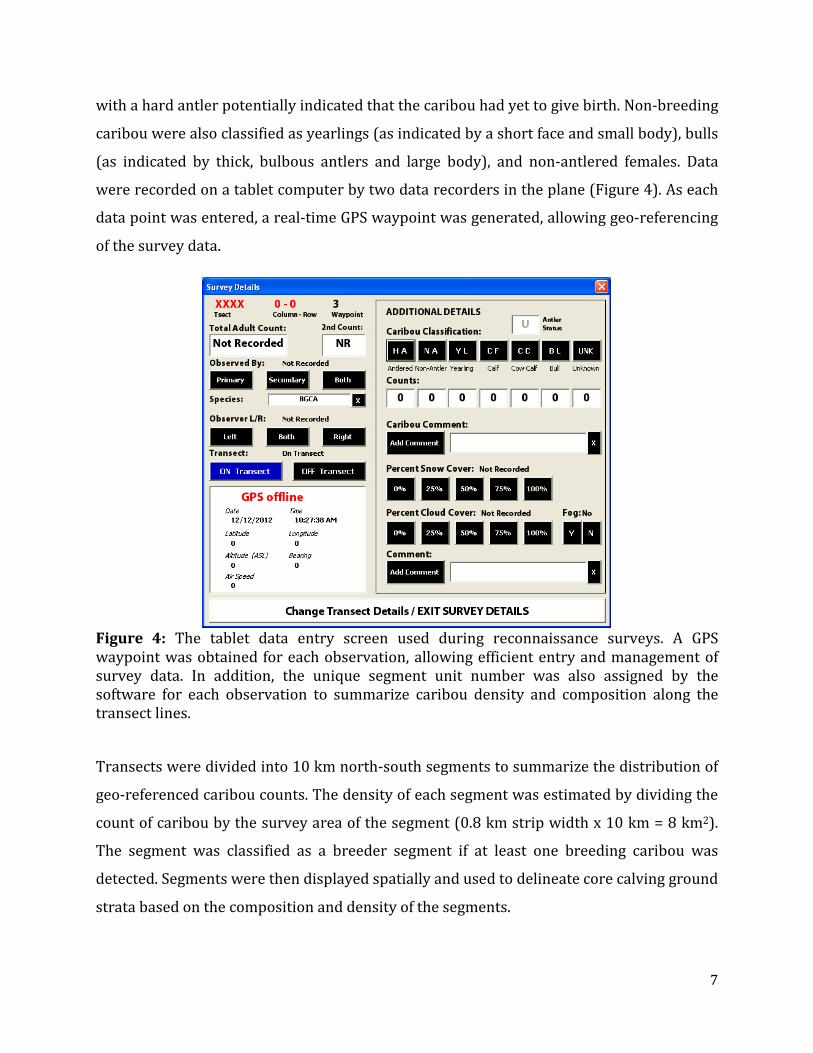
with a hard antler potentially indicated that the caribou had yet to give birth. Non-breeding
caribou were also classified as yearlings (as indicated by a short face and small body), bulls
(as indicated by thick, bulbous antlers and large body), and non-antlered females. Data
were recorded on a tablet computer by two data recorders in the plane (Figure 4). As each
data point was entered, a real-time GPS waypoint was generated, allowing geo-referencing
of the survey data.
Figure 4: The tablet data entry screen used during reconnaissance surveys. A GPS waypoint was obtained for each observation, allowing efficient entry and management of survey data. In addition, the unique segment unit number was also assigned by the software for each observation to summarize caribou density and composition along the transect lines.
Transects were divided into 10 km north-south segments to summarize the distribution of
geo-referenced caribou counts. The density of each segment was estimated by dividing the
count of caribou by the survey area of the segment (0.8 km strip width x 10 km = 8 km2).
The segment was classified as a breeder segment if at least one breeding caribou was
detected. Segments were then displayed spatially and used to delineate core calving ground
strata based on the composition and density of the segments.
8
Areas that were to the far west and far east including those to the east of Bathurst Inlet
were surveyed at 10 or 20 km transect spacing to ensure that no larger aggregations of
breeding caribou were missed.
Stratification and Allocation of Survey Effort The main goal of the survey was to obtain a precise and accurate estimate of breeding
caribou on the calving ground. To achieve this objective, the survey area was stratified, a
procedure in which neighbouring segments with similar density were grouped into a
contiguous area so that each stratum enveloped caribou distributions of similar densities.
In addition, stratification was used to determine if a stratum required the use of a photo
survey plane, or if visual estimates could be used to estimate density. Strata that contained
medium to high densities of breeding caribou were surveyed using the photo survey plane
to ensure more accurate counts, with strata that had low densities being surveyed visually.
Given that the objective of the survey was to estimate the number of breeding females, only
areas that contained breeding females were surveyed. Areas that contained non-breeders
were not surveyed after initial reconnaissance because they would not contribute to the
breeding female population estimate.
Once the survey strata were delineated, an estimate of caribou numbers were derived from
the reconnaissance data using the formulas of Jolly (1969). The relative population size of
each stratum and the degree of variation of each estimate was used to allocate the number
of transects to each stratum that would be sampled by the photo plane, or by visual
surveys.
Two potential strategies for allocation were considered for the aerial survey. First, optimal
allocation of survey effort was considered based on sampling theory (Heard 1987,
Thompson 1992, Krebs 1998). Optimal allocation basically assigns more effort to strata
with higher densities given that the amount of variation in counts is proportional to the
9
relative density and size of caribou within the stratum. Optimal allocation was estimated
using estimates of population size for each stratum and survey variance.
If strata were reasonably small, then optimal allocation was further adjusted to ensure an
adequate number of transect lines for each stratum. In particular, previous surveys
suggested that there should be a minimum of ten transects per stratum with closer to 20
transects being optimal for higher density areas. In general, coverage should be at least
15% with higher levels of coverage for high density strata. In the context of sampling,
increasing the number of lines in a stratum is “insurance” in that it minimizes the influence
of any one line on estimate precision. As populations become more clustered, a higher
number of transect lines is required to achieve adequate precision (Thompson 1992, Krebs
1998).
Estimation of Caribou on the Calving Ground
Photo Surveys Photo surveys were planned for the higher-density stratum to ensure accurate counting of
larger groups of caribou on the Photo Stratum. GeodesyGroup Inc. aerial survey company
(Calgary, AB) was contracted for photo surveys. They used a Piper PA46-310P Jetprop DLX
and a Cessna TI206D aircraft with a digital camera mounted on the belly of the aircraft.
Survey height to be flown for photos was determined at the time of stratification based on
expected cloud ceilings and desired ground coverage. Caribou detected on photos were
counted by a team of photo interpreters and supervised by Derek Fisher, president of
Green Link Forestry Inc., (Edmonton, AB) using specialized software that allowed three
dimensional viewing of photographic images. The number of caribou counted was tallied
by stratum and transect. The exact survey strip width of photos was also determined using
the geo-referenced digital photos by Green Link Forestry.
10
Visual Surveys Using Double-Observer Methods Visual surveys were conducted in medium and low density strata. For visual surveys, the
Caravan and Pilatus Porter aircraft were used with two observers on each side of the
aircraft and a data recorder on each side. The number of caribou sighted by observers were
then entered into the Trimble tablet computers and summarized by transect and stratum.
A double-observer method was used to estimate the sighting probability of caribou during
visual surveys. The double-observer method involves one “primary” observer who sits in
the front seat of the plane and a “secondary observer” who sits behind the primary
observer on the same side of the plane (Figure 5). The method adhered to five basic steps:
1. The primary observer called out all groups of caribou (number of caribou and location) he/she saw within the 400 m wide strip transect before they passed halfway between the primary and secondary observer (approximately at the wing strut). This included caribou groups that were between approximately 12 and 3 o’clock for right side observers and 9 and 12 o’clock for left side observers. The main requirement was that the primary observer be given time to call out all caribou seen before the secondary observer called them out.
2. The secondary observer called out whether he/she saw the caribou that the first observer saw and observations of any additional caribou groups. The secondary observer waited to call out caribou until the group observed passed half way between observers (between 3 and 6 o’clock for right side observers and 6 and 9 o’clock for left side observer).
3. The observers discussed any differences in group counts to ensure that they are calling out the same groups or different groups and to ensure accurate counts of larger groups.
4. The data recorder categorized and recorded counts of caribou groups into “primary only”, “secondary only”, and “both”, entered as separate records.
5. The observers switched places approximately half way through each survey day (i.e., at lunch) to monitor observer ability. The recorder noted the names of the primary and secondary observer (Boulanger et al. 2010, Buckland et al. 2010, Boulanger et al. 2014a).
11
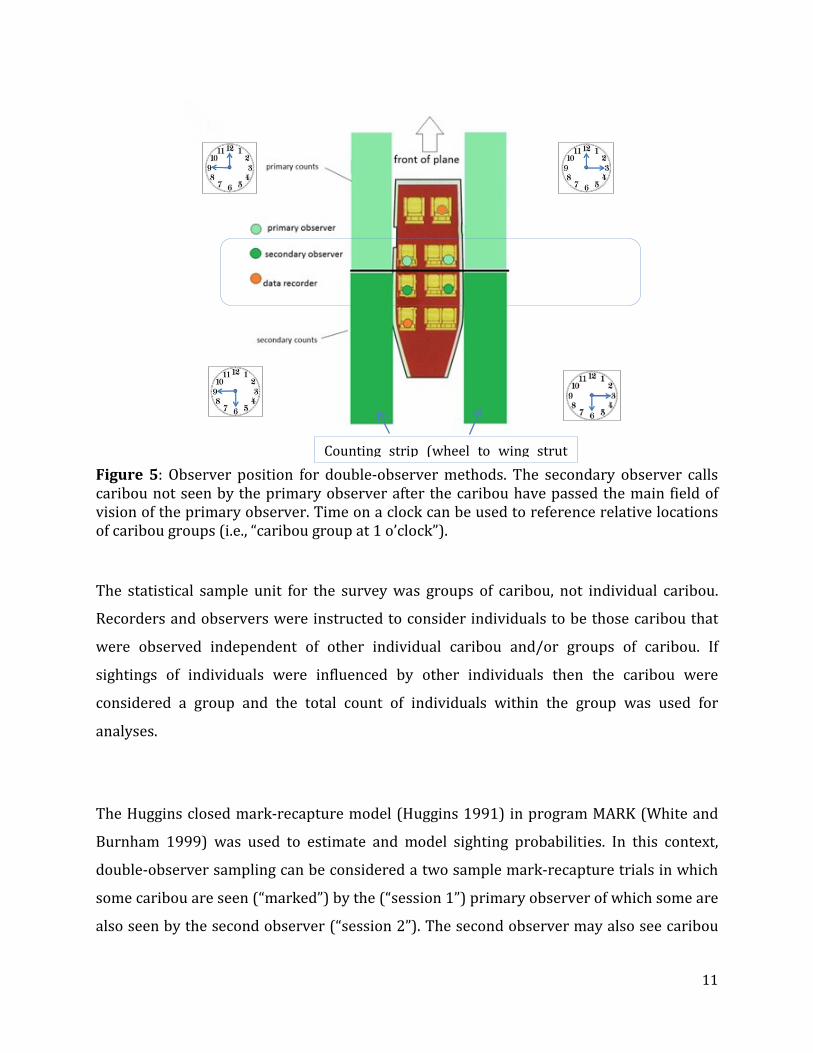
Figure 5: Observer position for double-observer methods. The secondary observer calls caribou not seen by the primary observer after the caribou have passed the main field of vision of the primary observer. Time on a clock can be used to reference relative locations of caribou groups (i.e., “caribou group at 1 o’clock”).
The statistical sample unit for the survey was groups of caribou, not individual caribou.
Recorders and observers were instructed to consider individuals to be those caribou that
were observed independent of other individual caribou and/or groups of caribou. If
sightings of individuals were influenced by other individuals then the caribou were
considered a group and the total count of individuals within the group was used for
analyses.
The Huggins closed mark-recapture model (Huggins 1991) in program MARK (White and
Burnham 1999) was used to estimate and model sighting probabilities. In this context,
double-observer sampling can be considered a two sample mark-recapture trials in which
some caribou are seen (“marked”) by the (“session 1”) primary observer of which some are
also seen by the second observer (“session 2”). The second observer may also see caribou
Counting strip (wheel to wing strut
12
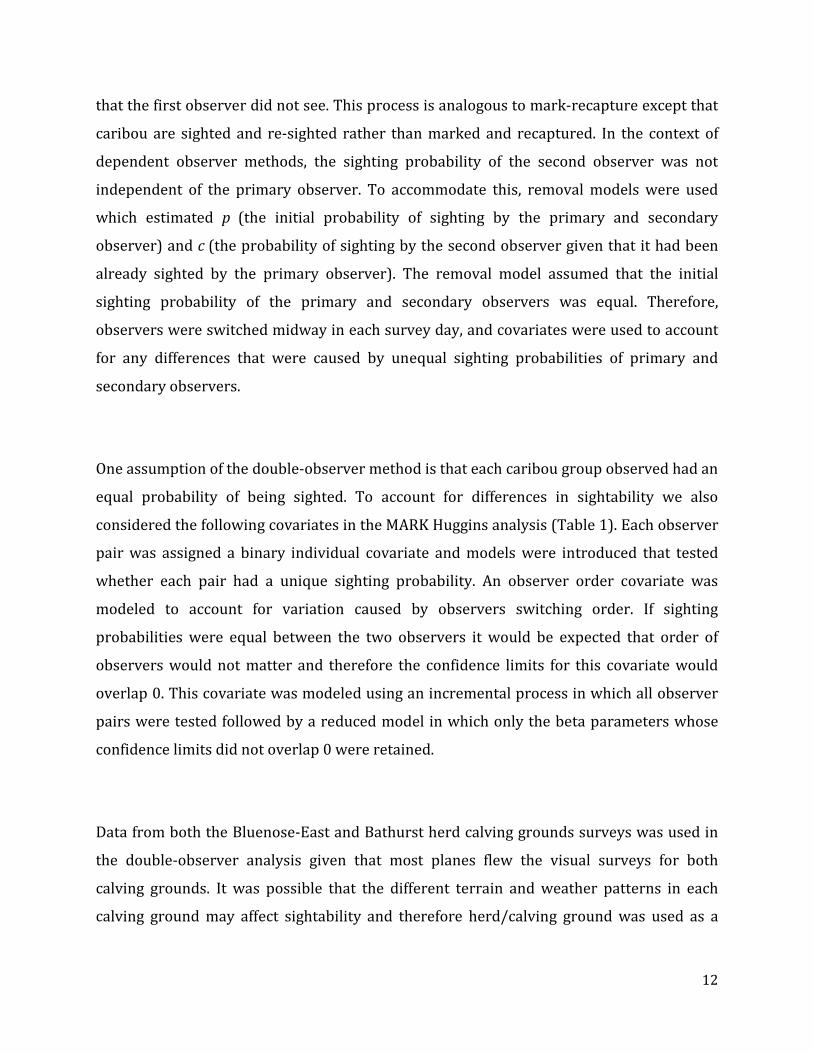
that the first observer did not see. This process is analogous to mark-recapture except that
caribou are sighted and re-sighted rather than marked and recaptured. In the context of
dependent observer methods, the sighting probability of the second observer was not
independent of the primary observer. To accommodate this, removal models were used
which estimated p (the initial probability of sighting by the primary and secondary
observer) and c (the probability of sighting by the second observer given that it had been
already sighted by the primary observer). The removal model assumed that the initial
sighting probability of the primary and secondary observers was equal. Therefore,
observers were switched midway in each survey day, and covariates were used to account
for any differences that were caused by unequal sighting probabilities of primary and
secondary observers.
One assumption of the double-observer method is that each caribou group observed had an
equal probability of being sighted. To account for differences in sightability we also
considered the following covariates in the MARK Huggins analysis (Table 1). Each observer
pair was assigned a binary individual covariate and models were introduced that tested
whether each pair had a unique sighting probability. An observer order covariate was
modeled to account for variation caused by observers switching order. If sighting
probabilities were equal between the two observers it would be expected that order of
observers would not matter and therefore the confidence limits for this covariate would
overlap 0. This covariate was modeled using an incremental process in which all observer
pairs were tested followed by a reduced model in which only the beta parameters whose
confidence limits did not overlap 0 were retained.
Data from both the Bluenose-East and Bathurst herd calving grounds surveys was used in
the double-observer analysis given that most planes flew the visual surveys for both
calving grounds. It was possible that the different terrain and weather patterns in each
calving ground may affect sightability and therefore herd/calving ground was used as a
13
covariate in the double-observer analysis. Appendix 1 provides more details on estimation
using double-observer methods.
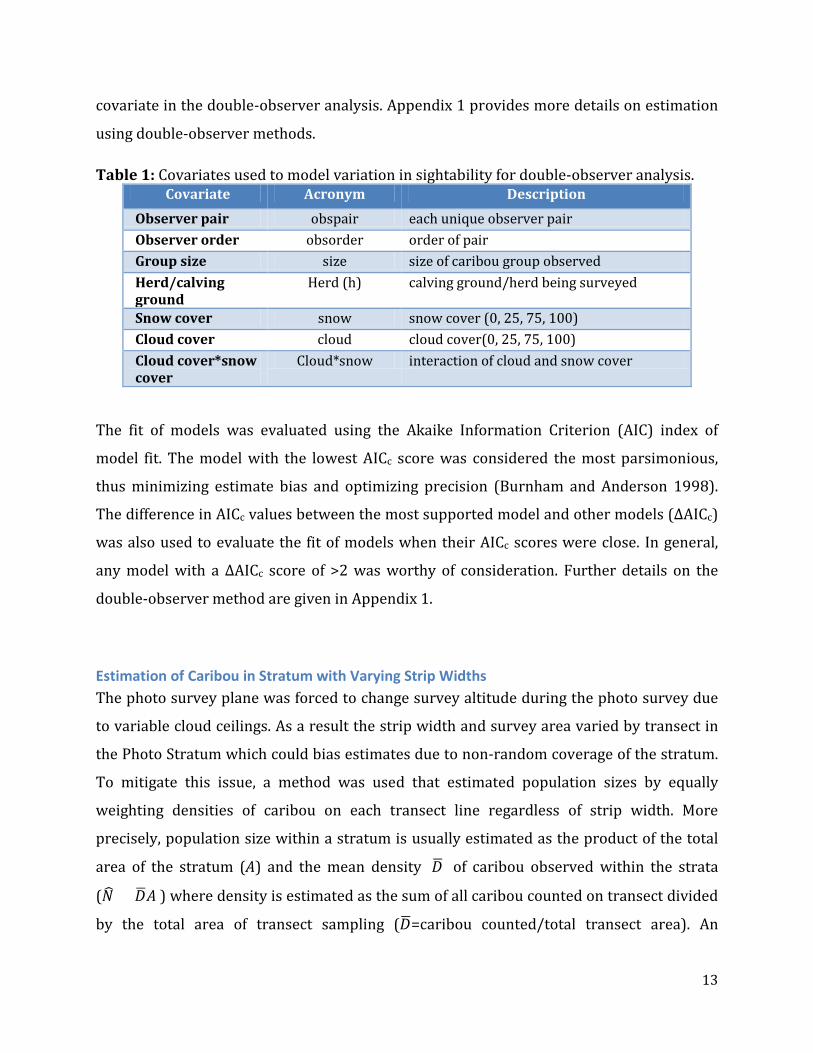
Table 1: Covariates used to model variation in sightability for double-observer analysis. Covariate Acronym Description
Observer pair obspair each unique observer pair Observer order obsorder order of pair Group size size size of caribou group observed Herd/calving ground
Herd (h) calving ground/herd being surveyed
Snow cover snow snow cover (0, 25, 75, 100) Cloud cover cloud cloud cover(0, 25, 75, 100) Cloud cover*snow cover
Cloud*snow interaction of cloud and snow cover
The fit of models was evaluated using the Akaike Information Criterion (AIC) index of
model fit. The model with the lowest AICc score was considered the most parsimonious,
thus minimizing estimate bias and optimizing precision (Burnham and Anderson 1998).
The difference in AICc values between the most supported model and other models (ΔAICc)
was also used to evaluate the fit of models when their AICc scores were close. In general,
any model with a ΔAICc score of >2 was worthy of consideration. Further details on the
double-observer method are given in Appendix 1.
Estimation of Caribou in Stratum with Varying Strip Widths The photo survey plane was forced to change survey altitude during the photo survey due
to variable cloud ceilings. As a result the strip width and survey area varied by transect in
the Photo Stratum which could bias estimates due to non-random coverage of the stratum.
To mitigate this issue, a method was used that estimated population sizes by equally
weighting densities of caribou on each transect line regardless of strip width. More
precisely, population size within a stratum is usually estimated as the product of the total
area of the stratum (A) and the mean density (𝐷�) of caribou observed within the strata
(𝑁� = 𝐷�𝐴 ) where density is estimated as the sum of all caribou counted on transect divided
by the total area of transect sampling (𝐷�=caribou counted/total transect area). An
14
equivalent estimate of mean density can be derived by first estimating transect-specific
densities of caribou (𝐷�𝑖 = 𝑐𝑎𝑟𝑖𝑏𝑜𝑢𝑖 𝑎𝑟𝑒𝑎𝑖)⁄ were cariboui is the number of caribou counted
in each transect and areai is the transect area (as estimated by transect length x strip
width). Each transect density is then weighted by the relative length of each transect line
(wi) to estimate mean density (𝐷�) for the stratum. More exactly, 𝐷� = ∑ 𝐷𝚤�𝑤𝑖𝑛𝑖 ∑ 𝑤𝑖
𝑛𝑖⁄ where
the weight (wi) is the ratio of the length of transect line (li) i to the mean length of all
transect lines (𝑤𝑖 = 𝑙𝑖 𝑙𝚤�⁄ ) and n is the total number of transects sampled. Using this
weighting term accommodates for different lengths of transect lines within the stratum
therefore ensuring that each transect line contributed to the estimate in proportion to its
length. Abundance of caribou in the stratum is then estimated using the standard formula
(𝑁� = 𝐷�𝐴). Estimates of variance were calculated using standard formulas that allow
transects of different size and area (Jolly 1969). Confidence limits for estimates were based
upon a t-statistic with degrees of freedom calculated using the number of lines surveyed in
all strata and survey variances (Gasaway et al. 1986).
Composition of Breeding and Non-breeding Caribou on the Calving Ground Immediately after photo and visual surveys commenced, composition sampling was
undertaken on each of the survey strata. For this, helicopters were used to systematically
survey groups of caribou allowing more in-depth classification of caribou by breeding
status. Caribou were classified following the methods of Gunn et al. (2005) where antler
status, presence of an udder, and presence of calf is used to categorize females by breeding
status while also counting yearlings, bulls, and newborn calves (Figure 6).
15
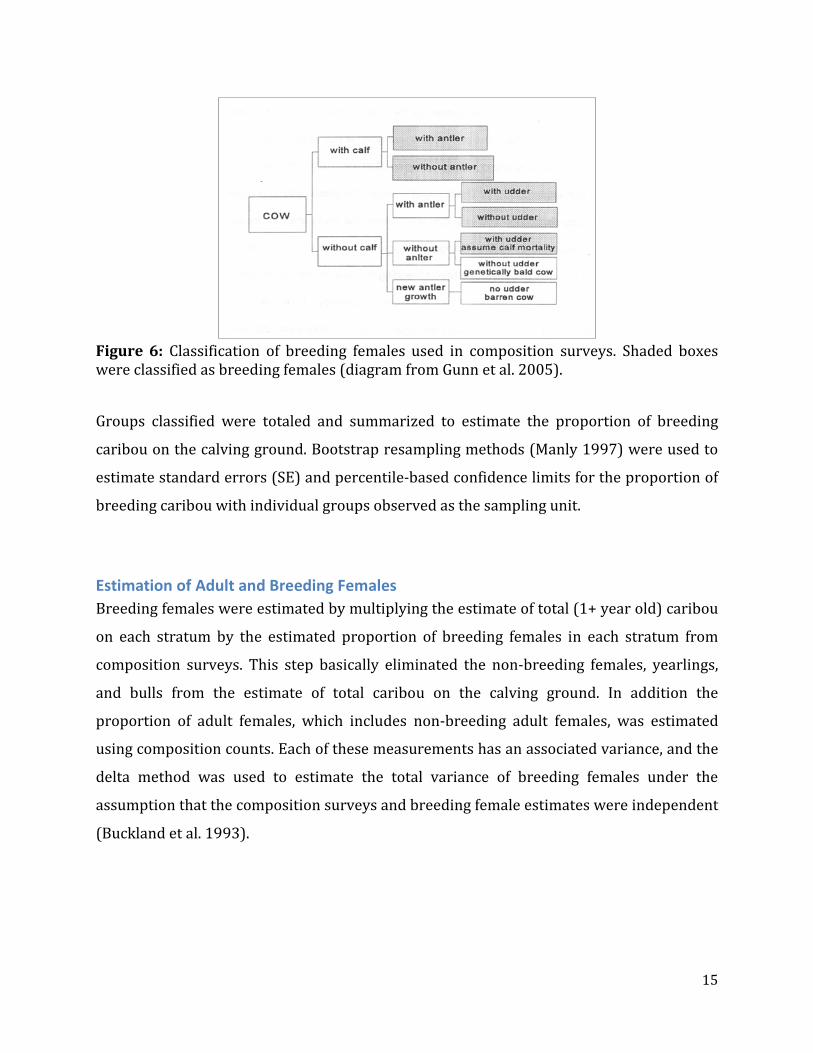
Figure 6: Classification of breeding females used in composition surveys. Shaded boxes were classified as breeding females (diagram from Gunn et al. 2005).
Groups classified were totaled and summarized to estimate the proportion of breeding
caribou on the calving ground. Bootstrap resampling methods (Manly 1997) were used to
estimate standard errors (SE) and percentile-based confidence limits for the proportion of
breeding caribou with individual groups observed as the sampling unit.
Estimation of Adult and Breeding Females Breeding females were estimated by multiplying the estimate of total (1+ year old) caribou
on each stratum by the estimated proportion of breeding females in each stratum from
composition surveys. This step basically eliminated the non-breeding females, yearlings,
and bulls from the estimate of total caribou on the calving ground. In addition the
proportion of adult females, which includes non-breeding adult females, was estimated
using composition counts. Each of these measurements has an associated variance, and the
delta method was used to estimate the total variance of breeding females under the
assumption that the composition surveys and breeding female estimates were independent
(Buckland et al. 1993).
16
Estimation of Adult Sex Ratio from Fall Composition Surveys The Bathurst herd was surveyed during the fall rut to estimate the bull-cow ratio and the
proportion of adult females in the herd in four years between 2008 and 2014. Details of
this approach are given in Cluff et al. (2016). The observation data was mapped using pie-
charts that indicated proportion bulls and cows in each sample as a way to assess spatial
variation in bull-cow ratio using QGIS software (QGIS_Foundation 2015). Estimates of
variance and confidence limits were estimated using bootstrap methods as with other
composition data with individual groups observed as the sampling unit.
Estimation of Total Herd Size Total herd size was estimated using two approaches. The first approach, used in historic
calving ground surveys assumed a fixed pregnancy rate for adult females whereas the
second approach used direct estimates of adult females in the surveyed area.
Estimation of Herd Size Assuming Fixed Pregnancy Rate As a first step, the total number of adult (2+ year old) females in the herd was estimated by
dividing the estimate of breeding females on the calving ground by the assumed pregnancy
rate of 0.72 (Dauphin'e 1976, Heard and Williams 1991). The estimate of total females was
then divided by the estimated proportion of females in the herd based on bull:cow ratios
from fall composition surveys conducted in October of 2013 to provide an estimate of total
adult caribou in the herd (methods described in Heard and Williams 1991). Note that this
estimate corresponds to adult caribou at least two years old and will not include yearlings.
This estimator assumes that all breeding females were within survey strata areas during
the calving ground survey and that the pregnancy rate of caribou was 0.72 for 2014-2015.
Estimate of Herd Size Based Upon Estimates of Adult Females An alternative extrapolated herd size estimate was developed as a means to explore the
effect of variable pregnancy rates as part of the 2014 Qamanirjuaq caribou herd (Campbell
et al. 2016). This estimator first uses data from the calving ground composition surveys to
17
estimate total proportion of adult females, and adult females in each of the survey stratum.
The estimate of total adult females is then divided by the proportion of adult females
(cows) in the herd from fall composition surveys. Using this approach, the fixed pregnancy
rate is eliminated from the estimate procedure. This estimate assumes that all adult
females (breeding and non-breeding) were within the survey strata during the calving
ground survey. It makes no assumption about the pregnancy rate of the females.
Trends in Herd Indicators
Trends in Calving Ground Size and Location The relative size and placement of the Bathurst calving ground was compared to determine
relative trend and how this trend might relate to overall herd demography.
Trends in Adult and Breeding Females The time series of adult and breeding female estimates was used to assess overall trends in
population size for the herd. Trends in breeding female estimates correspond best to the
overall reproductive potential of the herd and therefore provide a good indication of
overall herd status. However, estimates of breeding females will be affected by variation in
reproductive rate and therefore the trend in adult females was also considered. Two
methods were used to assess trends.
As an initial step, the 2015 estimate of breeding females was compared with the 2012
estimate to determine if the two estimates were statistically different, using a t-test (Zar
1996) with variances and degrees of freedom calculated using the formulas of (Gasaway et
al. 1986). This comparison gave an initial indication of change in population size, but did
not consider the survey interval between the two surveys.
18
Regression methods were used to estimate yearly rate of change of adult and breeding
females. Weighted least squares analysis was used to estimate trend from the time series of
data (Brown and Rothery 1993). Each estimate of breeding females was weighted by the
inverse of its variance to account for unequal variances of surveys, and to give more weight
to the more precise surveys. Estimates of trend of adult females were also conducted given
that these estimates will be less sensitive to yearly variation in pregnancy rate.
The main question of interest in the regression analysis was whether the trend as indicated
by the change from 2012-2015 was different than the trend from 2009-2012. As with
double-observer methods, information criteria (AICc scores) were used to evaluate the
relative support of models. Analyses were conducted with PROC GENMOD and PROC REG
within SAS statistical package (SAS Institute 2000).
Abundance estimates were log transformed to partially account for the exponential nature
of population change (Thompson et al. 1998). Annual population change (λ) was estimated
using the ratio of successive predicted population sizes from the regression model. The per
capita growth rate (r) was related to the population rate of change (λ) using the equation
λ=er=Nt+1/Nt. . If λ=1 then a population is stable; values > or <1 indicate increasing and
declining populations, respectively.
Trends in Estimates of Caribou on the Calving Ground from Reconnaissance Surveys Annual reconnaissance surveys have been conducted on the Bathurst calving ground to
assess trend in years between photo surveys. (Boulanger et al. 2014c) Estimates from the
2015 reconnaissance surveys was compared to earlier years and also estimates from photo
survey years.
19
Exploration of Demographic Factors Influencing Population Trend
Females Switching Calving Grounds Collar data for female caribou were compiled by GNWT Environment and Natural
Resources (ENR) staff for the Bathurst and neighbouring Beverly-Ahiak and Bluenose-East
herds 2008-2015. The locations of females during the peak of calving were used to assign
each female to a herd calving ground. Data points were pairs of consecutive June locations
where the cow either returned to the same calving ground or switched to a neighbouring
one.
Survival Rates of Collared Females Collar data for female caribou were compiled for the Bathurst caribou herd by Government
of the NWT (GNWT) ENR 2007-2015 to assess survival and mortality patterns. Fates of
collared caribou were determined by assessment of movement of collared caribou with
mortality being assigned to collared caribou based on lack of collar movement that could
not be explained by collar failure or device drop-off. The data were then summarized by
month as live or dead caribou. Caribou whose collars failed or were scheduled to drop off
were censored from the analysis. Data were grouped by “caribou year” that began during
calving of each year (June) and ended during the spring migration (May). Program MARK
known fate models (White and Burnham 1999) were used to then estimate caribou-year
estimates of survival rate from June 1996 - June 2015. Estimates from June 2007 - June
2015 were then used as an input into the demographic model described next.
Demographic Model using Multiple Data Sources One of the most important questions to answer for the Bathurst herd was whether the
breeding female segment of the population was increasing or stable. If the number of
breeding cows is stable, then the herd has the potential to increase. The most direct metric
that indicates the status of breeding females is their survival rate, which is the proportion
of breeding females that survive from one year to the next. This metric, along with
productivity (recruitment of yearlings to adult breeding females) determines the overall
20
trend in breeding females. For example, if breeding female survival is high then
productivity in previous years can be low and the overall trend in breeding females can be
stable. Alternatively, if productivity is consistently high, then slight reductions in adult
survival rate can be tolerated. The interaction of these various indicators can be difficult to
interpret and a population model can help further test hypotheses regarding breeding
female status.
We used the ordinary least squares (OLS) demographic model (White and Lubow 2002)
developed for the Bathurst herd (Boulanger et al. 2011) to further explore demographic
trends in the Bathurst data. For this exercise, we used the 2009, 2012, and 2015 breeding
female estimates as well as calf-cow ratios, bull-cow ratios, estimates of proportion
breeding females, and adult female survival rates from collared caribou to estimate the
most likely adult female survival values that would result in the observed trends in all of
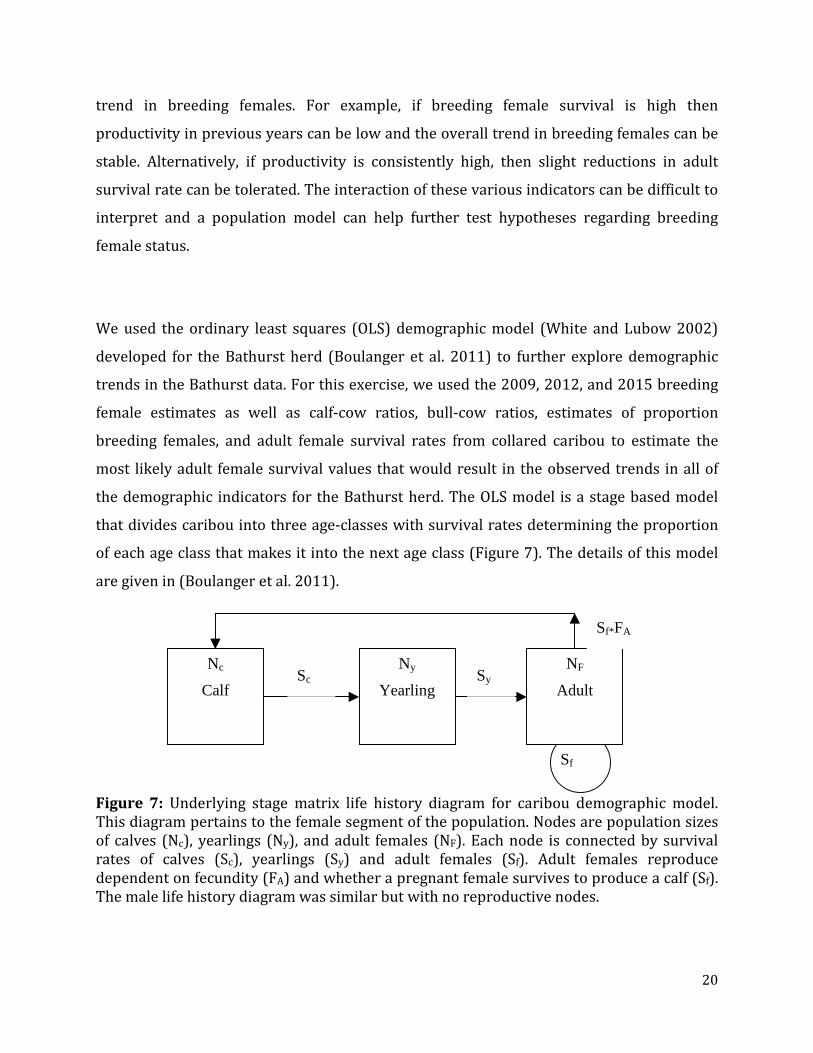
the demographic indicators for the Bathurst herd. The OLS model is a stage based model
that divides caribou into three age-classes with survival rates determining the proportion
of each age class that makes it into the next age class (Figure 7). The details of this model
are given in (Boulanger et al. 2011).
Figure 7: Underlying stage matrix life history diagram for caribou demographic model. This diagram pertains to the female segment of the population. Nodes are population sizes of calves (Nc), yearlings (Ny), and adult females (NF). Each node is connected by survival rates of calves (Sc), yearlings (Sy) and adult females (Sf). Adult females reproduce dependent on fecundity (FA) and whether a pregnant female survives to produce a calf (Sf). The male life history diagram was similar but with no reproductive nodes.
Nc
Calf
Ny
Yearling
NF
Adult Sc Sy
Sf*FA
Sf
21
An assumption of the OLS model is that net movement of Bathurst caribou to or from
adjacent calving grounds (Bluenose-East and Beverly-Ahiak) is negligible so that the
primary influence of change in population size is survival and recruitment of caribou
within the Bathurst herd. This assumption was tested through evaluation of frequencies of
collared caribou cows switching to or from neighbouring calving grounds (as described
previously).
We restricted the data set for this exercise to survey results between 2007 and 2015. Using
this approach ensured that past demographic values, that were recorded during the major
decline 2006-2009, did not unduly influence the estimates for the principal time frame of
interest (the interval between the 2009 and 2012 surveys). This interval basically covered
potential recruitment into the breeding female class since any female calf born 2007-2009
had the potential to become a breeding female in 2012, and breeding females recruited
prior to 2007 were accounted for by the 2009 calving ground estimate of breeding females
(Table 2). It was assumed that a female calf born in 2007 would not breed in the fall after it
was born, or the fall of its second year, but it could breed in its third year. It was considered
a non-breeder until 2010. Given this time-lag, productivity (calves born) in 2010, 2011, and
2012 had the most direct bearing on the number of new breeding females on the calving
ground that were not accounted for in the 2012 breeding female estimate.
22
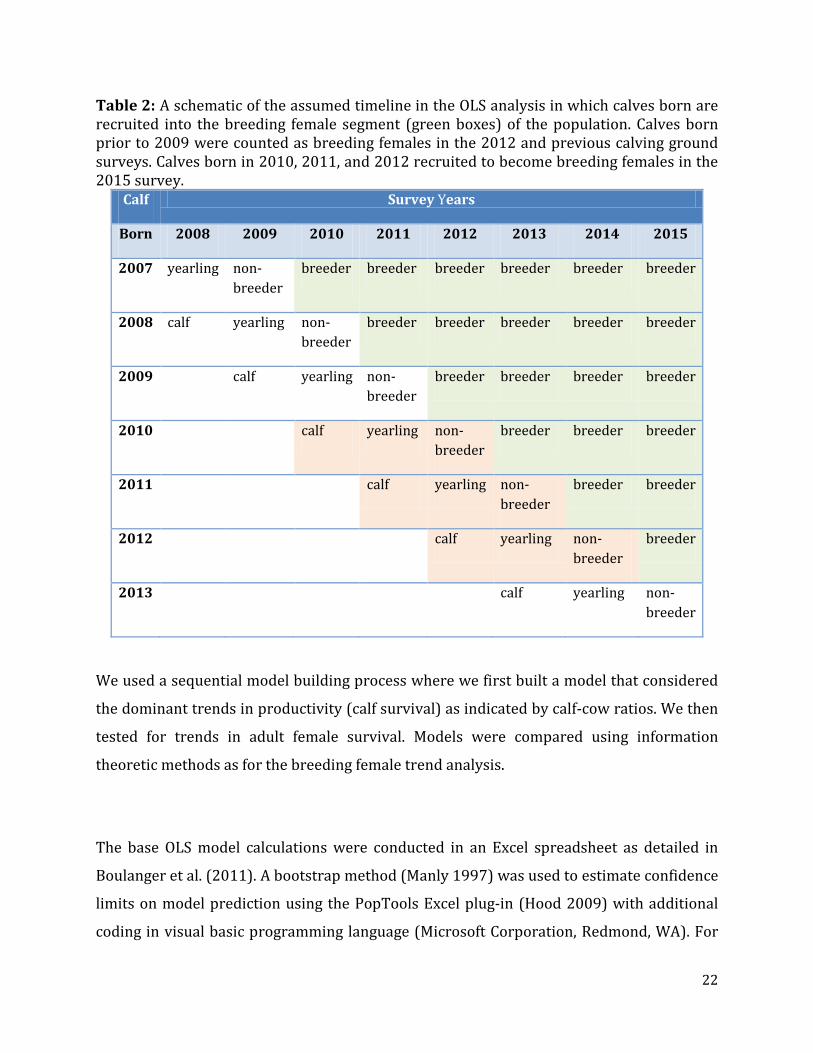
Table 2: A schematic of the assumed timeline in the OLS analysis in which calves born are recruited into the breeding female segment (green boxes) of the population. Calves born prior to 2009 were counted as breeding females in the 2012 and previous calving ground surveys. Calves born in 2010, 2011, and 2012 recruited to become breeding females in the 2015 survey.
Calf Survey Years
Born 2008 2009 2010 2011 2012 2013 2014 2015
2007 yearling non-breeder
breeder breeder breeder breeder breeder breeder
2008 calf yearling non-breeder
breeder breeder breeder breeder breeder
2009 calf yearling non-breeder
breeder breeder breeder breeder
2010 calf yearling non-breeder
breeder breeder breeder
2011 calf yearling non-breeder
breeder breeder
2012 calf yearling non-breeder
breeder
2013 calf yearling non-breeder
We used a sequential model building process where we first built a model that considered
the dominant trends in productivity (calf survival) as indicated by calf-cow ratios. We then
tested for trends in adult female survival. Models were compared using information
theoretic methods as for the breeding female trend analysis.
The base OLS model calculations were conducted in an Excel spreadsheet as detailed in
Boulanger et al. (2011). A bootstrap method (Manly 1997) was used to estimate confidence
limits on model prediction using the PopTools Excel plug-in (Hood 2009) with additional
coding in visual basic programming language (Microsoft Corporation, Redmond, WA). For
23
this procedure, the base field data set was randomly resampled 1,000 times and run
through the OLS model to obtain percentile based confidence limits (Manly 1997) on model
parameters and estimates of SE. In some cases, combinations of randomly sampled field
values created outlier estimates as indicated by high overall penalty values for overall
model fit. To address this, estimates from model runs with outlier penalty values (as
indicated by the top one percentile of penalties) were censored from confidence interval
calculations.
24
RESULTS
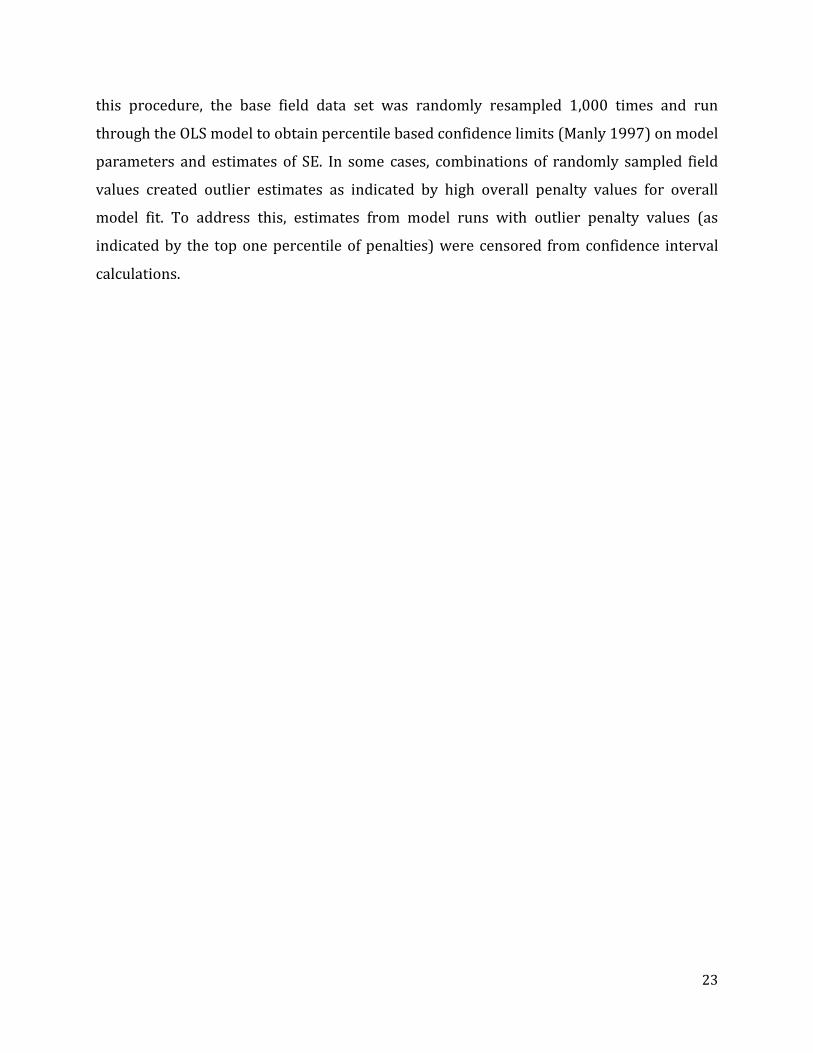
Survey Conditions Weather during the survey was mixed with variable snow and cloud cover throughout the
survey (Figure 8). Snow and cloud cover were summarized extensively using data from
Trimble YUMA 2 tablet computers for the double-observer analysis used in the visual
survey conducted on June 6th. Fog and low ceiling prevented flying on June 5th. A weather
system came into the survey area late on June 6th with fog and low ceiling grounding fixed
wing aircraft from June 7-9th and helicopters used for composition on June 7th.
Figure 8: Survey conditions during the June 6th visual and photo survey in the core survey area. In most cases cloud ceiling were high (left photo) with some pockets of lower cloud cover (right photo). Snow cover was generally <15%. Photos: David Lee.
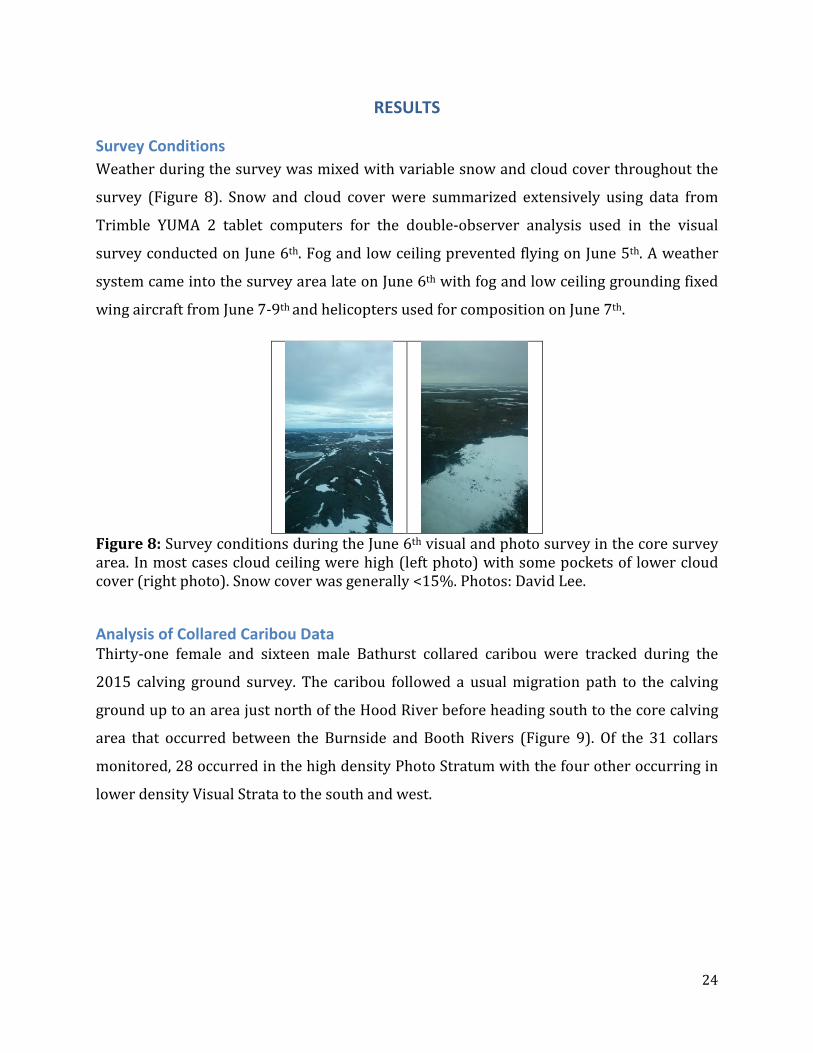
Analysis of Collared Caribou Data Thirty-one female and sixteen male Bathurst collared caribou were tracked during the
2015 calving ground survey. The caribou followed a usual migration path to the calving
ground up to an area just north of the Hood River before heading south to the core calving
area that occurred between the Burnside and Booth Rivers (Figure 9). Of the 31 collars
monitored, 28 occurred in the high density Photo Stratum with the four other occurring in
lower density Visual Strata to the south and west.
25
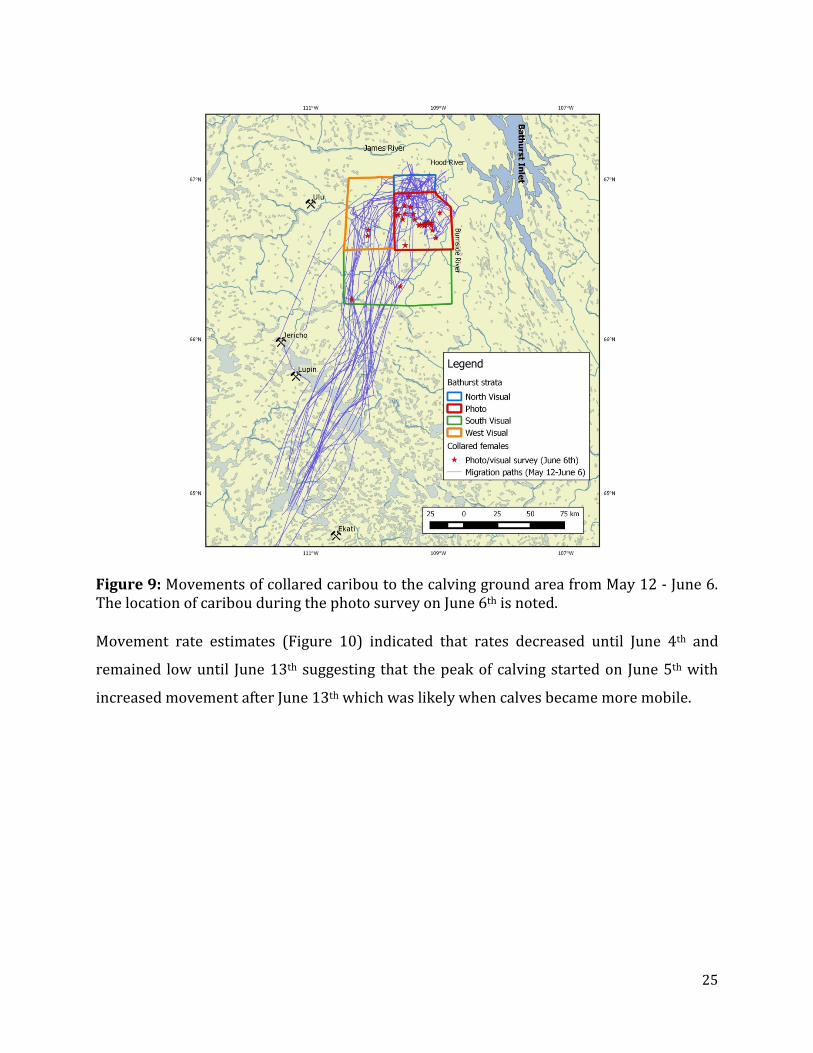
Figure 9: Movements of collared caribou to the calving ground area from May 12 - June 6. The location of caribou during the photo survey on June 6th is noted. Movement rate estimates (Figure 10) indicated that rates decreased until June 4th and
remained low until June 13th suggesting that the peak of calving started on June 5th with
increased movement after June 13th which was likely when calves became more mobile.
26
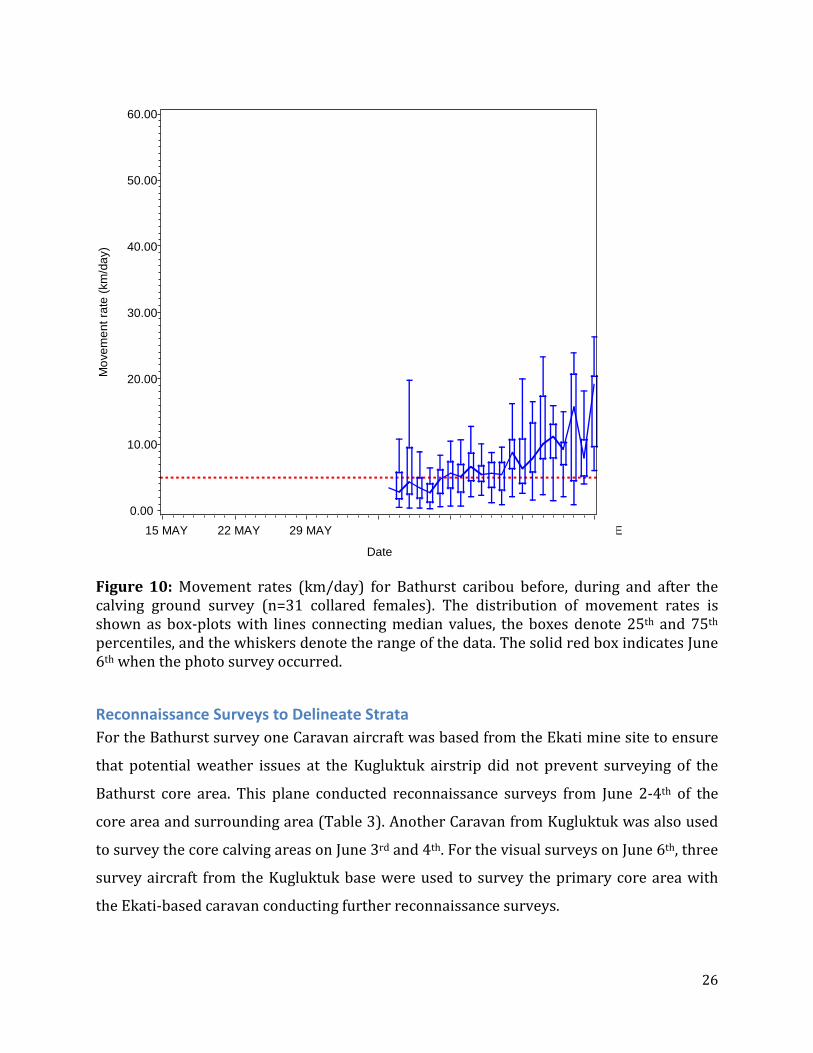
Figure 10: Movement rates (km/day) for Bathurst caribou before, during and after the calving ground survey (n=31 collared females). The distribution of movement rates is shown as box-plots with lines connecting median values, the boxes denote 25th and 75th percentiles, and the whiskers denote the range of the data. The solid red box indicates June 6th when the photo survey occurred.
Reconnaissance Surveys to Delineate Strata For the Bathurst survey one Caravan aircraft was based from the Ekati mine site to ensure
that potential weather issues at the Kugluktuk airstrip did not prevent surveying of the
Bathurst core area. This plane conducted reconnaissance surveys from June 2-4th of the
core area and surrounding area (Table 3). Another Caravan from Kugluktuk was also used
to survey the core calving areas on June 3rd and 4th. For the visual surveys on June 6th, three
survey aircraft from the Kugluktuk base were used to survey the primary core area with
the Ekati-based caravan conducting further reconnaissance surveys.
05 JUNE 12 JUNE 19 JUNE 26 JUNE
Mov
emen
t rat
e (k
m/d
ay)
0.00
10.00
20.00
30.00
40.00
50.00
60.00
Date 15 MAY 22 MAY 29 MAY
27
Table 3: Summary of reconnaissance and visual survey efforts for the Bathurst calving ground survey. There was one plane primarily based out of Ekati mine site for the survey, and three planes that flew both the Bluenose-East and Bathurst surveys based out of Kugluktuk.
Date Caravan 1 Base: Ekati Mine site Caravan 2 (and other planes) Base: Kugluktuk, NU
June 2, 2015 Recon: Initial survey of core area Bluenose-East survey June 3, 2015 Recon of areas south of core Recon: Areas west of core June 4, 2015 Recon of Core east to Bathurst Inlet Recon: Core calving area June 5, 2015 Grounded due to weather Bluenose-East survey June 6, 2015 Recon: south and east of Bathurst
Inlet Caravan 2: Visual West and South Strata Caravan 3: South Stratum Pilatus porter: North Stratum
June 7, 2015 Recon: North of core area Bluenose-East survey
The reconnaissance surveys identified a relatively small cluster of medium to high
densities of caribou situated in the core calving area with a trailing edge occurring to the
southwest (Figure 11). The observations of moderate to high densities coincided with the
locations of female collared caribou which also were aggregated in the core area (Figure
11). The locations of collared bulls extended far to the south with intermittent lower
densities of non-breeding cows and yearlings detected in this area.
28
Figure 11: Reconnaissance survey coverage of Bathurst calving ground in 2015 with segment densities and composition.
29
Stratification and Allocation of Survey Effort The proportion of calves in the core area (as defined by the Photo Stratum) was 34.2%
(SD=34.9%, min=0, max=1, n=25) during recon flying on June 4th suggesting that the herd
was close to the peak of calving. Newborn calves are small and often bedded or behind
their mothers, thus are easily missed by observers from fixed-wing aircraft. The peak of
calving was also indicated by reduced movements of collared cows beginning on June 4th
(Figure 10).
Closer inspection of the reconnaissance data (Figure 12) revealed mainly medium density
segments of caribou in areas between the Hood, Booth, and Burnside Rivers with a few
groups to the north of the Hood River. Overall, the density of segments was lower with only
two high density segments in the entire core area. One of the northern segments was
composed of a single group of 80 caribou 2 km north of the Hood River. In addition, 257
caribou were observed in one high density segment between the Burnside and Booth
Rivers which was also within the vicinity of many of the collared female caribou.
30
Figure 12: A closer view of segment with densities (caribou/km2) shown above each segment.
One principal Photo Strata was defined which encompassed the majority of collared
caribou and observations of medium to higher densities of breeding caribou. The Northern
Stratum was low density except for a single group of caribou observed near the Hood River.
For this reason this area was surveyed using visual methods. The South and West Stratum
were extended to include all the collared female caribou (Table 4).
31
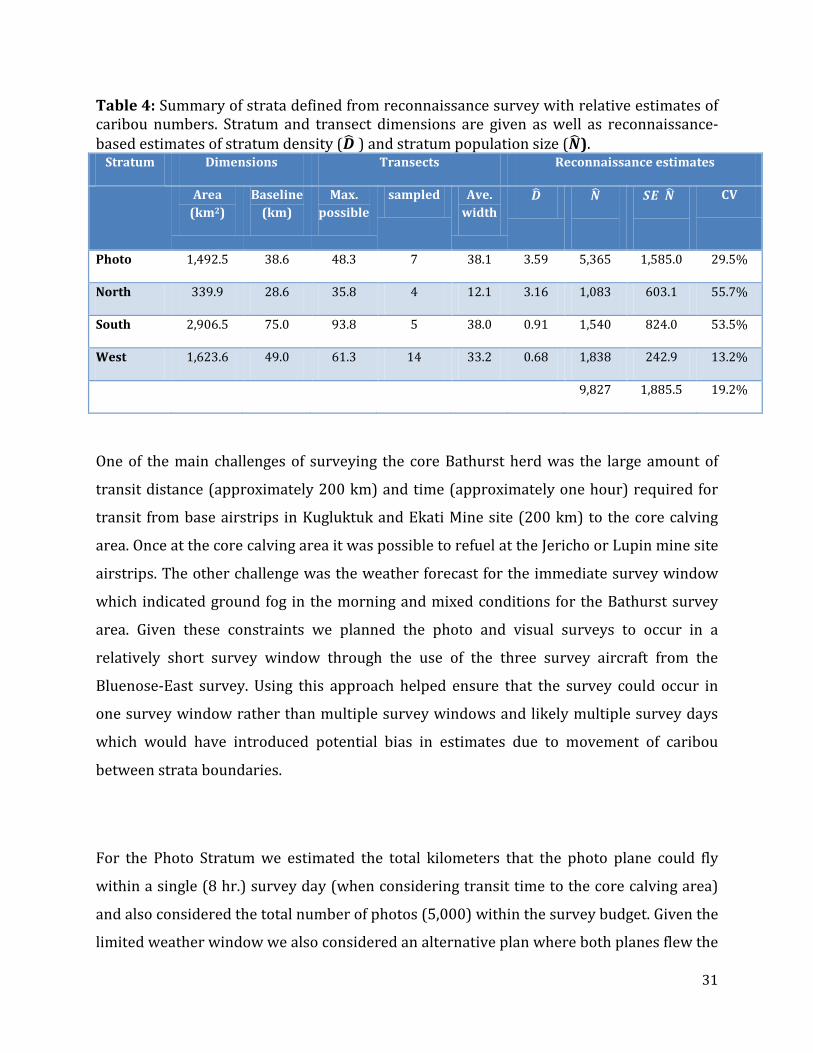
Table 4: Summary of strata defined from reconnaissance survey with relative estimates of caribou numbers. Stratum and transect dimensions are given as well as reconnaissance-based estimates of stratum density (𝑫� ) and stratum population size (𝑵�).
Stratum Dimensions Transects Reconnaissance estimates
Area (km2)
Baseline (km)
Max. possible
sampled Ave. width
𝑫� 𝑵�
𝑺𝑬(𝑵�)
CV
Photo 1,492.5 38.6 48.3 7 38.1 3.59 5,365 1,585.0 29.5%
North 339.9 28.6 35.8 4 12.1 3.16 1,083 603.1 55.7%
South 2,906.5 75.0 93.8 5 38.0 0.91 1,540 824.0 53.5%
West 1,623.6 49.0 61.3 14 33.2 0.68 1,838 242.9 13.2%
9,827 1,885.5 19.2%
One of the main challenges of surveying the core Bathurst herd was the large amount of
transit distance (approximately 200 km) and time (approximately one hour) required for
transit from base airstrips in Kugluktuk and Ekati Mine site (200 km) to the core calving
area. Once at the core calving area it was possible to refuel at the Jericho or Lupin mine site
airstrips. The other challenge was the weather forecast for the immediate survey window
which indicated ground fog in the morning and mixed conditions for the Bathurst survey
area. Given these constraints we planned the photo and visual surveys to occur in a
relatively short survey window through the use of the three survey aircraft from the
Bluenose-East survey. Using this approach helped ensure that the survey could occur in
one survey window rather than multiple survey windows and likely multiple survey days
which would have introduced potential bias in estimates due to movement of caribou
between strata boundaries.
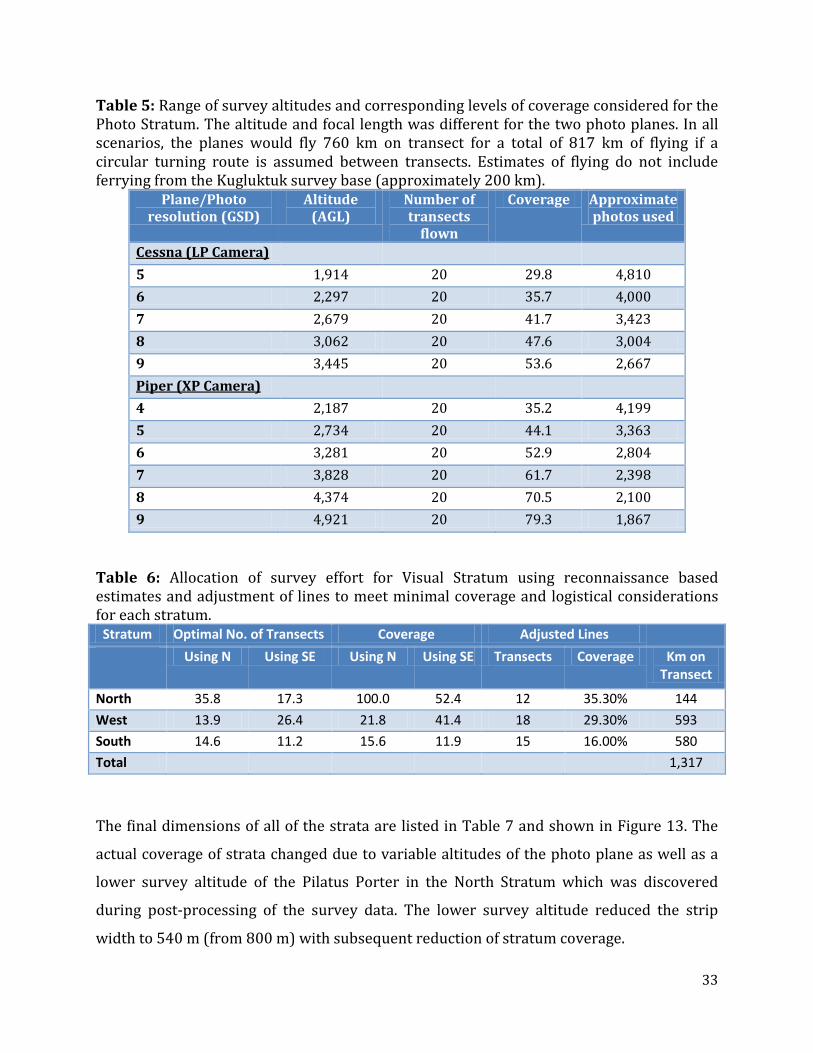
For the Photo Stratum we estimated the total kilometers that the photo plane could fly
within a single (8 hr.) survey day (when considering transit time to the core calving area)
and also considered the total number of photos (5,000) within the survey budget. Given the
limited weather window we also considered an alternative plan where both planes flew the
32
Photo Stratum if we felt that a full survey day of flying was not viable given survey
conditions. The actual number of kilometers that can be flown within a fixed number of
photos depends partially on the survey altitude of the photo plane. If the plane can fly
higher than it is possible to cover more survey area with less photos (Table 5).
On June 5th the entire Bathurst core area was enveloped in fog and it was not possible to
conduct a photo survey. On June 6th, clearing was forecast for the afternoon with a potential
storm front moving in the next day. For this reason, we decided to have both photo planes
fly the Photo Stratum with each plane flying every other line to mitigate potential bias
caused by a larger strip width for the plane with the XP camera compared to the plane with
the LP camera. Using this plan, the coverage was still systematic and random given that the
coverage systematically varied by every other line. The main penalty for this survey design
was a slight reduction of precision, however, any bias was negligible given that the survey
was still systematic random. We felt this approach was the best way to ensure the survey
was completed within a single survey session.
For the Visual Stratum we allocated 1,500 km of survey transect flying with additional
constraints for each stratum to ensure that they could be flown within a shorter survey
window. Using estimates from the reconnaissance surveys (Table 4) effort was allocated to
the three Visual Stratum using estimates of density and SE (Table 6). The highest amount of
coverage was allocated to the North Stratum based on the higher density of caribou in this
stratum. The South Stratum had the lowest coverage. The number of lines was adjusted to
allow coverage of the North Stratum in a single flight with the rest of the effort allocated to
the South and West Strata.
33
Table 5: Range of survey altitudes and corresponding levels of coverage considered for the Photo Stratum. The altitude and focal length was different for the two photo planes. In all scenarios, the planes would fly 760 km on transect for a total of 817 km of flying if a circular turning route is assumed between transects. Estimates of flying do not include ferrying from the Kugluktuk survey base (approximately 200 km).
Plane/Photo resolution (GSD)
Altitude (AGL)
Number of transects
flown
Coverage Approximate photos used
Cessna (LP Camera) 5 1,914 20 29.8 4,810 6 2,297 20 35.7 4,000 7 2,679 20 41.7 3,423 8 3,062 20 47.6 3,004 9 3,445 20 53.6 2,667 Piper (XP Camera) 4 2,187 20 35.2 4,199 5 2,734 20 44.1 3,363 6 3,281 20 52.9 2,804 7 3,828 20 61.7 2,398 8 4,374 20 70.5 2,100 9 4,921 20 79.3 1,867
Table 6: Allocation of survey effort for Visual Stratum using reconnaissance based estimates and adjustment of lines to meet minimal coverage and logistical considerations for each stratum.
Stratum Optimal No. of Transects Coverage Adjusted Lines Using N Using SE Using N Using SE Transects Coverage Km on
Transect
North 35.8 17.3 100.0 52.4 12 35.30% 144 West 13.9 26.4 21.8 41.4 18 29.30% 593 South 14.6 11.2 15.6 11.9 15 16.00% 580 Total 1,317
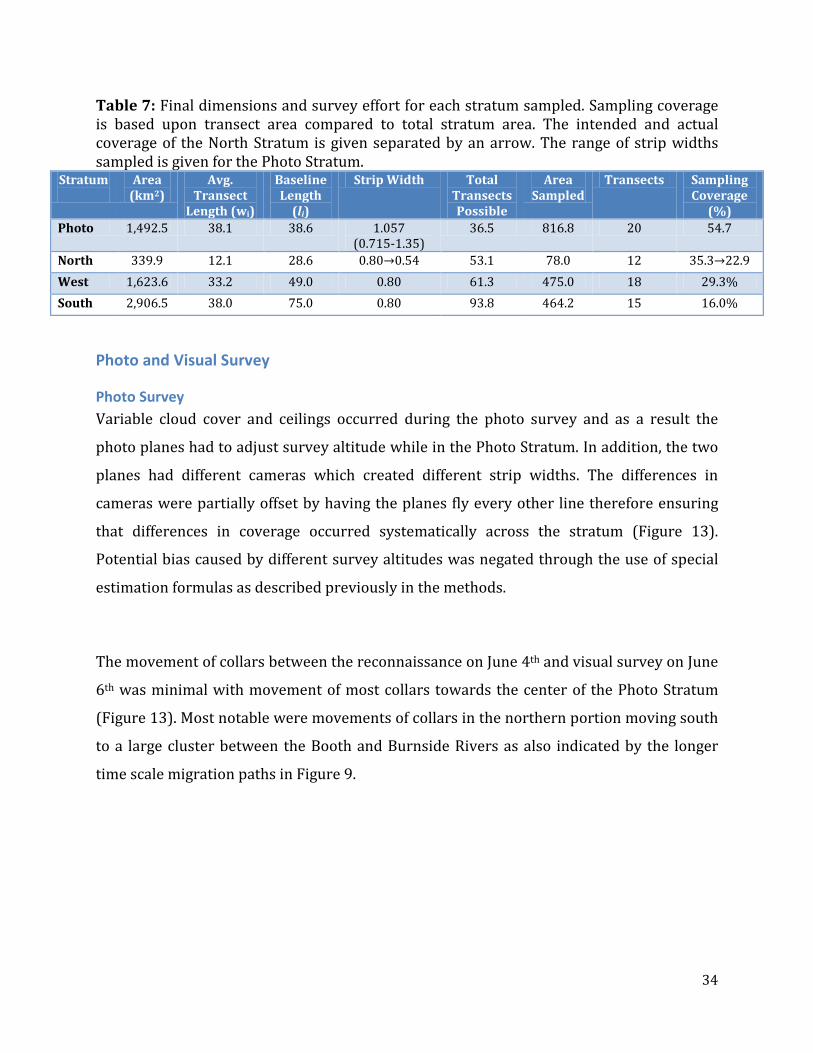
The final dimensions of all of the strata are listed in Table 7 and shown in Figure 13. The
actual coverage of strata changed due to variable altitudes of the photo plane as well as a
lower survey altitude of the Pilatus Porter in the North Stratum which was discovered
during post-processing of the survey data. The lower survey altitude reduced the strip
width to 540 m (from 800 m) with subsequent reduction of stratum coverage.
34
Table 7: Final dimensions and survey effort for each stratum sampled. Sampling coverage is based upon transect area compared to total stratum area. The intended and actual coverage of the North Stratum is given separated by an arrow. The range of strip widths sampled is given for the Photo Stratum.
Stratum
Area (km2)
Avg. Transect
Length (wi)
Baseline Length
(li)
Strip Width Total Transects Possible
Area Sampled
Transects Sampling Coverage
(%) Photo 1,492.5 38.1 38.6 1.057
(0.715-1.35) 36.5 816.8 20 54.7
North 339.9 12.1 28.6 0.80→0.54 53.1 78.0 12 35.3→22.9 West 1,623.6 33.2 49.0 0.80 61.3 475.0 18 29.3% South 2,906.5 38.0 75.0 0.80 93.8 464.2 15 16.0%
Photo and Visual Survey
Photo Survey Variable cloud cover and ceilings occurred during the photo survey and as a result the
photo planes had to adjust survey altitude while in the Photo Stratum. In addition, the two
planes had different cameras which created different strip widths. The differences in
cameras were partially offset by having the planes fly every other line therefore ensuring
that differences in coverage occurred systematically across the stratum (Figure 13).
Potential bias caused by different survey altitudes was negated through the use of special
estimation formulas as described previously in the methods.
The movement of collars between the reconnaissance on June 4th and visual survey on June
6th was minimal with movement of most collars towards the center of the Photo Stratum
(Figure 13). Most notable were movements of collars in the northern portion moving south
to a large cluster between the Booth and Burnside Rivers as also indicated by the longer
time scale migration paths in Figure 9.
35
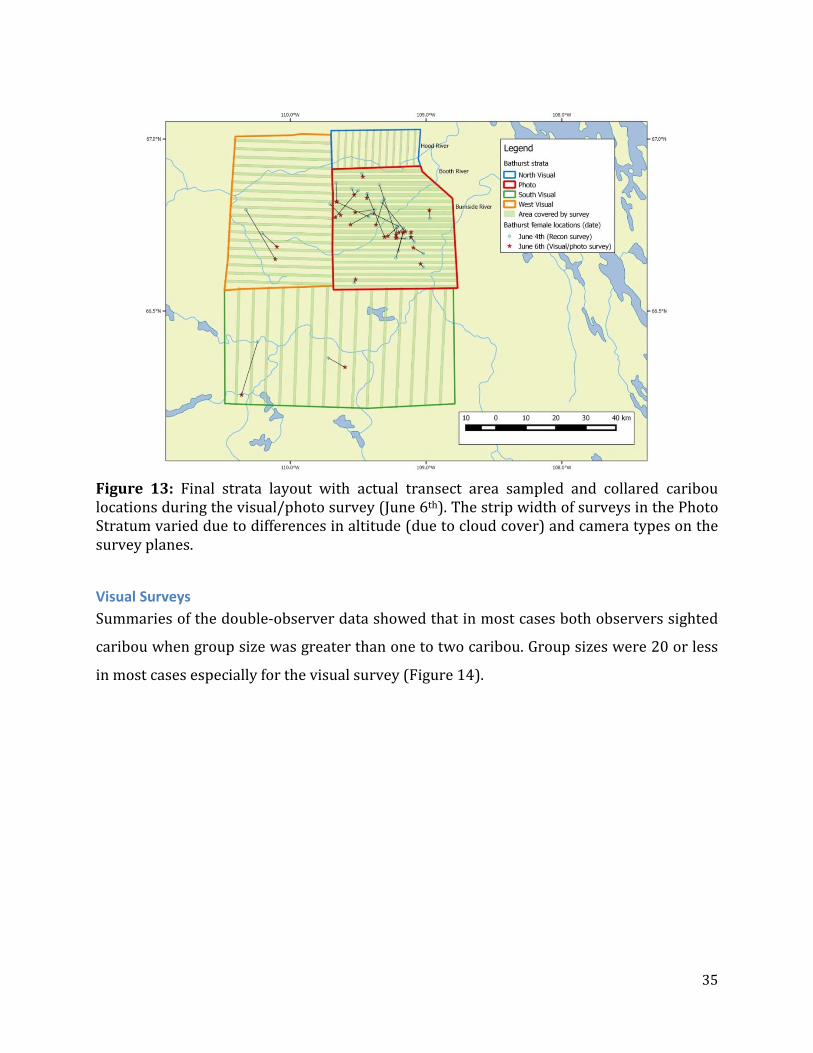
Figure 13: Final strata layout with actual transect area sampled and collared caribou locations during the visual/photo survey (June 6th). The strip width of surveys in the Photo Stratum varied due to differences in altitude (due to cloud cover) and camera types on the survey planes.
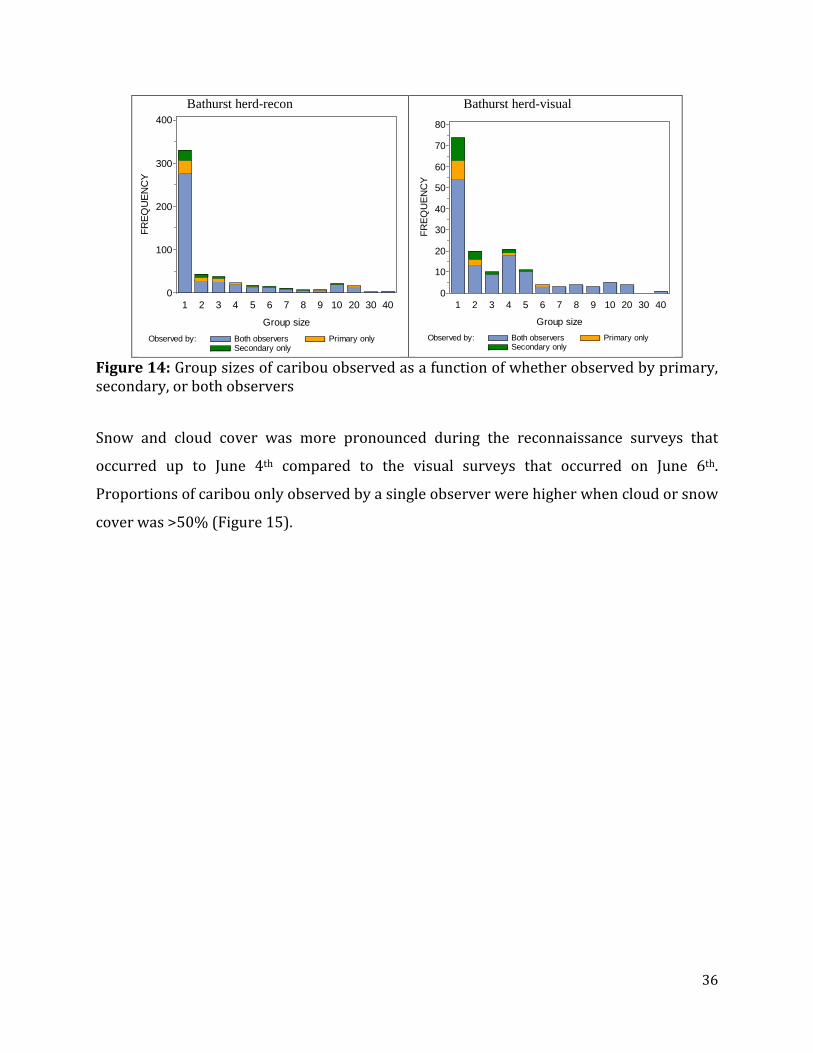
Visual Surveys Summaries of the double-observer data showed that in most cases both observers sighted
caribou when group size was greater than one to two caribou. Group sizes were 20 or less
in most cases especially for the visual survey (Figure 14).
36
Bathurst herd-recon
Bathurst herd-visual
Figure 14: Group sizes of caribou observed as a function of whether observed by primary, secondary, or both observers
Snow and cloud cover was more pronounced during the reconnaissance surveys that
occurred up to June 4th compared to the visual surveys that occurred on June 6th.
Proportions of caribou only observed by a single observer were higher when cloud or snow
cover was >50% (Figure 15).
Observed by: Both observers Primary onlySecondary only
FREQ
UEN
CY
0
100
200
300
400
Group size
1 2 3 4 5 6 7 8 9 10 20 30 40
Observed by: Both observers Primary onlySecondary only
FREQ
UEN
CY
0
10
20
30
40
50
60
70
80
Group size
1 2 3 4 5 6 7 8 9 10 20 30 40
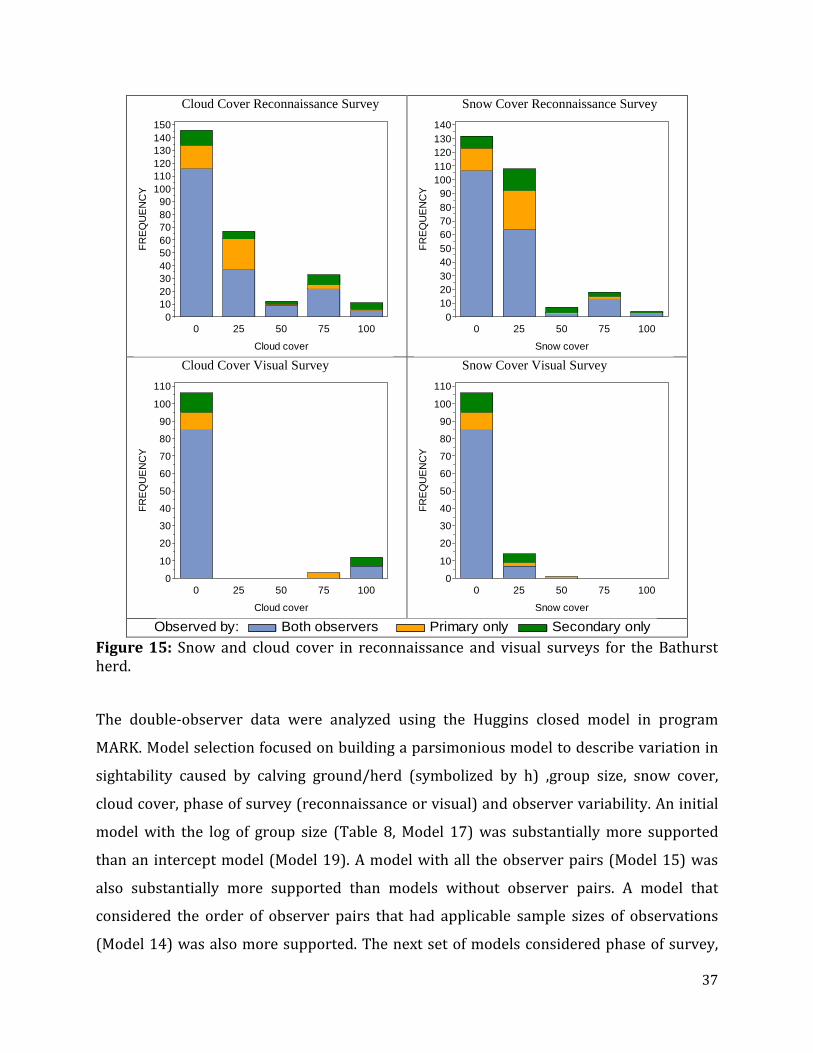
37
Cloud Cover Reconnaissance Survey
Snow Cover Reconnaissance Survey
Cloud Cover Visual Survey
Snow Cover Visual Survey
Figure 15: Snow and cloud cover in reconnaissance and visual surveys for the Bathurst herd.
The double-observer data were analyzed using the Huggins closed model in program
MARK. Model selection focused on building a parsimonious model to describe variation in
sightability caused by calving ground/herd (symbolized by h) ,group size, snow cover,
cloud cover, phase of survey (reconnaissance or visual) and observer variability. An initial
model with the log of group size (Table 8, Model 17) was substantially more supported
than an intercept model (Model 19). A model with all the observer pairs (Model 15) was
also substantially more supported than models without observer pairs. A model that
considered the order of observer pairs that had applicable sample sizes of observations
(Model 14) was also more supported. The next set of models considered phase of survey,
FRE
QU
EN
CY
0102030405060708090
100110120130140150
Cloud cover
0 25 50 75 100
FRE
QU
EN
CY
0102030405060708090
100110120130140
Snow cover
0 25 50 75 100
FRE
QU
EN
CY
0
10
20
30
40
50
60
70
80
90
100
110
Cloud cover
0 25 50 75 100
FRE
QU
EN
CY
0
10
20
30
40
50
60
70
80
90
100
110
Snow cover
0 25 50 75 100
Observed by: Both observers Primary only Secondary only
38
snow cover, and cloud cover. Survey conditions were appreciably different on the
Bluenose-East and Bathurst calving grounds. Cloud and snow cover was higher in
reconnaissance but reduced in visual surveys for the Bathurst herd (Figure 15). This issue
and differences in topography made it possible that mean levels of sightability and
relationships between sightability and cloud/snow cover could be different for the two
calving grounds. A model that assumed similar relationships between sightability and
snow/cloud cover between the two calving grounds (Model 11) was contrasted with
models that considered herd-specific relationships (Models 1-8). Of the models considered,
a model that estimated herd/calving ground specific relationships between cloud and snow
cover was more supported than models that considered similar relationships for each
calving ground (Model 1).
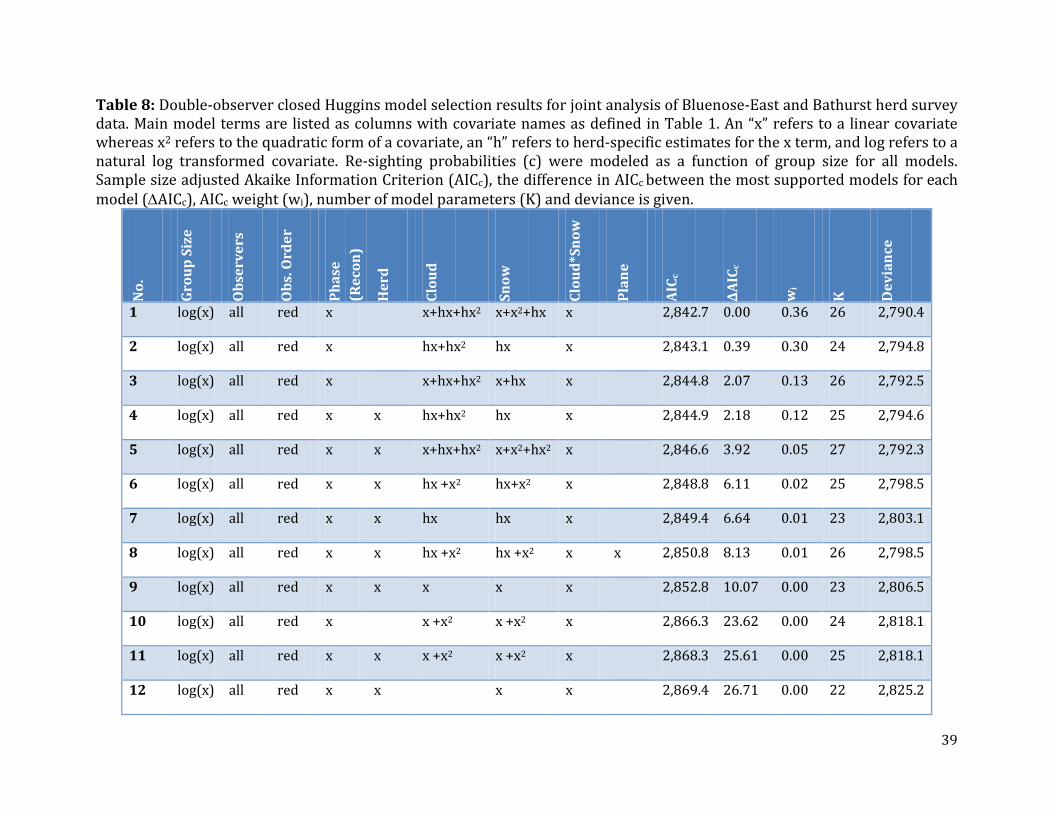
39
Table 8: Double-observer closed Huggins model selection results for joint analysis of Bluenose-East and Bathurst herd survey data. Main model terms are listed as columns with covariate names as defined in Table 1. An “x” refers to a linear covariate whereas x2 refers to the quadratic form of a covariate, an “h” refers to herd-specific estimates for the x term, and log refers to a natural log transformed covariate. Re-sighting probabilities (c) were modeled as a function of group size for all models. Sample size adjusted Akaike Information Criterion (AICc), the difference in AICc between the most supported models for each model (∆AICc), AICc weight (wi), number of model parameters (K) and deviance is given.
No.
Grou
p Si
ze
Obs
erve
rs
Obs
. Ord
er
Phas
e (R
econ
)
Her
d
Clou
d
Snow
Clou
d*Sn
ow
Plan
e
AIC c
∆AIC
c
wi
K
Dev
ianc
e
1 log(x) all red x x+hx+hx2 x+x2+hx x 2,842.7 0.00 0.36 26 2,790.4
2 log(x) all red x hx+hx2 hx x 2,843.1 0.39 0.30 24 2,794.8
3 log(x) all red x x+hx+hx2 x+hx x 2,844.8 2.07 0.13 26 2,792.5
4 log(x) all red x x hx+hx2 hx x 2,844.9 2.18 0.12 25 2,794.6
5 log(x) all red x x x+hx+hx2 x+x2+hx2 x 2,846.6 3.92 0.05 27 2,792.3
6 log(x) all red x x hx +x2 hx+x2 x 2,848.8 6.11 0.02 25 2,798.5
7 log(x) all red x x hx hx x 2,849.4 6.64 0.01 23 2,803.1
8 log(x) all red x x hx +x2 hx +x2 x x 2,850.8 8.13 0.01 26 2,798.5
9 log(x) all red x x x x x 2,852.8 10.07 0.00 23 2,806.5
10 log(x) all red x x +x2 x +x2 x 2,866.3 23.62 0.00 24 2,818.1
11 log(x) all red x x x +x2 x +x2 x 2,868.3 25.61 0.00 25 2,818.1
12 log(x) all red x x x x 2,869.4 26.71 0.00 22 2,825.2
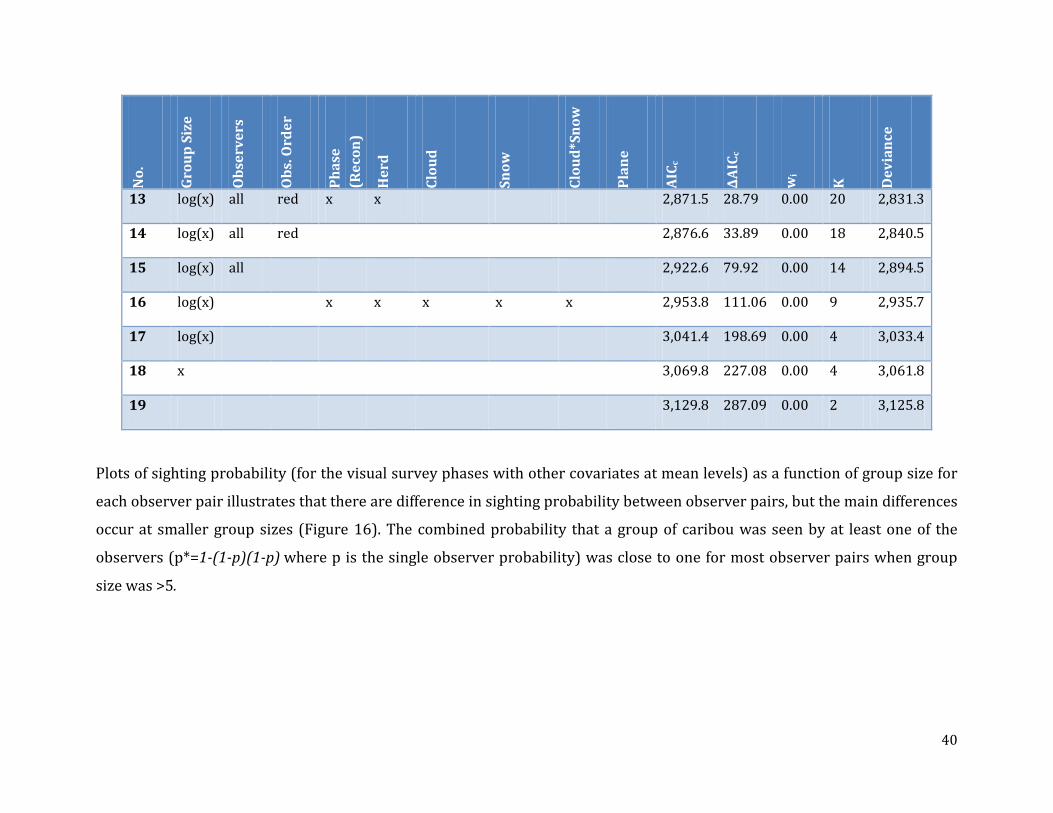
40
No.
Grou
p Si
ze
Obs
erve
rs
Obs
. Ord
er
Phas
e (R
econ
)
Her
d
Clou
d
Snow
Clou
d*Sn
ow
Plan
e
AIC c
∆AIC
c
wi
K
Dev
ianc
e
13 log(x) all red x x 2,871.5 28.79 0.00 20 2,831.3
14 log(x) all red 2,876.6 33.89 0.00 18 2,840.5
15 log(x) all 2,922.6 79.92 0.00 14 2,894.5
16 log(x) x x x x x 2,953.8 111.06 0.00 9 2,935.7
17 log(x) 3,041.4 198.69 0.00 4 3,033.4
18 x 3,069.8 227.08 0.00 4 3,061.8
19 3,129.8 287.09 0.00 2 3,125.8
Plots of sighting probability (for the visual survey phases with other covariates at mean levels) as a function of group size for
each observer pair illustrates that there are difference in sighting probability between observer pairs, but the main differences
occur at smaller group sizes (Figure 16). The combined probability that a group of caribou was seen by at least one of the
observers (p*=1-(1-p)(1-p) where p is the single observer probability) was close to one for most observer pairs when group
size was >5.
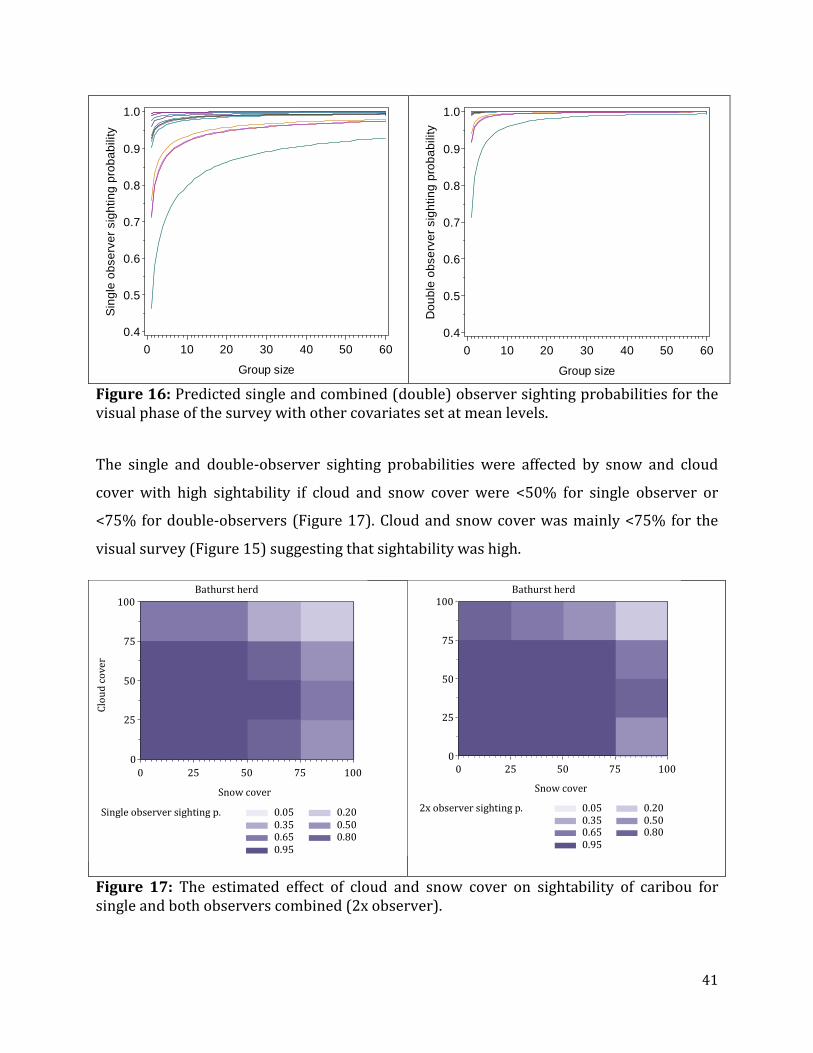
41
Figure 16: Predicted single and combined (double) observer sighting probabilities for the visual phase of the survey with other covariates set at mean levels.
The single and double-observer sighting probabilities were affected by snow and cloud
cover with high sightability if cloud and snow cover were <50% for single observer or
<75% for double-observers (Figure 17). Cloud and snow cover was mainly <75% for the
visual survey (Figure 15) suggesting that sightability was high.
Figure 17: The estimated effect of cloud and snow cover on sightability of caribou for single and both observers combined (2x observer).
Sin
gle
obse
rver
sig
htin
g pr
obab
ility
0.4
0.5
0.6
0.7
0.8
0.9
1.0
Group size
0 10 20 30 40 50 60
Dou
ble
obse
rver
sig
htin
g pr
obab
ility
0.4
0.5
0.6
0.7
0.8
0.9
1.0
Group size
0 10 20 30 40 50 60
Bathurst herd
Single observer sighting p. 0.05 0.20 0.35 0.50 0.65 0.80 0.95
Clou
d co
ver
0
25
50
75
100
Snow cover 0 25 50 75 100
Bathurst herd
2x observer sighting p. 0.05 0.20 0.35 0.50 0.65 0.80 0.95
Clou
d co
ver
0
25
50
75
100
Snow cover 0 25 50 75 100
42
Overall, the mean double-observer sighting probability estimates for reconnaissance and
visual surveys was 0.87 (SD=0.28, CI=0.1-1) and 0.99 (SD=0.02, CI=0.92-1). The increase in
sightability was due to better survey conditions as well as more attention to searching for
groups in the visual component survey with less attention to classification of groups. In
comparison, estimates of sightability for a single observer was 0.80 (SD=0.29, CI=0.1-1)
and 0.84 (SD=0.71-1.00) for the reconnaissance and visual surveys. This general result
demonstrates the increase in sightability with two observers searching for caribou per side
of the plane compared to a single observer.
Estimates of Caribou on the Calving Ground The majority (85%) of the estimated caribou were in the Photo Stratum with relatively low
densities in other strata (Table 9). The lower number of caribou counted in the North
Stratum was presumably due to southern movement of caribou between the
reconnaissance and visual/photo surveys as suggested by collared caribou (Figure 13). The
Northern Stratum was extensively surveyed during the composition survey with no
caribou detected. The overall estimate of caribou was 15,369 (CI=9,913-20,826).
The estimate of total caribou on the calving ground without double-observer correction
was 15,341 (SE=2,605.9, CV=17.0%) which was only 28 caribou less than the estimate with
double-observer corrections. The reasons for minimal difference between estimates was
that the Photo Stratum (which did not use double-observer correction) constituted most
(85.1%) of the caribou estimated on the calving ground, and double-observer sightability
was high (0.99) during the visual survey.
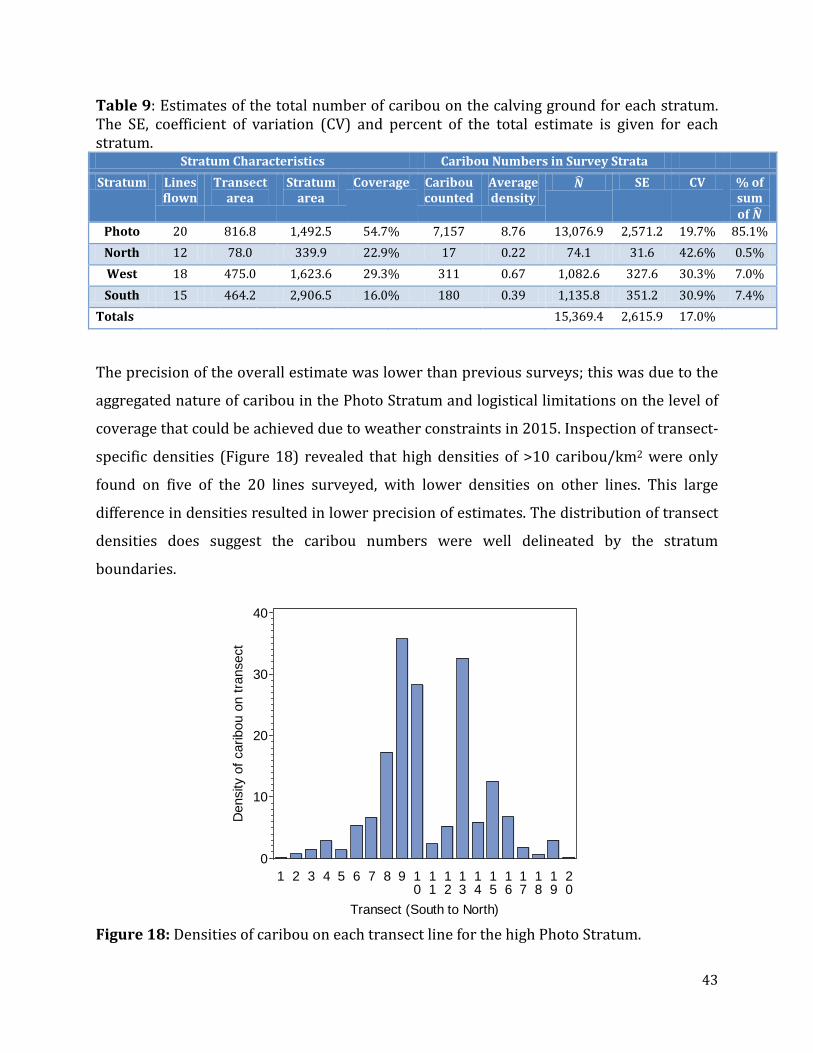
43
Table 9: Estimates of the total number of caribou on the calving ground for each stratum. The SE, coefficient of variation (CV) and percent of the total estimate is given for each stratum.
Stratum Characteristics Caribou Numbers in Survey Strata Stratum Lines
flown Transect
area Stratum
area Coverage Caribou
counted Average density
𝑵� SE CV % of sum of 𝑵�
Photo 20 816.8 1,492.5 54.7% 7,157 8.76 13,076.9 2,571.2 19.7% 85.1% North 12 78.0 339.9 22.9% 17 0.22 74.1 31.6 42.6% 0.5% West 18 475.0 1,623.6 29.3% 311 0.67 1,082.6 327.6 30.3% 7.0% South 15 464.2 2,906.5 16.0% 180 0.39 1,135.8 351.2 30.9% 7.4%
Totals 15,369.4 2,615.9 17.0%
The precision of the overall estimate was lower than previous surveys; this was due to the
aggregated nature of caribou in the Photo Stratum and logistical limitations on the level of
coverage that could be achieved due to weather constraints in 2015. Inspection of transect-
specific densities (Figure 18) revealed that high densities of >10 caribou/km2 were only
found on five of the 20 lines surveyed, with lower densities on other lines. This large
difference in densities resulted in lower precision of estimates. The distribution of transect
densities does suggest the caribou numbers were well delineated by the stratum
boundaries.
Figure 18: Densities of caribou on each transect line for the high Photo Stratum.
Den
sity
of c
arib
ou o
n tra
nsec
t
0
10
20
30
40
Transect (South to North)
1 2 3 4 5 6 7 8 9 10
11
12
13
14
15
16
17
18
19
20
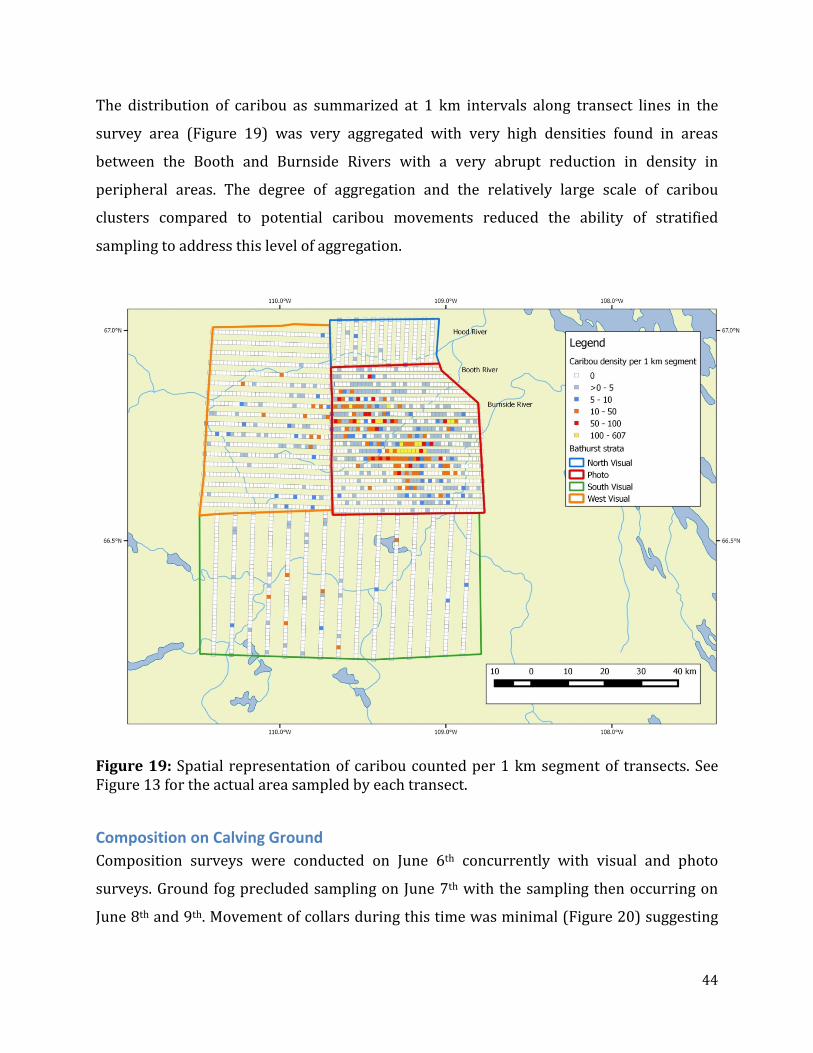
44
The distribution of caribou as summarized at 1 km intervals along transect lines in the
survey area (Figure 19) was very aggregated with very high densities found in areas
between the Booth and Burnside Rivers with a very abrupt reduction in density in
peripheral areas. The degree of aggregation and the relatively large scale of caribou
clusters compared to potential caribou movements reduced the ability of stratified
sampling to address this level of aggregation.
Figure 19: Spatial representation of caribou counted per 1 km segment of transects. See Figure 13 for the actual area sampled by each transect.
Composition on Calving Ground Composition surveys were conducted on June 6th concurrently with visual and photo
surveys. Ground fog precluded sampling on June 7th with the sampling then occurring on
June 8th and 9th. Movement of collars during this time was minimal (Figure 20) suggesting
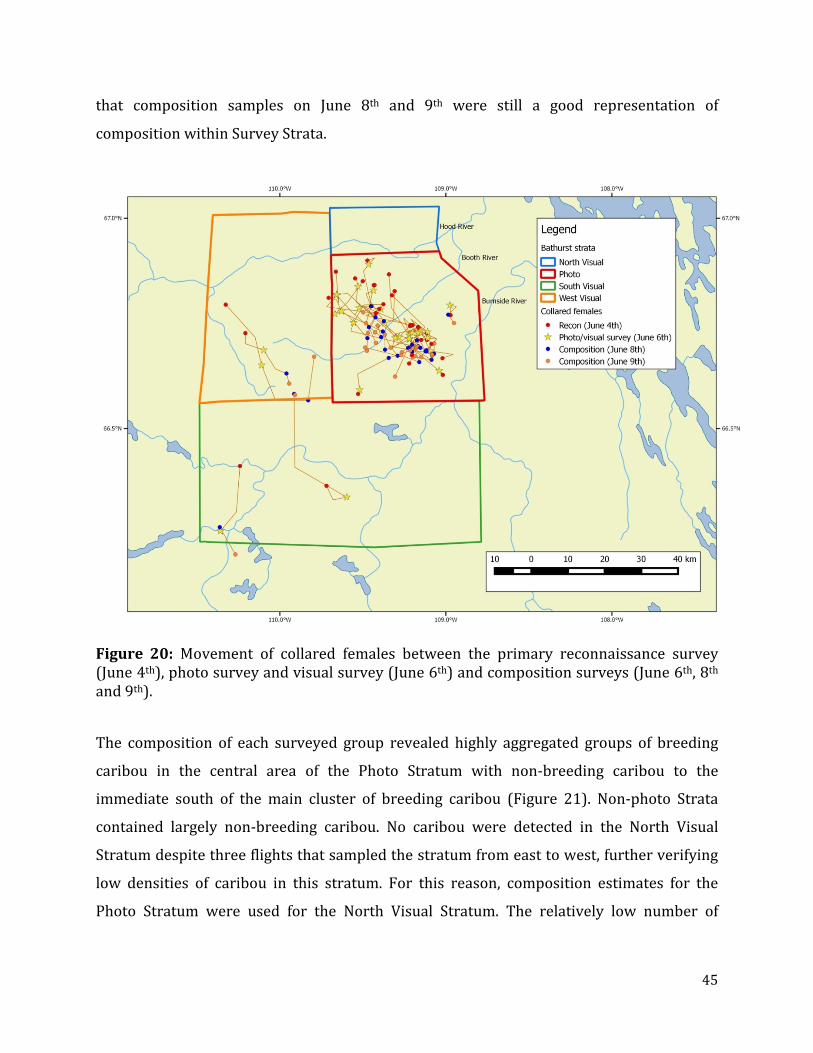
45
that composition samples on June 8th and 9th were still a good representation of
composition within Survey Strata.
Figure 20: Movement of collared females between the primary reconnaissance survey (June 4th), photo survey and visual survey (June 6th) and composition surveys (June 6th, 8th and 9th).
The composition of each surveyed group revealed highly aggregated groups of breeding
caribou in the central area of the Photo Stratum with non-breeding caribou to the
immediate south of the main cluster of breeding caribou (Figure 21). Non-photo Strata
contained largely non-breeding caribou. No caribou were detected in the North Visual
Stratum despite three flights that sampled the stratum from east to west, further verifying
low densities of caribou in this stratum. For this reason, composition estimates for the
Photo Stratum were used for the North Visual Stratum. The relatively low number of
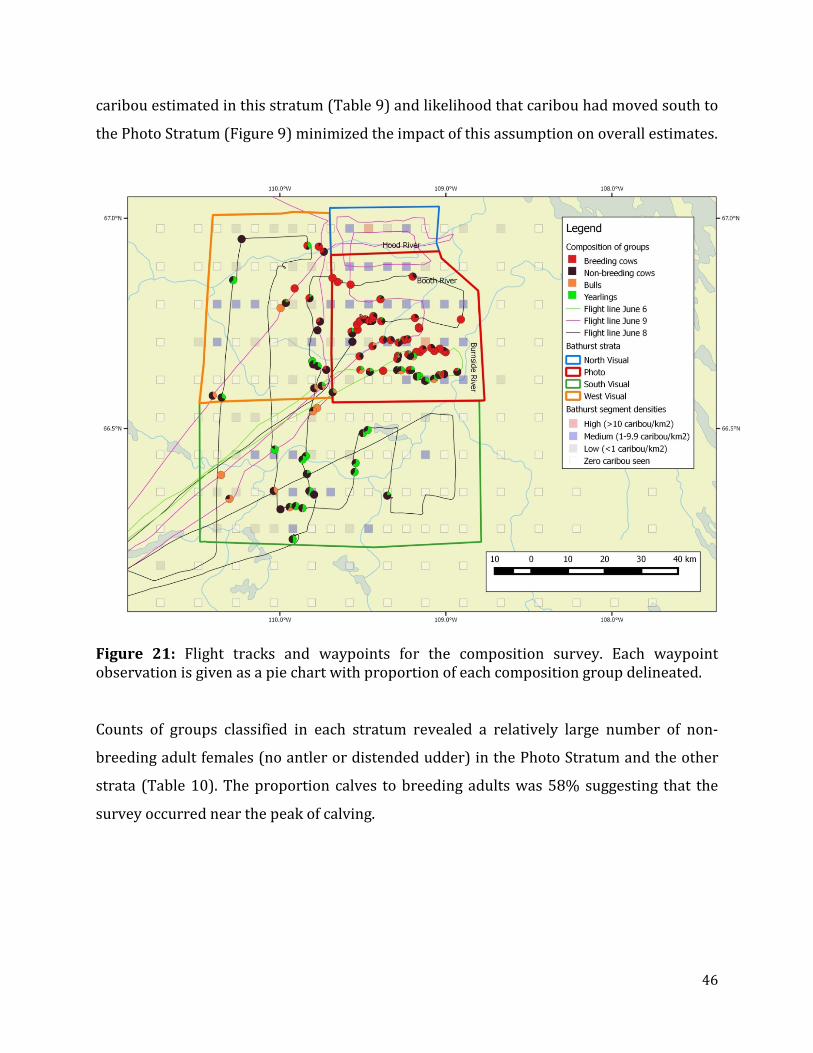
46
caribou estimated in this stratum (Table 9) and likelihood that caribou had moved south to
the Photo Stratum (Figure 9) minimized the impact of this assumption on overall estimates.
Figure 21: Flight tracks and waypoints for the composition survey. Each waypoint observation is given as a pie chart with proportion of each composition group delineated.
Counts of groups classified in each stratum revealed a relatively large number of non-
breeding adult females (no antler or distended udder) in the Photo Stratum and the other
strata (Table 10). The proportion calves to breeding adults was 58% suggesting that the
survey occurred near the peak of calving.
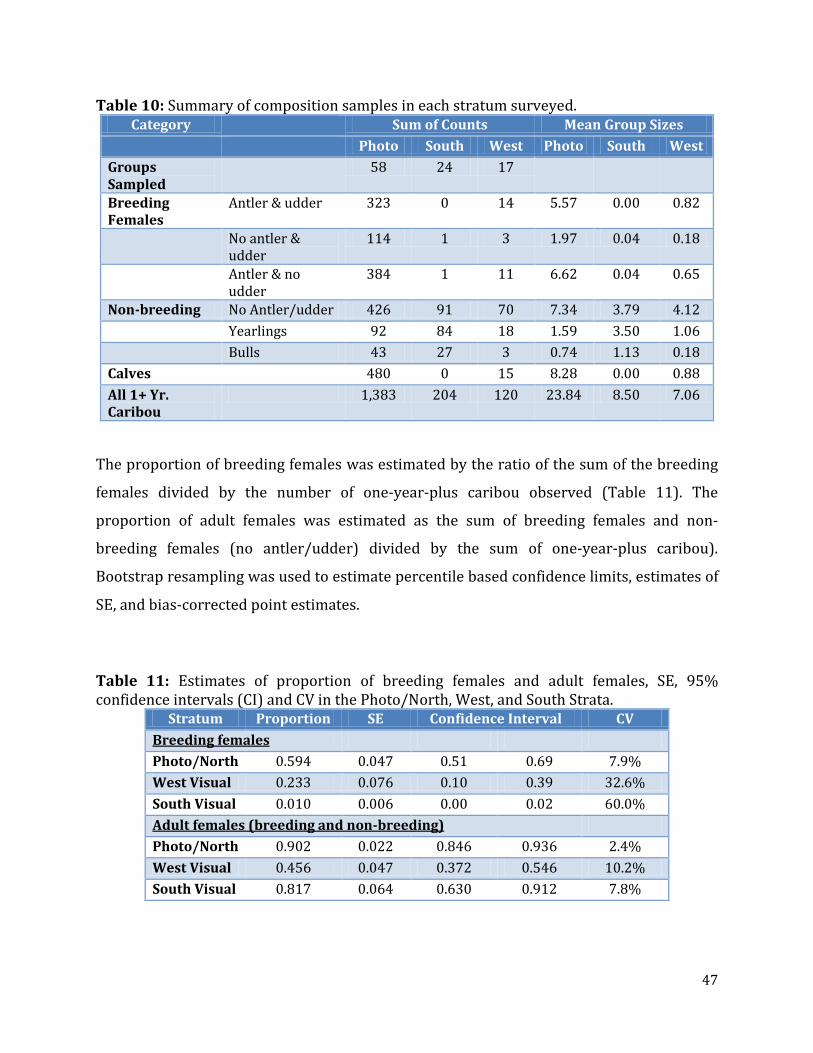
47
Table 10: Summary of composition samples in each stratum surveyed. Category Sum of Counts Mean Group Sizes
Photo South West Photo South West Groups Sampled
58 24 17
Breeding Females
Antler & udder 323 0 14 5.57 0.00 0.82
No antler & udder
114 1 3 1.97 0.04 0.18
Antler & no udder
384 1 11 6.62 0.04 0.65
Non-breeding No Antler/udder 426 91 70 7.34 3.79 4.12 Yearlings 92 84 18 1.59 3.50 1.06 Bulls 43 27 3 0.74 1.13 0.18 Calves 480 0 15 8.28 0.00 0.88 All 1+ Yr. Caribou
1,383 204 120 23.84 8.50 7.06
The proportion of breeding females was estimated by the ratio of the sum of the breeding
females divided by the number of one-year-plus caribou observed (Table 11). The
proportion of adult females was estimated as the sum of breeding females and non-
breeding females (no antler/udder) divided by the sum of one-year-plus caribou).
Bootstrap resampling was used to estimate percentile based confidence limits, estimates of
SE, and bias-corrected point estimates.
Table 11: Estimates of proportion of breeding females and adult females, SE, 95% confidence intervals (CI) and CV in the Photo/North, West, and South Strata.
Stratum Proportion SE Confidence Interval CV Breeding females Photo/North 0.594 0.047 0.51 0.69 7.9% West Visual 0.233 0.076 0.10 0.39 32.6% South Visual 0.010 0.006 0.00 0.02 60.0% Adult females (breeding and non-breeding) Photo/North 0.902 0.022 0.846 0.936 2.4% West Visual 0.456 0.047 0.372 0.546 10.2% South Visual 0.817 0.064 0.630 0.912 7.8%
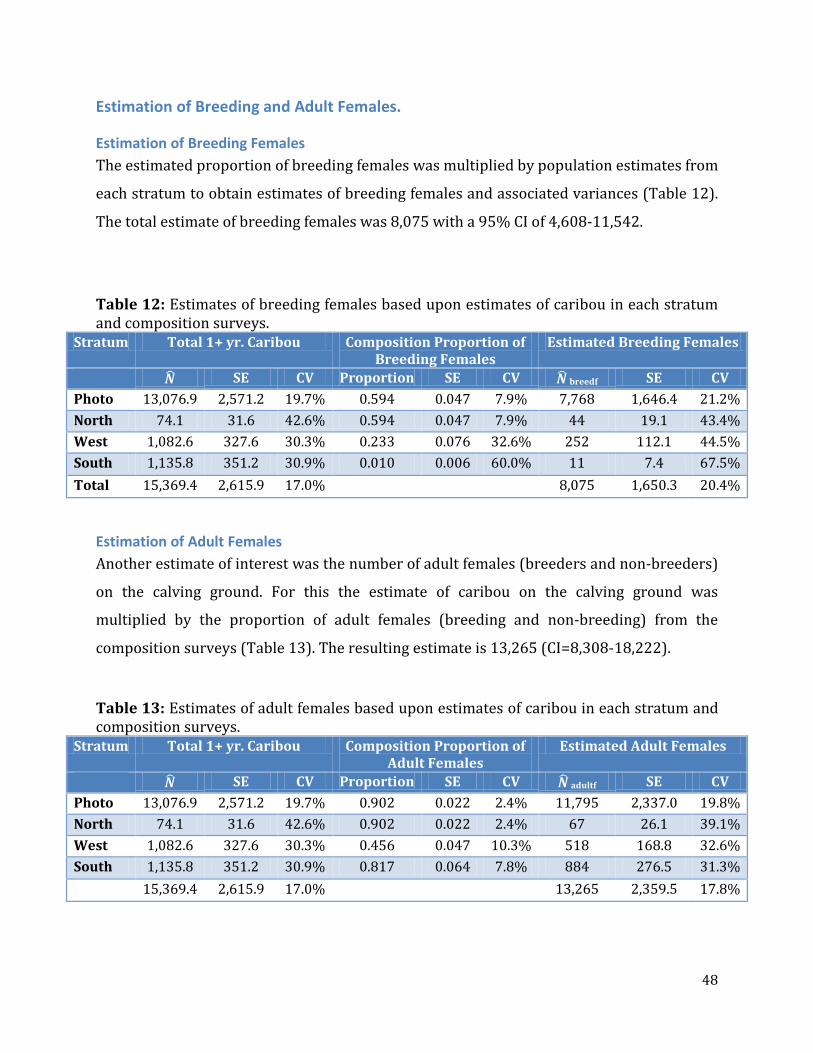
48
Estimation of Breeding and Adult Females.
Estimation of Breeding Females The estimated proportion of breeding females was multiplied by population estimates from
each stratum to obtain estimates of breeding females and associated variances (Table 12).
The total estimate of breeding females was 8,075 with a 95% CI of 4,608-11,542.
Table 12: Estimates of breeding females based upon estimates of caribou in each stratum and composition surveys.
Stratum Total 1+ yr. Caribou Composition Proportion of Breeding Females
Estimated Breeding Females
𝑵� SE CV Proportion SE CV 𝑵� breedf SE CV Photo 13,076.9 2,571.2 19.7% 0.594 0.047 7.9% 7,768 1,646.4 21.2% North 74.1 31.6 42.6% 0.594 0.047 7.9% 44 19.1 43.4% West 1,082.6 327.6 30.3% 0.233 0.076 32.6% 252 112.1 44.5% South 1,135.8 351.2 30.9% 0.010 0.006 60.0% 11 7.4 67.5% Total 15,369.4 2,615.9 17.0% 8,075 1,650.3 20.4%
Estimation of Adult Females Another estimate of interest was the number of adult females (breeders and non-breeders)
on the calving ground. For this the estimate of caribou on the calving ground was
multiplied by the proportion of adult females (breeding and non-breeding) from the
composition surveys (Table 13). The resulting estimate is 13,265 (CI=8,308-18,222).
Table 13: Estimates of adult females based upon estimates of caribou in each stratum and composition surveys.
Stratum Total 1+ yr. Caribou Composition Proportion of Adult Females
Estimated Adult Females
𝑵� SE CV Proportion SE CV 𝑵� adultf SE CV Photo 13,076.9 2,571.2 19.7% 0.902 0.022 2.4% 11,795 2,337.0 19.8% North 74.1 31.6 42.6% 0.902 0.022 2.4% 67 26.1 39.1% West 1,082.6 327.6 30.3% 0.456 0.047 10.3% 518 168.8 32.6% South 1,135.8 351.2 30.9% 0.817 0.064 7.8% 884 276.5 31.3% 15,369.4 2,615.9 17.0% 13,265 2,359.5 17.8%
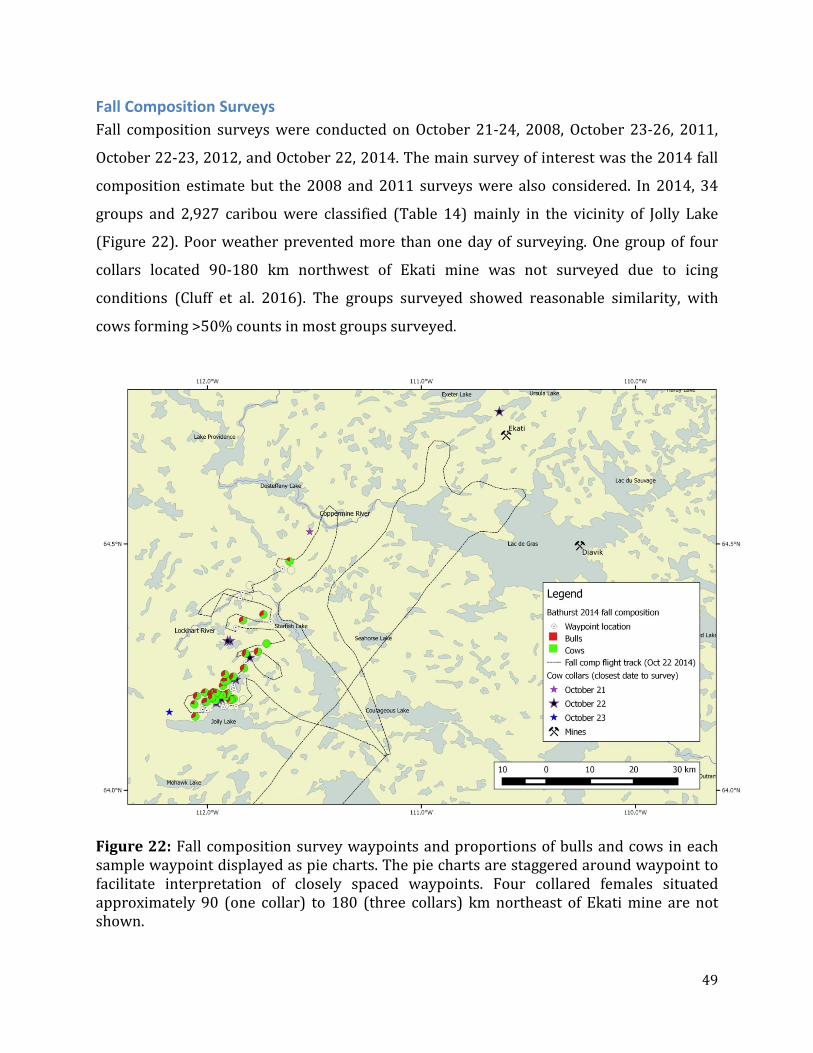
49
Fall Composition Surveys Fall composition surveys were conducted on October 21-24, 2008, October 23-26, 2011,
October 22-23, 2012, and October 22, 2014. The main survey of interest was the 2014 fall
composition estimate but the 2008 and 2011 surveys were also considered. In 2014, 34
groups and 2,927 caribou were classified (Table 14) mainly in the vicinity of Jolly Lake
(Figure 22). Poor weather prevented more than one day of surveying. One group of four
collars located 90-180 km northwest of Ekati mine was not surveyed due to icing
conditions (Cluff et al. 2016). The groups surveyed showed reasonable similarity, with
cows forming >50% counts in most groups surveyed.
Figure 22: Fall composition survey waypoints and proportions of bulls and cows in each sample waypoint displayed as pie charts. The pie charts are staggered around waypoint to facilitate interpretation of closely spaced waypoints. Four collared females situated approximately 90 (one collar) to 180 (three collars) km northeast of Ekati mine are not shown.
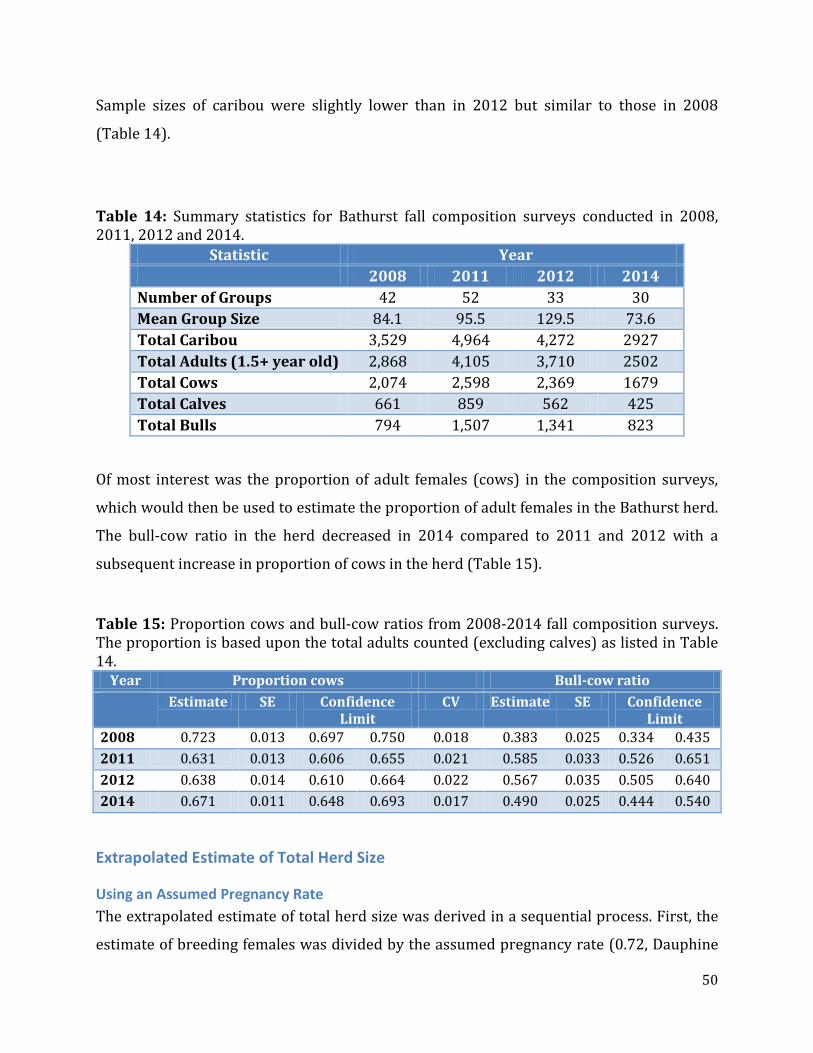
50
Sample sizes of caribou were slightly lower than in 2012 but similar to those in 2008
(Table 14).
Table 14: Summary statistics for Bathurst fall composition surveys conducted in 2008, 2011, 2012 and 2014.
Statistic Year 2008 2011 2012 2014
Number of Groups 42 52 33 30 Mean Group Size 84.1 95.5 129.5 73.6 Total Caribou 3,529 4,964 4,272 2927 Total Adults (1.5+ year old) 2,868 4,105 3,710 2502 Total Cows 2,074 2,598 2,369 1679 Total Calves 661 859 562 425 Total Bulls 794 1,507 1,341 823
Of most interest was the proportion of adult females (cows) in the composition surveys,
which would then be used to estimate the proportion of adult females in the Bathurst herd.
The bull-cow ratio in the herd decreased in 2014 compared to 2011 and 2012 with a
subsequent increase in proportion of cows in the herd (Table 15).
Table 15: Proportion cows and bull-cow ratios from 2008-2014 fall composition surveys. The proportion is based upon the total adults counted (excluding calves) as listed in Table 14.
Extrapolated Estimate of Total Herd Size
Using an Assumed Pregnancy Rate The extrapolated estimate of total herd size was derived in a sequential process. First, the
estimate of breeding females was divided by the assumed pregnancy rate (0.72, Dauphine
Year Proportion cows Bull-cow ratio Estimate SE Confidence
Limit CV Estimate SE Confidence
Limit 2008 0.723 0.013 0.697 0.750 0.018 0.383 0.025 0.334 0.435 2011 0.631 0.013 0.606 0.655 0.021 0.585 0.033 0.526 0.651 2012 0.638 0.014 0.610 0.664 0.022 0.567 0.035 0.505 0.640 2014 0.671 0.011 0.648 0.693 0.017 0.490 0.025 0.444 0.540
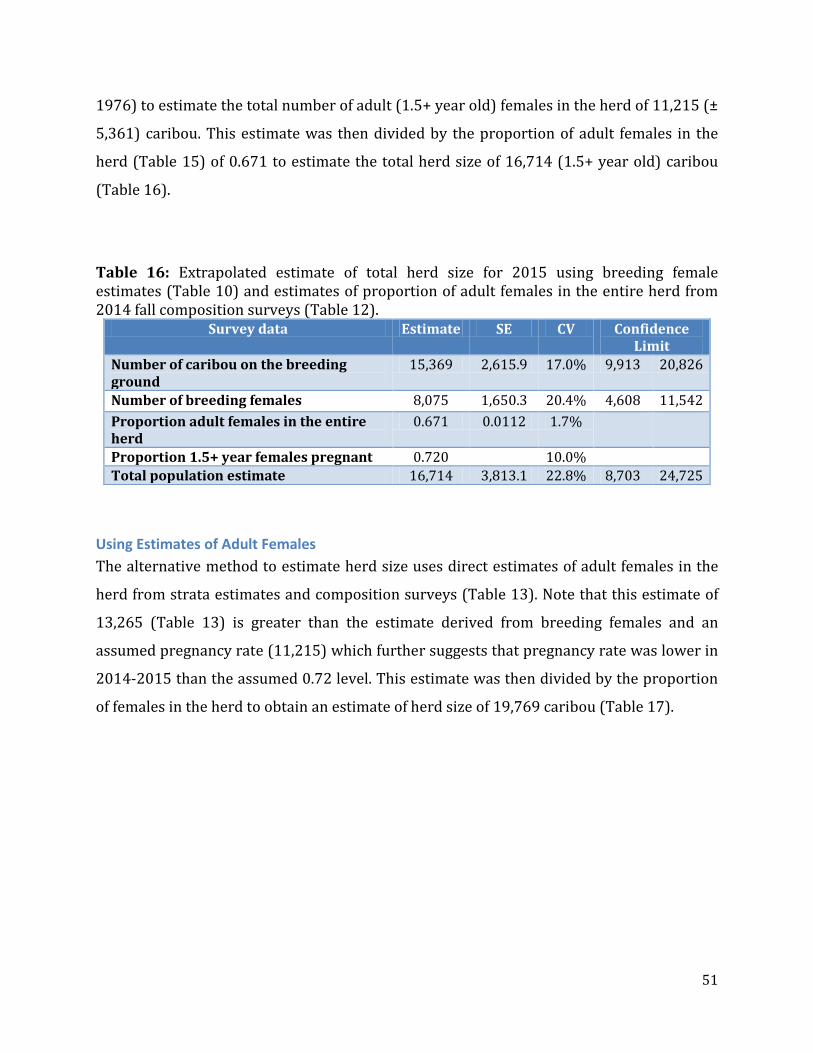
51
1976) to estimate the total number of adult (1.5+ year old) females in the herd of 11,215 (±
5,361) caribou. This estimate was then divided by the proportion of adult females in the
herd (Table 15) of 0.671 to estimate the total herd size of 16,714 (1.5+ year old) caribou
(Table 16).
Table 16: Extrapolated estimate of total herd size for 2015 using breeding female estimates (Table 10) and estimates of proportion of adult females in the entire herd from 2014 fall composition surveys (Table 12).
Survey data Estimate SE CV Confidence Limit
Number of caribou on the breeding ground
15,369 2,615.9 17.0% 9,913 20,826
Number of breeding females 8,075 1,650.3 20.4% 4,608 11,542 Proportion adult females in the entire herd
0.671 0.0112 1.7%
Proportion 1.5+ year females pregnant 0.720 10.0% Total population estimate 16,714 3,813.1 22.8% 8,703 24,725
Using Estimates of Adult Females The alternative method to estimate herd size uses direct estimates of adult females in the
herd from strata estimates and composition surveys (Table 13). Note that this estimate of
13,265 (Table 13) is greater than the estimate derived from breeding females and an
assumed pregnancy rate (11,215) which further suggests that pregnancy rate was lower in
2014-2015 than the assumed 0.72 level. This estimate was then divided by the proportion
of females in the herd to obtain an estimate of herd size of 19,769 caribou (Table 17).
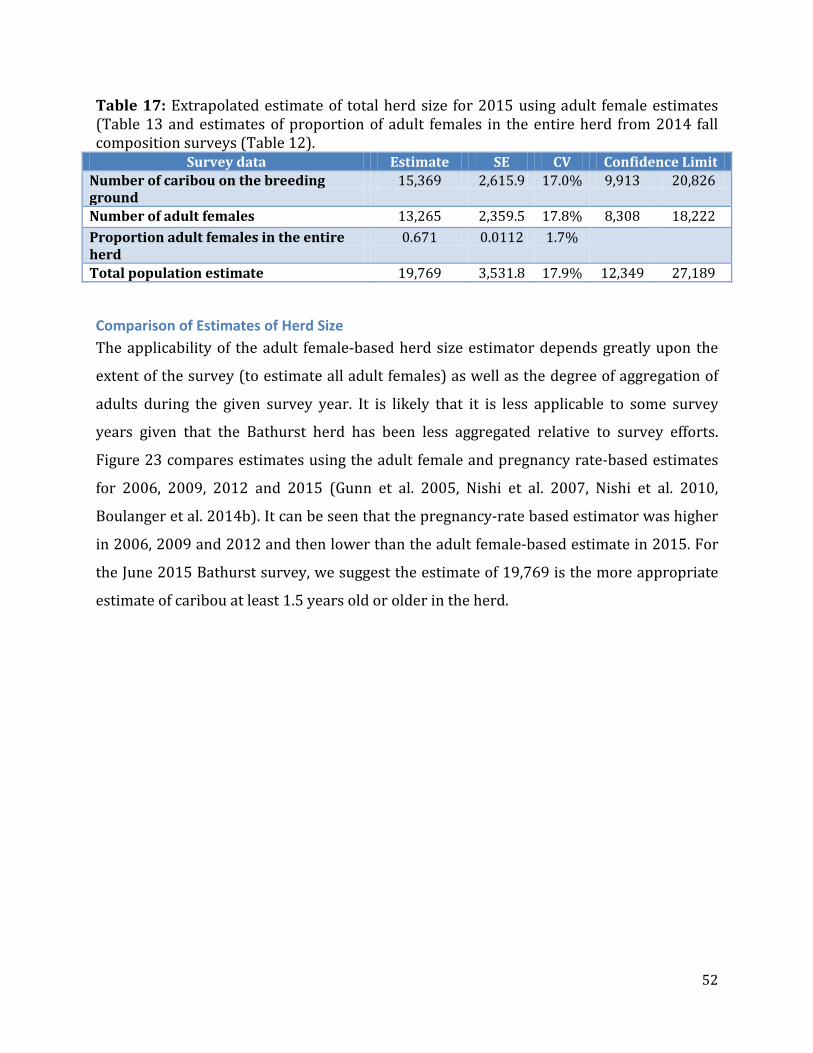
52
Table 17: Extrapolated estimate of total herd size for 2015 using adult female estimates (Table 13 and estimates of proportion of adult females in the entire herd from 2014 fall composition surveys (Table 12).
Survey data Estimate SE CV Confidence Limit Number of caribou on the breeding ground
15,369 2,615.9 17.0% 9,913 20,826
Number of adult females 13,265 2,359.5 17.8% 8,308 18,222 Proportion adult females in the entire herd
0.671 0.0112 1.7%
Total population estimate 19,769 3,531.8 17.9% 12,349 27,189
Comparison of Estimates of Herd Size The applicability of the adult female-based herd size estimator depends greatly upon the
extent of the survey (to estimate all adult females) as well as the degree of aggregation of
adults during the given survey year. It is likely that it is less applicable to some survey
years given that the Bathurst herd has been less aggregated relative to survey efforts.
Figure 23 compares estimates using the adult female and pregnancy rate-based estimates
for 2006, 2009, 2012 and 2015 (Gunn et al. 2005, Nishi et al. 2007, Nishi et al. 2010,
Boulanger et al. 2014b). It can be seen that the pregnancy-rate based estimator was higher
in 2006, 2009 and 2012 and then lower than the adult female-based estimate in 2015. For
the June 2015 Bathurst survey, we suggest the estimate of 19,769 is the more appropriate
estimate of caribou at least 1.5 years old or older in the herd.
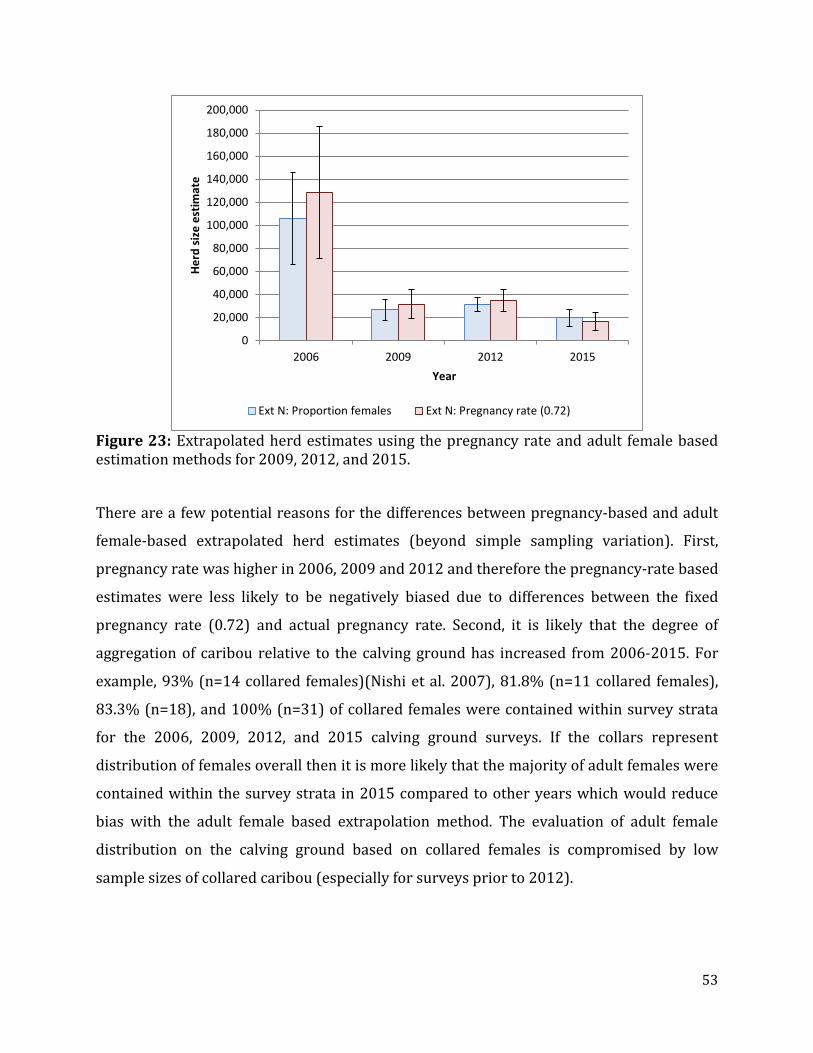
53
Figure 23: Extrapolated herd estimates using the pregnancy rate and adult female based estimation methods for 2009, 2012, and 2015.
There are a few potential reasons for the differences between pregnancy-based and adult
female-based extrapolated herd estimates (beyond simple sampling variation). First,
pregnancy rate was higher in 2006, 2009 and 2012 and therefore the pregnancy-rate based
estimates were less likely to be negatively biased due to differences between the fixed
pregnancy rate (0.72) and actual pregnancy rate. Second, it is likely that the degree of
aggregation of caribou relative to the calving ground has increased from 2006-2015. For
example, 93% (n=14 collared females)(Nishi et al. 2007), 81.8% (n=11 collared females),
83.3% (n=18), and 100% (n=31) of collared females were contained within survey strata
for the 2006, 2009, 2012, and 2015 calving ground surveys. If the collars represent
distribution of females overall then it is more likely that the majority of adult females were
contained within the survey strata in 2015 compared to other years which would reduce
bias with the adult female based extrapolation method. The evaluation of adult female
distribution on the calving ground based on collared females is compromised by low
sample sizes of collared caribou (especially for surveys prior to 2012).
0
20,000
40,000
60,000
80,000
100,000
120,000
140,000
160,000
180,000
200,000
2006 2009 2012 2015
Herd
size
est
imat
e
Year
Ext N: Proportion females Ext N: Pregnancy rate (0.72)
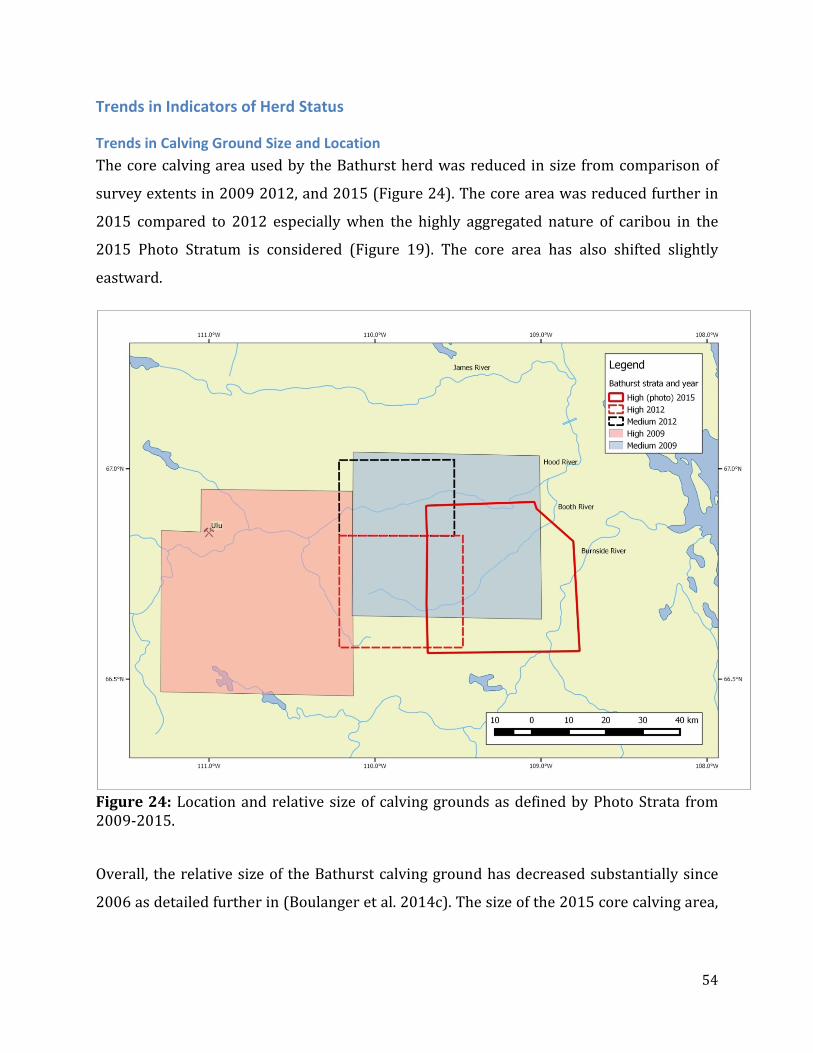
54
Trends in Indicators of Herd Status
Trends in Calving Ground Size and Location The core calving area used by the Bathurst herd was reduced in size from comparison of
survey extents in 2009 2012, and 2015 (Figure 24). The core area was reduced further in
2015 compared to 2012 especially when the highly aggregated nature of caribou in the
2015 Photo Stratum is considered (Figure 19). The core area has also shifted slightly
eastward.
Figure 24: Location and relative size of calving grounds as defined by Photo Strata from 2009-2015.
Overall, the relative size of the Bathurst calving ground has decreased substantially since
2006 as detailed further in (Boulanger et al. 2014c). The size of the 2015 core calving area,
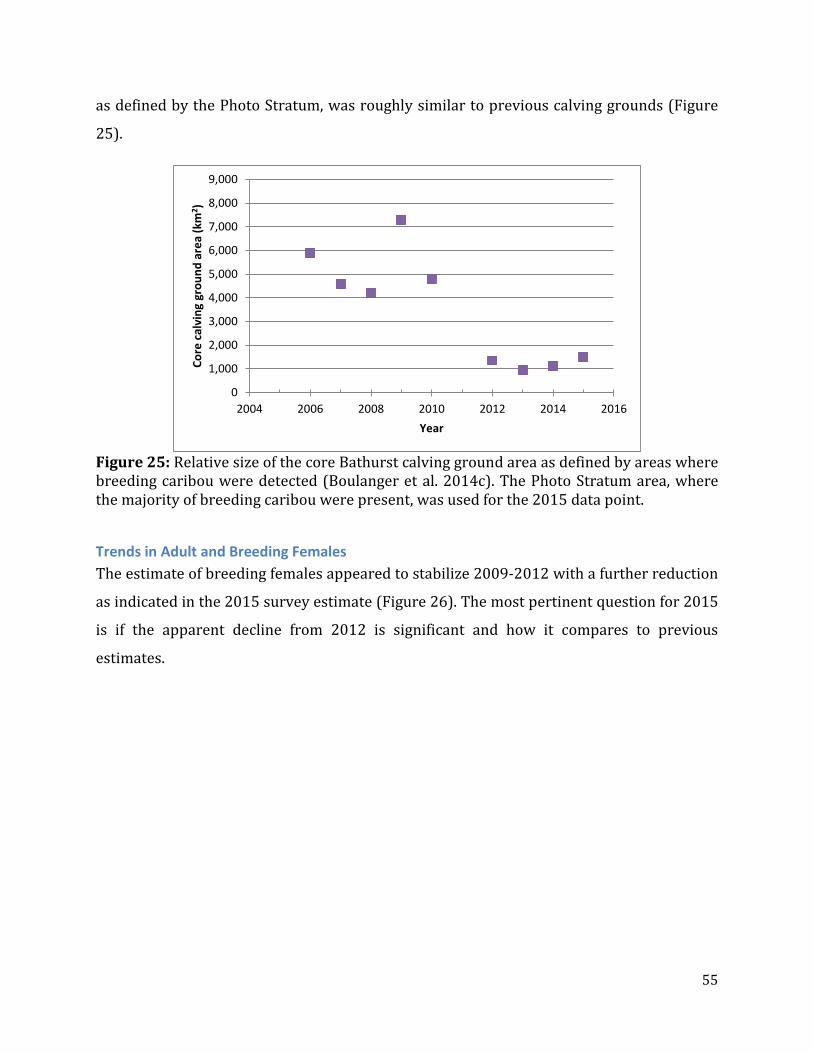
55
as defined by the Photo Stratum, was roughly similar to previous calving grounds (Figure
25).
Figure 25: Relative size of the core Bathurst calving ground area as defined by areas where breeding caribou were detected (Boulanger et al. 2014c). The Photo Stratum area, where the majority of breeding caribou were present, was used for the 2015 data point.
Trends in Adult and Breeding Females The estimate of breeding females appeared to stabilize 2009-2012 with a further reduction
as indicated in the 2015 survey estimate (Figure 26). The most pertinent question for 2015
is if the apparent decline from 2012 is significant and how it compares to previous
estimates.
0
1,000
2,000
3,000
4,000
5,000
6,000
7,000
8,000
9,000
2004 2006 2008 2010 2012 2014 2016
Core
cal
ving
gro
und
area
(km
2 )
Year
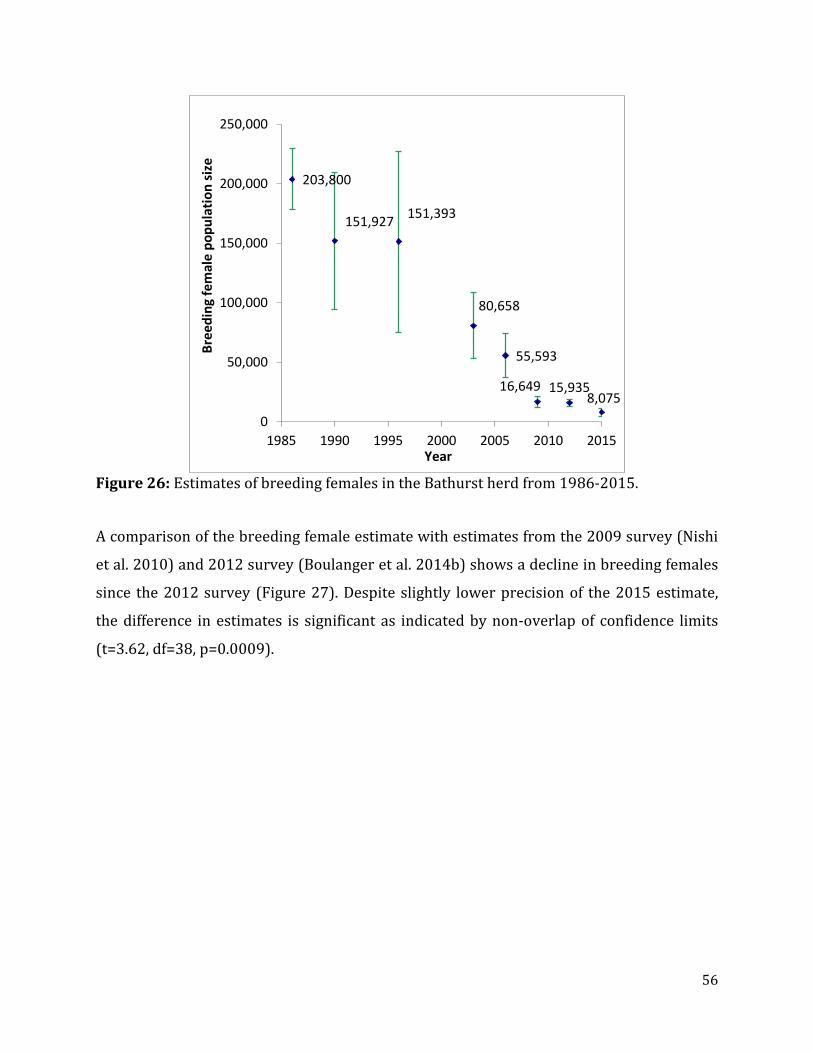
56
Figure 26: Estimates of breeding females in the Bathurst herd from 1986-2015.
A comparison of the breeding female estimate with estimates from the 2009 survey (Nishi
et al. 2010) and 2012 survey (Boulanger et al. 2014b) shows a decline in breeding females
since the 2012 survey (Figure 27). Despite slightly lower precision of the 2015 estimate,
the difference in estimates is significant as indicated by non-overlap of confidence limits
(t=3.62, df=38, p=0.0009).
8,07515,93516,649
55,593
80,658
151,393151,927
203,800
0
50,000
100,000
150,000
200,000
250,000
1985 1990 1995 2000 2005 2010 2015
Bree
ding
fem
ale
popu
latio
n si
ze
Year
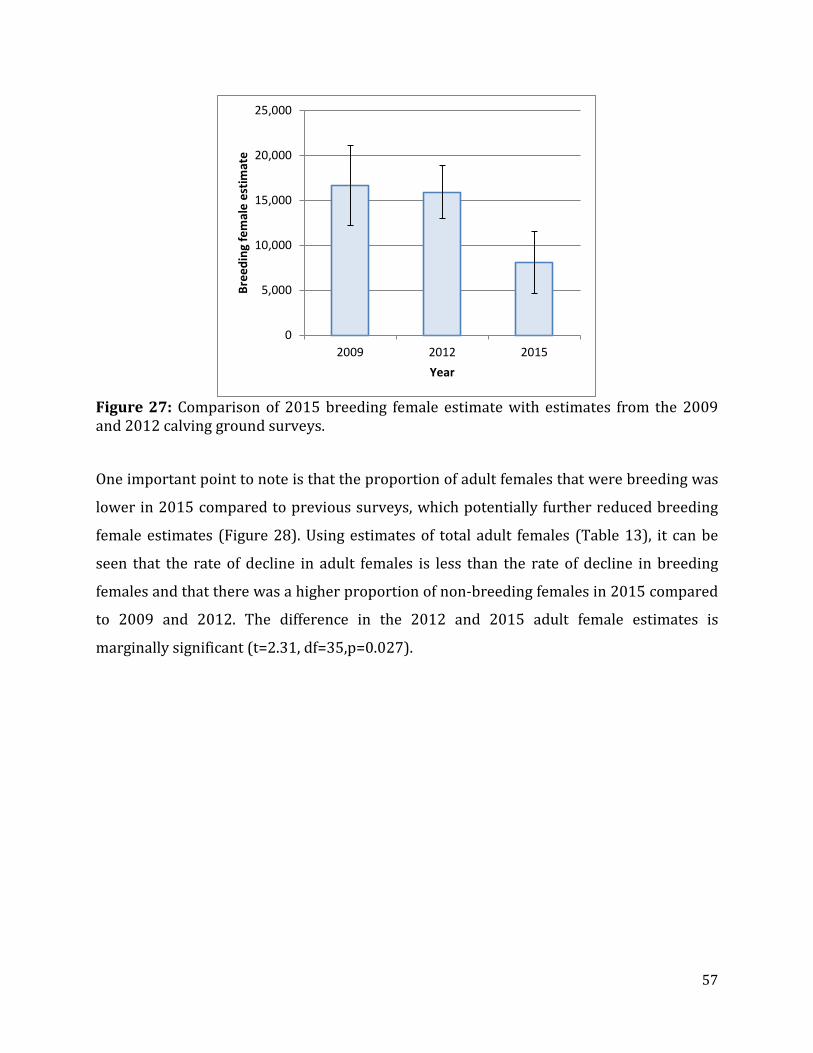
57
Figure 27: Comparison of 2015 breeding female estimate with estimates from the 2009 and 2012 calving ground surveys.
One important point to note is that the proportion of adult females that were breeding was
lower in 2015 compared to previous surveys, which potentially further reduced breeding
female estimates (Figure 28). Using estimates of total adult females (Table 13), it can be
seen that the rate of decline in adult females is less than the rate of decline in breeding
females and that there was a higher proportion of non-breeding females in 2015 compared
to 2009 and 2012. The difference in the 2012 and 2015 adult female estimates is
marginally significant (t=2.31, df=35,p=0.027).
0
5,000
10,000
15,000
20,000
25,000
2009 2012 2015
Bree
ding
fem
ale
estim
ate
Year
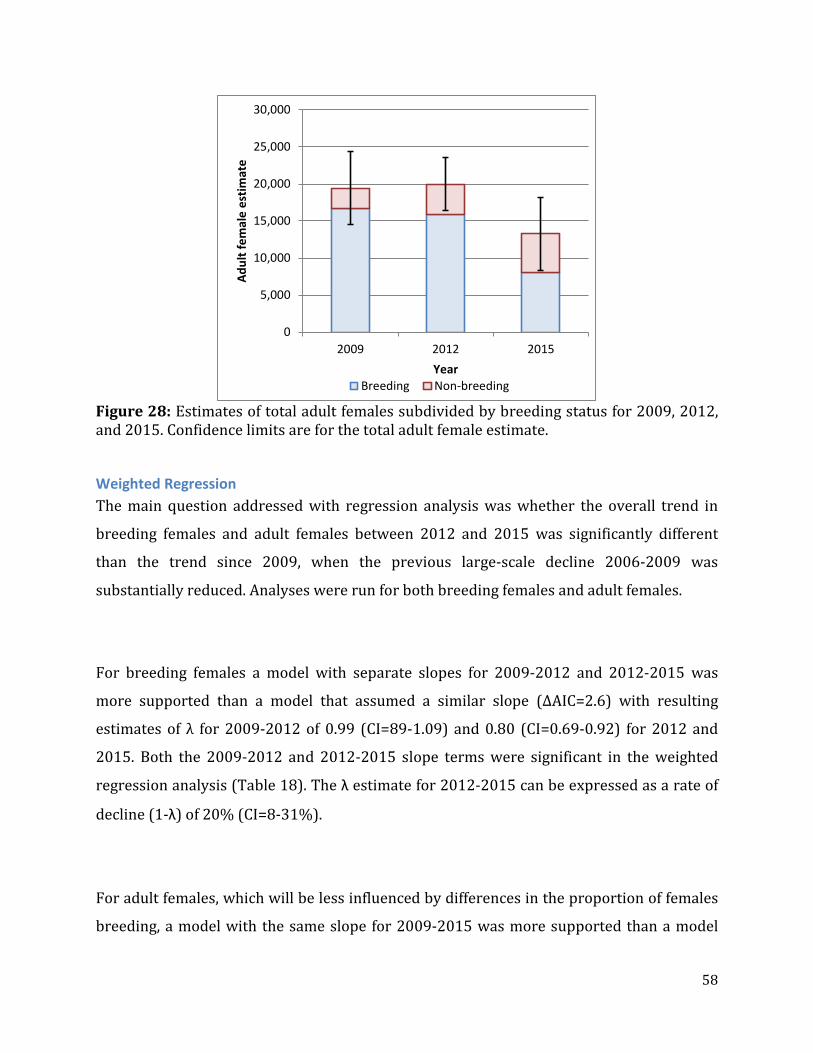
58
Figure 28: Estimates of total adult females subdivided by breeding status for 2009, 2012, and 2015. Confidence limits are for the total adult female estimate.
Weighted Regression The main question addressed with regression analysis was whether the overall trend in
breeding females and adult females between 2012 and 2015 was significantly different
than the trend since 2009, when the previous large-scale decline 2006-2009 was
substantially reduced. Analyses were run for both breeding females and adult females.
For breeding females a model with separate slopes for 2009-2012 and 2012-2015 was
more supported than a model that assumed a similar slope (∆AIC=2.6) with resulting
estimates of λ for 2009-2012 of 0.99 (CI=89-1.09) and 0.80 (CI=0.69-0.92) for 2012 and
2015. Both the 2009-2012 and 2012-2015 slope terms were significant in the weighted
regression analysis (Table 18). The λ estimate for 2012-2015 can be expressed as a rate of
decline (1-λ) of 20% (CI=8-31%).
For adult females, which will be less influenced by differences in the proportion of females
breeding, a model with the same slope for 2009-2015 was more supported than a model
0
5,000
10,000
15,000
20,000
25,000
30,000
2009 2012 2015
Adul
t fem
ale
estim
ate
YearBreeding Non-breeding
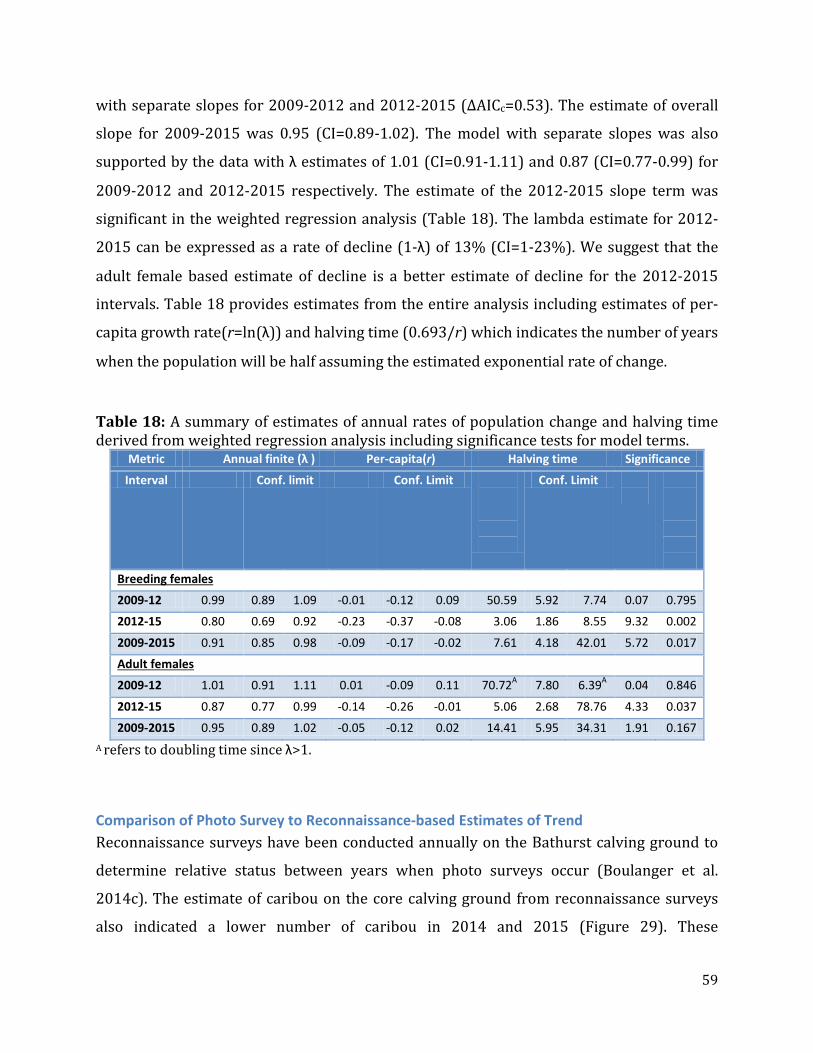
59
with separate slopes for 2009-2012 and 2012-2015 (∆AICc=0.53). The estimate of overall
slope for 2009-2015 was 0.95 (CI=0.89-1.02). The model with separate slopes was also
supported by the data with λ estimates of 1.01 (CI=0.91-1.11) and 0.87 (CI=0.77-0.99) for
2009-2012 and 2012-2015 respectively. The estimate of the 2012-2015 slope term was
significant in the weighted regression analysis (Table 18). The lambda estimate for 2012-
2015 can be expressed as a rate of decline (1-λ) of 13% (CI=1-23%). We suggest that the
adult female based estimate of decline is a better estimate of decline for the 2012-2015
intervals. Table 18 provides estimates from the entire analysis including estimates of per-
capita growth rate(r=ln(λ)) and halving time (0.693/r) which indicates the number of years
when the population will be half assuming the estimated exponential rate of change.
Table 18: A summary of estimates of annual rates of population change and halving time derived from weighted regression analysis including significance tests for model terms.
Metric Annual finite (λ ) Per-capita(r) Halving time Significance
Interval Conf. limit Conf. Limit
Conf. Limit
Breeding females
2009-12 0.99 0.89 1.09 -0.01 -0.12 0.09 50.59 5.92 7.74 0.07 0.795
2012-15 0.80 0.69 0.92 -0.23 -0.37 -0.08 3.06 1.86 8.55 9.32 0.002
2009-2015 0.91 0.85 0.98 -0.09 -0.17 -0.02 7.61 4.18 42.01 5.72 0.017
Adult females
2009-12 1.01 0.91 1.11 0.01 -0.09 0.11 70.72A 7.80 6.39A 0.04 0.846
2012-15 0.87 0.77 0.99 -0.14 -0.26 -0.01 5.06 2.68 78.76 4.33 0.037
2009-2015 0.95 0.89 1.02 -0.05 -0.12 0.02 14.41 5.95 34.31 1.91 0.167 A refers to doubling time since λ>1.
Comparison of Photo Survey to Reconnaissance-based Estimates of Trend Reconnaissance surveys have been conducted annually on the Bathurst calving ground to
determine relative status between years when photo surveys occur (Boulanger et al.
2014c). The estimate of caribou on the core calving ground from reconnaissance surveys
also indicated a lower number of caribou in 2014 and 2015 (Figure 29). These
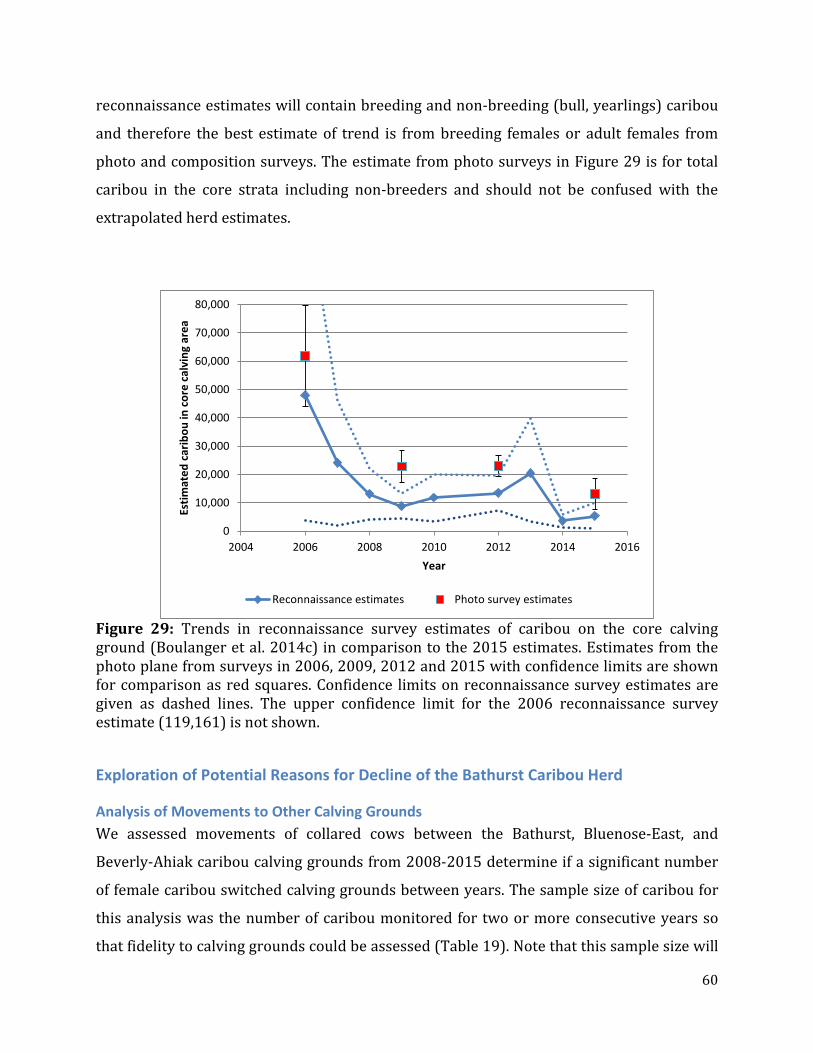
60
reconnaissance estimates will contain breeding and non-breeding (bull, yearlings) caribou
and therefore the best estimate of trend is from breeding females or adult females from
photo and composition surveys. The estimate from photo surveys in Figure 29 is for total
caribou in the core strata including non-breeders and should not be confused with the
extrapolated herd estimates.
Figure 29: Trends in reconnaissance survey estimates of caribou on the core calving ground (Boulanger et al. 2014c) in comparison to the 2015 estimates. Estimates from the photo plane from surveys in 2006, 2009, 2012 and 2015 with confidence limits are shown for comparison as red squares. Confidence limits on reconnaissance survey estimates are given as dashed lines. The upper confidence limit for the 2006 reconnaissance survey estimate (119,161) is not shown.
Exploration of Potential Reasons for Decline of the Bathurst Caribou Herd
Analysis of Movements to Other Calving Grounds We assessed movements of collared cows between the Bathurst, Bluenose-East, and
Beverly-Ahiak caribou calving grounds from 2008-2015 determine if a significant number
of female caribou switched calving grounds between years. The sample size of caribou for
this analysis was the number of caribou monitored for two or more consecutive years so
that fidelity to calving grounds could be assessed (Table 19). Note that this sample size will
0
10,000
20,000
30,000
40,000
50,000
60,000
70,000
80,000
2004 2006 2008 2010 2012 2014 2016
Estim
ated
car
ibou
in c
ore
calv
ing
area
Year
Reconnaissance estimates Photo survey estimates
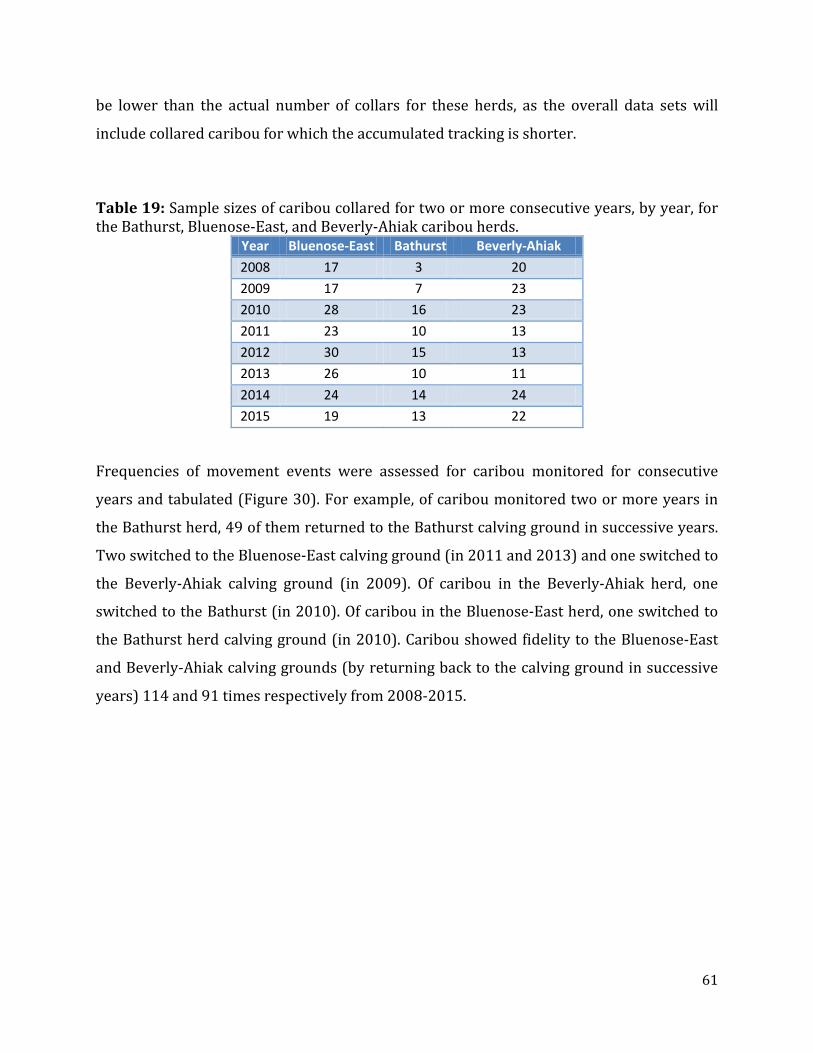
61
be lower than the actual number of collars for these herds, as the overall data sets will
include collared caribou for which the accumulated tracking is shorter.
Table 19: Sample sizes of caribou collared for two or more consecutive years, by year, for the Bathurst, Bluenose-East, and Beverly-Ahiak caribou herds.
Frequencies of movement events were assessed for caribou monitored for consecutive
years and tabulated (Figure 30). For example, of caribou monitored two or more years in
the Bathurst herd, 49 of them returned to the Bathurst calving ground in successive years.
Two switched to the Bluenose-East calving ground (in 2011 and 2013) and one switched to
the Beverly-Ahiak calving ground (in 2009). Of caribou in the Beverly-Ahiak herd, one
switched to the Bathurst (in 2010). Of caribou in the Bluenose-East herd, one switched to
the Bathurst herd calving ground (in 2010). Caribou showed fidelity to the Bluenose-East
and Beverly-Ahiak calving grounds (by returning back to the calving ground in successive
years) 114 and 91 times respectively from 2008-2015.
Year Bluenose-East Bathurst Beverly-Ahiak 2008 17 3 20 2009 17 7 23 2010 28 16 23 2011 23 10 13 2012 30 15 13 2013 26 10 11 2014 24 14 24 2015 19 13 22
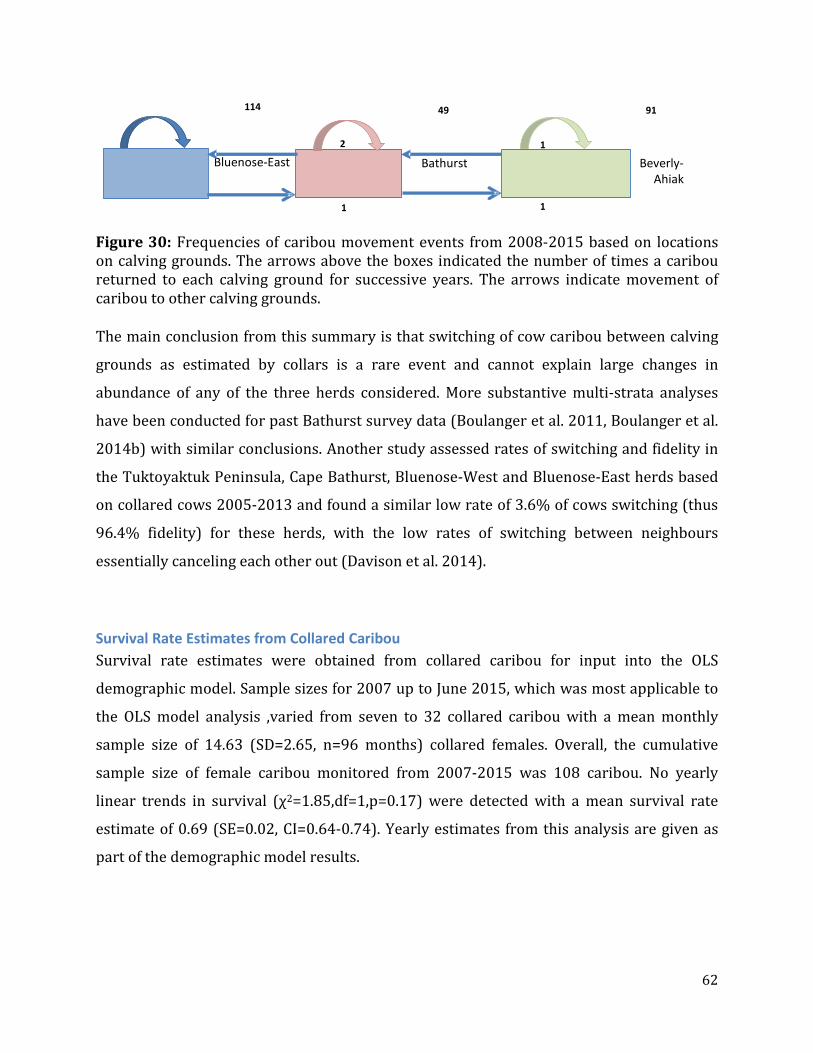
62
Figure 30: Frequencies of caribou movement events from 2008-2015 based on locations on calving grounds. The arrows above the boxes indicated the number of times a caribou returned to each calving ground for successive years. The arrows indicate movement of caribou to other calving grounds.
The main conclusion from this summary is that switching of cow caribou between calving
grounds as estimated by collars is a rare event and cannot explain large changes in
abundance of any of the three herds considered. More substantive multi-strata analyses
have been conducted for past Bathurst survey data (Boulanger et al. 2011, Boulanger et al.
2014b) with similar conclusions. Another study assessed rates of switching and fidelity in
the Tuktoyaktuk Peninsula, Cape Bathurst, Bluenose-West and Bluenose-East herds based
on collared cows 2005-2013 and found a similar low rate of 3.6% of cows switching (thus
96.4% fidelity) for these herds, with the low rates of switching between neighbours
essentially canceling each other out (Davison et al. 2014).
Survival Rate Estimates from Collared Caribou Survival rate estimates were obtained from collared caribou for input into the OLS
demographic model. Sample sizes for 2007 up to June 2015, which was most applicable to
the OLS model analysis ,varied from seven to 32 collared caribou with a mean monthly
sample size of 14.63 (SD=2.65, n=96 months) collared females. Overall, the cumulative
sample size of female caribou monitored from 2007-2015 was 108 caribou. No yearly
linear trends in survival (χ2=1.85,df=1,p=0.17) were detected with a mean survival rate
estimate of 0.69 (SE=0.02, CI=0.64-0.74). Yearly estimates from this analysis are given as
part of the demographic model results.
Bathurst Bluenose-East Beverly- Ahiak
2
1 1
1
114 49 91
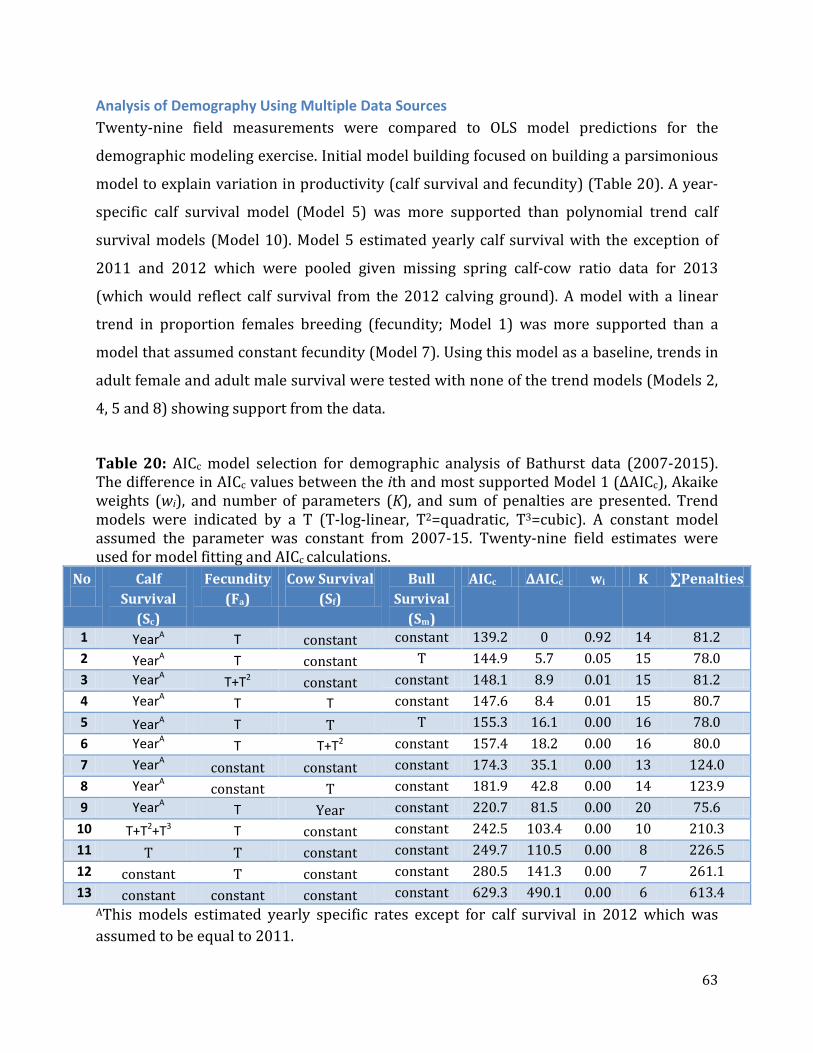
63
Analysis of Demography Using Multiple Data Sources Twenty-nine field measurements were compared to OLS model predictions for the
demographic modeling exercise. Initial model building focused on building a parsimonious
model to explain variation in productivity (calf survival and fecundity) (Table 20). A year-
specific calf survival model (Model 5) was more supported than polynomial trend calf
survival models (Model 10). Model 5 estimated yearly calf survival with the exception of
2011 and 2012 which were pooled given missing spring calf-cow ratio data for 2013
(which would reflect calf survival from the 2012 calving ground). A model with a linear
trend in proportion females breeding (fecundity; Model 1) was more supported than a
model that assumed constant fecundity (Model 7). Using this model as a baseline, trends in
adult female and adult male survival were tested with none of the trend models (Models 2,
4, 5 and 8) showing support from the data.
Table 20: AICc model selection for demographic analysis of Bathurst data (2007-2015). The difference in AICc values between the ith and most supported Model 1 (ΔAICc), Akaike weights (wi), and number of parameters (K), and sum of penalties are presented. Trend models were indicated by a T (T-log-linear, T2=quadratic, T3=cubic). A constant model assumed the parameter was constant from 2007-15. Twenty-nine field estimates were used for model fitting and AICc calculations.
No
Calf Survival
(Sc)
Fecundity (Fa)
Cow Survival (Sf)
Bull Survival
(Sm)
AICc ΔAICc wi K ∑Penalties
1 YearA T constant constant 139.2 0 0.92 14 81.2 2 YearA T constant T 144.9 5.7 0.05 15 78.0 3 YearA T+T2 constant constant 148.1 8.9 0.01 15 81.2 4 YearA T T constant 147.6 8.4 0.01 15 80.7 5 YearA T T T 155.3 16.1 0.00 16 78.0 6 YearA T T+T2 constant 157.4 18.2 0.00 16 80.0 7 YearA constant constant constant 174.3 35.1 0.00 13 124.0 8 YearA constant T constant 181.9 42.8 0.00 14 123.9 9 YearA T Year constant 220.7 81.5 0.00 20 75.6
10 T+T2+T3 T constant constant 242.5 103.4 0.00 10 210.3 11 T T constant constant 249.7 110.5 0.00 8 226.5 12 constant T constant constant 280.5 141.3 0.00 7 261.1 13 constant constant constant constant 629.3 490.1 0.00 6 613.4
AThis models estimated yearly specific rates except for calf survival in 2012 which was assumed to be equal to 2011.
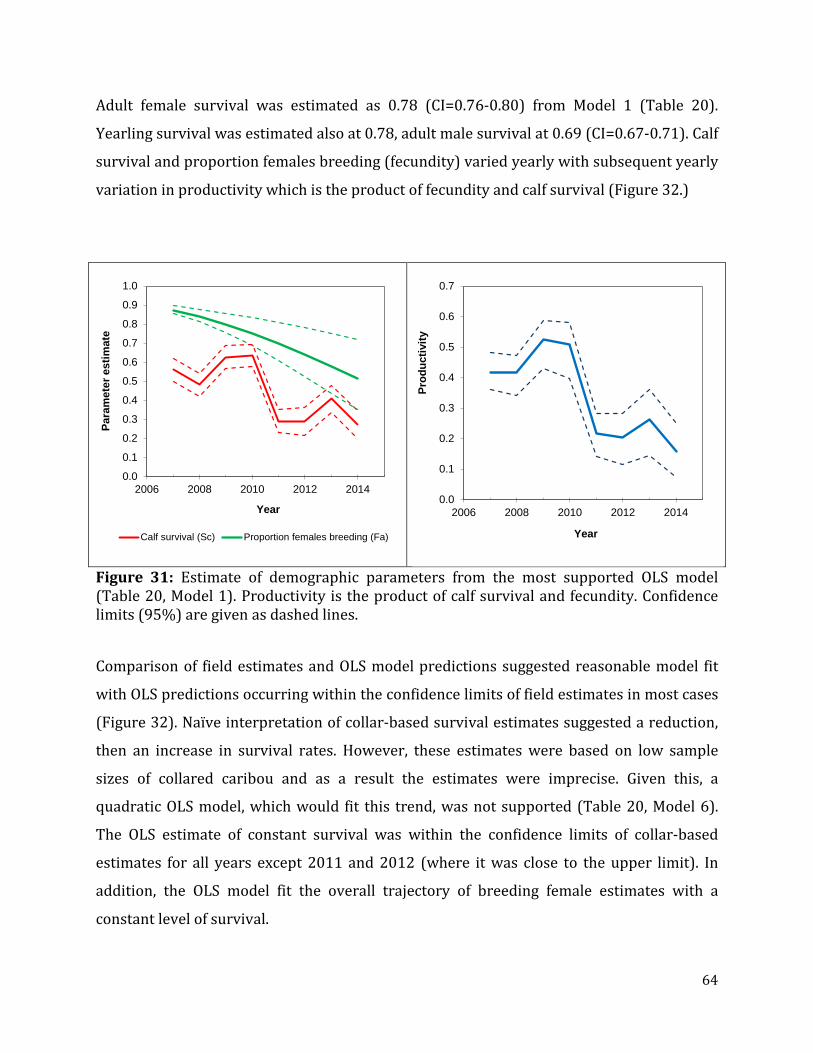
64
Adult female survival was estimated as 0.78 (CI=0.76-0.80) from Model 1 (Table 20).
Yearling survival was estimated also at 0.78, adult male survival at 0.69 (CI=0.67-0.71). Calf
survival and proportion females breeding (fecundity) varied yearly with subsequent yearly
variation in productivity which is the product of fecundity and calf survival (Figure 32.)
Figure 31: Estimate of demographic parameters from the most supported OLS model (Table 20, Model 1). Productivity is the product of calf survival and fecundity. Confidence limits (95%) are given as dashed lines.
Comparison of field estimates and OLS model predictions suggested reasonable model fit
with OLS predictions occurring within the confidence limits of field estimates in most cases
(Figure 32). Naïve interpretation of collar-based survival estimates suggested a reduction,
then an increase in survival rates. However, these estimates were based on low sample
sizes of collared caribou and as a result the estimates were imprecise. Given this, a
quadratic OLS model, which would fit this trend, was not supported (Table 20, Model 6).
The OLS estimate of constant survival was within the confidence limits of collar-based
estimates for all years except 2011 and 2012 (where it was close to the upper limit). In
addition, the OLS model fit the overall trajectory of breeding female estimates with a
constant level of survival.
0.0
0.1
0.2
0.3
0.4
0.5
0.6
0.7
0.8
0.9
1.0
2006 2008 2010 2012 2014
Para
met
er e
stim
ate
Year
Calf survival (Sc) Proportion females breeding (Fa)
0.0
0.1
0.2
0.3
0.4
0.5
0.6
0.7
2006 2008 2010 2012 2014
Prod
uctiv
ity
Year
65
A declining trend in proportion of females breeding is suggested by the OLS analysis based
upon reduction in both calf-cow ratios and observed proportions of females breeding on
the calving ground. Note that the proportion of females breeding estimated for the OLS
model excluded yearlings and bulls and therefore was different (higher) than proportion
breeding females on the calving ground used for breeding female estimates (
Table 1111) as detailed in Boulanger et al (2014b). One assumption in this case is a
directional trend in proportional females breeding so that it decreases evenly between
calving ground surveys. The proportion females breeding is estimated with information
from calf-cow ratios as well as estimates of proportion females breeding from the calving
ground. Both of these field indicators suggest decreasing productivity from 2012-2015.
OLS model predictions suggest a declining trend (λ=0.79) from 2013-2015 in breeding
female numbers which is similar to the estimate from weighted regression of field
estimates (0.80; Table 18). The estimates of breeding females from the OLS model fall well
within the confidence limits of the breeding female estimates from the 2009, 2012, and
2015 surveys (Figure 32). The estimate of trend in adult females from the OLS model
(λ=0.86) for 2013-2015 was similar to weighted regression estimate based of 0.87 (Table
18). In both cases, the overall trend from adult females is higher than the trend from
breeding females due to lower proportions of females breeding in 2014-2015.
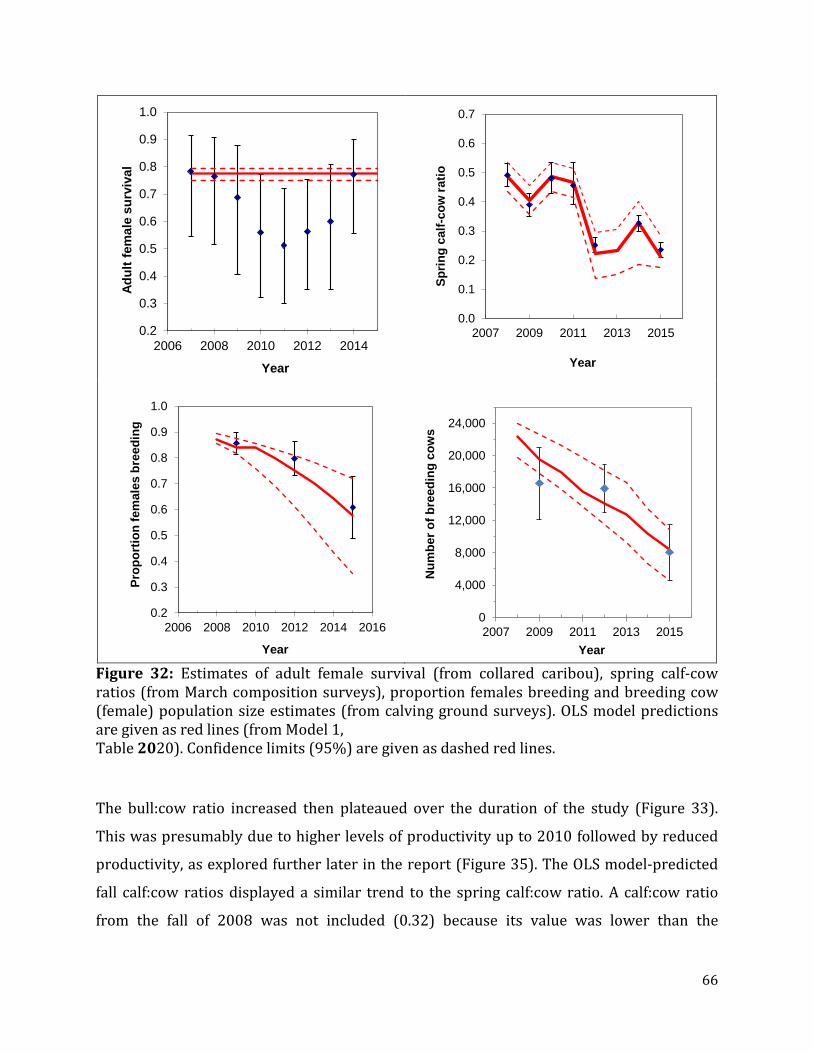
66
Figure 32: Estimates of adult female survival (from collared caribou), spring calf-cow ratios (from March composition surveys), proportion females breeding and breeding cow (female) population size estimates (from calving ground surveys). OLS model predictions are given as red lines (from Model 1, Table 2020). Confidence limits (95%) are given as dashed red lines.
The bull:cow ratio increased then plateaued over the duration of the study (Figure 33).
This was presumably due to higher levels of productivity up to 2010 followed by reduced
productivity, as explored further later in the report (Figure 35). The OLS model-predicted
fall calf:cow ratios displayed a similar trend to the spring calf:cow ratio. A calf:cow ratio
from the fall of 2008 was not included (0.32) because its value was lower than the
0.2
0.3
0.4
0.5
0.6
0.7
0.8
0.9
1.0
2006 2008 2010 2012 2014
Adul
t fem
ale
surv
ival
Year
0.0
0.1
0.2
0.3
0.4
0.5
0.6
0.7
2007 2009 2011 2013 2015
Sprin
g ca
lf-co
w ra
tio
Year
0.2
0.3
0.4
0.5
0.6
0.7
0.8
0.9
1.0
2006 2008 2010 2012 2014 2016
Prop
ortio
n fe
mal
es b
reed
ing
Year
0
4,000
8,000
12,000
16,000
20,000
24,000
2007 2009 2011 2013 2015
Num
ber o
f bre
edin
g co
ws
Year
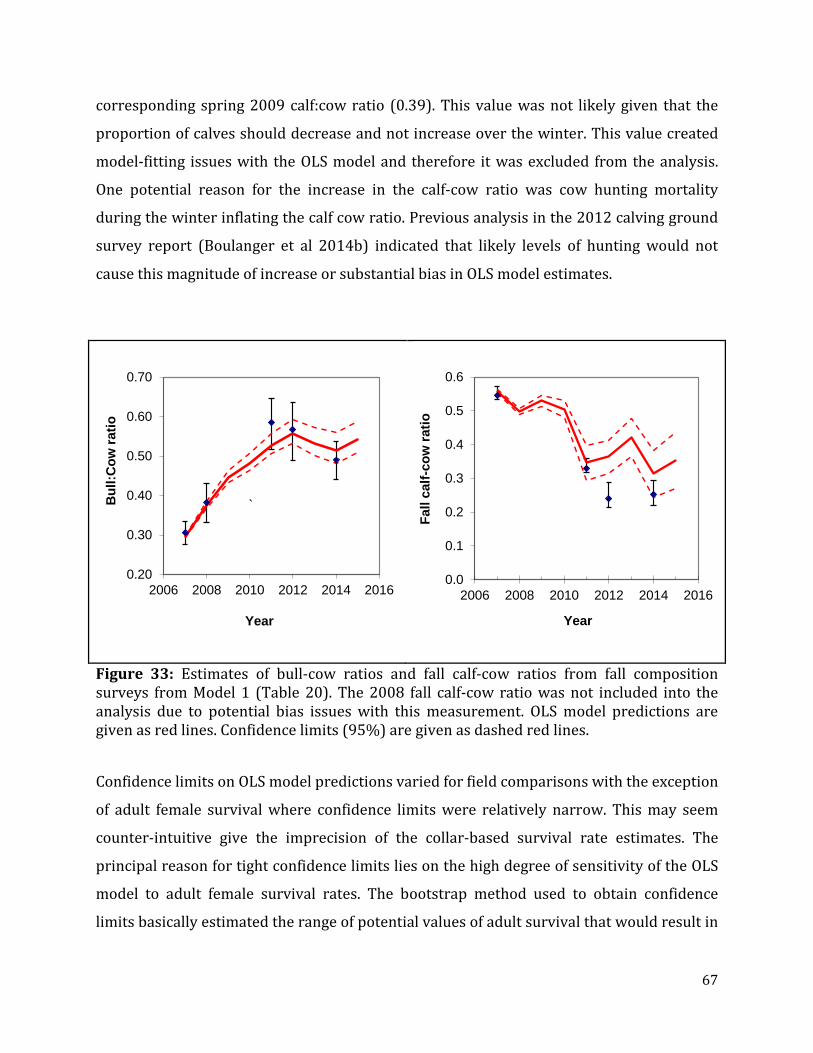
67
corresponding spring 2009 calf:cow ratio (0.39). This value was not likely given that the
proportion of calves should decrease and not increase over the winter. This value created
model-fitting issues with the OLS model and therefore it was excluded from the analysis.
One potential reason for the increase in the calf-cow ratio was cow hunting mortality
during the winter inflating the calf cow ratio. Previous analysis in the 2012 calving ground
survey report (Boulanger et al 2014b) indicated that likely levels of hunting would not
cause this magnitude of increase or substantial bias in OLS model estimates.
Figure 33: Estimates of bull-cow ratios and fall calf-cow ratios from fall composition surveys from Model 1 (Table 20). The 2008 fall calf-cow ratio was not included into the analysis due to potential bias issues with this measurement. OLS model predictions are given as red lines. Confidence limits (95%) are given as dashed red lines.
Confidence limits on OLS model predictions varied for field comparisons with the exception
of adult female survival where confidence limits were relatively narrow. This may seem
counter-intuitive give the imprecision of the collar-based survival rate estimates. The
principal reason for tight confidence limits lies on the high degree of sensitivity of the OLS
model to adult female survival rates. The bootstrap method used to obtain confidence
limits basically estimated the range of potential values of adult survival that would result in
0.20
0.30
0.40
0.50
0.60
0.70
2006 2008 2010 2012 2014 2016
Bul
l:Cow
ratio
Year
`
0.0
0.1
0.2
0.3
0.4
0.5
0.6
2006 2008 2010 2012 2014 2016
Fall
calf-
cow
ratio
Year
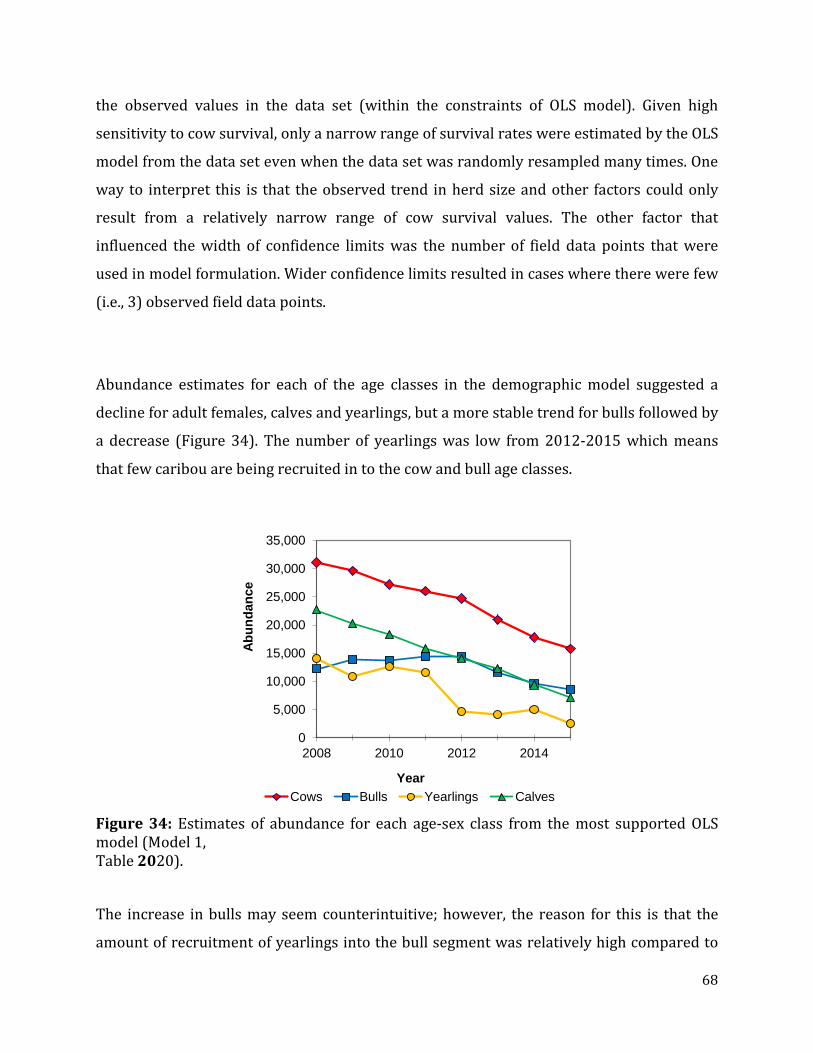
68
the observed values in the data set (within the constraints of OLS model). Given high
sensitivity to cow survival, only a narrow range of survival rates were estimated by the OLS
model from the data set even when the data set was randomly resampled many times. One
way to interpret this is that the observed trend in herd size and other factors could only
result from a relatively narrow range of cow survival values. The other factor that
influenced the width of confidence limits was the number of field data points that were
used in model formulation. Wider confidence limits resulted in cases where there were few
(i.e., 3) observed field data points.
Abundance estimates for each of the age classes in the demographic model suggested a
decline for adult females, calves and yearlings, but a more stable trend for bulls followed by
a decrease (Figure 34). The number of yearlings was low from 2012-2015 which means
that few caribou are being recruited in to the cow and bull age classes.
Figure 34: Estimates of abundance for each age-sex class from the most supported OLS model (Model 1, Table 2020).
The increase in bulls may seem counterintuitive; however, the reason for this is that the
amount of recruitment of yearlings into the bull segment was relatively high compared to
0
5,000
10,000
15,000
20,000
25,000
30,000
35,000
2008 2010 2012 2014
Abun
danc
e
YearCows Bulls Yearlings Calves
69
the actual size of the bull population and subsequent level of bull mortality (Figure 35). In
contrast, the recruitment of yearlings into the female segment, which is larger, was
relatively low compared to the level of mortality (Figure 35). Thus, the bull segment of the
population had a net gain (recruitment>mortality) up to 2011, whereas adult cows had a
net loss (mortality>recruitment) across all years.
The estimated trends in bull and cow abundance (Figure 35) explained the increase in the
bull:cow ratio observed in fall composition surveys (Figure 33). In general, an increasing
bull:cow ratio is associated with improving population trend. But in the case of this
analysis, the predicted OLS model increase in the bull:cow ratio, was partially due to a
decrease in cow abundance with a more stable trend in bull abundance from 2008-2012
(Figure 33). The increase in the bull:cow ratio of the Bathurst herd in this context further
highlights why data from age ratios should be interpreted cautiously (Harris et al. 2007).
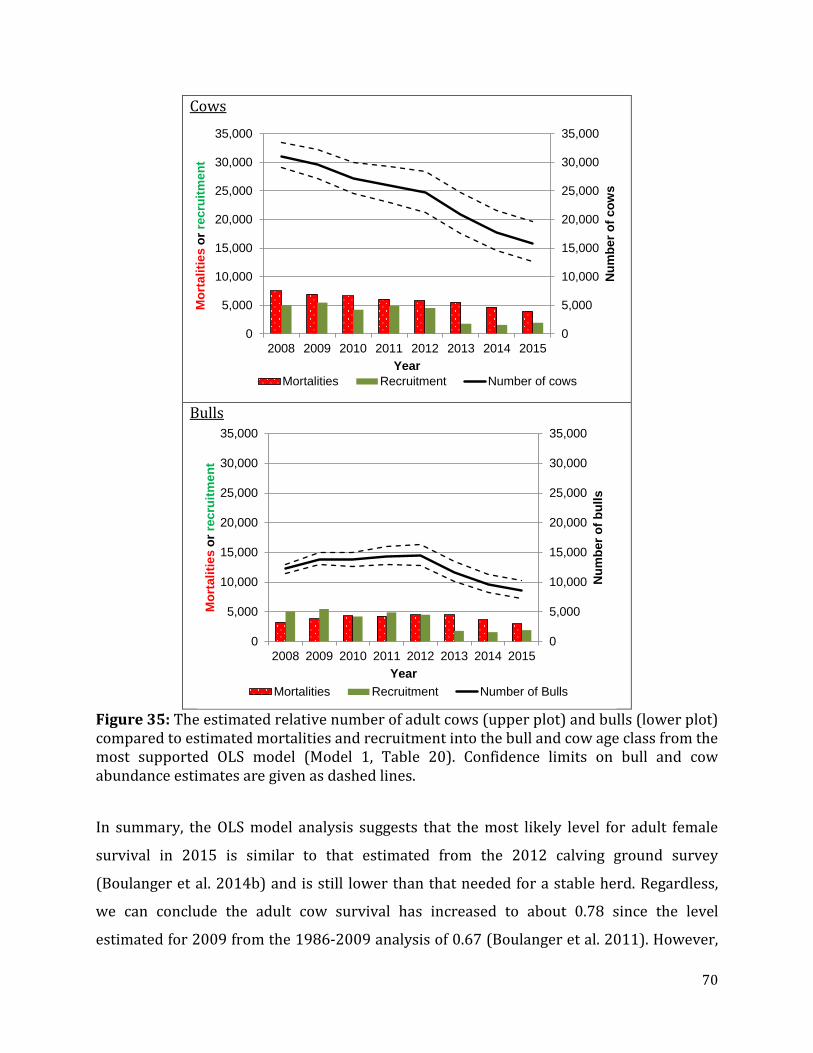
70
Cows
Bulls
Figure 35: The estimated relative number of adult cows (upper plot) and bulls (lower plot) compared to estimated mortalities and recruitment into the bull and cow age class from the most supported OLS model (Model 1, Table 20). Confidence limits on bull and cow abundance estimates are given as dashed lines.
In summary, the OLS model analysis suggests that the most likely level for adult female
survival in 2015 is similar to that estimated from the 2012 calving ground survey
(Boulanger et al. 2014b) and is still lower than that needed for a stable herd. Regardless,
we can conclude the adult cow survival has increased to about 0.78 since the level
estimated for 2009 from the 1986-2009 analysis of 0.67 (Boulanger et al. 2011). However,
0
5,000
10,000
15,000
20,000
25,000
30,000
35,000
0
5,000
10,000
15,000
20,000
25,000
30,000
35,000
2008 2009 2010 2011 2012 2013 2014 2015
Num
ber o
f cow
s
Mor
talit
ies
or re
crui
tmen
t
YearMortalities Recruitment Number of cows
0
5,000
10,000
15,000
20,000
25,000
30,000
35,000
0
5,000
10,000
15,000
20,000
25,000
30,000
35,000
2008 2009 2010 2011 2012 2013 2014 2015
Num
ber o
f bul
ls
Mor
talit
ies
or re
crui
tmen
t
YearMortalities Recruitment Number of Bulls

71
the continued lower level of adult female survival combined with low productivity has
resulted in a continued decline in overall herd size.
72
DISCUSSION
General Results The general results of this analysis shows the Bathurst herd has declined since the previous
survey in 2012 (Figure 25). The rate of decline as estimated by breeding females is higher
than the rate of decline in adult females due to lower pregnancy rates in 2014 affecting the
proportion of breeding females observed on the calving ground in 2015 (Figure 28). The
rate of decline for adult females was 13% per year (CI=3-22%) from 2013-2015 in contrast
to a rate of decline of breeding females of 20% per year (CI=3-20%) for the 2013-2015
period. Using adult females as a measure of overall herd status assumes that all adult
females (breeding and non-breeding) were in the surveyed areas for all of the years
considered. Switching of caribou between calving grounds was minimal for the Bathurst
and the neighbouring herds, suggesting that movement to other calving grounds is not a
likely explanation for changes in numbers of caribou observed on the Bathurst calving
ground.
Analysis of demography of the Bathurst herd using multiple data sources suggests that the
observed decline in herd size is due to a lower adult female survival rate (0.78, CI=0.76-
0.80) combined with relatively low productivity of the herd after 2010 (Figure 31), which
reduced the number of female caribou recruiting to become breeding females (Figure 32).
Low observed productivity levels after 2011 are of special concern given that the result will
be lower levels of recruitment to the breeding female cohort (Figures 35) to offset lower
adult female survival rates. As a result, the immediate prognosis for the herd is a continued
decline unless adult female survival rates increase.
The demographic decline of the Bathurst herd was also suggested in analyses conducted
during the 2012 calving ground survey report (Boulanger et al. 2014b). In this case the
demographic model estimated a decline in the population trajectory that still fell within the
confidence limits of the breeding female estimates; that is, there may have been a decline
73
2009-2012 that was not apparent from the actual survey estimates. It was for this reason
that the Bathurst herd status was suggested to be “fragile” and deserving of careful and
conservative management in 2012.
We note that the current estimate of adult female survival of 0.78 is higher than the
estimated survival rate of 0.67 after the larger scale decline of the herd from 2006-2009
(Boulanger et al. 2011). Prior to the 2009 survey (Nishi et al. 2010), harvest levels of up to
3,000-5,000 cows and 1,000-2,000 bulls were occurring on an annual basis (Adamczewski
et al. 2009, Boulanger et al. 2011). If this harvest level had continued it is likely that the
number of breeding females would have been less than 9,000 for the 2012 survey (Figure
28). It is likely that one reason for the increase in survival rate since 2009 is the reduction
of harvest pressure. However, the adult survival rate is still not at levels estimated in 1986
(0.85) or high enough to allow stabilization and recovery of the herd.
The Bathurst calving ground was relatively small in 2015 compared to the 2009 survey and
slightly smaller than the 2012 survey area (Figure 25). The high degree of aggregation
within the 2015 calving ground was quite striking. For example, the relatively small size of
the 2015 core area resulted in only one Photo Stratum (area of 1,492 km2) compared to
two Photo Strata in 2012. Densities in the Photo Stratum in 2012 were 23.1 and 3.0
caribou/km2 compared to a mean density of 8.76 caribou/km2 in 2015. Inspection of
segment densities (Figure 20) revealed relatively high densities of caribou within the 2015
Photo Stratum with an abrupt transition to areas of low or no caribou in surrounding areas.
The composition data also revealed a sharp transition from breeding caribou in the core
area to non-breeders in peripheral areas (Figure 22). This pattern may reflect an attempt
to maintain the benefits of gregarious calving despite the much reduced numbers of cows
in the herd. One study demonstrated that calves in the Porcupine herd born in the interior
of large groups of cows tended to survive at higher rates than calves in smaller groups or
on the periphery of large groups (Griffith et al. 2002).
74
The high levels of aggregation of caribou on the 2015 calving ground also created
challenges to our ability to sample caribou on the calving ground especially in the
reconnaissance and allocation phase of the survey. For example, despite relatively tight line
spacing of 5 km during the reconnaissance phase, only two segments of higher density of
caribou were detected, of which one was based on a single group of caribou in the North
Stratum (Figure 12) and only one density segment was defined in the area of highest
density of caribou (Figure 20). When populations are aggregated in a small area, it becomes
more likely that larger groups of caribou will be detected on very few survey lines,
reducing certainty and estimate precision. The effect of aggregation can also be seen in the
photo survey results where only four of 20 lines detected caribou densities of over ten
caribou/km2. To address this, we suggest that future surveys use an adaptive sampling
design where the core area is first surveyed at 5 km spacing. Once higher density segments
are detected then the areas in the proximity of these should be surveyed at 2.5 km spacing.
This approach should ensure that core densities are sampled more adequately, which
should allow for better reconnaissance estimates as well as more information to allow
more precise stratification of Photo Strata.
The recent decline in proportion of females breeding could be due to reduced female
condition due to poor summer range conditions (Chen et al. 2014) especially during the
summer of 2014 which experienced low precipitation and high temperatures. In addition,
variation in age structure of the adult female segment of the herd can create variation in
reproductive rates (Dauphin'e 1976, Boulanger et al. 2011). Ongoing demographic analyses
are being conducted to further assess the linkage between environmental covariates and
caribou demography.
Interpretation of Breeding Female Estimates. The main target population for the calving ground surveys is breeding female caribou. An
inherent assumption of this method is that breeding females will congregate on the calving
ground, allowing the photo survey to estimate this component of the herd. The breeding
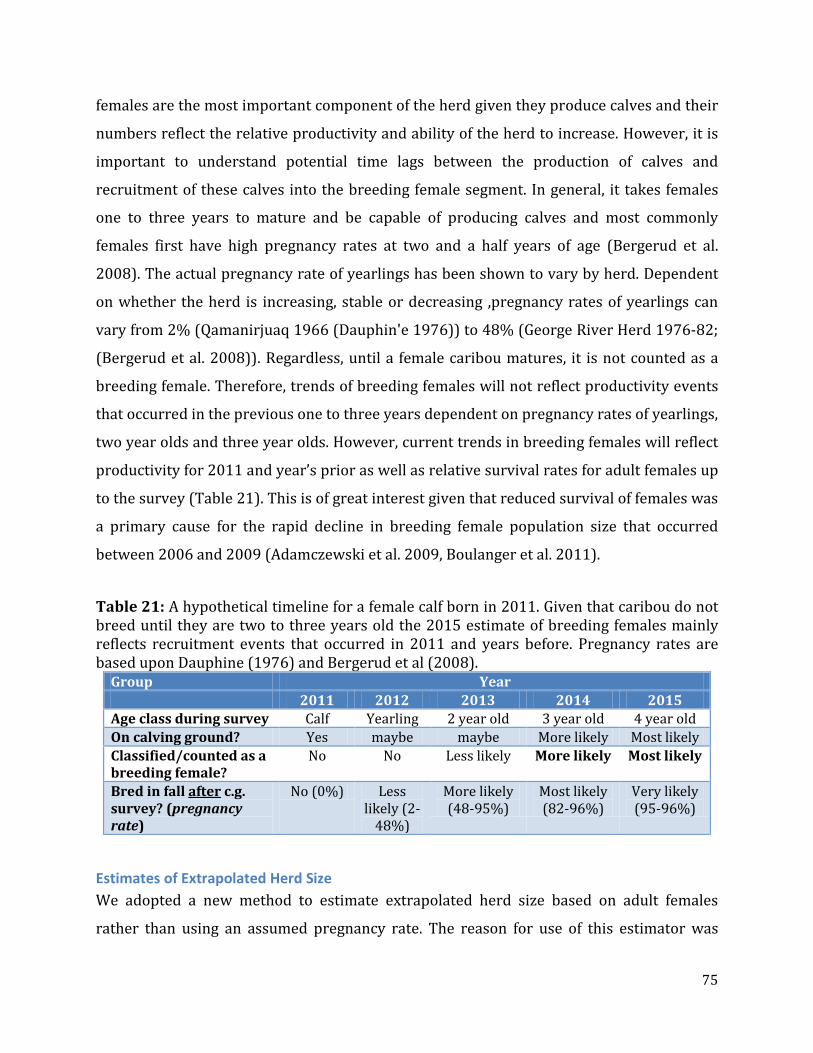
75
females are the most important component of the herd given they produce calves and their
numbers reflect the relative productivity and ability of the herd to increase. However, it is
important to understand potential time lags between the production of calves and
recruitment of these calves into the breeding female segment. In general, it takes females
one to three years to mature and be capable of producing calves and most commonly
females first have high pregnancy rates at two and a half years of age (Bergerud et al.
2008). The actual pregnancy rate of yearlings has been shown to vary by herd. Dependent
on whether the herd is increasing, stable or decreasing ,pregnancy rates of yearlings can
vary from 2% (Qamanirjuaq 1966 (Dauphin'e 1976)) to 48% (George River Herd 1976-82;
(Bergerud et al. 2008)). Regardless, until a female caribou matures, it is not counted as a
breeding female. Therefore, trends of breeding females will not reflect productivity events
that occurred in the previous one to three years dependent on pregnancy rates of yearlings,
two year olds and three year olds. However, current trends in breeding females will reflect
productivity for 2011 and year’s prior as well as relative survival rates for adult females up
to the survey (Table 21). This is of great interest given that reduced survival of females was
a primary cause for the rapid decline in breeding female population size that occurred
between 2006 and 2009 (Adamczewski et al. 2009, Boulanger et al. 2011).
Table 21: A hypothetical timeline for a female calf born in 2011. Given that caribou do not breed until they are two to three years old the 2015 estimate of breeding females mainly reflects recruitment events that occurred in 2011 and years before. Pregnancy rates are based upon Dauphine (1976) and Bergerud et al (2008).
Group Year 2011 2012 2013 2014 2015 Age class during survey Calf Yearling 2 year old 3 year old 4 year old On calving ground? Yes maybe maybe More likely Most likely Classified/counted as a breeding female?
No No Less likely More likely Most likely
Bred in fall after c.g. survey? (pregnancy rate)
No (0%) Less likely (2-
48%)
More likely (48-95%)
Most likely (82-96%)
Very likely (95-96%)
Estimates of Extrapolated Herd Size We adopted a new method to estimate extrapolated herd size based on adult females
rather than using an assumed pregnancy rate. The reason for use of this estimator was
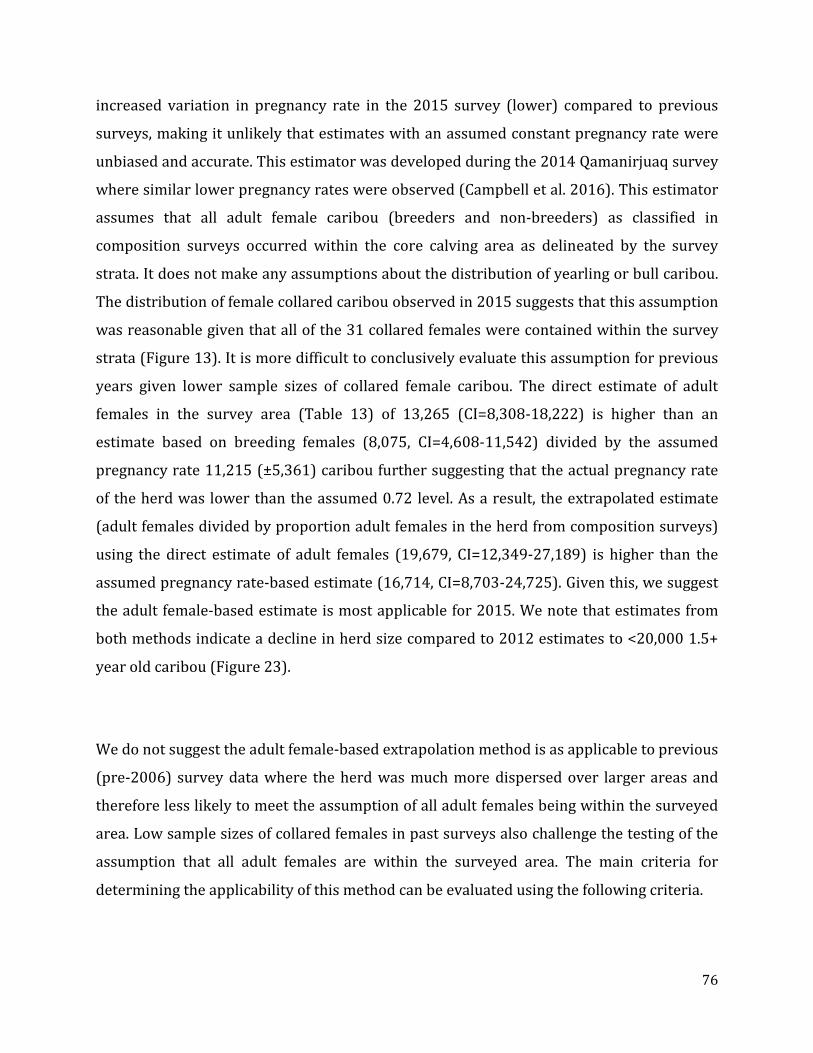
76
increased variation in pregnancy rate in the 2015 survey (lower) compared to previous
surveys, making it unlikely that estimates with an assumed constant pregnancy rate were
unbiased and accurate. This estimator was developed during the 2014 Qamanirjuaq survey
where similar lower pregnancy rates were observed (Campbell et al. 2016). This estimator
assumes that all adult female caribou (breeders and non-breeders) as classified in
composition surveys occurred within the core calving area as delineated by the survey
strata. It does not make any assumptions about the distribution of yearling or bull caribou.
The distribution of female collared caribou observed in 2015 suggests that this assumption
was reasonable given that all of the 31 collared females were contained within the survey
strata (Figure 13). It is more difficult to conclusively evaluate this assumption for previous
years given lower sample sizes of collared female caribou. The direct estimate of adult
females in the survey area (Table 13) of 13,265 (CI=8,308-18,222) is higher than an
estimate based on breeding females (8,075, CI=4,608-11,542) divided by the assumed
pregnancy rate 11,215 (±5,361) caribou further suggesting that the actual pregnancy rate
of the herd was lower than the assumed 0.72 level. As a result, the extrapolated estimate
(adult females divided by proportion adult females in the herd from composition surveys)
using the direct estimate of adult females (19,679, CI=12,349-27,189) is higher than the
assumed pregnancy rate-based estimate (16,714, CI=8,703-24,725). Given this, we suggest
the adult female-based estimate is most applicable for 2015. We note that estimates from
both methods indicate a decline in herd size compared to 2012 estimates to <20,000 1.5+
year old caribou (Figure 23).
We do not suggest the adult female-based extrapolation method is as applicable to previous
(pre-2006) survey data where the herd was much more dispersed over larger areas and
therefore less likely to meet the assumption of all adult females being within the surveyed
area. Low sample sizes of collared females in past surveys also challenge the testing of the
assumption that all adult females are within the surveyed area. The main criteria for
determining the applicability of this method can be evaluated using the following criteria.
77
1. Comparison of direct estimates of adult females to those derived by breeding females/0.72 (0.72 being the assumed pregnancy rate). If the direct adult female estimate is higher than this would suggest a lower pregnancy rate (and the appropriate use of the direct adult female estimator).
2. Evaluation of the proportion of collared females in the core surveyed/stratified area. If the proportion is high then it would suggest the survey has sampled the majority of adult females. The surveyed area is defined as the area that was sampled using aerial transect and composition surveys (to estimate adult females). A model-based framework is being developed to provide a statistical test of this assumption.
3. Comparison of estimates of proportion breeding (from composition surveys on the calving ground). This comparison is integrated currently into the OLS model demographic analysis.
Management Implications and Recommendations The results of the 2015 survey indicate that the herd size has decreased since the 2012
survey. Further analysis of the demographic data suggests that the population of breeding
females is “fragile” with estimated adult female survival rates still below levels needed for
herd stability or levels estimated in the 1980s. Of extra concern are recent levels of low
productivity as indicated by spring calf-cow ratios since 2012. Unless these indicators
change substantially in the near future, the herd is likely to decline further in the next few
years. The herd in 2015 has declined by about 96% from peak numbers in 1986. Given
these results, we make the following recommendations.
1. The herd’s ability to stabilize and increase depends most on breeding cows surviving in large numbers and producing calves, thus a very conservative approach to management, including harvest, would give the herd the best opportunity to recover.
2. One challenge of interpreting the demographics of the Bathurst caribou herd is imprecise survival rates from collared caribou given that in most years only 20 or less caribou have been collared. Low sample sizes of collared caribou also make it more difficult to delineate different herds on winter ranges. Given this, we suggest maintaining and considering an increase in the number of collared caribou for the Bathurst herd.
3. Continued monitoring of the number of breeding cows on the calving ground via annual reconnaissance surveys should occur with an emphasis on recommendations
78
made in (Boulanger 2011) to strive for adequate precision. In addition, spring composition surveys should continue on an annual basis to monitor relative recruitment. An increased effort to assess annual pregnancy rates, e.g. via collection of fecal samples in late winter, should be considered.
4. The photo-survey of the calving ground should be repeated in 2018 to allow for rigorous assessment of population size and trend.
The future trend of the Bathurst herd is difficult to predict accurately, as migratory barren-
ground caribou herds do not always return to high numbers on a predictable cycle, nor do
they necessarily return to the same peak numbers (Bergerud et al. 2008). The Bathurst
herd faces other stressors in 2015 and 2016, including climate change and the cumulative
effects of development. A cautious overall approach to management of harvest and other
human influences on this herd will provide this herd with its best opportunity to recover to
larger numbers and higher productivity.
79
ACKNOWLEDGEMENTS
We thank the following pilots for their expert and safe flying: Warren Wright and David
Wresk for Northwright Airways LTD, Randy Gregg from Air Tindi, Doug Ross (Great Slave
Helicopters), Robert Ferlisi (Summit Air) and Dan Montaneu (Great Slave Helicopters). We
thank Lisa Zetterberg (Caslys Consulting, Saanichton, British Columbia) for GIS and tablet
computer support during the survey. We thank the following individuals who assisted in
counting caribou on the aerial survey: Boyan Tracz, Lisa-Marie Leclerc, Sean Richardson,
Danny Allaire, Roy Judas, Mathieu Dumond, Myles Lamont, Heather Sayine-Crawford, Lisa
Zetterberg, Ron Fatt, Earl Evans, Archie Black, Joel Dragon-Smith, Jorgen Bolt, Allen Nip,
Gustin Adjun, and George Mandeville. We thank the photo survey crew of Marcel Joubert,
Klark Salmon, Louise Rawlinson, and Han Nguyen of GeodesyGroup Inc. (Calgary, AB). Max
Dupilka (TrueNorth Weather consulting) provided daily updates on survey weather. Derek
Fisher (president and photo interpreter with Green Link Forestry Inc.) counted caribou
from the photo survey. Ekati Mine provided lodging for part of the survey crew as well as
refueling of aircraft. Justin McPherson and Jason Shaw with Caslys Consulting Ltd.
(Saanichton, BC) developed software for the tablet computers. Judy Williams and Bonnie
Fournier (ENR, Yellowknife, NWT) provided collar and fate data for demographic analyses.
This survey was funded by Environment and Natural Resources, Government of Northwest
Territories.
80
LITERATURE CITED
Adamczewski, J., J. Boulanger, B. Croft, H.D. Cluff, B. Elkin, J. Nishi, A. Kelly, A. D'Hont and C. Nicolson. 2009. Decline in the Bathurst caribou herd 2006-2009: A technical evaluation of field data and modeling. Environment and Renewable Resources, Government of Northwest Territories.
Bergerud, A.T., S.N. Luttich and L. Camps. 2008. The return of the caribou to Ungava. Queen's University Press, Montreal, QC.
Boulanger, J. 2011. Optimal survey design, survey intervals, and analysis strategies for caribou calving ground surveys, reconnaissance surveys, and composition surveys. Environment and Natural Resources, Government of Northwest Territories.
Boulanger, J., M. Campbell, D. Lee, M. Dumond and J. Nishi. 2014a. A double-observer method to model variation in sightability of caribou in calving ground surveys. Rangifer In prep.
Boulanger, J., B. Croft and J. Adamczewski. 2014b. An estimate of breeding females and analysis of demographics from the 2012 Bathurst barren-ground caribou calving ground survey. Environment and Natural Resources, Government of Northwest Territories. File Report No. 142. 91pp.
Boulanger, J., B. Croft and H.D. Cluff. 2014c. Trends in size of the Bathurst caribou herd from the 2014 calving ground reconnaissance survey. Environmental and Natural Resources, Government of the Northwest Territories.
Boulanger, J., A. Gunn, J. Adamczewski, and B. Croft. 2011. A data-driven demographic model to explore the decline of the Bathurst caribou herd. Journal of Wildlife Management 75: 883-896.
Boulanger, J., K.G. Poole, J. Williams, J. Nishi and B. Croft. 2010. Estimation of sighting probabilities from caribou calving ground surveys using double-observer methods. Draft report. Governments of the Northwest Territories and Nunavat.
Brown, D. and P. Rothery. 1993. Models in biology: Mathematics, statistics, and computing. John Wiley and Sons, New York, NY.
Buckland, S.T., D.R. Anderson, K.P. Burnham and J.L. Laake. 1993. Distance Sampling. Estimating Abundance of Biological Populations. Chapman & Hall, London.
Buckland, S.T., J. Laake and D.L. Borchers. 2010. Double-observer line transect methods: levels of independence. Biometrics 66: 169-177.
Burnham, K.P. and D.R. Anderson. 1998. Model selection and inference: A practical information theoretic approach. Springer, New York, NY.
Campbell, M., J. Boulanger and D. Lee. 2016. Interim report: Estimating abundance of the Qamanirjuaq mainland migratory barren-ground sub-population; June 2014. Department of Environment, Government of Nunavut.
81
Chen, W., L. White, J. Adamczewski, B. Croft, K. Garner, J.S. Pellisey, K. Clark, I. Olthof, R. Latifovic and G. Finstad. 2014. Assessing the impacts of summer range on Bathurst caribou’s productivity and abundance since 1985. Natural Resources 5: 130-145.
Cluff, H.D., B. Croft and J. Boulanger. 2016. Calf survival and adult sex ratio in the Bathurst and Bluenose-East herds of barren-ground caribou 2006-2015. Environment and Natural Resources, Government of the Northwest Territories.
Dauphin'e, T.C. 1976. Biology of the Kaminuriak population of barren-ground caribou, Part 4: Growth, reproduction and energy reserves. Canadian Wildlife Service Report No. 38.
Davison, T., H. Sawada, P. Spencer, M. Branigan and R. Popko. 2014. Calving ground fidelity of the Tuktoyaktuk Peninsula, Cape Bathurst, Bluenose-Westand Bluenose-East barren-ground caribou herds. Poster at North American Caribou Workshop. Whitehorse, YK.
Gasaway, W.C., S.D. Dubois, D.J. Reed and S.J. Harbo. 1986. Estimating moose population parameters from aerial surveys. Biological Papers of the University of Alaska No. 22: 1-108.
Griffith, B., D.C. Douglas, N.E. Walsh, D.E. Young, T.R. McCabe, D.E. Russell, R.G. White, R.D. Cameron and K.R. Whitten. 2002. Section 3: The Porcupine caribou herd in Arctic refuge coastal plain terrestrial wildlife research summaries. Biological Science Report 2002-0001. U.S. Geological Survey.
Gunn, A., A. D'Hont, J. Williams and J. Boulanger. 2008. Satellite collaring in the Bathurst herd of barren-ground caribou 1996-2005. Resources, Wildlife and Economic Development, Government of the Northwest Territories.
Gunn, A., J. Dragon and J. Nishi. 1997. Bathurst Calving Ground Survey 1996. Resources, Wildlife and Economic Development, Government of the Northwest Territories. File Report No 119. 80pp.
Gunn, A., J. Nishi, J. Boulanger and J. Williams. 2005. An estimate of breeding females in the Bathurst herd of the barren-ground caribou, June 2003. Environment and Natural Resources, Government of Northwest Territories.
Gunn, A. and D.E. Russell, editors. 2008. Monitoring Rangifer herds (population dynamics): Manual. Circumarctic Rangifer Monitoring and Assessment Network (CARMA), www.carmanetwork.com.
Harris, N.C., M.J. Kauffman and L.S. Mills. 2007. Inferences about ungulate population dynamics derived from age ratios. Journal of Wildlife Management 72: 1,143-1,151.
Heard, D.C. 1985. Caribou census methods used in the Northwest Territories. McGill Subarctic Research Papers 40: 229-238.
Heard, D.C. 1987. Allocation of effort in a stratified survey design. Renewable Resources, Government of the Northwest Territories.
Heard, D.C. and J. Williams. 1991. Bathurst calving ground survey, June 1986. Renewable Resources, Government of Northwest Territories.
82
Heard, D.C. and M. Williams. 1990. Caribou project summary and review. Resources, Wildlife and Economic Development, Government of the Northwest Territories.
Hood, G.M. 2009. CSIRO. www.cse.csiro.au/poptools, Canberra, AU.
Huggins, R.M. 1991. Some practical aspects of a conditional likelihood approach to capture experiments. Biometrics 47: 725-732.
Innes, S., M.P. Heidi-Jorgensen, J.L. Laake, K.L. Laidre, H.J. Cleator, P. Richard and R.E.A. Stewart. 2002. Surveys of belugas and narwhals in the Canadian High Arctic. NAMMMCO Scientific Publications No. 3.
Jolly, G.M. 1969. Sampling methods for aerial censuses of wildlife populations. East African Agricultural and Forestry Journal 34: 46-49.
Krebs, C.J. 1998. Ecological Methodology (Second edition). 2 edition. Benjamin Cummins, Menlo Park, CA.
Laake, J., D.L. Borchers, L. Thomas, D. Miller and J. Bishop. 2012. Mark-recapture distance sampling (MRDS) 2.1.0. R statistical package program.
Laake, J., M.J. Dawson and J. Hone. 2008a. Visibility bias in aerial survey: mark-recapture, line-transect or both? Wildlife Research 35: 299-309.
Laake, J., R.J. Guenzel, J.L. Bengtson, P. Boveng, M. Cameron and M.B. Hanson. 2008b. Coping with variation in aerial survey protocol for line-transect sampling. Wildlife Research 35: 289-298.
Manly, B.F.J. 1997. Randomization and Monte Carlo Methods in Biology. 2nd edition. Chapman and Hall, New York, NY.
Nagy, J., D.L. Johnson, N.C. Larter, M. Campbell, A.E. Derocher, A. Kelly, M. Dumond, D. Allaire and B. Croft. 2011. Subpopulation structure of caribou (Rangifer tarandus L.) in Arctic and subarctic Canada. Ecological Applications 21: 2,334-2,348.
Nishi, J. 2010. Appendix M. Potential for systematic surveys of Bathurst caribou calving grounds to contribute to herd monitoring in J. Nishi, B. Croft, J. Boulanger, andJ. Adamczewski, editors. An estimate of breeding females in the Bathurst herd of barren-ground caribou. Environment and Natural Resources, Government of Northwest Territories. File Report No 144. 111pp.
Nishi, J., B. Croft, J. Boulanger and J. Adamczewski. 2010. An estimate of breeding females in the Bathurst herd of barren-ground caribou, June 2009. Environment and Natural Resources, Government of Northwest Territories. File Report No. 144. 111pp.
Nishi, J., B. Croft, J. Williams, J. Boulanger and D. Johnson. 2007. An estimate of breeding females in the Bathurst herd of barren-ground caribou, June 2006. Environment and Natural Resources, Government of Northwest Territories. File report No. 137. 118pp.
QGIS Foundation. 2015. QGIS: A free and open geographic information system (www.qgis.org).
R Development Core Team. 2009. R Foundation for Statistical Computing, Vienna, AT.
83
SAS Institute. 2000. Version 8.1. The SAS Institute, Cary NC.
Sutherland, M. and A. Gunn. 1996. Bathurst calving ground surveys: 1965-1996. Resources, Wildlife, and Economic Development, Government of the Northwest Territories. File Report No.118. 120pp.
Thomas, D.C., S.T. Buckland, E.A. Rexstad, J. Laake, S. Strindberg, S.L. Hedley, J.R.B. Bishop, T. A. Marques and K.P. Burnham. 2009. Distance software: Design and analysis of distance sampling surveys for estimating population size. Journal of Applied Ecology In Press.
Thompson, S.K. 1992. Sampling. John Wiley and Sons, New York, NY.
Thompson, W.L., G.C. White and C. Gowan. 1998. Monitoring Vertebrate Populations. Academic Press, San Diego, CA.
White, G.C. and K.P. Burnham. 1999. Program MARK: Survival estimation from populations of marked animals. Bird Study Supplement 46: 120-138.
White, G.C. and B. Lubow. 2002. Fitting population models to multiple sources of observed data. Journal of Wildlife Management 66: 300-309.
Worton, B.J. 1989. Kernal methods for estimating the utilization distribution in home-range studies. Ecology 70: 164-168.
Zar, J.H. 1996. Biostatistical analysis. Third edition. Prentice-Hall, London.
84
Appendix 1: Details on Double-Observer Estimation Methods
MARK produced estimates of sighting probability (p) and when possible re-sighting
probability (c) for the secondary observer. The combined probability that a group of
caribou was seen by at least one of the observers (p*) therefore 1-(1-p)(1-p). Corrected
counts for each group encountered were then estimated as group size divided by p* for
each group. The total corrected count for a series of observations could then be estimated
as:
𝑌� = �𝑦𝑖𝑝𝑖∗
𝑗
𝑖=1
where there were j groups encountered and yi is the count or average count (if two
observers both counted the caribou) and p*i was the sighting probability (from both
observers that was potentially influenced by the size of the group) of the ith group.
Therefore, for each stratum it was possible to add up all the corrected counts to obtain a
corrected count of caribou observed on transect for the given stratum. Using the ratio of
transect area sampled (a) to total stratum area (A) it was then possible to obtain an
estimate of total population size for the stratum (Buckland et al. 2010).
𝑁� =𝐴𝑎
�𝑦𝑖 𝑝𝑖∗
𝑗
𝑖=1
Note that this formula is equivalent to the estimator of (Jolly 1969) used for uncorrected
visual estimates (used in previous calving ground surveys) if p* is assumed to 1
(sightability is 1).
𝑁� =𝐴𝑎
�𝑦𝑖1
𝑗
𝑖=1
Estimates of herd size and associated variance were estimated using the mark-recapture
distance sampling (MRDS) package (Laake et al. 2012) in program R program
(R_Development_Core_Team 2009). In MRDS, a full independence removal estimator which
85
models sightability using only double-observer information (Laake et al. 2008a, Laake et al.
2008b) was used therefore making it possible to derive double-observer strip transect
estimates. For this component, program DISTANCE (Buckland et al. 1993, Thomas et al.
2009) was initially used to input data into program MRDS. Strata-specific variance
estimates were calculated using the formulas of (Innes et al. 2002). Estimates from MRDS
were cross checked with strip transect estimates (that assume sightability=1) using the
formulas of Jolly (1969) as well as double-observer estimates based on beta parameters in
program MARK. Strip widths were adjusted for the Northern Stratum given that it was
flown at a lower altitude.
86
Appendix 2: Details on Correction of Survey Altitude of Pilatus Porter Aircraft
It was discovered during post-processing of the survey data that one of the survey aircrafts
was flying below survey altitude which resulted in a smaller survey strip width (area under
the plane where caribou are counted) therefore potentially biasing estimates for areas that
this plane surveyed. As detailed in the report, estimation formulas were modified to allow
variable strip widths for individual transects within survey stratum therefore mitigating
potential bias.
This section details how survey altitude was estimated for the Pilatus Porter using on-
board GPS altitudes on the survey plane. We stress that this issue was limited to the Pilatus
aircraft, which did not have radar altimeter (which estimates altitude AGL during the flight
and provides a better estimate of altitude than GPS units or atmospheric pressure-based
altimeters). Other aircraft did have radar altimeters which effectively mitigated this issue.
The first step of the analysis was the application of a digital elevation model (DEM) to the
GPS log data from the survey airplane to determine the height AGL versus the absolute
elevation (or height above datum/mean sea level). This procedure associates the DEM
ground elevation to the altitude collected for each GPS location from the survey airplane
(which occurred at one minute intervals during the flight). The DEM model used for this
analysis was the 1:250,000 scale National Topographic Data Base (NTDB) Canadian Digital
Elevation Data with a vertical datum referenced to Mean Sea Level (Canadian Geodetic
Vertical Datum). The altitude AGL was then calculated as the GPS-based altitude minus the
elevation at ground level (from the digital elevation model). The GIS portion of this analysis
was conducted by Caslys Consulting (Saanichton, BC).
We tested estimates of AGL using this procedure by estimating altitude of the plane while it
was at the Kugluktuk airport (elevation of 23 m). The estimated altitude from the GPS unit
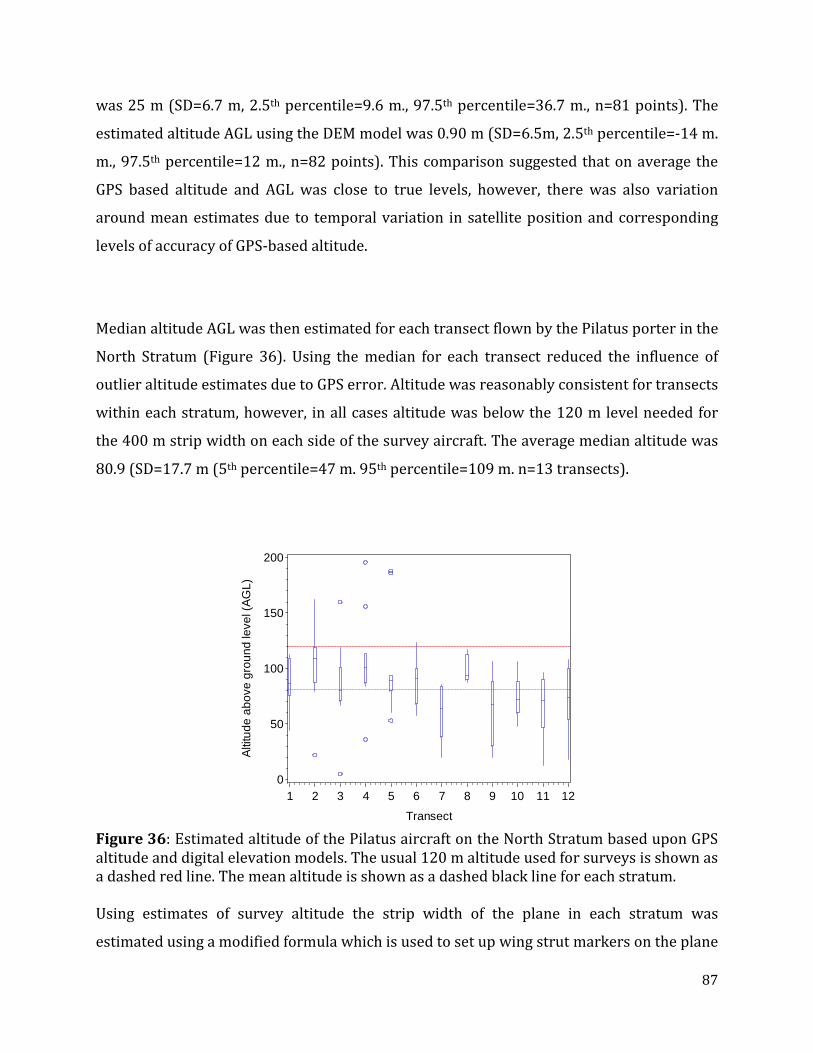
87
was 25 m (SD=6.7 m, 2.5th percentile=9.6 m., 97.5th percentile=36.7 m., n=81 points). The
estimated altitude AGL using the DEM model was 0.90 m (SD=6.5m, 2.5th percentile=-14 m.
m., 97.5th percentile=12 m., n=82 points). This comparison suggested that on average the
GPS based altitude and AGL was close to true levels, however, there was also variation
around mean estimates due to temporal variation in satellite position and corresponding
levels of accuracy of GPS-based altitude.
Median altitude AGL was then estimated for each transect flown by the Pilatus porter in the
North Stratum (Figure 36). Using the median for each transect reduced the influence of
outlier altitude estimates due to GPS error. Altitude was reasonably consistent for transects
within each stratum, however, in all cases altitude was below the 120 m level needed for
the 400 m strip width on each side of the survey aircraft. The average median altitude was
80.9 (SD=17.7 m (5th percentile=47 m. 95th percentile=109 m. n=13 transects).
Figure 36: Estimated altitude of the Pilatus aircraft on the North Stratum based upon GPS altitude and digital elevation models. The usual 120 m altitude used for surveys is shown as a dashed red line. The mean altitude is shown as a dashed black line for each stratum. Using estimates of survey altitude the strip width of the plane in each stratum was
estimated using a modified formula which is used to set up wing strut markers on the plane
Altit
ude
abov
e gr
ound
leve
l (AG
L)
0
50
100
150
200
Transect
1 2 3 4 5 6 7 8 9 10 11 12
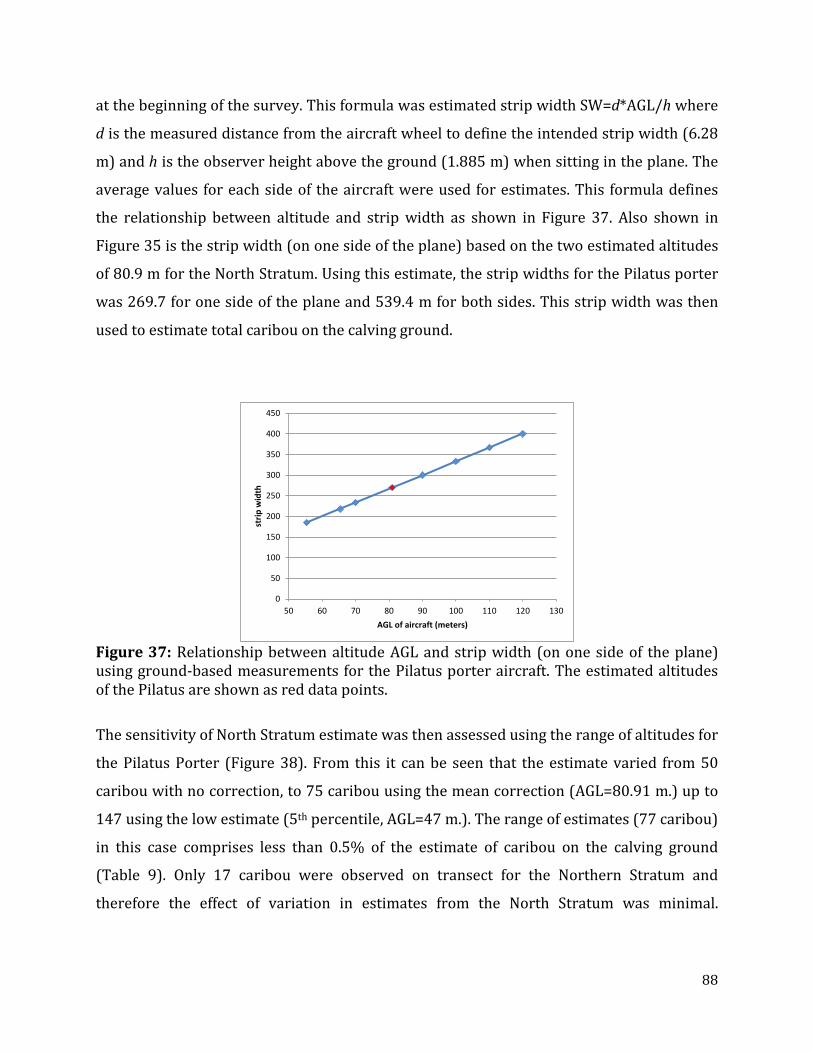
88
at the beginning of the survey. This formula was estimated strip width SW=d*AGL/h where
d is the measured distance from the aircraft wheel to define the intended strip width (6.28
m) and h is the observer height above the ground (1.885 m) when sitting in the plane. The
average values for each side of the aircraft were used for estimates. This formula defines
the relationship between altitude and strip width as shown in Figure 37. Also shown in
Figure 35 is the strip width (on one side of the plane) based on the two estimated altitudes
of 80.9 m for the North Stratum. Using this estimate, the strip widths for the Pilatus porter
was 269.7 for one side of the plane and 539.4 m for both sides. This strip width was then
used to estimate total caribou on the calving ground.
Figure 37: Relationship between altitude AGL and strip width (on one side of the plane) using ground-based measurements for the Pilatus porter aircraft. The estimated altitudes of the Pilatus are shown as red data points. The sensitivity of North Stratum estimate was then assessed using the range of altitudes for
the Pilatus Porter (Figure 38). From this it can be seen that the estimate varied from 50
caribou with no correction, to 75 caribou using the mean correction (AGL=80.91 m.) up to
147 using the low estimate (5th percentile, AGL=47 m.). The range of estimates (77 caribou)
in this case comprises less than 0.5% of the estimate of caribou on the calving ground
(Table 9). Only 17 caribou were observed on transect for the Northern Stratum and
therefore the effect of variation in estimates from the North Stratum was minimal.
0
50
100
150
200
250
300
350
400
450
50 60 70 80 90 100 110 120 130
strip
wid
th
AGL of aircraft (meters)
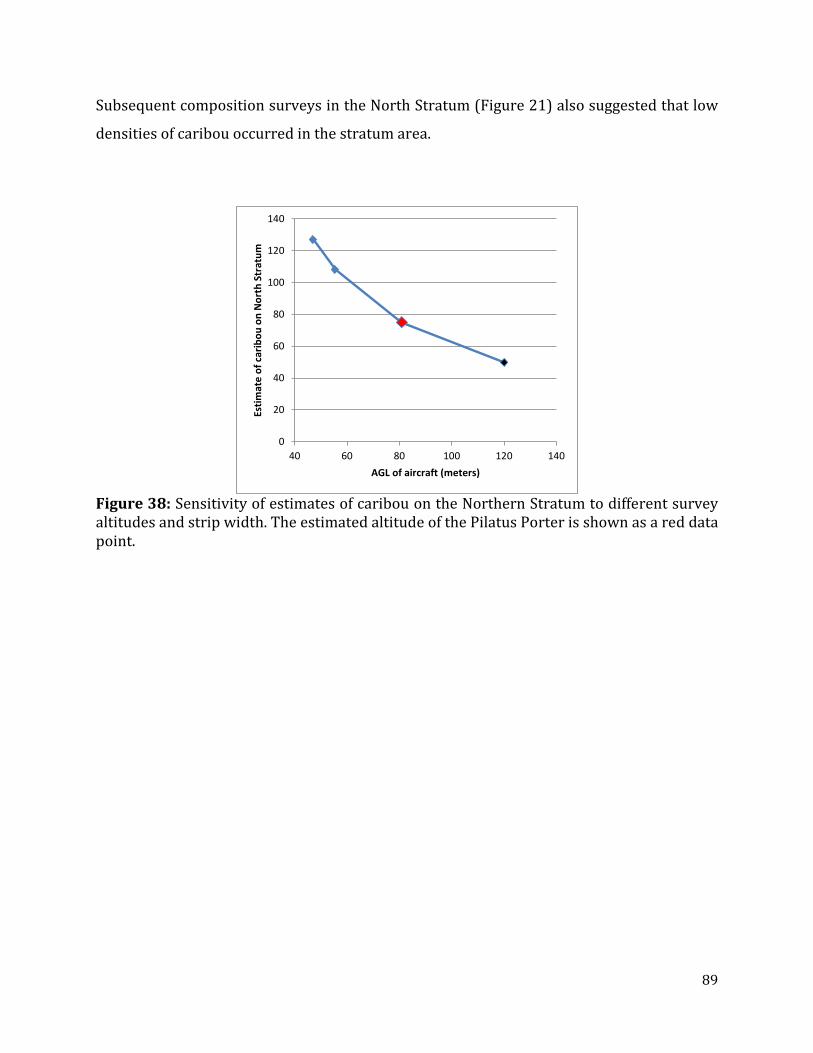
89
Subsequent composition surveys in the North Stratum (Figure 21) also suggested that low
densities of caribou occurred in the stratum area.
Figure 38: Sensitivity of estimates of caribou on the Northern Stratum to different survey altitudes and strip width. The estimated altitude of the Pilatus Porter is shown as a red data point.
0
20
40
60
80
100
120
140
40 60 80 100 120 140
Estim
ate
of c
arib
ou o
n N
orth
Str
atum
AGL of aircraft (meters)
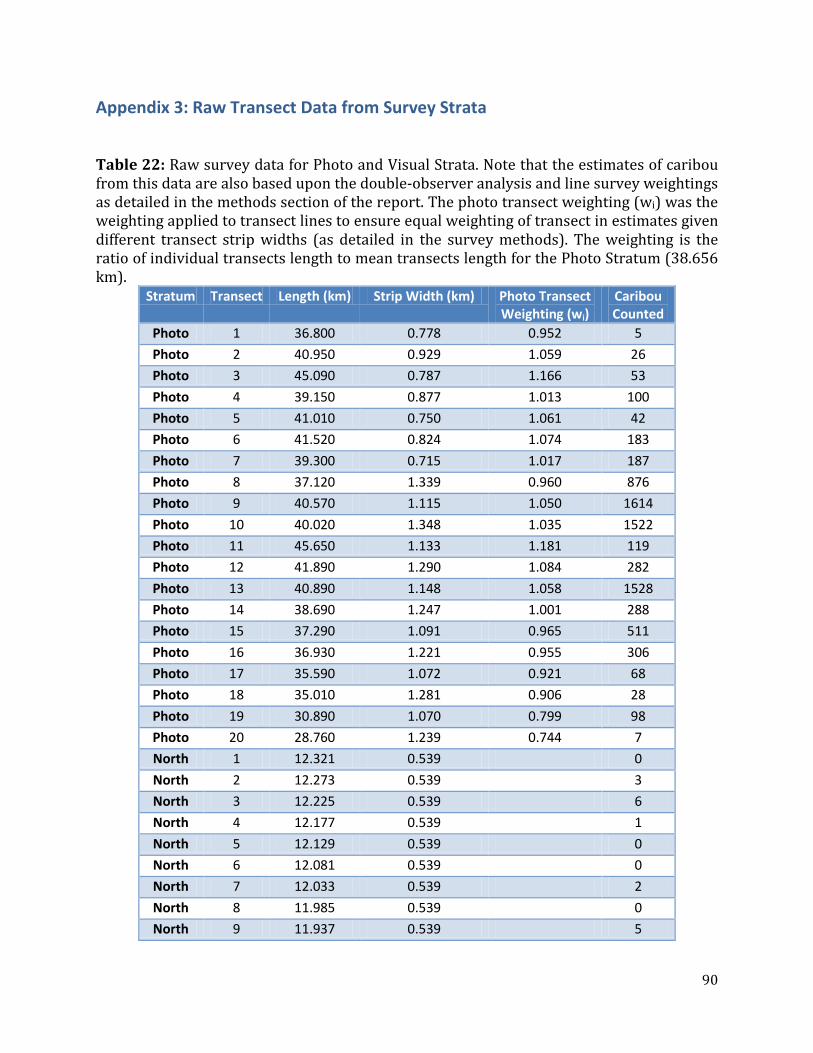
90
Appendix 3: Raw Transect Data from Survey Strata
Table 22: Raw survey data for Photo and Visual Strata. Note that the estimates of caribou from this data are also based upon the double-observer analysis and line survey weightings as detailed in the methods section of the report. The photo transect weighting (wi) was the weighting applied to transect lines to ensure equal weighting of transect in estimates given different transect strip widths (as detailed in the survey methods). The weighting is the ratio of individual transects length to mean transects length for the Photo Stratum (38.656 km).
Stratum Transect Length (km) Strip Width (km) Photo Transect Weighting (wi)
Caribou Counted
Photo 1 36.800 0.778 0.952 5 Photo 2 40.950 0.929 1.059 26 Photo 3 45.090 0.787 1.166 53 Photo 4 39.150 0.877 1.013 100 Photo 5 41.010 0.750 1.061 42 Photo 6 41.520 0.824 1.074 183 Photo 7 39.300 0.715 1.017 187 Photo 8 37.120 1.339 0.960 876 Photo 9 40.570 1.115 1.050 1614 Photo 10 40.020 1.348 1.035 1522 Photo 11 45.650 1.133 1.181 119 Photo 12 41.890 1.290 1.084 282 Photo 13 40.890 1.148 1.058 1528 Photo 14 38.690 1.247 1.001 288 Photo 15 37.290 1.091 0.965 511 Photo 16 36.930 1.221 0.955 306 Photo 17 35.590 1.072 0.921 68 Photo 18 35.010 1.281 0.906 28 Photo 19 30.890 1.070 0.799 98 Photo 20 28.760 1.239 0.744 7 North 1 12.321 0.539 0 North 2 12.273 0.539 3 North 3 12.225 0.539 6 North 4 12.177 0.539 1 North 5 12.129 0.539 0 North 6 12.081 0.539 0 North 7 12.033 0.539 2 North 8 11.985 0.539 0 North 9 11.937 0.539 5
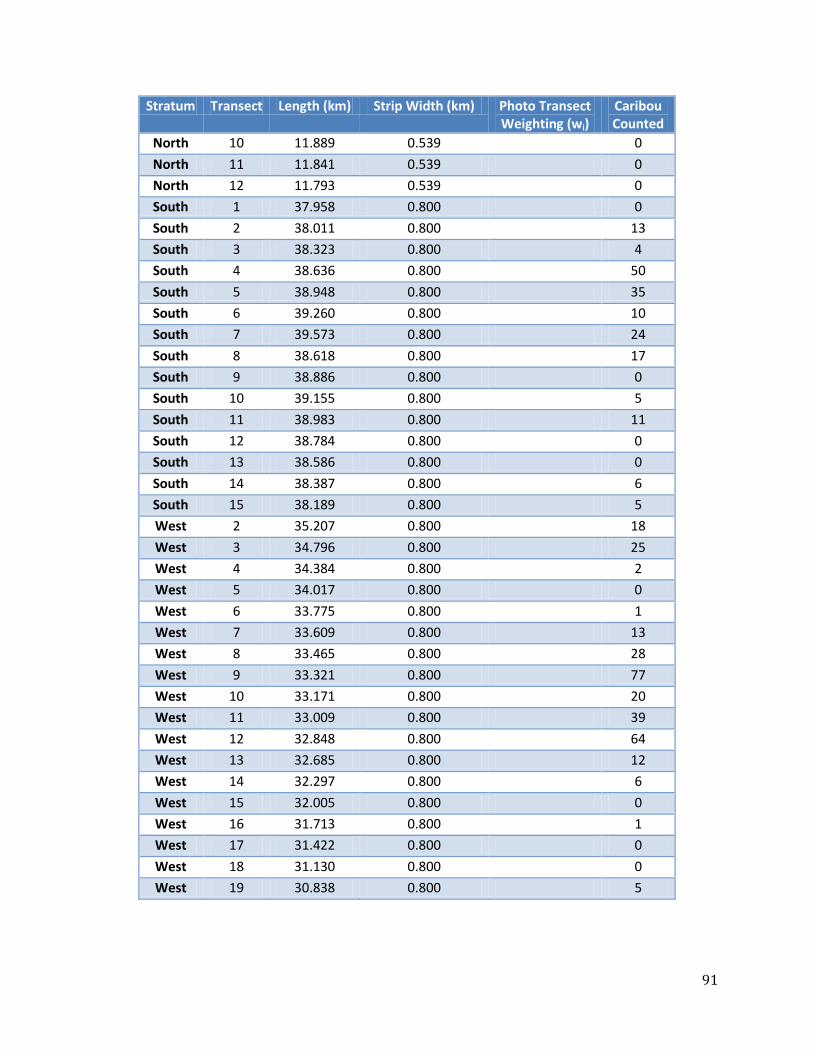
91
Stratum Transect Length (km) Strip Width (km) Photo Transect Weighting (wi)
Caribou Counted
North 10 11.889 0.539 0 North 11 11.841 0.539 0 North 12 11.793 0.539 0 South 1 37.958 0.800 0 South 2 38.011 0.800 13 South 3 38.323 0.800 4 South 4 38.636 0.800 50 South 5 38.948 0.800 35 South 6 39.260 0.800 10 South 7 39.573 0.800 24 South 8 38.618 0.800 17 South 9 38.886 0.800 0 South 10 39.155 0.800 5 South 11 38.983 0.800 11 South 12 38.784 0.800 0 South 13 38.586 0.800 0 South 14 38.387 0.800 6 South 15 38.189 0.800 5 West 2 35.207 0.800 18 West 3 34.796 0.800 25 West 4 34.384 0.800 2 West 5 34.017 0.800 0 West 6 33.775 0.800 1 West 7 33.609 0.800 13 West 8 33.465 0.800 28 West 9 33.321 0.800 77 West 10 33.171 0.800 20 West 11 33.009 0.800 39 West 12 32.848 0.800 64 West 13 32.685 0.800 12 West 14 32.297 0.800 6 West 15 32.005 0.800 0 West 16 31.713 0.800 1 West 17 31.422 0.800 0 West 18 31.130 0.800 0 West 19 30.838 0.800 5


