Embed Size (px)
Citation preview
84
http://ssrn.com/abstract=2201957
NNEETTWWOORRKK AANNAALLYYSSIISS PPaarrtt 66 -- MMIINNIIMMUUMM CCOOSSTT AANNDD AASSSSOOCCIIAATTEEDD DDUURRAATTIIOONN
SSaammiitthhaammbbyy SSeenntthhiillnnaatthhaann PPhhDD ((BBuussiinneessss)),, MM..SScc ((MMaannaaggeemmeenntt)),, BB..SScc ((BBuussiinneessss AAddmmiinniissttrraattiioonn))
DDeeppaarrttmmeenntt ooff MMaannaaggeemmeenntt,, FFCCMM
EEaasstteerrnn UUnniivveerrssiittyy,, SSrrii LLaannkkaa
Abstract
Part 6 of network analysis illustrates the determination of efficient (optimal)
minimum cost as the primary objective and its associated duration in relation
to completion of a project in consideration of the crashed durations and cost
slopes of activities, and the time based fixed cost, of a project.
This part is organized with Prioritised Minimum Cost, and Techniques and
Estimation of Prioritised Minimum Cost.
Key words: Minimum cost, critical path, associated duration
JEL code: C00, O22
Note: This paper is intended to provide a basic explanation about the network analysis in relation to managing duration and cost of a project. Further extension of this paper depends on the support from readers who are expected to provide me your valuable comments and suggestions to continue this task. Please send your comments to [email protected].
85
http://ssrn.com/abstract=2201957
6.1 PRIORITISED MINIMUM COST
In the previous Chapters 4 and 5, illustrations are given to determine in relation to
normal duration and normal (associated) cost, and minimum prioritised duration and
its associated optimal cost of a project, respectively. In the same context, there is a
possibility to explore the project minimum cost and its associated optimal duration. In
completing a project, it is possible to incur certain amount of fixed cost as per its unit
duration. Based on this possibility only, the minimum cost of a project is prioritized in
this chapter in association with the project completion duration.
The fixed cost based on unit duration plays a significant role in determining the
minimum cost of a project. Therefore, the leading role of fixed cost to prioritise and
estimate the minimum cost of a project can be explored in its comparison with the
savable durations and cost slopes of respective project critical activities. Either (a)
when the cost slopes of critical activities are more than the fixed cost or (b) when
critical activities with lowest cost slopes to the fixed cost have no room to save unit
duration, the minimum cost of the project would be equal to its normal cost.
6.2 TECHNIQUES AND ESTIMATION OF PRIORITISED MINIMUM COST
To understand the prioritized minimum cost of a project, consider the same example in
Chapter 5 with the additional information of fixed cost per unit of duration. In this
context, the example is reproduced below for convenience and easy understanding.
Example 6.1
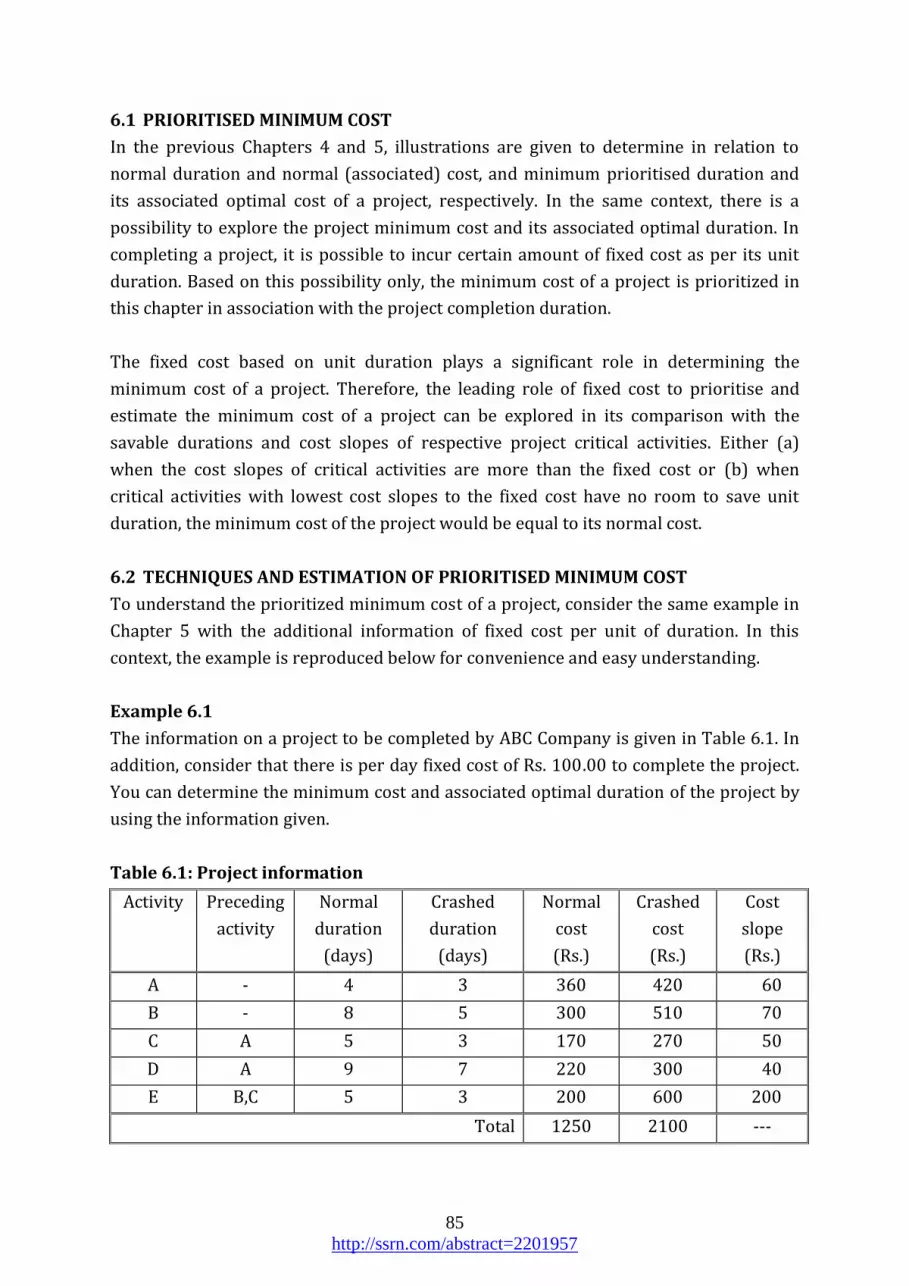
The information on a project to be completed by ABC Company is given in Table 6.1. In
addition, consider that there is per day fixed cost of Rs. 100.00 to complete the project.
You can determine the minimum cost and associated optimal duration of the project by
using the information given.
Table 6.1: Project information
Activity Preceding
activity
Normal
duration
(days)
Crashed
duration
(days)
Normal
cost
(Rs.)
Crashed
cost
(Rs.)
Cost
slope
(Rs.)
A - 4 3 360 420 60
B - 8 5 300 510 70
C A 5 3 170 270 50
D A 9 7 220 300 40
E B,C 5 3 200 600 200
Total 1250 2100 ---

86
http://ssrn.com/abstract=2201957
According to the project information in this example, it is important to initiate with
network diagram (Figure 6.1) and estimating associated (normal) cost of the project.
Figure 6.1: Project network for normal duration
Figure 6.1 shows project duration of 14 days and its associated cost is determined as:
Normal cost of activities = Rs. 1,250.00 (as in Table 6.1)
Fixed cost (for 14 days) = Rs. 1,400.00 (= 14 x Rs. 100)
Total normal cost for project duration = Rs. 2,650.00 and
The critical path of the project is A, C, and E.
Together with the above determined information, the bases 1, 2 and 3 organized for
Approach 2 in Chapter 5 are important, as given below, to determine the project
minimum cost and its associated duration.
Base 1: Related to activity, cost slope and duration to saved
Activity Cost slope
(Rs.)
Duration to
save (days)
A 60.00 1
B 70.00 3
C 50.00 2
D 40.00 2
E 200.00 2
Base 2: Identifying paths in the project
P1 A, D = 13 days
P2 A, C, E = 14 days
P3 B, E = 13 days
4
C 5 E
5
D 9
A
4
B 8
1
2
0
4 55
0
4
3
9 9
45
7
14 14
4
87
http://ssrn.com/abstract=2201957
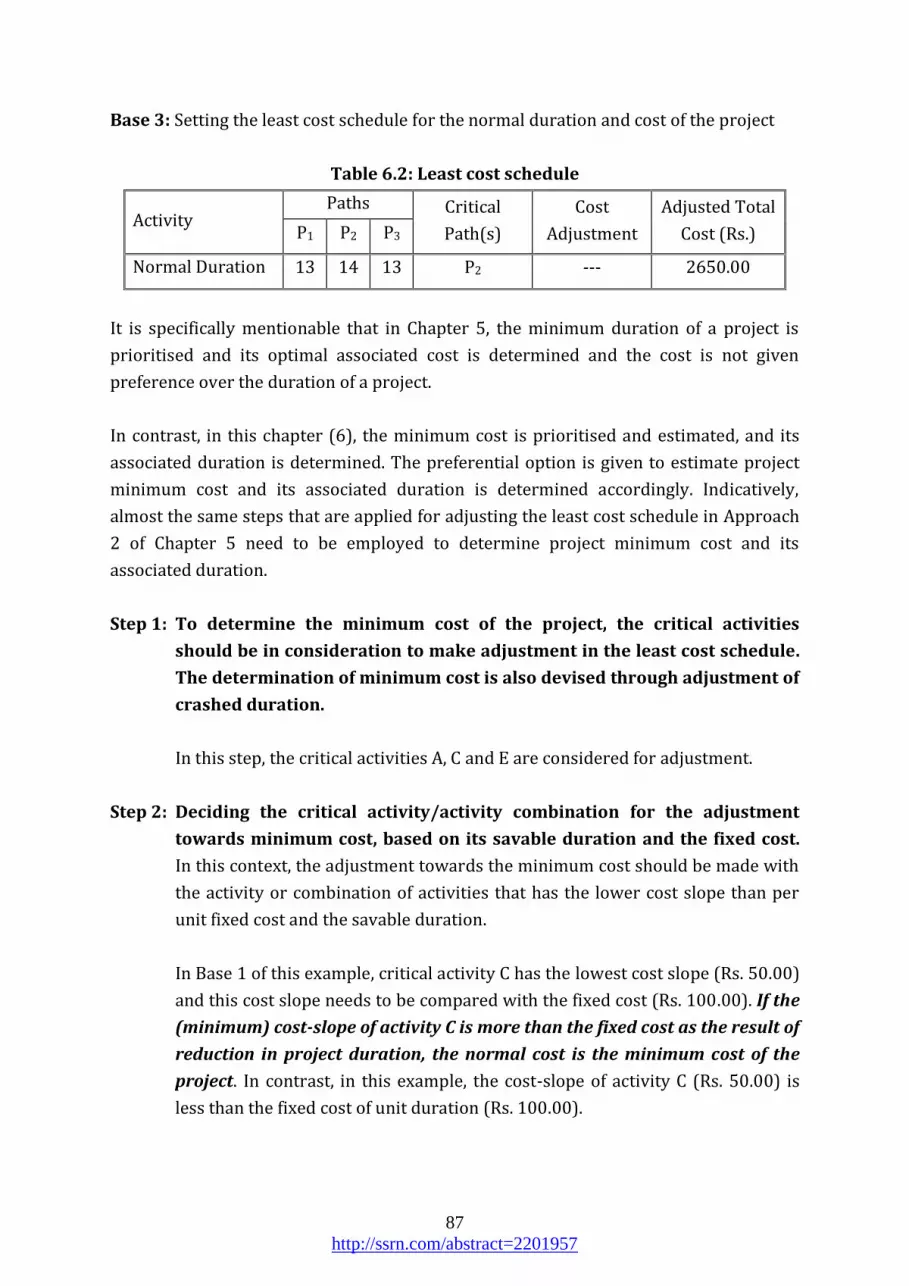
Base 3: Setting the least cost schedule for the normal duration and cost of the project
Table 6.2: Least cost schedule
Activity Paths Critical
Path(s)
Cost
Adjustment
Adjusted Total
Cost (Rs.) P1 P2 P3
Normal Duration 13 14 13 P2 --- 2650.00
It is specifically mentionable that in Chapter 5, the minimum duration of a project is
prioritised and its optimal associated cost is determined and the cost is not given
preference over the duration of a project.
In contrast, in this chapter (6), the minimum cost is prioritised and estimated, and its
associated duration is determined. The preferential option is given to estimate project
minimum cost and its associated duration is determined accordingly. Indicatively,
almost the same steps that are applied for adjusting the least cost schedule in Approach
2 of Chapter 5 need to be employed to determine project minimum cost and its
associated duration.
Step 1: To determine the minimum cost of the project, the critical activities
should be in consideration to make adjustment in the least cost schedule.
The determination of minimum cost is also devised through adjustment of
crashed duration.
In this step, the critical activities A, C and E are considered for adjustment.
Step 2: Deciding the critical activity/activity combination for the adjustment
towards minimum cost, based on its savable duration and the fixed cost.
In this context, the adjustment towards the minimum cost should be made with
the activity or combination of activities that has the lower cost slope than per
unit fixed cost and the savable duration.
In Base 1 of this example, critical activity C has the lowest cost slope (Rs. 50.00)
and this cost slope needs to be compared with the fixed cost (Rs. 100.00). If the
(minimum) cost-slope of activity C is more than the fixed cost as the result of
reduction in project duration, the normal cost is the minimum cost of the
project. In contrast, in this example, the cost-slope of activity C (Rs. 50.00) is
less than the fixed cost of unit duration (Rs. 100.00).

88
http://ssrn.com/abstract=2201957
Further, Base 1 shows that activity C has savable duration of 2 days. In this
context, it is important to ensure whether this savable duration (2 days) of
activity C can be adjusted towards minimum cost. For this purpose, consider
the critical path duration (14 days), the highest duration of non-critical path
(13 of P1 and P3 in Base 2), and compare the difference between them (1 day =
14 – 13) with the savable duration (2 days) of activity C. The lowest of them (1
day or 2 days) is the amount of duration (1 day) that can be adjustable with
activity C for minimum cost.
Step 3: Adjusting least cost schedule. In accordance with Step 2 above, the least cost
schedule in Base 3 should be adjusted as follows.
Table 6.3: Adjusted least cost schedule
Activity Paths Critical
path(s) Cost adjustment
Adjusted
cost (Rs.) P1 P2 P3
Normal duration 13 14 13 P2 --- 2650.00
C(1) 13 13 13 All +50(1) – 100(1) 2600.00
As per the adjustments made in the least cost schedule (Table 6.3), Bases 1 and
2 are also modified as improved as given below.
Base 1: Activity, cost slope and duration to be saved
Activity Cost slope
(Rs.)
Duration
saved (days)
A 60.00 1 1
B 70.00 3 3
C 50.00 2 1
D 40.00 2 2
E 200.00 2 2
Base 2: Identifying paths in network of the project
P1 A, D = 13 days
P2 A, C, E = 14 days, 13 days
P3 B, E = 13 days
Step 4: If there are two or more critical paths, their critical activities need to be
considered individually or in combination as required for adjustment
towards minimum cost, based on their cost slopes.

89
http://ssrn.com/abstract=2201957
At this point, due to the adjustments made in Bases 1, 2 and 3, all paths (P1, P2
and P3) are identifiable as the critical paths of the project. Therefore, to have
further improvement towards minimum cost of the project, the critical
activities on these paths should be considered individually or in combination to
reduce the project duration efficiently, based on their cost slopes and fixed cost.
As all paths are critical, not a single activity is found on all these paths.
Therefore, considering an activity individually to reduce project duration for
minimum cost becomes impossible. In this situation, it is only possible to
consider the combinations of activities, their cost slopes and fixed cost for
estimating efficient minimum cost.
In this example, the latest adjustment shows various combination of critical
activities on all three (P1, P2 and P3) critical paths as (A,B), (A,E), (A,D,B),
(A,C,B), (A,C,E), (A,D,E), (D,C,B) and (D,E). Comparatively, the combinations
(A,D,B), (A,C,B), (A,C,E) and (A,D,E) have higher cost slopes than other
combined cost slopes. Therefore, these combinations are not useful to improve
project cost and duration. In this context, the activity combinations (A,B), (A,E),
(D,C,B) and (D,E), and their respective cost slopes in Table 6.4 can only be
considered to determine the minimum cost efficiently and its associated
duration for the project.
Table 6.4: Cost slope of activity combination
Combination of activities
(per day)
Cost slope per unit of duration
(Rs.)
A(1), B(1) 60.00 + 70.00 = 130.00
A(1), E(1) 60.00 + 200.00 = 260.00
D(1), C(1), B(1) 40.00 + 50.00 + 70.00 = 160.00
D(1), E(1) 40.00 + 200.00 = 240.00
Table 6.4 shows that combination (A,B) has the lowest cost slope (Rs. 130.00)
to reduce a day on the critical paths. Therefore, the adjustment on duration for
further minimized cost improvement should be devised with the same
combination (A,B). However, while improving (minimizing) project duration
with the expense of Rs. 130.00 per day of combination (A,B), there is only one
(1) day saving of fixed cost Rs. 100.00.

90
http://ssrn.com/abstract=2201957
Comparatively, Rs. 130.00, the cost slope of combination (A,B), is more than Rs.
100.00 (the fixed cost of unit duration). Explicitly, it is clear that further
reduction in duration cannot improve the cost towards a minimum. Hence, the
minimum cost of the project is, as shown in Table 6.3, Rs. 2,600.00 and its
associated project duration is 13 days.
Note: In case, there are more than one critical paths with normal duration and cost
in completing a project, it is possible to continuously employ Step 4 to estimate
project minimum cost and its associated duration. However, it is important to have
a track on implementing this step, where the cost slopes of activity combinations
should not exceed the fixed cost in the adjustment process and should ultimately
reduce the total project cost beyond those cost slopes for crashing.
SELF REVIEW QUESTIONS
1. What do you understand about the minimum cost in relation to completing a
project?
2. What is the objective of prioritizing minimum cost in completing a project?
3. Indicate and explain the steps in determining the project minimum cost and its
associated duration.
4. Briefly explain how determination of project minimum cost and its associated
duration differ from estimating project normal duration and cost.
5. Explain in brief how determination of project minimum cost and its associated
duration differ from estimating project minimum duration and its associated
cost.
TERMINOLOGY
Adjusted Minimum Cost Schedule Cost slop of Combined Activities
Calculation of Minimum Cost Minimum Cost and Associated Duration
Combination of Activities Minimum Cost
Cost Combination
91
http://ssrn.com/abstract=2201957
Exercise
Lanka Company has a project to complete with the information given below. Using this
information, you are required to determine:
1. Critical path(s), normal cost and associated duration (in days) of the project.
2. Project minimum cost, its associated duration and the network that represents
the minimum cost.
Information I: Contract regulation
If the project is completed with more than 25 days, the additional days taken for
completion are charged with per day penalty cost of Rs. 400.00. The fixed cost per
day for the project is Rs. 700.00.
Information II: Activities
Activity Preceding
activity
Normal duration
in days
Normal cost
in Rs.
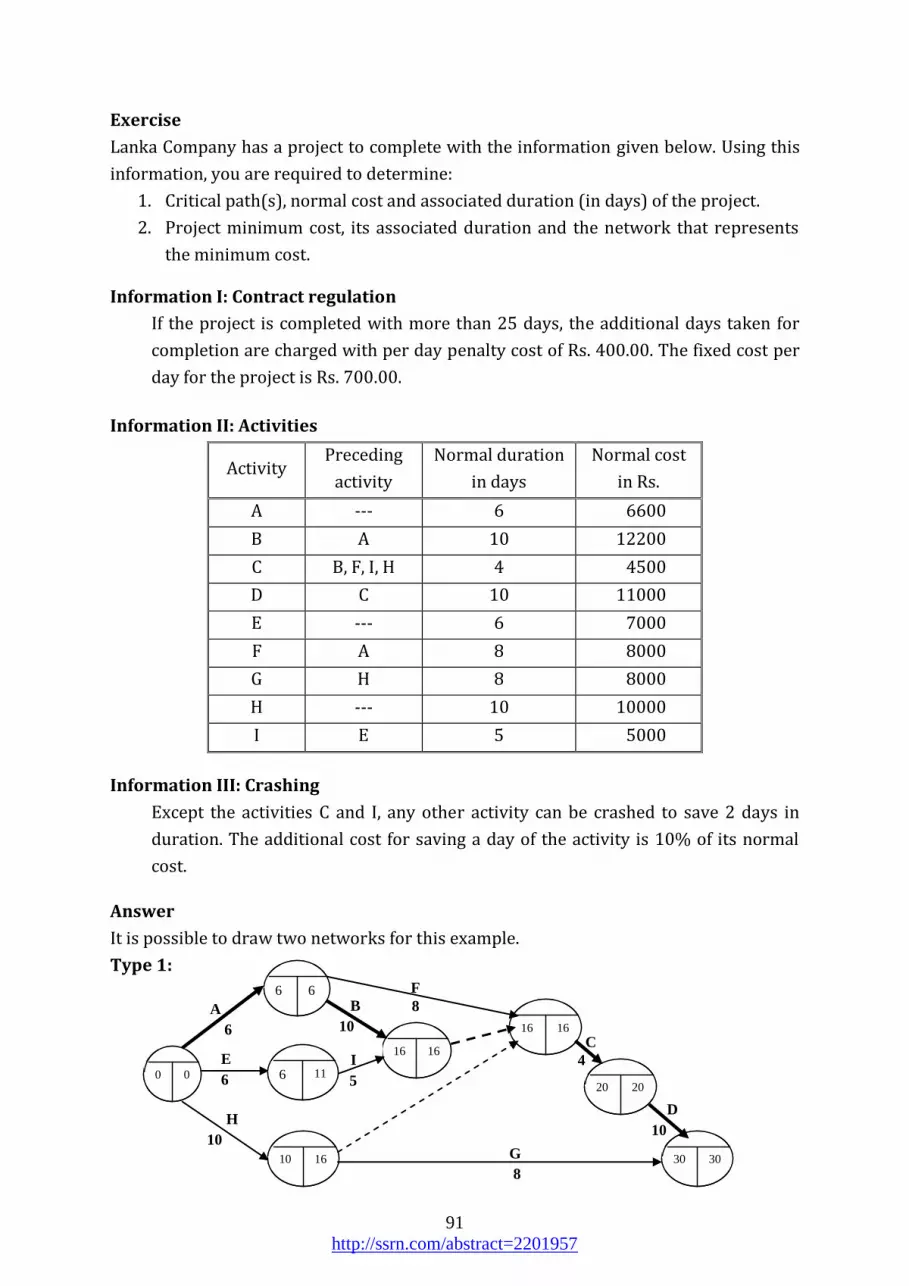
A --- 6 6600
B A 10 12200
C B, F, I, H 4 4500
D C 10 11000
E --- 6 7000
F A 8 8000
G H 8 8000
H --- 10 10000
I E 5 5000
Information III: Crashing
Except the activities C and I, any other activity can be crashed to save 2 days in
duration. The additional cost for saving a day of the activity is 10% of its normal
cost.
Answer
It is possible to draw two networks for this example.
Type 1:
F
8
C
4 0 0
16 16
16 16
A
6
B
10
H
10
I
5
G
8
D
10
6 6
20 20
30 30
E
6
10
00 16
6 11

92
http://ssrn.com/abstract=2201957
Type 2:
Normal Duration = 30 days
Critical Path:
Normal Cost = 72,300.00 + 5(400.00) + 30(700.00)
= 72,300.00 + 2000.00 + 21,000.00
= Rs. 95,300.00
Adjusted least cost schedule
Activity Paths Critical
path
Cost
adjustment
Adjusted
Cost (Rs.) P1 P2 P3 P4 P5
Normal
duration 28 30 25 24 18 P2 --- 95,300.00
A(2) 26 28 25 24 18 P2 +660(2) – 700(2)
–400(2) = –880 94,420.00
D(2) 24 26 23 22 18 P2 +(1100 –700)(2)
–400(2) = 0 94,420.00
Network diagram representing minimum cost
A B C D
6 + 10 + 4 + 10 = 30 days
F
8
C
4 0 0
16 16
A
6
B
10
H
10
I
5
G
8
D
10
6 6
20 20
30 30
E
6
10
00 16
6 11
16 16
F
8
C
4 0 0
14 14
A
4
B
10
H
10
I
5
G
8
D
8
4 4
18
0
18
0
26
0
26
0
E
6
10
00 14
6 9
14 14

93
http://ssrn.com/abstract=2201957
Bibliography
Anderson, D.R., Sweeney, D.J., and William, T.A. (2006), Quantitative Methods for
Business, 10th ed., India: Thomson South Western.
Gupta, P.K., and Hira, D.S. (2007), Operations Research, 20th ed., India: S.Chand &
Company Ltd.
Hillier, F.S., and Hillier, M.S. (2005). Introduction to Management Science – A
modeling and Case Studies Approach with Spreadsheets, 2nd ed., New
Delhi: Tata McGraw-Hill Publishing Company Limited.
Hillier, F.S., and Lieberman, G.J. (1994). Operations Research, 2nd ed., New Delhi:
CBS Publishers and Distributors.
Kalavathy, S. (2002). Operations Research, 2nd ed., Delhi: Vikas Publishing House
Pvt Ltd.
Karunaratna. K. R. M. T. (2005). Quantitative Methods for Management, 3rd ed.,
Sri Lanka.
Lawrence, J.A., and Pasternack, B.A. (2002). Applied Management Science, 2nd
ed., India: John Wiley & Sons, Ins, India
Lucey T. (1988). Quantitative Techniques – An Instructional Manual, 3rd ed.,
London: English Language Book Society/DP Publication.
Pinney, W.E., and McWilliams, D.B. (1987). Management Science: An
Introduction to Quantitative, Analysis for Management, 2nd ed., New
York: Harper and Row, Publishers.
Taha, H.A. (2004).Operations Research: An Introduction, 7th ed., New Delhi:
Prentice-Hall of India Private Ltd.
Tulsian, P.C., and Pandey, V. (2002). Quantitative Techniques – Theory and
Problem, Delhi: Pearson Education (Singapore) Pte.
Wagner, H.M. (2008). Principles of Operations Research, 2nd ed., New Delhi: PHI
Learning Pvt Ltd.