Embed Size (px)
Citation preview

AA99393 CENTER FOR NAVAL ANALYSES ALEXANDRIA VA INST OF NAVAL--ETC F/G 5/3
I A CROSS-SECTIONAL MODEL OF ANNUAL INTERREGIONAL MIGRATION AND E--ETC(U)I APR 81 M K DUFFY, M4 J GREENWOOD, J M MCDOWELLI ~~NASSIF EDC APP 3G NL
mhhEEEmmEEmmED

PROFESSIONAL PAPER 304 / April 1981ce.' LEVEL1a W'
A CROSS-SECTIONAL MODELOOF ANNUAL INTERREGIONAL
MIGRATION AND EMPLOYMENTGROWTH: INTERTEMPORALEVIDENCE OF STRUCTURALCHANGE, 1958-1975
Michael K. DuffyMichael J. GreenwoodJohn M. McDowell
DTICELECTESMAY 27 198113
DISTRIBUTION STATEMENT Aitppioved fox public release;
I Distribution Unlimited
CENTER FOR NAVAL ANALYSES
, '81 5 2'7 094
r ,'-
- - T
-" 4 . - , . . - , ,. . ..-- - .-r , " ,-.. . .T " -

." .
The ideas expressed in this paper are those of the author.The paper does not necessarily represent the views of theCenter for Naval Analyses.
S... ..li -- 'rs -'lIP ~ " " . '." 'i " -. . -• •• ; .,
(2 PROFESSIONAL PAP 04 p~prM81
/cZJ)
I . ROSS-_ECTIONAL JMODELOF NNUA)LNTERRE6JONAL, IGRATION AND tMPLOYMENT#ROWTH: JNTERTEMPORAL
f VIDENCE OF ,TRUCTURALCHANGE, 1958-1975,
Michael K. DuffyMichael J.itreenwood*John M. 1McDowell**
Aceession ForNTIS GRA&I
DTIC TAB F-Unannounced ElJust iticnt ion-
* University of Colorado By-
A rizonm State University D i st r i but t on/ .....Availability Codes
;Avail and/orDit Special
Institute ol Naval Studt c
CENTER FOR NAVAL ANALYSES
2000 North Se4uregard Stret, Alelandr0a, Vorlinul 22311
-low . ..
* I. Introduction
The empirical literature on interregional migration, particularly
that concerned with migration within the United States, is almost exclusively
focused on cross-sectional studies. The reason for this lack of attention
to time-series analyses is that until recently appropriate time series data
on migration within the U.S. were sfiply nonexistent. In the present study
we use recently developed annual data on migration, employment, and earnings
for 171 regions and for 18 years to examine changes in the structure of a
model of annual interregional migration and employment change.
The model developed in this study is set up in such a way as to yield
insight into an elusive question in migration analysis, namely, how many
additional jobs does one more employed net migrant mean to a region? A
subsidiary question is how many incremental jobs are required to attract one
more net migrant. We show that the answers to these questions vary from
year to year, and they also vary by type of region. In addition to consider-
ing the interrelationships between migration and employment change, we also
consider those between migration and (average) earnings change. Our study
actually yields estimates of the impacts that an additional migrant has on
average annual earnings within a region.
Because the available data had much to do with shaping the model used
* here, the data are briefly discussed in Section II. The model is presented
* in Section III, and the empirical results are given in Section IV.
11. The Data
The migration data utilized in this study are derived from a one-
percent sample of all persons employed in Social Security-covered jobs during
each year from 1958 to 1975. While the One-Percent Social Security Continuous
DJ
2
Work History Sample (CWHS) has been available for many years, all of the datac
tamned in the file were never put on an annual basis until done so for this
project. T he data are therefore unique. They are the only available U.S.
data that yield an annual measure of migration for a reasonably long period
of time and that also have nationally inclusive spatial detail. The spatial
unit is the Bureau of Economic Analysis (BEA) Economic Area. The coterminous
U.S. is divided into 171 such areas, and each area is supposed to delineate a
labor market. Hence, 171 observations are available for each of 18 years.
Migration refers to a change during the course of a year in the BEA Economic
Area in which an individual's place of work is located, as reported by his
employer. All migration, therefore, relates to employed persons.
Employment and earnings data are also from the CWHS and are consis-
tent with the migration data. Change in area employment during a given year
(AEit) is the difference between an area's Social Security employment at
the end of the year and that area's Social Security employment at the begin-
ning of the year. Change in average earnings (AWit) is the difference
between end-of-period and beginning-of-period average annual earnings of
persons in Social Security-covered employment in the area. Mutually consis-
tent employment and earnings data are also available for 10 industrial
categories, which correspond to one-digit SIC code industries (plus a
catchall industry termed "unclassified").
The CWHS data are not without their shortcomings. One problem that
2must be recognized Is that only employment and earnings data are available.
Annual measures of other economic variables of potential importance in
explaining migration, sucht as unemployment rates, are nonexistent for the
period of time under study. A second problem is that to be counted as a
migrant, a person must be employed in a Social Security covered job at both
IT
3
( - the beginning and the end of the year. As pointed out by McCarthy and
Morrison (1977), this problem biases migrants in favor of those who are
economically more successful. Other characteristics of the CWHS are dis-
cussed in detail in the U.S. Department of Commerce (1976a).
III. The Model
The nature of the model specified in this study is shaped by two con-
siderations. The first is our twin objectives of (a) ascertaining the absolute
amount of net migration caused by an additional job and (b) determining the
absolute employment impact of an additional migrant. The second is the avail-
able data, which are not abundant in terms of variables and which therefore
limit us to a fairly simple model.
The model is simultaneous, with the basic simultaneity running between
absolute net in-migration to area i during period t(NMit) and absolute employ-
ment change in i during t(AEit):
A
N it V f(AEit' ...), flI > 0, (I)
and AEit , g(NMit, ...), g > 0. (2)
While the latter relationship has an oral history, few attempts have been
made to directly measure it. Muth's studies (1968, 1971) are possible ex-
ceptions, but his models differ from o'rs in a number of ways.
Clearly, (3NMit/aAEit) is also expected to be positive. Employment
growth should reflect expanding job opportunities and should therefore be
* attractive to (net) migrants. (aAEit/~NMt) is also expected to be positive
because net in-migration causes both labor supply and labor demand to increase,
while net out-migration causes both to decrease.
Even if g, > 0, however, we do not know whether net in-migration results
a.- - . -*, 4 .
*
in increased or decreased employment among an area's indigenous residents.
Either outcome is possible. If we assume that the net migrant is employed, as
those in our data base are, then gI > I implies an increase in employment of
indigenous residents, while 0 < g, < 1 implies a decrease in employment of in-
digenous residents, or substitution of migrant for indigenous labor. Finally,
if g, - 1, no change .ccurs in employment of indigenous residents, and area
employment increases by exactly the amount of the migrant's contribution to
employment. Muth interprets his findings as indicating this third possibility.
Apart from the data contained in the CWHS, very little information is
available on all 171 BEA Economic Areas for all 18 years.l This lack of data
makes formulation of a very simple, two-equation model of the sort described
earlier quite questionable because few exogenous variables can be specified
that operate on employment without also operating on migration, which means
that identification of each equation is troublesome. To circumvent this problem
we have specified a model with industry-specific employment change. Eight
endogenous industry categories are identified, and each industry-specific
employment equation contains industry-specific explanatory variables from
the CWHS. The result is that each equation in the model is overidentified.
The impact of migration on industry-specific employment change is, moreover,
of some interest in itself.
In a model that focuses on particular categories of local labor demand
and supply and also assumes equilibrium within each of these submarkets,
either employment or wage rates must be chosen for particular attention, but
not 0 both. Consider a simple, equilibrium model of the local market for
labor in industry j at time t. (Occupational categories would be superior to
industrial categories, but are nonexistent in the CIJHS.)
Jt a0 +a1 Wijt + a2Yit + (demand equation) (3)
ai
• ,•. -
.5
5
QSt = b + biWijt + b2Pit + ... (supply equation) (4)
iB 0
QD - S (equilibrium condition) (5)l t ij t
where Q ijt and Q jt refer, respectively to the quantity of labor demanded
by and supplied to industry J in area i, at time t. Wijt is the industry-
specific wage prevailing in the area, and Yit and Pit are shifter Variables
that might relate, respectively, to income and population, for example.
If the structure of the model is assumed to remain stable over the
period, then an identical model might have been specified with (t-l) sub-
scripts, where (t-l) indicates the beginning of the period. Subtracting
beginning-of-period values from corresponding end-of-period values yields
an equilibrium model expressed in terms of first differences:
AQi j = aI (AWij) + a 2 ( AY i) + ... (6)
AQij - bl(AWij) + b2(APi) +... (7)
Since equilibrium is presumed to prevail, the D and S superscripts can be
dropped, and the system reduces to two equations in two unknowns, AQij and
SWij.
Note that Equation (7) can now be subtracted from Equation (6), with
the result that AQi j falls out of the system, which can in turn be solved
for LWj. Similarly, AWij might have been eliminated from the system, and
the equivalent of a reduced form equation for AQij might have been developed.
The equilibrium nature of the model suggests that either quantity (i.e.,
employment) change or wage change be utilized as a dependent variable, but
not both. Some degree of arbitrariness exists regarding which orientation
is selected for analysis. We have estimated the model each way, but present
, q
6
only the findings associated with the industry-specific employment-change
version, which yields considerably stronger results.
The employment change version of the model probably yields better
results because migration tends to shift labor demand and supply curves in
the same direction, thus causing an unequivocal change in employment in
that direction, but causing offsetting changes in wage levels. Muth (1968)
also finds that his results for a wage-change equation are much poorer than
those for an employment-change equation. While industry-specific wage
changes are not considered in the model presented here, area-wide wage
changes are taken into account because along with area-wide employment
changes, they determine area change in aggregate earnings, which is our
proxy for area income change.
The model consists of 12 equations and 12 endogenous variables. Ten
equations are structural and two are identities. The structural equations
are for absolute net in-migration (Nit), absolute industry-specific
employment change (A jt) where j - 1, ... , 8, and absolute change in earn-
ings per worker during year t (Nwit). Identities for total area employment
change (AEit) and for total area earnings change (AYit9 close the system.
Let us in turn consider each equation.
The Migration Equation
Research undertaken by economists has typically placed much emphasis
on economic considerations as motivational factors that influence the decisions
regarding whether and where to migrate. In recent years a number of
economists, such as Graves (1979) and Liu (1975), have demonstrated that
certain regional amenities are also important in determining the direction
( and magnitude of migration. We have attempted to account for each type of
4.'.
7
factor by specifying a migration equation of the following form:
Ntt " f(ECtt; Ait), (8)
where ECit is a vector of economic variables defined for area i during
period t, and Ait is a vector of amenity varibles defined for i during t.
Three economic variables are used to explain net migration, namely,
employment change (AEit), change in earnings per worker (AOit), and earnings
per worker at the beginning of the year (Wit-l). Each variable should have
a positive coefficient.
Five climatological variables are included in the analysis as regional
amenities. In a study that also seeks to explain net migration, Graves
(1979) has obtained reasonably convincing results using these same five
amenities, and we have therefore followed his innovative work. The variables
are annual heating degree days (liDi), annual cooling degree days (CDi),
temperature variance (TVARi), and two variables that enter respectively into
comfort and wind-chill indexes, namely, humidity (HUMi) and wind speed
(WINDi). These last two variables are defined as annual average daily
readings. 2 Each amenity variable is assumed to be invariant with respect
to time. Graves suggests that if individuals prefer either a cold or a warm
climate, but not much temperature variance, then HDi and CDi should take
positive signs, while TVARi, HUMi, and WINDi should take negative signs.
-- Objections might be raised to some of Graves' reasoning, especially regard-
ing HDi and TVARi, but we do not pursue these objections.
The Employment Equations
As pointed out previously, employment change has been disaggregated
into eight endogenous industry categories. The eight industries are: (1)
I
* .W
8
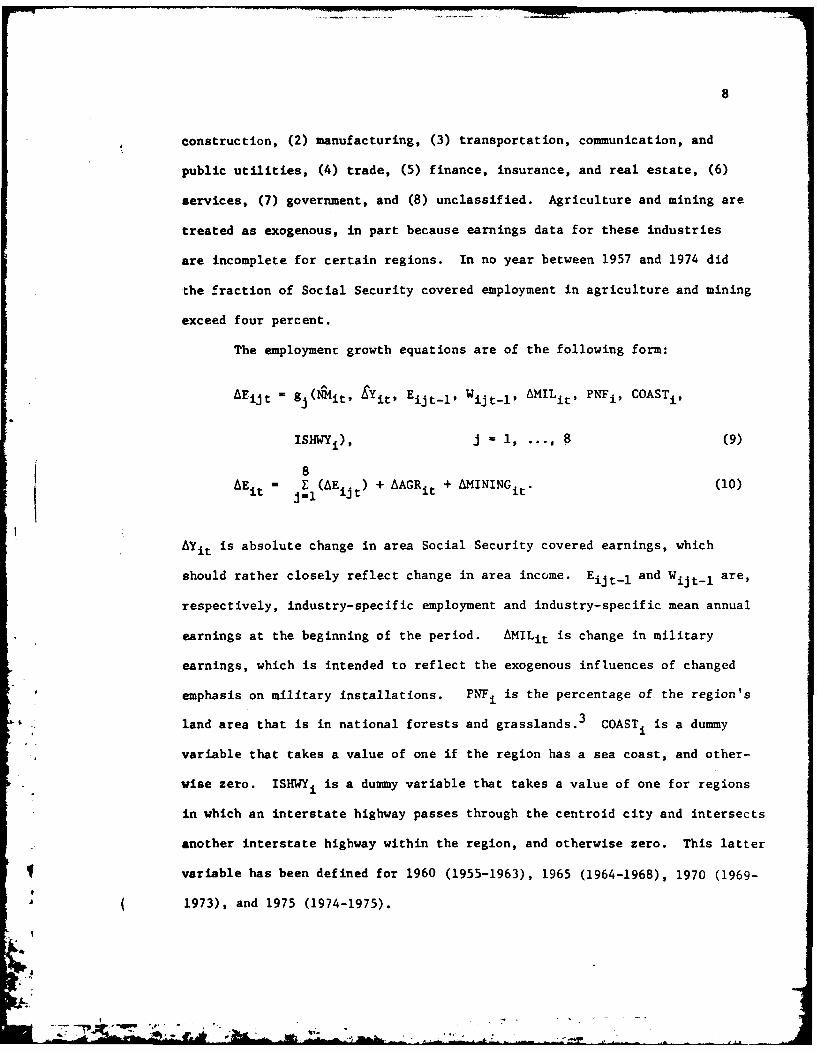
construction, (2) manufacturing, (3) transportation, communication, and
public utilities, (4) trade, (5) finance, insurance, and real estate, (6)
services, (7) government, and (8) unclassified. Agriculture and mining are
treated as exogenous, in part because earnings data for these industries
are incomplete for certain regions. In no year between 1957 and 1974 did
the fraction of Social Security covered employment in agriculture and mining
exceed four percent.
The employment growth equations are of the following form:
AEijt - gj(Nit, EYit, Eijt-l, Wijt-1 , AMILit, PNFi, COASTi,
ISHWYi), 8 , . (9)
8AEit - jE1(AEijt) + AAGRit + AMININGit. (10)
Yit is absolute change in area Social Security covered earnings, which
should rather closely reflect change in area income. Eijt I and Wijt I are,
respectively, industry-specific employment and industry-specific mean annual
earnings at the beginning of the period. AMILit is change in military
earnings, which is intended to reflect the exogenous influences of changed
emphasis on military installations. PNFi is the percentage of the region's
land area that is in national forests and grasslands. 3 COASTi is a dummy
variable that takes a value of one if the region has a sea coast, and other-
wise zero. ISHWYi is a dummy variable that takes a value of one for regions
in which an interstate highway passes through the centroid city and intersects
another interstate highway within the region, and otherwise zero. This latter
variable has been defined for 1960 (1955-1963), 1965 (1964-1968), 1970 (1969-
1973), and 1975 (1974-1975).
A-
9
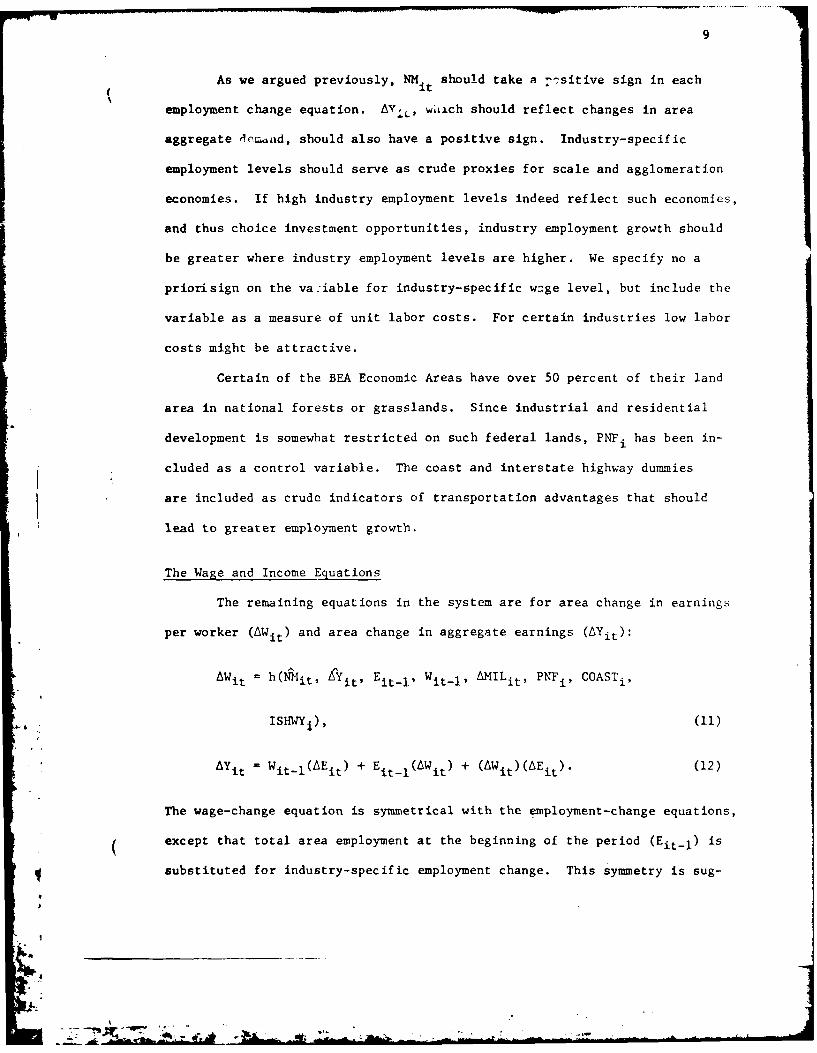
As we argued previously, NMit should take a -'sitive sign in each
employment change equation. V, wklich should reflect changes in area
aggregate Iemiad, should also have a positive sign. Industry-specific
employment levels should serve as crude proxies for scale and agglomeration
economies. If high industry employment levels indeed reflect such economies,
and thus choice investment opportunities, industry employment growth should
be greater where industry employment levels are higher. We specify no a
priorisign on the va:iable for industry-specific wzge level, but include the
variable as a measure of unit labor costs. For certain industries low labor
costs might be attractive.
Certain of the BEA Economic Areas have over 50 percent of their land
area in national forests or grasslands. Since industrial and residential
development is somewhat restricted on such federal lands, PNFi has been in-
cluded as a control variable. The coast and interstate highway dummies
are included as crude indicators of transportation advantages that should
lead to greater employment growth.
The Wage and Income Equations
The remaining equations in the system are for area change in earnings
per worker (AWit) and area change in aggregate earnings (AYit):
AWit = h(NMit, SYit' Eit- 1 Wit- 1, AMILit' PNFi' COASTil
ISHWY), (11)
AYit = Wit-.1(AEit) + Eit-l(LWit) + (AWit)(AEit) (12)itl i )Ai).(2
The wage-change equation is symmetrical with the employment-change equations,
except that total area employment at the beginning of the period (Eit-l) is
substituted for industry-specific employment change. This symmetry is sug-
A--

10
gested by our previous discussion of Equations (3) - (7).
The expected effect of net migration on wage change is ambiguous.
Greater net in-migration increases labor supply, which in itself tends to
depress local wage rates. However, greater net in-migration also increases
labor demand, which in itself tends to raise local wage rates. Since the
two effects tend to offset one another, migration's impact on local wage
levels depends upon the relative magnitudes of the labor supply and demand
shifts.
Note also that whether migration results in a net increase or a net
decrease in an area's wage level is an important determinant of the result-
ing impact that migration has on employment of indigenous residents. If
migration results in an increase in the area wage rate, then presumably the
labor force participation of indigenous residents will rise as they move up
along the indigenous (original) labor supply curve. Consequently, g, > 1
will result. If, on the other hand, migration results in a decrease in the
area wage rate, then presumably the labor force participation of indigenous
residents will fall as they move down along the indigenous labor supplyv
curve. Hence, 0 < g,< 1, or substitution of migrant for indigenous labor,
will result.
* * IV. The Empirical Results
The model discussed in Section Ill has been estimated by ordinary
least squares and by three stage least squares. Only the three stage least
squares estimates are presented. The residuals associated with the three
stage least squares estimates were examined for four years (1961, 1966, 1971,
and 1975). Heteroscadasticity does not appear to be a problem of concern,
and therefore no attempt was made to correct for it.
42
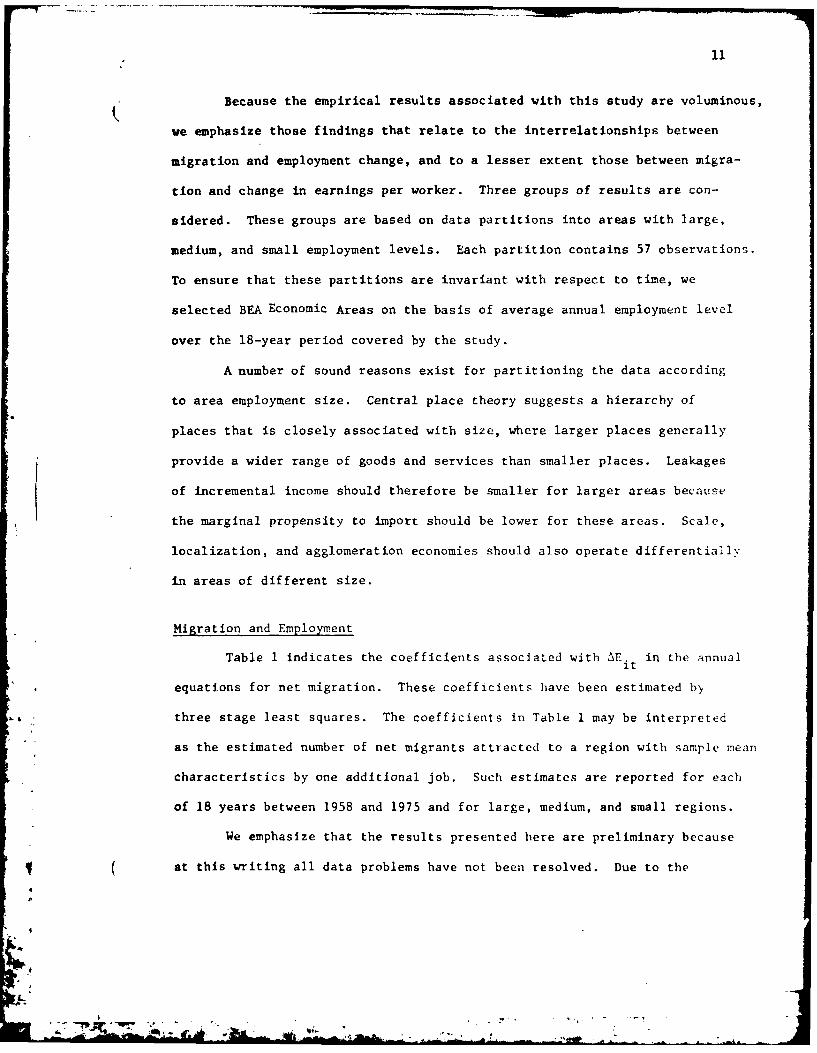
Because the empirical results associated with this study are voluminous,
ve emphasize those findings that relate to the interrelationships between
migration and employment change, and to a lesser extent those between migra-
tion and change in earnings per worker. Three groups of results are con-
sidered. These groups are based on data partitions into areas with large,
medium, and small employment levels. Each partition contains 57 observations.
To ensure that these partitions are invariant with respect to time, we
selected BEA Economic Areas on the basis of average annual employment level
over the 18-year period covered by the study.
A number of sound reasons exist for partitioning the data according
to area employment size. Central place theory suggests a hierarchy of
places that is closely associated with size, where larger places generally
provide a wider range of goods and services than smaller places. Leakages
of incremental income should therefore be smaller for larger areas because
the marginal propensity to import should be lower for these areas. Scale,
localization, and agglomeration economies should also operate differentially
in areas of different size.
Migration and Employment
Table 1 indicates the coefficients associated with AE. in the annualit
equations for net migration. These coefficients have been estimated by
* three stage least squares. The coefficients in Table I may be interpreted
as the estimated number of net migrants attracted to a region with sample mean
characteristics by one additional job. Such estimates are reported for each
of 18 years between 1958 and 1975 and for large, medium, and small regions.
We emphasize that the results presented here are preliminary because
at this writing all data problems have not been resolved. Due to the
_7 7
- d4_1
12
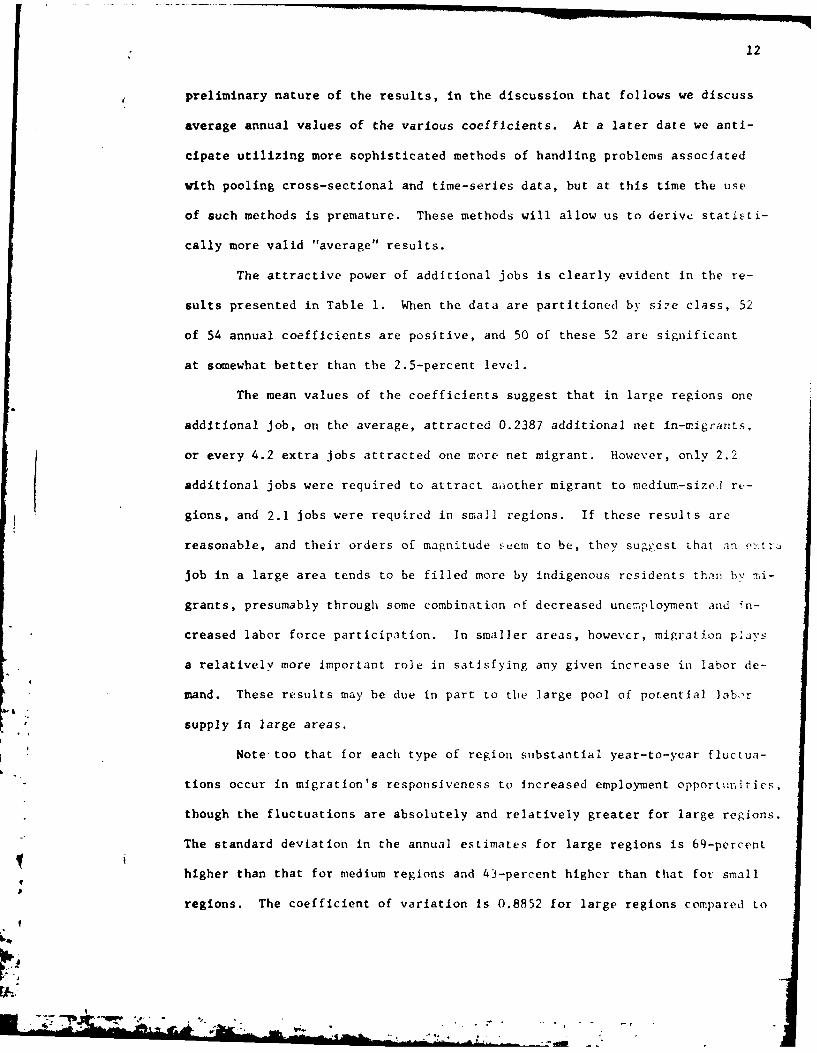
preliminary nature of the results, in the discussion that follows we discuss
average annual values of the various coefficients. At a later date we anti-
cipate utilizing more sophisticated methods of handling problems assoclated
with pooling cross-sectional and time-series data, but at this time the use
of such methods is premature. These methods will allow us to derive statisti-
cally more valid "average" results.
The attractive power of additional jobs is clearly evident in the re-
sults presented in Table 1. When the data are partitioned by sire class, 52
of 54 annual coefficients are positive, and 50 of these 52 are significant
at somewhat better than the 2.5-percent level.
The mean values of the coefficients suggest that in large regions one
additional job, on the average, attracted 0.2387 additional net in-migrants,
or every 4.2 extra jobs attracted one more net migrant. However, only 2.2
additional jobs were required to attract aoother migrant to medium-size] re-
gions, and 2.1 jobs were required in small regions. If these results are
reasonable, and their orders of magnitude see to be, they suggest that an e>:t:
job in a large area tends to be filled more by indigenous residents them1 by Iii-
grants, presumably through some combination of decreased unemployment and in-
creased labor force participation. In smaller areas, however, migration p;jvs
a relatively more important role in satisfying any given increase in labor de-
mand. These results may be due in part to the large pool of potential lab,'r
supply in large areas.
Note too that for each type of region substantial year-to-year fluctua-
tions occur in migration's responsiveness to increased employment opportunities,
though the fluctuations are absolutely and relatively greater for large regions.
The standard deviation in the annual estimates for large regions is 69-percent
higher than that for medium regions and 43-percent higher than that for small
regions. The coefficient of variation is 0.8852 for large regions compared to
- -
13
0.2724 for medium and 0.3139 for small regions. Moreover, for large regions
the relationship appears to have changed markedly over time. Durii.g the
1970-75 period an average of 2.5 extra jobs were required to attract one more
migrant, compared to an average of 4.6 extra jobs during the 1958-63 period.
Medium and small regions did not experience as sizeable an average change.
and during the later period all three types of regions were quite similar
in their behavior.
Since the extra job that is under consideration here is an actual job
that must have been filled, conversely large year-to-year fluctuations must
have occurred in local responses to employment growth. These fluctuations,
of course, amount to changes in the structure of the migration model through
time. The question that naturally arises is why model structure experiences
the observed year-to-year changes. In an attempt to explain these annual
changes in migration's responsiveness to increased employment, we have consi-
dered a number of national forces with which migration responsiveness may be
associated. The model we have estimated is cf the following form:
adEt = f(AGNPt ,GNPt-1' CVdE t CV d E t- 1 e) (13)
where
OdE = coefficient on dEt in the *1 equation for year t;
AGNP t = change in GNP, measured in 19ti prices during year t;
£AGNPt-1 M the above variable lagged one year;
CVdE coefficient of variation In employment change across all BEAt Economic Areas during year t; and
CV dE = the above variable lagged one year.
-dE
14
We expect a positive sign on &GNP During expansionary periods more
mobility should occur in response to improved job opportunities as workers
seek to better their positions. We also expect a positive sign on dCV Fd t
because as the dispersion of incremental Jobs increases around the mean, thL.
opportunity cost of remaining in a given location increases.
The appropriate method of estimating Relationship (13) is Generaliaed
Least Squares. The weights are the standard errors associated with the vari,)u,
estimates of AE in the net-migration equation.4 The estimates of (13) areit
presented in Table 2. The model yields reasonably good results for Lrgr and
for small regions, but not for medium-sized regions. For both large anj z,nma
regions the contemporaneous coefficient of variation in changed emplymert
opportunities is positive and highly significant, which indicates that ir yt-ars
when employment opportunities are relatively disperse,,, rcsspons'ven.'ss to sil.
opportunities is greater. Moreovei, lagged AGNP is positive and highlsv
significant for small places.
Tables 3, 4, and 5 present the estimated change in indusir'-_,i, ',,
employment due to one additional net migrant. These tables refe!, re-pL.ti','.V,
to the manufacturing, trade, and service industries. At the be,.!nr:n • ,
these three industries accounted for almost 76 percent of tota, Soi.a St _:it
covered employment, which is the reason thait we focus on the!'.
When the impacts of migration oin employment growth are corpi,.C a, .
the three classes of regions, the effects are found to be grtatest in lat,,,
regions and least in small regions. The mean values suggest that in an a'., ,,v
year an additional net in-migrant to a large region induces over twice as ma:v
manufacturing jobs (0.4787) as an additional net in-migrant to a small re?-gi
(0.1988). For trade employment the difference between large (0.3052) and sr:,2
7
5"
I . • -
15
regions (0.2149) is not quite so evident, but for service employment the dif-
ference is marked (0.2793 versus 0.0442). As might be expected, the mean
values decline monotonically across the three size classes.
As an approximation of the total impact on employment due to one more
net in-migrant, we have calculated the 18-year average for the industries
that were ignored in our earlier treatment. These industries are construction,
transportation-con,,uinicati oi-public utilities, government, finance-insurance-
real estate, and unclassified. For no one of these industries is the
employment effect of migration particularly large. This statement holds for
each of the size classes.
When the coefficients are sunr.ed across all eight industries, the
resulting estimates aie a- flis: large regions, 1.3075; medium regions,
0.8373; and stnall regions, 0.541. Recall that the measure of migration
utilized in this study tILers t emtplovtid pursons. Thus, in large regions,
for example, one n-', ni t ut r it rcs l Cs in approximately 1.3 more jobs,
but one of thuest is ht, , h, tl'. mnticxtt i~ it self. Thus 0.3 (t a job is induced
among oth. rs in th. recion. In s,:,l regions, however, an additional employed
in-migrant results in in, Ofi.ii . 4 nlv about 0.5 of a job, which me.-ns that
the migrant sulbstitC t,, foi . I ut 0." of an indigenos rpsident.
In an exain,init io .I tn i s ". I ivt , I iniatological anenit ies that we
have conside red t, Ct, (1,tves (I -47i ha,, tcently found that net migration ov, r
the decade of the 19is was -. r.flcantly associated with these amenities.
He concludes that, tetertP, ptilus, migrants were attracted to both warm and
cold places, but weiv tepulsed by high temperature variance, high humidity, and
wind. Our results are somewhat difturrnt than those of Graves. To our sur-
prise, the amenity variable, are rat ly siurilficant. For large places 27.8
percent of the amenity coefticients had absolute t-values in excess of 1.7,
•-

16
compared to 10.0 percent for medium places and 20.0 percent for small places.
However, for large places only 7.8 percent of the coefficients had both the
same sign obtained by Graves and such absolute t-values, compared to 7.8
percent for medium places and 18.9 percent for small places. On the other
hand, the results associated with the economic variables utilized in our study
appear to be much stronger than those obtained by Graves.
Another coefficient of some interest is the industry-specific average
earnings level in the industry-specific employment change equations. An
hypothesis frequently advanced for the differentially high rates of employment
growth, particularly manufacturing employment growth, in the South and the
West relative to the Northeast and North Central regions is that low unit labor
costs are available in the former areas. When the coefficients are compared
across all three size classes of regions and across all industries, roughly
the same fraction of coeflicients is negative (46 percent) as positive (54
percent). Less. than 27 percent (f the coefficients are significant at 10-
percent (when a two-t Ai. ,t i- applied). However, some tendency is evident
for manufacturing an' con mrjtion employment to grow most where wage levels
in these industries ,ire low, ,aod the tendency is evident within each size
class. Hligh wage; app itrcut I va !e some tendency to encourage the growth of
employmcat in t he trai,,,;,ortiti oi, comirnunitation, and public utilities industry,
as well as in finance, insurane, and real estate and in government. No dis-
cernable trend is evident in the significance of wage levels in encouraging
employmeat growth in any of these industries.
Each industry-specific employment change equation contains as an
explanatory variable change in area income. This variable is typically
positive and is often significant. It might be argued that certain of the
demand effects of migration may be transmitted through the incremental income
r ,"
-~ ~~~~~~~~ " . , . .. .i. : :.< .
17
associated with migration. If this were the case, the migration variable it-
self would not capture the full effects of migration, and the estimates we
present here would thus be biased downward.
Migration and Earnings
Table 6 summarizes the results associated with AWit in the net migration
equation. The coefficients reported in Table 6 indicate the number of net
migrants attracted to a region by a one-dollar increase in average annual
earnings. Over the entire 18-year period the results associated with AWit are
quite mixed, with substantial year-to-year fluctuations in both signs and
significance levels. For example, in the regressions for large regions the
coefficient on AWit is positiv' and significant for five years, but is actually
negative with an absolute t-value of greater than 2.0 for three years.
Fairly substantial differences also exist between large regions compared
to medium and especially compared to small regions. Increased money earnings
tended to result in net in-migration to small regions. For eight years the
coefficient on AWit is positive and highly significant for small areas. The
coefficient is negative with an absolute t-value in excess of 2.0 for only two
years.
One possible explanation for the negative sihns that appear on AWit is
that increased money earnings are serving in part to compensate for increased
disamenities associated with living in certain types of places at certain times.
Increased pollutioi, congestion, and crime are examples of such disamenities
that could be associated with increased size of an area. If the increase in
money earnings were to completely compensate for the increase in disamenities,
out-migration would not be expected. However, if the increase in money earn-
ings fails to compensate rompletely for the increased disamenities, places with
greater growth of money earnings could experience out-migration because real
5
18
earnings would have fallen, ceteris paribus.
McCarthy and Morrison (1977) recently used the CWHS to examine the
relationship between earnings per worker and net migration to nonmetropolitan
counties over the 1971-73 period. They find that counties with lower earnings
levels actually had greater net in-migration. Our results show a good deal of
contrast between large and small areas. The coefficient on W t1for large
regions is more frequently negative and significant at better than 10 percent
(5 years) than positive and significant at 10 percent (3 years). However, the
coefficient for small areas is generally psoitive and significant (10 years)
and is never negative and significant at even 10 percent. Two of the six
years for which the coefficient is negative for small regions are 1972 and
1973, which may suggest that McCarthy and Morrison's results are not
generalizable.
Table 7 reports the coefficients on the net-migration variable in the
equation for change in average annual earnings. These coefficients may be
interpreted as the change in such earnings caused by one additional net in-
migrant. Migration's impact on mean earnings levels is generally negative and
Is somewhat greater for smaller than for larger regions. For all regions taken
as a whole, the coefficient on NM it is, for seven different years, negative and
has an absolute i-value in excess of 2.0. The coefficient is positive with such
a t-value for three years. For medium and small regions net in-migration has
uniformly depressing effects on mean annual earnings. For 16 of 18 years
medium regions have a negative coefficient and for 15 of these 16 years the
absolute t-value exceeds 2.0. For small regions the coefficient Is negative
for every year and the absolute t-value exceeds 2.0 for 13 years.
The results suggest that in 1975, for example, one additional net in-
migrant In small areas resulted in a $5.19 decrease in average annual earnings.
19
Such a decrease, while statistically significant, amounted to 0.00095 percent
of average annual earnings (in small regions) at the beginning of 1975.
Moreover, this $5.19 decrease suggests that regional wage payments measured
at the beginning-of-period level of employment fell by $5,717 due to one more
net in-migrant.
Note that this decrease in wage payments does not necessarily mean that
the region's annual wage bill declined, because migration also contributes to
increased employment. In 1975 migration to small regions resulted in a good
deal of displacement of native workers such that the increase in area total
employment due to one more migrant was only 0.137 jobs. (Since the migrant
himself was employed, this estimate suggests that 0.863 of a local person who
would otherwise have been employed was not so employed.) -In part because of
the small factor by which employment increased due to net in-migration, wage
payments increased by only about $750 due to the employment increase associated
with migration. Thus, in 1975 net migration to small regions had the conse-
quence of reducing the region's wage bill by approximately $4,967 per migrant.
Note also that this negative figure does not indicate that migration caused the
region's income level to fall, because the returns to other factors should rise
due to in-migration. Actually, the $5,717 mentioned above would accrue to non-
labor factors of production and to consumers.
By way of contrast, in 1975 large regions had quite sizeable impacts of
migration on employment, such that the increase in their wage bill due to in-
creased employment caused by migration outweighted the decrease in the wage
bill due to decreased average earnings levels. The result was that a net migrant
to a large area resulted in a net increase in the area's wage bill of about
$12,544. Of course, if the migrant were to leave such an area, the area's wage
bill would decline by this magnitude. The absolutely greater impacts associated
6 IJS Aj~ . .- k3&6
20
with net migration to larger areas may be due in part to more extensive
interindustry linkages in such areas. In part these results may also be due
to the higher earnings required to attract a migrant to a large area.
Keep in mind that the figures presented above are due to the estimated
effects of net migration, other factors held constant. These other factors
may in fact have changed appreciably enough to far outweigh the effects of
migration, as well as to conceal these effects. In interpreting the behavior
over time of the coefficients presented in Table 7, the reader should also
keep in mind that the values shown are money values. Due to the generally
rising level of prices over the 1958-1975 perird, corresponding real values
would presumably be somewhat lower in absolute value.
V. Summary and Conclusions
In the context of a fairly simple simultaneous-equations model of
migration and employment change, and using a new and unique data base, we
have estimated the migrant attractive power of an additional job and the
number of jobs induced by an additional migrant for each year from 1958 to
1975. These relationships have been estimated for areas with absolutely large
employment size, as well as for those of intermediate and small size. The
results are quite preliminary, but they do suggest appreciable differences in
the magnitudes of the relationships between larger and smaller areas. Fewer
incremental jobs are required to attract an additional migrant to small
* .',areas; moreover, fewer incremental jobs are induced in small areas by an
additional migrant. Considerable year-to-year changes are also evident in the
magnitudes of the relationships.
Higher per worker earnings levels and earnings growth tend to attract
migrants to smaller areas, but the migrants in turn tend to depress wage levels
in these areas, ceteris paribus. Certain types of employment, namely manu-
J
-_77WX - -

21
facturing and construction, are attracted to low-wage areas, while other
types are attracted to high-wage areas. These latter relationships, however,
are not particularly strong. Finally, climatological amenities have had
surprisingly little influence on annual migration flows.
I'I
-4
I
* -_ V, , ' :: -, .. *.' - ....
22
Footnotes
The research reported in this paper has been supported by the
Economic Development Administration. The authors bear full responsibility
for any claims made herein.1Another potential source of annual data on BEA Economic Areas is the
annual estimates of employment and income provided by BEA. However, these
data are not available for every year between 1958 and 1975 and therefore
require interpolation for certain years. We have used this source for one
variable utilized herein, namely, wage and salary disbursements to military
personnel (AMIL it). Otherwise, we have used migration, employment, and
earnings data from the CWHS because of their inherent compatibility.2The source of the climatological data is U.S. Department of Commerce
(1976b). Where data are reported as annual averages over long periods of
time, such as with heating degree days, we have utilized these measures.
Other data, such as cooling degree days, have a more recent history, and
these we defined for 1975.3The source of these data is U.S. Department of Agriculture (1978) and
U.S. Department of Commerce (1978).4 See Saxonhouse (1976).
5These percentages were as follows: manufacturing, 27.2; trade, 24.3;
aad services, 24.2.
IL
Al t .
23
References
Graves, Philip E., "A Life-Cycle Empirical Analysis of Migration and Climate,
by Race," Journal of Urban Economics, 6, April 1979, 135-147.
Liu, Ben-chieh, "Differential Net Migration Rates and the Quality of Life,"
Review of Economics and Statistics, 57, August 1975, 329-337.
McCarthy, Kevin F., and Peter A. Morrison, "The Changing Demographic and
Economic Structure of Nonmetropolitan Areas in the United States,"
International Regional Science Review, 2, Winter 1977, 123-142.
Muth, Richard F., "Differential Growth Among Large U.S. Cities," in Papers
in Quantitative Economics, ed. by J. P. Quirk and A. M. Zarley
(Lawrence: The University Press of Kansas, 1968), 311-355.
____________, "Migration: Chicken or Egg," Southern Economic Journal, 37,
January 1971, 295-306.
Saxonhouse, Gary R., "Estimated Parameters as Dependent Variables," American
Economic Review, 66, March 1976, 178-183.
U.S. Department of Agriculture, Forest Service, "Land Areas of the National
Forest System, as of 9/30/77," (Washington, D.C.: U.S. Government
Printing Office, 1978).
U.S. Department of Commerce, Bureau of Economic Analysis, Regional Work Force
Characteristics and Migration Data (Washington, D.C.: U.S. Government
Printing Office, 1976a).
______________________National Oceanic and Atmospheric Administration,
"Climatological Data: National Summary," vol. 26, Nos. 1-13 (Washington,
D.C.: U.S. Government Printing Office, 1976b).
L.

24
_____________________U.S. Bureau of the Census, County and City Data
Book, 1977 (Washington, D.C.: U.S. Government Printing Office, 1978).
-lo
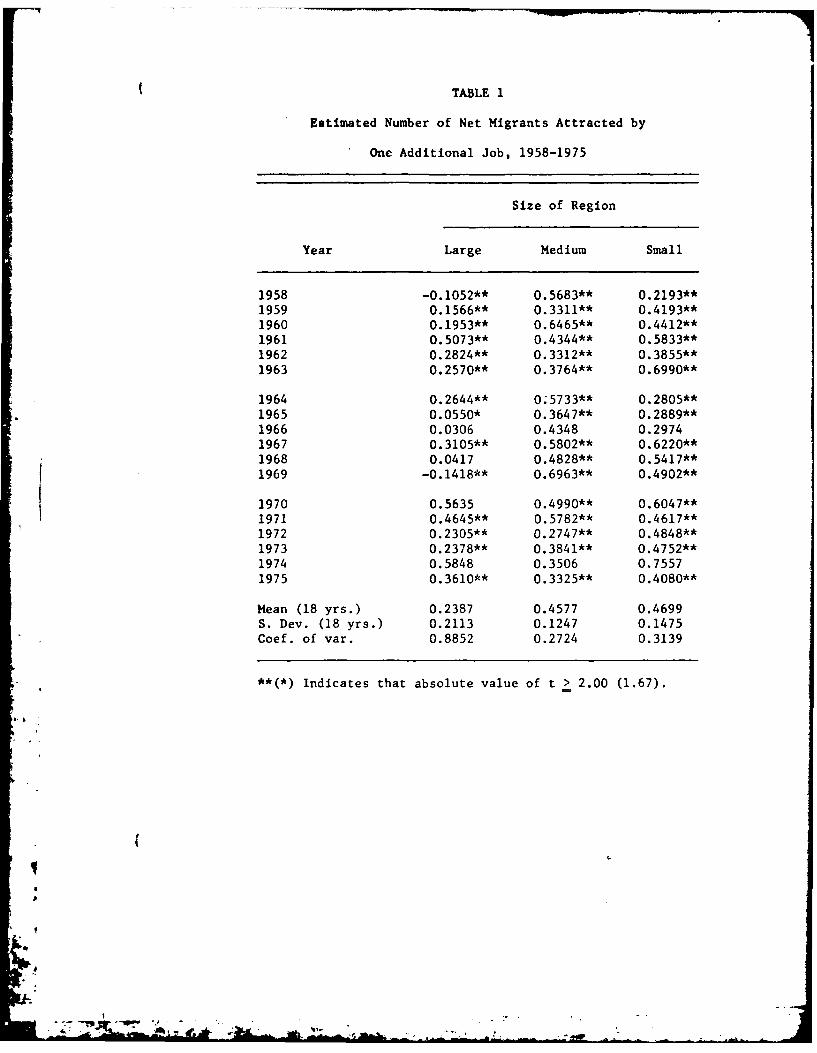
TABLE I
Estimated Number of Net Migrants Attracted by
One Additional Job, 1958-1975
Size of Region
Year Large Medium Small
1958 -0.1052** 0.5683** 0.2193**1959 0.1566** 0.3311** 0.4193**1960 0.1953** 0.6465** 0.4412**1961 0.5073** 0.4344** 0.5833**1962 0.2824** 0.3312** 0.3855**1963 0.2570** 0.3764** 0.6990**
1964 0.2644** 0;5733** 0.2805**1965 0.0550* 0.3647** 0.2889**1966 0.0306 0.4348 0.29741967 0.3105** 0.5802** 0,6220**1968 0.0417 0.4828** 0.5417**1969 -0.1418** 0.6963** 0.4902**
1970 0.5635 0.4990** 0.6047**1971 0.4645** 0.5782** 0.4617**1972 0.2305** 0.2747** 0.4848**1973 0.2378** 0.3841** 0.4752**1974 0.5848 0.3506 0.75571975 0.3610** 0.3325** 0.4080**
Mean (18 yrs.) 0.2387 0.4577 0.4699S. Dev. (18 yrs.) 0.2113 0.1247 0.1475Coef. of var. 0.8852 0.2724 0.3139
**(*) Indicates that absolute value of t > 2.00 (1.67).
i~,,
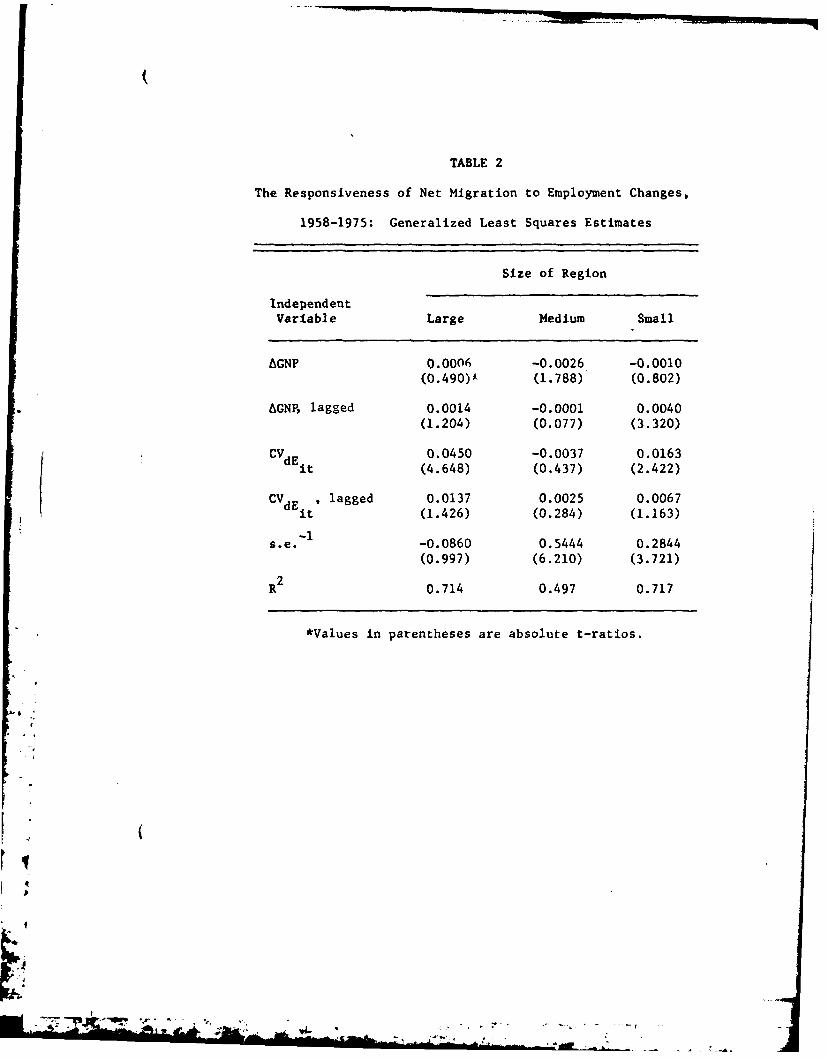
TABLE 2
The Responsiveness of Net Migration to Employment Changes,
1958-1975: Generalized Least Squares Estimates
Size of Region
IndependentVariable Large Medium Small
AGNP 0.0006 -0.0026 -0.0010(0.490)* (1.788) (0.802)
eAGNP, lagged 0.0014 -0.0001 0.0040(1.204) (0.077) (3.320)
C~E0.0450 -0.0037 0.0163C~Eit (4.648) (0.437) (2.422)
CV dE ' lagged 0.0137 0.0025 0.0067it (1.426) (0.284) (1.163)
s.e. -1 -0.0860 0.5444 0.2844(0.997) (6.210) (3.721)
R20.714 0.497 0.717
*Values in parentheses are absolute t-ratios.
Af I
dI
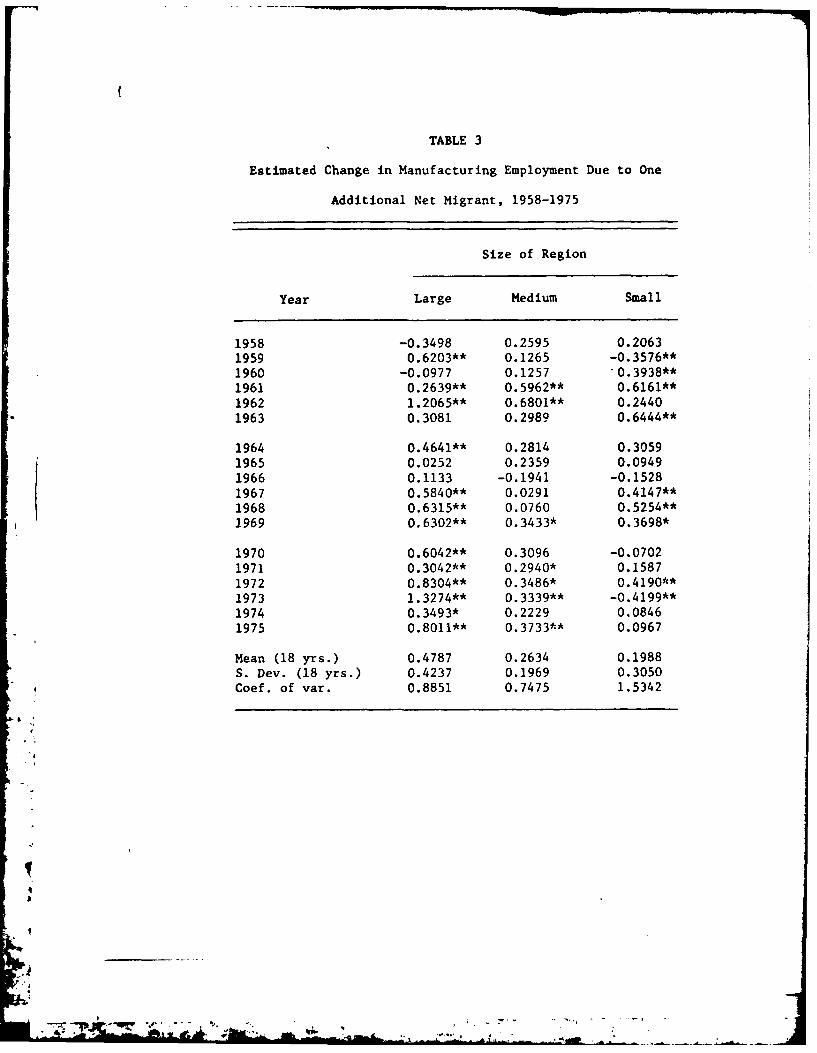
TABLE 3
Estimated Change in Manufacturing Employment Due to One
Additional Net Migrant, 1958-1975
Size of Region
Year Large Medium Small
1958 -0.3498 0.2595 0.20631959 O.6203** 0.1265 -O.3576**1960 -0.0977 0.1257 033*1961 0.2639** 0.5962** O.6161**1962 1.2065** 0.6801** 0.24401963 0.3081 0.2989 O.6444**
1964 O.4641** 0.2814 0.30591965 0.0252 0.2359 0.09491966 0.1133 -0.1941 -0.15281967 O.5840** 0.0291 0.4147**1968 0.6315** 0.0760 0.5254**1969 0.6302** 0.3433* 0.3698*
1970 0.6042** 0.3096 -0.07021971 0.3042** 0.2940* 0.15871972 0.8304** 0.3486* 0.4190**1973 l.3274** 0.3339** -O.4199**1974 0.3493* 0.2229 0.08461975 O.8011** Q.3733** 0.0967
Mean (18 yrs.) 0.4787 0.2634 0.1988S. Dev. (18 yrs.) 0.4237 0.1969 0.3050Coef. of var. 0.8851 0.7475 1.5342
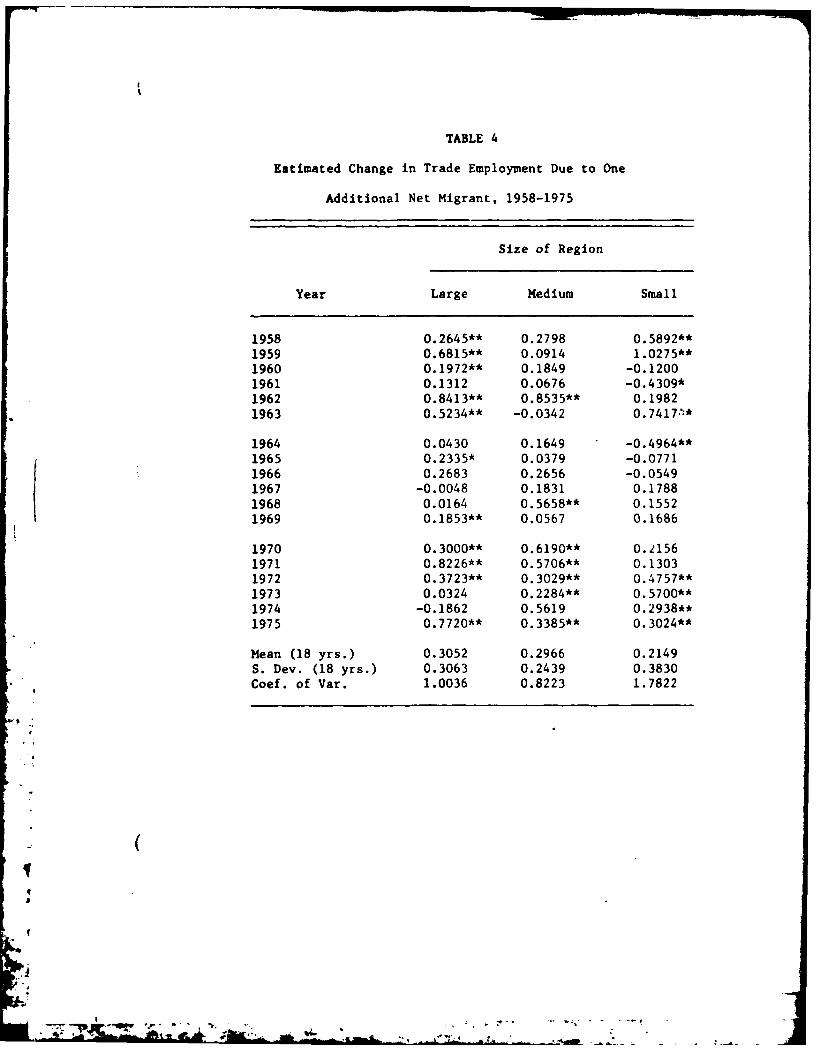
TABLE 4
Estimated Change in Trade Employment Due to One
Additional Net Migrant, 1958-1975
Size of Region
Year Large Medium Small
1958 0.2645** 0.2798 0.5892**1959 0.6815** 0.0914 1.0275**1960 0.1972** 0.1849 -0.12001961 0.1312 0.0676 -0.4309*1962 0.8413** 0.8535** 0.19821963 0.5234** -0.0342 0.7417 .*
1964 0.0430 0.1649 -0.4964**1965 0.2335* 0.0379 -0.07711966 0.2683 0.2656 -0.05491967 -0.0048 0.1831 0.17881968 0.0164 0.5658** 0.15521969 0.1853** 0.0567 0.1686
1970 0.3000** 0.6190** 0.21561971 0.8226** 0.5706** 0.13031972 0.3723** 0.3029** 0.4757**1973 0.0324 0.2284** 0.5700**1974 -0.1862 0.5619 0.2938**1975 0.7720** 0.3385** 0.3024**
Mean (18 yrs.) 0.3052 0.2966 0.2149S. Dev. (18 yrs.) 0.3063 0.2439 0.3830Coef. of Var. 1.0036 0.8223 1.7822
g' -(
I:
I P, r" : .,,,
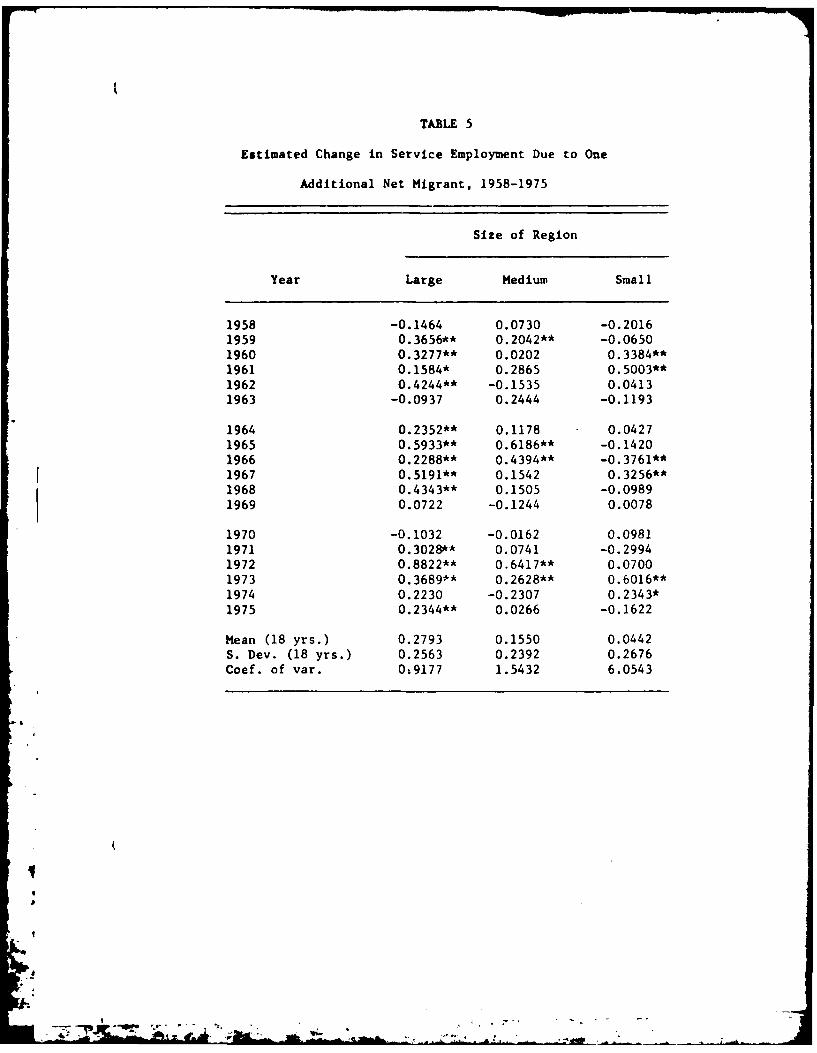
TABLE 5
Estimated Change in Service Employment Due to One
Additional Net Migrant, 1958-1975
Size of Region
Year Large Medium Small
1958 -0.1464 0.0730 -0.20161959 0.3656** 0.2042** -0.06501960 0.3277** 0.0202 0.3384**1961 0.1584* 0.2865 0.5003**1962 0.4244** -0.1535 0.04131963 -0.0937 0.2444 -0.1193
1964 0.2352** 0.1178 0.04271965 0.5933** 0.6186** -0.14201966 0.2288** 0.4394** -0.3761**1967 0.5191** 0.1542 0.3256**1968 0.4343** 0.1505 -0.09891969 0.0722 -0.1244 0.0078
1970 -0.1032 -0.0162 0.09811971 0.3028** 0.0741 -0.29941972 0.8822** 0,6417** 0.07001973 0.3689** 0.2628** 0.6016**1974 0.2230 -0.2307 0.2343*1975 0.2344** 0.0266 -0.1622
Mean (18 yrs.) 0.2793 0.1550 0.0442S. Dev. (18 yrs.) 0.2563 0.2392 0.2676Coef. of var. 0%9177 1.5432 6.0543
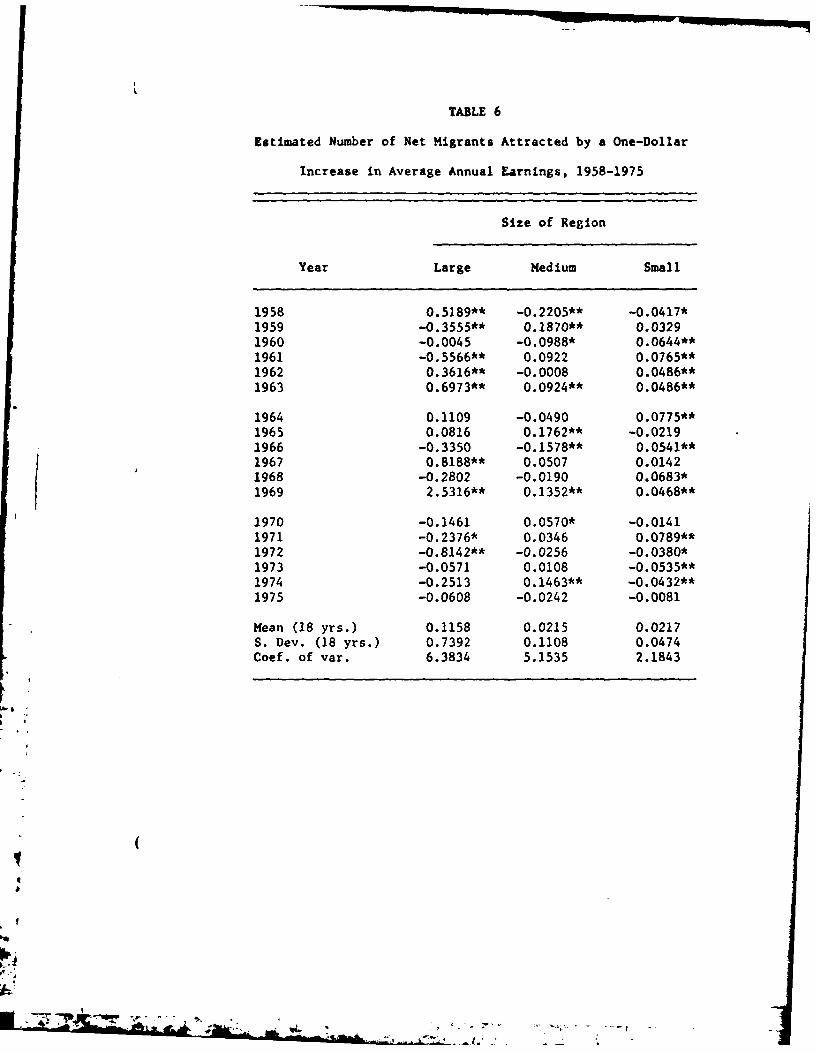
TABLE 6
Estimated Number of Net Migrants Attracted by a One-Dollar
Increase in Average Annual Earnings, 1958-1975
Size of Region
Year Large Medium Small
1958 0.5189** -0.2205** -0.0417*1959 -0.3555** 0.1870** 0.03291960 -0.0045 -0.0988* 0.0644**1961 -0.5566** 0.0922 0.0765**1962 0.3616** -0.0008 0.0486**1963 0.6973** 0.0924** 0.0486**
1964 0.1109 -0.0490 0.0775**1965 0.0816 0.1762** -0.02191966 -0.3350 -0.1578** 0.0541**1967 0.8188** 0.0507 0.01421968 -0.2802 -0.0190 0.0683*1969 2.5316** 0.1352** 0.0468**
1970 -0.1461 0.0570* -0.01411971 -0.2376* 0.0346 0.0789**1972 -0.8142** -0.0256 -0.0380*1973 -0.0571 0.0108 -0.0535**1974 -0.2513 0.1463** -0.0432**1975 -0.0608 -0.0242 -0.0081
Mean (18 yrs.) 0.1158 0.0215 0.0217S. Dev. (18 yrs.) 0.7392 0.1108 0.0474Coef. of var. 6.3834 5.1535 2.1843
hAI
b
d(
q
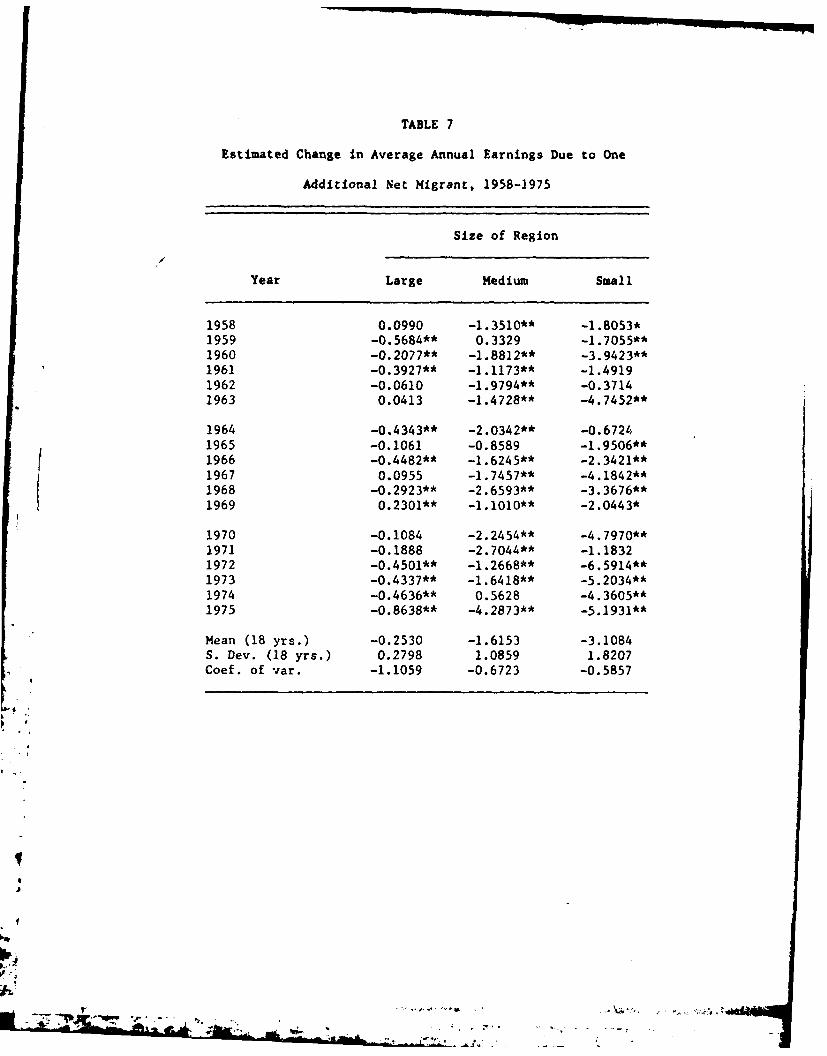
TABLE 7
Estimated Change in Average Annual Earnings Due to One
Additional Net Migrant, 1958-1975
Size of Region
Year Large Medium Small
1958 0.0990 -1.3510** -1.8053*1959 -0.5684** 0.3329 -1.7055**1960 -0.2077** -1.8812** -3.9423**1961 -0.3927** -1.1173** -1.49191962 -0.0610 -1.9794** -0.37141963 0.0413 -1.4728** -4.7452**
1964 -0.4343** -2.0342** -0.67241965 -0.1061 -0.8589 -1.9506**1966 -0.4482** -1.6245** -2.3421**1967 0.0955 -1.7457** -4.1842**1968 -0.2923** -2.6593** -3.3676**1969 0.2301** -1.1010** -2.0443*
1970 -0.1084 -2.2454** -4.7970**1971 -0.1888 -2.7044** -1.18321972 -0.4501** -1.2668** -6.5914**1973 -0.4337** -1.6418** -5.2034**1974 -0.4636** 0.5628 -4.3605**1975 -0.8638** -4.2873** -5.1931**
Mean (18 yrs.) -0.2530 -1.6153 -3.1084S. Dev. (18 yrs.) 0.2798 1.0859 1.8207Coef. of var. -1.1059 -0.6723 -0.5857
kip
,
h
CNA Profussional Papers - 1076 to Preserwtt
Sir 141 15 l6 IpP l6p
abd. a" .. N M .o.~~ "N"'hbo" P.O Sq.....s bo4 L Sov.l F-W~p Pf4wy and Kisisomati 6000.4il ROTC 1000.sm lCksawasaomalmbb0,4 Fo 1 p06 976 IfIloonotd float ft. Timid Wo,44 Nations.. 26,pp Jt.om 1976 (Propod Colaiiostft 4 FalNow 1976. IPoublild sit Philb
o-, vlamaoooml .0" Apeiod Marble to PonI~toof e: 4 , of 4.I..M sevoinica Cb..ssm Vol X XI9V F.4 Wil6l AD £033 306.ini.. Vol I No0 4 111117b1 273 2771 Ajo sqomossuin Ap. 30 1976) AD A029 384
* Rstxam .. ppolooli bV tb. himofnfl So-,. pp IPPesalr Sop SSG Lo" ini Rob.l IF Rovallemoio, .1 C-4
Stlbolp Wi06..or £00044.0..n on Cl...... Clow... 1669001vi limalso4 SomicrohNo..... 36 pp No.
PP 143 -0 Rvicts"Ialo. 12 PP J... 1079 (flip....: 1976
Has-1,i SI0.NI 0.d S.0. £140. II Cd, I-.. P.1,..s .. og..otio. (P..o. F4.0 VlI
UIPOI '.,on Pailnna ft,sina. .. fitl. pap 67 99 1976, AO) £026 697 lp I66
Nxv, 33 ppo Join, 1916 ififflosfml atbth RAND) Jtooboo to. S vilonp Ltoo. of Work.,,nN... o. tanss F.o.bN~o~o . 19761 P101 0094.04 914064.Otn o Indimill-0 38 Thi
AD) £021 461 Whoog.. Will..- kl.owniiloiviii -d4 lb. Pon,. Nov 1976 (Chdha...dmi at tAB Con4...nci in O
Soon auonit IS~l.. A...l%.nq ,, lb. fmW Posh 16761 AD A039 W11PP I44 Ratios' 20 w A..
9 197 6 AK) £030 4S6
Match. 44.44....w 3 Tb. kavv of it" Rwp..04 of PP 170
Clin.a Kart-o PNobilt sind PIo'oii, 66 Fil FiPl Ise 11.0.44.00v F,.nh P A r..... Saivism A.Msy.0 04
Am, 1976 Ifilalisod in A Guid. so, Ap-lw NMbsll 114. R-osb.,0 K USN'0 L tbo, I.,-,~o No. 1676 f0sl.6.0.0 0 ICAS
Flosous .ad So,.Bwt NM Weohmw.,owi Rob-, V.04bt,0,, of P,,ba6lb,, Plad-clo,,. 2!, pp Aogt C00-1.- ., Dcf 19161
Dbo-. Navas I...,,l~i. ft-., AK) A030 .161) 1976 so.,,4* lif. 4411. 1plopson, Ft.
-,t,09 5...., .l, F.' 191W AK) £031 4M IPP Ill
PP 146 30040.. A 5 * ..1d R.Nlwo J IS A K).411oro
KSSH9 Ansiv. M Po. V,.,, -. 1 h.. Wa, lpP 14.9 Mo. So, GliP 1R.d L ft) De.gadation 10 ppo O.omm.co..m,.l 1A..oo.1 .0.. So-,, N-., 36 pp McU,,nn.I, S.,.., N 70.,1, (io04.o, A~l., Th,. 1916 iltulishob. it oira of..90 Asohsi Pbvucs
AM. 1976 AK) £023 436 ft.. G.,,.b4.,,. Slo,,- .,,.s fU..,, - s. o P-1,11 Wi of pmp 44.164627 (Oct 19161
93 o., Jo, 1976 Pu11mm,0. .. , %... ... I i, S1i~.i.PP' 147 Iloos Kosso,, -.d * oq K),..omofo# i
11.04.l I Ch..,Ioan SOe ._., o' 0,0,001.0 N GoC.,,, .,.i 0c),,, o. so k ns17014,1.0.. Sl,...lob. 33 pp J-. 1976 PI~ltopo.. Plaintiff 197 1 AK) A0?9 12' ti..... 4.1q.4o- P it- l*00ov*ions1I-,-l~lbond. mkb 0i., 000014 68 A0091 01013 to, "0 it. tassel, .1 un~iolnisi D. Il91ONAI AK) £029 399 ~P I6W Plsid as.ot,o,.. .1 Rooh...l.. to..-
*,I'-o ti.,oo"d I' h, '. II S1 o,4 I sins00o. voml.bon 016 lft.. 19161Fils149 lb. Data.,,,o~ [11 ,, .,.. 'A,0 F1it4 Sop
Sq.....o Micheal Couolfl.,4,c Effair,,.oo,, A 1914. AK) A030 447Cormilp..-.of .9 lis Tp" K N...... .0d4 Cost li 173
plt SfouoII. 29 ppl Wis, 1974 IP,.bovlnd ., Pis 161 iisln%-a D AN, lsi
lb. I....Ilo-11 St.d, Afmofwsoit 6 .lng. 2l hilrchIt. !lc4... F -,d Pool V-st Adis Rai tISO. I...1 -~ l0 Addmt.d o4..kas, o.p W4.Fob 1976) AK) A0f24'91 Rillodl float , ,,l.,,Allo-, ,'A,..,. (---,o,, 2' pp Lt. 19 76 IPubliod .,, Ito.
9 p .p1974' U-.o.,oo 1,,,, 1-5 N14~ ~ ,, AO,..11., Vol 00 No 1 Swoslo 1916.
PP ISO ,ll..1 ... ~q% 3,, 1470* A() A030 4..6
K111 An...t Nl and Issol,..,, Cho.,I.. RHo.,, Pit 114Clim.., .. Soos, N-1o.04FgO~ FNotp., I,, A, - " 142 s4.i,,oosV Rot.., P J, A 0o.p.,o Isis0
Loo 0.. lb. his klif ,,...... and m-d-sio f0,,.4', Ro.. I IS'nolsoI,,[bp.,g, a~...np d 1~.,n-l,0.1 o.0.,,, P ..... s 7K)man 26 pp All. 1976 AK) A 023 723 1(*1 Wt Sao 194% All £01 I1 1411. Fit F.4. 1917 At' £037 206
lp 14.1 Ppt 14.
HoloollO Sltaiw A Tt.. Ec.-oo, 1," L0..., R..,I 0 A fiodesl in., P,.d-,rq p09owno. of Political P44owopfh 8 Fit As. 14M R0,,, 1,.-, 9 pp Sa1, 1476 P,...ild &I lb. I V.-~ K)..iol St.fl9 Pol.. -.14 SoWo4 N-..,
I Reprinted Isom 6aoomc lno, V,,l 0101 Nl, 9,h.... 111 ,.. - ......o so 14. A--o.., Fych. Pis4.4, K)V.9 1,. l, .. 4 Add.s" C..on Jon
1 Wit, 19761 Iosoc.ii A-m.o.1, VY.h4,lo 91 D1 4 Sop 1976. 1970 IP,.64.Shd n .10.l81 of 00444il Studiss Vol
P"Ithlhido4 ,., ois ask""F,,,. Mop PollIR,,4.,d V I No, 21
PP 152 1 Cso.... .d I , Tb.aRod lo-prolon 19191PA,,.,bh, us.,,,. N Ko. Fatoyt. .141 Sbo,n m9 AK) A030 4S.9 PP 179
c9oua * 10 pp Ap. 1979 111tp.,..a0 I,~. PP l64 1-0 , USNA Go,.4..., 35 pp it%. 197
Jo.,.Si o ft Nolbratica Pb,.,.,c Vol 17 No0 4 0,1-., Ro.,, Po I A,, A ... ,,.. sit Puablic AD) A039 040lAp. 19791)5646761 .nd 11,,. P-,.p-,,, .. Ft-,, Tb. Unload King~
*R.,w.4 .. pporlod 69 the. National. Sc...,. do-, sond lb.s 1.4.. R.p..tj, of Goo,nn 31 PP17
100.1, ppindtw fal 4Fo 1917 P,..lonfd at ConfW.*n. P.,oickp took.a. Robort F .d4W..o. Jolti. I Pi.I,os of Ilb. 1)1S So,,.st Rla..on .04 lb P.1oll d,.-9 £1111.00 A TomIt .1 A9....,.l, Ap~P 43 t0401 119 N,It... Istivis -p.,1', bir D o r *-9," 33 pp, Rot. 1977 IP,...nlad .1 lb.
Foi9.oo.. Nio.-. N 4416ls..,o' ho Path AdVoo,. R....t-,, Prolpols Agioct AprlI 19761 0 'INR Confe,..,..e 0 ..1, Allo,. 4..,,.Ins0aga4. 44,16 Appkoml-nh 90 lb.i Anhl,vo.. AK) Anl 499 I si,0004 T,oi,n. Castro, L..,...il V-11n..Owil9ior. - 137 imp No, 1676. AD A02S 940 pill 1977) AK) A039 047*Reo..oh ouppwnd by, lb. Noltoml Soc,.. PP lOT,
FonotnJ.,orru Mm..io N 1090,1, of T,mdo Rosifcloom,0n lmo,,. of StI 67 ppo Nlovoninb., 1976 4F a
Sp Sad l014,..4 01 tLAB Co,fave.. Oft 0.. 8 111761,,4.,ma. So..ose K) An E14o.9. of Maal oist].
Wbl0I01. Whist... N 0. lb., Solo C1064 .t10.d L.- 0lcav A..oo PNoqovi :!) IPlieaicaf .o. . 0Owsmnwo. Mo.4... I.., Ar~so., PP I66 Roove Ap..9 1977, (iveo..l04. lb.i NATO Colvolvenm, -Ihaisialamor 19 PP Mai, 1976 lIsibbtod so F.44.0.1sa o..I *69 i I Dirls.0,1 to CIhosi. Nenpoow Pamlostrig. 0.1 (3a.p....o 00.9johmnsl of Aloths.,.we Pis,.... Vol Is No 4, Rlo94lo 0" 1979 AK) A037 692 Stilo. WASy 20 Jifn.l 19771 AD A039 10141pp 709 790 Ago 1977) AD) A029441
tCNA Proffional Papers with an AD number may be obtained flrim the National Technical lnfopmoutron Service. U.S. Dopatiment
of Commemrce, Seringlield. Virginia 22151. Other paers. are availaler from the Maflagrmelt Infornothon Offices Center too NevelAnalyss 2000 North Seworep SOtrew, Alexandria, Virginia 22311. An Index of Salecrted Publicetisona is ales. ateilabile on reaiaThe index inickie. a Listing of Professional Papes; wpithl atm3 m9uted from 196 to June 1960.
.3.-. m -. -
111,g ISO9 PP9202
Bais". Pealo H. ad slut. Staplen J., "Vacua: A Coast, Ruselfl C.. "Error Detection in Coinputeonfrd Fredman. Peel, "Why Regulations Doesn't Work,"
WMl fo, Preris Invenstory, Planning Under, Informtioin Retievedal Data Sam,." July, 1077, 13 I Reprinted from Traduioopseit Changse ed Wellers,
Chapeisw %Bwxspmeen Policy." 14 pp. April 1977. pp. (Preesoted at the Sixth Cronsfil Interaional in toe Regulated Industries. BrOoking Reparn 210.
tFe.nW at the NATO Confernc on Meuipow Conference on Merchanrized Informion Storage And 1971. and Review of Social Economy. Vol. XXIX,
Naiem and Ortimnlaaeion Deign. Strmt. Italy, 20 Retrieval Systems. Crenfield institute of Tec. Mardi. 1071. No. 1.1 Sep 1077. 8 PP.
um 7 7). AD A&V2 DID nologfr, Crionfogld. Badlord. England. 26-20 July1977). AD A043 S00 PP 203
pp ISO Feldman, Paoul. "Efficiency. Ditribution fad the
ftreat. Stanley A and Sherman., Allan, "The PP 190 Role of Governm~ent in a Market Econcioy.'Characteristics of Naval personnel and Personnel mishoney. Robert B.. Jr., "European Percesptos (Repotiale from The Journal of Political Economy,
Pevrformance.," Is pp April 1977, lProated at te and Eaet.Wee Competiion."' 96 pp.. July 1977 Vol. 79. No. 3. ay/June 1971.) SeP 1977. 19 PP..
NATO Conferenc on Mapower Planning and (proposed for presentation at the annual matealn of AD A045 6Organisation Design. Strta. Italy. 20 June 1977), the International Sttudiet Associationt. St. LOun.
AD A030 050 Mo., March. 1977). AD A043 661 PP 204Walls. Anthony If.. '"The 1967 June We,: Soviet
pp III pp 191 Noel Diplomacy end The Sixth Fleet - A Rio,
goahit. Stepen j and Stoloff. Peter, An Inventory Saweyer. Ronald. "Ther Independent Field Assugn- appretiai." Oct 1977, 36 pp.. AD A047 236Plianing Modal foe Nary Enlisted Personnel.- 35 malt One Men's View." Auguet 1977. 25 pp.
pp.. May 1977 (Prepered for presentation at the PP 206
Joint National Meeting of Cho Opererron Ret Icl pp 192 Code., Russell C., 'A Biblomtnic Examination of
Society of America and The Institute fot Manage mison, Arlene, 'Effecto of tsUemployment In- the Square Root Theory of Scientific Publicatuin
meet Sciece 9 Mlay 1977. Sari P iaci. Coo iurance Entitfenent on Duration and! Job Search Productivrty." 11Proaentad at the annual ntemtng of
loenoal. AD A042 ft1 Outcome.," August 1977. 6 pp. isprinted from the American Society for Information Science.
industrial and Labor Rlations Review. Vol. 30. Chicago. Illimos. 29 Setember6 1977.1 Oct 1977, 6
pp 182 No 4. Jul 19771 pp.. AD A047 237Morney Russell 2nd, 'The Quest for the PortinStuidy or My F-ir11t tlDayst CdA' 57PP, PP9193 PP 206
Aprdl t977 Hlorowitz, Stanley A, "A Model of Unemployment McConnell, James; M.. "Strastegy and Msusons, of theinsounence and the Work Tier," August 1977 7 pp Sorit Navy in the Year 2000." 40 pp. Nov 1977
pp tel IReprinied from Industrial and Labor Relatioms Ifireented at a Conference on Problemo of See
Kawse. Devid. 'Changes ton Soviet Ne.. Force."* Review. Vol 30.1No. 40. Jul 1977) Power an we Approach thes 21st Century. sponsored
33 pp Novemiber 1976 Pllublished at pert of by the Ameuricans Enterprise Institute for Public
Chapter 3 "Gersnrl Prurpose Forcer Naery an pp 194 Policy Research. 6 October 1977. and ubeequeitlY
arine Corp, in Arn- Men end Miiilitr Budget% Cerman. Katlfeen P. -The Effect, of Uinemon1y published in a collection of paper, by the Iosim
Fianos P Heoather and William Schneder Jt lod. m garl insurance on the Duration of Unemplloymraent tute), AD A047 244
Crae Russeal & Company Inc: New, yorkl and Subeaqeentri Earnig." August 1977 7 PP
tO77) AD A040 t06 (Reprited her lnduntrrl and Lobor Relations PP 207
Flattest, Vol 30 No 40. Juil 1977) Goldberg. Lawrence. "Cost Effeirenemr, Of Po
pp 194 rnsuet fedeal Policies Affecting Research So
P Lockina Roear F A- Overtewvio the OSO pp 195 Develfopmentm E pendsurtis in the Auto. Steelt and
061R Conro nv on- Forist Term Enlisted Attit-ion, Brecllng. Frank. 'Uiimployienrt IurceTo.e. Food Indattr. 36 pp Oct 1977 (Presenteid at
22 pp June 1977 ir-nteod to the 310h MORS and Labor Turnower Summary of Theoretical Southern Ernioi Association Meetines befloning
Work.i Gro9 -n Manpow endt Paiiiseo Finding. 12 pp (Riapmnied from Indusrial end 2 November 1977), AD A046 266
Pianning. Anvsapois sod 20 30 Jun 19771 Labtr Relations Revisit Vol 30. No 40. Jul 1977)
AD A043 618 PP20
pp 196 Roberts Stephen S. "The 00011ne of the Onetiloee.i
pp 166 Raelrln J As and L.rim- 0 G 'Dieadaition of Siation Fleet The United States Asiatic Floor and
Karing Deval Now lachnoioer and here) Forcs Bulk l, crlwte n fficiency ir Zoo. 0 Doped ther Shanghai Co... 1932' 16 PP Nov, 1977 Ill
.n the Souths Atlantic 2? pp (This paper wes rhe GaP LED's' July 1977 3 pp IRepritd fom printed foroms The America Nelptune. Vol XXXVII
base for a presenstation, mae& 1 at. rise Iitiu rolv IEE Trnactionis or Electron Devices, Vol1 No 3 July 19771 AD A047 745
Forsegn Polcy, Antalyrat CantleiWg st 2 Aprl ED U4 No 7 July 1971
1077) AD A143 619 PP 206 Clinsited
pp 197
pp 199 Walls Anthont R 'The, Contre for Nanal Anal PP 210
iraisi MAturice As posro Space integral, With yer, 14 pp Dec 1977 AD A049 107 Keelung Derid Protarting The Flet" 40 pp Dec
ou Leering Morcaduir 31 pae Mar 1977 In- 1977 (Prepared lot ths American Enterrprise in
erred pape prosenated at thei 1977 NATO Instolto pp 196 sirfte Conence or Problem, of See Power in We
on fath .ne .aaid Too-i, Applicti on iv aewe Kjothlee P "The Distributions) Effect, cof Approach thu 71,rt Cantur" October 6 7 1977)
Duanisim Siatistical and Solid Stain Physics Utinnoplymnt Insurance"I 25 pa, Sept 1977 AD A069 09
Aniweip Selgunt July 17 30 1977) Ifloishud . Presented at a Hooset, Instituter- Conferec on
Joonal of Morfmaticef~a Pftirs 19(f) pp Income Disirtrbto Ont IS 197) AD A0l6d 423 pp ?ft
M 6307 Jon 1978) AD A040 107 Mourifh, Maurriw M Or Approsimeingr thepp 169 Circular, Cover function 14 pp Feb 1906
pp Is7 Duth. Wdlliamr J Revolution Froni A F A If AD A064 420Code. Russell C ergiepal I., Operation Re The Cuban Armed frcer .. Africa and thuiddl
iead lb PP Apil 1077 Preaceletrd yr th. J-in East Sep 1977 16 pp AD A046I 266 PP 212
N"ata meein .4 the (Iperions kerrfrMngel Marc 'On Sungula r Cfierarerrsti Irietief
Scietyls of Aneric and The Institute fI- Manage PP 2010 Value, Problems with Unique Solutions 70 pp
ansot Servce Sari Ftwoo )'.forrie 9 May Powers. Bruce P "The United $Stte Nary ' 40 Jun 1978 AD Allie 535
tO 7) AD A041620 pp Dec 1977 )PuEosablef" re a refusel in Thes us
Wart Macine by Salamander Books Endsurd.1973) PP 213
pp a9 AD A046 108 Mangra Marc "Fluctuations in Systems with Mult
Duryl rirai.- I Inrmrni rrsn nd ple Steray Stofes Applicatior, to Lavocieterlf Sa.
Olutcome Foerecasting fin Millatal Negotiations Pp 201 hron 12 pp Feb 73 Ifaiamsned at the firm
ting. GOve approachr 53 pa May 1971 (Pr. Doenh. Wawpr J 'The Cohen Military in, Al nm Annual Workefip on de IMnfomto Linage Be
mean) le, presentation to the 1144, Annual Con and Tim Middle fant From AWNrs to Angola" tor Apled Med~teme "n Industry Nae PG
rawsnnro ofs die nernational Studers Ar.ociator, Sop I97" 67 pp AD A046 06 School Feb 23 2S 1972) AD A011 472
Chine Pork Pipue ""at St Leians '1seou M.a
1630 tP) 4004777
PP 214 PP 226 PP 241Wounlarrd. Robert G.. "A Somnewhrat Differnt Vaew Ralston. J. M. aird J W. Mnrn -Tampattr aid Menrgel, Marc. -Fluctuations at Chemircal tnstabilof The Optimal Naval Naiture." 37 pp.. Jtun 1978 Current Dopendomce of Degrodsto in Red iti%." 24 pp.. Dec 1978 IPulolshed in Journa offlnestedl at the 1975 Convention of ftre Amarica Eittinig GaP LED&.- 34 pp.. Jun 1978 (Puiblihed Chemticl Phtysics, Vol. 69. No. 8, Oct 15. 1978).Polittca Sctance Astocrttn (APSA/IUS Panel on in Journal of Applied Phtysics, 50. 3630. May 19?9) AD A063 781"Chaeng Strategic Reqirements and Military AD A058 $38Poetire"). Chicago, III., September 2. 19)61, * alTelophrotr Laboratories. IncAD A066 228 PP 242
PP 227 Sitrpot, William Ft "Th. Anralysis of DynamiciallyPP 215 Maitgal, Marc. "Unifolct Treatment of Flucluntrioe Interactive Syttemsi lA., Comtbat by the Nunrberfl."
Coale. Rustsell C , Comm~enrts amt; Principles of in at Critical Poin"t.." 50 pp. May 1978. 160 pp. Dec 1978, AD A063 760formtation Retriteval by Maanfred Kochtn. 10 pp.. AD A058 $29Mar 78. (Prublished -a .Latter to the Editor.Jouarnal of Documten~tation. Vol. 31, No, 4. pagas PP 228 pp 243298.301. Decmlba 19751, AD A054 426 Mactal. Marc, -Raanton at Critical Pointt Sampsonr. William, R. "A Probabalitc, Fortanastion
Determnis~tic and Stochtastic Theory." 54 pp. Jun of Murphy Dynamics a Applied to the Analysot of
pp 216 1978. AD A058 540 Ope~rainal Rearct Problemsn." 18 PP. Dec 1978.
Coil*. Russell C., "Ltha's Frequency Distribution AD A003 761of Scienttific Producctivity," 18 pp.. Fab 1978. PP 229(PUbjrthed or thre Jou,ta of tire American Society Mengel. Marc. "Diffusion Theory of Reaction PP 244lor Ittformnation Science. Vol, 28. No. 6. pp. Rates. I Formulation and Einttein Stnolctchowriie Sheitarti. Allan and Horowitz. Stanley A.. "Main.36370. Novembrt 1977). AD A054 425 Approximnaton.' 50 pp. Jan 1978. AD AO58 541 tanaence Costs of Complex Equitpment." 20 pp. Dec
1978 flPublitled By The Americet Scot of Natalpp 217 PP 230 Engineer,. Natal Engineers Journal, Vol, 91. No 6,
Caote Russall C. "Bibitaineutric Studtes of Scietific Mongol, Marc. "Diffusion Theory of Reaction Dec 19791 AD A071 473Produtivty.** 17 pp.. Mae 78. (Presentedt at the Ratet. 11 Orntr, llhlenbec Approximration," 34Annual meintg of the Amrerican Society for In pp.. Feb 1978, AD A058 542 PP 245fration Science held in Sar Francisco, CaliforniaSmen d~n . Th ceeoee ehd
Octoer 176).AD A54 42 PP231of Obtaining Aircraft Perlorrnsnce fromr Flight TetWilton. Daendm P. Jr . "Natal Projeccton Force, Data (Dynamric Performance Tinting)," 403 pp.
PP 218 - Ctatotfied The Cusa for a Ressrnrit MAP." Aug 1978. Jun 1979. AD A075 226AD A058 543
PP21 PP 246Ifnona.R LaVar, 'Markt Analysis writh PP 232 Brecrting, Frank. "Layoffs and Unemployment
RunlExpctcations Theory anid Estimation." 60 Jacobtoin totit. 'Can Policy Change, Do Ma~e Inruranco." 35 pp . Fabr 1979 [Praeted at thep_ Apr 78. AD A054 422 Acceptabla to Labcrt" Aug 1918 (Subartitted foir NBER Conference on "Lowt Incomes Labor
publication .r lndr.,rrl an Labor Rotation, Rt. Markeut,, Chicago, Jan 1978)pp 21 view). AD A061 528
Messier. Donald E , "Dragonaeliros by Group PP 248Mouatrtce..' 26 pp. Apra M. AD A054 443 PP 233 Thoma, Jamsn A. Jr. 'The Transport Properties
Jacobson Loait "An Alterrourree Enpla...t-of -4o Dalian, Gavec in Applied Finld." 163 pp. Marpp 221 te Cyclical Pattern of Onr - 23 p, Sep 1978 1979
Manniad. Robert G "Sopperiate Na..al Orplotracy in the October 1973 Arab Itrael, Wer. 76 PP 2 34 - RecitedOp. Jun 1978 il".laitad in Sonaower in the Joedro Jae .. nd Leo, Robert A. Doe PP 249
Medit*rranea Political Urdi-1ty and Military Con F1 era1 6 nporurr Ditlace, StaM and Local Glaster. Kenneth S . "A Secretary Problaem witha
sttarts. The Washintegon Papers No 61 Boently Expenditure The Case rf Comfar.nri- Groert' 25 Randomr Numiber of Choice, 23 pp. Mar 1979Hilt and London Sega Publicatron,, 19791 PP r Oct 1979. 40 A061 529AD 4065 5" PP 250
PP 235 Macgal. Marc. "Motdaling Fluctuations in Maccaspp 722 Mitrahi Maurice Me "The Stoiclassncol Expansion tcoPrc Systemt" 26 pp. Jun 1978
Mitirfhi Maurice M. 'CorreOorrdence Ruler nd of the Arrharitsoc Orscillato Propagator.- 41 pp.Path leit-aa 30 PPva Jun 1978 llnntod paper Ocr 1979 (Published in Journal of Mathematical PP 2%1peannrd at the CNRlS meerrirgl on 'Mathematical Fhlryie 20 (11791 PP 844 8551. AD A061 538 Trot, Robert P, 'The Estimation and Intersaneto
Problemsa in Feyntttc,' Path Iniegalt Miarteile. tin of Several Selectiity Models 37 pp. Jun
Prance May 2226. 19181 (Publirhad .n Sprnger PP 237 1879, AD A075 941
Vertlg Letnre Notem in Phtytcs, 106 (1979) Maurer Donald "A Met, Criterion toi Normal234 253) AD A055 S36 Sntgra Bae 10 pp Jan 1979 (Published in the PP 252
Illinoit Journal of Mathrematics Vol 22 119781. pp Nuny" Walter ft, "Potition Finding -it, PrtoPP 223 672681
MisIPIMar 'Sochsti Mtauacsof lloloclsKnowledge of Coarietr Paarater,' 5 pp Junforte Macl 'ochtin Mehame of. Jun 918 P 23 1979 1PUblished in IEEE Transactions on AerOtece
a AD A066 227 1,1190" Kathleen Clasren "Unemployment In &Eetoi ytm o E 5 o3 ac
turatter, and The Empoyvnm Rate 20 pp , c 17
Pp 224 1978 (Piernrd or the Conference on Economic P 5
Mael Marc ,Aggegtion nsitrrc:roc. and En Indticator, and Perlormance The Current Dlata- P 5
lurori In Explsoited AAurea Poossarin, 48 Factng Government and Businers Leadefrs, pee~ted Glatser. Kenneth S. "The d Citosae Secretary Nrob
pp Mer 11178 AD 6064536 by Indiana Unirerart Graduate School of lsninrl. lein." 32 pp, Jun 1979. AD 6075 225
*PC"- otr f this .oeS "ere Rerad at the Inatt AD A061 527of Apiead Nanrernatit and Sureoni unai.ty of PP 2MOinlt Cejdofa Vaneouina 6 C Canada pp 239 Named. Marc and tnibecli. Deali 8. "Intaerion
Trost. ft P andt Wairnr J T The Effacts of of a Sicare Norama oeer an Offoe Circle" 14PP M2 Mtlirary Oceeational Training on Civilian Earnings pp, Jun 1678
%UgAW " Ondllrat Fleti-V -atie and the An Inoni Selectivity Approach,' 30 pp NoaHeol Siaati. 41 pp Jun 1979 1979 AD 6077 831 pp 26 Ctaatilrod AD 6061 441.AD 406S37*1 01aaw of lttre Worl, ae eaaseetad at the pp ?40 PP 266Inlea of Appoed Metfrantc and Strtit Parsons Brucer 'God, .f the Centrta for Noval Muatrt Donald E "Urthng Peonna DistributionJasinewn of lbnrre Colaurree Vorainm Canada ANter" 13 PP Dec 1978 AD A0637110 Modest. 27 PP, Feb IM6, AD 6062 21@
.3
Ple 217 pp270 pp20M
Tha. ft.. 0.sopoeo eAd Fiscal Constraints Roes m;. R.Fwihd. "Sovet Plio on the sootm Of othMunoN.O h
Why Dteisountin a Alesyt, got." 10 pp.. Aeg Afr... The Decoion to Inlenese.- 52 pp, jo
197. AD LA07 22 1960 ITO be published in "The Soeet Loell in the p
old Woold Sueccess or freue.. ed by Robe H Miortho Malinke M.. "On the WAS Approximaeton
pp 258 Ocoadeoes, Wasttions Prows. Ulouid..., Co. SummoerroeeottAtottyHmlttn.'2
Ma1 i Marc S. &,d Thomas.. Jaesw A. Jr 1I60). AD £001 19 t pthe Aroga00to tod Atrar Joteornisof at." Pyt
Anadyti Methods on Switch Thewo.. ft Pa. 22. 1 Ag 1960 (rne oJunlo od.1lfis
No. 1676$. AD Ad"l 632 pp 271 2 T a 90
MCConell Jumea. "So-we end Antetocir Strategic PP 287pp 250 Docirtoar, On0 Mo,. Timw 43 pp, Jan 1900 Cops. Davis. "Limit Cycle Solutions of Roeslctoon
a.... Dentd V fewn. lb Owg Nuts.' Iftelt. A AD AUT 192 Diffusion Equtitons,"' 2 pp. hoot 1960
and parron. Dnd A *ACasoCnvxte.Watekov Miato..... 17 pp No0. 11179. AD A01? 6 33 PP 272AD0814
the.% Kennetht G Th. Alms., on Oopbotnaoy .ot pp 288pp.M Ol,-oo , 1940 1945 40 pp Me, 196. Golmann Wait.. Don't Lot You, Stores Flip oos,
Ma0ge. Marc S and One. Davis. K 'Doolelionr AD £065 094 A Painless Good* to Voeals That Really Ai." 28
te wid Sosisep Width to Vowel Search 14 p
Nov 1979. AD A077 834 pp 2n p, c 18
Nalootwto Moofodo K L.bo, Stipply Of W.It. *0th PP 289pp 20 I"uo'bando f-otloterd E,rho F.11l Imv 00 POan Robinson, .ta. "Adequsate Cliesfoot.,too Gosodenici
Vila. Ceolon L iesio. Deso J -nd Ross. John Tinme 39 pp. Mo, 1960 AD £0012 220 - A Solution and a Problem," 7 pp.. Aug 1980
'litarsck Condo" Theory of Chavo,.cah Dynaemics VI
Anigoeie Distributonst of Ratatoon Pstooti 14 pp 275 PP 29
pp. No. 1979 (Reaprinted froest Josothl Cho. Golidberg I~.-nc Rec-is-, Ad.n.'t~ng find Watso, Gregory H.. "Evaluation of Comper~o Soil
Phy. 70(121. 15 Jun 15?1. AD A076 237 ft., v's,ito.'ttt 34 pp Me, 1660AD A082 21 vvos, on ain Operational Enritonotnt." 17 pp.. Aug
PP 262 18
peruisite. Chusello. C 'T60.4 Wfooed Mothifrr Elone in PP 276 p 9
SotetPe.Pct.. 50 p~ N.199 Godbeg I--n- o.~,g An 0-h- Osand MladodeM. G S ' and Trost, R. P.. -Some. E.AD £077 036 ship I tgs.p-nn 40 pp oney 1960
AD A085 09Stensons of the Nfo.10,. Press Model." ' 1 pp. Oct
PPA00503 1980
foo.onw. Kathy I Uttot commeratol To.4.at pp 277 *Unsot'ttty of Florida
ndContflhoop, to. N. Und.,-.v Replenish Meng.. Most, Smelt Plotctiotoont. svltem ovoh PP29
meeat '2S PP No. 1979 AD A077 636 111Molp L.-s Cyd,. 19 pp Ma, 1980 Pfub Thomos.. Jo. James. A. "The Trasport properltie11 hod "o SIAM J1 Appo Nioh Vo) 38 NOt 1 PF, o tno o Muue s piodMga
pp 264 IZI0 AD £066 229 od,." 10 pp. Situe 198 Appeled soJotna .o
Waindand, Robert G The U S N. in the-od. 0Pp et18 Pbise nJunlo
Pacotu Past present end Gjhmnon, of the Future. PP 2708hmclPy, 2 11 5My18
21 pp No. 1979 fDobonmadf I. the Iteratnoal M-.h. 1101s-- A Ioltng Poobf.. [- Io f t p 9
Symtoof nthe forpon~oa byotep th tt.t Th.ata VAD t AA085 096 23 pp Amt 1980 Th 0 .a., .1 . Jaese A. "Etolustton of Kisetic
fltootelg Intituton lotrete sd the ADnot 5065 096 Theory Coltition loitegrels Usng the Gonatulsod
Toky. 1620 ct 1781AD A615 37 p tt Ph. Shoft Approtich' 12 pp Sept 1800 Iotioed
Toall 1te20e 0M 1oo7ie ADf e £066 837 PPw 27iso Jotottal of Chonvoceal Physics 72 $101 15 Mary
pp 26 of Footer A Ctststto00f osc, Wh-,t Woo h0O 98
Wrionrlarod. Robert G 'We, end Posoe on tho ooth PP Me, 1960 AD £065 097 PP 294
toSotueoo oni Imlonoftheos Changing ' s9 od ppR0fotbot" Stephten S.' "Ptevh Naval Policy DOortdetoy itutio inNorher Eurpe 8 p No pp280of Europe. 30 pp Sept 19S0 IPt,.inord et the
1976 I1safeeied fm oe aoation to the "Confitoc. GoI.8t..g Lewoottot Estitsnont Of the Effect% oft Confereeoota f the Section on Mitery Stuedie,
of the Noodoc Balance on Perpacoote The Chioog A Shops* Steamsng otn the Fool~~ Rate otf -t Equsp Intonational Studs., Asoctoo K"ahe Istand,
MoIiter end PoltK.tce Situation Centetl. t m.,ot A- Appticationotfa Ecosiontotoc Analytis ScSteetal". fond interntonal Stuodies Gotooetoott 2S pp Apmo) 1960 AD £0115 096
Univsityt Jto, 15 16. 1978) AD £0778938 pp21PP 295
p9 281 Roerts, Stephen' S. "An Indicatot tot InformalPP 206 Ftorahi. Misutooe M. "Cotmtent on taatzot, Evopore Pattetns of U S Navy Ctsing oni Overseas
U,,ptff Kathty Cloron end Steosctlng stank Probliemt of Funtiontal Intgagolt in Plae Spe. Stetson., 1869 1897." 40 pp. Stept 19110 (Itoe**ntd
Tax*, end inftatton 2S pp Not. 1979 pp,. May 10t0otf aalHtoySttottot.U o0
ADp AC 19 Acony 26 Ortobet 1979
pp 267 Ototmeket. Bradford, "Exopectd Deand to, the PP 296Trott Robert Ps end Valel Roert C Th. U.S. Navy to Setve Of An, Inrtrumeott of u.s Conit,b Biraidliod and Pat*,an. Chuoi. C NMets
fitpvnfe, ott Stae Ginvernveni t Roropts to loep Poloocy Thinkiong About Pssotierm and Mollt to,a Fact-,. Afforctstg Ibetian Securtot. ' Factor.s,
Ecos.otc Plitirtton, end the All-otsov of fifty Envatonerwortal Patoe." 30 pp. April 121) Molreo .. u Al act... L. Soxuedeid lbottot 14
Count., Cylocel A.-- Suaring0. Giantt 12 pp AD A.01116 ONp ct18
Dff, 1679 Iftolonted ft.. the Raysawo ofPpOt19
8ootn o, ol Stattics Vol LXI No 3 Atott PP 284 PP 297 - Classifited19"1 J, Kanteon. " Nunn,. end U Sutmt.-- -- h,
L.,toevo Ttoixufoot. 119 pp. May 1660g pp .pjPp 2" "That 0.aeduate Seitooi of homagewrtwnt. Usnoviftoty M.,rat Mourrice III A Mahvisov Approach to Lung
Thieont Jam.., S Seonm Dependantso and Of Rod" 1t1- end the Cent. for Naval Anetytaor Nattolo Attacks,: 31 pp. Jon 1961Ino State Cooperationt The Cow. of SubsSaheteto "The Gorraduae Spoot of Management. Utovanty
Aft... 141 pp Josn 1980 AD A0OSi 193 of Rocitete, AD AOIG 100 pp 299
PP 20pp MJondeow. Jaesa N end Robet A Levy, 'Wae
W1110" Kertht G The Soviet Iveonn so, th Rt-Wk, Rickteed 8. '8trproopota.r Setoutty In Lieeni nCntrcin1 p w18
Ogeden Wfoo 42 PP Jun 1960 (Ii,tvttd et the tetotin tO l ot*t Deaer 00.,' 26 pp. Jutn
bouoh.. Confeence. en so"nt Stiecdoat in Octobot 1860 AD £067 113
* 19791 AD A092 719
.4.
PP 30.fonchow. James and Pete, Schnmid-t. tn he Est.-
mation of Tecfhnical Inefficrovcy int rfe Stochaoti,
Frsoner Producion Funcion Model, 11 pp., Jan1981'Michigan State tjnwenty
pp 301jondrow, James M.; Lev. Robert A. and Najitet.claim, -Teani Change and Employment 'in
Steel AUeNe. Aluminum, and iron 0..." 17 pp., Mar
1961
Pp 302jondroer. James MA. and Linv. Robert ik.. "The
ffec of Imports oat Employment Under WtIlondl
Expacmatons." to pp.. Apt 1961
PP 304
Duffy. MiWae K.: Greenwood. Michael J.'* and
McDoell. John M.' "A Crossammtonal Model of
Annual Internignol Migration and EmoloymntGrowth: tntetempo'a Evidance of Structuralchange. 19581975." 31 pp.. Apr 1981-Uninersit of Colorado*Aeora State Unimnty
a'p
Ai