Embed Size (px)
Citation preview
AD-Ai21 139 THE STREANBRN( EROSION CONTROL EVALURTWRWDEMONSTRATION ACT OF 1974 S..(U) ARMY ENGINEERWATERHAYS EXPERIMENT STATION VICKSBURG HS HYDRA..
UNCLASSIFIED M P KEOWN ET AL. DEC 81 F/G 03/2 NL
I:IIIIIIIIII
I-iIiilh//h//llllllllllllfl
SmhhhhhhhhhhhhIINNUBIIIIIII
U-11 28 L2,1111.2
I ~ ~ ~ ~ ~ L . Q2 i iiliJ m
.. iA
IIIII I25 I 111.6
MICROCOPY RESOLUTION TEST CHARTNATIONAL BUREAU OF STANOAROS-1963-A
-jj
US ArmynCors THE STREAMBANK EROSION CONTROL( ofEngieersEVALUATION AND DEMONSTRATION ACT OF 1974
December 1981 SECTION 32, PUBLIC LAW 93-251
0
FT0
No 818
3. k A- 0 S00
0 *
4v w
ME
FINAL REPORT TO CONGRESS
THE STREAMBANK EROSION CONTROLEVALUATION AND DEMONSTRATION ACT OF 1974
SECTION 32, PUBLIC LAW 93-251
APPENDIX GDEMONSTRATION PROJECTS ONOTHER STREAMS, NATIONWIDE
VOLUME 2 OF 2
Consisting ofA BRIEF SUMMARY REPORT AND INDIVIDUAL EVALUATIONREPORTS ON TWENTY STREAMBANK EROSION CONTROL
DEMONSTRATION PROJECTS ON SIXTEEN DIFFERENT STREAMSTHROUGHOUT THE UNITED STATES 0
Accession For'
NTIS GRA&IDTIC TABU nnnounc ed
Distribution/ .
Availability Codes
Avail and/or
Dist Special
U.S. ARMY CORPS OF ENGINEERSDecember 1981
. .. ...... --- --w w w-| i wRll -- - - - - 0
APPENDIX GDemonstration Projects on Other
Streams, Nationwide
CONTENTS
VOLUME 1 of 2Page
Summary ....................................................... G-1 to 13Yellowstone River, Intake, Montana to Mouth ....................... 0-49/50-1 to 76Eel River near Fernbridge, California ............................... G-51-1 to 27Van Duzen River near Carlotta, California ........................... 0-52-1 to 20Allegheny River near Wattersonville, Pennsylvania ..................... 0G-53-1 to 46
Connecticut River at Haverhill, New Hampshire.......................0G-54-1 to 36Connecticut River at Northfield, Massachusetts.......................0G-55-1 to 25Delaware River at Paulsboro, New Jersey ........................... G-56-1 to 33Green River near Kent, Washington ................................ 0-57-1 to 35Kansas River near Eudora, Kansas ................................. 0-58-1 to 20Kanawha River at South Charleston, West Virginia ..................... G-59-1 to 27
VOLUME 2 of 2
Iowa River at Wapello, Iowa.......................................0G-60-1 to 40Little Miami River at Milford, Ohio ................................. 0-61-1 to 30Lower Chippewa River near Eau Claire, Wisconsin ..................... 0G-62-1 to 88Pearl River at Monticello, Mississippi ............................... 0-3-1 to 27Rio Chama near Ablquiu, New Mexico..............................0-64-1 to 20Roanoke River near Leesville, Virginia...............................0G-85-1 to 47Sacramento River near Ordbend, California..........................0G-66-1 to 25White River near Jacksonport, Arkansas.............................0-7-1 to 26White River at Des Arc, Arkansas .................................. 0G-881 to 60
W W W W W 10 W 1W 6 W
q 0
0
0
4 0
IOWA RIVER ATWAPELLO, IOWA
* S
S S
* S
S
Section 32 Program Streambank Erosion ControlEvaluation and Demonstration Act of 1974
IOWA RIVER AT WAPELLO, IOWA -DEMONSTRATION PROJECT PERFORMANCE REPORT
I. INTRODUCTION
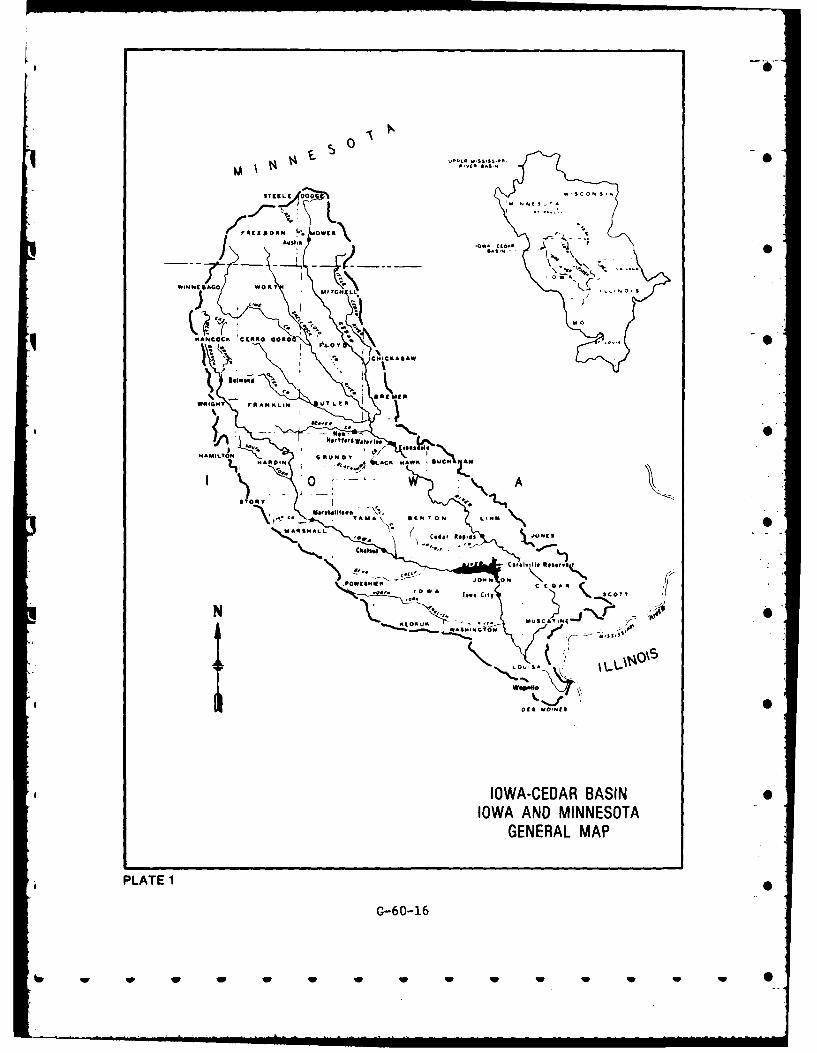
1. Project Name and Location. Streambank Erosion Demonstration
Project, Iowa River at Wapello, Iowa. See Plate 1 for location map.
2. Authority. Streambank Erosion Control Evaluation and Demonstration
Act of 1974, Section 32, Public Law 93-251.
3. Purpose and Scope. This report describes a bank erosion problem,
the types of bank protection used, and a performance evaluation of a
demonstration viroject on the Iowa River at Wapello, Iowa, constructed and
monitored by the Rock Island District.
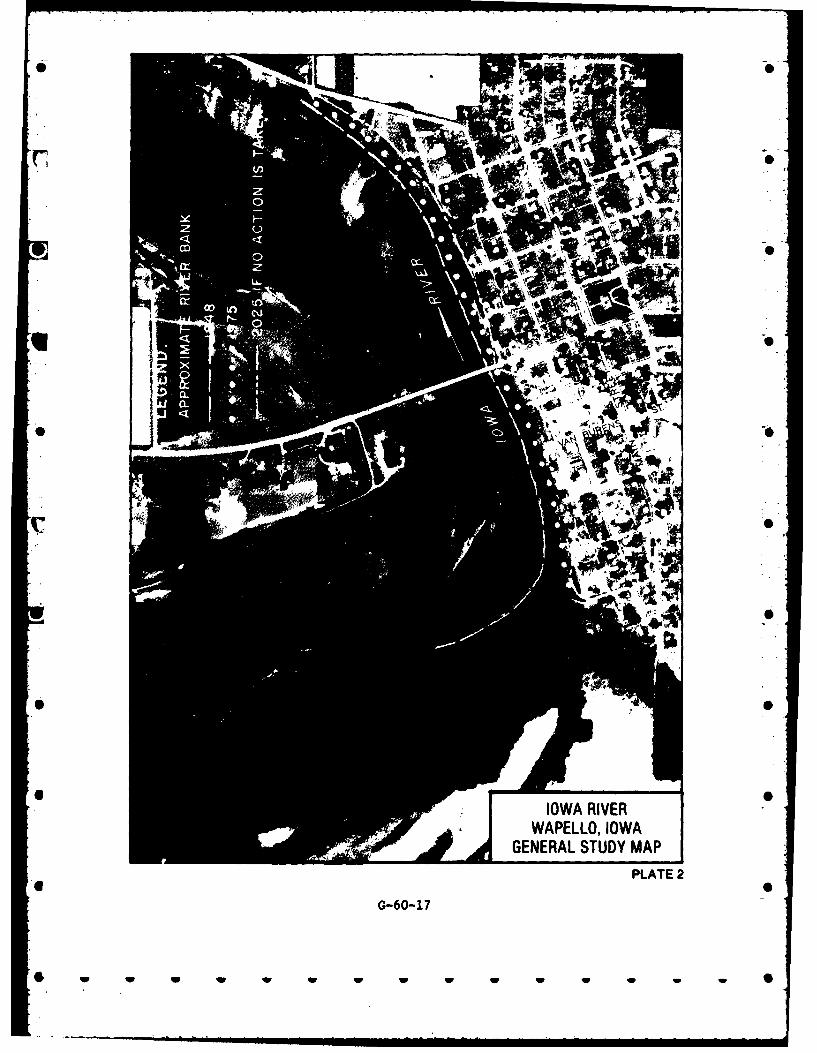
4. Problem Resume. The city of Wapello, Iowa, is the county seat of
Louisa County and is located on the right bank of the Iowa River,
approximately 16 miles above its confluence with the Mississippi River.
At the upstream end of the community, the river makes a 90* bend, and
over the years the right bank has been eroding. The main business
district is within 180 feet of the riverbank; without man made
modifications this cm ercial area will be subject to erosion damage in
the near future. The general area Is shown on Plate 2.
II. HISTORICAL DESCRIPTION
5. Stream.
a. Topography. The combined basin of the Iowa and Cedar Rivers
covers an area of 12,640 square miles of which 11,590 square miles are in
Iowa and 1,050 square miles are in Minnesota. The basin is about 230
G-60-1
W - - .W W W WW W W W W
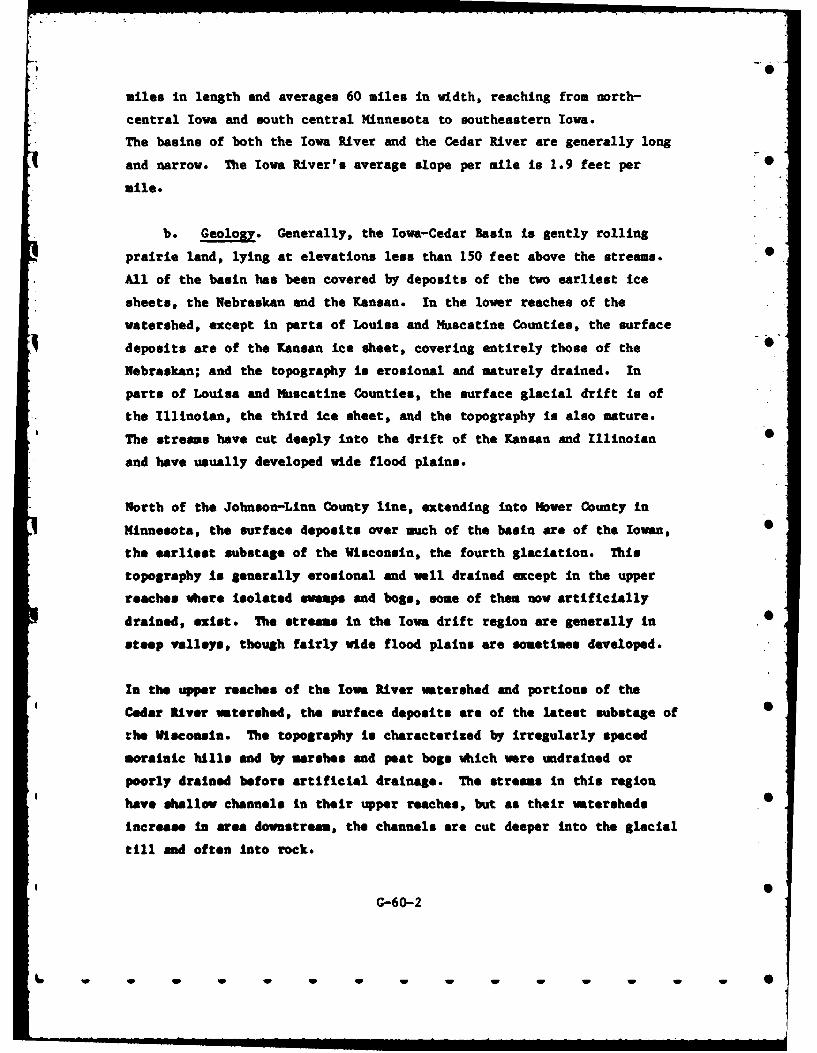
miles in length and averages 60 mile. in width, reaching from north-
central Iowa and south central Minnesota to southeastern Iowa.
The basins of both the Iowa River and the Cedar River are generally long
and narrow. The Iowa River's average slope per mile is 1.9 feet per
mile.
b. Geology. Generally, the Iowa-Cedar Basin is gently rolling
prairie land, lying at elevations less than 150 feet above the streams.
All of the basin has been covered by deposits of the two earliest ice
sheets, the Nebraskan and the Kansan. In the lower reaches of the
watershed, except in parts of Louisa and Muscatine Counties, the surface
deposits are of the Kansan ice sheet, covering entirely those of the 0
Nebraskan; and the topography is erosional and maturely drained. In
parts of Louisa and Muscatine Counties, the surface glacial drift is of
the Illinolan, the third ice sheet, and the topography is also mature.
The streams have cut deeply into the drift of the Kansan and Illinoian 0
and have usually developed wide flood plains.
North of the Johnson-Linn County line, extending into Mower County in
Minnesota, the surface deposits over much of the basin are of the Iowan,
the earliest substage of the Wisconsin, the fourth glaciation. This
topography is generally erosional and wall drained except in the upper
reaches where isolated swamps and bogs, some of them now artificially
drained, exist. The streams In the Iowa drift region are generally In *
steep valleys, though fairly wide flood plains are sometimes developed.
In the upper reaches of the Iowa River watershed and portions of the
Cedar River watershed, the surface deposits are of the latest substage of 0
the Wisconsin. The topography is characterized by irregularly spaced
morainic hills and by marshes and peat bogs which were undrained or
poorly drained before artificial drainage. The streams in this region
have shallow channels in their upper reaches, but as their watersheds 0
increase in area downstream, the channels are cut deeper into the glacial
till and often into rock.
G-60-2
IF - - - n . Is VP W
c. Natural Resources. The Iowa-Cedar River basin's most valuable
natural resource is its rich farmland and generally abundant rainfall.
In many parts of the basin, limestone can be found close to the surface.
This limestone is used for the manufacture of Portland Cement, as
building stone, and for macadam roads. However, in the Wapello area
farming is the dominant livelihood.
d. Land Development and Use. About 95 percent of the basin is in 0
farmland, and 77 percent of the farmland is used for crops and pasture.
Farm woodland varies from about 8 to 10 percent in the southern part of
the basin to 2 to 4 percent in the northern part.
e. Transportation. Wapello is located on US Highway 61, which is
the major north-south route along the eastern edge of Iowa. Iowa Highway
99 also connects Wapello to points directly east and south. State
Highway 91, which runs the width of Iowa, is located six miles north of
Wapello at US 61. Wapello is also served by the CRI&P Railroad and
numerous county roads.
f. Hydrologic Characteristics. The Iowa-Cedar watershed has a
typical continental climate in the temperate zone. The climate is
typified by conditions at Waterloo, where the average annual temperature
is about 48 degrees. Extreme monthly averages are 19 degrees for
January, and 74 degrees for July. Average annual precipitation is about
31.8 inches, with runoff of about 7 inches. Snowfall averages 29 inches.
The Iowa River at the town of Wapello, which is near its mouth, has a
bank-full capacity of 29,000 cubic feet per second, and at bank-full
stage has a width of about 740 feet and a mean depth of 10.7 feet. At
the city of Cedar Rapids, the Cedar River has a bank-full capacity of
10,000 cubic feet per second, and at bank-full stage has a width of 485
feet and a mean depth of 5.1 feet. No sediment, wave, or ice studies
have ever been conducted on the Iowa River in the Wapello vicinity.
G-60-3
W W W W W W W W W W
.
g. nvironamental Characteristics. Five thousand dollars has been
set aside for a study by Rock Island District environmental section staff
to determine if any changes to the cultural, water quality, fish, etc.,
have occurred due to the streambank construction measures undertaken at @
Wapello.
6. Demonstration Site-Test Reach.
a. Hydrologic Characteristics. As previously stated, the annual
precipitation at Waterloo, which is similar to Wapello, is 31.8 inches.
The nearest stream gaging station is located at Wapello at the Highway 99
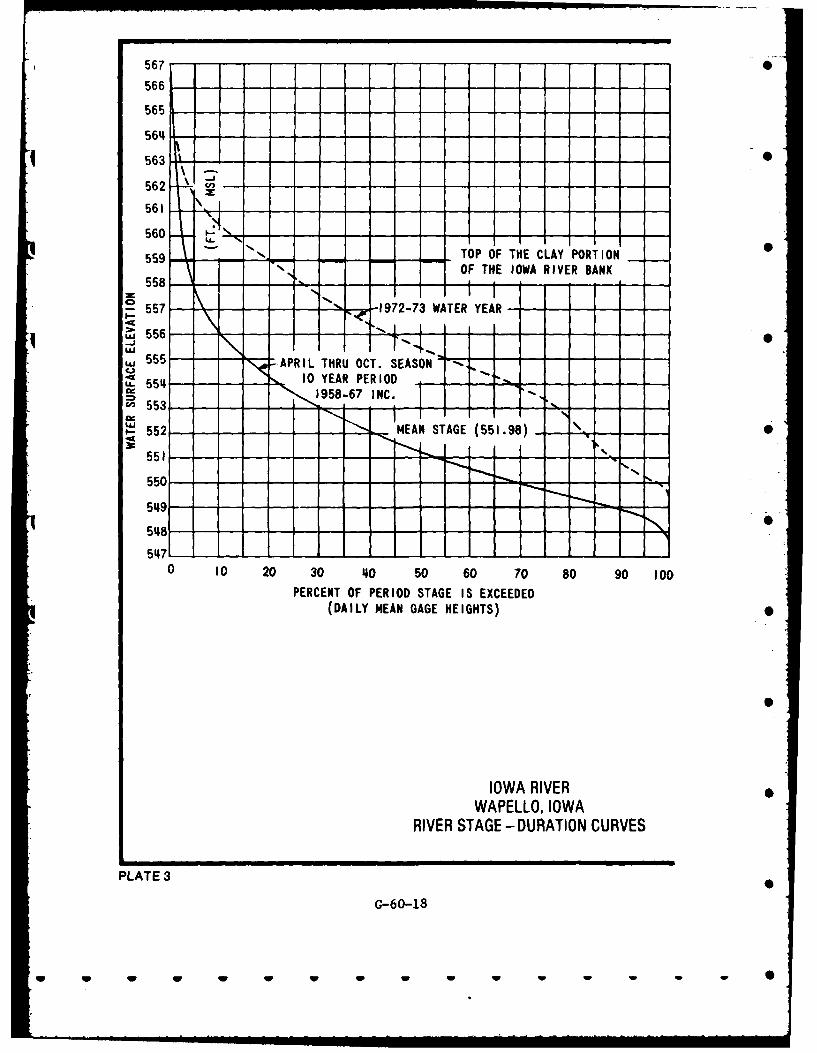
bridge on the downstream end of the project. Plate 3 is a river stage
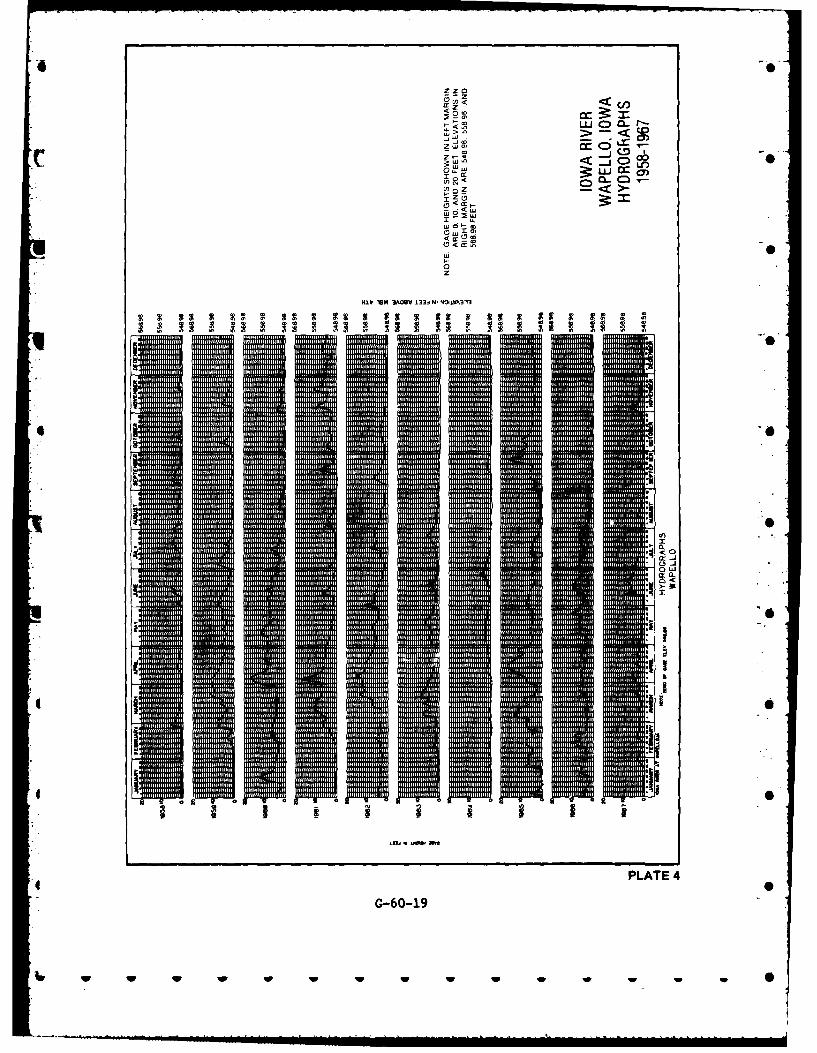
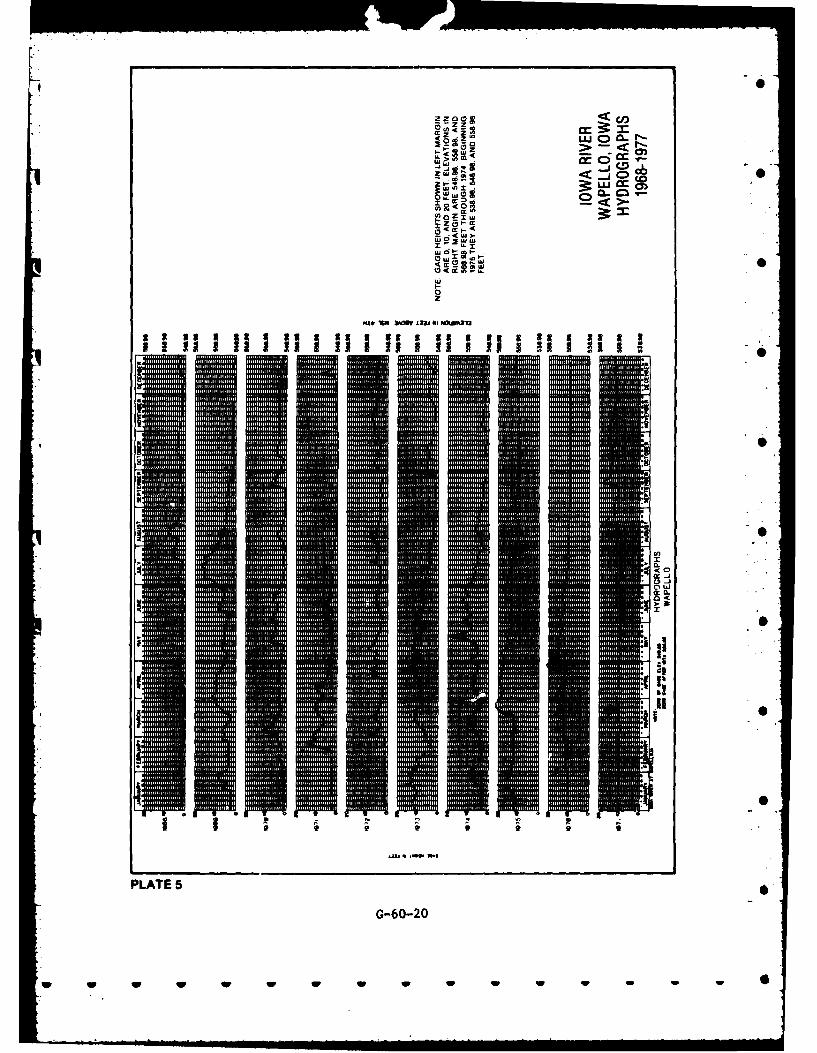
versus duration curve of the Iowa River at the Wapello gage. Plates 4
and 5 show the hydrographs developed from data obtained at this gaging
station.
@
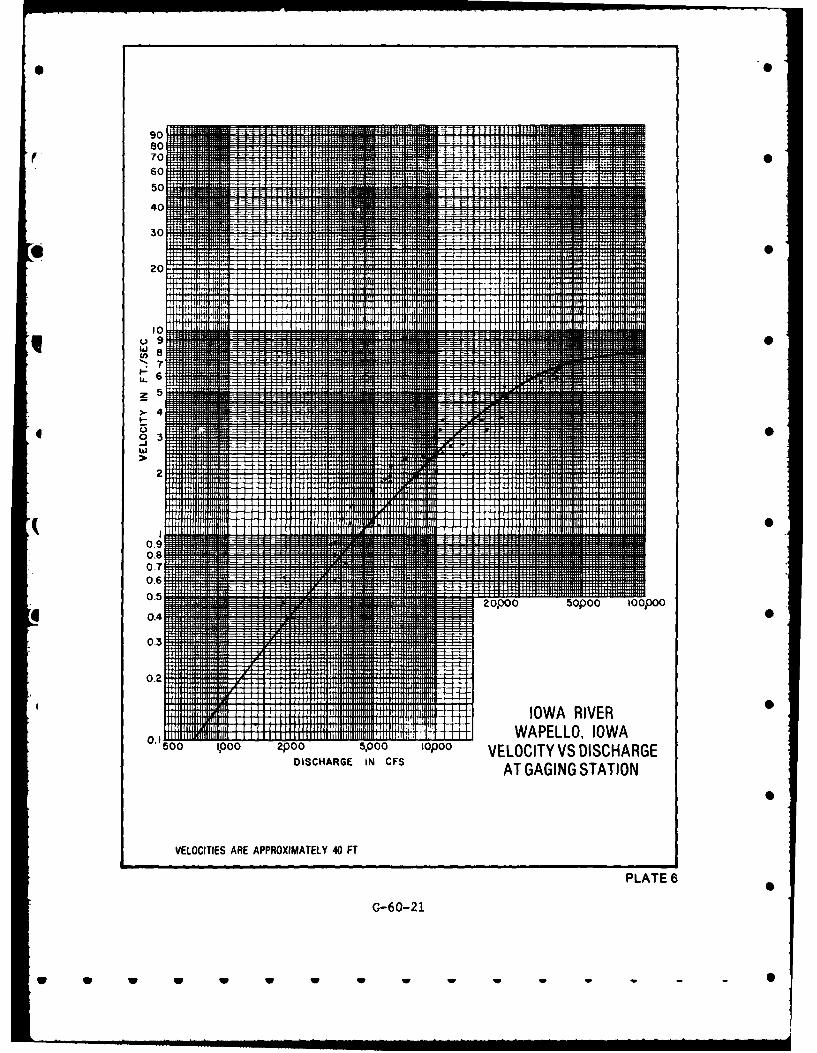
b. Eydraulic Characteristics. Flood flow velocities in the Iowa
River range from 0.1 to 0.15 f.p.s. at discharges of about 900 c.f.s. to
6.0 to 7.0 f.p.s. as discharges approach 35,000 c.f.s. Plate 6 shows the
velocity vs. discharge relationship taken at the Wapello gaging station. 0
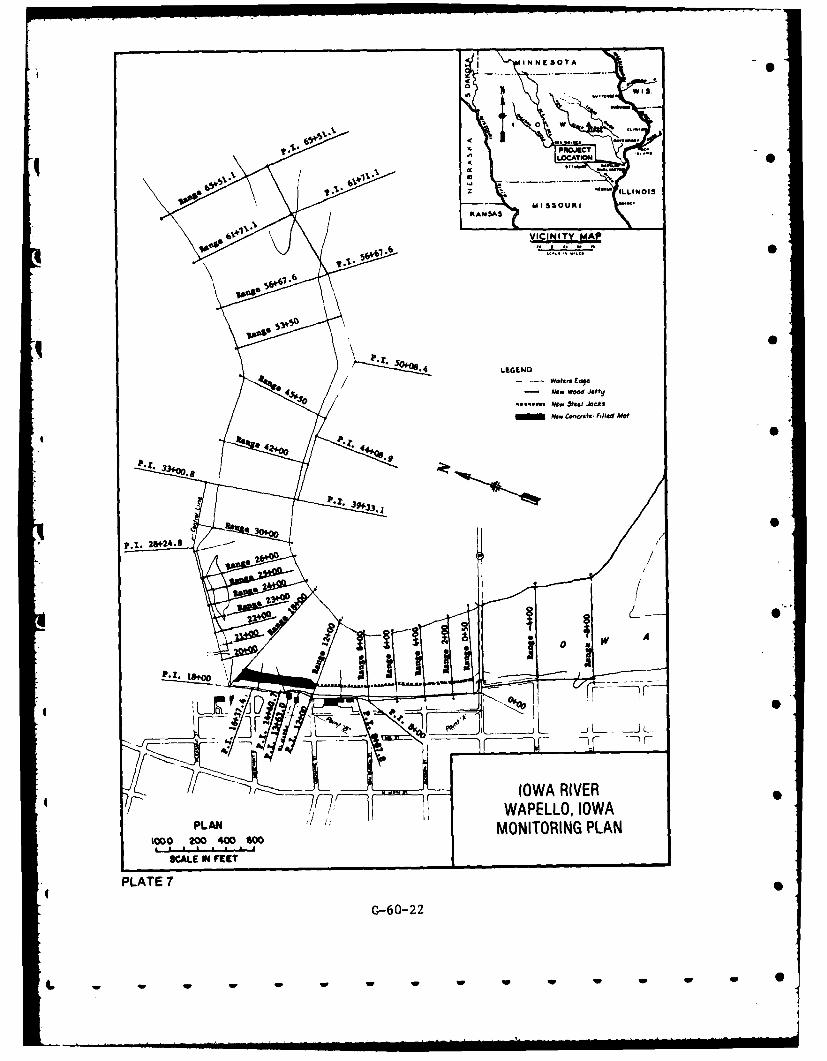
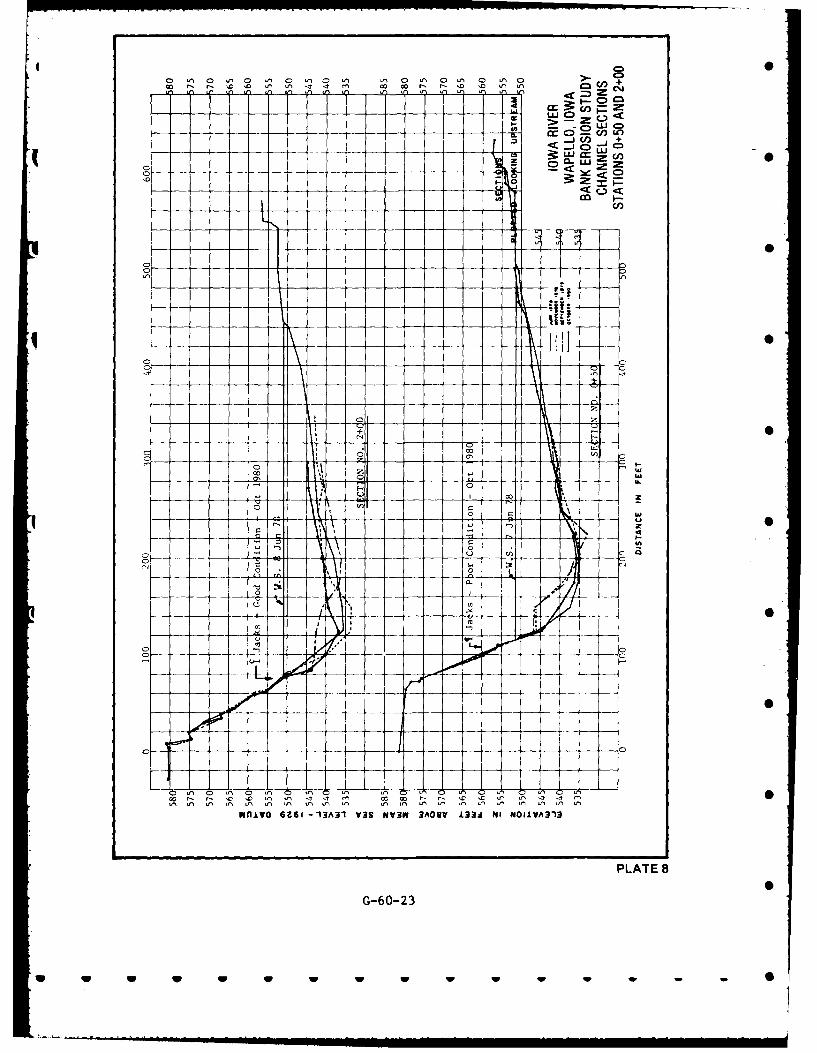
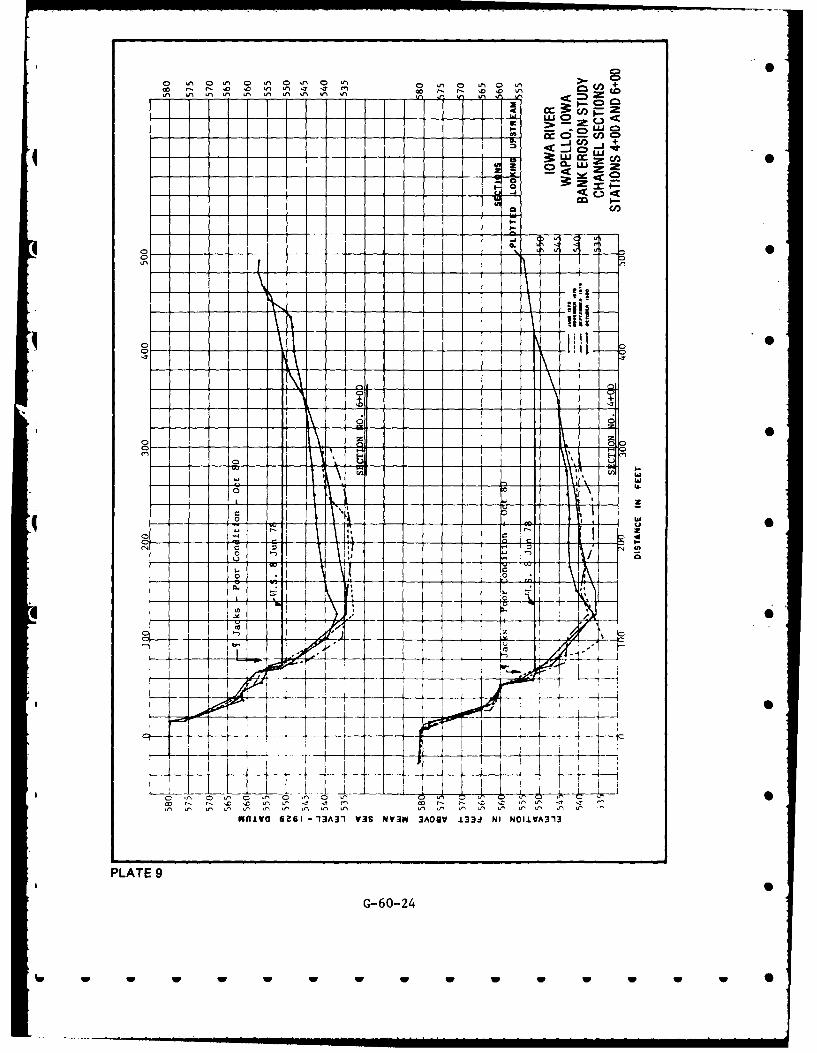
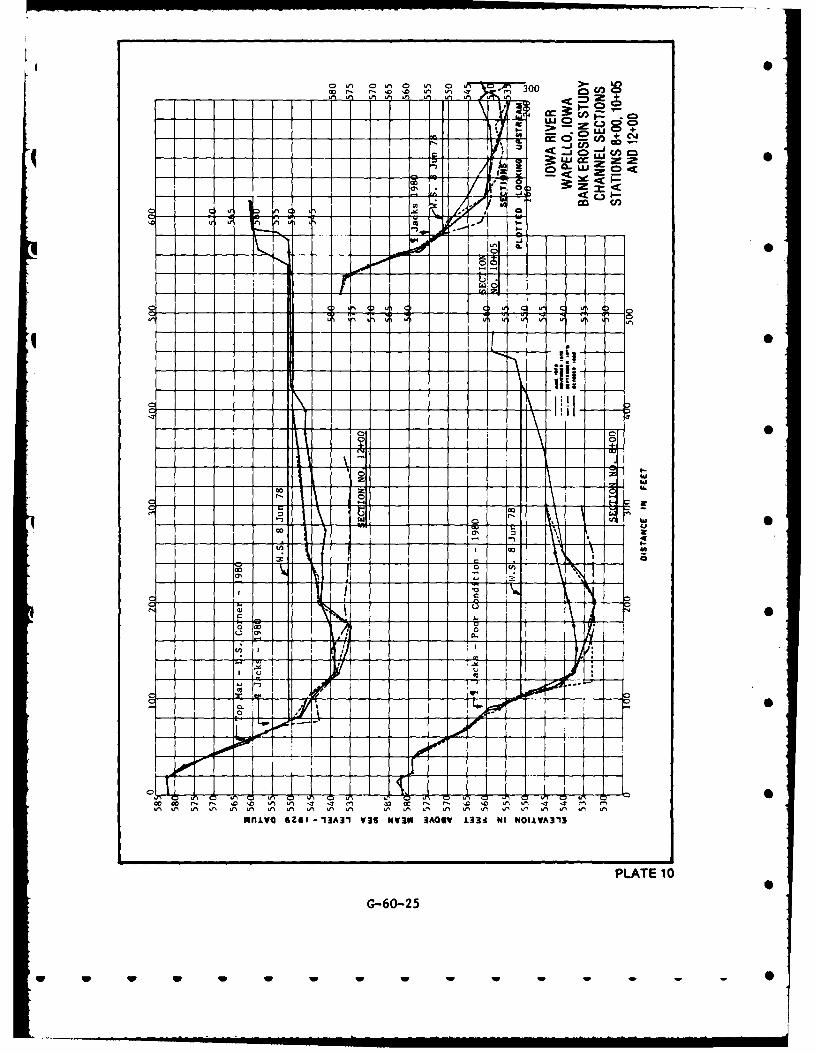
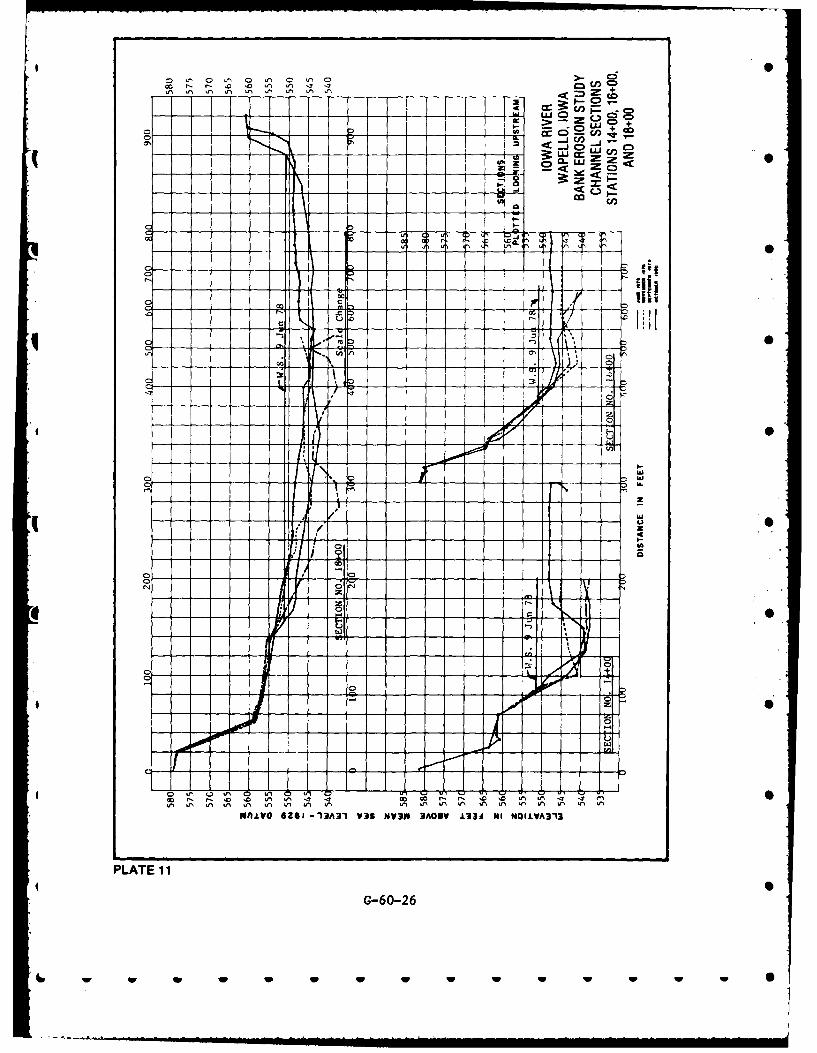
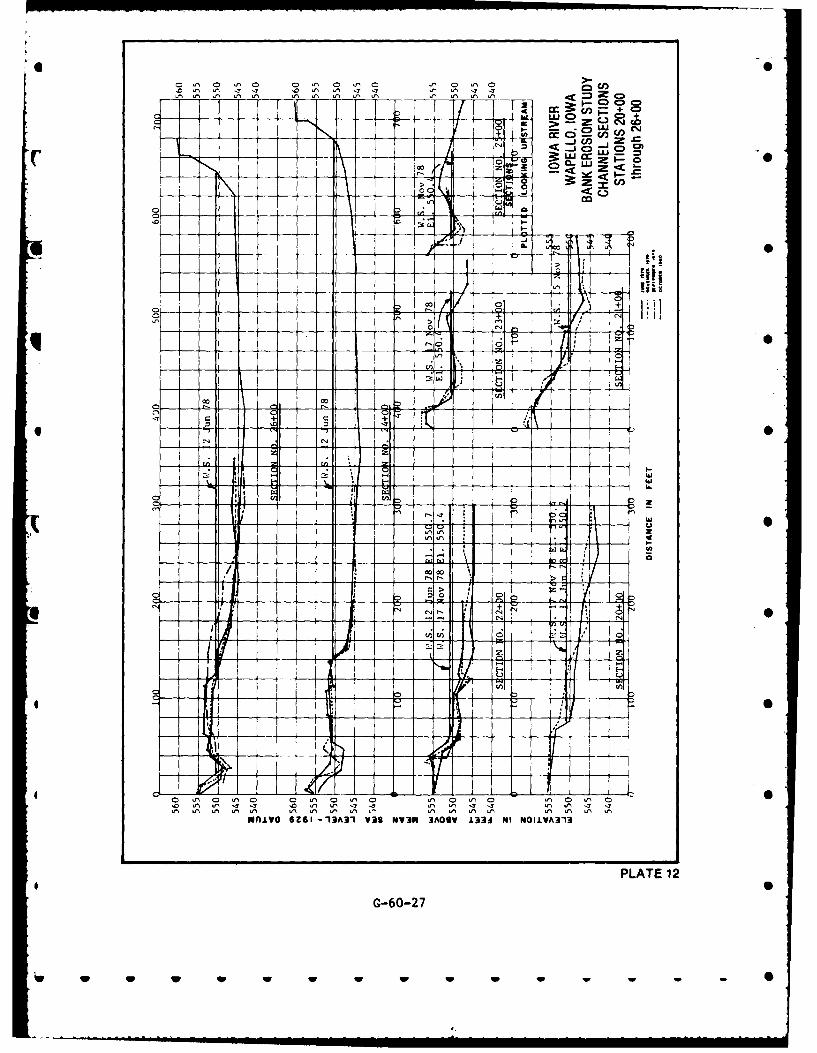
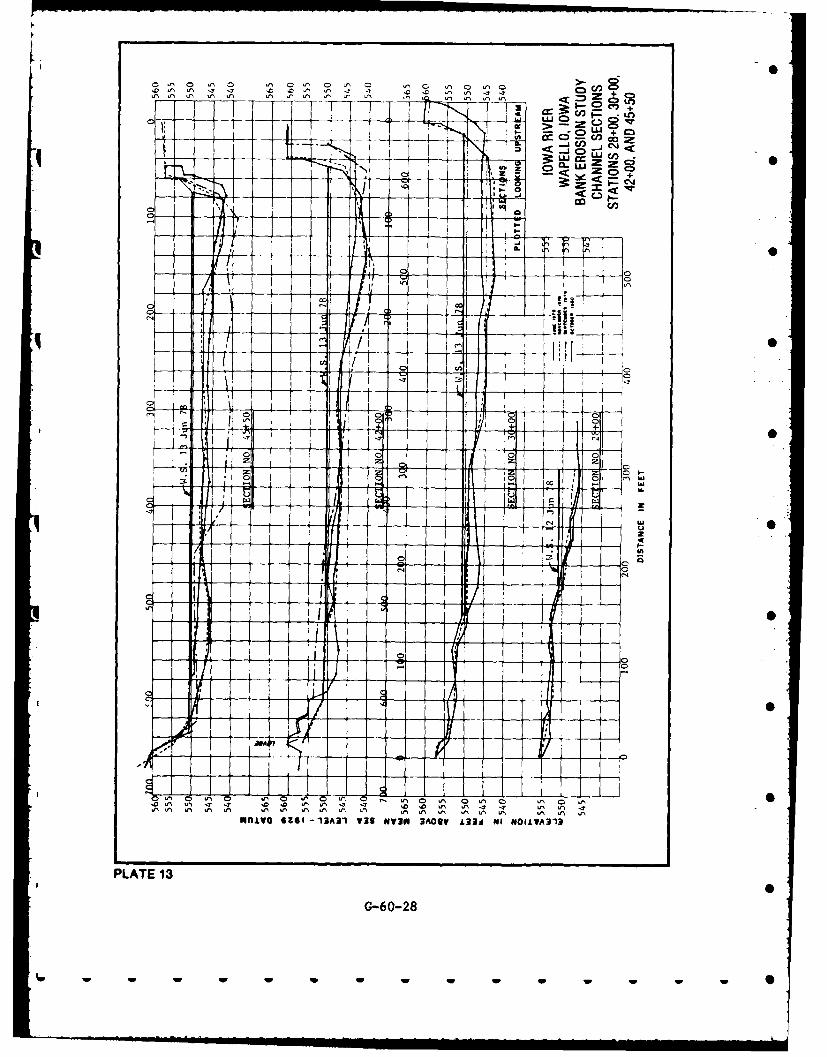
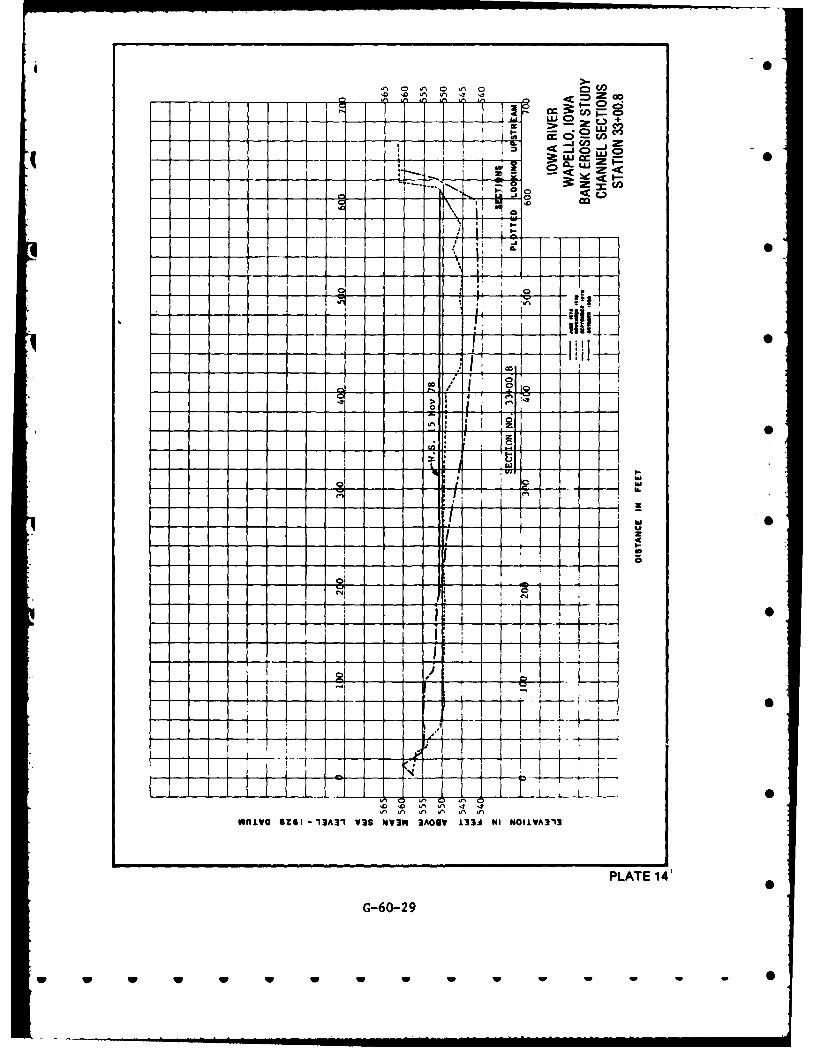
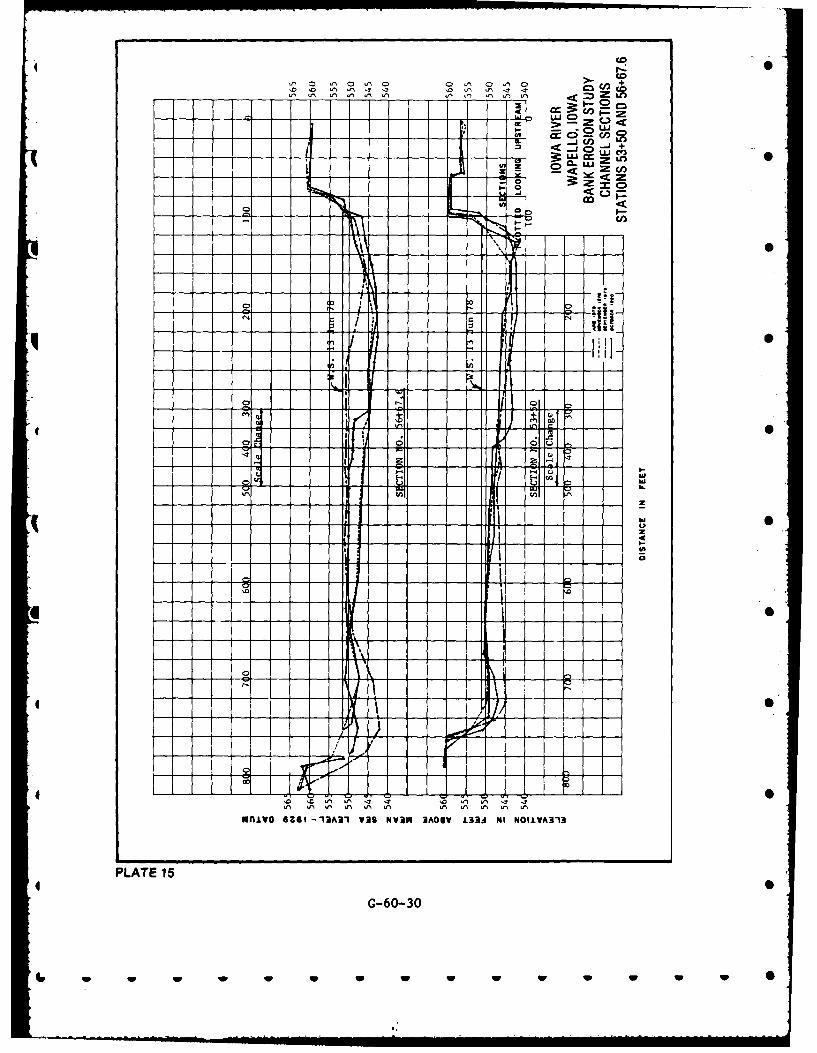
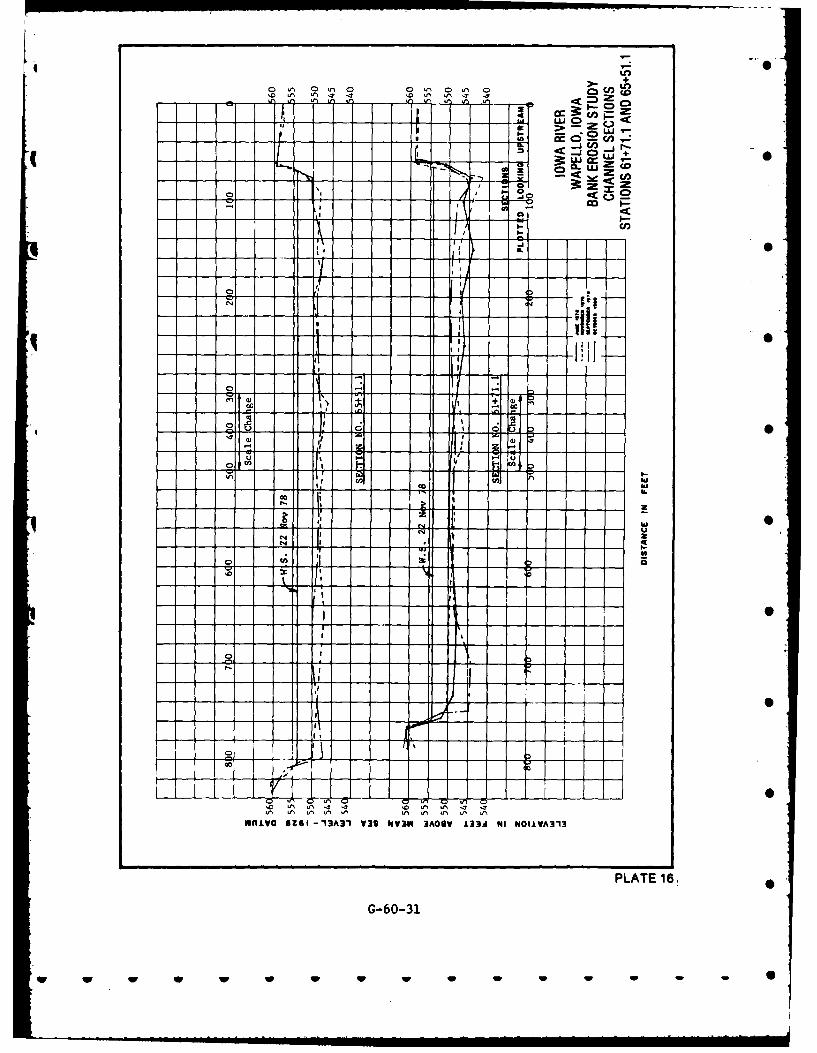
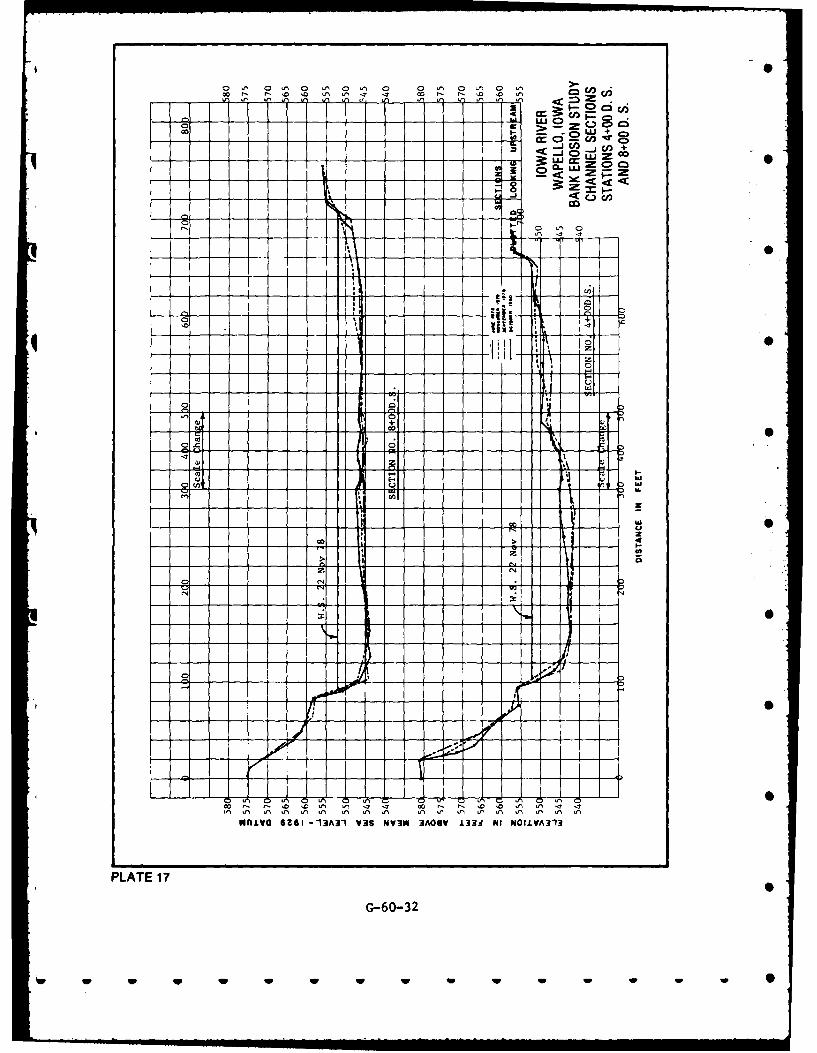
Channel cross-section locations are shown on Plate 7. Channel cross-
sections were taken at 19 ranges along the test reach and are shown on
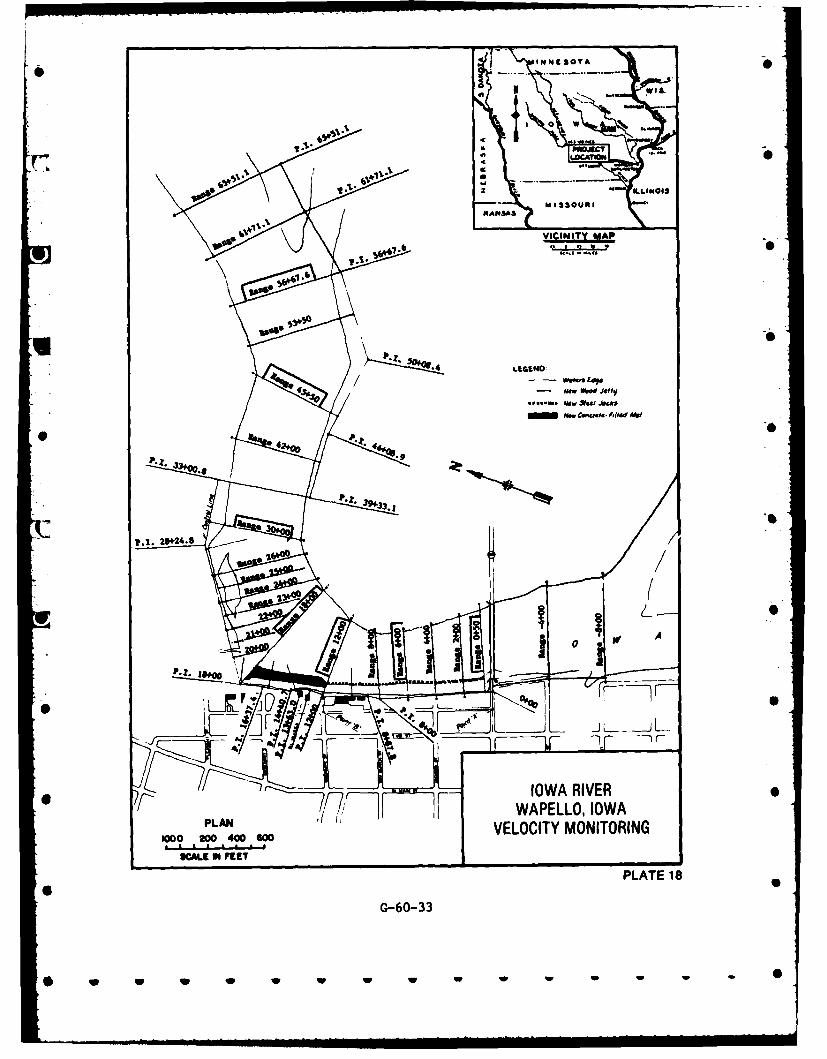
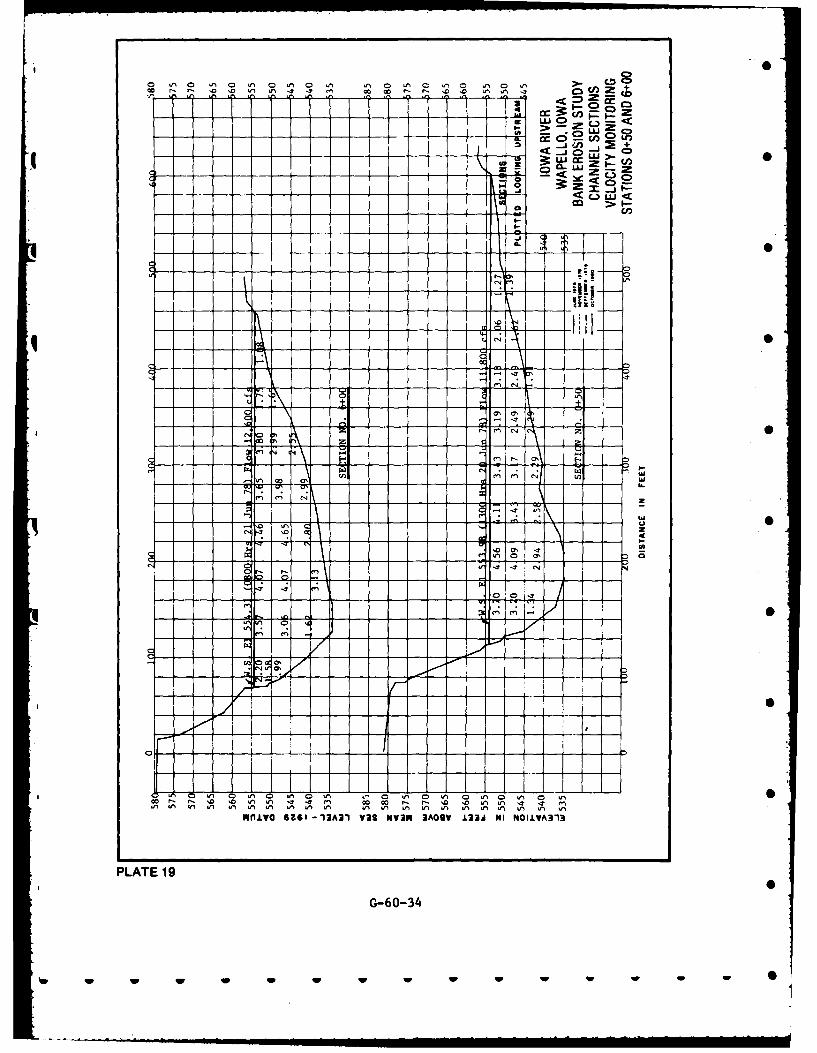
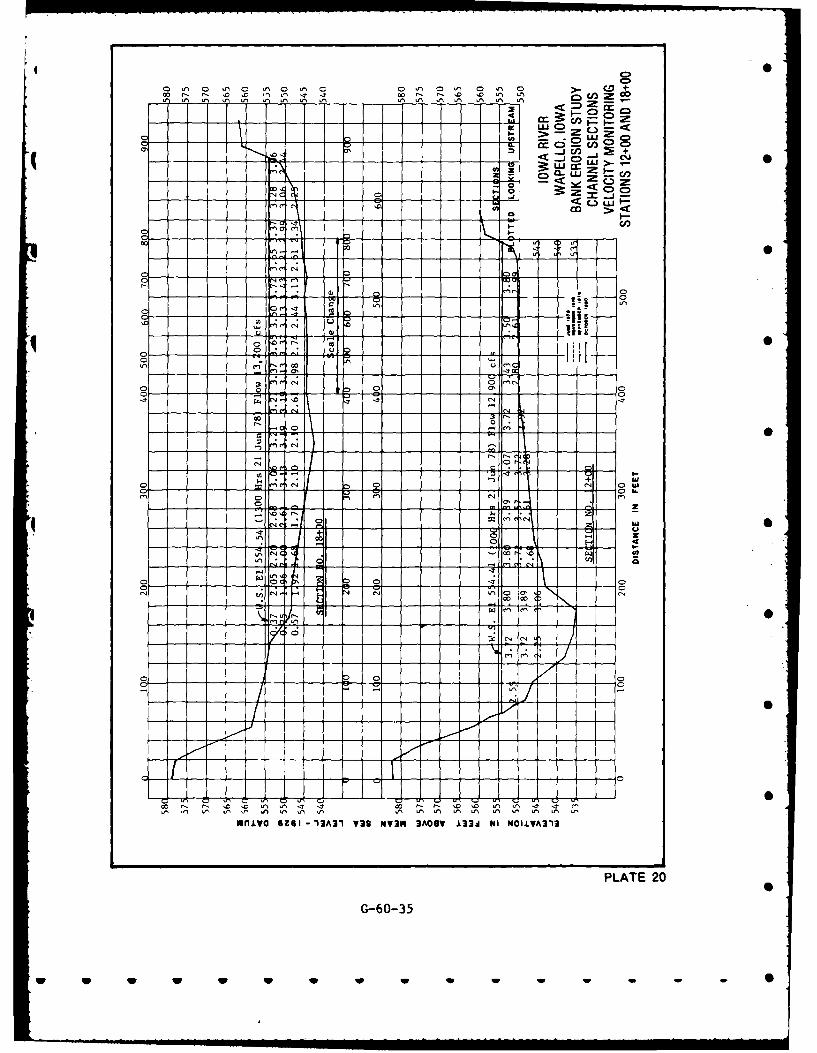
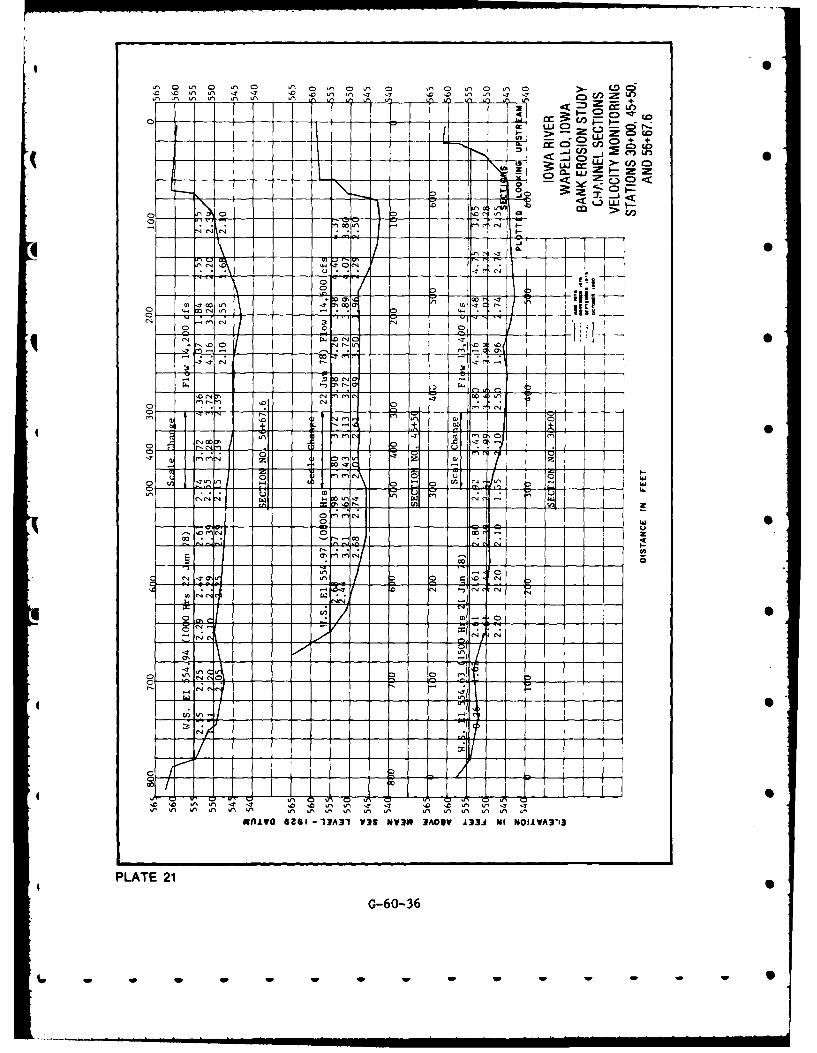
Plates 8 thru 17. The velocity ranges are shown on Plate 18. Velocity
distribution within the channel cross-section for these selected ranges 0
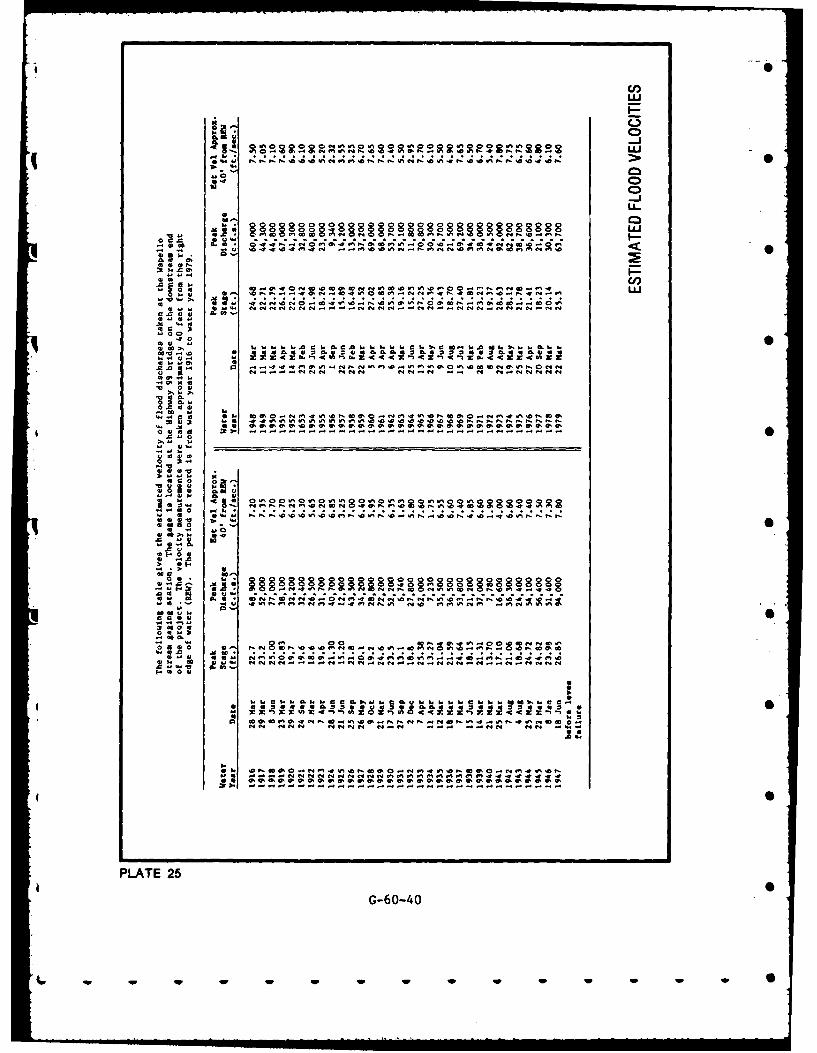
are shown on Plate 19 thru 21. The flood of record for a period from
1916 to 1979 is the 1973 flood which had a peak stage of 28.63 feet and a
peak discharge of 92,000 cubic feet per second. See Plate 25 for
estimated yearly peak flood velocities. 0
c. Riverbank Description.
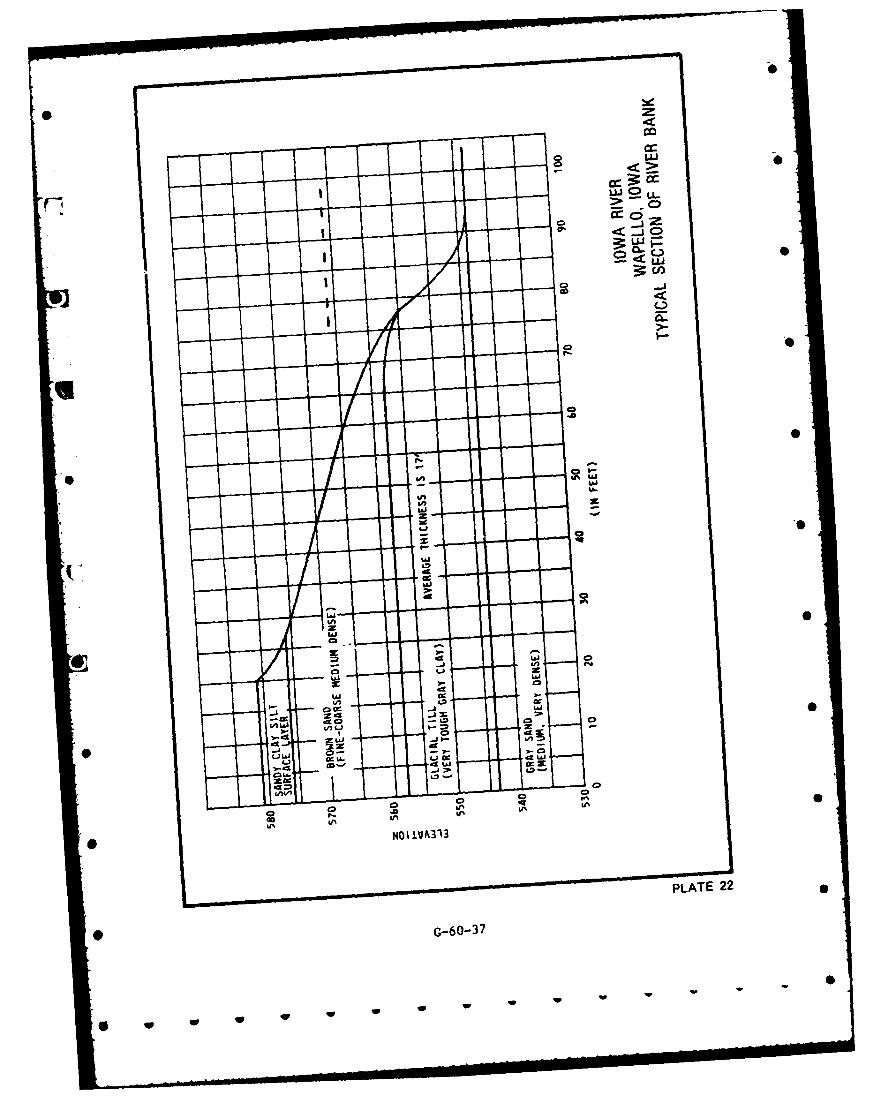
(1) Bank Materials. Materials composing the banks of the Iowa
River are of two principal soll types. The top portion of the bank con-
sists of a sandy clay till surface layer underlain with a brown sand
which is fine to coarse and has a medium density. The bottom portion of
G-60-4
#0-' W i i i . . 0
the bank is a glacial till that is a very tough gray clay. This layer is
about seventeen feet thick. A typical section of the riverbank showing
the principal soil types and their thicknesses is shown on Plate 22.
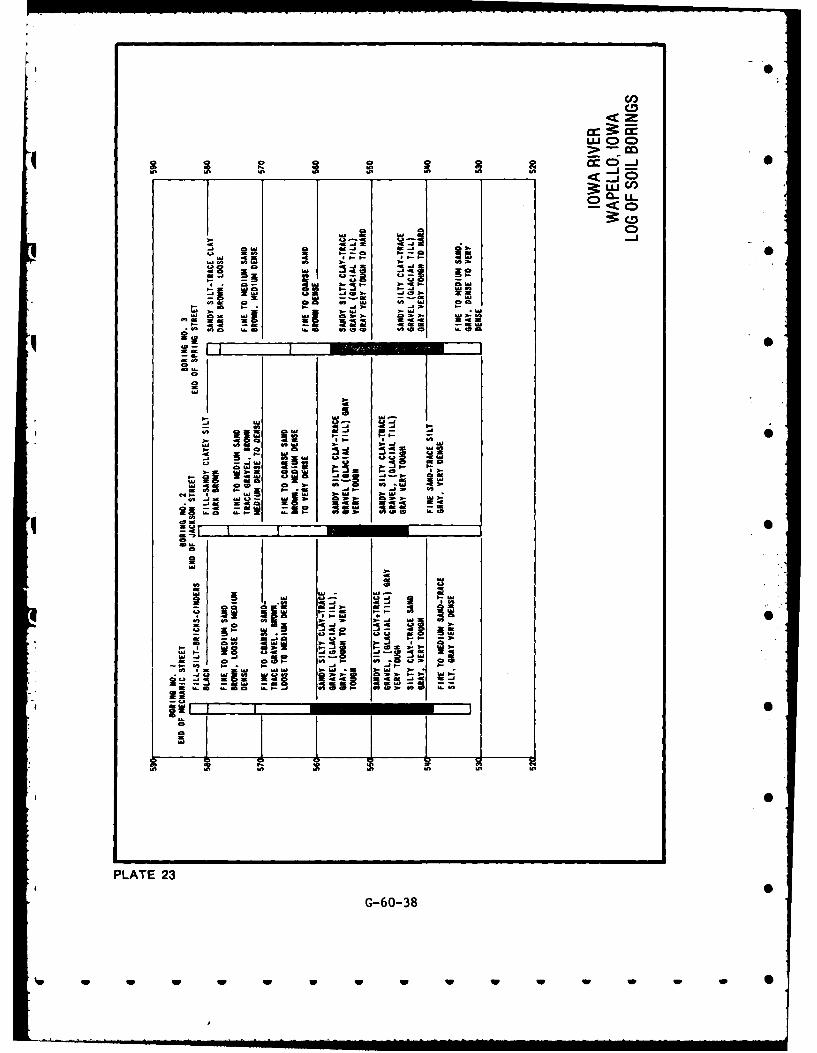
Plate 23 shows the boring logs of three soil borings taken adjacent to
the Iowa River in Wapello. These borings show that the depths of the
principal soil types of the Iowa River bank adjacent to Wapello are quite
uniform.
(2) Normal Bank Vegetation. Vegetation cover on the banks
consists mainly of grasses, willows, cottonwoods, and various other
* shrubs and quick-growth trees. Vegetation is present in nearly all
photographs.
(3) Bank Erosion Tendencies. The test site had been eroding
at a rate of up to 2 feet per year. In some areas it has been determined
that over 200 feet of the right riverbank have eroded away since 1848.
Plate 2 displays the historical and projected erosion of the riverbank.
The erosion rate of the Iowa River bank at Wapello is controlled by the
rate that the Iowa River flows wear away the tough clay comprising the
*i lower portion of the riverbank. Of the two principal soil types that
make up the riverbank (see plate 22), the lower clay portion is much more
erosion resistant. However, due to the moderately dense vegetation on
the upper sand portion of the riverbank, this portion has held up quite
well during high flows that subject it to erosive forces. Over 90 per-
cent of the time the river levels fluctuate within the lower clay portion
of the riverbank as shown on Plate 3. Therefore, most of the erosive
forces of the Iowa River act on this portion of the riverbank.
III. MSIGN AND CONSTRUCTION
7. General. Wapello is situated on a terrace that is 25 to 30 feet
above the normal river levels. The Iowa River bank erosion has been a
problem at Wapello since the community was established in the mid 1800's.
G-60-5
-- W - W w i i im. l - - m
-e-
However, it was not until the mid 1900's that the erosion had progressed
to the point that existing residential and commercial structures were
being threatened.
In the past, the Wapello community and individual property owners have
exerted considerable effort to stabilize the riverbank. A deflection di
or jetty has been constructed between Mechanic Street and Van Buren
Street. There have been large quantities of rubble dumped along the
riverbank. These efforts may have reduced the erosion rate; however,
they have not been effective in eliminating the bank erosion problem.
8. Basis for Design. The primary reason for selecting the combinatio
plan was the fact that this project was a demonstration site. Using th
combination of permeable timber jetties, erosion control mat, and Kelln
Jacks, allows engineering scrutiny as to which erosion control measures
are beneficial for future use. The jetties are designed to direct flov
to the center of the channel; the Jacks are placed to stabilize the to(
of the sloping bank; and the erosion mat was designed to protect the I
against erosion during high flows.
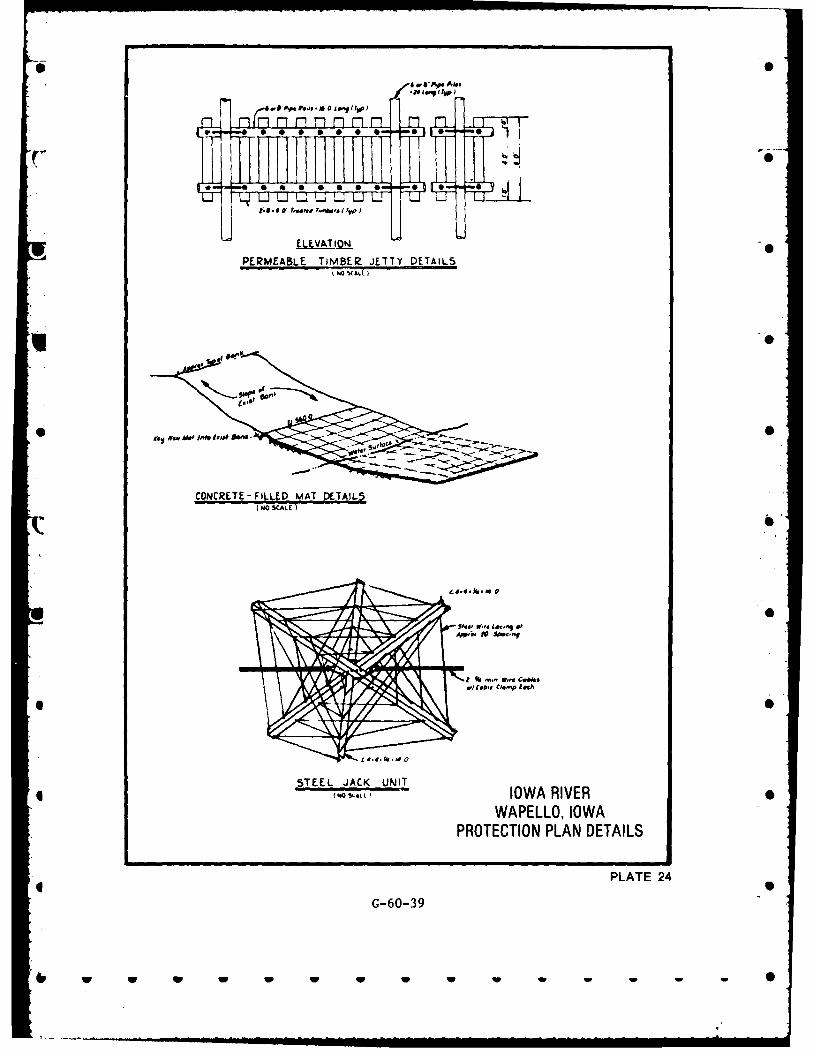
9. Construction Details. The steel Jacks were constructed of the
materials as shown and identified on Plate 24. At the Wapello site, 7
of the steel Jacks were arranged on one line on 15-foot centers extend
upstream from the Highway 99 bridge and parallel to the bank. Plate 7
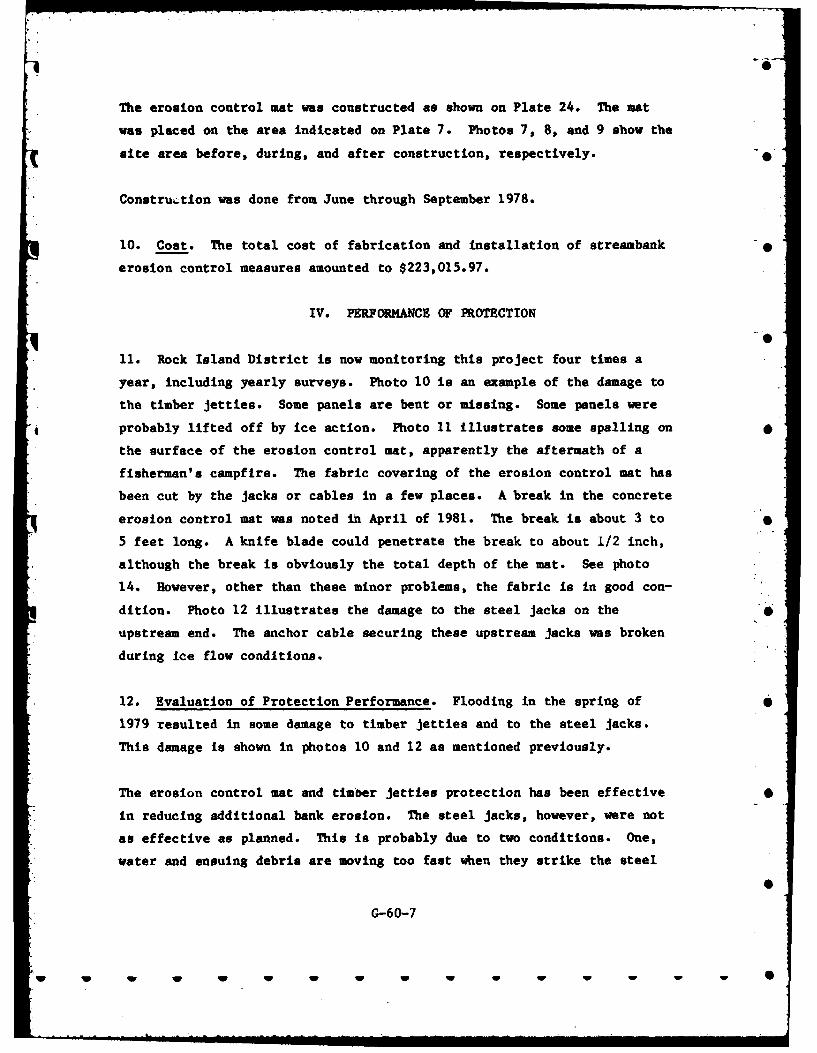
illustrates the layout of the steel ja'cs. Photo 1 shows the area of
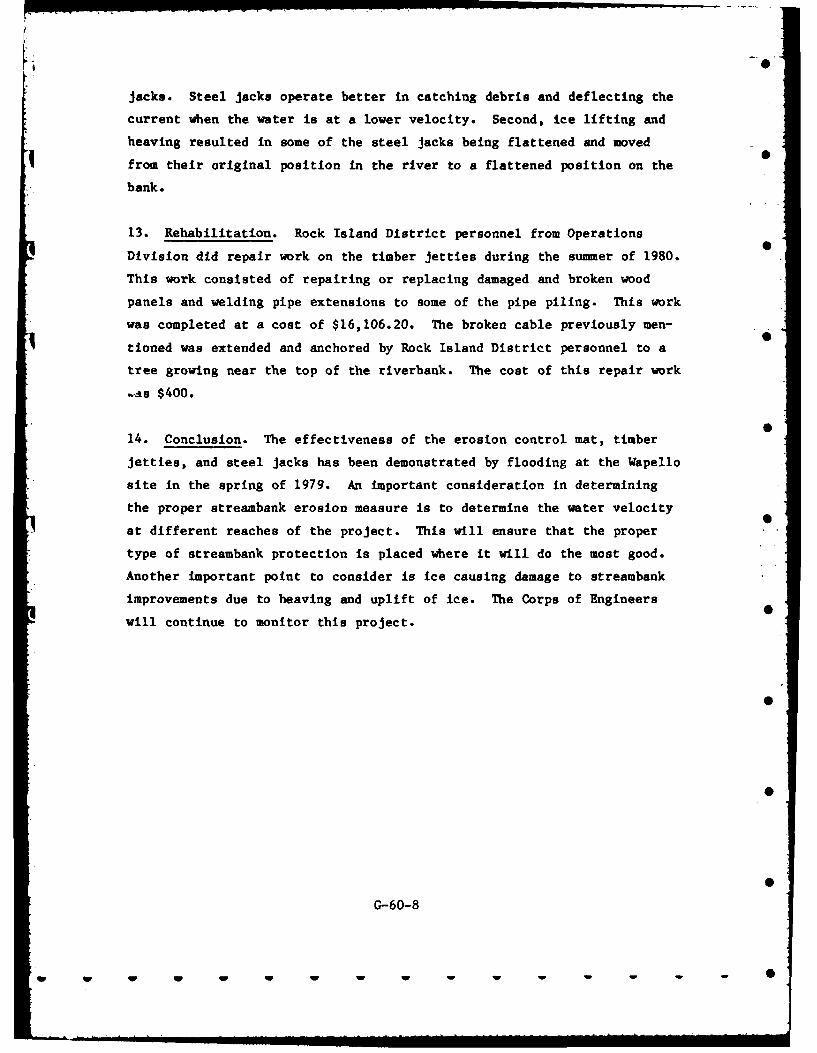
site before construction. The steel Jacks during and after constructJ
are shown in photos 2 and 3, respectively.
The permeable timber jetties were constructed of the materials as shoi
and identified olk Plate 24. At the Wapello site, six ranges of the
timber Jetties were located as shown on Plate 7. Photos 4, 5, and 6
the site area before, during, and after construction, respectively.
0-60-6
W W w . i WW W 1 a0 ".
The erosion control mat was constructed as shown on Plate 24. The mat
was placed on the area indicated on Plate 7. Photos 7, 8, and 9 show the
site area before, during, and after construction, respectively.
Constru;tion was done from June through September 1978.
10. Cost. The total cost of fabrication and installation of streambank
erosion control measures amounted to $223,015.97.
IV. PERFORMANCE OF PROTECTION
11. Rock Island District is now monitoring this project four times a
year, including yearly surveys. Photo 10 is an example of the damage to
the timber jetties. Some panels are bent or missing. Some panels were
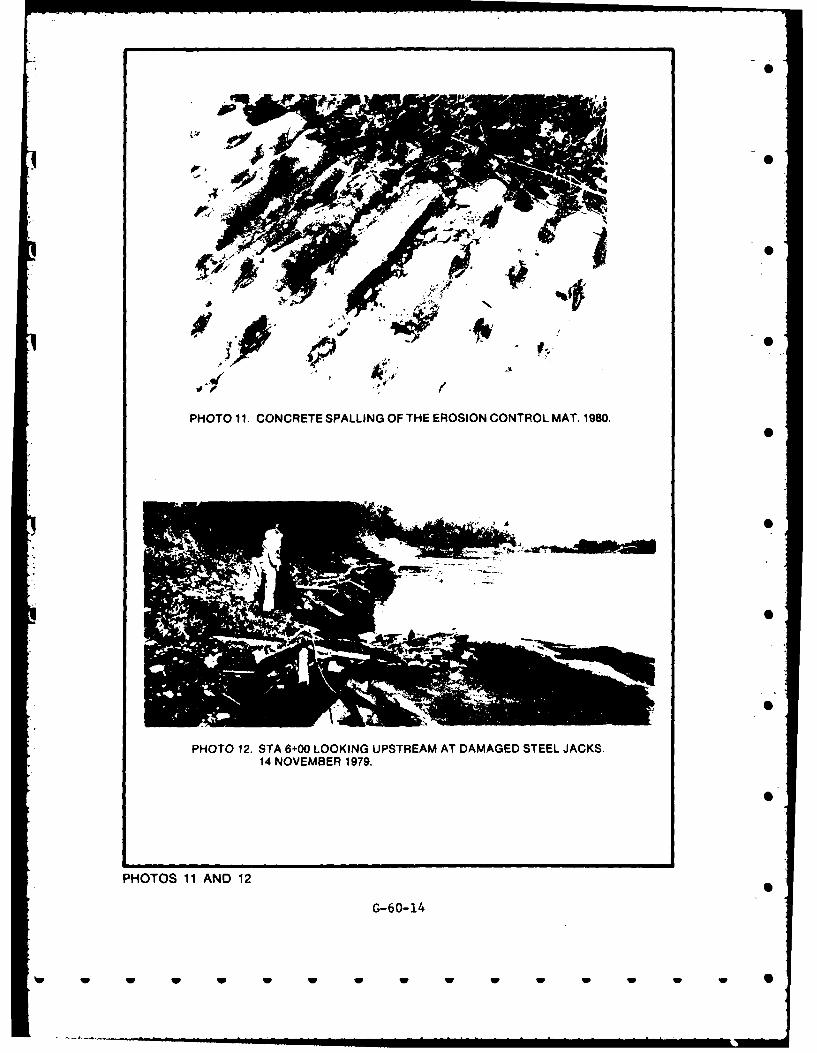
* probably lifted off by ice action. Photo 11 illustrates some spalling on
the surface of the erosion control mat, apparently the aftermath of a
fisherman's campfire. The fabric covering of the erosion control mat has
been cut by the jacks or cables in a few places. A break in the concrete
erosion control mat was noted in April of 1981. The break is about 3 to
'" 5 feet long. A knife blade could penetrate the break to about 1/2 inch,
although the break is obviously the total depth of the mat. See photo
14. However, other than these minor problems, the fabric is in good con-
dition. Photo 12 illustrates the damage to the steel jacks on the 0
upstream end. The anchor cable securing these upstream jacks was broken
during ice flow conditions.
12. Evaluation of Protection Performance. Flooding in the spring of S
1979 resulted in some damage to timber jetties and to the steel jacks.
This damage is shown in photos 10 and 12 as mentioned previously.
The erosion control mat and timber jetties protection has been effective S
* in reducing additional bank erosion. The steel jacks, however, were not
as effective as planned. This is probably due to two conditions. One,
water and ensuing debris are moving too fast when they strike the steel
G-60-7
W W W W W W W -Wil l
jacks. Steel jacks operate better in catching debris and deflecting the
current when the water is at a lower velocity. Second, ice lifting and
heaving resulted in some of the steel jacks being flattened and moved
from their original position in the river to a flattened position on the
bank.
13. Rehabilitation. Rock Island District personnel from Operations
Division did repair work on the timber jetties during the summer of 1980.
This work consisted of repairing or replacing damaged and broken wood
panels and welding pipe extensions to some of the pipe piling. This work
was completed at a cost of $16,106.20. The broken cable previously men-I0
tioned was extended and anchored by Rock Island District personnel to a
tree growing near the top of the riverbank. The cost of this repair work
.s $400.
14. Conclusion. The effectiveness of the erosion control mat, timber
jetties, and steel jacks has been demonstrated by flooding at the Wapello
site in the spring of 1979. An important consideration in determining
the proper streambank erosion measure is to determine the water velocity
at different reaches of the project. This will ensure that the proper
type of streambank protection is placed where it will do the most good.
Another important point to consider is ice causing damage to streambank
improvements due to heaving and uplift of ice. The Corps of Engineers
will continue to monitor this project.
G-60-8
• - w-- w W wm-m~mUgl - wl . .... - '
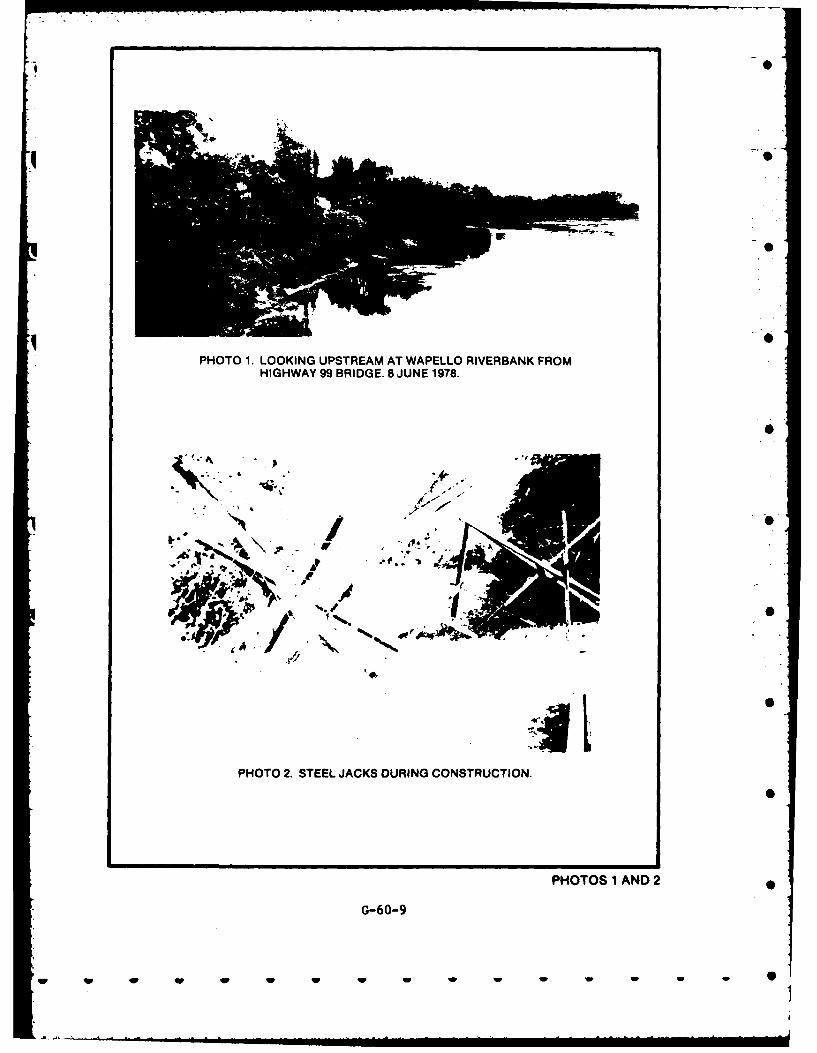
PHOTO 1. LOOKING UPSTREAM AT WAPELLO RIVERBANK FROMHIGHWAY 99 BRIDGE. 8 JUNE 1978.
G-60-9
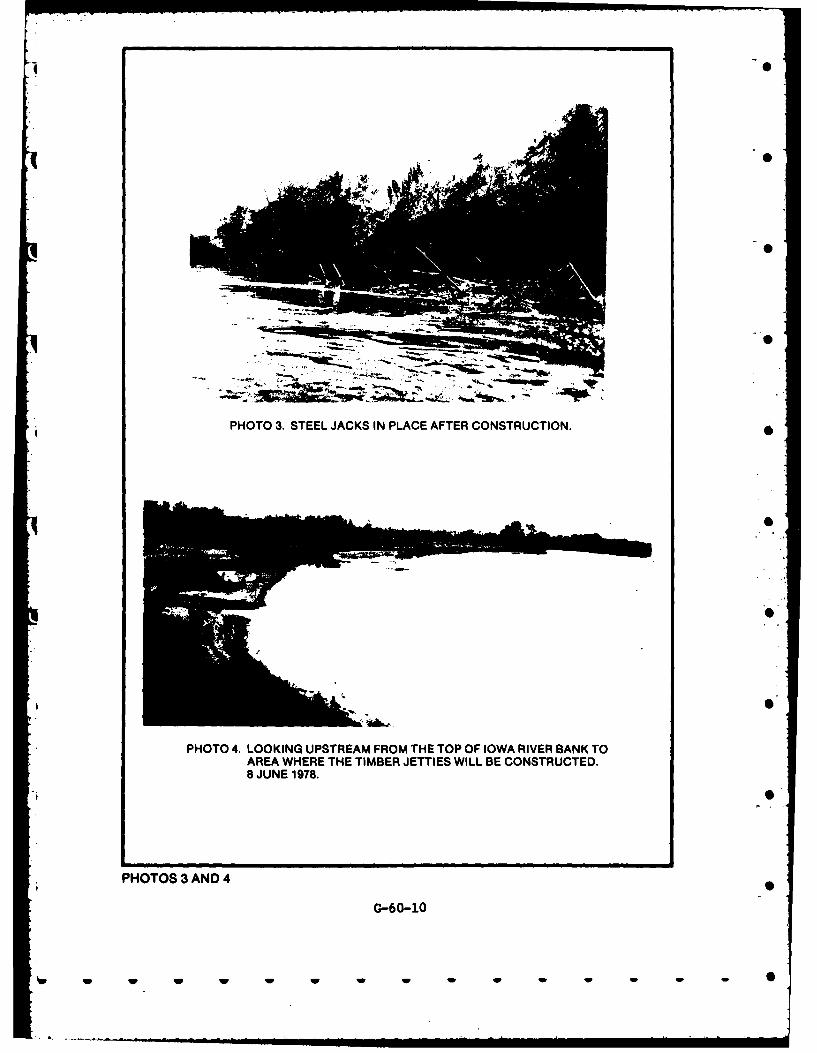
PHOTO 3. STEEL JACKS IN PLACE AFTER CONSTRUCTION.
IS
PHOTO 4. LOOKING UPSTREAM FROM THE TOP OF IOWA RIVER BANK TOAREA WHERE THE TIMBER JETTIES WILL BE CONSTRUCTED.8 JUNE 1978.
PHOTOS 3 AND 4
0-60-10
. .... w w w w -. w w, ,
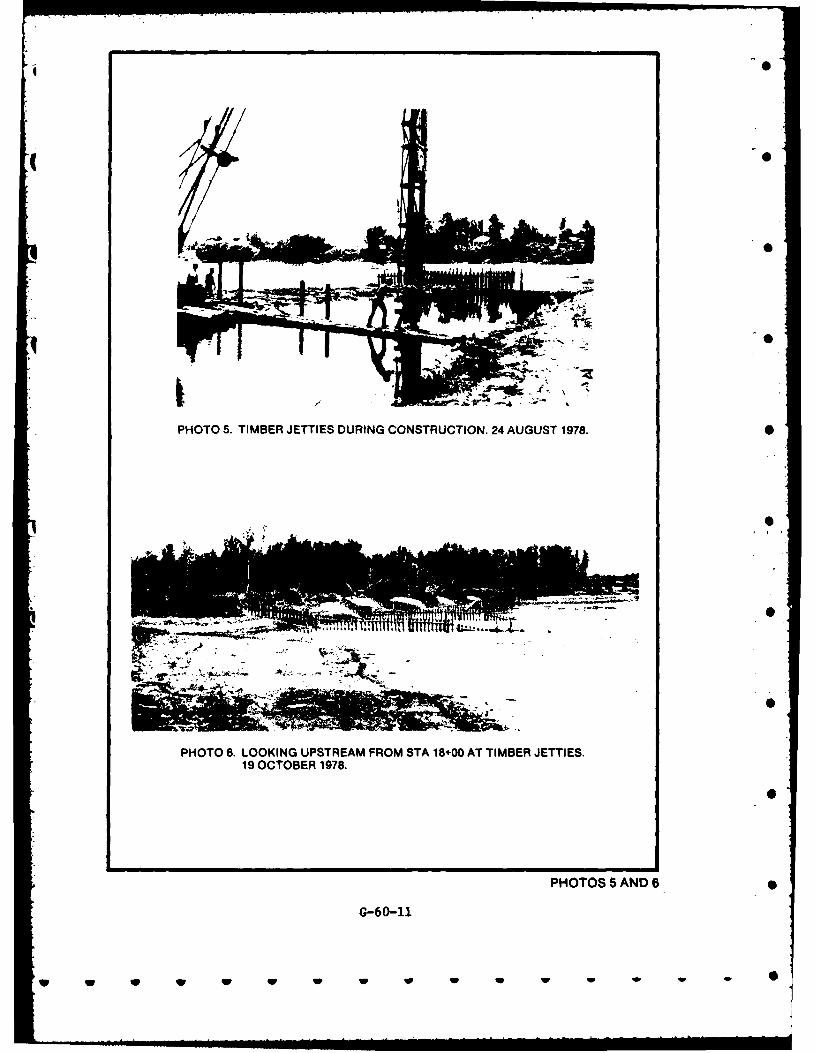
PHOTO 5. TIMBER JETTIES DURING CONSTRUCTION. 24 AUGUST 1978.0
PHOTO 6. LOOKING UPSTREAM FROM STA 18+00 AT TIMBER JETTIES.19 OCTOBER 1978.
PHOTOS 5 AND 6
G-60-11
w wV V w w w w w w
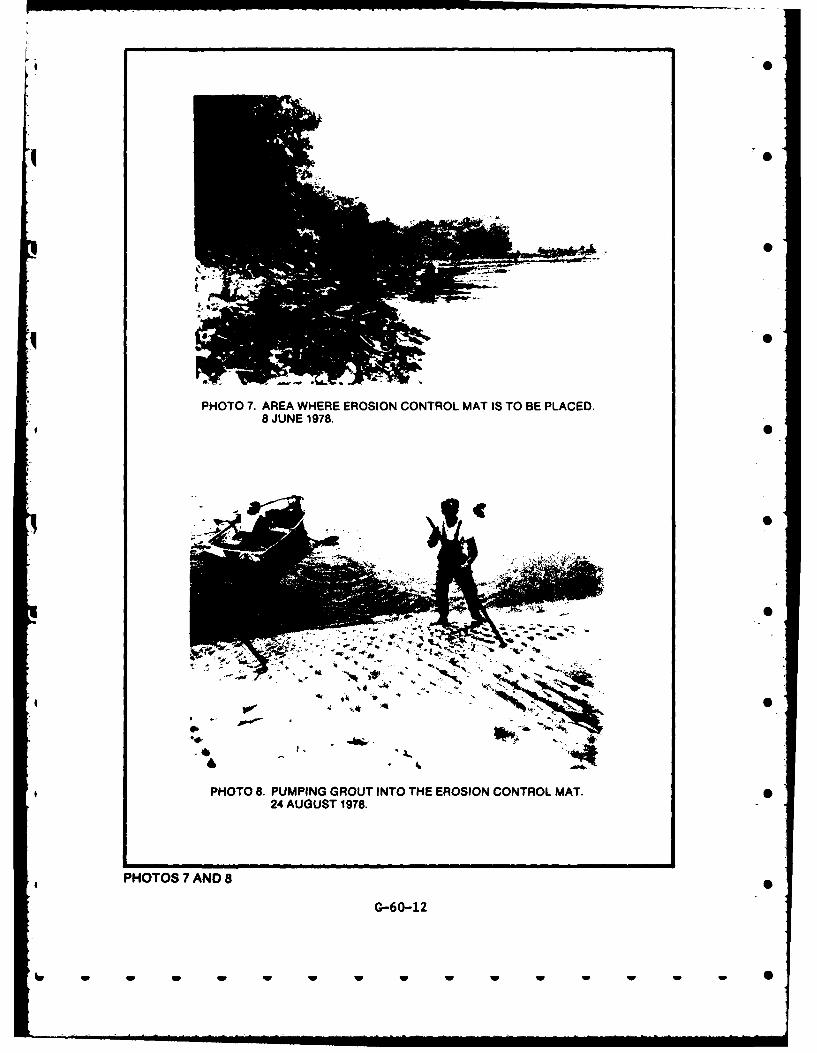
PHOTO 7. AREA WHERE EROSION CONTROL MAT IS TO BE PLACED.8 JUNE 1978.
~~PHOTO 8. PUMPING GROUT INTO THE EROSION CONTROL MAT.5
PHOTOS 7 AND 8
G-60-12
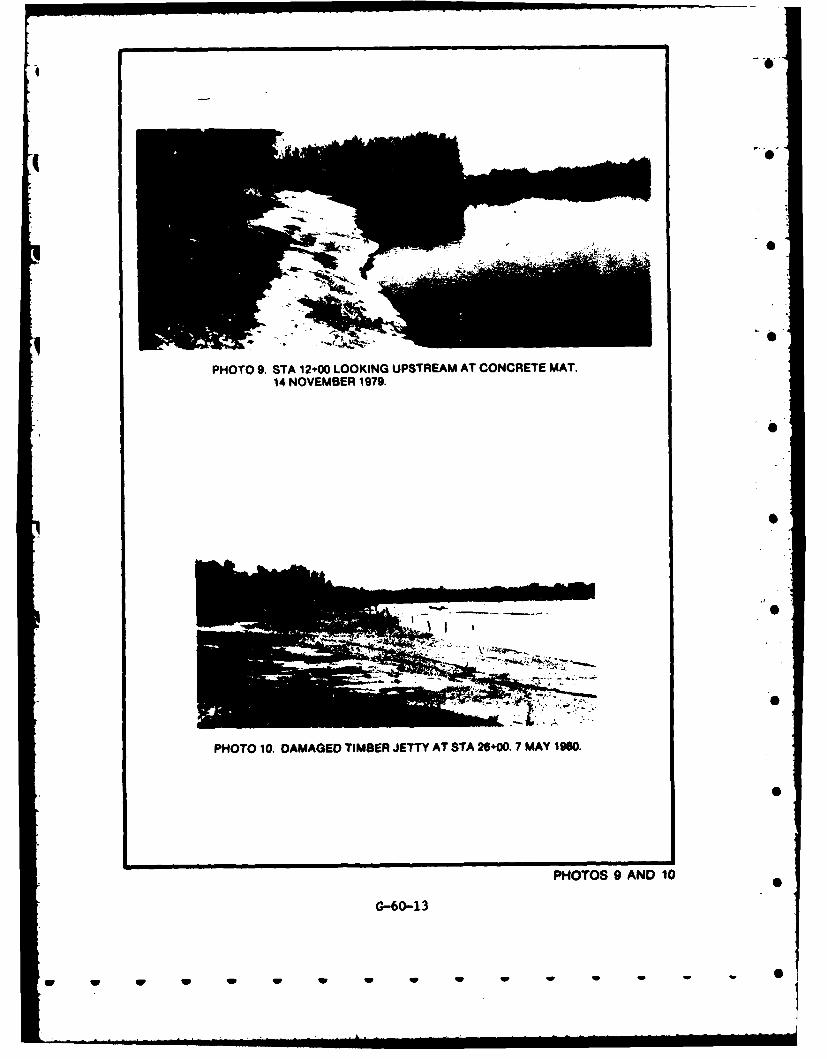
PHOTO 9. STA 12+00 LOOKING UPSTREAM AT CONCRETE MAT.14 NOVEMBER 1979.
PHOTO 10. DAMAGED TIMBER JETTY AT STA 28+00.7 MAY 1980.
PHOTOS 9 AND 10
G-60-13
lw w w w w 1 w w 10 0
op,
PHOTO 11. CONCRETE SPALLING OF THE EROSION CONTROL MAT. 1980.
PHOTO 12. STA 6+00 LOOKING UPSTREAM AT DAMAGED STEEL JACKS.14 NOVEMBER 1979.
PHOTOS 11 AND 12
G-60-1 4
w w w w w ww w w w w w wS
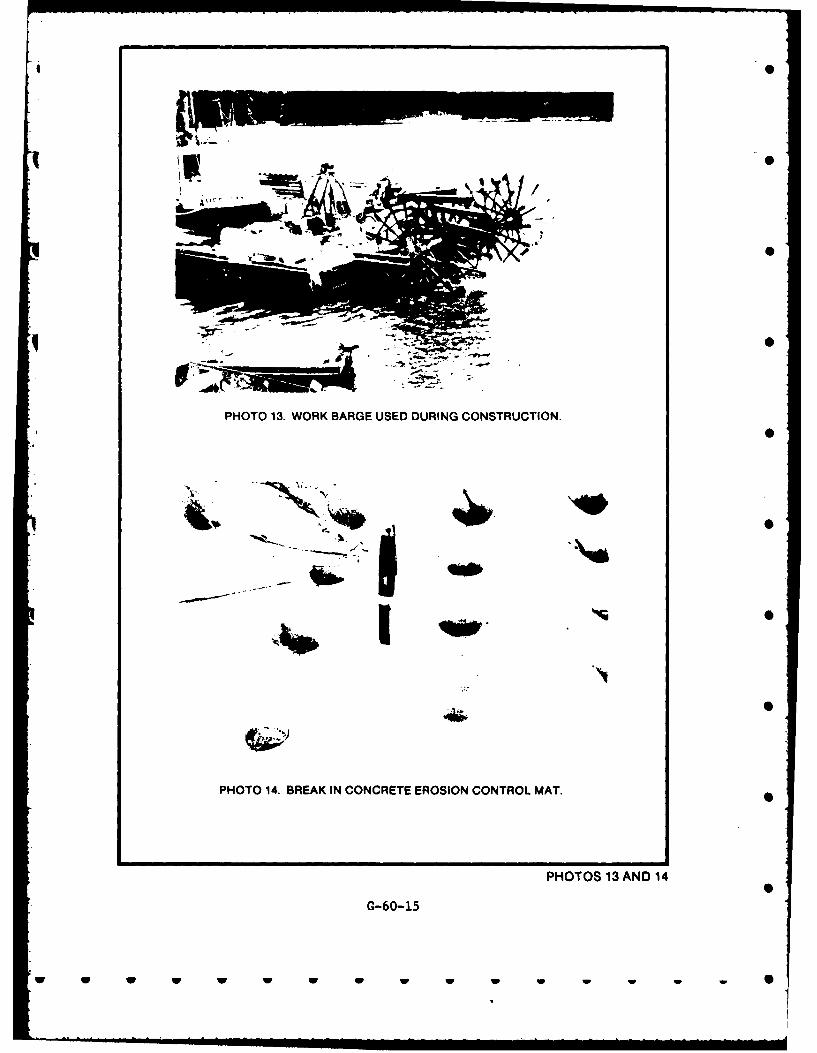
PHOTO 13. WORK BARGE USED DURING CONSTRUCTION.
* - .
PHOTO 14. BREAK IN CONCRETE EROSION CONTROL MAT.
II
PHOTOS 13 AND 14
G-60-15
. . . w , h m w a . .. .. ..
a.: ct.
*.NNEAQO0bIUOA .SS.*
MA A c *V( *AS.o oR
I 'S %~llC'
f mso.
0 A-* tEo RN . O (I JL
Awit
. OfmCIft 4.d\" ~ ~ ~ N a* N LM
..NOC CI\R
---- r
- ~ ~ ~ o '- - *(
IOASN MNEST
*~ *~ tGENERAL MAPC
;LAT A
G-60-1
w ~ ~ ~ ~ ~ ( TONF w w w
GEEA STD A
PLATE 2
G-60-17
566
565 - -
564
563 ~ - - - - - - - - -
562 ' - - - -
561
560 t ~ -- - - - -
559 .1 1 1 TOP OF THE CLAY PORTION
55 OF THE IOWA RIVER BANK
557... -1972-73 WATER YEAR-
I.- -I
- -- __ 10YEAR PERIOD
'958-67 INC. -r
i I
S552--- MEAN STAGE (551.98)....: 551
-9 T
550---548--
0 10 20 30 410 50 60 70 80 90 100PERCENT OF PERIOD STAGE IS EXCEEDED
(DAILY MEAN GAGE HEIGHTS) 0
IOWA RIVERWAPELLO, IOWA
RIVER STAGE-DURATION CURVES
PLATE 3
G-60-18
w w w ww w
Zzo
Lu o o. r,-
WJ < : 00
aw LA O04j
(2DCL C
- O4<W-U
HIV 'an JAO6W 1.33A N- 0VA1
sl a t. 1 Ma y.w as a M, .1 M
PLATE 4
G-60-19
w w ww w w w w w - 0
<0
-C2gzo LI.. 0 0D
Z.,W >Zca
'aI-c0 :
J. u r
Mi lSa~6V13jli mw i
U~~ 3U 3 3LI3
~~~~~~~~. cc W 1 3 1 I iIli~
PLATE 5
G-60-20
w w w w w w w w w w w 0w
* 90
9, 0
1 0
* 00
100
6 2O00 0~0 10,09
Li 8
2 .........1
....... ...
I INNESOTA
a w
KSA
VICINITY MAP
4 Ne. Wood JONt~
0 ~... Mfew 3fei Jack$
Ne -~t. AI ~ d
1000 28240 0S
00
-+00
040
-~~~1 C j rr
r~ re <Z c,
1 D I
----- ~ ~ --cfl-
rC,)
00
- - --- 4- ----
0 _____
MC
00
CC IL 'I ' O w
"niI-' GZ 133 03 VW 3OV 13AN OIA1
C~CPLATC 8
- -- - 6- 23- - - ~ -.----
I- -
- Luirf wI~LL"
----- l'-zo~ < -
- +
C ___ 0
- 0 ifI ~~zz~zz _
---
__~ I
-J
IL .r Co Cr C r- j - -
'nfI VO 6 ?6 'I 3A 31 W3S NV3I" 3A09V .133.4 Ni N011VA313
PLATE 9
G-60-24
w w w w w w w w WW w W 0
00 .P. 0 ~0 oo0
- In 'L W _ _M +~
-iii)U-,c
-- <~z 111< .
cc w
zj~~iz~z~1LZiUflIO 6~I -~A3~ 31 9V3W CIV ~3~ I NLWA~
PLTE1I", u I o
G-60-cc5
w w ww w - - -All
-~- - >W
0 ~. aC/) z p0
- -- --D-- -/) Go
CL ,
- ~ ~ ~ r CD-----. I-~ _ .1-
01'0
- 0 r0z0
00 -- - DS 1 O
V% "' -.1 - -L- Ln
626 -1A3 V3 5p A~ 3. i OIA
PLATE- 11
0 -02
.1 w
C '' 0 0' 0 0 0 0 ' C)
fl ~ ~ ~ ~ ~ ~ ~ C CD, 4m f f~\U~d f ~i
0 cc - C
-. K-- cc-- - - - -
I- c
~~liiil -111
intip
*1t -_ _- - -----
-r >
z- I 216 -- l
NflAVO GZG -13ATI V39 NV394 3AOUV 1334 N1 NOllVA3'13
PLATE 12
G-60-27
w w w w w w w w w S
cm
=
-Z C
0'4 ILI~~
.r~C I-.!
000
G-60-28
I~ - .owc
00
zcn
01,~
I~It
In IWnIV' 4 G4-1A1VSN3 3V 1 AI NOLA1
-4-- - ' -- m -L--
PLAT 14
G-60---29 +--*~~
-- w j -v- w
'n V0Lc
- . 0 L L 0
< z
CA~
IN -
o I 0I
PLAT 1.5UI
_ _ IMP
0 LA~ Cun CD C L9C1)
= 3: ~ cn z
re _ 2C
I-~ < -j0 ai
/ CD
C-4C4 Cq ~ I
ow
I C-zzzzz ~~ ~ PAT 16z i i zi,G-60-31 IH
w ~ -w-. -- v-w- w 0 w w w I
a V) a a f 0 0 /' 0 0 '
0 00 - - 1 I
< cin:\ ------------ -
00
-- - -<
o oo
I1
__ __
- -- - 1
L io --
-
v) (-'4
WnJV 6 -1A1V3 VW AG 33 INOLA1
PL T 17 - I
G-60-3
w w w w w w w w w
I" 1 9SOYA
C Wis.
LOCATION 0
M *ISSOURIXANSA)
VICINITY MAP.60
00
00
PLMWAPLLO PLOATE1
G-60-33
0w Il w w
z -a ~ r - n 00 co l o 'n ch z. -1+0~c
-- -, C- E.j <
a 83w-
-l- U,
I z.- - - - - i - -.--.. ~- - - - - -
- 4
- ---- ,.J, 4- - -4
m- c4
zz
- --- U-1- -
M a2
-n o - - - -In- - -n wi o A nco ao 4o *L n o LA LI n~~~- In' "Ia I n0 n & ' m ' n L n
mn.Lvo ~ ~ ~ ~ ~ ~ ~ ~ - .?.-3W VSN3 AOV134H NLA1
PLAT 19t- --
-G-60-34
%w~~ ~~ ~ ~ w0 w w w w w
a 0' V ) 0 Lr) 0 c 0 0 C) 0I 0 +
- ID Ic 1 1 - ao - 1 ID W) ) 0v)I -l tn ,) L Jf
I- C.)
-- J 83 --. -- - 0
-~ .-.mz lz - L
0 < 'e
< (.5'I
-n a - - --- - a -
e4 ; -
0~ CD
oDo
-nv GZG -1A3 V- VM 3OV 13 INIV31
* PLATEN20
G-6_-3
-3 -- w0 - - -w w w
~L 00 0 o0 0 O ~z -. C L +
I~ +o
C) >C/ O
z ..Z
ol -J,
C ~~~~~~ ~ ~ U ------- - -- - - -~
o 0 1 Ir o
Do01
0
0
b 0)
0, n- c4 000 . - -
u)c 4 '
CH 0. - -
anva4Z4 -1331 2S M30 AO8V133 NI OLLAY1
PLT ---1--
:G360-36
WLL
rc
W 4
3.- 0
da 2-
UlU"
t41iA313
S G-603 7 PLATE 22
G-60-3
* 0 - 0 - 0
i. . ~ ~ ~~ ~~- - -. .... -,i - - - -II l ! ii , ,
CD -
"woo
IW I
~2<0
I- c.- It
,ft Zc am
" -I tJ;5 I •
. a ... o
ma Cw- w .0UJ C
ol MW
-II sa - -
10M 10
PLATE 23:mG-03
w
m 0- l
TwPp IAM
(No LwALL I
#.hr * 0 O .1-1 0
COCETE - FILE MTTILSTYEALI~N MO CAL
14 0
STEEL JACK UNIT* (WOSaLL -IOWA RIVER
WAPELLO, IOWAPROTECTION PLAN DETAILS
PLATE 24
G-60-39
C6Cu
LL
0.0
4i 4
0 w a
000 a 4'. 4e44 w e L *
4400 S. 000 " -e- -VP
4 a 0
0.0 .4 444
440
a 0
-tO 000
0 044: a.
o~1 .0 4 @
0,00 0, 440,
G-60-4
lw w w w w l w 0 w V w w
LITTLE MIAMI RIVER ATMILFORD, OHIO
w S
•0
Section 32 Program Streambank Erosion ControlEvaluation and Demonstration Act of 1974
LITTLE MIAMI RIVER AT MILFORD, OHIODEMONSTRATION PROJECT PERFORMANCE REPORT
I. INTRODUCTION
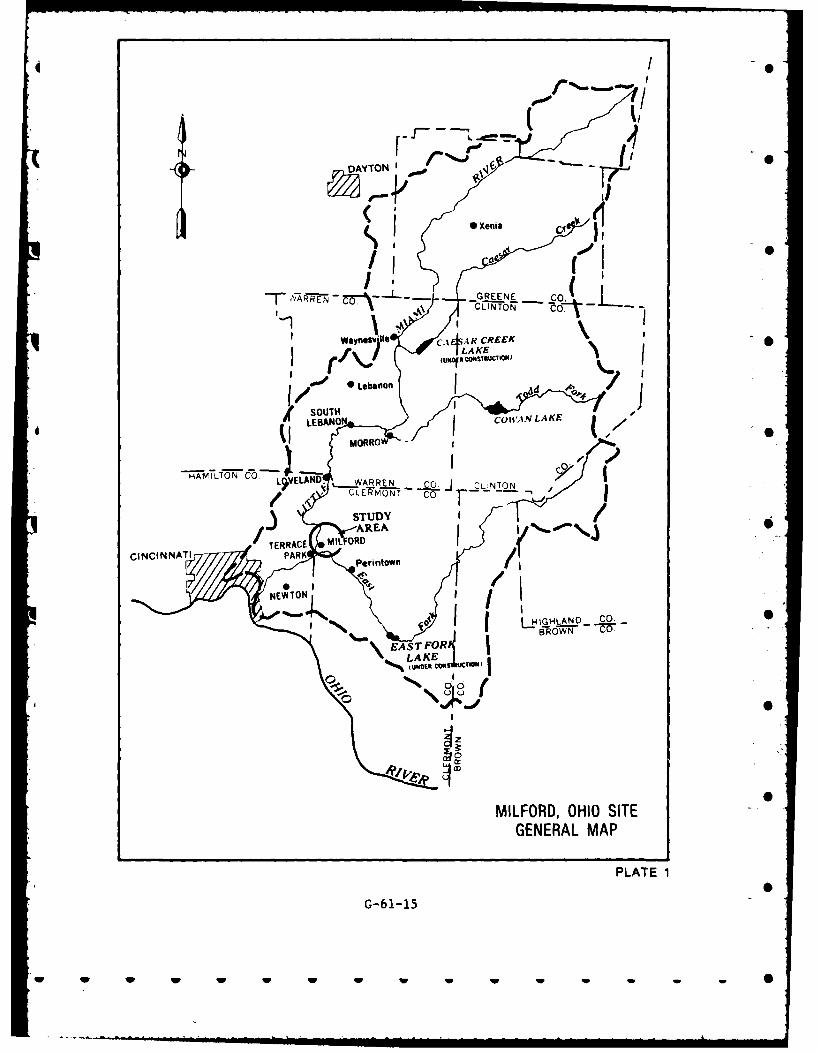
1. Project Name and Location. Milford, Ohio Bank Protection, Little Miami
River, Mile 13, Milford, Ohio. Plates 1 and 2 show a General Map and Location
Plan for the site.
2. Authority. Streambank Erosion Control Evaluation and Demonstration Act of
1974, Section 32, Public Law 93-251.
3. Purpose and Scope. This report describes a bank erosion problem, the
types of bank protection used, and a performance evaluation of a demonstration
project on the Little Miami River, Ohio, constructed and monitored by the
Louisville District.
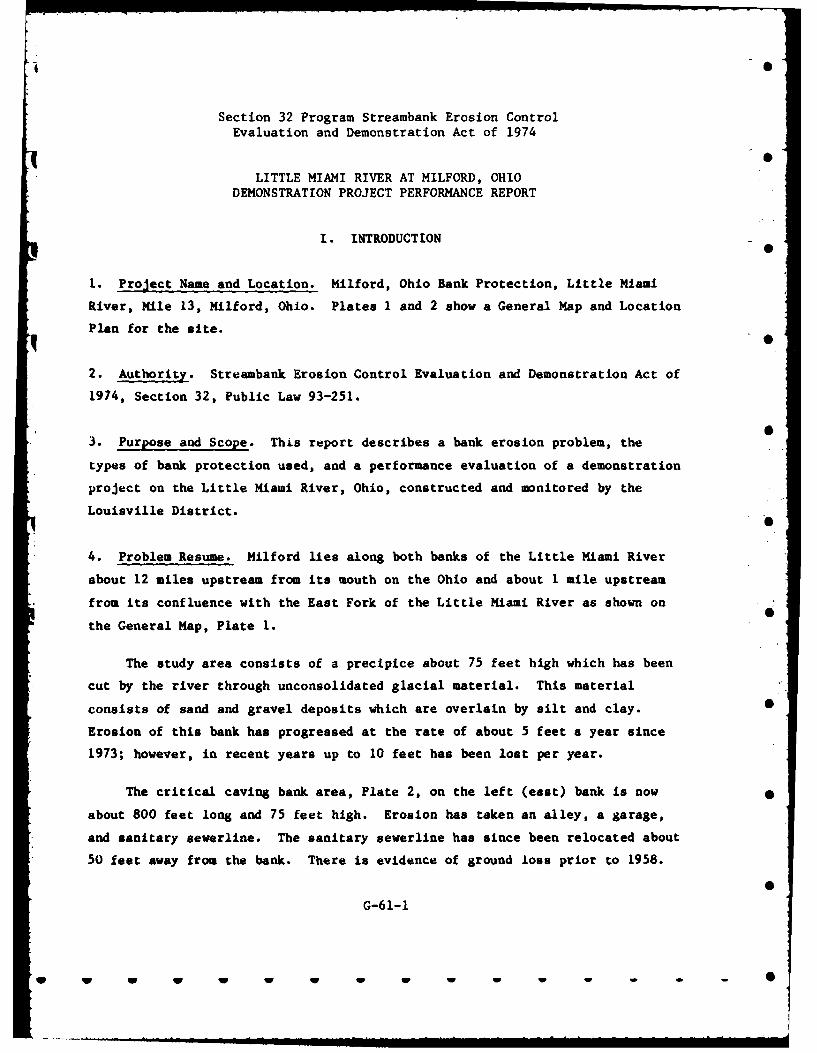
4. Problem Resume. Milford lies along both banks of the Little Miami River
about 12 miles upstream from its mouth on the Ohio and about I mile upstream
from its confluence with the East Fork of the Little Miami River as shown on
the General Map, Plate 1.
The study area consists of a precipice about 75 feet high which has been
cut by the river through unconsolidated glacial material. This material
consists of sand and gravel deposits which are overlain by silt and clay. 0
Erosion of this bank has progressed at the rate of about 5 feet a year since
1973; however, in recent years up to 10 feet has been lost per year.
The critical caving bank area, Plate 2, on the left (east) bank is now
about 800 feet long and 75 feet high. Erosion has taken an alley, a garage,
and sanitary sewerline. The sanitary sewerline has since been relocated about
50 feet away from the bank. There is evidence of ground loss prior to 1958.
G-61-1
W.. , w W m m W W W W W W
Erosion progressed to the Mound Street Alley Area during 1974. Most erosion
has occurred since then. The purpose of the project was to stop erosion of
the lower bank and to lessen and eventually stop erosion of the high bank and
thereby reduce loss of private property and public utilities. &
II. HISTORICAL DESCRIPTION
5. Stream. 0
a. Topography. The topographic features along the left bank of Milforc
consist of a low flood plain and multilevel plateau areas. The topographic
q relief along the left overbank ranges from approximately 500 feet mean sea 0
level along the left overbank, while less than 1/2-mile landward, an elevati,
of 690 feet mean sea level exists. The topographic information listed above
was taken from 1970 photo revised U.S.G.S. quadrangle maps with 10 foot
contour intervals. Most of the recent land development at Milford has been 0
the upper plateaus away from the flood plain. The City of Milford has zonin
ordinances which include the designation of flood plain lands.
The Little Miami River begins in Clark County, Ohio, not far from South •
Charleston, and flows south to the Ohio River. The main branch passes throu
Clark, Greene, Warren, and Hamilton Counties. It drops from an elevation of
1,137 feet mean sea level at its source to 448 feet mean sea level at its
mouth, an average slope of 6.5 feet per mile. The Little Miami River throug
the Milford reach was designated a Scenic River by the state in 1969. The
Little Miami River has three principal tributaries: Caesar Creek, Todd Fork
and East Fork.
East Fork is a major tributary of the Little Miami River which has its
confluence 1.5 miles downstream of Milford. East Fork has a basin area of
500.7 square miles in its 81.7 miles of length. The Corps of Engineers
has recently completed East Fork Lake. The lake is a multipurpose
project with water supply, water quality, recreation, and controls a 342
square mile drainage area for flood control purposes. The damsite Is locat,
about 21 miles above the confluence.
G-61-2
. i i B . . .. W W W.
4 0
The drainage area of Little Miami River at Milford is 1,203 square
miles. Recently, the Corps of Engineers has completed Caesar Creek Lake, a
multipurpose project on Caesar Creek, a major tributary of the Little Miami( River. This lake controls a drainage area of 237 square miles and is designed
to provide for storage of water for water supply and water quality control,
recreation, and flood control. The damsite is three miles above the mouth of
Caesar Creek, a tributary of the Little Miami River, about 30 miles north of
Milford.
b. Geology. The Village of Milford, Ohio, is approximately 10 miles
east of Cincinnati. Preliminary study indicates that much of Milford is
situated on unconsolidated, largely pervious, glacial outwash that is 0
generally covered by a few feet of impervious till. The critical caving bank
area is composed of thick deposits of permeable sand and gravel underlying
relatively thin layers of fine sand and clay. Bedrock throughout most of the
basin is overlain by unconsolidated clay, silt, sand, and gravel deposits of 0
glacial origin. Two major types of deposits left by glaciers are till,
composed of clay with sand and boulders, and outwash composed chiefly of sand
and gravel. As a result of several periodic advances of glaciers, both till
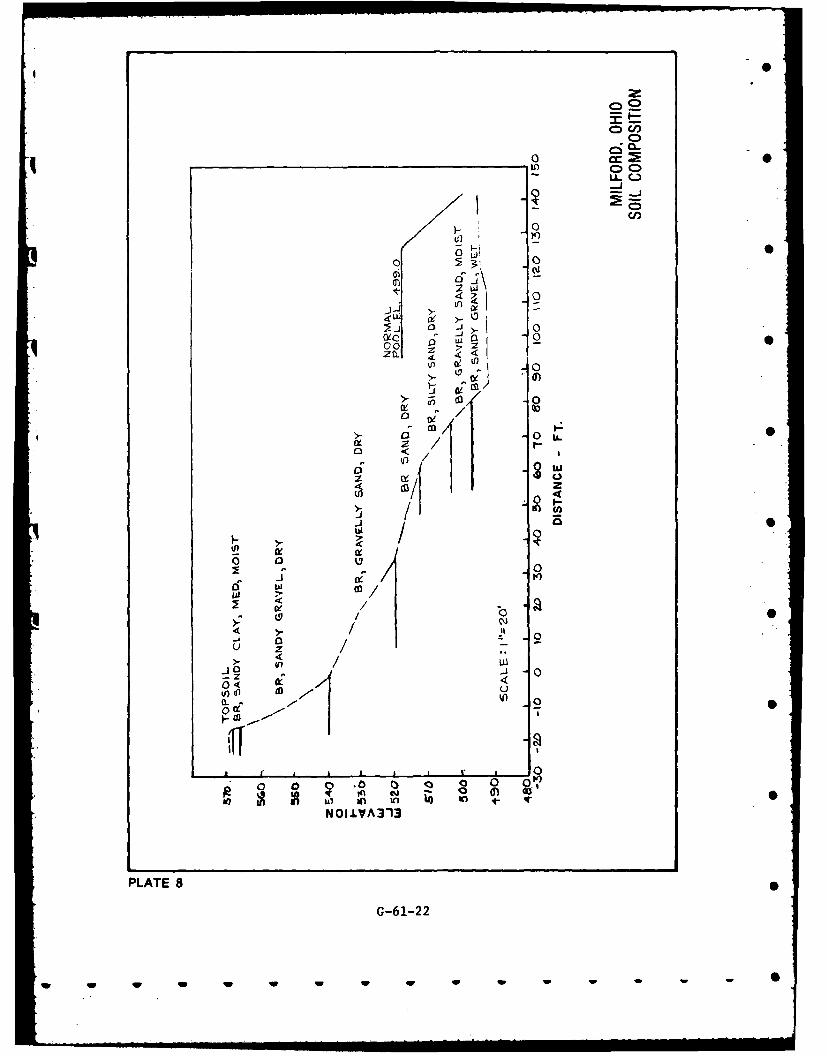
and outwash were deposited in the basin. Plate 8 is a natural section at the 0
project site showing soil composition.
The soil deposits exposed in the bank slope consist of granular
materials ranging from fine sands to coarse gravel. The deposits vary 0
in gradation and are encountered at interbedded conditions with some zones
exhibiting cemented formations. The stable bank slopes to either side of the
problem area are covered with overburden and vegetation including trees.
These slopes are standing at apparently stable condition at a slope of 1 hori- 0
zontal to 1 vertical.
The slope conditions in the most severely affected problem areas reflect
a vertical drop of 30 feet from the alley grade of elevation 570 down to
elevation 540. From this level down, the materials which have accumulated
from the gravitational "drop" from above have come to rest at an approximate
slope of 1-1/2 horizontal to 1 vertical. Such is considered to be the angle
G-61-3
... . .. "wm ' l i i a m wIi i I w . . .. . ... . .
of repose for these materials and therefore constitute a stable condition
providing the toe of slope (at water line) is not undermined.
Buried valley aquifers have been identified in the Little Miami flood 0
plain with yields estimates at 3 to 4 million gallons per day per valley
mile. This water supply is rated as available but some exploratory boring
would be necessary.
c. Locality, Development and Occupation. Milford, Ohio, is located on
both banks of the Little Miami River, approximately 13 miles upstream of its
confluence with the Ohio River (see Plate 1). It is in Miami Township,
Clermont County, just west of the Clermont-Hamilton County line. Milford is
within the Cincinnati metropolitan area, 15 miles east of the city's central
business district. Terrace Park and Indian Hill Village are adjacent
communities to the south and west of Milford, respectively.
Population in 1960 was 4,131; in 1975 was 6,000 and is expected to be S
about 10,000 by the year 2000. Because of the expansion of the metropolitan
Cincinnati area, development has occurred on both banks of the Little Miami
River in the Milford area. Milford is located on the left bank of the Little
Miami River, while Terrace Park is situated downstream of Milford on the right 0
* bank. Indian Hills is located northwest of Milford.
Most of the Clermont County residents in the labor market are employed in
Hamilton County. The employment structure of Clermont County in 1970
consisted of a high percent of manufacturing (42 percent), wholesale and
retail (17 percent), and 11 percent in services. The remaining market
consists of a relatively equal distribution of agriculture, construction,
public services, government, and education.
Transportation facilities have recently been enhanced at Milford with the
local completion of 1-275 beltway located two miles east of the village. This
beltway circumscribes the Cincinnati metropolitan area linking Interstate
Highways 1-71, 1-74, and 1-75. Another major transportation route serving the
Milford area is U.S. 50, which links Milford to Mariemont and Cincinnati to
the west, and Perintown to the east.
G-61-4
. .- w m m m m .W W W W
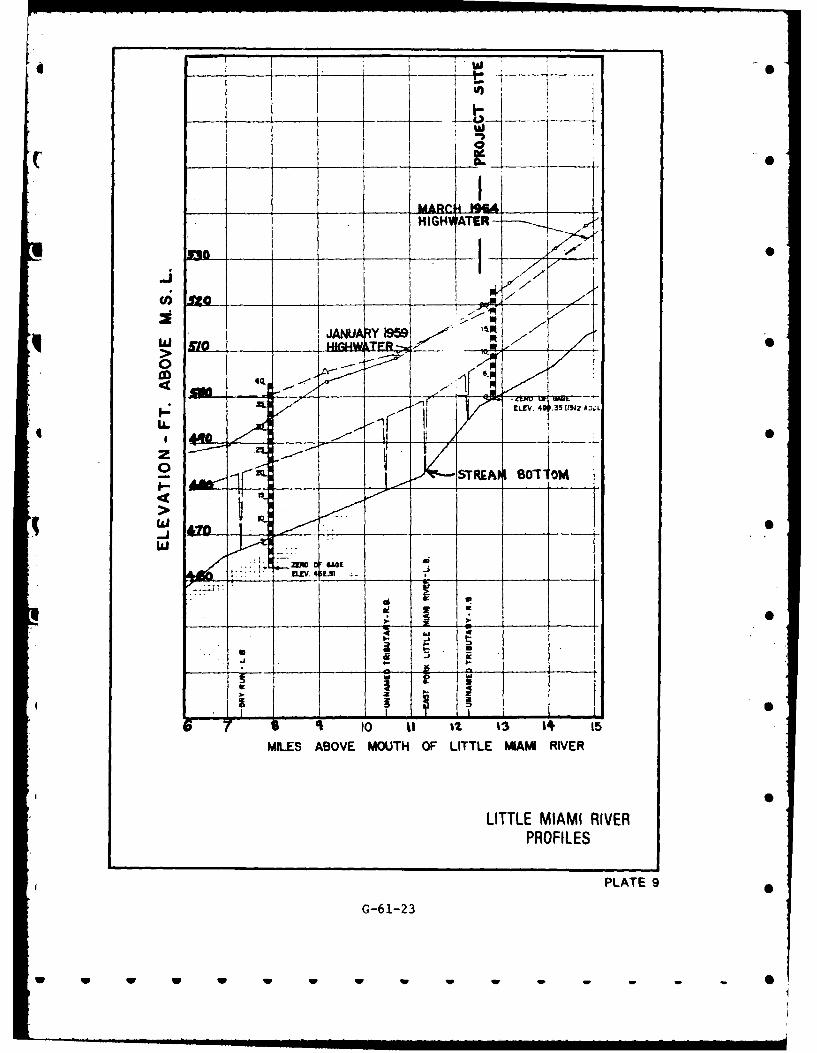
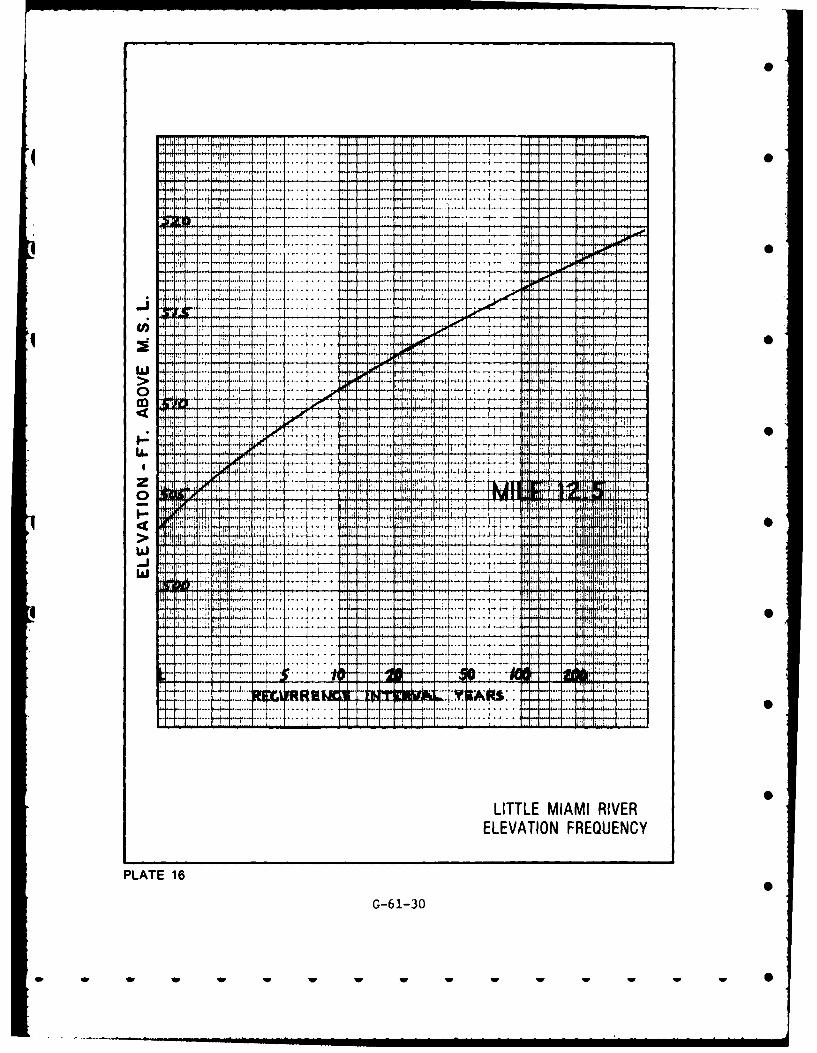
d. Hydrologic Characteristics. The drainage area of the Little Miami
River at Milford is 1,203 square miles. The average discharge is 1,189
c.f.s. A record discharge of 84,100 c.f.s. occurred on 22 January 1959. The
discharge of the historic high water of March 1913 exceeded this. Elevation
at the project site was 519.0 for this flood. An elevation-frequency curve is
Plate 16. Velocities at the site range from 2 to 5 feet per second for normal
flows to around 10 feet per second for floods. The average slope of the
stream is 6.5 feet per mile. Plate 9 is a profile of the stream showing
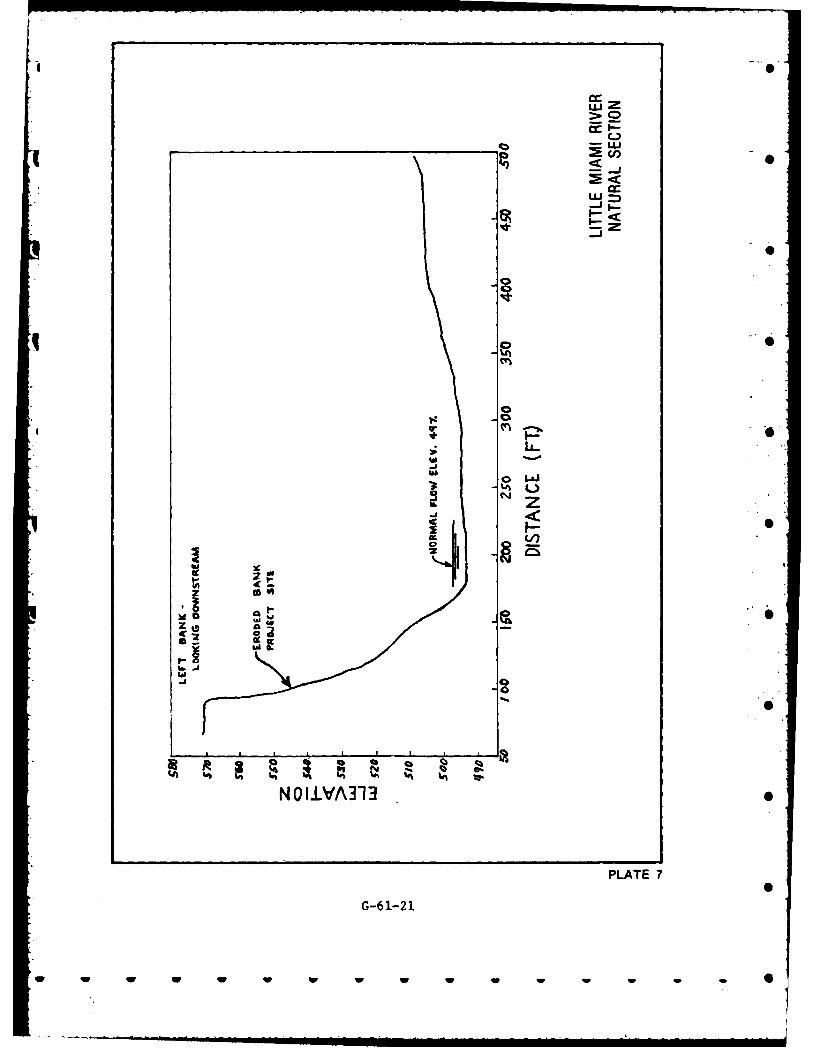
previous flood levels, thalweg, and Ordinary High Water. Plate 7 is a full
natural cross section at the project site. The main stem of the Little Miami
River from Loveland to its headwaters in Clark County has been designated a
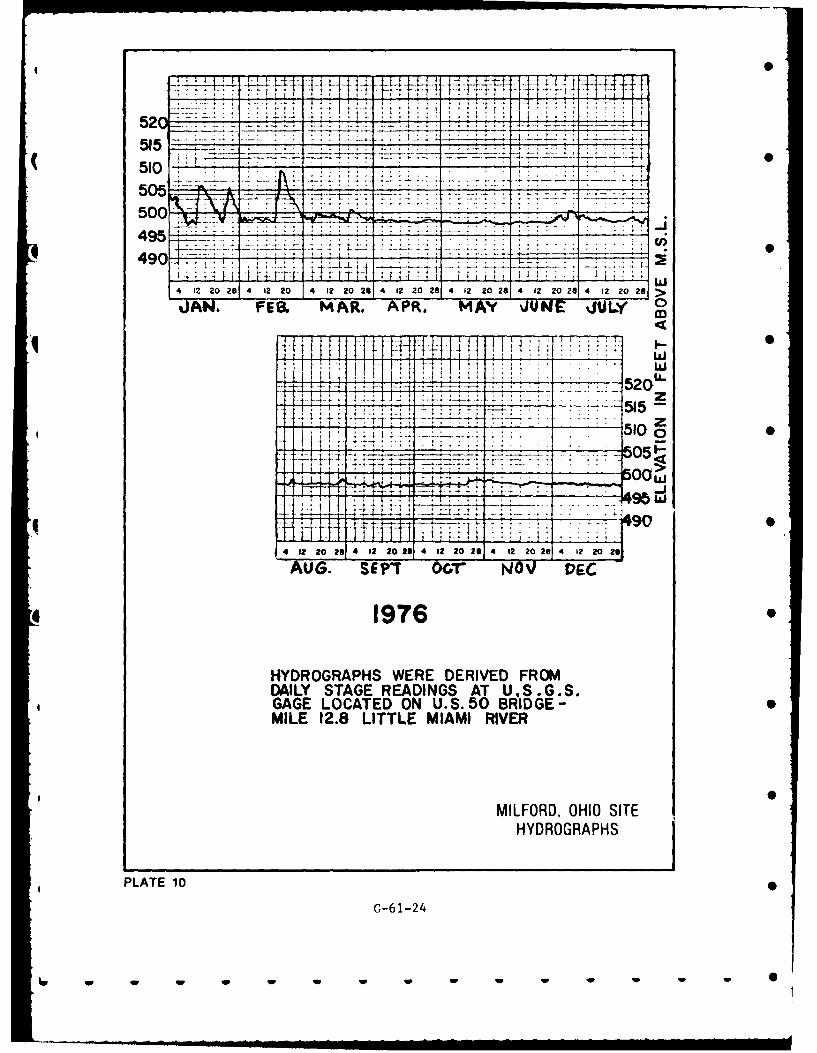
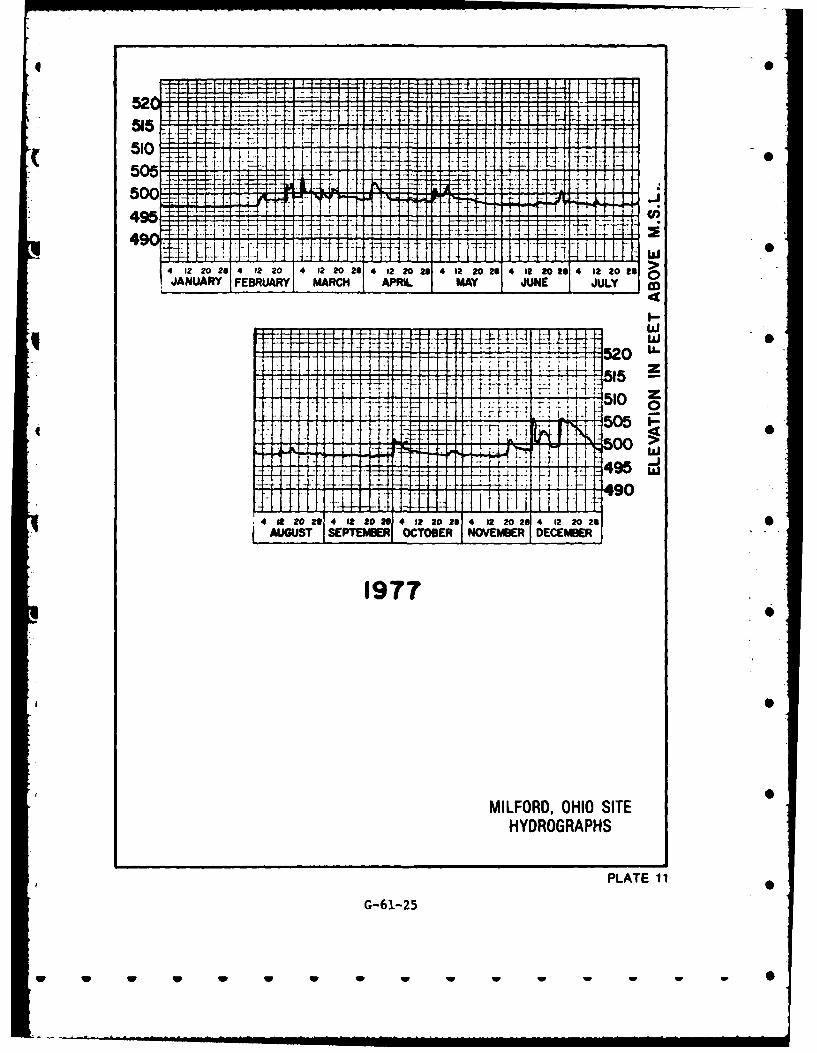
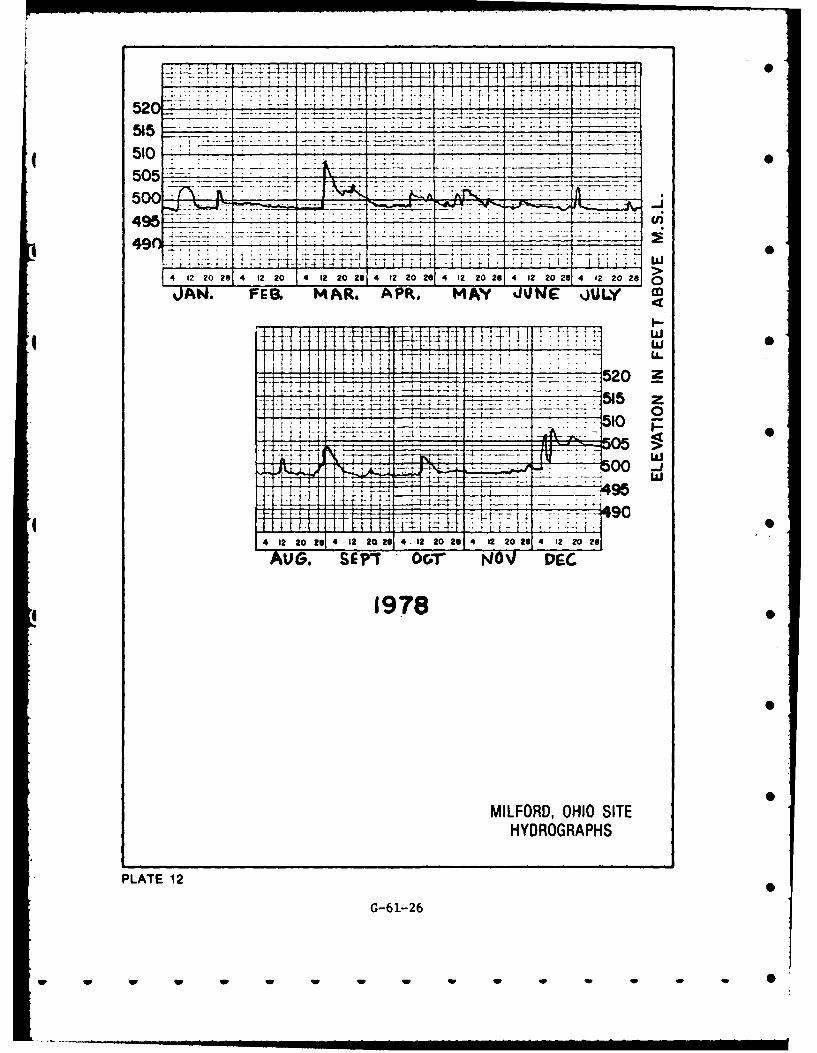
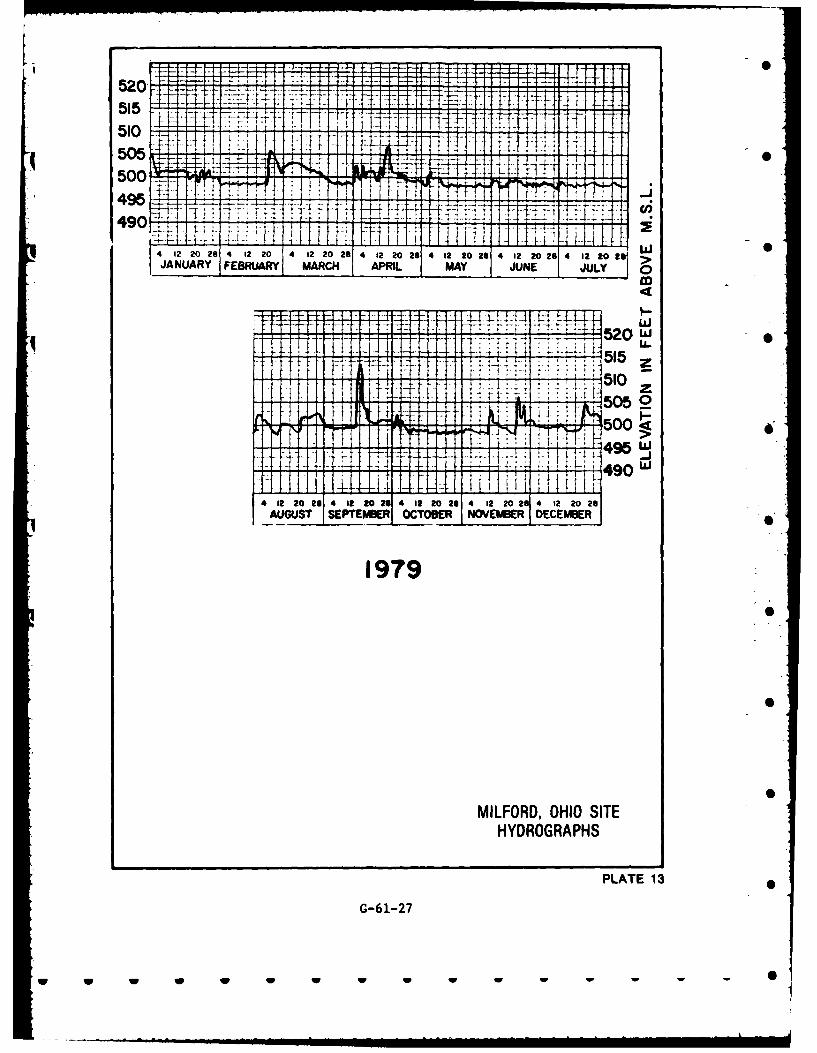
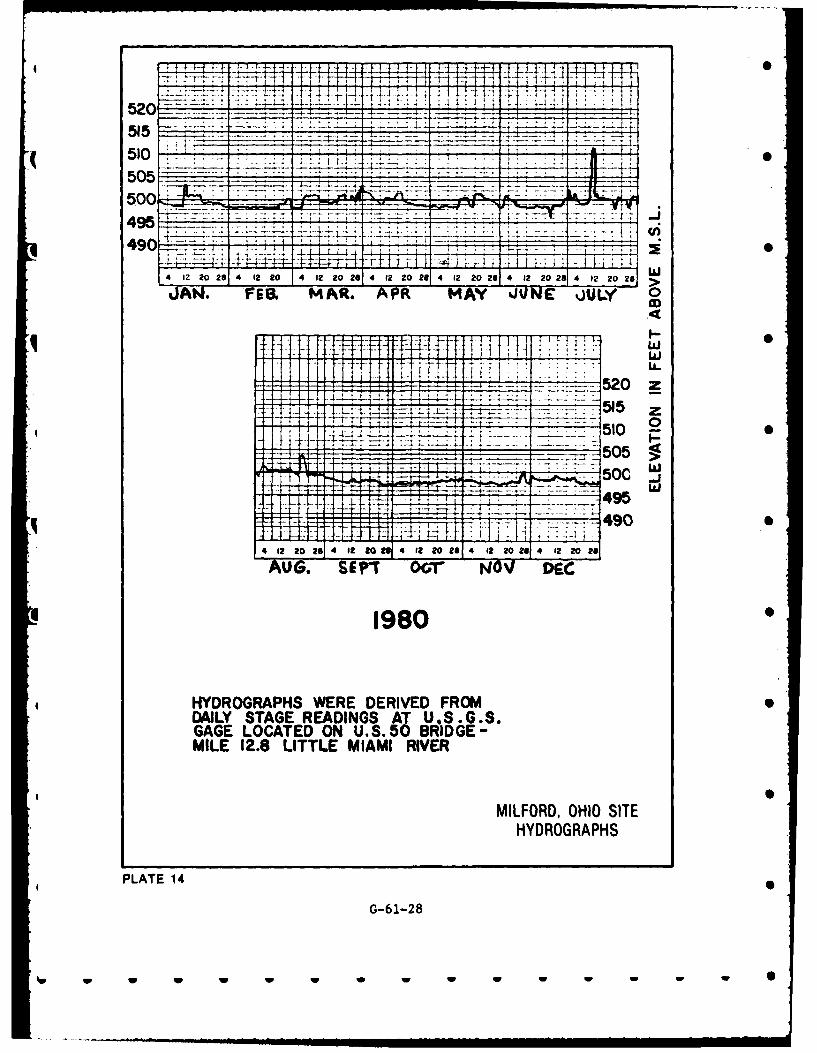
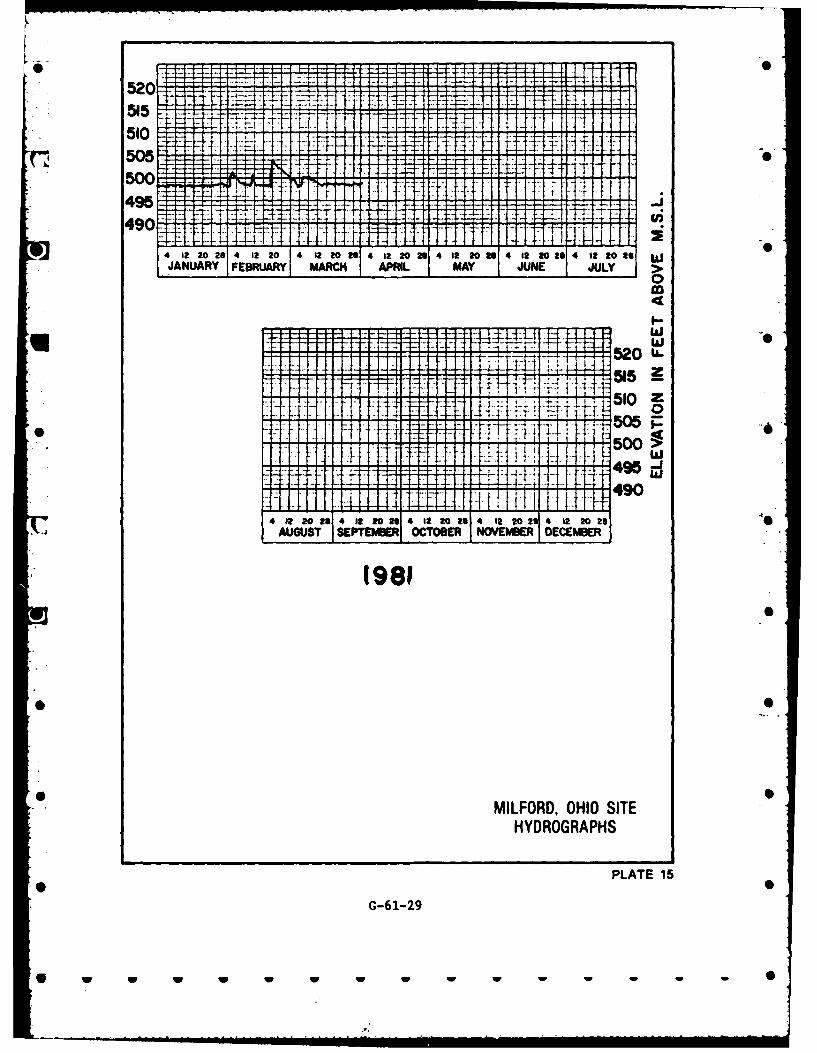
scenic river by Ohio Department of Natural Resources. Elevation hydrographs
at the site are shown on Plates 10 through 15. Air temperatures at the site
are generally moderate, seldom above 100°F and only occasionally below OF.
The U.S. Geological Survey has a water-stage recorder gage located 500 •
feet downstream from U.S. Highway 50 at Milford. Gage zero is 499.20 feet
mean sea level, adjustment of 1929. Gage data are available from 1915 to
present with the exceptions of two periods: 1918-1925 and 1937-1938. The
maximum flood of record is the January 1959 flood when a gage height of 22.3 S
feet was recorded. Current information indicates that the flood in March 1913
reached a stage of 25.5 feet, present datum.
The average annual precipitation at Milford is approximately 41 inches.
The average runoff rate has been determined to be about 35 percent. Runoff
rates are relatively low and vary considerably due to the pervious soil in the
river basin. Antecedent rainfall in the basin is reflected in the ground
water table which, in turn, effects the degree of runoff.
e. Channel Characteristics. The elevation-frequency curve, Plate 16,
shows that flows which meet or exceed top of bank (near Milford) run more than
once per year probably almost 3 to 5 times per year. During average years the
stream always flows-never drying up. The channel is composed of random
deeper pools, bars, and riffle areas. During high flow considerable movement
of sand and gravel takes place--rearranging to some degree the location and/or
G-61-5
- W W W Wi . . . .W W
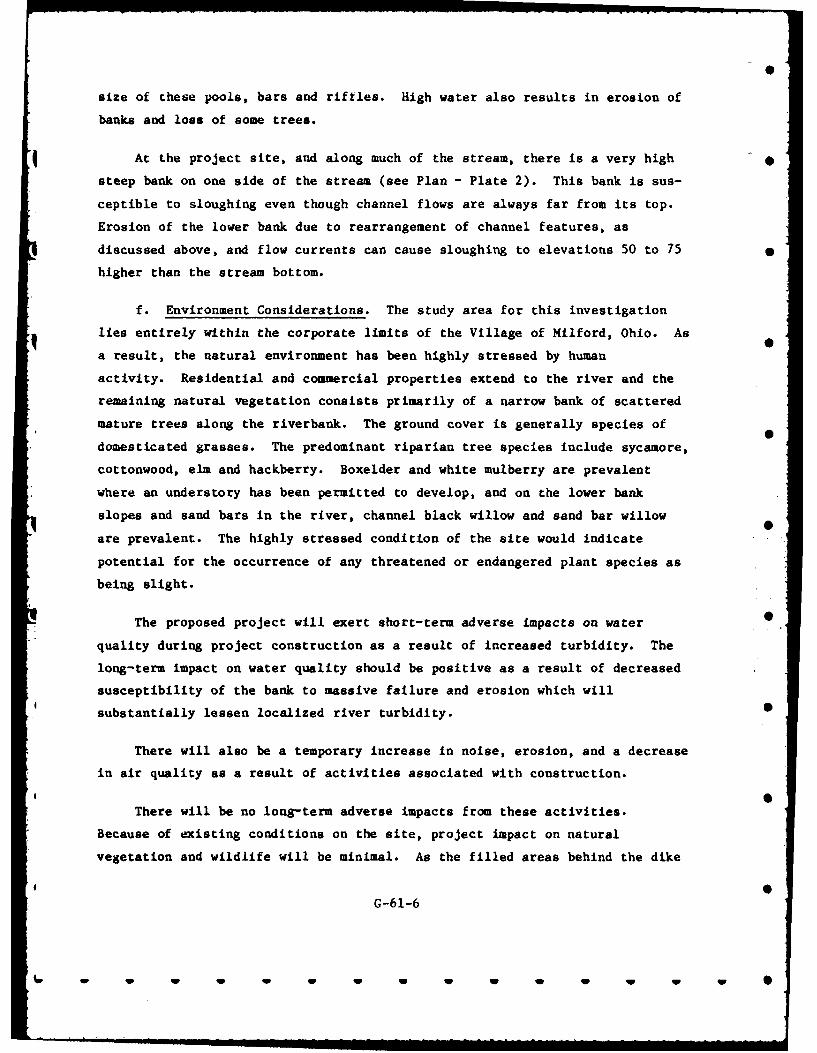
size of these pools, bars and riffles. High water also results in erosion of
banks and loss of some trees.
At the project site, and along much of the stream, there is a very high 0steep bank on one side of the stream (see Plan - Plate 2). This bank is sus-
ceptible to sloughing even though channel flows are always far from its top.
Erosion of the lower bank due to rearrangement of channel features, as
discussed above, and flow currents can cause sloughing to elevations 50 to 75 0
higher than the stream bottom.
f. Environment Considerations. The study area for this investigation
lies entirely within the corporate limits of the Village of Milford, Ohio. As
a result, the natural environment has been highly stressed by human
activity. Residential and commercial properties extend to the river and the
remaining natural vegetation consists primarily of a narrow bank of scattered
mature trees along the riverbank. The ground cover is generally species of
domesticated grasses. The predominant riparian tree species include sycamore,
cottonwood, elm and hackberry. Boxelder and white mulberry are prevalent
where an understory has been permitted to develop, and on the lower bank
slopes and sand bars in the river, channel black willow and sand bar willow
are prevalent. The highly stressed condition of the site would indicate
potential for the occurrence of any threatened or endangered plant species as
being slight.
The proposed project will exert short-term adverse impacts on water
quality during project construction as a result of increased turbidity. The
long-term impact on water quality should be positive as a result of decreased
susceptibility of the bank to massive failure and erosion which will
substantially lessen localized river turbidity. •
There will also be a temporary increase in noise, erosion, and a decrease
in air quality as a result of activities associated with construction.
There will be no long-term adverse impacts from these activities.
Because of existing conditions on the site, project impact on natural
vegetation and wildlife will be minimal. As the filled areas behind the dike
G-61-6
... ='"'=., wnm I wl~l Ww.....
o -o
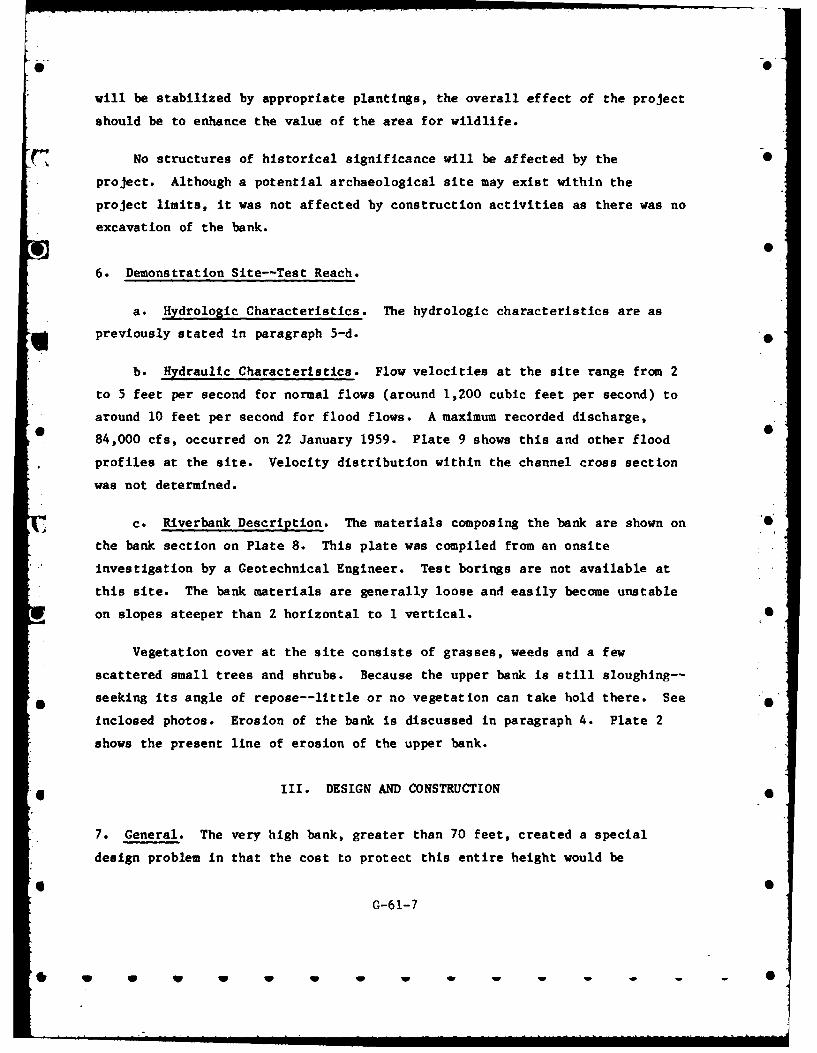
will be stabilized by appropriate plantings, the overall effect of the project
should be to enhance the value of the area for wildlife.
No structures of historical significance will be affected by the oproject. Although a potential archaeological site may exist within the
project limits, it was not affected by construction activities as there was no
excavation of the bank.
6. Demonstration Site--Test Reach.
a. Hydrologic Characteristics. The hydrologic characteristics are as
g previously stated in paragraph 5-d.
b. Hydraulic Characteristics. Flow velocities at the site range from 2
to 5 feet per second for normal flows (around 1,200 cubic feet per second) to
around 10 feet per second for flood flows. A maximum recorded discharge,
84,000 cfs, occurred on 22 January 1959. Plate 9 shows this and other flood
, profiles at the site. Velocity distribution within the channel cross section
was not determined.
c. Riverbank Description. The materials composing the bank are shown on "
the bank section on Plate 8. This plate was compiled from an onsite
investigation by a Geotechnical Engineer. Test borings are not available at
this site. The bank materials are generally loose and easily become unstable
on slopes steeper than 2 horizontal to 1 vertical. 0
Vegetation cover at the site consists of grasses, weeds and a few
scattered small trees and shrubs. Because the upper bank is still sloughing--
* seeking its angle of repose--little or no vegetation can take hold there. See
inclosed photos. Erosion of the bank is discussed in paragraph 4. Plate 2
shows the present line of erosion of the upper bank.
III. DESIGN AND CONSTRUCTION
7. General. The very high bank, greater than 70 feet, created a special
design problem in that the cost to protect this entire height would be
G-61-7
! W W W W W W W W -
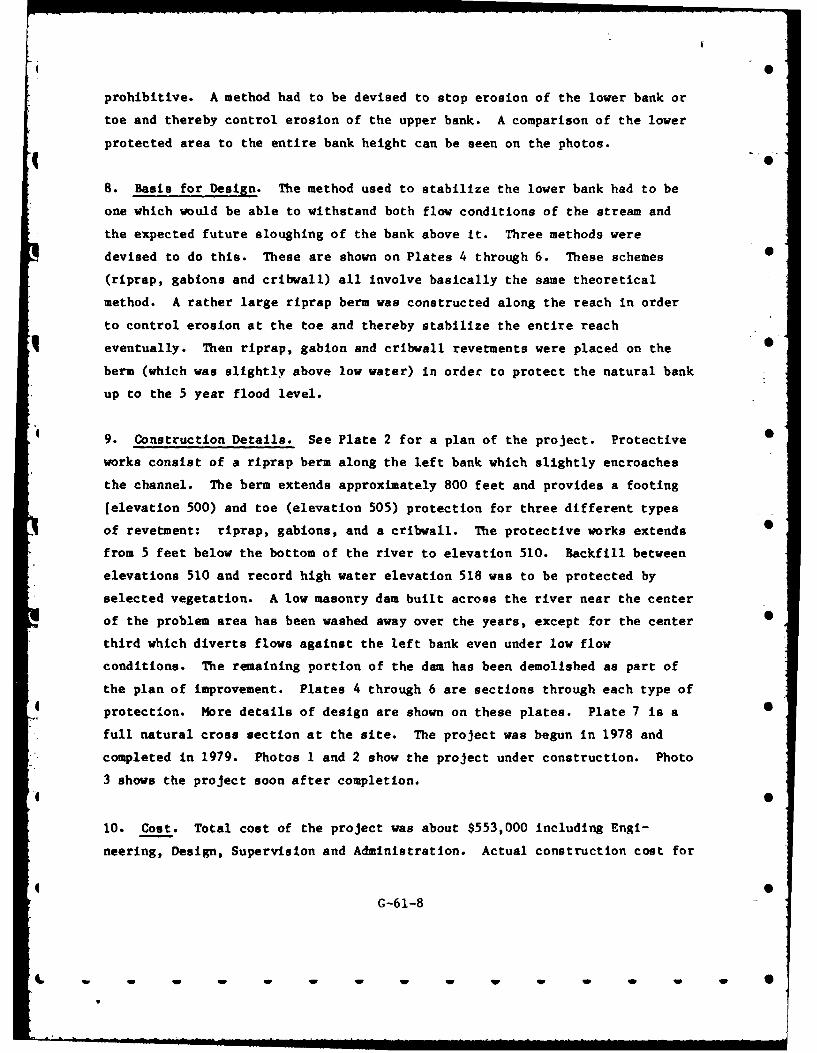
prohibitive. A method had to be devised to stop erosion of the lower bank or
toe and thereby control erosion of the upper bank. A comparison of the lower
protected area to the entire bank height can be seen on the photos.
8. Basis for Design. The method used to stabilize the lower bank had to be
one which would be able to withstand both flow conditions of the stream and
the expected future sloughing of the bank above it. Three methods were
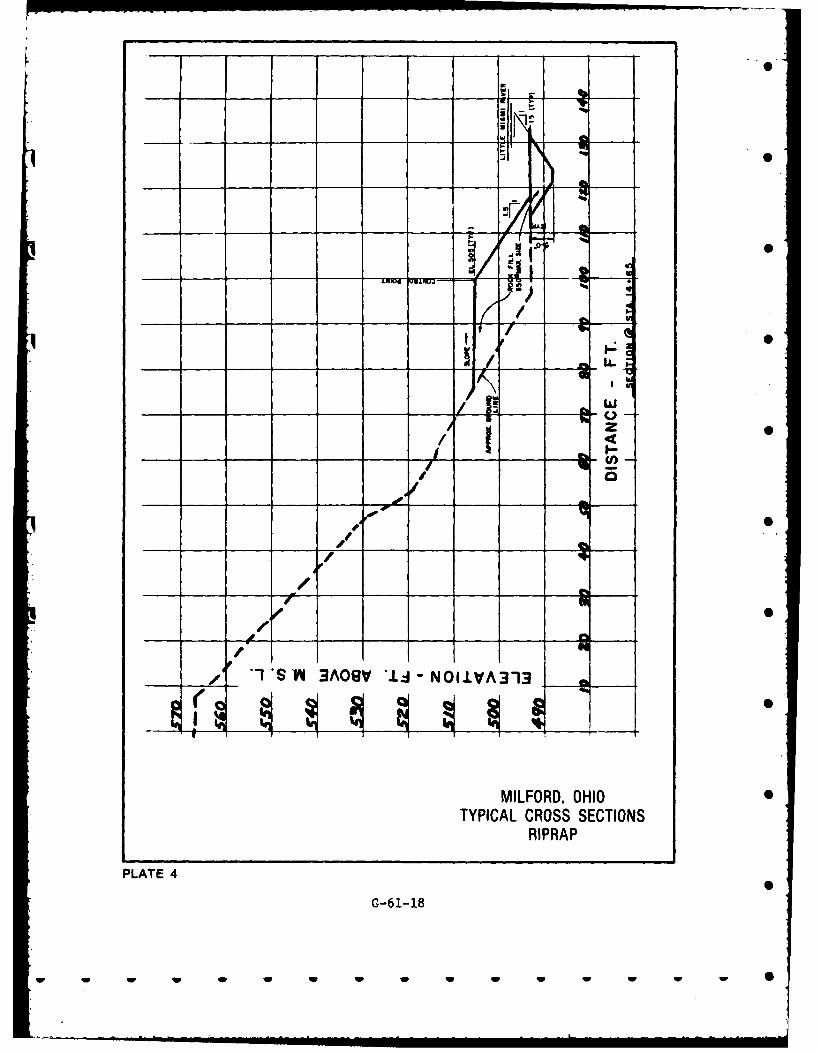
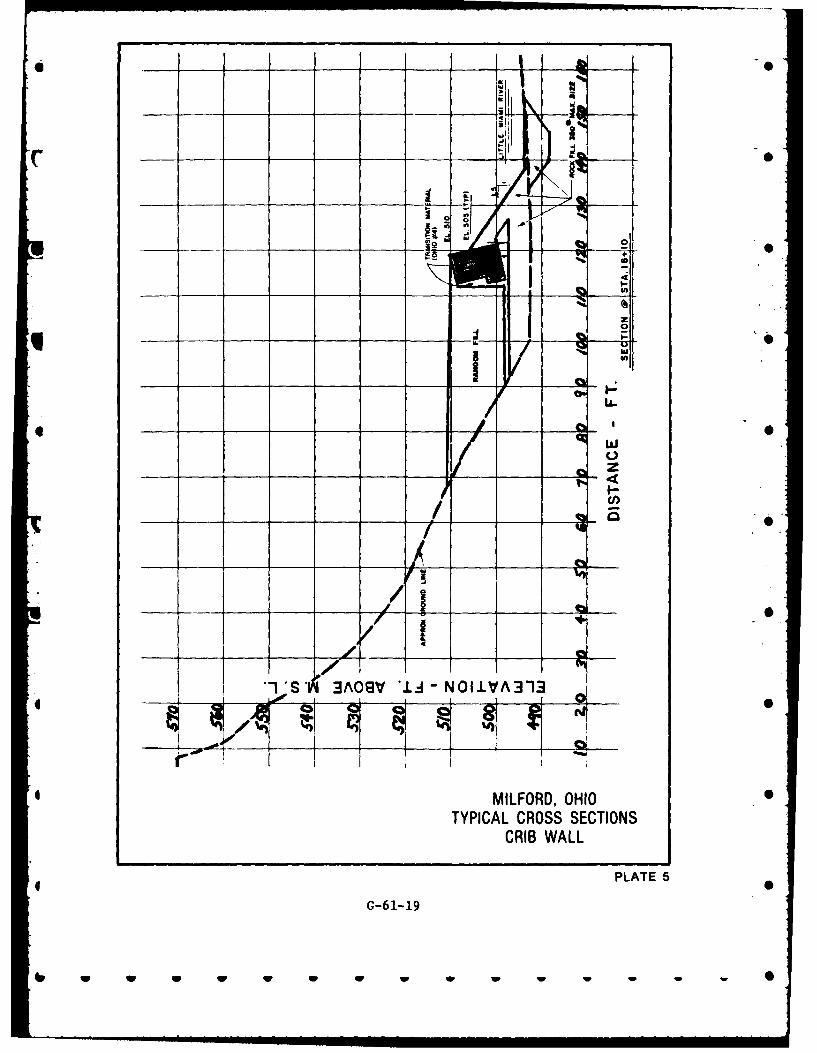
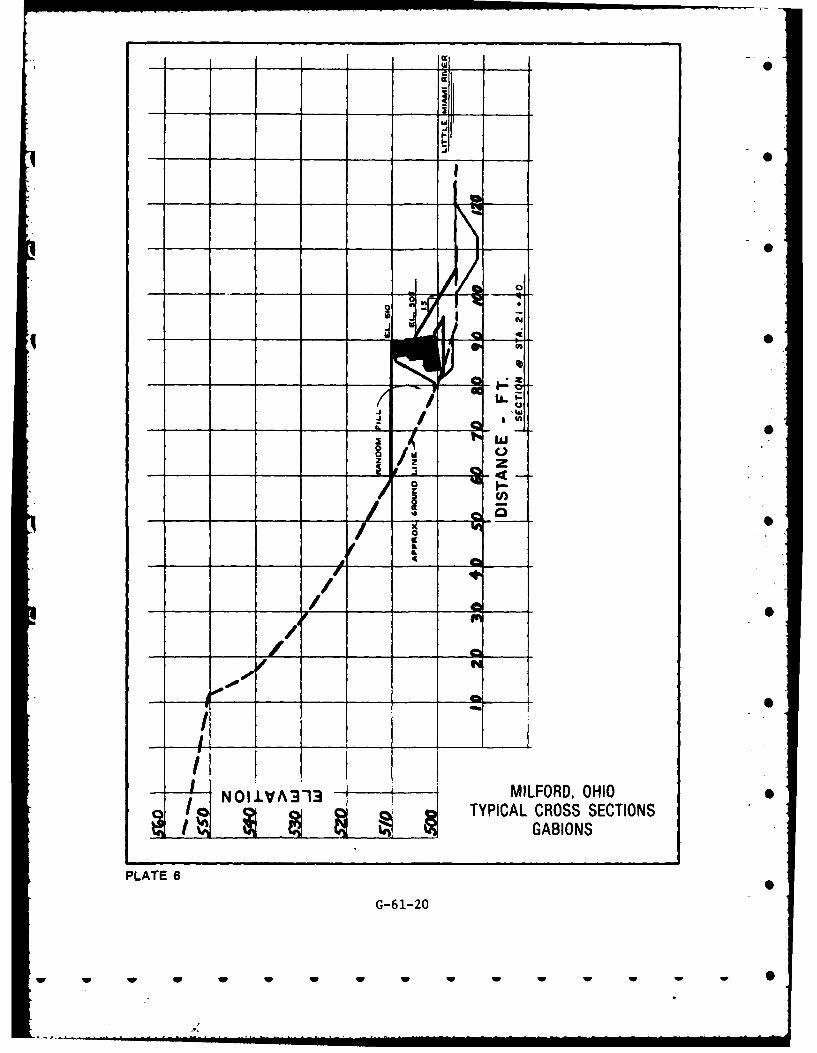
devised to do this. These are shown on Plates 4 through 6. These schemes 0
(riprap, gabions and cribwall) all involve basically the same theoretical
method. A rather large riprap berm was constructed along the reach in order
to control erosion at the toe and thereby stabilize the entire reach
q eventually. Then riprap, gabion and cribwall revetments were placed on the
berm (which was slightly above low water) in order to protect the natural bank
up to the 5 year flood level.
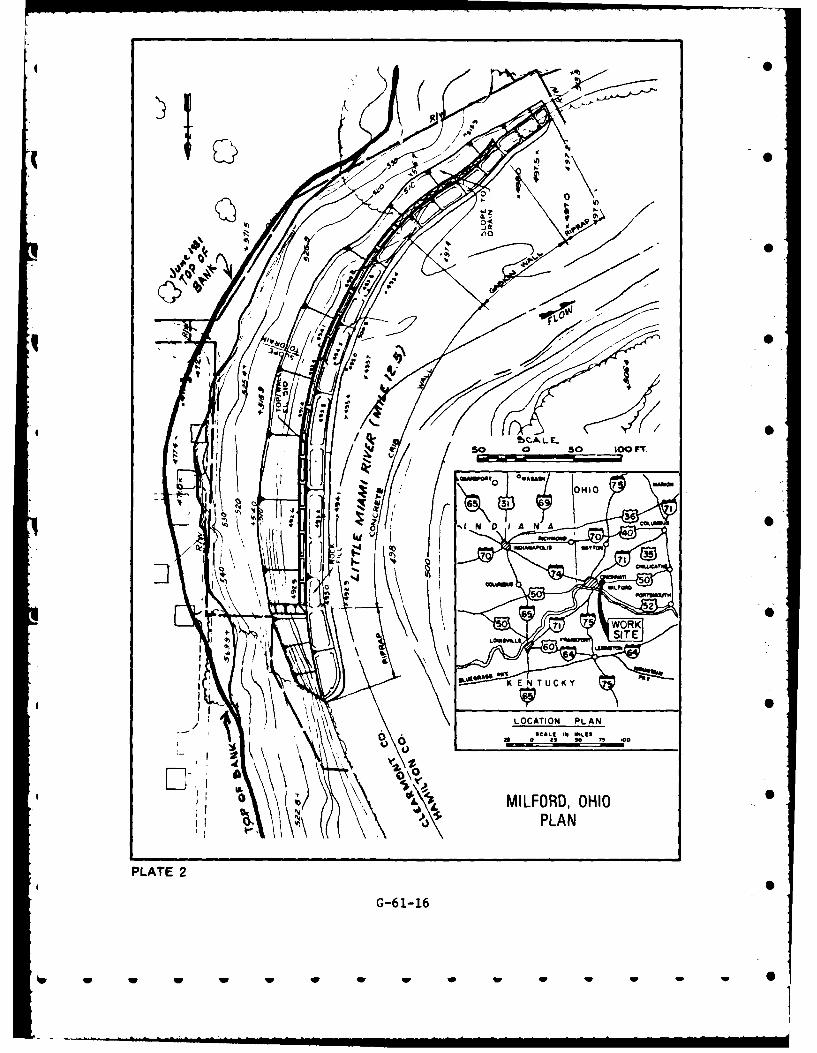
9. Construction Details. See Plate 2 for a plan of the project. Protective 0
works consist of a riprap berm along the left bank which slightly encroaches
the channel. The berm extends approximately 800 feet and provides a footing
[elevation 500) and toe (elevation 505) protection for three different types
of revetment: riprap, gabions, and a cribwall. The protective works extends
from 5 feet below the bottom of the river to elevation 510. Backfill between
elevations 510 and record high water elevation 518 was to be protected by
selected vegetation. A low masonry dam built across the river near the center
of the problem area has been washed away over the years, except for the center 0
third which diverts flows against the left bank even under low flow
conditions. The remaining portion of the dam has been demolished as part of
the plan of improvement. Plates 4 through 6 are sections through each type of
protectLon. More details of design are shown on these plates. Plate 7 is a
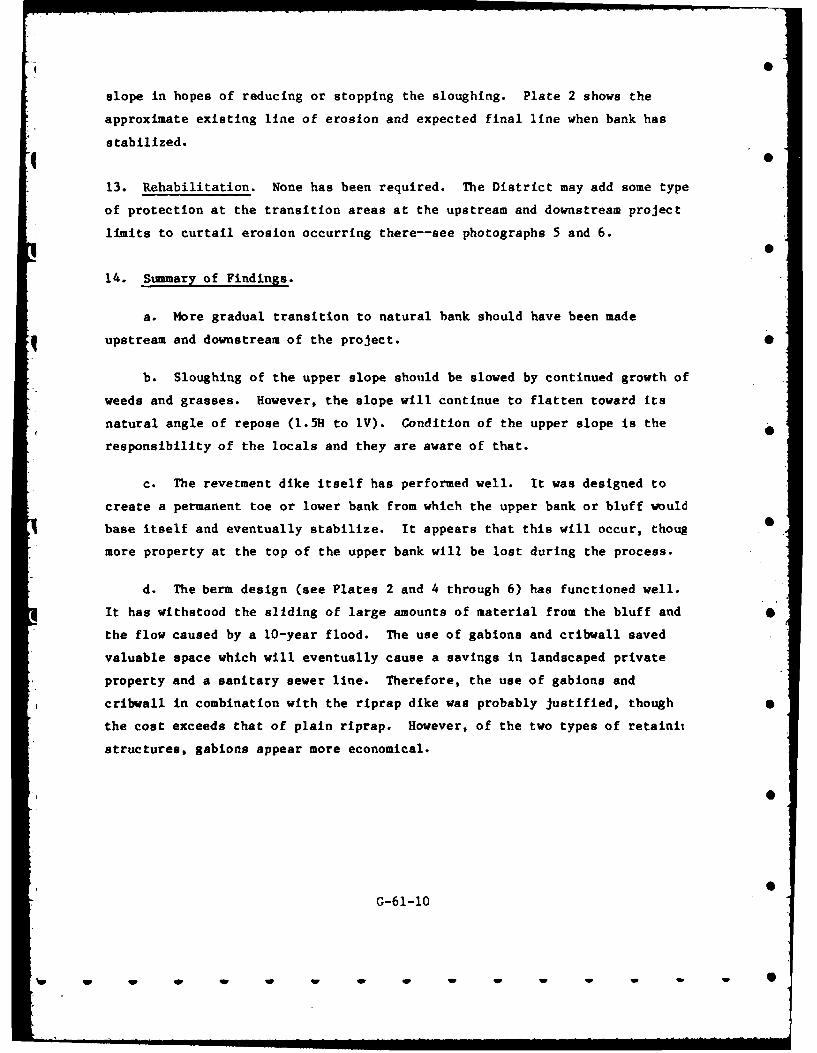
full natural cross section at the site. The project was begun in 1978 and
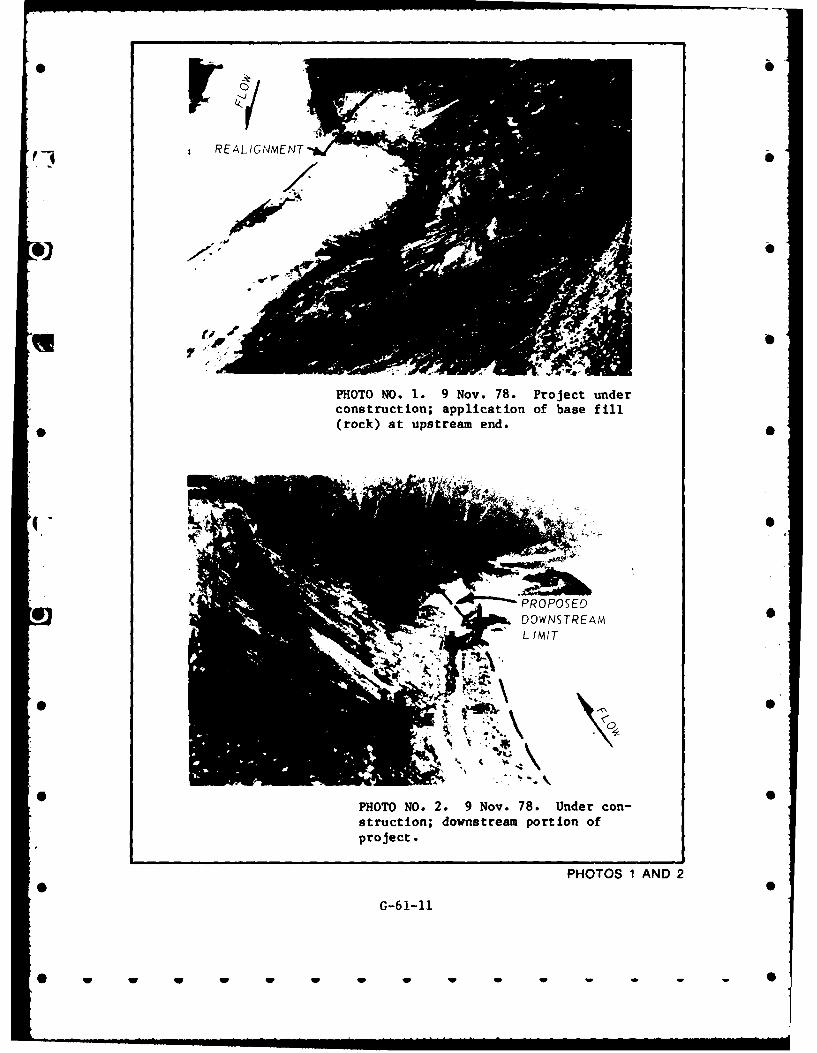
completed in 1979. Photos 1 and 2 show the project under construction. Photo
3 shows the project soon after completion.
10. Cost. Total cost of the project was about $553,000 including Engi-
neering, Design, Supervision and Administration. Actual construction cost for
G-61-8
qp - -' l i li i nlw w wI ... . ..
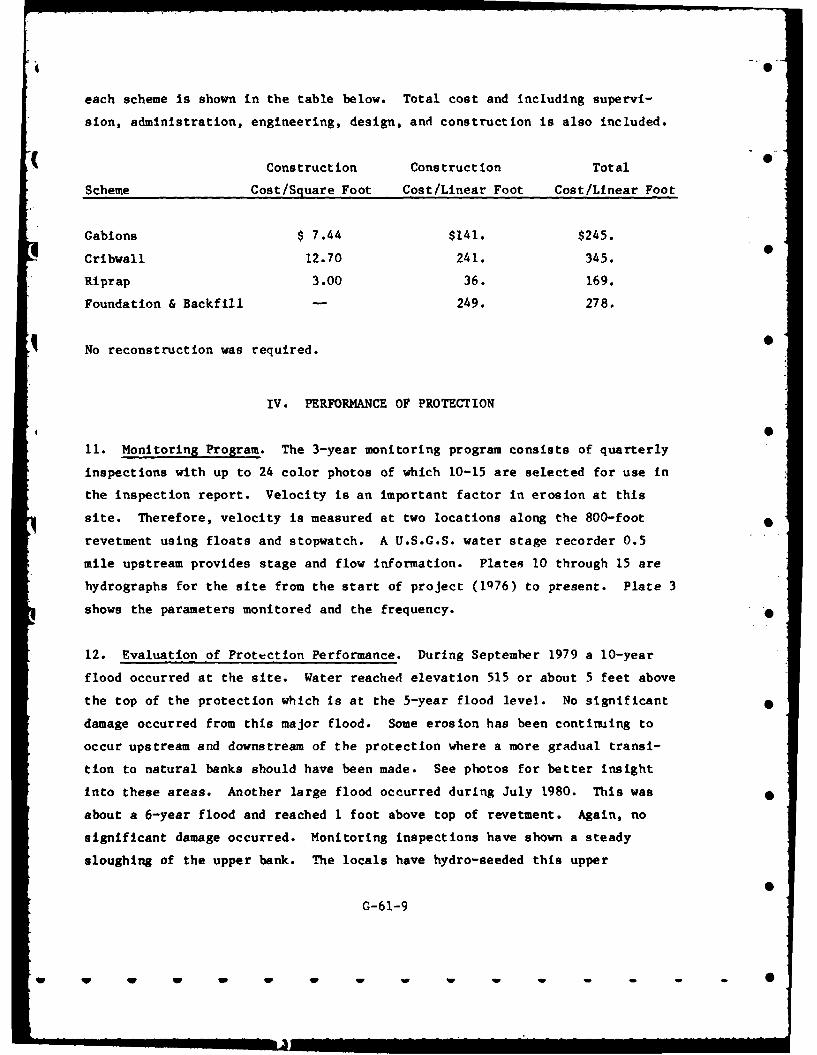
each scheme is shown in the table below. Total cost and including supervi-
sion, administration, engineering, design, and construction is also included.
Construction Construction Total 0
Scheme Cost/Square Foot Cost/Linear Foot Cost/Linear Foot
Gabions $ 7.44 $141. $245.
Cribwall 12.70 241. 345.
Riprap 3.00 36. 169.
Foundation & Backfill - 249. 278.
No reconstruction was required.
IV. PERFORMANCE OF PROTECTION
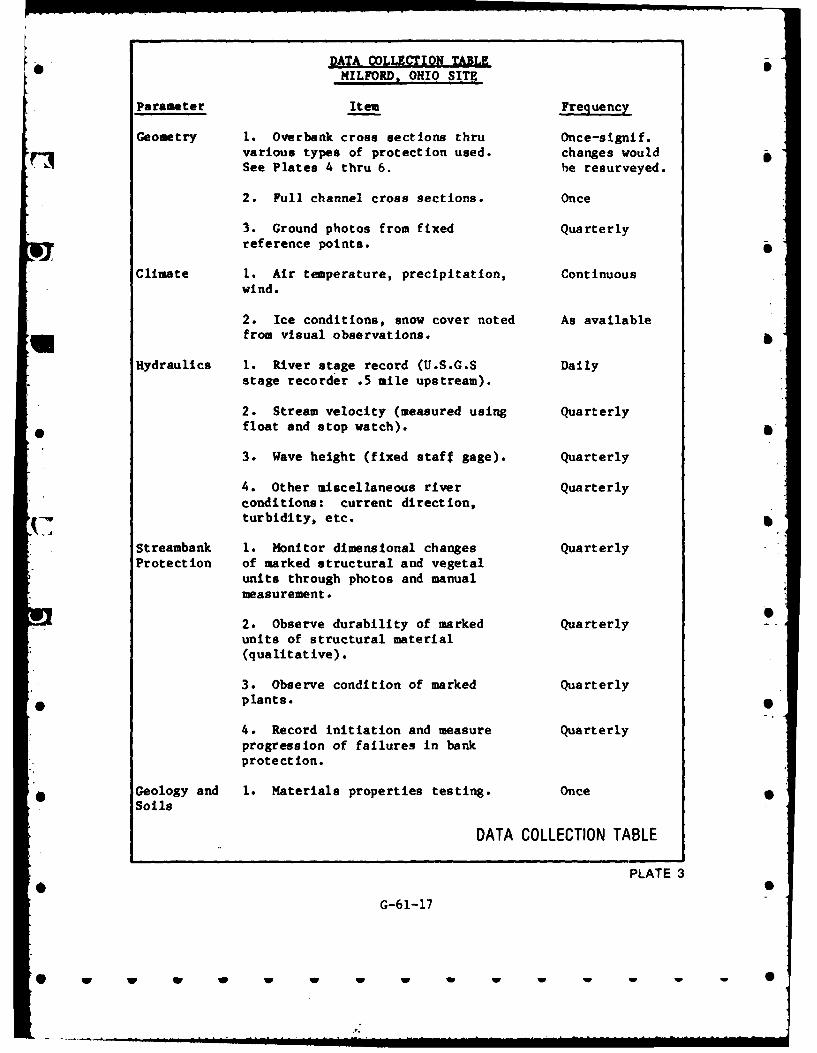
11. Monitoring Program. The 3-year monitoring program consists of quarterly
inspections with up to 24 color photos of which 10-15 are selected for use in
the inspection report. Velocity is an important factor In erosion at this
site. Therefore, velocity is measured at two locations along the 800-foot
revetment using floats and stopwatch. A U.S.G.S. water stage recorder 0.5
mile upstream provides stage and flow information. Plates 10 through 15 are
hydrographs for the site from the start of project (1976) to present. Plate 3
shows the parameters monitored and the frequency. 0
12. Evaluation of Protection Performance. During September 1979 a 10-year
flood occurred at the site. Water reached elevation 515 or about 5 feet above
the top of the protection which is at the 5-year flood level. No significant 0
damage occurred from this major flood. Some erosion has been contiming to
occur upstream and downstream of the protection where a more gradual transi-
tion to natural banks should have been made. See photos for better insight
into these areas. Another large flood occurred during July 1980. This was •
about a 6-year flood and reached 1 foot above top of revetment. Again, no
significant damage occurred. Monitoring inspections have shown a steady
sloughing of the upper bank. The locals have hydro-seeded this upper
G-61-9
- a l W l I W -' -
slope in hopes of reducing or stopping the sloughing. Plate 2 shows the
approximate existing line of erosion and expected final line when bank has
stabilized.
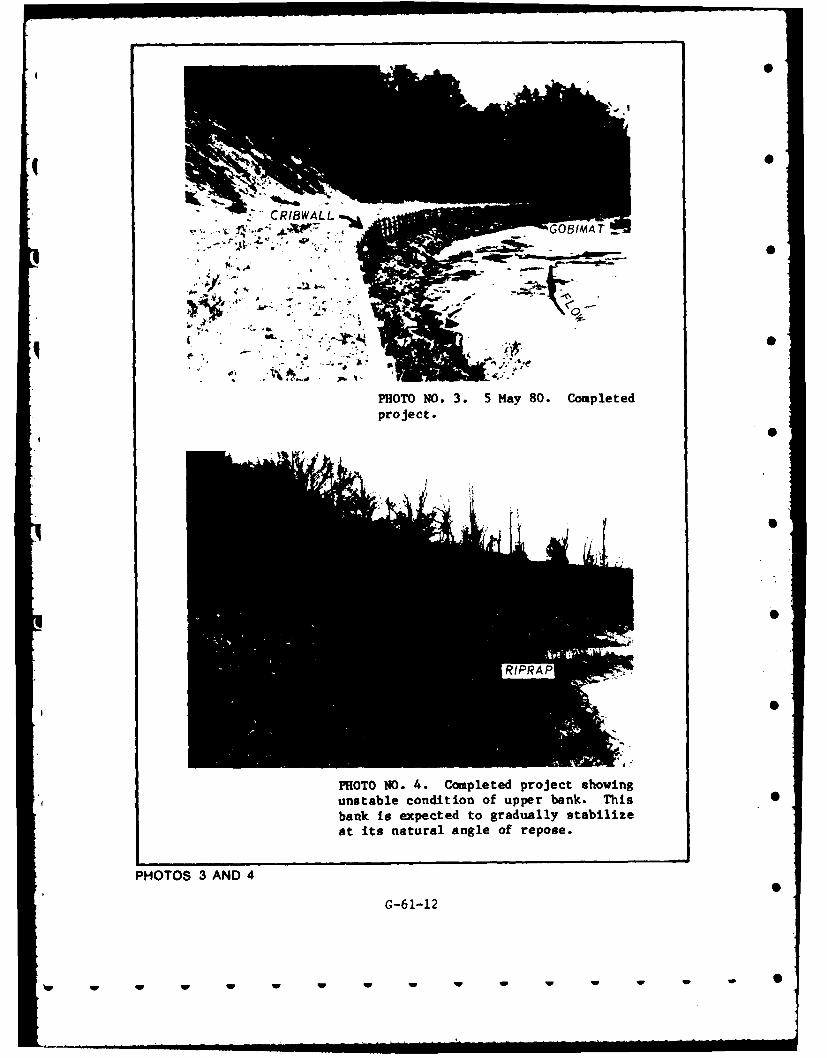
13. Rehabilitation. None has been required. The District may add some type
of protection at the transition areas at the upstream and downstream project
limits to curtail erosion occurring there--see photographs 5 and 6.!
14. Summary of Findings.
a. More gradual transition to natural bank should have been made
upstream and downstream of the project.
b. Sloughing of the upper slope should be slowed by continued growth of
weeds and grasses. However, the slope will continue to flatten toward its
natural angle of repose (l.5H to 1V). Condition of the upper slope is the
responsibility of the locals and they are aware of that.
c. The revetment dike itself has performed well. It was designed to
create a permanent toe or lower bank from which the upper bank or bluff would
base itself and eventually stabilize. It appears that this will occur, thoug •
more property at the top of the upper bank will be lost during the process.
d. The berm design (see Plates 2 and 4 through 6) has functioned well.
It has withstood the sliding of large amounts of material from the bluff and ,
the flow caused by a 10-year flood. The use of gabions and cribwall saved
valuable space which will eventually cause a savings in landscaped private
property and a sanitary sewer line. Therefore, the use of gabions and
cribwall in combination with the riprap dike was probably justified, though
the cost exceeds that of plain riprap. However, of the two types of retainil
structures, gabions appear more economical.
G-61-10
.. w . . -,a , -n - - w w | I I
REAL)GNMENT
PHOTO NO. 1. 9 Nov. 78. Project underconstruction; application of base fill(rock) at upstream end.
DOWNSTREAM
0
PHOTO NO. 2. 9 Nov. 78. Under con-struction; downstream portion ofproject.
PHOTOS 1 AND 2
G-6 1-11
0-0
PHOTO NO. 3. 5 May 80. Completedproject.
PHOTO No. 4. Completed project shovingunstable condition of upper bank. Thisbanik is expected to gradually stabilizeat its natural angle of repose.
PHOTOS 3 AND 4
G-61-12
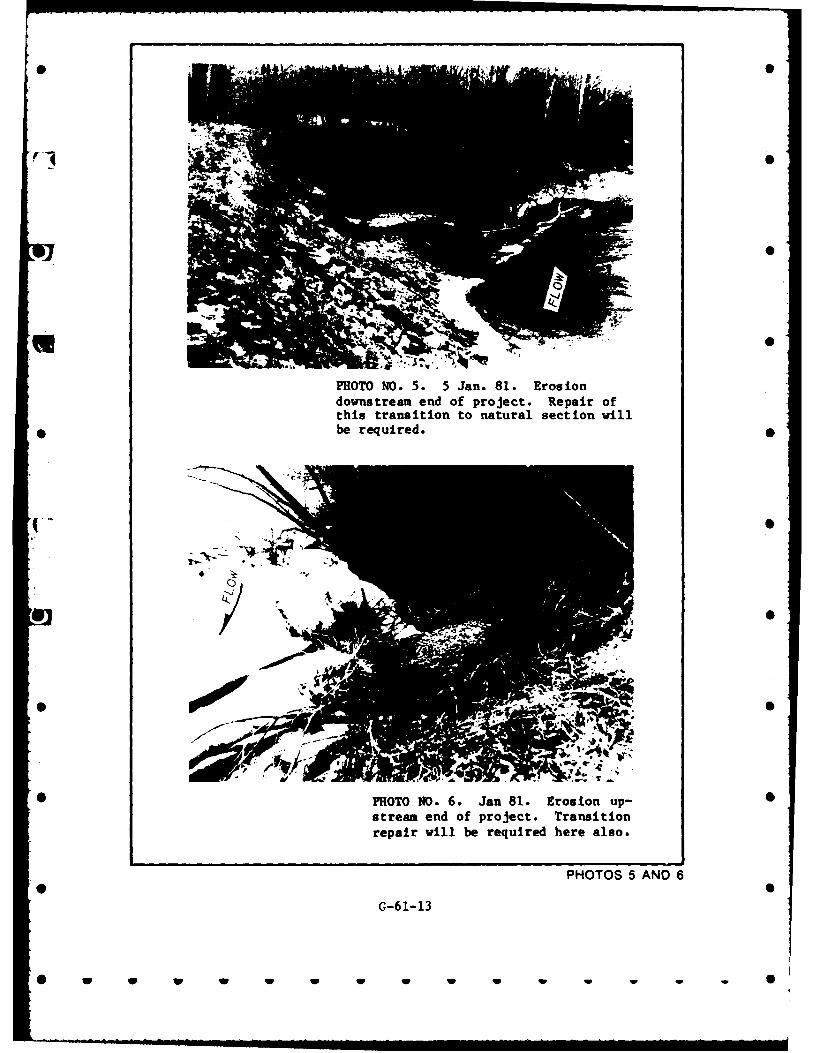
PHOTO NO. 5. 5 Jan. 8 1. Eros iondownstream end of project. Repair ofthis transition to natural section willbe required.
*PHOTO NO. 6. Jan 81. Eros ion up-stream end of project. Transitionrepair will be required here also.
PHOTOS 5 AND 6
G-61-13
W W W W W W W W W0 1
0
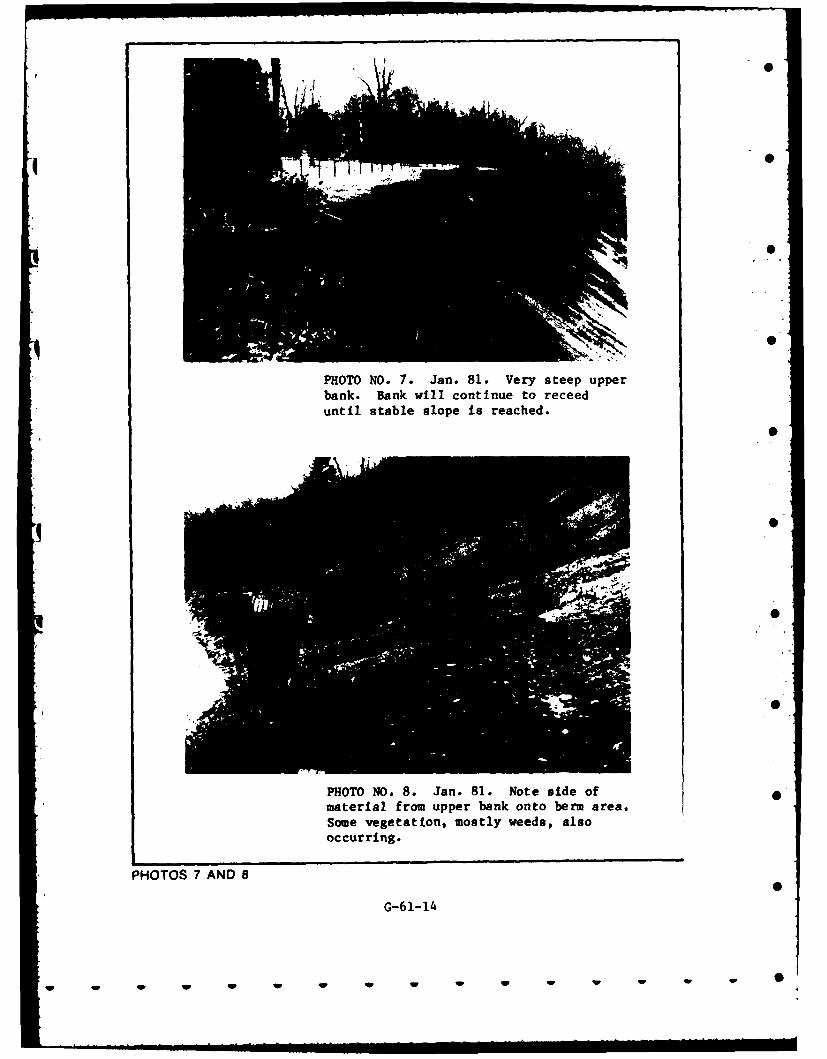
PHOTO NO. 7. Jan. 81. Very steep upperbank. Bank will continue to receeduntil stable slope is reached.
PHOTO NO. 8. Jan. 81. Note side ofmaterial from upper bank onto berm area.Some vegetation, mostly weeds, alsooccurring.
PHOTOS 7 AND 8
G-61-14
w ---- W W W W W W
/ -.
A YTON O. KI ,Tfr~
0 eXenia c lIi
STRAE IFO a
CN PINTO g ,1< I ,Co .o. C PLAKE
a-- *'~ UPbsO ad A-,/
SOT CojjAN1 LAKE ~ -
L E A N M O RtR O W -
HAMILTO LVELAD W.ARREN SL LNO ~/ ~CLERMONT- CO. ~ -
STUDY1
TMRRACE OMOFRODSI
CINCINNATPLAT 1AKPrit
"E1110
G-61.6W
w~ w w w w w w CO-
0\0
00
jS
0 \ \\IlaC, OCTONPA+ y: \- SC~ S ~0
~K~' ~ O~. ILFOD, OIO0
'3 PLAN
PLATE2
ILS
G-6 1-1
so 0 so to FT.w w
DATA COLLECTION TABLE
MILFORD, OHIO SITE
Parameter Item Frequency
Geometry 1. Overbank cross sections thru Once-signif.various types of protection used. changes wouldSee Plates 4 thru 6. be resurveyed.
2. Full channel cross sections. Once
3. Ground photos from fixed Quarterlyreference points.
Climate 1. Air temperature, precipitation, Continuouswind.
2. Ice conditions, snow cover noted As availablefrom visual observations.
Hydraulics I. River stage record (U.S.G.S Dailystage recorder .5 mile upstream).
2. Stream velocity (measured using Quarterly
float and stop watch).
3. Wave height (fixed staff gage). Quarterly
4. Other miscellaneous river Quarterlyconditions: current direction,
.j__ turbidity, etc. 5
Streambank 1. Monitor dimensional changes QuarterlyProtection of marked structural and vegetal
units through photos and manualmeasurement.
2. Observe durability of marked Quarterlyunits of structural material(qualitative).
3. Observe condition of marked Quarterly* plants.
4. Record initiation and measure Quarterlyprogression of failures in bankprotection.
* Geology and 1. Materials properties testing. Once 0
Soils
DATA COLLECTION TABLE
PLATE 3* 0
G-61-17
W - - W W V m W W W W W W
'00 I
IIi A
I, S
, I-
L4 wK Z
PLATE 4
//
G-6 -1MILFORD, OHIO 5TYPICAL CROSS SECTIONS
RIPRAP
PLATE 4
G-61-18
.. . i iWiliiW W m iwi ig l l .......
i ~~~~~~i i , I I l t .. . .. .
' "
i - I - P b " - '- ' - '
_ _ I. - -_-
w
SI .A8 1 OIA 1
SI-
I n~
_ _ _ _ I ii
I Zl-
,MIL ORD OHIO 1
CRI WALL.-I/
"7 "8"O6 iJ :A QV "..IOI V A 3 7"3
MILFORD, OHIO 5
TYPICAL CROSS SECTIONSCRIB WALL
PLATE 5
G-61-19
4p w w w ww w - - - 0 I
iSq
i
-- 4N
0
clq _U 4'L ___
cb
3 M D O
0 I-z
T C ,S
//
SN OIJ.YA3"I3 -MILFORD, OHIO
A tan GABIONS
PLATE 6
G-61-20
w w w w w w w w w w w
>0
LU
<0
LU-
z -z
CC
A
jC
N$UA31
PLAT 7
G-61-2
w w w w ~w w w w
C 2
U)) 00
U)
4W-
000l 0
(Y~
0 U
6 0I~nin
0
0 V7*z /
2 2 I 0:
PLATE8NOIILVA313
PLT 8
MARCe
HIGH AER
ECLIEV. 41,35(1912 AD;Wm _ _ •
zJ
0I
_ t-1.£ I I V .., 1 Cl ' M
3M -4
1 11 it 43 14 15
MILES ABOVE MOUTH OF LITTLE MIAMI RIVER
LITTLE MIAMI RIVERPROFILES
PLATE 9
G-61-23
. ... .. i m t I tI l i .. ..
520
510 - K- -.--,-. - - -.
5
490 .. ..: ,
--+. W W 4 .- ..2 ; - ;:+: .- i. .
4 220284 1220 20 28 4 12 0 28 4 12 20 28 4 12 20 28 4 12 202 1>
AUN. FEB M AR. APR. MA J JULY 0
* wGAGE LADN52G
515
MILFORD, OHIO SIT
GGLADN0 10
0o0
G-61-24
t w
520-
II
4 00
495 ll~b 9
.'977
520 u-
515MI4ORD OHI SITE
_tPLATE _V
G-61490
V~ ~~ ~~~~ I I
I t
515 _ _ _
510
505-__ 0
490
r ~'I211.1 4 12 20 4 12 20 21 4 12 2026 4 12 20 26 412 20 26Q2 2
41 0
510
PLATE1 12
4 1 20284 1 2 2- .12 2 0 2 2 0 1 02
AUG S 6 P1 - Uc- t U U U
0
i 44
q2 11 4 - 52O"77.
495
- -M 4-
4 12 0 20 4 0 12 20 2 4 12208120102 4 12 2028 412 20
-520 0
4 4 U-
515 1
-5 -- -- -4 --
5154 ---- - - - -___ __ __ ___ __ __ ___ __ __ ___ __ __ 4
510
500- -.---
4 12 20 2 4220 4 12 20 24112 20 21412_20 2 4 1220 2641220 26>
JAN. ER. M AR. APRt M AY - IU1W- 1 JLY 0
4--
~4 -4 0:
505
IG t~ I c I-I DEC
1980
HYDROGRAPHS WERE DERIVED FROMDAILY STAGE READINGS AT U.IS.G.S.GAGE LOCATED ON U.S.50 BRIDGE-MILE 12.8 LITTLE MIAMI RIVER
MILFORD, OHIO SITEHYDROGRAPHS
PLATE 14
G-61-28
ww w w w w
520
-:1 7
510
7 - , _ - - --. -- -. ... ... 75M - 4
tja
A It
*490
* 0
S~~~~~ 7 w-
T I II F0
4 I
lie
>.z::
4C
OD 70
Lu 7742
2 0uLrl-itl'0 t :o
'IIl:
ia,
PL T 16 L 'l1
I- 1-301411
w w ww w w w w 1w ww
LOWER CHIPPEWA RIVER NEAREAU CLAIRE, WISCONSIN
w w
Section 32 Program Streambank Erosion ControlEvaluation and Demonstration Act of 1974
LOWER CHIPPEWA RIVER NEAR EAU CLAIRE, WISCONSIN
DEMONSTRATION PROJECT PERFORMANCE REPORT
0
I. INTRODUCTION
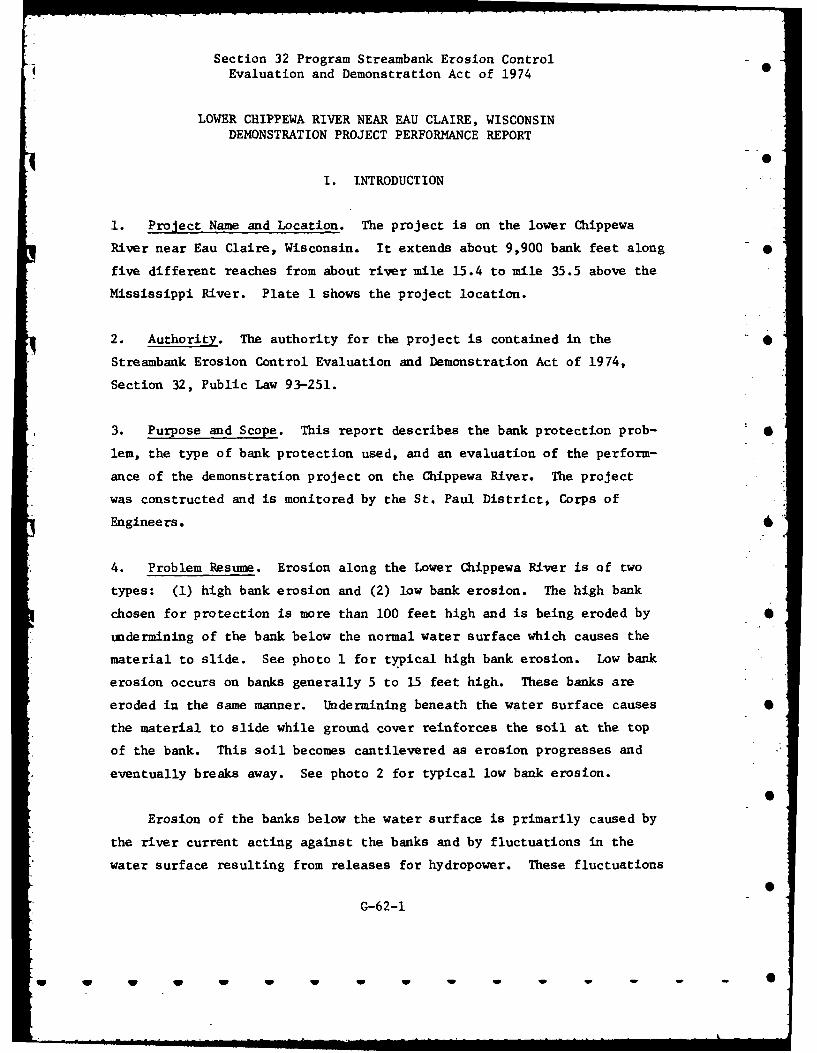
1. Project Name and Location. The project is on the lower Chippewa
River near Eau Claire, Wisconsin. It extends about 9,900 bank feet along
five different reaches from about river mile 15.4 to mile 35.5 above the
Mississippi River. Plate I shows the project location.
2. Authority. The authority for the project is contained in the 0
Streambank Erosion Control Evaluation and Demonstration Act of 1974,
Section 32, Public Law 93-251.
3. Purpose and Scope. This report describes the bank protection prob- 0
lem, the type of bank protection used, and an evaluation of the perform-
ance of the demonstration project on the Chippewa River. The project
was constructed and is monitored by the St. Paul District, Corps of
Engineers.
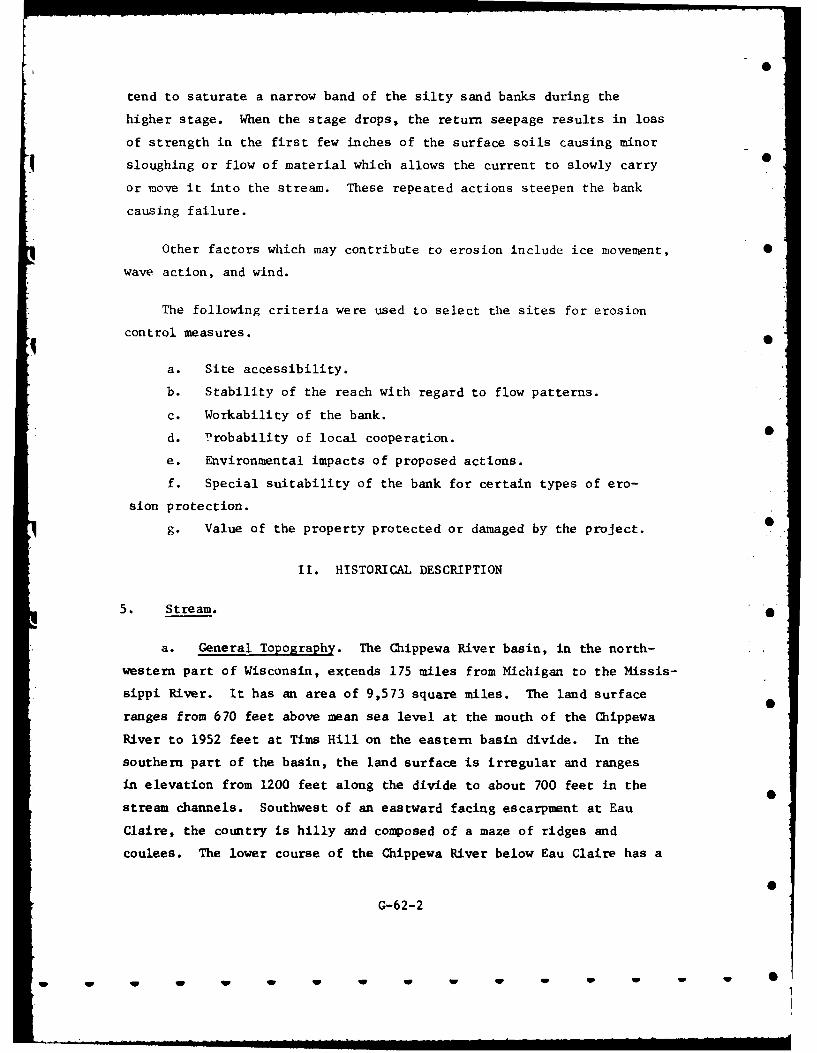
4. Problem Resume. Erosion along the Lower Chippewa River is of two
types: (i) high bank erosion and (2) low bank erosion. The high bank
chosen for protection is more than 100 feet high and is being eroded by •
undermining of the bank below the normal water surface which causes the
material to slide. See photo I for typical high bank erosion. Low bank
erosion occurs on banks generally 5 to 15 feet high. These banks are
eroded in the same manner. Undermining beneath the water surface causes 0
the material to slide while ground cover reinforces the soil at the top
of the bank. This soil becomes cantilevered as erosion progresses and
eventually breaks away. See photo 2 for typical low bank erosion.
Erosion of the banks below the water surface is primarily caused by
*the river current acting against the banks and by fluctuations in the
water surface resulting from releases for hydropower. These fluctuations
G-62-1
V w.... w, 1W W -i .. . ..
tend to saturate a narrow band of the silty sand banks during the
higher stage. When the stage drops, the return seepage results in loss
of strength in the first few inches of the surface soils causing minor
sloughing or flow of material which allows the current to slowly carry
or move it into the stream. These repeated actions steepen the bank
causing failure.
Other factors which may contribute to erosion include ice movement, 0
wave action, and wind.
The following criteria were used to select the sites for erosion
control measures. •
a. Site accessibility.
b. Stability of the reach with regard to flow patterns.
c. Workability of the bank.
d. Probability of local cooperation. 0
e. Environmental impacts of proposed actions.
f. Special suitability of the bank for certain types of ero-
sion protection.
g. Value of the property protected or damaged by the project. S
II. HISTORICAL DESCRIPTION
5. Stream.
a. General Topography. The Chippewa River basin, in the north-
western part of Wisconsin, extends 175 miles from Michigan to the Missis-
sippi River. It has an area of 9,573 square miles. The land surface
ranges from 670 feet above mean sea level at the mouth of the Chippewa
River to 1952 feet at Tims Hill on the eastern basin divide. In the
southern part of the basin, the land surface is irregular and ranges
in elevation from 1200 feet along the divide to about 700 feet in the
stream channels. Southwest of an eastward facing escarpment at Eau
Claire, the country is hilly and composed of a maze of ridges and
coulees. The lower course of the Chippewa River below Eau Claire has a
G-62-2
- w w''''l iiW W,.=mWiW Wni - W
uniform gradient of about 1.5 feet per mile and meanders broadly over its
1- to 2-mile wide floodplain. Erosional terraces more than 100 feet
above the valley floor indicate the depth to which the valley was origi-
nally filled. The most striking feature of the lower Chippewa River is
the delta, a great accumulation of sediment at its mouth, in the gorge
of the Mississippi River. Because the gradient of the Chippewa River
is much steeper than that of the Mississippi River, the smaller Chippewa
River was able to bring in more and coarser debris than the master
stream could handle. Thus, the delta was formed. Lake Pepin in the
Mississippi River valley was created upstream of the dam-like delta.
b. Geology. The project area lies within the Western Upland geo-
graphic province of Wisconsin. The upland is a cuesta or plateau,
capped with dolomite, in which the streams have cut deep, steep-sided
valleys. Till and outwash were deposited over the area probably during
the first substage of Wisconsin glaciation. The thin layer of sandy,
silty, clayey till mantling the upland is now fairly well weathered,
strongly leached, and therefore, acid. Most of the upland areas of
till and rock are covered with a mantle of loess, a medium- to coarse-
textured silt laid down by winds during Wisconsin glaciation. The silt
is generally 3 to 5 feet thick. On the terraces and outwash plains ad-
joining the Chippewa River, the soils are mostly glacial sands and
gravels. A mantle of silt and fine sand, laid down by wind, overlies
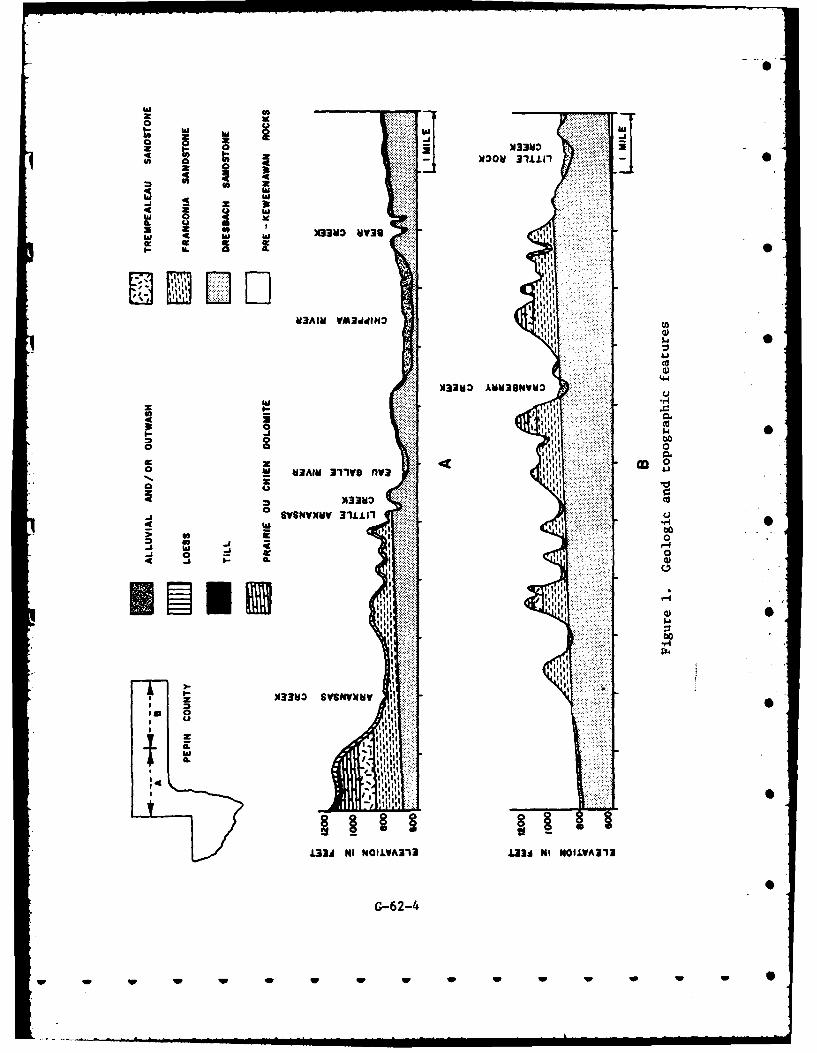
the more granular soils on the terraces in many places. Figure 1 is a
generalized cross section showing the geologic and topographic features
in the vicinity of the project area.
Surface relief and soils of the area have been greatly influenced
by the bedrock. The sequence of rock stratigraphy is, in ascending
order, igneous and metamorphic Precambrian basement rocks which dip
southwest at 15 feet per mile and lie 500 feet below the land surface
at the mouth of the Chippewa River, easily erodible soft Cambrian
sandstones which underlie the alluvial and outwash sediments in the
valleys and abutting walls, and Ordovician dolomite which caps hills
G-62-3
SW W W W W W WW W
.4 NMoo 31J111
.33m MV38
V3a a ~ ~ dN
. U0.
SVSNVXV 111i1
oill
;1i1
11
1
134N OLA1 33 MhI NILVA1
3 G-62-4
w w w w w i
and ridges. The town of Durand is built on a sandstone terrace covered
with a thin veneer of silts and sands from 4 to 15 feet thick.
Along the lower reaches of the Chippewa River, the valley bottom
is deep and wide and bounded by uplands that rise abruptly 200 to 400
feet above the sandy floodplain. Along the main stream and its tribu-
taries in the area, several levels of terraces and steep escarpments
rise above the floodplains. The terraces were formed by the entrench-
ment of these streams, which cut deeply into the old floodplains. Ero-
sional downcutting continues as the more steeply graded Chippewa River
seeks the level of the Mississippi River. The natural lowering of the
Chippewa River channel and streambank erosion are chiefly responsible
for the heavy sediment load deposited in the Mississippi River at the
mouth of the Chippewa River. Downstream 400 feet from site No. 1-Low, the
floodplain is restricted to less than 1,200 feet in width as the riverE 0passes through a shallow rock gorge of sandstone at Round Hill. Sand-
stone is exposed on both sides of the river. Sandstone outcrops along
the river in Spring Brook Township approximately 5 miles upstream of
Site No. 3-High. On the basis of well records and geologic interpretation,
sandstone bedrock is expected to underlie the river at a depth of 50 feet
or less in the project area.
c. Climate. The Chippewa River basin has a temperate climate
characterized by marked seasonal changes. Average monthly tempera-
tures range from 100 F for January in the north to 720 F for July in
the south. The temperature extremes for the State of Wisconsin are
1140 F on 13 July 1936 and -540 F for 22 January 1922. The average
growing season is shorter than 100 days in the north and longer than
140 days in the south. In recent years, continuous temperatures below
freezing have been recorded in the vicinity of the study area for
about 60 to 70 days.
Precipitation is abundant in the basin, and periods of drought
occur infrequently. Average annual precipitation for the basin was
G-62-5
........ . . . .-- - --- ,wnn a u n mm ,H - i
31.2 inches from 1931 to 1960. February is normally the driest month
(about 1 inch), and June is the wettest (about 5 inches). Snowfall
q averages about 50 inches annually and is approximately 16 percent of the
average annual precipitation.
Water temperature records for the Chippewa River at Durand, Wiscon-
sin, can be found in the Water Quality Records (1964-65, 1967, 1973 to
current year) published by the U.S. Geological Survey in the Annual
Water Resources Data for Wisconsin. The Chippewa River station is also
a national stream quality accounting station, national pesticide moni-
toring network station, and national radio chemical surveillance sta-
tion. Suspended sediment concentrations are published with the other
water quality data. Mean suspended sediment concentrations for more
than 20 percent of the year are estimated.
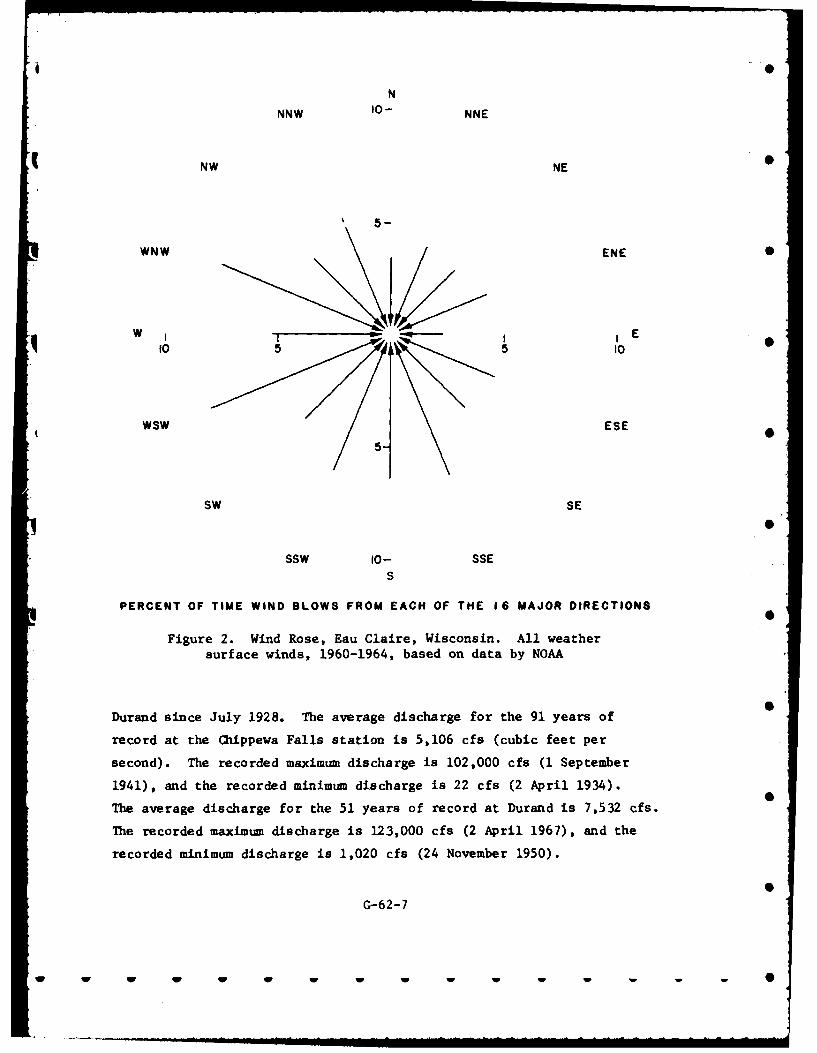
Surface wind rose data are available both annually and monthly.
Published data show the percent of time wind blows from each of the
16 major directions. These data are available from climatic maps of
the United States and regional summaries. Wind rose data from Eau
Claire are shown on figure 2. Data on wind extremes are available
from the National Oceanic and Atmospheric Administration for the first
order stations and from the Federal Aviation Administration near
airports.
d. Existing Hydrologic Data. Discharge records are available on
the Chippewa River at Eau Claire for two periods: from November 1902
to March 1909 and from March 1944 to September 1954 (when the station
was discontinued). The records were obtained from a former U.S. Geo-
logical Survey gaging station on the State Highway 37 and 85 bridge,
about 2.8 miles downstream from the mouth of the Eau Claire River.
Daily stage readings are available since June 1967 on the Chippewa River
at Eau Claire, just below the junction of the Eau Claire River. Stream-
flow records have been kept on the Chippewa River upstream from Eau
Claire at Chippewa Falls, Wisconsin, since June 1888 and at
G-62-6
W W W W W W W
N
NNW 10- NNE
NW NE
5-
WNW ENE0
WII - I EtO 5I0 5' 5 10
WSW ESE
SW SE
SSW 10- SSE
S
PERCENT OF TIME WIND SLOWS FROM EACH OF THE 16 MAJOR DIRECTIONS
Figure 2. Wind Rose, Eau Claire, Wisconsin. All weathersurface winds, 1960-1964, based on data by NOAA
Durand since July 1928. The average discharge for the 91 years of
record at the Chippewa Falls station is 5,106 cfs (cubic feet per
second). The recorded maximum discharge is 102,000 cfs (1 September
1941), and the recorded minimum discharge is 22 cfs (2 April 1934).
The average discharge for the 51 years of record at Durand is 7,532 cfs.
The recorded maximum discharge is 123,000 cfs (2 April 1967), and the
recorded minimum discharge is 1,020 cfs (24 November 1950).
G-62-7
.W W W W I W W W -W W
0
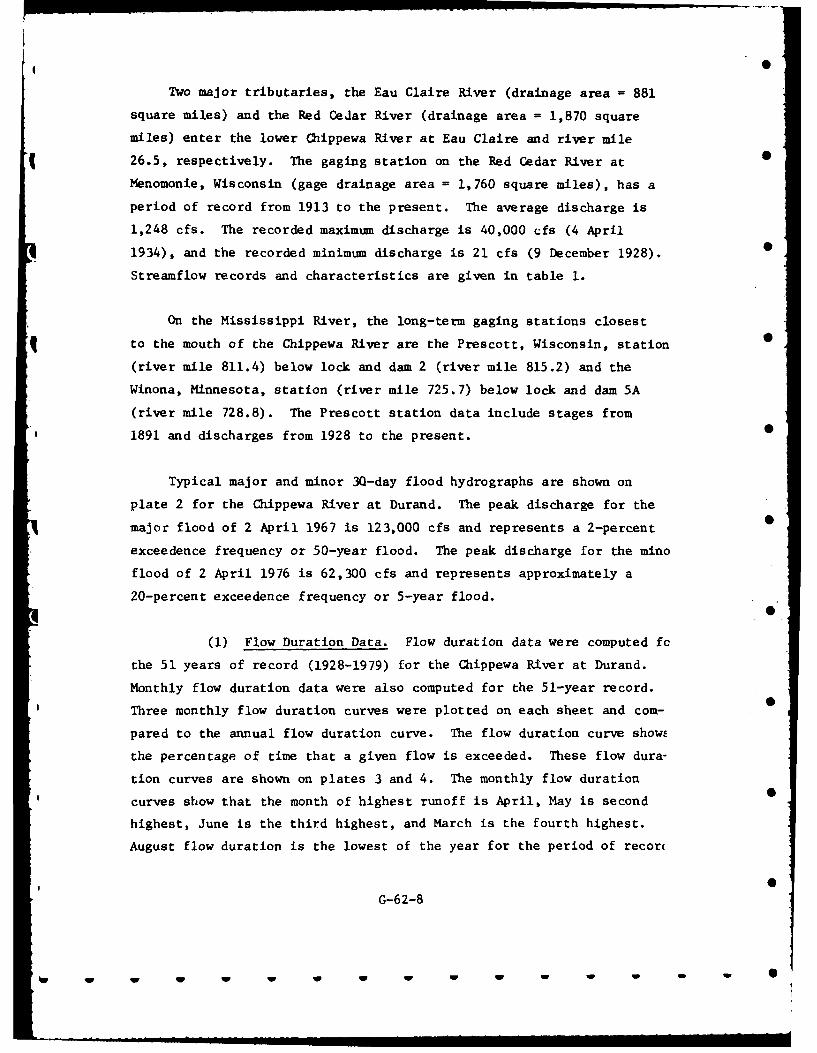
Two major tributaries, the Eau Claire River (drainage area 881
square miles) and the Red Cedar River (drainage area = 1,870 square
miles) enter the lower Chippewa River at Eau Claire and river mile
26.5, respectively. The gaging station on the Red Cedar River at 0
Menomonie, Wisconsin (gage drainage area = 1,760 square miles), has a
period of record from 1913 to the present. The average discharge is
1,248 cfs. The recorded maximum discharge is 40,000 cfs (4 April
1934), and the recorded minimum discharge is 21 cfs (9 December 1928).
Streamflow records and characteristics are given in table 1.
On the Mississippi River, the long-term gaging stations closest
to the mouth of the Chippewa River are the Prescott, Wisconsin, station 0
(river mile 811.4) below lock and dam 2 (river mile 815.2) and the
Winona, Minnesota, station (river mile 725.7) below lock and dam 5A
(river mile 728.8). The Prescott station data include stages from
1891 and discharges from 1928 to the present. 0
Typical major and minor 30-day flood hydrographs are shown on
plate 2 for the Chippewa River at Durand. The peak discharge for the
major flood of 2 April 1967 is 123,000 cfs and represents a 2-percent
exceedence frequency or 50-year flood. The peak discharge for the mino
flood of 2 April 1976 is 62,300 cfs and represents approximately a
20-percent exceedence frequency or 5-year flood.
(1) Flow Duration Data. Flow duration data were computed fc
the 51 years of record (1928-1979) for the Chippewa River at Durand.
Monthly flow duration data were also computed for the 51-year record.
Three monthly flow duration curves were plotted on each sheet and com-
pared to the annual flow duration curve. The flow duration curve showE
the percentage of time that a given flow is exceeded. These flow dura-
tion curves are shown on plates 3 and 4. The monthly flow duration
curves show that the month of highest runoff is April, May is second
highest, June is the third highest, and March is the fourth highest.
August flow duration is the lowest of the year for the period of recorc
G-62-8
- l l l W W W W W W W
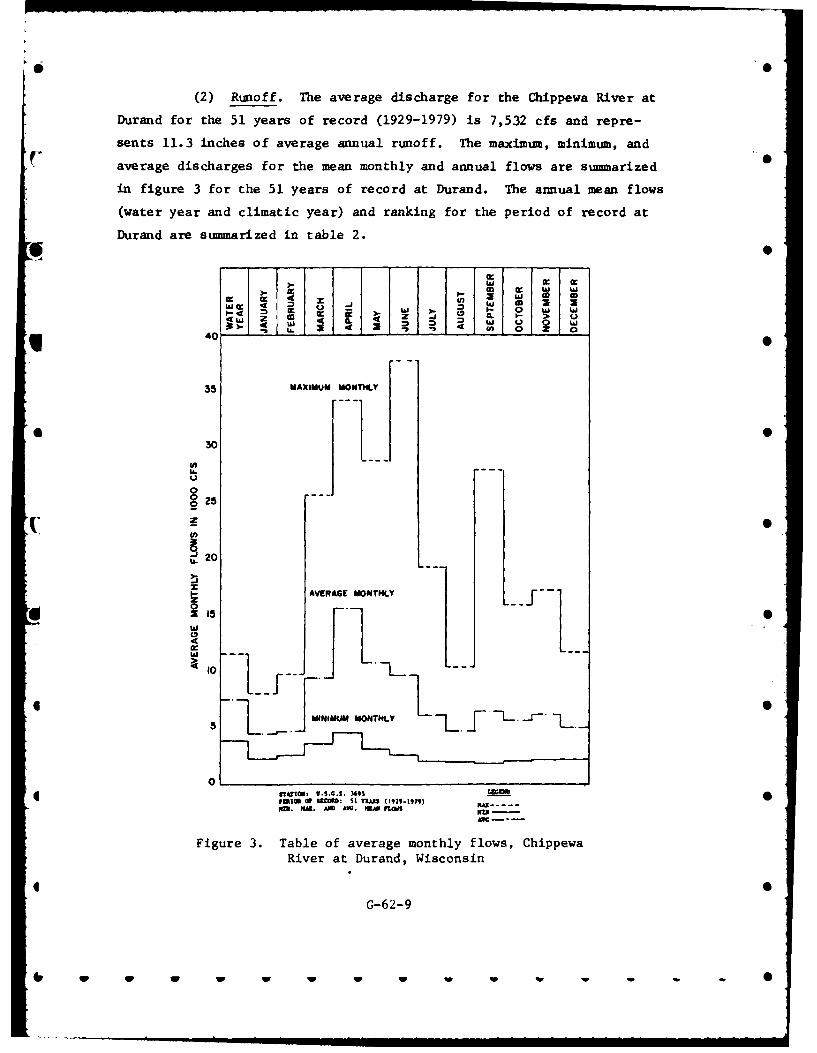
(2) Runoff. The average discharge for the Chippewa River at
Durand for the 51 years of record (1929-1979) is 7,532 cfs and repre-
sents 11.3 inches of average annual runoff. The maximum, minimum, and
average discharges for the mean monthly and annual flows are summarized
in figure 3 for the 51 years of record at Durand. The annual mean flows
(water year and climatic year) and ranking for the period of record at
Durand are summarized in table 2. •S
W W W
0 rE 0 0 I.
* 40 .
35 MAXIMUM MONTHLY
30
,aU JlU.
§25
20
AVERAGE MONTHLY
w
0o ___ _-'-__ ___--_10- 1-!
STa1II U.S.G.S. 3695 01510 or UCM0 St TUKAS (1129-I9) ...IU.GNA. AND AV,. SWJ M lasi -
Figure 3. Table of average monthly flows, ChippewaRiver at Durand, Wisconsin
G-62-9
, , W - . i , W W W W
The average discharge for the Red Cedar River at Menomonie for the
67 years of record (1913-1979) is 1,248 cfs and represents 9.6 inches
of average annual runoff.
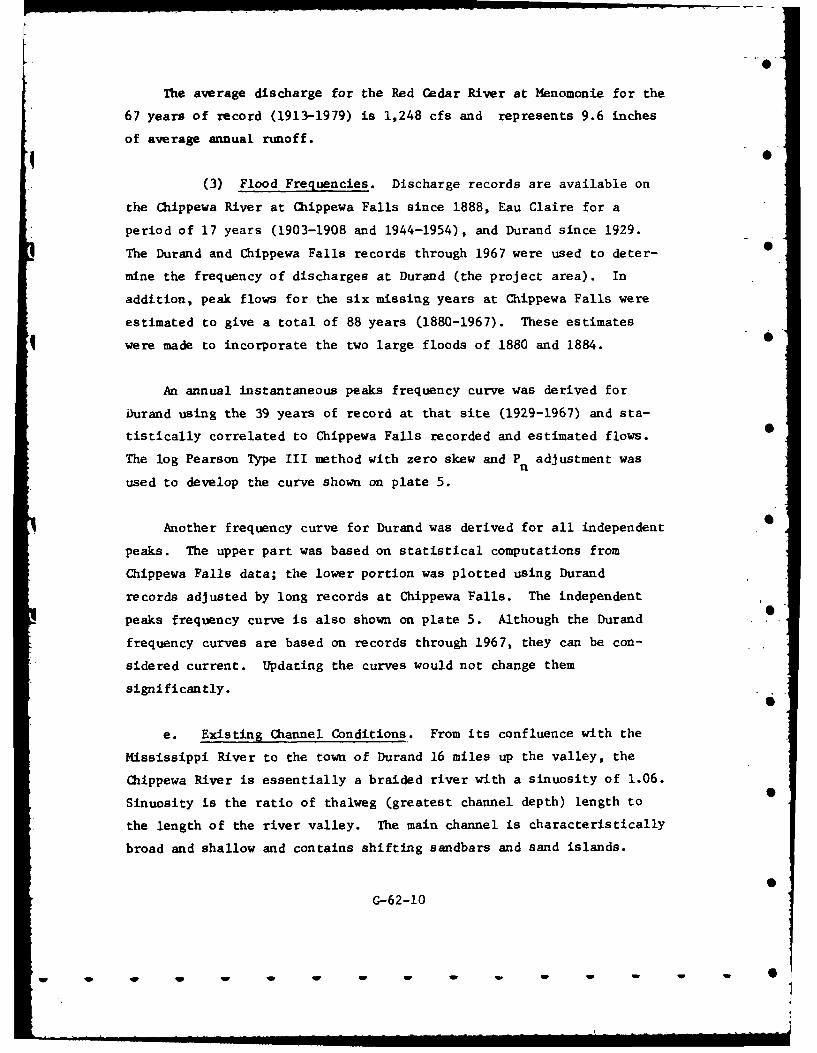
(3) Flood Frequencies. Discharge records are available on
the Chippewa River at Chippewa Falls since 1888, Eau Claire for a
period of 17 years (1903-1908 and 1944-1954), and Durand since 1929.
The Durand and Chippewa Falls records through 1967 were used to deter-
mine the frequency of discharges at Durand (the project area). In
addition, peak flows for the six missing years at Chippewa Falls were
estimated to give a total of 88 years (1880-1967). These estimates
were made to incorporate the two large floods of 1880 and 1884. 0
An annual instantaneous peaks frequency curve was derived for
Durand using the 39 years of record at that site (1929-1967) and sta-
tistically correlated to Chippewa Falls recorded and estimated flows.
The log Pearson Type III method with zero skew and Pn adjustment was
used to develop the curve shown on plate 5.
Another frequency curve for Durand was derived for all independent
peaks. The upper part was based on statistical computations from
Chippewa Falls data; the lower portion was plotted using Durand
records adjusted by long records at Chippewa Falls. The independent
peaks frequency curve is also shown on plate 5. Although the Durand
frequency curves are based on records through 1967, they can be con-
sidered current. Updating the curves would not change them
significantly.
e. Existing Channel Conditions. From its confluence with the
Mississippi River to the town of Durand 16 miles up the valley, the
Chippewa River is essentially a braided river with a sinuosity of 1.06.
Sinuosity is the ratio of thalweg (greatest channel depth) length to
the length of the river valley. The main channel is characteristically
broad and shallow and contains shifting sandbars and sand islands.
G-62-10
w"'----==" - , w w ,' wI -.. . I 0 I
The average channel width is 700 feet and the average depth is about
3 feet. The bank-full width is approximately 1,000 feet. Channel
slope for this river reach is 1.76 feet per mile. Upstream from Durand
to Eau Claire at river mile 61, the Chippewa River has a meandering
configuration with a sinuousity of 1.49. This reach is characterized
by eroding sand and gravel banks. The channel width is somewhat less
than that below Durand, averaging about 600 feet. The channel slope for
this reach is about 1.5 feet per mile.
A geomorphic study of the Chippewa River indicates that erosion of
steep high banks is evident at several locations between Eau Claire and
Durand. These locations include Yellow Bank at river mile 20.5, the
right bank of the Chippewa River near Happy Island at river mile 35.5,
and the left bank of the Lower Elk Creek entering the Chippewa River
near river mile 45.5.
f. Locality, Dei !lopment, and Occupation. Suatistics on employ-
ment show that about two-thirds of the workers in the project area found
employment in agriculture, services, and retail trade. Agriculture was
the single largest sector of employment with about 25 percent.
Agriculture remains the predominant industry despite decreasing
employment in this category from 1964 to 1974. Decreasing employment
in agriculture appears to be primarily caused by a shift toward greater
energy-intensive farming practices rather than a lessening of importance
of agriculture in the region.
Population in the project area (Buffalo, Dunn, and Pepin Counties)
was 53,313 in 1975, up 8.8 percent from 1950. About half this gain can
be attributed to the national population increase in the area (i.e.,
birth rates exceeding mortality rates); the remainder resulted from
immigration to the three-county area.
Median family income for the area (about $7,600) for 1969 shows
G-62-11
. . ............. . V - -. - ., W ,,W -. n ln nnm nW W n I W - -
families earn typically less than the median family income for Wiscon-
sin ($10,068). These differences may be attributed to the predominance
of agriculture in the area which usually has lower cash incomes associ-
ated with it.
g. Environmental Considerations. The floodplain vegetation of
the Chippewa River is composed primarily of lowland hardwood and is
characterized by species such as silver maple, green ash, elm, box elder,
and willow. Vegetation along the upper hank includes oak, aspen, and
birch with scattered stands of red and white pine along some of the
higher banks. Upland areas adjacent to the Chippewa River are pre-
dominantly agricultural in nature.
Aquatic macrophytes in the study area are scarce because of the
continual water level fluctuations, naturally occurring dark water
color, shifting substrates, and harmful effluents. Sedges (carex sp.)
are the most prevalent emergent aquatic vegetation in the study area.
A wide variety of wildlife may be found along the Chippewa River.
Fauna of the region include 65 species of mammals, 44 species of rep-
tiles and amphibians, and 237 species of birds. Some common species
include white-tailed deer, fox squirrel, cottontail rabbit, muskrat,
raccoon, woodchuck, leopard frog, garter snake, American toad, and
turtle. Numerous passerine birds are common to the floodplain forest.
Waterfowl such as mallards, wood ducks, and blue-winged teal inhabit
the many ponds and marshy areas within the bottomland forest. Walleye,
northern pike, black crappie, and channel catfish are the most abun-
dant sport fish in the project area. Rough fish common to the area
include sculpin, white sucker, northern redhorse, and carp.
The following species are listed as threatened or endangered by
the U.S. Fish and Wildlife Service and could occur along the Chippewa
River: prairie chicken, prairie falcon, peregrine falcon, bald eagle,
Indiana bat, eastern timber wolf, and eastern cougar.
G-62-12
-- - -. - --w ,m w wm m | [ w
The Chippewa River, like many rivers in the Upper Mississippi
River basin, is a nutrient-rich stream. Water quality degradation is
caused more by agricultural drainage than municipal and industrial dis-
Ccharges. The water quality of the Chippewa River is considered fair
for a warmwater stream.
Because of the localized nature of the anticipated impacts during
construction, no significant adverse impacts on the fish and wildlife
resources are anticipated.
The Chippewa River has potential for inclusion in the National
Wild and Scenic Rivers System. The project was coordinated with appro-
priate State and Federal agencies to minimize the impacts and make the
project more compatible in terms of its wild and scenic river poten-
tial. No negative comments were received from these agencies.
6. Demonstration Site - Test Reach.
a. Hydraulic Characteristics. Three across river sections were sur-
veyed at each of the five sites. Velocity measurements were obtained 5
in the fall of 1980 just before construction. These velocities ranged
from less than 1 fps to 5.5 fps (feet per second) at discharges which
ranged from 3,690 cfs to 18,100 cfs. Plate 6 shows the velocity dis-
tribution within the channel at the time the measurements were taken S
for two typical cross sections. This plate also shows that the banks
have eroded over about a 1-year period. Velocity measurements ob-
tained prior to construction are shown in Appendix A. Plate 7 shows
* the elevation-discharge relationship at the U.S. Geological Survey
gage near Durand. This curve is based on historic records from the
Geological Survey. Water surface profiles are shown on plate 8.
4 b. Riverbank Description. 5
(1) Bank Materials. The major soils of the low banks in-
clude undifferentiated sandy alluvial soils overlain by a shallow
G-62-13
4 . - , -
silty horizon. The high bank is distinguished by a thick sandy sub-
surface horizon with up to 40 inches of silty topsoil. Mechanical
analysis of sand samples taken from the banks in the test reaches indi-
cate that the soils are basically poorly graded fine to medium sands to
poorly graded silty sands. See plates 9-12 for typical gradation curves.
(2) Vegetation. The floodplain area vegetation consists
primarily of lowland hardwoods (silver maple, green ash, elm, box
elder, and willow). The vegetation near the upper banks is mostly
scattered oak, aspen, and birch. Along some of the higher banks are
scattered red and white pines.
III. DESIGN AND CONSTRUCTION
7. General. The five sites chosen for erosion control allowed for a
design of 19 different test sections. The materials used for protection
include concrete block, filter fabric, quarried rock fill, Enkamat,
woven wire fencing, sandbags, snow fence, and local trees. Various
placement techniques and configurations of materials make up the scheme
of the demonstration project. Generally, construction will extend from
the top of the bank into the water and along the bottom to a point less
than 50 feet from the waterline at the river mean low-water level to
limit erosion at the toe of the slope.
8. Basis for Design. The methods of protection were designed pri-
marily on three considerations:
a. Use of inexpensive methods which may be applied by local
interests.
b. Use of easily obtainable products or products designed for
other applications that could be modified for erosion control.
c. Methods that have been effective or partially effective in
other areas or other projects.
G-62-14
..... w -w....=i itn W ii wl iN w ww
* S
Some design configurations were altered so a determination could be
made as to which configuration would be most effective.
Erosion of the banks caused by wind was not considered a major de-
sign factor. The geometry of the banks, and the materials and nature
of the topsoil and ground cover indicate that erosion caused by wind
is minor compared to erosion from river flow. °0
9. Construction Details. The design plan and sections for the five
sites are shown on plates 13 through 34. Final surveys for these sites
will be taken in spring 1981. Therefore, as-built drawings will not be
included in this report. A brief description of the protection measure
for each site follows.
a. Site No. 1 - Low (five test sections, plates 13-17).
(1) Two sections with a single layer of concrete blocks
filled with sand above the water level. The blocks were placed with
their major axis perpendicular to the shore for half of each section
and parallel to the shore for the remaining half. One section was
underlain with a filter fabric blanket; rock was placed at the toe of
the other section.
0(2) Three sections of various configurations of quarry-rm
rock fill.
b. Site No. 2 - Low (seven test sections, plates 18-24).
(1) One section of filter fabric weighted with rock fill at
the top and bottom and rock laid randomly on the slope.
6 (2) Two sections with different styles of Enkamat soil rein-
forcement matting weighted with rock fill at the top and bottom and
secured to the bank with metal pins.
G-62-15
... W W W . IWI .. .
(3) Three sections of upright woven wire fencing parallel to
the bank with small trees, brush, and clippings placed landward of the
fence.0
(4) One section protected with nonbiodegradable sand-filled
bags.
0c. Site No. 3 - Low (five test sections, plates 25-28).
(1) Two sections of wire and wood snow fencing weighted with
concrete blocks, partially submerged at the toe of the streambank, ly-
ing along the bottom parallel to the bank.
(2) One section with wire and wood snow fencing placed as
above, with addition of upright fencing backfilled with brush along
the streambank.
(3) Two sections with the trunks of large trees cabled to
the bank at various spacings and lying in the river perpendicular to
the bank or angled downstream.
d. Site No. 7 - Low (plates 29-31). Consists of two configura-
tions of short rock-fill wing dams at various spacings. 0
e. Site No. 3 - High (plates 32-34). Erosion protection con-
sists of varying quantities of rock fill dumped from the top of the
100-foot high bank.
Rock for the protection work was quarried stone with at least 50 per-
cent greater than 25 pounds. The maximum size stone had to fit within
the finished grade lines as shown for the typical sections. The
finished structures presented a reasonably well-graded distribution of
sizes.
G-62-16
0 W W W W W W
.... ------- ...-- li..= nm li ll ii ii - l "1
10. Construction Problems. No significant problems were encountered
in construction of the project. Dumping of rock fill over the top of
the bank at Site No. 3 - High had unanticipated results. More than
three-fourths of the rock lodged near the top of the bank during dumping.
Most of the rock was expected to roll or slide to the bottom of the
100-foot high bank immediately. With spring runoff-induced erosiun,
more of the rock should make its way to the toe of the bank as origi-
nally intended. At Site No. 2 - Low, wooden stakes used to anchor the
Enkamat pulled out of the bank and floated when placed beneath water.
Metal stakes were fabricated and used to repin the matting. Distance
between rock groins at Site No. 7 - Low was measured from the top of
the bank at time of construction so their locations may vary with regard
to the range lines as shown on the drawings.
No instrumentation was installed other than locations flagged ,or
measuring velocity and range lines marked for surveying.
Construction activities had some temporary adverse impacts, which
were generally restricted to the immediate project area. Clearing in
the construction areas resulted in a minor loss of some vegetation.
Erosion resulting from construction activities and consequent increases
in the levels of suspended solids in the surface waters temporarily
degraded water quality.
The placement of riprap and the construction of wing dams at
selected demonstration sites resulted in temporary adverse impacts on
shoreline and benthic communities because existing habitat was covered.
However, these construction measures provided new habitat which was
available for colonization by organisms outside of the construction
area.
11. Costs. Costs for the project totaled $423,000. This included
final site selection, preconstruction planning and coordination, project
design, preparation of plans and specifications, project construction,
G-62-17
W . W w w - - -i
and administration and supervision of the construction contract.
Construction costs including modifications for the project were
$327,437. With a project length of 9,900 feet, the average cost for
rprotection was about $33/foot. Costs ranged from $5.40/foot for trees
anchored to the bank (Site No. 3 - Low, Section 5) to $87.70/foot for
concrete blocks with rock fill toe protection (Site No. 1 - Low, Sec-
tion 2). Table 3 summarizes costs for each section of the project.
IV. PERFORMANCE OF PROTECTION
12. Monitoring Program. The sites will be monitored after project con- 0struction. Monitoring will consist of gathering survey data, velocity
measurements, and climatological and hydrologic data. Visual observa-
tions will be recorded and a complete photographic record will be made
during site inspections.
Testing of materials in existing banks and of the rock fill is com-
pleted for each finished site and is not scheduled to be retested in
the monitoring plan. The elements of the monitoring program are summar-
ized in table 4.
13. Evaluation of Protection Performance. Because the completed sites
were finished late in fall 1980, very little performance data have been
collected. The prefinal inspection on 5 December 1980 revealed that
an uprooted tree had floated into the bank and had broken and dis-
rupted a small section of concrete blocks in section 1 of Site No. I -
Low. At Site No. 2 - Low, ice movement had displaced some of the con-
crete blocks connected to the woven wire fencing in sections 5 and 6.
This minor displacement causes no problems at this time; however, larger
ice flows may distort the wire to which the block is connected. Deer
tracks were seen on the sandbags in section 7 of Site No. 2 - Low, but
the bags had not been damaged.
Because construction on most sites was so recently completed,
G-62-18
.... .. . w-=,.=mmmmmim mm - -[] - -
results of revegetation (seeded and native) cannot be evaluated at this
time.
Typical photos taken before, during, and after construction are
shown on plates 35 through 47.
14. Rehabilitation. No major rehabilitation of the project or portions
of the project is planned by the Corps. Because of the demonstration
nature of the project and the strong potential for failure, the local
sponsors (Pepin and Dunn Counties, Wisconsin) will not be required to
reconstruct or maintain any portions of the project which fail during 0
the monitoring period. They will, however, be required to maintain
and operate the project later on provided that (1) the project has been
deemed by the Government to be structurally and functionally sound for
maintenance and the project is no longer needed for demonstration pur- •
poses and (2) the project has been formally tirned over to the county
(counties) for operation.
15. Conclusions. An evaluation of the effectiveness of the project is
difficult at this time because most reaches were constructed in fall
1980. Preliminary indications are that:
a. Rock fill and concrete block configurations demonstrated at •
Site No. 1 - Low will perform satisfactorily under conditions similar
to the Chippewa River with no or slight modifications from project
designs.
b. Ice effects on filter fabric, Enkamat, and vertical longi-
tudinal wire fencing as demonstrated at Site No. 2 - Low could preclude
their use in areas where ice damage is a problem. However, Enkamat
sections probably would perform much better if vegetation were established 0
before ice effects occur. The St. Paul District in cooperation with The
American Enka Company is contemplating reestablishment of Enkamat sections
in early summer 1981. Sand-filled bags could also fail as a result of
G-62-19
..- w ,i - Now
ice and weather effects although they withstood the winter of 1980-81
and spring high flows relatively intact.
c. Measures proposed at Site No. 3-Low will be constructed in
spring 1981. Therefore, no conclusions as to their effectiveness can
be made at this time.
d. Wing dams constructed at Site No. 7 - Low performed well
during the first 6 months after construction and were not affected by
ice. High flows in spring 1981, however, have eroded the banks between
some wing dams. Long-term effectiveness uf wing dams and optimal
spacing between them cannot be determined at this time.
e. Dumped rock fill at Site No. 3 - High cannot be evaluated
at this time because of the before-mentioned construction problems. The
site will continue to be monitored to determine whether the rock reaches
the toe as intended and whether the rock is effective in preventing ero-
sion if it reaches the toe.
G-62-20
... .-- ,w ,.. --,.- - Inlmmnnll u n Imain -il -" i - S
,AD-A12i 139 THE STREAMBANK EROSION CONTROL EVALUATION AND 2/4DEMONSTRATION ACT OF 1974 S.. (U) ARMY ENGINEERWATER;dAYS EXPERIMENT STATION YICKSBURG MS HYDRA..
UNCLASSIFIED M P KEOWN ET AL. DEC Bi F/0 13/2 N
llll//ImhIIll/llll/E|l/lEumhhhhhhhE///
I HWEEEEEIElhhIEImhhhhhhhhhhhhIB
1j..2.
111 =2 11111_L4
IIIII1*** * 5:2 I
MICROCOPY RESOLUTION TEST CHARTNATIONAL BUREAU OF STANDARDS-I 963-A
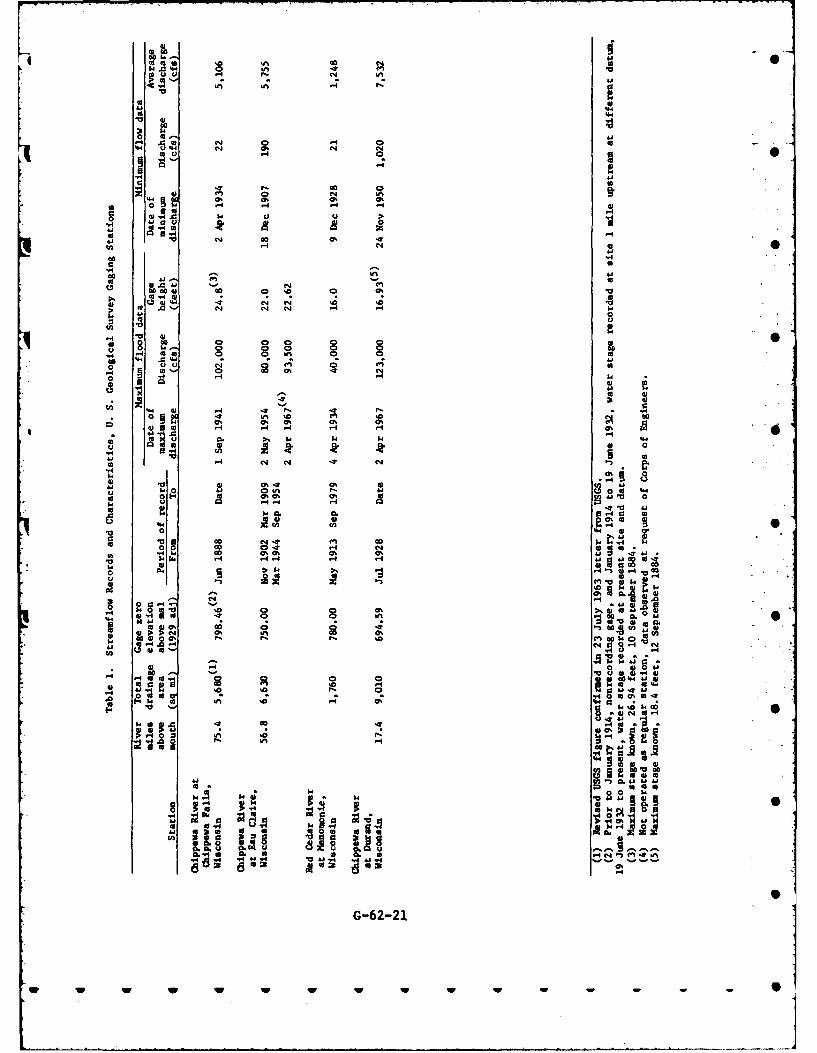
K El C4 -ACEoE Wo
CAjoEJ
N N60
U *1
*0 Elto
o l ap8 bN
0E
to .4 to
0) .4 N- El
'.4 W' k k
w cltotj t 0 InS0 0 '.6
0 N0 N4 10
w "ac00-4 10 -0
I IL 00
9 0 9 0.4 1--4 $ - 43 o
1 NA 4.0 3ECp 60. ton.
c.4 -
to a. 'I
Ell
U El 0.4 E ow 0
El0I E % % ' 0a to
El .~0 p, a-I 6
.44..~e .4t w,%0%
00 -1
tG-62-2
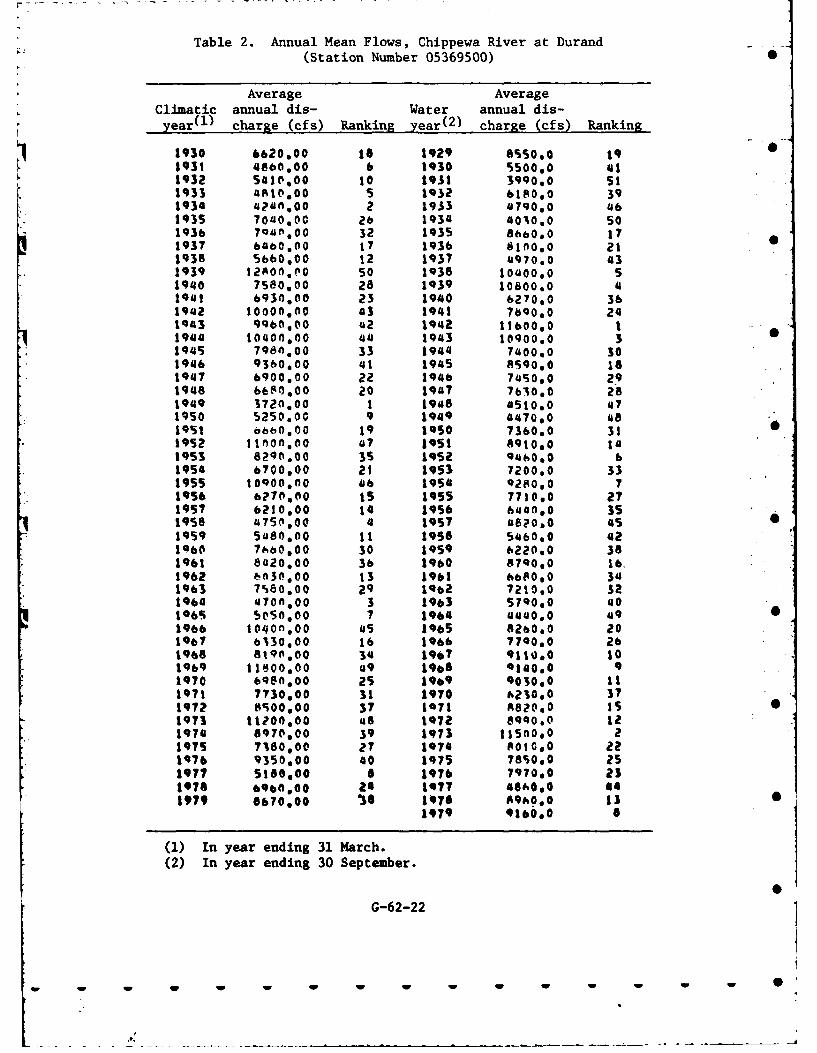
Table 2. Annual Mean Flows, Chippewa River at Durand(Station Number 05369500) -
Average AverageClimatic annual dis- Water annual dis-Syear(1 ) charge (cfs) Ranking year(2) charge (cfs) Ranking
1930 6620,00 18 1929 8%5010 191931 4860,00 6 1930 S500,0 411932 5410,00 to 1931 3990,0 511933 4Rt0,00 5 1932 6180,0 391934 '?40,00 2 1933 4790.0 461935 7040.00 26 1934 4010.0 501936 7Qo.O00 32 1935 866000 171937 6460,00 17 1936 8100.0 211938 56b6000 12 1937 4970.0 431939 12RO0,00 so 1938 104000. 51940 7580.00 28 1939 10800.0 41941 6930,00 23 1940 6270,0 361942 10000.00 43 1941 7b0,O0 241943 99boo0 u2 1942 11600,0 11944 10400,00 44 1943 10900,0 3 01945 7980,00 33 1944 7400.0 301946 9360,00 41 1945 8S90,0 161947 6900.00 22 1946 7450,0 291946 66S0000 20 1947 7610.0 281949 3720.00 1 1948 0510.0 471950 5250.00 9 1949 4470,0 481951 6660.00 19 oso 7360,0 311952 1lnon'o0 a7 1o51 891000 141953 8290.00 35 1952 94 0,0 b1954 6700,00 21 1953 7200,0 331955 1000,00 46 1954 928OO 71956 6710,00 15 l955 7710.0 271957 6210,00 14 1956 6440,0 351959 4750.00 4 1957 @820.O 4S 01959 5480,00 11 1956 5460,0 421460 7660.00 30 1959 6220.0 381961 8420,00 36 1960 8790,0 16.1962 030.00 13 1961 t680a0 341963 7S80.00 29 1962 7210,0 321964 470f0,O0 3 1963 579000 401o65 5050,00 7 1964 4400,0 49 01966 tO1n00 0 45 1965 8260,0 201o7 6330,00 16 1966 7700,0 261968 819o000 34 1967 911000 101969 11800,00 49 1968 014000 91970 6980,00 25 1969 903000 111971 7730000 31 1970 6230.0 3?19?2 0500,00 37 1071 A820.0 i51973 11200.00 48 1072 8900,0 121974 8970000 39 1973 11500.0 2197S 7380,00 27 1074 0010,0 221976 9350000 40 1975 78s000 251977 5180o00 a 1976 7970,0 23,976 696,00 26 1977 460.0 441979 8670,00 *6 J970 89,o00 13
1979 9160.0 0
(1) In year ending 31 March.(2) In year ending 30 September.
G-62-22
w - ww w W W WI
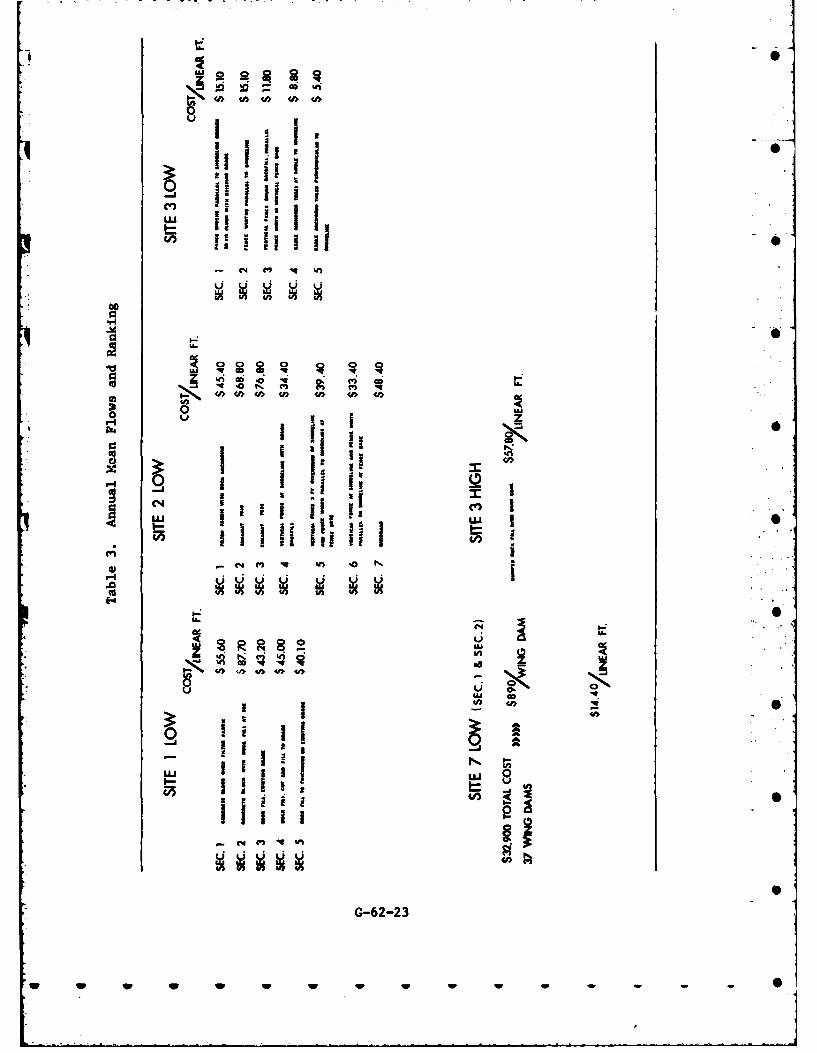
52 5
U
C4 mII tuI
S31 IH ii
09L4L
U-
C4 r) vI
* IJ94 4 z
~ C~d ~ a~ G-62-23
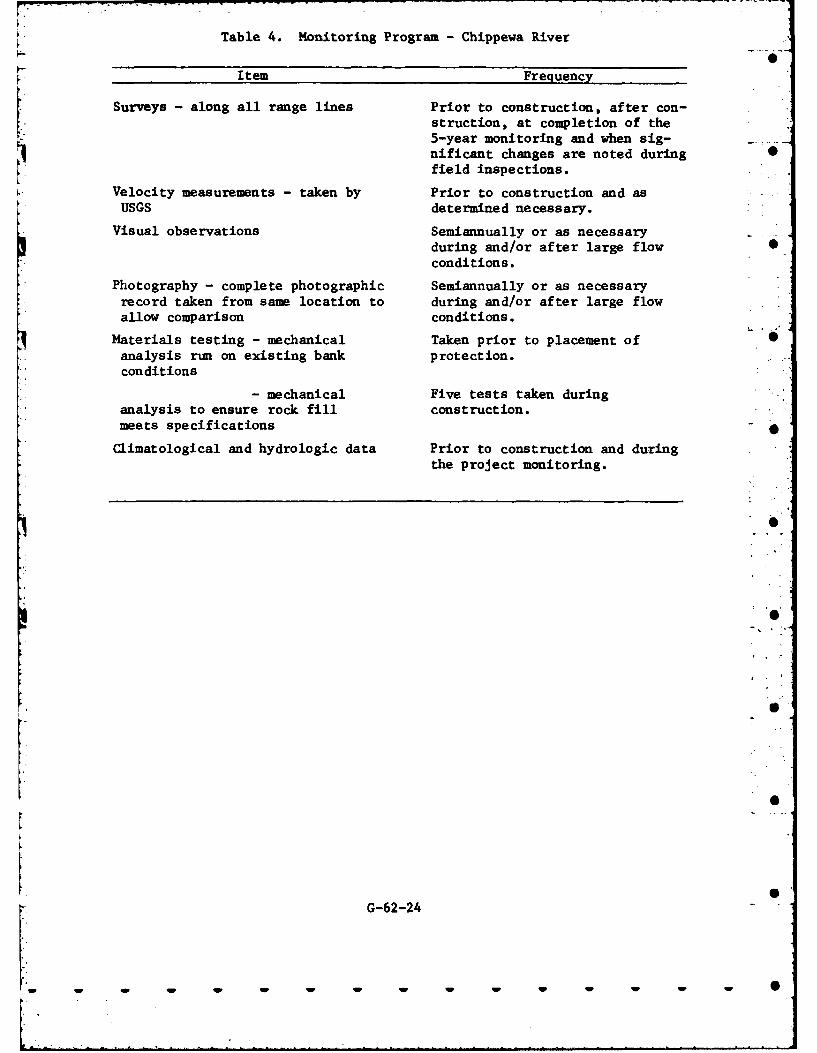
Table 4. Monitoring Program - Chippewa River
Item Frequency
Surveys - along all range lines Prior to construction, after con-struction, at completion of the5-year monitoring and when sig-
nificant changes are noted during -field inspections.
Velocity measurements - taken by Prior to construction and asUSGS determined necessary.
Visual observations Semiannually or as necessaryduring and/or after large flow 0conditions.
Photography - complete photographic Semiannually or as necessaryrecord taken from same location to during and/or after large flowallow comparison conditions.
Materials testing - mechanical Taken prior to placement of 0analysis run on existing bank protection.conditions
-mechanical Five tests taken duringanalysis to ensure rock fill construction.meets specifications
Climatological and hydrologic data Prior to construction and duringthe project monitoring.
G
S
G-62-24
-' ' - . . . ." - . . . W Wn W~m .,a ,=.la m,, mm S •,m ,,, .,..#.. .
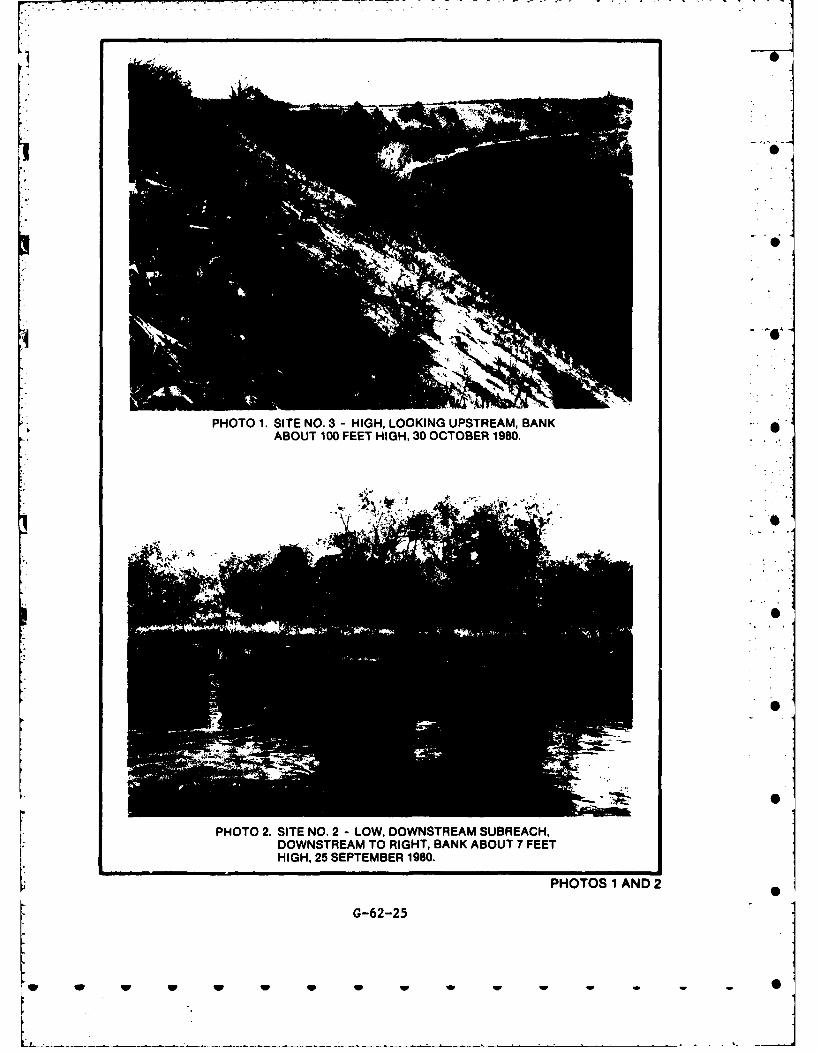
PHOTO 1. SITE NO. 3 - HIGH, LOOKING UPSTREAM, BANKABOUT 100 FEET HIGH, 30 OCTOBER 1980.
r0
PHOTO 2. SITE NO. 2 - LOW, DOWNSTREAM SUBREACH,DOWNSTREAM TO RIGHT, BANK ABOUT 7 FEETHIGH, 25 SEPTEMBER 1980.
PHOTOS 1 AND 2
G-62-25
w w w w w w w
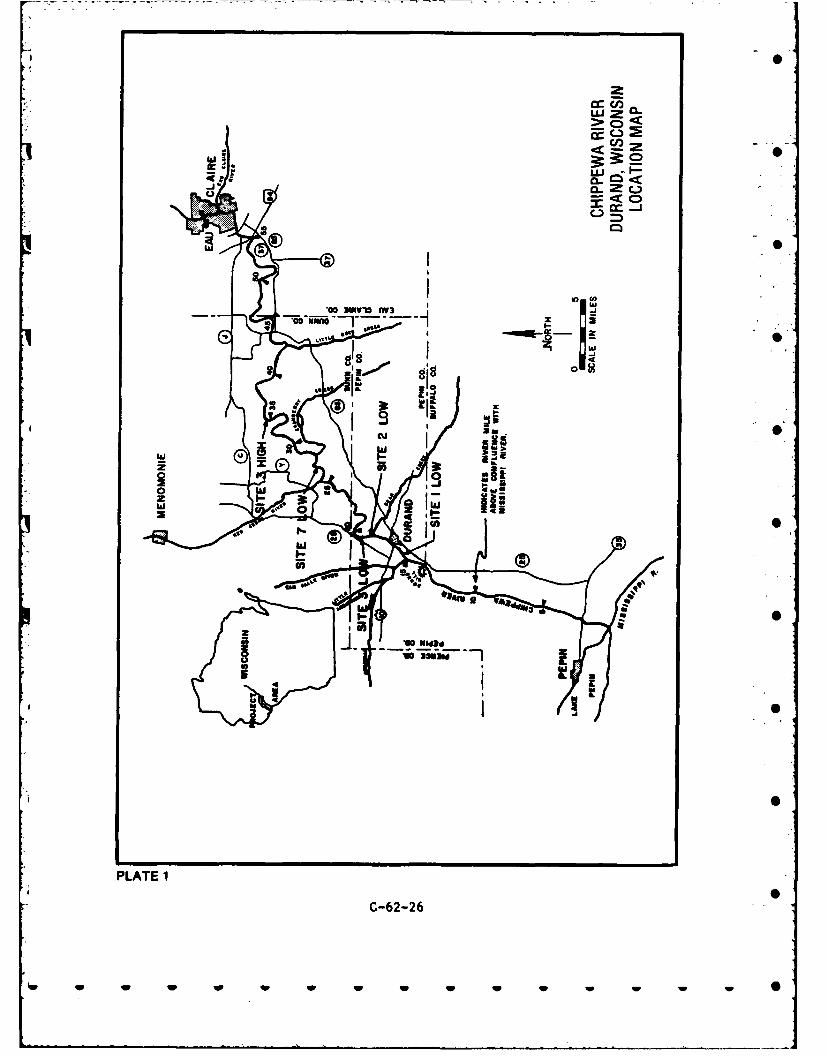
w cr0LuZ
UU
< CD-~~~c -. Mi
SgIN
'Pt
0z a- Iw
U S)
PLATE 1
C-62-26
w w w w w w w w w w
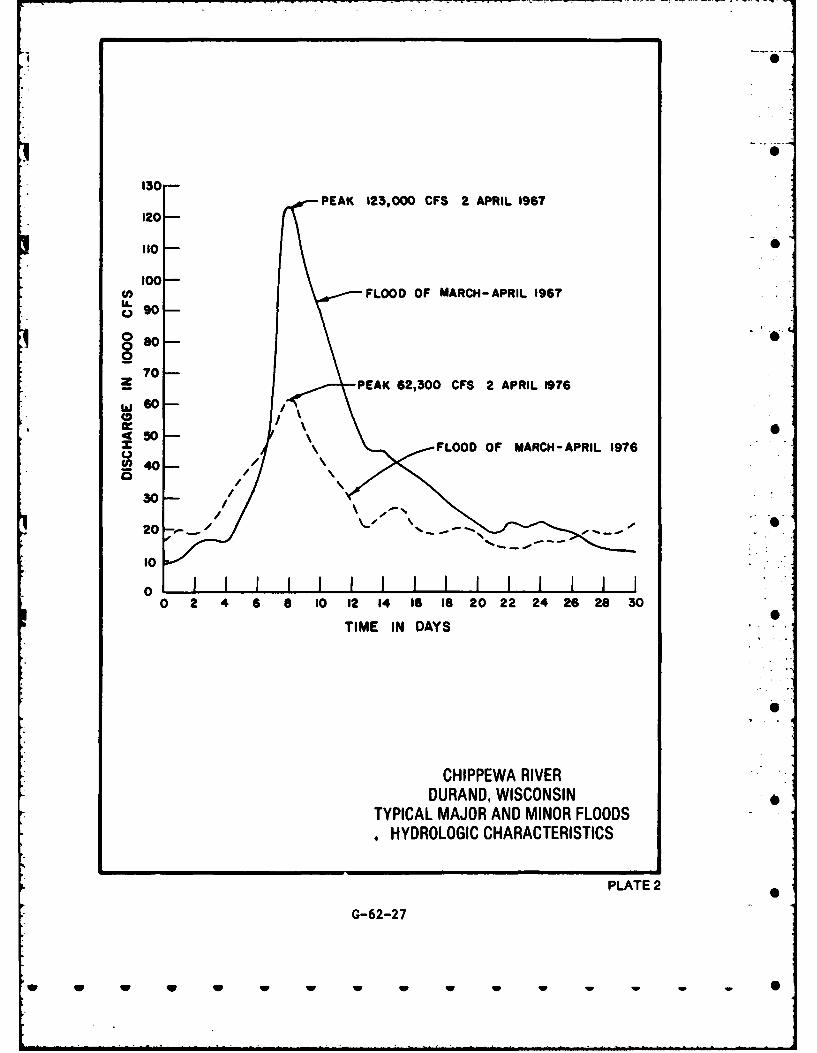
130PEAK 123,000 CFS 2 APRIL 1967
120-
Ito-
100-FLOOD OF MARCH-APRIL 1967
p.000
70-z PEAK 62,300 CFS 2 APRIL 1976
50
Q FLOOD OF MARCH-APRIL 1976
30- ,
I0
0 2 4 6 68 10 12 14 IS I8 20 22 24 26 28 30
TIME IN DAYS
CHIPPEWA RIVERDURAND, WISCONSIN
TYPICAL MAJOR AND MINOR FLOODS4HYDROLOGIC CHARACTERISTICS
PLATE 2
G-62-27
w w w w w w w w w w w
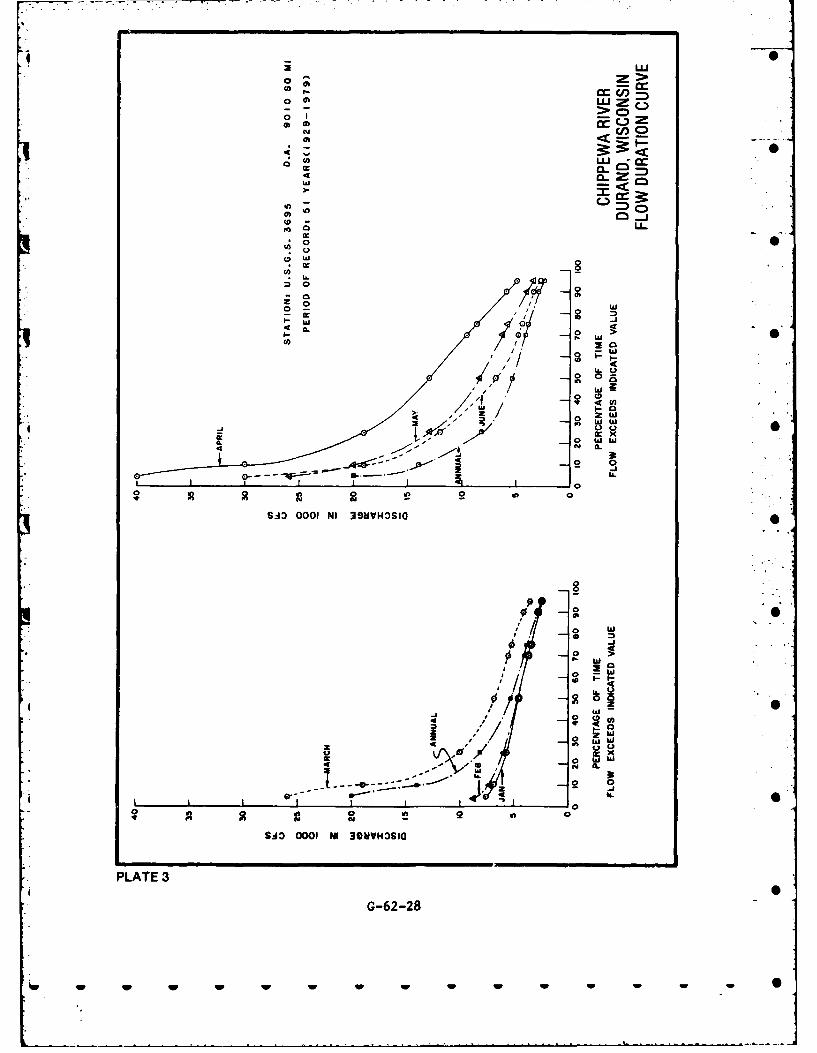
2 LUJ
o> 0D C)Z
o I >0
CflM
C-'=D C)
0-
AX W2 o
w -
o w wCLN CL39
0 0
40
W o
1/4 lit
2
SA 001N Sv~l
PLATEw
G-62-28
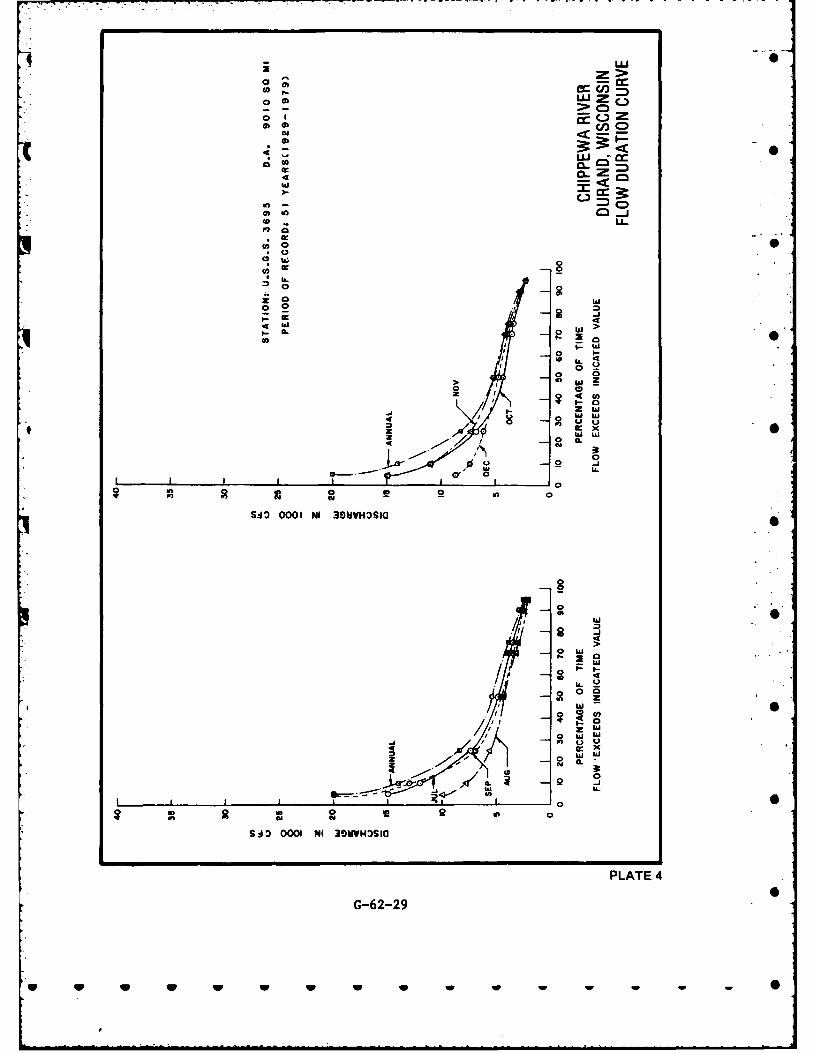
LU 0
>0 CD4'M
In-r
Ca0
0 80 20
00 w000
z4
4 EM
Ca w
C0 0
d 2W
a
SA 3 000 1 NI 39WVHOSIO
0u. 2
02 z
20 W W-a CL~C
00
G-62-29
w l *l w - - 0
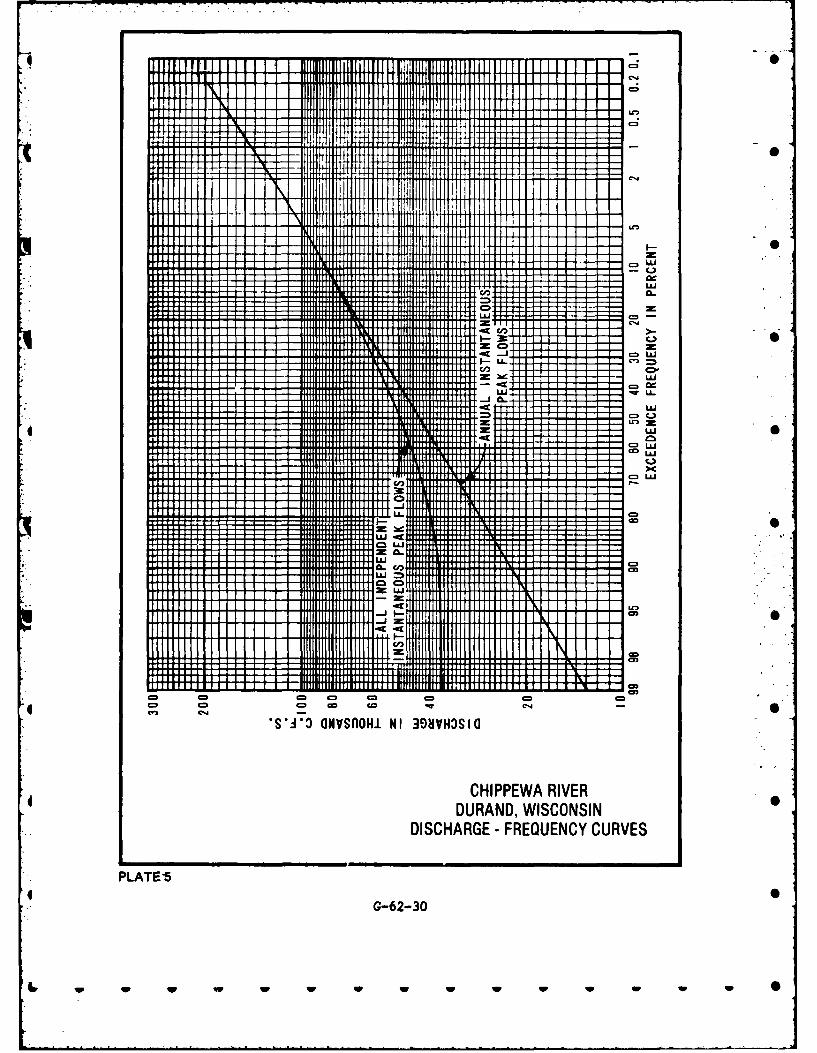
I M0 IL
-C-)
1 1 1uX
III H 1 U -
C-)
f ill [ILL 11 1I til. i p Lp
LLJ__ w
LJ
cmIll, LA
I I I A I2
C=
A (01-AI cm- - 0
*SV NVfOI I C=,SI
CHPPWARIEDURAN, WISONSI
DICHRG -REUNC URE
PLATt I-- 0uj ..
. G....... 30
~~~~'~~I w~ til 9 1 9 1 9 1 9 1 9 1 9 1
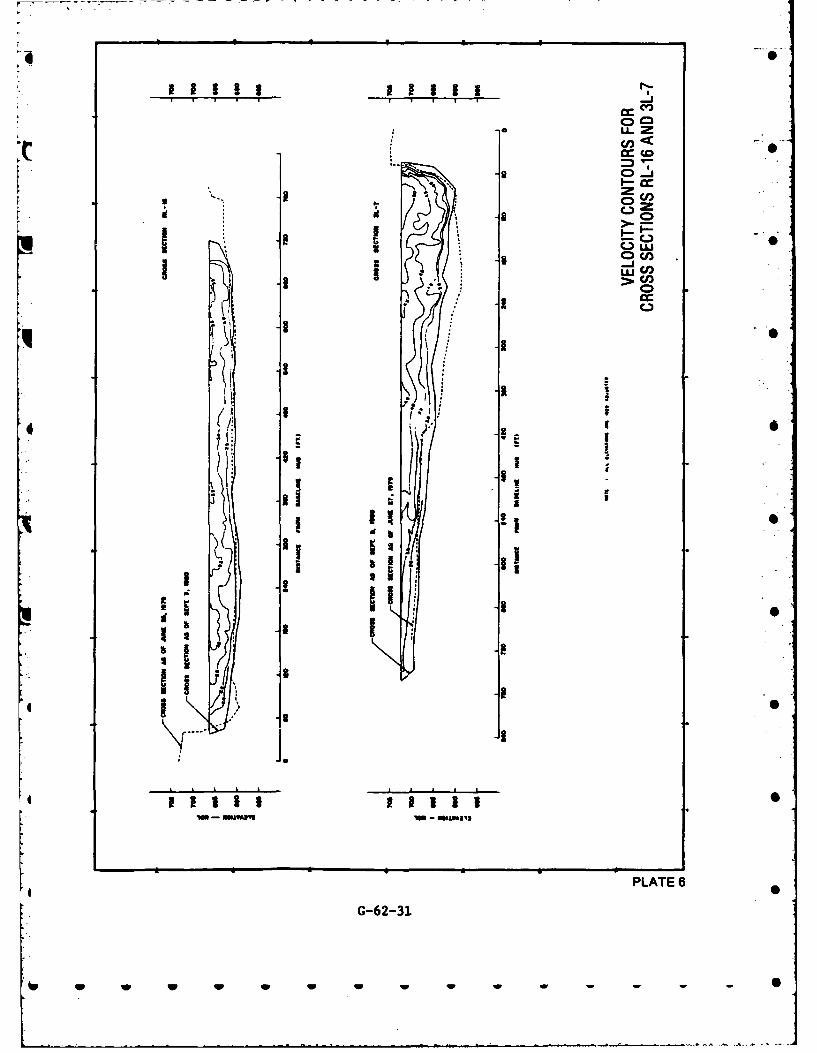
*3 3.r- c
ccc-0C
-t Lco
-I
aE
Li0
PLT
G-23
II w
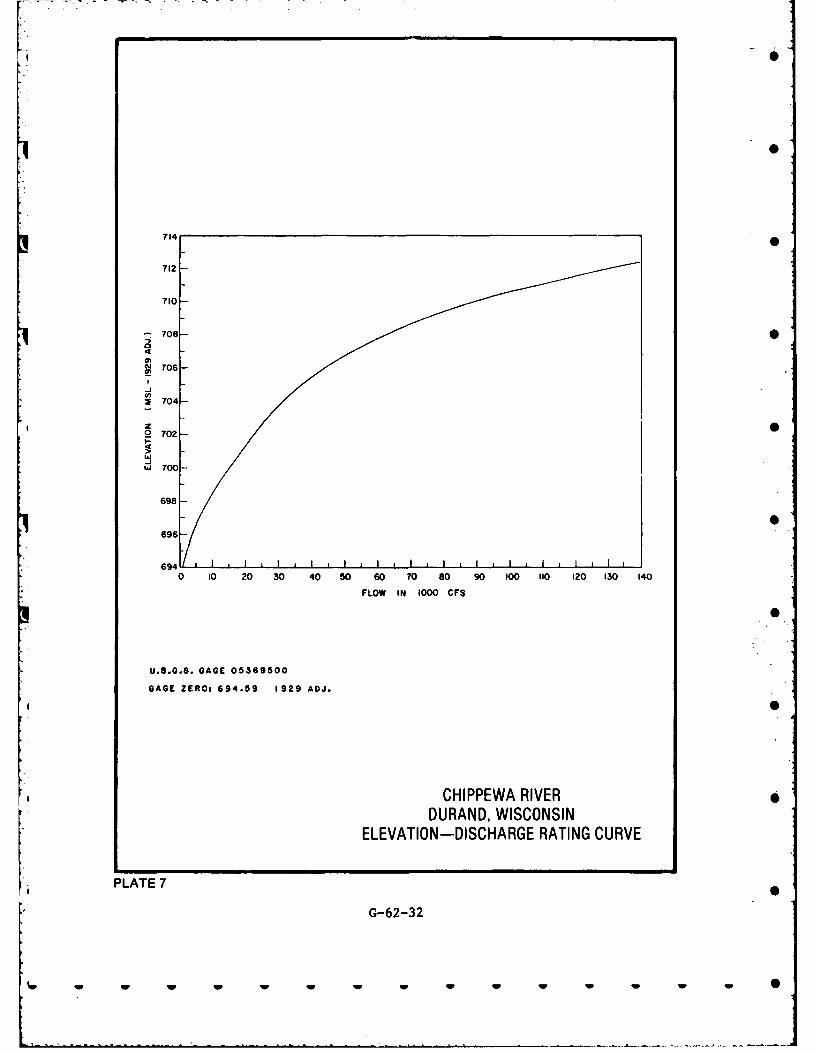
0
714
712
710-
708-
706-
U)S704-
2702 0
lA700-
698-
696-
0 10 20 30 40 50 60 70 s0 90 100 110 120 130 140
FLOW IN 1000 CFS
U.S.G.S. GAGE 05369500
GAGE 2EROt 694.59 1929 ADJ.
CHIPPEWA RIVERDURAND, WISCONSIN
ELEVATION-DISCHARGE RATING CURVE
PLATE 7
G-62-32
w w w w IV w w W w
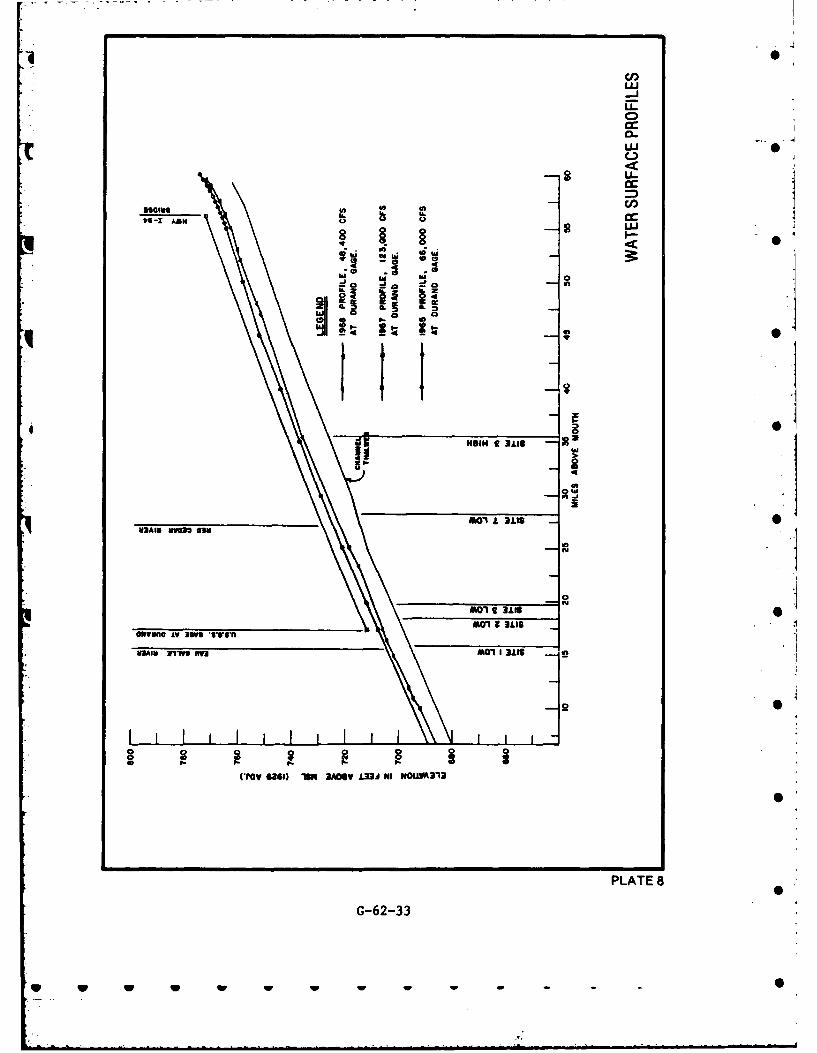
-4iU,
0-
LUI
2LA-
4ASH cc 2L L*1
ft. z
a- 0
IT
#101t 31S 8______________________________am a~ 3118
aWmEwo iv iongy
N2MV Iw Iw3 MIA I ls
(I'OW Gl 1MK 3ADOV 133 NI NOUVAWIS
PLATE 8
G-62-33
*w w w w w w w w
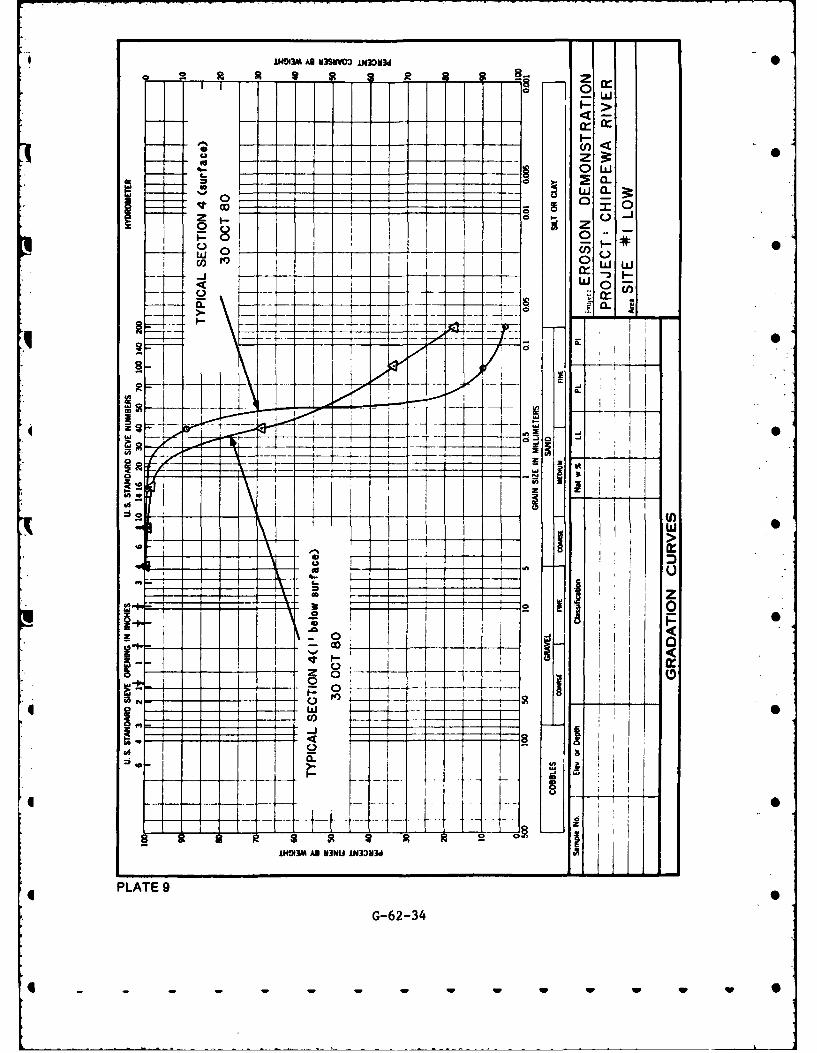
iI3M A N3SWOD AMUd
0 0
0I-
OD 0
0 z
I-- Ls _
-I 00o
-J -J 0 -
- CC
2\rIQ
N 0
0 QwH
0
1"IM AS M3NU INIO3d
PLATE 9
G-62-34
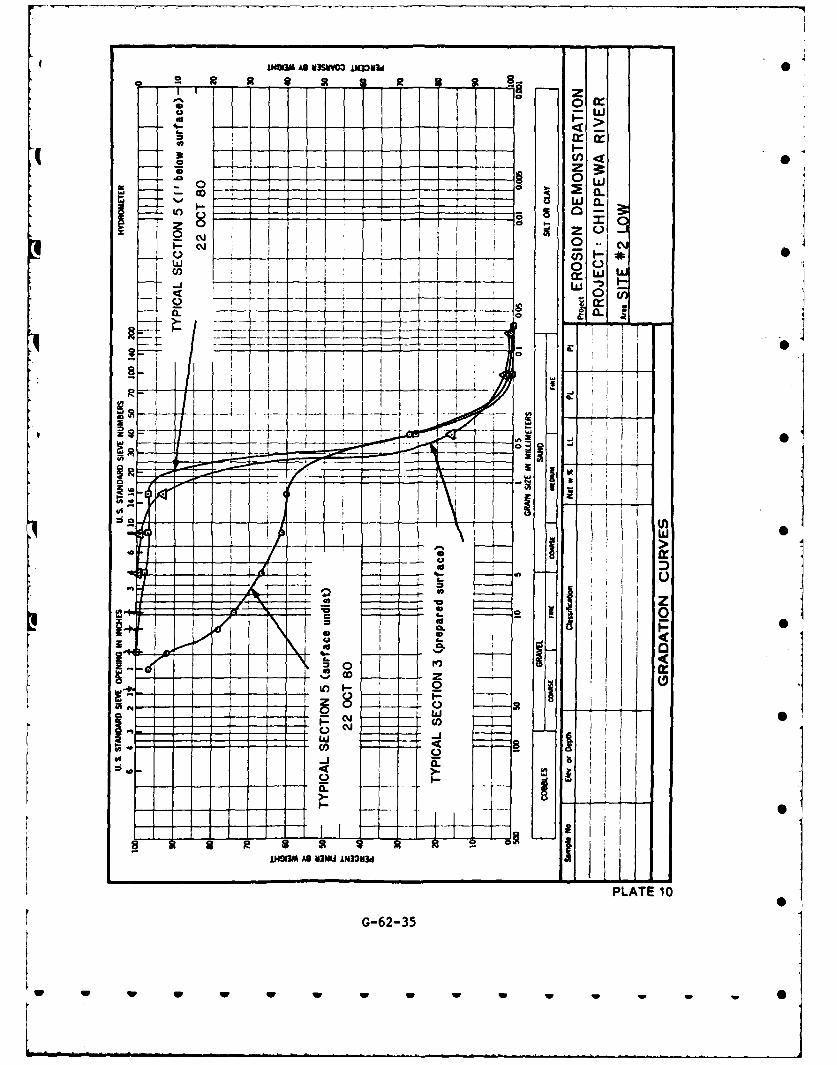
MWO GA 03SVMO A330
C~~~ cr. _2 _
0
g 0
00
-0J
0IJ
=i C,wS
>I
D-
zS
<S
IHIIA adwu 1fu -
PLATE 10
G-62-35
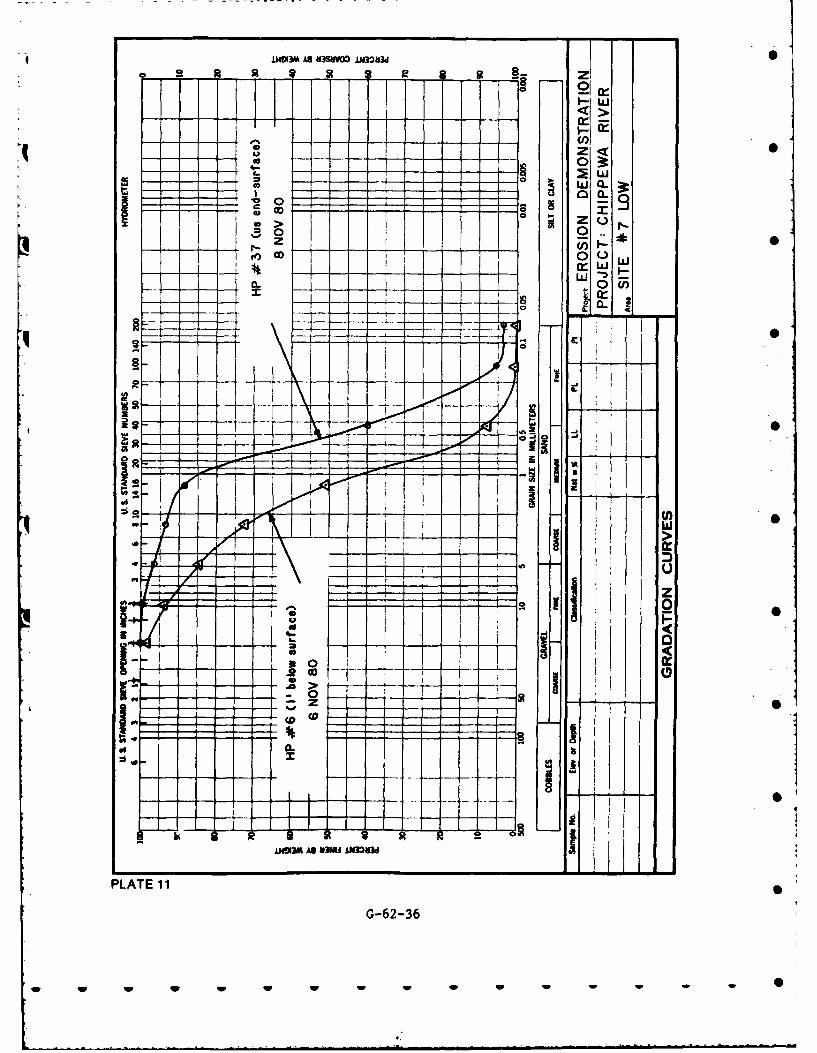
JmmI3m As v3swwO 0M
2
0 C0
0 0
CO 0-~r -r --
_ w
Jd I
400
"361M AS U 3Mi1GUd
PLATE 11
G-62-36
w W w w -
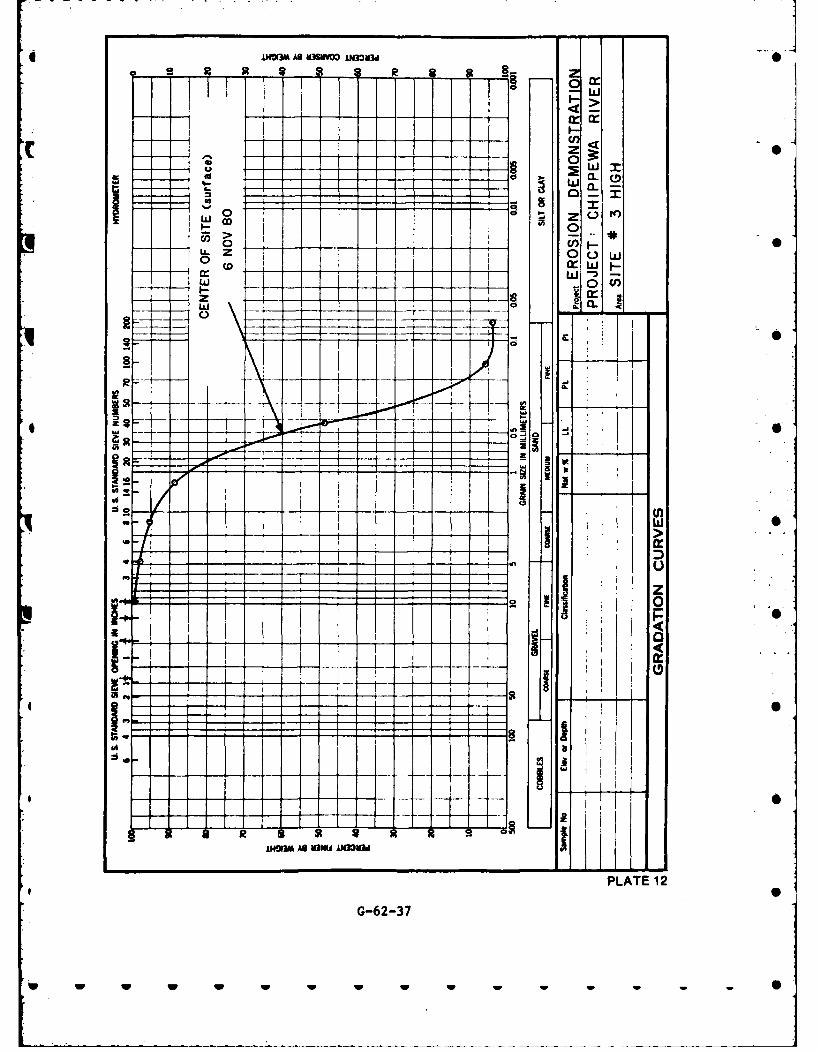
* I4MA A V9SOO LM33V3d 0
C CL
W COV5~~ 0',F
1 0 1 (f -LL Z L
- w L1K2 &1w E
03.
O -- 7- -.
nc.-.o 4i -L4U IA 0
* K - zz~zPLATE.,12G-62-3
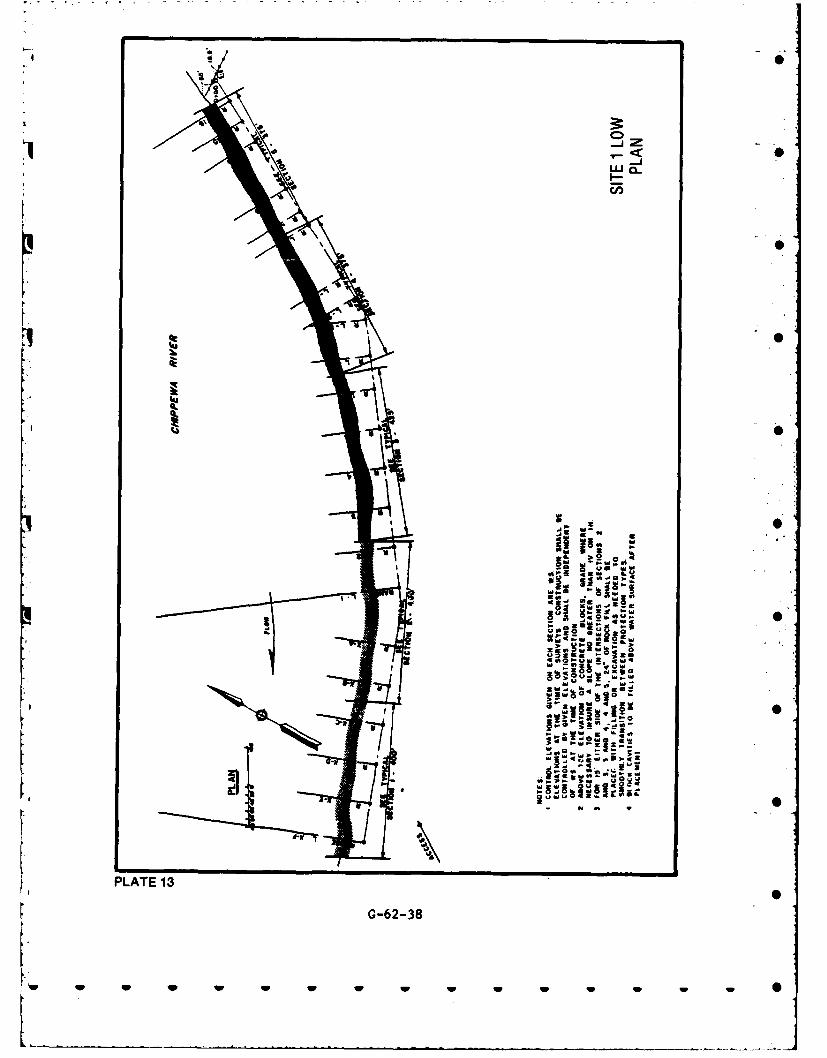
- - - - - - - - -- --
I-
'IW
Hw 0.
PLAE1
G-62-3
w w w w w w w w
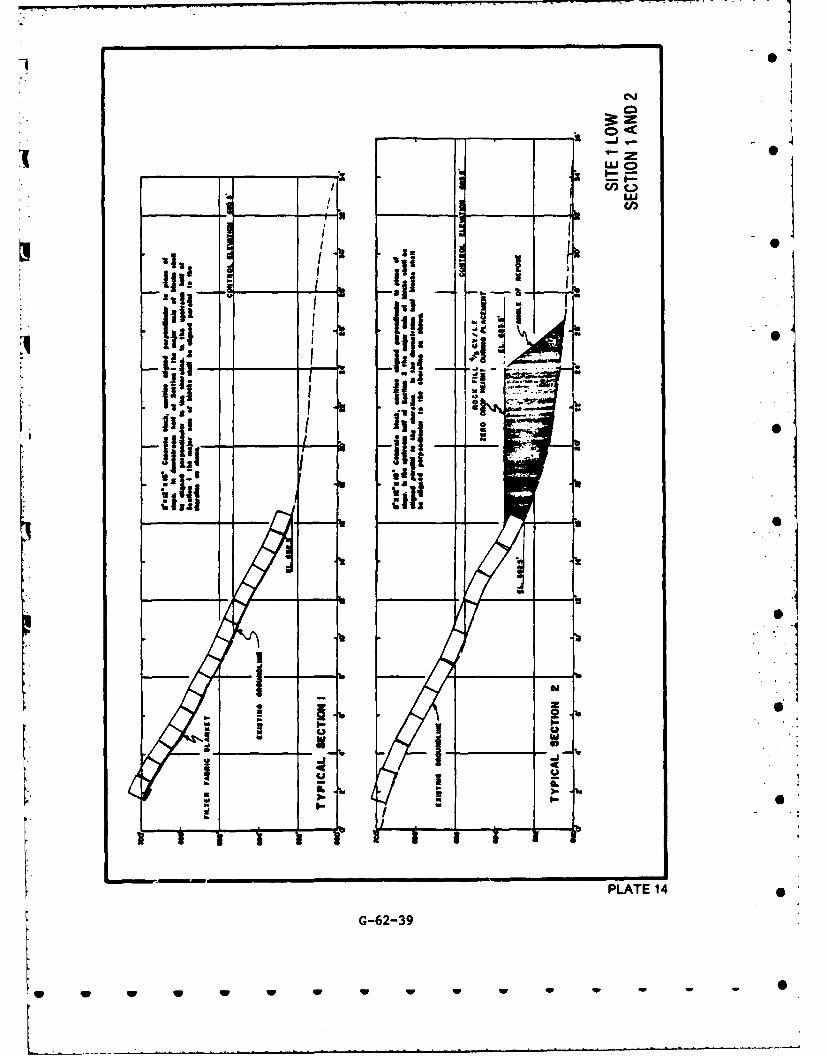
C. D
•1 I
-' "
,jC ,
ifit
al It'
," I"
PLATE 14
G-62-39
I I 'w , I
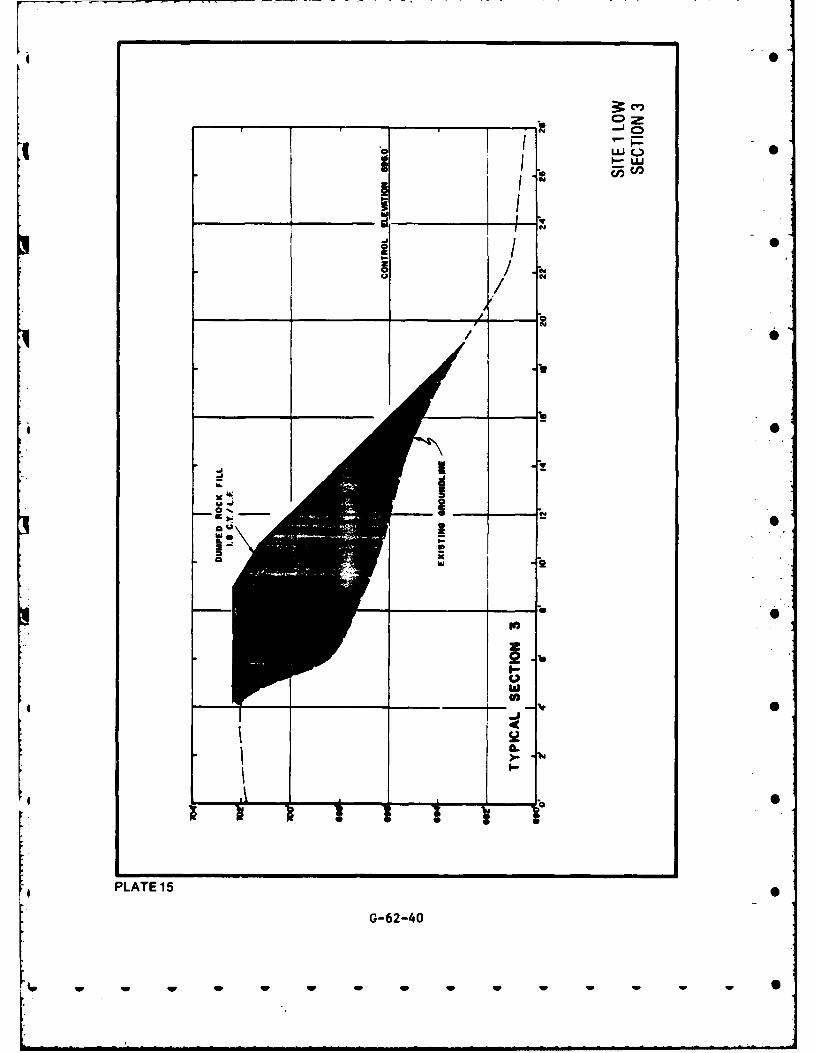
KI
_____ _____ _____ ~cv,
________ *6 OZr .d ~ 0I I-u-Iu-Ic., 0
_____ 111
1 #4 0
II .4#4
/
/
__ 1 0
~1 I-l
II.
* #4 0IS
N
ha Q
-u 0In
-J 04'
a.I-.
0S
PLATE15
G-62-40
'U W W - W W W w w 0
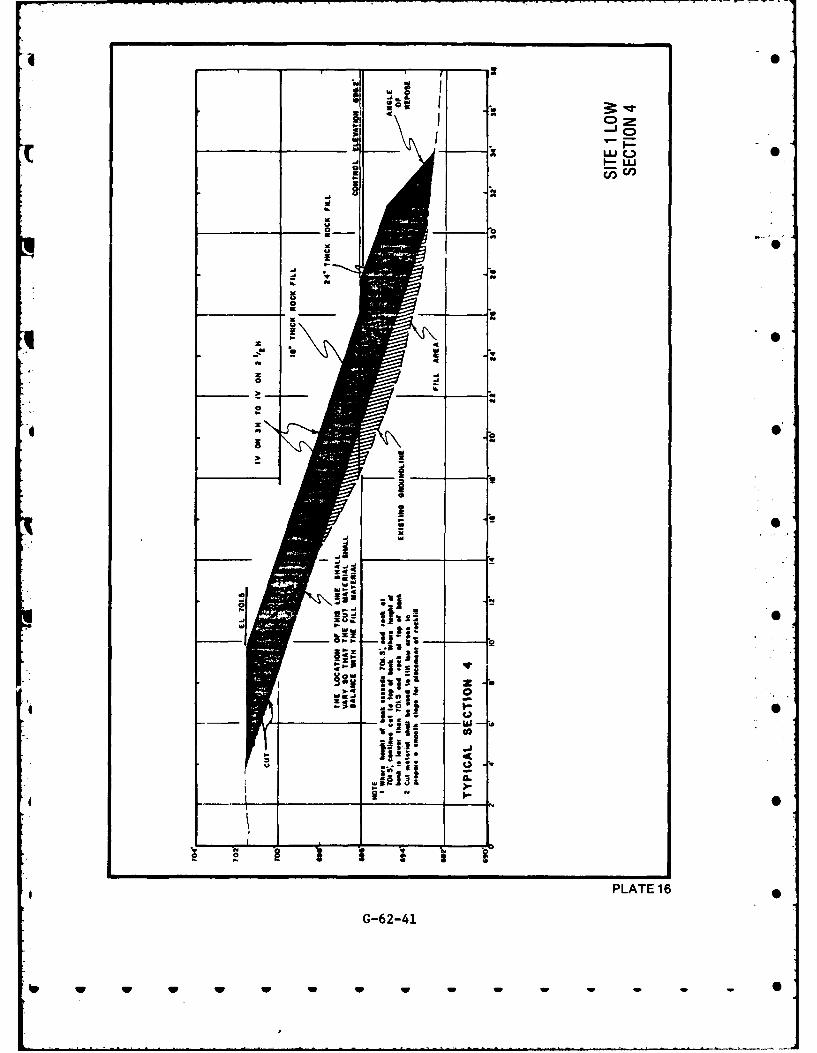
1 00jam-- -W
#44
Io
M.
n 8eri
oc
-A
PLTE1
G-24
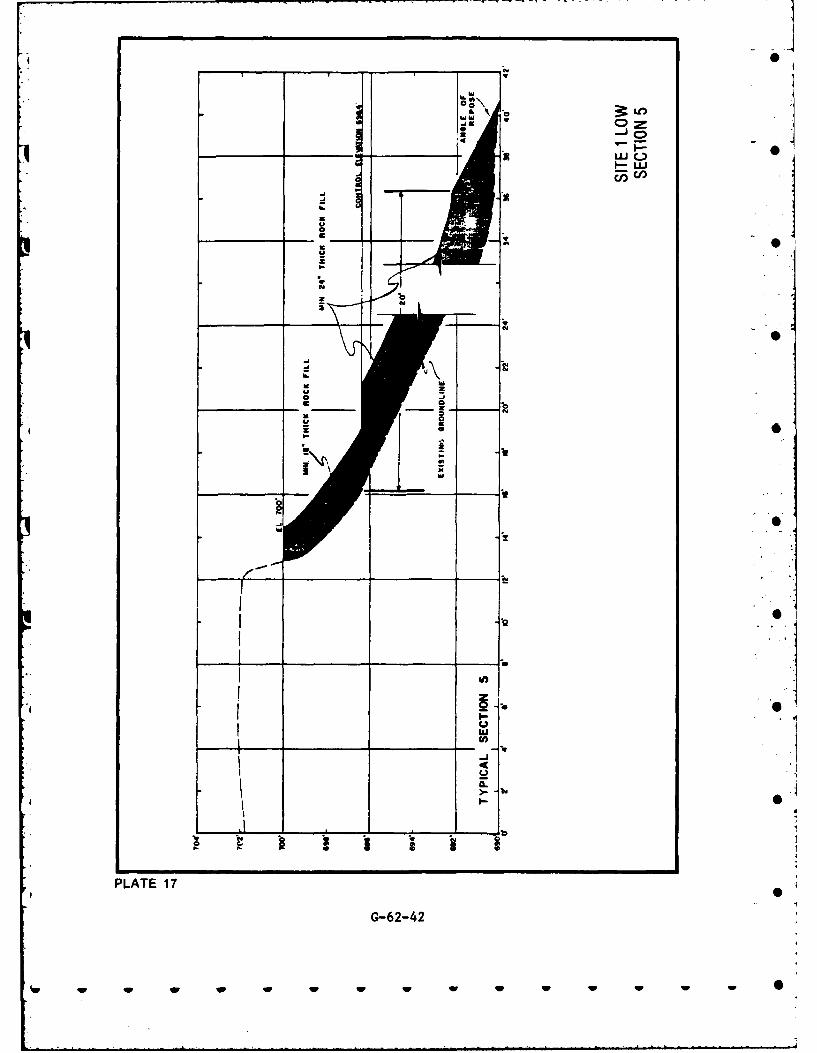
0z C:0
Lu C.>
ui0
ty
2
I-.
PLATE 17
G-62-42
ww w w w w w w w w w w w
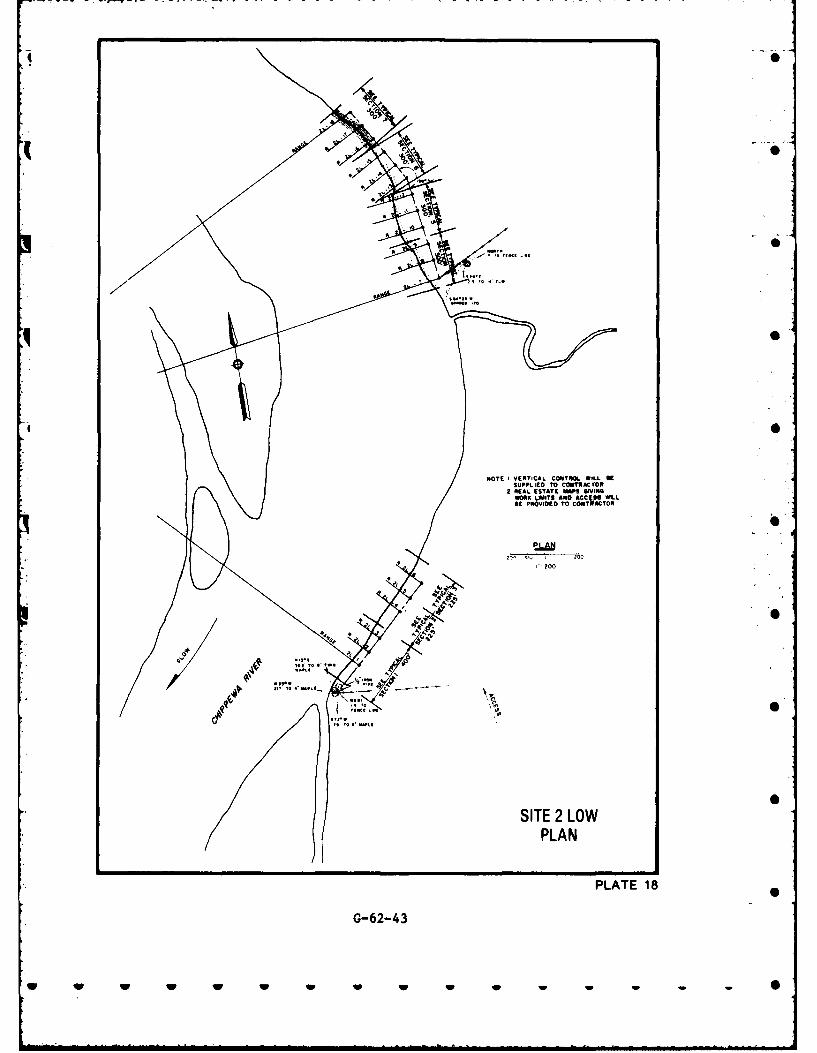
NOT01I VERTICAL CONTOL W#.LKSUPPLIED TO COSNACTYf
2 REAL. ESTATE MOS GIVINGWOOE JLIMIT AND ACCCH WILLBE PROVIDED 10 CONTRWACTOR
SITE 2 LOWPLAN
PLATE 18
G-62-43
U U U W W W w w- MP
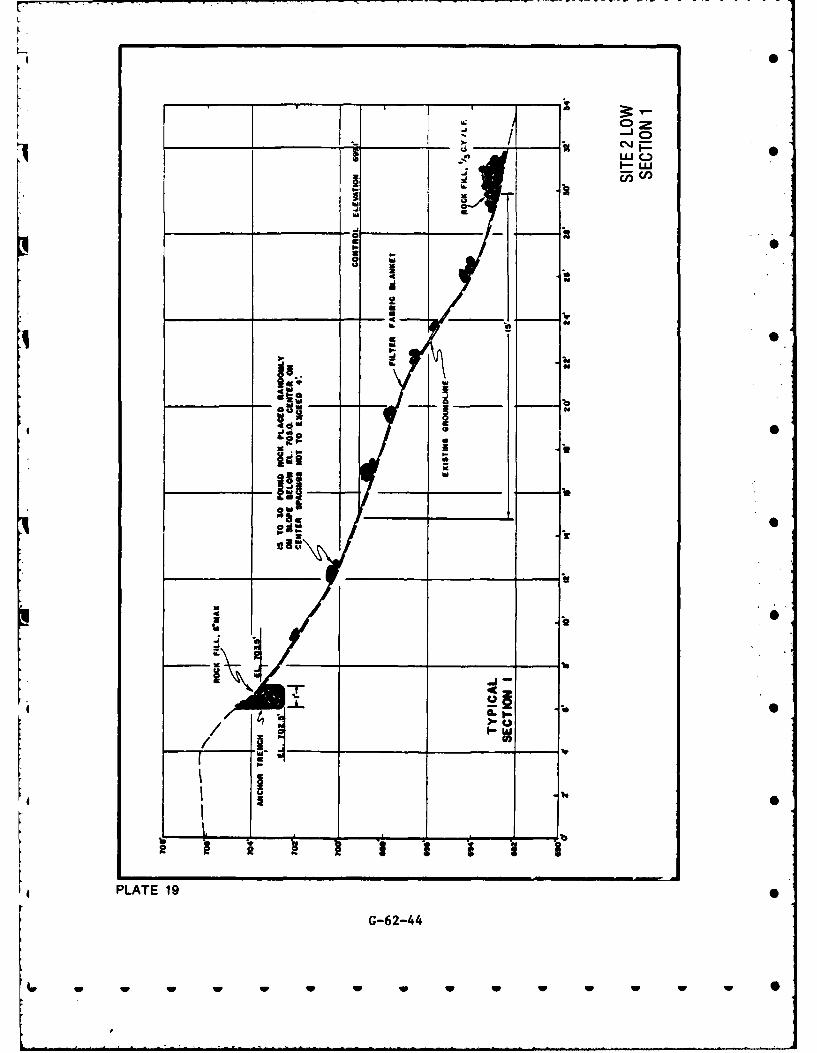
0 -
4'I-aX
owl
.81 Ic --- ----- --4 U'
ji
PLATE 19
G-62-44
W. W W W W W W W W W
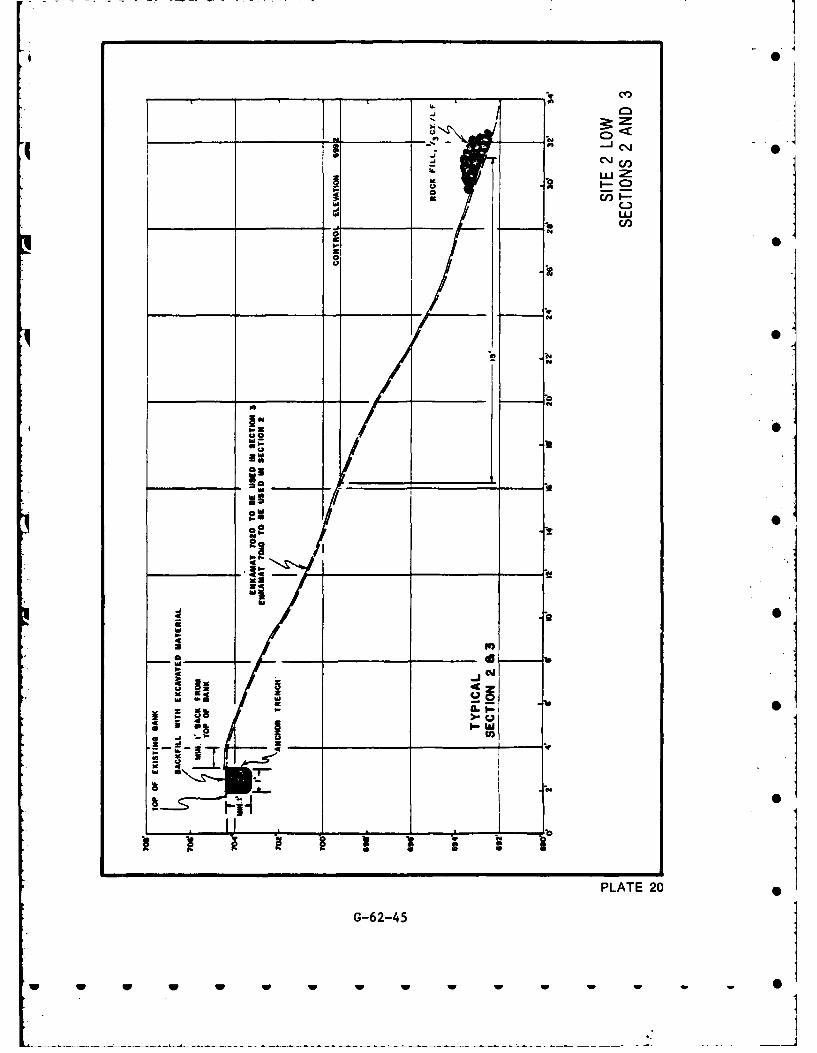
I..L
~C
UL
0.0
I. wJI
PLTE2
G-62-45
wU w w ww l
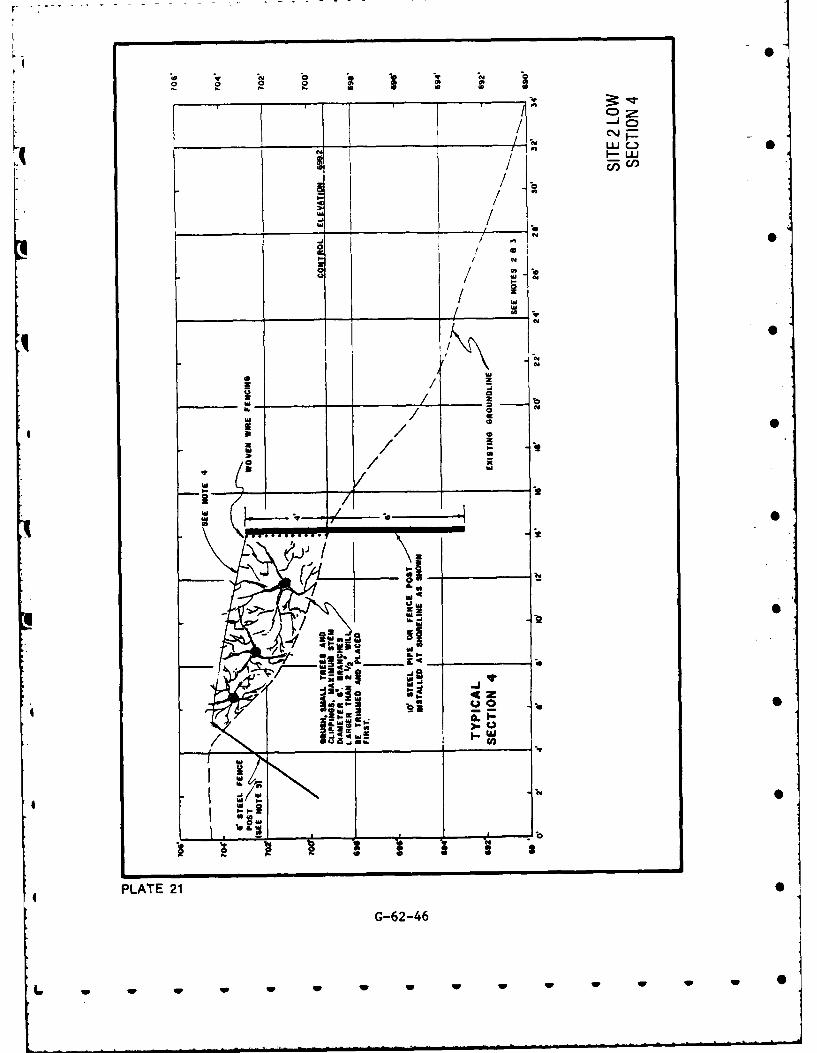
ini
IL I - '1linj /
4c
o ___ -gas_ 0
0o0
PLATE 21
G-62-4
w w
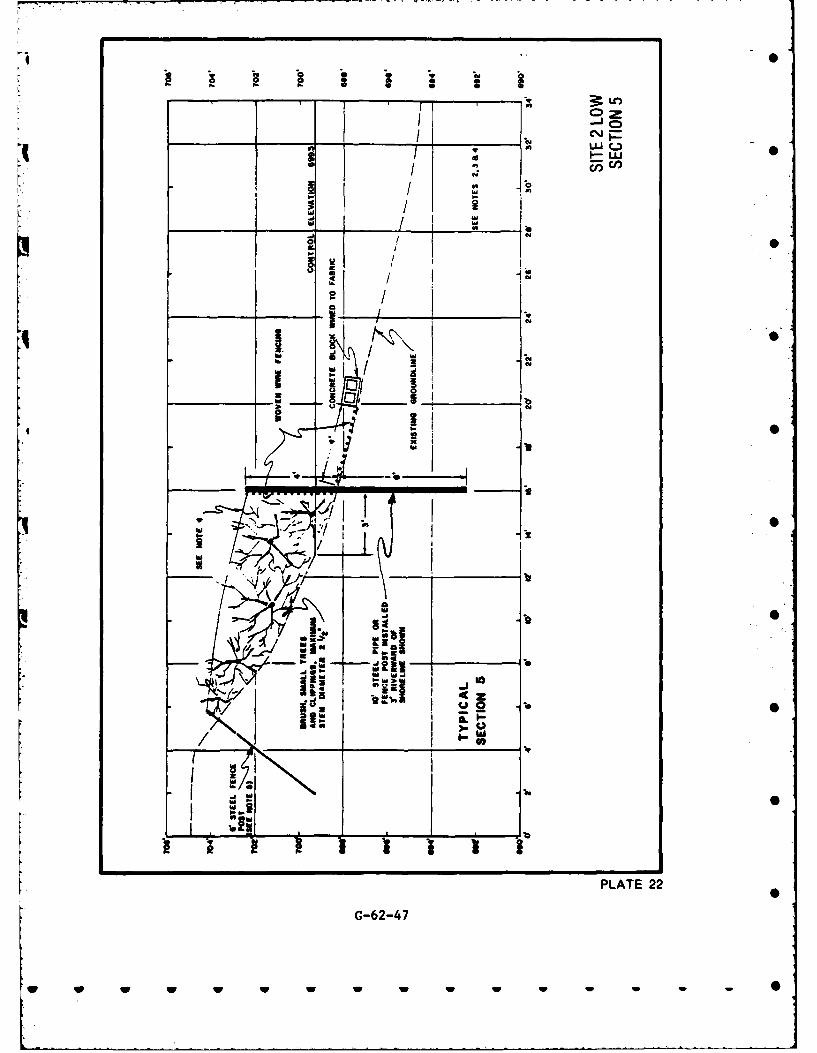
- I C\J)
I
UpJ~
PLATE 2
G-62-4I w w 1
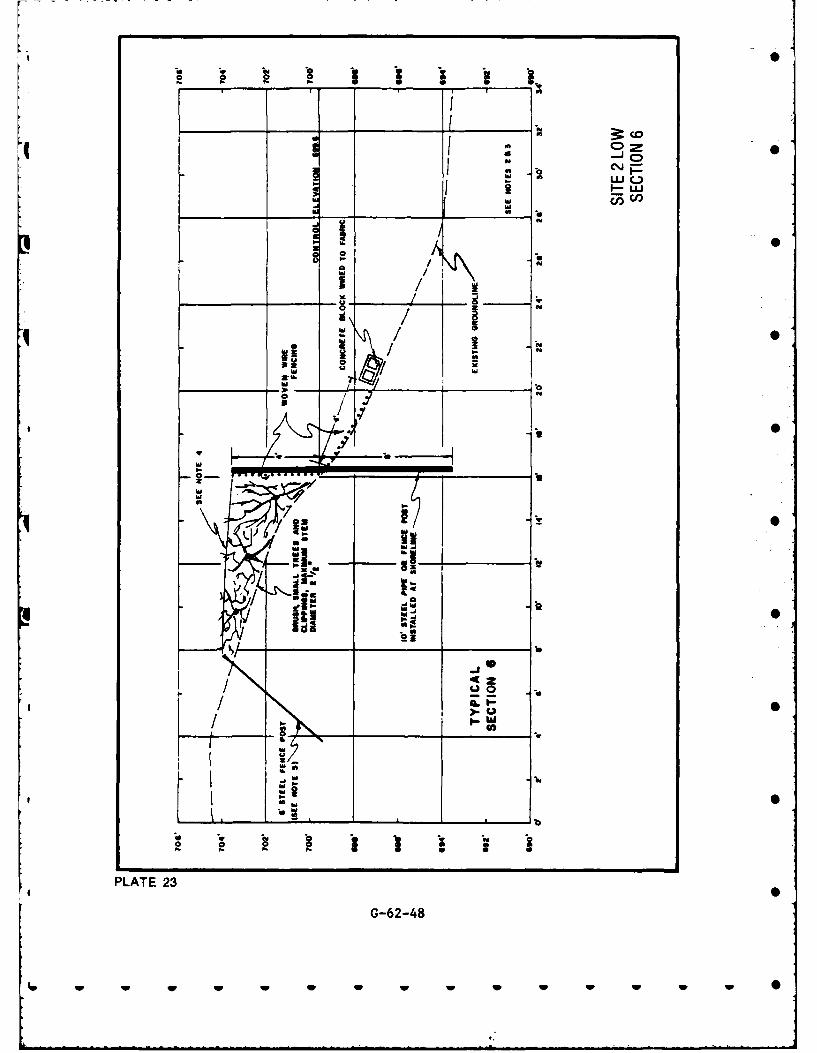
U U U
lid
Idl .
/
0 0
vi
3Ib
PLATE 2 G-62118w w w w w w w w w
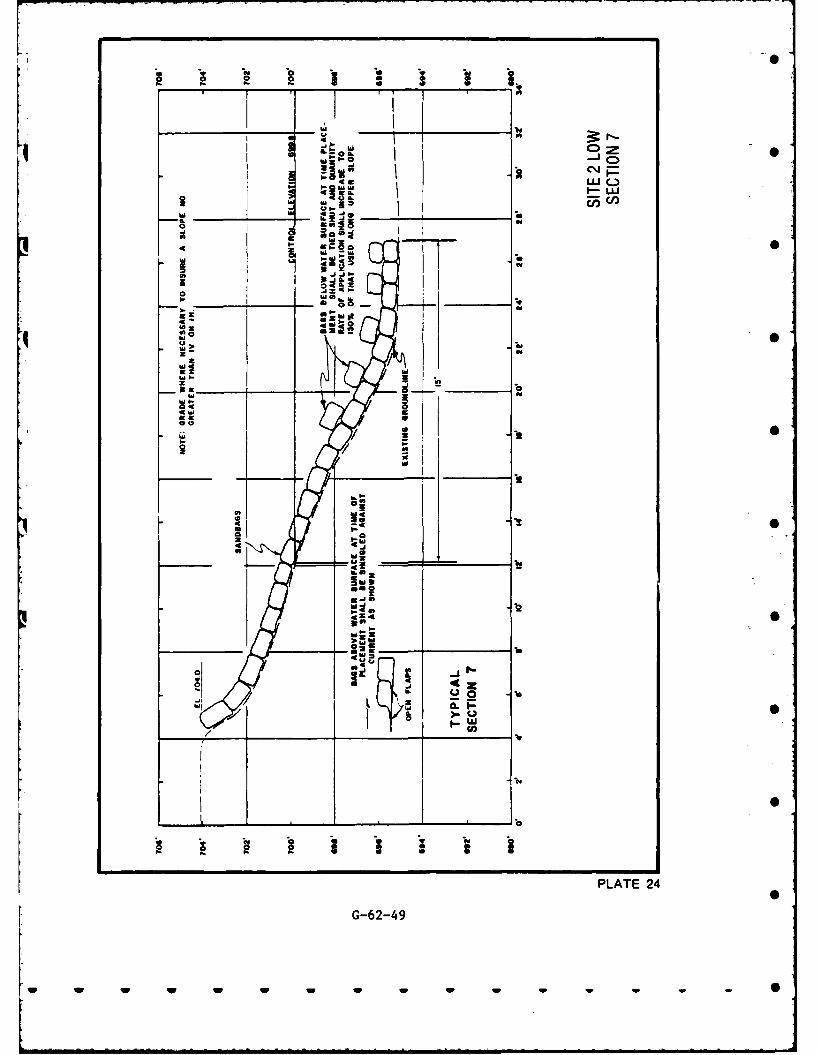
4C- P=1~
ILU
aa
4 ~ *owU? H N
hiidzw
i- Ix
2 __PLATE 24
3= G-62-49
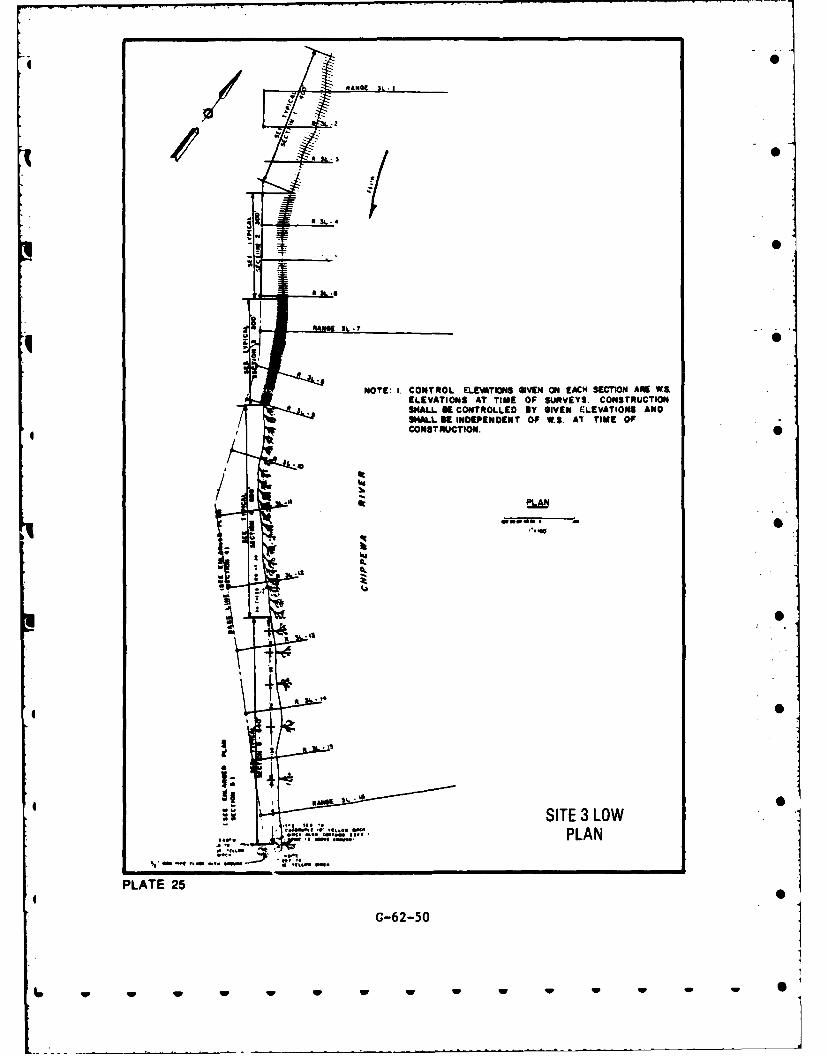
N SL-4
SL .7
- NOTE: 1. CONTROL ELVATIONS GIVEN ON EACH1 SECTION ARE W.ELEVATIONS AT TIME OF SURVEYS. CONSTRUCTIONSMIALL K CONTROLLED BY GIVEN ELEVATIONS ANDSMIALL ME INDEPENDENT OF WS. AT TIME OFCONSTRUCTION.
SITE 3 LOWPLAN
PLATE 25
G-62-50
w w w W S
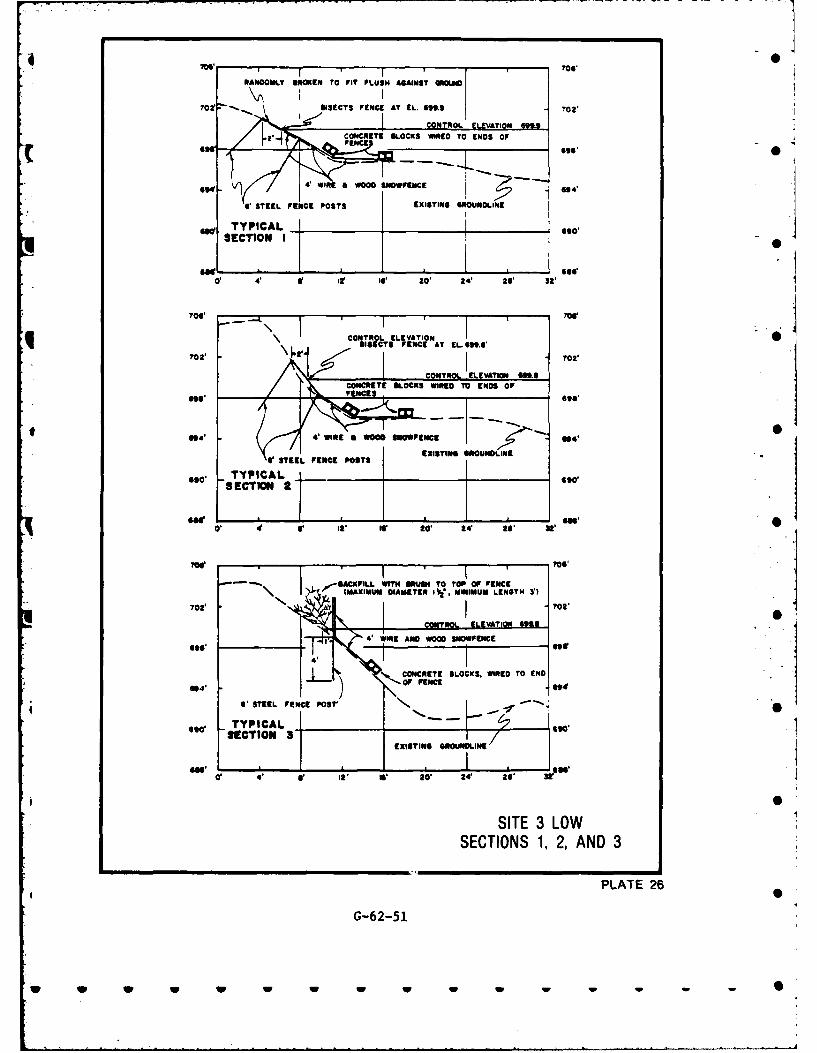
RANOMLY BROKEN To FIT PLusm "AiusT opomie1
G0a ISECTS PENCE al' EL. 631.9 702'
I CONTROL ELEVATION 69.9COW-METE BLOCKS WINED TO ENDS Of
4' WINE a WOOD SNWrENCE 694'
6' STEEL FIENCE POSTS EXISTING GROIJNOLINE
* TYPICAL Goo, .~oSECTION II
O1 4- lf t 6 20' 24' to, 32
706' 06
CONTROL JELEVATION
702' M9T CC ATZ-6911 702'
614* 4' WINE 8 WOOD SIPNC pae 0EXISTING GROUNOLINC
6' STEEL FENCE POSTS
' TYIA 3' 1' 9 0' 2' 1
706,
702' OrRLIEEAIN61 702'
096' o
614'
CONREEBOC S IE 3 LOW
S'~~~L T 26E FNE OT
Ste TYPICAL2ago
VEXISTING Gw w w - 0
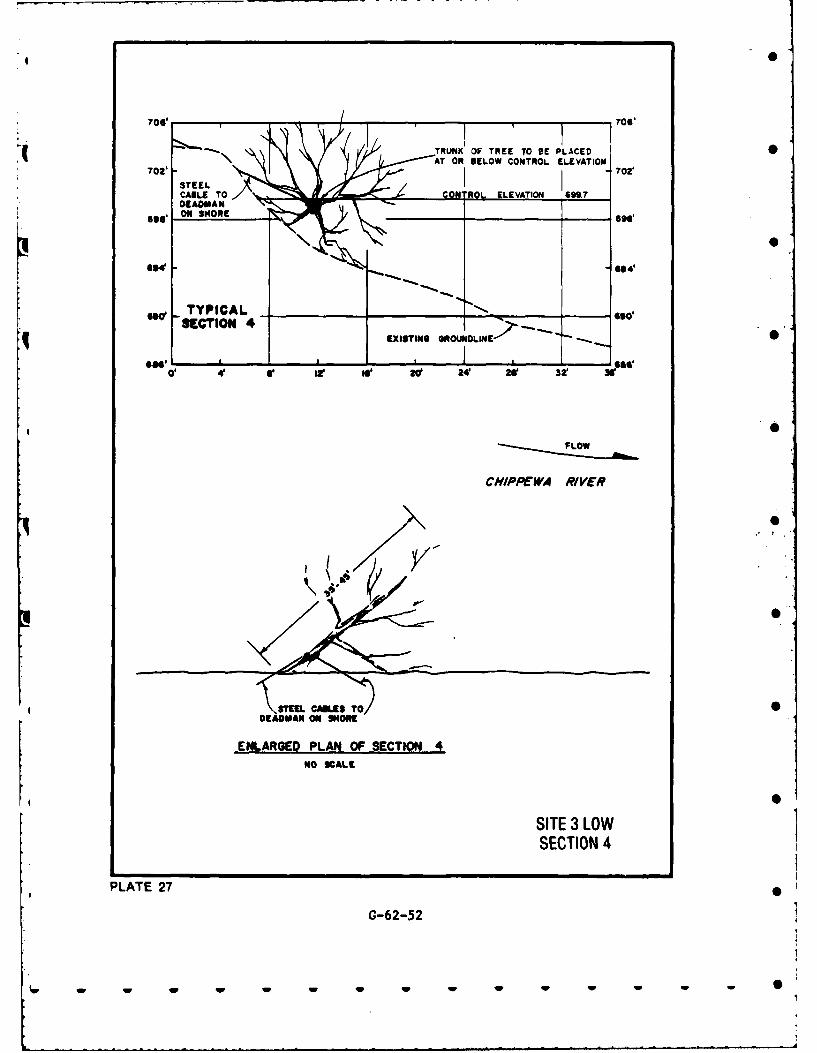
70'TRUNK OF TREE TO SE P LACED
7 0 2 E E'II 7 0 2 '
69.0
-TYPICAL ________ ________ ________ - co
q SCCTON ~EXISTINGO NOUNLINE')
It6 2d* . 24~ 20' 3Z
FLOW
CHIP PE WA RIVER
SEAD AN ON SHONE0
ENLARGED PLAN OF SECTION 4NO SCALE
SITE 3 LOW
SECTION 4
PLATE 27
G-62-52
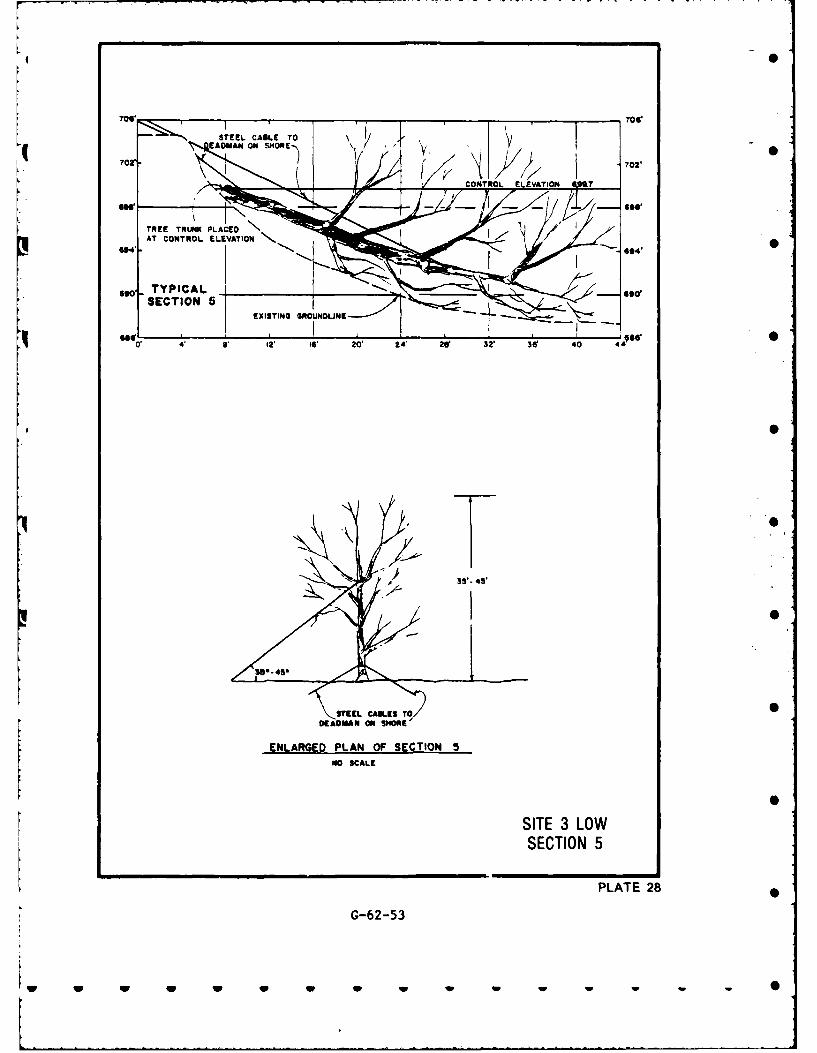
?o02' EADMAN ON SHORE ~ S 02.
?NE TRU5N PLACEDAT CONTROL ELEVATION N.
664'-64
0 4' .6 12' 16 20' 24' 26 3v 36w 40 44'
35'- 45'
STEEL CABLES TODIEADMAN4 ON SNORG'
ENLARGED PLAN OF SECTION 5WO SCALE
SITE 3 LOWSECTION 5
PLATE 28
[ G-62-53
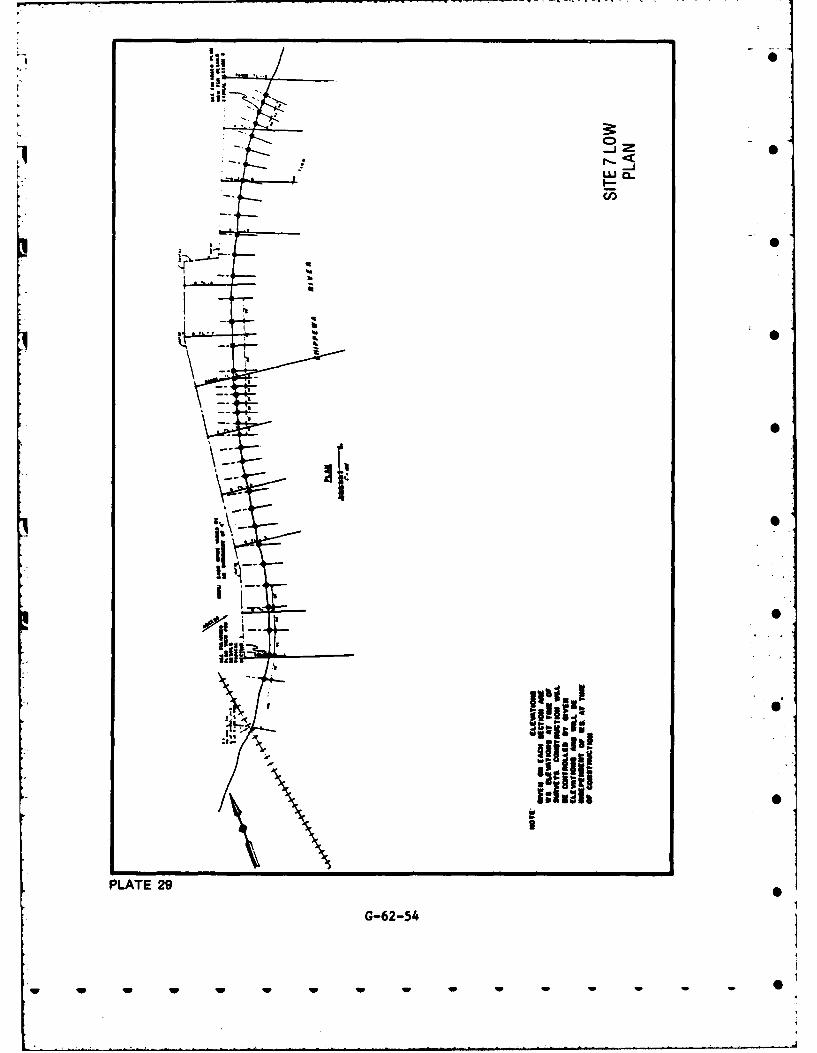
.13
0 S1-J
LU 0..I-U,
S. SL2Z1*
-- 0
'~\ ~>I
-*6
1
S
Vi
'II-I ).~
I
9~ii 0I; ~
a~ii,
WI sz.ia3
A'
- ~~iiii5I;Iu~Ib S
PLATE 29
G-62-54
w w W w w W W W - - - - 51
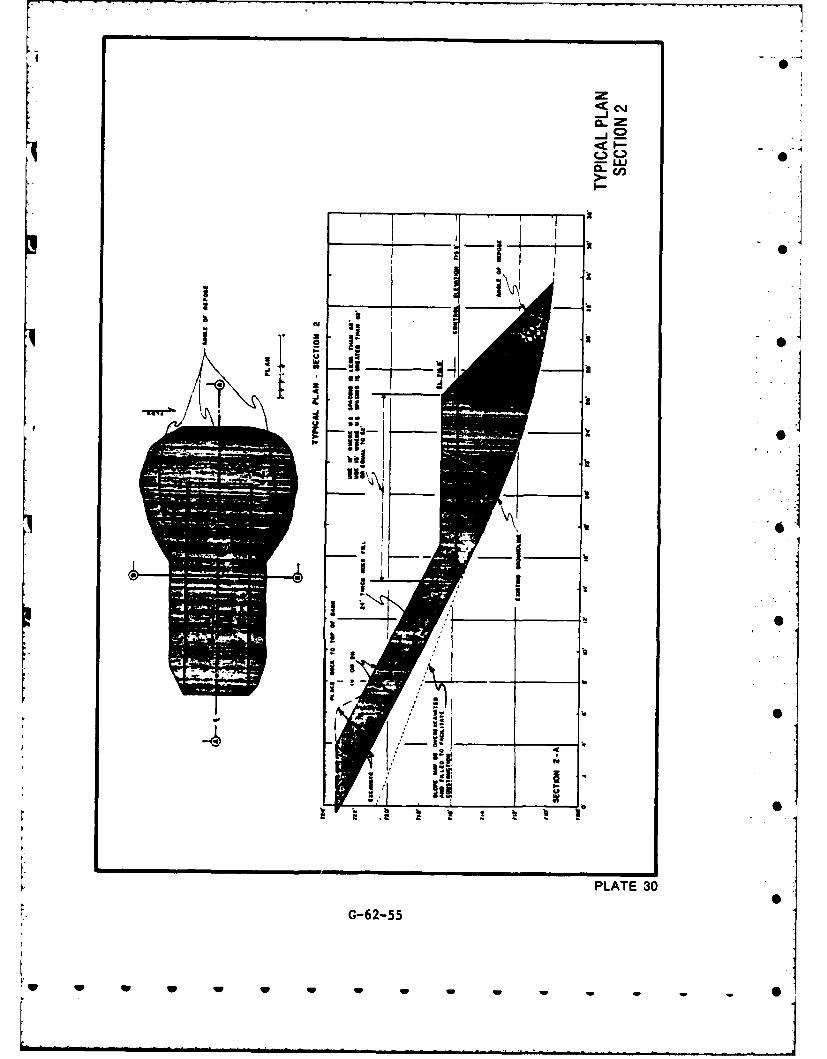
0
z~CJ-Jo~Z-'9<I- -
C.)C.~ 0-uJa-c,,
I-
I
-I---.- :13 *' a
________ j ________ I
z 3 3 0I-
Ua.-
I. 332 0b4
____ ____ .9-4 4 0
0
PLATE 30
G-62-55 0
w w w w - - - S
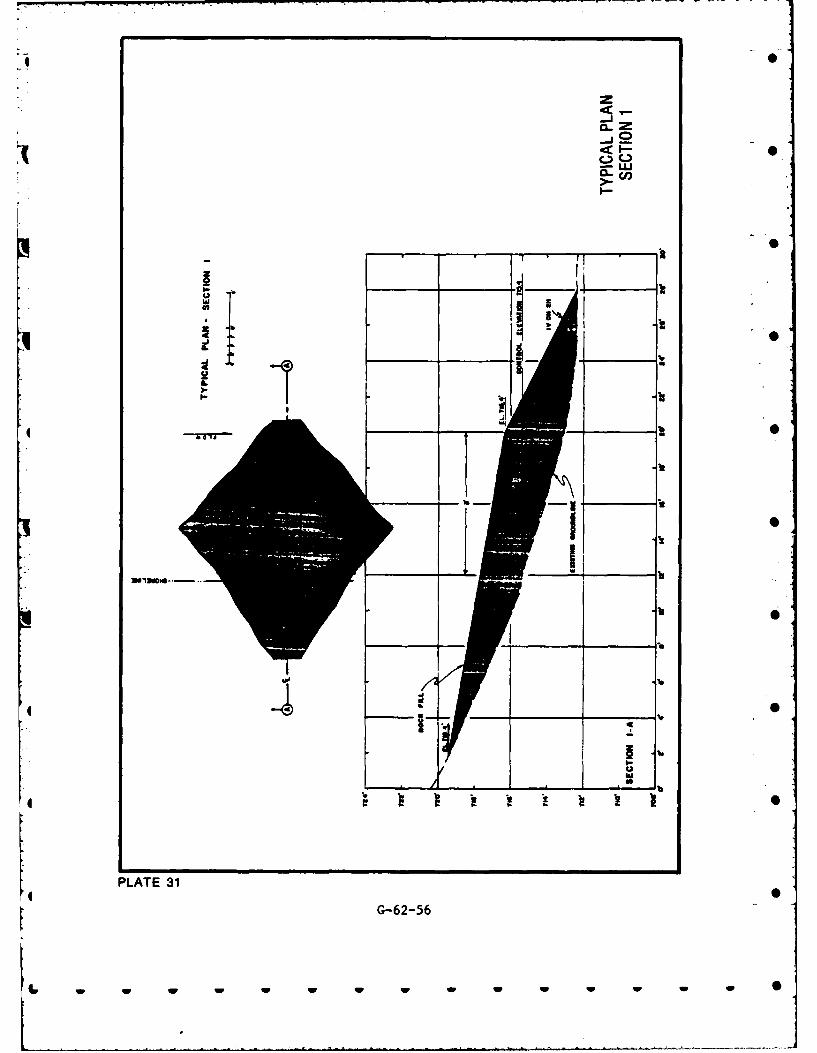
-Jo-z
&CIA-
00 .70
it
PLATEc31G-62-56
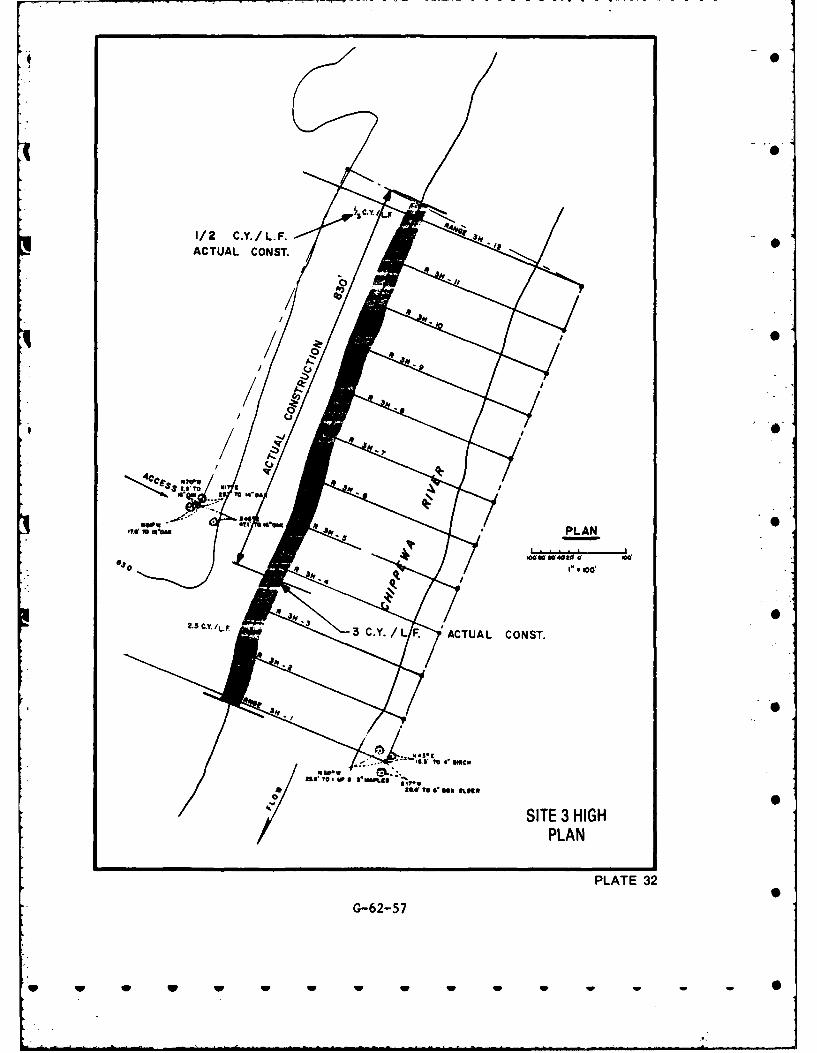
1/2 C.Y./L. F.ACTUAL CONST.
q 40
9, r-0
meow£
a.~~We W.020 Su~
SITE 3 HIGHPLAN
G-62-57 PAE3
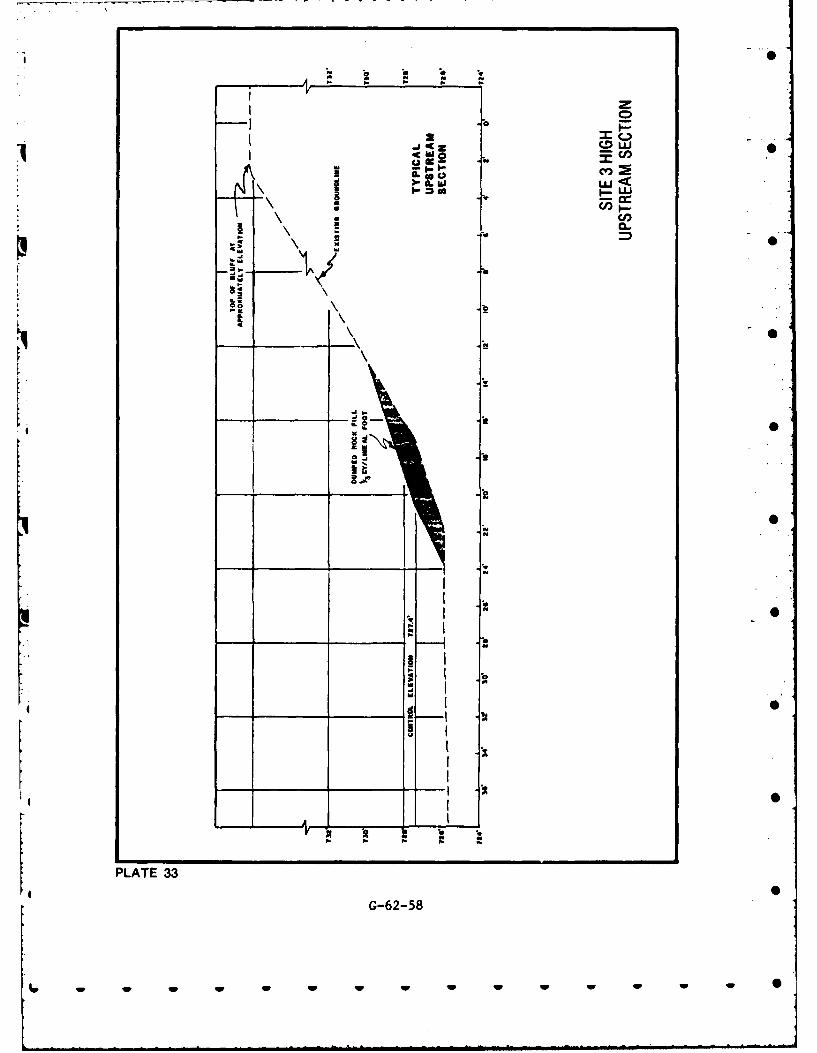
Zoo=
)I I.LU
2 CL
BICt
F46
.Jiv
PLATE -
G-62-5
I' _ _ -\ .4 w w w
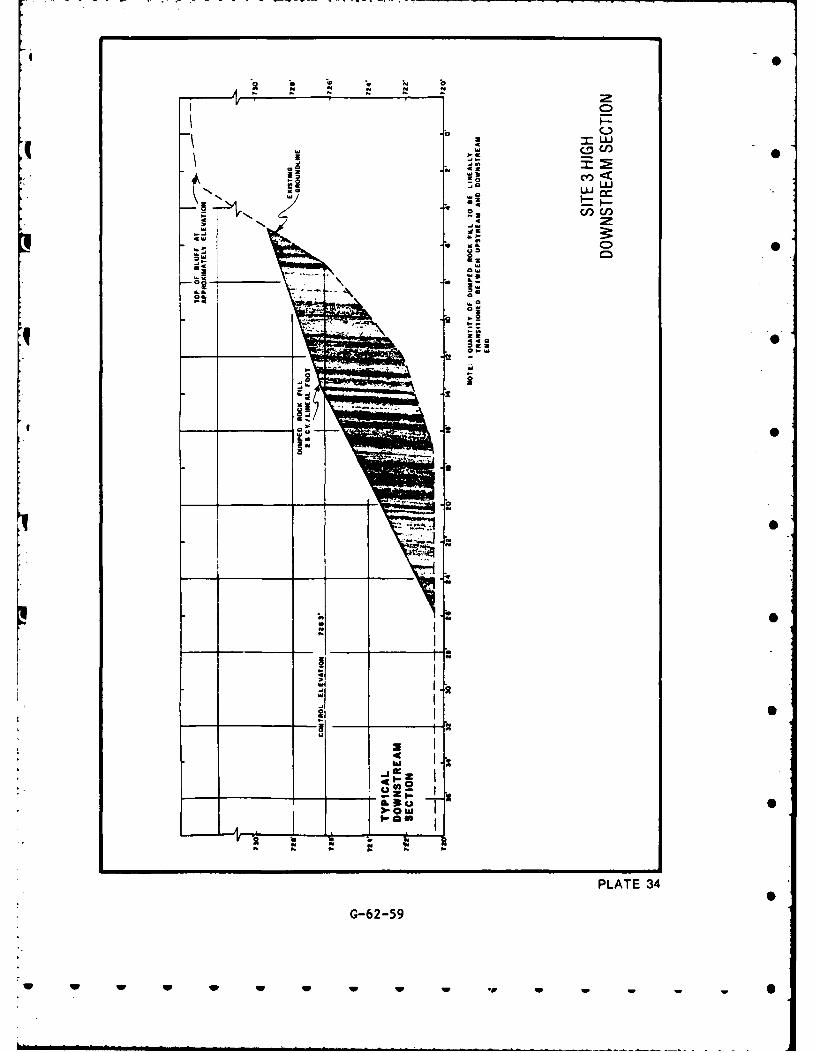
0,a ZLU
- -C.C/) 0
N S
ftCa Z2
20 C. o
460
!2
PLAT 34
G-62-5
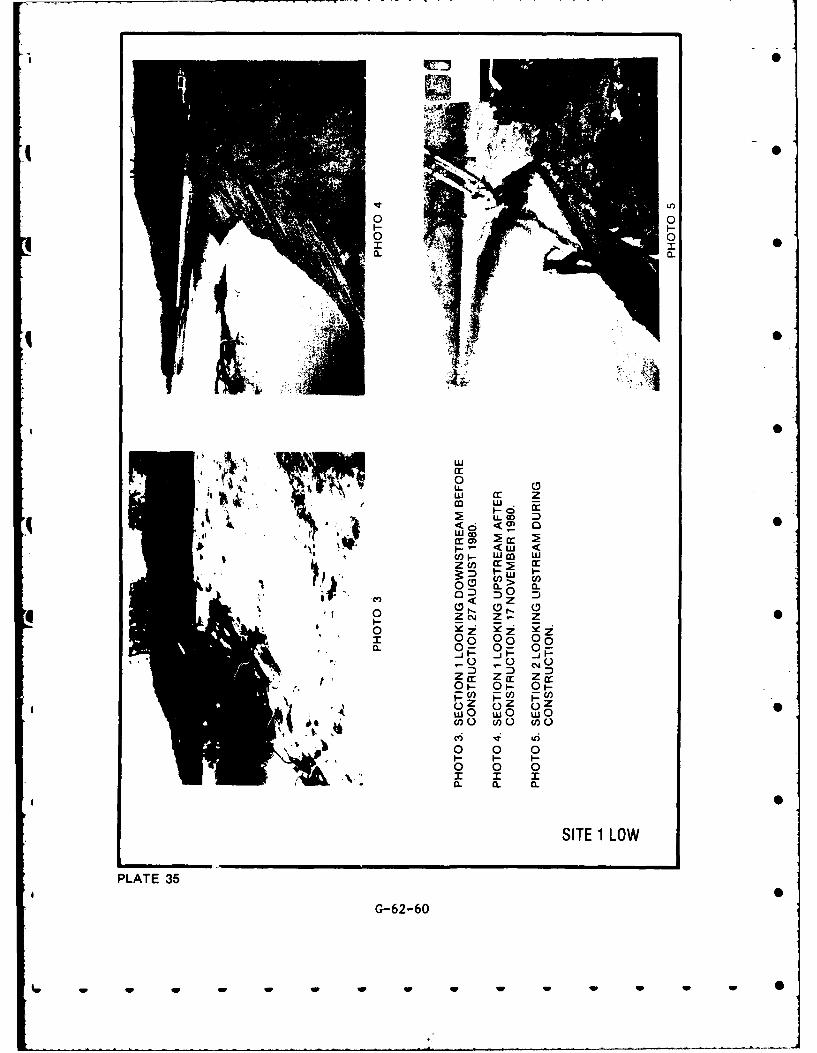
0 0
LLn
0 0cLL 0
00 00 U
CL - 0
w wo
06 0 0
-0k. 0 0
lp w w wOwww w wO
-~I -- -- - -
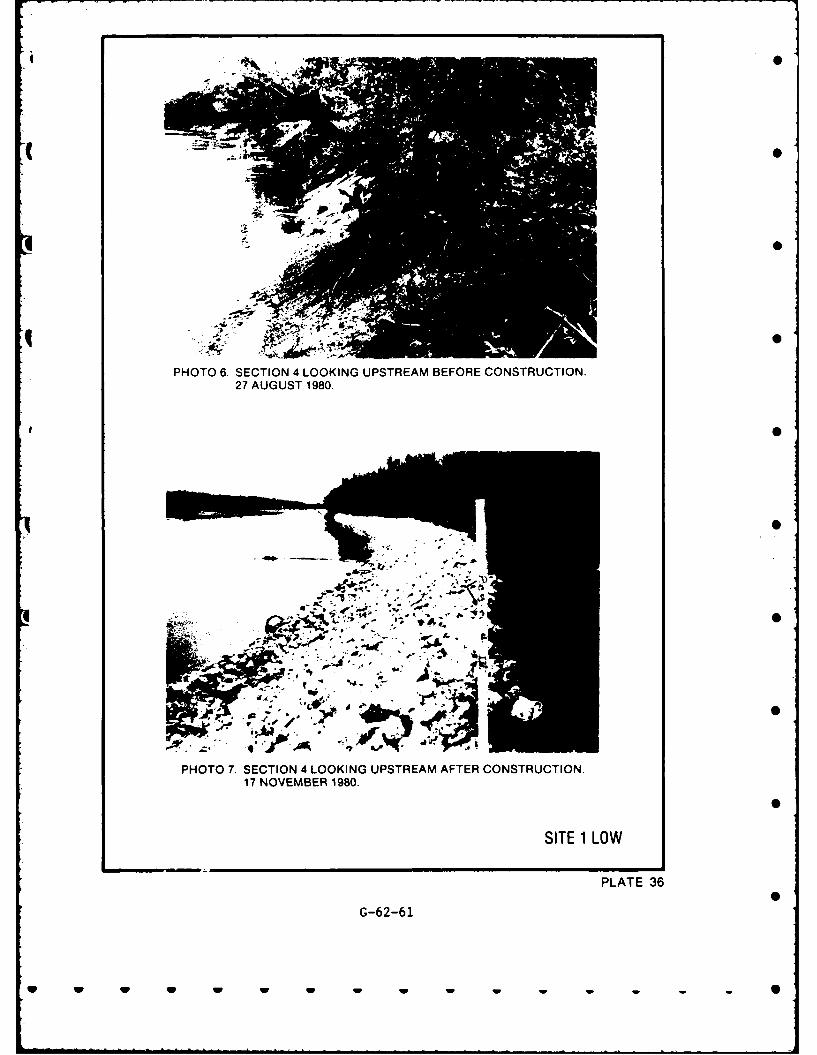
PHOTO 6. SECTION 4 LOOKING UPSTREAM BEFORE CONSTRUCTION.27 AUGUST 1980.
0~0
.A '• - -,,
PHOTO 7. SECTION 4 LOOKING UPSTREAM AFTER CONSTRUCTION.17 NOVEMBER 1980.
SITE 1 LOW
PLATE 36
G-62-61
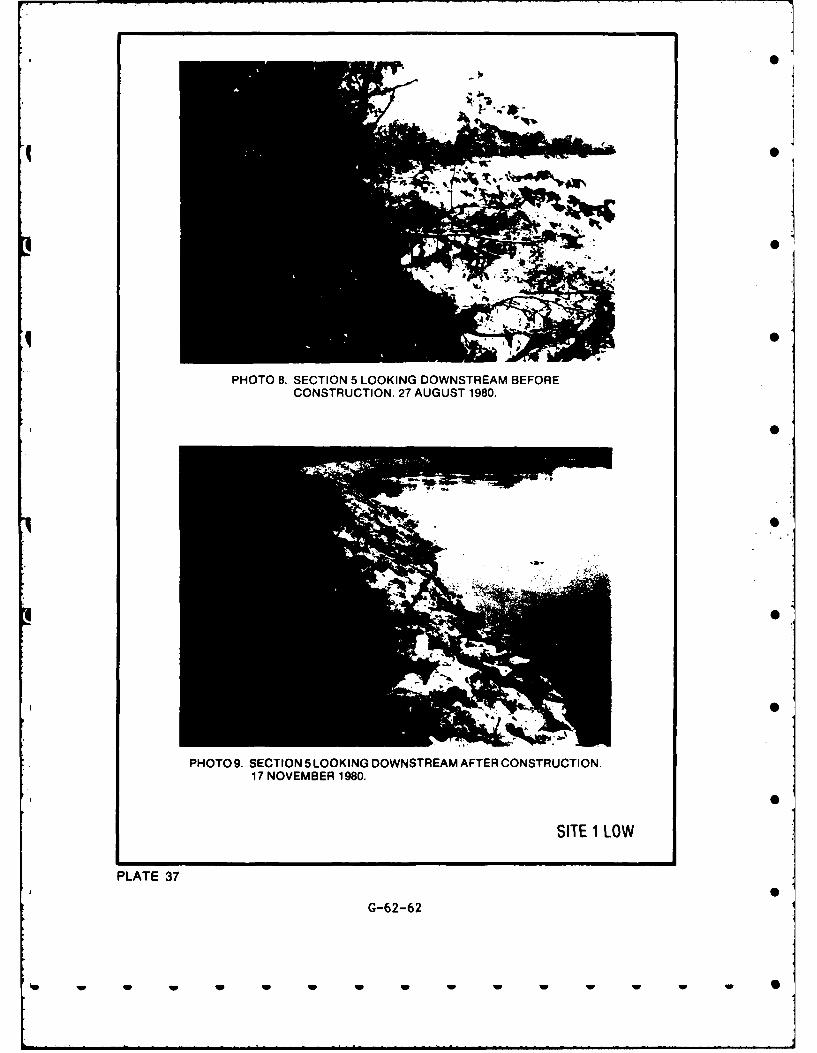
PHOTO 8. SECTION 5 LOOKING DOWNSTREAM BEFORECONSTRUCTION. 27 AUGUST 1980.
PHOTO9. SECTION 5 LOOKING DOWNSTREAM AFTER CONSTRUCTION.17 NOVEMBER 1980.
SITE 1 LOW
PLATE 37
G-62-62
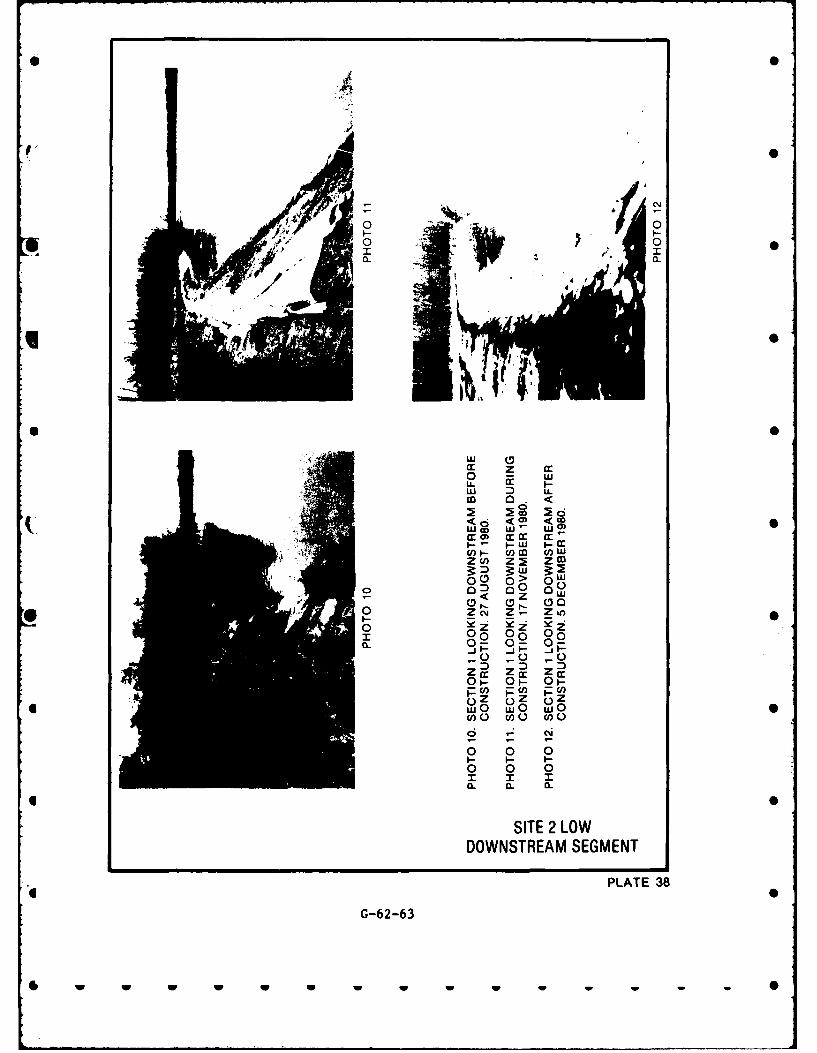
-IA 0
00
w LL
0 2.- mw:
W CDw
co 00 00z wo
0 C) <0
n-cm 00 05 0
Z Z~ Z
~0 00 0
m m 3:
Q. 0- 0- .0
Z 0 Z
SITE 2i LOW
DONTRA SEGMENT
cflOLAT 38O n
G-62-6
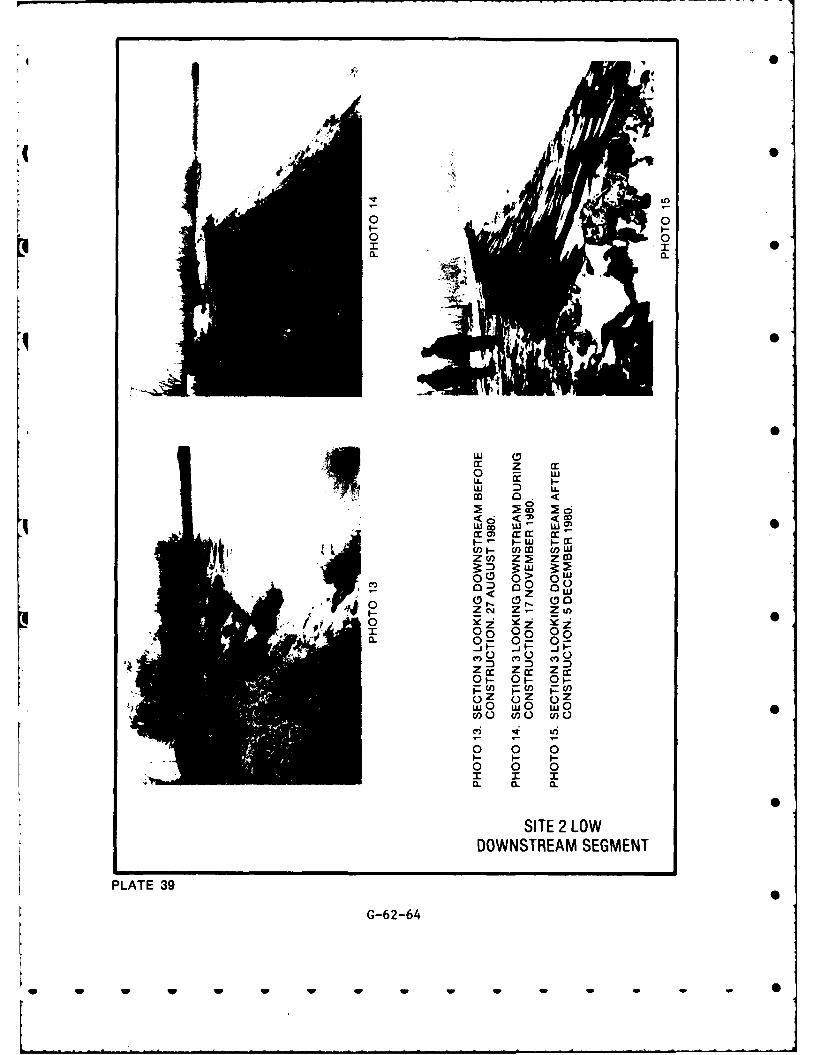
0 0
00a- a
IL C
zSFW 0
w LL
m o m6<0 <' <W
w m w W~
~z (f)z m z
0,- qi- a a
C.) C-) U,)
0 1-0 0
SIT LOW
w 0 w w 0
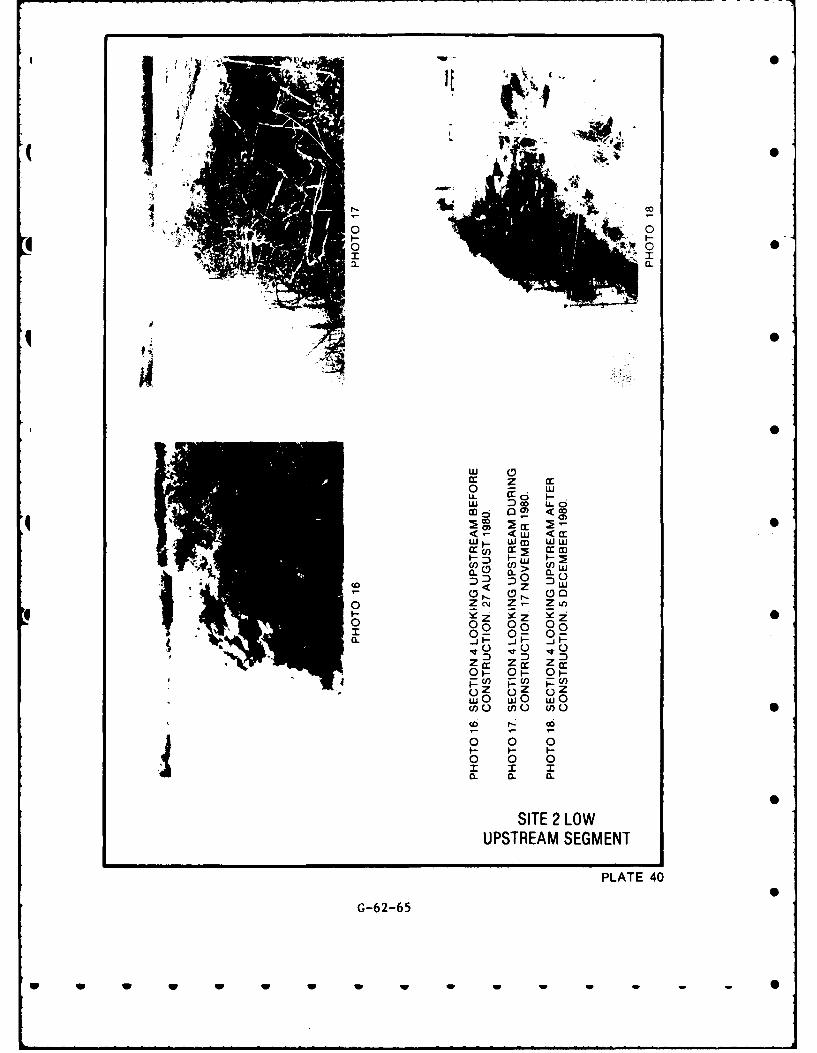
( 0
00
Wu 0 LLOc
W1. W C W W~c ) a:2 :
U) (! n>w wCL Z)CL0 (L0
-: < ( z :)w0 Z C'~ Z. Zu)n
ez Y. Y 2 00 00 00 00
0 0- 0 - 0-
D DZca: Z c Z c
(10 (10 0n
0 0 0m I mCL aL a.
SITE 2 LOWUPSTREAM SEGMENT
PLATE 40
G-62-65
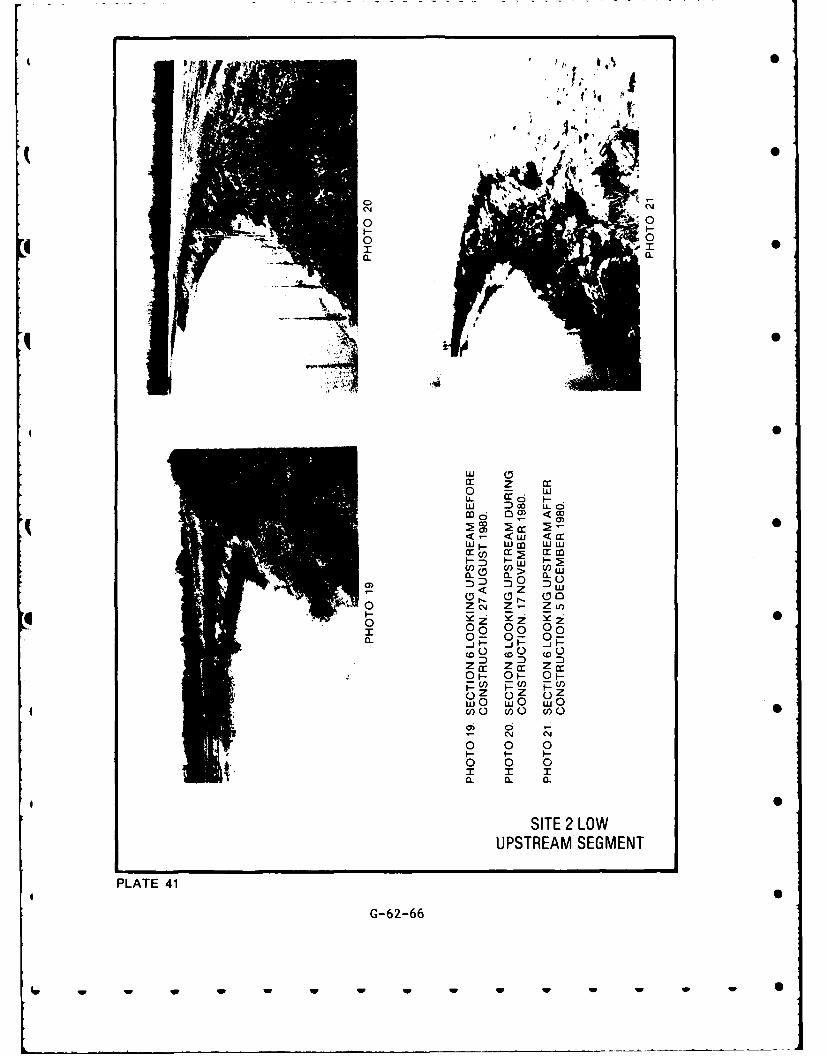
0 0
4k 00
4 A
0. w0Hw 00 LI-
< w < iH wM W w
CL CL C
-< z :: U
0.%. (Dr. cl0Z C\ Zr Z o
(D 0 DZ a Z c Z cr
0 z 0 z 0
w 0 -
On0( 0 U)0
O 0 00 0 0
SITE 2 LOWUPSTREAM SEGMENT
PLATE 41
G-62-66
4 w W w w w w w w w -w
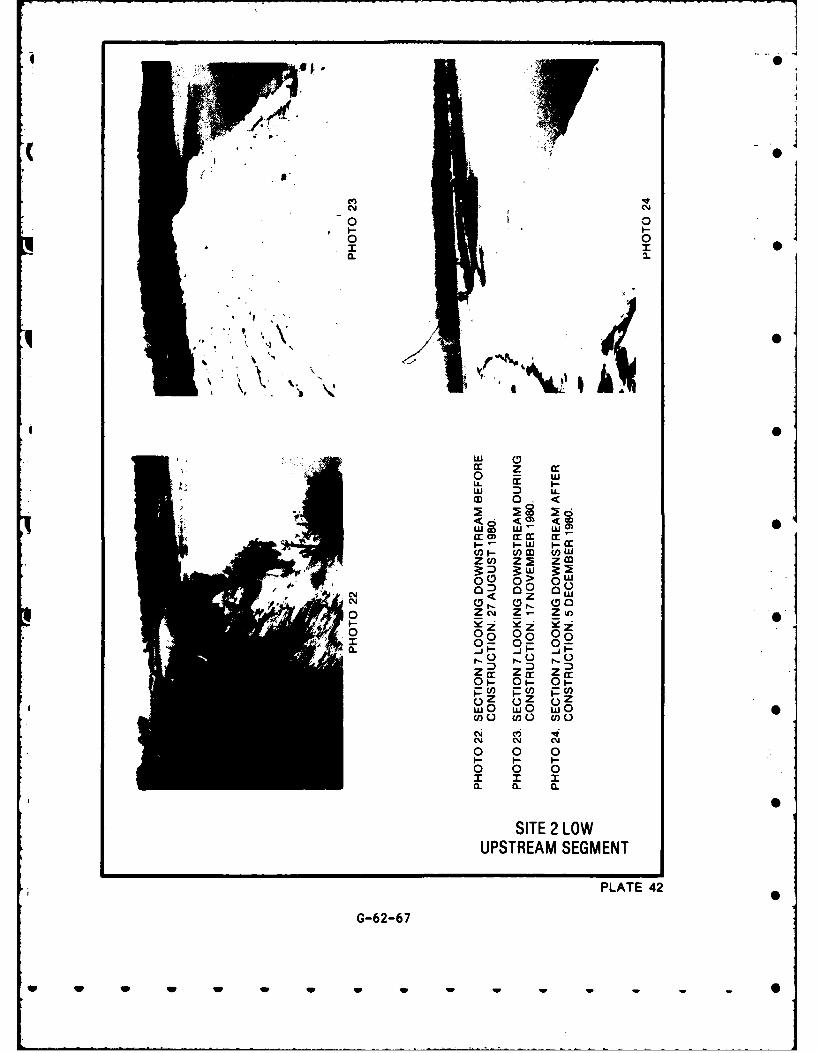
C- 04
0 0
0 0
0 0u
w CCzw 0. 2 (
M0< z <w
0~ Z cm z~ Z W
05 00 000-P 0- 0-
C)O r- 0 ,-
Z cr Z c Z c0O1- 0 1- 0g
wco wcno c
0O L 0 0O
0 0 0
0. CL 0.
SITE 2 LOWUPSTREAM SEGMENT
G-62-67PLATE 42
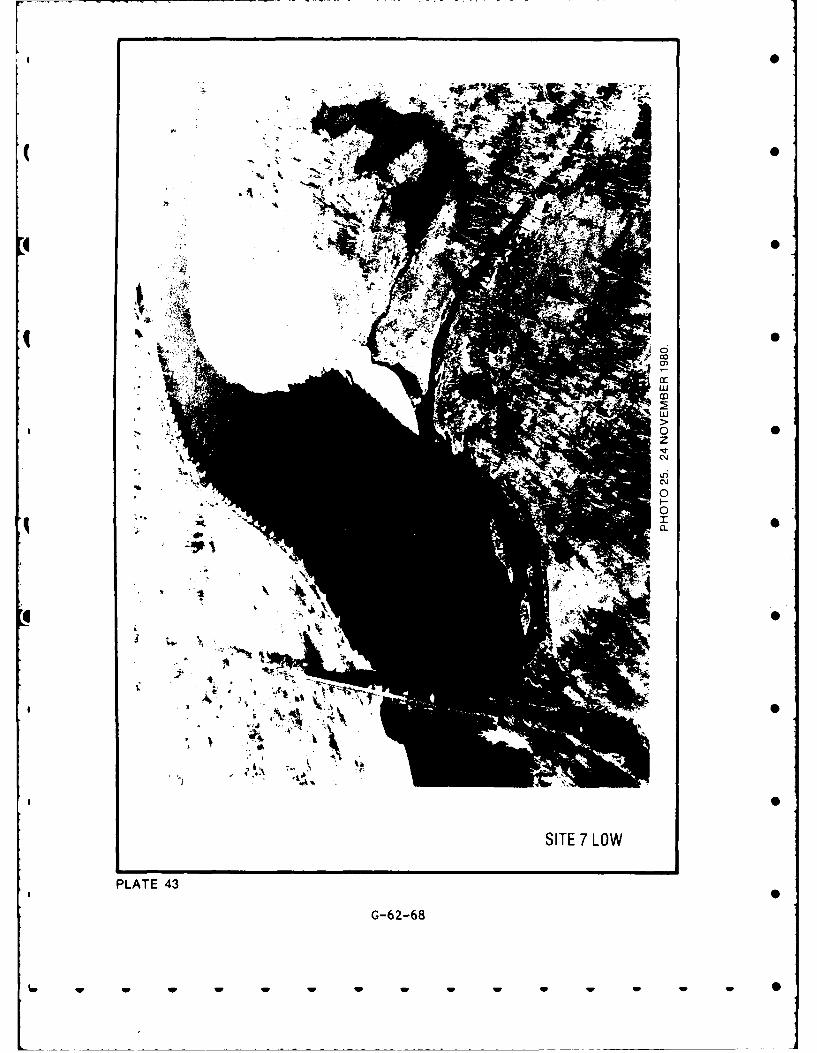
I 0I
( 0
1 06
PLT 43
G-62-68
iw w w w w w w w
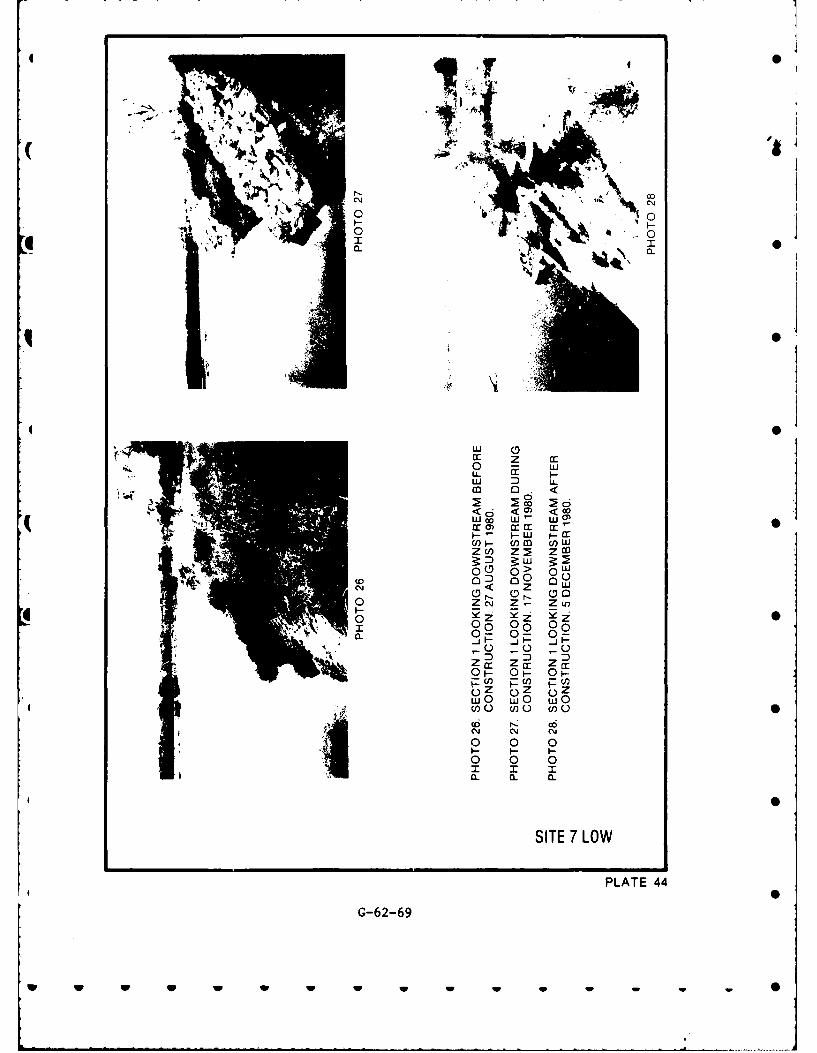
4I
0 0
00
w D L
a 0. <
6<~ <~
- -HW j-a
~z (nz m z m
QH r- I (3 0H
0 z oz z Z o
00 05 00
O 0 P0 F
0 F 0 0
0 w 0 w
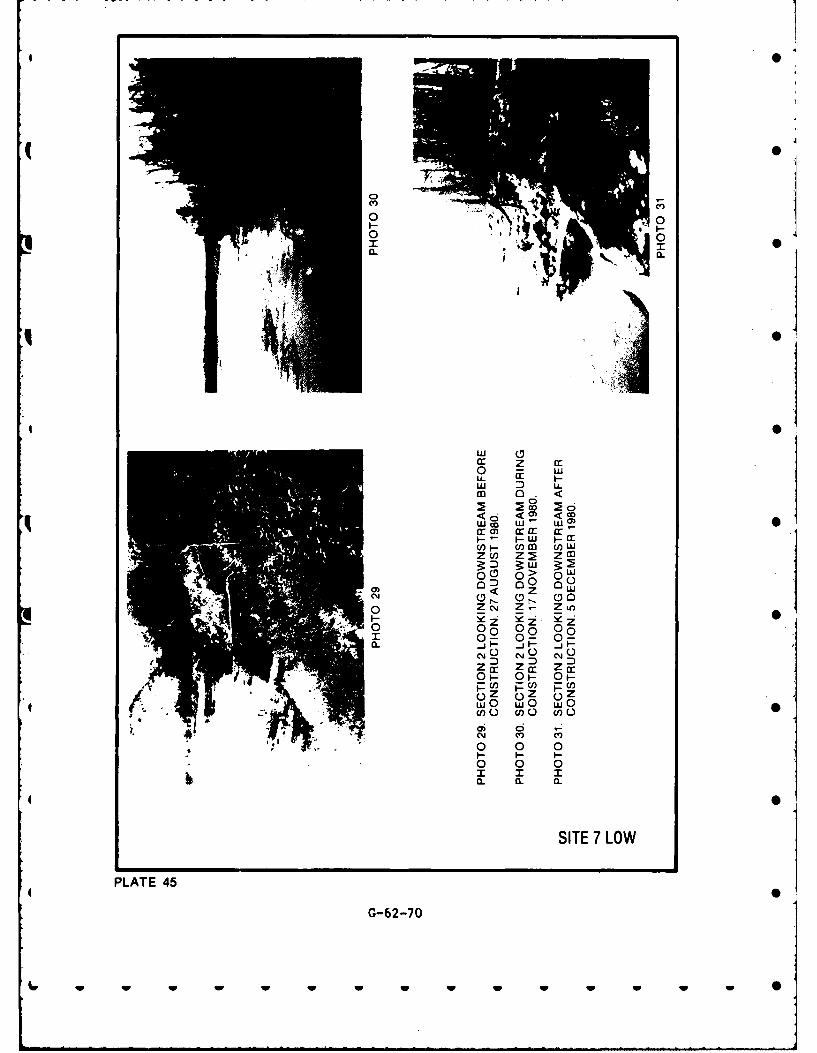
0 0
0 0
cc z cc0 -
w D LL
co o 0
<~ Ci<( <~ 0I - .Co w -Cl
z~j z~ 2ZM
c' < z w04 o ( c0Co ~ Z CM Z - Z U.
1 ~ 0- 0- 0-
Z 0 Z~ Z
4w 0w0 wO0
0~ 0 0
o 0 0
0. . 0.
SITE 7 LOW
4 PLATE 450
G-62-70
w. w IV w w w w w w w w 0
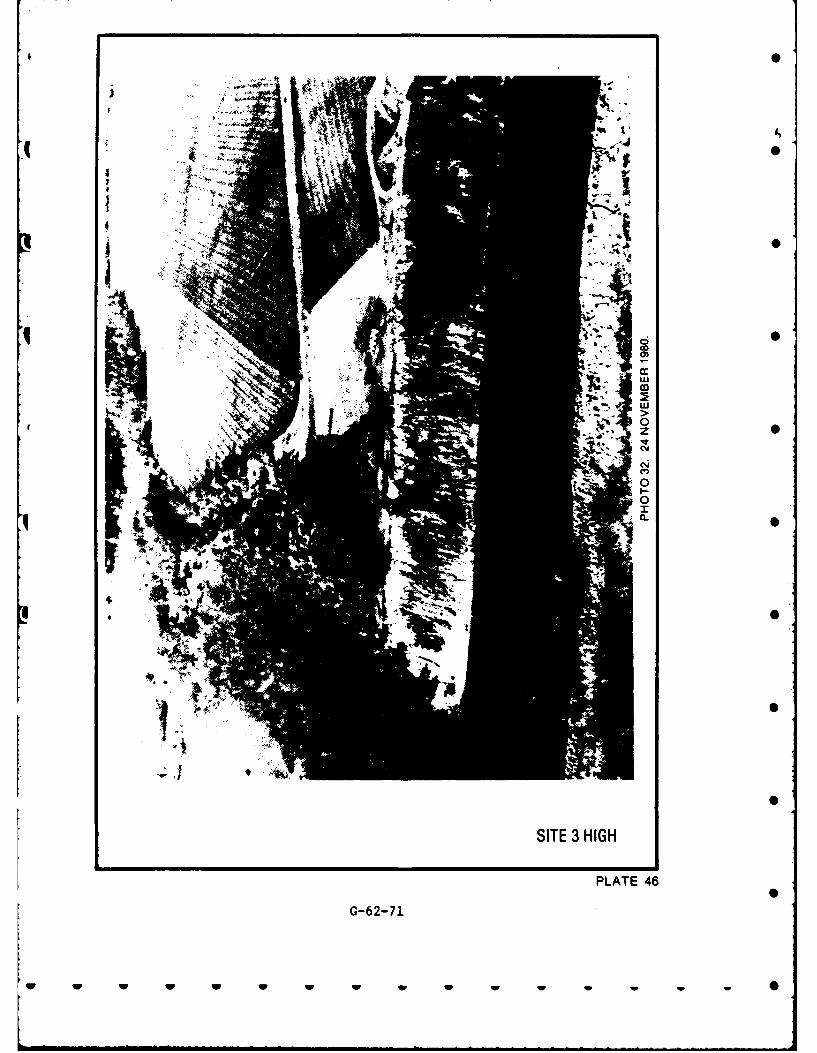
0
-
I 0
CYS
a..
V0
SITE 3 HIGH
PLATE 46
G-62-71S
w w w w w w w w w w S
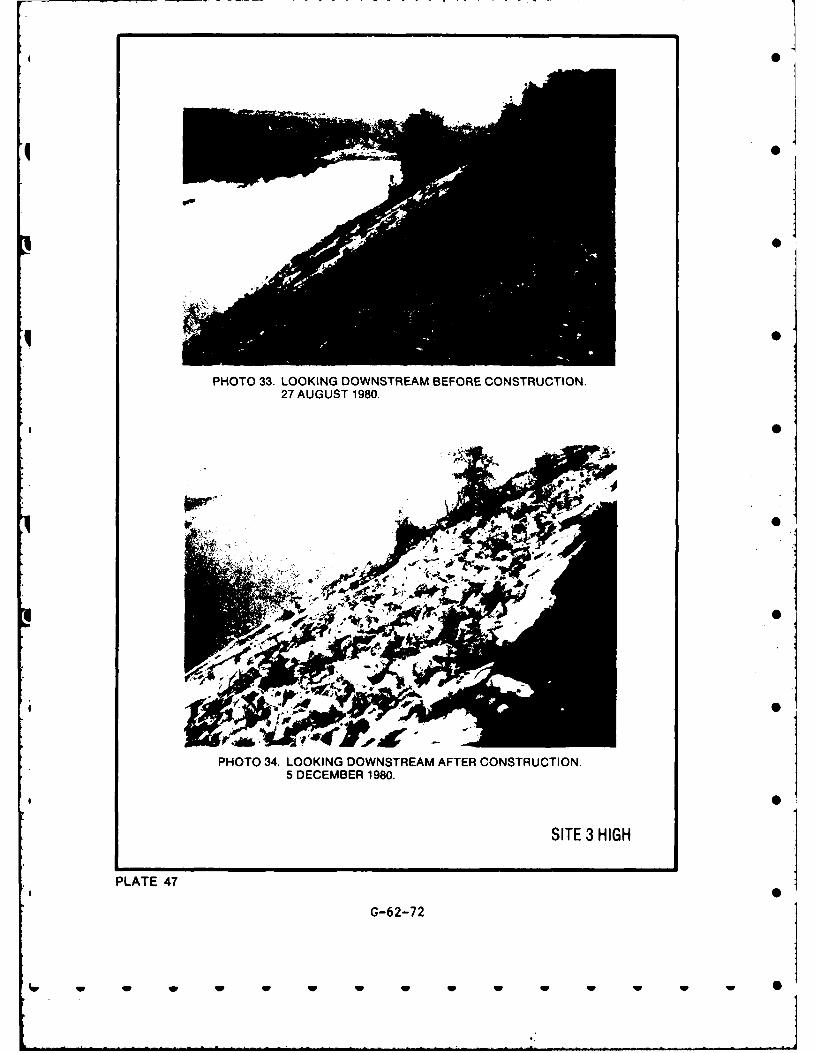
I0
PHOTO 33. LOOKING DOWNSTREAM BEFORE CONSTRUCTION.27 AUGUST 1980.
PHOTO 34. LOOKING DOWNSTREAM AFTER CONSTRUCTION.5 DECEMBER 1980.
SITE 3 HIGH
PLATE 47
G-62-72
w w w w w w w w
APPENDIX A -
VELOCITY DATA
G-62-73
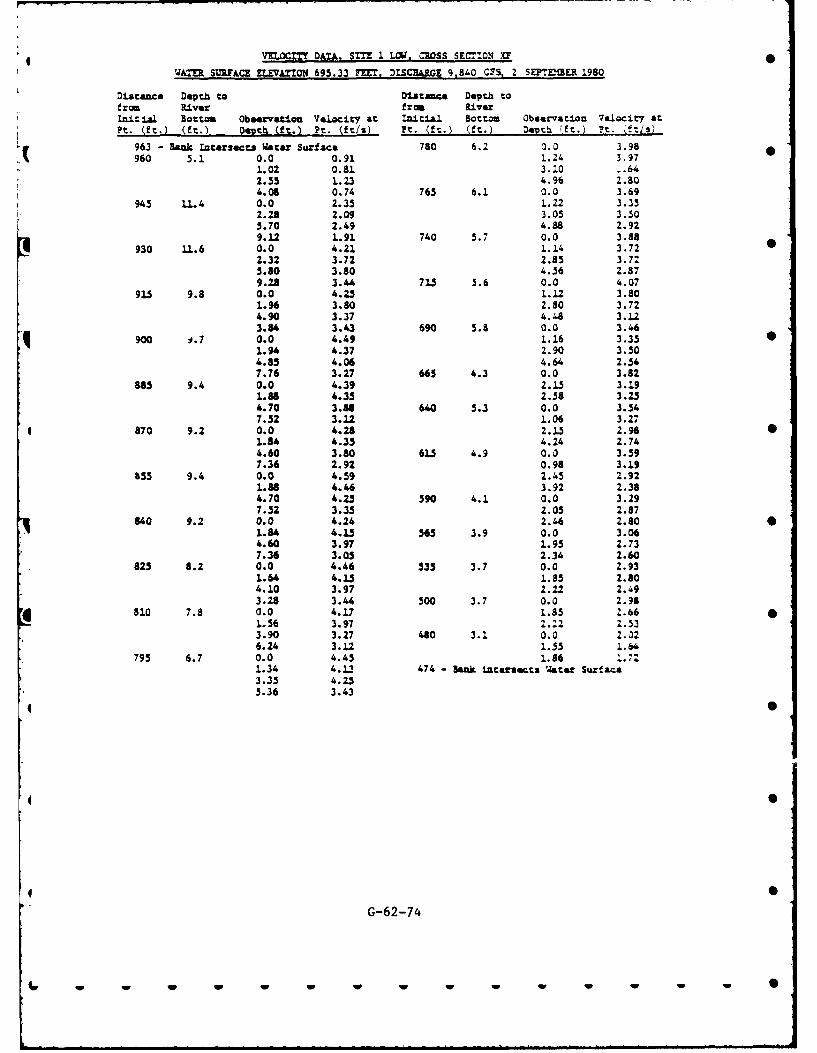
VELOCITY DATA. SIT! 1 LOW. CROSS SEC":0ON XF
WATER SURFACZ ELEVATION 695.33 FEET, DISCHARGE 9.840 CFS 2 SEP'rMBER 1980
Distance Depth to Distance Depth tofrom River from RiverLnacal Bottom Observation Velocity at Int. t1.a. Bottom Obser ation 7locit atPt. (ft.) (ft.) Depth (ft.) Pt. (ft/s) Pt. (ft.) (ft.) :e4i1 "ft.) ?t. (f:/c)
.1 963 - ank intesects Jatar Surtface 780 6.2 0.0 3.98960 5.1 0.0 0.91 1.24 3.97
1.02 0.81 3.10 -. 642.55 1.23 4.96 2.804.08 0.74 765 6.1 0.0 3.69
945 11.4 0.0 2.35 1.22 3.352.28 2.09 3.05 3.505.70 2.49 4.88 2.929.12 1.91 740 5.7 0.0 3.88
930 1.6 0.0 4.21 1. 3.722.32 3.72 2.85 3.725.80 3.80 4.56 2.879.28 3.44 715 5.6 0.0 4.07
915 9.8 0.0 4.25 1.12 3.801.96 3.80 2.80 3.724.90 3.37 4.4a 3.1.23.84 3.43 690 5.9 0.0 3.46
q 900 1.7 0.0 4.49 1.16 3.35 01.94 4.37 2.90 3.504.85 4.06 4.64 2.547.76 3.27 665 4.3 0.0 3.82
885 9.4 0.0 4.39 2.15 3.191.88 4.35 2.58 3.254.70 3.M 640 5.3 0.0 3.547.52 3.12 1.06 3.27
870 9.2 0.0 4.28 2.1.5 2.98 01.84 4.35 4.24 2.744.60 3.80 62.5 ,.9 0.0 3.597.36 2.92 0.98 3.19
655 9.4 0.0 4.59 2.45 2.921.38 4.46 3.92 2.384.70 4.Z5 590 4.1 0.0 3.297.52 3.35 2.05 2.87
840 9.2 0.0 4.24 2.46 2.801.84 4.15 565 3.9 0.0 3.064.60 3.97 1.95 2.737.36 3.05 2.34 2.60
825 8.2 0.0 4.46 535 3.7 0.0 2.931.64 4.15 1.85 2.804.10 3.97 2.22 2.493.28 3.44 500 3.7 0.0 2.98
810 7.8 0.0 4.17 1.85 2.661.56 3.97 2.2"21 Z.533.90 3.27 480 3.1 0.0 2.026.24 3.12 1.55 1.64
795 6.7 0.0 4.45 1.86 1.721.34 4.1-1 474 - Bank intersects water Surface3.35 4.255.36 3.43
G-62-74
... . . ..w w ~ ' 0 i e l l a
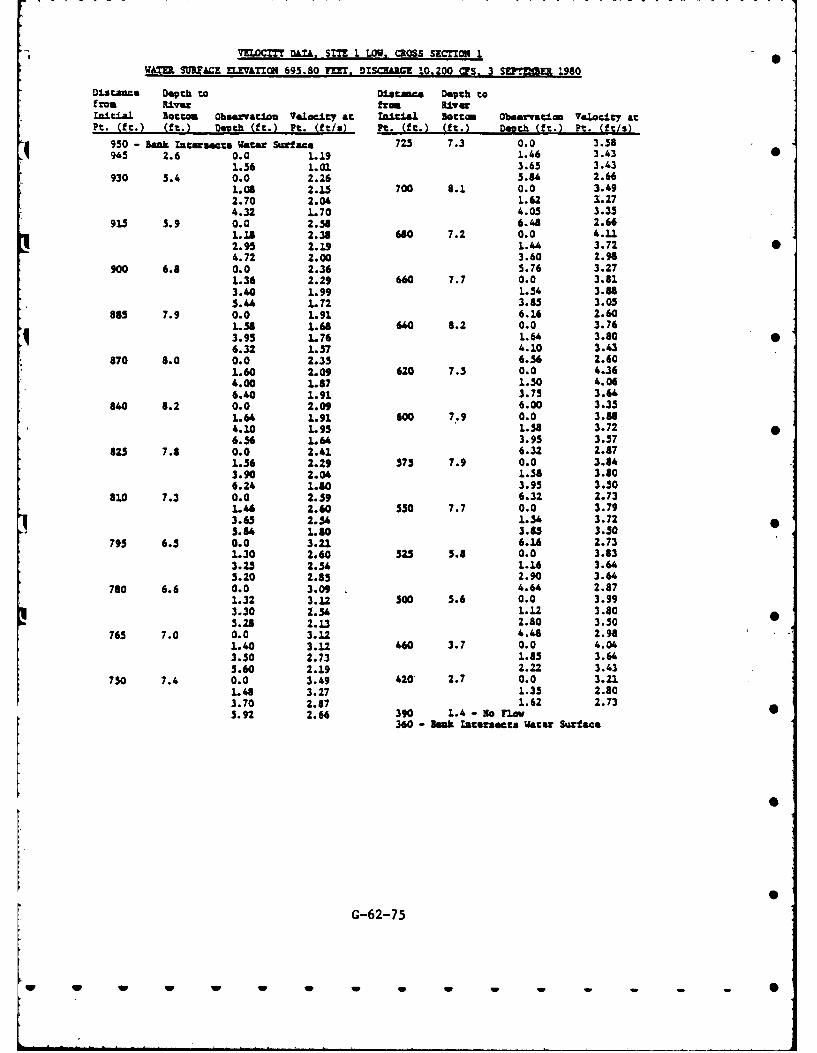
VU.OC DAT. SITE I LOW. CROSS SECTION 1
WATER SURACZ ELZVATIZ(I 695.80 FM . DISCARGE 10.200 CFS. 3 SEPT ER 1980
Distance Depth to Ditance Depth tofrou River from River1±tiLl Bottom Observatiou VeaLcity at initial attom Observation Velocity atPt. (ft.) (ft.) Dpth (ft.) Pt. (ft/$) Pt. (ft.) (ft.) Deyth (ft.) Pt. (ft/u)
950 - Bank Intersects Water Surface 725 7.3 0.0 3.58945 2.6 0.0 1.19 1.46 3.43 0
1.56 1.01 3.65 3.43930 5.4 0.0 2.26 5.84 2.66
1.06 2.L5 700 8.1 0.0 3.492.70 2.04 1.62 1.274.32 ..70 4.05 3.35
915 5.9 0.0 2.56 6.48 2.661.18 2.38 660 7.2 0.0 4.112.95 2.19 1.4 3.72 S4.72 2.00 3.60 2.98
900 6.8 0.0 2.36 5.76 3.271.36 2.29 660 7.7 0.0 3.813.40 1.99 1.54 3.185.44 1.72 3.85 3.05
885 7.9 0.0 1.91 6.16 2.601..58 1.6 640 8.2 0.0 3.763.95 1.76 1.64 3.806.32 1.57 4.10 3.43
870 8.0 0.0 2.35 6.56 2.601.60 2.09 620 7.5 0.0 4.364.00 1.87 1.50 4.066.40 1.91 3.75 3.64
840 8.2 0.0 2.09 6.00 3.351.64 1.91 600 7.9 0.0 3.864.10 1.95 1.58 3.726.56 1.6 3.95 3.57
825 7.8 0.0 2.41 6.32 2.871.36 2.29 575 7.9 0.0 3.843.90 2.04 1.58 3.806.24 1.80 3.95 3.50
810 7.3 0.0 2.59 6.32 2.7316 2.60 550 7.7 0.0 3.793.65 2.54 1.54 3.725.84 1.80 3.85 3.50 0
795 6.5 0.0 3.21 6.16 2.731.30 2.60 525 5.8 0.0 3.833.25 2.54 1.16 3.645.20 2.85 2.90 3.64
780 6.6 0.0 3.09 4.64 2.871.32 3.12 500 5.6 0.0 3.993.30 1.54 1.12 3.805.28 2.13 2.80 3.50
765 7.0 0.0 3.12 4.48 2.981.40 3.12 460 3.7 0.0 4.043.50 2.73 1.85 3.645.60 2.19 2.22 3.43
750 7.4 0.0 3.49 420 2.7 0.0 3.211.48 3.27 1.35 2.803.70 2.87 1.62 2.735.92 2.66 390 L.4 -lo w 0
360 - lank Tntersects Water Surface
G-62-75
w w w w w w w OF- -
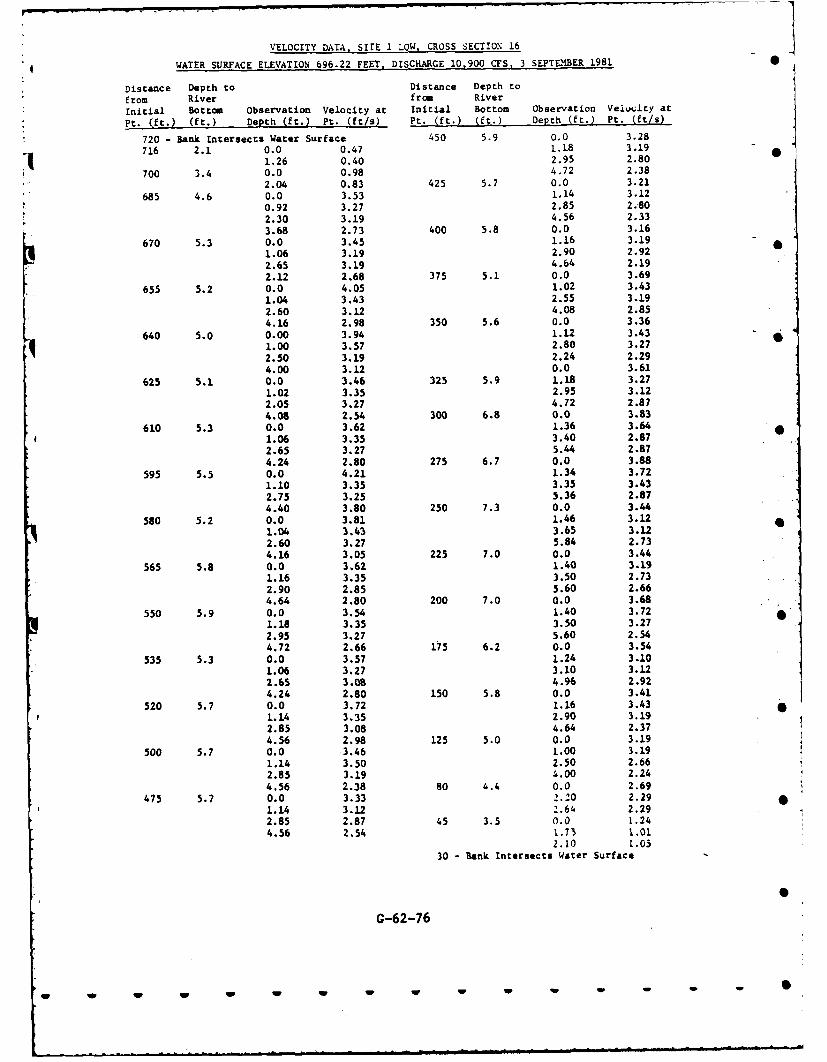
VELOCITY DATA, SITE 1 LOW. CROSS SECTION 16
WATER SURFACE ELEVATION 696.22 FEET. DISCHARGE 10.900 CFS. 3 SEPTEMBER 1981 0
Distance Depth to Distance Depth tofrom River from RiverInitial Bottom Observation Velocity at Initial Bottom Observation Veiucity at
Pt. (ft.) (ft.) Depth (ft.) Pt. (ft/s) Pt. (ft.) (ft.) Depth (ft.) Pt. (ft/s)
720 - Bank Intersects Water Surface 450 5.9 0.0 3.28716 2.1 0.0 0.47 1.18 3.1976 .1.26 0.40 2.95 2.80
700 3.4 0.0 0.98 4.72 2.38
2.04 0.83 425 5.7 0.0 3.21
685 4.6 0.0 3.53 1.14 3.120.92 3.27 2.85 2.802.30 3.19 4.56 2.33
3.68 2.73 400 5.8 0.0 3.16
670 5.3 0.0 3.45 1.16 3.191.06 3.19 2.90 2.922.65 3.19 4.64 2.192.12 2.68 375 5.1 0.0 3.69
655 5.2 0.0 4.05 1.02 3.431.04 3.43 2.55 3.192.60 3.12 4.08 2.854.16 2.98 350 5.6 0.0 3.36
640 5.0 0.00 3.94 1.12 3.431.00 3.57 2.80 3.272.50 3.19 2.24 2.294.00 3.12 0.0 3.61
625 5.1 0.0 3.46 325 5.9 1.18 3.271.02 3.35 2.95 3.122.05 3.27 4.72 2.874.08 2.54 300 6.8 0.0 3.83
610 5.3 0.0 3.62 1.36 3.641.06 3.35 3.40 2.872.65 3.27 5.44 2.874.24 2.80 275 6.7 0.0 3.88
595 5.5 0.0 4.21 1.34 3.721.10 3.35 3.35 3.432.75 3.25 5.36 2.874.40 3.80 250 7.3 0.0 3.44
580 5.2 0.0 3.81 1.46 3.121.04 3.43 3.65 3.122.60 3.27 5.84 2.734.16 3.05 225 7.0 0.0 3.44
565 5.8 0.0 3.62 1.40 3.191.16 3.35 3.50 2.732.90 2.85 5.60 2.664.64 2.80 200 7.0 0.0 3.68
550 5.9 0.0 3.54 1.40 3.721.18 3.35 3.50 3.272.95 3.27 5.60 2.544.72 2.66 175 6.2 0.0 3.54
535 5.3 0.0 3.57 1.24 3.101.06 3.27 3.10 3.122.65 3.0, 4.96 2.924.24 2.80 150 5.8 0.0 3.41
520 5.7 0.0 3.72 1.16 3.431.14 3.35 2.90 3.19
2.85 3.08 4.64 2.374.56 2.98 125 5.0 0.0 3.19
500 5.7 0.0 3.46 1.00 3.191.14 3.50 2.50 2.662.85 3.19 4.00 2.24
4.56 2.38 80 4.4 0.0 2.69475 5.7 0.0 3.33 2.20 2.29
1.14 3.12 2.64 2.292.85 2.87 45 3.5 0.0 1.244.56 2.54 1.75 1.01
2.10 1.05
30 - Bank Intersects Water Surface
G-62-76
- W W w' m •m w w -mmmmm -mm ~ mj m' d mw lm .amm S m m
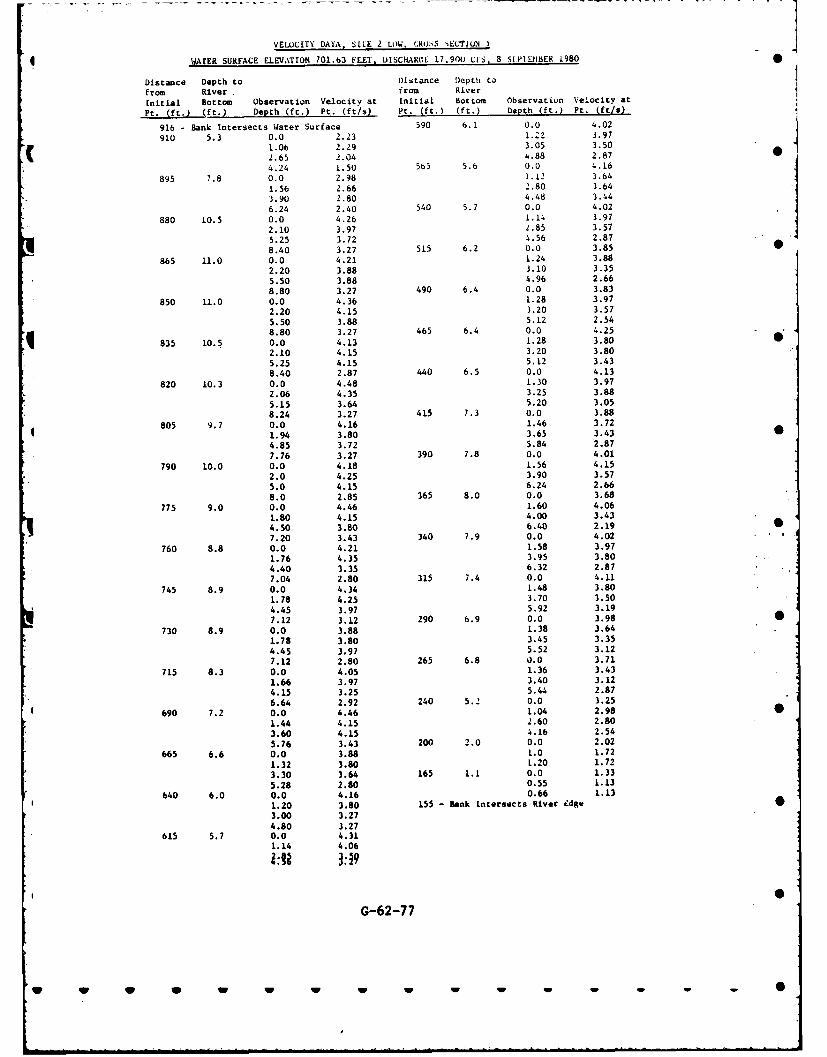
VEWC[TY DALA, S'LE 2 LOW. (ROSS ELTl0N I
WATER SURFACE ELEVATION 701.3 FEET, UISCHARGE 17.900 CI-S, 8 SMEIBER .980
Distance Depth to Distance Depth tofrom River from River
Initial Bottom Observation Velocity at Initial Bottom Observatiun Velocity at
Pt. (ft.) (ft.) Depth (ft.) Pt. (ft/s) Pt. (ft.) (ft.) Depth (ft.) Pt. (ft/l)
916 - Bank Intersects Water Surface 590 6.1 0.0 4.02
910 5.3 0.0 2.23 1.22 3.97
1.06 2.29 3.05 3.50
.2.65 2.04 4.88 2.874.24 1.50 55 5.6 0.0 4.16
895 7.8 0.0 2.98 1.12 3.64
1.56 2.66 2.80 3.64
3.90 2.80 4.48 3.44
6.24 2.40 540 5.7 0.0 4.02
880 10.5 0.0 4.26 1.14 3.97
2.10 3.97 2.85 3.57
5.25 3.72 4.56 2.87
8.40 3.27 515 6.2 0.0 3.85 0865 11.0 0.0 4.21 1.24 3.88
2.20 3.88 3.10 3.35
5.50 3.88 4.96 2.66
8.80 3.27 490 6.4 0.0 3.83
850 11.0 0.0 4.36 1.28 3.97
2.20 4.15 3.20 3.57
5.50 3.88 5.12 2.54
8.80 3.27 465 6.4 0.0 4.25
835 10.5 0.0 4.13 1.28 3.80 02.10 4.15 3.20 3.80
5.25 4.15 5.12 3.438.40 2.87 440 6.5 0.0 4.13
820 10.3 0.0 4.48 1.30 3.972.06 4.35 3.25 3.88
5.15 3.64 5.20 3.058.24 3.27 415 7.3 0.0 3.88
805 9.7 0.0 4.16 1.46 3.72
1.94 3.80 3.65 3.43 •4.85 3.72 5.84 2.877.76 3.27 390 7.8 0.0 4.01
790 10.0 0.0 4.18 1.56 4.152.0 4.25 3.90 3.575.0 4.15 6.24 2.668.0 2.85 365 8.0 0.0 3.68
775 9.0 0.0 4.46 1.60 4.061.80 4.15 4.00 3.434.50 3.80 6.40 2.19 07.20 3.43 340 7.9 0.0 4.02
760 8.8 0.0 4.21 1.58 3.971.76 4.35 3.95 3.804.40 3.35 6.32 2.877.04 2.80 315 7.4 0.0 4.11
745 8.9 0.0 4.34 1.48 3.801.78 4.25 3.70 3.504.45 3.97 5.92 3.197.12 3.12 290 6.9 0.0 3.98 0
730 8.9 0.0 3.88 1.38 3.641.78 3.80 3.45 3.354.45 3.97 5.52 3.127.12 2.80 265 6.8 0.0 3.71
715 8.3 0.0 4.05 1.36 3.431.66 3.97 3.40 3.12
4.15 3.25 5.44 2.876.64 2.92 240 5.2 0.0 3.25
690 7.2 0.0 4.46 1.04 2.98 •
1.44 4.15 2.60 2.80
3.60 4.15 4.16 2.545.76 3.43 200 2.0 0.0 2.02
665 6.6 0.0 3.88 1.0 1.721.32 3.80 L.20 1.723.30 3.64 165 1.1 0.0 1.33
5.28 2.80 0.55 L.13640 6.0 0.0 4.16 0.66 1.13
1.20 3.80 155 - Bank Intersects River Edge 03.00 3.274.80 3.27
615 5.7 0.0 4.311.14 4.06
6-3:79
G-62-7 7
L - - - -- - -
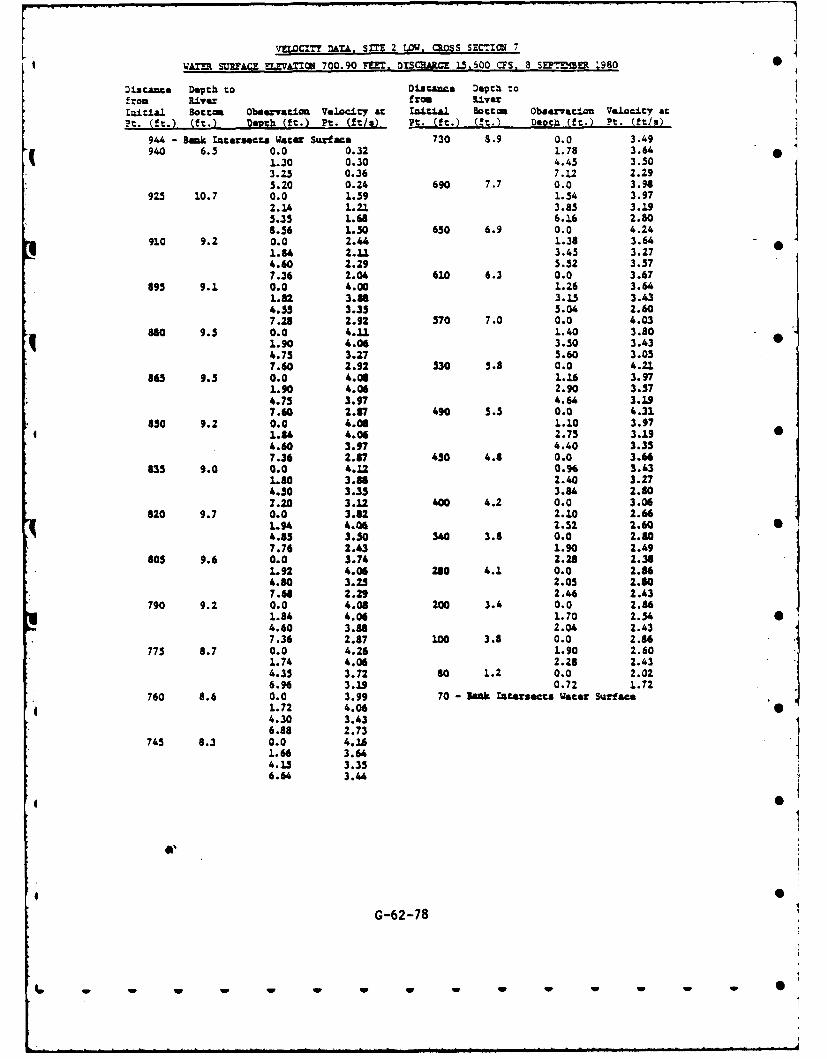
VLOCZTT DA. STZ 2 LOW, CROSS SECZ ION
WATR SRFAE .EVhflW 700.90 TU=. DrSCARGZ L.5,600 CFS. 8 S~rrE 1-980
Distance Depth to Diat ce Depth tofrom River from RiverI4ita.L Bottom Observation Ve.lcty at tznota.l 3oct Observation 7elocity at?t. (ft.) (ft.) Dayth (ft.) Pt. (ft/$) ?t. (ft.) (ft.) Devch (ft.) ?t. (ftls)
944 Bak It:ersects Wter Surface 730 8.9 0.0 3.49940 6.5 0.0 0.32 1..78 3.64
1.30 0.30 4.45 3.50
3.25 0.36 7..2 2.295.20 0.24 690 7.7 0.0 3.98
925 10.7 0.0 1.59 1.54 3.972.14 1. 2. 3.85 3.195.35 1.68 6.16 2.808.56 1.50 650 6.9 0.0 4.24
910 9.2 0.0 2.44 1.38 3.641.84 2.11 3.45 3.274.60 2.29 5.52 3.577.36 2.04 610 6.3 0.0 3.67
895 9.1 0.0 4.00 1.26 3.641.82 3.86 3.1.5 3.434.55 3.35 5.04 2.607.28 2.92 570 7.0 0.0 4.03
880 9.5 0.0 4.11 1.40 3.801.90 4.06 3.50 3.434.75 3.27 5.60 3.057.60 2.92 530 5.8 0.0 4.21
865 9.5 0.0 4.08 1.16 3.971.90 4.06 2.90 3.574.75 3.97 4.64 3.197.60 2.87 490 5.5 0.0 4.31
850 9.2 0.0 4.06 1.10 3.971.84 4.06 2.75 3.19 04.60 3.97 4.40 3.357.36 2.87 450 4.8 0.0 3.66
635 9.0 0.0 4.12 0.96 3.431.80 3.88 2.40 3.274.50 3.35 3.84 2.807.20 3.12 400 4.2 0.0 3.06
820 9.7 0.0 3.82 2.10 2.661.94 4.06 2.52 2.60 S4.85 3.50 360 3.8 0.0 2.807.76 2.43 1.90 2.49
805 9.6 0.0 3.74 2.28 2.381.92 4.06 280 4.1 0.0 2.864.80 3.23 2.05 2.807.6 2.29 2.46 2.43
790 9.2 0.0 4.08 200 3.4 0.0 2.861.84 4.06 1.70 2.54 04.60 3.88 2.04 2.437.36 2.87 100 3.8 0.0 2.86
775 8.7 0.0 4.26 1.90 2.601.74 4.06 2.28 2.434.35 3.72 80 1.2 0.0 2.026.96 3.19 0.72 1.72
760 8.6 0.0 3.99 70 - Usk aitersects Water Surface1.72 4.064.30 3.436.88 2.73
745 8.3 0.0 4.161.66 3.644.15 3.35
6.64 3.4
G-62-78
I. w w w w W W- w
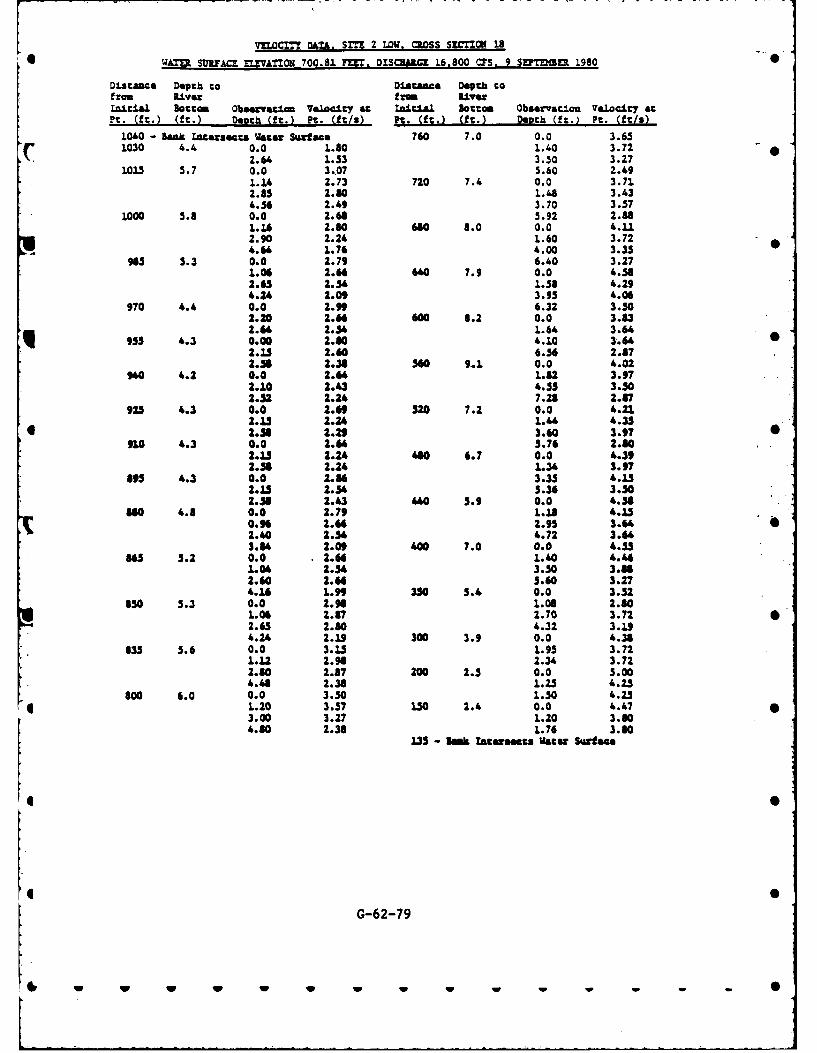
VELOCZTT 0AT SM 2 LOW. CROSS SECTI is• '~~AZU SURF=.. ELE VATION 700.81 FEET. DISCURGE 16,00 CPS, 9 SEPEMER 1980
DLstance Depth to Disace Dpth cofrom Rilver from R,.iver
La.itiaJ. Bottom Observation Valoc.Lcy at i la..1 Bottom Observratiou .,oc.Lt atPt.(f.)(ft.) Deoth (ft.) Pt. (ft/u) Pt. (ft.) (ft.) Dayth f. t.(t
10a0 SU Za tersects Water Surface 760 7.0 0.0 3.651030 4.4 0.0 1.80 1.0 3.72
2.64 1.53 3.50 3.271015 5.7 0.0 3.07 5.60 2.49
1.14 2.73 720 7.4 0.0 3.712.85 2.80 1.48 3.434.56 2.49 3.70 3.57
1000 5.8 0.0 2.6G 5.92 2.881.16 2.80 660 8.0 0.0 4.1U2.90 2.24 1.60 3.724.64 1.76 4.00 3.35
905 5.3 0.0 2.79 6.40 3.271.06 2.66 640 7.9 0.0 4.582.65 2.34 1.58 4.294.24 2.09 3.95 4.06
970 4.4 0.0 2.99 6.32 3.302.20 2.66 600 8.2 0.0 3.832.64 2.54 1.64 3.64
95. 4.3 0.00 2.80 4.10 3.64
2.15 2.60 6.36 2.872.5 2.38 340 9.1 0.0 4.02
960 4.2 0.0 2.64 1.82 3.972.10 2.43 4.35 3.502.52 2.24 7.28 2.67
M 4.3 0.0 2.69 520 7.2 0.0 4.2.2.15 2.24 1.4 4.33
0 2.38 2.29 3.60 3.97 0910 4.3 0.0 2.64 5.76 2.80
2.15 2.24 4680 6.7 0.0 4.392.38 2.24 1.34 3.97
8$ 4.3 0.0 2.U 3.35 4.152.15 2.54 5.36 3.502.56 2.43 440 5.9 0.0 4.38
860 4.8 0.0 2.79 1.18 4.50.9 2.66 2.95 3.64 02.40 2.54 4.72 3.643.864 2.09 400 7.0 0.0 4..5
865 5.2 0.0 2.66 1.40 4.461.04 2.54 3.50 3.862.60 2.64 5.60 3.274.16 1.9 350 5.4 0.0 3.52
850 5.3 0.0 2.96 1.08 2.801.06 2.87 2.70 3.72 S2.65 2.60 4.32 3.194.24 2.19 300 3.9 0.0 4.38
835 5.6 0.0 3.15 1.95 3.721.12 2.98 2.34 3.722.80 2.87 200 2.3 0.0 5.004.48 2.38 1.25 4.25
g00 6.0 0.0 3.50 1.30 4.251 L.20 3.57 150 2.4 0.0 4.473.00 3.27 1.20 3.804.80 2.38 1.76 3.80
135 - lInk Zaeretrs Water Surface
I4 0
G-62-79
w F w IF lw w
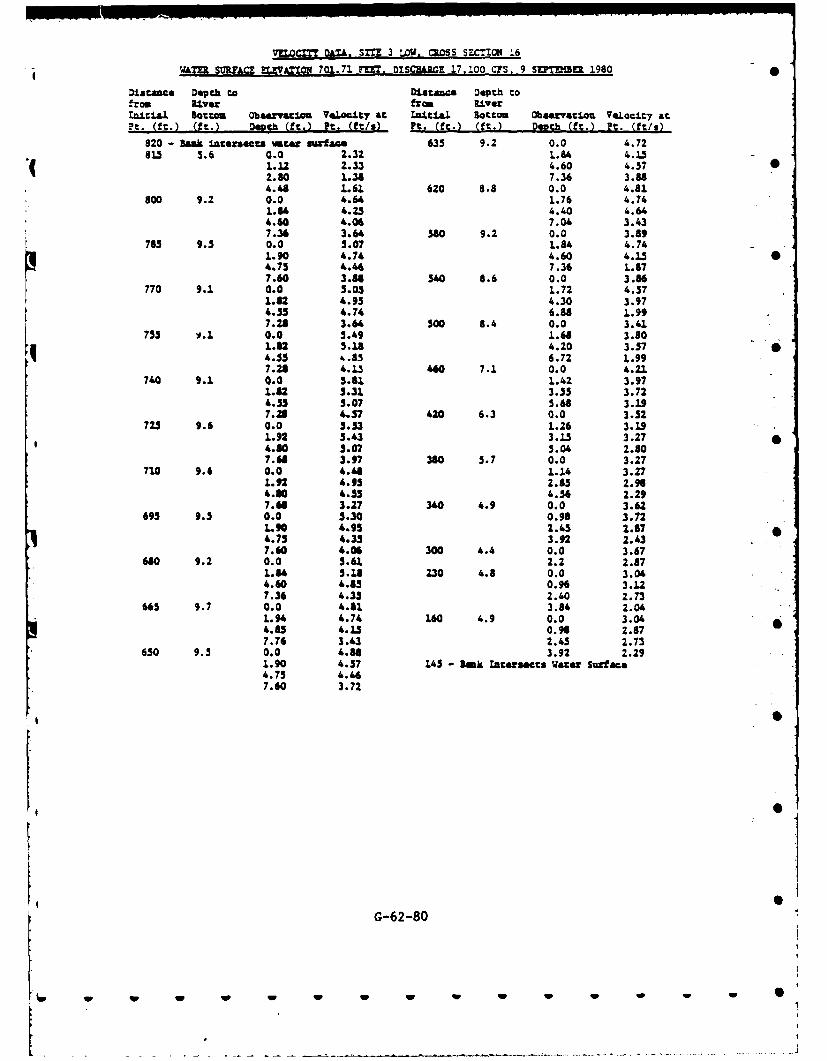
VILOCZTT D*X.. SITZ 3 LOW. CROSS SECTION 16
WAUTZ SUR.FACE UEVATION 701.71 FlfT. DISCHARGE 17.100 CPS. 9 SDTrEU 1980
Disctace Depth to Disa ce Depth tofrot lver from River.zitial Battot Obser aion Velocity at ZoLitii, Bottom Obervation VLocit7 atPt. (ft.) (ft.) D3epth (ft.) Zt. (ft/s) Pt. (ft.) (ft.) De~th (ft.) Pt. (ft/s)
820 - Bank intersets uaer surface 635 9.2 0.0 4.728.5 5.6 0.0 2.32 1.8" 4.15
" 1.12 2.33 4.60 4.57 02.80 1.38 7.36 3.884.41 1.63. 620 8.8 0.0 4.81
800 9.2 0.0 4.64 1.76 4.741.84 4.25 4.40 4.644.60 4.06 7.04 3.437.36 3.64 580 9.2 0.0 3.89
785 9.5 0.0 5.07 1.84 4.741.90 4.74 4.60 4.1.3 04.75 4.46 7.36 1.877.60 3.86 54 8.6 0.0 3.86
770 9.1 0.0 5.05 1.72 4.571.82 4.95 4.30 3.974.55 4.74 6.88 1.997.28 3.6" 500 8.4 0.0 3.41
755 .1 0.0 5.49 1.6" 3.801.82 5.18 4.20 3.574.55 ,.8S 6.72 1.997.23 4.1.5 4,0 7.1 0.0 4.21
740 9.1 0.0 5.8. 1.42 3.971.82 5.31 3.55 3.724.55 5.07 S.68 3.197.28 4.57 420 6.3 0.0 3.52
725 9.6 0.0 5.53 1.26 3.191.92 5.43 3.15 3.274.80 5.07 5.04 2.807." 3.97 380 5.7 0.0 3.27
710 9.6 0.0 4.41 1.14 3.271.92 4.95 2.85 2.9"4.80 4.53 4.56 2.297.66 3.27 340 4.9 0.0 3.62
695 9.5 0.0 5.30 0.9 3.721.90 4.9S 2.45 2.674.75 4.35 3.92 2.4307.60 4.06 300 4.4 0.0 3.67
610 9.2 0.0 5.63. 2.2 2.871.34 5..18 230 4.8 0.0 3.044.60 4.83 0.9 3..27.36 4.35 2.40 2.73
66S 9.7 0.0 4.82 3.84 2.041.94 4.74 160 4.9 0.0 3.044.85 4.135 0.96 2.877.74 3.43 2.45 2.73
650 9.5 0.0 4.88 3.92 2.291.90 4.57 145 B nk tatcrsects Water Surface4.75 4.467.60 3.72
G-62-80
w w W W
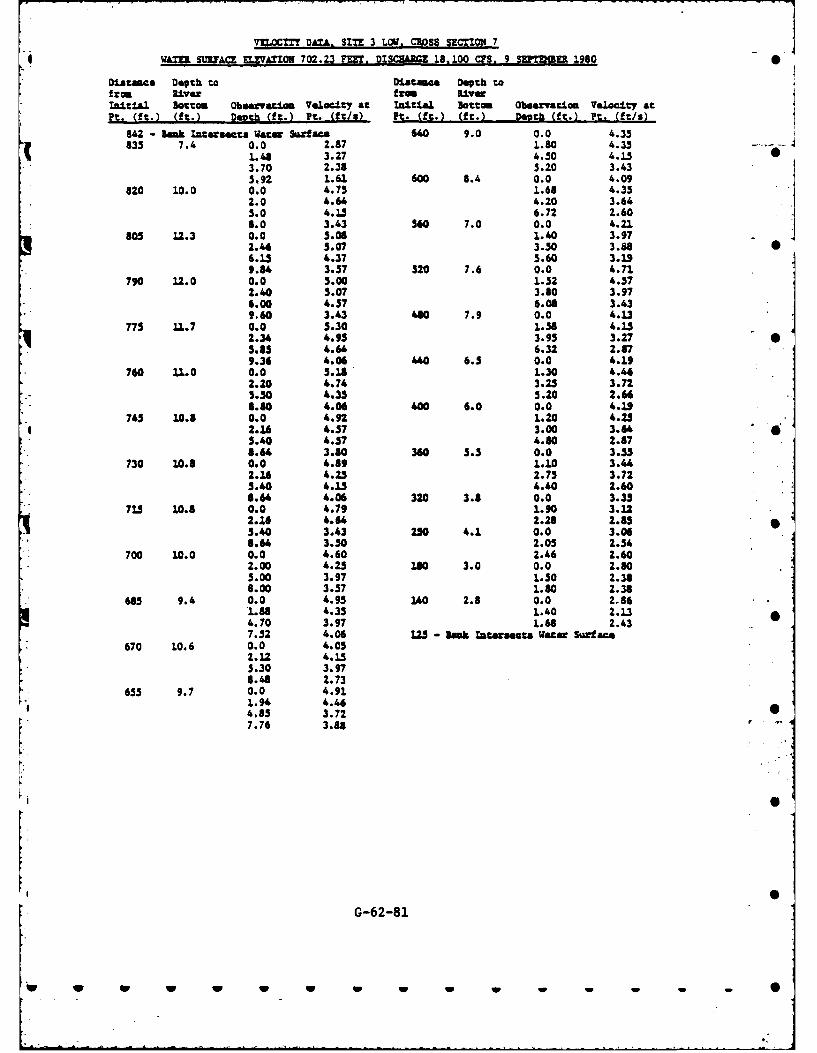
7UOCZ"" DATA, SITE 3 Low. CROSS SECTZO 7WLTE =UFACE E VA.=ON 702.2 Z3 e FW SCHklRGZ 18,100 CFS, 9 SMM3 ER 1980
Distance Depth to Distanme Depth tofrom River f:m Lver
:nitial Bottom Observation VelocitY at A.LtAJL Bottoi Observation VeLocity atPt. (ft.) (ft.) Death (ft.) Pt. (ft/u) Pt. (ft.) (ft.) Death (ft.) Pt. (ft/s)
842 - Bank Intersects Waer Surface 640 9.0 0.0 4.35835 7.4 0.0 2.87 1.80 4.351o.48 3.27 4.50 4.15
3.70 2.38 5.20 3.435.92 1.61 600 8.4 0.0 4.09
820 10.0 0.0 4.75 1.68 4.352.0 4.6 4.20 3.645.0 4.15 6.72 2.608.0 3.43 560 7.0 0.0 4.21
805 12.3 0.0 5.08 1.40 3.972.46 5.07 3.50 3.886.13 4.37 5.60 3.199.84 3.57 520 7.6 0.0 4.71
790 12.0 0.0 5.00 1.52 4.572.40 3.07 3.80 3.976.00 4.57 6.08 3.43960 3.43 440 7.9 0.0 4.13
773 11.7 0.0 5.30 1.58 4.152.34 4.95 3.95 3.27 •5.85 4.64 6.32 2.879.36 4.06 440 6.5 0.0 4.19
760 1.0 0.0 5.18 1.30 4.462.20 4.74 3.25 3.725.30 4.35 5.20 2.668.80 4.04 400 6.0 0.0 4.19
745 10.8 0.0 4.92 1.20 4.2.2.16 4.57 3.00 3.645.40 4.57 4.80 2.878.64 3.80 360 5.5 0.0 3.55
730 10.8 0.0 4.89 1.10 3.442.16 4.25 2.75 3.723.40 4.15 4.40 2.608.64 4.06 320 3.8 0.0 3.35
715 10.8 0.0 4.79 1.90 3.122.16 4.64 2.28 2.855.40 3.43 250 4.1 0.0 3.068.6 3.50 2.05 2.54
700 10.0 0.0 4.60 2.46 2.602.00 4.25 0 3.0 0.0 2.805.00 3.97 1.50 2.388.00 3.57 1.80 2.38
685 9.4 0.0 4.95 140 2.8 0.0 21861.88 4.35 1.40 2.134.70 3.97 1.68 2.437.52 4.06 125 - Bank aerinect Water Surface
670 10.6 0.0 4.052.12 4.155.30 3.978.48 2.73
655 9.7 0.0 4.911.94 4.464.85 3.727.76 3.88
G-62-81
w w w w w w w - S
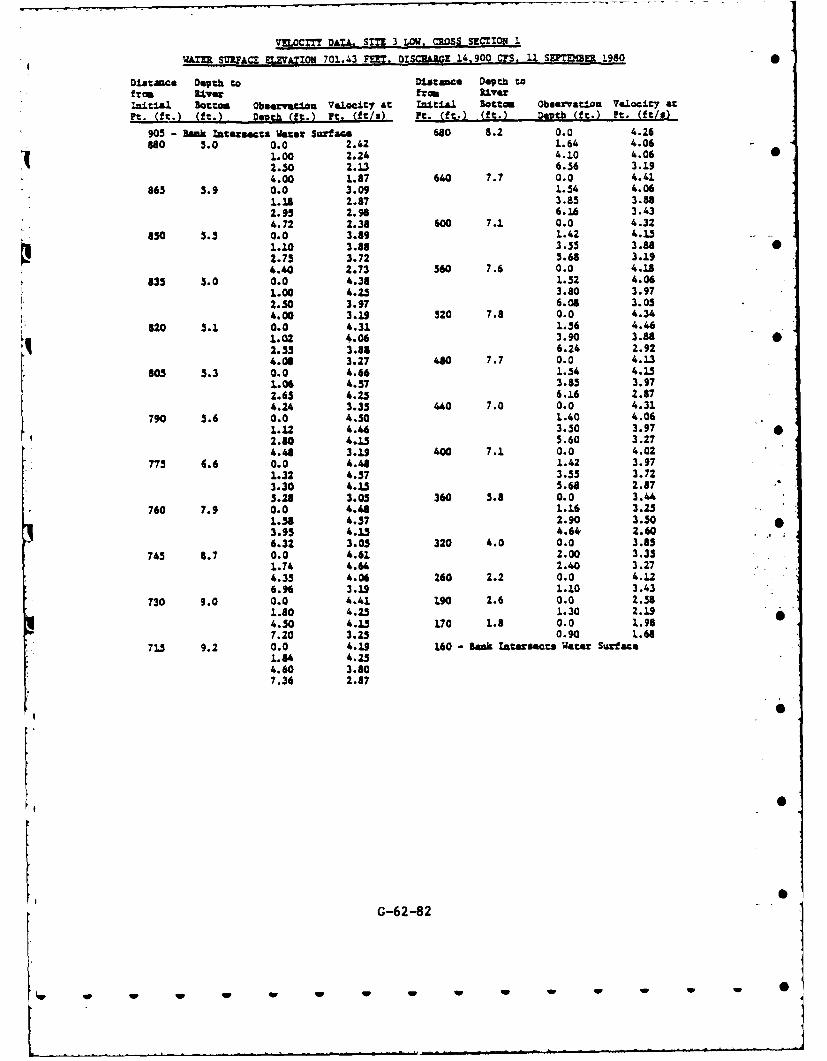
VUOCIT 0AT. SITE 3 LOW. CROS SECTION I.
WAER SOA ELE.z7AION 701.43 r. DTSCRARGE _ 14,900 CPS, 11 SRT "TEM 1980 0
Distance Depth to Distance Depth tofrom lver from RiverInitial attoim Observaon Velocity at Initial. Sottom observation Velocity atPt. (ft.) (ft.) Depth ( ft.) Pt. ( t/u) Pt. (ft.) (ft.) Depth (ft.) Pt. (ft/u)
905 - Bank i rsects Water Surf ace 680 8.2 0.0 4.26880 3.0 0.0 2.42 1.64 4.06
* 1.00 2.24 4.10 4.06 02.30 2.13 6.56 3.194.00 1.87 640 7.7 0.0 4.41
865 3.9 0.0 3.09 1.54 4.061.18 2.87 3.85 3.882.95 2.98 6.16 3.434.72 2.38 600 7.1 0.0 4.32
850 3.5 0.0 3.89 1.42 4.1.5 -
1.10 3.88 3.55 3.88 02.75 3.72 5.68 3.194.40 2.73 560 7.6 0.0 4.18
835 5.0 0.0 4.38 1.52 4.061.00 4.25 3.80 3.972.30 3.97 6.0 3.04.00 3.19 420 7.8 0.0 4.34
820 5.1 0.0 4.31 1.56 4.151.02 4.06 3.90 3.882.5 3.85 6.2 2.124.08 3.7 480 7.0 0.0 4.3
70 53. 0.0 4.50 1.4 0 4.1.0 4.46 3.5 3.972.80 4.15 5.16 2.274.1. 3.3 40 7.0 0.0 4.31
770 6.6 0.0 4.0 1.40 3.01.12 4.57 3.50 3.972.30 4.15 5.60 3.274.48 3.19 30 7.1 0.0 4.02
77 7.6 0.0 4.48 1.42 3.971.32 4.57 3.5 3.723.30 4.15 5.6 2.675.28 3.05 360 4.8 0.0 3.8
760 7.9 0.0 4.61 2.00 3.351.78 4.37 2.90 3.203.95 4.13 4.64. 2.606.32 3.0 320 4.0 0.0 3.3
745 9.7 0.0 4.61 2.00 3.31.7 4.6 2.30 3.274.35 4.06 260 2.2 0.0 4.126.20 3.19 1.0 3.63
730 9.0 0.0 4.1 190 2 0.0 2.81.80 4.25 1.30 2.194.50 4.1.5 L70 L.8 0.0 1.987.20 3.253 0.90 1."8
715 9.2 0.0 4.9160 Bank aT.acrsctm W'ater Surf'ace1.8, 4.23.
4.60 3.807.36 2.87
G
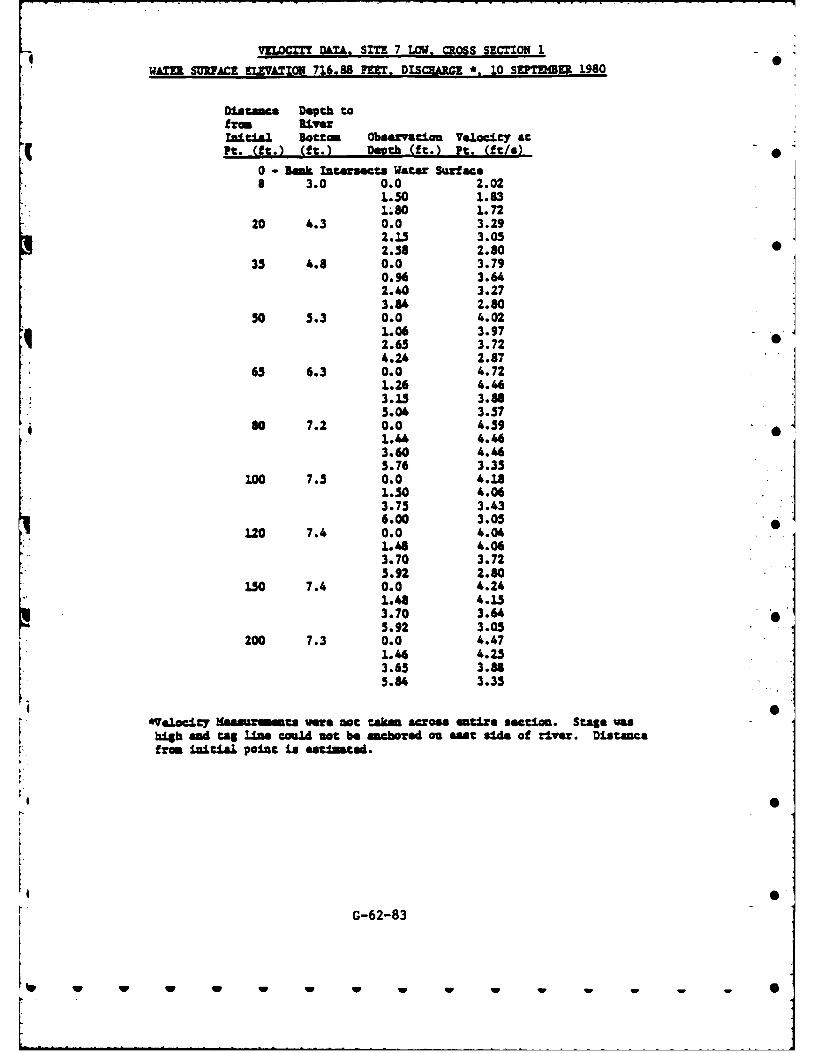
0VELOCIT DAl.T SITE 7 LW CROSS SECTION I
WAXT SURFACE ELVATION 716.88 FEET. DISCHARGE *, 10 SEPTEMBER 1980
Distance Depth tofrom RiverInitial Bottom Observation Velocity atPt. (ft.) (ft.) Deuch (ft.) Pt, (ft/s)-
0 - lnk Zatereecta Water Surface8 3.0 0.0 2.02
1.50 1.83.80 1.72
20 4.3 0.0 3.292.15 3.052.58 2.80 0
35 4.8 0.0 3.790.96 3.642.40 3.27
3.8 2.8050 5.3 0.0 4.02
1.06 3.972.65 3.72 •
4.24 2.8765 6.3 0.0 4.72
1.26 4.463.15 3.885.04 3.57
80 7.2 0.0 4.59
3.60 4.465.76 3.35
100 7.5 0.0 4.181.50 4.063.75 3.436.00 3.05
120 7.4 0.0 4.041.48 4.063.70 3.725.92 2.80
150 7.4 0.0 4.241.48 4.153.70 3.645.92 3.05
200 7.3 0.0 4.471.46 4.233.65 3.885.84 3.35
*YelociCY MeAeiarcs were not taken acroma entire section. Stage washigh and tag Lie could not be anchor" an east aide of river. DistancefTrC initial point is estIaMted.
G-62-83
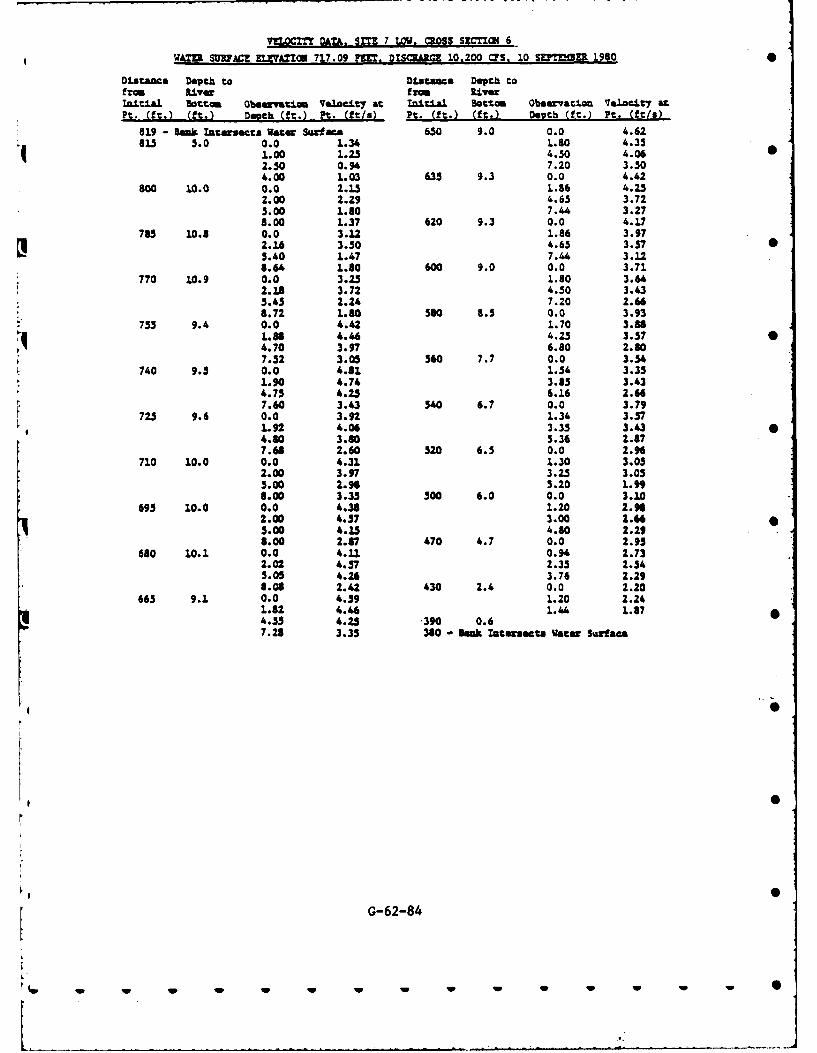
VU.OCZTT DATA, SfTR 7 LOW. CROSS SCTZK( 6
WATZI SRL7Z LZ'=T2l 717.09 fn=e. DISCUMZ 10.200 CPS. 10 SUMMER 1980 0
Distance Depth to Distance DepCh tofrom River from U,.ve:Ini.laJ. Bttm Obsemrt.lou Veloc:ty at In±±Al Bottom Observaetion Valoct7 atPt. (ft.) (ft.) Depth (ft.) ft. (ft/2) ft. (ft.) (ft.) Deuch (ft.) Pt. (ft/u)
819 - BaM Titersects Water Sufac 650 9.0 0.0 4.6285 ,.0 0.0 1.34 1.80 4.35
1.00 1.25 4.50 4.062.50 0.94 7.20 3.504.00 1.03 635 9.3 0.0 4.42
goo 10.0 0.0 2.15 1.86 4.252.00 2.29 4.65 3.725.00 1.80 7."1 3.278.00 1.37 620 9.3 0.0 4.17
785 10.8 0.0 3.12 1.86 3.972.16 3.50 4.65 3.57 05.40 1.47 7.4 3.128.64 1.80 600 9.0 0.0 3.71
770 10.9 0.0 3.23 1.80 3.642.13 3.72 4.50 3.435.45 2.24 7.20 2.666.72 1.80 580 8.5 0.0 3.93
753 9.4 0.0 4.42 1.70 3.881.88 4.46 4.25 3.57 04.70 3.97 6.80 2.807.52 3.05 560 7.7 0.0 3.54
740 9.5 0.0 4.81 1.54 3.351.90 4.74 3.85 3.434.75 4.25 6.16 2.67.60 3.43 540 6.7 0.0 3.79
725 9.6 0.0 3.92 1.34 3.571.92 4.06 3.35 3.434.80 3.80 5.36 2.877.68 2.60 520 6.5 0.0 2.9
710 10.0 0.0 4.31 1.30 3.052.00 3.97 3.25 3.035.00 2.96 5.20 1.998.00 3.35 500 6.0 0.0 3.10
695 10.0 0.0 4.38 1.20 2.962.00 4.57 3.00 2.665.00 4.15 4.80 2.298.00 2.87 470 4.7 0.0 2.95
680 10.1 0.0 4.11. 0.94 2.732.02 4.37 2.35 2.545.05 4.26 3.76 2.298.08 2.42 430 2.4 0.0 2.20
665 9.1 0.0 4.59 1.20 2.241.82 4."4 1."- 1.874.55 4.25 390 0.67.28 3.35 380 - Bank rTtersect Water Surface
"-2
G-62-84
qw -- WW W
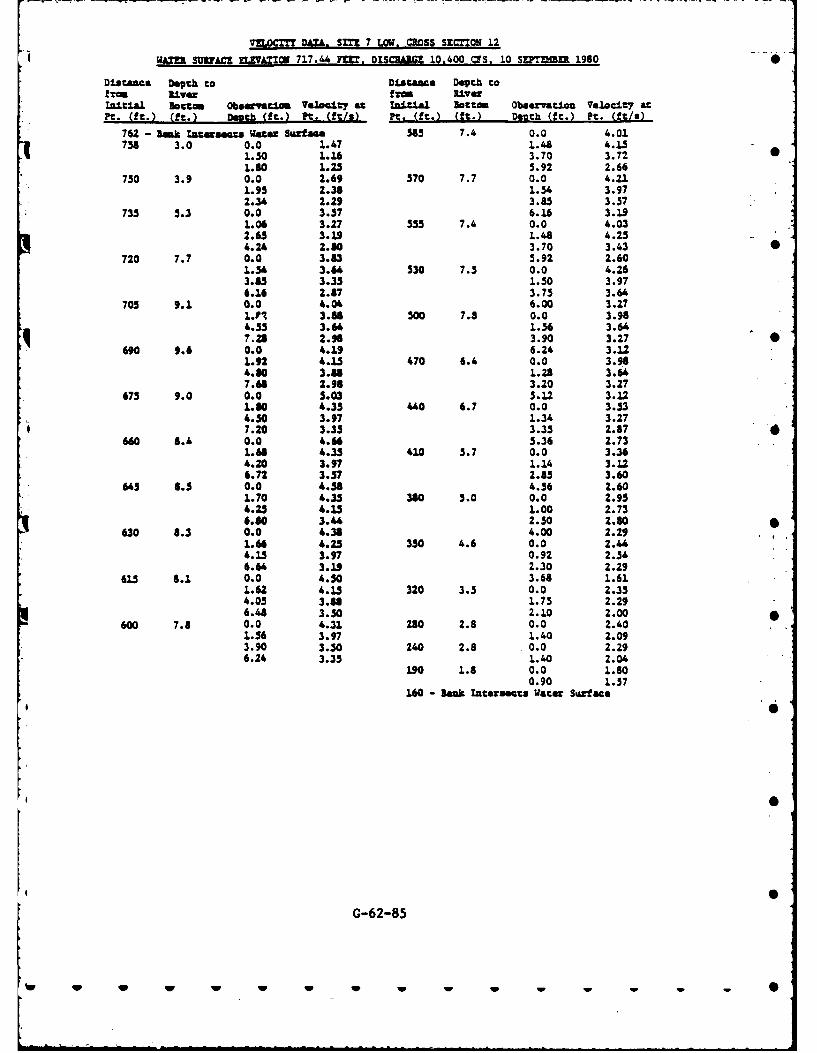
VynxC-TM =AL. SI"E 7 LOW. CROSS SKCTON 12
WATER SRFUACZ ELVZA8XZ 717.44 FEM. DISCBAWGZ 10.400 CYS. 10 SEPTEMIL 1980 0
Distan=. Depth to Distance Depth tofrom fsver f RiverInlt:J Bot:om Obs-vation VJlancty e Z .TLLW Bottom Observtcion Velocit atPt. (ft.) (ft.) Depch (ft.) ft. (ft/s) Pt. (ft.) (ft.) Deth (ft.) Pt. (ft/s)
762 - Bank Ta sects Wate Surface 585 7.4 0.0 4.017538 3.0 0.0 1.47 1.48 4.1.5
1.50 1.16 3.70 3.721.80 1.25 5.92 2.66
750 3.9 0.0 2.69 570 7.7 0.0 4.211.95 2.38 1.54 3.972.34 2.29 3.85 3.37
735 3.3 0.0 3.57 6.16 3.191.06 3.27 535 7.4 0.0 4.032.65 3.19 1.48 4.254.24 2.80 3.70 3.43 0
720 7.7 0.0 3.83 5.92 2.601.34 3.64 530 7.5 0.0 4.263.85 3.35 1.50 3.976.16 2.87 3.75 3.64
705 9.1 0.0 4.06 6.00 3.Z71.P1 3.8 500 7.8 0.0 3.984.55 3.64 1.56 3.647.28 2.98 3.90 3.27 0
690 9.6 0.0 4.19 6.24 3.121.92 4.13 470 6.4 0.0 3.984.80 3.88 1.28 3.647. 2.96 3.20 3.27
675 9.0 0.0 5.03 5.12 3.121.80 4.35 40 6.7 0.0 3.534.50 3.97 1.34 3.27
* 7.20 3.35 3.35 2.87660 8.4 0.0 4.6 5.36 2.73
1.68 4.35 410 5.7 0.0 3.364.20 3.97 1.14 3.126.72 3.57 2.85 3.60
645 8.5 0.0 4.58 4.56 2.601.70 4.35 380 5.0 0.0 2.954.25 4.15 1.00 2.736.80 3.4 2.50 2.80
630 8.3 0.0 4.38 4.00 2.291.64 4.25 350 4.6 0.0 2.4"4.15 3.97 0.92 2.546.64 3.19 2.30 2.29
615 8.1 0.0 4.30 3.68 1.611.62 4.15 320 3.5 0.0 2.354.05 3.88 1.75 2.296.48 3.50 2.10 2.00
600 7.8 0.0 4.31 280 2.8 0.0 2.401.56 3.97 1.40 2.093.90 3.50 240 2.8 0.0 2.296.24 3.35 1.40 2.04
190 1.8 0.0 1.800.90 1.57
160 - lank Intersects Water Sface
G
G-62-85
w w w -w . .. .. -m - -,l,,d S mbe ,,
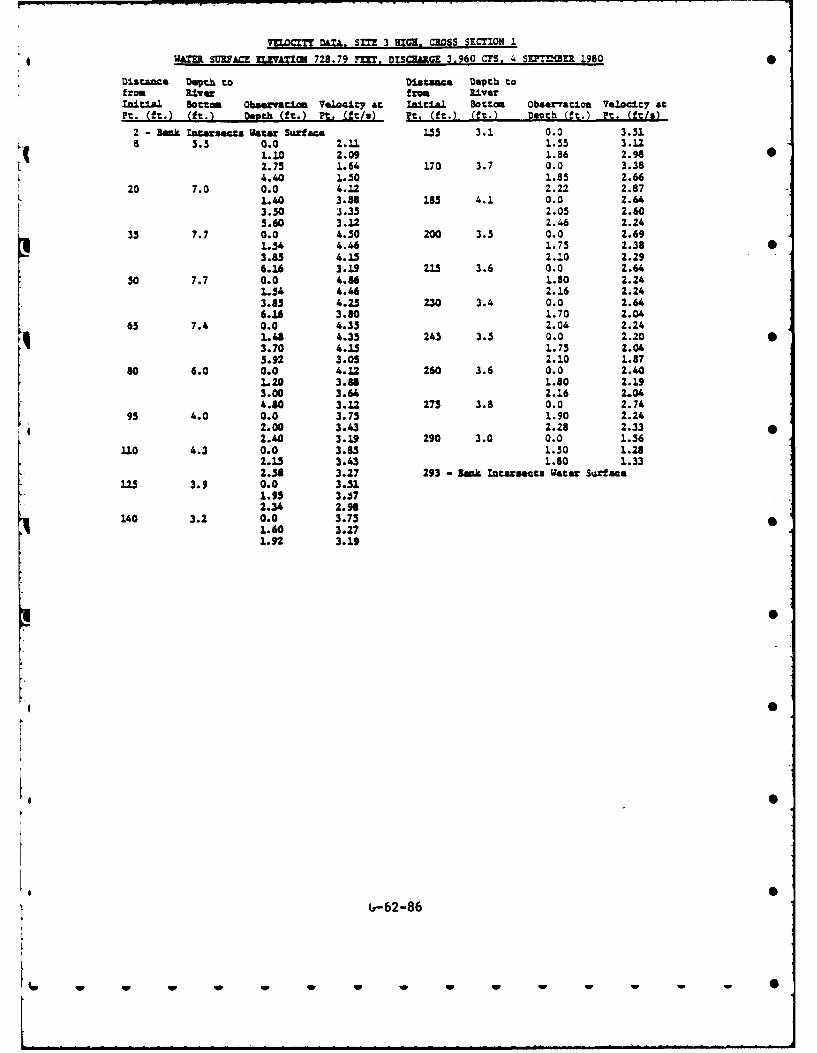
VILOCETM DTA. SIT! 3 IMG, CROSS SECTION .
WAUR SURFACE ELEATIW 728.79 FEET. DZSCHARGE 3,960 CYS 4 SE37'2ER 1980
Distance Depth to Distance Depth tofrom R:Lvqw from Riverinital BOttom ObiervatioS VaLocir7 a: Inlt:l Bottom Obs~ar.aion V.Loc.Lit atFt. (ft.) (ft.) Death (ft.). Ft. (ft/u) Pt. (ft*.) (ft.) Devch (ft.) Ft. (ft/u)
2 - Bank Tgersecta Water Surface 155 3.1 0.0 3.515.5 0.0 2.11 1.55 3.12
1.10 2.09 1.86 2.98 02.75 1.64 170 3.7 0.0 3.384.4.0 1.50 1.85 2.66
20 7.0 0.0 4.12 2.22 2.871.40 3.88 183 4.1 0.0 2.643.50 3.35 2.05 2.605.60 3.12 2.46 2.24
35 7.7 0.0 4.50 200 3.5 0.0 2.6911.54 4.46 1.75 2.38 03.85 4.15 2.10 2.296.16 3.19 21.5 3.6 0.0 2.64
50 7.7 0.0 4.86 1.80 2.241.54 4.46 2.16 2.243.85 4.25 230 3.4 0.0 2.646.16 3.80 1.70 2.04
65 7.4 0.0 4.35 2.04 2.241.438 4.35 245 3.5 0.0 2.20 03.70 4.15 1.75 2.045.92 3.05 2.10 1.87
80 6.0 0.0 4.12 260 3.6 0.0 2.401.20 3.88 1.80 2.193.00 3.64 2.16 2.044.80 3.12 275 3.8 0.0 2.74
95 4.0 0.0 3.75 1.90 2.242.00 3.43 2.28 2.33
2.40 3.19 290 3.0 0.0 1.56110 4.3 0.0 3.85 1.50 1.28
2.15 3.43 1.80 1.332.38 3.27 293 - Bank Intersects Water Surface
125 3.9 0.0 3.511.99 3.72.36 2.98
140 3.2 0.0 3.751.60 3.271.92 3.19
[, .
y.-62-86
Iw w W w w w
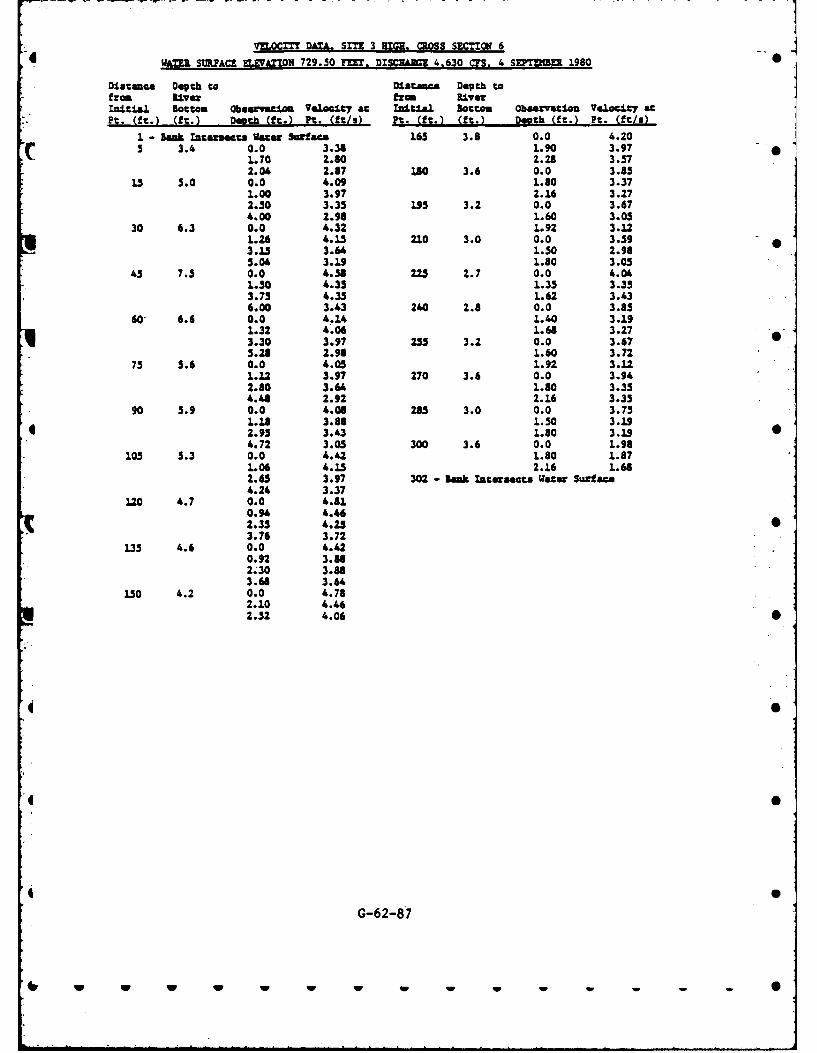
VELOCITY DATA& SITE 3 HIGIR. CROSS SZCZTZOI 614- J WATER SURFACE EL VATTON 729.50 FEET, DSCIAME 4.630 US. 4 SEFT I .960 190
Dfsatmce Depth to Distance Depth tofrom Uver from RiverItial Batton Observation Ve.o.lty at InituaL Botton Obeervatiou V.locty atPt. (ft.) (ft.) Depth (ft.) Pt. (ft/3) Pt. (ft.) (ft.) Deuth (ft.) Pt. (ft/s)
1 - lank Intersects Water Sumaca 165 3.8 0.0 4.205 3.4 0.0 3.38 1.90 3.97
L.70 2.80 2.28 3.572.04 2.87 X80 3.6 0.0 3.85
13 5.0 0.0 4.09 1.80 3.371.O0 3.97 2.16 3.272.50 3.35 1,95 3.2 0.0 3.674.00 2.96 1.60 3.05
30 6.3 0.0 4.32 1.92 3.121.26 4.15 2.0 3.0 0.0 3.593.15 3.6 1.50 2.985.04 3.19 1.80 3.05
45 7.5 0.0 4.38 225 2.7 0.0 4.041.50 4.35 1.35 3.353.75 4.35 1.62 3.436.00 3.43 240 2.8 0.0 3.85
60' 6.6 0.0 4.14 1.40 3.191.32 4.06 1.68 3.273.30 3.97 255 3.2 0.0 3.67 05.28 2.96 1.60 3.72
75 5.6 0.0 4.05 1.92 3.121.12 3.97 270 3.6 0.0 3.942.80 3.64 1.80 3.354.48 2.92 2.16 3.35
90 5.9 0.0 4.06 285 3.0 0.0 3.751.18 3.88 1.50 3.192.95 3.43 1.80 3.19 04.72 3.05 300 3.6 0.0 1.98
105 5.3 0.0 4.42 1.80 1.871.06 4.15 2.16 1.682.65 3.97 302 - lank Intersects Water Surtace4.24 3.37
120 4.7 0.0 4.810.94 4.462.35 4.25 03.76 3.72
135 4.6 0.0 4.420.92 3.862.3O 3.863.68 3.6
150 4.2 0.0 4.782.10 4.462.52 4.06
G-62-87
. . ... . . . .... - - - S,
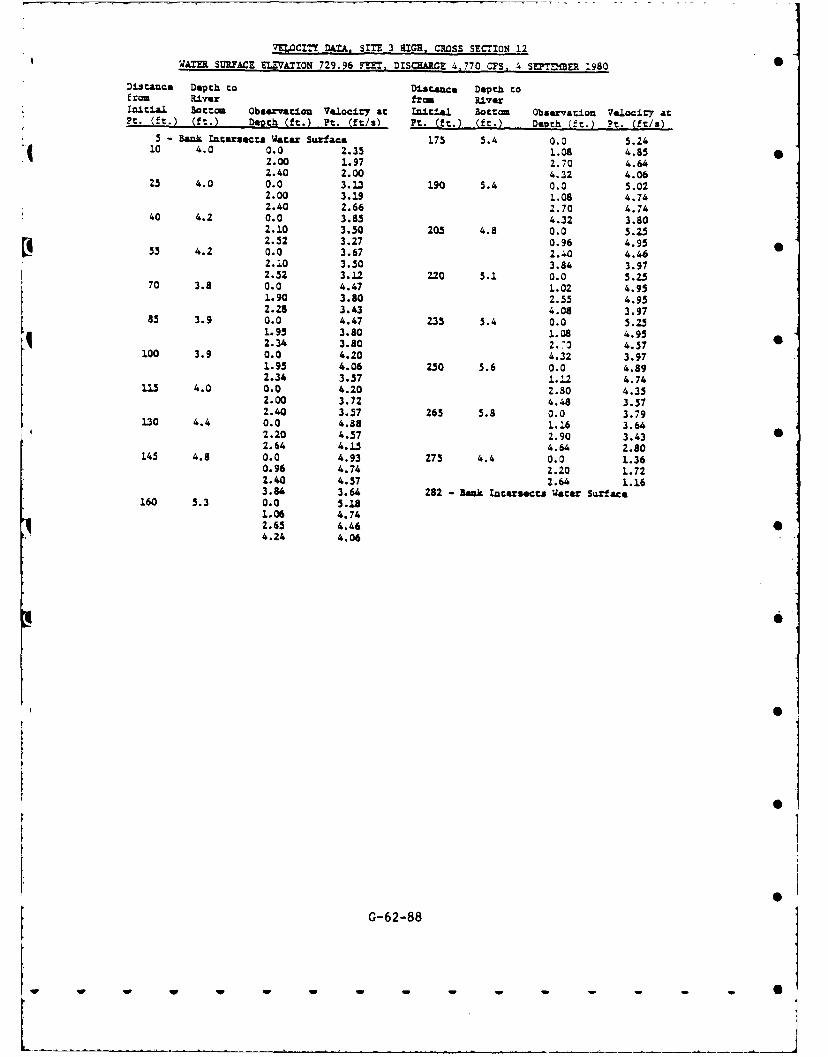
VELOCITY DATA SITE 3 RIGH. CROSS SECTON 12WATER SURFACE ELEVATION 729.96 7.!ET DISCMARGE 4,770 CFS, 4 SEP.'-mMER 1980 0
Distance Depth to Dis.anca Depth tofroa River from RiverInitial Bo:um Observation Velocity at Initial 3ottom Observation Velocity atPt. -(ft.) (ft.) Depth (ft.) Pt. (ft/a) Pt. (ft.) (ft.) Depth (!t.) Pt. (ft/a)
5 - Bank Intceraecr. Water Surface 175 5.4 0.0 5.2410 4.0 0.0 2.35 1.08 4.85 0
2.00 1.97 2.70 4.642.40 2.00 4.32 4.06
23 4.0 0.0 3.13 190 5.4 0.0 5.022.00 3.19 1.08 4.742.40 2.66 2.70 4.74
40 4.2 0.0 3.85 4.32 3.802.10 3.50 205 4.8 0.0 5.252.52 3.27 0.96 4.95
55 4.2 0.0 3.67 2.40 4.462.10 3.50 3.84 3.972.52 3.12 220 5.1 0.0 5.25
70 3.8 0.0 4.47 1.02 4.951.90 3.80 2.55 4.952.28 3.43 4.08 3.97
85 3.9 0.0 4.47 235 5.4 0.0 5.251.95 3.80 1.08 4.952.34 3.80 2.70 4.57
100 3.9 0.0 4.20 4.32 3.971.95 4.06 250 5.6 0.0 4.892.3 3.57 1.90 4.74
115 4.0 . 4.20 2.80 4.352.00 3.72 4.48 3.572.40 3.57 265 5.8 0.0 3.79
130 4.4 0.0 4.78 1.16 3.62.20 4.57 2.90 3.432.64 4.6 226 2.14,5 4.8 0.0 4.93 273 4.4 0.0 1.360.96 4.74 2.20 1. 722.40 4.57 2.64 1.163.94 3.64 282 -Bank Itermsects Water Surface
160 5.3 0.0 5.181.06 4.742.65 4.46 04.24 4.06
G
G-62-88
C 0
4 0
q S
S
PEARL RIVER ATMONTICELLO, MISSISSIPPI
4 S
I S
S
0
S
U V U w w w w w S
Section 32 Program Streambank Erosion Control -Evaluation and Demonstration Act of 1974
PEARL RIVER AT MONTICELLO, MISSISSIPPIDEMONSTRATION PROJECT PERFORMANCE REPORT
I. INTRODUCTION
1. Project Name and Location. Section 32 Streambank Erosion control
Demonstration Project, located on the Pearl River (Mile 191) at
Monticello, Mississippi, as shown on Plates 1 and 2.
2. Purpose. This report describes three bank erosion problems, the
types of protection used and a limited performance evaluation of the
constructed project.
3. Problem. Bank caving along the Pearl River at Monticello has been
a major concern. Several structures including a city maintenance shop,
the county health clinic, the city library and a boat ramp were threat-
ened by steady erosion. This erosion is directly attributable to 0
direct current attack, hydrostatic forces induced in slopes after
periods of rapid recession, and to local drainage.
4. Authority. The Streambank Erosion Control Evaluation and Demonstra-
tion Act of 1974, Section 32, PL 93-251 authorizes the Secretary of the
Army, acting through the Chief of Engineers, to establish and conduct
a national streambank erosion prevention and demonstration program.
II. HISTORICAL DESCRIPTION S
5. Stream Morphology. The Pearl River drains approximately 8760
square miles in South Central Mississippi. The river flows in a
generally southern direction from its origin northeast of Jackson, to
the Mississippi Sound at the Louisiana-Mississippi boundary. The •
approximate river slope at Monticello is between .6 and .8 feet per
mile.
6. Hydrologic Characteristics. The weather conditions at Monticello
are typical of the Central Mississippi region. The average rainfall is
56 inches per year and the average temperature, 650 F. The area averages
38 days per year when .5 inches of rainfall or greater is received. In
G-63-1
- w mu mlia w ww ww -um ,m m,,mm k -m lm -~am ,a WO 0
general, the major floods occur during the spring and are associated 0
with frontal systems. The maximum recorded discharge of 122,000 cfs
occurred on 20 April 1979 with the stage at elevation 192.7 feet NGVD.
The next largest flood, with an approximate discharge of 100,000 cfs
and a stage at elevation 191.7 feet NGVD, occurred in April 1902. This 0
data is obtained from a USGS stream gage on the downstream side of the
Highway 84 bridge, approximately one mile east of Monticello. Data for
the station is provided in the annual "Water Resource Data for
Mississippi" published by USGS. Precipitation and temperature stations 0
exist at Monticello, Brookhaven,Columbia, Hattiesburg, Jackson and
many other cites in the immediate area. This information is in the
"Climatological Data Annual Summary, Mississippi," published by
National Weather Service.
7. Geology. The site is in the Coastal Plain Geophysical Province,
located in Lawrence County, Mississippi, along the Pearl River. The
overburden is typically a yellowish brown loam containing much silt and
clay which normally ranges in thickness from 3 to 5 feet. The 0
Hattiesburg and Pascagoula formations outcrop in the river, along roads
and in other cuts throughout the area. The formations are normally
composed of sandy clay rock of light gray to brownish gray color with
a cementing material of reddish brown to purplish iron oxide, but
occasionally a hard thin layer of siltstone or limestone may be found.
The formation is characterized by oyster fossils, indicating the marine
or estuarine character of this deposit. The formations are of the
oligocene and miocene geologic age. The logs of borings presented in
Appendix A show the results of five borings. Holes No. 55-1-77 and
55-2-77 represent conditions at Sites I and 2 respectively, while
Holes No. 55-1-78, 55-2-78 and 55-3-78 represent conditions at Site 3.Locations of these borings are shown on Plates 3 and 4.
8. Channel Conditions. Sites 1 and 2 shown on Plates 2 and 3 are on
the outside of a 1350 bend situated on a bank 25-30 feet above lowwater. Site 3 (Plate 4) is on the outside and downstream of a 900
bend on a bank which extends approximately 8 feet above low water. The
upstream bend, near Sites 1 and 2, is characteristic of "abrupt angle"
bends wherein the majority of the current attack is concentrated on
G-63-2
resistant material located at the base of the bluff. These type bends
are also characterized by comparatively long straight reaches down-
stream from the bend.
9. Environmental Consideration. Implementation of the demonstration
project has resulted in the stabilization, to date, of the existing
bank erosion. Approximately 0.8 acres of eroded bank have been
covered by the three stabilization methods. The biological producti-
vity of the three areas involved, due to the steep slopes and exposed
soil, is of low value. Therefore, the impact on it should be insigni-
ficant. The lower portions of the three protective measures extend
into the water and provide a different substrate than that which existed
prior to construction. Both the U.S. Fish and Wildlife Service and the
Mississippi Game and Fish Commission were contacted and advised of the
project plans. Both agencies had no objections to the project and felt
that the fish habitats provided by each of the three different stabili-
zation methods would be more advantageous than the natural sandybottoms. They were also of the opinion that wildlife habitat would not
be significantly affected by the project.
10. Demonstration Site Description.
a. Hydraulic Characteristics. Stage-frequency, stage-discharge, 6 -
and average velocity-water surface elevation data are shown on Plates
6, 7 and 8, respectively. This data was provided by information taken
from the previously mentioned USGS gaging station at the Highway 84
bridge. A typical cross-section (pre-construction) of the Pearl River
in the project area is shown on Plate 5.
b. Overbank Description and Erosion Trends. The type of material
discussed in the Geology Section (paragraph 7) is typical of the over-
bank material at Monticello. The excavation of these beds normally can •
*i be accomplished with conventional mechanical equipment. Although thebase of the slope is highly resistant to erosion, the upper slope is,
in several isolated reaches, unstable due to: (a) current attack on the
erodible upper slope material, (b) loss of vegetative cover as a result
of human activity, (c) hydrostatic forces from ground water, and
(d) local drainage. Also, after a heavy rainfall in the upper portion
of the basin, stages at Monticello increase as this runoff is passed
G-63-3
downstream. After being at near peak stages for long periods of time,
the river is subject to relatively sudden stage recession of 10 to 15
feet. As a consequence, the saturated stream bank sloughs into the
river.
III. DESIGN AND CONSTRUCTION
11. Project Design. This demonstration project consists of three sites
* using differing bank stabilization measures. The three sites are
Flocated on the Pearl River near Monticello as shown on Plates 1 thru 4.
Site 1 utilizes dumped rubble on a slope of 1 to 1 back to existing
ground. The top width of the rubble is 10 feet, located at elevation
190.0. Site 2 utilizes a mat constructed of used tires. The tires
are banded together and anchored at 10-foot centers to concrete anchors
on the bank. The top elevation of the tire mat is also at elevation
190.0. Site 3 consists of a mat composed of concrete blocks, placed
atop plastic filter cloth, and anchored with steel stakes. The mat
is covered with topsoil and grassed. The top elevation for Site 3
is elevation 180.0 with riprap placed at the toe of the mat. Typical
cross-sections for Sites 1, 2 and 3 are shown on Plate 9. Before-and-after photographs and after flooding photographs for each site are
shown on Plates 10 through 15.
12. Construction Details.
a. Delays. Bids for construction were opened on four different
occasions, dating back to the fall of 1978, before an awardable bid
was received in the spring of 1980. This created an extremely long
delay between final design and completion of construction and reduced
the monitoring period to date to six months, starting in December 1980.
(At present this program will be terminated as of 31 December 1981 in
accordance with Public Law 93-251.)
b. Completion Date and Cost. All three sites were completed in
December 1980 at a total cost of approximately $353,000. The unit costs
per linear foot of Sites 1, 2 and 3 were $381, $266 and $471, 0
respectively.
c. Other Methods Considered. Three other methods of protection
were considered for this project, but were not chosen for various
G-63-4
reasons. They were: (1) Fabriform, Hydromat, Gobi Blocks or other
forms of articulated mat, (2) low bulkhead with vegetative protection
along the upper slope, and (3) soil cement.
IV. MONITORING,
13. Description of Monitoring Activities and Cost.
a. Cross Section. Cross sections will be taken annually at per-
manent survey points established during the pre-construction phase.
The cost of this surveying is estimated to be $9,000 annually. 0
b. Photographic Coverage. Aerial photography of the three sites
will be taken annually or after major flooding (Plate 16). Ground
level photos will be taken during each site visit with total annual
cost for photography estimated to be $1,500. (Plates 10 thru 15 show
photos taken during various stages of the project.)
c. Visual Inspection. Site visits have been made prior to, and
immediately after construction, and presently visits are planned to be
made twice yearly at an annual cost of about $750. 0
14. Conclusions. The "final inspection" after construction was made in
early December 1980. This trip concluded the construction phase and
initiated the monitoring effort. During late April 1981 a minor flood
occurred at Monticello. After this flood, a site visit was made to
monitor and note any damage. Except for minor erosion at the toe of
Site 3, all three sites appeared to be in excellent condition and have
halted the erosion, to date, at each location.
G-63-5
W W W W W W W W W0
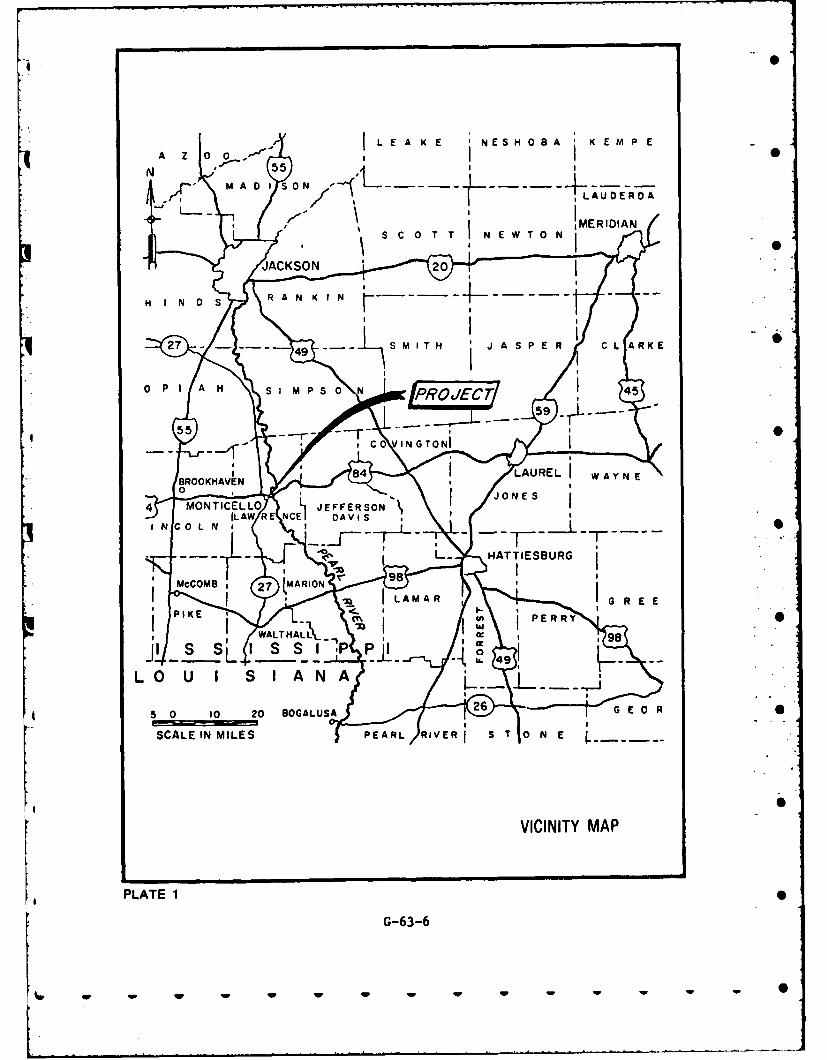
0
0 E A X SI ES 0 N PROJEMECT
N 55
SCAL INME PEA RIE S 0 NE
ACKSON
PLT 1 A PS0 N4G-63-6
5 5 5 9 wW--
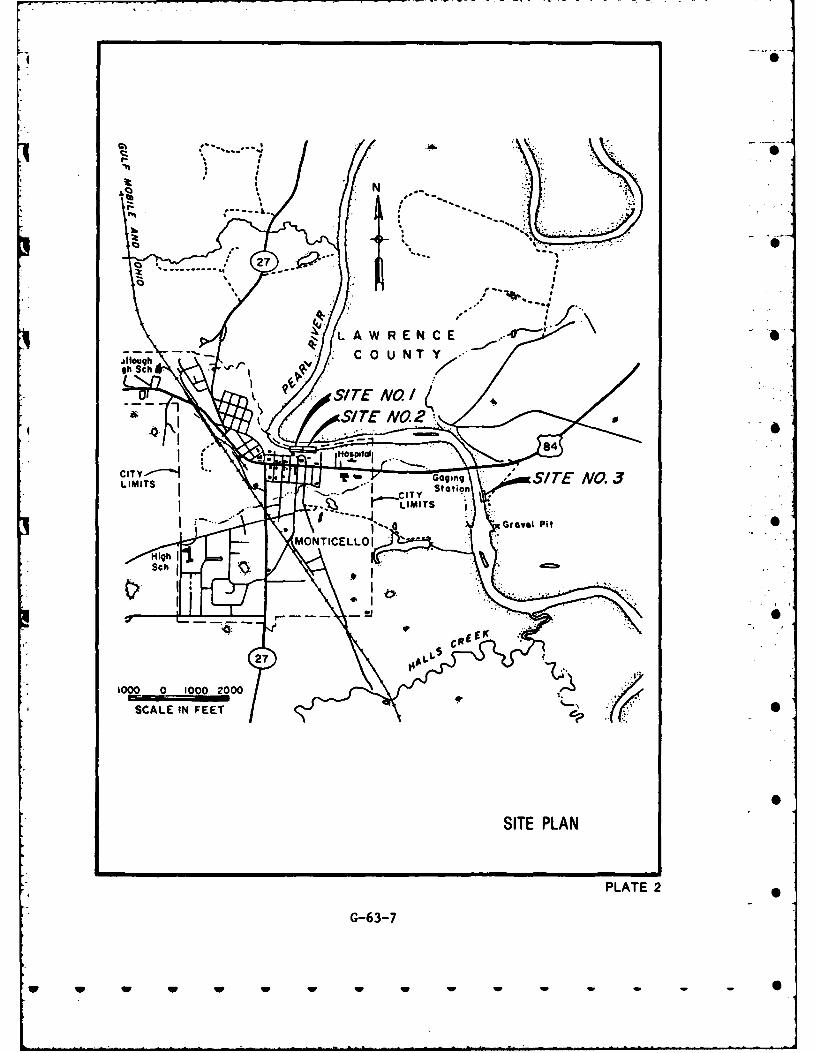
0
-------------
L A-
466
LIMITS
GraTel PLAN
PLATE 2LLS
High-
w w w w w w w w w- -
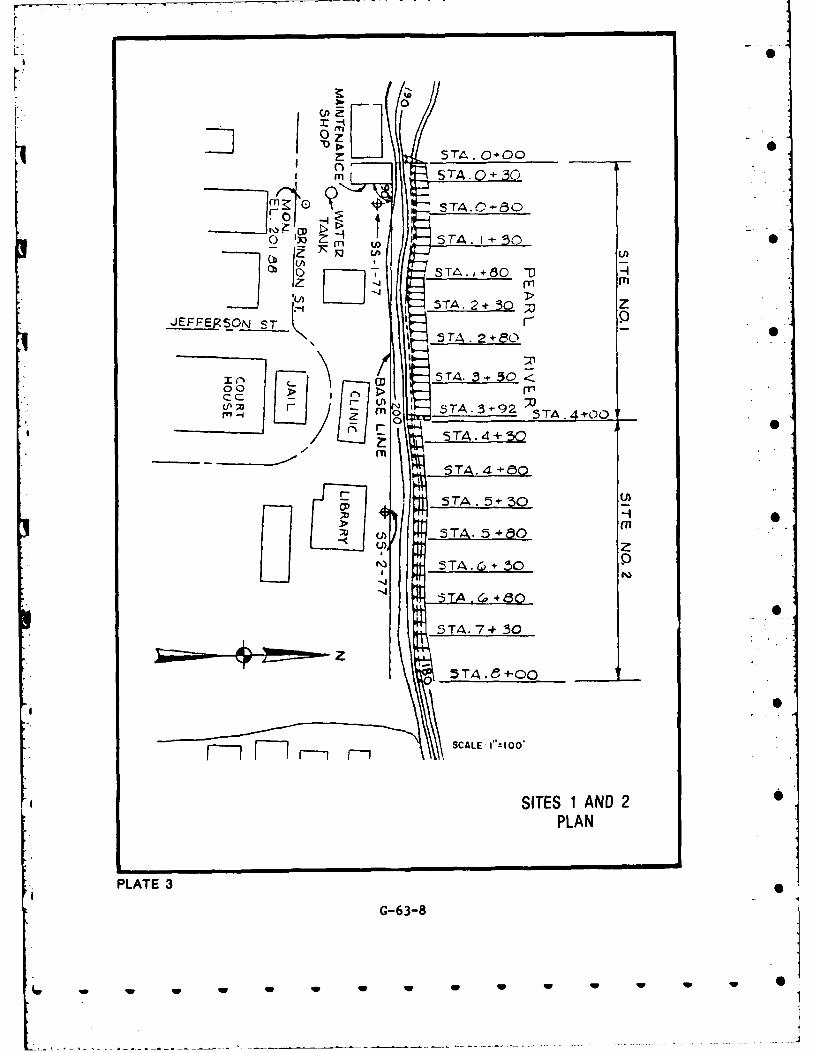
.w0
7]STA.O0+0
'- 0 ,STA. 0 + 30
C) 13"Zw+ 15 0~ mM o - STA.J +80 -0
--- _, 5TA .2 30 ; Jm
JEFFERSON ST 1' I-_ _
S 7
CD .STA. 3'+0
W ;oM r" STA .3 92 "-T9 4 +00
C) 0 5TA. 4 +// m
-TA, 4 +50
-- 57A. 5+ 5)0< ), z
5T4.7 + 0
5TA. 7 + 30
5 TA. 8 +00
SCALE I"=100'
SITES 1 AND 2PLAN
PLATE 3
G-63-8
t A
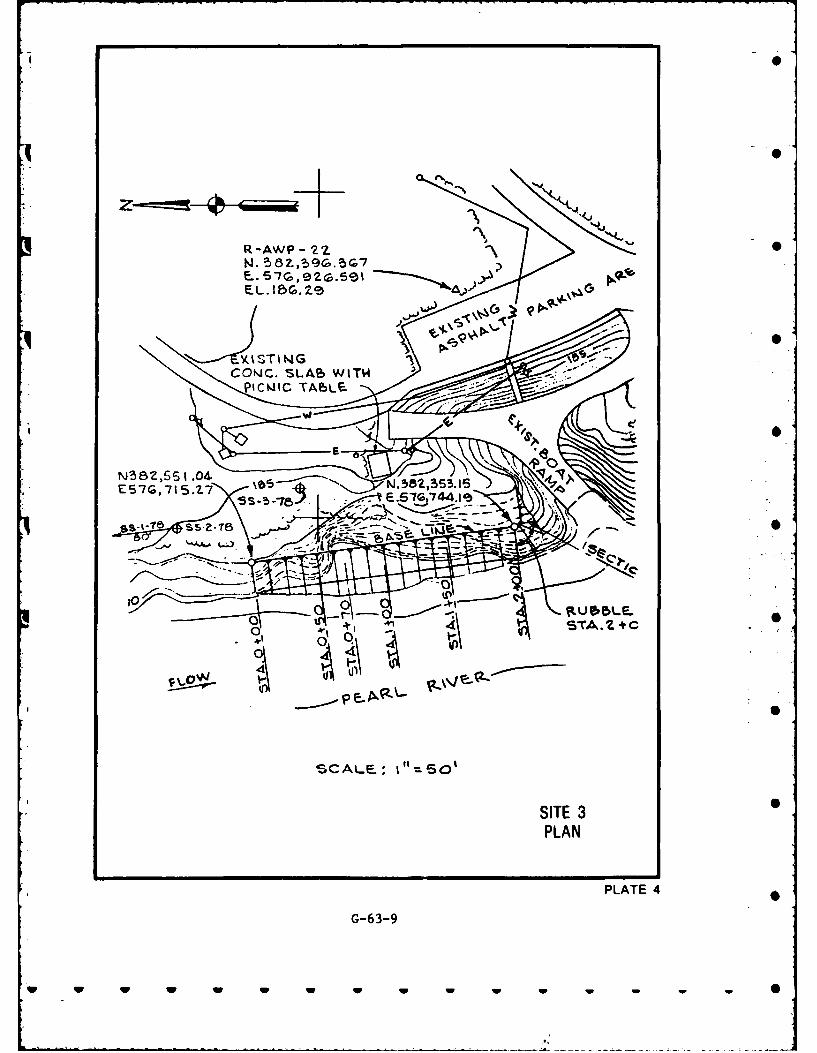
0
0
5 7G, 18 S.Z-7
0r.-7 SZT
100
P.U 4 LF
SCALP-: ~ O
SITE 3 0PLAN
PLATE 4
G-63-9
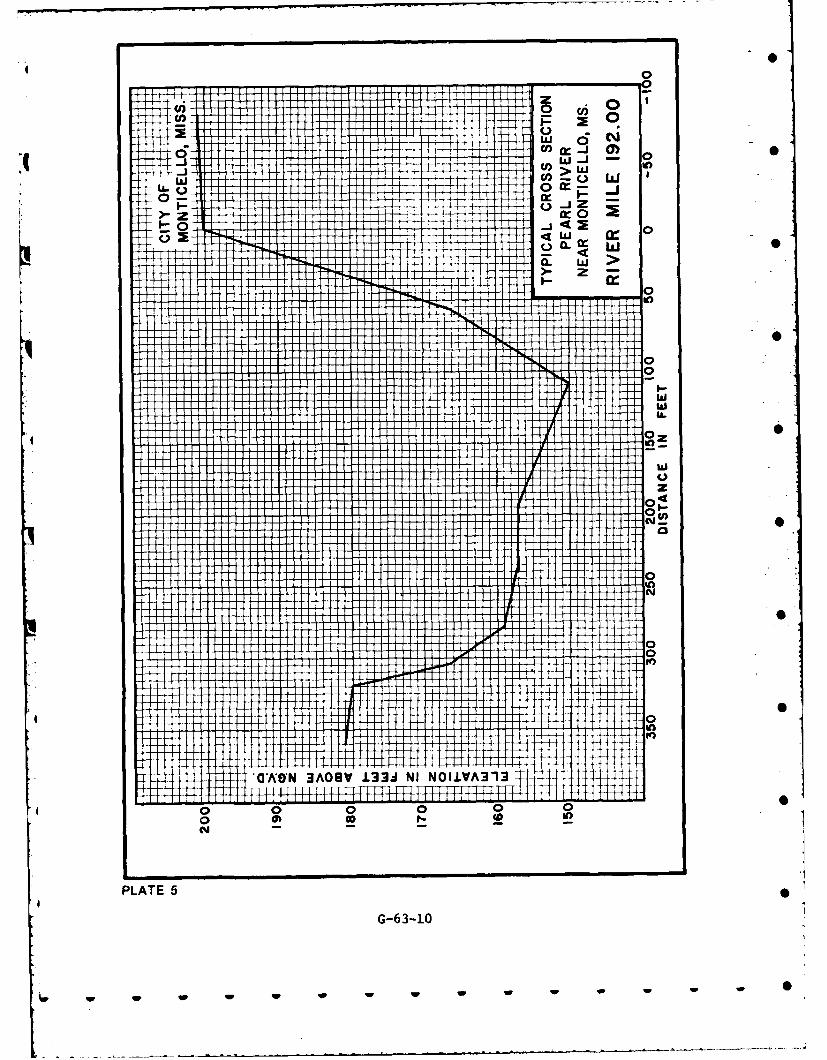
_j 00
w -A 0
_j z
00
1 -4 ----
I I w
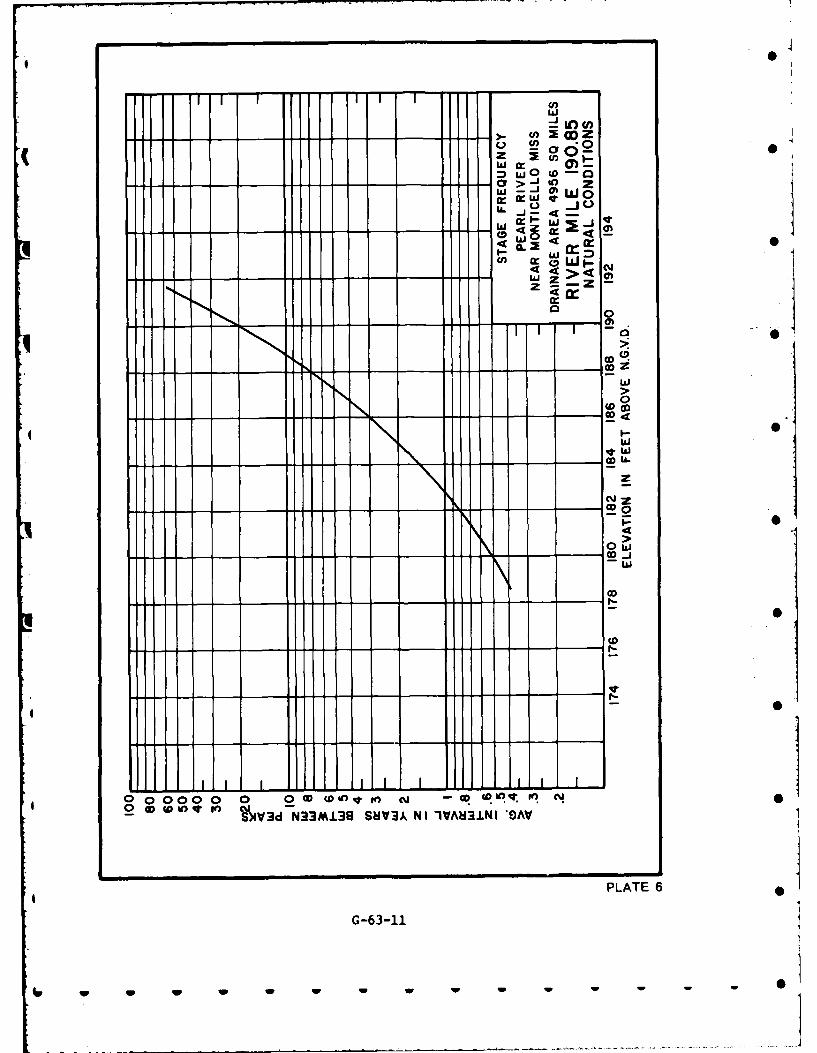
LJ
C.
w--Jw ww 0
0 0
0
4 I- 0w
q~w
O_ DL
00000 0- 0 in ~i f!'J4
W)IVd N3MI38SNVk NI lVNUNI'D4
PLATE
- - ~-3-11--
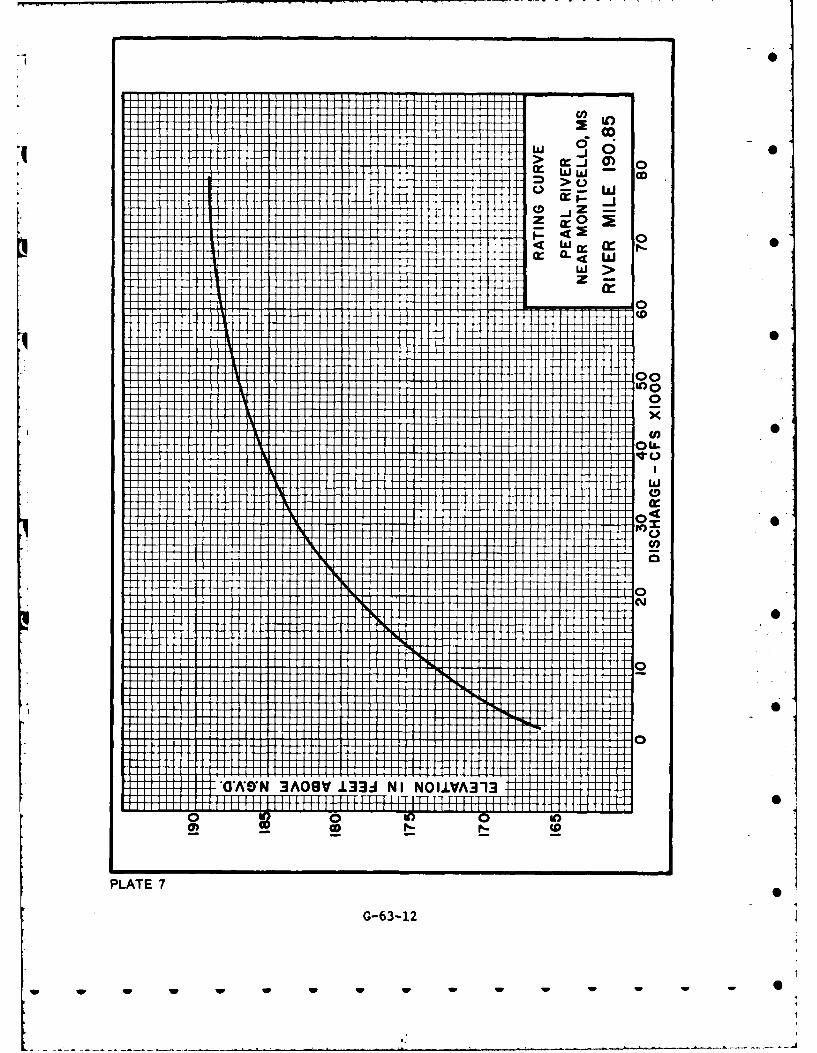
CD0
I ITT0
00
0 0
a:
00
Till
PLATEf7llG-6fill
w~~i if WW-
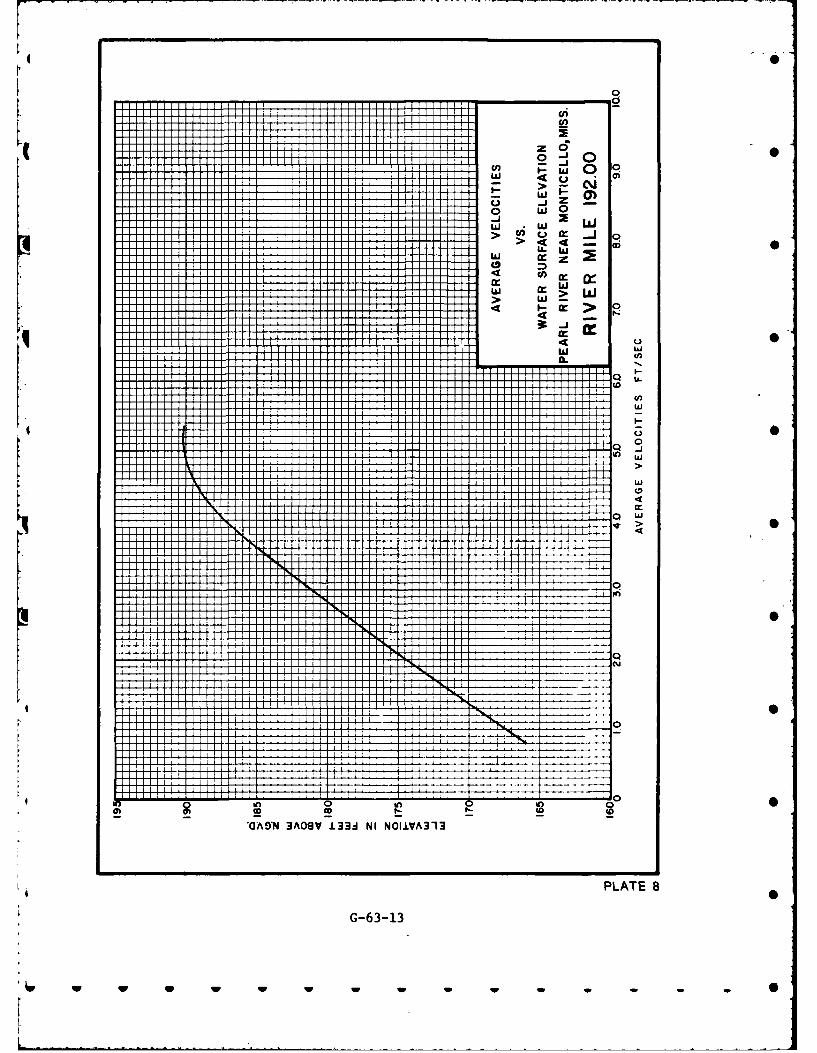
0 -J 0
wwKi z_j o
w _ >D 0
w~~ w
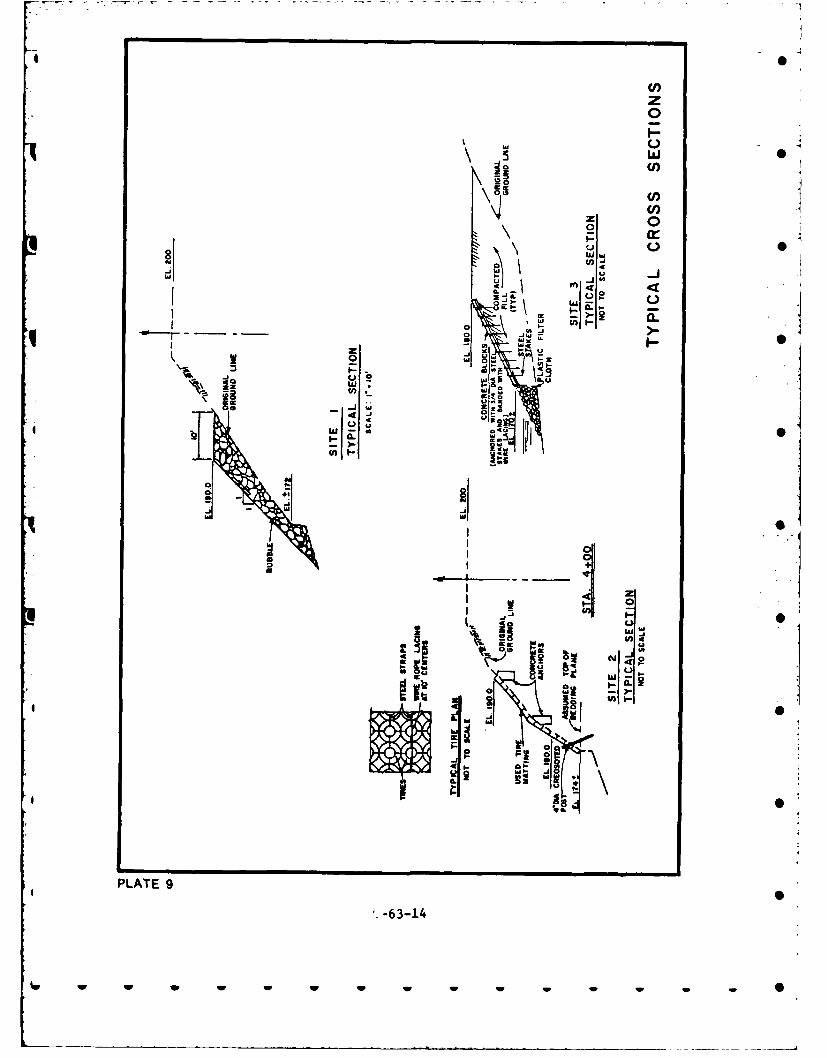
z!008,)z
00
-0 0.
Do-
hi,+ ( •
C')U)0
J J
--
.09
I'~- 0z04
I
w I-u2
-64 1
w -
. og -
PLATE 9
'-63-14
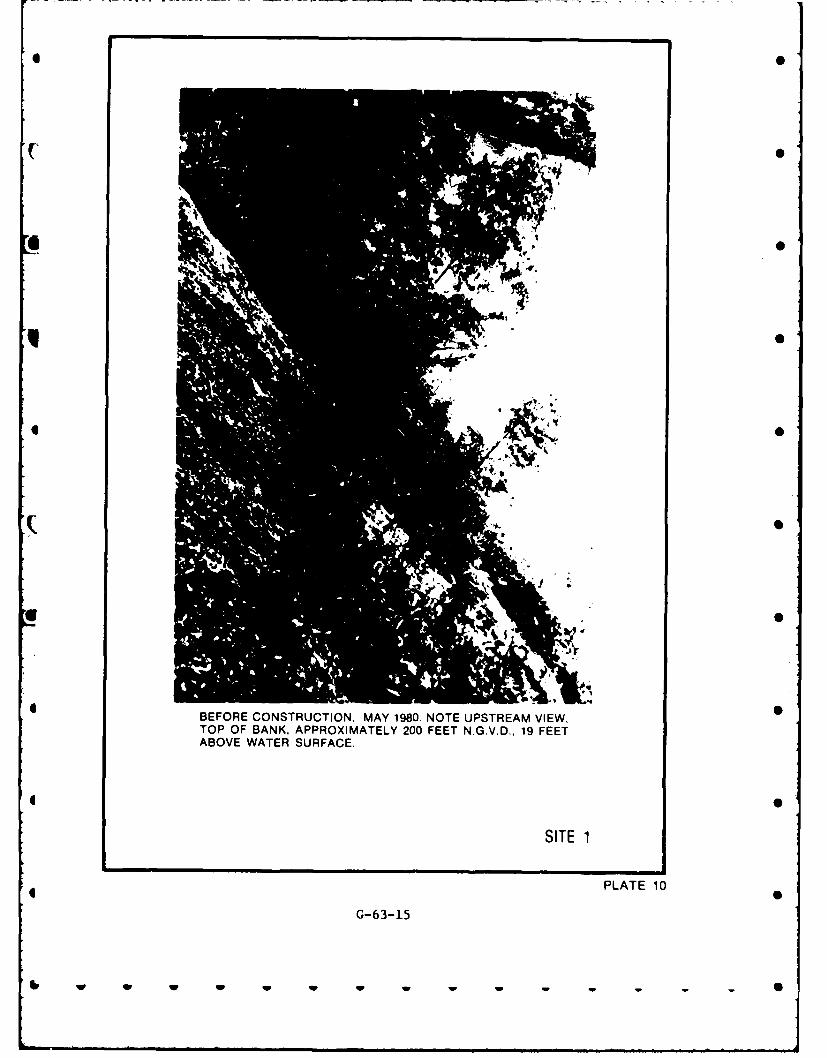
* 0
00
1I10
* 0°
6 0.
* 0
BEFORE CONSTRUCTION. MAY 1980. NOTE UPSTREAM VIEW,TOP OF BANK, APPROXIMATELY 200 FEET N.G.V.D., 19 FEETABOVE WATER SURFACE.
SITE 1
PLATE 10
G-63-15
w w w -w w
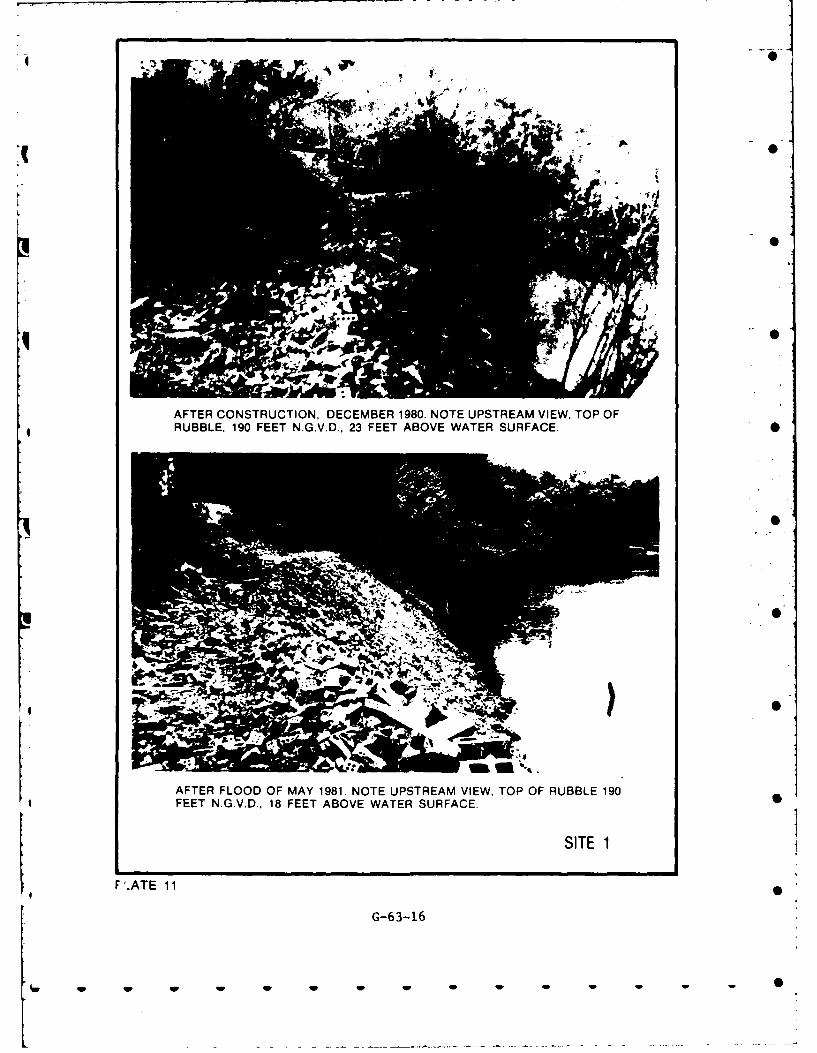
]- .
AFTER CONSTRUCTION, DECEMBER 1980. NOTE UPSTREAM VIEW, TOP OFRUBBLE, 190 FEET N.G.V.D., 23 FEET ABOVE WATER SURFACE. 0
AFTER FLOOD OF MAY 1981. NOTE UPSTREAM VIEW. TOP OF RUBBLE 190FEET N.G.V.D., 18 FEET ABOVE WATER SURFACE.
SITE 1
F'.ATE 11
G-63-16
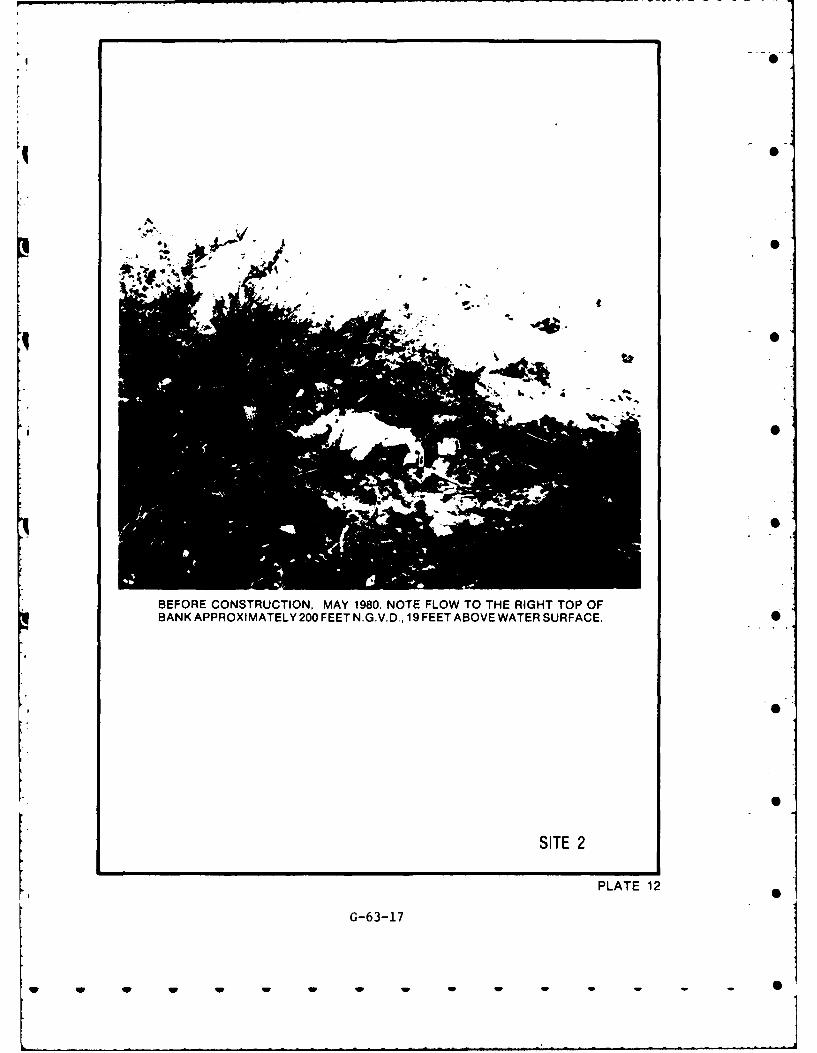
!q•
I ,
BEFORE CONSTRUCTION, MAY 1980. NOTE FLOW TO THE RIGHT TOP OFBANK APPROXIMATELY 200 FEET N.G.V.D., 19 FEET ABOVE WATER SURFACE. 0
SITE 2
PLATE 12
G-63-17
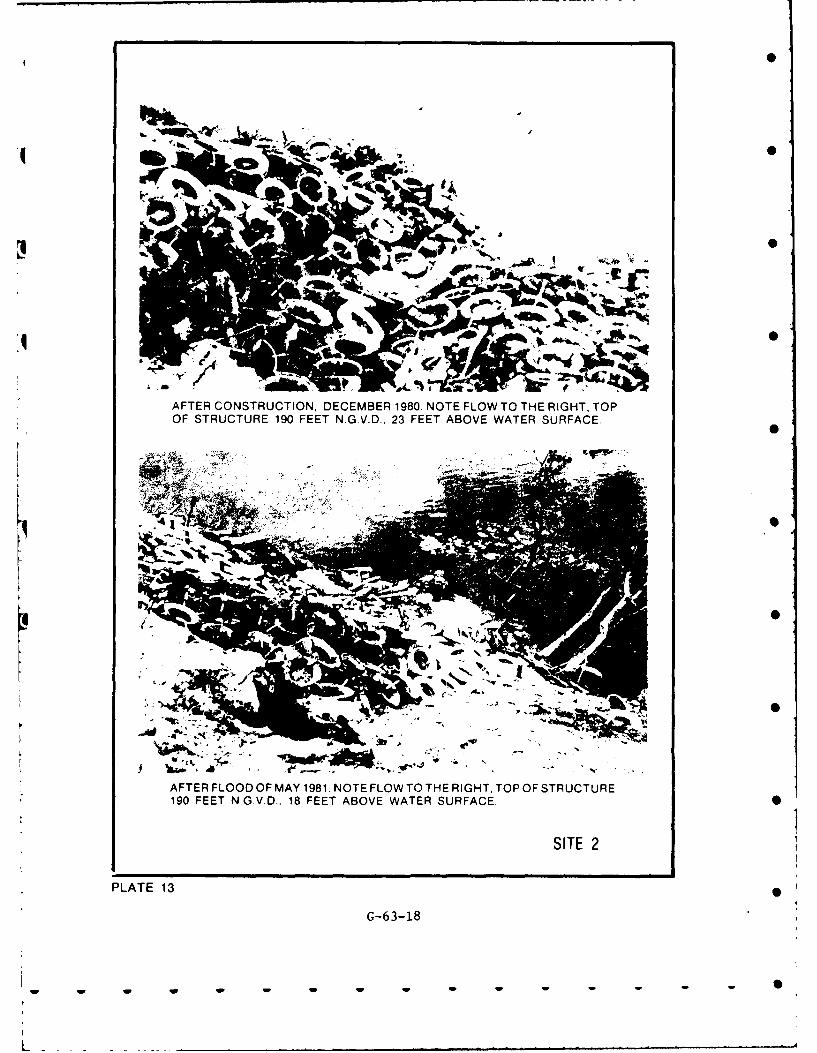
Orr ..to
L. gL
! he,,;,
AFTER CONSTRUCTION, DECEMBER 1980. NOTE FLOW TO THE RIGHT. TOPOF STRUCTURE 190 FEET N.G.VD., 23 FEET ABOVE WATER SURFACE.
I 0t
: • ~~A...2 ,,
AFTER FLOOD OF MAY 1981. NOTE FLOW TO THE RIGHT, TOP OF STRUCTURE190 FEET N.G.V.D., 18 FEET ABOVE WATER SURFACE. S
SITE2
PLATE 13 0
G-63-18
W 1-
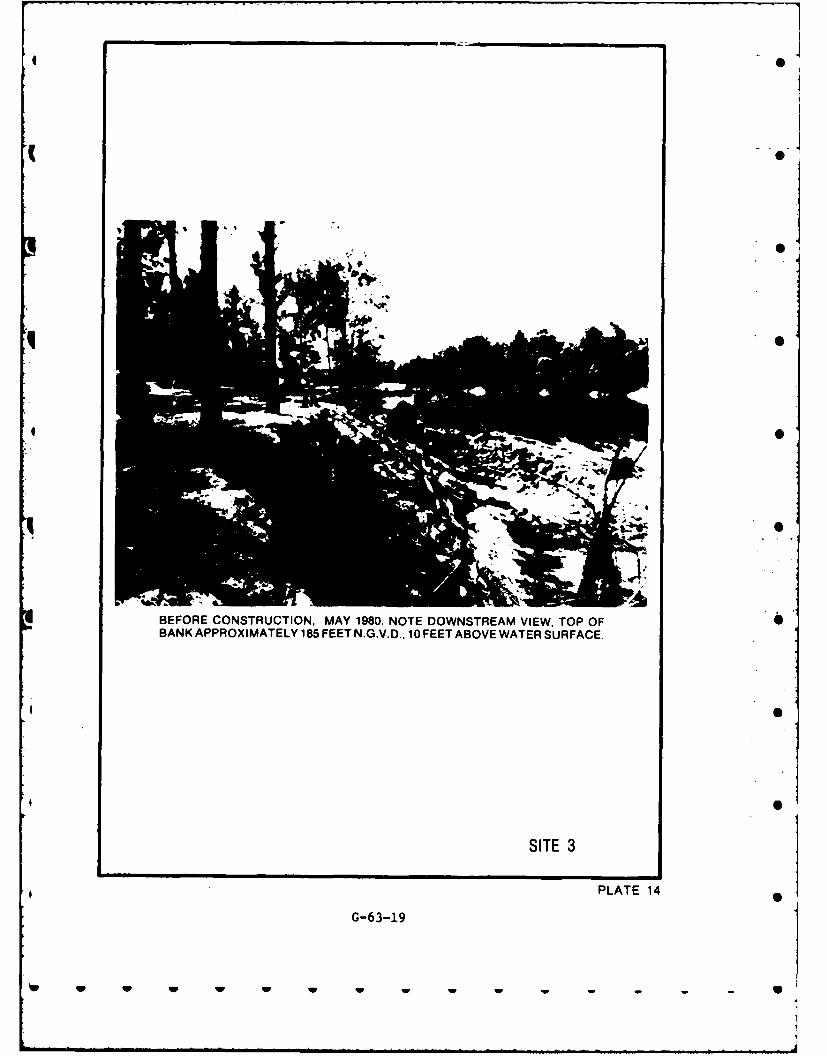
SIT 3
PLAE 1
G-6-1
w w w w w w w w0
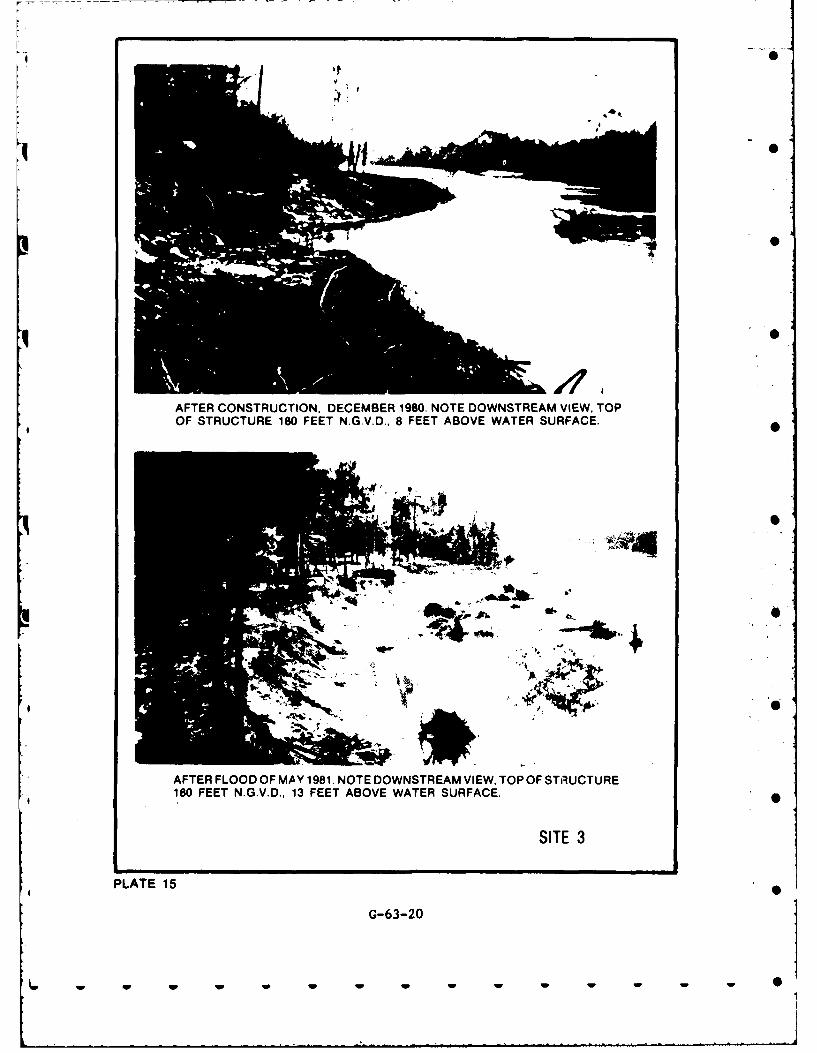
I ,S
I .
AFTER CONSTRUCTION. DECEMBER 1980. NOTE DOWNSTREAM VIEW, TOPOF STRUCTURE 180 FEET N.GV.D., 8 FEET ABOVE WATER SURFACE.
AFTER FLOOD OF MAY 1981. NOTE DOWNSTREAM VIEW, TOP OF STiUCTURE180 FEET N.G.V.D., 13 FEET ABOVE WATER SURFACE.
SITE 3
PLATE 15
G-63-20
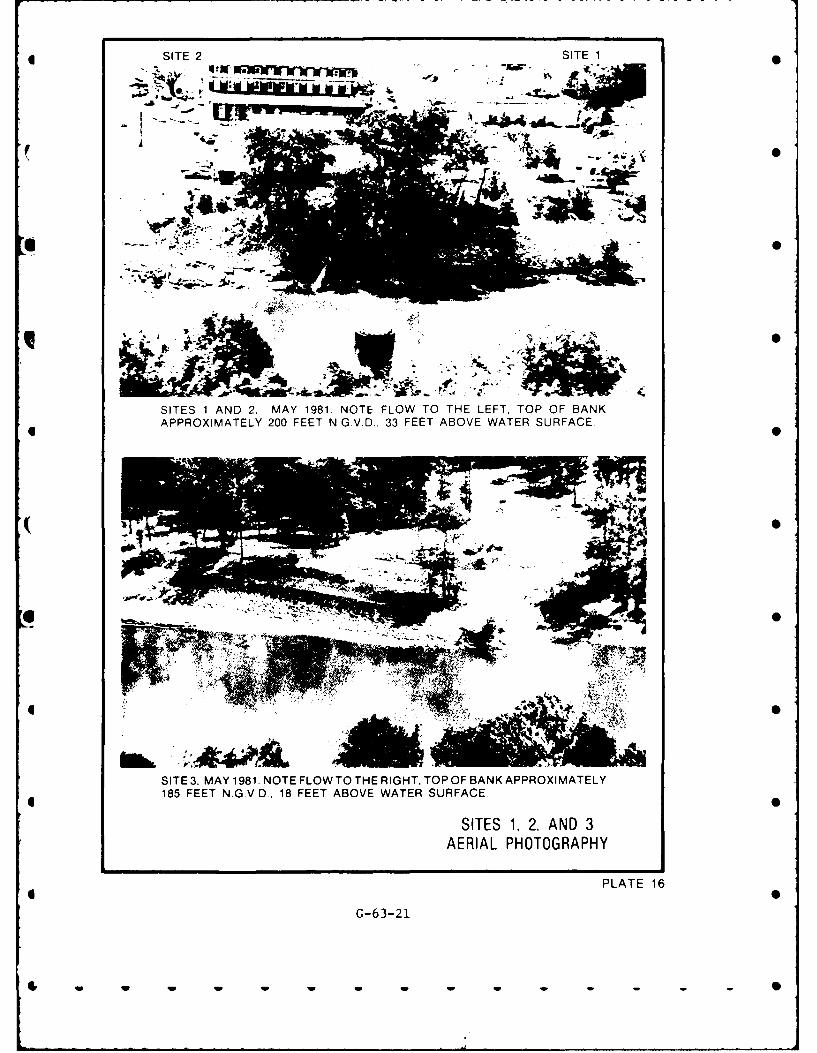
SITE 2 SITE 1
44 e 14.
SITES 1 AND 2, MAY 1981. NOTE FLOW TO THE LEFT, TOP OF BANKAPPROXIMATELY 200 FEET N.G.V.D., 33 FEET ABOVE WATER SURFACE.
SITE 3 MAY 1981. NOTE FLOW TO THE RIGHT, TOP OF BANK APPROXIMATELY185 FEET N.G.V.D. 18 FEET ABOVE WATER SURFACE.
SITES 1, 2, AND 3AERIAL PHOTOGRAPHY
PLATE 16
G-63-21
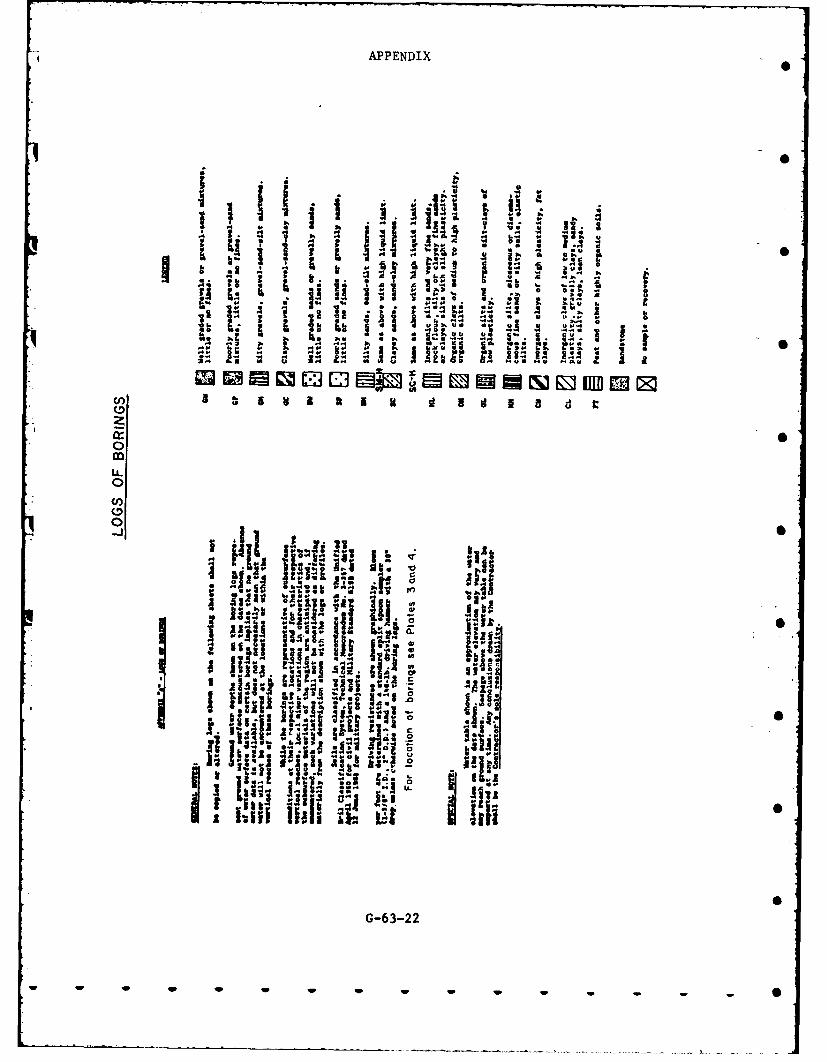
APPENDIX
.B a
a u
s' f-n m a. d~ P4uA u
crA0. 3 *.0 £4
1.co1~~4UU_ SS ~ ..
0s s.4 '~4
(n b~2~' .~ i!-
00
bJ . &.1
%a-..J
as.~i. as as asi
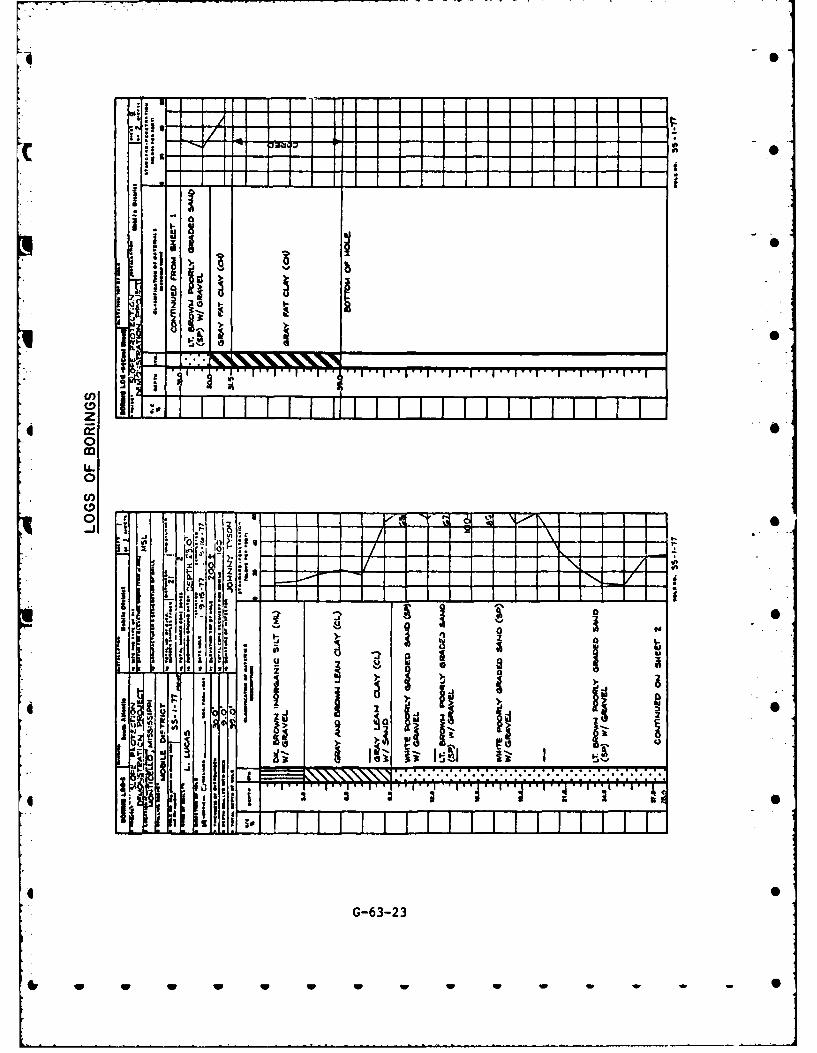
r. - I, lI II
-1 F I I I II
-I f _ ' L
0 ', 0
LL0
C -~ .! !-
. . . .. . . . . . . . .. .
G 6 i 2 I
' - - 1- -- l- - '-t _- -i 't- - - - - -
S i I.: t..11 " ri:I: • -i Ii
Ii o o
i rrl i a
, ilt.l == I I
I il'' i" ''_________' _____""_____"__"1"_I I * i : 1 I
SG-63-23
'Il t w w wl w w w -i w i -o ,, -P.
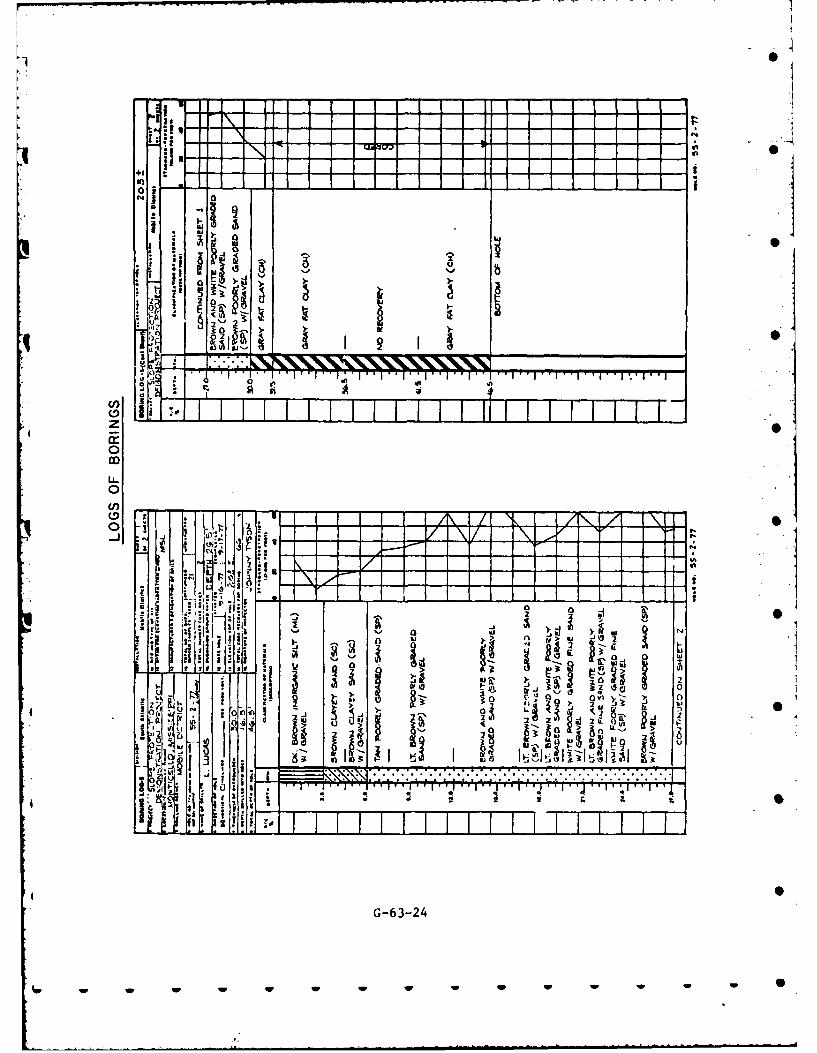
00
fir .. '
I J
* j.j
, g. 0, 0
al I __ _ _ __ _ _
3:0
-( Itu c() :2 2 i
........... ....
~ ~r'-- -6-24w~ w w w
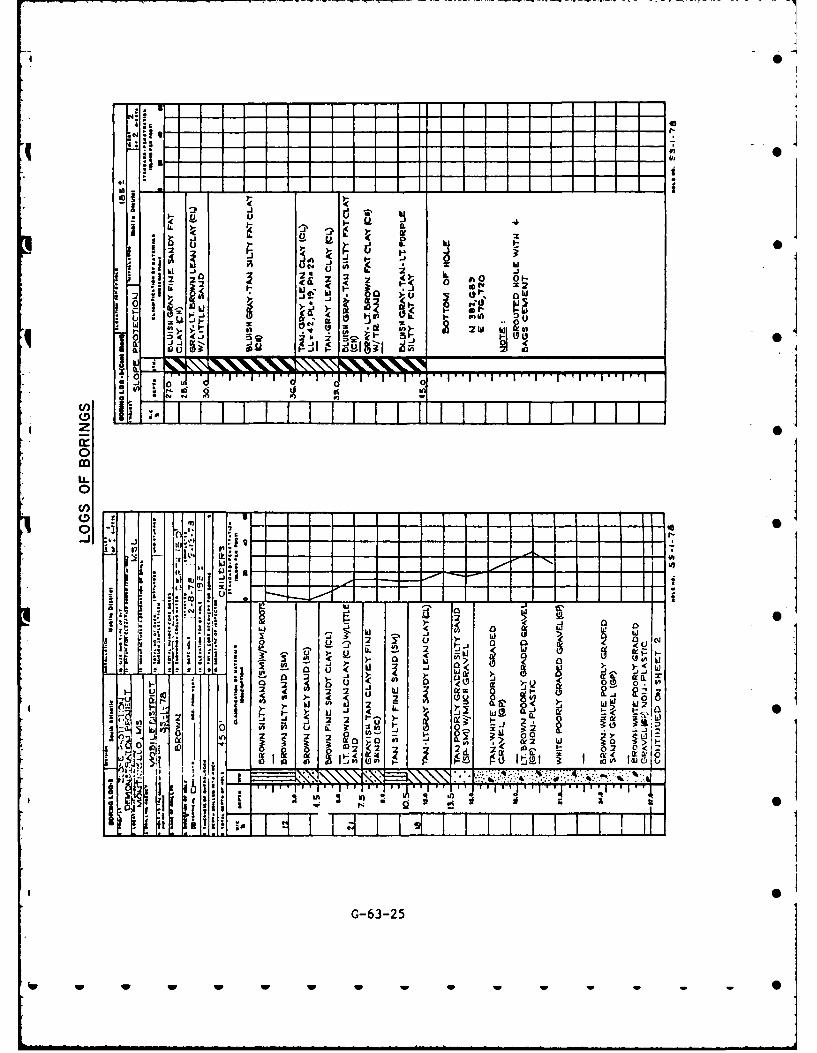
I
< 0 0 0- 2-
2. t-0&0 2
bi
00
h :I U) Uci* I I I I I I I I
ti 02 o
bj I . I Z I I Iq ~,-. o_ I______I__II_ .
011
o 1I 2
-i t2 w t: " C
" .£: .. , : .,:: : , _," .I I.'I. -, :
' So •
,1i-j A 2 - 0 L I C
II
21 4.- 1
G-63-25
IV IV 1w 1w I I w M
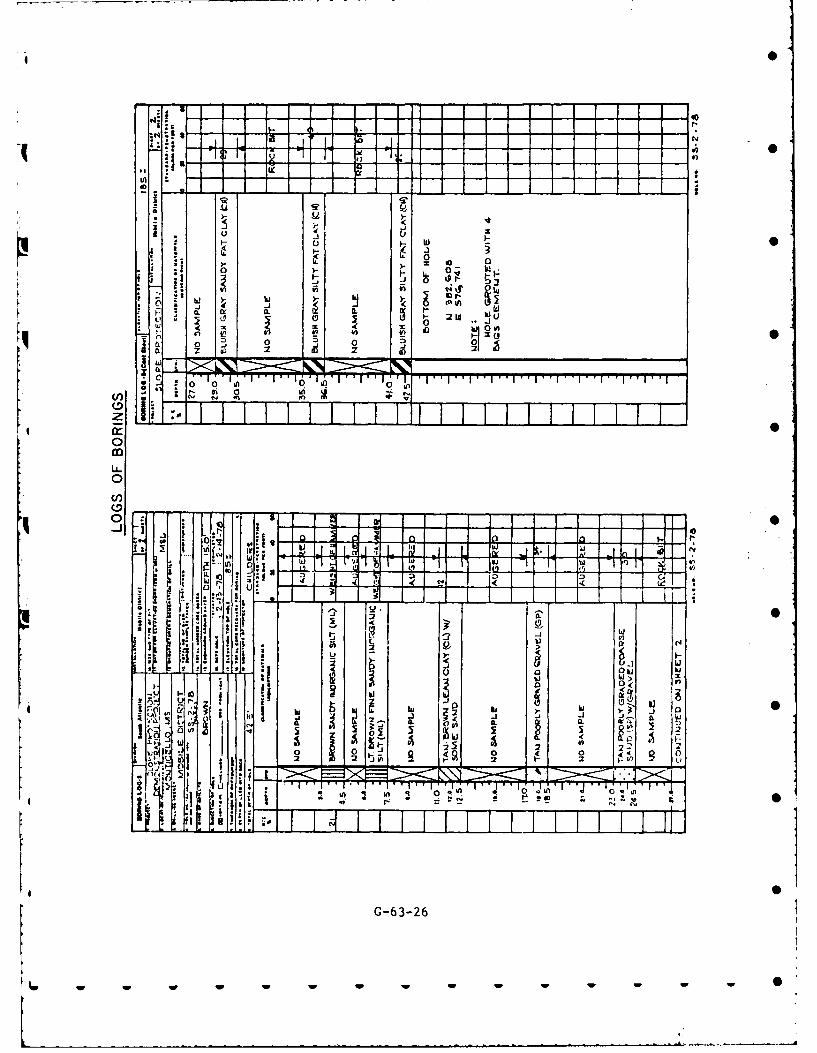
- 0N
F5 qf 9I w_ _ k )101
2 Wr-JJ
0 U)J
*T Ia I I
IL A
CDD
~ 29L1k * !!Off
40 i~ L9'
:fA ? *''It'
ILC
luS
G-63-26
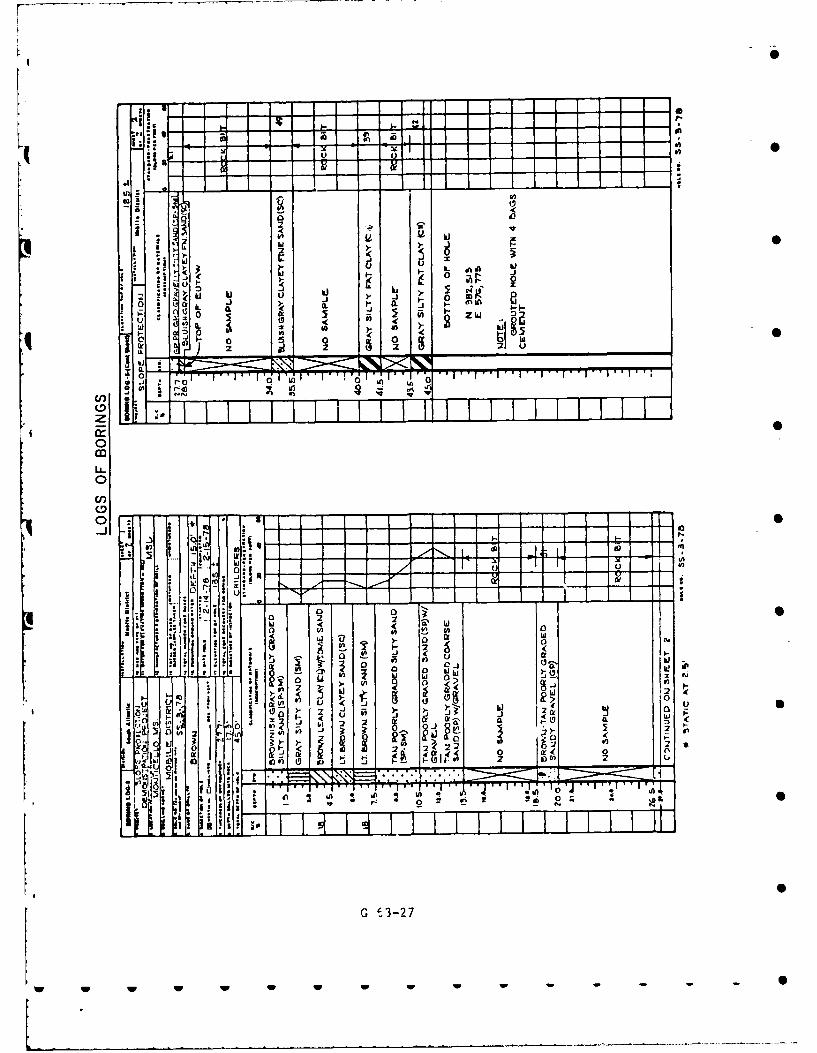
0~
u 0_
or iL! a
05
'I.0 id z0 0,
2 2
CIO
0
00o - -u -- - - *
t - -t
~~~~~C 0, >~'-------
-~~~ of!~; -fU) -
0a tl <- 0 00 0 :j -j
-t U S
10. I I
~~ U 3-27
w w't w w w -~
~D-R12i 139 THE STREAMBANK EROSION CONTROL EVALUATION AND3/DEMONSTRATION ACT OF 1974 5.. (U) ARMY ENGINEERWATERWAYS EXPERIMENT STATION VICKSBURG MS HYDRA..
UC SSIFIED M P ICEON ET AL. DEC8 F/G 13/2 , NmhhhisonhE0 0 0101 ismE-EhhhhhhhEEhhhI-EhhhhhIsmhhhhhhhhhhhhI-DEE-I--HEmo
-I - - - - - L6 M32 111112.**' .. S * '
r
.°4 I111IL 11111125
i MICROCOPY RESOLUTION TEST CHART
, NATIONAL BUREAU OF STANDARDS- 1963-A111 t
S
0
S
S
S
RIO CHAMA NEARABIQUIU, NEW MEXICO
Sq
I S
S
S
S
w w w w w w w w S
Section 32 Program Steambank Erosion ControlEvaluation and Demonstration Act of 1974 -
RIO CHAMA AT ABIQUIU, NEW MEXICODEMONSTRATION PROJECT PERFORMANCE REPORT
I. INTRODUCTION S
1. Project Name and Location. The Rio Chama project is protection for
an historic Hispanic chapel and village ruins located on Rio Chama,
river mile 21 in Rio Arriba County, New Mexico. The project is located
one and a half miles south of the community of Abiquiu, and ten miles
downstream from Abiquiu Dam and reservoir which was constructed in
1963. See Plate 1 for Location and Vicinity Map.
2. Authority. Streambank Erosion Control Evaluation and Demonstration
Act of 1974, Section 32, Public Law 93-251.
3. Purpose and Scope. This report describes a bank erosion problem on
the Rio Chama near an historic site listed on the National Register of
Historic Places and the types of solutions used to prevent future 0
threat by floodwater. The project was completed on 20 March 1981 and
was judged to be in excellent condition at the time of the final in-
spection.
4. Problem Resume. Bank erosion has been threatening the ruins of a
Spanish Colonial Chapel and village site on the right bank of the Rio
Chama at a critical bend (Plate 2, Artist's Conception). Some of the
village site has already been claimed by the erosioi.al process. In-
terested local residents alarmed at the irretrievable loss, incorpor-
ated to form La Asosiacion de Lima de Abiquiu, Inc., in 1976. This
non-profit corporation worked closely with the Albuquerque District
Corps of Engineers to accomplish the project.
II. HISTORICAL DESCRIPTION
5. Chapel and Village Site. The village site was settled in 1734
around a chapel dedicated to Saint Rose of Lima Peru, the first saint
of the Americas. Abandoned in 1748 because of Indian attack, it was
resettled in 1750. The community surrounding Capilla de Santa Rosa
(Chapel of Saint Rose) became known as "La Capilla" and its population
G-64-1
w~~~ W w W - - - - 0
numbered 254 in 1776. See Plate 3 for an archaeology map of the site.
The present day village of Abiquiu was established in 1754 when a land
grant was made for the Abiquiu Genizaros, Hispanicized Indians. The
two neighboring communities eventually merged as common problems of
the frontier encouraged cooperation. For over 100 years the Abiquiu
communities constituted the northernmost Hispanic settlement in New
Mexico. The community of La Capilla is now abandoned with only one
wall remaining of the old chapel. A shift in the course of the Rio
Chama in the 1800's destroyed much of the adjacent farmland and the
last inhabited house was abandoned in 1920. The remaining wall of the
chapel is an important symbol to those whose ancestors are buried
there. The descendents of the pioneers who lived there and other mem-
bers of La Asosiacion de Santa Rosa de Lima de Abiquiu, Inc., have
plans to construct a Spanish community museum on the site.
6. Rio Chama. 0
a. Topography. The headwaters of the Rio Chama are in the San
Juan Mountains of southern Colorado in Conejos County. From there it
flows south to El Vado, New Mexico then southeast through the Chains
Basin to its confluence with the Rio Grande six miles north of Espanola, ...
New Mexico, approximately 130 miles total. A map of the watershed is
shown on Plate 1. Elevations range from about 12,000 feet in the
mountains to 5,600 feet at the confluence. The drainage area is
about 3,159 square miles, of which about 2,146 square miles are above
Abiquiu Dam. The upper areas have steep slopes with a dense coniferous
tree cover while slopes are much more gradual at lower elevations
where the vegetation trends to pinon-juniper woodland, shrubs, and
short grass prairie.
b. Geology. The project is situated in the Chama Basin, a shallow
basinal structure merging on the norhtwest with the larger San Juan
Basin. The basin is bounded on the west by the Gallina Arch, on the
south by the Jemez Plateau, on the southeast by the Espanola Basin and
on the northeast by the Brazos Uplift. The sedimentary rocks present
within the Chains Basin Range in age from Pennsylvanian to Pliocene.
G-64-2
Igneous rocks of the basin are divided into the Precambrian intrusives
of the San Pedro Mountains in the west and the Pliocene and Pleistocene
extrusives of the Jemez Mountains to the south. The southeastern part
- of the basin is characterized by broad folds and gentle regional dips
to the north and west. Steeply dipping normal faults with a general
north to northeast trend are common and often exhibit throws in excess
of 200 feet. Volcanic activity in the Valle Grande of the nearby
Jemez Mountains began in the Miocene, and the thick tuffs of the •
Abiquiu formation were deposited by westward flowing streams. The
Jemez Plateau continued as an active volcanic center during the Pleisto-
cene, contributing andesitic and basaltic flows and rhyolitic tuffs to
the Abiquiu formation.
c. Hydrology. The climate of the Rio Chama Basin ranges from
humid and semi-humid in the mountainous upper reaches of the watershed
to semi-arid in the lower elevations. The mean annual temperature6over the entire basin is 420F (Based on mean annual temperature for
increments of elevation and weighted in proportion to the areas in the
increments). Extreme maximum and minimum temperatures in Abiquiu
since 1959 are 0 F and -25*F respectively. The average annual precip-
itation in the Rio Chama Watershed is about 19 inches.
The National Weather Service Rainfall Station at Chama, New Mexico
(located about 30 miles north of the project), with 60 years of record,
has a normal annual precipitation of 20.83 inches, a maximum of 32.14 •
inches in 1916, and minimum of 8.72 inches in 1956.
During the winter months, heavy snowfall occurs in the upper moun-
tainous areas of the watershed, whereas over the lower portion snowfall
is light. Snow usually remains in the mountains above elevation 8,000
feet from the beginning of heavy snows in December until early in April
when snowmelt runoff begins. Snow below 8,000 feet seldom stays on
the ground more than a few days. During the spring months, the depth4 and water content is measured at seven snow courses in the subbasin for
purposes of estimating characteristics of spring runoff.
d. Channel Conditions. The soils in the project area are derived
G-64-3
W W w w W W - - - 0
from the middle member of the Chinle shale formation. The parent ma-
V. terials are then predominantly Salitral shale and Poleo sandstone. Soil
in the channel was characterized as SM, Silty sand. (Plate 12). Both
streambank erosion and aggradation of the channel are a problem during
high velocity flows. The variation in stream quantity and competence
may be affected by rainfall and runoff, but for the most part it is
subject only to the controlled release from Abiquiu Dam. In May 1980,
a rainstorm occurred which was centered about 5 miles upstream from the
project and this storm caused dramatic erosion due to interior drainage
flows. The ruins sit on a high bank approximately 20 feet above the
streambed so they are not subject to inundation. This storm caused
severe sloughing of the bank at the village site and was an impetus
for local residents to secure the area from future devastation.
7. Environmental Consideration. An environmental impact statement
was not required for this project. No endangered, threatened, or
otherwise unique species of vegetation or wildlife are known to be
present cn project lands or in the Rio Chama Valley in the vicinity.
The peregrine falcon (Falcoperegrinus) which is on the U.S. Department
of Interior list of endangered wildlife and the golden eagle (Aquila
chrysaetos), which is not listed by either the state or the U.S.
Department of Interior, but which is capable of generating special
enthusiasm and concern among birdwatchers, are worthy of mention.
The ranges of these species include the project area but are not
reported on project land.
a. Wildlife. The overall project area and adjacent lands are of
generally marginal value as wildlife habitat. Upland areas have been
heavily grazed and habitat at lower elevations has been adversely S
affected by flooding and sedimentation. Pinon-juniper areas near the
project support mice, packrats, rock squirrels, least chipmunks, rock
wrens, brown towees, house finches, mourning doves, rufus crowned
sparrows and western flycatchers. Owls, kestrels, prairie falcons, S
meadowlarks, horned larks, and chipping sparrows were also noted.
Modest numbers of mule deer, antelope, cottontail, muskrat, raccoon,
skunk, coyote, and badger are seen in the vicinity by residents.
G-64-4
Seven species of fish are presently known to inhabit the Rio Chama:
Channel catfish (Ictalurus punctatus), Carp (Cyprinus carpio), River
carpsucker (Carpiodes carpio), White sucker (Catastomus commersoni),
Rio Grande chub (Gila nigrescens), Brown trout (Salmo trutta), and - 0
Rainbow trout (Salmo dairdneri). The Abiquiu Reservoir is presently
being managed as a "two-story" fishery in which both cold-water
(Rainbow trout) and warm-water (Channel catfish) fish are maintained.
b. Terrestrial Vegetation. The vegetation in the vicinity of 0
Abiquiu trends from short-grass prairie to pinon-juniper woodland
depending primarily upon elevations, slope, exposure, and soils. The
one-seed juniper is fairly prominent on the steeper slopes of the sides
of dissected terraces of plateaus. The juniper and pinon pine are both
common on the foothills. Ground cover is sparse due to low rainfall
and poor soil. Woodlands were cleared to create increased gaging. Range
conditions tend to be only fair. Cattle production is dominated by
galleta, blue grama, and bottlebrush-squirreltail. Broom snakeweed •
and other shrubs are also present. Cultivated fields in the flood
plain to the north of the project grow apples, corn, beans and other
vegetables.0
8. Demonstration Site-Test Reach.
a. Hydrologic Characteristics. The hydrologic characteristics are
as previously stated. Streamflow data are available at five locations
in the Rio Chama Basin below Abiquiu Dam. Two of these gage sites are
on tributaries to the Rio Chama. They are the El Rito Creek gage near
El Rito, New Mexico, and the Rio Ojo Caliente gage near La Madera,
New Mexico. The other three gage sites are all on the Rio Chama. They
are the Rio Chama below Abiquiu Dam, the Rio Chama near Abiquiu, and
the Rio Chama near Chamita. Based on analysis from all of the gages
except the one right below the dam (it reflects only the controlled
release), a discharge-frequency curve was computed (Plate 1). The
maximum flow for all frequencies from the annual to that approaching
the Standard Project Flood should not exceed 4,000 c.f.s. However,
for present channel conditions, a more realistic maximum flow would be
in the range of 1,200 to 2,000 c.f.s.
G-64-5
w w w w w - -
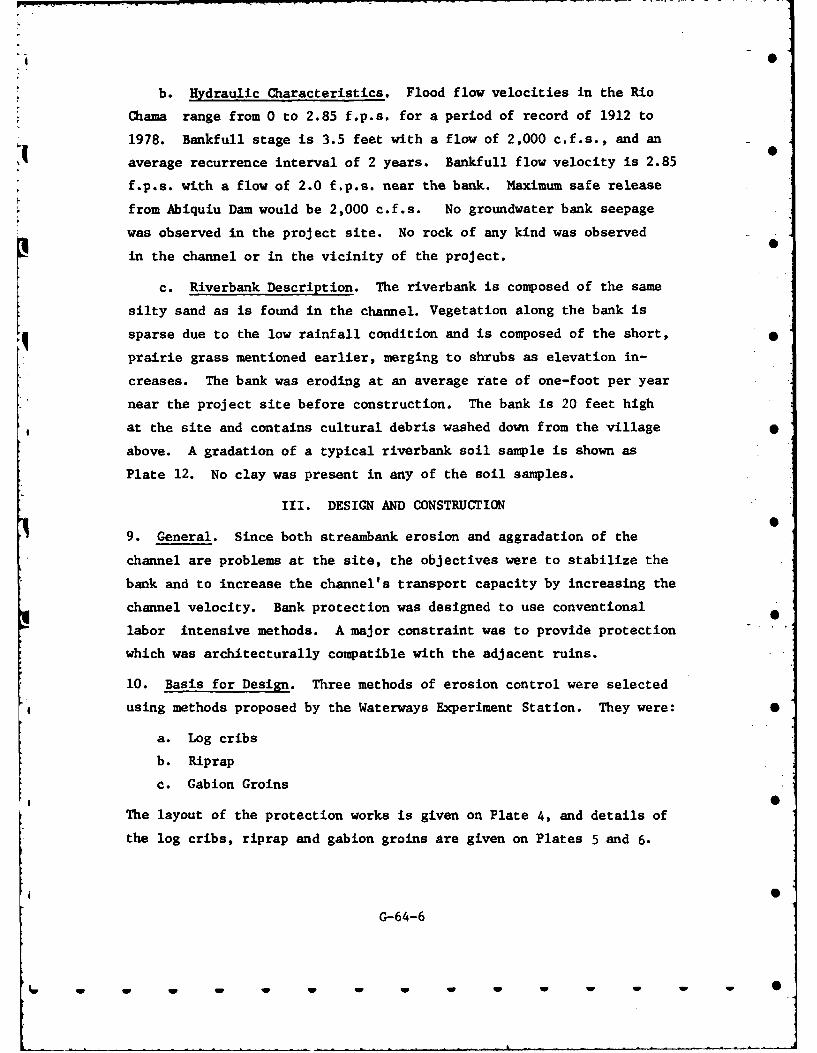
b. Hydraulic Characteristics. Flood flow velocities in the Rio
hama range from 0 to 2.85 f.p.s. for a period of record of 1912 to
1978. Bankfull stage is 3.5 feet with a flow of 2,000 c.f.s., and an
average recurrence interval of 2 years. Bankfull flow velocity is 2.85
f.p.s. with a flow of 2.0 f.p.s. near the bank. Maximum safe release
from Abiquiu Dam would be 2,000 c.f.s. No groundwater bank seepage
was observed in the project site. No rock of any kind was observed
in the channel or in the vicinity of the project.
c. Riverbank Description. The riverbank is composed of the same
silty sand as is found in the channel. Vegetation along the bank is
sparse due to the low rainfall condition and is composed of the short,
prairie grass mentioned earlier, merging to shrubs as elevation in-
creases. The bank was eroding at an average rate of one-foot per year
near the project site before construction. The bank is 20 feet high
at the site and contains cultural debris washed down from the village
above. A gradation of a typical riverbank soil sample is shown as
Plate 12. No clay was present in any of the soil samples.
III. DESIGN AND CONSTRUCTION
9. General. Since both streambank erosion and aggradatior, of the
channel are problems at the site, the objectives were to stabilize the
bank and to increase the channel's transport capacity by increasing the
channel velocity. Bank protection was designed to use conventional
labor intensive methods. A major constraint was to provide protection
which was architecturally compatible with the adjacent ruins.
10. Basis for Design. Three methods of erosion control were selected
using methods proposed by the Waterways Experiment Station. They were: 0
a. Log cribs
b. Riprap
c. Gabion Groins
The layout of the protection works is given on Plate 4, and details of
the log cribs, riprap and gabion groins are given on Plates 5 and 6.
G-64-6
W W W W W W W W W
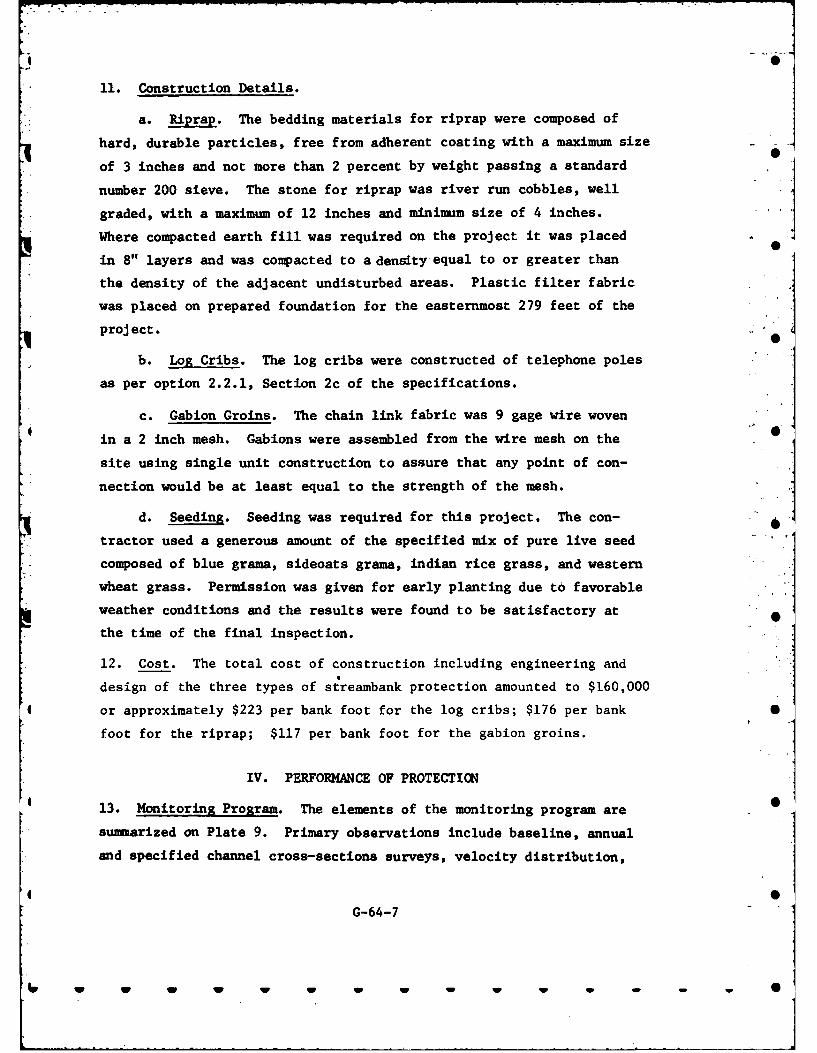
11. Construction Details.
a. Riprap. The bedding materials for riprap were composed of
hard, durable particles, free from adherent coating with a maximum size
of 3 inches and not more than 2 percent by weight passing a standard
number 200 sieve. The stone for riprap was river run cobbles, well
graded, with a maximum of 12 inches and minimum size of 4 inches.
Where compacted earth fill was required on the project it was placed
in 8" layers and was compacted to a density equal to or greater than
the density of the adjacent undisturbed areas. Plastic filter fabric
was placed on prepared foundation for the easternmost 279 feet of the
project.
b. Log Cribs. The log cribs were constructed of telephone poles
as per option 2.2.1, Section 2c of the specifications.
c. Gabion Groins. The chain link fabric was 9 gage wire woven
in a 2 inch mesh. Gabions were assembled from the wire mesh on the 0
site using single unit construction to assure that any point of con-
nection would be at least equal to the strength of the mesh.
d. Seeding. Seeding was required for this project. The con-
tractor used a generous amount of the specified mix of pure live seed
composed of blue grama, sideoats grama, indian rice grass, and western
wheat grass. Permission was given for early planting due to favorable
* weather conditions and the results were found to be satisfactory at
the time of the final inspection.
12. Cost. The total cost of construction including engineering and
design of the three types of streambank protection amounted to $160,000
4 or approximately $223 per bank foot for the log cribs; $176 per bank •
foot for the riprap; $117 per bank foot for the gabion groins.
IV. PERFORMANCE OF PROTECTION
13. Monitoring Program. The elements of the monitoring program are
sunmarized on Plate 9. Primary observations include baseline, annual
and specified channel cross-sections surveys, velocity distribution,
G 4G-64-7
w - • -
L0
visual inspections, and periodic and special photographs (Plates 7 & 8).
Any flood event in the project area will be observed by Corps of
Engineers personnel from the Abiquiu Dam residence office. The project
was completed on 20 March 1981, therefore, it is unchanged from the
.. condition described in the final inspection. The site will be
monitored after appreciable flows have been experienced and the re-
sulting evaluation and conclusions reports furnished Southwest Division.
See Plate10, Evaluation of Existing Protection.
14. Conclusion. Based on the construction final inspection, the
project was judged to be a very satisfactory performance on the part
of the contractor. The ability of the design to function for the
intended purposes will be decided later when an actual flood occurs.
The residents of Abiquiu who participated with the Corps of Engineers
in the real estate requirements were more than happy with the project.
The esthetics of the design blend harmoniously with the environment
and it can be seen from U.S. 84 by all who pass. The Corps of Engineers
gained a positive political benefit with this project. This project
brought letters of praise to the District Office from Abiquiu
residents and will possibly have a long range effect to promote good
public relations between the Corps and the people we are trying to
serve.
G-64-8
w -W WW
A
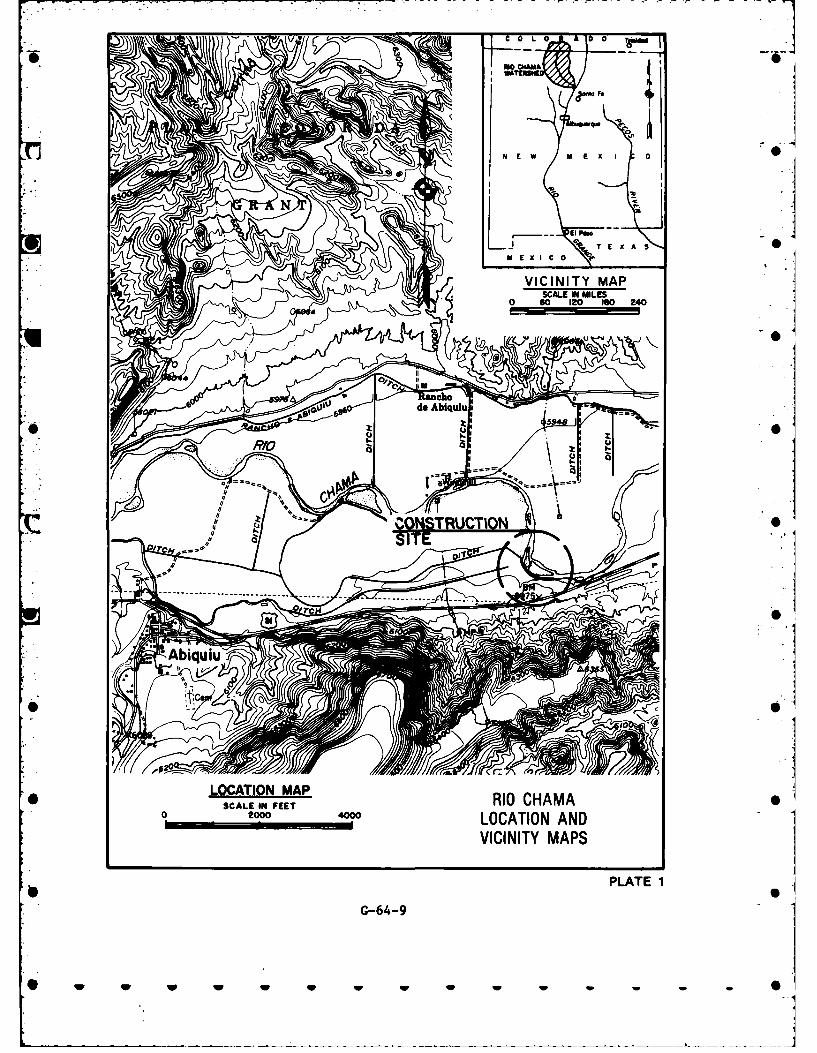
LO 0 ~i
00 CAMA -
0
r
N0
070
LOCTIN MPICAMAY MASCALLE IN FEET
0 200 LOCATION AND
VIINT MAPStanch1aPLSTTE
---------------- ---- -- - -------- ---- ---- 7rc1
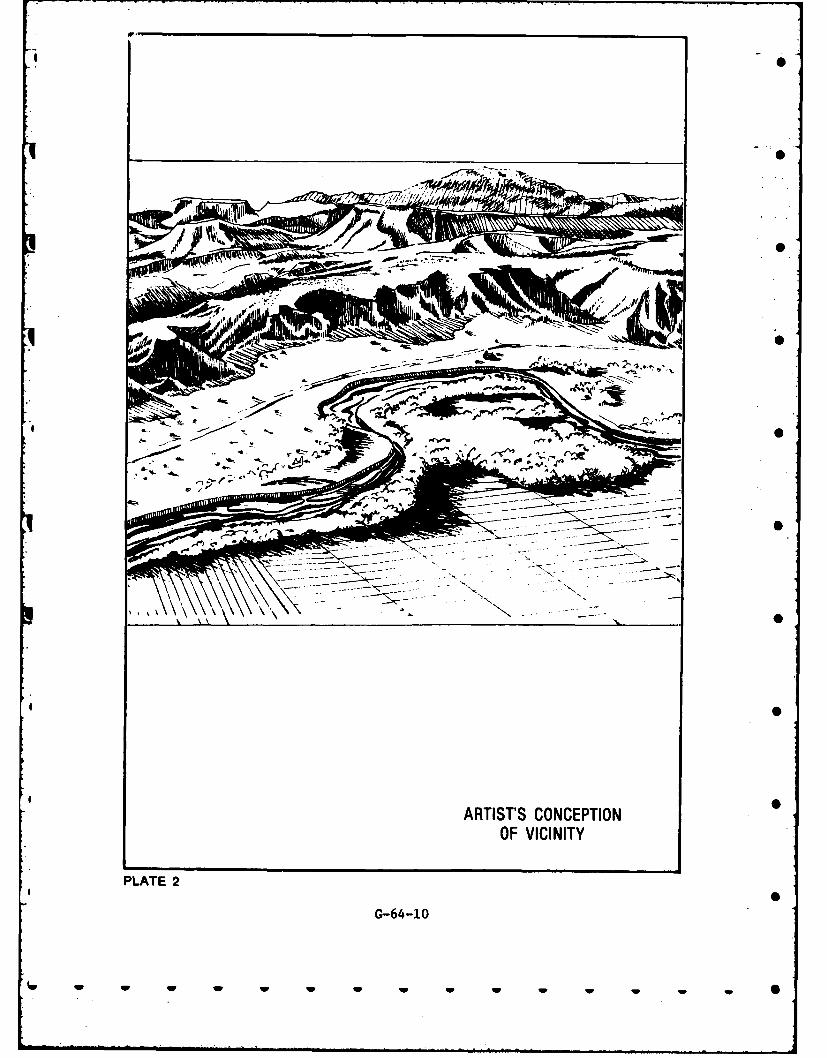
ioo.
I SL
dL0
ARTIST'S CONCEPTIONOF VICINITY
P L A T E 2G - 4 1
4 0p
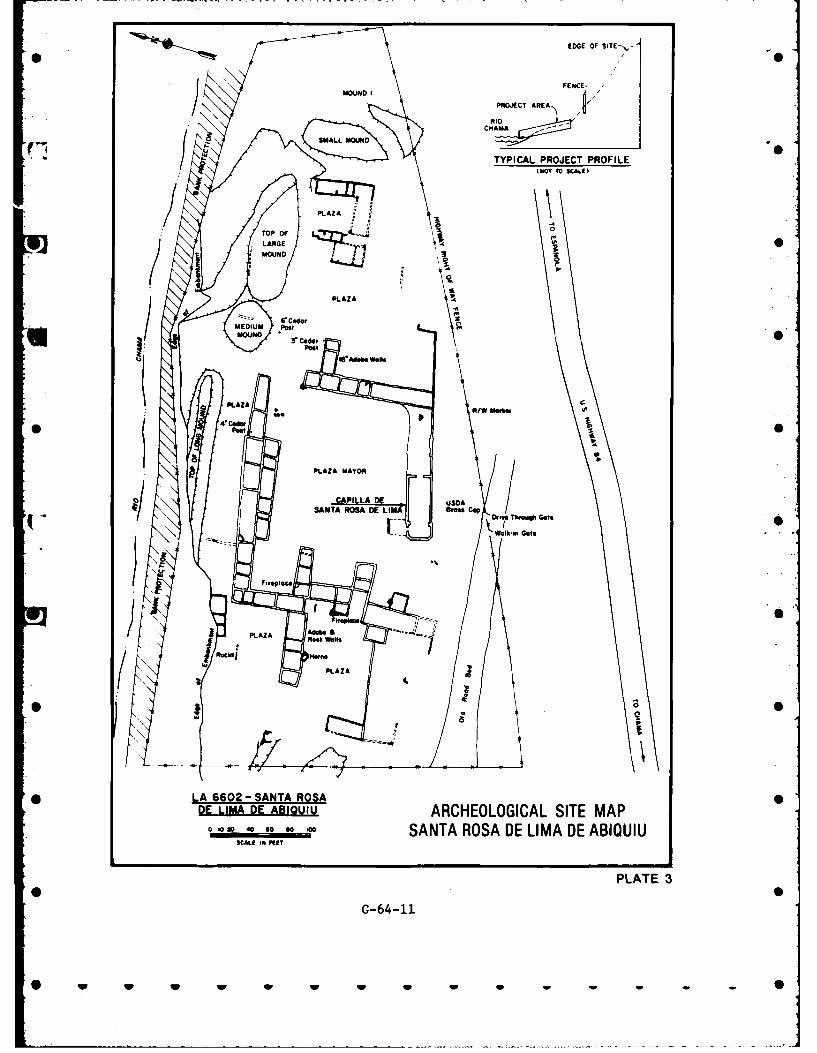
EDGE OF SITE--,,-
FENCE,
MOUND IPROJECT AREA
TYPICAL PROJECT PROFILE0INoT TO SCAL.E)
/ j :MOUJND
PLAZA P
CoderR
MEDIUM Ceoo/
MOUND 3! Co er DAPullj ~aoal
I-G
PLAZA ~ ~ od 111W N r .
*L66 2 SA N TA ROSA D E L 11a m C p
PLAZAP AT 3ekWof
*
00
* w w w w wPLAZA
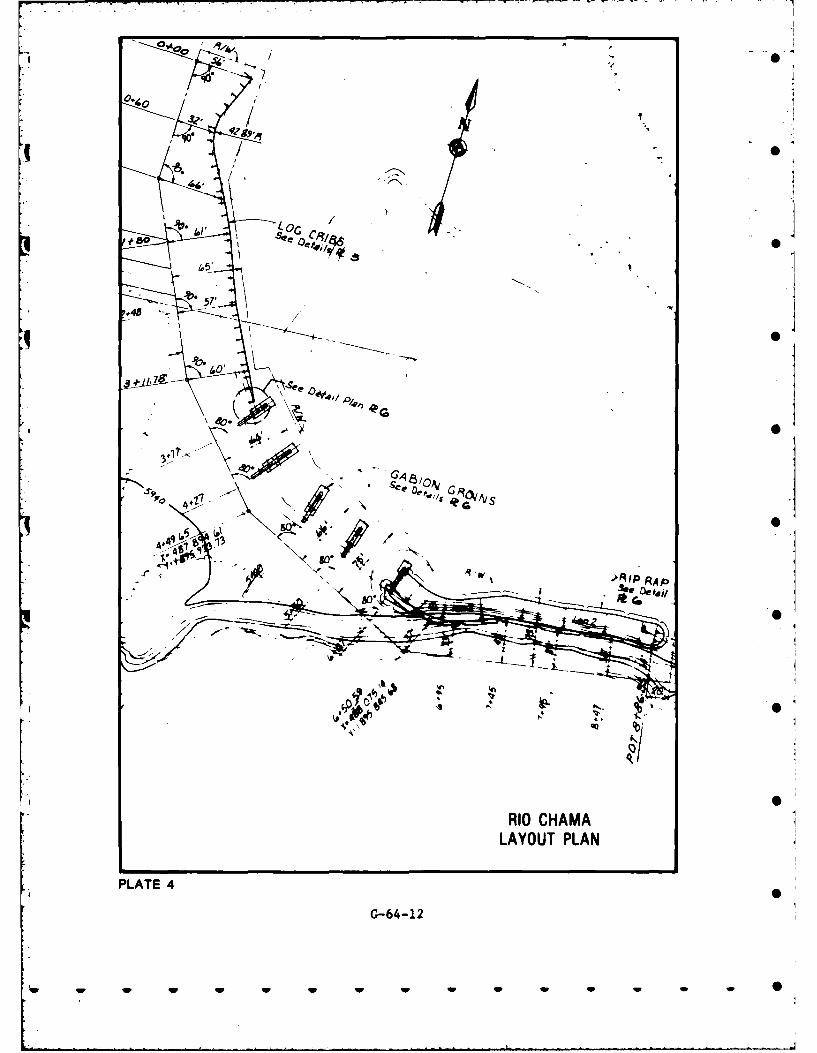
o.57'
lb.1
S46'
- 0~
, RAP
RIO CHAMALAYOUT PLAN
PLATE 4
G-64-12
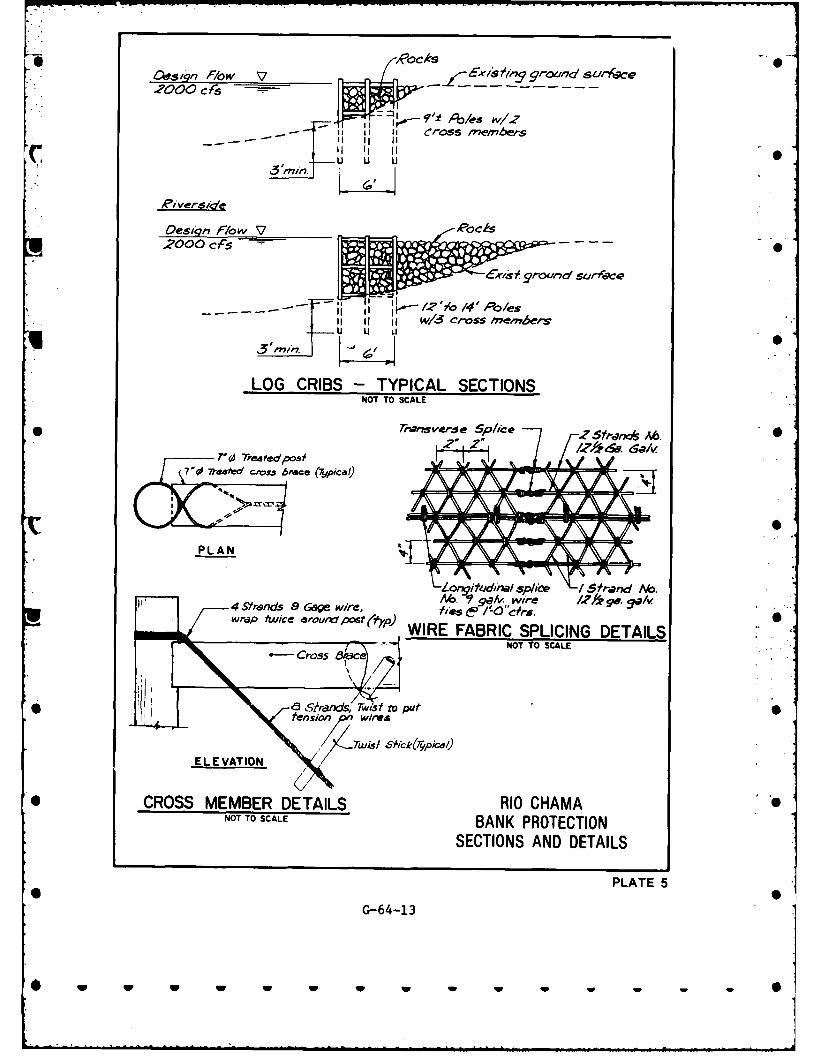
27000 Cis;-
- ~-flt Poles w/27
Design rlow V2000 cfs 0
&r/s,' groun~d sucn-ee
-;; O F ii w3cos ebrsU U U
3'. "fi7
LOG CRIBS - TYPICAL SECTIONSNOT TO SCALE
* rraPsve,-se sph/ee z frlanads A6.
7'( W~atedposi'7"e0 Ta.~o rms blece (7?&pica/)
PLAN ~i
Lon itQdirhal spabe / 5anrd A.Ao. galv wire lzfr 5. ga/e4 S~rands 9 Gage wre, ~ /,~,
&'Jdptwie ror~d~ot(Yp) WIRE FABRIC SPLICING DETAILS
~~~~~NOT O SCALE BAKPOETN
fesio w w w w
TII
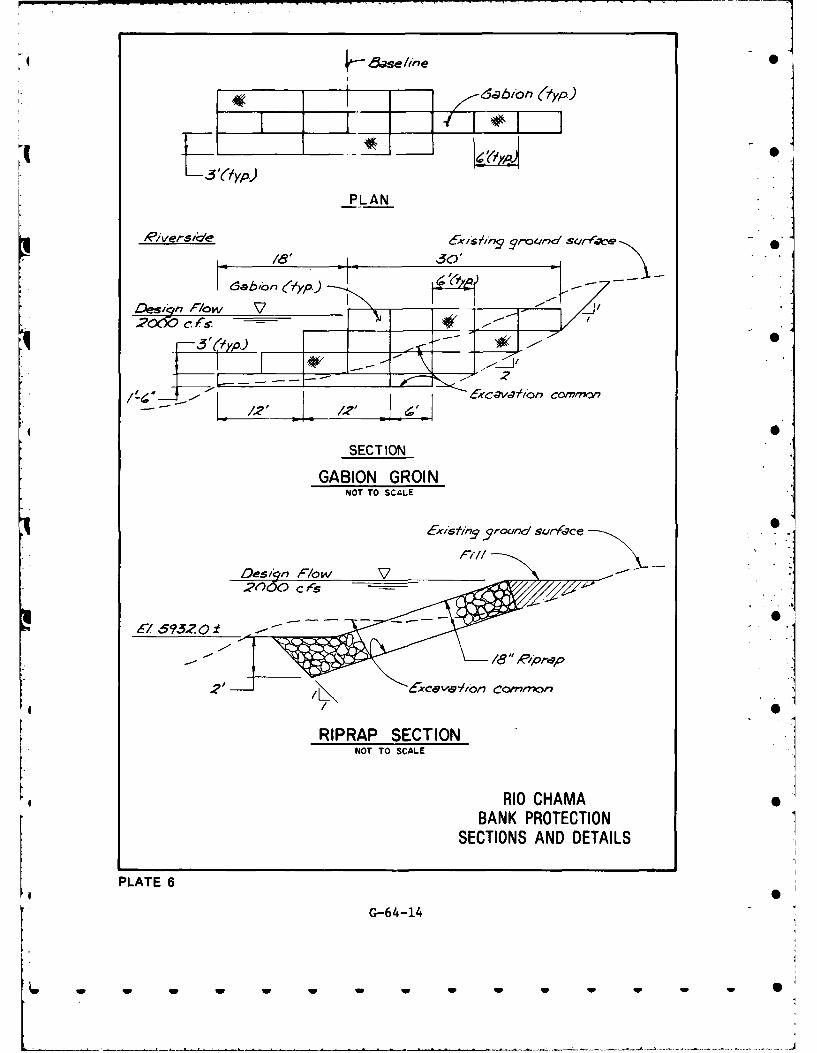
6c~bldn (typ.)
PLAN
2/lvers&/e r,~ roidsurla!e
/86' /'s - -
F/ow 6ab ~il~ I~1
SECTION-0
GABION GROINNOT TO SCALE
='l hnqagrond suJr{vce
Qesl n Flo
45X- RIO-/Ot CAMA
BANK PROTECTIONSECTIONS AND DETAILS
PLATE 6
G-64-14
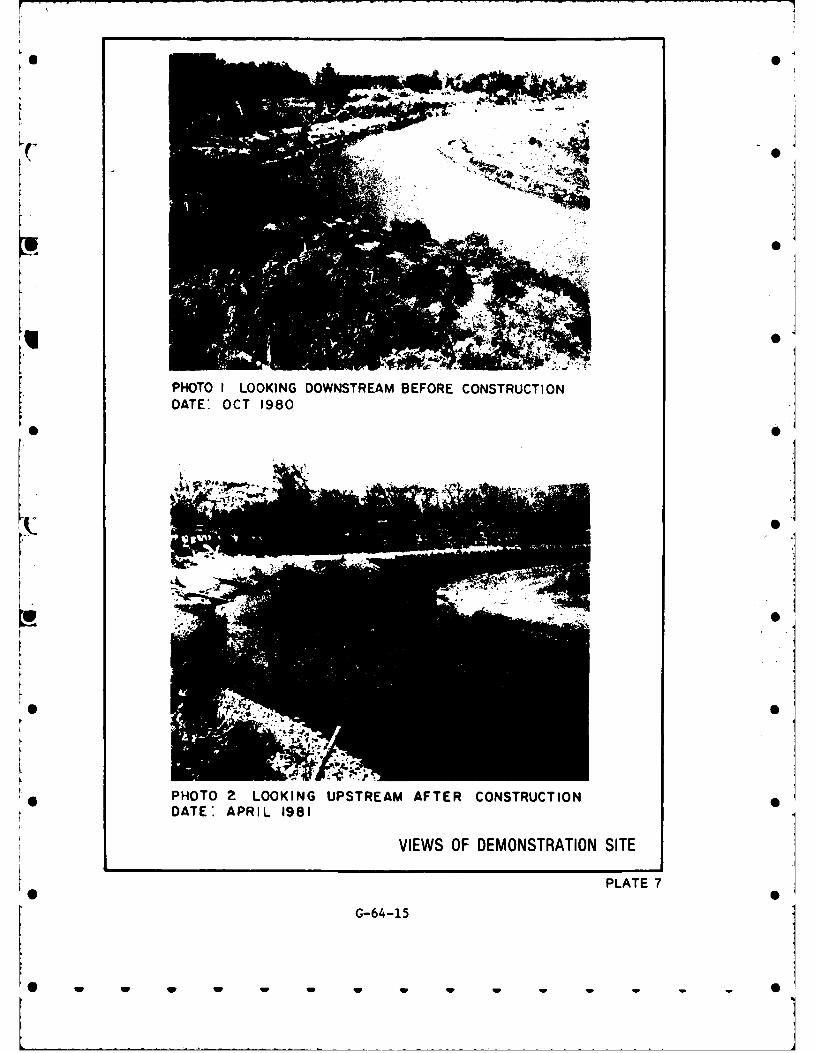
& A
1 .4
PHOTO I LOOKING DOWNSTREAM BEFORE CONSTRUCTIONDATE: OCT 1980
* .SUAS
* S
PHOTO 2 LOOKING UPSTREAM AFTER CONSTRUCTIONDATE: APRIL 1981
VIEWS OF DEMONSTRATION SITE
PLATE 7
G-64-15
• PS w ww q w, - - -, -
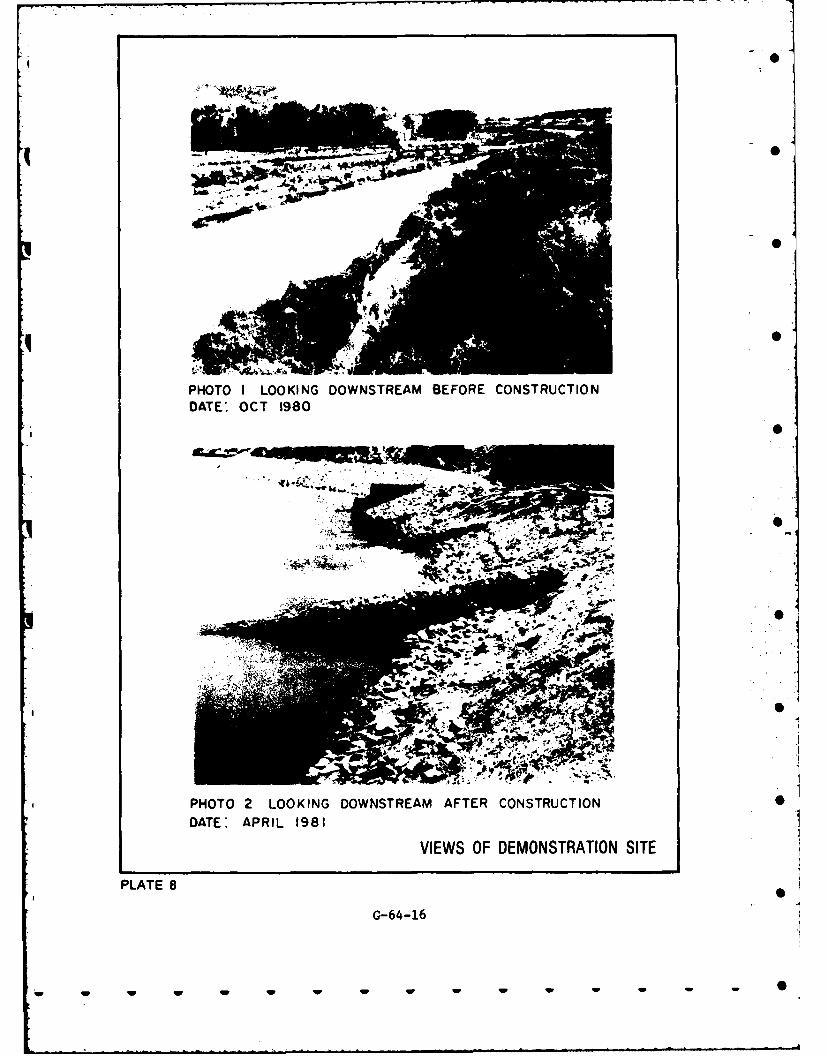
.S
PHOTO I LOOKING DOWNSTREAM BEFORE CONSTRUCTIONDATE* OCT 1980
0
PHOTO 2 LOOKING DOWNSTREAM AFTER CONSTRUCTION
DATE: APRIL 1981
VIEWS OF DEMONSTRATION SITE
PLATE 8
G-64-16
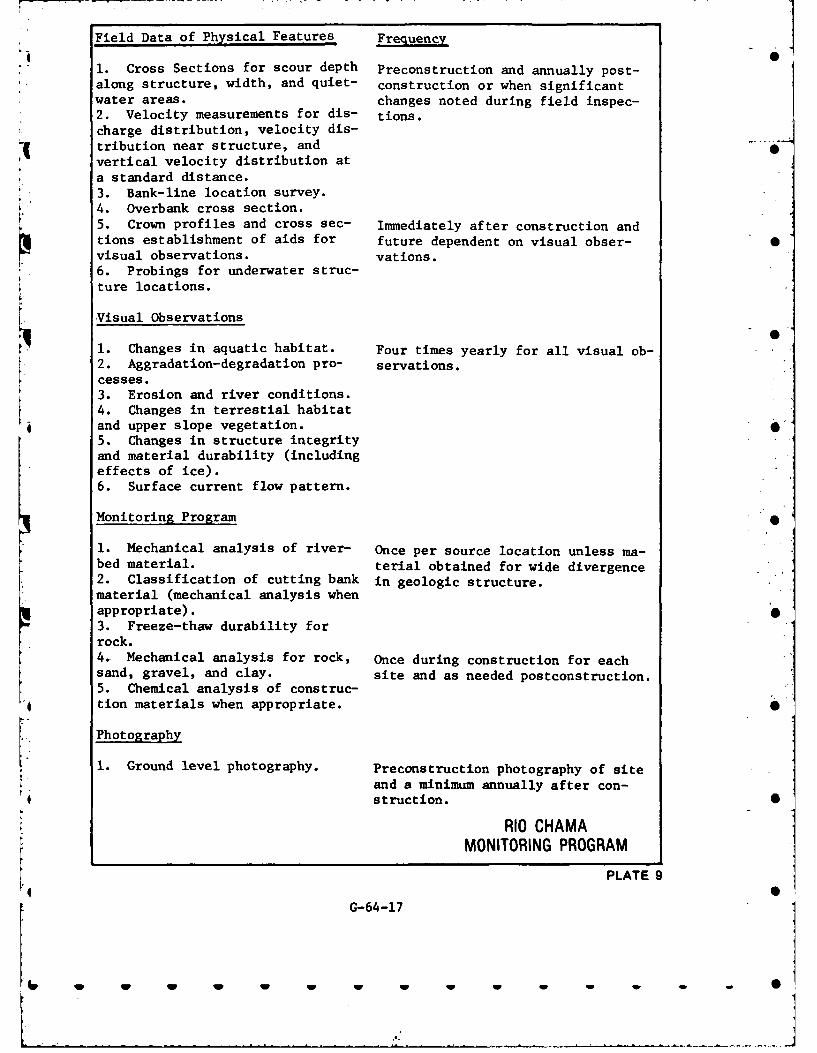
Field Data of Physical Features Frequency
1. Cross Sections for scour depth Preconstruction and annually post-along structure, width, and quiet- construction or when significantwater areas. changes noted during field inspec-2. Velocity measurements for dis- tions.charge distribution, velocity dis-tribution near structure, andvertical velocity distribution ata standard distance.3. Bank-line location survey.4. Overbank cross section.5. Crown profiles and cross sec- Immediately after construction andtions establishment of aids for future dependent on visual obser- S
visual observations. vations.6. Probings for underwater struc-ture locations.
Visual Observations
1. Changes in aquatic habitat. Four times yearly for all visual ob-2. Aggradation-degradation pro- servations.cesses.3. Erosion and river conditions.4. Changes in terrestial habitatand upper slope vegetation.5. Changes in structure integrityand material durability (includingeffects of ice).6. Surface current flow pattern.
Monitoring Program
1. Mechanical analysis of river- Once per source location unless ma-bed material. terial obtained for wide divergence2. Classification of cutting bank in geologic structure.material (mechanical analysis whenappropriate).3. Freeze-thaw durability forrock.4. Mechanical analysis for rock, Once during construction for eachsand, gravel, and clay. site and as needed postconstruction.5. Chemical analysis of construc-
" tion materials when appropriate. 0
Photography
1. Ground level photography. Preconstruction photography of siteand a minimum annually after con-struction.
RIO CHAMAMONITORING PROGRAM
PLATE 9
G-64-17
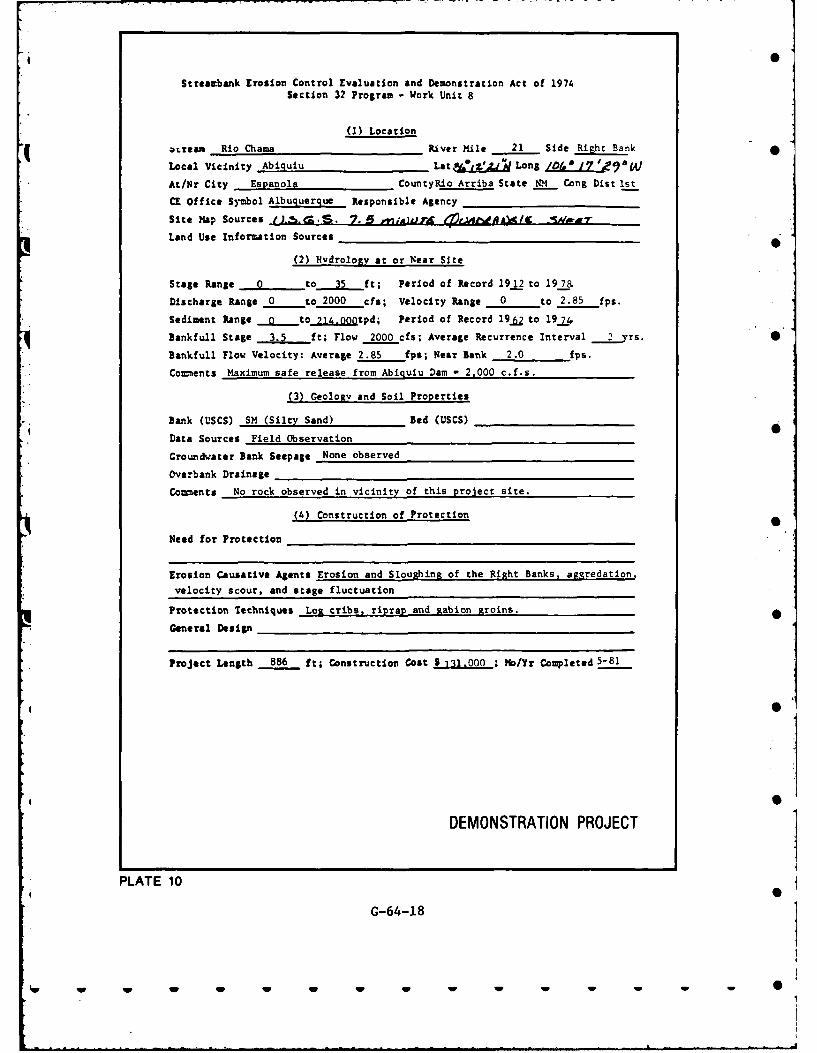
Streambank Erosion Control Evaluation and Demonstration Act of 1974Section 32 Program - Work Unit 8
(1) Location
*rream Rio Chama River Mile 21 Side Right Bank
Local Vicinity Abiquiu Lat 1 z' LV Long L0t/7.Ift
At/Nr City Espanola CountyRio Arriba State N4 Cong Dist 1st
CE Office Symbol Albuquerque Responsible Agency
Site Map Sources tJ.5.c .S. 7. A .i. (4,r . fI h1IC 5Arl
Land Use Information Sources _
(2) Hydrologv at or Near Site
Stage Range 0 to 3 ft; Period of Record 19 12 to 19 7a
Discharge Range 0 to 2000 cfs; Velocity Range 0 to 2.85 fps.
Sediment Range tot214.ontpd; Period of Record 1962to 9.
Bankfull Stage 3.5 ft; Flow 2000 cfs; Average Recurrence Interval ._yrs. Slankfull Flow Velocity: Average 2.85 fps; Near Bank 2.0 fps.
Co=ents Maximum safe release from Abiguiu Dam - 2,000 c.f.s.
(3) Geology and Soil Properties
Bank (USCS) SM (Silty Sand) Bed (USCS) •
Data Sources Field Observation
Ground'ater Bank Seepage None observed
Overbank Drainage
Coments No rock observed in vicinity of this project site.
(4) Construction of Protection
Need for Protection
Erosion Causative Agents Erosion and Sloughing of the Right Banks, agredation
velocity scour, and stage fluctuation
Protection Techniques Los cribs. riprap and gabion groins.
General Design
Project Length 886 ft; Construction Cost$ 131,000 ; Mo/Yr Completed 5-81
DEMONSTRATION PROJECT
PLATE 10
G-64-18
W W W W W W W 0W
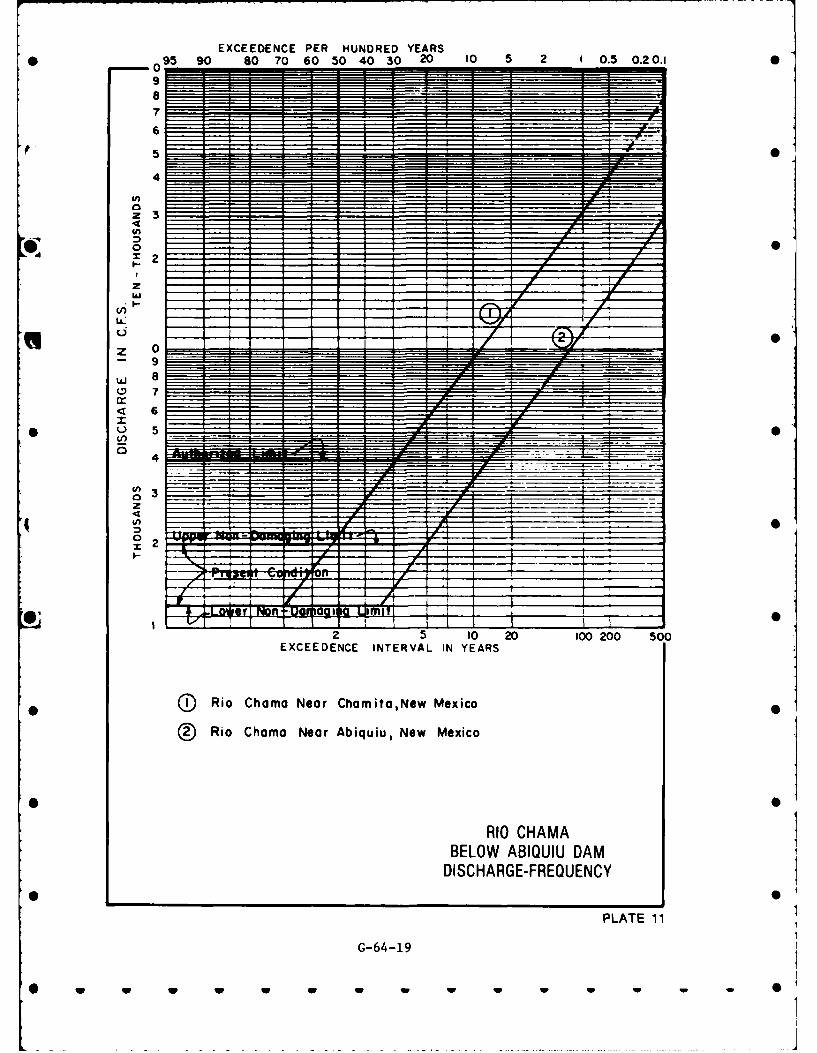
EXCEEDENCE PER HUNDRED YEARS95 90 80 70 60 504030 20 10 5 2 1 0.5 0.20.10
9
.7
69 5
z 3-
12
z -1
- 9
W 8(D 7
< 6___
4
1 1I IT i I02 5 10 20100 200 500
EXCEEDENCE INTERVAL IN YEARS
* ~ Rio Chama Near Chamita,New Mexico
(~Rio Choma Near Abiquiu, New Mexico
RIO CHAMABELOW ABIOUIU DAM
DISCHARGE-FREQUENCY
PLATE 11
G-64-19
* W W W W W W W W W S
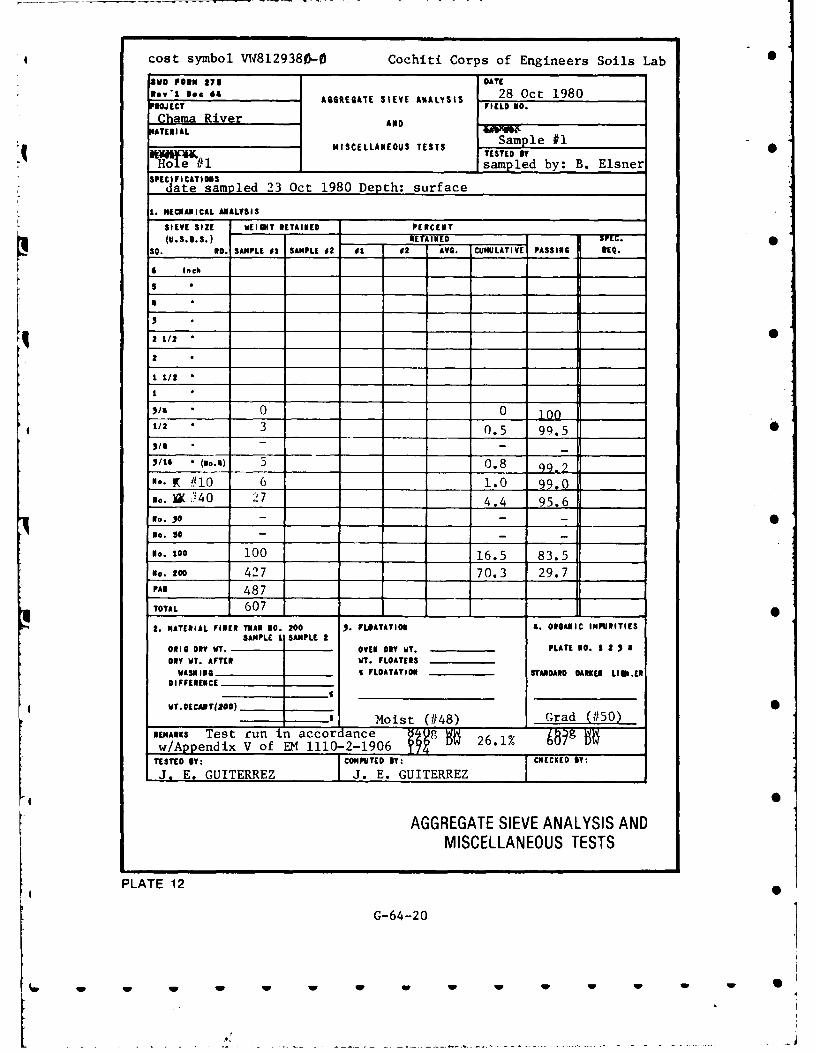
cost symbol V48129380-0 Cochiti Corps of Engineers Soils Lab 0
4S FOR 275 DATE
lev'1 Doc 64 AGGREGATE SIEVE ANALYSIS 28 Oct 1980PROJECT FIELD NO.Chama River ANDAT1i! AL
MISCELLANEOUS TESTS Sample #1TESTED IT
Hole_ #1 sampled by: B. ElsnerSPIE l FICAT iS
date sampled 23 Oct 1980 Depth: surface
1. NE€IAPICAL MALSS
SIEVE SIZE WEIGHT RETAINED PERCENT
(U.S.S..) RETAINED s___.__
SQ. RD. SAMPLE 0I SAMPLE 02 I1 02 AVG. CUMULATIVE PASSING IQ.
6 Inch
5
2 1/2
2
11/2
* 0 0 _00 _1
1/2 • 3 0.5 99.5 S
/16 • (No.*) 5 0.8 99-2
No. K #10 6 1.0 99.0No. XK i40 27 4.4 95.6
No. o - - -
No. SO - - -
No. 100 100 16.5 83.5
No. 200 427 1 70.3 29.7PAN 487
TOTAL 607 _
2. MATERIAL FINER THAN NO. 200 .1. FLOATATION S. ORGANIC IMPUITIES
SAMPLE I SAMPLE 2
Oill DRY C T. OVEN DRY WT. PLATE NO. 1 2 3 S
DRY WT. AFTER VT. FLOATERSWASHING S FLOATATION STANDARD DARKER LIS.El
DIF FERENCE
g T. OECAIT(*OD)_____________ Moist (#48) Grad (#50)
REMARKS Test run in accordance R 26.1% Wg Nw/Appendix V of EN 1110-2-1906TESTED BY: COMPUTED IY: CHECKEO Y:KJ. E. GUITERREZ J. E. GUITERREZ
AGGREGATE SIEVE ANALYSIS ANDMISCELLANEOUS TESTS
PLATE 12
G-64-20
Iw w w w W U
I 0
0
4 0
q
I jROANOKE RIVER NEAR
LEESYILLE, VIRGINIA
0
I S
I S
I S
I S
w w w V V V V W W 0
Section 32 Program Streambank Erosion ControlEvaluation and Demonstration Act of 1974
ROANOKE (STAUNTON) RIVER NEAR LEESVILLE, VIRGINIADEMONSTRATION PROJECT PERFORMANCE REPORT 0
I. INTRODUCTION
1 1. Project Name and Location. Roanoke (Staunton) River near
Leesville, Virginia, Section 32 Demonstration Project. Figure I shows
location map.
2. Authority. Streambank Erosion Control Evaluation and Demonstration 0
Act of 1974, Public Law 93-251.
3. Purpose and Scope. This report describes a bank erosion problem,
the types of bank protection used, and (later) a performance evaluation
of a demonstration project on two sites on the Roanoke (Staunton)
River, Virginia, constructed (construction began 13 December 1980 and
was completed 13 March 1981) and monitored by the Wilmington District.!0
4. Problem Resume. Operation of the hydropower facility at Leesville
Dam results in normal river stage fluctuation from about 0.5 feet to
about 5 feet twice daily. Portions of the 5 miles of streambank
immediately downstream from the dam have eroded significantly, some •
areas receding as much as 200 feet. Two of the most severely eroded
locations, which are pasturelands, have been selected as demonstration
sites. Site A (1,300 feet long) is about I mile downstream from the
Leesville Dam on the left bank facing downstream, Site C (700 feet S
long) is about 3-1/2 miles downstream from the Leesville Dam, at the
town of Leesville, on the right bank facing downstream. Nearby river
erosion of Virginia Highway 43 east of Leesville has been partially
G-65-1
W 1W W W _ W
solved by placement of sandstone riprap by the Virginia Department of
Highways.
I I. HISTORICAL DESCRIPTION
5. Stream.
a. Topography. The Roanoke River watershed lies within four
physiographic provinces known as the Valley and Ridge Province, the
Blue Ridge Province, the Piedmont Plateau, and the Atlantic Coastal
Plain. The Leesville project is in the western part of the Piedmont
physiographic province which extends from northeast to southwest
between the Blue Ridge Mountains and the Coastal Plain. The Piedmont
Plateau is a low, eastward- sloping plateau, well dissected by
long-continued erosion. The Plateau is characterized by rolling
conformation with elevation ranging from 150 to 900 feet above mean sea
level (ft., m.s.l.). The elevation near the Leesville project is
between 500 and 600 ft., m.s.l. The Piedmont area is traversed
by highlands which are cut by numerous tributary valleys. The flood
plain along the Roanoke River in the Piedmont Plateau near the
Leesville project ranges from 1,000 to 1,500 feet in width. The fall
in the river at the project location is about 2.5 feet per mile of
river.0
b. Geology.
(1) Regional. The Piedmont area is formed largely in very old
sedimentary and igneous rocks that have been so greatly altered through
metamorphism that most of them bear but slight resemblance to the
original rocks. The rock underlying the site is Wissahickon schist,
which is a finegrained, chlorite schist whose principal mineral
constituents are quartz, white mica, and chlorite. While it is a
relatively soft rock, it is tough and resistant to erosion.
G-65-2
(2) Project Area. The project area is located in alluvial
material which overlays the bedrock. The eroding material is generally
silty sand. The erosion appears to be most active in the area from the
Leesville Dam to approximately 5 miles downstream. The rate of
erosion, although not determined exactly, is fairly high. Erosion has
taken place on both sides of the river in this area, but primary loss
area observed is on the left bank, in a moderate curve. Maximum width
of erosion is about 150'-200'. The channel side slope is in alluvium
that assumes an unstable vertical slope for about 6 feet below ground
surface, then eroded material (silty sand) assumes about a 1-1/2 to I
slope to the bottom of the stream. Vertical distance from top of bank
to streambed varies from about 8 feet to 15 feet. Some old logs and
leaf mold are exposed near the toe of slope. Many trees, mostly
sycamore, have eroded from the bank and lie in the river. The toe of
the slope in some areas is silt and in other areas appears to be "pipe
clay," a sticky "weathered-in-place" residual from bedrock. Much small
gravel is in the streambed and some bars of large boulders are in the
river. In several areas the bank consists of fill material resulting
from a reconstruction project several years ago. The banks are
vertical and virtually void of vegetation in many areas. It was noted
that the water level is raised from 0 to approximately 10 feet, two to
three times daily, resulting in a continuous wetting and drying of
these erodable soils.
c. Hydrologic Characteristics.
(1) Climate. Moderate temperatures generally prevail in the
Roanoke River Basin at the project location, with occasional extremes.
The highest and lowest temperatures recorded at nearby Roanoke,
Virginia are 104"F and -4"F, respectively.
(2) Precipitation. The average annual precipitation over the
Roanoke River Basin above the Leesville project is about 41 inches.
The maximum annual rainfall over the Basin was 57 inches in 1937 and
again near 57 inches in 1972, and the minimum was 30 inches in 1963.
G-65-3
w w
Annual snowfall averages about 22 inches, but only a small amount
accumulates for any length of time.
(3) Runoff. The annual runoff of the Roanoke River at
Leesville averages about one cubic foot per second per square mile of
drainage area and slightly greater than 30 percent of annual
precipitation. Flood producing storms occur in all seasons of the
year. Generally, floods are caused by brief periods of intense
rainfall on a major portion of the watershed. In the winter and
spring, the intense rainfall has occasionally been a part of a
protracted storm period in which prior rainfall served to fill the
stream channels and to soak the ground, thereby decreasing the
absorptive capacity of the soil. In the summer and fall, intense
rainfall is often associated with tropical hurricanes. Runoff is
regulated by upstream hydropower reservoirs to some degree (Smith
Mountain and Leesville Reservoirs).
d. Development. The setting of the project area is largely rural
with row-crop farming and pasturing cattle being the major sources of
income. The Leesville Dam and Reservoir, the lower unit of a
pumped-storage hydroelectric system, is located about I mile upstream
from site A of the project area.
e. Channel Conditions. Project area flows are controlled most of
the time by releases from one or both of the turbines within the
Leesville Dam. The flow from one turbine produces a flow depth of
about 4 feet, which may persist for several hours each day, depending
on demand. During heavy demand periods, both turbines operating
produce flow depths of about 8 feet in the project area. Flow during
nongenerating periods is on the order of 50-100 cubic feet per second,
causing flow depths of about 1/2 feet. Floods, since the reservoir was
built about 1965, have caused substantial overbank flooding and damages
to crops and pastures. Cross sections surveyed in 1976 (see figure 1)
showed that the channel at about station 2+00 on site A (section 1) had
a bottom width of 210 feet, top width of 270 feet, and depth of 20
G-65-4
w w w w w w w
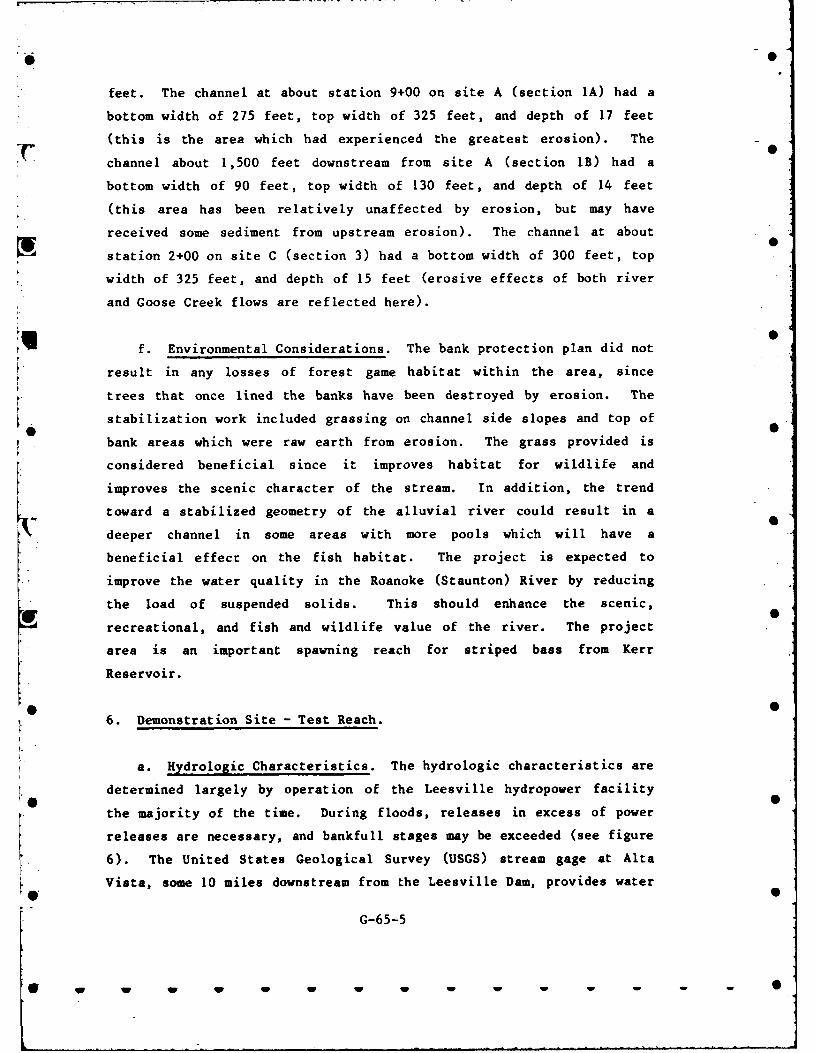
feet. The channel at about station 9+00 on site A (section 1A) had a
bottom width of 275 feet, top width of 325 feet, and depth of 17 feet
(this is the area which had experienced the greatest erosion). The
channel about 1,500 feet downstream from site A (section IB) had a
bottom width of 90 feet, top width of 130 feet, and depth of 14 feet
(this area has been relatively unaffected by erosion, but may have
received some sediment from upstream erosion). The channel at about
station 2+00 on site C (section 3) had a bottom width of 300 feet, top
width of 325 feet, and depth of 15 feet (erosive effects of both river
and Goose Creek flows are reflected here).
f. Environmental Considerations. The bank protection plan did not
K result in any losses of forest game habitat within the area, since
trees that once lined the banks have been destroyed by erosion. The
stabilization work included grassing on channel side slopes and top of
bank areas which were raw earth from erosion. The grass provided is
considered beneficial since it improves habitat for wildlife and
improves the scenic character of the stream. In addition, the trend
toward a stabilized geometry of the alluvial river could result in a" deeper channel in some areas with more pools which will have a
beneficial effect on the fish habitat. The project is expected to
improve the water quality in the Roanoke (Staunton) River by reducing
the load of suspended solids. This should enhance the scenic,
recreational, and fish and wildlife value of the river. The project
area is an important spawning reach for striped bass from Kerr
Reservoir.
6. Demonstration Site - Test Reach.
a. Hydrologic Characteristics. The hydrologic characteristics are
determined largely by operation of the Leesville hydropower facility
the majority of the time. During floods, releases in excess of power
releases are necessary, and bankfull stages may be exceeded (see figure
6). The United States Geological Survey (USGS) stream gage at Alta
Vista, some 10 miles downstream from the Leesville Dam, provides water* S
G-65-5
0 W W W W W 1W W 1W 0W
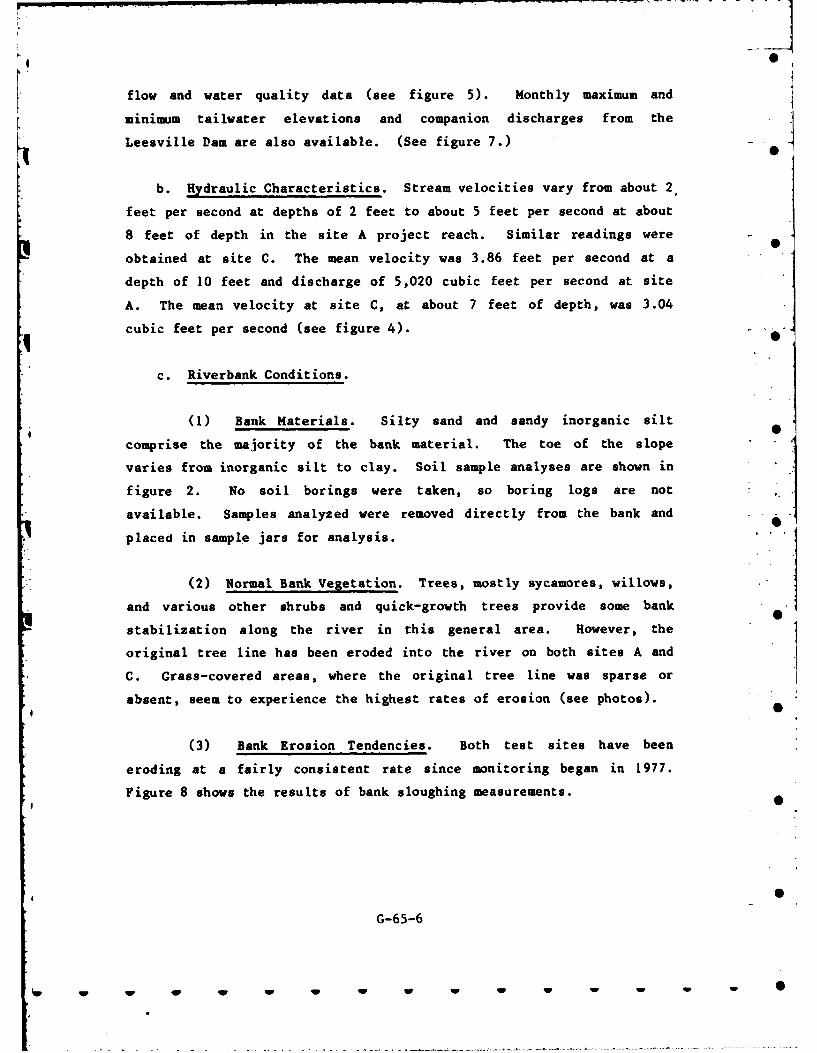
•0
flow and water quality data (see figure 5). Monthly maximum and
minimum tailwater elevations and companion discharges from the
Leesville Dam are also available. (See figure 7.)
b. Hydraulic Characteristics. Stream velocities vary from about 2,
feet per second at depths of 2 feet to about 5 feet per second at about
8 feet of depth in the site A project reach. Similar readings were
obtained at site C. The mean velocity was 3.86 feet per second at a
depth of 10 feet and discharge of 5,020 cubic feet per second at site
A. The mean velocity at site C, at about 7 feet of depth, was 3.04
cubic feet per second (see figure 4).
c. Riverbank Conditions.
(1) Bank Materials. Silty sand and sandy inorganic silt
comprise the majority of the bank material. The toe of the slope
varies from inorganic silt to clay. Soil sample analyses are shown in
figure 2. No soil borings were taken, so boring logs are not
available. Samples analyzed were removed directly from the bank and
placed in sample jars for analysis.
(2) Normal Bank Vegetation. Trees, mostly sycamores, willows,
and various other shrubs and quick-growth trees provide some bank
stabilization along the river in this general area. However, the
original tree line has been eroded into the river on both sites A and
C. Grass-covered areas, where the original tree line was sparse or
absent, seem to experience the highest rates of erosion (see photos).
(3) Bank Erosion Tendencies. Both test sites have been
eroding at a fairly consistent rate since monitoring began in 1977.
Figure 8 shows the results of bank sloughing measurements.
G-65-6
Iw~~ w ww
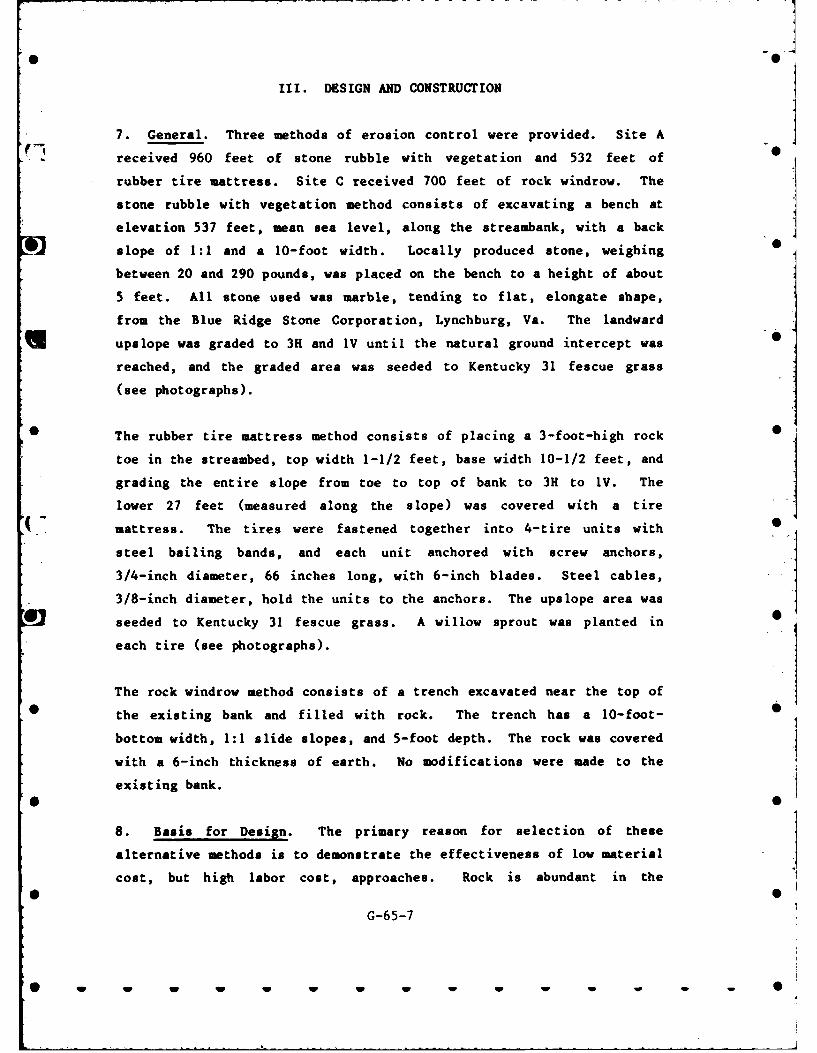
III. DESIGN AND CONSTRUCTION
7. General. Three methods of erosion control were provided. Site A
received 960 feet of stone rubble with vegetation and 532 feet of 0
rubber tire mattress. Site C received 700 feet of rock windrow. The
stone rubble with vegetation method consists of excavating a bench at
elevation 537 feet, mean sea level, along the streambank, with a back
slope of 1:1 and a 10-foot width. Locally produced stone, weighing 0
between 20 and 290 pounds, was placed on the bench to a height of about
5 feet. All stone used was marble, tending to flat, elongate shape,
from the Blue Ridge Stone Corporation, Lynchburg, Va. The landward
U upslope was graded to 3H and IV until the natural ground intercept was 0reached, and the graded area was seeded to Kentucky 31 fescue grass
(see photographs).
* The rubber tire mattress method consists of placing a 3-foot-high rock 0
toe in the streambed, top width 1-1/2 feet, base width 10-1/2 feet, and
grading the entire slope from toe to top of bank to 3H to IV. The
lower 27 feet (measured along the slope) was covered with a tire
( mattress. The tires were fastened together into 4-tire units with 0
steel bailing bands, and each unit anchored with screw anchors,
3/4-inch diameter, 66 inches long, with 6-inch blades. Steel cables,
3/8-inch diameter, hold the units to the anchors. The upslope area was
seeded to Kentucky 31 fescue grass. A willow sprout was planted in
each tire (see photographs).
The rock windrow method consists of a trench excavated near the top of
5 the existing bank and filled with rock. The trench has a 10-foot-
bottom width, 1:1 slide slopes, and 5-foot depth. The rock was covered
with a 6-inch thickness of earth. No modifications were made to the
existing bank.* 0
8. Basis for Design. The primary reason for selection of these
alternative methods is to demonstrate the effectiveness of low material
cost, but high labor cost, approaches. Rock is abundant in the
G-65-7
W W W 1 W w w
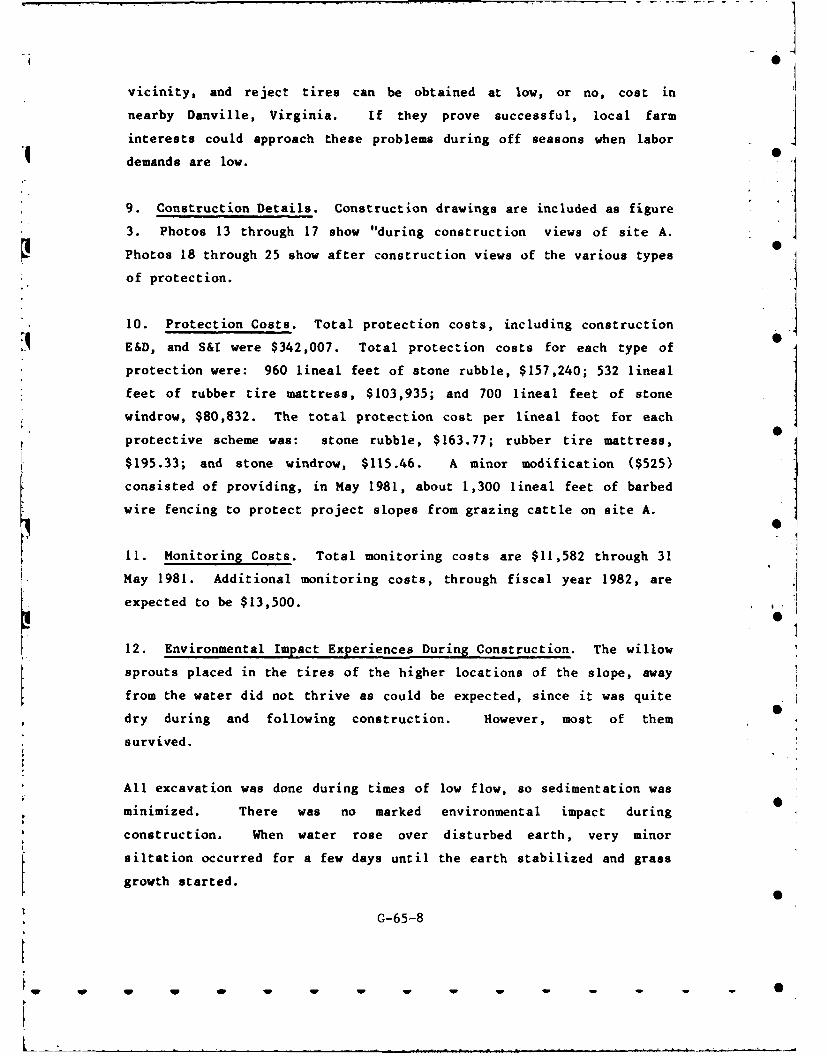
ISvicinity, and reject tires can be obtained at low, or no, cost in
nearby Danville, Virginia. If they prove successful, local farm
interests could approach these problems during off seasons when labor
demands are low.
9. Construction Details. Construction drawings are included as figure
3. Photos 13 through 17 show "during construction views of site A.
Photos 18 through 25 show after construction views of the various types
of protection.
10. Protection Costs. Total protection costs, including construction
E&D, and S&I were $342,007. Total protection costs for each type of
protection were: 960 lineal feet of stone rubble, $157,240; 532 lineal
feet of rubber tire mattress, $103,935; and 700 lineal feet of stone
windrow, $80,832. The total protection cost per lineal foot for each
protective scheme was: stone rubble, $163.77; rubber tire mattress,
$195.33; and stone windrow, $115.46. A minor modification ($525)
consisted of providing, in May 1981, about 1,300 lineal feet of barbed
wire fencing to protect project slopes from grazing cattle on site A.
11. Monitoring Costs. Total monitoring costs are $11,582 through 31
May 1981. Additional monitoring costs, through fiscal year 1982, are
expected to be $13,500.S
12. Environmental Impact Experiences During Construction. The willow
sprouts placed in the tires of the higher locations of the slope, away
from the water did not thrive as could be expected, since it was quite S
dry during and following construction. However, most of them
survived.
All excavation was done during times of low flow, so sedimentation was
minimized. There was no marked environmental impact during
construction. When water rose over disturbed earth, very minor
siltation occurred for a few days until the earth stabilized and grass
growth started.
G-65-8
IV. PERFORMANCE OF PROTECTION
13. Monitoring Program. Observations, started in 1977, include stage-
discharge data in tailwater of Leesville Dam, USGS stage-discharge data
at Alta Vista, baseline survey (1978), velocity distribution curves by
USGS (1978), visual inspections, periodic ground photography (every 3
months), and "sloughing" measurements from baseline points to top of
bank (every 3 months). Monitoring continued during and after the
construction period. Monitoring results are displayed in figures 7 and
8 and in photos I through 25. Monitoring is expected to continue
through fiscal year 1982.
14. Evaluation of Protection Performance. The daily wetting and
drying of bank material seems to be the primary cause of bank erosion,
rather than flood flows. Since the project construction was completed
in March 1981, only limited experience with the effectiveness of the
completed project is available at this time.
15. Rehabilitation. The judgment on the need for rehabilitation
cannot be made until 2 to 3 years following construction, or about
Spring 1984.
16. Conclusion. None possible at this time. Initial impressions,
based on experience over 3 months since construction was completed, are
that the project is functioning well and as designed.
4 0
G-65-9
w " - -I - 0
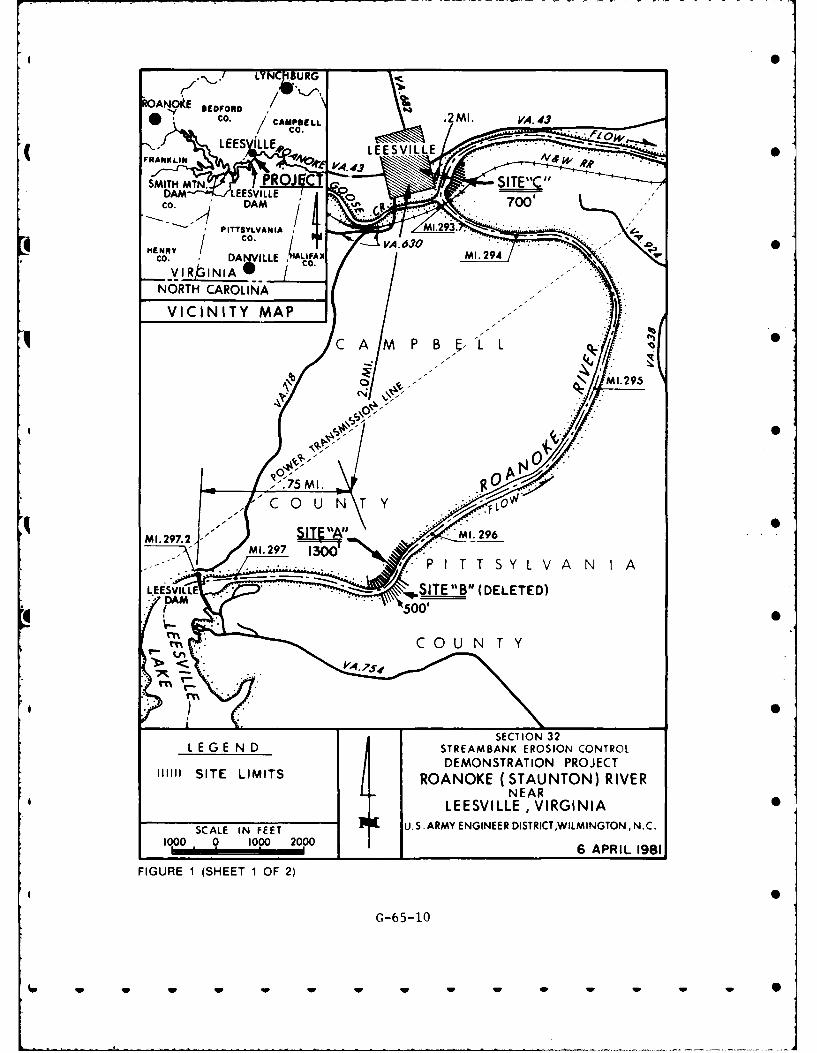
CO 0
v _- I0,1- - , . .
FRANKLECTIO 32S WA
SMITDEMONSTRATION PROJECT
LESVLL LVERVINIASCCo E INM 7ETUS0RM0NIER'ITITWMNTN C
PITTSYLVOO 6MPRL.28FIGUR 1 (SEET 1OF. 2
H IR0A 3Elk ALFAX MI'62,9O
Co DAVILLE -
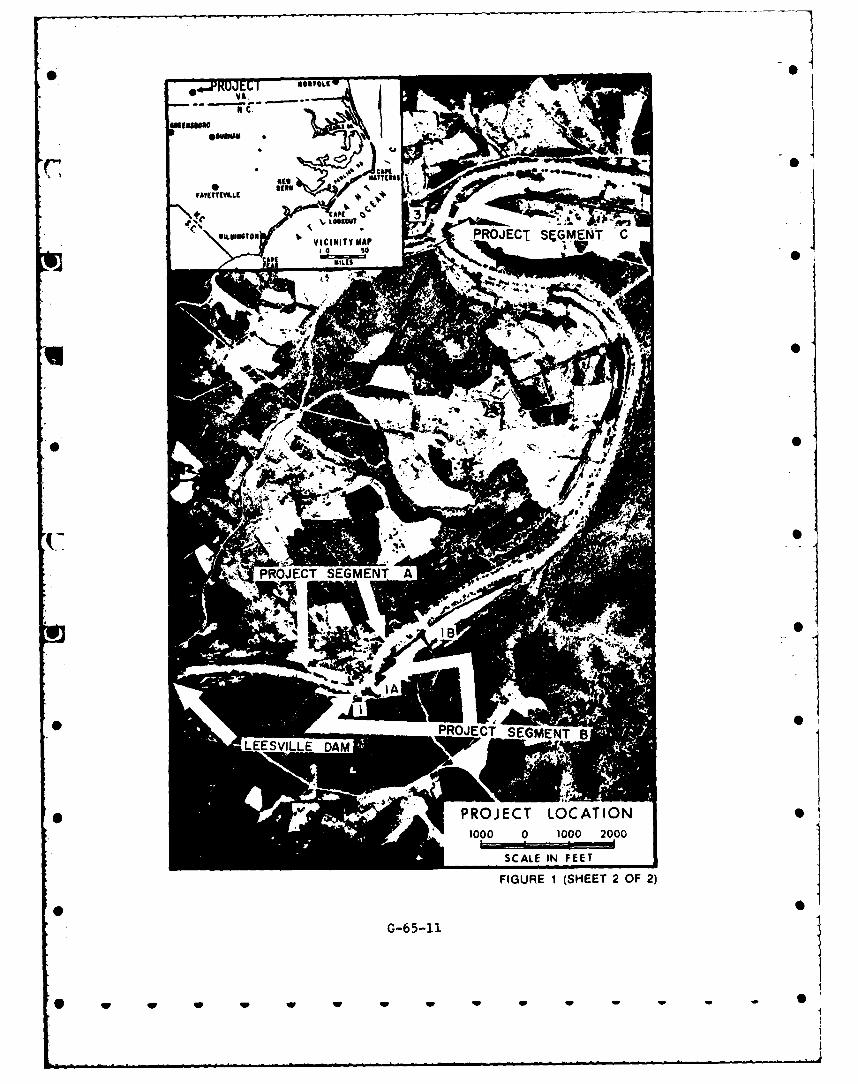
N c*$UNMA
APEC
TguS
1 0SIES5
PRJC PROJECT LOAIOA
SCALEVILLEE
FIGURE 1 (SHEET 2 OF 2)
G-65-11
w w w w w IM w - - - S
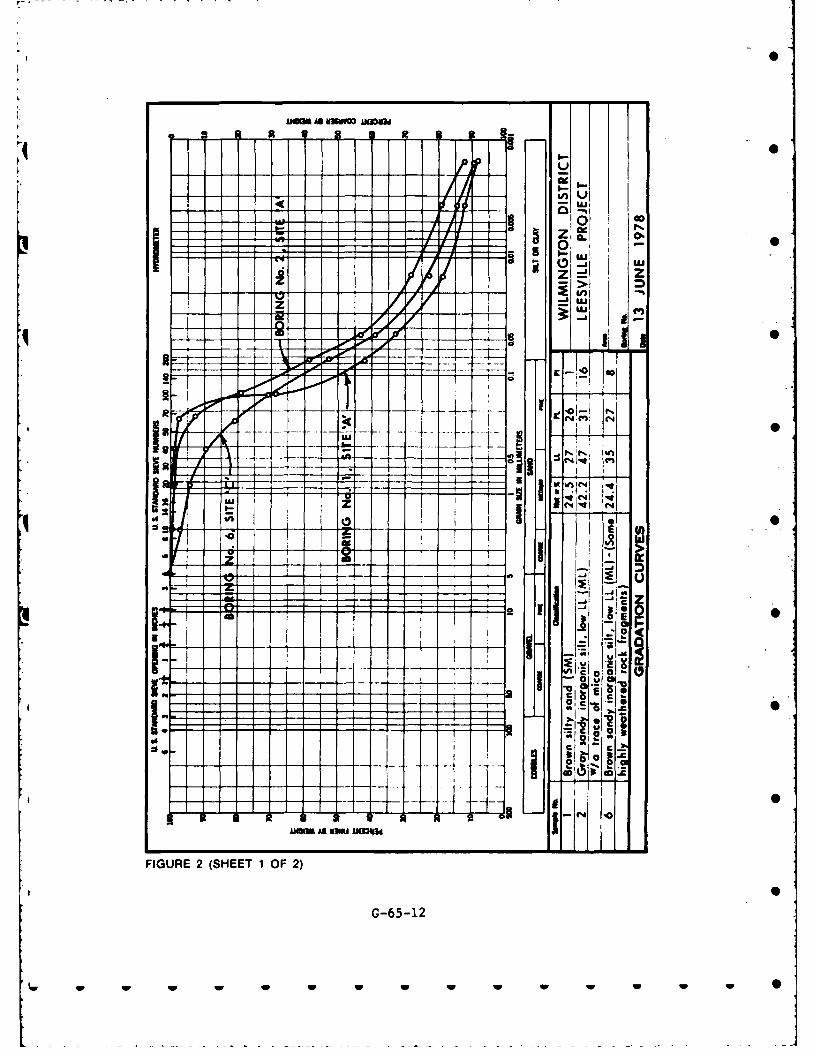
0 go
~qu.
00-0
LLi
Ii Nj 'T I -- -4 * - v iC -
I:EFIGUR 2 (SEE 1 OF2
00
G-65-12
w~~~~2 W WWW
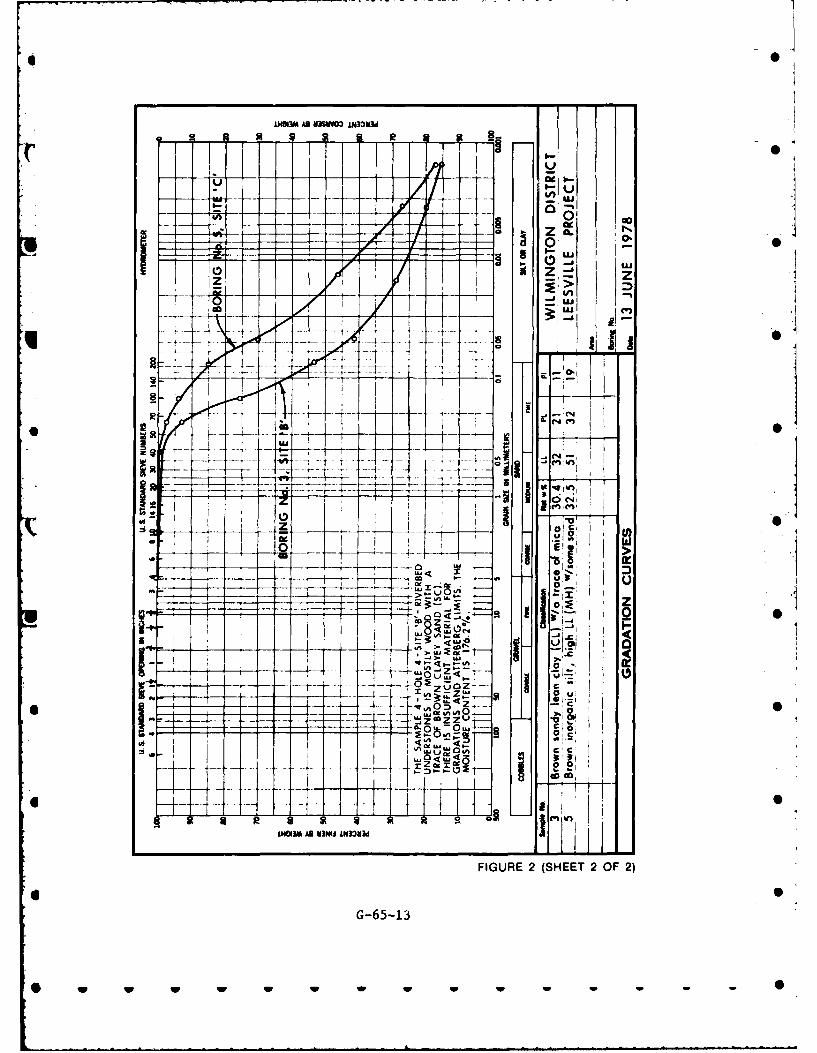
* 0
iiN0S31 AS U3SVV03 IN33M
00 ail
0 09
4 I A I I
A r T Jm
C,
* 00
G-65-1
* w w w w w -+
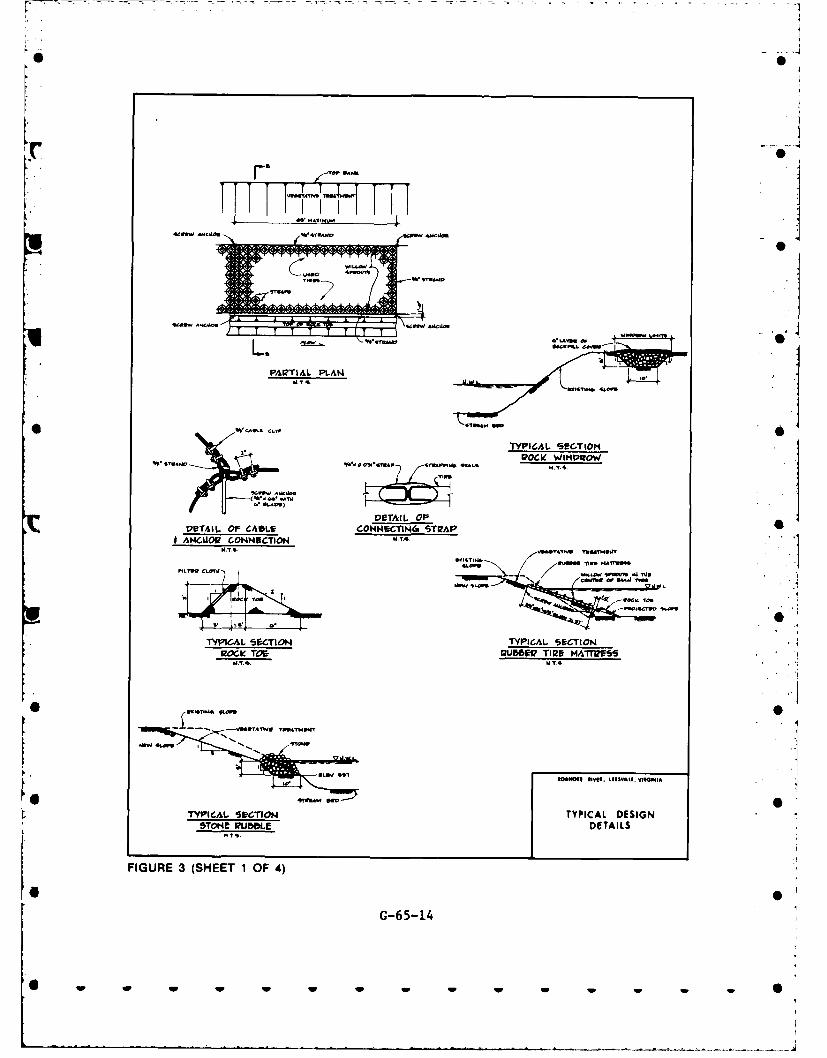
6M -lf
PAWTIAL PLAW
TYPICAL SECTIOMIoCle wiw4flow
VBTAIL. OF CADSI cmectAIL OTRA* ACQOQ CONNECTION U.vT4.
*.UOSI ywoq 111
"do"4 Tl- - Lo
TYPICAL SECTION TYPICAL S~ECTIONLIZ0CJC TOD AUBS9I2 TIRE M;0TRIES
20AN0S1 NIVESt. L11SIVIl. VIRGMIA
* ~4,.S.-SW TYPICAL SCTION TYPICAL DESIGN
5TOHE PUBLE DETAILS
FIGURE 3 (SHEET 1 OF 4)
G-65-14
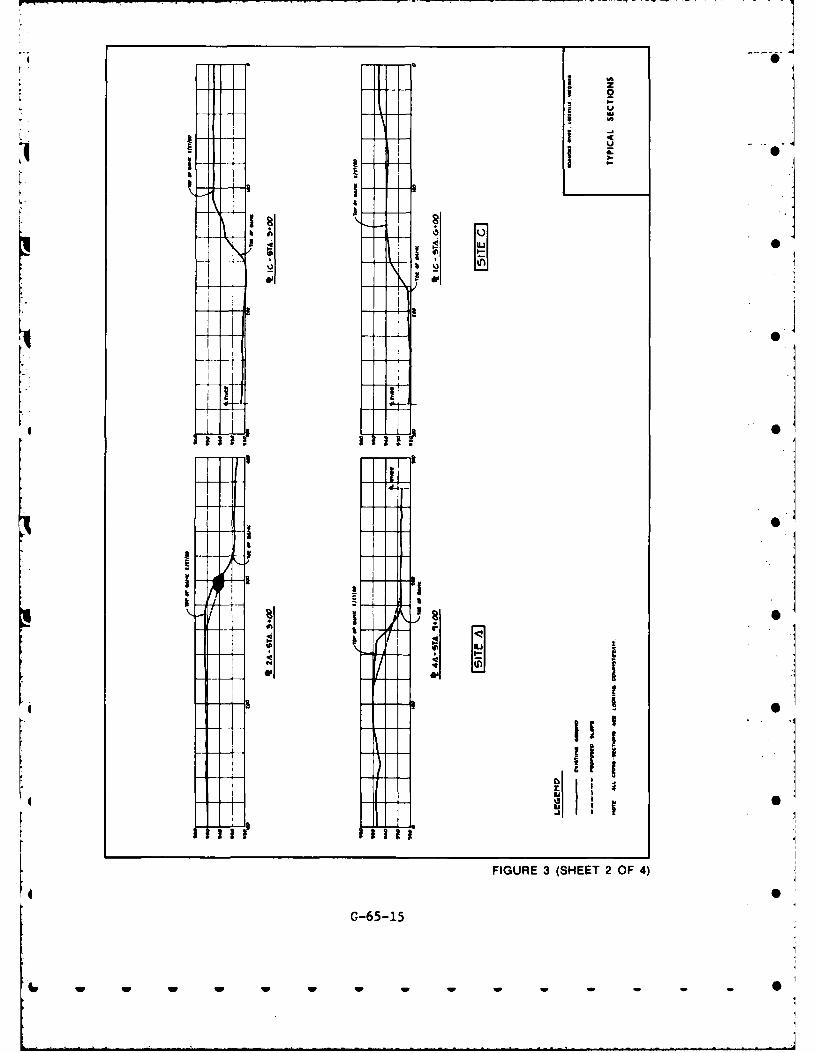
0
- VI
z2* I-
U- Md* VI
I SIb
3 3 III
A
I~I 031 I~I
U I~Jha
1 .1
I,
0133. 1
I I
3 0aI
I
I - I 9- I
A rI~I
I- I II* 0 IILII
i'i'a
4 1
~
iiiii ~
4 liii.. 0II II t
11I1~ 1131
FIGURE 3 (SHEET 2 OF 4)
0
G-65-15
- - - 0
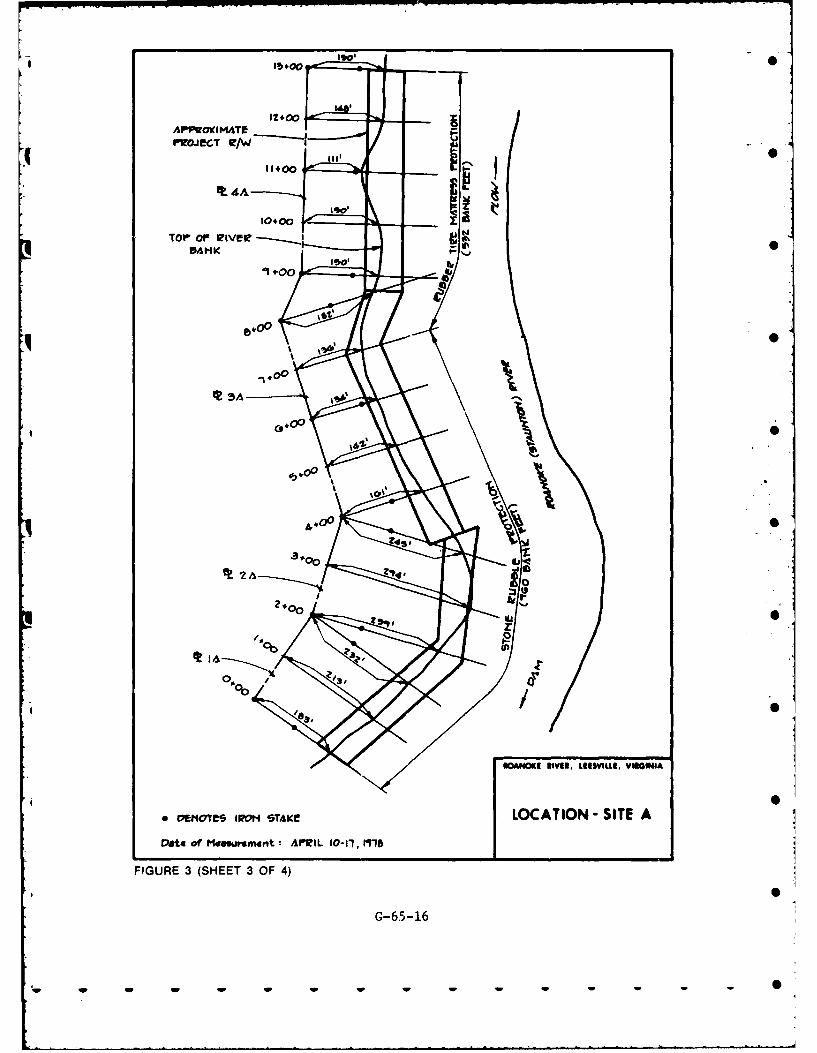
11+00APVWOIKIM4TE
ISO
TOP OF WIV~e -VAHK
1100
'415
C0400
oao)4WI. ISVUE 0~I
&,ATONooE
f~~~~et4~ ~~ % 0fMaumnt P1I 0-,m
FIGUR 2A (SEE 3F40S
0-6-1
- - - - - - -
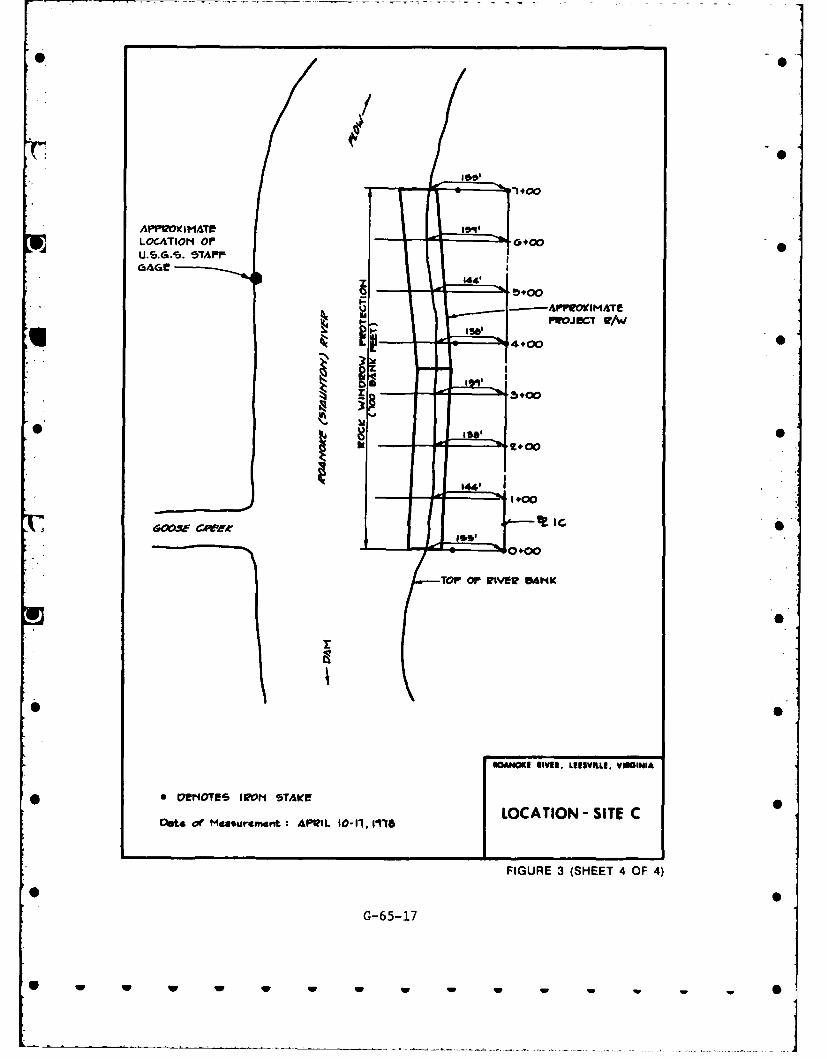
4100
A XOIMATE ~AlLOCATION OF 0+00
U.S.GAS. S7A I.GAGE!
144' 50
#'4 ) 4+00 0
1 ,O TIO Or" I too
000
TOP Or .. V . D4NK
* "
ROANOKE ROVER. LEESVILLE.* VIGIIA
* * CPrViOTES IWON STAKE
Oats of Mossourcant: AWI L 10-11, 191 LOCATION - SITE C
FIGURE 3 (SHEET 4 OF 4)
G 5G-65-17
0 w w -w - - - ,- S
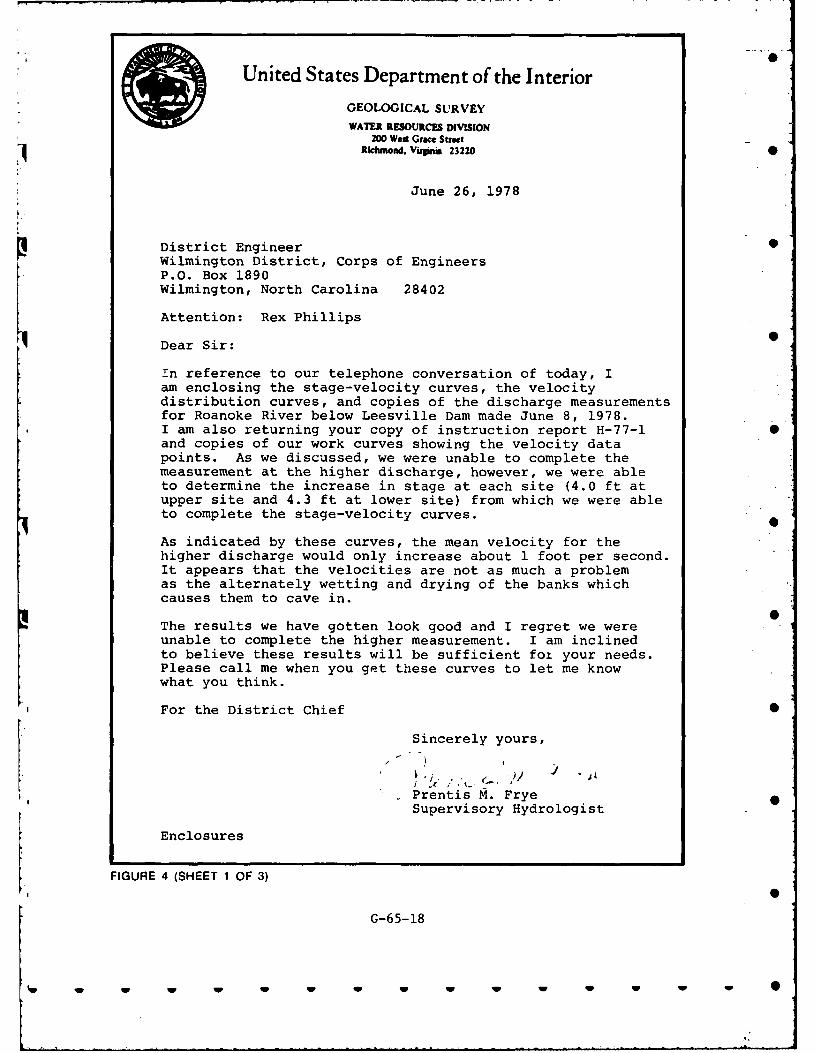
United States Department of the InteriorGEOLOGICAL SURVEYWATER RESOURCES DIVISION200 Wed Grace Street
li RIchmond. Vuipna 23220
June 26, 1978
District EngineerWilmington District, Corps of EngineersP.O. Box 1890Wilmington, North Carolina 28402
Attention: Rex Phillips
Dear Sir:
in reference to our telephone conversation of today, Iam enclosing the stage-velocity curves, the velocitydistribution curves, and copies of the discharge measurementsfor Roanoke River below Leesville Dam made June 8, 1978.I am also returning your copy of instruction report H-77-1 Sand copies of our work curves showing the velocity datapoints. As we discussed, we were unable to complete themeasurement at the higher discharge, however, we were ableto determine the increase in stage at each site (4.0 ft atupper site and 4.3 ft at lower site) from which we were ableto complete the stage-velocity curves.
As indicated by these curves, the mean velocity for thehigher discharge would only increase about 1 foot per second.It appears that the velocities are not as much a problemas the alternately wetting and drying of the banks whichcauses them to cave in.
The results we have gotten look good and I regret we wereunable to complete the higher measurement. I am inclinedto believe these results will be sufficient for your needs.Please call me when you get these curves to let me knowwhat you think.
For the District Chief 0
Sincerely yours,
Prentis M. FryeSupervisory Hydrologist
Enclosures
FIGURE 4 (SHEET 1 OF 3)
G-65-18
1 w~ ~~ w ww w W S
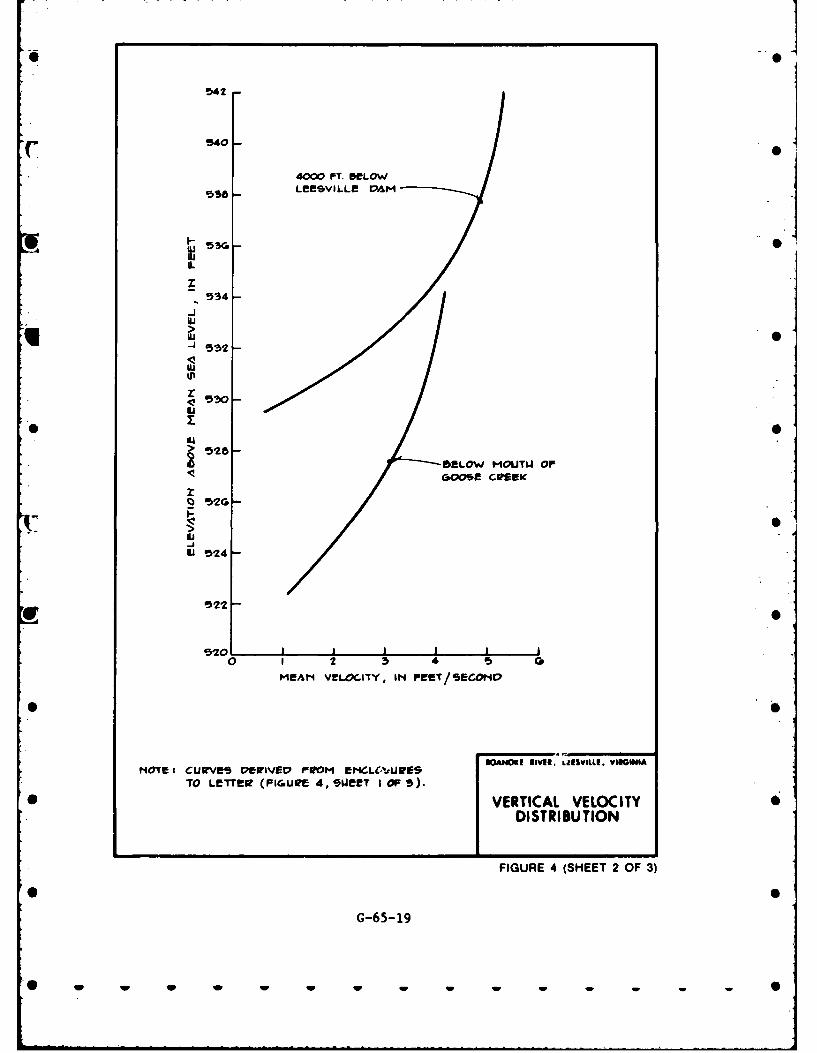
*J542u
540-
4000 FT. CLOW
538 LLEESVILLE IAM
F-
L
-J
I
>
kuS530-NJ
BELOW MOUTWl OPGOOse Cr2EIc
IQi 95- - -
_J
IU 524-
522
520I I i I I0 I 2 3 4 05
MEAN VELOCITY, IN EET/SECONDt
* S
ROANOKI RIVER. L4ISVLLI, VISGINIAMOTEs cUirVBe vEWIVWe 11'om E"4CLQlUPE5
TO LETTEw (FIGUIe 4, swEET I OF 5).
* VERTICAL VELOCITYDISTRIBUTION
FIGURE 4 (SHEET 2 OF 3)
G 5G-65-19
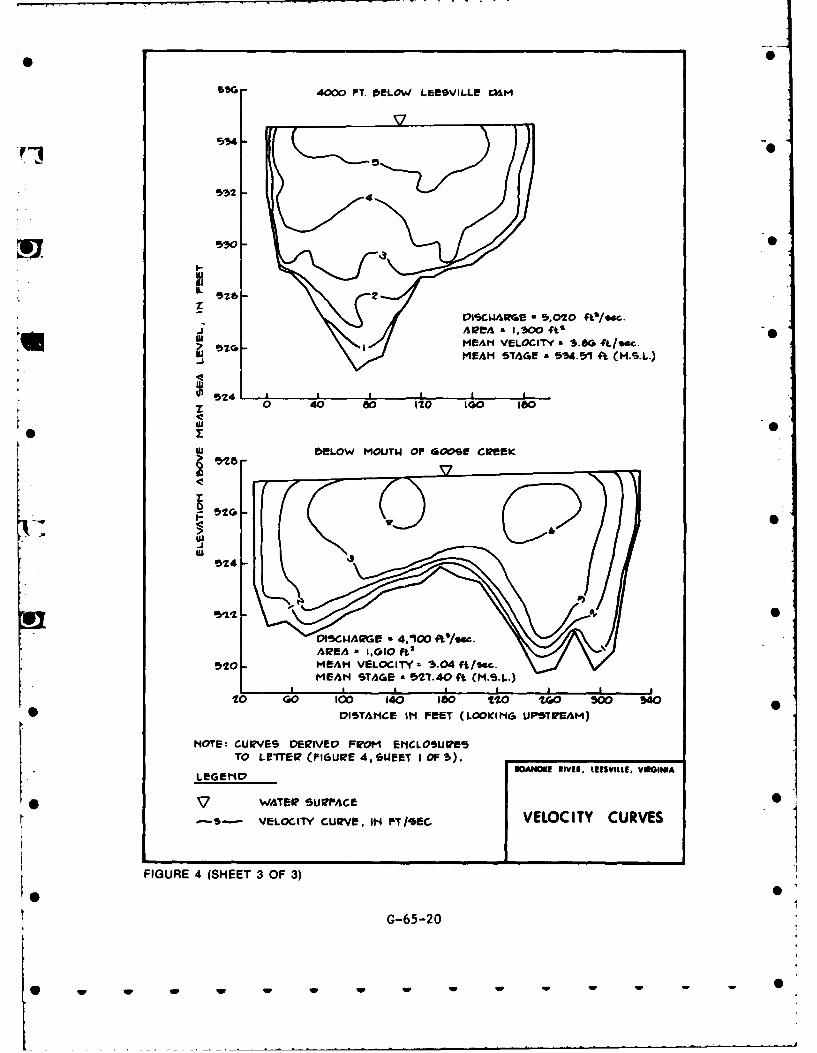
SSG -4000 FT. DELOW. LEESVILLE DIM
05900
z171SCWARGE * 5,020 fk'/6..
meAN VELOCITY -3-61 -ft(..c.
MEAN STAGE SS54.91 ft (M.S.L.)
z0 40 0 120 1 co 10
DeLOW MOUTh OF GOOSE! CREE K
632 -
1320- MEAN VELOCITY a .04 ft/sc.MEAN STAGE a 521.40 ft (M.S.L.)
.20 too 140 100 tO 1w0 3w0 40* DISTANCE IN FEET (LOOKCING UPSTIFEAM)
NOTE: CUeVES VEIZIVEP FIFOM Et1CLOSUPESTo Lvrrew (FIGUZE 4, SWEET lOF 3).
O0ANOKE NIVER. LEESILLE. VIRGINALEGEND
* VWATERI SURACE-lb-- VELOCITY CUIZVE, IN I'r/vseC VELOCITY CURVES
FIGURE 4 (SHEET 3 OF 3)
G-65-20
w w w ww w w
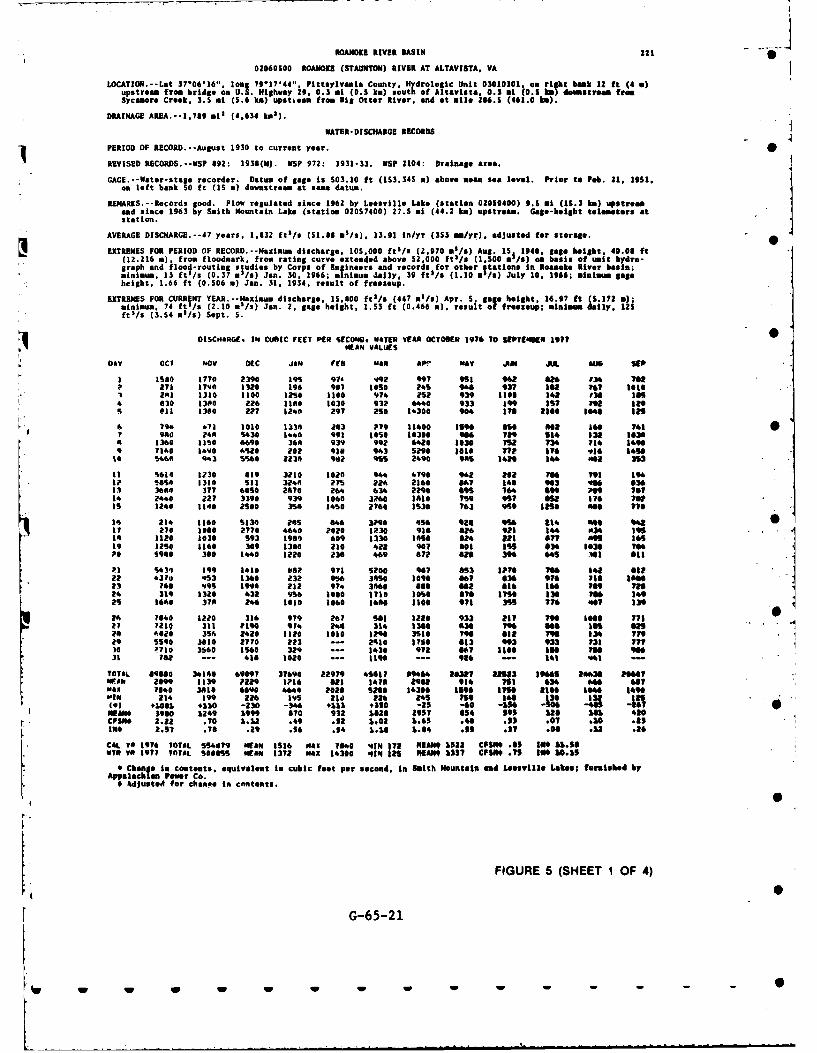
ROANOKE RIVER BASIN 221
02060500 ROANOKI (STAUNTON) RIVER AT ALTAVISTA. VA
LOCATION.--Lat 37106'16". long 79*17'44", Pittaylvania County. Hydrologic Unit 03010101, a. right bank 12 ft (4 6)upstream from bridge on US. Highway 29, 0.3 n1 (0.S ki) south of Altavista. 0.3 mi (0.S ka) dowetream fremSycamore Creek. 3.5 ml (S.6 kn) upstieam from Big Otter River. end at mile 210.S (401.0 ha).
DRAINAGE AREA.--1,789 ai3 (4.634 Wa2).
WATER-DISCHARGE RECORDS
PERIOD OF RECORD.--August 1930 to current year. 0REVISED RECORDS.--WSP £92: 1938(N). WSP 972: 1931-33. NSP 2104: Drainage area.
GAGE.-Water-stage recorder. Datum of gage is 303.10 ft (153,345 n) above mean sea level. Prior to Pob. 21. 19S1.on left bank SO ft (15 a) downstream at same datum.
RE4ARKS.--Records good. Flow regulated since 1962 by Leesville Lake (station 02059400) 9. mi (1S.3 ka) upstreamand since 1963 by Smith Mountain Lake (station 02057400) 27.5 ai (44.2 k) upstream. Gage-height telmters atstation.
AVERAGE DISCHARGE.--47 years, 1,832 ftl/s (51.88 mn/s). 13.91 in/yr (353 mm/yr). adjusted for storage.
EXTREMES FOR PERIOD OF RECORD.--Maximum discharge, 105,000 ft5/s (2.970 ml/s) Aug. 15 1940, gage height. 40.08 ft
(12.216 a). from floodmark from rating curve extended above 52,000 ft3/s (1.500 a*/s) on bais of unit hydro-graph and flood-routing studies by Corps of Engineers and records for other Itations in Roanoke River basin;ininum. 13 ft3/s (0.37 os/s) Jan. 30. 196; minimum Jatly. 39 ft /A (1.10 MIs) July 10. 1966; minimum 8ae
height, 1.66 ft (0.506 a) Jan. 31, 1934. result of frnaseup.
EXTREMES FOR CURRENT YEAR.--Maximum discharge. 15.800 fts/s (447 al/s) Apr. S, Sage height, 16.97 ft (S.172 a);minimum. 74 ftl/s (2.10 m
2/s) Jan. 2, Sage height, 1.53 ft (0.466 a), result of freesoup; minimm daily. 120
ft /s (3.54 m5/S) Sept. 5.
DISCH4ARGE. Id CUBIC FEET PER SECOND, WaTER YEAR OCTOoER 1976 TO SEPTINKS 1977 •MEAN VALUES
OAT OCT NOv DEC JAN Fes MAR *p. may JM JUL aUG SEP
1 11580 1770 230 19" 976 412 997 "1 "12 826 136 708P 2? I 196 31320 196 981 l050 4S 98 93? 1" 767 l0e01 2"1 1310 1100 12S0 1100 976 252 9"3 110i 14 13£ 1054 £30 13:0 2Z6 1180 1030 93? 6440 033 1" IS? 112 In% l £1 1380 2?? 1240 297 PS0 14300 904 In ti00 3048 Its
. 79& 671 1a10 1330 863 P79 11600 IS9 as0 * 10 16£ " 71r 910 ?4m 5430 1*4 991 lose 10300 906 7T" s14 132 1138A 1360 Is*0 £690 364 939 992 6420 1630 712 74 714 34909 7*60 6VO 06%2£ 202 91£ 943 S290 I018 772 370 via los10 S460 943 S56 2230 982 9s5 2698 gas 1428 144 "0a 313
is S610 130 £19 32i0 *020 944 4790 942 Rot 786 71 3961? S85o 1310 SI 3240 27S 281 2160 OA7 34 943 986 83613 31*0 377 605 2*?10 24 634 2290 891 t64 a99 P99 ?Ii4 2440 227 3390 939 1060 3?60 *sl0 759 917 92 176 ?a8i5 1*84 1140 2S0 3S1 1460 2760 130 ?63 969 IM1£ *14 770
I4 21* 1160 130 2R5 946 3290 81S6 l2 444 at# Res 142IT 270 180 2770 4640 7020 1230 916 826 98* 144 034 1"1: l10 1030 s93 3900 609 1330 610 024 al* l 77 9 1639 *250 1*60 309 I3£ a*0 422 907 G01 1S1 634 1030 70£?1 890 380 *440 * 1 2 136 469 872 828 396 44S "I 0l
P* S63I 199 3410 be6 97 So0 987 8153 Irv* 70£ I4 all2 437u qS3 1360 232 9S6 34SO l00 "17 836 976 via low23 76£ 995 *9v 9 212 974 3460 8o 042 £16 *66 709 ts24 319 1320 432 956 1088 171i lobe 071 IT0 130 70£ 34925 361. 376 246 l08 1066 1610 tie0 97 35S 776 of? I3"
21. 7840 1220 316 979 261 1 l22 933 237 7 104000 M7*2? 7819 311 ?19 91£ 146 314 1380 638 7 00 11 126 6020 3S6 2420 1120 *0le *206 3530 794 IR T9 134 ?7729 S190 38t0 2770 23 --- 2130 IS0 8*3 93 933 131 11110 R710 3s0 3560 329 --- 1*30 972 967 ties Is* 7i0 99931 17 -- 41£ 1020 -- 3398 --- 926 - 141 -4 -
TOTAL £980 34148 69097 37690 22979 4561 19464 8327 283 19661 24639 201441EAk 2898 1139 P229 116 £23 376 8962 914 "1 634 666 68I
max 7040 36*0 6690 £640 2020 SO0 14300 *10a 115 0 300 3041 349801 2*i 199 226 39S 2*d 2.26 ,4s 7s * . .. 0 . ,
d6) *1001 110 -230 -346 Zs11 +3S0 -2S -60 -S1 -40 -6i 1NMIAN 3980 1249 1999 £?0 932 sal6 2957 05' 595 328 i1 420CFSM# 2.22 .70 1.12 .49 .52 1,02 1.65 .48 .1 .0 .10 .25IN$ 2.57 .78 .29 .56 .54 1.1£ S.04 .S .57 .08 .12 .26
CAL V 197 TOTAL S56879 MEAN IS16 "AN ?4 'it *7 I 1N9 1522 CFSI" .I5 I30 11.56WIN T *1977 TOTAL S0005 MEAN 3372 MX 1*300 "11431 ts *EAN 139t CFS0 .?S IM 10.15
Aphsala lfn ontents, equivalent in cubic ftet per second, in Smith Mountain and Leesville Lakess fur ished by
* 4djusted for cheame in contents.
FIGURE 5 (SHEET I OF 4)
G-65-21
IM W 1 W -
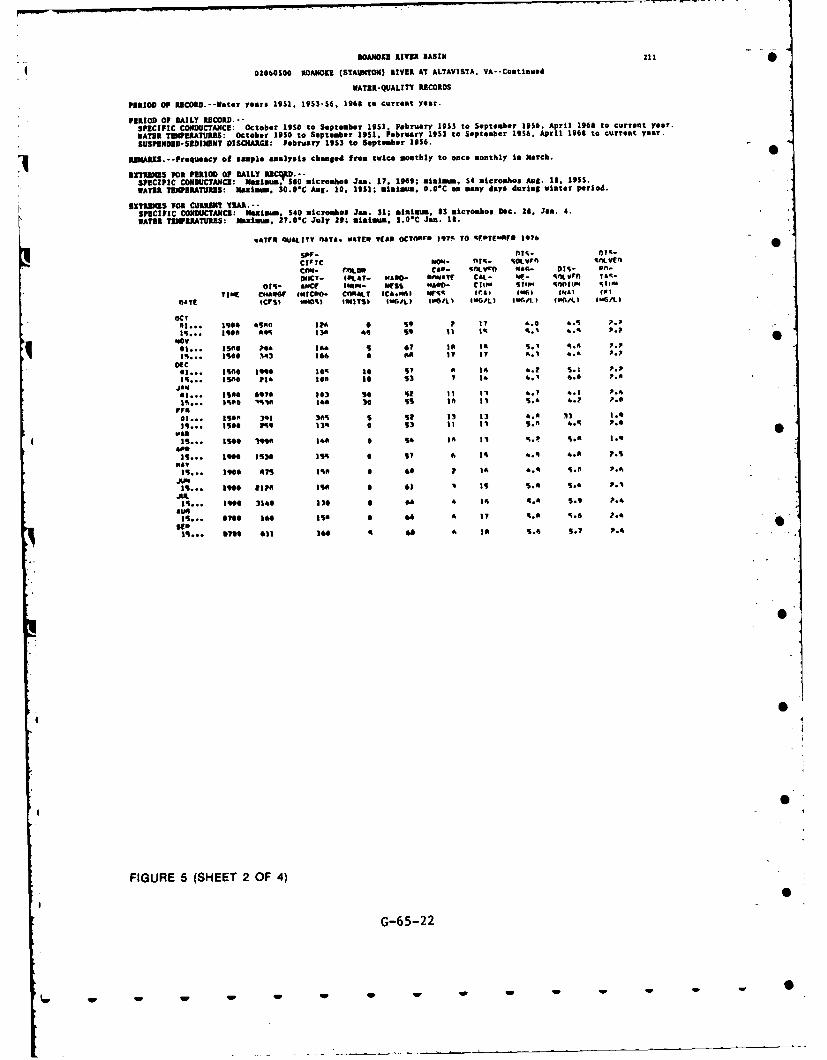
ROANOKE RIVER BASIN I-I
02060100 ROANOKIE (STAUNTON) RIVER AT ALTAVISTA, VA--Conttnuod
ATER-QUALITY RECORDS
PERIOD OF UCOlD.--Wter yers 1951. 1953-SO. 196 to current year.
PERIOD Of DAILY RCORD.--SPECIFIC CONDUCTANCE: October 19S0 to September 1951. February 19S3 to September 1956. April 1960 to current yeer.
WATER TEMPERATURES: October 1950 to September 191. February 1953 to September 1256, April 1965 to current year.
SUSPENDED-SOIMINT DISCHARGE: February 19S3 to September 1916.
RIAZS. -Proquonacy of smiple anlysis changed from twice monthly to once monthly In March.
EXREMESS FOR PERIOD OF DAILY RECEtD.--SPECIFIC CONDUCTANCE: Maximum, 580 micromos Ja. 17. 199; minimm, It micro.,os Aug. 1,. 1955.WATER TEUPERATURES: Maxim.us0 30.00C Aug. 10, 195i; minimm. 0.01C on many days during winter period.
EZYRMIS FOR CURRENT YEA.-SPECIFIC CONDUCTANE: Maximum. S40 micrombos Jan. 31. minimum. 1S micromboos Dec. 29, Jan. 4.WATER TEIERATURES: Maximum. 27.0*C July 19; minimum. S.C Jan. It.
OaTFS IUALITY OAA. WATER YEAR OCT11nre I9T" TO O YTroff rle I16
spar. nl- Of€-t
cIvIC NoN- f1lo- %OLvrn "ILVE111CO- COLOR CP- !I'ILwVI' 1116 01%- On"-OCT- I4tLAT- "*ll . ans1001r CAL- ME- vo VrD TAO;-
011- alCf IMlUMi. NSs "Awn- Citf" stfleP. -OtnIU" %lowTImE CHARE
r MwICRO- CemISLT fCA.N1 Nr0 fr.&) (IlN tIal 1011
eT (C1| %I.OO % 155$ IWo/L) IPA) I 10'LI 1106/.) I 1i/1L I lIMG/LI
OCTIt... 1900 40 IA 0 S ? I? 6.0 6.1 ?.P
3*... IS0 A"n 130 4s SO It 1 .. '; 4.1 P.?
NOYei... I'n "e0 1 07 I is 0.' 0.0 ;71,... 1500 303 366 • 0n I? 3? A.1 a.' a.?
DEC5 ... Igo 9110 1o% is 5 a I 6.? S.1 I.,
3e... IS00 213 t0o is 93 1 14 4.1 6..1 P.m
h... Iso e,7n 103 so 02 II 11 46.? 4.1 P.6
1s... 10,9 "je, 14 0 30 S0 i0 11 S.' A.? 1.0r.n
03... IBA% 3I 30 $ 52 13 13 6.5A 31 1.0
. ... Isoe PSO 13 e 53 3I I3 S.11 4.. P."
vai ... ISO 19141 140. O S4 In 11 %.7 %.A 1.n
A".is... 304 130 3S 0? A i A.4 4.A P.S
WAYIf... 39910 470 is" 60 P IA 6.4 %.a1 P.4
JuL
I;... ee 1h4 e140 13 0 A& i 0.e S.9 P."Uq
Is... 070 a e 3 0 A ? o. A %.6 ?.A
iSo... eille 611 160 0 41 A IN5 S.4 S.? P.n
.0
FIGURE 5 (SHEET 2 OF 4)
G-65-22
4111" m or . . . .-
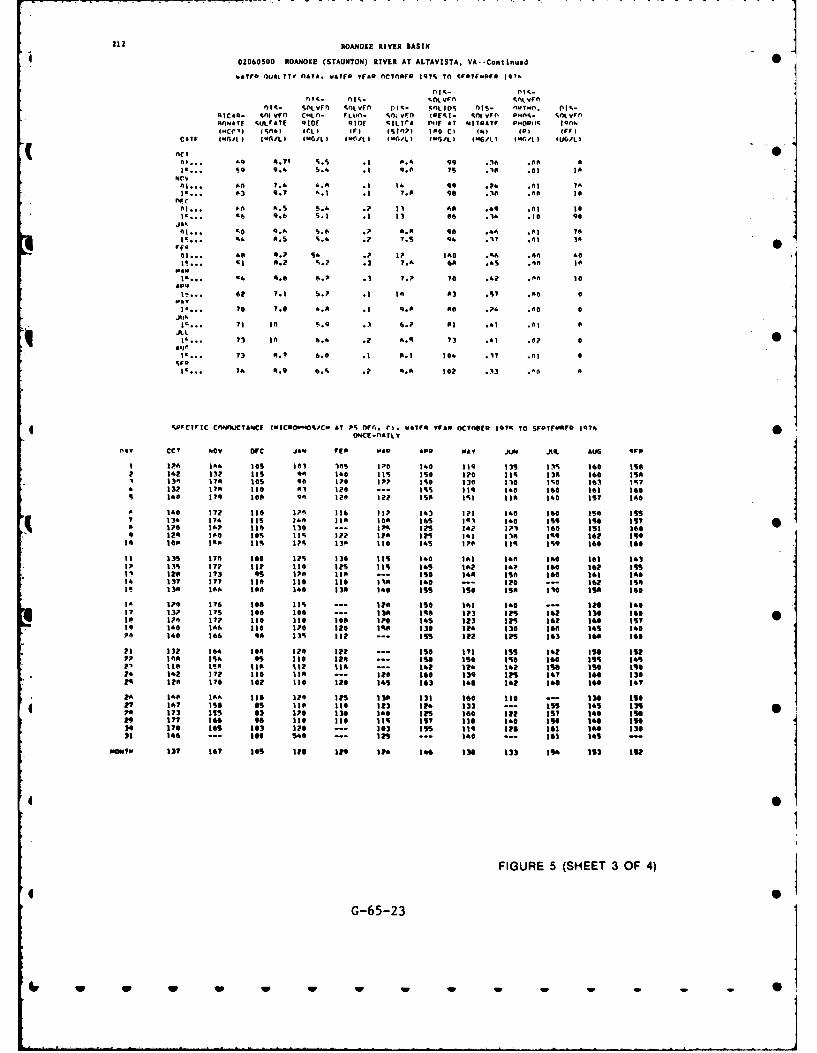
212 ROANOKE RIVER BASIN
02060500 ROANdOKE (STAUNTON) RIVER AT ALTAVISTA, VA- Continued
*a170 01101 110 0*10. wAvfO 0040 ncinpro to?%, To %ray10670 39'
035.- n144;"
ni5- nt' s-f m00( CVV5 00130 v3. W.7 1PICO. yq00 coiVn qLyII. 1~t
0 IMLSI- D0100 n.00,. %'vl
nk&TYF S;IJLrA7 QIOF 9300 %31 3C4 Mir1 AT WIIDATO 0009115% lankII4CCI 10%A6) ICL) if) ISM?)7 ]No C) (4) IV) 1,01
COWF (WOrl I MILI I-G/L) f-C-4 I C-I6fLj ('I IWO/1i"111l IW, /ft IJO/L)
" ... 'q 4*70 5.5 .1 N.A. 99 .1A .on14 . 9 9.6 5.4 .3 9.0 75 .1 .01 in
41 ... An ?.6 4.0 .1 Id. 99 P4' .01 101.... 63 9.7 ^.1 .1 1.61 90 .10 .no 10
JO..
Sd4 6 6.11- 0 7.5' ?a .42 onl 10
AOL
I.. 62 7.3 S.? .1 to 613 S57 .00 a
1.. 70 7.0 &.A6 .1 9.0 60 .;-4 .00 0
1.... 71 to !..Q .1 6.P 63 .4I .01t 0q JLI3'. 3 t0 6.d. .? A.% 73 .41 .0? 0
?'. 3 4.7 6.0 .1 P.1 106. T? .01 0
3~ 70 61.9 6. .2 .0 102 .33 A'l
4 PFCIVIC CVIOKTOICf I"IC*Ov405/Cw AT P% 070. CI. W6709 Y0*6 OCTIOER17 10?4 TO 660 3F~wf 070 %ONCE-11AILY
1160 CCI hOV OFC JAN 0(6 40 ape "AV JUNd .116. AUG -C06
I A'* 306 I0 101 10 1170 16,0 119 111 131 160 11182 162 13? I1S 1 10 111 1 S 10 154 1 3 10 Go 56.11 30 176 los g0 320 IP? ISO 130 130 M5 163 35.7
o 1321 176 110 17 10 - I1%S 119 16 160 161 16
6 160 372 I10 17n 116 It? 143 121 160 160 )so 1557 13 17 1 36 106 165 30 60 39 IS
6 12 16?41 16S 1306 !-A- 3 P5 125 1:? 324,1 160 1510 IS,1 26 lAfO 105 1% 12? IPA 12: 161 136 %59 162 3S:
In Iop Ina 115 1?% 13 tic 165 1 P Il 1 -% 39 160 360
11 135 1 370 0 263 1 101 36 fl 10 300 161 13137 115 N7 ? 11 0 I 2T 115 IS 165 0 1., 360 6li 126, 1 73 OS 320 1.- --- 3s0 366 3SO M6 36:1 300O16 33 37l 7 336 Ili 130 30 Ilia 360 --- I20 --- 362 Is"I1 136 106 30 0 1 It 136 360 355 ]so 356 130 ISO 360
3' I3P 376 S 1 - 2 5 M0 360 --- 3261I 320 11 2 11 330 It 0lo 1 P0 14'5 3 23 32S 362 360 157
19 of0 30 : 330 12 120 356 330 326 130 360 365 360PO 360 3 66 96 33 14 ip --- 355 it2 125 363 166 360
13 332 3 66 106 12 322 I5 PI" 171 355 I62 I5 352 sPP 3"A 350 95 33 32 I IS. 3I0 1 5. 10 355% 365P2 ti' 136 356 336 -I2 33 -- 32 i26 162 Is* ISO ISO26 36 7 3 3 - 20 360 139 32 36 17 360 130
29 20 370 302 33 320 1663 360 362 36 30 37
*26 100 300 330 320 325 13 133 360 310 ... 330 3501 7 37 1so 05 316 330 323 IPA, 33 --- 355 365 13P, 1 373 3I5 0 320 330 360 3ts 360 322 357 160 Is@
36 37 35 03 32 - 03 3i5 3312 63 300 13
1-00011 137 37 305 320 329 326 166 30 333 356 353 ISE
FIGURE 5 (SHEET 3 OF 4)
G-65-23
40 w w w w -IM TIP
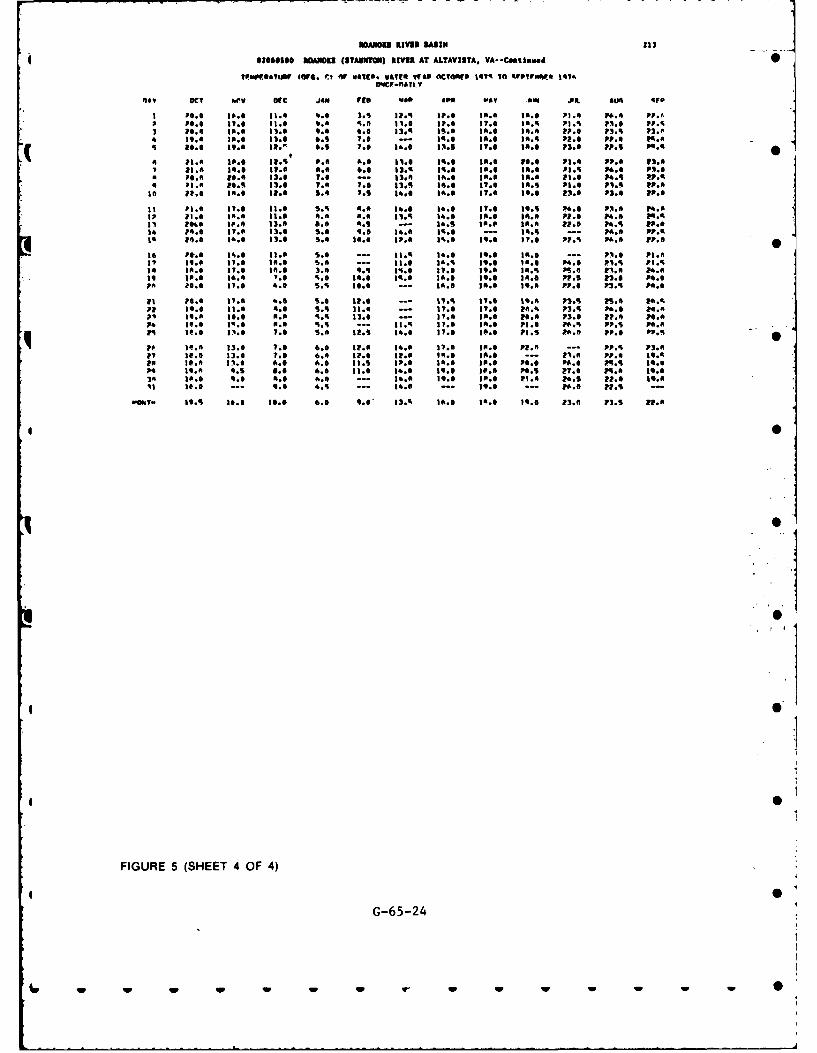
muAO Rival BAIN 13
4 02000100OANOU1 (STAIIITON) RIVIR AT ALTAVISTA. VA- Contlamed -I-
1P!"MMte MSo. r.1 'V 11411. MATO Twas Actn1040 I3616 Tel 60110u606 197
9301 OCT hev SOC jam o5 use AP0 WAY and .1. Aug CoP
I V0.0 I#..0 33.6 V.* U.s 32 1.6 3?. 3.0 10.0 P3.6 1 4.4 IPSP Pa.* 1.0 23.0 0. 6 117.0 3?.4 17.0 Ia.% 2.6I Me* PP.,.
112.0 3.. 33.0 1.9 .0 36 0.0 36.4 M P3.6 PP. .0
0.1 .0 11.0 Me. IA.* Pa.$ 001.4 PP.0 103.4
A 6.4 2.06 21 P. . 3:. 1.0 1,:.: 14.0 P36 P. 3 .
it 33. .0 31.9 0 0.0 S.% 33.0 10.0 36.8 P3.6 P9.& 6 P1.6
16 P0.8 14.4 33.0 7.0 -- .6I1I.. 10.0 20.0 3.. I.0 P9.6 63.
* '::e 30.6 I30 76 10 3. 90 1. 06 P. P1.0 P.
II ~ ~ 1 33.6 31. 31.%0 1. 6.Pa.3. 70 05 2. 70 3.*
1 10.0 3t6 M30 50 6* 91 3. 30.6 23. .0 P 4.0E29:, 166 3.030 . . 90 6.0 Im 361.6 p P3.41 PP.*
31 39.6 16.0 10.0 13.0 ---0 19.6 3.0 Pa.* P . 0 7.6 P.Pa *.0 37. --.0 I. W.t3. 17.0 39.. 10.. p53.6 310, 20I's 1'. 0.6 '.0: ".3.0 3... 379 3a* PS0.0 60PPs3.0 pp...0Pf 10.0 13.0 7.0 16 3.0 39.0 30. I .0 pp. 0 PP.0 -- P3. P3.4
31 0.6 31. 9. 1. . 0 17.0 141.0 39.6 16 360 3p. 1908 %0.0 . 6.6 37.0 1.. 310 3. 06 P.0 4:6 0.34 36.0 160 00 6. 963.0 16.0 P1.4 70. PP. pp 3is 460 3. . .% 3-.1 39.0 37.0 396 P--- P0.0 I'M .
pptT IV..6 330.0 e6.0 3.0 9.6 0 37. 0 36.0 P3.6 e 3. 10P.6 P3.
FI 1R 35 . 13.0E 4 .O.6 4)0 3. 60 3. -- 3. P6 3
30 1. 3.0 0. 90 3.1 130 0~ 2.0G-.65.0-24 9.
Pt~ ~~~~~ ~~~ VI.P 6.w. . 20 3. 0 3. 05 3. 60 3.
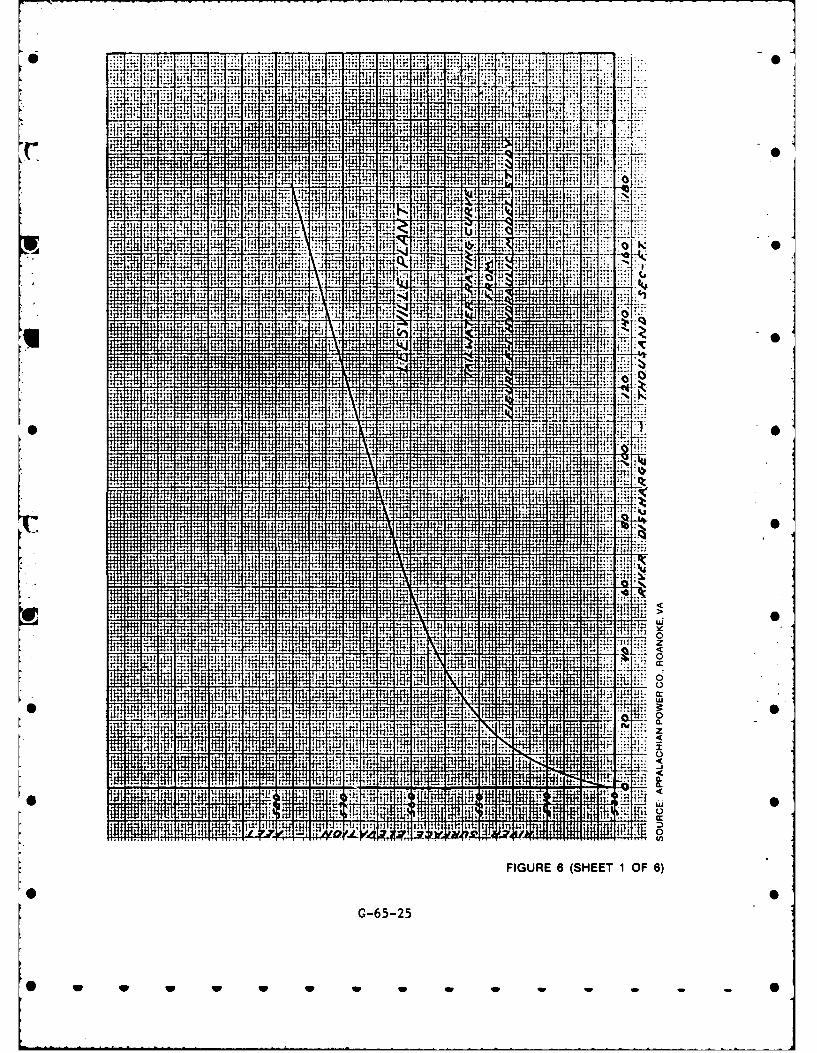
':v ni: v";
v J Mfli! ff wli NfPp.34 15i -k il Ivi 4 -4 4
.14 I.KI : ".. i *::, m-,fit I ®rr - ;r
O tit' fl, W, * T-w.;
ii; 7.
.... . .. ...
"g T; jTT
4 IN
I r
vi "ti 1j: 7L:-
J i 1* :T t 1 i 1*1 4 i flr4IF -M N 4ii -
T;r 71: tiff 4 41i3 ou
r j2q:Pi
.ZIN
V1
M
iiiii!!!! It IH-+- 4444 i -. lil*.-- W'.
T.. ::I'*.::!lp-
4,4#f M M If. vjig, ONO It7 ....-1 Hq - - mom"m 49444
'91 Irlfi
tl
i TOM 1:1 -:ijmi sum, sm VM
t it f: $
Q it al 141 t Iffl IN
M .I I I I I +A
>032
-1 Z4t
rIT, Vt N 'K +1 f-PT4, t!44lar
Wr 1 14 ME!T
Liu Lit 4$ 4 'i - j . ...... 4 4
V 14, MI 9 4 14 NIS111t I Mgm i I "u T . AaL CL10-1 An NIT 04IL T' 7rIwn Ifit I 11AM-1
M 1141 IMN If" - Fq-, N-W V 4: amm
omw r rdlif]Mvjm M11" I Lipt ;I4
P IM P A 4 i i . Nh, 11 M11.. .........
RUMt ft 4- IN wIM Wasp
FIGURE 6 (SHEET 1 OF 6)
G-65-25
w w w w w w v w w Ir w 1w w
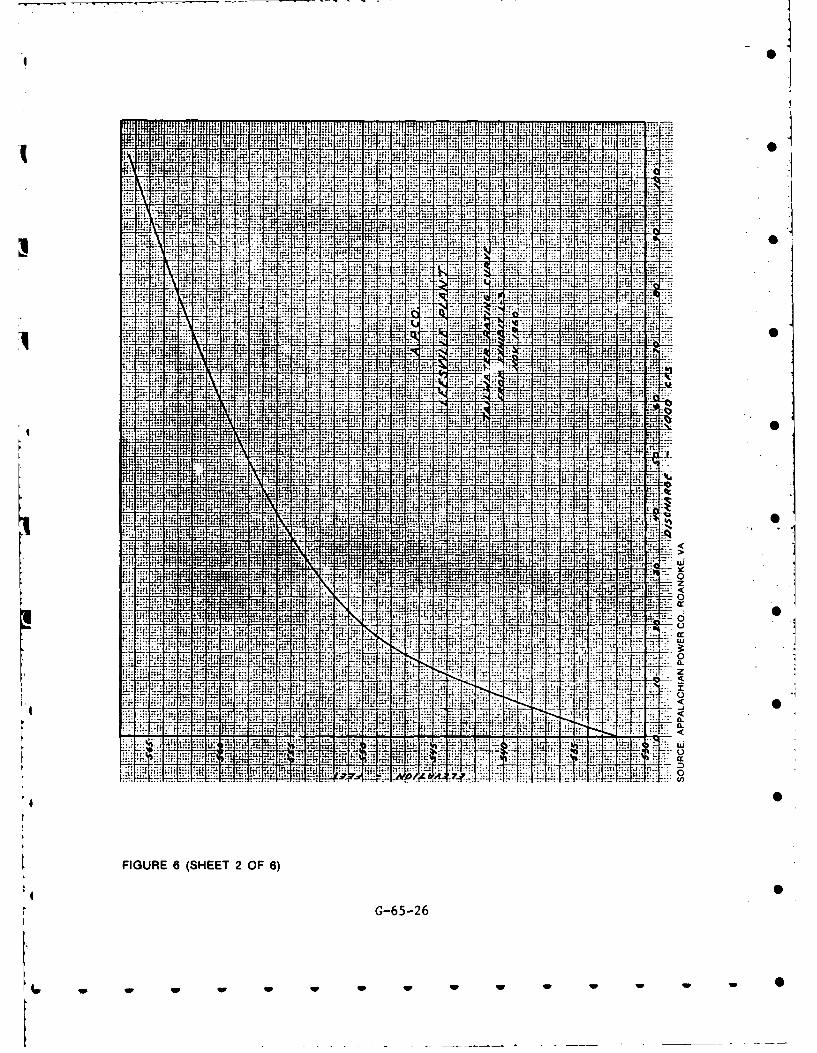
if tri !isl!'i-01110 1 Mi" ... ... ft U.ldflth!iT f 4
MIT .... .... 1, r, , i I . hiff W-1 IJf .Jint Pit
If.... .... .... .... . :F i
:ilw :I!,- i i p:! I;
nu ;Irt:iz iii, 1 15:191: diT Til H jr-li M; _T IN F if if.
r-t_! TIM A_w.. 77 :T7
ITT' n: t.tt:! ... Ti r- r.: :L4.p
.. . .... . .... ... .... ... .. t nrw: Ab
L". :H :-.if ::tcJ. .... .... ..
tira 771.
J. m ft imR UH R!1 1 7:1 T... TH: F;
iT ip- -,!:i F.- -.:H tii! i: Hii W2.*.fi- iTMAtt"T
uz*It
jjjj ifln v_K
ff 1!.! :1., r::: 14
if-
fli q
Tt vi: ;- - _vl
-.1i iin,"0iIv
alin! v T 1 71 RM-PRIAMIM111if! HT 'Iff! NH ffR i-.. zjrjr _4! 0.4 p4 _4!
.7t.. 4: LITE 4uLp 4 ff , T i4 Raii L4"It . i t m ri;T -j- .rtt I. It It-
L)i'ii ii4 p, tl CC1H
Fn T. zF7:7,
-IF77!. 77 .:. I N - :*i'F ... H7 H.
= LM, irr.
.K I if :;r :_.: :u , .1 . . ** :, : -4- =!. - : . .7 L.z CL:.t Z;: CL11 :41 N., ILI i
I= rrTHE! tO
tij; :-.t 'T" 0-, 4--t
FIGURE 6 (SHEET 2 OF 6)
G-65-26
w w w w w w w w w w
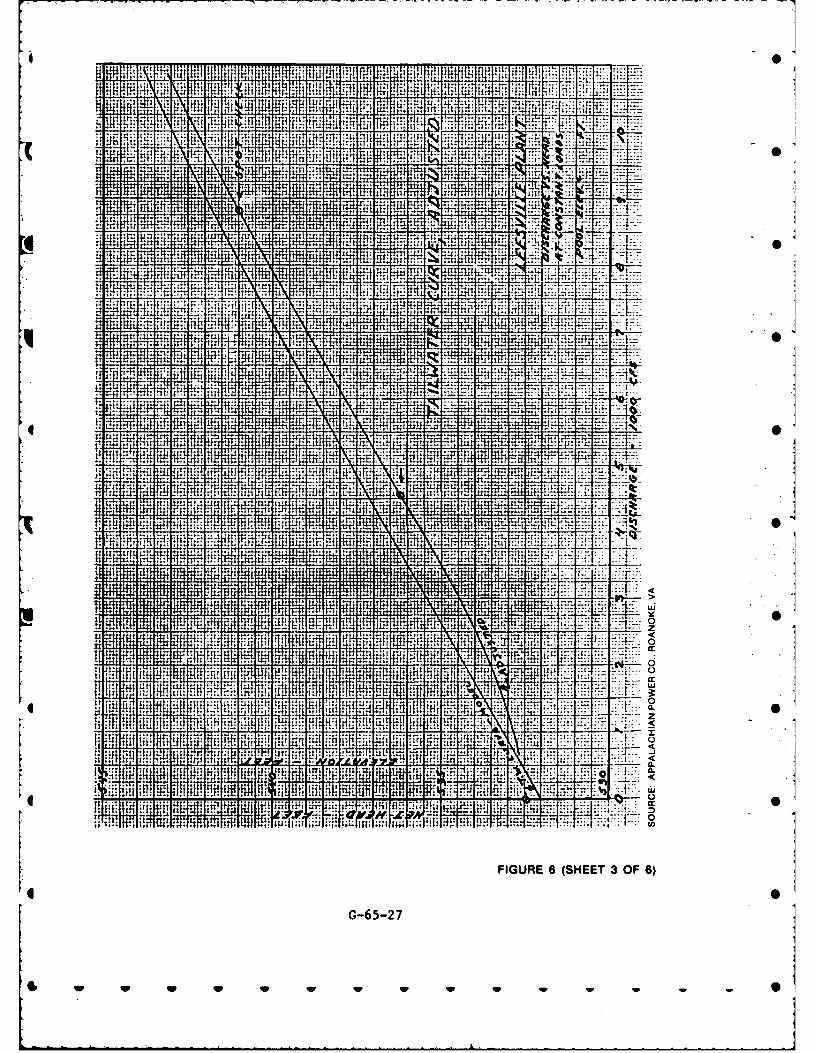
0
ifI r
tip t.~:* Mt*~* 140 I
4R 0kW ji nqG-65-2
*p w ww w w - -
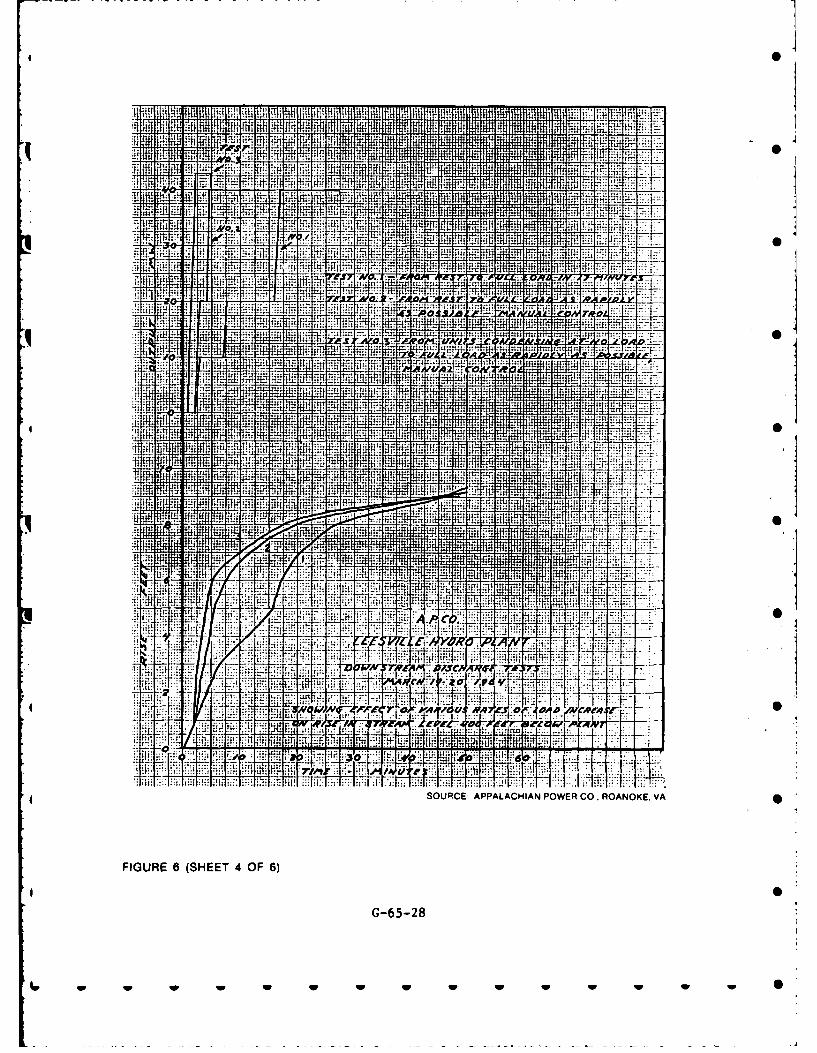
I. tin it"t 111t;! IRRIMMIN rMublIffivip'll-M! I inli
:,-T'111 A! to Nam , t 10 T"-V 4i Q Slum 4 - P4 9;M,IJ' r, 4. fl, W! Ar a a 499 klm m
MAI;.... .... Is! 4 TV4 rl:li IMT =!:rE
iT IN.
Mj 4wr; a anm0w . ......ig.1 tm 4 V 14 stq I M. A iI il lipU A4 7-1:,tv . "; 4- list 14 9 %10 VIM Asi T,'
mt1 5
F tz a 175. - t It,wa L I- - -- !I
tt I T- tu lit itt 4t
44 JA 7.9
wr. it it itsHHa 4! 'n: ,
rtlt
g: i!,ttrl i%at! 2% Nd
;r it
7_ HH M rlf =
4 ri Hi I 'i ff K 1 W wfil fi f;14
it.it.17;1
gg rn "XMt.4
v: Mt;
t i9f qii :3E iii-M fjf:;
tie 11 M M h 1 -9 14two:N, l I THE i L a Mist t:.:!:
tt CIt fftstjME is -IiA 1H qwum5 1 M a t
RMR T-dw [M R fF4Iff V. J:i = !i4. B-q i WEV t'7
p 44 Jil I:;:.it it
7% t:'.T t;.K ;Fit
4 itl". A'7- -7-
v vl
o.;
UU: V ... ... .....'7: "
U jr.
rtf:. Nn! 1::A.A
g'PE i; V I i: 1;; ;H: r
4:1.FRFia! 144 R. I
SOURCE APPALACHIAN POWER CO. ROANOKE. VA
FIGURE 6 (SHEET 4 OF 6)
G-65-28
w w w w w w w
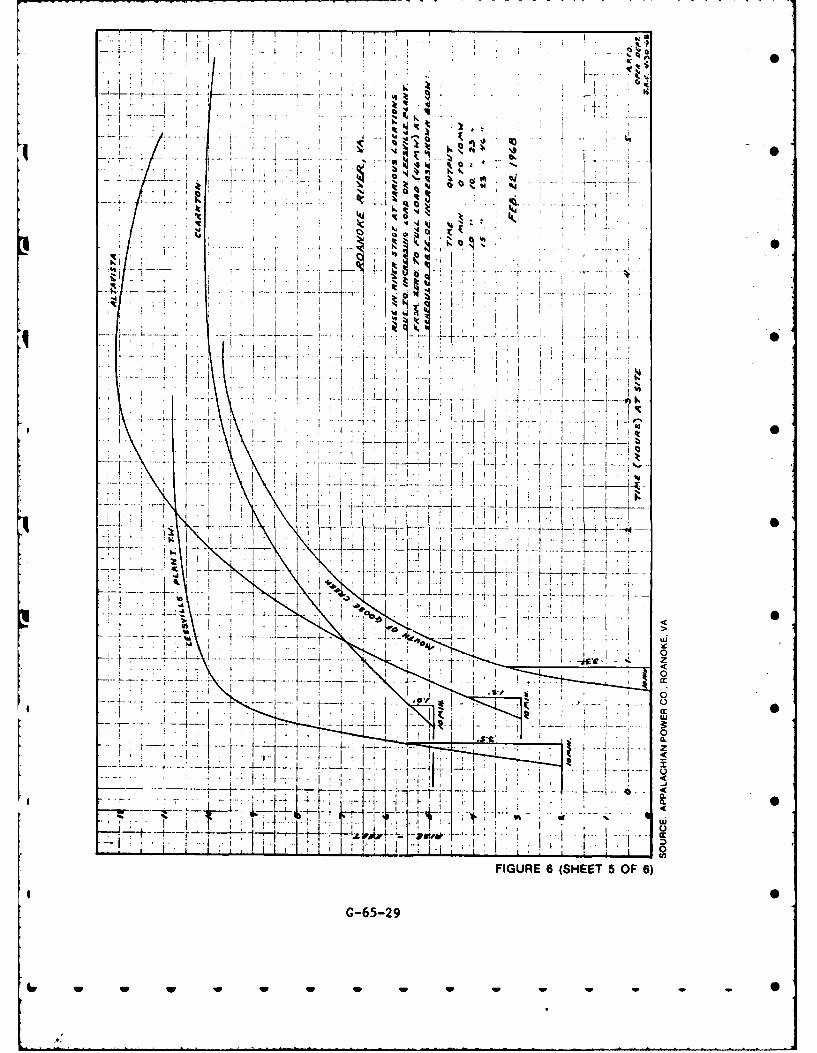
I It
I L
4ok x -~a
00
I it
'IIIt
'J I
7 J lFIUR 6 r (SEE 5OF6
G-65-2
I w
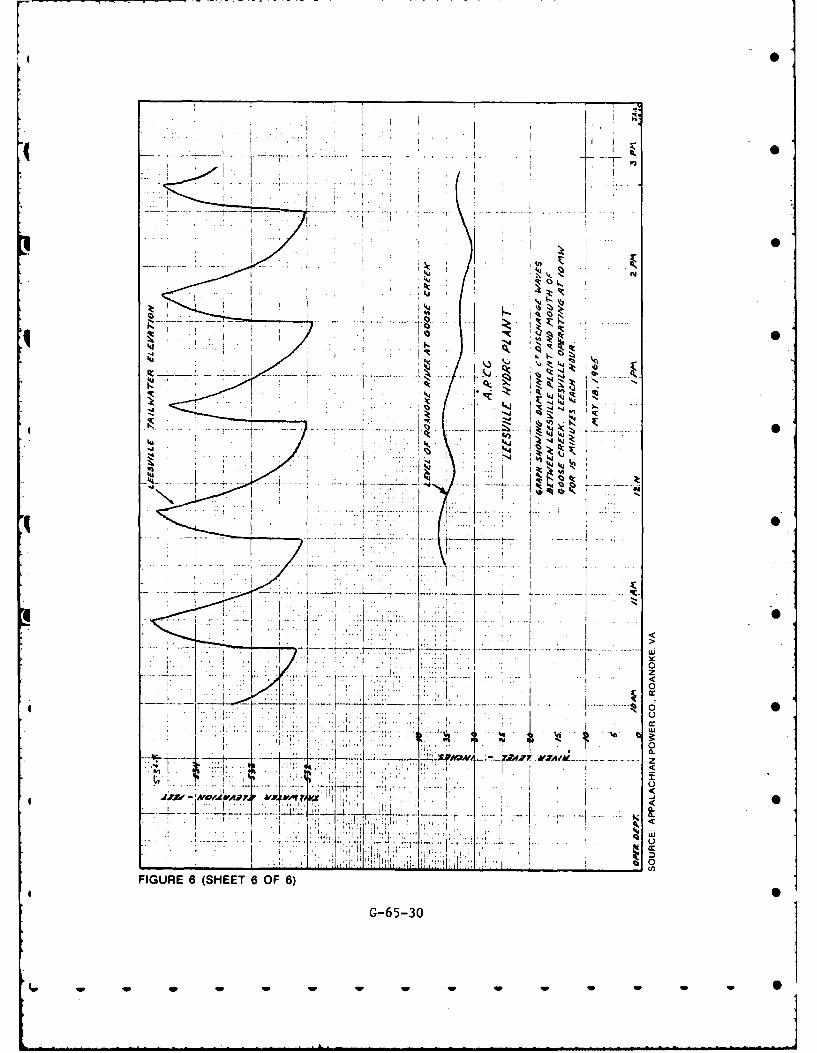
W k4
44 I
400
Z eA
* 7
I~j ~ >~ q~ i
:le
I - I
7t I'0
JIM MAW,.K0Ijl a.. 1-7 - 7* .1 ::itx. <~9 T ~ 3AJ. T
~~ccen
FIGUE 6 SHET 6 F 6
G-65-30-- a
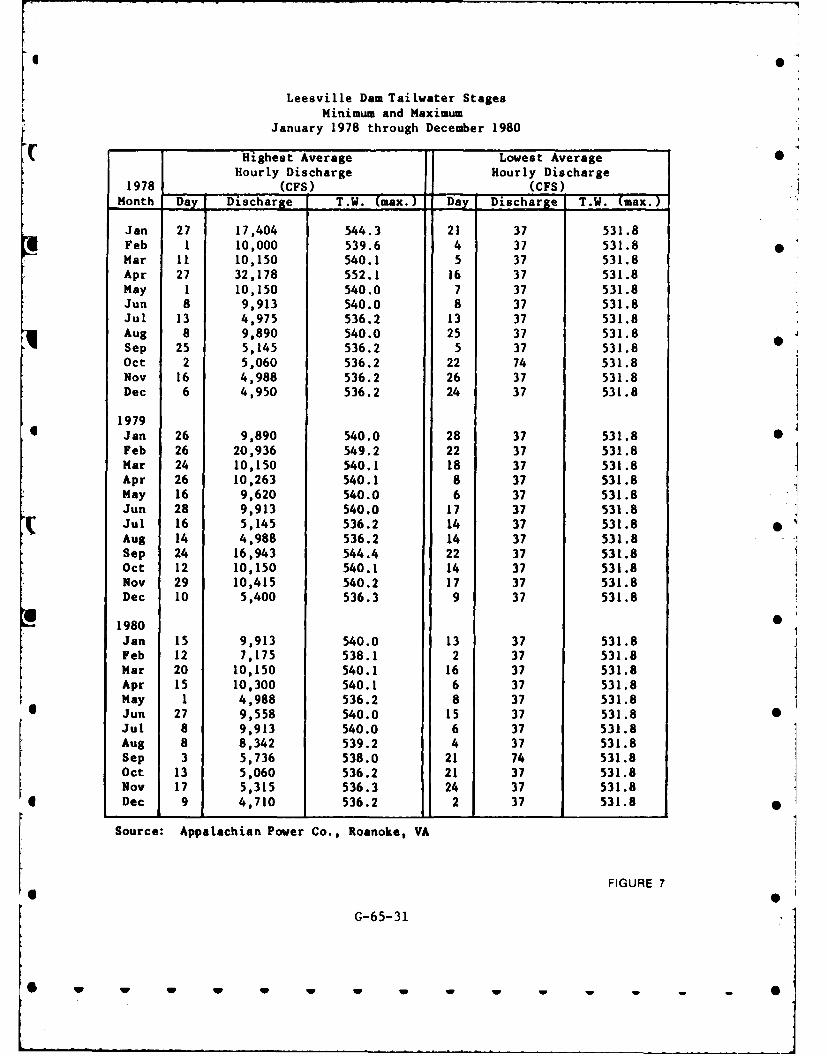
0
Leesville Dam Tailwater StagesMinimum and Maximum
January 1978 through December 1980
Highest Average Lowest AverageHourly Discharge Hourly Discharge
1978 (CFS) (CFS)Month Day Discharge T.W. (max.) Day Discharge T.W. (max.
Jan 27 17,404 544.3 21 37 531.8Feb 1 10,000 539.6 4 37 531.8Mar 11 10,150 540.1 5 37 531.8Apr 27 32,178 552.1 16 37 531.8May 1 10,150 540.0 7 37 531.8Jun 8 9,913 540.0 8 37 531.8Jul 13 4,975 536.2 13 37 531.8Aug 8 9,890 540.0 25 37 531.8Sep 25 5,145 536.2 5 37 531.8Oct 2 5,060 536.2 22 74 531.8Nov 16 4,988 536.2 26 37 531.8Dec 6 4,950 536.2 24 37 531.8
19794 Jan 26 9,890 540.0 28 37 531.8 0
Feb 26 20,936 549.2 22 37 531.8Mar 24 10,150 540.1 18 37 531.8Apr 26 10,263 540.1 8 37 531.8May 16 9,620 540.0 6 37 531.8Jun 28 9,913 540.0 17 37 531.8Jul 16 5,145 536.2 14 37 531.8Aug 14 4,988 536.2 14 37 531.8Sep 24 16,943 544.4 22 37 531.8Oct 12 10,150 540.1 14 37 531.8Nov 29 10,415 540.2 17 37 531.8Dec 10 5,400 536.3 9 37 531.8
1980 0Jan 15 9,913 540.0 13 37 531.8Feb 12 7,175 538.1 2 37 531.8Mar 20 10,150 540.1 16 37 531.8Apr 15 10,300 540.1 6 37 531.8May 1 4,988 536.2 8 37 531.8Jun 27 9,558 540.0 15 37 531.8 SJul 8 9,913 540.0 6 37 531.8Aug 8 8,342 539.2 4 37 531.8Sep 3 5,736 538.0 21 74 531.8
Oct 13 5,060 536.2 21 37 531.8Nov 17 5,315 536.3 24 37 531.8Dec 9 4,710 536.2 2 37 531.8
Source: Appalachian Power Co., Roanoke, VA
FIGURE 7* 0
G-65-31
w~~ W ww W - - S
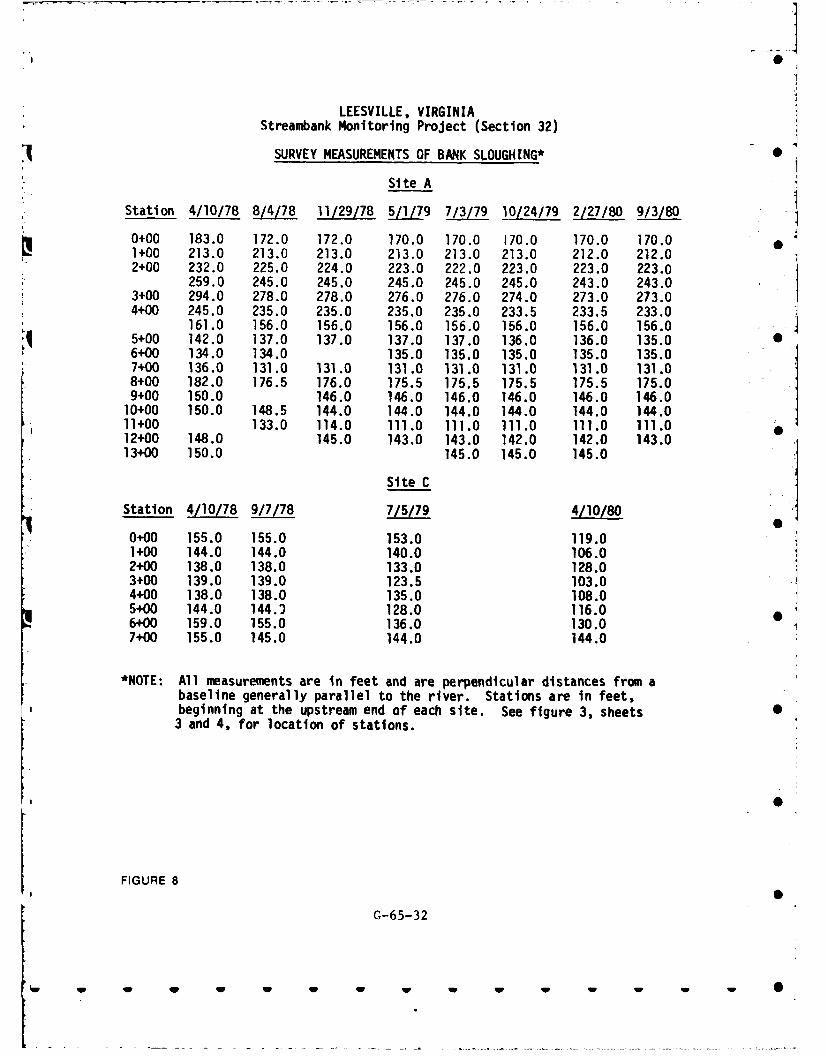
LEESVILLE, VIRGINIA
Streambank Monitoring Project (Section 32)
SURVEY MEASUREMENTS OF BANK SLOUGHING* -
Site A
Station 4/10/78 8/4/78 11/29/78 5/l/79 7/3/79 10/24/79 2/27/80 9/3/80
0+00 183.0 172.0 172.0 170.0 170.0 170.0 170.0 170.01+00 213.0 213.0 213.0 213.0 213.0 213.0 212.0 212.02+00 232.0 225.0 224.0 223.0 222.0 223.0 223.0 223.0
259.0 245.0 245.0 245.0 245.0 245.0 243.0 243.03+00 294.0 278.0 278.0 276.0 276.0 274.0 273.0 273.04+00 245.0 235.0 235.0 235.0 235.0 233.5 233.5 233.0
161.0 156.0 156.0 156.0 156.0 156.0 156.0 156.05+00 142.0 137.0 137.0 137.0 137.0 136.0 136.0 135.06+00 134.0 134.0 135.0 135.0 135.0 135.0 135.07+00 136.0 131.0 131.0 131.0 131.0 131.0 131.0 131.08+00 182.0 176.5 176.0 175.5 175.5 175.5 175.5 175.09+00 150.0 146.0 146.0 146.0 146.0 146.0 146.010+00 150.0 148.5 144.0 144.0 144.0 144.0 144.0 144.011+00 133.0 114.0 111.0 111.0 111.0 111.0 111.012+00 148.0 145.0 143.0 143.0 142.0 142.0 143.0 0
13+00 150.0 145.0 145.0 145.0
Site C
Station 4/10/78 9/7/78 7/5/79 4/10/80
0+00 155.0 155.0 153.0 119.01+00 144.0 144.0 140.0 106.02+00 138.0 138.0 133.0 128.03+00 139.0 139.0 123.5 103.04+00 138.0 138.0 135.0 108.05+00 144.0 144.) 128.0 116.06+00 159.0 155.0 136.0 130.0 17+00 155.0 145.0 144.0 144.0
*NOTE: All measurements are in feet and are perpendicular distances from abaseline generally parallel to the river. Stations are in feet,beginning at the upstream end of each site. See figure 3, sheets3 and 4, for location of stations.
FIGURE 8
G-65-32
qw w w w w w0
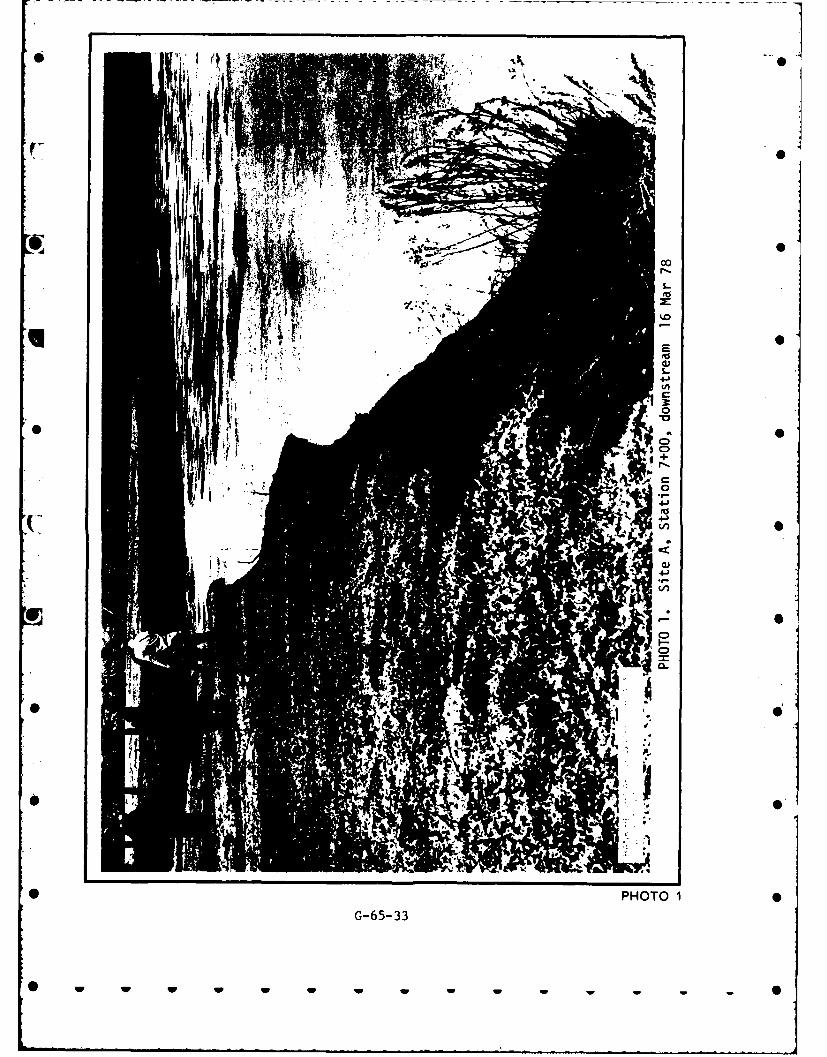
000
41
40
* a
* PHOTO 1IG-65-33
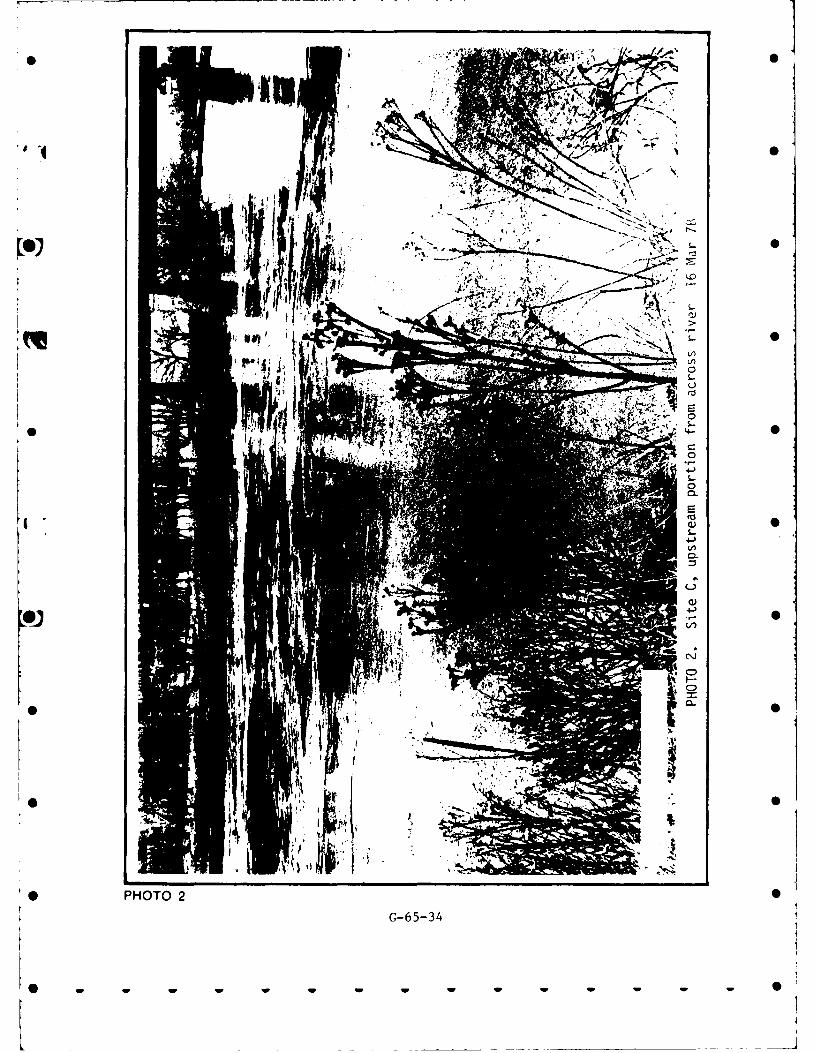
* S-
it3-.5 *4 4
I ~'*'I.., .- -oh ,-. L
*F E
[q ~I. -f
4-
C-
0)
4-,
0.j
PHOTO 2
G-65-34
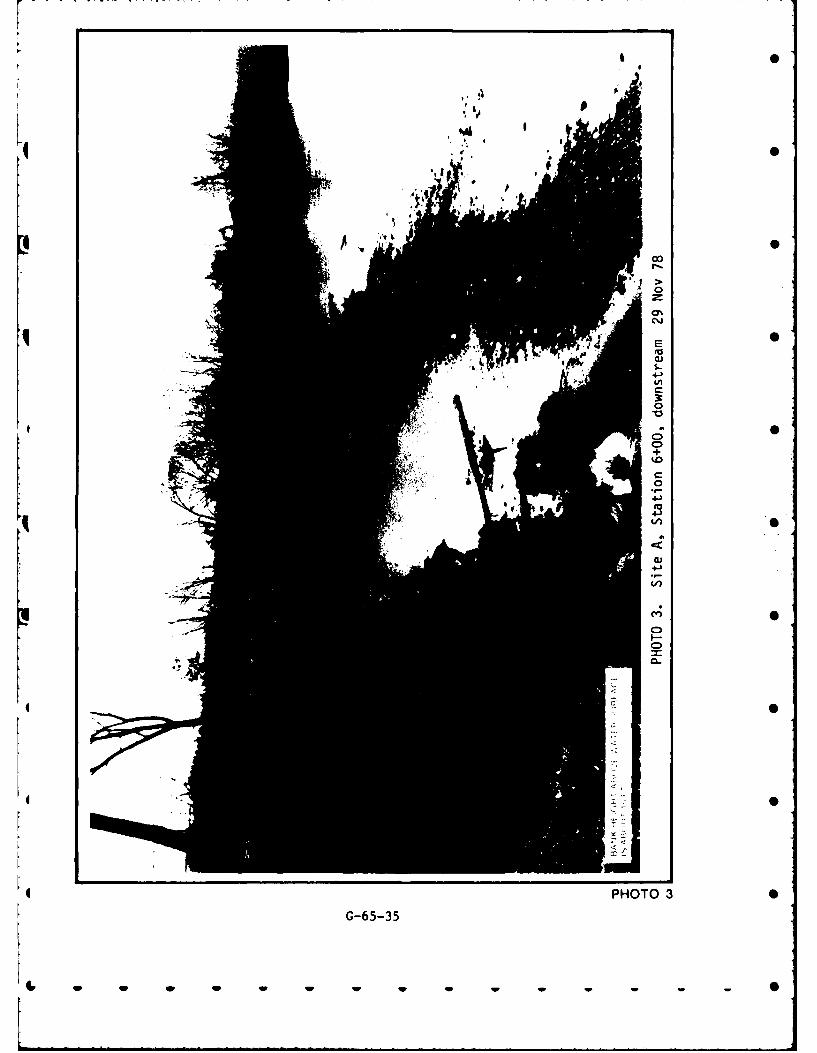
000
I.-
q 01
Clko
CD
PHT 3
G-65-0
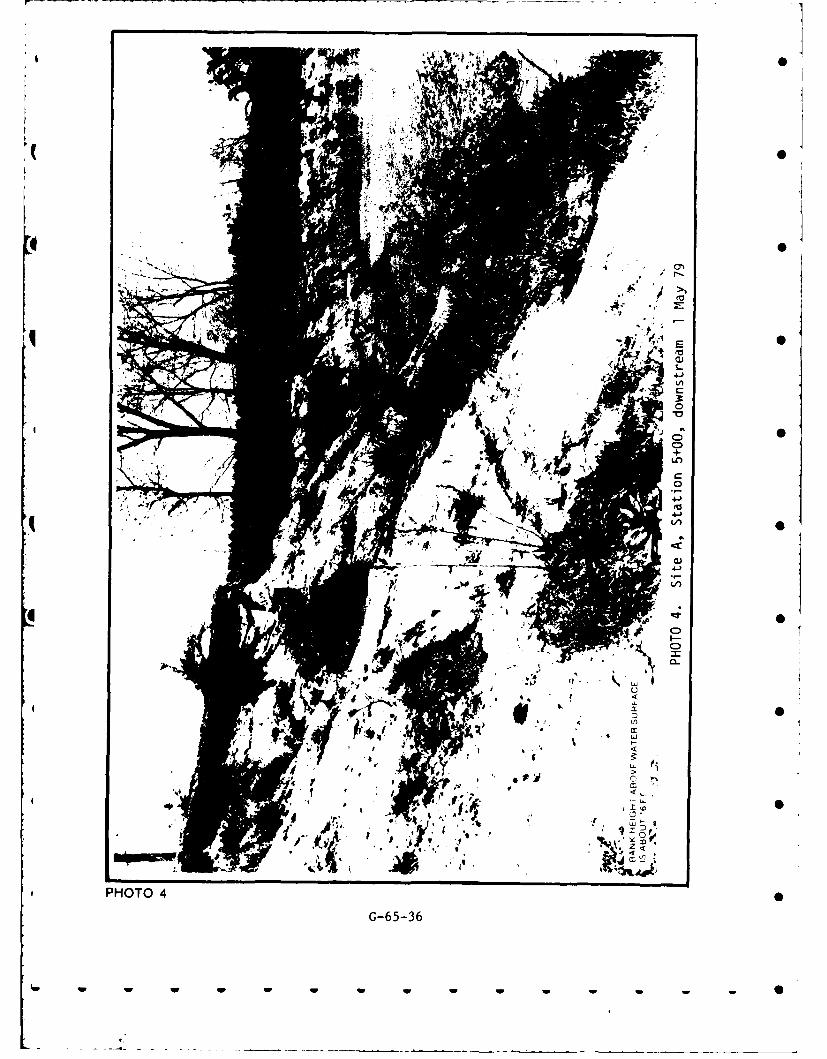
A~
I a0
) fl,
'Z 0.
G-65-36
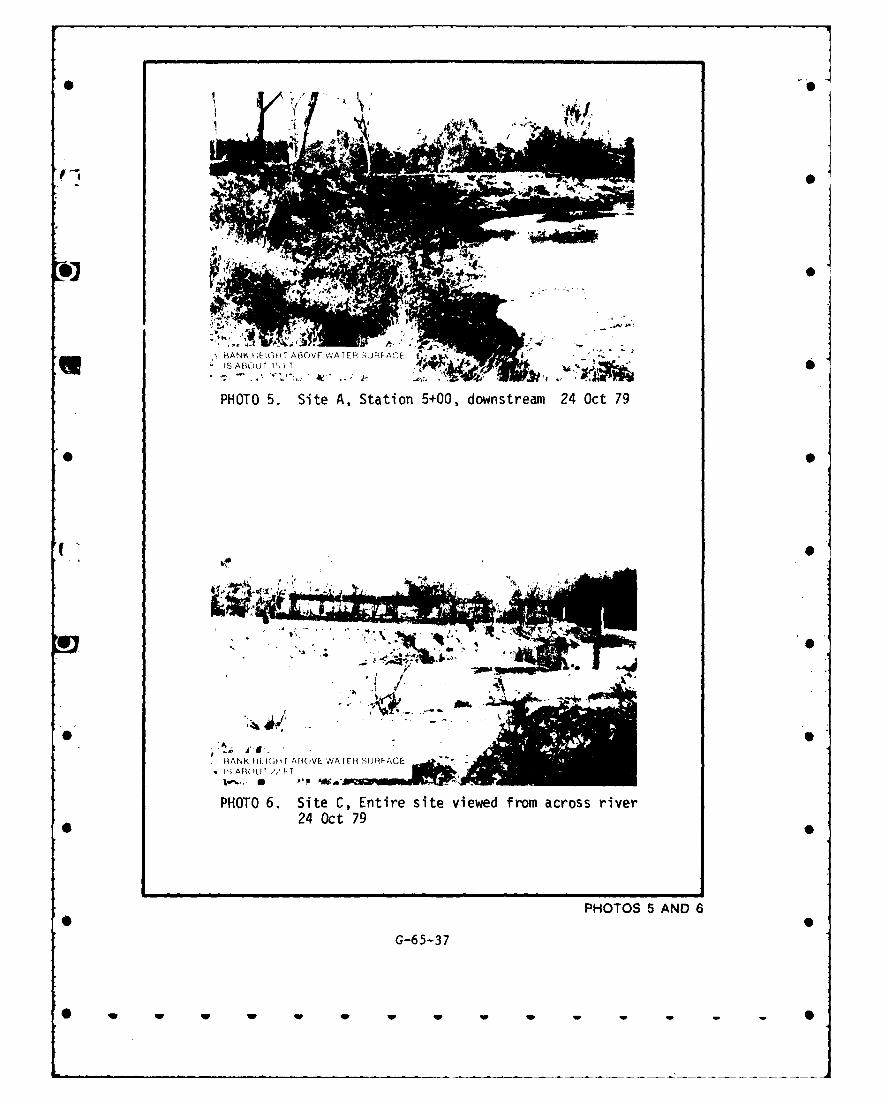
0 -
q. B ANK I EJCHT A60VE VVA TER 5IJBF ACL
PHOTO 5. Site A, Station 5+00, downstream 24 Oct 79
V. 0
MA 0
RANK Hfl iftl ABC VE WA TER ';JRF~
PHOTO 6. Site C, Entire site viewed from across river24 Oct 79
PHOTOS 5 AND 6
G-65-37
0~~~ W
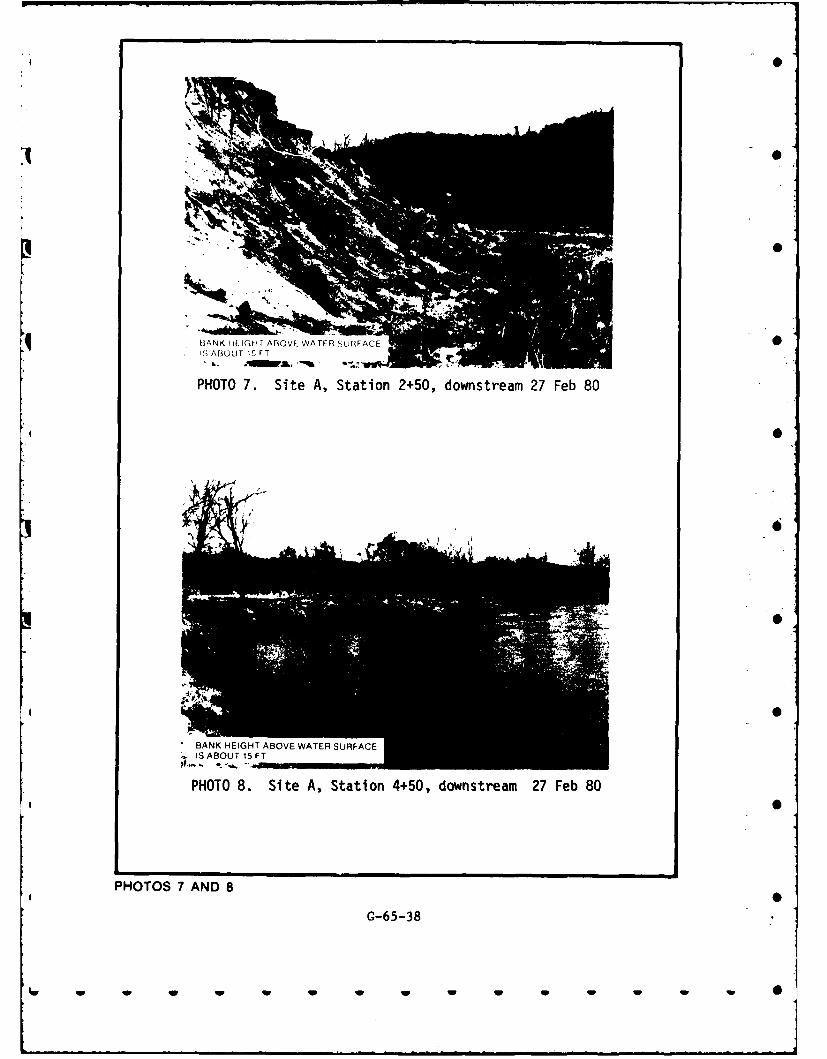
I'IN
13ANK i L IGhl r ABOVE WATER Su IRFACE
PHOTO 7. Site A, Station 2+50, downstream 27 Feb 80
PHOTO 8. Site A, Station 4+50, downstream 27 Feb 80
PHOTOS 7 AND 8
G-65-38I
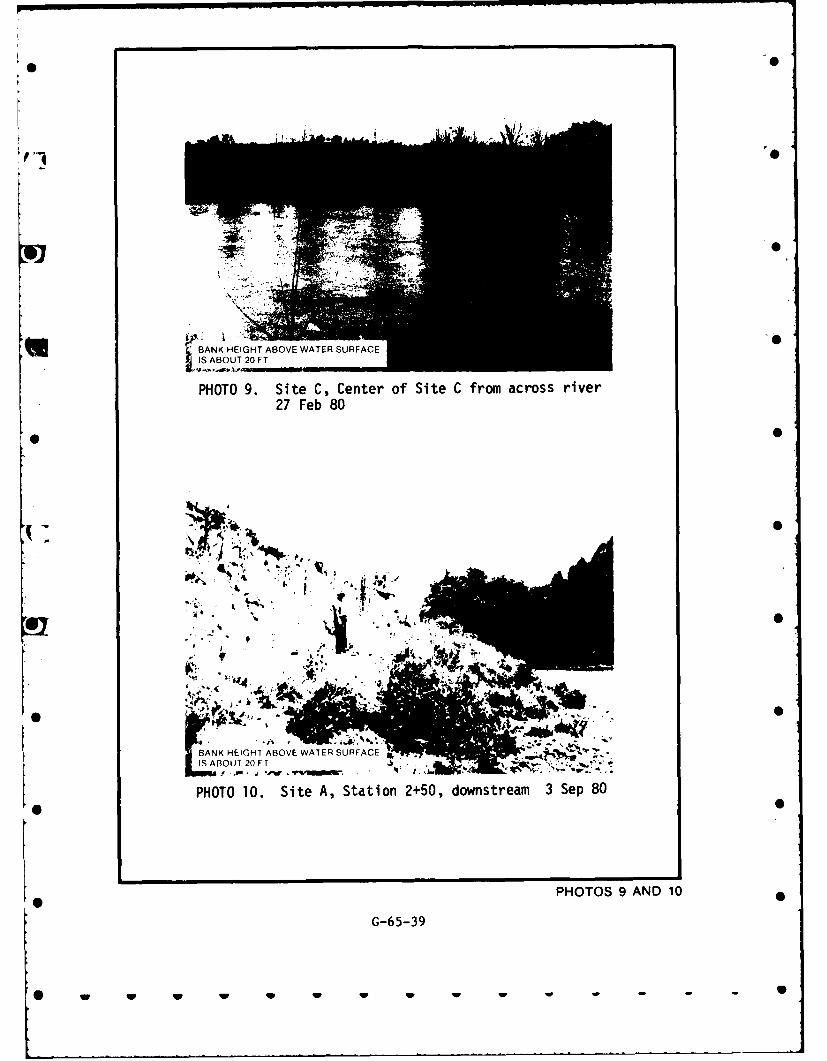
BANK HEIGHT ABOVE WATER SURFACEIS ABOUT 20 FT
PHOTO 9. Site C, Center of Site C from across river27 Feb 80
0SI ABU 2S
PHTO 9 AN 10
G-65-39
S w w w W W W W-
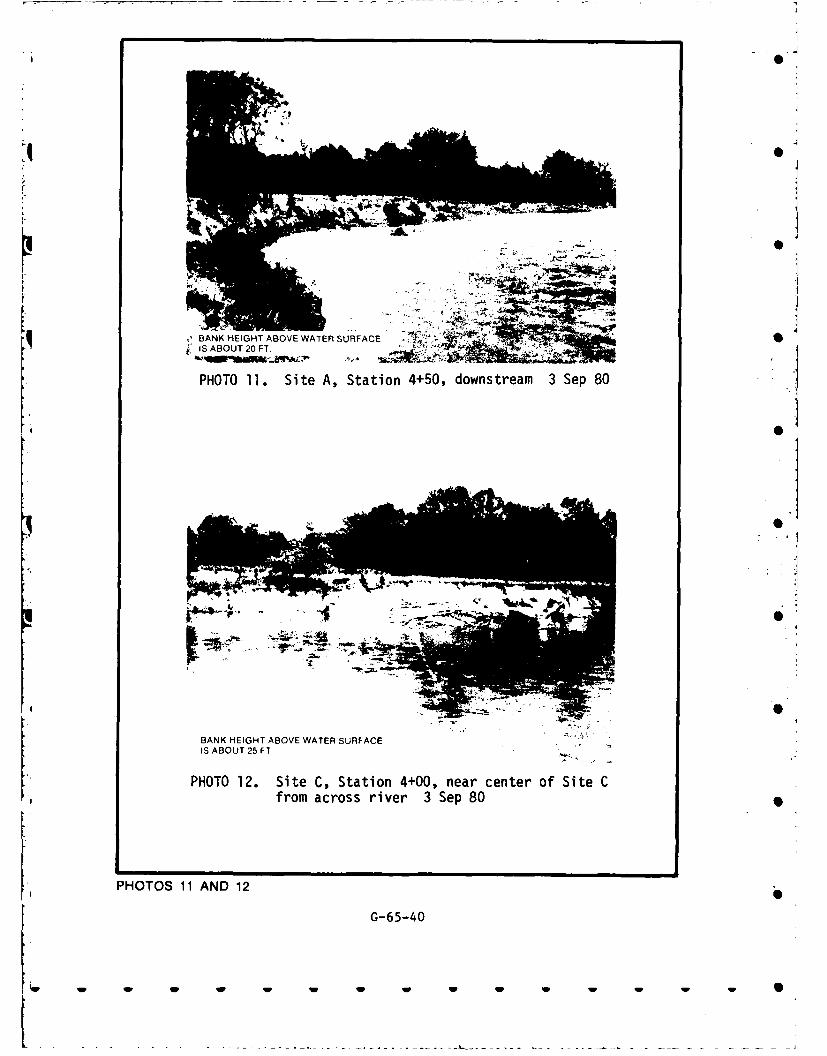
4
q~ BANK HEIGHT ABOVE WATER SURFACE '
IS ABOUT 20 FT. l
PHOTO 11. Site A, Station 4+50, downstream 3 Sep 80
BANK HEIGHT ABOVE WATER SURFACEIS ABOUT 25 FT -
PHOTO 12. Site C, Station 4+00, near center of Site C
from across river 3 Sep 80
PHOTOS 11 AND 12
G-65-40
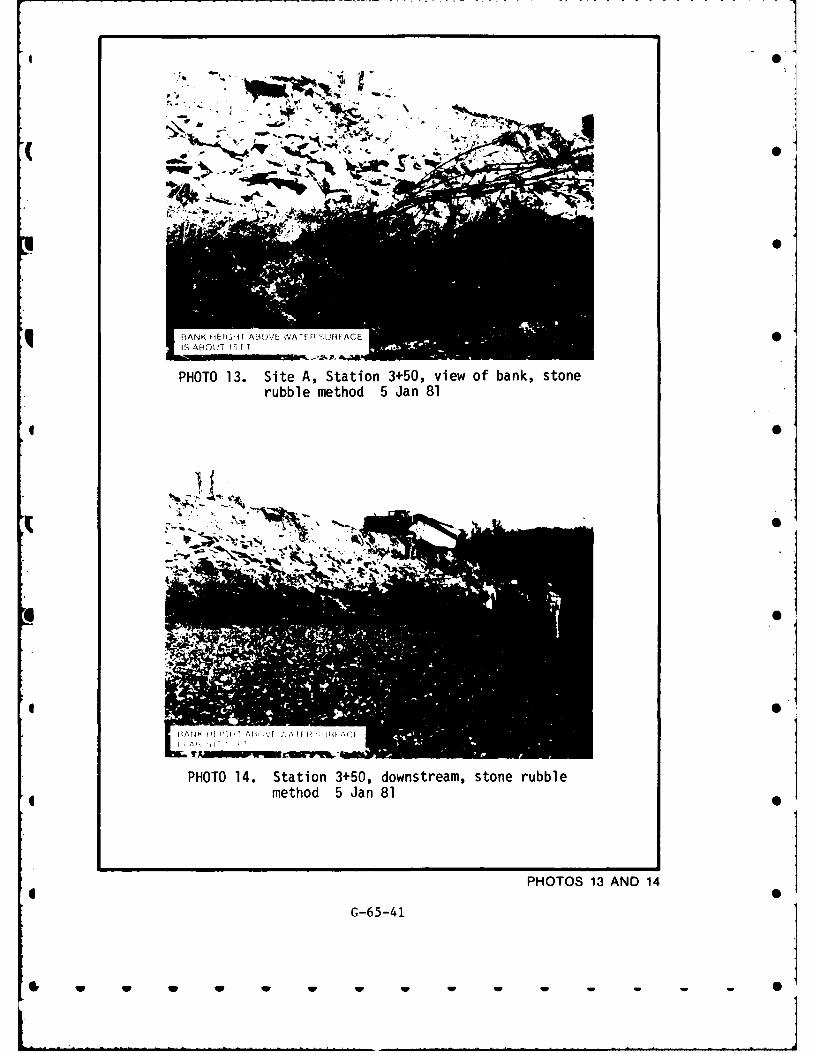
AN1
RANK HEIGH rABOVEVVA TFBRFACIS ABOUT 15 I
PHOTO 13. Site A, Station 3+50, view of bank, stonerubble method 5 Jan 81
4j T
PHOTO 14. Station 3+50, downstream, stone rubble4method 5 Jan 81
4 PHOTOS 13 AND 14
G-65-41
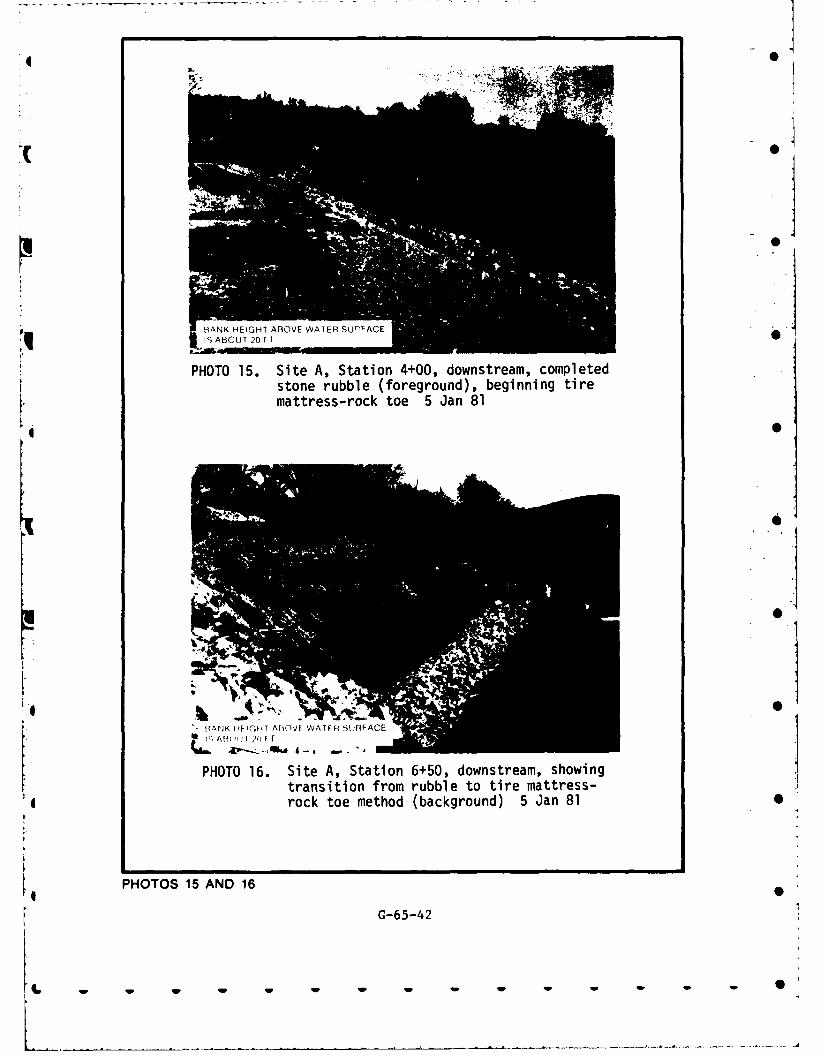
PHOTO 15. Site A, Station 4+00, downstream, completedstone rubble (foreground), beginning tiremattress-rock toe 5 Jan 81
fANK 4FI-H ARC)VE WATEH SUWRFACE
PHOTO 16. Site A, Station 6+50, downstream, showingtransition from rubble to tire mattress-
Irock toe method (background) 5 Jan 810
PHOTOS 15 AND 16
G-65-42
...................................................-..-..-........A. ..-.. - - .----.
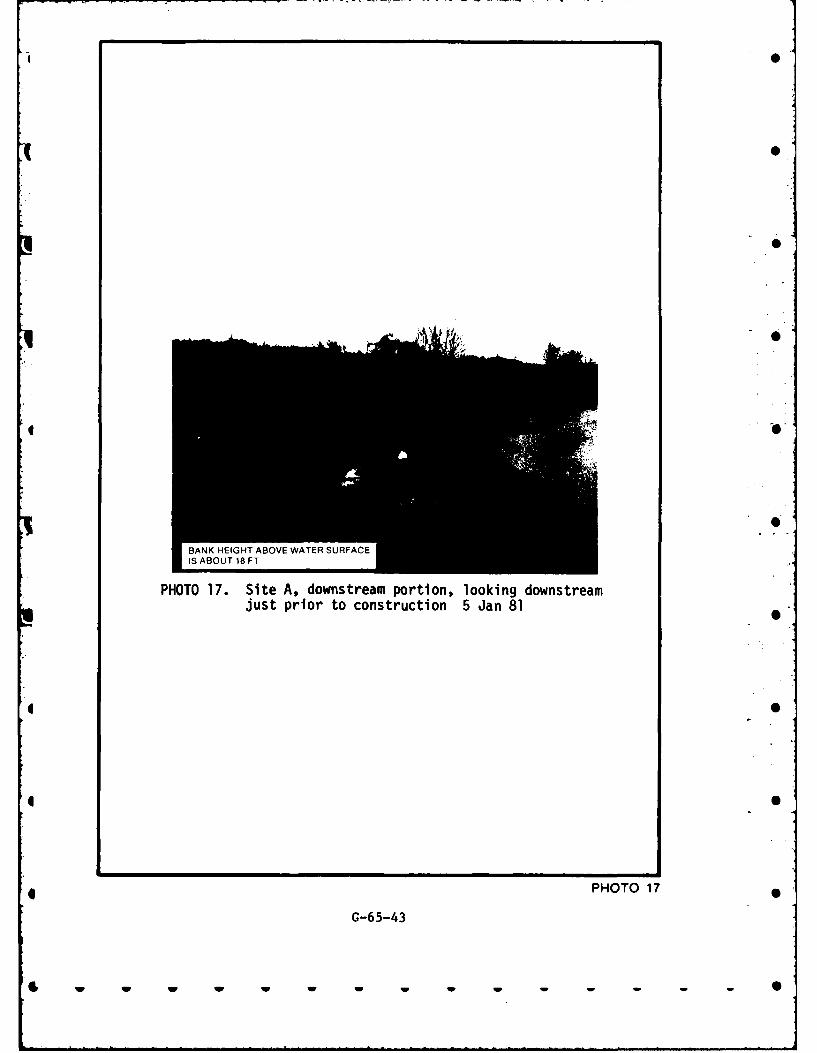
BANK HEIGHT ABOVE WATER SURFACEIS ABOUT 18 FT
PHOTO 17. Site A, downstream portion, looking downstreamjust prior to construction 5 Jan 81
40* S
PHOTO 17
G-65-43
6. w w-------------
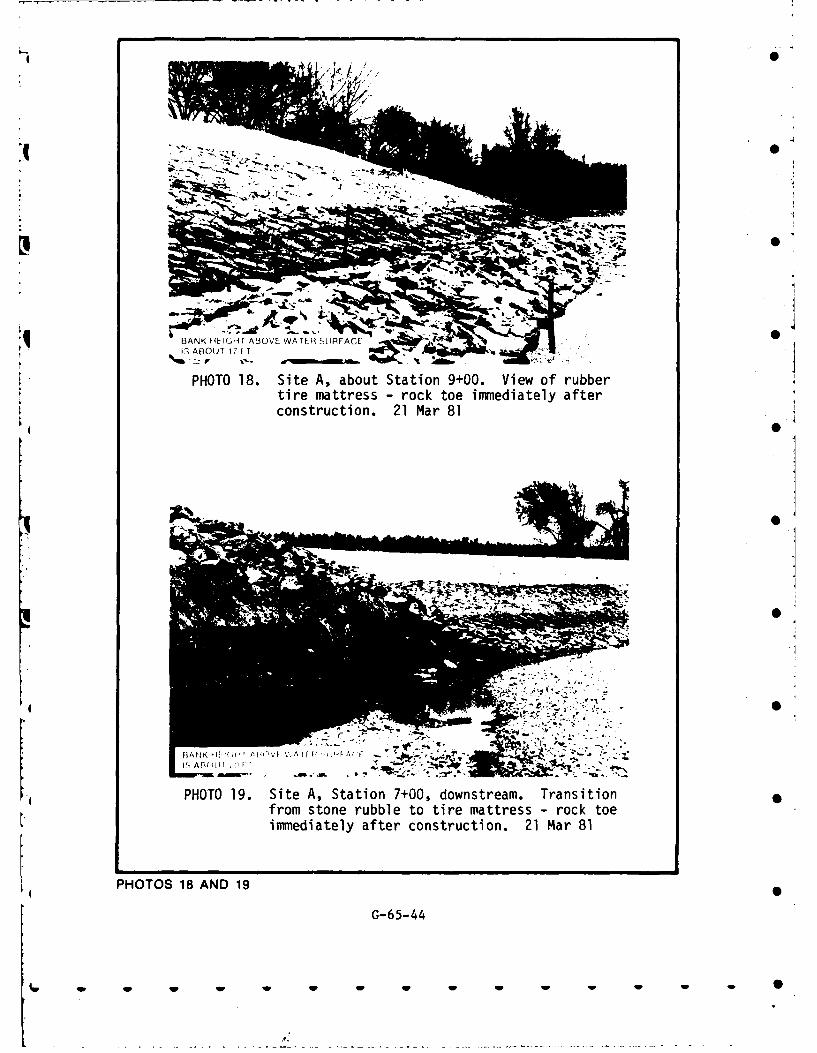
PHOTO 18. Site A, about Station 9+00. View of rubbertire mattress -rock toe immediately afterconstruction. 21 Mar 81
I: ~1' AROt(T 17f
PHOTO 19. Site A, Station 7+00, downstream Transitionfrom stone rubble to tire mattress - rock toeimmediately after construction. 21 Mar 81
PHOTOS 18 AND 19
G-65-44
.
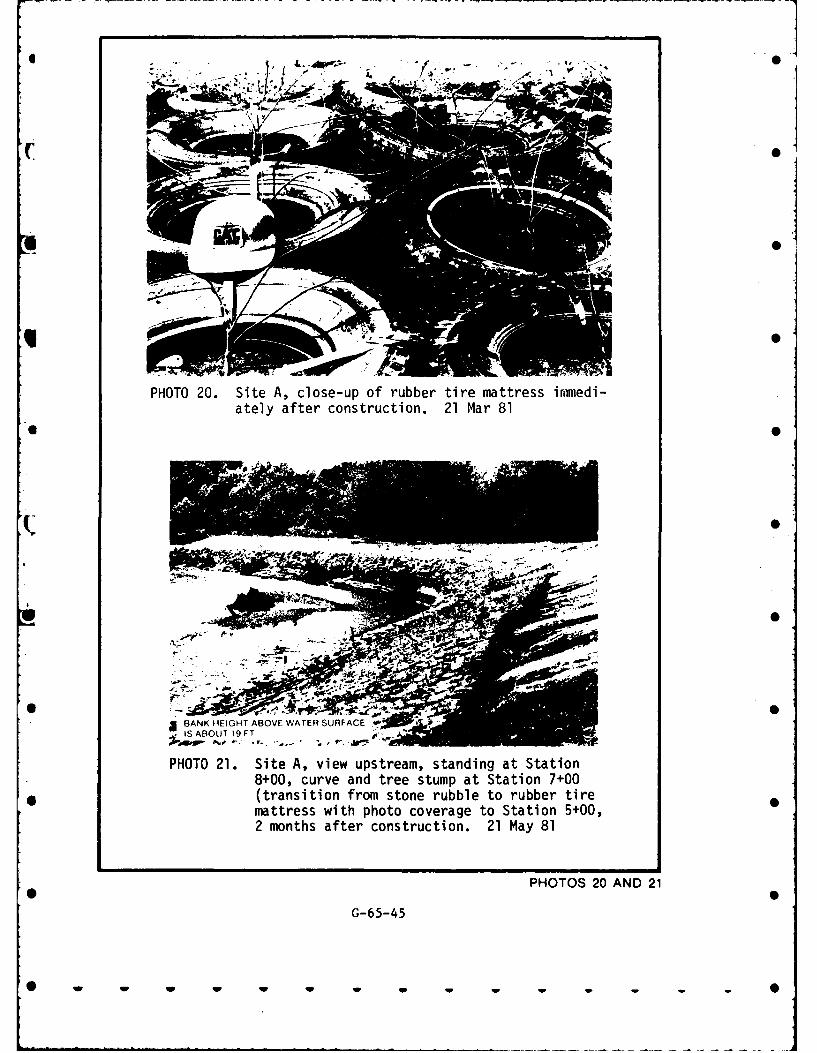
APA
PHOTO 20. Site A, close-up of rubber tire mattress immedi-ately after construction. 21 Mar 81
' ;I BANK HEIGHT ABOVE WAER U RACE '
s AIIOUT 19 FT
PHOTO 21. Site A, view upstream, standing at Station8+00, curve and tree stump at Station 7+00
* (transition from stone rubble to rubber tiremattress with photo coverage to Station 5+00, 52 months after construction. 21 May 81
PHOTOS 20 AND 21
G-65-45
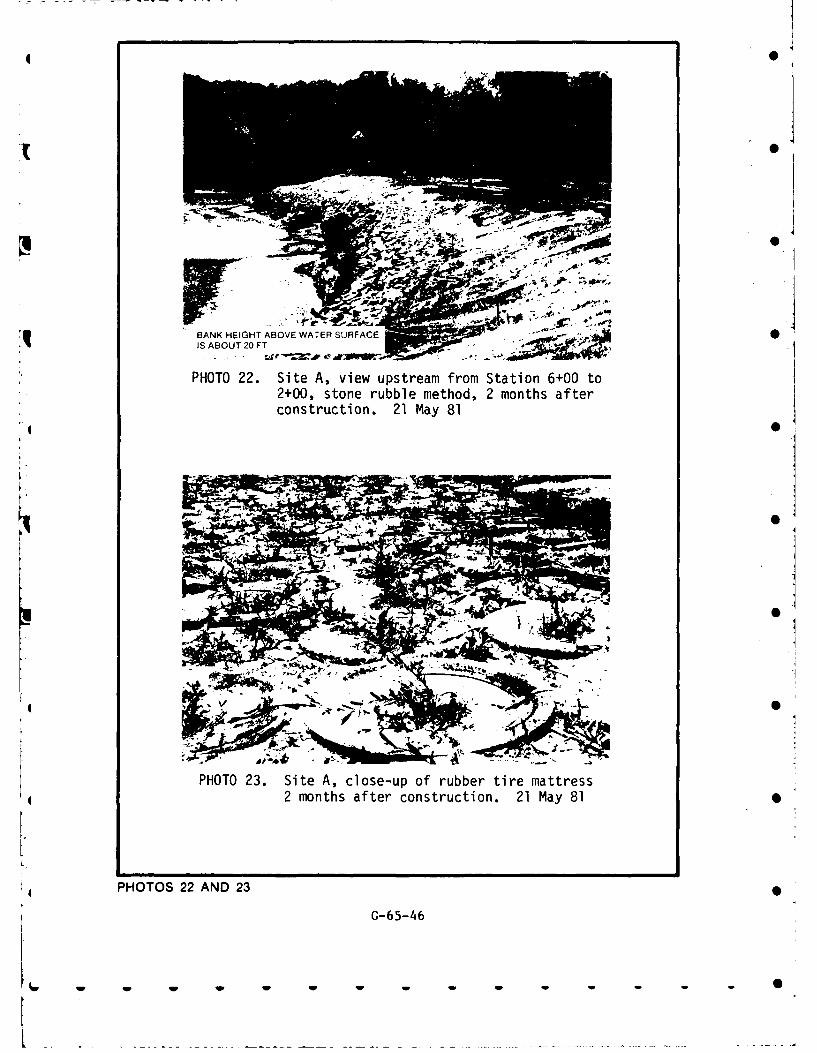
I&
iIIS ABOUT 20 FTBANK HEIGHT ABOVE WATER SURFACE , .- "" ;.,•
PHOTO 22. Site A, view upstream from Station 6+00 to2+00, stone rubble method, 2 months afterconstruction. 21 May 81
I
_ 0
4WS
PHOTO 23. Site A, close-up of rubber tire mattress42 months after construction. 21 May 81
K
PHOTOS 22 AND 23
G-65-46
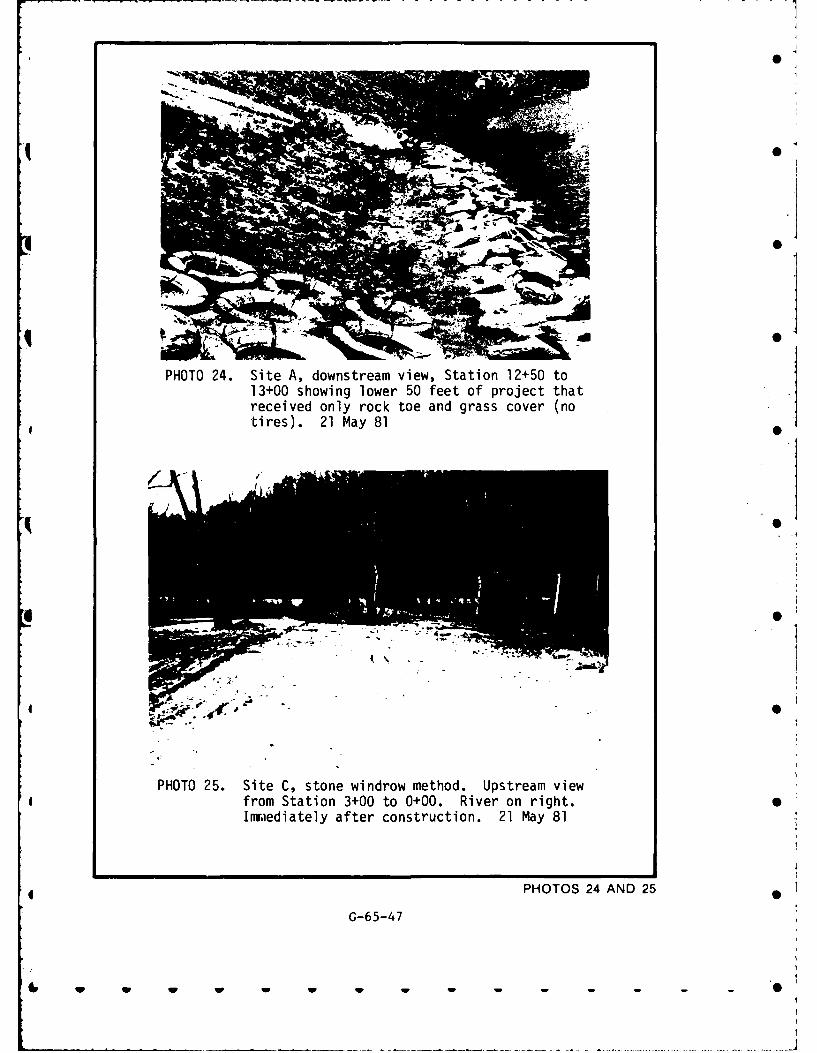
70
PHOTO 24. Site A, downstream view, Station 12+50 to13+00 showing lower 50 feet of project thatreceived only rock toe and grass cover (notires). 21 May 81
S77t
PHOTO 25. Site C, stone windrow method. Upstream viewfrom Station 3+00 to 0+00. River on right. SInmediately after construction. 21 May 81
PHOTOS 24 AND 25 .1G-65-47
W W W W I W -
SACRAMENTO RIVER NEARORDBEND, CALIFORNIA
w w w w w wU 0
V SO
Section 32 Program Streambank Erosion Control
Evaluation and Demonstration Act of 1974
SACRAMENTO RIVER NEAR ORDBEND, CALIFORNIA
DEMONSTRATION PROJECT PERFORMANCE REPORT 0
I - INTRODUCTION
1. Project Name and Location. - Sacramento River Streambank Erosion "
Control Evaluation and Demonstration Project, Glenn County,
California. The demonstration site is located on the west bank of the
Sacramento River just south of Ordbend and near River Mile 179.5.
Plate I shows the location of the project.
2. Authority. - Streambank Erosion Control Evaluation and
Demonstration Act of 1974, Section 32, Public Law 93-251. The
California State Reclamation Board, as the local sponsor of this
project, provided the assurances of local cooperation. The Board has
agreed to operate and maintain the project upon termination of the
Section 32 program.
3. Purpose and Scope. - Although construction was not yet completed
at the time of report preparation, this report has been prepared for
inclusion in the final report to the Congress on the Streambank
Erosion Lontrol Evaluation and Demonstration Program. The report 0
describes the two types of bank protection measures constructed on the
Sacramento River as part of the demonstration program. Included in
this report is a description of the historical and existing stream
conditions and characteristics, the demonstration project's design and S
construction, and the monitoring program for evaluating project
performance. An evaluation of project effectiveness is not available
at this time.
G-66-1 -
w w w w w w - - - -
4. Problem Resume. - The concept described in this report was
proposed to investigate alternatives to the use of stone riprap for
streambank erosion protection along the Sacramento River. The natural
banks, berms and manmade flood control levees along the Sacramento
River are eroding. During recent years, stone riprap has been used
almost exclusively in private, local, State and Federal programs for
erosion control along the Sacramento River. The erosion at the
demonstration project site is typical of the erosion problems along 0
the upper reaches of the river. The upper bank is steep and primarily
composed of sandy and silty clay of low plasticity. The lateral
erosion rate at the site was about 15 feet per year based on recent
bank erosion measurements taken by the California Department of Water
Resources. (See Plate 2) Photographs of the site are shown on pages
13 through 17. The bank erosion measurements were analyzed by Corps
personnel to determine if bank erosion (in this instance represented
by bank surface area eroded away) is a function of discharge.
Initially, cumulative erosion (surface area) was plotted against
cumulative discharge as shown in Plate 3. A review of the data
plotted on Plate 3 indicates that the surface area of bank erosion is
related to discharge, but that cumulative discharge does not always
adequately explain the increase or decrease in the rate of erosion.
Although physical conditions are constantly changing at this site,
subsequent analyses indicate that bank erosion varies exponentially
with discharge.
II - HISTORICAL DESCRIPTION
5. Stream.
a. Topography. - The Sacramento River is the largest stream in
California. It originates in northern California and has an extensive 0
basin which drains an area of 26,000 square miles producing an average
annual runoff of about 21,300,000 acre-feet. The river follows a 300
mile meandering course from Redding to Suisun Bay. The lower portion
G-66-2
of the river is commercially navigable from Suisun Bay to the Port of
Sacramento. The average gradient of the Sacramento River in the reach
of the demonstration site is about 2 feet per mile.
b. Geology. - The project area is located within the Great
Valley Geomorphic Province of California, a nearly flat, alluvial
plain about 450 miles long with an average width of 50 miles. From
the Tertiary to Recent Age, the Great Valley has been filled with a 0
* thick accumulation of sedimentary rocks and alluvial deposits. The
topography of the area is generally flat, with soils derived from
flood basin deposits consisting of clay and silt, which is the
predominant riverbed composition. Through recent geologic ages, flood 0
deposits created natural levees (rimlands) so that the river now flows
through an incised channel flanked on either side by broad upraised
rimlands and beyond by low-lying flood basins. The deposition phase
of the main streams indicates that the Sacramento River and alluvial 0
valley have reached a somewhat stable stage of development.
Elevations range from 90 to 100 feet along the river adjacent to the
project area.
c. Locality, development, and occupation. - Historically the
: :project area was part of the Mexican land grant given to Jacinto
Rodriquez. In 1867, Dr. Hugh J. Glenn purchased 55,000 acres
surrounding the demonstration site to the north, south, and west. Dr. 0
Glenn began large scale cultivation of wheat in the 1870's and at one
time employed two to three hundred workers. In 1883, Dr. Glenn was
shot to death and his vast agricultural holdings were eventually
divided into small farms. Today the area remains in agricultural
producation with wheat, corn, rice, walnuts and almonds bc.ng the
predominant crops.
* d. Hydrologic characteristics. - Heavy rainfall and accompanying
runoff from the 12,260 square mile drainage basin upstream of the
demonstration site is seasonal. Most of the heavy rainfall and runoff
G 0G-66-3
occur during the months of November through March. Normal annual
precipitation ranges from 15 to 18 inches. Water temperatures average
470F in the winter, increasing to 76°F in the summer. Flows in the
river at Ord Ferry have ranged from a minimum of about 2,400 cubic
feet per second (cfs) to about 370,000 cfs during the February 1940
flood. Maximum flow since completion of Shasta Dam was 265,000 cfs in
January 1970. This flow included inbank and overbank flow. Flows in
the overbank area are roughly estimated since the Ord Ferry gage
measures flow only in the main channel. The Sacramento River Flood
Control Project design flow at the site is 160,000 cfs. Discharges at
this location may be correlated with discharges recorded at stream
gaging station "Sacramento River at Ord Ferry" which has a drainage
area of about 12,250 square miles and stream gaging station
"Sacramento River near Butte City" which has a drainage area of 12,270
square miles. The peak discharge versus frequency relationship at the
Ord Ferry station is presented in the following tabulation:
SACRAMENTO RIVER ATEVENT ORD FERRY (flow in cfs)
500 year 666,000100 year 370,00050 year 300,00020 year 240,00010 year 210,0005 year 150,0002 year 98,000
A discharge versus stage relationship was developed for Sacramento
River at Ord Ferry in 1977. The discharge versus stage relationship
is presented in the following tabulation:
PEAK DISCHARGE GAGE HEIGHT*(cfa) (feet)
20,000 50.7850,000 57.55
100,000 64.50150,000 67.00200,000 68.55250,000 69.60
*The zero on the gage is at Elevation 50.00 feet Corps of EngineersDatum
G-66-4
1 i W - I I Ili w I
* 0
6. Demonstration Project Test Site.
a. Hydrologic characteristics. - The hydrologic characteristics
are described in paragraph 5. The nearest gaging station is located 0
at Ord Ferry approximately 4.5 miles upstream of the project site.
b. Hydraulic characteristics. - Average flow velocities in
Sacramento River in the vicinity of the demonstration site range from
t i4 to 6 fps at a discharge of about 30,000 cfs, and from 8 to 11 fps at
* discharges approaching 160,000 cfs. The velocity ranges are based on
the mean cross-sectional velocity as determined from discharge
measurements at the Ord Ferry gaging station and channel cross 0
* sections along the test reach. Velocity distribution within the
channel cross section was not determined.
* c. Site conditions prior to construction. S
(1) Riverbank description. - The natural ground elevation at
* the site is about 20 feet above normal summer water elevations and the
bank slopes varied from vertical to about 1V on 2H. The curve radius 0
at the site is about 3,000 feet and the channel has an overall
streambed width of about 400 feet. The Sacramento River Flood Control
Project levee is adjacent to the site. The river frequently flows
over the top of the natural bank and inundates the project site. S
(2) Bank materials. - Materials composing the banks and
valley floor of the Sacramento River are sandy and silty clay with
* deposits of sand, gravel, and clay. Logs of borings at the 0
demonstration site are shown on Plate 4. Soil classification for bank
material is given in Plate 5.
* (3) Normal bank vegetation. - Vegetation on the bank 0
consists of grasses, willows, cottonwood, buttonbush, and various
other shrubs and trees. Prior to construction, most of the vegetation
located at the project site was on a low level clay bench. The bank*o S
G-66-5
S 4 w w w-
0
slopes above the bench were sandy and did not sustain vegetation
because of the vertical slopes.
(4) Bank erosion tendencies. - Summer low flows erode the 0
toe of the bank and sloughing of the upper bank occurs when the bank
is saturated by winter floods. The downstream end of the test site
had been eroding laterally at a rate of about 8 to 10 feet per year
for the past several years. Recent analysis indicates that the 0
lateral erosion rate was about 15 feet per year immediately prior to
the start of construction of the demonstation site. Plate 3 shows the
cumulative bank erosion from January 1977 to April 1979, and Plate 2
shows the lateral bank surface area lost to erosion. 0
d. Environmental considerations. - Environmental aspects of the
project, including water quality, vegetation, fish, wildlife, benthos,
rare and endangered species, and cultural resources, were coordinated "
with other interested agencies. An assessment was prepared in
accordance with Section 404(b) of Public Law 92-500. A public notice
describing the proposed project was prepared and distributed to about
125 Federal, State and local officials and agencies, including
property owners in the vicinity of the project. The assessment of the
impacts of construction at the site was included. The selected bank
protection concepts reflect concern for existing on-site environmental
values. 0
III - DESIGN AND CONSTRUCTION
7. General. - Two types of bank protection are being constructed at
the site: (1) vegetative cover and (2) embedded concrete pile
groins. Schematic drawings of the project are shown on Plates 6, 7
and 8. These designs were based on engineering judgement, physical
characteristics of the site, soils and foundation investigations and,
in the case of the vegetative cover design, information on various
planting schemes developed by others. Use of vegetation for erosion
control along the Sacramento River is being investigated because
G-66-6
vegetation is considered by some to be esthetically pleasing and it
may provide wildlife habitat. The purpose of the vegetation cover
demonstration site is to evaluate the erosion resistance potential of
selected vegetation and planting schemes. Many areas along the -
Sacramento River have vegetation buffer strips along the top of bank,
and the concept of the concrete pile groin design was to allow
construction of erosion control facilities behind and/or at
intermittent intervals throughout vegetation buffer strips. This 0
method would eliminate the disturbances at the existing land-water
interface that are associated with construction of stone riprap. The
erosion would continue until retarded by the groins, thereby forming
an irregular bank line. This method of intermittent erosion 0
protection would preserve some of the natural land-water interface
along the bank and the area between the groins would be available for
root systems of vegetation.
8. Basis of Design.
a. Vegetative cover. - The purpose of the vegetative cover site
is to test the erosion control potential of selected plants and 0
planting schemes without the use of artificial supports or soil
stabilizers. The slope for the 1,000-foot long section of the
vegetation demonstration site is 1V on 2H below normal water
elevations and 1V on 3H above normal water elevations. A continuous
2-foot thick layer of stone riprap was selected for protecting the toe
of the slope below normal water. A 1V on 3H slope was selected for
the vegetation to be planted above normal water. This slope was
considered to be the steepest slope that could be stabilized by the
vegetation. In addition, a flatter slope would have required greater
disturbance of the existing bank slopes and berm area. The slopes at
each end of the site were warped to conform to the existing bank
• slopes. Literature on various vegetation studies conducted along the
Sacramento River was reviewed, and a list of plants to use in the
vegetation demonstration site developed. The plant list includes
trees, shrubs, ground cover, vines, and various grasses. The use of
G-66-7
various materials for adding support and strength to the soil and
plant root systems was not considered appropriate for this
demonstration site since the purpose was to test the erosion control
potential of vegetation, not artificial soil stabilizers. The common
names of plant species selected are listed below:
GROUND COVER,TREES SHRUBS VINES & ANNUALS 0
Valley Oak California Wild Rose Oregon GrapeCoulter Pine Elderberry California GrapeCalifornia Walnut Holly-leaf Cherry California PoppyCalifornia Redbud Coffeeberry Blue LupineBox Elder Toyon 0Cottonwood CeanothusIncense CedarBlack LocustWestern SycamoreWillow
0
Various parts of the vegetation site were hydromulched after planting
to permit observation of the results. The construction contract
required the vegetation to be planted in the spring, and the
contractor is responsible for watering the vegetation through the
first summer.
b. Concrete pile groins. - The downstream 500-foot long groin
demonstration site consists of poured-in place reinforced concretepile groins, as shown on Plates 6 and 7. The piles form a series of
embedded groins. The groins are each about 20 feet long and placed* perpendicular to the river flow at about 30-foot intervals. The
spacing and length of the groins was determined based on information
in a report published by the United Nations Economic Commission for
Asia and the Far East entitled "River Training and Bank Protection."
The spacing of 1-1/2 times the groin lengths was adopted for this
test, recognizing the narrowness of the Sacramento River, the
relatively high velocities, and soil conditions at the site. The
groin lengths are considered to be sufficient to move the eroding
G-66-8
4. - - - -lmm-dm - . . . w W . . . w
0
current away from the bank. The length of each groin was also limited
by site conditions. The piles are reinforced and tied together with a
concrete cap on top. Minimum compressive strength for the concrete
was specified as 2,000 psi. The length of the piles was determined 0
based on various loading conditions including the impact of high flows
and anticipated soil loads once material between the groins is eroded.
9. Construction Details. - The invitation for bids for construction S
was issued on 17 March 1980. A contract was awarded on 10 September
1980, construction is in progress, and the estimated completion date
is October 1981. The contractor completed construction of the
concrete pile groins in the latter part of December 1980.
Construction operations ceased for the winter months and resumed in
May 1981. Subsurface conditions encountered during construction
varied from the subsurface conditions shown in the contract documents,* resulting in constructive change orders. The contractor altered his
drilling and placement procedure. Construction of the concrete pilegroins involved working two adjacent groins simultaneously. A crane-
mounted hydraulic vibrator would drive a 24-inch diameter casing 4feet below pile tip elevation in one groin while a crane mounted auger Sdrilled out the previously driven casing in an adjacent groin. The
drill crane would then hang the rebar cage in the drilled out casing
while a concrete pumper located between the two cranes placed concretefill using a full depth steel trunk. The vibrator crane then pulled 0
*. out the completed pile casing at the second groin and immediately
drove the same casing into the first groin. The crane auger then
started drilling out the next adjacent casing and the cycle continued* until completion of the two groins. It is not expected that differing S
site conditions will be encountered at the vegetative cover portion of
the demonstration site. Construction of the vegetation site consists
of excavating the required slopes, placing the stone riprap toe* protection, planting the vegetation as described in paragraph 8, and S
watering the vegetation through the first summer.
* S
G-66-9
- - - - - - -
10. Cost. - The estimated construction cost for the 1,000-foot long
vegetative cover site is $220,000 or $220 per lineal foot of bank.
Due to the constructive change orders, the estimated cost for
construction of the 500-foot long concrete pile groin site has
increase from $220,000 to $380,000, or from $440 to $760 per linealfoot of bank. Barring any additional constructive change orders, the
estimated total construction cost for the demonstration site will be
about $600,000. The estimated final allocation of total project costs 0
is shown below:
Contract Construction Cost $600,000Engineering and Design 67,000Supervision and Administration 34,000Operation and Maintenance Manual 4,000Final Report 3,000Total Allocated Funds $708,000
The above costs do not include costs incurred by the State Reclamation
Board in procuring rights-of-way for the project.
IV - PERFORMANCE OF PROTECTION
11. Monitoring Program. - The monitoring program that will be used at
this site is outlined on Plate 9. Field observations, surveys andphotographs will form the basis for evaluating the erosion control
performance of the bank protection demonstration methods. Bankerosion will be monitored and documented by photographs and surveys.
Displacement of project structures will be documented, and shoulddisplacement bccur, pertinent hydraulic and soils data will be
analyzed so that corrective actions can be considered. Districtpersonnel will note predominant current directions and eddy currents
and will obtain velocity data adjacent to the site by float
measurements. Point bar growth just opposite and downstream of the
site will be monitored. During the monitoring phase of the project,
spot surveys of river cross sections will be made annually. Should
these spot surveys indicate that significant changes in bank or river
G-66-10
I
cross sections are occurring, more extensive surveys will be
considered on an as-needed basis. Natural environmental conditions
such as vegetative growth, flora, and wildlife in the project vicinity
will be noted and photographs taken. The project area will also be 0
video taped prior to, during and immediately after construction.
12. Evaluation of Protection Performance. - Preliminary observation
of the performance of the concrete pile groins has been possible since S
the groins have sustained one winter's flow. Seventeen concrete pile
groins were constructed as shown on Plate 6. The groins were
inspected in April 1981. Most of the groins were found to be
completely embedded in the natural river bank with no portion of the
structure being visible. However piles 5, 11, 14, 15 and 17 had been
partially exposed due to the erosive action of the river and bank
failure caused by flow over the berm. Piles 5, 11 and 17 appeared to
e have been exposed by river currents, whereas piles 14 and 15 appeared
to have been exposed by flows over the berm returning to the river.
During construction of the vegetation cover section, the area
immediately behind the groins was regraded so return flows on the berm
would be diverted away from the groins.
13. Rehabilitation. - None.
14. Conclusion. - The only conclusion that can be made at this time
involves the engineering and construction of the concrete pile
groins. The concrete pile groin method involves greater engineering
costs than conventional bank protection practices because of the need
* for detailed explorations to identify subsurface conditions. Even
after exploring, there are still unknowns that can increase
construction costs, as was experienced at this demonstration site.
Soil conditions varied from one drilled hole to the next, with sand
* and gravel layers at different elevations between holes. Also 0
encountered was the unexpected presence of trees, stumps, and other
subsurface debris, all of which, acting together, increased
* SG-66-11
W W W W W W W W
construction costs. The concept of the concrete pile groin design was
to allow construction of erosion control facilities set back from
and/or at intermittent intervals along the river bank, thereby leaving
the river bank or strips along the bank undisturbed by construction.
However, the construction area actually required for maneuvering the
cranes and the additional area needed for access of the pump and
concrete trucks is greater than anticipated, and the berm was
disturbed for the entire length of the groin site.
G-66-12
W 0
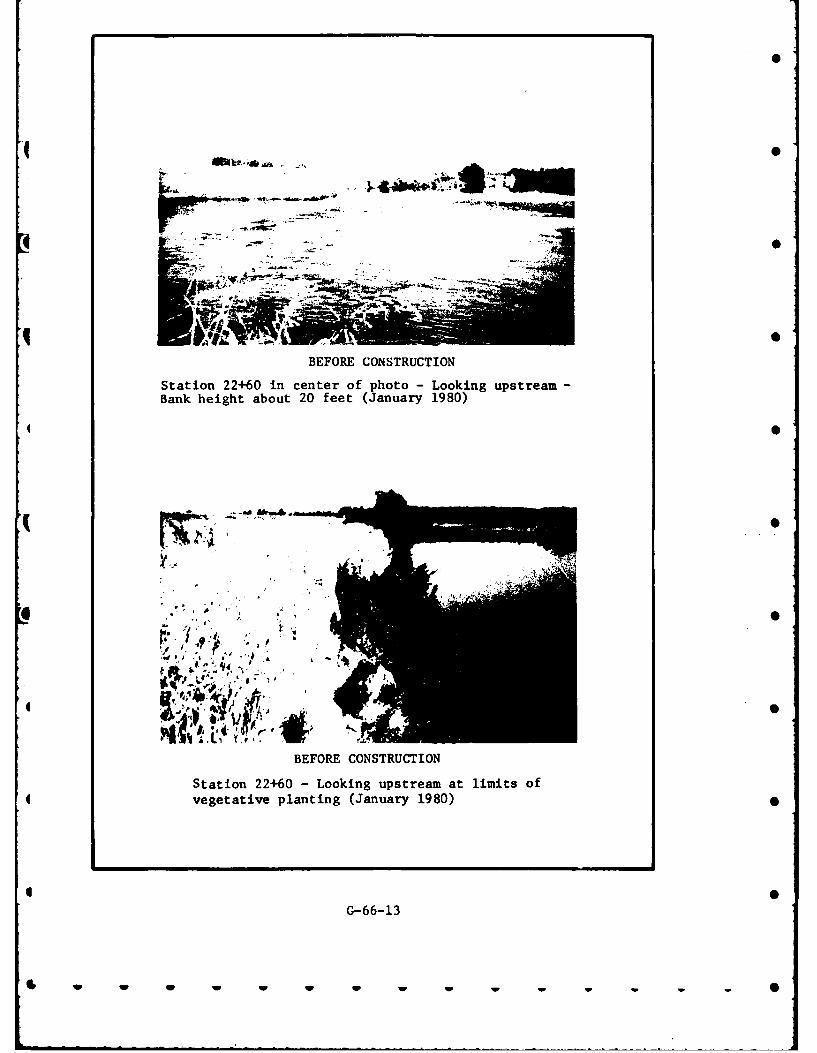
BEFORE CONSTRUCTION
Station 22+60 in center of photo - Looking upstream-Bank height about 20 feet (January 1980)
t:. . .
BEFORE CONSTRUCTION
Station 22+60 - Looking upstream at limits of4 vegetative planting (January 1980)
4
G-66-13
- - - - - -w - - - -
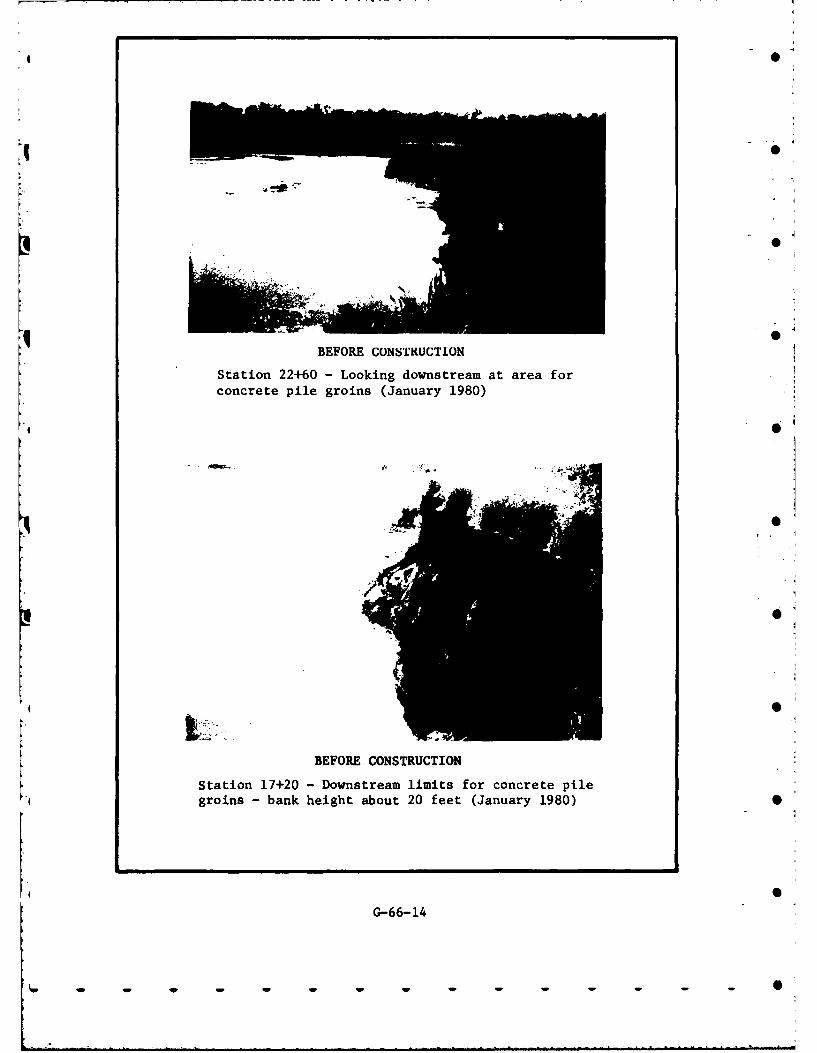
BEFORE CONSTRUCTION
Station 22+60 - Looking downstream at area forconcrete pile groins (January 1980) 3
BEFORE CONSTRUCTION
Station 17+20 - Downstream limits for concrete pilegroins - bank height about 20 feet (January 1980) 0
G-66-14
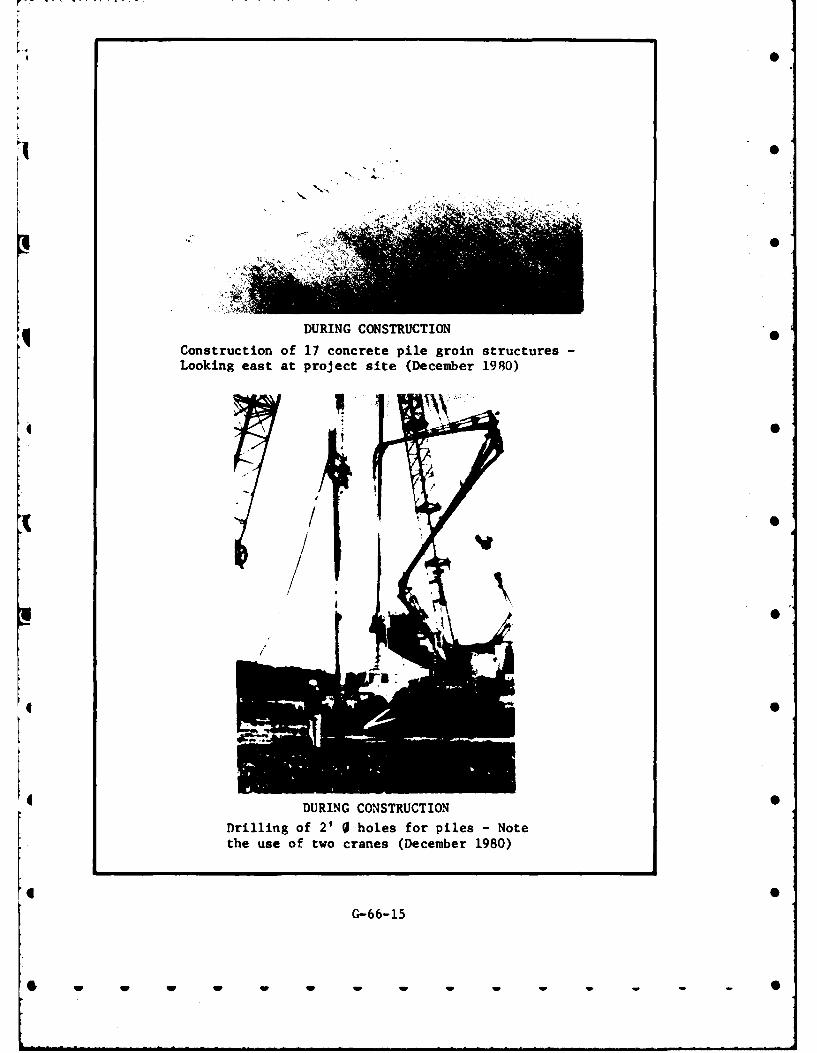
0
14
DURING CONSTRUCTION
Construction of 17 concrete pile groin structures -Looking east at project site (December 1980)
4 S
/ 0
1S
4 .
DURING CONSTRUCTION
Drilling of 2' 0 holes for piles - Notethe use of two cranes (December 1980)
G-66-15
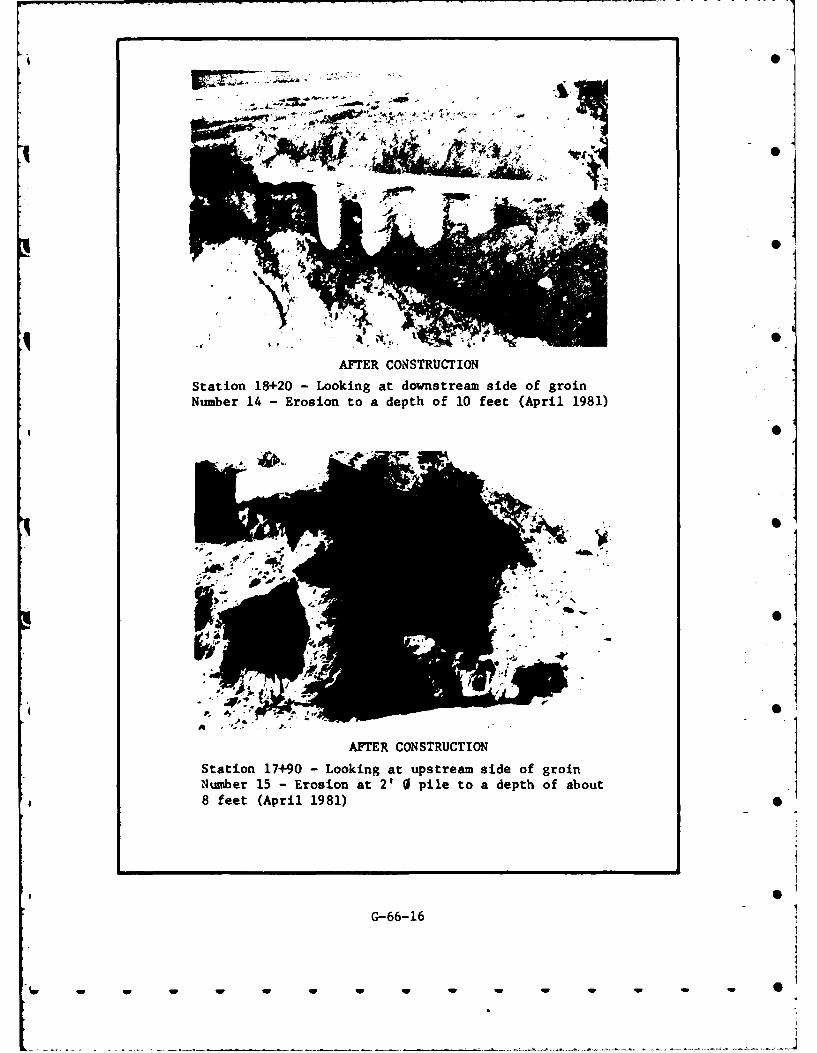
0
Number 14 ~ ~ ~ '~.''* -Erso oadpho 1 et(pi 91
4
''PA
q ..7
AFTER CONSTRUCTION
Station 18+20 - Looking at downstream side of groin
Number 14 - Erosion to a depth of 10 feet (April 1981)
AFTER CONSTRUCTION
Station 17+90 - Looking at upstream Bide of groinNumber 15 - Erosion at 2' 0 pile to a depth of about8 feet (April 1981) 0
G0-66-16-
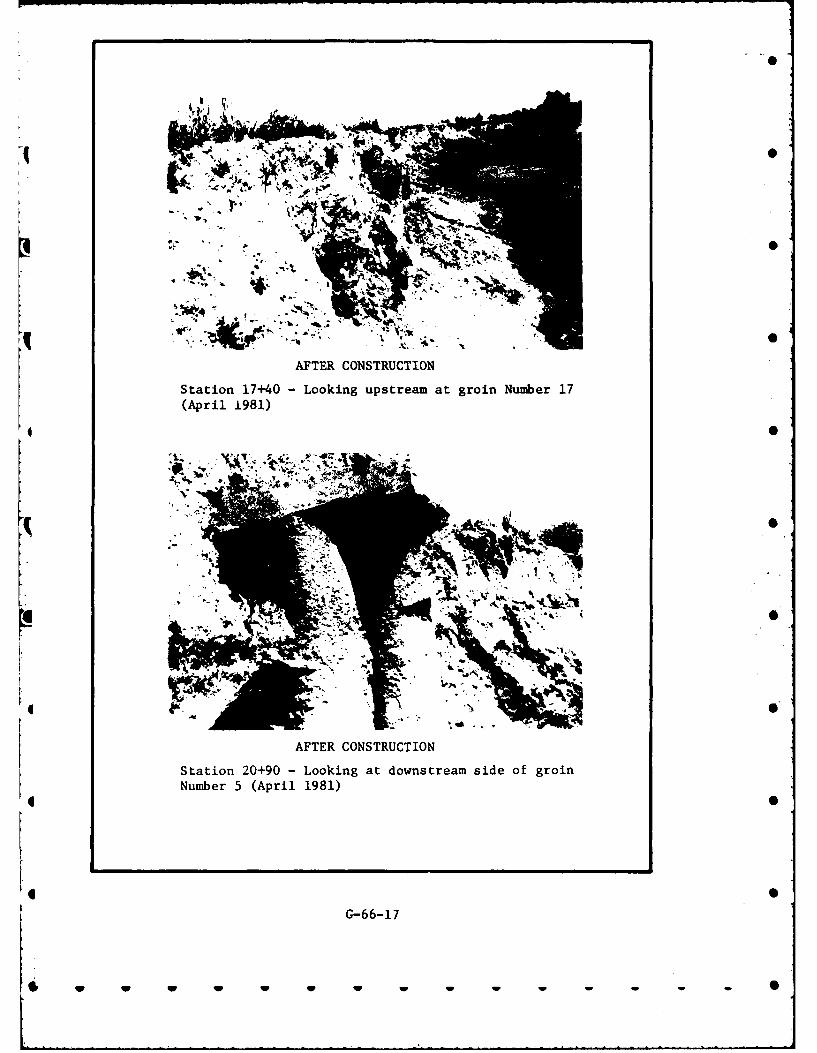
4S
-ItS
AFTER CONSTRUCTION
Station 17+40 -Looking upstream at groin Number 17
(April 1981)
4 b,
AFTER CONSTRUCTION
Station 20+90 -Looking at downstream side of groinNumber 5 (April 1981)
G-66-17
Wp W W W W W W W W W W
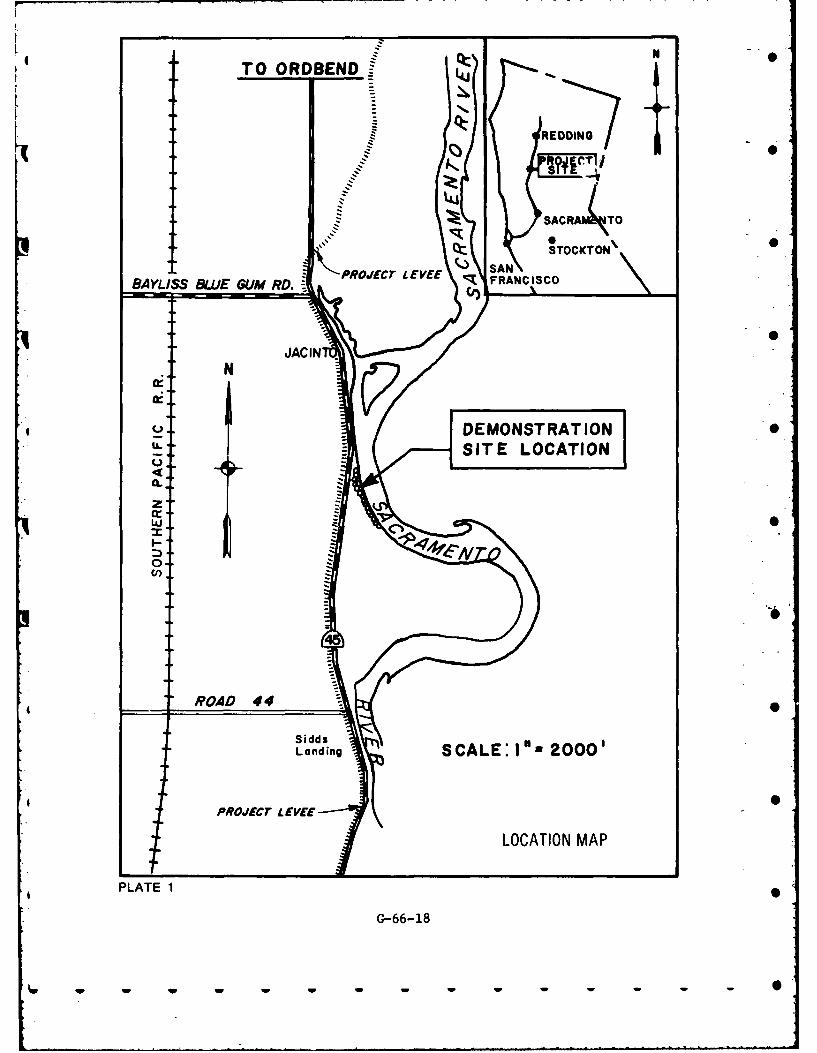
z0
TO OROBEND
K REDDING
SAC RATO
STOCKTON~
- PROJECT EVEE FRANCISCOBAYLISS BLUE GUM RD.;_________
JACIN
N
DEMONSTRATION
w
4 -- ROAD 4 4
Landing SCALE: I's 2000'
PROJECT LEVE
LOCATION MAP
PLATE 1
G-66-18
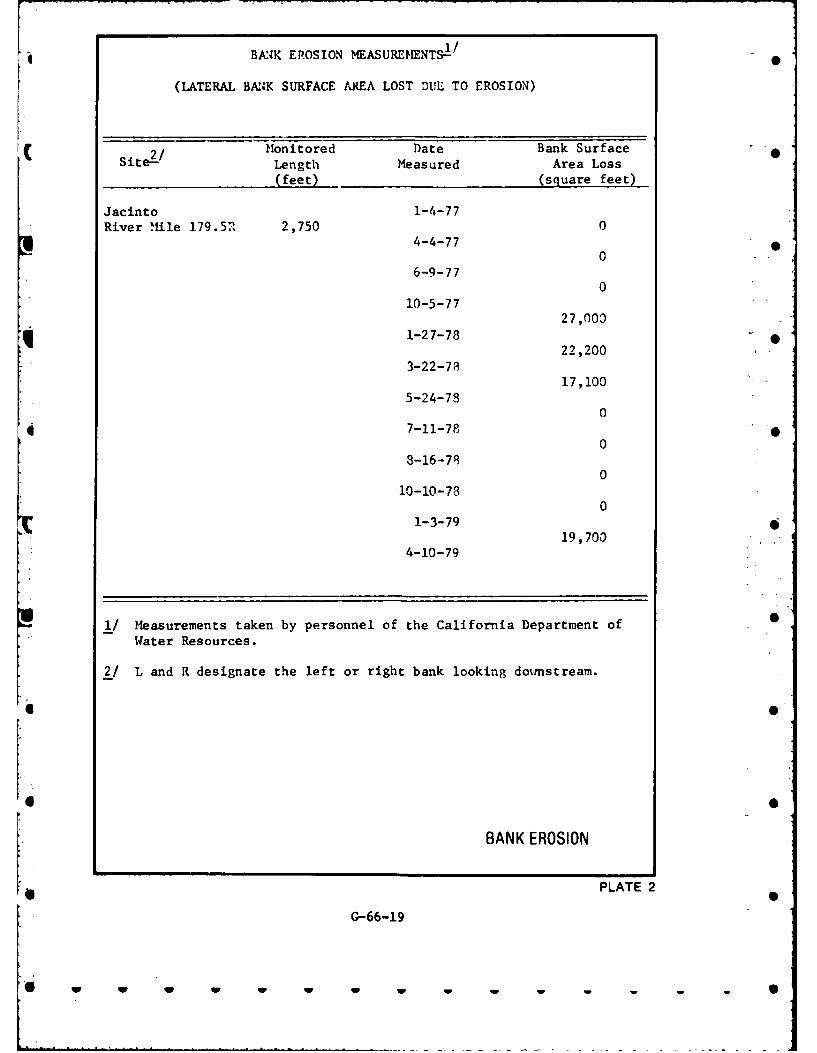
1/BANK EROSION MEASUREMENTS--
(LATERAL BANK SURFACE AREA LOST DUL TO EROSION)
Monitored Date Bank SurfaceSite-'/ Length Measured Area Loss
(feet) (square feet)
Jacinto 1-4-77River .1ile 179.5" 2,750 0
4-4-77 0
06-9-77
0
10-5-7727,000
q 1-27-78 222,200
3-22-7817,100
5-24-780
7-11-780
8-16-780
10-10-780
1-3-7919,700
4-10-79
l/ Measurements taken by personnel of the California Department of 0
Water Resources.
2/ L and R designate the left or right bank looking dowmstream.
*, .
BANK EROSION
PLATE 2
G-66-19
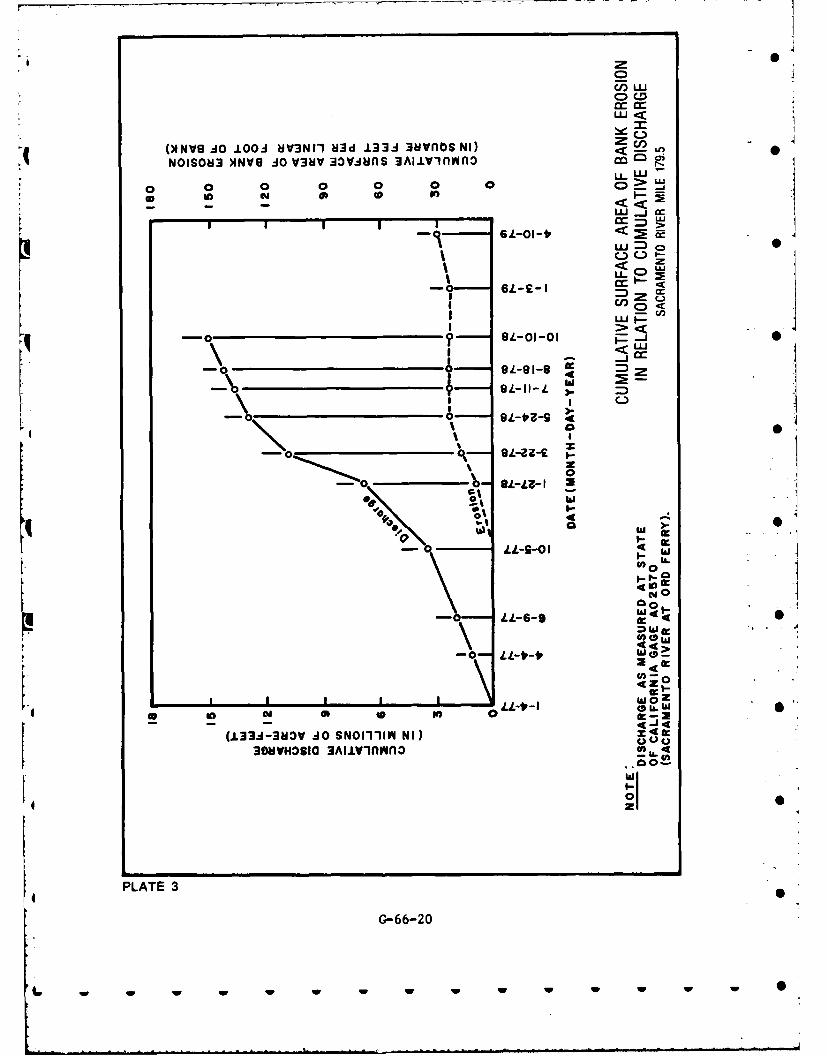
00
LLLU <
0 0 0 0 0 0 0 C* N 0 * I
I I -c
<~ cc
6LI L I. cc
PLAT (13 :3 &i~ v4:NI) LL6C-*
w 0
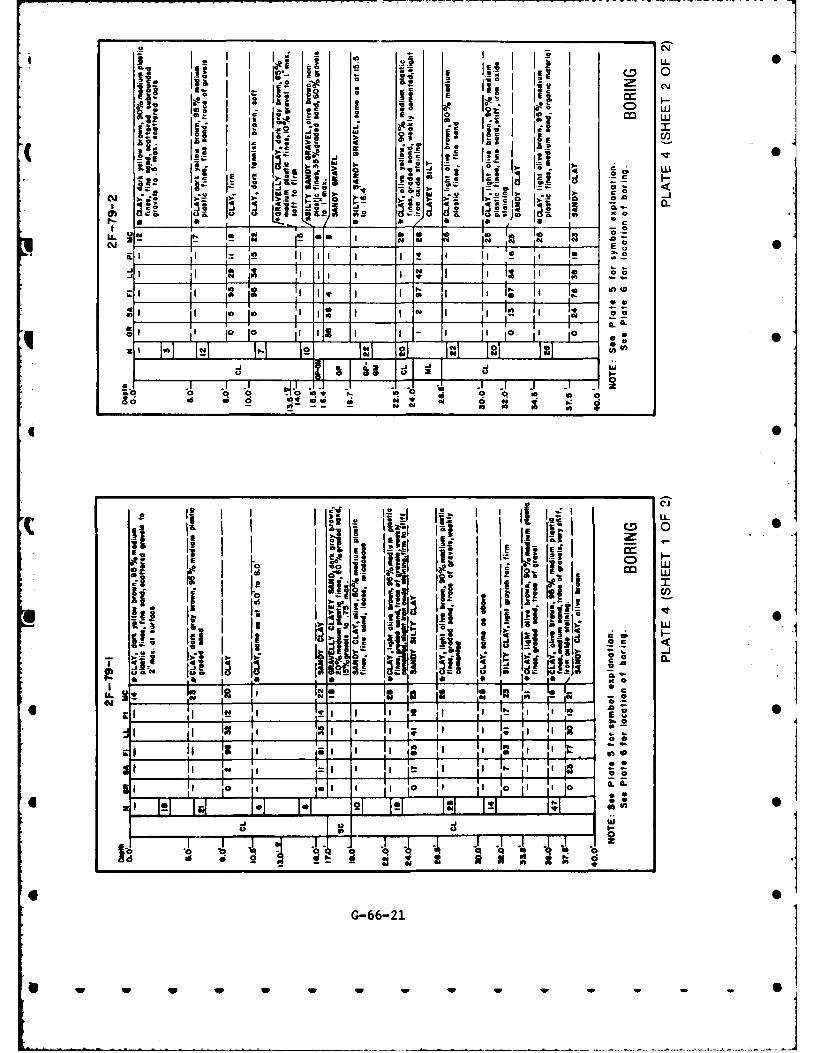
.1.0 0 1=
we I, 0. C L. I ~ m LL
A-
0
01 01, .! Ii 1 i
I , -A2 I c
0 -d-
~~~ I. -
Is
100
I -. . - -7
Pi i
I I 3.
~ i I i -
I0 1 c- U)I 'c 1
T i-0
c, l ta.c -
___IN
0
lm3 0
-2 21 1-- -, I IN I II
9 d
G-66-21
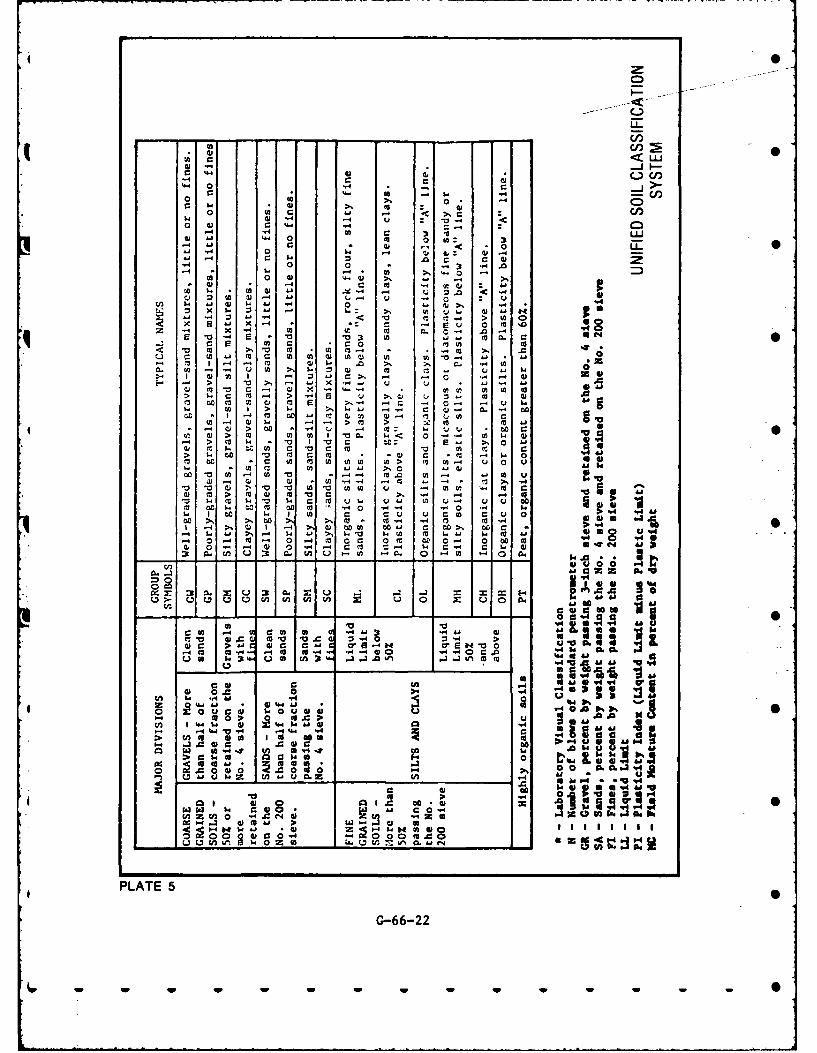
CDS
00
<- L,
14 '4 LII
"4
4.40 0 4 )
41 u4 40444
44 4.1 0 (A o A LU X A cc 44 - - * 0L
-J a4 c 0- r4 W44: 4cc4 .- C3 4- . m4
u ( (n "4 *A w A V) '-o* -4 - 4 C ( )~4
C AL. * A 4 U) >," m U w. "0(D V) I Z " .- U *-4 -4 0
0 414 X4 "4>- S. (A .,4 u '4 (
'C '0 A > ca 0
a) >- m "4A I. w- <0 -4*0 >A cc wA 1 .W: 0. &
Q) CC I.. t(A 0 a j ( C C(A 4. A C (A mA w 44 M (A > (1 A '0- u 0 u. 0w
00 .0 . CA "a M. >. 0 " toA.. ( - ,f . GO 0) >, M. 44 vA (A , (40
a >44 a '-4 cc c 4
w- c > cc0 ) - ~ ".. U U * - -4 Uc A44 cc w0 to m 00 to "4 ' 4-0-4 wAA ( ( 4
00 W vA 0 "4 (A U 41 . ~ (
WC -4 ( D CO A.. (0 C:4 o >' 9 "L. -4 4N (.4 w - S. A -0 w c WA mA w 'I.4 4
-4 04 r- 0' cc 00 C0 0C 5. 0V4 CC ca a) (A C- 41C(A' A
a, 4- -a( A 4 44 '4 4
0. C A (A :1 ow'. fn u .44M4w
w ~ M4 V4 444 4A (A *44 -C S. "
In W04 c W0 '0 (A '0 4 U - (AA U4 A (AV2 V- C 4 to V- V CU a 4 z '. CC z- U U0 a". Iw4 (A> A 44 (w '0 C A4 - -4 &4 V (0( C M- CC - (a to -A "4 0 "4" .0 $4 (
- I d CC 4- .3 (A C3 CU Uc C C Uacc~~~~- 41 .0c 44' ( 4 ( A"
44 0 C- 4 0 4 CC -4 4 44 ( 4- 4
0 :0. wo " U r. 0.. COj 4, ( ' 0 A 0% 0
4.4 4 Z A. 44 "
( 0 0 "40" ima a0
4 0 44.4 0 604, 0 0' *0 "A! 'A 3
*-4CC A'v4 A (AA "4 44 k0 . -4 0.0
V4 0.44 1 4( 0 .4 0 AP.CO 4- '.445 .4 Q
"Z0 044- &J 44)4 z g4 P m 00 0 08! 400..4 0 OO AW- 0 A0 W v% 0A z NL Wr A
PLAT 5 4-- 4 4--4
- .- 4'4~'.G-66-22
W(U wD I( w0 w w w w w w w w w w
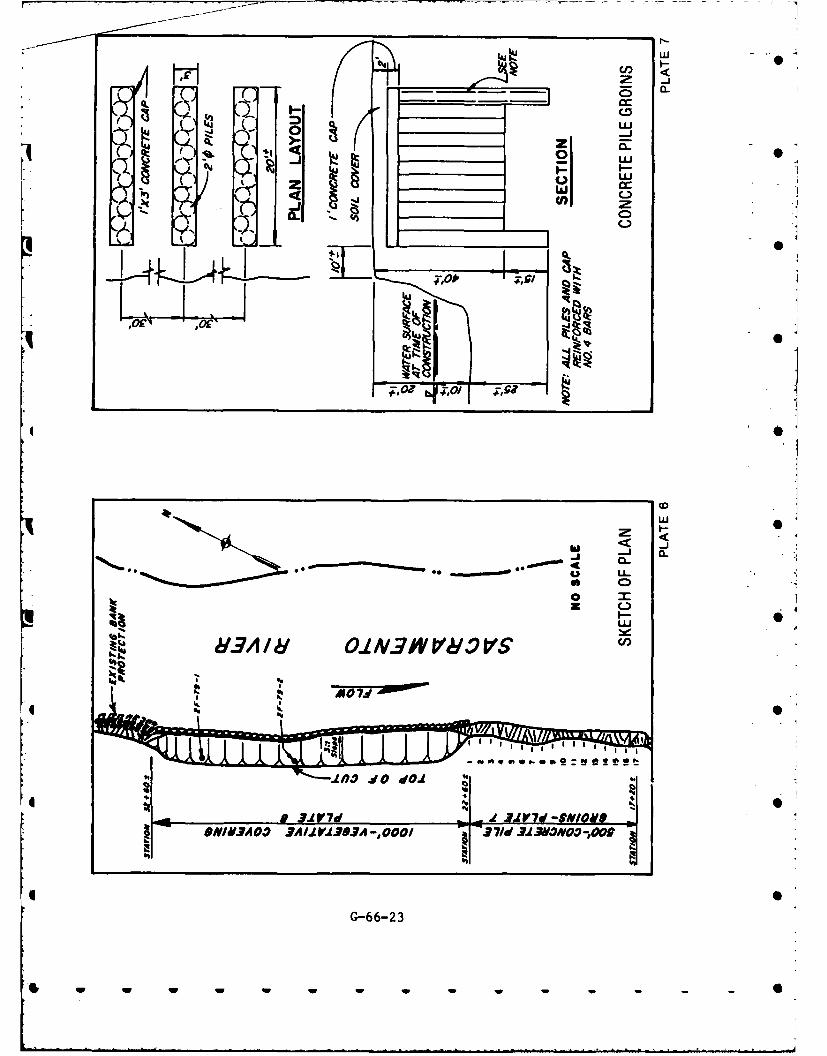
I'J~ LU00
LU
-A" C.__ _ _
~ LU
LL
I--
Moldk
4
...........
f~ 0 NJ Of 7dW 3JfdS S/m
UN/VA0 03 AIL VJ303A -,F000I 371d iJJ3fN03-O0
G-66-23
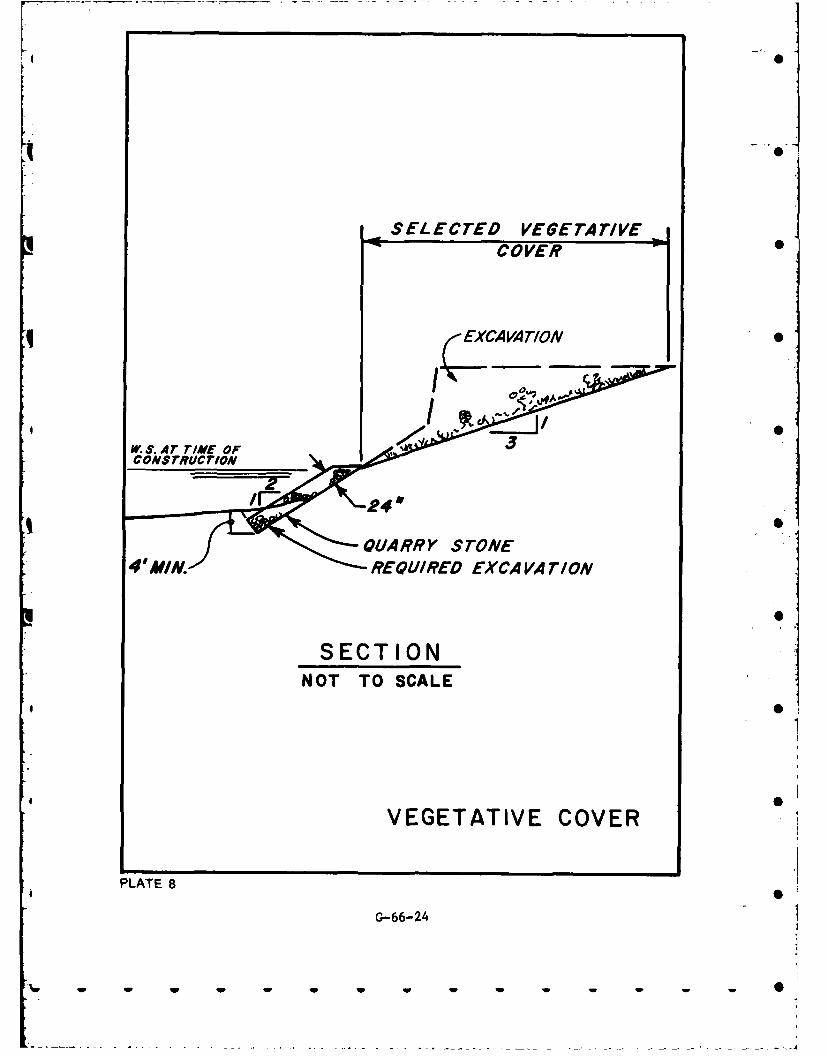
SELECTED VEGETATIVECOVER0
r EXCAVATION
'S A
4#MIN.REQUIRED ExcA VA TION
SECT IONNOT TO SCALE
VEGETATIVE COVER
PLATE 8
G-66-24
'ml w -w w q w- - 0
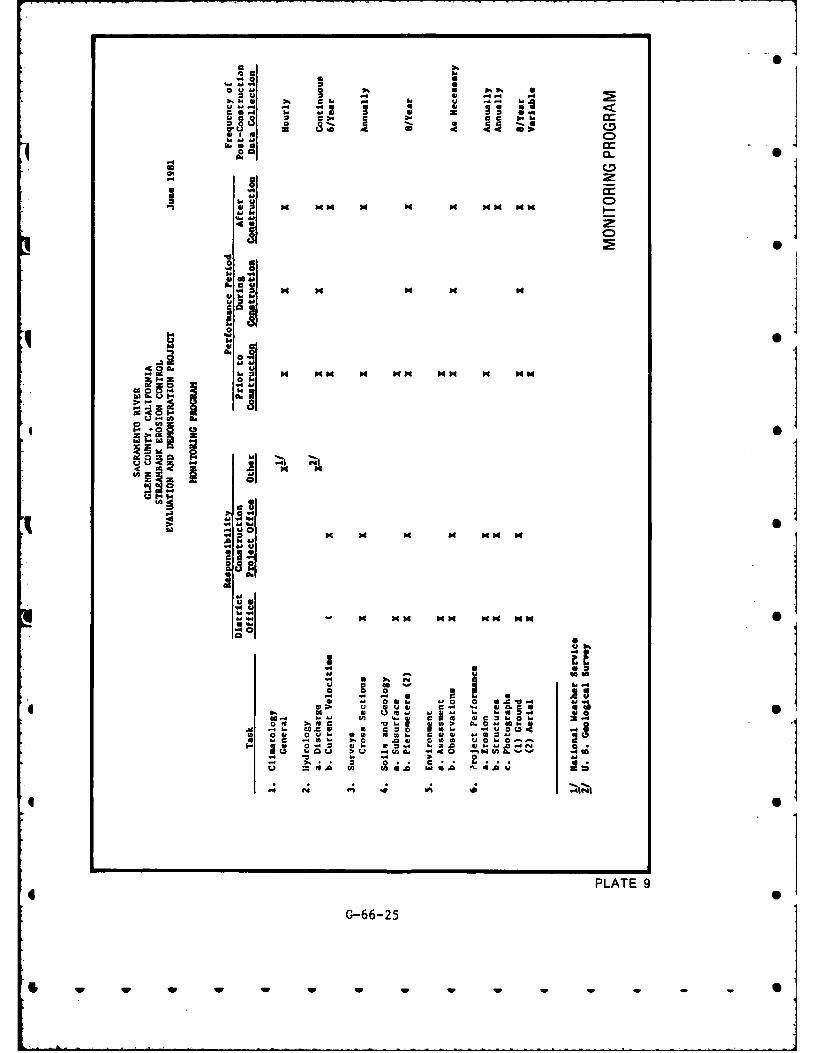
aJa2 u
2;1 20 1 . .. . c
"412 M M K K K MM KMN
a o-
"8 0
.
.4 0
Id 0
1.8
. .3 w
! ..U
8 ,
P44LAT 9
. I--d-2
0I'IN
0.41.41* 0 SC 0
to4 9 o" t 6 .* 4.. K M MM KMfK
A In
-~ - - - - - - - - -
S
1 0
I 0
q S
4 S
WHITE RIVER NEARJACKSONPORT, ARKANSAS
1: 0
0
I S
I 0
I
0 w w w w - S
R-A121 139 THE STRERMBRNK EROSION CONTROL EVALUATION AND 4/4 V
DEMONSTRATION ACT OF 1974 S.. (U) ARMY ENGINEERWATERWAYS EXPERIMENT STATION VICKSBURG MS HYDRA..
UCASIFIED M P KEOWN ET AL. DEC Si F/G 13/2 , NEhhhh NO E L shhiEw-omhhhhhhhhhhIEhhhhhhhhhhhhIm1I-I--..smhhhhhhhhhhh
*f0000flf
IND
mC
I
11011-
="I~liii. '.- 4 1111I- ii . -l o
MICROCOPY RESOLUTION TEST CHARTNATIONAL BUREAU OF STANDARDS-1963-A
L.
.I
I
K. . *
Section 32 Program Streambank Erosion ControlEvaluation and Demonstration Act of 1974
JACKSONPORT STATE PARK BANK PROTECTION WORKSDEMONSTRATION PROJECT PERFORMANCE REPORT
I. INTRODUCTION
1. Project Name and Location. This project is called the Jacksonport
State Park Bank Protection Works. It is located on the White River,
Mile 260, near the town of Jacksonport, in Jackson County, Arkansas,
Photo I and Plates I and 2 show the project location.
2. Authority. Streambank Erosion Control Evaluation and Demonstration
Act of 1974, Section 32, Public Law 93-251.
3. Purpose and Scope. This report describes a bank erosion problem,
the types of bank protection used, and a performance evaluation of a
demonstration project on the White River at Jacksonport State Park. The
protection works were constructed and monitored by the Little Rock eDistrict.
4. Problem Resume'. The average recession of the park bankline between
1949 and 1975 was 6 feet annually. Within the project area, erosion of "
the park shoreline caused as much as 35 feet of parkland to cave into
the river between 1973 and 1975. Continuing erosion and loss of
parkland produces significant damage and adversely affects the
navigation channel, Jacksonport State Park, and surrounding area in the
following ways:
a. It discourages development of the park along the riverbank by
4 threatening facilities placed near the bank.
b. It threatens the existing locally constructed Jacksonport
levee.
G 7G-67-1
S w Ww-
c. It threatens, and will eventually destroy, the overall historic
and environmental setting of this park which is associated with early
river navigation during the steamboat era, and is listed in the National
Register of Historic Places.
d. It presents the possibility that the river may eventually cut
across the narrow neck north of Mason Bend, creating an island and
cutting off the lower end of the park from land access.
There were no existing improvements related to the correction of bank
erosion problems prior to project inception.
II. HISTORICAL DESCRIPTION
5. Stream Description, General. The White River rises in northwest
Arkansas, flows northerly into Missouri, thence easterly and 0
southeasterly through eastern Arkansas to join the Mississippi River
about 61 miles upstream from Greenville, Mississippi. It is about
720 miles long and has a total drainage area of 27,765 square miles,
* 10,622 in southern Missouri and 17,143 in northern and eastern 0
Arkansas.
6. Topography. The White River rises in the Boston "Mountains" in
western Arkansas. The elevation of its source is about 2,050 feet above "
mean sea level and low water elevation at the -outh is 107 feet above
mean sea level. The fall ranges from 25 feet per mile near the source
to an average of 0.3 feet per mile downstream from the Black River.
The demonstration project is about 0.5 mile downstream from the mouth of
Black River. The topography in the project area is flat with a regional
slope to the south in this vicinity, the river is characterized by a *
meandering channel and flat slopes. Riverbanks range from 20 to 25 feet *
in height and channel widths from 200 to 400 feet. Along the park
shoreline, the low bank area is about 215 feet above mean sea level and
high park land is 220 feet above mean sea level.
G-67-2
7. Geology. The demonstration project lies in the Mississippi Alluvial
Plain of the Coastal Plain Province. The site is characterized by two
flat surface configurations. The flood plain comprising the lower
surface is underlain by sediment deposited in recent times. The higher
surface is a dissected plain or terrace about 10 to 35 feet above the
flood plain and underlain by deposits of glacial age. The well defined
i* traces of river migration on the surface of the flood plain show that
all the flood plain area is a part of the meander belt.
Alluvial deposits under the flood plain have a total thickness of about
*75 feet. These consist of a coarse grained substratum of coarse sand
and gravel and a fine grain top stratum of clays, silts, and fine sands.
The top stratum sediments have been deposited by the present day White
- iand Black Rivers and generally form a continuous blanketing layer
averaging 10 to 20 feet in thickness, although locally it may be just a
few feet thick or absent. Underlying the bottom stratum deposits are
interbedded, fine-to-coarse-grained sands and carbonaceous clays of the
Wilcox Group of Teritiary Age. Point bar deposits are generally less
than 20 feet thick. Channel filling in abandoned meanders are generally
less than 30 feet thick. Soils borings were made along the project 0
length. Specific soils logs and borings locations are shown on Plates 4
and 7.
8. Hydrologic Characteristics. The climate of the demonstration area 0
is humid. Summers are usually long and hot and winters relatively short
!*, and mild. The maximum and minimum temperatures as recorded at Newport,
Arkansas, (located about 3 miles from the demonstration site) were
114 degrees and minus 14 degrees, respectively, and the average annual
;" temperature at that location is about 61 degrees. The prevailing wind
" is from the south and has an average velocity of about 7.5 miles per
hour. The average annual precipitation over the area, based on the
" standard United States Weather Bureau mean at the Newport station, is
50.0 inches. The wettest and driest years of record had 80.88 and
22.35 inches of precipitation, respectively. The average annual
.* snowfall, based on records from the Newport station, is about
G-67-3
. W
7
6.0 inches. Runoff from the melted snow seldom contributes to flooding
in the area.
9. Flooding conditions.
General. The community of Jacksonport, Arkansas, is subject to flooding
by the White and Black Rivers. Partial protection from frequent
flooding is provided by a locally constructed levee which separates the
community and portions of the park from the riverfront parkland and
facilities. Riverfront parklands are about 220 feet above mean sea
level and are flooded normally about once a year for a period of about
three days.
Normally, the principal flood season occurs during the late winter to
early summer season. However, intense local storms can occur at any
time of the year. Since 1964, discharges and flow durations on the
*' White River at Jacksonport have been modified by five major flood
control reservoirs constructed in the upper basin. A tabulation of mean
monthly flows for 13 years is shown on Plate 6. Hydropower generation
* has also affected daily flows past the site. Typical flood hydrographs
are shown on Plate 5. Discharge rating and discharge duration curves
are shown on Plate 5. Discharges at Jacksonport for 5, 10, 50 and 100
year frequencies of recurrance are about 112,000, 164,000, 340,000, and
388,000 c.f.s. River discharge profiles through the reach are shown on
Plate 3.
10. Bank erosion. The riverbank at rhe project site is subject to
continuous attack by river currents. The high bank along the west side
of the park was practically vertical, unstable, and dangerous to park
visitors. Typical pre- project riverbank sections are shown on Photo 2
through 9 and on Plates 9 through 12. Loss of valuable parkland, trees,
and vegetation has occurred as a result of bank caving and sloughing.
A comparison of 1964 and 1975 aerial photographs indicates serious bank
caving has occurred along the entire project site. As much as 35 feet
G-67-4
w
of parkland caved into the river during that period. The parkland river
bank receded an average of about 6 feet annually between 1949 and 1975.
11. Environmental considerations. A large portion of the areasurrounding the project site is agricultural land and clearing has
occurred almost to the river banks leaving a small corridor of timber
and grassland. Within the lower White River region, this segment has a
low wildlife potential. Most understory species of plants have been 0
eliminated. Within the immediate project site, willows and grasses
predominate in the low bank area and native trees occupy the high bank
area of the park. Small mammals and birds are well represented in the
park. Numerous species of fresh water fishes are found in the White
River. Amphibian and reptilian fauna is abundant and quantitatively
consistent in the area. No rare or endangered species are known to be
in the vicinity of the work. The Little Rock District Engineer found
that no long- range adverse environmental impacts will occur as a result 0
of the implementation of the improvements and there are no unresolved
conflicts. In accordance with the National Environmental Act of 1969
(PL 91-190), he determined that an Environmental Statement is not
required. 0
III. DESIGN AND CONSTRUCTION
12. Scope. A boat mooring slip is located at the Jacksonport 0
waterfront. The slip plus about 150 feet of the left bankline upstream
and downstream from the slip are protected against river velocity
erosion with a quarry run stone paved revetment section. The
* demonstration site extends along the left bank of the river for a
*, distance of over 4,000 feet downstream from the boat slip protection. A
plan view with project stationing is shown on Plate 7.
*G 13. Basis of Design. The demonstration project protection consists •
basically of a standard quarry run stone toe revetment section along the
full length of the site plus various combinations of stone, compacted
clay, and uncompacted clay in situ sections on the upper bank slopes.
G •• ° 0-67-5
The elevations of the protection sections were related to the
construction reference plane (CRP) of the project reach. The CRP
corresponds to the water surface profile for a very low river discharge -
about 3,000 c.f.s. The toe trench section was designed with an adequate
volume of stone to launch and protect the bank from all anticipated
riverbed scouring. Greater scouring tendencies were anticipated at the
upstream end of the site, and larger stone sections were provided. The
* bottom of the toe trench was established so that its excavation would be
not more than 5 to 6 feet below the anticipated water surface during the
expected construction period. The top of the toe trench section was set
10 feet above the CRP.
a. Test Sections. Eight different revetment cross-section designs
incorporating various toe sizes, types of material (clay or stone) and
heights of upper bank protection were developed. Label Sections A through
H, details of each are shown on Plates 9 through 12.
b. Test Reaches. As layed out in the field, the demonstration
project consists of 13 test reaches each incorporating various lengths
of one or two of the test sections. Each test reach is described in the
tabulation on the following page.
c. Stone. Stone fill material for protection design is based on
dumped quarry-run stone available from a local quarry about 18 miles
from the site. Specified gradation was maximum size of 350 pounds with
50 percent weighing 25 pounds or more.
d. Clay material. Samples of clay from borings JP-7 through JP-12
were tested for dispersion by pinhole erosion, total cation, and SCS
dispersion tests. The samples all tested non-dispersive.
Twelve samples of clay from borings JP-7 through JP-12 were classified
in the laboratory. One sample from 7.5 to 8.0 feet depth in boring JP-9
had I percent sand and 99 percent fines. It had a liquid limit of 51, a
plastic limit of 18, a plasticity index of 33, and was classified a fat
G-67-6
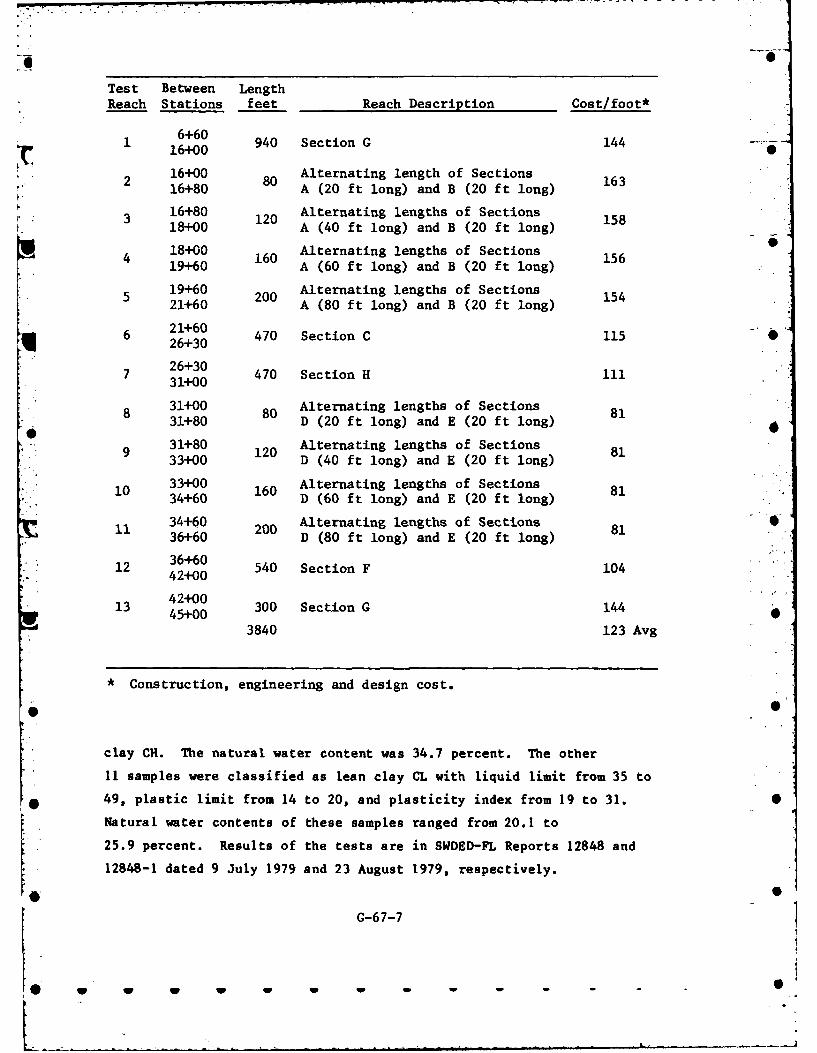
•0
Test Between LengthReach Stations feet Reach Description Cost/foot*
6+60
1 6+60 940 Section G 144
16+00 Alternating length of Sections2 16+80 80 A (20 ft long) and B (20 ft long) 163
16+80 Alternating lengths of Sections3 68 120 15818+00 A (40 ft long) and B (20 ft long)
4 18+00 Alternating lengths of Sections 15619+60 160 A (60 ft long) and B (20 ft long)
5 19+60 Alternating lengths of Sections21+60 200 A (80 ft long) and B (20 ft long)
6 21+60 470 Section C 115
26+30
7 31+00 470 Section H 111
8 31+00 80 Alternating lengths of Sections 8131+80 D (20 ft long) and E (20 ft long)
9 31+800 Alternating lengths of Sections 8133+80 120 D (40 ft long) and E (20 ft long)
1 0 33+00 160 Alternating lengths of Sections 8134+60 D (60 ft long) and E (20 ft long)
ii 34+60 Alternating lengths of Sections36+60 200 D (80 ft long) and E (20 ft long) 81
12 36+60 540 Section F 10442+00'42+00
13 45+00 300 Section G 144
3840 123 Avg
• Construction, engineering and design cost.
S 6
clay CH. The natural water content was 34.7 percent. The other
11 samples were classified as lean clay CL with liquid limit from 35 to
* 49, plastic limit from 14 to 20, and plasticity index from 19 to 31. 6
Natural water contents of these samples ranged from 20.1 to
25.9 percent. Results of the tests are in SWDED-FL Reports 12848 and
12848-1 dated 9 July 1979 and 23 August 1979, respectively.
* S
G-67-7
* W W W W W 4 - - •
L • 1The graded clay bank paving and clay fill bank paving is compacted by
making not less than 6 passes over the entire surface by a track-type
tractor weighing at least 10 tons and exerting a unit pressure of not
less than 6 pounds per square inch or by 6 passes of a sheep's-foot
roller.
e. Disposal site. Disposal of excess earth from revetment
excavation is placed in a berm along the east border of the park. It is
a semi-compacted earth embankment having a crown width of 24 feet, grade
elevation 226 feet, m.s.l. and side slopes of 1V on 3H.
14. Construction Details. The contractor started clearing, grubbing,
and grading the top bank in the fall of 1978. He was delayed by high
river stages until June 1979. To expedite the work, in 1979 he was
allowed to build the toe section 3 feet higher than specified until
lower river stages occurred in late September. Transition to the
specified lower section was accomplished in the vicinity of Station
18+75.
The contractor used the top of the toe section berm for truck delivery
of stone fill for revetment construction. Temporary down ramps at
convenient points along the bank were allowed for access to the toe berm
and deliveryof stone fill material and equipment. Where a bermed toe
section was not specified (Station 30+20 to 41+15), the contractor
* added, temporarily, an excess of stone fill to the toe section as a
working berm for stone placement. At a convenient time, excess stone
fill was removed for bank paving fill and the toe section restored to
its specified dimensions.
During the winter of 1978-1979, high river flows of 122,000 c.f.s.
resulted in stages of about elevation 224 and caused some bank caving in
the vicinity of Station 29+00. About 200 to 300 feet of bank was
affected. As a result, the revetment was realigned about six to eight
feet landward of the proposed alignment.
G7G-6 7-8
Project construction was completed in February 1980.
The total contract cost of the Jacksonport Demonstration Project
amounted to $373,000. Adding construction engineering and design, the
total cost was $473,600 or an average of $123 per bank foot.
IV. PERFORMANCE OF PROTECTION
15. Monitoring Program. The approved monitoring program for the test
site includes periodic observations, photographs, and measurements of the
following data: River stages, stream velocity, and structure damage.
16. Evaluation of Protection Performance. No floods or unusually high
flows have occurred on the White River between the time of project
completion and preparation of this report. It should be noted however,
that heavy local rainfall during early spring of 1980 caused extensive
rill channels to be cut in most clay bank paving where turfing was not
specified. Accordingly, the construction contract was extended to
include the seeding and mulching of the exposed clay bank paving. An
inspection in October 1980 confirmed a limited stand of vegetative
cover. Little Rock District proposes to inspect the site following the
occurance of a major river flow and prepare a report of findings and
conclusions on project performance for transmittal to the Southwestern
Division Office. •
17. Conclusion. The effectiveness of the Jacksonport State Park
Demonstration Project cannot be determined at this time owing to lack of
flow conditions under which performance can be evaluated.
G 7G-67-9
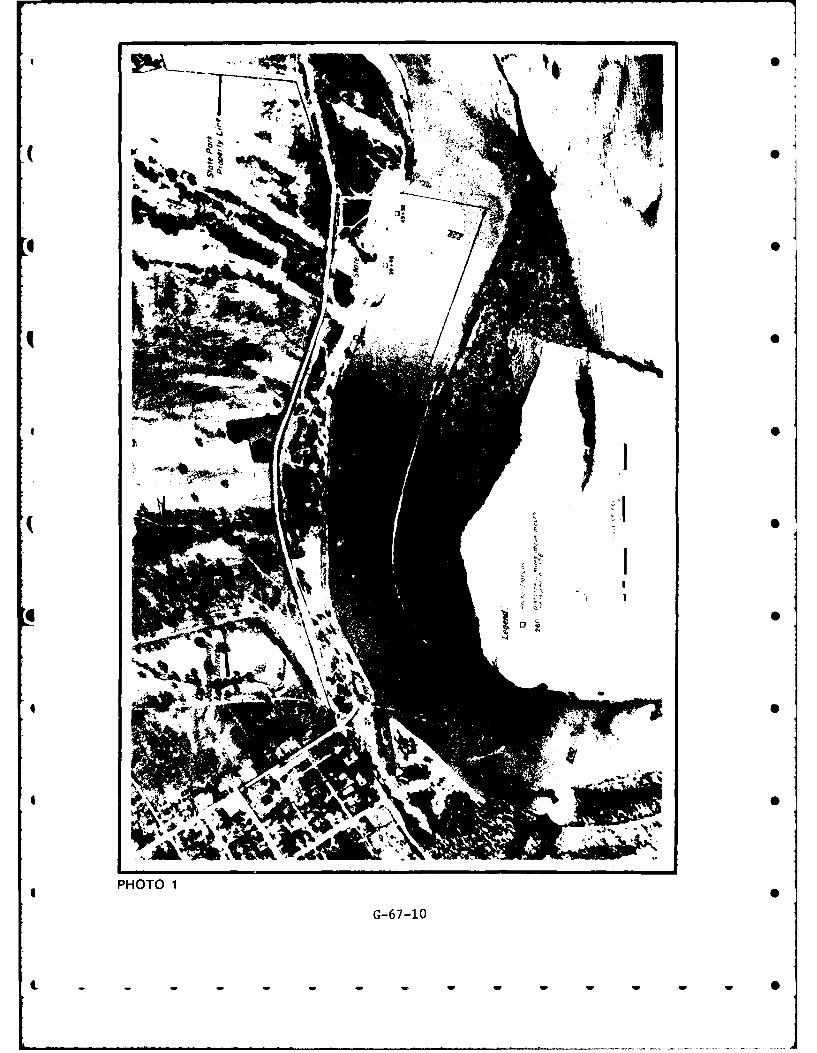
( V 0
4 Sw
PHOTO 1
G-67-10
t - - - ....... .....
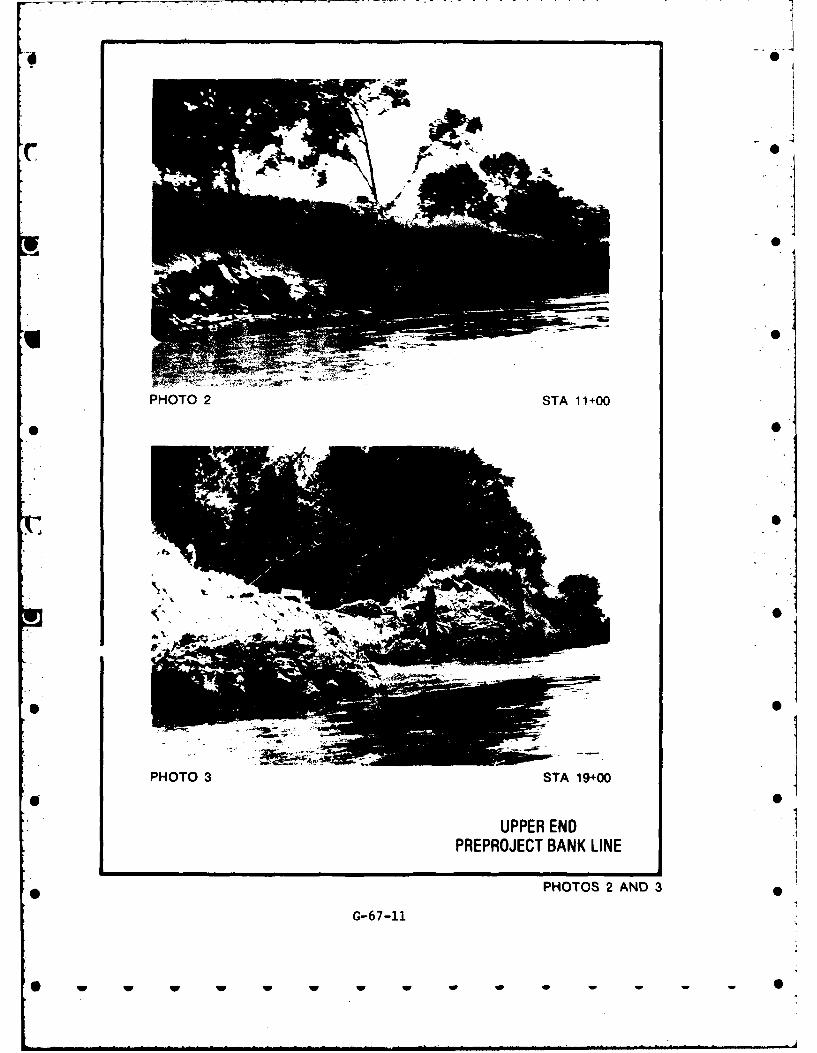
A1
PHOTO 2 STA 11 +00
PHOTO 3 STA 19+00
UPPER ENDPREPROJECT BANK LINE
PHOTOS 2 AND 3
G-67-11
w w w w w w w w
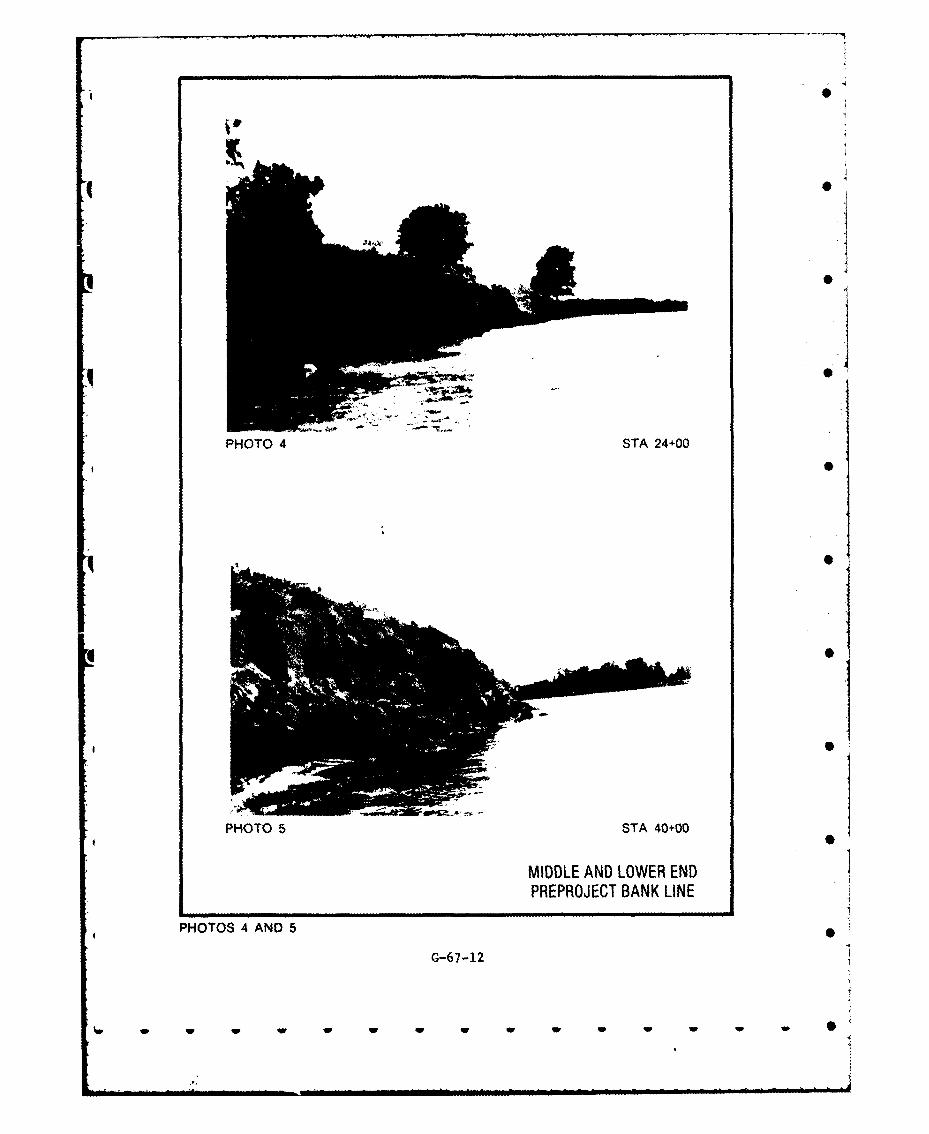
PHOTO 4 STA 24+00
PHOTO 5 STA 40+00
MIDDLE AND LOWER END 0
PREPROJECT BANK LINE
PHOTOS 4 AND 5
G-6 7-12
w w w w w
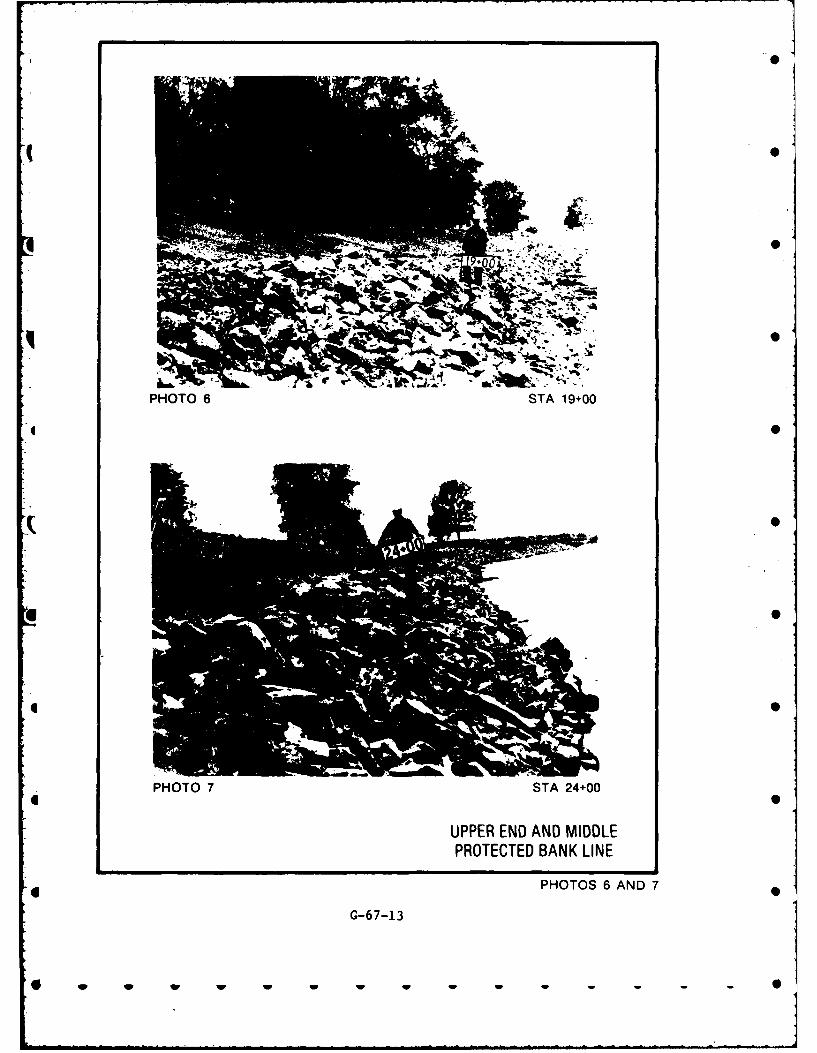
ILA.
PHOTO 6 STA 19+00
PHOTO 7 STA 24+00
UPPER END AND MIDDLEPROTECTED BANK LINE
PHOTOS 6 AND 7
G-6 7-13
ww w w w w w w - - - - S
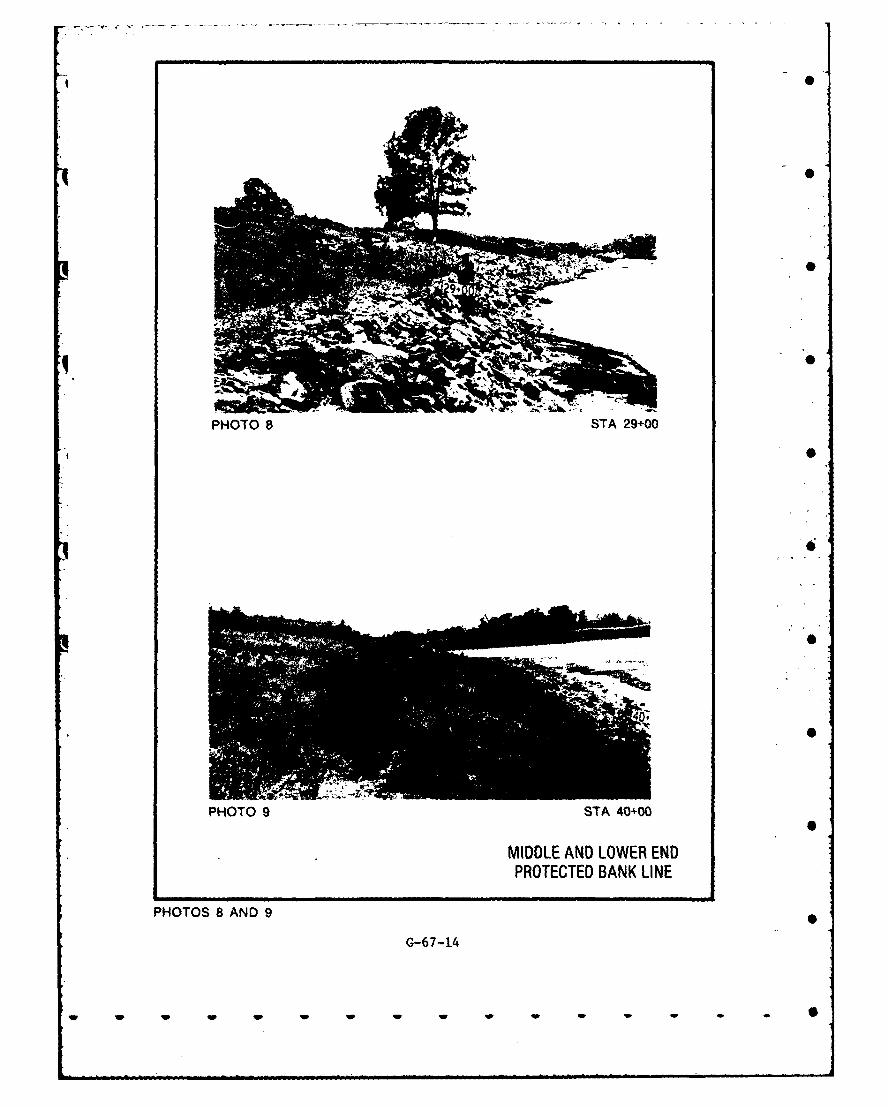
PHOTO 8 STA 29+00
PHOTO 9 STA 40+00
MIDDLE AND LOWER ENDPROTECTED BANK LINE
PHOTOS 8 AND 9
G-67-14
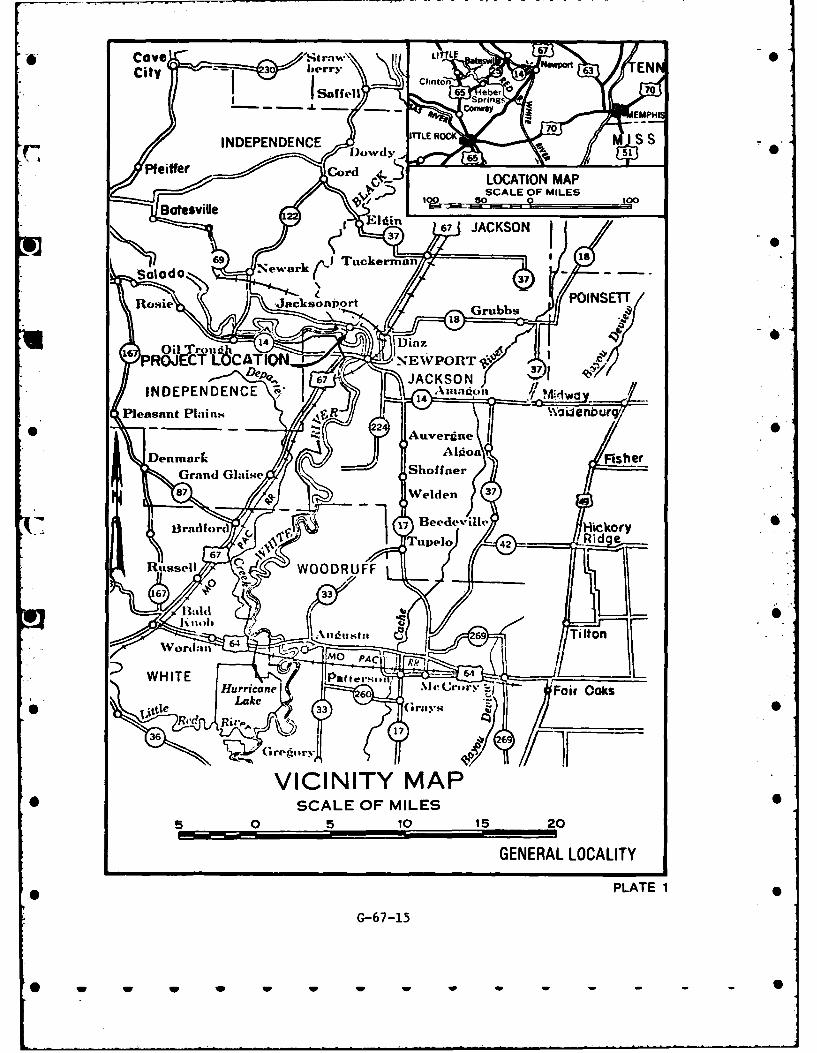
Cov L0L ei 6
700
VLOCANITY MAP* ~SCALE OF MILES
505100 15 200
37 167PJACES1
Salad 69 Nwark I TuGerman371i
* w ww - - - -I
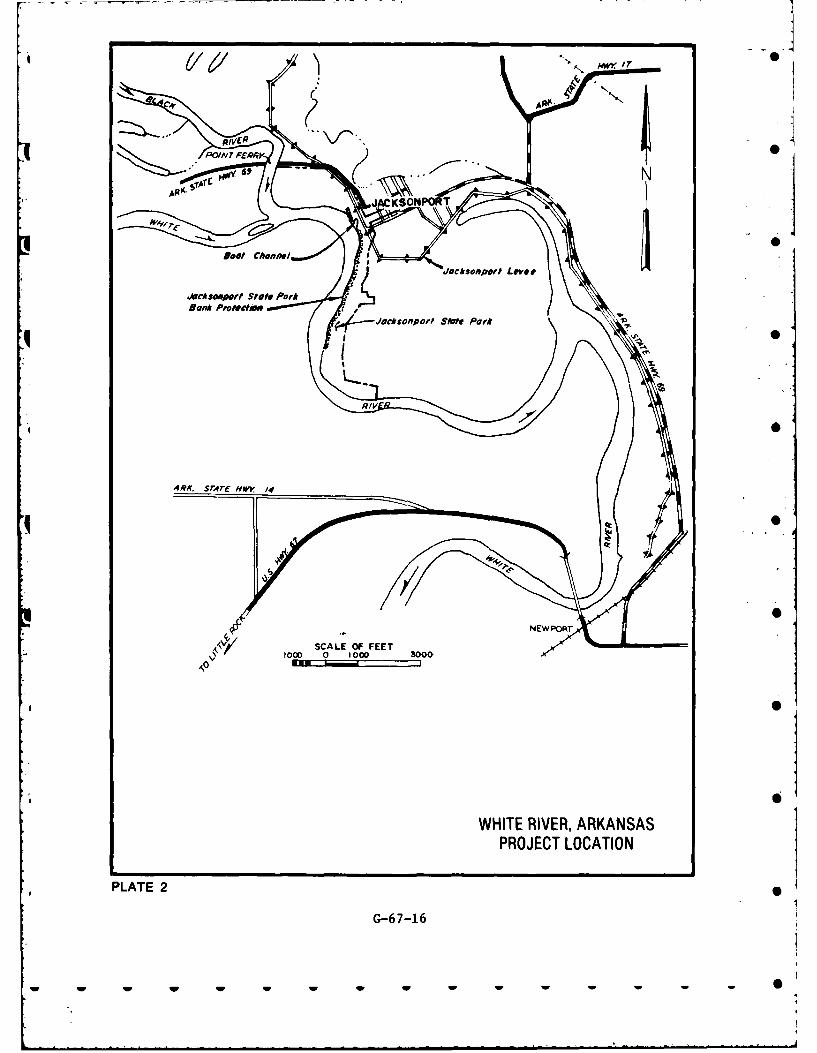
170
A0
ER0
J~ckpef SloePJacksomport LOe
ART STATE HWY 14
SCALE OF FEET
1000 0 1000 3000
110
WHITE RIVER, ARKANSASPROJECT LOCATION
PLATE 2
G-67-16
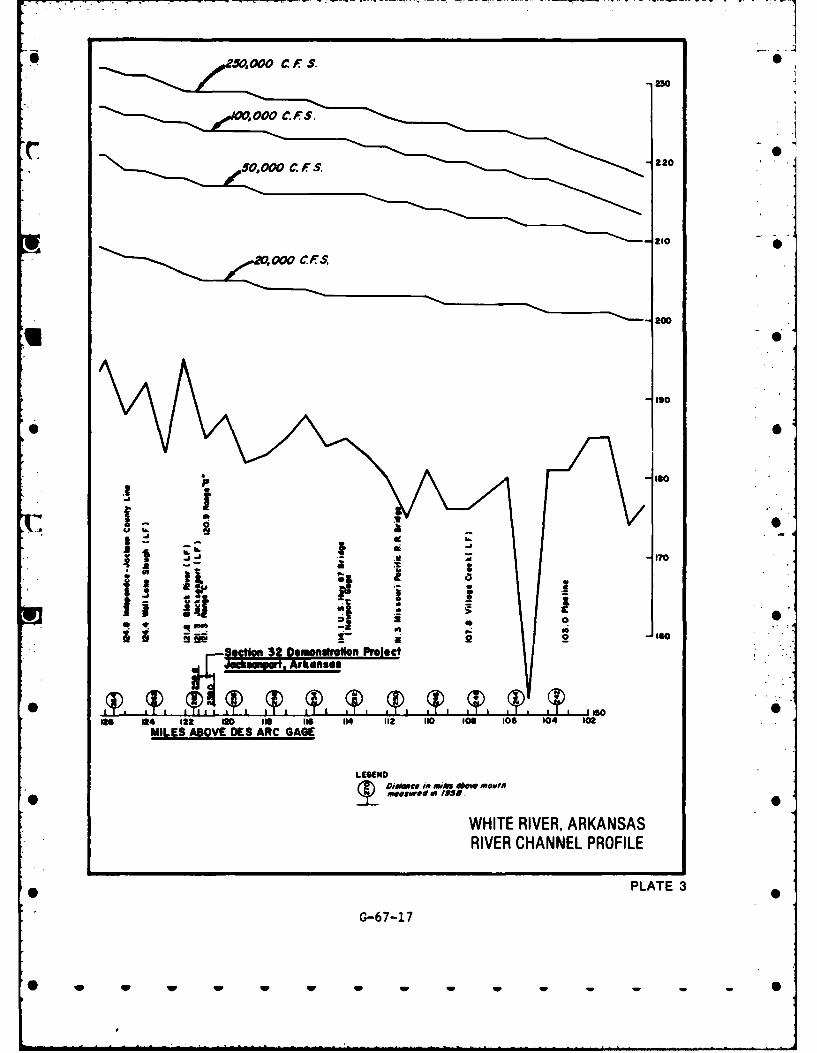
*141
*220
* 00
-18
s- -I
*~ fl jJ 'S
Sectkin 32 Deondralon ProjectJecmwto, Arhenses
126 24 122 no0 t lie 114 112 110 106 toe 104 102MILES ABOVE DES ARC GAGE
WHITE RIVER, ARKANSASRIVER CHANNEL PROFILE
PLATE 3
G-67-17
w w w w w ww w w
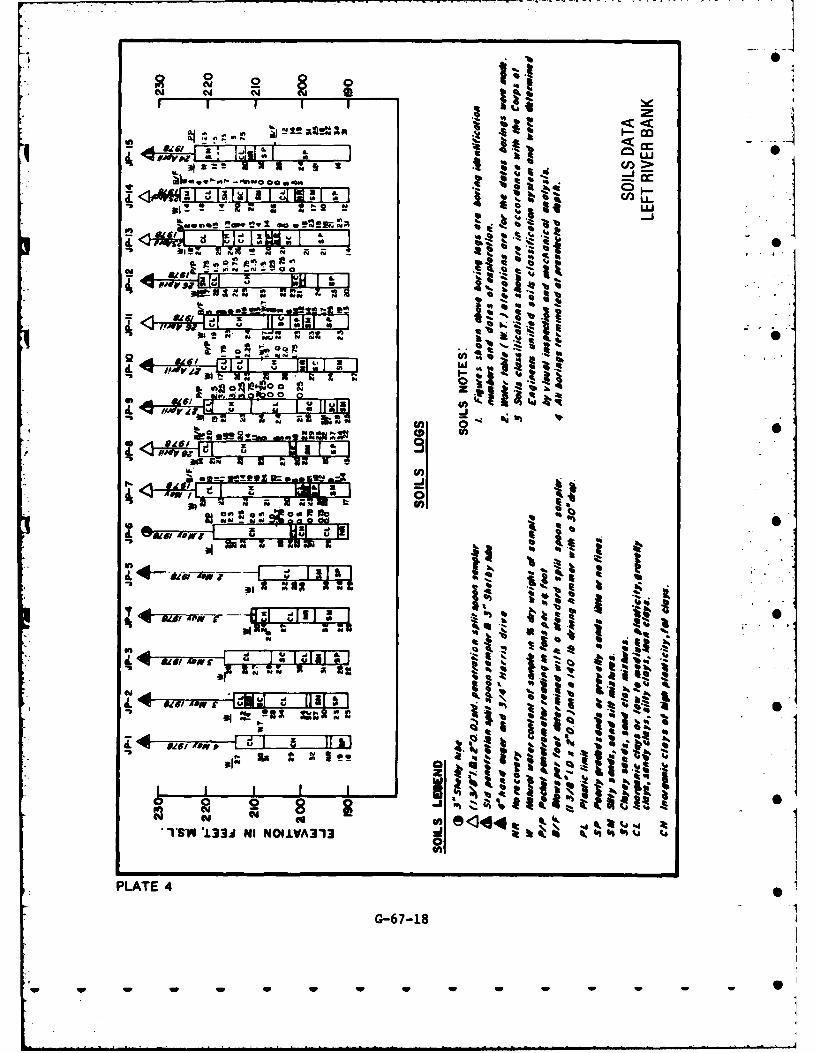
In a-
225.CALL
z ~~ 2 '0
~ 4
r d .1 Q Z 74O
Isa
b
24 -J
. ,aug, S
I' U)
ONO~ T I oi
ft 4%aI
aa.0 QL.Avow-
Is~
CYa 8
',S*M '133A NI NOI.LVA313 ',""
PLATE 4
G-67-18
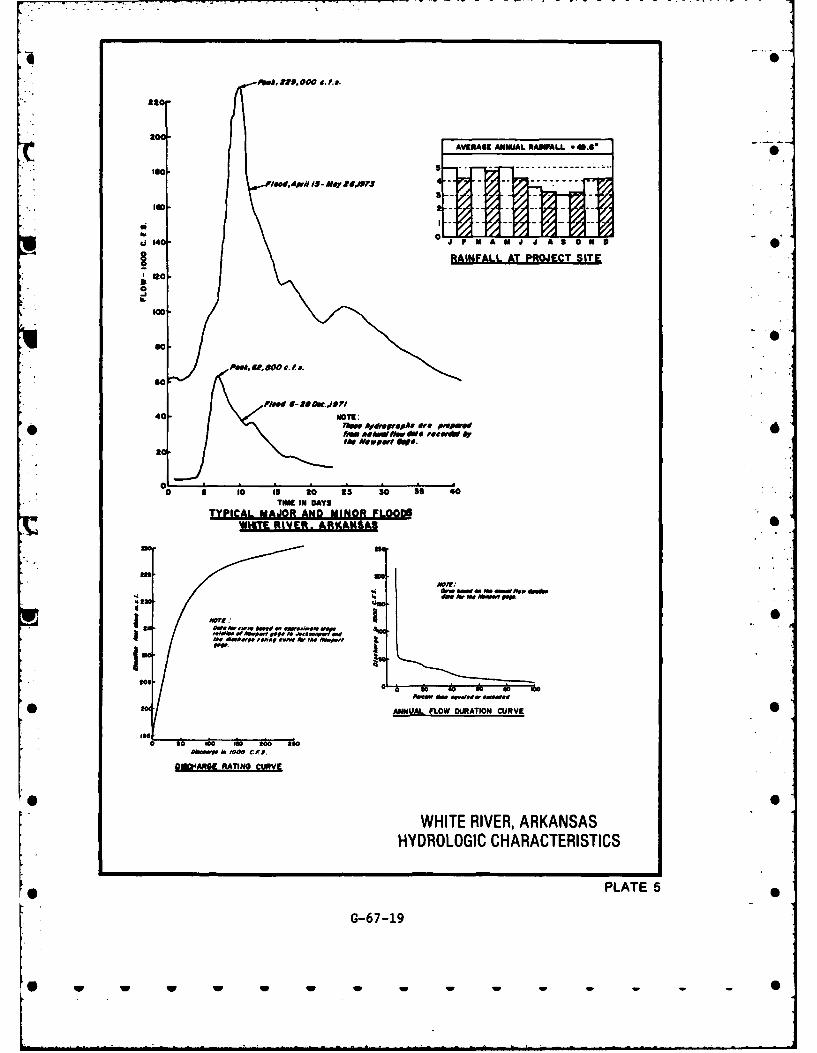
ac AVERAGE ANUSAL RAiMLL * .6-
loiApwAF15I- Mff*?J7
ii 540
RANAL AT PROJECT SIT
120.
1.
go,0, 90C.fS
pSo000mo
40- MOM-Me h.nbm ~ EW Ewfep Mff MV ff.
A..
SMM.WNO FL/00 ./S
WHITRRIERARKNSA
0 w w w ~~~WE.w E WE - -
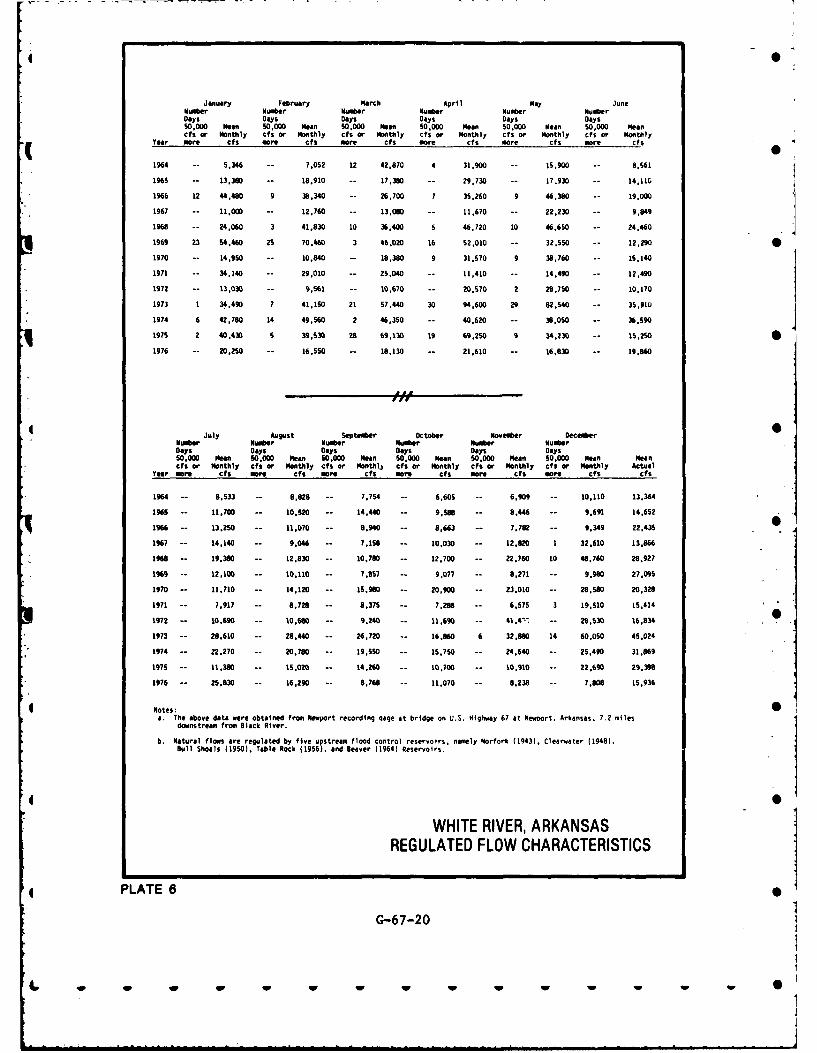
0
January February March April May JuneNumer Number Number Numer Number NumberDays Days Days Days Days Days50,000 Mean 50,000 Mean 50.000 Mean 50.000 Mean 50,000 Mean S0,000 Meancfs or Monthly cfs or Monthly cfs or Monthly ¢fs or Monthly cfs or monthly cfs or Monthly
Year mort cfs more cfs more cfs ore efs more efi more cfs
1964 -- 5,346 -- 7,062 12 42,870 4 31,900 -- 1S.900 -- 8,561
1965 -- 13.380 18,910 -- 17,380 -- 29.730 -- 17.930 -- 14.110
1966 12 44,480 9 38,340 -- 26,700 7 35.260 9 46.380 -- 19,000
1967 -- 11.000 -- 12,760 -- 13,060 -- 11.670 -- 22,230 -- 9.849
1968 -- 24,060 3 41,830 10 36,400 5 46.720 10 46,650 -- 24.460
1969 23 S4,460 25 70,460 3 46,020 16 52,010 -- 32,550 -- 12.290 01970 - 14,950 -- 10,840 -- 18.380 9 31.570 9 38,760 -- 15,140
1971 -- 34,140 -- 29,010 -- 25.040 -- 11,410 -- 14,490 -- 12,490
1972 -- 13.030 -- 9,561 -- 10,670 -- 20.570 2 28.760 -- 10,170
1973 1 34,490 7 41,160 21 57.440 30 94.600 29 82,540 -- 35,910
1974 6 42.780 14 49,560 2 46,350 -- 40,620 -- 38.050 -- 36.590
1975 2 40,430 S 19,530 28 69,130 19 69.260 9 34.230 -- 15,2S 01976 -- 20,2S0 -- 16,550 -- 18,130 -- 21,610 -- 16,830 -- 19,860
OAF
July August September October Novemer Deceamber 0Number Number Number Number Number NumberDays Days Days Days Days Days50,000 Mean SO,000 Mean 60,000 Mean S0,000 Mean 50,000 Man 50,00 Mean mancfs or Monthly cfs Or Monthly cfs or Monthlb cfs or Monthly cfs or Monthly cfs or Monthly Actual
Year more cfs m mor ef ore cls more c ore cli ore cfs cfs
1964 -- 8,533 -- 8,828 7,754 -- 6,605 -o 6,909 -- 10,110 13,364
1965 11.700 -- 10,520 14,440 9,S88 8,446 9,691 14,652
1966 13,250 -- 11,070 ,940 8.663 7.782 9,349 22.435
1967 -- 14,140 -- 9.046 -- 7.1S8 -- 10,030 -- 12,820 1 32,610 13,866
1968 - 19,380 -- 12.830 -- 10,780 -. 12,700 -- 22,760 10 48,760 28,927
1969 -- 12,100 -- 10,110 ** 7,857 -- 9,077 -- 8,271 -- 9.980 27,091
1970 -- 11,710 -- 14,120 -- I,980 -- 20,900 23.010 -- 28,580 20,328
1971 - 7,917 -- 8,728 -- 8,37S -- 7,288 6,575 3 19,5I1 15,414
1972 -- 10,690 -- 10.660 9,240 -- 11,690 -- 41,4-' -- 28,530 16,834
1973 -- 28,610 -- 28,440 -- 26,720 -- 16,860 6 32,880 14 60,060 45,024
1974 -- 22,270 -- 20,780 -- 19,650 15S,70 -- 24,640 -- 25,490 31,869
197S -- 11.380 -- 15.020 -- 14,20 -- 10,700 -- 10,910 22,690 29,398
1976 -- 25,830 16,290 -- 8,768 -- 11,070 8.238 -- 7,808 15,936
Notes:a. The above data were obtained from Newport recording qage at bridge on U.S. Highway 67 at Newoort. Arkansas. 7.2 miles
downstream from Black River.
6. Natural flows are regulated by five upstream flood control reservoirs, namely Norfork (1943). Clearwater (1948).Bull Shoals (19S0), Table Rock (1956), and Beaver (1964) Reservoirs.
WHITE RIVER, ARKANSASREGULATED FLOW CHARACTERISTICS
PLATE 6
G-67-20
W W W W W --W W OI
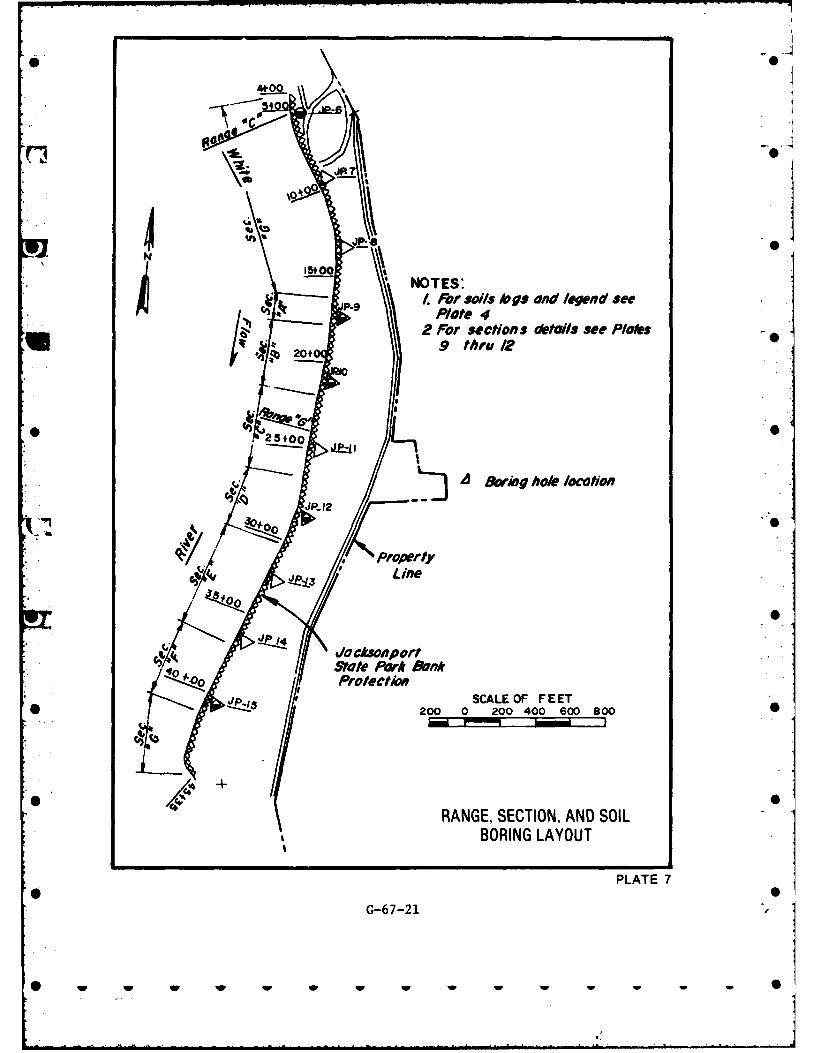
5444100
-N \c"o' --
NOTES:-I. For soils logs ad legend see
P101e 42 For sections detals see Pals
204 9 thru 12
JP..12 '7]A &,rh7g hol0 l0Moio
* property
Line
}. . > JP /4 ocksonport
0 MStale Pork ank
Pr' inSCALE OF FEET2 2 0 200 400 600 800
RANGE, SECTION, AND SOIL
BORING LAYOUT
PLATE 7* 0
G-67-21
*ww w w w w w - - S
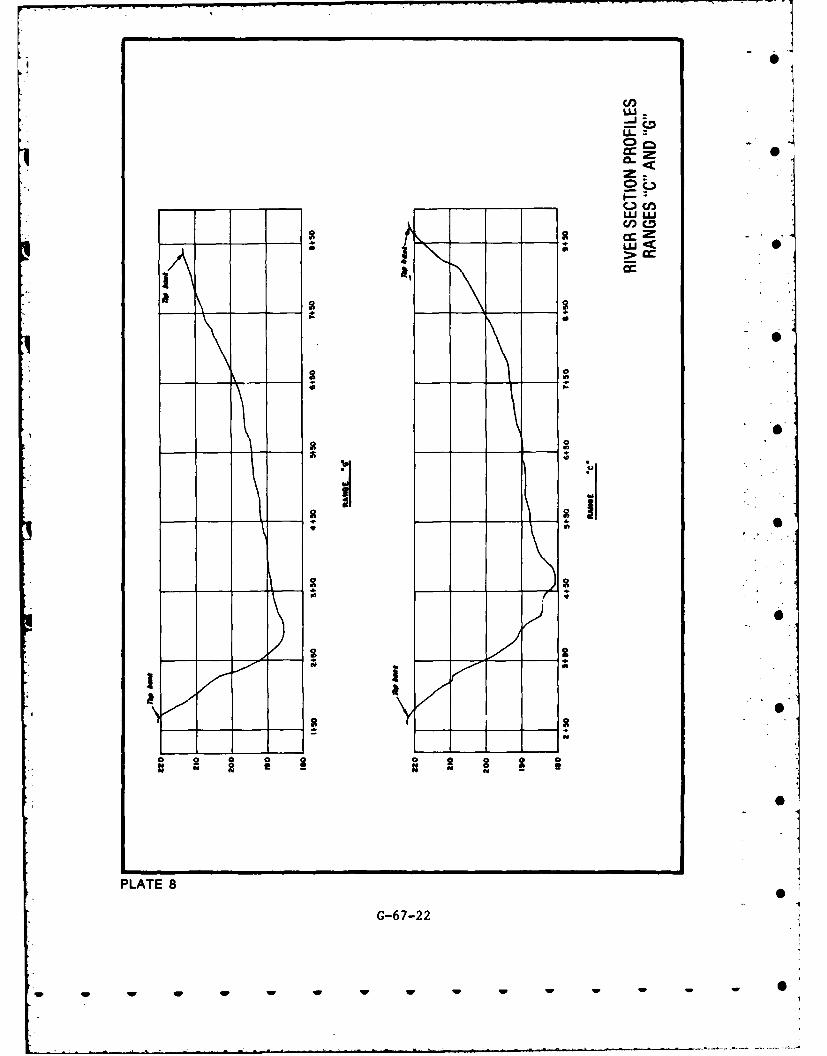
K 0C/)LU.
cr- 0
w uJcn cm
a1 0
I- p 0
00
0
I L'
PLAT 8 0
0I0
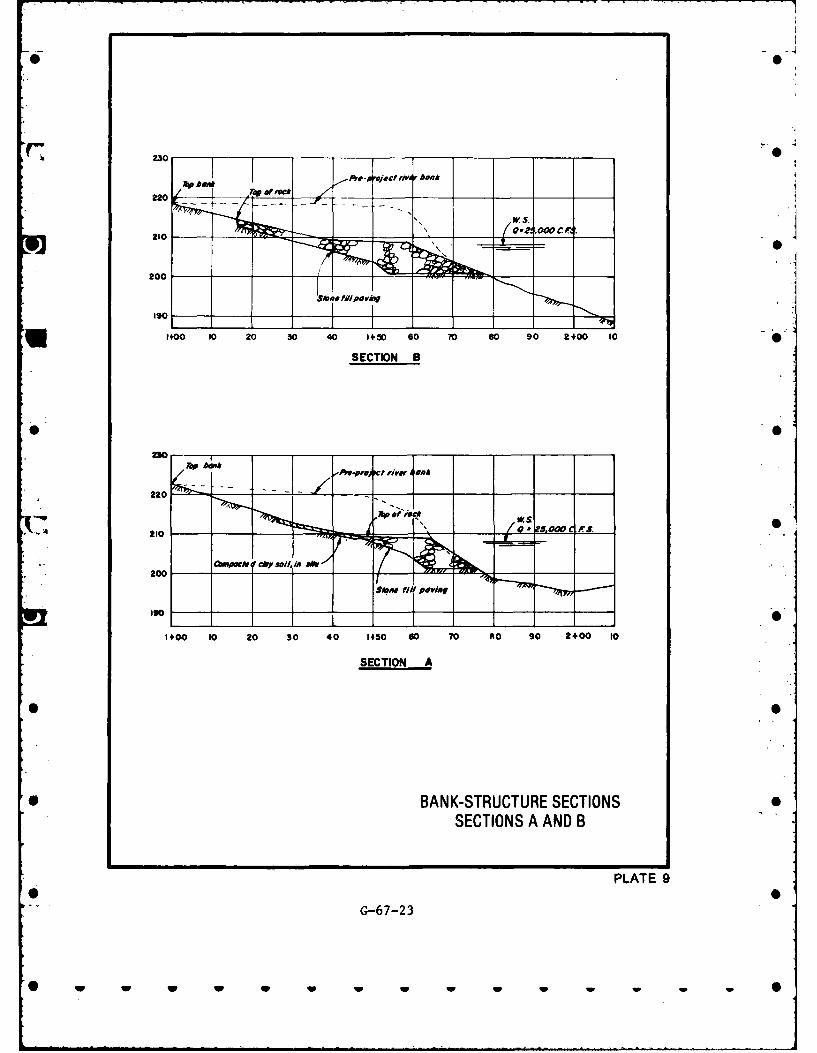
ws210 ________ ___ ___
200
ISO_ _ __ _
U1400 10 20 30 40 14-50 s0 70 80 90 2+00 10
SECTION B
20 a Mwt ci, soil,a is A
1+00 10 20 30 40 1450 s0 70 Ito 90 2+00 10
SECTION A
* BANK-STRUCTURE SECTIONSSECTIONS A AND B
PLATE 9
G-67-23
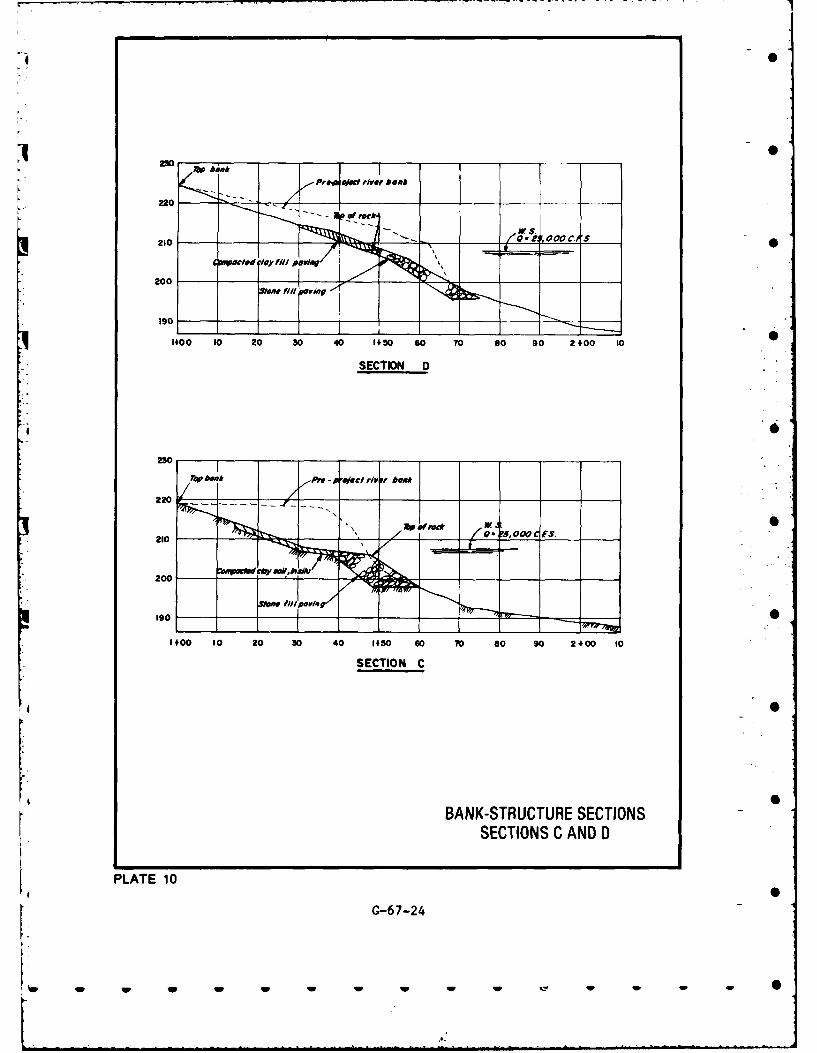
230 _
w S.210 0a.2 OOOC"S.
200 ______
1#00 lo 20 30 40 1+50 60 70 so 90 2+00 10
SECTION D
Tq~hPro i'- *clip p hook
210 ___
190 0aanefl
/
1+00 10 20 30 40 1+50 60 10 so 90 2+00 10
SECTION C
BANK-STRUCTURE SECTIONSSECTIONS C AND D
PLATE 10
G-6 7-24
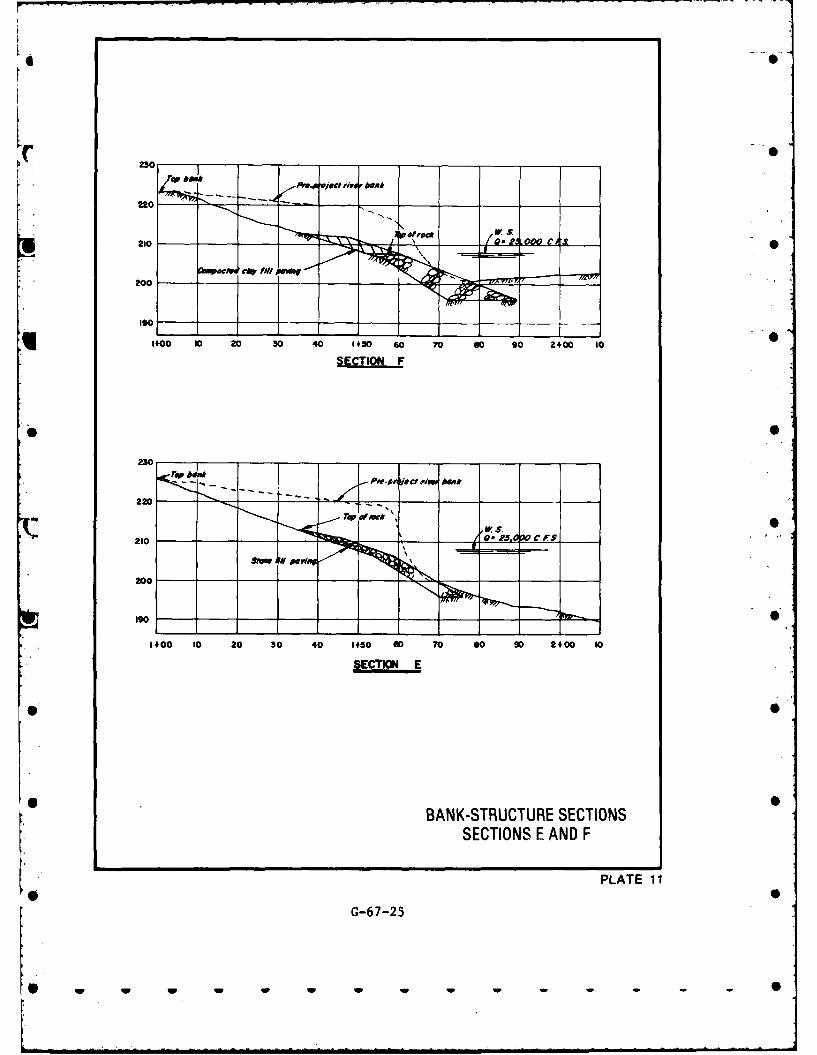
210 L 0 '
10 Pwre-t capeI'i
210
1+.00 10 20 30 40 1430 60 70 s0 90 2400 t0
SECTIONE
r* Av*P iSe i M
*220
SETIN F AND
PLATE 11
G-67-25
w w -Im w 1w w
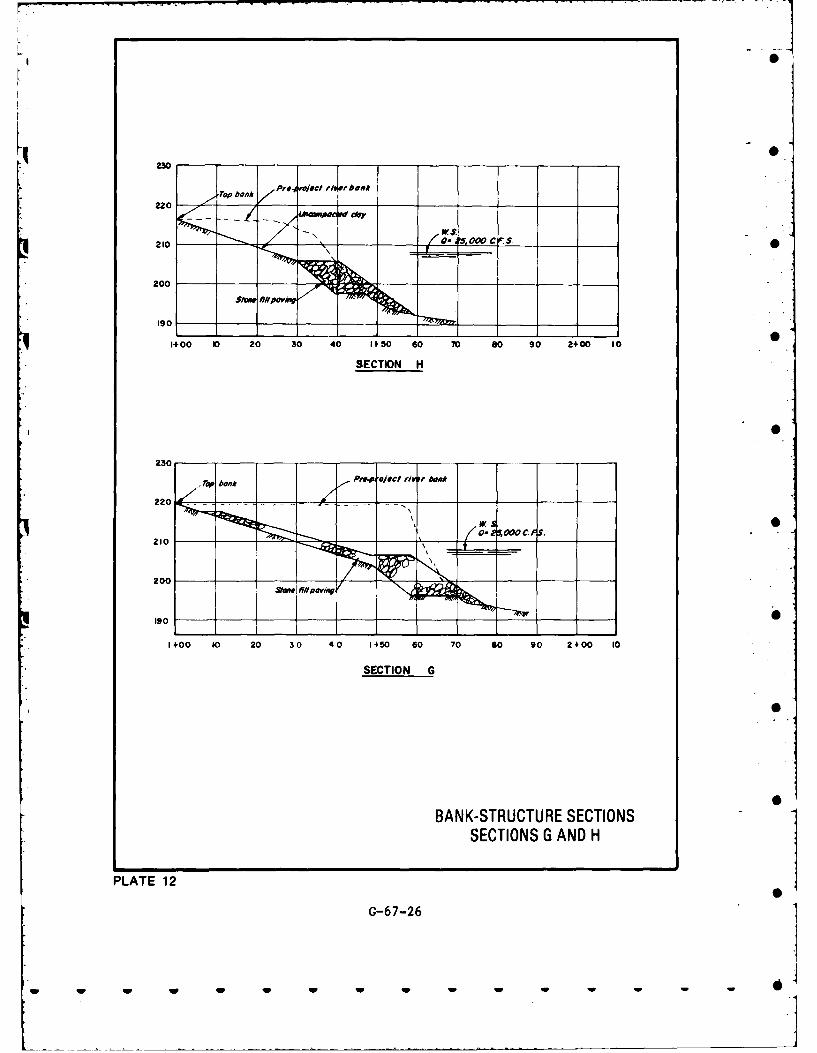
2302rap ,at RO ojectrip ,e,,do
220 ___ ______
ws210 0!. 600 c s.
2 0 0 S A W_ _
6 / / P O V_
1+00 10 2 30 40 1150 60 70 s0 90 2+00 10
SECTION H
230
r~p bookPf"p ee rip Pf 60k
220
210 ______ ____ ____
200 __ __
1+00 60 20 30 40 1450 60 70 s0 90 2400 10
SECTION G
BANK-STRUCTURE SECTIONSSECTIONS G AND H
PLATE 12 .G-6 7-26
- w w w w w w w -0
*
0
V 0
S
[I S
4
0
WHITE RIVER ATDES ARC, ARKANSAS
0
I
S
S
S
0
S V - -
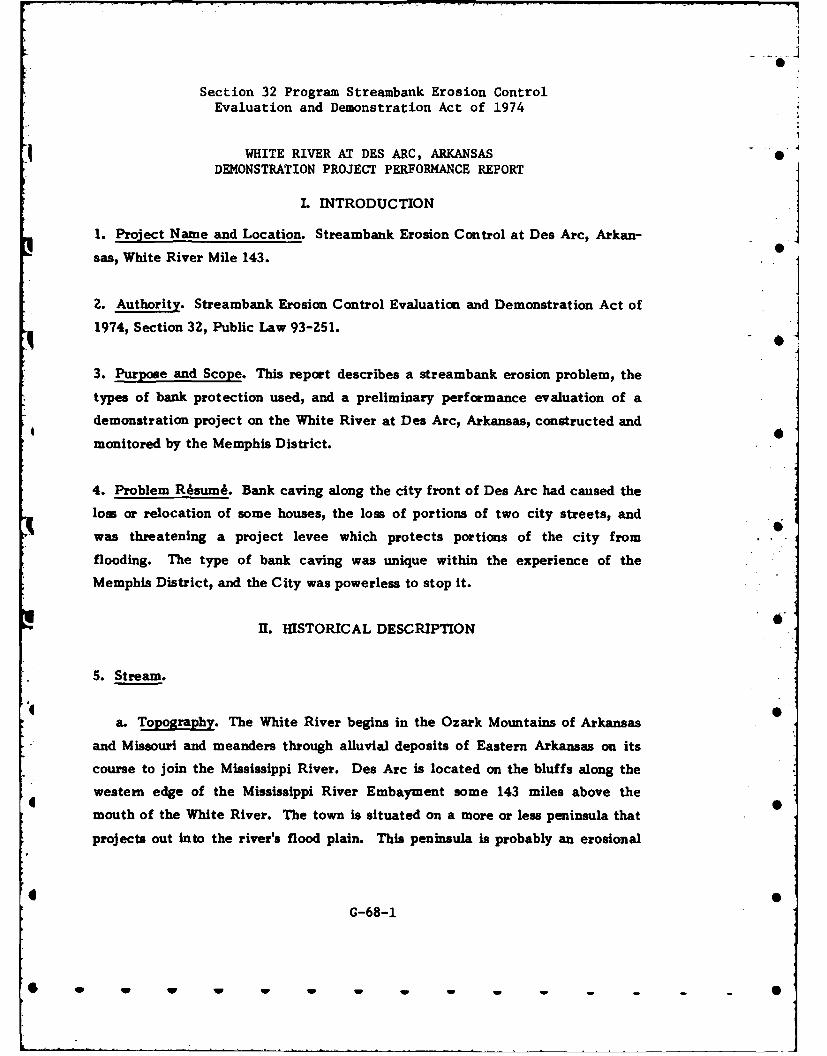
Section 32 Program Streambank Erosion ControlEvaluation and Demonstration Act of 1974
WHITE RIVER AT DES ARC, ARKANSAS
DEMONSTRATION PROJECT PERFORMANCE REPORT
I. INTRODUCTION
1. Project Name and Location. Streambank Erosion Control at Des Arc, Arkan-
sas, White River Mile 143.
2. Authority. Streambank Erosion Control Evaluation and Demonstration Act of
1974, Section 3Z, Public Law 93-251.!0
3. Purpose and Scope. This report describes a streambank erosion problem, the
types of bank protection used, and a preliminary performance evaluation of a
demonstration project on the White River at Des Arc, Arkansas, constructed and
monitored by the Memphis District.
4. Problem R~sumA. Bank caving along the city front of Des Arc had caused the
loss or relocation of some houses, the loss of portions of two city streets, and
was threatening a project levee which protects portions of the city from
flooding. The type of bank caving was unique within the experience of the
Memphis District, and the City was powerless to stop it.
I. HISTORICAL DESCRIPTION
5. Stream.
'4 S
a. Topography. The White River begins in the Ozark Mountains of Arkansas
and Missouri and meanders through alluvial deposits of Eastern Arkansas on its
course to join the Mississippi River. Des Arc is located on the bluffs along the
western edge of the Mississippi River Embayment some 143 miles above the
mouth of the White River. The town is situated on a more or less peninsula that
projects out into the river's flood plain. This peninsula is probably an erosional
4 -G-68-1
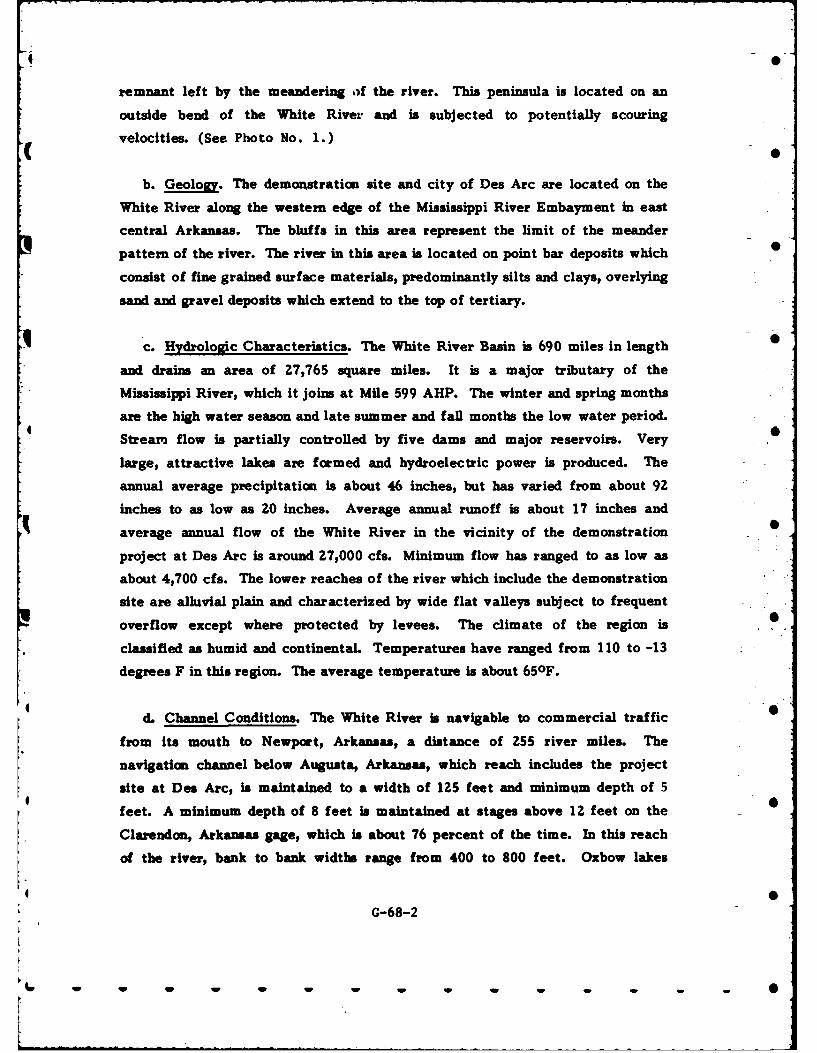
remnant left by the meandering c-f the river. This peninsula is located on an
outside bend of the White River and is subjected to potentially scouring
velocities. (See Photo No. 1.)
b. Geology. The demonstration site and city of Des Arc are located on the
White River along the western edge of the Mississippi River Embayment in east
central Arkansas. The bluffs in this area represent the limit of the meander
pattern of the river. The river in this area is located on point bar deposits which 0
consist of fine grained surface materials, predominantly silts and clays, overlying
sand and gravel deposits which extend to the top of tertiary.
c. Hydrologic Characteristics. The White River Basin is 690 miles in length
and drains an area of 27,765 square miles. It is a major tributary of the
Mississippi River, which it joins at Mile 599 AHP. The winter and spring months
are the high water season and late summer and fail months the low water period.
Stream flow is partially controlled by five dams and major reservoirs. Very
large, attractive lakes are formed and hydroelectric power is produced. The
annual average precipitation is about 46 inches, but has varied from about 92
inches to as low as 20 inches. Average annual runoff is about 17 inches and
average annual flow of the White River in the vicinity of the demonstration
project at Des Arc is around 27,000 cfs. Minimum flow has ranged to as low as
about 4,700 cfs. The lower reaches of the river which include the demonstration
site are alluvial plain and characterized by wide flat valleys subject to frequent
overflow except where protected by levees. The climate of the region is
classified as humid and continental. Temperatures have ranged from 110 to -13
degrees F in this region. The average temperature is about 65 0 F.
d. Channel Conditions. The White River Is navigable to commercial traffic
from its mouth to Newport, Arkansas, a distance of 255 river miles. The
navigation channel below Augusta, Arkansas, which reach includes the project
site at Des Arc, is maintained to a width of 125 feet and minimum depth of 5I
feet. A minimum depth of 8 feet is maintained at stages above 12 feet on the
Clarendon, Arkansas gage, which is about 76 percent of the time. In this reach
of the river, bank to bank widths range from 400 to 800 feet. Oxbow lakes
G-68-2
- - w-'
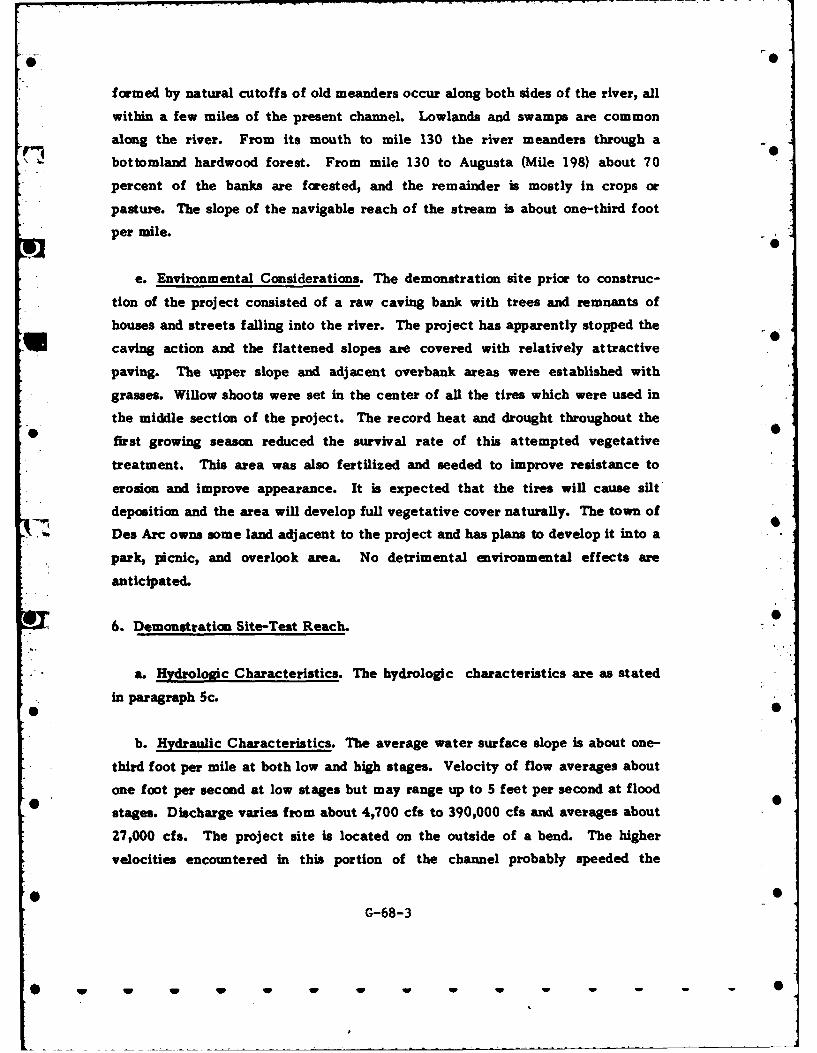
IO 0
formed by natural cutoffs of old meanders occur along both sides of the river, all
within a few miles of the present channel. Lowlands and swamps are common
along the river. From its mouth to mile 130 the river meanders through a
6; bottomland hardwood forest. From mile 130 to Augusta (Mile 198) about 70
percent of the banks are forested, and the remainder is mostly in crops or
pasture. The slope of the navigable reach of the stream is about one-third foot
per mile.
e. Environmental Considerations. The demonstration site prior to construc-
tion of the project consisted of a raw caving bank with trees and remnants of
houses and streets falling into the river. The project has apparently stopped the
caving action and the flattened slopes are covered with relatively attractive
paving. The upper slope and adjacent overbank areas were established with
grasses. Willow shoots were set in the center of all the tires which were used in
the middle section of the project. The record heat and drought throughout the0 •
first growing season reduced the survival rate of this attempted vegetative
treatment. This area was also fertilized and seeded to improve resistance to
erosion and improve appearance. It is expected that the tires will cause silt'
deposition and the area will develop full vegetative cover naturally. The town of
Des Arc owns some land adjacent to the project and has plans to develop it into a
park, picnic, and overlook area. No detrimental environmental effects are
anticipated.
6. Demonstration Site-Test Reach.
a. Hydrologic Characteristics. The hydrologic characteristics are as stated
in paragraph 5c.
b. Hydraulic Characteristics. The average water surface slope is about one-
third foot per mile at both low and high stages. Velocity of flow averages about
one foot per second at low stages but may range up to 5 feet per second at flood
stages. Discharge varies from about 4,700 cfs to 390,000 cfs and averages about
27,000 cfs. The project site is located on the outside of a bend. The higher
velocities encountered in this portion of the channel probably speeded the
* •G-68-3
0
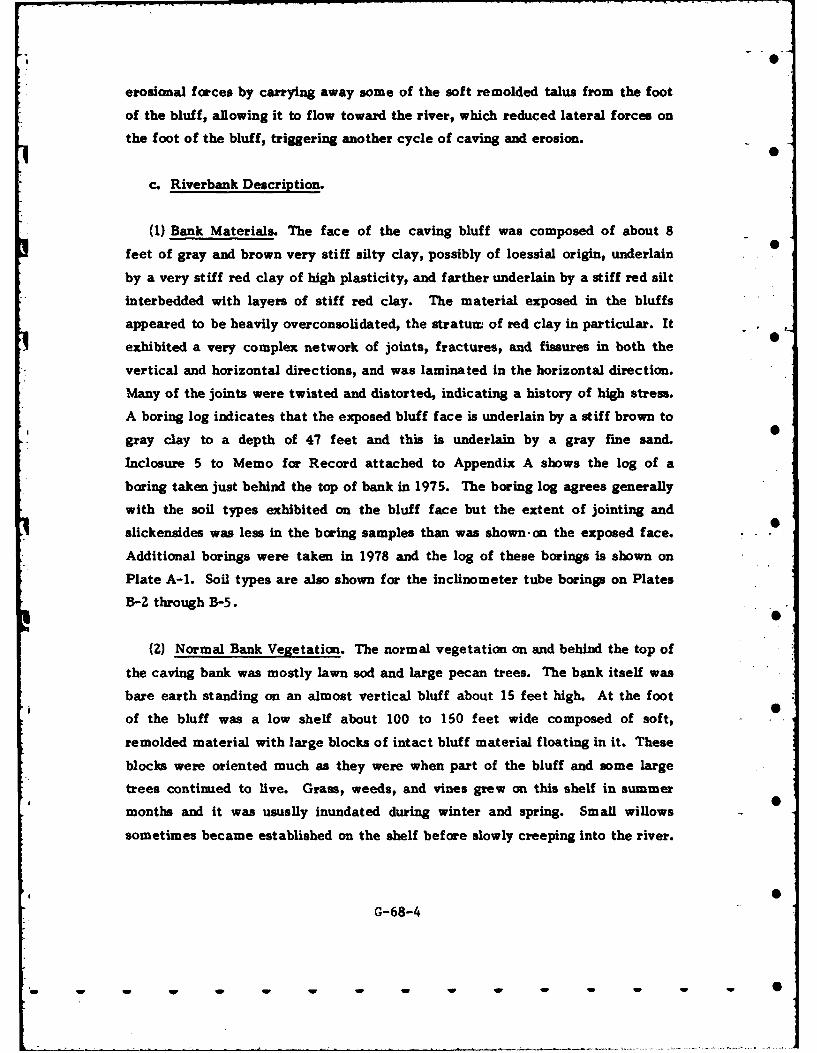
erosional forces by carrying away some of the soft remolded talus from the foot
of the bluff, allowing it to flow toward the river, which reduced lateral forces on
the foot of the bluff, triggering another cycle of caving and erosion.
c. Riverbank Description.
(1) Bank Materials. The face of the caving bluff was composed of about 8
feet of gray and brown very stiff silty clay, possibly of loessial origin, underlain
by a very stiff red clay of high plasticity, and farther underlain by a stiff red silt
interbedded with layers of stiff red clay. The material exposed in the bluffs
appeared to be heavily overconsolidated, the stratum of red clay in particular. It
exhibited a very complex network of joints, fractures, and fissures in both the
vertical and horizontal directions, and was laminated in the horizontal direction.
Many of the joints were twisted and distorted, indicating a history of high stress.
A boring log indicates that the exposed bluff face is underlain by a stiff brown to
gray clay to a depth of 47 feet and this is underlain by a gray fine sand.
Inclosure 5 to Memo for Record attached to Appendix A shows the log of a
boring taken just behind the top of bank in 1975. The boring log agrees generally
with the soil types exhibited on the bluff face but the extent of jointing and
slickensides was less in the boring samples than was shown, on the exposed face.
Additional borings were taken in 1978 and the log of these borings is shown on
Plate A-1. Soil types are also shown for the inclinometer tube borings on Plates
B-2 through B-5.
(2) Normal Bank Vegetation. The normal vegetation on and behind the top of
the caving bank was mostly lawn sod and large pecan trees. The bank itself was
bare earth standing on an almost vertical bluff about 15 feet high. At the foot
of the bluff was a low shelf about 100 to 150 feet wide composed of soft,
remolded material with large blocks of intact bluff material floating in it. These
blocks were oriented much as they were when part of the bluff and some large
trees continued to live. Grass, weeds, and vines grew on this shelf in summer
months and it was ususlly inundated during winter and spring. Small willows
sometimes became established on the shelf before slowly creeping into the river.
G-68-4
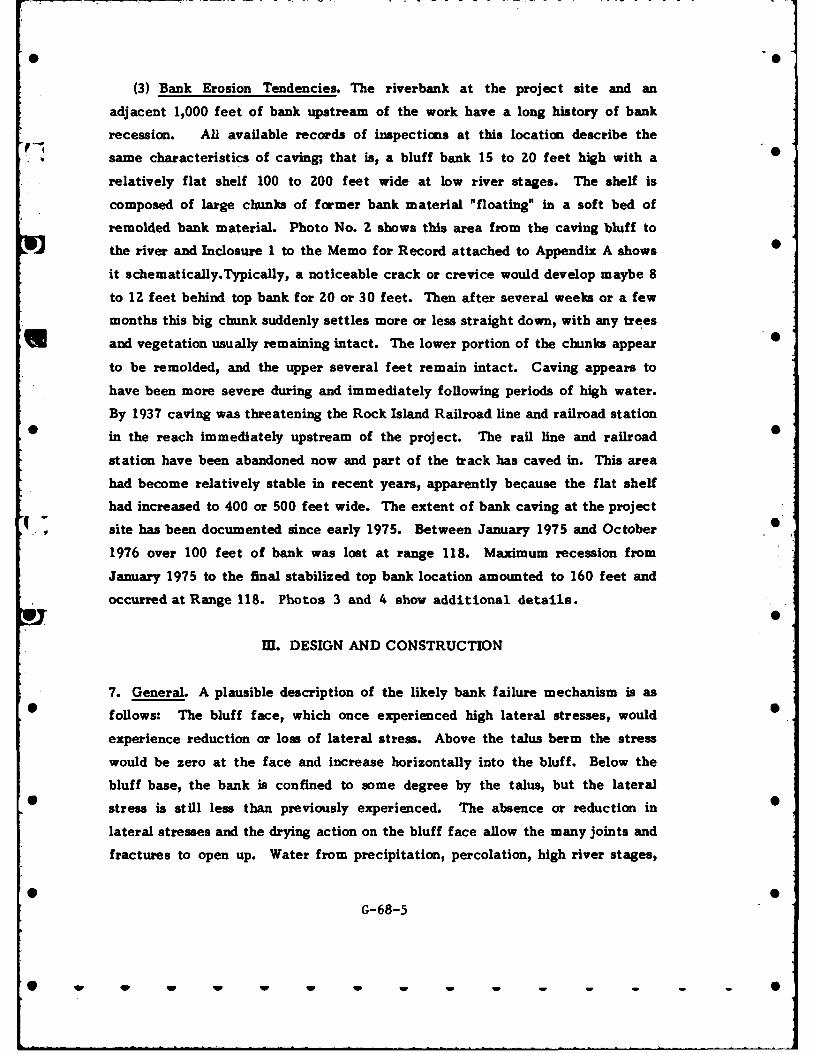
* S
(3) Bank Erosion Tendencies. The riverbank at the project site and an
adjacent 1,000 feet of bank upstream of the work have a long history of bank
recession. All available records of inspections at this location describe the
same characteristics of caving- that is, a bluff bank 15 to 20 feet high with a
relatively flat shelf 100 to Z00 feet wide at low river stages. The shelf is
composed of large chunks of former bank material "floating" in a soft bed of
remolded bank material. Photo No. 2 shows this area from the caving bluff to
the river and Inclosure I to the Memo for Record attached to Appendix A shows 0
it schematically.Typically, a noticeable crack or crevice would develop maybe 8
to 12 feet behind top bank for 20 or 30 feet. Then after several weeks or a few
months this big chunk suddenly settles more or less straight down, with any trees
U and vegetation usually remaining intact. The lower portion of the chunks appear 0
to be remolded, and the upper several feet remain intact. Caving appears to
have been more severe during and immediately following periods of high water.
By 1937 caving was threatening the Rock Island Railroad line and railroad station• in the reach immediately upstream of the project. The rail line and railroad •
station have been abandoned now and part of the track has caved in. This area
had become relatively stable in recent years, apparently because the flat shelf
had increased to 400 or 500 feet wide. The extent of bank caving at the project
site has been documented since early 1975. Between January 1975 and October
1976 over 100 feet of bank was lost at range 118. Maximum recession from
January 1975 to the final stabilized top bank location amounted to 160 feet and
occurred at Range 118. Photos 3 and 4 show additional details.
I. DESIGN AND CONSTRUCTION
7. General. A plausible description of the likely bank failure mechanism is as0 follows: The bluff face, which once experienced high lateral stresses, would 5
experience reduction or loss of lateral stress. Above the talus berm the stress
would be zero at the face and increase horizontally into the bluff. Below the
bluff base, the bank is confined to some degree by the talus, but the lateral
S stress is still less than previously experienced. The absence or reduction in 0
lateral stresses and the drying action on the bluff face allow the many joints and
fractures to open up. Water from precipitation, percolation, high river stages,
G-68-5
L
[0
etc., can enter the opened joints, softening the clays at the faces of the joints
and causing extensive reduction in shear strength. This shear strength reduction
is furthered by the presence of the highly plastic clays on the joint faces. The
talus, which consists primarily of the softened and remolded material from the 0
bluffs, is barely stable wider its own weight but does offer lateral support at the
foot of the bluff. However, with high stages on the river, the talus becomes
fully saturated and experiences loss to erosion. Water also enters the joints in
the bluff clays, lessening their shear strength. On recession of stages, 0
hydrostatic pressures are generated in the soil mass. This, along with the
softened and reduced mass of the talus, could lead to bluff failure and movement
of the talus. Movement of the talus could generate shearing strains in the
underlying sands, causing excess pore water pressures to develop and a lique-
faction failure at the toe of the talus, increasing the rate of movement. With
movement of the talus, lateral pressures are also reduced at the foot of the
bluff, allowing collapse of the bluff. This occurrence adds mass to the talus,
causes more movement, causing more liquefaction failures at the toe of the talus
and further collapse of the bluff. The mechanism, once initiated, is essentially
self-perpetuating and should continue until the slope of the entire bank is flat
enough to attain stability. Except for erosion at the toe of the talus and possibly
some minor erosion of its top surface, a state of equilibrium would eventually 0
develop. Inclosure 6 to Memo for Record attached to Appendix A schematically
illustrates this theory. A precarious state of such stability has apparently
occurred in the approximately 1,000-foot section immediately upstream of the
project. Obviously, no erosion control measure can be effective unless the 0
causative failure mechanism can first be halted. This could possibly be done by
halting the erosion and riverward migration of the talus shelf. This could
possibly have been accomplished by covering the leading edge and most of the
talus mass with a filter cloth and riprap paving. Then subsequent erosion and S
flattening of the bank would eventually lead to an overall stable slope. This
would, however, have allowed loss of the project levee (which, incidently, is
quite small in this area) as well as additional city lots, streets, and homes. The
work under such an approach would also likely have taken frequent repair and
reinforcement work before the advancing mass could be halted and stabilized.
Again, the above described failure mechanism is somewhat conjectural but
G-68-6
appears to be supported by the tentative stability of the adjacent upstream
reach. Another, and more immediately obtainable, plan which does not sacrifice
significantly more bank, consists substantially of grading and paving the bluff
and placing a massive stone fill between the solid bank material and the talus
berm throughout the length of the project.
8. Basis of Design. The project design consists of halting progress of the bluff
caving by grading the bank to a stable slope; excavating between the original 0
bank material and the talus berm; backfilling with a massive stone fill to provide
lateral stability at the foot of the slope; and then provide different types of
experimental bank paving on the face of the slope. Several soil borings were
taken at the site and a slope stability analysis was performed on a typical section 0
using shear strength parameters from the borings. The soil stability analysis
indicated a IV on 2.5H bank slope and a requirement for stone fill 17 feet thick
extending to the underlying sands, and a required quantity of approximately 43
6 tons of stone per linear foot of bank to provide the necessary mass to assure 0
resistance of the lateral forces at the base of the slope. The projected cost of
this design was about double the funding that could be made available for the
work. Reducing the length to about one-half the length of actively caving bank
was rejected because the shorter length would be of little value to the local
sponsors, the whole project could be lost to caving from one or both ends, and
such a reduced length would provide too short a reach to adequately demonstrate
the effectiveness of the different experimental erosion protection schemes.
Since the work envisioned under the Section 32 program is experimental in 0
nature, it was concluded that the factor of safety which might otherwise have
been prudent could be reduced substantially and still maintain a reasonable
likelihood of successful project accomplishment. A design stone fill quantity of
* 20 tons per linear foot was arrived at as a figure that was affordable and still 0
stood a reasonable chance, in the designers' view, of achieving the project
purpose. The trench for the stone fill section was designed to be excavated as
deep as could likely be accomplished with equipment which could work on the
• soft talus and without going too far below the water table at low river stages, 6
where the material might flow. Side slopes of the trench were as steep on both
the original material and talus sides as would stand during construction in order
G 8G-68-7"
to provide the most compact stone section. Experimental erosion protection
measures which were conside.red for use on the graded slope included use of a
section of riprap paving 12 ir, ches thick to serve as a control against which the
other measures could be comparei. This is generally considered the most 0
practicable and inexpensive pro.vin method of erosion control in this area. This
was rejected because the expected level of performance can be anticipated
sufficiently close to permit an objective judgment of the chosen methods. Three
bank protection measures were selected whose economy and effectiveness were
considered experimental. The three protective measures chosen for use on the
slope consisted of: (1) a grout-filled fabric mattress, (2) a revetment of used
tires banded together, and (3) a mixed-in-place soil cement paving, These
measures were chosen because they are adaptable to small bank protection -0
projects, could conceivably be used by indivichals but more likely companies,
municipalities, or local governments with their own resources. A plan view and
typical cross sections for the work are shown on Plates 1 through 3.
9. Construction Details. The bank was graded and excavation of the toe trench
was begun. At this time the bank began to collapse in the upstream and middle
portions of the project. Excavation of the toe trench proceeded, followed
closely by placement of the stone fill at the rate of 20 tons per linear foot. 0
Excavation of the toe trench was not a factor in collapse of the bank, as the
bank failure occurred just as excavation was commenced at the upstream end of
the project. As the trench was excavated along the failed slope, the landward
wall of the trench would move riverward perceptibly before the trench could be 0
filled with stone. The material continued to settle and flow out over the stone
filled toe trench. Before grading and excavation operations were completed, the
lower half of the bank had failed throughout virtually the entire 1,000-foot
length of the project. Geotechnical engineers determined that the disturbed 0
material in the failure zone would have to be removed because it had almost
zero shear strength. This remolded or failed bank material was removed and
replaced with a semi-compacted clay gravel. A typical section of this is shown
on Plate 4 and Photos 5 through 8 show the failure condition and repairs in • I
progress. The upstream 333-foot section consists of a concrete grout with a
minimum thickness of 4 inches placed between two layers of fabric held not
G-68-8
closer together than 4 inches at close intervals. The specifications were written
to encourage the contractor to improvise in this construction, if feasible, but he
chose to have this section performed by a nationally known firm that specializes
in this type of bank protection. In this method two very strong layers of woven
nylon fabric are used. At about 3-inch spacing each way, the fabric has nylon
strands to limit separation of the two layers of fabric to not less than the
specified minimum thickness when a slurry of grout is pumped between the
layers. The grout-filled fabric mattress was keyed into the bank at the upstream
edge and ends and lapped onto the stone-filled trench at the foot of the slope.
Photos 9 and 10 show details of this construction. The middle one-third of the
1,000-foot section is a used tire revetment. Used tires were laid on the graded
I bank in a close-packed arrangement and banded together at the contact points 0
with 3/4" X 0.020" galvanized steel strapping and heavy duty galvanized steel
*seals. Tire sizes permitted were automobile or truck type tires 13" to 16" wheel
size. In retrospect, it would have been better if a mixture of sizes had not been
* permitted because the mixed tire sizes did not lend themselves to a close packed S
arrangement with edges touching and some bands had to span several inches to
reach a small tire between larger ones. Screw anchors 3/4" X 66" with 6" blades
were set to full depth in the bank on 30-foot spacing each way and 3/8 inch
galvanized steel strand attached between them. Tires along the strands were
banded to them to anchor the whole system to the riverbank. Photos 11 and 12
show construction of the used tire revetment. A native willow shoot or sprout
about 18 inches long and 1/4" to 1" diameter was planted approximately 12" deep
in the center of each tire. The area was also fertilized and seeded to help hasten
the establishment of vegetative cover. The downstream 333 feet of sloped bank
was protected with mixed-in-place soil cement paving. Due to the high clay
content, the bank was first stabilized by cutting in 133 pounds per square of
S hydrated lime, which was allowed to set for at least two days. Then the soil 6
moisture content was to be brought within the range of 31 to 33 percent and
portland cement applied at the rate of 575 pounds per square and tilled or disked
thoroughly into the ground to a depth of six inches. Some confusion developed
during this phase of construction and the actual construction procedure consisted 0
of all the cement for the entire area being distributed and lightly disked in on
one day. Water was applied to the slope to raise the soil cement mixture to the
G 8I• G-68-9
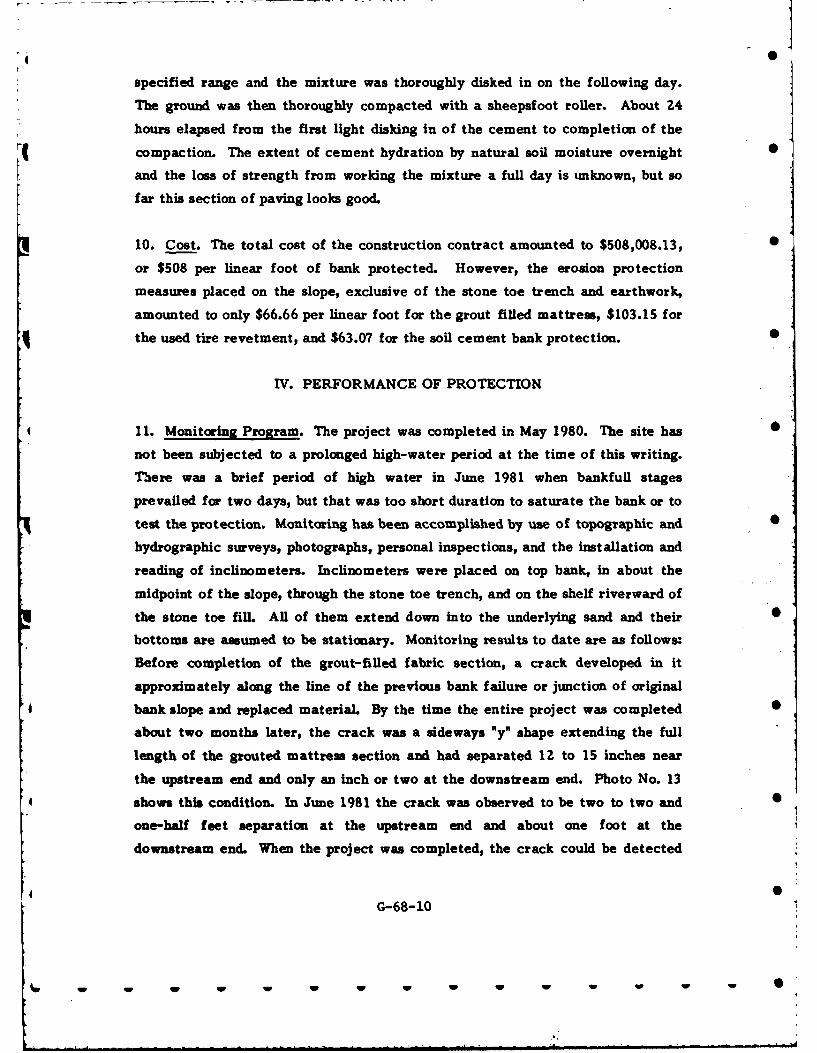
specified range and the mixture was thoroughly disked in on the following day.
The ground was then thoroughly compacted with a sheepsfoot roller. About 24
hours elapsed from the first light disking in of the cement to completion of the
compaction. The extent of cement hydration by natural soil moisture overnight 0
and the loss of strength from working the mixture a full day is unknown, but so
far this section of paving looks good.
10. Cost. The total cost of the construction contract amounted to $508,008.13, 0
or $508 per linear foot of bank protected. However, the erosion protection
measures placed on the slope, exclusive of the stone toe trench and earthwork,
amounted to only $66.66 per linear foot for the grout filled mattress, $103.15 for
the used tire revetment, and $63.07 for the soil cement bank protection. •
IV. PERFORMANCE OF PROTECTION
11. Monitoring Program. The project was completed in May 1980. The site has •
not been subjected to a prolonged high-water period at the time of this writing.
There was a brief period of high water in June 1981 when bankfull stages
prevailed for two days, but that was too short duration to saturate the bank or to
test the protection. Monitoring has been accomplished by use of topographic and 0
hydrographic surveys, photographs, personal inspections, and the installation and
reading of inclinometers. Inclinometers were placed on top bank, in about the
midpoint of the slope, through the stone toe trench, and on the shelf riverward of
the stone toe fill. All of them extend down into the underlying sand and their 0
bottoms are assumed to be stationary. Monitoring results to date are as follows:
Before completion of the grout-filled fabric section, a crack developed in it
approximately along the line of the previous bank failure or junction of original
bank slope and replaced material. By the time the entire project was completed 0
about two months later, the crack was a sideways "y" shape extending the full
length of the grouted mattress section and had separated 12 to 15 inches near
the upstream end and only an inch or two at the downstream end. Photo No. 13
shows this condition. In June 1981 the crack was observed to be two to two and
one-half feet separation at the upstream end and about one foot at the
downstream end. When the project was completed, the crack could be detected
G-68-10
Imp w w w w
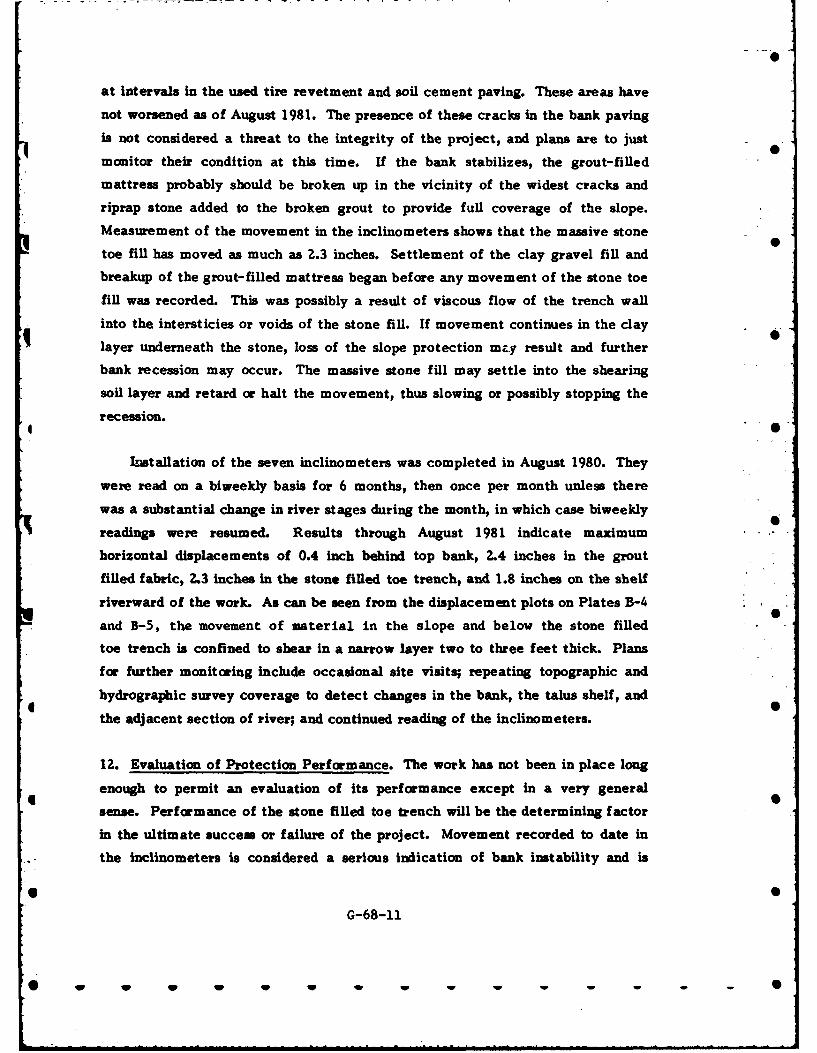
at intervals in the used tire revetment and soil cement paving. These areas have
not worsened as of August 1981. The presence of these cracks in the bank paving
is not considered a threat to the integrity of the project, and plans are to just
monitor their condition at this time. If the bank stabilizes, the grout-filled
mattress probably should be broken up in the vicinity of the widest cracks and
riprap stone added to the broken grout to provide full coverage of the slope.
Measurement of the movement in the inclinometers shows that the massive stone
toe fill has moved as much as 2.3 inches. Settlement of the clay gravel fill and
breakup of the grout-filled mattress began before any movement of the stone toe
fill was recorded. This was possibly a result of viscous flow of the trench wall
into the intersticies or voids of the stone fill. If movement continues in the clay
layer underneath the stone, loss of the slope protection mz~y result and further
bank recession may occur. The massive stone fill way settle into the shearing
soil layer and retard or halt the movement, thus slowing or possibly stopping the
recession.
Installation of the seven inclinometers was completed in August 1980. They
were read on a biweekly basis for 6 months, then once per month unless there
was a substantial change in river stages during the month, in which case biweekly
readings were resumed. Results through August 1981 indicate maximum
horizontal displacements of 0.4 inch behind top bank, 2.4 inches in the grout
filled fabric, 2.3 inches in the stone filled toe trench, and 1.8 inches on the shelf
riverward of the work. As can be seen from the displacement plots on Plates B-4
and B-5, the movement of material in the slope and below the stone filled
toe trench is confined to shear in a narrow layer two to three feet thick. Plans
for further monitoring include occasional site visits; repeating topographic and
hydrographic survey coverage to detect changes in the bank, the talus shelf, and
the adjacent section of river; and continued reading of the inclinometers.
12. Evaluation of Protection Performance. The work has not been in place long
enough to permit an evaluation of its performance except in a very general
sense. Performance of the stone filled toe trench will be the determining factor
in the ultimate success or failure of the project. Movement recorded to date in
the inclinometers is considered a serious indication of bank instability and is
G-68-11
W W W W , , W W -W ,
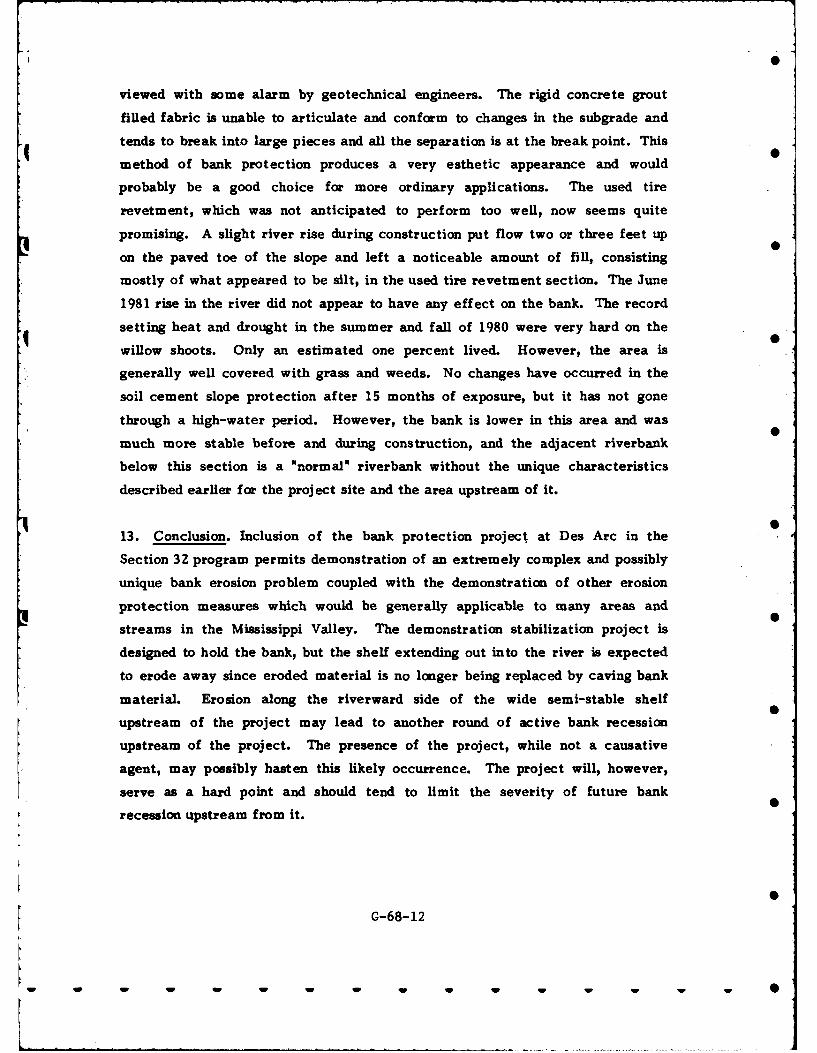
viewed with some alarm by geotechnical engineers. The rigid concrete grout
filled fabric is unable to articulate and conform to changes in the subgrade and
tends to break into large pieces and all the separation is at the break point. This
method of bank protection produces a very esthetic appearance and would
probably be a good choice for more ordinary applications. The used tire
revetment, which was not anticipated to perform too well, now seems quite
promising. A slight river rise during construction put flow two or three feet up
on the paved toe of the slope and left a noticeable amount of fill, consisting
mostly of what appeared to be silt, in the used tire revetment section. The June
1981 rise in the river did not appear to have any effect on the bank. The record
setting heat and drought in the summer and fall of 1980 were very hard on the
qwillow shoots. Only an estimated one percent lived. However, the area is
generally well covered with grass and weeds. No changes have occurred in the
soil cement slope protection after 15 months of exposure, but it has not gone
through a high-water period. However, the bank is lower in this area and was
much more stable before and during construction, and the adjacent riverbank
below this section is a "normal" riverbank without the unique characteristics
described earlier for the project site and the area upstream of it.
13. Conclusion. Inclusion of the bank protection project at Des Arc in the
Section 32 program permits demonstration of an extremely complex and possibly
unique bank erosion problem coupled with the demonstration of other erosion
protection measures which would be generally applicable to many areas and
streams in the Mississippi Valley. The demonstration stabilization project is
designed to hold the bank, but the shelf extending out into the river is expected
to erode away since eroded material is no longer being replaced by caving bank
material. Erosion along the riverward side of the wide semi-stable shelf
upstream of the project may lead to another round of active bank recession
upstream of the project. The presence of the project, while not a causative
agent, may possibly hasten this likely occurrence. The project will, however,
serve as a hard point and should tend to limit the severity of future bank
recession upstream from it.
G-68-12
.. . . ww
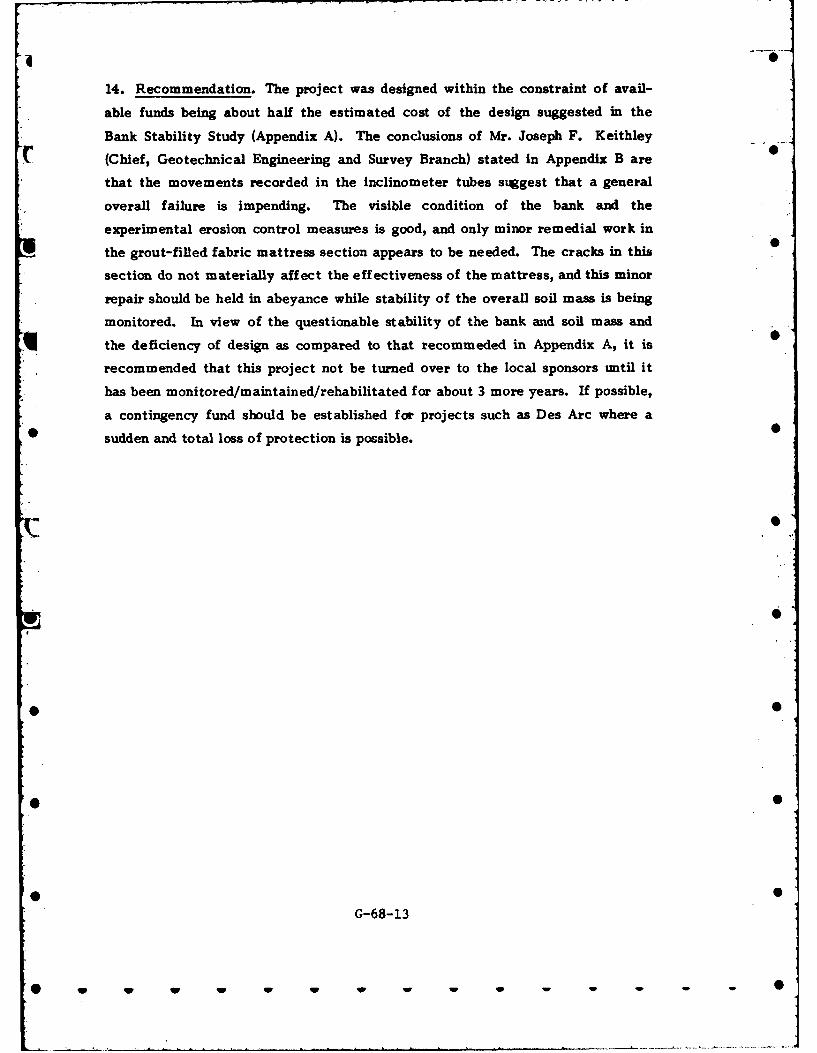
1 0
14. Recommendation. The project was designed within the constraint of avail-
able funds being about half the estimated cost of the design suggested in the
Bank Stability Study (Appendix A). The conclusions of Mr. Joseph F. Keithley
C (Chief, Geotechnical Engineering and Survey Branch) stated in Appendix B are
that the movements recorded in the inclinometer tubes suggest that a general
overall failure is impending. The visible condition of the bank and the
experimental erosion control measures is good, and only minor remedial work in
the grout-filled fabric mattress section appears to be needed. The cracks in this
section do not materially affect the effectiveness of the mattress, and this minor
repair should be held in abeyance while stability of the overall soil mass is being
monitored. In view of the questionable stability of the bank and soi mass and
the deficiency of design as compared to that recommeded in Appendix A, it is
recommended that this project not be turned over to the local sponsors until it
has been monitored/maintained/rehabilitated for about 3 more years. If possible,
a contingency fund should be established for projects such as Des Arc where a
sudden and total loss of protection is possible.
* •
G-68-13
W W W W IV W W
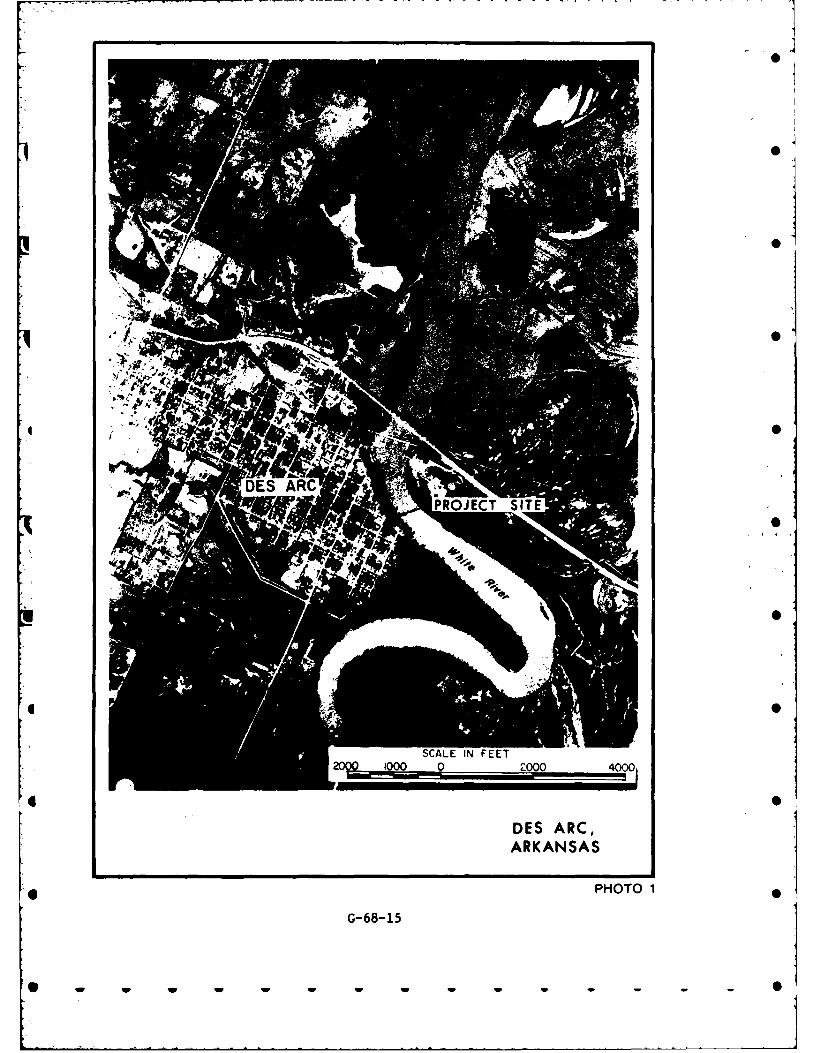
7- .1 20
*A 4.
100 000040
DES ARC,ARKANSAS
PHOTO 1
G-68-15
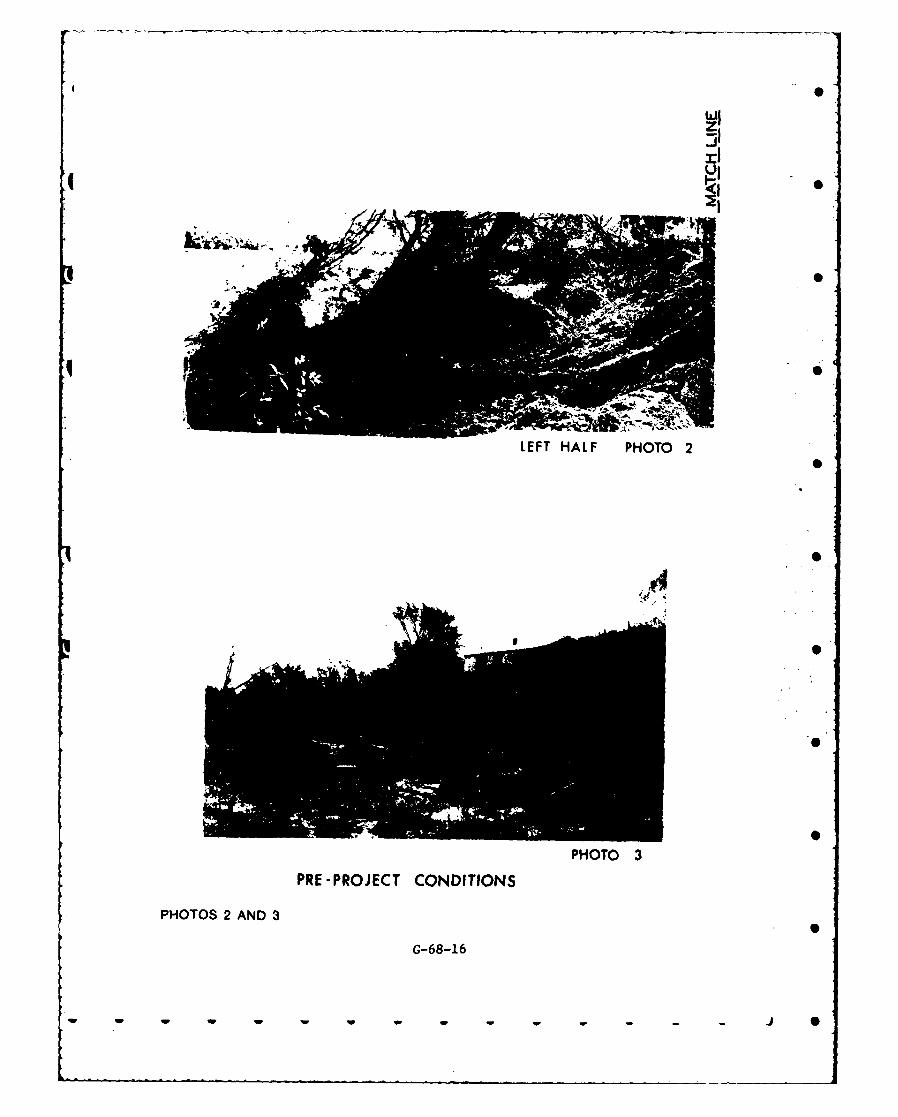
ml
LEFT HALF PHOTO 2
PHOTO 3
PRE -PROJECT CONDITIONS
PHOTOS 2 AND 3
G-68-16
w w w -- - -A
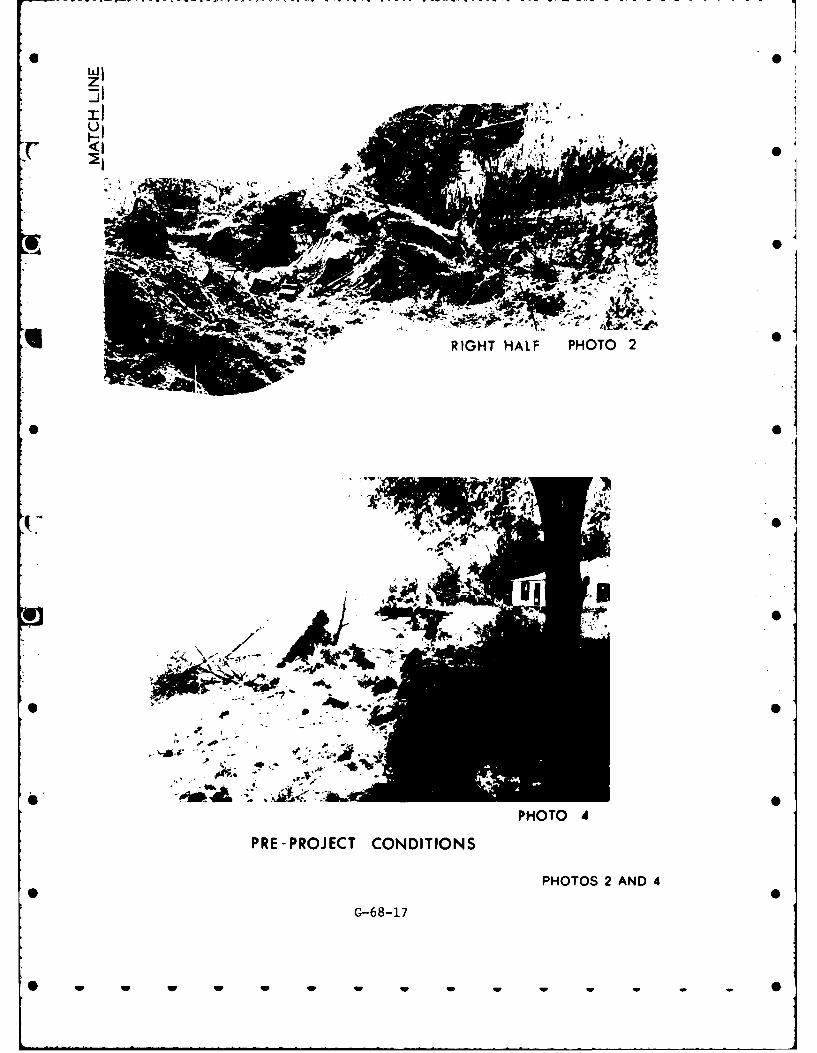
z1
* 0f
-4 0
R IGHT HALF PHOTO 2
PHT 0
PR-POJC ODTIN
PHOTO 2 AN 4l
0-81
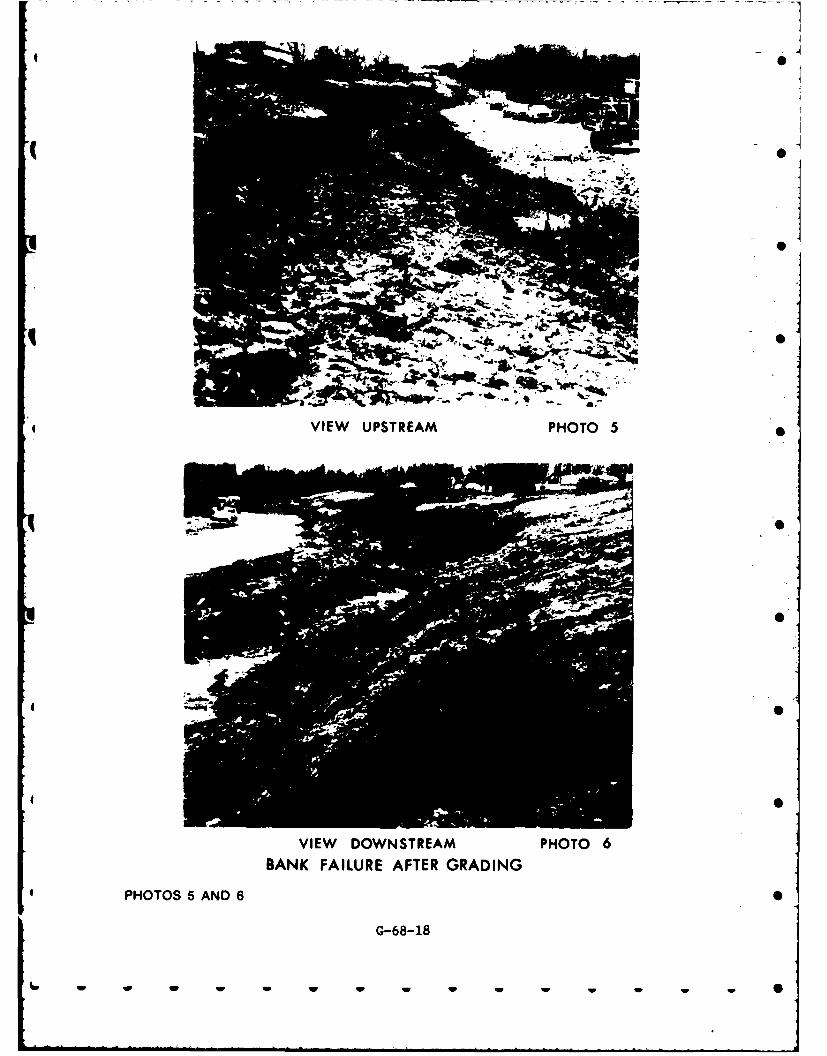
VIEW UPSTREAM PHOTO 5
VIEW DOWNSTREAM PHOTO 6BANK FAILURE AFTER GRADING
PHOTOS 5 AND 6
G-68-18
w w w w w-S
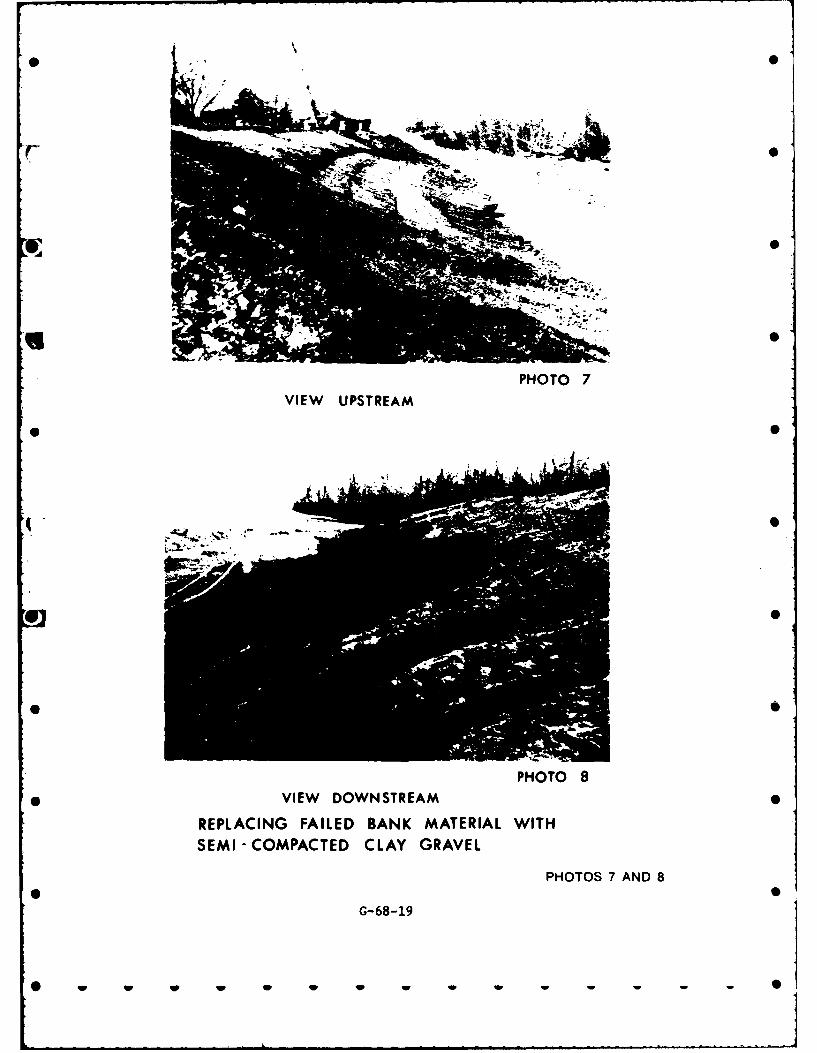
PHOTO 7VIEW UPSTREAM
* S
PHOTO 8* VIEW DOWNSTREAM
REPLACING FAILED BANK MATERIAL WITHSEMI-COMPACTED CLAY GRAVEL
PHOTOS 7 AND 8
G-68-19
w w w w w w w
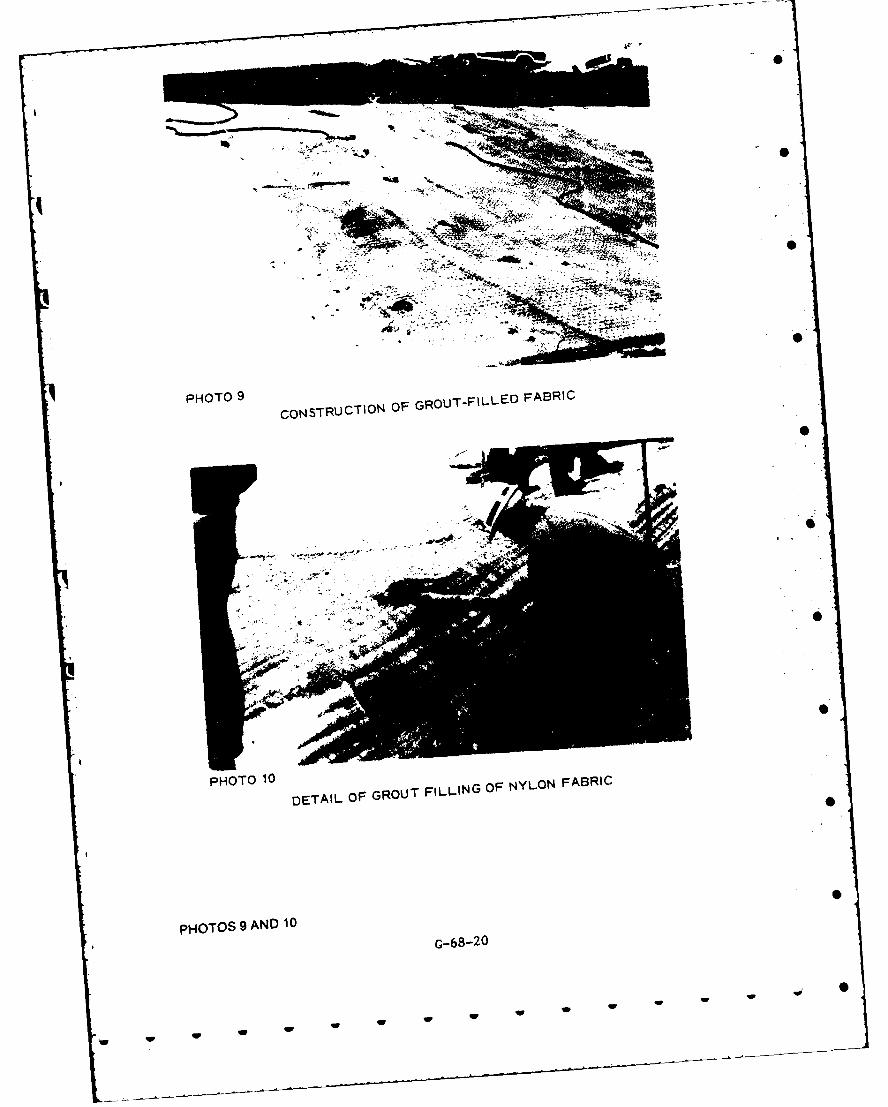
PHOT09 CONSTRUCTION OF GROUTFILLED FABRIC
PHOT 10DETAIL OF GROUT FILLING OF NYLON FABRIC
PHOTOS 9 AND 10G-68- 20
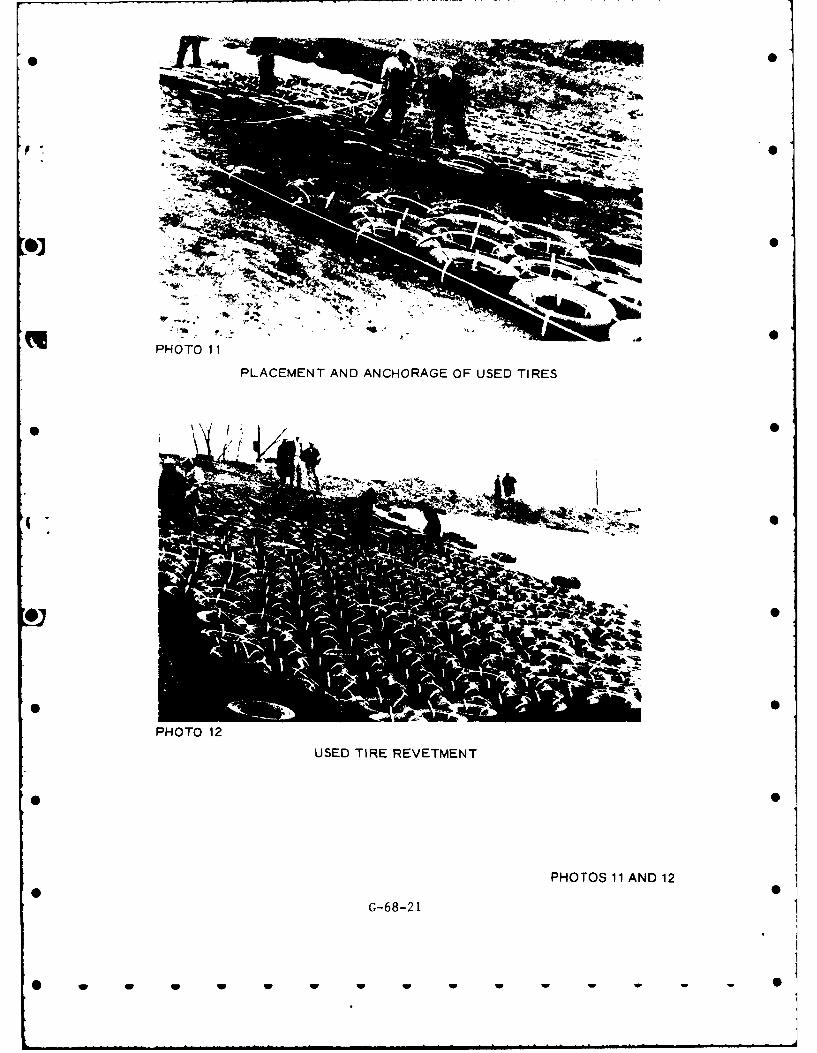
qPHOTO I1IPLACEMENT AND ANCHORAGE OF USED TIRES
PHOTO 12
USED TIRE REVETMENT
PHOTOS 11 AND 12
G-68-21
* w w w w
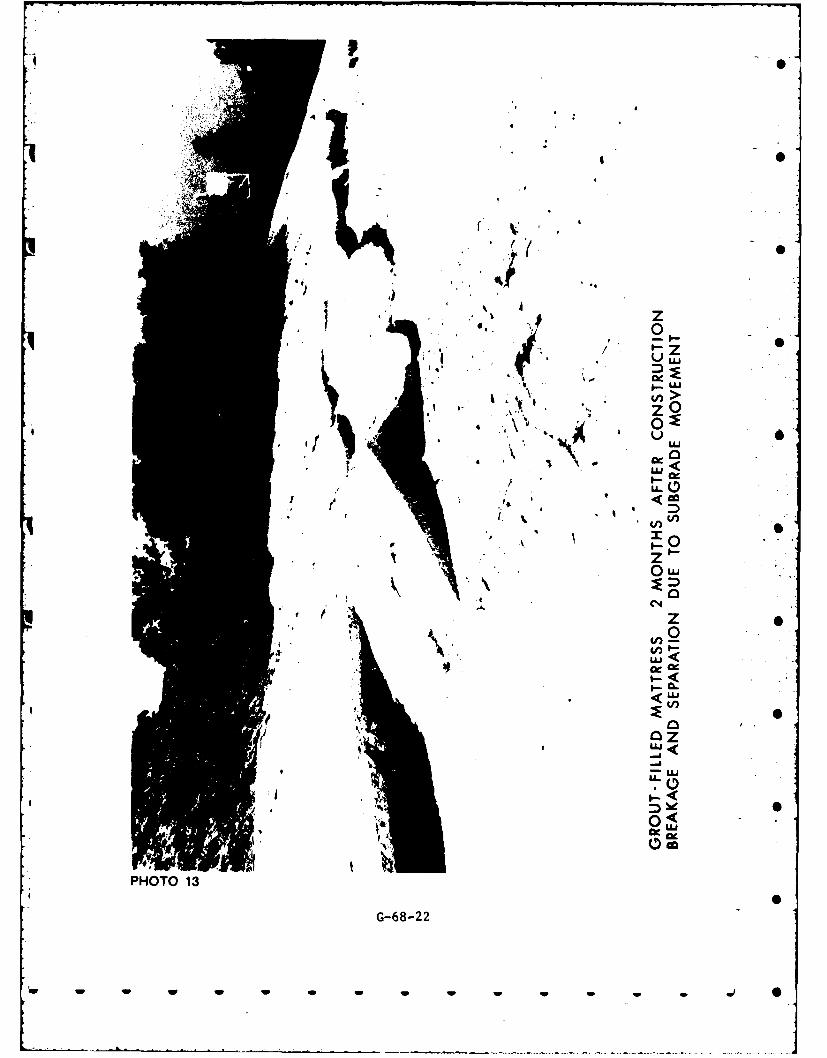
. 0s
z 0V.- cm4 z4
a 0-I--
< Lu
S S \'~ i <
0uj
0<CieCID
PHOTO 1
G-68-22
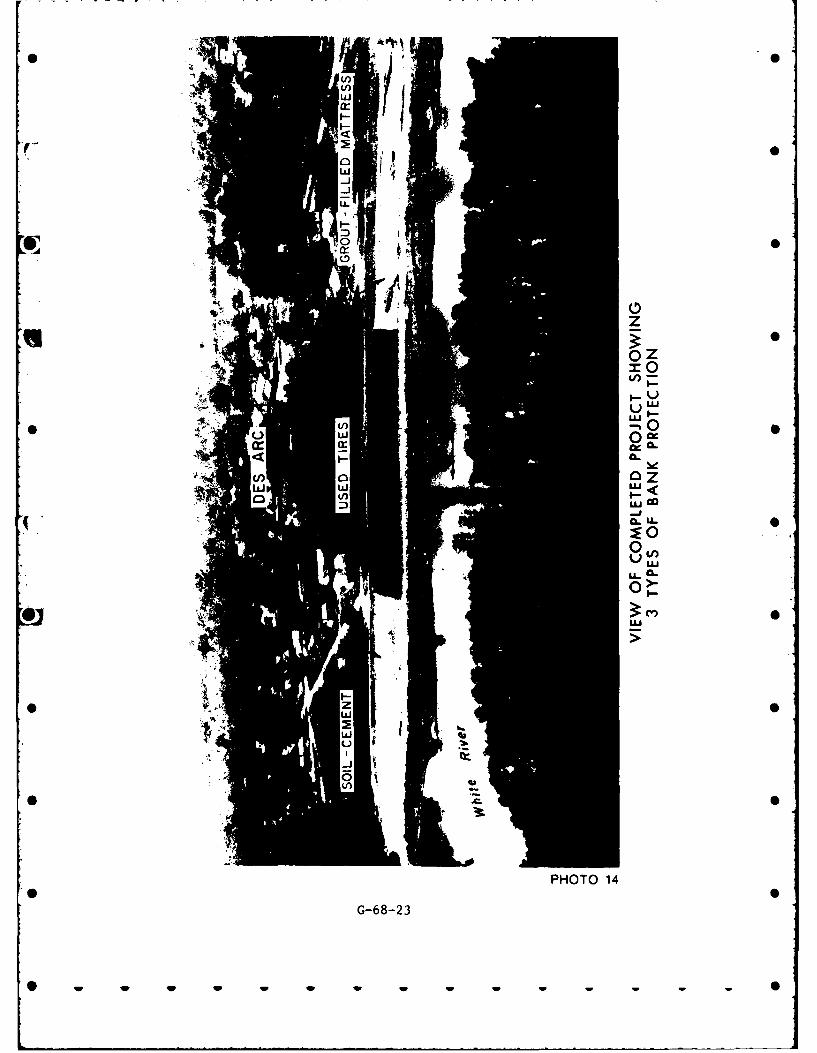
* 0
w 0c
0
L.
00
6j CV0
PHOTO 1-
G-68-23
LI
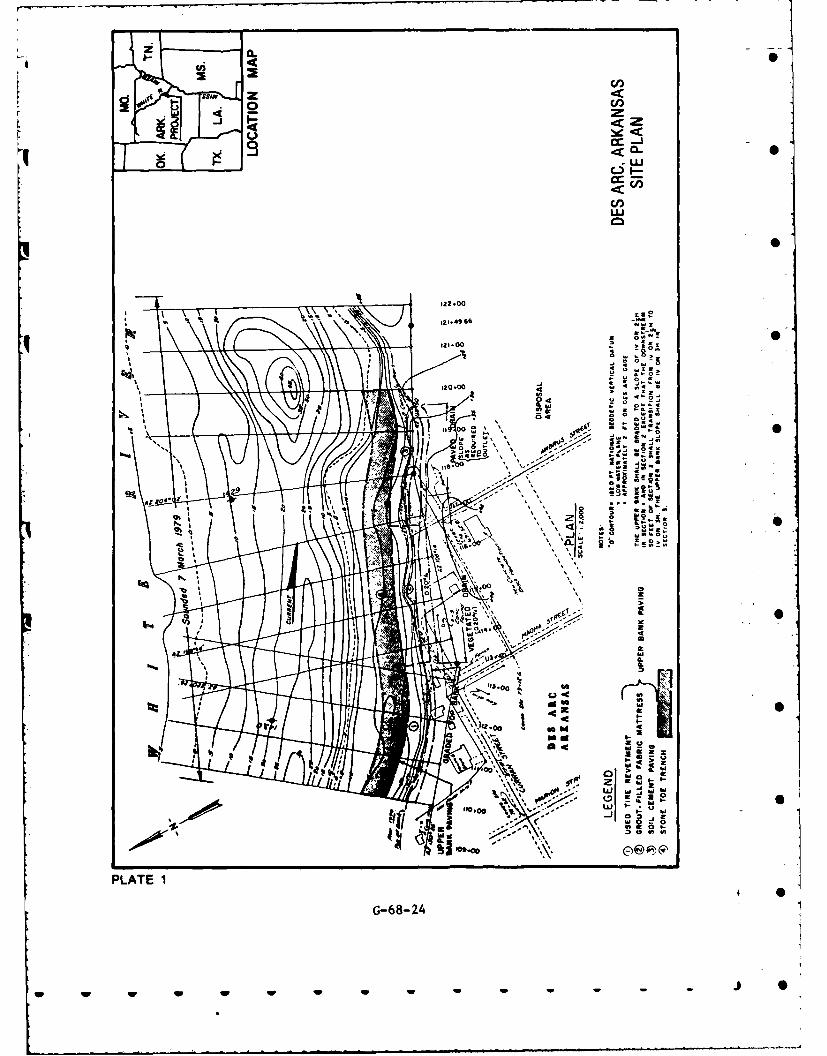
-8))
0i~ 0 C
LUJ
922.00
q 2~?1.4966 5
11 o
~~~~ Z-- 0~
%: %
183.00
.0, SO
in 4c
w Q.I-
100.0 0 '~ '~w -S
z,0000,'
PLATE I
G-68- 24
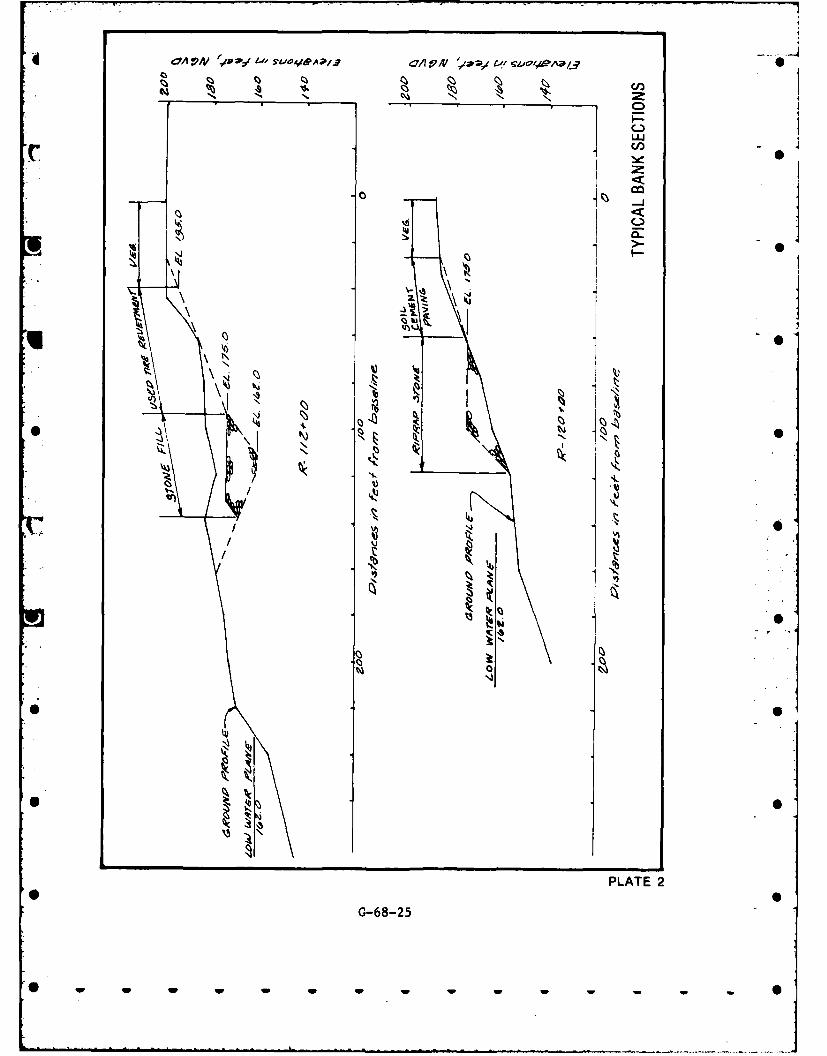
CA AI ,e2-_4 w'O 4 -- A P/j CallN 4 1iqo1,ze2 Aa0
0cc
I -)<
vy'
C3
CsIz4
Ik
010
PLATE 2
G-68-25
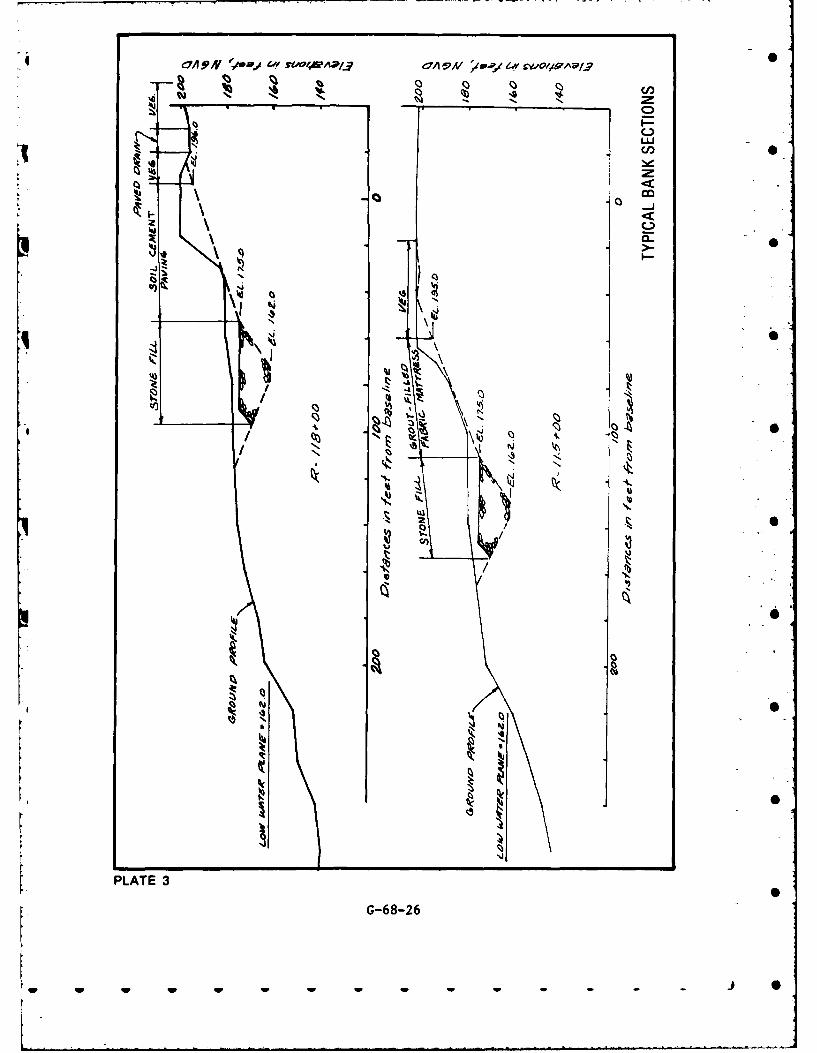
4 ,1A 1-!'4 4'014A e7A VW Z'-y 4s wo/pAw/
4 C,
C,
Ic-
'8
Ni
PLAT 3.
G-6-2
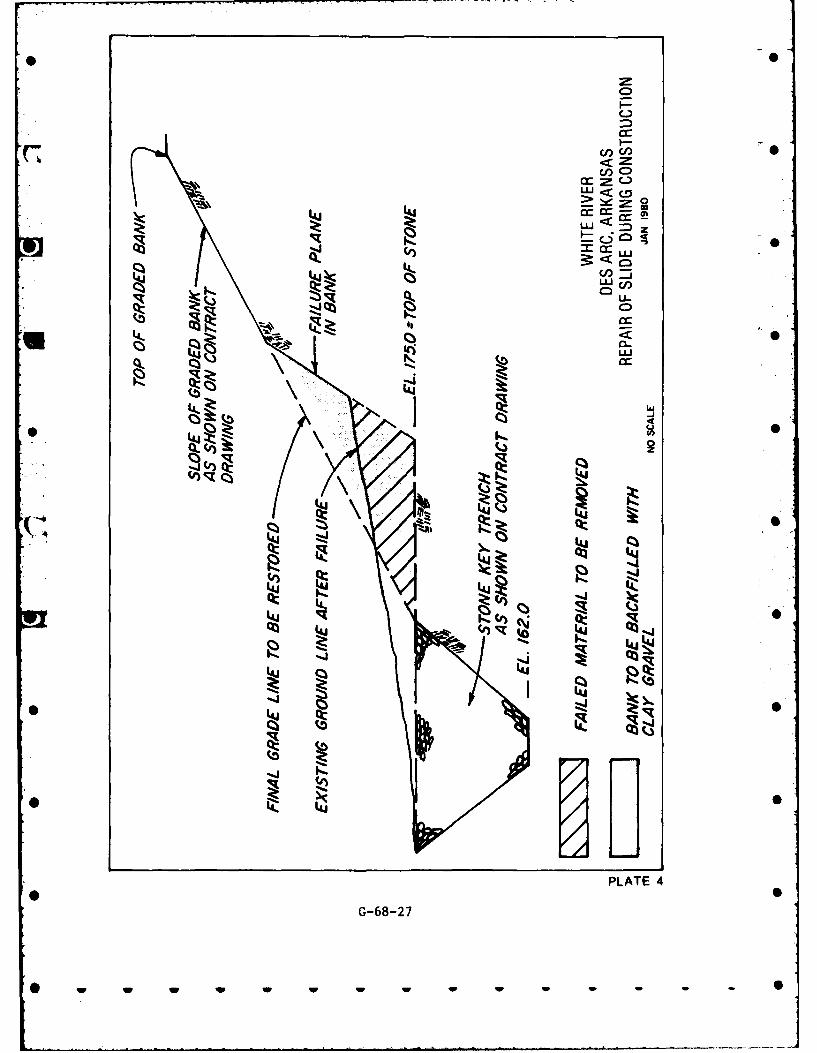
C)
UJ <ZtL
K~ CZ-
U 41Sr LU U
4. <
LuU
L Q
tu I.F.
~CC4W u
LuPLATE 4G-68-27
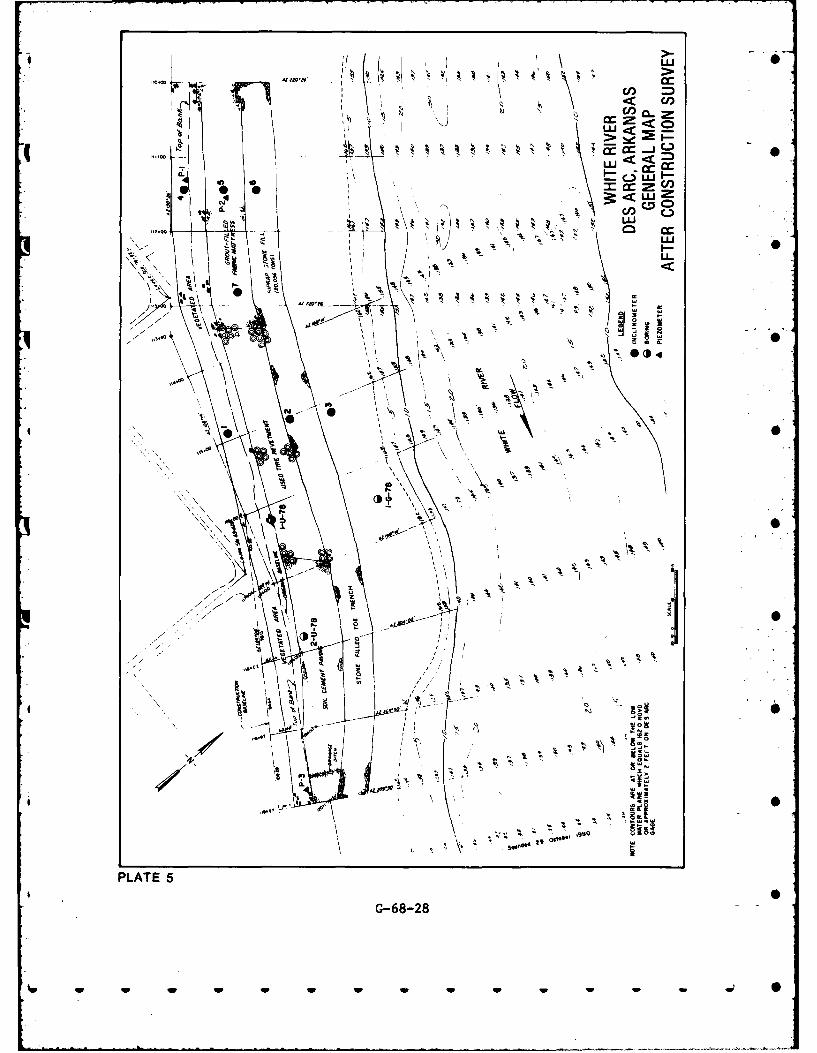
CC,
\J CC,
c2*O 0 C/
/ , t,~- L0cc
- U-
it0~
'Iva,
'. o -A
A j
iz-
2 L i(L
4j 0
'.Hale
PLATE 5
G-68-28
APPENDIX ADES ARC, ARKANSAS
BANK STABILITY STUDY
a. General. The town of Des Arc is situated atop the bluffs located along
the west bank of the White River in east central Arkansas. The western bank of
the White River immediately alongside the town has been the scene of serious
bank caving in recent years. Several inspections of the area have been made in
the past in an effort to determine what remedial measures would be appropriate.
Memo for Record, LMMED-F, dated 21 December 1976, (copy attached) gives a
detailed account of one such inspection. The Memo for Record also addresses
the geological and subsurface conditions at the site, past occurrences of bank
caving, probable cause and mechanism of bank failure, and possible remedial
measures.
b. Soils Exploration. The soil conditions in the vicinity of the bank caving
were investigated by taking 2 undisturbed borings and one general sample boring. 0
Samples were taken with auger, 5-inch tube, and split spoon samplers. The
boring locations are shown on Plate 5 and the logs of these borings are shown on
Plate A-I.
c. Selected Plan of Repair. The failure mechanism associated with the
*- bank caving was assumed to be similar to that as described in para 5 of attached
Memo for Record. Therefore, it was felt that the placement of erosion
protection on the bank surface alone would not be adequate to stabilize the •
banks. Several remedial measures were considered for stabilizing the bank
section, but the one which appeared to have the most merit consisted of grading
the banks to a stable slope, providing slope protection, and constructing a
massive rock toe throughout the length of the affected area. A section 0
*illustrating the proposed method of repair is shown on Plate A-Z.
d. Shear Strength Characteristics. The selection of design values for cohe-
sive and semi-cohesive soils for the Q and R condition based was on consistencies 0
indicated by the boring logs, natural moisture contents, the Atterberg limits, and
the unconfined compression test results when available. Design values for the S
condition for these soils were based on a plot of the plasticity index versus 0'
G-68-29
0 W W W W W W
correlation shown on page 5 of TR-3-604. The cohesion for the S case was
assumed equal to zero. For all cohesionless soils, shear strength design values of
0'=330 and c=0 were selected for the Q, R, and S conditions. Values of 0'=380
and c=0 were selected for the stone fill.
e. Stability Analysis. Logs and test results from Borings 1-U-78, Z-U-78
and 3-G-78 were examined to determine appropriate soil stratification and shear
strengths to use in slope stability analyses. Bank slopes were analyzed using
criteria specified in DIVR 1110-1-400, Section 5, Part 4, Item 1, dated March
1973. Because the bank caving was located in an urban area where availability
of right-of-way was somewhat restricted, it was intended to provide the steepest
stable bank slope possible to minimize right-of-way requirements. A series of
slope stability analyses were performed on a typical section using shear strength
parameters and soil stratification from the borings. It was assumed in the
analyses that a trench would be excavated at the base of the slope between the
bluff material and the talus material for the placement of the rock toe (See
Plate A-Z). The cut on the bluff side would be made through undisturbed bluff
material. It was also assumed that the trench would be excavated down to sand
(EL 158*) and would have a bottom width of six feet. The trench would then be
backfilled to elevation 175.0 with a sufficient quantity of stone to provide a
stable bank section. The section was initially analyzed to determine the required
slopes to provide adequate stability during excavation of the trench. Before
excavation slopes in the talus could be determined, it was necessary to assign
shear strength to the talus material. Therefore a stability analysis as shown on
Plate A-3 was performed in an effort to determine the cohesive strength of the
talus material. Since the talus was actively failing at the time of inspection, it
was assumed that the factor of safety for the section was probably somewhere in
the range between 0.95 and 1.00. From the results of several trials it was found
that a cohesive value of 240 psf for the talus material yielded a factor of safety
in this range. A cohesive value of 240 psf was then used in the analysis as shown
on Plate A-4 to determine the appropriate excavation slope for the talus
material. This analysis indicated that a IV on 2.75 H excavation slope was
required. An additional stability analysis was performed for the bluff side of the
proposed trench to determine the required excavation slopes there. Soil
stratification and shear strength values for the bluff material were based on a
G-68-30
W W W W W W W W W
composite of Borings 1-U-78 and 2-U-78. The analysis as shown on Plate A-5
indicates that a IV on 1.5 H slope from elevation 158.0 to 175.0 and a IV on 2.5
H slope from elevation 175.0 to top bank is adequate. An overall analysis
F, indicating the stability of the section after the placement of stone is presented
on Plate A-6. It was assumed that approximately 43 tons of stone per linear foot
of bank would initially be placed as shownon Plate A-7. For purposes of analysis,
however, it was assumed that bank scour and failure in the talus would progress
even after placement of the stone fill until enough stone was displaced from the
riverside portion of the trench to line and protect the slope immediately below it
from further scour. Plate A-6 represents the assumed configuration of this bank
section.
All stability analyses were performed for the after construction loading
condition using both wedge and circular a.c methods of analysis with applicable
WES computer programs SSWT28 and SSA003. Since the banks are composed of
* •predominantly clay materials, the sudden drawdown and partial pool loading
conditions were not considered applicable.
f. Recommendations. Based on available data and the results of the stabil-
ity analyses, the following is the recommended plan for bank stabilization:
The existing bank should be graded to provide a slope no steeper than IV on
2.5 H from top bank down to elevation 175.0. Slope protection should be
provided for this area. A trench should be excavated at the base of the slope
between the bluff material and the talus material for placement of a stone fill
along the toe of the bank section. The trench should be excavated from
elevation 175.0 down at least to the top of sand (El. 158t). Excavation side
* slopes should not be steeper than IV on 1.5 H on the bluff side of the trench and
should not be steeper than 1V on 2.75 H on the talus side. Provisions should be
made so that the excavation of the trench on the bluff side is made through the
undisturbed bluff materials. The trench should have a minimum bottom width of
* six feet. A stone fill should be placed in the trench from elevation 158 to
elevation 175. This will require a stone quantity of approximately 43 tons per
linear foot of bank section. The recommended plan of stabilization is illustrated
on Plate A-7.
G-68-31
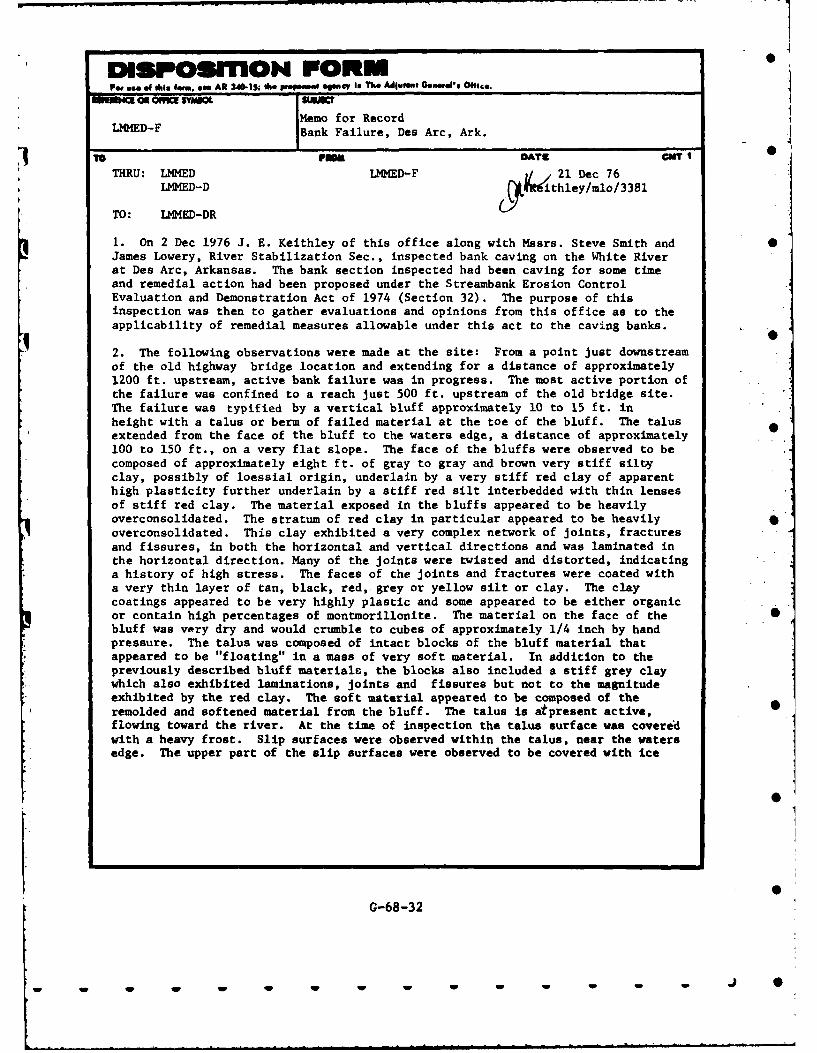
DISPOSlION FORMFor e w, tis fern. se AR 340-15 the pepmema esnaay Is The Adjutant GeneIs 044,*.
Memo for RecordLMMED-F Bank Failure, Des Arc, Ark.
TO 'Ft"O DATZ GMT I•
THRU: LMMED LMMED-F 21 Dec 76LMMED-D &Kithley/mlo/3381
TO: LMMED-DR
I. On 2 Dec 1976 J. E. Keithley of this office along with Mssrs. Steve Smith and 0James Lowery, River Stabilization Sec., inspected bank caving on the White Riverat Des Arc, Arkansas. The bank section inspected had been caving for some timeand remedial action had been proposed under the Streambank Erosion ControlEvaluation and Demonstration Act of 1974 (Section 32). The purpose of thisinspection was then to gather evaluations and opinions from this office as to theapplicability of remedial measures allowable under this act to the caving banks.
2. The following observations were made at the site: From a point just downstreamof the old highway bridge location and extending for a distance of approximately1200 ft. upstream, active bank failure was in progress. The most active portion ofthe failure was confined to a reach just 500 ft. upstream of the old bridge site.The failure was typified by a vertical bluff approximately 10 to 15 ft. inheight with a talus or berm of failed material at the toe of the bluff. The talusextended from the face of the bluff to the waters edge, a distance of approximately100 to 150 ft., on a very flat slope. The face of the bluffs were observed to becomposed of approximately eight ft. of gray to gray and brown very stiff siltyclay, possibly of loessial origin, underlain by a very stiff red clay of apparenthigh plasticity further underlain by a stiff red silt interbedded with thin lensesof stiff red clay. The material exposed in the bluffs appeared to be heavilyoverconsolidated. The stratum of red clay in particular appeared to be heavilyoverconsolidated. This clay exhibited a very complex network of joints, fracturesand fissures, in both the horizontal and vertical directions and was laminated inthe horizontal direction. Many of the joints were twisted and distorted, indicatinga history of high stress. The faces of the joints and fractures were coated witha very thin layer of tan, black, red, grey or yellow silt or clay. The claycoatings appeared to be very highly plastic and some appeared to be either organicor contain high percentages of montmorillonite. The material on the face of the 0bluff was v*ry dry and would crumble to cubes of approximately 1/4 inch by handpressure. The talus was composed of intact blocks of the bluff material thatappeared to be "floating" in a mass of very soft material. In addition to thepreviously described bluff materials, the blocks also included a stiff grey claywhich also exhibited laminations, joints and fissures but not to the magnitude
* exhibited by the red clay. The soft material appeared to be composed of theremolded and softened material from the bluff. The talus is atpresent active,flowing toward the river. At the time of inspection the talus surface was coveredwith a heavy frost. Slip surfaces were observed within the talus, near the watersedge. The upper part of the slip surfaces were observed to be covered with ice
0
S
G-68-32
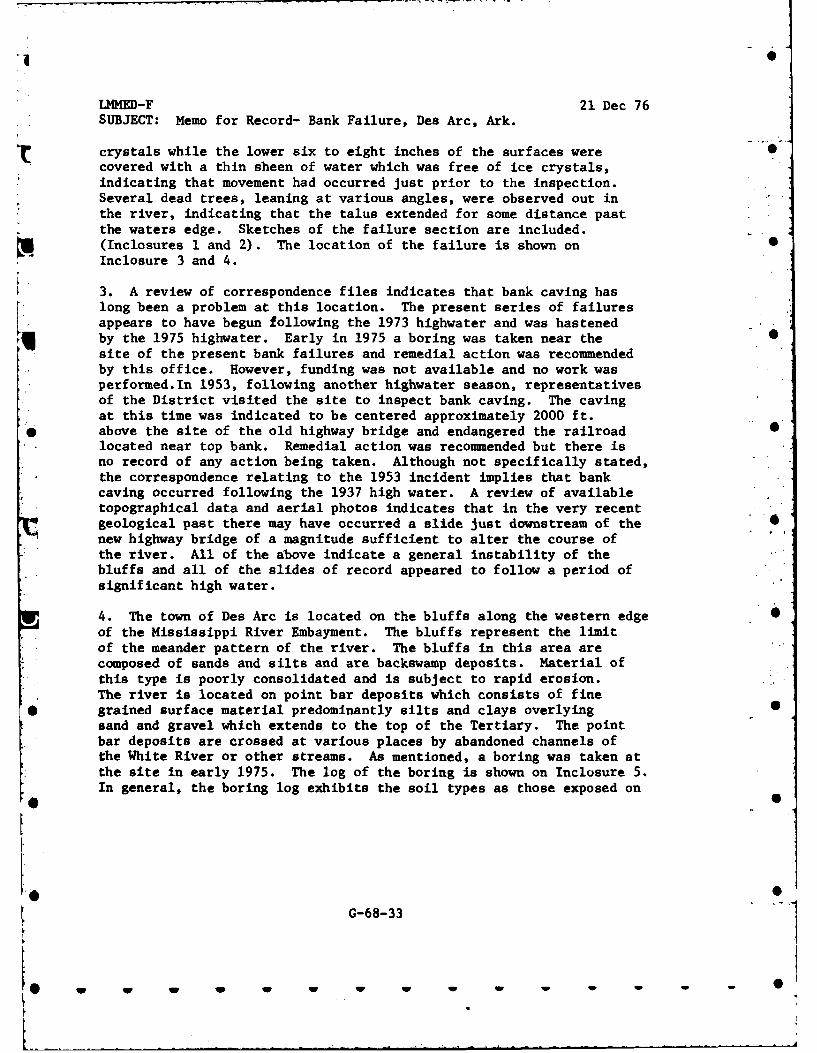
LMMED-F 21 Dec 76SUBJECT: Memo for Record- Bank Failure, Des Arc, Ark.
crystals while the lower six to eight inches of the surfaces were 0covered with a thin sheen of water which was free of ice crystals,indicating that movement had occurred just prior to the inspection.Several dead trees, leaning at various angles, were observed out inthe river, indicating that the talus extended for some distance pastthe waters edge. Sketches of the failure section are included.(Inclosures I and 2). The location of the failure is shown onInclosure 3 and 4.
3. A review of correspondence files indicates that bank caving haslong been a problem at this location. The present series of failuresLappears to have begun following the 1973 highwater and was hastenedby the 1975 highwater. Early in 1975 a boring was taken near thesite of the present bank failures and remedial action was recommendedby this office. However, funding was not available and no work wasperformed.In 1953, following another highwater season, representativesof the District visited the site to inspect bank caving. The cavingat this time was indicated to be centered approximately 2000 ft.
@ above the site of the old highway bridge and endangered the railroad 0located near top bank. Remedial action was recommended but there isno record of any action being taken. Although not specifically stated,the correspondence relating to the 1953 incident implies that bankcaving occurred following the 1937 high water. A review of availabletopographical data and aerial photos indicates that in the very recentgeological past there may have occurred a slide just downstream of the Snew highway bridge of a magnitude sufficient to alter the course ofthe river. All of the above indicate a general instability of thebluffs and all of the slides of record appeared to follow a period ofsignificant high water.
4. The town of Des Arc is located on the bluffs along the western edge 0of the Mississippi River Embayment. The bluffs represent the limitof the meander pattern of the river. The bluffs in this area arecomposed of sands and silts and are backswamp deposits. Material ofthis type is poorly consolidated and is subject to rapid erosion.The river is located on point bar deposits which consists of fine
• grained surface material predominantly silts and clays overlying 6sand and gravel which extends to the top of the Tertiary. The pointbar deposits are crossed at various places by abandoned channels ofthe White River or other streams. As mentioned, a boring was taken atthe site in early 1975. The log of the boring is shown on Inclosure 5.In general, the boring log exhibits the soil types as those exposed on
* 0
G-68-33
V W
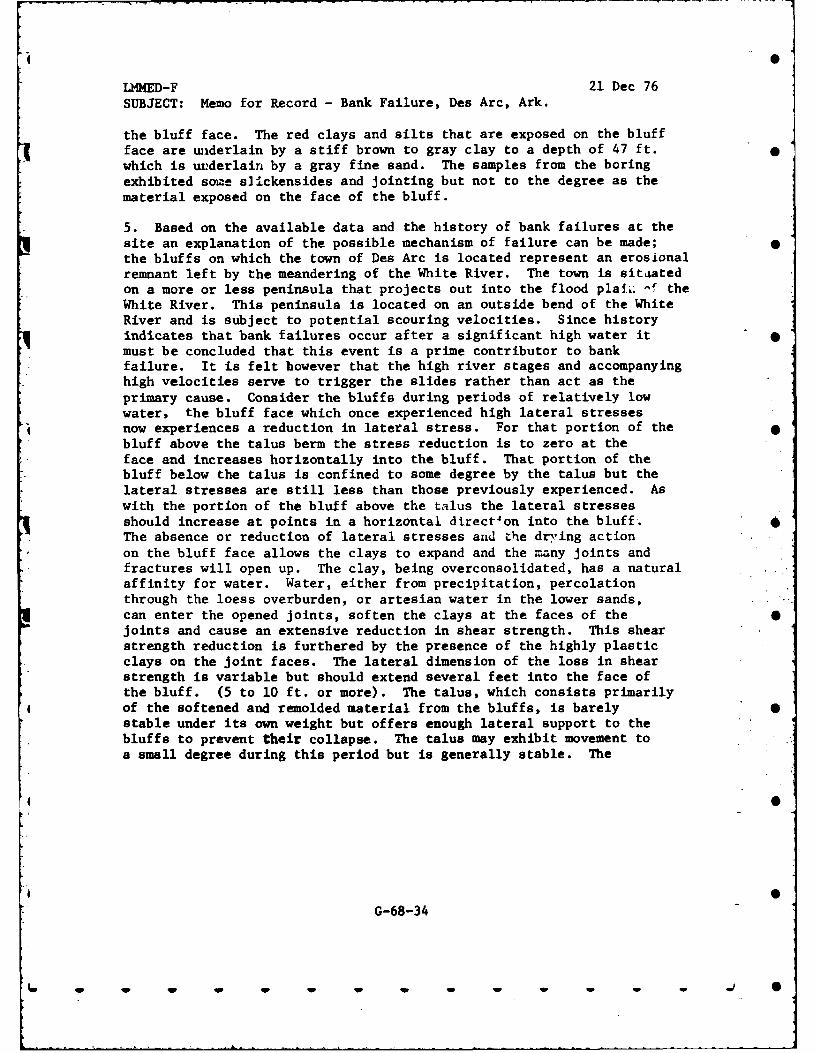
0
L 4MED-F 21 Dec 76SUBJECT: Memo for Record - Bank Failure, Des Arc, Ark.
the bluff face. The red clays and silts that are exposed on the bluffface are tuderlain by a stiff brown to gray clay to a depth of 47 ft. 0which is uzderlain by a gray fine sand. The samples from the boringexhibited some slickensides and jointing but not to the degree as thematerial exposed on the face of the bluff.
5. Based on the available data and the history of bank failures at thesite an explanation of the possible mechanism of failure can be made; 0the bluffs on which the town of Des Arc is located represent an erosionalremnant left by the meandering of the White River. The town is situatedon a more or less peninsula that projects out into the flood plaib -f theWhite River. This peninsula is located on an outside bend of the WhiteRiver and is subject to potential scouring velocities. Since historyindicates that bank failures occur after a significant high water itmust be concluded that this event is a prime contributor to bankfailure. It is felt however that the high river stages and accompanyinghigh velocities serve to trigger the slides rather than act as theprimary cause. Consider the bluffs during periods of relatively lowwater, the bluff face which once experienced high lateral stressesnow experiences a reduction in lateral stress. For that portion of the 0bluff above the talus berm the stress reduction is to zero at theface and increases horizontally into the bluff. That portion of thebluff below the talus is confined to some degree by the talus but thelateral stresses are still less than those previously experienced. Aswith the portion of the bluff above the talus the lateral stressesshould increase at points in a horizontal directon into the bluff.The absence or reduction of lateral stresses and Lhe drying actionon the bluff face allows the clays to expand and the many joints andfractures will open up. The clay, being overconsolidated, has a naturalaffinity for water. Water, either from precipitation, percolationthrough the loess overburden, or artesian water in the lower sands,can enter the opened joints, soften the clays at the faces of the 0joints and cause an extensive reduction in shear strength. This shearstrength reduction is furthered by the presence of the highly plasticclays on the Joint faces. The lateral dimension of the loss in shearstrength is variable but should extend several feet into the face ofthe bluff. (5 to 10 ft. or more). The talus, which consists primarilyof the softened and remolded material from the bluffs, is barely 0stable under its own weight but offers enough lateral support to thebluffs to prevent their collapse. The talus may exhibit movement toa small degree during this period but is generally stable. The
G-68-34
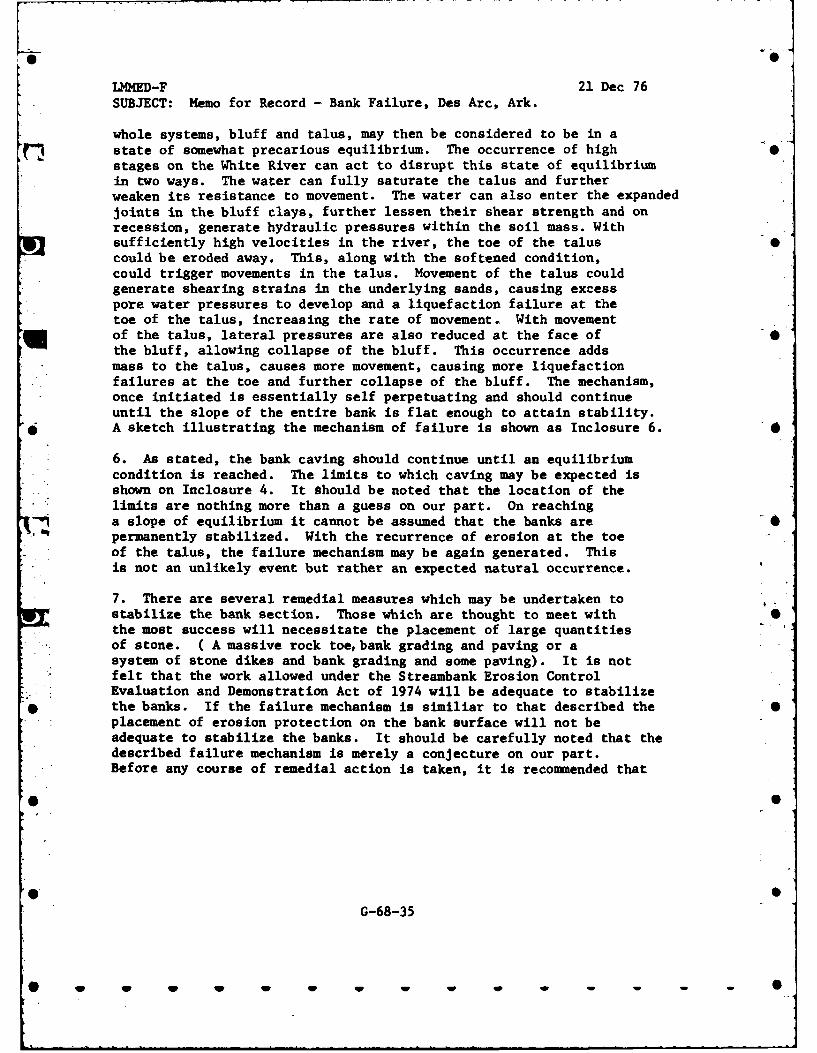
LMMED-F 21 Dec 76SUBJECT: Memo for Record - Bank Failure, Des Arc, Ark.
whole systems, bluff and talus, may then be considered to be in astate of somewhat precarious equilibrium. The occurrence of high 0stages on the White River can act to disrupt this state of equilibriumin two ways. The water can fully saturate the talus and furtherweaken its resistance to movement. The water can also enter the expandedjoints in the bluff clays, further lessen their shear strength and onrecession, generate hydraulic pressures within the soil mass. Withsufficiently high velocities in the river, the toe of the talus 0could be eroded away. This, along with the softened condition,could trigger movements in the talus. Movement of the talus couldgenerate shearing strains in the underlying sands, causing excesspore water pressures to develop and a liquefaction failure at thetoe of the talus, increasing the rate of movement. With movementof the talus, lateral pressures are also reduced at the face of 0the bluff, allowing collapse of the bluff. This occurrence addsmass to the talus, causes more movement, causing more liquefactionfailures at the toe and further collapse of the bluff. The mechanism,once initiated is essentially self perpetuating and should continueuntil the slope of the entire bank is flat enough to attain stability.
*O A sketch illustrating the mechanism of failure is shown as Inclosure 6.
6. As stated, the bank caving should continue until an equilibriumcondition is reached. The limits to which caving may be expected isshown on Inclosure 4. It should be noted that the location of thelimits are nothing more than a guess on our part. On reachinga slope of equilibrium it cannot be assumed that the banks are
* permanently stabilized. With the recurrence of erosion at the toeof the talus, the failure mechanism may be again generated. Thisis not an unlikely event but rather an expected natural occurrence.
7. There are several remedial measures which may be undertaken tostabilize the bank section. Those which are thought to meet with Sthe most success will necessitate the placement of large quantitiesof stone. ( A massive rock toe, bank grading and paving or asystem of stone dikes and bank grading and some paving). It is notfelt that the work allowed under the Streambank Erosion ControlEvaluation and Demonstration Act of 1974 will be adequate to stabilize
* the banks. If the failure mechanism is similiar to that described the Splacement of erosion protection on the bank surface will not beadequate to stabilize the banks. It should be carefully noted that thedescribed failure mechanism is merely a conjecture on our part.Before any course of remedial action is taken, it is recommended that
G-68-35
LMMED-F 21 Dec 76SUBJECT: Memo for Record - Bank Failure, Des Arc, Ark.
the bank failures be carefully studied to clearly define the cause andmethod of failure. The apparent uniqueness of the mechanism of the 0bank failures may be such that the problem merits special study toclearly define the events and parameters governing failure. A somewhatabbreviated review of available literature indicates that many publicationsspeak of failures in overconsolidated clays and progressive liquefaction
* failures in sands. However, none were found that describe a problemwhere both occur at the same site and where one is complimented by the 0other. It is recommended that consideration be given to performanceof a special study to define the mechanism of failure at this siteand the factors that influence failure. The study should includerecommendations and design of remedial measures to be undertaken.Should funding be made available for construction of the remedialmeasures, they should be monitored after construction to determinetheir adequacy.
K. R. AKERS •C/F&M Br.
G-68-36
w w w ~w .1 9
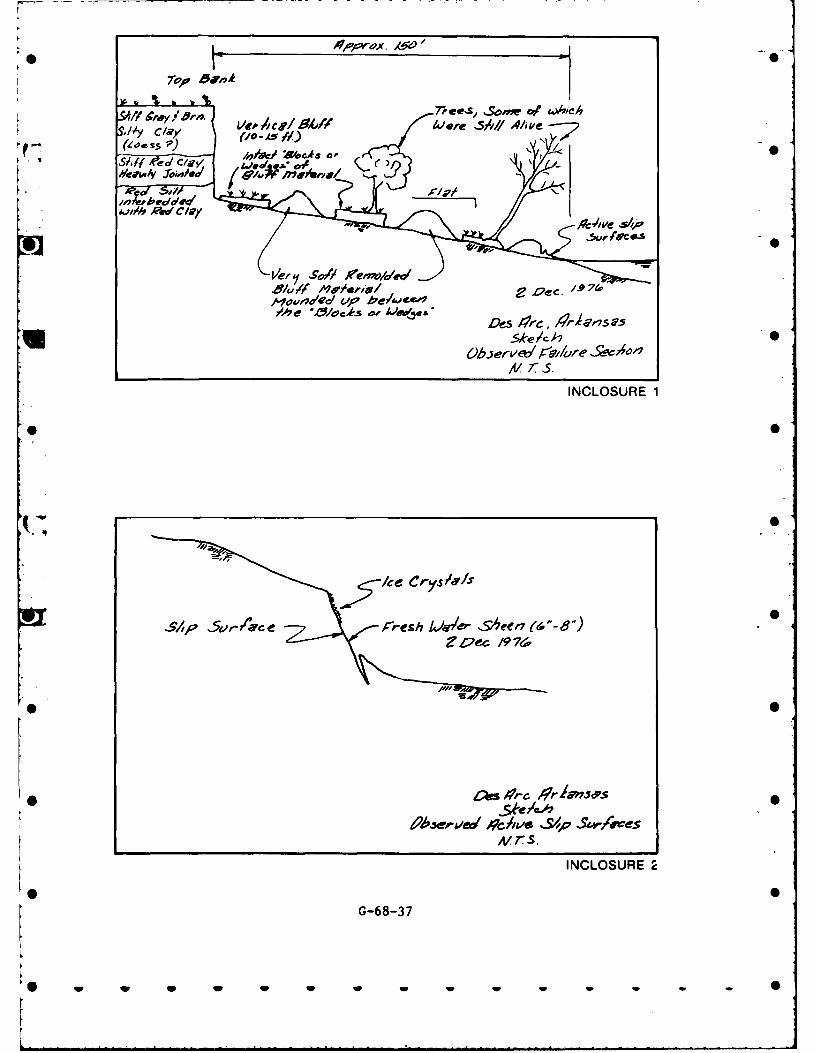
ASS
6A 1 0
,V r Is.
.4
0
1~9e 9 74:g.
lo-,
Alrs.
INCLOSURE 2
G-68-37
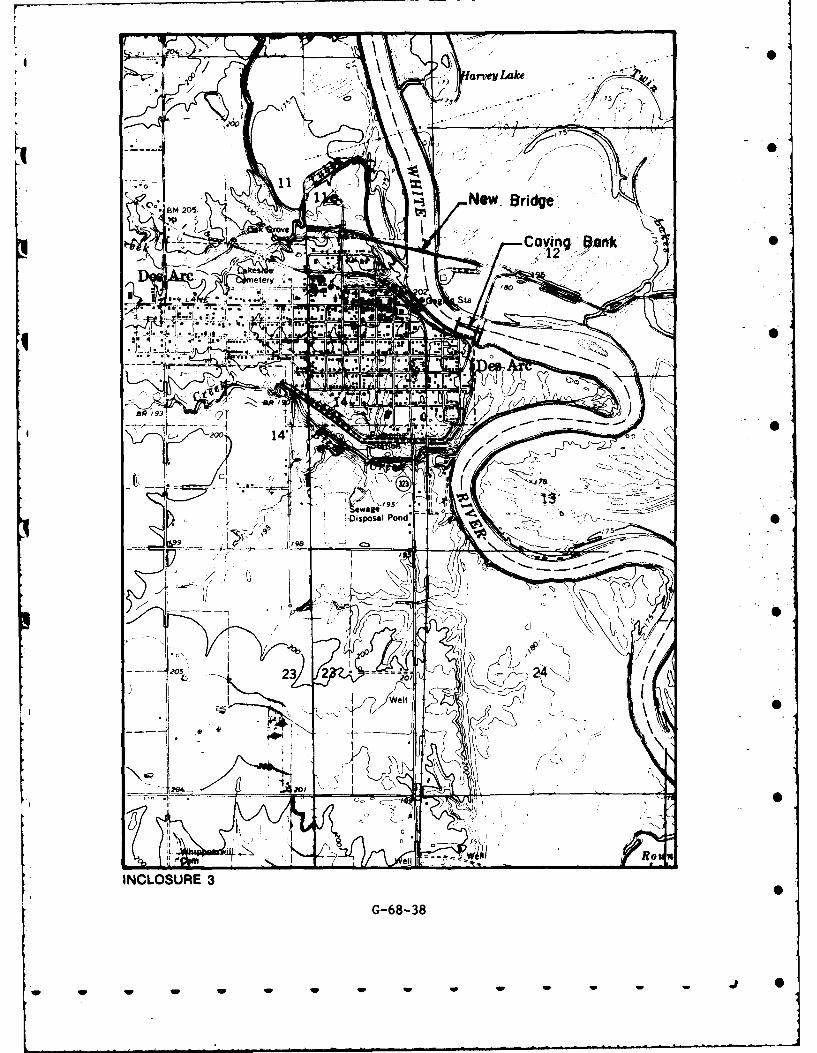
C , 75,'m
0 /8
Sta
000
IN14SU' 3f
e~wagSDispsal -ond
w - ww w -- /75
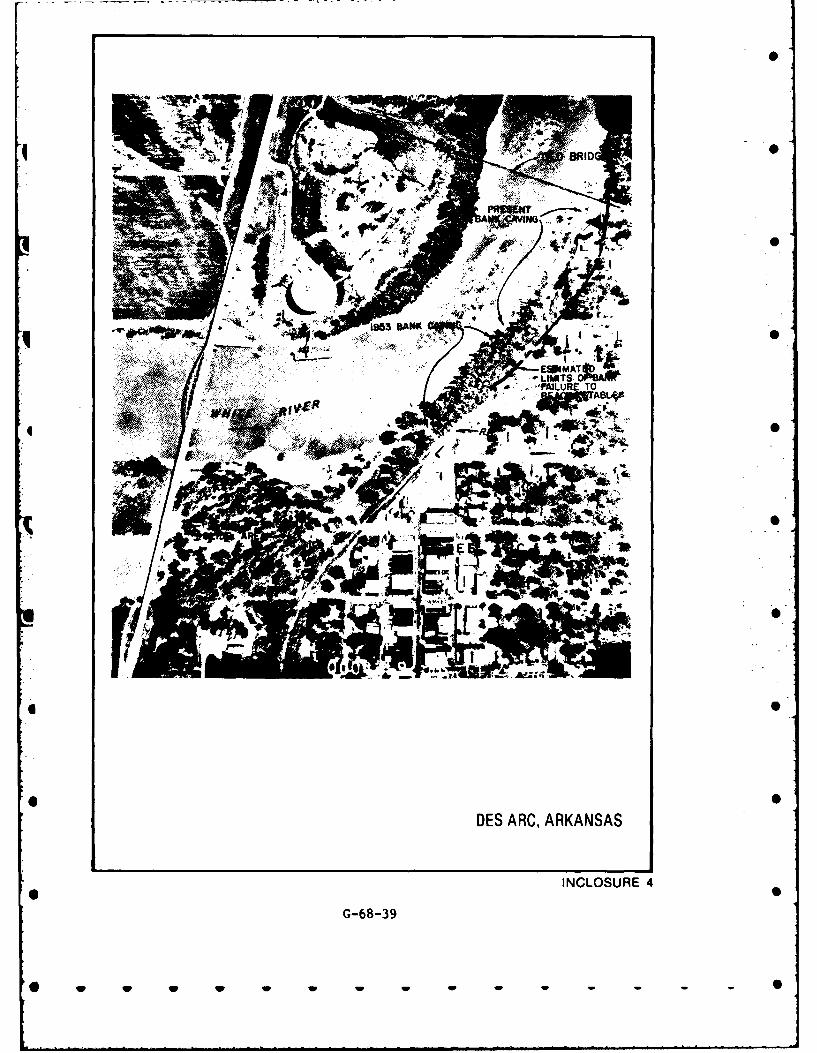
ESP AT
'LIMTS
* 0
DES ARC, ARKANSAS
INCLOSURE 4
G-68-39
0 w w w w w w w w w - - - - 0
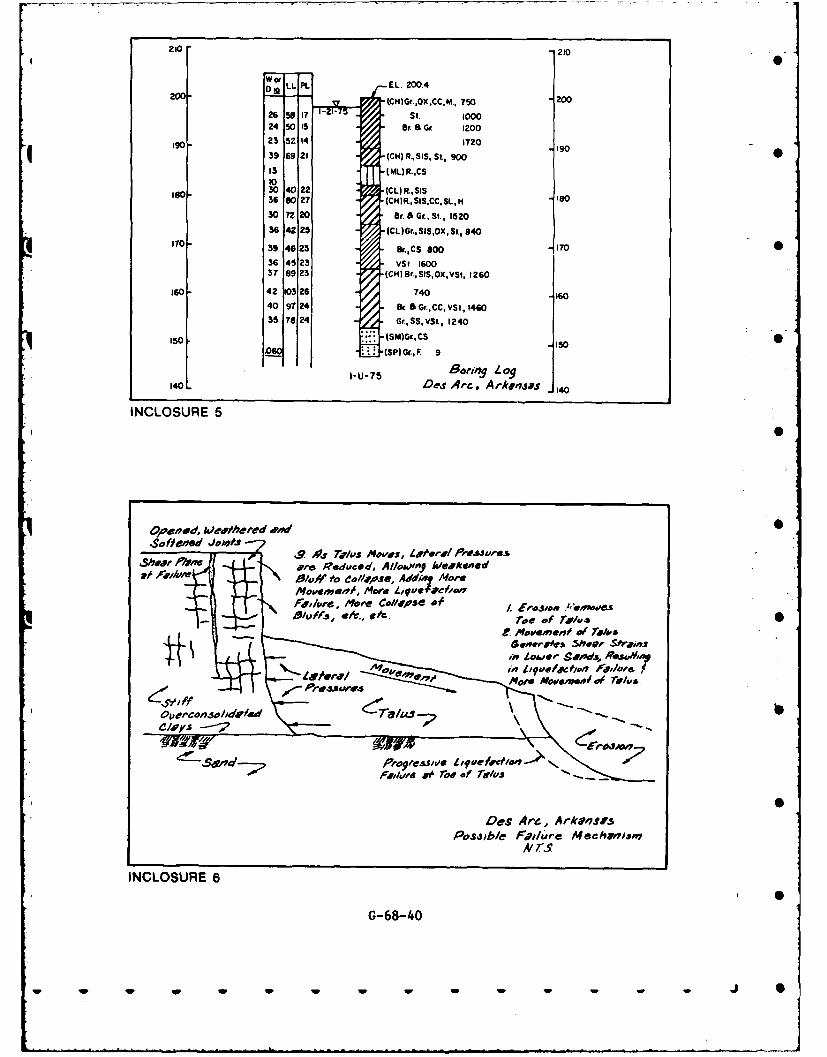
210 210
DWI L P E L. 200.4
200- (CI)Gi.,0X'CCM.' ?S -200
26 5817 St. 100024 50 15 er a G. 1200
190o 23 52 14 1720 .19o39 69 21 (CH) R, SIS St, 900
13 (MLDR..C$1030 40 22 (CL)Rf.. SIS .8to-36 60 27 (CN)Rt.SIS.CC,SL, H
30 72 20 Br.6 Gr., St., 152036 4225 ICL)Gr., SIS,OX, St, 640
170 39 46 23 Br.,CS B00 -170
36 45 23 VS? 160037 89 23 (CH)Br.,SS,0X,VSt, 1260
ie0 42 103 26 740 160o40 91 24 lk & Gr.. CC, VSI1., 1460
35 76 24 Ge.. SS.vSt. 1240
15. SM)G[.CSIS0
(S P)U(. F B ri ng to 9i40 -U7 Des A re A rku',,ss 140
INCLOSURE 5
Safleed' Jo,0AS3 .41. ro/us movas *aV'// tss
.~M~tP~Jpro Reduced, AI/ow,091 AICgkeAed*1' S/I&iW 8.6' o eo//opse, Addi7 More
140meme1#, Mcare 1.4&'0 Pe/,w
O/uffs, w/c., e&. ~ roe of 7/,.s0
Des Are. Arkg'osf-s
N rS
INCLOSURE 6
G-68-40
w~ ~~ ~ w - -.
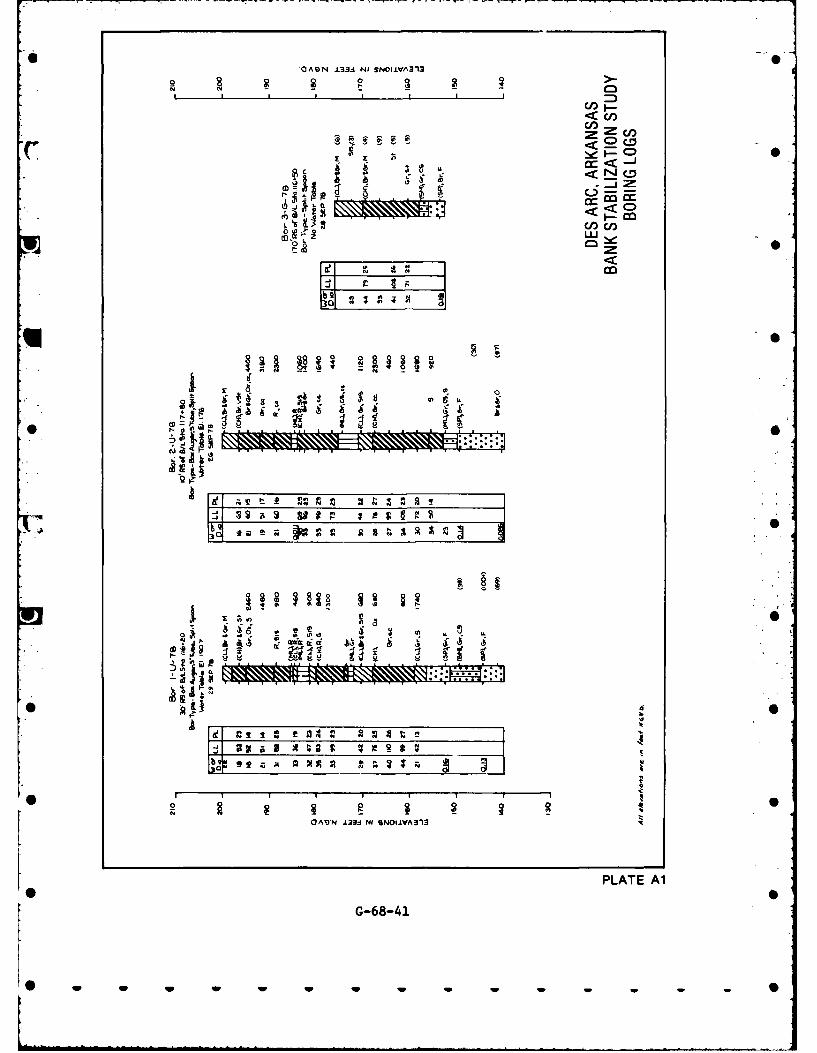
OAQN 133.d NI SNOI.lVA3'13
0 _ _ _ _ _ _ _ 0
U U,
Z co
8i3
QI-r
7~CiL a2~D~sS~
CIO
Ln S
O~ -~00 §1
a! r. I I 1 0A Lsi ii 1 S
12.0 rS
CA9*N .Z3C NI SNO11VA313
PLATE Al
G-68-41
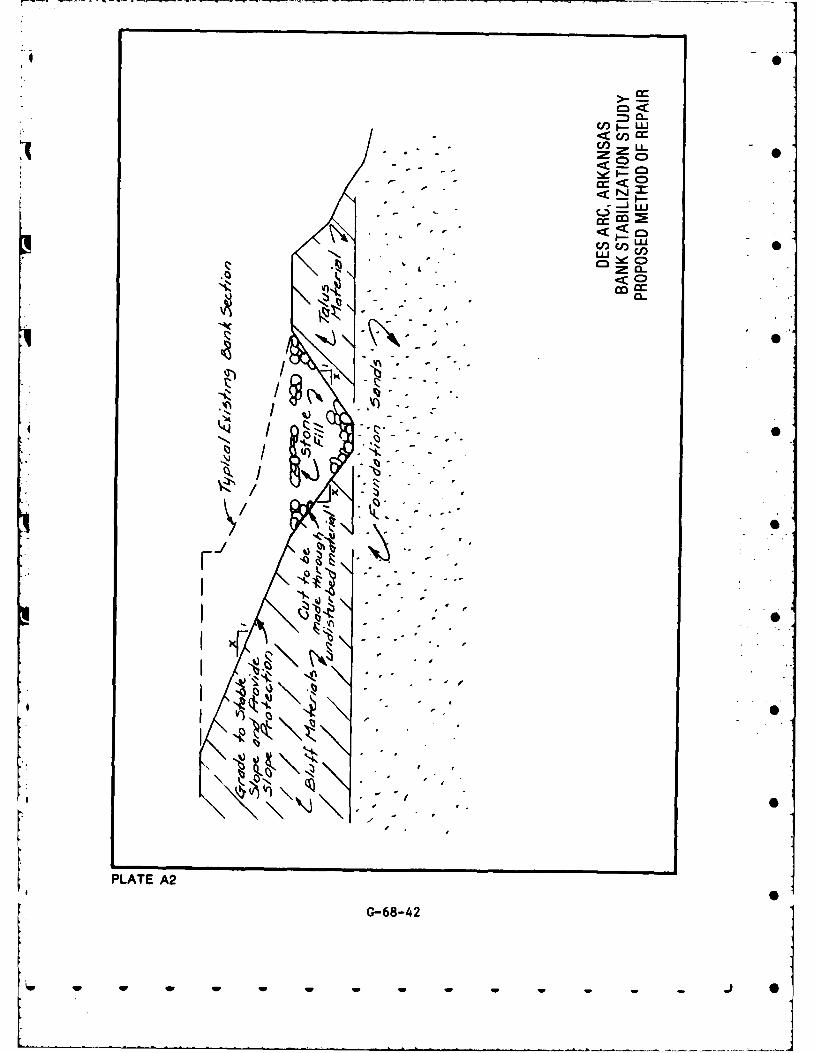
I CL
C/)g-LU
C/ LU -
-. )
< <0
I.'I
~< C
CO CC
Q
- * -
- -
34I
PLATE A2
G-84
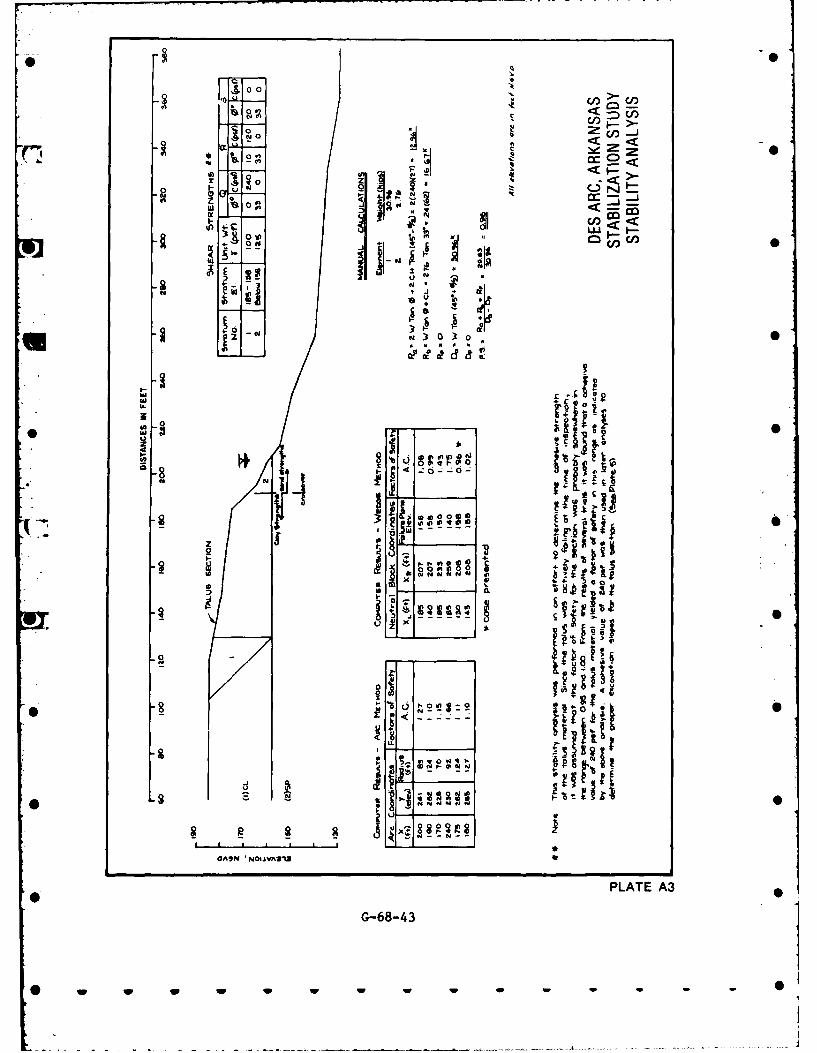
00'
00
Iso0 <~
0 V) C/3
0.0
to~
0
400
00
1 0 -0m
Ls-I 9 0uu
o ~I-iOAM2CUA-
PLTEA
£ viG-68-43
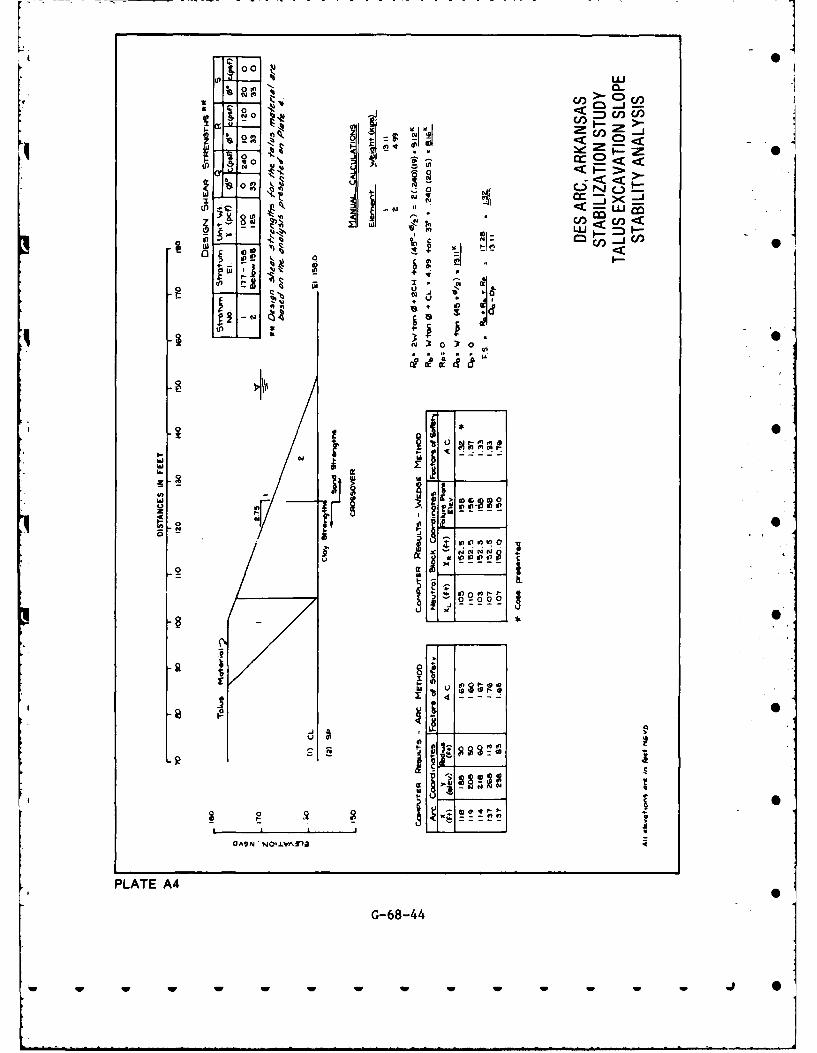
K700 LLuI
< 4DNN
L) 'U
C3 <
W.2W
In0(
w u
uJ 0'LR~OA9JY NoI.kvA3lr
PLATE A4
G-68-44
ww w w w w IV w -w w
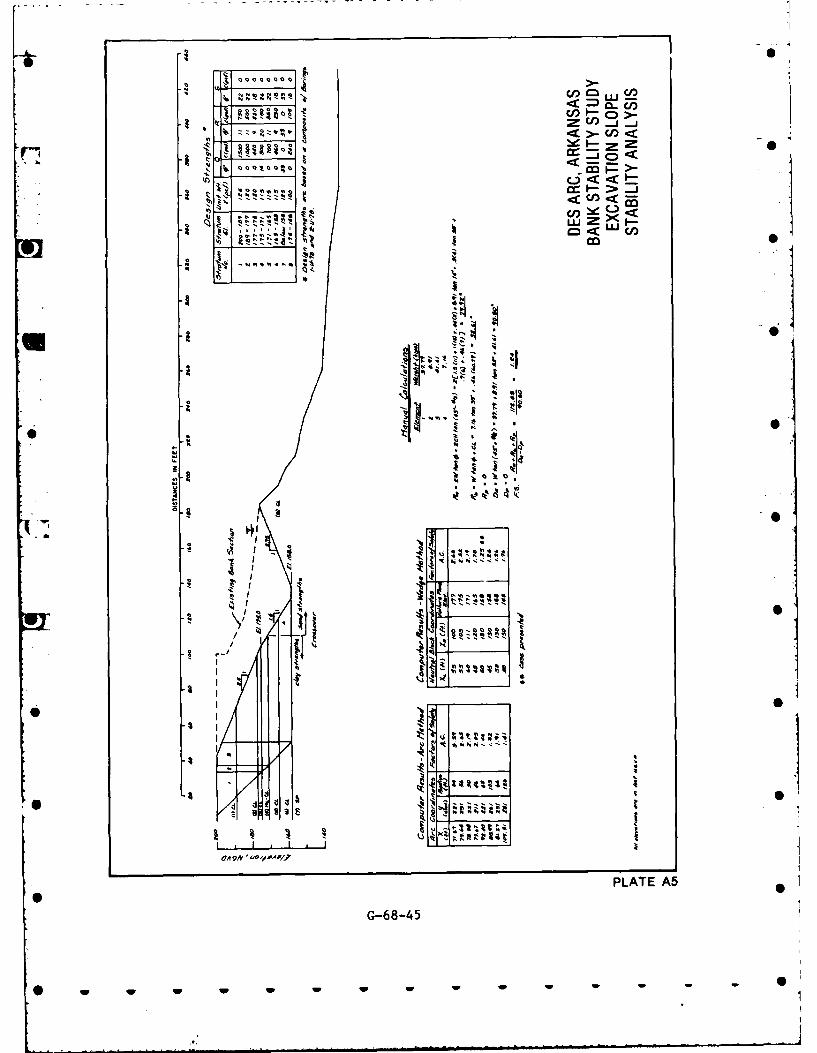
4.~~~ ZZ491",Ic =.< a- u~C/),
m >-~~~~ < O~8~
in'j, <~ <LLJ cf)
* .~ -.i44.*'
w 0
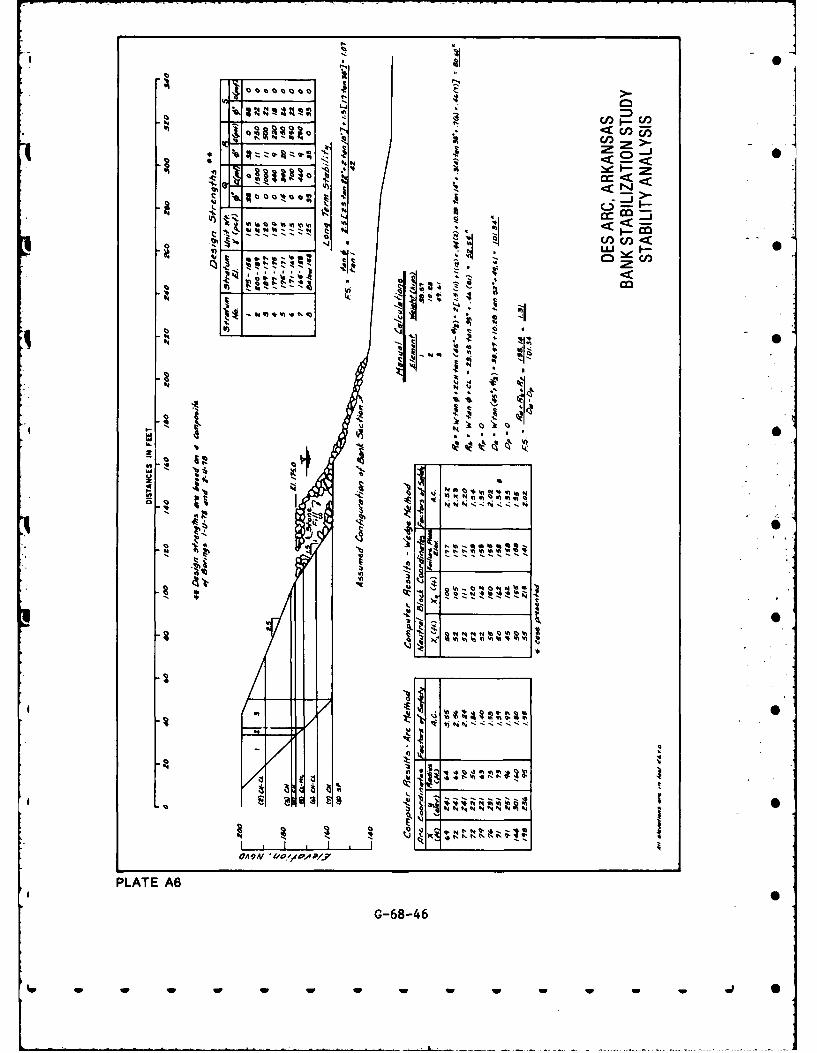
• ,m .,'9o , +
~Iz'9l _ j
<.<
.4 <. "<, .,," I-
'9~o I
'.~ * ~-4 C/)4) 0ia s 4
'n4
I4 ,j It I I
PLATE A6
G-68-46
, .w9 J Iq. I .i
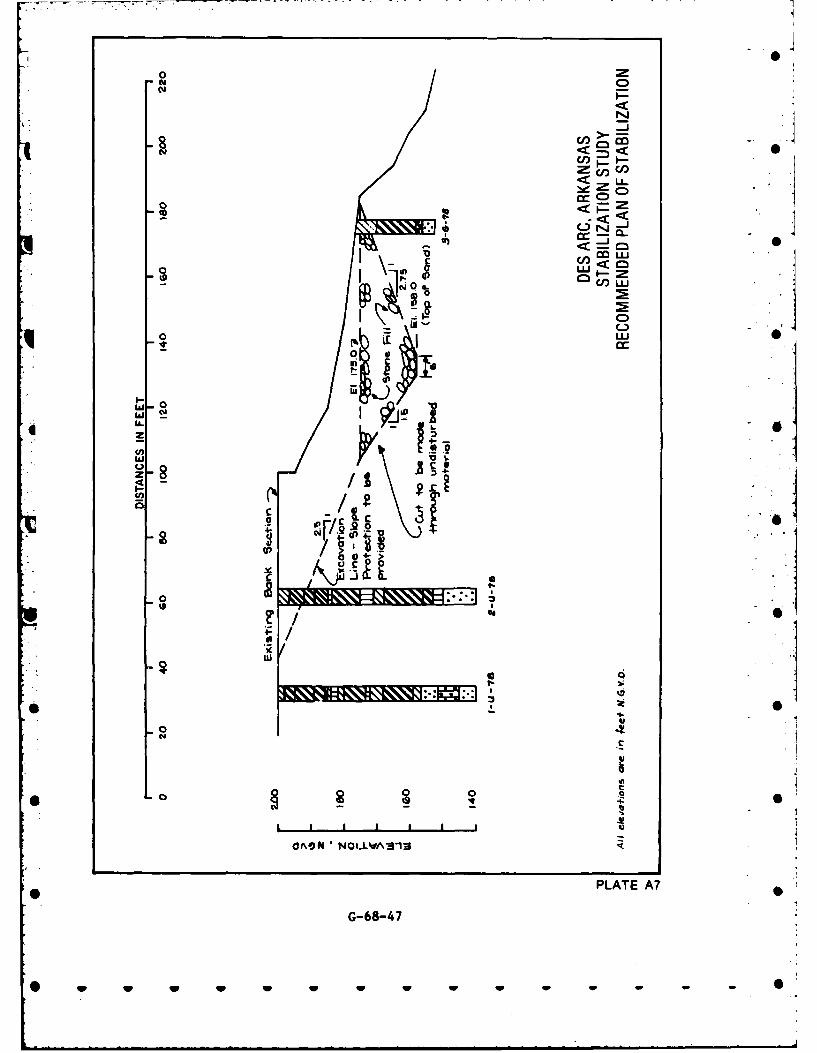
00
CdC0
Cd C)
o cm0 dl L0
00
L-L.* 0 ~ A LiNh )
I4-
a C
0 0
CAO NUVISI3IC
PLTEAIiG-68-47
w w w w w w w
lLI
0
APPENDIX BREPORT OF MONITORING PROGRAM
WHITE RIVER AT DES ARC, ARKANSAS
a. General. Following completion of construction of the Streambank Ero-
sion Control Project on the White River at Des Arc, Arkansas, a monitoring
program was initiated to evaluate the effectiveness of the project. The purpose
of this report is to report the significant findings of the program to date and 0
preliminary conclusions that may be drawn.
b. Instrumentation. During the month of August 1980, seven slope indicator
tubes and three piezometers were installed at the project site. Locations of 0
these items are shown on Plate 5. Following installation, the slope indicator
tubes were sounded using a Digitilt Model 50301 borehole inclinometer in order
to establish an initial base reading. Subsequent readings were all made using the
same device.
c. Monitoring Interval. The slope indicators and peizometers were moni-
tored weekly following installation until approximately February 1981 when the
monitoring interval was changed to a biweekly schedule. Along with the 0
monitoring of instrumentation, visual monitoring of the project was also per-
formed with changes in surface characteristics noted.
d. Discussion of Data Collected. From the time of installation to June 0
1981, slope indicator readings indicated little movement of the riverbank.
Although there was a general indication of movement toward the river and
downstream, the movements measured were slight. However, slope indicator
data recorded in June 1981 indicated significant movement had occurred within S
the riverbank, particularly in the area protected by the grouted mattress
(inclinometer tubes 5, 6, and 7). The plane of movement was indicated to occur
between approximate elevations 157 and 165 NGVD and exhibited the same
pattern of movement toward the river and downstream. Plots of movement 0
versus elevation are shown on Plates B-Z through B-S. For the sake of clarity,
only selected data is shown. During the same interval, June 1981, the
piezometric surfacev which had been fairly consistent previously, showed a
G-68-48
w WW W
significant rise, especially Piezometer No. Z which indicated a rise of approxi-
mately 10 feet to within approximately seven feet of ground surface.
(e. Discussion of Reported Visual Observations. During construction of the •
project, a slope failure occurred along the landside of the trench excavation. On
completion of the project, a crack opened along the grouted mattress portion of
the project along the juncture of the original slope and the clay gravel fill which
was used to replace the failed material. The crack appeared to extend through 0
the tire mattress and the soil cement area. A review of survey information
indicates that the slope failure and the crack follow the orginal top bank that
existed prior to construction. As with the slope indicators, the crack showed
little movement until June 1981 when significant movement was observed. The
river also experienced a slight rise at this time, as a drift line was observed
approximately one to two feet above the toe of the reveted slopes.
* f. Evaluation of Data. While no evaluation as to the effectiveness of the 0erosion prevention measures may be advanced at this time since no significant
water has been against the protected slopes, a preliminary evaluation of the
. stability of the riverbank has been performed. The evaluation was performed
using the wedge method of analysis and by placing the failure surface through
the planes of movement indicated by the slope indicator data. The assumptions
made, calculations and results of the evaluation are shown in attached sheets 1
through 9.
g. Conclusions. Based on the instrumentation data, visual observations and
stability evaluation, it is concluded that localized failure has occurred within the
river bank in the area represented by inclinometer tubes 4, 5, and 6 and is in the
* early stages of development in the area represented by tubes 1, 2, and 3 (see •
Plates Nos. B-2 - B-4). The failure surface appears to be confined to the failed
bluff material that had formed the bench at the base of the bluffs and passes
beneath the rock filled toe trench. Based on the behavioral history of this
* material, it must also be concluded that these localized failures will be 0
progressive in nature and will continue until general overall failure of the bank
has occurred. The progression of failure may occur at a relatively rapid rate
but, if not occurring beforehand, may very well be expected following the
G-68-49
0
recession of the next highwater against the banks. The rock filled toe trench
lacks adequate depth and mass to be effective in halting failure and may be
expected to be carried out with the failing embankment. Following the
occurrence of the expected failure it may be anticipated that a mechanism of
failure similar to that described in the Memo for Record attached to the Bank
Stability Study (Appendix A) will again develop within the bluffs. It is further
concluded that the developing failure may be attributed to the failure to
construct the rock filled toe trench to adequate depth and section and to the
failure to set the grading limits back sufficiently to assure all of the graded bank
landward of the toe trench would be in undisturbed material.
h. Recommendations. Since the program under which the project was
constructed is experimental in nature, it is recommended that the monitoring of
the instrumentation be continued with significant occurrences being evaluated
and documented. Due to the experimental nature of the program, funds should
be made available to rectify problem areas which develop or rehabilitate the
project in the event of a general failure of the soil mass.
G8
G-68-50
w w ww - .9V * __ ____ ___ ____ ___ ___ ____ ___ ____ ___ ____ ___ ___
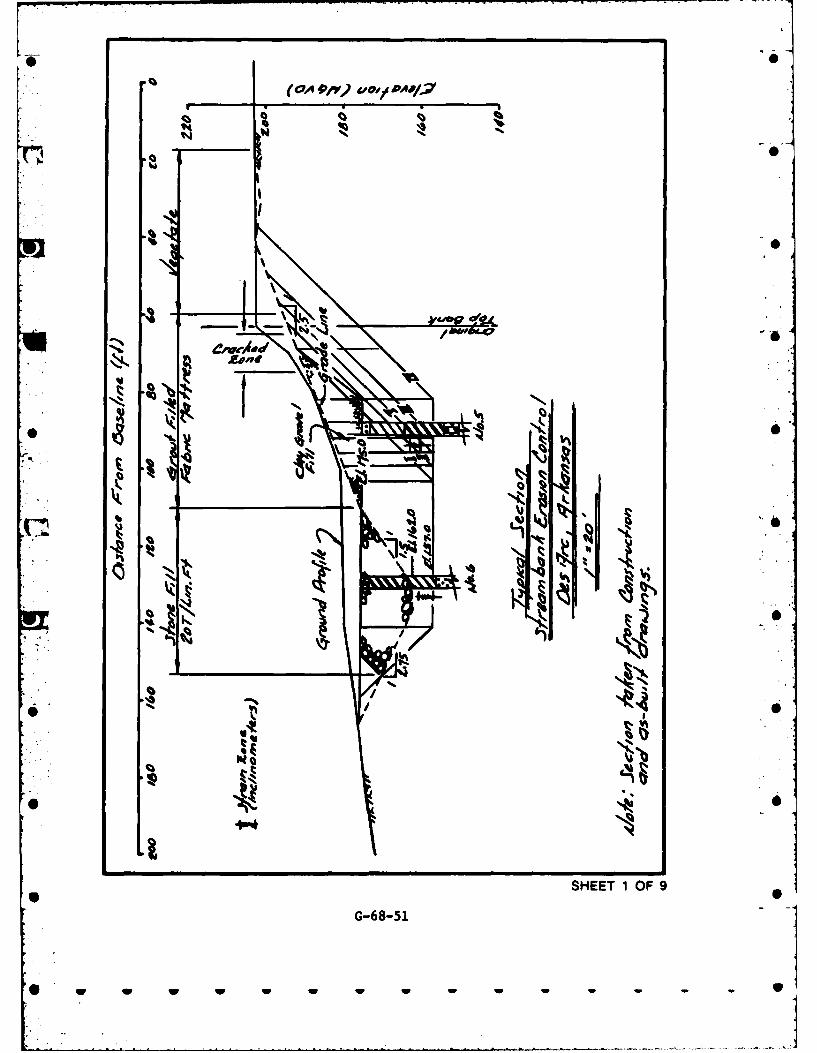
INI
NN
SHEET 1OF 9
G-68-51
0w w w w w w w w w w w
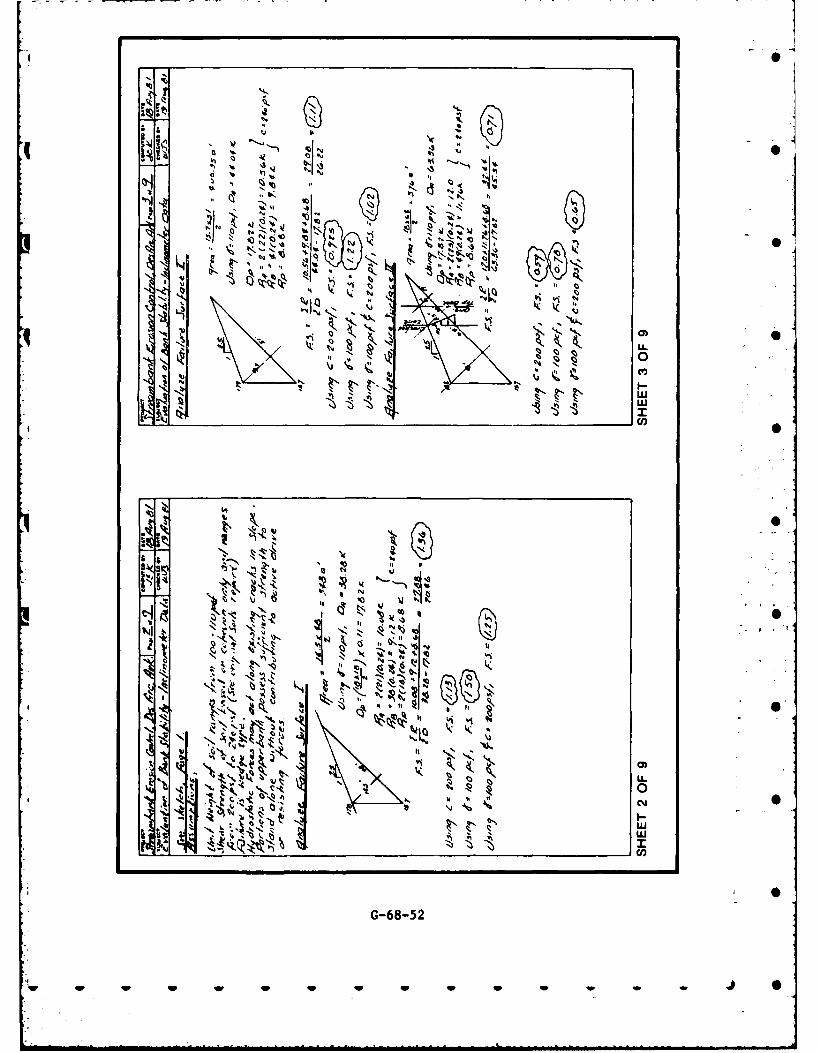
ItI
0 z Q 0 1
~tI
S. -
00
N1
If"
~~40
'IIN
0KA ACM I
-*~l %J~.')
G-68-52
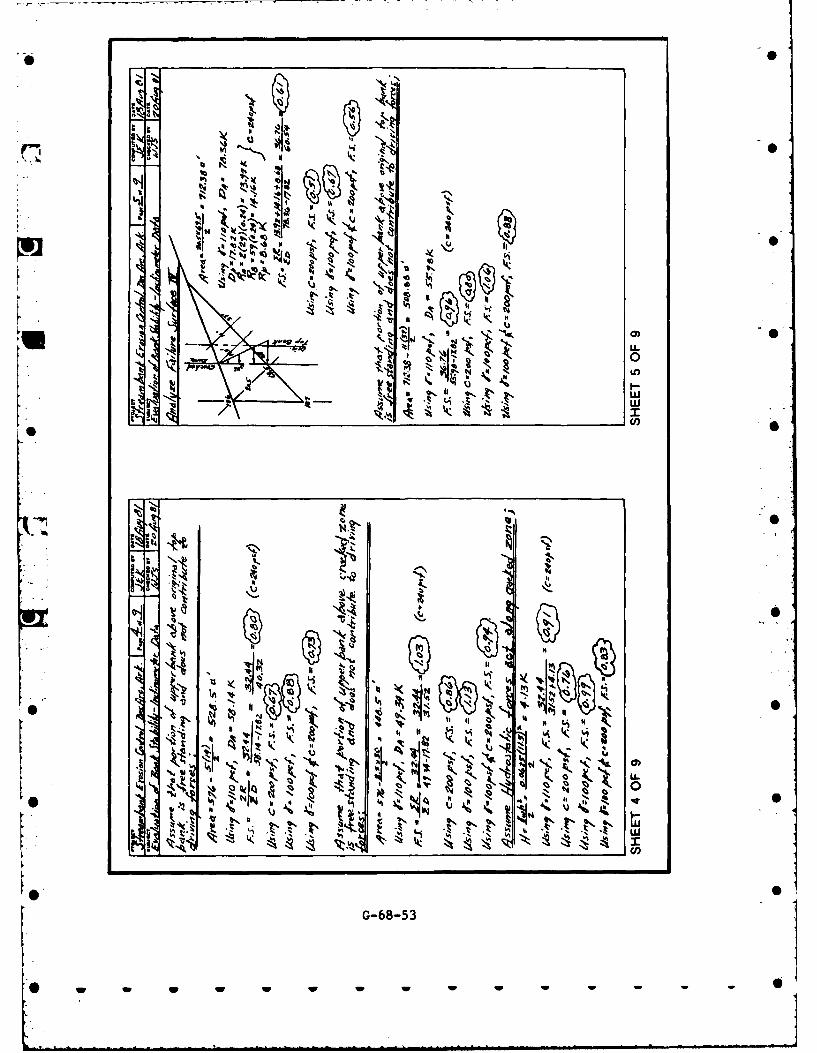
A.4
Oi
" '" -4 c ,,
.. .1b,
* 0
. . ~. 4:z - .." -
• - -0z Cl,
-LM
H~4G-68-53
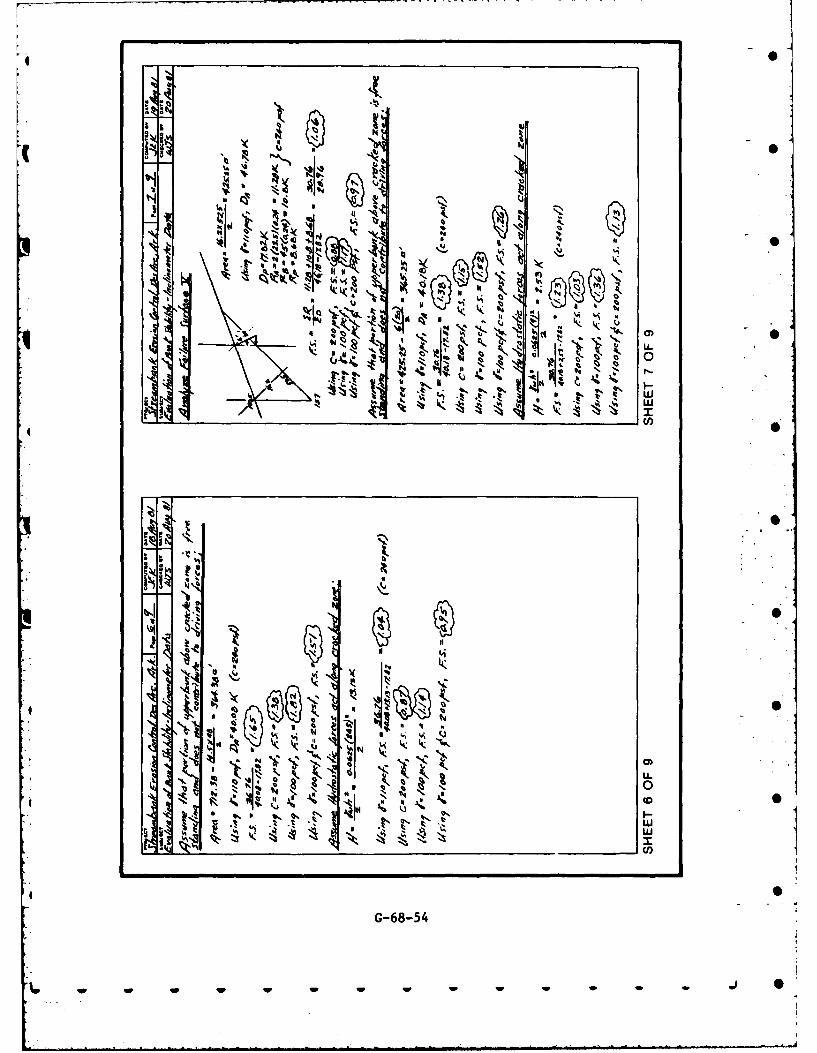
-tor0
Ai
, . .,too,.A\
ob, umw
"CA
,R*o
U
wp ,
G-68-54"
II
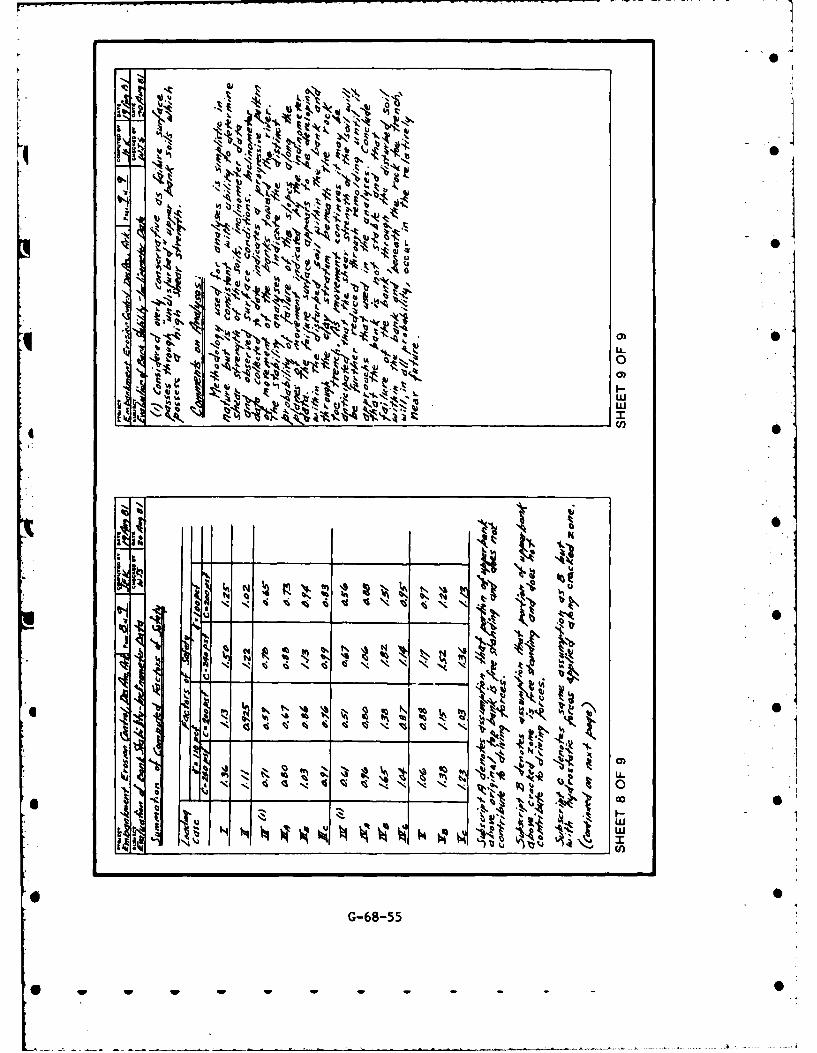
16k
t. 't *
L.
l4 "t 1 41* U
A 0.I0
;' 0)ZR'.~
s~ ~ ~'b w~t ~ '
G - 6 8 - 5 5
It m
lb -
---
lit------~----~-------..-
,.---"
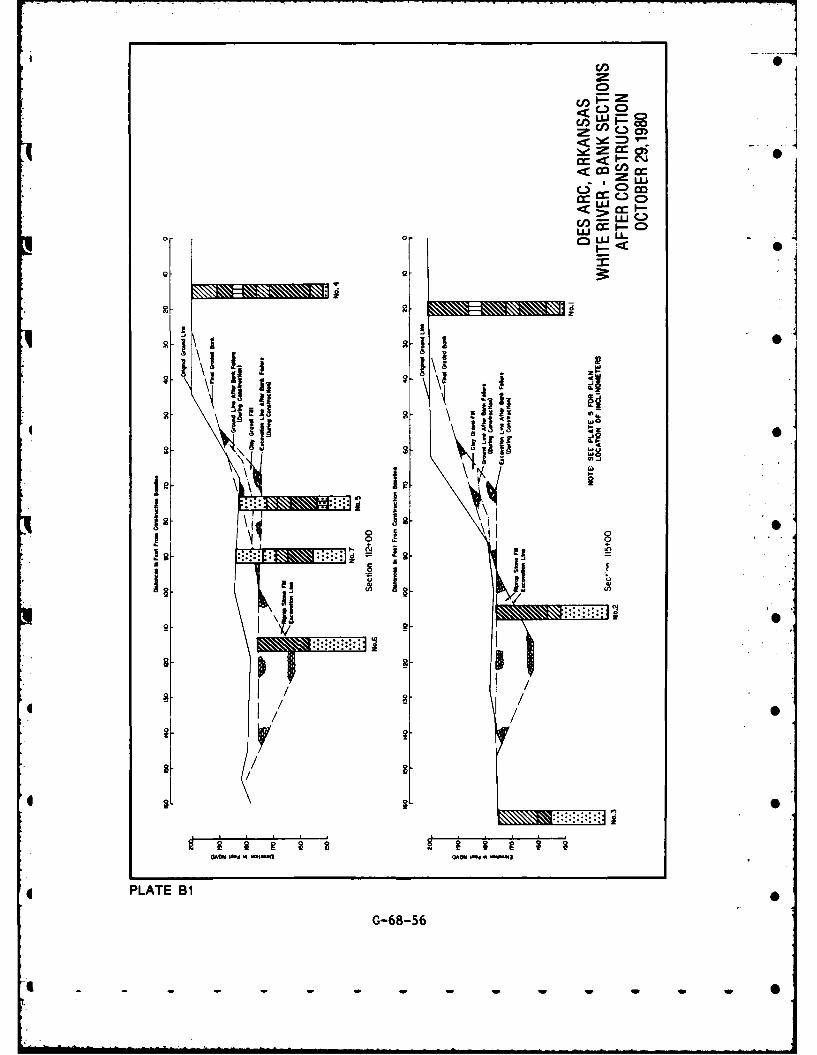
'ID
zJC0/ f) G
<bu
0 CC -
~ \~ I- bC/) F-'L
2i 2U \ !J<0
2 8
4II6
GAO &"10 AO "PLT BII
G*-85
l. q,'0
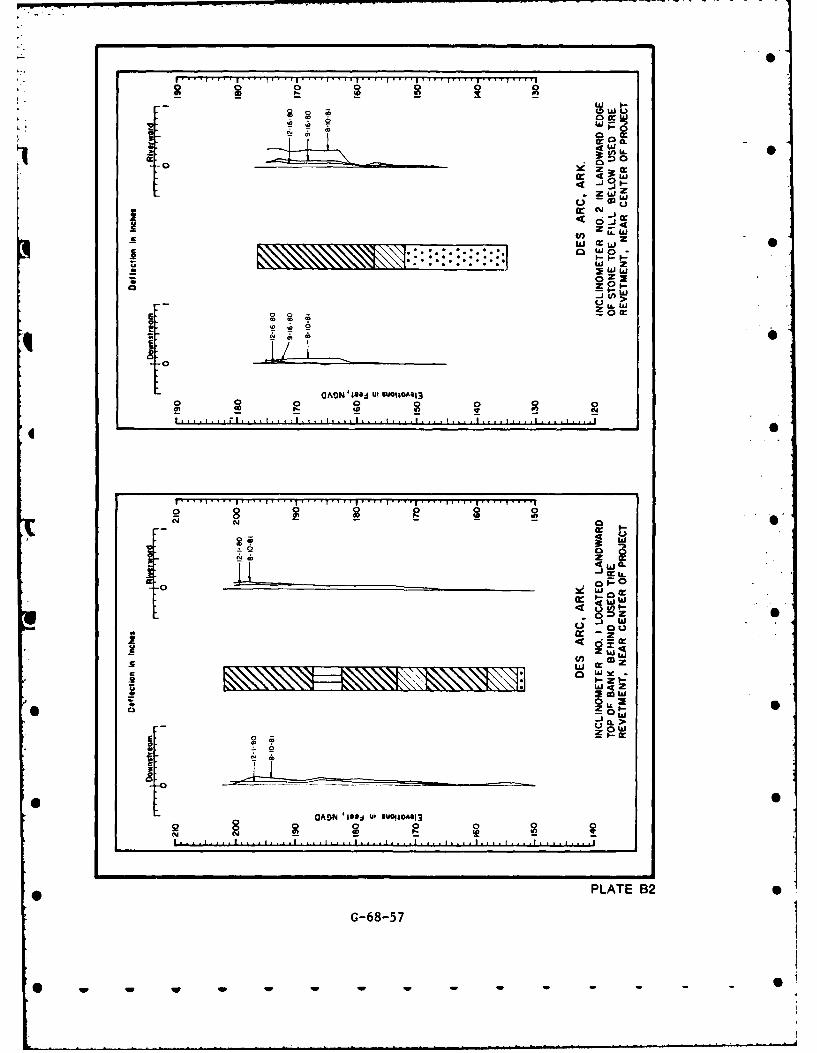
o oLo
00 w
IFCzW
0V9
o 0 0 0
4r 0
01N Sz
.GO
0 WO
I.S>
OANts U! -- Aw1
* 0 he 0
2y 8 1N N
P LTSB
c4,6- 7
S w W w - - - - - -%
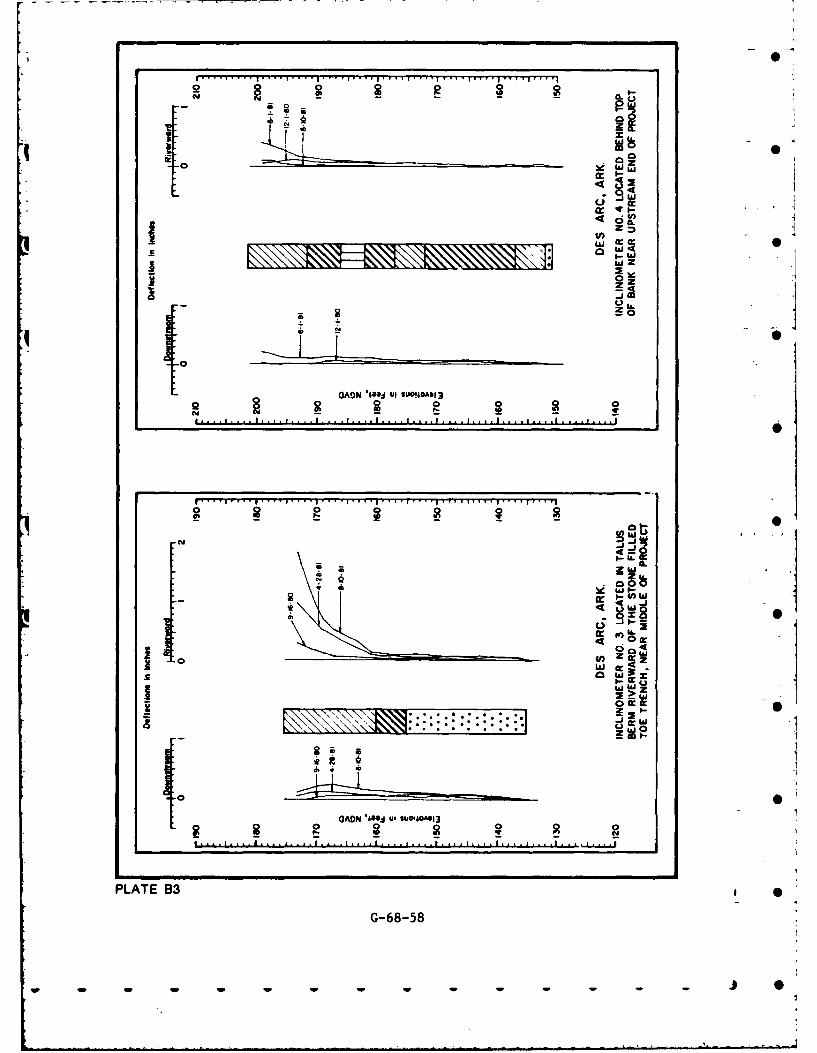
01 CL I.-p0
C'.i
L 4
Cw 0
400
ED 30
0AN'"4ulSOIA1
-J J
w1c 00~
0 Zaz
Sc
LI W
2I.-
GAON 'I"A ul -1i1-0130 00
PLATE B3
G-68-58
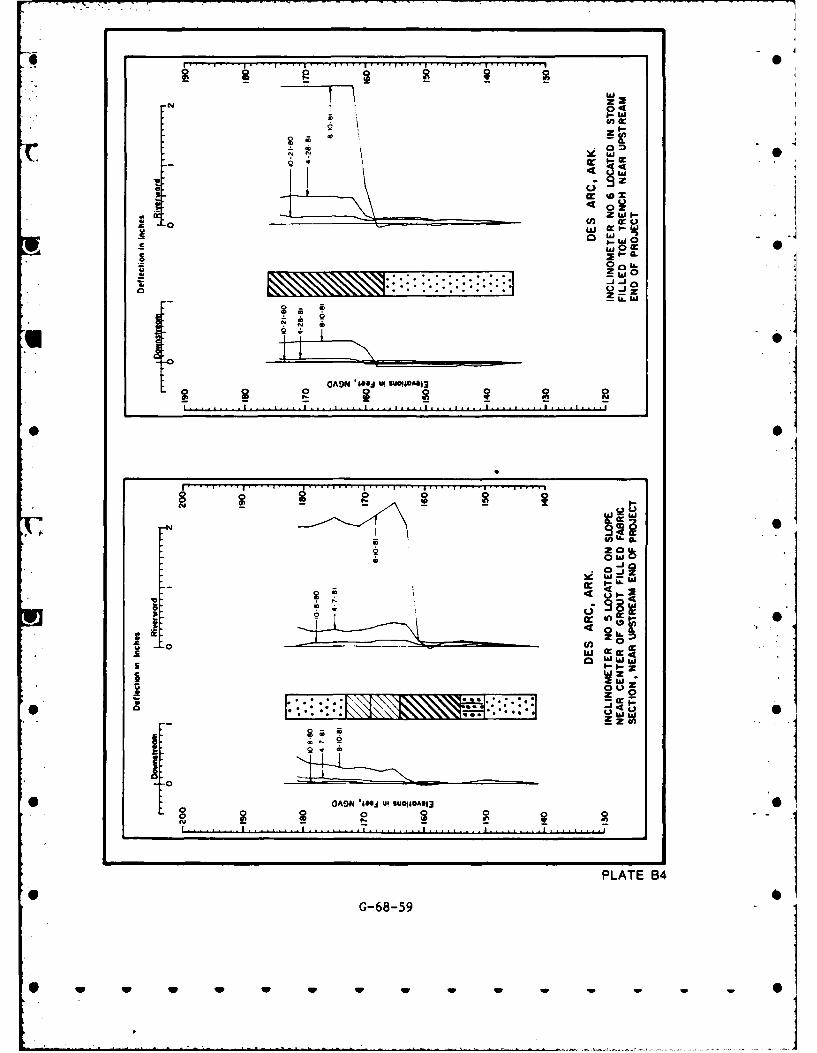
I l-'-A Ix04v
"1-o 0
I I ;I.- I"4 0. . . . . .zeio "
C 0 w~ 0
GAO '6 0. w "0 0 1040
0-ij
• _-- _ 00
o~W a: w.
*9 0
0
I ". .. ..* I a .... .... .. ... .. ... .... ... .... .....
00
I- I-* ' , , , , , , ,0..
2
00 U
a~ 0~
z.
II. 0
S ... .... . .. . ...... ... ... .
PLATE B4
G-68-59
* w w w ww w - -w w w
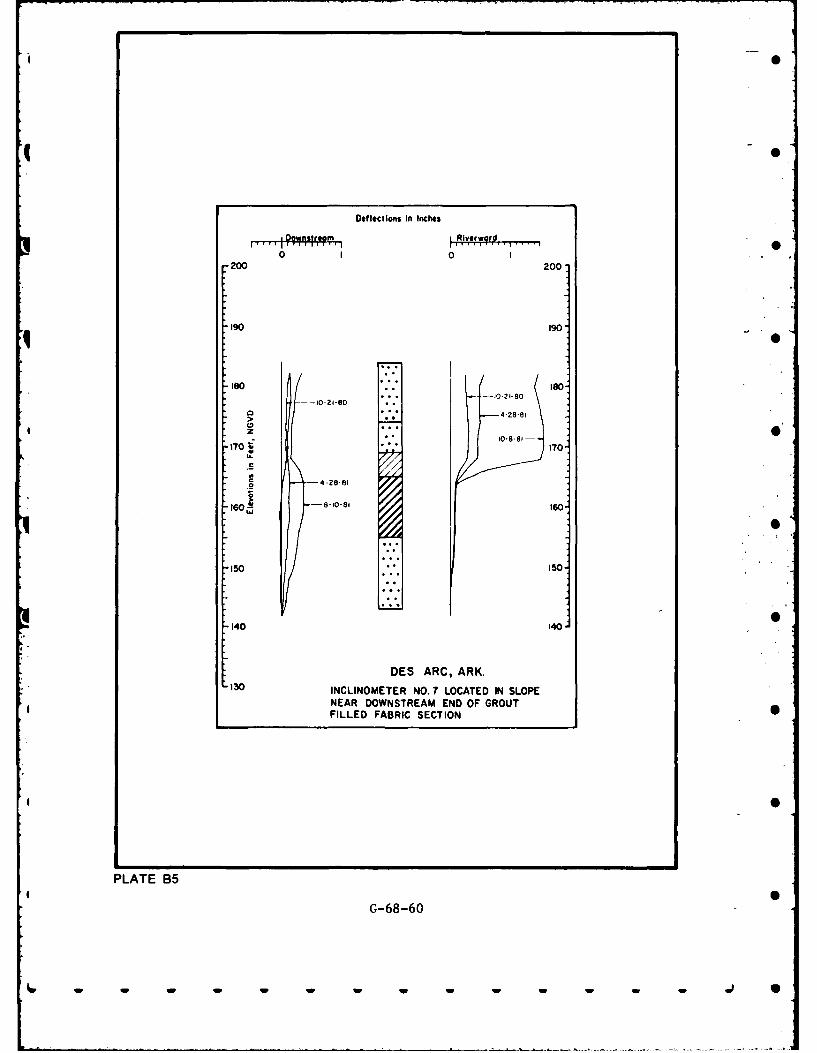
Deflections In Inches
0 1 0200 200-
190 190-
-- 10-21-80 -018
o * 4228
41-8-81-
1700 170
o 4-28-81
Irso -8-10681
-150
150
140 1401
DES ARC, ARK.-130INCLINOMETER NO.?7 LOCATED IN SLOPE
NEAR DOWNSTREAM END OF GROUTFILLED FABRIC SECTION
PLATE B5
G-68-60
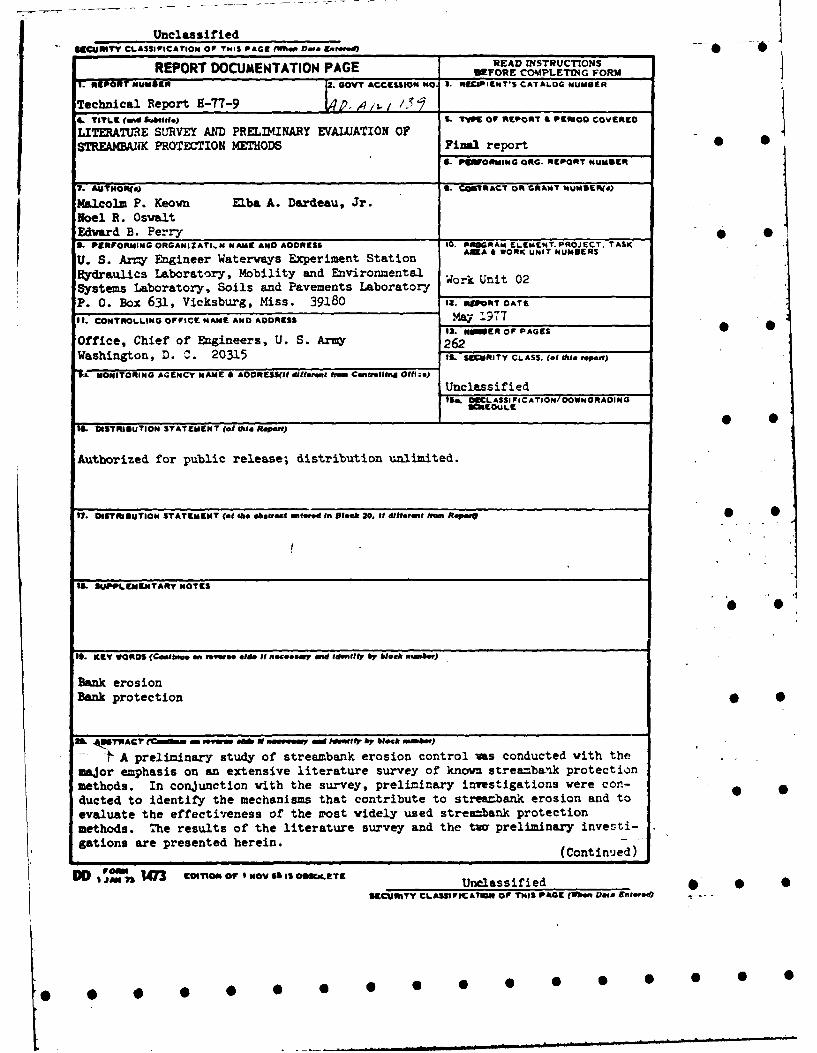
Unclassified8UCURITY CLASSIPICATION OP TMIS PAGE fien Dute Entuesd)-
REPORT DOCUMENTATION PAGE VORE COMSPLETING FORM
1. REPORT NUMB&A j GOVT ACCESSION MO 3. RUPIENT'S CATALOG NUMBER
Technical Report H-77-9 5- /-4. TITL. (and Subtitle) L 9 OF REPORT & PIO COVERED
LITERATURE SURVEY AND PRELIMINARY EVALUATION OFSTREAMBAK PROTECTION METHODS Finl0 report
4. PSGOiRMING 011G. REPORT NUMBlERq
?. AUT"OR(s) 0. €OMIRAC" OR GRANT NUMSERIe)
Malcolm P. Keovn Elba A. Dardeau, Jr.Noel R. OswaltEdvard B. Perry9. PERFORMING ORGANIZATI.N NAME AND ADDRESS 10. PGRAM ELEMENT. PROJECT. TASK
U. S. Arzy Engineer Waterways Experiment Station AMA & WORK UNIT NUMBERS
Hydraulics Laboratory, Mobility and EnvironentalSystems Laboratory, Soils and Pavements Laborator-iP. 0. Box 631, Vicksburg, Miss. 39180 12. RPORT OATE
It. CONTROLLING OFFICE NAME AND ADDRESS May 1977,U. NMSER OP PAGES • '
Office, Chief of Engineers, U. S. Army 262
Washington, D. C. 20315 I, SEWRNTY CLASS. (o. hi. ropwJ
LL MONITORING AGENCY NAME & ADDRESS(Il difemI fMm CentralloW Offldo)
Unclassified,0. MEC ASSIFCATION/OOOWNGRAOING
8 EOULE
14. OISTRIBUTION STATEMENT (of tis Rave)
Authorized for public release; distribution unlimited.
17. OISTRIUTION STATEMENT (at the bussat antmrsd In Black 20. It differet ftrm R Ipu
Itl SUPPIMENTARY NOTES
IS. KEY WORDS (ait an r bewoe sde. it sue..uay aid 1~10y by bock P&sb.r)
Bank erosionBank protection •
=2 41ISTVIACY (Ma~ uns nP IVm ef fooveu Ma Dth Apr bNock nmbuer)
t A preliminary study of streambank erosion control as conducted with the
major emphasis on an extensive literature survey of known strea=bnk protectionmethods. In conjunction with the survey, preliminary investigations were con-ducted to identify the mechanisms that contribute to strean-bank erosion and toevaluate the effectiveness of the most widely used strea-bank protectionmethods. The results of the literature survey and the tw preliminary investi-gations are presented herein. (Continued)
DD 'M S473 Emcol O , MOeVoSiOestLeTz Unclassified •
SgCSURITY CLAS31PCATIlYM OF THIS PACE (Wen Vol.E Enufew * .
0O • 0 0 6 0 0 0 0 • S 0 0 0
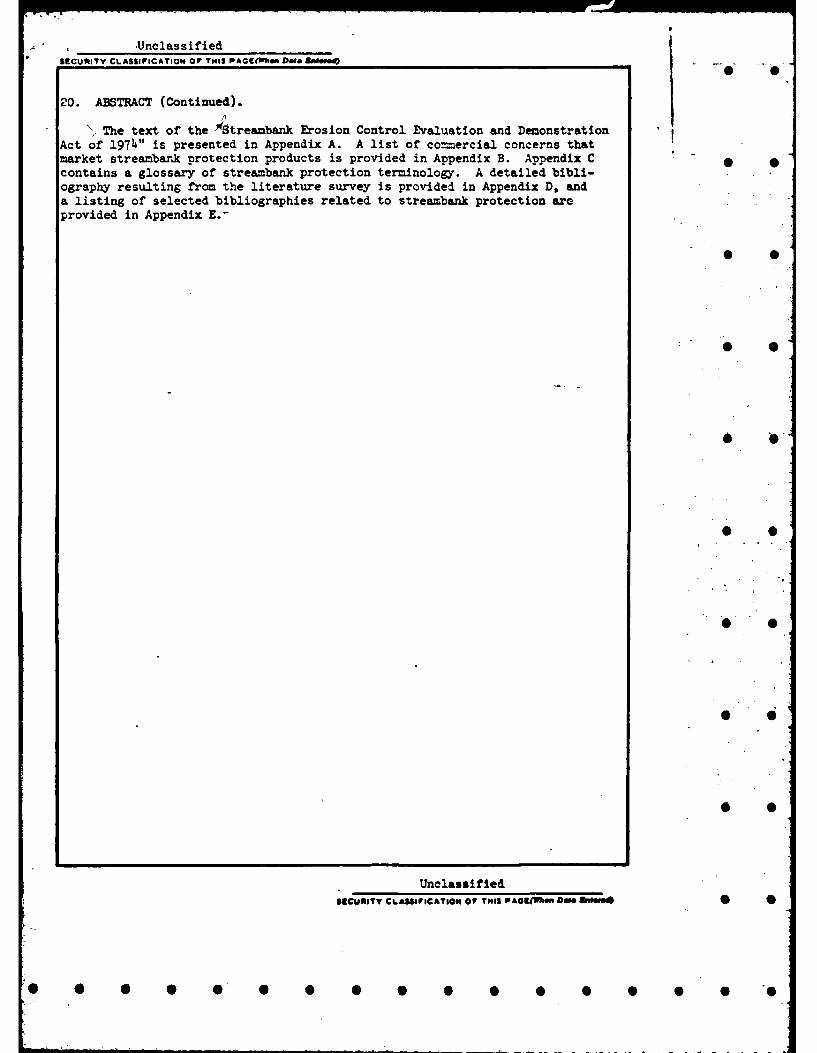
-UnclassifiedSECUMITY CLASSIFICATION OF THIS PAGCCO(OR Do NINmd--6
S 0
20. ABSTRACT (Continued).
\ The text of the -BStreambank Erosion Control Evaluation and DemonstrationAct of 1974" is presented in Appendix A. A list of co-ercial concerns thatmarket streambank protection products is provided in Appendix B. Appendix Ccontains a glossary of streambank protection terminology. A detailed bibli-ography resulting from the literature survey is provided in Appendix D, anda listing of selected bibliographies related to streambank protection areprovided in Appendix E.-
* 0
Unclassified
Sl1CumITY CLASIFICATION OF TMIS PAGl(MM D 0 RImI 5 •
IF 0 0 0 0 0 0


