Embed Size (px)
Citation preview

ISSN: 2281-1346
Department of Economics and Management
DEM Working Paper Series
Finance, Foreign (Direct) Investment and Dutch Disease: The Case of
Colombia
Alberto Botta
(Università Mediterranea di Reggio Calabria)
Antoine Godin
(University of Limerick)
Marco Missaglia
(Universidad Nacional de Colombia)
# 90 (09-14)
Via San Felice, 5
I-27100 Pavia
http://epmq.unipv.eu/site/home.html
September 2014
Finance, Foreign (Direct) Investment and Dutch Disease:
the Case of Colombia*
Alberto Botta , Antoine Godin and Marco Missaglia§
September 3, 2014
Abstract In the recent years the Colombian economy grew relatively rapidly, but it was a biased
growth. The energy sector (the locomotora minero-energetica, to use the rhetorical expression
of President Juan Manuel Santos) grew much faster than the rest of the economy. The
manufacturing sector registered a negative rate of growth. These are the symptoms of the well-
k o Dut h disease a d the ase of Colo ia has ee al ead idel a al zed i the literature. In this paper, we investigate a different reason why an economy may suffer from an
expansion of the mining sector. In particular, we want to shed some light on the financial side of
the economy and its links with a resource-boom. We can observe several unsustainable
dynamics: (i) a traditional Dutch Disease due to a large increase in mining exports and a
significant exchange rate appreciation, (ii) a massive increase in foreign direct investment (FDI),
particularly in the mining sector (iii) a rather passive monetary policy, aiming at increasing
purchasing power via exchange rate appreciation, (iv) recently, a large dividends distribution
from Colombia to the rest of the world and the accumulation of mounting financial liabilities.
The paper shows why these dynamics may be interpreted as a case of financial Dutch disease
and constitute a potential danger for the stability of the Colombian economy. Some policy
recommendations are discussed.
Keywords: Colombia, Dutch Disease, Balance of Payments
JEL Codes: F40, F21, F32
* We thank Diego Guevara, Miguel Uribe, Stephen Kinsella for their valuables comments. All errors remaining are
ours. The authors gratefully acknowledge funding support of the Institute for New Economic Thinking.
Mediterranean University of Reggio Calabria (Italy), [email protected]
University of Limerick (Ireland), [email protected] § Universidad Nacional de Colombia (Colombia), [email protected]

1
1. Colombia: a bonanza for international investors?
Since 2011, CIVETS stands out as the new word and perhaps dogma in the near future, circulating
among financial operators. In the jargon of financial markets, this term is nothing but the acronym of
six developing countries1 international investors should bet upon in search for high (and safe?)
returns.
Most observers believe that recent macroeconomic data fully confirm optimistic perspectives on
Colo ia. I , The E o o ist I tellige e U it EIU po t a s Colo ia as a su ess sto [which] is now one of the most open and most business-friendly countries in Latin America [...and in
which] new opportunities are opening up for foreign investors, particularly in hydrocarbons and
mining, construction, and electricity, and there is free-trade access to the US market (EIU, 2013, p.
. Park Madison Partners (PMP), a New York-based business leader in the real estate sector,
acknowledges Colombian achievements due to the (sound) macroeconomic management of the
economy. According to PMP, fiscal discipline and a successful inflation-targeting monetary policy have
contributed to create a stable macroeconomic environment on top of persistently positive growth
rates, even in the wake of the most recent worldwide financial crisis,2 see figure 1. PMP further notes
that Colombian monetary authorities have wisely decided not to obstacle market-driven
app e iatio s of the Colo ia peso i o de to eassu e fo eig i esto s a out political
commitment to avoid market distortions and policy-induced exchange rate risks. Thanks to such
policy stands, Colombia is now ha a te ized a i a t a d de elopi g apital a ket [...a d the above] attractive fundamentals also create significant opportunities in the real estate (PMP, 2013, p.
. The increasing Balance of Payments surpluses (figure 1) and mounting capital inflows seem to
o fi Colo ia s bright future.
Figure 1: Annual real GDP growth (left), Balance of Payments surplus (right). Source DANE.
1 CIVETS stands for Colombia, Indonesia, Vietnam, Egypt, Turkey and South Africa.
2 In the last decade, Colombian per capita income grew at rates that are certainly not comparable to the fastest-growing
Asian economies. Still, despite an inevitable slowdown from 2007 to 2009, Colombian per capita GNI grew annually at an
average of 5.3% between 2004 and 2013.

2
The above reports and recent analyses by the Colombian government3 tend to describe a perfectly
sound economy enjoying high and stable growth. In this paper, we argue that there is much more to
this story and such seemingly good performances hide more disturbing processes. On the one hand,
past and prospected macroeconomic records largely depended on and will hinge upon the increasing
exploitation of Colombian natural resources, as well as high commodity prices on international
markets. On the other hand, and perhaps more fundamentally, two dangerous processes currently
unfold in the Colombian economy: (i) a premature de-industrialization process; (ii) the dependence on
foreign capital inflow to support a surprising current account deficit.4 We believe these facts might
cast serious challenges to Colombian development in the near future. In this paper, we aim to analyze
in more details what we believe to be a particular case of Dutch Disease for Colombia.
International and domestic institutions have shared some of the above concerns. OECD (2013), for
instance, explicitly points out the relative, and at times absolute, contraction of the non-resource-
based tradable good sector with respect to the energy and mining industry. In a working paper
published by the Central Bank, Ojeda et al. (2014) elaborate a DSGE model to assess the effects of a
natural resource boom in the context of a three-sector small open economy. Both analyses share the
description of the structural (sectorial) changes of the Colombian economy following the lines of a
standard Dutch disease phenomenon. In a nutshell, the expansion of the energy sector and the
ensuing foreign revenue windfall first raise domestic expenditures and lead to a real exchange rate
appreciation. This, in turn, makes domestic manufacture less profitable and less attractive for
investment, thus downsizing it. The two papers conclude on similar policy implications. For example,
they advise for counter-cyclical fiscal policies in order to cut expenditures and soften real exchange
rate appreciation. In this paper, we argue that the de-industrialization and the current account deficit
are certainly the two faces of a same coin (as they are in the standard model of Dutch disease), but
represent symptoms of a rather different kind of Dutch disease – we will call it financial Dutch
disease.
The astonishing expansion of the energy and mining industry in Colombia mostly relies on Foreign
Direct Investment (FDI) targeting the sector. The idea of this paper is to check whether such a boom
might give rise to financial fragility (boom-and bust cycles) and a deterioration of growth prospects.
The mechanics we have in mind is the following. A large FDI inflow leads to balance of payments
surpluses and, in a flexible exchange rate regime, to nominal (and real) appreciation of the domestic
currency. At first, such an app e iatio jeopa dizes Colo ia a ufa tu e s o petiti e ess a d exports, thus inducing considerable manufactured goods trade deficits and a premature de-
industrialization.5 On top of this, the exchange rate nominal appreciation attracts short-term portfolio
3 See Ministry of Finance and Public Credit (2014a , A Outlook of the Colo ia E o o , f eel a aila le fo
download at http://www.minhacienda.gov.co/HomeMinhacienda/saladeprensa/Presentaciones. 4 Increasing exploitation of domestic natural resources and high commodity prices are usually associated to long-lasting
current account surpluses, see Ojeda et al. (2014) for an example. 5 Goda and Torres (2013) perform an econometric analysis in order to test the existence of any effects of FDI on
Colombian real exchange rate and, in turn, on manufacturing development. Their sample coverage runs from 1996 (first
quarter) to 2012 (fi st ua te . O the o e ha d, the o lude that et FDI a d et othe i flo s a e the main drivers of

3
investments, thus further appreciation, further de-industrialization and mounting foreign debt.
Eventually, the repatriation of profits accruing to foreign investors in the energy sector as well as the
growing manufacturing trade deficit leads to a deterioration in the current account such that the
overall balance of payments a tu egati e. The oo tu s i to a ust a d, ithout e t al a k s i te e tio s, the e change rate depreciates. Such medium run cyclical dynamics may be
detrimental to long run growth because it is likely to reduce (both directly and indirectly) the share of
manufacture in total GDP and manufacturing constitutes, à la Kaldor, the ultimate source of labor
productivity growth and long-run development. Should this story make sense, it is clear that it
strongly depends on exchange rate, balance of payments and portfolio investments volatility. None of
this is included in the traditional idea on Dutch disease (see next section) and this is why we label our
hypothesis as financial Dutch disease.
In this paper, we will describe the peculiar mechanisms that characterize such a financial Dutch
disease by analyzing the prevailing trends in the most relevant Colombian macro variables since the
mid-1990s. We will focus both on real and monetary variables. Differently from previous
contributions on the same topic, we will then take into account the monetary/financial side of natural
resource-induced structural changes, and thus frame the Dutch disease story in a wider macro
perspective. Section 2 briefly outlines the abundant literature on Dutch disease. Section 3 provides
evidences supporting the idea that Colombia is currently experiencing a de-industrialization process, a
widely accepted symptom of Dutch disease. Section 4 continues the analysis by observing
manifestations of what we labeled a financial Dutch disease. Namely, we look at changes in the
sectorial destination of Foreign Direct Investments and at the decoupling in the dynamics of the
current account and trade balance. Section 5 recapitulates our finding and describes briefly our
concept of financial Dutch disease. Furthermore, we provide a scenario analysis, assessing the
financial stability of the current process occurring in the Colombian economy. We conclude offering
policy option to cope with the highlighted processes.
2. Dutch disease
Dutch disease is a well-known issue in the field of development economics. According to the
original contribution by Corden and Neary (1982), it refers to the structural consequences in the
sectorial composition of an economy due to a boom in the exploitation of domestic natural resources.
The story goes as follows. A technological progress in the energy sector,6 the discovery of new natural
resource endowments, and/or rising international prices of primary commodities increase input
productivity in the energy sector. In a general equilibrium framework, productive inputs employed
elsewhere in the economic system are relocated and drawn into the expanding energy industry. The
the post- apital i flo app e iatio effe t i Colo ia Goda a d To es, , p. . On the other hand, they find
that real exchange rate appreciation explains most of the de-industrialization episode currently underway in Colombia. 6 Corden and Neary (1982) assume a Hicks-neutral technological progress to take place in the energy sector, raising both
labor and capital productivity in that sector. Similar results, however, could be obtained if an increase of primary
o odities p i es is assu ed a d the ou t u de o side atio is a et e po te of p i a e e g o odities, o if there is an increase in the endowment of the natural resource input specific to the energy sector.

4
non resource-based tradable industry, say manufacturing, and the non-tradable sector of the
economy, say services, both shrink. Besides this, larger abundance of natural resources increase
domestic income, hence expenditures, on both manufactured goods and services. In a small open
economy, whilst the price of manufactured goods is generally fixed and set on international markets,
the price of services increases to clear the market. A real exchange rate appreciation thus takes place.
The relatively low profitability of domestic manufacturing forces it to downsize even further.
While it is worth studying such structural changes on their own, they are even more important if
they entail consequences on the long-run growth potential of the economy. Indeed, several studies
interpret Dutch disease as the main source of a natural resource curse, i.e. the general disappointing
economic performance of natural resource-rich countries with respect to natural resource-poor
economies (see Sachs and Warner, 1995, 2001). The core point of the Dutch disease-natural resource
curse nexus lies in the growth-enhancing properties generally attributed to manufacturing. Sachs and
Warner (1995), for instance, propose a theoretical model in which learning-by-doing is the only
source of long-run growth and depends on the size of the manufacturing sector. Accordingly, a
contraction of manufacturing induced by a natural resource boom provokes the growth rate to slow
down (at least temporary with respect to a given steady state growth path) in the following years.7
Sachs and Warner (1999) and Ros (2001) reach similar results through theoretical models in which
growth comes from the interaction between increasing returns to scale (IRS) in the production of
intermediate goods and backward productive linkages characterizing manufacturing. Here, the
expansion of manufacturing induces an increase in the production of intermediates or in their variety
this last ase is e t e el lose to Ada “ ith s des iptio of di isio of la o . Due to the existence of increasing returns to scale in the intermediate-good sector, both real wages and the
profit rate rise. Eventually, they turn out to be higher in sufficiently large manufacturing-based
economy with respect to countries specialized in non-manufacturing and non-tradable sectors (Ros,
2001).8 Ha-Joon-Chang (2010) offers a very convincing explanation as to why manufacturing, even in
this digital era, still constitutes the engine of long-run growth.9
Tregenna (2011) identifies three possible processes leading to de-industrialization as measured by
a reduction of the manufacturing employment share. First, a reduction in labor-intensity (increase in
labor productivity) coupled with a contraction of that sector output; second, a reduction in labor-
intensity that outweighs the expansion of sector production; finally, the contraction of sectorial
activity that outweighs the increase in labor-intensity (decline in labor productivity). Such processes,
all giving rise to a lower manufacturing employment share, are likely to prompt different and perhaps
7 Torvik (2001) allows for different results by admitting for learning-by-doing to take place in the non-tradable sector as
well, and technological spill-over running both ways (from manufacturing to services and vice versa). 8 Gylfason and Zoega (2006) present an aggregated model, in which large dependence on natural resources cut optimal
savings, physical and human capital accumulation, hence long-run growth. 9 His point is that the so- alled de-i dust ializatio i i h ou t ies does ot o e p i a il f o Chinese competition
o E gel La . ‘athe , it o es f o the edu tio i i dust ial p odu ts elati e p i e, hi h is i tu the out o e of the
(relatively) rapid technical progress in manufacturing.
5
opposite effects on overall economic records.10 This is also the reason why analogous trends in
manufacturing employment in Asian and Latin American economies (Colombia among them) have
been often associated to diverging economic performances. Whilst the former registered increasing
manufacturing value added shares and even stronger improvements in manufacturing labor
productivity, most Latin American economies experienced worrisome premature reductions in
manufacturing GDP shares, and dismal increases in labor productivity by international standards.11
Regardless of the specific mechanisms at work and their theoretical or empirical character, all
these analyses share the common aspect to be real side studies without a well-defined
macroeconomic framework based on national accounting. In a way, they seem to follow the original
o t i utio of Co de a d Nea , p. ig o i g the o eta i pli atio s of atu al resource booms and the ensuing structural changes, i.e. the effects such events may trigger off on the
external balance and financial solidity of the economies under observation. Sachs and Warner (1995,
1999), for instance, assume the current account of the balance of payments to be always in
equilibrium thanks to natural esou e a a ou te ala i g t ade defi its a isi g from
increased imports of tradable goods. Gylfason, Herbertsson, and Zoega (1999) assume an exogenous
trade surplus in order to meet interest payments on a given and constant stock of foreign debt. When
capital movements and financial transactions are considered (see Mansoorian, 1991), they are
formalized in a perfect foresight infinite life framework, in which international borrowing and
accumulating foreign debt today are repaid through expanding manufacturing productions, increasing
domestic savings and rising current account surpluses tomorrow.12 Accordingly, in these models
boom-and-bust cycles linked to mounting foreign debts are ignored by assumption, even though they
may represent relevant ways natural resource booms may influence long-run economic dynamics
(Manzano and Rigobon, 2001).
Our contribution draws inspirations from previous works by Dutt (1997) and Taylor (2004). Dutt
e phasizes that i o i g FDI a i du e det i e tal effe ts o de elopi g ou t ies catching-up process on developed economies, depending on the productive sector targeted by FDI.
10
If a de ease i a ufa tu i g e plo e t sha e is primarily accounted for by falling labor-intensity of manufacturing,
this alls i to uestio the e te t to hi h de-i dust ializatio is a app op iate ha a te izatio . The poi t is that a fall in the share of manufacturing employment that is mostly accounted for by falling labor intensity (i.e. increasing labor
productivity) would not necessary have a negative impact on growth. This is different from the case where the fall in the
share of manufacturing employment is associated primarily with a decline of the manufacturing sector as a share of GDP.
In such a scenario, an economy would be particularly at risk of losing out on the growth-pulling effects of manufacturing
T ege a, , p. . 11
Despite the fa t that a ufa tu i g as ge e all a lo er share of total value added in these countries than in the
Asian newly industrializing countries (NICs), manufacturing shrank as a share of total value added in the Latin American
countries while growing further in the Asian NICs (Tregenna, 2011, pp.14-1 . 12
A tuall , diffe e t o lusio s ith espe t to the sta da d Dut h disease lite atu e a e o tai ed he i te -
temporal optimization and consumption smoothing is allowed through financial market mechanisms. Mansoorian (1991),
for instance, finds that a real depreciation and an expanding manufacturing sector could emerge in the long run as the
optimal response to over-borrowing, real exchange rate appreciation and de-industrialization in the short run. These
conclusions reinforce those provided by B u o a d “a hs, ho st ess that opti izi g fa -sight households (and
go e e t ill ot o su e all u e t oil e e ues, ut ill athe sa e i a ti ipatio of the futu e de li e […] to the extent that the u e t e e ues o e state the pe petuit e ui ale t of oil earnings, a focus on current production levels
overstates the resource allocation consequences of the oil sector B u o a d “a hs, , p. .
6
Taylor (2004, chapter 12) describes the cyclical boom-and-bust dynamics possibly set in motion by
temporary capital inflows in developing economies. Our paper represents an attempt at putting these
two perspectives together to offer a non-standard interpretation of Colombian Dutch disease.
3. Structural Change and Sectorial dynamics in Colombia
Colombia already went through various episodes of de-industrialization.13 On top of the current
sharp decli e i the a ufa tu e s sha e i eal alue added, a similar trend also emerged from 1990
to 1999. Colombian 1990s de-industrialization episode was likely due to the radical switch in
economic policy Colombia went through during that period. The reform process, centered on trade
liberalization, is deemed to have harshly hit Colombian industry, manufacturing in particular, which
had been traditionally supported by a protectionist trade regime (Ocampo, 1994). Colombian
manufacturing output share eventually reached a minimum point in 1999, also due to the deep
economic downturn affecting Colombia in that year as a result of the contagion from financial crises
in other emerging countries.
After such initial shock, Colombian manufacturing partially recovered at the beginning of the
2000s. Once again, since 2007, the share of the manufacturing sector has been shrinking in a
remarkable and consistent way. The current episode of de-industrialization (or, better, de-
manufacturing) does not consist in a general and somewhat proportional decline of all the several
components of the industrial sector. A contracting manufacturing is now accompanied by an increase
in the energy sector real GDP share. By the first quarter in 2014, Colombian manufacturing accounts
for less than 11% of real GDP, while the energy sector share has been constantly expanding.
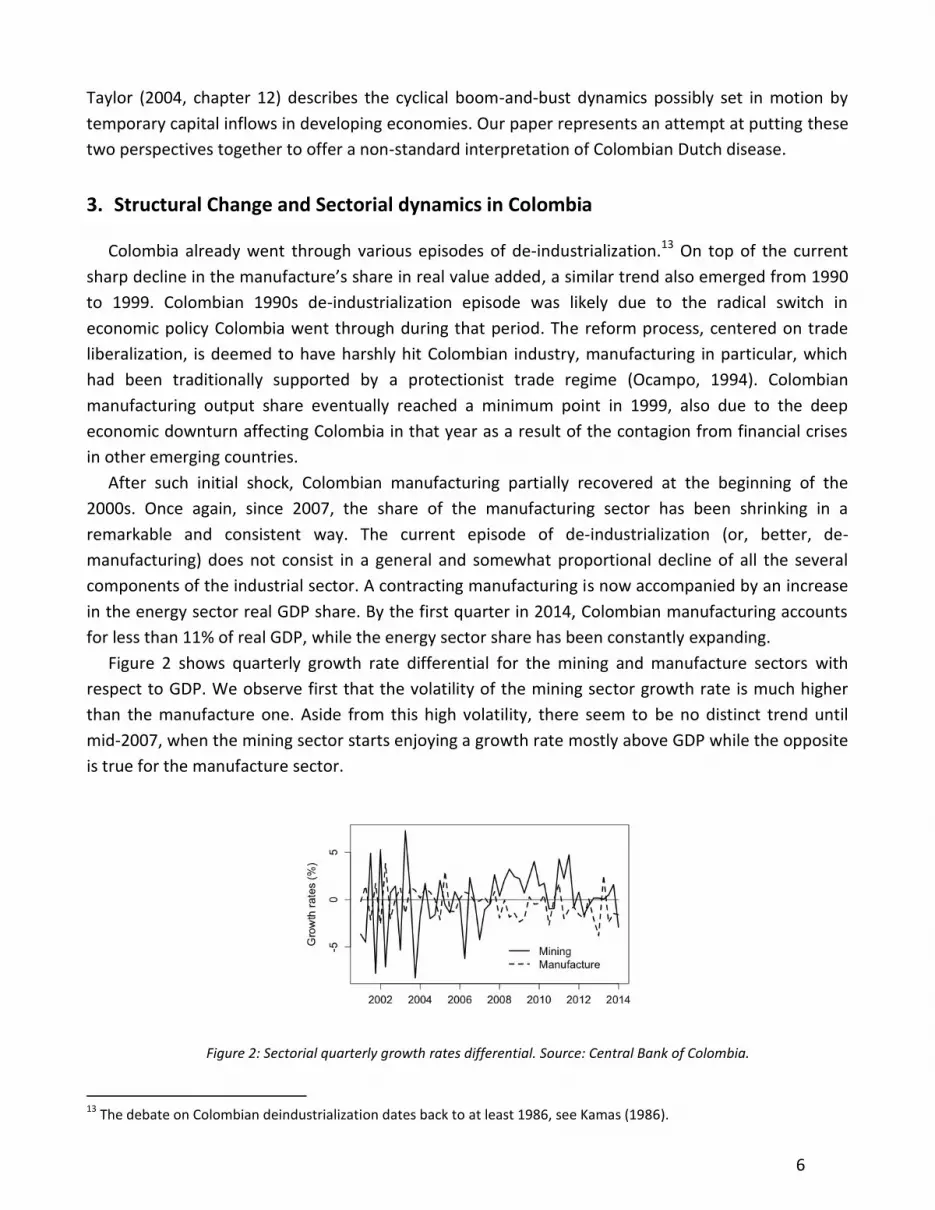
Figure 2 shows quarterly growth rate differential for the mining and manufacture sectors with
respect to GDP. We observe first that the volatility of the mining sector growth rate is much higher
than the manufacture one. Aside from this high volatility, there seem to be no distinct trend until
mid-2007, when the mining sector starts enjoying a growth rate mostly above GDP while the opposite
is true for the manufacture sector.
Figure 2: Sectorial quarterly growth rates differential. Source: Central Bank of Colombia.
13
The debate on Colombian deindustrialization dates back to at least 1986, see Kamas (1986).
7
We use standard Chow test to validate the structural break that seem to emerge from the data.
The data set consists of 53 quarterly observations from 2001 Q1 to 2014 Q1. Unfortunately, due to a
change in the methodology used by the Colombian statistical office (DANE) we cannot include
previous data. Table 1 and Table 2 show the estimation results for the mining and manufacture
sector. The tests indicate that there seems to be a structural break for both series in 2007Q3. There is
no clear trend before 2007Q3. The mining sector seems to grow less than GDP (1.07% below GDP, not
statistically significant), while the manufacture is growing at par with GDP (0.13% above GDP, not
statistically significant). After 2007Q3, the trend is instead very clear. The mining sector experienced
an above-than-GDP growth rate (+1.15%) while the manufacture sector is growing at a rate lower
than GDP (-0.99%).
Variable Full sample 2001Q1-2007Q3 2007Q4-2012Q4
Constant 0.02 (0.45) −1.07(0.75) 1.15**(0.37)
Chow Test (2007Q3) 6.79 (0.01)
Table 1: Estimation of Mining sector to GDP growth rate differential.
Variable Full sample 2001Q1-2007Q3 2007Q4-2012Q4
Constant -0.42 (0.22) 0.13(0.29) −0.99**(0.28)
Chow Test (2007Q3) 7.23* (0.01)
Table 2: Estimation of Manufacture sector to GDP growth rate differential.
All the above-mentioned de-industrialization episodes are consistent with the worst de-
industrialization case stressed by Tregenna (2011). From 1985 to 1995, Colombia is the only
developing economy in which the contraction of the manufacturing sector outweighed the increase in
labor-intensity (a decreasing labor productivity). Sadly, these findings are confirmed for the 2007-
2013 period.14 Data reported in table 3 show that a negative variation in manufacturing employment
share in the order of 1,8 percentage points is due to the significant contraction of manufacturing
participation to GDP. Such a contraction outweighs the reduction in manufacturing labor productivity.
These puzzling and worrisome dynamics in Colombian manufacturing labor productivity can be
partially explained by manufacturing sub-se to s d a i s. “i e , o e disagg egated data (see
DANE, 2014) reveal that production of basic metallic and non-metallic goods have expanded their
participation in manufacturing value added. On the contrary, the manufacturing value added share
imputed to the chemical industry has decreased. The same story applies to the capital good sector.
While the formers are usually classified as labor-intensive and low-skill sectors, with little scope for
innovation and productivity growth, the latters are medium and high-skill technology intensive
14
Variations in the sectorial employment share can be decomposed into three elements: variations in the labor-intensity
ha a te izi g se to s p odu tio i.e. the la o -intensity effect); variations in the sectorial GDP share (i.e. the sector
share effect); variations of overall labor productivity, which obviously affect overall employment dynamics (i.e. the above
labor-productivity effects). We can represent the sectorial employment share (hence its variation) according to this
formula: , Lit being employment level in sector i at time t, Yit sectorial production at time t, Lt and Yt
overall employment and production levels.
8
sectors characterized by stronger (productivity) growth opportunities.15 Overall, it seems that
Colombian manufacturing not only is shrinking in relative and absolute terms, but it is concentrating
in labor-intensive low-skill industries. Hence, there might be the reasonable concern that the ongoing
de-industrialization process might seriously impinge on Colombian long run development, provided
that the non-traditional sophisticated tradable good sectors still represent a fundamental source of
labor productivity dynamics (Rodrik, 2007; Szirmai, 2012).
labor share variation labor-intensity variation sector share variation overall labor productivity variation
-1,8 0,8 -3,0 0,4
Table 3: Decomposition of the manufacturing employme t sha e’s va iatio , 7-2013, source Central Bank of
Colombia, ILO (Labor Fo e Su ve a d Autho s’ o putatio .
4. Real exchange rate dynamics, Foreign Direct Investments, and the Colombian
external account.
The macroeconomic dynamics briefly sketched in the first sections of this paper depend on a wide
range of endogenous and exogenous factors of both long- and short-run nature. In 2008 and 2009,
there is no doubt that te po a i u sta es li ked to the o ld ide G eat ‘e essio ha e negatively affected Colombian GDP growth. At a more profound level, Colombian performances are
likely to be affected by some radical changes in the Colombian domestic policy framework. Since the
end of the 80s, Colombia is experiencing a long-lasting and deep reform process. At the beginning of
the 90s, the so- alled apertura hacia adentro as launched aiming to move Colombia, and the
Colombian industrial sector in particular, from a fairly protected trade regime to an open and
liberalized setting. More recently, this process has continued through a long series of free trade
agreements.16 Further, since the mid-2000s the regulation of the mining and energy sectors has been
subject to important modifications. In 2004, the government lifted the restrictions to foreign
o pa ies e ploitatio of do esti oil resources (UNCTAD, 2006). Accordingly, the monopolistic
control of the oil sector by domestic firms has been removed and the national company Ecopetrol
partially privatized. Such a regime shift, together with significant natural resource discoveries and
high prices of primary commodities have stimulated massive foreign direct investment towards
Colombia.
4.1 The FDI-exchange rate nexus
Most economists would interpret the recent appreciation of the Colombian peso as the main
factor curtailing the profitability and viability of Colombian manufacturing. Such an appreciation
15
“ee UNCTAD , Ma ufa tu ed goods deg ee of a ufa tu i g , f eel a aila le fo do load f o http://unctadstat.unctad.org/EN/Classifications.html. 16
United States of America (22/11/2006), Chile (27/11/2006), Northern Triangle (El Salvador, Guatemala and Honduras,
09/08/2007), Canada (21/11/2008), European Free Trade Association (25/11/2011) and European Union (26/06/2012),
sou e: O ga izatio of A e i a “tate s Fo eig T ade Information System, http://www.sice.oas.org.

9
would in turn be attributed to a natural resource boom raising domestic expenditures and lifting
inflation, in particular non-tradable sector inflation.
Since 2003, the Colombian real exchange rate has appreciated by 6.6% yearly on average (see
figure 3)17. However, differently from what expected, most of this trend comes from nominal
appreciation, in the order of 6.4% yearly, rather than strong inflationary pressures. Data from
international economic organizations confirm that Colombian inflation has been under control and
has remarkably decreased since 2008. Since 2003 Colombia has experienced the lowest inflation rates
among CIVETS countries.18 Colombian inflation has often been lower than that registered in many of
its most relevant trading partners, Latin American ones in particular. According to IMF (2014), it was
below 3% in 2013 and it is expected to be around 1,9% in 2014.19
Figure 3: Colombian effective real and nominal exchange rate (index number). Source: UNCTAD Datastat.
Of course, nominal and real appreciation of the Colombian peso might come from Colombian trade
and current account surpluses, one might say. Data on Colombian external account show this is not
the case. Since 2001, Colombia experienced a persistent although modest trade deficit only replaced
by a mild surplus in 2011. Yet, Colombian current account has remained in deficit, and it has
surprisingly worsened and diverged from an improving trade account. It is now in the order of more
than 3% of GDP.
In order to understand why despite a growing current account deficit the Colombian peso
revaluated so heavily over the last ten years, it is instructive to have a look to all the different
components of the Colombian balance of payments. It is crucial to be emphasize is that the capital
account surplus more than compensated the current account deficit. In the period 2002-2013 the
cumulated current account deficit amounted to US$ 67 billion, whereas the capital account surplus
reached more than US$ 97 billion. These numbers make us suspect that the origin of the Colombian
Dutch disease is perhaps to be found in the macro sphere, in the financial one in particular.
17
In Figure 3, according to UNCTAD data, upward trends in the nominal and real effective exchange rate indexes stand for
appreciations. Depreciations are represented by downward sloping sections in exchange rates dynamics. 18
According to data provided by the IMF (2014), from 2003 to 2012, Colombia has experienced average inflation rates
significantly lower than those observed in other emerging economies such as Brazil (1,6 percentage point less), India (2,6),
South Africa (0,8) and Turkey (5,7). 19
See IMF World Economic Outlook (April 2014). Data freely available from http://www.imf.org.

10
In the case of Colombia, Foreign Direct Investment has shown some degree of volatility and
i sta ilit due to e oge ous e o o i fa to s i.e. the o ld ide G eat ‘e essio , a d their links
to one-shot i est e t oppo tu ities. “ABMille Co pa s a uisitio of the lo al ee a d
Bavaria lies behind the erratic jump in Colombian FDI in 2005, for instance. This fact notwithstanding,
Colombia has experienced a significant and apparently structural increase in incoming FDI since 2005.
Indeed, before 2005 and all along the 1990s, overall Foreign Direct Investments in Colombia have
rarely been higher than 3% of GDP (according to UNCTAD, they stood out at 4,37% of GDP only in
1997). On the contrary, they picked up to almost 7% of Colombian GDP in 2005, and have remained
systematically and remarkably above 3% of GDP since then (with the only exception of 2010). In
absolute terms, from 1990 to 2004, net FDI were equal to US$ 1,6 billion on a yearly average. Since
2005, they averaged US$ 6,5 billion. In 2012, net FDI represented almost 100% of the positive net
Colombian financial account, these same figures being far higher than 50% in 2007 and 2008.
Beyond such aggregate data, it is worth noting that the composition and nature of Colombian
incoming FDI has changed remarkably in the last decade. In 2003, the real price of oil started
increasing and peaked in 2008 (well above the level it reached in the 1982, at the top of the second oil
shock). Today, it is more than 150% higher than it was in 2000 (Missaglia, 2012). Faced with such
tremendously strong incentives, global oil companies accelerated their investment processes and oil-
rich countries experienced a rapid growth of incoming FDI and an important expansion of mining
sectors. Colombia was no exception. According to a more disaggregated sectorial perspective, since
2006, FDI in the energy sector have accounted for more or close to 50% of all Colombian incoming FDI
on an annual base. Figure 4 below shows quarterly FDI per sector (Oil or Other) from 1996Q1 to
2012Q4 (68 observations).
Figure 4: FDI in Mining and Petrol, Others, and Total. Source: DANE.
The data seems to indicate a change in FDI distribution from around 2001 onwards. As for the
previous exercise, we ran Chow tests to check for structural breaks and estimated the average shares
for different samples. Table 4 presents the results. First, there is a structural break in 2001Q2 where
the share of FDI accruing to Oil and Other sector has substantially changed. Second, the Oil (resp.
Other) sector has observed an increase (resp. decrease) in FDI share.

11
Variable Full sample 1996Q1-2001Q2 2001Q3-2012Q4
Petrol and Mining share 0.42***(0.04) 0.12 (0.06) 0.56***(0.03)
Chow Test (2007Q3) 52.08*** (0)
Table 4: Estimation of FDI share accruing to Oil and Other sectors
Incoming Foreign Direct Investment, in particular those targeting the domestic energy sector, have
greatly contributed to the surplus in the Colombian capital account and overall Balance of Payments
since 2004. On top of this, in the last five years increasing net foreign portfolio investment has further
reinforced the ma oe o o i i pli atio s, ead Colo ia peso s o i al a d eal e ha ge ate appreciation, of the above mentioned FDI flows. Indeed, in the first part of the 2000s, net foreign
portfolio investment in Colombia was low or even negative. A remarkable change has apparently
taken place since 2007. With the only exception of 2008 (likely due to the worldwide consequences of
the subprime financial turmoil), since that year net foreign portfolio investment has been always
positive and increasing. In 2007, it amounted to 1.3 billion dollars, i.e. 0.64% of Colombian GDP. From
2011 to 2013 they surged to far more than 5.5 billion dollars yearly, i.e. more than 1.5% of Colombian
GDP. According to data provided by the Central Bank of Colombia, they amounted to 2.5 billion
dollars in the first quarter of 2014.
A sort of self-reinforcing process between FDI flows, portfolio investment, and exchange rate
appreciation seems thus to characterize the more recent evolution of the Colombian external
account. Mounting FDI flows have provided the first mo e fo Colo ia peso s o goi g appreciation.
I te atio al i esto s e thusias a out Colo ia growth opportunities and, say, exchange rate-
induced capital gains have then led to increasing net foreign short-term portfolio investment. In light
of the structural (sectorial) consequences of such macroeconomic trends and of the current account
imbalances reported in next section, it is straightforward to wonder whether such a self-feeding
process may turn on to be unsustainable in the near future.
4.2 The Colombian trade and current account
Figure 5 provides a closer look at the evolution of the Colombian current account and of its sub-
components. Colombian structural dependence on imports of manufactured goods comes up
strikingly clear. Despite of fluctuations linked to economic cycles, trade deficit in manufactured goods
is increasing since the beginning of the 2000s. It is now close to 10% of GDP. Needless to say, these
figures change radically when trade flows linked to the energy and mining sectors are taken into
account. Since 2001, the overall trade account in goods and services has registered deficits no higher
than 2% of GDP. In the last four years, it has been close to balance, even though not positive yet
(except of 2009), thanks to high prices of primary commodities.

12
Figure 5. Colombian trade and current account balances, sou e: Ce t al Ba k of Colo ia a d Autho s’ omputations.
Interestingly, before 2005, Colombian trade and current accounts showed closely similar dynamics
and positively co-moved. Rising (decreasing) trade deficits were associated to increasing (decreasing)
current account deficits. Since 2005, however, diverging trends have emerged. While the overall trade
account has kept on being close to balance, current account deficit has steadily increased to above 3
percent of GDP. Such apparently puzzling fact can be explained through data portrayed in figure 6.
Here we describe the dynamics of some of the above components of the current account, (net)
repatriated profits linked to FDIs in particular. Data are expressed as index numbers, 1995 being the
base year. Both the current account deficit and manufacturing trade deficit show an upward trend. In
2013, the manufacturing trade deficit is more than four times higher than it was in 1995. What is
more, net factor income show an astonishing dynamics. While they amounted to 0.29 percent of GDP
in 1995, they stand at the 2.85 percent of Colombian GDP in 2013 (practically the whole current
account deficit). Their 2013 value is more than 30 times higher than the initial 1995 value.
Figure 6: Ove all u e t a ou t a d sele ted o po e ts’ d a i s, source: from Central Bank of Colombia and
Autho ’s o putatio .
13
5. The Macroeconomics of the Financial Dutch Disease: Possible real and financial
consequences
According to the literature reviewed in section 2 and to the empirical evidence presented in
sections 3 and 4, the picture we have described so far seems to suggest the existence of a strange sort
of Dutch disease in Colombia. Its peculiar ingredients and the main mechanisms at work can be
summarized in a few points.
First, the Colombian peso has significantly revaluated in the last decade, both in nominal and real
terms. The excess world demand for Colombian pesos, however, does not come from the need to
finance a rest-of-the-world current account deficit vis-à-vis Colombia. The world is not invaded by
Colombian exports. Well on the contrary, Colombia continues to experience a structural and
increasing manufacturing trade deficit. High international prices of primary commodities and an
expanding energy sector have helped to bring the overall Colombian trade account back to
equilibrium. Yet, the Colombian current account is negative and worsening.
Second, Colombian peso revaluation is explained by the dynamics of capital inflows, and among
them FDI are overwhelmingly important. In the o e e e t pe iod, Colo ia peso s appreciation
has also fed back with positive and increasing net foreign portfolio investment aiming to exploit profit
and capital gain opportunities emerging in the economy. A brief sectorial analysis also reveals that FDI
are more and more directed toward the oil sector. Both facts (the exchange rate revaluation and
massive energy sector-oriented FDI) contribute to shift the Colombian productive structure away
from manufacturing and to make it increasingly dependent on the exploitation of domestic natural
resources.
Third, this kind of FDI generates high returns, but profits are typically expatriated. Indeed, between
2009 and 2012, the incoming flows of FDI (39,306 US$ millions) have been lower than the outgoing
flow of profits (42,469 US$ millions), see Cabrera Galvis (2013). This fact is worrisome on a twofold
level. First, before being expatriated, these profits are not taxed. Following Ocampo, this efle ts Colo ia s i a ilit to take ad a tage of o odities p i es oo th ough ta atio […] this as done in the past during the coffee price boom. This contrast is even more striking when thinking that
offee p ofits e e aptu ed so eo e i the ou t . O the o t a , toda s oil p ofits a e essentially going to foreign enterprises (Ocampo 2013, p.15) . Second, huge profits repatriation by
foreign investment in the Colombian oil sector emerges as the leading force behind Colombian
current account imbalances. Whilst these imbalances may easily turn out to be structural and
permanent, we cannot say the same as to the FDIs that have so far financed such external gap.
The kind of productive changes and external imbalances currently underway in Colombia cast
serious doubts on its long-run growth potential and financial stability. Let us discuss in more details
these topics and portray some possible future scenarios.20
20
The R source code and the datasets used to generate all graphs and econometric results of this paper can be found on
the website http://www.antoinegodin.eu/ColombiaDutchDisease.

14
5.1 Possible future scenarios
We have already emphasized our concern about a negative link between de-industrialization and
productivity dynamics. Even more so if we think that the current reduction in manufacturing
participation to GDP couples with a decreasing manufacturing labor productivity. Needless to say,
such facts are at odds with those historically observed in developed and successful East Asian
catching-up countries. The relative concentration of Colombian manufacturing in labor-intensive low-
skill productions may significantly downsize Colombia opportunities as to the accumulation of human
capital and generation of innovation and technological spillovers on the rest of the economy. It will
likely weaken productivity dynamics and harm economic development.
Persistent and large current account imbalances have been often perceived as destabilizing factors,
potentially leading to exchange rate crises and financial turmoil in developing countries. Colombia
makes no exception and data presented in section 4 make us wonder whether the current Colombian
development pattern is financially sustainable. In order to address this issue, we perform some
scenario analysis on the possible evolutions of the various components of the Colombian Balance of
Payments. Our analysis relies on the data provided by the Colombian government as to the expected
dynamics of oil prices, oil production and exports, GDP and imports growth rates (Ministry of Finance
and Public Credit, 2014a).21 We also k o go e e t s expectations in terms of current account
dynamics and net capital inflows and variation in foreign reserves. We do not dispose of additional
information concerning net factor payments, profit repatriation in particular, and non-oil exports. The
aim of our analysis is twofold. First, we compute the e ui ed e olutio s i ou u k o a ia les, et fa to pa e ts o o -oil exports alternatively, in order to meet go e e t s expectations.
Second, we simulate future possible dynamics of some relevant components of Colombian Balance of
Payments according to past-observed trends. We are interested in the implications of such trends,
should they persist in the upcoming years, in terms of current account, capital account, foreign
reserve accumulation. In this sense, we want to test the consistency of these emerging figures with
government expectations.
The right-hand side of figure 7 ep odu es go e e t s e pe tations in terms of foreign capital
inflows and current account. The left-hand side of figure 7 in turn portrays government projections as
to oil e po ts a d o e all i po ts of goods a d se i es. Go e e t s e pe tatio s a e su h that a persistent current account deficit should slightly decrease from 3,6% of GDP in 2014 to around 3% of
GDP in 2024. Capital account and net FDI inflows are expected to remain, on average, in the order of
4% and 3.7% of GDP, respectively (in 2014, Colombian government expects a capital account surplus
close to 5% of GDP). The capital account surplus is thus expected to fully cover current account
deficits and allow Colombian foreign reserves to pile up even further.
21
Unfortunately, we do not have detailed yearly values for the capital account and Foreign Direct Investment but only
averages over the time period.

15
Figure 7: Government trade flow forecasts and expectations on current and capital account, and net FDI, source:
Mi ist of Fi a e a d Pu li C edit , Ce t al Ba k of Colo ia a d Autho s’ o putatio .
In the left-hand side of figure 8, we show the current dynamics of Colombian net factor payments.
Consistently with figure 6, it has become astonishingly negative in the last decade mainly due to an
enormous increase in FDIs profit repatriation. We assume three possible scenarios as to future net
factor payments evolution. First, we assume it maintains a constant nominal value, equal to its 2013
level, all along the next ten years (dashed line). Second, we assume NFP to move at the same pace
than Colombian nominal GDP, i.e. the NFP/GDP ratio is constant (dotted line). Finally, we projected
possible increases in NFP Colombian outflows using an HP-filter trend (dashed-dotted line). In the
right-hand side of figure 8, we plot the required increase in Colombian non-oil export in order to meet
go e e t s u e t a ou t expectations. The three different dynamics are portrayed in line with
different assumptions on NFP evolution and with expected dynamics of total imports and oil export
flows. What emerges clearly is the enormous increase of non-oil export (as a percentage of GDP) that
should take place since 2020 on in order to bring the trade balance under control and maintain the
overall current account deficit around 3% of GDP by the end of 2024.
Figure 8: NFP (different scenarios) and required non-oil e po ts to eet gove e t’s CA ta get, source: Ministry of
Fi a e a d Pu li C edit , Ce t al Ba k of Colo ia a d Autho s’ o putatio .
16
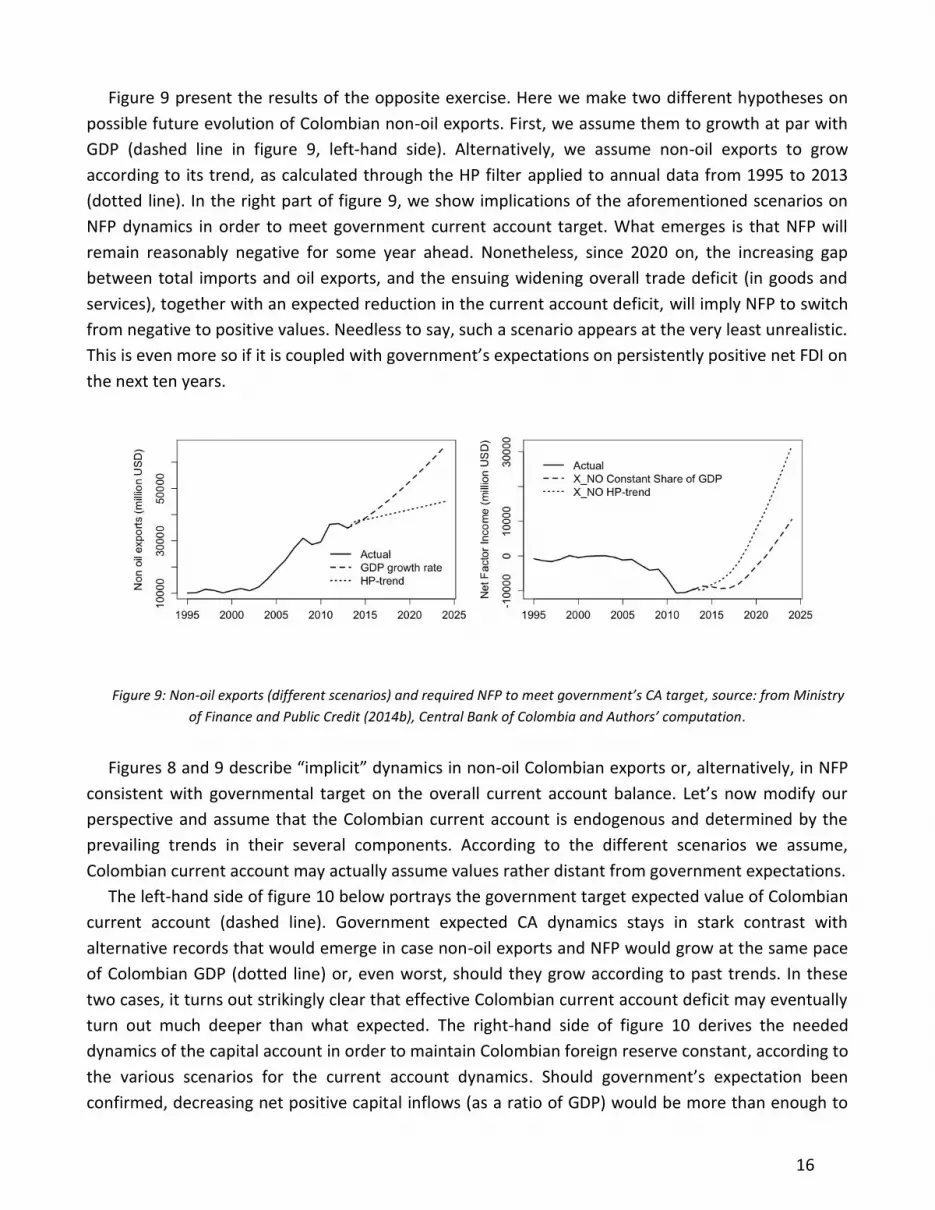
Figure 9 present the results of the opposite exercise. Here we make two different hypotheses on
possible future evolution of Colombian non-oil exports. First, we assume them to growth at par with
GDP (dashed line in figure 9, left-hand side). Alternatively, we assume non-oil exports to grow
according to its trend, as calculated through the HP filter applied to annual data from 1995 to 2013
(dotted line). In the right part of figure 9, we show implications of the aforementioned scenarios on
NFP dynamics in order to meet government current account target. What emerges is that NFP will
remain reasonably negative for some year ahead. Nonetheless, since 2020 on, the increasing gap
between total imports and oil exports, and the ensuing widening overall trade deficit (in goods and
services), together with an expected reduction in the current account deficit, will imply NFP to switch
from negative to positive values. Needless to say, such a scenario appears at the very least unrealistic.
This is e e o e so if it is oupled ith go e e t s e pe tatio s o pe siste tl positi e et FDI o the next ten years.
Figure 9: Non-oil e po ts diffe e t s e a ios a d e ui ed NFP to eet gove e t’s CA ta get, source: from Ministry
of Fi a e a d Pu li C edit , Ce t al Ba k of Colo ia a d Autho s’ o putatio .
Figures 8 and 9 des i e i pli it d a ics in non-oil Colombian exports or, alternatively, in NFP
o siste t ith go e e tal ta get o the o e all u e t a ou t ala e. Let s o odif ou perspective and assume that the Colombian current account is endogenous and determined by the
prevailing trends in their several components. According to the different scenarios we assume,
Colombian current account may actually assume values rather distant from government expectations.
The left-hand side of figure 10 below portrays the government target expected value of Colombian
current account (dashed line). Government expected CA dynamics stays in stark contrast with
alternative records that would emerge in case non-oil exports and NFP would grow at the same pace
of Colombian GDP (dotted line) or, even worst, should they grow according to past trends. In these
two cases, it turns out strikingly clear that effective Colombian current account deficit may eventually
turn out much deeper than what expected. The right-hand side of figure 10 derives the needed
dynamics of the capital account in order to maintain Colombian foreign reserve constant, according to
the various scenarios for the current account dynamics. “hould go e e t s e pe tatio ee confirmed, decreasing net positive capital inflows (as a ratio of GDP) would be more than enough to

17
match the current account deficit and ensure stable Colombian foreign reserves (small dashed line). In
the last decade Colombia has experienced a remarkable surge in net capital inflows. Things change
radically if we assume that the Colombian current account will be the result of non-oil exports and net
factor payments moving at part with GDP (dash-dotted line) or, even worst, following past HP trends
(long dash line). In both scenarios, Colombia would need constantly growing and indeed mounting
capital account surpluses in order to cover huge current account imbalances.
Figure 10: current account and capital account under different scenarios, source: from Ministry of Finance and Public
Credit (2014b), Central Ba k of Colo ia a d Autho s’ o putatio .
Figure 11 finally portrays the effects of different scenarios on the accumulation of foreign reserves.
We assume two trends for each account of the balance of payment accounts, thus implying four
different scenarios. Both trends of the current account are based on the expectations of the
government on imports and oil exports. The first trend assumes non-oil exports and net factor
payment to follow the GDP growth while the second trend assume HP-filter trends for these two
o po e ts of the u e t a ou t. The fi st t e d of the apital a ou t is ased o go e e t s expectation and the second trend is constructed using the HP-filter trend.
The possible increase, or stabilization, of Colombian foreign reserves basically requires foreign net
capital inflows to move accordingly to observed dynamics in the current account. In the event that the
Colombian current account deficit would effectively follow the expected trajectory by the
government, decreasing net capital inflows (in percentage of GDP) since 2014 and in line with
government expectations (3,4% of GDP yearly from 2014 to 2015) will ensure a slightly increase in
foreign reserves (small dashed line). Things get even better whether foreign capitals follow their HP-
filter trend (scenario 3 and 4). In such a case, a large capital account surplus will materialize and allow
Colombian foreign reserves to increase at first even in the event that non-oil exports and, above all,
NFP move at par with GDP (scenario 3). However, in this scenario, the Balance of payment surplus
turns negative from 2018 onwards and the reserve stock starts decreasing and reaches 0 in 2023. In
the case of the HP-filter trend of the current account (scenario 4) foreign reserves will actually
increase until 2020, where they reach almost $ 83 billion.

18
However, things may change dramatically in the case of the capital account meeting government
forecasts (scenario 1 and 2). If non-oil exports and NFP grow according to GDP growth trends
(scenario 1), foreign reserves start decreasing immediately and turn negative by 2022 (dash-dotted
line). Needless to say, such a reduction will be even faster should NFP and non-oil exports follow their
HP-filter trends (scenario 2)22. In such a scenario, Colombian foreign reserves will be driven close to
zero by the end of 2019.
Figure 11: Expected dynamics in Colombian foreign reserves stock (different scenarios) , source: from Ministry of
Fi a e a d Pu li C edit , Ce t al Ba k of Colo ia a d Autho s’ computation.
5.2 Policy Options
Which are the policy implications of these scenarios and expected dynamics in Colombian foreign
reserves? In the last decade, the Colombian economy has become far more dependent on the
exploitation and exports of its own natural resources in order to pay for increasing imports of capital
goods. The exports of oil and related products represent in 2012 much more than 50% of Colombian
exports. According to data provided by DANE (2014), by the end of 2012, foreign imports represent
more than 60% of the total supply (domestic production plus imports) of capital goods. This ratio was
less than 47% in 2000. Such a deep structural change in the Colombian economy implies that the
nominal exchange rate appreciation is a fundamental macroeconomic variable affecting Colombian
capability to invest, accumulate capital stock and support economic growth. A depreciation of the
exchange rate, by making imported capital goods more expensive, could easily curtail investments
and growth. In order to avoid such an event to take place, available foreign reserves play a
fundamental role – they are the weapon in the hands of the Central Bank to defend the domestic
currency. A shortage of foreign reserves might start a financial crisis.
Our analysis shows that there is no risk such events will take place very soon in Colombia. The
right-hand side of figure 8, for instance, reveals that slightly increasing non-oil exports, as a share of
22
It must be emphasized that, due to the mining-sector boom, the evolution of non-primary exports over the last decade
has been particularly disappointing. The share of primary export (oil, coffee, flowers, bananas, etc.) in total exports rose
from 74% in 2001 to 81% in 2012 (Consejo Privado de Competitividad, 2013).

19
GDP, will be enough to compensate for negative NFP and guarantee the Colombian current account
to get go e e t s ta get i the e t -3 years. Similarly, negative NFP do not need to be
immediately reduced in order to ensure an easy management of the Colombian external account and
Colombian peso. Yet, our analysis also shows that some trends characterizing Colombia since the mid
2000s are unsustainable in the long run. Should huge profit repatriation continue in the upcoming
years according to the astonishing dynamics registered so far, net positive capital inflows will not
suffice, even in the best possible scenario, to preserve Colombian foreign reserve to decline and
possibly to avoid an exchange rate crisis23.
On top of this, government optimistic forecasts rely upon a sort of apital a ou t-current
account counter-bala i g e ha is that ight e suita le to add ess sho t-term problems, but is
likely to give rise to a vicious unstable dynamics in the long run. In the end, it may turn out to be the
main source of Colombia possible financial instability. According to Singh, FDI i est e t eates foreign exchange liabilities not only now but also into the future. This characteristic leads to the
danger that unfettered FDI may create a time profile of foreign exchange outflows (in the form of
dividends payments or profit repatriation) and inflows (i.e. fresh FDI) which may be time inconsistent
(Singh, 2003, p. 209 . To put it another way, huge current foreign capital inflows, FDI in particular, for
sure provide the country with foreign currency flows covering current account deficits and, possibly,
stabilizing the exchange rate (or create room for an exchange rate stabilization). However, they also
create the basis for even higher foreign currency outlays in the upcoming years, hence the need for
even stronger capital account inflows. Such a spiral may have a weak basis and may easily break
do . “hould apital i flo s, FDI i pa ti ula , de ease due to, let s sa , a edu tio i atu al esou e se to s p ofita ilit , a fu da e tal sou e of fo eig u e inflows will stop playing
while foreign currency outflows will be still on the ground. This is the kind of risk Singh was putting
forward and Colombia may face in the medium/long-run.
In order to tackle with such possible undesirable outcomes in advance, two policy measures come
at mind. They are strictly linked each other. First, Colombia should reduce its dependence on foreign
direct investment as both source of foreign currency inflows and productive investment. In order to
be clear, this does not imply that Colombia should discourage FDI to take place, in particular those
that may lead to a diversification of its productive and export pattern. We are simply saying that FDI
should represent only part, perhaps not the most relevant one, of Colombian capital accumulation
and development process together with productive initiatives undertaken by domestic actors.
Second, and accordingly with the previous point, Colombian government should implement policies
devoted to significantly diversify its export base. The Colombian government foresee a reduction in
the production of oil since 2017 on. There is not any guarantee that non-oil export (which also include
other primary commodities) dynamics will be sustained enough to avoid a widening current account
deficit to take pla e o to pa fo la ge epat iatio of fo eig o pa ies p ofits. The e pa sio of Colombian product and export space may provide the required dynamics. In the end, such a strategy
would be absolutely in line with the most recent evidence on successful episodes of long-run
23
See Ocampo (2009) on the disruptive effects on the Colombian external account of a possible reduction in the price of
primary commodities.

20
economic development. The kind of goods you export matters for growth (Haussmann et al. 2007),
and product diversification characterize a relevant part of the development process (Imbs and
Wacziarg, 2003; Rodrik, 2007). Apparently Colombia has followed a radically different development
pattern that put too much emphasis on the exploitation of domestic natural resources as main source
of e o o i g o th the so alled lo o oto a i e a-energetica . It ight e ise to e ploit natural in advance resource revenues to support a clear diversification strategy that might at least
partially change and make more balanced the development strategy followed so far.
21
References
Bruno M. and Sachs J.D. (1982) – E e g a d ‘esou e Allo atio : A D a i Model of the Dut h Disease , Review of Economic Studies, vol. 49 (5), pp. 845 – 859.
Cabrera Galvis M.C. (2013) – Diez Años de Revaluación, Bogotà: Editorial Oveja Negra.
Claveijo C., Vera A. and Fandino R. (2014) – De-industrialization in Colombia: Quantitative Analysis of
the Determinants, ANIF Estudios Especiales 2014, freely available for download from
http://anif.co/node/10697.
Chang H.J. (2010) – Thi gs The Do ’t Tell You A out Capitalis , London: Penguin Books.
Consejo Privado de Competitividad (2013) – Informe Nacional de Competitividad 2013-2014, Bogotá,
Colombia.
Corden W.M. and Neary J.P. (1982) – Booming Sector and De-industrialization in a small open
economy, The Economic Journal, vol. 92 (368), pp. 825 – 848.
DANE (2014) – DANE Supply and Uses Matrix Table, freely available for download from
https://www.dane.gov.co/index.php/cuentas-economicas/cuentas-anuales.
Dutt A.K. (1997) – The Pattern of Direct Foreign Investment and Economic Growth, World
Development, vol. 25 (11), pp. 1925 – 1936.
The Economist Intelligence Unit (2013) – Latin America as an FDI Hotspot: Opportunities and Risks.
Gylfason T., Herbertsson T.T. and Zoega G. (1999) – A Mixed Blessing: Natural Resources and
Economic Growth, Macroeconomic Dynamics, vol. 3 (2), pp. 204 – 225.
Gylfason T. and Zoega G. (2006) – Natural Resources and Economic Growth: The Role of Investment,
The World Economy, vol. 29 (8), pp. 1091 – 1115.
Goda T. and Torres A. (2013) – Overvaluation of the Real Exchange rate and the Dutch Disease: The
Colombian Case, CIEF Working Paper n. 28-13.
Hausmman R. Hwang J. and Rodrik D. (2007) – What you export matters, Journal of Economic Growth,
vol. 12 (1), pp. 1 – 25.
Kamas L. (1986) – Dutch Disease Economics and the Colombian Export Boom, World Development,
vol. 14 (9), pp. 1177 – 1198.
22
Imbs J. and Wacziarg R. (2003) - Stages of Diversification, American Economic Review, vol. 93 (1), pp.
63-86.
IMF (2014) – World Economic Outlook April 2014.
Mansoorian A. (1991) – Resource Discoveries and Excessive External Borrowing, The Economic
Journal, vol. 101 (409), pp. 1497-1509.
Manzano O. and Rigobon R. (2001) – Resource Curse or Debt Overhang, NBER Working Paper n. 8390.
Missaglia M. (2012) - Finanza, Povertà e Tensioni Internazionali, in Strazzari F. (ed.), Mercati di Guerra,
il Mulino.
Ministry of Finance and Public Credit (2014a) – An Outlook of the Colombian Economy, freely available
for download at http://www.minhacienda.gov.co.
Ministero of Finance and Public Credit (2014b) – Marco Fiscal de Mediano Plazo, June 2014.
Ocampo, J. A. (1994) – Trade Policy and Industrialization in Colombia, 1967 – 91, in Helleiner G.K. (ed.)
– Trade Policy and Industrialization in Turbulent Times, London and New York: Routhledge, pp. 132
– 169.
Ocampo J. A. (2009) – Performance and Challenges of the Colombian Economy, freely available for
download from http://policydialogue.org/publications.
Ocampo J. A. (2013) – Prologo, in Cabrera Galvis M.C. - Diez Años de Revaluación, Bogotà: Editorial
Oveja Negra.
OECD (2013) – OECD Economic Assessment of Colombia 2013, available from
www.oecd.org/Colombia.
Ojeda J.N., Parra-Polonia A. and Vargas C.O. (2014) – Natural-Resource Booms, Fiscal Rules and
Welfare in a Small Open Economy, Banco de la Republica Colombiana Borradores de Economia n.
807.
Park Madison Partners (2013) – Colo ia’s Rise: A P i e fo I te atio al I vesto s, freely available
for download from http://www.parkmadisonpartners.com/cgi-bin/news.pl.
Rodrik D. (2007) – I dust ial De elop e t: “o e “t lised Fa ts a d Poli Di e tio s , i UN-DESA
(ed.), Industrial Development for the 21st Century: Sustainable Development Perspectives, New
York: UN Publishing.
23
Ros J. (2001) – Industrial Policy, Comparative Advantages and Growth, CEPAL Review, vol. 73, pp. 127
– 145.
Sachs J.D. and Warner A.M. (1995) – Natural Resource Abundance and Economic Growth, NBER
Working Paper n. 5398.
Sachs J.D. and Warner A.M. (1999) – The Big Push, Natural resource Booms and Growth, Journal of
Development Economics, vol. 59 (1), pp. 43-76.
Sachs J.D., and Warner A.M. (2001) – The Curse of natural resources, European Economic Review, vol.
45 (4), pp. 827-838.
Singh A. (2003) – Capital Account Liberalization, Free long-term Capital Flows, Financial Crises and
Economic Development, Eastern Economic Journal, vol. 29 (2), pp. 191 – 216.
Szirmai (2012) – Industrialization as an Engine of Growth in Developing Countries, 1950 – 2005,
Structural Change and Economic Dynamics, vol. 23 (4), pp. 406 – 420.
Taylor L. (2004) – Reconstructing Macroeocnomics: Structuralist Proposals and Critiques to the
Mainstream, Harvard University Press.
Torvik R. (2001) – Learning by Doing and the Dutch Disease, European Economic Review, vol. 45 (2),
pp. 285-306.
Tregenna F. (2011) - Manufacturing Productivity, Deindustrialisation and Reindustrialisation, UNU-
WIDER, Working Paper No. 2011/57.
UNCTAD (2006) – Investment Policy Review: Colombia. Geneva: United Nations Press.
UNCTAD (2014) – Manufactured goods by degree of manufacturing, freely available for download
from http://unctadstat.unctad.org/EN/Classifications.html.


![[Dutch] Godsdienst of Levensbeschouwing?](https://img.dokumen.tips/doc/110x75/634cc13e1f34f32f730d51ee/dutch-godsdienst-of-levensbeschouwing.jpg)