Embed Size (px)
Citation preview

CORPORATEFINANCE
ffirs 13 January 2012; 9:6:55

CFA Institute is the premier association for investment professionals around the world, withover 101,000 members in 134 countries. Since 1963 the organization has developed andadministered the renowned Chartered Financial Analysts Program. With a rich history ofleading the investment profession, CFA Institute has set the highest standards in ethics,education, and professional excellence within the global investment community, and is theforemost authority on investment profession conduct and practice.
Each book in the CFA Institute Investment Series is geared toward industry practi-tioners along with graduate-level finance students and covers the most important topics inthe industry. The authors of these cutting-edge books are themselves industry professionalsand academics and bring their wealth of knowledge and expertise to this series.
ffirs 13 January 2012; 9:6:55

CORPORATEFINANCE
A Practical Approach
Second Edition
Michelle R. Clayman, CFA
Martin S. Fridson, CFA
George H. Troughton, CFA
John Wiley & Sons, Inc.
ffirs 13 January 2012; 9:6:56

Copyright r 2012 by CFA Institute. All rights reserved.
Published by John Wiley & Sons, Inc., Hoboken, New JerseyPublished simultaneously in Canada
No part of this publication may be reproduced, stored in a retrieval system, or transmitted in any form or byany means, electronic, mechanical, photocopying, recording, scanning, or otherwise, except as permitted underSection 107 or 108 of the 1976 United States Copyright Act, without either the prior written permission of thePublisher, or authorization through payment of the appropriate per-copy fee to the Copyright Clearance Center, Inc.,222 Rosewood Drive, Danvers, MA 01923, (978) 750-8400, fax (978) 646-8600, or on the web at www.copyright.com. Requests to the Publisher for permission should be addressed to the Permissions Department, JohnWiley & Sons, Inc., 111 River Street, Hoboken, NJ 07030, (201) 748-6011, fax (201) 748-6008, or online athttp://www.wiley.com/go/permission.
Limit of Liability/Disclaimer of Warranty: While the publisher and author have used their best efforts in preparingthis book, they make no representations or warranties with respect to the accuracy or completeness of the contents ofthis book and specifically disclaim any implied warranties of merchantability or fitness for a particular purpose. Nowarranty may be created or extended by sales representatives or written sales materials. The advice and strategiescontained herein may not be suitable for your situation. You should consult with a professional where appropriate.Neither the publisher nor author shall be liable for any loss of profit or any other commercial damages, including butnot limited to special, incidental, consequential, or other damages.
For general information on our other products and services or for technical support, please contact our CustomerCare Department within the United States at (800) 762-2974, outside the United States at (317) 572-3993 orfax (317) 572-4002.
Wiley also publishes its books in a variety of electronic formats. Some content that appears in print may not beavailable in electronic formats. For more information about Wiley products, visit our web site at www.wiley.com.
Library of Congress Cataloging-in-Publication Data:
Corporate finance : a practical approach / [edited by] Michelle R. Clayman, Martin S. Fridson,George H. Troughton. — 2nd ed.
p. cm. — (CFA Institute investment series ; 42)Includes index.ISBN 978-1-118-10537-5 (cloth); ISBN 978-1-118-21729-0 (ebk);ISBN 978-1-118-21730-6 (ebk); ISBN 978-1-118-21731-3 (ebk)1. Corporations—Finance. I. Clayman,Michelle R. II. Fridson,Martin S. III. Troughton,GeorgeH.
HG4026.C67 2012658.15—dc23
2011039258Printed in the United States of America
10 9 8 7 6 5 4 3 2 1
ffirs 13 January 2012; 9:6:56
CONTENTS
Foreword xiAcknowledgments xvAbout the CFA Institute Investment Series xvii
CHAPTER 1Corporate Governance 1
Learning Outcomes 11. Introduction 12. Corporate Governance: Objectives and Guiding Principles 23. Forms of Business and Conflicts of Interest 3
3.1. Sole Proprietorships 43.2. Partnerships 53.3. Corporations 5
4. Specific Sources of Conflict: Agency Relationships 64.1. Manager–Shareholder Conflicts 64.2. Director–Shareholder Conflicts 10
5. Corporate Governance Evaluation 105.1. The Board of Directors 115.2. Examples of Codes of Corporate Governance 24
6. Environmental, Social, and Governance Factors 377. Valuation Implications of Corporate Governance 398. Summary 40
Problems 42
CHAPTER 2Capital Budgeting 47
Learning Outcomes 471. Introduction 482. The Capital Budgeting Process 493. Basic Principles of Capital Budgeting 504. Investment Decision Criteria 52
4.1. Net Present Value 524.2. Internal Rate of Return 534.3. Payback Period 554.4. Discounted Payback Period 574.5. Average Accounting Rate of Return 584.6. Profitability Index 584.7. NPV Profile 59
ftoc 13 January 2012; 9:9:50
v

4.8. Ranking Conflicts between NPV and IRR 614.9. The Multiple IRR Problem and the No IRR Problem 654.10. Popularity and Usage of the Capital Budgeting Methods 68
5. Cash Flow Projections 705.1. Table Format with Cash Flows Collected by Year 705.2. Table Format with Cash Flows Collected by Type 725.3. Equation Format for Organizing Cash Flows 72
6. More on Cash Flow Projections 746.1. Straight-Line and Accelerated Depreciation Methods 746.2. Cash Flows for a Replacement Project 776.3. Spreadsheet Modeling 796.4. Effects of Inflation on Capital Budgeting Analysis 81
7. Project Analysis and Evaluation 827.1. Mutually Exclusive Projects with Unequal Lives 827.2. Capital Rationing 847.3. Risk Analysis of Capital Investments—Standalone Methods 867.4. Risk Analysis of Capital Investments—Market Risk Methods 927.5. Real Options 957.6. Common Capital Budgeting Pitfalls 99
8. Other Income Measures and Valuation Models 1018.1. The Basic Capital Budgeting Model 1018.2. Economic and Accounting Income 1028.3. Economic Profit, Residual Income, and Claims Valuation 106
9. Summary 110Problems 113
CHAPTER 3Cost of Capital 127
Learning Outcomes 1271. Introduction 1282. Cost of Capital 128
2.1. Taxes and the Cost of Capital 1292.2. Weights of the Weighted Average 1312.3. Applying the Cost of Capital to Capital Budgeting and
Security Valuation 1333. Costs of the Different Sources of Capital 135
3.1. Cost of Debt 1353.2. Cost of Preferred Stock 1383.3. Cost of Common Equity 140
4. Topics in Cost of Capital Estimation 1464.1. Estimating Beta and Determining a Project Beta 1464.2. Country Risk 1534.3. Marginal Cost of Capital Schedule 1544.4. Flotation Costs 1574.5. What Do CFOs Do? 160
5. Summary 160Problems 163
ftoc 13 January 2012; 9:9:50
vi Contents

CHAPTER 4Measures of Leverage 171
Learning Outcomes 1711. Introduction 1712. Leverage 1723. Business Risk and Financial Risk 173
3.1. Business Risk and Its Components 1743.2. Sales Risk 1743.3. Operating Risk 1763.4. Financial Risk 1823.5. Total Leverage 1843.6. Breakeven Points and Operating Breakeven Points 1893.7. The Risks of Creditors and Owners 191
4. Summary 194Problems 194
CHAPTER 5Capital Structure 199
Learning Outcomes 1991. Introduction 1992. The Capital Structure Decision 200
2.1. Proposition I without Taxes: Capital Structure Irrelevance 2012.2. Proposition II without Taxes: Higher Financial Leverage
Raises the Cost of Equity 2032.3. Taxes, the Cost of Capital, and the Value of the Company 2052.4. Costs of Financial Distress 2102.5. Agency Costs 2112.6. Costs of Asymmetric Information 2122.7. The Optimal Capital Structure According to the Static
Trade-Off Theory 2133. Practical Issues in Capital Structure Policy 216
3.1. Debt Ratings 2163.2. Evaluating Capital Structure Policy 2173.3. Leverage in an International Setting 218
4. Summary 222Problems 223
CHAPTER 6Dividends and Share Repurchases: Basics 229
Learning Outcomes 2291. Introduction 2292. Dividends: Forms 230
2.1. Regular Cash Dividends 2312.2. Extra or Special (Irregular) Dividends 2322.3. Liquidating Dividends 234
ftoc 13 January 2012; 9:9:50
Contents vii

2.4. Stock Dividends 2342.5. Stock Splits 236
3. Dividends: Payment Chronology 2383.1. Declaration Date 2383.2. Ex-Dividend Date 2383.3. Holder-of-Record Date 2393.4. Payment Date 2393.5. Interval between Key Dates in the Dividend Payment Chronology 239
4. Share Repurchases 2414.1. Share Repurchase Methods 2434.2. Financial Statement Effects of Repurchases 2454.3. Valuation Equivalence of Cash Dividends and
Share Repurchases: The Baseline 2495. Concluding Remarks 2506. Summary 251
Problems 252
CHAPTER 7Dividends and Share Repurchases: Analysis 257
Learning Outcomes 2571. Introduction 2582. Dividend Policy and Company Value: Theory 258
2.1. Dividend Policy Does Not Matter 2582.2. Dividend Policy Matters: The Bird-in-the-Hand Argument 2602.3. Dividend Policy Matters: The Tax Argument 2602.4. Other Theoretical Issues 2612.5. Dividend Theory: Summary 271
3. Factors Affecting Dividend Policy 2713.1. Investment Opportunities 2723.2. The Expected Volatility of Future Earnings 2723.3. Financial Flexibility 2733.4. Tax Considerations 2733.5. Flotation Costs 2763.6. Contractual and Legal Restrictions 2773.7. Factors Affecting Dividend Policy: Summary 278
4. Payout Policies 2794.1. Types of Dividend Policies 2794.2. The Dividend versus Share Repurchase Decision 2854.3. Global Trends in Payout Policy 291
5. Analysis of Dividend Safety 2936. Summary 297
Problems 298
CHAPTER 8Working Capital Management 303
Learning Outcomes 3031. Introduction 304
ftoc 13 January 2012; 9:9:51
viii Contents

2. Managing and Measuring Liquidity 3052.1. Defining Liquidity Management 3052.2. Measuring Liquidity 307
3. Managing the Cash Position 3123.1. Forecasting Short-Term Cash Flows 3133.2. Monitoring Cash Uses and Levels 315
4. Investing Short-Term Funds 3164.1. Short-Term Investment Instruments 3164.2. Strategies 3204.3. Evaluating Short-Term Funds Management 322
5. Managing Accounts Receivable 3235.1. Key Elements of the Trade Credit Granting Process 3245.2. Managing Customers’ Receipts 3265.3. Evaluating Accounts Receivable Management 328
6. Managing Inventory 3306.1. Approaches to Managing Levels of Inventory 3316.2. Inventory Costs 3326.3. Evaluating Inventory Management 332
7. Managing Accounts Payable 3347.1. The Economics of Taking a Trade Discount 3357.2. Managing Cash Disbursements 3367.3. Evaluating Accounts Payable Management 337
8. Managing Short-Term Financing 3378.1. Sources of Short-Term Financing 3378.2. Short-Term Borrowing Approaches 3398.3. Asset-Based Loans 3408.4. Computing the Costs of Borrowing 341
9. Summary 343Problems 344
CHAPTER 9Financial Statement Analysis 347
Learning Outcomes 3471. Introduction 3472. Common-Size Analysis 348
2.1. Vertical Common-Size Analysis 3502.2. Horizontal Common-Size Analysis 353
3. Financial Ratio Analysis 3563.1. Activity Ratios 3573.2. Liquidity Analysis 3633.3. Solvency Analysis 3653.4. Profitability Analysis 3693.5. Other Ratios 3833.6. Effective Use of Ratio Analysis 386
4. Pro Forma Analysis 3924.1. Estimating the Sales-Driven Relations 3954.2. Estimating the Fixed Burdens 396
ftoc 13 January 2012; 9:9:51
Contents ix

4.3. Forecasting Revenues 3974.4. Constructing Pro Forma Statements 397
5. Summary 401Problems 402
CHAPTER 10Mergers and Acquisitions 407
Learning Outcomes 4071. Introduction 4082. Mergers and Acquisitions: Definitions and Classifications 4103. Motives for Merger 413
3.1. Synergy 4133.2. Growth 4133.3. Increasing Market Power 4143.4. Acquiring Unique Capabilities and Resources 4143.5. Diversification 4143.6. Bootstrapping Earnings 4153.7. Managers’ Personal Incentives 4163.8. Tax Considerations 4163.9. Unlocking Hidden Value 4163.10. Cross-Border Motivations 417
4. Transaction Characteristics 4184.1. Form of Acquisition 4194.2. Method of Payment 4204.3. Mind-Set of Target Management 422
5. Takeovers 4245.1. Pre-Offer Takeover Defense Mechanisms 4245.2. Post-Offer Takeover Defense Mechanisms 426
6. Regulation 4296.1. Antitrust 4306.2. Securities Laws 433
7. Merger Analysis 4347.1. Target Company Valuation 4347.2. Bid Evaluation 446
8. Who Benefits from Mergers? 4509. Corporate Restructuring 45110. Summary 452
Problems 454
Glossary 463References 475About the Authors 481About the CFA Program 487Index 489
ftoc 13 January 2012; 9:9:51
x Contents

FOREWORD
I am honored to introduce this second edition of Corporate Finance: A Practical Approach,which promises to be an important and comprehensive discourse on corporate financialmanagement. The significant additions in this edition and revisions to the first edition buildon the topic areas introduced in 2008. Furthermore, they bring much-needed practicaldimensions to the complex and dynamic aspects of corporate finance.
Certainly, the global financial landscape has changed dramatically since the release ofthe first edition of this work. The economic drama and financial carnage injected into themarketplace starting in late 2007 have penetrated the very core of financial thought andpractice and have challenged long-standing economic beliefs and relationships. The effects oncorporate governance, capital structure, and budgeting caused by this extreme market vola-tility and economic upheaval have moved corporate treasurers and chief financial officers tothe front lines in their companies’ continuing pursuits of profitability and financial security.Only those institutions that can quickly adapt their financial management and corporatestructure to this “new normal” will survive well into the future. The chapters in this editionhave been revised to take into consideration some of the profound changes that have affectedthis new global financial setting. Yet, it is refreshing to note that no matter what economicenvironment exists in the future, sound, traditional financial management practices willalways be essential to the long-term success of any entity.
The authors of these chapters are leading industry practitioners and recognized academicthought leaders. Their unique perspectives and thorough understanding of their respectivetopic areas are invaluable in providing readers with a factual exposition of the subject matter.In addition, their commonsense approach of highlighting important learning outcomes andincorporating practical problem-solving tools gives readers techniques they can apply in real-world financial settings.
Like the original text, this edition is assembled from readings used in the CFA Pro-gram curriculum. The CFA Program is a comprehensive, self-directed, distance learningprogram administered by CFA Institute. Since the early 1960s, the attainment of the CFAdesignation has been viewed as a significant achievement in the realm of finance and investmentmanagement. Those who enter the CFA Program sit for three consecutive and rigorousexaminations that cover a broad range of important financial topics, including accounting,quantitative methods, equity and fixed-income analysis, portfolio management, and ethics.Most who enter this program already possess a strong record of achievement in the financialindustry, as well as advanced business degrees, but welcome the additional focus and com-prehensive curriculum of this designation program. I am fortunate to have earned the CFAcharter and am proud to serve on the Board of Governors of CFA Institute.
fbetw 13 January 2012; 9:5:34
xi

WHY THIS TEXT IS IMPORTANT
Competing in the global financial arena has been a far more daunting challenge during thisdecade than in earlier periods. The scarcity of credit and risk capital following the globalfinancial challenges of the past few years, along with the evolution of emerging economies asformidable players on the world financial stage, demands that businesses operate at utmostefficiency. Optimal financial management and peak operating effectiveness are prerequisitesnot only for success but also for survival. And in order to successfully commit risk capital,companies must incorporate disciplined, systematic capital-budgeting techniques so as toallocate capital to only those projects with optimal returns. Furthermore, companies must beable to understand the life spans of projects, effectively anticipate cash flow needs, andaccurately forecast lean periods in their liquidity to avoid potentially devastating shocks totheir financial and market health. Also critical in this new financial environment is the abilityto properly analyze the effects of inflation, disinflation, foreign currency shocks, and regu-latory risk on existing projects, as well as the ability to recognize capital-budgeting biases anderrors. This book offers comprehensive insights into avoiding these common pitfalls.
In particular, the chapter on capital budgeting is instrumental in instilling in the readerthe discipline to anticipate extraneous influences on capital planning. Another critical sectionof the book concerns forecasting and evaluating the weighted average cost of capital that anentity faces. Recent as well as long-term financial history has taught everyone the importanceof properly analyzing this crucial financial component. The degree of assumed leverage, taxbenefits and implications of using debt over other forms of capitalization, the cost of debtversus common and preferred equity, and the impact of changes in debt ratings—all areessential areas of knowledge for company leaders. The ability to use the cost of capital as aneffective discipline in organizational budgeting is yet another key component of continuedfinancial stability.
In addition to the tools and techniques for measuring the cost of capital, the appropriateuse of financial leverage is an important topic in this text. Clearly, increased leverageheightens the level of earnings volatility and, ultimately, the cost of equity and the overall riskattached to any company. Properly understanding the prudent use of financial leverage as anearnings-enhancement vehicle is essential. Furthermore, examining the degree of operatingleverage and the impact of cost structure on production is a vital component of measuringand evaluating the operating efficiency of any organization. And last but not least, anincredibly large part of ultimately determining the financial competitiveness of a company issuccessfully anticipating and accounting for the effect of taxes.
A key element of attracting investors and maintaining adequate sources of capital is fullyunderstanding how an entity manages its own equity in the context of dividends and sharerepurchases. In addition, I cannot overstate the advantages of having a technical grasp of theeffects on financial statements of altering dividend policy or engaging in share buybacks orsecondary offerings, nor can I overemphasize the commensurate impacts on a company’seffective cost of capital and overall financial flexibility. In this environment of heightenedinvestor focus on liquidity and financial health, effective working capital management is anecessity. The text walks the reader through the important steps in successfully monitoring anoptimal cash balance, contains a primer on short-term investment instruments, and delvesinto accounts receivable and inventory management. It also examines the benefits of short-term borrowing versus cash disbursements and other accounts payable strategies.
fbetw 13 January 2012; 9:5:34
xii Foreword

Finally, the critical steps in a merger and acquisition strategy are defined and analyzed.This segment of the text highlights the effects of the successful use of these approaches onfirm competitiveness, scale, and market power and addresses the potential pitfalls of inte-gration and cost management. Finally, this section examines the impact of taxes and regu-latory challenges on a potentially successful business combination tactic, as well as discussingwhen an acquisition posture makes sense.
WHAT HAS CHANGED SINCE THE FIRST EDITION
This second edition provides the reader with comprehensive updates on all topics, especiallywhere new techniques or technologies have emerged, and gears the learning outcomes,descriptions, and end-of-chapter exercises to the new economic realities of this decade. Thesections on dividend policy, share repurchases, and capital structure have also been revisedand reconstructed. These chapters contain significantly new content as well as updatedexercises.
No book can provide a practitioner or student with a no-fail recipe for comprehensivesuccess in financial management, and most entities have discovered that challenges andimpacts generally appear from unexpected sources and directions. The authors have tried tocreate a substantial taxonomy of corporate financial topics with real-world, commonsenseapplications as well as rigorous problems and exercises that allow readers to test their com-prehension of the subjects covered.
This book will become an important resource for a wide array of individuals. Some mayask whether the intricacies of capital budgeting, corporate liquidity, and dividend policy areof interest to a cross section of practitioners, but as many have discovered over the past fiveyears, ignoring the key building blocks of an optimal corporate financial structure and a lean,competitive, and well-capitalized organization can be perilous. Today’s corporate landscape,with all its volatility and high barriers to entry, requires that most members of a corporateentity be well schooled in the fundamentals of financial management. Organizations todaymust deal with formidable foreign competition, an older workforce, and significant capitalinvestments in order to achieve critical scale. A sound understanding of the capital man-agement techniques needed to maintain competitiveness and innovation is a necessity.Students will use this book either as a resource to gain a broad understanding of corporatefinancial practice or as a useful reference tool for quickly comprehending specific areas of thefinancial domain.
The long-term performance of all organizations is based on sound decision making bytheir constituents, whose decisions have wide-ranging implications for the future soundnessof their companies. I hope this book will prove to be a valuable resource for present andfuture members of these organizations.
Matthew Scanlan, CFAPresident and CEO
Renaissance Institutional Management LLCCFA Institute Board of Governors
fbetw 13 January 2012; 9:5:34
Foreword xiii

fbetw 13 January 2012; 9:5:34

ACKNOWLEDGMENTS
We would like to thank the many individuals who played important roles in producingthis book.
The standards and orientation of the second edition are a continuation of those set forthe first edition. Robert R. Johnson, CFA, former senior managing director of CFA Institute,supported the creation of custom curriculum readings in this area and their revision. DennisW. McLeavey, CFA, initiated the project during his term as head of Curriculum Develop-ment. Christopher B. Wiese, CFA, oversaw final organization, writing, and editing of the firstedition for the CFA curriculum.
First edition manuscript reviewers were Jean-Francois Bureau, CFA, Sean D. Carr,Rosita P. Chang, CFA, Jacques R. Gagne, CFA, Gene C. Lai, Asjeet S. Lamba, CFA, PimanLimpaphayom, CFA, and Zhiyi Song, CFA. Chapter authors Pamela P. Drake, CFA, andJohn D. Stowe, CFA, provided notable assistance at critical junctures. We thank all of theabove for their excellent and detailed work.
For this second edition, Gregory Noronha, CFA, was added to the author lineup.Second edition manuscript reviewers were Evan Ashcraft, CFA, David K. Chan, CFA, LeeDunham, CFA, Philip Fanara, CFA, Usman Hayat, CFA, William Jacobson, CFA, FrankLaatsch, CFA, Murli Rajan, CFA, Knut Reinertz, CFA, Sanjiv Sabherwal, Sandeep Singh,CFA, Frank Smudde, CFA, and Peter Stimes, CFA. Jerald E. Pinto, CFA, director, Cur-riculum Projects, had primary responsibility for the delivery of the revised chapters.
flast 13 January 2012; 9:8:54
xv

flast 13 January 2012; 9:8:54

ABOUT THE CFA INSTITUTEINVESTMENT SERIES
CFA Institute is pleased to provide you with the CFA Institute Investment Series, whichcovers major areas in the field of investments. We provide this best-in-class series for the samereason we have been chartering investment professionals for more than 45 years: to lead theinvestment profession globally by setting the highest standards of ethics, education, andprofessional excellence.
The books in the CFA Institute Investment Series contain practical, globally relevantmaterial. They are intended both for those contemplating entry into the extremely com-petitive field of investment management as well as for those seeking a means of keepingtheir knowledge fresh and up to date. This series was designed to be user friendly andhighly relevant.
We hope you find this series helpful in your efforts to grow your investment knowledge,whether you are a relatively new entrant or an experienced veteran ethically bound to keep upto date in the ever-changing market environment. As a long-term, committed participant inthe investment profession and a not-for-profit global membership association, CFA Instituteis pleased to provide you with this opportunity.
THE TEXTS
One of the most prominent texts over the years in the investment management industry hasbeen Maginn and Tuttle’s Managing Investment Portfolios: A Dynamic Process. The thirdedition updates key concepts from the 1990 second edition. Some of the more experiencedmembers of our community own the prior two editions and will add the third edition to theirlibraries. Not only does this seminal work take the concepts from the other readings and putthem in a portfolio context, but it also updates the concepts of alternative investments,performance presentation standards, portfolio execution, and, very importantly, individualinvestor portfolio management. Focusing attention away from institutional portfolios andtoward the individual investor makes this edition an important and timely work.
Quantitative Investment Analysis focuses on some key tools that are needed by today’sprofessional investor. In addition to classic time value of money, discounted cash flowapplications, and probability material, there are two aspects that can be of value over tra-ditional thinking.
The first involves the chapters dealing with correlation and regression that ultimatelyfigure into the formation of hypotheses for purposes of testing. This gets to a critical skill thatchallenges many professionals: the ability to distinguish useful information from the over-whelming quantity of available data. For most investment researchers and managers, their
flast 13 January 2012; 9:8:54
xvii

analysis is not solely the result of newly created data and tests that they perform. Rather, theysynthesize and analyze primary research done by others. Without a rigorous manner by whichto explore research, you cannot understand good research or have a basis on which to evaluateless rigorous research.
Second, the last chapter of Quantitative Investment Analysis covers portfolio concepts andtakes the reader beyond the traditional capital asset pricing model (CAPM) type of tools andinto the more practical world of multifactor models and arbitrage pricing theory.
Fixed Income Analysis has been at the forefront of new concepts in recent years, and thisparticular text offers some of the most recent material for the seasoned professional who is nota fixed-income specialist. The application of option and derivative technology to the once-staid province of fixed income has helped contribute to an explosion of thought in this area.Professionals have been challenged to stay up to speed with credit derivatives, swaptions,collateralized mortgage securities, mortgage-backed securities, and other vehicles, and thisexplosion of products has strained the world’s financial markets and tested central banks toprovide sufficient oversight. Armed with a thorough grasp of the new exposures, the pro-fessional investor is much better able to anticipate and understand the challenges our centralbankers and markets face.
International Financial Statement Analysis is designed to address the ever-increasingneed for investment professionals and students to think about financial statement analysisfrom a global perspective. The text is a practically oriented introduction to financial state-ment analysis that is distinguished by its combination of a true international orientation, astructured presentation style, and abundant illustrations and tools covering concepts asthey are introduced in the text. The authors cover this discipline comprehensively andwith an eye to ensuring the reader’s success at all levels in the complex world of financialstatement analysis.
Equity Asset Valuation is a particularly cogent and important resource for anyone involvedin estimating the value of securities and understanding security pricing. A well-informedprofessional knows that the common forms of equity valuation—dividend discount modeling,free cash flow modeling, price/earnings modeling, and residual income modeling—can all bereconciled with one another under certain assumptions. With a deep understanding of theunderlying assumptions, the professional investor can better understand what other investorsassume when calculating their valuation estimates. This text has a global orientation, includingemerging markets. The second edition provides new coverage of private company valuationand expanded coverage of required rate of return estimation.
Investments: Principles of Portfolio and Equity Analysis provides an accessible yet rigorousintroduction to portfolio and equity analysis. Portfolio planning and portfolio managementare presented within a context of up-to-date, global coverage of security markets, trading, andmarket-related concepts and products. The essentials of equity analysis and valuation areexplained in detail and profusely illustrated. The book includes coverage of practitioner-important but often neglected topics, such as industry analysis. Throughout, the focus is onthe practical application of key concepts with examples drawn from both emerging anddeveloped markets. Each chapter affords the reader many opportunities to self-check his orher understanding of topics. In contrast to other texts, the chapters are collaborations ofrespected senior investment practitioners and leading business school teachers from aroundthe globe. By virtue of its well-rounded, expert, and global perspectives, the book should beof interest to anyone who is looking for an introduction to portfolio and equity analysis.
The New Wealth Management: The Financial Advisor’s Guide to Managing and InvestingClient Assets is an updated version of Harold Evensky’s mainstay reference guide for wealth
flast 13 January 2012; 9:8:54
xviii About the CFA Institute Investment Series

managers. Harold Evensky, Stephen Horan, and Thomas Robinson have updated the coretext of the 1997 first edition and added an abundance of new material to fully reflect today’sinvestment challenges. The text provides authoritative coverage across the full spectrum ofwealth management and serves as a comprehensive guide for financial advisors. The bookexpertly blends investment theory and real-world applications and is written in the samethorough but highly accessible style as the first edition.
Corporate Finance: A Practical Approach is a solid foundation for those looking to achievelasting business growth. In today’s competitive business environment, companies must findinnovative ways to enable rapid and sustainable growth. This text equips readers with thefoundational knowledge and tools for making smart business decisions and formulatingstrategies to maximize company value. It covers everything from managing relationshipsbetween stakeholders to evaluating merger and acquisition bids, as well as the companiesbehind them. The second edition of the book preserves the hallmark conciseness of the firstedition while expanding coverage of dividend policy, share repurchases, and capital structure.
Through extensive use of real-world examples, readers will gain critical perspective intointerpreting corporate financial data, evaluating projects, and allocating funds in ways thatincrease corporate value. Readers will gain insights into the tools and strategies used inmodern corporate financial management.
flast 13 January 2012; 9:8:54
About the CFA Institute Investment Series xix

flast 13 January 2012; 9:8:54

CHAPTER 1CORPORATE GOVERNANCE
Rebecca T. McEnally, CFANew Bern, North Carolina, U.S.A.
Kenneth KimBuffalo, New York, U.S.A.
LEARNING OUTCOMES
After completing this chapter, you will be able to do the following:
! Explain corporate governance, describe the objectives and core attributes of an effectivecorporate governance system, and evaluate whether a company’s corporate governance hasthose attributes.
! Compare major business forms and describe the conflicts of interest associated with each.! Explain conflicts that arise in agency relationships, including manager-shareholder conflicts
and director-shareholder conflicts.! Describe responsibilities of the board of directors and explain qualifications and core
competencies that an investment analyst should look for in the board of directors.! Explain effective corporate governance practice as it relates to the board of directors, and
evaluate the strengths and weaknesses of a company’s corporate governance practice.! Describe elements of a company’s statement of corporate governance policies that
investment analysts should assess.! Explain the valuation implications of corporate governance.
1. INTRODUCTION
The modern corporation is a very efficient and effective means of raising capital, obtainingneeded resources, and generating products and services. These and other advantages havecaused the corporate form of business to become the dominant one in many countries. Thecorporate form, in contrast to other business forms, frequently involves the separation ofownership and control of the assets of the business. The ownership of the modern, publiccorporation is typically diffuse; it has many owners, most with proportionally small stakes in
1
c01 13 January 2012; 9:5:40

the company, who are distant from, and often play no role in, corporate decisions. Profes-sional managers control and deploy the assets of the corporation. This separation of own-ership (shareholders) and control (managers) may result in a number of conflicts of interestbetween managers and shareholders. Conflicts of interest can also arise that affect creditors aswell as other stakeholders such as employees and suppliers. In order to remove or at leastminimize such conflicts of interest, corporate governance structures have been developed andimplemented in corporations. Specifically, corporate governance is the system of principles,policies, procedures, and clearly defined responsibilities and accountabilities used by stake-holders to overcome the conflicts of interest inherent in the corporate form.
The failure of a company to establish an effective system of corporate governancerepresents a major operational risk to the company and its investors.1 Corporate governancedeficiencies may even imperil the continued existence of a company. Consequently, tounderstand the risks inherent in an investment in a company, it is essential to understand thequality of the company’s corporate governance practices. It is also necessary to continuallymonitor a company’s practices, because changes in management, the composition of its boardof directors, the company’s competitive and market conditions, or mergers and acquisitions,can affect them in important ways.
A series of major corporate collapses in North America, Europe, and Asia, nearly all ofwhich involved the failure or direct override by managers of corporate governance systems,have made it clear that strong corporate governance structures are essential to the efficient andeffective functioning of companies and the financial markets in which they operate. Investorslost great amounts of money in the failed companies. The collapses weakened the trust andconfidence essential to the efficient functioning of financial markets worldwide.
Legislators and regulators responded to the erosion of trust by introducing strong newregulatory frameworks. These measures are intended to restore the faith of investors incompanies and the markets, and, very importantly, to help prevent future collapses. Never-theless, the new regulations did not address all outstanding corporate governance problemsand were not uniform across capital markets. Thus, we may expect corporate governance-related laws and regulations to further evolve.
The chapter is organized as follows: Section 2 presents the objectives of corporate gov-ernance systems and the key attributes of effective ones. Section 3 addresses forms of businessand conflicts of interest, and Section 4 discusses two major sources of governance problems.In Section 5 we discuss standards and principles of corporate governance, providing threerepresentative sets of principles from current practice. Section 6 addresses environmental,social, and governance factors. Section 7 touches on the valuation implications of the qualityof corporate governance, and Section 8 summarizes the chapter.
2. CORPORATE GOVERNANCE: OBJECTIVESAND GUIDING PRINCIPLES
The modern corporation is subject to a variety of conflicts of interest. This fact leads to thefollowing two major objectives of corporate governance:
1An operational risk is the risk of loss from failures in a company’s systems and procedures or fromexternal events.
2 Corporate Finance
c01 13 January 2012; 9:5:40

1. To eliminate or mitigate conflicts of interest, particularly those between managers andshareholders.
2. To ensure that the assets of the company are used efficiently and productively and in thebest interests of its investors and other stakeholders.
How then can a company go about achieving those objectives? The first point is that itshould have a set of principles and procedures sufficiently comprehensive to be called acorporate governance system. No single system of effective corporate governance applies to allfirms in all industries worldwide. Different industries and economic systems, legal and reg-ulatory environments, and cultural differences may affect the characteristics of an effectivecorporate governance system for a particular company. However, there are certain char-acteristics that are common to all sound corporate governance structures. The core attributesof an effective corporate governance system are:
! Delineation of the rights of shareholders and other core stakeholders.! Clearly defined manager and director governance responsibilities to stakeholders.! Identifiable and measurable accountabilities for the performance of the responsibilities.! Fairness and equitable treatment in all dealings betweenmanagers, directors, and shareholders.! Complete transparency and accuracy in disclosures regarding operations, performance, risk,
and financial position.
These core attributes form the foundation for systems of good governance, as well as forthe individual principles embodied in such systems. Investors and analysts should determinewhether companies in which they may be interested have these core attributes.
3. FORMS OF BUSINESS AND CONFLICTS OF INTEREST
The goal of for-profit businesses in any society is simple and straightforward: to maximizetheir owners’ wealth. This can be achieved through strategies that result in long-term growthin sales and profits. However, pursuing wealth maximization involves taking risks. A businessitself is risky for a variety of reasons. For example, there may be demand uncertainty for itsproducts and/or services, economic uncertainty, and competitive pressures. Financial risk ispresent when a business must use debt to finance operations. Thus, continued access tosufficient capital is an important consideration and risk for businesses. These risks, andthe inherent conflicts of interests in businesses, increase the need for strong corporategovernance.
A firm’s ability to obtain capital and to control risk is perhaps most influenced by themanner in which it is organized. Three of the predominant forms of business globallyare the sole proprietorship, the partnership, and the corporation. Hybrids of these threeprimary business forms also exist, but we do not discuss them here because they are simplycombinations of the three main business forms. With regard to the three primary businessforms, each has different advantages and disadvantages. We will discuss each of them, theconflicts of interest that can arise in each, and the relative need for strong corporate gover-nance associated with each form. However, a summary of the characteristics is provided inExhibit 1-1.
Chapter 1 Corporate Governance 3
c01 13 January 2012; 9:5:40

EXHIBIT 1-1 Comparison of Characteristics of Business Forms
Characteristic Sole Proprietorship Partnership Corporation
Ownership Sole owner Multiple owners Unlimited ownership
Legal requirementsand regulation
Few; entity easilyformed
Few; entity easilyformed
Numerous legalrequirements
Legal distinction betweenowner and business
None None Legal separation betweenowners and business
Liability Unlimited Unlimited but sharedamong partners
Limited
Ability to raise capital Very limited Limited Nearly unlimited
Transferability ofownership
Nontransferable(except by sale ofentire business)
Nontransferable Easily transferable
Owner expertise inbusiness
Essential Essential Unnecessary
3.1. Sole Proprietorships
The sole proprietorship is a business owned and operated by a single person. The owner ofthe local cleaner, restaurant, beauty salon, or fruit stand is typically a sole proprietor.Generally, there are few, if any, legal formalities involved in establishing a sole proprietorshipand they are relatively easy to start. In many jurisdictions, there are few, if any, legal dis-tinctions between the sole proprietor and the business. For example, tax liabilities and relatedfiling requirements for sole proprietorships are frequently set at the level of the sole pro-prietor. Legitimate business expenses are simply deducted from the sole proprietor’s taxableincome.
Sole proprietorships are the most numerous form of business worldwide, representing,for example, approximately 70 percent of all businesses in the United States, by number.2
However, because they are usually small-scale operations, they represent the smallest amountof market capitalization in many markets. Indeed, the difficulties of the sole proprietor inraising large amounts of capital, coupled with unlimited liability and lack of transferability ofownership, are serious impediments to the growth of a sole proprietorship.
From the point of view of corporate governance, the sole proprietorship presents fewerrisks than the corporation because the manager and the owner are one and the same. Indeed,the major corporate governance risks are those faced by creditors and suppliers of goods andservices to the business. These stakeholders are in a position to be able to demand the typesand quality of information that they need to evaluate risks before lending money to thebusiness or providing goods and services to it. In addition, because they typically maintaindirect, recurring business relations with the companies, they are better able to monitor thecondition and risks of the business, and to control their own exposure to risk. Consequently,we will not consider sole proprietorships further in this chapter.
2Megginson (1997), 40.
4 Corporate Finance
c01 13 January 2012; 9:5:40

3.2. Partnerships
A partnership, which is composed of more than one owner/manager, is similar to a soleproprietorship. For the most part, partnerships share many of the same advantages anddisadvantages as the sole proprietorship. Two obvious advantages of a partnership over a soleproprietorship are the pooling together of financial capital of the partners and the sharing ofbusiness risk among them. However, even these advantages may not be as important as thepooling together of service-oriented expertise and skill, especially for larger partnerships.Some very large international partnerships operate in such fields as real estate, law, investmentbanking, architecture, engineering, advertising, and accounting. Note also that larger part-nerships may enjoy competitive and economy-of-scale benefits over sole proprietorships.
Partners typically overcome conflicts of interest internally by engaging in partnershipcontracts specifying the rights and responsibilities of each partner. Conflicts of interestwith those entities outside the partnership are similar to those for the sole proprietorship andare dealt with in the same way. Hence, we will not consider these conflicts further in thischapter.
3.3. Corporations
Corporations represent less than 20 percent of all businesses in the United States but generateapproximately 90 percent of the country’s business revenue.3 The percentage is lowerelsewhere, but growing. The corporation is a legal entity, and has rights similar to those of aperson. For example, a corporation is permitted to enter into contracts. The chief officers ofthe corporation, the executives or top managers, act as agents for the firm and are legallyentitled to authorize corporate activities and to enter into contracts on behalf of the business.
There are several important and striking advantages of the corporate form of business.First, corporations can raise very large amounts of capital by issuing either stocks or bonds tothe investing public. A corporation can grant ownership stakes, common stock, to individualinvestors in exchange for cash or other assets. Similarly, it can borrow money, for example,bonds or other debt from individual or institutional investors, in exchange for interest pay-ments and a promise to pay back the principal of the loan. Shareholders are the owners of thecorporation, and any profits that the corporation generates accrue to the shareholders.
A second advantage is that corporate owners need not be experts in the industry ormanagement of the business, unlike the owners of sole proprietorships and partnerships wherebusiness expertise is essential to success. Any individual with sufficient money can own stock.This has benefits to both the business and the owners. The business can seek capital frommillions of investors, not only in domestic markets but worldwide.
Among the most important advantages of the corporate form is that stock ownership iseasily transferable. Transferability of shares allows corporations to have unlimited life. A finaland extremely important advantage is that shareholders have limited liability. That is, theycan lose only the money they have invested, nothing more.
The corporate form of business has a number of disadvantages, however. For example,because many corporations have thousands or even millions of nonmanager owners, they aresubject to more regulation than are partnerships or sole proprietorships. While regulationserves to protect shareholders, it can also be costly to shareholders as well. For example, thecorporation must hire accountants and lawyers to deal with accounting and other legal
3Megginson (1997).
Chapter 1 Corporate Governance 5
c01 13 January 2012; 9:5:40

documents to comply with regulations. Perhaps the most significant disadvantage with thecorporation (and the one most critical to corporate governance) is the difficulty that share-holders have in monitoring management and the firm’s operations. As a sole proprietor of asmall business, the owner will be able to directly oversee such day-to-day business concerns asinventory levels, product quality, expenses, and employees. However, it is impossible for ashareholder of a large corporation such as General Motors or International Business Machinesto monitor business activities and personnel, and to exert any control rights over the firm. Infact, a shareholder of a large firm may not even feel like an owner in the usual sense, especiallybecause corporations are owned by so many other shareholders, and because most owners of alarge public corporation hold only a relatively small stake in it.
Agency relationships arise when someone, an agent, acts on behalf of another person,the principal. In a corporation, managers are the agents who act on behalf of the owners, theshareholders. If a corporation has in place a diligent management team that works in the bestinterests of its shareholders and other stakeholders, then the problem of passive shareholdersand bondholders becomes a nonissue. In real life, unfortunately, management may not alwayswork in the stakeholders’ best interests. Managers may be tempted to see to their own well-being and wealth at the expense of their shareholders and others to whom they owe a fiduciaryduty. This is known as an agency problem, or the principal–agent problem. The money ofshareholders, the principals, is used and managed by agents, the managers, who promise thatthe firm will pursue wealth-maximizing business activities. However, there are potentialproblems with these relationships, which we will discuss next.
4. SPECIFIC SOURCES OF CONFLICT:AGENCY RELATIONSHIPS
Conflicts among the various constituencies in corporations have the potential to cause pro-blems in the relationships among managers, directors, shareholders, creditors, employees, andsuppliers. However, we will concentrate here on the relationships between (1) managers andshareholders, and (2) directors and shareholders. These two relationships are the primaryfocus of most systems of corporate governance. However, to the extent that strong corporategovernance structures are in place and effective in companies, the agency conflicts amongother stakeholders are mitigated as well. For example, managers are responsible for maxi-mizing the wealth of the shareholders and minimizing waste (including excessive compen-sation and perquisite consumption). To the extent that managers do so, the interests ofemployees and suppliers are more likely to be met because the probability increases thatsufficient funds will be available for payment of salaries and benefits, as well as for goods andservices. In this section, we will describe these agency relationships, discuss the problemsinherent in each, and will illustrate these agency problems with real-world examples. Anunderstanding of the nature of the conflicts in each relationship is essential to a full under-standing of the importance of the provisions in codes of corporate governance.
4.1. Manager–Shareholder Conflicts
From the point of view of investors, the manager–shareholder relationship is the most criticalone. It is important to recognize that firms and their managers, the shareholders’ agents,obtain operating and investing capital from the shareholders, the owners, in two ways. First,although shareholders have a 100 percent claim on the firm’s net income, the undistributed
6 Corporate Finance
c01 13 January 2012; 9:5:40

net income (the earnings remaining after the payment of dividends) is reinvested in thecompany. We normally term this reinvested income retained earnings. Second, the firm canissue stock to obtain the capital, either through an initial public offering (IPO) if the firm iscurrently privately owned, or through a seasoned equity offering (SEO) if the firm already hasshares outstanding. By whatever means the firm obtains equity capital, shareholders entrustmanagement to use the funds efficiently and effectively to generate profits and maximizeinvestors’ wealth.
However, although the manager is responsible for advancing the shareholder’s bestinterests, this may not happen. For example, management may use funds to try to expand thesize of the business to increase their job security, power, and salaries without consideration ofthe shareholders’ interests. In addition, managers may also grant themselves numerous andexpensive perquisites, which are treated as ordinary business expenses. Managers enjoy thesebenefits, and shareholders bear the costs. This is a serious agency problem and, unfortunately,there are a number of recent real-world examples of their occurrence in corporations.
Managers also may make other business decisions, such as investing in highly risky ven-tures, that benefit themselves but that may not serve the company’s investors well. For example,managers who hold substantial amounts of executive stock options will receive large benefitsif risky ventures pay off, but will not suffer losses if the ventures fail. By contrast, managerswhose wealth is closely tied to the company and who are therefore not well diversified maychoose to not invest in projects with a positive expected net present value because of excessiverisk aversion. The checks and balances in effective corporate governance systems are designedto reduce the probability of such practices.
The cases of Enron (bankruptcy filing: 2001, in the United States) and Tyco (resignation ofCEO: 2002, in the United States) make clear that in the absence of the checks and balancesof strong and effective corporate governance systems, investors and others cannot necessarilyrely uponmanagers to serve as stewards of the resources entrusted to them. Example 1-1, dealingwith Enron, illustrates the problems that can ensue from a lack of commitment to a corporategovernance system. Example 1-2, dealing with Tyco, illustrates a case in which there wereinadequate checks and balances to the power of a CEO.
EXAMPLE 1-1 Corporate Governance Failure (1)
Enron was one of the world’s largest energy, commodities, and services companies.However, it is better known today as a classic example of how the conflicts of interestbetween shareholders and managers can harm even major corporations and theirshareholders. Enron executives, with the approval of members of the board of directors,overrode provisions in Enron’s code of ethics and corporate governance system thatforbade any practices involving self-dealing by executives. Specifically, Enron’s chieffinancial officer set up off-shore partnerships in which he served as general partner. Asan Enron executive, he was able to make deals with these partnerships on behalf ofEnron. As a general partner of the partnerships, he received the enormous fees that thedeals generated.4
4See Powers, Troubh, and Winokur (2002).
Chapter 1 Corporate Governance 7
c01 13 January 2012; 9:5:40

The role of complete transparency in sound corporate governance, including under-standable and accurate financial statements, cannot be overestimated. Without full infor-mation, investors and other stakeholders are unable to evaluate the company’s financialposition and riskiness, whether the condition is improving or deteriorating, and whetherinsiders are aggrandizing themselves, or making poor business decisions, to the detriment oflong-term investors.
The partnerships served other useful purposes. For example, they made it possibleto hide billions of dollars in Enron debt off of the company’s balance sheet, andgenerated artificial profits for Enron. Thus, disclosure of the company’s rapidly dete-riorating financial condition was delayed, preventing investors and creditors fromobtaining information critical to the valuation and riskiness of their securities. At thesame time, Enron executives were selling their own stock in the company.
These egregious breaches of good governance harmed both Enron’s outsideshareholders and their creditors. The bonds were becoming riskier but the creditorswere not informed of the deteriorating prospects. The exorbitant fees the executivespaid themselves came out of the shareholders’ earnings, earnings that were alreadyoverstated by the artificial profits. Investors did not receive full information about theproblems in the company until well after the collapse and the company’s bankruptcyfiling, by which time their stock had lost essentially all of its value.
Most, if not all, of the core attributes of good governance were violated by Enron’smanagers, but especially the responsibility to deal fairly with all stakeholders, includinginvestors and creditors, and to provide full transparency of all material information on atimely basis.
EXAMPLE 1-2 Corporate Governance Failure (2)
Tyco provides another well-known example of a corporate governance failure. TheCEO of Tyco used corporate funds to buy home decorating items, including a $17,000traveling toilette box, a $445 pincushion, and a $15,000 umbrella stand. He alsoborrowed money from the company’s employee loan program to buy $270 million-worth of yachts, art, jewelry, and vacation estates. Then, in his capacity as CEO, heforgave the loan. All told, the CEO may have looted the firm, and thereby its share-holders, of over $600 million.5
It is instructive that in court proceedings in the Tyco case, the CEO and hisrepresentatives have not argued that he did not do these things, but rather that it wasnot illegal for him to do so. Tyco is a striking example of excessive perquisite con-sumption by a CEO.
5Maremont and Cohen (2002), A1.
8 Corporate Finance
c01 13 January 2012; 9:5:41

Two additional cases illustrate how false, misleading, or incomplete corporate disclosuremay harm investors and other stakeholders.
The severity of the agency problems of the companies discussed in Examples 1-1 through1-4 does not represent the norm, although the potential for serious conflicts of interestbetween shareholders and managers is inherent in the modern corporation. Strong corporategovernance systems provide mechanisms for monitoring managers’ activities, rewarding goodperformance and disciplining those in a position of responsibility for the company to makesure they act in the interests of the company’s stakeholders.
EXAMPLE 1-3 Corporate Governance Failure (3)
The Italian firm, Parmalat, was one of the world’s largest dairy foods suppliers. Thefounders and top executives of Parmalat were accused of fictitiously reporting theexistence of a $4.9 billion bank account so that the company’s enormous liabilitieswould appear less daunting.6 By hiding the true financial condition of the firm, theexecutives were able to continue borrowing. The fraud perpetrated by Parmalat’s largestshareholders and executives hurt Parmalat’s creditors as well as the shareholders. Par-malat eventually defaulted on a $185 million bond payment in November 2003 andthe company collapsed shortly thereafter.
EXAMPLE 1-4 Corporate Governance Failure (4)
During the late 1990s, Adelphia, the fifth-largest provider of cable entertainment in theUnited States, and the company’s founders embarked on an aggressive acquisitioncampaign to increase the size of the company. During this time, the size of Adelphia’sdebt more than tripled from $3.5 billion to $12.6 billion. However, the founders alsoarranged a $2.3 billion personal loan, which Adelphia guaranteed, but this arrangementwas not fully disclosed to Adelphia’s other stakeholders.7 In addition, it is alleged thatfictitious transactions were recorded to boost accounting profits.8 These actions byAdelphia’s owners were harmful to all of Adelphia’s nonfounder stakeholders, includinginvestors and creditors. The company collapsed in bankruptcy in 2002.
6Edmondson (2004).7Nofsinger and Kim (2003), 60–61.8Markon and Frank (2002), A3.
Chapter 1 Corporate Governance 9
c01 13 January 2012; 9:5:41

4.2. Director–Shareholder Conflicts
Corporate governance systems rely on a system of checks and balances between the managersand investors in which the board of directors plays a critical role. The purpose of boards ofdirectors in modern corporations is to provide an intermediary between managers and theowners, the shareholders. Members of the board of directors serve as agents for the owners,the shareholders, a mechanism designed to represent the investors and to ensure that theirinterests are being well served. This intermediary generally is responsible for monitoring theactivities of managers, approving strategies and policies, and making certain that these serveinvestors’ interests. The board is also responsible for approving mergers and acquisitions,approving audit contracts and reviewing the audit and financial statements, setting managers’compensation including any incentive or performance awards, and disciplining or replacingpoorly performing managers.
The conflict between directors and shareholders arises when directors come to identifywith the managers’ interests rather than those of the shareholders. This can occur when theboard is not independent, for example, or when the members of the board have business orpersonal relationships with the managers that bias their judgment or compromise their dutiesto the shareholders. If members of the board have consulting agreements with the company,serve as major lenders to the firm, are members of the manager’s family, or are from thecircle of close friends, their objectivity may be called into question. Many corporations havebeen found to have inter-linked boards. For example, one or more senior managers fromone firm may serve as directors in the companies of their own board members, frequentlyon compensation committees. Another ever-present problem is the frequently overly generouscompensation paid to directors for their services. Excessive compensation may incline directorsto accommodate the wishes of management rather than attend to the concerns of investors.
All of the examples cited in this section involve compliant or less than independent boardmembers. In Section 5, we formulate the most important points to check in evaluating acompany’s corporate governance system.
5. CORPORATE GOVERNANCE EVALUATION
An essential component of the analysis of a company and its risk is a review of the quality ofits corporate governance system. This evaluation requires an assessment of issues relating tothe board of directors, managers, and shareholders. Ultimately, the long-term performance ofa company is dependent upon the quality of managers’ decisions and their commitment toapplying sound management practice. However, as one group concerned with the issuesobserves, “by analyzing the state of corporate governance for a given company, an analyst orshareholder may ascertain whether the company is governed in a manner that produces bettermanagement practices, promotes higher returns on shareholder capital, or if there is a gov-ernance and/or management problem which may impair company performance.”9
In the following sections we provide a set of guidelines for evaluating the quality ofcorporate governance in a company. We reiterate that there is no single system of governancethat is appropriate for all companies in all industries worldwide. However, this core set ofglobal best practices is being applied in financial markets in Europe, Asia, and North America.They represent a standard by which corporate practices may be evaluated.
9New York Society of Securities Analysts (2003).
10 Corporate Finance
c01 13 January 2012; 9:5:41

The information and corporate disclosure available in a specific jurisdiction will varywidely. However, most large financial markets and, increasingly, smaller ones require asubstantial amount of information be provided about companies’ governance structures andpractices. In addition, a few regulatory jurisdictions will require a subset of the criteria weshall give as part of registration, exchange listing, or other requirements.
The analyst should begin by carefully reviewing the requirements in effect for thecompany. Information is generally available in the company’s required filings with reg-ulators. For example, in the United States, such information is provided in the 10-K report,the annual report, and the Proxy Statement (SEC Form DEF 14A). All of these are filedwith the U.S. Securities and Exchange Commission (U.S. SEC), are available on the U.S.SEC website, usually are available on the company’s website, and are provided by thecompany to current investors as well as on request. In Europe, the company’s annual reportprovides some information. However, in an increasing number of EU countries, companiesare required to provide a report on corporate governance. This report typically will provideinformation on board activities and decisions, whether the company has abided by itsrelevant national code, and explain why it departed from the code, if it has. In addition,the announcement of the company’s annual general meeting should disclose the issues on theagenda that are subject to shareholder vote. The specific sources of information will differ byjurisdiction and company.
5.1. The Board of Directors
Boards of directors are a critical part of the system of checks and balances that lie at the heartof corporate governance systems. Board members, both individually and as a group, have theresponsibility to:
! Establish corporate values and governance structures for the company to ensure that thebusiness is conducted in an ethical, competent, fair, and professional manner.
! Ensure that all legal and regulatory requirements are met and complied with fully and in atimely fashion.
! Establish long-term strategic objectives for the company with a goal of ensuring that thebest interests of shareholders come first and that the company’s obligations to others aremet in a timely and complete manner.
! Establish clear lines of responsibility and a strong system of accountability and performancemeasurement in all phases of a company’s operations.
! Hire the chief executive officer, determine the compensation package, and periodicallyevaluate the officer’s performance.
! Ensure that management has supplied the board with sufficient information for it to befully informed and prepared to make the decisions that are its responsibility, and to be ableto adequately monitor and oversee the company’s management.
! Meet frequently enough to adequately perform its duties, and meet in extraordinary sessionas required by events.
! Acquire adequate training so that members are able to adequately perform their duties.
Depending upon the nature of the company and the industries within which the com-pany operates, these responsibilities will vary; however, these general obligations are commonto all companies.
Chapter 1 Corporate Governance 11
c01 13 January 2012; 9:5:41

In summarizing the duties and needs of boards of directors, The Corporate Governance ofListed Companies: A Manual for Investors10 states:
Board members owe a duty to make decisions based on what ultimately is best for thelong-term interests of shareowners. In order to do this effectively, board membersneed a combination of three things: independence, experience and resources.
First, a board should be composed of at least a majority of independentboard members with the autonomy to act independently from management. Boardmembers should bring with them a commitment to take an unbiased approach inmaking decisions that will benefit the company and long-term shareowners, rather thansimply voting with management. Second, board members who have appropriateexperience and expertise relevant to the Company’s business are best able to evaluatewhat is in the best interests of shareowners. Depending on the nature of the business,thismay require specialized expertise by at least some boardmembers.Third, there needto be internal mechanisms to support the independent work of the board, including theauthority to hire outside consultants without management’s intervention or approval.This mechanism alone provides the board with the ability to obtain expert help inspecialized areas, to circumvent potential areas of conflict with management, and topreserve the integrity of the board’s independent oversight function. [Emphasis added]
In the following sections we detail the attributes of the board that an investor orinvestment analyst must assess.
5.1.1. Board Composition and IndependenceThe board of directors of a corporation is established for the primary purpose of serving thebest interests of the outside shareholders in the company. Other stakeholders includingemployees, creditors, and suppliers are usually in a more powerful position to oversee theirinterests in the company than are shareholders. The millions of outside investors cannot,individually or collectively, monitor, oversee, and approve management’s strategies andpolicies, performance, and compensation and consumption of perquisites.
The objectives of the board are to see that company assets are used in the best long-terminterests of shareholders and that management strategies, plans, policies, and practices aredesigned to achieve this objective. In a recent amendment to the Investment Company Act of1940 rules, the U.S. SEC argues that a board must be “an independent force in [company]affairs rather than a passive affiliate of management. Its independent directors must bring tothe boardroom a high degree of rigor and skeptical objectivity to the evaluation of [company]managements and its plans and proposals, particularly when evaluating conflicts of interest.”11
Similarly, the Corporate Governance Handbook12 observes:
Board independence is essential to a sound governance structure. Without inde-pendence there can be little accountability. In the words of Professor Jeffrey Son-nenfeld of Yale University, “The highest performing companies have extremelycontentious boards that regard dissent as an obligation and that treat no subject asundiscussable.”
10The Corporate Governance of Listed Companies: A Manual for Investors (2005), 11.11Amendments to Rules Governing the Investment Company Act of 1940, 17 CFR Part 270 (July 2004): 3.12New York Society of Securities Analysts (2003), 3.
12 Corporate Finance
c01 13 January 2012; 9:5:41

Clearly, for members who are appointed to the board to be in a position to best performtheir fiduciary responsibilities to shareholders, at a minimum a majority of the members mustbe independent of management. However, global best practice now recommends that at leastthree-quarters of the board members should be independent.
Some experts in corporate governance have argued that all members of the board shouldbe independent, eliminating the possibility of any senior executives serving on the board.Those who hold this position argue that the presence of managers in board deliberations maywork to the detriment of the best interests of investors and other shareholders by intimidatingthe board or otherwise limiting debate and full discussion of important matters. Others arguethat with appropriate additional safeguards, such potential problems can be overcome to thebenefit of all stakeholders.
Independence is difficult to evaluate. Factors that often indicate a lack of independenceinclude:
! Former employment with the company, including founders, executives, or other employees.! Business relationships, for example, prior or current service as outside counsel, auditors, or
consultants, or business interests involving contractual commitments and obligations.! Personal relationships, whether familial, friendship, or other affiliations.! Interlocking directorships, a director of another company whose independence might be
impaired by the relationship with the other board or company, particularly if the directorserves on interlocking compensation committees.
! Ongoing banking or other creditor relationships.
Information on the business and other relationships of board members as well asnominees for the board may be obtained from regulatory filings in most jurisdictions. Forexample, in the United States, such information is required to be provided in the ProxyStatement, SEC Form DEF 14A, sent to shareholders and filed with the SEC prior to share-holder meetings.
5.1.2. Independent Chairman of the BoardMany, if not most, corporate boards now permit a senior executive of a corporation to serve asthe chairman of the board of directors. However, corporate governance experts do not regardsuch an arrangement to be in the best interests of the shareholders of the company. As theU.S. SEC observes,
This practice may contribute to the [company’s] ability to dominate the actions ofthe board of directors. The chairman of a . . . board can largely control the board’sagenda, which may include matters not welcomed by the [company’s manage-ment] . . . Perhaps more important, the chairman of the board can have a sub-stantial influence on the . . . boardroom’s culture. The boardroom culture canfoster (or suppress) the type of meaningful dialogue between . . . management andindependent directors that is critical for healthy . . . governance. It can support (ordiminish) the role of the independent directors in the continuous, active engagementof . . . management necessary for them to fulfill their duties. A boardroom cultureconducive to decisions favoring the long-term interest of . . . shareholders may bemore likely to prevail when the chairman does not have the conflicts of interestinherent in his role as an executive of the [company]. Moreover, a . . . board may be
Chapter 1 Corporate Governance 13
c01 13 January 2012; 9:5:41

more effective when negotiating with the [company] over matters such as the[compensation] if it were not at the same time led by an executive of the [company]with whom it is negotiating.13
Not all market participants agree with this view. Many corporate managers argue thatit is essential for efficient and effective board functioning that the chairman be the seniorexecutive in the company. They base their arguments on the proposition that only suchan executive has the knowledge and experience necessary to provide needed informationto the board on questions on strategy, policy, and the operational functioning of thecompany. Critics of this position counter that it is incumbent upon corporate manage-ment to provide all such necessary information to the board. Indeed, many argue that thisobligation is the sole reason that one or more corporate managers serve as members of theboard.
Whether the company has separate positions for the chief executive and chairman of theboard can be determined readily from regulatory filings of the company. If the positions arenot separate, an investor may doubt that the board is operating efficiently and effectively in itsmonitoring and oversight of corporate operations, and that decisions made are necessarily inthe best interests of investors and other stakeholders.
Tradition and practice in many countries prescribes a so-called “unitary” board system,a single board of directors. However, some countries, notably Germany, have developed aformal system whose intent is to overcome such difficulties as lack of independence of boardmembers and lack of independence of the chairman of the board from company manage-ment. The latter approach requires a tiered hierarchy of boards, a management boardresponsible for overseeing management’s strategy, planning, and similar functions, and anindependent supervisory board charged with monitoring and reviewing decisions of themanagement board, and making decisions in which conflicts of interest in the managementboard may impair their independence, for example, in determining managerial compensation.
Clearly, independence of the chairman of the board does not guarantee that the boardwill function properly. However, independence should be regarded as a necessary condition,even if it is not a sufficient one.
5.1.3. Qualifications of DirectorsIn addition to independence, directors need to bring sufficient skill and experience to theposition to ensure that they will be able to fulfill their fiduciary responsibilities to investorsand other stakeholders. Information on directors’ prior business experience and other bio-graphical material, including current and past business affiliations, can generally be found inregulatory filings.
Boards of directors require a variety of skills and experience in order to function prop-erly. These skills will vary by industry although such core skills as knowledge of finance,accounting, and legal matters are required by all boards. Evaluation of the members shouldinclude an assessment of whether needed skills are available among the board members.Among the qualifications and core competencies that an investor should look for in the boardas a group, and in individual members or candidates for the board, are:
13Amendments to Rules Governing the Investment Company Act of 1940 (2004): 4.
14 Corporate Finance
c01 13 January 2012; 9:5:41

! Independence (see factors to consider in Section 5.1.1 above).! Relevant expertise in the industry, including the principal technologies used in the business
and in financial operations, legal matters, accounting and auditing; and managerial con-siderations such as the success of companies with which the director has been associated inthe past.
! Indications of ethical soundness, including public statements or writings of the director,problems in companies with which the director has been associated in the past such as legalor other regulatory violations involving ethical lapses.
! Experience in strategic planning and risk management.! Other board experience with companies regarded as having sound governance practices and
that are effective stewards of investors’ capital as compared to serving management’sinterests.
! Dedication and commitment to serving the board and investors’ interests. Board memberswith such qualities will not serve on more than a few boards, have an excellent record ofattendance at board meetings, and will limit other business commitments that require largeamounts of time.
! Commitment to the needs of investors as shown, for example, by significant personalinvestments in this or other companies for which he or she serves as a director, and by anabsence of conflicts of interest.
Such attributes are essential to the sound functioning of a board of directors and shouldbe carefully considered in any investment decision. Board members may be selected as muchfor their general stature and name recognition as for the specialized expertise they bringto their responsibilities. However, the skills, knowledge, and experience we have describedare essential to effective corporate governance, oversight, and monitoring on behalf ofshareholders.
5.1.4. Annual Election of DirectorsMembers of boards of directors may be elected either on an annual or a staggered basis. Inannual votes, every member of the board stands for reelection every year. Such an approachensures that shareholders are able to express their views on individual members’ performanceduring the year, and to exercise their right to control who will represent them in corporategovernance and oversight of the company. Opponents argue that subjecting members toannual reelection is disruptive to effective board oversight over the company.
Those who support election of board members on a staggered basis with reelection of onlya portion of the board each year, argue that such a scheme is necessary to ensure continuity ofthe knowledge and experience in the company essential for good corporate governance. Criticsexpress the view that such a practice diminishes the limited power that shareholders haveto control who will serve on the board and ensure the responsiveness of board members toinvestor concerns, such as poor management performance and practices. They also argue thatstaggered boards better serve the interests of entrenched managers by making the boardless responsive to the needs of shareholders, more likely to align their interests with those ofmanagers, and more likely to resist takeover attempts that would benefit shareholders to thedetriment of managers.
Corporate governance best practice generally supports the annual election of directors asbeing in the best interests of investors. When shareholders can express their views annually,either by casting a positive vote or by withholding their votes for poorly performing directors,directors are thought to be more likely to weigh their decisions carefully, to be better prepared
Chapter 1 Corporate Governance 15
c01 13 January 2012; 9:5:41

and more attentive to the needs of investors, and to be more effective in their oversight ofmanagement.
Information on directors’ terms and the frequency of elections may be obtained byexamining the term structure of the board members in regulatory filings.
5.1.5. Annual Board Self-AssessmentBoard members have a fiduciary duty to shareholders to oversee management’s use of assets,to monitor and review strategies, policies and practices, and to take those actions necessary tofulfill their responsibilities to stakeholders. It is essential that a process be in place for peri-odically reviewing and evaluating their performance and making recommendations forimprovement. Generally, this evaluation should occur at least once annually. The reviewshould include:
! An assessment of the board’s effectiveness as a whole.! Evaluations of the performance of individual board members, including assessments of the
participation of each member, with regard to both attendance and the number and rele-vance of contributions made, and an assessment of the member’s willingness to thinkindependently of management and address challenging or controversial issues.
! A review of board committee activities.! An assessment of the board’s effectiveness in monitoring and overseeing their specific
functions.! An evaluation of the qualities the company will need in its board in the future, along with a
comparison of the qualities current board members currently have.! A report of the board self-assessment, typically prepared by the nominations committee,
and included in the proxy in the United States and in the corporate governance report inEurope.
The process of periodic self-assessment by directors can improve board and companyperformance by reminding directors of their role and responsibilities, improving their under-standing of the role, improving communications between board members, and enhancing thecohesiveness of the board. Self-assessment allows directors to improve not only their ownperformance but to make needed changes in corporate governance structures. All of these willlead to greater efficiency and effectiveness in serving investors’ and other stakeholders’ interests.
The process of self-assessment should focus on board responsibilities and individualmembers’ accountability for fulfilling these responsibilities. It should consider both substantivematters and procedural issues, for example, evaluations of the adequacy and effectiveness of thecommittee structure. The committees regarded as essential by corporate governance expertsinclude the auditing, nominations, and compensation committees, all of which should bestaffed by independent directors who are experts in the relevant areas. (The specific functions ofthese committees will be considered in later sections.)
The company, however, may need to establish additional committees. For example, for amutual fund company, these might include a securities valuation committee responsible forsetting policies for the pricing of securities, and monitoring the application of the policies bymanagement. For a high technology company, the committees might include one tasked withthe valuation of intellectual property, or perhaps, management’s success in creating newintellectual property through its investments in research and development.
In evaluating the effectiveness of the corporate governance system and specifically, theboard of directors, an investment professional should consider the critical functions specific to
16 Corporate Finance
c01 13 January 2012; 9:5:42

a particular company and evaluate whether or not the board’s structure and membershipprovides adequate oversight and control over management’s strategic business decision-making and policy-making.
5.1.6. Separate Sessions of Independent DirectorsCorporate governance best practice requires that independent directors of the board meet atleast annually, and preferably quarterly, in separate sessions—that is, meetings without thepresence of the management, other representatives, or interested persons (for example, retiredfounders of the company). The purpose of these sessions is to provide an opportunity forthose entrusted with the best interests of the shareholders to engage in candid and frankdiscussions and debate regarding the management of the company, their strategies and pol-icies, strengths and weaknesses, and other matters of concern. Such regular sessions wouldavoid the suggestion that directors are concerned with specific problems or threats to thecompany’s well-being. Separate sessions could also enhance the board’s effectiveness byimproving the cooperation among board members, and their cohesiveness as a board, attri-butes that can strengthen the board in the fulfillment of its responsibilities to shareholders.
Regulatory filings should indicate how often boards have met, and which meetings wereseparate sessions of the independent directors. The investment professional should be con-cerned if such meetings appeared to be nonexistent, infrequent, or irregular in occurrence.These could suggest a variety of negative conclusions, including the presence of a “captive,”that is, nonindependent board, inattention or disinterest among board members, lack ofcohesion and sense of purpose, or other conditions that can be detrimental to the interests ofinvestors.
5.1.7. Audit Committee and Audit OversightThe audit committee of the board is established to provide independent oversight of thecompany’s financial reporting, nonfinancial corporate disclosure, and internal control sys-tems. This function is essential for effective corporate governance and for seeing that theirresponsibilities to shareholders are fulfilled.
The primary responsibility for overseeing the design, maintenance, and continuingdevelopment of the control and compliance systems rests with this committee. At a minimumthe audit committee must
! Include only independent directors.! Have sufficient expertise in financial, accounting, auditing, and legal matters to be
able to adequately oversee and evaluate the control, risk management, and compliancesystems, and the quality of the company’s financial disclosure to shareholders and others.It is advisable for at least two members of the committee to have relevant accounting andauditing expertise.
! Oversee the internal audit function; the internal audit staff should report directly androutinely to this committee of the board, and, when necessary report any concernsregarding the quality of controls or compliance issues.
! Have sufficient resources to be able to properly fulfill their responsibilities.! Have full access to and the cooperation of management.! Have authority to investigate fully any matters within its purview.! Have the authority for the hiring of auditors, including the setting of contractual provi-
sions, review of the cost-effectiveness of the audit, approving of nonaudit services providedby the auditor, and assessing the auditors’ independence.
Chapter 1 Corporate Governance 17
c01 13 January 2012; 9:5:42

! Meet with auditors independently of management or other company interest partiesperiodically but at least once annually.
! Have the full authority to review the audit and financial statements, question auditorsregarding audit findings, including the review of the system of internal controls, and todetermine the quality and transparency of financial reporting choices.
Strong internal controls, risk management, and compliance systems are critical to acompany’s long-term success, the meeting of its business objectives, and enhancing the bestinterests of shareholders. Nearly all of the major corporate collapses have involved an absenceof effective control systems, or the overriding of the systems by management to achieve theirown interests and objectives to the detriment of those of investors.
The internal audit function should be entirely independent and separate from anyof the activities being audited. Internal auditors should report directly to the chairman ofthe audit committee of the board of directors. The board should regularly meet with theinternal audit supervisor and review the activities and address any concerns.
In evaluating the effectiveness of the board of directors, an investor should review thequalifications of the members of the audit committee, being alert to any conflicts of interest thatindividual members might have, for example, having previously been employed or otherwiseassociated with the current auditor or the company, determine the number of meetings heldby the committee during the year and whether these meetings were held independentof management. A report on the activities of the audit committee, including a statementon whether the committee met independently and without the presence of management,should be included in the proxy in the United States and in the corporate governance reportin Europe.
The audit committee should discuss in the regulatory filings the responsibilities andauthority it has to evaluate and assess these functions, any findings or concerns the committee haswith regard to the audit, internal control and compliance systems, and corrective action taken.
5.1.8. Nominating CommitteeIn most corporations, currently, nominations of members of the board of directors and forexecutive officers of the company are made by members of the board, most often at therecommendation of, or in consultation with, the management of the company. In suchcircumstances, the criteria for selection of nominees may favor management’s best interests atthe expense of the interests of shareholders. This is all the more important because in the usualcase, shareholders have no authority to nominate slates of directors who might best representthem. Consequently, corporate governance best practice requires that nominees to the boardbe selected by a nominating committee comprising only independent directors. Theresponsibilities of the nominating committee are to
! Establish criteria for evaluating candidates for the board of directors.! Identify candidates for the general board and for all committees of the board.! Review the qualifications of the nominees to the board and for members of individual
committees.! Establish criteria for evaluating nominees for senior management positions in the company.! Identify candidates for management positions.! Review the qualifications of the nominees for management positions.! Document the reasons for the selection of candidates recommended to the board as a whole
for consideration.
18 Corporate Finance
c01 13 January 2012; 9:5:42

Given the pivotal role that the members of the nominating committee have in repre-senting and protecting the interests of investors and other stakeholders, it is essential that thequalifications of these members be carefully reviewed in assessing the long-term investmentprospects of a company. Particular attention should be paid to evaluating their independence,the qualities of those selected for senior management positions, and the success of businesseswith which they’ve been associated. This information is available in the regulatory filings ofthe company.
5.1.9. Compensation CommitteeIdeally, compensation should be a tool used by directors, acting on behalf of shareholders, toattract, retain, and motivate the highest quality and most experienced managers for thecompany. The compensation should include incentives to meet and exceed corporate long-term goals, rather than short-term performance targets.
Decisions regarding the amounts and types of compensation to be awarded to seniorexecutives and directors of a company are thought by many corporate governance experts tobe the most important decisions to be made by those in a position of trust. Reports abound ofcompensation that is excessive relative to corporate performance, awarded to executives bycompliant boards. The problem has been particularly acute in the United States, but examplesare found worldwide.
In recent years, a practice has developed of gauging levels of compensation awards basednot upon company objectives and goals but rather by comparison to the highest levels ofcompensation awarded in other companies. This occurs whether the reference companies arerelevant benchmarks or not, and has caused compensation packages in many cases to beunrelated to the performance of the company. Needless to say, such excessive compensation ishighly detrimental to the interests of shareholders.
In one well-known case, that of the New York Stock Exchange, the compensation of thechief executive was a substantial proportion of the net earnings of the Exchange and con-siderably higher than the compensation awarded to senior executives of comparable com-panies. The facts that have come to light in the case suggest that the compensation committeeof the board was not independent as measured by the usual criteria, was not expert incompensation matters and did not seek outside counsel, was not well informed on the detailsof the compensation package, and acquiesced in management’s proposal of its own com-pensation.14 This case is currently the subject of extensive legal and regulatory action.
Several different types of compensation awards are in common use today:
! Salary, generally set by contractual commitments between the company and the executiveor director.
! Perquisites, additional compensation in the form of benefits, such as insurance, use ofcompany planes, cars, and apartments, services, ranging from investment advice, taxassistance, and financial planning advice to household services.
! Bonus awards, normally based on performance as compared to company goals andobjectives.
! Stock options, options on future awards of company stock.! Stock awards or restricted stock.
14Thomas (2004a and 2004b).
Chapter 1 Corporate Governance 19
c01 13 January 2012; 9:5:42

In general, shareholders would prefer that salary and perquisite awards constitute a rel-atively small portion of the total compensation award. That is, the fixed, nonperformance-based portion of the award should be adequate, but not excessive. Because these fixed costsmust be borne by shareholders regardless of corporate performance, executives should not beautomatically rewarded by poor performance. Information on salaries and some perquisitescan be found in regulatory filings of companies. For example, in the United States, thisinformation is found in the Proxy Statement in tables and accompanying text. The investorshould be alert to the fact that significant amounts of perquisites may not be fully disclosed, ashas been shown to be the case in a number of corporate scandals recently in Europe and theUnited States.
Bonuses should be awarded based solely on exceeding expected performance. Theyshould provide an incentive to motivate managers to achieve the highest and most stable long-term performance, rather than to reward short-term nonsustainable “growth” at the expenseof the best interests of shareholders. To the extent that management controls the operations ofthe company as well as corporate disclosure, incentive-based awards require the most diligentmonitoring by the members of the compensation committee. Directors must ascertain thatmanagement is not manipulating variables within its control, for example, accounting dis-closure choices, to artificially achieve performance targets. The investor should examine thebonus awards carefully, evaluating the performance targets for reasonableness, and to makecertain that the awards are consistent with the investor’s best interests.
Stock options and stock awards have been argued to better align the interests of managerswith those of shareholders by making a portion of the manager’s compensation dependent onthe value of the stock. Unfortunately, as recent events have made clear, stock options do notalways result in such an alignment of interests. Indeed, until recently, the lack of appropriateaccounting recognition of the expense of stock option awards has led to widespread abuse ofthis form of compensation. Large grants of stock options dilute shareholders’ positions in thecompany and diminish the value of their holdings.
Appropriate accounting for stock options, that is, expensing in the income statementwith assumed conversion to stock in the earnings-per-share calculation, has come to be seen asa litmus test for high quality financial reporting and transparency.15 Nevertheless, abusivepractices involving information manipulation related to stock option grants and optionexercise still occur.
In theory, grants of stock options to executives and other employees should be subject toshareholder approval. As a practical matter, however, there are loopholes that permit man-agers and directors to by-pass such approval, although some jurisdictions have closed some ofthese loopholes recently.
Stock options’ potential dilutive effect on shareholders can be assessed by a measureknown as the “share overhang.” The overhang is simply the number of shares represented bythe options, relative to the total amount of stock outstanding. Both of these numbers arereadily available in company regulatory filings in most jurisdictions.
In addition, investors should be alert to any provisions permitting the so-called “repri-cing” of stock options. Repricing means that the company can, with approval of the board ofdirectors, adjust the exercise price of outstanding option grants downward to the current priceof the stock. This is done by some companies when the price of the stock has declined
15In 2003, the International Accounting Standards Board (IASB) issued a standard requiring the fairvalue expensing of stock options for all companies that use IASB standards. Some 90 countriesworldwide adhere to IASB standards.
20 Corporate Finance
c01 13 January 2012; 9:5:42

significantly and the options are out-of-the-money. As is readily apparent, such repricing isinconsistent with the argument that options should serve the interests of managers andshareholders and provide an incentive for managers to strive for excellent long-term corporateperformance. The managers may have at-the-money options following repricing, but investorscannot recoup their losses so easily. Abuse in this area has been stemmed somewhat byaccounting rule changes that now require that such repriced options be expensed in theincome statement, although companies can still cancel the options and reissue them later at atime consistent with the rules, usually six months.
Stock grants by companies to executives can be an effective means of motivating them toachieve sustainable, long-term performance objectives. Restricted stock grants, that is, stockawards that cannot be sold or otherwise disposed of for a period of time, or that are con-tingent upon reaching certain performance goals, can be subject to the same abusive practicesas stock option awards, depending upon the terms of the awards. Well-designed restrictedstock awards are increasingly used by companies to reward executives for their performance aswell as to remunerate lower-level employees. Most jurisdictions require companies to disclosesuch grants in regulatory filings.
5.1.10. Board’s Independent Legal and Expert CounselThe board of directors should have the ability and sufficient resources to hire such legal andother expert counsel as they require to fulfill their fiduciary duties. In most companies, forexample, the corporate counsel also has the responsibility to advise the board of directors.Because the board of directors is charged with overseeing management on behalf of theshareholders, this represents a direct conflict of interest. That is, the corporate counsel cannotbe wholly independent with regard to the advice provided to the directors if it also serves, andis paid by, corporate management.
Legal counsel will be needed to help the board assess the company’s compliance withlegal and regulatory requirements. Outside counsel becomes increasingly important forcompanies with global operations. Similarly, for example, in high technology companies, themembers of the board will likely require the assistance of experts in the particular specializedtechnologies employed or developed by the company. However, all boards, regardless of theindustry, are likely to require additional counsel and should be able to obtain such serviceswhen they require it.
The investor should review regulatory filings carefully to determine if the board makesuse of independent outside counsel. If the filings are silent on the issue, the analyst or investorshould specifically inquire about the board’s use of independent counsel. If satisfactoryanswers are not forthcoming, this should reflect negatively on the board’s independence aswell as its ability to perform its fiduciary duties.
5.1.11. Statement of Governance PoliciesCompanies that have a strong commitment to corporate governance frequently supply astatement of their corporate governance policies, variously in their regulatory filings, on theirwebsites, or as part other investor information packets. Investors and investment analystsshould assess the following elements of a statement of corporate governance policies:
! Codes of ethics.! Statements of the oversight, monitoring, and review responsibilities of directors, including
internal control, risk management, audit and accounting and disclosure policy, complianceassessment, nominations, compensation awards, and other responsibilities.
Chapter 1 Corporate Governance 21
c01 13 January 2012; 9:5:42

! Statements of management’s responsibilities to provide complete and timely informationto the board members prior to board meetings, and to provide directors with free andunfettered access to control and compliance functions within the company.
! Reports of directors’ examinations, evaluations, and findings in their oversight and reviewfunction.
! Board and committee performance self-assessments.! Management performance assessments.! Training provided to directors prior to joining the board and periodically thereafter.
Obviously, one cannot rely solely on the corporate governance statement for assurancethat the company has a sound corporate governance structure. Nevertheless, such disclosuresprovide investors with a comparison for evaluating company and director performance overtime. For example, such disclosures should not be “boilerplate” statements that do not changeover time and that provide no real content or information.
5.1.12. Disclosure and TransparencyThe purpose of accounting and disclosure is to tell the company’s economic story as it is, notas some might want it to be in order to achieve some personal objective. Investors dependcritically on the quality, clarity, timeliness, and completeness of financial information in valuingsecurities and assessing risk. Attempts to hide or otherwise obfuscate essential information canresult in the mispricing of securities and the misallocation of capital, reducing the efficiency andeffectiveness of markets.
It is worth observing that nearly all of the major corporate collapses in recent yearshave involved equally massive attempts to hide, obfuscate, or falsify information thatcould have alerted investors to the seriousness of the financial problems and the impendingimplosions. Enron attempted to hide its massive and growing debt by moving it off thebalance sheet and into “partnerships,” run by insiders, for which no information was avail-able. Tyco failed to report billions in “loans” to insiders. WorldCom not only hid $11 billionin operating expenses by recording them as assets in the balance sheet, but also failedto disclose hundreds of billions of dollars in loans to the chief executive. Parmalat stavedoff collapse for some time by reporting falsely that the company had nearly $5 billion in acorporate account with a major international financial institution.
The crisis of the loss of confidence and trust in the broad financial markets globally,rather than just the companies involved, signals the depths of the concern that investorshave had about the quality and completeness of the disclosure they are receiving. Not sur-prisingly, the response has been a major overhaul of legislative, regulatory, and relatedcriminal code provisions in countries in North America and Europe, as well as elsewhere.Such provisions as the requirements in the United States that the chief executive officer andchief financial officer certify the accuracy of financial statements and develop rigorous newsystems of internal controls, backed up by new audit attestation requirements and stiffercriminal penalties, make clear the seriousness of the offenses and the public’s response to suchmalfeasance.
However, such changes do not guarantee that those in a position of trust will not againwillingly mislead and misinform their investors and others, particularly when they are facedwith serious financial difficulties. Consequently, an evaluation of the quality and extent offinancial information provided to investors is a crucial element in evaluating the corporategovernance structure of a company and the risk borne by an investor in the company’s
22 Corporate Finance
c01 13 January 2012; 9:5:42

securities. In assessing the quality of disclosure, some indicators of good quality financialreporting are:16
! Conservative assumptions used for employee benefit plans.! Adequate provisions for lawsuits and other loss contingencies.! Minimal use of off-balance-sheet financing techniques and full disclosure of assets, lia-
bilities, revenues, and expenses associated with such activities.! Absence of nonrecurring gains.! Absence of noncash earnings.! Clear and adequate disclosure.! Conservative revenue and expense recognition methods.! Use of LIFO (last in, first out) inventory accounting (during periods of generally rising
prices).! Bad-debt reserves that are high relative to receivables and past credit losses.! Use of accelerated depreciation methods and short lives.! Rapid write-off of acquisition-related intangible assets.! Minimal capitalization of interest and overhead.! Minimal capitalization of computer software costs.! Expensing of startup costs of new operations.! Use of the completed contract method of accounting for contracts.
One area of concern in recent years is the reporting by companies of so-called “proforma” earnings numbers, earnings before noncash or “nonrecurring” charges. Pro formaearnings have occasionally been dubbed “earnings-before-the-bad-stuff.” Such misleadingdisclosures have been widely used by companies with poor performance and poor prospects.Unfortunately, some analysts and investors have been willing to accept the deception asreflective of economic reality, frequently to their regret. To survive and flourish long-term,companies must be able to cover all of their costs.
In addition to high-quality financial disclosure, the company should make readilyavailable in its regulatory filings clear and complete information on such items as:
! Governance policies and procedures.! Reporting lines and organizational structure.! Corporate strategy, goals, and objectives.! Competitive threats and other risks and contingencies faced by the company and the
potential effect of these on the company’s operations.! Insider transactions involving executives or other senior employees, and directors.! Compensation policies and amounts of compensation awarded, including perquisites, for
key executives and directors.! Changes to governance structures, including the corporate charter and bylaws.
The investor should be alert particularly to references to off-balance-sheet or insidertransactions that are not accompanied by full disclosure of the effects of the items on thecompany. The investor should also consider the implications of a lack of disclosure. Forexample, many large companies maintain fleets of corporate jets for the use of executives and
16White, Sondhi, and Fried (2003), 637 ff.
Chapter 1 Corporate Governance 23
c01 13 January 2012; 9:5:43

other employees. They routinely make such planes available to executives for their private useon holidays. A failure to mention such perquisites should raise questions, not only about thisitem but about other possible compensation that has not been disclosed.
5.1.13. Insider or Related-Party TransactionsThe corporate collapse cases cited above involve egregious insider transactions by seniorexecutives, frequently with the acquiescence of a compliant board of directors. The executives’objective was self-aggrandizement at the expense of shareholders and other stakeholders in thecompany. This is not a new problem. Indeed, audit standards have required for decades thatauditors investigate such items and flag them for users of the statements. However, both thefrequency and extent of the theft and fraud, and the losses incurred by investors, employees,and others recently have dismayed even the most seasoned professionals in the financialmarkets.
The analyst should assess the company’s policies concerning related-party transactions,whether the company has entered into any such transactions, and, if so, what the effects are onthe company’s financial statements. Any related-party transaction should require the priorapproval of the board of directors and a statement that such transactions are consistent withcompany policy. Financial disclosures and related notes in regulatory filings are a source foranalysts in researching such transactions.
5.1.14. Responsiveness of Board of Directors to Shareholder Proxy VotesA clear indicator of the extent to which directors and executives take seriously their fiduciaryresponsibility to shareholders is the response of the company to shareholder votes on proxymatters. A recent example involves the issue of expensing stock options, which has been put toproxy vote in a sizable number of companies. Shareholders in many of the companies havevoted in the majority that the company begin expensing stock options. Very few companymanagers and directors have responded positively to the votes.
Directors cannot be expected to respond to trivial or frivolous shareholder initiatives, butfew such issues carry a large portion of the vote of shareholders. However, when mattersrelated to governance, executive compensation, mergers and acquisitions, or other matters ofgreat importance to investors are put to a vote of the shareholders, and the results of the voteare ignored, the implications are abundantly clear: management and the board are notconcerned for or motivated by the best interests of the company’s shareholders. An analystshould review all such proxies put to the shareholders, determine the shareholders’ consensusas reflected in the relative size of the affirmative vote, and determine the directors’ response tothe vote as reflected in the actions taken by the board and management. The responsiveness isa clear signal of the board’s willingness to act in the best interests of the owners of thecompany.
5.2. Examples of Codes of Corporate Governance
We provide examples of three codes of corporate governance, one from General Electric, onefrom the Monetary Authority of Singapore, and a third from an international organization,the Organisation for Economic Co-operation and Development. The first code provides anexample for one of the largest globally diversified corporations. The second addresses cor-porate governance issues for financial institutions, specifically commercial banks and insurersoperating in Singapore. The third has a much broader scope, addressing corporate governanceissues in any type of firm in any industry, operating in a variety of countries that are members
24 Corporate Finance
c01 13 January 2012; 9:5:43

of the organization. Taken together, these three codes indicate the varying approaches tocorporate governance worldwide while also illustrating how the core conflicts of interestbetween managers and owners are addressed.
5.2.1. General Electric: Governance PrinciplesGeneral Electric’s Governance Principles are a particularly good example of a company code ofcorporate governance. GE established the code to guide not only its managers and boardof directors in their activities and decision-making, but to serve as a benchmark by which theirperformance may be evaluated. The company publishes their Principles in a prominent placeon their website. A review of these principles will show that many of the major governanceconcerns discussed above are reflected here. The principles also explicitly address issues such asthe company’s policy on the adoption of “poison pills” and director education.
EXAMPLE 1-5 General Electric’s Governance Principles
1. Role of Board and ManagementGE’s business is conducted by its employees, managers, and officers, under the direc-tion of the chief executive officer (CEO) and the oversight of the board, to enhance thelong-term value of the company for its shareowners. The board of directors is elected bythe shareowners to oversee management and to assure that the long-term interests of theshareowners are being served. Both the board of directors and management recognizethat the long-term interests of shareowners are advanced by responsibly addressingthe concerns of other stakeholders and interested parties including employees, recruits,customers, suppliers, GE communities, government officials, and the public at large.
2. Functions of BoardThe board of directors has eight scheduled meetings a year at which it reviews anddiscusses reports by management on the performance of the company, its plansand prospects, as well as immediate issues facing the company. Directors are expected toattend all scheduled board and committee meetings. In addition to its general oversightof management, the board also performs a number of specific functions, including:
! Selecting, evaluating, and compensating the CEO and overseeing CEO successionplanning.
! Providing counsel and oversight on the selection, evaluation, development, andcompensation of senior management.
! Reviewing, monitoring, and, where appropriate, approving fundamental financialand business strategies and major corporate actions.
! Assessing major risks facing the company—and reviewing options for theirmitigation.
! Ensuring processes are in place for maintaining the integrity of the company—theintegrity of the financial statements, the integrity of compliance with law and ethics,the integrity of relationships with customers and suppliers, and the integrity ofrelationships with other stakeholders.
Chapter 1 Corporate Governance 25
c01 13 January 2012; 9:5:44

3. QualificationsDirectors should possess the highest personal and professional ethics, integrity, andvalues, and be committed to representing the long-term interests of the shareowners.They must also have an inquisitive and objective perspective, practical wisdom, andmature judgment. We endeavor to have a board representing diverse experience atpolicy-making levels in business, government, education, and technology, and in areasthat are relevant to the company’s global activities.
Directors must be willing to devote sufficient time to carrying out their duties andresponsibilities effectively, and should be committed to serve on the board for anextended period of time. Directors should offer their resignation in the event of anysignificant change in their personal circumstances, including a change in their principaljob responsibilities.
Directors who also serve as CEOs or in equivalent positions should not serve onmore than two boards of public companies in addition to the GE board, and otherdirectors should not serve onmore than four other boards of public companies in additionto the GE board. Current positions in excess of these limits may be maintained unless theboard determines that doing so would impair the director’s service on the GE board.
The board does not believe that arbitrary term limits on directors’ service areappropriate, nor does it believe that directors should expect to be renominated annuallyuntil they reach the mandatory retirement age. The board self-evaluation processdescribed below will be an important determinant for board tenure. Directors will notbe nominated for election to the board after their 73rd birthday, although the fullboard may nominate candidates over 73 for special circumstances.
4. Independence of DirectorsA majority of the directors will be independent directors, as independence is deter-mined by the board, based on the guidelines set forth below.
All future nonemployee directors will be independent. GE seeks to have a mini-mum of 10 independent directors at all times, and it is the board’s goal that at leasttwo-thirds of the directors will be independent. Directors who do not satisfy GE’sindependence guidelines also make valuable contributions to the board and to thecompany by reason of their experience and wisdom.
For a director to be considered independent, the board must determine that thedirector does not have any direct or indirect material relationship with GE. The boardhas established guidelines to assist it in determining director independence, whichconform to or are more exacting than the independence requirements in the New YorkStock Exchange listing requirements (NYSE rules). In addition to applying theseguidelines, the board will consider all relevant facts and circumstances in making anindependence determination, and not merely from the standpoint of the director, butalso from that of persons or organizations with which the director has an affiliation.
The board will make and publicly disclose its independence determination for eachdirector when the director is first elected to the board and annually thereafter for allnominees for election as directors. If the board determines that a director who satisfiesthe NYSE rules is independent even though he or she does not satisfy all of GE’sindependence guidelines, this determination will be disclosed and explained in the nextproxy statement.
26 Corporate Finance
c01 13 January 2012; 9:5:44

In accordance with the revised NYSE rules, independence determinations underthe guidelines in section (a) below will be based upon a director’s relationships with GEduring the 36 months preceding the determination. Similarly, independence deter-minations under the guidelines in section (b) below will be based upon the extentof commercial relationships during the three completed fiscal years preceding thedetermination.
a. A director will not be independent if:! The director is employed by GE, or an immediate family member is an executive
officer of GE.! The director receives any direct compensation from GE, other than director
and committee fees and pension or other forms of deferred compensation forprior service (provided such compensation is not contingent in any way oncontinued service).
! An immediate family member who is a GE executive officer receives more than$100,000 per year in direct compensation from GE.
! The director is affiliated with or employed by GE’s independent auditor, or animmediate family member is affiliated with or employed in a professionalcapacity by GE’s independent auditor.
! A GE executive officer is on the compensation committee of the board ofdirectors of a company which employs the GE director or an immediate familymember as an executive officer.
b. A director will not be independent if, at the time of the independence determi-nation, the director is an executive officer or employee, or if an immediate familymember is an executive officer, of another company that does business with GE andthe sales by that company to GE or purchases by that company from GE, in anysingle fiscal year during the evaluation period, are more than the greater of onepercent of the annual revenues of that company or $1 million.
c. A director will not be independent if, at the time of the independence determi-nation, the director is an executive officer or employee, or an immediate familymember is an executive officer, of another company which is indebted to GE, or towhich GE is indebted, and the total amount of either company’s indebtednessto the other at the end of the last completed fiscal year is more than 1 percent of theother company’s total consolidated assets.
d. A director will not be independent if, at the time of the independence determina-tion, the director serves as an officer, director or trustee of a charitable organization,and GE’s discretionary charitable contributions to the organization are more thanone percent of that organization’s total annual charitable receipts during its lastcompleted fiscal year. (GE’s automatic matching of employee charitable contribu-tions will not be included in the amount of GE’s contributions for this purpose.)
5. Size of Board and Selection ProcessThe directors are elected each year by the shareowners at the annual meeting of share-owners. Shareowners may propose nominees for consideration by the nominating andcorporate governance committee by submitting the names and supporting informationto: Secretary, General Electric Company, 3135 Easton Turnpike, Fairfield, CT 06828.
Chapter 1 Corporate Governance 27
c01 13 January 2012; 9:5:45

The board proposes a slate of nominees to the shareowners for election to the board. Theboard also determines the number of directors on the board provided that there are atleast 10. Between annual shareowner meetings, the board may elect directors to serveuntil the next annual meeting. The board believes that, given the size and breadth of GEand the need for diversity of board views, the size of the board should be in the range of13 to 17 directors.
6. Board CommitteesThe board has established the following committees to assist the board in discharging itsresponsibilities: (i) audit; (ii) management development and compensation; (iii) nomi-nating and corporate governance; and (iv) public responsibilities. The current chartersand key practices of these committees are published on the GE website, and will bemailed to shareowners on written request. The committee chairs report the highlights oftheir meetings to the full board following each meeting of the respective committees.The committees occasionally hold meetings in conjunction with the full board. Forexample, it is the practice of the audit committee to meet in conjunction with the fullboard in February so that all directors may participate in the review of the annualfinancial statements and Management’s Discussion and Analysis of Financial Conditionand Results of Operations for the prior year and financial plans for the current year.
7. Independence of Committee MembersIn addition to the requirement that a majority of the board satisfy the independencestandards discussed in section 4 above, members of the audit committee must alsosatisfy an additional NYSE independence requirement. Specifically, they may notaccept directly or indirectly any consulting, advisory or other compensatory fee fromGE or any of its subsidiaries other than their directors’ compensation. As a matter ofpolicy, the board will also apply a separate and heightened independence standard tomembers of both the management development and compensation committee and thenominating and corporate governance committee. No member of either committeemay be a partner, member, or principal of a law firm, accounting firm or investmentbanking firm that accepts consulting or advisory fees from GE or any of its subsidiaries.
8. Meetings of Nonemployee DirectorsThe board will have at least three regularly scheduled meetings a year for the non-employee directors without management present. The directors have determined thatthe chairman of the management development and compensation committee willpreside at such meetings, and will serve as the presiding director in performing suchother functions as the board may direct, including advising on the selection of com-mittee chairs and advising management on the agenda for board meetings. The non-employee directors may meet without management present at such other times asdetermined by the presiding director.
9. Self-EvaluationAs described more fully in the key practices of the nominating and corporate gover-nance committee, the board and each of the committees will perform an annualself-evaluation. Each November, each director will provide to an independent
28 Corporate Finance
c01 13 January 2012; 9:5:45

governance expert his or her assessment of the effectiveness of the board and itscommittees, as well as director performance and board dynamics. The individualassessments will be organized and summarized by this independent governance expertfor discussion with the board and the committees in December.
10. Setting Board AgendaThe board shall be responsible for its agenda. At the December board meeting, the CEOand the presiding director will propose for the board’s approval key issues of strategy,risk, and integrity to be scheduled and discussed during the course of the next calendaryear. Before that meeting, the board will be invited to offer its suggestions. As a result ofthis process, a schedule of major discussion items for the following year will be estab-lished. Prior to each board meeting, the CEO will discuss the other specific agenda itemsfor the meeting with the presiding director, who shall have authority to approve theagenda for the meeting. The CEO and the presiding director, or committee chair asappropriate, shall determine the nature and extent of information that shall be providedregularly to the directors before each scheduled board or committee meeting. Directorsare urged to make suggestions for agenda items, or additional premeeting materials, tothe CEO, the presiding director, or appropriate committee chair at any time.
11. Ethics and Conflicts of InterestThe board expects GE directors, as well as officers and employees, to act ethically at alltimes and to acknowledge their adherence to the policies comprising GE’s code ofconduct set forth in the company’s integrity manual, “Integrity: The Spirit and theLetter of Our Commitment.” GE will not make any personal loans or extensions ofcredit to directors or executive officers, other than consumer loans or credit card serviceson terms offered to the general public. No nonemployee director may provide personalservices for compensation to GE, other than in connection with serving as a GEdirector. The board will not permit any waiver of any ethics policy for any director orexecutive officer. If an actual or potential conflict of interest arises for a director, thedirector shall promptly inform the CEO and the presiding director. If a significantconflict exists and cannot be resolved, the director should resign. All directors willrecuse themselves from any discussion or decision affecting their personal, business, orprofessional interests. The board shall resolve any conflict of interest question involvingthe CEO, a vice chairman or a senior vice president, and the CEO shall resolve anyconflict of interest issue involving any other officer of the company.
12. Reporting of Concerns to Nonemployee Directorsor the Audit CommitteeThe audit committee and the nonemployee directors have established the followingprocedures to enable anyone who has a concern about GE’s conduct, or any employeewho has a complaint about the company’s accounting, internal accounting controls orauditing matters, to communicate that concern directly to the presiding director, to thenonemployee directors, or to the audit committee. Such communications may beconfidential or anonymous, and may be e-mailed, submitted in writing or reported byphone to special addresses and a toll-free phone number that are published on thecompany’s website. All such communications shall be promptly reviewed by GE’s
Chapter 1 Corporate Governance 29
c01 13 January 2012; 9:5:46

ombudsman, and any concerns relating to accounting, internal controls, auditing orofficer conduct shall be sent immediately to the presiding director and to the chair ofthe audit committee. All concerns will be reviewed and addressed by GE’s ombudsmanin the same way that other concerns are addressed by the company. The status of alloutstanding concerns addressed to the nonemployee directors, the presiding director orthe audit committee will be reported to the presiding director and the chair of the auditcommittee on a quarterly basis. The presiding director or the audit committee chairmay direct that certain matters be presented to the audit committee or the full boardand may direct special treatment, including the retention of outside advisors or counsel,for any concern addressed to them. The company’s integrity manual prohibits anyemployee from retaliating or taking any adverse action against anyone for raising orhelping to resolve an integrity concern.
13. Compensation of the BoardThe nominating and corporate governance committee shall have the responsibility forrecommending to the board compensation and benefits for nonemployee directors. Indischarging this duty, the committee shall be guided by three goals: compensationshould fairly pay directors for work required in a company of GE’s size and scope;compensation should align directors’ interests with the long-term interests of share-owners; and the structure of the compensation should be simple, transparent and easyfor shareowners to understand. As discussed more fully in the key practices of thenominating and corporate governance committee, the committee believes these goalswill be served by providing 40 percent of nonemployee director compensation in cashand 60 percent in deferred stock units. At the end of each year, the nominating andcorporate governance committee shall review nonemployee director compensationand benefits.
14. Succession PlanThe board shall approve and maintain a succession plan for the CEO and seniorexecutives, based upon recommendations from the management development andcompensation committee.
15. Annual Compensation Review of Senior ManagementThe management development and compensation committee shall annually approvethe goals and objectives for compensating the CEO. That committee shall evaluate theCEO’s performance in light of these goals before setting the CEO’s salary, bonus, andother incentive and equity compensation. The committee shall also annually approvethe compensation structure for the company’s officers, and shall evaluate the perfor-mance of the company’s senior executive officers before approving their salary, bonus,and other incentive and equity compensation.
16. Access to Senior ManagementNonemployee directors are encouraged to contact senior managers of the companywithout senior corporate management present. To facilitate such contact, nonemployeedirectors are expected to make two regularly scheduled visits to GE businesses a yearwithout corporate management being present.
30 Corporate Finance
c01 13 January 2012; 9:5:46

5.2.2. Monetary Authority of Singapore: Guidelines and Regulationson Corporate GovernanceIn February 2003, the Monetary Authority of Singapore (MAS) established principles ofcorporate governance for the banks and insurers that fall within its regulatory purview. Thecode, Guidelines and Regulations on Corporate Governance,17 defines and explains corporategovernance as:
. . . The processes and structures by which the business and affairs of an Institutionare directed, managed and controlled. [p. 6]
17. Access to Independent AdvisorsThe board and its committees shall have the right at any time to retain independentoutside auditors and financial, legal or other advisors, and the company shall provideappropriate funding, as determined by the board or any committee, to compensate suchindependent outside auditors or advisors, as well as to cover the ordinary administrativeexpenses incurred by the board and its committees in carrying out their duties.
18. Director EducationThe general counsel and the chief financial officer shall be responsible for providing anorientation for new directors. Each new director shall, within three months of electionto the board, spend a day at corporate headquarters for personal briefing by seniormanagement on the company’s strategic plans, its financial statements, and its keypolicies and practices. In addition, directors shall be provided with continuing edu-cation on subjects that would assist them in discharging their duties, including regularprograms on GE’s financial planning and analysis, compliance and corporate gover-nance developments; business-specific learning opportunities through site visits andBoard meetings; and briefing sessions on topics that present special risks and oppor-tunities to the company.
19. Policy on Poison PillsThe term “poison pill” refers to the type of shareowner rights plan that some companiesadopt to make a hostile takeover of the company more difficult. GE does not have apoison pill and has no intention of adopting a poison pill because a hostile takeoverof a company of our size is impractical and unrealistic. However, if GE were everto adopt a poison pill, the board would seek prior shareowner approval unless, due totiming constraints or other reasons, a committee consisting solely of independentdirectors determines that it would be in the best interests of shareowners to adopt apoison pill before obtaining shareowner approval. If the GE board of directors wereever to adopt a poison pill without prior shareowner approval, the board would eithersubmit the poison pill to shareowners for ratification, or would cause the poison pill toexpire, without being renewed or replaced, within one year.
17These guidelines expand and build upon the Code of Corporate Governance, issued in 2001 bythe Corporate Governance Committee, established by the Ministry of Finance, the Authority, and theAttorney-General’s Chambers.
Chapter 1 Corporate Governance 31
c01 13 January 2012; 9:5:46

The MAS makes clear that the key element in an effective system of corporate governancerests with the board of directors, and that its primary duties are to shareholders anddepositors, or, in the case of an insurer, the policyholders:
The board of directors is responsible for directing the management of the Institu-tion. Besides its obligations to the shareholders, the board of directors of an Insti-tution has a duty to act in the best interest of the Institution and to ensure that theInstitution has sufficient resources to meet its obligations to other stakeholders, inparticular a bank’s depositors or an insurer’s policyholders
The Monetary Authority of Singapore has the following 13 principles to guide the banksand insurers within its regulatory authority in compliance with the corporate governancestandards in its Guidelines and Regulations on Corporate Governance:
Principle 1: Every Institution should be headed by an effective Board.
Principle 2: There should be a strong and independent element on the Board which is ableto exercise objective judgment on corporate affairs independently frommanage-ment and substantial shareholders.
Principle 3: The Board should set and enforce clear lines of responsibility and account-ability throughout the Institution.
Principle 4: There should be a formal and transparent process for the appointment of newdirectors to the Board.
Principle 5: There should be a formal assessment of the effectiveness of the Board as awhole and the contribution by each director to the effectiveness of the Board.
Principle 6: In order to fulfill their responsibilities, Board members should be providedwith complete, adequate, and timely information prior to board meetings andon an ongoing basis by the management.
Principle 7: There should be a formal and transparent procedure for fixing the remunera-tion packages of individual directors. No director should be involved indeciding his own remuneration.
Principle 8: The level and composition of remuneration should be appropriate to attract,retain, and motivate the directors to perform their roles and carry out theirresponsibilities.
Principle 9: The Board should establish an Audit Committee with a set of written terms ofreference that clearly sets out its authority and duties.
Principle 10: The Board should ensure that there is an adequate risk management system andsound internal controls.
Principle 11: The Board should ensure that an internal audit function that is independent ofthe activities audited is established.
Principle 12: The Board should ensure thatmanagement formulates policies to ensure dealingswith the public, the Institution’s policyholders and claimants, depositors, andother customers are conducted fairly, responsibly, and professionally.
Principle 13: The Board should ensure that related party transactions with the Institution aremade on an arm’s-length basis.
32 Corporate Finance
c01 13 January 2012; 9:5:46

These principles are supported by requirements for extensive disclosures regardingcompanies’ implementation and of the standards and their procedures for continuousmonitoring of compliance. It is notable that the Monetary Authority does not requirethat a majority of the board members be independent, but that only one-third meet sucha test.
5.2.3. Organisation for Economic Co-operation and Development:OECD Principles of Corporate GovernanceThe Organisation for Economic Co-operation and Development (OECD)18 issued its code,OECD Principles of Corporate Governance (OECD Principles), which applies to all Membercountries. These countries comprise a number of different legislative, regulatory, and marketsystems.
The OECD observes that its Principles “represent the first initiative by an intergov-ernmental organisation to develop the core elements of a good corporate governance regime.As such, the Principles can be used as a benchmark by governments as they evaluate andimprove their laws and regulations.” The Preface to the OECD Principles states:
A good corporate governance regime helps to assure that corporations use theircapital efficiently. Good corporate governance helps, too, to ensure that corporationstake into account the interests of a wide range of constituencies as well as of thecommunities within which they operate, and that their boards are accountable to thecompany and the shareholders. This, in turn, helps to assure that corporationsoperate for the benefit of society as a whole. It helps to maintain the confidence ofinvestors—both foreign and domestic—and to attract more “patient,” long-termcapital . . . Common to all good corporate governance regimes, however, is ahigh degree of priority placed on the interests of shareholders, who place theirtrust in corporations to use their investment funds wisely and effectively.[Emphasis added]
Despite the application of the OECD Principles to a wide variety of regimes, the OECDprovides a special emphasis on the rights and fair treatment of shareholders. This charac-teristic, although considered to be a fundamental requirement for good systems of corporategovernance, is not frequently found in either corporate codes or those of other businessorganizations. For example, the General Electric code is silent on shareholder rights althoughit acknowledges in the first principle that managers and the directors have an obligation toattend to the interests of shareholders. The Monetary Authority of Singapore’s code takes asimilar approach.
18Issued in 1999, and subsequently revised, the OECD Principles are intended to be adopted byeach of the OECD Member countries, which include: Australia, Austria, Belgium, Canada, the CzechRepublic, Denmark, Finland, France, Germany, Greece, Hungary, Iceland, Ireland, Italy, Japan, Korea,Luxembourg, Mexico, the Netherlands, New Zealand, Norway, Poland, Portugal, Spain, Sweden,Switzerland, Turkey, the United Kingdom, and the United States.
Chapter 1 Corporate Governance 33
c01 13 January 2012; 9:5:46

EXAMPLE 1-6 OECD Principles of Corporate Governance
I. The Rights of ShareholdersThe corporate governance framework should protect shareholders’ rights.
A. Basic shareholder rights include the right to: (1) secure methods of ownershipregistration; (2) convey or transfer shares; (3) obtain relevant information on thecorporation on a timely and regular basis; (4) participate and vote in generalshareholder meetings; (5) elect members of the board; and (6) share in the profitsof the corporation.
B. Shareholders have the right to participate in, and to be sufficiently informed on,decisions concerning fundamental corporate changes such as:1. Amendments to the statutes, or articles of incorporation or similar governing
documents of the company;2. The authorisation of additional shares; and3. Extraordinary transactions that in effect result in the sale of the company.
C. Shareholders should have the opportunity to participate effectively and vote ingeneral shareholder meetings and should be informed of the rules, including votingprocedures, that govern general shareholder meetings:1. Shareholders should be furnished with sufficient and timely information con-
cerning the date, location and agenda of general meetings, as well as full andtimely information regarding the issues to be decided at the meeting.
2. Opportunity should be provided for shareholders to ask questions of the boardand to place items on the agenda at general meetings, subject to reasonablelimitations.
3. Shareholders should be able to vote in person or in absentia, and equal effectshould be given to votes whether cast in person or in absentia.
D. Capital structures and arrangements that enable certain shareholders to obtain adegree of control disproportionate to their equity ownership should be disclosed.
E. Markets for corporate control should be allowed to function in an efficient andtransparent manner.1. The rules and procedures governing the acquisition of corporate control in the
capital markets, and extraordinary transactions such as mergers, and sales ofsubstantial portions of corporate assets, should be clearly articulated and dis-closed so that investors understand their rights and recourse. Transactionsshould occur at transparent prices and under fair conditions that protect therights of all shareholders according to their class.
2. Anti-take-over devices should not be used to shield management fromaccountability.
F. Shareholders, including institutional investors, should consider the costs andbenefits of exercising their voting rights.
II. The Equitable Treatment of ShareholdersThe corporate governance framework should ensure the equitable treatment of all share-holders, including minority and foreign shareholders. All shareholders should have theopportunity to obtain effective redress for violation of their rights.
34 Corporate Finance
c01 13 January 2012; 9:5:47

A. All shareholders of the same class should be treated equally.1. Within any class, all shareholders should have the same voting rights. All
investors should be able to obtain information about the voting rights attachedto all classes of shares before they purchase. Any changes in voting rights shouldbe subject to shareholder vote.
2. Votes should be cast by custodians or nominees in a manner agreed upon withthe beneficial owner of the shares.
3. Processes and procedures for general shareholder meetings should allow forequitable treatment of all shareholders. Company procedures should not makeit unduly difficult or expensive to cast votes.
B. Insider trading and abusive self-dealing should be prohibited.C. Members of the board and managers should be required to disclose any material
interests in transactions or matters affecting the corporation.
III. The Role of Stakeholders in Corporate GovernanceThe corporate governance framework should recognise the rights of stakeholders as establishedby law and encourage active co-operation between corporations and stakeholders in creatingwealth, jobs, and the sustainability of financially sound enterprises.
A. The corporate governance framework should assure that the rights of stakeholdersthat are protected by law are respected.
B. Where stakeholder interests are protected by law, stakeholders should have theopportunity to obtain effective redress for violation of their rights.
C. The corporate governance framework should permit performance-enhancingmechanisms for stakeholder participation.
D. Where stakeholders participate in the corporate governance process, they shouldhave access to relevant information.
IV. Disclosure and TransparencyThe corporate governance framework should ensure that timely and accurate disclosure ismade on all material matters regarding the corporation, including the financial situation,performance, ownership, and governance of the company.
A. Disclosure should include, but not be limited to, material information on:1. The financial and operating results of the company.2. Company objectives.3. Major share ownership and voting rights.4. Members of the board and key executives, and their remuneration.5. Material foreseeable risk factors.6. Material issues regarding employees and other stakeholders.7. Governance structures and policies.
B. Information should be prepared, audited, and disclosed in accordance with highquality standards of accounting, financial and nonfinancial disclosure, and audit.
C. An annual audit should be conducted by an independent auditor in order toprovide an external and objective assurance on the way in which financial state-ments have been prepared and presented.
D. Channels for disseminating information should provide for fair, timely, and cost-efficient access to relevant information by users.
Chapter 1 Corporate Governance 35
c01 13 January 2012; 9:5:47

This code, and its predecessor variants, is not only among the earliest efforts to establishguidelines for good governance, but with its global reach has had wide influence on thedevelopment of other codes and regulatory frameworks.
V. The Responsibilities of the BoardThe corporate governance framework should ensure the strategic guidance of the company,the effective monitoring of management by the board, and the board’s accountability to thecompany and the shareholders.
A. Board members should act on a fully informed basis, in good faith, with duediligence and care, and in the best interest of the company and the shareholders.
B. Where board decisions may affect different shareholder groups differently, theboard should treat all shareholders fairly.
C. The board should ensure compliance with applicable law and take into account theinterests of stakeholders.
D. The board should fulfill certain key functions, including:1. Reviewing and guiding corporate strategy, major plans of action, risk policy,
annual budgets and business plans; setting performance objectives; monitoringimplementation and corporate performance; and overseeing major capitalexpenditures, acquisitions and divestitures.
2. Selecting, compensating, monitoring, and, when necessary, replacing keyexecutives and overseeing succession planning.
3. Reviewing key executive and board remuneration, and ensuring a formal andtransparent board nomination process.
4. Monitoring and managing potential conflicts of interest of management, boardmembers and shareholders, including misuse of corporate assets and abuse inrelated party transactions.
5. Ensuring the integrity of the corporation’s accounting and financial reportingsystems, including the independent audit, and that appropriate systems ofcontrol are in place, in particular, systems for monitoring risk, financial control,and compliance with the law.
6. Monitoring the effectiveness of the governance practices under which it oper-ates and making changes as needed.
7. Overseeing the process of disclosure and communications.E. The board should be able to exercise objective judgement on corporate affairs
independent, in particular, from management.1. Boards should consider assigning a sufficient number of nonexecutive board
members capable of exercising independent judgement to tasks where there is apotential for conflict of interest. Examples of such key responsibilities arefinancial reporting, nomination, and executive and board remuneration.
2. Board members should devote sufficient time to their responsibilities.F. In order to fulfill their responsibilities, board members should have access to
accurate, relevant and timely information.
36 Corporate Finance
c01 13 January 2012; 9:5:48

6. ENVIRONMENTAL, SOCIAL, AND GOVERNANCE FACTORS
Investors now understand that nontraditional business factors—specifically, a company’senvironmental, social, and governance (ESG) risk exposures—may be as critical to thecompany’s long-term sustainability as more traditional concerns. Indeed, many majorfinancial institutions and portfolio managers routinely integrate ESG analyses into theirequity valuations and other investment decisions.19 Those analysts who fail to consider ESGfactors in their valuations may well be assuming far greater long-term risks than they or theirclients realize.20
ESG factors range from those associated with climate change (for example, carbon-basedgreenhouse gas emissions resulting from a company’s operations) to labor rights, public andoccupational health issues, and the soundness of the company’s governance structures.21
The risks resulting from exposure to these various issues include the following:
! Legislative and regulatory risk: The risk that governmental laws and regulations directlyor indirectly affecting a company’s operations will change with potentially severe adverseeffects on the company’s continued profitability and even its long-term sustainability.
For example, in the United States, a law enacted in California in 2004 requires a 30percent reduction in carbon dioxide emissions by 2016 for all new automobiles sold in thestate. Other states, including Connecticut, Maine, Massachusetts, New Jersey, New York,Oregon, Pennsylvania, Rhode Island, Vermont, and Washington, are following California’sexample.22 These states currently represent more than half of all U.S. automobile sales.Consequently, manufacturers that fail to meet the standards can expect to suffer a reductionin revenues and earnings as well as market power. Given strong industry competition, theeffects of the changes in the laws on companies operating in the industry could be severe.
Other national and global efforts have brought rapid changes in operations for companiesin affected countries. For example, the Kyoto Protocol is a 1997 amendment to the UnitedNations Framework Convention on Climate Change (UNFCCC). The Protocol now coversmore than 160 countries, not including the United States and Australia, and over 60 percentof greenhouse gas emissions. The agreement calls for staged reductions in emissions of carbondioxide and five other greenhouse gases for those countries that have ratified the agreement.The Protocol also provides for emissions credit trading for those signatories, principally inemerging countries, that could not otherwise afford the investment.
Companies in most industries are likely to be affected to at least some degree by thesemandated changes, although the effects will vary widely across industries. Even withinindustries with the greatest exposures, companies that have invested in newer, more up-to-date technologies are likely to be affected less by the changes than their competitors. Thus,investors who consider ESG factors and who monitor regulatory and legislative develop-ments for the companies they follow will be better equipped to make sound investmentdecisions.
19See, for example, Anderson and Gardiner (2006).20The Materiality of Social, Environmental and Corporate Governance Issues to Equity Pricing: 11 SectorStudies by Brokerage House Analysts (2004).21Ibid.22Anderson and Gardiner, 7.
Chapter 1 Corporate Governance 37
c01 13 January 2012; 9:5:48

! Legal risk: The risk that failures by company managers to effectively manage ESG factorswill lead to lawsuits and other judicial remedies, resulting in potentially catastrophic losses forthe company.
All areas of ESG can, and sometimes do, lead to such lawsuits. The actions can bebrought by employees for workplace issues and contractual defaults, by shareholders formanagement or director governance or other lapses that impair shareholder value, or bygovernment attorneys for abridgement of federal or state laws.
An investor can begin to analyze the potential for such risks in a particular company byreviewing regulatory filings for the particular jurisdictions in which the company operates.Many such filings, such as the U.S. SEC required disclosures in the Form 10-K Business,Risks, and Legal Proceedings sections, as well as the Management Discussion and Analysis ofFinancial Condition and Results of Operations, require substantial discussion of possible legalrisk exposures. For those companies that provide them, the GRI reports may include usefulinsights.23 However, an analyst should make an independent assessment of the company andcarefully consider the nature of a company’s operations to evaluate the possible scope of suchexposures and their potential effects. The business press may also be a good source ofinformation regarding such risks on both the company of immediate interest as well as othercompanies in the same industry.
! Reputational risk: This particular source of risk has risen in importance as ESG factors areincreasingly recognized as a potentially major source of risk. Specifically, companies whosemanagers have demonstrated a lack of concern for managing ESG factors in the past, so as toeliminate or otherwise mitigate risk exposures, will suffer a diminution in market value rel-ative to other companies in the same industry that may persist for a long period of time.! Operating risk: The risk that a company’s operations may be severely affected by ESGfactors, even to the requirement that one or more product lines or possibly all operationsmight be shut down.
An example of such a risk is that deriving from the industrial use of benzene, a powerfulcarcinogen and one of the most toxic chemicals known. Because of its use as both a buildingblock in the plastics and rubber industry, as well as its more general use as an industrialsolvent, benzene was widely used in industry and was dispersed into the air, drinking water,and soil. Billions of pounds of the chemical were produced and used annually.
Once studies confirmed the harmful effects of the chemical, the U.S. EnvironmentalProtection Agency (EPA) moved, for example, under the 1974 Safe Drinking Water Act to settargets for acceptable levels in water. The EPA Maximum Contaminant Level for benzene indrinking water was set at five parts per billion. Thus, companies that had previously relied onextensive use of benzene in their operations had either to modify their operations to ensurethat no benzene escaped into the environment, or to cease those operations that used benzenealtogether.
! Financial risk: The risk that ESG factors will result in significant costs or other losses tothe company and its shareholders. Any of the above sources of risk can affect a company andits financial health, sometimes severely.
23The Global Reporting Initiative (GRI) promotes systematic reporting of economic, environmental,and social performance. The website for the GRI is www.globalreporting.org.
38 Corporate Finance
c01 13 January 2012; 9:5:48

In summary, investors are well advised to consider the potential effects of ESG factors oncompanies in which they invest and to carefully analyze all sources of information relevant tosuch risk exposures. These analyses may alert the analyst to risk factors that should beincorporated into company valuations.
7. VALUATION IMPLICATIONS OF CORPORATEGOVERNANCE
The relative quality, strength, and reliability of a company’s corporate governance system havedirect and profound implications for investors’ assessments of investments and their valua-tions. As we have seen in the massive corporate collapses in recent years, most or all of aninvestor’s capital can be lost suddenly if a company fails to establish an effective corporategovernance system with the appropriate checks and balances.
Weak corporate governance systems pose the following risks to the value of investmentsin the company:
! Accounting risk—The risk that a company’s financial statement recognition and relateddisclosures, upon which investors base their financial decisions, are incomplete, misleading,or materially misstated.
! Asset risk—The risk that the firm’s assets, which belong to investors, will be mis-appropriated by managers or directors in the form of excessive compensation or otherperquisites.
! Liability risk—The risk that management will enter into excessive obligations, committedto on behalf of shareholders, that effectively destroy the value of shareholders’ equity; thesefrequently take the form of off-balance-sheet obligations.
! Strategic policy risk—The risk that managers may enter into transactions, such as mergersand acquisitions, or incur other business risks, that may not be in the best long-terminterest of shareholders, but which may result in large payoffs for management or directors.
Not surprisingly, a growing body of evidence indicates that companies with sound corporategovernance systems show higher profitability and investment performance measures, includingreturns, relative to those assessed to have weaker structures. For example, a joint study of Insti-tutional Shareholder Services (ISS) and Georgia State University24 found that the best-governedcompanies, as measured by the ISS Corporate Governance Quotient, generated returns oninvestment and equity over the period under study that were 18.7 percent and 23.8 percent,respectively, better than those of companies with poor governance. Similarly, a study of U.S.markets, conducted by researchers at Harvard University and the University of Pennsylvania25
found that portfolios of companies with strong shareholder-rights protections outperformedportfolios of companies with weaker protections by 8.5 percent per year. A study of Europeanfirms found annual mean return differences of 3.0 percent.26
24See Brown and Caylor (2004).25See Gompers, Ishii, and Metrick (2003). The authors compared the investment performance of some1,500 U.S.-listed companies against a corporate governance index the authors constructed from 24distinct governance rules.26Bauer and Guenster (2003). This study used Deminor Ratings as the basis for determining companies’relative corporate governance quality (www.deminor.org).
Chapter 1 Corporate Governance 39
c01 13 January 2012; 9:5:48

This phenomenon is not limited to developed markets. Even before the collapse ofEnron, a Malaysia-based analyst found that investors in emerging markets overwhelminglypreferred companies with good governance.27 Of the 100 largest emerging markets companieshis firm followed, those with the best governance, based on management discipline, trans-parency, independence, accountability, responsibility, fairness, and social responsibility,generated three-year U.S. dollar returns of 267 percent, compared with average returns of 127percent. The disparity in five-year returns was even greater, at 930 percent versus an average of388 percent.
The conclusion from these and other studies is that good corporate governance leads tobetter results, both for companies and for investors. Therefore, investors and analysts shouldcarefully evaluate the corporate governance structures of companies they are considering asinvestments and should continue to monitor the systems once the investments are made.
8. SUMMARY
Corporate governance is an essential concern for investors and investment analysts. Thischapter has presented the attributes of an effective corporate governance system and the typesof practices that should raise investors’ concerns. This chapter has made the following points:
! Corporate governance is the system of principles, policies, procedures, and clearly definedresponsibilities and accountabilities, used by stakeholders to eliminate or minimize conflictsof interest.
! The objectives of a corporate governance system are (1) to eliminate or mitigate conflicts ofinterest among stakeholders, particularly between managers and shareholders, and (2) toensure that the assets of the company are used efficiently and productively and in the bestinterests of the investors and other stakeholders.
! The failure of a company to establish an effective system of corporate governance representsa major operational risk to the company and its investors. To understand the risks inherentin an investment in a company, it is essential to understand the quality of the company’scorporate governance practices.
! The core attributes of an effective corporate governance system are:a. Delineation of the rights of shareholders and other core stakeholdersb. Clearly defined manager and director governance responsibilities to the stakeholdersc. Identifiable and measurable accountabilities for the performance of the responsibilitiesd. Fairness and equitable treatment in all dealings between managers, directors, and
shareholderse. Complete transparency and accuracy in disclosures regarding operations, performance,
risk, and financial position! The specific sources of conflict in corporate agency relationships are
a. Manager–shareholder conflicts—Managers may, for example:! Use funds to try to expand the size of a business even when this is not in the best
interests of shareholders! Grant themselves numerous expensive perquisites that are treated as ordinary
business expenses
27In Gill (2001), the author points out that CLSA assigned corporate governance ratings to 495companies in 25 markets.
40 Corporate Finance
c01 13 January 2012; 9:5:48

b. Director–shareholder conflicts—Directors may, for example, identify with the man-agers’ interests rather than those of the shareholders as a result of personal or businessrelationships with the manager.
! The responsibilities of board members, both individually and as a group, are toa. Establish corporate values and governance structures for the company to ensure that the
business is conducted in an ethical, competent, fair, and professional mannerb. Ensure that all legal and regulatory requirements are met and complied with fully and
in a timely fashionc. Establish long-term strategic objectives for the company with a goal of ensuring that the
best interests of shareholders come first and that the company’s obligations to others aremet in a timely and complete manner
d. Establish clear lines of responsibility and a strong system of accountability and per-formance measurement in all phases of a company’s operations
e. Hire the chief executive officer, determine the compensation package, and periodicallyevaluate the officer’s performance
f. Ensure that management has supplied the board with sufficient information for it to befully informed and prepared to make the decisions that are its responsibility, and tobe able to adequately monitor and oversee the company’s management
g. Meet regularly to perform its duties and in extraordinary session as required by eventsh. Acquire adequate training so that members are able to adequately perform their duties
! An investor or investment analyst must assessa. Board composition and independenceb. Whether the chairman of the board is independentc. The qualifications of the directorsd. Whether the board is elected on an annual or staggered basise. Board self-assessment practicesf. The frequency of separate sessions of independent directorsg. The audit committee and audit oversighth. The nominating committeei. The compensation committee and compensation awards to managementj. The use (or not) of independent legal and expert counsel
! Companies committed to corporate governance often provide a statement of corporategovernance policies. Analysts should assess: the code of ethics; statements of the oversight,monitoring, and review responsibilities of directors; statements of management’s respon-sibilities with respect to information and access of directors to internal company functions;reports of directors’ examinations, evaluations, and findings; board and committee self-assessments; management self-assessments; and training policies for directors.
! Weak corporate governance systems give rise to risks including accounting risk, asset risk,liability risk, and strategic policy risk. Such risks may compromise the value of investmentsin the company.
Chapter 1 Corporate Governance 41
c01 13 January 2012; 9:5:48

PROBLEMS
1. Which of the following best defines the concept of corporate governance?A. A system for monitoring managers’ activities, rewarding performance, and disciplining
misbehavior.B. Corporate values and governance structures that ensure the business is conducted in
an ethical, competent, fair, and professional manner.C. A system of principles, policies, and procedures used to manage and control the
activities of a corporation so as to overcome conflicts of interest inherent inthe corporate form.
2. Which of the following is an example of a conflict of interest that an effective corporategovernance system would mitigate or eliminate?A. A majority of the board is independent of management.B. Directors identify with the managers’ interests rather than those of the shareholders.C. Directors have board experience with companies regarded as having sound gover-
nance practices.
3. Which of the following best describes the corporate governance responsibilities ofmembers of the board of directors?A. Establish long-term strategic objectives for the company.B. Ensure that at board meetings no subject is undiscussable and dissent is regarded as
an obligation.C. Ensure that the board negotiates with the company over all matters such as
compensation.
4. Which of the following is least likely to be useful in evaluating a company’s corporategovernance system for investment analysis purposes?A. Assess issues related to the board, managers, and shareholders.B. Review the company’s regulatory filings and financial information provided to
shareholders.C. Flag items such as egregious use of insider transactions for users of the financial
statements.
5. The objectives of an effective system of corporate governance include all of the followingexcept:A. ensure that the assets of the company are used efficiently and productively.B. eliminate or mitigate conflicts of interest among stakeholders.C. ensure complete transparency in disclosures regarding operations, performance, risk,
and financial position.
6. All of the following are core attributes of an effective corporate governance systemexcept:A. fairness and accuracy in identifying inherent conflicts of interest.B. clearly defined governance responsibilities for managers and directors.C. delineation of shareholders and other core stakeholders’ rights.
42 Corporate Finance
c01 13 January 2012; 9:5:49

7. All of the following are examples of conflicts of interest that an effective corporategovernance system should address except relationships between:A. managers and shareholders.B. managers and directors.C. managers and institutional analysts.
8. All of the following are true of an effective system of corporate governance except:A. the system must be continually monitored especially with changes in management
and the board.B. a single system of effective corporate governance applies to all firms worldwide.C. there are a number of common characteristics of all sound corporate governance
structures.
The following information relates to Questions 9–14.Jane Smith, CFA, has recently joined Zero Asset Management, Inc. (Zero) as a board
member. Since Smith is also outside council for Zero, she is already very familiar with Zero’soperations and expects to begin contributing good ideas right away. Zero is a publicly tradedinvestment management firm that historically focused on mutual fund management.Although there is current market opportunity to add a new type of mutual fund, the boardrecently decided against adding the fund. Instead, the board decided to expand its business toinclude a hedge fund operation within the existing corporation.
Bill Week, CEO of Zero, has publicly stated that he is willing to bet the company’sfuture on hedge fund management. Week is the founder of Zero, as well as chairman of theboard, and maintains a controlling interest in the company.
Like the rest of Zero, the firm’s new hedge fund is quantitatively driven and index based.The fund has been set up in a separate office with new systems so that the analysts andmanagers can create a unique hedge fund culture. Trading and execution are the onlyoperations that remain with Zero. The fund is run by one of Zero’s most successful portfoliomanagers.
Smith learns that although none of the board members sit on other companies’ boards,most have at one point or another worked at Zero and so they are very familiar with Zero’soperations. A board member has attempted to make the health insurance and retirementconcerns of the board members an agenda item, without success to date. Smith eagerlyanticipates the next board meeting as they are always in a luxurious setting.
At the board meeting, Smith asks a number of questions about Zero’s corporate gov-ernance system. The board becomes concerned by Smith’s questions and decides to hire anindependent consultant to review their corporate governance responsibilities. The consultantstarts his analysis by stating that a corporate governance system relies upon checks and bal-ances among managers, directors, and investors. Smith asks if Zero has the proper systems inplace. The consultant says that he has looked at conflicts of interest and has one more area toreview in order to verify that the board is meeting its major objectives. Concerned about thecompany’s stock price, Smith asks the consultant what work he has done concerning Zero’scorporate disclosures for investment professionals. The consultant indicates that he hasreviewed Zero’s regulatory filings for clear and complete information, as well as the com-pany’s policies regarding related party transactions.
Chapter 1 Corporate Governance 43
c01 13 January 2012; 9:5:49

9. All of the following indicate Zero’s board’s lack of independence except:A. personal relationships.B. service of the outside counsel as a board member.C. lack of interlocking directorships.
10. Which of the following is the most effective action for the board to take to address theiroversight responsibilities concerning the hedge fund’s proxy voting?A. Establish corporate values and governance structure for the company.B. Establish long-term strategic objectives that are met and fully complied with.C. Perform adequate training so that employees are able to perform their duties.
11. Which of the following omissions best describes a corporate governance shortcoming ofZero’s board of directors? The board’s failure to:A. address the potential conflicts of interest between managing the firm’s hedge fund
and its mutual fund business.B. meet the market opportunity for a new kind of mutual fund.C. establish the hedge fund operation in a separate corporation.
12. Given that Zero’s directors all previously worked at the company, which of the followingwould you recommend for a more effective system of corporate governance?A. Ensure that assets are used efficiently and productively and in the best interests of
investors and stakeholders.B. Eliminate or mitigate conflicts of interest among stakeholders, particularly between
managers and shareholders.C. Identify andmeasure accountabilities for the performance of the board’s responsibilities.
13. Which of the following best describes the objectives of Zero’s board that the consultanthas not yet reviewed? The board should ensure:A. that the assets of the company are used efficiently and productively and in the best
interests of the investors and other stakeholders.B. that material foreseeable risk factors are addressed and considered.C. compliance with applicable laws and take into account the interest of stakeholders.
14. Which of the following is the most critical activity that an analyst can engage in to assessthe quality of the corporate governance system at Zero, among those that the consultantdid not review?A. Look for vague references to off-balance-sheet or insider information.B. Identify the responsiveness of the board to shareholder proxy votes.C. Evaluate the quality and extent of financial information provided to investors.
The following information relates to Questions 15–19.Shelley Newcome is the new CEO for a publicly traded financial services company, Asset
Management Co. (AMC). Newcome is new to the corporate governance requirements of apublicly traded company, as she previously worked for a family office that invested in privateequity.
At her first board meeting, the company’s first in six months, she asks a director whatthe objectives of corporate governance should be. The director tells her that the most importantobjective he can think of is to eliminate or mitigate conflicts of interest among stakeholders.
44 Corporate Finance
c01 13 January 2012; 9:5:49

One of Newcome’s first steps as CEO is to fly to New York City in order to address agroup of Wall Street analysts. Newcome is happy to discover that AMC provides her, andother senior management, with a company jet to attend such meetings.
At the opening of the meeting, Newcome is surprised to hear that most of the analysts areextremely interested in learning about AMC’s corporate governance system. One analystindicates that he has studied several of AMC’s competitors and found that they share a set ofcritical and core attributes. The analyst goes on to note that like its competitors, AMC hasincluded in its corporate governance system the following attributes: the rights of shareholdersand other core stakeholders are clearly delineated; there is complete transparency and accuracyin disclosures regarding operations, performance, risk, and financial position; and identifiableand measurable accountabilities for the performance of responsibilities. The analyst also saysthat in order to verify that the board is meeting its major objectives he has looked at AMC’sconflicts of interest and has one more area to review.
Newcome then asks the analyst why his corporate governance evaluation of AMC isso important. The analyst responds by saying that his decision whether or not to invest inAMC, and ultimately the long-term performance of the company, is dependent upon thequality of AMC’s managers’ decisions and the skill they use in applying sound managementpractices.
Closing the meeting, Newcome is delayed by one analyst who complains about thedifficulties of flying these days and how he has to get to the airport hours ahead of time.The analyst goes on to say that he reviewed AMC’s regulatory filings and was happy tosee that the company does not spend its money on frivolous perquisites like executive jets.
15. Which of the following would best complete the objectives of corporate governance forthe CEO?A. Ensure that assets of the company are used efficiently and productively and in the
best interests of investors and other stakeholders.B. Clearly define governance responsibilities for both managers and directors.C. Establish clear lines of responsibility and a strong system of accountability and
performance measurement in all phases of a company’s operations.
16. On the basis of the Wall Street analyst comments about AMC’s corporate governancesystem, which of the following would be most effective for AMC to attract investors’interest?A. Implement a corporate governance system in which business activity is encouraged
and rewarded, and that leads to innovation.B. Establish a corporate governance system that overcomes inherent conflicts of interest
since they represent a major operational risk to investors and the continued existenceof the company.
C. Provide full transparency of all material information on a timely basis to allinvestment analysts.
17. Which of the following is a core attribute that the Wall Street analyst left out of hisanalysis of AMC?A. Corporate governance systems rely on checks and balances among managers, direc-
tors, and investors.B. Fairness in all dealings between managers, directors, and shareholders.C. Complete, accurate, and transparent disclosure of loans to private equity funds.
Chapter 1 Corporate Governance 45
c01 13 January 2012; 9:5:49
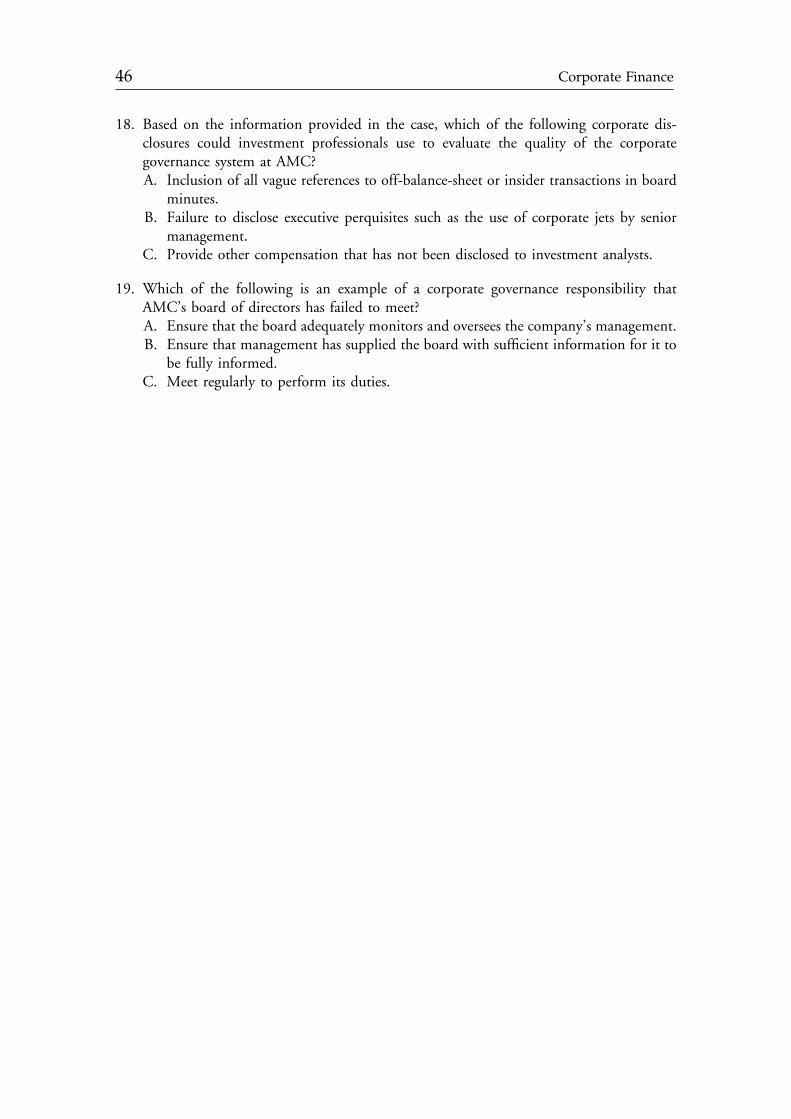
18. Based on the information provided in the case, which of the following corporate dis-closures could investment professionals use to evaluate the quality of the corporategovernance system at AMC?A. Inclusion of all vague references to off-balance-sheet or insider transactions in board
minutes.B. Failure to disclose executive perquisites such as the use of corporate jets by senior
management.C. Provide other compensation that has not been disclosed to investment analysts.
19. Which of the following is an example of a corporate governance responsibility thatAMC’s board of directors has failed to meet?A. Ensure that the board adequately monitors and oversees the company’s management.B. Ensure that management has supplied the board with sufficient information for it to
be fully informed.C. Meet regularly to perform its duties.
46 Corporate Finance
c01 13 January 2012; 9:5:49

CHAPTER 2CAPITAL BUDGETING
John D. Stowe, CFAAthens, Ohio, U.S.A.
Jacques R. Gagne, CFAQuebec City, Quebec, Canada
LEARNING OUTCOMES
After completing this chapter, you will be able to do the following:
! Describe the capital budgeting process, including the typical steps of the process, anddistinguish among the various categories of capital projects.
! Describe the basic principles of capital budgeting, including cash flow estimation.! Explain how the evaluation and selection of capital projects is affected by mutually
exclusive projects, project sequencing, and capital rationing.! Calculate and interpret the results using each of the following methods to evaluate a single
capital project: net present value (NPV), internal rate of return (IRR), payback period,discounted payback period, average accounting rate of return (AAR), and profitabilityindex (PI).
! Explain the NPV profile, compare NPV and IRR methods when evaluating independentand mutually exclusive projects, and describe the problems associated with each of theevaluation methods.
! Describe the relative popularity of the various capital budgeting methods and explain therelation between NPV and company value and stock price.
! Describe the expected relations among an investment’s NPV, company value, and stockprice.
! Calculate the yearly cash flows of an expansion capital project and a replacement capitalproject, and evaluate how the choice of depreciation method affects those cash flows.
! Explain the effects of inflation on capital budgeting analysis.! Evaluate and select the optimal capital project in situations of (1) mutually exclusive
projects with unequal lives, using either the least common multiple of lives approach or theequivalent annual annuity approach, and (2) capital rationing.
! Explain how sensitivity analysis, scenario analysis, and Monte Carlo simulation can be usedto estimate the standalone risk of a capital project.
47
c02 13 January 2012; 17:42:8

! Explain the procedure for determining the discount rate to be used in valuing a capitalproject and calculate a project’s required rate of return using the capital asset pricing model(CAPM).
! Describe the types of real options and evaluate the profitability of investments with realoptions.
! Explain capital budgeting pitfalls.! Calculate and interpret accounting income and economic income in the context of capital
budgeting.! Distinguish among and evaluate a capital project using the economic profit, residual
income, and claims valuation models.
1. INTRODUCTION
Capital budgeting is the process that companies use for decision making on capital projects—those projects with a life of a year or more. This is a fundamental area of knowledge forfinancial analysts for many reasons:
! First, capital budgeting is very important for corporations. Capital projects, which make upthe long-term asset portion of the balance sheet, can be so large that sound capital bud-geting decisions ultimately decide the future of many corporations. Capital decisionscannot be reversed at a low cost, so mistakes are very costly. Indeed, the real capitalinvestments of a company describe a company better than its working capital orcapital structures, which are intangible and tend to be similar for many corporations.
! Second, the principles of capital budgeting have been adapted for many other corporatedecisions, such as investments in working capital, leasing, mergers and acquisitions, andbond refunding.
! Third, the valuation principles used in capital budgeting are similar to the valuationprinciples used in security analysis and portfolio management. Many of the methods usedby security analysts and portfolio managers are based on capital budgeting methods.Conversely, there have been innovations in security analysis and portfolio management thathave also been adapted to capital budgeting.
! Finally, although analysts have a vantage point outside the company, their interest invaluation coincides with the capital budgeting focus of maximizing shareholder value.Because capital budgeting information is not ordinarily available outside the company, theanalyst may attempt to estimate the process, within reason, at least for companies that arenot too complex. Further, analysts may be able to appraise the quality of the company’scapital budgeting process; for example, on the basis of whether the company has anaccounting focus or an economic focus.
This chapter is organized as follows: Section 2 presents the steps in a typical capitalbudgeting process. After introducing the basic principles of capital budgeting in Section 3,in Section 4 we discuss the criteria by which a decision to invest in a project may be made.Section 5 presents a crucial element of the capital budgeting process: organizing the cash flowinformation that is the raw material of the analysis. Section 6 looks further at cash flowanalysis. Section 7 demonstrates methods to extend the basic investment criteria to addresseconomic alternatives and risk. Finally, Section 8 compares other income measures andvaluation models that analysts use to the basic capital budgeting model.
48 Corporate Finance
c02 13 January 2012; 17:42:8

2. THE CAPITAL BUDGETING PROCESS
The specific capital budgeting procedures that a manager uses depend on the manager’s levelin the organization, the size and complexity of the project being evaluated, and the size of theorganization. The typical steps in the capital budgeting process are as follows:
! Step 1, Generating Ideas. Investment ideas can come from anywhere, from the top or thebottom of the organization, from any department or functional area, or from outsidethe company. Generating good investment ideas to consider is the most important stepin the process.
! Step 2, Analyzing Individual Proposals. This step involves gathering the information toforecast cash flows for each project and then evaluating the project’s profitability.
! Step 3, Planning the Capital Budget. The company must organize the profitable proposalsinto a coordinated whole that fits within the company’s overall strategies, and it also mustconsider the projects’ timing. Some projects that look good when considered in isolationmay be undesirable strategically. Because of financial and real resource issues, schedulingand prioritizing projects is important.
! Step 4, Monitoring and Post-Auditing. In a post-audit, actual results are compared toplanned or predicted results, and any differences must be explained. For example, how dothe revenues, expenses, and cash flows realized from an investment compare to the pre-dictions? Post-auditing capital projects is important for several reasons. First, it helpsmonitor the forecasts and analysis that underlie the capital budgeting process. Systematicerrors, such as overly optimistic forecasts, become apparent. Second, it helps improvebusiness operations. If sales or costs are out of line, it will focus attention on bringingperformance closer to expectations if at all possible. Finally, monitoring and post-auditingrecent capital investments will produce concrete ideas for future investments. Managers candecide to invest more heavily in profitable areas and scale down or cancel investments inareas that are disappointing.
Planning for capital investments can be very complex, often involving many personsinside and outside of the company. Information about marketing, science, engineering,regulation, taxation, finance, production, and behavioral issues must be systematically gath-ered and evaluated. The authority to make capital decisions depends on the size and com-plexity of the project. Lower-level managers may have discretion to make decisions thatinvolve less than a given amount of money, or that do not exceed a given capital budget.Larger and more complex decisions are reserved for top management, and some are so sig-nificant that the company’s board of directors ultimately has the decision-making authority.
Like everything else, capital budgeting is a cost–benefit exercise. At the margin, thebenefits from the improved decision making should exceed the costs of the capital budgetingefforts.
Companies often put capital budgeting projects into some rough categories for analysis.One such classification would be as follows:
1. Replacement projects. These are among the easier capital budgeting decisions. If a piece ofequipment breaks down or wears out, whether to replace it may not require carefulanalysis. If the expenditure is modest and if not investing has significant implications forproduction, operations, or sales, it would be a waste of resources to overanalyze thedecision. Just make the replacement. Other replacement decisions involve replacing
Chapter 2 Capital Budgeting 49
c02 13 January 2012; 17:42:8

existing equipment with newer, more efficient equipment, or perhaps choosing one typeof equipment over another. These replacement decisions are often amenable to verydetailed analysis, and you might have a lot of confidence in the final decision.
2. Expansion projects. Instead of merely maintaining a company’s existing business activities,expansion projects increase the size of the business. These expansion decisions mayinvolve more uncertainties than replacement decisions, and these decisions will be morecarefully considered.
3. New products and services. These investments expose the company to even more uncer-tainties than expansion projects. These decisions are more complex and will involve morepeople in the decision-making process.
4. Regulatory, safety, and environmental projects. These projects are frequently required by agovernmental agency, an insurance company, or some other external party. They maygenerate no revenue and might not be undertaken by a company maximizing its ownprivate interests. Often, the company will accept the required investment and continue tooperate. Occasionally, however, the cost of the regulatory/safety/environmental project issufficiently high that the company would do better to cease operating altogether or toshut down any part of the business that is related to the project.
5. Other. The projects above are all susceptible to capital budgeting analysis, and they can beaccepted or rejected using the net present value (NPV) or some other criterion. Someprojects escape such analysis. These are either pet projects of someone in the company(such as the CEO buying a new aircraft) or so risky that they are difficult to analyze bythe usual methods (such as some research and development decisions).
3. BASIC PRINCIPLES OF CAPITAL BUDGETING
Capital budgeting has a rich history and sometimes employs some pretty sophisticated pro-cedures. Fortunately, capital budgeting relies on just a few basic principles. Capital budgetingusually uses the following five assumptions:
1. Decisions are based on cash flows. The decisions are not based on accounting concepts,such as net income. Furthermore, intangible costs and benefits are often ignored because,if they are real, they should result in cash flows at some other time.
2. Timing of cash flows is crucial. Analysts make an extraordinary effort to detail preciselywhen cash flows occur.
3. Cash flows are based on opportunity costs. What are the incremental cash flows that occurwith an investment compared to what they would have been without the investment?
4. Cash flows are analyzed on an after-tax basis. Taxes must be fully reflected in all capitalbudgeting decisions.
5. Financing costs are ignored. This may seem unrealistic, but it is not. Most of the time,analysts want to know the after-tax operating cash flows that result from a capitalinvestment. Then, these after-tax cash flows and the investment outlays are discounted atthe “required rate of return” to find the net present value (NPV). Financing costs arereflected in the required rate of return. If we included financing costs in the cash flowsand in the discount rate, we would be double-counting the financing costs. So eventhough a project may be financed with some combination of debt and equity, we ignorethese costs, focusing on the operating cash flows and capturing the costs of debt (andother capital) in the discount rate.
50 Corporate Finance
c02 13 January 2012; 17:42:8

Capital budgeting cash flows are not accounting net income. Accounting net income isreduced by noncash charges such as accounting depreciation. Furthermore, to reflect the costof debt financing, interest expenses are also subtracted from accounting net income. (Nosubtraction is made for the cost of equity financing in arriving at accounting net income.)Accounting net income also differs from economic income, which is the cash inflow plus thechange in the market value of the company. Economic income does not subtract the cost ofdebt financing, and it is based on the changes in the market value of the company, notchanges in its book value (accounting depreciation). We will further consider cash flows,accounting income, economic income, and other income measures at the end of this chapter.
In assumption 5 above, we referred to the rate used in discounting the cash flows as the“required rate of return.” The required rate of return is the discount rate that investors shouldrequire given the riskiness of the project. This discount rate is frequently called the“opportunity cost of funds” or the “cost of capital.” If the company can invest elsewhere andearn a return of r, or if the company can repay its sources of capital and save a cost of r, then ris the company’s opportunity cost of funds. If the company cannot earn more than itsopportunity cost of funds on an investment, it should not undertake that investment. Unlessan investment earns more than the cost of funds from its suppliers of capital, the investmentshould not be undertaken. The cost-of-capital concept is discussed more extensively else-where. Regardless of what it is called, an economically sound discount rate is essential formaking capital budgeting decisions.
Although the principles of capital budgeting are simple, they are easily confused inpractice, leading to unfortunate decisions. Some important capital budgeting concepts thatmanagers find very useful are given below.
! A sunk cost is one that has already been incurred. You cannot change a sunk cost. Today’sdecisions, on the other hand, should be based on current and future cash flows and shouldnot be affected by prior, or sunk, costs.
! Anopportunity cost is what a resource isworth in its next-best use. For example, if a companyuses some idle property, what should it record as the investment outlay: the purchase priceseveral years ago, the current market value, or nothing? If you replace an old machine with anew one, what is the opportunity cost? If you invest $10million, what is the opportunity cost?The answers to these three questions are, respectively: the current market value, the cash flowsthe old machine would generate, and $10 million (which you could invest elsewhere).
! An incremental cash flow is the cash flow that is realized because of a decision: the cashflow with a decision minus the cash flow without that decision. If opportunity costs arecorrectly assessed, the incremental cash flows provide a sound basis for capital budgeting.
! An externality is the effect of an investment on other things besides the investment itself.Frequently, an investment affects the cash flows of other parts of the company, and theseexternalities can be positive or negative. If possible, these should be part of the investmentdecision. Sometimes externalities occur outside of the company. An investment might benefit(or harm) other companies or society at large, and yet the company is not compensated forthese benefits (or charged for the costs). Cannibalization is one externality. Cannibalizationoccurs when an investment takes customers and sales away from another part of the company.
! Conventional versus nonconventional cash flows. A conventional cash flow pattern isone with an initial outflow followed by a series of inflows. In a nonconventional cash flowpattern, the initial outflow is not followed by inflows only, but the cash flows can flip frompositive to negative again (or even change signs several times). An investment that involvedoutlays (negative cash flows) for the first couple of years that were then followed by positive
Chapter 2 Capital Budgeting 51
c02 13 January 2012; 17:42:9

cash flows would be considered to have a conventional pattern. If cash flows change signsonce, the pattern is conventional. If cash flows change signs two or more times, the patternis nonconventional.
Several types of project interactions make the incremental cash flow analysis challenging.The following are some of these interactions:
! Independent versus mutually exclusive projects. Independent projects are projects whosecash flows are independent of each other. Mutually exclusive projects compete directly witheach other. For example, if Projects A and B are mutually exclusive, you can choose A or B,but you cannot choose both. Sometimes there are several mutually exclusive projects, andyou can choose only one from the group.
! Project sequencing. Many projects are sequenced through time, so that investing ina project creates the option to invest in future projects. For example, you might invest in aproject today and then in one year invest in a second project if the financial results of thefirst project or new economic conditions are favorable. If the results of the first project ornew economic conditions are not favorable, you do not invest in the second project.
! Unlimited funds versus capital rationing. An unlimited funds environment assumes thatthe company can raise the funds it wants for all profitable projects simply by paying therequired rate of return. Capital rationing exists when the company has a fixed amount offunds to invest. If the company has more profitable projects than it has funds for, it mustallocate the funds to achieve the maximum shareholder value subject to the fundingconstraints.
4. INVESTMENT DECISION CRITERIA
Analysts use several important criteria to evaluate capital investments. The two most com-prehensive measures of whether a project is profitable or unprofitable are the net present value(NPV) and internal rate of return (IRR). In addition to these, we present four other criteriathat are frequently used: the payback period, discounted payback period, average accountingrate of return (AAR), and profitability index (PI). An analyst must fully understand theeconomic logic behind each of these investment decision criteria as well as its strengths andlimitations in practice.
4.1. Net Present Value
For a project with one investment outlay, made initially, the net present value (NPV) is thepresent value of the future after-tax cash flows minus the investment outlay, or
NPV ¼Xn
t¼1
CFtð1þ rÞt
&Outlay ð2-1Þ
where
CFt ¼ after-tax cash flow at time tr ¼ required rate of return for the investment
Outlay ¼ investment cash flow at time zero
52 Corporate Finance
c02 13 January 2012; 17:42:9

To illustrate the net present value criterion, we will take a look at a simple example.Assume that Gerhardt Corporation is considering an investment of h50 million in a capitalproject that will return after-tax cash flows of h16 million per year for the next four years plusanother h20 million in year five. The required rate of return is 10 percent.
For the Gerhardt example, the NPV would be
NPV ¼ 161:101
þ 161:102
þ 161:103
þ 161:104
þ 201:105
& 50
NPV ¼ 14:545þ 13:223þ 12:021þ 10:928þ 12:418& 50
NPV ¼ 63:136& 50 ¼ h13:136 million1
The investment has a total value, or present value of future cash flows, of h63.136million. Since this investment can be acquired at a cost of h50 million, the investing companyis giving up h50 million of its wealth in exchange for an investment worth h63.136 million.The investor’s wealth increases by a net of h13.136 million.
Because the NPV is the amount by which the investor’s wealth increases as a result of theinvestment, the decision rule for the NPV is as follows:
Invest if NPV. 0
Do not invest if NPV, 0
Positive NPV investments are wealth-increasing, while negative NPV investments arewealth-decreasing.
Many investments have cash flow patterns in which outflows may occur not only at timezero, but also at future dates. It is useful to consider the NPV to be the present value of allcash flows:,
NPV ¼ CF0 þCF1
ð1þ rÞ1þ CFð1þ rÞ2
þ?þ CFnð1þ rÞn , or
NPV ¼Xn
t¼0
CFtð1þ rÞt
ð2-2Þ
In Equation 2-2, the investment outlay, CF0, is simply a negative cash flow. Future cashflows can also be negative.
4.2. Internal Rate of Return
The internal rate of return (IRR) is one of the most frequently used concepts in capitalbudgeting and in security analysis. The IRR definition is one that all analysts know by heart.For a project with one investment outlay, made initially, the IRR is the discount rate that
1Occasionally, you will notice some rounding errors in our examples. In this case, the present values ofthe cash flows, as rounded, add up to 63.135. Without rounding, they add up to 63.13627, or 63.136.We will usually report the more accurate result, the one that you would get from your calculator orcomputer without rounding intermediate results.
Chapter 2 Capital Budgeting 53
c02 13 January 2012; 17:42:9

makes the present value of the future after-tax cash flows equal that investment outlay.Written out in equation form, the IRR solves this equation:
Xn
t¼1
CFtð1þ IRRÞt
¼ Outlay
where IRR is the internal rate of return. The left-hand side of this equation is the presentvalue of the project’s future cash flows, which, discounted at the IRR, equals the investmentoutlay. This equation will also be seen rearranged as
Xn
t¼1
CFtð1þ IRRÞt
&Outlay ¼ 0 ð2-3Þ
In this form, Equation 2-3 looks like the NPV equation, Equation 2-1, except that thediscount rate is the IRR instead of r (the required rate of return). Discounted at the IRR, theNPV is equal to zero.
In the Gerhardt Corporation example, we want to find a discount rate that makes thetotal present value of all cash flows, the NPV, equal zero. In equation form, the IRR is thediscount rate that solves this equation:
&50þ 16ð1þ IRRÞ1
þ 16ð1þ IRRÞ2
þ 16ð1þ IRRÞ3
þ 16ð1þ IRRÞ4
þ 20ð1þ IRRÞ5
¼ 0
Algebraically, this equation would be very difficult to solve. We normally resort to trialand error, systematically choosing various discount rates until we find one, the IRR, thatsatisfies the equation. We previously discounted these cash flows at 10 percent and found theNPV to be h13.136 million. Since the NPV is positive, the IRR is probably greater than10 percent. If we use 20 percent as the discount rate, the NPV is –h0.543 million, so 20percent is a little high. One might try several other discount rates until the NPV is equal tozero; this approach is illustrated in Exhibit 2-1.
EXHIBIT 2-1 Trial and Error Process for Finding IRR
Discount Rate NPV
10% 13.136
20% –0.543
19% 0.598
19.5% 0.022
19.51% 0.011
19.52% 0.000
The IRR is 19.52 percent. Financial calculators and spreadsheet software have routinesthat calculate the IRR for us, so we do not have to go through this trial and error procedureourselves. The IRR, computed more precisely, is 19.5197 percent.
54 Corporate Finance
c02 13 January 2012; 17:42:9

The decision rule for the IRR is to invest if the IRR exceeds the required rate of return fora project:
Invest if IRR. r
Do not invest if IRR, r
In the Gerhardt example, since the IRR of 19.52 percent exceeds the project’s requiredrate of return of 10 percent, Gerhardt should invest.
Many investments have cash flow patterns in which the outlays occur at time zero and atfuture dates. Thus, it is common to define the IRR as the discount rate that makes the presentvalues of all cash flows sum to zero:
Xn
t¼0
CFtð1þ IRRÞt
¼ 0 ð2-4Þ
Equation 2-4 is a more general version of Equation 2-3.
4.3. Payback Period
The payback period is the number of years required to recover the original investment in aproject. The payback is based on cash flows. For example, if you invest $10 million ina project, how long will it be until you recover the full original investment? Exhibit 2-2illustrates the calculation of the payback period by following an investment’s cash flows andcumulative cash flows.
EXHIBIT 2-2 Payback Period Example
Year 0 1 2 3 4 5
Cash flow –10,000 2,500 2,500 3,000 3,000 3,000
Cumulative cash flow –10,000 –7,500 –5,000 –2,000 1,000 4,000
In the first year, the company recovers 2,500 of the original investment, with 7,500 stillunrecovered. You can see that the company recoups its original investment between Year 3and Year 4. After three years, 2,000 is still unrecovered. Since the Year 4 cash flow is 3,000, itwould take two-thirds of the Year 4 cash flow to bring the cumulative cash flow to zero. So,the payback period is three years plus two-thirds of the Year 4 cash flow, or 3.67 years.
The drawbacks of the payback period are transparent. Since the cash flows are not dis-counted at the project’s required rate of return, the payback period ignores the time value ofmoney and the risk of the project. Additionally, the payback period ignores cash flows afterthe payback period is reached. In Exhibit 2-2, for example, the Year 5 cash flow is completelyignored in the payback computation!
Example 2-1 is designed to illustrate some of the implications of these drawbacks of thepayback period.
Chapter 2 Capital Budgeting 55
c02 13 January 2012; 17:42:9

EXAMPLE 2-1 Drawbacks of the Payback Period
The cash flows, payback periods, and NPVs for Projects A through F are given inExhibit 2-3. For all of the projects, the required rate of return is 10 percent.
EXHIBIT 2-3 Examples of Drawbacks of the Payback Period
Year Cash Flows
Project A Project B Project C Project D Project E Project F
0 –1,000 –1,000 –1,000 –1,000 –1,000 –1,000
1 1,000 100 400 500 400 500
2 200 300 500 400 500
3 300 200 500 400 10,000
4 400 100 400
5 500 500 400
Payback period 1.0 4.0 4.0 2.0 2.5 2.0
NPV –90.91 65.26 140.60 243.43 516.31 7,380.92
Comment on why the payback period provides misleading information about thefollowing:
1. Project A2. Project B versus Project C3. Project D versus Project E4. Project D versus Project F
Solutions:
1. Project A does indeed pay itself back in one year. However, this result is misleadingbecause the investment is unprofitable, with a negative NPV.
2. Although Projects B and C have the same payback period and the same cash flowafter the payback period, the payback period does not detect the fact that Project C’scash flows within the payback period occur earlier and result in a higher NPV.
3. Projects D and E illustrate a common situation. The project with the shorterpayback period is the less profitable project. Project E has a longer payback andhigher NPV.
4. Projects D and F illustrate an important flaw of the payback period—that thepayback period ignores cash flows after the payback period is reached. In this case,Project F has a much larger cash flow in Year 3, but the payback period does notrecognize its value.
56 Corporate Finance
c02 13 January 2012; 17:42:10

The payback period has many drawbacks—it is a measure of payback and not a measureof profitability. By itself, the payback period would be a dangerous criterion for evaluatingcapital projects. Its simplicity, however, is an advantage. The payback period is very easy tocalculate and to explain. The payback period may also be used as an indicator of projectliquidity. A project with a two-year payback may be more liquid than another project with alonger payback.
Because it is not economically sound, the payback period has no decision rule like that ofthe NPV or IRR. If the payback period is being used (perhaps as a measure of liquidity),analysts should also use an NPV or IRR to ensure that their decisions also reflect the prof-itability of the projects being considered.
4.4. Discounted Payback Period
The discounted payback period is the number of years it takes for the cumulative discountedcash flows from a project to equal the original investment. The discounted payback periodpartially addresses the weaknesses of the payback period. Exhibit 2-4 gives an example ofcalculating the payback period and discounted payback period. The example assumes a dis-count rate of 10 percent.
EXHIBIT 2-4 Payback Period and Discounted Payback Period
Year 0 1 2 3 4 5
Cash flow (CF) –5,000 1,500.00 1,500.00 1,500.00 1,500.00 1,500.00
Cumulative CF –5,000 –3,500.00 –2,000.00 –500.00 1,000.00 2,500.00
Discounted CF –5,000 1,363.64 1,239.67 1,126.97 1,024.52 931.38
Cumulative discounted CF –5,000 –3,636.36 –2,396.69 –1,269.72 –245.20 686.18
The payback period is 3 years plus 500/1500¼ one-third of the fourth year’s cash flow,or 3.33 years. The discounted payback period is between four and five years. The discountedpayback period is four years plus 245.20/931.38¼ 0.26 of the fifth year’s discounted cashflow, or 4.26 years.
The discounted payback period relies on discounted cash flows, much as the NPV cri-terion does. If a project has a negative NPV, it will usually not have a discounted paybackperiod since it never recovers the initial investment.
The discounted payback does account for the time value of money and risk within thediscounted payback period, but it ignores cash flows after the discounted payback period isreached. This drawback has two consequences. First, the discounted payback period is not agood measure of profitability (like the NPV or IRR) because it ignores these cash flows.Second, another idiosyncrasy of the discounted payback period comes from the possibility ofnegative cash flows after the discounted payback period is reached. It is possible for a projectto have a negative NPV but to have a positive cumulative discounted cash flow in the middleof its life and, thus, a reasonable discounted payback period. The NPV and IRR, whichconsider all of a project’s cash flows, do not suffer from this problem.
Chapter 2 Capital Budgeting 57
c02 13 January 2012; 17:42:10

4.5. Average Accounting Rate of Return
The average accounting rate of return (AAR) can be defined as
AAR ¼ Average net incomeAverage book value
To understand this measure of return, we will use a numerical example.Assume a company invests $200,000 in a project that is depreciated straight-line over a
five-year life to a zero salvage value. Sales revenues and cash operating expenses for each yearare as shown in Exhibit 2-5. The table also shows the annual income taxes (at a 40 percent taxrate) and the net income.
EXHIBIT 2-5 Net Income for Calculating an Average Accounting Rate of Return
Year 1 Year 2 Year 3 Year 4 Year 5
Sales $100,000 $150,000 $240,000 $130,000 $80,000
Cash expenses 50,000 70,000 120,000 60,000 50,000
Depreciation 40,000 40,000 40,000 40,000 40,000
Earnings before taxes 10,000 40,000 80,000 30,000 –10,000
Taxes (at 40 percent) 4,000 16,000 32,000 12,000 –4,000*
Net income 6,000 24,000 48,000 18,000 –6,000
*Negative taxes occur in Year 5 because the earnings before taxes of –$10,000 can be deducted against earnings onother projects, thus reducing the tax bill by $4,000.
For the five-year period, the average net income is $18,000. The initial book value is$200,000, declining by $40,000 per year until the final book value is $0. The average bookvalue for this asset is ($200,000 – $0)/2¼ $100,000. The average accounting rate of return is
AAR ¼ Average net incomeAverage book value
¼ 18,000100,000
¼ 18%
The advantages of the AAR are that it is easy to understand and easy to calculate. TheAAR has some important disadvantages, however. Unlike the other capital budgeting criteriadiscussed here, the AAR is based on accounting numbers and not based on cash flows. This isan important conceptual and practical limitation. The AAR also does not account for the timevalue of money, and there is no conceptually sound cutoff for the AAR that distinguishesbetween profitable and unprofitable investments. The AAR is frequently calculated in dif-ferent ways, so the analyst should verify the formula behind any AAR numbers that aresupplied by someone else. Analysts should know the AAR and its potential limitations inpractice, but they should rely on more economically sound methods like the NPV and IRR.
4.6. Profitability Index
The profitability index (PI) is the present value of a project’s future cash flows divided by theinitial investment. It can be expressed as
58 Corporate Finance
c02 13 January 2012; 17:42:10

PI ¼ PV of future cash flowsInitial investment
¼ 1þ NPVInitial investment
ð2-5Þ
You can see that the PI is closely related to the NPV. The PI is the ratio of the PV offuture cash flows to the initial investment, while an NPV is the difference between the PVof future cash flows and the initial investment. Whenever the NPV is positive, the PI will begreater than 1.0, and conversely, whenever the NPV is negative, the PI will be less than 1.0.The investment decision rule for the PI is as follows:
Invest if PI. 1.0
Do not invest if PI, 1.0
Because the PV of future cash flows equals the initial investment plus the NPV, the PIcan also be expressed as 1.0 plus the ratio of the NPV to the initial investment, as shown inEquation 2-5 earlier. Example 2-2 illustrates the PI calculation.
The PI indicates the value you are receiving in exchange for one unit of currencyinvested. Although the PI is used less frequently than the NPV and IRR, it is sometimes usedas a guide in capital rationing. The PI is usually called the profitability index in corporations,but it is commonly referred to as a “benefit–cost ratio” in governmental and not-for-profitorganizations.
4.7. NPV Profile
The NPV profile shows a project’s NPV graphed as a function of various discount rates.Typically, the NPV is graphed vertically (on the y-axis) and the discount rates are graphedhorizontally (on the x-axis). The NPV profile for the Gerhardt capital budgeting project isshown in Example 2-3.
EXAMPLE 2-2 Example of a PI Calculation
The Gerhardt Corporation investment (discussed earlier) had an outlay of h50 million,a present value of future cash flows of h63.136 million, and an NPV of h13.136million. The profitability index is
PI ¼ PV of future cash flowsInitial investment
¼ 63:13650:000
¼ 1:26
The PI can also be calculated as
PI ¼ 1þ NPVInitial investment
¼ 1þ 13:13650:000
¼ 1:26
Because the PI. 1.0, this is a profitable investment.
Chapter 2 Capital Budgeting 59
c02 13 January 2012; 17:42:10

EXAMPLE 2-3 NPV Profile
For the Gerhardt example, we have already calculated several NPVs for different discountrates. At 10 percent the NPV is h13.136 million; at 20 percent the NPV is –h0.543million; and at 19.52 percent (the IRR), theNPV is zero.What is the NPV if the discountrate is 0 percent? TheNPVdiscounted at 0 percent is h34million, which is simply the sumof all of the undiscounted cash flows. Exhibits 2-6 and 2-7 show the NPV profile for theGerhardt example for discount rates between 0 percent and 30 percent.
EXHIBIT 2-6 Gerhardt NPV Profile
Discount Rate NPV h millions
0% 34.000
5.00% 22.406
10.00% 13.136
15.00% 5.623
19.52% 0.000
20.00% –0.543
25.00% –5.661
30.00% –9.954
EXHIBIT 2-7 Gerhardt NPV Profile
NPV
40
30
20
10
0
10
35
25
15
5
5
1515 251050 20 30
Discount Rate (%)
Three interesting points on this NPV profile are where the profile goes through thevertical axis (the NPV when the discount rate is zero), where the profile goes throughthe horizontal axis (where the discount rate is the IRR), and the NPV for the requiredrate of return (NPV is h13.136 million when the discount rate is the 10 percentrequired rate of return).
60 Corporate Finance
c02 13 January 2012; 17:42:11

The NPV profile in Exhibit 2-7 is very well-behaved. The NPV declines at a decreasingrate as the discount rate increases. The profile is convex from the origin (convex from below).You will shortly see some examples in which the NPV profile is more complicated.
4.8. Ranking Conflicts between NPV and IRR
For a single conventional project, the NPV and IRR will agree on whether to invest or to notinvest. For independent, conventional projects, no conflict exists between the decision rulesfor the NPV and IRR. However, in the case of two mutually exclusive projects, the twocriteria will sometimes disagree. For example, Project A might have a larger NPV than ProjectB, but Project B has a higher IRR than Project A. In this case, should you invest in Project Aor in Project B?
Differing cash flow patterns can cause two projects to rank differently with the NPV andIRR. For example, suppose Project A has shorter-term payoffs than Project B. This situationis presented in Example 2-4.
Whenever the NPV and IRR rank two mutually exclusive projects differently, as they doin the example above, you should choose the project based on the NPV. Project B, with thehigher NPV, is the better project because of the reinvestment assumption. Mathematically,whenever you discount a cash flow at a particular discount rate, you are implicitly assuming
EXAMPLE 2-4 Ranking Conflict Due to Differing Cash FlowPatterns
Projects A and B have similar outlays but different patterns of future cash flows. ProjectA realizes most of its cash payoffs earlier than Project B. The cash flows as well as theNPV and IRR for the two projects are shown in Exhibit 2-8. For both projects,the required rate of return is 10 percent.
EXHIBIT 2-8 Cash Flows, NPV, and IRR for Two Projects with Different CashFlow Patterns
Cash Flows
Year 0 1 2 3 4 NPV IRR
Project A –200 80 80 80 80 53.59 21.86%
Project B –200 0 0 0 400 73.21 18.92%
If the two projects were not mutually exclusive, you would invest in both because theyare both profitable. However, you can choose either A (which has the higher IRR) or B(which has the higher NPV).
Exhibits 2-9 and 2-10 show the NPVs for Project A and Project B for variousdiscount rates between 0 percent and 30 percent.
Chapter 2 Capital Budgeting 61
c02 13 January 2012; 17:42:11

EXHIBIT 2-9 NPV Profiles for Two Projects with Different Cash Flow Patterns
Discount Rate NPV for Project A NPV for Project B
0% 120.00 200.00
5.00% 83.68 129.08
10.00% 53.59 73.21
15.00% 28.40 28.70
15.09% 27.98 27.98
18.92% 11.41 0.00
20.00% 7.10 –7.10
21.86% 0.00 –18.62
25.00% –11.07 –36.16
30.00% –26.70 –59.95
EXHIBIT 2-10 NPV Profiles for Two Projects with Different Cash Flow Patterns
NPV
250
150
200
100
50
0
50
10050 15 2510 20 30
Discount Rate (%)
Note that Project B (broken line) has the higher NPV for discount rates between 0percent and 15.09 percent. Project A (solid line) has the higher NPV for discount ratesexceeding 15.09 percent. The crossover point of 15.09 percent in Exhibit 2-10 cor-responds to the discount rate at which both projects have the same NPV (of 27.98).Project B has the higher NPV below the crossover point, and Project A has the higherNPV above it.
62 Corporate Finance
c02 13 January 2012; 17:42:11

that you can reinvest a cash flow at that same discount rate.2 In the NPV calculation, you usea discount rate of 10 percent for both projects. In the IRR calculation, you use a discount rateequal to the IRR of 21.86 percent for Project A and 18.92 percent for Project B.
Can you reinvest the cash inflows from the projects at 10 percent, or 21.86 percent, or18.92 percent? When you assume the required rate of return is 10 percent, you are assumingan opportunity cost of 10 percent—you are assuming that you can either find other projectsthat pay a 10 percent return or pay back your sources of capital that cost you 10 percent. Thefact that you earned 21.86 percent in Project A or 18.92 percent in Project B does not meanthat you can reinvest future cash flows at those rates. (In fact, if you can reinvest future cashflows at 21.86 percent or 18.92 percent, these should have been used as your required rate ofreturn instead of 10 percent.) Because the NPV criterion uses the most realistic discountrate—the opportunity cost of funds—the NPV criterion should be used for evaluatingmutually exclusive projects.
Another circumstance that frequently causes mutually exclusive projects to be rankeddifferently by NPV and IRR criteria is project scale—the sizes of the projects. Would yourather have a small project with a higher rate of return or a large project with a lower rate ofreturn? Sometimes, the larger, low rate of return project has the better NPV. This case isdeveloped in Example 2-5.
EXAMPLE 2-5 Ranking Conflicts Due to Differing ProjectScale
Project A has a much smaller outlay than Project B, although they have similar futurecash flow patterns. The cash flows as well as the NPVs and IRRs for the two projects areshown in Exhibit 2-11. For both projects, the required rate of return is 10 percent.
EXHIBIT 2-11 Cash Flows, NPV, and IRR for Two Projects of Differing Scale
Cash Flows
Year 0 1 2 3 4 NPV IRR
Project A –100 50 50 50 50 58.49 34.90%
Project B –400 170 170 170 170 138.88 25.21%
If they were not mutually exclusive, you would invest in both projects because theyare both profitable. However, you can choose either Project A (which has the higherIRR) or Project B (which has the higher NPV).
2For example, assume that you are receiving $100 in one year discounted at 10 percent. The presentvalue is $100/1.10¼ $90.91. Instead of receiving the $100 in one year, invest it for one additional yearat 10 percent, and it grows to $110. What is the present value of $110 received in two years dis-counted at 10 percent? It is the same $90.91. Because both future cash flows are worth the same, you areimplicitly assuming that reinvesting the earlier cash flow at the discount rate of 10 percent has no effecton its value.
Chapter 2 Capital Budgeting 63
c02 13 January 2012; 17:42:12

Exhibits 2-12 and 2-13 show the NPVs for Project A and Project B for variousdiscount rates between 0 percent and 30 percent.
EXHIBIT 2-12 NPV Profiles for Two Projects of Differing Scale
Discount Rate NPV for Project A NPV for Project B
0% 100.00 280.00
5.00% 77.30 202.81
10.00% 58.49 138.88
15.00% 42.75 85.35
20.00% 29.44 40.08
21.86% 25.00 25.00
25.00% 18.08 1.47
25.21% 17.65 0.00
30.00% 8.31 –31.74
34.90% 0.00 –60.00
35.00% –0.15 –60.52
EXHIBIT 2-13 NPV Profiles for Two Projects of Differing Scale
NPV
300
150
200
250
100
50
0
50
10010 15 2550 20 30 35
Discount Rate (%)
Note that Project B (broken line) has the higher NPV for discount rates between0 percent and 21.86 percent. Project A has the higher NPV for discount rates exceeding21.86 percent. The crossover point of 21.86 percent in Exhibit 2-13 corresponds to thediscount rate at which both projects have the same NPV (of 25.00). Below the crossoverpoint, Project B has the higher NPV, and above it, Project A has the higher NPV.When cash flows are discounted at the 10 percent required rate of return, the choice isclear—Project B, the larger project, which has the superior NPV.
64 Corporate Finance
c02 13 January 2012; 17:42:12

The good news is that the NPV and IRR criteria will usually indicate the same investmentdecision for a given project. They will usually both recommend acceptance or rejection of theproject. When the choice is between two mutually exclusive projects and the NPV and IRRrank the two projects differently, the NPV criterion is strongly preferred. There are goodreasons for this preference. The NPV shows the amount of gain, or wealth increase, as acurrency amount. The reinvestment assumption of the NPV is the more economically realistic.The IRR does give you a rate of return, but the IRR could be for a small investment or for onlya short period of time. As a practical matter, once a corporation has the data to calculate theNPV, it is fairly trivial to go ahead and calculate the IRR and other capital budgeting criteria.However, the most appropriate and theoretically sound criterion is the NPV.
4.9. The Multiple IRR Problem and the No IRR Problem
A problem that can arise with the IRR criterion is the “multiple IRR problem.” We canillustrate this problem with the following nonconventional cash flow pattern:3
Time 0 1 2
Cash Flow –1,000 5,000 –6,000
The IRR for these cash flows satisfies this equation:
&1,000þ 5,000ð1þ IRRÞ1
þ &6,000ð1þ IRRÞ2
¼ 0
It turns out that there are two values of IRR that satisfy the equation: IRR¼ 1¼ 100percent and IRR¼ 2¼ 200 percent. To further understand this problem, consider the NPVprofile for this investment, which is shown in Exhibits 2-14 and 2-15.
As you can see in the NPV profile, the NPV is equal to zero at IRR¼ 100 percent andIRR¼ 200 percent. The NPV is negative for discount rates below 100 percent, positivebetween 100 percent and 200 percent, and then negative above 200 percent. The NPVreaches its highest value when the discount rate is 140 percent.
It is also possible to have an investment project with no IRR. The “no-IRR problem”occurs with this cash flow pattern:4
Time 0 1 2
Cash Flow 100 –300 250
The IRR for these cash flows satisfies this equation:
100þ &300ð1þ IRRÞ1
þ 250ð1þ IRRÞ2
¼ 0
For these cash flows, no discount rate exists that results in a zero NPV. Does that meanthis project is a bad investment? In this case, the project is actually a good investment. As
3This example is adapted from Hirschleifer (1958).4This example is also adapted from Hirschleifer.
Chapter 2 Capital Budgeting 65
c02 13 January 2012; 17:42:12

EXHIBIT 2-14 NPV Profile for a Multiple IRR Example
Discount Rate NPV
0% –2,000.00
25% –840.00
50% –333.33
75% –102.04
100% 0.00
125% 37.04
140% 41.67
150% 40.00
175% 24.79
200% 0.00
225% –29.59
250% –61.22
300% –125.00
350% –185.19
400% –240.00
500% –333.33
1,000% –595.04
2,000% –775.51
3,000% –844.95
4,000% –881.62
10,000% –951.08
1,000,000% –999.50
EXHIBIT 2-15 NPV Profile for a Multiple IRR Example
NPV
100
150
100
0
50
50
200
300
250
350
40050 400250200 300 350100 150
Discount Rate (%)
66 Corporate Finance
c02 13 January 2012; 17:42:12

Exhibits 2-16 and 2-17 show, the NPV is positive for all discount rates. The lowest NPV, of10, occurs for a discount rate of 66.67 percent, and the NPV is always greater than zero.Consequently, no IRR exists.
EXHIBIT 2-16 NPV Profile for a Project with No IRR
Discount Rate NPV
0% 50.00
25% 20.00
50% 11.11
66.67% 10.00
75% 10.20
100% 12.50
125% 16.05
150% 20.00
175% 23.97
200% 27.78
225% 31.36
250% 34.69
275% 37.78
300% 40.63
325% 43.25
350% 45.68
375% 47.92
400% 50.00
EXHIBIT 2-17 NPV Profile for a Project with No IRR
NPV
60
10
20
30
40
50
04502500 200 300 350 40010050 150
Discount Rate (%)
Chapter 2 Capital Budgeting 67
c02 13 January 2012; 17:42:12

For conventional projects that have outlays followed by inflows—negative cash flowsfollowed by positive cash flows—the multiple IRR problem cannot occur. However, fornonconventional projects, as in the example above, the multiple IRR problem can occur. TheIRR equation is essentially an nth degree polynomial. An nth degree polynomial can have upto n solutions, although it will have no more real solutions than the number of cash flow signchanges. For example, a project with two sign changes could have zero, one, or two IRRs.Having two sign changes does not mean that you will have multiple IRRs; it just meansthat you might. Fortunately, most capital budgeting projects have only one IRR. Analystsshould always be aware of the unusual cash flow patterns that can generate the multipleIRR problem.
4.10. Popularity and Usage of the Capital Budgeting Methods
Analysts need to know the basic logic of the various capital budgeting criteria as well as thepracticalities involved in using them in real corporations. Before delving into the many issuesinvolved in applying these models, we would like to present some feedback on theirpopularity.
The usefulness of any analytical tool always depends on the specific application. Cor-porations generally find these capital budgeting criteria useful. Two recent surveys by Grahamand Harvey (2001) and Brounen, De Jong, and Koedijk (2004) report on the frequencyof their use by U.S. and European corporations. Exhibit 2-18 gives the mean responses ofexecutives in five countries to the question, “How frequently does your company use thefollowing techniques when deciding which projects or acquisitions to pursue?”
EXHIBIT 2-18 Mean Responses about Frequency of Use of Capital Budgeting Techniques
United States United Kingdom Netherlands Germany France
Internal rate of return* 3.09 2.31 2.36 2.15 2.27
Net present value* 3.08 2.32 2.76 2.26 1.86
Payback period* 2.53 2.77 2.53 2.29 2.46
Hurdle rate 2.13 1.35 1.98 1.61 0.73
Sensitivity analysis 2.31 2.21 1.84 1.65 0.79
Earnings multiple approach 1.89 1.81 1.61 1.25 1.70
Discounted payback period* 1.56 1.49 1.25 1.59 0.87
Real options approach 1.47 1.65 1.49 2.24 2.20
Accounting rate of return* 1.34 1.79 1.40 1.63 1.11
Value at risk 0.95 0.85 0.51 1.45 1.68
Adjusted present value 0.85 0.78 0.78 0.71 1.11
Profitability index* 0.85 1.00 0.78 1.04 1.64
Respondents used a scale ranging from 0 (never) to 4 (always).*These techniques were described in this section of the chapter. You will encounter the others elsewhere.
68 Corporate Finance
c02 13 January 2012; 17:42:13

Although financial textbooks preach the superiority of the NPV and IRR techniques, it isclear that several other methods are heavily used.5 In the four European countries, the pay-back period is used as often as, or even slightly more often than, the NPV and IRR. In thesetwo studies, larger companies tended to prefer the NPV and IRR over the payback period.The fact that the U.S. companies were larger, on average, partially explains the greater U.S.preference for the NPV and IRR. Other factors influence the choice of capital budgetingtechniques. Private corporations used the payback period more frequently than did publiccorporations. Companies managed by an MBA had a stronger preference for the discountedcash flow techniques. Of course, any survey research also has some limitations. In this case,the persons in these large corporations responding to the surveys may not have been aware ofall of the applications of these techniques.
These capital budgeting techniques are essential tools for corporate managers. Capitalbudgeting is also relevant to external analysts. Because a corporation’s investing decisionsultimately determine the value of its financial obligations, the corporation’s investing pro-cesses are vital. The NPV criterion is the criterion most directly related to stock prices. If acorporation invests in positive NPV projects, these should add to the wealth of its share-holders. Example 2-6 illustrates this scenario.
The effect of a capital budgeting project’s positive or negative NPV on share price ismore complicated than Example 6 above, in which the value of the stock increased by theproject’s NPV. The value of a company is the value of its existing investments plus the netpresent values of all of its future investments. If an analyst learns of an investment, the impactof that investment on the stock price will depend on whether the investment’s profitability is
EXAMPLE 2-6 NPVs and Stock Prices
Freitag Corporation is investing h600 million in distribution facilities. The presentvalue of the future after-tax cash flows is estimated to be h850 million. Freitag has 200million outstanding shares with a current market price of h32.00 per share. Thisinvestment is new information, and it is independent of other expectations about thecompany. What should be the effect of the project on the value of the company andthe stock price?
Solution. The NPV of the project is h850 million – h600 million¼ h250 million. Thetotal market value of the company prior to the investment is h32.00 3 200 millionshares¼ h6,400 million. The value of the company should increase by h250 million toh6,650 million. The price per share should increase by the NPV per share, or h250million/200 million shares¼ h1.25 per share. The share price should increase fromh32.00 to h33.25.
5Analysts often refer to the NPV and IRR as “discounted cash flow techniques” because they accuratelyaccount for the timing of all cash flows when they are discounted.
Chapter 2 Capital Budgeting 69
c02 13 January 2012; 17:42:13

more or less than expected. For example, an analyst could learn of a positive NPV project, butif the project’s profitability is less than expectations, this stock might drop in price on thenews. Alternatively, news of a particular capital project might be considered as a signal aboutother capital projects underway or in the future. A project that by itself might add, say, h0.25to the value of the stock might signal the existence of other profitable projects. News of thisproject might increase the stock price by far more than h0.25.
The integrity of a corporation’s capital budgeting processes is important to analysts.Management’s capital budgeting processes can demonstrate two things about the qualityof management: the degree to which management embraces the goal of shareholder wealthmaximization, and its effectiveness in pursuing that goal. Both of these factors are importantto shareholders.
5. CASH FLOW PROJECTIONS
In Section 4, we presented the basic capital budgeting models that managers use to accept orreject capital budgeting proposals. In that section, we assumed the cash flows were given, andwe used them as inputs to the analysis. In Section 5, we detail how these cash flows are foundfor an “expansion” project. An expansion project is an independent investment that does notaffect the cash flows for the rest of the company. In Section 6, we will deal with a“replacement” project, in which the cash flow analysis is more complicated. A replacementproject must deal with the differences between the cash flows that occur with the newinvestment and the cash flows that would have occurred for the investment being replaced.
5.1. Table Format with Cash Flows Collected by Year
The cash flows for a conventional expansion project can be grouped into (1) the investmentoutlays, (2) after-tax operating cash flows over the project’s life, and (3) terminal year after-taxnonoperating cash flows. Exhibit 2-19 gives an example of the cash flows for a capital projectwhere all of the cash flows are collected by year.
The investment outlays include a $200,000 outlay for fixed capital items. This outlayincludes $25,000 for nondepreciable land, plus $175,000 for equipment that will bedepreciated straight-line to zero over five years. The investment in net working capital is thenet investment in short-term assets required for the investment. This is the investment inreceivables and inventory needed, less the short-term payables generated by the project. In thiscase, the project required $50,000 of current assets but generated $20,000 in current lia-bilities, resulting in a total investment in net working capital of $30,000. The total investmentoutlay at time zero is $230,000.
Each year, sales will be $220,000 and cash operating expenses will be $90,000. Annualdepreciation for the $175,000 depreciable equipment is $35,000 (one-fifth of the cost). Theresult is an operating income before taxes of $95,000. Income taxes at a 40 percent rate are0.40 3 $95,000¼ $38,000. This leaves operating income after taxes of $57,000. Adding backthe depreciation charge of $35,000 gives the annual after-tax operating cash flow of $92,000.6
6Examining the operating cash flows in Exhibit 19, we have a $220,000 inflow from sales, a $90,000outflow for cash operating expenses, and a $38,000 outflow for taxes. This is an after-tax cash flow of$92,000.
70 Corporate Finance
c02 13 January 2012; 17:42:13

At the end of Year 5, the company will sell off the fixed capital assets. In this case, thefixed capital assets (including the land) are sold for $50,000, which represents a gain of$25,000 over the remaining book value of $25,000. The gain of $25,000 is taxed at40 percent, resulting in a tax of $10,000. This leaves $40,000 for the fixed capital assets aftertaxes. Additionally, the net working capital investment of $30,000 is recovered, as the short-term assets (such as inventory and receivables) and short-term liabilities (such as payables) areno longer needed for the project. Total terminal year nonoperating cash flows are then$70,000.
The investment project has a required rate of return of 10 percent. Discounting thefuture cash flows at 10 percent and subtracting the investment outlay gives an NPV of$162,217. The internal rate of return is 32.70 percent. Because the investment has a positiveNPV, this project should be accepted. The IRR investment decision criterion would alsorecommend accepting the project because the IRR is greater than the required rate of return.
EXHIBIT 2-19 Capital Budgeting Cash Flows Example (Cash Flows Collected by Year)
Year 0 1 2 3 4 5
Investment outlays:
Fixed capital –200,000
Net working capital –30,000
Total –230,000
Annual after-tax operating cash flows:
Sales 220,000 220,000 220,000 220,000 220,000
Cash operating expenses 90,000 90,000 90,000 90,000 90,000
Depreciation 35,000 35,000 35,000 35,000 35,000
Operating income before taxes 95,000 95,000 95,000 95,000 95,000
Taxes on operating income 38,000 38,000 38,000 38,000 38,000
Operating income after taxes 57,000 57,000 57,000 57,000 57,000
Add back: Depreciation 35,000 35,000 35,000 35,000 35,000
After-tax operating cash flow 92,000 92,000 92,000 92,000 92,000
Terminal year after-tax nonoperating cash flows:
After-tax salvage value 40,000
Return of net working capital 30,000
Total 70,000
Total after-tax cash flow –230,000 92,000 92,000 92,000 92,000 162,000
Net present value at 10 percentrequired rate of return
162,217
Internal rate of return 32.70%
Chapter 2 Capital Budgeting 71
c02 13 January 2012; 17:42:13

5.2. Table Format with Cash Flows Collected by Type
In the layout in Exhibit 2-19, we essentially collected the cash flows in the columns, by year,and then found the NPV by summing the present values of the annual cash flows (at thebottom of each column). There is another way of organizing the same information. We couldalso find the NPV by finding the present values of the cash flows in Exhibit 2-19 by rows,which are the types of cash flows. This approach is shown in Exhibit 2-20.
EXHIBIT 2-20 Capital Budgeting Cash Flows Example (Cash Flows Collected by Type)
Time Type of Cash FlowBefore-TaxCash Flow
After-TaxCash Flow PV at 10%
0 Fixed capital &200,000 &200,000 &200,000
0 Net working capital &30,000 &30,000 &30,000
1&5 Sales minus cashexpenses
220,000 & 90,000¼ 130,000
130,000(1 & 0.40)¼ 78,000
295,681
1&5 Depreciation tax savings None 0.40(35,000)¼ 14,000
53,071
5 After-tax salvage value 50,000 50,000 & 0.40(50,000& 25,000)¼ 40,000
24,837
5 Return of net working capital 30,000 30,000 18,628
NPV ¼ 162,217
As Exhibit 2-20 shows, the outlays in fixed capital and in net working capital at time zerototal $230,000. For Years 1 through 5, the company realizes an after-tax cash flow for salesminuscash expenses of $78,000,which has a present value of $295,681.The depreciation charge resultsin a tax savings of $14,000 per year, which has a present value of $53,071. The present values ofthe after-tax salvage and of the return of net working capital are also shown in the table. Thepresent value of all cash flows is an NPV of $162,217. Obviously, collecting the after-tax cashflows by year, as in Exhibit 2-19, or by type, as in Exhibit 2-20, results in the same NPV.
5.3. Equation Format for Organizing Cash Flows
The capital budgeting cash flows in the example project above were laid out in one of twoalternative tabular formats. Analysts may wish to take even another approach. Instead ofproducing a table, you can also look at the cash flows using equations such as the following:
1. Initial outlay:For a new investment
Outlay ¼ FCInv þNWCInv
where
FCInv¼ Investment in new fixed capitalNWCInv¼ Investment in net working capital
72 Corporate Finance
c02 13 January 2012; 17:42:14

The above equation can be generalized for a replacement project (covered in Section6.2), in which existing fixed capital is sold and provides some of the funding for the newfixed capital purchased. The outlay is then
Outlay ¼ FCInv þNWCInv & Sal0 þTðSal0 &B0Þ ð2-6Þ
where
Sal0¼Cash proceeds (salvage value) from sale of old fixed capitalT¼Tax rateB0¼Book value of old fixed capital
2. Annual after-tax operating cash flow:
CF ¼ ðS&C&DÞð1&TÞ þD, or ð2-7Þ
CF ¼ ðS&CÞð1&TÞ þTD ð2-8Þ
where
S¼ salesC¼ cash operating expensesD¼ depreciation charge
3. Terminal year after-tax nonoperating cash flow:
TNOCF ¼ SalT þNWCInv &TðSalT&BTÞ ð2-9Þ
where
SalT¼Cash proceeds (salvage value) from sale of fixed capital on termination dateBT¼Book value of fixed capital on termination date
The outlay in the example is found with Equation 2-6:
Outlay ¼ 200,000þ 30,000& 0þ 0 ¼ $230,000
For a replacement project, the old fixed capital would be sold for cash (Sal0) and thenthere would be taxes paid on the gain (if Sal0 – B0 were positive) or a tax saving (if Sal0 – B0
were negative). In this example, Sal0 and T(Sal0 – B0) are zero because no existing fixed capitalis sold at time zero.
Using Equation 2-7, we find that the annual after-tax operating cash flow is
CF ¼ ðS&C&DÞð1&TÞ þD
¼ ð220,000& 90,000& 35,000Þð1& 0:40Þ þ 35,000 ¼ 95,000ð0:60Þ þ 35,000
¼ 57,000þ 35,000 ¼ $92,000
Equation 2-7 is the project’s net income plus depreciation. An identical cash flow resultsif we use Equation 2-8:
Chapter 2 Capital Budgeting 73
c02 13 January 2012; 17:42:14

CF ¼ ðS& CÞð1& TÞ þ TD
¼ ð220,000& 90,000Þð1& 0:40Þ þ 0:40ð35,000Þ
¼ 130,000ð0:60Þ þ 0:40ð35,000Þ ¼ 78,000þ 14,000 ¼ $92,000
Equation 2-8 is the after-tax sales and cash expenses plus the depreciation tax savings.The analyst can use either equation.
Equation 2-9 provides the terminal year nonoperating cash flow:
TNOCF ¼ SalT þNWCInv & TðSalT & BTÞ
¼ 50,000þ 30,000& 0:40ð50,000& 25,000Þ
¼ 50,000þ 30,000& 10,000 ¼ $70,000
The old fixed capital (including land) is sold for $50,000, but $10,000 of taxes must bepaid on the gain. Including the $30,000 return of net working capital gives a terminal yearnonoperating cash flow of $70,000.
The NPV of the project is the present value of the cash flows—an outlay of $230,000 attime zero, an annuity of $92,000 for five years, plus a single payment of $70,000 in five years:
NPV ¼ &230,000þX5
t¼1
92,000ð1:10Þt
þ 70,000ð1:10Þ5
¼ &230,000þ 348,752þ 43,465 ¼ $162,217
We obtain an identical NPV of $162,217 whether we use a tabular format collecting cashflows by year, a tabular format collecting cash flows by type, or an equation format usingEquations 2-6 through 2-9. The analyst usually has some flexibility in choosing how to solve aproblem. Furthermore, the analysis that an analyst receives from someone else could be invarying formats. The analyst must interpret this information correctly regardless of format.An analyst may need to present information in alternative formats, depending on what theclient or user of the information wishes to see. All that is important is that the cash flows arecomplete (with no cash flows omitted and none double-counted), that their timing is rec-ognized, and that the discounting is done correctly.
6. MORE ON CASH FLOW PROJECTIONS
Cash flow analysis can become fairly complicated. Section 6 extends the analysis of theprevious section to include more details on depreciation methods, replacement projects (asopposed to simple expansion projects), the use of spreadsheets, and the effects of inflation.
6.1. Straight-Line and Accelerated Depreciation Methods
Before going on to more complicated investment decisions, we should mention the varietyof depreciation methods that are in use. The example in Section 5.1 assumed straight-linedepreciation down to a zero salvage value. Most accounting texts give a good description ofthe straight-line method, the sum-of-years digits method, the double-declining balance
74 Corporate Finance
c02 13 January 2012; 17:42:14

method (and the 150 percent declining balance method), and the units-of-production andservice hours method.7
Many countries specify the depreciation methods that are acceptable for tax purposes intheir jurisdictions. For example, in the U.S., corporations use the MACRS (modified accel-erated cost recovery system) for tax purposes. Under MACRS, real property (real estate) isusually depreciated straight-line over a 27.5- or 39-year life, and other capital assets are usuallygrouped into MACRS asset classes and subject to a special depreciation schedule in each class.These MACRS classes and the depreciation rates for each class are shown in Exhibit 2-21.
EXHIBIT 2-21 Depreciation Rates under U.S. MACRS
Recovery Period Class
Year 3-Year 5-Year 7-Year 10-Year 15-Year 20-Year
1 33.33% 20.00% 14.29% 10.00% 5.00% 3.75%
2 44.45 32.00 24.49 18.00 9.50 7.22
3 14.81 19.20 17.49 14.40 8.55 6.68
4 7.41 11.52 12.49 11.52 7.70 6.18
5 11.52 8.93 9.22 6.93 5.71
6 5.76 8.93 7.37 6.23 5.28
7 8.93 6.55 5.90 4.89
8 4.45 6.55 5.90 4.52
9 6.55 5.90 4.46
10 6.55 5.90 4.46
11 3.29 5.90 4.46
12 5.90 4.46
13 5.90 4.46
14 5.90 4.46
15 5.90 4.46
16 2.99 4.46
17 4.46
18 4.46
19 4.46
20 4.46
21 2.25
For the first four MACRS classes (3-year, 5-year, 7-year, and 10-year), the depreciation isdouble-declining-balance with a switch to straight-line when optimal and with a half-yearconvention. For the last two classes (15-year and 20-year), the depreciation is 150 percent-declining-balance with a switch to straight-line when optimal and with a half-year convention.
7White, Sondhi, and Fried (2003) is a good example. Consult their chapter 8, “Analysis of Long-LivedAssets: Part II—Analysis of Depreciation and Impairment” for review and examples.
Chapter 2 Capital Budgeting 75
c02 13 January 2012; 17:42:15

Take 5-year property in Exhibit 2-21 as an example. With double-declining-balance, thedepreciation each year is 2/5¼ 40 percent of the beginning-of-year book value. However,with a half-year convention, the asset is assumed to be in service for only six months duringthe first year, and only one half of the depreciation is allowed the first year. After the first year,the depreciation rate is 40 percent of the beginning balance until Year 4, when straight-linedepreciation would be at least as large, so we switch to straight-line. In Year 6, we have one-half of a year of the straight-line depreciation remaining because we assumed the asset wasplaced in service halfway through the first year.
Accelerated depreciation generally improves the NPV of a capital project compared tostraight-line depreciation. For an example of this effect, we will assume the same capitalproject as in Exhibit 2-19, except that the depreciation is MACRS 3-year property. Whenusing straight-line, the depreciation was 20 percent per year ($35,000). The depreciationpercentages for MACRS 3-year property are given in Exhibit 2-21. The first-year deprecia-tion is 0.33333 175,000¼ $58,327.50, second-year depreciation is 0.44453 175,000¼$77,787.50, third-year depreciation is 0.14813 175,000¼ $25,917.50, fourth-year depre-ciation is 0.07413 175,000¼ $12,967.50, and fifth-year depreciation is zero. The impact onthe NPV and IRR of the project is shown in Exhibit 2-22.
EXHIBIT 2-22 Capital Budgeting Example with MACRS
Year 0 1 2 3 4 5
Investment outlays:
Fixed capital –200,000
Net working capital –30,000
Total –230,000
Annual after-tax operating cash flows:
Sales 220,000 220,000 220,000 220,000 220,000
Cash operating expenses 90,000 90,000 90,000 90,000 90,000
Depreciation 58,328 77,788 25,918 12,968 0
Operating income before taxes 71,673 52,213 104,083 117,033 130,000
Taxes on operating income (40%) 28,669 20,885 41,633 46,813 52,000
Operating income after taxes 43,004 31,328 62,450 70,220 78,000
Add back: Depreciation 58,328 77,788 25,918 12,968 0
After-tax operating cash flow 101,331 109,115 88,367 83,187 78,000
Terminal year after-tax nonoperating cash flows:
After-tax salvage value 40,000
Return of net working capital 30,000
Total 70,000
Total after-tax cash flows –230,000 101,331 109,115 88,367 83,187 148,000
Net present value at 10%required rate of return
$167,403
Internal rate of return 34.74%
76 Corporate Finance
c02 13 January 2012; 17:42:15

As the table shows, the depreciation charges still sum to $175,000 (except for $2 ofrounding), but they are larger in Years 1 and 2 and smaller in Years 3, 4, and 5. Although thismethod reduces operating income after taxes in Years 1 and 2 (and increases it in Years 3, 4,and 5), it reduces tax outflows in Years 1 and 2 and increases them later. Consequently, theafter-tax operating cash flows (which were $92,000 per year) increase in early years anddecrease in later years. This increases the NPV from $162,217 to $167,403, a difference of$5,186. The IRR also increases from 32.70 percent to 34.74 percent.8
The impact of accelerated depreciation can be seen without going through the completeanalysis in Exhibit 2-22. We previously showed in Exhibit 2-20 that the present value ofthe depreciation tax savings (which was an annuity of 0.403 $35,000¼ $14,000 a year forfive years) was $53,071. The present value of the tax savings from accelerated depreciation isshown in Exhibit 2-23.
EXHIBIT 2-23 Present Value of Tax Savings from Accelerated Depreciation
Year Depreciation Tax Savings PV at 10%
1 $58,327.50 0.403 $58,327.5¼ $23,331 $21,210
2 $77,787.50 0.403 $77,787.5¼ $31,115 $25,715
3 $25,917.50 0.403 $25,917.5¼ $10,367 $7,789
4 $12,967.50 0.403 $12,967.5¼ $5,187 $3,543
5 $0 0.403 $0¼ $0 $0
Total present value $58,257
By using the accelerated depreciation schedule, we increase the present value of the taxsavings from $53,071 (from Exhibit 2-20) to $58,257, an increase of $5,186. The tax deferralassociated with the accelerated depreciation (compared to straight-line) adds $5,186 to theNPV of the project.
There are a myriad of tax and depreciation schedules that apply to investment projectsaround the world. These tax and depreciation schedules are also subject to change from yearto year. To accurately assess the profitability of a particular capital project, it is vital to identifyand apply the schedules that are relevant to the capital budgeting decision at hand.
6.2. Cash Flows for a Replacement Project
In Section 5.1, we evaluated the cash flows for an expansion project, basing our after-tax cashflows on the outlays, annual operating cash flows after tax, and salvage value for the project byitself. In many cases, however, investing in a project will be more complicated. Investing couldaffect many of the company’s cash flows. In principle, the cash flows relevant to an investingdecision are the incremental cash flows: the cash flows the company realizes with the invest-ment compared to the cash flows the company would realize without the investment. For
8This example assumes that the investment occurs on the first day of the tax year. If the outlay occurslater in the tax year, the depreciation tax savings for the tax years are unchanged, which means that thecash savings occur sooner, increasing their present values. The result is a higher NPV and IRR.
Chapter 2 Capital Budgeting 77
c02 13 January 2012; 17:42:15

example, suppose we are investing in a new project with an outlay of $100,000 and we sell offexisting assets that the project replaces for $30,000. The incremental outlay is $70,000.
A very common investment decision is a replacement decision, in which you replace oldequipment with new equipment. This decision requires very careful analysis of the cash flows.The skills required to detail the replacement decision cash flows are also useful for otherdecisions in which an investment affects other cash flows in the company. We use the term“replacement” loosely, primarily to indicate that the cash flow analysis is more complicatedthan it was for the simpler expansion decision.
Assume we are considering the replacement of old equipment with new equipment thathas more capacity and is less costly to operate. The characteristics of the old and newequipment are given below:
Old Equipment New Equipment
Current book value $400,000
Current market value $600,000 Acquisition cost $1,000,000
Remaining life 10 years Life 10 years
Annual sales $300,000 Annual sales $450,000
Cash operating expenses $120,000 Cash operating expenses $150,000
Annual depreciation $40,000 Annual depreciation $100,000
Accounting salvage value $0 Accounting salvage value $0
Expected salvage value $100,000 Expected salvage value $200,000
If the new equipment replaces the old equipment, an additional investment of $80,000in net working capital will be required. The tax rate is 30 percent, and the required rate ofreturn is 8 percent.
The cash flows can be found by carefully constructing tables like Exhibit 2-19 or by usingEquations 2-6 through 2-9. The initial outlay is the investment in the new equipment plusthe additional investment in net working capital less the after-tax proceeds from selling theold equipment:
Outlay ¼ FCInv þNWCInv & Sal0 þTðSal0 &B0Þ
Outlay ¼ 1,000,000þ 80,000& 600,000þ 0:3ð600,000& 400,000Þ ¼ $540,000
In this case, the outlay of $540,000 is $1,080,000 for new equipment and net working capitalminus the after-tax proceeds of $540,000 the company receives from selling the old equip-ment. The incremental operating cash flows are
CF¼ ½S& C&D(ð1&TÞ þD
¼ ½ð450,000& 300,000Þ & ð150,000& 120,000Þ & ð100,000& 40,000Þ(
ð1& 0:30Þ þ ð100,000& 40,000Þ
¼ ð150,000& 30,000& 60,000Þð1& 0:30Þ þ 60,000 ¼ $102,000
78 Corporate Finance
c02 13 January 2012; 17:42:15

The incremental sales are $150,000, incremental cash operating expenses are $30,000,and incremental depreciation is $60,000. The incremental after-tax operating cash flow is$102,000 per year.
At the project termination, the new equipment is expected to be sold for $200,000,which constitutes an incremental cash flow of $100,000 over the $100,000 expected salvageprice of the old equipment. Since the accounting salvage values for both the new and oldequipment were zero, this gain is taxable at 30 percent. The company also recaptures itsinvestment in net working capital. The terminal year after-tax nonoperating cash flow is
TNOCF ¼ SalT þNWCInv &TðSalT & BTÞ¼ ð200,000& 100,000Þ þ 80,000& 0:30½ð200,000& 100,000Þ & ð0& 0Þ(¼ $150,000
Once the cash flows are identified, the NPV and IRR are readily found. The NPV, foundby discounting the cash flows at the 8 percent required rate of return, is
NPV ¼ &540,000þX10
t¼1
102,0001:08t
þ 150,0001:0810
¼ $213,907
The IRR, found with a financial calculator, is 15.40 percent. Because the NPV ispositive, this equipment replacement decision is attractive. The fact that the IRR exceeds the 8percent required rate of return leads to the same conclusion.
The key to estimating the incremental cash flows for the replacement is to compare thecash flows that occur with the new investment to the cash flows that would have occurredwithout the new investment. The analyst is comparing the cash flows with a particular courseof action to the cash flows with an alternative course of action.
6.3. Spreadsheet Modeling
Although the examples in this book can be readily solved with a financial calculator, capitalbudgeting is usually done with the assistance of personal computers and spreadsheets such asMicrosoft Excels. Spreadsheets are heavily used for several reasons. Spreadsheets provide a veryeffective way of building even complex models. Built-in spreadsheet functions (such as those forfinding rates of return) are easy to use. Themodel’s assumptions can be changed and solved easily.Models can be shared with other analysts, and they also help in presenting the results of theanalysis. Example 2-7 shows how a spreadsheet can be used to solve a capital budgeting problem.
EXAMPLE 2-7 Capital Budgeting with a Spreadsheet
Lawton Enterprises is evaluating a project with the following characteristics:
! Fixed capital investment is $2,000,000.! The project has an expected six-year life.
Chapter 2 Capital Budgeting 79
c02 13 January 2012; 17:42:16

! The initial investment in net working capital is $200,000. At the end of each year,net working capital must be increased so that the cumulative investment in networking capital is one-sixth of the next year’s projected sales.
! The fixed capital is depreciated 30 percent in Year 1, 35 percent in Year 2, 20 percentin Year 3, 10 percent in Year 4, 5 percent in Year 5, and 0 percent in Year 6.
! Sales are $1,200,000 in Year 1. They grow at a 25 percent annual rate for the nexttwo years, and then grow at a 10 percent annual rate for the last three years.
! Fixed cash operating expenses are $150,000 for Years 1–3 and $130,000 for Years 4–6.! Variable cash operating expenses are 40 percent of sales in Year 1, 39 percent of sales
in Year 2, and 38 percent in Years 3–6.! Lawton’s marginal tax rate is 30 percent.! Lawton will sell its fixed capital investments for $150,000 when the project termi-
nates and recapture its cumulative investment in net working capital. Income taxeswill be paid on any gains.
! The project’s required rate of return is 12 percent.! If taxable income on the project is negative in any year, the loss will offset gains
elsewhere in the corporation, resulting in a tax savings.
1. Determine whether this is a profitable investment using the NPV and IRR.2. If the tax rate increases to 40 percent and the required rate of return increases to 14
percent, is the project still profitable?
Solution to 1.
EXHIBIT 2-24 Cash Flows for Lawton Investment (rounded to nearest $1,000)
Year 0 1 2 3 4 5 6
Fixed capital investment –2,000
NWC investments –200 –50 –63 –31 –34 –38
Sales 1,200 1,500 1,875 2,063 2,269 2,496
Fixed cash expenses 150 150 150 130 130 130
Variable cash expenses 480 585 713 784 862 948
Depreciation 600 700 400 200 100 0
Operating income before taxes –30 65 613 949 1177 1417
Taxes on operating income –9 20 184 285 353 425
Operating income after taxes –21 45 429 664 824 992
Add back: Depreciation 600 700 400 200 100 0
After-tax operating cash flow 579 745 829 864 924 992
Salvage value 150
Taxes on salvage value –45
Return of NWC 416
Total after-tax cash flows –2,200 529 682 798 830 886 1,513
NPV (at r¼ 12 percent) 1,181
IRR 26.60%
80 Corporate Finance
c02 13 January 2012; 17:42:17

6.4. Effects of Inflation on Capital Budgeting Analysis
Inflation affects capital budgeting analysis in several ways. The first decision the analyst mustmake is whether to do the analysis in “nominal” terms or in “real” terms. Nominal cash flowsinclude the effects of inflation, while real cash flows are adjusted downward to remove theeffects of inflation. It is perfectly acceptable to do the analysis in either nominal or real terms,and sound decisions can be made either way. However, inflation creates some issues regardlessof the approach.
The cash flows and discount rate used should both be nominal or both be real. In otherwords, nominal cash flows should be discounted at a nominal discount rate, and real cashflows should be discounted at a real rate. The real rate, just like real cash flows, has had theeffect of inflation taken out. In general, the relationship between real and nominal rates is
ð1þNominal rateÞ ¼ ð1þReal rateÞð1þ Inflation rateÞ
Inflation reduces the value of depreciation tax savings (unless the tax system adjustsdepreciation for inflation). The effect of expected inflation is captured in the discounted cashflow analysis. If inflation is higher than expected, the profitability of the investment is cor-respondingly lower than expected. Inflation essentially shifts wealth from the taxpayer to thegovernment. Higher-than-expected inflation increases the corporation’s real taxes because itreduces the value of the depreciation tax shelter. Conversely, lower-than-expected inflationreduces real taxes (the depreciation tax shelters are more valuable than expected).
Inflation also reduces the value of fixed payments to bondholders. When bonds areoriginally issued, bondholders pay a price for the bonds reflecting their inflationary expec-tations. If inflation is higher than expected, the real payments to bondholders are lower thanexpected. Higher-than-expected inflation shifts wealth from bondholders to the issuing cor-porations. Conversely, if inflation is lower than expected, the real interest expenses of thecorporation increase, shifting wealth from the issuing corporation to its bondholders.
Finally, inflation does not affect all revenues and costs uniformly. The company’s after-tax cash flows will be better or worse than expected depending on how particular sales outputsor cost inputs are affected. Furthermore, contracting with customers, suppliers, employees,and sources of capital can be complicated as inflation rises.
The capital budgeting model accommodates the effects of inflation, although inflationcomplicates the capital budgeting process (and the operations of a business, in general).
Because the NPV of $1,181,000 is positive, the project is profitable for Lawton toundertake. The IRR investment decision rule also indicates that the project is profitablebecause the IRR of 26.60 percent exceeds the 12 percent required rate of return.
Solution to 2. The tax rate and required return can be changed in the spreadsheet model.When these changes are made, the NPV becomes $736,000 and the IRR becomes 24.02percent. (The revised spreadsheet is not printed here.) Although profitability is lower, thehigher tax rate and required rate of return do not change the investment decision.
Chapter 2 Capital Budgeting 81
c02 13 January 2012; 17:42:17

7. PROJECT ANALYSIS AND EVALUATION
Assessing the opportunity costs and analyzing the risks of capital investments becomes morecomplex and sophisticated as you examine real cases. The first project interaction we examinein this section is that of comparing mutually exclusive projects with unequal lives. We willbriefly describe other project interactions, but will not examine them in detail. We alsoexamine the process of capital budgeting under capital rationing.
Up to this point, we have largely ignored the issue of accounting for risk. We willintroduce risk analysis in two ways. The first is accounting for risk on a standalone basis. Thesecond is accounting for risk on a systematic basis.
7.1. Mutually Exclusive Projects with Unequal Lives
We have previously looked at mutually exclusive projects and decided that the best project isthe one with the greatest NPV. However, if the mutually exclusive projects have differinglives and the projects will be replaced (or replicated) repeatedly when they wear out, theanalysis is more complicated. The analysis of a one-shot (one time only) investment differsfrom that of an investment chain (in which the asset is replaced regularly in the future).
For example, assume we have two projects with unequal lives of two and three years, withthe following after-tax cash flows:
CFt 100 90
Project S
t (time) 0
60
1 2 3
CFt 140 70 60
Project L
t (time) 0
80
1 2 3
Both projects have a 10 percent required rate of return. The NPV of Project S is $28.93and the NPV of Project L is $35.66. Given that the two projects are mutually exclusive,Project L, with the greater NPV, should be chosen.
However, let us now assume that these are not one-shot investments, but investments inassets that the company will need to replace when they wear out. Project S would be replacedevery two years and Project L every three years. This situation is often referred to as areplacement chain. In this type of problem, you should examine the entire chain and not justthe first link in the chain. If the projects are part of a replacement chain, examining the cashflows for only the initial investment for Projects S and L is improper because Project Lprovides cash flows during Year 3, when Project S provides none.
There are two logically equivalent ways of comparing mutually exclusive projects in areplacement chain. They are the “least common multiple of lives” approach and the“equivalent annual annuity” approach.
7.1.1. Least Common Multiple of Lives ApproachFor the least common multiple of lives approach, the analyst extends the time horizon ofanalysis so that the lives of both projects will divide exactly into the horizon. For Projects S
82 Corporate Finance
c02 13 January 2012; 17:42:17

and L, the least common multiple of 2 and 3 is 6: The two-year project would be replicatedthree times over the six-year horizon and the three-year project would be replicated two timesover the six-year horizon.9 The cash flows for replicating Projects S and L over a six-yearhorizon are shown below.
CFt 100 60 ( 100+90) 60 ( 100+90) 60 90
Project S
t 0 1 2 3 4 5 6
CFt 140 80 70 ( 140+60) 80 70 60
Project L
t 0 1 2 3 4 5 6
Discounting the cash flows for the six-year horizon results in anNPV for Project S of $72.59and an NPV for Project L of $62.45. Apparently, investing in Project S and replicating theinvestment over time has a greaterNPV than choosing Project L and replicating it. This decisionis the reverse of the one we made when looking solely at the NPVs of the initial investments!
Because the NPV of a single investment represents the present values of its cash flows,you can also visualize the NPV of a replacement chain as the present value of the NPVs ofeach investment (or link) in the chain. For Projects S and L, the NPVs of each investment areshown on the timelines below:
CFt 28.93 28.93 28.93
Project S
t 0 1 2 3 4 5 6
CFt 35.66 35.66
Project L
t 0 1 2 3 4 5 6
Investing in Project S is equivalent to receiving values of $28.93 at times 0, 2, and 4,while investing in Project L is equivalent to receiving values of $35.66 at times 0 and 3. Thepresent values of these cash flow patterns are $72.59 for Project S and $62.45 for Project L.Discounting the NPVs of each investment in the chain is equivalent to discounting all of theindividual cash flows in the chain.
7.1.2. Equivalent Annual Annuity ApproachThe other method for properly evaluating a replacement chain is called the equivalent annualannuity (EAA) approach. The name for this approach is very descriptive. For an investment
9The least common multiple of lives is not necessarily the product of the two lives, as in the case ofProjects S and L. For example, if two projects have lives of 8 and 10 years, the least common multiple oflives is 40 years, not 80. Both 8 and 10 are exactly divisible into 40.
Chapter 2 Capital Budgeting 83
c02 13 January 2012; 17:42:17

project with an outlay and variable cash flows in the future, the project NPV summarizes theequivalent value at time zero. For this same project, the EAA is the annuity payment (series ofequal annual payments over the project’s life) that is equivalent in value to the NPV.
Analysts can use a simple two-step procedure to find the EAA. The first step is to find thepresent value of all of the cash flows for an investment—the investment’s NPV. The secondstep is to calculate an annuity payment that has a value equivalent to the NPV. For Project Sabove, we already calculated the NPV of the project over its two-year life to be $28.93. Thesecond step is to find an annuity payment for the two-year life that is equivalent. For a two-year life and a 10 percent discount rate, a payment of $16.66 is the equivalent annuity.
The EAA for Project L is found by annuitizing its $35.66 NPV over three years, so theEAA for Project L is $14.34.
The decision rule for the EAA approach is to choose the investment chain that has thehighest EAA, which in this case is Project S.
Given these two approaches to comparing replacement chains, which one should theanalyst use? As a practical matter, the two approaches are logically equivalent and will result inthe same decision.10 Consequently, the analyst can choose one approach over the other basedon personal preference. Or, if the audience for the analyst’s work prefers to see the analysisusing one approach, the analyst can simply produce the analysis in that format.
7.2. Capital Rationing
Capital rationing is the case in which the company’s capital budget has a size constraint. Forexample, the capital budget is a fixed money amount. A fixed capital budget can place thecompany in several interesting situations. To illustrate these, we will assume that the companyhas a fixed $1,000 capital budget and has the opportunity to invest in four projects. Theprojects are of variable profitability.
In the first situation, the budget is adequate to invest in all profitable projects. Considerthe four projects in Exhibit 2-25.
EXHIBIT 2-25 First Capital Rationing Example
Investment Outlay NPV PI IRR
Project 1 600 220 1.37 15%
Project 2 200 70 1.35 16%
Project 3 200 –60 0.70 10%
Project 4 400 –100 0.75 8%
In this case, the company has two positive-NPV projects, Projects 1 and 2, which involvea total outlay of $800. Their total NPV is $290. The company should choose these projects,and it will have $200 in its capital budget left over. These excess funds can be used elsewhere
10For Projects S and L, the NPVs of a replacement chain over the least common multiple of lives (sixyears) were $72.59 for Project S and $62.45 for Project L. If we discount the EAA for Project S ($16.66)and the EAA for Project L ($14.34) for six years (treating each as a six-year annuity), we have the sameNPVs. Hence, the least common multiple of lives and EAA approaches are consistent with each other.
84 Corporate Finance
c02 13 January 2012; 17:42:17

in the company (moved to someone else’s budget, used to pay dividends or repurchase shares,or used to pay down debt). If a manager is afraid to return the excess funds and chooses toinvest in Project 3, the manager will consume the whole capital budget but reduce the totalNPV to $230, essentially destroying $60 of wealth for the company.
A second case exists in which the company has more profitable projects than it canchoose, but it is able to invest in the most profitable ones available. Continuing with the$1,000 capital budget, this second case is illustrated in Exhibit 2-26.
EXHIBIT 2-26 Second Capital Rationing Example
Investment Outlay NPV PI IRR
Project 5 600 300 1.50 16%
Project 6 200 80 1.40 18%
Project 7 200 60 1.30 12%
Project 8 200 40 1.20 14%
When the analyst has a fixed budget, the PI is especially useful because it shows theprofitability of each investment per currency unit invested. If we rank these projects by theirPIs, Projects 5, 6, and 7 are the best projects and we are able to select them. This selectionresults in a total NPV of $440. The IRRs, shown in the last column, are not a reliable guide tochoosing projects under capital rationing because a high-IRR project may have a low NPV.Wealth maximization is best guided by the NPV criterion.
A third case exists in which the company has more profitable projects than it can choose,but it is not able to invest in the most profitable ones available. Assume the company cannotinvest in fractional projects: It must take all or none of each project it chooses. Continuingwith the $1,000 capital budget, this case is illustrated in Exhibit 2-27.
EXHIBIT 2-27 Third Capital Rationing Example
Investment Outlay NPV PI IRR
Project 9 600 300 1.50 15%
Project 10 600 270 1.45 16%
Project 11 200 80 1.40 12%
Project 12 400 100 1.25 11%
In this example, an unlimited budget of $1,800 would generate a total NPV of $750.However, when the budget constraint is imposed, the highest NPV results from choosingProjects 9 and 12. The company is forced to choose its best project and its fourth-best project,as indicated by their relative PIs. Any other combination of projects either violates the budgetor has a lower total NPV.
Capital rationing has the potential to misallocate resources. Capital markets are sup-posed to allocate funds to their highest and best uses, with the opportunity cost of funds
Chapter 2 Capital Budgeting 85
c02 13 January 2012; 17:42:17
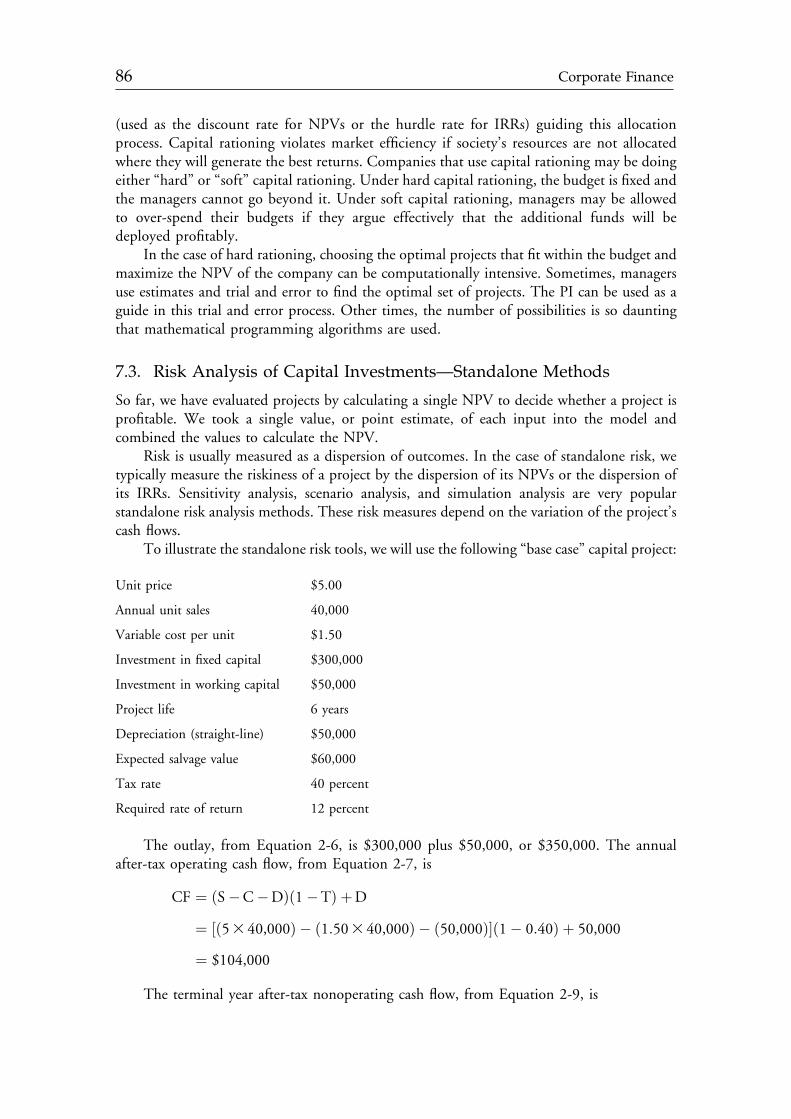
(used as the discount rate for NPVs or the hurdle rate for IRRs) guiding this allocationprocess. Capital rationing violates market efficiency if society’s resources are not allocatedwhere they will generate the best returns. Companies that use capital rationing may be doingeither “hard” or “soft” capital rationing. Under hard capital rationing, the budget is fixed andthe managers cannot go beyond it. Under soft capital rationing, managers may be allowedto over-spend their budgets if they argue effectively that the additional funds will bedeployed profitably.
In the case of hard rationing, choosing the optimal projects that fit within the budget andmaximize the NPV of the company can be computationally intensive. Sometimes, managersuse estimates and trial and error to find the optimal set of projects. The PI can be used as aguide in this trial and error process. Other times, the number of possibilities is so dauntingthat mathematical programming algorithms are used.
7.3. Risk Analysis of Capital Investments—Standalone Methods
So far, we have evaluated projects by calculating a single NPV to decide whether a project isprofitable. We took a single value, or point estimate, of each input into the model andcombined the values to calculate the NPV.
Risk is usually measured as a dispersion of outcomes. In the case of standalone risk, wetypically measure the riskiness of a project by the dispersion of its NPVs or the dispersion ofits IRRs. Sensitivity analysis, scenario analysis, and simulation analysis are very popularstandalone risk analysis methods. These risk measures depend on the variation of the project’scash flows.
To illustrate the standalone risk tools, we will use the following “base case” capital project:
Unit price $5.00
Annual unit sales 40,000
Variable cost per unit $1.50
Investment in fixed capital $300,000
Investment in working capital $50,000
Project life 6 years
Depreciation (straight-line) $50,000
Expected salvage value $60,000
Tax rate 40 percent
Required rate of return 12 percent
The outlay, from Equation 2-6, is $300,000 plus $50,000, or $350,000. The annualafter-tax operating cash flow, from Equation 2-7, is
CF ¼ ðS&C&DÞð1&TÞ þD
¼ ½ð53 40,000Þ & ð1:503 40,000Þ & ð50,000Þ(ð1& 0:40Þ þ 50,000
¼ $104,000
The terminal year after-tax nonoperating cash flow, from Equation 2-9, is
86 Corporate Finance
c02 13 January 2012; 17:42:18

TNOCF ¼ Sal6 þNWCInv &TðSal6 &B6Þ¼ 60,000þ 50,000& 0:40ð60,000& 0Þ ¼ $86,000
The project NPV is
NPV ¼ &350,000þX6
t¼1
104,0001:12t
þ 86,0001:126
¼ &350,000þ 471,157 ¼ $121,157
7.3.1. Sensitivity AnalysisSensitivity analysis calculates the effect on the NPV of changes in one input variable at a time.The base case above has several input variables. If we wish to do a sensitivity analysis of severalof them, we must specify the changes in each that we wish to evaluate. Suppose we want toconsider the following:
Base Value Low Value High Value
Unit price $5.00 $4.50 $5.50
Annual unit sales 40,000 35,000 45,000
Variable cost per unit $1.50 $1.40 $1.60
Expected salvage value $60,000 $30,000 $80,000
Tax rate 40% 38% 42%
Required rate of return 12% 10% 14%
We have changed each of six input variables. Exhibit 2-28 shows the NPV calculated forthe base case. Then the NPV is recalculated by changing one variable from its base case valueto its high or low value.
EXHIBIT 2-28 Sensitivity of Project NPV to Changes in a Variable
Project NPV
Variable Base Case With Low Estimate With High Estimate Range of Estimates
Unit price $121,157 $71,820 $170,494 $98,674
Annual unit sales $121,157 $77,987 $164,326 $86,339
Cost per unit $121,157 $131,024 $111,289 $19,735
Salvage value $121,157 $112,037 $127,236 $15,199
Tax rate $121,157 $129,165 $113,148 $16,017
Required return $121,157 $151,492 $93,602 $57,890
As Exhibit 2-28 shows, the project’s NPV is most sensitive to changes in the unit pricevariable. The project’s NPV is least sensitive to changes in the salvage value. Roughly
Chapter 2 Capital Budgeting 87
c02 13 January 2012; 17:42:18

speaking, the project’s NPV is most sensitive to changes in unit price and in unit sales. It isleast affected by changes in cost per unit, salvage value, and the tax rate. Changes in therequired rate of return also have a substantial effect, but not as much as changes in price orunit sales.
In a sensitivity analysis, the manager can choose which variables to change and by howmuch. Many companies have access to software that can be instructed to change a particularvariable by a certain amount—for example, to increase or decrease unit price, unit sales, andcost per unit by 10 percent. The software then produces the changes in NPV for each of thesechanges. Sensitivity analysis can be used to establish which variables are most influential onthe success or failure of a project.
7.3.2. Scenario AnalysisSensitivity analysis calculates the effect on the NPV of changes in one variable at a time.In contrast, scenario analysis creates scenarios that consist of changes in several of the inputvariables and calculates the NPV for each scenario. Although corporations could do a largenumber of scenarios, in practice they usually do only three. They can be labeled variously, butwe will present an example with “pessimistic,” “most likely,” and “optimistic” scenarios.Continuing with the basic example from the section above, the values of the input variablesfor the three scenarios are given in the table in Exhibit 2-29.
EXHIBIT 2-29 Input Variables and NPV for Scenario Analysis
Scenario
Variable Pessimistic Most Likely Optimistic
Unit price $4.50 $5.00 $5.50
Annual unit sales 35,000 40,000 45,000
Variable cost per unit $1.60 $1.50 $1.40
Investment in fixed capital $320,000 $300,000 $280,000
Investment in working capital $50,000 $50,000 $50,000
Project life 6 years 6 years 6 years
Depreciation (straight-line) $53,333 $50,000 $46,667
Salvage value $40,000 $60,000 $80,000
Tax rate 40% 40% 40%
Required rate of return 13% 12% 11%
NPV –$5,725 $121,157 $269,685
IRR 12.49% 22.60% 34.24%
The most likely scenario is the same as the base case we used above for sensitivity analysis,and the NPV for the most likely scenario is $121,157. To form the pessimistic and optimisticscenarios, managers change several of the assumptions for each scenario. For the pessimisticscenario, several of the input variables are changed to reflect higher costs, lower revenues, anda higher required rate of return. As the table shows, the result is a negative NPV for the
88 Corporate Finance
c02 13 January 2012; 17:42:18

pessimistic scenario and an IRR that is less than the pessimistic scenario’s 13 percent requiredrate of return. For the optimistic scenario, the more favorable revenues, costs, and requi-red rate of return result in very good NPV and IRR.
For this example, the scenario analysis reveals the possibility of an unprofitable invest-ment, with a negative NPV and with an IRR less than the cost of capital. The range for theNPV is fairly large compared to the size of the initial investment, which indicates thatthe investment is fairly risky. This example included three scenarios for which managementwants to know the profitability of the investment for each set of assumptions. Other scenarioscan be investigated if management chooses to do so.
7.3.3. Simulation (Monte Carlo) AnalysisSimulation analysis is a procedure for estimating a probability distribution of outcomes,such as for the NPV or IRR for a capital investment project. Instead of assuming a singlevalue (a point estimate) for the input variables in a capital budgeting spreadsheet, theanalyst can assume several variables to be stochastic, following their own probability dis-tributions. By simulating the results hundreds or thousands of times, the analyst can build agood estimate of the distributions for the NPV or IRR. Because of the volume of com-putations, analysts and corporate managers rely heavily on their personal computers andspecialized simulation software such as @RISK.11 Example 2-8 presents a simple simulationanalysis.
EXAMPLE 2-8 Capital Budgeting Simulation
Gouhua Zhang has made the following assumptions for a capital budgeting project:
! Fixed capital investment is 20,000; no investment in net working capital is required.! The project has an expected five-year life.! The fixed capital is depreciated straight-line to zero over a five-year life. The salvage
value is normally distributed with an expected value of 2,000 and a standard devi-ation of 500.
! Unit sales in Year 1 are normally distributed with a mean of 2,000 and a standarddeviation of 200.
! Unit sales growth after Year 1 is normally distributed with a mean of 6 percent andstandard deviation of 4 percent. Assume the same sales growth rate for Years 2–5.
! The sales price is 5.00 per unit, normally distributed with a standard deviation of0.25 per unit. The same price holds for all five years.
! Cash operating expenses as a percentage of total revenue are normally distributedwith a mean and standard deviation of 30 percent and 3 percent, respectively.
! The discount rate is 12 percent and the tax rate is 40 percent.
11@RISK is a popular and powerful risk analysis tool sold by Palisade Corporation. @RISK is an add-infor Microsoft Excel that allows simulation techniques to be incorporated into spreadsheet models.
Chapter 2 Capital Budgeting 89
c02 13 January 2012; 17:42:19

1. What are the NPV and IRR using the expected values of all input variables?2. Perform a simulation analysis and provide probability distributions for the NPV
and IRR.
Solution to 1.
EXHIBIT 2-30 Expected Cash Flows for Simulation Example
Time 0 1 2 3 4 5
Fixed capital –20,000
After-tax salvage value 1,200
Price 5.00 5.00 5.00 5.00 5.00
Output 2,000 2,120 2,247 2,382 2,525
Revenue 10,000 10,600 11,236 11,910 12,625
Cash operating expenses 3,000 3,180 3,371 3,573 3,787
Depreciation 4,000 4,000 4,000 4,000 4,000
Operating income before taxes 3,000 3,420 3,865 4,337 4,837
Taxes on operating income 1,200 1,368 1,546 1,735 1,935
Operating income after taxes 1,800 2,052 2,319 2,602 2,902
Depreciation 4,000 4,000 4,000 4,000 4,000
Total after-tax cash flow –20,000 5,800 6,052 6,319 6,602 8,102
NPV (at r ¼ 12 percent) 3,294
IRR 18.11%
Based on the point estimates for each variable (the mean values for each), which areshown in Exhibit 2-30 above, Zhang should find the NPV to be 3,294 and the IRR tobe 18.11 percent.
Solution to 2. Zhang performs a simulation using @RISK with 10,000 iterations. Foreach iteration, values for the five stochastic variables (price, output, output growth rate,cash expense percentage, and salvage value) are selected from their assumed distribu-tions and the NPV and IRR are calculated. After the 10,000 iterations, the resultinginformation about the probability distributions for the NPV and IRR is shown inExhibits 2-31 and 2-32.
As shown, the distributions for the NPV and IRR are somewhat normal looking.The means and standard deviations for each are given in Exhibit 2-32. Both dis-tributions have a slight positive skewness, which means the distributions are skewed tothe right. The two kurtosis values are fairly close to 3.0, which means that the dis-tributions are not peaked or fat-tailed compared to the standard normal distribution.The median is the value at which 50 percent of the 10,000 outcomes fall on eitherside. The 90 percent confidence intervals show that 90 percent of the observations fallbetween –379 and 7,413 for the NPV and between 11.38 percent and 25.13 percent
90 Corporate Finance
c02 13 January 2012; 17:42:19

for the IRR. Although not shown in the table, 7.04 percent of the observations had anegative NPV and an IRR less than the 12 percent discount rate.
The means of the NPV and IRR from the simulation (in Exhibit 2-32) are fairlyclose to their values calculated using point estimates for all of the input variables (inExhibit 2-30). This is not always the case, but it is here. The additional informationfrom a simulation is the dispersions of the NPV and IRR. Given his assumptions andmodel, the simulation results show Zhang the distributions of NPV and IRR outcomesthat should be expected. Managers and analysts often prefer to know these total dis-tributions rather than just their mean values.
EXHIBIT 2-31 Probability Distributions for NPV and IRR
A. Distribution for NPV
4 146 124 102 20 8NPV (thousands)
Mean = 3,338.362
B. Distribution for IRR
0 0.40.1 0.30.2IRR
Mean = 0.1807078
Chapter 2 Capital Budgeting 91
c02 13 January 2012; 17:42:19

This capital budgeting simulation example was not very complex, with only five stochasticvariables. The example’s five input variableswere assumed to be normally distributed—in reality,many other distributions can be employed. Finally, the randomly chosen values for each variablewere assumed to be independent. They can be selected jointly instead of independently. Sim-ulation techniques have proved to be a boon for addressing capital budgeting problems.
Sensitivity analysis, scenario analysis, and simulation analysis are well-developed standalonerisk analysis methods. These risk measures depend on the variation of the project’s cash flows.Market risk measures, presented in the next section, depend not only on the variation of a project’scash flows, but also on how those cash flows covary with (or correlate with) market returns.
7.4. Risk Analysis of Capital Investments—Market Risk Methods
Whenusingmarket riskmethods, the discount rate to be used in evaluating a capital project is therate of return required on the project by a diversified investor. The discount rate should thus be arisk-adjusted discount rate, which includes a premium to compensate investors for risk.12 Thisrisk premium should reflect factors that are priced or valued in the marketplace. The two
EXHIBIT 2-32 Summary Statistics for NPV and IRR
Statistic NPV IRR
Mean 3,338 18.07%
Standard deviation 2,364 4.18%
Skewness 0.2909 0.1130
Kurtosis 3.146 2.996
Median 3,236 18.01%
90% confidence interval –379 to 7,413 11.38% to 25.13%
Correlations between Input Variables and NPV and IRR
Input Variable NPV IRR
Output 0.71 0.72
Output growth rate 0.49 0.47
Price 0.34 0.34
Cash expense proportion –0.28 –0.29
Salvage value 0.06 0.05
The correlations in Exhibit 2-32 can be interpreted as sensitivity measures.Changes in the “output” variable have the highest correlation with NPV and IRRoutcomes. The salvage value has the lowest (absolute value) correlation.
12Our approach to capital budgeting is to discount expected cash flows at a risk-adjusted cost of capital.An alternative approach, which is also conceptually sound, is the “certainty-equivalent method.” In thismethod, certainty-equivalent cash flows (expected cash flows that are reduced to certainty equivalents)are valued by discounting them at a risk-free discount rate. The use of risk-adjusted discount rates ismore intuitive and much more popular.
92 Corporate Finance
c02 13 January 2012; 17:42:20

equilibriummodels for estimating this risk premium are the capital asset pricingmodel (CAPM)and arbitrage pricing theory (APT).We will discuss the CAPM as a way of finding risk-adjusteddiscount rates, although you should be aware that other methods can be used.
In the CAPM, total risk can be broken into two components: systematic risk andunsystematic risk. Systematic risk is the portion of risk that is related to the market and thatcannot be diversified away. Unsystematic risk is nonmarket risk, risk that is idiosyncratic andthat can be diversified away. Diversified investors can demand a risk premium for takingsystematic risk, but not unsystematic risk.13 Hence, the standalone risk measures—total riskmeasured by the dispersion of the NPV or the IRR—are inappropriate when the corporationis diversified, or, as is more likely, when the corporation’s investors are themselves diversified.
In the capital asset pricing model, a project’s or asset’s “beta,” or β, is generally used as ameasure of systematic risk. The security market line (SML) expresses the asset’s required rateof return as a function of β:
rj ¼ RF þ βi½EðRM Þ & RF ( ð2-10Þ
whereri ¼ required return for project or asset i
RF ¼ risk-free rate of return
βi ¼ beta of project or asset i
½EðRM Þ & RF ( ¼ market risk premium, the difference between theexpected market return and the risk-free rate of return
The project’s required rate of return is equal to the risk-free rate plus a risk premium,where the risk premium is the product of the project beta and the market risk premium.
Here, the required rate of return (sometimes called a hurdle rate) is specific to the risk ofthe project. There is no one hurdle rate appropriate for all projects.
EXHIBIT 2-33 SML for Capital Budgeting Projects
ri
r
rm
rf
β1.0 βi
13The capital asset pricing model uses this intuition to show how risky assets should be priced relative tothe market. While the CAPM assigns a single market risk premium for each security, the APT develops aset of risk premia. The CAPM and APT are developed in detail elsewhere in the CFA curriculum.
Chapter 2 Capital Budgeting 93
c02 13 January 2012; 17:42:20

The security market line (SML) is graphed in Exhibit 2-33. This line indicates therequired rate of return for a project, given its beta. The required rate of return can be used intwo ways:
1. The SML is used to find the required rate of return. The required rate of return is thenused to find the NPV. Positive NPV projects are accepted and negative NPV projects arerejected.
2. The SML is used to find the required rate of return. The project’s IRR is compared to therequired rate of return. If the IRR is greater than the required return, the project isaccepted (this point would plot above the SML in Exhibit 2-33). If the IRR is less thanthe required rate of return (below the SML), the project is rejected.
Example 2-9 illustrates how the capital asset pricing model and the security market lineare used as part of the capital budgeting process.
EXAMPLE 2-9 Using the SML to Find the Project RequiredRate of Return
Premont Systems is evaluating a capital project with the following characteristics:
! The initial outlay is h150,000.! Annual after-tax operating cash flows are h28,000.! After-tax salvage value at project termination is h20,000.! Project life is 10 years.! The project beta is 1.20.! The risk-free rate is 4.2 percent and the expected market return is 9.4 percent.
1. Compute the project NPV. Should the project be accepted?2. Compute the project IRR. Should the project be accepted?
Solution to 1. The project required rate of return is
ri ¼ RF þ βi½EðRM Þ & RF ( ¼ 4:2%þ 1:20ð9:4%& 4:2%Þ ¼ 4:2%þ 6:24%¼ 10:44%
The cash flows discounted at 10.44 percent give an NPV of
NPV ¼ &150,000þX10
t¼1
28,0001:1044t
þ 20,0001:104410
¼ h26,252
The project should be accepted because it has a positive NPV.
Solution to 2. The IRR, found with a financial calculator, is 14.24 percent. The requiredrate of return, established with the SML as in the solution to Question 1 above, is 10.44percent. Since the IRR exceeds the required rate of return, the project should beaccepted. For a beta of 1.20, the IRR of 14.24 percent would plot above the SML.
94 Corporate Finance
c02 13 January 2012; 17:42:20

Using project betas to establish required rates of return for capital projects is especiallyimportant when a project’s risk differs from that of the company. The cost of capital for acompany is estimated for the company as a whole—it is based on the average riskiness of thecompany’s assets as well as its financial structure. The required rates of return of debt andequity are used to estimate the weighted (overall) average cost of capital (WACC) for thecompany. When a project under consideration is more risky or less risky than the company,the WACC should not be used as the project required rate of return.
For example, assume that the risk-free rate of return is 3 percent, the market return is 8percent, and the company beta is 0.9. Assume also that the company is considering threeprojects: Project A with a 0.5 beta, Project B with a 0.9 beta, and Project C with a 1.1 beta.The required rates of return for the company and for each project are as follows:
Company: 3% + 0.9(8% – 3%)¼ 7.5%
Project A: 3% + 0.5(8% – 3%)¼ 5.5%
Project B: 3% + 0.9(8% – 3%)¼ 7.5%
Project C: 3% + 1.1(8% – 3%)¼ 8.5%
If management uses the company WACC as the required return for all projects, this rateis too high for Project A, making it less likely that Project A would be accepted. Project B hasthe same risk as the company, so it would be evaluated fairly. Using the WACC for Project Cmakes the error of using a discount rate that is too low, which would make it more likely thatthis high-risk project would be accepted. Whenever possible, it is desirable to use project-specific required rates of return instead of the company’s overall required rate of return.
Market returns are readily available for publicly traded companies. The stock betas ofthese companies can then be calculated, and this calculation assists in estimating the com-panies’ betas and WACC. Unfortunately, however, the returns for specific capital projects arenot directly observable, and we have to use proxies for their betas. Frequently, we can employthe pure-play method, in which the analyst identifies other publicly traded stocks in the samebusiness as the project being considered. The betas for the stocks of these companies are usedto estimate a project beta. In the pure-play method, these proxy companies need to be rel-atively focused in the same line of business as the project. When the pure-play method is notpossible, other methods, such as estimating accounting betas or cross-sectional regressionanalysis, are used.
7.5. Real Options
Real options are capital budgeting options that allow managers to make decisions in thefuture that alter the value of capital budgeting investment decisions made today. Instead ofmaking all capital budgeting decisions now, at time zero, managers can wait and makeadditional decisions at future dates when these future decisions are contingent upon futureeconomic events or information. These sequential decisions, in which future decisions dependon the decisions made today as well as on future economic events, are very realistic capitalbudgeting applications.
Real options are like financial options—they just deal with real assets instead of financialassets. A simple financial option could be a call option on a share of stock. Suppose the stockis selling for $50, the exercise (strike) price is $50, and the option expires in one year. If thestock goes up to $60, you exercise the option and have a gain of $10 in one year. If the stock
Chapter 2 Capital Budgeting 95
c02 13 January 2012; 17:42:20

goes down to $40, you do not exercise, and you have no gain. However, no gain is better thanthe $10 loss you would have had if you had purchased the stock at the beginning of the year.Real options, like financial options, entail the right to make a decision, but not the obligation.The corporation should exercise a real option only if it is value-enhancing.
Just as financial options are contingent on an underlying asset, real options are contingenton future events. The flexibility that real options give to managers can greatly enhance the NPVof the company’s capital investments. The following are several types of these real options:
Timing options. Instead of investing now, the company can delay investing. Delaying aninvestment and basing the decision on hopefully improved information that you mighthave in, say, a year could help improve the NPV of the projects selected.
Sizing options. If after investing, the company can abandon the project when the financialresults are disappointing, it has an abandonment option. At some future date, if the cashflow from abandoning a project exceeds the present value of the cash flows from con-tinuing the project, managers should exercise the abandonment option. Conversely, if thecompany can make additional investments when future financial results are strong,the company has a growth option or an expansion option.
Flexibility options. Once an investment is made, other operational flexibilities may beavailable besides abandonment or expansion. For example, suppose demand exceedscapacity. Management may be able to exercise a price-setting option. By increasingprices, the company could benefit from the excess demand, which it cannot do byincreasing production. There are also production-flexibility options. Even though it isexpensive, the company can profit from working overtime or from adding additionalshifts. The company can also work with customers and suppliers for their mutual benefitwhenever a demand–supply mismatch occurs. This type of option also includes thepossibility of using different inputs or producing different outputs.
Fundamental options. In cases like those above, there are options embedded in a project thatcan raise its value. In other cases, the whole investment is essentially an option. Thepayoffs from the investment are contingent on an underlying asset, just like mostfinancial options. For example, the value of an oil well or refinery investment is con-tingent upon the price of oil. The value of a gold mine is contingent upon the price ofgold. If oil prices are low, you may not drill a well. If oil prices are high, you go aheadand drill. Many R&D (research and development) projects also look like options.
There are several approaches to evaluating capital budgeting projects with real options.One of the difficulties with real options is that the analysis can be very complicated. Althoughsome of the problems are simple and can be readily solved, many of them are so complex thatthey are expensive to evaluate or you may not have much confidence in the analysis. Fourcommonsense approaches to real options analysis are presented below.
1. Use discounted cash flow (DCF) analysis without considering options. If the NPV ispositive without considering real options, and the project has real options that wouldsimply add more value, it is unnecessary to evaluate the options. Just go ahead and makethe investment.
2. Consider the Project NPV¼NPV (based on DCF alone) – Cost of options + Value ofoptions. Go ahead and calculate the NPV based on expected cash flows. Then simply addthe value associated with real options. For example, if a project has a negative NPV basedon DCF alone of $50 million, will the options add at least that much to its value?
96 Corporate Finance
c02 13 January 2012; 17:42:20

3. Use decision trees. Although they are not as conceptually sound as option pricing models,decision trees can capture the essence of many sequential decision making problems.
4. Use option pricing models. Except for simple options, the technical requirements forsolving these models may require you to hire special consultants or “quants.” Some largecompanies have their own specialists.
The analyst is confronted with (1) a variety of real options that investment projects maypossess and (2) a decision about how to reasonably value these options. Example 2-10 dealswith production flexibility; in this case, an additional investment outlay gives the company anoption to use alternative fuel sources.
Two of the most valuable options are to abandon or expand a project at some point afterthe original investment. Example 2-11 illustrates the abandonment option.
EXAMPLE 2-10 Production-Flexibility Option
Sackley AquaFarms estimated the NPV of the expected cash flows from a new pro-cessing plant to be –$0.40 million. Sackley is evaluating an incremental investment of$0.30 million that would give management the flexibility to switch between coal,natural gas, and oil as an energy source. The original plant relied only on coal. Theoption to switch to cheaper sources of energy when they are available has an estimatedvalue of $1.20 million. What is the value of the new processing plant including this realoption to use alternative energy sources?
Solution. The NPV, including the real option, should be:
Project NPV ¼NPV ðbased on DCF aloneÞ &Cost of optionsþValue of options
Project NPV ¼ &0:40 million& 0:30 millionþ 1:20 million ¼ $0:50 million
Without the flexibility offered by the real option, the plant is unprofitable. The realoption to adapt to cheaper energy sources adds enough to the value of this investmentto give it a positive NPV.
EXAMPLE 2-11 Abandonment Option
Nyberg Systems is considering a capital project with the following characteristics:
! The initial outlay is h200,000.! Project life is four years.! Annual after-tax operating cash flows have a 50 percent probability of being h40,000for the four years and a 50 percent probability of being h80,000.
Chapter 2 Capital Budgeting 97
c02 13 January 2012; 17:42:21

A fundamental real option could be a gold mine or an oil well. Example 2-12 looks at thepossibility of purchasing the rights to a gold mining property.
! Salvage value at project termination is zero.! The required rate of return is 10 percent.! In one year, after realizing the first-year cash flow, the company has the option to
abandon the project and receive the salvage value of h150,000.
1. Compute the project NPV assuming no abandonment.2. What is the optimal abandonment strategy? Compute the project NPV using that
strategy.
Solution to 1. The expected annual after-tax operating cash flow is 0.50(40,000) + 0.50(80,000)¼ h60,000. The cash flows discounted at 10 percent give an NPV of
NPV ¼ &200,000þX4
t¼1
60,0001:10t
¼ &h9,808
The project should be rejected because it has a negative NPV.
Solution to 2. The optimal abandonment strategy would be to abandon the project inone year if the subsequent cash flows are worth less than the abandonment value. If atthe end of the first year the low cash flow occurs, you can abandon for h150,000 andgive up h40,000 for the following three years. The h40,000 annual cash flow, dis-counted for three years at 10 percent, has a present value of only h99,474, so youshould abandon. Three years of the higher h80,000 cash flow has a present value ofh198,948, so you should not abandon. After the first year, abandon if the low cash flowoccurs, and do not abandon if the high cash flow occurs.
If the high cash flow occurs and you do not abandon, the NPV is
NPV ¼ &200,000þX4
t¼1
80,0001:10t
¼ h53,589
If you abandon when the low cash flow occurs, you receive the first year cashflow and the abandonment value and then no further cash flows. In that case, theNPV is
NPV ¼ &200,000þ 40,000þ 150,0001:10
¼ h27,273
The expected NPV is then
NPV ¼ 0:50ð53,589Þ þ 0:50ð&27,273Þ ¼ h13,158
Optimal abandonment raises the NPV by 13,158& (&h9,808)¼ h22,966.
98 Corporate Finance
c02 13 January 2012; 17:42:21

A critical assumption of many applications of traditional capital budgeting tools is thatthe investment decision is made now, with no flexibility considered in future decisions.A more reasonable approach is to assume that the corporation is making sequential decisions,some now and some in the future. A combination of optimal current and future decisions iswhat will maximize company value. Real options analysis tries to incorporate rational futuredecisions into the assessment of current investment decision making. This future flexibility,exercised intelligently, enhances the value of capital investments. Some real options can bevalued with readily available option pricing models, such as the binomial model or the Black–Scholes–Merton option pricing model.14 Unfortunately, many real options are very complexand hard to value, which poses a challenge as the analyst tries to lay out the economiccontingencies of an investment and assess their values. A real option, with the future flexibilityit provides, can be an important piece of the value of many projects.
7.6. Common Capital Budgeting Pitfalls
Although the principles of capital budgeting may be easy to learn, applying the principles toreal world investment opportunities can be challenging. Some of the common mistakes thatmanagers make are listed in Exhibit 2-34.
Economic responses. Economic responses to an investment often affect its profitability,and these responses have to be correctly anticipated. For example, in response to a successfulinvestment, competitors can enter and reduce the investment’s profitability. Similarly, ven-dors, suppliers, and employees may want to gain from a profitable enterprise. Companies that
EXAMPLE 2-12 Erichmann Gold Mine
The Erichmann family has offered a five-year option on one of its small gold miningproperties for $10 million. The current price of gold is $400 per ounce. The mine holdsan estimated 500,000 ounces that could be mined at an average cost of $450 per ounce.The maximum production rate is 200,000 ounces per year. How would you assess theErichmann family’s offer?
Solution. A binomial option model can be built for the underlying price of gold.These binomial models are very common in assessing the value of financial options suchas puts and calls on stocks, callable bonds, or mortgages with prepayment options.Whenever the price path for gold is above $450 per ounce, it might be attractive tocommence mining. Of course, you would cease mining whenever the price is lower.With additional information about the volatility of gold prices and the risk-free interestrate, an expert could build this binomial model and value the real option. Comparingthe value of this real option to its $10 million cost would enable you to make aninvestment decision.
14Chapter 4 of Chance (2003) gives an excellent overview of option pricing models.
Chapter 2 Capital Budgeting 99
c02 13 January 2012; 17:42:21

make highly profitable investments often find that a competitive marketplace eventuallycauses profitability to revert to normal levels.
Template errors. Because hundreds or even thousands of projects need to be analyzedover time, corporations have standardized capital budgeting templates for managers to use inevaluating projects. This situation creates risks in that the template model may not match theproject, or employees may input inappropriate information.
Pet projects. Pet projects are projects that influential managers want the corporation toinvest in. Ideally, pet projects will receive the normal scrutiny that other investments receiveand will be selected on the strength of their own merits. Often, unfortunately, pet projects areselected without undergoing normal capital budgeting analysis. Or the pet project receives theanalysis, but overly optimistic projections are used to inflate the project’s profitability.
EPS, net income, or ROE. Managers sometimes have incentives to boost EPS, netincome, or ROE. Many investments, even those with strong NPVs, do not boost theseaccounting numbers in the short run and may even reduce them. Paying attention to short-run accounting numbers can result in choosing projects that are not in the long-run economicinterests of the business.
Basing decisions on the IRR.TheNPVcriterion is economically sound.The IRR criterionis also sound for independent projects (with conventional cash flow patterns). If projects aremutually exclusive or competitive with each other, investing in projects based on the IRR willtend to result in choosing smaller, short-term projects with high IRRs at the expense of larger,longer-term, high NPV projects. Basing decisions on paybacks or accounting rates of return iseven more dangerous. These measures can be economically unsound.
Bad accounting for cash flows. In analyzing a complicated project, it is easy to omitrelevant cash flows, double count cash flows, and mishandle taxes.
Overhead costs. In large companies, the cost of a project must include the overhead itgenerates for such things as management time, information technology support, financialsystems, and other support. Although these items are hard to estimate, over- or under-estimating these overhead costs can lead to poor investment decisions.
Discount rate errors. The required rate of return for a project should be based on itsrisk. If a project is being financed with debt (or with equity), you should still use the project’s
EXHIBIT 2-34 Common Capital Budgeting Pitfalls
Not incorporating economic responses into the investment analysis
Misusing capital budgeting templates
Pet projects
Basing investment decisions on EPS, net income, or return on equity
Using IRR to make investment decisions
Bad accounting for cash flows
Overhead costs
Not using the appropriate risk-adjusted discount rate
Spending all of the investment budget just because it is available
Failure to consider investment alternatives
Handling sunk costs and opportunity costs incorrectly
100 Corporate Finance
c02 13 January 2012; 17:42:21

required rate of return and not the cost of debt (or the cost of equity). Similarly, a high-riskproject should not be discounted at the company’s overall cost of capital, but at the project’srequired rate of return. Discount rate errors have a huge impact on the computed NPVs oflong-lived projects.
Overspending and underspending the capital budget. Politically, many managers willspend all of their budget and argue that their budget is too small. In a well-run company,managers will return excess funds whenever their profitable projects cost less than theirbudget, and managers will make a sound case for extra funds if their budget is too small.
Failure to consider investment alternatives.Generating good investment ideas is themostbasic step in the capital budgeting process, andmany good alternatives are never even considered.
Sunk costs and opportunity costs. Ignoring sunk costs is difficult for managers to do.Furthermore, not identifying the economic alternatives (real and financial) that are theopportunity costs is probably the biggest failure in much analysis. Only costs that change withthe decision are relevant.
8. OTHER INCOME MEASURES AND VALUATION MODELS
Capital budgeting was one of the first widespread applications of discounted cash flow analysis.In the basic capital budgeting model, the analyst values an investment by discounting futureafter-tax cash flows at the rate of return required by investors. Subtracting the initial investmentresults in the project’s NPV. The future cash flows consist of after-tax operating cash flows plusreturns of investment (such as salvage value and sale of working capital).
Analysts will employ and encounter other concepts of income and other valuationapproaches besides this basic capital budgeting model. Because some of these other approa-ches are economically sound and widely employed, we will briefly describe some of them here.By considering these approaches, you can see the distinguishing features of each approach andthat they should result in consistent valuations (if they are used correctly).
To facilitate the comparison of income measures and valuation models, we will employas an example a simple company (the Granite Corporation) that invests in one project. Thecompany goes out of business when that project expires. After evaluating that project with theNPV and IRR capital budgeting models, we will examine that same project using the fol-lowing alternative methods:
! Economic income and accounting income! Economic profit valuation! Residual income valuation! Claims valuation
Our purpose is to show how the various income measures and valuation methods arerelated to each other.
8.1. The Basic Capital Budgeting Model
The basic capital budgeting model (presented earlier) identifies the after-tax operating cashflows from an investment as well as nonoperating cash flows (such as the initial investment orfuture recovery of invested capital or net working capital). Then, these cash flows are dis-counted at the required rate of return for the asset to establish the NPV.
Chapter 2 Capital Budgeting 101
c02 13 January 2012; 17:42:22

The base-case capital budgeting project is the following. The company is going to invest$150,000 and generate sales for the next five years as shown in Exhibit 2-35. Variable cashoperating expenses will be 50 percent of sales each year, and fixed cash operating expenses are$20,000. Depreciation is straight-line to zero, $30,000 per year with a zero book value atthe end of five years. The income tax rate is 40 percent. Salvage value is $10,000, which istaxable at 40 percent, leaving an after-tax salvage value of $6,000 at the end of five years. Therequired rate of return is 10 percent.
EXHIBIT 2-35 Basic Capital Budgeting Example for Granite Corporation
Year 0 1 2 3 4 5
Fixed capital investment –150,000
Sales 150,000 200,000 250,000 200,000 150,000
Variable cash expenses 75,000 100,000 125,000 100,000 75,000
Fixed cash expenses 20,000 20,000 20,000 20,000 20,000
Depreciation 30,000 30,000 30,000 30,000 30,000
Operating income before taxes 25,000 50,000 75,000 50,000 25,000
Taxes at 40 percent 10,000 20,000 30,000 20,000 10,000
Operating income after taxes 15,000 30,000 45,000 30,000 15,000
After-tax operating cash flow 45,000 60,000 75,000 60,000 45,000
Salvage value 10,000
Taxes on salvage value 4,000
After-tax salvage value 6,000
Total after-tax cash flow –150,000 45,000 60,000 75,000 60,000 51,000
NPV (at r¼ 10 percent) 69,492
IRR 26.27%
The present value of the after-tax cash flows for Years 1–5 is $219,492. Subtracting theinvestment of $150,000 results in the NPV of $69,492. The IRR for the investment is 26.27percent.
8.2. Economic and Accounting Income
Economic income and accounting income differ from the after-tax operating cash flows usedin the basic capital budgeting model.
Economic income is the profit realized from an investment. For a given year, economicincome is the investment’s after-tax cash flow plus the change in the market value:
Economic income ¼ Cash flow þChange in market value
Economic income ¼ Cash flow þðEnding market value&Beginning market valueÞð2-11Þ
102 Corporate Finance
c02 13 January 2012; 17:42:22

or
Economic income ¼ Cash flow &ðBeginning market value &Ending market valueÞ
Economic income ¼ Cash flow &Economic depreciation15
For the Granite Corporation, the cash flows are already calculated in Exhibit 2-35. Thebeginning market value at time zero is the present value of the future after-tax cash flows atthe 10 percent required rate of return, or $219,492. The market value at any future date is thepresent value of subsequent cash flows discounted back to that date. For the Granite Cor-poration, the cash flows, changes in market value, and economic incomes are shown inExhibit 2-36.
EXHIBIT 2-36 Economic Income for Granite Corporation
Year 1 2 3 4 5
Beginning market value 219,492 196,441 156,086 96,694 46,364
Ending market value 196,441 156,086 96,694 46,364 0
Change in market value –23,051 –40,356 –59,391 –50,331 –46,364
After-tax cash flow 45,000 60,000 75,000 60,000 51,000
Economic income 21,949 19,644 15,609 9,669 4,636
Economic rate of return 10% 10% 10% 10% 10%
In Year 1, the beginning value is $219,492 and the ending value is $196,441, so the change invalue is –$23,051. The economic income is the cash flow plus the change in value, or $45,000+ (–$23,051)¼ $21,949. The economic income for Years 2–5 is found similarly. The eco-nomic rate of return is the year’s economic income divided by its beginning market value.Notice that the economic rate of return is precisely 10 percent each year, which was therequired rate of return on the project.
Accounting income for this company will differ from the economic income for tworeasons. First, the accounting depreciation is based on the original cost of the investment (notthe market value of the investment). Consequently, the accounting depreciation schedule doesnot follow the declines in the market value of an asset. Besides being based on accountingdepreciation instead of economic depreciation, accounting net income is the after-tax incomeremaining after paying interest expenses on the company’s debt obligations. In contrast,interest expenses are ignored when computing the economic income for an asset or the after-tax operating cash flows in the basic capital budgeting model. As explained in Section 3, theeffects of financing costs are captured in the discount rate, not in the cash flows. In the capital
15These equations are conceptually identical because economic depreciation is the negative of the changein market value. For example, assume the cash flow is 10, the beginning market value is 30, and theending market value is 25. Cash flowþChange in market value¼Cash flowþ (Ending market value –Beginning market value)¼ 10þ (25 – 30)¼ 5. Or, Cash flow – Economic depreciation¼Cash flow –(Beginning market value – Ending market value)¼ 10 – (30 – 25)¼ 5.
Chapter 2 Capital Budgeting 103
c02 13 January 2012; 17:42:22

budgeting model, if we included interest expenses in the cash flows, we would be doublecounting them.
To illustrate these differences, we will assume that the company borrows an amountequal to one-half of the value of the company, which is 50 percent of $219,492, or $109,746,and that it pays 81/3 percent interest each year on the beginning balance. With a 40 percenttax rate, the after-tax interest cost is 81/3 percent (1 – 0.40)¼ 5.0 percent. Because the GraniteCorporation has a five-year life, it does not need to borrow or retain earnings for the future,
EXHIBIT 2-37 Condensed Financial Statements for Granite Corporation
Year 0 1 2 3 4 5
Balance Sheets:
Assets 150,000 120,000 90,000 60,000 30,000 0
Liabilities 109,746 98,221 78,043 48,347 23,182 0
Net worth 40,254 21,779 11,957 11,653 6,818 0
Income Statements:
Sales 150,000 200,000 250,000 200,000 150,000
Variable cash expenses 75,000 100,000 125,000 100,000 75,000
Fixed cash expenses 20,000 20,000 20,000 20,000 20,000
Depreciation 30,000 30,000 30,000 30,000 30,000
EBIT 25,000 50,000 75,000 50,000 25,000
Interest expense 9,146 8,185 6,504 4,029 1,932
EBT 15,854 41,815 68,496 45,971 23,068
Taxes at 40 percent 6,342 16,726 27,399 18,388 9,227
Net income before salvage 9,513 25,089 41,098 27,583 13,841
After-tax salvage value 6,000
Net income 9,513 25,089 41,098 27,583 19,841
Statements of Cash Flows:
Operating cash flows:
Net income 9,513 25,089 41,098 27,583 19,841
Depreciation 30,000 30,000 30,000 30,000 30,000
Total 39,513 55,089 71,098 57,583 49,841
Financing cash flows:
Debt repayment –11,525 –20,178 –29,696 –25,165 –23,182
Dividends/repurchases –27,987 –34,911 –41,402 –32,417 –26,659
Total –39,513 –55,089 –71,098 –57,583 –49,841
Investing cash flows 0 0 0 0 0
Total cash flows 0 0 0 0 0
104 Corporate Finance
c02 13 January 2012; 17:42:23

and all cash flows will be distributed to bondholders and stockholders. Granite will maintain a50 percent debt/value ratio on the company’s debt, so bondholders will receive 81/3 percentinterest on their beginning bond balance and the debt will also be amortized (paid down)whenever the value of the company goes down. Furthermore, after all operating costs, interestexpenses, and taxes are paid, stockholders will receive all remaining cash flows each year as acash dividend or share repurchase.16
The financial statements for the Granite Corporation are shown in Exhibit 2-37.The income statement for financial reporting purposes differs from that used in the
capital budgeting model because the interest on debt obligations is now taken out as anexpense before arriving at net income. The book value of the company’s assets is based on theoriginal accounting cost minus accumulated accounting depreciation. Note that the liabilitiesand net worth are also declining in the balance sheet. The liabilities decline each year,reflecting the amounts that were paid annually to reduce the principal of the loan. Notice,also, that the net worth is declining. Normally, the net worth of a company increasesbecause beginning equity is increased by net retentions—the excess of net income overdividends paid. In this case, the company is shrinking and going out of business in five years,so the distributions to shareholders (which can be either cash dividends or share repurchases)exceed net income and net worth declines. The amounts that are paid each year to reducedebt and for dividends/share repurchases are shown in the financing section of the statementof cash flows.
Accounting measures of performance also can differ from economic measures of per-formance. Exhibit 2-38 repeats the economic income and accounting income from Exhibits2-36 and 2-37. The exhibit also shows the economic rate of return each year and two popularaccounting measures of performance: the return on equity (ROE¼ net income divided bybeginning equity) and return on assets (ROA¼EBIT divided by beginning assets).
EXHIBIT 2-38 Economic Income, Accounting Income, and Rates of Return for GraniteCorporation
Year 1 2 3 4 5
Economic income 21,949 19,644 15,609 9,669 4,636
Accounting income 9,513 25,089 41,098 27,583 19,841
Economic rate of return 10.00% 10.00% 10.00% 10.00% 10.00%
Return on equity (ROE) 23.63% 115.20% 343.71% 236.70% 291.00%
Return on assets (ROA) 16.67% 41.67% 83.33% 83.33% 83.33%
As Exhibit 2-38 illustrates, economic and accounting incomes differ substantially. Overthe five years, economic income is much less than accounting income, and the patternscertainly differ. In addition, the accounting rates of return, the ROE and ROA, for thisadmittedly unusual company are quite different from the economic rate of return.
16The assumptions may be unrealistic, but this is a very simple corporation.
Chapter 2 Capital Budgeting 105
c02 13 January 2012; 17:42:23

8.3. Economic Profit, Residual Income, and Claims Valuation
Although the capital budgeting model is widely employed, analysts have used other proce-dures to divide up the cash flows from a company or project and then value them usingdiscounted cash flow methods. We present three of these alternative models here: the eco-nomic profit model, the residual income model, and the claims valuation model.Used correctly, they are all consistent with the basic capital budgeting model and with eachother.
8.3.1. Economic ProfitThe first alternative method for measuring income and valuing assets is based on economicprofit (EP).17 Economic profit has been used in asset valuation as well as in performancemeasurement and management compensation. Its calculation is loosely as follows:
EP ¼NOPAT& $WACC ð2-12Þ
where
EP ¼ Economic profit
NOPAT ¼ Net operating profit after tax ¼ EBITð1& Tax rateÞEBIT ¼ Operating income before taxes, or Earnings before interest and taxes
$WAC ¼ Dollar cost of capital ¼WACC3Capital
WACC ¼ Weighted average ðor overallÞ cost of capitalCapital ¼ Investment
EP is a periodic measure of profit above and beyond the dollar cost of the capital investedin the project. The dollar cost of capital is the dollar return that the company must make onthe project in order to pay the debt holders and the equity holders their respective requiredrates of return.18
For the Granite Corporation, for the first year, we have the following:
NOPAT ¼ EBITð1& Tax rateÞ ¼ 25,000ð1& 0:40Þ ¼ $15,000
$WACC ¼ WACC3Capital ¼ 10%3150,000 ¼ $15,000
EP ¼ NOPAT& $WACC ¼ 15,000& 15,000 ¼ $0
Exhibit 2-39 shows the EP for all five years for the Granite Corporation.
17Economic Value Addeds or EVA, trademarked by the consulting firm Stern Stewart & Company, is awell-known commercial application of the economic profit approach. See Stewart (1991) and Petersonand Peterson (1996) for complete discussion.18In the chapter on cost of capital, we will explain the relationship between the required rate of return onthe project or WACC (here 10 percent), the rate of return required by debtholders (here 81/3 percent),and the rate of return required by equityholders (here 15 percent).
106 Corporate Finance
c02 13 January 2012; 17:42:23

EXHIBIT 2-39 EP for Granite Corporation
Year 1 2 3 4 5**
Capital* 150,000 120,000 90,000 60,000 30,000
NOPAT 15,000 30,000 45,000 30,000 21,000
$WACC 15,000 12,000 9,000 6,000 3,000
EP 0 18,000 36,000 24,000 18,000
*Depreciation is $30,000 per year.**The $6,000 after-tax gain from salvage is included in NOPAT in Year 5.
EP is readily applied to valuation of an asset or a security. The NPV found by discountedcash flow analysis in the basic capital budgeting model will be equal to the present value offuture EP discounted at the weighted average cost of capital.
NPV ¼XN
t¼1
EPtð1þWACCÞt
ð2-13Þ
This NPV is also called the market value added (MVA).19 So we have
NPV ¼ MVA ¼XN
t¼1
EPtð1þWACCÞt
ð2-14Þ
Discounting the five years of EP for the Granite Corporation at the 10 percent WACCgives an NPV (and MVA) of $69,492. The total value of the company (of the asset) is theoriginal investment of $150,000 plus the NPV of $69,492, or $219,492. The valuation usingEP is the same as that found with the basic capital budgeting model.
8.3.2. Residual IncomeAnother method for estimating income and valuing an asset is the residual income method.20
This method focuses on the returns to equity, where
Residual income ¼Net income& Equity charge
or
RIt ¼ NIt & reBt&1 ð2-15Þ
19Peterson and Peterson define MVA as the market value of the company minus the capital invested,which is an NPV.20See Chapter 5 in Pinto, Henry, Robinson, and Stowe (2010) and Edwards and Bell (1961) fortreatments of residual income analysis.
Chapter 2 Capital Budgeting 107
c02 13 January 2012; 17:42:23

where
RIt ¼ Residual income during period t
NIt ¼ Net income during period t
reBt&1¼ Equity charge for period t ,which is the required rate of return on equity, re,
times the beginning-of -period book value of equity, Bt&1
For the first year for the Granite Corporation, the net income is $9,513. The beginningbook value of equity is $40,254 (from the balance sheet in Exhibit 2-37), and the requiredrate of return on equity is 15 percent. Consequently, the residual income for Year 1 is:
RIt ¼NIt & reBt&1 ¼ 9,513& 0:15ð40,254Þ ¼ 9,513& 6,038 ¼ $3,475
The residual income for all five years for Granite is shown in Exhibit 2-40.
EXHIBIT 2-40 Residual Income for Granite Corporation
Year 1 2 3 4 5*
NIt 9,513 25,089 41,098 27,583 19,841
reBt–1 6,038 3,267 1,794 1,748 1,023
RIt 3,475 21,822 39,304 25,835 18,818
*The $6,000 after-tax gain from salvage is included in NI in Year 5.
Residual income, like EP, can also be applied to valuation of an asset or security. TheNPV of an investment is the present value of future residual income discounted at therequired rate of return on equity.
NPV ¼XN
t¼1
RItð1þ reÞt
ð2-16Þ
Discounting the residual income for the Granite Corporation at the 15 percent requiredrate of return on equity gives an NPV of $69,492. The total value of the company (of theasset) is the present value of the residual income, the original equity investment, plus theoriginal debt investment:
PV of residual income $69,492Equity investment 40,254
Debt investment 109,746
Total value $219,492
The value of the company is the original book value of its debt and equity plus thepresent value of the residual income (which is the project’s NPV). Again, this is the samevalue we found with the basic capital budgeting model and with the EP model.
108 Corporate Finance
c02 13 January 2012; 17:42:23

8.3.3. Claims ValuationTo value a company, the EP valuation approach essentially adds the present value of EP to theoriginal investment. The residual income approach adds the present value of residual incometo the original debt and equity investments in the company. Since the EP approach is fromthe perspective of all suppliers of capital, EP is discounted at the overall WACC. The residualincome approach takes the perspective of equity investors, so residual income is discounted atthe cost of equity.
The third and final alternative valuation approach that we present is to divide theoperating cash flows between security-holder classes (in this example, debt and equity), andthen value the debt and equity cash flows separately.
Balance Sheet
AssetsLiabilities
Equity
The basic capital budgeting approach is to value the asset, which is on the left-hand sideof the balance sheet above. The claims valuation approach values the liabilities and equity, theclaims against the assets, which are on the right-hand side of the balance sheet. The value ofthe claims should equal the value of the assets.
For the Granite Corporation, the cash flows to debtholders are the interest payments andprincipal payments. These are valued by discounting them at the cost of debt, which is 81/3percent. The cash flows to stockholders are the dividends and share repurchases, which arevalued by discounting them at the 15 percent cost of equity. Exhibit 2-41 below lists thefuture cash flows for debt and equity.
EXHIBIT 2-41 Payments to Bondholders and Stockholders of Granite Corporation
Year 1 2 3 4 5
Interest payments 9,146 8,185 6,504 4,029 1,932
Principal payments 11,525 20,178 29,696 25,165 23,182
Total debt payments 20,671 28,363 36,199 29,194 25,114
Equity distributions 27,987 34,911 41,402 32,417 26,659
The present value of the total debt payments, discounted at the cost of debt, is $109,746.The value of the equity distributions, discounted at the cost of equity, is $109,746. The totalvalue of the company is the combined value of debt and equity, which is $219,492.
In our example, the basic capital budgeting model, the economic profit model, theresidual income model, and the claims valuation model all result in the same valuation ofthe company. In the real world, analysts must deal with many accounting complications.Some of these complications may include pension liability adjustments, valuations of mar-ketable securities held, exchange rate gains and losses, and adjustments for leases, inventories,goodwill, deferred taxes, and so forth. In theory, all of the valuation models are equivalent.In practice, even with due diligence and care, analysts may prefer one approach over othersand disagree about valuations.
Chapter 2 Capital Budgeting 109
c02 13 January 2012; 17:42:24

There are other approaches to valuation that analysts use and run across. Two commonones are the free cash flow to the firm (FCFF) and free cash flow to equity (FCFE) approa-ches.21 The free cash flow to the firm approach is fundamentally the same as the basic capitalbudgeting approach. The free cash flow to equity approach is related to the claims valuationapproach. In corporate finance, corporate managers usually value an asset by valuing its totalafter-tax cash flows. Security analysts typically value equity by valuing the cash flows tostockholders. Real estate investors often evaluate real estate investments by valuing the cash flowsto the equity investor after payments to creditors, which is like the claims valuation approach.
9. SUMMARY
Capital budgeting is the process that companies use for decision making on capital projects—those projects with a life of a year or more. This chapter developed the principles behind thebasic capital budgeting model, the cash flows that go into the model, and several extensions ofthe basic model.
! Capital budgeting undergirds the most critical investments for many corporations—theirinvestments in long-term assets. The principles of capital budgeting have been applied toother corporate investing and financing decisions and to security analysis and portfoliomanagement.
! The typical steps in the capital budgeting process are: (1) generating ideas, (2) analyzingindividual proposals, (3) planning the capital budget, and (4) monitoring and post-auditing.
! Projects susceptible to capital budgeting process can be categorized as: (1) replacement,(2) expansion, (3) new products and services, and (4) regulatory, safety, and environmental.
! Capital budgeting decisions are based on incremental after-tax cash flows discounted at theopportunity cost of funds. Financing costs are ignored because both the cost of debt andthe cost of other capital are captured in the discount rate.
! The net present value (NPV) is the present value of all after-tax cash flows, or
NPV ¼Xn
t¼0
CFtð1þ rÞt
where the investment outlays are negative cash flows included in the CFts and where r is therequired rate of return for the investment.
! The IRR is the discount rate that makes the present value of all future cash flows sum tozero. This equation can be solved for the IRR:
Xn
t¼0
CFtð1þ IRRÞt
¼ 0
! The payback period is the number of years required to recover the original investment in aproject. The payback is based on cash flows.
21The free cash flow to the firm and free cash flow to equity approaches are developed in Chapter 4 ofPinto, Henry, Robinson, and Stowe (2010).
110 Corporate Finance
c02 13 January 2012; 17:42:24

! The discounted payback period is the number of years it takes for the cumulative dis-counted cash flows from a project to equal the original investment.
! The average accounting rate of return (AAR) can be defined as follows:
AAR ¼Average net incomeAverage book value
! The profitability index (PI) is the present value of a project’s future cash flows divided bythe initial investment:
PI ¼ PV of future cash flowsInitial investment
¼ 1þ NPVInitial investment
! The capital budgeting decision rules are to invest if the NPV. 0, if the IRR. r, or if thePI. 1.0. There are no decision rules for the payback period, discounted payback period,and AAR because they are not always sound measures.
! The NPV profile is a graph that shows a project’s NPV graphed as a function of variousdiscount rates.
! For mutually exclusive projects that are ranked differently by the NPV and IRR, it iseconomically sound to choose the project with the higher NPV.
! The “multiple IRR problem” and the “no IRR problem” can arise for a project withnonconventional cash flows—cash flows that change signs more than once during theproject’s life.
! The fact that projects with positive NPVs theoretically increase the value of the companyand the value of its stock could explain the popularity of NPV as an evaluation method.
! Analysts often organize the cash flows for capital budgeting in tables, summing all of thecash flows occurring at each point in time. These totals are then used to find an NPV orIRR. Alternatively, tables collecting cash flows by type can be used. Equations for thecapital budgeting cash flows are as follows:
Initial outlay:
Outlay ¼ FCInv þNWCInv & Sal0 þTðSal0 & B0Þ
Annual after-tax operating cash flow:
CF ¼ ðS& C&DÞð1&TÞ þD; or
CF ¼ ðS& CÞð1&DÞ þTD
Terminal year after-tax nonoperating cash flow:
TNOCF ¼ SalT þNWCInv & TðSalT & BT Þ
! Depreciation schedules affect taxable income, taxes paid, and after-tax cash flows, andtherefore capital budgeting valuations.
! Spreadsheets are heavily used for capital budgeting valuation.! When inflation exists, the analyst should perform capital budgeting analysis in “nominal”
terms if cash flows are nominal and in “real” terms if cash flows are real.
Chapter 2 Capital Budgeting 111
c02 13 January 2012; 17:42:24

! Inflation reduces the value of depreciation tax savings (unless the tax system adjustsdepreciation for inflation). Inflation reduces the value of fixed payments to bondholders.Inflation usually does not affect all revenues and costs uniformly. Contracting with cus-tomers, suppliers, employees, and sources of capital can be complicated as inflation rises.
! Two ways of comparing mutually exclusive projects in a replacement chain are the “leastcommon multiple of lives” approach and the “equivalent annual annuity” approach.
! For the least common multiple of lives approach, the analyst extends the time horizon ofanalysis so that the lives of both projects will divide exactly into the horizon. The projectsare replicated over this horizon, and the NPV for the total cash flows over the leastcommon multiple of lives is used to evaluate the investments.
! The equivalent annual annuity is the annuity payment (series of equal annual paymentsover the project’s life) that is equivalent in value to the project’s actual cash flows. Analystsfind the present value of all of the cash flows for an investment (the NPV) and thencalculate an annuity payment that has a value equivalent to the NPV.
! With capital rationing, the company’s capital budget has a size constraint. Under “hard”capital rationing, the budget is fixed. In the case of hard rationing, managers use trial anderror and sometimes mathematical programming to find the optimal set of projects. In thatsituation, it is best to use the NPV or PI valuation methods.
! Sensitivity analysis calculates the effect on the NPV of changes in one input variable at atime.
! Scenario analysis creates scenarios that consist of changes in several of the input variablesand calculates the NPV for each scenario.
! Simulation (Monte Carlo) analysis is used to estimate probability distributions for theNPV or IRR of a capital project. Simulations randomly select values for stochastic inputvariables and then repeatedly calculate the project NPV and IRR to find their distributions.
! Risk-adjusted discount rates based on market risk measures should be used as the requiredrate of return for projects when the investors are diversified. The capital asset pricing model(CAPM) and arbitrage pricing theory (APT) are common approaches for finding market-based risk-adjusted rates.
! In the CAPM, a project’s or asset’s beta, or β, is used as a measure of systematicrisk. The security market line (SML) estimates the asset’s required rate of return asri¼RFþ βi[E(RM) – RF].
! Project-specific betas should be used instead of company betas whenever the risk of theproject differs from that of the company.
! Real options can be classified as (1) timing options; (2) sizing options, which can beabandonment options or growth (expansion) options; (3) flexibility options, which canbe price-setting options or production-flexibility options; and (4) fundamental options.Simple options can be evaluated with decision trees; for more complex options, the analystshould use option pricing models.
! Economic income is the investment’s after-tax cash flow plus the change in the marketvalue. Accounting income is revenues minus expenses. Accounting depreciation, based onthe original cost of the investment, is the decrease in the book (accounting) value, whileeconomic depreciation is the decrease in the market value of the investment. Accountingnet income is net of the after-tax interest expenses on the company’s debt obligations. Incomputing economic income, financing costs are ignored.
! Economic profit is
EP ¼ NOPAT& $WACC
112 Corporate Finance
c02 13 January 2012; 17:42:24

where NOPAT¼Net operating profit after tax¼EBIT(1 – Tax rate) and $WACC¼Dollar cost of capital¼WACC3Capital. When applied to the valuation of an asset orsecurity, the NPV of an investment (and its market value added) is the present value offuture EP discounted at the weighted average cost of capital.
NPV ¼ MVA ¼XN
t¼1
EPtð1þWACCÞt
The total value of the company (of the asset) is the original investment plus the NPV.! Residual income¼Net income – Equity charge, or RIt¼NIt – reBt–1 where RIt¼Residual
income during period t, NIt¼Net income during period t, re¼ the cost of equity, and Bt–
1¼ the beginning-of-period book value of equity. The NPV of an investment is the presentvalue of future residual income discounted at the required rate of return on equity:
NPV ¼XN
t¼1
RItð1þ reÞt
! The total value of the company (of the asset) is the NPV plus the original equity investmentplus the original debt investment.
! The claims valuation approach values an asset by valuing the claims against the asset. Forexample, an asset financed with debt and equity has a value equal to the value of the debtplus the value of the equity.
PROBLEMS
1. Given the following cash flows for a capital project, calculate the NPV and IRR. Therequired rate of return is 8%.
Year 0 1 2 3 4 5
Cash flow –50,000 15,000 15,000 20,000 10,000 5,000
NPV IRRA. $1,905 10.9%B. $1,905 26.0%C. $3,379 10.9%
2. Given the following cash flows for a capital project, calculate its payback period anddiscounted payback period. The required rate of return is 8%. The discounted paybackperiod is:
Year 0 1 2 3 4 5
Cash flow –50,000 15,000 15,000 20,000 10,000 5,000
A. 0.16 years longer than the payback period.B. 0.51 years longer than the payback period.C. 1.01 years longer than the payback period.
Chapter 2 Capital Budgeting 113
c02 13 January 2012; 17:42:24

3. An investment of $100 generates after-tax cash flows of $40 in Year 1, $80 in Year 2,and $120 in Year 3. The required rate of return is 20%. The net present value is closest to:A. $42.22.B. $58.33.C. $68.52.
4. An investment of $150,000 is expected to generate an after-tax cash flow of $100,000 inone year and another $120,000 in two years. The cost of capital is 10%. What is theinternal rate of return?A. 28.39%.B. 28.59%.C. 28.79%.
5. Kim Corporation is considering an investment of 750 million won with expected after-tax cash inflows of 175 million won per year for seven years. The required rate of return is10%. What is the project’s
NPV? IRR?
A. 102 million won 14.0%
B. 157 million won 23.3%
C. 193 million won 10.0%
6. Kim Corporation is considering an investment of 750 million won with expected after-tax cash inflows of 175 million won per year for seven years. The required rate of return is10%. Expressed in years, the project’s payback period and discounted payback period,respectively, are closest to:A. 4.3 years and 5.4 years.B. 4.3 years and 5.9 years.C. 4.8 years and 6.3 years.
7. An investment of $20,000 will create a perpetual after-tax cash flow of $2,000. Therequired rate of return is 8%. What is the investment’s profitability index?A. 1.08.B. 1.16.C. 1.25.
8. Hermann Corporation is considering an investment of h375 million with expected after-tax cash inflows of h115 million per year for seven years and an additional after-taxsalvage value of h50 million in year seven. The required rate of return is 10%. What isthe investment’s PI?A. 1.19.B. 1.33.C. 1.56.
114 Corporate Finance
c02 13 January 2012; 17:42:25

9. Erin Chou is reviewing a profitable investment project that has a conventional cash flowpattern. If the cash flows for the project, initial outlay, and future after-tax cash flows alldouble, Chou would predict that the IRR would:A. increase and the NPV would increase.B. stay the same and the NPV would increase.C. stay the same and the NPV would stay the same.
10. Shirley Shea has evaluated an investment proposal and found that its payback period isone year, it has a negative NPV, and it has a positive IRR. Is this combination of resultspossible?A. Yes.B. No, because a project with a positive IRR has a positive NPV.C. No, because a project with such a rapid payback period has a positive NPV.
11. An investment has an outlay of 100 and after-tax cash flows of 40 annually for four years.A project enhancement increases the outlay by 15 and the annual after-tax cash flows by5. As a result, the vertical intercept of the NPV profile of the enhanced project shifts:A. up and the horizontal intercept shifts left.B. up and the horizontal intercept shifts right.C. down and the horizontal intercept shifts left.
12. Projects 1 and 2 have similar outlays, although the patterns of future cash flows aredifferent. The cash flows as well as the NPV and IRR for the two projects are shownbelow. For both projects, the required rate of return is 10%.
Cash Flows
NPV IRRYear 0 1 2 3 4
Project 1 –50 20 20 20 20 13.40 21.86%
Project 2 –50 0 0 0 100 18.30 18.92%
The two projects are mutually exclusive. What is the appropriate investment decision?A. Invest in both projects.B. Invest in Project 1 because it has the higher IRR.C. Invest in Project 2 because it has the higher NPV.
13. Consider the two projects below. The cash flows as well as the NPV and IRR for the twoprojects are given. For both projects, the required rate of return is 10%.
Cash Flows
NPV IRRYear 0 1 2 3 4
Project 1 –100 36 36 36 36 14.12 16.37%
Project 2 –100 0 0 0 175 19.53 15.02%
Chapter 2 Capital Budgeting 115
c02 13 January 2012; 17:42:25

What discount rate would result in the same NPV for both projects?A. A rate between 0.00% and 10.00%.B. A rate between 10.00% and 15.02%.C. A rate between 15.02% and 16.37%.
14. Wilson Flannery is concerned that this project has multiple IRRs.
Year 0 1 2 3
Cash flows –50 100 0 –50
How many discount rates produce a zero NPV for this project?A. One, a discount rate of 0%.B. Two, discount rates of 0% and 32%.C. Two, discount rates of 0% and 62%.
15. With regard to the net present value (NPV) profiles of two projects, the crossover rate isbest described as the discount rate at which:A. two projects have the same NPV.B. two projects have the same internal rate of return.C. a project’s NPV changes from positive to negative.
16. With regard to net present value (NPV) profiles, the point at which a profile crosses thevertical axis is best described as:A. the point at which two projects have the same NPV.B. the sum of the undiscounted cash flows from a project.C. a project’s internal rate of return when the project’s NPV is equal to zero.
17. With regard to net present value (NPV) profiles, the point at which a profile crosses thehorizontal axis is best described as:A. the point at which two projects have the same NPV.B. the sum of the undiscounted cash flows from a project.C. a project’s internal rate of return when the project’s NPV is equal to zero.
18. With regard to capital budgeting, an appropriate estimate of the incremental cash flowsfrom a project is least likely to include:A. externalities.B. interest costs.C. opportunity costs.
19. FITCO is considering the purchase of new equipment. The equipment costs $350,000,and an additional $110,000 is needed to install it. The equipment will be depreciatedstraight-line to zero over a five-year life. The equipment will generate additional annualrevenues of $265,000, and it will have annual cash operating expenses of $83,000. Theequipment will be sold for $85,000 after five years. An inventory investment of $73,000
116 Corporate Finance
c02 13 January 2012; 17:42:25

is required during the life of the investment. FITCO is in the 40% tax bracket and itscost of capital is 10%. What is the project NPV?A. $52,122.B. $64,090.C. $97,449.
20. After estimating a project’s NPV, the analyst is advised that the fixed capital outlay willbe revised upward by $100,000. The fixed capital outlay is depreciated straight-line overan eight-year life. The tax rate is 40% and the required rate of return is 10%. No changesin cash operating revenues, cash operating expenses, or salvage value are expected. Whatis the effect on the project NPV?A. $100,000 decrease.B. $73,325 decrease.C. $59,988 decrease.
21. When assembling the cash flows to calculate an NPV or IRR, the project’s after-taxinterest expenses should be subtracted from the cash flows for:A. the IRR calculation, but not the NPV calculation.B. both the NPV calculation and the IRR calculation.C. neither the NPV calculation nor the IRR calculation.
22. Standard Corporation is investing $400,000 of fixed capital in a project that will bedepreciated straight-line to zero over its 10-year life. Annual sales are expected tobe $240,000, and annual cash operating expenses are expected to be $110,000.An investment of $40,000 in net working capital is required over the project’s life. Thecorporate income tax rate is 30 percent. What is the after-tax operating cash flowexpected in year one?A. $63,000.B. $92,000.C. $103,000.
23. Five years ago, Frater Zahn’s Company invested d38 million—d30 million in fixedcapital and another d8 million in working capital—in a bakery. Today, Frater Zahn’s isselling the fixed assets for d21 million and liquidating the investment in working capital.The book value of the fixed assets is d15 million and the marginal tax rate is 40%. Thefifth year’s after-tax nonoperating cash flow to Frater Zahn’s is closest to:A. d20.6 million.B. d23.0 million.C. d26.6 million.
The following information relates to Questions 24, 25, and 26.McConachie Company is considering the purchase of a new 400-ton stamping
press. The press costs $360,000, and an additional $40,000 is needed to install it. Thepress will be depreciated straight-line to zero over a five-year life. The press will generateno additional revenues, but it will reduce cash operating expenses by $140,000 annually.The press will be sold for $120,000 after five years. An inventory investment of$60,000 is required during the life of the investment. McConachie is in the 40 percent taxbracket.
Chapter 2 Capital Budgeting 117
c02 13 January 2012; 17:42:25

24. What is the McConachie net investment outlay?A. $400,000.B. $420,000.C. $460,000.
25. McConachie’s incremental annual after-tax operating cash flow is closest to:A. $116,000.B. $124,000.C. $140,000.
26. What is the terminal year after-tax nonoperating cash flow at the end of year five?A. $108,000.B. $132,000.C. $180,000.
The following information relates to Questions 27 through 32.Linda Pyle is head of analyst recruiting for PPA Securities. She has been very frustrated by
the number of job applicants who, in spite of their stellar pedigrees, seem to have littleunderstanding of basic financial concepts. Pyle has written a set of conceptual questions andsimple problems for the human resources department to use to screen for the better candidatesin the applicant pool. A few of her corporate finance questions and problems are given below.
Concept 1. “A company invests in depreciable assets, financed partly by issuing fixed-ratebonds. If inflation is lower than expected, the value of the real tax savings fromdepreciation and the value of the real after-tax interest expense are both reduced.”
Concept 2. “Sensitivity analysis and scenario analysis are useful tools for estimating theimpact on a project’s NPVof changing the value of one capital budgeting inputvariable at a time.”
Concept 3. “When comparing two mutually exclusive projects with unequal lives, theIRR is a good approach for choosing the better project because it does notrequire equal lives.”
Concept 4. “Project-specific betas should be used instead of company betas whenever therisk of the project differs from that of the company.”
Problem. “Fontenot Company is investing h100 in a project that is being depreciatedstraight-line to zero over a two-year life with no salvage value. The projectwill generate earnings before interest and taxes of h50 each year for two years.Fontenot’s weighted average cost of capital and required rate of return for theproject are both 12 percent, and its tax rate is 30 percent.”
27. For Concept 1, the statement is correct regarding the effects on:A. the real tax savings from depreciation, but incorrect regarding the real after-tax
interest expense.B. both the real tax savings from depreciation and the real after-tax interest expense.C. neither the real tax savings from depreciation nor the real after-tax interest expense.
28. For Concept 2, the statement is correct regarding:A. sensitivity analysis, but not correct regarding scenario analysis.B. scenario analysis, but not correct regarding sensitivity analysis.C. both sensitivity analysis and scenario analysis.
118 Corporate Finance
c02 13 January 2012; 17:42:25

29. Are the statements identified as Concept 3 and Concept 4 correct?A. No for Concepts 3 and 4.B. No for Concept 3, but yes for Concept 4.C. Yes for Concept 3, but no for Concept 4.
30. The after-tax operating cash flows in euros for the Fontenot Company are:A. 50 in both years.B. 70 in both years.C. 85 in both years.
31. The economic income in euros for the Fontenot Company is:A. 17.24 in year one and 9.11 in year two.B. 17.76 in year one and 24.89 in year two.C. 24.89 in year one and 17.76 in year two.
32. The market value added (MVA) in euros for the Fontenot Company is closest to:A. 38.87.B. 39.92.C. 43.65.
The following information relates to Questions 33–38.The capital budgeting committee for Laroche Industries is meeting. Laroche is a North
American conglomerate that has several divisions. One of these divisions, Laroche Livery,operates a large fleet of vans. Laroche’s management is evaluating whether it is optimal tooperate new vans for two, three, or four years before replacing them. The managers haveestimated the investment outlay, annual after-tax operating expenses, and after-tax salvagecash flows for each of the service lives. Because revenues and some operating costs areunaffected by the choice of service life, they were ignored in the analysis. Laroche Livery’sopportunity cost of funds is 10 percent. The table below gives the cash flows in thousands ofCanadian dollars (C$).
Service Life Investment Year 1 Year 2 Year 3 Year 4 Salvage
2 years –40,000 –12,000 –15,000 20,000
3 years –40,000 –12,000 –15,000 –20,000 17,000
4 years –40,000 –12,000 –15,000 –20,000 –25,000 12,000
Schoeman Products, another division of Laroche, has evaluated several investmentprojects and now must choose the subset of them that fits within its C$40 million capitalbudget. The outlays and NPVs for the six projects are given below. Schoeman cannot buyfractional projects, and must buy all or none of a project. The currency amounts are inmillions of Canadian dollars.
Chapter 2 Capital Budgeting 119
c02 13 January 2012; 17:42:26

Project Outlay PV of Future Cash Flows NPV
1 31 44 13
2 15 21 6
3 12 16.5 4.5
4 10 13 3
5 8 11 3
6 6 8 2
Schoeman wants to determine which subset of the six projects is optimal.A final proposal comes from the division Society Services, which has an investment
opportunity with a real option to invest further if conditions warrant. The crucial details areas follows:
! The original project:! An outlay of C$190 million at time zero.! Cash flows of C$40 million per year for Years 1–10 if demand is “high.”! Cash flows of C$20 million per year for Years 1–10 if demand is “low.”
! Additional cash flows with the optional expansion project:! An outlay of C$190 million at time one.! Cash flows of C$40 million per year for Years 2–10 if demand is “high.”! Cash flows of C$20 million per year for Years 2–10 if demand is “low.”
! Whether demand is “high” or “low” in Years 1–10 will be revealed during the first year.The probability of “high” demand is 0.50, and the probably of “low” demand is 0.50.
! The option to make the expansion investment depends on making the initial investment. Ifthe initial investment is not made, the option to expand does not exist.
! The required rate of return is 10 percent.
Society Services wants to evaluate its investment alternatives.The internal auditor for Laroche Industries has made several suggestions for improv-
ing capital budgeting processes at the company. The internal auditor’s suggestions are asfollows:
Suggestion 1. “In order to put all capital budgeting proposals on an equal footing, theprojects should all use the risk-free rate for the required rate of return.”
Suggestion 2. “Because you cannot exercise both of them, you should not permit agiven project to have both an abandonment option and an expansion/growth option.”
Suggestion 3. “When rationing capital, it is better to choose the portfolio of invest-ments that maximizes the company NPV than the portfolio thatmaximizes the company IRR.”
Suggestion 4. “Project betas should be used for establishing the required rate of returnwhenever the project’s beta is different from the company’s beta.”
120 Corporate Finance
c02 13 January 2012; 17:42:26

33. What is the optimal service life for Laroche Livery’s fleet of vans?A. Two years.B. Three years.C. Four years.
34. The optimal subset of the six projects that Schoeman is considering consists of Projects:A. 1 and 5.B. 2, 3, and 4.C. 2, 4, 5, and 6.
35. What is the NPV (C$ millions) of the original project for Society Services withoutconsidering the expansion option?A. –6.11.B. –5.66.C. 2.33.
36. What is the NPV (C$ millions) of the optimal set of investment decisions for SocietyServices including the expansion option?A. 6.34.B. 12.68.C. 31.03.
37. Should the capital budgeting committee accept the internal auditor’s first and secondsuggestions, respectively?A. No for Suggestions 1 and 2.B. No for Suggestion 1 and Yes for Suggestion 2.C. Yes for Suggestion 1 and No for Suggestion 2.
38. Should the capital budgeting committee accept the internal auditor’s third and fourthsuggestions, respectively?A. No for Suggestions 3 and 4.B. Yes for Suggestions 3 and 4.C. No for Suggestion 3 and Yes for Suggestion 4.
The following information relates to Questions 39–44.Maximilian Bohm is reviewing several capital budgeting proposals from subsidiaries of
his company. Although his reviews deal with several details that may seem like minutiae, thecompany places a premium on the care it exercises in making its investment decisions.
The first proposal is a project for Richie Express, which is investing $500,000, all in fixedcapital, in a project that will have depreciation and operating income after taxes, respectively,of $40,000 and $20,000 each year for the next three years. Richie Express will sell the asset inthree years, paying 30 percent taxes on any excess of the selling price over book value. Theproposal indicates that a $647,500 terminal selling price will enable the company to earn a 15percent internal rate of return on the investment. Bohm doubts that this terminal valueestimate is correct.
Another proposal concerns Gasup Company, which does natural gas exploration. A newinvestment has been identified by the Gasup finance department with the following projectedcash flows:
Chapter 2 Capital Budgeting 121
c02 13 January 2012; 17:42:26

! Investment outlays are $6 million immediately and $1 million at the end of the first year.! After-tax operating cash flows are $0.5 million at the end of the first year and $4 million
at the end of each of the second, third, fourth, and fifth years. In addition, an after-taxoutflow occurs at the end of the five-year project that has not been included in theoperating cash flows: $5 million required for environmental cleanup.
! The required rate of return on natural gas exploration is 18 percent.
The Gasup analyst is unsure about the calculation of the NPV and the IRR because the outlayis staged over two years.
Finally, Dominion Company is evaluating two mutually exclusive projects: The Pintogrinder involves an outlay of $100,000, annual after-tax operating cash flows of $45,000, anafter-tax salvage value of $25,000, and a three-year life. The Bolten grinder has an outlayof $125,000, annual after-tax operating cash flows of $47,000, an after-tax salvage value of$20,000, and a four-year life. The required rate of return is 10 percent. The net present value(NPV) and equivalent annual annuity (EAA) of the Pinto grinder are $30,691 and $12,341,respectively. Whichever grinder is chosen, it will have to be replaced at the end of its servicelife. The analyst is unsure about which grinder should be chosen.
Bohm and his colleague Beth Goldberg have an extended conversation about capitalbudgeting issues, including several comments listed below. Goldberg makes two commentsabout real options:
1. “The abandonment option is valuable, but it should be exercised only when the aban-donment value is above the amount of the original investment.”
2. “If the cost of a real option is less than its value, this will increase the NPV of theinvestment project in which the real option is embedded.”
Bohm also makes several comments about specific projects under consideration:
A. “The land and building were purchased five years ago for $10 million. This is the amountthat should now be included in the fixed capital investment.”
B. “We can improve the project’s NPV by using the after-tax cost of debt as the discountrate. If we finance the project with 100 percent debt, this discount rate would beappropriate.”
C. “It is generally safer to use the NPV than the IRR in making capital budgeting decisions.However, when evaluating mutually exclusive projects, if the projects have conventionalcash flow patterns and have the same investment outlays, it is acceptable to use either theNPV or IRR.”
D. “You should not base a capital budgeting decision on its immediate impact on earningsper share (EPS).”
39. What terminal selling price is required for a 15% internal rate of return on the Richieproject?A. $588,028.B. $593,771.C. $625,839.
40. The NPV and IRR, respectively, of the Gasup Company investment are closest to:A. $509,600 and 21.4%.B. $509,600 and 31.3%.C. $946,700 and 31.3%.
122 Corporate Finance
c02 13 January 2012; 17:42:26

41. Of the two grinders that the Dominion Company is evaluating, Bohm should recom-mend the:A. Bolten grinder because its NPV is higher than the Pinto grinder NPV.B. Bolten grinder because its EAA is higher than the Pinto grinder EAA.C. Pinto grinder because its EAA is higher than the Bolten grinder EAA.
42. Are Goldberg’s comments about real options correct?A. No for Comment #1 and Comment #2.B. No for Comment #1 and Yes for Comment #2.C. Yes for Comment #1 and No for Comment #2.
43. Is Bohm most likely correct regarding Comment A about the $10 million investment andComment B about using the after-tax cost of debt?A. No for both comments.B. Yes for both comments.C. No for Comment A and Yes for Comment B.
44. Is Bohm most likely correct regarding Comment C that it is acceptable to use either NPVor IRR and Comment D about the immediate impact on EPS?A. No for both comments.B. Yes for both comments.C. No for Comment C and Yes for Comment D.
The following information relates to Questions 45–50.Barbara Simpson is a sell-side analyst with Smith Riccardi Securities. Simpson covers the
pharmaceutical industry. One of the companies she follows, Bayonne Pharma, is evaluating aregional distribution center. The financial predictions for the project are as follows:
! Fixed capital outlay is h1.50 billion.! Investment in net working capital is h0.40 billion.! Straight-line depreciation is over a six-year period with zero salvage value.! Project life is 12 years.! Additional annual revenues are h0.10 billion.! Annual cash operating expenses are reduced by h0.25 billion.! The capital equipment is sold for h0.50 billion in 12 years.! Tax rate is 40 percent.! Required rate of return is 12 percent.
Simpson is evaluating this investment to see whether it has the potential to affectBayonne Pharma’s stock price. Simpson estimates the NPV of the project to be h0.41 billion,which should increase the value of the company.
Simpson is evaluating the effects of other changes to her capital budgeting assumptions.She wants to know the effect of a switch from straight-line to accelerated depreciation on thecompany’s operating income and the project’s NPV. She also believes that the initial outlaymight be much smaller than initially assumed. Specifically, she thinks the outlay for fixedcapital might be h0.24 billion lower, with no change in salvage value.
When reviewing her work, Simpson’s supervisor provides the following comments: “I notethat you are relying heavily on the NPV approach to valuing the investment decision. I don’tthink you should use an IRR because of the multiple IRR problem that is likely to arise with the
Chapter 2 Capital Budgeting 123
c02 13 January 2012; 17:42:26

Bayonne Pharma project. However, the equivalent annual annuity would be amore appropriatemeasure to use for the project than the NPV. I suggest that you compute an EAA.”
45. Simpson should estimate the after-tax operating cash flow for Years 1–6 and 7–12,respectively, to be closest to:A. h0.31 billion and h0.21 billion.B. h0.31 billion and h0.25 billion.C. h0.35 billion and h0.25 billion.
46. Simpson should estimate the initial outlay and the terminal year nonoperating cash flow,respectively, to be closest to:A. h1.50 billion and h0.70 billion.B. h1.90 billion and h0.70 billion.C. h1.90 billion and h0.90 billion.
47. Is Simpson’s estimate of the NPV of the project correct?A. Yes.B. No. The NPV is –h0.01 billion.C. No. The NPV is h0.34 billion.
48. A switch from straight-line to accelerated depreciation would:A. increase the NPV and decrease the first year operating income after taxes.B. increase the first year operating income after taxes and decrease the NPV.C. increase both the NPV and first year operating income after taxes.
49. If the outlay is lower by the amount that Simpson suggests, the project NPV shouldincrease by an amount closest to:A. h0.09 billion.B. h0.14 billion.C. h0.17 billion.
50. How would you evaluate the comments by Simpson’s supervisor about not using the IRRand about using the EAA? The supervisor is:A. incorrect about both.B. correct about IRR and incorrect about EAA.C. incorrect about IRR and correct about EAA.
The following information relates to Questions 51–56.Mun Hoe Yip is valuing Pure Corporation. Pure is a simple corporation that is going out
of business in five years, distributing its income to creditors and bondholders as planned inthe financial statements below. Pure has a 19 percent cost of equity, 81/3 percent before-taxcost of debt, 12 percent weighted average cost of capital, and 40 percent tax rate, and itmaintains a 50 percent debt/value ratio.
Yip is valuing the company using the basic capital budgeting method as well as othermethods, such as EP, residual income, and claims valuation. Yip’s research assistant, LindaRobinson, makes three observations about the analysis.
Observation 1: “The present value of the company’s economic income should be equal tothe present value of the cash flows in the basic capital budgeting approach.”
124 Corporate Finance
c02 13 January 2012; 17:42:27

Observation 2: “The economic income each year is equal to the cash flow minus theeconomic depreciation.”
Observation 3: “The market value added is the present value of the company’s economicprofit (EP), which equals the net worth of 77,973.”
Year 0 1 2 3 4 5
Balance Sheets:
Assets 200,000 160,000 120,000 80,000 40,000 0
Liabilities 122,027 107,671 88,591 64,222 33,929 0
Net worth 77,973 52,329 31,409 15,778 6,071 0
Income Statements:
Sales 180,000 200,000 220,000 240,000 200,000
Variable cash expenses 90,000 100,000 110,000 120,000 100,000
Fixed cash expenses 20,000 20,000 20,000 20,000 20,000
Depreciation 40,000 40,000 40,000 40,000 40,000
EBIT 30,000 40,000 50,000 60,000 40,000
Interest expense 10,169 8,973 7,383 5,352 2,827
EBT 19,831 31,027 42,617 54,648 37,173
Taxes at 40 percent 7,932 12,411 17,047 21,859 14,869
Net income before salvage 11,899 18,616 25,570 32,789 22,304
After-tax salvage value 12,000
Net income 11,899 18,616 25,570 32,789 34,304
Statements of Cash Flows:
Operating cash flows:
Net income 11,899 18,616 25,570 32,789 34,304
Depreciation 40,000 40,000 40,000 40,000 40,000
Total 51,899 58,616 65,570 72,789 74,304
Financing cash flows:
Debt repayment 14,357 19,080 24,369 30,293 33,929
Dividends/repurchases 37,542 39,536 41,201 42,496 40,375
Total –51,899 –58,616 –65,570 –72,789 –74,304
Investing cash flows: 0 0 0 0 0
Total cash flows: 0 0 0 0 0
Chapter 2 Capital Budgeting 125
c02 13 January 2012; 17:42:27

51. Economic income during Year 1 is closest to:A. 23,186.B. 29,287.C. 46,101.
52. What is EP during Year 1?A. –12,101.B. –6,000.C. 6,000.
53. What is residual income during Year 1?A. –2,916.B. 2,542.C. 8,653.
54. What is the value of equity at time zero?A. 44,055.B. 77,973.C. 122,027.
55. Are Robinson’s first two observations, respectively, correct?A. Yes for both observations.B. No for the first and Yes for the second.C. Yes for the first and No for the second.
56. Which of the following would be Yip’s most appropriate response to Robinson’s thirdobservation?A. The market value added is not equal to the present value of EP, although the market
value of equity is equal to 122,027.B. The market value added is equal to the present value of EP, which in this case is
44,055.C. The market value added is not equal to the present value of EP, and market value
added is equal to 44,055.
126 Corporate Finance
c02 13 January 2012; 17:42:27

CHAPTER 3COST OF CAPITAL
Yves Courtois, CFALuxembourg, Luxembourg
Gene C. LaiPullman, Washington, U.S.A.
Pamela Peterson Drake, CFAHarrisonburg, Virginia, U.S.A.
LEARNING OUTCOMES
After completing this chapter, you will be able to do the following:
! Calculate and interpret the weighted average cost of capital (WACC) of a company.! Describe how taxes affect the cost of capital from different capital sources.! Explain alternative methods of calculating the weights used in the WACC, including the
use of the company’s target capital structure.! Explain how the marginal cost of capital and the investment opportunity schedule are used
to determine the optimal capital budget.! Explain the marginal cost of capital’s role in determining the net present value of a project.! Calculate and interpret the cost of fixed rate debt capital using the yield-to-maturity
approach and the debt-rating approach.! Calculate and interpret the cost of noncallable, nonconvertible preferred stock.! Calculate and interpret the cost of equity capital using the capital asset pricing model
approach, the dividend discount approach, and the bond yield plus risk premium approach.! Calculate and interpret the beta and cost of capital for a project.! Explain the country equity risk premium in the estimation of the cost of equity for a
company located in a developing market.! Describe the marginal cost of capital schedule, explain why it may be upward sloping with
respect to additional capital, and calculate and interpret its break points.! Explain and demonstrate the correct treatment of flotation costs.
127
c03 13 January 2012; 9:13:22

1. INTRODUCTION
A company grows by making investments that are expected to increase revenues and profits.The company acquires the capital or funds necessary to make such investments by borrowingor using funds from owners. By applying this capital to investments with long-term benefits,the company is producing value today. But, how much value? The answer depends not onlyon the investments’ expected future cash flows but also on the cost of the funds. Borrowing isnot costless. Neither is using owners’ funds.
The cost of this capital is an important ingredient in both investment decision making bythe company’s management and the valuation of the company by investors. If a companyinvests in projects that produce a return in excess of the cost of capital, the company hascreated value; in contrast, if the company invests in projects whose returns are less than thecost of capital, the company has actually destroyed value. Therefore, the estimation of the costof capital is a central issue in corporate financial management. For the analyst seeking toevaluate a company’s investment program and its competitive position, an accurate estimateof a company’s cost of capital is important as well.
Cost of capital estimation is a challenging task. As we have already implied, the cost ofcapital is not observable but, rather, must be estimated. Arriving at a cost of capital estimaterequires a host of assumptions and estimates. Another challenge is that the cost of capitalthat is appropriately applied to a specific investment depends on the characteristics of thatinvestment: The riskier the investment’s cash flows, the greater its cost of capital. In reality, acompany must estimate project-specific costs of capital. What is often done, however, is toestimate the cost of capital for the company as a whole and then adjust this overall corporatecost of capital upward or downward to reflect the risk of the contemplated project relative tothe company’s average project.
This chapter is organized as follows: In the next section, we introduce the cost of capitaland its basic computation. Section 3 presents a selection of methods for estimating the costsof the various sources of capital, and Section 4 discusses issues an analyst faces in using thecost of capital. Section 5 summarizes the chapter.
2. COST OF CAPITAL
The cost of capital is the rate of return that the suppliers of capital—bondholders andowners—require as compensation for their contribution of capital. Another way of looking atthe cost of capital is that it is the opportunity cost of funds for the suppliers of capital:A potential supplier of capital will not voluntarily invest in a company unless its return meetsor exceeds what the supplier could earn elsewhere in an investment of comparable risk.
A company typically has several alternatives for raising capital, including issuing equity,debt, and instruments that share characteristics of debt and equity. Each source selectedbecomes a component of the company’s funding and has a cost (required rate of return) thatmay be called a component cost of capital. Because we are using the cost of capital in theevaluation of investment opportunities, we are dealing with a marginal cost—what it wouldcost to raise additional funds for the potential investment project. Therefore, the cost ofcapital that the investment analyst is concerned with is a marginal cost.
Let us focus on the cost of capital for the entire company (later we will address how toadjust that for specific projects). The cost of capital of a company is the required rate of return
c03 13 January 2012; 9:13:23
128 Corporate Finance

that investors demand for the average-risk investment of a company. The most common wayto estimate this required rate of return is to calculate the marginal cost of each of the varioussources of capital and then calculate a weighted average of these costs. This weighted average isreferred to as the weighted average cost of capital (WACC). The WACC is also referred toas the marginal cost of capital (MCC) because it is the cost that a company incurs foradditional capital. The weights in this weighted average are the proportions of the varioussources of capital that the company uses to support its investment program. Therefore, theWACC, in its most general terms, is
WACC ¼ wd rd ð1$ tÞ þ wprp þ were ð3-1Þ
where
wd is the proportion of debt that the company uses when it raises new fundsrd is the before-tax marginal cost of debtt is the company’s marginal tax ratewp is the proportion of preferred stock the company uses when it raises new fundsrp is the marginal cost of preferred stockwe is the proportion of equity that the company uses when it raises new fundsre is the marginal cost of equity
There are important points concerning the calculation of the WACC as shown inEquation 3-1 that the analyst must be familiar with. The next two sections address two keyissues: taxes and the selection of weights.
2.1. Taxes and the Cost of Capital
Notice that in Equation 3-1 we adjust the expected before-tax cost on new debt financing, rd,by a factor of (1 – t). In the United States and many other tax jurisdictions, the interest ondebt financing is a deduction to arrive at taxable income. Taking the tax deductibility of
EXAMPLE 3-1 Computing the Weighted AverageCost of Capital
Assume that ABC Corporation has the following capital structure: 30 percent debt,10 percent preferred stock, and 60 percent equity. ABC Corporation wishes to maintainthese proportions as it raises new funds. Its before-tax cost of debt is 8 percent, its cost ofpreferred stock is 10 percent, and its cost of equity is 15 percent. If the company’smarginaltax rate is 40 percent, what is ABC’s weighted average cost of capital?
Solution. The weighted average cost of capital is
WACC ¼ ð0:3Þð0:08Þð1$ 0:40Þ þ ð0:1Þð0:1Þ þ ð0:6Þð0:15Þ ¼ 11:44 percent
c03 13 January 2012; 9:13:23
Chapter 3 Cost of Capital 129

interest as the base case, we adjust thepretax cost of debt for this tax shield. Multiplying rd by(1 – t) results in an estimate of the after-tax cost of debt.
For example, suppose a company pays h1 million in interest on its h10 million of debt.The cost of this debt is not h1 million because this interest expense reduces taxable incomeby h1 million, resulting in a lower tax. If the company is subject to a tax rate of 40 percent,this h1 million of interest costs the company (h1 million)(1 $ 0.4)¼ h0.6 million becausethe interest reduces the company’s tax bill by h0.4 million. In this case, the before-tax costof debt is 10 percent, whereas the after-tax cost of debt is (h0.6 million)/(h10 million)¼6 percent.
Estimating the cost of common equity capital is more challenging than estimating thecost of debt capital. Debt capital involves a stated legal obligation on the part of the companyto pay interest and repay the principal on the borrowing. Equity entails no such obligation.Estimating the cost of conventional preferred equity is rather straightforward because thedividend is generally stated and fixed, but estimating the cost of common equity is chal-lenging. There are several methods available for estimating the cost of common equity, andwe discuss two in this chapter. The first method uses the capital asset pricing model, and thesecond method uses the dividend discount model, which is based on discounted cash flows.No matter the method, there is no need to make any adjustment in the cost of equity for taxesbecause the payments to owners, whether in the form of dividends or the return on capital, arenot tax deductible for the company.
EXAMPLE 3-2 Incorporating the Effect of Taxes onthe Costs of Capital
Jorge Ricard, a financial analyst, is estimating the costs of capital for the ZealeCorporation. In the process of this estimation, Ricard has estimated the before-tax costsof capital for Zeale’s debt and equity as 4 percent and 6 percent, respectively. What arethe after-tax costs of debt and equity if Zeale’s marginal tax rate is
1. 30 percent?2. 48 percent?
Solutions.
Marginal Tax Rate After-Tax Cost of Debt After-Tax Cost of Equity
1. 30 percent 0.04(1$ 0.30)¼ 2.80 percent 6 percent
2. 48 percent 0.04(1$ 0.48)¼ 2.08 percent 6 percent
Note: There is no adjustment for taxes in the case of equity; the before-tax cost of equity is equalto the after-tax cost of equity.
c03 13 January 2012; 9:13:23
130 Corporate Finance

2.2. Weights of the Weighted Average
How do we determine what weights to use? Ideally, we want to use the proportion of eachsource of capital that the company would use in the project or company. If we assume that acompany has a target capital structure and raises capital consistent with this target, we shoulduse this target capital structure. The target capital structure is the capital structure that acompany is striving to obtain.1 If we know the company’s target capital structure, then, ofcourse, we should use this in our analysis. Someone outside the company, however, such as ananalyst, typically does not know the target capital structure and must estimate it using one ofseveral approaches:
1. Assume the company’s current capital structure, at market value weights for the com-ponents, represents the company’s target capital structure.
2. Examine trends in the company’s capital structure or statements by managementregarding capital structure policy to infer the target capital structure.
3. Use averages of comparable companies’ capital structures as the target capital structure.
In the absence of knowledge of a company’s target capital structure, we may takeMethod 1 as the baseline. Note that in applying Method 3, we use unweighted, arithmeticaverage, as is often done for simplicity. An alternative is to calculate a weighted average, whichwould give more weight to larger companies.
Suppose we are using the company’s current capital structure as a proxy for the targetcapital structure. In this case, we use the market value of the different capital sources in thecalculation of these proportions. For example, if a company has the following market valuesfor its capital:
Bonds outstanding $5 million
Preferred stock 1 million
Common stock 14 million
Total capital $20 million
the weights that we apply would be
wd ¼ 0.25
wp ¼ 0.05
we ¼ 0.70
Example 3-3 illustrates the estimation of weights. Note that a simple way oftransforming a debt-to-equity ratio D/E into a weight—that is, D/(DþE)—is to divide D/Eby 1þD/E.
1In Chapter 5, we discuss the capital structure decision in greater detail, including a look at how it relatesto the value of the company.
c03 13 January 2012; 9:13:23
Chapter 3 Cost of Capital 131

EXAMPLE 3-3 Estimating the Proportions of Capital
Fin Anziell is a financial analyst with Analytiker Firma. Anziell is in the process ofestimating the cost of capital of Gewicht GmbH. The following information isprovided:
Gewicht GmbH
Market value of debt h50 million
Market value of equity h60 million
Primary competitors and their capital structures (in millions):
Competitor Market Value of Debt Market Value of Equity
A h25 h50
B h101 h190
C d40 d60
What are Gewicht’s proportions of debt and equity that Anziell would use if estimatingthese proportions using the company’s:
1. current capital structure?2. competitors’ capital structure?
Suppose Gewicht announces that a debt-to-equity ratio of 0.7 reflects its targetcapital structure.
3. What weights should Anziell use in the cost of capital calculations?
Solution to 1.Current capital structure
wd ¼ h50 millionh50 millionþ h60 million
¼ 0:4545 we ¼h60 million
h50 millionþ h60 million
¼ 0:5454
Solution to 2.Competitors’ capital structure2
2These weights represent the arithmetic average of the three companies’ debt proportion and equityproportion, respectively.
c03 13 January 2012; 9:13:24
132 Corporate Finance

2.3. Applying the Cost of Capital to Capital Budgetingand Security Valuation
With some insight now into the calculation of the cost of capital, let us continue to improveour understanding of the roles it plays in financial analysis. A chief use of the marginal cost ofcapital estimate is in capital-budgeting decision making. What role does the marginal costof capital play in a company’s investment program, and how do we adapt it when we need toevaluate a specific investment project?
A company’s marginal cost of capital (MCC) may increase as additional capital is raised,whereas returns to a company’s investment opportunities are generally believed to decrease asthe company makes additional investments, as represented by the investment opportunityschedule (IOS).3 We show this relation in Exhibit 3-1, graphing the upward-sloping mar-ginal cost of capital schedule against the downward-sloping investment opportunity schedule.In the context of a company’s investment decision, the optimal capital budget is that amountof capital raised and invested at which the marginal cost of capital is equal to the marginalreturn from investing. In other words, the optimal capital budget occurs when the margi-nal cost of capital intersects with the investment opportunity schedule as seen in Exhibit 3-1.
The relation between the MCC and the IOS provides a broad picture of the basicdecision-making problem of a company. However, we are often interested in valuing anindividual project or even a portion of a company, such as a division or product line. In theseapplications, we are interested in the cost of capital for the project, product, or division asopposed to the cost of capital for the company overall. The cost of capital in these appli-cations should reflect the riskiness of the future cash flows of the project, product, or division.For an average-risk project, the opportunity cost of capital is the company’s WACC. If thesystematic risk of the project is above or below average relative to the company’s currentportfolio of projects, an upward or downward adjustment, respectively, is made to thecompany’s WACC. Companies may take an ad hoc or a systematic approach to making such
wd ¼
h25h25þ h50
! "þ h101
h101þ h190
! "þ d40
d40þ d60
! "
3¼ 0:3601
we ¼
h50h25þ h50
! "þ h190
h101þ h190
! "þ d60
d40þ d60
! "
3¼ 0:6399
Solution to 3. A debt-to-equity ratio of 0.7 represents a weight on debt of 0.7/1.7¼ 0.4118 so that wd ¼ 0.4118 and we ¼ 1 – 0.4118¼ 0.5882. These would be thepreferred weights to use in a cost of capital calculation.
3The investment opportunity schedule originates with Fisher’s production opportunities (1930) and wasadapted to capital budgeting by John Hirshleifer (1958), 329–352.
c03 13 January 2012; 9:13:24
Chapter 3 Cost of Capital 133

adjustments. The discussion of a systematic approach is a somewhat advanced topic that wedefer to Section 4.1.
The WACC or MCC corresponding to the average risk of the company, adjustedappropriately for the risk of a given project, plays a role in capital-budgeting decision makingbased on the net present value (NPV) of that project. Recall from the capital-budgetingchapter that the NPV is the present value of all the project cash flows. It is useful to think of itas the difference between the present value of the cash inflows, discounted at the opportunitycost of capital applicable to the specific project, and the present value of the cash outflows,discounted using that same opportunity cost of capital:
NPV ¼ Present value of inflows$ Present value of outflows
If an investment’s NPV is positive, the company should undertake the project. If wechoose to use the company’s WACC in the calculation of the NPV of a project, we areassuming that the project:
! Has the same risk as the average-risk project of the company.! Will have a constant target capital structure throughout its useful life.4
These may not be realistic or appropriate assumptions and are potential drawbacks tousing the company’s WACC in valuing projects. However, alternative approaches are subjectto drawbacks as well, and the approach outlined has wide acceptance.5
EXHIBIT 3-1 Optimal Investment Decision
Optimal capital budget
Marginalcost of capital
Investmentopportunity
CostorReturn
Amount of New Capital
4WACC is estimated using fixed proportions of equity and debt. The NPV method assumes a constantrequired rate of return, whereas a fluctuating capital structure would cause WACC to fluctuate. Theimportance of this issue is demonstrated by Miles and Ezzell (1980), 719–730.5See the chapter on capital budgeting for a discussion.
c03 13 January 2012; 9:13:24
134 Corporate Finance

For the analyst, the second key use of the marginal cost of capital is in security valuationusing any one of several discounted cash flow valuation models available.6 For a particularvaluation model, if these cash flows are cash flows to the company’s suppliers of capital (thatis, free cash flow to the firm), the analyst uses the weighted average cost of capital of thecompany in the valuation.7 If these cash flows are strictly those belonging to the company’sowners, such as the free cash flow to equity, or dividends, the analyst uses the cost of equitycapital to find the present value of these flows.8
In the next section, we discuss how an analyst may approach the calculation of thecomponent costs of capital, focusing on debt, preferred stock, and common equity.
3. COSTS OF THE DIFFERENT SOURCES OF CAPITAL
Each source of capital has a different cost because of the differences among the sources, suchas seniority, contractual commitments, and potential value as a tax shield. We focus on thecosts of three primary sources of capital: debt, preferred equity, and common equity.
3.1. Cost of Debt
The cost of debt is the cost of debt financing to a company when it issues a bond or takes outa bank loan. We discuss two methods to estimate the before-tax cost of debt, rd: the yield-to-maturity approach and debt-rating approach.
3.1.1. Yield-to-Maturity ApproachThe yield to maturity (YTM) is the annual return that an investor earns on a bond if theinvestor purchases the bond today and holds it until maturity. In other words, it is the yield,rd, that equates the present value of the bond’s promised payments to its market price:
P0 ¼PMT1
1þ rd2
! " þ ' ' ' þ PMTn
1þ rd2
! "n þ FV
1þ rd2
! "n
¼Xn
t ¼1
PMTt
1þ rd2
! "t
0
BBB@
1
CCCAþ FV
1þ rd2
! "n ð3-2Þ
6See Pinto, Henry, Robinson, and Stowe (2010) for a presentation of such models.7Free cash flow to the firm (FCFF) is the cash flow available to the company’s suppliers of capital afterall operating expenses (including taxes) have been paid and necessary investments in working capital(e.g., inventory) and fixed capital (e.g., plant and equipment) have been made.8Free cash flow to equity (FCFE) is the cash flow available to holders of the company’s common equityafter all operating expenses, interest, and principal payments have been paid and necessary investmentsin working capital and fixed capital have been made. See Pinto, Henry, Robinson, and Stowe (2010) formore details on FCFF and FCFE and valuation models based on those concepts.
c03 13 January 2012; 9:13:24
Chapter 3 Cost of Capital 135

where
P0 is the current market price of the bondPMTt is the interest payment in period trd is the yield to maturity9
n is the number of periods remaining to maturityFV is the maturity value of the bond
This valuation equation assumes the bond pays semiannual interest and that any inter-mediate cash flows (in this case the interest prior to maturity) are reinvested at the rate rd/2.
Example 3-4 illustrates the calculation of the after-tax cost of debt.
3.1.2. Debt-Rating ApproachWhen a reliable current market price for a company’s debt is not available, the debt-ratingapproach can be used to estimate the before-tax cost of debt. Based on a company’s debt
EXAMPLE 3-4 Calculating the After-Tax Cost of Debt
Valence Industries issues a bond to finance a new project. It offers a 10-year, 5 percentsemiannual coupon bond. Upon issue, the bond sells at $1,025. What is Valence’sbefore-tax cost of debt? If Valence’s marginal tax rate is 35 percent, what isValence’s after-tax cost of debt?
Solution.Given:
PV ¼ $1,025
FV ¼ $1,000
PMT ¼ 5 percent of 1,000 4 2 ¼ $25
n ¼ 103 2¼ 20
$1,025 ¼X20
t¼1
$25ð1þ iÞt
!
þ $1,000ð1þ iÞ20
Use a financial calculator to solve for i, the six-month yield. Because i ¼ 2.342percent, the before-tax cost of debt is rd ¼ 2.342 percent3 2¼ 4.684 percent,and Valence’s after-tax cost of debt is rd (1$ t)¼ 0.04684 (1$ 0.35)¼ 0.03045 or3.045 percent.
9rd is expressed as an annual rate and is divided by the number of payment periods per year. Becausemost corporate bonds pay semiannual interest, we divided rd by 2 in this calculation. The interestpayment for each period thus corresponds with the bond’s semiannual coupon payment.
c03 13 January 2012; 9:13:25
136 Corporate Finance

rating, we estimate the before-tax cost of debt by using the yield on comparably rated bondsfor maturities that closely match that of the company’s existing debt.
Suppose a company’s capital structure includes debt with an average maturity (orduration) of 10 years and the company’s marginal tax rate is 35 percent. If the company’srating is AAA and the yield on debt with the same debt rating and similar maturity (orduration) is 4 percent, the company’s after-tax cost of debt is10
rd ð1$ tÞ ¼ 4 percentð1$ 0:35Þ ¼ 2:6 percent
A consideration when using this approach is that debt ratings are ratings of the debt issueitself, with the issuer being only one of the considerations. Other factors, such as debt seniorityand security, also affect ratings and yields, so care must be taken to consider the likely type ofdebt to be issued by the company in determining the comparable debt rating and yield. Thedebt-rating approach is a simple example of pricing on the basis of valuation-relevant char-acteristics, which in bond markets has been known as evaluated pricing or matrix pricing.
3.1.3. Issues in Estimating the Cost of Debt
3.1.3.1. Fixed-Rate Debt versus Floating-Rate Debt Up to now, we have assumed that theinterest on debt is a fixed amount each period. We can observe market yields of the company’sexisting debt or market yields of debt of similar risk in estimating the before-tax cost of debt.However, the company may also issue floating-rate debt in which the interest rate adjustsperiodically according to a prescribed index, such as the prime rate or LIBOR, over the life ofthe instrument.
Estimating the cost of a floating-rate security is difficult because the cost of this form ofcapital over the long term depends not only on the current yields but also on the future yields.The analyst may use the current term structure of interest rates and term structure theory toassign an average cost to such instruments.
3.1.3.2. Debt with Option-Like Features How should an analyst determine the cost of debtwhen the companyused debtwith option-like features, such as call, conversion, or put provisions?Clearly, options affect the value of debt. For example, a callable bond would have a yield greaterthan a similar noncallable bond of the same issuer because bondholders want to be compensatedfor the call risk associated with the bond. In a similar manner, the put feature of a bond, whichprovides the investor with an option to sell the bond back to the issuer at a predetermined price,has the effect of lowering the yield on a bond below that of a similar nonputable bond.
If the company already has debt outstanding incorporating option-like features that theanalyst believes are representative of the future debt issuance of the company, the analyst maysimply use the yield to maturity on such debt in estimating the cost of debt.
If the analyst believes that the company will add or remove option features in future debtissuance, the analyst can make market value adjustments to the current YTM to reflect thevalue of such additions and/or deletions. The technology for such adjustments is an advancedtopic that is outside the scope of this chapter.11
10Duration is a more precise measure of a bond’s interest rate sensitivity than maturity.11See Fabozzi (2004), for example, for an introduction. Fabozzi discusses the estimation of an option-adjusted spread (OAS) to price the call option feature of a callable bond.
c03 13 January 2012; 9:13:25
Chapter 3 Cost of Capital 137

3.1.3.3. Nonrated Debt If a company does not have any debt outstanding or if the yieldson the company’s existing debt are not available, the analyst may not always be able to use theyield on similarly rated debt securities. It may be the case that the company does not haverated bonds. Though researchers offer approaches for estimating a company’s “synthetic” debtrating based on financial ratios, these methods are imprecise because debt ratings incorporatenot only financial ratios but also information about the particular bond issue and the issuerthat are not captured in financial ratios.
3.1.3.4. Leases A lease is a contractual obligation that can substitute for other forms ofborrowing. This is true whether the lease is an operating lease or a capital lease, though onlythe capital lease is represented as a liability on the company’s balance sheet.12 If the companyuses leasing as a source of capital, the cost of these leases should be included in the cost ofcapital. The cost of this form of borrowing is similar to that of the company’s other long-termborrowing.
3.2. Cost of Preferred Stock
The cost of preferred stock is the cost that a company has committed to pay preferredstockholders as a preferred dividend when it issues preferred stock. In the case of noncon-vertible, noncallable preferred stock that has a fixed dividend rate and no maturity date (fixedrate perpetual preferred stock), we can use the formula for the value of a preferred stock:
Pp ¼Dprp
where
Pp is the current preferred stock price per shareDp is the preferred stock dividend per sharerp is the cost of preferred stock
We can rearrange this equation to solve for the cost of preferred stock:
rp ¼Dp
Ppð3-3Þ
Therefore, the cost of preferred stock is the preferred stock’s dividend per share dividedby the current preferred stock’s price per share. Unlike interest on debt, the dividend on
12In the United States, an operating lease is distinguished from a capital lease in Statement of FinancialAccounting Standards No. 13, Accounting for Leases (FASB, November 1976). (IAS No. 17 similarlydistinguishes between operating and finance leases, another term for capital-type leases.) These twoforms of leases are distinguished on the basis of ownership transference, the existence of a bargainpurchase option, the term of the lease relative to the economic life of the asset, and the present value ofthe lease payments relative to the value of the asset. In either case, however, the lease obligation is a formof borrowing, even though it is only in the case of a capital lease that the obligation appears as a liabilityon the company’s balance sheet. The discount rate applied in the valuation of a capital lease is the rate ofborrowing at the time of the lease commencement; therefore, it is reasonable to apply the company’slong-term borrowing rate when estimating the cost of capital for leasing.
c03 13 January 2012; 9:13:26
138 Corporate Finance

preferred stock is not tax deductible by the company; therefore, there is no adjustment to thecost for taxes.13
A preferred stock may have a number of features that affect the yield and hence the cost ofpreferred stock. These features include a call option, cumulative dividends, participatingdividends, adjustable-rate dividends, or convertibility into common stock. When estimating ayield based on current yields of the company’s preferred stock, we must make appropriateadjustments for the effects of these features on the yield of an issue. For example, if the companyhas callable, convertible preferred stock outstanding, yet it is expected that the company willissue only noncallable, nonconvertible preferred stock in the future, we would have to either usethe current yields on comparable companies’ noncallable, nonconvertible preferred stock orestimate the yield on preferred equity using methods outside the scope of this chapter.14
EXAMPLE 3-5 Calculating the Cost of Preferred Equity
Alcoa has one class of preferred stock outstanding, a $3.75 cumulative preferred stock,for which there are 546,024 shares outstanding.15 If the price of this stock is $72, whatis the estimate of Alcoa’s cost of preferred equity?
Solution. Cost of Alcoa’s preferred stock¼ $3.75/$72.00¼ 5.21 percent.
EXAMPLE 3-6 Choosing the Best Estimate of the Costof Preferred Equity
Wim Vanistendael is finance director of De Gouden Tulip N.V., a leading Dutchflower producer and distributor. He has been asked by the CEO to calculate the cost ofpreferred equity and has recently obtained the following information:
! The issue price of preferred stock was h3.5 million and the preferred dividend is5 percent.
! If the company issued new preferred stock today, the preferred coupon rate would be6.5 percent.
! The company’s marginal tax rate is 30.5 percent.
What is the cost of preferred equity for De Gouden Tulip N.V.?
13This is not to be confused, however, with the dividends received deduction, which reduces the effectivetax on intercorporate preferred dividends received.14A method for estimating this yield involves first estimating the option-adjusted spread (OAS). Forfurther information on the OAS, see Fabozzi (2004).15Alcoa Annual Report 2004, footnote R, p. 56.
c03 13 January 2012; 9:13:26
Chapter 3 Cost of Capital 139

3.3. Cost of Common Equity
The cost of common equity (re), usually referred to simply as the cost of equity, is the rate ofreturn required by a company’s common shareholders. A company may increase commonequity through the reinvestment of earnings—that is, retained earnings—or through theissuance of new shares of stock.
As we discussed earlier, the estimation of the cost of equity is challenging because of theuncertain nature of the future cash flows in terms of the amount and timing. Commonly usedapproaches for estimating the cost of equity include the capital asset pricing model, thedividend discount model, and the bond yield plus risk premium method.
3.3.1. Capital Asset Pricing Model ApproachIn the capital asset pricing model (CAPM) approach, we use the basic relationship from thecapital asset pricing model theory that the expected return on a stock, E(Ri), is the sum of therisk-free rate of interest, RF, and a premium for bearing the stock’s market risk, βi (RM $ RF):
EðRiÞ ¼ RF þ βi½EðRM Þ $ RF ) ð3-4Þ
where
βi ¼ the return sensitivity of stock i to changes in the market returnE(RM)¼ the expected return on the market
E(RM)$RF ¼ the expected market risk premium
A risk-free asset is defined here as an asset that has no default risk. A common proxy forthe risk-free rate is the yield on a default-free government debt instrument. In general, theselection of the appropriate risk-free rate should be guided by the duration of projected cashflows. If we are evaluating a project with an estimated useful life of 10 years, we may want touse the rate on the 10-year Treasury bond.
Solution. If De Gouden Tulip were to issue new preferred stock today, the coupon ratewould be close to 6.5 percent. The current terms thus prevail over the past terms whenevaluating the actual cost of preferred stock. The cost of preferred stock for De GoudenTulip is, therefore, 6.5 percent. Because preferred dividends offer no tax shield, there isno adjustment made based on the marginal tax rate.
EXAMPLE 3-7 Using the CAPM to Estimate theCost of Equity
Valence Industries wants to know its cost of equity. Its CFO believes the risk-free rate is5 percent, equity risk premium is 7 percent, and Valence’s equity beta is 1.5. What isValence’s cost of equity using the CAPM approach?
Solution. Cost of common stock¼ 5 percentþ 1.5(7 percent)¼ 15.5 percent.
c03 13 January 2012; 9:13:26
140 Corporate Finance

The expected market risk premium, or E(RM$ RF), is the premium that investorsdemand for investing in a market portfolio relative to the risk-free rate. When using theCAPM to estimate the cost of equity, in practice we typically estimate beta relative to anequity market index. In that case, the market premium estimate we are using is actually anestimate of the equity risk premium (ERP).
An alternative to the CAPM to accommodate risks that may not be captured by themarket portfolio alone is a multifactor model that incorporates factors that may be othersources of priced risk (risk for which investors demand compensation for bearing), includingmacroeconomic factors and company-specific factors. In general
EðRiÞ ¼ RF þ βi1ðFactor risk premiumÞ1 þ βi2ðFactor risk premiumÞ2 þ ' ' 'þ βijðFactor risk premiumÞj ð3-5Þ
where
βij is stock i’s sensitivity to changes in the jth factor(Factor risk premium)j is expected risk premium for the jth factor
The basic idea behind these multifactor models is that the CAPM beta may not captureall the risks, especially in a global context, which include inflation, business-cycle, interestrate, exchange rate, and default risks.16,17
There are several ways to estimate the equity risk premium, though there is no generalagreement as to the best approach. The three we discuss are the historical equity risk premiumapproach, the dividend discount model approach, and the survey approach.
The historical equity risk premium approach is a well-established approach based onthe assumption that the realized equity risk premium observed over a long period of time is agood indicator of the expected equity risk premium. This approach requires compiling his-torical data to find the average rate of return of a country’s market portfolio and the averagerate of return for the risk-free rate in that country. For example, an analyst might use thehistorical returns to the TOPIX Index to estimate the risk premium for Japanese equities.The exceptional bull market observed during the second half of the 1990s, and the bursting ofthe technology bubble that followed during the years 2000–2002, reminds us that the timeperiod for such estimates should cover complete market cycles.
Elroy Dimson, Paul Marsh, and Mike Staunton conduct an analysis of the equity riskpremiums observed in markets located in 16 countries, including the United States, over theperiod 1900–2002.18 These researchers found that the annualized U.S. equity risk premiumrelative to U.S. Treasury bills was 5.3 percent (geometric mean) and 7.2 percent (arithmeticmean). They also found that the annualized U.S. equity risk premium relative to bonds was
16An example of the multifactor model is the three-factor Fama and French model (Fama and French[1992], 427–465), which includes factors for the market, equity capitalization, and the ratio of bookvalue of equity to the market value of equity.17These models are discussed in more detail by Bruner, et al. (2003) and by Fama and French (2004),3–24.18Dimson, Marsh, and Staunton (2003), 27–38.
c03 13 January 2012; 9:13:27
Chapter 3 Cost of Capital 141

4.4 percent (geometric mean) and 6.4 percent (arithmetic mean).19 Note that the arithmeticmean is greater than the geometric mean as a result of the significant volatility of the observedmarket rate of return and of the observed risk-free rate. Under the assumption of anunchanging distribution of returns through time, the arithmetic mean is the unbiased estimateof the expected single-period equity risk premium, but the geometric mean better reflectsgrowth rate over multiple periods.20 In Exhibit 3-2 we provide historical estimates of theequity risk premium for 16 developed markets from Dimson, Marsh, and Staunton’s study.
EXHIBIT 3-2 Equity Risk Premiums Relative to Bonds (1900 to 2001)
Mean
Country Geometric Arithmetic
Australia 6.3% 7.9%
Belgium 2.8 4.7
Canada 4.2 5.7
Denmark 1.8 3.1
France 4.6 6.7
Germany 6.3 9.6
Ireland 3.1 4.5
Italy 4.6 8.0
Japan 5.9 10.0
The Netherlands 4.4 6.4
South Africa 5.4 7.1
Spain 2.2 4.1
Sweden 4.9 7.1
Switzerland 2.4 3.9
United Kingdom 4.2 5.5
United States 4.8 6.7
World 4.3 5.4
Note: Germany excludes 1922–1923. Switzerland commences in 1911.Source: Dimson, Marsh, and Staunton (2003).
19Jeremy Siegel presents a longer time series of market returns, covering the period from 1802 through2004, and observes an equity return of 6.82 percent and an equity risk premium in the range of 3.31 to5.36 percent. See Siegel (2005), 61–73. The range depends on the method of calculation (compoundedor arithmetic) and the benchmark (bonds or bills).20Aside from the method of averaging (geometric versus arithmetic), estimates of the historical equity riskpremium differ depending on the assumed investment horizon (short versus intermediate versus long),whether conditional on some variable or unconditional, whether U.S. or global markets are examined, thesource of the data, the period observed, and whether nominal or real returns are estimated.
c03 13 January 2012; 9:13:27
142 Corporate Finance

To illustrate the historical method as applied in the CAPM, suppose that we usethe historical geometric mean for U.S. equity of 4.8 percent to value Citibank Inc. (NYSE: C)as of early January 2006. According to Standard & Poor’s, Citibank had a beta of 1.32 atthat time. Using the 10-year U.S. Treasury bond yield of 4.38 percent to represent the risk-freerate, the estimate of the cost of equity for Citibank is 4.38 percentþ 1.32(4.8 percent)¼10.72 percent.
The historical premium approach has several limitations. One limitation is that the levelof risk of the stock index may change over time. Another is that the risk aversion of investorsmay change over time. And still another limitation is that the estimates are sensitive to themethod of estimation and the historical period covered.
A second approach for estimating the equity risk premium is the dividend discountmodel based approach or implied risk premium approach, which is implemented using theGordon growth model (also known as the constant-growth dividend discount model). Fordeveloped markets, corporate earnings often meet, at least approximately, the model’sassumption of a long-run trend growth rate. We extract the premium by analyzing how themarket prices an index. That is, we use the relationship between the value of an index andexpected dividends, assuming a constant growth in dividends:
P0 ¼D1
re $ g
where P0 is the current market value of the equity market index, D1 are the dividendsexpected next period on the index, re is the required rate of return on the market, and g isthe expected growth rate of dividends. We solve for the required rate of return on the market as
re ¼D1
P0þ g ð3-6Þ
EXAMPLE 3-8 Estimating the Equity Risk Premium UsingHistorical Rates of Return
Suppose that the arithmetic average T-bond rate observed over the past 100 years is anunbiased estimator for the risk-free rate and amounts to 5.4 percent. Likewise, supposethe arithmetic average of return on the market observed over the past 100 years is anunbiased estimator for the expected return for the market. The average rate of return ofthe market was 9.3 percent. Calculate the equity risk premium.
Solution.
ERP ¼ !RM $ !RF ¼ 9:3 percent$ 5:4 percent ¼ 3:9 percent:
c03 13 January 2012; 9:13:27
Chapter 3 Cost of Capital 143

Therefore, the expected return on the market is the sum of the dividend yield and the growthrate in dividends.21 The equity risk premium thus is the difference between the expectedreturn on the equity market and the risk-free rate.
Suppose the expected dividend yield on an equity index is 5 percent and the expectedgrowth rate of dividends on the index is 2 percent. The expected return on the marketaccording to the Gordon growth model is
EðRmÞ ¼ 5 percent þ 2 percent ¼ 7 percent
A risk-free rate of interest of 3.8 percent implies an equity risk premium of 7 percent$ 3.8percent¼ 3.2 percent.
Another approach to estimate the equity risk premium is quite direct: Ask a panel offinance experts for their estimates and take the mean response. This is the survey approach.For example, one set of U.S. surveys found that the expected U.S. equity risk premium overthe next 30 years was 5.5 percent to 7 percent forecasting from 2001 as the baseline year and7.1 percent using 1998 as the baseline year.
Once we have an estimate of the equity risk premium, we fine-tune this estimate for theparticular company or project by adjusting it for the specific systematic risk of the project. Weadjust for the specific systematic risk by multiplying the market risk premium by beta to arriveat the company’s or project’s risk premium, which we then add to the risk-free rate todetermine the cost of equity within the framework of the CAPM.22
3.3.2. Dividend Discount Model ApproachEarlier we used the Gordon growth model to develop an estimate of the equity risk premiumfor use in the CAPM. We can also use the Gordon growth model directly to obtain anestimate of the cost of equity. To review, the dividend discount model in general states thatthe intrinsic value of a share of stock is the present value of the share’s expected futuredividends:
V0 ¼XN
t¼1
Dð1þ reÞt
! "¼ D
ð1þ reÞþ D
ð1þ reÞ2þ ' ' '
where
V0 is the intrinsic value of a shareDt is the share’s dividend at the end of period tre is the cost of equity
Based on Gordon’s constant growth formulation, we assume dividends are expectedto grow at a constant rate, g.23 Therefore, if we assume that price reflects intrinsic value(V0¼ P0), we can rewrite the valuation of the stock as
21We explain Equation 3-6 in more detail in Section 3.3.2.22Some researchers argue that the equity risk premium should reflect a country risk premium. Forexample, a multinational company or project may have a higher cost of capital than a comparabledomestic company because of political risk, foreign exchange risk, or higher agency costs. In most cases,this risk is unsystematic and hence does not affect the cost of capital estimate.23See Gordon (1962).
c03 13 January 2012; 9:13:27
144 Corporate Finance

P0 ¼D1
re $ g
We can then rewrite the above equation and estimate the cost of equity as we did for Equation3-6 in Section 3.3.1:
re ¼D1
P0þ g
Therefore, to estimate re, we need to estimate the dividend in the next period and theassumed constant dividend growth rate. The current stock price, P0, is known, andthe dividend of the next period, D1, can be predicted if the company has a stable dividendpolicy. (The ratio D1/P0 may be called the forward annual dividend yield.) The challenge isestimating the growth rate.
There are at least two ways to estimate the growth rate. The first is to use a forecastedgrowth rate from a published source or vendor. A second is to use a relationship between thegrowth rate, the retention rate, and the return on equity. In this context, this is often referredto as the sustainable growth rate and is interpretable as the rate of dividend (and earnings)growth that can be sustained over time for a given level of return on equity, keeping thecapital structure constant and without issuing additional common stock. The relationship isgiven in Equation 3-7:
g ¼ ð1$ D=EPSÞROE ð3-7Þ
where D/EPS represents the assumed stable dividend payout ratio and ROE is the historicalreturn on equity. The term (1 – D/EPS) is the company’s earnings retention rate.
Consider Citigroup, Inc. Citigroup has an earnings retention rate of 59 percent. As ofearly January 2006, Citigroup had a forward annual dividend yield of 3.9 percent, a trailingreturn on equity of approximately 20 percent, but an estimated average return on equitygoing forward of approximately 16.6 percent. According to Equation 3-7, Citigroup’s sus-tainable growth rate is 0.59(16.6 percent)¼ 9.79 percent. The dividend discount modelestimate of the cost of equity is, therefore, 9.79 percentþ 3.9 percent¼ 13.69 percent.
3.3.3. Bond Yield Plus Risk Premium ApproachThe bond yield plus risk premium approach is based on the fundamental tenet in financialtheory that the cost of capital of riskier cash flows is higher than that of less risky cash flows. Inthis approach, we sum the before-tax cost of debt, rd, and a risk premium that captures theadditional yield on a company’s stock relative to its bonds. The estimate is, therefore,
re ¼ rd þ Risk premium ð3-8Þ
The risk premium compensates for the additional risk of equity compared with debt.24
Ideally, this risk premium is forward looking, representing the additional risk associated withthe stock of the company as compared with the bonds of the same company. However, we
24This risk premium is not to be confused with the equity risk premium. The equity risk premium is thedifference between the cost of equity and the risk-free rate of interest. The risk premium in the bond yieldplus risk premium approach is the difference between the cost of equity and the company’s cost of debt.
c03 13 January 2012; 9:13:27
Chapter 3 Cost of Capital 145

often estimate this premium using historical spreads between bond yields and stock yields. Indeveloped country markets, a typical risk premium added is in the range of 3 to 5 percent.
Looking again at Citigroup, as of early January 2006, the yield to maturity of theCitigroup 5.3s bonds maturing in 2016 was approximately 4.95 percent. Adding an arbitraryrisk premium of 3.5 percent produces an estimate of the cost of equity of 4.95þ 3.5¼ 8.45percent. This estimate contrasts with the higher estimates of 10.72 percent, under the CAPMapproach, and 13.69 percent, under the dividend discount model approach. Such disparitiesare not uncommon and reflect the difficulty of cost of equity estimation.
4. TOPICS IN COST OF CAPITAL ESTIMATION
When calculating a company’s weighted average cost of capital (WACC), it is essential tounderstand the risk factors that have been considered in determining the risk-free rate, theequity risk premium, and beta to ensure a consistent calculation of WACC and avoidthe double counting or omission of pertinent risk factors.
4.1. Estimating Beta and Determining a Project Beta
When the analyst uses the CAPM to estimate the cost of equity, he or she must estimate beta.The estimation of beta presents many choices as well as challenges.
One common method of estimating the company’s stock beta is to use a market modelregression of the company’s stock returns (Ri) against market returns (Rm) over T periods:25
Rit ¼ ba þ bb Rmt t ¼ 1, 2, : : :T
where ba is the estimated intercept and bb is the estimated slope of the regression that is used asan estimate of beta. However, beta estimates are sensitive to the method of estimation anddata used. Consider some of the issues:
! Estimation period. The estimated beta is sensitive to the length of the estimation period,with beta commonly estimated using data over two to nine years. Selection of the esti-mation period is a trade-off between data richness captured by longer estimation periodsand company-specific changes that are better reflected with shorter estimation periods. Ingeneral, longer estimation periods are applied to companies with a long and stable oper-ating history, and shorter estimation periods are used for companies that have undergonesignificant structural changes in the recent past (such as restructuring, recent acquisition, ordivestiture) or changes in financial and operating leverage.
! Periodicity of the return interval (e.g., daily, weekly, or monthly). Researchers have observedsmaller standard error in beta estimated using smaller return intervals, such as dailyreturns.26
! Selection of an appropriate market index. The choice of market index affects the estimateof beta.
25This equation is commonly referred to as the market model and was first introduced by Michael C.Jensen (1969), 389–416.26Daves, Ehrhardt, and Kunkel (2000), 7–13.
c03 13 January 2012; 9:13:28
146 Corporate Finance

! Use of a smoothing technique. Some analysts adjust historical betas to reflect the tendency ofbetas to revert to 1.27 As an example, the expression βi,adj¼ 0.333þ 0.667βi adjusts betasabove and below 1.0 toward 1.0.
! Adjustments for small-capitalization stocks. Small-capitalization stocks have generallyexhibited greater risks and greater returns than large-capitalization stocks over the long run.Roger Ibbotson, Paul Kaplan, and James Peterson argue that betas for small-capitalizationcompanies be adjusted upward.28
Arriving at an estimated beta for publicly traded companies is generally not a problembecause of the accessibility of stock return data, the ease of use of estimating beta using simpleregression, and the availability of estimated betas on publicly traded companies from financialanalysis vendors, such as Barra, Bloomberg, Thompson Financial’s Datastream, Reuters, andValue Line. The challenge is to estimate a beta for a company that is not publicly traded or toestimate a beta for a project that is not the average or typical project of a publicly tradedcompany. Estimating a beta in these cases requires proxying for the beta by using theinformation on the project or company combined with a beta of a publicly traded company.
The beta of a company or project is affected by the systematic components of businessrisk and by financial risk. Both of these factors affect the uncertainty of the cash flows ofthe company or project. The business risk of a company or project is the risk related to theuncertainty of revenues, referred to as sales risk, and as operating risk, which is the riskattributed to the company’s operating cost structure. Sales risk is affected by the elasticity ofthe demand of the product, the cyclicality of the revenues, and the structure of competition inthe industry. Operating risk is affected by the relative mix of fixed and variable operatingcosts: the greater the fixed operating costs, relative to variable operating costs, the greater theuncertainty of income and cash flows from operations.
Financial risk is the uncertainty of net income and net cash flows attributed to the use offinancing that has a fixed cost, such as debt and leases. The greater the use of fixed-financingsources of capital, relative to variable sources, the greater the financial risk. In other words, acompany that relies heavily on debt financing instead of equity financing is assuming a greatdeal of financial risk.
How does a financial analyst estimate a beta for a company or project that is not publiclytraded? One common method is the pure-play method, which requires using a comparablepublicly traded company’s beta and adjusting it for financial leverage differences.
A comparable company is a company that has similar business risk. The reason it isreferred to as the pure-play method is that one of the easiest ways of identifying a comparablefor a project is to find a company in the same industry that is in that single line of business. Forexample, if the analyst is examining a project that involves drug stores, appropriate compar-ables in the United States may be Walgreens, CVS Corporation, and Rite Aid Corporation.
In estimating a beta in this way, the analyst must make adjustments to account fordiffering degrees of financial leverage. This requires a process of “unlevering” and “levering”the beta. The beta of the comparable is first “unlevered” by removing the effects of itsfinancial leverage.29 The unlevered beta is often referred to as the asset beta because it reflectsthe business risk of the assets. Once we determine the unlevered beta, we adjust it for the
27Blume (1971), 1–10.28See Ibbotson, Kaplan, and Peterson (1997), 104–110.29The process of unlevering and levering a beta was developed by Robert S. Hamada (1972, 435–452)and is based on the capital structure theories of Franco Modigliani and Merton Miller.
c03 13 January 2012; 9:13:28
Chapter 3 Cost of Capital 147

capital structure of the company or project that is the focus of our analysis. In other words, we“lever” the asset beta to arrive at an estimate of the equity beta for the project or company ofinterest.
For a given company, we can unlever its equity beta to estimate its asset beta. To do this,we must determine the relationship between a company’s asset beta and its equity beta.Because the company’s risk is shared between creditors and owners, we can represent thecompany’s risk, βasset, as the weighted average of the company’s creditors’ market risk, βdebt,and the market risk of the owners, βequity:
βasset ¼ βdebt wd þ βequity we
or
βasset ¼ βdebtD
D þ E
! "þ βequity
ED þ E
! "
where
E ¼ market value of equity
D ¼ market value of equity
wd ¼ proportion of debt D=D þ E
we ¼ proportion of equity E=D þ E
But interest on debt is deducted by the company to arrive at taxable income, so the claimthat creditors have on the company’s assets does not cost the company the full amount but,rather, the after-tax claim; the burden of debt financing is actually less due to interestdeductibility. We can represent the asset beta of a company as the weighted average of thebetas of debt and equity after considering the effects of the tax deductibility of interest:
βasset ¼ βdebtð1$ tÞD
ð1$ tÞD þ Eþ βequity
Eð1$ tÞD þ E
where t is the marginal tax rate.We generally assume that a company’s debt does not have market risk, so βdebt¼ 0. This
means that the returns on debt do not vary with the returns on the market, which we generallyassume to be true for most large companies. If βdebt¼ 0, then30
βasset ¼ βequity1
1þ ð1$ tÞDE
! "
2
664
3
775 ð3-9Þ
Therefore, the market risk of a company’s equity is affected by both the asset’s marketrisk, βasset, and a factor representing the nondiversifiable portion of company’s financial risk,[1þ (1 – t)D/E)]:
30The first step is βasset¼ βequityE
ð1$ tÞD þ E
# $, which we simplify to arrive at Equation 3-9.
c03 13 January 2012; 9:13:28
148 Corporate Finance

βequity ¼ βasset 1þ ð1$ tÞDE
! "# $ð3-10Þ
Suppose a company has an equity beta of 1.5, a debt-to-equity ratio of 0.4, and amarginal tax rate of 30 percent. Using Equation 3-9, the company’s asset beta is 1.1719:
βasset ¼ 1:5 1
1þ%ð1$ 0:3Þð0:4Þ
&
2
4
3
5 ¼ 1:5½0:7813) ¼ 1:719
In other words, if the company did not have any debt financing, its βasset¼ βequity¼1.1719; however, the use of debt financing increases its βequity from 1.1719 to 1.5. Whatwould the company’s equity beta be if the company’s debt-to-equity ratio were 0.5 instead of0.4? In this case, we apply Equation 3-10, using the debt-to-equity ratio of 0.5:
βequity ¼ 1:1719 1þ%ð1$ 0:3Þð0:5Þ
&h i¼ 1:5821
Therefore, the unlevering calculation produces a measure of market risk for the assets ofthe company—ignoring the company’s capital structure. We use the levering calculation inEquation 3-10 to estimate the market risk of a company given a specific asset risk, marginaltax rate, and capital structure.
We can use the same unlevering and levering calculations to estimate the asset risk andequity risk for a project. We start with the equity beta of the comparable company, which isthe levered beta, βL,comparable, and then convert it into the equivalent asset beta for theunlevered company, βU,comparable. Once we have the estimate of the unlevered beta, which isthe company’s asset risk, we then can use the project’s capital structure and marginal tax rateto convert this asset beta into an equity beta for the project, βL,project.
Estimating a Beta Using the Pure-Play Method
Step 1: Select the ComparableDetermine comparable company or companies. These are companies with similarbusiness risk.
ò
Step 2: Estimate Comparable’s BetaEstimate the equity beta of the comparable company or companies.
ò
Step 3: Unlever the Comparable’s BetaUnlever the beta of the comparable company or companies, removing the financial riskcomponent of the equity beta, leaving the business risk component of the beta.
ò
Step 4: Lever the Beta for the Project’s Financial RiskLever the beta of the project by adjusting the asset beta for the financial risk of theproject.
c03 13 January 2012; 9:13:28
Chapter 3 Cost of Capital 149

We begin by estimating the levered beta of the comparable company, βL,comparable. Usingthe capital structure and tax rate of the levered company, we estimate the asset beta for thecomparable company, βU,comparable:
βU;comparable ¼βL;comparable
1þ ð1$ tcomparableÞDcomparable
Ecomparable
! "# $ ð3-11Þ
We then consider the financial leverage of the project or company and calculate its equityrisk, βL,project:
βL;project ¼ βU;comparable 1þ ð1$ tprojectÞDproject
Eproject
! "# $ð3-12Þ
To illustrate the use of these equations, suppose we want to evaluate a project that will befinanced with debt and equity in a ratio of 0.4:1 (a debt-to-equity ratio of 0.4, correspondingto approximately 0.4/(0.4þ 1.0)¼ h0.286 for each euro of capital needed). We find acomparable company operating in the same line of business as the project. The marginal taxrate for the company sponsoring the project and the comparable company is 35 percent. Thecomparable company has a beta of 1.2 and a debt-to-equity ratio of 0.125. The unleveredbeta of the comparable is 1.1098:
βU;comparable ¼1:2
½1þ ð1$ 0:35Þ0:125) ¼ 1:1098
The levered beta for the project is 1.3983:
βL;project ¼ 1:1098½1þ'ð1$ 0:35Þ0:4
() ¼ 1:3983
We then use the 1.3983 as the beta in our CAPM estimate of the component cost ofequity for the project and, combined with the cost of debt in a weighted average, provide anestimate of the cost of capital for the project.31
EXAMPLE 3-9 Inferring an Asset Beta
Suppose that the beta of a publicly traded company’s stock is 1.3 and that the marketvalue of equity and debt are, respectively, C$540 million and C$720 million. If themarginal tax rate of this company is 40 percent, what is the asset beta of this company?
Solution.
βU ¼ 1:3
1þ ð1$ 0:4Þ 720540
! "# $ ¼ 0:72
31In this example, the weights are wd¼ 0.4/1.4¼ 0.2857 and we¼ 1/1.4¼ 0.7143.
c03 13 January 2012; 9:13:29
150 Corporate Finance
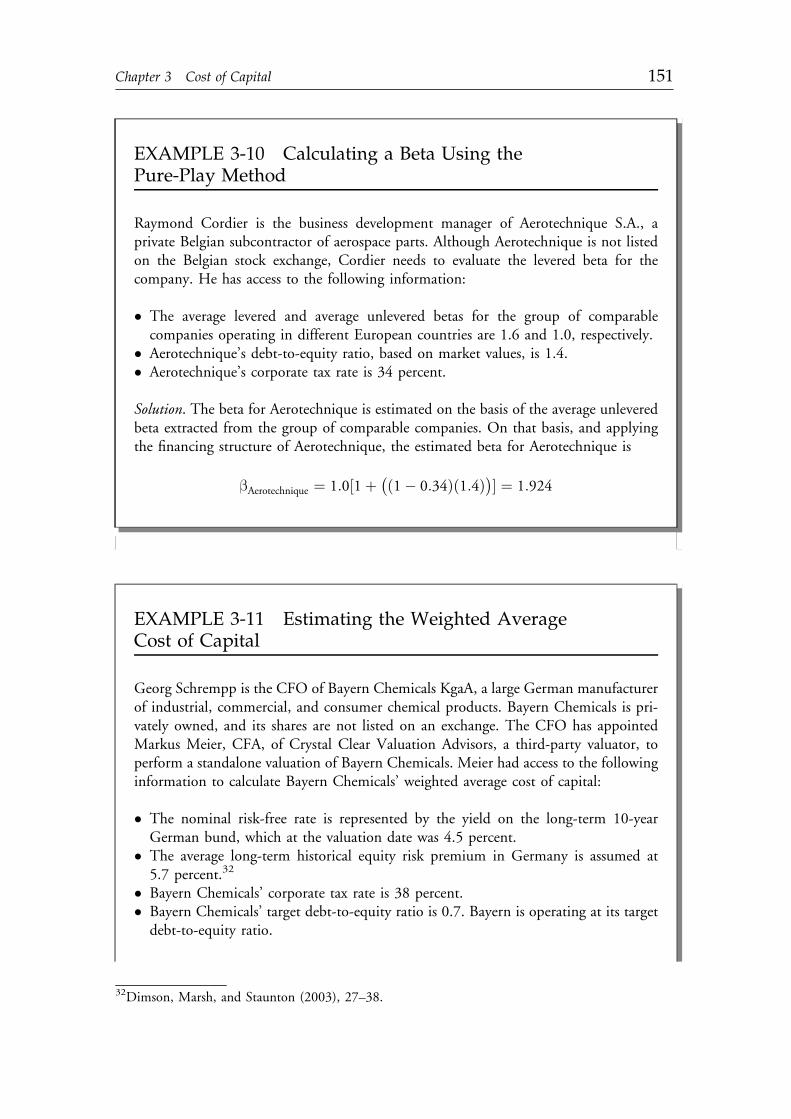
EXAMPLE 3-10 Calculating a Beta Using thePure-Play Method
Raymond Cordier is the business development manager of Aerotechnique S.A., aprivate Belgian subcontractor of aerospace parts. Although Aerotechnique is not listedon the Belgian stock exchange, Cordier needs to evaluate the levered beta for thecompany. He has access to the following information:
! The average levered and average unlevered betas for the group of comparablecompanies operating in different European countries are 1.6 and 1.0, respectively.
! Aerotechnique’s debt-to-equity ratio, based on market values, is 1.4.! Aerotechnique’s corporate tax rate is 34 percent.
Solution. The beta for Aerotechnique is estimated on the basis of the average unleveredbeta extracted from the group of comparable companies. On that basis, and applyingthe financing structure of Aerotechnique, the estimated beta for Aerotechnique is
βAerotechnique ¼ 1:0½1þ'ð1$ 0:34Þð1:4Þ
() ¼ 1:924
EXAMPLE 3-11 Estimating the Weighted AverageCost of Capital
Georg Schrempp is the CFO of Bayern Chemicals KgaA, a large German manufacturerof industrial, commercial, and consumer chemical products. Bayern Chemicals is pri-vately owned, and its shares are not listed on an exchange. The CFO has appointedMarkus Meier, CFA, of Crystal Clear Valuation Advisors, a third-party valuator, toperform a standalone valuation of Bayern Chemicals. Meier had access to the followinginformation to calculate Bayern Chemicals’ weighted average cost of capital:
! The nominal risk-free rate is represented by the yield on the long-term 10-yearGerman bund, which at the valuation date was 4.5 percent.
! The average long-term historical equity risk premium in Germany is assumed at5.7 percent.32
! Bayern Chemicals’ corporate tax rate is 38 percent.! Bayern Chemicals’ target debt-to-equity ratio is 0.7. Bayern is operating at its target
debt-to-equity ratio.
32Dimson, Marsh, and Staunton (2003), 27–38.
c03 13 January 2012; 9:13:29
Chapter 3 Cost of Capital 151

! Bayern Chemicals’ cost of debt has an estimated spread of 225 basis points over the10-year bund.
! Exhibit 3-3 supplies additional information on comparables for Bayern Chemicals.
EXHIBIT 3-3 Information on Comparables
ComparableCompanies Country Tax Rate
MarketCapitalizationin Millions
Net Debtin Millions D/E Beta
British Chemicals Ltd. UK 30.0% 4,500 6,000 1.33 1.45
CompagniePetrochimique S.A.
France 30.3% 9,300 8,700 0.94 0.75
RotterdamChemie N.V.
Netherlands 30.5% 7,000 7,900 1.13 1.05
Average 1.13 1.08
Based only on the information given, calculate Bayern Chemicals’ WACC.
Solution. To calculate the cost of equity, the first step is to “unlever” the betas of thecomparable companies and calculate an average for a company with business risksimilar to the average of these companies:
Comparable Companies Unlevered Beta
British Chemicals Ltd. 0.75
Compagnie Petrochimique S.A. 0.45
Rotterdam Chemie N.V. 0.59
Average33 0.60
Levering the average unlevered beta for the peer group average, applying BayernChemicals’ target debt-to-equity ratio and marginal tax rate, results in a beta of 0.86:
βBayernChemicals ¼ 0:60f1þ ½ð1$ 0:38Þ0:7)g ¼ 0:86
The cost of equity of Bayern Chemicals (re) can be calculated as follows:
re ¼ 4:5percent þ ð0:86Þð5:7percentÞ ¼ 9:4percent
33An analyst must apply judgment and experience to determine a representative average for the com-parable companies. This example uses a simple average, but in some situations a weighted average basedon some factor such as market capitalization may be more appropriate.
c03 13 January 2012; 9:13:30
152 Corporate Finance

4.2. Country Risk
The use of a stock’s beta to capture the country risks of a project is well supported in empiricalstudies that examine developed nations. However, beta does not appear to adequately capturecountry risk for companies in developing nations.34 A common approach for dealing with thisproblem is to adjust the cost of equity estimated using the CAPMby adding a country spread tothemarket risk premium.35 The country spread is also referred to as a country equity premium.
Perhaps the simplest estimate of the country spread is the sovereign yield spread, whichis the difference between the government bond yield in that country, denominated in thecurrency of a developed country, and the Treasury bond yield on a similar maturity bond inthe developed country.36 However, this approach may be too coarse for the purposes of equityrisk premium estimation.
Another approach is to calculate the country equity premium as the product of the sov-ereign yield spread and the ratio of the volatility of the developing country equity market to thatof the sovereign bond market denominated in terms of the currency of a developed country:37
Country equity premium ¼ Sovereign yield spread
Annualized standard deviationof equity index
Annualized standard deviation of thesovereign bond market in termsof the developed market currency
0
BBBBBB@
1
CCCCCCA
ð3-13Þ
The weights for the cost of equity and cost of debt may be calculated as follows:
wd ¼ D=EDE
þ 1! "
¼ 0:71:7
¼ 0:41
we ¼ 1$ wd ¼ 1$ 0:41 ¼ 0:59
The before-tax cost of debt of Bayern Chemicals (rd) is 6.75 percent:
rd ¼ 4:5 percent þ 2:25 percent ¼ 6:75 percent:
As a result, Bayern Chemicals’ WACC is 7.27 percent:
WACC ¼ ½ð0:41Þð0:0675Þð1$ 0:38Þ) þ ½ð0:59Þð0:094Þ) ¼ 0:0726 or 7:26 percent
34See Campbell R. Harvey (2001).35Adding the country spread to the market risk premium for a developing country and then multiplyingthis sum by the market risk of the project is making the assumption that the country risk premium variesaccording to market risk. An alternative method calculates the cost of equity as the sum of three terms:(1) the risk-free rate of interest, (2) the product of the beta and the developed market risk premium, and(3) the country risk premium. This latter method assumes that the country risk premium is the same,regardless of the project’s market risk.36Mariscal and Lee (1993).37See Damodaran (1999 and 2003).
c03 13 January 2012; 9:13:30
Chapter 3 Cost of Capital 153

The logic of this calculation is that the sovereign yield spread captures the general risk ofthe country, which is then adjusted for the volatility of the stock market relative to the bondmarket. This country equity premium is then used in addition to the equity premium esti-mated for a project in a developed country. Therefore, if the equity risk premium for a projectin a developed country is 4.5 percent and the country risk premium is 3 percent, the totalequity risk premium used in the CAPM estimation is 7.5 percent. If the appropriate beta is1.2 and the risk-free rate of interest is 4 percent, the cost of equity is
Cost of equity ¼ 0:04 þ 1:2ð0:045 þ 0:03Þ ¼ 0:13 or 13 percent
Still another approach is to use country credit ratings to estimate the expected rates ofreturns for countries that have credit ratings but no equity markets.38 This method requiresestimating reward to credit risk measures for a large sample of countries for which there areboth credit ratings and equity markets and then applying this ratio to those countries withoutequity markets based on the country’s credit rating.
4.3. Marginal Cost of Capital Schedule
As we noted in Section 2.3, as a company raises more funds, the costs of the different sourcesof capital may change, resulting in a change in the weighted average cost of capital for dif-ferent levels of financing. The result is the marginal cost of capital (MCC) schedule, which we
EXAMPLE 3-12 Estimating the Country Equity Premium
Miles Avenaugh, an analyst with the Global Company, is estimating a country equitypremium to include in his estimate of the cost of equity capital for Global’s investmentin Argentina. Avenaugh has researched yields in Argentina and observed that theArgentinean government’s 10-year bond is 9.5 percent. A similar maturity U.S.Treasury bond has a yield of 4.5 percent. The annualized standard deviation of theArgentina Merval stock index, a market value index of stocks listed on the Buenos AiresStock Exchange, during the most recent year is 40 percent. The annualized standarddeviation of the Argentina dollar-denominated 10-year government bond over therecent period was 28 percent.
What is the estimated country equity premium for Argentina based on Avenaugh’sresearch?
Solution.
Country equity premium ¼ 0:05 0:400:28
! "¼ 0:05ð1:4286Þ ¼ 0:0714, or 7:14 percent
38Erb, Harvey, and Viskanta (1996), 46–58.
c03 13 January 2012; 9:13:31
154 Corporate Finance

often depict in graphical form as the weighted average cost of capital for different amounts ofcapital raised, as we showed earlier in Exhibit 3-1.39
Why would the cost of capital change as more capital is raised? One source of a differencein cost depending on the amount of capital raised is that a company may have existing debtwith a bond covenant that restricts the company from issuing debt with similar seniority asexisting debt. Or, a debt incurrence test may restrict a company’s ability to incur additionaldebt at the same seniority based on one or more financial tests or conditions. For example, if acompany issues senior debt such that any additional debt at that seniority violates the debtincurrence test of an existing bond covenant, the company may have to issue less seniordebt or even equity, which would have a higher cost.
Another source of increasing marginal costs of capital is a deviation from the targetcapital structure. In the ideal, theoretical world, a company has a target capital structure andgoes to the market each period and raises capital in these proportions. However, as a practicalmatter, companies do not necessarily tap the market in these ideal proportions because ofconsiderations for economies of scale in raising new capital and market conditions. Becauseof such perceived economies of scale, companies tend to issue new securities such that in anygiven period, it may deviate from the proportions dictated by any target or optimal capitalstructure. In other words, these short-run deviations are due to the “lumpiness” of securityissuance. As the company experiences deviations from the target capital structure, the mar-ginal cost of capital may increase, reflecting these deviations.
The amount of capital at which the weighted average cost of capital changes—whichmeans that the cost of one of the sources of capital changes—is referred to as a break point.The reality of raising capital is that the marginal cost of capital schedule is not as smooth as wedepicted in Exhibit 3-1 but, rather, is a step-up cost schedule as shown in Exhibit 3-4.
EXHIBIT 3-4 Marginal Cost of Capital Schedule
0%
1%
2%
3%
4%
5%
6%
7%
$0.5 $2.5 $4.5 $6.5 $8.5 $10.5 $12.5 $14.5 $16.5 $18.5Amount of New Capital
WA
CC
39In later chapters we discuss cases where a company’s WACC may actually decrease as additional capitalis raised. For example, if a company financed solely with common equity raises additional capital viadebt, then the tax advantages provided by debt will result in a lower WACC under the newcapital structure. For this discussion, we are assuming that the company is already operating at or near itsoptimum balance of debt versus equity.
c03 13 January 2012; 9:13:31
Chapter 3 Cost of Capital 155

Consider the case of a company facing the costs of capital given in Exhibit 3-5.
EXHIBIT 3-5 Schedule of the Costs of Debt and Equity
Amount of New Debt(in millions)
After-Tax Costof Debt
Amount of NewEquity (in millions) Cost of Equity
new debt# h2 2.0 percent new equity# h6 5.0 percent
h2, new debt# h5 2.5 percent h6, new equity# h8 7.0 percent
h5, new debt 3.0 percent h8, new equity 9.0 percent
If the company raises capital according to its target capital structure proportions of 40percent debt and 60 percent equity, this company faces a marginal cost of capital schedulethat is upward sloping, with break points at h5 million, h10 million, h12.5 million, andh13.3 million, as depicted in Exhibit 3-4. These break points are determined from theamounts of capital at which the cost changes, calculated as
Break point ¼ Amount of capital at which the source’s cost of capital changesProportion of new capital raised from the source
ð3-14Þ
For example, the first break point for debt financing is reached with h2 million/0.4¼ h5million of new capital raised. The first break point attributed to a change in equity cost occursat h6 million/0.6¼ h10 million. Example 3-13 illustrates a marginal cost of capital schedulewith break points and also how the WACC figures in the choice of an optimal capital structure.
EXAMPLE 3-13 Marginal Cost of Capital Schedule
Alan Conlon is the CFO of Allied Canadian Breweries Ltd. He wants to determine thecapital structure that will result in the lowest cost of capital for Allied. He has access tothe following information:
! The minimum rate at which the company can borrow is the 12-month LIBOR rateplus a premium that varies with the debt-to-capital ratio [D/(Dþ E )] as given inExhibit 3-6.
! The current 12-month LIBOR is 4.5 percent.! The market risk premium is 4 percent, and unlevered beta is 0.9.! The risk-free rate is 4.25 percent.! The company’s tax rate is 36 percent.
1. Determine the WACC for levels of the debt-to-capital ratio given in Exhibit 3-6.2. Recommend a target capital structure given that the company is concerned with
achieving the lowest possible cost of capital.
c03 13 January 2012; 9:13:31
156 Corporate Finance

4.4. Flotation Costs
When a company raises new capital, it generally seeks the assistance of investment bankers.Investment bankers charge the company a fee based on the size and type of offering. This feeis referred to as the flotation cost. In the case of debt and preferred stock, we do not usuallyincorporate flotation costs in the estimated cost of capital because the amount of these costs isquite small, often less than 1 percent.40
EXHIBIT 3-6 Spreads over LIBOR forAlternative Debt-to-Capital Ratios
D=D þ E Spread (bps)
Less than 0.40 200
0.40 to 0.49 300
0.50 to 0.69 400
0.60 to 0.69 600
0.70 to 0.79 800
0.80 to 0.89 1,000
0.90 or higher 1,200
Solution to 1. The WACC expressed as a function of the capital structure is shown inExhibit 3-7.
EXHIBIT 3-7 WACC for Alternative Capital Structures
D=D þ E β rd (percent) re (percent) WACC (percent)
0.1 0.96 6.5 8.1 7.7
0.2 1.04 6.5 8.4 7.6
0.3 1.15 6.5 8.8 7.4
0.4 1.28 7.5 9.4 7.6
0.5 1.48 8.5 10.2 7.8
0.6 1.76 10.5 11.3 8.6
0.7 2.24 12.5 13.2 9.6
0.8 3.20 14.5 17.1 10.8
0.9 6.08 16.5 28.6 12.4
Solution to 2. The optimal capital structure is 30 percent debt.
40We can incorporate them for these sources by simply treating the flotation costs as an outlay, hencereducing proceeds from the source.
c03 13 January 2012; 9:13:32
Chapter 3 Cost of Capital 157

However, with equity issuance, the flotation costs may be substantial, so we shouldconsider these when estimating the cost of external equity capital. For example, Inmoo Lee,Scott Lochhead, Jay Ritter, and Quanshui Zhao observe average flotation costs for new equityin the United States of 7.11 percent.41 The flotation costs in other countries differ from theU.S. experience: Thomas Buhner and Christoph Kaserer observe flotation costs around 1.65percent in Germany, Seth Armitage estimates an average issuance cost of 5.78 percent in theUnited Kingdom, and Christoph Kaserer and Fabian Steiner observe an average cost of 4.53for Swiss capital offerings.42 A large part of the differences in costs among these studies islikely attributed to the type of offering; cash underwritten offers, typical in the United States,are generally more expensive than rights offerings, which are common in Europe.
Should we incorporate flotation costs into the cost of capital? There are two views on thistopic. One view, which you can find often in textbooks, is to incorporate the flotation costsinto the cost of capital. The other view is that flotation costs should not be included in thecost of capital but, rather, incorporated into any valuation analysis as an additional cost ofthe project.
Consistent with the first view, we can specify flotation costs in monetary terms, as anamount per share or as a percentage of the share price. With flotation costs in monetary termson a per share basis, F, the cost of external equity is
re ¼D1
P0 $ F
! "þ g ð3-15Þ
As a percentage applied against the price per share, the cost of external equity is
re ¼D1
P0ð1$ f Þ
! "þ g ð3-16Þ
where f is the flotation cost as a percentage of the issue price.Suppose a company has a current dividend of $2 per share, a current price of $40 per
share, and an expected growth rate of 5 percent. The cost of internally generated equity wouldbe 10.25 percent:
re ¼!$2ð1þ 0:05Þ
$40
"þ 0:05 ¼ 0:0525þ 0:05 ¼ 0:1025 or 10:25 percent
If the flotation costs are 4 percent of the issuance, the cost of externally generated equitywould be slightly higher at 10.469 percent:
re ¼$2ð1þ 0:05Þ$40ð1$ 0:04Þ
! "þ 0:05 ¼ 0:05469þ 0:05 ¼ 0:1047, or 10:47 percent
The problem with this approach is that the flotation costs are a cash flow at the initiationof the project and affect the value of any project by reducing the initial cash flow. Adjusting thecost of capital for flotation costs is incorrect because by doing so, we are adjusting the present
41Lee, Lochhead, Ritter, and Zhao (1996), 59–74.42See, for example, Buhner and Kaserer (2002), 249; Armitage (2000), 57–68; and Kaserer and Steiner(2004).
c03 13 January 2012; 9:13:32
158 Corporate Finance

value of the future cash flows by a fixed percentage—in the above example, a difference of 22basis points, which does not necessarily equate to the present value of the flotation costs.43
The alternative and recommended approach is to make the adjustment to the cash flowsin the valuation computation. For example, consider a project that requires a h60,000 initialcash outlay and is expected to produce cash flows of h10,000 each year for 10 years. Supposethe company’s marginal tax rate is 40 percent and that the before-tax cost of debt is 5 percent.Furthermore, suppose that the company’s dividend next period is h1, the current price of thestock is h20, and the expected growth rate is 5 percent so that the cost of equity usingthe dividend discount model is (h1/h20)þ 0.05¼ 0.10 or 10 percent. Assume the companywill finance the project with 40 percent debt and 60 percent equity. Exhibit 3-8 summarizesthe information on the component costs of capital.
EXHIBIT 3-8 After-Tax Costs of Debt and Equity
Source of Capital Amount Raised Proportion Marginal After-Tax Cost
Debt h24,000 0.40 0.05(1 $ 0.4)¼ 0.03
Equity h36,000 0.60 0.10
The weighted average cost of capital is 7.2 percent calculated as 0.40(3 percent)þ 0.60(10 percent). Ignoring flotation costs for the moment, the net present value (NPV) of thisproject is
NPV ¼ h69,591$ h60,000 ¼ h9,591
If the flotation costs are, say, 5 percent of the new equity capital, the flotation costs areh1,800. The net present value considering flotation costs is
NPV ¼ h69,591$ h60,000$ h1,800 ¼ h7,791
if flotation costs are not tax deductible, or h69,591 – h60,000 – h1,800(0.6)¼ h8,511 ifflotation costs are tax deductible. If, instead of considering the flotation costs as part of thecash flows, we adjust the cost of equity, the cost of capital is 7.3578 percent and the NPV is
NPV ¼ h69,089$ h60,000 ¼ h9,089
As you can see, we arrive at difference assessments of value using these two methods.So, if it is preferred to deduct the flotation costs as part of the net present value calcu-
lation, why do we see the adjustment in the cost of capital so often in textbooks? The firstreason is that it is often difficult to identify particular financing associated with a project.Using the adjustment for the flotation costs in the cost of capital may be useful if specificproject financing cannot be identified. Second, by adjusting the cost of capital for the flotationcosts, it is easier to demonstrate how costs of financing a company change as a companyexhausts internally generated equity (i.e., retained earnings) and switches to externally gen-erated equity (i.e., a new stock issue).
43This argument is made by Ezzell and Porter (1976, 403–413). They argue that the correct treatment isto deduct flotation costs as part of the valuation as one of the initial-period cash flows.
c03 13 January 2012; 9:13:32
Chapter 3 Cost of Capital 159

4.5. What Do CFOs Do?
In this chapter, we have introduced you to methods that may be used to estimate the cost ofcapital for a company or a project. What do companies actually use when making investmentdecisions? In a survey of a large number of U.S. company CFOs, John Graham and CampbellHarvey asked about the methods that companies actually use.44 Their survey revealed thefollowing:
! The most popular method for estimating the cost of equity is the capital asset pricingmodel.
! Few companies use the dividend cash flow model to estimate a cost of equity.! Publicly traded companies are more likely to use the capital asset pricing model than are
private companies.! In evaluating projects, the majority use a single company cost of capital, but a large portion
apply some type of risk adjustment for individual projects.
The survey also reveals that the single-factor capital asset pricing model is the mostpopular method for estimating the cost of equity, though the next most popular methods,respectively, are average stock returns and multifactor return models. The lack of popularityof the dividend discount model indicates that this approach, which was once favored, has lostits following in practice.45
In a survey of publicly traded multinational European companies, Franck Bancel andUsha Mittoo provide evidence consistent with the Graham and Harvey survey.46 They findthat over 70 percent of companies use the CAPM to determine the cost of equity; thiscompares with the 73.5 percent of U.S. companies that use the CAPM. In a survey of bothpublicly traded and private European companies, Dirk Brounen, Abe de Jong, and KeesKoedijk confirm the result of Graham and Harvey that larger companies are more likely to usethe more sophisticated methods, such as CAPM, in estimating the cost of equity.47 Brounen,Jong, and Koedijk find that the popularity of the use of CAPM is less for their sample(ranging from 34 percent to 55.6 percent, depending on the country) than for the other twosurveys, which may reflect the inclusion of smaller, private companies in the latter sample.
We learn from the survey evidence that the CAPM is a popular method for estimatingthe cost of equity capital and that it is used less by smaller, private companies. This latterresult is not surprising because of the difficulty in estimating systematic risk in cases in whichthe company’s equity is not publicly traded.
5. SUMMARY
In this chapter, we provided an overview of the techniques used to calculate the cost of capitalfor companies and projects. We examined the weighted average cost of capital, discussing themethods commonly used to estimate the component costs of capital and the weights applied
44Graham and Harvey (2002), 8–23.45A survey published in 1982 by Lawrence Gitman and V. Mercurio (1982, 21–29) indicated that fewerthan 30 percent used the CAPM model in the estimation of the cost of equity.46Bancel and Mittoo (2004).47Brounen, de Jong, and Koedijk (2004).
c03 13 January 2012; 9:13:33
160 Corporate Finance

to these components. The international dimension of the cost of capital, as well as key factorsinfluencing the cost of capital, were also analyzed.
! The weighted average cost of capital is a weighted average of the after-tax marginal costs ofeach source of capital: WACC¼wdrd (1$ t)þwprpþwere
! An analyst uses the WACC in valuation. For example, the WACC is used to valuea project using the net present value method: NPV ¼ Present value of inflows$ Presentvalue of the outflows:
! The before-tax cost of debt is generally estimated by means of one of the two methods:yield to maturity or bond rating.
! The yield-to-maturity method of estimating the before-tax cost of debt uses the familiarbond valuation equation. Assuming semiannual coupon payments, the equation is
P0 ¼PMT1
1þ rd2
! "þ ' ' ' þ PMTn
1þ rd2
! "n þFV
1þ rd2
! "n ¼Xn
t¼1
PMTt
1þ rd2
! "t
0
BBB@
1
CCCAþ FV
1þ rd2
! "n
We solve for the six-month yield (rd/2) and then annualize it to arrive at the before-taxcost of debt, rd.
! Because interest payments are generally tax deductible, the after-tax cost is the true,effective cost of debt to the company. If a current yield or bond rating is not available, suchas in the case of a private company without rated debt or a project, the estimate of the costof debt becomes more challenging.
! The cost of preferred stock is the preferred stock dividend divided by the current preferredstock price:
rp ¼Dp
Pp
! The cost of equity is the rate of return required by a company’s common stockholders. Weestimate this cost using the CAPM (or its variants) or the dividend discount method.
! The CAPM is the approach most commonly used to calculate the cost of common stock.The three components needed to calculate the cost of common stock are the risk-free rate,the equity risk premium, and beta:
EðRiÞ ¼ RF þ βi½EðRM Þ $ RF )
! When estimating the cost of equity capital using the CAPM when we do not have publiclytraded equity, we may be able to use the pure-play method in which we estimate theunlevered beta for a company with similar business risk, βU,
βU;comparable ¼βL;comparable
1þ ð1$ tcomparableÞDcomparable
Ecomparable
! "# $
and then lever this beta to reflect the financial risk of the project or company:
c03 13 January 2012; 9:13:33
Chapter 3 Cost of Capital 161

βL;project ¼ βU;comparable 1þ ð1$ tprojectÞDproject
Eproject
! "# $
! It is often the case that country and foreign exchange risk are diversified so that we can usethe estimated β in the CAPM analysis. However, in the case in which these risks cannot bediversified away, we can adjust our measure of systematic risk by a country equity premiumto reflect this nondiversified risk:
Country equity premium ¼ Sovereign yield spread
Annualized standard deviationof equity index
Annualized standard deviation of thesovereign bond market in termsof the developed market currency
0
BBBBBB@
1
CCCCCCA
! The dividend discount model approach is an alternative approach to calculating the cost ofequity, whereby the cost of equity is estimated as follows:
re ¼D1
P0þ g
! We can estimate the growth rate in the dividend discount model by using publishedforecasts of analysts or by estimating the sustainable growth rate:
g ¼ ð1$ D=EPSÞROE
! In estimating the cost of equity, an alternative to the CAPM and dividend discountapproaches is the bond yield plus risk premium approach. In this approach, we estimate thebefore-tax cost of debt and add a risk premium that reflects the additional risk associatedwith the company’s equity.
! The marginal cost of capital schedule is a graph plotting the new funds raised by a companyon the x-axis and the cost of capital on the y-axis. The cost of capital is level to the point atwhich one of the costs of capital changes, such as when the company bumps up against adebt covenant, requiring it to use another form of capital. We calculate a break point usinginformation on when the different sources’ costs change and the proportions that thecompany uses when it raises additional capital:
Break point ¼ Amount of capital at which the source’s cost of capital changesProportion of new capital raised from the source
! Flotation costs are costs incurred in the process of raising additional capital. The preferredmethod of including these costs in the analysis is as an initial cash flow in the valuationanalysis.
! Survey evidence tells us that the CAPM method is the most popular method used bycompanies in estimating the cost of equity. The CAPM is more popular with larger,publicly traded companies, which is understandable considering the additional analyses andassumptions required in estimating systematic risk for a private company or project.
c03 13 January 2012; 9:13:33
162 Corporate Finance

PROBLEMS
1. The cost of equity is equal to the:A. expected market return.B. rate of return required by stockholders.C. cost of retained earnings plus dividends.
2. Which of the following statements is correct?A. The appropriate tax rate to use in the adjustment of the before-tax cost of debt to
determine the after-tax cost of debt is the average tax rate because interest isdeductible against the company’s entire taxable income.
B. For a given company, the after-tax cost of debt is generally less than both the cost ofpreferred equity and the cost of common equity.
C. For a given company, the investment opportunity schedule is upward sloping becauseas a company invests more in capital projects, the returns from investing increase.
3. Using the dividend discount model, what is the cost of equity capital for Zeller Mining ifthe company will pay a dividend of C$2.30 next year, has a payout ratio of 30%, a returnon equity (ROE) of 15%, and a stock price of C$45?A. 9.61%.B. 10.50%.C. 15.61%.
4. Dot.Com has determined that it could issue $1,000 face value bonds with an 8% couponpaid semiannually and a five-year maturity at $900 per bond. If Dot.Com’s marginal taxrate is 38%, its after-tax cost of debt is closest to:A. 6.2%.B. 6.4%.C. 6.6%.
5. The cost of debt can be determined using the yield-to-maturity and the bond ratingapproaches. If the bond rating approach is used, the:A. coupon is the yield.B. yield is based on the interest coverage ratio.C. company is rated and the rating can be used to assess the credit default spread of the
company’s debt.
6. Morgan Insurance Ltd. issued a fixed-rate perpetual preferred stock three years ago andplaced it privately with institutional investors. The stock was issued at $25 per share witha $1.75 dividend. If the company were to issue preferred stock today, the yield would be6.5%. The stock’s current value is:A. $25.00.B. $26.92.C. $37.31.
7. A financial analyst at Buckco Ltd. wants to compute the company’s weighted average costof capital (WACC) using the dividend discount model. The analyst has gathered thefollowing data:
c03 13 January 2012; 9:13:33
Chapter 3 Cost of Capital 163

Before-tax cost of new debt 8%
Tax rate 40%
Target debt-to-equity ratio 0.8033
Stock price $30
Next year’s dividend $1.50
Estimated growth rate 7%
Buckco’s WACC is closest to:A. 8%.B. 9%.C. 12%.
8. The Gearing Company has an after-tax cost of debt capital of 4%, a cost of preferredstock of 8%, a cost of equity capital of 10%, and a weighted average cost of capital of 7%.Gearing intends to maintain its current capital structure as it raises additional capital. Inmaking its capital-budgeting decisions for the average-risk project, the relevant cost ofcapital is:A. 4%.B. 7%.C. 8%.
9. FranMcClure of Alba Advisers is estimating the cost of capital of Frontier Corporation as partof her valuation analysis of Frontier.McClure will be using this estimate, alongwith projectedcash flows fromFrontier’s new projects, to estimate the effect of these newprojects on the valueof Frontier. McClure has gathered the following information on Frontier Corporation:
Current Year Forecasted for Next Year
Book value of debt $50 $50
Market value of debt $62 $63
Book value of shareholders’ equity $55 $58
Market value of shareholders’ equity $210 $220
The weights that McClure should apply in estimating Frontier’s cost of capital for debtand equity are, respectively:A. wd¼ 0.200; we¼ 0.800.B. wd¼ 0.185; we¼ 0.815.C. wd¼ 0.223; we¼ 0.777.
10. Wang Securities had a long-term stable debt-to-equity ratio of 0.65. Recent bank bor-rowing for expansion into South America raised the ratio to 0.75. The increased leveragehas what effect on the asset beta and equity beta of the company?A. The asset beta and the equity beta will both rise.B. The asset beta will remain the same and the equity beta will rise.C. The asset beta will remain the same and the equity beta will decline.
c03 13 January 2012; 9:13:34
164 Corporate Finance

11. Brandon Wiene is a financial analyst covering the beverage industry. He is evaluating theimpact of DEF Beverage’s new product line of flavored waters. DEF currently has a debt-to-equity ratio of 0.6. The new product line would be financed with $50 million of debtand $100 million of equity. In estimating the valuation impact of this new productline on DEF’s value, Wiene has estimated the equity beta and asset beta of comparablecompanies. In calculating the equity beta for the product line, Wiene is intending touse DEF’s existing capital structure when converting the asset beta into a project beta.Which of the following statements is correct?A. Using DEF’s debt-to-equity ratio of 0.6 is appropriate in calculating the new product
line’s equity beta.B. Using DEF’s debt-to-equity ratio of 0.6 is not appropriate, but rather the debt-to-
equity ratio of the new product, 0.5, is appropriate to use in calculating the newproduct line’s equity beta.
C. Wiene should use the new debt-to-equity ratio of DEF that would result from theadditional $50 million debt and $100 million equity in calculating the new productline’s equity beta.
12. Trumpit Resorts Company currently has 1.2 million common shares of stock out-standing and the stock has a beta of 2.2. It also has $10 million face value of bonds thathave five years remaining to maturity and 8% coupon with semiannual payments, and arepriced to yield 13.65%. If Trumpit issues up to $2.5 million of new bonds, the bondswill be priced at par and have a yield of 13.65%; if it issues bonds beyond $2.5 million,the expected yield on the entire issuance will be 16%. Trumpit has learned that it canissue new common stock at $10 a share. The current risk-free rate of interest is 3% andthe expected market return is 10%. Trumpit’s marginal tax rate is 30%. If Trumpit raises$7.5 million of new capital while maintaining the same debt-to-equity ratio, its weightedaverage cost of capital is closest to:A. 14.5%.B. 15.5%.C. 16.5%.
The following information relates to Questions 13–18.Jurgen Knudsen has been hired to provide industry expertise to Henrik Sandell, CFA, an
analyst for a pension planmanaging a global large-cap fund internally. Sandell is concerned aboutone of the fund’s larger holdings, auto parts manufacturer Kruspa AB. Kruspa currently operatesin 80 countries, with the previous year’s global revenues at h5.6 billion. Recently, Kruspa’s CFOannounced plans for expansion into China. Sandell worries that this expansion will change thecompany’s risk profile and wonders if he should recommend a sale of the position.
Sandell provides Knudsen with the basic information. Kruspa’s global annual free cashflow to the firm is h500 million and earnings are h400 million. Sandell estimates thatcash flow will level off at a 2 percent rate of growth. Sandell also estimates that Kruspa’s after-tax free cash flow to the firm on the China project for next three years is, respectively, h48million, h52 million, and h54.4 million. Kruspa recently announced a dividend of h4.00 pershare of stock. For the initial analysis, Sandell requests that Knudsen ignore possible currencyfluctuations. He expects the Chinese plant to sell only to customers within China for the firstthree years. Knudsen is asked to evaluate Kruspa’s planned financing of the required h100million with a h80 public offering of 10-year debt in Sweden and the remainder with anequity offering.
c03 13 January 2012; 9:13:34
Chapter 3 Cost of Capital 165

Additional information:
Equity risk premium, Sweden 4.82%
Risk-free rate of interest, Sweden 4.25%
Industry debt-to-equity ratio 0.3
Market value of Kruspa’s debt h900 million
Market value of Kruspa’s equity h2.4 billion
Kruspa’s equity beta 1.3
Kruspa’s before-tax cost of debt 9.25%
China credit A2 country risk premium 1.88%
Corporate tax rate 37.5%
Interest payments each year Level
13. Using the capital asset pricing model, Kruspa’s cost of equity capital for its typical projectis closest to:A. 7.62%.B. 10.52%.C. 12.40%.
14. Sandell is interested in the weighted average cost of capital of Kruspa AB prior to itsinvesting in the China project. This weighted average cost of capital (WACC) is closest to:A. 7.65%.B. 9.23%.C. 10.17%.
15. In his estimation of the project’s cost of capital, Sandell would like to use the asset beta ofKruspa as a base in his calculations. The estimated asset beta of Kruspa prior to the Chinaproject is closest to:A. 1.053.B. 1.110.C. 1.327.
16. Sandell is performing a sensitivity analysis of the effect of the new project on thecompany’s cost of capital. If the China project has the same asset risk as Kruspa,the estimated project beta for the China project, if it is financed 80% with debt, is closestto:A. 1.300.B. 2.635.C. 3.686.
17. As part of the sensitivity analysis of the effect of the new project on the company’s cost ofcapital, Sandell is estimating the cost of equity of the China project considering that theChina project requires a country equity premium to capture the risk of the project. Thecost of equity for the project in this case is closest to:A. 10.52%.B. 19.91%.C. 28.95%.
c03 13 January 2012; 9:13:34
166 Corporate Finance

18. In his report, Sandell would like to discuss the sensitivity of the project’s net present valueto the estimation of the cost of equity. The China project’s net present value calculatedusing the equity beta without and with the country risk premium are, respectively:A. h26 million and h24 million.B. h28 million and h25 million.C. h30 million and h27 million.
The following information relates to Questions 19–22.Boris Duarte, CFA, covers initial public offerings for Zellweger Analytics, an indepen-
dent research firm specializing in global small-cap equities. He has been asked to evaluatethe upcoming new issue of TagOn, a U.S.-based business intelligence software company. Theindustry has grown at 26 percent per year for the previous three years. Large companiesdominate the market, but sizable “pure-play” companies such as Relevant, Ltd., ABJ, Inc.,and Opus Software Pvt. Ltd also compete. Each of these competitors is domiciled in a dif-ferent country, but they all have shares of stock that trade on the U.S. NASDAQ. The debtratio of the industry has risen slightly in recent years.
CompanySales
(in millions)
Market ValueEquity
(in millions)
Market ValueDebt
(in millions)EquityBeta
TaxRate
SharePrice
Relevant Ltd. $752 $3,800 $0.0 1.702 23% $42
ABJ, Inc. $843 $2,150 $6.5 2.800 23% $24
Opus SoftwarePvt. Ltd. $211 $972 $13.0 3.400 23% $13
Duarte uses the information from the preliminary prospectus for TagOn’s initialoffering. The company intends to issue 1 million new shares. In his conversation with theinvestment bankers for the deal, he concludes the offering price will be between $7 and $12.The current capital structure of TagOn consists of a $2.4 million five-year noncallable bondissue and 1 million common shares. Other information that Duarte has gathered:
Currently outstanding bonds $2.4 million five-year bonds, coupon of 12.5percent, with a market value of $2.156 million
Risk-free rate of interest 5.25%
Estimated equity risk premium 7%
Tax rate 23%
19. The asset betas for Relevant, ABJ, and Opus, respectively, are:A. 1.70, 2.52, and 2.73.B. 1.70, 2.79, and 3.37.C. 1.70, 2.81, and 3.44.
c03 13 January 2012; 9:13:34
Chapter 3 Cost of Capital 167

20. The average asset beta for the pure players in this industry, Relevant, ABJ, and Opus,weighted by market value of equity is closest to:A. 1.67.B. 1.97.C. 2.27.
21. Using the capital asset pricing model, the cost of equity capital for a company in thisindustry with a debt-to-equity ratio of 0.01, asset beta of 2.27, and a marginal tax rate of23% is closest to:A. 17%.B. 21%.C. 24%.
22. The marginal cost of capital for TagOn, based on an average asset beta of 2.27 for theindustry and assuming that new stock can be issued at $8 per share, is closest to:A. 20.5%.B. 21.0%.C. 21.5%.
23. Two years ago, a company issued $20 million in long-term bonds at par value with acoupon rate of 9%. The company has decided to issue an additional $20 million inbonds and expects the new issue to be priced at par value with a coupon rate of 7%. Thecompany has no other debt outstanding and has a tax rate of 40%. To compute thecompany’s weighted average cost of capital, the appropriate after-tax cost of debt is closestto:A. 4.2%.B. 4.8%.C. 5.4%.
24. An analyst gathered the following information about a company and the market:
Current market price per share of common stock $28.00
Most recent dividend per share paid on common stock (D0) $2.00
Expected dividend payout rate 40%
Expected return on equity (ROE) 15%
Beta for the common stock 1.3
Expected rate of return on the market portfolio 13%
Risk-free rate of return 4%
Using the discounted cash flow (DCF) approach, the cost of retained earnings for thecompany is closest to:A. 15.7%.B. 16.1%.C. 16.8%.
c03 13 January 2012; 9:13:34
168 Corporate Finance

25. An analyst gathered the following information about a company and the market:
Current market price per share of common stock $28.00
Most recent dividend per share paid on common stock (D0) $2.00
Expected dividend payout rate 40%
Expected return on equity (ROE) 15%
Beta for the common stock 1.3
Expected rate of return on the market portfolio 13%
Risk-free rate of return 4%
Using the capital asset pricing model (CAPM) approach, the cost of retained earnings forthe company is closest to:A. 13.6%.B. 15.7%.C. 16.1%.
26. An analyst gathered the following information about a private company and its publiclytraded competitor:
Comparable Companies Tax Rate Debt/Equity Equity Beta
Private company 30.0% 1.00 N.A.
Public company 35.0% 0.90 1.75
Using the pure-play method, the estimated equity beta for the private company isclosest to:A. 1.029.B. 1.104.C. 1.877.
27. An analyst gathered the following information about the capital markets in the UnitedStates and in Paragon, a developing country.
Selected Market Information
Yield on U.S. 10-year Treasury bond 4.5%
Yield on Paragon 10-year government bond 10.5%
Annualized standard deviation of Paragon stock index 35.0%
Annualized standard deviation of Paragon dollar-denominated government bond 25.0%
Based on the analyst’s data, the estimated country equity premium for Paragon isclosest to:A. 4.29%.B. 6.00%.C. 8.40%.
c03 13 January 2012; 9:13:35
Chapter 3 Cost of Capital 169

c03 13 January 2012; 9:13:35

CHAPTER 4MEASURES OF LEVERAGE
Pamela Peterson Drake, CFAHarrisonburg, Virginia, U.S.A.
Raj Aggarwal, CFAAkron, Ohio, U.S.A.
Cynthia Harrington, CFACalifornia, Los Angeles, U.S.A.
Adam Kobor, CFAWashington, DC, U.S.A.
LEARNING OUTCOMES
After completing this chapter, you will be able to do the following:
! Define and explain leverage, business risk, sales risk, operating risk, and financial risk andclassify a risk, given a description.
! Calculate and interpret the degree of operating leverage, the degree of financial leverage,and the degree of total leverage.
! Describe the effect of financial leverage on a company’s net income and return on equity.! Calculate the breakeven quantity of sales and determine the company’s net income at
various sales levels.! Calculate and interpret the operating breakeven quantity of sales.
1. INTRODUCTION
This chapter presents elementary topics in leverage. Leverage is the use of fixed costs in acompany’s cost structure. The fixed costs that are operating costs (such as depreciation orrent) create operating leverage. Fixed costs that are financial costs (such as interest expense)create financial leverage.
171
c04 13 January 2012; 9:12:38

Analysts refer to the use of fixed costs as leverage because these fixed costs act as a fulcrumfor the company’s earnings. Leverage can magnify earnings both up and down. The profits ofhighly leveraged companies might soar with small upturns in revenue. But the reverse is alsotrue: Small downturns in revenue may lead to losses.
Analysts need to understand a company’s use of leverage for three main reasons. First, thedegree of leverage is an important component in assessing a company’s risk and returncharacteristics. Second, analysts may be able to discern information about a company’sbusiness and future prospects from management’s decisions about the use of operating andfinancial leverage. Knowing how to interpret these signals also helps the analyst evaluate thequality of management’s decisions. Third, the valuation of a company requires forecastingfuture cash flows and assessing the risk associated with those cash flows. Understanding acompany’s use of leverage should help in forecasting cash flows and in selecting an appropriatediscount rate for finding their present value.
The chapter is organized as follows: Section 2 introduces leverage and defines importantterms. Section 3 illustrates and discusses measures of operating leverage and financial leverage,which combine to define a measure of total leverage that gauges the sensitivity of net incometo a given percent change in units sold. This section also covers breakeven points in usingleverage and corporate reorganization (a possible consequence of using leverage inappropri-ately). Section 4 summarizes the chapter.
2. LEVERAGE
Leverage increases the volatility of a company’s earnings and cash flows and increases the riskof lending to or owning a company. Additionally, the valuation of a company and its equity isaffected by the degree of leverage: The greater a company’s leverage, the greater its risk andhence, the greater the discount rate that should be applied in its valuation. Further, highlyleveraged (levered) companies have a greater chance of incurring significant losses duringdownturns, thus accelerating conditions that lead to financial distress and bankruptcy.
Consider the simple example of two companies, Impulse Robotics, Inc., and MalveyAerospace, Inc. These companies have the following performance for the period of study.1
(See Exhibit 4-1.)
EXHIBIT 4-1 Impulse Robotics and Malvey Aerospace
Impulse Robotics Malvey Aerospace
Revenues $1,000,000 $1,000,000
Operating costs 700,000 750,000
Operating income $300,000 $250,000
Financing expense 100,000 50,000
Net income $200,000 $200,000
1We are ignoring taxes for this example, but when taxes are included, the general conclusions remain thesame.
c04 13 January 2012; 9:12:38
172 Corporate Finance

These companies have the same net income, but are they identical in terms of operatingand financial characteristics? Would we appraise these two companies at the same value? Notnecessarily.
The risk associated with future earnings and cash flows of a company are affected by thecompany’s cost structure. The cost structure of a company is the mix of variable and fixed costs.Variable costs fluctuate with the level of production and sales. Some examples of variable costsare the cost of goods purchased for resale, costs ofmaterials or supplies, shipping charges, deliverycharges, wages for hourly employees, sales commissions, and sales or production bonuses. Fixedcosts are expenses that are the same regardless of the production and sales of the company. Thesecosts include depreciation, rent, interest on debt, insurance, and wages for salaried employees.
Suppose that the cost structures of the companies differ in the manner shown inExhibit 4-2.
EXHIBIT 4-2 Impulse Robotics and Malvey Aerospace
Impulse Robotics Malvey Aerospace
Number of units produced and sold 100,000 100,000
Sales price per unit $10 $10
Variable cost per unit $2 $6
Fixed operating cost $500,000 $150,000
Fixed financing expense $100,000 $50,000
The risk associated with these companies is different, although, as we saw in Exhibit 4-1,they have the same net income. They have different operating and financing cost structures,resulting in differing volatility of net income.
For example, if the number of units produced and sold is different from 100,000, the netincome of the two companies diverges. If 50,000 units are produced and sold, ImpulseRobotics has a loss of $200,000 and Malvey Aerospace has $0 earnings. If, on the other hand,the number of units produced and sold is 200,000, Impulse Robotics earns $1 millionwhereas Malvey Aerospace earns $600,000. In other words, the variability in net income isgreater for Impulse Robotics, which has higher fixed costs in terms of both fixed operatingcosts and fixed financing costs.
Impulse Robotics’ cost structure results in more leverage than that of Malvey Aerospace.We can see this effect when we plot the net income of each company against the number ofunits produced and sold, as in Exhibit 4-3. The greater leverage of Impulse Robotics isreflected in the greater slope of the line representing net income. This means that as thenumber of units sold changes, Impulse Robotics experiences a greater change in net incomethan does Malvey Aerospace for the same change in units sold.
Companies that have more fixed costs relative to variable costs in their cost structureshave greater variation in net income as revenues fluctuate and, hence, more risk.
3. BUSINESS RISK AND FINANCIAL RISK
Risk arises from both the operating and financing activities of a company. In the following, weaddress how that happens and themeasures available to the analyst to gauge the risk in each case.
c04 13 January 2012; 9:12:39
Chapter 4 Measures of Leverage 173

3.1. Business Risk and Its Components
Business risk is the risk associated with operating earnings. Operating earnings are riskybecause total revenues are risky, as are the costs of producing revenues. Revenues are affected bya large number of factors, including economic conditions, industry dynamics (includingthe actions of competitors), government regulation, and demographics. Therefore, prices of thecompany’s goods or services or the quantity of sales may be different from what is expected.We refer to the uncertainty with respect to the price and quantity of goods and services assales risk.
Operating risk is the risk attributed to the operating cost structure, in particular the use offixed costs in operations. The greater the fixed operating costs relative to variable operating costs,the greater the operating risk. Business risk is therefore the combination of sales risk and operatingrisk. Companies that operate in the same line of business generally have similar business risk.
3.2. Sales Risk
Consider Impulse Robotics once again. Suppose that the forecasted number of units producedand sold in the next period is 100,000 but that the standard deviation of the number of unitssold is 20,000. And suppose the price that the units sell for is expected to be $10 per unit butthe standard deviation is $2. Contrast this situation with that of a company named TolleyAerospace, Inc., which has the same cost structure but a standard deviation of units sold of40,000 and a price standard deviation of $4.
EXHIBIT 4-3 Net Income for Different Numbers of Units Produced and Sold
$1,000,000
$500,000
$0
$500,000
$1,000,000
$1,500,000
10,000
30,000
50,000
70,000
90,000
110,000
130,000
150,000
170,000
190,000
210,000
230,000
250,000
Number of Units Produced and Sold
Net
Inco
me
Impulse Robotics Net Income
Malvey Aerospace Net Income
c04 13 January 2012; 9:12:39
174 Corporate Finance

If we assume, for simplicity’s sake, that the fixed operating costs are known with certaintyand that the units sold and price per unit follow a normal distribution, we can see the impactof the different risks on the operating income of the two companies through a simulation; theresults are shown in Exhibit 4-4. Here, we see the differing distributions of operating incomethat result from the distributions of units sold and price per unit. So, even if the companieshave the same cost structure, differing sales risk affects the potential variability of the com-pany’s profitability. In our example, Tolley Aerospace has a wider distribution of likelyoutcomes in terms of operating profit. This greater volatility in operating earnings means thatTolley Aerospace has more sales risk than Impulse Robotics.
EXHIBIT 4-4 Operating Income Simulations for Impulse Robotics and Tolley Aerospace
0
100
200
300
400
$400,000
$0 $400,000
$800,000
$1,200,000
$1,600,000
$2,000,000
$2,400,000
$2,800,000
Operating Profit
Freq
uenc
y
Panel A: Impulse Robotics
0
100
200
300
400
$400,000
$0 $400,000
$800,000
$1,200,000
$1,600,000
$2,000,000
$2,400,000
$2,800,000
Operating Profit
Freq
uenc
y
Panel B: Tolley Aerospace
c04 13 January 2012; 9:12:39
Chapter 4 Measures of Leverage 175

3.3. Operating Risk
The greater the fixed component of costs, the more difficult it is for a company to adjust itsoperating costs to changes in sales. The mixture of fixed and variable costs depends largely onthe type of business. Even within the same line of business, companies can vary their fixedand variable costs to some degree. We refer to the risk arising from the mix of fixed andvariable costs as operating risk. The greater the fixed operating costs relative to variableoperating costs, the greater the operating risk.
Next, we look at how operating risk affects the variability of cash flows. A concept taughtin microeconomics is elasticity, which is simply a measure of the sensitivity of changes inone item to changes in another. We can apply this concept to examine how sensitivea company’s operating income is to changes in demand, as measured by unit sales. We willcalculate the operating income elasticity, which we refer to as the degree of operatingleverage (DOL). DOL is a quantitative measure of operating risk as it was defined earlier.
The degree of operating leverage is the ratio of the percentage change in operatingincome to the percentage change in units sold. We will simplify things and assume that thecompany sells all that it produces in the same period. Then,
DOL ¼ Percentage change in operating incomePercentage change in units sold
ð4-1Þ
For example, if DOL at a given level of unit sales is 2.0, a 5 percent increase in unit salesfrom that level would be expected to result in a (2.0)(5%)¼ 10 percent increase in operatingincome. As illustrated later in relation to Exhibit 4-6, a company’s DOL is dependent on thelevel of unit sales being considered.
Returning to Impulse Robotics, the price per unit is $10, the variable cost per unit is $2,and the total fixed operating costs are $500,000. If Impulse Robotics’ output changes from100,000 units to 110,000 units—an increase of 10 percent in the number of units sold—operating income changes from $300,000 to $380,000.2 (See Exhibit 4-5.)
EXHIBIT 4-5 Operating Leverage of Impulse Robotics
Item Selling 100,000 units Selling 110,000 units Percentage Change
Revenues $1,000,000 $1,100,000 þ10.00%
Less variable costs 200,000 220,000 þ10.00%
Less fixed costs 500,000 500,000 0.00%
Operating income $300,000 $380,000 þ26.67%
Operating income increases by 26.67 percent when units sold increases by 10 percent.What if the number of units decreases by 10 percent, from 100,000 to 90,000? Operatingincome is $220,000, representing a decline of 26.67 percent.
2We provide the variable and fixed operating costs for our sample companies used in this chapter toillustrate the leverage and breakeven concepts. In reality, however, the financial analyst does not havethese breakdowns but rather is faced with interpreting reported account values that often combinevariable and fixed costs and costs for different product lines.
c04 13 January 2012; 9:12:39
176 Corporate Finance

What is happening is that for a 1 percent change in units sold, the operating incomechanges by 2.67 times that percentage, in the same direction. If units sold increases by 10percent, operating income increases by 26.7 percent; if units sold decreased by 20 percent,operating income would decrease by 53.3 percent.
We can represent the degree of operating leverage as given in Equation 4-1 in terms ofthe basic elements of the price per unit, variable cost per unit, number of units sold, and fixedoperating costs. Operating income is revenue minus total operating costs (with variable andfixed cost components):
Operatingincome
¼ Priceper unit
! "Number ofunits sold
! "# $& Variable cost
per unit
! "Number ofunits sold
! "# $
& Fixed operatingcosts
# $
or
Operatingincome
¼Number ofunits sold
! "Price
per unit
! "& Variable cost
per unit
! "# $
|fflfflfflfflfflfflfflfflfflfflfflfflfflfflfflfflfflfflfflfflfflfflfflfflfflfflfflfflfflfflfflfflfflfflfflfflfflfflfflfflfflfflfflfflfflffl{zfflfflfflfflfflfflfflfflfflfflfflfflfflfflfflfflfflfflfflfflfflfflfflfflfflfflfflfflfflfflfflfflfflfflfflfflfflfflfflfflfflfflfflfflfflffl}Contribution margin
& Fixed operatingcosts
# $
The per unit contribution margin is the amount that each unit sold contributes tocovering fixed costs—that is, the difference between the price per unit and the variable costper unit. That difference multiplied by the quantity sold is the contribution margin, whichequals revenue minus variable costs.
How much does operating income change when the number of units sold changes? Fixedcosts do not change; therefore, operating income changes by the contribution margin. Thepercentage change in operating income for a given change in units sold simplifies to
DOL ¼ QðP & V ÞQðP & V Þ & F
ð4-2Þ
where Q is the number of units, P is the price per unit, V is the variable operating cost perunit, and F is the fixed operating cost. Therefore, P – V is the per unit contribution marginand Q(P&V) is the contribution margin.
Applying the formula for DOL using the data for Impulse Robotics, we can calculate thesensitivity to change in units sold from 100,000 units:
DOL @100,000 units
¼ 100,000ð$10& $2Þ100,000ð$10& $2Þ & $500,000
¼ 2:67
ADOL of 2.67means that a 1 percent change in units sold results in a 1%3 2.67¼ 2.67%change in operating income; a DOL of 5 means that a 1 percent change in units sold results in a5 percent change in operating income, and so on.
Why do we specify that the DOL is at a particular quantity sold (in this case, 100,000units)? Because the DOL is different at different numbers of units produced and sold. Forexample, at 200,000 units,
c04 13 January 2012; 9:12:40
Chapter 4 Measures of Leverage 177

DOL @200,000 units
¼ 200,000ð$10& $2Þ200,000ð$10& $2Þ & $500,000
¼ 1:45
We can see the sensitivity of the DOL for different numbers of units produced and soldin Exhibit 4-6. When operating profit is negative, the DOL is negative. At positions justbelow and just above the point where operating income is $0, operating income is at its mostsensitive on a percentage basis to changes in units produced and sold. At the point at whichoperating income is $0 (at 62,500 units produced and sold in this example), the DOL isundefined because the denominator in the DOL calculation is $0. After this point, the DOLgradually declines as more units are produced and sold.
EXHIBIT 4-6 Impulse Robotics’ Degree of Operating Leverage for Different Number of UnitsProduced and Sold
30
25
20
15
10
5
0
5
10
15
10,000
30,000
50,000
70,000
90,000
110,000
130,000
150,000
170,000
190,000
210,000
230,000
250,000
270,000
290,000
Units Produced and Sold
DO
L
P¼ $10; V¼ $2; F¼ $500,000
We will now look at a similar situation in which the company has shifted some of theoperating costs away from fixed costs and into variable costs. Malvey Aerospace has a unitsales price of $10, a variable cost of $6 a unit, and $150,000 in fixed costs. A change in unitssold from 100,000 to 110,000 (a 10 percent change) changes operating profit from $250,000to $290,000, or 16 percent. The DOL in this case is 1.6:
DOL @100,000 units
¼ 100,000ð$10& $6Þ100,000ð$10& $6Þ & $150,000
¼ 1:6
and the change in operating income is 16 percent:
Percentage changein operating income
¼ ðDOLÞ Percentage changein units sold
! "¼ ð1:6Þð10%Þ ¼ 16%
c04 13 January 2012; 9:12:40
178 Corporate Finance

We can see the difference in leverage in the case of Impulse Robotics and MalveyAerospace companies in Exhibit 4-7. In Panel A, we see that Impulse Robotics has higheroperating income than Malvey Aerospace when both companies produce and sell more than87,500 units, but lower operating income than Malvey when both companies produce andsell less than 87,500 units.3
EXHIBIT 4-7 Profitability and the DOL for Impulse Robotics and Malvey Aerospace
$800,000
$400,000
$0
$400,000
$800,000
$1,200,000
10,000
30,000
50,000
70,000
90,000
110,000
130,000
150,000
170,000
190,000
Units Produced and Sold
Impulse RoboticsMalvey Aerospace
Panel A: Operating Income and Number of Units Produced and Sold
30
20
10
0
10
20
30
10,000
30,000
50,000
70,000
90,000
110,000
130,000
150,000
170,000
190,000
Units Produced and Sold
Ope
ratin
g In
com
e D
OL
Impulse Robotics
Malvey Aerospace
Panel B: Degree of Operating Leverage (DOL)
Impulse Robotics: P ¼ $10; V¼ $2; F ¼ $500,000 Malvey Aerospace: P ¼ $10; V¼ $6; F ¼ $150,000
3We can calculate the number of units that produce the same operating income for these two companiesby equating the operating incomes and solving for the number of units. Let X be the number of units.The X at which Malvey Aerospace and Impulse Robotics generate the same operating income is the Xthat solves the following: 10X& 2X& 500,000 ¼ 10X& 6X& 150,000; that is, X ¼ 87,500.
c04 13 January 2012; 9:12:40
Chapter 4 Measures of Leverage 179

This example confirms what we saw earlier in our reasoning of fixed and variable costs:The greater the use of fixed, relative to variable, operating costs, the more sensitive operatingincome is to changes in units sold and, therefore, the more operating risk. Impulse Roboticshas more operating risk because it has more operating leverage. However, as Panel B ofExhibit 4-7 shows, the degrees of operating leverage are similar for the two companies forlarger numbers of units produced and sold.
Both sales risk and operating risk influence a company’s business risk. And both salesrisk and operating risk are determined in large part by the type of business the company isin. But management has more opportunity to manage and control operating risk than salesrisk.
Suppose a company is deciding which equipment to buy to produce a particular product.The sales risk is the same no matter what equipment is chosen to produce the product. Butthe available equipment may differ in terms of the fixed and variable operating costs ofproducing the product. Financial analysts need to consider how the operating cost structureof a company affects the company’s risk.
Industries that tend to have high operating leverage are those that invest up front toproduce a product but spend relatively little on making and distributing it. Software devel-opers and pharmaceutical companies fit this description. Alternatively, retailers have lowoperating leverage because much of the cost of goods sold is variable.
Because most companies producemore than one product, the ratio of variable to fixed costsis difficult to obtain. We can get an idea of the operating leverage of a company by looking atchanges in operating income in relation to changes in sales for the entire company. This relationcan be estimated by regressing changes in operating income (the variable to be explained) on
EXAMPLE 4-1 Calculating the Degree of Operating Leverage
Arnaud Kenigswald is analyzing the potential impact of an improving economy onearnings at Global Auto, one of the world’s largest car manufacturers. Global isheadquartered in Berlin. Two Global Auto divisions manufacture passenger cars andproduce combined revenues of h93 billion. Kenigswald projects that sales will improveby 10 percent due to increased demand for cars. He wants to see how Global’s earningsmight respond given that level of increase in sales. He first looks at the degree ofleverage at Global, starting with operating leverage.
Global sold 6 million passenger cars in 2009. The average price per car was h24,000,fixed costs associated with passenger car production total h15 billion per year, and variablecosts per car are h14,000. What is the degree of operating leverage of Global Auto?
Solution.
DOL @6 million units
¼ 6 million ðh24,000& h14,000Þ6 million ðh24,000& h14,000Þ & h15 billion
¼ 1:333
For a 10 percent increase in cars sold, operating income increases by 1.333310% ¼ 13.33%.
c04 13 January 2012; 9:12:40
180 Corporate Finance

changes in sales (the explanatory variable) over a recent time period.4 Although this approachdoes not provide a precise measure of operating risk, it can help provide a general idea of theamount of operating leverage present. For example, compare the relation between operatingearnings and revenues for Abbott Laboratories, a pharmaceutical company, and Wal-MartStores, a discount retailer, as shown in Exhibit 4-8. Note that the slope of the least-squaresregression line is greater for Abbott (with a slope coefficient of 0.1488) than forWal-Mart (witha slope coefficient of 0.0574). (A visual comparison of slopes should not be relied upon becausethe scales of the x- and y-axes are different in diagrams for the two regressions.) We can see thatoperating earnings are more sensitive to changes in revenues for the higher-operating-leveragedAbbott Laboratories as compared to the lower-operating-leveraged Wal-Mart Stores.
EXHIBIT 4-8 Relation between Operating Earnings and Revenues
$0
$500
$1,000
$1,500
$2,000
$2,500
$3,000
$3,500
$4,000
$4,500
$0 $5,000 $10,000 $15,000 $20,000 $25,000Revenues in Millions
Ope
ratin
g Ea
rnin
gs in
Mill
ions
Estimated Regression: Operating Earnings = $754.77 + 0.1488 Revenues, R2 = 66.25%
Panel A: Abbott Laboratories Operating Earnings and Revenues, 1990–2004
$0
$2,000
$4,000
$6,000
$8,000
$10,000
$12,000
$14,000
$16,000
$18,000
$0 $50,000 $100,000 $150,000 $200,000 $250,000 $300,000Revenues in Millions
Op
erat
ing
Earn
ings
in M
illio
ns
Estimated Regression: Operating Earnings = $152.762 + 0.0574 Revenues, R2 = 99.38%
Panel B: Wal-Mart Stores Operating Earnings and Revenues, 1990–2004
Source: Abbott Laboratories 10-K filings and Wal-Mart Stores 10-K filings, various years.
4A least-squares regression is a procedure for finding the best-fitting line (called the least squaresregression line) through a set of data points by minimizing the squared deviations from the line.
c04 13 January 2012; 9:12:40
Chapter 4 Measures of Leverage 181

3.4. Financial Risk
We can expand on the concept of risk to accommodate the perspective of owning a security.A security represents a claim on the income and assets of a business; therefore, the riskof the security goes beyond the variability of operating earnings to include how the cashflows from those earnings are distributed among the claimants—the creditors and ownersof the business. The risk of a security is therefore affected by both business risk andfinancial risk.
Financial risk is the risk associated with how a company finances its operations. If acompany finances with debt, it is legally obligated to pay the amounts that make up its debtswhen due. By taking on fixed obligations, such as debt and long-term leases, the companyincreases its financial risk. If a company finances its business with common equity, generatedeither from operations (retained earnings) or from issuing new common shares, it does notincur fixed obligations. The more fixed-cost financial obligations (e.g., debt) incurred by thecompany, the greater its financial risk.
We can quantify this risk in the same way we did for operating risk, looking at thesensitivity of the cash flows available to owners when operating income changes. This sen-sitivity, which we refer to as the degree of financial leverage (DFL), is
DFL ¼ Percentage change in net incomePercentage change in operating income
ð4-3Þ
For example, if DFL at a given level of operating income is 1.1, a 5 percent increase inoperating income would be expected to result in a (1.1)(5%)¼ 5.5 percent increase in netincome. A company’s DFL is dependent on the level of operating income being considered.
Net income is equal to operating income, less interest and taxes.5 If operating incomechanges, how does net income change? Consider Impulse Robotics. Suppose the interestpayments are $100,000 and, for simplicity, the tax rate is 0 percent: If operating incomechanges from $300,000 to $360,000, net income changes from $200,000 to $260,000. (SeeExhibit 4-9.)
EXHIBIT 4-9 Financial Risk of Impulse Robotics (1)
Operating Incomeof $300,000
Operating Incomeof $360,000
PercentageChange
Operatingincome
$300,000 $360,000 þ20%
Less interest 100,000 100,000 0%
Net income $200,000 $260,000 þ30%
5More complex entities than we have been using for our examples may also need to account for otherincome (losses) and extraordinary income (losses) together with operating income as the basis forearnings before interest and taxes.
c04 13 January 2012; 9:12:41
182 Corporate Finance

A 20 percent increase in operating income increases net income by $60,000, or 30percent. What if the fixed financial costs are $150,000? A 20 percent change in operatingincome results in a 40 percent change in the net income, from $150,000 to $210,000.(See Exhibit 4-10.)
EXHIBIT 4-10 Financial Risk of Impulse Robotics (2)
Operating Incomeof $300,000
Operating Incomeof $360,000
PercentageChange
Operating income $300,000 $360,000 þ20%
Less interest 150,000 150,000 0%
Net income $150,000 $210,000 þ40%
Using more debt financing, which results in higher fixed costs, increases the sensitivity ofnet income to changes in operating income. We can represent the sensitivity of net income toa change in operating income, continuing the notation from before and including the fixedfinancial cost, C, and the tax rate, t, as
DFL ¼ ½QðP & V Þ & F (ð1& tÞ½QðP & V Þ & F & C (ð1& tÞ ¼ ½QðP & V Þ & F (
½QðP & V Þ & F & C ( ð4-4Þ
As you can see in Equation 4-4, the factor that adjusts for taxes, (1& t), cancels out of theequation. In other words, the DFL is not affected by the tax rate.
In the case in which operating income is $300,000 and fixed financing costs are$100,000, the degree of financial leverage is
DFL @$300,000 operating income ¼
$300,000$300,000& $100,000
¼ 1:5
If, instead, fixed financial costs are $150,000, the DFL is equal to 2.0:
DFL @$300,000 operating income
¼ $300,000$300,000& $150,000
¼ 2:0
Again, we need to qualify our degree of leverage by the level of operating income becauseDFL is different at different levels of operating income.
The greater the use of financing sources that require fixed obligations, such as interest,the greater the sensitivity of net income to changes in operating income.
c04 13 January 2012; 9:12:41
Chapter 4 Measures of Leverage 183
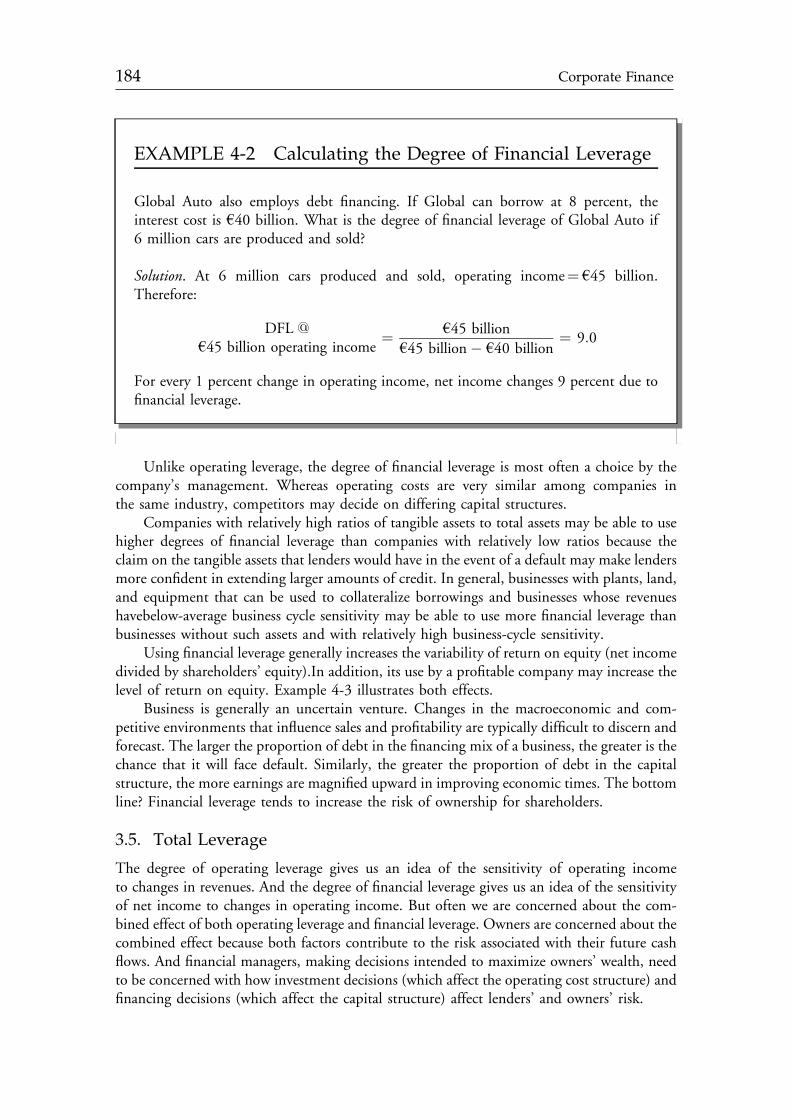
Unlike operating leverage, the degree of financial leverage is most often a choice by thecompany’s management. Whereas operating costs are very similar among companies inthe same industry, competitors may decide on differing capital structures.
Companies with relatively high ratios of tangible assets to total assets may be able to usehigher degrees of financial leverage than companies with relatively low ratios because theclaim on the tangible assets that lenders would have in the event of a default may make lendersmore confident in extending larger amounts of credit. In general, businesses with plants, land,and equipment that can be used to collateralize borrowings and businesses whose revenueshavebelow-average business cycle sensitivity may be able to use more financial leverage thanbusinesses without such assets and with relatively high business-cycle sensitivity.
Using financial leverage generally increases the variability of return on equity (net incomedivided by shareholders’ equity).In addition, its use by a profitable company may increase thelevel of return on equity. Example 4-3 illustrates both effects.
Business is generally an uncertain venture. Changes in the macroeconomic and com-petitive environments that influence sales and profitability are typically difficult to discern andforecast. The larger the proportion of debt in the financing mix of a business, the greater is thechance that it will face default. Similarly, the greater the proportion of debt in the capitalstructure, the more earnings are magnified upward in improving economic times. The bottomline? Financial leverage tends to increase the risk of ownership for shareholders.
3.5. Total Leverage
The degree of operating leverage gives us an idea of the sensitivity of operating incometo changes in revenues. And the degree of financial leverage gives us an idea of the sensitivityof net income to changes in operating income. But often we are concerned about the com-bined effect of both operating leverage and financial leverage. Owners are concerned about thecombined effect because both factors contribute to the risk associated with their future cashflows. And financial managers, making decisions intended to maximize owners’ wealth, needto be concerned with how investment decisions (which affect the operating cost structure) andfinancing decisions (which affect the capital structure) affect lenders’ and owners’ risk.
EXAMPLE 4-2 Calculating the Degree of Financial Leverage
Global Auto also employs debt financing. If Global can borrow at 8 percent, theinterest cost is h40 billion. What is the degree of financial leverage of Global Auto if6 million cars are produced and sold?
Solution. At 6 million cars produced and sold, operating income¼ h45 billion.Therefore:
DFL @h45 billion operating income
¼ h45 billionh45 billion& h40 billion
¼ 9:0
For every 1 percent change in operating income, net income changes 9 percent due tofinancial leverage.
c04 13 January 2012; 9:12:41
184 Corporate Finance

EXAMPLE 4-3 The Leveraging Role of Debt
Consider the Capital Company, which is expected to generate $1,500,000 in revenuesand $500,000 in operating earnings next year. Currently, the Capital Company doesnot use debt financing and has assets of $2,000,000.
Suppose Capital were to change its capital structure, buying back $1,000,000 ofstock and issuing $1,000,000 in debt. If we assume that interest on debt is 5 percentand income is taxed at a rate of 30 percent, what is the effect of debt financing onCapital’s net income and return on equity if operating earnings may vary as much as 40percent from expected earnings?
EXHIBIT 4-11 Return on Equity of Capital Company
No DebtShareholders’Equity¼ $2 million
Expected OperatingEarnings, less 40%
Expected OperatingEarnings
Expected OperatingEarnings, plus 40%
Earnings before interestand taxes
$300,000 $500,000 $700,000
Interest expense 0 0 0
Earnings before taxes $300,000 $500,000 $700,000
Taxes 90,000 150,000 210,000
Net income $210,000 $350,000 $490,000
Return on equity6 10.5% 17.5% 24.5%
Debt to TotalAssets ¼ 50%Shareholders’Equity¼ $1 million
Expected OperatingEarnings, less 40%
Expected OperatingEarnings
Expected OperatingEarnings, plus 40%
Earnings before interestand taxes
$300,000 $500,000 $700,000
Interest expense 50,000 50,000 50,000
Earnings before taxes $250,000 $450,000 $650,000
Taxes 75,000 135,000 195,000
Net income $175,000 $315,000 $455,000
Return on equity 17.5% 31.5% 45.5%
6Recall that ROE is calculated as net income/shareholders’ equity.
c04 13 January 2012; 9:12:42
Chapter 4 Measures of Leverage 185

Look back at the example of ImpulseRobotics. The sensitivity of owners’ cash flow to a givenchange in units sold is affected by both operating and financial leverage. Consider using 100,000units as the base number produced and sold. A 10 percent increase in units sold results in a27 percent increase in operating income and a 40 percent increase in net income; a like decrease inunits sold results in a similar decrease in operating income and net income. (See Exhibit 4-13.)
Combining a company’s degree of operating leverage with its degree of financial leverageresults in the degree of total leverage (DTL), a measure of the sensitivity of the cash flows toowners to changes in the number of units produced and sold. We again make the simplifyingassumption that a company sells all that it produces in the same period:
DTL ¼ Percentage change in net incomePercentage change in the number of units sold
ð4-5Þ
or
DTL ¼ QðP & V ÞQðP & V Þ & F
3½QðP & V Þ & F (
½QðP & V Þ & F & C ( ¼QðP & V Þ
QðP & V Þ & F & Cð4-6Þ
DOL 3 DFL
Depicting a broader array of capital structures and operating earnings, rangingfrom an operating loss of $500,000 to operating earnings of $2,000,000, Exhibit 4-12shows the effect of leverage on the return on equity for Capital Company:
EXHIBIT 4-12 Return on Equity of Capital Company for Different Levels of OperatingEarnings and Different Financing Choices
100%
50%
0%
50%
100%
150%
200%
250%
300%
$500,000 $100,000 $300,000 $700,000 $1,100,000 $1,500,000 $1,900,000Earnings before Interest and Taxes
Debt to total assets = 0%Debt to total assets = 33.33%Debt to total assets = 50%Debt to total assets = 67%
Ret
urn
on E
quity
c04 13 January 2012; 9:12:42
186 Corporate Finance

Suppose
Number of units sold ¼ Q ¼ 100,000
Price per unit ¼ P ¼ $10
Variable cost per unit ¼ V ¼ $2
Fixed operating cost ¼ F ¼ $500,000
Fixed financing cost ¼ C ¼ $100,000
Then,
DTL ¼ 100,000ð$10& $2Þ100,000ð$10& $2Þ & $500,000& $100,000
¼ 4:0
which we could also have determined by multiplying the DOL, 2.67, by the DFL, 1.5. Thismeans that a 1 percent increase in units sold will result in a 4 percent increase in net income; a50 percent increase in units produced and sold results in a 200 percent increase in netincome; a 5 percent decline in units sold results in a 20 percent decline in income to owners;and so on.
Because the DOL is relative to the base number of units produced and sold and the DFLis relative to the base level of operating earnings, DTL is different depending on the numberof units produced and sold. We can see the DOL, DFL, and DTL for Impulse Robotics fordifferent numbers of units produced and sold, beginning at the number of units for which thedegrees are positive, in Exhibit 4-14.
EXHIBIT 4-13 Total Leverage of Impulse Robotics
Units Produced and Sold:
90,000 100,000 110,000
Revenues $900,000 $1,000,000 $1,100,000
Less variable costs 180,000 200,000 220,000
Less fixed costs 500,000 500,000 500,000
Operating income $220,000 $300,000 $380,000
Less interest 100,000 100,000 100,000
Net income $120,000 $200,000 $280,000
Relative to 100,000 units produced and sold
Percentage change in units sold &10% þ10%
Percentage change in operating profit &27% þ27%
Percentage change in net income &40% þ40%
c04 13 January 2012; 9:12:42
Chapter 4 Measures of Leverage 187

EXHIBIT 4-14 DOL, DFL, and DTL for Different Numbers of Units Produced and Sold
0
2
4
6
8
10
12
14
16
18
80,000
90,000
100,000
110,000
120,000
130,000
140,000
150,000
160,000
170,000
180,000
190,000
200,000
210,000
220,000
230,000
240,000
250,000
Number of Units Produced and Sold
Deg
ree
of L
ever
age
DOL
DFL
DTL
P¼ $10, V¼ $2, F¼ $500,000, C¼ $100,000
In the case of operating leverage, the fixed operating costs act as a fulcrum. The greaterthe proportion of operating costs that are fixed, the more sensitive operating income is tochanges in sales. In the case of financial leverage, the fixed financial costs, such as interest, actas a fulcrum. The greater the proportion of financing with fixed cost sources, such as debt, themore sensitive cash flows available to owners are to changes in operating income. Combiningthe effects of both types of leverage, we see that fixed operating and financial costs togetherincrease the sensitivity of earnings to owners.
EXAMPLE 4-4 Calculating the Degree of Total Leverage
Continuing from Example 4-2, Global Auto’s total leverage is
DTL@6 million units
¼ DOL@6 million units
3DFL@
h45 million operating income
DTL@6 million units
¼ 6 million ðh24,000&h14,000Þ6 millionðh24,000&h14,000Þ&h15 billion
3h45 billion
h45 billion&h40 billion
DTL@6 million units
¼ 1:3333 9:0 ¼ 12
Given Global Auto’s operating and financial leverage, a 1 percent change in unit saleschanges net income by 12 percent.
c04 13 January 2012; 9:12:42
188 Corporate Finance

3.6. Breakeven Points and Operating Breakeven Points
Looking back at Exhibit 4-3, we see that there is a number of units at which the company goesfrom being unprofitable to being profitable—that is, the number of units at which the netincome is zero. This number is referred to as the breakeven point. The breakeven point, QBE,is the number of units produced and sold at which the company’s net income is zero—thepoint at which revenues are equal to costs.
Plotting revenues and total costs against the number of units produced and sold, as inExhibit 4-15, indicates that the breakeven is at 75,000 units. At this number of units pro-duced and sold, revenues are equal to costs and, hence, profit is zero.
EXHIBIT 4-15 Impulse Robotics Breakeven
$0
$500,000
$1,000,000
$1,500,000
$2,000,000
$2,500,000
$3,000,000
10,000
30,000
50,000
70,000
90,000
110,000
130,000
150,000
170,000
190,000
210,000
230,000
250,000
Number of Units Produced and Sold
Revenues Total Costs
Breakevenat 75,000 units
Profit
Loss
Rev
enue
s or
Exp
ense
s
We can calculate this breakeven point for Impulse Robotics and Malvey Aerospace.Consider that net income is zero when the revenues are equal to the expenses. We canrepresent this equality of revenues and costs (summing variable operating costs, fixed oper-ating costs, and fixed financing costs) by the following equation:
PQ ¼ VQ þ F þ C
where
P is the price per unitQ is the number of units produced and soldV is the variable cost per unitF is the fixed operating costsC is the fixed financial cost
c04 13 January 2012; 9:12:43
Chapter 4 Measures of Leverage 189

Therefore,
PQBE ¼ VQBE þ F þ C
and the breakeven number of units, QBE, is7
QBE ¼ F þ CP & V
ð4-7Þ
In the case of Impulse Robotics and Malvey Aerospace, Impulse Robotics has a higherbreakeven point. Using numbers taken from Exhibit 4-2:
Impulse Robotics: QBE ¼ $500,000þ $100,000$10& $2
¼ 75,000 units
Malvey Aerospace: QBE ¼ $150,000þ $50,000$10& $6
¼ 50,000 units
This means that Impulse Robotics must produce and sell more units to achieve a profit.So, while the higher-leveraged Impulse Robotics has a greater breakeven point relative toMalvey Aerospace, the profit that Impulse Robotics generates beyond this breakeven point isgreater than that of Malvey Aerospace. Therefore, leverage has its rewards in terms ofpotentially greater profit, but it also increases risk.
In addition to breakeven point specified in terms of net income, QBE, we can also specifythe breakeven point in terms of operating profit, which we refer to as the operatingbreakeven point, QOBE. Revenues at theoperating breakeven point are set equal to operatingcosts at the operating breakeven point to solve for the operating breakeven number of units,QOBE. The expression shows QOBE as equal to fixed operating costs divided by the differencebetween price per unit and variable cost per unit:
PQOBE ¼ VQOBE þ F
QOBE ¼ FP & V
For the two companies in our example, Impulse Robotics and Malvey Aerospace, theoperating breakevens are 62,500 and 37,500 units, respectively:
Impulse Robotics : QOBE ¼ $500,000$10& $2
¼ 62,500 units
Malvey Aerospace : QOBE ¼ $150,000$10& $6
¼ 37,500 units
Impulse Robotics has a higher operating breakeven point in terms of the number of unitsproduced and sold.
7You will notice that we did not consider taxes in our calculation of the breakeven point. This is becauseat the point of breakeven, taxable income is zero.
c04 13 January 2012; 9:12:43
190 Corporate Finance

As business expands or contracts beyond or below breakeven points, fixed costs do notchange. The breakeven points for companies with low operating and financial leverage are lessimportant than those for companies with high leverage. Companies with greater total leveragemust generate more revenue to cover fixed operating and financing costs. The farther unitsales are from the breakeven point for high-leverage companies, the greater the magnifyingeffect of this leverage.
3.7. The Risks of Creditors and Owners
As we discussed earlier, business risk refers to the effect of economic conditions as well as thelevel of operating leverage. Uncertainty about demand, output prices, and costs are amongthe many factors that affect business risk. When conditions change for any of these factors,companies with higher business risk experience more volatile earnings. Financial risk is the
EXAMPLE 4-5 Calculating Operating Breakeven andBreakeven Points
Continuing with his analysis, Kenigswald considers the effect of a possible downturn onGlobal Auto’s earnings. He divides the fixed costs of h15 billion by the per unitcontribution margin:
QOBE ¼ h15 billionh24,000& h14,000
¼ 1,500,000 cars
The operating breakeven for Global is 1,500,000 cars, or h36 billion in revenues.We calculate the breakeven point by dividing fixed operating costs, plus interest costs,by the contribution margin:
QBE ¼ h15 billionþ h40 billionh24,000& h14,000
¼ h55 billionh10,000
¼ 5,500,000 cars
Considering the degree of total leverage, Global’s breakeven is 5.5 million cars, orrevenues of h132 billion.
We can verify these calculations by constructing an income statement for thebreakeven sales (in h billions):
1,500,000 Cars 5,500,000 Cars
Revenues (¼ P 3 Q) h36 h132
Variable operating costs (¼ V 3 Q) 21 77
Fixed operating costs (F) 15 15
Operating income h0 h40
Fixed financial costs (C) 40 40
Net income &h40 h0
c04 13 January 2012; 9:12:43
Chapter 4 Measures of Leverage 191

additional risk that results from the use of debt and preferred stock. The degree of financialrisk grows with greater use of debt. Who bears this risk?
The risk for providers of equity and debt capital differs because of the relative rights andresponsibilities associated with the use of borrowed money in a business. Lenders have a priorclaim on assets relative to shareholders, so they have greater security. In return for lendingmoney to a business, lenders require the payment of interest and principal when due. Thesecontractual payments to lenders must be made regardless of the profitability of the business.A business must satisfy these claims in a timely fashion or face the pain of bankruptcy should itdefault. In return for their higher priority in claims, lenders get predefined yet limited returns.
In contrast, equity providers claim whatever is left over after all expenses, including debtservice, have been paid. So, unlike the fixed and known commitments to the lenders, what is leftover for the owners may be a great deal or may be nothing. In exchange for this risk, providers ofequity capital exercise the decision-making power over the business, including the right to hire,guide, and if necessary, fire managers. In public companies, ownership rights are usuallyexercised through an elected board of directors. They undertake the decisions over what portionof the business’s earnings should be paid out as dividends for common shareholders.
Legal codes in most countries provide for these rights, as well as conditions for companiesto file for bankruptcy (with reference to businesses, often called insolvency). A number ofbankruptcy codes provide in some form for two categories of bankruptcies. One form pro-vides for a temporary protection from creditors so that a viable business may reorganize. Inthe United States, the U.S. Bankruptcy Code sets the terms for the form of negotiatedreorganization of a company’s capital structure that allows it to remain a going concern inChapter 11.8 For businesses that are not viable, the second form of bankruptcy process allowsfor the orderly satisfaction of the creditors’ claims. In the United States, this form of bank-ruptcy is referred to as liquidation.9 Whereas both types of bankruptcy lead to major dis-locations in the rights and privileges of owners, lenders, employees, and managers, it is in thislatter category of bankruptcy that the original business ceases to exist.
The difference between a company that reorganizes and emerges from bankruptcy andone that is liquidated is often the difference between operating and financial leverage.Companies with high operating leverage have less flexibility in making changes, and bank-ruptcy protection does little to help reduce operating costs. Companies with high financialleverage use bankruptcy laws and protection to change their capital structure and, once therestructuring is complete, can emerge as ongoing concerns.
8U.S. Code, Title 11—Bankruptcy, Chapter 11—Reorganization. Companies filing for bankruptcyunder this code are referred to as having filed for Chapter 11 bankruptcy.9U.S. Code, Title 11—Bankruptcy, Chapter 7—Liquidation.
EXAMPLE 4-6 Chapter 11 Reorganization andOwens Corning
The world’s largest manufacturer of glass fiber insulation, Owens Corning Corporationof Toledo, Ohio, filed for Chapter 11 bankruptcy on 5 October 2000, as it facedgrowing asbestos liability claims. With revenues exceeding $6 billion per year, Owens
c04 13 January 2012; 9:12:43
192 Corporate Finance

Whereas the ability to file for bankruptcy is important to the economy, the goal of mostinvestors is to avoid ownership of companies that are heading toward this extreme step, as wellas to be able to evaluate opportunities among companies already in bankruptcy. Under bothChapter 7 and Chapter 11, providers of equity capital generally lose all value during thebankruptcy. On the other hand, debtholders typically receive at least a portion of their capital,but the payments of principal and interest are delayed during the period of bankruptcyprotection.
Corning was one of the largest corporations ever afforded bankruptcy protection by theU.S. courts.
From 1952 to 1972, Owens Corning produced an asbestos-containinghigh-temperature pipe coating called Kaylo, and at the time of its bankruptcy filing,it had received more than 460,000 asbestos personal injury claims and had paid oragreed to pay more than $5 billion for asbestos-related awards and settlements, legalexpenses, and claims processing fees. While the company had assets of $7 billion andliabilities of $5.7 billion, the trust fund it set aside to pay those claims appearedinadequate.
The company’s stock traded at between $15 and $25 per share in the year prior tothe announcement; the price fell to $1 per share when Owens Corning declaredbankruptcy and admitted that it had been overwhelmed by the asbestos liabilities.
EXAMPLE 4-7 Chapter 7 and Webvan Do Not Deliver
Since the peak of the NASDAQ in March of 2000, many technology companies havefound either that they cannot raise enough capital to implement their business plans orthat they have an untenable business plan. Some have simply shut their doors and goneout of business, while others have filed for bankruptcy. Either way, these companieshave left many unsatisfied creditors.
For example, Webvan.com was a start-up company in the late 1990s that raisedover $1.2 billion in equity, $375 million of which came from an IPO in November1999. It had very ambitious business plans to build a series of warehouses and delivergroceries to fulfill customer orders placed over the Internet. Webvan.com, however,faced a number of challenges, including a downturn in the economy, and quickly ranthrough its capital.
Webvan.com filed for Chapter 11 bankruptcy protection in July 2001 andreported that it owed $106 million to creditors. By the time it began liquidation underChapter 7 in January 2002, it reported that the value of its liquidated assets totaled only$25 million, leaving its creditors to receive pennies on the dollar and its investors toreceive little or nothing for their $1.2 billion investment in the company.
c04 13 January 2012; 9:12:44
Chapter 4 Measures of Leverage 193
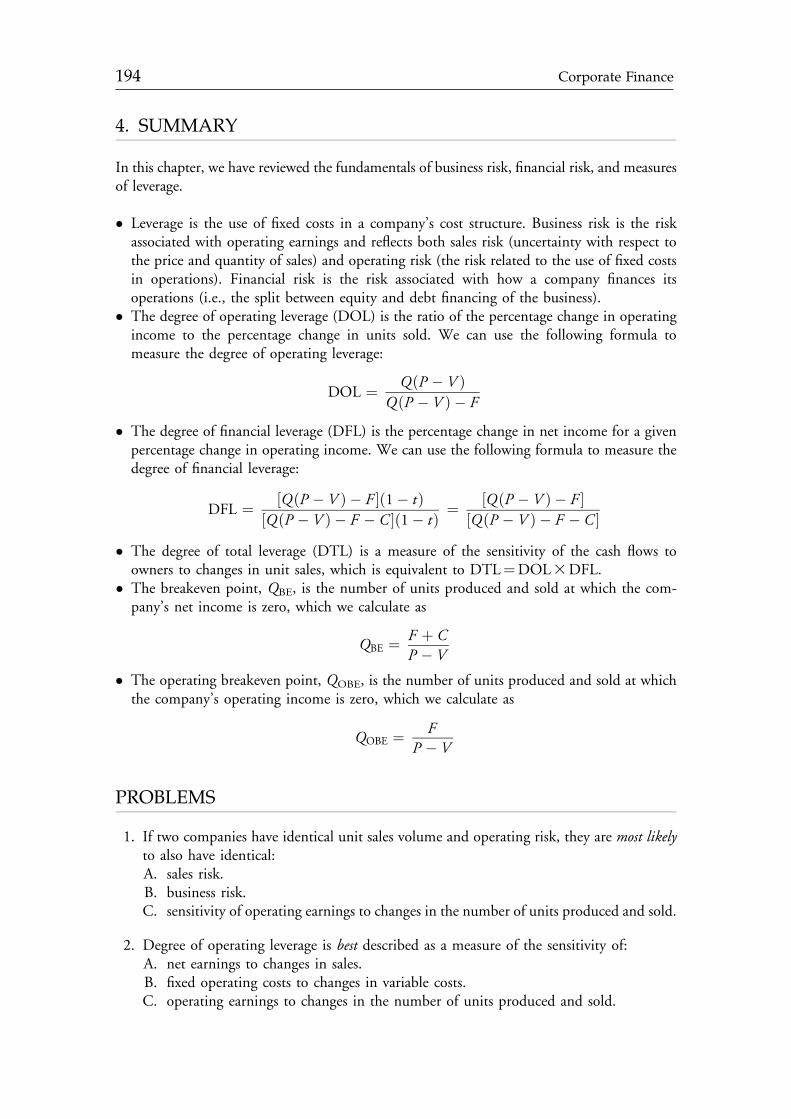
4. SUMMARY
In this chapter, we have reviewed the fundamentals of business risk, financial risk, and measuresof leverage.
! Leverage is the use of fixed costs in a company’s cost structure. Business risk is the riskassociated with operating earnings and reflects both sales risk (uncertainty with respect tothe price and quantity of sales) and operating risk (the risk related to the use of fixed costsin operations). Financial risk is the risk associated with how a company finances itsoperations (i.e., the split between equity and debt financing of the business).
! The degree of operating leverage (DOL) is the ratio of the percentage change in operatingincome to the percentage change in units sold. We can use the following formula tomeasure the degree of operating leverage:
DOL ¼ QðP & V ÞQðP & V Þ & F
! The degree of financial leverage (DFL) is the percentage change in net income for a givenpercentage change in operating income. We can use the following formula to measure thedegree of financial leverage:
DFL ¼ ½QðP & V Þ & F (ð1& tÞ½QðP & V Þ & F & C (ð1& tÞ ¼ ½QðP & V Þ & F (
½QðP & V Þ & F & C (
! The degree of total leverage (DTL) is a measure of the sensitivity of the cash flows toowners to changes in unit sales, which is equivalent to DTL¼DOL3DFL.
! The breakeven point, QBE, is the number of units produced and sold at which the com-pany’s net income is zero, which we calculate as
QBE ¼ F þ CP & V
! The operating breakeven point, QOBE, is the number of units produced and sold at whichthe company’s operating income is zero, which we calculate as
QOBE ¼ FP & V
PROBLEMS
1. If two companies have identical unit sales volume and operating risk, they are most likelyto also have identical:A. sales risk.B. business risk.C. sensitivity of operating earnings to changes in the number of units produced and sold.
2. Degree of operating leverage is best described as a measure of the sensitivity of:A. net earnings to changes in sales.B. fixed operating costs to changes in variable costs.C. operating earnings to changes in the number of units produced and sold.
c04 13 January 2012; 9:12:44
194 Corporate Finance

3. The Fulcrum Company produces decorative swivel platforms for home televisions. IfFulcrum produces 40 million units, it estimates that it can sell them for $100 each.Variable production costs are $65 per unit and fixed production costs are $1.05 billion.Which of the following statements is most accurate? Holding all else constant, theFulcrum Company would:A. generate positive operating income if unit sales were 25 million.B. have less operating leverage if fixed production costs were 10% greater than $1.05
billion.C. generate 20% more operating income if unit sales were 5% greater than 40
million.
4. The business risk of a particular company is most accurately measured by the company’s:A. debt-to-equity ratio.B. efficiency in using assets to generate sales.C. operating leverage and level of uncertainty about demand, output prices, and
competition.
5. Consider two companies that operate in the same line of business and have the samedegree of operating leverage: the Basic Company and the Grundlegend Company. TheBasic Company and the Grundlegend Company have, respectively, no debt and50 percent debt in their capital structure. Which of the following statements is mostaccurate? Compared to the Basic Company, the Grundlegend Company has:A. a lower sensitivity of net income to changes in unit sales.B. the same sensitivity of operating income to changes in unit sales.C. the same sensitivity of net income to changes in operating income.
6. Myundia Motors now sells 1 million units at f3,529 per unit. Fixed operating costs aref1,290 million and variable operating costs are f1,500 per unit. If the company paysf410 million in interest, the levels of sales at the operating breakeven and breakevenpoints are, respectively:A. f1,500,000,000 and f2,257,612,900.B. f2,243,671,760 and f2,956,776,737.C. f2,975,148,800 and f3,529,000,000.
7. Juan Alavanca is evaluating the risk of two companies in the machinery industry: TheGearing Company and Hebelkraft, Inc. Alavanca used the latest fiscal year’s financialstatements and interviews with managers of the respective companies to gather thefollowing information:
The Gearing Company Hebelkraft, Inc.
Number of units produced and sold 1 million 1.5 million
Sales price per unit $200 $200
Variable cost per unit $120 $100
Fixed operating cost $40 million $90 million
Fixed financing expense $20 million $20 million
c04 13 January 2012; 9:12:44
Chapter 4 Measures of Leverage 195

Based on this information, the breakeven points for The Gearing Company andHebelkraft, Inc. are:A. 0.75 million and 1.1 million units, respectively.B. 1 million and 1.5 million units, respectively.C. 1.5 million and 0.75 million units, respectively.
The following information relates to Questions 8–16.10
Mary Benn, CFA, is a financial analyst for Twin Fields Investments, located in Storrs,Connecticut, U.S.A. She has been asked by her supervisor, Bill Cho, to examine twosmall Japanese cell phone component manufacturers: 4G, Inc., and Qphone Corp. Choindicates that his clients are most interested in the use of leverage by 4G and Qphone.Benn states, “I will have to specifically analyze each company’s respective business risk,sales risk, operating risk, and financial risk.”
“Fine, I’ll check back with you shortly,” Cho answers.Benn begins her analysis by examining the sales prospects of the two firms. The results of
her sales analysis appear in Exhibit A. She also expects very little price variability for these cellphones. She next gathers more data on these two companies to assist her analysis of theiroperating and financial risk.
When Cho inquires as to her progress, Benn responds, “I have calculated Qphone’sdegree of operating leverage (DOL) and degree of financial leverage (DFL) at Qphone’s 2009level of unit sales. I have also calculated Qphone’s breakeven level for unit sales. I will have4G’s leverage results shortly.”
Cho responds, “Good, I will call a meeting of some potential investors for tomorrow.Please help me explain these concepts to them, and the differences in use of leverage by thesetwo companies.” In preparation for the meeting, Cho says he has a number of questions:
! “You mentioned business risk; what is included in that?”! “How would you classify the risk due to the varying mix of variable and fixed costs?”! “Could you conduct an analysis and tell me how the two companies will fare relative to
each other in terms of net income if their unit sales increased by 10 percent above their2009 unit sales levels?”
! “Finally, what would be an accurate verbal description of the degree of total leverage?”
The relevant data for analysis of 4G is contained in Exhibit B, while Benn’s analysis ofthe Qphone data appears in Exhibit C.
EXHIBIT A Benn’s Unit Sales Estimates for 4G, Inc., and Qphone Corp.
Company 2009 Unit SalesStandard Deviation
of Unit Sales2010 Expected UnitSales Growth Rate
4G, Inc. 1,000,000 25,000 15%
Qphone Corp. 1,500,000 10,000 15%
10Questions developed by Philip Fanara, CFA.
c04 13 January 2012; 9:12:44
196 Corporate Finance

EXHIBIT B Sales, Cost, and Expense Data for 4G, Inc.(At Unit Sales of 1,000,000)
Number of units produced and sold 1,000,000
Sales price per unit f108
Variable cost per unit f72
Fixed operating cost f22,500,000
Fixed financing expense f9,000,000
EXHIBIT C Benn’s Analysis of Qphone (At UnitSales of 1,500,000)
Degree of operating leverage 1.40
Degree of financial leverage 1.15
Breakeven quantity (units) 571,429
8. Based on Benn’s analysis, 4G’s sales risk relative to Qphone’s is most likely to be:A. lower.B. equal.C. higher.
9. What is the most appropriate response to Cho’s question regarding the components ofbusiness risk?A. Sales risk and financial risk.B. Operating risk and sales risk.C. Financial risk and operating risk.
10. The most appropriate response to Cho’s question regarding the classification of riskarising from the mixture of variable and fixed costs is:A. sales risk.B. financial risk.C. operating risk.
11. Based on the information in Exhibit B, the degree of operating leverage (DOL) of 4G,Inc., at unit sales of 1,000,000, is closest to:A. 1.60.B. 2.67.C. 3.20.
12. Based on the information in Exhibit B, 4G, Inc.’s degree of financial leverage (DFL), atunit sales of 1,000,000, is closest to:A. 1.33.B. 2.67.C. 3.00.
c04 13 January 2012; 9:12:45
Chapter 4 Measures of Leverage 197

13. Based on the information in Exhibit A and Exhibit C, Qphone’s expected percentagechange in operating income for 2010 is closest to:A. 17.25%.B. 21.00%.C. 24.30%.
14. 4G’s breakeven quantity of unit sales is closest to:A. 437,500 units.B. 625,000 units.C. 875,000 units.
15. In response to Cho’s question regarding an increase in unit sales above 2009 unit saleslevels, it is most likely that 4G’s net income will increase at:A. a slower rate than Qphone’s.B. the same rate as Qphone’s.C. a faster rate than Qphone’s.
16. The most appropriate response to Cho’s question regarding a description of the degree oftotal leverage is that degree of total leverage is:A. the percentage change in net income divided by the percentage change in units sold.B. the percentage change in operating income divided by the percentage change in units
sold.C. the percentage change in net income divided by the percentage change in operating
income.
c04 13 January 2012; 9:12:45
198 Corporate Finance

CHAPTER 5CAPITAL STRUCTURE
Raj Aggarwal, CFAAkron, Ohio, U.S.A.
Pamela Peterson Drake, CFAHarrisonburg, Virginia, U.S.A.
Adam Kobor, CFAWashington, DC, U.S.A.
Gregory Noronha, CFATacoma, Washington, U.S.A.
LEARNING OUTCOMES
After completing this chapter, you will be able to do the following:
! Explain the Modigliani–Miller propositions concerning capital structure, including theimpact of leverage, taxes, financial distress, agency costs, and asymmetric information on acompany’s cost of equity, cost of capital, and optimal capital structure.
! Explain the target capital structure and why actual capital structure may fluctuate aroundthe target.
! Describe the role of debt ratings in capital structure policy.! Explain factors an analyst should consider in evaluating the impact of capital structure
policy on valuation.! Describe international differences in financial leverage and their implications for invest-
ment analysis.
1. INTRODUCTION
The most important decision a company makes in its pursuit of maximizing its valueis typically the decision concerning what products to manufacture and/or what services tooffer. The decision on how to finance investments (e.g., in factories and equipment), the so-called capital structure decision, is often seen as less important, even secondary. As we will see
199
c05 13 January 2012; 9:26:5

in this chapter, the importance of the capital structure decision depends on the assumptionsone makes about capital markets and the agents operating in it.
Under the most restrictive set of assumptions, the capital structure decision—the choicebetween how much debt and how much equity a company uses in financing its investments—is irrelevant. That is, any level of debt is as good as any other, and the capital structuredecision is not only secondary, it is irrelevant. However, as some of the underlyingassumptions are relaxed, the choice of how much debt to have in the capital structurebecomes meaningful. Under a particular set of assumptions, it is even possible to have anoptimal level of debt in the capital structure; that is, a level of debt at which company value ismaximized.
The chapter is organized as follows: In Section 2 we introduce the capital structuredecision, and discuss the assumptions and theories that lead to alternative capital structures.In Section 3 we present important practical issues for the analyst, such as the role of debtratings in the capital structure decision and international differences in capital structurepolicies. The final section summarizes the chapter.
2. THE CAPITAL STRUCTURE DECISION
A company’s capital structure is the mix of debt and equity the company uses to finance itsbusiness. The goal of a company’s capital structure decision is to determine the financialleverage or capital structure that maximizes the value of the company by minimizing theweighted average cost of capital. The weighted average cost of capital (WACC) is given bythe weighted average of the marginal costs of financing for each type of financing used. For acompany with both debt and equity in its capital structure for which interest expense is taxdeductible at a rate t, the WACC, which we will denote rwacc is
rwacc ¼DV
! "rd ð1$ tÞþ E
V
! "re ð5-1Þ
where rd is the before-tax marginal cost of debt, re is the marginal cost of equity, and t is themarginal tax rate.1 Variables D and E denote the market value of the shareholders’ out-standing debt and equity, respectively, and the value of the company is given by V¼D þ E.You will notice that the debt and equity costs of capital and the tax rate are all understood tobe “marginal” rates. The overall cost of capital is therefore a marginal cost also: what it coststhe company to raise additional capital using the specified mixture of debt and equity.Further, this is the current cost: what it would cost the company today. What it cost in thepast is not relevant. Therefore, the cost of equity, the cost of debt, and the tax rate that we usethroughout the remainder of this chapter are marginal: the cost or tax rate for additionalcapital.
In the following section, we first consider the theoretical relationship between leverageand a company’s value. We then examine the practical relationship between leverage andcompany value in equal depth.
1For simplicity, this discussion ignores preferred stock.
c05 13 January 2012; 9:26:5
200 Corporate Finance

2.1. Proposition I without Taxes: Capital Structure Irrelevance
In a now classic paper, Nobel Prize–winning economists Franco Modigliani and MertonMiller argued the important theory that, given certain assumptions, a company’s choice ofcapital structure does not affect its value.2 The assumptions relate to expectations andmarkets:
1. Investors agree on the expected cash flows from a given investment. This means that allinvestors have the same expectations with respect to the cash flows from an investment inbonds or stocks. In other words, expectations are homogeneous.
2. Bonds and shares of stock are traded in perfect capital markets. This means that thereare no transactions costs, no taxes, no bankruptcy costs, and everyone has the sameinformation. In a perfect capital market, any two investments with identical cash flowstreams and risk must trade for the same price.
3. Investors can borrow and lend at the risk-free rate.4. There are no agency costs. This means that managers always act to maximize shareholder
wealth.5. The financing decision and the investment decision are independent of each other. This
means that operating income is unaffected by changes in the capital structure.
Many of these assumptions are unrealistic, and we will examine the consequences ofrelaxing some of them later in this section. The important point is that Modigliani and Millerprovided a basis for thinking about capital structure and the starting point for analysis.Consider the capital of a company to be a pie: Each slice represents how much of total capitalis provided by a specific type of capital, for example, by common equity. One can split it inany number of ways, but the size of the pie remains the same. Saying that the pie remains thesame size is equivalent to saying that the present value of cash flows to the company remainsthe same. This can only happen if the future cash flow stream is expected to remain the sameand the risk of that cash flow stream, as reflected by the cost of capital, remains the same.Modigliani and Miller prove that under these conditions, and given their assumptions,changing the capital structure (i.e., how the pie is sliced) does not affect value. In other words,in a perfect capital market with risk-free borrowing and lending and with investment andfinancing decisions independent of each other, investors can create the capital structure theyindividually prefer for the company by borrowing and lending on their own accounts. Thecapital structure chosen by management does not matter because it can be adjusted to thedesired capital structure by investors at no cost.
Suppose that a company has a capital structure consisting of 50 percent debt and 50percent equity and that an investor would prefer that the company’s capital structure be70 percent debt and 30 percent equity. The investor uses borrowed money to finance his orher share purchases so that effectively ownership of company assets reflects the preferred 70percent debt financing. To the extent this changing capital structure has no effect on thecompany’s expected operating cash flows, the capital structure decision has no impact oncompany value. Modigliani and Miller use the concept of arbitrage to demonstrate theirpoint: If the value of an unlevered company—that is, a company without any debt—is not
2Modigliani and Miller (1958).
c05 13 January 2012; 9:26:5
Chapter 5 Capital Structure 201

equal to that of a levered company, investors could make an arbitrage profit. The arbitrageoperation (selling the overvalued asset and using the proceeds to buy the undervalued asset)would quickly force the values to be equivalent.
The importance of the Modigliani and Miller theory is that it demonstrates that man-agers cannot create value simply by changing the company’s capital structure. Consider whythis might be true. The operating earnings of a business are available to the providers of itscapital. In an all-equity company (that is, a company with no debt), all of the operatingearnings are available to the equityholders and the value of the company is the presentvalue of these operating earnings. If, on the other hand, a company is partially financed bydebt, these operating earnings are split between the providers of capital: the equityholders andthe debtholders. Under market equilibrium, the sum of the values of debt and equity in sucha case should equal the value of the all-equity company. In other words, the value of acompany is determined solely by its cash flows, not by the relative reliance on debt andequity capital.
This principle does not change the fact of the relative risks of leverage to debtholdersversus equityholders. Adding leverage does increase the risk faced by the equityholders.In such a case, equityholders seek compensation for this extra risk by requiring a higherreturn. Indeed, in equilibrium, the increase in equity returns is exactly offset by increases inthe risk and the associated increase in the required rate of return on equity, so that there is nochange in the value of the company.3
Modigliani and Miller (MM) first illustrated the capital structure irrelevance propositionunder the condition of no taxes:
MM Proposition I:
The market value of a company is not affected by the capital structure of the company.
In other words, the value of the company levered (VL) is equal to the value unlevered(VU), or VL¼VU. A crucial implication of MM Proposition I is that the weighted averagecost of capital for a company in the no-tax case is unaffected by its capital structure.
To understand this proposition, we can think about two companies with the sameexpected, perpetual cash flows and uncertainty and, hence, the same discount rate applied tovalue these cash flows. Even if the companies have different capital structures, these twocompanies must have the same present value using discounted cash flow models. If capitalstructure changes were to have any effect on a company’s value, there would exist an arbitrageopportunity to make riskless profits.
In a perfect market, investors can substitute their own leverage for a company’s leverageby borrowing or lending appropriate amounts in addition to holding shares of the company.Because this process is costless for investors (we assume perfect markets), a company’sfinancial leverage should have no impact on its value. Therefore, a company’s capital structureis irrelevant in perfect markets (which assume no taxes).
3As a final point, in the absence of taxes, MM’s capital structure irrelevance result holds whether debt isassumed to be risk-free (as MM assumed in their 1958 article) or risky, so long as there are no bank-ruptcy costs.
c05 13 January 2012; 9:26:5
202 Corporate Finance

2.2. Proposition II without Taxes: Higher Financial LeverageRaises the Cost of Equity
Modigliani and Miller’s second proposition focuses on the cost of capital of the company:
MM Proposition II:
The cost of equity is a linear function of the company’s debt/equity ratio.
Assuming that financial distress has no costs and that debtholders have prior claim toassets and income relative to equityholders, the cost of debt is less than the cost of equity.According to this proposition, as the company increases its use of debt financing, the cost ofequity rises. We know from MM Proposition I that the value of the company is unchangedand the weighted average cost of capital remains constant if the company changes its capitalstructure. What Proposition II then means is that the cost of equity increases in such amanner as to exactly offset the increased use of cheaper debt in order to maintain a constantWACC.
The risk of the equity depends on two factors: the risk of the company’s operations(business risk) and the degree of financial leverage (financial risk). Business risk determines thecost of capital, whereas the capital structure determines financial risk.
The weighted average cost of capital, or rwacc, ignoring taxes, is
rwacc ¼DV
! "rd þ
EV
! "re ð5-2Þ
where
rwacc is the weighted average cost of capital of the companyrd is the before-tax marginal cost of debt capital, and is equal to the after-tax marginal
cost of debt because there are no taxes by assumptionre is the marginal cost of equity capitalD is the market value of debtE is the market value of equityV is the value of the company, which is equal to Dþ E
Let us define r0 as the cost of capital for a company financed only by equity (an“all-equity company”). Then, by MM Proposition I, rwacc¼ r0, so
rwacc ¼DV
! "rd þ
EV
! "re ¼ r0 ð5-3Þ
Recalling that Dþ E¼V and using this to substitute for V, we can rearrange Equation5-3 to solve for the cost of equity:
re ¼ r0 þ ðr0 $ rd ÞDE
ð5-4Þ
Equation 5-4 is the precise expression for the cost of equity in MM Proposition II. Asshown in Equation 5-4, the cost of equity is a linear function of the debt/equity ratio (D/E)with the intercept equal to r0 and the slope coefficient equal to the positive quantity (r0 $ rd).We know that (r0$ rd) is positive because the cost of equity must be an increasing function of
c05 13 January 2012; 9:26:5
Chapter 5 Capital Structure 203

the debt/equity ratio for WACC to be unchanged as the use of debt in financing is increased,as required by Proposition I. Thus, as the debt/equity ratio increases, the cost of equity capitalalso increases. See Exhibit 5-1 later in this section.
Consider the example of the Leverkin Company, which currently has an all-equity capitalstructure. Leverkin has an expected operating income of $5,000 and a cost of equity, which isalso its WACC, of 10 percent. Adopting a common practice, we represent operating incomeby earnings before interest and taxes, EBIT. For simplicity, we will assume that the EBIT andother cash flows are perpetual. Let us suppose that Leverkin is planning to issue $15,000 indebt at a cost of 5 percent in order to buy back $15,000 worth of its equity.
Because there are no taxes and the EBIT is a perpetuity, we can compute the value of theall-equity Leverkin as the present value of its expected cash flows:
V ¼ EBITrwacc
¼ $5,0000:10
¼ $50,000
Under MM Proposition I, because VL¼VU, the value of Leverkin remains the samewhether it is all-equity financed or has $15,000 of debt. When it issues the debt, Leverkinpays an interest charge of 5 percent on this debt. That is, Leverkin’s interest payment is 0.05($15,000)¼ $750.
By MM Proposition II, the cost of Leverkin’s equity when it has $15,000 debt and$50,000$ $15,000¼ $35,000 equity is
re ¼ 0:10þ ð0:10$ 0:05Þ $15,000$35,000
' 0:12143 ¼ 12:143%
The value of Leverkin with $15,000 debt in its capital structure must equal the sum ofthe present value of cash flows to debtholders and equityholders. With $15,000 debt,Leverkin makes an interest payment of $750 to debtholders, leaving $5,000 $ $750¼$4,250 for equityholders.
V ¼ D þ E ¼ $7500:05
þ $4,2500:12143
¼ $15,000þ $34,999:59 ' $50,000
It is straightforward to demonstrate that Leverkin’s value remains at $50,000 at any levelof debt.4 We can also confirm, using Equation 5-3, that Leverkin’s WACC with the newcapital structure remains at 10 percent as required by Proposition I:
rwacc ¼$15,000$50,000
! "0:05þ $35,000
$50,000
! "0:12143 ¼ 0:10 ¼ 10%
Just as we can express the beta of any investment portfolio as a market-value weightedaverage of the betas of the investments in that portfolio, we can express the systematic risk ofeach of the sources of a company’s capital in a similar manner.5 In other words, we canrepresent the systematic risk of the assets of the entire company as a weighted average of thesystematic risk of the company’s debt and equity:
4Note that this statement is true even with 100 percent debt financing because in that case, the debt-holders are effectively the company’s owners (equityholders).5Hamada (1972).
c05 13 January 2012; 9:26:5
204 Corporate Finance

βa ¼DV
! "βd þ E
V
! "βe ð5-5Þ
where βa is the asset’s systematic risk, or asset beta, βd is the beta of debt, and βe is the equitybeta. The asset beta represents the amount of the assets’ risk that is nondiversifiable (cannot beeliminated by holding those assets as part of a large, well-diversified portfolio).
According to Modigliani and Miller, the company’s cost of capital does not depend on itscapital structure but rather is determined by the business risk of the company. On the otherhand, as the level of debt rises, the risk of the company defaulting on its debt increases. Thesecosts are borne by the equityholders. So as the proportionate use of debt rises, the equity’sbeta, βe, also rises. By reordering the formula of βa to solve for βe, we get
βe ¼ βa þ ðβa $ βd ÞDE
! "ð5-6Þ
In the next section, we look at the decision to use debt financing given the taxes andmarket imperfections found in the real world.
2.3. Taxes, the Cost of Capital, and the Value of the Company
Taxes are the first practical consideration in modifying the results of the MM propositions. Inthe discussion below we will present MM Propositions I and II with taxes.
Because interest paid is deductible from income for tax purposes in most countries, theuse of debt provides a tax shield that translates into savings that enhance the value of acompany. Indeed, ignoring other practical realities of costs of financial distress and bank-ruptcy, the value of the company increases with increasing levels of debt. In effect, by makingthe interest costs deductible for income taxes, the government subsidizes companies’ use ofdebt. The actual cost of debt is reduced by the level of the company’s tax benefit:
After-tax cost of debt ¼ Before-tax cost of debt3 ð1$Marginal tax rateÞ
Modigliani and Miller show that, in the presence of corporate taxes,6 the value of thecompany with debt is greater than that of the all-equity company by an amount equalto the tax rate multiplied by the value of the debt. That is, MM Proposition I with corporatetaxes is:
VL ¼ V U þ tD ð5-7Þ
where t is the marginal tax rate. The term tD is often referred to as the debt tax shield.By introducing corporate tax, we adjust the weighted average cost of capital formula to
reflect the impact of the tax benefit:
rwacc ¼DV
! "rd ð1$ tÞ þ E
V
! "re ð5-8Þ
Because by Proposition I with taxes the value of a company with debt is greater than thatof the same company without debt, for the same level of operating income, it must follow that
6We continue to assume that there are no personal taxes.
c05 13 January 2012; 9:26:5
Chapter 5 Capital Structure 205

the WACC for the company with debt must be lower than that for the all-equity company. Ifwe continue to define r0 as the cost of capital for an all-equity company, MM show that thecost of equity for the same company with debt is:
re ¼ r0 þ ðr0 $ rd Þð1$ tÞDE
ð5-9Þ
This is MM Proposition II when there are corporate taxes.7 Notice that the differencebetween Equation 5-9 and MM Proposition II in the no-tax case (Equation 4) is the presenceof the term (1$ t). When t is not zero, the term (1$ t) is less than 1 and serves to lower thecost of leveraged equity when compared to the no-tax case.8 That is, the cost of equitybecomes greater as the company increases the amount of debt in its capital structure, but thecost of equity does not rise as fast as it does in the no-tax case. Equivalently, the slopecoefficient is (r0$ rd)(1$ t), which is smaller than the slope coefficient (r0$ rd) in the case ofno taxes. As a consequence, the WACC for the leveraged company falls as debt increases, andoverall company value increases. Therefore, if taxes are considered but financial distress andbankruptcy costs are not, debt financing is highly advantageous, and in the extreme, acompany’s optimal capital structure is all debt.
Let us return to the example of the Leverkin Company, which is currently all-equity, hasan EBIT of $5,000, and a WACC—which is also its cost of equity—of 10 percent. As before,Leverkin is planning to issue $15,000 of debt in order to buy back an equivalent amount ofequity. Now, however, Leverkin pays corporate taxes at a rate of 25 percent.
Because Leverkin must pay taxes, the after-tax cash flow available to its shareholders isearnings before taxes, EBT, times (1$ t), or EBT(1$ t). EBT(1$ t) is the same here as EBIT(1$ t) because I¼ 0. If we continue to assume perpetual cash flows, the value of theall-equity, or unlevered, Leverkin is:
VU ¼ EBTð1$ tÞWACC
¼ $5,000ð1$ 0:25Þ0:10
¼ $37,500
Note that the value of Leverkin when there are corporate taxes is less than its value in theno-tax case. This is simply because a new claimant on Leverkin’s cash flows, the governmentthrough its ability to impose taxes, has entered the picture.
Let us now see what happens to Leverkin’s value when it issues $15,000 in debt andbuys back stock. According to MM Proposition I when there are corporate taxes, that is,Equation 5-7,
VL ¼ VU þ tD ¼ $37,500þ 0:25ð$15,000Þ ¼ $41,250
Because the value of the debt is $15,000, the value of the equity (after the buy back) mustbe ($41,250$ $15,000)¼ $26,250. According to MM Proposition II with corporate taxes(Equation 5-9), the cost of the levered equity is:
7The derivation of Equation 5-9 can be found in more advanced texts. See, for example, Copeland,Weston, and Shastri (2005).8Leveraged and levered as used in discussion of capital structure are synonyms. Both terms are commonlyused.
c05 13 January 2012; 9:26:6
206 Corporate Finance

re ¼ 0:10þ ð0:10$ 0:05Þð1$ 0:25Þ $15,000$26,250
¼ 0:12143 ¼ 12:143%
Because the value of the company must equal the present value of cash flows to debt andto equity,
VL ¼ D þ E ¼ rdDrd
þ ðEBIT$ rdDÞð1$ tÞre
¼ $7500:05
þ ð$5,000$ $750Þð1$ 0:25Þ0:12143
' $41,250
This is the value of the company as given by MM Proposition I. As a further check, usingEquation 5-8, the WACC for the levered Leverkin is:
rwacc ¼$15,000$41,250
ð0:05Þð1$ 0:25Þ þ $26,250$41,250
ð0:12143Þ ¼ 0:09091 ¼ 9:091%
As expected, this is lower than the unlevered WACC of 10 percent. Because after taxesare paid whatever is left of the cash flows can be claimed by debtholders and equityholders, wemust also have:
VL ¼ EBITð1$ tÞWACC
¼ $5,000ð1$ 0:25Þ0:09091
' $41,250
We can see the effect of taxes on the cost of capital in Exhibit 5-1. Here, we see that ifthere are no taxes, as shown in Panel B, the cost of capital is constant at rwacc¼ r0. If, on theother hand, interest is tax deductible, the cost of capital declines for ever-increasing use ofdebt financing, as shown in Panel C.
Miller (1977) introduced another aspect into the analysis of the tax benefits from the useof debt financing. He argued that if investors face different tax rates on dividend and interestincome for their personal taxes, this situation may reduce the advantage of debt financingsomewhat. If investors face a higher personal rate of tax on income from debt investmentsrelative to stock investments, they will demand a higher return on debt—driving up the costof debt to the company.9 Thus, in the Miller model, whether or not financing with debt addsvalue to the company depends on the corporate tax rate, the personal tax rate on interestincome, and the personal tax rate on dividend income. It is therefore possible in the Millermodel, depending on the levels of the various tax rates, for debt to add value, lower value, orto have no effect on value.
In practice, however, the value of a levered company is affected by more than the taxissues surrounding the use of debt. The analysis gets more complicated once we introducefactors such as the cost of financial distress, agency costs, and asymmetric information.We address these additional factors next.
9It can be argued that there is a higher personal tax on debt income because debt instruments typicallyprovide investors with taxable interest periodically, whereas taxable income from stock investmentscould, conceivably, be lower because the tax consequences of investing in non-dividend-paying stocks aredeferred until the stock is sold.
c05 13 January 2012; 9:26:6
Chapter 5 Capital Structure 207
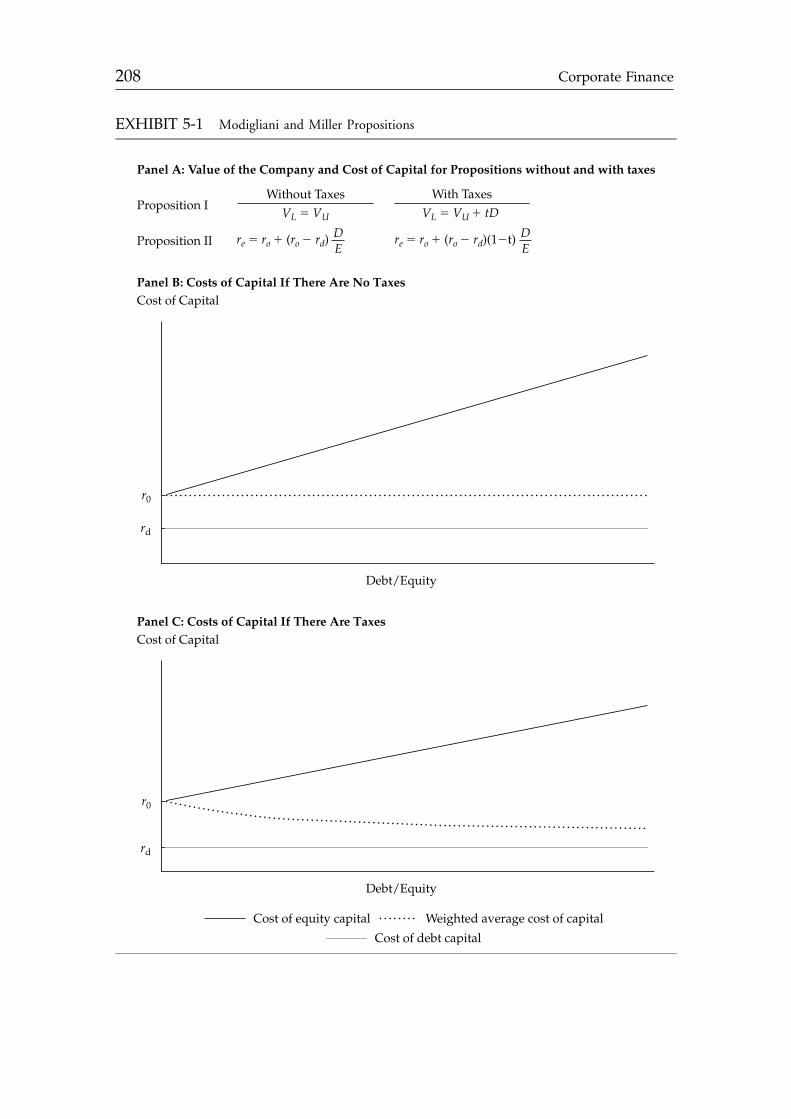
EXHIBIT 5-1 Modigliani and Miller Propositions
Cost of CapitalPanel B: Costs of Capital If There Are No Taxes
r0
rd
Debt/Equity
Cost of equity capital Weighted average cost of capitalCost of debt capital
Cost of CapitalPanel C: Costs of Capital If There Are Taxes
r0
rd
Debt/Equity
Panel A: Value of the Company and Cost of Capital for Propositions without and with taxes
Proposition I
Proposition II
Without TaxesVL ! VU
With TaxesVL ! VU " tD
re ! ro " (ro # rd) DE
re ! ro " (ro # rd)(1#t) DE
c05 13 January 2012; 9:26:6
208 Corporate Finance

EXAMPLE 5-1 The After-Tax Cost of Debt
Payment People, a provider of temporary accounting workers, is considering an $85million acquisition. The company could raise capital by selling either debt or equity. Ifthe company finances the acquisition with debt at 8 percent interest, what is the after-tax cost of issuing debt if the company’s marginal tax rate is 34 percent?
Solution: Annual interest expense on $85 million at 8 percent is $6.8 million. The $6.8million is deducted from income, saving $6.8 million3 0.34¼ $2.312 million in taxes.The after-tax interest cost is $6.8 million$ $2.312 million¼ $4.488 million. Thebefore-tax cost of debt is 8 percent; the after-tax cost of debt is
After-tax cost of debt ¼ $4:488 million=$85 million ¼ 5:28%; or; equivalently;
0:08ð1$ 0:34Þ ¼ 0:0528; or 5:28%:
EXAMPLE 5-2 The Cost of Equity
Hotel chain Hostales Vacaciones finances land purchases for new hotels. Its current costof capital, as an all-equity company, is 13 percent. The company is opening ten newhotels and is considering issuing debt at 9 percent for its financing needs. If it issuesdebt, its debt to equity ratio would be 0.5. The corporate tax rate is 32 percent. Whatwould be the company’s cost of equity with and without the consideration of taxes?
Solution:Without taxes
re ¼ r0 þ ðr0 $ rd ÞDE
! "
re ¼ 0:13þ ½ð0:13$ 0:09Þð0:5Þ) ¼ 0:15, or 15%
With taxes
re ¼ r0 þ ðr0 $ rd Þð1$ tÞDE
re ¼ 0:13þ ½ð0:13$ 0:09Þð1$ 0:32Þð0:5Þ) ¼ 0:1436, or 14:36%
Thus, as expected, the cost of equity rises in both the cases due to the addition ofdebt, but the increase is less when taxes are considered.
c05 13 January 2012; 9:26:6
Chapter 5 Capital Structure 209

2.4. Costs of Financial Distress
The downside of operating and financial leverage is that earnings are magnified downwardduring economic slowdowns. Lower or negative earnings put companies under stress, and thisfinancial distress adds costs—both explicit and implicit—to a company. Even before takingthe drastic step of filing for bankruptcy, companies under stress may lose customers, creditors,suppliers, and valuable employees to more secure competitors.
The expected cost of financial distress is composed of two key ingredients: (1) the costs offinancial distress and bankruptcy, in the event they happen, and (2) the probabilitythat financial distress and bankruptcy happen. We can classify the costs of financial distressinto direct and indirect costs. Direct costs of financial distress include the actual cash expensesassociated with the bankruptcy process, such as legal and administrative fees. Indirect costs offinancial distress include forgone investment opportunities, impaired ability to conduct
10Enron Corporation Organizational Meeting, 12 December 2001.11Houston Business Journal, 19 November 2003.
EXAMPLE 5-3 Costs of Financial Distress
Enron is an extreme example of the loss of value due to financial distress. Up until itsdemise in 2001, Enron was a large player in the natural gas industry. Events leading upto the eventual bankruptcy protection filing caused investors to flee the common stockas creditors refused new lending. Enron went from a favored to a disdained company inrecord time.
According to a company presentation made 10 days after its 2 December 2001bankruptcy filing, the company’s common stock price plunged from $80 per share to$1 per share prior to the bankruptcy announcement, losing $25 billion in marketvalue.10 This loss in value was due to a number of factors, including:
! Investors’ and creditors’ lost confidence.! Financial market reaction from a lack of access to capital markets.! Current maturities greatly exceeding operating cash flow because of the inability to
refinance debt.! Nervous trade creditors.! Dynegy pulling out of the merger on 28 November 2001.! The bond ratings downgrade on 28 November 2001.
Cash bankruptcy expenses listed in the bankruptcy filing documents totaled $17.3million, though the bankruptcy costs including accountants’, advisors’, and lawyers’fees were over $500 million by November of 2003.11
c05 13 January 2012; 9:26:6
210 Corporate Finance

business, and agency costs associated with the debt during periods in which the company isnear or in bankruptcy.
Companies whose assets have a ready secondary market have lower costs associated withfinancial distress. Companies with relatively marketable tangible assets, such as airlines,shipping companies, and steel manufacturers, incur lower costs from financial distress becausesuch assets are usually more readily marketable. On the other hand, companies with fewtangible assets, such as high-tech growth companies, pharmaceutical companies, informationtechnology companies, and others in the service industry, have less to liquidate and thereforehave a higher cost associated with financial distress.
The probability of bankruptcy increases as the degree of leverage increases. The proba-bility of bankruptcy for a given company depends on how the fixed costs of debt serviceinteract with the instability of the business environment and the reserves available to thecompany to delay bankruptcy. In other words, the probability of bankruptcy depends, in part,on the company’s business risk. Other factors that affect the likelihood of bankruptcy includethe company’s corporate governance structure and the management of the company.
2.5. Agency Costs
Agency costs are the costs associated with the fact that all public companies and the largerprivate companies are managed by nonowners. Agency costs are the incremental costs arisingfrom conflicts of interest when an agent makes decisions for a principal. In the context of acorporation, agency costs arise from conflicts of interest between managers, shareholders, andbondholders. In the following, “perquisite consumption” refers to items that executives maylegally authorize for themselves that have a cost to shareholders, such as subsidized dining, acorporate jet fleet, chauffeured limousines, and so forth.
The smaller the stake that managers have in the company, the less is their share in bearingthe cost of excessive perquisite consumption or not giving their best efforts in running thecompany. The costs arising from this conflict of interest have been called the agency costs ofequity. Given that outside shareholders are aware of this conflict, they will take actions tominimize the loss, such as requiring audited financial statements. The net agency costs ofequity therefore have three components:12
1. Monitoring costs. These are the costs borne by owners to monitor the management ofthe company and include the expenses of the annual report, board of director expenses,and the cost of the annual meeting.
2. Bonding costs. These are the costs borne by management to assure owners that they areworking in the owners’ best interest. These include the implicit cost of noncompeteemployment contracts and the explicit cost of insurance to guarantee performance.
3. Residual loss. This consists of the costs that are incurred even when there is sufficientmonitoring and bonding, because monitoring and bonding mechanisms are not perfect.
The better a company is governed, the lower the agency costs. Good governance practicestranslate into higher shareholder value, reflecting the fact that managers’ interests are betteraligned with those of shareholders. Additionally, agency theory predicts that a reduction innet agency costs of equity results from an increase in the use of debt versus equity. That is,
12Jensen and Meckling (1976) provide this breakdown of agency costs.
c05 13 January 2012; 9:26:7
Chapter 5 Capital Structure 211

there are equity-agency cost savings associated with the use of debt. Similarly, the morefinancially leveraged a company is, the less freedom managers have to either take on moredebt or unwisely spend cash. This is the foundation of Michael Jensen’s free cash flowhypothesis.13 According to Jensen’s hypothesis, higher debt levels discipline managers byforcing them to manage the company efficiently so the company can make its interest andprincipal payments and by reducing the company’s free cash flow and thus management’sopportunities to misuse cash.14
2.6. Costs of Asymmetric Information
Asymmetric information (an unequal distribution of information) arises from the fact thatmanagers have more information about a company’s performance and prospects (includingfuture investment opportunities) than do outsiders such as owners and creditors. Whereas allcompanies have a certain level of asymmetric information, companies with comparativelyhigh asymmetry in information are those with complex products like high-tech companies,companies with little transparency in financial accounting information, or companies withlower levels of institutional ownership. Providers of both debt and equity capital demandhigher returns from companies with higher asymmetry in information because they have agreater likelihood of agency costs.
Some degree of asymmetric information always exists because investors never know asmuch as managers and other insiders. Consequently, investors often closely watch managerbehavior for insight into insider opinions on the company’s future prospects. Being aware ofthis scrutiny, managers take into account how their actions might be interpreted by outsiders.The signaling model of capital structure suggests there may be a hierarchy (“pecking order”)to the selection of methods for financing new investments.
The pecking order theory, developed by Myers and Majluf (1984), suggests thatmanagers choose methods of financing according to a hierarchy that gives first preference tomethods with the least potential information content (internally generated funds) and lowestpreference to the form with the greatest potential information content (public equity offer-ings).15 In brief, managers prefer internal financing; and if internal financing is insufficient,managers next prefer debt, and finally, equity. Another implication of the work of Myers andMajluf is that financial managers tend to issue equity when they believe the stock is overvaluedbut are reluctant to issue equity if they believe the stock is undervalued. Thus, additionalissuance of stock is often interpreted by investors as a negative signal.
We can read the signals that managers provide in their choice of financing method. Forexample, commitments to fixed payments, such as dividends and debt service payments, maybe interpreted as the company’s management having confidence in the company’s futureprospects of making payments. Such signals are considered too costly for poorly performingcompanies to afford. Alternatively, the signal of raising money at the top of the pecking orderand issuing equity at the bottom of the pecking order holds other clues. If, for instance, thecompany’s cost of capital increases after an equity issuance, we may interpret this effect as an
13Jensen (1986).14Harvey, Lins, and Roper (2004) observe that this discipline is especially important in emergingmarkets, in which there is a tendency to overinvest.15In general, public equity offerings are very closely scrutinized because investors are typically skepticalthat existing owners would share ownership of a company with a great future with other investors.
c05 13 January 2012; 9:26:7
212 Corporate Finance

indication that management needed capital beyond what comes cheaply; in other words, thisis a negative signal regarding the company’s future prospects.
2.7. The Optimal Capital Structure According to the StaticTrade-Off Theory
When companies make decisions about financial leverage, they must weigh the value-enhancing effects of leverage from the tax deductibility of interest against the value-reducingimpact of the costs of financial distress or bankruptcy, agency costs of debt, and asymmetricinformation. Putting together all the pieces of the theory of Modigliani and Miller, along withthe taxes, costs of financial distress, debt agency costs, and asymmetric information, we seethat as financial leverage is increased, there comes a point beyond which further increases invalue from value-enhancing effects are offset completely by value-reducing effects. This pointis known as the optimal capital structure. In other words, the optimal capital structure isthat capital structure at which the value of the company is maximized.
Considering only the tax shield provided by debt and the costs of financial distress, theexpression for the value of a leveraged company becomes
VL ¼ VU ¼ þ tD $ PVðCosts of financial distressÞ ð5-10Þ
Equation 5-10 represents the static trade-off theory of capital structure. It results in anoptimal capital structure such that debt constitutes less than 100 percent of a company’scapital structure. We diagram this optimum in Exhibit 5-2.
The static trade-off theory of capital structure is based on balancing the expected costsfrom financial distress against the tax benefits of debt service payments, as shown in Panel A ofExhibit 5-2. Unlike the Modigliani and Miller proposition of no optimal capital structure, ora structure with almost all debt when the tax shield is considered, static trade-off theory putsforth an optimal capital structure with an optimal proportion of debt. Optimal debt usage isfound at the point where any additional debt would cause the costs of financial distress toincrease by a greater amount than the benefit of the additional tax shield.
We cannot say precisely at which level of debt financing a company reaches its optimalcapital structure. The optimal capital structure depends on the company’s business risk,combined with its tax situation, corporate governance, and financial accounting informationtransparency, among other factors. However, what we can say, based on this theory, is that acompany should consider a number of factors, including its business risk and the possiblecosts of financial distress, in determining its capital structure.
A company’s management uses these tools to decide the level of debt appropriate for thecompany. The tax benefit from the deductibility of the interest expense on debt must bebalanced against the risk associated with the use of debt. The extent of financial leverage usedshould thus depend on owners’ and management’s appetites for risk, as well as the stability ofthe company’s business environment. Indeed, as shown in Panel B of Exhibit 5-2, as theproportion of debt in a business rises, the costs of both debt and equity are likely to rise tooffset the higher risks associated with higher levels of debt. These cost increases reduce or evennegate the cost savings due to the greater use of debt, the cheaper source of financing. Theresult is a U-shaped weighted average cost of capital curve.
When the company recognizes its most appropriate or best capital structure, it may adoptthis as its target capital structure. Because management may exploit short-term opportu-nities in one or another financing source and because market-value fluctuations continuously
c05 13 January 2012; 9:26:7
Chapter 5 Capital Structure 213

EXHIBIT 5-2 Trade-Off Theory with Taxes and Cost of Financial Distress
Optimal Debt/Equity Ratio
Market Value of the Firm
Maximumvalue of firm
Value of levered firm
PV of costsof financialdistress
Value ofunlevered
firm
Cost of equity
PV of interesttax shields
Panel A: Value of the Company and the Debt/Equity Ratio
Debt/Equity
Optimal Debt/Equity Ratio
Debt/Equity
Weighted average cost of capital
After-tax cost of debt
Cost of CapitalPanel B: Cost of Capital and the Debt/Equity Ratio
c05 13 January 2012; 9:26:7
214 Corporate Finance

affect the company’s capital structure, a company’s capital structure at any point in time maydiffer from the target. In addition, it may be impractical (due to market conditions making itinadvisable to raise capital) and expensive (because of flotation costs) for a company tocontinuously maintain its target structure. Nevertheless, so long as the assumptions of theanalysis and the target are unchanged, analysts and management should focus on the targetcapital structure.
EXAMPLE 5-4 Financial Leverage and the Cost of Capital
The (hypothetical) Singapore-based Chuang Ho Company provides copper wiredcomponents for cellular telephone manufacturers globally. Chuang Ho is going toestablish a subsidiary that would require assets of SGD 3 billion, and wants to select acapital structure that would minimize its cost of capital for the subsidiary. Alex Ahn, thecompany’s CFO, wants to evaluate a target leverage structure and uses a scenarioapproach to evaluate the cost of capital for the present 0 percent debt and possible 50percent debt or 80 percent debt. Chuang Ho’s marginal tax rate is 35 percent. Ahn hasgathered the following information regarding costs of capital:
! The marginal cost of equity rises with increased levels of debt from 13.5 percent (nodebt) to 18 percent (50 percent debt), to 28 percent (80 percent debt).
! The marginal cost of borrowing is 12 percent on 50 percent debt, and 18 percent on80 percent debt.
Which capital structure is expected to have the lowest cost of capital?
Solution. First, calculate the cost of capital under the three scenarios:
EXHIBIT 5-3 Chuang Ho Subsidiary
Leverage
No Debt 50% Debt 80% Debt
Assets $3,000,000,000 $3,000,000,000 $3,000,000,000
Debt $0 $1,500,000,000 $2,400,000,000
Equity $3,000,000,000 $1,500,000,000 $600,000,000
Debt/equity ratio 0 1 4
Proportion of debt 0% 50% 80%
Proportion of equity 100% 50% 20%
Before-tax cost of debt — 12% 18%
Cost of equity 13.5% 18% 28%
After-tax cost of debt¼ rd (1$ t) — 7.8% 11.7%
Weighted average cost of capital 13.5% 12.9% 14.96%
Of the three capital structures that we are evaluating, the cost of capital is lowestfor 50 percent debt.
c05 13 January 2012; 9:26:7
Chapter 5 Capital Structure 215

3. PRACTICAL ISSUES IN CAPITAL STRUCTURE POLICY
Although capital structure theories should serve to inform an analyst’s decision-makingprocess in valuing a company, there are several practical aspects of capital structure to con-sider. These include the evaluation of company creditworthiness by independent agencies, anunderstanding of the industry to which the company belongs, and an analysis of the legal,institutional, and macroeconomic environment in which the company operates. We considerthese factors in the next section.
3.1. Debt Ratings
Debt ratings are an important consideration in the practical management of leverage.As leverage rises, rating agencies tend to lower the ratings of the company’s debt to reflect thehigher credit risk resulting from the increasing leverage. Lower ratings signify higher risk toboth equity and debt capital providers, who therefore demand higher returns.
Most large companies pay one or more rating services to rate their bonds. Debt issues arerated for creditworthiness by credit rating agencies. Among credit ratings agencies with statusas “Nationally Recognized Statistical Rating Organizations” from the U.S. Securities andExchange Commission (SEC), the three largest are Moody’s, Standard & Poor’s, and Fitch.Rating agencies perform a financial analysis of the company’s ability to pay the promised cashflows, as well as an analysis of the bond’s indenture, the set of complex legal documentsassociated with the issuance of debt instruments.
EXHIBIT 5-4 Bond Ratings by Moody’s, Standard & Poor’s, and Fitch
Moody’s Standard & Poor’s Fitch
Highest quality Aaa AAA AAA9>=
>; Investment gradeHigh quality Aa AA AA
Upper medium grade A A A
Medium grade Baa BBB BBB
Speculative Ba BB BB9>>>>>>>>=
>>>>>>>>;
Speculative grade
Highly speculative B B B
Substantial risk Caa CCC CCC
Extremely speculative Ca
Possibly in default C
Default D DDD-D
These agencies evaluate a wealth of information about the issuer and the bond, includingthe bond’s characteristics and indenture, and provide investors with an assessment of thecompany’s ability to pay the interest and principal on the bond as promised. We providethe bond rating classifications in Exhibit 5-4. Although there is significant agreement inratings among the three major services, some disagreements do occur. For example, Standard
c05 13 January 2012; 9:26:7
216 Corporate Finance

& Poor’s lowered the credit rating of General Motors to speculative grade in early May of2005, but Moody’s did not do so until late August of 2005.
In practice, most managers consider the company’s debt rating in their policies regardingcapital structure. Managers must be mindful of their company’s bond ratings because the costof capital is tied closely to bond ratings. Consider the difference in the yields on Aaa and Baarated corporate bonds, as shown in Exhibit 5-5. Typically, a difference of 100 basis pointsexists between the yields of Aaa and Baa bonds, though this spread widens in economicrecessions.16 The cost of debt increases significantly when a bond’s rating drops frominvestment grade to speculative grade. For example, when the rating of General Motors’unsecured 7.2 percent bond maturing in 2011 was changed by Moody’s from Baa to Ba, thebond’s price fell by over 7.5 percent and its yield rose from 7.541 percent to 9.364 percent.
EXHIBIT 5-5 Yields on Aaa and Baa Rated Corporate Bonds, 1984–2005
Annual Yield (%)
Aaa Yield
Baa Yield
16
14
12
10
8
6
41/84 1/88 1/92 1/961/86 1/90 1/94 1/00 1/041/98 1/02
Source: Board of Governors of the Federal Reserve System, release H.15.
3.2. Evaluating Capital Structure Policy
In evaluating a company’s capital structure, the financial analyst must look at the capitalstructure of the company over time, the capital structure of competitors that have similarbusiness risk, and company-specific factors, such as the quality of corporate governance, thatmay affect agency costs, among other factors.17 The financial analyst is not privy to thecompany’s target capital structure but rather can evaluate the company’s ability to handle its
16The Board of Governors of the Federal Reserve System H.15 series of Aaa and Baa corporate yieldsshows an average spread of 119 basis points (bps) between Aaa and Baa rated bonds, on average, from1919 to mid-2005. The largest spread occurred in 1932, with 565 bps, and the lowest spread occurredin 1966, with a 32 bp difference.17Good corporate governance should lower the net agency costs of equity.
c05 13 January 2012; 9:26:7
Chapter 5 Capital Structure 217

financial obligations and the potential role of costs of financial distress in determining howmuch financial leverage a company can handle.
Several practical considerations are important in this regard, such as the industry inwhich a company operates, the volatility of the company’s cash flows, and its need forfinancial flexibility. Regulatory aspects can also play a role. For example, companies in theutility industry have relatively stable cash flows because they have a natural monopoly. Suchcompanies usually also have a low degree of information asymmetry. As a result, utilitycompanies tend to have much more debt than companies in other industries. Similarly, theguarantee afforded by deposit insurance in the United States, for example, allows banks inthe United States to have debt levels in excess of 80 percent of assets. In contrast, companiesin the technology or pharmaceutical industries tend to have little or no debt for the followingreasons: (1) they have few tangible assets (their assets are chiefly human capital, patents, ideas,etc.), (2) there is a high degree of information asymmetry (such companies spend a lot onresearch and development and are very secretive about their products), and (3) they have agreat need for financial flexibility (they need to respond quickly to competitive and otherchanges in their operating environment).
A common goal of capital structure decisions is to finance at the lowest cost of capital.Analysts can use a scenario approach to assess this point for a particular company, startingwith the current cost of capital for a company and considering various changes to answer thefollowing questions:
1. What happens to the cost of capital as the debt ratio is changed?2. At what debt ratio is the cost of capital minimized and company value maximized?3. To what extent are stock price and company value affected when market conditions make
it difficult or impossible for a company to maintain its optimal capital structure?
3.3. Leverage in an International Setting
Modigliani and Miller told us that under several conditions the market value of a company isindependent of its capital structure. However, we know that a company’s capital structureis indeed relevant in the real world because of the effects of taxation, the costs of financialdistress, and agency costs. The static trade-off theory suggests that the optimal level of leverageshould be the level at which the value of the company is maximized; this is the level of debtfinancing at which any additional debt increases the costs of financial distress by an amountgreater than the benefit from interest deductibility.
A company’s capital structure largely depends on company-specific factors such as theprobability of bankruptcy, profitability, quality and structure of assets, and growth opportu-nities. Beyond these factors, the company’s industry affiliation, aswell as the characteristics of thecountry where the company operates, can also account for differences in capital structure.
The general business environment differs from one country to another, and researchersshow that country-specific factors have explanatory power similar to or even greater than thatof the company’s industry affiliation in determining a company’s capital structure.18 Com-paring financial leverage indicators of a U.S.-based energy company and a Japanese energycompany is not meaningful if we do not take country-specific differences into account.Tradition, tax policy, and regulation may largely explain the different degrees of leverage inthe two countries.
18See, for example, Fan, Titman, and Twite (2004).
c05 13 January 2012; 9:26:8
218 Corporate Finance

In examining the capital structure and debt maturity structure of corporations in aninternational context, researchers generally find that differences in the capital structures existbetween developed and emerging markets, as well as across the developed countries. More-over, the debt maturity structure—another important capital structure decision—also tendsto vary across the international setting. Therefore, when analysts focus on the capital structureof companies in an international setting, they must consider both the relative use of debt andthe maturity structure of debt. In fact, short-term and long-term debt ratios follow verydifferent patterns in an international comparison:
! Taking total debt into account, companies in France, Italy, and Japan tend to be morehighly levered than companies in the United States and the United Kingdom.
! Focusing on the use of long-term debt, on the other hand, a different picture emerges:North American companies tend to use more long-term debt than do Japanese companies.
! Companies in developed markets typically use more long-term debt and tend to havehigher long-term debt to total debt ratios compared to their emerging market peers.
Beyond the pure comparison of the capital structures, it is equally or evenmore important toidentify and understand the country-specific factors that explain the cross-country differences.19
Three major types of factors may be used to explain most capital structure differences in aninternational comparison:
1. Institutional and legal environment: These factors represent the legal and regulatoryenvironment in which companies operate, as well as the requirements related to financialreporting. These institutional factors—including taxation, accounting standards, andeven the presence or lack of corruption—may affect a company’s optimal capitalstructure.
2. Financial markets and banking sector: These factors include characteristics of the bankingsector, as well as the size and activity of the financial markets. Financial institutions arecrucial for companies’ access to financing.
3. Macroeconomic environment: These factors capture the general economic and businessenvironment, addressing the influence of economic growth and inflation on the capitalstructure.
3.3.1. Institutional and Legal EnvironmentTaxation, financial legislation, the content of laws (e.g., bankruptcy law), and the quality oftheir enforcement all differ from one country to another. These differences may influence thecapital structures of companies and explain many of the differences that we observe acrosscountries.
The apparent conflict of interest between a company’s management and outside investorshas already been addressed as the agency problem. This problem is, in fact, one of the keydeterminants of a company’s ability to obtain capital; hence, agency costs are one of the majorfactors determining the capital structure. This conflict may be mitigated by carefully prepared
19We should note that conclusions drawn in different studies are not always consistent with each other.The results of empirical studies, in fact, may depend on several factors, such as the set of countries andcompanies taken into the data sample, the analyzed historical period, the hypotheses that the researchersintended to test, and even the definition of leverage that they considered.
c05 13 January 2012; 9:26:8
Chapter 5 Capital Structure 219

contracts. The quality of investors’ legal protections depends on both the content and theenforcement of the contracts and laws. As a result, we expect to see higher financial leverage inthose countries that have weaker legal systems. Further, in countries with weaker legal sys-tems, we expect a greater use of short-term debt financing versus long-term debt financing.Researchers find that companies operating in countries with an efficient legal system tend touse more long-term debt than short-term debt and exhibit lower leverage than comparablecompanies in countries with weaker legal systems.
Some researchers assume that legal systems based on common law offer external capitalproviders (both equity and debt providers) better protection compared to the legal systems ofcivil-law countries. Common law originated in England and is also followed in othercountries, such as the United States, Canada, Australia, New Zealand, Singapore, India, andMalaysia. Civil law, on the other hand, has origins going back to ancient Rome; the countriesof continental Europe and most of the rest of the world have legal systems based on thistradition. Researchers find mixed and limited evidence that companies operating in common-law countries tend to have longer debt maturity structures compared to their peers in civil-lawcountries, and use less debt and more equity in their capital structure.
Similar to the rationale described in the case of legal system efficiency, a high level ofinformation asymmetry between insiders and outsiders encourages a greater use of debt rel-ative to equity, as well as a greater reliance on short-term debt than on long-term debt in thecapital structure. This is likely due to the fact that enforcing the debt contract is easier thanenforcing the less clearly contracted shareholders’ rights. Auditors and financial analysts canhelp reduce information asymmetries and increase the level of transparency.20 Researchersconfirm that the presence of auditors and analysts is associated with lower financial leverage.The importance of auditors is usually strongest in emerging markets, whereas the presence ofanalysts is more important in developed markets.
As we discussed earlier, taxes affect the capital structure decision by lowering the cost ofdebt financing to the issuer in those jurisdictions in which interest expense is tax deductible.In the absence of debt agency costs and bankruptcy costs, the benefit from the tax deduct-ibility of interest encourages companies to use debt financing instead of equity financing.However, if dividend income is taxed at lower rates than interest income, some of theadvantage of debt versus equity financing may be reduced from the corporate perspectivebecause the price at which equity can be sold should reflect that advantage. Taxes are animportant factor in a company’s capital structure decision.
Researchers find mixed results on the effect of the corporate tax rate on capital structures,but they find that personal tax rates do matter. Because the tax treatment of dividends differsacross countries, researchers can examine the importance of different tax treatments of div-idend income.21 They find that companies in countries that have lower tax rates on dividendincome also have less debt in their capital structures.
3.3.2. Financial Markets and Banking SectorThe size, activity, and liquidity of capital markets are crucial for corporations’ access tocapital. Several researchers have analyzed the impact of capital markets’ characteristics oncompanies’ capital structures. Some find that liquid and active capital markets affect com-panies’ debt maturity structure. Specifically, they find that companies in countries that haveliquid and active capital markets tend to use more long-term (as opposed to short-term) debt
20Fan et al. (2003).21Fan et al. (2003).
c05 13 January 2012; 9:26:8
220 Corporate Finance

with longer maturity (30-year maturity is preferred to 15-year maturity). Researchers attributethis finding to the heightened external monitoring of companies by market participants inactive markets.22
The banking sector is one of the primary sources of funds for the corporate sector inmany countries, and its role is especially significant in countries that do not have a corporatebond market. The importance of the banking sector relative to the capital markets can varyfrom one country to another, however. Countries with a common-law tradition, where theshareholders’ rights are stronger, tend to be more market-based, whereas civil-law countriestend to be more bank-based. Because the relationship between a bank and a company isstronger and closer than between a company and a bondholder, banks can handle informationasymmetries more efficiently. This effect may partly explain why civil-law countries are morebank-oriented.
However, researchers’ findings are mixed regarding the effect of the banking system. Someresearchers claim that banks have no effect on companies’ financial leverage and that the differencebetween the bank-oriented and market-oriented countries is more reflected by the relativeimportance of public financing (i.e., stock and bonds) and private financing (i.e., bank loans).23
On the other hand, some researchers find that companies in bank-based countries exhibit higherfinancial leverage compared to those that operate in market-based countries.24
The presence of institutional investors may also affect the companies’ capital structurechoice. Some institutional investors may have preferred debt maturities (“preferred habitats”),and this preference may affect companies’ debt maturity structure. Insurance companies andpension plans, for example, may prefer investing in long-term debt securities in order tomatch the interest rate risk of their long-term liabilities. Researchers find limited resultsregarding the influence of preferred habitats; companies in countries that have more insti-tutional investors in their markets tend to have more long-term debt and somewhat lowerdebt to equity ratios.25
3.3.3. Macroeconomic EnvironmentInflation is a widely recognized macroeconomic indicator. High inflation has a negativeimpact on both the level of debt financing and the use of long-maturity debt.26 Companies inhigher-inflation countries usually exhibit lower levels of financial leverage, rely more on equityfinancing, and have a shorter debt maturity structure compared to their peers in lower-inflation countries.
Researchers have also found that the growth in gross domestic product is associated withlonger debt maturity in developed markets. In addition, researchers focusing on developingcountries find that companies in countries with high growth rely more on equity financing.27
3.3.4. ConclusionsFinancial analysts must consider country-specific factors when analyzing and comparingcompanies that operate in different countries. We have summarized these factors inExhibit 5-6.
22See Demirguc-Kunt and Maksimovic (1998).23Rajan (1995).24See, for example, Claessens, Djankov, and Nevova (2001).25See Fan et al. and Domowitz, Glen, and Madhavan (2000).26Demirguc-Kunt and Maksimovic (1999), Domowitz et al., and Fan et al.27See Domowitz et al.
c05 13 January 2012; 9:26:8
Chapter 5 Capital Structure 221

EXHIBIT 5-6 Country-Specific Factors and Their Assumed Impacts on the Companies’Capital Structure
Country-Specific Factor If a Country
. . . then D/ERatio IsPotentially
. . . and DebtMaturityIs Potentially
Institutional framework
Legal system efficiency is more efficient Lower Longer
Legal system origin has common law as opposed tocivil law
Lower Longer
Information intermediaries has auditors and analysts Lower Longer
Taxation has taxes that favor equity Lower
Banking system, financialmarkets
Equity and bond markets has active bond and stockmarkets
Longer
Bank-based or market-basedcountry
has a bank-based financialsystem
Higher
Investors has large institutional investors Lower Longer
Macroeconomic environment
Inflation has high inflation Lower Shorter
Growth has high GDP growth Lower Longer
These factors include the differences in the business and legal environments in othercountries, taxes, and macroeconomic factors, among others. Companies’ optimal capitalstructures may differ simply as a consequence of these many country-specific differences.In addition to presenting challenges for international financial and credit analysis, theseinternational differences in debt ratios present some challenges in developing debt policies forthe foreign subsidiaries of multinational companies. Theory provides little guidance, andcorporate practices in this area seem to vary widely.
4. SUMMARY
In this chapter, we have reviewed theories of capital structure and considered practical aspectsthat an analyst should examine when making investment decisions.
! The goal of the capital structure decision is to determine the financial leverage thatmaximizes the value of the company (or minimizes the weighted average cost of capital).
! In the Modigliani and Miller theory developed without taxes, capital structure is irrelevantand has no effect on company value.
! The deductibility of interest lowers the cost of debt and the cost of capital for the companyas a whole. Adding the tax shield provided by debt to the Modigliani and Miller frameworksuggests that the optimal capital structure is all debt.
c05 13 January 2012; 9:26:8
222 Corporate Finance

! In the Modigliani and Miller propositions with and without taxes, increasing a company’srelative use of debt in the capital structure increases the risk for equity providers and, hence,the cost of equity capital.
! When there are bankruptcy costs, a high debt ratio increases the risk of bankruptcy.! Using more debt in a company’s capital structure reduces the net agency costs of equity.! The costs of asymmetric information increase as more equity is used versus debt, suggesting
the pecking order theory of leverage, in which new equity issuance is the least preferredmethod of raising capital.
! According to the static trade-off theory of capital structure, in choosing a capitalstructure, a company balances the value of the tax benefit from deductibility of interestwith the present value of the costs of financial distress. At the optimal target capitalstructure, the incremental tax shield benefit is exactly offset by the incremental costs offinancial distress.
! A company may identify its target capital structure, but its capital structure at anypoint in time may not be equal to its target for many reasons, including that man-agement may exploit tactical opportunities in financing sources, market-value fluctuationsin its securities, or just be unable to maintain the capital structure due to marketconditions.
! Many companies have goals for maintaining a certain credit rating, and these goals areinfluenced by the relative costs of debt financing among the different rating classes.
! In evaluating a company’s capital structure, the financial analyst must look at the capitalstructure of the company over time, the capital structure of competitors that have similarbusiness risk, and company-specific factors, such as the quality of corporate governance,that may affect agency costs, among other factors.
! Good corporate governance and accounting transparency should lower the net agency costsof equity.
! When comparing capital structures of companies in different countries, an analyst mustconsider a variety of characteristics that might differ and affect both the typical capitalstructure and the debt maturity structure. The major characteristics fall into three cate-gories: institutional and legal environment, financial markets and banking sector, andmacroeconomic environment.
PROBLEMS
1. If investors have homogeneous expectations, the market is efficient, and there are notaxes, no transactions costs, and no bankruptcy costs, the Modigliani and Miller Prop-osition I states that:A. bankruptcy risk rises with more leverage.B. managers cannot change the value of the company by using more or less debt.C. managers cannot increase the value of the company by employing tax saving
strategies.
2. According to Modigliani and Miller’s Proposition II without taxes:A. the capital structure decision has no effect on the cost of equity.B. investment and the capital structure decisions are interdependent.C. the cost of equity increases as the use of debt in the capital structure increases.
c05 13 January 2012; 9:26:8
Chapter 5 Capital Structure 223

3. Suppose the weighted average cost of capital of the Gadget Company is 10%. If Gadgethas a capital structure of 50% debt and 50% equity, a before-tax cost of debt of 5%, anda marginal tax rate of 20%, then its cost of equity capital is closest to:A. 12%.B. 14%.C. 16%.
4. The current weighted average cost of capital (WACC) for Van der Welde is 10%. Thecompany announced a debt offering that raises the WACC to 13%. The most likelyconclusion is that for Van der Welde:A. the company’s prospects are improving.B. equity financing is cheaper than debt financing.C. the company’s debt/equity ratio has moved beyond the optimal range.
5. All else equal, the use of long-maturity debt is expected to be greater in those markets inwhich:A. inflation is low.B. capital markets are passive and illiquid.C. the legal system’s protection of bondholders’ interests is weak.
6. According to the pecking order theory:A. new debt is preferable to new equity.B. new debt is preferable to internally generated funds.C. new equity is always preferable to other sources of capital.
7. According to the static trade-off theory:A. debt should be used only as a last resort.B. companies have an optimal level of debt.C. the capital structure decision is irrelevant.
The following information relates to Questions 8–13.Barbara Andrade is an equity analyst who covers the entertainment industry for
Greengable Capital Partners, a major global asset manager. Greengable owns a significantposition with a large unrealized capital gain in Mosely Broadcast Group (MBG). On a recentconference call, MBG’s management states that they plan to increase the proportion of debtin the company’s capital structure. Andrade is concerned that any changes in MBG’s capitalstructure will negatively affect the value of Greengable’s investment.
To evaluate the potential impact of such a capital structure change on Greengable’sinvestment, she gathers the information about MBG given in Exhibit A.
Andrade expects that an increase in MBG’s financial leverage will increase its costs ofdebt and equity. Based on an examination of similar companies in MBG’s industry, Andradeestimates MBG’s cost of debt and cost of equity at various debt-to-total capital ratios, asshown in Exhibit B.
c05 13 January 2012; 9:26:8
224 Corporate Finance
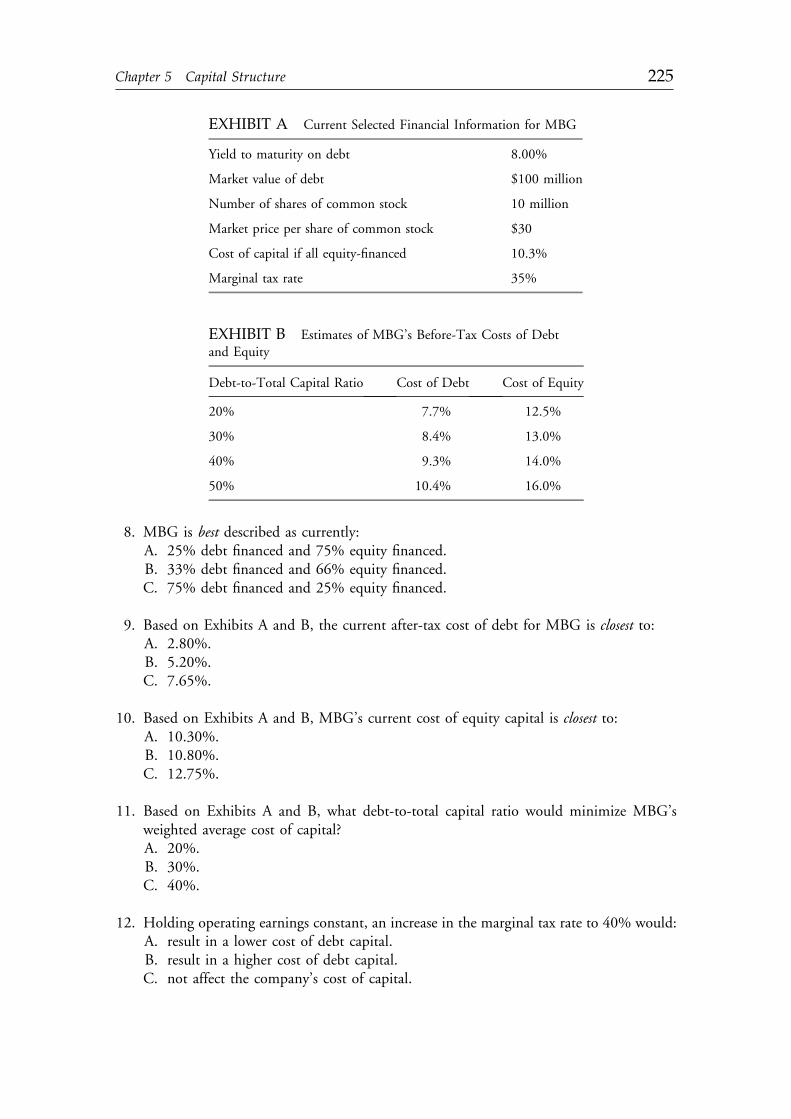
EXHIBIT B Estimates of MBG’s Before-Tax Costs of Debtand Equity
Debt-to-Total Capital Ratio Cost of Debt Cost of Equity
20% 7.7% 12.5%
30% 8.4% 13.0%
40% 9.3% 14.0%
50% 10.4% 16.0%
8. MBG is best described as currently:A. 25% debt financed and 75% equity financed.B. 33% debt financed and 66% equity financed.C. 75% debt financed and 25% equity financed.
9. Based on Exhibits A and B, the current after-tax cost of debt for MBG is closest to:A. 2.80%.B. 5.20%.C. 7.65%.
10. Based on Exhibits A and B, MBG’s current cost of equity capital is closest to:A. 10.30%.B. 10.80%.C. 12.75%.
11. Based on Exhibits A and B, what debt-to-total capital ratio would minimize MBG’sweighted average cost of capital?A. 20%.B. 30%.C. 40%.
12. Holding operating earnings constant, an increase in the marginal tax rate to 40% would:A. result in a lower cost of debt capital.B. result in a higher cost of debt capital.C. not affect the company’s cost of capital.
EXHIBIT A Current Selected Financial Information for MBG
Yield to maturity on debt 8.00%
Market value of debt $100 million
Number of shares of common stock 10 million
Market price per share of common stock $30
Cost of capital if all equity-financed 10.3%
Marginal tax rate 35%
c05 13 January 2012; 9:26:9
Chapter 5 Capital Structure 225

13. According to the pecking order theory, MBG’s announced capital structure change:A. is optimal because debt is cheaper than equity on an after-tax basis.B. may be optimal if new debt is issued after new equity is made complete use of as a
source of capital.C. may be optimal if new debt is issued after internally generated funds are made
complete use of as a source of capital.
The following information relates to Questions 14–19.28
Lindsay White, CFA, is an analyst with a firm in London, England. She is responsible forcovering five companies in the Consumer Staples industry. White believes the domestic andglobal economies will grow slightly below average over the next two years, but she is alsoconcerned about the possibility of a mild recession taking hold. She has been asked to reviewthe companies that she covers and has collected information about them, presented inExhibit C. White has estimated that earnings before interest and taxes (EBIT) will remainconstant for all five companies for the foreseeable future. Currency is in terms of the Britishpound (d). The marginal corporate tax rate is 30 percent for all five companies.
EXHIBIT C Selected Company Financial Data
Aquarius Bema Garth Holte Vega
EBIT (d) 600,000 600,000 400,000 400,000 400,000
Debt-to-equity ratio (market value) 0.60 0.00 0.00 0.71 0.62
Debt (market value) (d) 2,000,000 0 0 2,000,000 2,000,000
S&P debt rating Aþ n.a. n.a. A– A
Weighted average cost of capital – 10% 10% – –
Based on conversations with management of the five companies, as well as on her ownindependent research and analysis, White notes the following:
Aquarius:
! Has lower bonding costs than does Bema.! Has a higher percentage of tangible assets to total assets than does Bema.! Has a higher degree of operating leverage than does Bema.
Garth:
! Invests significantly less in Research and Development than does Holte.! Has a more highly developed corporate governance system than does Holte.! Has more business risk than does Holte.
28Item set developed by Sean Cleary, CFA (Ontario, Canada).
c05 13 January 2012; 9:26:9
226 Corporate Finance

In addition, White has reached various conclusions regarding announcements by Bema,Garth, and Vega:
Announcement: Bema has announced that it will issue debt and use the proceeds torepurchase shares. As a result of this debt-financed share repurchaseprogram, Bema indicates that its debt/equity ratio will increase to 0.6and its before-tax cost of debt will be 6 percent.
Conclusion: As result of the announced program, Bema’s total market value shoulddecrease relative to Aquarius’s.
Announcement: Garth has announced that it plans to abandon the prior policy of all-equity financing by the issuance of d1 million in debt in order to buyback an equivalent amount of equity. Garth’s before-tax cost of debt is6 percent.
Conclusion: This change in capital structure is reasonable, but Garth should takecare subsequently to maintain a lower D/E ratio than Holte.
Announcement: Vega has announced that it intends to raise capital next year, but isunsure of the appropriate method of raising capital.
Conclusion: White has concluded that Vega should apply the pecking order theoryto determine the appropriate method of raising capital.
14. Based on the Modigliani and Miller (MM) propositions with corporate taxes, Aquarius’sWACC is closest to:A. 3.38%.B. 7.87%.C. 11.25%.
15. Based on MM propositions with corporate taxes, what is Bema’s weighted average cost ofcapital after the completion of their announced debt-financed share repurchase program?A. 6.52%.B. 7.83%.C. 8.88%.
16. Based on Exhibit C and White’s notes, which of the following is least consistent withWhite’s conclusion regarding Bema’s announcement?A. Bema’s bonding costs will be higher than Aquarius’s.B. Bema will have a lower degree of operating leverage than does Aquarius.C. Bema will have a lower percentage of tangible assets to total assets than does Aquarius.
17. Based on the MM propositions with corporate taxes, Garth’s cost of equity after the debtissuance is closest. to:A. 10.00%.B. 10.85%.C. 11.33%.
c05 13 January 2012; 9:26:9
Chapter 5 Capital Structure 227

18. Based on Exhibit C and White’s notes, which of the following is most consistent withWhite’s conclusion regarding Garth’s announcement?A. Garth has more business risk than does Holte.B. Garth invests significantly less in Research and Development than does Holte.C. Garth has a more highly developed corporate governance system than does Holte.
19. Based on White’s conclusion regarding determining the appropriate method of raisingcapital, Vega should raise capital in the following order:A. debt, internal financing, equity.B. equity, debt, internal financing.C. internal financing, debt, equity.
c05 13 January 2012; 9:26:9
228 Corporate Finance

CHAPTER 6DIVIDENDS AND SHAREREPURCHASES: BASICS
1
George H. Troughton, CFAAnthem, Arizona, U.S.A.
Gregory Noronha, CFATacoma, Washington, U.S.A.
LEARNING OUTCOMES
After completing this chapter, you will be able to do the following:
! Describe regular cash dividends, extra dividends, stock dividends, stock splits, and reversestock splits, including their expected effect on a shareholder’s wealth and a company’sfinancial ratios.
! Describe dividend payment chronology, including the significance of declaration, holder-of-record, ex-dividend, and payment dates.
! Compare share repurchase methods.! Calculate and compare the effects of a share repurchase on earnings per share when (1) the
repurchase is financed with the company’s excess cash and (2) the company uses fundeddebt to finance the repurchase.
! Calculate the effect of a share repurchase on book value per share.! Explain why a cash dividend and a share repurchase of the same amount are equivalent in
terms of the effect on shareholders’ wealth, all else being equal.
1. INTRODUCTION
This chapter covers the features and characteristics of dividends and share repurchases, thetwo ways a company can distribute cash to its shareholders. A dividend is a distribution paid
1CFA Institute gratefully acknowledges the contributions of Catherine E. Clark, CFA, as coauthor of aprior version of this chapter.
229
c06 13 January 2012; 9:15:8

to shareholders based on the number of shares owned. Dividends are declared by a cor-poration’s board of directors, whose actions may require approval by shareholders (e.g., inmost of Europe and in China) or may not require such approval (e.g., in the United States).In contrast to the payment of interest and principal on a bond by its issuer, the payment ofdividends is discretionary rather than a legal obligation and may be limited by legal statutes(e.g., in relation to not impairing such accounting quantities as stated capital) and by debtcontract provisions (to protect more senior interests). Interest and dividends in many jur-isdictions are subject to different tax treatment at the corporate level. Interest on debt isusually tax deductible on a corporate tax return, whereas dividends are not. Dividendsare taxed a second time in some jurisdictions at the shareholder level. Dividends may also betaxed differently from capital gains. In this chapter, we focus on dividends on common shares(as opposed to preferred shares) and on publicly traded companies. (Synonyms for commonshares include ordinary shares and common stock; for brevity, the chapter often uses shares orstock to refer to such securities.) Taken together, cash dividends and the value of sharesrepurchased in any given year constitute a company’s payout for the year. A company’spayout policy is the set of principles guiding payouts.
Dividends and share repurchases concern analysts because, as distributions to shareholders,they affect investment returns and financial ratios. When share price volatility is high, investorssometimes forget the importance of dividends as a source of return. From its inception at year-end1969 to the end of 2008, the gross total return on the MSCI EAFE Index was 9.7 percent com-pounded annually with dividends reinvested, as compared with 6.7 percent on the basis of pricealone.2The contributionof dividends to total return for large-capU.S. stocks over the 1926–2008period is even more formidable. From the inception of the Ibbotson U.S. large-cap data at thebeginning of 1926, the total compound annual return with dividends reinvested fromthe beginning of 1926 to the end of 2008 was 9.6 percent, as compared with 5.3 percent on thebasis of price alone.3 Dividends also may provide important information about future companyperformance and investment returns. Analysts should strive to become familiar with all invest-ment-relevant aspects of dividends and share repurchases.
The chapter is organized as follows: Section 2 describes how cash and stock dividends arepaid and the mechanics of stock splits. Section 3 describes the chronology of dividendpayment procedures, including record date, ex-dividend date, and payment date. Section 4presents share repurchases, including their income statement and balance sheet effects andequivalence to cash dividends (making certain assumptions). Section 5 offers concludingremarks, and a summary and practice problems complete the chapter.
2. DIVIDENDS: FORMS
Companies can pay dividends in a number of ways. Cash dividends can be distributed toshareholders through regular, extra (also called special or irregular), or liquidating dividends.
2See www.mscibarra.com. Gross return is in U.S. dollars and before withholding taxes. Gross return isused to make the MSCI returns comparable to Ibbotson returns.3See 2009 Ibbotson SBBI Classic Yearbook (Chicago: Morningstar, 2009): 59. The first monographs ofSBBI containing the Ibbotson return data were published by the Institute of Chartered FinancialAnalysts in 1977, 1979, and 1982.
c06 13 January 2012; 9:15:8
230 Corporate Finance

Other forms of dividends include stock dividends and stock splits. In this section, we willexplore the different forms that dividends can take and their impact on both the shareholderand the issuing company.
2.1. Regular Cash Dividends
Many companies choose to distribute cash to their shareholders on a regular schedule. Thecustomary frequency of payment, however, may vary among markets. In the United Statesand Canada, most companies that pay dividends choose a quarterly schedule of payments,whereas in Europe and Japan, the most common choice is to pay dividends twice a year(i.e., semiannually). Elsewhere in Asia, companies often favor paying dividends once ayear (i.e., annually). Exhibit 6-1 summarizes typical dividend payment schedules for selectedmarkets.
EXHIBIT 6-1 Geographic Differences in Frequency of Paymentof Cash Dividends
Market Most Common Frequency
United States and Canada Quarterly
Europe Semiannually
Japan Semiannually
China Annually
Thailand Annually
Source: Author’s survey of CFA charterholders ( June 2009).
Most companies that pay cash dividends strive to maintain or increase their dividends.A record of consistent dividends over a long period of time is important to many companiesand shareholders because such a record is widely interpreted as evidence of consistent profit-ability. At a minimum, most dividend-paying companies strive not to reduce dividends whenthey are experiencing transitory problems, whereas some companies seek to consistently increasethe dividend so as to indicate to investors that their shares are of high investment quality.
Regular dividends, and especially increasing regular dividends, also signal to investorsthat their company is growing and will share profits with their shareholders. Perhaps moreimportantly, management can use dividend announcements to communicate confidence intheir company’s future. Consistent with that, an increase in the regular dividend (especially ifit is unexpected) often has a positive effect on share price.
2.1.1. Dividend Reinvestment Plans (DRPs)In some world markets, companies are permitted4 to have in place a system that allowsshareholders to automatically reinvest all or a portion of cash dividends from a company inadditional shares of the company. Such a dividend reinvestment plan is referred to as a DRP(pronounced “drip” and therefore often represented also as “DRIP”). Shareholders wishing to
4In some cases, after registering the plan with or gaining approval of the plan from local securitiesregulators.
c06 13 January 2012; 9:15:9
Chapter 6 Dividends and Share Repurchases: Basics 231

participate in a DRP must so indicate to the entity administering it. The three types of DRPsare distinguished by the company’s source of shares for dividend reinvestment:5
! Open-market DRPs in which the company purchases shares in the open market to acquirethe additional shares credited to plan participants.
! New-issue DRPs (also referred to as scrip dividend schemes in the United Kingdom)6 inwhich the company meets the need for additional shares by issuing them instead of pur-chasing them.
! Plans that are permitted to obtain shares through either open-market purchases or newshare issuance.
A company may have several advantages in offering such plans. They may encourage adiverse shareholder base by providing small shareholders an easy means to accumulateadditional shares. They may stimulate long-term investment in the company by encouragingshareholders to build loyalty to the company. New-issue DRPs allow the company to raisenew equity capital without the flotation costs associated with secondary equity issuance usinginvestment bankers. The potential advantages to the shareholder include the facts that suchplans allow the accumulation of shares using cost averaging and that they are a cost-effectivemeans for small shareholders to make additional investments in the company. Participatingshareholders typically have no transaction costs in obtaining the additional shares through aDRP. Some companies, typically new-issue DRPs, offer the additional benefit to DRP par-ticipants of purchasing shares at a discount (usually 2–5 percent) to the market price. Notethat such discounts dilute the holdings of shareholders who do not participate in the DRP.
A disadvantage to the shareholder is the extra recordkeeping involved in jurisdictions inwhich capital gains are taxed. Shares purchased through such plans change the average costbasis for capital gains tax purposes. If the share price for the reinvested dividend is higher(lower) than the original purchase price, reinvesting the dividend will increase (decrease) theaverage cost basis. Either way, detailed records must be kept to accurately compute gains orlosses when shares are sold. A further perceived disadvantage to the shareholder is that cashdividends are fully taxed in the year received even when reinvested, which means theshareholder is paying tax on cash not actually received. For these reasons, use of such plansmay be especially appropriate in a tax-deferred account (in which current investment earningsare not taxed), such as certain types of retirement accounts.
2.2. Extra or Special (Irregular) Dividends
An extra or special dividend, also known as an irregular dividend, is a dividend paid by acompany that does not pay dividends on a regular schedule, or a dividend that supplementsregular cash dividends with an extra payment. These extra dividend payments may be broughtabout by special circumstances. For example, in 2004, Microsoft Corporation had a hugeamount of excess cash and paid a $3.08 cash dividend when the stock price was $30.
5See He (2009) for more details.6For a detailed description of one such plan, see www.hsbc.com/1/2/investor-relations/dividends/scrip-dividend. Sometimes a contrast is drawn between “scrip dividend schemes” and “dividend repur-chase plans,” in which the latter term is understood to be only what the text describes as “open-marketdividend reinvestment plans.”
c06 13 January 2012; 9:15:9
232 Corporate Finance

Companies, particularly in cyclical industries, have sometimes chosen to use specialdividends as a means of distributing more earnings only during strong earnings years. Duringeconomic downturns, when earnings are low or negative, cash that might otherwise be usedfor dividends is conserved. For example, a company may choose to declare a small regulardividend and then, when operating results are good, declare an extra dividend at the end ofthe year. Prior to the recession that began in 2008, which led to the suspension7 of all FordMotor Company and General Motors common dividends, Ford and GM often declaredmoderate regular quarterly dividends and used an “extra dividend” at the end of the year inparticularly good earnings years.
Example 6-1 concerns a company with a stated policy regarding the payment of extradividends. In the example, the dividend payout ratio refers to common share cash dividendsdivided by net income available to common shares over the same time period.
7Suspension occurs when a company stops paying any cash dividends.
EXAMPLE 6-1 TeliaSonera’s Dividend Policy
TeliaSonera AB (OMX AB: TLSN) is the leading provider of telecommunicationservices in Sweden and Finland, with an important presence in other Nordic and Balticmarkets. The company is headquartered in Stockholm, Sweden, and TLSN’s sharestrade on the Swedish and Finnish stock exchanges.TLSN’s financial data are reported inSwedish kronor (SEK). In October 2007, TLSN’s board of directors modified itsdividend policy, stating:
“The company shall target a solid investment grade long-term credit rating(A" to BBBþ) to secure the company’s strategically important financial flexi-bility for investments in future growth, both organically and by acquisitions.Theordinary dividend shall be at least 40 percent of net income attributable toshareholders of the parent company. In addition, excess capital shall be returnedto shareholders, after the Board of Directors has taken into consideration thecompany’s cash at hand, cash flowprojections and investment plans in amediumterm perspective, as well as capital market conditions.”
Source: www.teliasonera.com/investor_relations/share_data/dividend.
Selected TLSN Financial per Share Data
2008 2007
Shares outstanding 4,490.5 million 4,490.5 million
Earnings per share SEK4.23 SEK3.94
Cash dividends per share SEK1.80 SEK4.00
Source: www.teliasonera.com/investor_relations.
c06 13 January 2012; 9:15:9
Chapter 6 Dividends and Share Repurchases: Basics 233

2.3. Liquidating Dividends
A dividend may be referred to as a liquidating dividend when a company:
! Goes out of business and the net assets of the company (after all liabilities have been paid)are distributed to shareholders.
! Sells a portion of its business for cash and the proceeds are distributed to shareholders.! Pays a dividend that exceeds its accumulated retained earnings (impairs stated capital).
2.4. Stock Dividends
Stockdividends are a non-cash formof dividends.With a stockdividend (also known as abonusissue of shares), the company distributes additional shares (typically 2–10 percent of the sharesthen outstanding) of its common stock to shareholders instead of cash. Although the share-holder’s total cost basis remains the same, the cost per share held is reduced. For example, if ashareholder owns 100 shares with a purchase price of $10 per share, the total cost basis would be$1,000. After a 5 percent stock dividend, the shareholder would own 105 shares of stock at a totalcost of $1,000. However, the cost per share would decline to $9.52 ($1,000/105).
Superficially, the stock dividend might seem an improvement on the cash dividend fromboth the shareholders’ and the company’s point of view. Each shareholder ends up with moreshares, which did not have to be paid for, and the company did not have to spend anyactual money issuing a dividend. Furthermore, stock dividends are generally not taxable toshareholders because a stock dividend merely divides the “pie” (the market value of share-holders’ equity) into smaller pieces. The stock dividend, however, does not affect theshareholder’s proportionate ownership in the company (because other shareholders receivethe same proportionate increase in shares), nor does it change the value of each shareholder’sownership position (because the increase in the number of shares held is accompanied by anoffsetting decrease in earnings per share, and other measures of value per share, resulting fromthe greater number of shares outstanding).
The second point is illustrated in Exhibit 6-2, which shows the impact of a 3 percent stockdividend to a shareholder who owns 10 percent of a companywith amarket value of $20million.
1. Calculate the cash dividend payout ratio for 2008 and 2007.2. Assuming the board’s new dividend policy became effective in 2008, calculate the
amount of the annual ordinary dividend on the basis of TLSN’s minimum payoutpolicy in 2008 and the amount that could be considered an extra dividend.
Solution to 1. With the same number of shares outstanding, the dividend payout ratioon a per share basis is dividends per share divided by earnings per share.
For 2008 : SEK1:80=SEK4:23 ¼ 42:6 percent:
For 2007 : SEK4:00=SEK3:94 ¼ 101:5 percent:
Solution to 2. Under a policy of 40 percent of earnings, the minimum amountof dividends would be SEK4.233 0.40¼ SEK1.69, and the amount of the extradividend would then be SEK1.80" SEK1.69¼ SEK0.11.
c06 13 January 2012; 9:15:10
234 Corporate Finance

As one can see, the market value of the shareholder’s wealth does not change, assuming anunchanged price-to-earnings ratio (the ratio of share price, P, to earnings per share, E, or P/E).That assumption is reasonable because a stock dividend does not alter a company’s asset base orearning power. (As the reader will see shortly, the same is true of a stock split.) In effect, the totalmarket value of the company is unaffected by the stock dividend because the decrease in the shareprice is exactly offset by the increase in the number of shares outstanding.
EXHIBIT 6-2 Illustration of the Effect of a Stock Dividend
Before Dividend After Dividend
Shares outstanding 1,000,000 1,030,000
Earnings per share $1.00 $0.97 (1,000,000/1,030,000)
Stock price $20.00 $19.4175 (203 0.9709)
P/E 20 20
Total market value $20 million $20 million (1,030,0003 $19.4175)
Shares owned 100,000 (10%3 1,000,000) 103,000 (10%3 1,030,000)
Ownership value $2,000,000 (100,0003 $20) $2,000,000 (103,0003 $19.4175)
Note: The exhibit shows intermediate results rounded to four decimal places, but final results are based on carryingintermediate results at full precision.
The propensity to pay stock dividends varies by market. Stock dividends are verycommonly used in China, for example. Some 78 percent of the companies in the ShanghaiA-share Index paid stock dividends in 2009 according to Bloomberg data, whereas anadditional 7 percent of A-shares had a stock split.
Companies that regularly pay stock dividends see some advantages to this form of dividendpayment. From the company’s point of view, more shares outstanding broaden the shareholderbase. With more shares outstanding, there is a higher probability that more individual share-holders will own the stock—almost always a plus for companies. A traditional belief is that alower stock price will attract more investors, all else equal. U.S. companies often view theoptimal share price range as $20 to $80. For a growing company, a systematic stock dividendwill be more likely to keep the stock in the “optimal” range. For example, Tootsie RollIndustries (NYSE: TR) has issued a 3 percent stock dividend every year since 1966 in additionto its regular quarterly cash dividend.8 When the company pays the same dividend rate on thenew shares as it did on the old shares, a shareholder’s dividend income increases, but thecompany could have accomplished the same result by increasing the cash dividend.
From a company’s perspective, the key difference between a stock dividend and acash dividend is that a cash dividend affects a company’s capital structure whereas a stockdividend has no economic impact on a company. Cash dividends reduce assets (because cashis being paid out) and shareholders’ equity (by reducing retained earnings). All else equal,liquidity ratios, such as the cash ratio (cash and short-term marketable securities divided bycurrent liabilities) and current ratio (current assetsdivided by current liabilities), should
8It should be noted that Tootsie Roll follows a practice of increasing its cash dividend as well as paying astock dividend.
c06 13 January 2012; 9:15:10
Chapter 6 Dividends and Share Repurchases: Basics 235

decrease (reflecting the reduction in cash). Financial leverage ratios, such as the debt-to-equityratio (total debtdivided by total shareholders’ equity) and debt-to-assets ratio (total debt-divided by total assets), should also increase. Stock dividends, on the other hand, do not affectassets or shareholders’ equity. Although retained earnings are reduced by the value of the stockdividends paid (i.e., by the number of shares issued3 price per share), contributed capitalincreases by the same amount (i.e., the value of the shares issued). As a result, total share-holders’ equity does not change. Neither stock dividends nor stock splits (which are discussedin the next section) should affect either liquidity ratios or financial leverage ratios.
2.5. Stock Splits
Stock splits are similar to stock dividends in that they have no economic effect on thecompany and the shareholders’ total cost basis does not change. For example, if a companyannounces a two-for-one stock split, each shareholder will be issued an additional share foreach share currently owned. Thus, a shareholder will have twice as many shares after the splitas before the split. Therefore, earnings per share (and all other per share data) will decline byhalf, leaving the P/E and equity market value unchanged. Assuming the corporation main-tains the same dividend payout ratio9 as before the split, dividend yield (annual dividends pershare divided by share price) will also be unchanged. Apart from the effect of any informationor benefit that investors perceive a stock split to convey, stock splits (like stock dividends)should be neutral in their effect on shareholders’ wealth.
Although two-for-one and three-for-one stock splits are the most common, unusualsplits, such as five-for-four or seven-for-three, sometimes occur. It is important for eachshareholder to recognize that their wealth is not changed by the stock split (just as it was notchanged for a stock dividend, all else equal). Exhibit 6-3 shows an example of a two-for-onesplit and its impact on stock price, earnings per share, dividends per share, dividend payoutratio, dividend yield, P/E, and market value.
EXHIBIT 6-3 Before and After a Two-for-One Stock Split
Before Split After Split
Number of shares outstanding 4 million 8 million
Stock price h40.00 h20.00 (h40/2)
Earnings per share h1.50 h0.75 (h1.50/2)
Dividends per share h0.50 h0.25 (h0.50/2)
Dividend payout ratio 1/3 1/3
Dividend yield 1.25% 1.25% (h0.25/h20.00)
P/E 26.7 26.7 (h20.00/h0.75)
Market value of company h160 million h160 million (h20.003 8 million)
As can be seen, a two-for-one stock split is basically the same as a 100 percent stockdividend because all per share data have been reduced by 50 percent. The only difference is inthe accounting treatment: Although both stock dividends and stock splits have no effect on
9The dividend payout ratio is dividends declared during a fiscal year divided by net income available forcommon shares for the same fiscal year.
c06 13 January 2012; 9:15:10
236 Corporate Finance

total shareholders’ equity, a stock dividend is accounted for as a transfer of retained earningsto contributed capital. A stock split, however, does not affect any of the balances in share-holder equity accounts.
A company may announce a stock split at any time. Typically, a split is announced after aperiod in which the stock price has risen. Many investors view the announcement of a stocksplit as a positive sign pointing to future stock price increases. More often, however,announced stock splits merely recognize that the stock has risen enough to justify a stock splitto return the stock price to a lower, more marketable price range.
Several of the largest companies in the world (as measured by market value) had stocksplits or large stock dividends in the mid-2000s. For example, Total SA (France) had a two-for-one split in 2006, Proctor & Gamble (United States) had a two-for-one split in 2004, andUnilever PLC (United Kingdom) had an 80 percent stock dividend in 2006. In each of thesecases, the stock split or the stock dividend came after a significant rise in stock price but wasnot, in and of itself, a meaningful predictor of future price action.
Much less common than stock splits are reverse stock splits. A reverse stock splitincreases the share price and reduces the number of shares outstanding—again, with no effecton the market value of a company’s equity or on shareholders’ total cost basis. Just as a highstock price might lead a company to consider a stock split, so too a low stock price may lead acompany to consider a reverse stock split. The objective of a reverse stock split is to increasethe price of the stock to a higher, more marketable range. As reported in Barron’s, companiesexecute reverse splits “to attract institutional investors and mutual funds that often shy frombuying stocks trading below $5.”10 Reverse stock splits are perhaps most common forcompanies in, or coming out of, financial distress. As part of its government-aided recapi-talization, shareholders of American International Group (NYSE: AIG), a global financialinsurance company, approved a 1-for-20 reverse stock split effective 1 July 2009. On 30 June2009, AIG shares closed at US$1.16, which implies a post-reverse-split price of about US$23.11 KIT digital, a Dubai, UAE-based global provider of Internet-protocol-based videoenhancement technology, announced a 1-for-35 reverse split effective 6 March 2009 in orderto meet minimum share price listing criteria on NASDAQ Global Markets.
Reverse splits are less common in Asia. For example, reverse stock splits were not per-mitted in Japan under Corporation Law until 2001.
10Sears (2009), M10. Furthermore, some brokerages do not permit clients to buy stocks on margin (i.e.,with money lent by the brokerage) if the stocks are trading at less than $5 per share.11Wall Street Journal (2 July 2009):C5.
EXAMPLE 6-2 Citigroup Announces a Planned Reverse Split
In March 2009, Citigroup, a major U.S.-based global bank, was in severe financialdistress and required significant U.S. government investment. Citigroup announced itwould seek shareholder approval for up to a 1-for-30 reverse split. At that time, thestock was perilously close to the $1 a share minimum price required for continued
c06 13 January 2012; 9:15:10
Chapter 6 Dividends and Share Repurchases: Basics 237

3. DIVIDENDS: PAYMENT CHRONOLOGY
In the previous section, we saw that dividends can take several forms. Once a company’sboard of directors votes to pay a dividend, a fairly standard dividend chronology is set inmotion. The following sections describe dividend payment chronology. Although paymentchronology has some differences across world markets, declaration dates, ex-dividend dates,and record dates are common on global exchanges.
3.1. Declaration Date
The first date on the time line is the declaration date, the day that the corporation issues astatement declaring a specific dividend. Whether it is a regular, irregular, special, liquidating,or stock dividend, a dividend begins with a company’s board of directors authorizing itspayment. In China and several European countries, company shareholders must approvethe payment. In Japan, the requirement of shareholder approval of dividend payments wasabolished in 2006.
On the declaration date, the company will also announce the holder-of-recorddate andthe payment date. Company websites, as well as some financial websites, post dividendsdeclared, as well as record and payment dates.
3.2. Ex-Dividend Date
After the declaration date, the next pertinent date is the ex-dividend date (also referred toas the ex-date). In most global markets, the ex-date is two business days before the holder-of-record date, but in Hong Kong it is one business day. The amount of time between the
listing on the NYSE. In July 2009, the reverse split had not yet taken place, but theshares were trading at $2.90.
1. If the reverse split were to take place when the share price was $2.90 on the daybefore the ex-dividend date, find the expected stock price after a 1-for-30 split, allother factors remaining unchanged.
2. Comment on the following statement: “Shareholder wealth is negatively affected bya reverse stock split.”
Solution to 1. If the stock was $2.90 before the reverse split, for every 30 shares,a shareholder would have 1 share priced at 303 $2.90¼ $87.
Solution to 2. The statement is not generally correct. Considering the reverse split on itsown, the market capitalization of the common equity would be unchanged. If thereverse split was interpreted as a good decision (e.g., because the company will be ableto retain the advantages of being listed on the NYSE), the market capitalization mightincrease. But other factors—such as continued deterioration of its loan and derivativeportfolios, or more required government investment leading to further common sharedilution—could drive down the share’s value.
c06 13 January 2012; 9:15:10
238 Corporate Finance

ex-date and the holder-of record date is linked to the trade settlement cycle of the particularexchange on which the shares are listed for trading.12 The ex-date is the first date that a sharetrades without (i.e., “ex”) the dividend. Investors who own shares on the ex-date or whopurchase shares on the business day before the ex-date will receive the dividend. For example,if the ex-date is Monday, shares must be purchased by Friday (assuming that is a business dayrather than a holiday on which markets are closed) to receive the dividend (most globalmarkets are not open on Saturday and Sunday). The ex-dividend trading day is often des-ignated in the share price tables of business publications with an x in the volume column. Thisindicates that the monetary value of the upcoming dividend has been subtracted from theprevious day’s closing price. For example, if a share closes at $20 on Friday (the day beforethe ex-date) and the upcoming dividend is $0.25, then on Monday (the ex-date), all otherthings being equal, the shares will begin trading at $19.75. If it closes at $20 on Monday, thegain will be $0.25 for the day, even though the closing price is the same as it wasthe previous Friday.
3.3. Holder-of-Record Date
The holder-of-record date (also called the owner-of-record date, shareholder-of-record date,record date, date of record, or date of book closure) is typically two business days afterthe ex-dividend date. It is the date that a shareholder listed in the corporation’s records will bedeemed to have ownership of the shares for purposes of receiving the upcoming dividend.Although the ex-date is determined by the security exchange on which the shares are listed,the holder-of-record date is determined by the corporation.
3.4. Payment Date
The final pertinent date in the dividend chronology is the payment date (also called thepayable date). It is the day that the company actually mails out (or, more recently, elec-tronically transfers) the dividend payment. As discussed earlier, the company states thepayment date when the dividend declaration is made. Unlike other pertinent dates, such asthe ex-date and record date, which occur only on business days, the payment date can occuron a weekend or holiday. For example, a company may list its payment dates as 15 March, 15June, 15 September, and 15 December, even though some of those dates will inevitably fallon a Saturday, Sunday, or holiday.
3.5. Interval between Key Dates in the Dividend Payment Chronology
The time between the ex-date and the record date is fixed (generally at two business days)but the time between the other pertinent dates is determined by each company and can varysubstantially. For example, record dates typically occur anywhere from a week to a monthafter the declaration date but can occur later for less common irregular dividends, specialdividends, liquidating dividends, and stock dividends. Similarly, the time between the recorddate and the payment date is typically anywhere from a few days to a month or more. Most
12In most of the world’s equity markets, trades settle three business days after the trade date (“T þ 3settlement”), so a trade two business days before the record date settles one day too late for the buyer inthe trade to be recorded as an owner. The Hong Kong Stock Exchange, however, has T þ 2 settlement,so the ex-date is one business day before the record date.
c06 13 January 2012; 9:15:10
Chapter 6 Dividends and Share Repurchases: Basics 239

companies follow a fairly set routine for their regular cash dividends, whether quarterly,semiannual, or annual. Some business publications, such as The Value Line Investment Survey,include in their individual company reports the approximate date of a company’s next div-idend meeting, the ex-date, and the payment date. Example 6-3 deals with a typical dividendchronology time line.
EXAMPLE 6-3 NYSE Euronext Dividend Payment Time Line
On 1 May 2009, NYSE Euronext (NYSE Euronext: NYX), the largest global stockexchange, announced in both Paris and New York City its annual dividend of US$1.20,payable on a quarterly basis. The first quarterly dividend of $1.20/4¼ $0.30 waspayable on 30 June. The record date on the interim payment was 15 June, and the ex-dividend date was fixed at 11 June. Note that 11 June 2009 was a Thursday, so thesecond business day after the ex-day was Monday, 15 June 2009. Shareholders couldelect to be paid in U.S. dollars or in euros on the basis of exchange rates on the paymentdate. Draw a time line for the upcoming NYSE Euronext quarterly dividend.
Solution.
EXHIBIT 6-4 Time Line for a NYSE Euronext Quarterly Dividend
2009 1 May 11 June 15 June
Declaration Date Ex-DateHolder-of-Record
Date Payment Date
30 June
Source for data: www.nyse.com/press/1241172979897.html.
EXAMPLE 6-4 Capturing Dividends
In mid-2009, Paul Desroches, a France-based investor, is considering investment in theshares of Paris-headquartered Total SA (Euronext Paris: FP), one of the world’s largestintegrated oil companies and a major chemical manufacturer. Total pays a cash divi-dend twice a year, so the amount of the semiannual cash dividend is significant: almosta 3 percent cash dividend yield per six-month period, or 6 percent annually, based oncurrent share prices. Desroches reasons that Total’s high dividend yield is particularlyattractive in the 2009 context of low yields on short-term investment-grade bonds.
c06 13 January 2012; 9:15:11
240 Corporate Finance

4. SHARE REPURCHASES
A share repurchase (or buyback) is a transaction in which a company buys back its ownshares. Unlike stock dividends and stock splits, share repurchases use corporate cash. Hence,share repurchases can be viewed as an alternative to cash dividends. Shares that have been
Desroches decides to buy Total shares on the last possible trading day he can to receivean announced dividend. He explains to a colleague, “It would be like buying a bond onthe last day of a six-month period without having to pay the seller accrued interest yetreceiving the interest for the entire six months.”
On 15 May 2009, Total reported that shareholders had adopted the board ofdirectors’ resolution to pay a dividend of h1.14 per share in May 2009. The relevantdates are
Ex-date Tuesday, 19 May
Payment date Monday, 22 June
Using only the above information and ignoring taxes and any tax effects, addressthe following:
1. Assuming all of Desroches’s assumptions are correct, what is the last date he couldbuy the stock and still receive the dividend?
2. If Total closed at h38.39 a share on the last day Desroches was entitled to thedividend, what is the likely opening price on the next day assuming all other factorsare unchanged?
3. Critique Desroches’s statement.
Solution to 1. The day before the ex-date, or 18 May.
Solution to 2. The likely opening price on 19 May is h38.39 minus the dividend ofh1.14, or h37.25.13
Solution to 3. Assuming other factors do not change overnight and ignoring taxes,Desroches’s wealth position would be the same whether he bought the stock the daybefore the ex-date or on the ex-date. If he bought on 18 May, he would pay h38.39 buthave a h1.14 dividend receivable on 22 May, so his effective cost would be h38.39minus h1.14 or h37.25—the same as the estimated opening price the next trading day.Desroches’s statement did not take account of the expected ex-dividend date drop instock price.
13An advanced point outside the scope of this chapter is that tax effects may cause share price to drop byan amount that is different from the amount of the dividend on the ex-date.
c06 13 January 2012; 9:15:11
Chapter 6 Dividends and Share Repurchases: Basics 241

issued and subsequently repurchased are classified as treasury shares (treasury stock) or insome jurisdictions canceled; in either case they are not then considered for dividends, voting,or computing earnings per share.14
In contrast to the case of cash dividends, usage or growth in usage of share repurchases hashistorically required enabling regulation. In the United Kingdom, share repurchases becamelegal in 1981. They were never explicitly illegal in the United States15 but usage becamesubstantial only subsequent to U.S. Securities and Exchange Commission rule 10b–18 in 1982.(That rule protected repurchasing companies from charges of share manipulation if repurchaseswere conducted consistent with the terms of the rule.) Other markets in continental Europeand Asia have undertaken enabling regulation relatively recently (e.g., 1995 for Japan, 1998 forGermany and Singapore, 1999 for India and Norway, 2000 for Denmark and Sweden).16
Share repurchases in many markets remain subject to more restrictions than in the UnitedStates. Restrictions include requiring shareholder approval of share repurchase programs,limiting the percent of share repurchases to a certain fraction (often 10 percent) of outstandingshares, allowable repurchase mechanisms, and other restrictions serving to protect creditors.17
Share repurchases growth can be measured in relation to cash dividends. For the UnitedStates, in the early 1980s, cash dividends were approximately five times greater than themarket value of share repurchases. In the late 1990s and again in the first decade ofthe twenty-first century, the value of share repurchases often exceeded the value of cashdividends in the United States.18 In many other markets, such as Canada, the UnitedKingdom, Germany, France, Hong Kong, and Korea, use of share repurchases is becomingincreasingly common.
In general, when an amount of share repurchases is authorized, the company is notstrictly committed to carrying through with repurchasing shares. This situation contrasts withthe declaration of dividends, where that action does commit the company to pay the divi-dends. Another contrast with cash dividends is that whereas cash dividends are distributed toshareholders proportionally to their ownership percentage, share repurchases in general do notdistribute cash in such a proportionate manner. For example, if repurchases are executed by acompany via buy orders in the open market, cash is effectively being received by only thoseshareholders with concurrent sell orders.
Among the reasons that corporations have given for engaging in share repurchases are thefollowing:
! To communicate that management perceives shares in the company to be undervalued inthe marketplace or more generally to support share prices—this motivation was the mostfrequently mentioned by U.S. chief financial officers in one survey.19
! Flexibility in distributing cash to shareholders—share repurchases permit the company’smanagement flexibility as to amount and timing and are not perceived as establishing anexpectation that a level of repurchase activity will continue in the future.
14Across different markets, regulations differ on the permissible treatment of shares that have beenrepurchased.15See Grullon and Michaely (2002).16Sabri (2003).17See Vermaelen (2005), 31.18Brealey, Myers, and Marcus (2007), 432.19See Brav, Graham, Harvey, and Michaely (2005).
c06 13 January 2012; 9:15:11
242 Corporate Finance

! Tax efficiency in distributing cash, in markets in which the tax rate on cash dividendsexceeds the tax rate on capital gains.
! To absorb increases in shares outstanding resulting from the exercise of employee stockoptions.
Other motivations for a share repurchase are also possible. For example, share repurchasemight merely reflect that the corporation has accumulated more cash than it has profitableuses for and does not want to pay an extra cash dividend.
The next section presents the means by which a company may execute a share repurchaseprogram.
4.1. Share Repurchase Methods
Following are the four main ways that companies repurchase shares, listed in order ofimportance.
1. Buy in the open market. This method of share repurchase is the most common, withthe company buying its own shares as conditions warrant in the open market. Theopenmarket share repurchase method gives the company maximum flexibility. Open marketrepurchases are the most flexible option for a company because there is no legal obli-gation to undertake or complete the repurchase program—a company may not followthrough with an announced program for various reasons, such as unexpected cash needsfor liquidity, acquisitions, or capital expenditures. In the United States, open markettransactions do not require shareholder approval. Because shareholder approval isrequired in Europe, Vermaelen (2005) suggested that all companies have such authori-zation in place in case the opportunity to buy back undervalued shares occurs in thefuture.20 Authorizations to repurchase stock can last for years. In many shareholders’minds, the announcement of a repurchase policy provides support for the share price. Ifthe share repurchases are competently timed to minimize price impact and to exploitperceived undervaluation in the marketplace, this method is also relatively cost effective.
2. Buy back a fixed number of shares at a fixed price. Sometimes a company will make afixed price tender offer to repurchase a specific number of shares at a fixed price that istypically at a premium to the current market price. For example, in Australia, if a stockis selling at A$37 a share, a company might offer to buy back 5 million shares fromcurrent shareholders at A$40. If shareholders are willing to sell more than 5 millionshares, the company will typically buy back a pro rata amount from each shareholder. Bysetting a fixed date, such as 30 days in the future, a fixed price tender offer can beaccomplished quickly.
3. Dutch auction. A Dutch auction is also a tender offer to existing shareholders, butinstead of specifying a fixed price for a specific number of shares, the company stipulatesa range of acceptable prices. A Dutch auction uncovers the minimum price at which thecompany can buy back the desired number of shares with the company paying that priceto all qualifying bids. For example, if the stock price is A$37 a share, the company wouldoffer to buy back 5 million shares in a range of A$38 to A$40 a share. Each shareholder
20See Vermaelen (2005), 8.
c06 13 January 2012; 9:15:11
Chapter 6 Dividends and Share Repurchases: Basics 243

would then indicate the number of shares and the lowest price at which he or she wouldbe willing to sell. The company would then begin to qualify bids beginning with thoseshareholders who submitted bids at A$38 and continue to qualify bids at higher pricesuntil 5 million shares had been qualified. In our example, that price might be A$39.21
Shareholders who bid between A$38 and A$39, inclusive, would then be paid A$39 pershare for their shares. Like Method 2, Dutch auctions can be accomplished in a shorttime period.22
4. Repurchase by direct negotiation. In some markets, a company may negotiate with amajor shareholder to buy back its shares, often at a premium to the market price. Thecompany may do this to keep a large block of shares from overhanging the market (andthus acting to dampen the share price). A company may try to prevent an “activist”shareholder from gaining representation on the board of directors. In some of the moreinfamous cases, unsuccessful takeover attempts have ended with the company buyingback the would-be suitor’s shares at a premium to the market price in what is referredto as a greenmail transaction, often to the detriment of remaining shareholders.23 Ver-maelen (2005) reported, however, that 45 percent of private repurchases between 1984and 2001 were actually made at discounts, indicating that many direct negotiationrepurchases are generated by the liquidity needs of large investors who are in a weaknegotiating position.
Outside the United States and Canada, almost all share repurchases occur in the openmarket (Method 1), and not all the methods listed may be permissible according to localregulations.24
21Shareholders who set an A$39 price would be subject to a pro rata amount.22Vermaelen (2005), 7.23Greenmail is the purchase, usually at a substantial premium over market price, of the accumulatedshares of a hostile investor by a company that is targeted for takeover by that investor.24See Vermaelen (2005), 31.
EXAMPLE 6-5 BCII Considers Alternative Methodsof Share Repurchase
The board of directors of British Columbia Industries, Inc. (BCII), is considering a5 million common share repurchase program. BCII has a sizable cash and marketablesecurities portfolio. BCII’s current stock price is C$37. The company’s chief financialofficer wants to accomplish the share repurchases in a cost-effective manner. Someboard members want repurchases accomplished as quickly as possible, whereasother board members mention the importance of flexibility. Discuss the relativeadvantages of each of the following methods with respect to cost, flexibility, and speed:
c06 13 January 2012; 9:15:12
244 Corporate Finance

4.2. Financial Statement Effects of Repurchases
Share repurchases affect both the balance sheet and income statement. Both assets andshareholders’ equity decline if the repurchase is financed with cash. As a result, leverageincreases. Debt ratios (leverage) will increase even more if the repurchase is financedwith debt.
On the income statement, fewer shares outstanding could increase earnings per share(i.e., by reducing the denominator) depending on how and at what cost the repurchase isfinanced. We discuss the effects on the income statement and balance sheet in the followingsections.
4.2.1. Changes in Earnings per ShareOne rationale for share repurchases often cited by corporate financial officers and someinvestment analysts is that reducing the number of shares outstanding can increase earningsper share (EPS). Assuming a company’s net income does not change (or even that any declineis less than proportional to the decrease in outstanding shares after the buyback), a smallernumber of shares after the buyback may produce a higher EPS (because EPS is net incomedivided by the number of shares outstanding).
Examples 6-6 and 6-7 show changes in EPS resulting from alternative methods offinancing a share repurchase.
1. Open market share repurchases2. A fixed price tender offer3. Dutch auction tender offer
Solution to 1. Open market share repurchases give the company the most flexibility.BCII can time repurchases, making repurchases when the market prices its stock belowits perceived intrinsic value. BCII can also change amounts repurchased or even notexecute the repurchase program. Open market repurchases are typically made oppor-tunistically, with cost a more important consideration than speed. Because open marketrepurchases can be conducted to minimize any effects on price and can be timed toexploit prices that are perceived to be below intrinsic value, this method is also relativelycost effective.
Solution to 2. A fixed price tender offer can be accomplished quickly, but the companyusually has to offer a premium.
Solution to 3. Dutch auctions have become quite popular in some markets because theygenerally enable a company to do the buyback at a lower price than with a fixed pricetender offer. For example, a fixed price tender offer for 5 million shares at C$40 wouldcost BCII C$200 million. If the Dutch auction were successful at C$38, the costwould be C$190 million, a savings of C$10 million. Similar to fixed price tender offers,Dutch auctions can be accomplished quickly.
c06 13 January 2012; 9:15:12
Chapter 6 Dividends and Share Repurchases: Basics 245

In the absence of idle cash and equivalents, companies may fund share repurchases byusing long-term debt. Example 6-7 shows that any increase in EPS is dependent on thecompany’s after-tax borrowing rate on the funds used to repurchase stock.
EXAMPLE 6-6 Share Repurchase Using Idle Cash
Takemiya Industries, a Japanese company, has been accumulating cash in recent yearswith a plan of expanding in emerging Asian markets. The global recession has per-suaded Takemiya’s management and directors that such expansion is no longer prac-tical, and they are considering a share repurchase using surplus cash. Takemiya has 10million shares outstanding and its net income is f100 million. Takemiya’s share price isf120. Cash not needed for operations totals f240 million and is invested in Japanesegovernment short-term securities that earn virtually zero interest. For a share repurchaseprogram of the contemplated size, Takemiya’s investment bankers think the stock couldbe bought in the open market at a f20 premium to the current market price, or f140 ashare. Calculate the impact on EPS if Takemiya uses the surplus cash to repurchaseshares at f140 per share.25
Solution: First, note that current EPS¼ (f100 million net income)/(10 millionshares)¼ f10.00. If Takemiya repurchases shares, net income is unchanged at f100million. A share repurchase at f140 a share reduces share count by approximately 1.7million shares (f240,000,000/f140) so that 8.3 million shares remain outstanding.Thus, after the share repurchase, EPS should be (f100 million)/(8.3 million shares)¼ f12.00, approximately. EPS would increase by 20 percent as a result of the sharerepurchase. Note that EPS would increase even more if the open market purchases wereaccomplished at the prevailing market price without the premium.
25Accounting principles in some countries require that the calculation of EPS in a given year be on thebasis of the weighted average number of shares outstanding during the year. For purposes of illustration,we ignore that convention in our examples.
EXAMPLE 6-7 Share Repurchases Using Borrowed Funds
Jensen Farms, Inc., plans to borrow $12 million, which it will use to repurchase shares.The following information is given:
! Share price at time of share repurchase¼ $60! Earnings after-tax¼ $6.6 million! EPS before share repurchase¼ $3! Price/Earnings ratio (P/E)¼ $60/$3¼ 20
c06 13 January 2012; 9:15:12
246 Corporate Finance

In summary, a share repurchase may increase, decrease, or have no effect on EPS. Theeffect depends on whether the repurchase is financed internally or externally. In the case ofinternal financing, a repurchase increases EPS only if the funds used for the repurchase wouldnot earn their cost of capital if retained by the company.27 In the case of external financing,the effect on EPS is positive if the earnings yield exceeds the after-tax cost of financing the
! Earnings yield (E/P)¼ $3/$60¼ 5%26
! Shares outstanding¼ 2.2 million! Planned share repurchase¼ 200,000 shares
1. Calculate the EPS after the share repurchase, assuming the after-tax cost of bor-rowing is the company’s customary after-tax borrowing rate of 5 percent.
2. Calculate the EPS after the share repurchase, assuming the company’s borrowingrate increases to 6 percent because of the increased financial risk of borrowing the$12 million.
Solution to 1.EPS after buyback¼ (Earnings – After-tax cost of funds)/Shares outstanding after
buyback
¼ ½$6:6 million" ð$12 million3 0:05Þ(=2 million shares
¼ ½$6:6 million" ð$0:6 millionÞ(=2 million shares
¼ $6:0 million=2 million shares
¼ $3:00
With the after-tax cost of borrowing at 5 percent, the share repurchase has no effect onthe company’s EPS. Note that the stock’s earnings yield, the ratio of earnings per share toshare price or E/P, was $3/$60¼ 0.05 or 5 percent, equal to the after-tax cost of debt.
Solution to 2.EPS after buyback¼ (Earnings – After-tax cost of funds)/Shares outstanding after
buyback
¼ ½$6:6 million" ð$12 million3 0:06Þ(=2 million shares
¼ ½$6:6 million" ð$0:72 millionÞ(=2 million shares
¼ $5:88 million=2 million shares
¼ $2:94
Note that in this case, the after-tax cost of debt, 6 percent, is greater than the 5percent earnings yield, and a reduction in EPS resulted.
26The E/P is the reciprocal of the price-to-earnings ratio, P/E.27See Cornell (2009).
c06 13 January 2012; 9:15:13
Chapter 6 Dividends and Share Repurchases: Basics 247

repurchase. In Example 6-7, when the after-tax borrowing rate equaled the earnings yield of 5percent, EPS was unchanged as a result of the buyback. Any after-tax borrowing rate abovethe earnings yield would result in a decline in EPS, whereas an after-tax borrowing rate lessthan the earnings yield would result in an increase in EPS.
These relationships should be viewed with caution so far as any valuation implications areconcerned. Notably, to infer that an increase in EPS indicates an increase in shareholders’wealth would be incorrect. For example, the same idle cash could also be distributed as a cashdividend. Informally, if one views the total return on a stock as the sum of the dividend yieldand a capital gains return, any capital gains as a result of the boost to EPS from the sharerepurchase may be at the expense of an offsetting loss in terms of dividend yield.
4.2.2. Changes in Book Value per SharePrice to book value per share is a popular ratio used in equity valuation. The followingexample shows the impact of a share repurchase on book value per share (BVPS).
EXAMPLE 6-8 The Effect of a Share Repurchase on BookValue per Share
The market price of both Company A’s and Company B’s common stock is $20 ashare, and each company has 10 million shares outstanding. Both companieshave announced a $5 million buyback. The only difference is that Company A has amarket price per share greater than its book value per share, whereas Company B hasa market price per share less than its book value per share:
! Company A has a book value of equity of $100 million and BVPS of $100 million/10million shares¼ $10. The market price per share of $20 is greater than BVPS of $10.
! Company B has a book value of equity of $300 million and BVPS of $300 million/10 million shares¼ $30. The market price per share of $20 is less than BVPS of $30.
Both companies
! Buy back 250,000 shares at the market price per share ($5 million buyback/$20 pershare¼ 250,000 shares).
! Are left with 9.75 million shares outstanding (10 million pre-buyback shares – 0.25million repurchased shares¼ 9.75 million shares).
After the share repurchase:
! Company A’s shareholders’ equity at book value falls to $95 million ($100 million –$5 million), and its book value per share decreases from $10 to $9.74 (shareholders’equity/shares outstanding¼ $95 million/9.75 million shares¼ $9.74).
! Company B’s shareholders’ equity at book value falls to $295 million ($300 million –$5 million), and its book value per share increases from $30 to $30.26 (shareholders’equity/shares outstanding¼ $295 million/9.75 million¼ $30.26).
c06 13 January 2012; 9:15:13
248 Corporate Finance
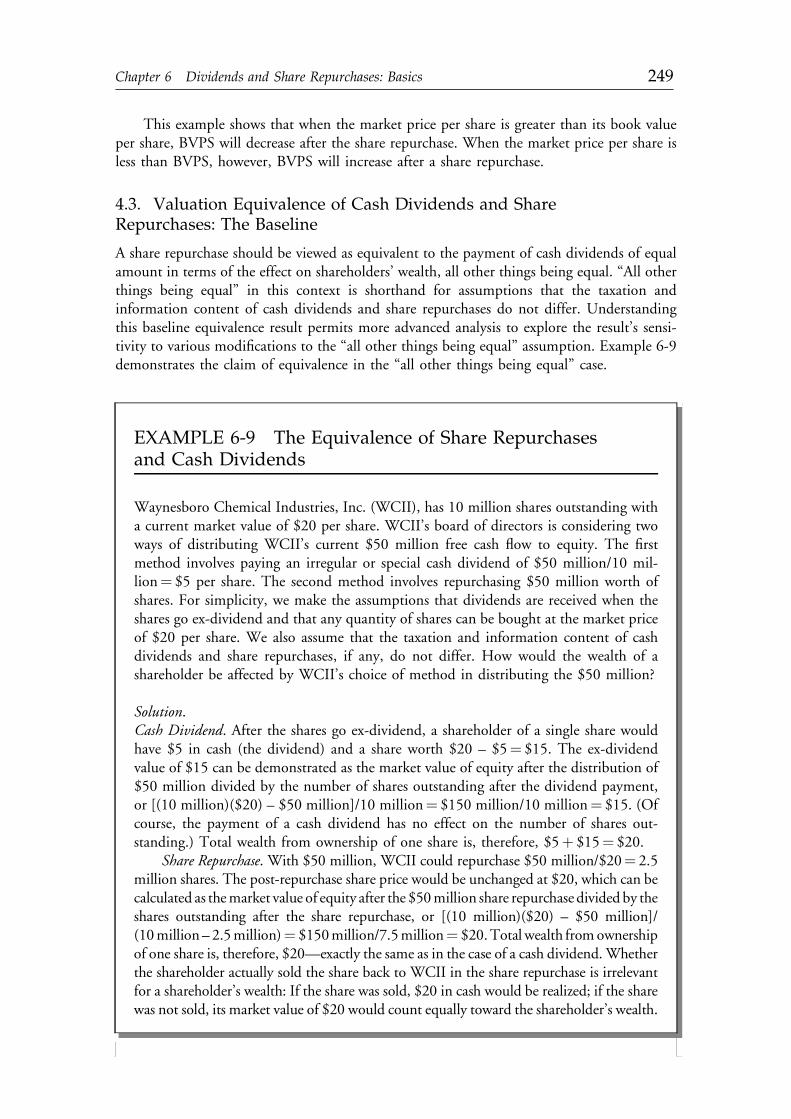
This example shows that when the market price per share is greater than its book valueper share, BVPS will decrease after the share repurchase. When the market price per share isless than BVPS, however, BVPS will increase after a share repurchase.
4.3. Valuation Equivalence of Cash Dividends and ShareRepurchases: The Baseline
A share repurchase should be viewed as equivalent to the payment of cash dividends of equalamount in terms of the effect on shareholders’ wealth, all other things being equal. “All otherthings being equal” in this context is shorthand for assumptions that the taxation andinformation content of cash dividends and share repurchases do not differ. Understandingthis baseline equivalence result permits more advanced analysis to explore the result’s sensi-tivity to various modifications to the “all other things being equal” assumption. Example 6-9demonstrates the claim of equivalence in the “all other things being equal” case.
EXAMPLE 6-9 The Equivalence of Share Repurchasesand Cash Dividends
Waynesboro Chemical Industries, Inc. (WCII), has 10 million shares outstanding witha current market value of $20 per share. WCII’s board of directors is considering twoways of distributing WCII’s current $50 million free cash flow to equity. The firstmethod involves paying an irregular or special cash dividend of $50 million/10 mil-lion¼ $5 per share. The second method involves repurchasing $50 million worth ofshares. For simplicity, we make the assumptions that dividends are received when theshares go ex-dividend and that any quantity of shares can be bought at the market priceof $20 per share. We also assume that the taxation and information content of cashdividends and share repurchases, if any, do not differ. How would the wealth of ashareholder be affected by WCII’s choice of method in distributing the $50 million?
Solution.Cash Dividend. After the shares go ex-dividend, a shareholder of a single share wouldhave $5 in cash (the dividend) and a share worth $20 – $5¼ $15. The ex-dividendvalue of $15 can be demonstrated as the market value of equity after the distribution of$50 million divided by the number of shares outstanding after the dividend payment,or [(10 million)($20) – $50 million]/10 million¼ $150 million/10 million¼ $15. (Ofcourse, the payment of a cash dividend has no effect on the number of shares out-standing.) Total wealth from ownership of one share is, therefore, $5þ $15¼ $20.
Share Repurchase. With $50 million, WCII could repurchase $50 million/$20¼ 2.5million shares. The post-repurchase share price would be unchanged at $20, which can becalculated as themarket value of equity after the $50million share repurchase divided by theshares outstanding after the share repurchase, or [(10 million)($20) – $50 million]/(10million – 2.5million)¼ $150million/7.5million¼ $20.Total wealth fromownershipof one share is, therefore, $20—exactly the same as in the case of a cash dividend. Whetherthe shareholder actually sold the share back to WCII in the share repurchase is irrelevantfor a shareholder’s wealth: If the share was sold, $20 in cash would be realized; if the sharewas not sold, its market value of $20 would count equally toward the shareholder’s wealth.
c06 13 January 2012; 9:15:13
Chapter 6 Dividends and Share Repurchases: Basics 249

The theme of Example 6-9 is that a company should not expect to create or destroyshareholder wealth merely by its method of distributing money to shareholders (i.e., by sharerepurchases as opposed to cash dividends).28 Example 6-10 illustrates that if a companyrepurchases shares from an individual shareholder at a negotiated price representing a pre-mium over the market price, the remaining shareholders’ wealth is reduced.
5. CONCLUDING REMARKS
The question of the valuation implications of share repurchases and dividends is of greatinterest to investors but outside the scope of the current chapter. Many investors and cor-porate managers, however, believe that share repurchases have, on average, a net positive effecton shareholder value. Vermaelen (2005) reviewed major studies and found that sharerepurchase announcements are accompanied by significant positive excess returns botharound the announcement date and for the next two years—and in some studies, five years.
EXAMPLE 6-10 Direct Negotiation: A Share RepurchaseThat Transfers Wealth
Florida Citrus (FC) common shares sell at $20, and there are 10 million shares out-standing. Management becomes aware that Kirk Parent recently purchased a majorposition in its outstanding shares with the intention of influencing the businessoperations of FC in ways the current board does not approve. An adviser to the boardhas suggested approaching Parent privately with an offer to buy back $50 million worthof shares from him at $25 per share, which is a $5 premium over the current marketprice. The board of FC declines to do so because of the effect of such a repurchase onFC’s other shareholders. Determine the effect of the proposed share repurchase on thewealth of shareholders other than Parent.
Solution. With $50 million, FC could repurchase $50 million/$25¼ 2 million sharesfrom Parent. The post-repurchase share price would be $18.75, which can be calculatedas the market value of equity after the $50 million share repurchase divided by theshares outstanding after the share repurchase, or [(10 million)($20) – $50 million]/(10 million – 2 million)¼ $150 million/8 million¼ $18.75. Shareholders other thanParent would lose $20 – $18.75¼ $1.25 for each share owned. Although this sharerepurchase would conserve total wealth (including Parent’s), it effectively transferswealth to Parent from the other shareholders.
28Oded and Michel (2008) lend support to the argument of value neutrality. Using a simulation, aswell as the example of ExxonMobil, they find that no difference exists in shareholder wealth over aperiod of years regardless of whether a company used its cash to repurchase shares or pay dividends, orhoarded the cash.
c06 13 January 2012; 9:15:13
250 Corporate Finance

An explanation consistent with that finding is that managements tend to buy back their stockwhen it is undervalued in the marketplace and issue stock when it is overvalued.
Likewise, dividend initiations and unexpected increases in dividends are frequentlyassociated with positive excess returns. The most common explanation relates to the infor-mation that dividends may be perceived to carry because management and the board ofdirectors are presumed to know more than outsiders about a company’s finances andopportunities. Investors may share the view of one money manager that “dividends are awonderful gauge for management’s confidence in forward-looking profitability.”29 Empiricalsupport exists for the notion that managements justifiably feel more confident about theircompany’s future when they pay a cash dividend for the first time. In a study of U.S. equities,Healy and Palepu (1988) found that company earnings increased by an average of 43 percentin the year of dividend initiation and 164 percent in the subsequent four years. Furthermore,the announcement of the initiation of a regular cash dividend was accompanied by an excessreturn of 4 percent on average. One possible reason might be that cash dividends broaden thepotential market for a company’s shares. Some institutional investors are governed by bylawsthat require them to invest only in dividend-paying shares. The observations in Example 6-11support these ideas.
6. SUMMARY
A company’s cash dividend payments and share repurchase policies, taken together, constituteits payout policy. Both entail the distribution of the company’s cash to its shareholders. Aftermanagement’s decision on capital expenditures and how to fund those expenditures, payout
EXAMPLE 6-11 Information in Dividend Initiations
A. Oracle Corporation, a leading business software maker, initiated a $0.05 quarterlydividend in May 2009. Oracle’s annual $0.20 dividend amounts to about $1billion, a relatively small amount compared with operating cash flow of $8 billionand another $9 billion in cash and cash-equivalent assets on its balance sheet at theend of fiscal year 2009. An analyst who follows Oracle for institutional investorssaw the Oracle announcement as a signal that the company is well positioned toride out the downturn and also gain market share.30
B. In mid-2009, Paris-based Groupe Eurotunnel announced its first ever dividendafter it completed a debt restructuring and received insurance proceeds resultingfrom a fire that had closed the Channel Tunnel. In a 2 June 2009 press release,Eurotunnel’s CEO said that this “marked a turning point for the company as itsbusiness has returned to the realm of normality,” as the company anticipated areturn to profitability.
29Robert Arnott, quoted in the New York Times (3 May 2009):BU7.30Wall Street Journal (19 March 2009):B1.
c06 13 January 2012; 9:15:14
Chapter 6 Dividends and Share Repurchases: Basics 251

policy is perhaps the most important decision sent to the board of directors for approval. InEurope and Asia, shareholders often vote on the board’s recommendation. This chapter hasmade the following points:
! Dividends can take the form of regular or irregular cash payments, stock dividends, orstock splits. Only cash dividends are payments to shareholders. Stock dividends andsplits merely carve equity into smaller pieces and do not create wealth for shareholders.Reverse stock splits usually occur after a stock has dropped to a very low price and donot affect shareholder wealth—they represent cosmetic repackaging of shareholderequity.
! Regular cash dividends—unlike irregular cash dividends, stock splits, and stock divi-dends—represent a commitment to pay cash to stockholders on a quarterly, semiannual, orannual basis.
! The key dates for cash dividends, stock dividends, and stock splits are the declaration date,the ex-date, the shareholder-of-record date, and the payment date. Share price will reflectthe amount of the cash payment (or shares in the case of a stock dividend or split) on theex-date.
! Share repurchases, or buybacks, most often occur in the open market. Alternatively, tenderoffers occur at a fixed price or at a price range through a Dutch auction. Shareholders whodo not tender increase their relative position in the company. Direct negotiations withmajor shareholders to get them out of the company are less common because they coulddestroy value for remaining stockholders.
! Share repurchases made with excess cash have the potential to increase earnings per share,whereas share repurchases made with borrowed funds can increase, decrease, or not affectearnings per share, depending on the after-tax borrowing rate.
! A share repurchase is equivalent to the payment of a cash dividend of equal amount in itseffect on shareholders’ wealth, all other things being equal.
! If the buyback market price is greater (less) than the book value, the book value will decline(increase).
! Announcement of a share repurchase is sometimes accompanied by positive excess returnsin the market when the market price is viewed as reflecting management’s view that thestock is undervalued, and earnings per share can increase as a result of fewer sharesoutstanding.
! Initiation of regular cash dividends can also have a positive impact on share value. Man-agement is seen as having enough confidence in the future to make a commitment to payout cash to shareholders. In addition, some institutional, as well as individual, shareholderssee regular cash dividend payments as a measure of investment quality.
PROBLEMS
1. The payment of a 10% stock dividend by a company will result in an increase in thatcompany’s:A. current ratio.B. financial leverage.C. contributed capital.
c06 13 January 2012; 9:15:14
252 Corporate Finance

2. If a company’s common shares trade at relatively very low prices, that company would bemost likely to consider the use of a:A. stock split.B. stock dividend.C. reverse stock split.
3. In a recent presentation, Doug Pearce made two statements about dividends:Statement 1: “A stock dividend will increase share price, all other things being equal.”Statement 2: “One practical concern with a stock split is that it will reduce the company’sprice-to-earnings ratio.”
Are Pearce’s two statements about the effects of the stock dividend and stock splitcorrect?A. No for both statements.B. Yes for Statement 1 and No for Statement 2.C. No for Statement 1 and Yes for Statement 2.
4. All other things being equal, the payment of an internally financed cash dividend is mostlikely to result in:A. a lower current ratio.B. a higher current ratio.C. the same current ratio.
5. The calendar dates in Column 1 are potentially significant dates in a typical dividend chro-nology. Column 2 lists descriptions of these potentially significant dates (in random order).
Column 1 Column 2
Friday, 10 June A. Holder-of-record date
Thursday, 23 June B. Declaration date
Friday, 24 June C. Payment date
Tuesday, 28 June D. Ex-dividend date
Sunday, 10 July E. Last day shares trade with the right to receive the dividend
Match the significance of these typical dividend chronology dates by placing the correctletter of the description by the appropriate date. Use the template for your answer.
Dividend Chronology
Friday, 10 June
Thursday, 23 June
Friday, 24 June
Tuesday, 28 June
Sunday, 10 July
6. Mary Young intends to take a position in Megasoft Industries once Megasoft beginspaying dividends. A dividend of C$4 is payable by Megasoft on 2 December. The
c06 13 January 2012; 9:15:14
Chapter 6 Dividends and Share Repurchases: Basics 253

ex-dividend date for the dividend is 10 November, and the holder-of-record date is 12November. What is the last possible date for Young to purchase her shares if she wants toreceive the dividend?A. 9 November.B. 10 November.C. 12 November.
7. Aiken Instruments (AIK) has recently declared a regular quarterly dividend of $0.50,payable on 12 November, with an ex-dividend date of 28 October. Which date belowwould be the holder-of-record date assuming all the days listed are business days and thattrades settle three business days after the trade date?A. 27 October.B. 30 October.C. 11 November.
8. A company has 1 million shares outstanding and earnings are d2 million. The companydecides to use d10 million in idle cash to repurchase shares in the open market. Thecompany’s shares are trading at d50 per share. If the company uses the entire d10 millionof idle cash to repurchase shares at the market price, the company’s earnings per sharewill be closest to:A. d2.00.B. d2.30.C. d2.50.
9. Devon Ltd. common shares sell at $40 a share and their estimated price-to-earnings ratio(P/E) is 32. If Devon borrows funds to repurchase shares at its after-tax cost of debt of5%, its EPS is most likely to:A. increase.B. decrease.C. remain the same.
10. A company can borrow funds at an after-tax cost of 4.5%. The company’s stock price is$40 per share, earnings per share is $2.00, and the company has 15 million sharesoutstanding. If the company borrows just enough to repurchase 2 million shares of stockat the prevailing market price, that company’s earnings per share is most likely to:A. increase.B. decrease.C. remain the same.
11. Crozet Corporation plans to borrow just enough money to repurchase 100,000 shares.The following information relates to the share repurchase:
Shares outstanding before buyback 3.1 million
Earnings per share before buyback $4.00
Share price at time of buyback $50
After-tax cost of borrowing 6%
c06 13 January 2012; 9:15:15
254 Corporate Finance

Crozet’s earnings per share after the buyback will be closest to:A. $4.03.B. $4.10.C. $4.23.
12. A company with 20 million shares outstanding decides to repurchase 2 million shares atthe prevailing market price of h30 per share. At the time of the buyback, the companyreports total assets of h850 million and total liabilities of h250 million. As a result of thebuyback, that company’s book value per share will most likely:A. increase.B. decrease.C. remain the same.
13. An analyst gathered the following information about a company:
Number of shares outstanding 10 million
Earnings per share $2.00
P/E 20
Book value per share $30
If the company repurchases 1 million shares at the prevailing market price, theresulting book value per share will be closest to:A. $26.B. $27.C. $29.
14. If a company’s objective is to support its stock price in the event of a market downturn, itwould be advised to authorize:A. a Dutch auction tender offer effective in 30 days.B. a tender offer share repurchase at a fixed price effective in 30 days.C. an open market share repurchase plan to be executed over the next five years.
15. A company has positive free cash flow and is considering whether to use the entireamount of that free cash flow to pay a special cash dividend or to repurchase shares at theprevailing market price. Shareholders’ wealth under the two options will be equivalentunless the:A. company’s book value per share is less than the prevailing market price.B. company’s book value per share is greater than the prevailing market price.C. tax consequences and/or information content for each alternative is different.
16. Assume that a company is based in a country that has no taxes on dividends or capitalgains. The company is considering either paying a special dividend or repurchasing itsown shares. Shareholders of the company would have:A. greater wealth if the company repurchased its shares.B. greater wealth if the company paid a special cash dividend.C. the same wealth under either a cash dividend or share repurchase program.
c06 13 January 2012; 9:15:15
Chapter 6 Dividends and Share Repurchases: Basics 255

c06 13 January 2012; 9:15:15

CHAPTER 7DIVIDENDS AND SHARE
REPURCHASES: ANALYSIS1
Gregory Noronha, CFATacoma, Washington, U.S.A.
George H. Troughton, CFAAnthem, Arizona, U.S.A.
LEARNING OUTCOMES
After completing this chapter, you will be able to do the following:
! Compare theories of dividend policy and explain implications of each for share value, givena description of a corporate dividend action.
! Describe types of information (signals) that dividend initiations, increases, decreases, andomissions may convey.
! Explain how clientele effects and agency issues may affect a company’s payout policy.! Explain factors that affect dividend policy.! Calculate and interpret the effective tax rate on a given currency unit of corporate earnings
under double-taxation, split-rate, and tax imputation dividend tax regimes.! Compare stable dividend, target payout, and residual dividend policies and calculate the
dividend under each policy.! Explain the choice between paying cash dividends and repurchasing shares.! Describe global trends in corporate dividend policies.! Calculate and interpret dividend coverage ratios based on (1) net income and (2) free
cash flow.! Identify characteristics of companies that may not be able to sustain their cash dividend.
1CFA Institute gratefully acknowledges the contributions of Catherine E. Clark, CFA, as co-author of aprior version of this chapter.
257
c07 13 January 2012; 9:16:37

1. INTRODUCTION
One of the longest running debates in corporate finance concerns the impact, if any, oncommon shareholders’ wealth of a company’s payout policy (i.e., the principles by which acompany distributes cash to common shareholders by means of cash dividends and/or sharerepurchases).2 Payout decisions, along with financing (capital structure) decisions, generallyinvolve the board of directors and most senior levels of management and are closely watchedby investors and analysts. This chapter introduces the theory and practice of dividend policywith reference to world markets.
This chapter is organized as follows: In Section 2, we present theories of the effects ofdividend policy on company value. In Section 3, we discuss factors that affect dividend policy.In Section 4, we cover the types of dividend policies, the dividend-share repurchase decision,and global trends in payout policy. Section 5 covers analysis of dividend safety, and con-clusions and summary are in Section 6.
2. DIVIDEND POLICY AND COMPANY VALUE: THEORY
Over the past 40 years, financial theorists have debated the extent to which dividend policyshould and does matter to a company’s shareholders. One group of theorists believes thatdividend policy is irrelevant to shareholders. This group typically holds that only the decisionsof the company that are directly related to investment in working and fixed capital affectshareholders’ wealth. A second group holds that dividend policy does matter to investors, forone or more reasons, and that a company can affect shareholders’ wealth through its dividendpolicy. Typically, dividend relevance is attributed to either a presumption that investors valuea unit of dividends more highly than an equal amount of uncertain capital gains, or to one ormore market imperfections. Such imperfections include taxes (in which a given amount ofdividends is taxed differently than an equal amount of capital gains), asymmetric information(specifically, that corporate insiders are better informed about their company’s prospects thanoutside investors), and agency costs (in particular, that management has a tendency tosquander extra cash). We examine these positions and the assumptions that underlie them inthe following subsections.
2.1. Dividend Policy Does Not Matter
In a 1961 paper, Miller and Modigliani (“MM”) argued that in a world without taxes,transaction costs, and equal (“symmetric”) information among all investors—that is, underperfect capital market assumptions—a company’s dividend policy should have no impact onits cost of capital or on shareholder wealth.3 Their argument begins by assuming a companyhas a given capital budget (e.g., it accepts all projects with a positive net present value [NPV]),and that its current capital structure and debt ratio are optimal. Another way of stating this
2The term payout policy, or sometimes distribution policy, is more general than dividend policy because itreflects the fact that companies can return cash to shareholders by means of share repurchases and cashdividends.3See Miller and Modigliani (1961).
c07 13 January 2012; 9:16:38
258 Corporate Finance

argument is that the dividend decision is independent of a company’s investment andfinancing decisions. For example, suppose that a company decided to pay out all of itsearnings as dividends. To finance capital projects, it could issue additional common shares inthe amount of its capital budget (such financing would keep its capital structure unchanged).The value of the newly issued shares would exactly offset the value of the dividend. Thus, if acompany paid out a dividend that represented 5 percent of equity, its share price would beexpected to drop by 5 percent. If a common stock in Australia is priced at A$20 before an A$1a share dividend, the implied new price would be A$19. The shareholder has assets worthA$20 if the dividend is not paid or assets worth A$20 if the stock drops to A$19 and an A$1dividend is paid.
Note that under the MM assumptions, there is no meaningful distinction betweendividends and share repurchases (repurchases of outstanding common shares by the issuingcompany)—they are both ways for a company to return cash to shareholders. If a companyhad few investment opportunities such that its current cash flow was more than that neededfor positive NPV projects, it could distribute the excess cash flow via a dividend or a sharerepurchase. Shareholders selling shares would receive A$20 a share, and shareholders notselling would hold shares whose value continued to be A$20. To see this, suppose thecompany being discussed has 10,000 shares outstanding, a current free cash flow ofA$10,000, and the present value of its future cash flows is A$190,000. Thus, the share price is(A$10,000þA$190,000)/10,000¼A$20. Now if the company uses the free cash flow torepurchase shares, in lieu of paying a dividend of A$1, it will repurchase 500 shares(A$10,000/A$20¼ 500). The 9,500 shares left outstanding have a claim on the A$190,000future cash flow, which results in a share price of A$20.
An intuitive understanding of MM dividend irrelevance also follows from the conceptof a “homemade dividend.”4 In a world with no taxes or transactions costs, if shareholderswanted or needed income, they could construct their own dividend policy by selling suf-ficient shares to create their desired cash flow stream. Using the example above, assume thecompany did not pay the A$1 dividend and the stock remained at A$20. A holder of 1,000shares who desired A$1,000 in cash could sell 50 shares at A$20, thereby reducing his or herholdings to 950 shares. Note that by reducing share holdings, second period dividendincome is reduced: higher dividend income in one period is at the expense of exactly off-setting lower dividend income in subsequent periods. The irrelevance argument does notstate that dividendsper seare irrelevant to share value but that dividend policy is irrelevantbecause by taking the earning power of assets as a given and assuming perfect capitalmarkets, policy alternatives merely involve trade-offs of different dividend streams of equalpresent value.
In the real world, there are market imperfections that create some problems for MM’sdividend policy irrelevance propositions. First, both companies and individuals incur trans-actions costs. A company issuing new shares incurs flotation costs (i.e., costs in selling sharesto the public that include underwriters’ fees, legal costs, registration expenses, and possiblenegative price effects) often estimated to be as much as 4 percent to 10 percent of the capital
4MM use a similar idea in their irrelevance proposition for capital structure—that of “homemadeleverage.” If a shareholder can undo anything a company does at no cost, then it follows that whateverthe company does in terms of capital structure or dividend decisions should not have an impact onshareholder value because the shareholder can always alter the outcome to suit his or her own needs.Thus, under the MM assumptions, only investment decisions, which determine the amount of futurecash flows from operations, have an effect on company value.
c07 13 January 2012; 9:16:38
Chapter 7 Dividends and Share Repurchases: Analysis 259

raised, depending on the size of the company and the size of the issue.5 Shareholders sellingshares to create a “homemade” dividend would incur transaction costs and, in some countries,capital gains taxes (of course, cash dividends incur taxes in most countries). Furthermore,selling shares on a periodic basis to create an income stream of dividends can be problematicover time if share prices are volatile. If share prices decline, shareholders have to sell moreshares to create the same dividend stream.
2.2. Dividend Policy Matters: The Bird-in-the-Hand Argument
Financial theorists, such as Myron Gordon (1963), John Lintner (1962), and BenjaminGraham (1934), have argued that, even under perfect capital markets assumptions, investorsprefer a dollar of dividends to a dollar of potential capital gains from reinvesting earningsbecause they view dividends as less risky. Graham’s viewpoint is that “. . . the typical dollar ofreinvestment has less economic value to the shareholder than a dollar paid in dividends.”6 TheGordon, Lintner, and Graham arguments are similar and have sometimes been calledthe “bird in the hand” argument, a reference to the proverb, “A bird in the hand is worth twoin the bush.” By assuming that a given amount of dividends is less risky than the same amountof capital gains, the argument is that a company that pays dividends will have a lower cost ofequity capital than an otherwise similar company that does not pay dividends; the lower costof equity should result in a higher share price. MM contend that this argument is incorrectbecause, under their assumptions, paying or increasing the dividend today does not affectthe risk of future cash flows. Such actions only lower the ex-dividend price of the share (theex-dividend price is the share price when the share first trades without the right to receive anupcoming dividend).
2.3. Dividend Policy Matters: The Tax Argument
In some countries, dividend income has traditionally been taxed at higher rates than capitalgains. For instance in the 1970s, tax rates on dividend income in the United States were ashigh as 70 percent whereas the long-term capital gains rate was 35 percent. Even as recentlyas 2002, U.S. tax rates were as high as 39.1 percent on dividends and 20 percent on long-termcapital gains. (From 2003 to 2010, dividends and long-term capital gains were taxed at15 percent in the United States.)
An argument could be made that in a country that taxes dividends at higher rates thancapital gains, taxable investors should prefer companies that pay low dividends and reinvestearnings in profitable growth opportunities. Presumably, any growth in earnings in excess ofthe opportunity cost of funds would translate into a higher share price. If, for any reason,a company lacked growth opportunities sufficient to consume its annual retained earnings, itcould distribute such funds through share repurchases (again, the assumption is that capitalgains are taxed more lightly than dividends). Taken to its extreme, this argument wouldadvocate a zero payout ratio. Real world market considerations may complicate the picture;for example, in some jurisdictions, governmental regulation may preclude companies from
5Because net income is calculated after payment of interest, net income is considered a flow to equity orinternally generated equity. New share issuance—externally generated equity—is thus the closestfinancing substitute to internally generated equity. Dividends also may be financed with debt (if bondcovenants permit), which is subject to flotation costs.6Graham, Dodd, Cottle, and Tatham (1962), 486.
c07 13 January 2012; 9:16:38
260 Corporate Finance

never distributing excess earnings as dividends or deeming share repurchases to be dividends ifthe repurchases appear to be ongoing in lieu of dividend payments.
2.4. Other Theoretical Issues
In the following section, we present other important issues that arise in theory of dividendpolicy.
2.4.1. Clientele EffectAnother factor that may affect a company’s dividend policy is a clientele effect. In thiscontext, a clientele effect is the existence of groups of investors (clienteles) attracted by (anddrawn to invest in) companies with specific dividend policies.
For example, some retired investors may have a preference for higher current income andprefer to hold stocks with relatively high dividend payouts and yields. Alternatively, otherinvestor groups, such as younger workers with a long time horizon, might favor owning sharesof companies that reinvest a high proportion of their earnings for long-term capital growthand thus prefer stocks that pay little or no dividends.
When the investor’s marginal tax rate on capital gains (i.e., the tax on the next euro of capitalgains) is lower than the marginal tax rate on dividends (i.e., the tax on the next euro of dividends),the investormay be influenced by tax considerations to have a preference for returns in the form ofcapital gains. All else being equal, however, tax-exempt investors would be expected to be indif-ferent about returns in the forms of capital gains or dividends from a tax perspective. Taxableinvestors might be similarly indifferent regarding investments held in tax-exempt accounts.
Many investors indicate a preference for dividends. Some institutional investors, includingcertain mutual funds, banks, and insurance companies, will only invest in companies that pay adividend. Some investors require a specific minimum dividend yield or require that the dividendyield be in the top quartile (or half) of the relevant stock universe. Some mutual funds andexchange-traded funds specifically seek high dividend yield. Various high-yield equity indicesexist in response to this demand (e.g., the Dow Jones Select Dividend Index family or theMSCIHighDividend Yield Indices). Trusts and foundationsmay be under a restriction that onlyincome (i.e., interest and dividends) may be distributed to beneficiaries. Some individual inves-tors use a discipline of “only spend the dividends, not the principal” to preserve their capital.7
Furthermore, in some jurisdictions, there are legal or approved lists of equity investments forinstitutions, such as insurance companies, or trusts for individuals. Such lists typically mandatethat permissible investments consist only of companies that pay dividends. Often, such restrictivelists are intended to discourage investment in high-risk stocks. All of these considerations suggestthat a clientele effect does exist and that equity market participants can be sorted by those whoprefer to receive returns in the form of dividends and those who prefer capital gains returns.
Even if a clientele effect exists, however, it would not follow that dividendpolicy affects equityvalues; only that investors care about dividends and gravitate toward owning companies with thedividend policies they prefer. In particular, if the dividend market is in equilibrium in the sensethat the demands of all clienteles for various dividend policies are satisfied by sufficient numbers ofcompanies, a company cannot affect its own share value by changing its dividend policy. Thechange would only result in a switch in clientele. Thus, dividend clienteles may tend to promotestability of dividend policy and do not contradict dividend policy irrelevance.
7See Shefrin and Statman (1984).
c07 13 January 2012; 9:16:38
Chapter 7 Dividends and Share Repurchases: Analysis 261

Investors seeking yield will often be found to consistently overweight in some industrysectors relative to the benchmark weights of those sectors. Exhibit 7-1 shows the dividendyield for five of the FTSE 100 industry sectors: Utilities, Travel and Leisure, Energy (Oil andGas), Mining, and Information Technology.
EXHIBIT 7-1 Dividend Yield of Major FTSE 100 Industry Sectors, June 2009 (percent)
6.5
4.2
2.7
1.4
0 1 2 3 4 5 6 7
Utilities
Travel and Leisure
Mining
Energy
Technology
3.8
Source: www.itpaysdividends.co.uk.
As is evident, there is a dramatic difference in dividend yields for these five industries,with Utilities having the highest yield and Technology having a relatively low one. Thispattern in industry dividend yields appears to be global, as is shown in Exhibit 7-2.
EXHIBIT 7-2 Gross Dividend Yield on Selected FTSEAll-World Sector Indices
Industries (percent)
Oil and gas 3.1
Basic materials 3.1
Consumer goods 3.1
Health care 2.8
Consumer services 2.5
Financials 3.4
Utilities 5.0
Technology 1.6
Source: Financial Times, 5 June 2009, p. 19.
If the tax rates applied to dividends and capital gains are the same, then (all else beingequal) the expected price drop when a share goes ex-dividend (i.e., first trades without theright to receive an upcoming dividend) is the amount of the dividend. When the ex-dividendday price change is consistently different from that amount, the discrepancy may carryinformation about the marginal tax rates of investors trading in the share on the ex-dividend
c07 13 January 2012; 9:16:38
262 Corporate Finance

date (the first date that the share trades without the right to receive an upcoming dividend).The point is worth developing in greater detail.
Suppose that a taxable investor purchases a share at price Pb (where bis for buy) and hasmarginal tax rates on dividends and capital gains of TD and TCG, respectively. Consider twotrading strategies distinguished by whether a share is sold just before or just after the sharegoes ex-dividend:
1. Sell just before the share goes ex-dividend. The share is sold at the end of the last trading daybefore the ex-dividend day at price Pw (where w stands for with right to receive thedividend ). By selling the share at that time the investor will not appear as a holder ofrecord of the share as of the record date and will not be entitled to the dividend. (Thepurchaser of the share will be the owner of record.)
The resulting cash flow is the sale price Pw minus the capital gains tax owed on thesale: Pw$ (Pw$ Pb)(TCG).
2. Sell just after the share goes ex-dividend. The share is sold when it opens for trading on theex-dividend day at pricePx (where x is for ex-dividend ). The investorwill receive the dividend.
The resulting cash flow is the sale price Px minus the capital gains tax owed on thesale plus the after-tax amount of the dividend: Px$ (Px$ Pb)(TCG)þD(1$TD).
Amarginal investor in a given share is defined as an investor who is very likely to be part ofthe next trade in the share and who is therefore important in setting price. Suppose that theinvestor whose marginal tax rates we are describing is such an investor. The prices Pw and Pxrepresentan equilibrium if this marginal investor is indifferent about selling the share just beforeand just after it goes ex-dividend. For that to be the case, the two cash flows given must be equal:
Pw $ ðPw $ PbÞðTCGÞ ¼ Px $ ðPx $ PbÞðTCGÞ þ Dð1$ TDÞ
This equation can be solved for the amount of the price decrease when the share goesex-dividend, Pw$ Px:
8
Pw $ Px ¼ D 1$ TD
1$ TCGð7-1Þ
Equation 7-1 implies three relationships. If the investor’s marginal tax rate on dividendsis equal to the marginal tax rate on capital gains, the share’s price should drop by the amountof the dividend when the share goes ex-dividend. If the investor’s marginal tax rate ondividends is higher than the marginal tax rate on capital gains, the share’s price should dropby less than the amount of the dividend when the share goes ex-dividend. Finally, if theinvestor’s marginal tax rate on dividends is less than the marginal tax rate on capital gains,the share’s price should drop by more than the amount of the dividend when the share goesex-dividend. For example, if the dividend is h12 and the marginal tax rate on dividends at0.40 is higher than the marginal tax rate on capital gains at 0.20, we expect the price to dropby less than the amount of the dividend on the ex-dividend day. The expected price drop iscalculated as (h12)(1$ 0.40)/(1$ 0.20)¼ (h12)(0.75)¼ h9.
The ratio (1$TD)/(1$TCG) can be viewed as establishing an indifferent relationshipbetween dividends and capital gains. For example, assuming an investor pays taxes of
8See Elton and Gruber (1970), 68–74. Technically, the expression does not take into account the timevalue of money and assumes investors are risk neutral (indifferent to risk).
c07 13 January 2012; 9:16:38
Chapter 7 Dividends and Share Repurchases: Analysis 263

40 percent on the next unit of dividend income and taxes of 15 percent on the next unit ofcapital gains, h1 of dividend is worth as much as (1$ 0.40)/(1$ 0.15)¼ h0.71 in capital gains.
The amount of the ex-dividend price drop may provide information on the tax ratesapplying to those trading in the stock. Example 7-1 shows details about this type of analysis.
EXAMPLE 7-1 Clienteles and Preferences for Dividendsversus Capital Gains
1. An individual investor pays taxes of 28 percent on the next dollar of dividendincome and taxes of 15 percent on the next dollar of capital gains. Which would sheprefer: $1 in dividends or $0.87 in capital gains?
2. Suppose the tax rate on capital gains is 20 percent for all investors but the tax rate ondividend income differs among investors. A share drops by 70 percent of the amountof the dividend, on average, when the share goes ex-dividend. Assume that anyappropriate corrections for equity market price movements on ex-dividend dayshave been made. Calculate the marginal tax rate on dividend income applying tothose who trade the issue around the ex-dividend day.
3. Consider a U.S. corporation with a corporate income tax rate of 40 percent. Thecorporation needs to report as taxable income only 30 percent of dividends receivedfrom other corporations—that is, it takes a 70 percent deduction on that type ofdividend income in calculating taxes owed. Assume that both capital gains andreported dividends (dividends net of any deductible amount) are taxed at 40 percent.What is $1 of dividends worth in terms of capital gains for such a corporate investor?
4. Explain why the ex-dividend share price would be expected to drop by more thanthe amount of the dividend if such investors as the corporation described in question3 are the marginal trader in the issue.
5. For a given share issue, the share price consistently drops by an amount very close tothe amount of the dividend when the share goes ex-dividend. Describe the marginalinvestor in the shares.
Solution to 1. For this investor, after taxes, $1 in dividends is worth $1(1$ 0.28)/(1$ 0.15)¼ $0.85 in capital gains. Because $0.87 exceeds $0.85, this investor wouldprefer $0.87 in capital gains to $1 in dividends. Viewed another way, the $0.87 incapital gains gives the investor $0.74¼ ($0.87)(1$ 0.15) after tax, compared with$0.72¼ ($1)(1$ 0.28) after tax for a $1 of dividends.
Solution to 2. The statement of the problem implies that (Pw$ Px)/D¼ 0.70. Thus,0.70¼ (1$TD)/(1$TCG)¼ (1$TD)/(1$ 0.20). So, (0.80)(0.70)¼ 1$TD and TD¼1$ (0.80)(0.70)¼ 0.44. The average ex-dividend day pricemovement reflects a 44 percentmarginal tax rate on dividend income for those who trade around the ex-dividend day.
Solution to 3. Because 70 percent of the dividend is excluded from taxation, theeffective tax rate on dividends, TD, is 0.4(1 – 0.7)¼ 0.12. Thus, a $1 dividend is worth(1$ 0.12)/(1 – 0.4)¼ $1.47 of capital gains for the corporate investor described.
c07 13 January 2012; 9:16:39
264 Corporate Finance

The existence of dividend clienteles does not contradict the hypothesis of dividend policyirrelevance. Example 7-2 addresses the point. In the example, dividend payout ratio refers to thepercentage of total earnings paid out in dividends in a given year; in per-share terms, it isDPS/EPS.
2.4.2. The Information Content of Dividend Actions: SignalingMM assumed that all investors—including outside investors—have the same informationabout the company: a situation of symmetric information. In reality, corporate managerstypically have access to more detailed and extensive information about the company than dooutside investors.
A situation of asymmetric information raises the possibility that dividend increases ordecreases may affect share price because they may convey new information about the company.A company’s board of directors and management, having more information than outsideinvestors, may use dividends to signal to investors (i.e., convey information) how the company isreally doing. A company’s decision to initiate, maintain, increase, or cut a dividend may conveymore credible information than positive words frommanagement because cash is involved. For a
Solution to 4. Because 70 percent of the dividends received are excluded from taxation,the corporation has a tax-motivated preference for dividends over capital gains.Therefore, the ratio (1$TD)/(1$TCG) exceeds 1.0; that is, (Pw$ Px) . D. Theex-dividend day price decline is expected to exceed the amount of the dividend.
Solution to 5. The marginal investor may be a tax-exempt investor. A taxable investorwith the same marginal tax rate on dividends and capital gains is another possibilityconsistent with the data.
EXAMPLE 7-2 Clienteles and Preferences for Dividendsversus Capital Gains
Suppose it is established that about 70 percent of investors prefer a relatively highincome stream from a given size position in shares. You are on the board of directors ofa company with a dividend policy that specifies a particularly low dividend payoutratio. Give two reasons why having your company adopt a higher dividend payout ratiomay not lead to an increase in shareholder wealth.
Solution. First, even if the dividend payout ratio is not increased, individual share-holders may be able to manufacture their desired income stream by selling shares asneeded (creating “homemade dividends”). Second, if there are tax clienteles, byadopting a higher dividend payout ratio, the company may be merely exchanging oneclientele (which it satisfies currently) for a different clientele.
c07 13 January 2012; 9:16:39
Chapter 7 Dividends and Share Repurchases: Analysis 265

signal to be effective it must be difficult or costly to mimic by another entity without the sameattributes. Dividend increases are costly to mimic because a company that does not expect itscash flows to increase will not be able to maintain the dividend at increasingly high levels in thelong run.9 (In the short run, a company can borrow to fund dividends.)
Empirical studies broadly support the thesis that dividend initiations or increases conveypositive information and are associated with future earnings growth, whereas dividend omissionsor reductions convey negative information and are associated with future earnings problems.10
A dividend declaration can help resolve some of the information asymmetry between insidersand outsiders and help close any gap between the market price of shares and their intrinsic value.
Some researchers11 have argued that a company’s dividend initiation or increase tends tobe associated with share price increases because it attracts more attention to the company.Managers have an incentive to increase the company’s dividend if they believe the company tobe undervalued because the increased scrutiny will lead to a positive price adjustment. Incontrast, according to this line of reasoning, managers of overvalued companies have littlereason to mimic such a signal because increased scrutiny would presumably result in adownward price adjustment to their shares.
EXAMPLE 7-3 Signaling with Dividends and the Costsof Mimicking
Suppose that the management of a company with poor future prospects recommendsto the board of directors an increase in its dividend. Management explains to the boardthat investors may then believe that the company has positive future prospects, leadingto an increase in share value and shareholder wealth.
1. State whether such imitation is likely to achieve the stated objective over the longterm.
2. Justify your answer to Question 1.
Solution to 1. No, such dividend increases are not likely to achieve the stated objectiveover the long term for the company described.
Solution to 2. Dividend increases are costly to mimic because a company that does notexpect its cash flows to increase will not be able to maintain the increased dividend. Thecompany will have to either cut the dividend in the future, or go to the market toobtain new equity funding to pay the dividend. Both these alternatives are costly for thecompany because they result in downward revisions to the stock price.
9See, for example, Ross (1977), 23–40, and Myers and Majluf (1984), 187–221.10See Filbeck (2009) for a short summary of the evidence, including the evidence that does not supportthe thesis stated.11See Grinblatt, Masulis, and Titman (1984), 461–490.
c07 13 January 2012; 9:16:39
266 Corporate Finance

Many companies take pride in their record of consistently increasing dividends over along period of time. Standard &Poor’s, for example, identifies companies in its U.S.-basedS&P 500 Index, Europe 350 Index, Pan Asia Index, and S&P/TSX Canadian Index that are“Dividend Aristocrats” in the sense that they have increased their dividend for a number ofconsecutive years (at least 25 years in the case of the S&P 500, at least 10 years in the caseof the Europe 350, at least 7 years in the case of Pan Asia Index, and at least 5 years in thecase of the S&P/TSX). These companies are in various industries and include Procter &Gamble, Nestle, Novartis, Sanofi-Aventis, Wal-Mart, 3M, ExxonMobil, and Automatic DataProcessing. When a company’s earnings and cash flow outlook has been and continues to bepositive, it often views a policy of increasing dividends as an important tool to convey thatinformation to existing and potential shareholders. Companies that consistently increase theirdividends seem to share certain characteristics:
! Dominant or niche positions in their industry.! Global operations.! Relatively high returns on assets.! Relatively low debt ratios (dividend payouts unlikely to be affected by restrictions in debt
covenants).
Dividend cuts or omissions, in contrast, present powerful and often negative signals. Forcompanies under financial or operating stress, the dividend declaration date may be viewedwith more than usual interest. Will they cut the dividend? Will they omit the dividendaltogether? In these instances, merely maintaining the dividend or not cutting it as much asexpected is usually viewed as good news (i.e., that current difficulties are transitory andmanageable), unless investors view managers as trying to convey erroneous information to themarket.
In principle, management can attempt to send a positive signal by cutting the dividend,although that is difficult in practice. For example, IBM, long the giant of mainframe com-puters and a company with an enviable record of dividend increases over the years, announcedin 1993 a more than 50 percent cut in its dividend. IBM explained that their intention was touse the funds conserved to shift its business into nonmainframe technology and consultingservices for the purpose of improving future returns. Although the message was met withvarying reactions, it was, in retrospect, a positive signal because IBM successfully used its cashflow to reorganize its business. IBM resumed its dividend increases again in 1996 and, as ofthe time of writing, it has increased every year since.
EXAMPLE 7-4 Dividend Reductions and Price Increases
On 6 March 2003, the BBC reported that Royal & Sun Alliance Group, Britain’ssecond largest insurer, had announced it would cut its dividend from 16 pence a shareto 6 pence a share. The company also revealed that it had a shortfall of d406 million inits pension fund and was planning to increase contributions to the fund by about d30million a year for the next 10 years.
c07 13 January 2012; 9:16:40
Chapter 7 Dividends and Share Repurchases: Analysis 267

Another even more complicated example of the signaling content of dividends can befound in Microsoft’s initial dividend declaration. As Exhibit 7-1 showed, technology companieshave among the lowest dividend yields and, it can be shown, below average dividend payoutratios. These facts make sense. Most technology companies have high R&D requirements andsome (e.g., integrated circuit manufacturers) are capital intensive; those that are profitable oftenachieve returns on assets and owners’ equity that are well above average. In addition, businessrisk is considerable as discoveries and unforeseen advances change the product landscape. All ofthese considerations would suggest a policy of low (or no) dividend payments, so that internallygenerated funds are directed for new product development and/or capital investment that willmaintain high returns. Some companies in the technology sector, however, do mature. Forexample, in the mid 1990s, because of Microsoft’s past phenomenal growth and its dominanceof its industry, net cash grew to tens of billions of dollars and many wondered if the companycould effectively use its cash “hoard,” and if it were time for Microsoft to pay a dividend.
In late 2003, Microsoft declared its first annual dividend of $0.06 a share, equaling about7 percent of its yearly cash flow, less than two percent of its net cash position, and representing ayield of 0.3 percent. Then, in the summer of 2004, the company increased its annual dividend to$0.32 a share and announced a special year-end dividend of $3.00 a share. Clearly, the signalingeffectwasmore important than the actual cash impact on either the companyor its investors. Someinvestors viewed these declarations positively, whereas others viewed them negatively. On theone hand, some believed that Microsoft was signaling an interest in broadening its investor focuswhile refraining from undertaking unprofitable expansion. The clientele effect, discussed earlier,would suggest thatMicrosoft’s dividend possibly attracted a new group of potential shareholders.On the other hand, others viewed the dividend declaration as an admission that it was becoming amature company—that it could no longer reap high returns from reinvesting its earnings. Thefuture growth prospects for the stock, theywould argue, had beendiminished, although a questionwas the extent to which themarket already understood that. In any event, few could argue that the2003–2004 dividend declarations by Microsoft were not corporate events of some importance.
2.4.3. Agency Costs and Dividends as a Mechanism to Control ThemIn large, publicly traded corporations, there is typically a substantial separation between theprofessional managers who control the corporation’s operations and the outside investors wholargely own it.When agents (themanagers) and owners (the shareholders) are different, managersmay have an incentive to maximize their own welfare at the company’s expense because they ownnone or relatively small percentages of the company for which they work and they do not bear allthe costs of such actions. This incentive is ultimately also a problem of unequal (asymmetric)information between managers and outside investors because, if outside investors could perfectlyobserve managers, managers would be dissuaded from such actions. One managerial incentive ofparticular concern is investment in negative net present value (NPV) projects. Such projects may
All this was despite the fact that the company reported operating profits of d226million at the end of 2002, up from just d16 million at the end of 2001. The insurerwas in the process of reorganizing its business to focus on general insurance policies,and expanding into Australia and New Zealand, while replacing its chief executive. Theinterim chief executive told reporters that future dividends would depend on decisionsmade by the new leadership. As the market digested all this information, the insurancecompany’s shares rose 2 percent.
Source: BBC News, http://news.bbc.co.uk/2/hi/business/2824527.stm.
c07 13 January 2012; 9:16:40
268 Corporate Finance

grow the size of the company (measured in sales or assets) and thus enlarge the manager’s span ofcontrol, while they generate negative economic returns. This potential overinvestment agencyproblemmight be alleviated by the payment of dividends. In particular, by paying out all free cashflow to equity in dividends, managers would be constrained in their ability to overinvest byundertaking negativeNPVprojects.12 This concern or hypothesis thatmanagementmay create anoverinvestment agency cost is known as Jensen’s free cash flow hypothesis.13
That management will squander free cash flow by undertaking unprofitable projects can beviewed as a possible concern to be evaluated case by case. For example, as discussed previously,Microsoft accumulated increasingly large cash positions but was not observed to squandermonieson unprofitable projects. In some cases, such cash positions may provide financial flexibility torespond quickly to changes in the environment, to grasp unforeseen opportunities, or to surviveperiods of restricted credit, as in the case of FordMotor Company’s accumulation of cash duringprofitable years in the 1990s. Clearly, there are industry-specific and life-cycle conditionsto consider. In general, it makes sense for growing companies in industries characterized byrapid change to hold cash andpay lowor nodividends, but it does notmake sense for large,maturecompanies in relatively noncyclical industries. In general, there is empirical support for themarket reaction to dividend change announcements to be stronger for companies with greaterpotential for over investment than for companies with lesser potential for over investment.14
There is another concern when a company is financed by debt as well as equity. Payingdividends can exacerbate the agency conflict between shareholders and bondholders. Whena company has risky debt, the payment of dividends reduces the cash cushion available to thecompany for the disbursement of fixed payments to bondholders. The payment of largedividends, with the intention of transferring wealth from bondholders to shareholders, couldlead to underinvestment in profitable projects. All else equal, both dividends and sharerepurchases increase the risk that the company will default on its debt. Reflecting bondholders’concern, the bond indenture (contract) often includes a covenant restricting distributions toshareholders that might impair the position of bondholders.15 A typical form of this restrictionis to define an amount that distributions to shareholders during the life of the bond may notexceed. This amount of funds is usually a positive function of the company’s current and pastearnings and issues of new equity, and a negative function of dividends paid since the bondswere issued. Dividends are not permitted if their payment would make the amount zero or ifthe amount is negative (e.g., because of negative earnings). Such covenants often do not reallyrestrict the level of dividends as long as those dividends come from new earnings or from newissues of stock. What the covenant attempts to do is prevent the payment of dividends financedby the sale of the company’s existing assets or by the issuance of new debt. Covenants thatspecify minimum levels of EBITDA and/or EBIT coverage of interest charges are frequentlyused as well. These covenants provide some assurance that operating earnings include a cushionfor the payment of fixed charges.16 Other covenants focus on balance sheet strength—forexample, by specifying a maximum value for the ratio of debt to tangible net worth.
12Informally, free cash flow to equity is the cash flow available to be distributed as dividends after thecompany has accepted all positive NPV projects.13See Jensen (1986).14For more information, see Mukherjee (2009).15This discussion draws on Smith and Warner (1979), 117–161.16EBITDA and EBIT are earnings before interest, taxes, depreciation, and amortization and earningsbefore interest and taxes, respectively. Bond covenants typically indicate that EBITDA and EBIT areadjusted for nonrecurring items.
c07 13 January 2012; 9:16:40
Chapter 7 Dividends and Share Repurchases: Analysis 269

The final example in this section illustrates the complex agency considerations that mayaffect dividend policy.
EXAMPLE 7-5 Agency Issues and Dividends
Two dividend-paying companies, A and B, directly compete with each other. Bothcompanies are all-equity financed and have recent dividend payout ratios averaging35 percent. The corporate governance practices at Company B are weaker than atCompany A. For example, at B but not A, the chief executive officer is also chairpersonof the board of directors. Recently, profitable investment opportunities for B havebecome fewer although operating cash flow for A and B is strong.
Based only on the information given, investors who own shares in both A and Bare most likely to press for a dividend increase at:
A. Company A, because it has better growth prospects than Company B.B. Company B, because a dividend increase may mitigate potential over investment
agency problems.C. Company B, because a dividend increase may mitigate potential underinvestment
agency problems.
Solution. B is correct. Company B’s strong operating cash flow in an environment offewer profitable growth opportunities may tempt Company B management to overinvest. The concern is increased because of Company B’s relatively weak corporategovernance.
17See Hansen, Kumar, and Shome (1994), 16–22.
EXAMPLE 7-6 Electric Utilities, Agency Costs, and Dividends
Electric utilities often have above average dividend yields. A distinctive characteristic ofmany utility companies is that they pay a high percentage of earnings as dividends,while periodically issuing new equity to invest in the many projects necessitated by thecapital-intensive nature of their business. This practice of financing dividends with newequity appears unwise because new equity is expensive. Researchers17 examining a set ofU.S.-based electric utilities, however, have demonstrated that there may be a goodreason for paying dividends and then issuing equity: the mitigation of the agencyproblems between managers and shareholders and between utility regulators and utilityshareholders.
c07 13 January 2012; 9:16:40
270 Corporate Finance

2.5. Dividend Theory: Summary
What can we conclude about the link between dividends and valuation? In theory, in theabsence of market imperfections, Miller and Modigliani (1961) find that dividend policy isirrelevant to the wealth of a company’s investors. But in reality, the existence of marketimperfections makes matters more complicated. In addition, some investors are led, by logicor custom, to prefer dividends.
Unfortunately, in the search for the link between dividend policy and value, the evidenceis inconclusive. It is difficult to show an exact relationship between dividends and valuebecause there are so many variables affecting value. We have presented factors that wouldseem to explain why some companies put emphasis on dividends and others do not. Financialtheory predicts that reinvestment opportunities should be the dominant factor. Indeed, nomatter where they are located in the world, smaller, fast-growing companies pay out little ornone of their earnings. Regardless of jurisdiction, more mature companies with fewer rein-vestment opportunities tend to pay dividends. For these mature companies, taxes, laws,tradition, signaling, ownership structure, and attempts to reconcile agency conflicts all seemto play a role in determining the dividend payout ratio. At a minimum, in looking at acompany, an analyst should evaluate whether a given company’s dividend policy matches itsreinvestment opportunities, clientele preferences, and legal/financial environment.
3. FACTORS AFFECTING DIVIDEND POLICY
In Section 2, we discussed theories of dividend policy and value and concluded that the issueis, at best, unresolved. In this section we explore six factors that affect a company’s dividendpolicy (decisions about whether and in what amount to pay dividends):
Because electric utilities are typically monopolies in the sense that they are usually theonly providers of electricity in a given area, they are regulated so they are not able to setelectricity rates atmonopolistically high levels. The regulators are expected to set rates suchthat the company’s operating expenses are met and investors are provided with a fairreturn. The regulators, however, are usually elected, or are political appointees, and viewratepayers as potential voters. Thus, utility shareholders, in addition to facing potentialmanager–shareholder agency issues because managers have incentives to consume per-quisites or to over invest, also face a regulator–shareholder conflict, in which regulators setrates low to attract the votes of individuals being served by the utility.
In the utility industry, therefore, dividends and the subsequent equity issue are usedas mechanisms to monitor managers and regulators. The company pays high dividendsand then goes to the capital markets to issue new equity. If the market does not think thatshareholders are getting a fair return because regulators are setting rates too low, or becausemanagers are consuming toomany perks, the price at which new equity can be soldwill falluntil the shareholder expectations for returns aremet. As a result, the companymay not beable to raise sufficient funds to expand its plant to meet increasing electricity demand—the electric utility industry is very capital intensive—and, in the extreme, the lights may goout. Faced with this possibility, and potentially angry voters, regulators have incentives toset rates at a fair level. Thus, the equity market serves to monitor and arbitrate conflictsbetween shareholders and both managers and regulators.
c07 13 January 2012; 9:16:40
Chapter 7 Dividends and Share Repurchases: Analysis 271

! Investment opportunities! The expected volatility of future earnings! Financial flexibility! Tax considerations! Flotation costs! Contractual and legal restrictions
Boards of directors andmanagers spend considerable time setting dividend policy despite thelack of clear guidance from theory to guide their deliberations. The factors listed are, however,often mentioned by managers themselves as relevant to dividend policy selection in practice.Some of the factors we explore, such as taxation, are not company-specific, whereas other factors,such as possible contractual restrictions on dividend payments and the expected volatility of futureearnings, aremore company-specific. The factors may be interrelated and the presence of onemayenhance or diminish the effect of another. Importantly, the independence between the invest-ment, financing, and dividend decisions assumed byMMmay no longer hold when such marketimperfections as information effects, agency problems, and taxes are recognized.
3.1. Investment Opportunities
All else equal, a company with many profitable investment opportunities will tend to pay out lessin dividends than a company with fewer opportunities because the former company will havemore uses for internally generated cash flows. Internally generated cash flow is generally a cheapersource of equity funding than new equity issuance. Opportunities for new investments, and thespeed with which a company needs to respond to them, are influenced by the industry in whichthe company operates. A company with the ability to delay the initiation of projects withoutpenalty may be willing to pay out more in dividends than a company that needs to act imme-diately to exploit profitable investment opportunities. From Exhibit 7-1, we see that technologycompanies have the lowest dividend yields whereas utilities have the highest. The chief expla-nation may be the size and time horizon of profitable investment opportunities in relation toannual operating cash flow generated. For technology companies the pace of change is rapid, sohaving internally generated funds available to react to profitable opportunities affords suchcompanies valuable flexibility. For utility companies, for which there are typically fewersuch opportunities and for which change is much slower, higher dividend payouts are indicated.
3.2. The Expected Volatility of Future Earnings
In 1956, Lintner18 published a survey of managers at 28 companies that identified severalimportant factors in the dividend payout decision. Most managers:
! Had a target payout ratio based on long-run sustainable earnings.! Focused more on dividend changes (increases or decreases) than on dividend levels.! Were reluctant to increase the dividend if the increase might soon need to be reversed.
More recently, Brav et al. (2005), in a survey of treasurers and chief financial officers,reported that managers are very reluctant to cut dividends and tend to smooth dividends.19
18Lintner (1956), 97–113.19Brav, Graham, Harvey, and Michaely (2005), 483–527.
c07 13 January 2012; 9:16:40
272 Corporate Finance

All else equal, the more volatile earnings are, the greater the risk that a given dividend increasemay not be covered by earnings in a future time period. Thus, when earnings are volatile weexpect companies to be more cautious in the size and frequency of dividend increases.
3.3. Financial Flexibility
Companies may not initiate, or may reduce or omit, dividends to obtain the financial flexibilityassociated with having substantial cash on hand. A company with substantial cash holdings is ina relatively strong position to meet unforeseen operating needs and to exploit investmentopportunities with minimum delay. Having a strong cash position can be particularly valuableduring economic contractions when the availability of credit may be reduced. Financial flexi-bility may be viewed as a tactical consideration that is of greater importance when access toliquidity is critical and when the company’s dividend payout is relatively large.
A classic example of explaining a dividend decision in terms of the need to preservefinancial flexibility occurred on 28 February 2009 when General Electric Company, whichhad not reduced its dividend at any time in the previous 71 years, announced that goingforward it was cutting its quarterly dividend rate from US$0.31 to US$0.10. GE ChairmanJeffrey Immelt stated:
“We made the decision to cut the dividend because it is a prudent measure to furtherenhance our balance sheet and provide us with flexibility for potential futureopportunities. It is the right, precautionary action to keep the company safe and securein the difficult operating environment we see today. We believe it further strengthensour Company for the long-term, while still providing an attractive dividend.”
Source: www.gereports.com/jeff-immelt-talks-about-ges-dividend/
The cut was expected to conserve $9 billion on annual basis. With approximately $50billion of cash on hand at the time of the statement and with operating cash flow at leastcovering the previous dividend, the dividend reduction appeared to be accurately character-ized as “precautionary.” Nevertheless, the dividend cut was widely anticipated20 despite theassurance in GE’s February 2009 Investor Update (2 February 2009) that “We are committedto our plan for $1.24 per share dividend for 2009” (page 1). Furthermore, most analystsgreeted GE’s decision to cut the dividend favorably given the uncertainty about the magni-tude of credit losses at its financing division, GE Capital, the duration of the economiccontraction, and partially frozen credit markets.
When increasing financial flexibility is an important concern, a company may decide todistribute money to shareholders primarily by means of share repurchases rather than regulardividends. A program to repurchase shares in the open market does not involve a formalrequirement that any repurchases be executed and share repurchases in general do notestablish the same expectations for continuation in the future as regular dividends.
3.4. Tax Considerations
Taxation is an important factor that affects investment decisions for taxable investors in par-ticular, because it is the after-tax return that is most relevant to investors. Different countries tax
20The precipitous decline in GE’s share repurchases in the preceding quarter indicated to many investorsan urgent concern for conserving cash.
c07 13 January 2012; 9:16:40
Chapter 7 Dividends and Share Repurchases: Analysis 273

corporate dividends in a wide variety of ways. Some tax both capital gains and dividend income.Others tax dividends but not capital gains. Hong Kong is an exception in that it levies no tax oneither dividends or capital gains. Within a given country, tax policy can be quite complex. Inaddition, as a major fiscal policy tool that is subject to politics, governments have a tendency to“re-address” tax issues, sometimes with great frequency, thereby complicating the issue evenmore. As with other aspects of taxation, governments use the taxation of dividends to address avariety of goals: to encourage or discourage the retention or distribution of corporate earnings;to redistribute income; or to address other political, social, and/or investment goals.
For the global investor, foreign taxes can be just as important as domestic taxes. Foreigntax credits in the investor’s home country also may figure importantly into the overall taxationissue. For example, France requires French companies to withhold 15 percent of dividendspaid to foreign investors, but investors in the United States can claim a tax credit on their U.S.tax return for the amount of the French tax.
3.4.1. Taxation MethodsWe look at three main systems of taxation that impact dividends: double taxation, split-rate,and imputation. Other tax systems can be a combination of these.
In a double taxation system, corporate earnings are taxed at the corporate level and thentaxed again at the shareholder level if they are distributed to taxable shareholders as dividends.Exhibit 7-3 illustrates double taxation. The United States is used as an example. In 2003, theindividual tax rate on dividends was lowered from a maximum of 39.6 percent (the highestmarginal income tax rate) to a maximum of 15 percent.21 At the same time, the tax rate onlong-term capital gains was also reduced from a 20 percent maximum rate to the same15 percent. Exhibit 7-3 depicts the double taxation system using the highest marginal rate ondividends in the United States both before and after the 2003 tax law change.22
EXHIBIT 7-3 Double Taxation of Dividends at Different Personal TaxRates (per $100)
39.6% 15%
Net income before taxes $100 $100
Corporate tax rate 35% 35%
Net income after tax $65 $65
Dividend assuming 100 percent payout $65 $65
Shareholder tax on dividend $25.74 $9.75
Net dividend to shareholder $39.26 $55.25
Double tax rate per $ of dividend 60.7% 44.8%
21For this 15 percent tax rate to apply, the dividends must meet certain criteria such that they areconsidered to be “qualified dividends.” For dividends to be qualified for this tax rate, they must be out ofaccumulated taxable earnings of the corporation and recipients of dividends must meet certain mini-mum holding periods during which they have not hedged away the economic risk of the security held.22Under U.S. tax law as of mid-2009, both dividend and capital gains tax rates are scheduled to return topre-2003 levels in 2011.
c07 13 January 2012; 9:16:41
274 Corporate Finance

Although there is still double taxation of dividends before and after the 2003 taxchange, the net tax rate on a dollar of income distributed in dividends declined from61 percent to 45 percent: a decline of about 26 percent. U.S. investors clearly prefer thelower tax rate on dividends, but it is not clear whether they would prefer a higher or lowerpayout because the current tax rate is the same on both dividends and long-term capitalgains for most shareholders. Later we will discuss a company’s decision with respect to thedividend payout ratio.
A second major taxation system is the dividend imputation tax system, which effec-tively assures that corporate profits distributed as dividends are taxed just once, at theshareholder’s tax rate. Australia, New Zealand, and France use a dividend imputation taxsystem, whereas the United Kingdom uses a modified dividend imputation system. Underthis system, a corporation’s earnings are first taxed at the corporate level. When thoseearnings are distributed to shareholders in the form of dividends, however, shareholdersreceive a tax credit, known as a franking credit, for the taxes that the corporation paid onthose distributed earnings (i.e., corporate taxes paid are imputed to the individual share-holder). If the shareholder’s marginal tax rate is higher than the company’s, the shareholderpays the difference between the two rates. Exhibit 7-4 shows one variation of a taximputation system in which a shareholder with a lower marginal tax bracket than that of thecompany actually receives a tax credit for the difference between the corporate rate and hisown rate.
EXHIBIT 7-4 Taxation of Dividends Based on Tax Imputation System ($Australian)
Marginal Shareholder Tax Rate
15% 47%
Pretax income $100 $100
Taxes at 30 percent corporate tax rate 30 30
Net income after tax 70 70
Dividend assuming 100 percent payout 70 70
Shareholder tax on pretax income 15 47
Less tax credit for corporate payment 30 30
Tax due from shareholder (15) 17
Effective tax rate on dividend 15/100 47/100
¼ 15% ¼ 47%
A split-rate tax system is a third taxation system of greater historical than currentimportance. Under this system, corporate earnings that are distributed as dividends are taxedat a lower rate at the corporate level than earnings that are retained. At the level of theindividual investor, dividends are taxed as ordinary income. Earnings distributed as dividendsare still taxed twice, but the relatively low corporate tax rate on earnings mitigates thatpenalty. Exhibit 7-5 depicts this split-rate tax system for dividends.
c07 13 January 2012; 9:16:41
Chapter 7 Dividends and Share Repurchases: Analysis 275

EXHIBIT 7-5 Taxation of Dividends Based on Split-Rate System (per h100)
Pretax earnings h200
Pretax earnings retained 100
35 percent tax on retained earnings 35
Pretax earnings allocated to dividends 100
20 percent tax on earnings allocated to dividends 20
Dividends distributed 80
Shareholder tax rate 35%
After tax dividend to shareholder [(1$ 0.35)' 80]¼ 52
Effective tax rate on dividend [20%þ (80' 35)%]¼ 48%23
3.4.2. Shareholder Preference for Current Income versus Capital GainsAll other things being equal, one could expect that the lower an investor’s tax rate on dividendsrelative to his or her tax rate on capital gains, the stronger the investor’s preference for divi-dends. But other issues also impinge on this preference. The investor may buy high-payoutshares for a tax-exempt retirement account. Even if dividends are taxed at a lower rate thancapital gains, it is not clear that shareholders will necessarily prefer higher dividends. Afterall, capital gains taxes do not have to be paid until the shares are sold, whereas taxes ondividends must be paid in the year received, even if reinvested. In addition, in some countries,such as the United States, shares held at the time of death benefit from a step-up valuation as ofthe death date.24 Finally, tax-exempt institutions, such as pension funds and endowment funds,are major shareholders in most industrial countries. Such institutions are typically exempt fromboth taxes on dividends and taxes on capital gains. Hence, all other things being equal, they areindifferent as to whether their return comes in the form of current dividends or capital gains.
3.5. Flotation Costs
Another factor that affects a company’s dividend policy is flotation costs. Flotation costsinclude: (1) the fees that the company pays (to investment bankers, attorneys, securitiesregulators, auditors, and others) to issue shares and (2) the possible adverse market priceimpact from a rise in the supply of shares outstanding. Aggregate flotation costs are pro-portionally higher (in terms of percentage of gross proceeds) for smaller companies (who issuefewer shares) than for larger companies. Flotation costs make it more expensive for companiesto raise new equity capital than to use their own internally generated funds. As a result, manycompanies try to avoid establishing a level of dividends that would create the need to raisenew equity to finance positive NPV projects.25
23Note that of every h100 allocated to dividends, shareholder receives h52, which implies that theeffective tax rate on dividend is 100$ 52¼ 48%.24The tax basis of the shares received by the beneficiary from the decedent is stepped up to fair marketvalue at the date of death of the decedent.25We mentioned this earlier. There are companies, however, that pay dividends and issue equity, mainlyin the utility industry. For a further discussion, see Parrino and Kidwell (2009).
c07 13 January 2012; 9:16:41
276 Corporate Finance

The solution to Example 7-7 can also be stated in terms of free cash flow to equity(FCFE). FCFE equals operating cash flow (OCF) minus fixed capital investment (FCInv) forthe period (capital expenditures) plus net borrowing for the period. Conceptually, FCFEis the cash flow available for the payment of dividends and in this case it is negative:FCFE¼ d500 million$ d800 millionþ net borrowing¼ –d300 millionþ net borrowing,which is negative for values of net borrowing below d300 million.
3.6. Contractual and Legal Restrictions
The payment of dividends is often affected by legal or contractual restrictions or rules. In somecountries, such as Brazil, the distribution of dividends is legally mandated (with certainexceptions).26 In some countries (e.g., Canada and the Unites States) the payment of a dividendnot specifically indicated to be a liquidating dividend may be restricted by an impairment ofcapital rule. Such a rule requires that the net value of the remaining assets as shown on thebalance sheet be at least equal to some specified amount (related to the company’s capital).
Contractual restrictions on the amount of dividends that can be paid are often imposedby bondholders in bond indentures.27 These restrictions require that the company maintain
EXAMPLE 7-7 A Company that Needs to Reinvest AllInternally Generated Funds
Boar’s Head Spirits Ltd., based in the United Kingdom, currently does not pay adividend on its common shares. Boar’s Head has an estimated operating cash flow ofd500 million. The company’s financial analyst has calculated its cost of capital as12 percent. The same analyst has evaluated modernization and expansion projects witha positive NPV that would require d800 million. The cost of positive NPV projectsexceeds estimated operating cash flow by d300 million (d800 million$ d500 million).Having an above average debt ratio for its industry, Boar’s Head is reluctant to increaseits long-term debt in the next year. Discuss whether you would expect Boar’s Head toinitiate a dividend based on the above facts.
Solution. One would expect Boar’s Head not to initiate a dividend. As things stand,internally generated funds, as represented by operating cash flow, are not sufficient tofund positive NPV projects. So payment of a dividend would be at the expense ofpassing by positive NPV projects unless the balance of such projects and the dividendwere both financed by debt. Given its concern about debt levels, the company wouldnot be expected to pay a dividend that needs to be financed by debt. Because thecompany has unfunded positive NPV projects, it could consider issuing new shares tofund those projects. The company, however, would not be expected to issue shares onlyfor the purpose of paying dividends.
26See www.mzweb.com.br/positivo/web/conteudo_en.asp?idioma=1&tipo=3667&conta=44#1.27An indenture is a written contract between a lender and borrower that specifies the terms of the loan,such as interest rate, interest payment schedule, maturity, and so on.
c07 13 January 2012; 9:16:41
Chapter 7 Dividends and Share Repurchases: Analysis 277

certain ratios (interest coverage ratios, current ratio, etc.) or fulfill certain conditions beforedividend payments can be made. Debt covenants in a bond indenture are a response to theagency problems that exist between shareholders and bondholders and are put in place tolimit the ability of the shareholders to expropriate wealth from bondholders. As an extremeexample, in the absence of covenants or legal restrictions,28 management could liquidate thecompany’s assets and pay the proceeds to the shareholders as a liquidating dividend, leavingthe bondholders with nothing to settle their claims.
If a company has issued preference shares, dividends on common shares may not be paiduntil preference share dividends are paid. In addition, if the preference dividends arecumulative, then preference dividends that are in arrears must be paid before any commondividend can be paid.
3.7. Factors Affecting Dividend Policy: Summary
There are several factors of varying degrees of importance that can affect a company’s divi-dend policy. In the following example, we explore how these factors affected Toyota MotorCompany’s dividend policy.
28An example of a legal restriction is a law against fraudulent transfer of assets.29Source: www.bloomberg.com/apps/news?pid=20601101&sid=aYuKh9k5NZGQ.
EXAMPLE 7-8 Toyota Motor Company Cuts Its Dividend29
On 8 May 2009, Toyota Motor Company, the world’s largest automobile manufac-turer, announced that it was going to cut its dividend for the first time. Toyota, whichpays dividends twice a year, said the dividend would be reduced to f35 a share fromthe f75 paid a year earlier. The 2008 total dividend was f140 a share. The dividendcut ends a 600 percent cumulative increase in the dividend over 10 years. Facedwith plunging global demand for cars (Toyota’s vehicle sales were forecasted to fall14 percent) and ongoing turmoil in the auto industry, Toyota was expecting a loss ashigh as f550 billion (operating loss of f850 billion) for fiscal year ending March 2010,compared with the analyst forecast loss of f284 billion for the same period. Thecompany already had a loss of f437 billion in fiscal year 2009 (the operating losswas f461 billion). Toyota is focused on aggressively cutting costs—it plans to cutproduction-related costs by f340 billion and fixed costs by f460 billion—and has saidthat the lower dividend is because of the difficulty of sustaining the dividend at itsprevious level. Board member bonuses have been eliminated and manager summerbonuses were reduced by 60 percent. Capital spending will be cut by 36 percent tof830 billion, and R&D spending will be cut by 9.3 percent to f820 billion.
The company announced plans to raise capital via a bond issue of as much as f700billion. Standard & Poor’s cut Toyota’s bond rating from AAþ to AA. Anotherproblem facing Toyota and other Japanese automakers is the strong yen, which has
c07 13 January 2012; 9:16:42
278 Corporate Finance

4. PAYOUT POLICIES
In this section, we categorize and discuss three types of dividend policy. Dividend policy isthe strategy that a company follows to determine the amount and timing of dividendpayments.
4.1. Types of Dividend Policies
In the following sections we discuss stable dividend, constant dividend payout ratio, andresidual dividend policies. A stable dividend policy is one in which regular dividends are paidthat generally do not reflect short-term volatility in earnings. This type of dividend policy isthe most common because managers are very reluctant to cut dividends, as discussed earlier.A constant dividend payout ratio policy is the policy of paying out a constant percentage ofnet income in dividends. A residual dividend policy is based on paying out as dividends anyinternally generated funds remaining after such funds are used to finance positive NPVprojects. This type of policy has often been mentioned in theoretical discussions of dividendpolicy but is rarely used in practice. In Section 4.2, we discuss share repurchases, which are analternative to the payment of cash dividends.
4.1.1. Stable Dividend PolicyThis dividend policy is the most common. Companies that use a stable dividend policy basedividends on a long-term forecast of sustainable earnings, and increase dividends whenearnings have increased to a sustainably higher level. Thus, if the long-term forecast forsustainable earnings is slow growth, the dividends would be expected to grow slowly overtime, more or less independent of cyclical upward or downward spikes in earnings. If sus-tainable earnings were not expected to grow over time, however, the corresponding dividendswould be level (i.e., not growing). Compared with the two other types of dividend policies
gained 13 percent against the U.S. dollar in the preceding quarter. Toyota said that aone yen gain against the dollar trims profits by about f30 billion and that a similar gainagainst the euro trims profits by f4 billion.
Discuss Toyota’s decision to cut its dividend in light of the factors affecting div-idend policy covered in this section.
Solution: Of the six factors discussed in this section, the volatility of future earnings andpreservation of financial flexibility are the major factors influencing Toyota’s decision tocut its dividend. Paying the full dividend would have lowered Toyota’s liquidity ratiosand forced it to raise even more external capital. In addition, paying the full dividendprobably would have resulted in a more severe downgrade in its bond rating, whichwould have increased its interest rate on its borrowed funds. Paying the full dividendwhen faced with huge, and larger than expected, operating losses might have also sent asignal to investors that Toyota was not serious about cutting costs and curtailing losses.Flotation costs could also play a role in Toyota’s case. Flotation costs on new equity aretypically higher than those on new debt, and it is possible that if it paid more than f35a share it would have to issue new equity in addition to the f700 billion in debt.
c07 13 January 2012; 9:16:42
Chapter 7 Dividends and Share Repurchases: Analysis 279

that will be presented, a stable dividend policy typically involves less uncertainty for share-holders about the level of future dividends. This is so because the other types of policies reflectto a higher degree short-term volatility in earnings and/or in investment opportunities.
Many companies pride themselves on a long record of gradually and consistentlyincreasing dividends. Exhibit 7-6 shows the recent record of E.ON AG, Europe’s largestutility. Dividends per share (DPS) show an upward trajectory. The decline in earnings in2008 was actually associated with an increase in dividends, underscoring the long-termperspective of a stable dividend policy. To explain further, the exhibit shows adjusted earningsper share (EPS) reported by E.ON that attempt to remove “special effects” (to use the lan-guage of the Annual Report), such as restructuring expenses, marking to market of derivatives,and so on. In 2008, earnings were severely affected by book losses on disposals. For the longterm, E.ON management was obviously optimistic about earnings prospects.
EXHIBIT 7-6 E.ON AG Earnings and Dividends
Year EPS EPS (adjusted) DPSDividend
Payout RatioDividend Payout
Ratio Using Adjusted EPS
2008 h0.68 h3.01 h1.50 221% 50%
2007 h3.69 h2.62 h1.37 37 52%
2006 h2.82 h2.22 h1.12 40 50%
2005 h3.75 h1.84 h0.92 25 50%
2004 h2.20 n/c h0.78 35 n/c
Source for data: www.eon.com/en/investoren/19886.jsp.
As the example shows, dividends over the period were fairly stable, even while earnings,affected by restructuring costs, experienced considerable variability.
A stable dividend policy can be modeled as a process of gradual adjustment towards atarget payout ratio based on long-term sustainable earnings. A target payout ratio is a goalthat represents the proportion of earnings that the company intends to distribute (pay out) toshareholders as dividends over the long term.
A model of gradual adjustment (which may be called a “target payout adjustmentmodel”) was developed by John Lintner.30 The model reflects three basic conclusions fromhis study of dividend policy: (1) Companies have a target payout ratio, based on long-term,sustainable earnings; (2) managers are more concerned with dividend changes than with thelevel of the dividend; and (3) companies will cut or eliminate a dividend only in extremecircumstances or as a last resort.
A simplified version of Lintner’s model can be used to show how a company can adjustits dividend.31 For example, suppose that the payout ratio is below the target payout ratio andearnings are expected to increase. The expected increase in the dividend can be estimated asthe product of three quantities: the expected increase in earnings next year, the target payoutratio, and the adjustment factor (one divided by the number of years over which theadjustment in dividends should take place). Suppose that the current dividend is $0.40,
30Lintner (1956).31Lease et al. (2000), 124.
c07 13 January 2012; 9:16:42
280 Corporate Finance

the target payout ratio is 50 percent, the adjustment factor is 0.2 (i.e., the adjustment is tooccur over five years), and that the expected earnings increase is $0.50 (from earnings of $1.00over the past year to earnings of $1.50 for the year ahead). The expected increase in dividends is
¼ Increase in earnings'Target payout ratio'Adjustment factor
¼ $0:50' 0:5' 0:2
¼ $0:05 Increase in dividends
Therefore, even though earnings increased 50 percent from $1.00 to $1.50, the dividendwould only incrementally increase by about 13 percent from $0.40 to $0.45.
By using this model, note that if in the following year earnings temporarily fell from$1.50 to $1.00, the dividend might well be increased by up to $0.05 a share, as the impliednew dividend of $0.50 would still be moving the company toward its target payout ratio of50 percent. Even if earnings were to fall further or even experience a loss, the company wouldbe reluctant to cut or eliminate the dividend (unless its estimate of sustainable earnings ortarget payout ratio were lowered), but would rather opt to maintain the current dividend untilfuture earnings increases justified an increase in the dividend.
4.1.2. Constant Dividend Payout Ratio PolicyIn this type of policy, a dividend payout ratio decided on by the company is applied to currentearnings to calculate the dividend. With this type of dividend policy, dividends fluctuatewith earnings in the short term. Constant dividend payout ratio policies are infrequentlyadopted in practice. Example 7-10 illustrates this type of policy.
EXAMPLE 7-9 Determining Dividends by Using a TargetPayout Adjustment Model
Last year Luna Inc. had earnings of $2.00 a share and paid a regular dividend of $0.40.For the current year, the company anticipates earnings of $2.80. It has a 30 percenttarget payout ratio and uses a 5-year period to adjust the dividend. Compute theexpected dividend for the current year.
Solution.
Expected dividend ¼ Last dividendþ ðExpected increase in earnings
'Target payout ratio' Adjustment factorÞ
¼ $0:40þ ½ð$2:80$ $2:00Þ ' 0:3' ð1=5Þ)¼ $0:40þ ð$0:80' 0:3' 0:2Þ¼ $0:45
Thus, although earnings are expected to increase by 40 percent, the increase in thedividend would be 12.5 percent.
c07 13 January 2012; 9:16:42
Chapter 7 Dividends and Share Repurchases: Analysis 281

EXAMPLE 7-10 Cal-Maine Foods Changes from a Stableto a Constant Dividend Payout Ratio Policy
Cal-Maine Foods, Inc. (NASDAQ: CALM) is the leading egg producer in the UnitedStates. Cal-Maine’s earnings tend to be highly volatile. Demand for eggs is seasonal,typically being higher in winter than in summer. On the supply side, costs are driven,to a great extent, by corn prices that are subject to business cycle influences and arethus very volatile. In consideration of earnings volatility, Cal-Maine might havedifficulty sustaining a steadily rising dividend level. Probably in view of suchconsiderations, Cal-Maine changed its dividend policy from a stable dividend policyto a constant dividend payout ratio policy (denoted a “variable dividend policy”by management) in its fiscal year 2008. The following is the explanation by thecompany:
“We have paid cash dividends on our Common Stock since 1998. The annualdividend rate of $0.05 per share of Common Stock, or $0.0125 per quarter,was paid in each of the fiscal quarters shown in the table above, through thesecond quarter of fiscal 2008. We have also paid cash dividends on our ClassA Common Stock at a rate equal to 95 percent of the annual rate on ourCommon Stock.
Effective 30 November 2007, the Company’s Board of Directorsapproved the adoption of a variable dividend policy to replace the Company’sfixed dividend policy. Commencing with the third quarter of fiscal 2008Cal-Maine began to pay a dividend to shareholders of its Common Stock andClass A Common Stock on a quarterly basis for each quarter for which theCompany reports net income computed in accordance with generally acceptedaccounting principles in an amount equal to one-third (1/3) of such quarterlyincome. The amount of the dividend payable on each share of Class ACommon Stock is in an amount equal to 95 percent of the amount paid oneach share of Common Stock. Dividends are paid to shareholders of record asof the sixtieth day following the last day of such quarter, and are payable onthe fifteenth day following the record date. Following a quarter for which theCompany does not report net income, the Company shall not pay a dividendfor a subsequent profitable quarter until the Company is profitable ona cumulative basis computed from the date of the last quarter for which adividend was paid.
Management and Board of Directors of Cal-Maine believe the variabledividend policy will more accurately reflect the results of our operations whilerecognizing and allowing for the cyclicality of the egg industry.”
Source: www.calmainefoods.com/.
Exhibit 7-7 shows quarterly data for fiscal years 2009 and 2008.
c07 13 January 2012; 9:16:43
282 Corporate Finance

4.1.3. Residual Dividend PolicyThe residual dividend policy is an intuitively appealing dividend policy that is rarely used inpractice because it typically results in highly volatile dividend payments. The residual divi-dend policy is based on paying out as dividends the full amount of any internally generatedfunds remaining after financing the current period’s capital expenditures (investment inpositive net present value projects) consistent with the target capital structure. A residualdividend policy presumes that equity financing comes from reinvested earnings rather thannew share issuance, which is more expensive. Directing internally generated funds first topositive NPV projects is consistent with shareholder wealth maximization as is, typically,distributing to shareholders the balance that cannot be so invested. The residual dividendpolicy puts investment in positive NPV projects ahead of considerations of not reducing the
EXHIBIT 7-7 Earnings per Share (EPS) and Dividendsper Share (DPS) for Cal-Maine Foods (Fiscal Years End 31 or30 May)
Fiscal Period EPS ($) DPS ($)
2009:Q4 0.43 0.1438
2009:Q3 1.30 0.4322
2009:Q2 1.15 0.3817
2009:Q1 0.47 0.1570
2008:Q4 1.54 0.5138
2008:Q3 2.41 0.8038
2008:Q2 1.70 0.0125
2008:Q1 0.76 0.0125
Source: www.calmainefoods.com.
1. From the table above, identify the fiscal quarter when Cal-Maine first applied aconstant dividend payout ratio policy.
2. Demonstrate that the dividend for 2009:Q4 reflects the stated current dividendpolicy.
Solution to 1. Cal-Maine first used that policy in the third quarter of fiscal year 2008.Until then a quarterly dividend of $0.0125 was paid no matter what the quarterlyearnings per share were. The payout ratios in all subsequent quarters round toapproximately 33.3 percent.
Solution to 2. (EPS $0.43)/3¼ $0.1433, which differs only slightly from reporteddividend of $0.1438 (EPS are rounded to two decimal places so rounding error isexpected).
c07 13 January 2012; 9:16:43
Chapter 7 Dividends and Share Repurchases: Analysis 283

dividend. Under a residual dividend policy, however, dividends may swing from low or zerowhen capital expenditure needs are high (relative to internally generated funds) to high whenthe reverse situation holds. The increased uncertainty about future dividends may leadinvestors to require a higher rate of return on equity investment as compensation, possiblyoffsetting any advantages to the policy.
Exhibit 7-8 provides an illustration of the residual dividend policy. The company hasearnings of h100 million, a target capital structure of 30 percent debt and 70 percent equity,and three prospective capital expenditure levels of h50 million, h100 million, and h150million. As Exhibit 7-8 shows, Dividend¼Earnings$ (Capital budget'Equity percent incapital structure) or zero, whichever is greater.
EXHIBIT 7-8 Residual Dividend Policy for a Target Capital Structure of 30 Percent Debtand 70 Percent Equity (h millions)
h50Capital Budget
h100Capital Budget
h150Capital Budget
Earnings h100 h100 h100
Capital spending h50 h100 h150
Financed from new debt 0.3' 50¼ h15 0.3' 100¼ h30 0.3' 150¼ h45
Financed from retainedearnings 0.7' 50¼ h35 0.7' 100¼ h70 (0.7' 150. 100)¼ h100
Financed from new equityor debt h0 h0 h5
Residual cash flow¼ Residual dividend h100–$35¼ h65 h100–$70¼ h30 h100–$100¼ h0
Implied payout ratio 65/100¼ 65% 30/100¼ 30% 0/100¼ 0%
In the final column of Exhibit 7-8, the h150 million in capital spending requires h105million in equity (h150 million' 0.70), which is greater than the company’s total earnings ofh100 million. The company would probably finance the shortfall with debt, temporarilydeviating from its target capital structure, rather than use more costly external equity financing.
As can be seen from Exhibit 7-8, various capital spending plans result in dramaticallydifferent implied dividend payments. Payout ratios, too, range from a zero payment ofdividends under the highest capital spending plan, to a 65 percent payout ratio under thelowest capital spending plan.
To overcome the problem of volatile dividends, companies may use a long-term residualdividend approach to smooth their dividend payments. The approach would involve fore-casting earnings and capital expenditures over the next 5 or 10 years, determining theresulting total amount of residual dividends for the period, which would then be paid outevenly over the forecast period. The company could also set a relatively low stable cashdividend based on the calculation and distribute a more flexible amount to shareholdersin the form of share repurchases or even a special dividend, as in the Microsoft casedescribed earlier.
c07 13 January 2012; 9:16:43
284 Corporate Finance

4.2. The Dividend versus Share Repurchase Decision
Theory concerning the dividend–share repurchase decision generally concludes that sharerepurchases are equivalent to cash dividends of equal amount in their effect on shareholders’
EXAMPLE 7-11 Determining Dividends
1. Suppose a company has h900 million in planned capital spending (representingpositive NPV projects).The company’s target capital structure is 60 percent debt and40 percent equity. Given that the company follows a residual dividend policy, thecompany’s indicated dividend with earnings of h500 million is closest to:A. h140 million.B. h360 million.C. h500 million.
2. Suppose a company has paid semiannual dividends of h3 a share over the prior two yearsand h2.75 for four years prior. During that six-year period, earnings and capitalexpenditure needs have shownconsiderable interimvariability anddividendpayout ratioshave ranged from 55 to 86 percent, with an average of 65 percent. In the current six-month period, suppose that 8million shares are issued and outstanding and that earningsare anticipated to be h28 million. The company has h5 million in planned capitalspending for the six-month period (representing positive NPV projects). The company’slong-term target capital structure is 50 percent debt and 50 percent equity. Based on thefacts given, the most likely dividend per share for the current six-month period is:A. h2.28.B. h3.00.C. h3.19.
Solution to 1. A is correct. To fund its h900 million in projects while maintaining its targetdebt ratio of 60 percent, the company will obtain h900 million' 0.60¼ h540 million innew debt financing. The amount that needs to be financed by internally generated funds ish900 million$ h540 million¼ h360 million. Netting that amount from earnings givesh500 million$ h360 million¼ h140 million that can be paid out in dividends. Thesolution can also be obtained as h500$ h900' 0.4¼ h500$ h360¼ h140 million.
Solution to 2. B is correct. The historical description of the company’s dividend pay-ments is consistent with a stable dividend policy. The total cost of the dividend at8 million shares' h3 a share¼ h24 million is covered by current earnings of h28million. Just maintaining the current dividend implies a dividend payout ratio of(h24 million)/(h28 million)¼ 85.7 percent, which is at the high end of the historicalrange. No information is provided that points to increasing the dividend.
Answer A at h2.28* h2.275¼ (h28 million)(0.65)/(8 million shares) wouldbe a possible value of the dividend under a target payout ratio policy, and answer Ch3.19* h3.1875¼ [h28 million$ 0.5(h5 million)]/(8 million shares) would be apossible answer under a residual dividend policy.
c07 13 January 2012; 9:16:43
Chapter 7 Dividends and Share Repurchases: Analysis 285

wealth, all other things being equal. Further discussion about the choice revolves around whatmight not “be equal” and what might cause one distribution mechanism to be preferred overthe other. The use of share repurchases also may be legally restricted.32
In general, share repurchases can be considered part of a company’s broad policy ondistributing earnings to shareholders and a company may engage in share repurchases forreasons similar to those mentioned in connection with cash dividends—for example, todistribute free cash flow to equity to common shareholders. A number of additional reasonshave been brought forward that apply to share repurchases, including:
! Potential tax advantages.! Share price support/signaling that the company considers its shares a good investment.! Added managerial flexibility.! Offsetting dilution from employee stock options.! Increasing financial leverage.
Potential tax advantages. In jurisdictions that tax shareholder dividends at higher ratesthan capital gains, share repurchases have a tax advantage over cash dividends.
Share price support/signaling that the company considers its shares a good investment. Man-agement of a company may view its own shares as undervalued in the marketplace and hence agood investment. Although management’s stock market judgment can be just as good or bad asthat of any other market participant, corporate management typically does have more infor-mation about the company’s operation and future prospects than does any outside investor oranalyst. Furthermore, share repurchases via open market purchase, the dominant repurchasemechanism, allow management to time share repurchases with respect to market price. Theannouncement of a share repurchase program is often understood as a positive signal aboutthe company’s prospects and attractiveness as an investment. An unexpected announcement ofa meaningful share repurchase program can often have the same positive impact on share priceas would a better-than-expected earnings report or similar positive event. In the days followingthe global stock market crash of October 1987, a number of prominent companies announcedhuge buybacks in an effort to halt the slide in the price of their shares and show confidence inthe future. It may have been an important aspect in the stock market recovery that followed.Some investment analysts, however, take issue with the notion that initiation of sharerepurchases is a positive signal, because a repurchase program could mean that the company hasno new profitable investment opportunities and is thus returning cash to shareholders.
Added managerial flexibility. Unlike regular cash dividends, share repurchase programsappear not to create the expectation among investors of continuance in the future. Fur-thermore, in contrast to an announced dividend, the announcement of a share repurchase byopen market purchase does not typically create an obligation to follow through withrepurchases. Additionally, the timing of share repurchases via open market activity is atmanagers’ discretion. Share repurchases also afford shareholders flexibility because partici-pation is optional, which is not the case with the receipt of cash dividends.
Offsetting dilution from employee stock options. For some companies, share repurchases areused to offset the possible dilution of earnings per share that may result from the exercise ofemployee stock options. Whether stated or not, many companies try to repurchase at least asmany shares as were issued in the exercise of stock options—even though the options aretypically exercised at lower prices than the repurchase price.
32See Vermaelen (2005) for details.
c07 13 January 2012; 9:16:44
286 Corporate Finance

Increasing financial leverage. Another reason for repurchasing shares is to modify thecompany’s capital structure, if greater leverage in the company’s capital structure is viewed asefficient. Share repurchases increase leverage.
Among other reasonsmentioned for share repurchases by corporatemanagers is the objectiveof increasing EPS. This objective is problematic for two reasons. First, even when sharerepurchases result in an EPS increase, the required rate of return will likely increase reflectinghigher leverage. Second, according to finance theory, changing EPS by changing the number ofshares outstanding does not affect shareholder wealth given that total free cash flow is unchanged.
EXAMPLE 7-12 Share Repurchase to IncreaseFinancial Leverage
Canadian Holdings, Inc. (CHI), with debt and a debt ratio of C$30 million and30 percent, respectively, plans a share repurchase program involving C$7 million or10 percent of the market value of its common shares. What debt ratios would resultfrom financing the repurchases using (1) cash on hand and (2) new debt?
Solution: (1) If CHI uses cash on hand to make the share repurchase the debt ratiowould rise to 32 percent. (2) If CHI uses debt to finance the share repurchases, the debtratio would increase to 37 percent. Exhibit 7-9 shows the calculations. By either meansof financing the share repurchase, it increases financial leverage.33
EXHIBIT 7-9 Estimated Impact on Capital Structure (C$ millions)
After Buyback
Before Buyback All Cash All Debt
C$ % C$ % C$ %
Debt $30 30% $30 32% $37 37%
Equity (at market) $70 70% $63 68% $63 63%
Total Cap $100 100% $93 100% $100 100%
Canadian Holdings’ beginning debt ratio was 30 percent. If Canadian Holdingsuses borrowed funds to repurchase equity, the debt ratio at market will increase to37 percent, which is significantly more than if it used excess cash (32 percent).
33Note that using a ratio of net debt to capital based on net debt (defined as debt net of cash) and capital(defined as net debt plus equity), the effect of using cash or using debt in the share repurchase would bethe same. The initial ratio of net debt to capital is (30$ 7)/(23þ 70)¼ 25 percent. Using cash for theshare repurchase, this ratio would become (30)/(30þ 63)¼ 32 percent, and using debt in the trans-action, it would also be (37$ 7)/(30þ 63)¼ 32 percent.
c07 13 January 2012; 9:16:44
Chapter 7 Dividends and Share Repurchases: Analysis 287

A company can use both special cash dividends and share repurchases as a supplementto regular cash dividends. These means of distributing cash are often used in years whenthere are large and extraordinary increases in cash flow that are not expected to continue infuture years. In making these types of payments, the company essentially communicates thatthe distribution, like the increase in cash flow, should not be expected to continue in thefuture. In this context, a share repurchase is effectively an alternative to paying a special cashdividend.
EXAMPLE 7-13 Siemens AG Announces Share Buybackto Achieve Target Capital Structure
On 7 November 2007, Siemens AG, a world leader in electrical and electronicequipment, reported that in order to optimize its capital structure it would repurchaseshares by fiscal year end 2010 to achieve a target ratio of net industrial debt to EBITDAin the range 0.8'$ 1.0'. Accordingly, Siemens said it could repurchase shares in theamount up to h10 billion in several tranches. Siemens’ repurchases in the first twotranches were as follows:
EXHIBIT 7-10 Share Buyback Activities, First Tranche (2008)
Month Shares Repurchased Average Price (h) Total Value (h)
January 1,829,000 84.6186 154,767,464.62
February 9,579,498 88.2335 845,232,489.97
March 9,943,030 75.4019 749,723,178.63
April 3,503,013 71.4466 250,278,201.67
Sum 24,854,541 80.4682 2,000,001,334.89
Share Buyback Activities, Second Tranche (2008)
Month Shares Repurchased Average Price (h) Total Value (h)
June 13,709,495 72.8857 999,225,910.57
July 14,207,169 70.3870 999,999,975.00
Sum 27,916,664 71.6141 1,999,225,885.57
Source: a1.siemens.com/investor/en/siemens_share/share_buyback_program.htm.
The company bought back about 52.77 million shares for approximately h4 bil-lion. No further repurchases have been announced, and it is possible that Siemens hasshelved the program to conserve cash in the economic downturn.
c07 13 January 2012; 9:16:44
288 Corporate Finance

Some companies initiate payouts to shareholders using share repurchases rather than cashdividends.34 As with the case of a share repurchase substituting for a special cash dividend, the useof share repurchases is paid with the expectation that it will not be viewed as creating a fixedcommitment.
Although all of the preceding can be the stated or unstated reasons for share repurchases, ingeneral, share repurchases increase in volume when the economy is strong and companies havemore cash. During recessions, when cash is often short, share repurchases typically fall. Fromthe fourth quarter of 2004 to the fourth quarter of 2008, the 500 companies in the S&P 500spent $1.8 trillion on share repurchases as compared with $2 trillion on capital expendituresand $1 trillion on cash dividends. In the market crash of 2008–2009, share repurchasesplummeted.35 Major companies (particularly in the global financial sector) that had made largeshare repurchases encountered challenges to their financial viability in 2008 and 2009.
Example 7-14, in which a company’s board of directors initiates a cash dividend, inte-grates a number of themes related to cash dividends, stock dividends (in which additionalshares are distributed to shareholders instead of cash), and share repurchases.
EXAMPLE 7-14 Scottsville Instruments’ DividendPolicy Decision
Scottsville Instruments, Inc., (SCII) is a U.S.-based company emerging as a leader inproviding medical testing equipment to the pharmaceutical and biotechnology indus-tries. SCII’s primary markets are growing and the company is spending $100 million ayear on research and development to enhance its competitive position. SCII is highlyprofitable and has substantial positive free cash flow after funding positive NPV pro-jects. During the past three years, SCII has made significant share repurchases. Sub-sequent to the reduction in the tax rate on cash dividends to 15 percent in the UnitedStates, the same tax rate as that on long-term capital gains, SCII management is pro-posing the initiation of a cash dividend. The first dividend is proposed to be an annualdividend of $0.40 a share to be paid during the next fiscal year. Based on estimatedearnings per share of $3.20, this dividend would represent a payout ratio (DPS/EPS) of0.125 or 12.5 percent. The proposal that will be brought before the board of directorsis the following:
Proposed: Scottsville Instruments, Inc., will institute a program of cashdividends. The first dividend will be an annual dividend of $0.40 a share, tobe paid at a time to be determined during the next fiscal year. Thereafter, anannual dividend will be paid consistent with retaining funds sufficient tofinance profitable capital projects.
The company’s board of directors will formally consider the dividend proposal atits next meeting in one month’s time. Although some directors favor the dividend
34Grullon and Michaely (2002).35Grace and Curran (2009), C9.
c07 13 January 2012; 9:16:45
Chapter 7 Dividends and Share Repurchases: Analysis 289

initiation proposal, other directors, led by William Marshall, are skeptical of it.Marshall has stated:
“The initiation of a cash dividend will suggest to investors that SCII is nolonger a growth company.”
As a counterproposal, Marshall has offered his support for the initiation of anannual 2 percent stock dividend. Elise Tashman, a director who is neutral to both thecash dividends and stock dividend ideas, has told Marshall the following:
“A 2 percent stock dividend will not affect the wealth of our shareholders.”
Exhibit 7-11 presents selected pro forma financials of SCII, if the directors approvethe initiation of a cash dividend.
EXHIBIT 7-11 Scottsville Instruments, Inc., Pro Forma Financial Data Assuming CashDividend ($ millions)
Income Statement Statement of Cash Flows
Sales $1,200 Cash flow from operations $135
Earnings before taxes 155 Cash flow from investing activities (84)
Taxes 35 Cash flow from financing activities:
Net income 120 Debt repayment (4)
Share repurchase (32)
Proposed dividend (15)
Estimated change in cash 0
Ratios Five-Year Forecasts
Current ratio 2.1 Sales growth 8% annually
Debt/equity (at market) 0.27 Earnings growth 11% annually
Interest coverage 10.8' Projected cost of capital 10%
ROA 10.0%
ROE 19.3%
P/E 20'E/P 5.0%
Using the information provided, address the following:
1. Critique Marshall’s statement.2. Justify Tashman’s statement.3. Identify and explain the dividend policy that the proposed $0.40 a share cash
dividend reflects.
c07 13 January 2012; 9:16:45
290 Corporate Finance
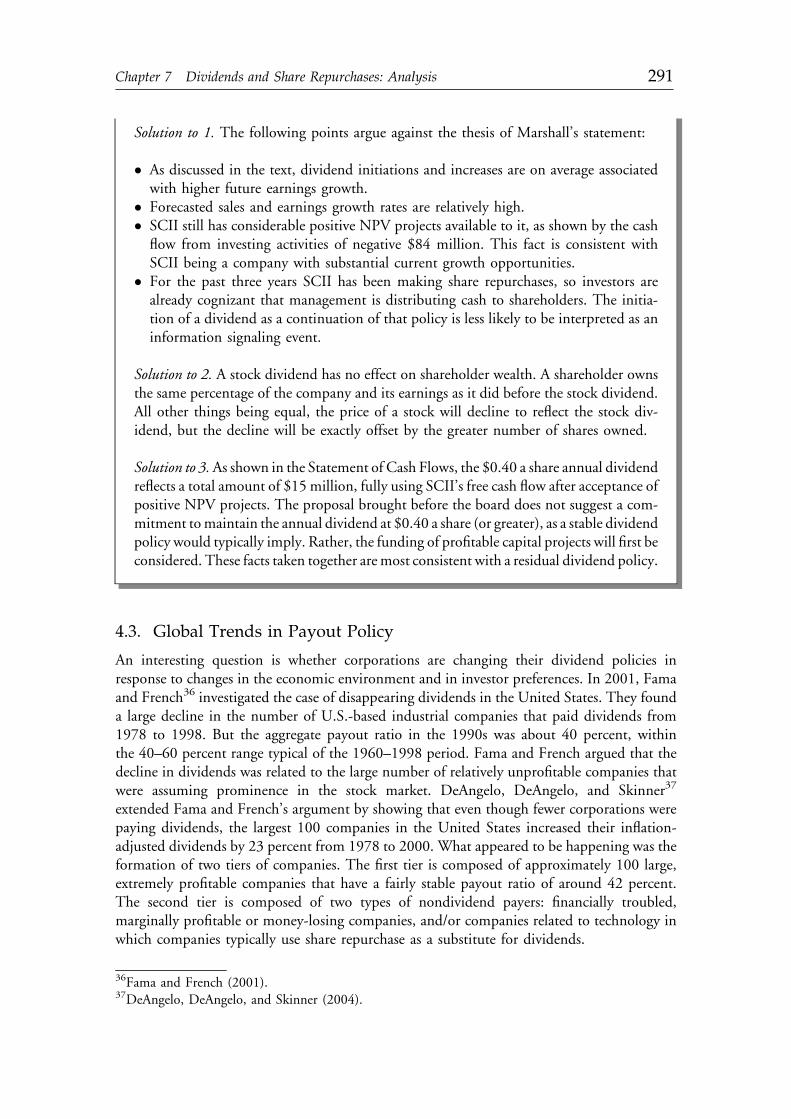
4.3. Global Trends in Payout Policy
An interesting question is whether corporations are changing their dividend policies inresponse to changes in the economic environment and in investor preferences. In 2001, Famaand French36 investigated the case of disappearing dividends in the United States. They founda large decline in the number of U.S.-based industrial companies that paid dividends from1978 to 1998. But the aggregate payout ratio in the 1990s was about 40 percent, withinthe 40–60 percent range typical of the 1960–1998 period. Fama and French argued that thedecline in dividends was related to the large number of relatively unprofitable companies thatwere assuming prominence in the stock market. DeAngelo, DeAngelo, and Skinner37
extended Fama and French’s argument by showing that even though fewer corporations werepaying dividends, the largest 100 companies in the United States increased their inflation-adjusted dividends by 23 percent from 1978 to 2000. What appeared to be happening was theformation of two tiers of companies. The first tier is composed of approximately 100 large,extremely profitable companies that have a fairly stable payout ratio of around 42 percent.The second tier is composed of two types of nondividend payers: financially troubled,marginally profitable or money-losing companies, and/or companies related to technology inwhich companies typically use share repurchase as a substitute for dividends.
Solution to 1. The following points argue against the thesis of Marshall’s statement:
! As discussed in the text, dividend initiations and increases are on average associatedwith higher future earnings growth.
! Forecasted sales and earnings growth rates are relatively high.! SCII still has considerable positive NPV projects available to it, as shown by the cash
flow from investing activities of negative $84 million. This fact is consistent withSCII being a company with substantial current growth opportunities.
! For the past three years SCII has been making share repurchases, so investors arealready cognizant that management is distributing cash to shareholders. The initia-tion of a dividend as a continuation of that policy is less likely to be interpreted as aninformation signaling event.
Solution to 2. A stock dividend has no effect on shareholder wealth. A shareholder ownsthe same percentage of the company and its earnings as it did before the stock dividend.All other things being equal, the price of a stock will decline to reflect the stock div-idend, but the decline will be exactly offset by the greater number of shares owned.
Solution to 3.As shown in the Statement of Cash Flows, the $0.40 a share annual dividendreflects a total amount of $15 million, fully using SCII’s free cash flow after acceptance ofpositive NPV projects. The proposal brought before the board does not suggest a com-mitment tomaintain the annual dividend at $0.40 a share (or greater), as a stable dividendpolicy would typically imply. Rather, the funding of profitable capital projects will first beconsidered. These facts taken together aremost consistent with a residual dividend policy.
36Fama and French (2001).37DeAngelo, DeAngelo, and Skinner (2004).
c07 13 January 2012; 9:16:45
Chapter 7 Dividends and Share Repurchases: Analysis 291

Dividend policy practices have international differences and change through time, evenin one market, consistent with the catering theory of Baker and Wurgler (2004), whichpredicts that companies adapt their dividend policy over time to changing investor tastes.38
Typically, a lower percentage of companies in a given U.S. stock market index have paiddividends than have companies in a comparable European stock market index. In addition,the following broad trends in dividend policy have been observed:
! The fraction of companies paying cash dividends has been in long-term decline inmost developed markets (e.g., the United States, Canada, the European Union, the UnitedKingdom, and Japan).39
! Since the early 1980s in the United States40 and the early 1990s in the United Kingdomand continental Europe,41 the fraction of companies engaging in share repurchases hastrended upward.
Ferris, Sen, and Unlu (2009) study dividend behavior across 25 countries and concludethat both aggregate dividend amounts as well as payout ratios have generally increased overtime, although the fraction of dividend payers has decreased.42 (See Exhibit 7-12.)
EXHIBIT 7-12 Dividend Payout Ratios by Country and Over Time43
Country 1994 1998 2001 2004 2007
Australia 0.28 0.37 0.48 0.36 0.38
Austria 0.14 0.27 0.27 0.18 0.24
Canada 0.17 0.19 19.16 0.25 0.27
Denmark 0.07 0.15 0.25 0.13 0.13
Finland 0.06 0.19 0.29 0.41 0.35
France 0.10 0.14 0.31 0.24 0.26
Germany 0.20 0.30 0.48 0.20 0.26
Hong Kong 0.33 0.58 0.32 0.32 0.39
Indonesia 0.25 0.11 0.16 0.27 0.37
Ireland 0.12 0.14 0.28 0.27 0.11
Italy 0.04 0.14 0.45 0.49 0.25
38For the international evidence of catering and of international differences, see Ferris, Jayaraman, andSabherwal (2009), 1730–1738.39See Von Eije and Megginson (2008) and references therein.40Important in the United States was the adoption of Securities and Exchange Commission Rule 10b-18in 1982, which relieved companies from concerns of stock manipulation in repurchasing shares as longas companies follow certain guidelines.41See Von Eije and Megginson (2008).42The reader should be aware that the samples for each market shown generally represent differentproportions of the total market and high proportions of large cap stocks.43The data in Exhibit 7-12 are excerpted from Ferris et al. (2009), and appear as shown in the originaldocument.
c07 13 January 2012; 9:16:46
292 Corporate Finance

5. ANALYSIS OF DIVIDEND SAFETY
The global recession that began in late 2007 was predicted to give rise to the largest number ofdividend cuts and suspensions since the Great Depression of the 1930s.44 Global titans, such asGE, Toyota, Barclays, UBS, and Daimler AG, cut their dividend. By mid 2009, S&P 500dividends for U.S. companies were down by 25 percent from the prior year, British investorswere predicting a worst-case decline in dividends for U.K. companies of 35 percent, and marketanalysts forecast similar declines for the MSCI Global Index.45 In this section, we discuss howan analyst can form a judgment on the likelihood a company’s cash dividend may be cut.
The traditional way of looking at dividend safety is the dividend payout ratio (dividends/netincome) and its inverse, the dividend coverage ratio (net income/dividends). A higher dividendpayout ratio or a lower dividend coverage ratio tends to indicate, all else equal, higher risk of adividend cut. The logic is that with a relatively high dividend payout ratio, a relatively smallpercentage decline in earnings could cause the dividend not to be payable out of earnings.
In judging these ratios, various generalizations may be stated based on observed practice.In stating these generalizations, we emphasize that they should be confirmed for the particularmarket and time period being addressed.
Large mature companies typically target dividend payout ratios of 40 percent to 60 percent,so that dividend coverage ratios range from about 1.7' to 2.5' , excluding “extra” payments.Mature companies are expected to be in this range over the course of a 5- to 10-year business cycle.Higher dividendpayout ratios (or lower dividend coverage ratios) often constitute a risk factor that
Country 1994 1998 2001 2004 2007
Japan 0.13 0.13 0.13 0.10 0.13
South Korea 0.03 0.05 0.10 0.10 0.12
Malaysia 0.20 0.46 0.25 0.25 0.31
Mexico 0.35 0.21 0.10 0.16 0.18
Norway 0.09 0.25 0.12 0.19 0.21
Philippines 0.05 0.08 0.13 0.13 0.25
Portugal 0.11 0.25 0.30 0.22 0.31
Singapore 0.21 0.24 0.39 0.32 0.39
South Africa 0.23 0.19 0.27 0.23 0.25
Spain 0.19 0.20 0.19 0.33 0.26
Sweden 0.09 0.22 0.72 0.37 0.37
Switzerland 0.14 0.18 0.25 0.23 0.24
United Kingdom 0.27 0.38 0.49 0.38 0.29
United States 0.21 0.20 0.30 0.20 0.20
EXHIBIT 7-12 (Continued)
44The Economist, 7 March 2009, 77.45FT.com, “Investors fear new flood of dividend cuts,” 13 May 2009.
c07 13 January 2012; 9:16:46
Chapter 7 Dividends and Share Repurchases: Analysis 293

a dividend may be cut if earnings decline. When a dividend coverage ratio drops to 1.0, thedividend is considered to be in jeopardy unless nonrecurring events, such as an employee strike, ora typhoon, are responsible for a temporary decline in earnings. In judging safety, qualitative plusesare awarded for companies that have had stable or increasing dividends, while minuses accrue tocompanies that have reduced their dividend in the past. Indeed, concerning this issue, the 1962edition of Graham et al. stated that “[t]he absence of rate reduction in the past record is perhaps asimportant as the presence of numerous rate advances.”46
The payout and coverage ratios are often compared on an industry basis when evaluatingthem. Fast growing industries, often with relatively new companies, are associated with no orlow dividend payouts, and mature and highly regulated companies have higher payouts. Inthe early 1990s, technology companies were regarded as quintessential growth companieswith little concern for cash dividends. As the technology industry has matured, its dividendpayout has become more significant.
Free cash flow to equity (FCFE), defined earlier, represents the cash flow available fordistribution as dividends after taking account of working and fixed capital expenditure needs. Ifthose needs are ignored, distribution of dividends may be at cross purposes with shareholderwealth maximization. Cash flow (specifically free cash flow to equity), not reported net income,should be viewed as the source of cash dividend payments from that perspective. Thus, analysisof dividend safety can properly include payout and coverage ratios based on FCFE rather thannet income. Other cash flow definitions besides FCFE have also been used in such ratios.Examining the correlation of dividends with cash flow measures may also provide insights.
This chapter has taken the position that payouts should be considered in terms of sharerepurchases as well as dividends because they both represent cash distributions to share-holders. Arguably, a comprehensive measure of dividend safety would relate FCFE to bothcash dividends and share repurchases:47
EXAMPLE 7-15 Traditional Measures of Dividend Safety
Given the following data, calculate the dividend payout and coverage ratios:
Mature European SA 2010 FY
Net Income Available for Common Stock EUR 100 mil.
Dividends Paid EUR 40 mil.
Solution:
Dividend Payout Ratio 40/100¼ 40%
Dividend Coverage Ratio 100/40¼ 2.5'
46Graham, Dodd, Cottle, and Tatham (1962), 487.47See Damodaran (2001), 689–704. Damodaran actually shows the inverse, the FCFE payout ratio.
c07 13 January 2012; 9:16:46
294 Corporate Finance

FCFE Coverage Ratio ¼ FCFE=ðDividendsþ Share RepurchasesÞ
If that ratio is 1, the company is returning all available cash to shareholders. If it is significantlygreater than 1, the company is improving liquidity by using funds to increase cash and/or mar-ketable securities. A ratio significantly less than 1 is not sustainable because the company is payingout more than it can afford by drawing down existing cash/marketable securities, therebydecreasing liquidity. At some point the company will have to raise new equity.
Fundamental risk factors with regard to dividend safety include above-average financialleverage. Additional issuance of debt, whether to fund projects or to finance the dividend, maybe restricted during business downturns.
Example 7-16 shows an analysis of the sustainability of the dividend of the iconicmotorcycle company, Harley Davidson, Inc. The analysis includes the traditional earnings/dividend coverage approach and an alternative FCFE approach that considers total cashpayouts to shareholders—dividends and share repurchases.
EXAMPLE 7-16 Harley Davidson’s Coverage Ratios
Harley Davidson, Inc. (NYSE symbol HOG), produces and sells luxury motorcycles inthe United States and Europe. The company has paid dividends since 1993.
EXHIBIT 7-13 Harley Davidson
Years Ending 31 December (US$ millions) 2006 2007 2008
Net income (earnings) $1,043 $934 $655
Cash flow from operations 762 798 (685)
FCInv (capital expenditures) 220 242 332
Net borrowing 493 352 1,845
Dividends paid 213 261 302
Stock repurchases 936 1,132 249
Source: Yahoo! Finance website, 24 July 2009.
1. Using the above information, calculate the following for 2006, 2007, and 2008:A. Dividend/earnings payout ratioB. Earnings/dividend coverage ratioC. Free cash flow to equity (FCFE)D. FCFE/[dividendþ stock repurchase] coverage ratio
2. Discuss the trend in earnings/dividend coverage as compared with the trend inFCFE/[dividendþ stock repurchase] coverage.
3. Comment on the sustainability of HOG’s dividend and stocks repurchase policyafter 2008.
c07 13 January 2012; 9:16:47
Chapter 7 Dividends and Share Repurchases: Analysis 295

Whether based on a company’s net income or free cash flow, past financial data do notalways predict dividend safety. Surprise factors and other unexpected events can confound themost rigorous analysis of past data. Equity and debt markets were shaken in 2008–2009 bythe losses taken by almost all U.S. and European banks. These losses led to the cutting and, insome cases, virtual elimination of cash dividends. Not all twenty-first century investors wouldagree with Graham and Dodd’s 1962 assertion that “For the vast majority of common stocks,the dividend record and prospects have always been the most important factor controllinginvestment quality and value.”48 But most investors would agree that when the market evenbegins to suspect a decrease or suspension of a company’s cash dividend, that expectation islikely to weigh unfavorably on that company’s common stock valuation. Therefore, manyanalysts look for external stock market indicators of market expectations of dividend cuts.
Solutions to 1.
A. Dividend/earnings payout¼ 213/1043¼ 0.20 or 20 percent in 2006, 0.28 or28 percent in 2007, and 0.46 or 46 percent in 2008.
B. Earnings/dividend coverage¼ 1043/213¼ 4.9' in 2006, 3.6' in 2007, and 2.2'in 2008.
C. FCFE¼Cash flow from operations (CFO)$ FCInvþNet borrowing¼ $762$$220þ $493¼ $1035 in 2006, $798$ $242þ $352¼ $908 in 2007, and $828in 2008.
D. FCFE coverage of dividendsþ share repurchases¼ FCFE/dividendsþ stockrepurchases¼ $1035/($213þ $936)¼ 0.90' in 2006. Similar calculations resultin 0.65' in 2007 and 1.50' in 2008.
2. Earnings/dividend coverage declined over the three years. Still, even in 2008,accounting earnings were more than twice the amount necessary to pay the divi-dend. An analyst who looked at only this metric might not have suspected problems.
The FCFE coverage of both the dividend and stock repurchases was less than 1 in2006 and 2007, indicating the company was reducing liquidity (and/or consciouslyelecting to move to a more leveraged capital structure) by returning money toshareholders. The increase in this ratio to1.5' in 2008 was the result of net bor-rowings. Harley was funding almost everything (negative CFO, capital expenditures,dividends, and share buyouts) with new borrowings. Analysis of FCFE generation in2008, showing its reliance on net borrowing, was a better indicator of problemslatent in Harley’s payout policies than earnings/dividend coverage.
4. Funding dividends and stock repurchases with net borrowings is a short-termproposition and not a sustainable policy. Something has to give: cut the dividendand/or curtail share repurchases.
Update: On 12 February 2009, Harley Davidson announced a cut in its quarterlydividend to $0.10 a share, a decline of 70 percent from its old rate of $0.33, andfurther announced that no stock repurchases would be made in the first quarter.
48Graham, Dodd, Cottle, and Tatham (1962), 480.
c07 13 January 2012; 9:16:47
296 Corporate Finance

Extremely high dividend yields compared with a company’s past record and current bondyields is often another warning signal that investors are predicting a dividend cut. For example, thedividend yield on General Electric shares just prior to its 68 percent dividend cut in 2008 wasnearly 14 percent.49 After the dividend cut, GE shares still yielded about 4.7 percent, relativelyhigh compared with its yields in recent years (generally under 3 percent) and the then current10 year T-bond yield of about 3 percent. In such cases, investors bid down the price of sharessuch that, after the expected cut, the expected total return on the shares was still adequate.
The observations of Madden (2008) support an attitude of caution with respect to very highdividend yields. Madden examined yields for the 1,963 stocks in the MSCI World Index.50 Hiscompany classified 865 companies out of the 1,963 companies as a “High Dividend Universe”(HDU). In the early months of the economic decline, Madden found that 78.6 percent of thecompanies in the HDU had questionable ability to maintain their dividend payments as com-pared with 30.7 percent of all the companies in the MCSI World Index.
6. SUMMARY
The dividend policy of a company affects the form in which shareholders receive the return ontheir investment and is a prominent decision of a company’s board of directors. This chapterhas made the following points:
! There are three general theories on investor preference for dividends. The first, MM,argues that given perfect markets dividend policy is irrelevant. The “bird in hand” theorycontends that investors value a dollar of dividends today more than uncertain capital gainsin the future. The third theory argues that in countries in which dividends are taxed athigher rates than capital gains, taxable investors should prefer that companies reinvestearnings in growth opportunities or repurchase shares so they receive more of the return inthe form of capital gains.
! An argument for dividend irrelevance given perfect markets is that the corporate dividendpolicy is irrelevant because shareholders can create their preferred cash flow stream byselling any company’s shares (“homemade dividends”).
! The clientele effect suggests that different classes of investors have differing preferences fordividend income. Those who prefer dividends will tend to invest in higher yielding shares.
! Dividend declarations may provide information to current and prospective shareholdersregarding the prospects of the company. Initiating a dividend or increasing a dividendsends a positive signal, whereas cutting a dividend or omitting a dividend typically sends anegative signal.
! Payment of dividends can help reduce the agency conflicts between managers and share-holders, but can worsen conflicts of interest between shareholders and debt holders.
! Empirically, several factors appear to influence dividend policy, including investmentopportunities for the company, the volatility expected in its future earnings, financialflexibility, tax considerations, flotation costs, and contractual and legal restrictions.
! Under double taxation systems, dividends are taxed at both the corporate and shareholderlevel. Under tax imputation systems, a shareholder receives a credit on dividends for the tax
49Glader, Laise, and Browning (2009), A1.50Madden (2008), 42–44.
c07 13 January 2012; 9:16:47
Chapter 7 Dividends and Share Repurchases: Analysis 297

paid on corporate profits. Under split-rate taxation systems, corporate profits are taxed atdifferent rates depending on whether the profits are retained or paid out in dividends.
! Companies with outstanding debt often are restricted in the amount of dividends they canpay because of debt covenants and legal restrictions. Some institutions require that acompany pay a dividend to be on their “approved” list. If a company funds capitalexpenditures by borrowing while paying earnings out in dividends, it will incur flotationcosts on new issues.
! Using a stable dividend policy, a company tries to align its dividend growth rate to thecompany’s long-term earnings growth rate. Dividends may increase even in years whenearnings decline, and dividends will increase at a lower rate than earnings in boom years.
! According to Lintner (1956), the stable dividend policy can be represented by a gradualadjustment process in which the expected dividend is equal to last year’s dividend per share,plus [(this year’s expected increase in earnings per share)' (the target payout ratio)' (anannual adjustment factor)].
! Using a constant dividend payout ratio policy, a company applies a target dividend payout ratioto current earnings; therefore, dividends are more volatile than with a stable dividend policy.
! In a residual dividend policy, the amount of the annual dividend is equal to annualearnings minus the capital budget times the percent of the capital budget to be financedthrough retained earnings or zero, whichever is greater. An advantage of this policy is thatpositive NPV opportunities have the first priority in the use of earnings.
! Companies can repurchase shares in lieu of increasing cash dividends. Share repurchasesusually offer more flexibility than cash dividends by not establishing the expectation that aparticular level of cash distribution will be maintained.
! Companies can pay regular cash dividends supplemented by share repurchases. In years ofextraordinary increases in earnings, share repurchases can substitute for special cash dividends.
! Share repurchases can signal that company officials think their shares are undervalued. Onthe other hand, share repurchases could send a negative signal that the company has fewpositive NPV opportunities.
! The issue of dividend safety deals with how safe a company’s dividend actually is, spe-cifically whether the company’s earnings and, more importantly, its cash flow are sufficientto sustain the payment of the dividend.
! Early warning signs of whether a company can sustain its dividend include the level ofdividend yield, whether the company borrows to pay the dividend, and the company’spast dividend record.
PROBLEMS
1. Match the phrases in Column A with the corresponding dividend theory in Column B.Note that you may use the answers in Column B more than once.
Column A Column B
1. Bird in the hand2. Homemade dividends3. High tax rates on dividends
a) dividend policy mattersb) dividend policy is irrelevant
c07 13 January 2012; 9:16:47
298 Corporate Finance
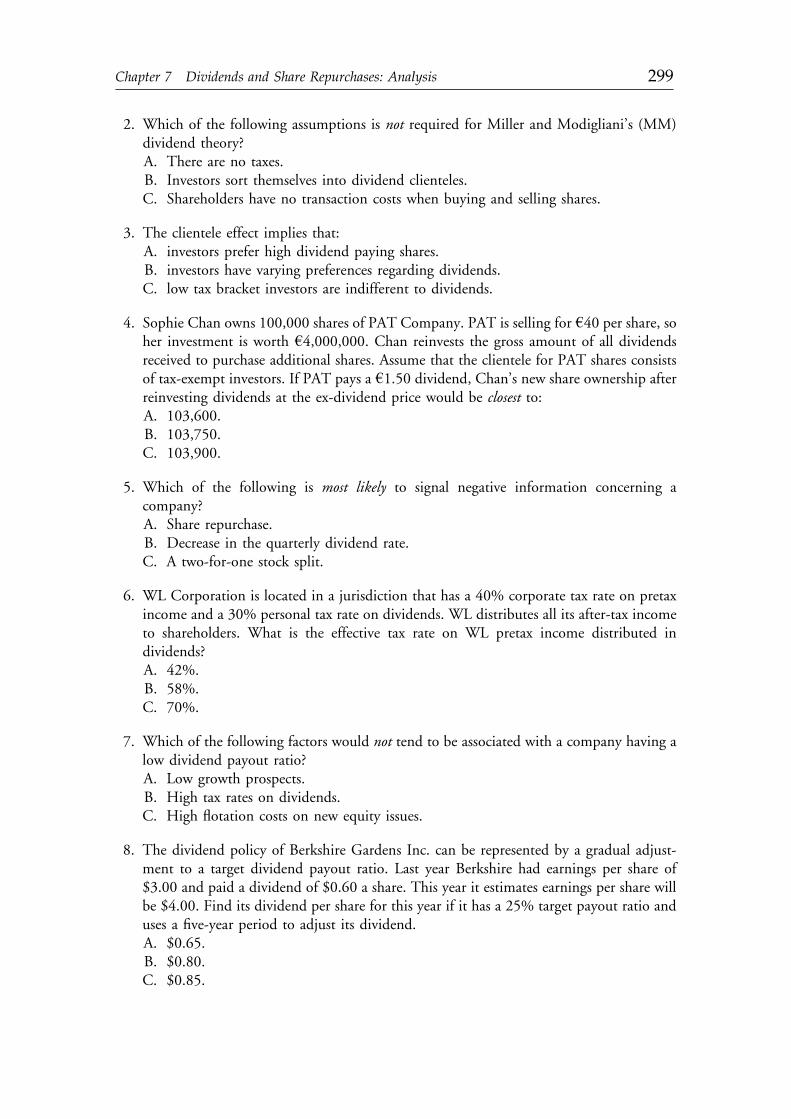
2. Which of the following assumptions is not required for Miller and Modigliani’s (MM)dividend theory?A. There are no taxes.B. Investors sort themselves into dividend clienteles.C. Shareholders have no transaction costs when buying and selling shares.
3. The clientele effect implies that:A. investors prefer high dividend paying shares.B. investors have varying preferences regarding dividends.C. low tax bracket investors are indifferent to dividends.
4. Sophie Chan owns 100,000 shares of PAT Company. PAT is selling for h40 per share, soher investment is worth h4,000,000. Chan reinvests the gross amount of all dividendsreceived to purchase additional shares. Assume that the clientele for PAT shares consistsof tax-exempt investors. If PAT pays a h1.50 dividend, Chan’s new share ownership afterreinvesting dividends at the ex-dividend price would be closest to:A. 103,600.B. 103,750.C. 103,900.
5. Which of the following is most likely to signal negative information concerning acompany?A. Share repurchase.B. Decrease in the quarterly dividend rate.C. A two-for-one stock split.
6. WL Corporation is located in a jurisdiction that has a 40% corporate tax rate on pretaxincome and a 30% personal tax rate on dividends. WL distributes all its after-tax incometo shareholders. What is the effective tax rate on WL pretax income distributed individends?A. 42%.B. 58%.C. 70%.
7. Which of the following factors would not tend to be associated with a company having alow dividend payout ratio?A. Low growth prospects.B. High tax rates on dividends.C. High flotation costs on new equity issues.
8. The dividend policy of Berkshire Gardens Inc. can be represented by a gradual adjust-ment to a target dividend payout ratio. Last year Berkshire had earnings per share of$3.00 and paid a dividend of $0.60 a share. This year it estimates earnings per share willbe $4.00. Find its dividend per share for this year if it has a 25% target payout ratio anduses a five-year period to adjust its dividend.A. $0.65.B. $0.80.C. $0.85.
c07 13 January 2012; 9:16:47
Chapter 7 Dividends and Share Repurchases: Analysis 299

9. The Apex Corp. has a target debt/equity ratio of 40/60. Its capital budget for next year isestimated to be $40 million. Estimated net income is $30 million. If Apex follows aresidual dividend policy, its dividend is expected to be:A. $6 million.B. $12 million.C. $18 million.
10. Beta Corporation is a manufacturer of inflatable furniture. Which of the followingscenarios best reflects a stable dividend policy for Beta?A. Maintaining a constant dividend payout ratio of 40–50%.B. Maintaining the dividend at $1.00 a share for several years given no change in Beta’s
long-term prospects.C. Increasing the dividend 5% a year over several years to reflect the two years in which
Beta recognized mark-to-market gains on derivative positions.
11. Investors may prefer companies that repurchase their shares instead of paying a cashdividend when:A. capital gains are taxed at lower rates than dividends.B. capital gains are taxed at the same rate as dividends.C. the company needs more equity to finance capital expenditures.
The following information relates to Questions 12–14.Janet Wu is treasurer of Wilson Paper Company, a manufacturer of paper products for the
office and school markets. Wilson Paper is selling one of its divisions for $70 million cash. Wu isconsidering whether to recommend a special dividend of $70million or a repurchase of 2 millionshares of Wilson common stock in the open market. She is reviewing some possible effects of thebuyback with the company’s financial analyst. Wilson has a long-term record of graduallyincreasing earnings and dividends. Wilson’s board has also approved capital spending of $15million to be entirely funded out of this year’s earnings.
Book value of equity $750 million ($30 a share)
Shares outstanding 25 million
12-month trading range $25–$35
Current share price $35
After-tax cost of borrowing 7%
Estimated full year earnings $25 million
Last year’s dividends $9 million
Target debt/equity (market value) 35/65
12. In investors’ minds, Wilson’s share buyback could be a signal that the company:A. is decreasing its financial leverage.B. views its shares as undervalued in the marketplace.C. has more investment opportunities than it could fund internally.
c07 13 January 2012; 9:16:48
300 Corporate Finance

13. Assume that Wilson Paper funds its capital spending out of its estimated full yearearnings. If Wilson uses a residual dividend policy, determine Wilson’s implied dividendpayout ratio:A. 36%.B. 40%.C. 60%.
14. The most likely tax environment in which Wilson Paper’s shareholders would prefer thatWilson repurchase its shares (share buybacks) instead of paying dividends is one in which:A. the tax rate on capital gains and dividends is the same.B. capital gains tax rates are higher than dividend income tax rates.C. capital gains tax rates are lower than dividend income tax rates.
c07 13 January 2012; 9:16:48
Chapter 7 Dividends and Share Repurchases: Analysis 301

c07 13 January 2012; 9:16:48

CHAPTER 8WORKING CAPITAL
MANAGEMENT
Edgar A. Norton, Jr., CFANormal, Illinois, U.S.A.
Kenneth L. ParkinsonNew York, New York, U.S.A.
Pamela Peterson Drake, CFAHarrisonburg, Virginia, U.S.A.
LEARNING OUTCOMES
After completing this chapter, you will be able to do the following:
! Describe primary sources of liquidity and factors that influence a company’s liquidityposition.
! Compare a company’s liquidity measures with those of peer companies.! Evaluate working capital effectiveness of a company based on its operating and cash
conversion cycles, and compare the company’s effectiveness with that of peer companies.! Explain the effect of different types of cash flows on a company’s net daily cash position.! Identify and evaluate the necessary tools to use in managing a company’s net daily cash
position.! Calculate and interpret comparable yields on various securities, compare portfolio returns
against a standard benchmark, and evaluate a company’s short-term investment policyguidelines.
! Evaluate a company’s management of accounts receivable, inventory, and accounts payableover time and compared to peer companies.
! Evaluate the choices of short-term funding available to a company and recommend afinancing method.
303
c08 13 January 2012; 9:16:36

1. INTRODUCTION
The focus of this chapter is on the short-term aspects of corporate finance activities collectivelyreferred to asworking capital management. The goal of effective working capital managementis to ensure that a company has adequate ready access to the funds necessary for day-to-dayoperating expenses, while at the same time making sure that the company’s assets are invested inthemost productive way. Achieving this goal requires a balancing of concerns. Insufficient accessto cash could ultimately lead to severe restructuring of a company by selling off assets, reorga-nization via bankruptcy proceedings, or final liquidation of the company. On the other hand,excessive investment in cash and liquid assets may not be the best use of company resources.
Effective working capital management encompasses several aspects of short-term finance:maintaining adequate levels of cash, converting short-term assets (i.e., accounts receivable andinventory) into cash, and controlling outgoing payments to vendors, employees, and others. Todo this successfully, companies invest short-term funds in working capital portfolios of short-dated, highly liquid securities, or they maintain credit reserves in the form of bank lines of creditor access to financing by issuing commercial paper or other money market instruments.
Working capital management is a broad-based function. Effective execution requiresmanaging and coordinating several tasks within the company, including managing short-terminvestments, granting credit to customers and collecting on this credit, managing inventory,and managing payables. Effective working capital management also requires reliable cashforecasts, as well as current and accurate information on transactions and bank balances.
Both internal and external factors influence working capital needs; we summarize them inExhibit 8-1.
EXHIBIT 8-1 Internal and External Factors that Affect Working Capital Needs
Internal Factors External Factors
! Company size and growth rates! Organizational structure! Sophistication of working capital management! Borrowing and investing positions/activities/capacities
! Banking services! Interest rates! New technologies and new products! The economy! Competitors
The scope of working capital management includes transactions, relations, analyses,and focus:
! Transactions include payments for trade, financing, and investment.! Relations with financial institutions and trading partners must be maintained to assure that
the transactions work effectively.! Analyses of working capital management activities are required so that appropriate strat-
egies can be formulated and implemented.! Focus requires that organizations of all sizes today must have a global viewpoint with strong
emphasis on liquidity.
In this chapter, we examine the different types of working capital and the managementissues associated with each. We also look at methods of evaluating the effectiveness of workingcapital management.
c08 13 January 2012; 9:16:37
304 Corporate Finance

2. MANAGING AND MEASURING LIQUIDITY
Liquidity is the extent to which a company is able to meet its short-term obligations usingassets that can be readily transformed into cash. When we evaluate the liquidity of an asset, wefocus on two dimensions: the type of asset and the speed at which the asset can be convertedto cash, either by sale or financing. Unlike many aspects of corporate finance, corporateliquidity management does not involve a great deal of theory or generally accepted principles.For companies that have the luxury of large excesses of cash, liquidity is typically taken forgranted, and the focus is on putting the excess liquidity to its most productive use. On theother hand, when a company faces tighter financial situations, it is important to have effectiveliquidity management to ensure solvency. Unfortunately, this recognition comes too late forsome companies, with bankruptcy and possible liquidation representing the company’sfinal choice.
2.1. Defining Liquidity Management
Liquidity management refers to the ability of an organization to generate cash when andwhere it is needed. Liquidity refers to the resources available for an entity to tap into cashbalances and to convert other assets or extend other liabilities into cash for use in keeping theentity solvent (i.e., being able to pay bills and continue in operation). For the most part, weassociate liquidity with short-term assets and liabilities, yet longer-term assets can be con-verted into cash to provide liquidity. In addition, longer-term liabilities can also be renego-tiated to reduce the drain on cash, thereby providing liquidity by preserving the limitedsupply of cash. Of course, the last two methods may come at a price as they tend to reduce thecompany’s overall financial strength.
The challenges of managing liquidity include developing, implementing, and main-taining a liquidity policy. To do this effectively, a company must manage all of its key sourcesof liquidity efficiently. These key sources may vary from company to company, but theygenerally include the primary sources of liquidity, such as cash balances, and secondarysources of liquidity, such as selling assets.
2.1.1. Primary Sources of LiquidityPrimary sources of liquidity represent the most readily accessible resources available. Theymay be held as cash or as near-cash securities. Primary sources include:
! Ready cash balances, which is cash available in bank accounts, resulting from paymentcollections, investment income, liquidation of near-cash securities (i.e., those with matu-rities of less than 90 days), and other cash flows.
! Short-term funds, which may include items such as trade credit, bank lines of credit, andshort-term investment portfolios.
! Cash flow management, which is the company’s effectiveness in its cash managementsystem and practices, and the degree of decentralization of the collections or paymentsprocesses. The more decentralized the system of collections, for example, the more likelythe company will be to have cash tied up in the system and not available for use.
These sources represent liquidity that is typical for most companies. They represent fundsthat are readily accessible at relatively low cost.
c08 13 January 2012; 9:16:37
Chapter 8 Working Capital Management 305

2.1.2. Secondary Sources of LiquidityThe main difference between the primary and secondary sources of liquidity is that using aprimary source is not likely to affect the normal operations of the company, whereas usinga secondary source may result in a change in the company’s financial and operating positions.Secondary sources include:
! Negotiating debt contracts, relieving pressures from high interest payments or principalrepayments.
! Liquidating assets, which depends on the degree to which short-term and/or long-termassets can be liquidated and converted into cash without substantial loss in value.
! Filing for bankruptcy protection and reorganization.
Use of secondary sources may signal a company’s deteriorating financial health andprovide liquidity at a high price—the cost of giving up a company asset to produce emergencycash. The last source, reorganization through bankruptcy, may also be considered a liquiditytool because a company under bankruptcy protection that generates operating cash will beliquid and generally able to continue business operations until a restructuring has beendevised and approved.
2.1.3. Drags and Pulls on LiquidityCash flow transactions—that is, cash receipts and disbursements—have significant effects on acompany’s liquidity position. We refer to these effects as drags and pulls on liquidity. A dragon liquidity is when receipts lag, creating pressure from the decreased available funds; apull on liquidity is when disbursements are paid too quickly or trade credit availability islimited, requiring companies to expend funds before they receive funds from sales that couldcover the liability.
Major drags on receipts involve pressures from credit management and deterioration inother assets and include:
! Uncollected receivables. The longer these are outstanding, the greater the risk that they willnot be collected at all. They are indicated by the large number of days of receivables andhigh levels of bad debt expenses. Just as the drags on receipts may cause increased pressureson working capital, pulls on outgoing payments may have similar effects.
! Obsolete inventory. If inventory stands unused for long periods, it may be an indication thatit is no longer usable. Slow inventory turnover ratios can also indicate obsolete inventory.Once identified, obsolete inventory should be attended to as soon as possible in order tominimize storage and other costs.
! Tight credit. When economic conditions make capital scarcer, short-term debt becomesmore expensive to arrange and use. Attempting to smooth out peak borrowings can helpblunt the impact of tight credit as can improving the company’s collections.
In many cases, drags may be alleviated by stricter enforcement of credit and collectionpractices.1
1In a recent survey of CFOs, companies have become more efficient in working capital management,with U.S. companies in 2005 reducing their investment in working capital by 2.5 percent from 2004levels and European companies reducing their investment by 3.3 percent (REL 2005 CFO Survey, www.relconsult.com).
c08 13 January 2012; 9:16:37
306 Corporate Finance

However, managing the cash outflows may be as important as managing the inflows. Ifsuppliers and other vendors who offer credit terms perceive a weakened financial position orare unfamiliar with a company, they may restrict payment terms so much that the company’sliquidity reserves are stretched thin. Major pulls on payments include:
! Making payments early. By paying vendors, employees, or others before the due dates, companiesforgo the use of funds. Effective payment management means not making early payments.Payables managers typically hold payments until they can be made by the due date.
! Reduced credit limits. If a company has a history of making late payments, suppliers may cutthe amount of credit they will allow to be outstanding at any time, which can squeeze thecompany’s liquidity. Some companies try to extend payment periods as long as possible,disregarding the possible impact of reduced credit limits.
! Limits on short-term lines of credit. If a company’s bank reduces the line of credit it offers thecompany, a liquidity squeeze may result. Credit line restrictions may be government-mandated, market-related, or simply company-specific. Many companies try to avert thissituation by establishing credit lines far in excess of what they are likely to need. This “over-banking” approach is often commonplace in emerging economies or even in more-developed countries where the banking system is not sound and the economy is shaky.
! Low liquidity positions. Many companies face chronic liquidity shortages, often because oftheir particular industry or from their weaker financial position. The major remedy for thissituation is, of course, to improve the company’s financial position, or else the companywill be heavily affected by interest rates and credit availability. Most companies facing thissituation have to deal with secured borrowing to obtain any working capital funds.Therefore, it is important for these companies to identify assets that can be used to helpsupport the company’s short-term borrowing activities.
It is critical that these drags and pulls be identified as soon as possible, often when theyhave not yet happened or have just arisen.
2.2. Measuring Liquidity
Liquidity contributes to a company’s creditworthiness.Creditworthiness is the perceived abilityof the borrower to pay what is owed on the borrowing in a timely manner and represents theability of a company to withstand adverse impacts on its cash flows. Creditworthiness allowsthe company to obtain lower borrowing costs and better terms for trade credit and contributesto the company’s investment flexibility, enabling it to exploit profitable opportunities.
The less liquid the company, the greater the risk itwill suffer financial distress or, in the extremecase, insolvency or bankruptcy. Because debt obligations are paid with cash, the company’s cashflowsultimately determine solvency.The immediate sourceof funds for payingbills is cashonhand,proceeds from the sale of marketable securities, or the collection of accounts receivable. Additionalliquidity also comes from inventory that can be sold and thus converted into cash either directlythrough cash sales or indirectly through credit sales (i.e., accounts receivable).
There is, however, some point at which a company may have too much invested inlow-and nonearning assets. Cash, marketable securities, accounts receivable, and inventoryrepresent a company’s liquidity. However, these investments are low earning relative to thelong-term, capital investment opportunities that companies may have available.
Various financial ratios can be used to assess a company’s liquidity as well as its man-agement of assets over time. Here we will look at some of these ratios in a little more detail.
c08 13 January 2012; 9:16:37
Chapter 8 Working Capital Management 307

We calculate liquidity ratios to measure a company’s ability to meet short-term obli-gations to creditors as they mature or come due. This form of liquidity analysis focuses on therelationship between current assets and current liabilities and the rapidity with whichreceivables and inventory can be converted into cash during normal business operations.
In short-term financial management, a great deal of emphasis is placed on the levels of andchanges in current assets and liabilities. The two most common measurements are the currentratio and the quick ratio. The current ratio is the ratio of current assets to current liabilities:
Current ratio ¼ Current assetsCurrent liabilities
The quick ratio (also known as the acid test ratio) is the ratio of the quick assets tocurrent liabilities. Quick assets are those assets that can be most readily converted to cash. Inmost situations, the least liquid of the current assets is inventory. Hence, we typically excludeinventory when calculating the quick ratio:
Quick ratio ¼ Cashþ Short-term marketable investmentsþ ReceivablesCurrent liabilities
The greater the current ratio or the quick ratio (that is, the greater the potential ability tocover current liabilities), the higher a company’s liquidity. Whether a given current or quickratio is good or bad, however, depends on a number of factors, including the trend in theseratios, the comparability of these ratios with competitors, and the available opportunities inmore-profitable, long-lived, capital investments.
In addition to looking at the relations among these balance sheet accounts, we can alsoform ratios that measure how well key current assets are managed over time. The key ratios forasset management are turnover ratios. For example, the accounts receivable turnover is theratio of sales on credit to the average balance in accounts receivable:2
Accounts receivable turnover ¼ Credit salesAverage receivables
This ratio is a measure of how many times, on average, accounts receivable are created bycredit sales and collected on during the fiscal period. As another example, the inventoryturnover is the ratio of the cost of goods sold to the balance in inventory:
Inventory turnover ¼ Cost of goods soldAverage inventory
This ratio is a measure of how many times, on average, inventory is created or acquiredand sold during the fiscal period.
Another perspective on the activity within the current accounts is to estimate the numberof days of the current asset or liability that are on hand. For example, the number of days of
2You will notice that we use credit sales instead of total revenue; the difference lies in the context. Withinthe context of working capital management, the corporate financial analyst would have access to detailsregarding the company’s credit versus cash sales. For some companies, sales may be for cash or be somecombination of cash sales and credit sales. For the analyst who is looking at the company without benefitof internal information regarding how much of sales is in the form of credit sales, an approximation isgenerally used based on industry norms for credit practices.
c08 13 January 2012; 9:16:37
308 Corporate Finance

receivables, also referred to as the day’s sales outstanding and days in receivables, gives usan idea of the management of the extension and collection of credit to customers:
Number of days of receivables ¼ Accounts receivableAverage day’s sales on credit
¼ Accounts receivableSales on credit=365
For example, if this number of days is 35.5, this tells us that it takes, on average, 35.5days to collect on the credit accounts. Whether this is good or bad depends on credit termsthat are offered to customers and the relation between sales and the extension of credit, whichis often dictated by industry customs and competitive pressures.
The number of days of inventory gives us an indication of how well the inventoryacquisition, process, and distribution is managed:
Number of days of inventory¼ InventoryAverage day’s cost of goods sold
¼ InventoryCost of goods sold=365
The number of days of inventory, also known as the average inventory period, day’ssales in ending inventory, and the inventory holding period, is the length of time, onaverage, that the inventory remains within the company during the fiscal period. We expectvariation in the number of days of inventory among industries because of differences in theproduction cycle of different types of inventory. For example, we expect a grocery store tohave a lower number of days inventory than, say, an aircraft manufacturer.
We can also look at the disbursement side of cash flows with the number of days of pay-ables, which provides a measure of how long it takes the company to pay its own suppliers:
Number of days of payables ¼ Accounts payableAverage day’s purchases
¼ Accounts payablePurchases=365
The number of days of payables is also referred to as theday’s payables outstanding and theaverage day’s payable. Purchases are not an item on published financial statements, so if you areevaluating a company’s payables, you can estimate the purchases by using what you know aboutthe company’s cost of goods sold and beginning and ending balances in inventory.3
Each of these turnover ratios and numbers of days helps tell a story of how the company ismanaging its liquid assets. Like all ratios, the numbers themselves do not indicate much, butwhen we put these together with trends, information on the company’s profitability, andinformation about competitors, we develop a good understanding of a company’s performance.4
Some of the major applications of this type of analysis include performance evaluation,monitoring, creditworthiness, and financial projections. But ratios are useful only when they
3We know that Beginning inventory þ Purchases$Cost of good sold ¼ Ending inventory. Therefore, if weknow the inventory balances (from the balance sheet) and the cost of goods sold (from the income statement),we can determine the purchases: Purchases ¼ Cost of goods sold þ Ending inventory –Beginning inventory.4For example, if we see a small number of days of inventory, it could mean that the company ismanaging its production very efficiently or it could mean that the company is at significant risk of ashortage of inventory. We don’t know more until we look at what is needed or usual for companies inthe industry, trends in turnover for the company, and the company’s profitability in relation to thenumber of days of inventory.
c08 13 January 2012; 9:16:38
Chapter 8 Working Capital Management 309

can be compared. The comparison should be done in two ways—comparisons over time forthe same company and over time for the company compared with its peer group. Peer groupscan include competitors from the same industries as the company as well as other companieswith comparable size and financial situations.
Consider Wal-Mart Stores, Inc. We can see the change in the current ratio and quick ratioover the fiscal years 1992 through 2005 in Exhibit 8-2, Panel A. Here, we see that the currentratio has declined, yet the quick ratio has increased slightly. We can see what is driving thesetrends in Panel B of this exhibit. One driver is the efficiency in the management of inventory,which results in holding on to inventory fewer days, as indicated by the downward trend in thenumber of days of inventory. Putting it in perspective, this trend may be because of, in part,the product shift when Wal-Mart Stores increased its presence in the grocery line of business.Another driver is the increasing number of days of payables, which means that company is takinglonger to pay what it owes suppliers.
EXHIBIT 8-2 Liquidity Analysis of Wal-Mart Stores
Panel A: Current and Quick Ratios (1992–2005)
0.0
0.2
0.4
0.6
0.8
1.0
1.2
1.4
1.6
1.8
1992
1993
1994
1995
1996
1997
1998
1999
2000
2001
2002
2003
2004
2005
Fiscal Year
1992
1993
1994
1995
1996
1997
1998
1999
2000
2001
2002
2003
2004
2005
Fiscal Year
Num
ber o
f Ti
mes
Num
ber o
f D
ays
Panel B: Number of Days of Inventory and Number of Days of Payables
0
10
20
30
40
50
60
70
80
90Number of days of inventoryNumber of days of payables
Current ratioQuick ratio
Source: Wal-Mart Stores, Inc., 10-K filings, various years.
c08 13 January 2012; 9:16:38
310 Corporate Finance

Comparing Wal-Mart with Target, Inc., and Kohl’s in the 2005 fiscal year, as shown inExhibit 8-3, we see differences among these three competitors. These differences may beexplained, in part, by the different product mixes (e.g., Wal-Mart has more sales from grocerylines than the others), as well as different inventory management systems and differentinventory suppliers. The different need for liquidity may also be explained, in part, by thedifferent operating cycles of the companies.
EXHIBIT 8-3 Liquidity Ratios among Discount Retailers
Company
Ratio for 2005 fiscal year Wal-Mart Target Kohl’s
Current ratio 0.9 1.5 2.4
Quick ratio 0.2 0.9 1.2
Number of days of inventory 48.9 61.0 94.5
Number of days of payables 38.1 64.7 33.9
Source: Company 10-K filings with Securities and Exchange Commission for fiscal year 2005.
EXAMPLE 8-1 Measuring Liquidity
Given the following ratios, how well has the company been managing its liquidity forthe past two years?
Ratio
Current Year Past Year
Company Industry Company Industry
Current ratio 1.9 2.5 1.1 2.3
Quick ratio 0.7 1.0 0.4 0.9
Number of days of receivables 39.0 34.0 44.0 32.5
Number of days of inventory 41.0 30.3 45.0 27.4
Number of days of payables 34.3 36.0 29.4 35.5
Solution. The ratios should be compared in two ways—over time (there would typicallybe more than two years’ worth of data) and against the industry averages. In all ratiosshown here, the current year shows improvement over the previous year in terms ofincreased liquidity. In each case, however, the company remains behind the industryaverage in terms of liquidity. A brief snapshot such as this example could be the startingpoint to initiate or encourage more improvements with the goal of reaching or beatingthe industry standards.
c08 13 January 2012; 9:16:38
Chapter 8 Working Capital Management 311

We can combine the number of days of inventory, number of days of receivables, andnumber of days of payables to get a sense of the company’s operating cycle and net operatingcycle. The operating cycle is a measure of the time needed to convert raw materials into cashfrom a sale. It consists of the number of days of inventory and the number of days of receivables:
Operating cycle ¼ Number of daysof inventory
þ Number of daysof receivables
The operating cycle does not take everything into account, however, because the availablecash flow is increased by deferring payment to suppliers. This deferral is considered in thenet operating cycle, also called the cash conversion cycle. The net operating cycle is ameasure of the time from paying suppliers for materials to collecting cash from the subse-quent sale of goods produced from these supplies. It consists of the operating cycle minus thenumber of days of payables:
Net operating cycle ¼ Number of daysof inventory
þ Number of daysof receivables
$ Number of daysof payables
In general, the shorter these cycles the greater a company’s cash-generating ability and theless its need for liquid assets or outside finance. For many companies, the cash conversioncycle represents a period of time that requires financing; that is, the company offsets some ofthe financing need by deferring payments through payables terms, but the remainder must befinanced.
3. MANAGING THE CASH POSITION
Although the mix or magnitude of data items may change from day to day, the goal is thesame: assuring that the net cash position is not negative. Ideally, the company’s daily cashinflows and outflows would be equal, but this is rarely the case. Without the reliability ofmatching these flows, companies must take other steps to ensure that the flows net out eachday. Most companies try to avoid negative balances because the cost of garnering daily fundsby issuing debt or by drawing on bank overdraft facilities is very costly, although the cost ofmaintaining a small short-term investment portfolio, in terms of an opportunity cost, isregarded as an acceptable cost of doing business.
In addition, it is difficult to borrow the exact amount needed, so many companies borrow alittle extra to be safe and invest any small excesses overnight at lower rates than if they could investthem earlier or in securities with higher rates. To manage the cash position effectively, thetreasury function, which is usually responsible for this activity, must gather information fromvarious sources at all times during the day, making decisions based on the latest information.
Several critical factors help determine how a company can establish an efficient cash flowsystem. In most cases, the central treasury function may not be able to dictate how thecompany collects from customers or pays its vendors. What it can do, however, is use the bestservices and techniques associated with the company’s payment configuration.
As an example of a typical cycle of cash management information that occursdaily, consider the process outlined in Exhibit 8-4. This hypothetical schedule shows howimportant it is to have an efficient, smooth-flowing information system that can meet the timerequirements.
c08 13 January 2012; 9:16:39
312 Corporate Finance

EXHIBIT 8-4 An Example of the Daily Cycle of Cash Management
Information from bank reporting systems is gathered and analyzed. Morning
k
The cash manager receives information from company sources.
k
The cash manager receives updates from the company’s bank(s) oncurrent-day transactions.
k
The cash management staff is arranging short-term investments and/orloans, as necessary, through broker–dealers from their banks or
investment banks.
k
The cash management staff makes funds transfers. Midday
k
The cash movements for the day are completed or are scheduled forcompletion, and the company’s cash position is finalized.
k
Necessary paperwork for all transactions is completed. Also, the runningcash worksheet is updated and set for the next business day.
Close of thebusiness day
3.1. Forecasting Short-Term Cash Flows
Forecasting cash flows is necessary to allow effective management of working capital accounts.For cash forecasting to be effective, it has to be relatively precise. However, a forecast that isprecise may not be accurate. There are many factors that are outside of the company’s control,such as the general economy, unexpected raw material shortages, and changing interest rates.The uncertainty in forecasting encourages companies to maintain some minimum level ofcash on hand as a buffer.
3.1.1. Minimum Cash BalancesMost companies want a cash buffer as protection from unexpected cash needs or to providethe financial flexibility to take advantage of attractive opportunities, such as procuring rawmaterial inventory at a discount. This buffer is often expressed as a minimum desired cashbalance. The size of this buffer depends on several influences, including the variation inthe levels of the company’s cash inflows and outflows, the company’s ability to accessother liquidity sources, and the company’s ability to access borrowing facilities with littlelead time.
3.1.2. Identifying Typical Cash FlowsHaving an accurate forecast can help a financial manager make better use of the company’sfinancial history. Many product lines, especially those that are not in high-growth stages but
c08 13 January 2012; 9:16:39
Chapter 8 Working Capital Management 313

rather are in steadier, mature stages, will have similar cash flows from year to year or season toseason. If an extensive database has been established, it will be possible to draw reasonableprojections for the current period or longer.
Even in cases of heavy growth through mergers and acquisitions, companies should try totransfer the acquired company’s cash flow history to be used as a starting point for consol-idating the new operation into the rest of the company. The cash manager must identify cashflow elements to build a reliable forecast. These elements are not difficult to identify ingeneral terms, but it is much harder to define them more specifically to be able to collect dataregularly.
The cash elements that comprise a total forecast vary from company to company.However, it is good practice to identify the elements that pertain to any one individualcompany. Exhibit 8-5 shows typical elements arranged as inflows and outflows. It may bemore useful to try to arrange the elements in this manner—that is, show matching elementsby the direction of their flow (in or out). In most cases, a company’s data elements can bearranged this way to facilitate data gathering, reviewing variances, and presenting final reportsto management and other cash users or providers.
EXHIBIT 8-5 Examples of Cash Inflows and Outflows
Inflows Outflows
! Receipts from operations, broken downby operating unit, departments, etc.
! Funds transfers from subsidiaries,joint ventures, third parties.
! Maturing investments.! Debt proceeds (short and long term).! Other income items (interest, etc.).! Tax refunds.
! Payables and payroll disbursements, brokendown by operating unit, departments, and so forth.
! Funds transfers to subsidiaries.! Investments made.! Debt repayments.! Interest and dividend payments.! Tax payments.
These elements should reflect real cash flows, excluding such items as deprecia-tion or accruals that are paid at a later date (these should be included when they are tobe paid).
3.1.3. Cash Forecasting SystemsCash forecasting should be structured as a system in order to be effective, and to do this,several aspects of the forecast must be considered. We provide some examples of these aspectsin Exhibit 8-6, which highlights each aspect for three different forecast horizons. In somecases, one aspect may be more important than others. For instance, if daily cash is beinghandled fairly easily, it may be more critical to spend time and resources to assure that themedium-term forecasting part of the overall system is functioning at the highest levels ofreliability. In addition, some factors, such as format or time horizon, should not be changedarbitrarily because change may affect their accuracy and reliability levels.
c08 13 January 2012; 9:16:39
314 Corporate Finance

EXHIBIT 8-6 Examples of Cash Forecasting Aspects over Different Forecast Horizons
Short Term Medium Term Long Term
Datafrequency
Daily/weekly for 4–6weeks
Monthly for one year Annually for 3–5 years
Format Receipts anddisbursements
Receipts anddisbursements
Projected financialstatements
Techniques Simple projections Projection models andaverages
Statistical models
Accuracy Very high Moderate Lowest
Reliability Very high Fairly high Not as high
Uses Daily cash management Planning financialtransactions
Long-range financialposition
3.2. Monitoring Cash Uses and Levels
Another facet of cash forecasting is monitoring and control. Managing the cash positionessentially means keeping a “running score” on daily cash flows. Monitoring daily cash flowsis a key aspect of a company’s cash forecasting system in that the financial manager in chargeof managing the cash position must know the company’s cash balance in the bank on virtuallya real-time basis. However, it really is not forecasting as such, because most of the transactionsare actually known; the challenge lies in the collection of this known information in time todo something with that information. For example, receiving information about a deposit toolate to transfer the funds renders the information valueless.
To receive the appropriate information on a timely basis, information should be gatheredfrom principal users and providers of cash, supplemented by short-term cash projections in daysor even throughout the current day. Theminimum level of cash available is estimated in advance,adjusted for known funds transfers, seasonality, or other factors, and is used as a target balancefigure for each bank. Note that most companies use one major bank as their lead bank (orconcentration bank) and control the balances for the bank through one main concentrationaccount, with the target balance applied to the main account. For larger companies, more thanone concentration bank is possible, but managing the cash positions in multiple concentrationbanks quicklymakes the system complex and requires an efficient information processing system.
For most companies, it is necessary to manage a cash position with the assistance ofshort-term investments and borrowings. These short-term liquidity sources help counter theexcesses and deficits that typically occur in a company’s cash flow. The short-term investmentsare usually kept in a portfolio that is very liquid, with short maturities. In this way, funds areavailable whenever they are needed, but the company gives up the extra yield that might havebeen earned if the investments were made for longer periods of time or with securities withless liquidity. Short-term borrowing is for very short periods of time, but a borrower may findmore economies in borrowing for regular periods, such as 30 days, to reduce the number oftransactions and associated paperwork. Also, by extending the borrowing period, companiescan usually obtain better rates and availabilities of funds than if they continually borrow veryshort maturities.
c08 13 January 2012; 9:16:40
Chapter 8 Working Capital Management 315

Many companies face predictable peaks and valleys in their business throughout the year.For instance, manufacturers of consumer electronics products achieve the bulk of their salesduring the holiday shopping season (from late November through the end of the year), whichmeans that they have build-up of products that are shipped well before they receive payment.Thus, they have to finance this inventory roll-out before they receive any cash. During thisperiod, they are likely to use up most or all of the temporary excess funds they set aside orto tap into the credit lines they arranged for this purpose. When sales roll in during thebusy shopping season, they use the proceeds to pay down the borrowing and then invest anyexcess.
Other influencing factors on a company’s cash needs may be associated with nonoper-ating activities, such as major capital expenditure programs, mergers and acquisitions, sales ordisposition of company assets, and the timing of long-term financial transactions, such asbond issues, private placements of debt or equity, and equity issues.
Predicting the peak need caused by seasonality of other nonoperating activities isimportant if the company is going to have to borrow funds to cover the need. If a companysets aside too much, it will incur excess costs that are unjustified. If it sets aside too little, itwill have to pay a penalty to raise funds quickly. Either case is a costly error. A reliable forecastcan help avoid this situation.
4. INVESTING SHORT-TERM FUNDS
Short-term investments represent a temporary store of funds that are not necessarily needed ina company’s daily transactions. If a substantial portion of a company’s working capitalportfolio is not needed for short-term transactions, it should be separated from a workingcapital portfolio and placed in a longer-term portfolio. Such longer-term portfolios are oftenhandled by another area or are handled by an outside money manager under the company’ssupervision. In this way, the risks, maturities, and portfolio management of longer-termportfolios can be managed independently of the working capital portfolio.
Short-term working capital portfolios consist of securities that are highly liquid,less risky, and shorter in maturity than other types of investment portfolios. Thus, a com-pany’s working capital portfolio may consist of short-term debt securities, such as short-termU.S. government securities and short-term bank and corporate obligations. This type ofportfolio changes almost constantly, as cash is needed or more excess cash is available forinvestments.
4.1. Short-Term Investment Instruments
We describe examples of the major instruments for short-term investments in Exhibit 8-7.The relative amounts of each security can vary from one company to another, depending onthe company’s risk tolerance and how quickly the invested funds will be needed.
4.1.1. Computing Yields on Short-Term InvestmentsSome securities, such as T-bills and banker’s acceptances, are issued at a discount. Thus, theinvestor invests less than the face value of the security and receives the face value back at
c08 13 January 2012; 9:16:40
316 Corporate Finance

EXHIBIT 8-7 Examples of Short-Term Investment Instruments
InstrumentsTypicalMaturities Features Risks
U.S. TreasuryBills (T-bills)
13, 26, 52weeks
! Obligations of U.S. government(guaranteed), issued at a discount
! Active secondary market! Lowest rates for traded securities
Virtually no risk
Federal agencysecurities
5–30 days ! Obligations of U.S. federal agencies (e.g.,Fannie Mae, Federal Home Loan Board)issued as interest-bearing
! Slightly higher yields than T-bills
Slight liquidity risk;insignificant creditrisk
Bank certificatesof deposit (CDs)
14–365days
! Bank obligations, issued interest-bearing in$100,000 increments
! “Yankee” CDs offer slightly higher yields
Credit and liquidityrisk (depending onbank’s credit)
Banker’s accep-tances (BAs)
30–180days
! Bank obligations for trade transactions (usuallyforeign), issued at a discount
! Investor protected by underlying company andtrade flow itself
! Small secondary market
Credit and liquidityrisk (depending onbank’s credit)
Eurodollar timedeposits
1–180days
! Time deposit with bank off-shore (outsideUnited States, such as Bahamas)
! Can be CD or straight time deposit (TD)! Interest-bearing investment! Small secondary market for CDs, but not TDs
! Credit risk (depend-ing on bank)
! Very high liquidityrisk for TDs
Bank sweepservices
1 day ! Service offered by banks that essentiallyprovides interest on checking account balance(usually over a minimum level)
! Large number of sweeps are for overnight
Credit and liquidityrisk (depending onbank)
Repurchaseagreements(Repos)
1 dayþ ! Sale of securities with the agreement of thedealer (seller) to buy them back at a future time
! Typically over-collateralized at 102 percent! Often done for very short maturities (,1 week)
Credit and liquidityrisk (depending ondealer)
Commercialpaper (CP)
1–270days
! Unsecured obligations of corporations andfinancial institutions, issued at discount
! Secondary market for large issuers! CP issuers obtain short-term credit ratings
Credit and liquidityrisk (depending oncredit rating)
Mutual fundsand money mar-ket mutual funds
Varies ! Money market mutual funds commonly usedby smaller businesses
! Low yields but high liquidity for money marketfunds; mutual fund liquidity dependent onunderlying securities in fund
! Can be linked with bank sweep arrangement
Credit and liquidityrisk (depending onfund manager)
Tax-advantagedsecurities
7, 28, 35,49, 90days
! Preferred stock in many forms, includingadjustable rate preferred stocks (ARPs), auctionrate preferred stocks (AURPs), and convertibleadjustable preferred stocks (CAPs)
! Dutch auction often used to set rate! Offer higher yields
Credit and liquidityrisk (depending onissuer’s credit)
c08 13 January 2012; 9:16:40
Chapter 8 Working Capital Management 317

maturity. For instance, a $1 million security that pays 5 percent in interest with one monthremaining to maturity would be purchased at:
Purchase price ¼ $1,000,000$ ½ð0:05Þð1=12Þð$1,000,000Þ( ¼ $995,833:33
Proceeds ðface valueÞ ¼ $1,000,000
The difference between the purchase price and the face value, $4,166.67, is the discountinterest.
Interest-bearing securities differ from discounted securities in that the investor pays the faceamount and receives back that same face amount plus the interest on the security. For example, a5 percent, 30-day, $1 million security would return $1 million face value plus interest earned:
Purchase price ðface valueÞ ¼ $1,000,000
Proceeds ¼ $1,000,000þ ½ð0:05Þð1=12Þð$1,000,000Þ( ¼ $1,004,166:67
Rates on securities may be quoted as nominal rates or as yields. A nominal rate is a rateof interest based on the security’s face value. In the previous two examples, the nominal rate ineach instance was 5 percent. A yield, on the other hand, is the actual return on the investmentif it is held to maturity. For example, if you buy the discount security for $995,833.33 andhold it for one month until it matures for $1 million, your yield on this investment is
Yield ¼ $1; 000; 000$ 995; 833:33995; 833:33
! "ð12Þ ¼ ð0:004184Þð12Þ ¼ 5:0209%
where the second factor, 12, annualizes the monthly yield of 0.4184 percent. The factor thatis used to annualize the yield depends on the type of security and the traditions for quotingyields. For example, the money market yield is typically annualized using the ratio of 360 tothe number of days to maturity:
Money market yield ¼ Face value$ Purchase pricePurchase price
! "360
Number of days to maturity
! "
On the other hand, the bond equivalent yield is typically annualized using the ratio of365 to the number of days to maturity:
Bond equivalent yield ¼ Face value$Purchase pricePurchase price
! "365
Number of days to maturity
! "
One source of confusion is that the yield on U.S. T-bills may be quoted on the basis ofthe discount basis or the bond equivalent basis (also referred to as the investment yield basis).The yield on a T-bill using the discount basis is calculated using the face value as the basis forthe yield and then using a 360-day year:
Discount-basis yield ¼ Face value$Purchase priceFace value
! "360
Number of days to maturity
! "
Although the relevant yield for investment decision purposes is the bond equivalent yield,it is important to understand the discount basis because it is often quoted in the context ofthese securities.
c08 13 January 2012; 9:16:41
318 Corporate Finance

4.1.2. Investment RisksInvestors face several types of risks. We list a number of these in Exhibit 8-8. In this exhibit,we list the types of risk—credit, market, liquidity, and foreign exchange—and the attributesand safety measures associated with each type. The attributes describe the conditions thatcontribute to the type of risk, and the safety measures describe the steps that investors usuallytake to prevent losses from the risk. With the exception of foreign exchange risk, the key safetymeasures taken are to shift to “safety” (i.e., government securities, such as U.S. T-bills) or toshorten maturities so that securities will mature quicker, allowing an investor to shift fundsto a safer type of security.
EXHIBIT 8-8 Types of Investment Risks and Safety Measures
Type of Risk Key Attributes Safety Measures
Credit (ordefault)
! Issuer may default! Issuer could be adversely affected byeconomy, market
! Little secondary market
! Minimize amount! Keep maturities short! Watch for “questionable” names! Emphasize government securities
Market (orinterest rate)
! Price or rate changes may adversely affectreturn
! There is no market to sell the maturity to,or there is only a small secondary market
! Keep maturities short! Keep portfolio diverse in terms ofmaturity, issuers
Liquidity ! Security is difficult or impossible to (re)sell! Security must be held to maturity andcannot be liquidated until then
! Stick with government securities! Look for good secondary market! Keep maturities short
Foreignexchange
! Adverse general market movement againstyour currency
! Hedge regularly! Keep most in your currency and domes-tic market (avoid foreign exchange)
EXAMPLE 8-2 Computing Investment Yields
For a 91-day $100,000 U.S. T-bill sold at a discounted rate of 7.91 percent, calculatethe following:
1. Money market yield.2. Bond equivalent yield.
Purchase price¼ $100,000$ [(0.0791)(91/360)($100,000)]¼ $98,000.53
Solution to 1. Money market yield¼ (1,999.47/98,000.53)3 (360/91)¼ 8.07 percent
Solution to 2. Bond equivalent yield¼ (1,999.47/98,000.53)3 (365/91)¼ 8.18 percent
c08 13 January 2012; 9:16:41
Chapter 8 Working Capital Management 319

4.2. Strategies
Short-term investment strategies are fairly simple because the securities in a working capitalportfolio are limited in type and are much shorter in maturity than a longer-term portfolio.Most short-term investors seek “reasonable” returns and do not want to take on substantialrisk. Short-term investment strategies can be grouped into two types: passive and active. Apassive strategy is characterized by one or two decision rules for making daily investments,whereas an active strategy involves constant monitoring and may involve matching, mis-matching, or laddering strategies.
Passive strategies are less aggressive than active ones and place top priority on safety andliquidity. Yet, passive strategies do not have to offer poor returns, especially if companies havereliable cash forecasts. Often, companies with good cash forecasts can combine a passivestrategy with an active matching strategy to enhance the yield of a working capital portfoliowithout taking on substantially greater risks.
The major problem associated with passive strategies is complacency, which can cause thecompany to roll over the portfolio mechanically, with little attention paid to yields and morefocus on simply reinvesting funds as they mature. Passive strategies must be monitored, andthe yield from investment portfolios should be benchmarked regularly against a suitablestandard, such as a T-bill with comparable maturity.
Active strategies require more daily involvement and possibly a wider choice of invest-ments. Although investments are rolled over with an active strategy, just as they are with apassive strategy, this type of strategy calls for more shopping around, better forecasts, anda more flexible investment policy/guideline.
Active strategies can include intentional matching or mismatching the timing of cashoutflows with investment maturities. Amatching strategy is the more conservative of the twoand uses many of the same investment types as are used with passive strategies. A mis-matching strategy is riskier and requires very accurate and reliable cash forecasts. Thesestrategies usually use securities that are more liquid, such as T-bills, so that securities can beliquidated if adverse market conditions arise. Mismatching strategies may also be accom-plished using derivatives, which may pose additional risks to a company unaccustomed tobuying and selling derivatives.
A laddering strategy is another form of active strategy, which entails schedulingmaturities on a systematic basis within the investment portfolio such that investments arespread out equally over the term of the ladder. A laddering strategy falls somewhere between amatching and a passive strategy. Laddering strategies have been used effectively in managinglonger-term investment portfolios, but laddering also should be an effective short-termstrategy.
Managing a working capital portfolio involves handling and safeguarding assets of thecompany. Accordingly, companies with investment portfolios should have a formal,written policy/guideline that protects the company and the investment managers. Invest-ment policy/guidelines should not be very lengthy, especially because they must be under-stood by the company’s investment managers and communicated to the company’sinvestment dealers.
Although the investment policy/guideline should be customized for an individualcompany, the basic structure of such a policy is provided in Exhibit 8-9.
c08 13 January 2012; 9:16:41
320 Corporate Finance

EXHIBIT 8-9 Sample Format of an Investment Policy
Purpose List and explain the reasons that the portfolio exists and also describe the generalattributes of the portfolio, such as a summary of the strategy that will be usedand the general types of securities that are acceptable investments.
Authorities Identify the executives who oversee the portfolio managers who make theinvestments that compose the portfolio and the outside managers that could beused and how they would be managed. Also describe procedures that mustbe performed if the policy is not followed.
Limitations and/orrestrictions
Describe, in general terms, the types of investments that should be consideredfor inclusion in the portfolio. The list should not consist of specific securities; itshould describe the general types of securities, such as commercial paper,U.S. T-bills, or bank CDs. In this manner, the policy retains more flexibilitythan if specific issuers or securities are listed. In the latter case, the policy wouldrequire change every time an issuer was no longer issuing any securities. Thissection should also include any restrictions as to the relative amount of eachsecurity that is allowable in the overall portfolio. This section may also includeprocedures when a maximum has been exceeded or must be exceeded underspecial circumstances, such as when the portfolio is temporarily inflated prior tousing the funds for an acquisition or other long-term use.
Quality May be in a separate section or may be included with the previous one.Investments with working capital funds must be safe, so many companiesinclude credit standards for potential investments in their policy statements.Reference may be made to long-term ratings or, more frequently, to short-termcredit ratings. The ratings cited are usually those from the major rating agencies:Standard & Poor’s and Moody’s.
Other items Other items are sometimes included in a policy/guideline, such as statementsthat require the portfolio to be included in the financial audit or that regularreports will be generated by the investment manager. Some companies alsodefine the types of securities that are “eligible,” but this does not seem necessaryif the policy is well written.
EXAMPLE 8-3 Evaluating an Investment Policy
A sample investment policy is shown below. Review the client’s investment policy,considering the basic investment policy structure shown in Exhibit 8-9. The averageportfolio size is $100 million, with no significant peaks or valleys throughout the year.After reviewing the policy, answer the following questions:
1. Is the policy an effective one?2. What shortcomings or potential problem areas, if any, does it have?3. How would you change this policy, if at all?
c08 13 January 2012; 9:16:42
Chapter 8 Working Capital Management 321

4.3. Evaluating Short-Term Funds Management
Tracking tools can range from simple spreadsheets to more expensive treasury workstations. Ifboth portfolios are not too large or diversified, a spreadsheet may be sufficient to be able tocompare effective yields and borrowing costs on an ongoing basis and to generate periodicperformance reports.
Investment returns should be expressed as bond equivalent yields, to allow comparabilityamong investment alternatives. In addition, the overall portfolio return should be weightedaccording to the currency size of the investment. We provide an abbreviated example of aportfolio report in Exhibit 8-10. The report provides the weighted average returns of thedifferent investments. The yields are all calculated on a bond equivalent yield basis.
Working Capital Portfolio Investment Policy/Guidelines
! Purpose: This is a working capital portfolio with emphasis on safety and liquidity.We will sacrifice return for either of these two goals.
! Authorities: The treasurer, with agreement from the CFO, will be in charge ofmanaging short-term investments. Authority and control to execute can be delegatedby the treasurer or CFO to another treasury manager if documented.
! Maximum maturity: Securities may not be made for longer than three (3) years.! Types/amounts of investments permitted: no more than 10 percent of the portfolio
or $50 million with any issuer, subject to the credit limitation that any eligible issuermust be rated A-1, P-1 by Standard & Poor’s and Moody’s.
! Repurchase agreements must be equal or to or, preferably exceed, the PSA StandardInvestment Agreement, which requires 102 percent collateral for repurchases.
! All investments must be held in safekeeping by XYZ Bank.! The investment manager can execute exception transactions, but must document
them in writing.
Solution to 1. The policy is fairly effective in that it tries to provide simple, under-standable rules. It calls for credit quality, limits the possible position with any singleissuer, accepts market standards (such as the PSA), and calls for safekeeping. It also hasan exception procedure that is straightforward.
Solution to 2. The credit ratings may be too restrictive. Many investment securities maynot be rated by both S&P and Moody’s, which is implied, if not stated, in the policy.Also, the 10 percent limitation apparently is to be applied to all securities. However,most investment managers do not consider securities issued by governmental agenciesor the government itself to be so risky that a limitation needs to be applied.
Solution to 3. The words “or equivalent” should be added to the credit quality of thetypes of investments. Also, there should be no limitation to highly rated governmentalsecurities, such as U.S. Treasury bills and the equivalent from the major developedcountries. A credit rating reference could be applied to determine eligible governmentalsecurities.
c08 13 January 2012; 9:16:42
322 Corporate Finance
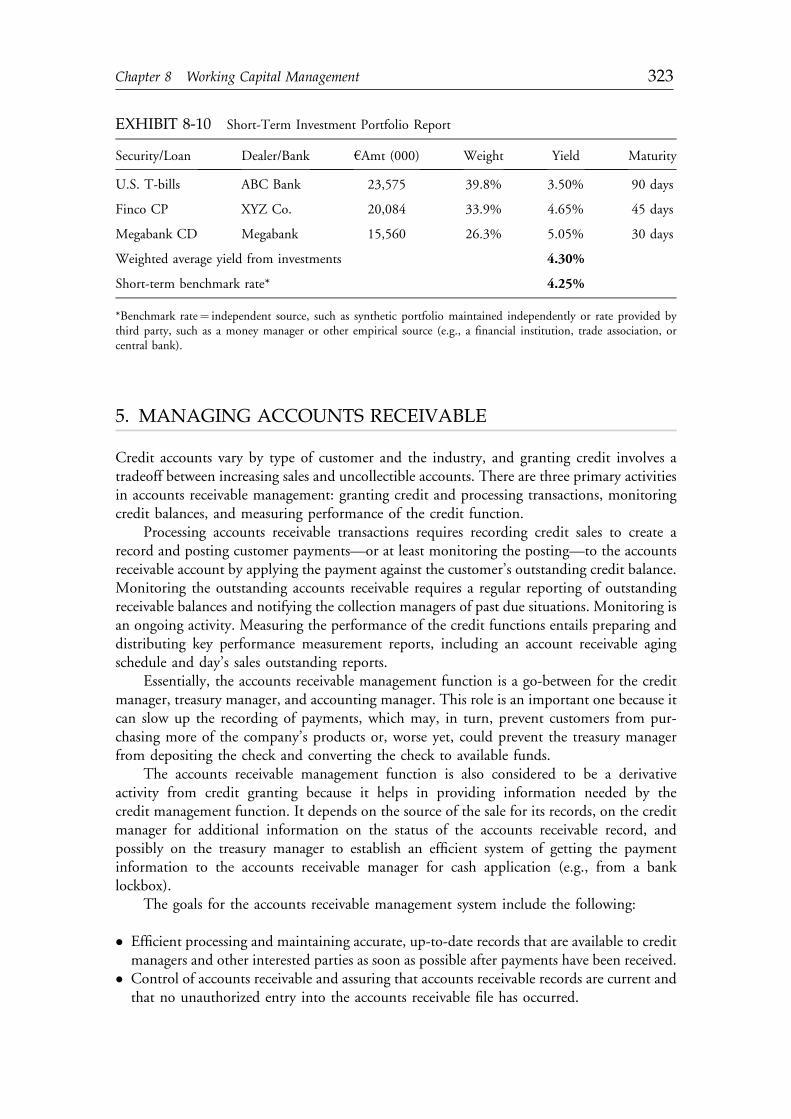
EXHIBIT 8-10 Short-Term Investment Portfolio Report
Security/Loan Dealer/Bank hAmt (000) Weight Yield Maturity
U.S. T-bills ABC Bank 23,575 39.8% 3.50% 90 days
Finco CP XYZ Co. 20,084 33.9% 4.65% 45 days
Megabank CD Megabank 15,560 26.3% 5.05% 30 days
Weighted average yield from investments 4.30%
Short-term benchmark rate* 4.25%
*Benchmark rate¼ independent source, such as synthetic portfolio maintained independently or rate provided bythird party, such as a money manager or other empirical source (e.g., a financial institution, trade association, orcentral bank).
5. MANAGING ACCOUNTS RECEIVABLE
Credit accounts vary by type of customer and the industry, and granting credit involves atradeoff between increasing sales and uncollectible accounts. There are three primary activitiesin accounts receivable management: granting credit and processing transactions, monitoringcredit balances, and measuring performance of the credit function.
Processing accounts receivable transactions requires recording credit sales to create arecord and posting customer payments—or at least monitoring the posting—to the accountsreceivable account by applying the payment against the customer’s outstanding credit balance.Monitoring the outstanding accounts receivable requires a regular reporting of outstandingreceivable balances and notifying the collection managers of past due situations. Monitoring isan ongoing activity. Measuring the performance of the credit functions entails preparing anddistributing key performance measurement reports, including an account receivable agingschedule and day’s sales outstanding reports.
Essentially, the accounts receivable management function is a go-between for the creditmanager, treasury manager, and accounting manager. This role is an important one because itcan slow up the recording of payments, which may, in turn, prevent customers from pur-chasing more of the company’s products or, worse yet, could prevent the treasury managerfrom depositing the check and converting the check to available funds.
The accounts receivable management function is also considered to be a derivativeactivity from credit granting because it helps in providing information needed by thecredit management function. It depends on the source of the sale for its records, on the creditmanager for additional information on the status of the accounts receivable record, andpossibly on the treasury manager to establish an efficient system of getting the paymentinformation to the accounts receivable manager for cash application (e.g., from a banklockbox).
The goals for the accounts receivable management system include the following:
! Efficient processing and maintaining accurate, up-to-date records that are available to creditmanagers and other interested parties as soon as possible after payments have been received.
! Control of accounts receivable and assuring that accounts receivable records are current andthat no unauthorized entry into the accounts receivable file has occurred.
c08 13 January 2012; 9:16:42
Chapter 8 Working Capital Management 323

! Collection on accounts and coordination with the treasury management function.! Coordination and notification with the credit managers frequently.! Preparation of regular performance measurement reports.
Companies may achieve scale economies by centralizing the accounts receivable functionby using a captive finance subsidiary.5 A captive finance subsidiary is a wholly ownedsubsidiary of the company that is established to provide financing of the sales of the parentcompany.
One of the challenges in accounts receivable management is monitoring receivables andcollecting on accounts. Many companies resort to outsourcing the accounts receivablefunction, primarily to increase the collection on accounts, provide credit evaluation services,and to apply the most recent technology.6 Also, some companies may invest in creditinsurance, which reduces the risk of bad debts and shifts some of the evaluation ofcreditworthiness to the insurer.
5.1. Key Elements of the Trade Credit Granting Process
Credit management is an integral part of the collection process. It sets the framework for salesin that it can restrict sales by rejecting credit or expand it by loosening acceptance criteria. Italso links the collection and cash application processes and has a profound effect on themethod of collection as well. In addition, credit management techniques incorporate fun-damental financial analysis methods in setting credit policy, granting credit, and managingexisting credit customers.
A weak, ineffective credit management function may enhance sales, but many of thosesales may become bad debts. On the other hand, a strong, active credit management functioncan work in tandem with sales and marketing on one side and accounting and treasury on theother. To establish an effective credit management function a company must have a well-conceived strategy customized to the company’s needs and reflecting the company’s goals.
Credit management policies are usually established as a set of basic guidelines to be usedby credit managers. A company’s credit policy sets the boundaries for the credit managementfunction. It lays out procedures as part of the policy and offers guidance for each typicalsituation. The policy shows the steps in the granting process and provides decision rules forspecific situations. The policy can also influence the sales level by making it easy or difficultfor customers to buy on credit.
Customers may start out with one type of credit account that is restrictive, such as cashon delivery, and may eventually demonstrate that they are regular payers and can be givenopen book credit accounts.
The major types of credit accounts include the following:
! Open book, which is the most common for company to company.! Documentary, with or without lines of credit, most common for cross-border transactions.! Installment credit, with regular timed payments.! Revolving credit.
5As pointed out by Mian and Smith (1992, 169–200), companies that have highly variable accountsreceivable (for example, from seasonality) may find the use of a captive finance subsidiary attractivebecause it may allow the subsidiary’s debt indentures to differ from those of the parent company.6Hall (2003), 1–2.
c08 13 January 2012; 9:16:42
324 Corporate Finance

The types of credit terms offered vary by type of customer, relative financial strengthby the customer, and the type of credit terms the competition is offering. The differentforms of terms of credit other than cash, which generally implies 7 to 10 days, include thefollowing:
! Ordinary terms. Terms are set forth in a standard format—net t or d/t1 net t2, where t inthe first example refers to the length of time a customer has to pay the invoice beforebecoming past due. In the second example, t1 is the time period for taking discounts, and t2is the same as t in the first example. For example, net 60 means that the full amount of theinvoice is due in 60 days. Most trade credit customers will take the full 60 days. Terms of1/10 net 30 mean that the customer can take a 1 percent discount if the invoice is paidwithin 10 days or else pay the full amount of the invoice by 30 days from the invoice date.
! Cash before delivery (CBD) terms require that the amount of the invoice must be paid inadvance before delivery will be scheduled. Checks must clear before any shipment is made.
! Cash on delivery (COD) terms require that payment must be made (usually in the form ofa bank check) when the product is delivered; otherwise, no delivery will be made.
! Bill-to-bill. These terms require that each prior bill must be paid before new shipments arepossible.
! Monthly billing. These terms require payment monthly. They have a different format; forexample, 2/10th Prox net 30th means that the customer can take a 2 percent discount if itpays within the first 10 days of the next month or else it must pay the full amount of theinvoice by the 30th day of the next month.
Credit managers may evaluate customers’ creditworthiness using a credit scoring model. Acredit scoring model is a statistical model used to classify borrowers according to creditwor-thiness. These models were first designed for assisting in making consumer credit decisions.Major credit card issuers needed a tool they could use to make mass credit decisions. It was alsoused for small business loans after many larger banks discovered that their costs of reviewingand deciding whether to grant loans were such that they could not efficiently make loans ofthe smaller sizes required by smaller businesses. To overcome this problem, they adoptedcredit scoring models.
Credit scoring models offer an opportunity for a company to make fast decisions on thebasis of simple data, not requiring a great deal of paperwork. The scoring models give greaterweight to such factors as:
! Ready cash (e.g., high checking account balances).! Organization type, with corporations rated higher than sole proprietorships or partnership.! Being current in supplier payments, as indicated by financial services such as Dun &
Bradstreet.
The models penalize the potential borrower for:
! Prior late payment behavior or defaults: Payment patterns are habitual.! Heavy use of personal credit cards: No reserves or reduced reserves available.! Previous personal bankruptcy or tax liens: Carries over from person to company.! High-risk categories: food services, hospitality industries.
Credit scoring can also be used to predict late payers.
c08 13 January 2012; 9:16:43
Chapter 8 Working Capital Management 325

5.2. Managing Customers’ Receipts
Cash collections systems are a function of the types of customers a company has and themethods of payment that the customers use. For instance, if a company’s sales are made atretail locations, it cannot take advantage of the benefits offered by bank lockbox services.Instead, it must deal with organizing and controlling local deposits and concentrating thesedeposits efficiently and economically. On the other hand, if a company manufactures and sellsproducts to other businesses, it can use a bank lockbox services to expedite processing andclearing of check payments.
We illustrate a typical network for a company with both electronic and check payments inExhibit 8-11. Checks from one type of customer are directed to a bank lockbox, while electronicpayments from another type of customer are transmitted via electronic funds transfer (EFT)throughone of the available networks, such as theAutomatedClearingHouse (ACH) systemorthe Giro system. The ACH system is an electronic payment network available to businesses,individuals, and financial institutions in the United States, U.S. Territories, and Canada. TheGiro systems are postal-based systems in Europe and elsewhere.
EXHIBIT 8-11 Cash Collections and Concentration
EC/EDIsystem
ACH
Check
Bank lockbox
Electronicpaymentinstructions
Sendingbank
Buyer
Buyer
Remittance information
Payment Data
Seller
• Information reporting• Direct EDI transmission• Paper advices
In most cases, the best practice for collections involves the establishment of a system thataccelerates payments as well as their information content, such as the customer’s name andidentification number and which invoices are being paid. From the collecting company’spoint of view, the way to achieve this best practice is to establish an electronic collectionnetwork. This can apply to either retail or wholesale companies.
Retail payments can be made by credit/debit cards or electronic checks, which areconverted to electronic debits or digitized images, or by direct debit. These payments clearelectronically that can be facilitated through point of sale (POS) systems, which are systemsthat capture the transaction data at the physical location in which the sale is made. A directdebit program is an arrangement whereby the customer authorizes a debit to a demandaccount and is used by companies—such as utilities, telecommunications service providers,
c08 13 January 2012; 9:16:43
326 Corporate Finance

cable companies, insurance companies, and credit card companies—to collect routine pay-ments for services.
If payments cannot be converted to electronic payments, the next best practice is to use abank lockbox service. A lockbox system is coordinated with the banking institution in whichcustomer payments are mailed to a post office box and the banking institution retrieves anddeposits these payments several times a day, enabling the company to have use of the fundsooner than in a centralized system in which customer payments are sent to the company. Anacceptable bank lockbox arrangement is one in which the checks deposited today are availabletomorrow or the next business day. This one-day availability lays the groundwork for bestpractices in cash concentration.
A good performance measure for check deposits is a calculated float factor. The float inthis context is the amount of money that is in transit between payments made by customersand the funds that are usable by the company. We compute the float factor by dividing theaverage daily deposit in dollars into the average daily float:7
Float factor ¼ Average daily floatAverage daily deposit
¼ Average daily floatTotal amount of checks deposited=Number of days
This calculation gives the average number of days it took deposited checks to clear. If thefloat factor is very small (e.g., less than 1.0), it is probably worthwhile to investigate further todetermine whether same-day wire transfers from the depository account are warranted,assuming the depository account is with a bank other than the company’s lead bank. The floatfactor only measures how long it takes for checks to clear, not how long it takes to receive thechecks, deposit them, and then have them clear. However, it is still very useful and can becomputed easily for any depository accounts.
7We determine the average daily float from an analysis of cash accounts.
EXAMPLE 8-4 Calculating Float Factors
Given the following data, compute a float factor for this company bank account.
Total deposits for the month: $3,360,900
Number of days in month: 30 days
Average daily float: $154,040
Solution.
Average daily deposit ¼ ð$3,360,900Þ=30 ¼ $112,030
Float factor ¼ Average daily float=Average daily deposit
¼ $154,040=$112,010 ¼1:375
c08 13 January 2012; 9:16:43
Chapter 8 Working Capital Management 327

Cash concentration involves two major activities: consolidating deposits and movingfunds between company accounts or to outside points. The best practice for cash concen-tration may be different for concentration than for moving funds, depending on the timingrequired and the availability of the funds being transferred.
For bank lockbox concentration, assuming that the checks clear in one business day (onaverage), the concentration technique of choice is the electronic funds transfer method. In thismethod, bank lockbox personnel call in the deposit via a reporting service or directly to theconcentration bank. The concentration bank creates an electronic funds transfer debit thatclears overnight, giving the company available funds in its concentration account. This systemcan be set up to run with or without intervention by the company’s cash manager. In mostcases, the best practice does not involve any intervention.
Electronic funds transfers offer distinct advantages to companies that use them forconcentration of funds. First, they are substantially cheaper than the alternative, the wiretransfer. In addition, they are reliable in that the transfer can be made part of a routine thatcan be performed daily without exception. Even small payments that would not be eco-nomical to transfer out by wire can be transferred economically by electronic funds transfer.
5.3. Evaluating Accounts Receivable Management
There are numerous ways of measuring accounts receivable performance. Most of them dealwith how effectively outstanding accounts receivable items can be converted into cash.Measures can be derived from general financial reports as well as more detailed internalfinancial records.
Many measures, such as number of days of receivables, can be calculated easily fromfinancial statements. The standard number of days of receivables evaluates the total receivablesoutstanding but does not consider the age distribution within this outstanding balance.
5.3.1. Accounts Receivable Aging ScheduleOne key report that accounts receivable managers should use is the aging schedule, which is abreakdown of the accounts into categories of days outstanding. We provide an example of anaging schedule in Exhibit 8-12, Panel A. As you can see in this example, the report shows thetotal sales and receivables for each reporting period (typically 30 days). It is handier to convertthe aging schedule to percentages, as we show in this exhibit. Note that in the exhibit, it is easyto spot a change in April’s aging: Accounts receivable have not been collected and convertedto cash as rapidly as in previous months. In this case, the April change should be scrutinized.For example, the extension of credit terms may have been increased as part of a specialprogram. This change could also signal a change in payments by the company’s customers.
5.3.2. The Number of Days of ReceivablesThe number of days of receivables gives us the overall picture of accounts receivable collec-tion. We can compare the number of days with the credit policy to give us an idea of how wellthe company is collecting on its accounts, relative to the terms that it grants credit. But we cantake this a step further by calculating a weighted average of the collection period, or weightedaverage day’s sales outstanding. By focusing on the time it takes to collect receivables, theweighted average collection period is a good measure of how long it is taking to collect fromthe company’s customers regardless of the sales level or the changes in sales.
The calculation of the weighted average collection period requires data on the number ofdays it takes to collect accounts of each age grouping. For example, we could group receivables
c08 13 January 2012; 9:16:43
328 Corporate Finance

in regular increments, such as 30-day periods, and then weight the collection period in eachgroup by the monetary amount of accounts in the group.
Using the data provided in Exhibit 8-12, Panel A, it is possible to compute number ofdays of receivables for March and April, as shown in Panel B of this exhibit. As you can see inthis example, we can get a better idea of why the number of days of receivables changed from
EXHIBIT 8-12 An Accounts Receivable Aging Schedule
Panel A: The Aging Schedule
($ millions) January February March April
Sales 530 450 560 680
Total accounts receivable 600 560 650 720
Current (1–30 days old) 330 290 360 280
1–30 days past due 90 120 160 250
31–60 days past due 80 60 60 110
61–90 days past due 70 50 40 50
. 90 days past due 30 40 30 30
Aging Expressed as Percent January February March April
Current (1–30 days old) 55.0% 51.8% 55.4% 38.9%
1–30 days past due 15.0% 21.4% 24.6% 34.7%
31–60 days past due 13.3% 10.7% 9.2% 15.3%
61–90 days past due 11.7% 8.9% 6.2% 6.9%
. 90 days past due 5.0% 7.1% 4.6% 4.2%
Panel B: Calculation of the Weighted Average Collection Period
March April
Aging GroupCollectionDays1 Weight2
WeightedDays3
CollectionDays Weight
WeightedDays
Current (1–30days)
20 55.4% 11.1 29 38.9% 11.3
31–60 days 48 24.6% 11.8 55 34.7% 19.1
61–90 days 80 9.2% 7.4 88 15.3% 13.5
91–120 days 110 6.2% 6.8 115 6.9% 7.9
121þ days 130 4.6% 6.0 145 4.2% 6.1
Weighted averagecollection days4 43.0 57.9
Notes:1. The average days for collecting receivables in each grouping.2. The weighting from the aging schedule.3. This figure, expressed in days, is the product of the previous two columns.4. The sum of each grouping’s product equals the overall days.
c08 13 January 2012; 9:16:44
Chapter 8 Working Capital Management 329

one month to the next. The weighted average collection days increased from March to April,primarily because of the large representation in receivable accounts in the 31–60 and 61–90day ranges, which made up only 24.6 percentþ 9.2 percent¼ 33.8 percent of accounts inMarch, but 50 percent of accounts in April.
The primary drawback to this measure is that it requires more information than numberof days of receivables, and this information is not readily available, especially for comparisonsamong companies.
6. MANAGING INVENTORY
The primary goal for an inventory system is to maintain the level of inventory so that pro-duction management and sales management can make and sell the company’s products withoutmore than necessary invested in this asset. Like cash and accounts receivable management,inventory management involves balancing: having sufficient inventory, but not too much.
Inventory is a current asset that is created by purchasing, paid by accounts payable, andfunded by the treasury. The investment in inventory does not produce cash until it is sold orotherwise disposed of. Excessive levels of inventory can possibly overstate the value ofinventory because the more that is on hand, the greater the potential for obsolete inventory,which can be sold off, but at a discount. Shortages of inventory result in lost sales.
The amount of inventory that a company holds or feels it has to hold creates a financialrequirement for the company. If the company’s product lines are more diverse or if itsproduction processes are more involved in using inventory to make final products and thenstore the products, the company may have a significant financial investment in inventory.
The investment in inventory has been quite staggering for many companies, which hascaused them to look for new inventory management techniques. New techniques in inventorycontrol, aided by improved technology, have enabled substantial reduction of the inventorylevels a company must maintain and still be able to make products and have them availablefor sale as needed. For instance, newer just-in-time approaches to inventory management havelowered required inventory balances and cemented major trading partner relationships.
The motives for holding inventory, which dictate how much inventory will be held and,in turn, how much working capital will be tied up in inventory, are very similar to the needfor holding cash. The major motives include the transactions motive, the precautionarymotives, and the speculative motive.
The transactions motive reflects the need for inventory as part of the routine produc-tion–sales cycle. Inventory need is equal to the planned manufacturing activity, and theapproach to inventory will be dictated by the manufacturing plan.
Precautionary stocks also may be desirable to avoid any stock-out losses, which areprofits lost from not having sufficient inventory on hand to satisfy demand. Managinginventory well means keeping extra inventory, especially if it could become obsolete quickly,at a minimum. To do this, a company must have a reliable forecast and a flexible inventoryapproach. In addition, many companies that do not have a reliable forecast maintain a reserveas a precaution for shortfalls in the plan. Of course, how much stock is determined by the leadtime for additional inventory purchases, the length of time it takes to deliver final products tothe market, and how much can be spent on extra inventory.
In certain industries, managers may acquire inventory for speculative reasons, such asensuring the availability and pricing of inventory. Inventory managers working together withpurchasing managers can benefit from out-of-the-ordinary purchases. For instance, if apublisher is certain that paper costs will be increasing for the next year, it can buy more paper
c08 13 January 2012; 9:16:44
330 Corporate Finance

in the current year and store it for future use. This decision assumes that the storage costs arenot greater than the savings.
Companies usually attempt to strike a balance in managing their inventory levels. Over-investment can result in liquidity squeezes or related problems with an increase in debt withoutan increase in cash. Overinvestment can also lead to the misuse of facilities as more storage isrequired for the built-up inventory. Having large amounts of inventory on hand can result inlosses from shrinkage, spoilage, and so on. Finally, overinvestment can reduce the company’scompetitiveness as it may not be able to match pricing because of its large inventory costs.
On the other hand, underinvestment in inventory can create problems from losingcustomers who could not purchase a product, or gaining their ill-will from long delays indelivery. Plant shutdowns and expensive special runs can also be costly. Finally, a risk withunderinvestment is the company’s inability to avoid price increases by suppliers.
6.1. Approaches to Managing Levels of Inventory
To control inventory costs, a company should adopt the appropriate approach for itsinventory. The two basic approaches are the economic order quantity and just-in-time.
Many companies use the classical approach, economic order quantity–reorder point(EOQ–ROP), at least for some portion of their inventory. This method is based on expecteddemand and the predictability of demand, and it requires determining the level of inventoryat which new inventory is ordered. This ordering point is determined based on the costs ofordering and carrying inventory, such that the total cost associated with inventory is mini-mized. The demand and lead times determine the inventory level. For EOQ–ROP to workwell, there must be a reliable short-term forecast. Often, a company may use EOQ–ROP forsmaller items that have low unit costs.
Use of the EOQ–ROP method may involve safety stocks and anticipation stocks. A safetystock is a level of inventory beyond anticipated needs that provides a cushion in the event that ittakes longer to replenish inventory than expected or in the case of greater than expected demand. Acompanymay consider the number of days of inventory on hand and the lead time in replenishingstock indetermining the appropriate level of the safety stock.An anticipation stock is inventory inexcess of that needed for anticipated demand, which may fluctuate with the company’s sales orproduction seasonality. We illustrate the EOQ–ROP method in Exhibit 8-13.
EXHIBIT 8-13 EOQ–ROP Inventory Method
Ord
er
Economic OrderQuantity
Safety StockInve
ntor
y Le
vel
Time
Ord
er
Ord
er
Ord
er
c08 13 January 2012; 9:16:44
Chapter 8 Working Capital Management 331

The just-in-time (JIT) method is a system that minimizes in-process inventory stocks—raw materials and in production—by evaluating the entire system of the delivery of materialsand production. Materials are ordered, for example, at a point at which current stocks ofmaterial reach a reorder point, a point determined primarily by historical demand. Materialsor manufacturing resource planning (MRP) systems incorporate production planning intoinventory management. The analysis of production and materials needed for production areincorporated into an analysis that provides both a materials acquisition schedule and a pro-duction schedule. Combining the JIT and MRP methods can provide a broader base forintegrating inventory into the company’s supply chain management and effectively reduceinventory levels.8
In most instances, companies will have several types of inventory that can be managedeffectively using one or more of these approaches. Obviously, a company should select themethod that allows the most cost-beneficial investment in inventory.
6.2. Inventory Costs
There are several component costs of inventory. Some components represent opportunitycosts, whereas others may be real costs. The component costs include:
! Ordering. Procurement or replenishment costs, both of which may be fixed or variable.These costs depend on number of orders placed. Examples: freight, labor and handling,paperwork, and machine setup.
! Carrying. Financing and holding costs, which are opportunity or real costs. These costsdepend on average inventory levels and the type of goods. Examples: storage, capital costs,obsolescence, insurance, and taxes.
! Stock-out. Opportunity or real costs, which are affected by level of inventory, item mix, andprocessing time versus term of sale. These costs might vary greatly depending on how theyare estimated. Examples: lost sales, back-order costs, and substitution costs.
! Policy. Costs of gathering data and general operating costs, which may be real costs or “soft”costs. These costs depend on inventory mix and complexity. Examples: data processing,labor charges, overtime, and training.
6.3. Evaluating Inventory Management
The most common way to measure the company’s investment in inventory and evaluate itsinventory management is to compute the inventory turnover ratio and the number of days ofinventory. The inventory turnover is a rough measure, but it is simple to calculate andcompare with other standards or past history. Inventory turnover will vary among industries,as you can see in Exhibit 8-14, which provides a calculated inventory turnover and number ofdays of inventory for various industries.
8More recent innovations have integrated cash management and inventory management. For example,the moment a customer orders and pays for a computer with Dell Corporation, the production processbegins. This efficiency results in a negative operating cycle; that is, Dell Corporation is collecting onaccounts as it invests in the inventory production. Because it uses trade credit for its supplies, it has littleneed for working capital.
c08 13 January 2012; 9:16:44
332 Corporate Finance

EXHIBIT 8-14 Inventory Turnover and Number of Days of Inventory for U.S. Corporations inDifferent Industries, 2002
IndustryInventory Turnover
(times)Number of Daysof Inventory
Apparel manufacturing 4.9 74.0
Chemical manufacturing 5.7 64.4
Electronics and appliances stores 7.3 50.2
Food manufacturing 8.1 44.9
Food, beverage, and liquor stores 11.2 32.7
Machinery manufacturing 5.6 65.2
Mining 10.4 35.2
Motor vehicle dealers and parts dealers 5.6 65.2
Paper manufacturing 6.8 53.8
Transportation equipment manufacturing 9.7 37.7
Source of data: Statistics of Income, 2002, Corporation Returns with Net Income, Table 7, www.irs.gov.
Further, the inventory turnover may differ among companies within an industry because ofdifferent product mixes. For example, in fiscal year 2005, Wal-Mart Stores had an inventoryturnover of 7.5 times compared with Target’s 5.7 times. This difference may be because of Wal-Mart’s greater foothold in the higher turnover grocery business, as compared with Target.
Although the analysis of trends is important, care should be taken when interpretingchanges. For example, a decrease in the inventory turnover may mean that more inventory ison hand and is not moving through manufacturing and being sold. On the other hand, adecrease in inventory turnover may indicate a change in the company’s product mix, or it maymean that the company is reducing its risk of inventory stock-outs.
EXAMPLE 8-5 Financial Impact of Inventory Methods
If a company’s inventory turnover ratio is 6.1 times (annually) and the industry averagenumber of days of inventory is 52 days, how does the company compare with theindustry average?
Solution. Convert the turnover ratio to a number of days of inventory:
Number of days of inventory ¼ 365=Inventory turnover ¼ 365=6:1 ¼ 59:84 days
Comparing this answer with the industry average, 52.0 days, it appears that thecompany’s inventory turnover is slower than the industry average.
c08 13 January 2012; 9:16:44
Chapter 8 Working Capital Management 333

7. MANAGING ACCOUNTS PAYABLE
Accounts payable are amounts due suppliers of goods and services that have not beenpaid. They arise from trade credit, which is a spontaneous form of credit in which apurchaser of the goods or service is, effectively, financing its purchase by delaying the date onwhich payment is made. Trade credit may involve a delay of payment, with a discount for earlypayment. The terms of the latter form of credit are generally stated in the discount form: Adiscount from the purchase price is allowed if payment is received within a specified number ofdays, otherwise the full amount is due by a specified date. For example, the terms “2/10, net 30”indicate that a two percent discount is available if the account is paid within 10 days, otherwisethe full amount is due by the 30th day. The terms will differ among industries, influenced bytradition within the industry, terms of competitors, and current interest rates.
A key working capital link is the purchasing–inventory–payables process. This process isconcerned with the procurement of goods—finished or not—that become the company’sitems for sale. Handled efficiently, the process minimizes excess funds “in the pipeline.”Handled inefficiently, the process can create a severe drain on a company’s liquidity, tying upfunds and reducing the company’s financial reserves.
Inefficiencies may arise in managing purchasing, inventory, and payables. Each area hasto be organized and efficiently linked with the other areas. Purchasing can often influence howpayments are to be made and the terms of credit. Here again, purchasing management needsto be kept informed as to the types of payment mechanisms the company can handle to avoidagreeing with suppliers to make payments in a medium that the company does not yetsupport.
The effectivemanagement of accounts payable is an important working capital managementactivity because inefficient payables management may result in opportunity costs from paymentsmade too early, lost opportunities to take advantage of trade discounts, and failure to use thebenefits of technologies offered by e-commerce and other web-based activities.
Accounts payable is the final step in the procurement cycle because it combines thepaperwork, approvals, and disbursements of funds. An effective accounts payable functionhelps integrate the components of the cycle and does not require the uneconomical outlay ofthe company’s funds until the outlay is due.
A company may not believe that it needs a formal guideline or policy to manage thefunction well. However, there must be some method to assure that payables practices areorganized, consistent, and cost-effective. For example, if payables management is decen-tralized and more than one operating entity deals with the same supplier, the credit termsoffered to each entity should be the same unless there are special circumstances, such asvolume constraints, that warrant different terms. To handle payables effectively, a companyneeds rules to ensure that company assets are not being depleted unnecessarily.
There are several factors that a company should consider as guidelines for effectivelymanaging its accounts payable, including:
! Financial organization’s centralization. The degree to which the company’s core financialfunction is centralized or decentralized affects how tightly payables can be controlled.
! Number, size, and location of vendors. The composition of the company’s supply chain andhow dependent the company is on its trading partners (and vice versa) determines howsophisticated a payables system it needs.
! Trade credit and cost of borrowing or alternative cost. The importance of credit to thecompany and its ability to evaluate trade credit opportunities, such as trade discounts,
c08 13 January 2012; 9:16:45
334 Corporate Finance

encourages standardized payables procedures and enhanced information managementthroughout the company.
! Control of disbursement float. Many companies still pay suppliers by check and createdisbursement float—the amount of time between check issuance and a check’s clearingback against the company’s account. This float has value to many companies because itallows them to use their funds longer than if they had to fund their checking account onthe day the checks were mailed.
! Inventorymanagement. Newer inventory control techniques, such asMRP and JIT, increase thenumber of payments that must be processed by accounts payable. Many older systems cannotaccommodate this extra volume, so newer management techniques and systems are required.
! E-commerce and electronic data interchange (EDI). Global developments to use the Internetand other direct connections between customer and supplier are revolutionizing the supplychain for many companies. Because payments for many of these activities should beconsidered as part of the overall process, many companies have determined that payingelectronically offers a more efficient, cost-effective alternative to checks, which only aremore valuable when the disbursement float value is large and interest rates (which providevalue to float) are also high.
Stretching payables, also known as pushing on payables when it stretches beyond thedue date, is sometimes done by corporate cash managers and other financial managers.9
Stretching payables is taking advantage of vendor grace periods. The evaluation of payablesstretching opportunities is fairly straightforward. The number of additional days that pay-ments can be extended or stretched is determined and valued by applying the company’sopportunity cost for the additional days times the amount of the payable.
For example, if a payable that averaged $100,000 can be stretched for an additional sevendays, the company gains an additional seven days’ use of the funds. This opportunity can bevalued by multiplying the amount, $100,000, by the company’s opportunity cost for short-term funds. For example, if the company’s estimated cost for short-term funds is 8 percentannually (0.02191 percent daily), then the value of stretching a $100,000 payment for sevendays is $153.42. The values for each opportunity (throughout a year’s activity) can be valuedin this way to determine the overall benefit, which can then be weighed against the costs (bothfinancial and nonfinancial ones).
There are basically two countering forces: Paying too early is costly unless the company cantake advantage of discounts, and paying late affects the company’s perceived creditworthiness.
7.1. The Economics of Taking a Trade Discount
One key activity that companies should review from time to time is the evaluation of tradediscounts. Trade discounts should be evaluated using the formula shown below, whichcomputes the implicit rate (of return) that is represented by the trade discount offer; that is, itis the equivalent return to the customer of an alternative investment.
The implicit rate is calculated as follows:
Cost of trade credit ¼ 1þ Discount1$Discount
! " 365= Number of daysbeyond discount period
# $
$ 1
9Keep in mind that stretching payments beyond their due dates might be considered unethical and maydraw retaliation from suppliers in the form of tighter credit terms in the future.
c08 13 January 2012; 9:16:45
Chapter 8 Working Capital Management 335

The cost of funds during the discount period is 0 percent, so it is beneficial for thecustomer to pay close to the end of the discount period. Once the discount period ends,the cost of the credit to the customer jumps up and then declines as the net day is approached.For example, if the terms are 2/10, net 30, which means that there is a 2 percent discount forpaying within 10 days and the net amount is due by the 30th day, the cost of trade creditis 109 percent if the credit is paid on the 20th day, but it is only 44.6 percent if paid on the30th day.
If the customer’s cost of funds or short-term investment rate is less than the calculatedrate, the discount offers a better return or incremental return over the company’s short-termborrowing rate.
7.2. Managing Cash Disbursements
Handling cash disbursements effectively is a common goal for most companies. To accom-plish this, companies use best practices that include the ability to delay funding bank accountsuntil the day checks clear, to erect safeguards against check fraud, to pay electronically when itis cost effective to do so, and to manage bank charges for disbursement services. Best practicesin cash disbursements, like check collections, depend on the nature of the payments—that is,whether they are made electronically or by check.
Banks offer controlled disbursement services to optimize the funding of checks on thesame day they clear against the company’s account. When combined with a positive payservice, which provides a filter against check fraud, this method provides the best practice inhandling paper-based (check) disbursements.
EXAMPLE 8-6 Evaluating Trade Discounts
Compute the cost of trade credit if terms are 1/10, net 30 and the account is paid on
! 20th day.! 30th day.
Solution.
Cost of trade credit if paid on day 20¼ 1þ 0:011$ 0:01
0
@
1
Að365=10Þ
$ 1¼ 44:32 percent
Cost of trade credit if paid on day 30¼ 1þ 0:011$ 0:01
0
@
1
Að365=20Þ
$ 1¼ 20:13 percent
As you can see, the cost of the credit is much lower when the company pays on thenet day than any day prior to the net day.
c08 13 January 2012; 9:16:45
336 Corporate Finance

7.3. Evaluating Accounts Payable Management
The number of days of payables, which is also referred to as the average age of payables, isa useful measure in evaluating a company’s credit extension and collection.
If the accounts payable balance from the company’s balance sheet is h450 million and theamount of purchases is h4,100 million, the number of days of payables is
Number of days of payables ¼ Accounts payableAverage day’s purchases
¼ 4504100=365
¼ 40:06 days
Comparing the number of days of payables with the credit terms under which credit wasgranted to the company is important; paying sooner than necessary is costly in terms of thecost of credit, and paying later than the net day is costly in terms of relations with suppliers.
In some cases, treasurers will manage the company’s payables closely, comparing thenumber of days of payables with the number of days of inventory because in some industriesthese two numbers of days are similar to one another.
8. MANAGING SHORT-TERM FINANCING
An overall short-term financial strategy should focus on assuring that the company maintainsa sound liquidity position. It should also reflect the degree of risk the company believes can bemanaged without affecting the company’s stability. It is common to consider short-termfinancial strategies as applying mostly to investments. However, they should include otherfinancial activities as well. In many cases, a company will only be an investor or borrower, butit is common for large multinational corporations to have both short-term investments andshort-term borrowing.
A short-term policy should include guidelines for managing investment, borrowing,foreign exchange, and risk management activities and should encompass all the company’soperations, including foreign subsidiaries and other domestic subsidiaries that are self-financing. These guidelines accomplish several things.
Too often companies do not explore their options sufficiently, and as a result, they donot take advantage of cost savings that some forms of borrowing offer. This lack of awarenessusually indicates that a company’s treasurer may not be familiar with the common forms ofshort-term borrowing and has not factored them into an effective borrowing strategy.
8.1. Sources of Short-Term Financing
The main types of short-term borrowing alternatives that borrowers should consider includebank sources as well as money market sources. The main types of bank short-term borrowinginclude uncommitted and committed bank lines of credit and revolving credit agreements(“revolvers”). The latter two types can be unsecured or secured, depending on the company’sfinancial strength and the general credit situation, whichmay vary from country to country. Twoof these types—uncommitted lines and revolvers—are more common in the United States,whereas regular lines are more common in other parts of the world. We provide examples ofseveral types of short-term borrowing options in Exhibit 8-15, with bank sources in Panel Aof this exhibit and nonbank sources in Panel B. In this exhibit, we provide the primary featuresfor each type of borrowing, including the typical users, source(s) for the alternative, the baserate for computing interest, type of compensation required, and any other comments.
c08 13 January 2012; 9:16:45
Chapter 8 Working Capital Management 337
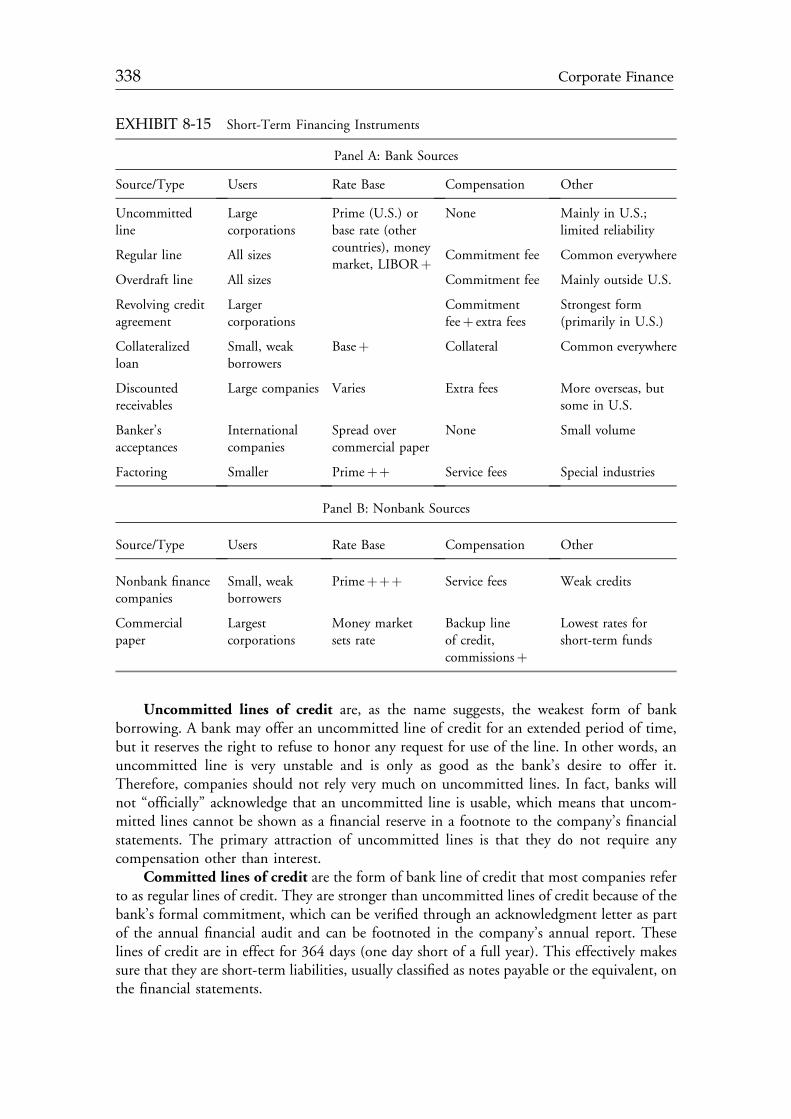
EXHIBIT 8-15 Short-Term Financing Instruments
Panel A: Bank Sources
Source/Type Users Rate Base Compensation Other
Uncommittedline
Largecorporations
Prime (U.S.) orbase rate (othercountries), moneymarket, LIBORþ
None Mainly in U.S.;limited reliability
Regular line All sizes Commitment fee Common everywhere
Overdraft line All sizes Commitment fee Mainly outside U.S.
Revolving creditagreement
Largercorporations
Commitmentfeeþ extra fees
Strongest form(primarily in U.S.)
Collateralizedloan
Small, weakborrowers
Baseþ Collateral Common everywhere
Discountedreceivables
Large companies Varies Extra fees More overseas, butsome in U.S.
Banker’sacceptances
Internationalcompanies
Spread overcommercial paper
None Small volume
Factoring Smaller Primeþþ Service fees Special industries
Panel B: Nonbank Sources
Source/Type Users Rate Base Compensation Other
Nonbank financecompanies
Small, weakborrowers
Primeþþþ Service fees Weak credits
Commercialpaper
Largestcorporations
Money marketsets rate
Backup lineof credit,commissionsþ
Lowest rates forshort-term funds
Uncommitted lines of credit are, as the name suggests, the weakest form of bankborrowing. A bank may offer an uncommitted line of credit for an extended period of time,but it reserves the right to refuse to honor any request for use of the line. In other words, anuncommitted line is very unstable and is only as good as the bank’s desire to offer it.Therefore, companies should not rely very much on uncommitted lines. In fact, banks willnot “officially” acknowledge that an uncommitted line is usable, which means that uncom-mitted lines cannot be shown as a financial reserve in a footnote to the company’s financialstatements. The primary attraction of uncommitted lines is that they do not require anycompensation other than interest.
Committed lines of credit are the form of bank line of credit that most companies referto as regular lines of credit. They are stronger than uncommitted lines of credit because of thebank’s formal commitment, which can be verified through an acknowledgment letter as partof the annual financial audit and can be footnoted in the company’s annual report. Theselines of credit are in effect for 364 days (one day short of a full year). This effectively makessure that they are short-term liabilities, usually classified as notes payable or the equivalent, onthe financial statements.
c08 13 January 2012; 9:16:46
338 Corporate Finance
Regular lines are unsecured and are prepayable without any penalties. The borrowing rateis a negotiated item. The most common interest rates negotiated are borrowing at the bank’sprime rate or at a money market rate plus a spread. The most common money market rate isan offshore rate—the London Interbank Offered Rate (LIBOR), which is a Eurodollarrate—plus a spread. The spread varies depending on the borrower’s creditworthiness. Regularlines, unlike uncommitted lines, require compensation, usually in the form of a commitmentfee. The fee is typically a fractional percent (e.g., 1/2 percent) of the full amount or the unusedamount of the line, depending on bank–company negotiations.
Revolving credit agreements, which are often referred to as revolvers, are the strongestform of short-term bank borrowing facilities. They have formal legal agreements that definethe aspects of the agreement. These agreements are similar to regular lines with respect toborrowing rates, compensation, and being unsecured. Revolvers differ in that they are in effectfor multiple years (e.g., 3–5 years) and may have optional medium-term loan features. Inaddition, they are often done for much larger amounts than a regular line, and these largeramounts are spread out among more than one bank.
For companies with weak financial positions, such as those facing financial distress or thathave deteriorated profitability, and many smaller companies that do not have sufficientcapital, banks or other lenders (see nonbank sources in Exhibit 8-15) require that the com-pany (or individual for much smaller companies) provide collateral in the form of an asset,such as a fixed asset that the company owns or high quality receivables and inventory. Theseassets are pledged against the loans, and banks or other lenders file a lien against them with thestate in which the loan is made. This lien becomes part of the borrower’s financial record andis shown on its credit report.
8.2. Short-Term Borrowing Approaches
Given the various forms of short-term borrowing, it is essential that a borrower have aplanned strategy before getting stuck in an uneconomical situation. Many borrowing com-panies spend too little time establishing a sound strategy for their short-term borrowingbeyond making sure that they are able to borrow at all, from any source.
The major objectives of a short-term borrowing strategy include the following:
! Ensuring that there is sufficient capacity to handle peak cash needs.! Maintaining sufficient sources of credit to be able to fund ongoing cash needs.! Ensuring that rates obtained are cost effective and do not substantially exceed market
averages.
In addition, there are several factors that borrowers should consider as part of their short-term borrowing strategies, including the following:
! Size and creditworthiness. There is no doubt that the size of the borrower dictates theoptions available. Larger companies can take advantage of economies of scale to accesscommercial paper, banker’s acceptances, and so on. The size of the borrower often reflects amanufacturing company’s need for short-term financing. The size of lender is also animportant criterion as larger banks have higher house or legal lending limits. Creditwor-thiness of the borrower will determine the rate, compensation, or even whether the loanwill be made at all.
c08 13 January 2012; 9:16:46
Chapter 8 Working Capital Management 339

! Sufficient access. Borrowers should diversify to have adequate alternatives and not be relianttoo much on one lender or form of lending if the amount of their lending is very large.Even so, it is typical for borrowers to use one alternative primarily, but often with morethan one provider. Borrowers should be ready to go to other sources and know how to.Borrowers should not stay too long with just one source or with lowest rates. Manyborrowers are usually prepared to trade off rates (somewhat) for certainty.
! Flexibility of borrowing options. Flexibility means the ability to manage maturities effi-ciently; that is, there should not be any “big” days, when significant amounts of loansmature. To do this successfully, borrowers need active maturity management, awareness ofthe market conditions (e.g., knowing when the market or certain maturities should beavoided), and the ability to prepay loans when unexpected cash receipts happen.
Borrowing strategies, like investment strategies, can be either passive or active. Passivestrategies usually involve minimal activity with one source or type of borrowing and with little(if any) planning. This “take what you can get” strategy is often reactive in responding toimmediate needs or “panic attacks.” Passive strategies are characterized by steady, often routinerollovers of borrowings for the same amount of funds each time, without much comparisonshopping. Passive strategies may also arise when borrowing is restricted, such as instances whereborrowers are limited to one or two lenders by agreement (e.g., in a secured loan arrangement).
Active strategies are usually more flexible, reflecting planning, reliable forecasting, andseeking the best deal. With active strategies, borrowers are more in control and do not fall intothe rollover “trap” that is possible with passive strategies.
Many active strategies are matching strategies. Matching borrowing strategies function ina manner similar to matching investment strategies—loans are scheduled to mature whenlarge cash receipts are expected. These receipts can pay back the loan, so the company doesnot have to invest the funds at potentially lower rates than the borrowing cost, therebycreating unnecessary costs.
8.3. Asset-Based Loans
Many companies that do not have the credit quality sufficient to qualify for unsecured bankloans may borrow from financial institutions by arranging for a secured loan, where the loan issecured using assets of the company. These secured loans are often referred to as asset-basedloans. Often the assets used in short-term secured loans are the current assets of receivablesand inventory. Unlike the collateral that may be used in longer-term borrowing, asset-basedloans secured by accounts receivable and inventory present a challenge for the lender becausethe cash flows from accounts receivable depend on the amount and timing of collections andare influenced by the business risk of the company and its customers.
Lenders of these short-term asset-based loans are protected by the existence of the col-lateral and by provisions in the law that may provide them with a blanket lien on current andfuture assets of the company. The downside of a blanket lien is that even if the asset-basedloan was secured by, say, accounts receivable, the lender may have a legal interest in otherassets of the company until the loan is repaid.
Besides using working capital as the security for a loan, a company can use other meansto generate cash flow from these working capital accounts. For example, a company can use itsaccounts receivable to generate cash flow through the assignment of accounts receivable,which is the use of these receivables as collateral for a loan, or a company can factor itsaccounts receivable, which is selling the receivables to the factor. In an assignment
c08 13 January 2012; 9:16:46
340 Corporate Finance

arrangement, the company remains responsible for the collection of the accounts, whereas in afactoring arrangement the company is shifting the credit granting and collection process tothe factor. The cost of this credit depends on the credit quality of the accounts and the costs ofcollection.
Like accounts receivables, inventory may be a source of cash flow through the use of theinventory as collateral, with different types of arrangements possible:
! An inventory blanket lien, in which the lender has a claim on some or all of the com-pany’s inventory, but the company can sell the inventory in the ordinary course of business.
! A trust receipt arrangement, in which the lender requires the company to certify that thegoods are segregated and held in trust, with proceeds of any sale remitted to the lenderimmediately.
! A warehouse receipt arrangement is similar to the trust receipt arrangement, but there is athird party (i.e., a warehouse company) that supervises the inventory.
The cost of asset-based loans security by inventory depends on the length of time it takesto sell the goods.
8.4. Computing the Costs of Borrowing
In carrying out a sound short-term borrowing strategy, one of the key decisions is selecting themost cost effective form of short-term loan. However, this selection is often not a simple task,because each of the major forms has to be adjusted to be on a common basis for compara-bility. The fundamental rule is to compute the total cost of the form of borrowing and dividethat number by the total amount of loan you received (i.e., net proceeds), adjusted for anydiscounting or compensating balances.
For example, in the case of a line of credit that requires a commitment fee,10 the cost ofthe line of credit is
Cost ¼ Interest þ Commitment feeLoan amount
On the other hand, if the interest rate is stated as “all inclusive” such that the amountborrowed includes the interest, as may be the case in a banker’s acceptance, the interest iscompared with the net proceeds when determining the cost:
Cost ¼ InterestNet proceeds
¼ InterestLoan amount$ Interest
If there are dealer’s fees and other fees, the cost must consider the expenses beyond theinterest. For example, if a borrowing involves a dealer’s fee and a back-up fee and is quoted asall inclusive, the cost is
Cost ¼ InterestþDealer’s commissionþ Back-up costsLoan amount$ Interest
10A commitment fee is a fee paid to the lender in return for the legal commitment to lend funds in thefuture.
c08 13 January 2012; 9:16:46
Chapter 8 Working Capital Management 341
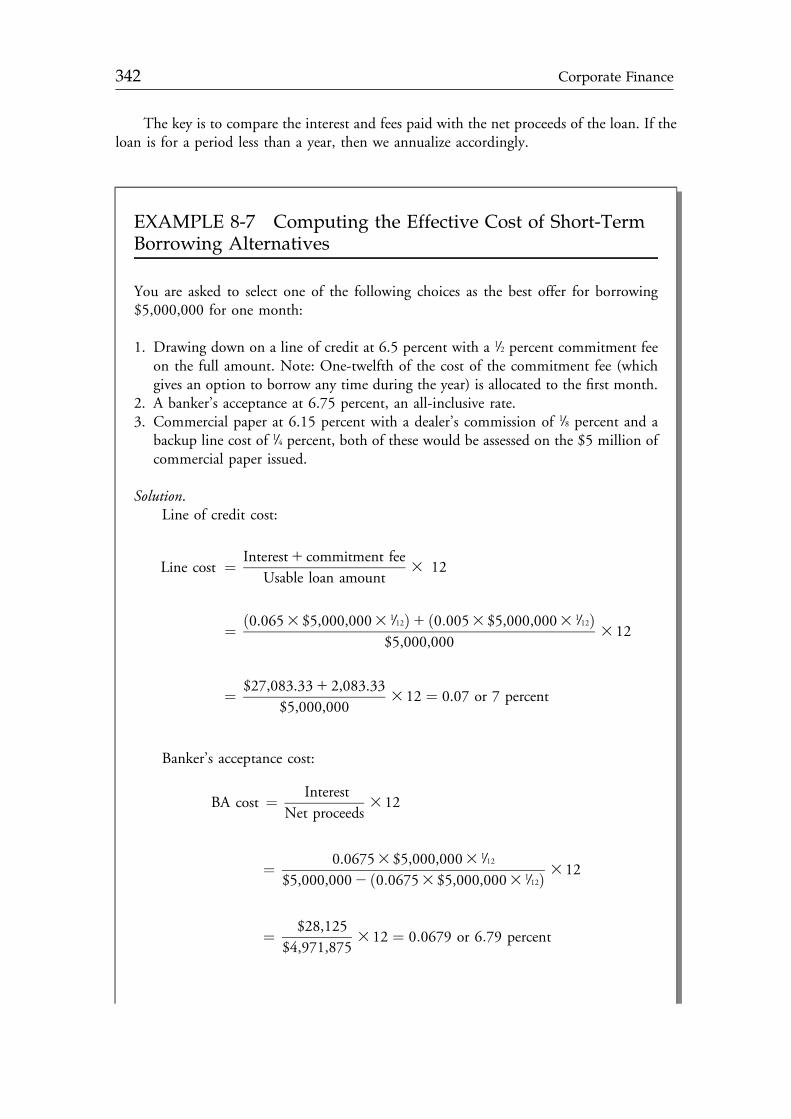
The key is to compare the interest and fees paid with the net proceeds of the loan. If theloan is for a period less than a year, then we annualize accordingly.
EXAMPLE 8-7 Computing the Effective Cost of Short-TermBorrowing Alternatives
You are asked to select one of the following choices as the best offer for borrowing$5,000,000 for one month:
1. Drawing down on a line of credit at 6.5 percent with a 1/2 percent commitment feeon the full amount. Note: One-twelfth of the cost of the commitment fee (whichgives an option to borrow any time during the year) is allocated to the first month.
2. A banker’s acceptance at 6.75 percent, an all-inclusive rate.3. Commercial paper at 6.15 percent with a dealer’s commission of 1/8 percent and a
backup line cost of 1/4 percent, both of these would be assessed on the $5 million ofcommercial paper issued.
Solution.Line of credit cost:
Line cost ¼Interest1 commitment fee
Usable loan amount3 12
¼ 0.0653 $5,000,0003 1/12ð Þ1 0:0053 $5,000,0003 1/12ð Þ$5,000,000
3 12
¼ $27,083.331 2,083.33
$5,000,0003 12 ¼ 0.07 or 7 percent
Banker’s acceptance cost:
BA cost ¼ InterestNet proceeds
3 12
¼ 0.06753 $5,000,0003 1/12
$5,000,0002 0:06753 $5,000,0003 1/12ð Þ 3 12
¼ $28,125
$4,971,8753 12 ¼ 0:0679 or 6:79 percent
c08 13 January 2012; 9:16:46
342 Corporate Finance

9. SUMMARY
In this chapter, we considered a key aspect of financial management: the management of acompany’s working capital. This aspect of finance is a critical one in that it assures, if doneeffectively, that the company will stay solvent and remain in business. If done improperly, theresults can be disastrous for the company.
Working capital management covers a wide range of activities, most of which are focusedon or involve the company’s cash levels. Competing uses for the company’s cash, which isoften a scarce resource, create the need for an efficient method of handling the short-termfinancing of company activities.
Major points that were covered in this chapter:
! Understanding how to evaluate a company’s liquidity position.! Calculating and interpreting operating and cash conversion cycles.! Evaluating overall working capital effectiveness of a company and comparing it with other
peer companies.! Identifying the components of a cash forecast to be able to prepare a short-term (i.e., up to
one year) cash forecast.
Commercial paper cost (quoted as nominal rate at a discount)
CP cost ¼ Interest1Dealer’s commission1Back-up costsNet proceeds
3 12
¼ 0:06153 $5,000,0003 1/12ð Þ þ 0:001253 $5,000,0003 1/12ð Þ þ 0:00253 $5,000,0003 1/12ð Þ$5,000,000$ 0:06153 $5,000,0003 1/12ð Þ 3 12
¼ $25; 625þ 520:83þ 1041:67$5,000,000$ 25,625
3 12 ¼ 0.0656 or 6.56 percent
We have simplified this cost analysis by assuming a loan for one month, using afactor of 1/12 to determine the interest and a factor of 12 to annualize. For specificarrangements for which the cost is determined using a 365-day or 360-day year, theappropriate adjustment would be required.
As the results show, the commercial paper alternative comes out with the lowesteffective cost and the line of credit has the highest effective cost. The commitment feethat was payable on the full line added more additional costs than the additional feesand discounting effects added in the other two options.
Line cost 7.00 percent
Banker’s acceptance cost 6.79 percent
Commercial paper cost 6.56 percent
c08 13 January 2012; 9:16:47
Chapter 8 Working Capital Management 343

! Understanding the common types of short-term investments, and computing comparableyields on securities.
! Measuring the performance of a company’s accounts receivable function.! Measuring the financial performance of a company’s inventory management function.! Measuring the performance of a company’s accounts payable function.! Evaluating the short-term financing choices available to a company and recommending a
financing method.
Working capital management is an integral part of the financial management of acompany because many short-term activities have effects on long-term financial decisions.Having an effective short-term financial strategy, for example, allows a company to plan aheadwith the confidence that its short-term concerns are being handled properly. Perhaps unlikeother areas of finance, short-term finance has more qualitative features, making each com-pany’s case somewhat different from another’s. This unique nature, combined with the shorttime frame associated with this aspect of finance, makes short-term finance a dynamic,challenging activity.
PROBLEMS
1. Suppose a company has a current ratio of 2.5 times and a quick ratio of 1.5 times. If thecompany’s current liabilities are h100 million, the amount of inventory is closest to:A. h50 million.B. h100 million.C. h150 million.
2. Given the following financial statement data, calculate the operating cycle for thiscompany.
In millions
Credit sales $25,000
Cost of goods sold $20,000
Accounts receivable $2,500
Inventory – Beginning balance $2,000
Inventory – Ending balance $2,300
Accounts payable $1,700
The operating cycle for this company is closest to:A. 42.0 days.B. 47.9 days.C. 78.5 days.
c08 13 January 2012; 9:16:47
344 Corporate Finance

3. Given the following financial statement data, calculate the net operating cycle for thiscompany.
In millions
Credit sales $40,000
Cost of goods sold $30,000
Accounts receivable $3,000
Inventory – Beginning balance $1,500
Inventory – Ending balance $2,000
Accounts payable $4,000
The net operating cycle of this company is closest to:A. 3.8 days.B. 24.3 days.C. 51.7 days.
4. The bond equivalent yield for a 182-day U.S. Treasury bill that has a price of $9,725 per$10,000 face value is closest to:A. 5.44%.B. 5.53%.C. 5.67%.
5. A company increasing its credit terms for customers from 1/10, net 30 to 1/10, net 60will most likely experience:A. an increase in cash on hand.B. a higher level of uncollectible accounts.C. an increase in the average collection period.
6. Suppose a company uses trade credit with the terms of 2/10, net 50. If the company paystheir account on the 50th day, the effective borrowing cost of skipping the discount onday 10 is closest to:A. 14.9%.B. 15.0%.C. 20.2%.
7. William Jones is evaluating three possible means of borrowing $1 million for one month:1. Drawing down on a line of credit at 7.2% with a 1/2 percent commitment fee on the
full amount with no compensating balances.2. A banker’s acceptance at 7.1%, an all-inclusive rate.3. Commercial paper at 6.9% with a dealer’s commission of 1/4% and a backup line cost
of 1/3%, both of these would be assessed on the $1 million of commercial paper issued.Which of these forms of borrowing results in the lowest cost of credit?A. Line of credit.B. Banker’s acceptance.C. Commercial paper.
c08 13 January 2012; 9:16:47
Chapter 8 Working Capital Management 345

The following information relates to Questions 8–12.Mary Gonzales is evaluating companies in the office supply industry and has compiled
the following information:
20X1 20X2
Company Credit Sales ($)Average Receivables
Balance ($) Credit Sales ($)Average Receivables
Balance ($)
A 5.0 million 1.0 million 6.0 million 1.2 million
B 3.0 million 1.2 million 4.0 million 1.5 million
C 2.5 million 0.8 million 3.0 million 1.0 million
D 0.5 million 0.1 million 0.6 million 0.2 million
Industry 25.0 million 5.0 million 28.0 million 5.4 million
8. Which company had the highest number of days of receivables for the year 20X1?A. Company A.B. Company B.C. Company C.
9. Which company has the lowest accounts receivable turnover in the year 20X2?A. Company A.B. Company B.C. Company D.
10. The industry average receivables collection period:A. increased from 20X1 to 20X2.B. decreased from 20X1 to 20X2.C. did not change from 20X1 to 20X2.
11. Which company reduced the average time it took to collect on accounts receivable from20X1 to 20X2?A. Company B.B. Company C.C. Company D.
12. Gonzales determined that Company A had an operating cycle of 100 days in 20X2,whereas Company D had an operating cycle of 145 days for the same fiscal year. Thismeans that:A. Company D’s inventory turnover is less than that of Company A.B. Company D’s inventory turnover is greater than that of Company A.C. Company D’s cash conversion cycle is shorter than that of Company A.
c08 13 January 2012; 9:16:47
346 Corporate Finance

CHAPTER 9FINANCIAL STATEMENT
ANALYSIS
Pamela Peterson Drake, CFAHarrisonburg, Virginia, U.S.A.
LEARNING OUTCOMES
After completing this chapter, you will be able to do the following:
! Interpret common-size balance sheets and common-size income statements and demon-strate their use by applying either vertical analysis or horizontal analysis.
! Calculate and interpret measures of a company’s operating efficiency, internal liquidity (liquidityratios), solvency, and profitability, and demonstrate the use of thesemeasures in company analysis.
! Calculate and interpret variations of the DuPont expression and demonstrate use of theDuPont approach in corporate analysis.
! Calculate and interpret basic earnings per share and diluted earnings per share.! Calculate and interpret book value of equity per share, price-to-earnings ratio, dividends
per share, dividend payout ratio, and plowback ratio.! Demonstrate the use of pro forma income and balance sheet statements.
1. INTRODUCTION
The financial analysis of a company is a process of selecting, evaluating, and interpretingfinancial data, along with other pertinent information, in order to formulate an assessment ofthe company’s present and future financial condition and performance. We can use financialanalysis to evaluate the efficiency of a company’s operations, its ability to manage expenses,the effectiveness of its credit policies, and its creditworthiness, among other things.
The analyst draws the data needed in financial analysis from many sources. The primarysource of these data is the company itself, through its annual and quarterly reports and otherrequired disclosures. The annual report comprises the income statement, the balance sheet,the statement of cash flows, and the statement of shareholders’ equity, as well as footnotes tothese statements and management’s discussion and analysis.
347
c09 13 January 2012; 17:47:38

In addition to information that companies are required to disclose through financialstatements, we can find other useful information quite readily, including the market prices ofsecurities of publicly traded corporations and industry statistics. Another source of infor-mation is economic data, such as the gross domestic product (GDP), the producer price index(PPI), and the consumer price index (CPI), which we can use in assessing the recent per-formance or future prospects of a company or industry.1
Suppose you are evaluating a company that owns a chain of retail outlets. What infor-mation do you need to judge the company’s performance and financial condition? You needfinancial data, but those data do not tell the whole story. You also need information onconsumer spending, producer prices, consumer prices, and competition. These are economicdata that are readily available from government and private sources. We are often concernedabout how a company performs in different economic climates, so we would want to makesure to evaluate the company through at least one full economic cycle.2
In addition to financial statement data, market data, and economic data, we also need toexamine events that may help explain the company’s present condition and may have abearing on its future prospects. For example, did the company recently close productionfacilities? Is the company developing a new product or acquiring another company? Currentevents can provide information that may be incorporated into financial analysis—both toexplain recent performance and to help predict future performance.
The financial analyst must select the pertinent information, analyze it, and interpret theanalysis, offering judgments on the current and future financial condition and operatingperformance of the company. This chapter introduces you to the tools of financial analysis.These tools include common-size analysis, financial ratio analysis, and pro forma analysis.
In common-size analysis, we restate financial statements in a form that helps the analystdetect significant changes and trends. The approach requires us to use a reference point—either an account in a given financial statement or a prior year’s entire statement—to scale thefinancial statement data. This approach allows us to compare a company with itself over timeor to compare companies of different sizes.
In financial ratio analysis, we select relevant information—primarily from the financialstatement data—and evaluate it in the context of other financial data, as well as over time andin comparison with other companies or the industry. We show how to incorporate marketdata and economic data into the analysis and interpretation of financial ratios.
In pro forma analysis, we use what we have learned through common-size and financialratio analyses to forecast the company’s financial condition and performance. We can then usethese pro forma statements to perform sensitivity analyses for future periods.
2. COMMON-SIZE ANALYSIS
If we examine financial statements over time for a company, it is fairly difficult to spotchanges in relationships because the scale of the company’s accounts changes over time due to
1In the United States, for example, the GDP is calculated by the U.S. Department of Commerce,Bureau of Economic Analysis, and the PPI and CPI are produced by the U.S. Department of Labor,Bureau of Labor Statistics.2An economic cycle is generally viewed as the period over which we can observe expansion, a peak,recession, and a trough in economic activity.
c09 13 January 2012; 17:47:39
348 Corporate Finance
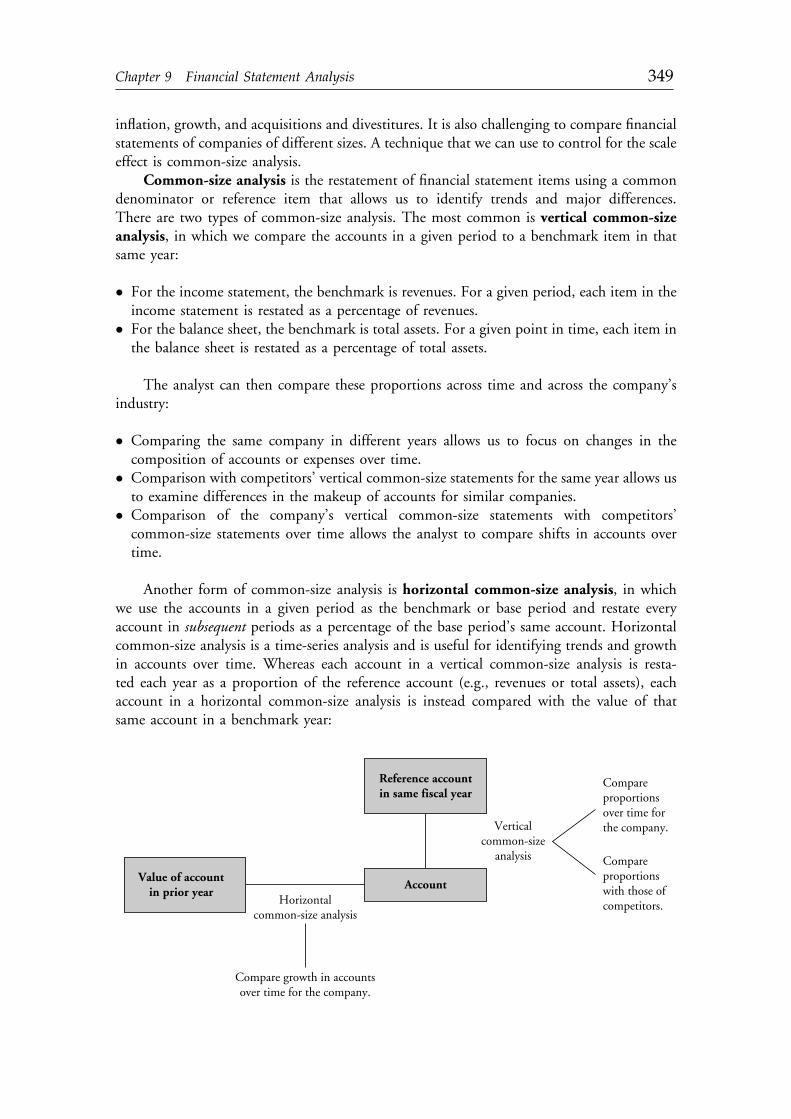
inflation, growth, and acquisitions and divestitures. It is also challenging to compare financialstatements of companies of different sizes. A technique that we can use to control for the scaleeffect is common-size analysis.
Common-size analysis is the restatement of financial statement items using a commondenominator or reference item that allows us to identify trends and major differences.There are two types of common-size analysis. The most common is vertical common-sizeanalysis, in which we compare the accounts in a given period to a benchmark item in thatsame year:
! For the income statement, the benchmark is revenues. For a given period, each item in theincome statement is restated as a percentage of revenues.
! For the balance sheet, the benchmark is total assets. For a given point in time, each item inthe balance sheet is restated as a percentage of total assets.
The analyst can then compare these proportions across time and across the company’sindustry:
! Comparing the same company in different years allows us to focus on changes in thecomposition of accounts or expenses over time.
! Comparison with competitors’ vertical common-size statements for the same year allows usto examine differences in the makeup of accounts for similar companies.
! Comparison of the company’s vertical common-size statements with competitors’common-size statements over time allows the analyst to compare shifts in accounts overtime.
Another form of common-size analysis is horizontal common-size analysis, in whichwe use the accounts in a given period as the benchmark or base period and restate everyaccount in subsequent periods as a percentage of the base period’s same account. Horizontalcommon-size analysis is a time-series analysis and is useful for identifying trends and growthin accounts over time. Whereas each account in a vertical common-size analysis is resta-ted each year as a proportion of the reference account (e.g., revenues or total assets), eachaccount in a horizontal common-size analysis is instead compared with the value of thatsame account in a benchmark year:
Verticalcommon-size
analysis
Horizontalcommon-size analysis
Compare growth in accountsover time for the company.
Compareproportionswith those ofcompetitors.
Compareproportionsover time forthe company.
Reference accountin same fiscal year
Value of accountin prior year
Account
c09 13 January 2012; 17:47:39
Chapter 9 Financial Statement Analysis 349

2.1. Vertical Common-Size Analysis
We use vertical common-size analysis to analyze patterns in profitability (using common-sizeincome statements) and patterns in investments and financing (using common-size balancesheets). Because we scale each account by the reference account, we can also use the resultingpercentages to make comparisons across companies. For example, we can get a sense of howprofit margins have changed over time by examining gross profit as a percentage of revenuesover successive periods. Additionally, we can examine this percentage relative to the com-pany’s competitors. We can also see how a company’s reliance on debt financing has changedover time by focusing on liabilities as a percentage of assets. Moreover, we can represent thisinformation in graphical form, which allows us to more readily visualize trends in thesecomponents over time.
To see how this approach works, consider The Procter & Gamble Company’s financialstatements for 2003 and 2004, summarized below. The reported financial data from the“Amount” columns have been converted into percentages of revenues (i.e., common-sizestatements), shown in the “Common-Size Statement” columns:
Amount(millions of dollars)
Common-Size Statement(percent of revenues)
Fiscal Year Ending 30 June 2003 2004 2003 2004
Revenues $43,377 $51,407 100.0 100.0
Cost of goods sold 22,141 25,076 51.0 48.8
Gross profit $21,236 $26,331 49.0 51.2
Selling, general, andadministrative expenses
13,383 16,504 30.9 32.1
Operating income $7,853 $9,827 18.1 19.1
Interest expense 561 629 1.3 1.2
Other nonoperating income, net 238 152 0.5 0.3
Earnings before income taxes $7,530 $9,350 17.4 18.2
Income tax 2,344 2,869 5.4 5.6
Net income $5,186 $6,481 12.0 12.6
Preparing these statements over several periods allows us to spot trends and interruptionsin trends. For example, we can examine changes in profitability by comparing variousexpenses and net income as percentages of revenues, as in Exhibit 9-1. Panel A shows thedollar amounts of income and expenses, whereas Panel B shows the common-size incomestatement. In Panel B, in which everything has been scaled relative to revenues, it is easier tosee the proportions of income and expenses and how those proportions changed over theyears. In Panel B, we see that Procter & Gamble’s net income has increased over time as a
c09 13 January 2012; 17:47:39
350 Corporate Finance

percentage of sales and that this increase is concurrent with a gradual decrease in the costof sales.
EXHIBIT 9-1 Procter & Gamble Company Income Statements, 1995–2004
$0
$5,000
$10,000
$15,000
$20,000
$25,000
$30,000
$35,000
$40,000
$45,000
1995
1996
1997
1998
1999
2000
2001
2002
2003
2004A
mou
nt (m
illio
ns)
Fiscal Year
Panel A: As Reported
Net income Income tax Nonoperating income or expenseSelling, general, and administrative expenses Cost of sales
1995
1996
1997
1998
1999
2000
2001
2002
2003
2004Pe
rcen
tage
of R
even
ues
Fiscal Year
0%
10%
20%
30%
40%
50%
60%
70%
80%
90%
100%Panel B: Common-Size Income Statement
Source of data: The Procter & Gamble Company annual reports, various years.
As we did for the income statement, we can restate Procter & Gamble’s reported balancesheet items in terms of a percentage of total assets:
c09 13 January 2012; 17:47:39
Chapter 9 Financial Statement Analysis 351
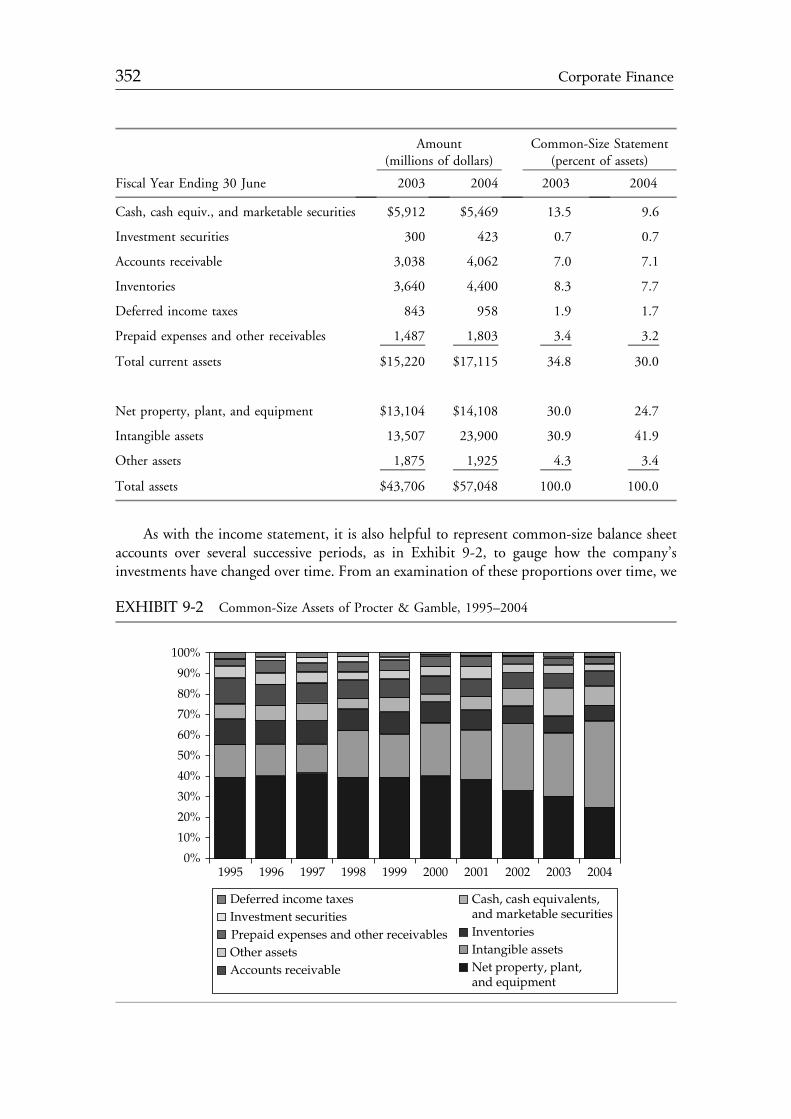
Amount(millions of dollars)
Common-Size Statement(percent of assets)
Fiscal Year Ending 30 June 2003 2004 2003 2004
Cash, cash equiv., and marketable securities $5,912 $5,469 13.5 9.6
Investment securities 300 423 0.7 0.7
Accounts receivable 3,038 4,062 7.0 7.1
Inventories 3,640 4,400 8.3 7.7
Deferred income taxes 843 958 1.9 1.7
Prepaid expenses and other receivables 1,487 1,803 3.4 3.2
Total current assets $15,220 $17,115 34.8 30.0
Net property, plant, and equipment $13,104 $14,108 30.0 24.7
Intangible assets 13,507 23,900 30.9 41.9
Other assets 1,875 1,925 4.3 3.4
Total assets $43,706 $57,048 100.0 100.0
As with the income statement, it is also helpful to represent common-size balance sheetaccounts over several successive periods, as in Exhibit 9-2, to gauge how the company’sinvestments have changed over time. From an examination of these proportions over time, we
EXHIBIT 9-2 Common-Size Assets of Procter & Gamble, 1995–2004
0%
10%
20%
30%
40%
50%
60%
70%
80%
90%
100%
1995 1996 1997 1998 1999 2000 2001 2002 2003 2004
Prepaid expenses and other receivables
Deferred income taxesInvestment securities
Other assetsAccounts receivable
Cash, cash equivalents,and marketable securitiesInventoriesIntangible assetsNet property, plant,and equipment
c09 13 January 2012; 17:47:39
352 Corporate Finance

can see how the company’s investments in working capital accounts, fixed assets, andintangible assets have changed over the years. In the case of Procter & Gamble, there is anincrease in the investment in intangibles, attributable to goodwill and other intangiblesthrough acquisitions, and a lower relative investment in net property, plant, and equipment.
We can similarly restate liabilities and equity in terms of total assets, providing a look atpatterns and changes in the composition of the company’s capital structure:
Amount(millions of dollars)
Common-Size Statement(percent of assets)
Fiscal Year Ending 30 June 2003 2004 2003 2004
Accounts payable $2,795 $3,617 6.4 6.3
Accrued and other liabilities 5,512 7,689 12.6 13.5
Taxes payable 1,879 2,554 4.3 4.5
Debt due in one year 2,172 8,287 5.0 14.5
Total current liabilities $12,358 $22,147 28.3 38.8
Long-term debt $11,475 $12,554 26.3 22.0
Deferred income taxes 1,396 2,261 3.2 4.0
Other noncurrent liabilities 2,291 2,808 5.2 4.9
Total liabilities $27,520 $39,770 63.0 69.7
Convertible Class A preferred stock $1,580 $1,526 3.6 2.7
Common shareholders’ equity 14,606 15,752 33.4 27.6
Total shareholders’ equity $16,186 $17,278 37.0 30.3
Total liabilities and shareholders’ equity $43,706 $57,048 100.0 100.0
The common-size liabilities and equity for the years 1995–2004 are provided in Exhibit 9-3.As we can see in this exhibit, Procter & Gamble has increased is relative use of debt in its
capital structure over time, most notably following 1999, which coincides with its majorrestructuring in the 1999–2001 period.
2.2. Horizontal Common-Size Analysis
In horizontal common-size analysis, we use a base year as the benchmark and then restate allsubsequent years relative to that base. In the case of Procter & Gamble, if we choose 2003 asthe base, we would then calculate the common-size income statement for 2004 as follows:3
3Horizontal common-size analysis, as in this example, is often also referred to as “common-base-yearanalysis.” Note that for illustrative purposes we are examining the difference between two years. Inpractice, however, an analyst would typically examine trends over several years.
c09 13 January 2012; 17:47:39
Chapter 9 Financial Statement Analysis 353

Amount(millions of dollars)
Common-Size Statement(percent of 2003 value)
Fiscal Year Ending 30 June 2003 2004 2003 2004
Revenues $43,377 $51,407 100.0 118.5
Cost of goods sold 22,141 25,076 100.0 113.3
Gross profit $21,236 $26,331 100.0 124.0
Selling, general, andadministrative expenses
13,383 16,504 100.0 123.3
Operating income $7,853 $9,827 100.0 125.1
Interest expense 561 629 100.0 112.1
Other nonoperating income, net 238 152 100.0 63.9
Earnings before income taxes $7,530 $9,350 100.0 124.2
Income tax 2,344 2,869 100.0 122.4
Net income $5,186 $6,481 100.0 125.0
We can see that the growth in net income is traceable largely to the slower growth of costof goods sold and interest expense relative to revenue growth.
Calculating Procter & Gamble’s common-size assets for 2004 relative to 2003, we seethat much of the growth in assets is attributable to the growth in intangible assets:
EXHIBIT 9-3 Common-Size Liabilities and Equity for Procter & Gamble, 1995–2004
0%
10%
20%
30%
40%
50%
60%
70%
80%
90%
100%
1995 1996 1997 1998 1999 2000 2001 2002 2003 2004
Other noncurrent liabilitiesDeferred income taxesDebt due in one yearTaxes payable
Accrued and other liabilitiesAccounts payableLong-term debtTotal shareholders’ equity
Source of data: The Procter & Gamble Company annual reports, various years.
c09 13 January 2012; 17:47:40
354 Corporate Finance

Amount(millions of dollars)
Common-Size Statement(percent of 2003 value)
Fiscal Year Ending 30 June 2003 2004 2003 2004
Cash, cash equiv., and marketable securities $5,912 $5,469 100.0 92.5
Investment securities 300 423 100.0 141.0
Accounts receivable 3,038 4,062 100.0 133.7
Inventories 3,640 4,400 100.0 120.9
Deferred income taxes 843 958 100.0 113.6
Prepaid expenses and other receivables 1,487 1,803 100.0 121.3
Total current assets $15,220 $17,115 100.0 112.5
Net property, plant, and equipment $13,104 $14,108 100.0 107.7
Intangible assets 13,507 23,900 100.0 176.9
Other assets 1,875 1,925 100.0 102.7
Total assets $43,706 $57,048 100.0 130.5
Procter & Gamble’s common-size liabilities for 2004 relative to 2003 indicate that muchof the growth in assets was financed by debt rather than equity:
Amount(millions of dollars)
Common-Size Statement(percent of 2003 value)
Fiscal Year Ending 30 June 2003 2004 2003 2004
Accounts payable $2,795 $3,617 100.0 129.4
Accrued and other liabilities 5,512 7,689 100.0 139.5
Taxes payable 1,879 2,554 100.0 135.9
Debt due in one year 2,172 8,287 100.0 381.5
Total current liabilities $12,358 $22,147 100.0 179.2
Long-term debt $11,475 $12,554 100.0 109.4
Deferred income taxes 1,396 2,261 100.0 162.0
Other noncurrent liabilities 2,291 2,808 100.0 122.6
Total liabilities $27,520 $39,770 100.0 144.5
Convertible Class A preferred stock $1,580 $1,526 100.0 96.6
Common shareholders’ equity 14,606 15,752 100.0 107.8
Total shareholders’ equity $16,186 $17,278 100.0 106.7
Total liabilities and shareholders’ equity $43,706 $57,048 100.0 130.5
c09 13 January 2012; 17:47:40
Chapter 9 Financial Statement Analysis 355

In the case of Procter & Gamble, total liabilities rose 44.5 percent from 2003 to 2004whereas shareholders’ equity increased by only 6.7 percent. We can also see that the increasein current liabilities is primarily attributable to the increase in debt due in one year.
As you can see in our example of Procter & Gamble, common-size analysis is useful forcomparing different periods because we have scaled all the accounts either to a reference pointwithin the statement (vertical common-size analysis) or to a reference point in time (hori-zontal common-size analysis). We can also use common-size analysis to aid in our compar-isons of companies of different sizes. For example, to compare Procter & Gamble withClorox, a much smaller company, we can apply vertical common-size analysis to scale theassets in the balance sheet for each company:
2004 Amounts(millions of dollars)
Common-Size Statement(percent of total assets)
Fiscal Year Ending 30 June Clorox P&G Clorox P&G
Cash, cash equiv., and marketable securities $232 $5,469 6.1 9.6
Investment securities 0 423 0.0 0.7
Accounts receivable 460 4,062 12.0 7.1
Inventories 306 4,400 8.0 7.7
Other current assets 45 2,761 1.2 4.8
Total current assets $1,043 $17,115 27.2 30.0
Net property, plant, and equipment $1,052 $14,108 27.4 24.7
Intangible assets 1,375 23,900 35.9 41.9
Other assets 364 1,925 9.5 3.4
Total assets $3,834 $57,048 100.0 100.0
We can see from this comparison that Clorox has a heavier investment in accountsreceivable than Procter & Gamble, less invested in intangible assets, and less in cash and cashequivalents.
3. FINANCIAL RATIO ANALYSIS
Financial ratio analysis is the use of financial accounting and other information to assess acompany’s financial performance and financial condition. Specifically, financial ratio analysisuses comparisons of financial data in the form of ratios to assess a company’s financial healthand profitability.
There are hundreds of ratios that can be formed using available financial data. One ofthe challenges in financial analysis is determining which ratios are most appropriate for theparticular company in question. In the analysis of a retail store, for example, ratios that relateto inventory, collections on credit, and comparative sales on a per store basis are informativein assessing financial performance. However, in assessing the success of an airline, ratios such
c09 13 January 2012; 17:47:40
356 Corporate Finance

as seats sold versus capacity, costs per passenger or flight mile, and efficiency in using theinvestment in aircraft would be important, whereas ratios related to inventory or collectionson credit might be less useful.
Another challenge is selecting ratios that are most appropriate for the purpose at hand. Forexample, if the purpose of the analysis is to understand a company’s profitability, the ratios thatrelate to returns, which include profit margins and asset utilization, are important. If we want tounderstand a company’s effectiveness in its credit policies and collections, we focus on ratiosinvolving its accounts receivable. To evaluate a company’s creditworthiness, an analyst mightinstead focus on ratios related to the company’s debts and its ability to satisfy those obligations.
Financial ratios are calculated using a company’s financial statement and market data, yetthe interpretation of these ratios should also consider company-specific events and the generaleconomic cycle. For example, if a company acquires another company that is in a differentline of business, a noticeable shift in some ratios may accompany that acquisition. Such shiftsmay simply reflect the different balance in accounts and margins of the acquired business.Further, changes in ratios may be in response to changes in general economic conditions; forexample, a cyclical company will likely experience a change in profitability as economicconditions change.
Though this chapter demonstrates the calculation of financial ratios, in practice, manyanalysts rely on financial ratios that have been calculated and provided by a vendor. In theseinstances, care must be taken to understand how the ratio is calculated by the vendor for severalreasons. First, some ratios do not have a unique calculation. For example, the return on assetsmay be calculated by comparing operating profit to total assets by one financial service butcalculated as the ratio of net profit to total assets by another. Second, a ratiomay be calculated byone vendor using end-of-period values and by another using average values over the period. Forexample, one vendor may calculate the return on assets using the net profit for the fiscal year andthe end-of-period balance in total assets, whereas another vendor may calculate the return onassets using the net profit for the fiscal year and the average of the total assets over the same year.Third, with the large number of possible financial ratios that can be calculated, there are manyratios that do not have a unique name. For example, the plowback ratio, which is the proportionof earnings reinvested in the company, may also be referred to as the retention ratio.
We can classify ratios into several types, based on the dimension of the company’sperformance and condition:
! We use activity ratios to evaluate a company’s effectiveness in putting its asset investmentto good use.
! We use liquidity ratios to measure a company’s ability to meet its short-term, immediateobligations.
! We look at a company’s solvency ratios to gauge its ability to meets its debt obligations.! We use profitability ratios to analyze a company’s ability to manage its expenses to
generate profits from its sales.
A thorough financial analysis of a company requires the use of ratios from more than oneof these classifications, along with other information about the company.
3.1. Activity Ratios
We often want to evaluate how well a company does in putting its investments to use. We canuse activity ratios as measures of how well assets are used. Activity ratios can help us evaluate
c09 13 January 2012; 17:47:40
Chapter 9 Financial Statement Analysis 357

the benefits produced by specific assets, such as inventory or accounts receivable. Or they canbe used to evaluate the benefits produced by all of a company’s assets collectively. There aretwo types of activity measures: turnover ratios and numbers of days. With turnover ratios, wemeasure how many times during the period the company has effectively used its assets toproduce a benefit. With number of days measures, we arrive at an approximation of how longit takes to recoup the company’s investment. As you will see, there is a direct relationshipbetween turnover ratios and the numbers of days.
3.1.1. Turnover RatiosWe use turnover ratios to gauge the company’s efficiency in the use of its assets. A turnoverratio compares a measure of output to the investment used to generate that output. The mostcommon turnover ratios are the inventory turnover, the total asset turnover, and thereceivables turnover. Inventory turnover is the ratio of cost of goods sold to inventory. Thisratio is an indication of the resources tied up in inventory relative to the speed at whichinventory is sold during the period:
Inventory turnover ¼ Cost of goods soldAverage inventory
Though it is possible to construct such a ratio with account balances as of the most recentfinancial statements, for account balances drawn from the balance sheet, it is ideal to useaverage balances over multiple periods. Many companies exhibit seasonality in their revenues.Additionally, many companies choose fiscal year-ends that coincide with the lowest points intheir operating cycles. Consequently, inventory and other balance sheet items that are drawnfrom a company’s annual financial statements may not be representative of the typical accountbalances that are carried throughout the year.
In the case of Procter & Gamble, we can see that there is seasonality in both revenues andinventory, as shown in Exhibit 9-4 with quarterly revenues and inventory over a four-yearperiod. Procter & Gamble’s revenues and inventory levels are lowest in the quarter ending inJune of each year, its fiscal year-end. Therefore, in the calculation of the inventory turnoverratio, we would want to use an average inventory amount if it differs significantly from theyear-end inventory.4
There is no particular number for an inventory turnover ratio that is inherently good orbad. An appropriate turnover ratio may vary among companies and even among product linesin the same company. What is important is the interaction of turnover and profitability,which then influences the returns on the company’s or owners’ investment.
Receivables turnover is the ratio of total revenue to average accounts receivable. Thisratio provides an indication of the resources tied up in accounts receivable and the speed atwhich receivables are collected during the period:
Receivables turnover ¼ Total revenueAverage receivables
4This is the case for any ratio that involves the balance in an account that is seasonal, such as inventoryand accounts receivable. However, when we are on the outside looking in, as is often the case in financialanalysis, we must use annual amounts or the average of the quarterly amounts to estimate this turnoverratio.
c09 13 January 2012; 17:47:40
358 Corporate Finance
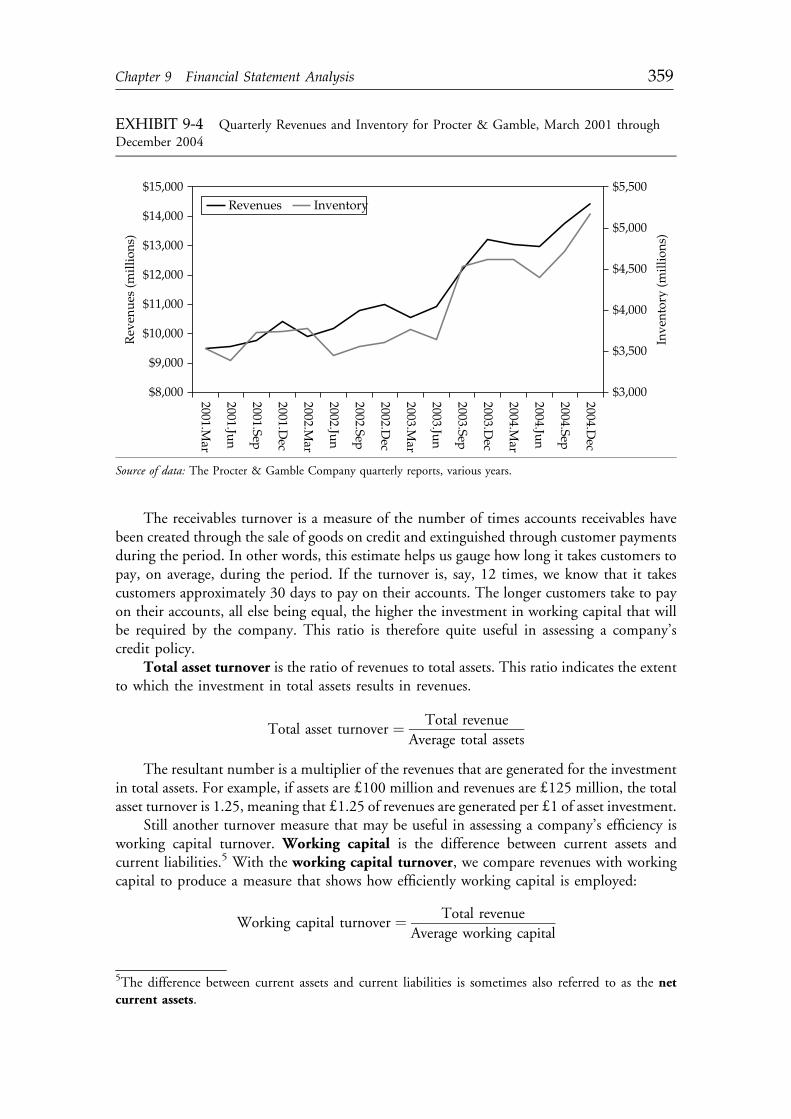
The receivables turnover is a measure of the number of times accounts receivables havebeen created through the sale of goods on credit and extinguished through customer paymentsduring the period. In other words, this estimate helps us gauge how long it takes customers topay, on average, during the period. If the turnover is, say, 12 times, we know that it takescustomers approximately 30 days to pay on their accounts. The longer customers take to payon their accounts, all else being equal, the higher the investment in working capital that willbe required by the company. This ratio is therefore quite useful in assessing a company’scredit policy.
Total asset turnover is the ratio of revenues to total assets. This ratio indicates the extentto which the investment in total assets results in revenues.
Total asset turnover ¼ Total revenueAverage total assets
The resultant number is a multiplier of the revenues that are generated for the investmentin total assets. For example, if assets are d100 million and revenues are d125 million, the totalasset turnover is 1.25, meaning that d1.25 of revenues are generated per d1 of asset investment.
Still another turnover measure that may be useful in assessing a company’s efficiency isworking capital turnover. Working capital is the difference between current assets andcurrent liabilities.5 With the working capital turnover, we compare revenues with workingcapital to produce a measure that shows how efficiently working capital is employed:
Working capital turnover ¼ Total revenueAverage working capital
EXHIBIT 9-4 Quarterly Revenues and Inventory for Procter & Gamble, March 2001 throughDecember 2004
$8,000
$9,000
$10,000
$11,000
$12,000
$13,000
$14,000
$15,000
2001.Mar
2001.Jun
2001.Sep
2001.Dec
2002.Mar
2002.Jun
2002.Sep
2002.Dec
2003.Mar
2003.Jun
2003.Sep
2003.Dec
2004.Mar
2004.Jun
2004.Sep
2004.Dec
Rev
enue
s (m
illio
ns)
$3,000
$3,500
$4,000
$4,500
$5,000
$5,500
Inve
ntor
y (m
illio
ns)
Revenues Inventory
Source of data: The Procter & Gamble Company quarterly reports, various years.
5The difference between current assets and current liabilities is sometimes also referred to as the netcurrent assets.
c09 13 January 2012; 17:47:40
Chapter 9 Financial Statement Analysis 359

As with any other ratio, turnover ratios cannot be judged in isolation but rather must beconsidered in conjunction with other dimensions of the company’s condition and perfor-mance, the trends of the ratios over time, and industry norms.
Consider that a turnover ratio may be constructed to evaluate the use of any set of assetsby comparing the gross benefit—usually revenues—to the employed assets. For example, ifyou wish to focus on a company’s fixed assets, you can construct a fixed asset turnover as theratio of revenues to net plant and equipment.
3.1.2. The Operating Cycle and Its ComponentsTurnover ratios help us measure how efficiently a company’s management puts various assetsto use. Another way of looking at efficiency is to examine the company’s operating cycle—inother words, to “follow the money.” The operating cycle is the duration between the time acompany makes an investment in goods and services—for example, to purchase inventory—and the time that investment produces cash. For example, a company that produces and sellsgoods has an operating cycle comprising four events:
1. The company purchases raw materials from suppliers and produces goods, investing ininventory.
2. The company sells goods, generating revenues, which may or may not be cash.3. The company extends credit to customers, creating accounts receivable.4. The company collects accounts receivable from customers, generating cash.
EXAMPLE 9-1 Turnover Ratios for Procter & Gamble, 2004
Given the 2004 financial results for Procter & Gamble provided in Section 2, calcu-late the inventory turnover, receivables turnover, and total asset turnover ratios forProcter & Gamble.
Inventory turnover ¼ $25,076$4,400
¼ 5:70 times
Receivables turnover ¼ $51,407$4,062
¼ 12:66 times
Total asset turnover ¼ $51,407$57,048
¼ 0:90 times
Notes:
1. Working capital turnover is not meaningful for Procter & Gamble for 2004 becauseworking capital is negative.
2. Preferably, we would use the average of several quarterly balance sheets in calculatingthese ratios. But for the sake of brevity, in these examples, the calculations are basedon the 2004 balance sheet.
c09 13 January 2012; 17:47:41
360 Corporate Finance

The operating cycle is therefore the length of time it takes to convert an investment ofcash in inventory back into cash through collection of accounts.
Just as a company might extend credit to customers and create accounts receivable, notall investments in inventory and other purchases a company makes are paid for immediatelywith cash. The net operating cycle is the length of time it takes to convert an investment ofcash in inventory back into cash considering that the company makes some purchases oncredit.6 (See Exhibit 9-5.)
EXHIBIT 9-5 Operating Cycle and Net Operating Cycle
Sell inventoryon credit
Collect on accountsreceivable
Number of days of inventory
Net Operating CycleNumber of Days ofPayables
Operating Cycle
Buy inventoryon credit
Pay accountspayable
Time
Number of days of receivables
The number of days a company ties up funds in inventory is determined by the totalamount of money represented in inventory and the average day’s cost of goods sold. Thecurrent investment in inventory—that is, the money “tied up” in inventory—is the endingbalance of inventory on the balance sheet. The average day’s cost of goods sold is the cost ofgoods sold on an average day in the year, which can be estimated by dividing the cost of goodssold found on the income statement by the number of days in the year.
We compute the number of days of inventory by calculating the ratio of the amount ofinventory on hand to the average day’s cost of goods sold:
Number of days of inventory¼ InventoryAverage day’s cost of goods sold
¼ InventoryðCost of goods sold=365Þ
We can extend the same logic from the inventory turnover to estimate the number ofdays of receivables, which is the length of time between a sale—when an account receivableis created—and the collection of the account receivable in cash. If the balance of receivables atthe end of the year is representative of the receivables on any day throughout the year, then it
6The net operating cycle is also known as the cash conversion cycle.
c09 13 January 2012; 17:47:41
Chapter 9 Financial Statement Analysis 361

takes, on average, approximately the number of days of receivables to collect the accountsreceivable:
Number of days of receivables ¼ Accounts receivableAverage day’s revenue
¼ Accounts receivableðRevenue=365Þ
We also need to look at the liabilities on the balance sheet to see how long it takes acompany to pay its short-term obligations. We can apply the same logic to accounts payableas to accounts receivable and inventories, calculating the number of days of payables. Howlong does it take a company, on average, to go from creating a payable (buying on credit) topaying for it in cash?
Number of days of payables ¼ Accounts payableAverage day’s purchases
¼ Accounts payableðPurchases=365Þ
First, we need to determine the amount of an average day’s purchases on credit.If we assume all purchases are made on credit, the total purchases for the year would be thecost of goods sold less any amounts included in this cost of goods sold that are not purchases,such as depreciation. An analyst outside the company would not have access to detailedpurchasing data but could use the following accounting relationship to estimate purchases:
Purchases ¼ COGSþEnding inventory &Beginning inventory
The operating cycle is a measure of how long it takes to convert an investment in cash ininventory back into cash through collection of accounts receivable:
Operating cycle ¼ Number of daysof inventory
þ Number of daysof receivables
The number of days of payables tells us how long it takes the company to pay forpurchases made to create the inventory. If we put these two pieces of information together, wecan see how long, net, the company ties up cash. The difference between the operating cycleand the number of days of payables is the net operating cycle:
Net operating cycle ¼Operating cycle &Number of days of payables,
or, substituting for the operating cycle,
Net operating cycle ¼ Number of daysof inventory
þ Number of daysof receivables
& Number of daysof payables
The net operating cycle is an estimate of how long it takes for the company to get cashback from its investment in inventory and accounts receivable, considering that purchasesmay be made on credit. By not paying for purchases immediately (that is, by using tradecredit), the company reduces its liquidity needs.
c09 13 January 2012; 17:47:41
362 Corporate Finance

3.1.3. Turnover and the Numbers of DaysAs you can see, there is a relationship between the turnover ratios and the numbers of days.Dividing 365 by inventory turnover will produce the number of days of inventory. Likewise,dividing 365 by the number of days of inventory will produce the inventory turnover. Forexample, suppose a company has a cost of goods sold of $100 and an average inventory of$20. Then, the inventory turnover is found as $100/$20¼ 5 times. The number of daysof inventory can be found as either 20/(100/365)¼ 73 or 365/5¼ 73. The same relationshipexists with other turnover and corresponding number of days ratios, such as receivablesturnover and number of days of receivables.
The operating cycle connects the level of the company’s activity with its liquidity. Forexample, the lower the turnover of its inventory, the longer its operating cycle and hence themore investment in current assets needed (relative to current liabilities) because it takes longerto convert inventory into cash. In other words, the longer the operating cycle, the moreworking capital required.
3.2. Liquidity Analysis
In the context of financial analysis, we refer to liquidity as the company’s ability to satisfy itsshort-term obligations using assets that are most readily converted into cash. We refer to the
EXAMPLE 9-2 The Net Operating Cycle Componentsfor Procter & Gamble, 2004
Number of days of inventory ¼ $4,400ð$25,076=365Þ ¼ 4,400
68:70¼ 64:05 days
Number of days of receivables ¼ $4,062ð$51,407=365Þ
¼ 4,062140:84
¼ 28:84 days
Number of days of payables' ¼ $3,617ð$25,836=365Þ
¼ 3,61770:78
¼ 51:10 days
Operating cycle¼ 92.89 days
Net operating cycle¼ 41.79 days
*Purchases estimated as COGSþEnding inventory&Beginning inventory¼$25,076þ $4,400& $3,640¼ $25,836.
c09 13 January 2012; 17:47:41
Chapter 9 Financial Statement Analysis 363

assets that may be converted into cash in a short period of time as the company’s liquidassets. These assets are listed in financial statements as current assets.7
We assume that current assets are used to satisfy short-term obligations, or currentliabilities. Current liabilities include accounts payable, wages payable, and accrued liabilities.The amount by which current assets exceed current liabilities is referred to as the company’sworking capital.
3.2.1. Measures of LiquidityLiquidity ratios provide a measure of a company’s ability to generate cash to meet itsimmediate needs. There are several liquidity ratios that we can construct to assess a company’sliquidity. We will look at three of these ratios: the current ratio, the quick ratio, and thecash ratio.
The current ratio is the ratio of current assets to current liabilities. This ratio is ameasure of a company’s ability to satisfy its current liabilities with its current assets:
Current ratio ¼ Current assetsCurrent liabilities
A more stringent measure of liquidity is the quick ratio. This ratio indicates a com-pany’s ability to satisfy current liabilities with its most liquid assets:
Quick ratio ¼ Cashþ Short-term marketable investmentsþ ReceivablesCurrent liabilities
The quick ratio is also referred to as the acid test ratio. We can provide an even morestringent test with the cash ratio, which is a measure of the company’s ability to meet itscurrent obligations with just the cash and cash equivalents on hand:
Cash ratio ¼ Cashþ Short-term marketable investmentsCurrent liabilities
In this ratio, we are not considering less liquid assets, such as accounts receivable, in thecoverage of current liabilities. Rather, we are considering whether the company can pay off itsimmediate obligations without selling inventory or collecting on its accounts.
Generally, the larger these liquidity ratios are, the better the ability of the company tosatisfy its immediate obligations. Is there a magic number that defines good or bad? Notreally. Consider the current ratio. A large amount of current assets relative to current liabilitiesprovides assurance that the company will be able to satisfy its immediate obligations.However, if the company has more current assets than it needs to provide this assurance, thecompany may be investing too heavily in these non- or low-earning assets and therefore notputting its assets to the most productive use. A more thorough interpretation of this liquidityratio requires taking a look at the profitability of the company, trends in liquidity, andindustry norms. As mentioned earlier, another consideration is the operating cycle.
7Current assets are often referred to as working capital because they represent the resources needed forthe day-to-day operations of the company. However, we use the term working capital in this chapter tomean the difference between current assets and current liabilities.
c09 13 January 2012; 17:47:41
364 Corporate Finance

A company with a long operating cycle may have more need for liquid assets than a companywith a short operating cycle.8
3.3. Solvency Analysis
A company can finance its assets with equity, debt, or some combination of the two.Financing with debt involves risk because debt legally obligates the company to payinterest and to repay the principal as promised. Equity financing does not obligate thecompany to pay anything; dividends are paid at the discretion of the board of directors.There is always some risk, which we refer to as business risk, inherent in any operatingsegment of a business. But how a company chooses to finance its operations—the par-ticular mix of debt and equity—may add financial risk on top of business risk. Financialrisk is the risk arising from the company’s obligation to meet required payments under itsfinancing agreements, such as the payment of promised interest and principal repaymenton a bond issue.9
We use solvency ratios to assess a company’s level of financial risk. There are two types ofsolvency ratios: component percentages and coverage ratios. Component percentages typicallycompare a company’s debt level with either its total assets or its equity capital.10 Coverage
EXAMPLE 9-3 Liquidity Ratios for Procter & Gamble, 2004
Current ratio ¼ $17,115$22,147
¼ 0:77
Quick ratio ¼ ð$5,469þ $423þ $4,062Þ$22,147
¼ 0:45*
Cash ratio ¼ ð$5,469þ $423Þ$22,147
¼ 0:27*
*We have assumed that “investment securities” are short-term marketable investments.However, we would need to investigate this assumption further when interpreting thisratio.
8We should note that there may be a specific requirement—say, to comply with a bond covenant—thatthe current ratio be at least a specified number. In this case, the ratio is indeed “good” or “bad” as itrelates to compliance with the bond indenture.9Business risk and financial risk are discussed in greater detail in the chapters on Measures of Leverageand Capital Structure.10Recall that total assets are equivalent to a company’s total capital because of the following accountingrelationship: Assets¼ Liabilitiesþ Shareholders’ equity.
c09 13 January 2012; 17:47:42
Chapter 9 Financial Statement Analysis 365

ratios reflect a company’s ability to satisfy the obligations that arise out of debt financing, suchas interest, principal repayment, and lease payments.
3.3.1. Component-Percentage Solvency RatiosWe use component-percentage solvency ratios to gauge how reliant a company is on debtfinancing. Solvency ratios that compare debt with either equity or total assets are alsocommonly referred to as financial leverage ratios and gearing ratios. We construct theseratios by comparing the amount of debt either to the total capital of the company or to theequity capital. The amount of debt can be measured in several ways. Short-term debtincludes those obligations due in less than a year as well as the portion of longer-termobligations that is due in less than a year. The calculation for long-term debt includesobligations with a maturity of more than a year. These obligations may be in the form ofinterest-bearing debt, such as bonds, or other long-term liabilities, such as deferred incometaxes. In calculating total debt, analysts commonly disregard short-term liabilities that arisefrom the company’s typical day-to-day operations, such as accounts payable, accrued currentliabilities, and taxes payable.
The debt-to-assets ratio is a measure of the proportion of assets that is financed withdebt (both short-term and long-term debt):
Debt-to-assets ratio ¼ Total debtTotal assets
The long-term debt-to-assets ratio is the proportion of the company’s assets that isfinanced with long-term debt:
Long-term debt-to-assets ratio ¼ Long-term debtTotal assets
With the debt-to-equity ratio, we compare the uses of debt and equity as sources ofcapital to finance the company’s assets, evaluated using book values of the capital sources,which are provided on the balance sheet:
Debt-to-equity ratio ¼ Total debtTotal shareholders’ equity
Still another ratio in this category is the financial leverage ratio, also called the equitymultiplier. The significance of this ratio will become apparent in the sections covering return-on-investment ratios and DuPont analysis.
Financial leverage ¼ Total assetsTotal shareholders’ equity
Though we compute these financial leverage ratios using different comparisons, theyshare a common characteristic: The greater the use of debt relative to equity in financing thecompany, the greater the financial leverage ratio.
One problem with looking at risk through a financial ratio that uses the book value ofequity—for example, the debt-to-equity ratio—is that most often there is little relationbetween the book value of equity and its market value. The book value of equity consists of:
c09 13 January 2012; 17:47:42
366 Corporate Finance

! The proceeds to the company of all the stock issued since it was first incorporated, less anytreasury stock (stock repurchased by the company).
! The accumulation of all the earnings of the company, less any dividends, since it was firstincorporated.
Consider the following example of book value versus market value of equity. Procter &Gamble was incorporated in 1890. Its book value of equity represents the sum of all its stockissued and all its earnings, less all dividends paid, since 1890. As of the end of June 2004,Procter & Gamble’s book value of equity was approximately $15.8 billion and its marketvalue of equity was approximately $140.5 billion. The book value understates themarket value by nearly $125 billion. The book value generally does not give a true picture ofthe investment of shareholders in the company because:
! Earnings are recorded according to accounting principles, which may not reflect the trueeconomics of transactions.
! Due to inflation, the dollars from earnings and proceeds from stock issued in the past donot reflect today’s values.
The market value, on the other hand, is the value of equity as perceived by investors. So,why bother with the book value of equity? First, many financial services and rating servicesreport ratios using the book value rather than the market value, and it is important tounderstand the construction of these ratios. Second, many bond covenants are written interms of the book value of accounts rather than the market value.
Incorporating the market value of equity into these ratios is straightforward: Replace thebook value of shareholders’ equity with the market value of equity (which is the currentnumber of shares outstanding times the current market price per share of stock).11
3.3.2. Coverage RatiosIn addition to the component-percentage solvency ratios, which use information about howdebt is related to either assets or equity, there are a number of ratios that capture the com-pany’s ability to satisfy its debt obligations. Many ratios accomplish this end, but the twomost common are the interest coverage ratio and the fixed-charge coverage ratio.
The interest coverage ratio, also referred to as the times-interest-earned ratio, com-pares the earnings available to meet the interest obligation with the interest obligation:
Interest coverage ratio ¼ Earnings before interest and taxesInterest payments
The assessment of the coverage of financial obligations may be expanded to include otherobligations; for example, a fixed-charge coverage ratio can be constructed to include any fixed
11It is much less common to replace the book value of debt with the market value of debt in component-percentage solvency ratios. Doing so can lead to contradictory results. For example, if the market valueof a company’s debt falls dramatically because of a ratings downgrade, using the market value of thecompany’s debt would lead to a decline in the debt-to-assets ratio, which would make the companyappear better off instead of worse off following the downgrade.
c09 13 January 2012; 17:47:42
Chapter 9 Financial Statement Analysis 367

charges, such as lease payments and preferred dividends.12 For example, to gauge a company’sability to cover its interest and lease payments, you could use the following ratio:
Fixed-charge coverage ratio ¼ Earnings before interest and taxesþ Lease paymentsInterest paymentsþ Lease payments
Because earnings may not fully reflect available funds, we often look at the coverage ofinterest using the cash flow coverage ratio. This ratio is similar to the interest and fixed-charge coverage ratios, yet we substitute cash flow from operations plus interest and taxes inthe numerator to reflect the funds available to satisfy interest:
Cash flow coverage ratio ¼ Cash flow from operationsþ Interest payments þTax paymentsInterest payments
Because we use cash flow instead of earnings to indicate available funds, we get a truerpicture of the company’s ability to satisfy its debt obligations.
Another measure of debt coverage is the cash-flow-to-debt ratio:
Cash-flow-to-debt ratio ¼ Cash flow from operationsTotal debt
With this ratio, we can estimate the length of time it would take for the company torepay its debt if it were to apply all of its cash flow from operations toward debt repayment.For example, if the cash-flow-to-debt ratio is 0.25, the company could pay off one quarter ofits debt obligation with its current cash flow. This figure also means that if cash flows continueat the current level and there are no changes in the debt obligation, the company could pay offits debt obligation in 1/0.25¼ 4 years. Therefore, the greater the cash-flow-to-debt ratio, thegreater the company’s ability to repay its obligations and take on additional obligations ifnecessary.13
An alternative formulation of the cash-flow-to-debt ratio uses earnings before interest,taxes, depreciation, and amortization (EBITDA) in the numerator. Though widely used insome applications, this form of the ratio relies on EBITDA as a measure of cash flow. In someapplications, the EBITDA-to-debt ratio will be similar to the cash-flow-to-debt ratio and willprovide an indication of the ability of a company to meet its obligations that is similar to thatof the interest coverage ratio. However, unlike cash flow from operations, EBITDA does notconsider changes in working capital that could affect a company’s ability to meet its obli-gations. A company with significant growth in investments in its receivables and inventorymay have difficulty meeting its debt obligations because of the cash tied up in current assets,but this situation may not be apparent when EBITDA is compared with total debt.
12When you plan to include an obligation that is paid out of after-tax earnings, such as preferred stockdividends, you must first gross up the obligation to place it on a pretax basis. This is accomplished bydividing the obligation by a factor equal to one minus the tax rate.13The use of cash flow from operations in the numerator assumes that the company’s cash flows can bedevoted to the repayment of debt. Though depreciation and amortization are noncash expenses, theyrepresent expenditures that the company may eventually have to make for replacement of existingdepreciable assets.
c09 13 January 2012; 17:47:42
368 Corporate Finance
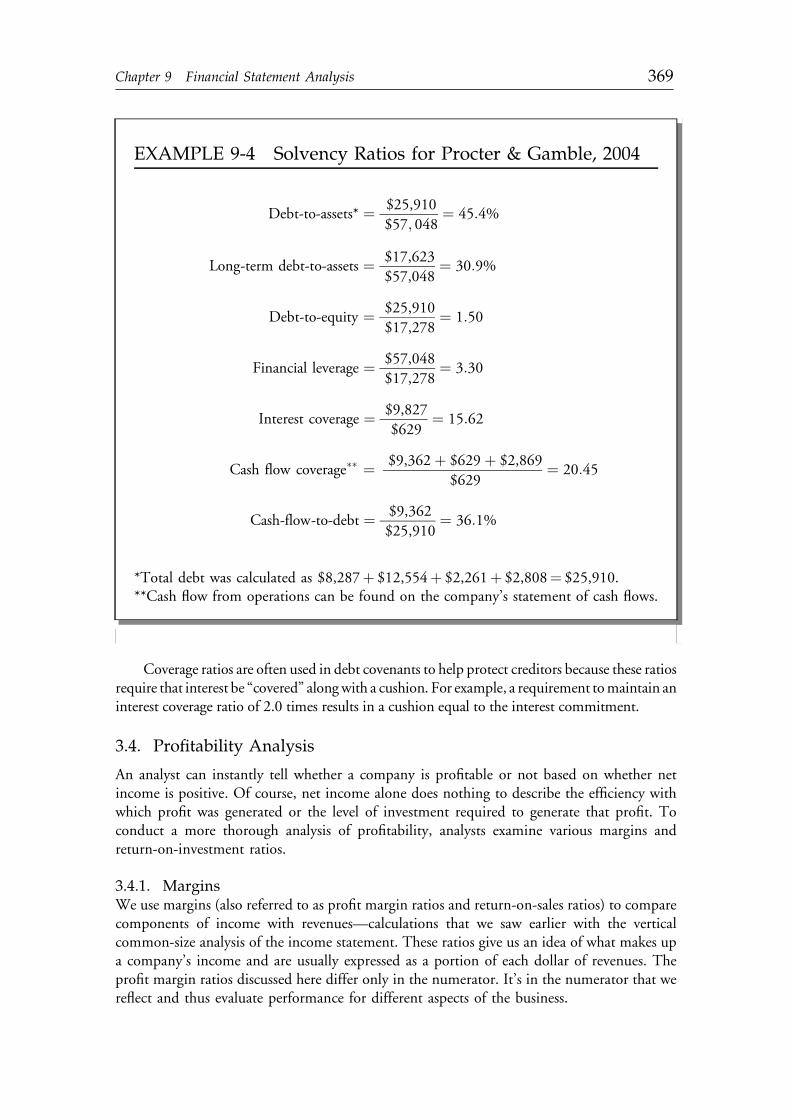
Coverage ratios are often used in debt covenants to help protect creditors because these ratiosrequire that interest be “covered” alongwith a cushion. For example, a requirement tomaintain aninterest coverage ratio of 2.0 times results in a cushion equal to the interest commitment.
3.4. Profitability Analysis
An analyst can instantly tell whether a company is profitable or not based on whether netincome is positive. Of course, net income alone does nothing to describe the efficiency withwhich profit was generated or the level of investment required to generate that profit. Toconduct a more thorough analysis of profitability, analysts examine various margins andreturn-on-investment ratios.
3.4.1. MarginsWe use margins (also referred to as profit margin ratios and return-on-sales ratios) to comparecomponents of income with revenues—calculations that we saw earlier with the verticalcommon-size analysis of the income statement. These ratios give us an idea of what makes upa company’s income and are usually expressed as a portion of each dollar of revenues. Theprofit margin ratios discussed here differ only in the numerator. It’s in the numerator that wereflect and thus evaluate performance for different aspects of the business.
EXAMPLE 9-4 Solvency Ratios for Procter & Gamble, 2004
Debt-to-assets* ¼ $25,910$57; 048
¼ 45:4%
Long-term debt-to-assets ¼ $17,623$57,048
¼ 30:9%
Debt-to-equity ¼ $25,910$17,278
¼ 1:50
Financial leverage ¼ $57,048$17,278
¼ 3:30
Interest coverage ¼ $9,827$629
¼ 15:62
Cash flow coverage'' ¼ $9,362þ $629þ $2,869$629
¼ 20:45
Cash-flow-to-debt ¼ $9,362$25,910
¼ 36:1%
*Total debt was calculated as $8,287þ $12,554þ $2,261þ $2,808¼ $25,910.**Cash flow from operations can be found on the company’s statement of cash flows.
c09 13 January 2012; 17:47:42
Chapter 9 Financial Statement Analysis 369

The gross profit margin is the ratio of gross profit to revenues. Gross profit is thedifference between revenues and the cost of goods sold. We use this ratio to see how much ofevery dollar of revenues is left after the cost of goods sold:
Gross profit margin ¼ Gross profitTotal revenue
The operating profit margin is the ratio of operating income (i.e., income beforeinterest and taxes) to revenues. This ratio indicates how much of each dollar of revenues is leftover after both cost of goods sold and operating expenses are considered:
Operating profit margin ¼ Operating incomeTotal revenue
The net profit margin is the ratio of net income (a.k.a. net profit) to revenues andindicates how much of each dollar of revenues is left over after all costs and expenses:
Net profit margin ¼ Net incomeTotal revenue
A further refinement in margins is to look at the company’s profit margin before tax, orpretax profitmargin, which allows us to isolate the effects of taxes on the company’s profitability:
Pretax profit margin ¼ Earnings before taxesTotal revenue
Profit margins alone do not tell us much about the company’s performance or its abilityto generate profits in the future. Additional information that we would need includes thetrends in these profit margins over time, the company’s turnover ratios and the trends in theseratios, and the industry norms for these ratios.
EXAMPLE 9-5 Profit Margins for Procter & Gamble, 2004
Gross profit margin ¼ $26,331$51,407
¼ 51:2%
Operating profit margin ¼ $9,827$51,407
¼ 19:1%
Net profit margin ¼ $6,481$51,407
¼ 12:6%
Pretax profit margin ¼ $9,350$51,407
¼ 18:2%
c09 13 January 2012; 17:47:42
370 Corporate Finance

3.4.2. Return-on-Investment RatiosWe use return-on-investment ratios, also commonly called return-on-assets ratios, to comparebenefits generated from investments. We represent the benefit in the numerator and theresources affecting that benefit, such as the total assets of the company, in the denominator.14
The operating return on assets is the ratio of operating earnings to assets:15
Operating return on assets ¼ Operating incomeAverage total assets
This ratio is a measure of the operating income resulting from the company’s investmentin total assets and is useful in comparing companies that are in the same line of business.
The return on assets is the ratio of net income to assets and indicates the company’s netprofit generated per dollar invested in total assets:
Return on assets ¼ Net incomeAverage total assets
This ratio is a measure of what the company receives, as a whole, from the investment ithas made in assets. We can be more specific and focus on the return to the investments madeby both creditors and shareholders by calculating a return on total capital:
Return on total capital¼ Net incomeTotal capital
¼ Net incomeAverage interest-bearing debtþAverage total equity
The capital of the company consists of the interest-bearing debt and the equity—bothpreferred and common—of the company.
The return on equity is more specifically directed to the return to shareholders and is theratio of net income to shareholders’ equity. This return represents the profit generated perdollar of shareholders’ investment:
Return on equity ¼ Net incomeAverage shareholders’ equity
The difference between the return-on-assets ratio and the return-on-equity ratio is theinvestment that is considered; the return on equity is affected by the financial leverage ofthe company:
Return on equity ¼ Net incomeAverage shareholders’ equity
¼ Net incomeAverage total assets
3Average total assets
Average shareholders’ equity
14What distinguishes return-on-investment ratios from the activity ratios (such as inventory turnoverand receivables turnover) is that the numerator is the net benefit, rather than the gross benefit, from anactivity.15This ratio is also referred to as the basic earning power ratio.
c09 13 January 2012; 17:47:42
Chapter 9 Financial Statement Analysis 371

We can also be more specific in terms of the type of equity. For example, we canconstruct a return on common equity, which is the ratio of net income available to commonshareholders to common shareholders’ equity. This return is the profit generated per dollar ofcommon shareholders’ investment:
Return on common equity ¼ Net income&Preferred dividendsAverage common shareholders’ equity
3.4.3. DuPont AnalysisDuPont analysis was developed by E.I. du Pont de Nemours in 1919 as a way to betterunderstand return ratios and why they change over time.16 The bases for this approach are thelinkages made through financial ratios between the balance sheet and the income statement.We can better understand a company’s returns over time or its returns in comparison with itscompetitors by breaking returns into their components. This approach began as an analysis ofthe elements in the return on assets. For example,
Return on assets ¼ Net incomeAverage total assets
¼ Net incomeRevenues
3Revenues
Average total assets
EXAMPLE 9-6 Return-on-Investment Ratios for Procter &Gamble, 2004
Operating return on assets ¼ $9,827$57,048
¼ 17:23%
Return on assets ¼ $6,481$57,048
¼ 11:36%
Return on total capital ¼ $6,481$12,554þ 8,287þ 17,278
¼ 17:00%
Return on equity ¼ $6,481$17,278
¼ 37:51%
Return on common equity' ¼ $6,481& $131$17,278& $1,526
¼ 40:31%
*Preferred stock dividends were $131 million in 2004.
16American Management Association (1960). This system is consistent with the logic set forth by AlfredMarshall in his Elements of Economics of Industry (1892).
c09 13 January 2012; 17:47:43
372 Corporate Finance

orReturn on assets ¼ Net profit margin3Total asset turnover
This breakdown of a return on assets into a two-component model is the simplest formof the DuPont approach.17 This approach to breaking down return ratios was originallydepicted as the DuPont Triangle, shown in Exhibit 9-6, with the return on assets at the top ofthe triangle and the profit margin and total asset turnover at the bottom.
EXHIBIT 9-6 The DuPont Triangle
Return onAssets
Net ProfitMargin
Total AssetTurnover
For example, using the financial data found in Exhibit 9-7, we can calculate that for thefiscal year 2004, Office Depot, Inc., had a return on assets of 4.95 percent. We can usethe DuPont approach to look at the components of this return, with dollar amounts inmillions:18
Return on assets ¼ Net incomeRevenues
3Revenues
Average total assets
$335$6,767
¼ $335$13,565
3$13,565$6,767
4:95% ¼ 2:47%32:00
17An easy way to remember the DuPont system is to keep in mind that cross-cancellation of terms
produces the desired return. For example, Return on assets ¼ Net incomeAverage total assets
¼
Net incomeRevenues
3Revenues
Average total assets.
18Source of financial data: Office Depot, 2004 annual report for fiscal year ending 25 December 2004.
c09 13 January 2012; 17:47:43
Chapter 9 Financial Statement Analysis 373

EXHIBIT 9-7 Financial Data for Office Depot, Inc.
Office Depot, Inc.Consolidated Balance Sheet
(millions of dollars)
2003 2004
Assets
Cash and cash equivalents $791 $794
Investment securities 100 161
Accounts receivable 1,112 1,304
Inventories 1,336 1,409
Deferred income taxes 170 133
Prepaid expenses and other current assets 68 115
Total current assets $3,577 $3,916
Net property, plant, and equipment $1,294 $1,463
Goodwill 1,004 1,050
Other assets 320 338
Total Assets $6,195 $6,767
Liabilities and Stockholders’ Equity
Accounts payable $1,323 $1,650
Accrued and other liabilities 814 820
Taxes payable 129 133
Current maturities of long-term debt 13 15
Total current liabilities $2,279 $2,618
Deferred income taxes $340 $342
Long-term debt 829 584
Total liabilities $3,448 $3,544
Common shareholders’ equity $489 $630
Retained earnings 2,258 2,593
Total shareholders’ equity $2,747 $3,223
Total liabilities and shareholders’ equity $6,195 $6,767
c09 13 January 2012; 17:47:43
374 Corporate Finance

Office Depot, Inc.
Consolidated Statement of Earnings
(millions of dollars)
2003 2004
Sales $12,359 $13,565
Cost of sales 8,484 9,309
Gross profit $3,875 $4,256
Selling, general, and administrative expenses 3,409 3,726
Operating income $466 $530
Interest expense and other nonoperating expenses 25 69
Earnings before income taxes $441 $461
Income tax 142 126
Earnings after income taxes $299 $335
Cumulative effect of accounting change (26) 0
Net earnings $273 $335
Fiscal year ending 25 December
Source: Office Depot, Inc., 10-K.
Using the two-component breakdown, we can also use the DuPont approach to compareOffice Depot’s return on assets for 2003 and 2004 and examine why the return changed from4.41 percent in 2003 to 4.95 percent in 2004:
Return on assets ¼ Net incomeRevenues
3Revenues
Average total assets
$273$6,195
¼ $273$12,359
3$12,359$6,195
4:41% ¼ 2:21%31:99
Comparing the breakdowns from 2003, we see that we can attribute the increase in thereturn on assets to the increase in the net profit margin from 2.21 percent to 2.47 percent.Taking a look over a longer span of time, 1991–2004, as shown in Exhibit 9-8, we see that theprimary driver of Office Depot’s return on assets over time is its net profit margin. In 2000,for example, the return on assets declined, along with the net profit margin, despite anincreasing total asset turnover. This observation tells us that to understand changes in return,we need to better understand what drives Office Depot’s net profit margin.
EXHIBIT 9-7 (Continued )
c09 13 January 2012; 17:47:43
Chapter 9 Financial Statement Analysis 375

EXHIBIT 9-8 Return on Assets for Office Depot for Fiscal Years 1991–2004
0%
1%
2%
3%
4%
5%
6%
7%
1991 1992 1993 1994 1995 1996 1997 1998 1999 2000 2001 2002 2003 2004Fiscal Year
0.0
0.5
1.0
1.5
2.0
2.5
3.0
Turn
over
Ret
urn
or M
argi
n
Return on assets Net profit margin Total asset turnover
Source of data: The Office Depot, Inc., annual reports, various years.
We can also compare one company with another using the DuPont approach. ConsiderOffice Depot’s competitor Staples, Inc. In 2004, Staples had revenues of $14,448 million, netincome of $708 million, and total assets of $7,071 million. Its return on assets for 2004 ishigher than Office Depot’s—10.01 percent versus 4.95 percent—due to its higher net profitmargin:
Return on assets ¼ Net incomeRevenues
3Revenues
Average total assets
$708$7,071
¼ $708$14,448
3$14,448$7,071
10:01% ¼ 4:90%32:04
The key to understanding Office Depot’s return on assets, both in comparison with itselfover time and in comparison with competitors, is the net profit margin. We can gain a betterunderstanding of the net profit margin by breaking this ratio into three components: theoperating profit margin, the effect of nonoperating expenses (or nonoperating income), andthe tax effect. Exhibit 9-9 shows this finer breakdown, with return on assets broken downinto the four components of total asset turnover, the operating profit margin, the effect ofnonoperating items, and the tax effect in Panel A. Panel B of this exhibit provides the two-component and four-component DuPont models for Office Depot’s return on assetsfor 2004.
c09 13 January 2012; 17:47:43
376 Corporate Finance

EXHIBIT 9-9 Two-Component and Four-Component DuPont Models of the Return on Assets
Return on Assets
Net incomeTotal assets
Net profit margin
Net income
Revenues
1 –
Total asset turnover
RevenuesTotal assets
Operating profit margin
Operating income
Revenues
Effect of nonoperating items
Income before taxesOperating income
Tax effect
TaxesIncome before taxes
Return on Assets4.95%
Net profit margin2.47%
Operating profit margin3.91%
Effect of nonoperating items0.8698
Tax effect0.7267
Total asset turnover2.00
Panel A: Return-on-Assets Components
Panel B: Return-on-Assets Components for Office Depot (2004 Fiscal Year)
The effect of nonoperating items reflects everything in the company’s income statementbetween its operating income and its earnings before taxes. If the company has net nonop-erating expense, the ratio of income before tax to operating income is less than 1.0; on theother hand, if the company has net nonoperating income, this ratio is greater than 1.0.The effect of nonoperating items is often referred to as the interest effect or interest burdenbecause for many companies the interest expense is the primary nonoperating expense.Companies with higher interest expense have lower ratios of income before taxes to operatingincome, whereas companies with larger nonoperating income have higher ratios of incomebefore taxes to operating income. In the case of Office Depot in 2004, its nonoperating netexpenses are 13.02 percent of its operating income.
The tax effect is one minus the ratio of taxes to income before taxes, or 1 – (Taxes/Income before taxes). The complement of the tax effect is the average tax burden, which is the
c09 13 January 2012; 17:47:43
Chapter 9 Financial Statement Analysis 377

ratio of taxes to income before taxes. For Office Depot, the tax effect ratio is 0.7267;therefore, its average tax rate for 2004 is 1& 0.7267¼ 27.33 percent.
So far, we have seen how the return on assets can be broken down into two or fourcomponents. Similarly, we can represent the return on shareholders’ equity as a three-com-ponent DuPont model:
Return on equity ¼ Net incomeAverage shareholders’ equity
¼ Net incomeRevenues
3Revenues
Average total assets
3Average total assets
Average shareholders’ equity
Extending this model to include the net profit margin in components as we did previ-ously, we can produce a five-component DuPont model, as illustrated in the correspondingexpanded DuPont Triangle in Exhibit 9-10.
EXHIBIT 9-10 The Five-Component DuPont Triangle
Returnon Assets
FinancialLeverage
Net ProfitMargin
Total AssetTurnover
FinancialLeverage
Operating ProfitMargin
Effect ofNonoperating
Items
TaxEffect
Total AssetTurnover
FinancialLeverage
Returnon Equity
For example, we can use the five-component DuPont model for Office Depot’s return onequity, as Panel A of Exhibit 9-11 shows.
c09 13 January 2012; 17:47:43
378 Corporate Finance

EXHIBIT 9-11 Five-Component DuPont Model
Return on Equity10.39%
Net Profit Margin2.47%
Operating profit margin3.91%
Effect of nonoperating items0.8698
Tax effect0.7267
Financial leverage2.0996
Total asset turnover2.0046
Return on Equity17.21%
Net Profit Margin4.90%
Operating profit margin7.79%
Effect of nonoperating items0.9909
Tax effect0.6350
Financial leverage1.7184
Total asset turnover2.0433
Panel A: Office Depot, Inc. (2004)
Panel B: Staples, Inc. (2004)
Using the breakdown in Panel A, we can show that the product of the five components isthe return on equity:
c09 13 January 2012; 17:47:44
Chapter 9 Financial Statement Analysis 379
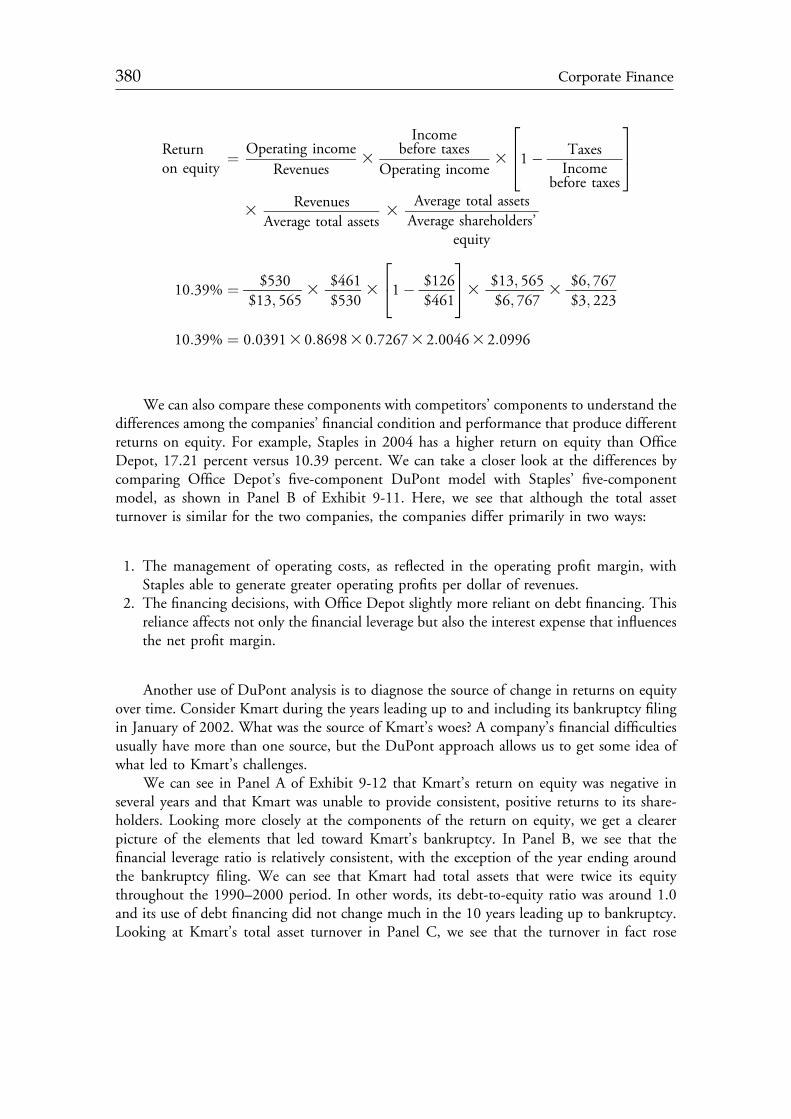
Returnon equity
¼ Operating incomeRevenues
3
Incomebefore taxes
Operating income3 1& Taxes
Incomebefore taxes
2
64
3
75
3Revenues
Average total assets3
Average total assetsAverage shareholders’
equity
10:39% ¼ $530$13; 565
3$461$530
3 1& $126$461
2
4
3
53 $13; 565$6; 767
3$6; 767$3; 223
10:39% ¼ 0:03913 0:86983 0:72673 2:00463 2:0996
We can also compare these components with competitors’ components to understand thedifferences among the companies’ financial condition and performance that produce differentreturns on equity. For example, Staples in 2004 has a higher return on equity than OfficeDepot, 17.21 percent versus 10.39 percent. We can take a closer look at the differences bycomparing Office Depot’s five-component DuPont model with Staples’ five-componentmodel, as shown in Panel B of Exhibit 9-11. Here, we see that although the total assetturnover is similar for the two companies, the companies differ primarily in two ways:
1. The management of operating costs, as reflected in the operating profit margin, withStaples able to generate greater operating profits per dollar of revenues.
2. The financing decisions, with Office Depot slightly more reliant on debt financing. Thisreliance affects not only the financial leverage but also the interest expense that influencesthe net profit margin.
Another use of DuPont analysis is to diagnose the source of change in returns on equityover time. Consider Kmart during the years leading up to and including its bankruptcy filingin January of 2002. What was the source of Kmart’s woes? A company’s financial difficultiesusually have more than one source, but the DuPont approach allows us to get some idea ofwhat led to Kmart’s challenges.
We can see in Panel A of Exhibit 9-12 that Kmart’s return on equity was negative inseveral years and that Kmart was unable to provide consistent, positive returns to its share-holders. Looking more closely at the components of the return on equity, we get a clearerpicture of the elements that led toward Kmart’s bankruptcy. In Panel B, we see that thefinancial leverage ratio is relatively consistent, with the exception of the year ending aroundthe bankruptcy filing. We can see that Kmart had total assets that were twice its equitythroughout the 1990–2000 period. In other words, its debt-to-equity ratio was around 1.0and its use of debt financing did not change much in the 10 years leading up to bankruptcy.Looking at Kmart’s total asset turnover in Panel C, we see that the turnover in fact rose
c09 13 January 2012; 17:47:44
380 Corporate Finance

slightly over the 10 years leading up to bankruptcy. The company’s net profit margin, asshown in Panel D, is evidently the source of the problem. The changing net profit margin—and hence Kmart’s inability to manage its expenses—appears to have been a strong influenceon Kmart’s return on equity.
EXHIBIT 9-12 DuPont Analysis of Kmart’s Return on Assets Leading Up to Bankruptcy in 2002
Panel A: Return on Equity
60%
40%
20%
0%
20%
1990
1991
1992
1993
1994
1995
1996
1997
1998
1999
2000
2001R
etur
n on
Equ
ity
Fiscal Year
Panel B: Financial Leverage
0
1
2
3
4
1990
1991
1992
1993
1994
1995
1996
1997
1998
1999
2000
2001
Fiscal Year
Fina
ncia
l Lev
erag
e
c09 13 January 2012; 17:47:44
Chapter 9 Financial Statement Analysis 381

EXHIBIT 9-12 (Continued )
Panel C: Total Asset Turnover
0.0
0.5
1.0
1.5
2.0
2.5
3.0
1990
1991
1992
1993
1994
1995
1996
1997
1998
1999
2000
2001
Fiscal Year
Tota
l Ass
et T
urno
ver
Panel D: Net Profit Margin
8%
6%
4%
2%
0%
2%
4%
1990
1991
1992
1993
1994
1995
1996
1997
1998
1999
2000
2001N
et P
rofit
Mar
gin
Fiscal Year
Source of data: Kmart’s 10-K reports, various years.
What does this all mean? What we surmise from this analysis is that Kmart’s difficultiesare related to the management of expenses, rather than the deployment and use of its assets orits assumption of financial risk. If we wanted a more detailed picture, we would:
! Break the net profit margin into its components—the operation profit margin, the interestburden, and the tax burden—as we did for Office Depot and Staples, to see why the netprofit margin changed over time.
! Compare the trends in these components with those of Kmart’s major competitors duringthis period, namely, Wal-Mart Stores and Target Corporation.
c09 13 January 2012; 17:47:44
382 Corporate Finance

3.5. Other Ratios
The ratios discussed thus far deal with the company’s performance and financial condition.These ratios provide information for managers (who are interested in evaluating the com-pany’s performance) and for creditors (who are interested in the company’s ability to pay itsobligations). We will now take a look at ratios that focus on the interests of the owners:shareholder ratios. These ratios translate the overall results of operations so that they can becompared in terms of a share of stock.
Earnings per share (EPS) is the amount of income earned during a period per share ofcommon stock:
Earnings per share ¼ Net income available to common shareholdersNumber of common shares outstanding
Companies provide information on earnings per share in their annual and quarterlyfinancial statements, as well as in their periodic press releases. There are two numbers ofearnings per share currently disclosed in financial reports: basic and diluted earnings per share.These numbers differ with respect to the definition of available net income and the number ofshares outstanding.
Basic earnings per share is net income, minus preferred dividends, divided by theaverage number of common shares outstanding. Diluted earnings per share is net income,minus preferred dividends, divided by the number of shares outstanding considering alldilutive securities (e.g., convertible debt and options).19 Diluted earnings per share gives theshareholder information about the potential dilution of earnings. For companies with a largenumber of dilutive securities (e.g., stock options, convertible preferred stock, or convertiblebonds), there can be a significant difference between basic and diluted EPS.
Book value equity per share is the amount of the book value (also called carrying value) ofcommon equity per share of common stock, calculated by dividing the book value of share-holders’ equity by the number of shares of common stock outstanding. As we saw earlier, thebook value of equity may differ from the market value of equity. The market value per share, ifavailable, is a much better indicator of the investment of shareholders in the company.
The price-to-earnings ratio (P/E, or PE ratio) is the ratio of the price per share ofcommon stock to the earnings per share:
Price-to-earnings ratio ¼ Market price per shareEarnings per share
The earnings per share typically used in the denominator is the sum of the earnings pershare for the last four quarters. In this case, the P/E is often referred to as the trailing P/E. Incontrast, the leading P/E is typically calculated using an estimate or forecast for earnings pershare over the next four quarters.
The P/E is sometimes used as a proxy for investors’ assessment of the company’s abilityto generate cash flows in the future. If the company has zero or negative earnings, the P/E thatwe calculate is meaningless.
A financial analyst is often interested in how much of a company’s earnings is paid out toinvestors. Two common measures address this issue: dividends per share and the dividend
19If dilutive securities have obligations that affect the earnings available to shareholders (e.g., interest),these obligations are added back to the numerator in the diluted EPS calculation.
c09 13 January 2012; 17:47:44
Chapter 9 Financial Statement Analysis 383

payout ratio. Dividends per share (DPS) is the dollar amount of cash dividends paid duringa period per share of common stock:
Dividends per share ¼ Dividends paid to shareholdersWeighted average number of ordinary shares outstanding
This measure represents the amount paid out in cash during a given period but does notreflect noncash distributions, such as stock dividends.
The dividend payout ratio is the ratio of cash dividends paid to earnings for a period:
Dividend payout ratio ¼ Dividends paid to common shareholdersNet income attributable to common shares
EXHIBIT 9-13 Procter & Gamble Dividends, 1996–2004
Panel A: Dividend Payout Ratio
0%
10%
20%
30%
40%
50%
60%
70%
1996 1997 1998 1999 2000 2001 2002 2003 2004
Panel B: Dividends per Share
$0.00
$0.10
$0.20
$0.30
$0.40
$0.50
$0.60
$0.70
$0.80
$0.90
$1.00
Perc
enta
ge o
f Ear
ning
s
Fiscal Year Ending 30 June
1996 1997 1998 1999 2000 2001 2002 2003 2004Fiscal Year Ending 30 June
Am
ount
per
Sha
re
Source of data: The Procter & Gamble Company annual reports, various years.
c09 13 January 2012; 17:47:44
384 Corporate Finance

The dividend payout ratio is the complement of the plowback ratio, which is the pro-portion of earnings that is reinvested in the company.20
Plowback ratio ¼ Net income attributable to common shares & Common share dividendsNet income attributable to common shares
¼ 1& DividendsNet income attributable to common shares
2
4
3
5
Some companies’ dividends appear to follow a pattern of constant or constantly growingdividends per share, while a smaller number of companies’ dividends appear to be a constantpercentage of earnings. Panel A of Exhibit 9-13 shows Procter & Gamble’s dividend payoutratio, and Panel B shows its dividends per share. We can see in these charts that Procter &Gamble tends to pay dividends that increase by a relatively constant amount each year.
EXAMPLE 9-7 Other Ratios for Procter & Gamble, 2004
Basic earnings per share' ¼ ð$6,481& $131Þ2,580:1
¼ $2:46
Diluted earnings per share' ¼ ð$6,481& $4Þ2,790:1
¼ $2:32
Market price per share ¼ $54:44
Book value per share ¼ $17,278& $1,5262,580:1
¼ $6:11
Dividends per share ¼ $2,4082,580:1
¼ $0:93
Dividends per share ¼ $2; 4082; 580:1
¼ $0:93
Dividend payout ratio ¼ $2,408$6,481& $131
¼ 37:92%
Plowback ratio ¼ $3,942$6,350
¼ 62:08%
*Average number of common shares outstanding and the effects of dilutive securitieswere found in Procter & Gamble’s 2004 10-K filing.
20The plowback ratio is also commonly referred to as the retention ratio or retention rate.
c09 13 January 2012; 17:47:44
Chapter 9 Financial Statement Analysis 385

3.6. Effective Use of Ratio Analysis
Financial analysis requires pulling together many pieces of information. Analysis of a com-pany requires gathering information such as the following:
! A description of the company, including its line(s) of business, and major corporate events,such as acquisitions and divestitures.
! Information on the industry or industries in which the company operates and its majorcompetitors.
! Major factors (e.g., economic, competitive, and legal) that have affected the company in therecent past and may affect the company in the future.
! Relevant financial ratios for at least the past five years, but preferably extending over at leastone complete economic cycle.
A thorough analysis of a company would require more space than can be allowed here, butwe can look at the basic financial ratio analysis. We will take Procter & Gamble as an example,using published annual financial data for fiscal years 30 June 1995 through 30 June 2004.
One of the important lessons of financial ratio analysis is that there is no value for aparticular ratio that is good or bad. The interpretation of a financial ratio depends on howthat ratio fits into the broader scheme of the company’s overall financial condition andperformance. For example, a company that has 65 percent of its assets financed with debt maybe worrisome to its creditors and owners if it has a high degree of business risk, but thesituation may be less troubling in cases where the company has a lower degree of business risk.As another example, consider a company that has a high rate of inventory turnover. Highturnover may be good, indicating that the company is managing its inventory very efficiently.On the other hand, high turnover may be bad, indicating that the company has a high risk ofstock-outs. How do we resolve whether this situation is good or bad? We look at otherdimensions of the company. In the case of the inventory turnover, for example, we would alsolook at the company’s profitability to see whether the high turnover is a problem.
With respect to trends over time, we generally look at the company’s ratios over a periodof at least five years, but preferably over enough years to see how the company performs atdifferent points in an economic cycle (i.e., peaks and troughs). Additionally, we must considermajor company events that may explain changes over time. For example, a major acquisitionor divestiture will affect any trends.
Also, consider whether there were significant changes in accounting principles that mayaffect the observed trend. For example, consider goodwill, an intangible balance sheet account.In 2001, goodwill was changed so that it is no longer amortized. Instead, goodwill is nowreviewed annually to see whether its value is impaired. Consequently, financial statements after2001 will show a slight upward bias in the company’s net income because goodwill amorti-zation is no longer charged against earnings. For companies that choose to write off a portion ofthis goodwill (e.g., because it is found to be impaired), the financial picture is distorted because:
! The company takes a large, one-time expense when the goodwill is written off.! Returns on assets are enhanced from a lower asset base following the write-off.21
21For example, Therma-Wave, Inc., a manufacturer of systems used in semiconductor manufacturing,wrote off $68 million of goodwill for its year ending March 2003, which was 34 percent of its totalassets.
c09 13 January 2012; 17:47:45
386 Corporate Finance

Therefore, it is important to consider the impact of accounting changes on the com-parability of financial results over time.
3.6.1. Company Description, Industry, and Major FactorsThe Procter & Gamble Company is a consumer products producer with a wide range ofhousehold and personal care products. Procter & Gamble is the largest consumer productscompany, with approximately 50 percent of the market share and revenues over $51 billion in2004. Its major U.S. competitors are Kimberly-Clark Corporation and Colgate-PalmoliveCompany.
The consumer and household products industry is a noncyclical industry, which meansthat the revenues and earnings are not affected by the health of the general economy. As wesaw earlier, there is seasonality in Procter and Gamble’s revenues, with the peak in theDecember-ending quarter of each year and the trough in the June-ending quarter. Procter &Gamble is the leading U.S. company in its industry and is continuing to grow, partly throughacquisitions.
In this example, we are using financial data for the past 10 years to analyze the financialcondition and performance of this company in order to assess how the company is likely toperform in the future. In doing so, we need to understand the major influences on the past 10years’ performance so that we can include this information in our analysis of trends. Factorsoccurring in the past 10 years that affect the financial data that we are using in this analysisinclude the following:
! Changes in accounting, including accounting for derivatives and hedging (Statement ofFinancial Accounting Standards [SFAS] Nos. 133 and 149), accounting for businesscombinations and goodwill (SFAS Nos. 141 and 142), and accounting for asset retirementobligations (SFAS No. 143).
! Changes in the product mix, including the divestiture of Hawaiian Punch in 1999 and theacquisition of Tambrands in 1997, Iams in 1999, Clairol in 2001, and Wella in 2003.
! A restructuring program during the years 1999–2000.
The changes in the product mix, the changes in the accounting, and the restructuringshould be kept in mind when looking at the trends in financial ratios over the 10-yearperiod.
3.6.2. ActivityExhibit 9-14 shows the turnover ratios for Procter & Gamble over the period 1995–2004.The turnover ratios provide information on the effectiveness with which a company puts itsassets to use. In the case of Procter & Gamble, we see that inventory turnover declinedslightly over time, with a significant increase in the 1999–2000 restructuring period, andthat accounts receivable turnover remained relatively stable throughout the 1995–2004period.
3.6.3. LiquidityExhibit 9-15 provides a chart of the current and quick ratios of Procter & Gamble for the1995–2004 fiscal years. These ratios follow similar trends over these years, with a drop inthe restructuring years, 1999–2000.
c09 13 January 2012; 17:47:45
Chapter 9 Financial Statement Analysis 387

EXHIBIT 9-15 Liquidity Ratios of Procter & Gamble, 1995–2004
0.0
0.2
0.4
0.6
0.8
1.0
1.2
1.4
1.6
1995 1996 1997 1998 1999 2000 2001 2002 2003 2004Fiscal Year
Tim
es
Current ratioQuick ratio
Source of data: The Procter & Gamble Company annual reports, various years.
You will notice a change in the physical distance between these two trend lines in thisexhibit. The difference between the quick and current ratios is in the numerator, where thequick ratio excludes inventory. The tightening of these two lines indicates that inventory hasdeclined relative to the other current assets over time. This decline may reflect changes in themanagement of inventory but also may reflect changes in the product mix from acquisitionsand divestitures.
3.6.4. SolvencyExhibit 9-16 provides both the total debt-to-assets and the long-term debt-to-assets ratios forProcter & Gamble over the 1995–2004 fiscal years. Procter & Gamble increased its financialleverage overall from 1995 to 2004. However, the change in the leverage in the latter part of
EXHIBIT 9-14 Turnover Ratios for Procter & Gamble, 1995–2004
1995 1996 1997 1998 1999 2000 2001 2002 2003 2004Fiscal Year
Num
ber
of T
imes
Inventory turnoverAccounts receivable turnover
0
2
4
6
8
10
12
14
16
18
20
Source of data: The Procter & Gamble Company annual reports, various years.
c09 13 January 2012; 17:47:45
388 Corporate Finance

this period is due to a greater reliance on short-term liabilities, as indicated by the divergenceof the two debt ratios.
EXHIBIT 9-16 Solvency Ratios, Procter & Gamble, 1995–2004
1995 1996 1997 1998 1999 2000 2001 2002 2003 2004Fiscal Year
Perc
enta
ge o
f Ass
ets
Total debt to total assetsLong-term debt to total assets
0%
20%
40%
60%
80%
100%
Source of data: The Procter & Gamble Company annual reports, various years.
3.6.5. ProfitabilityThe profit margins of Procter & Gamble are shown in Exhibit 9-17. These profit marginshave increased over time, with the noticeable exception of the 1999 and 2000 fiscal years.A look at the management’s discussion of the financial results in that period indicates that thisfall in margins is attributable to spending on acquisitions and lower earnings in those yearsdue to restructuring expenses.
EXHIBIT 9-17 Profit Margins, Procter & Gamble, 1995–2004
1995 1996 1997 1998 1999 2000 2001 2002 2003 2004Fiscal Year
Mar
gin Gross profit margin
Operating profit marginNet profit margin
0%
10%
20%
30%
40%
50%
60%
Source of data: The Procter & Gamble Company annual reports, various years.
c09 13 January 2012; 17:47:45
Chapter 9 Financial Statement Analysis 389

3.6.6. ReturnsExhibit 9-18 provides a graph of the return on assets and the return on equity for Procter &Gamble for the period 1995–2004. The return on assets is flat during the 1995–2004 period,whereas the return on equity trends upward. This situation is attributed to Procter & Gamble’sincreased use of short-term debt financing, which is consistent with what we saw in Exhibit 9-16.
EXHIBIT 9-18 Return on Investment for Procter & Gamble, 1995–2004
1995 1996 1997 1998 1999 2000 2001 2002 2003 2004Fiscal Year
Ret
urn
Return on assetsReturn on equity
0%
5%
10%
15%
20%
25%
30%
35%
40%
Source of data: The Procter & Gamble Company annual reports, various years.
The return on equity trended upward during this 10-year period, though there was adrop-off in 2001, which is consistent with the lower profit margins in 2001.
The breakdownof the return on equity into the three components of net profitmargin, totalasset turnover, and financial leverage, as shown in Exhibit 9-19, indicates that the upward trendin the return on equity is attributable to the increased ability to manage expenses and theincreased use of debt. The downward trend in the turnover, which puts downward pressure onreturns, likely reflects the change in product mix due to divestures and joint ventures.
EXHIBIT 9-19 DuPont Components, Procter & Gamble, 1995–2004
1995 1996 1997 1998 1999 2000 2001 2002 2003 2004Fiscal Year
Mar
gin
Net profit margin Total asset turnover Financial leverage
0%
2%
4%
6%
8%
10%
12%
14%
0.000
0.500
1.000
1.500
2.000
2.500
3.000
3.500
Turn
over
or
Mul
tiplie
r
Source of data: The Procter & Gamble Company annual reports, various years.
c09 13 January 2012; 17:47:45
390 Corporate Finance

One interpretation of the data represented in Exhibits 9-18 and 9-19 is that the primarydriver for the change in return on equity is the change in the net profit margin. A secondarydriver is the change in debt, specifically the short-term debt.
3.6.7. Other Analysis and FactorsTo this point, we have focused on a few ratios that depict the condition and performance ofProcter &Gamble over a limited period of time. Additional information that we would want toconsider includes the condition and performance of competitors and forecasts of the economy.
3.6.8. ComparablesIn assessing the financial health of a company, we often compare the financial ratios of acompany with those of its major competitors or the industry as a whole. The challenge isoften found in identifying the appropriate competitors or industry to use as a basis forcomparison. With respect to competitors, we want to compare the company with thosecompetitors that have similar lines of business in similar proportions.
It may be difficult in some cases to find competitors that are truly comparable. Considerthe comparison of Procter & Gamble (PG) with Colgate-Palmolive (CL). Though bothcompanies are in the consumer products industry, their participation in the industry differs, aswe can see from the business segment data from their respective 10-K filings for 2004:
Procter & Gamble Revenues (in billions)
P&G Beauty $19.483
Health Care 7.786
Baby Care and Family Care 11.890
Fabric Care and Home Care 15.262
Snacks and Coffee 3.140
Colgate-Palmolive Revenues (in billions)
Oral, Personal, and Home Care $8.587
Pet Nutrition 1.316
The competitor dimension of the analysis is an important aspect to explore in orderto gauge the normal or typical ratio level for businesses with similar product lines and tounderstand the ability of competitors to affect the market in the future. For example, asProcter & Gamble incorporates its newest acquisition, Gillette, and perhaps embarks onadditional products, how financially nimble are its competitors and how fast might they beable to introduce competing products?
Suppose we wish to use an industry average instead of comparing a company with one ortwo competitors. This approach would give us a broader picture of the condition and perfor-mance of the industry. One issue that becomes important, especially in industries that includecompanies of different sizes, is how to compute the average. Suppose we are calculating anindustry average of the return on assets for the consumer products industry. Andsuppose we want to calculate an average that includes Procter & Gamble’s major competitors:
c09 13 January 2012; 17:47:45
Chapter 9 Financial Statement Analysis 391

Kimberly-Clark, Colgate-Palmolive, Newell Rubbermaid, and Clorox.22 These companies areof different sizes, so just howwe compute the averagewill affect the conclusions we draw.We cancalculate an equal-weighted industry average, in which each company has the same weight in theaverage, or a value-weighted industry average, in which each company’s ratio is included inproportion to its size.23Procter&Gamble’smajor competitors range in size fromKimberly-Clark,with total assets of over $17 billion, to Clorox, which has assets of just over $3.6 billion. Therefore,the weighting may make a difference in what is considered “average” for these competitors.
Another consideration in looking at an industry average is that, no matter how it iscalculated, it is less volatile than a given company’s ratio because of the portfolio effect; theups and downs of an individual company are smoothed by the ups and downs of the othercompanies that are not perfectly in synch with one another.
A thorough analysis of Procter & Gamble requires examining each dimension of its financialcondition and performance—activity, liquidity, solvency, and profitability—and comparing thesedimensions over time and against major competitors and the industry as a whole. In addition, athorough analysis requires an examination of the company’s common-size statements in con-junction with those of the major competitors. Further, company-specific information (e.g., theexpected length of time for incorporating its newest acquisition) must be incorporated into anyprojectionsmade of future condition andperformancebasedon the analysis of financial statements.
4. PRO FORMA ANALYSIS
We use common-size statements and financial ratios to gauge the company’s financial con-dition and performance over recent fiscal periods. These analyses are useful in the assessmentof what the company has done in the past and what trends and patterns may continue into thefuture. We can get an even stronger sense of a company’s future by constructing pro formastatements, based both on relationships that existed in the recent past and on anticipatedevents and changes.24 Pro forma statements are income statements and balance sheets basedon projections. We often make these projections by using relations that we estimate from therecent past, forecasting revenues, and then using these forecasted revenues in conjunction withthe past relations to develop a picture of the company’s future.
22It is important for analysts to carefully consider the benchmark that is desired. Is it of interest toconsider all the companies in the industry? A drawback to this approach is that we are including resultsfor both the leaders and the laggards in the industry. Another issue is identifying the appropriatecompetitors. For example, some analysts consider Johnson & Johnson to be in the consumer productsindustry, whereas other analysts classify this company within the health care sector.23An equal-weighted industry average includes each company with an equal weight, so the calculation issimple: Sum the returns on assets and divide by the number of companies in the average. A value-weighted industry average, on the other hand, allows larger companies to play a larger role. Computing avalue-weighted average requires summing the components and then calculating the ratio. For the value-weighted industry average return on assets, for example, we sum the net income for all companies anddivide this result by the sum of the total assets of the companies.24Pro forma statements should not be confused with pro forma financial information released by com-panies in disclosures regarding financial performance. In the former use of the term pro forma, we arereferring to projections or predictions of future results and conditions; in the latter case, the term proforma is used to indicate reported results that are not calculated in conformity with generally acceptedaccounting principles.
c09 13 January 2012; 17:47:45
392 Corporate Finance

If we simply take a company’s current balance sheet and income statement and make thebold assumptions that all elements vary with sales and that the company will continue to growat a rate similar to its most recent past growth rate, we can generate pro forma incomestatements and balance sheets quite easily. For example, using Procter & Gamble andassuming the same growth in revenues in 2005 as in 2004, the pro forma income statementfor 2005 is as follows:
Fiscal Year Ending 30 JuneActual 2004(in millions)
ProjectedPercent of Sales
Pro forma 2005(in millions)
Sales $51,407 100.0 $60,924
Cost of sales 25,076 48.8 29,718
Gross profit $26,331 51.2 $31,206
Selling, general, and administrative expenses 16,504 32.1 19,559
Operating income $9,827 19.1 $11,647
Interest expense 629 1.2 745
Other nonoperating income, net 152 0.3 180
Earnings before income taxes $9,350 18.2 $11,082
Income tax 2,869 5.6 3,400
Net income $6,481 12.6 $7,682
How far did we miss in our projections? We predicted $7.682 billion in net income, yetthe actual net income for 2005 was $7.257 billion. As you can see, we were off by approx-imately $425 million:
Fiscal Year Ending30 June
ProjectedPercent of Sales
Pro Forma 2005(in millions)
Actual Percentof Sales
Actual 2005(in millions)
Sales 100.0 $60,924 100.0 $56,741
Cost of sales 48.8 29,718 49.0 27,804
Gross profit 51.2 $31,206 51.0 $28,937
Selling, general, andadministrative expenses
32.1 19,559 31.7 18,010
Operating income 19.1 $11,647 19.3 $10,927
Interest expense 1.2 745 1.5 834
Other nonoperatingincome, net
0.3 180 0.6 346
Earnings before incometaxes
18.2 $11,082 18.4 $10,439
Income tax 5.6 3,400 5.6 3,182
Net income 12.6 $7,682 12.8 $7,257
c09 13 January 2012; 17:47:46
Chapter 9 Financial Statement Analysis 393

Why did we miss the mark? The projected percentages of sales were actually quite close tothe actual percentages of sales, with the primary exception being “other nonoperating income,net,” which is difficult to predict for most companies. We also missed slightly in terms ofrevenue growth. Using 2004 revenue growth of 18.5 percent, we predicted sales of roughly$60.9 billion. Actual revenue growth was lower, at 10.4 percent.
As you can see in this example, it is important to produce a good prediction of revenuegrowth, as well as refinement in terms of how other income and expenses vary with sales. Wecan develop more accurate forecasts by determining which accounts in the income statementand balance sheet tend to vary with revenues and which do not. For example, interest expenseand nonoperating income and expenses do not tend to vary with revenues but rather aredriven by other factors. Exhibit 9-20 outlines the process of considering both sales-driven andnon-sales-driven accounts in the development of pro forma statements.
EXHIBIT 9-20 Pro Forma Analysis
Estimate typical relation between revenues andsales-driven accounts
Estimate fixed burdens, such as interest andtaxes
Forecast revenues
Estimate sales-driven accounts based onforecasted revenues
Estimate fixed burdens
Construct future period income statement andbalance sheet
For purposes of demonstrating this process, we will use the statements for Imaginaire, afictitious company:25
Imaginaire Company IncomeStatement, Year 0 (in millions)
Imaginaire Company Balance Sheet,End of Year 0 (in millions)
Sales revenues h1,000.0 Current assets h600.0
Cost of goods sold 600.0 Net plant and equipment 1,000.0
25Note that at various points throughout our Imaginaire example, the calculations may vary slightly dueto rounding. For this example, calculations were completed with a spreadsheet.
c09 13 January 2012; 17:47:46
394 Corporate Finance

Imaginaire Company IncomeStatement, Year 0 (in millions)
Imaginaire Company Balance Sheet,End of Year 0 (in millions)
Gross profit h400.0 Total assets h1,600.0
Selling, general, andadministrative expenses
100.0
Operating income h300.0 Current liabilities h250.0
Interest expense 32.0 Long-term debt 400.0
Earnings before taxes h268.0 Common stock and paid-in capital 25.0
Taxes 93.8 Retained earnings 925.0
Net income h174.2 Total liabilities and equity h1,600.0
Dividends h87.1
4.1. Estimating the Sales-Driven Relations
There are several accounts that tend to vary with the revenues of a business. In other words,the relation between these accounts and revenues is relatively fixed over time. In general,these sales-driven accounts include the cost of goods sold; selling, general, and admini-strative expenses; and the working capital accounts included in current assets and currentliabilities.
In the case of the Imaginaire Company, we calculate the following:
Cost of goods sold as a percentage of sales 60%
Operating expenses as a percentage of sales 10%
Current assets as a percentage of sales 60%
Current liabilities as a percentage of sales 25%
As a real-world example, Exhibit 9-21 shows the sales-driven relations for Wal-MartStores. The cost of goods sold as a percentage of sales has been rather constant at about 79percent during the past 15 years. Operating expenses, including selling, general, andadministrative expenses, have been approximately 16 percent of sales. When making pro-jections involving Wal-Mart Stores, we can be fairly confident that the sales-driven costs ofsales and operations are relatively constant.
If we look at Wal-Mart’s current assets and current liabilities, we see that while these maybe sales-driven, there is some variability in the percentages. The current assets range from 12.5percent to 19 percent of sales, whereas the current liabilities range from 10.4 percent to 15.6percent of sales. However, the past five years’ percentages are rather constant for bothaccounts, providing a reasonable estimation of current assets of approximately 13.5 percent ofsales and current liabilities of approximately 15 percent of sales.
c09 13 January 2012; 17:47:46
Chapter 9 Financial Statement Analysis 395

4.2. Estimating the Fixed Burdens
The fixed burdens are primarily interest and taxes. If we make the assumption that tax rateswill not change in the near future, we can look at the company’s recent experience with taxesto assess the tax burden. In the case of the Imaginaire Company, the tax rate is 35 percent. Inmost cases, the tax burden is constant unless a change occurs in the federal corporate taxstructure. We can see this constancy in the income tax burden of Procter & Gamble inExhibit 9-1. If tax rates are expected to change, this estimate can be adjusted accordingly.
EXHIBIT 9-21 Sales-Driven Accounts for Wal-Mart Stores, 1990–2004
Panel A: Sales-Driven Income Statement Accounts
0%
10%
20%
30%
40%
50%
60%
70%
80%
90%
1991
1992
1993
1994
1995
1996
1997
1998
1999
2000
2001
2002
2003
2004
2005
Fiscal Year Ending 31 January
Perc
enta
ge o
f Sal
es
Panel B: Sales-Driven Balance Sheet Accounts
1991
1992
1993
1994
1995
1996
1997
1998
1999
2000
2001
2002
2003
2004
2005
Fiscal Year Ending 31 January
Perc
enta
ge o
f Sal
es
Cost of sales as a percent of sales Operating expenses as a percent of sales
Current assets as a percent of sales Current liabilities as a percent of sales
0%
5%
10%
15%
20%
25%
Source of data: Wal-Mart Stores annual reports, various years.
c09 13 January 2012; 17:47:46
396 Corporate Finance

Also, if we project that a company will, say, generate losses instead of gains, we will want toadjust the tax burden to reflect this change.26
The interest burden is a function of the company’s capital structure. In making our fore-casts, we must make an assumption about the company’s capital structure in the future and thenwork from there to determine the interest burden. If we assume that the capital structure will notchange, we look at the interest burden in the past to make our projections for the future.
In the case of Procter & Gamble, we can see in Exhibit 9-3 that the capital structure haschanged over time, with more financial leverage in the more recent years. In making ourpredictions, we may want to focus on the more recent years (say, 2000–2004), which reflectthe capital structure most likely to continue in the future.
4.3. Forecasting Revenues
We can forecast future revenues a number of ways.We already saw that if we simply use themostrecent year’s revenue growth for Procter & Gamble, we wind up with a significant forecast errorfor 2005. If we forecast revenues into the future using the average growth rate of 5.43 percentover the period 1994–2004, we predict revenues of $54,198million for the fiscal year ending 30June 2005.27 On the other hand, if we use a time-series linear regression to forecast revenues, wepredict revenues of $47,841 million in 2005.28 The actual revenues for 2005 were $56,741million. In other words, whether relying on the average growth rate to continue for the followingyear or extrapolating a linear trend, we would have under fore casted revenues. Why are we off?
Strictly using forecasts from prior periods does not take into account the other factorsthat affect revenues. In the case of Procter & Gamble, recent acquisitions and divestitureschanged the product mix, affecting the predictability of the different segments’ revenues.
In predicting revenues, we want to consider not only the path that revenues have taken inthe past but also company-specific, market, and economic events that may affect futurerevenues. If the company provides consistent segment data, we can often track trends in thesesegments to develop the forecasts for the company as a whole.
4.4. Constructing Pro Forma Statements
We construct the financial statements based on the sales-driven estimates and the interest andtax burdens. If all accounts vary with sales, the projections that we provide in the pro formastatements are simple: We extrapolate forward in time using the percentages, typically usingthe components we determined in our common-size analysis. But not all accounts vary withsales, so we will encounter a residual that we need to resolve.
When we make predictions for both the sales-driven accounts and the fixed burdens, wewill inevitably encounter either a financing deficiency or a surplus. We must then make anassumption regarding how we expect the company to deal with this residual. Will thecompany finance expansion with debt? Equity? Both? When funds are available in excess ofoperating needs, will they be used to pay down debt? Repurchase stock? Both? In other words,
26In the case of Kmart, for example, the losses generated tax-loss carryovers and actually produced a taxbenefit instead of a burden in the years leading up to bankruptcy in 2002.27The growth rate of revenues varied widely between 1994 and 2004, from –1.77 percent in 2001 to18.51 percent in 2004.28We estimate the linear regression based on the 11 years of revenues, 1994 through 2004, against time,forecasting the following year’s revenues as $29,301þ $1,545(12)¼ $47,841.
c09 13 January 2012; 17:47:46
Chapter 9 Financial Statement Analysis 397

we need to make an assumption about the company’s capital structure decisions. To see howthis question plays out, we will forecast one year ahead for the Imaginaire Company. If weassume that revenues will grow at 5 percent, the predicted net income one year ahead,assuming no changes in financing, is h184 million:
Imaginaire Company Income Statement (in millions)
Year 0One YearAhead
Sales revenues h1,000.0 h1,050.0 ï Growth at 5 percent
Cost of goods sold 600.0 630.0 ï 60 percent of revenues
Gross profit h400.0 h420.0 ï Sales revenues less cost of goods sold
Selling, general, and admin.expenses
100.0 105.0 ï 10 percent of revenues
Operating income h300.0 h315.0 ï Gross profit less operating expenses
Interest expense 32.0 32.0 ï 8 percent of long-term debt
Earnings before taxes h268.0 h283.0 ï Operating income less interest expense
Taxes 93.8 99.1 ï 35 percent of earnings before taxes
Net income h174.2 h184.0 ï Earnings before taxes less taxes
Dividends h87.1 h92.0 ï Assume dividend payout ratioof 50 percent
We then carry the income statement information into our forecast for the next year’sbalance sheet:
Imaginaire Company Balance Sheet, End of Year (in millions)
Year 0One YearAhead
Current assets h600.0 h630.0 ï 60 percent of revenues
Net plant and equipment 1,000.0 1,050.0 ï 100 percent of revenues
Total assets h1,600.0 h1,680.0
Current liabilities h250.0 h262.5 ï 25 percent of revenues
Long-term debt 400.0 400.0 ï Assume no change
Common stock and paid-in capital 25.0 25.0 ï Assume no change
Retained earnings 925.0 1,017.0 ï Retained earnings in Year 0,plus net income, less dividends
Total shareholders’ equity 950.0 1,042.0
Total financing h1,600.0 h1,704.5 ï Sum of projected liabilities and equity
Total assets 1,680.0
Financing surplus (or deficiency) h24.5 ï Difference between financing and assets
c09 13 January 2012; 17:47:46
398 Corporate Finance

Whenever we make projections with a combination of percentages of sales and fixedburdens, we are likely to need a “plug” item to balance the accounts. In this case, we see thatthere is a financing surplus of h24.5 million, which means that the company can pay downdebt, repurchase equity, or increase dividends by h24.5 million. If we assume that thecompany’s capital structure does not change, we assume that the h24.5 million is spreadproportionately between debt and equity. But now we have another issue: If debt changes,there are consequences for the interest expense, taxes, net income, and equity. In other words,the adjustment is not a simple one but rather one that requires iterations until the appropriatesolution is determined.
For example, if we assume that Imaginaire will make adjustments only in debt, then thepro forma financial statements are as follows:
Imaginaire Company Income Statement (in millions)
Year 0One YearAhead
Sales revenues h1,000.0 h1,050.0 ï Growth at 5 percent
Cost of goods sold 600.0 630.0 ï 60 percent of revenues
Gross profit h400.0 h420.0 ï Sales revenues less cost of goods sold
Selling, general, andadmin. expenses
100.0 105.0 ï 10 percent of revenues
Operating income h300.0 h315.0 ï Gross profit less operating expenses
Interest expense 32.0 30.0 ï 8 percent of long-term debt (originallyh400 million, now h375.5 million)
Earnings before taxes h268.0 h285.0 ï Operating income less interest expense
Taxes 93.8 99.7 ï 35 percent of earnings before taxes
Net income h174.2 h185.2 ï Earnings before taxes less taxes
Dividends h87.1 h92.6 ï Assume dividend payout ratio of 50 percent
Imaginaire Company Balance Sheet, End of Year (in millions)
Year 0One YearAhead
Current assets h600.0 h630.0 ï 60 percent of revenues
Net plant and equipment 1,000.0 1,050.0 ï 100 percent of revenues
Total assets h1,600.0 h1,680.0
Current liabilities h250.0 h262.5 ï 25 percent of revenues
Long-term debt 400.0 375.5 ï Financing surplus applied toward debt
(Continued )
c09 13 January 2012; 17:47:47
Chapter 9 Financial Statement Analysis 399

Year 0One YearAhead
Common stock and paid-in capital 25.0 25.0 ï Assume no change
Retained earnings 925.0 1,017.6 ï Retained earnings in Year 0,plus net income, less dividends
Total liabilities and equity h1,600.0 h1,680.6
With one iteration, we have reduced the financing surplus to h0.6 million. Additionaliterations would eventually reduce the surplus (or deficit) to the point where it would be smallenough to eliminate through rounding. For example, a second iteration would reduce long-term debt to h374.9 million and reduce the surplus to h328.00.
If we were instead to make the assumption that the company will maintain its currentrelation between total debt and equity, the pro forma statements would be slightly different:
Imaginaire Company Income Statement (in millions)
Year 0 One Year Ahead
Sales revenues h1,000.0 h1,050.0 ï Growth at 5 percent
Cost of goods sold 600.0 630.0 ï 60 percent of revenues
Gross profit h400.0 h420.0 ï Sales revenues less cost of goods sold
Selling, general, andadmin. expenses
100.0 105.0 ï 10 percent of revenues
Operating income h300.0 h315.0 ï Gross profit less operating expenses
Interest expense 32.0 33.6 ï 8 percent of long-term debt(now h420.0 million)
Earnings before taxes h268.0 h281.4 ï Operating income less interest expense
Taxes 93.8 98.5 ï 35 percent of earnings before taxes
Net income h174.2 h182.9 ï Earnings before taxes less taxes
Dividends h87.1 h91.5 ï Assume a dividend payout ratio of 50 percent
Imaginaire Company Balance Sheet, End of Year (in millions)
Year 0One YearAhead
Current assets h600.0 h630.0 ï 60 percent of revenues
Net plant and equipment 1,000.0 1,050.0 ï 100 percent of revenues
Total assets h1,600.0 h1,680.0
c09 13 January 2012; 17:47:47
400 Corporate Finance

Year 0One YearAhead
Current liabilities h250.0 h262.5 ï 25 percent of revenues
Long-term debt 400.0 420.0 ï Debt increased by h20 million tomaintain the same capital structure
Common stock andpaid-in capital
25.0 25.0 ï Assume no change
Treasury stock (44.0) ï Repurchased shares
Retained earnings 925.0 1,016.5 ï Retained earnings in Year 0,plus net income, less dividends
Total liabilities and equity h1,600.0 h1,680.0
Retained earnings for one year ahead were found by adding net income less dividends toretained earnings in Year 0. If the common stock and paid-in capital account remains ath25.0 million, then a Treasury stock purchase of h44.0 million is required to eliminate thefinancing surplus. A repurchase of shares creates a Treasury stock contra-equity account,which results in a reduction of the company’s reported equity.
As you can see, generating pro forma statements requires a reliance on assumptions aboutthe growth in revenues, which items in the balance sheet and income statement tend to varywith revenues, and how the company will deal with financing shortfalls or surpluses.Divergences from these assumptions can have a dramatic impact on overall results. Thus,great care should be taken to ensure that pro forma assumptions are as realistic as possible.
5. SUMMARY
A challenge that we face in financial analysis is making sense of the wealth of information thatis available about a company and the industry in which it operates. Companies provideshareholders and investors with quarterly and annual financial statements, as well as numerousother financial releases. Financial ratio analysis and common-size analysis help us gauge thefinancial performance and condition of a company through an examination of relationshipsamong these many financial items.
A thorough financial analysis of a company requires examining its efficiency in putting itsassets to work, its liquidity position, its solvency, and its profitability. We can use the tools ofcommon-size analysis and financial ratio analysis, including the DuPont model, to helpunderstand where a company has been. We then apply these relationships in pro formaanalysis, forecasting the company’s income statements and balance sheets for future periods,to see how the company’s performance is likely to evolve.
c09 13 January 2012; 17:47:47
Chapter 9 Financial Statement Analysis 401

PROBLEMS
The following information relates to Problems 1, 2, and 3.
Tab, Inc., Income Statements for Fiscal Years 2003, 2004, and 2005
Amount (in millions of dollars)
2005 2004 2003
Revenues $25,000 $22,000 $21,000
Cost of sales 20,000 18,000 17,000
Gross profit $5,000 $4,000 $4,000
Selling, general, and administrative expenses 500 500 800
Operating income $4,500 $3,500 $3,200
Interest and other nonoperating expense 200 250 250
Earnings before income taxes $4,300 $3,250 $2,950
Income tax 1,410 975 885
Net income $2,890 $2,275 $2,065
Tab, Inc., Balance Sheets as of End of Fiscal Years 2003, 2004, and 2005
Amount (in millions of dollars)
2005 2004 2003
Cash, cash equiv., and marketable securities $200 $150 $100
Accounts receivable 1,800 1,350 900
Inventories 8,000 7,500 7,000
Total current assets $10,000 $9,000 $8,000
Net property, plant, and equipment $20,000 19,000 19,000
Intangible assets 1,000 1,000 1,000
Total assets $31,000 $29,000 $28,000
Accounts payable $500 $790 $615
Debt due in one year 1,000 1,000 1,000
Long-term debt 12,000 13,000 14,000
Shareholders’ equity 17,500 14,210 12,385
Total liabilities and equity $31,000 $29,000 $28,000
c09 13 January 2012; 17:47:47
402 Corporate Finance

1. Using vertical common-size analysis and restating the balance sheets using total assets asthe benchmark to analyze changes at Tab between fiscal year 2003 and fiscal year 2005,an analyst would correctly conclude that Tab:A. reduced its relative investment in inventory.B. increased the role of intangible assets in its investments.C. decreased its reliance on debt financing relative to equity financing.
2. Using vertical common-size analysis of the income statement of Tab for 2005, the cost ofsales relative to the benchmark is closest to:A. 75%.B. 80%.C. 85%.
3. Using horizontal common-size analysis of the income statement of Tab for 2005, the costof sales relative to the benchmark of 2003 is closest to:A. 95%.B. 118%.C. 123%.
4. Common-size analysis is used in financial analysis to:A. evaluate changes in a company’s operating cycle over time.B. compare companies of different sizes or to compare a company with itself over time.C. restate each element in a company’s financial statement as a proportion of the similar
account for another company in the same industry.
5. The TBI Company has a number of days of inventory of 50. Therefore, the TBICompany’s inventory turnover is closest to:A. 4.8 times.B. 7.3 times.C. 8.4 times.
6. The difference between a company’s operating cycle and its net operating cycle is:A. the number of days that it takes, on average, for the company to sell its inventory.B. the number of days that it takes the company to pay on the accounts due its suppliers.C. the number of days that it takes for the company’s cash investment in inventory to
result in cash collections from customers.
7. The net operating cycle is:A. inversely related to a company’s need for liquidity.B. the length of time it takes for an investment in inventory to be returned from col-
lected accounts.C. the sum of the number of days of inventory and the number of days of receivables,
less the number of days of payables.
8. A measure of the extent to which a company is able to satisfy its short-term obligations isreferred to as:A. a liquidity ratio.B. an activity ratio.C. a financial leverage ratio.
c09 13 January 2012; 17:47:47
Chapter 9 Financial Statement Analysis 403

9. Which of the following best describes the relationship between the current ratio and thecash ratio?A. The current ratio and the cash ratio should not bear any relation to one another.B. The current ratio is at least equal to the cash ratio but may be larger than the
cash ratio.C. The cash ratio is at least equal to the current ratio but may be larger than the current
ratio.
10. Suppose a company has earnings before taxes of $20 billion and its income tax is 35% ofits earnings before taxes. If the company has an interest expense of $2 billion, its interestcoverage ratio is closest to:A. 6.5 times.B. 10.0 times.C. 11.0 times.
11. If a company has a net profit margin of 12% and a tax rate of 40%, the before-tax profitmargin is closest to:A. 7.2%.B. 12.4%.C. 20.0%.
12. If a company’s operating profit margin is 4% and its total asset turnover is 1.5 times, itsoperating return on assets is:A. 2.7%.B. 6.0%.C. 7.3%.
13. DuPont analysis involves breaking return-on-assets ratios into their:A. marginal and average components.B. operating and financing components.C. profit margin and turnover components.
14. The DuPont system allows us to break down the return on equity into:A. return on assets and the financial leverage ratio.B. profit margin, the tax retention ratio, and inventory turnover.C. gross profit margin, total asset turnover, and the debt-to-equity ratio.
15. If a company’s net profit margin is –5%, its total asset turnover is 1.5 times, and itsfinancial leverage ratio is 1.2 times, its return on equity is closest to:A. –9.0%.B. –7.5%.C. –3.2%.
c09 13 January 2012; 17:47:48
404 Corporate Finance

The following information relates to Problems 16 and 17.
LaPearla Company Income Statementfor Year 2005 (in millions)
LaPearla Company Balance Sheet,End of Year 2005 (in millions)
Revenues h10,000 Current assets h2,000
Cost of goods sold 5,500 Net plant and equipment 18,000
Gross profit h4,500 Total assets h20,000
Selling, general, andadministrative expenses
800
Operating income h3,700 Current liabilities h1,000
Interest expense 500 Long-term debt 5,000
Earnings before taxes h3,200 Common stock and paid-in capital 500
Taxes 960 Retained earnings 13,500
Net income h2,240 Total liabilities and equity h20,000
16. Suppose that LaPearla’s revenues are expected to grow at a rate of 10% and all elementsof the income statement and balance sheet are sales-driven except for the tax burden,which remains at 30%. LaPearla’s pro forma net income for 2006 is closest to:A. h2.2 billion.B. h2.5 billion.C. h2.8 billion.
17. If LaPearla’s long-term debt and paid-in capital accounts remain at their 2005 levels, thetax rate remains at the 2005 rate, and all other income statement and balance sheetaccounts are sales-driven with an expected growth rate of revenues of 10%, in 2006LaPearla will have a financing:A. deficiency if it pays no dividends.B. surplus if it pays out 50% of its net income in dividends.C. deficiency if it pays out 50% of its net income in dividends.
c09 13 January 2012; 17:47:48
Chapter 9 Financial Statement Analysis 405

c09 13 January 2012; 17:47:48

CHAPTER 10MERGERS ANDACQUISITIONS
Rosita P. Chang, CFAHonolulu, Hawaii, U.S.A.
Keith M. Moore, CFAGreenlawn, New York, U.S.A.
LEARNING OUTCOMES
After completing this chapter, you will be able to do the following:
! Classify merger and acquisition (M&A) activities based on forms of integration and typesof mergers.
! Explain common motivations behind M&A activity.! Explain how earnings per share (EPS) bootstrapping works and calculate a company’s post-
merger EPS.! Explain the relationship among merger motivations and types of mergers based on industry
life cycles.! Contrast merger transaction characteristics by form of acquisition, method of payment,
and attitude of target management.! Distinguish among pre-offer and post-offer takeover defense mechanisms.! Calculate the Herfindahl–Hirschman Index (HHI) and evaluate the likelihood of an
antitrust challenge for a given business combination.! Compare the discounted cash flow, comparable company, and comparable transaction
analyses for valuing a target company, including the advantages and disadvantages of each.! Calculate free cash flows for a target company and estimate the company’s intrinsic value
based on discounted cash flow analysis.! Estimate the value of a target company using comparable company and comparable
transaction analyses.! Evaluate a merger bid, calculate the estimated post-merger value of an acquirer, and cal-
culate the gains accrued to the target shareholders versus the acquirer shareholders.
407
c10 13 January 2012; 17:52:36

! Explain the effects of price and payment method on the distribution of risks and benefits ina merger transaction.
! Describe empirical evidence related to the distribution of benefits in a merger.! Distinguish among divestitures, equity carve-outs, spin-offs, split-offs, and liquidation.! Explain major reasons for divestitures.
1. INTRODUCTION
Companies enter into merger and acquisition activities for a variety of reasons. Many com-panies use mergers as a means to achieve growth. Others seek to diversify their businesses.In all cases, it is important for corporate executives and analysts to understand both themotives for mergers and their financial and operational consequences.
Merger and acquisition (M&A) activities involve a variety of complexities and risks. Forthe case described in Example 10-1, corporate managers, investors, regulators, and a bevy ofadvisers—including investment bankers, financial analysts, lawyers, and accountants—eachevaluated the various offers from a variety of perspectives.
EXAMPLE 10-1 Guidant–Boston Scientific Merger
On 15 December 2004, Guidant Corporation (GDT), a manufacturer of heart defi-brillators and other specialized medical equipment, agreed to merge with Johnson &Johnson (JNJ), a large, multinational producer of medical products and equipment.Guidant shareholders were to receive $30.40 in cash and $45.60 in JNJ stock (subjectto conditions) per share of Guidant stock held. Although a merger such as the com-bination between GDT and JNJ normally would take about four months to complete,unanticipated events caused the planned merger transaction to become a yearlong saga.
While the companies worked to obtain the required regulatory clearances, anumber of investigative articles exposing problems with GDT’s defibrillators appearedin the New York Times in the spring of 2005. The company issued notices to physicianswho prescribed the company’s products warning them of potential problems withvarious defibrillator models. During the summer of 2005, GDT removed some defi-brillators from the market as it tried to correct the technical problems. Meanwhile,numerous liability suits were filed against the company, and GDT subsequently lost asignificant portion of its sales. Because of these negative developments, JNJ sought torenegotiate the terms of the transaction claiming that the “material adverse change”clause in the merger agreement had been violated.1
GDT held that the loss of business did not violate the “material adverse change”clause. After initially filing a lawsuit in the U.S. District Court in an attempt to forceJNJ to adhere to the original agreement, GDT later decided to enter into negotiations
1Many merger and acquisition agreements include provisions for renegotiation or cancellation followingevents that have a significant negative effect on the company’s value or business operations.
c10 13 January 2012; 17:52:36
408 Corporate Finance

This chapter will discuss many of the issues brought forth in Example 10-1, such as theforms of payment in a merger, legal and contractual issues, and the necessity for regulatoryapproval. More important, this chapter aims to equip you with the basic tools for analyzingM&A deals and the companies behind them. In subsequent sections, we will discuss themotives behind business combinations, various transaction characteristics of M&A deals,the regulations governing M&A activity, and how to evaluate a target company and a pro-posed merger. Section 2 discusses the basic types of mergers. Section 3 examines the commonmotives that drive merger activities. In Section 4, we consider various transaction char-acteristics and their impact on different facets of M&A deals. Section 5 focuses on takeoversand the common defenses used to defeat unwelcome takeover attempts. In Section 6, we
with JNJ to see if the two companies could agree on an acceptable modified agreement.In November 2005, the two companies agreed to modify the consideration that JNJwould pay GDT shareholders. In the new agreement, GDT shareholders were toreceive $33.25 in cash and 0.493 shares of JNJ stock for each share of GDT held. WithJNJ stock trading at a price of about $62.00 in November 2005, the total value of thedeal to GDT shareholders was about $63.82 per share of GDT held, which was asignificantly lower merger price than in the original agreement.
Shortly after the modified merger agreement was announced, the chairman ofanother medical device manufacturer, Boston Scientific Corporation (BSX), contactedthe chairman of GDT and indicated an interest in pursuing a business combination asan alternative to the JNJ merger. Because of the existing GDT–JNJ merger agreement,Guidant’s legal advisers reminded the company’s managers that they were preventedfrom entering into any competing merger discussions unless there was a merger pro-posal that could be deemed “superior” to the JNJ offer. As a result, on 5 December2005, BSX communicated an offer to acquire GDT for $36 in cash and $36 in BSXcommon stock (subject to various conditions).
Although JNJ had fought for many months to acquire GDT at a reduced price,within a month, it improved the price it was willing to pay for GDT. A bidding warwas under way. On 11 January 2006, JNJ’s offer was for $37.25 in cash and 0.493shares of JNJ stock—an increase of $4 in cash. The following day, BSX responded byincreasing its offer to a total of $73—$36.50 in cash and $36.50 in stock plus $0.012interest per day for every day after 1 April that the merger was not completed.By offering compensation for any delay past 1 April, BSX sought to reassure anyshareholders who might otherwise decline the offer out of concerns that antitrustobjections might delay completion of the merger.
JNJ responded the next day, on 13 January, by increasing its offer to $40.52 incash and 0.493 shares of JNJ stock. Although some believed that the auction was over,BSX was not done. On 15 January 2006, BSX increased its offer to $42 in cash and $38in BSX stock for a total of $80. The two companies entered into a definitive mergeragreement, the agreement with JNJ was terminated, and the GDT–BSX merger wasultimately completed in April 2006.
Despite all the legal issues and product liability problems, a competitive biddingwar resulted in a more lucrative merger consideration for Guidant shareholders, whoultimately received $4.00 more than the original JNJ merger proposal.
c10 13 January 2012; 17:52:36
Chapter 10 Mergers and Acquisitions 409

outline the various regulations that apply to M&A activity. Section 7 explores methods foranalyzing a target company and provides a framework for analyzing merger bids. In Section 8,we review the empirical evidence related to the distribution of gains in mergers. Section 9provides a brief introduction to corporate restructuring activities, and Section 10 summarizesthe chapter.
2. MERGERS AND ACQUISITIONS: DEFINITIONS ANDCLASSIFICATIONS
Business combinations come in different forms. A distinction can be made between acqui-sitions and mergers. In the context of M&A, an acquisition is the purchase of some portionof one company by another. An acquisition might refer to the purchase of assets from anothercompany, the purchase of a definable segment of another entity, such as a subsidiary, or thepurchase of an entire company, in which case the acquisition would be known as a merger.A merger represents the absorption of one company by another. That is, one of thecompanies remains and the other ceases to exist as a separate entity. Typically, the smaller ofthe two entities is merged into the larger, but that is not always the case.
Mergers can be classified by the form of integration. In a statutory merger, one of thecompanies ceases to exist as an identifiable entity and all its assets and liabilities become part ofthe purchasing company. In a subsidiary merger, the company being purchased becomes asubsidiary of the purchaser, which is often done in cases where the company being purchased hasa strong brand or good image among consumers that the acquiring company wants to retain.A consolidation is similar to a statutory merger except that in a consolidation, both companiesterminate their previous legal existence and become part of a newly formed company. A con-solidation is common in mergers where both companies are approximately the same size.
The parties to a merger are often identified as the target company and the acquiringcompany. The company that is being acquired is the target company, or simply the target.The company acquiring the target is called the acquiring company, or the acquirer. We willuse this terminology throughout the chapter.
In practice, many of the terms used to describe various types of transactions are usedloosely such that the distinctions between them are blurred. For example, the term “con-solidation” is often applied to transactions where the entities are about the same size, even ifthe transaction is technically a statutory merger. Similarly, mergers are often described moregenerally as takeovers, although that term is often reserved to describe hostile transactions,which are attempts to acquire a company against the wishes of its managers and board ofdirectors. A friendly transaction, in contrast, describes a potential business combination thatis endorsed by the managers of both companies, although that is certainly no guaranteethat the merger will ultimately occur.
An additional way that mergers are classified is based on the relatedness of the mergingcompanies’ business activities. Considered this way, there are three basic types of mergers:horizontal, vertical, and conglomerate.
A horizontal merger is one in which the merging companies are in the same kind ofbusiness, usually as competitors. The Vodafone AirTouch acquisition of telecommunicationscompetitor Mannesmann AG in 2000 is one example of a horizontal merger. Anotherexample is the merger of Mobil and Exxon in 1999. One of the great motivators behindhorizontal mergers is the pursuit of economies of scale, which are savings achieved throughthe consolidation of operations and elimination of duplicate resources. Another common
c10 13 January 2012; 17:52:36
410 Corporate Finance

reason for horizontal mergers is to increase market power, because the merger results in areduction of the number of industry competitors and an increase in the size of the acquiringcompany.
In a vertical merger, the acquirer buys another company in the same production chain,for example, a supplier or a distributor. In addition to cost savings, a vertical merger mayprovide greater control over the production process in terms of quality or procurement ofresources or greater control over the distribution of the acquirer’s finished goods. If theacquirer purchases a target that is ahead of it in the value chain (a supplier), it is calledbackward integration. An example of backward integration is if a steel manufacturer pur-chases an iron ore mining company. When an acquirer purchases a company that is furtherdown the value chain (a distributor), it is called forward integration. An example of forwardintegration is Merck & Co.’s 1993 acquisition of Medco Containment Services, a marketer ofdiscount prescription medicines. The merger brought together the production and distri-bution of pharmaceuticals into one integrated company.
When an acquirer purchases another company that is unrelated to its core business, itmay be called a conglomerate merger. General Electric is an example of a conglomerate,having purchased companies in a wide range of industries, including media, finance, homeappliances, aircraft parts, and medical equipment. Conglomerate mergers were particularlypopular from the 1960s through the 1980s. The concept of company-level diversification wascommonly used as a rationale for inter-industry mergers during this period. By investingin companies from a variety of industries, companies hoped to reduce the volatility of theconglomerate’s total cash flows. As we will discuss in the section on merger motivations,company-level diversification is not necessarily in the shareholders’ best interests.
EXAMPLE 10-2 History of U.S. Merger Activity
The history of merger activity in the United States illustrates the various types of M&Acombinations. Merger and acquisition activities have historically been clustered inwaves. The predominant types of mergers and the structures of merger deals have variedwith each wave, typically as a result of differences in the regulatory environment.Similarly, the industries involved tend to vary by wave. Merger activity is apt to beconcentrated in a relatively small number of industries, usually those going throughdramatic changes, such as deregulation or rapid technological advancement.
First Wave (1897–1904)At the close of the 1800s, growth in the railroads linked regional markets and created anenvironment conducive to larger companies that could capitalize on the emergingnational U.S. economy, particularly within the mining and manufacturing industries.A relatively lax regulatory environment contributed to the situation, and manyhorizontal mergers resulted in near monopolistic conditions in several industries.The wave ended in 1904 as a result of a landmark decision by the U.S. Supreme Courtlimiting horizontal mergers among large competitors.
c10 13 January 2012; 17:52:37
Chapter 10 Mergers and Acquisitions 411

2As we will point out later in the section on takeover defenses, in some circumstances a corporate raidercan profit from an unsuccessful takeover attempt. It was common during this merger wave for com-panies to pay raiders a premium in exchange for the raider terminating the attempted takeover, a tacticcommonly referred to as “greenmail.” Indeed, many raiders initiated takeover attempts withoutexpecting to complete the acquisition.
Second Wave (1916–1929)In the 1920s, motor vehicles and radio coupled with improved railroad infrastructurefurther bolstered the U.S. economy. Like the previous wave, the second wave wasaccompanied by a sharp increase in stock prices. This time, however, the regulatoryenvironment was less friendly to horizontal combinations and more sensitive to marketpower. Because market power was already concentrated among a few companies andfurther horizontal integration was difficult, companies sought to integrate backwardinto supply and forward into distribution through vertical mergers. Consequently,business combinations in this wave tended to create oligopolies. This second wave cameto a conclusion with the 1929 stock market crash.
Third Wave (1965–1969)The third wave occurred in a regulatory environment that strongly discouraged anymerger—horizontal or vertical—that would reduce competition within an industry.Companies seeking to expand thus looked outside their own industries and beganforming conglomerates. Many of the conglomerates created during this period subse-quently underperformed the market. The third merger wave ended in 1969 as antitrustenforcement curtailed the rise of conglomerates.
Fourth Wave (1981–1989)The regulatory environment in the 1980s was friendlier to both horizontal and verticalmergers than it had been in the 1960s, but what really fueled business combinationsduring this period was the development of the high-yield bond market, which benefitedas falling interest rates and rising stock prices created an environment conducive to thegreater use of leverage.
Although hostile takeovers were nothing new, increased ability to tap the high-yield bond market put the capacity to finance a takeover in the hands of people andcompanies that otherwise might not have had access to the necessary capital. Thisperiod was marked by the rise of the corporate raider and increasingly sophisticatedtakeover attempts (and defenses). A corporate raider is a person or organizationseeking to profit by acquiring a company and reselling it.2 As the 1980s came to a close,the stock market and economy softened, bringing the fourth wave to its conclusion.
Fifth Wave (1992–2001)Following the 1990–1991 recession, merger activity increased in 1992 and intensifiedthroughout the decade. A strong and long-running bull market created many com-panies with high market valuations, which were then more easily able to use their equityto purchase other companies; thus, stock-swap mergers became more common duringthis wave. Additionally, during the latter half of the 1990s, U.S. regulators were more
c10 13 January 2012; 17:52:37
412 Corporate Finance

3. MOTIVES FOR MERGER
In the previous section, we mentioned some of the basic motives behind mergers, such as thesearch for economies of scale (in a horizontal merger) or cost savings through integration (in avertical merger). In this section, we will expand on this topic and survey some of the reasonscompanies merge—the motives or rationales for a merger.
The topic is important because in assessing a proposed combination, investors and analystsneed to carefully evaluate the rationale behind the merger. Does the stated rationale make sense?Is the merger likely to create value? What is the probability that each of the stated goals for themerger will be attained? Keep in mind that many motives are interrelated and that there aretypically several motives, both acknowledged and tacit, behind any given merger.
3.1. Synergy
Among the most common motivations for a merger is the creation of synergy, in which thewhole of the combined company will be worth more than the sum of its parts. Generallyspeaking, synergies created through a merger will either reduce costs or enhance revenues.Cost synergies are typically achieved through economies of scale in research and development,procurement, manufacturing, sales and marketing, distribution, and administration. Revenuesynergies are created through the cross-selling of products, expanded market share, or higherprices arising from reduced competition. For example, a bank that acquires its competitorscan both increase its market share and realize operating efficiencies by closing duplicatebranches and integrating back-office operations.
3.2. Growth
Corporate managers are under constant pressure to grow their companies’ revenues, and theyoften turn to M&A activity to achieve that growth. Companies can grow either by making
open to industry consolidation as merger waves in Europe and Asia created largerinternational competitors. Deregulation and technological advancement further fueledmerger activity, particularly in banking, health care, defense, and telecommunications.The fifth wave ended with a dramatic decline in transactions in 2001 as the market andthe economy waned following the end of the Internet bubble of the late 1990s.
Sixth Wave (2003–Present)Based on M&A industry statistics, such as M&A deal volume, it appears that we are inthe midst of a sixth wave that began in 2003. After a sharp decline in the number ofM&A deals directly following the conclusion of the fifth wave in 2001, the marketbegan to pick up again in 2003 and strengthened rapidly through 2004. The number oftransactions increased again in 2005 and surpassed the transaction volume records set atthe height of the Internet bubble to reach a new all-time high. As in the fifth wave, therehas been much industry consolidation in the sixth wave, which is producing largercompanies that are better able to compete globally.
c10 13 January 2012; 17:52:37
Chapter 10 Mergers and Acquisitions 413

investments internally (i.e., organic growth) or by buying the necessary resources externally(i.e., external growth). It is typically faster for companies to grow externally. Growth throughM&A activity is common when a company is in a mature industry. For example, the globaloil industry is a mature industry, and BP, Exxon Mobil, and Chevron Corporation haveincreased their reserves and output by acquiring smaller competitors.
External growth can also mitigate risk. It is considered less risky to merge with an existingcompany than to enter an unfamiliar market and establish the resources internally. The pastseveral years of the fifth merger wave in the 1990s were characterized by a surge in cross-border M&A transactions, many of which were motivated by the desire to establish footholdsin international markets.
3.3. Increasing Market Power
In industries where there are few competitors or where market share is sufficiently concen-trated, horizontal integration may be a means by which to increase market power. When acompany increases its market power through horizontal mergers, it may have a greater abilityto influence market prices. Taken to an extreme, horizontal integration results in a monopoly.
Vertical integration may also result in increased market power. Vertical mergers can lockin a company’s sources of critical supplies or create captive markets for its products. Imagine,for example, an industry in which one company supplies raw materials to two separatemanufacturing companies. If one of the manufacturers were to acquire the raw materialsprovider, the acquirer would be in a position to influence industry output and ultimatelyprices. As we will discuss further in the section on antitrust regulation, government regulatorsroutinely block both horizontal and vertical mergers that sufficiently reduce competition in anindustry and concentrate market power in the hands of too few companies.
3.4. Acquiring Unique Capabilities and Resources
Many companies undertake a merger or an acquisition either to pursue competitive advan-tages or to shore up lacking resources. When a company cannot cost-effectively createinternally the capabilities needed to sustain its future success, it may seek to acquire themelsewhere. For example, a company may engage in M&A activity in order to acquire specificcompetencies or resources it lacks, such as a strong research department, nimble sales force,intellectual capital, or creative talent.
3.5. Diversification
Companies sometimes cite diversification as one of the motives behind a merger. Indeed, thiswas an especially popular motive for conglomerates during the third merger wave. The ideabehind company-level diversification is that the company can be treated as a portfolio ofinvestments in other companies. If a conglomerate invests in companies from a varietyof industries, then the variability of the conglomerate’s total cash flows should be reduced, atleast to the extent that the industries are uncorrelated.
Although this may seem like a rational motive, typically, it is not in the best interests ofthe conglomerate’s shareholders. In a well-functioning capital market, investors can diversifytheir own portfolios more easily and at less expense. Additionally, the desire to diversify hasled some companies to lose sight of their major competitive strengths and to expand intobusinesses where they lack comparative advantages.
c10 13 January 2012; 17:52:37
414 Corporate Finance

3.6. Bootstrapping Earnings
Even when there are no reasons to believe that synergies or growth would result from amerger, it is possible to create the illusion of synergies or growth. When a company’s earningsincrease as a consequence of the merger transaction itself (rather than because of resultingeconomic benefits of the combination), it is referred to as the “bootstrap effect” or “boot-strapping earnings.” The bootstrap effect occurs when the shares of the acquirer trade at ahigher price–earnings ratio (P/E) than those of the target and the acquirer’s P/E does notdecline following the merger.
EXAMPLE 10-3 Bootstrapping Earnings
Assume two companies are planning a merger. Company A is the acquirer, Company Tis the target, and Company A* is the post-merger combination of the two companies.The companies’ stock prices and earnings per share are as shown below. Note that theacquirer has a P/E of 25.0 and the target has a P/E of 20.0:
A T A*
Stock price $100.00 $50.00
EPS $4.00 $2.50 $4.20
P/E 25.0 20.0
Total shares outstanding 100,000 50,000 125,000
Total earnings $400,000 $125,000 $525,000
Market value of equity $10,000,000 $2,500,000
Given its stock price, the acquirer can issue 25,000 of its own shares and use theproceeds to buy the target company. This amount is determined by dividing the target’smarket value by the acquirer’s stock price ($2,500,000/$100¼ 25,000). The totalshares outstanding of the merged company will be 125,000—the acquirer’s initial100,000 shares plus the 25,000 shares that the acquirer issued to purchase the target.After the merger, the company’s combined earnings are divided by the number ofshares outstanding to determine the new EPS ($525,000/125,000¼ $4.20), which is$0.20 higher per share than the acquirer would have reported without the merger.
If the acquirer’s pre-merger stock price had been $80 instead of $100, then A’s pre-merger P/E would have been 20.0 ($80/$4.00). Under that scenario, the acquirerwould have issued 31,250 shares to purchase the target. The EPS of the mergedcompany would then have been $525,000/131,250¼ $4.00, thus illustrating that forbootstrapping to work, the acquirer’s P/E must be higher than the target’s P/E.
c10 13 January 2012; 17:52:37
Chapter 10 Mergers and Acquisitions 415

If the market is efficient, the post-merger P/E should adjust to the weighted average ofthe two companies’ contributions to the merged company’s earnings. In the previousexample, the P/E of the merged company would be about 23.8, which implies that theacquirer’s stock price would remain at $100. If, however, the acquiring company’s P/E ishigher than the target’s and management can convince investors to value the merged companyusing the acquirer’s pre-merger P/E, then the stock price of the new company should rise. Ifthe acquirer bootstraps earnings to $4.20 per share as shown in the example above, then theshare price should increase to $105 if investors apply the pre-merger P/E of 25.0 timesearnings ($4.20 3 25.0¼ $105). When there are no expected gains from synergy or otherfactors, such share price increases are not expected.
The market usually recognizes the bootstrapping effect, and post-merger P/Es adjustaccordingly. But there have been periods when bootstrapping seemed to pay off for managers,at least in the short run. During the third merger wave, many conglomerates benefited frombootstrapping as investors grappled with how to value these diversified corporate behemoths.Likewise, during the dot-com bubble of the late 1990s, many high P/E companies boot-strapped their earnings and showed continuous EPS growth through a constant string ofmergers with lower P/E companies.
3.7. Managers’ Personal Incentives
Various managerial-related theories for mergers have been developed over the years based onevidence of agency problems. Managerialism theories posit that because executive com-pensation is highly correlated with company size, corporate executives are motivated to engagein mergers to maximize the size of their companies rather than shareholder value. Additionally,corporate executives may be motivated by self-aggrandizement. For example, being the seniorexecutive of a large company conveys greater power and more prestige.
3.8. Tax Considerations
It is possible for a profitable acquirer to benefit from merging with a target that has accu-mulated a large amount of tax losses. Instead of carrying the tax losses forward, the mergedcompany would use the tax losses to immediately lower its tax liability. In many countries, thetaxing authority disallows an offset in cases where the primary reason for the merger is taxavoidance. Mergers are typically conducted for a variety of reasons, however, and it is difficultfor regulatory authorities to prove that tax considerations are a primary motivator.
3.9. Unlocking Hidden Value
A potential target company may be uncompetitive over a sustained period for a host of reasons,including poor management, lack of resources, high legacy costs, or poor organizational struc-ture. In those instances, when a potential target is underperforming, an acquirer may believe itcan acquire the company cheaply and then unlock hidden value through reorganization, bettermanagement, or synergy. If the target has been underperforming significantly, the acquirer mayeven believe it can obtain the company for less than its breakup value. A company’s breakupvalue is the value that can be achieved if a company’s assets are divided and sold separately.
Sometimes mergers are conducted because the acquirer believes that it is purchasingassets for below their replacement cost. For example, a pharmaceutical company may believeit can acquire another company’s research more cheaply than to undergo a lengthy devel-opment process of its own. Or, an oil company may believe it will be less expensive to acquireanother oil company’s assets than to find and develop additional reserves of its own.
c10 13 January 2012; 17:52:37
416 Corporate Finance

3.10. Cross-Border Motivations
The growth of cross-border deals was high during the 1990s, and foreign M&A became apopular strategic tool for multinational companies seeking to extend their market reach,acquire new manufacturing facilities, develop new sources of raw materials, and tap into thecapital markets. Given the increasing international privatization trends, reduction in cum-bersome industry regulations and bureaucracy, and development of uniform accountingstandards, cross-border mergers and acquisitions will likely intensify in the future. In additionto the various factors that drive domestic mergers, cross-border mergers can provide anefficient way of achieving other international business goals.
3.10.1. Exploiting Market ImperfectionsCross-border transactions can enable companies to more fully exploit market imperfections.For example, to take advantage of differences in the relative cost of labor, a manufacturer maypurchase a company in a country where the relative cost of labor is lower.
3.10.2. Overcoming Adverse Government PolicyCross-border mergers can be a means by which to overcome disadvantageous governmentpolicy, for example, to circumvent protective tariffs, quotas, or other barriers to free trade.
3.10.3. Technology TransferCompanies that possess a new or superior technology may make acquisitions abroad in orderto open new markets or otherwise more fully exploit their business advantage. Conversely, it iscommon for a company to purchase a foreign company that possesses a new or superiortechnology in order to enhance the acquirer’s competitive position both at home and abroad.
3.10.4. Product DifferentiationCompanies often purchase foreign companies to exploit the advantages of having a highlydifferentiated line of products. Similarly, buying certain intangibles, such as a good reputa-tion, helps to ensure success in the global market. Lenovo’s (China) acquisition of IBM’s(United States) personal computer line is one example of this strategy.
3.10.5. Following ClientsCompanies may engage in a cross-border merger to follow and support domestic clients moreeffectively. As an example, many German banks have established cross-border presences toprovide services abroad to their domestic clients.
EXAMPLE 10-4 Mergers and the Industry Life Cycle
The types of mergers (e.g., horizontal, vertical, or conglomerate) occurring in anindustry and the motivations behind those mergers will vary over time as an industryproceeds through its life cycle. The stages in an industry life cycle are normally cate-gorized by their rates of growth in sales; growth stages can vary in length.
c10 13 January 2012; 17:52:38
Chapter 10 Mergers and Acquisitions 417

4. TRANSACTION CHARACTERISTICS
The specifics of M&A transactions can vary along many dimensions, including the form ofacquisition, financing, timing, control and governance, accounting choices, and numerousdetails ranging from the post-merger board composition to the location of the new head-quarters. In this section, we will focus on the form of acquisition, method of payment, and
Mergers and the Industry Life Cycle
Industry LifeCycle Stage Industry Description Motives for Merger
Types ofMergers
Pioneeringdevelopment
Industry exhibits sub-stantial developmentcosts and has low, butslowly increasing, salesgrowth.
Younger, smaller companies may sellthemselves to larger companies in matureor declining industries and look for waysto enter into a new growth industry.Young companies may look to mergewith companies that allow them to poolmanagement and capital resources.
ConglomerateHorizontal
Rapid accel-eratinggrowth
Industry exhibits highprofit margins caused byfew participants in themarket.
Explosive growth in sales may requirelarge capital requirements to expandexisting capacity.
ConglomerateHorizontal
Maturegrowth
Industry experiences adrop in the entry of newcompetitors, but growthpotential remains.
Mergers may be undertaken to achieveeconomies of scale, savings, and opera-tional efficiencies.
HorizontalVertical
Stabilizationand marketmaturity
Industry faces increasingcompetition and capaci-ty constraints.
Mergers may be undertaken to achieveeconomies of scale in research, produc-tion, and marketing to match the lowcost and price performance of othercompanies (domestic and foreign).Large companies may acquire smallercompanies to improve management andprovide a broader financial base.
Horizontal
Decelerationof growthand decline
Industry faces overca-pacity and eroding profitmargins.
Horizontal mergers may be undertakento ensure survival.Vertical mergers may be carried out toincrease efficiency and profit margins.Companies in related industries maymerge to exploit synergy. Companies inthis industry may acquire companies inyoung industries.
HorizontalVerticalConglomerate
Source: Adapted from Weston, Chung, and Hoag (1990, 102), and Solnik and McLeavey (2004, 264–265).
c10 13 January 2012; 17:52:38
418 Corporate Finance

mind-set of target management. These three characteristics play a large role in determininghow the transaction will occur, which regulatory rules might apply, how the transaction willbe valued, and how it will be taxed.
4.1. Form of Acquisition
There are two basic forms of acquisition: An acquirer can purchase the target’s stock or itsassets. The decision will have several consequences, as summarized in Exhibit 10-1.
Stock purchases are the most common form of acquisition. A stock purchase occurswhen the acquirer gives the target company’s shareholders some combination of cash andsecurities in exchange for shares of the target company’s stock. For a stock purchase toproceed, it must be approved by at least 50 percent of the target company’s shareholders andsometimes more depending on the legal jurisdiction. Although it can be difficult and timeconsuming to win shareholder approval, it also stands as an opportunity to circumvent thetarget company’s management in cases where management opposes the merger.
In an asset purchase, the acquirer purchases the target company’s assets and payment ismade directly to the target company. One advantage of this type of transaction is that it canbe conducted more quickly and easily than a stock purchase because shareholder approval isnot normally required unless a substantial proportion of the assets are being sold, usuallymore than 50 percent. Another advantage is that an acquirer can focus on buying the parts ofa company of particular interest, such as a specific division, rather than the entire company.
EXHIBIT 10-1 Major Differences of Stock versus Asset Purchases
Stock Purchase Asset Purchase
Payment Target shareholders receive compen-sation in exchange for their shares.
Payment is made to the selling companyrather than directly to the shareholders.
Approval Shareholder approval required. Shareholder approval might not be required.
Tax:Corporate
No corporate-level taxes. Target company pays taxes on any capitalgains.
Tax:Shareholder
Target company’s shareholders aretaxed on their capital gain.
No direct tax consequence for target com-pany’s shareholders.
Liabilities Acquirer assumes the target’s liabilities. Acquirer generally avoids the assumption ofliabilities.
Some of the more dramatic consequences of the decision to pursue one form ofacquisition versus another concern taxation. In a stock purchase, the target company’sshareholders exchange their shares for compensation and must pay tax on their gains, butthere are no tax consequences at the corporate level.3 For an asset purchase, in contrast, thereare no direct tax consequences for the target company’s shareholders but the target companyitself may be subject to corporate taxes.
3Keep in mind throughout this discussion of taxation that we are speaking in generalities and that thecomplexity of M&A deals, coupled with the complexity and variability of tax laws in different jur-isdictions, can generate a host of exceptions.
c10 13 January 2012; 17:52:38
Chapter 10 Mergers and Acquisitions 419

In addition to shifting the basic tax burden, the form-of-acquisition decision plays a rolein determining how tax rules are applied in accounting for the merger. For example, use of atarget’s accumulated tax losses is allowable in the United States for stock purchases, but notfor asset purchases.
Another key difference between stock and asset purchases relates to the assumption ofliabilities. In stock purchases, the acquiring company assumes the target company’s liabilities.Acquiring companies must thus be on guard to avoid assuming unexpected or undisclosedliabilities. With asset purchases, acquiring companies generally avoid assuming the target’s liabil-ities. However, purchasing substantially all of a company’s assets instead of conducting a stockpurchase so as to specifically avoid assuming liabilities is fraught with legal risk because courts havetended to hold acquirers responsible for the liabilities in these cases.
4.2. Method of Payment
The acquirer can pay for the merger with cash, securities, or some combination of the two inwhat is called a mixed offering. In a cash offering, the cash might come from the acquiringcompany’s existing assets or from a debt issue. In the most general case of a securitiesoffering, the target shareholders receive shares of the acquirer’s common stock as compen-sation.4 Instead of common stock, however, the acquirer might offer other securities, such aspreferred shares or even debt securities.
In a stock offering, the exchange ratio determines the number of shares that stockholdersin the target company receive in exchange for each of their shares in the target company.Because share prices are constantly fluctuating, exchange ratios are typically negotiated inadvance for a range of stock prices. The acquirer’s cost is the product of the exchange ratio,the number of outstanding shares of the target company, and the value of the stock given totarget shareholders. Each shareholder of the target company receives new shares based on thenumber of target shares he or she owns multiplied by the exchange ratio.
4In the case of a consolidation, the target company’s shareholders may receive new shares in the survivingentity.
EXAMPLE 10-5 Stock Offering
Discount Books, a Canadian bookseller, has announced its intended acquisition ofPremier Marketing Corporation, a small marketing company specializing in printmedia. In a press release, Discount Books outlines the terms of the merger, whichspecify that Premier Marketing’s shareholders will each receive 0.90 shares of DiscountBooks for every share of Premier Marketing owned. Premier Marketing has 1 millionshares outstanding. On the day of the merger announcement, Discount Books’ stockclosed at C$20.00 and Premier Marketing’s stock closed at C$15.00. Catherine Willisis an individual investor who owns 500 shares of Premier Marketing, currently worthC$7,500 (500 3 C$15.00).
c10 13 January 2012; 17:52:38
420 Corporate Finance

A variety of factors influence a company’s decision to negotiate for one method ofpayment versus another. As we shall explore in more detail later, the form of payment has animpact on the distribution of risk and reward between acquirer and target shareholders. In astock offering, target company shareholders assume a portion of the reward as well as aportion of the risk related to the estimated synergies and the target company’s value. Con-sequently, when an acquiring company’s management is highly confident both in their abilityto complete the merger and in the value to be created by the merger, they are more inclined tonegotiate for a cash offering rather than a stock offering.
Another factor in the decision relates to the relative valuations of the companies involvedin the transaction. When an acquirer’s shares are considered overvalued by the market relativeto the target company’s shares, stock financing is more appropriate. In effect, the shares aremore valuable as a currency. In fact, investors sometimes interpret an acquirer’s stock offeringas a signal that the company’s shares may be overvalued. This effect is similar to the negativemarket reaction observed in seasoned equity offerings. Indeed, during the stock marketbubble in the late 1990s, stock financing of mergers was quite popular.
Another important consideration when deciding on the payment method is theaccompanying change in capital structure. The costs and benefits of different paymentstructures reflect how the offer will affect the acquirer’s capital structure. For instance, on theone hand, borrowing to raise funds for a cash offering increases the acquirer’s financialleverage and risk. On the other hand, issuing a significant number of new common shares fora stock offering can dilute the ownership interests of existing shareholders.
Preferences in the use of cash versus stock vary over time, but the proportions in 2005 arecharacteristic of the past several years. According to Mergerstat Review 2006, cash paymentaccounted for 54 percent of merger transactions in 2005, pure stock exchanges accounted
1. Based on the current share prices, what is the cost of the acquisition for DiscountBooks?
2. How many shares of Discount Books will Catherine Willis receive, and what is thevalue of those shares (based on current share prices)?
Solution to 1. Because there are 1 million shares of Premier Marketing outstandingand the exchange ratio is 0.90 shares, Discount Books will need to issue 0.90 31 million¼ 900,000 shares of Discount Books stock to complete the transaction.Because the cost per share of Discount Books stock is currently C$20.00, the cost of thetransaction to Discount Books will be C$20.00 3 900,000¼C$18 million.
Solution to 2. Catherine Willis will turn over her 500 shares of Premier Marketingstock. As compensation, she will receive 0.90 3 500¼ 450 shares of stock in DiscountBooks. With each share of Discount Books being worth C$20.00, the value of thoseshares to Catherine is C$9,000.
Note that the value of Willis’s Premier Marketing shares was C$7,500. TheC$1,500 difference in value is a premium paid by Discount Books for control ofPremier Marketing. The pre-merger value of Premier Marketing was C$15 million, butDiscount Books’ total cost to purchase the company was C$18 million. The 20 percentor C$3 million difference is the total-control premium paid by Discount Books.
c10 13 January 2012; 17:52:38
Chapter 10 Mergers and Acquisitions 421

for about 19 percent, and mixed offerings represented 25 percent.5 A very small portion ofdeals, about 2 percent, were completed with other securities, such as debt, options, or warrants.
4.3. Mind-Set of Target Management
Mergers are referred to as either friendly or hostile depending on how the target company’ssenior managers and board of directors view the offer. The distinction is not trivial because anenormous amount of time and resources can be expended by both acquirer and target whenthe takeover is hostile. Whether a merger is friendly or hostile has an impact on how it iscompleted, what regulations must be followed, how long the transaction takes, and possiblyhow much value is created (or destroyed) as a result of the combination.
4.3.1. Friendly MergersUnless there is cause to think the target will be hostile to a merger, the acquirer will generallystart the process by approaching target management directly. The target could approach theacquirer, although this method is much less common. If both management teams are ame-nable to a potential deal, then the two companies enter into merger discussions. The nego-tiations revolve around the consideration to be received by the target company’s shareholdersand the terms of the transaction as well as other aspects, such as the post-merger managementstructure.
Before negotiations can culminate in a formal deal, each of the parties examines theothers’ books and records in a process called due diligence. The purpose of due diligence is toprotect the companies’ respective shareholders by attempting to confirm the accuracy ofrepresentations made during negotiations. For example, an acquirer would want to ensurethat the target’s assets exist and are worth approximately what was claimed by the target.Likewise, a target might want to examine an acquirer’s financial records to gauge the likeli-hood that the acquirer has the capacity to pay for the acquisition as outlined in negotiations.Any deficiencies or problems uncovered during the due diligence process could have animpact on negotiations, resulting in adjustments to the terms or price of the deal. If the issueis large enough, the business combination might be called off entirely.
Once due diligence and negotiations have been completed, the companies enter into adefinitive merger agreement. The definitive merger agreement is a contract written by bothcompanies’ attorneys and is ultimately signed by each party to the transaction. The agreementcontains the details of the transaction, including the terms, warranties, conditions, termina-tion details, and the rights of all parties.
Common industry practice has evolved such that companies typically discuss potentialtransactions in private and maintain secrecy until the definitive merger agreement is reached.This trend may have been influenced by shifts in securities laws toward more stringent rulesrelated to the disclosure of material developments to the public. Additionally, news of amerger can cause dramatic changes in the stock prices of the parties to the transaction.Premature announcement of a deal can cause volatile swings in the stock prices of thecompanies as they proceed through negotiations.
After the definitive merger agreement has been signed, the transaction is generallyannounced to the public through a joint press release by the companies. In a friendly merger,the target company’s management endorses the merger and recommends that its stockholders
5Mergerstat Review 2006. FactSet Mergerstat, LLC (www.mergerstat.com).
c10 13 January 2012; 17:52:39
422 Corporate Finance

approve the transaction. In cases where a shareholder vote is needed, whether it is the targetshareholders approving the stock purchase or the acquirer shareholders approving the issuanceof a significant number of new shares, the material facts are provided to the appropriateshareholders in a public document called a proxy statement, which is given to shareholders inanticipation of their vote.
After all the necessary approvals have been obtained—from shareholders as well as anyother parties, such as regulatory bodies—the attorneys file the required documentation withsecurities regulators and the merger is officially completed. Target shareholders receive theconsideration agreed upon under the terms of the transaction, and the companies are officiallyand legally combined.
4.3.2. Hostile MergersIn a hostile merger, which is a merger that is opposed by the target company’s management,the acquirer may decide to circumvent the target management’s objections by submitting amerger proposal directly to the target company’s board of directors and bypassing the CEO.This tactic is known as a bear hug.
Because bear hugs are not formal offers and have not been mutually agreed upon, there areno standard procedures in these cases. If the offer is high enough towarrant serious consideration,then the board may appoint a special committee to negotiate a sale of the target.
Although unlikely in practice, it is possible that target management will capitulate after abear hug and enter into negotiations, which may ultimately lead to a friendly merger. Ifthe bear hug is not successful, then the hopeful acquirer will attempt to appeal more directlyto the target company’s shareholders.
One method for taking a merger appeal directly to shareholders is through a tenderoffer, whereby the acquirer invites target shareholders to submit (“tender”) their shares inreturn for the proposed payment.6 It is up to the individual shareholders to physically tendershares to the acquiring company’s agent in order to receive payment. A tender offer can bemade with cash, shares of the acquirer’s own stock, other securities, or some combination ofsecurities and cash. Because a cash tender offer can be completed in less time than a cashmerger, some acquiring companies use this type of transaction to gain control of a targetcompany quickly.
Anothermethod of taking over a target company involves the use of a proxy fight. In aproxyfight, a company or individual seeks to take control of a company through a shareholder vote.Proxy solicitation is approved by regulators and then mailed directly to target company share-holders. The shareholders are asked to vote for the acquirer’s proposed slate of directors. If theacquirer’s slate is elected to the target’s board, then it is able to replace the target company’smanagement. At this point, the transaction may evolve into a friendly merger.
Regardless of how an acquirer seeks to establish control, target managers have a varietyof alternatives available for defending the company against unwanted overtures. In thesecases, the target usually retains the services of law firms and investment bankers to design adefense against the unwanted takeover attempt. As we will discuss in the next section, targetcompany managers may use a variety of legal and financial defensive maneuvers to ward offa takeover attempt.
6Tender offers are often associated with hostile mergers, but they also occur in a friendly context. Tenderoffers are considered hostile only when the offer is opposed by the target company’s management andboard of directors.
c10 13 January 2012; 17:52:39
Chapter 10 Mergers and Acquisitions 423

5. TAKEOVERS
When a target company is faced with a hostile tender offer (takeover) attempt, the targetmanagers and board of directors face a basic choice. They can decide to negotiate and sell thecompany, either to the hostile bidder or a third party, or they can attempt to remain inde-pendent. Aside from the strength of the company’s defenses and target management’s resolveto stay independent, the premium over the market price offered by the acquirer for the targetcompany’s shares is the major driving factor in the decision to support or resist any giventakeover.
If the target management decides to resist the unwanted overture, they have a variety oftakeover defense mechanisms at their disposal. Once the decision has been reached, the targetcompany generally seeks the counsel of investment bankers and lawyers to explore the fairnessof the hostile offer and to advise the board of the alternatives.
A target might use defensive measures to delay, negotiate a better deal for shareholders, orattempt to keep the company independent. Defensive measures can be implemented eitherbefore or after a takeover attempt has begun. Most law firms specializing in takeovers rec-ommend that defenses be set up before a company receives or expects any takeover activity.
5.1. Pre-Offer Takeover Defense Mechanisms
In the United States, most hostile takeover attempts result in litigation. The courts generallybless legal pre-offer defense mechanisms but tend to scrutinize post-offer defenses very closely.The target usually assumes the burden of proof in showing that the recently enacted defensesare not simply intended to perpetuate management’s tenure at the target company. It is forthis reason that most attorneys recommend that target companies put defenses in place priorto any takeover action. Following this policy gives the target more flexibility when defendingagainst a takeover bid.
With different twists in takeover strategy come new innovations and variations intakeover defenses. Given the many possible variations, the following is not an exhaustive listbut an overview of the more well known anti-takeover strategies. The two broad varieties ofpre-offer defenses are rights-based defenses, such as poison pills and poison puts, and a varietyof changes to the corporate charter (e.g., staggered boards of directors and supermajorityprovisions) that are sometimes collectively referred to as shark repellents.
5.1.1. Poison PillsThe poison pill is a legal device that makes it prohibitively costly for an acquirer to takecontrol of a target without the prior approval of the target’s board of directors. Most poisonpills make the target company less attractive by creating rights that allow for the issuance ofshares of the target company’s stock at a substantial discount to market value.
There are two basic types of poison pills: the flip-in pill and the flip-over pill. When thecommon shareholder of the target company has the right to buy its shares at a discount,the pill is known as a flip-in. The pill is triggered when a specific level of ownership isexceeded. Because the acquiring company is generally prohibited from participating in thepurchase through the pill, the acquirer is subject to a significant level of dilution. Most plansgive the target’s board of directors the right to redeem the pill prior to any triggering event.If the takeover becomes friendly, the board generally exercises this waiver.
In the case of a flip-over pill, the target company’s common shareholders receive the rightto purchase shares of the acquiring company at a significant discount from the market price,
c10 13 January 2012; 17:52:39
424 Corporate Finance

which has the effect of causing dilution to all existing acquiring company shareholders. Again,the board of the target generally retains the right to redeem the pill should the transactionbecome friendly.
Another possible aspect of the poison pill is the “dead-hand” provision. This provisionallows the board of the target to redeem or cancel the poison pill only by a vote ofthe continuing directors. Because continuing directors are generally defined as directors whowere on the target company’s board prior to the takeover attempt, this provision has the effectof making it much more difficult to take over a target without prior board approval.
5.1.2. Poison PutsWhereas poison pills grant common shareholders certain rights in a hostile takeover attempt,poison puts give rights to the target company’s bondholders. In the event of a takeover,poison puts allow bondholders to put the bonds to the company. In other words, if theprovision is triggered by a hostile takeover attempt, then bondholders have the right to selltheir bonds back to the target at a redemption price that is pre-specified in the bondindenture, typically at or above par value. The effect of a poison put defense is to require thatan acquirer be prepared to refinance the target’s debt immediately after the takeover. Thisdefense increases the need for cash and raises the cost of the acquisition.
5.1.3. Incorporation in a State with Restrictive Takeover Laws (United States)In the United States, many states have adopted laws that specifically address unfriendlytakeover attempts. These laws are designed to provide target companies with flexibility indealing with unwanted suitors. Some states have designed their laws to give the companymaximum protection and leeway in defending against an offer. As a result, companies thatanticipate the possibility of a hostile takeover attempt may find it attractive to reincorporate ina jurisdiction that has enacted strict anti-takeover laws. Ohio and Pennsylvania are examplesof two U.S. states that have been regarded historically as “target friendly” states; their statelaws tend to give target companies the most power in defending against hostile takeoverattempts.7
5.1.4. Staggered Board of DirectorsInstead of electing the entire board of directors each year at the company’s annual meeting, acompany may arrange to stagger the terms for board members so that only a portion of theboard seats are due for election each year. For example, if the company has a board consistingof nine directors, members could be elected for three-year terms with only three directorscoming up for election each year. The effect of this staggered board is that it would take atleast two years to elect enough directors to take control of the board.
5.1.5. Restricted Voting RightsSome target companies adopt a mechanism that restricts stockholders who have recentlyacquired large blocks of stock from voting their shares. Usually, there is a trigger stockholdinglevel, such as 15 or 20 percent. Shareholders who meet or exceed this trigger point are no
7Delaware has historically been the most popular state for corporations to domicile their legal entities.To protect this status, the state has found it necessary to toughen its laws regarding takeover attempts.In the past, as some states adopted strict takeover laws, some corporations left Delaware and reincor-porated in these “friendly” states. In order to compete, Delaware has changed its own laws to make itmore difficult to take over a Delaware corporation on a hostile basis.
c10 13 January 2012; 17:52:39
Chapter 10 Mergers and Acquisitions 425

longer able to exercise their voting rights without the target company’s board releasing theshareholder from the constraint. The possibility of owning a controlling position in the targetwithout being able to vote the shares serves as a deterrent.
5.1.6. Supermajority Voting ProvisionsMany target companies change their charter and bylaws to provide for a higher percentageapproval by shareholders for mergers than normally is required. A typical provision mightrequire a vote of 80 percent of the outstanding shares of the target company (as opposed to asimple 51 percent majority). This supermajority requirement is triggered by a hostile takeoverattempt and is frequently accompanied by a provision that prevents the hostile acquirer fromvoting its shares. Thus, even if an acquirer is able to accumulate a substantial portion of thetarget’s shares, it may have great difficulty accumulating enough votes to approve a merger.
5.1.7. Fair Price AmendmentsFair price amendments are changes to the corporate charter and bylaws that disallow mergersfor which the offer is below some threshold. For example, a fair price amendment mightrequire an acquirer to pay at least as much as the highest stock price at which the target hastraded in the public market over a specified period. Fair price amendments protect targetsagainst temporary declines in their share prices by setting a floor value bid. Additionally, fairprice amendments protect against two-tiered tender offers where the acquirer offers a higherbid in a first step tender offer with the threat of a lower bid in a second step tender offer forthose who do not tender right away.
5.1.8. Golden ParachutesGolden parachutes are compensation agreements between the target company and its seniormanagers. These employment contracts allow the executives to receive lucrative payouts,usually several years worth of salary, if they leave the target company following a change incorporate control. In practice, golden parachutes do not offer much deterrent, especially forlarge deals where the managers’ compensation is small relative to the overall takeover price.One reason they persist is that they help alleviate target management’s concerns about jobloss. Golden parachutes may encourage key executives to stay with the target as the takeoverprogresses and the target explores all options to generate shareholder value. Without a goldenparachute, some contend that target company executives might be quicker to seek employ-ment offers from other companies to secure their financial future. Whether this is actually thecase and whether golden parachutes are fair and in the best interest of shareholders isthe subject of considerable debate among shareholder rights activists and senior managers.
5.2. Post-Offer Takeover Defense Mechanisms
A target also has several defensive mechanisms that can be used once a takeover has alreadybeen initiated. Because they may not be as successful when used in isolation and becausethey have historically been subject to greater scrutiny by the courts, post-offer defensesare typically used in conjunction with pre-offer defenses.
5.2.1. “Just Say No” DefenseProbably the simplest place for a target company to start when confronted with a hostiletakeover bid is to rely on pre-takeover defenses and to decline the offer. If the acquirerattempts a bear hug or tender offer, then target management typically lobbies the board of
c10 13 January 2012; 17:52:39
426 Corporate Finance

directors and shareholders to decline and build a case for why the offering price is inadequateor why the offer is otherwise not in the shareholders’ best interests. This strategy forcesthe hopeful acquirer to adjust its bid or further reveal its own strategy in order to advancethe takeover attempt.
5.2.2. LitigationA popular technique used by many target companies is to file a lawsuit against the acquiringcompany based on alleged violations of securities or antitrust laws. In the United States, thesesuits may be filed in either state or federal courts. Unless there is a serious antitrust violation,these suits rarely stop a takeover bid. Instead, lawsuits often serve as a delaying tactic to createadditional time for target management to develop other responses to the unwanted offer.Generally, any securities law violations, even if upheld, can be corrected with additionalpublic disclosures. In the United States, most antitrust claims that eventually prevent takeoverattempts are initiated by either antitrust or securities regulators rather than by the targetcompany.
5.2.3. GreenmailThis technique involves an agreement allowing the target to repurchase its own shares backfrom the acquiring company, usually at a premium to the market price. Greenmail is usuallyaccompanied by an agreement that the acquirer will not pursue another hostile takeoverattempt of the target for a set period. In effect, greenmail is the termination of a hostiletakeover through a payoff to the acquirer. The shareholders of the target company do notreceive any compensation for their shares. Greenmail was popular in the United States duringthe 1980s, but its use has been extremely restricted since 1986 when the U.S. InternalRevenue Code was amended to add a 50 percent tax on profits realized by acquirers throughgreenmail.
5.2.4. Share RepurchaseRather than repurchasing only the shares held by the acquiring company, as in greenmail, atarget might use a share repurchase to acquire shares from any shareholder. For example,a target may initiate a cash tender offer for its own outstanding shares. An effective repurchasecan increase the potential cost for an acquirer by either increasing the stock’s price outright orby causing the acquirer to increase its bid to remain competitive with the target company’stender offer for its own shares. Additionally, a share repurchase often has the effect ofincreasing the target company’s use of leverage because borrowing is typically required topurchase the shares. This additional debt makes the target less attractive as a takeovercandidate.
In some cases, a target company buys all of its shares and converts to a privately heldcompany in a transaction called a leveraged buyout. In a leveraged buyout (LBO), themanagement team generally partners with a private equity firm that specializes in buyouts.The new entity borrows a high proportion of the overall purchase price; the financial firmcontributes a certain amount of capital; and the management team provides the managementexpertise to run the business. In exchange for their expertise, management generally receives apayout percentage based on the profitability and success of the company after the LBO iscompleted. This strategy may allow the target to defend against a hostile bid provided that theLBO provides target shareholders with a level of value that exceeds the would-be acquirer’soffer.
c10 13 January 2012; 17:52:39
Chapter 10 Mergers and Acquisitions 427

5.2.5. Leveraged RecapitalizationA technique somewhat related to the leveraged buyout is the leveraged recapitalization. A lev-eraged recapitalization involves the assumption of a large amount of debt that is then used tofinance share repurchases (but in contrast to a leveraged buyout, in a recapitalization, some sharesremain in public hands). The effect is to dramatically change the company’s capital structurewhile attempting to deliver a value to target shareholders in excess of the hostile bid.
5.2.6. “Crown Jewel” DefenseAfter a hostile takeover is announced, a target may decide to sell off a subsidiary or asset to athird party. If the acquisition of this subsidiary or asset was one of the acquirer’s majormotivations for the proposed merger, then this strategy could cause the acquirer to abandonits takeover effort. When a target initiates such a sale after a hostile takeover bid is announced,there is a good chance that the courts will declare this strategy illegal.
5.2.7. “Pac-Man” DefenseThe target can defend itself by making a counteroffer to acquire the hostile bidder. Thistechnique is rarely used because, in most cases, it means that a smaller company (the target) ismaking a bid for a larger entity. Additionally, once a target uses a Pac-Man defense, it forgoesthe ability to use a number of other defensive strategies. For instance, after making acounteroffer, a target cannot very well take the acquirer to court claiming an antitrustviolation.
5.2.8. White Knight DefenseOften the best outcome for target shareholders is for the target company’s board to seek athird party to purchase the company in lieu of the hostile bidder. This third party is called awhite knight because it is coming to the aid of the target. A target usually initiates thistechnique by seeking out another company that has a strategic fit with the target. Based on agood strategic fit, the third party can often justify a higher price for the target than what thehostile bidder is offering.
Once a white knight bid is made public, it may elicit an additional higher bid from thehostile bidder. This can help kick off a competitive bidding situation. In some cases, becauseof the competitive nature of the bidders, the winner’s curse can prevail and the targetcompany shareholders may receive a very good deal. Winner’s curse is the tendency for thewinner in certain competitive bidding situations to overpay, whether because of overesti-mation of intrinsic value, emotion, or information asymmetries.8
5.2.9. White Squire DefenseIn the white squire defense, the target seeks a friendly party to buy a substantial minoritystake in the target—enough to block the hostile takeover without selling the entire company.Although the white squire may pay a significant premium for a substantial number of thetarget’s shares, these shares may be purchased directly from the target company and the targetshareholders may not receive any of the proceeds.9
8The winner’s curse is most likely to occur when the target company has roughly the same value to allbidders but the target’s true value is hard to ascertain. The average bid in such cases may represent thebest estimate of the target’s intrinsic value, and the high (winning), an overestimate of its intrinsic value.9For example, the white squire may purchase shares of convertible preferred stock instead of commonstock.
c10 13 January 2012; 17:52:39
428 Corporate Finance

The use of the white squire defense may carry a high litigation risk depending on thedetails of the transaction and local regulations. Additionally, stock exchange listing require-ments sometimes require that target shareholders vote to approve these types of transactions,and shareholders may not endorse any transaction that does not provide an adequate pre-mium to them directly.
6. REGULATION
Even when a merger has been accepted by the target company’s senior managers, the board ofdirectors, and shareholders, the combination must still be approved by regulatory authorities.Additionally, there are a variety of rules that companies must follow when initiating and
10Shares of participating preferred stock offer the possibility of a higher dividend when the dividend oncommon shares reaches a prespecified threshold.
EXAMPLE 10-6 Engelhard Takeover Defenses
On 14 December 2005, BASF, a worldwide producer of chemicals and high-perfor-mance products, offered to acquire Engelhard Corporation for $37 cash per share.Engelhard, a manufacturer and developer of value-added technologies, determined thatthe $37 offer was inadequate and decided to defend itself against the unwantedtakeover attempt.
Prior to the BASF takeover offer, Engelhard had participating preferred stockpurchase rights in place.10 These rights acted as a poison pill by allowing Engelhard toissue shares at a discount if triggered by a takeover that was unsupported by Engelhard’sboard of directors. Additionally, in advance of the takeover attempt, Engelhard restatedits certificate of incorporation to include a supermajority provision. It stated thatbusiness combinations with a holder of more than 5 percent of Engelhard’s outstandingshares would require an affirmative vote of both the holders of 80 percent of theoutstanding shares and at least 50 percent of the outstanding shares not held by theacquirer unless the board of directors approved the business combination.
After the tender offer was commenced by BASF, Engelhard also pursued arecapitalization plan that involved the repurchase of approximately 20 percent ofEngelhard’s outstanding shares through a tender offer at $45 per share, a price superiorto BASF’s tender offer. Together these pre- and post-offer defenses made it very dif-ficult for BASF to succeed with its $37 cash tender offer.
Although Engelhard did not complete the tender for its own shares, the recapi-talization plan was incentive enough for BASF to increase its offer. Takeover targetsfrequently use their takeover defenses to negotiate a better deal for their shareholders.After much negotiation, BASF increased its tender offer and Engelhard withdrew alltakeover defenses. On 30 May 2006, the companies announced a definitive mergeragreement under which BASF would acquire all outstanding shares of Engelhard for$39 per share in cash.
c10 13 January 2012; 17:52:40
Chapter 10 Mergers and Acquisitions 429

completing the merger transaction itself. This section provides an overview of the key rulesand issues that arise from M&A activity.
The two major bodies of jurisprudence relating to mergers are antitrust law and securitieslaw. Antitrust laws are intended to ensure that markets remain competitive; the securities lawswe will discuss are concerned largely with maintaining both fairness in merger activities andconfidence in the financial markets.
6.1. Antitrust
Most countries have antitrust laws, which prohibit mergers and acquisitions that impedecompetition. Antitrust legislation began in the United States with the Sherman Antitrust Act of1890, which made contracts, combinations, and conspiracies in restraint of trade or attempts tomonopolize an industry illegal. The ShermanAntitrust Act was not effective at deterring antirustactivity partly because the U.S. Department of Justice at the time lacked the resources necessaryto enforce the law rigorously. Within a few years of its passage, the law was challenged in thecourts and rendered unenforceable because of ambiguous aspects of its wording.
To resurrect antitrust law, the U.S. Congress passed the Clayton Antitrust Act in 1914,which clarified and strengthened the Sherman Antitrust Act by detailing the specific businesspractices that the U.S. Congress wished to outlaw. In order to ensure that the law could beeffectively enforced, the legislature also passed the Federal Trade Commission Act of 1914,which established the Federal Trade Commission (FTC) as a regulatory agency to work intandem with the Department of Justice to enforce antitrust law.
During the ensuing years, additional weaknesses and loopholes in antitrust legislationbecame apparent. For instance, the Clayton Act regulated only the acquisition of shares ofstock, not the acquisition of assets. The Celler–Kefauver Act was passed in 1950 to close thisloophole; the law also addressed vertical and conglomerate mergers, whereas previous legis-lation had focused primarily on horizontal combinations.
The last major piece of U.S. antitrust legislation was the Hart–Scott–Rodino AntitrustImprovements Act of 1976, which required that the FTC and Department of Justice have theopportunity to review and approvemergers in advance. A key benefit of theHart–Scott–RodinoAct is that it gives regulators an opportunity to halt a merger prior to its completion rather thanhaving to disassemble a company after a merger is later deemed to be anticompetitive.
Just as U.S. transactions are reviewed by the FTC and the Department of Justice, theEuropean Commission (EC) has the authority to review the antitrust implications of transac-tions among companies that generate significant revenueswithin theEuropeanUnion. Althoughthe European Commission’s member states have jurisdiction on mergers within their respectivenational borders, mergers with significant cross-border effects are subject to EC review. Similarto the requirements in the United States, pre-merger notification is required.
In addition to regulatory watchdogs, such as the FTC and the European Commission,approval may be needed from other regulatory agencies. For example, in the United States, amerger involving banks requires approvals from state banking authorities as well as theFederal Reserve Bank and possibly the Federal Deposit Insurance Corporation (FDIC).Insurance mergers require the approval of state insurance commissioners. In some cases whereone of the company’s businesses is deemed to be of strategic national interest, additionalgovernment approvals may be necessary. Each merger must be analyzed by legal experts todetermine the specific regulatory approvals required to comply with the relevant rules andlaws. This is a very specialized area and can cause significant delays in the closing of sometransactions.
c10 13 January 2012; 17:52:40
430 Corporate Finance

The situation can become further complicated when the merging companies have aglobal presence that falls within multiple jurisdictions of regulatory control. For example, alarge trans-Atlantic merger would require approval of both the United States regulatorybodies and the European Commission. Global companies often face dozens of regulatoryagencies with different standards and filing requirements. For example, Coca-Cola Com-pany’s 1999 acquisition of the Cadbury Schweppes beverage brands involved sales andproduction in more than 160 countries, requiring antitrust approval in more than 40 jur-isdictions around the world.
Prior to 1982, the FTC and Department of Justice used market share as a measure ofmarket power when determining potential antitrust violations among peer competitors in anindustry. Using a simple measure of industry concentration and the market shares of theacquirer and the target, companies contemplating a horizontal merger could determine inadvance whether the combination would likely be challenged. The transparency andpredictability of the measure was advantageous, but the approach proved to be too simplisticand rigid in practice.
In 1982, the agencies shifted toward using a new measure of market power called theHerfindahl–Hirschman Index (HHI). By summing the squares of the market shares for eachcompany in an industry, the HHI does a better job of modeling market concentration whileremaining relatively easy to calculate and interpret. To calculate the HHI, the market sharesfor competing companies are squared and then summed:
HHI ¼Xn
i
Sales or output of firm iTotal sales or output of market
3 100! "2
ð10-1Þ
Regulators initially calculate the HHI based on post-merger market shares. If post-mergermarket shares results in an HHI of less than 1,000, the market is not considered to beconcentrated and a challenge is unlikely unless other anticompetitive issues arise. A moder-ately concentrated HHI measure of between 1,000 and 1,800, or a highly concentratedmeasure of more than 1,800, requires a comparison of post-merger and pre-merger HHI.A merger resulting in an increase of 100 points in a moderately concentrated market or 50points in a highly concentrated market is likely to evoke antitrust concerns; smaller increasesare less likely to pose a problem.11 Exhibit 10-2 summarizes HHI ranges and the corre-sponding probability for regulatory action:
EXHIBIT 10-2 HHI Concentration Level and Possible Government Action
HHI Concentration Level
Post-Merger HHI Concentration Change in HHI Government Action
Less than 1,000 Not concentrated Any amount No action
Between 1,000 and 1,800 Moderately concentrated 100 or more Possible challenge
More than 1,800 Highly concentrated 50 or more Challenge
11See the U.S. Department of Justice and the Federal Trade Commission’s Horizontal MergerGuidelines, issued 2 April 1992 and revised 8 April 1997.
c10 13 January 2012; 17:52:40
Chapter 10 Mergers and Acquisitions 431

EXAMPLE 10-7 Herfindahl–Hirschman Index
Given an industry with 10 competitors and the following market shares, calculate thepre-merger HHI. How would the HHI change if Companies 2 and 3 merged? Howwould it change if Companies 9 and 10 merged instead? Would either set of mergers belikely to evoke an antitrust challenge?
Company 1 2 3 4 5 6 7 8 9 10
Market Share (%) 25 20 10 10 10 5 5 5 5 5
Solution. To calculate the pre-merger HHI, first square the market share for eachcompany. Then add together the squared market shares to obtain an HHI of 1,450,which indicates that this is a moderately concentrated industry. If Companies 2 and 3were to merge, the HHI would jump 400 points to 1,850. The large change in the HHIcombined with the high post-merger HHI value indicates that this merger would likelyevoke antitrust objections. If Companies 9 and 10 were to merge instead of Companies2 and 3, the HHI would climb only 50 points to 1,500. Although the post-merger HHIindicates a moderately concentrated industry, the combination is unlikely to raiseantitrust concerns because the post-merger HHI is only 50 points higher than the pre-merger HHI.
Pre-MergerPost-Merger:
Companies 2 and 3Post-Merger:
Companies 9 and 10
Company
MarketShare(%)
MarketShare
Squared CompanyMarket Share
(%)
MarketShare
Squared Company
MarketShare(%)
MarketShare
Squared
1 25 625 1 25 625 1 25 625
2 20 400 2þ3 30 900 2 20 400
3 10 100 4 10 100 3 10 100
4 10 100 5 10 100 4 10 100
5 10 100 6 5 25 5 10 100
6 5 25 7 5 25 6 5 25
7 5 25 8 5 25 7 5 25
8 5 25 9 5 25 8 5 25
9 5 25 10 5 25 9þ10 10 100
10 5 25
HHI: 1,450 HHI: 1,850 HHI: 1,500
HHI Change: 400 HHI
Change: 50
c10 13 January 2012; 17:52:40
432 Corporate Finance

Although the introduction of the Herfindahl–Hirschman Index was an improvement,regulators still found it to be too mechanical and inflexible. Thus, by 1984, the Departmentof Justice sought to increase the flexibility of its policies through the inclusion of additionalinformation, such as market power measured by the responsiveness of consumers to pricechanges, as well as qualitative information, such as the efficiency of companies in the industry,the financial viability of potential merger candidates, and the ability of U.S. companies tocompete in foreign markets.12
When reviewing quantitative and qualitative data, one should note that merger guide-lines are just that—guidelines. It is possible that under unusual circumstances the governmentmay not challenge one merger that does violate the guidelines and may challenge anothermerger that does not. Each transaction must be analyzed carefully to fully explore all potentialantitrust issues.
When conflicts between companies and regulators arise, it is often because of disagree-ments about how the markets are defined. Regulators must consider the market in terms ofboth geography and product. When considering the industry’s geography, regulators mustdecide whether the relevant competitors are global, national, regional, or local. When con-sidering product offerings, there may be one or multiple relevant product market overlaps.In some cases the overlap may be clear, and in other transactions it may not be obvious.
Parties to the transaction are usually counseled by attorneys who have relevant experiencein the antitrust area. Most companies try to complete their analyses prior to signing a mergeragreement in order to avoid entering into a long period of uncertainty while the governmentdecides whether to challenge the transaction. Not only do delays increase costs, but they mayalso cause the companies to lose other important strategic opportunities.
6.2. Securities Laws
As we discussed in the section covering pre-offer takeover defense mechanisms, in the UnitedStates individual states regulate M&A activities to varying degrees. But companies must alsocomply with federal U.S. securities regulations. In the United States, the cornerstone ofsecurities legislation regulating merger and acquisition activities is the Williams Amendmentto the Securities Exchange Act of 1934 (also known as the Williams Act), which was passed in1968 near the end of the third merger wave.
During the 1960s, tender offers became a popular means to execute hostile takeovers.Acquirers often announced tender offers that expired in short time frames or threatened lowerbids and less desirable terms for those shareholders who waited to tender. In addition togiving shareholders little time to evaluate the fairness of an offer, it gave target managementlittle time to respond. The Williams Act sought to remedy these problems in two keys ways:disclosure requirements and a formal process for tender offers.
Section 13(d) of the Williams Act requires public disclosure whenever a party acquires 5percent or more of a target’s outstanding common stock. As part of this disclosure, thecompany acquiring the stake must provide a variety of details, including self-identification,the purpose of the transaction, and the source of the funds used to finance the stock pur-chases. This disclosure requirement calls target managers’ and shareholders’ attention to largeshare purchases, which keeps acquirers from gaining too large a toehold before the target isaware of the acquirer’s interest.
12Gaughan (2002), 95.
c10 13 January 2012; 17:52:41
Chapter 10 Mergers and Acquisitions 433

Section 14 of the Williams Act creates a tender offer process by setting forth various rulesand restrictions that companies must observe. For example, as part of initiating a tender offer,an acquirer must file a public statement that contains the details of the offer and informationabout the acquirer. Target management must then respond through a formal statementcontaining their opinion and advice to accept or reject the offer; target management canabstain from offering an opinion as long as they provide the reasons for doing so.
Other important provisions of Section 14 are that the tender offer period be at least 20business days, that the acquirer must accept all shares tendered, that all tendered shares mustreceive the same price, and that target shareholders can withdraw tendered shares during theoffer period. These provisions ensure that target shareholders receive equitable treatment andthat they have adequate time to investigate and evaluate a tender offer without the risk ofreceiving a lower price. Section 14 also gives target management the time and opportunity toadequately respond to a hostile tender offer.
7. MERGER ANALYSIS
In this section, we will examine the analysis of merger activity from two perspectives. First, wewill discuss valuation of the target company, something of key importance for analysts onboth sides of the deal as well as for shareholders as they all grapple to determine the fairnessand adequacy of an offer. Then, we will discuss the analysis of the bid. Analysts can estimatethe distribution of benefits in a merger based on expected synergies relative to the premiumpaid for the target in excess of its intrinsic value.
7.1. Target Company Valuation
The three basic valuation techniques that companies and their advisers use to value companiesin an M&A context are discounted cash flow analysis, comparable company analysis, andcomparable transaction analysis. An analyst is likely to use some combination of these primarytechniques, and possibly others, when gauging a company’s fair value.
7.1.1. Discounted Cash Flow AnalysisDiscounted cash flow (DCF) analysis, as it is generally applied in this context, discounts thecompany’s expected future free cash flows to the present in order to derive an estimate for thevalue of the company. Free cash flow (FCF) is the relevant measure in this context because itrepresents the actual cash that would be available to the company’s investors after making allinvestments necessary to maintain the company as an ongoing enterprise.13 Free cash flows arethe internally generated funds that can be distributed to the company’s investors (e.g.,shareholders and bondholders) without impairing the value of the company.
There are several variations to the models an analyst might use to estimate and discountfree cash flows. In the following, we will develop an approximation to free cash flow andillustrate its use in valuation using a two-stage model.14 Estimating a company’s free cash
13Free cash flow as used here is also called free cash flow to the firm, particularly when a distinction isbeing made between free cash flows accruing to all providers of capital and those accruing only toequityholders (free cash flow to equity).14See Pinto, Henry, Robinson, and Stowe (2010) for details of estimating free cash flow (free cash flowto the firm) more precisely.
c10 13 January 2012; 17:52:41
434 Corporate Finance

flows begins with the creation of pro forma financial statements. The first step is to select anappropriate time horizon for the first stage. The first stage should include only those yearsover which the analyst feels capable of generating reasonably accurate estimates of thecompany’s free cash flows. These free cash flow estimates are then discounted to their presentvalue.
To incorporate value deriving from years beyond the first stage, the analyst estimates thevalue of expected second-stage free cash flows as of the end of the first stage. The resultis the so-called terminal value (or continuing value) of the company. The analyst thendiscounts the terminal value back to the present. The sum of the two pieces (the present valueof first-stage expected free cash flows plus the present value of the company’s terminal value) isthe estimated value of the company.
There is no standard approach for creating pro forma financial statements. The art offinancial analysis involves an ability to use the appropriate tools and to exercise good judg-ment in order to produce the best possible estimates for each financial statement item. In theprocess, analysts make adjustments to their prior projections based on proposed synergies andthe announced plans for the merged company. For example, duplicated resources might resultin the sale of one of the target’s divisions. Or, the operating costs might be adjusteddownward in anticipation of economies of scale. These adjustments are easier to estimate infriendly mergers where the analyst has access to detailed financial data about the target thanin hostile mergers. But even in a hostile merger scenario, an analyst with experience in theappropriate industry can still make reasonably good estimates.
Once pro forma financial statements have been generated, the analyst can begin theconversion from pro forma net income to pro forma free cash flow for each year of the firststage. To demonstrate this process, we will use the pro forma financial statements and FCFcalculations provided in Exhibit 10-3. The perspective is that of a valuation being done at thebeginning of 2007.
The calculation of FCF involves first making adjustments to net income to convert it tonet operating profit less adjusted taxes (NOPLAT). This adjustment is made so that theresulting estimate of FCF represents the after-tax cash flows available to all providers of capitalto the company. The first step in this process is to add net interest after tax to net income.This step removes the tax shield from interest payments and puts the cash flows on commonfooting with other cash flows that are available to all capital providers of the company.15 Thisis referred to as unlevered net income.16 For the year 2007 in Exhibit 10-3, pro forma netincome for the year is $2.296 million. There is no reported interest income, so net interestexpense is simply $642,000. The company’s estimated tax rate is 35 percent, found bydividing the previous year’s income tax by the company’s earnings before tax.
Step 1 :Unlevered net income ¼Net incomeþNet interest after tax ð10-2Þ
Net interest after tax ¼ ðInterest expense & Interest incomeÞ3 ð1& tax rateÞ
For 2007, Unlevered net income ¼ $2,296þ 642ð1& 0:35Þ ¼ $2,713 ¼ $2:713 million
15The tax deductibility of interest will be accounted for later in the calculation when we discount freecash flows by the weighted average cost of capital (WACC).16It is also possible to calculate unlevered net income as earnings before interest and taxes (EBIT) 3(1–tax rate).
c10 13 January 2012; 17:52:41
Chapter 10 Mergers and Acquisitions 435

EXHIBIT 10-3 Sample Pro Forma Financial Statements and FCF Calculations
Historical Pro Forma
2006 2007 2008 2009 2010 2011
Income Statement (thousands of dollars)
Revenues $14,451 $15,752 $17,327 $19,060 $20,966 $23,063
Cost of goods sold 7,948 8,664 9,530 10,483 11,531 12,685
Gross profit $6,503 $7,088 $7,797 $8,577 $9,435 $10,378
Selling, general, and administrativeexpenses
2,168 2,363 2,599 2,859 3,145 3,459
Depreciation 506 551 606 667 734 807
Earnings before interest and taxes $3,829 $4,174 $4,592 $5,051 $5,556 $6,112
Net interest expense 674 642 616 583 543 495
Earnings before taxes $3,155 $3,532 $3,976 $4,468 $5,013 $5,617
Income tax 1,104 1,236 1,392 1,564 1,755 1,966
Net income $2,051 $2,296 $2,584 $2,904 $3,258 $3,651
Balance Sheet (thousandsof dollars)
Current assets $8,671 $9,451 $10,396 $11,436 $12,580 $13,838
Net property, plant, and equipment 10,116 11,026 12,129 13,342 14,676 16,144
Total assets $18,787 $20,477 $22,525 $24,778 $27,256 $29,982
Current liabilities $3,613 $3,938 $4,332 $4,765 $5,242 $5,766
Deferred income taxes 92 111 132 155 181 209
Long-term debt 7,924 7,548 7,243 6,862 6,394 5,830
Total liabilities $11,629 $11,597 $11,707 $11,782 $11,817 $11,805
Common stock and paid-in capital 1,200 1,200 1,200 1,200 1,200 1,200
Retained earnings 5,958 7,680 9,618 11,796 14,239 16,977
Shareholders’ equity $7,158 $8,880 $10,818 $12,996 $15,439 $18,177
Total liabilities and shareholders’equity
$18,787 $20,477 $22,525 $24,778 $27,256 $29,982
Selected Pro Forma Cash FlowData (thousands of dollars)
Change in net working capital $455 $551 $607 $667 $734
Capital expenditures $1,461 $1,709 $1,880 $2,068 $2,275
c10 13 January 2012; 17:52:41
436 Corporate Finance

To convert unlevered net income to NOPLAT, we must account for differences indepreciation for financial reporting purposes versus depreciation for tax purposes, which hasan impact on cash flows. Companies typically report depreciation for property, plant, andequipment at a faster rate for tax purposes (higher depreciation shields more income fromtaxes) than for financial reporting purposes (lower depreciation results in higher net income).The differences in depreciation result in different taxes. This difference is accounted for as aliability on the balance sheet—deferred income taxes. To account for this impact on cashflow, we add the change in deferred taxes to unlevered net income (an increase in deferredtaxes increases cash flow; a decrease in deferred taxes reduces cash flow).17
Step 2 : NOPLAT ¼Unlevered net incomeþChange in deferred taxes ð10-3Þ
For 2007, NOPLAT ¼ $2,713þ ð111& 92Þ ¼ $2,732 ¼ $2:732 million
Pro Forma
FCF Calculations 2007 2008 2009 2010 2011
Net income $2,296 $2,584 $2,904 $3,258 $3,651
Plus: Net interest after tax 417 400 379 353 322
Unlevered net income $2,713 $2,984 $3,283 $3,611 $3,973
Plus: Change in deferred taxes 19 21 23 26 28
Net op profit less adj. taxes (NOPLAT) $2,732 $3,005 $3,306 $3,637 $4,001
Plus: Depreciation 551 606 667 734 807
Less: Change in net working capital 455 551 607 667 734
Less: Capital expenditures 1,461 1,709 1,880 2,068 2,275
Free cash flow $1,367 $1,351 $1,486 $1,636 $1,799
Valuation Calculations
WACC 9.41%
PV of FCF $5,802
Terminal growth rate 6.0%
Terminal value, 2011 $55,922
Terminal value, 2006 $35,670
Enterprise Value, 2006 $41,471
17Some analysts also estimate and subtract the value of after-tax nonoperating income to obtain anestimate more closely reflecting operating results only. See Copeland, Koller, Murrin (2000), Chapter 9,for more details on NOPLAT.
c10 13 January 2012; 17:52:42
Chapter 10 Mergers and Acquisitions 437

At this point, NOPLAT is adjusted to add back net noncash charges (NCC), whichprominently include depreciation (of tangible assets) and amortization and impairment (ofintangible assets); noncash charges affect net income but do not represent cash expenditures.To estimate free cash flow, we then subtract the value of necessary or otherwise plannedinvestments in working capital and property, plant, and equipment.18 They are recorded asthe change in net working capital and capital expenditures (capex), respectively.
Step 3 : FCF ¼ NOPLAT þ NCC &Change in net working capital &Capex ð10-4Þ
For 2007, FCF ¼ $2,732þ 551& 455& 1,461 ¼ $1,367 ¼ $1:367 million
(The only NCC in this example is depreciation)
Summarizing, FCF is approximated by:
Net income
þ Net interest after tax
Unlevered net income
þ Change in deferred taxes
Net operating profit less adjusted taxes (NOPLAT)
þ Net noncash charges
& Change in net working capital
& Capital expenditures (capex)
Free cash flow (FCF)
Once free cash flow has been estimated for each year in the first stage (2007–2011 inExhibit 10-3), the free cash flows are discounted back to present at the company’s weightedaverage cost of capital (WACC).19 When evaluating the target from a noncontrol perspective,we would use the target’s WACC, which reflects that company’s existing business risk andoperating environment. In anticipation of a merger, however, we would adjust that WACC toreflect any anticipated changes in the target’s risk from such actions as a redeployment ofassets or change in capital structure.
For the company in Exhibit 10-3, we will assume that the appropriate discount rate is 9.41percent. Discounting free cash flow for the years 2007 through 2011 at 9.41 percent results in apresent value of $5.802 million. That is the portion of the company’s current value that canbe attributed to the free cash flows that occur over the first stage. Next, we must determine theportion of the present value attributable to the company’s terminal value, which arises fromthose cash flows occurring from the end of the first stage to perpetuity.
There are two standard methods for calculating a terminal value. The first method makesuse of the constant growth formula. To apply the constant growth formula, an analyst mustselect a terminal growth rate, which is the long-term equilibrium growth rate that thecompany can expect to achieve in perpetuity, accounting for both inflation and real growth.
18Working capital is defined in this use as current assets (excluding cash and equivalents) minus currentliabilities (excluding short-term debt).19For details on the estimation of WACC, see Chapter 3 on Cost of Capital.
c10 13 January 2012; 17:52:42
438 Corporate Finance

The terminal growth rate is often lower than the growth rate applied during the first stagebecause any advantages from synergies, new opportunities, or cost reductions are transitory ascompetitors adjust and the industry evolves over time. The constant growth formula can beapplied whenever the terminal growth rate is less than the WACC.
Terminal valueT ¼ FCFT ð1þ gÞðWACC& gÞ ð10-5Þ
where
FCFT ¼ free cash flow produced during the final year of the first stageg ¼ terminal growth rate
For the company in Exhibit 10-3, we will assume a terminal growth rate of 6.0 percent:
Terminal value2011 ¼$1,799ð1þ 0:06Þð0:0941& 0:06Þ
¼ $55,922 ¼ $55:922 million
A secondmethod for estimating the terminal value involves applying amultiple at which theanalyst expects the average company to sell at the end of the first stage. The analyst might use afree cash flow or other multiple that reflects the expected risk, growth, and economic conditionsin the terminal year. Market multiples are rules of thumb applied by analysts, investmentbankers, and venture capitalists to produce rough estimates of a company’s value.Multiples tendto vary by industry. They can be based on anything applicable to the industry and correlatedwithmarket prices. Some service industries tend to be priced asmultiples of EBITDA (earnings beforeinterest, taxes, depreciation, and amortization). In contrast, retail stores in some industriesmightbe priced based onmultiples applied to floor space. In these cases, the respective multiples can beused directly to produce a terminal value, or they can be incorporated into a pro forma analysis toconvert the multiple into a consistent value for free cash flow.
If the company in Exhibit 10-3 is in an industry where the typical company sells forabout 20 times its free cash flow, then the company’s terminal value estimate would be:
Terminal value2011 ¼ 203 $1,799 ¼ $35,980 ¼ $36:0million
Having established an estimate for the terminal value, the analyst must discount it backfrom the end of the estimate horizon to present. The discount rate used is the same WACCestimate that was previously applied to discount the free cash flows. If we decide that theterminal value found using the constant growth method is more accurate than a marketmultiple, we would discount that value back five years (2011 back to the present):
Terminal value2006 ¼$55,922
ð1þ 0:0941Þ5¼ $35,670 ¼ $35:670 million
Adding the present value of the free cash flows ($5.802 million) to the present value ofthe terminal value ($35.670 million), we can estimate the value of the company to be $41.471million.20 Note that a large proportion of the company’s value is attributable to its terminalvalue (more than 85 percent in our example). The assumed terminal growth rate and WACC
20The estimate differs slightly from the sum due to rounding.
c10 13 January 2012; 17:52:42
Chapter 10 Mergers and Acquisitions 439

estimate can have a dramatic impact on the terminal value calculation: The final estimate ofthe company’s value will only be as accurate as the estimates used in the model.
Advantages of Using Discounted Cash Flow Analysis
! Expected changes in the target company’s cash flows (e.g., from operating synergies andcost structure changes) can be readily modeled.
! An estimate of intrinsic value based on forecast fundamentals is provided by the model.! Changes in assumptions and estimates can be incorporated by customizing and modifying
the model.
Disadvantages of Using Discounted Cash Flow Analysis
! It is difficult to apply when free cash flows do not align with profitability within the firststage. For example, a rapidly expanding company may be profitable but have negative freecash flows because of heavy capital expenditures to the horizon that can be forecast withconfidence. The free cash flow value of the company will then derive from a later andharder to estimate period when free cash flow turns positive.
! Estimating cash flows and earnings far into the future is not an exact science. There is agreat deal of uncertainty in estimates even for the following year, much less in perpetuity.
! Estimates of discount rates can change over time because of capital market developments orchanges that specifically affect the companies in question. These changes can also signifi-cantly affect acquisition estimates.
! Terminal value estimates often subject the acquisition value calculations to a dispropor-tionate degree of estimate error. The estimate of terminal value can differ depending on thespecific technique used. Additionally, the range of estimates can be affected dramatically bysmall changes in the assumed growth and WACC estimates.
7.1.2. Comparable Company AnalysisA second approach that investment bankers use to estimate acquisition values is called“comparable company analysis.” In this approach, the analyst first defines a set of othercompanies that are similar to the target company under review. This set may include com-panies within the target’s primary industry as well as companies in similar industries. Thesample should be formed to include as many companies as possible that have similar size andcapital structure to the target.
Once a set of comparable companies is defined, the next step is to calculate variousrelative value measures based on the current market prices of the comparable companies in thesample. Such valuation is often based on enterprise multiples. A company’s enterprise value isthe market value of its debt and equity minus the value of its cash and investments. Examplesinclude enterprise value to free cash flow, enterprise value to EBITDA, enterprise value toEBIT, and enterprise value to sales. Because the denominator in such ratios is pre-interest,they may be preferred when the companies being compared have differences in leverage. Theequity can also be valued directly using equity multiples, such as price to cash flow per share(P/CF), price to sales per share (P/S), price to earnings per share (P/E), and price to bookvalue per share (P/BV).
The specific ratios that the analyst selects are determined by the industry under observa-tion. Often, in addition to common market multiples, analysts will include industry-specific
c10 13 January 2012; 17:52:42
440 Corporate Finance

multiples. For instance, in the oil and gas industry, in addition to looking at price paid toearnings and cash flow ratios, many analysts evaluate the price paid per barrel of oil or perthousand cubic feet of natural gas reserves.
Analysts typically review the mean, median, and range for whichever metrics are chosen,and then they apply those values to corresponding estimates for the target to develop anestimated company value. This is quite similar to the approach we discussed earlier for usingmultiples to produce a terminal value estimate. In this case, however, we are calculatingvarious relative value metrics rather than using an industry rule of thumb.
Each metric (P/E, P/CF, etc.) is likely to produce a different estimate for the target’svalue. Analysts hope that these values converge because that increases confidence in the overallestimate. To the extent that they diverge, analysts must apply judgment and experience todecide which estimates are producing the most accurate market values.
It should be noted that the value determined up to this point in the process yields anestimate of where the target company should trade as a stock in the marketplace relative to thecompanies in the sample. In order to calculate an acquisition value, the analyst must alsoestimate a takeover premium. The takeover premium is the amount by which the takeoverprice for each share of stock must exceed the current stock price in order to entice share-holders to relinquish control of the company to an acquirer. This premium is usuallyexpressed as a percentage of the stock price and is calculated as:
PRM ¼ ðDP & SPÞSP
ð10-6Þwhere
PRM ¼ takeover premium (as a percentage of stock price)DP ¼ deal price per share of the target companySP ¼ stock price of the target company21
To calculate the relevant takeover premium for a transaction, analysts usually compile alist of the takeover premiums paid for companies similar to the target. Preferably, the cal-culations will be from the recent past because acquisition values and premiums tend to varyover time and economic cycles.
EXAMPLE 10-8 Comparable Company Analysis
Sam Jones, an investment banker, has been retained by the Big Box Company toestimate the price that should be paid to acquire New Life Books, Inc. Jones decidesto use comparable company analysis to find a fair value for New Life, and has gatheredthe following information about three comparable companies:
21The analyst must be careful to note any pre-deal jump in the price that may have occurred because oftakeover speculation in the market. In these cases, the analyst should apply the takeover premium to aselected representative price from before any speculative influences on the stock price.
c10 13 January 2012; 17:52:43
Chapter 10 Mergers and Acquisitions 441
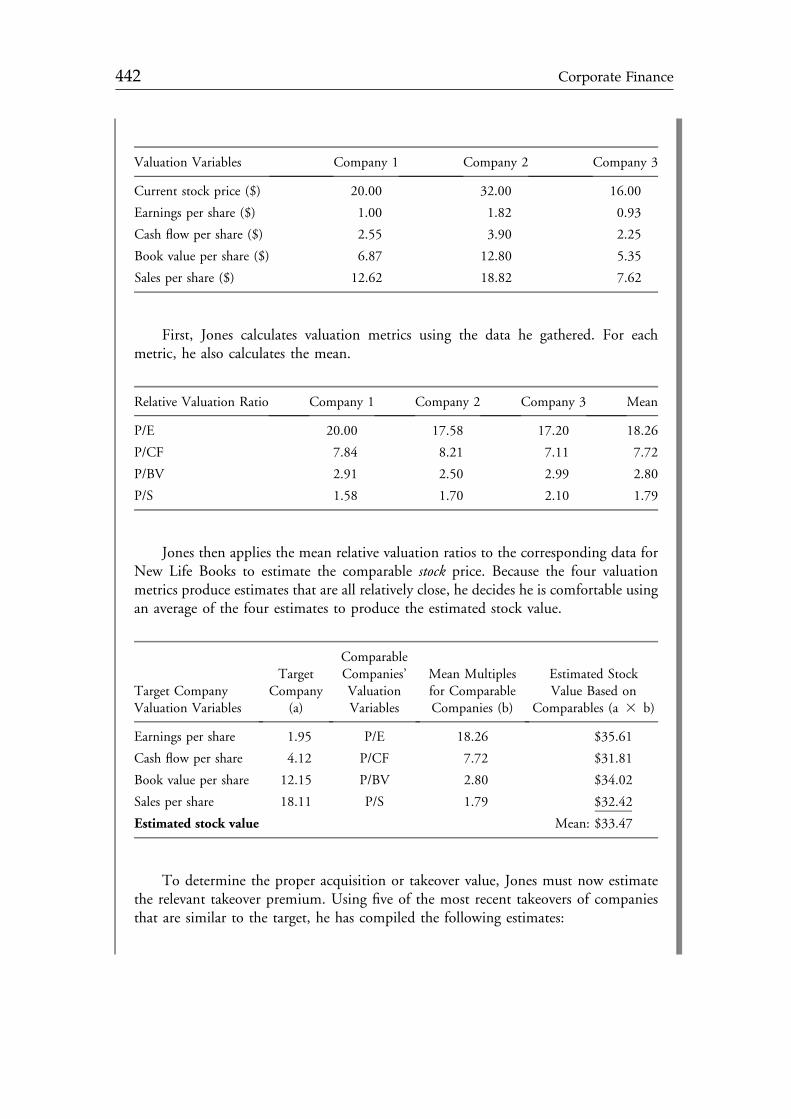
Valuation Variables Company 1 Company 2 Company 3
Current stock price ($) 20.00 32.00 16.00
Earnings per share ($) 1.00 1.82 0.93
Cash flow per share ($) 2.55 3.90 2.25
Book value per share ($) 6.87 12.80 5.35
Sales per share ($) 12.62 18.82 7.62
First, Jones calculates valuation metrics using the data he gathered. For eachmetric, he also calculates the mean.
Relative Valuation Ratio Company 1 Company 2 Company 3 Mean
P/E 20.00 17.58 17.20 18.26
P/CF 7.84 8.21 7.11 7.72
P/BV 2.91 2.50 2.99 2.80
P/S 1.58 1.70 2.10 1.79
Jones then applies the mean relative valuation ratios to the corresponding data forNew Life Books to estimate the comparable stock price. Because the four valuationmetrics produce estimates that are all relatively close, he decides he is comfortable usingan average of the four estimates to produce the estimated stock value.
Target CompanyValuation Variables
TargetCompany
(a)
ComparableCompanies’ValuationVariables
Mean Multiplesfor ComparableCompanies (b)
Estimated StockValue Based on
Comparables (a 3 b)
Earnings per share 1.95 P/E 18.26 $35.61
Cash flow per share 4.12 P/CF 7.72 $31.81
Book value per share 12.15 P/BV 2.80 $34.02
Sales per share 18.11 P/S 1.79 $32.42
Estimated stock value Mean: $33.47
To determine the proper acquisition or takeover value, Jones must now estimatethe relevant takeover premium. Using five of the most recent takeovers of companiesthat are similar to the target, he has compiled the following estimates:
c10 13 January 2012; 17:52:44
442 Corporate Finance

Target Company Stock Price Prior to Takeover Takeover Price Takeover Premium
Target 1 $23.00 $28.50 23.9%
Target 2 $17.25 $22.65 31.3%
Target 3 $86.75 $102.00 17.6%
Target 4 $45.00 $53.75 19.4%
Target 5 $36.75 $45.00 22.4%
Mean premium 22.9%
After examining the data, Jones decides that the mean estimated premium isreasonable. His next step is to apply the takeover premium to his mean estimate of thestock price for New Life Books:
Target’s estimated stock value $33.47
Estimated takeover premium 22.9%
Estimated takeover price of target ($33.47)(1.229)¼ $41.14
From all the calculations and estimates above, Jones concludes that a fair takeoverprice for the Big Box Company to pay for each share of New Life Books would be$41.14.22
Advantages of Using Comparable Company Analysis
! This method provides a reasonable approximation of a target company’s value rel-ative to similar companies in the market. This assumes that “like” assets should bevalued on a similar basis in the market.
! With this method, most of the required data are readily available.! The estimates of value are derived directly from the market. This is unlike the
discounted cash flow method where the takeover value is determined based on manyassumptions and estimates.
Disadvantages of Using Comparable Company Analysis
! The method is sensitive to market mispricing. To illustrate the issue, suppose that thecomparable companies are overvalued. A valuation relative to those companies maysuggest a value that is too high in the sense that values would be revised downwardwhen the market corrects.
22As we shall discuss in the section covering bid evaluation, the analysis in Example 10-8 is not quitecomplete because the acquirer must evaluate the estimated takeover price relative to any expectedsynergies.
c10 13 January 2012; 17:52:44
Chapter 10 Mergers and Acquisitions 443

7.1.3. Comparable Transaction AnalysisA third common approach to value target companies is known as “comparable transactionanalysis.” This approach is closely related to comparable company analysis except that theanalyst uses details from recent takeover transactions for comparable companies to makedirect estimates of the target company’s takeover value.
The first step in comparable transaction analysis is to collect a relevant sample of recenttakeover transactions. The sample should be as broad as possible but limited to companiesin the same industry as the target, or at least closely related. Once the transactions areidentified, the analyst can look at the same types of relative value multiples that were used incomparable company analysis (P/E, P/CF, other industry-specific multiples, etc.). In this case,however, we are not comparing the target against market multiples. For this approach wecompare the multiples actually paid for similar companies in other M&A deals. As before,analysts typically look at descriptive statistics, such as the mean, median, and range forthe multiples, and apply judgment and experience when applying that information toestimate the target’s value.
! Using this approach yields a market-estimated fair stock price for the target company.In order to estimate a fair takeover price, analysts must additionally estimate a fairtakeover premium and use that information to adjust the estimated stock price.
! The analysis may be inaccurate because it is difficult for the analyst to incorporateany specific plans for the target (e.g., changing capital structure or eliminatingduplicate resources) in the analysis.
! The data available for past premiums may not be timely or accurate for the particulartarget company under consideration.
EXAMPLE 10-9 Comparable Transaction Analysis
Joel Hofer, an analyst with an investment banking firm, has been asked to estimate afair price for the General Health Company’s proposed acquisition of Medical Services,Inc. He has already taken the initial step and assembled a sample containing companiesinvolved in acquisitions within the same industry in which Medical Services operates.These companies have all been acquired in the past two years. Details on the acquisitionprices and relevant pricing variables are shown below.
Valuation VariablesAcquired
Company 1Acquired
Company 2Acquired
Company 3
Acquisition share price ($) 35.00 16.50 87.00
Earnings per share ($) 2.12 0.89 4.37
Cash flow per share ($) 3.06 1.98 7.95
Book value per share ($) 9.62 4.90 21.62
Sales per share ($) 15.26 7.61 32.66
c10 13 January 2012; 17:52:44
444 Corporate Finance

The next step in the process is for Hofer to calculate the multiples at which eachcompany was acquired:
Relative ValuationRatio
ComparableCompany 1
ComparableCompany 2
ComparableCompany 3 Mean
P/E 16.5 18.5 19.9 18.3
P/CF 11.4 8.3 10.9 10.2
P/BV 3.6 3.4 4.0 3.7
P/S 2.3 2.2 2.7 2.4
After reviewing the distribution of the various values around their respectivemeans, Hofer is confident about using the mean value for each ratio because the rangein values above and below the mean is reasonably small. Based on his experience withthis particular industry, Hofer believes that cash flows are a particularly importantpredictor of value for these types of companies. Consequently, instead of finding anequally weighted average, Hofer has decided to apply the weights shown below forcalculating a weighted average estimated price.
Target CompanyValuationVariables
TargetCompany
(a)
ComparableCompanies’ValuationMultiples
Mean MultiplePaid for
ComparableCompanies(b)
EstimatedTakeover Value
Based onComparables(c¼ a 3 b)
Weight(d)
WeightedEstimates(e¼ c 3 d)
Earningsper share
$2.62 P/E 18.3 $47.95 20% $9.59
Cash flow pershare
$4.33 P/CF 10.2 $44.17 40% $17.67
Book value pershare
$12.65 P/BV 3.7 $46.81 20% $9.36
Sales per share $22.98 P/S 2.4 $55.15 20% $11.03
Weighted averageestimate
$47.65
In sum, Hofer multiplied each valuation multiple by the corresponding variable forthe target company to produce an estimated takeover value based on each comparable.He then decided to overweight cash flow per share and calculated a weighted average todetermine an overall takeover value estimate of $47.65 per share for Medical Services.The same procedure could be repeated using the median, high, and low valuations foreach of the valuation variables. This would generate a range of takeover values forMedical Services.
c10 13 January 2012; 17:52:45
Chapter 10 Mergers and Acquisitions 445

Advantages of Comparable Transaction Approach
! It is not necessary to separately estimate a takeover premium. The takeover premium isderived directly from the comparable transactions.
! The takeover value estimates come directly from values that were recently established in themarket. This is unlike the discounted cash flow method where the takeover value isdetermined based on many assumptions and estimates.
! The use of prices established through other recent transactions reduces litigation risk forboth companies’ board of directors and managers regarding the merger transaction’spricing.
Disadvantages of Comparable Transaction Approach
! Because the value estimates assume that the M&A market has properly determined theintrinsic value of the target companies, there is a risk that the real takeover values in pasttransactions were not accurate. If true, these inaccurate takeover values are imputed in theestimates based on them.
! There may not be any, or an adequate number of, comparable transactions to use forcalculating the takeover value. In these cases, analysts may try to use data from relatedindustries. These derived values may not be accurate for the specific industry under study.
! The analysis may be inaccurate because it is difficult for the analyst to incorporate anyspecific plans for the target (e.g., changing capital structure or eliminating duplicateresources) in the analysis.
7.2. Bid Evaluation
Assessing the target’s value is important, but it is insufficient for an assessment of the deal.Even if both the acquirer and the target separately agree on the target company’s underlyingvalue, the acquirer will obviously want to pay the lowest price possible while the target willnegotiate for the highest price possible. Both the price and form of payment in a mergerwill determine the distribution of risks and benefits between the counterparties to the deal.
Acquirers must typically pay a premium to induce the owners of the target company torelinquish control. In an M&A transaction, the premium is the portion of the compensationreceived by the target company’s shareholders that is in excess of the pre-merger market valueof their shares. The target company’s managers will attempt to negotiate the highest possiblepremium relative to the value of the target company.23
Target shareholders’ gain ¼ Premium ¼ PT & VT ð10-7Þ
where
PT ¼ price paid for the target companyVT ¼ pre-merger value of the target company
23A burst of speculative stock activity typically accompanies merger negotiations. This activity typicallyresults in a higher share price for the target company in anticipation of a takeover premium. Whenconducting a bid evaluation, the analyst should use some combination of an assessment of the com-pany’s intrinsic value and a representative stock price from before any merger speculation.
c10 13 January 2012; 17:52:45
446 Corporate Finance

The acquirer is willing to pay in excess of the target company’s value in anticipation ofreaping its own gains. The acquirer’s gains are derived from the synergies generated by thetransaction—usually from some combination of cost reductions and revenue enhancements.All else constant, synergies increase the value of the acquiring company by the value of thesynergies minus the premium paid to target shareholders:
Acquirer’s gain ¼ Synergies &Premium ¼ S & ðPT & VT Þ ð10-8Þ
where
S¼ synergies created by the business combination
The post-merger value of the combined company is a function of the pre-merger valuesof the two companies, the synergies created by the merger, and any cash paid to the targetshareholders as part of the transaction:
VA* ¼ VA þ VT þ S & C ð10-9Þ
where
VA* ¼ post-merger value of the combined companiesVA ¼ pre-merger value of the acquirerC ¼ cash paid to target shareholders
When evaluating a bid, the pre-merger value of the target company is the absoluteminimum bid that target shareholders should accept. Individual shareholders could sell theirshares in the open market for that much instead of tendering their shares for a lower bid.At the other extreme, unless there are mitigating circumstances or other economic justifica-tions, the acquirer’s shareholders would not want to pay more than the pre-merger valueof the target company plus the value of any expected synergies. If the acquirer were to paymore than that, then the acquirer’s post-merger value would be lower than its pre-mergervalue—therefore, a reduction in shareholder value.
Bidding should thus generally be confined to a range dictated by the synergies expectedfrom the transaction, with each side of the transaction negotiating to capture as much of thesynergies as possible. Consequently, analysis of a merger depends not only on an assessment ofthe target company’s value but also on estimates of the value of any synergies that the mergedcompany is expected to attain.
Confidence in synergy estimates will have implications not only for the bid price but alsofor the method of payment. The reason for this is that different methods of payment for themerger—cash offer, stock offer, or mixed offer—inherently provide varying degrees of riskshifting with respect to misestimating the value of merger synergies. To see why this is thecase, we will first walk through the evaluation of an offer for each method of payment.
EXAMPLE 10-10 Adagio Software Offer
Adagio Software, Inc., and Tantalus Software Solutions, Inc., are negotiating a friendlyacquisition of Tantalus by Adagio. The management teams at both companies haveinformally agreed upon a transaction value of about h12.00 per share of Tantalus
c10 13 January 2012; 17:52:45
Chapter 10 Mergers and Acquisitions 447

Software Solutions stock but are presently negotiating alternative forms of payment.Sunil Agrawal, CFA, works for Tantalus Software Solutions’ investment banking teamand is evaluating three alternative offers presented by Adagio Software:
1. Cash offer: Adagio will pay h12.00 per share of Tantalus stock.2. Stock offer: Adagio will give Tantalus shareholders 0.80 shares of Adagio stock per
share of Tantalus stock.3. Mixed offer: Adagio will pay h6.00 plus 0.40 shares of Adagio stock per share of
Tantalus stock.
Agrawal estimates that the merger of the two companies will result in economies ofscale with a net present value of h90 million. To aid in the analysis, Agrawal has alsocompiled the following data:
Adagio TantalusPre-merger stock price h15.00 h10.00
Number of shares outstanding (millions) 75 30
Pre-merger market value (millions) h1,125 h300
Based only on the information given, which of the three offers should Agrawalrecommend to the Tantalus Software Solutions management team?
Solution.Alternative 1: Cash offer of h12.00 per share of Tantalus stockA cash offer is themost straightforward and easiest to evaluate. The price paid for the targetcompany, PT, is equal to cash price per share times the number of target shares: h12.00 330 million¼ h360 million. Because Tantalus’ value, VT, is h300 million, the premium isthe difference between the two: h360 million – h300 million¼ h60 million.
Adagio’s gain in this transaction is h30 million, which equals the value of thesynergies minus the premium paid to Tantalus shareholders. A longer way to get to thesame conclusion is to remember that the value of the post-merger combined companyequals the pre-merger values of both companies plus the value of created synergies lessthe cash paid to target shareholders: VA*¼VAþVTþ S&C¼ h1,125þ 300þ 90&360¼ h1,155 million. Adagio’s pre-merger market value was h1,125 million, andAdagio’s gain from the transaction is thus h1,155 – 1,125¼ h30 million. Agrawal candivide the post-merger market value of h1,155 by the number of shares outstanding todetermine Adagio’s post-merger stock price. Under a cash offer, Adagio will not issueadditional shares of stock, so Agrawal divides h1,155 by 75 million shares to see that, allelse constant, Adagio’s stock price after the merger should rise to h15.40.
In an all cash offer, Tantalus shareholders receive h60 million—the premium.Adagio’s gain from the transaction equals the expected synergies (h90 million) less thepremium paid to Tantalus shareholders (h60 million), which equals h30 million.
Alternative 2: Stock offer of 0.80 shares of Adagio stock per share of Tantalus stockA stock offer of 0.80 shares might seem at first glance to be equivalent to a cash offer ofh12.00 because Adagio’s share price is h15.00 (0.80 3 h15¼ h12). The results areactually slightly different, however, because Agrawal must account for the dilution that
c10 13 January 2012; 17:52:46
448 Corporate Finance

In Example 10-10, Adagio’s gain ranged from h30 million in the pure cash offer to h26million in the mixed offer and h23 million in the pure stock offer. If the dilution of a stockoffer reduces the acquirer’s gains from the transaction, why would an acquirer ever pay stockin a merger? The answer brings us back to the beginning of the section where we pointed out
occurs when Adagio issues new shares to Tantalus stockholders. Because there are30 million shares of the target outstanding, Adagio must issue: 30 million 30.80¼ 24 million shares.
To calculate the price paid for Tantalus, Agrawal starts by ascertaining the post-merger value of the combined company. Agrawal uses the same formula as before whileusing a value of zero for C because this is a stock offer and no cash is changing hands:VA*¼VAþVTþ S&C¼ h1,125þ 300þ 90& 0¼ h1,515 million. Next, Agrawaldivides Adagio’s post-merger value by the post-merger number of shares outstanding.Because Adagio issued 24 million shares to complete the transaction, Agrawal adds 24million to the original 75 million shares outstanding and arrive at 99 million. Dividingthe post-merger market value by the post-merger number of shares outstanding,Agrawal determines that the value of each share given to Tantalus shareholders isactually worth h1,515 million/99 million¼ h15.30 and that the total value paid toTantalus shareholders is h15.30 3 24 million¼ h367 million.
The premium is thus h367 – 300¼ h67 million, which is h7 million higher than itwas for the cash offer. Because the target shareholders receive h7 million more than inthe cash offer, the acquirer’s gain is correspondingly less. Because the synergies arevalued at h90 million and the premium is h67 million, the acquirer’s gain under a stocktransaction with these terms is h23 million.
Alternative 3: Mixed offer of h6.00 plus 0.40 shares of Adagio stock per share of TantalusstockA mixed offer will still result in some dilution, although not as much as a pure stockoffer. Agrawal begins by calculating Adagio’s post-merger value. Agrawal inserts h180million for C because the company is paying h6 per share for 30 million shares:VA*¼VAþVTþ S – C¼ h1,125þ 300þ 90& 180¼ h1,335 million.
Next, Agrawal determines that Adagio must issue 12 million shares to complete thetransaction: 0.40 3 30 million¼ 12 million. Combined with the original 75 millionshares outstanding, Adagio’s post-merger number of shares outstanding will be87 million. Agrawal divides h1,335 million by 87 million and find that each share givento the Tantalus shareholders is worth h15.35.
The total value paid to Tantalus shareholders includes a cash component, h6.00 330 million¼ h180 million, and a stock component, 12 million shares issued with a valueof h15.35 each equaling h184 million. Added together, the total valueis h180þ 184¼ h364 million, and the premium is therefore h364 million – 300million¼ h64 million. The acquirer’s gain is $26 million.
Conclusion: Agrawal should recommend that the Tantalus Software Solutions man-agement team opt for the all stock offer because that alternative provides Tantalusshareholders the most value (the highest premium).
c10 13 January 2012; 17:52:46
Chapter 10 Mergers and Acquisitions 449

that the price and form of payment in a merger determine the distribution of risks andbenefits. The choice of payment method is influenced by both parties’ confidence in theestimated synergies and the relative value of the acquirer’s shares.
The more confident the managers are that the estimated synergies will be realized, themore the acquiring managers will prefer to pay with cash and the more the target managerswill prefer to receive stock. And the more the merger is paid for with the acquirer’s stock, themore that the risks and benefits of realizing synergies will be passed on to the target share-holders. For example, in the cash offer we analyzed in Example 10-10, if the synergies laterturned out to be worth h60 million rather than the originally estimated h90 million, then theTantalus shareholders’ premium would be unaffected but Adagio’s gain would completelyevaporate. In contrast, if the synergies were greater than estimated, then Tantalus share-holders’ premium would still be unchanged but Adagio’s gain would increase.
When stock is used as payment, the target shareholders become part owners of theacquiring company. In the Adagio stock offer, Tantalus shareholders would receive 24 millionshares and thus own 24/99 (24.2 percent) of the post-merger acquirer. Thus, Tantalusshareholders would participate by that proportion in any deviation of synergies from pre-merger estimates. If synergies were worth only h60 million, Adagio would lose its h23 milliongain and Tantalus shareholders’ gain from the transaction would fall by h7 million.
The other factor affecting the method of payment decision relates to the counterparties’confidence in the companies relative values. The more confident managers are in estimates ofthe target company’s value, the more the acquirer would prefer cash and the more the targetwould prefer stock. For example, what if Adagio estimates that Tantalus is worth more thanh10 per share and consequently offers h12.50 per share in cash instead of h12.00? In thatcase, Tantalus shareholders would receive a premium that is h15 million higher and Adagio’sgain from the transaction would be reduced by h15 million to h15 million.
8. WHO BENEFITS FROM MERGERS?
What does the empirical evidence say about who actually gains in business combinations?Studies on the performance of mergers fall into two categories: short-term performancestudies, which examine stock returns surrounding merger announcement dates, and long-termperformance studies of post-merger companies. The empirical evidence suggests that mergertransactions create value for target company shareholders in the short run. On average, targetshareholders reap 30 percent premiums over the stock’s pre-announcement market price, andthe acquirer’s stock price falls, on average, between 1 and 3 percent.24 Moreover, on average,both the acquirer and target tend to see higher stock returns surrounding cash acquisitionoffers than around share offers.25
The high average premiums paid to target shareholders may be attributed, at least partly,to the winner’s curse—the tendency for competitive bidding to result in overpayment. Even ifthe average bidding company accurately estimates the target company’s value, some bidderswill overestimate the target’s value and other potential buyers will underestimate its value.Unless the winner can exploit some strong synergies that are not available to other bidders, thewinning bidder is likely to be the one who most overestimates the value.
24See Weston and Weaver (2001), 93–116.25Bruner (2005), 33.
c10 13 January 2012; 17:52:46
450 Corporate Finance

Roll argues that high takeover bids may stem from hubris, from “the overbearing pre-sumption of bidders that their valuations are correct.”26 Implied in this behavior is that theseexecutives are somehow smarter than everyone else and can see value where others cannot.Even if there were no synergies from a merger, managerial hubris would still lead to higher-than-market bids and a transfer of wealth from the acquiring company’s shareholders to thetarget’s shareholders. The empirical evidence is consistent with Roll’s hubris hypothesis.
When examining a longer period, empirical evidence shows that acquirers tend to under-perform comparable companies during the three years following an acquisition. This implies ageneral post-merger operational failure to capture synergies. Average returns to acquiring com-panies subsequent to merger transactions are negative 4.3 percent with about 61 percent ofacquirers lagging their industry peers.27This finding suggests that financial analystswould bewellserved to thoroughly scrutinize estimates of synergy and post-merger value creation.
Analysts must attempt to distinguish those deals that create value and those that do not.Too often, companies with surplus cash but few new investment opportunities are prone tomake acquisitions rather than distribute excess cash to shareholders. When distinguishingvalue-creating deals, analysts must examine the operational strengths possessed by the acquirerand the target to discern the likelihood that post-merger synergies will be achieved.
Based on past empirical results, the following are characteristics of M&A deals that createvalue28:
! The buyer is strong. Acquirers whose earnings and share prices grow at a rate above theindustry average for three years before the acquisition earn statistically significant positivereturns on announcement.
! The transaction premiums are relatively low. Acquirers earn negative returns onannouncement when paying a high premium.
! The number of bidders is low. Acquirer stock returns are negatively related to the numberof bidders.
! The initial market reaction is favorable. Initial market reaction is an importantbarometer for the value investors place on the gains from merging as well as an indicationof future returns. If the acquiring company’s stock price falls when the deal is announced,investors are sending a message that the merger benefits are doubtful or that the acquirer ispaying too much.
9. CORPORATE RESTRUCTURING
Just as mergers and acquisitions are a means by which companies get bigger, a corporaterestructuring is usually used in reference to ways that companies get smaller—by selling,splitting off, or otherwise shedding operating assets. When a company decides to sell, liq-uidate, or spin off a division or a subsidiary, it is referred to as a divestiture.
Given, as we have discussed, that many companies have great difficulty actually achievingthe planned synergies of a business combination, it is not surprising that many companiesseek to undo previous mergers. Indeed, periods of intense merger activity are often followedby periods of heightened restructuring activity. Of course, previous mergers that did not work
26See Roll (1986), 176–216.27Koller, Goedhart, and Wessels (2005), 439, footnotes 3 and 4.28Weston and Weaver (2001), Chapter 5.
c10 13 January 2012; 17:52:46
Chapter 10 Mergers and Acquisitions 451

out as planned are not the only reason companies may choose to divest assets. Some of thecommon reasons for restructuring follow:
! Change in strategic focus. Either through acquisitions or other investments over time,companies often become engaged in multiple markets. Management may hope to improveperformance by eliminating divisions or subsidiaries that are outside the company’s corestrategic focus.
! Poor fit. Sometimes a company will decide that a particular division is a poor fit within theoverall company. For example, the company many not have the expertise or resources to fullyexploit opportunities pursued by the division and may decide to sell the segment to anothercompany that does have the necessary resources. Or, the division might simply not be prof-itable enough to justify continued investment based on the company’s cost of capital.
! Reverse synergy. Managers may feel that a segment of the company is undervalued by themarket, sometimes because of poor performance of the overall company or becausethe division is not a good strategic fit. In these cases, it is possible that the divisionand the company will be worth more separately than combined.
! Financial or cash flow needs. If times are tough, managers may decide to sell off portionsof the company as a means by which to raise cash or cut expenses.
Restructuring can takemany forms, but the three basic ways that a company divests assets area sale to another company, a spin-off to shareholders, or liquidation. As part of a sale to anothercompany, a company might offer to sell the assets of a division or may offer an equity carve-out.An equity carve-out involves the creationof a new legal entity and sales of equity in it to outsiders.
In a spin-off, shareholders of the parent company receive a proportional number ofshares in a new, separate entity. Whereas the sale of a division results in an inflow of cash tothe parent company, a spin-off does not. A spin-off simply results in shareholders owningstock in two different companies where there used to be one. A similar type of transaction iscalled a split-off, where some of the parent company’s shareholders are given shares in anewly created entity in exchange for their shares of the parent company. Liquidation involvesbreaking up a company, division, or subsidiary and selling off its assets piecemeal. For acompany, liquidation is typically associated with bankruptcy.
10. SUMMARY
Mergers and acquisitions are complex transactions. The process often involves not only theacquiring and target companies but also a variety of other stakeholders, including securitiesantitrust regulatory agencies. To fully evaluate a merger, analysts must ask two fundamentalquestions: First, will the transaction create value; and second, does the acquisition priceoutweigh the potential benefit? This chapter has made the following important points.
! An acquisition is the purchase of some portion of one company by another. A mergerrepresents the absorption of one company by another such that only one entity survivesfollowing the transaction.
! Mergers can be categorized by the form of integration. In a statutory merger, one companyis merged into another; in a subsidiary merger, the target becomes a subsidiary of theacquirer; and in a consolidation, both the acquirer and target become part of a newlyformed company.
c10 13 January 2012; 17:52:46
452 Corporate Finance

! Horizontal mergers occur among peer companies engaged in the same kind of business.Vertical mergers occur among companies along a given value chain. Conglomerates areformed by companies in unrelated businesses.
! Merger activity has historically occurred in waves. These waves have typically coincidedwith a strong economy and buoyant stock market activity. Merger activity tends to beconcentrated in a few industries, usually those undergoing changes, such as deregulation ortechnological advancement.
! The motives for M&A activity include synergy, growth, market power, the acquisition ofunique capabilities and resources, diversification, increased earnings, management’s per-sonal incentives, tax considerations, and the possibilities of uncovering hidden value. Cross-border motivations may involve technology transfer, product differentiation, governmentpolicy, and the opportunities to serve existing clients abroad.
! Amerger transactionmay take the form of a stock purchase (when the acquirer gives the targetcompany’s shareholders some combination of cash or securities in exchange for shares of thetarget company’s stock) or an asset purchase (when the acquirer purchases the target company’sassets and payment ismade directly to the target company). The decision of which approach totake will affect other aspects of the transaction, such as how approval is obtained, which lawsapply, how the liabilities are treated, and how the shareholders and the company are taxed.
! The method of payment for a merger can be cash, securities, or a mixed offering with someof both. The exchange ratio in a stock or mixed offering determines the number of sharesthat stockholders in the target company will receive in exchange for each of their shares inthe target company.
! Hostile transactions are those opposed by target managers, whereas friendly transactions areendorsed by the target company’s managers. There are a variety of both pre- and post-offerdefenses a target can use to ward off an unwanted takeover bid.
! Examples of pre-offer defense mechanisms include poison pills and puts, incorporation in ajurisdiction with restrictive takeover laws, staggered boards of directors, restricted votingrights, supermajority voting provisions, fair price amendments, and golden parachutes.
! Examples of post-offer defenses include “just say no” defense, litigation, greenmail, sharerepurchases, leveraged recapitalization, “crown jewel” defense, “Pac-Man” defense, orfinding a white knight or a white squire.
! Antitrust legislation prohibits mergers and acquisitions that impede competition. Major U.S.antitrust legislation includes the Sherman Antitrust Act, the Clayton Act, the Celler–Kefauver Act, and the Hart–Scott–Rodino Act.
! The Federal Trade Commission and Department of Justice review mergers for antitrustconcerns in the United States. The European Commission reviews transactions in theEuropean Union.
! The Herfindahl–Hirschman Index (HHI) is a measure of market power based on the sum ofthe squared market shares for each company in an industry. Higher index values or combi-nations that result in a large jump in the index are more likely to meet regulatory challenges.
! The Williams Act is the cornerstone of securities legislation for M&A activities in theUnited States. The Williams Act ensures a fair tender offer process through the estab-lishment of disclosure requirements and formal tender offer procedures.
! Three major tools for valuing a target company are discounted cash flow analysis (whichinvolves discounting free cash flows estimated with pro forma financial statements),comparable company analysis (which estimates a company’s intrinsic value based on rel-ative valuation metrics for similar companies), and comparable transaction analysis (whichderives valuation from details of recent takeover transactions for comparable companies).
c10 13 January 2012; 17:52:46
Chapter 10 Mergers and Acquisitions 453

! In a merger bid, the gain to target shareholders is measured as the control premium, whichequals the price paid for the target company in excess of its value. The acquirer gains equalthe value of any synergies created by the merger minus the premium paid to targetshareholders. Together, the bid and the method of payment determine the distribution ofrisks and returns among acquirer and target shareholders with regard to realization ofsynergies as well as correct estimation of the target company’s value.
! The empirical evidence suggests that merger transactions create value for target companyshareholders. Acquirers, in contrast, tend to accrue value in the years following a merger.This finding suggests that synergies are often overestimated or difficult to achieve.
! When a company decides to sell, liquidate, or spin off a division or a subsidiary, it isreferred to as a divestiture. Companies may divest assets for a variety of reasons, including achange in strategic focus, poor fit of the asset within the corporation, reverse synergy, orcash flow needs.
! The three basic ways that a company divests assets are a sale to another company, a spin-offto shareholders, and liquidation.
PROBLEMS
The following information relates to Questions 1–6.Modern Auto, an automobile parts supplier, has made an offer to acquire Sky Systems,
creator of software for the airline industry. The offer is to pay Sky Systems’ shareholders thecurrent market value of their stock in Modern Auto’s stock. The relevant information it usedin those calculations is given below:
Modern Auto Sky Systems
Share price $40 $25
Number of outstanding shares (millions) 40 15
Earnings (millions) $100 $30
Although the total earnings of the combined company will not increase and are estimatedto be $130 million, Charles Wilhelm (treasurer of Modern Auto) argues that there are twoattractive reasons to merge. First, Wilhelm says, “The merger of Modern Auto and SkySystems will result in lower risk for our shareholders because of the diversification effect.”Second, Wilhelm also says, “If our EPS increases, our stock price will increase in line with theEPS increase because our P/E will stay the same.”
Sky Systems’ managers are not interested in the offer by Modern Auto. The managers,instead, approach HiFly, Inc., which is in the same industry as Sky Systems, to see if it wouldbe interested in acquiring Sky Systems. HiFly is interested, and both companies believe therewill be synergies from this acquisition. If HiFly were to acquire Sky Systems, it would do soby paying $400 million in cash.
HiFly is somewhat concerned whether antitrust regulators would consider the acquisitionof Sky Systems an antitrust violation. The market in which the two companies operateconsists of eight competitors. The largest company has a 25 percent market share. HiFly hasthe second-largest market share of 20 percent. Five companies, including Sky Systems, eachhave a market share of 10 percent. The smallest company has a 5 percent market share.
c10 13 January 2012; 17:52:46
454 Corporate Finance

1. The acquisition of Sky Systems by Modern Auto and the acquisition of Sky Systems byHiFly, respectively, would be examples of a:A. vertical merger and a horizontal merger.B. conglomerate merger and a vertical merger.C. conglomerate merger and a horizontal merger.
2. If Sky Systems were to be acquired by Modern Auto under the terms of the original offer,the post-merger EPS of the new company would be closest to:A. $2.00.B. $2.32.C. $2.63.
3. Are Wilhelm’s two statements about his shareholders benefiting from the diversificationeffect of the merger and about the increase in the stock price, respectively, correct?
The Merger Will Result inLower Risk for Shareholders
Stock Price Will Increase inLine with the EPS Increase
A. No No
B. No Yes
C. Yes No
4. Which of the following defenses best describes the role of HiFly in the acquisitionscenario?A. Crown jewel.B. Pac-Man.C. White knight.
5. Suppose HiFly acquires Sky Systems for the stated terms. The gain to Sky Systemsshareholders resulting from the merger transaction would be closest to:A. $25 million.B. $160 million.C. $375 million.
6. If HiFly and Sky Systems attempt to merge, the increase in the Herfindahl–HirschmanIndex (HHI) and the probable action by the Department of Justice and the FTC,respectively, in response to the merger announcement are:
Increase in the HHIProbable Response of Departmentof Justice and FTC
A. 290 To challenge the merger
B. 290 To investigate the merger
C. 400 To challenge the merger
c10 13 January 2012; 17:52:47
Chapter 10 Mergers and Acquisitions 455

The following information relates to Questions 7–12.Kinetic Corporation is considering acquiring High Tech Systems. Jim Smith, the vice
president of finance at Kinetic, has been assigned the task of estimating a fair acquisition pricefor High Tech. Smith is aware of several approaches that could be used for this purpose. Heplans to estimate the acquisition price based on each of these approaches, and has collected orestimated the necessary financial data.
High Tech has 10 million shares of common stock outstanding and no debt. Smith hasestimated that the post-merger free cash flows from High Tech, in millions of dollars, wouldbe 15, 17, 20, and 23 at the end of the following four years. After Year 4, he projects the freecash flow to grow at a constant rate of 6.5 percent a year. He determines that the appropriaterate for discounting these estimated cash flows is 11 percent. He also estimates that after fouryears High Tech would be worth 23 times its free cash flow at the end of the fourth year.
Smith has determined that three companies—Alpha, Neutron, and Techno—are com-parable to High Tech. He has also identified three recent takeover transactions—Quadrant,ProTech, and Automator—that are similar to the takeover of High Tech under consideration.He believes that price-to-earnings, price-to-sales, and price-to-book value per share of thesecompanies could be used to estimate the value of High Tech. The relevant data for the threecomparable companies and for High Tech are as follows:
Valuation Variables Alpha Neutron Techno High Tech
Current stock price ($) 44.00 23.00 51.00 31.00
Earnings/share ($) 3.01 1.68 2.52 1.98
Sales/share ($) 20.16 14.22 18.15 17.23
Book value/share ($) 15.16 7.18 11.15 10.02
The relevant data for the three recently acquired companies are given below:
Valuation Variables Quadrant ProTech Automator
Stock price pre-takeover ($) 24.90 43.20 29.00
Acquisition stock price ($) 28.00 52.00 34.50
Earnings/share ($) 1.40 2.10 2.35
Sales/share ($) 10.58 20.41 15.93
Book value/share ($) 8.29 10.14 9.17
While discussing his analysis with a colleague, Smith makes two comments. Smith’s firstcomment is: “If there were a pre-announcement run-up in Quadrant’s price because ofspeculation, the takeover premium should be computed based on the price prior to the run-up.” His second comment is: “Because the comparable transaction approach is based on theacquisition price, the takeover premium is implicitly recognized in this approach.”
c10 13 January 2012; 17:52:47
456 Corporate Finance

7. What is the present value per share of High Tech stock using the discounted cash flowapproach if the terminal value of High Tech is based on using the constant growth modelto determine terminal value?A. $39.38.B. $40.56.C. $41.57.
8. What is the value per share of High Tech stock using the discounted cash flow approachif the terminal value of High Tech is based on using the cash flow multiple method todetermine terminal value?A. $35.22.B. $40.56.C. $41.57.
9. The average stock price of High Tech for the three relative valuation ratios (if it is tradedat the mean of the three valuations) is closest to:A. $35.21.B. $39.38.C. $40.56.
10. Taking into account the mean takeover premium on recent comparable takeovers, whatwould be the estimate of the fair acquisition price of High Tech based on the comparablecompany approach?A. $35.22.B. $40.83.C. $41.29.
11. The fair acquisition price of High Tech using the comparable transaction approach isclosest to:A. $35.22.B. $40.86.C. $41.31.
12. Are Smith’s two comments about his analysis correct?A. Both of his comments are correct.B. Both of his comments are incorrect.C. His first comment is correct, and his second comment is incorrect.
The following information relates to Questions 13–18 and is based on “Corporate Governance”and “Mergers and Acquisitions.”
Mark Zin and Stella Lee are CEO and CFO, respectively, of Moonbase Corporation.They are concerned that Moonbase is undervalued and subject to a hostile takeover bid. Toassess the value of their own firm, they are reviewing current financial data for Jupiter PLC,Saturn Corporation, and Voyager Corporation, three firms they believe are comparable toMoonbase.
c10 13 January 2012; 17:52:47
Chapter 10 Mergers and Acquisitions 457

Relative Valuation Ratio Jupiter Saturn Voyager
P/E 23.00 19.50 21.50
P/B 4.24 5.25 4.91
P/CF 12.60 11.40 13.30
Zin believes Moonbase should trade at similar multiples to these firms and that eachvaluation ratio measure is equally valid. Moonbase has a current stock price of $34.00 pershare, earnings of $1.75 per share, book value of $8.50 per share, and cash flow of $3.20 pershare. Using the average of each of the three multiples for the three comparable firms, Zinfinds that Moonbase is undervalued.
Lee states that the low valuation reflects current poor performance of a subsidiary ofMoonbase. She recommends that the board of directors consider divesting the subsidiary in amanner that would provide cash inflow to Moonbase.
Zin proposes that some action should be taken before a hostile takeover bid is made. Heasks Lee if changes can be made to the corporate governance structure in order to make itmore difficult for an unwanted suitor to succeed.
In response, Lee makes two comments of actions that would make a hostile takeovermore difficult. Lee’s first comment is: “Moonbase can institute a poison pill that allows ourshareholders, other than the hostile bidder, to purchase shares at a substantial discount tocurrent market value.” Lee’s second comment is: “Moonbase can instead institute a poisonput. The put allows shareholders the opportunity to redeem their shares at a substantialpremium to current market value.”
Zin is also concerned about the general attitude of outside investors with the governanceof Moonbase. He has read brokerage reports indicating that the Moonbase governance ratingsare generally low. Zin believes the following statements describe characteristics that shouldprovide Moonbase with a strong governance rating.
Statement 1: Moonbase’s directors obtain advice from the corporate counsel to aidthem in assessing the firm’s compliance with regulatory requirements.
Statement 2: Five of the ten members of the board of directors are not employed byMoonbase and are considered independent. Though not employed bythe company, two of the independent directors are former executives ofthe company and thus can contribute useful expertise relevant for thebusiness.
Statement 3: The audit committee of the board is organized so as to have sufficientresources to carry out its task, with an internal staff that reports routinelyand directly to the audit committee.
Zin is particularly proud of the fact that Moonbase has begun drafting a “Statement ofCorporate Governance” (SCG) that would be available on the company website for viewingby shareholders, investment analysts, and any interested stakeholders. In particular, the SCGpays special attention to policies that ensure effective contributions from the board ofdirectors. These policies include:
c10 13 January 2012; 17:52:47
458 Corporate Finance

Policy #1: Training is provided to directors prior to joining the board and periodicallythereafter.
Policy #2: Statements are provided of management’s assessment of the board’sperformance of its fiduciary responsibilities.
Policy #3: Statements are provided of directors’ responsibilities regarding oversight andmonitoring of the firm’s risk management and compliance functions.
Zin concludes the discussion by announcing that Johann Steris, a highly regarded ex-CFO of a major corporation, is under consideration as a member of an expanded board ofdirectors. Zin states that Steris meets all the requirements as an independent directorincluding the fact that he will not violate the interlocking directorship requirement. Steris alsowill bring experience as a member of the compensation committee of the board of anotherfirm. He also comments that Steris desires to serve on either the audit or compensationcommittee of the Moonbase board and that good governance practice suggests that Steriswould not be prohibited from serving on either committee.
13. The value the CEO estimated based on comparable company analysis is closest to:A. $37.33.B. $39.30.C. $40.80.
14. The divestiture technique that Lee is recommending is most likely:A. a spin-off.B. a split-off.C. an equity carve-out.
15. With regard to poison pills and puts, Lee’s comments are:A. correct.B. incorrect with regard to the poison put.C. incorrect with regard to the poison pill.
16. Which statement by Zin provides the most support for a strong governance rating?A. Statement 1.B. Statement 2.C. Statement 3.
17. Which policy of the Statement of Corporate Governance is least likely to ensure effectivecontributions from the board of directors?A. Policy #1.B. Policy #2.C. Policy #3.
18. Is Zin’s comment that good governance practice does not preclude Steris from serving oneither of the two committees of the Moonbase board correct?A. Yes.B. No, good governance practice precludes Steris from serving on the audit committee.C. No, good governance practice precludes Steris from serving on the compensation
committee.
c10 13 January 2012; 17:52:47
Chapter 10 Mergers and Acquisitions 459
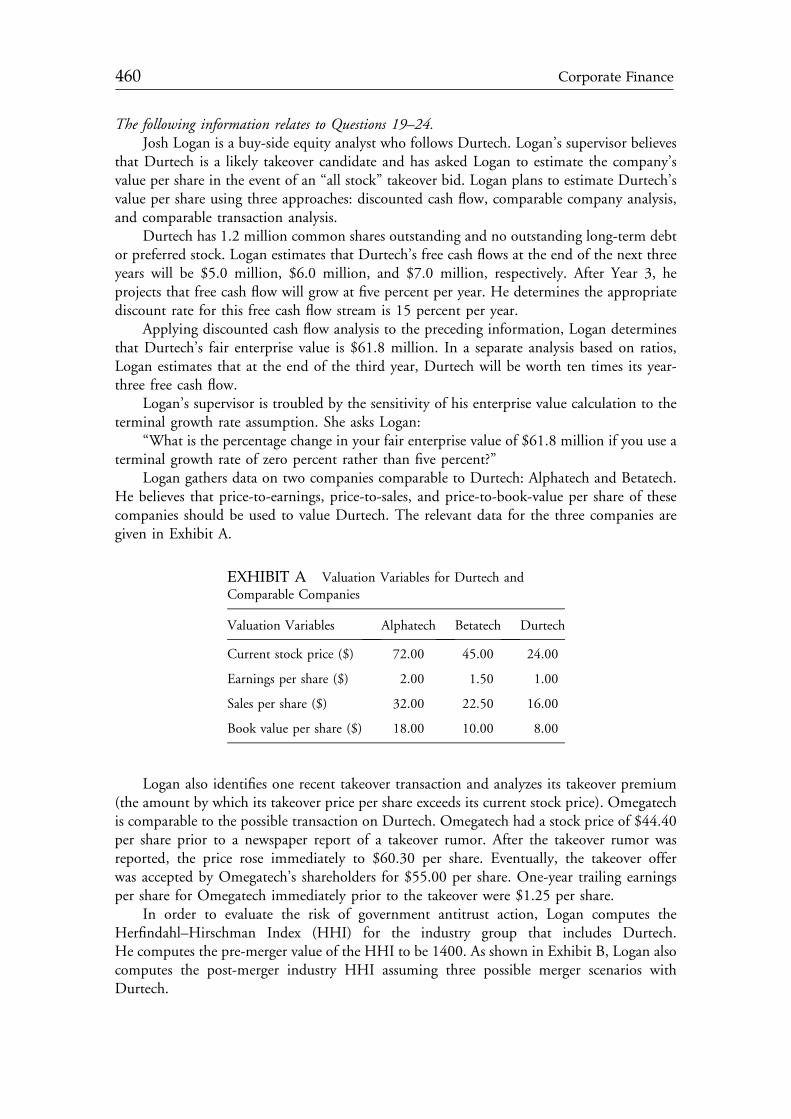
The following information relates to Questions 19–24.Josh Logan is a buy-side equity analyst who follows Durtech. Logan’s supervisor believes
that Durtech is a likely takeover candidate and has asked Logan to estimate the company’svalue per share in the event of an “all stock” takeover bid. Logan plans to estimate Durtech’svalue per share using three approaches: discounted cash flow, comparable company analysis,and comparable transaction analysis.
Durtech has 1.2 million common shares outstanding and no outstanding long-term debtor preferred stock. Logan estimates that Durtech’s free cash flows at the end of the next threeyears will be $5.0 million, $6.0 million, and $7.0 million, respectively. After Year 3, heprojects that free cash flow will grow at five percent per year. He determines the appropriatediscount rate for this free cash flow stream is 15 percent per year.
Applying discounted cash flow analysis to the preceding information, Logan determinesthat Durtech’s fair enterprise value is $61.8 million. In a separate analysis based on ratios,Logan estimates that at the end of the third year, Durtech will be worth ten times its year-three free cash flow.
Logan’s supervisor is troubled by the sensitivity of his enterprise value calculation to theterminal growth rate assumption. She asks Logan:
“What is the percentage change in your fair enterprise value of $61.8 million if you use aterminal growth rate of zero percent rather than five percent?”
Logan gathers data on two companies comparable to Durtech: Alphatech and Betatech.He believes that price-to-earnings, price-to-sales, and price-to-book-value per share of thesecompanies should be used to value Durtech. The relevant data for the three companies aregiven in Exhibit A.
EXHIBIT A Valuation Variables for Durtech andComparable Companies
Valuation Variables Alphatech Betatech Durtech
Current stock price ($) 72.00 45.00 24.00
Earnings per share ($) 2.00 1.50 1.00
Sales per share ($) 32.00 22.50 16.00
Book value per share ($) 18.00 10.00 8.00
Logan also identifies one recent takeover transaction and analyzes its takeover premium(the amount by which its takeover price per share exceeds its current stock price). Omegatechis comparable to the possible transaction on Durtech. Omegatech had a stock price of $44.40per share prior to a newspaper report of a takeover rumor. After the takeover rumor wasreported, the price rose immediately to $60.30 per share. Eventually, the takeover offerwas accepted by Omegatech’s shareholders for $55.00 per share. One-year trailing earningsper share for Omegatech immediately prior to the takeover were $1.25 per share.
In order to evaluate the risk of government antitrust action, Logan computes theHerfindahl–Hirschman Index (HHI) for the industry group that includes Durtech.He computes the pre-merger value of the HHI to be 1400. As shown in Exhibit B, Logan alsocomputes the post-merger industry HHI assuming three possible merger scenarios withDurtech.
c10 13 January 2012; 17:52:48
460 Corporate Finance

EXHIBIT B Post-Merger Industry HHI (assuming mergerwith Durtech)
Durtech Merger Partner Post-Merger Industry HHI
Alphatech 1500
Betatech 1510
Gammatech 1520
Based on this analysis, Logan concludes that the industry is moderately concentrated andthat a merger of Durtech (with any of the companies listed in Exhibit B) will face a possiblegovernment challenge.
19. Using the discounted cash flow approach and assuming that Durtech’s terminal value isbased on the cash flow multiple method, Logan’s best estimate of Durtech’s current valueper share is closest to:A. $49.60.B. $51.50.C. $53.51.
20. Logan’s best response to the supervisor’s question concerning the sensitivity of theenterprise value to the terminal growth rate assumption is closest to:A. –36.5%.B. –28.5%.C. –24.8%.
21. Based on Exhibit A and the mean of each of the valuation ratios, Logan’s estimate ofDurtech’s value per share should be closest to:A. $30.44.B. $33.67.C. $34.67.
22. Based on the premium on a recent comparable transaction, Logan’s best estimate of thetakeover premium for Durtech is closest to:A. 19.9%.B. 23.9%.C. 35.8%.
23. Using comparable transaction analysis, Logan’s estimate of the fair acquisition value pershare for Durtech is closest to:A. $35.52.B. $42.59.C. $44.00.
24. The best justification for Logan’s conclusion concerning possible government antitrustaction is that:A. the post- and pre-merger HHI are both between 1000 and 1800.B. the change in the HHI is 100 or more and the post-merger HHI is between 1000 and
1800.C. the change in the HHI is 100 or more and the pre-merger HHI is between 1000 and
1800.
c10 13 January 2012; 17:52:48
Chapter 10 Mergers and Acquisitions 461

c10 13 January 2012; 17:52:48

GLOSSARY
Abandonment option The ability to terminate a project at some future time if the financial results aredisappointing.
Accounts receivable turnover Ratio of sales on credit to the average balance in accounts receivable.Acid test ratio See Quick ratio.Acquiring company or acquirer The company in a merger or acquisition that is acquiring the target.Acquisition The purchase of some portion of one company by another; the purchase may be for
assets, a definable segment of another entity, or the purchase of an entire company.Active strategy In reference to short-term cash management, an investment strategy characterized by
monitoring and attempting to capitalize on market conditions to optimize the risk and returnrelationship of short-term investments.
Activity ratios Measure how efficiently a company performs day-to-day tasks, such as the collection ofreceivables and management of inventory.
Agency costs Costs associated with the conflict of interest present when a company is managed bynonowners. Agency costs result from the inherent conflicts of interest between managers and equityowners.
Agency costs of equity The smaller the stake that managers have in the company, the less is their sharein bearing the cost of excessive perquisite consumption or not giving their best efforts in runningthe company.
Agency problem A conflict of interest that arises when the agent in an agency relationship has goalsand incentives that differ from the principal to whom the agent owes a fiduciary duty.
Agency relationships An arrangement whereby someone, an agent, acts on behalf of another person,the principal.
Aging schedule A breakdown of accounts into categories of days outstanding.Anticipation stock Excess inventory that is held in anticipation of increased demand, often because of
seasonal patterns of demand.Asset beta The unlevered beta; reflects the business risk of the assets; the asset’s systematic risk.Asset purchase An acquisition in which the acquirer purchases the target company’s assets and
payment is made directly to the target company.Asset-based loan A loan that is secured with company assets.Assignment of accounts receivable The use of accounts receivable as collateral for a loan.Asymmetric information The differential of information between corporate insiders and outsiders
regarding the company’s performance and prospects. Managers typically have more informationabout the company’s performance and prospects than owners and creditors.
Automated Clearing House (ACH) An electronic payment network available to businesses, indivi-duals, and financial institutions in the United States, U.S. Territories, and Canada.
Average day’s payables See Number of days of payables.Average inventory period See Number of days of inventory.Backward integration A merger involving the purchase of a target ahead of the acquirer in the value
or production chain; for example, to acquire a supplier.Basic earnings per share Net income, minus preferred dividends, divided by the weighted average
number of common shares outstanding.
463
bgloss 13 January 2012; 9:18:26

Bear hug A tactic used by acquirers to circumvent target management’s objections to a proposedmerger by submitting the proposal directly to the target company’s board of directors.
Bill-to-bill Credit terms that require that each prior bill must be paid before new shipments are possible.Blanket lien A lien that gives a creditor the right to seize nearly all types of collatoral and assets in the
event of nonpayment by the debtor.Bond equivalent yield A calculation of yield that is annualized using the ratio of 365 to the number
of days to maturity. Bond equivalent yield allows for the restatement and comparison of securitieswith different compounding periods.
Bond yield plus risk premium approach An estimate of the cost of common equity that is producedby summing the before-tax cost of debt and a risk premium that captures the additional yield on acompany’s stock relative to its bonds. The additional yield is often estimated using historicalspreads between bond yields and stock yields.
Bonding costs Costs borne by management to assure owners that they are working in the owners’ bestinterest (e.g., implicit cost of non compete agreements).
Book value equity per share The amount of book value (also called carrying value) of commonequity per share of common stock, calculated by dividing the book value of shareholders’ equity bythe number of shares of common stock outstanding.
Bootstrapping earnings An increase in a company’s earnings that results as a consequence of theidiosyncrasies of a merger transaction itself rather than because of resulting economic benefits ofthe combination.
Break point In the context of the weighted average cost of capital (WACC), a break point is theamount of capital at which the cost of one or more of the sources of capital changes, leading to achange in the WACC.
Breakeven point The number of units produced and sold at which the company’s net income is zero(revenues ¼ total costs).
Breakup value The value that can be achieved if a company’s assets are divided and sold separately.Business risk The risk associated with operating earnings. Operating earnings are uncertain because
total revenues and many of the expenditures contributed to produce those revenues are uncertain.Buyback See Share repurchase.Cannibalization Cannibalization occurs when an investment takes customers and sales away from
another part of the company.Capital rationing A capital rationing environment assumes that the company has a fixed amount of
funds to invest.Capital structure The mix of debt and equity that a company uses to finance its business.Captive finance subsidiary A wholly owned subsidiary of a company that is established to provide
financing of the sales of the parent company.Cash before delivery (CBD) Credit terms that require payment in advance of delivery.Cash flow coverage ratio Measure of solvency that indicates a company’s ability to meet its obli-
gations using operating cash flows.Cash offering A merger or acquisition that is to be paid for with cash; the cash for the merger might
come from the acquiring company’s existing assets or from a debt issue.Cash on delivery (COD) Credit terms that require payment at delivery. If payment is not made,
delivery does not occur.Cash ratio A measure of a company’s ability to meet its current obligations with just the cash and cash
equivalents on hand.Clientele effect The preference some investors have for shares that exhibit certain characteristics.Commitment fee A fee charged by lenders for unused credit in a line of credit or to guarantee a future
loan. Typically it is a fractional percent (e.g., 1/2 percent) of the full amount or the unused amountof the line, depending on bank–company negotiations.
Committed lines of credit A bank commitment to extend credit up to a pre-specified amount; thecommitment is considered a short-term liability and is usually in effect for 364 days (one day shortof a full year).
bgloss 13 January 2012; 9:18:27
464 Glossary

Common-size analysis The restatement of financial statement items using a common denominator orreference item that allows one to identify trends and major differences.
Comparable company A company that has similar business risk, usually in the same industry andpreferably with a single line of business.
Component cost of capital The rate of return required by suppliers of capital for an individual sourceof a company’s funding, such as debt or equity.
Conglomerate merger A merger involving companies that are in unrelated businesses.Consolidation A merger in which both companies terminate their previous legal existence and
become part of a newly formed company.Contribution margin The amount available for fixed costs and profit after paying variable costs;
revenue minus variable costs.Conventional cash flow A conventional cash flow pattern is one with an initial outflow followed by a
series of inflows.Corporate governance The system of principles, policies, procedures, and clearly defined responsi-
bilities and accountabilities used by stakeholders to overcome the conflicts of interest inherent inthe corporate form.
Corporate raider A person or organization seeking to profit by acquiring a company and reselling it,or seeking to profit from the takeover attempt itself (e.g., greenmail).
Corporation A legal entity with rights similar to those of a person. The chief officers, executives, ortop managers act as agents for the firm and are legally entitled to authorize corporate activities andto enter into contracts on behalf of the business.
Cost of capital The rate of return that suppliers of capital require as compensation for their con-tribution of capital.
Cost of debt The cost of debt financing to a company, such as when it issues a bond or takes out abank loan.
Cost of preferred stock The cost to a company of issuing preferred stock; the dividend yield that acompany must commit to pay preferred stockholders.
Cost structure The mix of a company’s variable costs and fixed costs.Country equity premium See Country spread.Country spread, or country equity premium An adjustment to the market risk premium to account
for the additional risk posed to projects conducted in other countries. The country spread is alsoreferred to as a country equity premium.
Credit insurance Used to insure payment of credit extended. Reduces the risk of bad debts and shiftssome of the evaluation of creditworthiness to the insurer.
Credit scoring model A statistical model used to classify borrowers according to creditworthiness.Creditworthiness The perceived ability of the borrower to pay what is owed on the borrowing in a
timely manner; it represents the ability of a company to withstand adverse impacts on its cashflows.
Current assets, or liquid assets Assets that may be converted into cash in a short period of time.Current liabilities Short-term obligations, such as accounts payable, wages payable, or accrued
liabilities.Current ratio The ratio of current assets to current liabilities.Days in receivables See Number of days of receivables.Day’s payables outstanding See Number of days of payables.Day’s sales in ending inventory See Number of days of inventory.Day’s sales outstanding See Number of days of receivables.Dead-hand provision A poison pill provision that allows for the redemption or cancellation of a
poison pill provision only by a vote of continuing directors (generally directors who were on thetarget company’s board prior to the takeover attempt).
Debt incurrence test A financial covenant made in conjunction with existing debt that restricts acompany’s ability to incur additional debt at the same seniority based on one or more financial testsor conditions.
bgloss 13 January 2012; 9:18:27
Glossary 465

Debt-rating approach A method for estimating a company’s before-tax cost of debt based upon theyield on comparably rated bonds for maturities that closely match that of the company’s existingdebt.
Debt ratings An objectivemeasure of the quality and safety of a company’s debt based upon an analysis ofthe company’s ability to pay the promised cash flows, as well as an analysis of any indentures.
Debt-to-assets ratio A measure of the proportion of assets that is financed with debt.Declaration date The day that the corporation issues a statement declaring a specific dividend.Definitive merger agreement A contract signed by both parties to a merger that clarifies the details of
the transaction, including the terms, warranties, conditions, termination details, and the rights ofall parties.
Degree of financial leverage (DFL) The ratio of the percentage change in net income to the per-centage change in operating income; the sensitivity of the cash flows available to owners whenoperating income changes.
Degree of operating leverage (DOL) The ratio of the percentage change in operating income to thepercentage change in units sold; the sensitivity of operating income to changes in units sold.
Degree of total leverage (DTL) The ratio of the percentage change in net income to the percentagechange in units sold; the sensitivity of the cash flows to owners to changes in the number of unitsproduced and sold.
Diluted earnings per share Net income, minus preferred dividends, divided by the number of sharesoutstanding considering all dilutive securities (e.g., convertible debt and options).
Direct debit program An arrangement whereby a customer authorizes a debit to a demand account;typically used by companies to collect routine payments for services.
Disbursement float The amount of time between check issuance and a check’s clearing back againstthe company’s account.
Discount interest The implicit interest provided by discount securities; the difference between thepurchase price and the face value.
Discounted cash flow (DCF) analysis In the context of merger analysis, it is an estimate of a targetcompany’s value found by discounting the company’s expected future free cash flows to the present.
Divestiture The sale, liquidation, or spin-off of a division or subsidiary.Dividend A distribution paid to shareholders based on the number of shares owned.Dividend discount model based approach An approach for estimating a country’s equity risk pre-
mium. The market rate of return is estimated as the sum of the dividend yield and the growth ratein dividends for a market index. Subtracting the risk-free rate of return from the estimated marketreturn produces an estimate for the equity risk premium.
Dividend policy The strategy a company follows with regard to the amount and timing of dividendpayments.
Dividend payout ratio The ratio of cash dividends paid to earnings for a period.Dividend yield Annual dividends per share divided by share price.Dividends per share (DPS) The dollar amount of cash dividends paid during a period per share of
common stock.Double taxation Corporate earnings are taxed twice when paid out as dividends. First, corporate
earnings are taxed regardless of whether they will be distributed as dividends or retained at thecorporate level, and second, dividends are taxed again at the individual shareholder level.
Drag on liquidity When receipts lag, creating pressure from the decreased available funds.Earnings per share (EPS) The amount of income earned during a period per share of common stock.Economic order quantity–reorder point (EOQ–ROP) An approach to managing inventory based
on expected demand and the predictability of demand; the ordering point for new inventory isdetermined based on the costs of ordering and carrying inventory, such that the total cost associatedwith inventory is minimized.
Economies of scale In reference to mergers, this is the savings achieved through the consolidation ofoperations and elimination of duplicate resources.
bgloss 13 January 2012; 9:18:27
466 Glossary

Elasticity A measure of sensitivity; the incremental change in one variable with respect to an incre-mental change in another variable.
Electronic funds transfer (EFT) The use of computer networks to conduct financial transactionselectronically.
Equity carve-out A form of restructuring that involves the creation of a new legal entity and the sale ofequity in it to outsiders.
Equity risk premium (ERP) The expected return on equities minus the risk-free rate; the premiumthat investors demand for investing in equities.
Exchange ratio The number of shares that target stockholders are to receive in exchange for each oftheir shares in the target company.
Ex-dividend Trading ex-dividend refers to shares that no longer carry the right to the next dividendpayment.
Ex-dividend date or ex-date The first date that a share trades without (i.e., “ex”) the dividend.Ex-dividend price The share price at the time the share first trades without the right to receive an
upcoming dividend.External growth Company growth in output or sales that is achieved by buying the necessary
resources externally (i.e., achieved through mergers and acquisitions).Externality The effect of an investment on other things besides the investment itself.Extra or special dividend A dividend paid by a company that does not pay dividends on a regular
schedule, or a dividend that supplements regular cash dividends with an extra payment.Financial analysis The process of selecting, evaluating, and interpreting financial data in order to
formulate an assessment of a company’s present and future financial condition and performance.Financial distress Heightened uncertainty regarding a company’s ability to meet its various obliga-
tions because of lower or negative earnings.Financial risk The risk that environmental, social, or governance risk factors will result in significant
costs or other losses to a company and its shareholders; the risk associated with how a companyfinances its operations (e.g., debt, equity).
Fixed costs Costs that remain at the same level regardless of a company’s level of production and sales.Fixed price tender offer Offer made by a company to repurchase a specific number of shares at a fixed
price that is typically at a premium to the current market price.Fixed rate perpetual preferred stock Nonconvertible, noncallable preferred stock that has a fixed
dividend rate and no maturity date.Flip-in pill A poison pill takeover defense that dilutes an acquirer’s ownership in a target by giving
other existing target company shareholders the right to buy additional target company shares at adiscount.
Flip-over pill A poison pill takeover defense that gives target company shareholders the right topurchase shares of the acquirer at a significant discount to the market price, which as the effect ofcausing dilution to all existing acquiring company shareholders.
Float In the context of customer receipts, the amount of money that is in transit between paymentsmade by customers and the funds that are usable by the company.
Float factor An estimate of the average number of days it takes deposited checks to clear; average dailyfloat divided by average daily deposit.
Flotation cost Fees charged to companies by investment bankers and other costs associated withraising new capital.
Forward integration A merger involving the purchase of a target that is farther along the value orproduction chain; for example, to acquire a distributor.
Free cash flow (FCF) The actual cash that would be available to the company’s investors aftermaking all investments necessary to maintain the company as an ongoing enterprise (also referredto as free cash flow to the firm); the internally generated funds that can be distributed tothe company’s investors (e.g., shareholders and bondholders) without impairing the value of thecompany.
bgloss 13 January 2012; 9:18:27
Glossary 467

Free cash flow hypothesis The hypothesis that higher debt levels discipline managers by forcing themto make fixed debt service payments and by reducing the company’s free cash flow.
Free cash flow to equity (FCFE) The cash flow available to a company’s common shareholders afterall operating expenses, interest, and principal payments have been made, and necessary investmentsin working and fixed capital have been made.
Free cash flow to the firm (FCFF) The cash flow available to the company’s suppliers of capital afterall operating expenses have been paid and necessary investments in working capital and fixed capitalhave been made.
Friendly transaction A potential business combination that is endorsed by the managers of bothcompanies.
Giro system An electronic payment system used widely in Europe and Japan.Greenmail The purchase of the accumulated shares of a hostile investor by a company that is targeted
for takeover by that investor, usually at a substantial premium over market price.Gross profit margin The ratio of gross profit to revenues.Growth option or expansion option The ability to make additional investments in a project at some
future time if the financial results are strong.Herfindahl–Hirschman Index (HHI) A measure of market concentration that is calculated by
summing the squared market shares for competing companies in an industry; high HHI readings ormergers that would result in large HHI increases are more likely to result in regulatory challenges.
Historical equity risk premium approach An estimate of a country’s equity risk premium that is basedupon the historical averages of the risk-free rate and the rate of return on the market portfolio.
Holder-of-record date The date that a shareholder listed on the corporation’s books will be deemedto have ownership of the shares for purposes of receiving an upcoming dividend; two business daysafter the ex-dividend date.
Horizontal common-size analysis A form of common-size analysis in which the accounts in a givenperiod are used as the benchmark or base period, and every account is restated in subsequentperiods as a percentage of the base period’s same account.
Horizontal merger A merger involving companies in the same line of business, usually as competitors.Hostile transaction An attempt to acquire a company against the wishes of the target’s managers.Impairment of capital rule A legal restriction that dividends cannot exceed retained earnings.Implied risk premium approach See Number of days of receivables.Imputation In reference to corporate taxes, a system that imputes, or attributes, taxes at only one level
of taxation. For countries using an imputation tax system, taxes on dividends are effectively leviedonly at the shareholder rate. Taxes are paid at the corporate level but they are attributed to theshareholder. Shareholders deduct from their tax bill their portion of taxes paid by the company.
Incremental cash flow The cash flow that is realized because of a decision; the cash flow with adecision minus the cash flow without that decision.
Indenture A written contract between a lender and borrower that specifies the terms of the loan, suchas interest rate, interest payment schedule, maturity, and so on.
Independent projects Independent projects are projects whose cash flows are independent of eachother.
Interest coverage ratio Measures the number of times a company’s operating earnings can cover itsinterest payments.
Inventory blanket lien The use of inventory as collateral for a loan. Though the lender has claim tosome or all of the company’s inventory, the company may still sell or use the inventory in theordinary course of business.
Inventory holding period See Number of days of inventory.Inventory turnover The ratio of cost of goods sold to inventory.Investment opportunity schedule (IOS) A graphical depiction of a company’s investment oppor-
tunities ordered from highest to lowest expected return. A company’s optimal capital budget isfound where the investment opportunity schedule intersects with the company’s marginal cost ofcapital.
bgloss 13 January 2012; 9:18:28
468 Glossary

Just-in-time (JIT) method Method of managing inventory that minimizes in-process inventorystocks.
Laddering strategy A form of active strategy that entails scheduling maturities on a systematic basiswithin the investment portfolio such that investments are spread out equally over the term of theladder.
Legal risk The risk that failures by company managers to effectively manage a company’s environ-mental, social, and governance risk exposures will lead to lawsuits and other judicial remedies,resulting in potentially catastrophic losses for the company.
Legislative and regulatory risk The risk that governmental laws and regulations directly or indirectlyaffecting a company’s operations will change with potentially severe adverse effects on the com-pany’s continued profitability and even its long-term sustainability.
Leverage In the context of corporate finance, leverage refers to the use of fixed costs within a com-pany’s cost structure. Fixed costs that are operating costs (such as depreciation or rent) createoperating leverage. Fixed costs that are financial costs (such as interest expense) create financialleverage.
Leveraged buyout (LBO) A transaction whereby the target company management team converts thetarget to a privately held company by using heavy borrowing to financing the purchase the targetcompany’s outstanding shares.
Leveraged recapitalization A post-offer takeover defense mechanism that involves the assumption ofa large amount of debt that is then used to finance share repurchases; the effect is to dramaticallychange the company’s capital structure while attempting to deliver a value to target shareholders inexcess of a hostile bid.
Liquidating dividend A dividend that is a return of capital rather than a distribution from earnings orretained earnings.
Liquidation To sell the assets of a company, division, or subsidiary piecemeal, typically because ofbankruptcy; the form of bankruptcy that allows for the orderly satisfaction of creditors’ claims afterwhich the company ceases to exist.
Liquidity A company’s ability to satisfy its short-term obligations using assets that are most readilyconverted into cash.
Liquidity ratios A form of liquidity analysis that focuses on the relationship between current assetsand current liabilities and the rapidity with which receivables and inventory can be converted intocash during normal business operations.
Lockbox system A payment system in which customer payments are mailed to a post office box andthe banking institution retrieves and deposits these payments several times a day, enabling thecompany to have use of the fund sooner than in a centralized system in which customer paymentsare sent to the company.
London Interbank Offered Rate (LIBOR) The Eurodollar rate at which London banks lend dollarsto other London banks; considered to be the best representative rate on a dollar borrowed by aprivate, high-quality borrower.
Long-term debt-to-assets ratio The proportion of a company’s assets that is financed with long-termdebt.
Managerialism theories Theories that posit that corporate executives are motivated to engage inmergers to maximize the size of their companies rather than shareholder value.
Marginal cost of capital (MCC) The marginal cost of capital (MCC) is the cost of raising oneadditional unit of capital.
Marginal investor An investor who is likely to be part of the next trade in a share and who is thereforeimportant in setting price.
Matching strategy An active investment strategy that includes intentional matching of the timing ofcash outflows with investment maturities.
Materials or manufacturing resource planning (MRP) The incorporation of production planninginto inventory management. A MRP analysis provides both a materials acquisition schedule and aproduction schedule.
bgloss 13 January 2012; 9:18:28
Glossary 469

Matrix pricing In the fixed income markets, to price a security on the basis of valuation-relevantcharacteristics (e.g., debt-rating approach).
Merger The absorption of one company by another; that is, two companies become one entity andone or both of the pre-merger companies ceases to exist as a separate entity.
Mismatching strategy An active investment strategy whereby the timing of cash outflows is notmatched with investment maturities.
Mixed offering A merger or acquisition that is to be paid for with cash, securities, or some combi-nation of the two.
Money market yield Yield on short-term debt securities; typically annualized using the ratio of 360 tothe number of days to maturity.
Monitoring costs Costs borne by owners to monitor the management of the company (e.g., board ofdirector expenses).
Monthly billing Credit terms that require monthly payment.Mutually exclusive projects Mutually exclusive projects compete directly with each other. For
example, if Projects A and B are mutually exclusive, you can choose A or B, but you cannotchoose both.
Net current assets Current assets minus current liabilities.Net operating cycle (also cash conversion cycle) An estimate of the average time that elapses between
paying suppliers for materials and collecting cash from the subsequent sale of goods produced.Net operating profit less adjusted taxes (NOPLAT) A company’s operating profit with adjustments
to normalize the effects of capital structure.Net present value (NPV) For a project, the present value of the project inflows minus the present
value of the project outflows.Net profit margin The ratio of net income to revenues; indicates how much of each dollar of revenues
is left after all costs and expenses.New-issue DRP Dividend reinvestment plan in which the company meets the need for additional
shares by issuing them instead of purchasing them.Nominal rate A rate of interest based on the security’s face value.Nonconventional cash flow In a nonconventional cash flow pattern, the initial outflow is not fol-
lowed by inflows only, but the cash flows can flip from positive (inflows) to negative (outflows)again (or even change signs several times).
Number of days of inventory The average length of time that inventory remains within the company.Number of days of payables (also average age of payables) Estimate of the average number of days it
takes the company to pay its own suppliers.Number of days of receivables Estimate of the average number of days it takes to collect on credit
accounts.Open-market DRP Dividend reinvestment plan in which the company purchases shares in the open
market to acquire the additional shares credited to plan participants.Operating breakeven point The number of units produced and sold at which the company’s
operating profit is zero (revenues¼ operating costs).Operating cycle A measure of the time needed to convert raw materials into cash from a sale; it
consists of the number of days of inventory and the number of days of receivables.Operating profit margin The ratio of operating income (i.e., income before interest and taxes) to
revenues.Operating return on assets The ratio of operating earnings to assets.Operating risk The risk attributed to the operating cost structure, in particular the use of fixed costs in
operations; the risk arising from the mix of fixed and variable costs; the risk that a company’soperations may be severely affected by environmental, social, and governance risk factors.
Operational risk The risk of loss from failures in a company’s systems and procedures or fromexternal events.
Opportunity cost What a resource is worth in its next-best use.Optimal capital structure The capital structure at which the value of the company is maximized.
bgloss 13 January 2012; 9:18:28
470 Glossary

Ordinary terms Credit terms that set forth expected payment in a standard format that denotes whenpayment is due and what discounts are available for early payment.
Organic growth Company growth in output or sales that is achieved by making investments inter-nally (i.e., excludes growth achieved through mergers and acquisitions).
Partnership A business owned and operated by more than one individual.Passive strategy In reference to short-term cash management, it is an investment strategy characterized
by simple decision rules for making daily investments.Payment date The day that the company actually mails out (or electronically transfers) a dividend
payment.Payout Cash dividends and the value of shares repurchased in any given year.Payout policy A company’s set of principles guiding payouts.Payout ratio The percentage of total earnings paid out in dividends in any given year (in per-share
terms, DPS/EPS).Pecking order theory The theory that managers take into account how their actions might be
interpreted by outsiders and thus order their preferences for various forms of corporate financing.Forms of financing that are least visible to outsiders (e.g., internally generated funds) are mostpreferable to managers and those that are most visible (e.g., equity) are least preferable.
Per unit contribution margin The amount that each unit sold contributes to covering fixed costs—that is, the dierence between the price per unit and the variable cost per unit.
Perfect capital markets An assumption of the Modigliani and Merton model in which there are notransactions costs, no taxes, no bankruptcy costs, and everyone has the same information. In aperfect capital market, any two investments with identical cash flow streams and risk must trade forthe same price.
Pet projects Projects in which influential managers want the corporation to invest. Often, unfortu-nately, pet projects are selected without undergoing normal capital budgeting analysis.
Point of sale (POS) Systems that capture transaction data at the physical location in which the sale ismade.
Poison pill A pre-offer takeover defense mechanism that makes it prohibitively costly for an acquirerto take control of a target without the prior approval of the target’s board of directors.
Poison puts A pre-offer takeover defense mechanism that gives target company bondholders the rightto sell their bonds back to the target at a pre-specified redemption price, typically at or above parvalue; this defense increases the need for cash and raises the cost of the acquisition.
Precautionary stocks A level of inventory beyond anticipated needs that provides a cushion in the eventthat it takes longer to replenish inventory than expected or in the case of greater than expecteddemand.
Pretax profit margin A company’s earnings before taxes expressed as a percentage of revenues.Priced risk Risk for which investors demand compensation for bearing (e.g., equity risk, company-
specific factors, macroeconomic factors).Price-setting option The operational flexibility to adjust prices when demand varies from forecast.
For example, when demand exceeds capacity, the company could benefit from the excess demandby increasing prices.
Principal-agent problem. See Agency problem.Production-flexibility The operational flexibility to alter production when demand varies from
forecast. For example, if demand is strong, a company may profit from employees workingovertime or from adding additional shifts.
Profitability ratios Measure a company’s ability to generate profitable sales from its resources (assets).Project sequencing To defer the decision to invest in a future project until the outcome of some or all
of a current project is known. Projects are sequenced through time, so that investing in a projectcreates the option to invest in future projects.
Proxy fight An attempt to take control of a company through a shareholder vote.Proxy statement A public document that provides the material facts concerning matters on which
shareholders will vote.
bgloss 13 January 2012; 9:18:29
Glossary 471

Pull on liquidity When disbursements are paid too quickly or trade credit availability is limited, requiringcompanies to expend funds before they receive funds from sales that could cover the liability.
Pure-play method A method for estimating the beta for a company or project; it requires using acomparable company’s beta and adjusting it for financial leverage differences.
Quick assets Assets that can be most readily converted to cash (e.g., cash, short-term marketableinvestments, receivables).
Quick ratio, or acid test ratio A stringent measure of liquidity that indicates a company’s ability tosatisfy current liabilities with its most liquid assets.
Receivables turnover The ratio of total revenue to average accounts receivable.Reorganization Agreements made by a company in bankruptcy under which a company’s capital
structure is altered and/or alternative arrangements are made for debt repayment; U.S. Chapter 11bankruptcy. The company emerges from bankruptcy as a going concern.
Reputational risk The risk that a company will suffer an extended diminution in market value relativeto other companies in the same industry due to a demonstrated lack of concern for environmental,social, and governance risk factors.
Residual dividend policy A dividend payout policy under which earnings in excess of the fundsnecessary to finance the equity portion of company’s capital budget are paid out in dividends.
Residual loss Agency costs that are incurred despite adequate monitoring and bonding of management.Return on assets The ratio of net income to assets; indicates a company’s net profit generated per
dollar invested in total assets.Return on common equity The ratio of net income available to common shareholders to common
shareholders’ equity; the profit generated per dollar of common shareholders’ investment.Return on equity (ROE) The ratio of net income to shareholders’ equity; represents the profit
generated per dollar of shareholders’ investment.Return on total capital A profitability ratio calculated as EBIT divided by the sum of short- and
long-term debt and equity.Reverse stock split A reduction in the number of shares outstanding with a corresponding increase in
share price, but no change to the company’s underlying fundamentals.Revolving credit agreements (also revolvers) The strongest form of short-term bank borrowing
facilities; they are in effect for multiple years (e.g., 3–5 years) and may have optional medium-termloan features.
Safety stock A level of inventory beyond anticipated needs that provides a cushion in the event that it takeslonger to replenish inventory than expected or in the case of greater than expected demand.
Sales risk Uncertainty with respect to the quantity of goods and services that a company is able to selland the price it is able to achieve; the risk related to the uncertainty of revenues.
Securities offering A merger or acquisition in which target shareholders are to receive shares of theacquirer’s common stock as compensation.
Share repurchase or buyback A transaction in which a company buys back its own shares. Unlikestock dividends and stock splits, share repurchases use corporate cash.
Shark repellents A pre-offer takeover defense mechanism involving the corporate charter (e.g.,staggered boards of directors and supermajority provisions).
Sole proprietorship A business owned and operated by a single person.Solvency ratios Measure a company’s ability to meet long-term obligations. Subsets of these ratios are
also known as “leverage” and “long-term debt” ratios.Sovereign yield spread An estimate of the country spread (country equity premium) for a developing
nation that is based on a comparison of bonds yields in country being analyzed and a developedcountry. The sovereign yield spread is the difference between a government bond yield in thecountry being analyzed, denominated in the currency of the developed country, and the Treasurybond yield on a similar maturity bond in the developed country.
Spin-off A form of restructuring in which shareholders of the parent company receive a proportionalnumber of shares in a new, separate entity; shareholders end up owning stock in two differentcompanies where there used to be one.
bgloss 13 January 2012; 9:18:29
472 Glossary

Split-off A form of restructuring in which shareholders of the parent company are given shares in anewly created entity in exchange for their shares of the parent company.
Split-rate In reference to corporate taxes, a split-rate system taxes earnings to be distributed as divi-dends at a different rate than earnings to be retained. Corporate profits distributed as dividends aretaxed at a lower rate than those retained in the business.
Static trade-off theory of capital structure A theory pertaining to a company’s optimal capitalstructure; the optimal level of debt is found at the point where additional debt would cause thecosts of financial distress to increase by a greater amount than the benefit of the additional taxshield.
Statutory merger A merger in which one company ceases to exist as an identifiable entity and all itsassets and liabilities become part of a purchasing company.
Stock dividend (also bonus issue of shares) A type of dividend in which a company distributesadditional shares of its common stock to shareholders instead of cash.
Stock purchase An acquisition in which the acquirer gives the target company’s shareholders somecombination of cash and securities in exchange for shares of the target company’s stock.
Stock-out losses Profits lost from not having sufficient inventory on hand to satisfy demand.Stretching payables To postpone payment of payables.Subsidiarymerger Amerger inwhich the companybeingpurchasedbecomes a subsidiary of the purchaser.Sunk cost A cost that has already been incurred.Survey approach An estimate of the equity risk premium that is based upon estimates provided by a
panel of finance experts.Sustainable growth rate The rate of dividend (and earnings) growth that can be sustained over time
for a given level of return on equity, keeping the capital structure constant and without issuingadditional common stock.
Takeover A merger; the term may be applied to any transaction, but is often used in reference tohostile transactions.
Takeover premium The amount by which the takeover price for each share of stock must exceed thecurrent stock price in order to entice shareholders to relinquish control of the company to anacquirer.
Target balance A minimum level of cash to be held available—estimated in advance and adjusted forknown funds transfers, seasonality, or other factors.
Target capital structure A company’s chosen proportions of debt and equity.Target company, or target The company in a merger or acquisition that is being acquired.Target payout ratio A strategic corporate goal representing the long-term proportion of earnings that
the company intends to distribute to shareholders as dividends.Tender offer A public offer whereby the acquirer invites target shareholders to submit (“tender”) their
shares in return for the proposed payment.Times-interest-earned ratio See Interest coverage ratio.Total asset turnover The ratio of revenues to total assets.Trade credit A spontaneous form of credit in which a purchaser of the goods or service is financing its
purchase by delaying the date on which payment is made.Trailing P/E A calculation of the P/E ratio that uses earnings from previous periods as opposed to
forecasted earnings.Transactions motive In the context of inventory management, the need for inventory as part of the
routine production–sales cycle.Treasury shares (treasury stock) Shares that were issued and subsequently repurchased by the company.Trust receipt arrangement The use of inventory as collateral for a loan. The inventory is segregated
and held in trust, and the proceeds of any sale must be remitted to the lender immediately.Uncommitted lines of credit A line of credit for which the bank reserves the right to refuse to honor
any request for use of the line.Unlimited funds An unlimited funds environment assumes that the company can raise the funds it
wants for all profitable projects simply by paying the required rate of return.
bgloss 13 January 2012; 9:18:29
Glossary 473

Variable costs Costs that fluctuate with the level of production and sales.Vertical common-size analysis The most common type of common-size analysis, in which the
accounts in a given period are compared to a benchmark item in that same year.Vertical merger A merger involving companies at different positions of the same production chain;
for example, a supplier or a distributor.Warehouse receipt arrangement The use of inventory as collateral for a loan; similar to a trust receipt
arrangement except there is a third party (i.e., a warehouse company) that supervises the inventory.Weighted average cost of capital (WACC) The required rate of return that investors demand for the
average-risk investment of a company and the cost that a company incurs for additional capital.Found as the average of the company’s component costs of capital, weighted by their proportionsin the company’s capital structure.
White knight A third party that is sought out by the target company’s board to purchase the target inlieu of a hostile bidder.
White squire A third party that is sought out by the target company’s board to purchase a substantialminority stake in the target—enough to block a hostile takeover without selling the entire company.
Winner’s curse The tendency for the winner in certain competitive bidding situations to overpay,whether because of overestimation of intrinsic value, emotion, or information asymmetries.
Working capital The difference between current assets and current liabilities.Working capital management Corporate finance activities that ensure a company has adequate ready
access to the funds necessary for day-to-day operating expenses, while at the same time making surethat the company’s assets are invested in the most productive way.
Working capital turnover A comparison of revenues with working capital to produce a measure thatshows how efficiently working capital is employed.
Yield The actual return on a debt security if it is held to maturity.Yield to maturity (YTM) The annual return that an investor earns on a bond if the investor purchases
the bond today and holds it until maturity.
bgloss 13 January 2012; 9:18:29
474 Glossary

REFERENCES
Amendments to Rules Governing the Investment Company Act of 1940, 17 CFR Part 270, July 2004.American Management Association. 1960. “Executive Committee Control Charts.” AMA Management
Bulletin, No. 6: 22.Anderson, Miranda, and David Gardiner. 2006. Climate Risk and Energy in the Auto Sector: Guidance for
Investors and Analysts on Key Off-Balance Sheet Drivers. Thousand Oaks, CA: Ceres.Armitage, Seth. 2000. “The Direct Costs of UK Rights Issues and Open Offers.” European Financial
Management, Vol. 6, No. 1: 57!68.Baker, Malcolm, and Jeffrey Wurgler. 2004. “A Catering Theory of Dividends.” Journal of Finance,
Vol. 59, No. 3: 1125!1165.Bancel, Franck, and Usha Mittoo. 2004. “The Determinants of Capital Structure Choice: A Survey of
European Firms.” Financial Management, Vol. 44, No. 4.Bauer, Rod, and Nadja Guenster. 2003. “Good Corporate Governance Pays Off !: Well-Governed
Companies Perform Better on the Stock Market.” Working paper.Blume, Marshall. 1971. “On the Assessment of Risk.” Journal of Finance, Vol. 26, No. 1: 1!10.Brav, Alon, John Graham, Campbell Harvey, and Roni Michaely. 2005. “Payout Policy in the 21st
Century.” Journal of Financial Economics, Vol. 77, No. 3: 483!527.Brealey, Richard, Stewart Myers, and Alan Marcus. 2007. Fundamentals of Corporate Finance. New
York: McGraw-Hill Irwin.Brounen, Dirk, Abe de Jong, and Kees Koedijk. 2004. “Corporate Finance in Europe: Confronting
Theory with Practice.” Financial Management, Vol. 33, No. 4: 71!101.Brown, Lawrence D., and Marcus Caylor. 2004. “Corporate Governance Study: The Correlation
Between Corporate Governance and Company Performance.” Institutional Shareholder Services.www.tkyd.org/files/downloads/corporate_governance_study_104.pdf (accessed February 1, 2008).
Bruner, Robert F. 2005. Deals from Hell: M&A Lessons That Rise above the Ashes. Hoboken, NJ: JohnWiley & Sons.
Bruner, Robert F., Robert M. Conroy, Wei Li, Elizabeth O’Halloran, and Miquel Palacios Lleras. 2003.Investing in Emerging Markets. Charlottesville, VA: AIMR Research Foundation.
Buhner, Thomas, and Christoph Kaserer. 2002. “External Financing Costs and Economies of Scale inInvestment Banking: The Case of Seasoned Equity Offerings in Germany.” European FinancialManagement, Vol. 9, No. 2: 249!253.
Chance, Don M. 2003. Analysis of Derivatives for the CFA Program. Charlottesville, VA: Association forInvestment Management and Research.
Chetty, Raj, and Emmanuel Saez. 2004. “Do Dividends Respond to Taxes? Preliminary Evidence fromthe 2003 Dividend Tax Cut.” National Bureau of Economic Research, working paper 10572.
Claessens, Stijn, Simeon Djankov, and Titiana Nenova. 2001. “Corporate Risk around the World.” InFinancial Crises in Emerging Markets. Reuven Glick, Ramon Moreno, and Mark Speigel, editors.New York: Cambridge University Press.
Copeland, Thomas E., J. Fred Weston, and Kuldeep Shastri. 2005. Financial Theory and CorporatePolicy, 4th edition. Old Tappan, NJ: Pearson/Addison Wesley.
Copeland, Tom, Tim Koller, and Jack Murrin. 2000. Valuation: Measuring and Managing the Value ofCompanies, 3rd edition. New York: John Wiley & Sons.
475
bref 13 January 2012; 9:20:53

Cornell, Bradford. 2009. “Stock Repurchases and Dividends: Trade-Offs and Trends.” Dividends andDividend Policy. H. Kent Baker, editor. Hoboken, NJ: John Wiley & Sons.
Corporate Governance of Listed Companies: A Manual for Investors, The. 2005. Charlottesville, VA: CFAInstitute Centre for Financial Market Integrity.
Damodaran, Aswath. 1999. “Estimating Equity Risk Premiums.” New York University working paper.Damodaran, Aswath. 2001. Corporate Finance. New York: John Wiley & Sons.Damodaran, Aswath. 2003. “Measuring Company Exposure to Country Risk: Theory and Practice.”
New York University working paper.Daves, Phillip R., Michael C. Ehrhardt, and Robert A. Kunkel. 2000. “Estimating Systematic Risk: The
Choice of Return Interval and Estimation Period.” Journal of Financial and Strategic Decisions,Vol. 13, No. 1: 7!13.
DeAngelo, Harry, Linda DeAngelo, and Douglas Skinner. 1986. “Reversal of Fortune: Dividend Signalsand the Disappearance of Sustained Earnings Growth.” Journal of Financial Economics, Vol. 40,No. 3: 341!371.
DeAngelo, Harry, Linda DeAngelo, and Douglas Skinner. 2004. “Are Dividends Disappearing? Divi-dend Concentration and the Consolidation of Earnings.” Journal of Financial Economics, Vol. 72,No. 3: 425!456.
Demirguc-Kunt, Asli, and Voljislav Maksimovic. 1998. “Law, Finance, and Company Growth.” Journalof Finance, Vol. 53, No. 6: 2107!2137.
Demirguc-Kunt, Asli and Voljislav Maksimovic. 1999. “Institutions, Financial Markets, and CompanyDebt Maturity.” Journal of Financial Economics, Vol. 54, No. 3: 295!336.
Dimson, Elroy, Paul Marsh, and Mike Staunton. 2003. “Global Evidence on the Equity RiskPremium.” Journal of Applied Corporate Finance (Fall): 27!38.
Domowitz, Ian, Jack Glen, and Ananth Madhavan. 2000. “International Evidence on AggregateCorporate Financing Decisions.” Pennsylvania State University working paper.
Edmondson, Gail. 2004. “How Parmalat Went Sour.” BusinessWeek (July 12).Edwards, Edgar O., and Philip W. Bell. 1961. The Theory and Measurement of Business Income. Berkeley:
University of California Press.Elton, Edward, and Martin Gruber. 1970. “Marginal Tax Rates and the Clientele Effect.” Review of
Economics and Statistics, Vol. 52, No. 1: 68!74.Erb, Claude, Campbell R. Harvey, and Tadas Viskanta. 1996. “Expected Returns and Volatility in 135
Countries.” Journal of Portfolio Management.Ezzell, John R., and R. Burr Porter. 1976. “Flotation Costs and the Weighted Average Cost of Capital.”
Journal of Financial and Quantitative Analysis, Vol. 11, No. 3: 403!413.Fabozzi, Frank. 2004. Fixed Income Analysis for the Chartered Financial Analysts Program, 2nd edition.
Charlottesville, VA: CFA Institute.Fama, Eugene, and Kenneth French. 1992. “The Cross-Section of Expected Stock Returns.” Journal of
Finance, Vol. 47, No. 2: 427!465.Fama, Eugene, and Kenneth French. 2001. “Disappearing Dividends: Changing Firm Characteristics or
Lower Propensity to Pay?” Journal of Financial Economics, Vol. 60, No. 1: 3!43.Fama, Eugene, and Kenneth French. 2004. “The Capital Asset Pricing Model: Theory and Evidence.”
Journal of Economic Perspectives, Vol. 18, No. 3: 25!46.Fan, J. P. H., Sheridan Titman, and Garry J. Twite. 2004. “An International Comparison of Capital
Structure and Debt Maturity Choices.” European Finance Association 2003 Annual ConferencePaper No. 769.
Ferris, Stephen, Narayanan Jayaraman, and Sanjiv Sabherwal. 2009. “Catering Effects in CorporateDividend Policy: The International Evidence.” Journal of Banking and Finance, Vol. 33, No. 9:1730!1738.
Ferris, Stephen, Nilanjan Sen, and Emre Unlu. 2009. “An International Analysis of Dividend PaymentBehavior.” Journal of Business Finance & Accounting, Vol. 36, Nos. 3!4: 496!522.
Filbeck, Greg. 2009. “Asymmetric Information and Signaling Theory.” Dividends and Dividend Policy.H. Kent Baker, editor. Hoboken, NJ: John Wiley & Sons.
bref 13 January 2012; 9:20:54
476 References
Fisher, Irving. 1930. The Theory of Interest. New York: Macmillan.Gaughan, Patrick A. 2002. Mergers, Acquisitions, and Corporate Restructurings, 3rd edition. Hoboken,
NJ: John Wiley & Sons.Gill, Amar. 2001. “Corporate Governance in Emerging Markets—Saints and Sinners: Who’s Got
Religion?” CLSA Emerging Markets, CG Watch research report (April).Gitman, Lawrence, and V. Mercurio. 1982. “Cost of Capital Techniques Used by Major U.S. Firms:
Survey and Analysis of Fortune’s 1000.” Financial Management, Vol. 14, No. 4.Glader, Paul, Eleanor Laise, and E. S. Browning. 2009. “GE Joins Parade of Deep Dividend Cuts.”Wall
Street Journal (28 February 2009): A1.Gompers, Paul A., Joy L. Ishii, and Andrew Metrick. 2003. “Corporate Governance and Equity Prices.”
Quarterly Journal of Economics, Vol. 118, No. 1: 107!155.Gordon,Myron J. 1962.The Investment, Financing, andValuation of theCorporation.Homewood, IL: Irwin.Gordon, Myron. 1963. “Optimal Investment and Financing Policy.” Journal of Finance, Vol. 18, No. 2:
264!272.Grace, Kerry, and Rob Curran. 2009. “Stock Buybacks Plummet.” Wall Street Journal (27 March
2009): C9.Graham, Benjamin, and David L. Dodd. 1934. Security Analysis. New York: McGraw-Hill.Graham, Benjamin, David Dodd, Sidney Cottle, and Charles Tatham. 1962. Security Analysis, 4th
edition. New York: McGraw-Hill.Graham, John, and Campbell Harvey. 2001. “The Theory and Practice of Corporate Finance: Evidence
from the Field.” Journal of Financial Economics, Vol. 60, Nos. 2!3: 187!243.Graham, John, and Campbell Harvey. 2002. “How Do CFOs Make Capital Budgeting and Capital
Structure Decisions?” Journal of Applied Corporate Finance, Vol. 15, No. 1: 8!22.Grinblatt, Mark, Ronald Masulis, and Sheridan Titman. 1984. “The Valuation Effects of Stock Splits
and Stock Dividends.” Journal of Financial Economics, Vol. 13, No. 4: 461!490.Grullon, Gustavo, and Roni Michaely. 2002. “Dividends, Share Repurchases, and the Substitution
Hypothesis.” Journal of Finance, Vol. 57, No. 4: 1649!1684.Hall, Martin. 2003. “A/R Outsourcing: Coming of Age in the New Millennium.” Business Credit
(February): 1!2.Hamada, Robert. 1972. “The Effect of the Firm’s Capital Structure on the Systematic Risk of Common
Stocks.” Journal of Finance, Vol. 27, No. 2: 435!452.Hansen, Robert, Raman Kumar, and Dilip Shome. 1994. “Dividend Policy and Corporate Monitoring:
Evidence from the Regulated Electric Utility Industry.” Financial Management, Vol. 23, No. 1:16!22.
Harvey, Campbell R. 2001. “The International Cost of Capital and Risk Calculator.” Duke Universityworking paper.
Harvey, Campbell R., Karl V. Lins, and Andrew H. Roper. 2004. “The Effect of Capital StructureWhen Expected Agency Costs Are Extreme.” Journal of Financial Economics, Vol. 74, No. 1: 3!30.
He, Wei. 2009. “Dividend Reinvestment Plans.” In Dividends and Dividend Policy. H. Kent Baker,editor. Hoboken, NJ: John Wiley & Sons.
Healy, P., and K. Palepu. 1988. “Earnings Information Conveyed by Dividend Initiations andOmissions.” Journal of Financial Economics, Vol. 21, No. 2: 149!175.
Hirshleifer, Jack. 1958. “On the Theory of Optimal Investment Decisions.” Journal of Political Economy,Vol. 66, No. 4: 329!352.
Ibbotson, Roger G., Paul D. Kaplan, and James D. Peterson. 1997. “Estimates of Small Stock Betas AreMuch Too Low.” Journal of Portfolio Management, Vol. 23, No. 4: 104!111.
Jensen, Michael C. 1969. “The Performance of Mutual Funds in the Period 1945!1964.” Journal ofFinance. Vol. 23, No. 2: 389!416.
Jensen, Michael C. 1986. “Agency Costs of Free Cash Flow, Corporate Finance, and Takeovers.”American Economic Review, Vol. 76, No. 2: 323!329.
Jensen, Michael C., and William H. Meckling. 1976. “Theory of the Company: Managerial Behavior,Agency Costs, and Ownership Structure.” Journal of Financial Economics, Vol. 3, No. 4: 305!360.
bref 13 January 2012; 9:20:54
References 477

Kaserer, Christoph, and Fabian Steiner. 2004. “The Cost of Raising Capital—New Evidence fromSeasoned Equity Oerings in Switzerland.” Technische Universitat Munchen working paper(February).
Koller, T., M. Goedhart, and D. Wessels. 2005. Valuation: Measuring and Managing the Value ofCompanies, 4th edition. Hoboken, NJ: John Wiley & Sons.
Lease, Ronald, Kose John, Avner Kalay, Uri Loewenstein, and Oded Sarig. 2000. Dividend Policy: ItsImpact on Firm Value. Boston, MA: Harvard Business School Press.
Lee, Inmoo, Scott Lochhead, Jay R. Ritter, and Quanshui Zhao. 1996. “The Costs of Raising Capital.”Journal of Financial Research, Vol. 19, No. 1: 59!74.
Lintner, John. 1956. “Distribution of Incomes of Corporations among Dividends, Retained Earnings,and Taxes.” American Economic Review, Vol. 46: 97!113.
Lintner, John. 1962. “Dividends, Earnings, Leverage, Stock Prices and the Supply of Capital to Cor-porations.” Review of Economics and Statistics, Vol. 44, No. 3: 243!269.
Madden, Ian. 2008. “High Dividend Stocks: Proceed with Caution.” www.kbcam.com/newsandpressdivplus.jsp.
Maremont, Mark, and Laurie Cohen. 2002. “How Tyco’s CEO Enriched Himself.” The Wall StreetJournal (August 7).
Mariscal, Jorge O., and Rafaelina M. Lee. 1993. “The Valuation of Mexican Stocks: An Extension of theCapital Asset Pricing Model.” New York: Goldman Sachs.
Markon, Jerry, and Robert Frank. 2002. “Five Adelphia Officials Arrested on Fraud Charges.” WallStreet Journal (July 25): A3.
Marshall, Alfred. 1892. Elements of Economics of Industry, Book 2, Chapter 12, Sections 3 and 4. NewYork: Macmillan.
Materiality of Social, Environmental and Corporate Governance Issues to Equity Pricing: 11 Sector Studies byBrokerage House Analysts, The. 2004. New York: United Nations Environmental ProgrammeFinance Initiative (UNEP FI), Asset Management Working Group.
Megginson, William J. 1997. Corporate Finance Theory. Reading, MA: Addison-Wesley.Mian, Shehzad L., and Clifford W. Smith. 1992. “Accounts Receivable Management Policy: Theory
and Evidence.” Journal of Finance, Vol. 47, No. 1: 169!200.Miles, James A. and John R. Ezzell. 1980. “The Weighted Average Cost of Capital, Perfect Capital
Markets, and Project Life: A Clarification.” Journal of Financial and Quantitative Analysis, Vol. 15,No. 3: 719!730.
Miller, Merton H. 1977. “Debt and Taxes.” Journal of Finance, Vol. 32, No. 2: 261!275.Miller, Merton H., and Franco Modigliani. 1961. “Dividend Policy, Growth, and the Valuation of
Shares.” Journal of Business, Vol. 34, No. 4: 411!433.Modigliani, Franco, and Merton H. Miller. 1958. “The Cost of Capital, Corporation Finance, and the
Theory of Investment.” American Economic Review, Vol. 48, No. 3: 261!297.Modigliani, Franco, and Merton H. Miller. 1963. “Corporate Income Taxes and the Cost of Capital: A
Correction.” American Economic Review, Vol. 54, No. 3: 433!443.Mukherjee, Tarun. 2009. “Agency Costs and the Free Cash Flow Hypothesis.” Dividends and Dividend
Policy. H. Kent Baker, editor. Hoboken, NJ: John Wiley & Sons.Myers, Stewart, and Nicholas Majluf. 1984. “Corporate Financing and Investment Decisions When
Firms Have Information That Investors Do Not Have.” Journal of Financial Economics, Vol. 13,No. 2: 187!221.
New York Society of Securities Analysts. 2003. Corporate Governance Handbook. New York City.Nofsinger, John, and Kenneth Kim. 2003. Infectious Greed. Upper Saddle River, NJ: Prentice-Hall
Financial Times.Oded, Jacob, and Allen Michel. 2008. “Stock Repurchases and the EPS Enhancement Fallacy.”
Financial Analysts Journal, Vol. 64, No. 4: 62!75.Parrino, Robert, and David Kidwell. 2009. Fundamentals of Corporate Finance. Hoboken, NJ: John
Wiley & Sons.
bref 13 January 2012; 9:20:54
478 References

Peterson, Pamela P., and David R. Peterson. 1996. Company Performance and Measures of Value Added.Charlottesville, VA: The Research Foundation of the ICFA.
Pinto, Jerald E., Elaine Henry, Thomas R. Robinson, and John D. Stowe. 2010. Equity Asset Valuation,2nd edition. Hoboken, NJ: John Wiley & Sons.
Powers, William C., Jr., Raymond S. Troubh, and Herbert S. Winokur, Jr. 2002. Report of Investi-gation by the Special Investigative Committee of the Board of Directors of Enron Corp. (February1). Collingdale, PA: Diane Pub. Co.
Rajan, Raghuram G., and Luigi Zingales. 1995. “What Do We Know about Capital Structure? SomeEvidence from International Data.” Journal of Finance, Vol. 50, No. 5: 1421!1460.
Reilly, Frank, and Keith Brown. 2003. Investment Analysis and Portfolio Management, 7th edition.Mason, OH: South-Western.
Roll, Richard. 1986. “The Hubris Hypothesis on Corporate Takeovers.” Journal of Business, Vol. 59,No. 2: 176!216.
Ross, Stephen. 1977. “The Determination of Financial Structure: The Incentive-Signaling Approach.”Bell Journal of Economics, Vol. 8, No. 1: 23!40.
Sabri, Nidal Rashid. 2003. “Using Treasury ‘Repurchase’ Shares to Stabilize Stock Markets.” Interna-tional Journal of Business, Vol. 8, No. 4.
Sears, Steven M. 2009. “The Fortunes of Reversals.” Barron’s (3 August): M10.Shefrin, Hersh, and Meir Statman. 1984. “Explaining Investor Preference for Cash Dividends.” Journal
of Financial Economics, Vol. 13, No. 2: 253!282.Siegel, Jeremy J. 2005. “Perspectives on the Equity Risk Premium.” Financial Analysts Journal, Vol. 61,
No. 6: 61!73.Smith, Clifford, Jr., and Jerold Warner. 1979. “On Financial Contracting: An Analysis of Bond
Covenants.” Journal of Financial Economics, Vol. 7, No. 2: 117!161.Solnik, Bruno, and Dennis McLeavey. 2004. International Investments, 5th edition. Reading, MA:
Addison-Wesley.Stewart, G. Bennett. 1991. The Quest for Value. New York: HarperCollins.Thomas, Landon, Jr. 2004a. “Regulators Said to Be Focusing on Board’s Vote for Grasso Pay.” The New
York Times (March 26).Thomas, Landon, Jr. 2004b. “Saying Grasso Duped Big Board, Suit Seeks Return of $100 Million.”
New York Times (May 25).Vermaelen, Theo. 2005. Share Repurchases. Hanover, MA: Now Publishers.Von Eije, Henk, and William L. Megginson. 2008. “Dividends and Share Repurchases in the European
Union.” Journal of Financial Economics, Vol. 89, No. 2: 347!374.Weston, J. Fred, and Samuel C. Weaver. 2001. Mergers & Acquisitions. New York: McGraw-Hill.Weston, J. Fred, Kwang S. Chung, and Susan E. Hoag. 1990. Mergers, Restructuring, and Corporate
Control. Upper Sadde River, NJ: Prentice-Hall.White, Gerald I., Ashwinpaul C. Sondhi, and Dov Fried. 2003. The Analysis and Use of Financial
Statements, 3rd edition. Hoboken, NJ: John Wiley & Sons.
bref 13 January 2012; 9:20:55
References 479

bref 13 January 2012; 9:20:55

ABOUT THE AUTHORS
Raj Aggarwal, CFA, is the Frank C. Sullivan Professor of International Business andFinance at the University of Akron in Ohio. Prior to his current position, he was the FirestoneChair in Corporate Finance at Kent State University and the Mellen Chair in Finance at JohnCarroll University. He has also taught at Harvard University, the University of Michigan, andthe University of South Carolina. He serves as a director of Ancora Mutual Funds, Manco/Henkel AC, and the Financial Executives Research Foundation, a division of FinancialExecutives International.
He is an author of texts and widely cited scholarly books and papers and ranked highlyin studies of academic contributions in finance and international business. He has been anofficer of professional associations, such as the Financial Management Association, and is agraduate of Leadership Cleveland and a member of the Union Club.
Rosita P. Chang, CFA, is Professor of Finance and the codirector of the Asia PacificFinancial Markets (FIMA) Research Center at the Shidler College of Business, University ofHawaii at Manoa. Her research has appeared in the Journal of Finance, Journal of InternationalBusiness Studies, Journal of Financial Services Research, and the Pacific Basin Finance Journal,among others. In addition, she has conducted commissioned studies for international insti-tutions such as the Organisation for Economic Cooperation and Development (OECD),United Nations Industrial Development Organization, Securities & Futures Commission ofHong Kong, and several Asian stock exchanges. Her current research interests include issuesrelated to Chinese capital markets, financial services industry, and market microstructure.
Dr. Chang received her BA from Mills College and her MBA and PhD from theUniversity of Pittsburgh. She has been a CFA charterholder since 1984 and served as anindependent trustee for Zurich Scudder Investments, Inc., from 1995 to 2001.
Catherine Clark, CFA, was a Vice President at Bankers Trust and Reich & Tang, whereshe was a securities analyst and portfolio manager. Ms. Clark received her BA degree ineconomics from the University of Washington in 1972 and MBA degree from New YorkUniversity in 1975. She has been a CFA charterholder since 1979 and has been an activevolunteer with CFA Institute for more than 20 years.
Michelle R. Clayman, CFA, is the founder, Managing Partner, and Chief InvestmentOfficer of New Amsterdam Partners LLC, an institutional money management firm in NewYork. Ms. Clayman received a degree in philosophy, politics, and economics from OxfordUniversity in England and an MBA from Stanford University, California. She has been aCFA charterholder since 1983. Ms. Clayman sits on the boards of the Society of QuantitativeAnalysts (of which she is a past President) and the Institute for Quantitative Research inFinance.
Yves Courtois, CFA, is a Corporate Finance Partner at KPMG in Luxembourg, wherehe leads the corporate finance, private equity, and valuation practices. He is cohead ofKPMG’s Global Valuation Institute and a member of KPMG’s Global Valuation committee.
481
babout 13 January 2012; 9:17:39

He has extensive cross-border work experience in Europe and in the United States. He iscurrently head of the valuation and alternative investments advisory groups in Luxembourgand is an accredited valuer within the KPMG global corporate finance network. His other keyareas of expertise include M&A, due diligence, financial risk management, and structuring.He is a frequent speaker at alternative investment funds industry forums on private equity,hedge funds, and valuation. He has worked on a wide range of projects with CFA Institute,including a webcast and CFA curriculum development. He received his BSBA degree fromSolvay Business School in Brussels in 1995 and a MS degree in accountancy from KatholiekeUniversiteit Leuven in Belgium in 1996. He is also a Chartered Market Technician.
Pamela Peterson Drake, CFA, is Department Head and J. Gray Ferguson Professor ofFinance at James Madison University. Professor Peterson Drake received her PhD from theUniversity of North Carolina at Chapel Hill and taught at Florida State University andFlorida Atlantic University before joining James Madison University. She has been a CFAcharterholder since 1992. Professor Peterson Drake is author and coauthor of a number ofbooks, including the Basics of Finance, Analysis of Financial Statements, and Financial Man-agement and Analysis, all with Frank J. Fabozzi. Professor Peterson Drake has authored orcoauthored monographs and a number of chapters in books, as well as published numerousarticles in academic and practitioner journals.
Martin S. Fridson, CFA, is Global Credit Strategist at BNP Paribas Investment Part-ners. He is “perhaps the most well-known figure in the high-yield world,” according toInvestment Dealers’ Digest. Over a 25-year span with brokerage firms including SalomonBrothers, Morgan Stanley, and Merrill Lynch, he became known for his innovative work incredit analysis and investment strategy. He has served as president of the Fixed IncomeAnalysts Society, governor of the Association for Investment Management and Research (nowCFA Institute), and director of the New York Society of Security Analysts. In 2000, TheGreen Magazine called Fridson’s Financial Statement Analysis “one of the most usefulinvestment books ever.” The Financial Management Association International named Fridsonthe Financial Executive of the Year in 2002. In 2000, he became the youngest person everinducted into the Fixed Income Analysts Society Hall of Fame. Fridson received his BA cumlaude in history from Harvard College and his MBA from Harvard Business School.
Jacques R. Gagne, CFA, is director of asset and risk management at La societe del’assurance automobile du Quebec, in Quebec City. Previously, he had been Vice President atthe Quebec Pension Board and director of financial planning at the Quebec Ministry ofFinance. He also has 10 years of experience as a pension consulting actuary. Mr Gagnereceived his B.SC degree (mathematics) from McGill University in 1966, became a fellow ofthe Society of Actuaries and of the Canadian Institute of Actuaries in 1975, and has been aCFA charterholder since 1995.
Cynthia Harrington, CFA, is Principal in an executive coaching and business processconsulting firm specializing in the asset management sector, applying behavioral finance. Shehas written extensively on investment theory, accounting practices, and behavioral and neuroeconomics. She was a Contributing Editor for Accounting Today, and has written over450 articles that appear in national publications, including Bloomberg Wealth Manager,Entrepreneur Magazine, Fraud Magazine, CFA Magazine, Journal of Accountancy, andFinancial Engineering News. She is a coauthor of the “Financial Statement Fraud” coursefor the Association of Certified Fraud Examiners. Prior to her writing career in 1999, she wasPresident/Owner/CIO of Harrington Capital Management, Ltd., an SEC-registered value styleasset management company catering to high-net-worth individuals and small institutions. Sheholds a BA from St. Olaf College. She is a certified fraud examiner (CFE) and a member of
babout 13 January 2012; 9:17:39
482 About the Authors

the ACFE. Ms. Harrington has been a CFA charterholder since 1993 and served on theBoard of Trustees of the CFALA Charitable Foundation and on the board of the AppliedBehavioral Finance Group.
Kenneth Kim is an Associate Professor of Finance at the State University of New York atBuffalo. At SUNY-Buffalo, Dr. Kim teaches corporate finance and international corporatefinance to MBA students. During 1998 and 1999, Dr. Kim worked as a senior financialeconomist at the U.S. Securities and Exchange Commission in Washington, DC, where heworked on a wide variety of corporate finance and governance issues, including mergersand acquisitions regulations. His primary research interests include corporate finance andcorporate governance. He has been published in the Journal of Finance, the Journal of Business,the Journal of Corporate Finance, and the Journal of Banking and Finance, among otherleading journals. Dr. Kim is also a coauthor of Infectious Greed and the textbooks CorporateGovernance and Global Corporate Finance. Dr. Kim has also won numerous awards forteaching.
Adam Kobor, CFA, is a Principal Portfolio Manager at the World Bank Treasury.Mr. Kobor is responsible for the development of asset allocation strategies and managingmortgage-backed securities portfolios. Prior to joining the Investment ManagementDepartment in 2008, he worked for the Quantitative Strategies, Risk & Analytics Depart-ment for six years. His responsibilities included preparing strategic asset allocation recom-mendations for several internal and external clients, as well as developing quantitativefinancial models. Prior to joining the bank, he was a risk analyst at the National Bank ofHungary. He holds a PhD from the Budapest University of Economic Sciences, and he is aCFA charterholder. He is author and coauthor of several publications, and he speaks atconferences.
Gene C. Lai is Safeco Distinguished Professor of Insurance and Chairperson of theDepartment of Finance and Management Science at Washington State University. ProfessorLai received his bachelor’s degree in economics from National Chengchi University inTaiwan, his master’s degree in decision science from Georgia State University in 1981, andhis PhD in risk management and insurance and finance from the University of Texas atAustin in 1987. His publications have appeared in The Journal of Risk and Insurance andJournal of Banking and Finance, among others. Dr. Lai serves as associate editor for manyjournals, including Journal of Risk and Insurance. He is President of the American Risk andInsurance Association and past president of the Western Risk and Insurance Associationand was a board member of the Asia-Pacific Risk and Insurance Association.
Rebecca T. McEnally, CFA, until her retirement in 2008, was Director, CapitalMarkets Policy, with the Capital Markets Policy Group for the CFA Centre for FinancialMarket Integrity. She was responsible for financial reporting and capital markets advocacyefforts of the CFA Centre and appeared on behalf of the members of CFA Institute beforeregulatory authorities, legislative bodies, professional associations, and the general publicin both the United States and abroad to further the CFA Institute mandate to improvecorporate financial reporting and disclosure. Prior to joining CFA Institute, Dr. McEnallytaught financial reporting and financial statement analysis at various universities, includingthe University of North Carolina at Chapel Hill, the Stern School of Business at New YorkUniversity, and the School of Management at Boston University. She has published a numberof articles, monographs, and books, and she has served as a consultant on accounting andfinance to financial institutions in the United States, Europe, and Asia.
Keith M. Moore, CFA, is Managing Director of MKM Partners’ Event-Drivengroup. Prior to joining MKM Partners in December 2009, Mr. Moore served as Kellner
babout 13 January 2012; 9:17:40
About the Authors 483

DiLeo & Company’s Co-Chief Investment Officer, Portfolio Manager of the KDC MergerArbitrage Fund, and Director of Risk Management. His arbitrage career spans research,trading, and portfolio management at Neuberger & Berman; Donaldson, Lufkin & Jenrette;and Jupiter Capital. A former Assistant Professor of economics and finance at St. John’sUniversity and Adjunct Professor at the University of Rhode Island and New York University,Mr. Moore has earned numerous academic awards and honors. He holds a BS and a PhDfrom the University of Rhode Island and an MBA from New York University. He has been aCFA charterholder since 1982.
Gregory Noronha, CFA, is Professor of Finance at the University of Washington’sTacoma campus, where he currently teaches classes in business finance and investment val-uation to both undergraduate and MBA students. He has held previous academic appoint-ments at Arizona State University and Old Dominion University. Mr. Noronha earned aBSE in naval architecture and marine engineering from the University of Michigan andan MBA and PhD in finance from Virginia Tech. His research has focused on the areas ofcorporate finance and investments, and he has published articles in the Journal of Finance,Journal of Banking and Finance, and Financial Analysts Journal, among others. Mr. Noronhaearned the CFA charter in 1999 and has served CFA Institute in a variety of volunteer roles.He served as Education Chair of the Phoenix Society of Financial Analysts and is currently amember of the Seattle CFA Society.
Edgar A. Norton, CFA, is professor of finance at the College of Business at Illinois StateUniversity. He has authored or coauthored more than 30 papers that have been published injournals and conference proceedings, as well as presented at international, national, andregional conferences. He is coauthor of several textbooks, including Investments; Finance: AnIntroduction to Institutions, Investments, and Management; Foundations of Financial Manage-ment; and Economic Justice in Perspective: A Book of Readings. Mr. Norton has served on theboard of directors and as president of the Midwest Finance Association; on the board ofthe Financial Planning Association of Illinois; and on the board of the ISU Credit Union. Hehas served CFA Institute for many years in a number of capacities.
Kenneth L. Parkinson is managing director of Treasury Information Services, a con-sulting and publishing firm. He has been a visiting and adjunct associate professor at SternGraduate School of Business at New York University, where he teaches courses in workingcapital management, corporate finance, and corporate treasury practices. Mr. Parkinsonactively consults with corporations of all sizes on treasury management projects and is afrequent speaker at major industry conferences and seminars as well as private training ses-sions for certification candidates. He is the author or coauthor of several texts and a frequentauthor of articles in trade magazines. Previously, Mr. Parkinson was director of treasuryoperations at RCA Corporation, managing treasury and banking activities worldwide. Heholds a BS from Penn State and an MBA from Wharton Graduate School and is a perma-nently certified cash manager (CCM).
John D. Stowe, CFA, is the O’Bleness Professor of Finance at Ohio University. Priorto joining Ohio University, he was head, Curriculum Development at CFA Institute and alsoa Director of Exam Development. Before joining CFA Institute in 2003, he was financeprofessor, department head, and associate dean at the University of Missouri-Columbia. Inaddition to Equity Asset Valuation, he is coauthor of Corporate Financial Management. He haspublished professional and academic articles in finance journals such as the Journal of Finance,Journal of Financial and Quantitative Analysis, Financial Management, Journal of PortfolioManagement, and others. He received his BA degree from Centenary College and his PhDfrom University of Houston. He became a CFA charterholder in 1995 and has since served
babout 13 January 2012; 9:17:40
484 About the Authors

the CFA Program in a number of volunteer capacities. He has been a member of the St. Louisand Cleveland CFA societies.
George H. Troughton, CFA, is Professor Emeritus of Finance at California StateUniversity, Chico. He holds an AB degree from Brown, an MBA from Columbia, and a PhDfrom the University of Massachusetts, Amherst. He began his career as an investmentanalyst at Lehman Brothers and Scudder, Stevens & Clark in New York. He was professor offinance at Babson College before moving to Chico, California. Mr. Troughton has been anactive participant in the CFA Program for more than 20 years. At CFA Institute, he wasawarded the C. Stewart Sheppard Award in 1999 and the Donald L. Tuttle Award in 2004.He is a member of the Phoenix CFA Society.
babout 13 January 2012; 9:17:40
About the Authors 485

babout 13 January 2012; 9:17:40

ABOUT THECFA PROGRAM
The Chartered Financial Analysts designation (CFAs) is a globally recognized standard ofexcellence for measuring the competence and integrity of investment professionals. To earnthe CFA charter, candidates must successfully pass through the CFA Program, a globalgraduate-level self-study program that combines a broad curriculum with professional conductrequirements as preparation for a wide range of investment specialties.
Anchored by a practice-based curriculum, the CFA Program is focused on the knowledgeidentified by professionals as essential to the investment decision-making process. This bodyof knowledge maintains current relevance through a regular, extensive survey of practicingCFA charterholders across the globe. The curriculum covers 10 general topic areas, rangingfrom equity and fixed-income analysis to portfolio management to corporate finance—allwith a heavy emphasis on the application of ethics in professional practice. Known for its rigorand breadth, the CFA Program curriculum highlights principles common to every market sothat professionals who earn the CFA designation have a thoroughly global investmentperspective and a profound understanding of the global marketplace.
www.cfainstitute.org
487
both 13 January 2012; 9:20:21

both 13 January 2012; 9:20:21

INDEX
Abandonment options, 96–98, 463Abbott Laboratories, 181Accelerated depreciation, 74–77Accounting depreciation, 103Accounting income, 102–105, 112Accounting net income, 51, 112Accounting principles, 386–387Accounting rate of return, 68Accounting risk, 39, 41Accounts payable management, 334–337
cash disbursements, 336evaluating, 337trade discounts, 335–336
Accounts receivable management, 323–330aging schedule, 328, 329, 463collecting on accounts, 324evaluating, 328–330goals for, 323–324monitoring receivables, 324number of days of receivables, 328–330
Accounts receivable turnover, 308, 387, 463Acid test ratio, 308, 364, 463Acquiring company (acquirer), 410, 463Acquisitions, 410, 452, 463. See also Mergers and
acquisitions (M&A)Active strategy, 320, 340, 463Activity ratios, 357–363, 463Adelphia, 9Adjusted present value, 68After-tax cash flows, 50, 77After-tax cost of debt, 130, 136, 159After-tax cost of equity, 130, 159After-tax operating cash flow, 50, 70, 71, 73, 76, 77,
79, 80, 86, 94, 97, 98, 101, 102, 111Agency costs, 211–212, 463
corporate governance and, 217dividend policy and, 268–271
Agency costs of equity, 211, 217, 223Agency problem, 6, 463Agency relationships, 463
director-shareholder conflicts, 10, 41manager-shareholder conflicts, 6–9, 40sources of conflict in, 6–10, 40–41
Aging schedule, accounts receivable, 328,329, 463
Alcoa Annual Report, 139
American International Group (AIG), 237Annual reports, 11Anticipation stock, 331, 463Anti-takeover laws, 425Antitrust laws, 430–433, 453Arbitrage, 201–202Arbitrage pricing theory (APT), 93, 112Argentina, 154Arithmetic mean, 142Armitage, Seth, 158Arnott, Robert, 251Asset-based loans, 340–341, 463Asset beta (β), 147–148, 150, 205, 463Asset purchase acquisitions, 419–420, 453, 463Asset risk, 39, 41Assignment of accounts receivable, 340, 463Asymmetric information, 212–213, 223, 463Audit committee, board of directors, 17–18, 29–30Australia, 275Automated Clearing House (ACH), 326, 463Automatic Data Processing, 267Automobile industry, 37Average accounting rate of return (AAR), 58Average age of payables, 337Average day’s payables, 309, 463Average inventory period, 309, 463
Backward integration, 411, 463Bad-debt reserves, 23Bad debts, 324Baker, Malcolm, 292Balance sheets, 349, 392–395, 398–401, 436–437
sales-driven, 396Bancel, Franck, 160Bank certificates of deposit (CDs), 317Banker’s acceptances (BAs), 317, 338, 342Bank lines of credit, 337Bankruptcy, 192–193, 223
cash expenses, 210Chapter 7 liquidation, 192–193Chapter 11 reorganization, 192–193costs of, 210–211, 223probability of, 211
Banks and banking:deposit insurance, 218international, 219, 220–221, 222
489
bindex 13 January 2012; 9:32:27

Bank sweep services, 317Barclays, 293Barron’s, 237BASF, 429Basic earning power ratio, 371Basic earnings per share, 383, 385, 463Bear hugs, 423, 464Before-tax cost of debt, 161Beginning inventory, 309Bell, Philip W., 107Benzene, 38Beta (β):
adjustments for small-capitalization stocks, 147in capital asset pricing model, 93–95, 112determining project beta, 146–153estimating, 146–153estimating with pure-play method, 149–151estimation period, 146levered, 147–150, 161market index selection, 146periodicity of return interval, 146risk and, 147smoothing technique, 147unlevered, 147–150, 161
Bid evaluation, 446–450Bill-to-bill, 325, 464Binomial option model, 99“Bird in the hand” theory, 260, 297Black-Scholes-Merton option pricing models, 99Blanket liens, 340, 464Board of Governors of the Federal Reserve System,
217Boards of directors, 11–24
agenda setting, 29audit committee and oversight, 17–18chairman, 13–14committees, 28compensation of, 30composition of, 12–13conflicts of interest and, 10, 29director-shareholder conflicts, 10, 41disclosure, 22–23, 35education of members, 31elections, 15–16ethics and, 29excessive compensation to directors, 10functions of, 25independence of chairman, 13–14independence of members, 12–13, 17, 26–27, 28independent advisors and, 31inter-linked, 10legal counsel, 21meetings of nonemployee directors, 28member selection, 27–28poison pill policy, 31qualifications of members, 12, 14–15, 26reporting of concerns by, 29–30
resources of members, 12responsibilities of, 11–12, 36, 41role of, 25self-evaluation of, 16–17, 28–29senior management and, 30shareholder proxy votes and, 24size of, 27–28staggered terms for, 425succession plan, 30transparency, 22–23, 35unitary system, 14
Bond equivalent yield, 318, 322, 464Bond indentures, 269, 278Bonding costs, 211, 464Bond ratings, 216–217Bonds:
callable and noncallable, 137equity risk premium relative to, 142put feature, 137
Bond yield, 145–146, 153Bond yield plus risk premium approach, 145–146,
162, 464Bonus awards, 19, 20Bonus issue of shares, 234. See also
Stock dividendsBook value equity per share, 383, 464Book value of debt, 367Book value of equity, 366–367Book value per share, 248–449Bootstrapping earnings, 415–416, 464Borrowing costs, 341–343Borrowing strategies, 340
short-term, 339–343Boston Scientific Corporation, 409BP Corporation, 414Brav, Alon, 242, 272Breakeven points, 189–191, 194, 464
calculating, 189–191taxes and, 190
Break point, 155–156, 162, 464Breakup value, 416, 464Brounen, Dirk, 68, 160Bruner, Robert F., 141, 450Buhner, Thomas, 158Businesses. See Corporations; International
businessBusiness expertise, 5Business forms, 3–6Business risk, 147, 174, 194, 365, 464Buybacks (share repurchases), 241–250. See also
Share repurchases
Cadbury Schweppes, 431Callable, convertible preferred stock, 139Callable bonds, 137Cal-Maine Foods, Inc., 282–283Cannibalization, 51, 464
bindex 13 January 2012; 9:32:27
490 Index

Capital. See also Cost of capitalalternatives for raising, 128business forms and, 3, 4corporations and, 5estimating proportions of, 132–133sources of, 147valuing, 128
Capital asset pricing model (CAPM), 93–95, 112,140–144, 161, 162
country risk and, 153–154Capital budgeting, 47–113
applying cost of capital to, 133–135basic model, 101–102cash flow projections, 70–81claims valuation, 109common pitfalls, 99–101defined, 48, 110economic and accounting income, 102–105economic profit, 106–107free cash flow to equity approach, 110free cash flow to the firm approach, 110inflation and, 81, 112investment decision criteria, 52–70, 110methods, 52–70monitoring, 49planning, 49post-auditing, 49principles of, 48, 50–52process, 49–50, 110project analysis and evaluation, 81–101project types, 49–50, 52, 110residual income, 107–108spreadsheet modeling of, 79–81valuation and, 48
Capital gains:dividends and, 261–265long-term, 260marginal tax rate on, 261–265shareholder preferences and, 276taxes for dividend reinvestment plans, 232
Capital investments:investment decision criteria, 52–70risk analysis, market risk methods, 92–95risk analysis, standalone methods, 86–92
Capital leases, 138Capital rationing, 52, 84–86, 112, 464Capital structure, 199–223
agency costs, 211–212company value and, 201–209cost of capital and, 205–209cost of financial distress, 210–211costs of asymmetric information, 212–213country-specific impacts, 222defined, 199–200, 222, 464fixed burdens and, 397international business and, 218–223irrelevance of, 201–202
Modigliani and Miller theory and, 201–208optimal, 213–215, 223share repurchases and, 287static trade-off theory of, 213–215, 223target, 213–215, 217, 223, 288taxes and, 205–209without taxes, 201–205
Capital structure policy, 216–222banking sector and, 220–221debt ratings and, 216–217evaluating, 217–218, 223financial markets and, 220–221government regulations and, 218institutional and legal environment of, 219–220,222
leverage in an international setting and, 218–219macroeconomic environment and, 221
Captive finance subsidiary, 324, 464Carbon dioxide emissions regulations, 37Carrying costs, 332Cash balances, minimum, 313Cash before delivery (CBD), 325, 464Cash collection systems, 326–328Cash concentration, 328Cash conversion cycle, 312Cash disbursements, 336Cash dividends, 252, 289–291
pro forma financials, 290–291share repurchases and, 249–250stock dividends and, 235–236
Cash flow coverage ratio, 368, 464Cash flow management, 312–316
cash forecasting systems, 314, 315daily cycle of, 313forecasting short-term cash flows, 313identifying typical cash flows, 313–314minimum cash balances, 313monitoring cash uses and levels, 315–316
Cash flow projections, 70–74accelerated depreciation, 74–77equation format for organizing, 72–74straight-line depreciation, 74–77table format with cash flows collected by type, 72table format with cash flows collected by year,70–71
Cash flows:after-tax, 50, 77bad accounting for, 100capital budgeting decisions and, 50–51, 111conventional, 51–52free, to equity, 110free, to the firm, 110generating, 340–341incremental, 51inflows, 314liquidity and, 306nonconventional, 51–52
bindex 13 January 2012; 9:32:27
Index 491

Cash flows (Continued )NPV and IRR conflicts, 61–65operating risk and, 176outflows, 314payback period and, 55–57for replacement projects, 77–79short-term, forecasting, 313typical, identifying, 313–314
Cash-flow-to-debt ratio, 368Cash forecasting, 314, 315Cash offerings, 420, 464Cash on delivery (COD), 325, 464Cash ratio, 235, 364, 464Cash underwritten orders, 158Celler-Kefauver Act, 430Certainty-equivalent method, 92Chairman of the board, 13–14Chartered Financial Analyst (CFA) designation,
487Chevron Corporation, 414Chief executive, 14, 19Chief financial officers (CFOs), 160China, 235Chung, Kwang S., 418Citibank Inc., 143Citigroup, Inc., 145, 146Civil-law countries, 221Claessens, Stijn, 221, 252Claims valuation, 109–110, 113Clayton Antitrust Act, 430Clientele effect, 261–265, 297, 464Clients, mergers and acquisitions and, 417Clorox, 356, 392Coca-Cola Company, 431Code of Corporate Governance (Monetary Authority of
Singapore), 31Colgate-Palmolive, 391–392Collateralized loans, 338Commercial paper (CP), 317, 338, 342–343Commitment fees, 339, 341, 464Committed lines of credit, 338, 464Common-base-year analysis, 353Common equity:
bond yield plus risk premium approach,145–146
capital asset pricing model, 140–144cost of, 140–146dividend discount model approach, 144–145
Common-law countries, 221Common shares, 230Common-size analysis, 349–356, 465
defined, 349horizontal, 349, 353–356vertical, 349, 350–353
Common stock, 230Company valuation:
comparable company analysis, 440–444
comparable transaction analysis, 444–446cost of capital and, 128discounted cash flow analysis, 434–440leverage and, 172merger analysis, 434–450
Company value:capital structure and, 200, 201–208cost of capital and, 205–209debt/equity ratio and, 214debt financing and, 206–207financial distress and, 210–211leverage and, 200mergers and, 450–451taxes and, 205–209of unlevered companies, 201–202
Comparable companies, 147, 152, 465analysis, 440–444, 453financial analysis and, 391–392
Comparable transaction analysis, 444–446, 453Compensation:
of board of directors, 30of chief executive, 19excessive, 10
Compensation committee, board of directors,19–21
Component cost of capital, 128, 465Component-percentage solvency ratios,
366–367Concentration banks, 315Conflicts of interest:
board of directors and, 10, 29business forms and, 3–6corporate governance and, 3director-shareholder, 10, 41manager-shareholder, 2, 40partnership and, 5
Conglomerate mergers, 411, 412, 417–418, 465Consolidation, 410, 465Constant dividend payout ratio policy, 279,
281–283, 298Constant-growth dividend discount model, 143Consumer price index (CPI), 348Contractual restrictions, dividend policy and,
277–278Contribution margin, 177, 465Control premium, 421, 446, 454. See also Takeover
premiumConventional cash flows, 51–52, 465Copeland, Tom, 206, 437Cornell, Bradford, 247Corporate bond ratings, 216–217Corporate governance:
board of directors and, 11–24codes of, 24–36conflicts of interest and, 2, 3, 40–41deficiencies in, 2defined, 2, 40, 465
bindex 13 January 2012; 9:32:27
492 Index

effective, 40environmental, social, and governance (ESG), 37–39evaluation of, 10–36failure of, 7–9federal regulation and, 2guiding principles of, 2–3net agency costs of equity and, 217, 223objectives of, 2–3, 40policy statements, 21–22, 41risk and, 39stakeholders and, 3transparency in, 8valuation implications of, 39–40
Corporate Governance Handbook, 12Corporate Governance of Listed Companies, The:
A Manual for Investors, 12Corporate raiders, 412, 465Corporate taxes. See TaxesCorporations:
advantages of, 1–2, 5characteristics of, 4conflicts of interest between managers andshareholders, 2
defined, 5, 465disadvantages of, 5–6failure of, 2, 7–9, 22, 24financial risk and, 3monitoring operations in, 5ownership of, 1–2raising capital, 5restructuring, 451–452shareholders and, 5wealth maximization by, 3
Cost of capital, 127–162applying to capital budgeting and securityevaluation, 133–135
capital structure policy and, 218common equity costs, 140–146for a company, 128–129company value and, 205–209component, 128debt costs, 135–138debt/equity ratio and, 214defined, 128, 465estimates, 128flotation costs, 157–159, 162investment decisions and, 128marginal costs, 154–157, 200, 469preferred stock costs, 138–140risk and, 128sources of capital, 135–146taxes and, 129–130, 208weights of the weighted average and, 131–133
Cost of capital estimation, 146–160country risk and, 153–154estimating beta and determining a project beta,146–153
flotation costs, 157–159, 162marginal cost of capital schedule, 154–157
Cost of common equity, 140–146Cost of debt:
after-tax, 209debt-rating approach to, 136–137defined, 134, 465estimating, 134–138issues in estimating, 137–138marginal, 200, 215yield-to-maturity approach to, 135–136
Cost of equity, 140–146, 161, 162, 223capital asset pricing model approach to, 140–141marginal, 200, 215Modigliani and Miller (MM) theory and, 203taxes and, 209
Cost of preferred stock, 138–140, 161, 465Cost structure, 173, 174, 465Cottle, Sidney, 260, 294, 296Country equity premium, 153, 154, 161Country risk premium, 144, 153–154Country spread, 153–154, 465Coverage ratios, 367–369Credit accounts, 324Credit insurance, 324, 465Credit limits, 307Credit lines:
committed, 338costs of, 341–342regular, 338uncommitted, 337–338
Credit management, 323–330Creditors, risks of, 191–193Credit rating agencies, 216–217Credit ratings, 223Credit risks, 319Credit scoring models, 325, 465Credit sources, 337–338Credit terms, 325Creditworthiness, 339, 465
defined, 307evaluating, 325liquidity and, 307
Cross-border mergers and acquisitions, 417, 453Crown jewel defense, 428Current assets, 364, 465Current income, 276Current liabilities, 364Current ratio, 235–236, 308, 310, 311, 364,
387, 465Customer receipts management, 326–328
Daimler AG, 293Damodaran, Aswath, 153, 294Daves, Philip R., 146Days in receivables, 309, 465Day’s payables outstanding, 309, 465
bindex 13 January 2012; 9:32:27
Index 493

Day’s sales in ending inventory, 309, 465Day’s sales outstanding, 309, 465Dead-hand provision, 425, 465DeAngelo, Harry, 291DeAngelo, Linda, 291Debt. See also Cost of debt
after-tax cost of, 130, 136, 159bad-debt reserves, 23before-tax cost of, 161book value of, 367fixed-rate, 137floating debt rate, 137leveraging role of, 185manager preferences and, 212marginal cost of, 200market value of, 367nonrated, 138pretax cost of, 130synthetic, 138tax-deductible interest, 129–130, 148, 222
Debt capital, 192Debt covenants, 278Debt/equity ratio, 203, 214Debt financing:
company value and, 206–207dividend policy and, 269inflation and, 221interest and, 148–149optimal capital structure and, 213–215
Debt incurrence test, 155, 465Debt maturity structure, 219Debt net of cash, 287Debt ratings, 136–137, 216–217, 466Debt ratios, 287Debt tax shield, 205, 222Debt-to-assets ratio, 236, 366, 367, 388, 466Debt-to-capital ratio, 156–157Debt-to-equity ratio, 131, 149, 150, 236, 366Decision trees, 97Declaration date, 238, 466Declining balance method, 150 percent, 75Default, 319Definitive merger agreements, 422, 466Degree of financial leverage (DFL), 182–184,
187–188, 194, 466Degree of operating leverage (DOL), 176–181,
187–188, 194, 466calculating, 180–181profitability and, 179
Degree of total leverage (DTL), 186–188,194, 466
Delaware, 425Dell Computer, 332Deminor Ratings, 39Demirguc-Kunt, Asli, 221Deposit insurance, 218Deregulation, mergers and acquisitions and, 413
Desroches, Paul, 240–241Developing nations, 153–154Diluted earnings per share, 383, 385, 466Dimson, Elroy, 141, 142Direct debit programs, 326–327, 466Disbursement float, 335, 466Disclosure, board of directors and, 22–23, 35Discount basis, 318Discount Books, 420–421Discounted cash flow (DCF) analysis, 96, 434–440,
453, 466techniques, 68, 69
Discounted payback period, 57, 68, 111Discounted receivables, 338Discount interest, 318, 466Discount rate, 51
for capital leases, 138errors, 100–101risk-adjusted, 92–93, 112
Distribution policy, 258. See also Payout policiesDiversification, 414Divestiture, 451–452, 454, 466“Dividend Aristocrats,” 267Dividend coverage ratio, 293–296Dividend discount model approach, 130, 141,
143–146, 159–161, 466Dividend imputation tax system, 275Dividend payout policy, 233–234, 466
agency costs and, 268–271“bird in the hand” theory, 260, 297clientele effect, 261–265, 297constant dividend payout ratio policy, 279,281–283, 298
contractual and legal restrictions and, 277–278debt financing and, 269defined, 258, 279expected volatility of future earnings and,272–273, 279
factors affecting, 271–279financial flexibility and, 273, 279flotation costs and, 276–277, 279global trends, 291–293information content of dividend actions, 265–268investment opportunities and, 272irrelevance of, 258–260, 297Modigliani and Miller (MM) theory and,258–259, 297
perfect capital markets and, 258–259positive net present value (NPV) projects and,283–285
relevance of, 260–261residual dividend policy, 279, 283–285, 298share price and, 286share repurchases and, 285–291, 298stable, 279–281, 283, 298taxes and, 260–261, 273–276, 286, 297theory of, 258–271
bindex 13 January 2012; 9:32:27
494 Index

types of, 279–285variable dividend policy, 283
Dividend payout ratio, 233, 236, 265, 384, 385, 466by country, 292–293dividend safety and, 293–296
Dividend reinvestment plans (DRPs), 231–232Dividend repurchase plans, 232Dividends:
capital gains and, 261–265cuts, 267–268declarations, 230, 266defined, 229–230, 466extra or special (irregular) cash dividends,232–234
financial analysis and, 230forms of, 230–238, 252homemade, 29, 259–260liquidating, 234marginal tax rate on, 261–265omissions, 267payment chronology, 238–241payment schedules, 231payout and, 230regular cash dividends, 231–232signaling information with, 265–268, 286, 297stock, 234–236stock splits, 236–238suspension of, 233taxes and, 230, 260–265
Dividend safety:analysis, 293–298measures of, 294
Dividends per share (DPS), 280, 384, 385Dividend yield, 236, 262, 466Djankov, Simeon, 221Documentary credit accounts, 324Dodd, David, 260, 294, 296Domowitz, Ian, 221Double-declining balance method, 74–76Double taxation, 274–275, 297, 466Drag on liquidity, 306–307, 466DuPont analysis, 372–383, 378, 380Du Pont de Nemours, E.I., 372Dutch auctions, 243–244, 252
Earnings before interest, taxes, depreciation, andamortization (EBITDA), 269, 368, 439
EBITDA-to-debt ratio, 368Earnings before interest and taxes (EBIT), 204,
206–207, 435Earnings multiple approach, 68Earnings per share (EPS), 100, 245–248, 246, 287,
383, 466E-commerce, 335Economic cycles, 348Economic depreciation, 103Economic income, 51, 102–105, 112
Economic order quantity–reorder point(EOQ–ROP), 331, 466
Economic profit (EP), 106–107, 109, 112Economic responses, to investments, 99–100Economies of scale, 410, 466Edwards, Edgar O., 107Ehrhardt, Michael C., 146Elasticity, 176, 467Electric utilities, 270–271Electronic data interchange (EDI), 335Electronic funds transfer (EFT), 326, 328, 467Electronic payment networks, 326–328Elton, Edward, 263Employee stock options, 286Ending inventory, 309Endowment funds, 276Engelhard Corporation, 429Enron, 7–8, 22, 40, 210Enterprise multiples, 440Environmental, social, and governance (ESG) risk
exposure, 37–39Environmental projects, 50E.ON AG, 280Equal-weighted industry averages, 392Equitable treatment, 3Equity:
after-tax cost of, 130, 159agency costs of, 211, 217book value of, 366–367capital, 192–193carve-out, 452, 467cost of, 140–146, 161, 162, 223manager preferences and, 212marginal cost of, 200market value of, 366–367multiplier, 366
Equity beta (β), 149, 205Equity risk premium (ERP), 141, 145, 467
calculating, 143country risk premium and, 144in dividend discount model based approach, 144historical, 141–143, 468in survey approach, 144
Equivalent annual annuity (EAA) approach,83–84, 112
Erb, Claude, 154Ethics, 29Eurodollar time deposits, 317Europe 350, 267European Commission, 430, 431, 453Evaluated pricing, 137Exchange ratio, 420, 453, 467Ex-dividend, 262–263, 467Ex-dividend date (ex-date), 238–239,
262–263, 467Ex-dividend price, 260, 467Expansion projects, 50
bindex 13 January 2012; 9:32:28
Index 495

External growth, 414, 467Externalities, 51, 467Extra (special) dividends, 232, 467ExxonMobil, 250, 267, 414Ezzell, John R., 134, 159
Fabozzi, Frank, 137, 139Factoring, 338, 340Fair price amendments, 426Fama, Eugene, 141, 291Fan, J. P. H., 218, 220, 221Federal agency securities, 317Federal Deposit Insurance Corporation (FDIC),
430Federal Reserve Bank, 430Federal Trade Commission (FTC), 430, 431, 453Federal Trade Commission Act, 430Ferris, Stephen, 292Filbeck, Greg, 266Financial analysis:
capital budgeting decisions and, 50common-size analysis, 349–356comparables, 391–392defined, 347, 467dividends and, 230financial ratio analysis, 348, 356–392information needed for, 347–348, 386manager preferences and, 212–213pro forma analysis, 348, 392–401vertical common-size analysis of, 350
Financial distress, 210–211, 467. See alsoBankruptcy
Financial flexibility, 272–273, 279Financial markets, 219, 220–221Financial ratios, 348, 356–392, 386–392
activity ratios, 357–363defined, 356interpretation of, 386leverage, 236, 366, 390liquidity ratios, 363–365profitability ratios, 369–382selecting, 356–357solvency ratios, 365–369types of, 357
Financial reporting:falsification of, 9, 22quality of, 22–23
Financial risk, 38, 147, 182–184, 194, 467business form and, 3defined, 182sole proprietorship and, 4solvency ratios and, 365
Financial statements:accuracy of, 22–23analysis of, 347–401
Fisher, Irving, 133Fitch, 216
Fixed burdens, 396–397Fixed capital investment (FCInv), 277Fixed-charge coverage ratio, 368Fixed costs, 171–173, 177–180, 467Fixed-financing sources of capital, 147Fixed operating costs, 175, 176Fixed price tender offers, 243, 252, 467Fixed-rate debt, 137Fixed-rate perpetual preferred stock, 138, 467Flexibility options, 96Flip-in pills, 424, 467Flip-over pills, 424–425, 467Float, 467Float factor, 327, 328, 467Floating debt rate, 137Floating-rate securities, 137Flotation costs, 157–159, 162, 467
defined, 276dividend policy and, 259–260, 276–277, 279weighted average cost of capital and, 159
Ford Motor Company, 233, 269Foreign exchange risk, 319Forward annual dividend yield, 145Forward integration, 411Franking credit, 275Free cash flow (FCF), 212, 269, 294–296, 434, 438,
467, 468Free cash flow to equity (FCFE), 110, 135, 277,
294–296, 434, 468Free cash flow to the firm (FCFF), 110, 135, 434,
468French, Kenneth, 141, 291Fried, Dov, 75Friendly mergers, 422–423Friendly transactions, 410, 468Fundamental options, 96Future earnings, expected volatility of,
272–273, 279
General Electric Company, 24, 25–31, 273, 293,297
General Motors, 217, 233Geometric mean, 142Georgia State University, 39Giro system, 326, 468Gitman, Lawrence, 160Glen, Jack, 221Global payout policy trends, 291–293Global Reporting Initiative (GRI), 38Golden parachutes, 426Gold mines, 98–99Gordon, Myron J., 144, 260Gordon growth model, 143, 144Governance Principles (General Electric), 25–31Government regulations:
capital structure policy and, 218corporate governance and, 2
bindex 13 January 2012; 9:32:28
496 Index

hostile takeovers and, 425mergers and acquisitions and, 411–413, 417,429–434
Graham, Benjamin, 260, 294, 296Graham, John, 68, 160, 242, 272Greenmail, 244, 412, 427, 468Grinblatt, Mark, 266Gross domestic product (GDP), 348Gross profit margin, 370, 468Groupe Eurotunnel, 251Growth:
sustainable rates, 145through mergers and acquisitions, 414–415
Growth options, 96, 468Gruber, Martin, 263Grullon, Gusavo, 242Guidant Corporation (GDT), 408–409Guidelines and Regulations on Corporate Governance
(Monetary Authority of Singapore), 31–33
Hall, Martin, 324Hamada, Robert, 204Harley Davidson, Inc., 295–296Hart-Scott-Rodino Antitrust Improvements
Act, 430Harvard University, 39Harvey, Campbell R., 68, 153, 154, 160, 212, 242,
272He, Wei, 232Healy, P., 251Henry, Elaine, 107, 110, 135, 434Herfindahl-Hirschman Index (HHI), 431–433, 453,
468High Dividend Universe (HDU), 297Hirshleifer, John, 133Historical equity risk premium approach, 141–143,
468Hoag, Susan E., 418Holder-of-record date, 239, 468Homemade dividends, 29, 259–260Homemade leverage, 259Hong Kong, 274Hong Kong Stock Exchange, 239Horizontal common-size analysis, 349, 353–356,
468Horizontal mergers, 410, 417–418, 453, 468Hostile mergers, 31, 410, 412, 423, 453, 468.
See also Mergers and acquisitions (M&A);Takeovers
Hubris hypothesis, 451Hurdle rate, 68
Ibbotson, Robert, 147Ibbotson SBBI Classic Yearbook, 230Ibbotson U.S. large-cap data, 230IBM, 267Immelt, Jeffrey, 273
Impairment of capital rule, 277, 468Implied risk premium approach, 143–146, 468Imputation, 468Income statements, 349, 392–395, 398–401, 436
sales-driven, 396Incremental cash flow, 51, 468Indentures, 277, 468Independence of board members, 12–14Independent projects, 52, 468Industry life cycle, 417–418Industry sectors, 262Inflation:
capital budgeting analysis and, 81, 112international business and, 221
Initial outlay, 72, 78, 94, 111Initial public offerings (IPOs), 7Insider transactions, 23–24Installment credit accounts, 324Institute of Chartered Financial Analysts, 230Institutional environment, 219–220Interest:
on debt financing, 129–130, 148–149estimating, 396–397tax deductibility of, 129–130, 148, 161, 222, 230,435
Interest coverage ratio, 367, 468Interest effect (interest burden), 377Interest rate risk, 319Interest rates, risk-free, 144, 145Inter-linked boards, 10Internal financing, 212Internal rate of return (IRR), 69, 110
accelerated depreciation and, 77capital rationing and, 85–86conflicts with net present value, 61–65frequency of use, 68, 69investment decisions and, 53–55, 81multiple-IRR problem, 65–68, 111no-IRR problem, 65, 67, 68, 111NPV profile and, 60pitfalls, 100for replacement projects, 77, 79simulation (Monte Carlo) analysis and, 89–92
International Accounting Standards Board (IASB),20
International business:banking sector, 219, 220–221, 222financial markets, 219, 220–221, 222inflation and, 221, 222institutional environment, 219–220, 222legal environment, 219–220, 222leverage in, 218–222macroeconomic environment, 219, 221, 222taxes and, 220, 222
Inventory blanket liens, 341, 468Inventory costs, 332Inventory holding period, 309, 468
bindex 13 January 2012; 9:32:28
Index 497

Inventory management, 330–333accounts payable and, 335approaches to, 331–332evaluating, 332–333financial impact of inventory methods, 333goals for, 330inventory costs, 332overinvestment, 331underinvestment, 331
Inventory turnover, 308, 332–333, 358, 363, 387,468
Investment alternatives, 101Investment analysts, 21, 41Investment bankers, 157Investment Company Act of 1940, 12Investment decisions, 52–70
average accounting rate of return and, 58CFOs and, 160cost of capital and, 128internal rate of return and, 53–55marginal cost of capital and, 133net present value and, 52–53NPV profile and, 59–61payback period and, 55–57profitability index and, 58–59
Investment opportunities, 272Investment opportunity schedule (IOS), 133,
468Investment policy:
evaluating, 321–322sample format, 321
Investment risk, 319Investments:
short-term, 316–319vertical common-size analysis of, 350
Investment yield basis, 318Investment yields, 316, 318–319Investors:
assessment by, 21, 41clientele effect, 261–265, 297marginal, 263
Irregular dividends, 232–233, 232–334. See alsoExtra (special) dividends
ISS Corporate Governance Quotient, 39
Japan, 237Jayaraman, Narayanan, 292Jensen, Michael C., 146, 211, 212Jensen’s free cash flow hypothesis, 269Johnson & Johnson, 392, 408–409Jong, Abe de, 68, 160Just-in-time (JIT) method, 332, 469“Just say no” takeover defense, 426–427
Kaplan, Paul, 147Kaserer, Christoph, 158Kidwell, David, 276
Kim, Kenneth, 483KIT digital, 237Kmart, 380–382, 397Koedijk, Kees, 68, 160Koller, Tim, 437Kunkel, Robert A., 146Kyoto Protocol, 37
Laddering strategy, 320, 469Lead banks, 315Leading P/E, 383Lease, Robert, 280Leases, 138Least common multiple of lives approach, 82–83,
112Least squares regression, 181Lee, Inmoo, 158Lee, Rafaelina M., 153Legal counsel, for boards of directors, 21Legal environment, 219–220, 222Legal restrictions, dividend policy and, 277–278Legal risk, 38, 469Legislative risk, 37, 469Leverage:
company value and, 172, 200, 202defined, 171–172, 194, 469degree of operating leverage, 176–180homemade, 259in international business, 218–222measures of, 171–194risk and, 173–194share repurchases and, 287solvency analysis and, 388–389
Leveraged buyouts (LBOs), 427, 469Leveraged recapitalization, 428, 429, 469Levered beta (β), 147–150, 161Liabilities, fictitious reporting of, 9Liability risk, 39, 41LIFO (last in, first out) inventory accounting, 23Limited liability, of shareholders, 5Lins, Karl V., 212Lintner, John, 260, 272, 280, 298Liquid assets, 364, 465Liquidating dividends, 234, 469Liquidation, 192–193, 452, 469Liquidity, 469
analysis, 363–365cash flows and, 306defined, 305, 363–364low industry positions, 307management, 305–307measuring, 307–312, 364–365primary sources of, 305pulls and drags on, 306–307secondary sources of, 306
Liquidity ratios, 308, 363–365, 388, 469Liquidity risk, 319
bindex 13 January 2012; 9:32:28
498 Index

Litigation, takeover bids and, 427Lochhead, Scott, 158Lockbox systems, 327, 469London Interbank Offered Rate (LIBOR), 339, 469Long-term capital gains taxes, 260Long-term debt, 220–221Long-term debt-to-assets ratio, 366, 388, 469
Macroeconomic environment, 219, 221, 222MACRS (modified accelerated cost recovery system),
75–77capital budgeting example, 76depreciation rates under, 75
Madden, Ian, 297Madhavan, Ananth, 221Majluf, Nicholas, 212, 266Maksimovic, Voljislav, 221Managerialism theories, 416, 469Managers:
conflicts of interest with shareholders, 2, 40financing method preferences, 212–213mergers and acquisitions and, 416, 422perquisites, 7stakeholder conflicts, 6–9
Manufacturing or materials resource planning(MRP), 332, 469
Marcus, Alan, 242Marginal cost of borrowing, 215Marginal cost of capital (MCC), 129, 469. See also
Weighted average cost of capital (WACC)break point and, 155, 162capital-budgeting decision making and, 133debt-to-capital ratio and, 156–157investment opportunity schedule and, 133schedule, 154–157target capital structure and, 155–156
Marginal cost of equity, 215Marginal investors, 263, 469Marginal tax rate, 149, 150, 205
on capital gains, 261–265on dividends, 261–265
Margins, 369–370Mariscal, Jorge O., 153Market imperfections, 417Market model, 146Market multiples, 439Market price per share, 385Market risk, 92–95, 148, 319Market risk premium, 153Market share, 414, 431–433Market value added (MVA), 107Market value of debt, 367Market value of equity, 366–367Marsh, Paul, 141, 142Marshall, Alfred, 372Marshall, William, 290Masulis, Ronald, 266
Matching strategy, 320, 469“Material adverse change” clause, 408Materials or manufacturing resource planning
(MRP), 332, 469Matrix pricing, 137, 470Meckling, William H., 211Megginson, William L., 292Merck & Co., 411Mercurio, V., 160Merger analysis, 434–450
bid evaluation, 446–450comparable company analysis, 440–444comparable transaction analysis, 444–446discounted cash flow (DCF) analysis, 434–440target company valuation, 434–446
Mergers, 410, 470. See also Mergers and acquisitions(M&A)
Mergers and acquisitions (M&A), 407–454analysis, 434–50corporate restructuring and, 451–452forms of, 419–420friendly, 422–423government regulations and, 411–413, 417,429–434
growth through, 414–415hostile, 423industry life cycle and, 417–418motives for, 413–418, 453payment methods, 420–422reasons for, 408–409renegotiation or cancellation of, 408–409target management and, 422–423taxes and, 419transaction characteristics, 418–423types of, 410–411, 452–453U.S. history of, 411–413value created by, 450–451, 454
Mergerstat Review 2006, 421, 422Mian, Shehzad L., 324Michaely, Roni, 242Michel, Allen, 250Microsoft Corporation, 232, 268, 269Miles, James A., 134Miller, Merton H., 147, 201–208, 218, 258, 271Minimum cash balances, 313Mismatching strategy, 320, 470Mittoo, Usha, 160Mixed offerings, 420, 470Modigliani, Franco, 147, 201–208, 218, 258,
271Modigliani and Miller (MM) theory, 200–208,
222–223dividend policy and, 258–259, 271, 297Proposition I: company value not affected bycapital structure, 202, 203, 205–207, 208
Proposition II: leverage and cost of equity,202–205, 206, 208
bindex 13 January 2012; 9:32:28
Index 499

Monetary Authority of Singapore (MAS), 24,31–33
Money market mutual funds, 317Money market yield, 318, 470Monitoring costs, 211, 470Monte Carlo (simulation) analysis, 89–92, 112Monthly billing, 325, 470Moody’s, 216–217MSCI EAFE Index, 230MSCI Global Index, 293MSCI World Index, 297Multiple IRR problem, 65–68, 111Murrin, Jack, 437Mutual funds, 317Mutually exclusive projects, 52, 470
equivalent annual annuity approach, 83–84,112
least common multiple of lives approach,82–83, 112
with unequal lives, 82–84Myers, Stewart, 212, 242, 266
NASDAQ, 193NASDAQ Global Markets, 237Negative net present value (NPV) projects,
268–269Nestle, 267Net current assets, 470Net debt plus equity, 287Net debt to capital ratio, 287Net income:
capital budgeting and, 100operating income and, 182undistributed, 6–7
Net noncash charges (NCC), 438Net operating cycle, 312, 361, 363, 470Net operating profit less adjusted taxes (NOPLAT),
435, 437–438, 470Net present value (NPV), 50, 69, 110
accelerated depreciation and, 76–77capital budgeting decisions and, 134capital rationing and, 84–86conflicts with internal rate of return, 61–65defined, 161, 470frequency of use, 68, 69internal rate of return and, 54investment decisions and, 52–53, 81market value added, 107mutually exclusive projects with unequal lives,82–84
negative, 53, 59NPV profile, 59–61, 111payback period and, 56positive, 53, 54, 59, 134profitability index and, 59project scale and, 63–64real options and, 96, 97
for replacement projects, 77, 79risk analysis and, 86–94
Net profit margin, 370, 381–382, 390, 470Nevova, Titiana, 221New-issue DRPs, 232, 470New projects and services, 50New York Stock Exchange, 19, 26–27, 238
Euronext, 240No-IRR problem, 65, 67, 68, 111Nominal rate, 318, 470Nominating committee, board of directors,
18–19Nonbank finance companies, 338Noncallable bonds, 137Nonconventional cash flows, 51–52, 470Nonrated debt, 138Novartis, 267NPV profile, 59–61, 111Number of days of inventory, 309, 310, 311, 361,
363, 470Number of days of payables, 309, 310, 311, 337,
361, 470Number of days of receivables, 308–9, 311,
328–330, 361–362, 470
Obsolete inventory, 306Oded, Jacob, 250OECD Principles of Corporate Governance
(OECD Principles), 33–36Off-balance-sheet financing, 23Office Depot, 373–380Open book credit accounts, 324Open-market DRPs, 232, 470Open-market share repurchases, 243Operating breakeven points, 189–191, 194, 470
calculating, 190–191defined, 190
Operating cash flow (OCF), 277after-tax, 50, 70, 71, 73, 76, 77, 79, 80, 86, 94,97, 98, 101, 102, 111
Operating costs:fixed, 177–180variable, 177–180
Operating cycle, 312, 360–363, 470Operating income:
business risk and, 174changes in, 177defined, 177elasticity of, 176–180financial risk and, 182–184net income and, 182revenues and, 181sales risk and, 175
Operating leases, 138Operating leverage, 180, 184–188Operating profit margin, 370, 470Operating return on assets, 371–372, 470
bindex 13 January 2012; 9:32:28
500 Index

Operating risk, 38, 147, 176–181, 470defined, 174, 176operating leverage and, 180
Operational risk, 2, 470Opportunity costs, 50, 51, 101, 470Optimal capital structure, 223, 470
static trade-off theory and, 213–215taxes and, 222
Option-adjusted spread (OAS), 137, 139Option pricing models, 97Oracle Corporation, 251Ordering costs, 332Ordinary shares, 230Ordinary terms, 325, 471Organic growth, 414, 471Organisation for Economic Co-operation and
Development (OECD), 24, 33–36Overdraft line, 338Overhead costs, 100Overspending, 101Owens Corning Corporation, 192–193Owers, risks of, 191–193
Pac-Man defense, 428Palepu, K., 251Palisade Corporation, 89Pan Asia Index, 267Parmalat, 9, 22Parrino, Robert, 276Partnership:
characteristics of, 4conflicts of interest and, 5defined, 5, 471financial risk and, 3
Passive strategy, 320, 340, 471Payables stretching, 335Payback period:
defined, 110discounted, 57, 111drawbacks of, 55–57frequency of use, 68, 69investment decisions and, 55–57
Payment date (payable date), 239, 471Payments, liquidity and, 307Payout, 230, 471Payout policies, 279–293, 471
cash dividends and, 289–291defined, 230, 258expected volatility of future earnings and,272–723, 279
global trends in, 291–293share repurchase decision and, 285–291stable dividend policy, 279–281, 298types of, 279–285
Payout ratio, 471Pecking order theory, 212, 471Pennsylvania, University of, 39
Pension funds, 276Perfect capital markets, 471
capital structure and, 202defined, 201dividend policy and, 258–259
Perquisites, 7, 19, 20, 211Personal taxes, 220Per-unit contribution margin, 177, 471Peterson, David R., 107, 147Peterson, James, 147Peterson, Paula P., 107Pet projects, 100, 471Pinto, Jerald E., 107, 110, 135, 434Plowback ratio, 385Point of sale (POS), 326, 471Poison pills, 31, 424–425, 429, 471Poison puts, 425, 471Policy costs, 332Porter, R. Burr, 159Positive net present value (NPV) projects,
283–285Post-merger market share, 431Post-offer takeover defenses, 426–429, 453Precautionary stocks, 330, 471Preferred stock:
calculating cost of, 139–140callable, convertible, 139cost of, 138–140, 161dividends, 138, 139–140, 143–145, 158, 159, 161features affecting cost of, 139
Premier Marketing Corporation, 420–421Pre-offer takeover defenses, 424–426, 453Pretax cost of debt, 130Pretax profit margin, 370, 471Priced risk, 141, 471Price-setting options, 96, 471Price-to-earnings ratio, 235, 383, 415–416Principal-agent problem, 6, 471Procter & Gamble Company, 237, 267,
350–356, 358, 359, 360, 363, 365, 367,369, 370, 372, 384, 385, 386–392, 396–397
Producer price index (PPI), 348Product differentiation, 417Production-flexibility options, 96, 97, 471Product mix, 387Profitability:
degree of operating leverage and, 179vertical common-size analysis of, 350
Profitability analysis, 369–382, 389DuPont analysis, 372–383margins, 369–370return-on-investment ratios, 370–372
Profitability index (PI), 58–59, 111capital rationing and, 84–86frequency of use, 68
Profitability ratios, 369–382, 471Profit margin ratios, 369–370
bindex 13 January 2012; 9:32:28
Index 501

Pro forma analysis, 348, 392–401steps in, 394
Pro forma earnings, 23Pro forma financials, 290–291Pro forma statements, 436, 453
constructing, 397–401defined, 392example, 393variability in, 435
Project analysis and evaluation, 82–101capital budgeting pitfalls, 99–101capital rationing, 84–86, 112mutually exclusive projects with unequal lives,82–84
risk analysis of capital investment—market riskmethods, 92–95
risk analysis of capital investment—standalonemethods, 86–92
Project beta, 146–153Project scale, 63–64Project sequencing, 52, 471Project valuation, 134Proxy fights, 423, 471Proxy Statement (SEC Form DRF 14A), 11, 13, 20Proxy statements, 423, 471Public equity offerings, 212Pull on liquidity, 306–307, 472Pure-play method, 147, 149–151, 161, 472Pushing on payables, 335Put feature, 137
Quick assets, 308, 472Quick ratio, 308, 310, 311, 364, 387, 472
Ratio analysis, 386–392Real options approach, 68, 95–99, 112Receivables turnover, 358–359, 472Regular cash dividends, 231–232Regular lines of credit, 338Regulations. See Government regulationsRegulatory projects, 50Regulatory risk, 37, 469Related-party transactions, 24Reorganization, 472Replacement projects:
capital budgeting decisions on, 49–50cash flows for, 77–79
Repricing, stock options, 20–21Repurchase agreements (repos), 317Reputational risk, 38, 472Required rate of return, 50, 51
in dividend discount model based approach, 143security market line and, 94weighted (overall) average cost of capital and, 95
Residual dividend policy, 279, 283–285, 298, 472Residual income, 107–108, 112Residual loss, 211, 472
Restricted stock grants, 19, 21Retail payments, 326–327Retained earnings, 7, 401Return on assets, 371–378, 390, 472Return on common equity, 372, 472Return on equity (ROE), 100, 371–372, 378–381,
390, 472leveraging and, 185–186
Return-on-investment ratios, 370–372, 371–372Return-on-sales ratios, 369–370Return on total capital, 371, 472Revenues:
forecasting, 397growth rate, 397operating earnings and, 181
Reverse stock splits, 237–238, 252, 472Reverse synergy, 452Revolving credit, 324Revolving credit agreements (revolvers), 337, 338,
339, 472Rights offerings, 158Risk. See also Financial risk; Operating risk
accounting, 39, 41asset, 39, 41business, 147, 174, 194, 365, 464cost of capital and, 128credit, 319of creditors and owners, 191–193environmental, social, and governance (ESG) riskexposure, 37–39
financial, 147, 182–184, 194foreign exchange, 319investment, 319legal, 38, 469legislative, 37, 469leverage and, 173–194liability, 39, 41liquidity, 319market, 92–95, 148, 319operating, 147, 174, 176–181, 194operational, 2, 470priced, 141, 471regulatory, 37, 469sales, 147, 174–175, 194, 472standalone, 86–92strategic policy, 39, 41value at, 68
@Risk, 89, 90Risk-adjusted discount rates, 92–93, 112Risk analysis of capital investments:
market risk methods, 92–95standalone methods, 86–92
Risk-free assets, 140Risk-free rate of interest, 144, 145Risk neutral, 263Risk of equity, 203Risk premium, 145–146
bindex 13 January 2012; 9:32:28
502 Index

Ritter, Jay, 158Robinson, Thomas R., 107, 110, 135, 434Roll, Richard, 451Roper, Andrew H., 212Ross, Stephen, 266Royal & Sun Alliance Group, 267–268
Sabherwal, Sanjiv, 292Sabri, Nidal Rashi, 242Safe Drinking Water Act of 1974, 38Safety projects, 50Safety stock, 331, 472Salary, 19, 20Sales-driven accounts, 395, 396Sales risk, 147, 174–175, 194, 472Sanofi-Aventis, 267Scenario analysis, 88–89Scottsville Instruments, Inc., 289–291Scrip dividend schemes, 232Sears, 237Seasoned equity offering (SEO), 7Securities, risk of, 182Securities Exchange Act, 433–434Securities laws, 433–434Securities offerings, 420, 472Security market line (SML), 93–94, 112Security valuation:
applying cost of capital to, 133–135weighted average cost of capital and, 135
Sen, Nilanjan, 292Sensitivity analysis, 68, 87–88, 112Shareholders:
board of directors and, 12compensation and, 20corporations and, 5current income vs. capital gains and, 276directors and, 10, 41equitable treatment of, 3, 34–35limited liability of, 5managers and, 2, 40proxy votes, 24rights of, 3, 34voting rights, 425–426, 429
Share overhang, 20Share repurchases (buybacks), 230, 241–250, 252,
472book value per share and, 248–249cash dividends and, 249–250direct negotiation of, 250dividend policy and, 259, 285–291,294–295, 298
earnings per share and, 245–248, 287financial effects of, 245–249financial leverage and, 287hostile takeovers and, 427, 429methods, 243–245special cash dividends and, 288–289
target capital structure and, 288using borrowed funds, 246–248using idle cash, 246
Shark repellents, 424, 472Shastri, Kuldeep, 206Sherman Antitrust Act, 430Short-term borrowing approaches, 339–343Short-term cash flows, 313, 315Short-term financing, 337–343, 390
asset-based loans, 340–341borrowing approaches, 339–340costs of borrowing, 341–343instruments, 338sources of, 337–339
Short-term funds management, 322, 323Short-term investments, 315, 316–323
investment instruments, 316–319sample investment policy format, 321strategies, 320–322yields on, 316, 318–319
Siegel, Jeremy, 142Siemens AG, 288Signaling, with dividend actions, 265–268,
286, 297Simulation (Monte Carlo) analysis, 89–92, 112Sizing options, 96Skinner, Douglas, 291Small-capitalization stocks, 147Smith, Clifford W., 324Smoothing techniques, 147Sole proprietorship, 3–5, 4, 472Solvency analysis, 365–369, 388–389Solvency ratios, 365–369, 472Sondhi, Ashwinpaul C., 75Sonnenfeld, Jeffrey, 12Sovereign yield spread, 153, 161, 472S&P 500 Index, 267Special cash dividends, 288–289Special (irregular) dividends, 232–234Spin-offs, 452, 472Split-offs, 452, 473Split-rate tax system, 275, 276, 473Spreadsheet modeling of capital budgeting, 79–81S&P/TSX, 267Stable dividend policy, 279–281, 283, 298Stakeholders:
board of directors and, 12corporate governance and, 35directors and, 6–10, 41managers and, 6–10, 40rights and responsibilities of, 3sole proprietorship and, 4
Standalone risk, 86–92Standard & Poor’s, 143, 216–217, 267, 278Staples, 376, 379–380Statement on Financial Accounting No. 13,
Accounting for Leases (FASB), 138
bindex 13 January 2012; 9:32:29
Index 503

Static trade-off theory of capital structure, 213–215,223, 473
Statutory mergers, 410, 452, 473Staunton, Mike, 141, 142Steiner, Fabian, 158Stock dividends, 234–236, 473
cash dividends and, 235–236effects of, 235price-to-earnings ratio, 235propensity of companies to pay, 235
Stock-out costs, 332Stock-out losses, 330, 473Stock purchase acquisitions, 419–420, 453, 473Stocks:
awards, 19, 20, 21buying on the margin, 237issues, 212offerings, 420–421options, 19, 20–21transferability of ownership, 5
Stock splits, 236–238, 252dividends, 236–238reverse, 237–238, 252
Stock-swap mergers, 412Stowe, John D., 107, 110, 135, 434Straight-line depreciation, 74–77Strategic policy risk, 39, 41Stretching payables, 335, 473Subsidiary mergers, 410, 452, 473Sum-of-years digits method, 74Sunk costs, 51, 101, 473Supermajority voting provisions, 426, 429Survey approach, 144, 473Suspension of dividends, 233Sustainable growth rate, 145, 473Synergy, 413, 447, 450
reverse, 452Synthetic debt, 138Systemic risk of assets, 205
Takeover premium, 412, 421, 424, 427, 428, 429,434, 441–444, 446–451, 454, 473
Takeovers, 410, 424–429, 473hostile, 31, 412post-offer defenses, 426–429, 453pre-offer defenses, 424–426, 453
Takeover transactions data, 444Tangible assets, 211Target balance, 315, 473Target capital structure, 131, 200, 213–215, 217,
223, 473marginal cost of capital schedule and, 155–156share repurchases and, 288
Target companies, 410, 422–423, 473benefits of mergers for, 450, 454post-offer takeover defenses, 426–427, 453pre-offer takeover defenses, 424–429, 453valuation of, 434–446
Target payout ratio, 280–281, 473Tashman, Elise, 290Tatham, Charles, 260, 294, 296Tax-advantaged securities, 317Tax burden, 377–378Tax effect, 377–378Taxes:
accelerated depreciation and, 77breakeven points and, 190clientele effect and, 262–263company value and, 205–209cost of capital and, 129–130, 208cost of equity and, 209dividend policy and, 260–261, 273–276, 286, 297dividends and, 230double taxation, 274–275, 297, 466estimating, 396–397interest deductibility, 129–130, 148, 161, 222,230, 435
international business and, 220, 222long-term capital gains and, 260marginal rate, 200, 205mergers and acquisitions and, 416, 419methods, 274–276optimal capital structure and, 222
Tax-exempt institutions, 276Technology transfer, 417TeliaSonera AB, 233–234Template errors, 10010-K reports, 11Tender offers, 243, 252, 423, 429, 473Terminal value, 438–439Terminal year after tax nonoperating cash flows, 70,
71, 73, 74, 76, 79, 86, 101, 111Therma-Wave, Inc., 3863M, 267Tight credit, 306Times-interest-earned ratio, 367, 473Timing options, 96Titman, Sheridan, 218, 266Tootsie Roll Industries, 235TOPIX Index, 141Total asset turnover, 359–360, 390, 473Total leverage, 184–188Total SA, 237, 240–241Toyota Motor Company, 278–279, 293Trade credit, 334, 473Trade discounts, 335–336Trailing P/E, 383, 473Transactions motive, 330, 473Transparency:
board of directors and, 22–23, 35corporate governance and, 3, 8
Treasury shares (treasury stock), 242, 473Trust receipt arrangements, 341, 473Turnover ratios, 308–312, 358–360, 363, 388Twite, Garry J., 218Tyco, 7
bindex 13 January 2012; 9:32:29
504 Index

UBS, 293Uncollected receivables, 306Uncommitted lines of credit, 338, 473Underspending, 101Undistributed net income, 6–7Unilever PLC, 237Unitary board system, 14United Kingdom, 242United Nations Framework Convention on Climate
Change (UNFCCC), 37Units-of-production method, 75Unlevered beta (β), 147–150, 161Unlevered companies, 201–202Unlimited funds, 52, 473Unlu, Emre, 292U.S. Bankruptcy Code:
Chapter 7 liquidation, 192–193Chapter 11 reorganization, 192–193
U.S. Department of Justice, 430, 431, 433, 453U.S. Environmental Protection Agency (EPA), 38U.S. equity risk premium, 141–142U.S. Securities and Exchange Commission
(U.S. SEC), 216–217, 292board of directors and, 11, 12, 13–14share repurchases, 242
U.S. Supreme Court, 411U.S. Treasury bills, 317
U.S. equity risk premium relative to, 141Utility industry, 270–271
Value at risk, 68Value-weighted industry averages, 392Variable costs, 173, 177–180, 474Variable dividend policy, 283Variable operating costs, 176Vermaelen, Theo, 242, 244, 250, 286Vertical common-size analysis, 349, 350–353, 474Vertical mergers, 411, 414, 417–418, 453, 474Viskanta, Tadas, 154Von Eije, Henk, 292Voting rights, hostile takeovers and, 425–426
Wall Street Journal, 237Wal-Mart Stores, 181, 267, 310, 333, 395, 396Warehouse receipt arrangement, 341, 474Weaver, Samuel C., 450Webvan.com, 193Weighted average collection period, 328–330
Weighted average cost of capital (WACC), 95, 129,133–134. See alsoMarginal cost of capital (MCC)
break point and, 155–156capital structure and, 199–200computing, 129decrease in, 155, 474defined, 161, 200estimating, 134, 151–153flotation costs and, 159marginal cost of capital schedule and, 155–157merger analysis and, 435, 438Modigliani and Miller (MM) theory and, 203,206, 207
project valuation and, 134security valuation and, 135, 161
Weston, J. Fred, 206, 418, 450White, Gerald I., 75White knight defense, 428, 474White squire defense, 428–429, 474Williams Amendment, Securities Exchange
Act, 453Winner’s curse, 428, 474Working capital, 359–360, 364, 438Working capital management, 303–344, 474
accounts payable, 334–337accounts receivables, 323–330cash flow management, 312–316defined, 304external factors in, 304goal of, 304internal factors in, 304inventory management, 330–333liquidity management, 305–307liquidity measurement, 307–312scope of, 304short-term financing, 337–343short-term funds investment, 316–323
Working capital portfolio, 322Working capital turnover, 359–360, 474WorldCom, 22Wurgler, Jeffrey, 292
Yield, 318, 474Yield-to-maturity (YTM) approach, 135–136, 137,
161, 474
Zhang, Gouhua, 89–91, 158Zhao, Quanshui, 158
bindex 13 January 2012; 9:32:29
Index 505

bindex 13 January 2012; 9:32:29

badvert 18 January 2012; 10:20:13
badvert 18 January 2012; 10:20:15


