Embed Size (px)
Citation preview

University of South FloridaScholar Commons
Graduate Theses and Dissertations Graduate School
6-5-2014
Essays on Corporate FinanceHari Prasad AdhikariUniversity of South Florida, [email protected]
Follow this and additional works at: https://scholarcommons.usf.edu/etd
Part of the Business Administration, Management, and Operations Commons, and the Financeand Financial Management Commons
This Dissertation is brought to you for free and open access by the Graduate School at Scholar Commons. It has been accepted for inclusion inGraduate Theses and Dissertations by an authorized administrator of Scholar Commons. For more information, please [email protected].
Scholar Commons CitationAdhikari, Hari Prasad, "Essays on Corporate Finance" (2014). Graduate Theses and Dissertations.https://scholarcommons.usf.edu/etd/5165

Essays on Corporate Finance
by
Hari P. Adhikari
A dissertation submitted in partial fulfillment
of the requirements for the degree of
Doctoral of Philosophy
Department of Finance
College of Business
University of South Florida
Major Professor: Ninon Sutton, Ph.D.
Daniel Bradley, Ph.D.
Christos Pantzalis, Ph.D.
Jianping Qi, Ph.D.
Date of Approval:
June 5, 2014
Keywords: shareholder rights, innovation, mergers and acquisitions, family firms,
diversification
Copyright © 2014, Hari P. Adhikari

DEDICATION
I would like to dedicate this dissertation to my parents (Ganga Prasad Adhikari and
Ambika Devi Adhikari) and my wife, Binash. Thank you very much for always encouraging and
supporting me. I love you and I am sure I couldn’t have done it without you!

ACKNOWLEDGMENTS
First of all, I would like to offer my sincerest gratitude to my dissertation advisor, Dr.
Ninon Sutton, who has supported me throughout my doctoral years with her knowledge and
patience. I would also like to acknowledge my dissertation committee members, Dr. Daniel
Bradley, Dr. Christos Pantzalis, and Dr. Jianping Qi for their constant encouragement and help.

i
TABLE OF CONTENTS
List of Tables iii Abstract iv Essay 1- The Power of Control: The Acquisition Decisions of Newly Public Dual Class
Firms
1 Introduction 1
Arguments in Favor of and Against Dual-Class Structure 5 Entrenchment Hypothesis 6 Liquidity Hypothesis 7 Equity Measure Hypothesis 7
Why IPO Firms? 8 Relation to Existing Literature 9
Single versus Dual-Class Firms and Method of Payment 9
Single and Dual-Class Firm Long-Run Performance 11
Acquisition in Innovative Industries 11 Data and Descriptive Statistics 12 Empirical Results 15
Empirical Model and Multivariate Results 15
A Difference in Method of Payment in Acquisition by Single and
Dual-Class IPO Firms
16
Effect of Cash-Flow Rights and Voting Rights of the Insiders in the
Choice of Method of Payment
18
Effect of Wedge on the Choice of Method of Payment 19
Effect of High versus Low Edge on the Choice of Method of Payment 19
Acquisition Activity and Long-Term Performance 20
Acquisition Activities 20
Long-Term Performance of Acquiring Firms 22
Performance of Acquiring and Non-Acquiring Dual-Class IPO Firms 23 Conclusion 24
Essay 2 - All in the Family: The Effect of Family Ownership on Acquisition Performance
27 Introduction 27
Pros and Cons of Family and Non-Family Firms 32 Research on Family and Non-Family Firms 34 Research on Various Corporate Policies of Family and Non-Family Firms 36
Data 37 Multivariate Analysis 39
Buy-and-Hold Abnormal Returns (BHARs) 39 Calendar-Time Portfolio Regression 41 Multivariate Results 42

ii
Buy-and-Hold Abnormal Returns (BHARs) 42 Calendar-time Portfolio Regression 44 Family Firms, Diversifying, Mergers, and Firm Value 44
Conclusion 46 References 48 Appendix A 55 Appendix B 56 Appendix C 58

iii
LIST OF TABLES
Table 1 Descriptive Statistics 59 Table 2 Distributions of Acquirers 61 Table 3 Method of Payment 63 Table 4 Effect of Cash-Flow Right, Voting Right, and the Wedge on Method of
Payment
65 Table 5 Effect of High Low Wedge (HW) on the Choice of Method of Payment 69 Table 6 Acquisition Tendency of Single and Dual-Class IPO Firms 72 Table 7 Buy-and-Hold Abnormal Returns 74 Table 8 Acquirers in First Year and Non-Acquirers in First Year 78 Table 9 Distribution of Family and Non-Family Firms by Years and Industries 79 Table 10 Summary Statistics 81
Table 11 Correlation Matrix 82 Table 12 Buy and Hold Abnormal Returns 83 Table 13 Calendar Time Portfolio Regressions 85 Table 14 Diversifying and Non-Diversifying Acquisitions 86

iv
ABSTRACT
We compare acquisition activity, method of payment choice, and the long-run value
implications of acquisitions by newly public single-class and dual-class US companies. Our
results show that dual-class IPO firms make relatively more acquisitions in innovative industries
and are less likely to pay with stock as compared to single-class IPO firms. We provide evidence
that the reluctance of dual-class firms to pay with stock is not related to the insiders’ cash-flow
rights but it is significantly positively related to the insiders’ voting rights and wedge between
the insiders’ voting rights and cash-flow rights. We also find that acquiring dual-class IPOs
perform better in the long-run than acquiring single-class IPO firms, and the better performance
is mainly due to acquisitions in innovative industries. The results suggest that insiders of dual-
class IPOs try to retain control during subsequent M&A activities. The governance structure in
such firms allows them to make investments in high risk projects that enhance shareholder value
in the long-run. Next, we examine the acquisition performance of family and non-family firms in
the S&P 500 universe. Using style-adjusted and market-adjusted buy-and-hold returns (BHAR)
and controlling for firm and merger characteristics, we find that the post-merger performance of
family firms is significantly better than that of non-family firms. In particular, the mean one-year
style-adjusted buy-and hold abnormal return is around 18% higher for family acquirers than for
non-family acquirers. Further, contrary to the argument that founding family members make
value-destroying diversifying acquisitions to minimize the risk of their personal portfolio, we do

v
not find that family firms lose value in diversifying acquisitions. This result is consistent with
Stein’s model (1997) showing that diversification helps to reduce the cost of capital of the firm.

1
ESSAY 1: THE POWER OF CONTROL: THE ACQUISITION DECISIONS OF NEWLY
PUBLIC DUAL-CLASS FIRMS
Introduction
Recent research has established that the desire to acquire other firms is one of the main
motives of firms making an initial public offering (IPO). These studies find that going public
facilitates acquisitions by providing funding to the newly public firm in the form of cash as well
as the opportunity to raise capital through subsequent equity or debt issuance (Brau, Francis, and
Kohers, 2003; Celikyurt, Sevilir, and Shivdasani, 2010; Hovakimian and Hutton, 2010). When
going public, firms have two choices: to go public with only one class of shares with the same
voting rights (commonly called single-class); or to go public with two or more different classes
of shares with the same cash flow rights, but unequal voting rights (commonly called dual-class).
In a single-class firm, typically there is a provision of one share-one vote. In a representative
dual-class firm, there are “inferior” and “superior” classes of shares, and insiders hold “superior”
class of shares which come with higher voting rights per share (generally ten votes per share).
This creates a wedge between the voting rights and cash flow rights for the insiders in a typical
dual-class firm.
Previous studies have documented that the difference in cash flow rights and voting
rights in the dual-class structure makes some of their corporate behaviors, such as pay-out policy
(Jordan, Liu, and Wu, 2012), sensitivity of CEO turnover to performance (Smart, Thirumalai,
and Zutter, 2008), and selection of management team (Grossman and Hart, 1988), substantially

2
different from those of the single-class structure. Given that the desire to make acquisitions is a
key motivation behind going public, we are interested in examining the acquisition decision for
dual versus single-class firms, and the resulting shareholder wealth implications of these
decisions.
In this paper, we examine the following research questions. First, we investigate whether
the difference in cash flow and voting rights in single versus dual-class firms affects the quality
of acquisition decisions in these two types of firms. In particular, given that newly public firms
are active acquirers, we are interested in examining the acquisition tendency of single versus
dual-class IPO firms as well as the long-run wealth effects of these acquisition decisions. In this
analysis, the method of payment is a relevant consideration since previous studies have found the
stock versus cash payment choice influences both the short and long-run wealth effects of merger
decisions. Thus, we examine whether the likelihood of paying with stock is significantly
different in acquisitions by single and dual-class IPO firms. Furthermore, focusing only on dual-
class firms, we analyze how the cash flow rights, voting rights, and the wedge between cash flow
rights and voting rights of insiders affects the method of payment choice in takeovers.
In this analysis, we also consider the types of acquisitions that dual versus single-class
acquirers are inclined to make. Chemmanur and Tian (2011) find that firms with a larger number
of antitakeover provisions (ATPs) are more innovative, and Gompers, Ishii, and Metrick (2010)
posit that the dual-class structure is the most extreme example of antitakeover provisions. Based
on this evidence, we are interested to see whether dual-class IPO firms acquire more in
innovative industries, and whether those acquisitions create value.
Further, Brau, Couch, and Sutton (2012) have documented that firms that acquire within
a year of going public significantly underperform for one- through five-year periods following

3
the first year, whereas the firms which do not acquire within the first year do not significantly
underperform during those periods. Motivated by this result, we inquire whether there is a
difference in long-term performance between dual-class IPO firms that acquire within one year
of going public and those that do not acquire.
Our study is related to Mausulis, Wang, and Xie (2009), who highlight the potential
agency problems in a sample of dual class firms between 1995 and 2003. Their results show that
dual class firms with greater divergence in voting and cash flow rights have lower cumulative
abnormal returns around merger announcements. Our study is distinct from the Masulis et al.
(2009) study in several ways. First of all, we compare single and dual-class IPO firms, whereas
Masulis et al. (2009) focus on dual-class firms. Their dual-class sample is mostly of mature firms
whereas we study newly public firms, whose acquisition activity outpaces that of mature firms
both in number and volume, as noted in Celikyurt et al. (2010). Also, the focus of Masulis et al.
(2009) is on the short-term performance around the acquisition announcement, while we
compare the difference in acquisition activities for dual versus single class firms, the method of
payment choice, and the post-merger performance for newly public single and dual-class firms.
Using SDC data from 1990 to 2008, our empirical analysis provides the following results.
First of all, we do not find notable differences in the frequency of overall acquisitions by single
versus dual-class IPO firms. Both types of IPOs are active acquirers, consistent with recent
literature. Also, dual-class IPO firms are significantly more likely to pay with cash in
acquisitions than single-class IPO firms. That is, dual-class firms try to avoid paying with stock
as they want to retain control of the firm. Further, on average, acquiring dual-class IPOs perform
better in the long-run (up to four years) than acquiring single-class IPO firms. These results are
mainly driven by acquisitions by dual-class IPO firms in innovative industries. This finding

4
suggests that the governance structure in dual-class firms allows them to make long-term
investments in highly risky positive NPV projects as they do not have to face as much equity
market pressure to maintain short-run stock price. The shares with higher voting rights are
relatively illiquid in nature, so the insiders with such shares have incentive to monitor firm well.
This could be an explanation of why dual-class firms perform better in risky projects than their
single-class peers. Finally, we find some evidence that, compared to dual-class IPOs which do
not acquire after going public, those which acquire perform better in the long-run.
Our paper contributes to the finance literature in the following dimensions. First, to the
best of our knowledge, we are the first to compare the acquisition activities of single-class and
dual-class IPO firms. Some earlier studies compare the long-run performance of single-class and
dual-class firms, while others focus on performance within dual-class companies. As one of the
main motivations for firms to pursue IPO is to make acquisitions, our comparison sheds light on
the similarities and differences of acquisition activities of firms with different shareholder voting
rights arrangements.
Second, our paper’s finding that newly public dual-class firms are highly reluctant to pay
with stock provides further evidence that the dual-class firms prefer to maintain their control
rights when making acquisitions.
Most importantly, our finding that the long-run performance of dual-class IPO acquirers
is significantly better than those of single-class IPO acquirers contributes to the literature by
providing evidence that provisions like dual-class structures can be desirable for long-term value
creation. Such arrangements demand better monitoring by insiders, because of the lack of easy
exit, and also allow managers to focus on long-term goals instead of short-term stock price

5
fluctuations. Further, this finding suggests that the benefits of control might go beyond private
profits of insiders and actually can be value enhancing.
Arguments in Favor of and Against Dual-Class Structure
The presence of dual-class firms is significant in the US corporate world. Gompers et al.
(2010) point out that 6% of COMPUSTAT firms are dual-class, which comprises about 8% of
the market capitalization of all firms. The benefits and drawbacks of dual-class structure of
stocks are difficult to judge as stated by the columnist Andrew Hill (2011) of Financial Times:
“The advantage of a dual-class share structure is that it protects entrepreneurial management
from the demands of ordinary shareholders. The disadvantage of a dual-class share structure is
that it protects entrepreneurial management from the demands of shareholders.”
The implications of a dual-class structure for merger decisions have a bright side and a
dark side. When we view dual-class structure as a medium of raising outside capital without
losing substantial control, rather than just as a mechanism to separate cash-flow rights and voting
rights, we can see many positive consequences of this structure (Crone and Plaksen, 2010). For
example, the dual-class structure mitigates the problem of underinvestment as the managers will
be less afraid of their removal by misinformed investors (DeAngelo and DeAngelo, 1985). This
structure also facilitates long-term investments through the ability to raise outside capital without
substantial takeover threat. Thus, the dual-class structure solves the problem of managerial
myopia (Chemmanur and Jiao, 2006). Similarly, with the help of the dual-class provision,
corporate insiders can better diversify their personal wealth so that they will not be tempted to
make diversifying acquisitions (in order to diversify their personal wealth portfolio) which may
not create value (Morck, Shleifer, and Vishny, 1988). The above mentioned arguments in favor

6
of dual-class structure suggest that, on average, dual-class firms may make value-enhancing
acquisition decisions.
At the same time, there are negatives of having dual-class provisions as well. First of all,
the dual-class structure is infamous for providing managers (or corporate insiders) an opportunity
to extract private benefits of control at the expense of minority shareholders (Bebchuck and
Weisbach, 2010). The ability of insiders to redirect corporate resources has adverse
consequences to firm value, as well documented in the literature (Jensen and Meckling, 1976;
Zwiebel, 1995). Masulis et al. (2009) find that as the wedge between the voting rights and cash
flow rights increases, the managers are more likely to take private benefits at shareholders’
expense. Specifically in such firms, the authors find that “corporate cash holdings are worth less
to outside shareholders, CEOs receive higher compensation; managers make shareholder value-
destroying acquisitions more often and capital expenditures contribute less to shareholder value.”
Further, Cronqvist and Nilsson (2003) find that firms with disproportionate voting structure
exhibit worse operating performance because they make less efficient investment decisions.
Bebchuck, Kraakman, and Triantis (2000) also argue that the market for corporate control is less
effective and takeover discipline is weaker in dual-class firms compared to firms with dispersed
ownership (also see Smart et al., 2008). These arguments suggest that the acquisition decisions
of dual-class firms can be value destructive.
In addition to the above discussion, we further discuss three hypotheses which again
argue in favor of or against dual-class structure.
Entrenchment hypothesis. Recently, researchers (Gompers, Ishii, and Metrick, 2003;
Masulis, Wang, and Xie, 2007; Bebchuk, Cohen, and Ferrel, 2009, and others) have documented
that strong shareholder rights are positively related to stock returns, operating performance, and
7
valuation. This line of research mostly agrees that the most important restrictions to shareholder
rights are antitakeover provisions (ATPs), and Gompers et al. (2010) point out that the dual-class
firms are the most extreme examples of firms with ATPs. So, the common theme of this research
is that managers extract private benefits of control by exploiting ATPs and the divergence
between insiders’ voting rights and cash flow rights that exists in dual-class firms.
Liquidity hypothesis. This stream of research claims that stock-market liquidity
provides an opportunity for an “easy exit” for those investors who do not agree with the
incumbent management. Bhide (1993) argues that such “easy exit” because of liquidity access
discourages internal monitoring. Generally, the shareholders with superior voting shares of dual-
class firms cannot enjoy this ‘easy exit’ option because the shares with higher voting rights are
relatively illiquid. On this ground, Bohmer, Sanger, and Varshney (1996) argue that, to the
extent that holding this illiquid investment imposes a cost, it should reduce the divergence of
interest between management and outside shareholders. So, the better monitoring imposed by no
option of “easy exit” should help such firms perform better.
Equity market pressure hypothesis. Stein (1988) argues that the governance structure
with a higher number of ATPs could be optimal as those provisions reduce managerial “myopia”
of signaling firm quality by boosting short-term performance at the expense of long-term value.
Shliefer and Vishny (1989) point out that the managers of the firms with weaker shareholder
rights experience enough job security whereas the managers of firms with strong shareholder
rights might sub-optimally invest in their area of expertise to retain their job. Core, Guay, and
Rustics (2006) argue that there is no conclusive evidence that a large number of ATPs in a firm
is detrimental to long-term performance. Their point is that ATPs might destroy shareholders
value in a subset of firms, and they might be value enhancing or value neutral in other types of

8
firms. Chemmanur and Tian (2011) examine this possibility and provide evidence of a causal
relationship that firms with a larger number of ATPs are more innovative. Their argument is that
ATPs insulate managers from the short-term pressure of satisfying equity market expectations.
So, if dual class firms focus more acquiring innovation, we may expect that these firms perform
relatively well in the long term.
Why IPO Firms?
We follow Smart et al. (2008) and concentrate on IPO firms instead of seasoned firms.
They argue that firms set up governance rules prior to the IPO and abide by those rules and
evolve as a public company. They further mention that concentrating on newly public firms
avoids issues arising from the switch from single-class to dual-class status through
recapitalization. Further, they mention that, although it is common in both single and dual-class
firms for insiders to own large fraction of outstanding shares, when firms return to the seasoned
equity market (SEO), the voting power of single-class insiders’ declines at the same rate as their
cash flow rights, while dual-class insiders’ voting rights change at a much slower rate than their
economic ownership. So, focusing on IPOs minimizes the influence brought by such activities.
Bebchuck and Zingles (2000) and others also argue that firms are more likely to go public with
an already set governance structure because the cost of doing otherwise needs to be borne by
those making this decision.
The rest of the paper will proceed as follows. Section 2 describes the related literature
and presents the hypotheses. Section 3 discusses data and presents descriptive statistics. Section
4 and Section 5 explain the empirical results, while Section 6 provides the conclusions.

9
Relation to the Existing Literature
Single versus Dual-Class Firms and the Method of Payment
Given the importance of the method of payment choice on merger outcomes, we first
discuss reasons for differences in the choice of merger financing for single versus dual-class
IPO. Faccio and Masulis (2005) argue that cash and stock offers have conflicting effects. They
point out that most cash offers require debt financing, as many acquirers do not possess sufficient
cash and/or liquid assets to finance their cash payment. So, they note that the choice between
cash or stock financing becomes a tradeoff between corporate control concerns of issuing equity
and the bankruptcy cost of issuing debt. As one of the objectives of going IPO with dual-class is
to retain control (Arugaslan, Cook, and Kieschnick, 2010), we can expect that the dual-class IPO
firms might pay more with cash in takeovers, as this method of payment does not dilute their
voting rights and hence their control motive. However, there is another side of the story as well.
Many insiders with superior voting rights in dual-class firms have a significant amount of wealth
invested in the firm. These shareholders may be reluctant to use cash as a method of payment
since the debt financing typically used to finance the cash offer increases the likelihood of
bankruptcy of the firm.
Clearly, a similar tradeoff exists in single-class firms as well. Yet, the two structures
might weigh the threat of diminished control and the threat of increased bankruptcy risk
differently, which may lead to different methods of payment in acquisitions made by newly-
public single and dual-class firms.
Further, Dittmar and Mahrt-Smith (2007) provide evidence that an extra dollar of cash is
less valuable to shareholders at companies with more anti-takeover provisions. They attribute
their finding to managers extracting private benefits from corporate cash holdings in such firms.

10
This would suggest that the managers in dual-class firms will be more interested in paying with
stock and saving cash for future private benefits.
These different predictions regarding the payment choices of single versus dual-class
acquirers further motivates us to study this question empirically.
In examining a sample of dual-class firms between 1995 and 2003, Masulis et al. (2009)
provide summary statistics showing that 56% of the takeover deals are paid with cash, which is
similar to our summary statistics. In their analysis, they find that stock offers used to purchase
public targets are negatively related to the bidder CAR around the time of the merger
announcement, and stock offers used to purchase private targets are positively related to bidder
CAR. These findings for dual-class acquirers are in line with prior studies examining bigger
samples of non-dual-class acquirers.
Further, not all dual-class firms possess the same proportions of insiders’ cash-flow rights
and voting rights. These two rights have different effects on firm value, as is well-documented in
Gompers et al. (2010). They find that firm value increases with insiders’ cash-flow rights and
decreases with insiders’ voting rights. Motivated by that study, we test the effect of cash flow
rights, voting rights and the wedge (the difference between voting rights and cash flow rights) on
the choice of the method of payment by dual-class firms in corporate takeovers.
Single and Dual-Class Firm Long-Run Performance
Smart et al. (2008) study the short and long-run performance of single-class and dual-
class IPO firms but they do not consider the acquisition activities of single and dual-class firms.
Using the calendar-time portfolio regression method, they find insignificant abnormal returns for
both single-class and dual-class IPOs except in the case of the four-factor equal-weighted

11
portfolio regression in which they find significantly positive abnormal returns for single-class
IPO firms and insignificantly positive abnormal returns for dual-class firms. In comparing
operating performance for up to five years, measured by ROA and EBITDA, they do not find
significant differences between single-class IPOs and dual-class IPOs.
Furthermore, Gompers et al. (2010) focus only on dual-class firms between 1995 and
2003 and find that firm value is increasing in insiders’ cash-flow rights and decreasing in
insiders’ voting rights.
Acquisition in Innovative Industries
As discussed in Sevilir and Tian (2012), the previous literature highlights two main
channels through which innovation helps acquiring firms. One view, based on Aghion and Tirole
(1994), is that less innovative firms can become more innovative by acquiring firms which are
more efficient at innovation. This view suggests that acquisition enhances innovation where
firms with lower innovation efficiency acquire firms with higher innovation efficiency. The other
argument is based on Rhodes-Kropf and Robinson (2008), which suggests that M&A can
synergize innovation by bringing complementary assets of merging firms together.
Similarly, Sevilir and Tian (2012) find that acquiring a target that is more R&D intensive
than the acquirer enhances the innovative output of the acquirer. Bena and Li (2012) document
that technological overlaps such as proximity of innovation activities and mutual citations of
patents between two firms significantly affects in merger pair formation.
Hirshleifer, Low, and Teoh (2012) point out that overconfident CEOs invest more in
innovation, obtain more patents and patent citations, and are more successful in innovation for
given research and development expenditures. Paredes (2005) argues that high CEO pay

12
provides positive feedback to CEO and signals CEO’s success. He further reasons that positive
feedback and recent success can make CEOs overconfident. The finding of Masulis et al. (2009)
and Smart and Zutter (2003) suggest that dual-class CEOs get higher compensation. Overall,
these arguments support that the CEOs in dual-class firms are more likely to be overconfident.
So, we can expect more investment in innovation by dual-class firms.
These thoughts collectively imply that a firm’s investment in innovation (for example
acquiring innovative firm) is necessary but risky undertaking for long-term success of a firm.
Along with discussion in Section 1, the arguments here provide signal that dual-class firms
which are full with anti-takeover provisions and whose CEOs are more overconfident might
invest more and also perform better in long-run by acquiring firms in innovative industries. In
this paper, we test this speculation empirically.
Data and Descriptive Statistics
We obtain our initial sample of IPOs from the Security Data Company (SDC) New Issues
Database. From our initial sample of IPOs, we exclude foreign issuers, REITs, penny stocks
(issues with less than $5 offer price) and financial firms (firms with SIC codes between 6000 and
6999). We obtain the sample of dual-class IPOs from Jay Ritter’s website. Our sample period for
the single-class dual-class IPOs extends from 1990 through 2008.
Similarly, for our merger sample, we include all completed mergers over the period from
1990 through 2012 from the SDC Mergers and Acquisitions Database. We exclude acquisitions
of partial interests or acquisitions of remaining interests from our sample. If the consideration
structure is labeled unknown or other, then we exclude those acquisitions as well. In order for an

13
acquisition to be in our sample, the transaction value must be at least one million dollars and at
least one percent of the market value (one fiscal year before) of the acquiring firm.
Further, the data for the insiders’ cash flow rights and voting rights is generously
provided by Andrew Metrick, which is used in Gompers et al. (2010) where the details of the
data can be found. This data set is for dual-class firms (not necessarily IPOs) existing between
years 1995 and 2002. If the firm happens to have gone public during those years, then we get
their information for the year in which they go public and the subsequent years. If the firm has
gone public in earlier years (between 1990 and 1994), then we use the data for the insiders cash
flow rights and voting rights from the first available year. Here, we make an assumption that the
insiders’ cash flow rights and voting rights do not change after going public. While this might
not be true, in general, firms slowly become widely held, as noted by Helwege, Pirinsky, and
Stulz (2007) who find that a majority of IPO firms has insider ownership below 20%, 10 years
after going public. If this assumption provides a bias, but the bias is against finding significant
differences between dual and single-class firms. Finally, necessary accounting information
comes from COMPUSTAT.
As in Gompers et al. (2010), we define the wedge variable (Wedge) as the difference
between the voting rights and the cash flow rights of the insiders in the dual-class firms.
Following previous research, we also define wedge as the ratio of the voting right and cash flow
rights of the insiders.
Panel A of Table 1 provides an annual distribution of single-class and dual-class IPOs in
our sample between 1990 and 2008. The table shows that there are 7.6% dual-class IPOs overall
during the sample period. This finding is comparable to previous results showing 6% dual-class
firms in Gompers et al. (2010) and 9.6% dual-class IPOs in Smart and Zutter (2003).

14
In Panel B of Table 1, we report univariate comparison of certain characteristics of single
and dual-class firms which acquire within three years of going public. The result suggest that
dual-class IPO firms are relatively larger in terms of market capitalization, conduct more related
mergers, and have higher leverage than newly public single-class firms. In addition, the dual-
class IPO’s, on average, have lower Tobin’s Q and less VC-backing.
Panel A of Table 2 shows the number of acquisitions made by single-and dual-class firms
within 3-, 4-, and 5-years of going public, distributed by the method of payment used in the
acquisitions. We see that in all three year ranges, the methods of payments employed by single
and dual-class firms are significantly different. For example, in acquisitions made by dual-class
firms within three years of going public, 52% of the acquisitions are paid with cash and only
19% are paid with stock. In acquisitions made by single-class firms within three years of going
public only 36% are cash offer and 36% are stock offers. The percentages paid for with hybrid
method are pretty similar: 29% in both cases. Similar percentage distributions are true in cases of
acquisitions within four and five years of going public.
Panel B of Table 2 exhibits the distribution of types of acquisitions (mergers, acquisitions
of assets or other) made by single and dual-class IPOs within three, four, and five years of going
public. We see that dual-class firms acquire assets more than single-class firms do. Because of
this observation, we control for acquisition of assets in our regressions, and we also perform
separate tests excluding acquisitions of assets.

15
Empirical Results
Empirical Model and Multivariate Results
In panels A and B of Table 3, we test whether the share class structure (single or dual)
influences the choice between stock and cash as a method of payments by newly public firms in
corporate takeovers within three, four or five years after going public. Specifically, we run the
following logit regression:
log [𝑃(𝑦=1)
1−𝑃(𝑦=1)]
𝑖= 𝛽0 + 𝛽1𝐷𝑈𝐴𝐿𝑖 + 𝛽2𝑆𝐼𝑍𝐸𝑖 + 𝛽3𝑇𝑂𝐵𝐼𝑁𝑄𝑖 + 𝛽4𝑆𝐿𝐴𝐶𝐾𝑖 + 𝛽5𝐷𝐸𝐵𝑇𝑅𝐴𝑇𝐼𝑂𝑖 +
𝛽6𝐶𝑅𝐼𝑆𝐼𝑆𝑖 + 𝛽7𝐼𝑁𝑇𝐶𝑂𝑉𝑖 + 𝛽8𝐼𝑃𝑂𝑃𝑅𝑂𝑖 + 𝛽9𝑉𝐶𝐵𝐴𝐶𝐾𝐸𝐷𝑖 +
𝛽10𝑅𝐷𝐸𝐴𝐿𝑆𝐼𝑍𝐸𝑖 + 𝛽11𝑅𝐸𝐿𝐴𝑇𝐸𝐷𝑖 + 𝛽12𝑇𝐸𝐶𝐻𝑖 + 𝛽13𝑇𝐸𝑁𝐷𝐸𝑅𝑖 +
𝛽14𝑆𝑈𝐵𝑆𝑖 + 𝛽15𝐴𝑆𝑆𝐸𝑇𝑖 + 𝛽16𝐶𝐸𝑂𝐴𝐺𝐸𝑖 + 𝜀𝑖 (2)
where the dependent variable takes the value of 1 (that is 𝑦 = 1 ) if the acquiring firm i used
stock as a method of payment and zero otherwise. We include the hybrid method of payment as
non-stock payment. 𝐷𝑈𝐴𝐿 is a dummy variable equal to 1 if the acquirer is a dual-class firm and
0 if it is a single-class acquirer. 𝑆𝐼𝑍𝐸 is the logarithm of the market value of equity of the firm in
the year prior to the acquisition (in case of the firm going public and making an acquisition are in
the same year we use the market value of the same year). 𝑇𝑂𝐵𝐼𝑁𝑄 is the Tobin’s Q of the
acquiring firm measured as the ratio of the market value of equity to the book value of
assets. 𝑆𝐿𝐴𝐶𝐾 is cash and short-term investments of the firm divided by the total assets of the
firm in the year prior to the acquisition. 𝐷𝐸𝐵𝑇𝑅𝐴𝑇𝐼𝑂 is the total long term debt of the firm
divided by the market value of equity of the firm. 𝐶𝑅𝐼𝑆𝐼𝑆 is a dummy variable equal to 1 if the
year is 2001, 2002, 2007 or 2008 and zero otherwise. 𝐼𝑁𝑇𝐶𝑂𝑉 is the ratio of the earnings-

16
before-interest and taxes (EBIT) divided by the net interest paid by the firm. 𝐼𝑃𝑂𝑃𝑅𝑂 is the
logarithm of the IPO Proceeds value net of fees and expenses scaled by total assets. 𝑉𝐶𝐵𝐴𝐶𝐾𝐸𝐷
is a dummy variable equal to one if the firm had VC backing before the IPO and zero otherwise.
𝑅𝐷𝐸𝐴𝐿𝑆𝐼𝑍𝐸 is the transaction value of the acquisition divided by market value of equity of the
firm in the year prior to the acquisition. 𝑅𝐸𝐿𝐴𝑇𝐸𝐷 is a dummy variable equal to one if both
acquirer and target are in the same four digit industry and zero otherwise. 𝑇𝐸𝐶𝐻 is a dummy
variable equal to one if the acquiring firm is in a high tech industry and zero otherwise.
𝑇𝐸𝑁𝐷𝐸𝑅 is a dummy variable equal to one if the deal is a tender offer and zero otherwise. 𝑆𝑈𝐵𝑆
is a dummy variable equal to one if the target is a subsidiary and zero otherwise; and 𝐴𝑆𝑆𝐸𝑇 is a
dummy variable equal to one if the deal is an acquisition of assets and zero otherwise.
A Difference in Method of Payments in Acquisition by Single and Dual-Class IPO
Firms
In Panel A of Table 3, the dependent variable is stock, which is equal to 1 if the method
of payment is stock and 0 if the method of payment is cash or hybrid. The coefficients of the
dual-class dummy are -0.66, -0.90 and -0.86 for the samples with acquisitions within 3-years of
going public ( with different control variables), each of which is significant at the 1 percent level.
This result suggests that, compared to single-class IPO firms, dual-class IPO firms are highly
reluctant to pay with stock in corporate takeovers. For example, Model 1 suggests that the odd of
paying with stock is ½ ( =exp(-0.66) if the acquiring firm is a newly public dual-class firm. We
get qualitatively similar results for the samples with acquisitions within four or five years of
going public. In these models, we use several control variables which are considered as
determinants of method of payment in acquisitions in the existing literature. Most of the

17
variables have the expected signs. For example, we observe that larger firms (firms with larger
market cap) mostly use either cash or hybrid methods of payment, as evidenced by the variable
SIZE. The positive and significant coefficient of TOBINQ suggests that firms with higher growth
opportunities tend to pay with stock. Similarly, VCBACKED firms have a higher likelihood of
using stock offers in mergers. Firms are more likely to use cash offers when acquiring assets or
subsidiaries of other firms, consistent with prior studies which show that parent firms often sell
subsidiaries to obtain a needed cash infusion. The positive and significant coefficient of the
variable SLACK is counterintuitive as it suggests that firms with higher cash do not use cash or
hybrid as a method of payment. However, Havokimian and Hutton (2010) also find a similar
significantly positive relationship between slack and the decision to use stock. They attribute this
finding to the argument in the literature that financially constrained firms tend to hold more cash
and prefer to use stock as a method of payment (Almeida and Campello, 2007).
In Panel B of Table 3, we repeat the regression as in Panel A of Table 3 but we exclude
observations with the hybrid method of payment. Thus, in this table, the dependent variable is
stock, which is equal to 1 if the method of payment is stock and 0 if the method of payment is
cash. In this table, all the results are similar except that the significance level of the dual dummy
decreases slightly to the 5%.
These results suggest that share class structure is an important determinant of the method
of payment in mergers and acquisitions. The findings support the argument that dual-class firms
do not want to lose control of the firm by diluting their voting rights. In the next set of analysis,
we concentrate on newly public dual-class IPO firms only.

18
Effect of Cash-Flow Rights and Voting Rights of the Insiders in the Choice of
Methods of Payments
In Table 4A, we test the effect of insiders’ cash-flow rights in the choice of method of
payment in acquisitions by dual-class IPO firms. In all three columns, the dependent variable is
stock, which is equal to 1 if the method of payment is stock and 0 if the method of payment is
cash. The logit regressions show that the cash-flow rights of insiders’ (CFR) is not significant,
suggesting that insiders’ cash-flow rights are not an important determinant of the method of
payment choice in newly public dual-class firms. In this table, we have included fewer
explanatory variables than those in Tables 3A and 3B because of the small sample size. The
control variables have expected signs.
In Table 4B, we test the effect of insiders’ voting rights in the method of payment choice
for dual-class IPO firms. The specification is similar to the specification in Table 4A. We
observe that the variable capturing the voting rights of the insiders’ (VOTER), is negative and
significant at the 10% level for the sample with acquisitions within three years of going public
and at 5% in cases with acquisitions within four or five years of going public. The significant
negative coefficients of VOTER tell us that the higher the voting rights of insiders, the more
reluctant they are to pay with stock. This result supports the finding in Tables 3A and 3B
showing that dual-class IPO firms are less inclined to pay with stock in general, likely due to the
desire for control.
Together, the results of Tables 4A and 4B provide preliminary evidence that the desire
and/or ability to control firm is better substantiated if the insiders have higher voting rights than
if they have higher cash-flow rights.

19
Effect of Wedge on the Choice of Method of Payment
In Table 4C and 4D we test the effect of the wedge between the voting rights and cash-
flow rights of insiders in the choice of the method of payment by newly public dual-class firms.
We measure wedge in two ways. In Table 4C, WEDGE is defined as the insiders’ voting rights
minus the insiders’ cash-flow rights, whereas in Table 4D, WEDGE is defined as the ratio of the
insiders’ voting rights to the insiders’ cash-flow rights.
In Tables 4C and 4D, our variable of interest, WEDGE, is negative and significant in all
three columns. Thus, the higher the wedge between insiders’ voting rights and cash-flow rights,
the less likely the firms are to issue equity in takeovers. This result corroborates the finding of
Arugaslan et al. (2010) that the objective of going public with dual-class is to retain control of
the firm after going public as well.
Effect of High versus Low Wedge on the Choice of Method of Payment
In Tables 5A, 5B and 5C, we are interested in examining how high versus low wedge
influences the method of payment choice for dual-class IPO firms. When the wedge is very
small, firms might be indifferent in choosing stock or cash as a method of payment, but when the
wedge is substantial enough the firms might use that to seek rent. In order to investigate this, we
compare three logit regressions with cut-offs at 5%, 10% and 15% for the WEDGE variable.
Specifically, we create a dummy variable HW as follows: For 5% cut-off, HW is equal to 0 if the
wedge (insiders’ voting rights minus cash-flow rights) is less than 5% and equal to 1 otherwise;
similarly for 10% cut-off, HW is equal to 0 if the wedge is less than 10% and equal to 1
otherwise; and for 15% cut-off HW is equal to 0 if the wedge is less than 15% and equal to 1
otherwise. We perform logit regressions with acquisitions within three years, four years, and five

20
years in Tables 5A, 5B and 5C respectively. In each of the tables, we observe that as the cut-off
increases, the HW variable becomes more negative and more significant up to the 15 % cut-off.
Specifically, in Table 5A, when the cut-off is 5%, the coefficient of HW variable is -1.02 which
is not significant; when the cut-off is 10%, the coefficient of HW variable is -2.84 which is
significant at 5% level, and when the cut-off is 15%, the coefficient of HW variable is -4.72 and
is significant at 1% level. This result suggests that the magnitude of the wedge between insiders’
voting and cash flow rights is an important determinant of the method of payment choice for
dual-class acquirers.1
Acquisition Activity and Long-Term Performance
Acquisition Activities
Tables 6A and 6B report the acquisition activities of single and dual-class IPO firms. In
Table 6A, we consider the acquisitions that are at least one million dollars in transaction value
and are at least one percent of the market capitalization of the firm for firms going public
between 1980 and 2008. We see that 13.52% of the single-class and 13.09 % of the dual–class
firms make acquisitions within one year of going public. Similarly, the table reports that around
22.2% of single-class and 23.15 of the dual-class firms make such acquisitions within two years
of going public. Also, the total number of firms acquired by single and dual-class within two
years of going public are also comparable. Acquiring single-class firm acquire 1.55 targets, on
average, whereas acquiring dual-class firm acquire 1.51 targets on average within two years of
going public.
1 In these tables, we have removed eight acquisitions associated with negative wedge. The data indicates that in
those firms, a superior class of shares possess one vote per share and an inferior class of share possess zero votes per
share. As such, the insiders’ cash flow rights exceed the insiders voting rights. Interestingly, all those acquisitions
are made with stock.

21
Table 6B reports all qualified acquisitions with no restriction on the transaction value.
We see that 25.20% of the single-class and 25.34 % of the dual–class firms make at least one
acquisition within one year of going public, whereas 37.58% of single-class and 40.11% of dual-
class firms make acquisitions within two years of going public. Furthermore, acquiring single-
class firm acquire 1.95 targets on average whereas acquiring dual-class firm acquire 2.23 targets
on average within two years of going public. Thus, overall, we do not observe notable
differences in the frequency of acquisitions for single-class and dual-class acquirers in the period
after going public.
In Table 6C, we compare the acquisition of innovative and non-innovative targets by
single-class and dual-class IPO firms. By innovative targets, we mean firms with 4-digit SIC
codes in the top one-third innovative industries based on citations per patent produced by all
firms in that industry for the period during which patent data from NBER is available. We obtain
this data from Sevilir and Tian (2012). The table shows that dual-class firms acquire relatively
higher percentage of targets from innovative industry than single-class firms do. Specifically,
52.68% of the acquisitions that single-class firms make within two years of going public are in
innovative industries, while 60.87% of the targets that dual-class firms acquire are from
innovative industries.
Tables 6A, 6B and 6C collectively suggest that the dual-class IPO firms are involved in
smaller acquisitions more often than single-class IPO firms. Also, dual-class firms make higher
proportion of acquisitions of targets in innovative industries than their single-class counterparts.

22
Long-Term Performance of Acquiring Firms
As acquisitions are long-term investments, we test whether dual-class acquiring firms
perform better than acquiring single-class firms in the long-run. We measure the long-run
performance of an acquirer by style-adjusted buy-and-hold returns. Benchmark returns for style-
adjusted BHARs are the returns of 25 size and book to market matched portfolios obtained from
20 size and 20 book to market Fama-French portfolios: 20 size portfolios are grouped into 5 size
portfolios and similarly, 20 book-to-market portfolios are grouped into 5 book-to-market
portfolios and finally we have 5*5=25 size and book-to-market matched portfolios. The results
are shown in the multivariate regressions in Table 7. In the regression models, we control for
relevant firm characteristics, merger characteristics, as well as year and industry fixed effects.
The dual-class indicator variable, DUAL, shows a positive and significant relationship with the
acquirer’s long-run abnormal returns, as measured by the style-adjusted buy and hold abnormal
return. Thus, contrary to the argument that the agency problems inherent in dual-class firms
adversely affect their performance, our findings suggest that newly-public dual-class acquirers
outperform single-class acquirers. However, given that dual-class acquirers are more likely to
use cash payments in acquisitions, which are associated with better long-run performance, it is
important to control for the method of payment. The interaction term between dual dummy
(DUAL) and Cash dummy (MOPC) that is DUAL_MOPC, is not significant. This finding
suggests that, the positive long-run performance of dual-class acquirers is not driven by the
method of payment choice.
Next, we examine whether dual-class IPO firms which value innovation perform better in
the long-run. This test is partially a test of equity market pressure hypothesis. As innovation is a
time consuming and high risk process with large probability of failure, dual-class firms have an

23
edge to take such risk because of the large numbers of ATPs and less pressure from stock price
movements. In our multivariate regression, in Tables 7A to 7D we use an interaction of the dual
dummy (DUAL) with the dummy for innovative target (INNOT). In all four tables where the
dependent variables are one year BHAR to four year BHAR, respectively, we find that the
interaction term is significantly positive. The dual dummy (DUAL) becomes insignificant. In
column 3 of the models used in Table 7A to 7D, the coefficient of DUAL shows the effect of
dual dummy (DUAL) on long-term performance when INNOT=0 (that is acquiring targets in
non-innovative industries). The insignificant coefficient of DUAL suggests that BHAR is not
related to acquisitions by dual-class firms in non-innovative industries. The positive sum of the
coefficients of dual dummy (DUAL) and the interaction term DUAL_INNOT in models 7A to 7D
suggests that acquiring targets in innovative industries have significant positive effect on BHAR.
Thus, the results imply that dual-class IPO firms which acquire in innovative industries soon
after going public perform better for at least up to four years after the acquisition compared to
other single-class and other dual-class acquirers. We further investigate the effect on BHAR of
acquiring firms themselves being in the innovative industries. The results show that the
interaction term DUAL_INNOA (interaction of DUAL dummy and Aacquiring in innovative
industry dummy) are positive but not significant except in Panel B (in which it is significant at
10% level). These results substantiate the finding that it is the acquisition in the innovative
industries that creates value for newly public dual-class firms.
Performance of Acquiring and Non-Acquiring Dual-Class IPO Firms
Previous studies examining the acquisition activity of newly public firms has shown that
newly public firms are not the best acquirers. Thus, we are interested in comparing the long-term

24
performance of acquiring relative to non-acquiring dual-class IPO firms. In table 8, we compare
the style-adjusted BHARs of first year acquirers (that is, firms acquiring within one year of going
public) and first year non-acquirers (the firms which do not make an acquisition within first year
of going public). In the first year, the acquirers have an average BHAR of 2.04% which is
insignificantly different from zero, but the non-acquirers have an average BHAR of -6.56%
which is significantly negative at the 10% level. The result is different from the results of Brau,
Couch and Sutton (2012), which finds that firms that acquire within a year of going public
significantly underperform for 1-through 5-year periods following the first year whereas firms
which do not acquire within the first year do not underperform. The results for the single-class
acquirers and non-acquirers are qualititatively similar to the results of Brau et al. (2012). This
finding suggests that the distinct nature of the dual-class form can be beneficial in merger
decisions made by newly-public dual-class firms.
Conclusion
Recent studies provide evidence that firms go public to facilitate the process of acquiring
other firms. However, it is unclear how a dual versus single-class structure influences acquisition
activity after going public. We try to fill this void in the literature. We compare single and dual-
class IPO firms in terms of acquisition activity, payment method, and post-merger performance
to improve our understanding of how these two structures differ in major corporate decisions and
their implications for shareholder wealth.
Consistent with prior research, we find that both types of IPOs are active acquirers.
However, measuring long-run performance by buy and hold abnormal returns (BHAR), our
evidence shows that newly-public dual-class acquirers perform better than single-class acquirers

25
in the long-run. When we focus on the acquisition activities in innovative industries, we find that
compared to single-class firms, dual-class IPO firms acquire more firms from innovative
industries. Also, we find that dual-class IPO firms acquiring in innovative industries perform
better for at least up to four years after the acquisition compared to other single-class and dual-
class acquirers. Similarly, in examining dual-class IPOs which acquire within one year of going
public with those which do not acquire within one-year of going public, we observe that
acquirers perform better than the non-acquirers.
Given the importance of the method of payment in mergers and acquisitions, we also
carefully examine the method of payment choice for dual versus single-class firms. The findings
show that dual-class firms are highly reluctant to pay with stock. We attribute this trend of
payment method of dual-class firms to their control motive. In a typical dual-class firm insiders
normally possess “superior” class of stock which carries higher voting rights than their
corresponding cash-flow rights. When they issue shares, there could be a dilution in the insiders’
voting rights which is against their control motive. With the help of data from Gompers et.al
(2010), we disentangle the effect of insiders’ cash-flow rights, voting rights and the wedge
between the voting rights and cash-flow rights on the choice of the payment methods by dual-
class IPO firms. We find evidence that the reluctance to pay with stock is not significant with the
insiders’ cash-flow rights but it is highly significant with the insiders’ voting rights and with the
wedge between the voting rights and the cash-flow rights. These results substantiate the control
motive of going IPO with dual-class share structure.
Viewed in the context of existing literature, these findings indicate that there are certain
corporate activities in which dual-class firm structure is desirable. Also, the results are consistent
with liquidity hypothesis which argue that the shareholders with “superior voting” rights in dual-

26
class firms monitor firms more compared to the shareholders in single-class firms because those
shareholders do not have an easy exit option of quitting the firm by selling their shares if they do
not like the decisions of the existing management. Thus, better monitoring might be the reason
for the better performance of dual-class acquirers. These results are also consistent with equity
market pressure hypothesis which argue that the dual-class firms do not feel as much pressure
from stock price movements so that they can focus on their long-term endeavors and hence fare
better in the long-run.

27
ESSAY 2: ALL IN THE FAMILY: THE EFFECT OF FAMILY OWNERSHIP ON
ACQUISITION
Introduction
Family firms are as prevalent as non-family firms around the world, as is well-established
in the finance and business literature. For example, in an international study, La Porta, Lopez-de-
Silanes, and Shleifer (1999) report that 30% of firms are family controlled, whereas 36% are
widely-held. Furthermore, Faccio and Lang (2002) observe family firms being the dominant
ownership structure in Western Europe, excluding the UK and Ireland. Weisskopf (2012) also
highlights that about one-third of the firms in the Swiss Exchange are family firms. Similarly,
Claessens, Djankov, Fan, and Lang (2000) report that about two-thirds of the firms in Asian
countries have family ownership. Among large US companies (S&P 500), more than one-third of
firms are classified as family firms (Anderson and Reeb, 2003; Villalonga and Amit, 2006). The
substantial presence and unique ownership characteristics of family firms have attracted
researchers to compare their corporate policies and performance with those of non-family firms.
The main difference in the characteristics of family and non-family firms lies in the types
of agency problems they possess. Generally speaking, family firms have at least one large
shareholder and other small shareholders. For example, Anderson, Mansi, and Reeb (2003)
observe that founding families, on average, hold 19% of the firm’s outstanding equity in their
sample. Because of the incentive of the large shareholder(s) to monitor the manager, the classic
agency problem between shareholders and managers will generally be of a smaller degree in

28
family firms than in non-family firms. However, due to large shareholder’s control advantage,
another type of agency problem emerges in which large shareholders may procure private profits
at the cost of small shareholders. Hence, this type of agency problem is considered to be of larger
magnitude in family firms than in non-family firms.
Thus, there are two types of agency problems created by the difference in ownership,
control, and management structures in family and non-family firms. The relative influence of
these agency problems on the corporate strategies undertaken by firms may lead to differences in
performance as well. There is no clear answer regarding which of these two types of agency
problems is more impeding to value creation in a firm.
Following Anderson and Reeb (2003), we consider a US public company as a family firm
if the members of the instituting families still maintain share ownership in the firm or if family
members still serve as board of directors. To test how the unique agency problems in these two
different types of firms influence major corporate decisions, we focus on a decision area that is
susceptible to agency problems: mergers and acquisitions. In this paper, we empirically examine
the long run performance of family and non-family firms after they make an acquisition.
Addressing this question will provide evidence on the relative impact of two different types of
agency problems on the value creation or destruction in the M&A activities of U.S. corporations.
Furthermore, we specifically examine the value implications of diversifying mergers
made by family-firms. Founding families generally maintain undiversified portfolios in their
firms. Also, the strong emotional attachment of founding family members to their firms may
often lead to an unwavering commitment to firm survival. Anderson and Reeb (2003b) argue
that, because of such concentrated holdings of the family members and their strong motive to
warrant the continued existence of the firm, founding family members have inspirations to

29
moderate the risk of the firm. This argument signals that, in the hope of minimizing their firm
risk and hence the risk of their personal wealth portfolio, family firms may undertake value
destroying diversifying mergers. At the same time, some theories in the literature argue that
diversifying takeovers can be value creating. In a theoretical model, Stein (1997) shows that if
management has an ability to determine the outcomes of projects, diversification provides an
opportunity to minimize the cost of capital of the firm. Thus, diversification improves firms’
internal capital market, leading to lower cost of capital and thereby improving firm value.
Anderson and Reeb (2003) indeed find that the cost of debt is lower in firms with founding
family ownership. Another line of reasoning in favor of diversified firms is that, compared to
focused firms which have highly correlated projects; diversified firms have the flexibility to
choose from uncorrelated projects more often. As a result, diversified firms have a higher
opportunity of creating value by choosing the best among the available projects (DeLong, 2001).
Motivated by these arguments, we empirically compare the long-run performance of focus
increasing and diversifying acquisitions by family and non-family firms.
Most of the available evidence on the merger decisions of family firms is based on non-
U.S. firms. For example, Bae, Kang, and Kim (2002) show that influential shareholders in large
Korean firms use mergers and acquisitions to channel wealth away from minority equity holders.
However, Ben-Amar and Andre´ (2006) study Canadian firms and observe that the performance
of acquiring firms is better if the firm has sizeable family ownership. Shim and Okamuro (2011)
study Japanese firms from 1955-1973 and find that mergers occur less often in family firms than
in non-family firms. While pre-merger family ownership and the probability of mergers are
positively related in their study, they further find that mergers are more beneficial for non-family
firms than for family firms.

30
Analyzing acquisitions of public targets by 103 newly public US family firms, Basu,
Dimitrova, and Paeglis (2009) find a positive association between acquirer’s family ownership
and abnormal returns and a negative association between target’s family ownership and
abnormal returns around the merger announcement. Similar to Basu et al. (2009), Bauguess and
Stegemoller (2008) also study the short-term performance of acquiring family firms and find that
firms with founding family presence generally destroy firm value when they acquire.
While closely related, our study differs from Basu et al. (2009), and Bauguess and
Stegemoller (2008) in a number of important aspects. First, they look only at the short-run
announcement returns around M&A, while we focus on the influence of family firm ownership
on long-term value creation in the post-merger period. Also, we compare the value implications
of diversifying versus focus-increasing acquisitions whereas they do not. Further, Basu et al.
(2009) concentrates on newly public family firms and their acquisitions of public targets only. In
our study, we consider new as well as mature firms and all three types of targets, public, private
and subsidiary.
Similarly, Caprio, Croci, and Del Giudice (2011) is also related to our paper. They study
777 large continental European companies for the period 1990-2008. They find that the size of
the voting rights of the largest shareholder in a family firm is negatively related to the propensity
to acquire. They also find that the chance of being acquired by an unrelated party diminishes for
the firms with family ownership. Studying cumulative abnormal returns (CAR), they find that
family ownership does not reduce value when they acquire other companies. Though related, our
paper is distinct from this paper in key ways. They mainly focus on relating the control motives
of the largest shareholder in the family firms to the propensity to acquire, whereas we focus on
the long-run value implications of acquisition decisions by family firms. We also find that family

31
firms do not destroy value during acquisitions in search of wealth diversification, whereas they
do not examine this point of view. Also, their sample consists of large European firms whereas
we study S&P 500 US companies.
Our results show that family acquirers perform significantly better than non-family
acquirers based on style-adjusted and market-adjusted buy-and-hold three-year abnormal returns.
Calendar time portfolio regression models also show that the average monthly abnormal return
for acquiring family firms is significantly positive, while it is insignificant for non-family
acquiring firms during the three years after the effective date of acquisition. These results are
consistent with Li and Srinivasan (2011), who find that stock returns around M&A
announcements, as well as board attendance, are higher in founder-director firms compared with
non-founder firms. They argue that if having a founder-director on the board implies better
monitoring of the acquisition process, this enhanced monitoring would lead to more favorable
M&A decisions and hence higher returns after M&A announcements. Furthermore, our analysis
of diversifying mergers shows that family firms that engage in focus-decreasing mergers do not
destroy shareholder value. This finding suggests that, in general, the main goal of acquisitions
by family firms is not simply to diversify the personal portfolio of the family members. This
finding is consistent with the theory that diversification helps to reduce the cost of capital of the
firm which could enhance value of the firm.
This study contributes to the literature examining M&A, agency problems, and family
ownership. First, the findings help us to better understand the role of ownership structure in
mergers and acquisitions activities. Contrary to the notion that family blockholders use M&A
transactions to expropriate private benefits from small shareholders, we show that family
acquirers perform better than non-family acquirers in the long-run. Second, this paper adds to

32
the vast literature in mergers and acquisition. To the best of our knowledge, this is the first paper
to study the long-term performance of family firm acquirers versus non-family acquirers. The
findings provide evidence on the effect of ownership and control on the takeover decisions of
firms, showing that family firms are better acquirers than non-family firms. Implicitly, these
findings suggest that the agency problem between shareholders and managers (which is of higher
magnitude in non-family firms) is more detrimental than the agency problem between large and
small shareholders (which is of higher magnitude in family firms) in acquisition activities by
large US firms. Also, the finding that diversifying acquisitions by family-firms do not destroy
value provides avenues for future research to investigate how family-firms perform in cross-
border acquisitions or in geographic diversification.
Furthermore, starting with Anderson and Reeb (2003), studies have shown that the
market- and accounting performance of family firms is better than comparable non-family firms.
However, the factors that lead to this better performance are not well understood. This paper tries
to partially fill that gap by finding M&A as a channel through which family firms perform better
than non-family firms. Finally, this study contributes to the M&A literature by providing another
dimension to creation and destruction of firm value in mergers and acquisitions.
Pros and Cons of Family and Non-Family Firms
As reviewed in Anderson and Reeb (2003) and other studies, founding family ownership
and control can be less profitable than dispersed ownership. For example, Anderson and Reeb
(2003) argue that firms with diversified shareholders normally base their investments on the
basic finance rules that maximize the value of the firm. However, large shareholders with
undiversified holdings may have incentives to increase firm growth, technological innovation, or

33
firm survival as their primary objective, which may not necessarily lead to shareholder
maximization. This point is in line with the Fama and Jensen’s (1983) position that combining
ownership and control provides large shareholders an opportunity to swap profits for personal
advantages. This logic is also consistent with Demsetz’s (1983) argument that concentrated
shareholders with control rights may choose non-monetary consumption and, hence, take scant
resources away from valuable investments.
Also, many family firms hire top executives from inside the family, so they limit their
pool of labor force to family members, thus missing the opportunity to hire talented and capable
individuals from outside. Villalonga and Amit (2006) find that the disagreement between the
family and nonfamily shareholders in descendant-CEO firms is more detrimental than the owner-
manager disagreement in nonfamily firms. Similarly, managerial entrenchment is another cost
associated with family firms. Because of the family’s large stake, these firms may avoid positive
NPV projects that cause them to relinquish control (e.g., takeovers).
While some studies have pointed out the disadvantages of the family firm structure, other
papers have argued that the family firm structure is value-enhancing as compared to nonfamily
firms. For example, Berle and Means (1932) claim that the value of the firm with concentrated
ownership should increase as it reduces the conflict of interest between owners and managers.
Demsetz and Lehn (1985) pose that the ownership and control combination can be beneficial as
the large shareholders can minimize managerial expropriation. Undiversified shareholding and
control of management strengthen them to monitor and influence the firm. Similarly, James
(1999) argues that family owners have longer investment prospects, which leads to better
investment productivity. Similarly, Stein (1988, 1989) models how long investment horizons of
large shareholders mitigate the short-sighted decisions of managers.

34
Recent literature posits that blockholders can govern firms through “exit.” That is, selling
a firm’s stock based on private information (Adamati and Pfliederer, 2009; Edamans, 2009;
Edmans and Manso, 2011; Bharath, Jayaraman, and Nagar. 2012). These models suggest that the
negative stock price impact of blockholder exit is detrimental to managers because of their equity
interest in the firm (equity holding and/or compensation linked to equity). So, managers try to
make sure that large blockholders do not exit the firm. This reasoning suggests that the family
firms’ ownership structure, in which a founding family member is generally a blockholder or a
reputed shareholder, reduces the agency problem between shareholders and managers and leads
to better performance.
These arguments suggest that, by minimizing the conflict of interest between owners and
managers, by enhanced monitoring of managers, and by widening the investment horizon,
concentrated ownership and control might increase firm value.
Research on Family and Non-Family Firms
Whether family ownership creates or destroys firm value is an intriguing question of
interest in the academic research (Morck, Strangeleand, and Yeung, 2000; Anderson and Reeb,
2003; Cronqvist and Nilsson, 2003). The results are mixed so far.
Studying large U.S. firms, Holderness and Sheehan (1988) find that family firms have a
lower Tobin’s q than nonfamily firms. Similarly, Morck et al. (2000) find that family successor
controlled Canadian firms have lower labor to capital ratios, less R&D spending, and worse
financial performance compared to other similar firms. Similarly, Faccio, Lang, and Young
(2001) provide evidence that family control may harm minority shareholders in East Asian firms
where transparency is low.

35
However, some studies provide evidence that family-owned firms are more valuable. For
example, Claessens et al. (2002) find that firm value increases with the cash-flow ownership of
the largest shareholder for a sample of public firms in eight East Asian countries. Also, Anderson
and Reeb (2003) find that family firms perform better than nonfamily firms, based on accounting
performance and Tobin’s q, and after controlling for industry and firm characteristics. Their
results are relatively unaffected by the consideration of other block holders or by the discrepancy
between the family’s ownership and control rights. Their findings further show that the gain
from family control becomes higher when the ownership stake exceeds about 30%. Using a more
specific classification of family firms, Villalonga and Amit (2006) identified family and
nonfamily firms as founder-CEO firms and descendant-CEO firms. Measuring firm performance
by Tobin’s q and industry-adjusted q, they find that the classic principal-agent problem in
nonfamily firms is more disadvantageous than the problem between family and nonfamily
owners in the firms led by founder CEOs. However, the conflict between family and nonfamily
shareholders in descendant-CEO firms is more costly than the owner manager conflict in non-
family firms. In comparing the performance of family controlled firms in Western Europe,
Maury (2006) reports that active family control is associated with higher profitability compared
to non-family firms, whereas passive family control doesn’t affect profitability. By separating the
founding family ownership effect from the general blockholder effect, Andres (2008) provides
evidence from German exchange-listed companies that family firms outperform widely-held
firms as well as firms with other types of concentrated holdings. They further report that family
businesses are better only in firms in which a member of the instituting family is still serving
either as an executive or as a board member.

36
Research on Various Corporate Policies of Family and Non-Family Firms
Recent studies have uncovered differences in corporate policies adopted by family and
non-family firms. For example, Anderson et al. (2003) show that debt is less expensive for the
firms with founding family ownership, both statistically and economically. Furthermore, Hu,
Wang, and Zhang (2007) find that family firms pay relatively less dividend (as measured by
payout ratio) than non-family firms. Chen, Chen, Cheng, and Shevlin (2010) study the tax
aggressiveness of family and non-family firms and find that family firms are less tax aggressive
than nonfamily firms. They attribute this result to the family owners being more concerned with
the non-tax costs of potential price discounts from non-family shareholders, the potential penalty
imposed by the IRS, and the potential damage on family reputation. Liu (2011) find that cash
holdings are significantly lower at family firms than in nonfamily firms. Examining the
relationship between founding family ownership and compensation practice in Swiss Exchange
listed firms, Weisskopf (2012) reports that founding family firms use cash compensation as a
substitute for equity-based pay in most cases.
In a similar vein, we are interested in studying the mergers and acquisitions decisions
made by family versus non-family firms and the effect of such decisions on their long run
performance. This investigation is interesting, particularly, because mergers and acquisitions are
major restructuring events that have long-term implications for the firm. Furthermore, previous
researchers have documented the agency problems which can affect takeover decisions. The
literature argues that members of the founding families value control of the firm and they avoid
becoming a takeover target. Also, as Liu (2011) notes, these firms quickly utilize cash, mostly on
projects profiting the controlling family owners. Thus, family firms might be tempted to make
acquisitions to deploy cash quickly and to avoid being taken over themselves.

37
Data
Anderson and Reeb (2003) provide the original sample of family and non-family firms in
the S&P 500 universe. The sample begins with the companies in the S&P 500 index as of the end
of 1992 and continues through 1999. Anderson and Reeb (2003) categorize a firm as family
owned if the members of the instituting families of a US public company still maintain share
ownership in the firm or if family members still serve as board of directors. The sample for the
period 2000-2006 is generously made available by Liu (2011), who expanded the sample until
2006 using a variety of sources such as proxy statements of the firms, 10-Ks, histories of the
companies, and different web sources.
We obtained mergers and acquisitions data from Thompson Reuters’ SDC Database.
Only completed acquisitions with majority stakes are considered. That is, buybacks, acquisitions
of assets, minority stake acquisitions, exchange offers etc. are excluded from the sample. We
have also omitted the firms in highly regulated industries, utilities and financials. Further, to
capture deals with a significant economic impact on the bidder, we only include transactions
with a value greater than $100 million.
In order to study long-run performance, we include only the first acquisition (satisfying
the above mentioned criterion) made by a firm within three years. As stated in Lyon, Barber, and
Tsai (1999), the process of avoiding overlapping returns addresses the concern of cross-sectional
dependence caused by overlapping observations. Loughran and Vijh (1997) point out that no
look-ahead bias is present in this restriction. Also, we omit the year 1992 in the classification of
family and non-family firm, to make sure that the firm was already classified under that type

38
before they started the acquisition process. With this selection procedure, we obtained 226
acquisitions made by family and non-family S&P 500 firms.
Finally, our source of financial data is COMPUSTAT and the source of return data is
CRSP. We hand-collected Institutional ownership (INSOWN) and age of the CEO (CEOAGE)
variables. The financial data was not available for 10 firms. Thus, our final sample consists of
213 acquisitions from 1993 to 2006. Among those, 67 acquisitions are made by family firms, and
146 are made by non-family firms.
Table 9 Panel A provides a breakdown of the sample of 213 acquisitions by year, and
Panel B shows the industry distribution. The percentage in Panel A is the percentage of family
firms in a given year out of the total number of acquisitions in the sample in that year. In Panel
B, percentages in the fourth column provide the percentage of acquisitions in that industry by
both family and non-family firms. Columns 2 and 3 show that acquisitions by family firms are
proportionately higher in industries like: Printing and Publishing, Consumer goods, Business
Services, Machinery, and Restaurants, Hotels and Motels. Given the distribution of these
acquisitions in years and industries, we control for year fixed effects and industry fixed effects in
the multivariate analysis.
Table 10 provides descriptive statistics for the control variables used in the multivariate
analysis. Panel A provides the summary statistics for the continuous variables, and Panel B
shows the percentage of family versus non family firms in different groups used as dummy
variables. In panel A, we find that the mean transaction value (TVAL) for family firm
acquisitions is $752 million whereas it is $2.34 billion for non-family firms. However, after
scaling the transaction value by the bidder’s total assets, the values (TVAT) are 0.54 and 0.56 for
family and non-family firms, respectively, and the difference is insignificant. Similarly, the

39
market value of equity for family and non-family firms are respectively $18 billion and $23
billion. While the descriptive statistics are generally not significantly different for family versus
non family firms, two notable exceptions are the level of cash holdings (CHLD), which is 0.36
for family firms and 0.21 for non-family firms, and institutional ownership (INSOWN), which is
56.54% for family firms and 66.35% for non-family firms. The difference between family and
non-family firms in these two characteristics is significant at the 1% level. These descriptive
variables are measured as of the fiscal-year end before the effective date of the acquisition.
Panel B shows that the percentage of acquisitions involving public targets is larger for
family acquirers (about 40%) than for non-family acquirers (about 27%). The percentage of
focus-increasing mergers, stock offers, and tender offers are similar for both types of firms.
Almost half of the deals made by non-family acquirers are in high tech industries (based on SDC
definitions), as compared to 42% for family acquirers. The full description of variables is
provided in Appendix A.
Table 11 presents the correlation coefficients of the variables used in empirical studies in
the article. Our variable of interest, FAM, is a dummy variable equal to one if the firm is a family
firm and zero if the firm is a non-family firm. The correlation coefficient between FAM and any
of the other control variables is generally small.
Multivariate Analysis
Buy-and-Hold Abnormal Returns (BHARs)
We calculate the buy and hold abnormal returns (BHAR) for each firm i for the period
t=1 to t=T in the following way:

40
𝐵𝐻𝐴𝑅𝑖,𝑇 = ∏ (1 + 𝑅𝑖,𝑡)𝑇
𝑡=1− ∏ (1 + 𝑅𝑏𝑒𝑛𝑐ℎ𝑚𝑎𝑟𝑘,𝑡)
𝑇
𝑡=1
where the mean buy and hold abnormal return is the value weighted average of the individual
BHARs:
𝐵𝐻𝐴𝑅 = ∑ 𝑤𝑖 ∗
𝑁
𝑖=1
𝐵𝐻𝐴𝑅𝑖
In order to test our hypothesis, we estimate the following cross-sectional regression:
BHARi,t+k = α0 + β1FAMi,t + β2LMVLi,t−1 + β3TVATi,t + β4PUB + β5SHR + β6ROAi,t
+ β7DIVR + β8CHLDi,t + β9TO + β10INSOWNi,t + β11CEOAGEi,t
+ YearDummies + IndustryDummies + εi,t
where BHARi,t+k is the buy-and-hold abnormal return k year(s) after the effective date of
acquisition. The two benchmarks used when measuring BHAR are: style-adjusted (size and
book-to-market adjusted) returns and market adjusted returns. Benchmark returns for style-
adjusted BHARs are the returns of 25 size and book to market matched portfolios obtained from
20 size and 20 book to market Fama-French portfolios: 20 size portfolios are grouped into 5
portfolios based on size and similarly, 20 portfolios based on book-to-market of the firms are
grouped into 5 book-to-market portfolios and finally we have 5*5=25 size and book-to-market
matched portfolios. The benchmark returns for market-adjusted BHARs are the CRSP valued-
weighted market returns. FAMi,t is a dummy variable equal to 1 if firm i is a family firm in year
t and zero otherwise. LMVLi,t is the common logarithm of the market value for firm i in the last

41
trading day of the month before the effective date of the merger. TVATi,t is the SDC deal value
(in millions) of the merger (TVAL) for firm i in year t ,scaled by lagged assets. PUB is a dummy
variable equal to 1 if the target firm is public and zero otherwise. SHR is a method of payment
variable equal to 1 if the transaction is paid with stock only and zero otherwise. ROAi,t is the
operating income before depreciation for firm i in year t scaled by lagged asset. DIVR is a
dummy variable equal to 1 if the acquirer and target are not in the same 2-digit industry and zero
otherwise. CHLDi,t is the sum of the Cash and Short term investments for firm i in year t scaled
by lagged assets. TO is a tender offer indicator variable. INSOWNi,t is the percentage of
institutional ownership of firm i in the year t. CEOAGEi,t is the age of the CEO of the firm i in
year t.We also provide the definitions of these variables in Appendix C.
Calendar-Time Portfolio Regression
In addition to the cross-sectional approach described above, we also evaluate the long-
term returns using Calendar-time factor model regressions. The returns of the acquiring family
and non-family firms are the value-weighted average of returns for firms in the sample. The
value weighted averaging is performed separately for family and non-family firms for three years
after the acquisition, and the models are also run separately.
We start with a four factor model including the traditional Fama French three factors plus
the momentum factor. We obtain the three factor data from Kenneth French’s website. We also
include a liquidity factor of Pastor and Stambaugh (2003). The two models we use are as
follows:
𝑅𝑝𝑡 − 𝑟𝑓𝑡 = 𝐴𝑅𝑡 + 𝛼1(𝑅𝑚𝑡 − 𝑟𝑓𝑡) + 𝛼2𝑆𝑀𝐵𝑡 + 𝛼3𝐻𝑀𝐿𝑡 + 𝛼4𝑈𝑀𝐷𝑡 (𝐴)

42
and
𝑅𝑝𝑡 − 𝑟𝑓𝑡 = 𝐴𝑅𝑡 + 𝛼1(𝑅𝑚𝑡 − 𝑟𝑓𝑡) + 𝛼2𝑆𝑀𝐵𝑡 + 𝛼3𝐻𝑀𝐿𝑡 + 𝛼4𝑈𝑀𝐷𝑡 + 𝛼5𝐿𝐼𝑄𝑡 (𝐵)
Where:
𝑅𝑝𝑡 = monthly return on a value-weighted calendar time portfolio of family (non-family) firms.
𝑟𝑓𝑡 = monthly return on three-month T-bill.
𝐴𝑅𝑡 = intercept term, or the mean monthly abnormal return for the calendar time portfolio.
𝑅𝑚𝑡 = monthly return on a value-weighted market index.
𝑆𝑀𝐵𝑡 = monthly difference in the returns of a value-weighted portfolio of small and big stocks.
𝐻𝑀𝐿𝑡 = monthly difference in the returns of a value-weighted portfolio of high book-to-market
stocks and low book-to-market stocks.
𝑈𝑀𝐷𝑡 = monthly difference in the returns of a value-weighted portfolio of past winner stocks
and past loser stocks.
𝐿𝐼𝑄𝑡 = the value-weighted return on the 10-1 portfolio from a sort on historical liquidity betas, as
defined in Robert F. Stambaugh’s website.
Multivariate Results
Buy-and-hold abnormal returns (BHARs). Table 12 provides the results of the cross
sectional analysis of buy-and-hold abnormal returns (BHARs). In Panel A, the dependent
variable is the 1-year buy-and-hold abnormal return of the whole sample of firms, where the
returns are calculated from the month after the effective date of the acquisition through the next

43
twelve months. After controlling for firm and deal characteristics as well as year and industry
fixed effects, we see that family firms have around 15 to 18 % higher returns (significant at the
5% level) than non-family firms in the first year after the merger, based on style adjusted and
market adjusted benchmark returns.
In Panel B of Table 12, the dependent variable is the 3-year buy-and-hold abnormal
return, where the returns are calculated from the month after the effective date through the next
thirty-six months. Using the same specification as in Panel A, we find that family firms have
around 40% higher returns than the non-family firms in the three years following the merger
based on style-adjusted returns. Similarly, using market-adjusted returns, the three year post-
merger returns are 36% higher for family acquirers than for non-family acquirers. The coefficient
of the family firm dummy (FAM) is significant at the 5% level in the style-adjusted
specification, and at 10% in the market-adjusted specification. Thus, our results are in line with
other studies such as Anderson and Reeb (2003); Villalonga and Amit (2006) who have found
better long term performance for family firms as compared to non-family firms.
The control variables are not significant in explaining the acquirers’ three year post-
merger performance, with the one exception of the public target indicator variable, which is
negative and significant. The lower announcement period abnormal return associated with
purchasing public, as opposed to non-public, targets is a well-known phenomenon. For example,
Fuller, Netter, and Stegemoller (2002) find that bidder abnormal returns around the merger
announcement are significantly higher when the target is private than when the target is public.
However, this finding has not been well-established in the long-run. Thus, our result provides
long-run evidence to support the short-run findings, highlighting the importance of the target’s
public status in acquisitions.

44
Calendar-time portfolio regression. In Table 13, we report the results of the four-factor
model and five-factor model, which are run separately for family and non-family firms. Panel A
shows that the average monthly abnormal return for non-family acquirers is 0.21%, with a t-
statistic of 1.15 (p-value 0.25). In contrast, the monthly abnormal return is 0.75% for the
portfolio of family firms, with a t-statistic of 2.34 (p-value 0.02). The other factors have
generally the expected signs.
In Panel B of Table 13, we report the results for the five factor model (including Pastor
and Stambaugh’s liquidity factor). In this case, the intercept for the non-family acquirers is
0.25%, with a t-statistic of 1.40 (p-value 0.16). The average monthly abnormal return for family
acquirers is 0.69%, with a t-statistic of 1.98 (p-value 0.04). These time-series results help to
confirm the cross-sectional findings showing better post-merger performance for family
acquirers as compared to non-family acquirers.
Family firms, diversifying mergers, and firm value. Given the potential increased
diversification incentives of family firms, we also study the long-run value implications of
diversifying and focus-increasing acquisitions by family and non-family firms in Table 6. In
Panel A of Table 6, we provide results of regressions with year and industry fixed-effects. The
dependent variables are one-year style-adjusted and market-adjusted (respectively in first and
second models) buy and hold abnormal returns (BHARs) measured after the effective date of
acquisition. The variables of interest are the family firm dummy (FAM) and the interaction term
between family firm dummy and the dummy for diversifying merger (DIVR), that is
FAM_DIVR. We consider an acquisition as diversifying, that is DIVR=1, if the acquiring and
the target firms are not in the same two-digit (four-digit) industry. In the first model, we
calculate style-adjusted buy and hold abnormal returns (BHARs): the large positive sum of the

45
coefficients of FAM and FAM_DIVR (that is 5.80+26.35= 32.15) implies that diversifying
acquisitions by family firms do not destroy value in the long-run. In the second model, we
calculate market-adjusted buy and hold abnormal returns (BHARs). Again, the large positive
sum of the coefficients of FAM and FAM_DIVR (that is 2.50+27.72= 30.22) reconfirms that
diversifying acquisitions by family firms do not destroy value in the long-run. These results are
based on two-digit definition of the DIVR dummy. We get qualitatively similar results when we
use a four-digit SIC code definition of the DIVR dummy.
In Panel B of Table 14, our dependent variable is the three-year buy and hold abnormal
returns (BHARs). In Model 1, we use the style-adjusted BHARs as dependent variables and in
Model 2; we use the market-adjusted BHARs as dependent variables. The results suggest that the
three year stock-return performance (as measured by BHARs) is positively related (with large
coefficients: 9.27+58.87=68.14and 8.32+54.62=62.94 for style-adjusted and market adjusted
respectively) for diversifying mergers by family firms. The results indicate that the diversifying
acquisitions by family firms do not destroy value in such undertakings.
Overall, our results do not support the risk minimization via diversification motive of
family firms during major corporate takeovers. That is, the results imply that family firms do not
acquire firms from other industries just to diversify the portfolio of their personal wealth. Rather,
the results are consistent with Stein’s model that diversification helps firms to create value by the
lowering cost of capital. Graham, Lemmon, and Wolf (2002) find that, on average, corporate
diversification do not destroy value. They provide evidence that the occurrence of much of the
excess value reduction of acquiring firms is because they acquire already discounted business
units and not because the acquisitions are diversifying. They suggest that the practice of using
stand-alone firms as a benchmark for valuing the conglomerate needs to be reconsidered. In our

46
tests, we compare only acquiring firms and our benchmarks are from the universe of all US
firms. Further, our findings are also consistent with the argument of DeLong (2001) that
diversified firms can choose a good project from the pool of many unrelated projects so that they
can create value in the long-run.
Conclusion
The value of the family firm structure, as compared to the non-family structure, has been
the subject of much debate in the literature, which has shown largely mixed findings. There is
relatively little evidence on the performance implications of these two different types of
ownership structures for U.S. firms, especially in the long-run. Using a sample of 213 S&P 500
family and non-family firms, we compare the long-run acquisition performance of family firms
versus non-family firms. We employ cross-sectional regression models using buy-and-hold
abnormal returns, as well as calendar time portfolio regression models too. We find that family
acquirers perform significantly better than their non-family counterparts when performance is
measured as style-adjusted or market-adjusted buy-and-hold abnormal returns in the three years
following the merger. Calendar time portfolio regression models also show that the average
monthly abnormal return for family acquirers is significantly positive, while it is insignificant for
non-family acquirers. These results are consistent with recent literature that has found that family
firms tend to perform better than non-family firms. These results imply that the agency problem
between shareholders and managers in traditional non-family firms might be more severe than
the agency conflict between large and small shareholders in family firms. This line of research
provides a rich source for future investigation.

47
Conflicting hypotheses motivate us to study diversifying versus focus-increasing
acquisitions by family firms. One line of research suggests that family firms undertake value-
destroying diversifying acquisitions to reduce the risk of their wealth concentrated in the firm.
An alternative argument is that diversification has positive aspects such as reduction in cost of
capital and the ability to choose the most valuable projects from a wide set of uncorrelated
projects. Our empirical analysis implies that, on average, family firms do not make value-
destroying diversifying acquisitions, suggesting that family firms do not pursue acquisitions
simply to diversify the personal portfolios of the founding family members. The argument that
diversifying acquisitions assist firms to reduce their cost of capital and enable firms to improve
value is consistent with this finding. Our result is also in line with the logic that diversification
provides firms with a set of uncorrelated projects so that firms may enhance value by selecting
some of the most promising among them.

48
REFERENCES
Aghion, P. & Tirole, J. (1994). The management of innovation. Quarterly Journal of Economics,
109, 1185-1209.
Almeida, H. & Campello, M. (2007). Financial constraints, asset tangibility, and corporate
investment. Review of Financial Studies, 20, 1429-1460.
Anderson, R., Mansi, S., & Reeb, R. (2003). Founding family ownership, Corporate
diversification, and firm leverage. Journal of Law and Economics, 46, 653-684.
Anderson, R. & Reeb, D. (2003a). Founding-family ownership and firm performance: Evidence
from the S&P 500. Journal of Finance 58, 1301-1328.
Anderson, R. & Reeb, R. (2003b). Founding family ownership and the agency cost of debt.
Journal of Financial Economics, 68, 263-285.
Andre, P., Ben-Amar, W., & Saadi, S. (2012). Family firms and high technology mergers and
acquisitions. Journal of Management & Governance, published online.
Andres, C. (2011). Family ownership, financing constraints and investment decisions. Applied
Financial Economics, 21, 1641-1659.
Arugaslan, O., Cook, D., & Kieschnick, R. (2010). On the decision to go public with dual-class
stock. Journal of Corporate Finance, 16, 170-181.
Bae, K., Kang, J., & Kim, J. (2002). Tunnelling or value addition? Evidence from mergers by
Korean business groups. Journal of Finance, 57, 2695-2740.
Basu, N., Dimitrova, L., & Paeglis, I. (2009). Family control and dilution in mergers. Journal of
Banking and Finance, 33, 829-841.
Bauguess, S. & Stegemoller, M. (2008). Protective governance choices and the value of
acquisition activity. Journal of Corporate Finance, 14, 550-566.
Bebchuck, L., Cohen, A. & Ferrel, A. (2009). What matters in corporate governance? Review of
Financial Studies, 22, 783-827.

49
Bebchuck, L., Kraakman, R. & Triantis, G. (2000). Stock pyramids, cross-ownership, and dual-
class equity: The mechanisms and agency costs of separating control from cash-flow
rights. NBER Working Paper.
Bebchuk, L. & Weisbach, M. (2010). The state of corporate governance research. Review of
Financial Studies, 23, 939-961.
Bebchuck, L. & Zingles, L. (2000), Ownership structure and the decision to go public: Private
versus social optimality. NBER Working Paper.
Bena, J. and Li, K. (2013). Corporate innovations and mergers and acquisitions. Journal of
Finance, forthcoming.
Ben-Amar, W. & Andre´, P. (2006). Separation of ownership and control and acquiring firm
performance: The case of family ownership in Canada. Journal of Business Finance &
Accounting, 33, 517-543.
Berle, A. & Means, G. (1932). The modern corporation and private property. Transactions
Publishers.
Bharath, S., Jayaraman, S., & Nagar,V. (2013). Exit as governance: An empirical analysis.
Journal of Finance, 68(6), 2515-2547.
Bhide, A. (1993). The hidden costs of stock market liquidity. Journal of Financial Economics,
34, 31-51.
Bigelli, M. & Mengoli, S. (2004). Sub-optimal acquisition decision under a majority shareholder
system. Journal of Management and Governance, 8, 373-405.
Bohmer, E., Sanger, G., & Varshney, S. (1996). The effect of consolidated control on firm
performance: The case of dual-class IPOs. In M. Levis (Ed.), Empirical Issues in Raising
Equity Capital.
Bouwman, C., Fuller, K., & Nain, A. (2007). Market valuation and acquisition duality: Empirical
evidence. Review of Financial Studies, 22, 633-679.
Brau, J., Francis, B., and Kohers, N. (2003). The choice of IPO versus takeover: Empirical
evidence. Journal of Business, 76, 583-612.
Brau, J., Couch, R., & Sutton, N. (2012). The desire to acquire and IPO long-run
underperformance. Journal of Financial and Quantitative Analysis, 47, 493-510.
Celikyurt, U., Sevilir, M., & Shivdasani, A. (2010), Going public to acquire? The acquisition
motive in IPOs. Journal of Financial Economics, 96,345-363.

50
Chang, S., Wu, W., & Wong, Y. (2010). Family control and stock market reactions to innovation
Announcements. British Journal of Management, 21, 152-170.
Chemmanur, T. and Tian, X. (2011). Do anti-takeover provisions spur corporate innovation?
American Finance Association 2011 Denver meetings paper.
Chemmanur, T. & Jiao, Y. (2006). Dual-class IPOs, share recapitalizations, and unification: A
theoretical analysis. ECGI - Finance Working Paper.
Chen, H. & Hsu, W. (2009). Family ownership, board independence, and R&D investment.
Family Business Review, 22, 347-362.
Chen, S., Chen, X., Cheng, Q., & Shevlin, T. (2010). Are family firms more tax aggressive than
non-family firms? Journal of Financial Economics, 95, 41-61.
Claessens, S., Djankov, S., Fan, J., & Lang, L. (2002). Disentangling the incentive and
entrenchment effects of large shareholdings. Journal of Finance, 57, 2741-2772.
Core, J., Guay, W., & Rustics, T. (2006). Does weak governance cause weak stock returns? An
examination of firm operating performance and investors' expectations. Journal of
Finance, 61, 655-687.
Crone, H. & Plaksen, E. (2010). The value of dual-class shares in Switzerland, Working Paper.
Cronqvist, H. & Nilsson, M. (2003). Agency costs of controlling minority shareholders. Journal
of Financial and Quantitative Analysis, 38, 695-719.
DeAngelo, H. & DeAngelo, L. (1985). Managerial ownership of voting rights: A study of public
corporations with dual-classes of common stock. Journal of Financial Economics, 14,
33-69.
DeLong, G. (2001). Stockholder gains from focusing versus diversifying mergers. Journal of
Financial Economics, 59, 221-252.
Demsetz, H. (1983).The structure of ownership and the theory of the firm. Journal of Law and
Economics, 25, 375-390.
Demsetz, H. & Lehn, K. (1985). The structure of corporate ownership: Causes and
consequences. Journal of Political Economy, 93, 1155-1177.
Dittmar, A. & Mahrt-Smith, J. (2007). Corporate governance and the value of cash holdings.
Journal of Financial Economics, 83, 599-634.
Edmans, A. (2009). Blockholder trading, market efficiency, and managerial myopia. Journal of
Finance, 64, 2481-2583.

51
Edmans, A. & Manso, G. (2009). Governance through exit and voice: A theory of multiple
blockholders, University of Pennsylvania Working Paper.
Faccio, M. & Lang, L. (2002). The ultimate ownership of Western European Corporations.
Journal of Financial Economics, 65, 365-395.
Faccio, M., Lang, L., & Young, L. (2001). Dividends and expropriation. American Economic
Review, 91, 54-78.
Faccio, M. & Mausulis, R. (2005). The choice of payment method in European mergers and
acquisitions. Journal of Finance, 60, 1345-1388.
Fama, E.F. & Jensen, M.C. (2002). Separation of ownership and control. Journal of Law &
Economics, 26, 301-325.
Feito-Ruiz, I. & Menedez-Requejo, S. (2010). Family firm mergers and acquisitions in different
legal environments. Family Business Review, 23, 60-75.
Fuller, K., Netter, J., & Stegemoller, M. (2002). What do returns to acquiring firms tell us?
Evidence from firms that make many acquisitions. Journal of Finance, 57, 1763-1794.
Gokkaya, S. & K. Roskelley. (2012). Seasoned equity offerings and ownership structure: A
comparison of dual-class and single-class SEOs, Working Paper.
Gompers, P., Ishii, J., & Metrick, A. (2003). Corporate governance and equity prices. Quarterly
Journal of Finance, 118, 107-156.
Gompers, P., Ishii, J. & and Metrick, A. (2010), Extreme governance: An analysis of dual-class
firms in the United States. Review of Financial Studies, 23, 1051-1088.
Graham, J., Lemmon, M., & Wolf, J. (2002). Does corporate diversification destroy value?
Journal of Finance, 57, 695-720.
Grossman, S. & Hart, O. (1988). One share-one vote and the market for corporate control.
Journal of Financial Economics, 20, 175-202.
Hall, B. (2010). The financing of innovative firms. Review of Economics and Institutions,1, 00.
Harford, J., Klasa, S. & Walcott, N. (2009). Do firms have leverage targets? Evidence from
acquisitions. Journal of Financial Economics, 93, 1-14.
Harris, M. & Raviv, A. (1988). Corporate governance: Voting rights and majority rules. Journal
of Financial Economics, 20, 203-235.
Helwege, J., Pirinsky, C., & Stulz, R. (2007). Why do firms become widely held? An analysis of
the dynamics of corporate ownership. Journal of Finance, 62, 995-1028.

52
Hill, A. (2011). Enrolment open for an MBA in Murdoch. The Financial Times, July 18, 2011.
Hirshleifer, D., Low, A., & Teoh, S. (2012). Are overconfident CEOs better innovators? Journal
of Finance, 67, 1457-1498.
Holderness, C. & Sheehan, D. (1988). The role of majority shareholders in publicly held
corporations. Journal of Financial Economics, 20, 317-346.
Holmstrom, B. (1989). Agency costs and innovation. Journal of Economic Behavior and
Organization, 12, 305-327.
Hovakimian, A. & Hutton, I. (2010). Merger-motivated IPOs. Financial Management, 39, 1547-
1573.
Hu, Y., Wang, D., & Zhang, S. (2007). Founding family ownership, management and payout
policy. Working Paper.
James, H. (1999). Owner as manager, extended horizons and the family firm. International
Journal of the Economics of Business, 6, 41-56.
Jensen, M. & Meckling, W. (1976). Theory of the firm: Managerial behavior, agency costs and
ownership structure. Journal of Financial Economics, 3, 305-360.
Jordan, B., Liu, M. & Wu, Q. (2012). Corporate payout policy in dual-class firms. Working
Paper. Available at SSRN 1985683 (2012).
La Porta, R., Lopez-de-Silanes, F., & Shleifer, A. (1999). Corporate ownership around the world.
Journal of Finance, 54, 471-517.
Li, F. & Srinivasan, S. (2011). Corporate governance when founders are directors. Journal of
Financial Economics, 102, 454-469.
Liu, Y. (2011). Founding family ownership and cash holding. Journal of Financial Research, 34,
279-294.
Loughran, T. & Vijh, A. (1997). Do long-term shareholders benefit from corporate acquisitions?
Journal of Finance, 52, 1765-1790.
Lyon, J., Barber, B., & Tsai, C. (1999). Improved methods for tests of long-run abnormal stock
returns. Journal of Finance, 54, 165-201.
Masulis, R., Wang, C., & Xie, F. (2007), Corporate governance and acquirer returns. Journal of
Finance, 62, 1851-1889.
Masulis, R., Wang, C., & Xie, F. (2009), Agency problems at dual-class companies. Journal of
Finance, 64, 1697-1727.

53
Maury, B. (2006). Family ownership and firm performance: Empirical evidence from Western
European corporations. Journal of Corporate Finance, 12, 321-341.
Miller, D., Le Breton-Miller, I., & Lester, R. (2010). Family ownership and acquisition behavior
in publicly-traded companies. Strategic Management Journal, 31, 201-223.
Morck, R., Shleifer, A., & Vishny, R. (1988). Management ownership and market valuation: An
empirical analysis. Journal of Financial Economics, 20, 293-315.
Morck, R., Strangeland, D., & Yeung, B. (2000). Inherited wealth, corporate control, and
economic growth. In R. Morck (Ed.), Concentrated Corporate Ownership, Chicago, IL,:
University of Chicago Press.
Paredes, T. (2005). Too much pay, too much deference: Behavioral corporate finance, CEOs,
and corporate governance. American Law & Economics Association Annual Meetings
Paper.
Pastor, L. & Stambaugh, R. (2003). Liquidity risk and expected stock returns. Journal of
Political Economy, 111, 642-685.
Rhodes-Kropf, M. & Robinson, D. (2008). The market for mergers and the boundaries of the
firm. Journal of Finance, 63, 1169-1211.
Sevilir, M. & Tian, X. (2012), Acquiring innovation, Working Paper.
Shim, J. & Okamuro, H. (2011). Does ownership matter in mergers? A comparative study of the
causes and consequences of mergers by family and non-family firms. Journal of Banking
and Finance, 35, 193-203.
Shleifer, A. & Vishny, R. (1986). Large shareholders and corporate control. Journal of Political
Economy, 94, 461-489.
Shliefer, A. & Vishny, R. (1989). Management entrenchment: The case of manager-specific
investments. Journal of Financial Economics, 25, 123-139.
Shleifer, A. & Vishny, R. (2003). Stock market driven acquisitions. Journal of Financial
Economics, 70, 295-311.
Smart, S., Thirumalai, R., & Zutter, C. (2008). What's in a vote? The short- and long-run impact
of dual-class equity on IPO firm values. Journal of Accounting and Economics, 45, 94-
115.
Smart, S. & Zutter, C. (2003). Control as a motivation for underpricing: A comparison of dual
and single-class IPOs. Journal of Financial Economics, 69, 85-110.

54
Stein, J. (1988). Takeover threats and managerial myopia. Journal of Political Economy, 96, 61-
80.
Stein, J. (1989). Efficient capital markets, inefficient firms: A model of myopic corporate
behavior. Quarterly Journal of Economics, 103, 655-669.
Stein, J. (1997). Internal capital markets and the competition for corporate resources. Journal of
Finance, 52, 111-133.
Villalonga, B. & Amit, R. (2006). How do family ownership, control, and management affect
firm value? Journal of Financial Economics, 80, 385-417.
Weisskopf, J. (2012). Executive compensation in family firms: Fat cats or benefactors,
University of Fribourg Working Paper.
Yen, T. & Andre´, P. (2007). Concentrated ownership and long term operating performance of
acquiring firms: The case of English origin countries. Journal of Economics and
Business, 59, 380-405.
Zwiebel, J. (1995). Corporate conservatism and relative compensation. Journal of Political
Economy, 103, 1-25.

55
APPENDIX A:
DEFINITION OF VARIABLES
Variables Definitions
DUAL A dummy variable equal to one if the acquirer is a dual-class firm and 0 if it is a
single-class acquirer.
SIZE
Logarithm of the market value of equity of the firm in the year prior to the acquisition
(in case the firm going public and making an acquisition are in the same year, we use
the market value of the same year).
TOBINQ The Tobin’s Q of the acquiring firm
SLACK Cash and short-term investments of the firm divided by the total assets of the firm in
the year prior to the acquisition.
DEBTRATION The total long-term debt of the firm divided by the market value of equity of the firm.
CRISIS A dummy variable equal to one if the year is 2001, 2002, 2007, or 2008 and zero
otherwise.
INTCOV The ratio of the earnings-before-interest and taxes (EBIT) divided by the net interest
paid by the firm.
IPOPRO Logarithm of the IPO Proceeds value net of fees and expenses scaled by total assets.
VCBACKED A dummy variable equal to one if the firm had VC backing before the IPO and zero
otherwise.
RDEALSIZE The transaction value of the acquisition divided by market value of equity of the firm
in the year prior to the acquisition.
RELATED A dummy variable equal to one if both the acquirer and the target are in the same
four-digit industry and zero otherwise.
TECH A dummy variable equal to one if the acquiring firm is in a high tech industry (details
of SIC codes is provided in Appendix A) and zero otherwise.
TENDER A dummy variable equal to one if the deal is a tender offer and zero otherwise.
SUBS A dummy variable equal to one if the target is a subsidiary and zero otherwise.
ASSET A dummy variable equal to one if the deal is an acquisition of assets and zero
otherwise.
INNOT A dummy variable equal to one if the target is in one of the top sixteen industries by
cite/pat from the table in Appendix B (reproduced from Sevilir and Tian, 2012).
INNOTA A dummy variable equal to one if the target is in one of the top 16 industries by
cite/pat from the table in Appendix B (reproduced from Sevilir and Tian, 2012).
MOPC A dummy variable equal to one if the method of payment is Cash.
PUBTAR A dummy variable equal to one if the target is a public firm.
DUAL_MOPC Interaction term between DUAL and MOPC.
DUAL_INNOT Interaction term between DUAL and INNOT.
DUAL_INNOA Interaction term between DUAL and INNOT.
CEOAGE Age of the acquiring CEO in the year of acquisition.

56
APPENDIX B:

57
Source: Sevilir and Tian (2012)

58
APPENDIX C:
DESCRIPTION OF THE VARIABLES
TVAL = Deal value (in million) of the merger from SDC
TVAT = TVAL/ Total Asset
MVAL = (closing price of the stock in the last trading day of the month before the effective date
of the merger) * Number of shares outstanding (in millions).
LMVL = Common logarithm of MVAL.
ROA = Operating income before depreciation/Total Assets.
CHLD = Cash and Short term investments/Total Assets.
INSOWN = Institutional ownership (in the percentage) in the acquiring firm in the year of
acquisition.
CEOAGE = Age of the CEO of the acquiring firm in the year of acquisition.
All of the above variables are constructed for the acquiring firms.
Dummy Variables
FAM = One if the firm is a family firm and zero if it is a non-family firm.
PUB= One if the target corporation is public and zero otherwise (non-public).
DIVR = One if the acquirer and target are not in the same two-digit (four-digit) industry, else
zero (focus increasing).
SHR =One if the transaction is paid by stocks only, else zero (other payments).
TO = One if the bid is a tender offer, else zero (Non-tender offer).

59
Table 1. Descriptive Statistics
Panel A. Distribution of Single and Dual-Class IPOs
This table provides the number of firms going public with single and dual-class of shares
between 1990 and 2008. All the issues are from U.S. markets. The financial firms (SIC 6000-
6999), REITS, and issues with less than $5.00 issue prices are excluded. IPO year is the year of
issue date.
IPO Year Single-Class Dual-Class Total
1990 99 6 105
1991 238 20 258
1992 349 17 366
1993 427 28 455
1994 336 28 364
1995 381 26 407
1996 556 55 611
1997 374 36 410
1998 220 24 244
1999 390 31 421
2000 318 19 337
2001 61 6 67
2002 47 9 56
2003 43 6 49
2004 135 11 146
2005 111 16 127
2006 128 6 134
2007 127 12 139
2008 16 3 19
Total 4356(92.4%) 359(7.6%) 4715(100%)

60
Table 1. Descriptive Statistics
Panel B.
This table provides the difference in mean test of some important variables used in empirical
examination. SIZE is logarithm of the market value of equity of the firm in the year prior to the
acquisition (in the case of the firm going public and making an acquisition in the same year, we
use the market value of the same year). TOBINQ is the Tobin’s Q of the acquiring firm measured
as the ratio of the market value of equity to the book value of assets. VCBACKED is a dummy
variable equal to one if the firm had VC backing before the IPO and zero otherwise. RDEALSIZE
is the transaction value of the acquisition divided by the market value of equity of the firm in the
year prior to the acquisition. RELATED is a dummy variable equal to one if both the acquirer and
the target are in the same four-digit industry and zero otherwise. DEBTRATION is the total long-
term debt of the firm divided by the market value of equity of the firm.
Variables Dual-
Class
Single-
Class p-value
Number of firms 113 1,266
SIZE (in millions) 3,122.5 1,654.8 0.05
TOBINQ 1.29 2.94 <0.001
VCBACKED 0.26 0.51 <0.001
RDEALSIZE 2.35 2.98 0.67
RELATED 0.5 0.36 0.01
DEBTRATIO 0.63 0.45 0.09
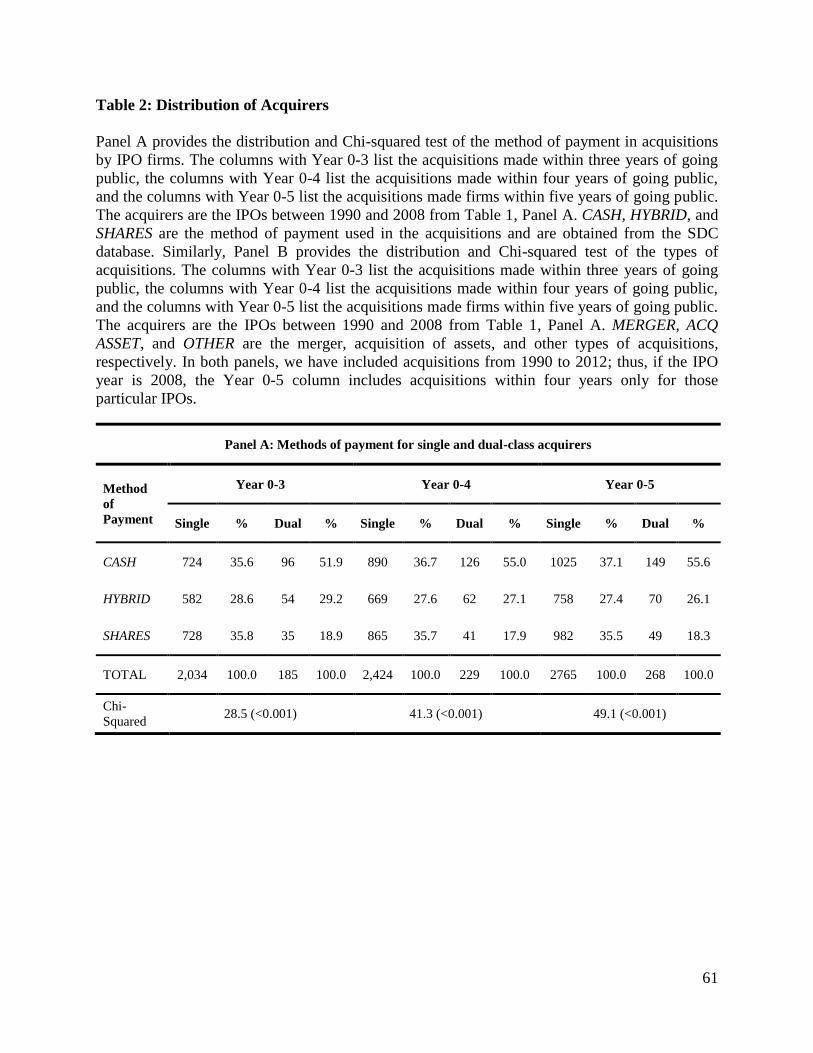
61
Table 2: Distribution of Acquirers
Panel A provides the distribution and Chi-squared test of the method of payment in acquisitions
by IPO firms. The columns with Year 0-3 list the acquisitions made within three years of going
public, the columns with Year 0-4 list the acquisitions made within four years of going public,
and the columns with Year 0-5 list the acquisitions made firms within five years of going public.
The acquirers are the IPOs between 1990 and 2008 from Table 1, Panel A. CASH, HYBRID, and
SHARES are the method of payment used in the acquisitions and are obtained from the SDC
database. Similarly, Panel B provides the distribution and Chi-squared test of the types of
acquisitions. The columns with Year 0-3 list the acquisitions made within three years of going
public, the columns with Year 0-4 list the acquisitions made within four years of going public,
and the columns with Year 0-5 list the acquisitions made firms within five years of going public.
The acquirers are the IPOs between 1990 and 2008 from Table 1, Panel A. MERGER, ACQ
ASSET, and OTHER are the merger, acquisition of assets, and other types of acquisitions,
respectively. In both panels, we have included acquisitions from 1990 to 2012; thus, if the IPO
year is 2008, the Year 0-5 column includes acquisitions within four years only for those
particular IPOs.
Panel A: Methods of payment for single and dual-class acquirers
Method
of
Payment
Year 0-3 Year 0-4 Year 0-5
Single % Dual % Single % Dual % Single % Dual %
CASH 724 35.6 96 51.9 890 36.7 126 55.0 1025 37.1 149 55.6
HYBRID 582 28.6 54 29.2 669 27.6 62 27.1 758 27.4 70 26.1
SHARES 728 35.8 35 18.9 865 35.7 41 17.9 982 35.5 49 18.3
TOTAL 2,034 100.0 185 100.0 2,424 100.0 229 100.0 2765 100.0 268 100.0
Chi-
Squared 28.5 (<0.001) 41.3 (<0.001) 49.1 (<0.001)
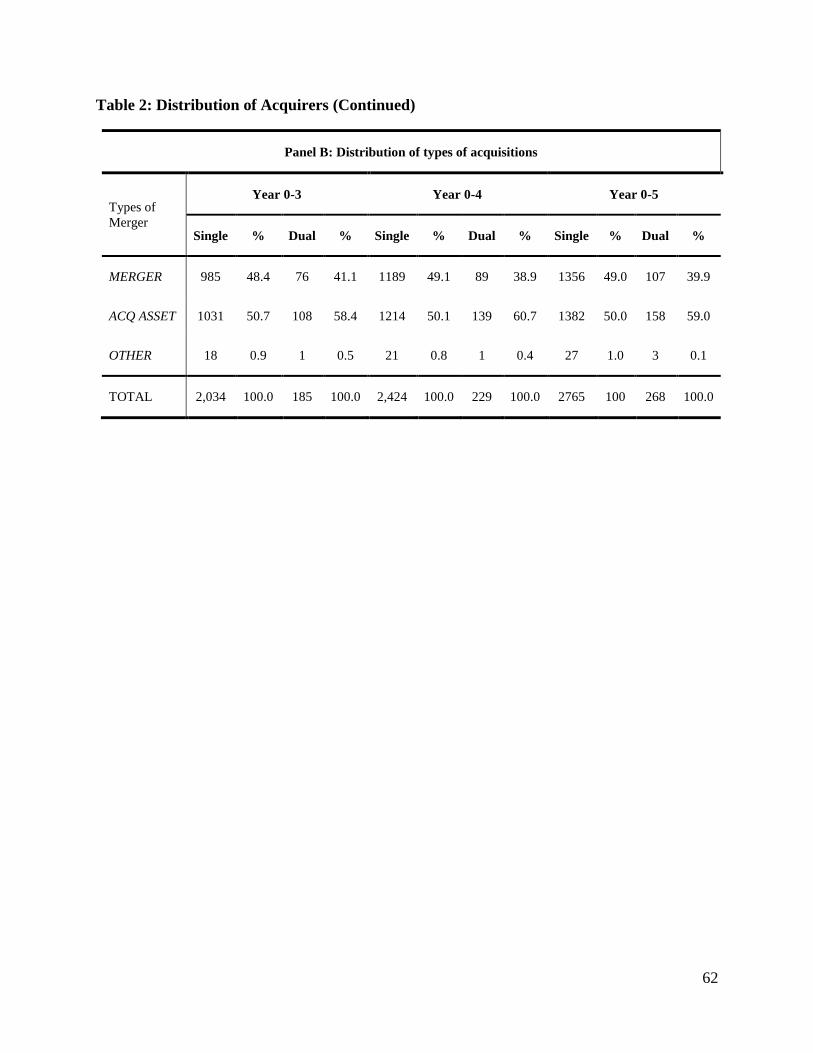
62
Table 2: Distribution of Acquirers (Continued)
Panel B: Distribution of types of acquisitions
Types of
Merger
Year 0-3 Year 0-4 Year 0-5
Single % Dual % Single % Dual % Single % Dual %
MERGER 985 48.4 76 41.1 1189 49.1 89 38.9 1356 49.0 107 39.9
ACQ ASSET 1031 50.7 108 58.4 1214 50.1 139 60.7 1382 50.0 158 59.0
OTHER 18 0.9 1 0.5 21 0.8 1 0.4 27 1.0 3 0.1
TOTAL 2,034 100.0 185 100.0 2,424 100.0 229 100.0 2765 100 268 100.0

63
Table 3: Method of Payment
In Panel A, the dependent variable is STOCK, which is equal to one if the method of payment is
STOCK and zero if the method of payment is CASH or HYBRID. The regression model is
described in Section 4.2. The definitions of the control variables are provided in Appendix A.
Acquisitions with all three types of methods of payment are included. In Panel B, we exclude
acquisitions with HYBRID as a method of payment.
Panel A: Acquirers including HYBRID method of payment
MODEL 1 MODEL 2 MODEL 3
Variables Coefficient p-value Coefficient p-value Coefficient p-value
INTERCEPT 0.33 0.58 1.47 0.09 1.01 0.25
DUAL -0.66*** 0.01 -0.90*** <.001 -0.86*** <.001
SIZE -0.07 0.14 0.01 0.92 0.00 1.00
TOBINQ 0.05*** <.001 0.04** 0.02 0.04** 0.02
SLACK 0.99*** <.001 1.34*** <.001 1.40*** <.001
CRISIS 1.00*** <.001 0.82*** 0.01 0.85*** <.001
DEBTRATIO 0.21* 0.07 0.25** 0.05 0.25** 0.05
INTCOV 0.01 0.88 -0.01 0.74 -0.01 0.71
IPOPRO -0.08 0.15 -0.01 0.88 -0.01 0.94
VCBACKED 0.46*** <.0001 0.45*** <.001 0.46*** <.001
RDEALSIZE 0.01 0.63 0.01 0.29 0.00 0.31
RELATED 0.10 0.42 0.03 0.85 0.02 0.88
INNOA
-0.50*** <.001
INNOT
-0.44*** 0.01
CEOAGE
-0.04*** <.0001 -0.04*** <.001
TECH -0.71*** <.001
TENDER -2.48*** <.001 -1.93*** 0.01 -1.97*** 0.01
SUBS -0.57*** <.001 -0.83*** <.001 -0.82*** <.001
ASSET -2.08*** <.001 -2.03*** <.001 -2.04*** <.001
N 1,977
1,185
1,185
R2 0.28
0.30
0.30

64
Table 3 (Continued)
Panel B: Acquirers excluding HYBRID method of payment
MODEL 1 MODEL 2 MODEL 3
Variables Coefficient p-value Coefficient p-value Coefficient p-value
INTERCEPT 2.77*** 0.01 4.53*** 0.01 4.48 0.01
DUAL -0.64** 0.03 -0.75*** 0.04 -0.72*** 0.05
SIZE -0.13** 0.03 -0.11 0.17 -0.11 0.17
TOBINQ 0.14** 0.04 0.07** 0.04 0.07** 0.04
SLACK 1.20*** <.001 2.59*** <.001 2.59*** <.001
CRISIS 0.60** 0.04 0.74* 0.06 0.80*** 0.051
DEBTRATIO 0.23* 0.07 0.27** 0.05 0.26** 0.05
INTCOV 0.01 0.55 -0.13 0.40 -0.13 0.40
IPOPRO -0.16** 0.02 -0.16* 0.08 -0.14 0.11
VCBACKED 0.70*** <.001 0.81*** <.001 0.89*** <.001
RDEALSIZE -0.01 0.59 -0.01 0.37 -0.01 0.39
RELATED 0.16 0.30 0.05 0.79 0.03 0.88
INNOA
-0.61*** 0.01
INNOT
-0.60*** 0.01
CEOAGE
-0.04*** 0.01 -0.04*** 0.01
TECH -0.93*** <.001
TENDER -3.92*** <.001 -3.94*** <.001 -3.98*** 0.01
SUBS -1.40*** <.001 -2.33*** <.001 -2.32*** <.001
ASSET -2.38*** <.001 -2.40*** <.001 -2.41*** <.001
N
1,408
865
865
R2
0.40
0.44
0.44
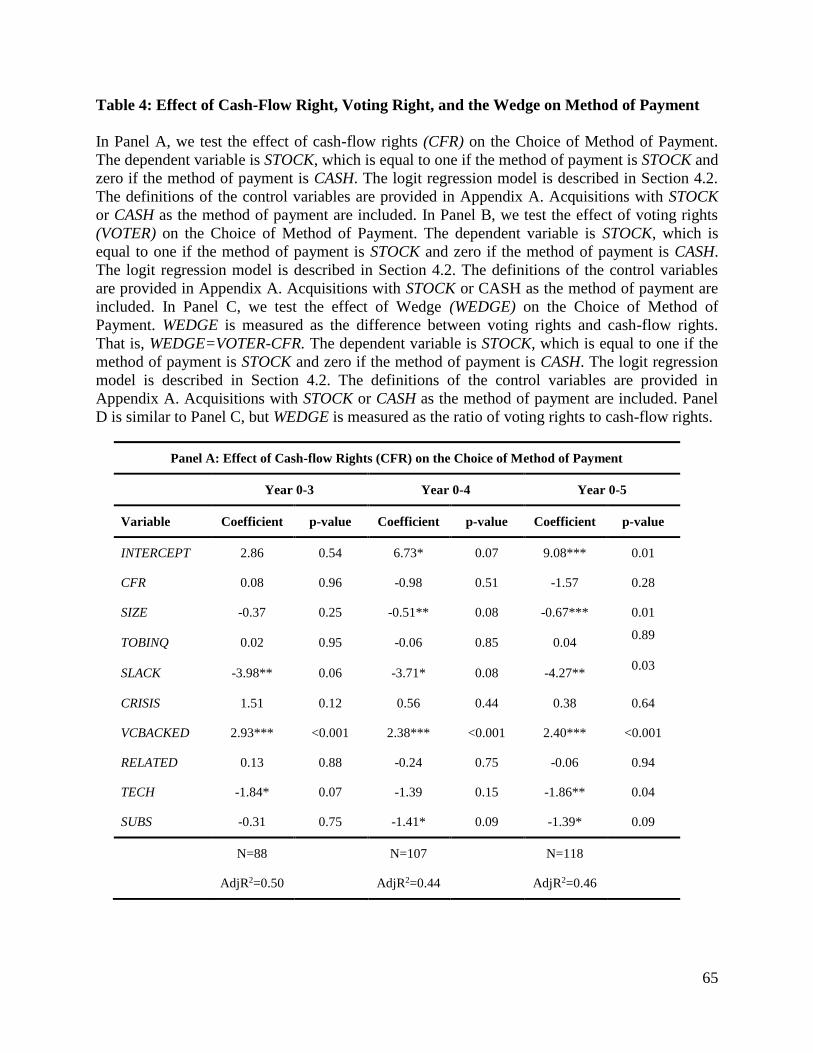
65
Table 4: Effect of Cash-Flow Right, Voting Right, and the Wedge on Method of Payment
In Panel A, we test the effect of cash-flow rights (CFR) on the Choice of Method of Payment.
The dependent variable is STOCK, which is equal to one if the method of payment is STOCK and
zero if the method of payment is CASH. The logit regression model is described in Section 4.2.
The definitions of the control variables are provided in Appendix A. Acquisitions with STOCK
or CASH as the method of payment are included. In Panel B, we test the effect of voting rights
(VOTER) on the Choice of Method of Payment. The dependent variable is STOCK, which is
equal to one if the method of payment is STOCK and zero if the method of payment is CASH.
The logit regression model is described in Section 4.2. The definitions of the control variables
are provided in Appendix A. Acquisitions with STOCK or CASH as the method of payment are
included. In Panel C, we test the effect of Wedge (WEDGE) on the Choice of Method of
Payment. WEDGE is measured as the difference between voting rights and cash-flow rights.
That is, WEDGE=VOTER-CFR. The dependent variable is STOCK, which is equal to one if the
method of payment is STOCK and zero if the method of payment is CASH. The logit regression
model is described in Section 4.2. The definitions of the control variables are provided in
Appendix A. Acquisitions with STOCK or CASH as the method of payment are included. Panel
D is similar to Panel C, but WEDGE is measured as the ratio of voting rights to cash-flow rights.
Panel A: Effect of Cash-flow Rights (CFR) on the Choice of Method of Payment
Year 0-3 Year 0-4 Year 0-5
Variable Coefficient p-value Coefficient p-value Coefficient p-value
INTERCEPT 2.86 0.54 6.73* 0.07 9.08*** 0.01
CFR 0.08 0.96 -0.98 0.51 -1.57 0.28
SIZE -0.37 0.25 -0.51** 0.08 -0.67*** 0.01
TOBINQ
SLACK
0.02
-3.98**
0.95
0.06
-0.06
-3.71*
0.85
0.08
0.04
-4.27**
0.89
0.03
CRISIS 1.51 0.12 0.56 0.44 0.38 0.64
VCBACKED 2.93*** <0.001 2.38*** <0.001 2.40*** <0.001
RELATED 0.13 0.88 -0.24 0.75 -0.06 0.94
TECH -1.84* 0.07 -1.39 0.15 -1.86** 0.04
SUBS -0.31 0.75 -1.41* 0.09 -1.39* 0.09
N=88
N=107
N=118
AdjR2=0.50
AdjR2=0.44
AdjR2=0.46

66
Table 4 (Continued)
Panel B: Effect of Voting Rights (VOTER) on the Choice of Method of Payment
Year 0-3 Year 0-4 Year 0-5
Variable Coefficient p-value Coefficient p-value Coefficient p-value
INTERCEPT 10.53 0.13 13.29** 0.02 14.90*** 0.01
VOTER -3.16* 0.09 -3.75** 0.03 -4.02** 0.02
SIZE -0.71 0.11 -0.81 0.03 -0.92 0.01
TOBINQ
SLACK
-0.03
-4.39**
0.96
0.05
-0.05
-4.61**
0.89
0.04
0.02
-5.00***
0.96
0.02
CRISIS 0.76 0.48 -0.04 0.96 0.20 0.80
VCBACKED 2.67*** <0.001 2.25*** <0.001 2.37*** <0.001
RELATED 0.33 0.71 0.18 0.82 0.37 0.64
TECH -2.79** 0.03 -2.30* 0.06 -2.58** 0.03
SUBS -0.70 0.45 -1.57* 0.06 -1.61* 0.06
N=88
N=107
N=118
AdjR2=0.49
AdjR2=0.49
AdjR2=0.51

67
Table 4 (Continued)
Panel C: Effect of WEDGE on the Choice of Method of Payment
Wedge= VOTER-CFR
Year 0-3 Year 0-4 Year 0-5
Variable Coefficient p-value Coefficient p-value Coefficient p-value
INTERCEPT 5.00 0.25 7.60 0.03 9.85 0.01
WEDGE -3.90** 0.04 -3.48* 0.07 -3.79** 0.05
SIZE -0.46 0.34 -0.56** 0.05 -0.74*** 0.01
TOBINQ
SLACK
0.07
-4.78**
0.84
0.03
-0.01
-4.61**
0.97
0.03
0.11
-5.27***
0.66
0.01
CRISIS 1.13 0.23 0.37 0.62 0.06 0.93
VCBACKED 2.87*** <0.001 2.41*** <0.001 2.49*** <0.001
RELATED 0.27 0.74 0.03 0.97 0.26 0.73
TECH -1.87* 0.07 -1.40 0.15 -1.92** 0.04
SUBS -0.18 0.83 -1.17 0.13 -1.07 0.15
N=88
N=107
N=118
AdjR2=0.50
AdjR2=0.47
AdjR2=0.48

68
Table 4 (Continued)
Panel D: Effect of WEDGE on the Choice of Method of Payment
WEDGE= VOTER/CFR
Year 0-3 Year 0-4 Year 0-5
Variable Coefficient p-value Coefficient p-value Coefficient p-value
INTERCEPT 3.71 0.33 6.41 0.04 9.02 0.01
WEDGE -1.05** 0.04 -0.89** 0.05 -0.90* 0.08
SIZE -0.30 0.30 -0.43* 0.08 -0.62*** 0.01
TOBINQ
SLACK
0.06
-5.35**
0.86
0.02
-0.03
-4.91
0.90
0.02
0.12
-5.60
0.62
0.01
CRISIS 1.32 0.17 0.63 0.40 0.20 0.79
VCBACKED 3.00*** 0.01 2.48*** <0.001 2.48*** <0.001
RELATED 0.40 0.61 0.08 0.91 0.25 0.72
TECH -1.60 0.11 -1.12 0.24 -1.81** 0.04
SUBS -0.07 0.94 -1.10 0.15 -0.95 0.20
N=88
N=107
N=118
AdjR2=0.53
AdjR2=0.50
AdjR2=0.50

69
Table 5: Effect of High Low Wedge (HW) on the Choice of Method of Payment
In Panels A, B, and C, the results are from the logit regression model. The dependent variable is
STOCK, which is equal to one if the method of payment is STOCK and zero if the method of
payment is CASH. The samples for Panels A, B, and C are acquisitions within three, four, and
five years by dual-class IPOs, respectively.
Panel A: Acquisitions within three years of going public (With Metrick data)
(HW: 5%, 10%, 15%)
Year 0-3 (5%) Year 0-3 (10%) Year 0-3 (15%)
Variable Coefficient p-value Coefficient p-value Coefficient p-value
INTERCEPT 7.19 0.18 4.47 0.37 6.99 0.22
HW -1.02 0.39 -2.84** 0.03 -4.72*** 0.01
SIZE -0.62 0.14 -0.46 0.27 -0.58 0.19
TOBINQ
SLACK
0.15
-1.53
0.73
0.55
0.15
-0.13
0.76
0.97
0.12
1.27
0.84
0.71
CRISIS 0.09 0.94 0.95 0.52 1.18 0.52
VCBACKED 2.13 0.06 2.62 0.06 2.56 0.16
RELATED 0.33 0.76 0.01 0.99 2.12 0.23
TECH -2.73 0.07 -2.51 0.10 -5.63 0.01
SUBS -0.87 0.36 -0.86 0.40 -1.14 0.41
N=80
N=80
N=80
AdjR2=0.44
AdjR2=0.52
AdjR2=0.62

70
Table 5 (Continued)
Panel B: Acquisitions within four years of going public (With Metrick data)
Year 0-4 (5%) Year 0-4 (10%) Year 0-4 (15%)
Variable Coefficient p-value Coefficient p-value Coefficient p-value
INTERCEPT 9.00** 0.05 7.94* 0.07 9.76** 0.04
HW -0.65 0.59 -1.86** 0.08 -2.97*** 0.01
SIZE -0.70* 0.06 -0.62* 0.08 -0.63* 0.10
TOBINQ
SLACK
0.10
-2.07
0.80
0.41
0.21
-1.34
0.60
0.59
0.17
-0.04
0.73
0.99
CRISIS -0.45 0.68 -0.26 0.81 -0.80 0.50
VCBACKED 1.95* 0.06 1.92* 0.07 1.27 0.28
RELATED 0.14 0.89 -0.08 0.94 0.77 0.53
TECH -2.30 0.13 -2.12 0.15 -3.35* 0.06
SUBS -1.57* 0.06 -1.51* 0.08 -2.22** 0.04
N=99
N=99
N=99
AdjR2=0.46
AdjR2=0.50
AdjR2=0.57

71
Table 5 (Continued)
Panel C: Acquisitions within four years of going public (With Metrick data)
(High Low wedge: 5%, 10%,15%)*
Year 0-5 (5%) Year 0-5 (10%) Year 0-5 (15%)
Variable Coefficient p-value Coefficient p-value Coefficient p-value
INTERCEPT 10.40*** 0.01 9.69*** 0.01 11.07*** 0.01
HW -0.75 0.54 -1.84** 0.08 -3.06*** 0.01
SIZE -0.81** 0.02 -0.75** 0.02 -0.73** 0.04
TOBINQ
SLACK
0.20
-2.12
0.55
0.40
0.32
-1.50
0.38
0.54
0.26
-0.08
0.55
0.98
CRISIS -0.74 0.46 -0.64 0.51 -1.10 0.31
VCBACKED 1.85* 0.07 1.77* 0.08 1.10 0.33
RELATED 0.37 0.69 0.23 0.80 1.06 0.35
TECH -2.78** 0.04 -2.74** 0.03 -3.85*** 0.01
SUBS -1.49* 0.07 -1.37* 0.10 -2.13** 0.04
N=110
N=110
N=110
AdjR2=0.48
AdjR2=0.52
AdjR2=0.59

72
Table 6: Acquisition Tendency of Single and Dual-Class IPO Firms
Panels A and B compare the acquisition activities of single and dual-class IPOs within the first
two years of going public. In Panel A, we consider acquisitions with at least 1 million dollars of
transaction value and 1% of the market capitalization. In Panel B, we consider any qualified
acquisitions. In Panel C, we compare acquisitions in innovative industries (top one-third from
Sevilir and Tian, 2012).
Panel A: Acquisitions with at least 1 million dollars of transaction value and 1% of the market capitalization
No.
of
Firms
Acquiring
Within First Year of IPO Acquiring Within Two Years of IPO
IPO
Type
Acq
Firms %
Total
M&As Ratio Acq Firms %
Total
M&As Ratio
Single
4,356 589 13.52 801 1.36 969 22.2 1506 1.55
Dual
359 47 13.09 59 1.26 83 23.1 125 1.51
Total 4,715 636 13.49 860 1.35 1,052 22.3 1631 1.55
Panel B: Any qualified acquisition
No. of
Firms Acquiring Within First Year of IPO Acquiring Within Two Years of IPO
IPO
Type Acq Firms %
Total
M&As Ratio Acq Firms %
Total
M&As Ratio
Single
4,356 1,098 25.20 1745 1.59 1,637 37.58 3191 1.95
Dual
359 91 25.34 157 1.73 144 40.11 322 2.23
Total 4,715 1,189 25.22 1902 1.60 1,781 37.77 3513 1.97

73
Table 6 (Continued)
Panel C: Acquisition of innovative targets by single and dual-class IPO firms
IPO
Type
No. of
Firms
Acquiring within first year of IPO Acquiring within two years of IPO
Acq
Firms
Total
M&As INNOT
%
INNOT
Acq
Firms
Total
M&As INNOT
%
INNOT
Single 4,356 1,098 1,745 901 51.63 1,637 3,191 1,681 52.68
Dual 359 91 157 88 56.05 144 322 196 60.87
Total 4,715 1,189 1,902 989 52 1,781 3,513 1,877 53.43

74
Table 7: Buy-and-Hold Abnormal Returns
In Panel A, the dependent variable is style-adjusted one-year BHAR. The sample of firms
consists of single and dual-class acquirers making acquisitions within three years of going
public. Targets in innovative industries are the targets in the top one-third of the industries in
Table 1, Panel B of Sevilir and Tian’s (2012) paper, “Acquiring Innovation,” which is
reproduced in Appendix B.
Panel A: One year buy-and-hold abnormal return (BHAR)
Variable Coefficient p-
value Coefficient
p-
value Coefficient
p-
value Coefficient
p-
value
INTERCEPT -0.07 0.79 -0.08 0.76 -0.02 0.94 -0.11 0.69
DUAL 0.13* 0.07 0.20* 0.06 -0.09 0.43 0.01 0.96
DUAL_MOPC
-0.13 0.36
DUAL_INNOT
0.39*** 0.01
DUAL_INNOA
0.19 0.18
PUBTAR 0.01 0.91 0.01 0.92 0.01 0.91 -0.02 0.78
SIZE -0.01 0.51 -0.01 0.5 -0.01 0.55 0.01 0.83
TOBINQ 0.01 0.24 0.01 0.23 0.01 0.25 0.00 0.18
VCBACKED 0.05 0.23 0.05 0.22 0.06 0.15 0.05 0.20
RDEALSIZE 0.01 0.57 0.01 0.58 0.01 0.49 0.00 0.44
RELATED 0.01 0.79 0.01 0.77 0.02 0.71 0.03 0.47
DEBTRATIO 0.02 0.69 0.02 0.68 0.01 0.81 0.02 0.60
TENDER 0.21 0.22 0.22 0.21 0.18 0.28 0.24 0.17
ASSET -0.05 0.21 -0.06 0.2 -0.05 0.22 -0.05 0.26
MOPC 0.03 0.46 0.05 0.33 0.03 0.45 0.03 0.56
INNOT 0.02 0.68 0.02 0.68 -0.01 0.9
INNOA
-0.10 0.23
INDUSTRY YES
YES
YES
YES
YEAR YES
YES
YES
YES
R-squared 10.8
10.86
11.28
11.17
N 1,379
1,379
1,379
1,379

75
Table 7 (Continued)
Panel B: Two year buy-and-hold abnormal return (BHAR)
Variable Coefficient p-
value Coefficient
p-
value Coefficient
p-
value Coefficient
p-
value
INTERCEPT -0.27 0.51 -0.29 0.48 -0.21 0.62 -0.26 0.52
DUAL 0.27*** 0.01 0.40*** 0.01 0.01 0.99 0.07 0.67
DUAL_MOPC
-0.23 0.29
DUAL_INNOT
0.49** 0.03
DUAL_INNOA
0.36* 0.09
PUBTAR -0.01 0.92 -0.01 0.91 -0.01 0.92 -0.03 0.77
SIZE 0.01 0.67 0.01 0.68 0.01 0.63 0.01 0.53
TOBINQ 0.01 0.85 0.01 0.87 0.01 0.84 0.00 0.96
VCBACKED 0.18*** 0.01 0.18*** 0.01 0.19*** 0.01 0.19 0.00
RDEALSIZE 0.01 0.11 0.01 0.12 0.01* 0.09 0.00 0.08
RELATED 0.01 0.99 0.01 0.97 0.01 0.92 0.03 0.60
DEBTRATIO -0.02 0.79 -0.02 0.81 -0.03 0.69 -0.02 0.80
TENDER 0.3 0.25 0.31 0.24 0.26 0.32 0.31 0.24
ASSET -0.1 0.11 -0.11 0.1 -0.1 0.12 -0.10 0.11
MOPC 0.11 0.13 0.13 0.08 0.11 0.13 0.09 0.21
INNOT -0.01 0.86 -0.01 0.86 -0.05 0.54
INNOA
-0.23 0.06
INDUSTRY YES
YES
YES
YES
YEAR YES
YES
YES
YES
R-squared 10.27
10.35
10.61 10.64
N 1,379
1,379
1,379
1379

76
Table 7 (Continued)
Panel C: Three year buy-and-hold abnormal return (BHAR)
Variable Coefficient p-
value Coefficient
p-
value Coefficient
p-
value Coefficient
p-
value
INTERCEPT -0.14 0.78 -0.15 0.76 -0.06 0.90 -0.15 0.76
DUAL 0.29** 0.03 0.37** 0.05 -0.02 0.91 0.08 0.68
DUAL_MOPC
-0.16 0.52
DUAL_INNOT
0.55** 0.04
DUAL_INNOA
0.36 0.16
PUBTAR -0.08 0.55 -0.08 0.54 -0.08 0.55 -0.11 0.41
SIZE 0.02 0.38 0.02 0.38 0.02 0.35 0.02 0.24
TOBINQ 0.01 0.75 0.01 0.76 0.01 0.74 0.00 0.89
VCBACKED 0.18** 0.02 0.18** 0.02 0.19*** 0.01 0.18** 0.02
RDEALSIZE 0 0.78 0 0.77 0.00 0.85 0.00 0.92
RELATED 0.01 0.9 0.01 0.89 0.01 0.84 0.04 0.60
DEBTRATIO -0.11 0.14 -0.11 0.15 -0.12 0.11 -0.11 0.16
TENDER 0.41 0.19 0.42 0.19 0.37 0.24 0.43 0.17
ASSET -0.18** 0.02 -0.18** 0.02 -0.18** 0.02 -0.17 0.03
MOPC 0.25*** 0.01 0.26*** 0.01 0.25*** 0.01 0.22 0.01
INNOT 0.01 0.9 0.01 0.9 -0.03 0.77
INNOA
-0.22 0.13
INDUSTRY YES
YES
YES
YES
YEAR YES
YES
YES
YES
R-squared 9.21
9.24
9.52
9.30
N 1,379
1,379
1,379
1,379

77
Table 7 (Continued)
Panel D: Four year buy-and-hold abnormal return (BHAR)
Variable Coefficient p-
value Coefficient
p-
value Coefficient
p-
value Coefficient
p-
value
INTERCEPT -0.62 0.23 -0.62 0.23 -0.59 0.25 -0.67 0.19
DUAL 0.24* 0.09 0.28 0.17 -0.11 0.62 0.03 0.90
DUAL_MOPC
-0.08 0.78
DUAL_INNOT
0.59** 0.04
DUAL_INNOA
0.35 0.20
PUBTAR -0.03 0.83 -0.03 0.83 -0.03 0.83 0.01 0.92
SIZE 0.04* 0.07 0.04* 0.07 0.04* 0.06 0.05** 0.04
TOBINQ 0.01 0.67 0.01 0.66 0.01 0.67 0.00 0.58
VCBACKED 0.07 0.38 0.07 0.37 0.09 0.28 0.09 0.24
RDEALSIZE 0.01 0.39 0.01 0.38 0.01 0.45 0.00 0.48
RELATED -0.05 0.55 -0.05 0.56 -0.04 0.61 0.00 0.96
DEBTRATIO -0.05 0.53 -0.05 0.53 -0.06 0.44 -0.06 0.48
TENDER 0.3 0.35 0.3 0.35 0.25 0.43 0.25 0.44
ASSET -0.12 0.15 -0.12 0.15 -0.12 0.16 -0.12 0.15
MOPC 0.18** 0.04 0.19** 0.04 0.18** 0.04 0.17* 0.05
INNOT 0.02 0.84 0.02 0.84 -0.02 0.83
INNOA
-0.16 0.30
INDUSTRY YES
YES
YES
YES
YEAR YES
YES
YES
YES
R-squared 8.2
8.21
8.52
8.43
N 1,346
1,346
1,346
1,346

78
TABLE 8: Acquirers in First Year and Non-Acquirers in First Year
The acquirers are the dual-class IPO firms acquiring within one-year of going public and the
non-acquirers are dual-class IPOs that do not acquire within one-year of going public. BHAR is
the style-adjusted buy-and-hold returns. Acquirers are the firms that acquire another firm within
one year of going public and non-acquirers are those that do not acquire any firm within one year
of going public.
Dual-class
Single-class
Acquirers
Non-
Acquirers
Difference
Test Acquirers
Non-
Acquirers
Difference
Test
N=82 N=233 p-value N=978 N=2849 p-value
BHAR(0,1) 2.04 -6.56 0.25 5.96 0.01 0.03
BHAR(0,2) 18.36 0.00 0.23 -1.11 -8.25 0.01
BHAR(0,3) 11.68 -3.14 0.40 -15.16 -2.73 0.01
BHAR(0,4) 14.95 -4.31 0.39 -24.21 -4.72 0.01
BHAR(1,2) 12.8 2.04 0.23 -11.61 4.14 0.01
BHAR(1,3) 11.6 -2.85 0.24 -7.14 0.15 0.01
BHAR(1,4) 6.55 0.05 0.70 -15.57 2.97 0.01

79
Table 9: Distribution of Family and Non-Family Firms by Years and Industries
Panel A provides the frequency distribution of non-family and family acquirers by year of the
effective date of acquisition. Only the first acquisition (satisfying all screening criterion) within
three years is taken into consideration. Percentage is the percentage of family firms in the given
year out of total acquisitions. Panel B provides the distribution of 213 acquisitions by the
industry of the acquirers. Industry classification is based on Fama -French 48 industries.
Panel A: By Years
Year Non-family Acquirers Family
Acquirers Total Percentage
1993 6 3 9 33.33
1994 12 6 18 33.33
1995 11 5 16 31.25
1996 15 6 21 28.57
1997 21 7 28 25.00
1998 10 6 16 37.50
1999 27 9 36 25.00
2000 12 6 18 33.33
2001 8 3 11 27.27
2002 1 7 8 87.50
2003 6 3 9 33.33
2004 8 4 12 33.33
2005 7 1 8 12.50
2006 2 1 3 33.33
Total 146 67 213 31.46

80
Table 9 (Continued)
Panel B: By Industries
Industry Non-Family
Frequency
Family
frequency Total Percentage
Food Products 4 3 7 3.29
Candy & Soda 1 0 1 0.47
Beer & Liquor 0 1 1 0.47
Recreation 3 2 5 2.35
Printing and Publishing 4 5 9 4.23
Consumer Goods 6 4 10 4.69
Apparel 1 2 3 1.41
Healthcare 1 0 1 0.47
Medical Equipment 11 1 12 5.63
Pharmaceutical Products 16 2 18 8.45
Chemicals 5 2 7 3.29
Rubber and Plastic Products 0 1 1 0.47
Textiles 0 1 1 0.47
Construction Materials 7 0 7 3.29
Steel Works Etc 3 2 5 2.35
Machinery 6 5 11 5.16
Electrical Equipment 2 0 2 0.94
Automobiles and Trucks 2 2 4 1.88
Aircraft 5 0 5 2.35
Shipbuilding, Railroad Equipment 0 3 3 1.41
Defense 3 0 3 1.41
Precious Metals 1 0 1 0.47
Non-Metallic and Industrial Metal Mining 2 0 2 0.94
Petroleum and Natural Gas 10 1 11 5.16
Personal Services 0 1 1 0.47
Business Services 8 8 16 7.51
Computers 10 6 16 7.51
Electronic Equipment 10 5 15 7.04
Measuring and Control Equipment 3 0 3 1.41
Business Supplies 8 0 8 3.76
Wholesale 2 0 2 0.94
Retail 11 6 17 7.98
Restaurants, Hotels, Motels 1 4 5 2.35
Total 146 67 213 100

81
Table 10: Summary Statistics
Panel A of this table provides the summary statistics of the variables used in the regression
specifications. The definition of the variables and their units are provided in Appendix C. Panel
B provides the number of observations for both categories of the dummy variables used in the
study. The details of the dummies are also provided in Appendix C. Transaction value (TVAL)
and Market value (MVL) are expressed in millions of dollars.
Panel A
Variable Family Non-family Difference test
Transaction Value ( TVAL) 752 2342.6 0.09
Transaction Value/Asset (TVAT) 0.54 0.56 0.93
Market Value (MVL) 17,967.2 23,037.2 0.33
Log(Market Value) (LMVL) 15.72 16.01 0.16
Return on Asset (ROA) 0.34 0.32 0.60
Cash holding (CHLD) 0.36 0.21 0.00
Insti Ownership (INSOWN)
Age of the CEO (CEOAGE)
0.53
56.54%
54
0.49
66.35%
55
0.66
< 0.001
0.91
Panel B:
Dummy Variables Categories Family Non-family
Number Percentage Number Percentage
Public target (PUB)
Public 27 40.30 40 27.40
Non-public 40 59.70 106 72.60
Diversifying (DIVR)
Focus Increasing 28 41.79 76 52.05
Non-focus Increasing 39 52.21 70 47.97
Share (SHR)
Share Payment 18 26.87 44 30.14
Other payments 49 73.13 102 69.86
Tender Offer (TO)
Tender Offer 17 25.37 30 20.55
Non-Tender Offer 50 74.63 116 79.45

82
Table 11: Correlation Matrix
This table reports the correlation coefficients for the key variables used in the regressions.
TVAL= Deal value (in millions) of the merger from SDC. TVAT= TVAT/Total Assets. MVAL=
(closing price of the stock in the last trading day of the month before the effective date of the
merger)*Number of shares outstanding. LMVL= Common logarithm of MVAL. ROA=
operating income before depreciation/Total Assets. MB = (MVAL +Book value of equity)/Total
Assets. CHLD = Cash and Short-term investments/Total Assets. LTD = Total long-term
debt/Total Assets, INSOWN = institutional ownership in the acquiring firm in the year of
acquisition, and CEOAGE = Age of the CEO of the acquiring firm in the year of acquisition. All
of the above variables are constructed for the acquiring firms. PUB is equal to one if the target
firm is public, zero otherwise (non-public). DIVR is equal to one if the acquirer and target are
not in the same two-digit industry, and zero otherwise (Non-focus increasing). SHR is equal to
one if the transaction is paid by stocks only and is zero otherwise (other payments). TO is equal
to one if the bid is a tender offer and zero otherwise (Non-tender offer). HI is equal to one if the
deal is classified as Hi-tech in SDC and zero otherwise (Non Hi-Tech).
Variables LMVL FAM TVAT PUB SHR ROA DIVR CHLD TO INSOWN CEOAGE
LMVL 1.00
FAM -0.11 1.00
TVAT -0.10 -0.01 1.00
PUB 0.11 -0.12 0.23 1.00
SHR 0.07 -0.04 -0.03 -0.09 1.00
ROA 0.27 0.03 0.20 0.05 0.02 1.00
DIVR 0.17 -0.12 -0.22 0.01 -0.11 -0.17 1.00
CHLD 0.06 0.18 -0.16 -0.07 0.12 -0.14 -0.18 1.00
TO -0.05 0.03 -0.08 0.37 -0.31 0.01 0.14 -0.03 1.00
INSOWN -0.18 -0.32 -0.01 0.11 0.03 -0.12 -0.02 -0.10 -0.05 1.00
CEOAGE 0.04 0.01 0.11 0.03 -0.04 -0.01 0.04 -0.09 0.03 0.03 1.00

83
Table 12: Buy and Hold Abnormal Returns
This table presents the coefficients and the p-values for the independent variables used to explain
the buy-and hold abnormal returns (BHARs) for the combined samples of family and non-family
acquirers. The dependent variable is BHAR for the 12 months (for Panel A) and 36 months (for
Panel B) after the month of the effective date of the acquisition and the variable of interest is the
dummy variable FAM, which is equal to one if the acquirer is a family firm in that year and zero
otherwise. Style-adjusted return uses the returns of the 25 size and book-to-market portfolios as
the benchmark return and market-adjusted return uses the value-weighted market return for that
month. The definition of other variables can be obtained in Appendix C.
Panel A: 1-year Buy and hold abnormal returns
Dependent variable: 1-year buy-and-hold abnormal returns
Variable
Style-adjusted Market Adjusted
Coefficient p-value Coefficient p-value
Intercept -89.69 0.11 -74.88 0.14
FAM 17.95 0.02 15.28 0.05
LMVL 2.59 0.38 2.07 0.50
TVAT 1.97 0.55 2.66 0.44
PUB -13.10 0.09 -11.10 0.16
SHR -5.17 0.48 -2.10 0.78
ROA -2.27 0.90 6.35 0.73
DIVR 8.55 0.22 8.63 0.23
CHLD -7.21 0.49 -8.39 0.44
TO -0.66 0.94 6.54 0.49
INSOWN 2.72 0.91 -4.68 0.85
CEOAGE 0.23 0.43 0.11 0.70
Year Fixed Effect Yes
Yes
Industry fixed Effect Yes
Yes
R2 18.09%
15.34%
N 213
213

84
Table 12: Buy and Hold Abnormal Returns
Panel B: 3-year Buy and hold abnormal returns
Dependent variable: 3-year buy-and-hold abnormal returns
Variable Style-adjusted Market Adjusted
Coefficient p-value Coefficient p-value
Intercept -115.63 0.33 -9.83 0.93
FAM 39.56 0.04 35.55 0.07
LMVL -1.24 0.86 -5.98 0.41
TVAT 9.18 0.26 11.67 0.16
PUB -32.46 0.08 -30.49 0.10
SHR -22.50 0.20 -13.94 0.44
ROA -8.21 0.85 -9.36 0.83
DIVR 33.41 0.05 26.17 0.12
CHLD 12.33 0.63 3.91 0.88
TO -24.42 0.27 -7.15 0.75
INSOWN 13.55 0.82 -7.74 0.90
CEOAGE 0.64 0.36 0.16 0.82
Year Fixed Effect Yes
Yes
Industry fixed Effect Yes
Yes
R2
N
18.42%
207
14.22%
207

85
Table 13: Calendar Time Portfolio Regressions
This table reports the results from the four- and five-factor calendar time portfolio regression as
specified in Equations (A) and (B) in Section 3.2. Intercept is the mean monthly return on the
calendar time portfolio given by ARt; MKT is Rmt − rft, which is the abnormal return on the
value-weighted market index; SMB is the monthly difference in the returns of a value-weighted
portfolio of small and big stocks; HML is the monthly difference in the returns of a value-
weighted portfolio of high book-to-market; UMD is the monthly difference in the returns of a
value-weighted portfolio of past winner stocks and past loser stocks; and LIQ is the value-
weighted return on the 10-1 portfolio from a sort on historical liquidity betas, as defined in
Robert F. Stambaugh’s website.
Panel A: Calendar time four factor model regression
Variable
Non-Family Acquirers Family Acquirers
Estimate t-value p-value Estimate t-value p-value
Intercept 0.21 1.15 0.251 0.75 2.35 0.0204
MKT 0.80 18.65 <.0001 0.97 12.7 <.0001
SMB -0.34 -6.56 <.0001 -0.03 -0.28 0.7835
HML -0.05 -0.89 0.3757 -0.4 -3.95 0.0001
UMD -0.10 -3.09 0.0023 -0.32 -5.34 <.0001
Number of months 190 190
Adjusted R-squared 72.49% 64.17%
Panel B: Calendar time five factor model regression
Variable Non-Family Acquirers Family Acquirers
Estimate t-value p-value Estimate t-value p-value
Intercept 0.25 1.40 0.1629 0.69 1.98 0.0493
MKT 0.78 15.92 <.0001 1.01 10.49 <.0001
SMB -0.32 -6.45 <.0001 -0.01 -0.09 0.925
HML -0.07 -1.12 0.2664 -0.38 -3.03 0.0028
UMD -0.13 -3.90 0.0001 -0.38 -5.65 <.0001
LIQ 0.06 1.25 0.2139 0.07 0.77 0.4424
Number of months 178 178
Adjusted R-squared 72.67% 62.71%

86
Table 14: Diversifying and Non-diversifying Acquisitions
In Panel A, the dependent variables are style-adjusted and market adjusted one-year BHARs. In
Panel B, the dependent variables are style-adjusted and market adjusted t-year BHARs. FAM is a
dummy variable equal to one if the firm is a family firm and zero otherwise. DIVR is a dummy
variable equal to one if acquirers and targets are not in the same two-digit SIC industry.
Panel A: 1-year buy-and-hold abnormal returns
Dependent variable: 1-year buy-and-hold abnormal returns
Variable
Style-Adjusted Market Adjusted
Coefficient p-value Coefficient p-value
Intercept -70.63 0.15 -54.84 0.28
FAM 5.80 0.58 2.50 0.82
FAM_DIVR 26.35 0.07 27.72 0.07
LMVL 2.08 0.48 1.53 0.61
TVAT 1.75 0.60 2.44 0.48
PUB -10.80 0.10 -8.68 0.21
SHR -5.41 0.45 -2.36 0.75
ROA -0.14 0.99 8.59 0.64
DIVR 0.94 0.91 0.62 0.94
CHLD -9.61 0.36 -10.91 0.31
TO -1.15 0.90 6.03 0.52
INSOWN -1.35 0.96 -8.97 0.72
CEOAGE 0.23 0.43 0.11 0.70
Year Fixed Effect
Industry Fixed Effect
Yes
Yes
Yes
Yes
R2
N
19.09%
213
18.37%
213

87
Table 14 (Continued)
Panel B: 3-year buy-and-hold abnormal returns
Dependent variable: 3-year buy-and-hold abnormal returns
Variable
Style-adjusted Market Adjusted
Coefficient p-value Coefficient p-value
Intercept -107.21 0.41 1.33 0.99
FAM 9.27 0.69 8.32 0.72
FAM_DIVR 58.87 0.06 54.62 0.08
LMVL -0.24 0.97 -5.52 0.45
TVAT 5.68 0.50 8.94 0.30
PUB -29.48 0.09 -27.31 0.10
SHR -22.28 0.21 -13.94 0.44
ROA -18.53 0.68 -16.25 0.72
DIVR 9.87 0.56 8.60 0.61
CHLD 4.71 0.85 -2.14 0.93
TO -22.25 0.31 -6.04 0.79
INSOWN 0.85 0.99 -18.93 0.75
CEOAGE 0.65 0.35 0.16 0.82
Year Fixed Effect
Industry Fixed Effect
Yes
Yes
Yes
Yes
R2
N
19.44%
207
16.77%
207