Embed Size (px)
Citation preview

Peter Dybdahl Hede
Behavioural Finance
Download free books at

Download free eBooks at bookboon.com
3
Behavioural Finance © 2012 Peter Dybdahl Hede & bookboon.comISBN 978-87-403-0200-4

Download free eBooks at bookboon.com
Click on the ad to read more
Behavioural Finance
4
Contents
Contents
1 Preface 71.1 Outlining the structure of the book 81.2 Acknowledgements and author’s foreword 8
2 From standard finance to behavioural finance? 102.1 The efficient market hypothesis 102.2 Behavioural Finance 122.3 Prospect theory 13
3 Heuristics and biases related to financial investments 203.1 Financial behaviour stemming from familiarity 213.2 Financial behaviour stemming from representativeness 233.3 Anchoring 283.4 Overconfidence and excessive trading 323.5 Path-dependent behaviour 40
www.sylvania.com
We do not reinvent the wheel we reinvent light.Fascinating lighting offers an infinite spectrum of possibilities: Innovative technologies and new markets provide both opportunities and challenges. An environment in which your expertise is in high demand. Enjoy the supportive working atmosphere within our global group and benefit from international career paths. Implement sustainable ideas in close cooperation with other specialists and contribute to influencing our future. Come and join us in reinventing light every day.
Light is OSRAM

Download free eBooks at bookboon.com
Click on the ad to read more
Behavioural Finance
5
Contents
4 Financial anomalies – Do behavioural factors explain stock market puzzles? 444.1 The January effect & Small-firm effect 454.2 The winner’s curse 484.3 The equity premium puzzle 494.4 Value premium puzzle 514.5 Other anomalies 53
5 Behavioural investing 565.1 Points to consider for the behavioural investor 57
6 List of references 59
7 Endnotes 69
EADS unites a leading aircraft manufacturer, the world’s largest helicopter supplier, a global leader in space programmes and a worldwide leader in global security solutions and systems to form Europe’s largest defence and aerospace group. More than 140,000 people work at Airbus, Astrium, Cassidian and Eurocopter, in 90 locations globally, to deliver some of the industry’s most exciting projects.
An EADS internship offers the chance to use your theoretical knowledge and apply it first-hand to real situations and assignments during your studies. Given a high level of responsibility, plenty of
learning and development opportunities, and all the support you need, you will tackle interesting challenges on state-of-the-art products.
We welcome more than 5,000 interns every year across disciplines ranging from engineering, IT, procurement and finance, to strategy, customer support, marketing and sales. Positions are available in France, Germany, Spain and the UK.
To find out more and apply, visit www.jobs.eads.com. You can also find out more on our EADS Careers Facebook page.
Internship opportunities
CHALLENGING PERSPECTIVES

Download free eBooks at bookboon.com
Behavioural Finance
6
To Pernille, and my daughter Marie, through whom my life
has been so greatly enriched.
Download free eBooks at bookboon.com
Behavioural Finance
7
Preface
1 PrefaceThe content of this book has become ever more relevant after the recent 2007–2009 and 2011 financial crises, one consequence of which was greatly increased scepticism among investment professionals about the received wisdom drawn from standard finance, modern portfolio theory and its later developments. The combined collapse of Goldman Sachs Asset Management quantitative funds during the summer of 2008 and then the formal academic recognition in 2009 that an equally divided asset-allocation strategy performed better than any statically optimised portfolio strategy cast serious doubts on the capability of modern standard finance, relying as it does on quantitative analytics, to provide value to investors. Modern portfolio theory suddenly appeared terribly old-fashioned and out of date for a very simple and straightforward reason: It did not work!
Finance and investment management are not like physics. In finance, there are very few systematic “laws of nature” to be observed. We instead observe the effects of compounded human behaviour on asset prices in an open environment where exogenous shocks take place on a continuous basis. Standard finance theory tackles this complexity through some rather extreme shortcuts. These include, for example, the assumption that the dynamics of asset prices are random and that the distribution of possible outcomes follows a Gaussian law. Further embedded within standard finance is the concept of “Homo economicus” being the idea that humans make perfectly rational economic decisions at all times. These shortcuts make it much easier to build elegant theories, but, after all in practice, the assumptions did not hold true.
So what is the alternative? Behavioural finance may be part of the solution, with its emphasis on the numerous biases and heuristics (i.e. deviations from rationality) attached to the otherwise exemplary rational “Homo economicus” individual assumed in standard finance. Anomalies have been accumulating that are difficult to explain in terms of the standard rational paradigm, many of which interestingly are consistent with recent findings from psychology. Behavioural finance makes this connection, applying insights from psychology to financial economics. It puts a human face on the financial markets, recognising that market participants are subject to biases that have predictable effects on prices. It, thus, provides a powerful new tool for understanding financial markets and one that complements, rather than replaces, the standard rational paradigm.
At its core, behavioural finance analyses the ways that people make financial decisions. Besides the impact on financial markets, this also has relevance to corporate decision making, investor behaviour, and personal financial planning. Our psychological biases and heuristics have real financial effects, whether we are corporate manager, professional investors, or personal financial planners. When we understand these human psychological phenomena and biases, we can make better investment decisions ourselves, and better understand the behaviours of others and of markets.

Download free eBooks at bookboon.com
Behavioural Finance
8
Preface
1.1 Outlining the structure of the book
In Chapter 2, the concepts of behavioural finance are introduced atop of a brief review of the efficient market hypothesis. Prospect theory is introduced and the coherent concepts of loss aversion, framing, mental accounting as well as integration versus segregation in decision-making are presented. Chapter 3 examines the numerous heuristics and biases related to financial investments including financial behaviour stemming from familiarity, financial behaviour stemming from representativeness, anchoring, path-dependent decision behaviour as well as overconfidence and excessive trading. Examples of financial anomalies related to the stock market is reviewed in the fourth chapter including the January effect, small-firm effect, the winner’s curse, the equity premium puzzle, the value puzzle and other anomalies. Chapter 5 provides a sum-up of behavioural investing presented in seven main points to consider for the modern investor.
1.2 Acknowledgements and author’s foreword
This book is for everyone interested in finance and investing. Although some of the sections will require some preceding knowledge, the aim has been to write a book for the “mass” rather than for the “class”, i.e. to introduce the eye-opening evidence of the behavioural side of investing, and to demonstrate its relevance, terms, and terminology. Readers acquainted with financial literature will be surprised to find very few equations. Although finance has much of its elegance (and most likely also its shortcomings!) from its mathematical representation, behavioural finance has not. Hopefully, however, those with a deep interest in the mathematical representation of finance will too be convinced, through this book, that there is far more to finance and investing, than what can be depicted by mathematical equations.
My thanks and gratitude to Assistant Professor Nigel Barradale and Professor Michael Møller (both at Copenhagen Business School, Denmark) as well as to Professor Terrence Odean (Haas School of Economics, Berkeley, California, U.S.), Professor Lucy Ackert (Michael J. Coles Colleges of Business, Kennesaw State University, Georgia, U.S.), and Richard Deaves (DeGroote School of Business, McMaster University, Ontario, Canada) for graciously allowing me to use some of their written material in this book.
A special thanks to graduate students of finance; Melena Johnsson, Henrik Lindblom, and Peter Platan (all at the School of Economics and Management, Lund University, Sweden), for generously giving me access to their comprehensive works on behavioural finance.

Download free eBooks at bookboon.com
Behavioural Finance
9
Preface
It is my sincere hope that you will find this book both interesting and relevant. I myself always find it amusing to realise how much alike our financial behaviour are, despite that fact that we all believe we are better-than-average. And even if this book will not make you rich overnight, it hopefully will make your investment decisions stronger and more contemplated, as well as bring your own general financial behaviour into a greater enlightenment!
I’ll be happy to receive any comments or suggestions for improvement.
Peter Dybdahl Hede,Vesterbro, 2012
Contact info:[email protected]
Download free eBooks at bookboon.com
Behavioural Finance
10
From standard finance to behavioural finance?
2 From standard finance to behavioural finance?
Standard finance stand on the arbitrage principles of Miller & Modigliani, the portfolio principles of Markowitz, the capital asset pricing theory of Sharpe, Lintner & Black, and the option-pricing theory of Black, Scholes & Merton. These approaches consider markets to be efficient and are highly normative and analytical.
Modern financial economic theory is based on the assumption that the representative market actor in the economy is rational in two ways: the market actor makes decisions according to the axiom of expected utility theory and makes unbiased forecasts about the future. According to the expected utility theory a person is risk averse and the utility function of a person is concave, i.e. the marginal utility of wealth decreases. Assets prices are set by rational investors and, consequently, rationality based market equilibrium is achieved. In this equilibrium securities are priced according to the efficient market hypothesis.
2.1 The efficient market hypothesis
According to the efficient market hypothesis, financial prices incorporate all available information and prices can be regarded as optimal estimates of true investment value at all times. The efficient market hypothesis is based on the notion that people behave rationally, maximise expected utility accurately and process all available information. In other words, financial assets are always priced rationally, given what is publicly known. Stock prices approximately describe random walks through time, i.e. price changes are unpredictable since they occur only in response to genuinely new information, which by the very fact that it is new, is unpredictable. Due to the fact that all information is contained in stock prices it is impossible to make an above average profit and beat the market over time without taking excess risk.
Eugene Fama has provided a careful description of an efficient market that has had a lasting influence on practitioners and academics in finance. According to Fama (1965), an efficient market is:
“...a market where there are large numbers of rational profit maximisers actively competing, with each trying to predict future market values of individual securities, and where important current information is almost freely available to all participants. In an efficient market, on the average, competition will cause the full effects of new information on intrinsic values to be reflected “instantaneously” in actual prices. A market in which prices always “fully reflect” all available information is called “efficient”.
Download free eBooks at bookboon.com
Behavioural Finance
11
From standard finance to behavioural finance?
Notice that the definition of an efficient market relies critically on information. Fama (1965) defined three versions of market efficiency to clarify what is intended by “all available information”. In the weak form, prices reflect all the information contained in historical returns. In the semi-strong form, prices reflect all publicly available information, including past earnings and earnings forecasts, everything in the publicly released financial statements (past and most recent), everything relevant appearing in the business press, and anything else considered relevant. In the strong form, prices even reflect information that is not publicly available, such as insiders’ information. Notice that if prices always reflect all information, we must be assuming that the cost of information acquisition and information generation is zero. Of course, we know that this is not reasonable. Thus, a better working definition of the efficient market hypothesis is that prices reflect all information such that the marginal benefit of acting on the information does not exceed the marginal cost of acquiring the information.
2.1.1 What does market efficiency imply?
In finance and economics, an efficient market is often taken to imply that an asset’s price equals its expected fundamental value. For example, according to the present value model of stock prices, a stock’s price equals the present value of expected future dividends. Price in this specific case is thus simply expressed as:
(2.1)
where pt is the stock price today at time t, Et(dt+i) is the expected value of the future dividend at time t+i using information available today, and δ is the discount rate, which reflects the stock’s risk. Some of the evidence against the efficient market hypothesis discussed later in the book is based on violations of this relationship. Test of the present value model must specify the information available to traders in forming their expectations of future dividends. The present model of stock prices says that, in an efficient market, a stock’s price is based on reasonable expectations of its fundamental value.
Note that market efficiency does not suggest that individuals are ill-advised to invest in stocks. Nor does it suggest that all stocks have the same expected return. The efficient market hypothesis in essence says that while an investment manager cannot systematically generate returns above the expected risk-adjusted return, stocks are priced fairly in an efficient market. Because investors have different attitudes toward risk, they may have different portfolios. The efficient market hypothesis, hence, does not suggest that any stock or portfolio is as good as any other.
In addition, while the efficient market hypothesis suggests that excess return opportunities are unpredictable, it does not suggest that prices levels are random. Prices are fair valuations of the firm based on the information available to the market concerning the actions of management and the firm’s investment and financing choices.

Download free eBooks at bookboon.com
Click on the ad to read more
Behavioural Finance
12
From standard finance to behavioural finance?
2.2 Behavioural Finance
For a while, theoretical and empirical evidence suggested that the capital asset pricing model, the efficient market hypothesis and other rational financial theories did a respectable job of predicting and explaining certain events. However, as time went on, academics in both finance and economics started to find anomalies and behaviours that couldn’t be explained by theories available at the time. While these theories could explain certain “idealised” events, the real world proved to be a very messy place in which market participants often behaved very unpredictably.
Behavioural finance is an add-on paradigm of finance, which seeks to supplement the standard theories of finance by introducing behavioural aspects to the decision-making process. Contrary to the Markowitz and Sharp approach, behavioural finance deals with individuals and ways of gathering and using information. At its core, behavioural finance analyses the ways that people make financial decisions. Behavioural finance seeks to understand and predicts systematic financial market implications of psychological decision processes. In addition, it focussed on the application of psychological and economic principles for the improvement of financial decision-making.
© Deloitte & Touche LLP and affiliated entities.
360°thinking.
Discover the truth at www.deloitte.ca/careers
© Deloitte & Touche LLP and affiliated entities.
360°thinking.
Discover the truth at www.deloitte.ca/careers
© Deloitte & Touche LLP and affiliated entities.
360°thinking.
Discover the truth at www.deloitte.ca/careers © Deloitte & Touche LLP and affiliated entities.
360°thinking.
Discover the truth at www.deloitte.ca/careers

Download free eBooks at bookboon.com
Behavioural Finance
13
From standard finance to behavioural finance?
2.2.1 Challenging the efficient market hypothesis
Market efficiency, in the sense that market prices reflect fundamental market characteristics and that excess returns on the average are levelled out in the long run, has been challenged by behavioural finance. There have been a number of studies pointing to market anomalies that cannot be explained with the help of standard financial theory, such as abnormal prices movements in connection with initial public offerings (IPOs), mergers, stock splits, and spin-offs. Throughout the 1990s and 2000s statistical anomalies have continued to appear which suggests that the existing standard finance models are, if not wrong, probably incomplete. Investors have been shown not to react “logically” to new information, but to be overconfident and to alter their choices when given superficial changes in the presentation of investment information. During the past few years there has, for example, been a media interest in social media stocks, as with Facebook IPO’s recently. Most of the time, as we know in retrospect, there was a positive bias in media assessments, which might have led investors in making incorrect investment decisions. These anomalies suggest that the underlying principles of rational behaviour, underlying the efficient market hypothesis, are not entirely correct and that we need to look, as well, at other models of human behaviour, as have been studied in other social sciences. The following sections introduce some of the basic findings and principal theories within behavioural finance that often contradict the basic assumption of standard financial theory.
2.3 Prospect theory
The first part of this chapter briefly presented the traditional standard economic approach to understanding individual behaviour, financial decision-making, and market outcomes. This subsection will consider more recent attempts to describe behaviour that incorporate observed aspects of human psychology. At the core of behavioural finance is the prospect theory suggested by two psychologists Kahnemann & Tversky in the 1970s.
Prospect theory is a mathematically formulated alternative to the theory of expected utility maximisation. The expected utility theory offers a representation of truly rational behaviour under certainty. According to the expected utility theory investors are risk averse. Risk aversion is equivalent to the concavity of the utility function, i.e. the marginal utility of wealth decreases. Every additional unit of wealth is valued less than the previous equivalent increase in wealth. Despite the obvious attractiveness of the expected utility theory, it has long been known that the theory has systematically failed to predict human behaviour, at least in certain circumstances1. Kahnemann & Tversky (1974) found empirically that people underweight outcomes that are merely probably in comparison with outcomes that are obtained with certainty; also that people generally discard components that are shared by all prospects under consideration. Under prospect theory, value is assigned to gains and losses rather than to final assets. Also probabilities are replaced by decision weights.
Download free eBooks at bookboon.com
Behavioural Finance
14
From standard finance to behavioural finance?
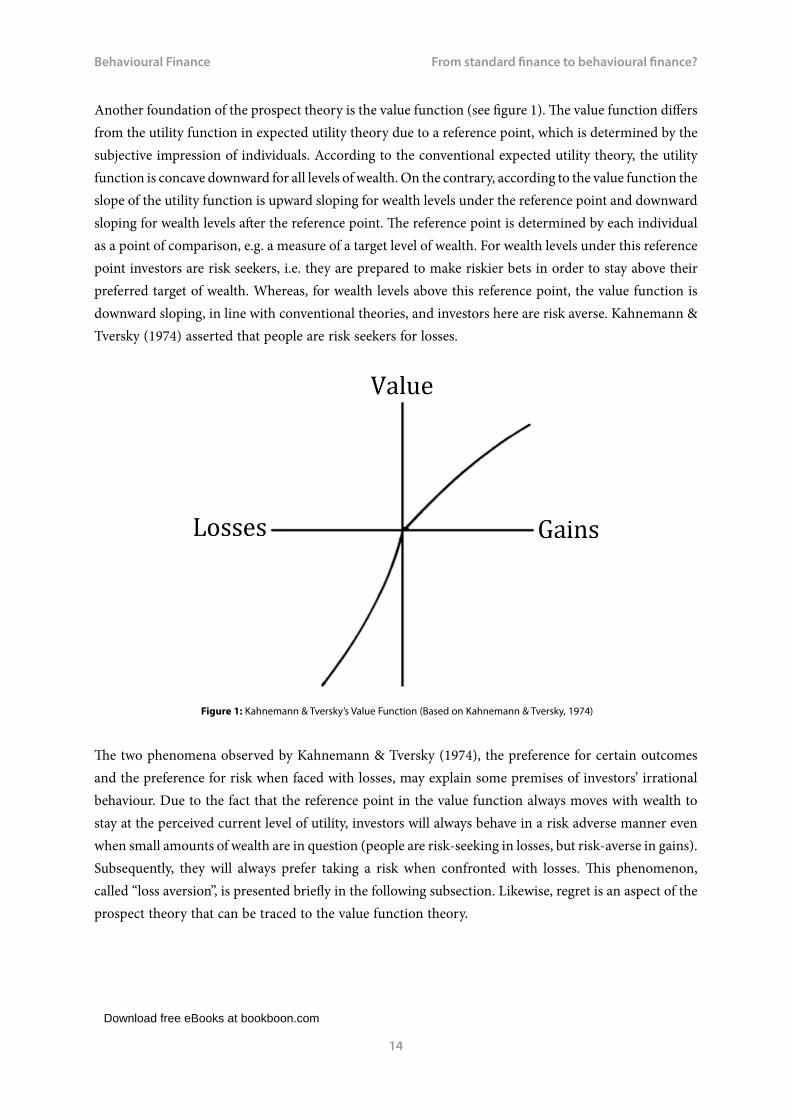
Another foundation of the prospect theory is the value function (see figure 1). The value function differs from the utility function in expected utility theory due to a reference point, which is determined by the subjective impression of individuals. According to the conventional expected utility theory, the utility function is concave downward for all levels of wealth. On the contrary, according to the value function the slope of the utility function is upward sloping for wealth levels under the reference point and downward sloping for wealth levels after the reference point. The reference point is determined by each individual as a point of comparison, e.g. a measure of a target level of wealth. For wealth levels under this reference point investors are risk seekers, i.e. they are prepared to make riskier bets in order to stay above their preferred target of wealth. Whereas, for wealth levels above this reference point, the value function is downward sloping, in line with conventional theories, and investors here are risk averse. Kahnemann & Tversky (1974) asserted that people are risk seekers for losses.
Figure 1: Kahnemann & Tversky’s Value Function (Based on Kahnemann & Tversky, 1974)
The two phenomena observed by Kahnemann & Tversky (1974), the preference for certain outcomes and the preference for risk when faced with losses, may explain some premises of investors’ irrational behaviour. Due to the fact that the reference point in the value function always moves with wealth to stay at the perceived current level of utility, investors will always behave in a risk adverse manner even when small amounts of wealth are in question (people are risk-seeking in losses, but risk-averse in gains). Subsequently, they will always prefer taking a risk when confronted with losses. This phenomenon, called “loss aversion”, is presented briefly in the following subsection. Likewise, regret is an aspect of the prospect theory that can be traced to the value function theory.

Download free eBooks at bookboon.com
Behavioural Finance
15
From standard finance to behavioural finance?
Figure 2: Kahnemann & Tversky’s Weighting Function (Based on Kahnemann & Tversky, 1974)
Like many theories, prospect theory has changed since its original form. While in the original version of prospect theory published in 1979 Kahnemann & Tversky spoke of what conditions an appropriate weighting function should embody, they did not attempt to formulate such a function. This was left to their more mathematically rigorous version of prospect theory, known as “cumulative prospect theory”. Cumulative prospect theory answers some technical objections to the original theory (for example that prospect theory originally violated statistical dominance). In this book, only graphical illustrations of the value function (see figure 1) and the weighting function (see figure 2) are presented. Cumulative prospect theory has been used to explain the “equity premium puzzle” (why stocks enjoy such high returns compared to bonds) and various stock market anomalies as is presented in chapter 4.
2.3.1 Loss aversion
Prospect theory supposes that people’s utility derives from losses and gains, rather than from final wealth. People work from a psychological reference point and strongly prefer to avoid losses below it. The value function shows the sharp asymmetry between the values that people put on gains and losses. This asymmetry is called “loss aversion”. Empirical tests indicate that losses are weighted about twice as heavily as gains, i.e. losing 1 € is about twice as painful as the pleasure of gaining 1 €. This can also be expressed as the phenomenon in which people will tend to gamble in losses, i.e. investors will tend to hold on to losing positions in the hope that prices will eventually recover. This is due to the fact that the utility function under the prospect theory is upward sloping for wealth levels under each individual’s reference point.

Download free eBooks at bookboon.com
Click on the ad to read more
Behavioural Finance
16
From standard finance to behavioural finance?
Loss aversion can help to explain the tendency of investors to hold on to loss making stocks while selling winning stocks too early. Shefrin (2000) called this occurrence the “disposition effect”. This hypothesis has been supported empirically for field data (Heisler, 1994; Odean, 1998), and in experimental asset markets (Heilmann et al., 2000; Weber & Camerer, 1998). Odean (1998) analysed trading records for 10,000 accounts at a large discount brokerage house and found that investors held losing stocks for a median of 124 days, while winners were held for only 104 days. Using an experimental call market, Heilmann et al. (2000) showed that the number of assets offered and sold was higher during periods of rising trading prices than during periods of falling trading prices. When investors view stocks on an individual basis, then risk aversion in gains will cause them to sell too quickly into rising stock prices, thereby depressing prices relative to fundamental values. Conversely, risk seeking in losses will cause investors to hold on too long when prices decline, thereby causing the prices of stocks with negative momentum to overstate fundamental values. Loss aversion also implies that decision-making is sensitive to the description of the action choices, i.e. to the way the alternatives are “framed”. This important role of frames is presented in the following section.
We will turn your CV into an opportunity of a lifetime
Do you like cars? Would you like to be a part of a successful brand?We will appreciate and reward both your enthusiasm and talent.Send us your CV. You will be surprised where it can take you.
Send us your CV onwww.employerforlife.com
Download free eBooks at bookboon.com
Behavioural Finance
17
From standard finance to behavioural finance?
2.3.2 Framing and mental accounting
Framing and mental accounting are both parts of the prospect theory. A decision frame is a decision-makers view of a problem and the possible outcomes. A frame is affected by the presentation, the person’s perception of the question, and personal characteristics. If a person’s decision changes simply because of a change in frame, expected utility theory is violated because it assumes that people should have consistent choices, regardless of presentation. Mental accounting describes the tendency of people to place particular events into different mental accounts, based on superficial attributes. The main underlying idea is that decision-makers tend to separate the different types of gambles they face into separate accounts, and then apply prospect theoretic decisions rules to each account, thereby ignoring possible interaction between the accounts. Mental accounts can be isolated not only by content, but also in respect to time.
The mental accounting bias also enters into investing. For example, some investors divide their investments between a safe investment portfolio and a speculative portfolio in order to prevent the negative returns that speculative investments may have from affecting the entire portfolio. The problem with such a practice is that despite all the work and money that the investor spends to separate the portfolio, the investor’s net wealth will be no different than if he had held one larger portfolio. Mental accounting can serve to explain why investors are likely to refrain from readjusting his or her reference point for a stock. When the stock is purchased, a new mental account for the particular stock is opened. The natural reference point, as in the Kahnemann & Tversky valuation function described in a previous subsection, is the asset purchase price. A running score is then kept on this account indicating gains or losses relative to the purchase price. When another stock is purchased, another separate account is created. A normative frame recognises that there is no substantive difference between the returns distributions of the two stocks, only difference in names. However, a situation involving the sale of the first stock when it has decreased in price and using the proceeds to buy the second stock may be framed as closing the first stock account at a loss. It has been argued that decision-makers encounter considerable difficulty in closing a mental account at such a loss.
The role of frames is also illustrated in the dividend puzzle according to which private investors treat dividends separately from capital gains. In a world without taxes and transaction costs, investors should be indifferent between a dividend Euro and a capital Euro. Moreover, in a world where dividends are taxed more heavily than capital gains, standard investors know that they are actually better off when companies refrain from paying dividends. So why do companies pay dividends? A dividend Euro is different from a capital Euro according to the prospect theory because the investor frames the Euros into two distinct mental accounts. Therefore, even though a stock paying out dividends might be decreasing in price an investor may be reluctant to sell the stock in fear of closing a mental account containing dividend income. Dividends can be thought of as a separate gain from the capital gain due to the rise in the stock price itself. Financing consumption out of dividends further avoids the anticipated regret of selling a stock that might later rise in value. One could argue that private investors think naturally in terms of having a “safe” part of their portfolio that is protected from downside risk and a risky part that is designed for getting rich.

Download free eBooks at bookboon.com
Behavioural Finance
18
From standard finance to behavioural finance?
Mental accounting can also result in “good money being thrown after bad money” by a continuous operation of non-profitable ventures in the hope that recovery will somehow take place. It may also explain framing which is beneficial to investors with imperfect self-control. Glick (1957) reports that the reluctance to realise losses constitutes a self-control problem. He describes professional traders who are very prone to let their losses “ride”. It is the control of losses that constitutes the essential problem. The traders’ problem was to exhibit sufficient self-control to close accounts at a loss even though they were clearly aware that riding losses was not rational. Self-control is also exhibited in the dividends puzzle, mentioned above. For example, old investors, especially retirees who finance their living expenditures from their portfolios, worry about spending their wealth too quickly, thereby outliving their assets. They fear a loss of self-control, where the urge for immediate gratification can lead to overspending.
2.3.3 Integration versus segregation
In many cases, the decision-maker chooses a reference point, and whether an outcome is perceived as positive or negative will depend on the reference point selected. For example, as adapted from Tversky & Kahnemann (1981), suppose you lost 150 € at the horse track today. You are considering betting another 10 € in the next and final race of the day on a horse with 15:1 odds. This means that if your horse wins, your payoff for the race will be 150 €, but if your horse loses, you lose the 10 € bet.
Notice how important the bettor’s reference point is here. If he includes his losses over the day, the bet will result in either a break even position if the horse wins or an overall loss of 150 € if the horse loses (plus the 10 € lost in the final race). But if the bettor ignores his prior losses and considers his reference point to be a fresh slate, the outcome of the final bet is either a gain of 150 € or a loss of 10 €. Prospect theory predicts that a decisions-maker who adopts the latter approach of segregating outcomes will be less inclined to accept risk in this situation, both because the gamble crosses over between loss and a gain so that loss aversion stares at the decision-maker, and, to the extent that we are in the domain of gains, the value function is concave. In contrast, a decision-maker who takes the first reference point and intergrates the outcomes of the bets on the day will be more risk seeking since this decision-maker will be in the domain of losses.
Integration occurs when positions are lumped together, while segregation occurs when situations are viewed one at a time. Standard prospect theory mostly assumes that people segregate, though Kahnemann & Tversky (1981) did recognise that sometimes people adopt the frame of integration. They note, for example, that more bets are places on long shots at the end of the racing day, suggesting that a least some bettors are integrating the outcomes of races and taking risks they would not ordinarily take in order to try to break even.

Download free eBooks at bookboon.com
Click on the ad to read more
Behavioural Finance
19
From standard finance to behavioural finance?
In the horse racing example, some people are willing to increase their risk in order to break even. When risk increases after losses, this is called the “break-even effect”. How would people behave, according to the prospect theory, after gains? Symmetry might suggest that risk taking would decline, but the reality is otherwise. If new decisions (e.g. whether and how much to bet on the next race) are integrated with prior gains, then, because you have moved up the value function and are some distance from the loss boundary, it is likely that you will be willing to assume greater risk. Using the language of the casino rather than from the track, you are betting with the “house money”. The “house money effect” is said to be operative when someone increases risk taking after prior gains. Both the break even effect and the house money effect are quite important in the context of financial decision-making because they may influence decisions after portfolio growth or shrinkage. We will look more into this in section 3.5.1. At first, however, we will introduce the theories behind heuristics and biases.
Maersk.com/Mitas
�e Graduate Programme for Engineers and Geoscientists
Month 16I was a construction
supervisor in the North Sea
advising and helping foremen
solve problems
I was a
hes
Real work International opportunities
�ree work placementsal Internationaor�ree wo
I wanted real responsibili� I joined MITAS because
www.discovermitas.com
Download free eBooks at bookboon.com
Behavioural Finance
20
Heuristics and biases related to financial investments
3 Heuristics and biases related to financial investments
The presence of regularly occurring anomalies in conventional economic theory was a big contributor to the formation of behavioural finance. These so-called anomalies, and their continued existence, directly violate modern financial and economic theories, which assume rational and logical behaviour. A relevant point of criticism, levied against traditional models in economics and finance, is that they are often formulated as if the typical decision-maker were an individual with unlimited cerebral RAM. Such a decision-maker would consider all relevant information and come up with the best choice under the circumstances in a process known as constrained optimisation.
Normal humans are imperfect and information requirements are for some financial models egregious. A well-known example is that capital asset pricing model, the famous model important enough that William Sharpe won the 1990 Nobel Prize for Economics Sciences for this contribution. This model assumes that investors are capable of studying the universe of securities in order to come up with all required model inputs. These inputs include expected returns and variances for all securities, as well as covariances among different securities. Only then is the investor able to make appropriate portfolio decisions.
The dictionary definition for heuristics refers to the process by which people find things out for themselves usually by trial and error. Trial and error often leads people to develop “rules of thumb”, but this process often leads to other errors. Heuristics can also be defined as the “use of experience and practical efforts to answer questions or to improve performance”. Due to the fact that more and more information is spread faster and faster, life for decision-makers in financial markets has become a mostly inevitable approach, but not always beneficiary. Heuristics may help to explain why the market sometimes acts in an irrational manner, which is opposite to the model of perfectly informed markets. The interpretation of new information may require heuristic decision-making rules, which might later have to be reconsidered.
There is a large number of identified heuristics and biases from psychology and they come in all shapes and sizes. One dichotomy is between those heuristics that are reflexive, autonomic, and noncognitive, and economise on effort (Type A); and others, which are cognitive in nature (Type B). Type A heuristics are appropriate when a very quick decision must be made or when the stakes are low (e.g. “I choose a burger over a pizza because I usually prefer them”). Type B heuristics are more effortful and are appropriate when the stakes are higher. In some cases, an initial reaction using Type A heuristic can be overruled or corroborated using Type B heuristic (e.g. “No, I will choose the pizza today because it is prepared a bit differently and I like to try new things”). In this book we shall focus on both types, but limit ourselves to only the most relevant for decision-making relevant for financial investments.
Download free eBooks at bookboon.com
Behavioural Finance
21
Heuristics and biases related to financial investments
3.1 Financial behaviour stemming from familiarity
In this section we explore a series of related heuristics that induce investors to exhibit preferences unrelated to objective considerations. One example is that investors are more comfortable with the familiar. They dislike ambiguity and normally look for ways to avoid unrewarded risk. Investors tend to stick with what they have rather than investigate other options. They put off undertaking new initiatives, even if deep down they know the effort could be worthwhile. All of these observations point to a tendency to seek comfort.
As an example, people are more likely to accept a gamble if they feel they have a better understanding of the relevant context, i.e. if they feel more competent. Heath & Tversky (1991) demonstrated based on an experimental questionnaire-based study that when people felt they had some competence on the question, they were more likely to choose a gamble based on this competence rather than a random lottery. This is evidenced by the positive relationship between judged probability of being right on the questions and the percentage choosing the competence bet. The logical conclusion is that people have a preference for the familiar.
3.1.1 Home bias – domestic investors hold domestic securities
Although preferences are slowly changing in this regard, it continues to be true that domestic investors hold mostly domestic securities, i.e. German investors hold mostly German securities; Japanese investors hold mostly Japanese securities and so on, as reported by French & Poterba (1991). Referring to the first column of table 1, we see displayed the aggregate market value of the six biggest stock markets in the world. The United States as of 1989 had 47.8% of the world market, Japan 26.5% etc. Nevertheless, a typical U.S. investor held 93.8% in U.S. stocks; a typical Japanese investor held 98.1% in Japanese stocks etc. Thus, domestic investors overweight domestics stocks. This behaviour is often referred to as the “Home bias”.
Bias toward the home country contradicts evidence indicating that diversifying internationally allows investors to reduce risk without surrendering return. This is particularly true since stock markets in different countries still are not highly correlated. Ackert & Deaves (2010) report that the average pairwise correlation coefficient for the countries listed in table 1 during 1975–1989 was 0.502, which attests to the gains from diversification. One reason why investors might hold domestic securities is because they are optimistic about their markets relative to foreign markets. Another behavioural explanation is along the lines of comfort-seeking and familiarity. Investors tend to favour that which is familiar; German investors are more familiar with German stocks and markets, and so they are more comfortable investing in German securities. The same holds equally true for other foreign investors.

Download free eBooks at bookboon.com
Click on the ad to read more
Behavioural Finance
22
Heuristics and biases related to financial investments
Market value weights U.S. investors Japanese investors U.K. investors
U.S. 47.8 % 93.8 % 1.3 % 5.9 %
Japan 26.5 % 3.1 % 98.1 % 4.8 %
U.K. 13.8 % 1.1 % 0.2 % 82.0 %
France 4.3 % 0.5 % 0.1 % 3.2 %
Germany 3.8 % 0.5 % 0.1 % 3.5 %
Canada 3.8 % 0.1 % 0.1 % 0.6 %
Table 1: Estimated country weights among international investors (adapted from French & Poterba, 1991)
3.1.2 Investing in your employer or brands you know
There is abundant evidence that investors overweight the stocks of companies whose brands are familiar or that they work for. Regarding the first, Frieder & Subrahmanyam (2005) looked at a survey data on perceived brand quality, brand familiarity and brand recognition, and asked whether these attributes impacted investor preferences. To answer this question, they correlated institutional holdings with these factors. Note that high institutional holding in a stock implies low retail holding in that same stock. Frieder & Subrahmanyam (2005) found that institutional holdings are significant and negatively related to brand recognition, but no discernible impact was present for brand quality. The former implies that retail investors have a higher demand for firms with brand recognition, which is consistent with comfort-seeking and familiarity.
Download free eBooks at bookboon.com
Behavioural Finance
23
Heuristics and biases related to financial investments
As for overweighting companies that one works for, while the same sort of familiarity versus informational advantage debate is possible, the extent to which some investors invest in these companies seems to transcend an informational explanation. According to Ackert & Deaves (2010), many employee-investors put a very high percentage of their investible wealth in their employer’s stock, thus foregoing a significant amount of possible diversification.
3.1.3 Diversification heuristic – “the 1/N buffet rule”
The diversification heuristic suggests that people in general like to try a bit of everything when choices are not mutually exclusive. A common behaviour among buffet diners is to sample most (if not all!) dishes. To concentrate on one or two runs the risk of not liking your selections and/or missing out on a good thing. Such behaviour is similar to that reported by Simonsen (1992), who reports shoppers are more likely to choose a variety of items when they must make multiple purchases for future consumption, versus the case when they make single purchases just prior to each consumption decision. Simonsen (1992) argues that certain factors drive such behaviour. First, many people have a hardwired preference for variety and novelty. This preference is much more salient when multiple purchases are made. Second, future preferences embody some uncertainty. Spreading purchases over different categories reduces risk in the same fashion that spreading your money over different stocks accomplishes the same risk-reduction goal in a well-diversified portfolio. A final motivation for variety-seeking is it makes your choice simpler, thus saving time and reducing decision conflict.
One popular form of naive diversification amongst investors is the 1/N strategy. The 1/N strategy entails equal division of investment money between the available funds. For example when given a choice of five funds for pension investments people will often divide their pension contributions equally between the funds. Siebenmorgen & Weber (2003) found that financial advisers were also prone to recommending 1/N strategies, and to ignoring correlations between investments when estimating portfolio risk. The 1/N strategy is often seen as irrational behaviour since it involves the loss of the benefits of Markowitz diversification in standard finance.
3.2 Financial behaviour stemming from representativeness
One of the more common heuristics is judging things by how they appear rather than how statistically likely they are. The classic example comes from works by Kahneman & Tversky (1973). It concerns Linda, a 31-year-old who is single, outspoken and very bright. She majored in philosophy. As a student, she was deeply concerned with issues of discrimination and equality. Which is more likely?
1. Linda works in a bank2. Linda works in a bank and is active in the feminist movement.

Download free eBooks at bookboon.com
Behavioural Finance
24
Heuristics and biases related to financial investments
An alarmingly high percentage of people go for the second option. However, it can’t possibly be true, as it represents a conjunction fallacy. That is, there must always be more people who work in banks than there are who work in banks and are active in the feminist movement. So why do so many people get this question wrong? The answer seems to be that the description is biased, it sounds like someone who might plausibly be involved in the feminist movement. People are driven by the narrative of the description rather than by the logic of the analysis.
Montier (2007) reports another example of representativeness: a health survey was conducted in a sample of adult males, in New Jersey, of all ages and occupations. Nearly 300 professional fund managers coming from all over the globe submitted themselves to the task of trying to answer these two questions:
1. What percentage of the men surveyed have had one or more heart attacks? 2. What percentage of the men surveyed are both over 55 and have had one or more heart
attacks?
The question is a conjunction fallacy in the same way as the Linda problem. There are always going to be more men who had one or more heart attacks than there are men over 55 and one or more heart attacks. However, across the 300 fund managers the estimated average percentage of men suffering one or more heart attacks was 12.5%, while the estimated percentage of men over 55 and suffering one or more heart attacks was 16%. Of course, averages can hide all sorts of things, so looking at the full data set reveals that 40% of the sample suffered from representativeness in as much as they had higher estimates of the latter part of the question compared to the first section answer!

Download free eBooks at bookboon.com
Behavioural Finance
25
Heuristics and biases related to financial investments
3.2.1 Good investments vs. good companies
There is a lot of empirical evidence in literature that representativeness and related biases induce inappropriate investment decisions. To casual observers it seems obvious that if a company has high-quality management, a strong image, and consistent growth in earnings, it must be a good investment. Students of finance, of course, know better. In valuation, future cash flows are forecasted and discounted back to the present using appropriate risk-adjusted discount rate. All the aforementioned attributes that make a company a good company should theoretically be reflected in these estimates of future cash flows (including the growth in cash flows) and the risk-adjusted discount rate, i.e. they should already be impounded in the stock price. In other words, good companies will sell at high prices, and bad companies will sell at low prices. But, once the market has adjusted, there is no reason to favour a good company over a bad company, or, for that matter, a bad company over a good company. Quite simply, it is a mistake to think that a good company is representative of a good investment, and yet, that is exactly what people often seem to believe.
In works by Shefrin & Statman (1995) some very revealing evidence is provided from a survey of senior executives on company attributes for a number of years. Executives are asked to assign values between “0” (poor) and “10” (excellent) to each company in their industry for the following items: quality of management; quality of products/services; innovativeness; long-term investment value: financial soundness; ability to attract, develop, and keep talented people; responsibility to the community and environment; and wise use of corporate assets. Because 82% of the respondents consider quality of management as the most important attribute of a company’s quality, Shefrin & Statman (1995) used it as their proxy for company quality. Results show that management quality (i.e. good company measure) and value as a long-term investment (i.e. good stock measure) are very highly correlated. The R2 value from the first regression of survey data suggests a correlation of 0.93. Executives apparently believe that good companies are good stocks. As discussed in the section above, it is important to understand that no company attributes should be associated with investment value. That is, all information on company quality should already be embedded in stock prices so that all companies (good and bad ones) on an ex ante basis are equally good investments.

Download free eBooks at bookboon.com
Behavioural Finance
26
Heuristics and biases related to financial investments
Other regressions from the same survey by Shefrin & Statman (1995) reveal that two company characteristics, size and the book-to-market ratio, are strongly associated with perceived management quality. Specifically, big companies and those that have low book-to-market ratios (where the latter are considered growth companies) are seen to be good companies. This is not overly surprising. Big companies have often become big because they are good (i.e. well managed), and growth should come from quality. Additionally, size and book-to-market, even after accounting for their impact on management quality, are observed to interdependently influence investment value. Big firms are viewed as good investments, and growth companies are viewed as good investments. In other words, big high-growth firms are perceived as representative of good investments. Interestingly, as discussed earlier, the empirical evidence points in the exact opposite direction. It is small-cap value firms that have historically outperformed. Indeed, the tendency for individuals to use representativeness in the context of investments may have contributed to the small-firm and value anomalies. We will address this further in chapter 4.
3.2.2 Chasing winners
Research has also shown that investors choose securities and investment funds based on past performance. To those with this view, investment performance in recent past is representative of future investment performance. This form of representativeness is often referred to as the “recency bias”. Such trend-following or momentum chasing, has long been a popular strategy, and, coupled with detecting turning points, it is the heart of technical analysis. Trend-following is indeed an international phenomenon in all stock markets. So is there any evidence in favour of the popular notion that momentum-chasing is profitable? Ackert & Deaves (2010) answers both yes and no to this question. There is evidence that risk-adjusted returns are positively correlated for three to twelve month return intervals. For longer periods of three years or more, however, the evidence favours reversals or negative serial correlation.

Download free eBooks at bookboon.com
Click on the ad to read more
Behavioural Finance
27
Heuristics and biases related to financial investments
3.2.3 Gambler’s fallacy in investing
It’s not hard to imagine that under certain circumstances, investors or traders can easily fall prey to the gambler’s fallacy being the erroneous belief that additional observations should be such that a sample will closely resemble the underlying distribution. For example, some investors believe that they should liquidate a position after it has gone up in a series of subsequent trading sessions because they don’t believe that the position is likely to continue going up. Conversely, other investors might hold on to a stock that has fallen in multiple sessions because they view further declines as “improbable”. Nevertheless, as students of finance will know: just because a stock has gone up on six consecutive trading sessions does not mean that it is less likely to go up on during the next session.
It’s important to understand that in the case of independent events, the odds of any specific outcome happening on the next chance remains the same regardless of what preceded it. With the amount of noise inherent in the stock market, the same logic applies: Buying a stock because you believe that the prolonged trend is likely to reverse at any second is irrational. One could suggest the investors to base their decisions on fundamental and/or technical analysis before determining what will happen to a trend.
Download free eBooks at bookboon.com
Behavioural Finance
28
Heuristics and biases related to financial investments
3.3 Anchoring
Anchoring refers to the decision-making process where quantitative assessments are required and where these assessments may be influenced by suggestions. The concept of anchoring draws on the tendency to attach our thoughts to a reference point, even though it may have no logical relevance to the decision at hand. People have in their mind some reference points (i.e. anchors) for example of previous stock prices. When they get new information they adjust this past reference insufficiently to the new information acquired. Anchoring describes how individuals tend to focus on recent behaviour and give less weight to longer time trends. Although it may seem an unlikely phenomenon, anchoring is even fairly prevalent in situations where people are dealing with concepts that are novel.
Values in speculative markets, like the stock market, are inherently ambiguous. It is hard to tell what the value of e.g. the Dow Jones Industrial Average should be as there is no agreed-upon economic theory that would provide an answer to this question. In the absence of any better information, past prices are likely to be important determinations of prices today. Therefore, the anchor is the most recent remembered price. The tendency of investors to use this anchor enforces the similarity of stock prices from one day to the next. Other possible anchors are remembered historical prices, and the tendency of past prices to serve as anchors may explain the observed tendency for trends in individual stocks prices to be reversed. For individual stocks, price changes may tend to be anchored to the price changes of other stocks, and price-earnings ratios may be anchored to other firms’ price-earnings levels. This kind of anchoring may explain why individual stock prices move together as much as they do, and thus why stock price indices are as volatile as they are. Likewise, it may help to explain why the averaging across stocks that is inherent in the construction of the index does not more solidly dampen its volatility. It may also explain why stocks of companies that are in different industries, but are headquartered in the same location, tend to have more similar price movements than stocks of companies that are in the same industry, but headquartered in different countries. This obviously being contrary to one’s expectation that the industry would defined the fundamentals of the company better than the location of its headquarters.
Anchoring can indeed be a source of frustration in the financial world, as investors base their decisions on irrelevant figures and statistics. For example, some investors invest in the stocks of companies that have fallen considerably in a very short amount of time. In this case, the investor is anchoring on a recent ”high” that the stock has achieved and, consequently, believes that the drop in price provides an opportunity to buy the stock at a discount. While, it is true that the fickleness of the overall market can cause some stocks to drop substantially in value, allowing investors to take advantage of this short- term volatility, stocks most often decline in value due to changes in their underlying fundamentals.

Download free eBooks at bookboon.com
Behavioural Finance
29
Heuristics and biases related to financial investments
As an example, suppose that stock X had a very strong revenue in the last year, causing its share price to shoot up from 25 € to 80 €. Unfortunately, one of the company’s major customers, who contributed to 50% of X’s revenue, has decided not to renew its purchasing agreement with X. This change of events causes a drop in X’s share price from 80 € to 40 €. By anchoring to the previous high of 80 € and the current price of 40 €, the investor erroneously believes that X is undervalued. Keep in mind that X is not being sold at a discount, instead the drop in share value is attributed to a change to X’s fundamentals (loss of revenue from a big customer). In this example, the investor has fallen prey to the dangers of anchoring.
When it comes to avoiding anchoring, there’s no substitute for rigorous critical thinking. Be especially careful about which figures you use to evaluate a stock’s potential. Successful investors don’t just base their decisions on one or two benchmarks. They evaluate each company from a variety of perspectives in order to derive the truest picture of the investment landscape.
3.3.1 Herding
A fundamental observation about human society is that people who communicate regularly with one another think similarly. This naturally also goes for investors. It is important to understand the origins of this similar thinking, so that one can judge the plausibility of theories of speculative fluctuations that ascribe price changes to faulty thinking. There are two primary reasons why herd behaviour happens. The first is the social pressure of conformity indeed being a powerful force. This is because most people are very sociable and have a natural desire to be accepted by a group, rather than be branded as an outcast. Therefore, following the group is an ideal way of becoming a member. The second reason is the common rationale that it’s unlikely that such a large group could be wrong. After all, even if you are convinced that a particular idea or course of action is irrational or incorrect, you might still follow the herd, believing they know something that you don’t. This is especially prevalent in situations in which an individual has very little experience.
Part of the reasons why people’s judgements are similar at similar times is that they are reacting to the same information. The social influence has an immense power on individual judgement. When people are confronted with the judgement of a large group of people, they tend to change their “wrong” answers. They simply think that all the other people could not be wrong. They are reacting to the information that a large group of people had reached a judgement different form theirs. This is a rational behaviour also viewed in terms of evolution. In everyday living we have learned that when a large group of people is unanimous in its judgement, they are certainly right. Herding and anchoring are thus closely related.
Download free eBooks at bookboon.com
Behavioural Finance
30
Heuristics and biases related to financial investments
People are influenced by their social environment and they feel pressure to conform. Fashion is a mild form of herd behaviour while an example of the strong form is fads that constitute speculative bubbles and crashes. Herd behaviour may be the most generally recognised observation on financial markets in a psychological context. Herd behaviour can play a role in the generation of speculative bubbles as there is a tendency to observe “winners” very closely, particularly when good performance repeats itself a couple of times. It seems plausible to make distinction between voluntary and enforced herd behaviour. Many players on financial markets might think that a currency or equity is not correctly priced, but they refrain, nevertheless, from a contrary financial exposure. These people simply feel that it is not worthwhile to combat the herd. This is an example of enforced herd behaviour. They follow the herd, not voluntarily, but to avoid being trampled and are therefore enforced into following the herd.
Even otherwise completely rational people can participate in herd behaviour when they take into account the judgements of others, and even if they know that everyone else is behaving in a herd-like manner. The behaviour, although individually rational, produces group behaviour that is irrational and causes fluctuations in the market. The “noise trading” theory stems from the fact that investors with a short time horizon are influencing the stock prices more than the long-term investors are. Investors, with no access to inside information, irrationally act on noise as if it were information that would give them an edge.
Another important variable to herding is the word of mouth. People generally trust friends, relatives and working colleagues more than they do the media. The conventional media, printed information, televisions, and radio have a profound capability for spreading ideas, but their ability to generate active behaviours is still limited. Talking to other people and other kinds of interpersonal communication are among the most important social connections humans have. It is therefore likely that news about buying opportunity will rapidly spread. In a study by Shiller & Pound (1989) private investors were asked what first draw their attention to a company they recently had invested in. Only six percent of the respondents specified newspapers and periodicals. Even if people read a lot, their attention and actions appear to be more stimulated by interpersonal communication.
A strong herd mentality can even affect financial professionals. The ultimate goal of an investment manager is obviously to follow an investment strategy to maximise a client’s invested wealth. The problem lies in the amount of scrutiny that investment managers receive from their clients whenever a new investment fad pops up. For example, a wealthy client may have heard about an investment gimmick that’s gaining notoriety and inquires about whether the investment manager employs a similar strategy. In many cases, it’s tempting for an investment manager to follow the herd of investment professionals. After all, if the aforementioned gimmick pans out, his clients will be happy. If it doesn’t, the money manager can justify his poor decision by pointing out just how many others were led astray.

Download free eBooks at bookboon.com
Click on the ad to read more
Behavioural Finance
31
Heuristics and biases related to financial investments
Herd behaviour is usually not a very profitable investment strategy and the cost of being led astray can often be very high. Investors that employ a herd-mentality investment strategy constantly buy and sell their investment assets in pursuit of the newest and hottest investment trends. For example, if a herd investor hears that internet stocks are the best investments right now, he will free up his investment capital and then dump it on internet stocks. If biotech stocks are all the rage six months later, he’ll probably move his money again, perhaps before he has even experienced significant appreciation in his internet investments. Keep in mind that all this frequent buying and selling incurs a substantial amount of transaction costs, which can eat away at available profits. Furthermore, it’s extremely difficult to time trades correctly to ensure that you are entering your position right when the trend is starting. By the time a herd investor knows about the newest trend, most other investors have already taken advantage of this news, and the strategy’s wealth-maximising potential has probably already peaked. This means that many herd-following investors will probably be entering into the game too late and are likely to lose money as those at the front of the pack move on to other strategies.
Download free eBooks at bookboon.com
Behavioural Finance
32
Heuristics and biases related to financial investments
3.4 Overconfidence and excessive trading
The key behavioural factor and perhaps the most robust finding in the psychology of financial judgement needed to understand market anomalies is overconfidence. Investors tend to exaggerate their talents and underestimate the likelihood of bad outcomes over which they have no control. The combination of overconfidence (i.e. overestimating or exaggerating one’s ability to successfully perform a particular task) and optimism causes people to overestimate the reliability of their knowledge, underestimate risks and exaggerate their ability to control events, which leads to excessive trading volume and speculative bubbles. The greater confidence a person has in himself, the more risk there is of overconfidence. This applies, in particular, to areas where people are not well-informed. Self-confidence, interestingly, usually bears no relation to the relationship between overconfidence and competence. March & Shapira (1987) demonstrated as one of many examples that portfolio managers overestimate the probability of success in particular when they think of themselves as experts.
In a 2007 study Montier found that 74% of the 300 professional fund managers surveyed believed that they had delivered above-average job performance. Of the remaining 26% surveyed, the majority viewed themselves as average. Incredibly, almost 100% of the survey group believed that their job performance was average or better. Clearly, only (slightly less than) 50% of the sample can be above average, suggesting the irrationally high level of overconfidence these fund managers exhibited. Clearly, overconfidence is not a trait that applies only to fund managers.
In terms of investing, overconfidence can be detrimental to the individual’s stock-picking ability in the long run. In a 1998 study Odean found that overconfident investors generally conduct more trades than their less-confident counterparts. Odean found that overconfident investors and traders tend to believe they are better than others at choosing the best stocks and the best times to enter/exit a position. Unfortunately, Odean (1998) also found that traders that conducted the most trades tended, on average, to receive significantly lower yields than the market. Keep in mind that professional fund managers, who have access to the best investment/industry reports and computational models in the business, can still struggle at achieving market-beating returns. High trading volumes and the pursuit of active investment strategies thus seems inconsistent with common knowledge of rationality.
Apparently, many investors feel that they do have speculative reasons to trade often, and apparently this have to do with a tendency for each individual to have beliefs that he or she perceives better than others’ beliefs. It is as if most people think that they are above average. Shiller (1987) observed in a survey of the market crash in 1987, a surprisingly high confidence among investors in intuitive feelings about the direction the market would take after the crash. Therefore, overconfidence may help to explain possible general market overreactions as well as excess volatility and speculative asset prices. It may also explain why investment professionals hold actively managed portfolios with the intention of being able to choose winners and why pension funds hire active equity managers.
Download free eBooks at bookboon.com
Behavioural Finance
33
Heuristics and biases related to financial investments
3.4.1 Evidence from the field of trading
Are the predications of overconfidence and excessive trading corroborated by evidence from the real world? Barber & Odean (2000) investigated the performance of individual investors by examining the trading histories of more than 60,000 U.S. discount brokerage investors between 1991 and 1996. Their goal was to see if the trades of these investors were justified in the sense that they led to improvements in portfolio performance. There is an important point to consider in respect to why and when a market transaction would make sense at all. Suppose, for example, you sell one stock and use the proceeds to buy another, and in doing so incur 100 € in transaction costs. This transaction is only logical if you expect to generate a higher portfolio return, i.e. high enough to at least offset the transaction cost. To be sure, individual investors do a lot of trading. Barber & Odean (2000) found that, on average, U.S. professional investors turn over 75% of their portfolio annually. This means that, for a typical investor who holds a 100,000 € portfolio, 75,000 € worth of stock is traded in a given year.
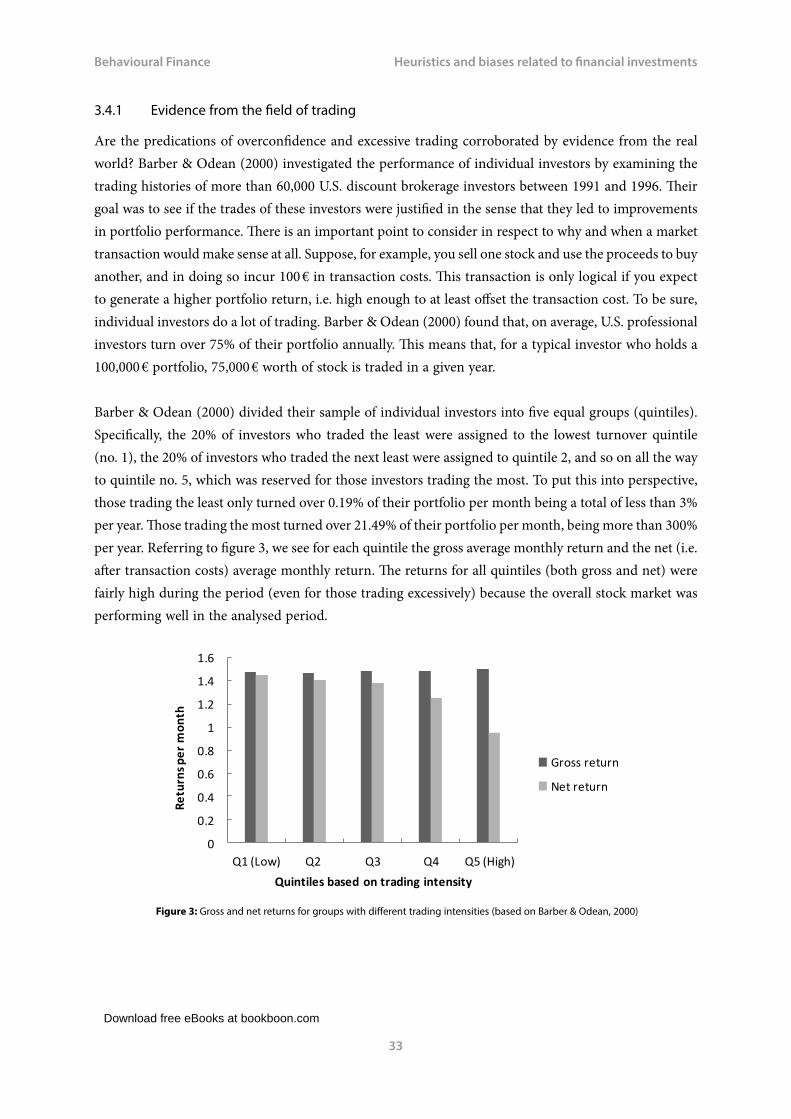
Barber & Odean (2000) divided their sample of individual investors into five equal groups (quintiles). Specifically, the 20% of investors who traded the least were assigned to the lowest turnover quintile (no. 1), the 20% of investors who traded the next least were assigned to quintile 2, and so on all the way to quintile no. 5, which was reserved for those investors trading the most. To put this into perspective, those trading the least only turned over 0.19% of their portfolio per month being a total of less than 3% per year. Those trading the most turned over 21.49% of their portfolio per month, being more than 300% per year. Referring to figure 3, we see for each quintile the gross average monthly return and the net (i.e. after transaction costs) average monthly return. The returns for all quintiles (both gross and net) were fairly high during the period (even for those trading excessively) because the overall stock market was performing well in the analysed period.
Figure 3: Gross and net returns for groups with different trading intensities (based on Barber & Odean, 2000)

Download free eBooks at bookboon.com
Behavioural Finance
34
Heuristics and biases related to financial investments
Returning to the central question: Was this trading worthwhile? Was it based on superior information, or was it based on the perception of superior information (i.e. misinformation)? An inspection of figure 3 reveals that while the additional trading did lead to a very slight improvement in gross performance, net performance suffered. The evidence reported by Barber & Odean (2000) suggest that the trades were not based on superior information, but rather were often conducted because of misinformation. While it is impossible to prove without a doubt that overconfidence was the culprit, the view appears to be a reasonable one.
While figure 3 is in terms of raw returns, sometimes returns are high because greater risk is taken and investors are merely being properly rewarded for the risk borne. If an investor earns high average returns only because high risk has been borne, this does not imply any sort of stock-picking skill. After risk-adjusting returns, Barber & Odean (2000) found that their results were quite similar to those displayed in figure 3. For all investors, the net risk-adjusted annual return (i.e. after taking into account transaction costs, bid-ask spreads, and differential risk) was below the market return by well over 3%. The 20% of investors who traded the most underperformed the market (again on a net risk-adjusted basis) by close to 10% per year.
3.4.2 Better-than-average effect
Numerous studies have asked people to rate themselves relative to average on certain positive personal attributes such as athletic skill or investor ability, and, consistent with the “better-than-average effect”, many rate themselves as above average on those attributes. Obviously, of course, only (slightly fewer than) 50% of the people in any pool can truly be superior. Similarly, people are likely to see themselves as “less than average” for negative traits. When subsequently asked how biased they themselves were, subjects rated themselves as being much less vulnerable to those biases than the average person.
One factor that facilitates a better-than-average belief is that often the exact definition of excellence or competence is unclear. Naturally enough, people have in the backs of their minds the definition that will make them look best. Some investors might see “best” as most adept at taking losses; others might see it as most competence at anticipating trends in technical analysis; while still others might see it as being most skilful at diversifying their portfolio. Both motivation and cognitive mechanisms are likely behind the better-than-average effect. On the motivational side, thinking that you are better than average enhances self-esteem. On the cognitive side, performance criteria that most easily come to mind are often those that you are best at.

Download free eBooks at bookboon.com
Click on the ad to read more
Behavioural Finance
35
Heuristics and biases related to financial investments
3.4.3 Hindsight bias and confirmation bias
In social science, attribution theory investigates how people make causal attributions, i.e. how they come up with explanations for the causes of actions and outcomes. Certain persistent errors occur. For example, people, when observing others, tend to over-attribute behaviour to dispositional (as opposed to situational) factors. In other words, if someone seems to be behaving badly, we naturally believe them to be of bad character, rather than searching out environmental details that may be explanatory. It’s often said that “seeing is believing”. While this is often the case in certain situations, what you perceive is not necessarily a true representation of reality. This is not to say that there is something wrong with ones senses, but rather that our minds have a tendency to introduce biases in processing certain kinds of information and events.
“The perfect start of a successful, international career.”
CLICK HERE to discover why both socially
and academically the University
of Groningen is one of the best
places for a student to be www.rug.nl/feb/education
Excellent Economics and Business programmes at:

Download free eBooks at bookboon.com
Behavioural Finance
36
Heuristics and biases related to financial investments
It can be difficult to encounter something or someone without having a preconceived opinion. This first impression can be hard to shake because people also tend to selectively filter and pay more attention to information that supports their opinions, while ignoring or rationalising the rest. This type of selective thinking is often referred to as the “confirmation bias”. In investing, the confirmation bias suggests that an investor would be more likely to look for information that supports his or her original idea about an investment rather than to seek out information that contradicts it. As a result, this bias can often result in faulty decision-making because one-sided information tends to skew an investor’s frame of reference, leaving him or her with an incomplete picture of the situation. Consider, for example, an investor that hears about a hot stock from an unverified source and is intrigued by the potential returns. That investor might choose to research the stock in order to prove whether or not its touted potential is real. What ends up happening is that the investor finds all sorts of green flags about the investment (such as growing cash flow or a low debt/equity ratio), while glossing over financially disastrous red flags, such as loss of critical customers or dwindling markets.
Confirmation bias represents a tendency for us to focus on information that confirms some pre-existing thought. Part of the problem with confirmation bias is that being aware of it isn’t good enough to prevent you from doing it. One solution to overcoming this bias would be finding someone to act as a “dissenting voice of reason”. That way you’ll be confronted with a contrary viewpoint to examine.
Download free eBooks at bookboon.com
Behavioural Finance
37
Heuristics and biases related to financial investments
Another common perception bias is the “hindsight bias”, which tends to occur in situations where a person believes (after the fact) that the onset of some past event was predictable and completely obvious, whereas in fact, the event could not have been reasonably predicted. Many events seem obvious in hindsight. Psychologists attribute hindsight bias to our innate need to find order in the world by creating explanations that allow us to believe that events are predictable. While this sense of curiosity is useful in many cases (take science, for example), finding erroneous links between the cause and effect of an event may result in incorrect oversimplifications. The hindsight bias appears to be especially prevalent when the focal event has well-defined alternative outcomes (e.g. an election or the European Cup final), when the event in question has emotional or moral overtones, or when the event is subject to process of imagination before its outcome is known.
3.4.4 Over and under-reaction in the market
One consequence of having emotion in the stock market is the overreaction toward new information. According to market efficiency, new information should more or less be reflected instantly in a security’s price. For example, good news should raise a business’ share price accordingly, and that gain in share price should not decline if no new information has been released since. Reality, however, tends to contradict this theory. Oftentimes, participants in the stock market predictably overreact to new information, creating a larger-than-appropriate effect on a security’s price. Furthermore, it also appears that this price surge is not a permanent trend. Although the price change is usually sudden and sizable, the surge erodes over time.
De Bondt & Thaler (1985) show that people tend to overreact to unexpected and dramatic news events. Consistent with the predictions of the overreaction hypothesis, portfolio of prior “losers” are found to outperform prior “winners”. In their study, they examined returns on the New York Stock Exchange for a three-year period. From these stocks, they separated the best 35 performing stocks into a “winners portfolio” and the worst 35 performing stocks were then added to a “losers portfolio”. De Bondt & Thaler (1985) then tracked each portfolio’s performance against a representative market index for three years. Surprisingly, it was found that the losers’ portfolio consistently beat the market index, while the winners’ portfolio consistently underperformed. In total, the cumulative difference between the two portfolios was almost 25% during the three-year time span. In other words, it appears that the original “winners” would became “losers”, and vice versa.
So what happened? In both the winners and losers portfolios, investors essentially overreacted. In the case of loser stocks, investors overreacted to bad news, driving the stocks’ share prices down disproportionately. After some time, investors realised that their pessimism was not entirely justified, and these losers began rebounding as investors came to the conclusion that the stock was underpriced. The exact opposite is true with the “winners’ portfolio”: investors eventually realised that their exuberance wasn’t totally justified.

Download free eBooks at bookboon.com
Click on the ad to read more
Behavioural Finance
38
Heuristics and biases related to financial investments
Overreaction seems to be related to some deep-set of psychological phenomena. Ross (1987) argues that much overconfidence is related to a broader difficulty in making adequate allowance for the uncertainty in one’s own viewpoints. Kahnemann & Tversky showed in their 1974 paper that people have a tendency to categorise events as typical or representative of a well-known class, and then, in making probability estimates overstress the importance of such categorisation disregarding evidence of the underlying probabilities. One consequence of this phenomenon is for people to see patterns in data that is truly random, to feel confident, for example, that that a series which is in fact random walk is not a random walk.
.

Download free eBooks at bookboon.com
Behavioural Finance
39
Heuristics and biases related to financial investments
Price reactions to information are crucial for market behaviour. Recent empirical research in finance has uncovered two families of pervasive regularities: under-reaction of stock prices to news such as earnings announcements, and overreaction of stock prices to a series of good or bad news. The under-reaction evidence shows that over horizons of one to twelve months, security prices under-react to news. As a consequence, news is incorporated only slowly into prices, which tend to exhibit positive autocorrelations over these horizons. A related way to make this point is to say that current good news has power in predicting positive returns in the future. The overreaction evidence shows that over longer horizons of three to five years, security prices overreact to consistent patterns of news pointing in the same direction. That is, securities that have had a long record of good news trend to become overpriced and have low average returns afterwards. The under-reaction evidence in particular is consistent with anchoring referring to the phenomenon according to which people mistrust new data and give too much weight to prior probabilities of events in a given situation. Edwards concluded in a 1968 study that “it takes anywhere from two to five observations to do one observation’s worth of work in inducing a subject to change his opinion”. According to this principle, people are slow to change their opinions. For this reason, it takes some time before investors begin to conclude that a trend, such as price increases in connection with a speculative bubble, will not continue. Further, it is over- and under-reaction that is one of the primary causes of trends, momentum and fads.
3.4.5 Under-diversification and excessive risk taking
Another investor error likely related to overconfidence is the tendency to be under-diversified. Under-diversified people are too quick to overweight/underweight securities when they receive a positive/negative signal, and insufficient diversification then results. Another factor is that most investors, lacking the time to analyse a large set of securities, will stop after a few. As long as they believe they have identified a few “winners” in this group, they are content. After all, if they are so sure that certain stocks are good buys, why dilute their portfolio with stocks that they have not studied?
In a study by Kelly (1995), the portfolio composition of more than 3,000 U.S. individuals was examined. Most individuals indentified held no stocks at all. Of those households that did hold stocks (more than 600), Kelly (1995) found that the median number of stocks in their portfolios was only one. And only about 5% of stock-holding households held 10 or more stocks. Most evidence says that to achieve a reasonable level of diversification, one has to hold more than 10 different stocks and preferably in different sectors of the economy. Thus, it seems clear that many individual investors are quite under-diversified.
In their study, Groetzmann & Kumar (2005) sought to ascertain who were most prone to being under-diversified. Not surprisingly, they found that under-diversification increased with income, wealth, and age. Those who traded the most also tended to be the least diversified. This is likely because overconfidence is the driving force behind both excessive trading and under-diversification. Also less diversified were those people who were sensitive to price trends and those who were influenced by home bias.
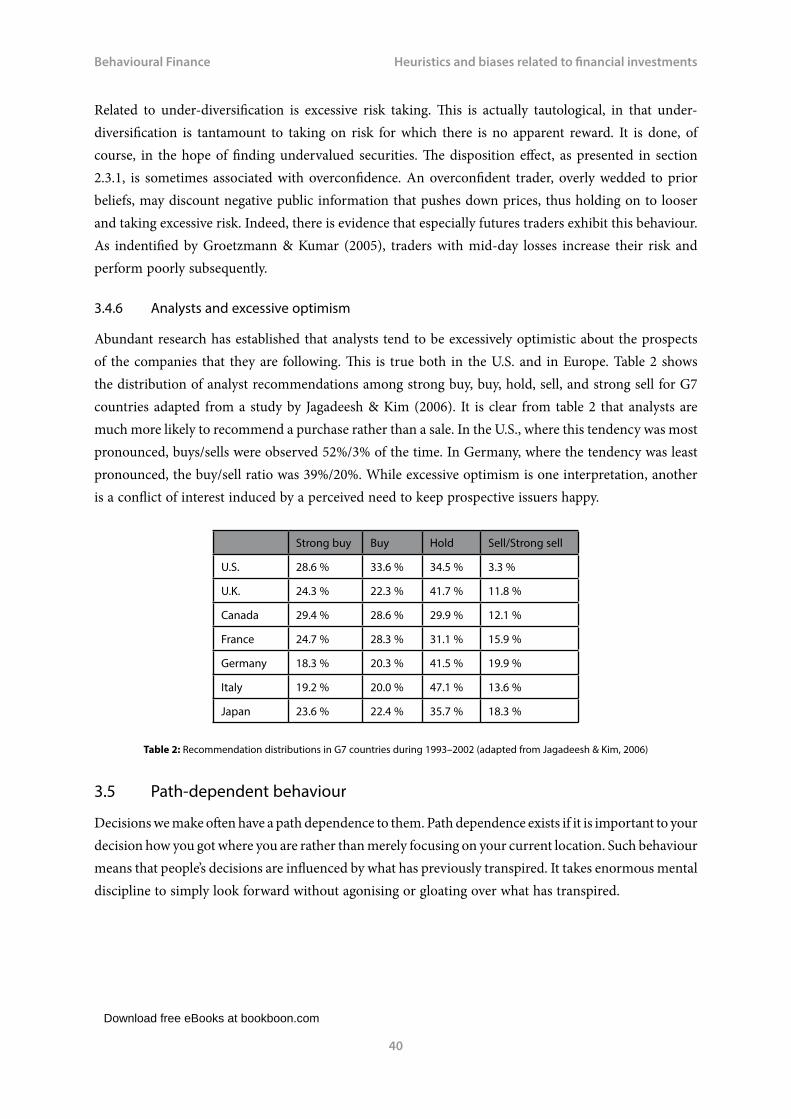
Download free eBooks at bookboon.com
Behavioural Finance
40
Heuristics and biases related to financial investments
Related to under-diversification is excessive risk taking. This is actually tautological, in that under-diversification is tantamount to taking on risk for which there is no apparent reward. It is done, of course, in the hope of finding undervalued securities. The disposition effect, as presented in section 2.3.1, is sometimes associated with overconfidence. An overconfident trader, overly wedded to prior beliefs, may discount negative public information that pushes down prices, thus holding on to looser and taking excessive risk. Indeed, there is evidence that especially futures traders exhibit this behaviour. As indentified by Groetzmann & Kumar (2005), traders with mid-day losses increase their risk and perform poorly subsequently.
3.4.6 Analysts and excessive optimism
Abundant research has established that analysts tend to be excessively optimistic about the prospects of the companies that they are following. This is true both in the U.S. and in Europe. Table 2 shows the distribution of analyst recommendations among strong buy, buy, hold, sell, and strong sell for G7 countries adapted from a study by Jagadeesh & Kim (2006). It is clear from table 2 that analysts are much more likely to recommend a purchase rather than a sale. In the U.S., where this tendency was most pronounced, buys/sells were observed 52%/3% of the time. In Germany, where the tendency was least pronounced, the buy/sell ratio was 39%/20%. While excessive optimism is one interpretation, another is a conflict of interest induced by a perceived need to keep prospective issuers happy.
Strong buy Buy Hold Sell/Strong sell
U.S. 28.6 % 33.6 % 34.5 % 3.3 %
U.K. 24.3 % 22.3 % 41.7 % 11.8 %
Canada 29.4 % 28.6 % 29.9 % 12.1 %
France 24.7 % 28.3 % 31.1 % 15.9 %
Germany 18.3 % 20.3 % 41.5 % 19.9 %
Italy 19.2 % 20.0 % 47.1 % 13.6 %
Japan 23.6 % 22.4 % 35.7 % 18.3 %
Table 2: Recommendation distributions in G7 countries during 1993–2002 (adapted from Jagadeesh & Kim, 2006)
3.5 Path-dependent behaviour
Decisions we make often have a path dependence to them. Path dependence exists if it is important to your decision how you got where you are rather than merely focusing on your current location. Such behaviour means that people’s decisions are influenced by what has previously transpired. It takes enormous mental discipline to simply look forward without agonising or gloating over what has transpired.

Download free eBooks at bookboon.com
Click on the ad to read more
Behavioural Finance
41
Heuristics and biases related to financial investments
Thaler & Johnson (1990) provide evidence regarding how individual behaviour is affected by prior gains and losses. After a prior gain, people become more open to assuming risk. This observed behaviour is referred to as the house money effect, alluding to casino gamblers who are more willing to risk money that was recently won. This was briefly introduced in section 2.3.3. Gamblers call this “playing with the house’s money.” Since they don’t yet consider the money to be their own, they are willing to take more risk with it. The house money effect predicts that investors will be more likely to purchase risky stocks after closing out a profitable trade. After a prior loss, matters are not so clear-cut. On the one hand, people seem to value breaking even, so a person with a prior loss may take a risky gamble in order to break even. This observed behaviour is referred to as the “break-even effect”. On the other hand, an initial loss can cause an increase in risk aversion in what has been called the “snake-bit effect”.
www.mastersopenday.nl
Visit us and find out why we are the best!Master’s Open Day: 22 February 2014
Join the best atthe Maastricht UniversitySchool of Business andEconomics!
Top master’s programmes• 33rdplaceFinancialTimesworldwideranking:MScInternationalBusiness
• 1stplace:MScInternationalBusiness• 1stplace:MScFinancialEconomics• 2ndplace:MScManagementofLearning• 2ndplace:MScEconomics• 2ndplace:MScEconometricsandOperationsResearch• 2ndplace:MScGlobalSupplyChainManagementandChange
Sources: Keuzegids Master ranking 2013; Elsevier ‘Beste Studies’ ranking 2012; Financial Times Global Masters in Management ranking 2012
MaastrichtUniversity is
the best specialistuniversity in the
Netherlands(Elsevier)

Download free eBooks at bookboon.com
Behavioural Finance
42
Heuristics and biases related to financial investments
3.5.1 Sequential decisions and prospect theory
Interestingly, at first, some of the findings on behaviour following gains and losses appear to contradict prospect theory. The house money effect suggests reduced risk aversion after an initial gain, whereas prospect theory makes no such prediction. It is notable, though, that the house money effect is not inconsistent with prospect theory, because prospect theory originally was developed to describe one-shot decisions. Recall the discussion of integration versus segregation in section 2.3.3. Under integration, an investor combines the results of successive gambles, whereas, under segregation, each gamble is viewed separately. Instead of presenting a challenge to prospect theory, the house money effect is best seen as evidence that sequential gambles are sometimes integrated rather than segregated. If one integrates after a large gain, one has moved safely away from the value function loss aversion kink in figure 1, serving to lessen risk aversion.
The evidence provided by Thaler & Johnson (1990) provides important insight into how individuals make sequential decisions. People do not necessarily combine the outcomes of different gambles. Financial theory is increasingly incorporating insights on individual behaviour provided by psychology and decision-making research on segregation vs. integration. For example, in the model by Barberis, Huang & Santos (2001), investors receive utility from consumption and changes in wealth. In traditional models, people value only consumption. In this extension, investors are loss averse so that they are more sensitive to decreases than to increases in wealth, and thus, prior outcomes affect subsequent behaviour. After a stock price increase, people are less risk averse because prior gains cushion subsequent losses, whereas after a decline in stock prices, people are concerned about further losses and risk aversion increases. Therefore, the model suggested by Barberis, Huang & Santos (2001) predicts that the existence of the house money effect in financial markets leads to greater volatility in stock prices. After prices rise, investors have a cushion of gains and are less averse to the risks involved in owning stocks. Indeed, as in this model, aspects of prospect theory are increasingly being embedded in modern financial models.

Download free eBooks at bookboon.com
Behavioural Finance
43
Heuristics and biases related to financial investments
Despite some progress, it does not seem that our financial understanding of sequential behaviour in a market is complete. How does individual behaviour translate to a market setting? A recent experimental study by Ackert et al. (2006), which includes a market with sequential decision-making, provides some insight. Traders who are given a greater windfall of income before trading begins bid higher to acquire the asset, and, thus, the market prices are significantly higher. In fact, prices remain higher over the entirety of the three-period markets. As the house money effect would predict, people seem to be less risk averse after a windfall of money, as if the earlier gain cushions subsequent losses. Observed behaviour does not always suggest that traders will pay more to acquire stock after further increases in wealth. There is no evidence that traders become more risk taking if additional profits are generated by good trades when the market is open. The results also indicate that the absolute level of wealth has a dominant influence on subsequent behaviour so that changes in wealth are less important. This observed behaviour among traders could be because professional traders are trained to act in a more normative (i.e. less prospect theory-like, less emotional) fashion. Indeed, more work is required to allow us to better understand the dynamics of markets and whether individual behaviour adapts to or influences market outcomes.

Download free eBooks at bookboon.com
Click on the ad to read more
Behavioural Finance
44
Financial anomalies
4 Financial anomalies – Do behavioural factors explain stock market puzzles?
In the previous chapters, we argued that behavioural considerations can contribute to an understanding of certain anomalies in the pricing of individual stocks as well as in the aggregate value of the stock market. Remember that anomalies are defined as empirical results that, unless adequately explained, seem to run counter to market efficiency. It turns out that, just as there are cross-sectional anomalies, there are also aggregate stock market puzzles. In this chapter, we will introduce some of the most famous financial anomalies and consider whether behavioural factors can help us account for these puzzles.
- ©
Pho
tono
nsto
p
redefine your future
> Join AXA,A globAl leAding
compAny in insurAnce And Asset mAnAgement
14_226_axa_ad_grad_prog_170x115.indd 1 25/04/14 10:23

Download free eBooks at bookboon.com
Behavioural Finance
45
Financial anomalies
4.1 The January effect & Small-firm effect
The January effect is named after the phenomenon in which the average monthly return for small firms is consistently higher in January than any other month of the year. This is at odds with the efficient market hypothesis, which predicts that stocks should move at a “random walk” as explained in section 2.1. However, a 1976 study by Rozeff & Kinney found that from 1904–74 the average amount of January returns for small firms was around 3.5%, whereas returns for all other months was closer to 0.5%. This suggests that the monthly performance of small stocks follows a relatively consistent pattern, which is contrary to what is predicted by conventional financial theory. Therefore, some unconventional factor (other than the random-walk process) must be creating this regular pattern.
One explanation is that the surge in January returns is a result of investors selling loser stocks in December to lock in tax losses, causing returns to bounce back up in January, when investors have less incentive to sell. While the year-end tax sell-off may explain some of the January effect, it does not account for the fact that the phenomenon still exists in places where capital gains taxes do not occur. This anomaly sets the stage for the line of thinking that conventional theories do not and cannot account for everything that happens in the real world.
Similar to the study by Rozeff & Kinney (1976), Gultekin & Gultekin (1983) studied stock markets in 15 different countries and discovered a January effect in all of them. This implies that the January effect is not explicable in terms of the specific tax (or other institutional) arrangements in a country. Keim (1983) found that about half of the small-firm effect occurred in January. In fact about a quarter of the small-firm effect for the year was typically accomplished during the first five trading days in January. Kato & Shallheim (1985) studied the Tokyo stock exchange and found excess returns for January and a strong relationship between size and returns (small firms substantially outperforming large firms).

Download free eBooks at bookboon.com
Behavioural Finance
46
Financial anomalies
Fama (1991) reported results from the United States for the period 1941–81. Stocks of small firms averaged returns of 8.06% in January, whereas the stocks of large firms averaged January returns of 1.342% (in both cases the January returns exceeded the average return in the other months). For the period 1982–91 the January returns were 5.32% and 3.2% for the stocks of small and large firms respectively. One possible explanation of the January effect is “window dressing” by fund managers. They are often required to publish the details of the portfolios that they hold at the end of the year. It has been suggested that they prefer to show large, well-known companies in their published portfolios. Thus, they sell small company shares and buy large company shares in December, and then do the opposite in January. Hence, the prices of small company shares rise in January. Although this may explain the relative outperformance of smaller company shares in January, it does not explain the general January effect (unless the window dressing entails a relative move to bonds and cash in December). Cooper et al. (2006) discovered another January-related anomaly. They found that stock market returns in January were predictive of returns during the next eleven months. Strong January returns were indicative of strong returns during the rest of the year. The effect was referred to as the “other January effect”.
Cross (1973), French (1980) and others have documented a weekend effect. They found that the average returns to stocks were negative between the close of trading on Friday and the close of trading on Monday. Gibbons & Hess (1983) examined a 17-year period between 1962 and 1978 and found that, on average, Monday returns were negative on an annualised basis (33.5% p.a.). Keim & Stambaugh (1984) investigated the daily returns on the S&P 500 from 1928 to 1982 and found that, on average, Monday returns were negative. Kohers & Kohers (1995) also found a weekend effect, suggesting that there would be an advantage from buying on Mondays and selling on Fridays.

Download free eBooks at bookboon.com
Behavioural Finance
47
Financial anomalies
Calendar effects, such as the January effect and the weekend effect, have been brought into doubt by Sullivan et al. (1999). They claim to have shown that the calendar effects can be completely explained by what they refer to as “data snooping”. They found that the same data that was used to identify a calendar effect was also used to test for the existence of the effect. They also demonstrated that, although the small number of calendar effects that have been reported are statistically significant, there are about 9,500 conceivable calendar effects. From these 9,500 some can be expected to be statistically significant through chance. Malkiel (2003) concluded that anomalies do not persist in the long run since they lose their predictive power when they are discovered. As an example, he stated that as soon as evidence of the January effect was made public investors acted on the information and the effect disappeared. Gu (2003, 2004) provided evidence consistent with Malkiel’s view by showing a decline in the January effect and a reversal of the weekend effect. Some calendar anomalies may persist since it is difficult for arbitragers, and other traders, to make profits from them. One well-known strategy is to “Sell in May and walk away”. This is an old stock market adage, which was researched by Keppler & Xue (2003). They studied the 18 most developed national stock markets over the period 1970 to 2001. It was found that during the months November to April the average rate of stock price rise was 8.36% whereas the average rate of price rise during the months May to October was 0.37%. Not only were returns higher between November and April, but also risk was lower. Keppler & Xue (2003) suggested a number of explanations including the observation that bonuses tend to be paid around the end or at the beginning of the year. Research on saving behaviour has found that people find it easier to save and invest from a lump sum than from regular earnings. Investment of such lump sums would tend to increase demand for stocks, and hence their prices, during the period in which the bonuses are invested.

Download free eBooks at bookboon.com
Behavioural Finance
48
Financial anomalies
4.2 The winner’s curse
One assumption found in standard finance and economics is that investors and traders are rational enough to be aware of the true value of some asset and will bid or pay accordingly. However, anomalies such as the “winner’s curse”, being a tendency for the winning bid in an auction setting to exceed the intrinsic value of the item purchased, suggest that this is not the case. Simply speaking, the winner’s curse is the problem that occurs when bidders of an auction have to estimate the true value of the good they are bidding for. Assuming that there are a reasonable number of bidders on the market, the average bid will be less than the true value (bidders are risk-averse), but the winning bid will be significantly higher (due to estimation errors). As the highest overestimation wins the auction, the winner will usually overpay in an auction. This observation contradicts the standard economic assumption of rationality and can be applied to various aspects of economic life. Rational-based theories assume that all participants involved in the bidding process will have access to all relevant information and will all come to the same valuation. Any differences in the pricing would suggest that some other factor not directly tied to the asset is affecting the bidding.
According to Robert Thaler’s 1988 article on winner’s curse, there are two primary factors that undermine the rational bidding process: the number of bidders and the aggressiveness of bidding. For example, the more bidders involved in the process means that you have to bid more aggressively in order to dissuade others from bidding. Unfortunately, increasing your aggressiveness will also increase the likelihood in that your winning bid will exceed the value of the asset.
Consider the example of prospective homebuyers bidding for a house. It’s possible that all the parties involved are rational and know the home’s true value from studying recent sales of comparative homes in the area. However, variables irrelevant to the asset (aggressive bidding and the amount of bidders) can cause valuation error, oftentimes driving up the sales price more than 25% above the home’s true value. In this example, the curse aspect is twofold: not only has the winning bidder overpaid for the home, but now that buyer might have a difficult time securing financing.
Another interesting area where the winner’s curse is observed is the market for initial public offerings (IPOs). In fact, the prices for IPOs are not set to clear the market, but to guarantee an excess demand (to alleviate buyers from the winner’s curse). This will generally result in lower revenues for the IPO company. The offset is that during an open-outcry auction-type, information of the other bidders is revealed that may have positive or negative effects on the resulting end-price. Such irrational effects were, for example, observed recently with the Facebook IPO.

Download free eBooks at bookboon.com
Click on the ad to read more
Behavioural Finance
49
Financial anomalies
Winner’s curse provides more proof that investors are not rational. Winner’s curse has a number of explainable causes related to behavioural finance theories including incomplete information and emotions. Regardless of the cause, the item being auctioned is awarded to the bidder with the greatest overestimation. Paying more for something than what is worth is not rational behaviour. Theoretically, if markets were efficient, no overestimation would occur. However, the market has historically experienced many overestimations and corrections. Stock bubbles, such as the dot-com or housing bubble, prove that people buy stocks and real-estate at irrational prices beyond their true values.
4.3 The equity premium puzzle
Much research has examined the equity premium puzzle, which was originally brought to light by Mehra & Prescott (1985) and ever since has left academics in finance and economics scratching their heads. The equity premium is defined as the gap between the expected return on the aggregate stock market and a portfolio of fixed-income securities.
Download free eBooks at bookboon.com
Behavioural Finance
50
Financial anomalies
Studies by Siegel (1998) among many others have shown that over a 70-year period, stocks yield average returns that exceed government bond returns by 6–7%. Stocks real returns are 10%, whereas bonds real returns are 3%. However, academics believe that an equity premium of 6% is extremely large and would imply that stocks are considerably risky to hold over bonds. Note of course that according to the capital asset pricing model, investors that hold riskier financial assets should indeed be compensated with higher rates of returns. Conventional economic models have, nevertheless, determined that this premium should be much lower than what it really is. This lack of convergence between theoretical models and empirical results represents a stumbling task for academics to explain.
Rietz (1988) proposed a solution to the equity premium puzzle that incorporates a small probability of a large drop in consumption. He found that the risk free rate in such a scenario is much lower than the return on an equity security. This model requires a 1 in 100 chance of a 25 percent decline in consumption to reconcile the equity premium with a risk-aversion parameter of 10. Such a scenario has not been observed in the United States for the past 100 years (the time for which there is data available). Nevertheless, one can evaluate the implications of the model. One implication is that the real interest rate and the probability of the occurrence of the extreme event move inversely. For example, the perceived probability of a recurrence of a depression was probably high just after WWII, but subsequently declined over time. If real interest rates had risen significantly as the war years receded, that evidence would support the Rietz (1988) hypothesis. Similarly, if the low-probability event precipitating the large decline in consumption is interpreted to be e.g. a nuclear war, the perceived probability of such an event has surely varied over the past 100 years. It must have been low before 1945, the first and only year the atom bomb was used, and it must have been higher before the Cuban missile crisis than after it. If real interest rates moved with these sentiments as predicted, that evidence would support Rietz’s disaster scenario. But interest rates did not move as predicted. So what then?
Download free eBooks at bookboon.com
Behavioural Finance
51
Financial anomalies
Constantinides et al. (2002) argued that the young part of the population, who should (in an economy scenario without frictions and with complete contracting) be holding equity, are effectively shut out of this market because of borrowing constraints. They have low wages; so, ideally, they would like to smooth lifetime consumption by borrowing against future wage income (consuming a part of the loan and investing the rest in higher-returning equity). They are prevented from doing so, however, because human capital alone does not collateralize major loans in modern economies (for reasons of moral hazard and adverse selection among others). In the presence of borrowing constraints, equity is thus exclusively priced by middle-aged investors and the equity premium is high. If the borrowing constraint were to be relaxed, the young would borrow to purchase equity, thereby raising the bond yield. The increase in the bond yield would induce the middle-aged to shift their portfolio holdings from equity to bonds. The increase in the demand for equity by the young and the decrease in the demand for equity by the middle-aged would work in opposite directions. On balance, the effect in the Constantinides et al. (2002) model is to increase both the equity and the bond return while simultaneously shrinking the equity premium. Furthermore, the relaxation of the borrowing constraint reduces the net demand for bonds, and the risk-free rate puzzle unfortunately re-emerges.
In conclusion, behavioural finance’s answer to the equity premium puzzle revolves around the tendency for people to have ”short-sighted (myopic) loss aversion”, a situation in which investors, overly preoccupied by the negative effects of losses in comparison to an equivalent amount of gains, take a very short-term view on an investment. What happens is that investors are paying too much attention to the short-term volatility of their stock portfolios. While it is not uncommon for an average stock to fluctuate a few percentage points in a very short period of time, a short-sighted investor may not react too favourably to the downside changes. Therefore, it is believed that equities must yield a high-enough premium to compensate for the investor’s considerable aversion to loss. Thus, the premium is seen as an incentive for market participants to invest in stocks instead of marginally safer government bonds.
4.4 Value premium puzzle
Extensive academic research has shown that value stocks (that is, stocks with low market prices relative to such financial statement fundamentals as earnings and book value) have a tendency to outperform growth stocks (stocks with high market values relative to their fundamentals) in the long run. Numerous test portfolios have shown that buying a collection of stocks with low price/book ratios will deliver market-beating performance. Such a simplistic strategy seems to be evidence against the efficient market hypothesis, but what if value stocks are riskier than growth stocks, and what if their risk is insufficiently captured by the capital asset pricing model? Then we do not have an anomaly after all, but just an inappropriate asset pricing model.

Download free eBooks at bookboon.com
Click on the ad to read more
Behavioural Finance
52
Financial anomalies
Many of the earlier empirical studies that identify a significant and consistent “value premium” suggest that a zero-net investment strategy of short-selling growth stocks and holding long positions in value stocks will produce consistent positive returns over time. More recent evidence, however, suggests that the value premium may not be robust or stable over time. For example, the value premium seems to have disappeared for almost all of the 1990s in the run-up to the technology bubble, only to reappear in 2000 when the bubble burst. It then persisted for a stretch of six years until the recent financial crisis started in 2007.
Get Help Now
Go to www.helpmyassignment.co.uk for more info
Need help with yourdissertation?Get in-depth feedback & advice from experts in your topic area. Find out what you can do to improvethe quality of your dissertation!
Download free eBooks at bookboon.com
Behavioural Finance
53
Financial anomalies
The debate about the cause of the value premium has been going on for as long as the empirical evidence of the phenomenon has existed. But what drives the value premium? Current explanations could be put into two broad categories. One explanation, first provided by Fama & French in 1992, is that the value premium is a rational phenomenon and represents an investor’s compensation for systematic risk. Fama & French (1992) argue that the value premium is associated with a stock’s relative financial distress. In a weakening economy, investors require a higher risk premium on firms with distress characteristics; value stocks thus must offer a higher average return in reward for the extra systematic risk borne by the investor. As argued in Bansal & Yaron (2004), risks related to long-term growth lead to large reactions in stock prices and, hence, entail a significant risk compensation. Assets’ valuations and risk premia, therefore, by large depend on the amount of low-frequency risks embodied in assets’ cash flows. As documented by Kiku (2006), value firms are highly exposed to long-run consumption shocks. Growth firm fluctuations, on the other hand, are mostly driven by short-lived fluctuations in consumption and risks related to future economic uncertainty. Consequently, value firms exhibit higher elasticity of their price/dividend ratios to long-run consumption news (relative to growth assets) and have to provide investors with high ex ante compensation.
Another explanation of the value premium is based on behavioural finance investor behaviour in the capital markets. Some investors have tendency to overreact to positive and negative news, which causes prices to move by more than what is justified by the underlying fundamentals. Thus, value stocks that have done badly are oversold at some point in time and get corrected at another point in the future when investor sentiment switches. Although the value premium puzzle makes sense to a point (unusually cheap stocks should attract buyers’ attention and revert to the mean), this is a relatively weak anomaly. Though it is true that low price-to-book stocks outperform as a group, the individual performance is very idiosyncratic and it takes very large portfolios of low price-to-book stocks to see the benefits.
4.5 Other anomalies
The efficient market hypothesis implies that publicly available information in the form of analyses published by investment advisory firms should not provide means of obtaining rates of return in excess of what would normally be expected on the basis of the risk of the investments. However, stock rankings provided by “The Value Line Investment Survey” appear to provide information that could be used to enhance investors’ returns (Huberman & Kandel 1990). There is, interestingly, evidence that the market adjusts to this information within two trading days (Stickel 1985). Similarly, Antunovich & Laster (2003) and Anderson & Smith (2006) found that companies identified by Fortune magazine, as the most admired, subsequently performed better than the S&P 500. The Antunovich & Laster (2003) study indicated that stock price reaction to the information is subject to drift, in that it takes a significant amount of time to occur, hence permitting investors to profit from the information. Conversely, Shefrin & Statman (1997) obtained the opposite result when analysing annual surveys of firm reputation published by Fortune magazine. They found that, on average, the shares of firms with good reputations turned out to be relatively poor investments whereas the shares of companies with poor reputations subsequently performed well.
Download free eBooks at bookboon.com
Behavioural Finance
54
Financial anomalies
Lee et al. (1991) suggest that the existence of investment trusts (closed-end funds) is an anomaly because rational investors would not be expected to buy new issues. The tendency for investment trusts to fall to a discount subsequent to issue appears to offer an early loss. Rational investors should not make an investment that is expected to result in an almost immediate loss. An anomaly that is consistent with the belief that markets in the shares of large firms are more likely to be efficient than the markets for small company shares is the “neglected firm effect”. Neglect means that few analysts follow the stock, or that few institutional investors hold it. So fewer market participants put new information into the market. Neglected stocks are more likely to be mispriced, and, hence, are more prone to offer profit opportunities. Arbel & Strebel (1983) found that an investment strategy based on changes in the level of attention devoted by security analysts to different stocks could lead to positive excess returns. Allen (2005) observed that institutional investment funds specialising in small capitalisation companies in the United States outperformed the Russell 2000 (a stock index for small companies) whereas the institutions underperformed stock indices when managing funds of large capitalisation stocks. Allen (2005) suggested that the outperformance in the small capitalisation sector was partly due to an “instant history bias” wherein performance figures are not reported unless there is a history of good performance prior to records being reported for the first time. However, the view was taken that the outperformance was primarily because small company stocks were often neglected and that the resulting mispricing offered fund managers profitable opportunities.
Merton (1987) showed that neglected firms might be expected to earn high returns as compensation for the risk associated with limited information. The information deficiency resulting from the limited amount of analysis renders neglected firms riskier as investments. The relative absence of investment analysis makes it less likely that all relevant information is reflected in the share price. There is greater likelihood that the stock is mispriced, and the mispricing could entail the stock being overpriced. Investors may require compensation for the risk that the stock is purchased at an overvalued price. This view sees the neglected firm premium as a form of risk premium rather than as a contradiction of the efficient market hypothesis. Investors require the higher returns as compensation for the additional risk, and the higher required rates of return entail lower prices. On a risk-adjusted basis, neglected firms do not provide returns above a normal level.
Doukas et al. (2005) observed that not only were the stocks of neglected firms likely to trade at relatively low prices, but also the shares of firms receiving excessive attention from analysts may trade at abnormally high prices. It was suggested that when an investment bank anticipates investment-banking business with a company, the coverage of that company by the bank’s investment analysts increases. If it were accepted that investment analysts tend to be overly optimistic about the stocks of firms which are prospective clients of their banks, the result of increased attention from analysts could be rises in the prices of such stocks. If a number of investment banks seek business with a firm, the result could be excessive attention from analysts and a resultant overpricing of its shares.

Download free eBooks at bookboon.com
Click on the ad to read more
Behavioural Finance
55
Financial anomalies
Related to the small-firm effect (as presented in section 4.1) and the neglected firm effect is the effect of liquidity on returns. Amihud & Mendelson (1991) argued that investors demand a premium to invest in illiquid stocks that entail high transaction costs. They found that such stocks did provide relatively high rates of return. Since the shares of small and neglected firms tend to be relatively illiquid, the liquidity effect may constitute part of the explanation of their high returns. However, the lack of liquidity, and high transaction costs, may remove the potential to profit from the liquidity effect on stock returns.
Some of the anomalies that apply to stocks within countries also seem to apply to international stock markets. Selecting countries for overseas investment on the basis of the anomalies appears to have potential. Asness et al. (1997) noted that within the United States the relative performance of stocks was positively related to high book-to-market ratios, small firm size, and high past year returns. For a 20-year period ending in 1994 they found that countries satisfying those three characteristics outperformed countries that did not. Richards (1997) investigated 16 national markets over the period 1970–95 and found that the type of winner-loser reversals found for U.S. stocks also applied to other countries. In particular, he found that for periods up to a year, relatively strong performance persisted, whereas over longer periods past relative outperformers (winners) became underperformers (losers) and vice versa. Emanuelli & Pearson (1994) studied 24 national markets and separated them on the basis of relative earnings revisions. They found that a portfolio of stocks from the countries with the greatest relative experience of positive earnings revisions outperformed an average of the 24 countries. A portfolio from the countries with the lowest positive (highest negative) earnings revisions underperformed.
By 2020, wind could provide one-tenth of our planet’s electricity needs. Already today, SKF’s innovative know-how is crucial to running a large proportion of the world’s wind turbines.
Up to 25 % of the generating costs relate to mainte-nance. These can be reduced dramatically thanks to our systems for on-line condition monitoring and automatic lubrication. We help make it more economical to create cleaner, cheaper energy out of thin air.
By sharing our experience, expertise, and creativity, industries can boost performance beyond expectations.
Therefore we need the best employees who can meet this challenge!
The Power of Knowledge Engineering
Brain power
Plug into The Power of Knowledge Engineering.
Visit us at www.skf.com/knowledge
Download free eBooks at bookboon.com
Behavioural Finance
56
Behavioural investing
5 Behavioural investingBehavioural finance has contributed to our understanding of how people value assets in a variety of markets. Investors and academics alike strive to quantify asset values based on observable factors, but experience clearly indicates that the human side has very real effects. A clear challenge for behavioural finance is obviously to bring what we have learned about how people make decisions to markets. Behavioural investing is thus defined as the attempt to enhance portfolio performance by applying lessons learned from behavioural finance.
In a recent study by Wright et al. (2006) addressing whether it is possible to enhance portfolio performance using behavioural finance, the performance of 16 self-proclaimed or media-identified behavioural mutual funds was evaluated. These funds claim to base their investment strategies in whole or in part on the principles of behavioural finance. Of course one of the weaknesses of the study, as also acknowledges by the authors, is the sparseness of the sample. Other funds not included in the sample may be following behavioural precepts as well, but their identity is unknown. Moreover, there is no guarantee that behavioural investing is really being followed by the funds in the sample. There is after all evidence that changing your name or professed strategy to what might be viewed as the flavour of the month (i.e. claiming that you run a behavioural-based investment fund may attract investor money in itself!) is successful at attracting flows of funds. Indeed, it turns out that the behavioural funds in the study are luring investor money, and their name or professed investment strategy may be one reason. Still, likely the main reason that these funds have been able to attract investors is that they, as a group, have outperformed the S&P 500. Wright et al. (2006) conclude that they have mostly capitalised on the value advantage presented in section 4.4, but also conclude from statistical analyses of the risk-adjusted investments that there is no statistical significance regarding the performance of behavioural mutual funds, with respect to mutual funds not claiming to use a behavioural investment approach.
The collection of anomalies, heuristics and biases presented in the previous chapters is to a large extent common knowledge, having been published in many of the highest ranked journals and in the popular press. Indeed some of them have been shown to be implications of an array of behavioural models. Is the utilisation of this knowledge in portfolio management tantamount to behavioural investing? One can always find a set of selection screens that would have worked well in the past. The big question for investors is which of these are likely to be operative going forward. One could argue that one of the main determinants of whether a pattern of data has usefulness for the future is whether or not it is behaviourally based. So should we expect behavioural investing to provide a payoff? While there is no evidence of this yet, given the limitations of the existing evidence and the currently amorphous nature of behavioural investing, it is reasonable to believe that the jury is still on this important question.

Download free eBooks at bookboon.com
Behavioural Finance
57
Behavioural investing
In the following sub-section, I have suggested seven main points to consider when investing. These points in essence sum up the previous chapters and (hopefully) bring some useful points for the modern investor to consider.
5.1 Points to consider for the behavioural investor
# Point 1: Biases and heuristics apply to me, you and everyone else as well!
Normal humans are imperfect. Psychological and emotional phenomena such as overconfidence, anchoring, availability and representativeness etc. are ever-present in all of us. Whether our brain controls our emotions, or vice versa, is important for us to understand, because, as financial decision-makers, we want to know how to control (or even put into good use) our emotional responses. Better awareness of these phenomena will not let you get rid of them, but it will increase your awareness in investment situations.
# Point 2: You know much less than you think you do!
The illusion of knowledge is the tendency for people to believe that the accuracy of their forecasts increases with more information. The simple truth is that more information is not necessarily better information; it is what you do with it, rather than how much you have, that matters. So be less certain about your views, especially if they are forecasts. Don’t be paralysed by informational overload and don’t confuse familiarity with knowledge.
# Point 3: Focus on the facts, not on the stories!
Listen to those who disagree with you and remember that more information is not better information. Judge asset prices on facts, not on appearance in the media: A watched stock almost never rises. Tune out from investor noise and focus on hard facts. Don’t confuse good firms with good investments or good earnings growth with good returns. Think in terms of enterprise value, not stock price!
# Point 4: Sell your losers and ride your winners!
Overcome your loss aversion and your preference for status quo. Taking a loss in due time is perhaps the most important quality an investor can have. Sell your mistakes and move on; you don’t have to make it back the same way you lost it! And remember to examine your mistakes: Failures most often are not simply bad luck. Admit and learn from mistakes, but learn the right lessons and don’t obsess!
# Point 5: If it looks too good to be true, it probably is!
Don’t take information at face value; think carefully about how it was presented to you. Big, vivid, easy to recall events are less likely than you think they are. Avoid projecting the immediate past into the distant future. Don’t anchor on irrelevant data, historical information or perceptions of stock prices. Be aware of the ever-present misunderstanding of randomness: Avoid seeing patterns in the market that don’t exist.

Download free eBooks at bookboon.com
Click on the ad to read more
Behavioural Finance
58
Behavioural investing
# Point 6: Don’t allow emotions to over-ride reason!
Know the inherent limitations of the human mind and behaviour, but don’t let it control you. Know the gap between stated behaviour and actual behaviour: it is called an empathy gap, and it matters! Be aware of the strong group-psychological behaviour ever-present among investors: herd-like investing and mental-accounting are not good investment strategies if you want to become rich! Do not be fooled by your fear of making an incorrect investment decision and feeling stupid: You didn’t know it all along, anyway; you just think you did!
# Point 7: Know your investment horizon!
Be humble and patient; make sure time is on your side and don’t try to get rich quick: It, most often, will lead you to the opposite! Go for stocks instead of options and forget a leverage-based investment strategy. Short-trading is both dangerous and leads to insomnia! Minimise trading and diversify your portfolio. Set buy and sell targets and stick to those, but be careful of panicking and selling at the bottom!

Download free eBooks at bookboon.com
Behavioural Finance
59
List of references
6 List of referencesAckert, L.F. & Deaves, R. -
Behavioural Finance – Psychology, Decision-Making and Markets, South-Western CENGAGE Learning, 2010
Ackert, L.F., Charupat, N., Church, B.K. & Deaves, R. -
An experimental examination of the house money effect in a multi-period setting, Experimental Economics, Vol. 9, pp. 5–16, 2006
Akerlof, G.A. & Kranton, R.E. -
Economics and Identity, The Quarterly Journal of Economics, Vol. 140, No. 3, pp. 715–753, 2000
Akerlof, G.A. & Kranton, R.E. -
Identity and Schooling: Some Lessons for the Economics of Education, Journal of Economic Literature, Vol. 40, pp. 1167–1201, 2002
Allen, G.C. - The Active Management Premium in Small-Cap U.S. Equities, Journal of Portfolio Management, Vol. 31, 2005
Amihud, Y. & Mendelson, H. -
Liquidity, Asset Prices, and Financial Policy, Financial Analysts Journal, Vol. 47, 1991
Anderson, P. - Choice: can we choose it?, In: Gender and Choice in Education and Occupation edited by John Radford, Routledge, 1998
Anderson, J. & Smith, G. -
A Great Company Can Be a Great Investment, Financial Analysts Journal, Vol. 62, 2006
Antunovich, P. & Laster, D.S -
Are Good Companies Bad Investments?, Journal of Investing, Vol. 12, 2003
Arbel, A. & Strebel, P.J. - Pay Attention to Neglected Firms, Journal of Portfolio Management, Vol. 9, 1983
Asness, C.S., Liew, J.M. & Stevens, R.L. -
Parallels between the Cross-Sectional Predictability of Stock and Country Returns, Journal of Portfolio Management, Vol. 23, 1997
Bansal, R. & Coleman, J.W. -
A Monetary Explanation of the Equity Premium, Term Premium and Risk-Free Rate Puzzles, Journal of Political Economy, Vol. 104, No. 6, pp. 1135–1171, 1996
Bansal, R. & Yaron, A. - Risks for the long run: A potential resolution of asset pricing puzzles, Journal of Finance, Vol. 59, pp. 1481–1509, 2004
Download free eBooks at bookboon.com
Behavioural Finance
60
List of references
Barber, B. & Odean, T. - Trading is hazardous to your wealth: The common stock investment performance of individual investors, Journal of Finance, No. 55, pp. 773–806, 2000
Barber, B. & Odean, T. - Too Many Cooks Spoil the Profits: Investment Club Performance, Financial Analysts Journal, Vol. 56, No. 1, pp. 17–25, 2000
Barberis, N., Huang, M. & Santos, T. -
Prospect Theory and Asset Prices, Quarterly Journal of Economics, Vol. 116, No. 1, pp. 1–53, 2001
Barradale, N.J. - Social Incentives and Human Evolution, University of California, Berkeley, pp. 1–39, 2009
Benartzi, S. & Thaler, R.H. -
Myopic Loss Aversion and the Equity Premium Puzzle, Quarterly Journal of Economics, Vol. 110, No. 1, pp. 73–92, 1995
Benoit, J. & Dubra, J. - Overconfidence?, Carnegie Mellon University, 2008
Benoit, J., Dubra, J. & Moore, D. -
Does the Better-Than-Average Effect Show That People Are Overconfident?: An Experiment, Carnegie Mellon University, 2009
Bowles, S., Gintis, H. & Osborne, M. -
The Determinants of Earnings: A Behavioral Approach, Journal of Economic Literature, Vol. 39, No. 4, pp. 1137–1176, 2001
Camerer, C.F. - Prospect Theory in the Wild: Evidence from the Field, Chapter 5 in: Choices, Values and Frames, pp. 288–300, Cambridge University Press, UK, 1981
Constantinides, G.M., Donaldson, J.B. & Mehra, R. -
Junior Can’t Borrow: A New Perspective on the Equity Premium Puzzle, Quarterly Journal of Economics, Vol. 117, No. 1, pp. 269–296, 2002
Cooper, M.J., Langdon, T.P. & Lemoine, C.W. -
Bridging the Gap: Academic Research That is Relevant to Practitioners, Journal of Financial Service Professionals, Vol. 60, 2006
Cross, F. - The Behavior of Stock Prices on Fridays and Mondays, Financial Analysts Journal, Vol. 29, 1973
De Bondt, W. & Thaler, R.
Does the Stock Market Overreact? Journal of Finance, Vol. 40, No. 3, pp. 793–808, 1985
Dalskov, M. - Store forskelle i danskernes indkomst gennem livet, Samfundsøkonomen, No. 3, 2009

Download free eBooks at bookboon.com
Click on the ad to read more
Behavioural Finance
61
List of references
Doukas, J.A., Kim, C. & Pantzalis, C. -
The Two Faces of Analyst Coverage, Financial Management, Vol. 34, 2005
Doya, K. - Modulators of decision making, Nature Neuroscience, Vol. 11, No. 4, pp. 410–416, 2008
Edwards, W. - Conservatism in human information processing, in: B. Kleinmuntz (Ed.), Formal representation of human judgment, Wiley, New York, pp. 17–52, 1968
Emanuelli, J.F. & Pearson, R.G. -
Using Earnings Estimates for Global Asset Allocation, Financial Analysts Journal, Vol. 50, 1994
Eurostat - Use of online data available at: http://epp.eurostat.ec.europa.eu, May 2012
Fama, E. - The Behavior of Stock Market Prices, The Journal of Business, Vol. 38, pp. 34–105, 1965
Fama, E. - Efficient Capital Markets II, Journal of Finance, Vol. 46, 1991
Fama, E. & French, K. - Dividend yields and expected stock returns, Journal of Financial Economics, Vol. 22, pp. 3–27, 1988
Download free eBooks at bookboon.com
Behavioural Finance
62
List of references
Fama, E. & French, K. - Business conditions and expected returns on stocks and bonds, Journal of Financial Economics, Vol. 25, pp. 23–49, 1989
Fama, E. & French, K. - The cross-section of expected stock returns, Journal of Finance, Vol. 59, pp. 427–465, 1992
Fama, E. & French, K. - Common risk factors in the returns on stocks and bonds, Journal of Financial Economics, Vol. 33, pp. 3–56, 1993
Fama, E. & French, K. - Multifactor explanations of asset pricing anomalies, Journal of Finance, Vol. 51, pp. 55–84, 1996
Firebaugh, G. - Empirics of World Income Inequality, American Journal of Sociology, Vol. 104, No. 6, pp. 1597–1630, 1999
Forbes, W. - Behavioural Finance, John Wiley & Sons, UK, 2009
Fox, J. - The Myth of the Rational Market: A History of Risk, Reward, and Delusion on Wall Street, Harper Business, New York, 2009
French, K.R. - Stock Returns and the Weekend Effect, Journal of Financial Economics, Vol. 8, 1980
French, K.R. & Poterba, J.M.
Investor diversification and international markets, American Economic Review, No. 81, pp. 222–226, 1991
Frieder, L. & Subrahmanyam, A. -
Brand perceptions and the market for common stock, Journal of Financial and Quantitative Analysis, Vol. 40, pp. 57–85, 2005
Gallup Use of the Online Gallup WorldView available at: https://worldview.gallup.com, January–May 2012
Gibbons, M. & Hess, P. - Day of the Week Effects and Asset Returns, Journal of Business, Vol. 54, 1983
Gilboa, I. - Rational Choice, Massachusetts Institute of Technology, 2010
Glick, I. - A Social Psychological Study of Futures trading, Ph.D. Dissertation, University of Chicago, 1957
Groetzmann, W.N. & Kumar, A. -
Equity portfolio diversification, Review of Finance, No. 12, pp. 433–463, 2005
Grossman, S. & Stiglitz, J. On the Impossibility of Informationally Efficient Markets, American Economic Review, Vol. 70, pp. 393–408, 1980
Download free eBooks at bookboon.com
Behavioural Finance
63
List of references
Grossman, J., Sanford, J. & Shiller R.J. -
The determinants of the variability of stock market prices, American Economic Review, Vol. 71, pp. 222–227, 1981
Gu, A.Y. The Declining January Effect: Evidences from the U.S. Equity Markets, Quarterly Review of Economics and Finance, Vol. 43, 2003
Gu, A.Y. The Reversing Weekend Effect, Review of Quantitative Finance and Accounting, Vol. 22, 2004
Gultekin, M.N & Gultekin, N.B. -
Stock Market Seasonality: International Evidence, Journal of Financial Economics, Vol. 12, pp. 469–481, 1983
Heath, C. & Tversky, A. - Preference and belief: Ambiguity and compentence in choice under uncertainty, Journal of Risk and Uncertainty, Vol. 4, pp. 5–28, 1991
Heilmann, K., Läger, V. & Oehler, A. -
The disposition effect: Evidence about the investor aversion to realize losses: A contribution to behavioral finance, through the use of experimental call markets, Working Paper, University of Bamberg, Germany, 2000
Heisler, D. - Loss aversion in a futures market: An empirical test, Review of Futures Markets, Vol. 13, pp. 793–822, 1994
Huberman, G. & Kandel, S. -
Market Efficiency and Value Line’s Record, Journal of Business, Vol. 63, 1990
Hwang, M.I. & Lin, J.W. - Information dimension, information overload and decision quality, Journal of Information Science, Vol. 25, No. 3, pp. 213–218, 1998
Interresearch - Use of data available at: http://www.interresearch.dk, May 2012
Jegadeesh, N. & Kim, W. -
Value of analyst recommendations: International evidence, Journal of Financial Markets, No. 9, pp. 274–309, 2006
Jensen, M. - Some Anomalous Evidence Regarding Market Efficiency, Journal of Financial Economics, Vol. 6, pp. 95–101, 1978
James, R., Baldwin, G. & McInnis, C. -
Which university? The factors influencing the choices of prospective undergraduate students, Canberra: AGPS, 1999
Ji, Y. - Identity and educational choice: a behavioural approach, Faculty of Economics and Applied Economics, Katholieke Universiteit LEUVEN, 2008

Download free eBooks at bookboon.com
Click on the ad to read more
Behavioural Finance
64
List of references
Kahneman, D. & Tversky, A. -
On the psychology of prediction, Psychological Review, Vol. 80, pp. 237–251, 1973
Kahneman, D. & Tversky, A. -
Judgment under Uncertainty: Heuristics and Biases, Science, Vol. 185, pp. 1124–1131, 1974
Kahneman, D. & Tversky, A. -
Prospect Theory: An analysis of decision under risk, Econometrica, Vol. 47, No. 2, pp. 297–323, 1979
Kahneman, D. & Tversky, A. -
Advances in Prospect Theory: Cumulative Representation of Uncertainty, Journal of Risk and Uncertainty, Vol. 5, No. 4, pp. 297–323, 1992
Kahneman, D. - Maps of Bounded Rationality: Psychology for Behavioral Economics, The Nobel Foundation, 2002
Kato, K. & Schallheim, J.S. -
Seasonal and Size Anomalies in the Japanese Stock Market. Journal of Financial and Quantitative Analysis, Vol. 20, No. 2, pp. 243–260, 1985
Keim, D.B. - Size Related Anomalies and Stock Return Seasonality: Further Empirical Evidence, Journal of Financial Economics, Vol. 12, pp. 29–51, 1983
Keim, D.B. & Stambaugh, R.F. -
A Further Investigation of the Weekend Effect in Stock Returns, Journal of Finance, Vol. 39, 1984
Kelly, M. - All their eggs in one basket: Portfolio diversification of U.S. households, Journal of Economic Behavior and Organization, Vol. 27, pp. 87–96, 1995
Keppler, M. & Xue, X.H. -
The Seasonal Price Behavior of Global Equity Markets, Journal of Investing, Vol. 12, 2003
Kiku, D. - Is the Value premium a Puzzle?, USC Finance Seminar, September 2006
Kohers, T. & Kohers, G. - The Impact of Firm Size Differences on the Day-of-the-Week Effect: A Comparison of Major Stock Markets, Applied Financial Economics, Vol. 5, 1995
Kübler, D., Müller, W. & Normann, H. -
Job market signalling: An experimental comparison, Technical University of Berlin, 2006
Lee, C., Shleifer, A. & Thaler, R. -
Investor Sentiment and the Closed-End Fund Puzzle, Journal of Finance, Vol. 46, 2001

Download free eBooks at bookboon.com
Behavioural Finance
65
List of references
Lintner, J. - Distribution of Incomes of Corporations among Dividends, Retained Earnings, and Taxes, American Economic Review, Vol. 46, No. 2, pp. 97–113, 1956
Malkiel, B.G. - The Efficient Market Hypothesis and its Critics, Journal of Economic Perspectives, Vol. 17, 2003
March, J. & Shapira, Z. - Managerial Perspectives on Risk Taking, Management Science, Vol. 33, pp. 1404–1417, 1987
Marmot, M. - The Status Syndrome – How Social Standing Affects Our Health and Longevity, Henry Holt Company, New York, 2004
Mehra, R. - The Equity Premium Puzzle: Why Is It a Puzzle?, AIMR, pp. 54–69, 2003
Mehra, R. & Prescott, E.C. -
The Equity Premium Puzzle: A Puzzle, Journal of Monetary Economics, Vol. 15, No. 2, pp.145–161, 1985
Merton, R.C. - A Simple Model of Capital Market Equilibrium with Incomplete Information, Journal of Finance, Vol. 42, 1987
Miller, G.F. - The mating mind: How sexual choice shaped the evolution of human nature, Doubleday, New York, 2000
Mitchell, G. - Review Essay: Libertarian Paternalism is an Oxymoron, Northwestern University Law Review, Vol. 99, No. 3, 2005
Mondaymorning - The great Danish tax paradox, Mondaymorning, No. 34, 2009
Montier, J. - Behavioural Investing: A practitioner’s guide to behavioural finance, John Wiley & Sons, 2007
Moore, D.A. & Healy, P.J. -
The trouble with overconfidence. Psychological Review, Vol. 115, No. 2, pp. 502–517, 2008
Nwogugu, M. - Towards multi-factor models of decision making and risk: A critique of Prospect Theory and related approaches, part I, Journal of Risk Finance, Vol. 6, No. 2, pp. 150–162, 2005
Odean, T. - Are investors reluctant to realize their losses?, Journal of Finance, Vol. 53, pp. 1775–1798, 1998
OECD - Information and data by Organisation for Economic Co-operation and Development available at: http://www.oecd.org, May–June 2012
Download free eBooks at bookboon.com
Behavioural Finance
66
List of references
Persky, J. - Retrospectives: The Ethology of Homo Economicus, The Journal of Economic Perspectives, Vol. 9, No. 2, 1995
Petruccelli, J.D., Nandram, B. & Chen, M. -
Applied Statistics for Engineers and Scientists, Prentice Hall, Upper Saddle River, New Jersey, 1999
Platt, M.L. & Huettel, S.A. -
Risky business: the neuroeconomics of decision making under uncertainty, Nature Neuroscience, Vol. 11, No. 4, pp. 398–403, 2008
Richards, A.J. - Winner-Loser Reversals in National Stock Market Indices: Can They be Explained?, Journal of Finance, Vol. 52, 1997
Rietz, T.A. - The Equity Risk Premium: A Solution, Journal of Monetary Economics, Vol. 22, No. 1, pp. 117–131, 1988
Ross, L. - The Problem of Construal in Social Inference and Social Psychology, Hillsdale, 1987
Rozeff, M.S. & Kinney, W.R. -
Capital Market Seasonality: The Case of Stock Returns, Journal of Financial Economics, Vol. 3, pp. 379–402, 1976
Schroder, H.M., Driver, M.J. & Streufert, S. -
Human Information Processing, Holt, Rinehart and Winston, 1967
Schultz, T.W. - Investment in Human Capital: The Role of Education and Research, Free Press, New York, 1971
Sewell, M. - Behavioural Finance, University of Cambridge, 2007
Shapiro, A.C. - Multinational Financial Management, John Wiley & Sons, California, USA, 2010
Shefrin, H. & Statman, M. -
Making sense of beta, size, and book-to-market, Journal of Portfolio Management, Vol. 21, pp. 26–34, 1995
Shefrin, H. & Statman, M. -
Comparing Expectations about Stock Returns to Realized Returns, Leavey School of Business, Santa Clara University, 1997
Shefrin, H. - Beyond Greed and Fear: Understanding Behavioral Finance and the Psychology of Investing, Oxford University Press, 2000
Shiller, R.J. - Do stock prices move too much to be justifed by subsequent changes in dividends?, American Economic Review, Vol. 71, pp. 421–436, 1981
Download free eBooks at bookboon.com
Behavioural Finance
67
List of references
Shiller, R.J. - Investor Behavior in the October 1987 Stock Market Crash: Survey Evidence, National Bureau of Economic Research, Working Paper No. 2446, 1987
Shiller, R.J. & Pound, J. - Survey evidence on diffusion of interest and information among investors, Journal of Economic Behavior and Organization, Vol. 10, pp. 47–66, 1989
Siebenmorgen, N. & Weber, M. -
A behavioral model for asset allocation, Financial markets and portfolio management, Vol. 17, No. 1, pp. 15–42, 2003
Siegel, J. - Stocks for the Long Run, 2nd Edition, Irwin, New York, 1998
Simonsen, I. - The influence of anticipating regret and responsibility on purchase decisions, Journal of Consumer Research, Vol. 19, pp. 105–118, 1992
Spence, M. - Job market signalling, Quartely Journal of Economics, Vol. 88, pp. 355–374, 1973
Statman, M. - Behavioral Finance: Past Battles, Future Engagements, Financial Analysts Journal, Vol. 55, No. 6, pp. 18–27, 1999
Stickel, S.E. - The Effect of Value Line Investment Survey Rank Changes on Common Stock Prices, Journal of Financial Economics, Vol. 14, 1985
Stiglitz, J.E. - Principal and agent, in: Eatwell, J., Milgate, M. and Newman, P. (eds.), The New Palgrave. Allocation, Information and Markets, W.W. Norton, New York, 1989
Sullivan, R., Timmermann, A. & White, H. -
Data-Snooping, Technical Trading Rule Performance, and the Bootstrap, Journal of Finance, Vol. 54, 1999
Sørensen, P.B. & Whitta-Jacobsen, H.J. -
Introducing Advanced Macroeconomics: Growth & Business Cycles, McGraw-Hill, UK, 2005
Thaler, R.H. - Anomalies: The Winner’s Curse, The Journal of Economic Perspectives, Vol. 2, No. 1, pp. 191–202, 1988
Thaler, R.H. - The End of Behavioral Finance, Financial Analysts Journal, Vol. 55, No. 6, pp. 12–17, 1999
Thaler, R.H. & Johnson, E.J. -
Gambling with the house money and trying to break even: The effects of prior outcomes on risky choice, Management Science, Vol. 36, No. 6, pp. 643–660, 1990
Download free eBooks at bookboon.com
Behavioural Finance
68
List of references
Thaler, R.H. & Sunstein, C.R. -
Nudge – Improving Decisions About Health, Wealth, and Happiness, Yale University Press, USA, 2008
The World Bank - Visit at the homepage of The World Bank at: http://web.worldbank.org, March 2012
Tversky, A. & Kahnemann, D. -
The framing of decisions and the psychology of choice, Science, Vol. 211, pp. 453–458, 1981
Weber, M. & Camerer, C.F. -
The disposition effect in securities trading: An experimental analysis, Journal of Economic Behaviour and Organization, Vol. 33, pp. 167–184, 1998
World Values Survey - Use of the Online Data Analyst at: http://www.worldvaluessurvey.org, January–May 2012
Wright, C., Banerjee, P. & Boney, V. -
Behavioural finance: Are the disciples profiting from the doctrine?, Working Paper, 2006
Zhang, L. - The value premium, Journal of Finance, Vol. 60, pp. 67–103, 2005

Behavioural Finance
69
Endnotes
7 Endnotes1. For more info about the expected utility theory, please consult the e-book: “Behavioural Economics and
Decision-making” by Peter Dybdahl Hede, available at bookboon.com