Embed Size (px)
Citation preview
® 1994 International Monetary Fund
December 1994
IMF Staff Country Report No. 94/15
Ethiopia—Recent Economic Developments
This report on recent economic developments in Ethiopia was prepared bya staff team of the International Monetary Fund as backgrounddocumentation for the periodic consultation with this member country. Inreleasing this document for public use, confidential material may havebeen removed at the request of the member.
Copies of this report are available to the public from
International Monetary Fund • Publication Services700 19th Street, N.W. • Washington, D.C. 20431
Telephone: (202) 623-7430 • Telefax: (202) 623-7201Telex (RCA): 248331 IMF UR
Price: $15.00 a copy
International Monetary FundWashington, D.C.
©International Monetary Fund. Not for Redistribution

This page intentionally left blank
©International Monetary Fund. Not for Redistribution
INTERNATIONAL MONETARY FUND
ETHIOPIA
Recent Economic Developments
Prepared by a staff mission consisting of Mr. P. Heller (head-AFR),Mr. M. Kitahara (AFR), Mr. G. Taube (AFR), Mr. E. M. Ucer (AFR),
Mr. C. McDonald (AFR), and Mr. C. Shiells (PDR)
Approved by the African Department
August 29, 1994
Contents Page
Basic Data vi-vii
I. Real Sector 1
1. Aggregate output and expenditure 22. Sectoral developments 2
a. Agriculture 2b. Manufacturing 10c. Energy 12d. Mining 13e. Building and construction 14f. Transportation 14
3. Employment 154. Wages 165. Prices 186. Private sector investment 197. Privatization 218. Revised GDP figures 21
II. Public Finance 22
1. Overall fiscal performance 222. Revenue and grants 23
a. Overview 23b. Tax revenue 25c. Nontax revenue 28d. External grants 29
3. Public expenditures 30a. Current expenditures 30b. Capital expenditures 34
4. The regionalization policy and fiscal implications 35a. Overview 35b. Tax policy and revenues 36c. Budget preparation and implementation in 1993/94 36d. Domestic and foreign financing 39
©International Monetary Fund. Not for Redistribution
- ii -
Contents Page
III. Balance of Payments 39
1. Overall developments, 1989/90-1993/94 392. Merchandise trade 41
a. Exports 42b. Imports 44c. Terms of trade 45d. Direction of trade 45
3. Services and transfers 464. Capital account 465. External debt 48
IV. Exchange and Trade System 49
1. Exchange arrangement 492. Administration of control 523. Prescription of currency 524. Nonresident accounts 525. Imports and import payments 526. Payments for invisible transactions 537. Exports and export proceeds 548. Proceeds from invisible transactions 549. Capital 5410. Gold 55
V. Money and Credit 56
1. Monetary and credit developments 56a. Overview 56b. Credit operations of the monetary system 58c. Domestic liabilities of the monetary system 60d. Specialized banks 61
2. Financial system 623. Monetary policy instruments 63
a. Credit allocation 63b. Reserve and liquidity requirements 65c. Refinancing facilities 65d. Interest rates 65e. Payment system 66
4. Financial sector reform 67a. Restructuring and recapitalization of theAIDB 67b. New legislation 68
©International Monetary Fund. Not for Redistribution
- iii -
Contents Page
VI. Assessing Eritrea's Impact on Ethiopia's Program 69
1. Overview 692. Possible adjustments 693. Numerical illustrations 71
VII. Estimation of Demand Curve for Foreign Exchange Auctions 73
1. Specification of equations 742. Structural issues 753. Estimation results and simulations 75
Text Tables
1. Wage Structure 172. Summary of Government Finance, 1988/89-1993/94 243. Distribution of Revenues, Expenditures and
Central Government Grants, 1993/94 384. Adjusted Monetary Survey, 1991/92-1992/93 725. Demand Estimates for Foreign Exchange 766. Prediction of Auction 31 Bid Rates 77
Appendix Tables
I. Growth Rate of Sectoral GDP at Constant 1980/81Factor Cost, 1988/89-1993/94 78
II. Gross Domestic Product by Sector at CurrentFactor Cost, 1988/89-1993/94 79
III. Expenditure on Gross Domestic Product at CurrentMarket Prices, 1988/89-1993/94 80
IV. Gross Domestic Product by Sector at Constant1980/81 Factor Cost, 1988/89-1993/94 81
V. Indices of Implicit GDP and Sectoral Deflators,1988/89-1993/94 82
VI. Estimates of Agricultural Production of MajorCrops, 1988/89-1991/92 83
VII. Estimates of Cultivated Areas Under Major Crops,1988/89-1991/92 84
VIII. Estimates of Coffee Production, Marketing, andStocks, 1988/89-1993/94 85
IX. Coffee Exports to ICO Member and NonmemberCountries, 1988/89-1993/94 86
X. Coffee Prices and Shipments, 1988/89-1993/94 87XI. Monthly Export and Arrival Volumes, Coffee Prices,
and Surtax, January 1991-May 1994 88XII. Value of Manufacturing and Processing at Constant
Prices, 1988/89-1991/92 89XIII. Output of Selected Public Sector Industrial
Corporations at Constant 1978/79 Prices,1988/89-1991/92 90
©International Monetary Fund. Not for Redistribution
- iv -
Contents
XIV. Income Statement for Selected Public SectorCorporations, 1989/90-1991/92
XV. Summary of Investment Projects,July 1992-June 7, 1994
XVI. Consumption of Petroleum Products, 1989/90-1993/94XVII. Ex Refinery and Retail Prices of Petroleum Products,
1989-94XVIII. Domestic Production of Refined Petroleum Products,
1988/89-1993/94XIX. Electricity Production, 1988/89-1993/94XX. Retail Price Index for Addis Ababa (Excluding Rent),
January 1991-June 1994XXI. Retail Price Index for Addis Ababa (Excluding Rent),
1990/91-1993/94XXII. Retail Price Index for Food Items in Addis Ababa,
1990/91-1993/94XXIII. Registered Unemployed and Reported Vacancies by
Occupational Classification, 1988/89-1992/93XXIV. Central Government Revenues and Grants,
1988/89-1993/94XXV. Central Government Current Expenditures by Functional
Classification, 1988/89-1993/94XXVI. Central Government Current Expenditures by
Economic Classification, 1988/89-1993/94XXVII. Central Government Capital Expenditures,
1988/89-1993/94XXVIII. Central Government External Borrowing by Sector,
1988/89-1993/94XXIX. Counterpart Funds Generation from External Grants
and Loans, 1991/92-1993/94XXX. Balance of Payments, 1988/89-1993/94XXXI. Balance of Payments, 1988/89-1993/94XXXII. Exports, 1988/89-1992/93XXXIII. International Prices for Selected CommoditiesXXXIV. Exports by Private Sector (Selected Commodities)XXXV. Value of Imports, c.i.f., by End Use, 1988/89-1992/93XXXVI. Merchandise Trade Unit Value and Volumes,
1988/89-1992/93XXXVII. Selected Effective Exchange Rates, 1988/89-1992/93XXXVIII. Percentage Shares of Private and Public Enterprises at
Foreign Exchange AuctionsXXXIX. Recorded Imports by Country of Origin, 1989-1992
XL. Exports by Country of Destination, 1989-92XLI. Balance in Services and Transfers Accounts,
1988/89-1992/93XLII. Capital Account, 1988/89-1992/93XLIII. External Public Debt Service, 1988/89-1992/93XLIV. External Public Debt Disbursements, 1988/89-1992/93XLV. New External Public Debt Commitments, 1988/89-1992/93XLVI. Suppliers' and Commercial Bank Credits Contracted,
1988/89-1992/93
Page
91
9293
94
9596
97
98
99
100
101
102
103
104
105
106107108109110111112
113114
115116117
118119120121122
123
©International Monetary Fund. Not for Redistribution
- V -
Contents
XLVII. External Public Debt Outstanding by Lender,June 1989-June 1993
XLVIII. External Arrears June 1991-June 1993XLIX. Monetary Survey, June 1989-June 1994
L. Factors Affecting Changes in Money Supply,June 1989-June 1994
LI. Loan Portfolio of the Banking System,June 1989-March 1994
LIT. Sectoral Breakdown of Commercial Bank Claims,June 1989-March 1994
LIII. Commercial Bank Lending and Deposits,June 1989-March 1994
LIV. The Commercial Bank of Ethiopia, Reserve andLiquidity Position, June 1989-June 1994
LV. Central Government's Domestic Financing,1988/89-1992/93
LVI. Consolidated Balance Sheet of the SpecializedBanks, June 1989-December 1993
LVII. Specialized Banks Lending, June 1989-December 1993LVIII. Structure of Interest Rates, as of June 30, 1994
Annex Summary of the Tax System as of June 1994
Charts
1. Developments in the Addis Ababa Retail PriceIndex, 1983-94
2. Developments in Foreign Exchange Auctions,May 1993-August 1994
3. Developments in Indices of Nominal and RealTrade-Weighted Exchange Rates, 1980-94.
124125126
127
128
129
130
131
132
133134135
136
18a
50a
50b
Page
©International Monetary Fund. Not for Redistribution
- vi -
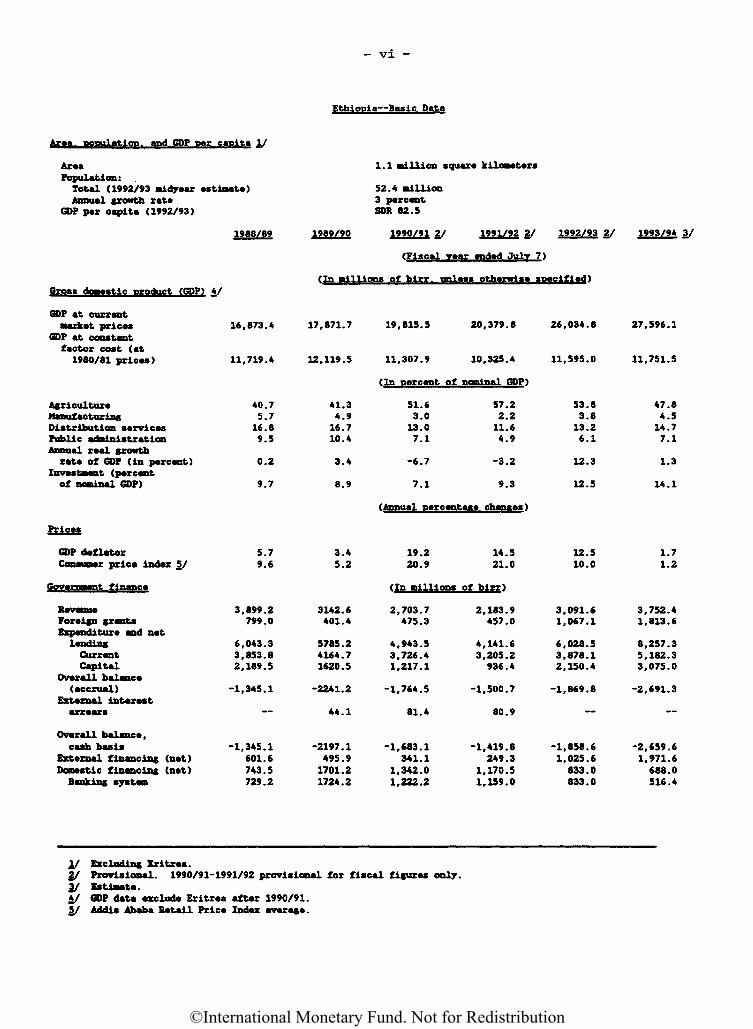
Ethiopia—Basic Data
1.1 million square kilometers
GDP at currantmarkat pricaa
GDP at constantfactor cost (at1980/81 prices)
AgricultureManufacturingDistribution servicesPublic administrationAnnual real growthrate of GDP (in percent)
Investment (percentof nominal GDP)
Prices
GDP deflatorConsumer price index 5/
Government finance
RevenueForeign grantsExpenditure and netlendingCurrentCapital
Overall balance(accrual)
External interestarrears
Overall balance,cash basis
External financing (net)Domestic financing (net)Banking system
16,873.4
11,719.4
40.75.716.89.5
0.2
9.7
5.79.6
3,899.2799.0
6,043.33,853.82,189.5
-1,345.1
-1.345.1601.6743.5729.2
17,871.7
12,119.5
41.34.916.710.4
3.4
8.9
3.45.2
3142.6401.4
5785.24164.71620.5
-2241.2
44.1
-2197.1495.91701.21724.2
19,815.5
11,307.9
(In percent ofnominal GDP )
51.63.013.07.1
-6.7
7.1
(Annual percent>ajse chm&es
19.220.9
(In millions
2,703.7475.3
4,943.53,726.41,217.1
-1.764.5
81.4
-1,683.1341.1
1,342.01,222.2
20,379.8
10,325.4
57.22.211.64.9
-3.2
9.3
14.521.0
of birr)
2,183.9457.0
4,141.63,205.2936.4
-1,500.7
80.9
-1,419.8249.3
1,170.51,159.0
26,034.8
11,595.0
53.83.813.26.1
12.3
12.5
12.510.0
3,091.61,067.1
6,028.53,878.12,150.4
-1,869.8
-1,858.61,025.6833.0833.0
27,596.1
11,751.5
47.84.514.77.1
1.3
14.1
1.71.2
3,752.41,813.6
8,257.35,182.33,075.0
-2,691.3
-2,659.61,971.6688.0516.4
I/ Excluding Eritrea.y Provisional. 1990/91-1991/92 provisional for fiscal figures only.3/ Estimate.4/ GDP data exclude Eritrea after 1990/91.5/ Addis Ababa Retail Price Index average.
Area, population, and GDP per capita \/
AreaPopulation:Total (1992/93 midyear estimate)Annual growth xata
GDP par capita (1992/93)
1988/89 1989/90
52.4 Billion3 parcantSDR 82.5
1990/91 2/ 1991/92 2/ 1992/93 £/ 1993/94 3/
(Fiscal rear andad July 7)
(In millions of birr, unless otherwise specified)GPORK d^BBQgt.4 e wT'oAtet'. fGDP^ A/
©International Monetary Fund. Not for Redistribution
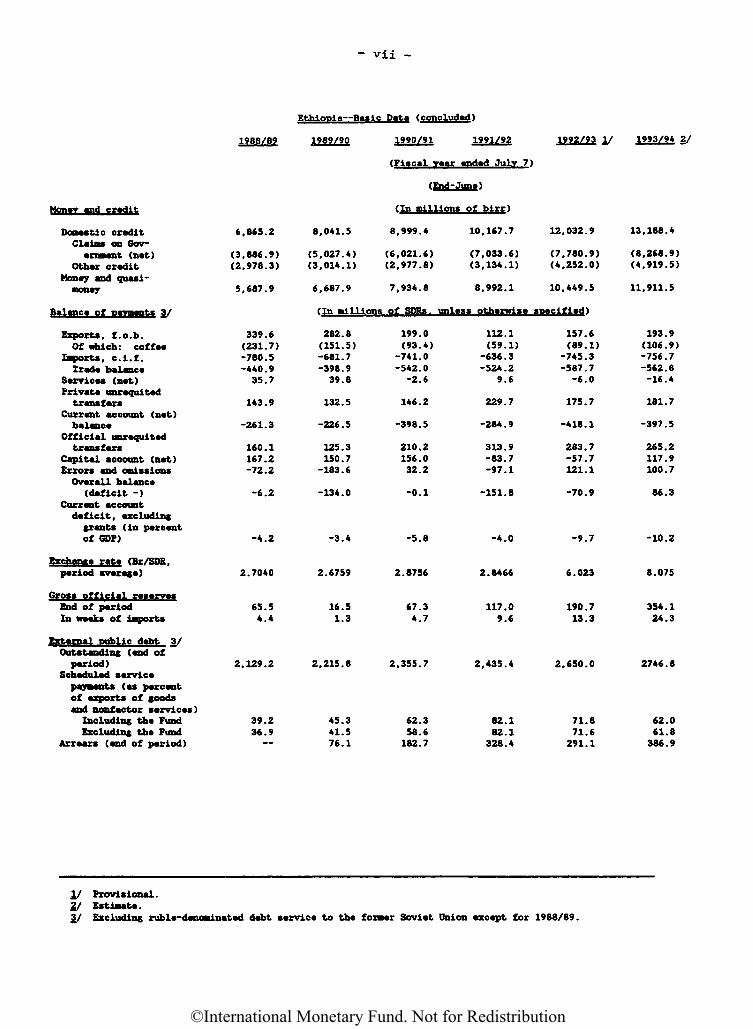
- vii -
Ethiopia—Basic Data (concluded)
1988/89 1989/90 1990/91
(Fiscal irear ended July 7
1991/92 1992/93 I/ 1993/94 2/
(End- June)
Money and credit
Domestic creditClaim* on Gov-ernment (net)
Other creditMoney and quasi -money
Balance of payments 3/
Exports, f.o.b.Of which: co£f««
Imports, c.i.f.Trad* balance
Services (net)Private unrequitedtransfers
Current account (netbalance
Official unrequitedtransfers
Capital account (net)Errors and omissionsOverall balance(deficit -)
Current accountdeficit, excludinggrants (in percentof GDP)
Exchange rate (Br/SDR.period average)
End of periodIn weeks of imports
External wiblic debt 3/Outstanding (end ofperiod)
Scheduled servicepayments (as percentof exports of goodsand nonf actor services)Including the FundExcluding the Fund
Arrears (end of period)
(In millions of birr)
6,865.2
(3,886.9)(2,978.3)
5,687.9
339.6(231.7)-780.5-440.935.7
143.9
-261.3
160.1167.2-72.2
-6.2
-4.2
2.7040
65.54.4
2,129.2
39.236.9~
8.041.5
(5.027.4)(3.014.1)
6,687.9
(In millio
282.8(151.5)-681.7-398.939.8
132.5
-226.5
125.3150.7-183.6
-134.0
-3.4
2.6759
16.51.3
2,215.8
45.341.576.1
8,999.4
(6,021.6)(2.977.8)
7,934.8
ins of SORs .
199.0(93.4)-741.0-542.0-2.6
146.2
-398.5
210.2156.032.2
-0.1
-5.8
2.8756
67.34.7
2.355.7
62.358.6182.7
10.167.7
(7,033.6)(3,134.1)
8,992.1
unless otherwise si
112.1(59.1)-636.3-524.2
9.6
229.7
-284.9
313.9-83.7-97.1
-151.8
-4.0
2.8466
117.09.6
2,435.4
82.182.1328.4
12,032.9
(7,780.9)(4,252.0)
10,449.5
sec if led)
157.6(89.1)-745.3-587.7-6.0
175.7
-418.1
283.7-57.7121.1
-70.9
-9.7
6.023
190.713.3
2,650.0
71.871.6291.1
13,188.4
(8,268.9)(4,919.5)
11,911.5
193.9(106.9)-756.7-562.6-16.4
181.7
-397.5
265.2117.9100.7
86.3
-10.2
8.075
354.124.3
2746.8
62.061.8386.9
i/ Provisional.2/ Estimate.3/ Excluding ruble-denominated debt service to the former Soviet Union except for 1988/89.
Groes officia reserves
©International Monetary Fund. Not for Redistribution

This page intentionally left blank
©International Monetary Fund. Not for Redistribution
I. Real Sector
1. Aggregate output and expenditure
Following a period of modest and fluctuating growth in the 1980s(averaging 2.5 percent), events surrounding the collapse of the Derg regimein 1991 led to a substantial worsening of economic conditions in theEthiopian economy, as reflected in a cumulative decline in economic activityof about 10 percent during 1990/91-1991/92 (Appendix Table I). The adverseimpact of overall instability and security-related problems during thisperiod was further magnified by variable weather conditions, depressedcoffee prices, and foreign exchange scarcity, leading to a continuousdeterioration in capacity utilization in the manufacturing sector.
Agricultural production, reflecting its significant sensitivity tofavorable weather conditions, exhibited a relatively strong, albeit erratic,performance during 1989/90-1991/92--an average growth of 4 percent during1989/90-1990/91, followed by a sharp drop in 1991/92 (2.6 percent). Thelatter also reflected a significant decline in the total area undercultivation as a result of the escalation of the civil war. In contrast,economic activity in the manufacturing and construction sectors declined byan annual average of 17.1 percent and 13.1 percent, respectively, during1989/90-1991/92, mainly owing to a severe shortage of raw materials andforeign exchange. Output from distribution and other services alsocontracted by an average of 7 percent and 1 percent per annum, respectively,reflecting the overall decline in economic activity.
In 1992/93, there was a significant recovery in the economy, which wasreflected in virtually all sectors, with real GDP rebounding by anexceptional 12.3 percent. While the improved security situation in thecountry and, subsequently, the emergence of a favorable economic andpolitical climate set the stage for the recovery, a number of additionalfactors contributed to this outcome. In the agricultural sector, goodweather conditions, coupled with increases in land under cultivation andgreater fertilizer usage, led to a bumper crop, with the sector registeringa strong 7 percent growth rate. In the manufacturing sector, a smooth flowof inputs through increased availability of foreign exchange led to adramatic recovery in the capacity utilization rate, mainly in the publicenterprise sector. Growth in manufacturing rebounded by an extraordinary51.9 percent, albeit from an extremely low base. Small-scale private sectoractivity also began to develop, reflecting a modest revival from itshistorically repressed condition.
Developments during 1993/94 have been less favorable, even though theeconomy is estimated to have grown modestly (1.3 percent). An erraticdistribution and pattern of rainfall throughout the country and inadequateusage of fertilizers and pesticides during the main rainy season areestimated to have contributed to a significant drop in agricultural output.This shortfall has been further aggravated by an unusually dry short rainy
©International Monetary Fund. Not for Redistribution
- 2 -
season, leading to severe drought in some northern regions, as well as inthe southern lowlands. In addition, the pest problems that emerged duringthe 1994 short harvest in these regions, as well as in the western parts ofthe country, are estimated to have contributed to the sharp drop inharvested output. As a consequence, agricultural output is estimated tohave declined by almost 6 percent. However, growth in the non-agriculturalsector (9.2 percent), most notably in the manufacturing sector(13.2 percent), continued to be robust, thereby helping the economy maintaina positive growth for the year as a whole. This was mainly attributable tothe continued recovery in the public enterprise sector, as well as inprivate sector activity, and to an improved investment rate.
The overall investment rate in the economy, after having stagnated atabout 9 percent for four consecutive years during 1988/89-1991/92, improvedconsiderably during 1992/93-1993/94, averaging 13.3 percent of GDP (AppendixTable III) . Although still low even in comparison with the average for sub-Saharan Africa (17.3 percent in 1993), this represented almost a doubling ofinvestment as a percent of GDP, compared with the 1990/91 level. In1992/93, about half of the 12.5 percent gross capital formation rate derivedfrom the private sector. In 1993/94, the investment rate further increased,to 14.1 percent, mainly reflecting a higher rate of capital budgetimplementation by the public sector. Domestic savings, while still weak,given Ethiopia's extremely low per capita income level, also improvedmodestly during 1992/93-1993/94, after having dropped sharply to zero in1990/91. This was attributable to a slight improvement in public sectorsavings, which increased from minus 1.7 percent of GDP in 1990/91 to1 percent in 1993/94, as well as a revival in private sector savings (from1.7 percent of GDP in 1990/91 to 4.6 percent in 1993/94). Although totalconsumption declined slightly during this period, the expansion ininvestment continued to be reflected in a large resource gap, whichincreased from an average of 6 percent of GDP percent during 1989/90-1991/92to 8.8 percent during 1992/93-1993/94.
2. Sectoral developments
a. Agriculture
The agricultural sec tor--including principally agriculture andlivestock, but, to a marginal degree, the forestry, fishing, and huntingsub-sectors--is by far the most important sector in the Ethiopian economy,constituting more than 50 percent of GDP (1993/94) , and employing more than80 percent of the labor force (Appendix Table II).
(1) Crops
Crop production is predominantly concentrated in staple crops,which are produced by smallholder, subsistence farmers. Irrigation islimited, such that production crucially depends on the amount anddistribution of rainfall. Although the average level of rainfall variesconsiderably across the different regions, broadly, two harvests occur
©International Monetary Fund. Not for Redistribution
- 3 -
during any given year. The main harvest season (the meher crop) follows thelong rains of July-September and the second harvest (the belg crop) followsthe short rains of February-April. In some regions, mostly in the centralhighlands, the above-mentioned two rainy seasons tend to merge and theharvest generally occurs in October and January. More than 90 percent oftotal crop production takes place during the meher season, while the shortseason accounts for the remainder. However, some areas (e.g., Bale and Omoin the South, and Wello and Tigray in the North) depend crucially on thebelg rains.
In a good year, cereal production, which mainly includes maize(28 percent of the total), teff (24 percent), barley (16 percent), wheat(13 percent), and sorghum (13 percent), is estimated at around 6 milliontons. I/ Of the total cultivated area, teff and maize cover more than50 percent, followed by barley (17 percent) and wheat and sorghum(13 percent each). Maize, sorghum, and wheat have relatively high yields,and are normally planted during the long season; nevertheless, their yields,on average, at about 12 quintals per hectare, are considered extremely loweven by African standards, mainly owing to rudimentary farming techniques aswell as limited usage of fertilizers and improved seeds. It is estimatedthat about 15 percent of total crop production is marketable while theremainder is used for self-consumption or animal feed. In general,switching across crops (particularly toward cash crops) is uncommon inEthiopia, because of the high priority that the farmers give to ensuringsubsistence through the planting of staple crops and the lack of knowledgeof the appropriate technology. 2/
Ethiopia's principal surplus areas in the production of cereals areconcentrated in the Oromiya (e.g., Arsi, and East and West Showa) and Amhara(e.g., East and West Go jam) regions, while many densely populated areas inthe north (e.g., Tigray, Wello, and Gondar) as well as the pastoral southare known as structural deficit areas. The incomes of the smallholderfarmers are particularly susceptible to drought, due to their limitedability to compensate for the impact of crop failure (e.g. lack ofalternative employment opportunities, limited asset base, isolation frommajor markets, and low level of farm technology). The majority of the4 million people in Ethiopia who are estimated to depend on food aid (evenunder normal circumstances) live in these regions. 3/
I/ Figures are averages for 1988/89-1991/92, and are stated aspercentages of total staple crop production (Tables VI, VII). Data are notavailable for 1992/93-1993/94, owing to the suspension of the annual cropsurvey conducted by the Central Statistical Authority (CSA) ; presently, theCSA is mainly involved in the preparation of the forthcoming census.
2J There has been some switching to root crops, but principally in thesouthern areas in order to cope with drought.3/ This implies, on average, an annual minimum food aid requirement of
roughly 500,000 tons, assuming an annual cereal requirement of about 120-130kilograms per person.
©International Monetary Fund. Not for Redistribution
. 4-
During 1992/93, cereal production is estimated to have grown by about9 percent, with the highest growth achieved from the relatively high-yielding maize (20 percent) and sorghum (10 percent), followed by barley(4 percent), wheat (4 percent), and teff (3 percent). In 1993/94,reflecting vagaries of the meher season as well as drought during the shortrainy season, crop production is estimated to have declined by10 percent. \J
Ethiopia's main cash crops include coffee, oil seeds, and pulses. £/Coffee. the most important cash crop and Ethiopia's principal export (seeSection III.2a for further discussion), is mostly grown in Oromiya and theSouthern Ethiopia Region, mainly by smallholder farmers (96 percent).Coffee is prepared and processed for the market in two different forms--sun-dried and washed. 3/ Exports are largely concentrated in sun-dried coffee(djimma, wollega, hararge, and sidamo) , while exports of the higher-qualitywashed coffee are constrained by a lack of infrastructure (viz. , washingstations, access roads, vehicles, training, etc.). Washed coffee isprocessed predominantly by service cooperatives (and a limited number ofstate farms), since the private sector has only recently been permitted toengage in coffee processing. There are about 130 washing stations inEthiopia, 2 of which are owned by the private sector.
As part of ongoing reforms in the coffee sector, the Ethiopian CoffeeMarketing Corporation (ECMC) was restructured into two separateenterprises--the Coffee Sales and Purchase Enterprise (CSPE) and theEthiopian Coffee Export Enterprise (ECEE)--in late 1993. While the CSPE isengaged in coffee purchases and transfers from the interior (to the twoexport auction centers at Addis Ababa and Dire Dawa) , the ECEE is in chargeof buying coffee at these auction centers from both the CSPE and individualtraders, and then exporting it. As a result of the liberalized licensingrequirements for coffee exports that were introduced in August 1993(reflecting significantly reduced issuance and renewal fees), the number of
I/ These figures are very preliminary.2/ In addition, small amounts of sugar cane and cotton are grown, mainly
in state farm plantations along the Awash river in the Afar region. Thelatter has been adversely affected during the transition to a marketeconomy, as most cotton growing state farms were dissolved, and smallholdersswitched to staple crop and livestock production, leading to a decline innational lint cotton production, to about 5,000 tons at present fromapproximately 30,000 tons during the Derg regime. There are efforts tostudy the problems of the sector with a view to reviving it. In addition,fruits and vegetables appear to have gained in importance in recent years,although no statistics have been compiled on production.I/ In dry processing, fully ripe red cherries are directly picked from
the tree and dried in the sun on raised beds, providing air circulation andavoiding soil contamination. The more capital-intensive wet processingmethod involves pulping, fermenting, as well as drying on elevated wiretrays.
©International Monetary Fund. Not for Redistribution
- 5 -
coffee exporters as well as private traders (both collectors (sebsabv) andtransporters (akrabv)̂ . have increased, thereby providing for greatercompetition in the various stages of the coffee marketing process. JL/ Themonopoly position of the ECMC in the exporting of washed coffee also endedduring 1991/92, as private exporters were allowed to participate in theauctions alongside the ECMC. 2/
Nevertheless, a number of regulations still pertain to the marketing ofcoffee; these appear to be aimed at controlling the quality and movement ofcoffee for export. These include: (i) the regulation that the amount ofcoffee that can be moved by an (unlicensed) individual must not exceed3 kilograms; (ii) the requirement that all exportable coffee must bechanneled through the auction and that all coffee sold in the domesticmarket must be coffee not acceptable for export (after inspection andgrading at the auction centers); and (iii) the restriction that privateexporters cannot make coffee purchases outside of the auctions.
In response to the sudden drop in coffee prices in mid-1989 (followingthe failure of ICO members to agree on quotas), and in order to restoreincentives to coffee growers, producer prices were increased substantially,with the increase being financed through both a reduction in the coffeeexport surtax and a direct subsidy from the budget. More recently,beginning in the 1992 coffee season ,3/> an^ in response to the volatilityof international prices, floor prices were set by the CSPE for sun-driedcoffee; these floor prices have remained unchanged since then. 4/ Owingto the recent surge in international prices (in mid-1994), these prices areno longer binding. Sun-dried coffee is regularly traded between thesabsabies and farmers on the basis of recent auction prices announced on thepublic radio and posted at local market places. As regards washed coffee,farmers receive a first payment from the service cooperatives before theirwashed coffee is sent to the auction market. They then get a second paymentif the resulting auction price is above the first payment. Currently, about60 percent of this difference is distributed to farmers 5J as a secondpayment and the remaining 40 percent is reserved (by the cooperatives) for
\J There are six types of coffee licenses: coffee export, coffeetransport, coffee cleaning, coffee collecting, coffee trade auxiliary, andcoffee washing.
2J Private exporters have been allowed in the exporting of sun-driedcoffee since late 1989.
3/ The coffee season extends from October through September.4/ These prices were set at 4.2 Br/kg for djinima, 6.15 Br/kg for sidamo,
7.0 Br/kg for nekempte, and 9.1 Br/kg for hararge. The setting of floorprices was complicated for some time because of low international prices aswell as the continuing demand in the domestic market, with domestic pricesremaining, on average, higher than the export prices.
5J The exact share varies across service cooperatives.
©International Monetary Fund. Not for Redistribution
- 6 -
management and reinvestment for farmers. There are no data on the actualproducer prices received by farmers. \J
During 1989/90-1991/92, coffee production is estimated to have grownevenly, albeit modestly, by about 2.5 percent per annum, averaging slightlyabove 200,000 tons (Appendix Table VIII). After a slight decline in1992/93, production is estimated to have increased by 5.7 percent in1993/94, reaching 222,000 tons. While this may be attributed partly to thefavorable impact of recent liberalization measures as well as to increasesin international prices, the full impact of such measures on the growth incoffee production is presumably restricted in the short term to efficiencygains (during the picking of coffee beans), which is estimated to remainnear 5 percent, given the usual cycle between the planting of new coffee andits harvesting. 2/ There is very little information on changes in thetotal area planted (presently estimated at some 400,000 hectares), althoughsome additional planting is estimated to have taken place in traditionalcoffee growing areas, such as Eastern Hararge.
Arrivals at the auction centers, 3/ although lower than the record1989 level, increased considerably to about 67,000 tons during January-May1994, as compared with an average of 51,000 tons for the same five-monthperiod extending from 1990 through 1993 (Appendix Table XI). While this ispartly attributable to the diminished role of the parallel market in thechanneling of coffee to the international market, 4/ the continuedincreases in international prices, which have substantially reduced thedifferential between the auction price and the domestic price, appear tohave contributed to this outcome. However, existing regulations (asdiscussed above)--coupled with a traditionally high domestic demand forcoffee, estimated to absorb about 35-40 percent of total coffee production--continue to induce a diversion of exportable coffee beans to the domesticmarket through irregular channels.
Pulses (horsebeans, chickpeas, haricots, and lentils) and oilseeds(neug, flax, rapeseed, sesame, and castor beans) constitute about 12-13 percent of crop production, and 17 percent of the total land undercultivation (excluding coffee and other cash crops). 5/ They are grownmostly as rotational crops by smallholder farmers in between the meher andbelg seasons. In 1992/93, preliminary estimates suggest that productiongrew by about 3.4 percent.
JL/ However, prices can be deduced from the auction price data byadjusting for taxes and transportation and handling costs.
7J Normally, coffee trees come into production 3-4 years after plantingand are in full production at 6-8 years.3/ Arrivals at the auctions increase during October through April,
following the coffee harvest in October.4/ However, leakages to Djibouti, Somalia, and Sudan are still estimated
to be high.5/ Averages for 1989/90-1991/92.
©International Monetary Fund. Not for Redistribution
- 7 -
(2) Livestock
Ethiopia's livestock herd of 75 million is estimated to be thelargest in Africa. It is difficult to calculate the sector's value added,since a significant part of meat and dairy production is produced forsubsistence purposes and in certain regions, particularly in the highlands,livestock is utilized only to support farming. Ethiopia's livestocksubsector continues to suffer from the vagaries of unpredictable weatherconditions, disease, and the lack of a coherent plan for the development ofthe sector. Although hides and skins and leather are Ethiopia's second mostimportant export, the sector's huge potential remains largely untapped. Theimpact of the recent drought is estimated to have been substantial forlivestock herds.
(3) Fertilizer usage
Since the launching of the economic reform program, progress hasbeen made in various areas, including in the usage of fertilizer, provisionof credit and agricultural extension services to farmers, and the marketingand pricing of agricultural products. Despite the introduction of theGovernment's "New (Fertilizer) Marketing System" in 1991/92, there have beendifficulties in ensuring adequate levels of fertilizer usage by thesmallholder sector. \J The monopoly of the Agricultural Input SupplyCorporation (AISCO) in fertilizer procurement and distribution was removed,resulting in a multiple channel procurement and distribution system withsignificant private sector involvement in retailing, and to some extent, inwholesaling. At the end of 1993, more than 1,000 private retailers wereregistered by AISCO (about 900 of whom are operational) and an additional600 are expected to be registered in 1994; these retailers operate alongsideapproximately 400 service cooperatives and 400 marketing centers, the lattermanaged by AISCO. It is estimated that the share of the private retailersin fertilizer distribution will increase to over 60 percent by the end of1994. The total number of wholesalers in 1994 is likely to remain the sameas in 1993 (at around 30), because of the large scale of the operationsinvolved. Almost all fertilizer imports continue to be funded by donorsthrough AISCO; in 1992/93 a private company started to import fertilizer aswell.
Fertilizer usage in Ethiopia is considered extremely low; only about15 percent of the farmers are estimated to use fertilizers. In 1993,fertilizer sales to the peasant sector (121,000 metric tons) were about
I/ Prior to 1991/92, AISCO used about 2,900 Service Cooperatives (SC) asthe only retail outlets for fertilizer retailing. During 1990/91, aconsiderable number of SCs were destroyed and damaged as a result of thecivil unrest and ceased to function. Following the substantial reduction inthe number of retail outlets (down to about 550), AISCO, with the assistanceof the United Nations Food and Agricultural Organization (FAO), introduced aNew Marketing System.
©International Monetary Fund. Not for Redistribution
- 8 -
20 percent lower than in 1992 (156,000 metric tons). I/ The reasons forthe decline included a delay in the announcement of fertilizer prices, 2/confusion over the associated subsidy scheme, lack of retail market outletsand credit facilities, and administrative constraints placed on the newprivate sector dealers in the context of the pan-territorial pricing policypursued by the Government. The Government's efforts to promote the benefitsof fertilizer, which should have been launched at the time of priceincreases, were also limited. The 1994 sales target is about 160,000 metrictons, slightly above 1992, and is likely to be achieved, given favorablestock positions (partly owing to lower-than-expected sales during thepreceding year) and the timely announcement of prices in mid-January.However, during January-April 1994, actual sales by AISCO to the peasantsector (27,510 metric tons) were lower than the level during thecorresponding period in 1992 (33,476 metric tons), an outcome partlyattributable to the delay in the commencement of the belg rains and the lateplanting season.
After four years without a direct financial fertilizer subsidy, theGovernment reintroduced a fixed subsidy of 15 percent on both types offertilizers in February 1993, amounting to Br 26.43 per quintal for DAP andBr 23.41 per quintal for urea. In 1994, the subsidy was raised to 20-21 percent (to Br 36.96 and Br 31.98 per quintal, respectively). I/ ANational Committee, chaired by the Ministry of Agriculture, with the GeneralManagers of the Agricultural and Industrial Development Bank (AIDB),Commercial Bank of Ethiopia (CBE), and AISCO as members, was recentlyestablished (along with regional committees) , to facilitate the provision offertilizer credit to needy farmers as well as to ensure the repayment ofcredit.
(4) Rural credit
As regards rural credit schemes, the Government recently enactedthe Agricultural Cooperative Societies Proclamation (issued on February 1,1994) , which sought to promote the role of service cooperatives (named"cooperative societies" under the proclamation) in the allocation of credit
i/ There is no domestic production of fertilizers in Ethiopia. Two typesof fertilizers are imported--Diammonium Phosphate, or DAP (about 85 percent)and urea (15 percent).2/ Given the regular crop cycle in Ethiopia, in order to increase
fertilizer usage during a particular crop season, price announcements needto be made around December of the preceding year or in January. The 1993crop season price was only announced in May 1993, which was already past thebelg season and behind the planting phase of the meher season.I/ The subsidy equals the difference between the cost of fertilizer to
the Government and the price charged to the farmer. When farmers purchasedirectly from the marketing centers, they are expected to pay an additionalBr 7 per quintal, which is the margin for private traders (included as partof the subsidy).
©International Monetary Fund. Not for Redistribution
- 9 -
in the rural areas. According to the Proclamation, the functions of thecooperatives will also include acceptance of deposits and the granting ofloans to other institutions. It is expected that the AIDE and the CBE willboth be involved in the scheme (contrary to the previous credit programs,which included only the AIDE).
(5) Agricultural Marketing and Pricing
In the areas of marketing and pricing of agricultural output,significant progress has been made in reorganizing the AgriculturalMarketing Corporation (AMC) , which has now been renamed the Ethiopian GrainTrade Enterprise (EGTE) . The focus of the EGTE within the new market-oriented economy is significantly different from its past role. ]L/ Themain objective of the EGTE is to stabilize the grain market throughintervention. In a normal year, based on the probability of grain supplyfluctuations in the market-dep endent population (i.e., urban, nomadic, andproducers/consumers in deficit areas), about 300,000 tons of grain areassumed to be needed as a buffer stock and for the purpose of seasonalstabilization. Of this amount, 150,000 tons are planned to be purchasedlocally, while the rest would be supplied from abroad, principally fromdonors.
The planned operations of the EGTE were disrupted in 1993/94 because ofthe adverse impact of the drought. In order to prevent a further increasein producer prices, the EGTE purchased 18,000 tons in 1993/94 (compared with150,000 tons the preceding year). Currently, the EGTE principally focuseson stabilizing the food situation in the country through the distribution offood aid. About 30,000 tons were provided to the drought-affected regionsdirectly from EGTE's stocks. As of mid-1994, the EGTE held stocks of110,000 tons of grains, down from 160,000 tons in January 1994.
Although there is some competition at the wholesale level, which is dueto its enormous infrastructure (trucks, warehouses, credit, etc.), the EGTEis by far the biggest participant in the grain market, with a substantialinfluence on producer prices. At present, producer prices are negotiatedbetween the local committees (acting as agents for the EGTE in the
I/ Previously, farmers were forced to surrender a minimum of 50 percentof agricultural output to the AMC at fixed prices, allowing a small marginover cost. Checkpoints were established along major grain routes, andillegally transported farm produce was confiscated. One consequence was thereduction of the smooth flow of grains from surplus to deficit areas. Thisled to very low prices in surplus areas and extremely high prices in deficitareas. On the other hand, AMC purchases were mostly allocated to urbanareas, institutions (such as flour mills) and, more importantly, themilitary. Given the heavy involvement of AMC in the grain trade, grainswere transacted at artificially low prices, which bore little relation tomarket prices. In March 1990, the quota system governing the surrender ofgrains was abolished, and merchants were allowed to operate freely.
©International Monetary Fund. Not for Redistribution
- 10 -
corresponding regions) and the fanners, on the basis of indicative pricesset by the EGTE. The EGTE, in turn, sets prices in line with regional pricedevelopments in the urban and rural markets.
The reorganization at the EGTE continued during 1993/94. As a resultof its new focus on selected markets, its collection points have beenreduced from 2,000 to 500. The number of trade centers (buying and selling)have been reduced from 104 to 66 and its coordinating branches now number17, instead of 27. At the start of the reorganization process, the totalstaff numbered 4,300. Currently, its staff is 3,089 and it is intended toreduce the staff further to about 2,500. At present, the EGTE makesavailable its excess storage capacity to the private sector, nongovernmentorganizations, and AISCO. Though it is not involved in the provision ofcredit to farmers, the EGTE supplies some inputs to farmers (particularlyfertilizer) in association with private traders.
(6) Agricultural land tenure
Since 1991, when the Government announced its policy of providing thefarmers with security of land user ship and eliminated restrictions on therental of land and the hiring of labor, there have been no changes in policyon the issue of land ownership. It is expected that the issue will beconsidered following the establishment of a nationally elected govern-ment. I/
b. Manufacturing
The manufacturing sector in Ethiopia is comprised of lightmanufacturing products such as construction materials, metal and chemicalproducts, and basic consumer goods such as food, beverages, and textiles.The sector is mainly dominated by about 150 public enterprises (PE) , whichcontribute more than 95 percent of the sector's value added. The productionof PEs is mostly concentrated in the food and beverages (50 percent) andtextiles industries (15.3 percent); in addition, tobacco (12.4 percent),leather and leather products (6 percent), rubber, plastic, and cement(5.5 percent) are also important subsectors. 2/ Private sectormanufacturing activity, although on a much smaller scale, follows a similarpattern. Of about 150 private sector firms, most are involved in bakeryproducts, textiles, footwear, and furniture production.
I/ For historical background of land issues, see Ethiopia: RecentEconomic Developments, SM/93/102, May 13, 1993.2/ Recent data on manufacturing pertaining to 1992/93-1993/94 are not
available because of disruptions related to the restructuring at theMinistry of Industry. Percentages reported are based on the gross value ofproduction in 1989/90, presumably a normal year, and before the onset ofacute shortages. Also see Tables XII-XIV.
©International Monetary Fund. Not for Redistribution
- 11 -
During 1989/90-1991/92, manufacturing was adversely affected by theescalation of the civil war; shortages of raw materials, foreign exchange,and fuel; and the frequent breakdowns arising from obsolete machinery andpower failures. As a result, the share of the manufacturing sector in GDPdeclined steadily, from around 5.7 percent in 1989/90 to 2.2 percent in1991/92. In 1992/93, the sector's share increased to 3.8 percent, owing toa sharp rebound following the elimination of some of these constraints(mainly the greater availability of foreign exchange). The average capacityutilization rate of the Pes climbed to almost 70 percent, from rates as lowas 20 percent in many industries at the end of 1991/92. In 1993/94, thesector's share increased further to 4.5 percent, though this was in part dueto the contraction in agricultural production.
In the short term at least, the sustainability of the recovery in themanufacturing sector is likely to be influenced by the rapidity with whichthe private sector responds to market incentives as well as by the capacityof the PEs to adapt to the more competitive market environment that has beenrecently introduced in the economy. With respect to the latter, as a resultof the Public Enterprise Proclamation enacted in August 1992, PEs electtheir own management boards, assume autonomy in their pricing and productiondecisions, and are no longer supervised by the Ministry of Industry. \JThe economic policy reforms that took place during 1992/93, most notably theliberalization of prices, the devaluation of the exchange rate, and thedismantling of the state distribution network, 2/ have created an unusualeconomic environment for PEs. Although most PEs succeeded in increasingoutput from unusually repressed levels and in improving their financialviability, the change in the cost structures following these reform measuresmade direct adherence by the PEs to the former cost-plus pricing principledifficult, partly because of low demand at the new, much higher prices.
In certain sectors, the need for restructuring is particularlypronounced. For instance, the textile sector currently suffers from seriousoverstocking, owing to a combination of supply and demand problems that havebeen developing over years, and which became acute during the transition toa market economy. On the demand side, changing tastes as well as
\J The Supervisory Authority is in charge of evaluating the performanceof PEs as well as in organizing their external auditing. The Authority isalso represented in a PE's Board of Directors for the purpose of assessingthe PE's investment budget.2/ At the level of retail trade, the private sector has already started
to play a more active role. Regarding wholesale trade, the previousinstitutions inherited from the earlier regime still occupy the dominantshare, although participation by the private sector is now allowed. Theformer institutions are now autonomous entities with their own Board ofDirectors and do not receive subsidies from the Government. The EthiopianDomestic Distribution Corporation and the Ethiopian Import-ExportCorporation were merged. The new organization will continue to be involvedin wholesale trade as well as in the importation of consumer goods.
©International Monetary Fund. Not for Redistribution
- 12 -
competitive prices offered by private sector firms--most importantly bycontraband trade from neighboring countries and increased sales of second-hand clothing--have resulted in a serious disruption in sales. Production,on the other hand, has been continuing, owing to the temporary availabilityof cotton supplies, and the concern to keep firms operating, given theirsizable work forces. The tobacco industry is faced with similar problemsarising from weak demand. Obsolete machinery is a major problem in manysectors, most notably in the food industry.
c. Energy
Ethiopia is excessively dependent on traditional fuels consistingmainly of wood, agricultural residues, and animal waste. Only about6 percent of Ethiopia's energy needs is met from modern energy sources suchas petroleum and electricity. As a result, deforestation, with its adverseimpact on soil productivity, has been an extremely serious problem.
Power generated by hydroelectric plants supplies most of Ethiopia'selectricity needs (over 95 percent), with total installed electricitycapacity at about 370 megawatts. Ethiopia's rich hydroelectric potential,with 40 river basins, remains almost completely untapped. Greater effort isbeing made to develop such energy sources. The construction of a new hydro-electric plant (rated at 180 megawatts) was supposed to start in 1992 as aresult of an agreement with North Korea. The agreement, however, iscurrently being renegotiated; four other hydroelectric projects are understudy. After almost complete stagnation between 1988/89 and 1991/92,electricity production increased by 11 percent in 1992/93 and 8.5 percent in1993/94, reaching 1.3 billion kilowatt-hours (Appendix Table XIX). Althoughonly 2 percent of the hydroelectric potential has been exploited, thecountry has excess capacity at the present rate of consumption. Thus theEthiopian authorities have been looking into the possibility of marketingelectricity to neighboring countries and progress has been made in theconstruction of transmission lines for the export of electricity.
Ethiopia imports crude oil (mainly from Saudi Arabia) for processing atthe Assab petroleum refinery, which is now owned by Eritrea. Ethiopia has acontract with the Eritrean Government for processing the crude oil importedby Ethiopia; the contract is renewed every year. Petroleum products refinedat Assab are considered "Ethiopian output" and are either shipped toEthiopia or sold to Eritrea as an export; about 20 percent of the productsrefined at Assab are sold in the Eritrean market, the remainder is used inEthiopia. Transactions are settled in birr, and the prices are revisedevery quarter based on international market prices. Additional petroleumproducts are imported from outside (and paid for in convertible currencies),and principally include kerosene, gasoline, and gas oil.
Recently, important steps have been taken to develop new energy sourcesfor Ethiopia, while reducing dependence on forests and the import ofpetroleum products. Financed under a World Bank loan, a project has beeninitiated to develop the natural gas deposits situated in the Ogaden region.
©International Monetary Fund. Not for Redistribution
- 13 -
The Calub gas reserves, estimated at about 2.7 trillion cubic feet (in tworeservoirs of 0.7 and 2.0 trillion cubic feet), are significant, with theupper layer (0.7 trillion cubic feet) also estimated to contain substantialassociated liquids (LPG, gasoline, kerosene, and diesel/gas oil). Theproject's contribution is expected to reach approximately 70,000 tons of oilequivalent per year (or about 8 percent of the current consumption ofpetroleum and electricity), providing energy sources for urban consumptionamounting to about 400,000 tons/year of fuelwood (about 18 percent ofcurrent urban consumption).
d. Mining
Mining and quarrying are relatively unimportant in Ethiopia,contributing less than 1 percent of GDP. However, based on the findings ofgeological surveys, it is estimated that there is substantial potential forexpansion. The Ethiopian Mineral Resource Corporation (EMRC) is responsiblefor the overall management of Ethiopia's mineral resources (except formarble) from the early stages of exploration through production andexporting; private sector involvement is encouraged to tap the sector'spotential.
Gold. Ethiopia's most important natural resource, is concentrated inthe Legedenbi area (500 kilometers south of Addis Ababa in the Sidamoregion) . Average annual production is about 3 tons, which is fully sold tothe National Bank of Ethiopia (NBE) for export. A project financed jointlyby the AfDB is expected to increase annual production capacity to about 4.8-5 tons by the year 1996, assuming that private sector involvement increases.In addition to primary gold (produced by modern techniques), small-scaleproduction takes place in the same region. Production from such sources isestimated to be around 500 kilograms. Tantalite production is about 30 tonsper annum, and is principally produced at a pilot plant, also located aroundLegedenbi. The production potential at this particular reserve is up to 200tons, but output has been limited by the competitiveness of theinternational markets.
Potash deposits exist around the very northern tip of Ethiopia by theEritrean border (close to the Red Sea). Soda ash is produced for localconsumption only, for use in the production of glass, bottles, detergents,etc.; current production is about 20,000 tons. If access to world marketscould be ensured, production could be raised to 1 million tons. Salt isproduced in very small quantities in a localized manner; large quantitiesare mostly imported from Eritrea. A reserve is being built in the Afarregion in the north-east, which is expected to produce about 300-400 milliontons of salt. There is an iron ore deposit in the western part of Ethiopia.Although it is not expected to be very rich, the Government is undertaking afeasibility study. Marble is handled by Natural Mining Company, a privateenterprise. West Wolega, East Hararge, and Tigray have particularly richmarble deposits.
©International Monetary Fund. Not for Redistribution
- 14 -
e. Building and construction
The construction sector was particularly repressed in the last years ofthe previous government, declining by a cumulative 56 percent during1988/89-1991/92; this largely reflected shortages in construction materialsas well as the overall decline in economic activity. As a result, thesector's share in GDP declined from 3.9 percent in 1988/89 to 2.1 percent in1991/92. In 1992/93, along with the overall recovery in economic activity,the sector rebounded by about 17 percent. This strong performance continuedin 1993/94, with the sector's share reaching 2.9 percent of GDP afteranother year of strong growth (10 percent). However, the share of GDP hasremained lower than in the pre-1989/90 period.
f. Transportation
The most common form of transportation in Ethiopia is road transport,accounting for more than 90 percent of all inter-urban freight and passengermovement. The jointly owned single track Ethiopia-Djibouti railway line,although in poor condition, handles most of the remaining load. Civilaviation is/not yet very important, although Ethiopian Airlines isconsidered to have established a highly profitable network of internationaland domestic routes. Given the rural nature of the economy, nonmotorizedtransport is also significant in areas where roads have not beenconstructed.
Ethiopia's road density is among the lowest in Africa, with anestimated 15.2 kilometers of road per 1,000 square kilometers. The mainroad network extends radially from Addis Ababa with few interconnectinglinks; large areas of the country have no linkage to regional and economiccenters. The public road network in Ethiopia consists of less than20,000 kilometers of main and rural roads. Of the main roads, approximately3,500 kilometers are paved and roughly 8,000 kilometers are graveled. It isestimated that about 65 percent of these roads are in poor condition, withthe deterioration in road conditions having intensified over the last decadebecause of a lack of maintenance.
In December 1992, central control of road transport operations wasabolished and the trucking industry was deregulated. Specifically, zonaltransport offices (Ketenas), established according to the Proclamation of1976 to control and regulate commercial road transport operations, wereclosed. State control of freight rates was removed, and the centralizedsystem of route and cargo assignment to private operators was liberalized.Although the state-owned Ethiopian Freight Transport Corporation (EFTC) isstill the largest single trucking operation in Ethiopia in terms of itsmassive infrastructure (cargo reservation and maintenance facilities as wellas load capacity), private sector participation has been increasing. By theend of 1993, in addition to 4,000 trucks that operated in association withEFTC, six private companies, with a capacity of about 1,450 trucks, havebeen established.
©International Monetary Fund. Not for Redistribution
- 15 -
After having risen by about 30-40 percent following deregulation,freight rates subsequently declined to levels lower than those prevailing inthe pre-deregulation period, which is partly due to the increase in thesupply of trucks, depressed demand, and to some extent, competition fromunlicensed operators. Rates appear to vary depending on routes; this isattributable to a number of factors, some of which are associated withproblems encountered by the trucking industry, including poor roadconditions, the aging fleet and high vehicle operating costs, and animbalance in the freight cargo load between inbound and outbound routes.
With the independence of Eritrea (with its ports of Assab and Massawa,Ethiopia is now a land-locked country. Assab is the principal port forimports to and exports from Ethiopia. Imports of dry, bulk, and oil cargoesenter through Assab, while other goods, particularly food aid, enter throughDjibouti. In addition, smaller quantities enter through Massawa for thenorthern regions. The government-owned Ethiopian Shipping Lines Corporationis the major shipping company servicing Assab; it owns 11 vessels, with acombined denarius weight (DWT) of 80,000 tons.
3. Emp 1 oymen t
Because of the rural nature of the economy, the modern wage sectoremployment in Ethiopia is small. Currently, the Government provides jobsfor about 240,000 employees in the civil service, and another 245,000 areemployed in the public enterprise sector, engaged in production andservices. Current data on employment by private formal (wage or self-employed) and informal sectors are virtually nonexistent. A surveyundertaken by the Ministry of Labor and Social Affairs (MLSA) in 1983, whichincluded establishments employing 10 people and more, put private sectorwage employment at slightly less than 200,000 (out of a total of about700,000), or 37 percent of the public sector wage employment in the sameyear. Assuming that a similar relation presently prevails, the current sizeof modern sector wage employment (at those establishments employing10 people or more) may be estimated at less than 1 million.
Over the last decade, high population growth coupled with less thansatisfactory improvements in the productive capacity of the economysharpened the existing imbalance in Ethiopia's labor market. On the basisof the last census conducted in 1984, Ethiopia's population is estimated tohave reached 52 million (excluding Eritrea) in 1992, from 40.7 million in1984, implying an average growth rate of 3 percent per annum. The growthrate of the urban population (6.4 percent) is estimated to have exceededthat of the rural population (2.7 percent) during this period, partly owingto migration. Given that employment opportunities have not expanded at thesame rate, it is likely that the unemployment problem has become more acutein the urban centers.
Data on the registered unemployed, vacancies, and placements, asreported by the MLSA and compiled from the Labor Exchange Offices (LEOs),suffer from a number of statistical problems, including the voluntary nature
©International Monetary Fund. Not for Redistribution
- 16 -
of registrations as well as reporting issues (e.g., cases where vacancieswere filled or applicants secured jobs by themselves are not regularlyreported to the LEO). However, an increase in the registered unemployedduring 1991/92-1992/93, coupled with a decline in reported vacancies,appears to indicate a worsening of the imbalance in the labor market(Appendix Table XXIII). While demobilization of the army, returnees fromEritrea, and an increasing number of graduates from the university areconsidered to have contributed to this outcome, some retrenchment also tookplace in the context of the recent restructuring of the ministries and thereform of the PEs. The Prime Minister's Office (PMO) is in charge of theNational Retrenchment Policy, with two committees--the RedeploymentCommittee and the Vocational Training Committee--dealing with the issue.Currently, policies are directed more toward the training of workers who arelikely to be retrenched, as privatization of PEs commences, while keepingthem on the payroll. Most retrenchment in the short term is expected totake the form of a redeployment of workers from the center to the regions;reportedly, regions are now operating with 70 percent vacancy rates, andthus there is room for most workers who are likely to be retrenched from thecentral government ministries to be redeployed at the regional level. Thereare also plans in the Government to subsidize some private sector firms toemploy retrenched workers. The revival in private sector activity isenvisaged to have dampened the unemployment problem to some extent.
Labor relations in Ethiopia are currently organized under the new LaborCode, which became effective in January 20, 1993, replacing the LaborProclamation Order of 1975. The objectives of this proclamation are (i) toestablish rules governing worker-employer relations according to basicprinciples of rights and obligations; (ii) to guarantee the right of workersand employers to form their respective associations and to engage incollective bargaining; and (iii) to strengthen and define the powers andduties of the government agency charged with ensuring that the law isadhered to with respect to collective bargaining, occupational safety,health, and the work environment. I/ In line with the new Labor Code,LEOs are now operating as service agencies, rather than regulatory placementagencies. There are about 30 offices around the country, operating more orless autonomously, partly owing to regionalization. The unemployed stillreport to the LEOs, but on a completely voluntary basis. However, noprivate employment agencies are allowed in the system, consistent with thecurrent policy stance of the International Labor Organization.
4. Wages
In October 1992, at the time of the exchange rate devaluation, theGovernment introduced significant wage increases, mainly for low-paid stateemployees. Increases were made on a progressively sliding scale, with theobjective of raising the incomes of those groups whose wages had fallensignificantly below the minimum consumption basket (calculated by the Wage
I/ See Ethiopia: Recent Economic Developments, SM/93/102, 5/13/93.
©International Monetary Fund. Not for Redistribution
- 17 -
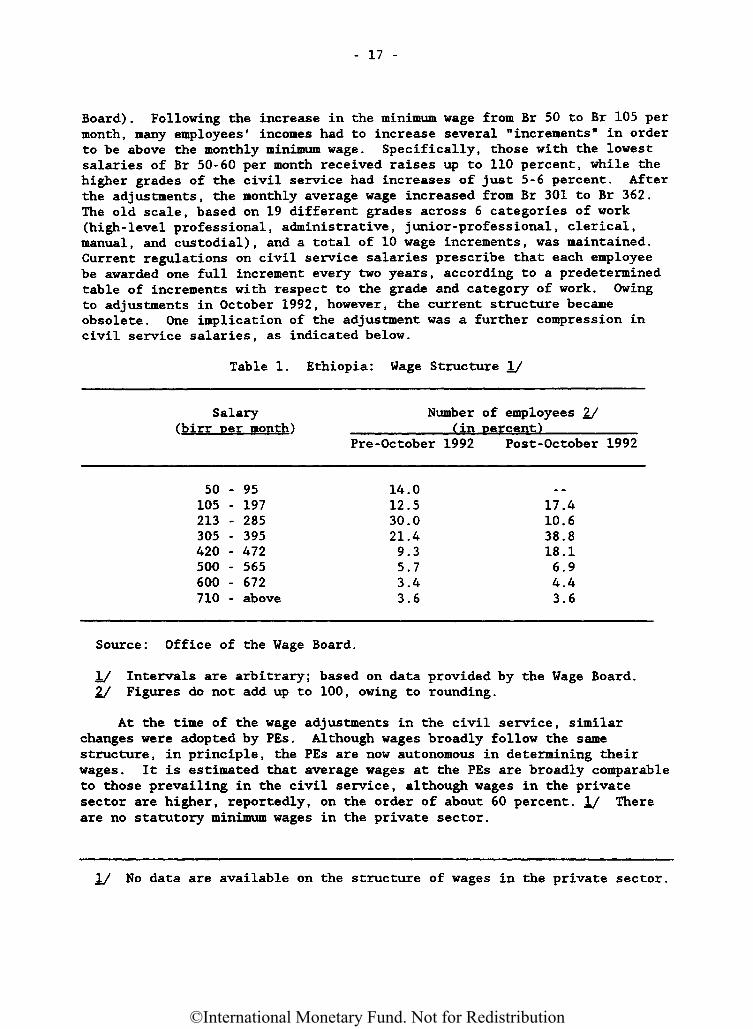
Board) . Following the increase in the minimum wage from Br 50 to Br 105 permonth, many employees' incomes had to increase several "increments11 in orderto be above the monthly minimum wage. Specifically, those with the lowestsalaries of Br 50-60 per month received raises up to 110 percent, while thehigher grades of the civil service had increases of just 5-6 percent. Afterthe adjustments, the monthly average wage increased from Br 301 to Br 362.The old scale, based on 19 different grades across 6 categories of work(high-level professional, administrative, junior-professional, clerical,manual, and custodial), and a total of 10 wage increments, was maintained.Current regulations on civil service salaries prescribe that each employeebe awarded one full increment every two years, according to a predeterminedtable of increments with respect to the grade and category of work. Owingto adjustments in October 1992, however, the current structure becameobsolete. One implication of the adjustment was a further compression incivil service salaries, as indicated below.
Table 1. Ethiopia: Wage Structure I/
Salary Number of employees 2/(birr per month) (in percent)
Pre-October 1992 Post-October 1992
50105213305420500600710
- 95- 197- 285- 395- 472- 565- 672- above
14.012.530.021.49.35.73.43.6
17.410.638.818.16.94.43.6
Source: Office of the Wage Board.
I/ Intervals are arbitrary; based on data provided by the Wage Board.7J Figures do not add up to 100, owing to rounding.
At the time of the wage adjustments in the civil service, similarchanges were adopted by PEs. Although wages broadly follow the samestructure, in principle, the PEs are now autonomous in determining theirwages. It is estimated that average wages at the PEs are broadly comparableto those prevailing in the civil service, although wages in the privatesector are higher, reportedly, on the order of about 60 percent. I/ Thereare no statutory minimum wages in the private sector.
I/ No data are available on the structure of wages in the private sector.
©International Monetary Fund. Not for Redistribution
- 18 -
A preliminary study on the reform of the civil service pay structurehas now been completed within the broader context of the civil servicereform. The study, which was prepared and carried out by the WageBoard, \J recommends modifications to the pay structure with a view todecompressing wages. Further analysis of the study is anticipated beforethe Government finalizes its decision on the magnitude and structure of payadjustments.
Over the years, price developments in Ethiopia have largely beeninfluenced by supply-side factors such as external shocks, volatility ofagricultural production, and shortages of foreign exchange. 2/ During1990/91-1991/92, the annual inflation rate averaged about 20 percent, assupply-side disruptions related to the end of the previous government werefurther aggravated by loose financial policies (Appendix Tables XX-XXII).During 1992/93, despite the substantial adjustment of the exchange rate ofthe birr in October 1992, inflation declined to 10 percent, owing to atightening of financial policies (including an improved fiscal position andpositive real interest rates), as well as the favorable impact of a goodmeher harvest on food prices, coupled with an overall normalization inagricultural production. Annual inflation continued to decelerate during1993/94, to 1.2 percent, mainly reflecting the continued positive effect ofthe good 1992/93 harvest as well as the tailing-off of the adverse effectsof devaluation. Inflation as measured by the GDP deflator, which reflectsdevelopments in wholesale prices to some extent, also followed a similarpattern.
During January-May 1994, there was an increase in monthly inflation,reflecting pressures developing in the cereal market. The price indexdropped in June by 2.0 percent, as a result of a decline in some other fooditems (e.g., meat and dairy products), while monthly inflation continued to
I/ The old structure within which the Wage Board used to operate has beendismantled; now the Board directly reports to the Prime Minister's Office.2/ Inflation is measured by the Addis Ababa Retail Price Index (AARPI),
which suffers from a number of statistical problems in terms of its coverageand expenditure weights. See Ethiopia: Recent Economic Developments,SM/91/122, 6/14/91.
5. Prices
©International Monetary Fund. Not for Redistribution
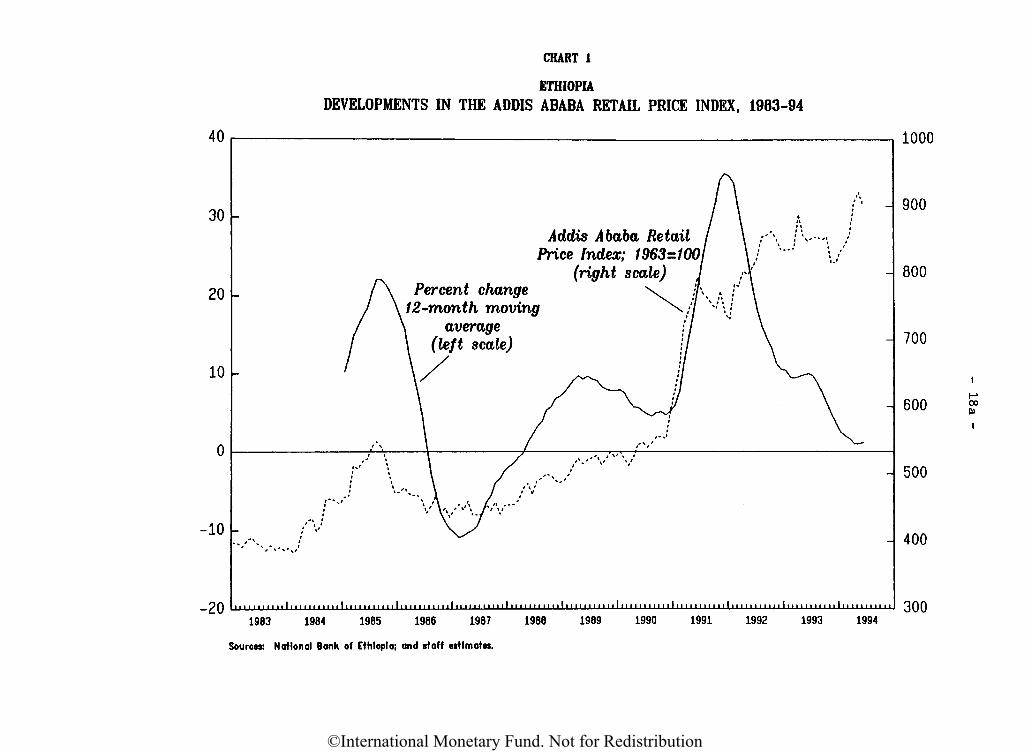
CHART 1
ETHIOPIADEVELOPMENTS IN THE ADDIS ABABA RETAIL PRICE INDEX, 1983-94
Sources: N at tonal Bank of Ethiopia; and staff estimates.
©International Monetary Fund. Not for Redistribution

This page intentionally left blank
©International Monetary Fund. Not for Redistribution
- 19 -
be positive for cereals and nonfood items as a whole. I/ On an annualbasis, reflecting the impact of the good harvests in 1992/93, the increasein food prices fell below that of nonfood prices during 1992/93-1993/94.
Ethiopia has abolished all price controls except for three productcategories, which remain subject to price controls at both the retail andthe wholesale levels. These include petroleum and petroleum products, somePharmaceuticals, and sugar for household consumption. Controls over pricesof a few essential items (cement, corrugated roofing, nails, reinforcingbars, khaki textiles, nylon textiles, traditional abujadid cloth, and cottonyarn) were eliminated in mid-1993. Price controls on spare parts, whichalso had been removed on a de facto basis in mid-1993, were removedstatutorily in July 1994. In mid-May, the retail prices of petroleumproducts were increased with a view to taking account of the impact ofadjustments in the official exchange rate on the import parity price.Utility prices remain under government control. Telephone tariffs wereadjusted in July 1994. The present electricity tariffs, which have remainedunchanged since March 1986, are currently being reviewed by the EthiopianElectric Light and Power Authority. A study on water and sewerage tariffshas been completed. Passenger transport tariffs also remain underGovernment control.
6- Private sector investment
Since the launching of the economic reform program in late 1992, theprivate sector environment in Ethiopia has improved considerably. In linewith the directives laid out in the new Investment Code (ProclamationNo. 15/1992), Regional Investment Offices (RIO) 2J nave been establishedas one-stop offices to issue licenses for domestic investments exceedingBr 250,000. The Investment Office of Ethiopia (IOE) , located in Region 14(the Addis Ababa Region) issues licenses for foreign investments (exceedingUS$500,000) and acts as the Regional Investment Office for Region 14. Inaddition, the IOE issues licenses and grants incentives on behalf of thoseAdministrative Regions that have not yet set up an investment office.
i/ About 57 percent of the AARPI is composed of food items; consequently,the seasonal pattern of inflation, as measured by the AARPI, is largelydetermined by the seasonal pattern of the food index. A simple regressionon food price inflation (covering the last ten years), including monthlyseasonal dummies and controlling for the escalation of war in 1990/91 andthe drought in 1984/85, indicates that the pattern of monthly inflation infood prices follows broadly the developments in the crop pattern.Specifically, monthly inflation is significantly lower in December andstarts increasing gradually thereafter during January through April; nosignificant trend is observed during May through July. In August, inflationappears significantly higher, and then remains stable till November.2/ There were 4 RIOs as of June 7, 1994.
©International Monetary Fund. Not for Redistribution
- 20 -
Between July 1992 and June 7, 1994, the IOE and other functioningregional investment offices have issued investment certificates to1,069 projects, of which eight were foreign investment projects (AppendixTable XV). The total capital implied by these project applications amountedto Br 7.3 billion (Br 6.9 billion issued by the IOE), of which foreigninvestment projects amounted to Br 677 million (9 percent). The totalemployment potential of the projects is estimated at some 60,000 permanentand 83,000 temporary jobs. The regional distribution of investment projectsis overwhelmingly in favor of Region 14 (75.7 percent), followed by Oromiya(12.5 percent), Region 3 (4 percent), Tigray (3.3. percent), and theSouthern Ethiopian Peoples Region (2.7 percent), while the remainder(1.8 percent) is shared by six other regions. Such a concentration ispartly attributable to delays encountered at the regional level during theinitial period following enactment of the Investment Code.
In terms of the sectoral distribution of investment licenses,manufacturing has the highest share (about 45 percent in value terms),followed by real estate (16.8 percent), agriculture (15.8 percent), hotelsand tourism (6.1 percent), and construction (5.7 percent). Manufacturinginvestment is mostly concentrated in the food and beverages sector, followedby textiles and leather products, building materials, and plastic products.The value of four cotton projects accounts for about 55 percent of theinvestment licenses issued by the IOE in the area of agriculture. As ofJune 7, 1994, 114 projects (valued at Br 961,367) were under implementationand 66 projects (valued at Br 338,940) were operational. The implementationratio (adjusted for those projects which are already operational) stillremains low, at about 13.7 percent, owing to uncertainties over theGovernment's urban land lease policy and to bottlenecks in the financingarea. As regards the latter, given that the credit needs for the proposedinvestments (as of June 7, 1994) are estimated to exceed Br 3 billion, thereis some uncertainty as to the capacity of Ethiopia's banking system toprovide the required credit for these investments.
In assessing the momentum of private investment, it would appear thatthere has been a slowdown in recent months. During 1992/93, the IOE issuedlicenses for 503 projects valued at Br 3.6 billion. A similar amount islikely to have been realized for 1993/94, as the value of total investmentlicenses issued by the IOE reached Br 3.2 billion as of June 7, 1994.However, in terms of the number of licenses issued, a considerable slowdownappears to have occurred; after a significant jump during the first quarterof 1993/94 (211 licenses), only 147 licenses were issued during January-May1994. Nevertheless, there has been no increase in the number of returnedlicenses.
As regards licensing policies, the IOE continues to guide investorinterests through its tax holidays (which extend 3 to 8 years) and tariffexemptions (mainly on machinery imports). In those areas where the IOEconcludes an excessive buildup has been taking place, investors areexplicitly advised to divert their interests to other areas. In addition to
©International Monetary Fund. Not for Redistribution
- 21 -
areas that are exclusively reserved for the Government, \J certain keyareas are exclusively reserved for the domestic private sector, such asradio and television broadcasting; printing and publishing; retail andwholesale trade; import trade; banking and insurance business; small andmedium-size air, rail and marine services (wet and dry cargo, and passengerservices); traditional commodity exports; and food processing (for the localmarket).
7. pr jva t i z a t i
Ethiopia is in the very early stages of the privatization process. APrivatization Agency has been set up (Proclamation No. 87/1994, February 17,1994) to study and execute the privatization/divestment process, and is inthe process of organizing its work activities, including the hiring ofadditional personnel. Over the next few months, the agency will review thework that has been done by other institutions (e.g., Ministry of Industry),and then formulate the exact time frame and specific modalities forprivatization. Some 29 hotels and restaurants and about 120 retail outlets,which were expected to be divested by the Government in the short term, arenow expected to be fully disposed of in the coming months. About 100 PEsare planned to be privatized; of these, about 50 will be privatized in theshort term (2-3 years). Privatization of state farms will be undertakenalong with the remaining PEs over the longer term. However, a small amountof land under the state farms (about 6,500 hectares) has been disposed of ortaken over by smallholders. In addition, a few enterprises were returned totheir original owners and some are in the process of being returned.
8. Revised GDP figures
A project was initiated in 1992 in the Ministry of Planning andEconomic Development, with technical assistance from the United NationsDevelopment Program (UNDP), to revise Ethiopia's national income accountsfor the period 1980/81-1990/91. The project is expected to be finalized,and figures published before the end of 1994. The figures include estimatesfor 1991/92-1993/94. The main objectives of the project were: (i) toidentify and correct methodological deficiencies in the old series after anin-depth study of the national accounts system; and (ii) to expand thesystem, to the extent possible, to cover hitherto uncompiled accounts. Asthe project continued, the objectives were enlarged to include estimation ofseries without Eritrea for the period 1980/81-1990/91 (for consistencypurposes) as well as to devise methodologies for the estimation of regionaldomestic products. 2/
The coverage has been increased mainly in livestock, forestry,transportation, education, government administration, and defense. Revised
I/ See Ethiopia: Recent Economic Developments, SM/93/102, 5/13/93.2/ Under the revised figures, Eritrea constitutes broadly about 7 percent
of Ethiopia.
©International Monetary Fund. Not for Redistribution
- 22 -
estimation procedures have been applied in agriculture (crops, livestock,and forestry), mining and quarrying, small-scale industries and handicrafts,water, trade, hotels, and restaurants, domestic services, and otherservices. In addition, new data sources have been used, including: (i) thenumber of economically active population (based on the 1984 Population andHousing Census); (ii) surveys on small-scale industries; (iii) the energysurvey for forestry; (iv) producer prices of various commodities; and(v) surveys on inputs to the agricultural sector. New aggregates werecompiled on "Private Final Consumption Expenditure" and the "Change inStocks."
The revised GDP figures are broadly about 25 percent higher than theold figures in constant prices; in current prices, while a similarcomparison applies for figures related to early 1980s, the differentialgrows during the latter half of the 1980s, yielding a revised series about50 percent higher than the old series. The principal reason for thedifferential appears to be that in the revised series, the value of theagricultural sector is much higher in current prices, mainly owing to theadoption of market-determined producer prices in its valuation as opposed tocontrolled prices.
II. Public Finance
1- Overall fiscal performance
During the period 1988/89-1990/91, fiscal performance was stronglyinfluenced by the civil war, the inadequate economic policies of theprevious government with its orientation toward central planning, and thedeepening economic and political crisis in the country. A relativelyfavorable budgetary outcome was achieved in 1988/89, but in the followingyears, fiscal performance worsened sharply. In 1989/90, the overall fiscaldeficit (on a cash basis, including grants) reached a record level of12.3 percent of GDP (14.5 percent excluding grants), reflecting both verylow levels of revenues and external grants, and high governmentexpenditures. During the last years of the previous regime, militaryexpenditures were particularly large--averaging 9.7 percent of GDP duringthe period 1988/89-1990/91.
After the Transitional Government of Ethiopia (TGE) came to power inMay 1991, the focus of fiscal policy began to shift. While revenueperformance improved, thanks to the economic recovery and other factors,military outlays were radically reduced and spending on both the current andcapital budgets was restructured toward infrastructure and social services,reflecting the priorities of the TGE's economic reform program.Increasingly, as external grants and concessional loans were made available,the generation of counterpart funds from external funding became moreimportant as a source of financing the budget. Also, Ethiopia began tobenefit from the rescheduling of its external debt service obligations thatresulted from a meeting of the Paris Club in December 1992.
©International Monetary Fund. Not for Redistribution
- 23 -
The fiscal performance has improved substantially during the past threeyears, particularly in terms of reduced domestic bank financing of thebudget. In 1991/92 and 1992/93, the overall fiscal deficit (on a cashbasis, including grants) fell to about 7 percent of GDP; in 1993/94, thebudget deficit (including grants) is estimated at 9.6 percent of GDP,largely reflecting an unexpected shortfall in counterpart funds generation,higher relief outlays associated with the drought, and a growth in donor-financed capital spending. Prior to 1991/92, domestic bank borrowing hadplayed a major role in financing the fiscal deficit. In 1989/90, governmentborrowing from the domestic banking system peaked at 9.6 percent of GDP, butwas sharply reduced to 3.2 percent of GDP in 1992/93 and to an estimated1.9 percent in 1993/94. Foreign financing, which until 1991/92 had droppedsharply (to 1.2 percent of GDP) because of the reluctance of donors tosupport the policies of the previous regime, rose to 3.9 percent of GDP in1992/93 and 7.1 percent of GDP in 1993/94. During 1992/93 and especially in1993/94, foreign financing in terms of structural adjustment credits andloans that generate counterpart funds gained significantly in importance.
2. Revenues and grants
a. Overview
In 1988/89, owing to favorable economic growth and the strong controlsassociated with a centrally planned economy, revenue performance was good,with a revenue to GDP ratio of 23.1 percent, almost two thirds of which wasfrom tax revenue. In the following two years, however, the revenueperformance worsened progressively, largely because of the intensifyingpolitical crisis. By 1991/92, the revenue-to-GDP ratio had fallen to thevery low level of 10.7 percent of GDP. The drop in nontax revenue wasparticularly strong (from 9.1 percent of GDP in 1988/89 to 2.9 percent in1991/92), mainly reflecting a sharp deterioration in the profitability ofpublic enterprises (with a dramatic decline in capacity utilization rates),and the inability of the Government to command profit remittances as in thepast. During the past two years, the revenue-to-GDP ratio roseconsiderably, to 11.9 percent in 1992/93, and an estimated 13.6 percent in1993/94. At the same time, a significant change occurred in the tax andnontax revenue structure with the change from a centrally planned to amarket economy. Receipts from external grants also rose sharply during thepast two years. Largely, this reflected receipts from donors associatedwith the World Bank-organized Emergency Recovery and Rehabilitation Program(ERRP) , as well as grants provided by the European Union (EU) , including thSTABEX scheme and structural adjustment support.
©International Monetary Fund. Not for Redistribution
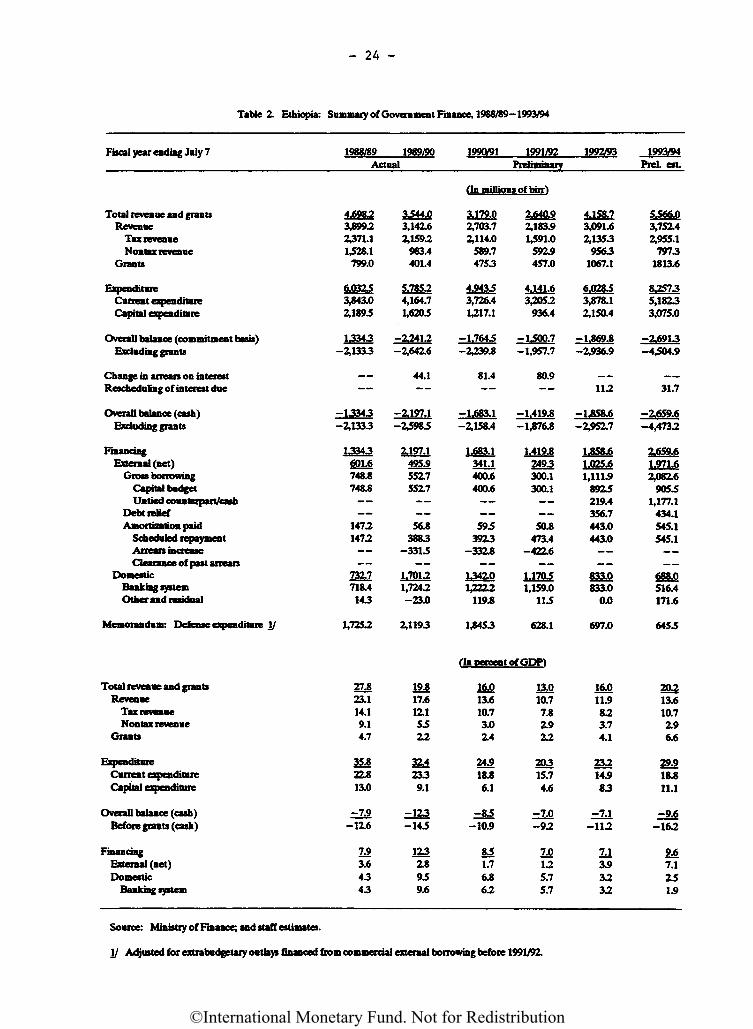
- 24 -
Table 2. Ethiopia: Summary of Government Finance, 1988/89-1993/94
Fiscal year ending July 7 1988/89 1989/90 1990/91Actual
1991/92Preliminary
1992/93 1993/94Prel. est.
fin trillions of bin*)
Total revenue and giantsRevenue
Tax revenueNontax revenue
Grants
ExpenditureCurrent expenditureCapital expenditure
Overall balance (commitment basis)Excluding grants
Change in arrears on interestRescheduling of interest due
Overall balance (cash)Excluding grants
FinancingExternal (net)
Gross borrowingCapital budgetUntied counterpart/cash
Debt reliefAmortization paid
Arrears increaseClearance of past arrears
DomesticBanking systemOther and residual
Total revenue and grantsRevenue
Tax revenueNontax revenue
Grants
ExpenditureCurrent expenditure
Overall balance (cash)Before grants (cash)
FinancingExternal (net)Domestic
Banking system
4.608.23,899.22371.11,528.1
799.0
6,03253,843.02,189.5
13343-2»1333
-13343-2,1333
13343601.6748.8748.8
147.2147.2
718.4143
1 7K7.
2L823.114.19.14.7
35*22.81*3 ft
-7.9-12.6
m3.64343
3544.03,14X62,159.2
983.4401.4
5.785.24,164.71,6205
-2341.2-2,642.6
44.1
-2.197.1-2^985
2.197.1495.955Z7552.7
56.83883
-3315
1.701.21,7242-23.0
4>)117O
1*817.612.15522
3Z423301JF.l
:zi23-145
1232.8959.6
3.179.02,703.72,114.0
589.74753
4.94353,726.41,217.1
-1.7645-2^39.8
81.4
-1.683.1-2,158.4
1.683.1341.1400.6400.6
5953923
-332.8
1342.01,2222
119.8
1 Hd^^
fin percci
16.013.610.73.02.4
24.918.8t\ iU.I
=**-10.9
851.76.86.2
2.640.92,183.91,591.0
592.9457.0
4.141.63,2052
936.4
-1500.7-1,957.7
80.9
-1.419.8-1,876.8
1.419.82493300.1300.1
50.8473.4
-422.6
1.17051,159.0
115
ms. i
it of GDP)
13,010.77.82.922
2Q315.7
Af.n.O
£LO-92
TO125.75.7
4.158.73,091.62,1353
95631067.1
6.02853,878.12,150.4
-1.869.8-2,936.9
112
-1.858.6-2,952.7
1.858.61.025.61,111.9
8925219.4356.7443.0443.0
833.0833.0
0.0
fuyrn
16.01L9823.74.1
23214.900OO
-n2
113.93232
5566.03,752.42,955.1
79731813.6
825735,18233,075.0
-2.6913-4^04.9
31.7
-Z659.6-4,4732
2.659.61.971.62,082.6
90551,177.1
434.1545.1545.1
688.0516.4171.6
O43O
20213.610.72.96.6
^918̂11 iii.i
=M-162
9*7.1251̂
Source: Ministry of Finance; and staff estimates.
I/ Adjusted for extrabudgetary outlays financed from commercial external borrowing before 1991/92.
-7.1
732.7
Scheduled repayment
Memorandum: defense expenditure 1/
Capital expendistare
©International Monetary Fund. Not for Redistribution
- 25 -
b. Tax revenue
Tax revenue rose from a very low level of 7.8 percent of GDP in 1991/92to 8.2 percent of GDP in 1992/93, and an estimated 10.7 percent of GDP in1993/94, reflecting not only the economic recovery, but also theimplementation of important tax and tariff policy reforms and successfulefforts to strengthen the institutional capacity of the tax and customsadministration. The composition of tax revenue during the whole periodchanged substantially; most notably, the share of direct tax revenue intotal revenue declined from more than 40 percent in 1988/89 to about31 percent in 1993/94; and the share of import duties and taxes rosesubstantially from 15 percent to 41 percent during the same period. Inaddition, export tax revenue declined from about 6.9 percent to 1.7 percentin the period 1988/89-1993/94.
The business profit tax and profit transfers from the public enterprisesector were the most important revenue instruments during the time of theprevious government. These tax bases effectively collapsed at the end ofthe 1980s with the deteriorating performance of public enterprises andparastatals. Revenue from these sources reached its lowest level inabsolute terms during the years 1991/92 and 1992/93, reflecting the after-effects of both the economic and political crisis and the transition to anew Government. For the TGE, restoring tax revenue levels and revising thetax system in a way commensurate with the systemic change from a centrallyplanned economy to a market-oriented system were important tasks and formedan integral part of the economic reform program.
Specifically, prior to 1991/92, Ethiopia's tax system was integral tothe needs of a command economy; the tax system was very complex, it had anarrow base, and tax rates were set at punitively high levels. Taxassessment and collection methods were administratively cumbersome, althoughcarried out under the discipline connected with a centrally planned economy.Tax reforms undertaken during 1992/93 and 1993/94 have focused on changingthis system toward one that is consistent with a market economy, i.e., aliberalized economy with a rapidly growing private sector. These reformshave included a reduction of the maximum rate of the personal income tax andthe rationalization of the large number of sales and excise taxes into asimpler system with fewer tax rates, and more services made subject to thesales tax. In a bid to broaden the tax base and make the tax system moreequitable, the taxation of rental incomes was introduced. All export taxesother than on coffee were abolished. With the devaluation of the birr, theGovernment also sought to significantly reduce tariff rates. In addition,it eliminated the higher sales tax rate on imports, incorporating thedifferential rate into the new tariff structure (see below).
In the context of its regional izat ion policy, the TGE in 1992/93delegated some tax collection tasks to the Regions, including theagricultural income tax and land-use fee, the profit and sales taxes onsmall-scale traders, and the personal income tax from regional governmentemployees and enterprises owned by the Regions (see section II.4 below).
©International Monetary Fund. Not for Redistribution
- 26 -
Also, the TGE began to strengthen the tax and customs administration. InMay 1994, steps were initiated to establish an autonomous Revenue Authority,comprising both the Inland Revenue Administration (IRA) and the CustomsAdministration.
Concerning specific taxes, after falling to a low level in 1991/92,revenue from the personal income tax increased slightly during 1992/93 and1993/94 (see Appendix Table XXIV) . The personal income tax is levied on thewages and salaries of civil servants and public enterprise employees. Thistax was reformed in October 1992; the maximum tax rate was lowered from85 percent to 50 percent, and the number of brackets was reduced from 17 to10. However, this reform left the incidence for most low-income wageearners largely unchanged. Also, at the same time, substantial salary andwage increases took place in the public sector, which more than offset thenegative impact of the reduction of the maximum tax rate on revenue.
With regard to the business profit tax, in 1993/94, a strong increasein revenue was achieved, reflecting the beginning of the recovery process inthe economy during 1992/93; revenue from this tax rose by 43.7 percentcompared with the previous year. I/ However, this was still lower thanthe level of receipts collected in 1988/89 and 1989/90. Taking into accountthe substantial improvements in capacity utilization and production outputin both the public and private nonagricultural sectors, the buoyancy of thebusiness profit tax during 1993/94 was lower than expected. Furtherimprovements in revenue performance from this tax were hampered by taxevasion in the face of high tax rates, cumbersome collection methods, andthe weak institutional capacity of the IRA and the Regional Finance Bureaus.
Other forms of income taxes yielded only limited revenues during theperiod under consideration. The rental income tax, which was introduced inJuly 1993, did not produce any noteworthy revenue in 1993/94, owing todelays in the preparation of directives by the Ministry of Finance for thecollection of this tax by the Regional Finance Bureaus. Generaladministrative weaknesses in the Regional Administrations also hamperedrevenue collections. Agricultural income tax and rural land-use feereceipts recovered considerably during 1992/93 and 1993/94, but were stilllimited by various factors. First, and most importantly, the land-use feeis uniform across the country and does not take into account theconsiderable variation in land quality and differences in cash-crop growingpotentials; substantial revenue from the commercial farming sector isthereby forgone. 2J Second, the agricultural land tax, which has amaximum tax rate of 89 percent (but a flat rate of 50 percent for all
I/ For most enterprises, this tax is assessed on the basis of profitsfrom the past fiscal year. For incorporated businesses, a flat rate of 50percent is applied; for unincorporated business, the tax has 18 brackets anda maximum tax rate of 59 percent (for taxable income above Br 24,000/year)
2/ Members of agricultural producers' cooperatives pay Br 5 per hectare,while other individual farmers pay Br 10 per hectare.
©International Monetary Fund. Not for Redistribution
- 27 -
incorporated commercial farms), has proven to be impractical from theperspective of the tax administration; collections appear mostly confined tothe minimum tax of Br 10 per farmer. Third, although revenue from theagricultural income tax is largely collected in agricultural surplus areas(e.g., Oromia, Amhara), drought and production shortfalls in large parts ofthe country during 1993/94 made it impossible to increase revenue collectionfrom this tax further.
Revenue from domestic sales and excise taxes also recovered during thepast two fiscal years. After falling by almost 30 percent in 1991/92,receipts rose by 32 percent in 1992/93 and by another 13 percent in 1993/94.However, the increase in revenue in 1993/94 was much lower than expected,considering that the tax reforms introduced in August 1993 resulted in abroader tax base for the sales tax on services, and that higher exfactoryprices prevailed for a large number of products. In part, the shortfall maybe explained by an increase in arrears of about Br 50 million in sales andexcise taxes from public enterprises in the textile, beverages, and tobaccosectors. These enterprises produced large stocks that they were unable tosell because of strong competition from smuggled imports (such as second-hand clothing, alcohol, and cigarettes), and noncompetitive output pricesthat reflected high production costs and the structural problems of theenterprises concerned.
Revenue from customs duties and taxes rose substantially in 1992/93 and1993/94, reflecting both higjher imports (especially from franco valutaimports subject to high tariff rates) and the impact of the October 1992devaluation, which had a major effect on the value of imports in localcurrency terms, particularly during 1993/94. \J Revenue from importduties and taxes rose by about 70 percent in 1992/93 and again by about72 percent in 1993/94. The tariff reforms that the Government introduced inAugust 1993 also contributed to this outcome--despite a substantialreduction of the maximum tariff rate (from 230 percent to 80 percent) and areduction in the average nominal tariff rate from 34 to 29 percent. 2/ Inaddition, the Government has begun to restructure and strengthen the CustomsAdministration, involving both external technical assistance and the hiringof an external company charged with preshipment inspection. However,revenue was forgone as a result of the smuggling of goods, especially
I/ During 1992/93, most imports that came into the country before April1993 were still recorded for customs valuation purposes at the old exchangerate of Br 2.07 - US$1, even though the devaluation took place in October1992. This reflected the fact that most of these imports were shipped orcontracted for prior to the devaluation announcement.
2/ Also, the minimum tariff rate was raised to 5 percent, the number ofzero-rated items was reduced (which also led to a reduction in the number ofbands from 25 to 10), all but three specific duties were converted into advalorem rates, the sales tax on imports was reduced to the level of thesales tax on domestic goods (12 percent), and the import duty drawbackmechanism was simplified and expanded.
©International Monetary Fund. Not for Redistribution
- 28 -
second-hand clothing, cigarettes, and alcohol via Djibouti and otherneighboring countries. Recent protocols signed between the Government andneighboring countries (including Djibouti and Eritrea) should improve theexchange of information and result in a reduction of smuggling.
Not surprisingly, revenue from export taxes fell considerably from1988/89 until 1991/92. In 1992/93, the Ethiopian Government abolished allexport taxes, except for coffee, in a bid to promote the expansion anddiversification of exports. I/ Owing to the recovery in the Ethiopiancoffee sector, the devaluation of the birr, and rising world market pricesfor coffee since mid-1993, revenue from export taxes increased *substantiallyduring 1993/94.
During the past fiscal year, the Government made progress in itsefforts to collect tax and customs arrears, although sales tax arrears frompublic enterprises have built up as mentioned above. At the end of fiscalyear 1993/94, total tax and customs arrears amounted to about Br 640 millionand Br 150 million, respectively, most of which had been incurred by publicenterprises and parastatals prior to 1991/92. Involving the SupervisingAuthority for Public Enterprises, the IRA and the Customs Administrationhave started to negotiate repayment schedules, and agreements have beenreached with a number of public enterprises and parastatals, including theTelecommunications Authority, the Ethiopian Shipping Lines Corporation, andsome 15 other public enterprises from various sectors (e.g., grinding mills,printing press companies, and woodworking factories).
c. Nontax revenue
Nontax revenue is principally derived from public enterprise andparastatal receipts, consisting of capital charges, residual surplus,interest payments, and from 1993/94 onward, state dividends. 2/ Afterhaving reached a historically high level of 9.1 percent of GDP in 1988/89,nontax revenue plummeted by two thirds until 1991/92, with the ratio to GDPdeclining to about 3.0 percent in 1990/91 and 1991/92 (see Table 2). Thedecline reflected the sharp drop in payments received from the publicenterprise sector, resulting from the deterioration in financial performanceand the inability of the Government to command profit transfers from theseenterprises.
During the past two fiscal years, the ratio of nontax revenue to GDPremained relatively low. However, sizable profit transfers were derived
JL/ Previously, the export of a number of other products--including cottonseed, sugar, and hides and skins--had been taxed at various rates.
2/ In addition, nontax revenue includes charges and fees, receipts fromsales of goods and services, pension contributions, reimbursements andproperty sales, and other extraordinary receipts. Under the previousgovernment, a war levy had also been introduced; this was abolished in1990/91.
©International Monetary Fund. Not for Redistribution
- 29 -
from a number of public enterprises and parastatals, including theCommercial Bank of Ethiopia, the Telecommunications Authority, the EthiopianShipping Lines, the National Bonded Warehouse, the Petroleum Corporation,and the Agency for the Administration of Rented Houses. Also, profitsremitted from the NBE increased substantially, to Br 90 million in 1992/93and Br 151 million in 1993/94. A one-time boost in nontax revenue wasrecorded in 1992/93 through a grant payment from Israel associated with theearlier emigration of the Felashas (see Appendix Table XXIV)
In 1992/93, the Government initiated a process of restructuring in thepublic enterprise and parastatal sector. Proclamation No. 25/1992 wasissued, through which about 160 of the total of more than 200 publicenterprises and parastatals were given an autonomous status. According tothis law, these state enterprises and parastatals are now formally under aSupervising Authority within the Prime Minister's Office, but have autonomyin terms of wages and staffing policy, price policy, and investment andfinancing decisions (see also Section 1.7). While all other publicenterprises and parastatals continue to pay capital charges, residualsurplus and interest payments, those enterprises covered by ProclamationNo. 25/1992 began to pay state dividends in 1993/94. The Government hasdevised a schedule, according to which those enterprises to be divested inthe short term pay a higher state dividend (up to 90 percent of net profits)than those that will be retained under government ownership over the mediumto long term (which will pay up to 50 percent of net profits) . At the endof 1993/94, outstanding arrears from public enterprises and parastatalsamounted to about Br 200 million, mostly from the period prior to 1991/92.
d. External grants
External grants plummeted from about Br 800 million (4.7 percent ofGDP) in 1988/89 to about Br 460 million (2.2 percent of GDP) in 1991/92 asdonors significantly curtailed their support of the previous government.During 1992/93 and 1993/94, the flow of external grants increased again,reflecting (i) the realization of counterpart funds from the sale ofimported goods and foreign exchange associated with the ERRP; (ii) counter-part funds realized through the EU's STABEX scheme; and (iii) donors'recognition of the economic reform efforts of the TGE. In 1992/93 and1993/94, Ethiopia received grants in kind and untied cash and counterpartfunds amounting to 4.1 percent of GDP and an estimated 6.6 percent of GDP,respectively.
After having played only a very minor role before, counterpart fundsgenerated from external grants and loans have become increasingly importantfor financing expenditures in the Government's budget over the past threeyears. In 1993/94, total counterpart funds amounted to 3.6 percent of GDPand financed 14.4 percent of expenditures (see Appendix Table XXIX).However, in 1993/94, the generation of counterpart funds was belowexpectations, reflecting both lower aid flows than anticipated and theaccumulation of arrears, mostly from the Agricultural Inputs Supply
©International Monetary Fund. Not for Redistribution
- 30 -
Corporation (AISCO) for the payment of fertilizer received under loans andcommodity grants.
In April 1993, supported by the Fund and the World Bank, the Governmentconcluded an agreement with a number of donors with regard to the budgetingand management of counterpart funds. Six donors have signed this Memorandumof Understanding on Counterpart Funds to date. \J The agreement involvesarrangements for the collection of counterpart funds in pooled accounts andthe general principles to be followed in the utilization of counterpartfunds, the most important of which is that counterpart funds should not beused to finance extra budgetary expenditures. In financing outlays from thepooled counterpart funds accounts, the Government agreed to adhere to anumber of important principles, including transparency, verifiability, andcost-effectiveness. A Counterpart Funds Administration Unit (CPFAU) wassubsequently established within the Ministry of Finance to monitor theapplication of the memorandum and any other matter relating to thecollection and utilization of counterpart funds. With technical assistanceprovided by the European Union, the Ministry of Finance has begun tostrengthen the capacity and authority of this unit in the management ofcounterpart funds.
3. Public expenditures
During the last years of the previous regime, total public expendituresrose to very high levels, reflecting both a growing bureaucracy andincreasing outlays to finance the civil war; in 1988/89 and 1989/90, totalexpenditures were 35.8 percent and 32.4 percent of GDP, respectively (seeTable 2). In the following years, public expenditures declined, withcutbacks being most drastic on capital outlays; the ratio of expenditures toGDP declined to 20.3 percent in 1991/92. In 1992/93 and 1993/94, as theeconomy recovered and the new Government began to implement its program ofeconomic reform and development, public expenditures also recovered and roseto 23.2 percent and 29.9 percent of GDP, respectively. Intrinsic to thisrecovery were government efforts to restructure public spending away frommilitary outlays and toward expenditures on basic economic infrastructureand social services.
a. Current expenditures
In line with the priorities of its economic reform policy agenda, theTGE in 1992/93 began to restructure current outlays in terms of thefunctional structure of the budget. Current spending on general services(including organs of state, judiciary, defense, public order, and security)
I/ The European Union, the World Bank, the African Development Bank(AfDB), the Canadian International Development Agency (CIDA), the SwedishInternational Development Agency (SIDA) , and the Netherlands. Also, theMinistry of Finance and representatives of donors began to hold regularconsultation meetings on counterpart funds issues.
©International Monetary Fund. Not for Redistribution
- 31 -
and productive activities in economic sectors (e.g., industry, mining, andcommerce) was contained; conversely, current outlays for basic economicinfrastructure (e.g., roads) and social sectors (health, education,community services) were increased substantially. For example, currentoutlays for education and health, which had fallen to the low level of2.8 percent in 1990/91, rose to 3.4 percent of GDP by 1993/94. Incontrast, military spending, which had averaged 9.7 percent of GDP in theperiod 1988/89-1990/91, was cut back to 2.7 percent of GDP in 1992/93, andto 2.3 percent of GDP in 1993/94 (see Appendix Table XXV).
There was also a shift in the structure of the current budget whenclassified on an economic basis. Prior to 1992/93, the public sector wagebill was severely repressed, with a cap imposed on salary increases for allcivil servants earning above Br 600 per month. Almost 80 percent of allemployees in the civil service received salaries below Br 400 per month,while an estimated 40 percent of civil servants had salaries below thepoverty line; this number appears to have risen to between 50 percent and70 percent through 1992. \J In October 1992, when the Ethiopian birr wasdevalued, the Government adjusted public sector wages to address thisproblem and to compensate for the expected cost of living increasesassociated with the devaluation. The minimum wage was raised by110 percent, from Br 50 to Br 105 per month; percentage increases weresubstantially lower for higher salary grades. 2/ Also, the general salarycap was abandoned. Despite the salary adjustment, in 1993/94, abouttwo thirds of all civil servants still received salaries below Br 400 permonth. Moreover, the October 1992 adjustment resulted in a furthercompression of civil service salaries; remuneration levels for high-rankingGovernment officials remain significantly below those of counterparts in theprivate sector.
The total wage bill increased from 5.8 percent of GDP in 1992/93 to7.1 percent of GDP in 1993/94 (see Appendix Table XXVI), mainly reflectingthe full impact of the October 1992 salary adjustment. Also, in 1993/94,costs associated with the regionalization policy contributed to theincrease; in the context of rationalizing central government ministries andstrengthening the regional administration employees, some 4,000 staff weretransferred from the Central Government to the Regions (for details seeSection II.4 on regionalization). However, this development masks the factthat the wage bill for military personnel was significantly reduced duringthe past two years.
!/ According to the World Bank, the poverty line for urban households in1990 was Br 244 per month.2/ The salary adjustment was accompanied by a reform of the personal
income tax, which favored the recipients of higher salaries relatively morethrougji the reduction of tax rates. For details on this, see Chapter IV.2;for more details on the public sector wage policy, refer to Chapter II.4.
©International Monetary Fund. Not for Redistribution
- 32 -
Since 1991/92, the Government has not increased the total number ofcivil servants, and the automatic hiring of university and college graduateshas been abolished. At the end of fiscal year 1993/94, the Governmentemployed about 242,000 civil servants, including Central Government andRegional Administrations. In September 1993, the Government published adocument on retrenchment policy, which provides guidelines and principles onthe implementation of the planned retrenchment from both the civil serviceand the public enterprise and parastatal sector, including compensationprograms and packages that will be made available.
Prior to 1991/92, outlays on materials and supply for operations andmaintenance (excluding the military) had been allowed to deteriorate dramati-cally. Over the past two fiscal years, while outlays on materials formilitary purposes declined strongly, progress was made in terms ofincreasing materials and supply expenditures in other sectors. In 1993/94,total expenditures for materials rose slightly to 3.3 percent of GDP,although there was still an imbalance between spending on wages andexpenditures for materials.
Outlays for grants and contributions comprise payments to internationalorganizations, grants to individuals (e.g., scholarships), and grantcontributions to various government institutions. Prior to 1991/92, generalprice subsidies for agricultural products (especially food grain) , whichwere untargeted and heavily biased toward the urban population, featuredprominently in the budget. I/ These subsidies were abolished in fiscalyear 1992/93 except for a modest coffee price subsidy. In the followingyear, the coffee price subsidy was fully terminated, while a subsidy onfertilizer was introduced. This subsidy, which was targeted at about Br 50million during 1993/94, was designed as a temporary measure to promotefertilizer usage among small-scale farmers and to increase agriculturalproduction. 2/ In 1993/94, higher-than-expected expenditures for droughtrelief were incurred through the Relief and Rehabilitation Commission (RRC).Pension payments rose modestly in 1992/93 and somewhat more rapidly in1993/94, owing to the larger number of civil servants who took earlyretirement.
During the period 1989/90-1991/92, the Ethiopian Government began toaccumulate external interest arrears, amounting to about Br 210 million.Through an agreement reached with Paris Club creditors in December 1992, theTGE was able to reschedule a substantial part of its foreign debt, includingarrears (see Chapter VI.5). Consequently, the authorities were able to keep
I/ According to a World Bank estimate, for example, urban consumers(about 13 percent of the population) received about 60 percent of the foodgrain subsidy. Moreover, some of these subsidies were hidden inextrabudgetary programs.
7J In fact, it can be argued that this explicit subsidy replaced theimplicit subsidy on fertilizer resulting from the overvalued exchange rateprevailing prior to October 1992.
©International Monetary Fund. Not for Redistribution
- 33 -
external interest payments at a relatively low level in 1992/93 and 1993/94(0.5 percent and 0.6 percent of GDP, respectively). In contrast, domesticinterest payments increased substantially during the past two fiscal years--from an average of 1.1 percent of GDP for the period 1988/89-1991/92 to1.6 percent of GDP in 1992/93 and 2.8 percent of GDP in 1993/94. Thisreflects that a substantial part of the Government's internal debt, totalingabout Br 10 billion, and taken up mostly by the previous government at lowinterest rates (2-5 percent), has had to be serviced at the market interestrate of 12 percent since October 1992.
Expenditures directly linked to external assistance, and mainly in theform of grants in kind (including technical assistance), were relatively lowuntil 1991/92, but rose strongly during 1992/93 and 1993/94. In part, thisreflected high levels of food aid as well as a substantial USAID commoditygrant to assist in the rehabilitation of the textile industry.
In 1992/93, the Government began to design social safety net measuresfor retrenched civil servants and employees from the public enterprise andparastatal sector as well as other groups adversely affected by thecountry's political transition and economic reform program, including ex-servicemen of the previous government's army, refugees and returnees, andother impoverished groups in the rural and urban areas. A steeringcommittee was given responsibility for developing the Government's policy inthis area and supervising the implementation of safety net measures. Thefollowing elements are part of the Government's safety net program:(i) public works programs for the unemployed, especially in the urban areas;(ii) agricultural production subsidies for ex-servicemen, refugees,returnees, and poor farmers; (iii) special projects for elderly people, thedisabled, orphans and widows; and (iv) severance payments and other programsfor retrenched civil servants and workers from public enterprises andparastatals.
During 1992/93 and 1993/94, the Government spent Br 37 million andabout Br 50 million, respectively, on social safety net measures. However,the implementation of these measures occurred at a considerably slower pacethan anticipated because of delays in the finalization of the safety netpolicy as well as in the preparation of guidelines and mechanisms forprogram implementation at the regional level. The generally weakadministrative set-up in a number of Regions, and their general inexperiencewith implementing safety net programs, were also contributing factors.
Compensation payments to retrenched workers from the public enterpriseand parastatal sector have been the most important safety net measures overthe past two years. Severance payments and other compensation packages weremade available for up to 20,000 workers who were laid off from the EthiopianBuilding Construction Authority, the Maritime Transport Authority, and otherpublic enterprises and parastatals, including state farms. Apart fromproviding severance payments, the Government has also begun to design anumber of programs and projects specifically geared to this target groupwithin the context of its retrenchment policy, including a revolving fund to
©International Monetary Fund. Not for Redistribution
- 34 -
provide credits for retrenched workers who want to start their ownbusinesses.
b. Capital expenditures
Capital expenditures, which had been relatively large through the late1980s, were sharply eroded in the last few years of the previous government.Capital outlays fell to 6.1 percent of GDP in 1990/91, and further, to4.6 percent of GDP in 1991/92 (see Table 2), as the new Government sortedout its investment priorities and as the disruptions to governmentadministration from the years of civil war were addressed. During thefollowing two fiscal years, capital expenditures recovered to 8.3 percentand 11.1 percent of GDP, respectively, reflecting the new Government'scommitment to rehabilitate existing infrastructure and initiate newdevelopment projects as well as its reassertion of control over the centralgovernment ministries. During the past two years, this policy was supportedby increasing external financing of capital projects; total externalfinancing of capital projects increased from about Br 300 million in 1991/92to about Br 900 million in each of the following two years (see AppendixTable XXVIII) .
The implementation rate of the capital budget gradually improved fromwell below 70 percent in previous years to 71 percent in 1992/93, and anestimated 87 percent in 1993/94. Much of the emphasis during the earlyyears of the new Government was on the completion of long-out standingproj ects, rather than on the introduction of new proj ects. Even through1993/94, much of the outstanding project portfolio is still in need ofcompletion. During 1993/94, the Government embarked on a detailedassessment of its strategies in the different sectors. Together with theWorld Bank, the Government also engaged in a detailed Public ExpenditureReview (PER) , which played an important role in the formulation of the1994/95 budget.
Within the capital budget, substantial expenditure restructuring tookplace during the past two years, with the focus shifting away frominvestments in general and economic services sectors, and toward projects inthe infrastructure and social services areas. The share of investments inmining, industry, and commerce in the total capital budget fell from morethan 25 percent in the years 1989/90 and 1990/91 to 14.8 percent in 1992/93and 13.2 percent in 1993/94 (see Appendix Table XXVII). In contrast, theshare of social services rose from 6 percent in 1991/92 to 12.5 percent in1992/93 and 18.9 percent in 1993/94. Also, government capital spending oninfrastructure (especially roads) increased considerably over the past twoyears. Within sectors, the TGE also began to shift its capital spendingpriorities; in 1992/93 and 1993/94, more emphasis was put on primaryeducation and primary health care in the social sectors. In theagricultural sector, substantially less was spent on investments in statefarms, while projects focusing on small-scale farmers received moreattention.
©International Monetary Fund. Not for Redistribution
- 35 -
4. The regionalization policy and fiscal implications
a. Overview
In 1992, the TGE initiated a far-reaching regionalization policythrough Proclamation No. 7/1992, which established 14 administrative regionsand granted the right to establish self-governments by a "nation,nationality, or people" within prescribed areas. I/ This policyrepresented an important departure from the strong tendency of centralizinggovernment administration under previous regimes, and an important steptoward the establishment of fiscal federalism and the development of ademocratic political system. In June 1992, elections for Regional Councilswere held in most of the country, forming the basis for establishingRegional Governments. At present, owing to the merger of four Regions intoone, there are 10 official Regions. 2/
Proclamation No. 41/1993, which became effective in January 1993,established the respective powers and duties of Central and RegionalGovernments. It provided the legal basis for the establishment of20 ministries and four commissions at the central government level, andoutlined the powers and duties of these ministries and commissions,including the responsibility of giving assistance and advice to the RegionalAdministrations. Also, according to this Proclamation, each RegionalGovernment was allowed to establish, as necessary, up to 20 regionalbureaus, following very similar sectoral divisions as applied for theestablishment of central government ministries. The Proclamation furtheroutlined the powers and functions of these bureaus.
An administrative base is already in existence in a number ofRegions, since the previous government had maintained 30 administrativeregional centers. In a few Regions--notably Tigray, Amhara, Oromia, andAddis Ababa--the administrative capacity has traditionally been strong.Shortly after having initiated its regionalization policy, the TGE began totransfer staff from the Central Government to the Regions; by January 1994,about 4,000 professional staff had been redeployed to the Regions. Therehave also been movements of personnel between Regions. Substantially largertransfers are envisaged during 1994/95 within the context of therestructuring and civil service reform of the Central Government. This will
I/ A total of 63 population groups were identified, of which 46 wereconsidered large enough to form their own governments.2/ The names of the 10 official Regions are: Tigray (Region 1),
Afar (2), Amhara (3), Oromia (4), Somali (5), Benshangul (6), SouthernEthiopian Peoples' Administrative Region (SEPA; former Regions 7,8,9,10 and11), Gambella (12), Harar (13), Addis Ababa (14). Dire Dawa is treated asan independent Region for budgetary purposes, although it is not officiallyrecognized. Administratively, each Region is divided into zones, which inturn are subdivided into districts called woredas.
©International Monetary Fund. Not for Redistribution
- 36 -
address the recognized shortage of skilled personnel in many of the Regions.In 1993/94, the Government also began a program to strengthen RegionalAdministrations with support from UNDP.
b. Tax policy and revenues
Overall tax policies are set by the Central Government, but the Regionshave substantial scope for designing and implementing their own taxinstruments. Proclamation No. 33/1992, which became effective in October1992, defined the division of revenue-sharing responsibilities between theCentral Government and the Regional Administrations. Revenue instrumentsare categorized as regional, joint, and central instruments.
Regional revenue instruments include the rural land use fee andagricultural income tax; the profit tax and sales tax on individual traders;the profit tax, sales tax, and personal income tax from enterprises owned byRegions; the personal income tax from regional government employees; therental income tax on property belonging to the Regions; the tax on incomefrom water transportation; royalty and rent of land from other than large-scale mining activities; and charges and fees for licenses and servicesrendered by the Regional Governments. Revenue sharing applies to the profittax, personal income tax, and sales tax from jointly owned enterprises;profit tax, sales tax, and personal income tax for incorporated businesses;all taxes on large-scale mining, petroleum, and gas operations; and forestroyalties. The Central Government collects revenue from levies on importsand exports, the personal income tax on central government employees andinternational organizations, the profit tax on enterprises owned by theCentral Government, the rental income tax for houses in the possession ofthe Central Government, taxes on lotteries, and fees and service charges onservices provided by the Central Government. According to current practice,the Central Government collects revenue from the profit tax, sales tax andpersonal income tax on businesses operating across regional boundaries(e.g., transport companies) and other large-scale incorporated privateenterprises, as well as the income tax, royalty and rents from large-scalemining activities.
c. Budget preparation and implementation in 1993/94
According to Proclamation No. 41/1993, each Region should prepare andimplement its own current and capital budget proposals; regional budgets arethen included in the overall consolidated budget of the Central Govern-ment. I/ This process was initiated for the first time for 1993/94, andit appeared to operate relatively smoothly, although only about half of theRegions were able to prepare their budgets independently. In the otherRegions, the Ministries of Finance and Economic Development and Planning had
\J In fact, annual budgets should be prepared starting at the woredalevel, and they should then be combined into zonal budgets, and finallyincorporated into a regional budget.
©International Monetary Fund. Not for Redistribution
- 37 -
to provide assistance to the Regional Finance Bureaus in forecastingrevenues and budgeting current and capital expenditures. However, muchprogress has been made in the meantime; reportedly, most Regions were ableto prepare the 1994/95 budgets without central government assistance.
In the budget preparation process for 1993/94, revenue forecasts weresubject to a high degree of uncertainty with regard to the capacity ofindividual regions to collect revenue from the tax and nontax instrumentslegally assigned to them. Given the distribution of responsibilities forrevenue collection and the existing ownership structure of publicenterprises and parastatals, only about 20 percent of all revenue (Br 806million) was expected to be collected by the Regions, while the CentralGovernment would collect about 80 percent in the 1993/94 budget. There werealso large differences in revenue shares of individual Regions; Afar,Oromia, and Addis Ababa accounted for about three fourths of the totalrevenue to be collected by Regions, while three Regions (Afar, Benshangul,Gambella) accounted for less than 1 percent each in the Regions' revenueshare (see Table 3).
Very preliminary data on the outcome of the 1993/94 budget suggest thaton average, the collection of revenue by the Regions has been somewhat lowerthan anticipated. In general, both the budget data and the preliminaryoutcome of 1993/94 mask the fact that relatively large tax bases in a numberof Regions, especially Oromia and Addis Ababa, have so far remainedunexploited to a significant extent, notably the commercial sector inagriculture, the large numbers of unincorporated businesses in theindustrial sector, and self-employed professionals in the services sectors.However, since Proclamation No. 33/1992 has become effective, RegionalAdministrations now have a strong incentive to improve their own tax andnontax instruments and intensify assessment and collection efforts on thegroup of taxes for which the revenue wholly accrues to the Regions.
The Regions are expected to finance about 25 percent of their totalexpenditure with own revenues, the other 75 percent being financed throughblock grants from the Central Government. These grants appear to have beenallocated in a way that reflected the Regions' own revenue potential as wellas economic and development policy priorities and such criteria aspopulation density. For example, taking into consideration its largerevenue base, Addis Ababa (Region 14) was only allocated a relatively smallgrant from the Central Government, whereas those Regions with a very narrowown revenue base were expected to receive very substantial grants from theCentral Government (Table 3).
On the expenditure side of the 1993/94 budget, the Regions wereexpected to be responsible for about 38 percent of total outlays, withroughly the same shares in the current and capital budgets, 38 percent and37 percent, respectively. However, the Regions' shares in individualsectors varied greatly, with the highest shares in health (85 percent)education (81 percent), and agriculture and natural resources (60 percent).
©International Monetary Fund. Not for Redistribution
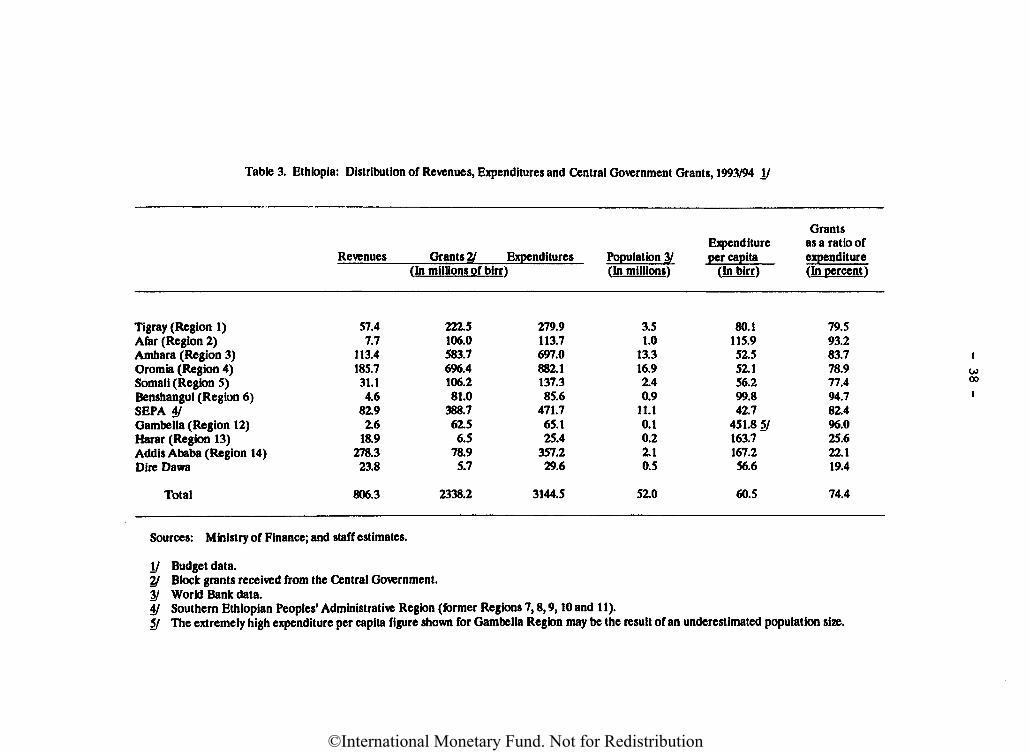
Table 3. Ethiopia: Distribution of Revenues, Expenditures and Central Government Grants, 1993/94 II
Revenues Grants 2/ Expenditures Population 3/fin millions of birr) (In millions)
Tigray (Region 1)Afar (Region 2)Amhara (Region 3)Oromia (Region 4)Somali (Region 5)Benshangul (Region 6)SEPA 4/Gambella (Region 12)Harar (Region 13)Addis Ababa (Region 14)Dire Dawa
Total
57.4 222.57.7 106.0
113.4 583.7185.7 696.431.1 106.24.6 81.0
82.9 388.72.6 62.5
18.9 6.5278.3 78.923.8 5.7
806.3 2338.2
279.9113.7697.0882.1137.385.6
471.765.125.4
357.229.6
3144.5
3.51.0
13.316.92.40.9
11.10.10.22.10.5
52.0
Expenditureper capita
(In birr)
80.1115.952.552.156.299.842.7
451.8 5/163.7167.256.6
60.5
Grantsas a ratio ofexpenditure(In percent)
79.593.283.778.977.494.782.496.025.622.119.4
74.4
Sources: Ministry of Finance; and staff estimates.
I/ Budget data.2/ Block grants received from the Central Government.3/ World Bank data.4/ Southern Ethiopian Peoples' Administrative Region (former Regions 7, 8, 9, 10 and 11).5/ The extremely high expenditure per capita figure shown for Gambella Region may be the result of an underestimated population size.
©International Monetary Fund. Not for Redistribution
- 39 -
The analysis above (Sections II. 3 and II.4) has shown, that theimplementation of budgeted expenditures during 1993/94 was hampered by theweak administrative capacity in the Regions. This was particularly so withregard to the execution of some programs under the current budget, notablysocial safety net measures. More importantly, capital budget implementationat the regional level was generally more difficult than originallyenvisaged. Until late into 1993/94, capital budget spending at the regionallevel was very slow and capital outlays were ultimately concentrated at theend of the fiscal year. It also appeared that in a number of Regions,capital budget implementation ratios were considerably below the levelachieved by the Central Government.
d. Domestic and foreign financing
In 1993/94, the Regional Administrations depended on their own revenueand transfers from the Central Government to finance their operations;preliminary data suggest that Regions did not borrow from the domesticbanking system. Although domestic bank borrowing by Regions is allowed dejure, de facto this has not yet happened. The Central Government hasindicated its strong determination to contain domestic bank borrowing by theRegions. With regard to foreign financing (and external grants) . theCentral Government has full control over the negotiation and spending offoreign funds; moreover, the management of foreign currency is also reservedfor the Central Government. Nevertheless, in 1993/94, the Central andRegional Governments have begun to develop a policy that will allow Regionsa greater degree of autonomy to negotiate external grant assistance programswith donors.
Ill- Balance of Payments
1. Overall developments. 1989/90-1993/94
Ethiopia's balance of payments has been significantly affected byweather conditions, the terms of trade, increasing lack of competitivenessof the birr as inflation accelerated followed by improved competitivenesswith the October 1992 devaluation, the civil war and change of government,and the emergency relief and rehabilitation efforts provided by theinternational community (Appendix Table XXXI) . During 1989/90. exports fellby 16.7 percent, reflecting mainly a decline in coffee prices; the currentaccount deficit (including transfers) remained broadly unchanged from theprevious year, at 1.5 percent of GDP, owing largely to a sharp cutback inregular imports. I/ Reflecting the successive overall balance of paymentsdeficits of the previous five years, gross official reserves in terms ofweeks of imports declined to only slightly more than one week at the end of1989/90. Moreover, as the overall balance of payments deficit was too large
\J Regular imports are defined as total imports less grain and commodityaid imports.
©International Monetary Fund. Not for Redistribution
- 40 -
to be financed by international reserves, Ethiopia accumulated externalpayments arrears for the first time.
Exports in 1990/91 fell further to their lowest level in 16 years,mostly because of a drop in recorded coffee shipments, but most otherexports fell in value as well, in response to falling prices and increasedsmuggling through neighboring countries as the exchange rate becameincreasingly uncompetitive. Imports rose mainly because of an increase incommodity assistance and aircraft purchases. Growing interest obligationsand a reduction in the normally strong external earnings by EthiopianAirlines turned the services balance negative for the first time. Whilegrant receipts rose sharply (reflecting mainly famine relief and emigration-related transfers late in the year) , this was insufficient to offset thedeterioration in the trade and services accounts, and thus the currentaccount (including transfers) widened to 2.7 percent of GDP.
Developments in 1991/92 mainly reflected the initial recovery andreconstruction following the change of government in May 1991, althoughconditions remained difficult after mid-1991 despite the end of the large-scale military conflict. Severe congestion was reported at the port ofAssab, Eritrea, capacity utilization in manufacturing was only 20-40 percent(owing to a severe shortage of imported inputs and parts), and a lack offertilizer and other inputs limited recovery in agricultural productiondespite favorable weather conditions. Official reserves in weeks of importsstrengthened, but this was largely due to the further compression of regularimports and a continuing accumulation of external payments arrears. Exportsof coffee continued to drop sharply (with the continuing weakening of worldcoffee prices) and other exports also fell, primarily because of the furtherincreasing overvaluation of the official exchange rate.
In 1992/93. the balance of payments began to be influenced by thestabilization and structural policies that were implemented, starting inOctober 1992 with the major devaluation, I/ the increasing availabilityand access of the private sector to foreign exchange from donor sources, andthe initial steps taken to liberalize the foreign trade and domesticmarketing systems. Despite weakening world prices, export earningsincreased by 41 percent, as the volume of coffee exports nearly doubled(reflecting an increasing share of exports through official channels).Imports (net of aircraft purchases) rose by 5.8 percent, in line with realeconomic growth. In view of the severe shortage of imported inputs andspare parts in prior years, this growth was less than anticipated, owingmainly to investment bottlenecks, tight private sector credit policy, delaysin tariff reform, and slow disbursements under the Emergency Recovery andReconstruction Project (ERRP). Overall, the trade balance worsened modestlyduring 1992/93. Service earnings weakened during 1992/93, as fare increasesauthorized for Ethiopian Airlines did not completely cover the full impact
I/ The trends described in 1992/93 and 1993/94 refer to SDR values sincethese adjust for the effects of devaluation.
©International Monetary Fund. Not for Redistribution
. 41 -
of the exchange rate depreciation. Combined with declines in private andofficial transfers to levels more in line with the years prior to 1991/92,the current account balance (including official transfers) worsened during1992/93. The capital account improved, however, as loan disbursementsincreased by 21.3 percent, although even this proved less than expected, asproject implementation lagged and ERRP inflows picked up only toward year-end.
The current account (including official transfers) remained broadlyunchanged during 1993/94 (although increasing slightly as a share of GDP).Exports increased by 23 percent, with a significant increase in noncoffeeexports, reflecting improved competitiveness following the October 1992devaluation. Coffee exports benefitted from the higher international pricesthat began to emerge in May 1994; however, initial reports suggest that thevolume of exports barely changed, reflecting disruptions arising from therestructuring of the ECMC, strong domestic coffee demand, and increasingcompetition in the world market for high-quality varieties. Imports (net ofaircraft purchases) grew by about 12 percent, reflecting large disbursementsunder the ERRP and increased availability of foreign exchange from thefortnightly foreign exchange auctions held starting in May 1993. In theservices account, an increase in net interest payments was partly offset byan improvement in other services such as travel (including tourism) andtransportation (including Ethiopian Airlines). The capital account swungsharply into surplus, largely because of disbursements under the World Bankstructural adjustment credit (SAC) and the Emergency Recovery andReconstruction Project (ERRP), leading to a substantial overall balance ofpayments surplus. As a result, international reserves strengthenedsignificantly at the NBE and the CBE, with official reserves increasing from14.7 weeks of imports (net of aircraft purchases) at end-June 1993 to 24.3weeks at end-June 1994; however, some of these reserves were not freelyavailable because they were being blocked in double signature accounts withdonors or were already committed for imports.
2. Merchandise trade
During the 1989/90-1991/92 period, the trade and exchange system wasvery restrictive, with a significantly overvalued real exchange rate, I/ aforeign exchange surrender requirement, administrative allocation of foreignexchange primarily to the government sector, high and widely dispersedtariffs, and a burdensome trade licensing system. The overvalued exchangerate led to rationing and thereby: (i) provided incentives for traders tooperate in the parallel (illegal) foreign exchange market at a moredepreciated rate; (ii) induced exporters to ship through unofficial channels(smuggling) to avoid having to surrender their foreign exchange; and(iii) protected import-competing firms because of the high cost of acquiringforeign exchange through the parallel market (thereby compressing imports).
\J The real effective exchange rate appreciated by about 30 percentduring 1989/90-1991/92.
©International Monetary Fund. Not for Redistribution
- 42 -
Additionally, trade volumes fell to a low level during 1990/91, owing to thewar and subsequent change of government in May 1991.
In 1992/93 and 1993/94, the authorities devalued Ethiopia's currency,the birr, developed a foreign exchange auction system, liberalized thetariff structure and other trade-related taxes, and streamlined the tradelicensing system (see Section IV). These reforms have stimulated and helpedreturn exports to official channels, reduced protection of import-competingfirms, and increased the supply of foreign exchange to private traders,thereby stimulating import purchases.
a. Exports
Ethiopia's main exports are coffee, gold, leather and leather products,chat, petroleum products, sugar and molasses, textiles, pulses, and fruitsand vegetables (Appendix Table XXXII). Among these categories, coffee is byfar the most important export good, constituting on average (1989/90-1993/94) about half of Ethiopia's export value. Coffee exports wereaffected by low world coffee prices during the 1989/90-1991/92 period, aswell as by restrictions in the domestic market and by an increasinglyovervalued exchange rate. Increases in world coffee prices, devaluation,and domestic market reform stimulated coffee exports, particularly throughofficial channels, during 1992/93 and 1993/94.
Since Ethiopia's share in the world market is currently under2 percent, receipts from coffee exports have been heavily influenced byexogenous developments in the world coffee market. Specifically, coffeeprices declined sharply from 1988 to 1992, when they stood at their lowestlevels in 20 years. Coffee prices only began to strengthen in 1993,especially during the second half of the year; price increases continuedthrough the remainder of 1993/94. The main reasons for the rise in pricesduring 1993 were reductions in world stocks, as world production fell shortof consumption, and the implementation of an export retention scheme by themajor coffee-producing countries.
Ethiopian coffee also came under increased competition in the worldmarket, especially for the high-end varieties for which it had been highlycompetitive. Reduced demand in some of Ethiopia's principal markets forhigh-quality varieties of coffee (viz., Japan, Western Europe, and SaudiArabia), together with the emergence of new suppliers of competing high-endvarieties (such as Yemen) , led to downward pressure on prices for some ofEthiopia's high-quality coffee varieties such as Harar coffee.
Domestic market factors have gradually facilitated a strengthening involume. The market was heavily regulated during 1989/90-1991/92, with thesector subject to marketing controls, restrictions on entry into theunwashed coffee export sector, the monopoly position of the government-ownedECMC regarding exports of washed coffee, and the overvaluation of theexchange rate. These factors reduced producer incentives and encouraged
©International Monetary Fund. Not for Redistribution
- 43 -
smuggling. I/ As a result, the volume of coffee exports dropped during1990/91 and 1991/92.
However, the coffee market was substantially reformed during 1992/93and 1993/94. The October 1992 devaluation substantially increasedincentives for export. The export licensing system was streamlined andminimum capital requirements were eliminated for exporters in December 1992,lowering the cost of exporting coffee and opening up access to the coffeeexport market to a wider range of private traders. The reduction of coffeeexport taxes in August 1993 also improved incentives for coffee exporters.Importantly, the ECMC was split into separate domestic and exportenterprises in November 1993, placing private exporters on an equal footingwith the new ECEE. These reforms have improved incentives for exportingthrough official channels and for improving the quality of coffee by, forinstance, improving harvesting and storage methods and by bringing morecoffee beans to washing stations. 2/ Many washing machines were destroyedduring the change of government in May 1991 and these are now being rebuilt.As a result of these domestic market reforms, export volume nearly doubledduring 1992/93.
With the recent strengthening of international coffee prices sincesximmer 1993, Ethiopia's coffee exports increased during 1993/94. However,the increase in export volume was less than expected, owing to the timeneeded for trees planted (following the change of government) to bear fruit,the diversion of coffee into the domestic market (as strong local demandboosted domestic prices above export prices), reduced government shipmentsin the months following reorganization of the former ECMC, and the roughlyhalf-year lag between world coffee price increases and the pass-througji intoshipments for export.
Leather and leather products (hides and skins) are Ethiopia's principalmanufactured exports. In value terms, the share of hides and skins exportshave fluctuated between 14 percent and 18 percent of total exports duringthe period, with 1992/93 exports at the lower end of this range, owing to asharp drop in export prices (corrected for devaluation) during 1992/93.Starting from a high base in 1989/90, exports of hides and skins declined interms of both value and volume during 1990/91 and 1991/92 because the sectorsuffered from an increasingly overvalued exchange rate, excessiveregulation, and the effects of the war. During 1992/93, supply increasedowing to devaluation, liberalization of domestic assembly activities, andintegration of previous war zones into the national economy; this led to anincrease in export volume and, correcting for devaluation, a decrease inexport prices. Overall, export value increased substantially during
I/ In contrast, subsidies for the export of coffee provided some stimulusto export supply.
2J Washed coffee constitutes about 15 percent of total exports by volume,the remainder being accounted for by unwashed coffee exports.
©International Monetary Fund. Not for Redistribution
- 44 -
1992/93. The export volume continued to increase significantly during1993/94 and this was accompanied by higher prices.
Exports of chat increased dramatically during the period, more thantripling in value terms from 1990/91 to 1992/93. This trend reflects theliberalization of the domestic market for chat, which was governmentcontrolled.
Petroleum products exports (surplus residues from the refining processof crude petroleum from the oil refinery at Assab, Eritrea) have followedthe general trend in exports, dropping from 1990/91 to 1991/92 and thenrising in 1992/93. The growth in export volume during 1992/93 (38 percent)was more than double that in export unit value, reflecting the increasingcapacity utilization of the refinery at Assab.
In general, the volume of exports of pulses. oilseeds, oilseed cake,sugar and molasses. and fruits and vegetables has been affected by weatherconditions and by changing foreign demand. Additionally, the export volumeof each of these commodities fell very substantially during 1991/92, giventhe displacement of farmers as a result of the civil war. The loss involume was especially significant for pulses, sugar, and molasses, giventheir historical importance in total export value. While there issubstantial scope for increased exports of these commodities, developmentsduring 1993/94 suggest that the potential for growth in these exports liesin the future. Gold exports in Ethiopia's balance of payments consist ofpurchases of gold by the NBE from the Ethiopian Mineral ResourcesDevelopment Corporation; an offsetting debit entry is contained in thecapital account under short-term capital (net).
b. Imports
By end-use category, Ethiopia's main imports consist of semifinishedgoods, crude petroleum and petroleum products, transport and industrialcapital goods, and durable and nondurable consumer goods (Appendix XXXV).Other imports include raw materials and agricultural capital goods. Totalimports (valued in birr) fell during 1991/92 and rose during 1992/93. Mostof the increase in the birr value of imports during 1992/93 may beattributed to the 142 percent increase in the birr/U.S. dollar official rate(from Br 2.07 - US$1 to Br 5.0 - US$1) in October 1992; the average exchangerate for imports in 1992/93 depreciated by about 66 percent, while the birrvalue of total imports (excluding aircraft) increased by 97 percent. Mostof the remaining increase in total imports can be accounted for by increasedimports of crude petroleum, which expanded once an agreement had beenreached with Eritrea on the terms for Ethiopia's use of the Assab refinery.Imports of raw materials and capital goods were weaker than expected during1992/93, principally because of delays in the implementation of projectsunder the ERRP.
The growth of imports during 1993/94 reflected the pickup of disburse-ments under the ERRP. Imports of cereals and other items, which had been
©International Monetary Fund. Not for Redistribution
- 45 -
expected to surge, reflecting the needs of those adversely affected by theerratic weather conditions of 1993, were held to normal levels, principallybecause of delays in the provision of drought relief supplies by donors,together with constraints at the port of Assab and in the making ofdeliveries to the interior of Ethiopia.
c. Terms of trade
Ethiopia's terms of trade deteriorated modestly during 1990/91 and thenrecovered during 1991/92 (Appendix Table XXXVI). In 1992/93, Ethiopiaexperienced a terms of trade deterioration of over 20 percent, which was thelargely to decreases in the export unit values of coffee, leather, andleather products associated with a weakening in world market prices. Theterms of trade appear to have improved markedly in 1993/94, owing tostronger world prices for Ethiopia's key exports; in the case of coffee, therebound in world prices began in mid-summer 1993.
d. Direction of trade
During the period 1988-92, Ethiopia's major trading partners were theEuropean Union (EU), the United States, Japan, Saudi Arabia, Sweden, and theformer Soviet Union (FSU) (Appendix Tables XXXIX and XL) . During the period1989-91, the share of imports from the EU averaged 41 percent of totalimports (including commodity aid); the share fell to 35 percent during 1992.The share of Eastern European countries had been about 20 percent of totalimports during 1989-90 (with the FSU by far the most important supplier),but fell to 3 percent in 1991 and 1 percent in 1992, as trade with the FSUdropped precipitously. Imports from the United States were steady at5 percent of total imports except for 1991, when they rose to 13 percent.Japanese imports were fairly steady during the period at about 7 percent oftotal imports. Imports from Saudi Arabia, which had averaged 2 percent oftotal imports during 1989-1990, increased substantially to 10 percent during1991 and 17 percent during 1992. Within Africa, imports from Djibouti morethan doubled in birr terms during 1992, principally because of blockages atthe port of Assab.
During the same period, Ethiopia's exports to the EU averaged about45 percent of its total exports. After having decreased to 39 percent in1990, the EU's share increased to 52 percent in 1991 and then dropped to40 percent in 1992. There was a notable drop in exports to Germany,especially during 1992, owing to decreased demand for high-quality Hararcoffee. Exports to the United Kingdom increased strongly in 1992. Exportsto Eastern European countries amounted to 11 percent of total exports in1989, falling to 5 percent in 1990, 1 percent in 1991, and 0.2 percent in1992; this reflected a steady decline in purchases by the FSU during theperiod, which had been the largest export buyer in the group of EasternEuropean countries. The share of exports to the United States declinedsteadily over the period (from 15 percent in 1989 to 4 percent in 1992),while Japan's share in total exports increased from 11 percent in 1989 to23 percent in 1991, falling slightly to 22 percent in 1992. Saudi Arabia
©International Monetary Fund. Not for Redistribution
- 46 -
increased its share of total Ethiopian exports substantially, from anaverage of 8 percent during 1989-91 to 20 percent in 1992, owing to exportsof coffee, live animals for religious ceremonies, and other agriculturalproducts such as flour.
3. Services and transfers
Ethiopia's services account has traditionally recorded a surplus,resulting mainly from net receipts from transportation and governmentservices (Appendix Table XLI) . Net receipts from transportation have beenattributable principally to passenger and port services of EthiopianAirlines and Ethiopian Shipping Lines. Government services include mainlyembassies (both foreign embassies in Addis Ababa and Ethiopian embassiesabroad), international organizations located in Addis Ababa, and foreigntechnical assistance. During 1989/90-1992/93, the combined surplus fromthese services more than offset net payments on investment income, travel,and (during 1990/91-1992/93) in other services. Other services includeclaims received from and premiums paid on nonmerchandise insurance providedby nonresidents. The travel account includes foreign exchange andtravelers' checks from foreign travelers in Ethiopia. While net receipts inother areas of the services account were stable or declining, transportationreceipts grew by 48 percent in 1991/92, and by 109 percent in 1992/93(reflecting the depreciation); receipts fell during 1990/91, owing to thewar and change of government.
The strong growth trend in transportation receipts is mainly due to theopening of new and profitable international routes by Ethiopian Airlines andefficiency gains in existing operations. As a result, net receipts fromnonfactor services increased from Br 144.5 million in 1990/91 toBr 312.7 million in 1992/93. With net payments on investment income risingfrom Br 138.8 million in 1989/90 to Br 348.7 million during 1992/93 owing tothe devaluation, the services account declined from Br 106.6 million in1989/90 to minus Br 7.6 million in 1990/91, rising to Br 27.4 million in1991/92, and then falling to minus Br 36.0 million in 1992/93.
Ethiopia's transfer receipts increased steadily during 1989/90-1992/93,reflecting increased flows of foreign assistance from both private agenciesand official organizations. Private transfers are accounted for mainly bydonations from nongovernmental organizations (NGOs), while transfers fromprivate individuals have assumed lesser but growing importance. Officialtransfers now come from the EU tinder the Stabilization of Export Earnings(STABEX) scheme and other programs, and also from bilateral donors such asthe United States and Japan.
4. Capital account
Disbursements of public long-term loans declined during 1989/90-1991/92, but grew substantially during 1992/93; repayments increasedsteadily during the period prior to 1992/93, with an increase in birr termsduring 1992/93 reflecting the devaluation (although amortization payments
©International Monetary Fund. Not for Redistribution
- 47 -
fell slightly in terms of SDRs) (Appendix Table XLII). In the period priorto 1992/93, almost all foreign loans received by Ethiopia were in the formof project assistance. While the transport and communications sector hadlong been the recipient of a large portion of official long-term loandisbursements, this emphasis especially increased during 1992/93 owing toaircraft purchases of Br 510 million by Ethiopian Airlines, along withsocial services; conversely, the share of the industrial and energy sectorsin total disbursements declined. Disbursements (excluding loans toEthiopian Airlines) declined from Br 969.4 million in 1988/89 toBr 566.4 million in 1991/92; during 1992/93, disbursements under the WorldBank's SAC were accompanied by those of bilateral donors such as the UnitedStates, for a total of Br 1,282.8 million.
About two thirds of public sector long-term borrowing in 1989/90 wasdisbursed by bilateral donors; during 1992/93 nearly two thirds wasaccounted for by multilateral borrowing. Of the multilateral lenders, theAfrican Development Bank disbursed the largest amount during 1992/93(Br 394.6 million), with the World Bank disbursing Br 299.7 million underits SAC and other facilities. The Fund disbursed Br 97.7 million under thefirst-year structural adjustment facility (SAF) arrangement. Among thebilateral lenders, the FSU and the former Yugoslavia were traditionallyimportant sources of official loans for Ethiopia, but these are currentlyinsignificant. Official loans have increasingly been supplied by the UnitedStates, with its share of bilateral official loan disbursements reaching98 percent during 1990/91-1992/93.
Reflecting large borrowing in previous years, amortization payments (onan accrual basis) on public long-term loans increased in birr terms duringthe period, although as noted above, in 1992/93, this principally reflectedthe depreciation of the birr. Net disbursements have mostly been absorbedby the Central Government. In fact, the remainder of the public sectorexperienced net outflows of long-term capital during 1992/93. Also,amortization payments have been financed partly by running arrears, whichamounted to Br 1.3 billion at end-1991/92 (excluding arrears on ruble-denominated debt to the FSU of Rub 625.9 million at end-December 1992). Inview of its foreign exchange shortage, Ethiopia unilaterally decided topostpone payments on non-OECD bilateral loans as of November 1989 and onOECD bilateral loans starting from October 1990, with the exception ofcollateralized loans (Ethiopian Airlines) or those owed to contractors withwork in progress. Excluding ruble-denominated debt to Russia, the UnitedStates, Italy, Libya, and Germany (including debt to the former GermanDemocratic Republic) were among Ethiopia's more important creditorcountries.
In addition to net official long-term capital flows, the capitalaccount also includes net short-term capital flows. This consists of nettrade credits and other net flows. The latter item, other net flows,consists of working balances of Ethiopian Airlines and Ethiopian Shipping
©International Monetary Fund. Not for Redistribution
- 48 -
Lines, as well as entries offsetting commodity gold exports \J and, tomaintain consistency with Ethiopia's monetary survey, certain inflows ofofficial transfers. 2/
5. External debt
Total new external long-term debt commitments contracted by the CentralGovernment fluctuated considerably during the 1989/90-1992/93 period,ranging from Br 166.8 million in 1990/91 to Br 3.3 billion in 1992/93(Appendix Table XLV) . At the same time, there were significant variationsin terms (maturity, grace period, and interest rates), with the averagematurity tending to increase during the period. In general, theseobservations also apply to debt contracted with suppliers and commercialbank creditors during the 1989/90-1990/91 period, but no new suppliers' orcommercial bank credits were contracted during 1991/92 and 1992/93 (AppendixTable XLVI) . This latter development reflects the Government's efforts toborrow only from official creditors on concessional terms.
Ethiopia's disbursed outstanding external debt (including interestarrears, but excluding ruble-denominated debt to Russia) increased fromminus Br 6,409.8 million (49.6 percent of GDP) at end-June 1991 toBr 7,985.0 at end-June 1992 (50.1 percent of GDP) and Br 19,024.1 million(92.0 percent of GDP) at end-June 1993, the latter increase reflecting thedevaluation (Appendix Table XLVII) . The share of debt owed to multilaterallenders (including the World Bank Group) remained at 27 percent during thisperiod, while the share of other multilateral organizations (including theAfrican Development Bank/Fund) increased from 14 percent at end-June 1991 to16 percent at end-June 1993. For bilateral creditors, the share of OECDcountries in outstanding debt increased from 30 percent at end-June 1991 to33 percent at end-June 1992, declining to 31 percent at end-June 1993. The
I/ Purchases of gold by the NBE from the Ethiopian Mineral ResourcesCorporation are included in Ethiopia's export account. These are notnormally treated as exports in the balance of payments of most countries,however, so a corresponding debit entry is included in the Ethiopian balanceof payments under the item, "short-term capital flows, net." Thus, goldpurchases by the NBE have no effect on the overall balance of payments.2/ Disbursements under the EU's STABEX fund are not initially owned by
the Government of Ethiopia even after there is an agreement between thedonor and the authorities in principle to disburse the funds. At thisstage, such funds are not reflected in the net foreign assets of the NBE(being reflected in both foreign assets and foreign liabilities). Tomaintain consistency with Ethiopia's monetary survey, therefore, a debitentry is included in the capital account corresponding to the credit entryin the official transfers item, so that the overall balance of payments andthe NBE's reserves are both unaffected. Once the document has been signedby both the EU and TGE representatives, ownership of the funds istransferred to the Government of Ethiopia, and the funds are reflected inthe NBE's net foreign assets as well as in external reserves.
©International Monetary Fund. Not for Redistribution
- 49 -
United States, Italy, and Germany (including the former German DemocraticRepublic) were Ethiopia's largest bilateral OECD creditors. The share ofnon-OECD bilateral creditors declined from 29 percent at end-June 1991 to26 percent at end-June 1993. Among these, Russia, the formerCzechoslovakia, and Bulgaria were the largest former-CMEA creditors ofEthiopia, while Libya, the former Yugoslavia, and the Democratic People'sRepublic of Korea, were Ethiopia's largest non-OECD, non-CMEAcreditors. \J
Ethiopia's debt service ratio increased during the 1989/90-1992/93period as a result of the increase in Ethiopia's external debt during the1980s. As a percentage of exports of goods and nonfactor services, the debtservice ratio increased from 45.3 percent in 1989/90 (accrual basis) to82.1 percent in 1991/92; the debt service ratio (prior to debt relief) fellto 71.8 percent during 1992/93.
In December 1992, representatives of Ethiopia and 12 countries, withobservers from five other countries and four international organizations,met for the first time at a Paris Club meeting to discuss Ethiopia's requestto alleviate its external debt service obligations to officialcreditors. £/ In the Agreed Minute of December 16, 1992, the representa-tives of the participating countries agreed to reschedule, under enhancedconcessional terms, outstanding arrears as well as debt service falling dueduring a three-year consolidation period ending in late 1995. Therescheduling applied to all publicly guaranteed debt contracted prior toend-December 1989. Ethiopia agreed to seek debt rescheduling on comparableterms from official bilateral creditors other than the participatingcountries. Multilateral and private commercial debts were excluded, as wellas debts incurred by Ethiopian Airlines. This rescheduling reduced thetotal debt service ratio (including nonparticipating countries as well asmultilateral organizations) to 65.4 percent during 1992/93.
IV. Exchange and Trade System 3/
1. Exchange arrangement
The currency of Ethiopia is the Ethiopian birr, which was peggedto the U.S. dollar from February 1973 until May 1993. At that time, a
I/ CMEA, Council of Mutual Economic Assistance.2/ The participating countries were Austria, Belgium, Canada, Finland,
France, Germany, Italy, Japan, the Netherlands, Sweden, the United Kingdom,and the United States. The observers were from Australia, Denmark, Israel,Spain, and Switzerland as well as from the African Development Bank, theWorld Bank, UNCTAD, and the Fund.
3/ A more detailed description of Ethiopia's exchange and trade system asof December 31, 1992 is provided in the IMF's 1993 Annual Report on ExchangeArrangements and Exchange Restrictions.
©International Monetary Fund. Not for Redistribution
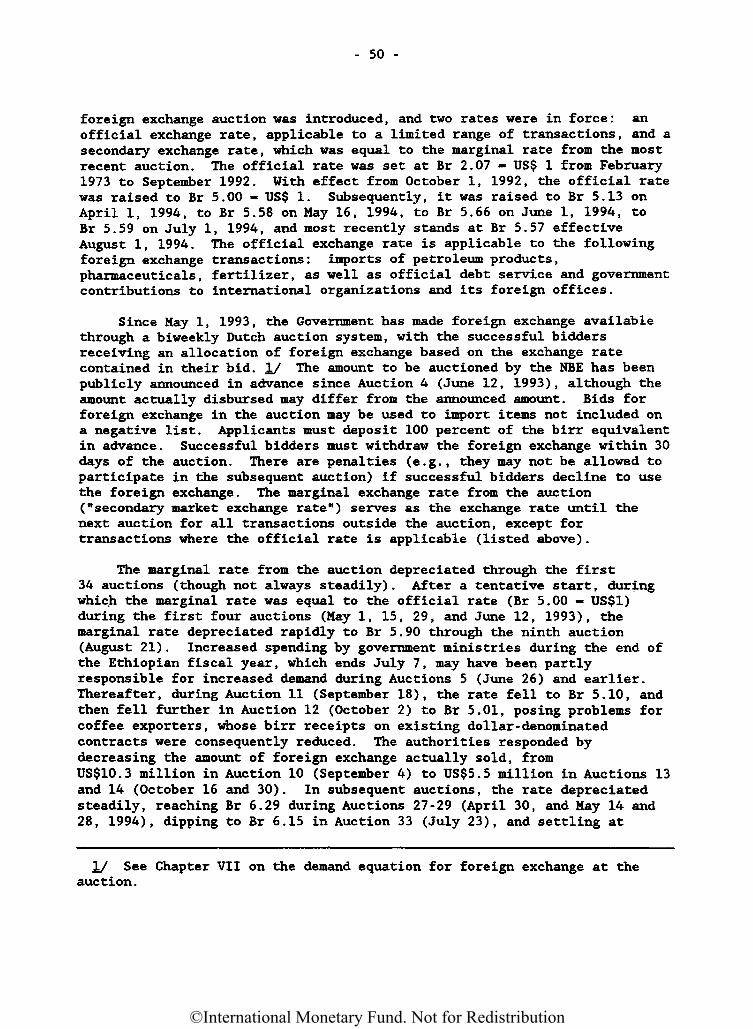
- 50 -
foreign exchange auction was introduced, and two rates were in force: anofficial exchange rate, applicable to a limited range of transactions, and asecondary exchange rate, which was equal to the marginal rate from the mostrecent auction. The official rate was set at Br 2.07 - US$ 1 from February1973 to September 1992. With effect from October 1, 1992, the official ratewas raised to Br 5.00 « US$ 1. Subsequently, it was raised to Br 5.13 onApril 1, 1994, to Br 5.58 on May 16, 1994, to Br 5.66 on June 1, 1994, toBr 5.59 on July 1, 1994, and most recently stands at Br 5.57 effectiveAugust 1, 1994. The official exchange rate is applicable to the followingforeign exchange transactions: imports of petroleum products,Pharmaceuticals, fertilizer, as well as official debt service and governmentcontributions to international organizations and its foreign offices.
Since May 1, 1993, the Government has made foreign exchange availablethrough a biweekly Dutch auction system, with the successful biddersreceiving an allocation of foreign exchange based on the exchange ratecontained in their bid. \J The amount to be auctioned by the NBE has beenpublicly announced in advance since Auction 4 (June 12, 1993), although theamount actually disbursed may differ from the announced amount. Bids forforeign exchange in the auction may be used to import items not included ona negative list. Applicants must deposit 100 percent of the birr equivalentin advance. Successful bidders must withdraw the foreign exchange within 30days of the auction. There are penalties (e.g., they may not be allowed toparticipate in the subsequent auction) if successful bidders decline to usethe foreign exchange. The marginal exchange rate from the auction("secondary market exchange rate") serves as the exchange rate until thenext auction for all transactions outside the auction, except fortransactions where the official rate is applicable (listed above).
The marginal rate from the auction depreciated through the first34 auctions (though not always steadily). After a tentative start, duringwhich the marginal rate was equal to the official rate (Br 5.00 - US$1)during the first four auctions (May 1, 15, 29, and June 12, 1993), themarginal rate depreciated rapidly to Br 5.90 through the ninth auction(August 21) . Increased spending by government ministries during the end ofthe Ethiopian fiscal year, which ends July 7, may have been partlyresponsible for increased demand during Auctions 5 (June 26) and earlier.Thereafter, during Auction 11 (September 18), the rate fell to Br 5.10, andthen fell further in Auction 12 (October 2) to Br 5.01, posing problems forcoffee exporters, whose birr receipts on existing dollar-denominatedcontracts were consequently reduced. The authorities responded bydecreasing the amount of foreign exchange actually sold, fromUS$10.3 million in Auction 10 (September 4) to US$5.5 million in Auctions 13and 14 (October 16 and 30). In subsequent auctions, the rate depreciatedsteadily, reaching Br 6.29 during Auctions 27-29 (April 30, and May 14 and28, 1994), dipping to Br 6.15 in Auction 33 (July 23), and settling at
I/ See Chapter VII on the demand equation for foreign exchange at theauction.
©International Monetary Fund. Not for Redistribution
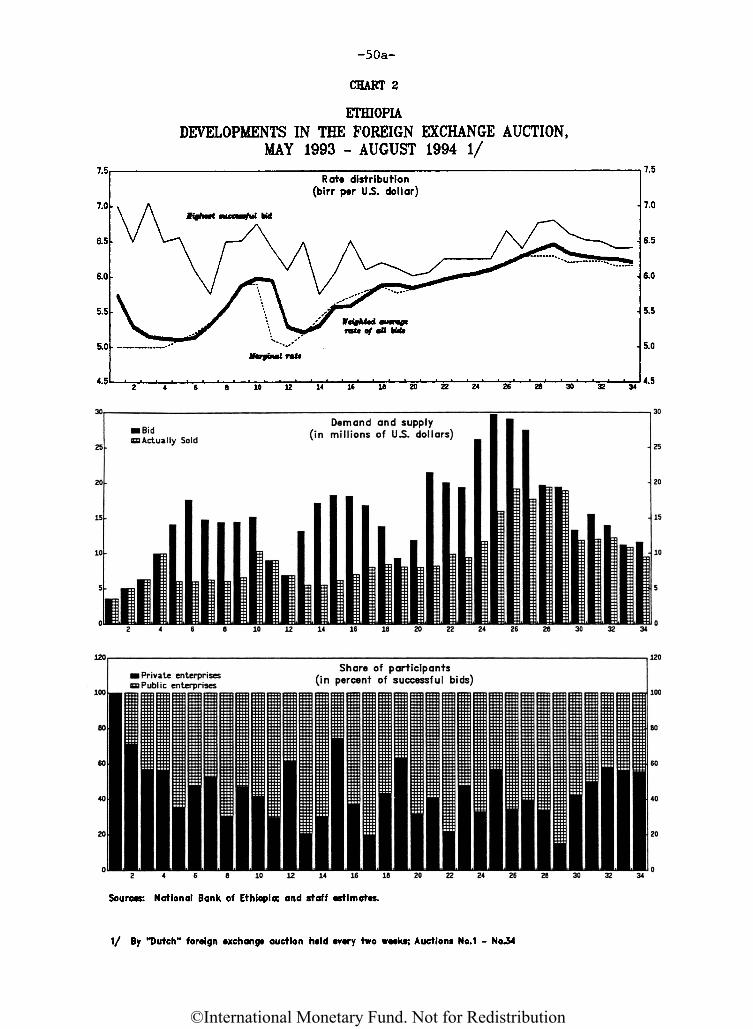
-50a-
CHART 2
ETHIOPIA
DEVELOPMENTS IN THE FOREIGN EXCHANGE AUCTION,MAY 1993 - AUGUST 1994 I/
I/ By 'Dutch" foreign exchange auction held every two weeks; Auctions No.1 - No34
Sou rets: Notional Bank of Ethiopia; and staff •sttmotts.
©International Monetary Fund. Not for Redistribution
CHART 3
ETHIOPIADEVELOPMENTS IN INDICES OF NOMINAL AND REAL
TRADE-WEIGHTED EXCHANGE RATES, 1980-94 I/(1960=100)
Sources: Inttrnotlonol Flnanclol Statistics: and National Bank of Ethiopia.
I/ Based on marginal rat* of foreign exchange auction sine* May 1993.
©International Monetary Fund. Not for Redistribution
- 51 -
Br 6.16 in Auction 34 (August 6, 1994). This was accompanied by an increasein the amount sold, which peaked at US$19.4 million during Auction 28 andsubsequently declined to US$9.5 million in Auction 34.
An examination of detailed bidding information shows the leadingcommodity groups and the average bid size, as well as the importance of theprivate sector, the latter having received only limited allocations offoreign exchange prior to the introduction of the auction system. Throughthe first 34 auctions, 43.9 percent of foreign exchange went to privatebidders. Also, successful bids were US$66,800 on average during Auctions 1-34; the average bid size increased during Auctions 20-31, with 9 of these 12auctions showing average bids greater than US$66,800. The leading commoditycategories in auction bids during the first 25 auctions were: machinery andequipment (an average of 21.8 percent of bids were in this category), spareparts (20.7 percent), chemicals and raw materials (19.8 percent), andconsumer goods (14.3 percent). These shares were highly variable fromauction to auction but there appears to have been an upward trend in theshare of machinery and equipment, especially starting with Auction 19(December 25, 1993). The authorities' actions to narrow the negative listeffective September 1, 1993 (announced September 5) may have beenresponsible for the increase in bids for the newly eligible items, since theshares of chemicals and raw materials and building materials increasedsubstantially during Auction 11 (September 18), as did the share of consumergoods during Auction 12 (October 2) . A second narrowing of the negativelist in March 1994 was not associated with comparable changes in thesectoral composition of bids.
Buying and selling rates for certain other currencies are set on thebasis of the relevant rate for the U.S. dollar and the previous day'sclosing rate of the currency concerned against the U.S. dollar in London.The NBE does not deal with the public; its transactions in U.S. dollars withauthorized dealers take place at the secondary rate. Authorized dealersmust observe the secondary rate for the U.S. dollar and the prescribedcommission charges, which accrue to the NBE, of 0.5 percent buying and1.5 percent selling; they are also authorized, but not obliged, to levyservice charges for their own account of up to 0.25 percent buying and0.75 percent selling and, for currencies other than the U.S. dollar, toinclude the margin charges applied by the correspondents abroad.
Reflecting movements in the secondary rate from the auction since May1993, as well as movements in the U.S. dollar and in relative prices betweenEthiopia and its trading partners, the trade-weighted real effectiveexchange rate of the birr appreciated by 30.2 percent from 1989/90 to1991/92, depreciated by 41.2 percent during 1992/93, reflecting the firstdevaluation in the official rate in October 1992, and then movements of thesecondary rate from the auction. The real effective rate continued todepreciate during 1993/94 as demand through the auction pushed up themarginal rate (in birr per U.S. dollar).
©International Monetary Fund. Not for Redistribution
- 52 -
Regarding the (illegal) parallel market for foreign exchange, there issome indication that the volume of transactions has shrunk significantly,although information on the parallel market is limited. Consistent with thedecline in volume, the parallel market premium over the auction rate hasdeclined from about 50 percent in May 1993, when the auction was introduced,to about 10 percent currently.
2. Administration of control
All transactions in foreign exchange must be carried out throughauthorized dealers under the control of the NBE. All payments abroadrequire licenses issued by the Exchange Controller. All exports arelicensed by the Exchange Controller to ensure the surrender of foreignexchange proceeds and shipments require permits issued by that office.
3. Prescription of currency
Outgoing payments are normally made in convertible foreign exchangeappropriate to the country of the recipient or in U.S. dollars. The netproceeds of exports must be surrendered in a foreign currency that is freelyconvertible, or in any other acceptable foreign currency.
4. Nonresident accounts
Nonresidents may, subject to exchange control approval, opennonresident accounts either in birr or in foreign currencies at authorizedbanks. Deposits to these accounts can be made only in foreign exchange.Balances on nonresident foreign currency accounts may be freely transferredabroad.
A joint venture may be permitted to open foreign currency,transferable or untransferable birr accounts to purchase raw materials,equipment, and spare parts not available in the local market.
5. Imports and import payments
Payments abroad for imports require exchange licenses. Certainimports, mostly consumer goods, may not be financed on an acceptance basis.Imports financed by suppliers' credits require prior approval and arelimited to raw and intermediate materials, Pharmaceuticals, and machineryand transport equipment.
Under the franco valuta (own foreign exchange) arrangement, importerscan bring in imports financed with their own sources of foreign exchange.This system was reintroduced in October 1989, and further liberalized in May1990 when the import restriction on private vehicles was abolished. InJanuary 1992, the Council of Ministers liberalized the regulations regardingfranco valuta trade still further. A special franco valuta permit is nolonger required for most imports, such as personal effects (including amaximum of one automobile every two years) and goods used to carry out an
©International Monetary Fund. Not for Redistribution
- 53 -
importer's licensed activities. The new regulations specify that in caseswhere a permit is still required, the Ministry of Trade will issue thepermit within 48 hours of application.
In August 1993, a new harmonized tariff schedule was implemented.Previously, the maximum tariff had been 230 percent and there had been 25different tariff bands. The new tariff schedule has a maximum of 80 percentand the number of bands has been narrowed to 10. A minimum tariff of5 percent was introduced on over 300 previously zero-rated items; the numberof zero-rated items declined to 78. All but 2 specific duties wereconverted into ad valorem duties and the differential sales tax on imports(24 percent vs. 12 percent on domestic goods) has been eliminated (i.e.,harmonized at 12 percent) with the extra tax effectively incorporated intothe tariff structure. Most exemptions have been eliminated. The overallnominal weighted average statutory tariff was thus reduced from 41 percentin 1991/92 to 29 percent in 1992/93.
6. Payments for invisible transactions
There are quantitative restrictions on foreign exchange payments forinvisibles (such as travel, education abroad, remittances by foreignemployees in Ethiopia, and medical payments abroad). Payments for invisibletransactions require exchange licenses. Invisibles connected with tradetransactions are treated on the same basis as the goods to which theyrelate.
Regarding travel, there are different restrictions on foreign exchangeavailability for business travel, tourism, and government travel. Forbusiness travel by exporters and importers only, the travel allowance iscurrently US$120 per day for a maximum of 20 days (except under exceptionalcircumstances). For tourism, there is a maximum of US$50 total per year;business travel for purposes other than exporting and importing is subjectto the limit applicable to tourists. For government travel, there is aschedule of rates that vary by country and city, based on cost of living.Effective July 1994, the requirement to go to the commercial bank and to theInland Revenue Administration prior to exit (supporting evidencerequirement) has been totally eliminated. However, an exit visa is stillneeded.
After providing for payment of local taxes, foreign companies may, inprinciple, remit dividends on their invested and reinvested capital in anycurrency. The exchange controller checks the company's profit/lossstatement on a monthly basis. Airlines are allowed to repatriate all"excess funds," defined as operating revenue minus expenses. Sharecompanies (i.e., companies with foreign equity participation limited to48 percent) such as oil companies and truck dealers, are allowed to transferonly the service charges (charges for technical services provided by thehome office as specified in a service agreement) . Profits (dividends)cannot be remitted.
©International Monetary Fund. Not for Redistribution
- 54 -
7- Exports and export proceeds
Exports of most cereals to any destination other than Djibouti areprohibited. All commodity exports require permits from the ExchangeController and some require, in addition, the approval of specified publicbodies. For exports on a c.i.f. basis, exporters must obtain full insurancefrom the Ethiopian Insurance Corporation. Foreign exchange receipts are tobe surrendered to the NBE, generally within three months, and the exportproceeds are received in an appropriate currency. Exports of hides andskins, which are regulated, are prohibited until the needs of localfactories have been met.
The export licensing system has been streamlined and fees have beenreduced. A general export licensing system (for commodities other thancoffee and tea) was implemented in December 1992. At that time, the half-million birr minimum capital requirement for exporters was also abolished.Separate export licenses are required for coffee and tea. The number ofprivate coffee exporters has been significantly expanded and coffee exportlicense fees were reduced in August 1993. Additionally, a duty drawbackscheme was implemented for exports in August 1993; duties paid on rawmaterials used in production for export are to be refunded, although theadministrative modalities of this scheme are still being worked out.
8. Proceeds from invisible transactions
Foreign exchange receipts from invisible transactions must besurrendered. Travelers may bring in Br 10 in Ethiopian currency. Foreignexchange must be declared by travelers on entry, and its re-export issubject to authorization, except for temporary visitors. Reconversion ofbirr must be supported by documentary evidence of prior exchange of foreigncurrency.
9. Capital
All receipts of capital in the form of foreign exchange must besurrendered. Exchange control authorization is required, and a registrationof capital inflows with the exchange control authorities establishesevidence of receipt, which is required for repatriation. All recognized andregistered foreign investments may be terminated on presentation ofdocuments regarding liquidation and payment of all taxes and otherliabilities.
Under a decree promulgated in July 1989, foreign investors arepermitted to hold a majority share in a joint venture, except in preciousmetals, public utilities, telecommunications, banking and insurance,transport, and retail trade sectors. Exemptions from income taxes aregranted for up to five years for new projects, and for up to three years formajor extensions to existing projects. Imports of investment goods andspare parts for joint ventures are also eligible for exemptions from customs
©International Monetary Fund. Not for Redistribution
- 55 -
duties and other specified import levies in the case of new projects ormajor expansions of existing projects.
In May 1990, a Special Decree on Investment was promulgated, whichremoved the restrictions on the size of activity and substantiallyliberalized restrictions on the types and sectors of activity for privateparticipation. It also guaranteed the right of foreign investors to remitprofits and dividends and the proceeds from the sale of assets. Under theDecree, investors in agriculture, industry, construction, and hotel serviceswere accorded such incentives as exemption from customs duties and incometax; incentives were made more attractive for larger investments andinvestments in priority areas.
In May 1992, the TGE issued a detailed proclamation to encourageinvestment in the domestic economy designed to promote diversification ofthe production base, increased employment opportunities, and improved exportincentives. I/ Building on the May 1990 Special Decree on Investment, theproclamation guaranteed the right of foreign investors to remit theirprofits and dividends and to pay related fees, royalties, and other foreignexchange costs. Further, proceeds from asset (or share) sales relating tothese foreign investments were allowed to be fully repatriated and wereexempt from the payment of any taxes. However, the code reserved certainsectors (including most of the financial, energy, and rail/airtransportation sectors) for investment by the Government. The code alsotreated domestic investors somewhat more favorably than foreign investors inthese and some other areas.
Borrowing abroad requires exchange control approval and is restricted.Authorized banks may freely place their funds abroad, except on fixed-termdeposits, but they may not acquire securities denominated in foreigncurrency without the permission of the NBE. In addition, they need priorapproval of the NBE to overdraw their accounts with foreign correspondents,to borrow funds abroad, or to accept deposits in foreign currency.
10. Gold
The ownership of personal jewelry, of which gold or platinum forms apart, is permitted. Newly mined gold is sold by the Ethiopian MineralResources Development Corporation to the NBE. Imports and exports of goldin any form other than jewelry requires exchange licenses, except forimports and exports by or on behalf of the monetary authorities.
I/ See Chapter II, SM/93/102, 5/13/92, for a detailed description of theMay 1992 investment code.
©International Monetary Fund. Not for Redistribution
- 56 -
V. Money and Credit
1. Monetary and credit developments \J
a. Overview
During 1988/89-1990/91, the annual growth rate of broad money increasedfrom 8.9 percent in 1988/89 to 18.6 percent in 1990/91 (AppendixTable XLIX) . The rapid growth in net domestic assets (NDA) was the majorfactor affecting the money supply; NDA movements mainly reflected variationsin domestic credit to the Government, which depended on central bankfinancing for its budget deficits. In contrast, net foreign assets, whichhad once reached Br 576.4 million (US$ 278.5 million) at end-June 1986, fellsharply and became negative in 1989/90 before rising to Br 270.7 million in1990/91. Interest rates were unchanged during the period.
From its inception, the TGE sought to adopt disciplined fiscal andmonetary policies; as a result, broad money growth declined to 13.3 percentin 1991/92, and 14.0 percent in 1993/94; broad money growth increased to16.2 percent in 1992/93, but this was a year when the currency wasdevaluated 58.6 percent in U.S. dollar terms. Compared with pre-TGEperiods, the principal factor affecting the money supply shifted tomovements in net foreign assets, reflecting the 1992 devaluation and themounting inflows of foreign aid from the international community (AppendixTable L) . In the meantime, the growth of net credit to the Government hasslowed from its recent peak of 29.3 percent in 1989/90, declining to10.6 percent in 1992/93, and further to 6.3 percent in 1993/94.
The velocity of circulation of broad money declined steadily during theperiod 1988/89-1991/92, from 2.97 in 1988/89 to 2.27 in 1991/92. It roseslightly to 2.49 in 1992/93, before declining again to 2.32 in 1993/94. 2/There was still an increase in velocity in the period 1991/92-1992/93, evenwhen the change in birr currency notes in Eritrea during this period isexcluded. The share of quasi-money (time and savings deposits of the CBE)in broad money decreased from 26.8 percent in 1988/89 to 22.8 percent in1990/91, but subsequently increased to 26.5 percent in 1992/93 and
I/ During the period covered, the monetary survey takes account oftransactions of Eritrean branches of the NBE and the Commercial Bank ofEthiopia (CBE) only through April and May 1991, respectively. Thereafter,their balances have been held constant in the monetary survey of Ethiopia.The monetary survey, however, does not attempt to identify the magnitude ofbirr notes circulating outside Ethiopia.
2/ From 1991/92 onward, GDP figures used for the calculation of velocityexclude Eritrea. For the purpose of providing comparable estimates ofvelocity for the full period, it would be necessary to add Eritrean GDP tothat of Ethiopia for 1991/92 onward. The velocity figures for Ethiopia andEritrea together would be 2.43 for 1991/92, 2.67 for 1992/93, and 2.48 for1993/94.
©International Monetary Fund. Not for Redistribution
- 57 -
28.8 percent in 1993/94. It is likely that some of this increase reflecteda movement of funds from non-interest-bearing narrow money to interest-earning deposits, given the large revision in the interest rate structure inOctober 1992.
Through the periods of the previous Government and the first year ofthe TGE (1991/92), overall domestic credit grew basically in line withdevelopments in net credit to the Government. While domestic financing ofthe government deficit (including grants) rose from 4.3 percent of GDP in1988/89 to 9.6 percent in 1989/90 and 6.2 percent in 1990/91, overall creditgrowth rose from 7.7 percent in 1988/89 to 17.1 percent in 1989/90, and thendropped to 11.9 percent in 1990/91. Domestic credit growth to thenongovernment sector, in sharp contrast, decelerated from 20.0 percent in1987/88 to 1.2 percent in 1989/90 and turned negative, to minus 1.2 percentin 1990/91.
With the commencement of the structural adjustment efforts, the TGEbegan to reduce its deficit financing through the domestic banking system,with a small reduction in 1991/92 (to 5.7 percent of GDP), and moresignificant reductions in 1992/93 and 1993/94 (3.2 percent of GDP and1.9 percent, respectively). Since 1992/93, the Government has attempted toensure that overall domestic credit growth is consistent with the overallmacroeconomic policy framework, rather than simply being driven by the paceof government credit expansion. Thus, the reduction in government creditexpansion has been offset by an increase in credit to the nongovernmentsectors (public enterprises, cooperatives, and private and individuals).
As briefly mentioned above, NFA became the major determinant ofmovements in broad money, as the TGE's economic reform efforts gathered pace(including the impact of the devaluation) and as the inflow of foreign aidincreased. During 1988/89-1990/91, the last three years of the pre-TGEperiod, NFA had contributed an annual average of 1.5 percent to broad moneygrowth. Thereafter, NFA's contribution increased from 12.9 percent in1991/92 to 86.5 percent in 1992/93, and further to 132.8 percent in 1993/94.
It should be noted, however, that a literal interpretation of thesefigures would lead to an over estimation of the role of NFA, since some ofthe factors that explain this large contribution in the latter years had, ineffective terms, no monetary consequences. Specifically, the effects of thedevaluation, from 1992/93 onward, show up both as an increase in NFA as wellas an offsetting increase in the valuation account component of "other itemsnet" (OIN). Also, certain foreign-aid-related funds, which are of a"blocked nature," were included in both NFA and OIN at the time that their
©International Monetary Fund. Not for Redistribution
- 58 -
ownership was transferred from the donor institution to the TGE (see below). JL/In effect, these NFA-related developments in OIN (in terms of theaccounting of the monetary survey) simply result in offsetting developmentsin NDA, thus masking to some extent the TGE's efforts to enhance credit tothe nongovernment sectors. The NDA's contribution in broad moneydevelopments declined as that of NFA increased and turned negative in1993/94.
During the period 1988/89-1990/91, interest rates were effectivelynegative in real terms. In October 1992, the Government raised the overalllevel of interest rates, with a view to achieving positive real interestrates. The spread between deposit and lending rates was compressedsomewhat, and the structure of rates was changed in order to eliminate alldifferentials by ownership and most of the differentials across sectors.Among sectors, agriculture, construction, and housing were treatedpreferentially by setting the lending rates slightly lower than for othersectors, in line with the Government's development priorities.
b. Credit operations of the monetary system
A major shift in the composition of the loan portfolio of the bankingsystem (including the NBE) took place over the period 1991/92-1993/94(Appendix Table LI). As of end-June 1991, about two thirds of the loans andadvances 2/ of the NBE and the CBE were to the Government. A fifth of theportfolio represented advances to the AIDB, 3/ while public enterprisesand private sector enterprises (including individuals) accounted for only7 percent and 4 percent, respectively. Taking account of the fact thatloans to the AIDB were virtually nonperforming, only about 11 percent oftotal loans were effectively allocated to the nongovernment sector. During1991/92-1993/94, credits were increasingly allocated toward the privatesector. Of the total net increase in loans and advances, the Government'sshare declined from 86.2 percent in 1991/92 to 45.5 percent in 1992/93 andfurther to 21.3 percent through end-March in 1993/94. 4/ Conversely, theprivate sector's share increased from 1.5 percent to 25.3 percent and to53.7 percent in the same period. The share of public enterprises rose from
I/ For example, the STABEX fund has a double signature feature. InEthiopia's monetary survey, it is initially treated as both a foreign assetand a foreign liability once the funds have been deposited in thecorrespondent account. When the formal document has been signed by the TGEand EC representatives, the ownership of the funds is transferred to the TGEand reclassified under other liabilities. The TGE, however, can onlyutilize these funds if the necessary documents have been submitted to theEC.
2/ Gross base, before provisions, and excludes local investment shares ofthe CBE.3/ Loans from the NBE, which were in turn loaned by the AIDB to the state
farms.4/ Based on the latest available figures.
©International Monetary Fund. Not for Redistribution
- 59 -
10.1 percent in 1991/92 to 22-24 percent in 1992/93-1993/94. As a result,at end-March 1994, the distribution of the loan portfolio was as follows:63.6 percent to the Government, 14.5 percent as advances to the AIDB,10.9 percent to public enterprises, and 10.0 percent to the private sector(of the remainder, loans to cooperatives and to the HSB were 0.3 percent and0.7 percent, respectively).
In terms of the sectoral allocation of credit, there has also been asignificant change (Appendix Table LII). I/ As of end-June 1991, theshares of loans and advances among the major sectors were: exports(19.0 percent), construction (18.2 percent), industry (17.8 percent),imports (16.5 percent), and domestic trade (12.2 percent). Agricultureaccounted for only 4.4 percent of total nongovernment credit. Most creditin recent years has flowed toward domestic trade, imports, exports, and theindustrial sector. This reflects a number of factors, including theincreased credit demand for raw materials and spare parts during theeconomic recovery, the cost increase induced by devaluation, theintroduction of the foreign exchange auction, the improvement in thecapacity utilization in the manufacturing sector, the relatively higherprice increases for manufactured products, which encouraged potentialborrowers in the industrial sector, and the gradual but steady shift fromgovernment to private borrowers.
As a result, at end-March 1994, the share of domestic tradesignificantly increased (to 25.5 percent) at the expense principally ofloans to the construction and the agricultural sectors (which declined toabout 8 and 2 percent, respectively). The shares of the other sectorsremain broadly unchanged.
The efforts made by the Government in recent years to encourage privatesector participation in the economy have also resulted in a shift of creditfrom public enterprises to the private sector. Focusing on creditallocation within the nongovernment sector (excluding the NBE loan to theAIDB) , the share of public enterprises in total nongovernment creditdeclined from 63.6 percent to 49.9 percent, while the share of the privatesector increased from 34.2 percent to 45.7 percent between end-June 1991 andMarch 1994. Credit to public enterprises continued to predominate in thosesectors where the private sector was slow to develop.
Despite its dominant role in the economy, loans and advances toagriculture declined between 1988/89-1992/93, picking up only in 1993/94.As the Government drastically curtailed its involvement in the sector (withthe reduced role of the state farms), credit to the state farms droppedsharply. While credit to the cooperatives and the private sectorexperienced some increase, their absorptive capacity for borrowing(including the lack of an adequate legal framework for the establishment ofpeasant cooperatives) remained limited. In addition, through 1993, both the
JL/ Measured by loans and advances by the CBE.
©International Monetary Fund. Not for Redistribution
- 60 -
private sector and cooperatives largely relied on their own funds forinvestment financing. Credit demand was also weak, given the relativelysmall number of investors entering into the commercial agricultural sectorand the weak realization rate of private agricultural projects. The smallincrease in agricultural product prices, particularly food prices, relativeto output prices for other sectors, reduced the rate of return to investmentin agricultural projects. The collapse of the AIDE also meant the absenceof an institutional vehicle for agricultural lending. Furthermore, theabsence of collateral and clear legal rights to land represented obstaclesto the CBE playing a greater financial role, and many peasants and theirpeasant association defaulted on previous fertilizer loans.
Construction and housing also experienced a decline in their share oftotal nongovernment credits. Outstanding loans and advances to this sectorconstituted 15-18 percent of the total during 1988/89-1991/92, but declinedthereafter, to less than 8 percent as of end-March 1994. Loans to thesector were restrained owing to: (i) a contraction in demand resultingdirectly from higher interest rates since late 1992, and indirectly, as aconsequence of the significant increase in the cost of acquiring land; (ii)the closure of the Building Construction Authority enterprise; (iii) thereduction in the number of new government projects; and (iv) the slowproject implementation rate in the budget.
c. Domestic liabilities of the monetary system
During 1989/90-1991/92, broad money grew at an annual average rate of16.5 percent, which was substantially higher than the annual nominal GDPgrowth rate of 8.5 percent (Appendix Table XLIX). Despite the negative rateof interest on deposits (which averaged minus 9.7 percent based on the AddisAbaba Retail Price Index (AARPI) I/), quasi-money (interest-earningdeposits) increased by an average of 12.3 percent, reflecting forced savingby the private sector owing to policies that restricted private expenditure.In 1992/93, the real interest rate on deposits increased to zero percentand, in 1993/94, to more than 5 percent; quasi-money increased by28.5 percent and 24.2 percent, respectively, during these two years. Thehigh growth in quasi-money was caused by a shift within households'portfolios from real to financial assets, from non-interest-earning currencyand demand deposits to interest-earning time and saving deposits. Between1991/92 and 1993/94, the share of quasi-money in broad money increased from23.9 percent to 28.8 percent.
Conversely, currency in circulation (cash), which increased48.1 percent in 1990/91 as a share of broad money, declined steadily in
I/ A real interest rate estimate based on the GDP deflator (factor cost)will give minus 7.6 percent for the same period. Both price indicators havesome deficiencies, such as limited coverage and an out-of-date base periodfor the AARPI, and limited reliability and lack of timeliness for the GDPdeflator.
©International Monetary Fund. Not for Redistribution
- 61 -
importance, to 43.3 percent by 1993/94. The cash-dominant nature of theeconomy as well as the moderate response of cash demand to interest ratechanges can be explained by several factors: (i) the primitive stage ofdevelopment of payment systems such as time-consuming procedures fortransferring and withdrawing money from the banks, the lack of networks,which makes it difficult for people to reach banks, and the high associatedtransactions costs of depositing funds at the banks;(ii) uncertainties regarding the political situation; (iii) a lack ofinformation regarding banking services; and (iv) a lingering suspicion ofbanks in terms of their maintaining the confidentiality of an individual'sfinancial information vis-a-vis the Government.
Despite the ending of the discrimination in deposit rates, interest-earning deposits of public enterprises and cooperatives have shown littlemovement (Appendix Table LIII). During 1989/90-1991/92, savings and timedeposits by public enterprises and cooperatives decreased fromBr 23.9 million (0.7 percent of total deposits) at end-June 1989 toBr 19.5 million (0.4 percent) at end-June 1992, and then increasedmarginally to Br 28.1 million (0.4 percent) at end-March 1994. The latterincrease can be explained partly by the growth of demand for liquid assetsto cover the cost-push effect of devaluation, the elimination of budgetarysupport for certain enterprises, and the increased wage bill, which wasfinanced from own resources.
In effect, as of March 1994, the private sector was virtually the soledepositor in interest-earning deposits, its share accounting for more than99 percent of savings deposit and more than 96 percent of time deposits. Theinterest-rate responsiveness of short-term saving deposits was larger thanthat of time deposits in absolute terms, while the rate of change wassmaller, owing to the difference in the size of both types of deposits (asof March 1994, private saving deposits stood at Br 2,753.0 million whiletime deposits were only Br 349.6 million), I/ The large magnitude ofsaving deposits is attributable to the low speculative demand for money ofhouseholds rooted in low income levels.
d. Specialized banks
Loans constituted about 90 percent of the total assets of specializedbanks and almost all of these loans were to the nongovernment sector.During 1989/90-1991/92, specialized banks' lending to the nongovernment
I/ The large difference in outstanding balances of savings and timedeposits seems to come from the different nature of the two deposits. Timedeposits have a predetermined maturity; withdrawal before the expiry datewill cost the depositor the loss of interest relevant to the year in whichthe withdrawal takes place. In addition, time deposits cannot beimmediately withdrawn and usually involve a waiting period of a few days.In contrast, savings deposits can be readily withdrawn within a short periodof time and without any cost in interest.
©International Monetary Fund. Not for Redistribution
- 62 -
sector grew at an annual average rate of 5.4 percent; it grew 6.0 percent in1992/93, and 7.6 percent as of end-December 1993. The AIDE has been themain vehicle for medium- and long-term lending and also deals with short-term lending to the agricultural sector. Agricultural credit, particularlyto state farms, accounted for 76.2 percent of the AIDB's total lending atend-December 1993, although most of those loans were nonperforming. TheHousing and Savings Bank (HSB) extends loans for residential and commercialbuildings to state enterprises, housing cooperatives, and privateindividuals. While the majority of loans in terms of the number ofcommitments are for residential buildings, the majority of loans in terms ofloan amounts are for commercial buildings.
On the liability side of specialized banks' balance sheets, as of end-December 1993, the major items were: borrowing from the NBE (57.0 percentof total liabilities), time and savings deposits (14.3 percent), and foreignloans --mainly from the IDA, African Development bank, and bilateral donors(7.9 percent). For the HSB, most time deposits were from the CBE, EIC andthe PSSA, which carried a 1 percent interest rate.
2. Financial system
Through the 1970s and 1980s, the financial sector of Ethiopia mirroredthe centrally planned nature of the economy. Presently the financial sectorcomprises: (i) the central bank (NBE); (ii) a commercial bank (CBE) with 154branches; (iii) two specialized banks--the AIDB, specializing in medium- andlong-term credits (mainly to agriculture), and the HSB, which services thehousing and construction industry; (iv) the Ethiopian Insurance Corporation(EIC), providing insurance services; (v) the Pension and Social SecurityAuthority (PSSA); (vi) some 400 savings and credit cooperatives (SACC) I/;and (vii) about 4000 service cooperatives (SC) £/.
With the exception of the SACCs and the SCs, all of these institutionsare owned by the Government. The banking sector is dominated by the NBE andCBE. Since the number of branches differs substantially between the CBE andother banks, a scheme was set up such that the CBE takes care of thedisbursement of loans on behalf of the HSB, with a commission paid to theCBE in areas where HSB branches do not exist. SACCs grant loans to memberswho might not qualify for credit elsewhere and who cannot afford the high
I/ SACCs are also known as Credit Union, Thrift and Credit Co-operatives,or Savings and Credit Associations. An SACC is defined as tta freeassociation of people with a common bond who save and lend money to oneanother at a low interest rate for productive and provident purposes." Theobjectives of SACCs are encouraging thrift among its members and providingservices, and not in making profit. Members are paid dividends on sharesand interest on savings deposits.2/ Service cooperatives are in the process of reorganizing as
"cooperative societies" under the Agricultural Cooperative SocietiesProclamation (issued on February 1, 1994).
©International Monetary Fund. Not for Redistribution
- 63 -
loan rates offered in either the informal sector or by the other financialinstitutions.
In a country where more than 80 percent of the population live in ruralareas, operational financial institutions are, in general, limited to urbanareas. Nationally, per capita deposits, measured by deposits (time andsavings deposits) of the CBE, are estimated at below 65 birr in 1993/94.
3. Monetary policy instruments
a. Credit allocation
The NBE regulates and monitors loans provided by the banking system,and determines which activities are to be financed and under whatconditions, particularly with regard to credit terms, maturities, andcollateral. Each bank provides credit to the specific economic sectors inwhich the bank specializes, and all transactions that exceed certain amountshave to be reported to the NBE for approval I/. The CBE provides mostlyshort-term credits for working capital. The AIDB is the main source ofcredit for cooperatives and state farms in the agricultural sector andpublic and private enterprises in the other sectors. The HSB concentrateson activities related to building, including private dwellings.
Within the banking system, loans are, in principle, disbursed againstphysical collateral, such as vehicles or project plans (in the case of newprojects). The formal collateral requirements of the banking system, viz.,the ratio at the value of the collateral (estimated by the registered priceof the collateralized good) to the amount to be borrowed, was revised inDecember 1992, when the ratio was reduced from 250 percent to 100 percent inthe case of the CBE (the AIDB maintained its collateral requirement ratio of125 percent). A joint working group (comprising of the NBE, CBE, and theMinistry of Industry (MOI)) has also been reviewing the formalities of theregistration scheme and a possible broadening in the range of eligible formsof collateral (currently limited to only registered vehicles) . Pending thisreview, agricultural machinery such as tractors, combines, and harvesters,which used to be rejected as collateral, have become acceptable ascollateral as they have been registered by local regions. In addition,efforts have also been made to make the collateral requirementsoperationally more flexible for loans related to fertilizer imports, coffee
i/ The Credit Unit of the NBE monitors and supervises a bank's creditlimits for a borrower, according to certain routine. If the borrower is apublic enterprise, the CBE and HSB can lend as much as 10 percent of the sumof working capital, reserves, and profits; the AIDB has to submit a projectappraisal when the contemplated loan amount exceeds Br 3 million. If theborrower is from the private sector, the HSB can lent as much as 5 percentof working capital, reserves, and profits; the CBE and AIDB are expected tosubmit a project appraisal when the contemplated loan amount exceeds Br 1million and Br 0.5 million, respectively.
©International Monetary Fund. Not for Redistribution
- 64 -
exports, and transport vehicles (where no collateral is being required), andto differentiate the collateral policy according to customers' credibilityratings.
In providing credit to the Government (through direct advances or theacquisition of Treasury bills and bonds), the recently issued Monetary andBanking Proclamation (Proclamation No. 84/1994, January 30, 1994) stipulateslimits on the Government's borrowing ability from the NBE and commercialbanks based on the average annual ordinary revenue (AAOR) for the threepreceding fiscal years for which accounts are available. Specifically, theoutstanding stock of (i) direct advances (overdraft facility) from the NBEare not to exceed 15 percent of AAOR; (ii) treasury bills purchased by theNBE and other banks are not to exceed 25 percent of AAOR; and (iii)government bonds purchased by the NBE and other banks are not to exceed50 percent of AAOR. I/ Regional governments are required to submit anyrequest for bank financing to either the Ministry of Finance or the Ministryof Planning and Economic Developments, along with a feasibility study forany project requiring financing as well as the full regional budget andrevenue forecast. Approval of the relevant ministries would be required,taking account of the overall financing constraints on the overall borrowingby the Government. Commercial banks are not allowed to extend directadvances or other credit facilities, whether directly or indirectly, to theCentral Government and the Regions.
In the agricultural sector, loans were provided only to service andproducers' cooperatives and state farms in the pre-TGE period. Since1991/92, the latter two institutions have either been dismantled or becomeinsolvent. Newly organized cooperative societies (operating under arecently passed Proclamation) are able to receive deposits from and extendloans to their members. Nevertheless, a large majority of the ruralpopulation have little or no access to official credits, and are forced torely on the curb market for loans. Despite wide recognition of theexistence and importance of the informal market in the economy, relativelylittle is known about its working and structure.
Based on available information, two of the most important informalinstitutions are the iqqub and the iddir. The iqqub is a saving associationbased on pre-established homogeneous groups, where each member agrees to paya small sum periodically into a common pool so that each member can, at agiven point in time, borrow the full amount in the pool; when a loan isrepaid, another member of the iqqub is then able to borrow (there is usuallya specified sequencing of borrowers). Iqqub loans are lent at zero nominalinterest rate. The iqqub is generally used for the purchase of consumer
I/ The outstanding borrowing prior to the issuance of the proclamation isexempt from these ceilings. For 1989/90-1991/92, AAOR was Br 2,677 million;outstanding balances for direct advances, treasury bills, and governmentbonds at end-June 1992, were Br 5,145 million (192 percent of AAOR) Br 562million (21 percent), and Br 3,390 million (127 percent), respectively.
©International Monetary Fund. Not for Redistribution
- 65 -
durables, payment of school fees, clothing, and the like. Depending on thesize and location, some iaaubs have linkages with a bank. The iddir is anon-profit making institution based on solidarity, friendship, and mutualassistance among members. It runs an insurance program to meet emergencysituations. The risks covered by iddirs include funeral expenses, financialassistance to families of the deceased, medical expenses, and losses due tofire or theft. Members have to pay certain amount to a common fund. Mostof the common funds are deposited in a bank.
b. Reserve and liquidity requirements
The CBE is required to maintain, at the end of each week, I/ at least5 percent of its total net deposit liabilities (defined as the sum of demanddeposits, saving deposits, and time deposits, less uncleared checks paid anduncleared foreign effects) in a nonremunerated reserve account with the NBEand to hold liquidity (defined as the sum of cash, reserve deposits at theNBE, demand balances with other banks, and government securities maturingwithin 370 days) of at least 20 percent of their total net current deposits(defined as net deposits less deposits payable after 30 days ofnotice) . 2/ An NBE committee is currently working to establish a newratio on the basis of Proclamation No. 84/1994. The CBE's reserve andliquidity holdings at the NBE have consistently exceeded the legallyrequired levels, owing both to the low levels of economic activity in thepast and the binding effect of the credit ceiling recently imposed by theNBE in connection with the macroeconomic adjustment program. 3/
c- Refinancing facilities
The NBE provides short- and long-term refinancing facilities to banksand other financial institutions. Owing to the considerable excessliquidity in these institutions, this refinancing facility has not been usedsince the mid-1970s for the CBE, while the bulk of the loans extended to theAIDB were converted to government bonds in March 1994 (see below) .
d. Interest rates
In July 1986, the lending rates of the CBE and specialized banks werereduced in order to encourage investment. Rates were differentiated inorder to favor certain sectors, including the state-owned enterprise sector.
I/ According to Proclamation No. 84/1994, reserve and liquid assets areto be calculated based on the last preceding monthly statement; in practice,the Accounts Department of the NBE monitors these levels on a more frequentbasis.2/ This definition has been in effect since August 17, 1993. Prior to
this, all time deposits were deducted from net deposits in order to obtainnet current deposits.3/ As of end-May, the actual reserve and liquidity ratios were 23.1
percent and 46.8 percent, respectively.
©International Monetary Fund. Not for Redistribution
- 66 -
Time and savings rates were raised to encourage long-term deposits fromsmall savers. These rates remained unchanged until October, 1992, when theywere adjusted upward in order to realize positive real interest rates andeliminate differentials according to the type of ownership (AppendixTable LVIII). As of end-June 1994, sectoral differences in lending rateswere narrowed but not fully liberalized, in order to make the changes moreacceptable to the public and to provide some preferential borrowing ratesfor priority sectors.
Since October 1992, the lending rate to the Government from thefinancial sector has been 12 percent (revised upward from 3 percent) forshort term loans and 13 percent (revised upward from 5 percent) for loanswith maturity of more than over five years. Differentiation of rates byownership I/ have been eliminated. In lending to other sectors of theeconomy, the preferential rates for housing construction, agriculture,exports, and imports of agricultural inputs (ranging from 4.5 to 7 percent)have been significantly reduced. As of end-June 1994, lending rates rangedbetween 10 percent and 14 percent according to sector. The term structureof lending rates to the nongovernment sector is slightly upward sloping,instead of being flat, as in the previous structure.
With regard to time deposits for individuals, savings and creditcooperatives, and self-help organizations, the term structure of interestrates is upward sloping, allowing greater returns to longer term deposits;interest rates on time deposits with a maturity of one year or longer rangefrom 11.5 percent (revised from 6 percent) for one year to 12.0 percent(revised from 7.5 percent) for five years. Time deposits with a maturity ofless than one year earn interest either 10.5 percent or 11.0 percent.Effective July 1989, savings deposits cannot be held by financialinstitutions and government-owned enterprises. Interest rates on savingsdeposits for individuals, savings and credit cooperatives, and private andself-help organizations have been revised upward to 10 (from 6) percent.
e. Payment system
Since there is only one commercial bank and neither a clearing housenor an interbank market exists in Ethiopia, the present payments system inEthiopia is quite rudimentary. Intrabranch settlements are, in principle,conducted through branch accounts held at the head office of the CBE, exceptfor some regional branches, which are given some autonomy to settle amongbranches in the same region. Money transfers are conducted by telegram,mail, or the issuance of draft (checks), followed by the sending of a creditsummary as an official payment instruction in the case of the former twomethods. A payment instruction is issued for all transactions (gross basis)and sent to the head office via mail, and the head office nets out thetransactions and feeds them back to each branch with the results. The
i/ Cooperatives used to enjoy the lowest rates (4.5-6 percent), relativeto the state-owned (2.5-8 percent) and private sectors (6-10 percent).
©International Monetary Fund. Not for Redistribution
- 67 -
normal time lag between an actual transaction and its final settlement isabout ten days. Interbank settlements (settlements among the CBE, HSB, andAIDE) are all conducted using the CBE account. The branches of the HSB andthe AIDB open current accounts at one of the branches of the CBE and settletheir transactions through certified payment order in the case of theGovernment or by cash payment orders (or drafts) in the case of the privatesector. There are no cable transactions between the HSB and the AIDB. Withrespect to settlements between the CBE and the NBE, a reserve account heldat the NBE is used, and both banks exchange daily a form of document thatconfirms the transactions that occurred during the previous day (i.e., avoucher system).
4. Financial sector reform
Since mid-1991, the TGE has made efforts to move progressively to astable market-based economy, with the banking system expected to play a keyrole in channeling deposits efficiently to productive investments on thebasis of economic considerations. Within this context, the NBE has soughtto create an environment conducive to the establishment of an efficient andcompetitive financial sector, supported by an effective regulatory andprudential supervision system.
a. Restructuring and recapitalization of the AIDB
The AIDB was established to extend loans to the agricultural andindustrial sectors. The AIDB drew its funds mainly by borrowing from theNBE, and loans were highly concentrated in the state farm sector with nocollateral required. Owing to the serious operating inefficiencies of thestate farms (and their consequent inability to repay loans), and thesubsequent dissolution of many state farms since 1988/89, more than90 percent of the AIDB's loans to some 90 state farms (over Br 2 billionincluding principal and interest) were nonperforming. These lossesdestroyed the profitability of the AIDB and fully eroded its capital base.
To restructure the AIDB's financial position, a proclamation was issuedin December 1993, which allowed for the transfer of AIDB's debt claims fromthe NBE's books to those of the Government. A special interest-freeGovernment bond with a maturity of ten years, with equal annual repaymentsi/, was issued in March 1994 by the Government in the amount ofBr 1.3 billion to the NBE in exchange for the Government's assuming theNBE's claims on the AIDB. A similar, second special bond of Br 85 millionwas issued and exchanged for the AIDB's remaining debt claims on state farmloans. In effect, combined with the drawdown of the NBE's provisions forbad debt, the nonperforming loans for state farms financed by the NBE andAIDB's own resources have thus been written off, and an independent trustfund established for the purpose of managing the sale or liquidation of
I/ The first repayment is due in November 1994.
©International Monetary Fund. Not for Redistribution
- 68 -
state farms in default and for the application of proceeds to compensate theGovernment in its repayment of the special bonds.
With respect to the recapitalization of the AIDE, a proclamation is nowawaiting gazetting, which will allow the AIDE to increase its capital to thelevel of Br 250 million (from a current loss position of negativeBr 131.5 million). I/
b. New legislation
The Monetary and Banking Proclamation (No. 83/1994) was issued onJanuary 30, 1994 and redefines the status, functions, and authority of theNBE under a free market economic environment. The legislation wasformulated so as to provide for a stronger and more autonomous role for theNBE. The legislation states the NBE's relations with the Government andother financial institutions through its supervision of credit, the settingof foreign exchange rates, and the framework of interest rate policy. Thelegislation stipulates that 20 percent of the net profit of the NBE is to beallocated to the General Reserve Fund, while 80 percent is to be credited tothe account of the Ministry of Finance.
As noted above, the Proclamation "Licensing and Supervision of BankingBusiness" (No. 84/1994) was issued on January 31, 1994, and allows for theestablishment and supervision of private domestic commercial banks (withequity participation limited to investors of Ethiopian nationality). Itstates the requirements for opening a commercial bank, including a minimumcapital requirement 2J as well as the stipulation that banks can only beestablished on a limited share basis, 3/ in order to protect a bank fromthe dangers that could arise from minority rule and decisions. Thelegislation also specifies that a minimum liquid assets position and reservebalance must be maintained and that the NBE is the sole organ allowed toissue a license to a financial institution. Upon receipt of an applicationfor license, the NBE is required to decide on its acceptability within90 days. No bank can pay dividends unless it has fully covered all of itscapital expenses; at the end of each financial year, a bank is required totransfer at least 25 percent of its net profits to a Legal Reserve Accountuntil the latter account reaches the required minimum capital amount.Subsequently, the NBE issued a directive in May 1994 that establishedcriteria for the selection of the members of the Board of Directors of a
\J This recapitalization scheme consists of two stages: (i) theGovernment will return buildings (Br 70.4 million) as well as inject cash(Br 57.5 million) to the AIDB, which will bring AIDB's capital level tozero; and (ii) Br 62.5 million will be initially provided in cash during1994/95, with a remaining Br 187.5 million paid over the followingfive years, in order to raise the capital base to Br 250 million.
2/ Br 10 million or 8 percent of bank's risk-weighted assets based on themost recent annual balance sheet, whichever is larger.I/ Each shareholder's share not exceeding 20 percent of the total.
©International Monetary Fund. Not for Redistribution
- 69 -
private bank, fee rates, the content of application forms, and otherrelevant information that has to be submitted along with the application.
Finally, the "Licensing and Supervision of Insurance BusinessProclamation" (No. 86/1994), which was issued on February 1, 1994,established the main requirements for establishing new insurance companies,including the minimum paid-up cash capital requirement (Br 3 million for thegeneral insurance business, Br 4 million for the life (long-term) insurancebusiness, and Br 7 million if both services are given) . If an insurancecompany is established by a share company, each shareholder's investment islimited to no more than 20 percent of the total equity. The law alsospecifies the requirements for the issuance of a license, the applicationfor license, share registration, required capital, reserves, and solvencymargin. This proclamation was followed by a Directive (No. SIB/1/94) inJune 1994, which set the criteria for the selection of members of the Boardof Directors of a proposed insurance company, as well as the fees, contentsof the application form, and other relevant information that have to besubmitted along with the application.
VI. Assessing Eritrea's Impact on Ethiopia's Program
1. Overview
One of the difficulties that emerges in the analysis and programming ofmonetary developments in Ethiopia is the statistical problem of separatingout movements in the money stock between Eritrea and Ethiopia, given theirde facto currency union. The issue arises principally because Ethiopia'smonetary survey, as currently compiled, does not explicitly distinguishbetween currency notes that are in Ethiopia proper rather than in Eritrea.This implies that movements of the overall monetary aggregate for Ethiopiamay not yield an accurate measure of the actual development of liquiditywithin Ethiopia, given the possibility of bilateral payment surpluses ordeficits with Eritrea. This chapter suggests several conceptual adjustmentsthat would allow for a more meaningful interpretation of developments inEthiopia's monetary aggregates (although these tasks are complicated bylimitations of the available data base) .
2. Possible adjustments
The level of broad money, as presently reported in Ethiopia's monetarysurvey, is larger than the actual level of broad money in Ethiopia. Speci-fically, the currency in circulation component of the survey not onlyincludes currency in circulation in Ethiopia, but also total currencyholdings in Eritrea. An attempt to reduce broad money by the amount ofcurrency in Eritrea would require a corresponding adjustment in Ethiopia'snet domestic assets (NDA) classification, which measures the net claims ofEthiopia's banking system on Ethiopian residents. Some of Ethiopia's NDAreflect claims on Eritrean residents that gave rise to their birr depositsas well as currency-in-circulation in Eritrea. Although a precise
©International Monetary Fund. Not for Redistribution
- 70 -
adjustment of individual elements of the Ethiopian monetary survey is notpossible, some broad accounting adjustments may be undertaken at aconceptual level.
On the liability side, Ethiopia's currency in circulation would need tobe adjusted for the amount of total currency notes in Eritrea, i.e.,currency in circulation in Eritrea as well as the vault cash of the Eritreanbanking system. On the asset side, counterpart adjustments would be made bysubtracting these items from Ethiopia's net domestic assets. I/ Inpractice, the amount of total currency in circulation in Eritrea is notknown and needs to be estimated. 2/ However, Eritrea's provisionalmonetary survey treats (net) claims on the Ethiopian banking system as partof Eritrea's net foreign assets, and thus this component, i.e., Eritrea'sbirr-denominated net foreign assets (NFABR) , is directly observable from thecurrent presentation of the Eritrean accounts. 3/ Ex post adjustments tothe Ethiopian accounts can therefore be undertaken on the basis of figuresobserved in the Eritrean accounts, even though the Ethiopian banking systemdoes not keep a separate record of its liabilities to and claims on Eritrea(i.e., Eritreans are effectively treated as residents rather thannonresidents). As noted above, however, the distribution of currency incirculation between the two countries would still need to be estimated (asof the beginning of each period).
In essence, these two components capture intra-union monetary flows,i.e., the bilateral balance of payments between Ethiopia and Eritrea, andare largely driven by the relative stance of macroeconomic policies pursuedin each country. While a change in cash in circulation in Eritrea reflects,inter alia, a net migration of currency that remains outside banks, changesin the (net) claims of the Eritrean banking system on Ethiopia provide anindicator of how much the former accumulates (or loses) reserves andliquidity vis-a-vis the latter (and vice versa).
An important conceptual distinction should be made. As in any standardmonetary survey, the factors affecting the area-wide money supply includerates of (net) domestic credit expansion in each country as well as the
I/ In this way, it is assumed that "other items net" pick up the slack onthe asset side.
2/ The amount of birr in circulation in Eritrea does not appear at all inEritrea's monetary accounts, since such currency notes are not a liabilityof the Bank of Eritrea, but rather of the National Bank of Ethiopia.Indeed, the BE does not have any information on currency in circulation noron any changes in birr in circulation that would arise from movements ofbirr currency across the Ethiopian and Eritrean borders.3/ In what follows, NFABR is assumed to be comprised of cash for
simplicity. Otherwise, depending on its exact composition, deposits wouldalso require adjustments. The noncash component of NFABR reportedlyincludes items that are still under negotiation between the two bankingsystems, and is relatively small.
©International Monetary Fund. Not for Redistribution
- 71 -
balance of payments position vis-a-vis the rest of the world. Therefore, aslong as accumulated claims between the two countries remain as reserves inthe (corresponding) banking system, area-wide broad money should not beaffected. I/ In that case, intra-union monetary flows would imply a lowerlevel of broad money for the country running the deficit and an adjustmentto that effect would need to be made. This broadly reflected the situationfor Ethiopia as of June 1993, when Eritrea held a sizable surplus in itsbirr-denominated NFA position. 2/
3. Numerical illustrations
On the basis of the preceding discussion, Eritrea's monetary accountscan be integrated within an overall analysis of monetary developments inEthiopia during 1992/93 (June-June), in order to illustrate the possibleimpact of Eritrea on monetary developments in Ethiopia. Two scenarios areindicated in Table 4. The first two columns (A and B) indicate theunadjusted monetary survey for Ethiopia and Eritrea; Column C indicates theadjustments required to produce a more economically meaningful monetarysurvey for the birr area as of June 1992. In making this adjustment, it isnecessary to make an assumption on the amount of currency in circulation inEritrea; column C assumes that 7 percent of total currency in circulation isheld outside the Eritrean banking system on June 1992, in line with therelative population shares of the two countries. Ethiopia's adjusted(effective) NDA is then derived by subtracting NFABR and cash in circulationin Eritrea from the unadjusted (reported) NDA.
Column D illustrates the impact of two additional assumptions on deve-lopments during 1992/93, viz., that (i) 10 percent of the total increase inNFABR during this year (of about Br 524 million) was due to the return tothe banking system of currency already in Eritrea (hence the Br 50 milliondecline in Eritrea's cash in circulation; and that (ii) the remainingincrease in the Eritrean NFABR was derived from new flows of cash from
\J Although the money multiplier would vary considerably.2/ In an ex ante sense, a further complication would arise; in addition
to the assumption on the distribution of currency-in-circulation between thetwo countries, an estimate on the size and direction of future intra-unionmonetary-flows would be required, if these adjustments were to be made forthe future. For instance, had these accumulated claims been used to extenddomestic credits in Eritrea, area-wide broad money could changesubstantially. In that context, an additional policy question would arisefor Ethiopia, i.e. to assess the share of the expansion that is expected tofall upon Ethiopian output.
©International Monetary Fund. Not for Redistribution
- 72 -
Table 4. Ethiopia: Adjusted Monetary Survey, 1991/92-1992/93
(In millions of birrt
1991/92June 92
(A)
1992/93June 93
(B)
1991/92June 92
(C)Current
1992/93June 93
(D)Adjusted
1992/93June 93
(E)
NFANDANFABR1/Cash io circulation 2/
MoneyCashDeposits
Memorandum items :Reserve moneyMultiplierCash/deposit ratioReserve ratioGDPVelocity
Broad moneyNDA
4078,585
...
...
8,99243164,676
5,7391.570.92030
20380237
...
...
16678,782
...
...
10,45043855^65
6,6641.570.88032
26,0342.49
162,23
4078385-741-302
7,9493,2734,676
4,6961.690.70030
203802.56
fin percentaee chaneel
...
...
16678,782
-1365-250
8,93533705,565
5,1491.740.61032
26,0342.91
12.4-3.6
16678,782
-1,265-302
838233185365
5,0971.740.60032
26,0342.93
11.7-43
Assumptions:The percentage of total cash in circulation that was in Eritreaas of June 1992: 7 7The percentage of the change in Entreat NFA in birr that was due to achange in currency—in circulation already in Eritrea: 10 0
I/ As reported in the Eritrean monetary survey.2/Estimate.
©International Monetary Fund. Not for Redistribution
- 73 -
Ethiopia, implying a reduction in the latter's cash in circulation. \JSuch a flow of notes from Ethiopia, equivalent to its running a bilateralbalance of payments deficit with Eritrea, could reflect a bilateral currentaccount deficit and/or net positive capital flows to Eritrea.
An immediate implication of the adjustments is that adjusted NDA inEthiopia is reduced to Br 7,542 million and Br 7,267 million in June 1992and June 1993, respectively, from the unadjusted amounts of Br 8,585 millionand Br 8,782 million. As a consequence, Ethiopia's adjusted broad moneyrecords a much lower growth rate of 12.4 percent, compared with anunadjusted growth of 16.2 percent. In Eritrea, broad money declines from anunadjusted 99 percent to an adjusted 66 percent, reflecting that theadjusted definition includes an additional component (i.e., Eritrea'scurrency in circulation). On the other hand, area-wide broad money grows by18.8 percent, as compared to Ethiopia's unadjusted 16.2 percent.
In column E, a similar exercise is carried out by assuming that none ofthe increase in NFABR in 1992/93 is derived from a return to the bankingsystem of currency in circulation from within Eritrea. As would beexpected, Ethiopia's money supply growth is correspondingly lower(11.7 percent) while Eritrea's is higher (71.1 percent). This simplyreflects the assumption that all money is now assumed to come from Ethiopiawhile currency in circulation in Eritrea remains unchanged over the period.Area-wide growth in broad money is unaffected by this compositionalmovement.
These variants demonstrate that without knowledge of financialdevelopments within Eritrea and its balance of payments with Ethiopia, itwould be difficult to assess how tight monetary policy was in Ethiopiaduring 1992/93. The variants also indicate that overall area-wide broadmoney growth is not highly sensitive to changes in cash in circulation inEritrea and NFABR, since neither NDA nor NFA (denominated in convertiblecurrencies) is assumed to change in any of the alternative variants.
VII. Estimation of Demand Curve for Foreign Exchange Auctions
The introduction of a foreign exchange auction system in Ethiopia sinceMay 1, 1993 has generated a rich data base that can be used to estimate ademand function for foreign exchange. As of June 25, 1994, 31 auctions hadtaken place, generating some 1,000 observations pooled in a cross section-time series data base consisting of the bid price and the correspondingcumulative demand at each auction. Data were also available on the numberof eligible bidders and the excess demand generated in each auction.Various specifications of the demand function were considered in estimating
I/ The transfer could also have derived from a shift of deposits.Focusing on a cash note transfer is a simplifying assumption and should notaffect the essence of the argument.
©International Monetary Fund. Not for Redistribution
- 74 -
a demand equation. On the basis of the simulation of Auction 31 (discussedhere) and earlier auctions, the model would appear to have relatively highpredictive power.
1. Specification of equations
The model specification not only reflects the usual price quantityrelationships, but also an attempt to capture the lagged response of biddersto any excess demand pressures revealed in the previous auctions. Inaddition, an aspect of the game theoretic behavior of bidders may becaptured by testing their response to the marginal bid which cleared themarket at the previous auction; in effect, this rate gives bidders a senseof which bid rates are likely to be successful in the current auction. Themodel specification is as follows:
Where:
BR^t — bid rate i for auction t;
CD t̂ - cumulative demand i for auction t;
MRt_i - marginal rate for the previous auction; and
EDt_i - excess demand for the previous auction;
€t,zt - error termsEquation (2) implicitly constrains the coefficient of MRt.̂ to be unity andtherefore considers bidders' behavior in terms of the difference betweentheir bid rates and the previous marginal rate. In general, this equationdid not provide a good fit, with R2 less than 0.5.
The number of eligible bidders for the previous auction, EBt.̂ , wasincluded as an additional independent variable, but was found not to improvethe fit of the equation significantly. A possible reason could be that thetwo variables EDt_i and EBt.̂ are strongly correlated with each other. As aconsequence, the variable EBt.̂ was dropped from the equation.
A semi-logarithmic form of the model \J was run to see if thisspecification would be able to capture any nonlinear relationship betweenthe explanatory variable (the bid rate) and the set of independentvariables. The fit improved slightly with the semilogarithmicspecification.
I/ The model specification is log(BR̂ t)-a-b(CD̂ t)-»- c(MRt.̂ )-i- d(EDt.̂ )+et
(1) BRit - a - p (CDit) + 7 (MR̂ ) + a (EDt-1) + et
(2) BRit - MRj-.! - A - W (CDit) + 6 (EDt-1) + zt
©International Monetary Fund. Not for Redistribution
- 75 -
2. Structural issues
Two main developments occurred over the auction periods, which mighthave led to a structural shift in the demand curve. First, as of the fifthauction, the quantity to be auctioned was preannounced. To capture thepossible effect of this development on the demand for foreign exchange, adummy variable, ID, was included. \J The second development was thenarrowing of the import negative list as of September 4, 1993 (Auction 10)and a further narrowing of the list as of March 5, 1994 (Auction 23). Twodummy variables, NL1 and NL2, were used to capture any possible effects onthe demand function 2/.
Various combinations of the three dummy variables were specified in themodel to find the best fit. The specification that best captures the twodevelopments appears to be that with the two slope dummy variables ID andNL2. Including NL1 as well did not improve the fit any further because bothNL1 and NL2 were essentially capturing similar effects. Indeed, NL2 wouldbe a better variable to include as the earlier narrowing of the negativelist was not adequately publicized.
3. Estimation results and simulations
Table 1 presents the results of the most significant equationsestimated. Equations Ml and M2 were estimated on the basis of the first 30auctions, and were used for the purpose of simulating the results ofAuction 31, of June 25, 1994. Equations M3 and M4 include the results ofAuction 31. All equations have good R^ with the semilogarithmicspecification providing a slightly better fit. The t-statistic and F-statistics are all significant. The demand curve appears to be relativelystable, as the coefficients change little when the Auction 31 data areadded. The simulation of Auction 31 is shown in Table 6, together with acomparison of the actual bid rates. The predictive value of the equationsis relatively strong, except for the extremely low bid rates. Inparticular, the prediction of the marginal rate by both equations differsfrom the actual marginal bid rate (6.22) by less than 1 percent.
In simulations of earlier auctions, the predicted values have ingeneral fallen within 3 percent of the actual marginal rates. Thepercentage errors have tended to be smaller over periods where the demandfor foreign exchange has remained relatively stable.
I/ The variable equals 0 for Auctions 1-4 and 1 thereafter.2/ NL1 equals 0 for Auctions 1-9 and 1 thereafter. NL2 equals 0 for
Auctions 1-22 and 1 thereafter.
©International Monetary Fund. Not for Redistribution
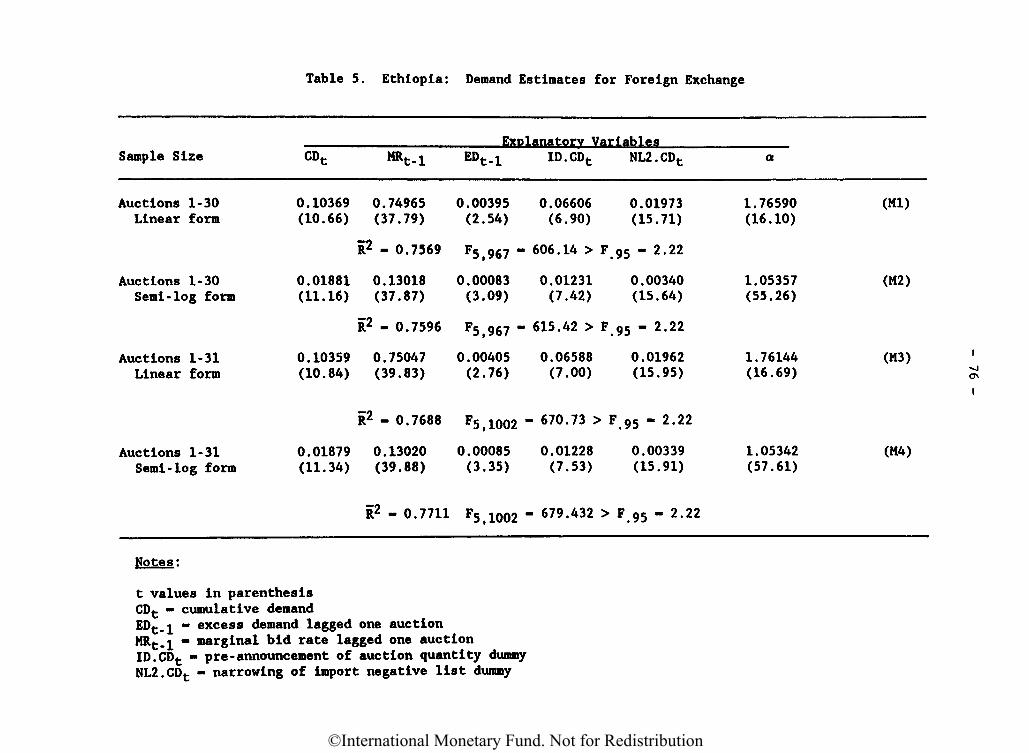
Table 5. Ethiopia: Demand Estimates for Foreign Exchange
Exolanatorv VariablesSample Size
Auctions 1-30Linear form
Auctions 1-30Semi -log form
Auctions 1-31Linear form
Auctions 1-31Semi -log form
CDt
0.10369(10.66)
0.01881(11.16)
0.10359(10.84)
0.01879(11.34)
*t-l
0.74965(37.79)
R2 - 0.7569
0.13018(37.87)
R2 - 0.7596
0.75047(39.83)
R2 - 0.7688
0.13020(39.88)
R2 - 0.7711
EDt-l
0.00395(2.54)
F5,967 -
0.00083(3.09)
F5,967 -
0.00405(2.76)
F5,1002
0.00085(3.35)
F5,1002
ID.CDt
0.06606(6.90)
606.14 > F
0.01231(7.42)
615.42 > F
0.06588(7.00)
- 670.73 >
0.01228(7.53)
NL2.CDt
0.01973(15.71)
.95 " 2-22
0.00340(15.64)
.95 - 2-22
0.01962(15.95)
F 95 - 2.22
0.00339(15.91)
a
1.76590(16.10)
1.05357(55.26)
1.76144(16.69)
1.05342(57.61)
(Ml)
(M2)
(M3)
(M4)
- 679.432 > F 95 - 2.22
Notes:
t values in parenthesisCDt - cumulative demandEDt_i - excess demand lagged one auctionMRt_i - marginal bid rate lagged one auctionID.CDt - pre-announcement of auction quantity dummyNL2.CDt - narrowing of import negative list dummy
©International Monetary Fund. Not for Redistribution
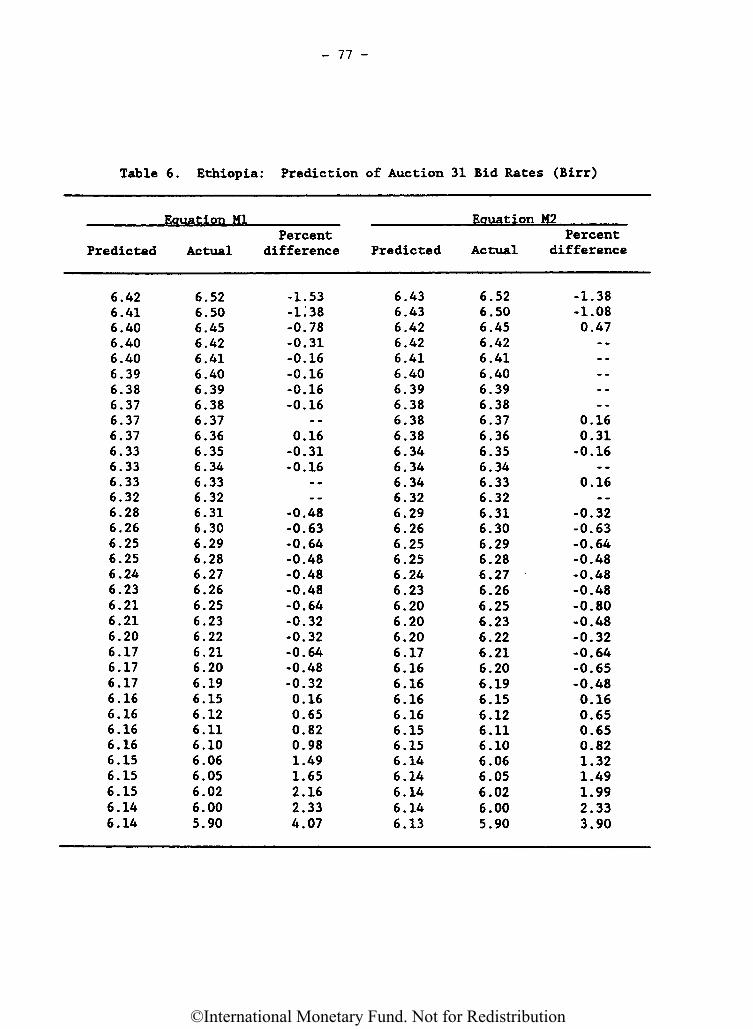
- 77 -
Table 6. Ethiopia: Prediction of Auction 31 Bid Rates (Birr)
Equation Ml
Predicted
6.426.416.406.406.406.396.386.376.376.376.336.336.336.326.286.266.256.256.246.236.216.216.206.176.176.176.166.166.166.166.156.156.156.146.14
Actual
6.526.506.456.426.416.406.396.386.376.366.356.346.336.326.316.306.296.286.276.266.256.236.226.216.206.196.156.126.116.106.066.056.026.005.90
Percentdifference
-1.53-i;38-0.78-0.31-0.16-0.16-0.16-0.16
--0.16-0.31-0.16
-----0.48-0.63-0.64-0.48-0.48-0.48-0.64-0.32-0.32-0.64-0.48-0.320.160.650.820.981.491.652.162.334.07
Predicted
6.436.436.426.426.416.406.396.386.386.386.346.346.346.326.296.266.256.256.246.236.206.206.206.176.166.166.166.166.156.156.146.146.146.146.13
Eauation
Actual
6.526.506.456.426.416.406.396.386.376.366.356.346.336.326.316.306.296.286.276.266.256.236.226.216.206.196.156.126.116.106.066.056.026.005.90
M2Percent
difference
-1.38-1.080.47
----------
0.160.31-0.16
--0.16
---0.32-0.63-0.64-0.48-0.48-0.48-0.80-0.48-0.32-0.64-0.65-0.480.160.650.650.821.321.491.992.333.90
©International Monetary Fund. Not for Redistribution
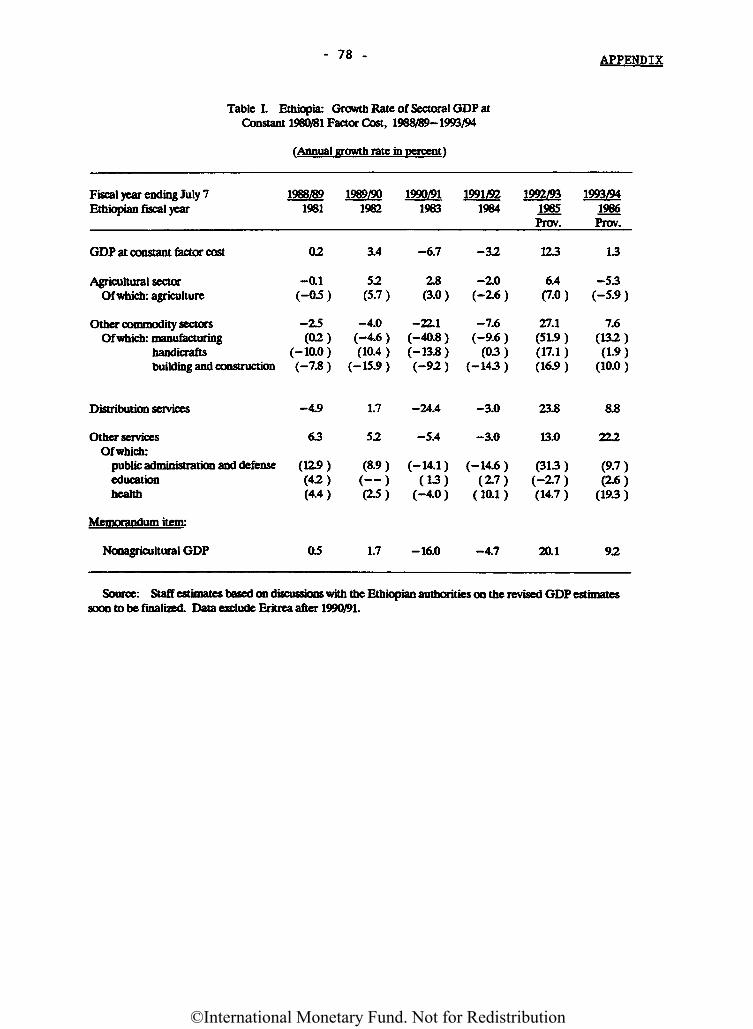
APPENDIX
Table I. Ethiopia: Growth Rate of Sectoral GDP atConstant 1980/81 Factor Cost, 1988/89-1993/94
(Annual growth rate in percent)
Fiscal year ending July 7Ethiopian fiscal year
GDP at constant factor cost
Agricultural sectorOf which: agriculture
Other commodity sectorsOf which: manufacturing
handicraftsbuilding and construction
Distribution services
Other servicesOf which:
public administration and defenseeducationhealth
Memorandum item*
Nonagricultural GDP
1968/891961
02
-0.1(-05)
-25(02)
(-10.0)(-7.8)
-4.9
63
(12.9)(42)(4.4)
05
1969/901962
3.4
52(5.7)
-4.0(-4.6 )(10.4 )
(-15.9)
1.7
52
(8.9)(—)(25)
1.7
1990/911983
-6.7
2.8(3.0)
-22.1(-40.8)(-13.8)(-92)
-24.4
-5.4
(-14.1)(13)
(-4.0)
-16.0
1991/921964
-32
-2.0(-2.6)
-7.6(-9.6)
(03)(-143 )
-3.0
-3.0
(-14.6 )(2.7)
(10.1)
-4.7
1992/931965
Prov.
123
6.4(7.0)
27.1(51.9 )(17.1 )(16.9 )
23.8
13.0
(313)(-2.7)(14.7 )
20.1
1993/941966Prov.
13
-53(-5.9)
7.6(132)(1.9)
(10.0 )
8.8
222
(9.7)(2.6)
(193)
92
- 78 -
Source: Staff estimates based on discussions with the Ethiopian authorities on the revised GDP estimatessoon to be finalized. Data exclude Eritrea after 1990/91.
©International Monetary Fund. Not for Redistribution
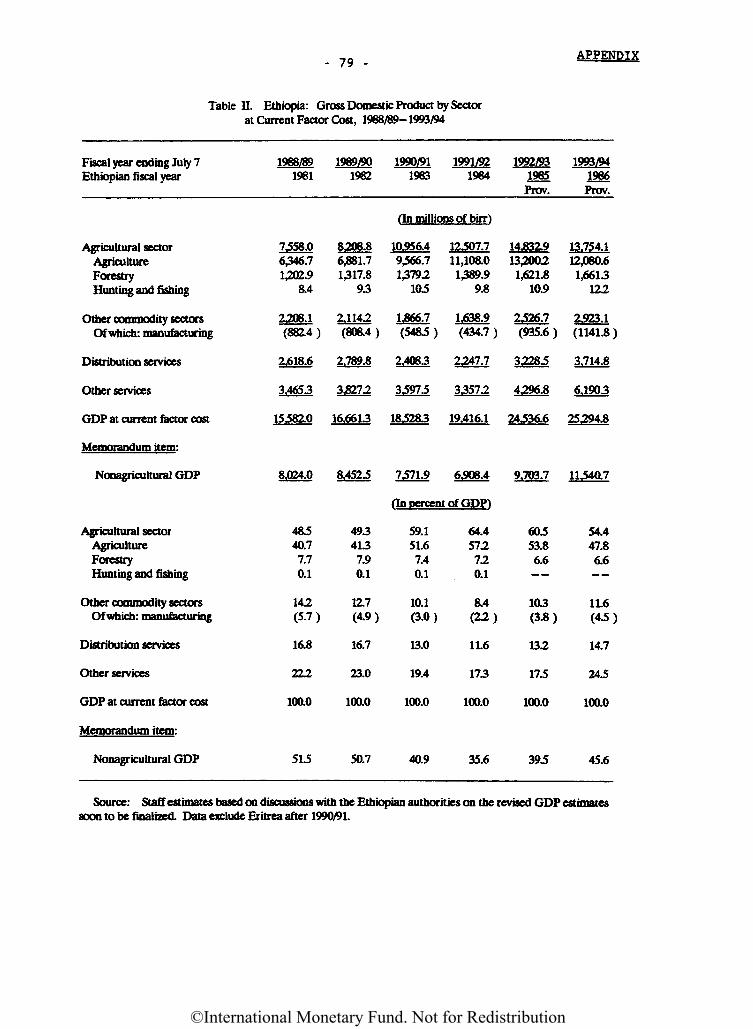
- 79 -APPENDIX
Table II. Ethiopia: Gross Domestic Product by Sectorat Current Factor Cost, 1988/89-1993/94
Fiscal year ending July 7Ethiopian fiscal year
1988/891981
1989/901982
1990/911983
1991/921984
1992/931985
Prov.
1993/941966
Prov.
On millions of birr)
Agricultural sectorAgricultureForestryHunting and fishing
Other commodity sectorsOf which: manufacturing
Distribution services
Other services
GDP at current factor cost
Memorandum item:
Nonagricultural GDP
7558.06346.71,202.9
8.4
2206.1(882.4)
2,618.6
3,4653
15582.0
8,024.0
8206.86,881.71317.8
93
2,1142(808.4)
2,789.8
3*272
16,6613
8,4525
10556.49,566.713792
105
1*66.7(5485)
2,4063
35975
185283
7571.9
12507.711,108.01389.9
9.8
1,638.9(434.7 )
2247.7
33572
19,416.1
6508.4
14*32513,20021,621.8
10.9
2526.7(935.6)
32285
4296.8
24536.6
9,703.7
13,754.112,080.61,6613
122
2523.1(1141.8 )
3,714.8
6,1903
25294*
11540.7
On percent of GDP1
Agricultural sectorAgricultureForestryHunting and fishing
Other commodity sectorsOf which: manufacturing
Distribution services
Other services
GDP at current factor cost
Memorandum item:
Nonagricultural GDP
48540.77.70.1
142(5.7)
16.8
222
100.0
515
4934137.90.1
12.7(4.9)
16.7
23.0
100.0
50.7
59.151.67.40.1
10.1(3.0)
13.0
19.4
100.0
40.9
64.4572720.1
8.4(22)
11.6
173
100.0
35.6
60553.86.6
103(3.8)
132
175
100.0
395
54.447.86.6
11.6(45)
14.7
245
100.0
45.6
Source: Staff estimates based on discussions with the Ethiopian authorities on the revised GDP estimatessoon to be finalized. Data exclude Eritrea after 1990/91.
©International Monetary Fund. Not for Redistribution
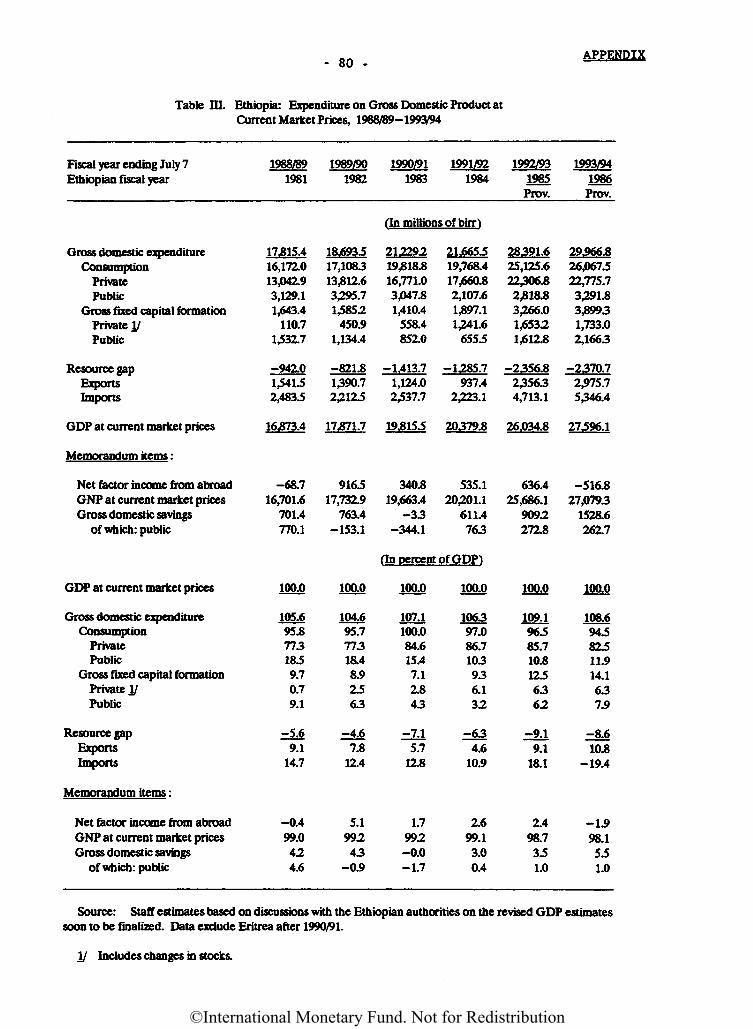
- 80 - APPENDIX
Table m. Ethiopia: Expenditure on Gross Domestic Product atCurrent Market Prices, 1983/89-1993/94
Fiscal year ending July 7Ethiopian fiscal year
1968/891981
1989/901982
1990/911983
1991/921984
1992/931985
Prov.
1993/941986
Prov.
(In millions of birr ̂
Gross domestic expenditureConsumption
PrivatePublic
Gross fixed capital formationPrivatel/Public
Resource gapExportsImports
GDP at current market prices
Memorandum items :
Net factor income from abroadGNP at current market pricesGross domestic savings
of which: public
17115.416,172.013,042.93,129.11,643.4
110.71,532.7
-942.01,541.52,483.5
16,873.4
-68.716,701.6
701.4770.1
18,693517,108313,812.63,295.71,585.2
450.91,134.4
-821.81390.72,212.5
17,871.7
916517,732.9
763.4-153.1
21229219,818.816,771.03,047.81,410.4
558.4852.0
-1,413.71,124.02,537.7
19.8155
340.819,663.4
-33-344.1
21,665519,768.417,660.82,107.61,897.11,241.6
6555
-1285.7937.4
2,223.1
20379.8
535.120,201.1
611.4763
28391.625,125.622306.82,818.83,266.01,65321,612.8
-2356.8235634,713.1
26,034.8
636.425,686.1
9092272.8
29,966.826,067522,775.73̂ 291.83,89931,733.02,1663
-2370.72,975.75346.4
27596.1
-516.827,0793
1528.6262.7
(In percent of GDP^
GDP at current market prices
Gross domestic expenditureConsumption
PrivatePublic
Gross fixed capital formationPrivate I/Public
Resource gapExportsImports
Memorandum items :
Net factor income from abroadGNP at current market pricesGross domestic savings
of which: public
100.0
105.695.87731859.70.79.1
-5.69.1
14.7
-0.499.0424.6
100.0
104.695.777318.48.92563
-4.67.8
12.4
5.199243
-0.9
100.0
107.1100.084.615.47.12.843
-7.15.7
12.8
1.7992-0.0-1.7
100.0
106397.086.7103936.132
^634.6
10.9
2.699.13.00.4
100.0
109.196585.710.81256362
-9.19.1
18.1
2.498.7351.0
100.0
108.694582511.914.1637.9
-8.610.8
-19.4
-1.998.1551.0
Source: Staff estimates based on discussions with the Ethiopian authorities on the revised GDP estimatessoon to be finalized. Data exclude Eritrea after 1990/91.
I/ Includes changes in stocks.
©International Monetary Fund. Not for Redistribution
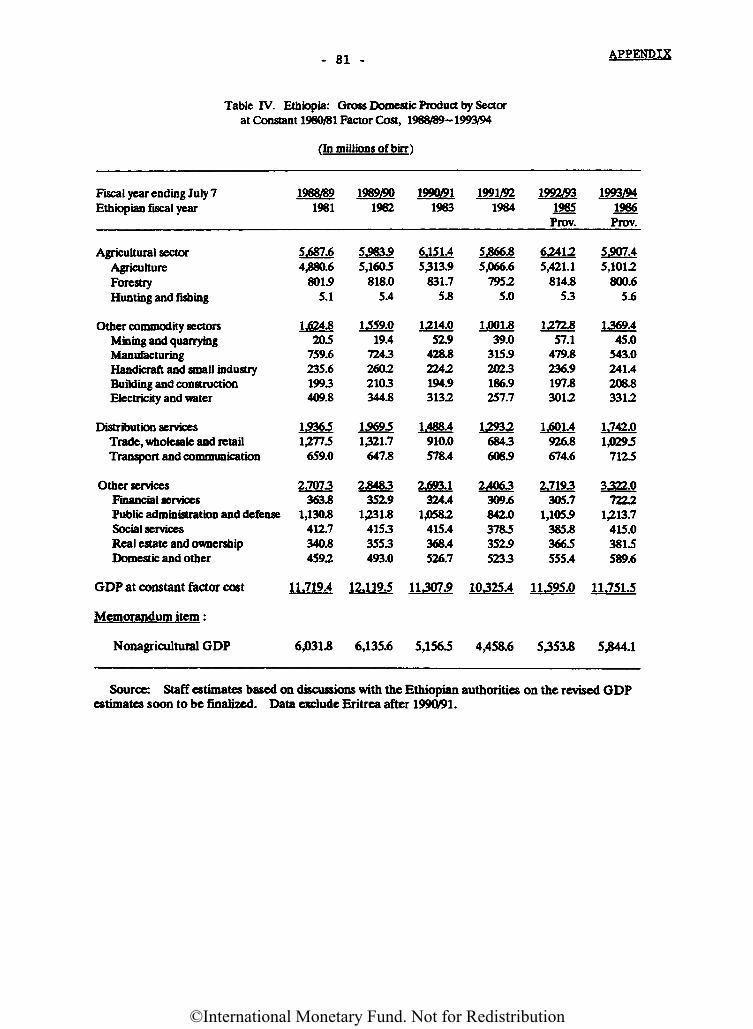
- 81 -
APPENDIX
Table IV. Ethiopia: Gross Domestic Product by Sectorat Constant 1980/81 Factor Cost, 1968/89-1993/94
(In millions of birr)
Fiscal year ending July 7Ethiopian fiscal year
1988/891981
1989/901962
1990/911983
1991/921984
1992/931985
Prov.
1993y941986
Prov.
Agricultural sectorAgricultureForestryHunting and fishing
Other commodity sectorsMining and quarryingManufacturingHandicraft and small industryBuilding and constructionElectricity and water
Distribution servicesTrade, wholesale and retailTransport and communication
Other servicesFinancial servicesPublic administration and defenseSocial servicesReal estate and ownershipDomestic and other
GDP at constant factor cost
Memorandum item:
Nonagricultural GDP
5.687.64,880.6
801.95.1
1.624.820.5
759.6235.61993409.8
153631,277.5
659.0
5.983.95,1605
818.05.4
1569.51321.7
647.8
5313.9 5,066.6831.7 7952
5.8 5.0
1214.0 1,001.852.9 39.0
428.8 315.92242 2023194.9 186.93132 257.7
1,488.4 12932910.0 6843578.4 608.9
5,421.1 5,1012814.8 800.6
53 5.6
1272.857.1
479.8236.9197.83012
1369.445.0
543.0241.4206.83312
23483352.9
1,231.841533553493.0
2,693.1324.4
1,0582415.4368.4526.7
2,4063309.6842.0378.5352.95233
1.601.4 1.742.0926.8 1,029.5674.6 712.5
2.7193305.7
1,105.9385.83665555.4
3322.07222
1,213.7415.0381.5589.6
11J19.4 12.119.5 11307.9 10325.4 11595.0 11J515
6,031.8 6,135.6 5,156.5 4,458.6 5,353.8 5344.1
Source: Staff estimates based on discussions with the Ethiopian authorities on the revised GDPestimates soon to be finalized. Data exclude Eritrea after 1990/91.
2J073363.8
1,130.8412.7340.8459.2
1,559.019.4
724326O22103344.8
6.151.4 5,866.8 6341.2 5,907.4
©International Monetary Fund. Not for Redistribution
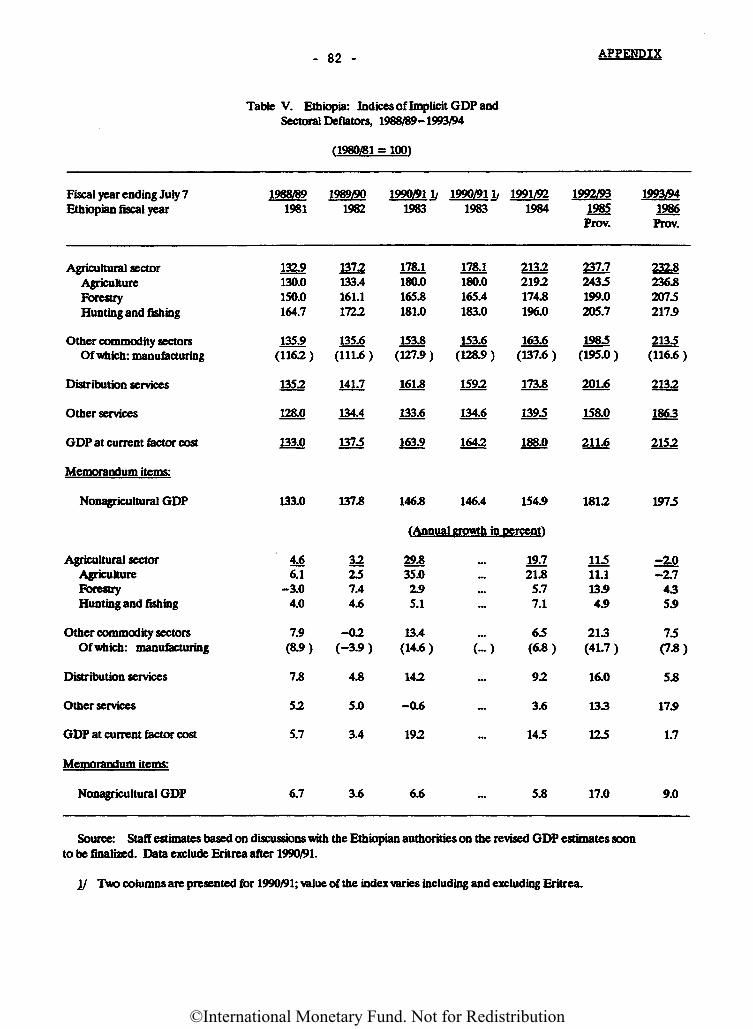
- 82 -
APPENDIX
Table V. Ethiopia: Indices of Implicit GDP andSectoral Deflators, 1988/89-1993/94
(1980/81 = 100)
Fiscal year ending July 7Ethiopian fiscal year
Agricultural sectorAgricultureForestryHunting and fishing
Other commodity sectorsOf which: manufacturing
Distribution services
Other services
GDP at current factor cost
Memorandum items:
Nonagricultural GDP
1988/891981
132.9130.0150.0164.7
135.9(116.2 )
135.2
128.0
133.0
133.0
1989/901982
137.2133.4161.11722
135.6(111.6 )
141.7
134.4
137.5
137.8
1990/91 1/1983
178.1180.0165.8181.0
153.8(127.9)
161.8
133.6
163.9
146.8
1990/91 lf1983
178.1180.0165.4183.0
153.6(128.9)
1592
134.6
1642
146.4
1991/921984
21322192174.8196.0
163.6(137.6 )
173.8
1395
188.0
154.9
1985Prov.
237.72435199.0205.7
1985(195.0)
201.6
158.0
211.6
1812
1966Prov.
232.8236.82075217.9
2135(116.6 )
2132
1863
2152
1975
f Annual growth in percent)
Agricultural sectorAgricultureForestryHunting and fishing
Other commodity sectorsOf which: manufacturing
Distribution services
Other services
GDP at current factor cost
Memorandum items:
Nonagricultural GDP
4.66.1
-3.04.0
7.9(8.9)
7.8
52
5.7
6.7
32257.44.6
-02(-3.9)
4.8
5.0
3.4
3.6
29.835.02.95.1
13.4(14.6)
142
-0.6
192
6.6
...
(-O
...
~
...
...
19/721.85.77.1
65(6-*)
92
3.6
145
5.8
11511.113.94.9
213(41.7 )
16.0
133
125
17.0
-2.0-2.7
435.9
75(7.8)
5.8
17.9
1.7
9.0
Source: Staff estimates based on discussions with the Ethiopian authorities on the revised GDP estimates soonto be finalized. Data exclude Eritrea after 1990/91.
\l Two columns are presented for 1990/91; value of the index varies including and excluding Eritrea.
1992/93 1993/94
©International Monetary Fund. Not for Redistribution
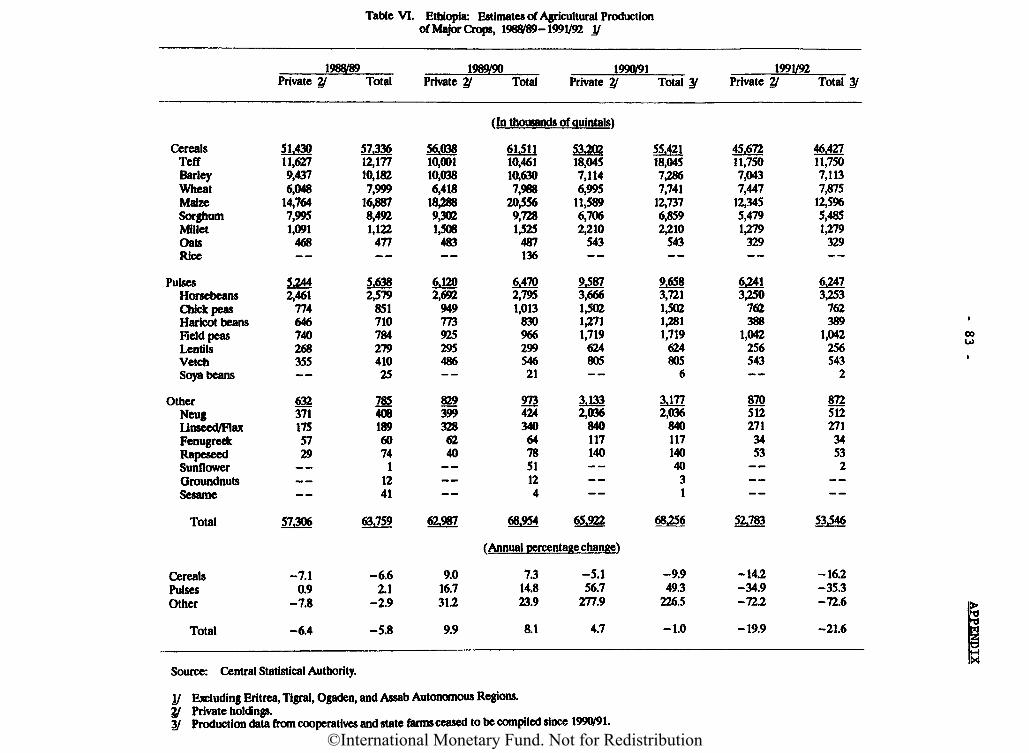
Table VI. Ethiopia: Estimates of Agricultural Productionof Major Crops, 1988/89-1991/92 ]/
Total
1988/89 1989/90Private 2/ Total
1990/91Private 2/ Total Private 7J
1991/92Total^ Private^
57,306 63.759 62,987 68,954 65,922 68056
Source: Central Statistical Authority.
\l Excluding Eritrea, Tigrai, Ogaden, and Assab Autonomous Regions.2/ Private holdings.31 Production data from cooperatives and state farms ceased to be compiled since 199CV91.
52,783
Total 3V
(In thousands of quintals)
CerealsTeffBarleyWheatMaizeSorghumMilletOatsRice
PulsesHorsebeansChickpeasHaricot beansField peasLentilsVetchSoya beans
OtherNeugUnseed/FlaxFenugreekRapeseedSunflowerGroundnutsSesame
51,43011,6279,4376,048
14,7647,9951,091
468
52442,461
774646740268355
6323711755729
57,33612,17710,1827,999
16,8878,4921,122
477
5,6382,579
85171078427941025
78540818960741
1241
56,03810,00110,0386,418
18,2889,3021,508
483
6,1202,692
949773925295486
8293993286240
61,51110,46110,6307,988
20,5569,7281,525
487136
6,4702,7951,013
83096629954621
973424340647851124
5320218,0457,1146,995
11,5896,7062,210
543
9,5873,6661,5021,2711,719
624805
3,1332,036
840117140
55,42118,0457,2867,741
12,7376,8592,210
543
9,6583,7211,5021,2811,719
624805
6
3,1772,036
8401171404031
45,67211,7507,0437,447
12,3455,4791,279
329
6,2413,250
762388
1,042256543
8705122713453
46,42711,7507,1137,875
12,5%5,4851,279
329
6,2473,253
762389
1,042256543
2
87251227134532
53,546
CerealsPulsesOther
Total
-7.10.9
-7.8
-6.4
-6.62.1
-2.9
-5.8
9.016.731.2
9.9
7.314.823.9
8.1
-5.156.7
277.9
4.7
-9.949.3
226.5
-1.0
-14.2-34.9-72.2
-19.9
-16.2-35.3-72.6
-21.6
(Annual percentage change)
©International Monetary Fund. Not for Redistribution
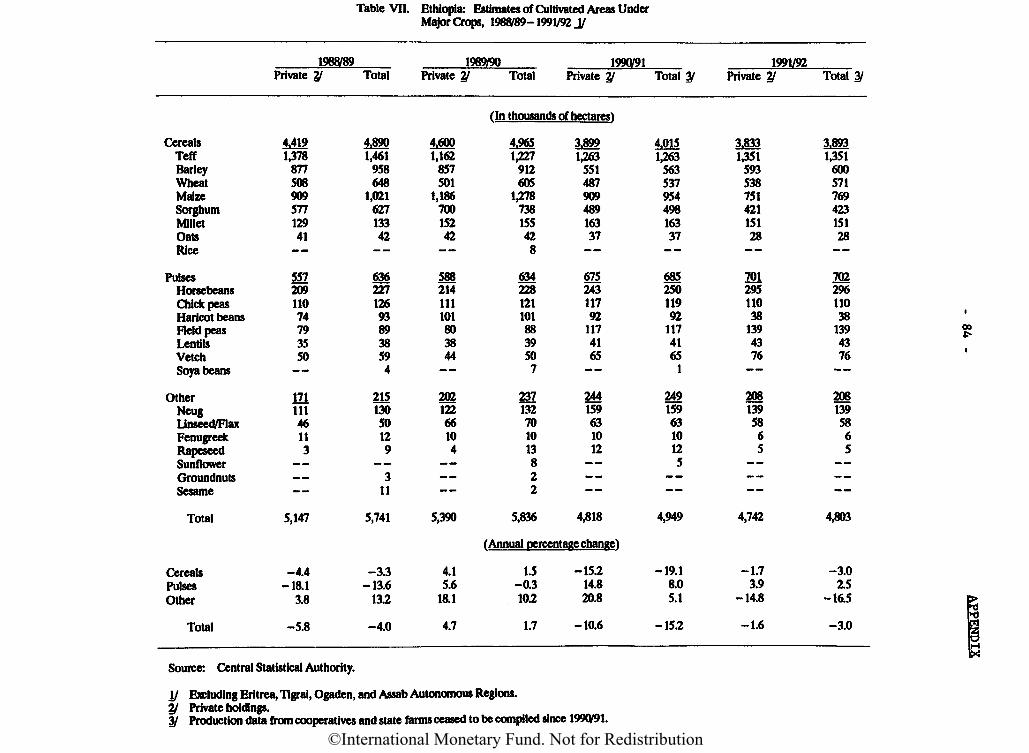
Table VII. Ethiopia: Estimates of Cultivated Areas UnderMajor Crops, 1988/89-1991/92 J/
1968/89Private 2/
1989/90Total Private 2/
1990/91Total Private 7J
1991/92Total 3f Private 2/ Total 3/
(In thousands of hectares)
CerealsTeffBarleyWheatMaizeSorghumMilletOatsRice
PulsesHorsebeansChickpeasHaricot beansField peasLentilsVetchSoya beans
OtherNeugUnseed/FlaxFenugreekRapeseedSunflowerGroundnutsSesame
Total
4,4191,378
87750890957712941
55720911074793550
HI11146113
5,147
4,8901,461
958648
1,02162713342
636227126938938594
21513050129
311
5,741
4.6001,162
857501
1,18670015242
5K214111101803844
20212266104
5,390
4,9651,227
912605
1,278738155428
6342281211018839507
237132701013822
5,836
3,8991,263
55148790948916337
67524311792
1174165
244159631012
4,818
4,0151,263
56353795449816337
68525011991
11741651
2491596310125
4,949
(Annual percentage change)
1,35159353875142115128
70129511038
1394376
2081395865
4,742
3,8931,351
60057176942315128
m29611038
1394376
2061395865
4,803
CerealsPulsesOther
Total
-4.4-18.1
3.8
-5.8
-3.3-13.6
13.2
-4.0
4.15.6
18.1
4.7
1.5-0.310.2
1.7
-15.214.820.8
-10.6
-19.18.05.1
-15.2
-1.73.9
-14.8
-1.6
-3.02.5
-16.5
-3.0
Source: Central Statistical Authority.
I/ Excluding Eritrea, Tigrai, Ogaden, and Assab Autonomous Regions.2/ Private holdings.3/ Production data from cooperatives and state farms ceased to be compiled since 1990/91.
3.833
©International Monetary Fund. Not for Redistribution
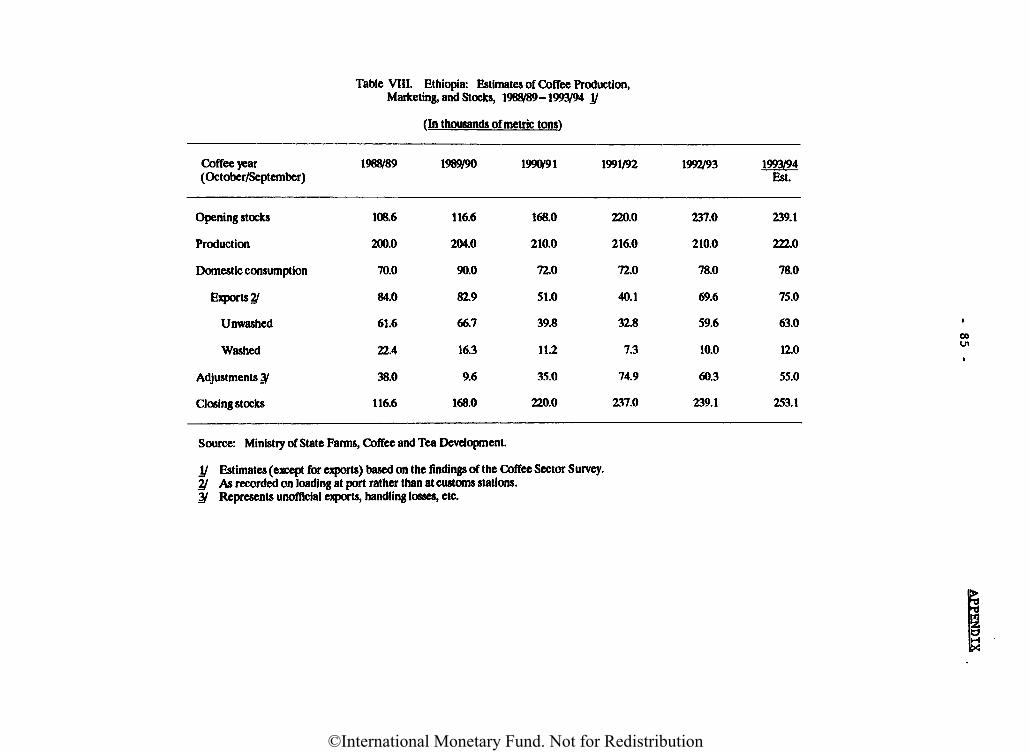
Table VIII. Ethiopia: Estimates of Coffee Production,Marketing, and Stocks, 1988/89-1993/94 \j
(In thousands of metric tons)
Coffee year(October/September)
Opening stocks
Production
Domestic consumption
Exports Sy
Unwashed
Washed
Adjustments 3/
Closing stocks
1988/89
108.6
200.0
70.0
84.0
61.6
22.4
38.0
116.6
1989/90
116.6
204.0
90.0
82.9
66.7
16.3
9.6
168.0
1990/91
168.0
210.0
72.0
51.0
39.8
11.2
35.0
220.0
1991/92
220.0
216.0
72.0
40.1
32.8
7.3
74.9
237.0
1992/93
237.0
210.0
78.0
69.6
59.6
10.0
60.3
239.1
1993/94Est.
239.1
222.0
78.0
75.0
63.0
12.0
55.0
253.1
Source: Ministry of State Farms, Coffee and Tea Development.
\J Estimates (except for exports) based on the findings of the Coffee Sector Survey.2/ As recorded on loading at port rather than at customs stations.3/ Represents unofficial exports, handling losses, etc.
©International Monetary Fund. Not for Redistribution
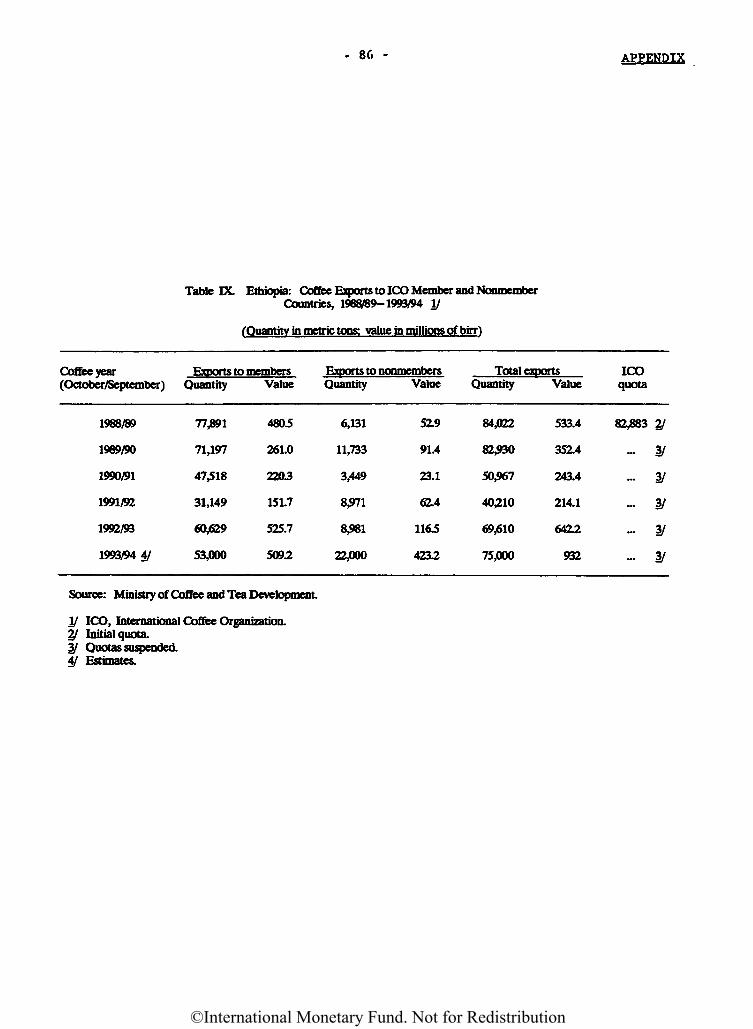
- 86 - APPENDIX
Table DC Ethiopia: Coffee Exports to ICO Member and NonmemberCountries, 1988/89-1993/94 I/
(Quantity in metric tons: value in millions of birr)
Coffee year Exports to members(October/September) Quantity Value
1988/89 77,891
1989/90 71,197
1990/91 47,518
1991/92 31,149
1992/93 60,629
1993/94 4/ 53,000
4805
261.0
2203
151.7
525.7
5092
Exports to nonmembcrsQuantity Value
6,131
11,733
3,449
8,971
8,981
22,000
5X9
91.4
23.1
62.4
1165
4232
Total exportsQuantity
84,022
82,930
50,967
40,210
69,610
75,000
Value
533.4
35X4
243.4
214.1
64X2
932
ICOquota
82,883 21
... 3/
... 3/
... 3/
... 3/
... 3/
Source: Ministry of Coffee and Tea Development
I/ ICO, International Coffee Organization.2/ Initial quota.3/ Quotas suspended.4/ Estimates.
©International Monetary Fund. Not for Redistribution
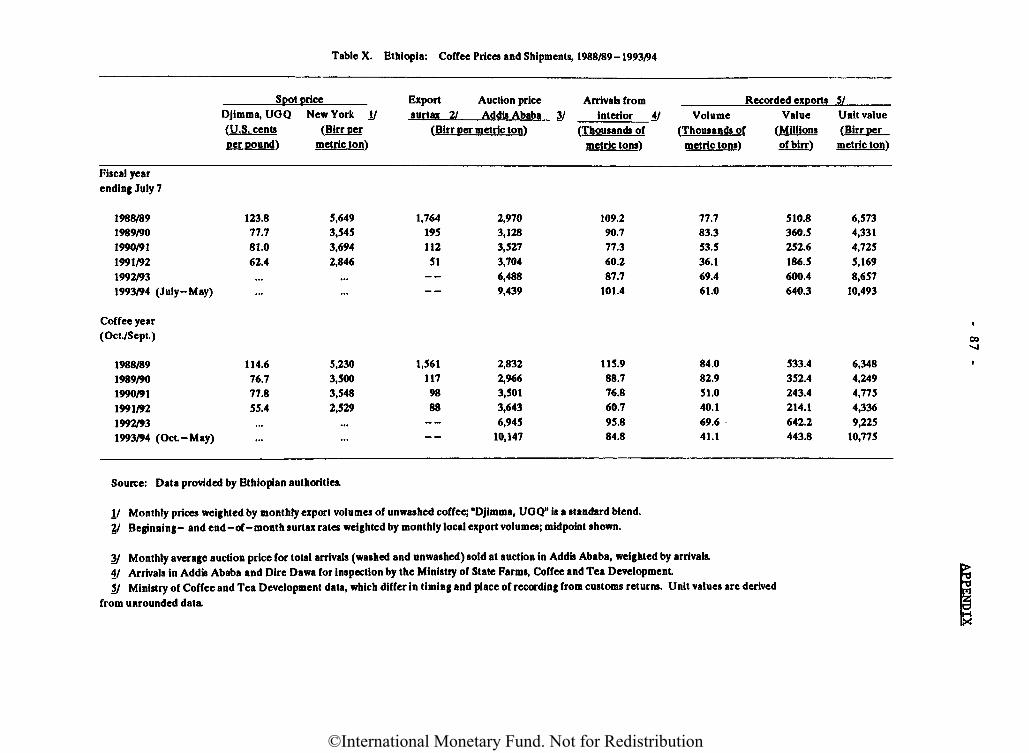
Table X. Ethiopia: Coffee Prices and Shipments, 1988/89 -1993/94
Spot priceDjimma, UGQ(U.S. centsper pound)
Fiscal yearending July 7
1988/891989/901990/911991/921992/931993/94 (July- May)
Coffee year(Oct/Sept.)
1988/891989/901990/911991/921992/931993/94 (Oct-May)
123.877.781.062.4......
114.676.777.855.4...
New York I/(Birr per
metric ton)
5,6493,5453,6942,846
...
...
5,2303,5003,5482,529
...
...
Exportsurtax 21
Auction price Arrivals fromAddis Ababa 3/ interior 4/
(Birr per metric ton)
1,76419511251__
1,5611179888--""
2,9703,1283,5273,7046,4889,439
2,8322,9663,5013,6436,945
10,147
(Thousands ofmetric tons)
109.290.777.360.287.7
101.4
115.988.776.860.795.884.8
Recorded exportsVolume
(Thousands ofmetric tons)
77.783.353.536.169.461.0
84.082.951.040.169.641.1
Value(Millionsofbirr)
510.8360.5252.6186.5600.4640.3
533.4352.4243.4214.1642.2443.8
5/Unit value(Birr per
metric ton)
6,5734,3314,7255,1698,657
10,493
6,3484,2494,7754,3369,225
10,775
Source: Data provided by Ethiopian authorities.
i/ Monthly prices weighted by monthly export volumes of unwashed coffee; "Djimma, UGQ1' is a standard blend.21 Beginning- and end-of-month surtax rates weighted by monthly local export volumes; midpoint shown.
3/ Monthly average auction price for total arrivals (washed and unwashed) sold at auction in Addis Ababa, weighted by arrivals.4/ Arrivals in Addis Ababa and Dire Dawa for inspection by the Ministry of State Farms, Coffee and Tea Development.5/ Ministry of Coffee and Tea Development data, which differ in timing and place of recording from customs returns. Unit values are derived
from unrounded data
©International Monetary Fund. Not for Redistribution
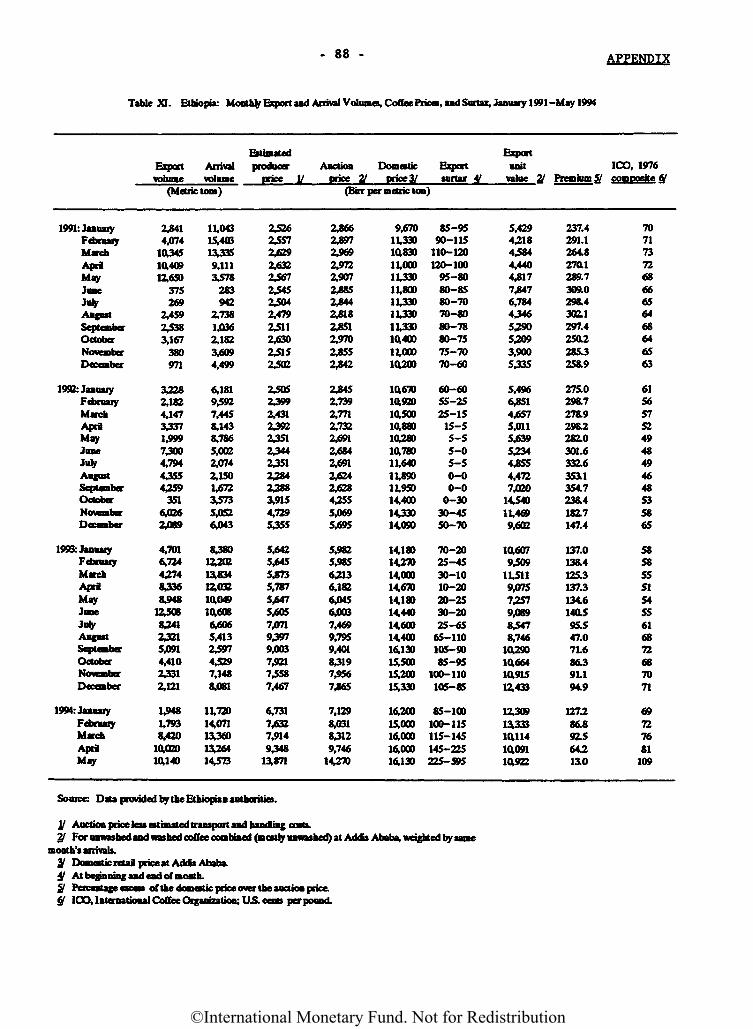
- 88 - APPENDIX
Table XL Ethiopia: Monthly Export and Arrival Volumes, Coffee Price, and Surtax, January 1991-May 1994
volumeArrivalvolume
producerPrice M
(Metric tons)
1991: JanuaryFebniaiyMarchApriMayJuneJu*AugustSeptemberOctoberNovemberDecember
1992: JanuaryFebruaryMarchAprilMayJuneJulyAugustSeptemberOctoberNovemberDecember
1993: JanuaryFebruaryMarchApriMayJuneJulyAugustSeptemberOctoberNovemberDecember
1994: JanuaryFebruaryMarchApriMay
2*414,074
103451040912,650
375269
2,45924383,167
380971
33282,1824,14733371,99973004,79443554359
3516,0262,089
4,7016,724437483368,948
12408834123215*914,41023312,121
1,9481,7938,420
1002010140
11,04315,40313̂ 3359,1113478
283942
2,7381,0362,1823,6094,499
6,18194927,4458,1438,7865,0022,0742,1501*7234735,0526,043
838012,20213,83412,03210049106086,6065,413249744297,1488,081
11,72014,07113,36013,26414,573
242624572*292*322467244524042,47924112*3024152402
240523992,4312392235123442351238423883,9154,7295355
5,6425,6455*735,7875*475,6057*7193979,0037,92174587,467
6,7317*327,9149348
13,871
AuctionPrice U
DomesticPriced
Exportsurtax 4/
unitvalue H
ICX), 1976Premium 5>/ composite 67
(Bar per metric ton)
2*662*972^692,9722,9072*852*442*182*512,9702*552*42
2*452,7392,7712,7322,6912,6842*912*242,62843555,0695*95
5,9825,98563136,1826*456,0037,4699,7959,40183197,9567*65
7,1298,03183129,746
14,270
9*7011,3301083011,00011,33011,80011,33011,33011,3301040011,00010200
10670109201050010880102801078011,64011,89011,95014,4001433014,090
14,18014,27014,00014,67014,18014,44014,60014,40016,13015,5001530015,330
1630015,00016,00016,00016,130
85-9590-115
110-120120-100
95-8080-8580-7070-8080-7880-7575-7070-60
60-6055-2525-15
15-55-55-05-50-00-0
0-3030-4550-70
70-2025-4530-1010-2020-2530-2025-65
65-110105-9085-95
100-110105-85
85-100100-115115-145145-225225-595
5,429431844844,4404*177*476,7844346539053093,9005335
5,4966*514*575,0115*3953344*554,4727,020
14,54011,4699,602
106079409
11,5119*7573579,08984478,746
10290106641091512,433
12,30913,333101141009110922
237.4291.1264827(11289.7309.0298.43011297.42502285.3258.9
275.0298.72T&9298.2282.0301.6332.6353.13547238L4182.7147.4
137.0138.4125.3137.3134.614a595.547.071.686,39L194.9
127.286.892564.2ISO
707173726866656468646563
615657524948494648535865
585855515455616872687071
69727681
109
Source: Data provided by the Bhiopian authorities.
y Auction price less estimated transport and handing costs.2/ For unwashedandwtthed coffee combined (m orttywwashed) at Adds Ababa, wdghted by same
month's arrivals.3/ r^^mffttrrrlail pir^at A^Ht* Ababa4/ AtbegMmingandendofmonth.S/ Percentage GK»» of the domestic price over the aoaion price.^ ICO, International Coffee Organization; US cents per pound.
ExportEstiesstd Expor
©International Monetary Fund. Not for Redistribution
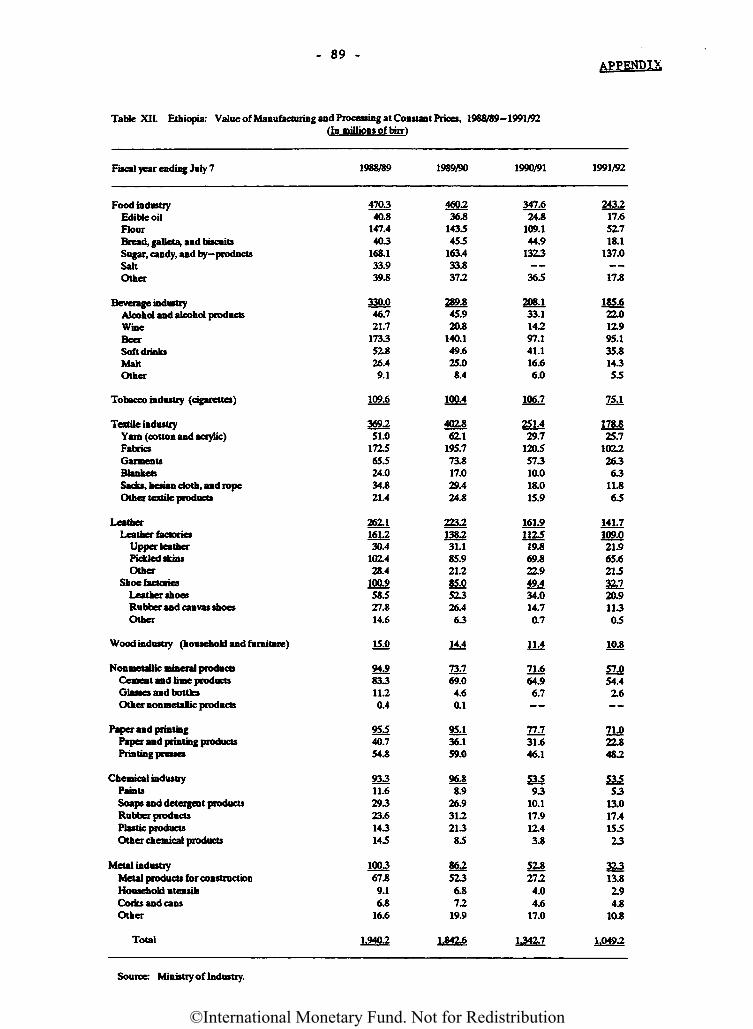
- 89 -APPENDIX
Table XII. Ethiopia: Value of Manufacturing and Processing at Constant Prices, 1988/89-1991/92(In millions of birr)
Fiscal year ending July 7 1988/89 1989/90 1990/91 1991/92
Food industryEdible oilFlourBread, galleta, and biscuitsSugar, candy, and by—productsSaltOther
Beverage industryAlcohol and alcohol productsWineBeerSoft drinksMaltOther
Tobacco industry (cigarettes)
Textile industryYarn (cotton and acrylic)FabricsGarmentsBlanketsSacks, hetian cloth, and ropeOther textile products
LeatherLeathe factories
Upper leatherPickled skinsOther
Shoe factoriesLeather shoesRubber and canvas shoesOther
Wood industry (household and furniture)
NonmetaUic mineral productsCement and lime productsGlasses and bottlesOther nonmetalic products
Paper and printingPaper and printing productsPrinting presses
Chemical industryPaintsSoaps and detergent productsRubber productsPlastic productsOther chemical products
Metal industryMetal products for constructionHousehold utensikCorks and cansOther
Total
470340.8
147,4403
168.133.939.8
330.046.721.7
173352.826.49.1
109.6
369251.0
172565.524.034.821.4
262.1161.230.4
102.428.4
100.958527.814.6
94.983311.20.4
95540.754.8
93311.629323.6143145
100367.89.16.8
16.6
1,9402
460.236.8
1435455
163.433.8372
347,624.8
109.144.9
1323
365
243217.652.718.1
137.0
17.8
289.845.920.8
140.149.625.08.4
100.4
401862.1
195.773.817.029.424.8
m2138231.185.921.285.052326.463
14.4
73269.04.60.1
95.136.159.0
96£8.9
26.931221385
8625236.872
19.9
1.842.6
mi33.114297.141.116.66.0
106.7
25L129.7
120557310.018.015.9
161.9112519.869.822.949434.014.70.7
114
7L664.96.7
77.731.646.1
53593
10.117.912.43.8
52.82724.04.6
17.0
1342.7
185.622.012.995.135.814355
75J.
178.825.7
102226363
11.86.5
141/7109.021.965.62153W20.91130.5
10.8
5LO54.42.6
7LO22.8482
53553
13.017.415523
3g313.82.94.8
10.8
1.0492
Source: Ministry of Industry.
1£0
©International Monetary Fund. Not for Redistribution
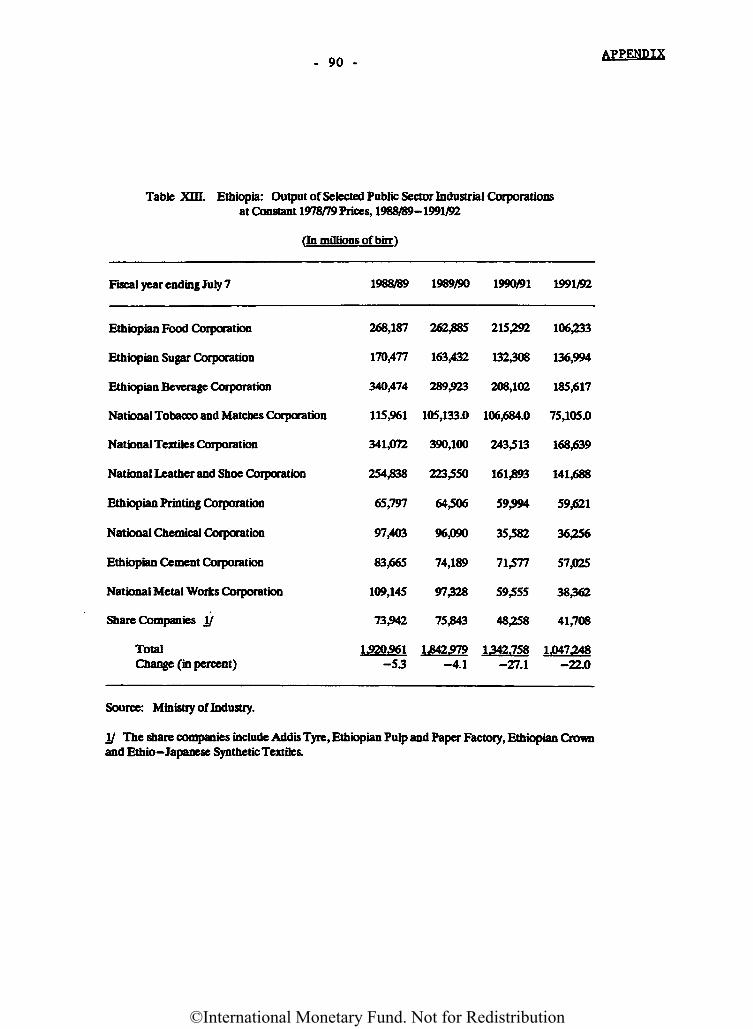
- 90 -APPENDIX
Table XIR Ethiopia: Output of Selected Public Sector Industrial Corporationsat Constant 1978/79 Prices, 1988/89-1991/92
(In millions of birr)
Fiscal year ending July 7
Ethiopian Food Corporation
Ethiopian Sugar Corporation
Ethiopian Beverage Corporation
National Tobacco and Matches Corporation
National Textiles Corporation
National Leather and Shoe Corporation
Ethiopian Printing Corporation
National Chemical Corporation
Ethiopian Cement Corporation
National Metal Works Corporation
Share Companies Ij
TotalChange (in percent)
1988/89
268,187
170,477
340,474
115,%1
341,072
254,838
65,797
97,403
83,665
109,145
73,942
1320,961-53
1989/90
262,885
163,432
289,923
105,133.0
390,100
223,550
64,506
96,090
74,189
97328
75,843
1,842,979-4.1
1990/91
215,292
132308
208,102
106,684.0
243,513
161̂ 93
59,994
35,582
71,577
59,555
48,258
1342.758-27.1
1991/92
106,233
136,994
185,617
75,105.0
168,639
141,688
59,621
36,256
57,025
38362
41,708
1,047248-22.0
Source: Ministry of Industry.
I/ The share companies include Addis Tyre, Ethiopian Pulp and Paper Factory, Ethiopian Crownand Ethio-Japanese Synthetic Textiles.
©International Monetary Fund. Not for Redistribution
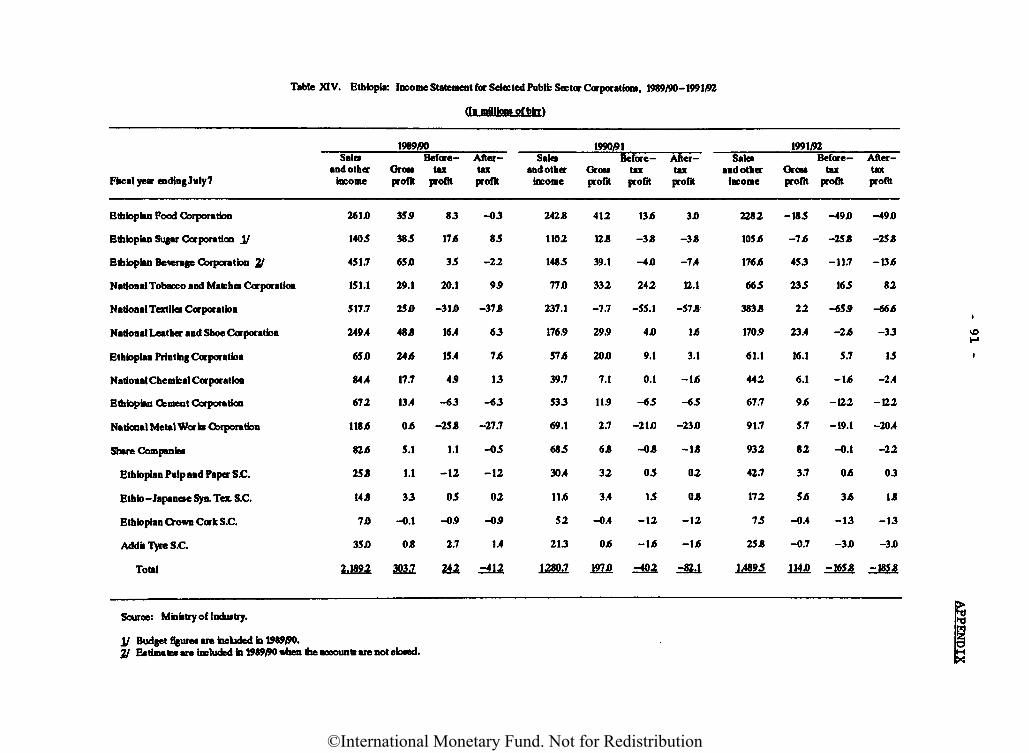
Table XIV. Ethiopia: Income Statement for Selected Publfc Sector Corporations, 1989/90-199102
flu millions of bkri
198900
Fiscal year ending July?
Ethiopian Pood Corporation
Ethiopian Sugar Corporation I/
Ethiopian Bevsrage Corporation 21
National Tobacco and Matches Corporation
National Textiles Corporation
National Leather and Shoe Corporation
Ethiopian Printing Corporation
National Chemical Corporation
Ethiopian Cement Corporation
National Metal Wor la Corporation
Share Companies
Ethiopian Pulp and Paper S.C.
Ethfo- Japanese Syn. Tex S.C.
Ethiopian Crown Cork S.C.
AddB Tyre S.C.
Total
Source: Ministry oflndustry.
Salesand other
income
2614
1405
451.7
151.1
517.7
2494
65 JO
844
672
118*
82 j6
25-8
144
7JD
35JO
2.1892
Before-Gross taxprofit profit
35 J9
385
65JO
29.1
25 JO
48 J8
24 J5
17.7
13.4
04
5.1
1.1
33
-0.1
OJ8
303.7
83
17 j$
35
20.1
-3UO
16.4
15.4
4.9
-63
-25 J8
1.1
-12
05
-0.9
2.7
211
After-taxprofit
-03
85
-22
9.9
-37 J8
63
7J6
13
-63
-27.7
-05
-12
02
-0.9
1.4
zill
Sale*and other
income
242,8
1102
1485
77 JO
237.1
176.9
57 6
39.7
533
69.1
685
30.4
11.6
52
213
1280.7
1990/91Before-
Gross taxprofit profit
412
124
39.1
332
-7.7
29.9
20JO
7.1
11.9
2.7
64
32
3.4
-0.4
Oj6
197 JO
13 J5
-3J8
-4 JO
242
-55.1
4 JO
9.1
0.1
-65
-21JO
-04
05
15
-12
-16
=A&2
After-taxprofit
3JO
-34
-7.4
12.1
-574
U5
3.1
-115
-65
-23 JO
-14
02
04
-12
-115
-82.1
Satesand other
income
2282
105.6
176/5
665
3834
170.9
61.1
442
67.7
91.7
932
42.7
172
75
254
1.4895
1991/92
Grossprofit
-185
-7j6
453
235
22
23.4
16.1
6.1
9.6
5.7
82
3.7
5.6
-0.4
-0.7
114 JO
Before-tax
profit
-49 JO
-254
-11.7
165
-65.9
-2J6
5.7
-16
-122
-19.1
-0.1
Oj6
3j6
-13
-3JO
-1654
After-taxprofit
-49,0
-254
-13 J6
82
-66 6
-33
15
-2.4
-122
-20.4
-22
03
14
-13
-3JO
-1854
I/ Budget figure* are included fal9*W>.2/ Estimate* are included fa 19*900 when the account! are not eioaed.
©International Monetary Fund. Not for Redistribution
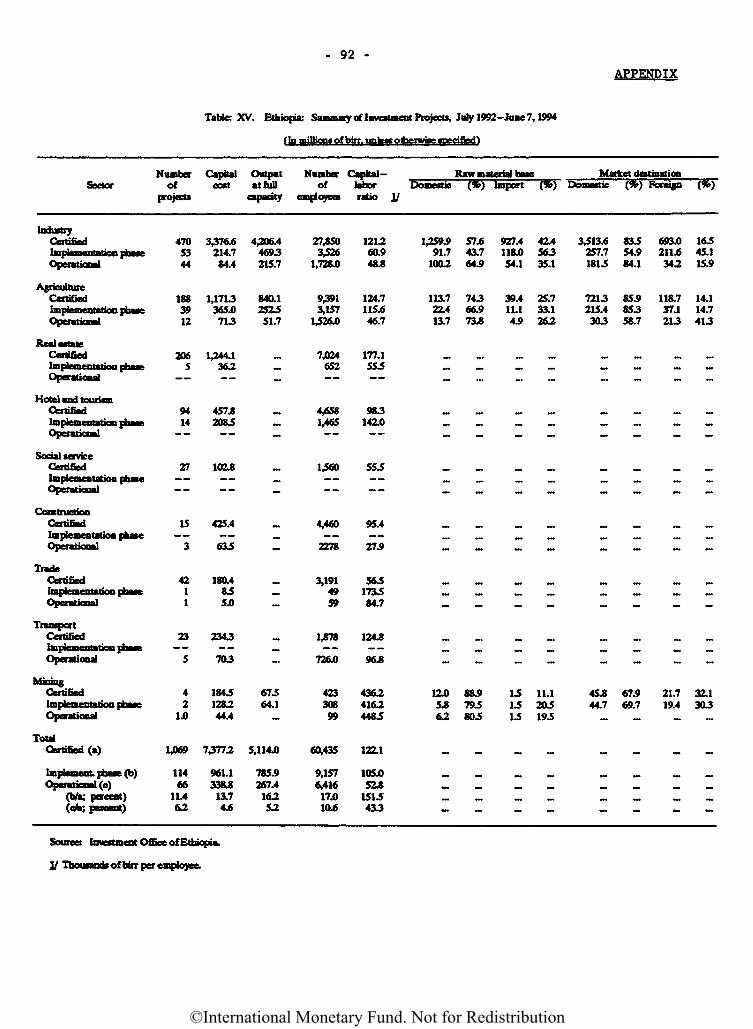
APPENDIX
Table: XV. Ethiopia: Summaiy of Investment Project*, July 1992- June 7,1994
NumberSector of
projects
IndustryCertifiedImplementation rhaarOperational
AgricultureCertifiedImplffnifntanon phaseOperational
4705344
1883912
Capitalcost
3,376.6214.784.4
1,1713365.0713
Outputat hill
capacity
4,206.44693215.7
840.1252551.7
Number Capital-of labor
employees ratio I/
27,8503,526
1,728.0
9^913,157
1,526.0
1212,60.948.8
124.7115.646.7
Raw material baseDomestic
1,259.991.7
100.2
113.722.413.7
(*)
57.643.764.9
74366.973*
Import
927.4118.054.1
39.411.14.9
(*)
42.456335.1
25.733.1263
Market dertmatiooDomestic
3,513.6257.71815
7213215.4303
(%) Foreign
83554.984.1
85.985358.7
693.0211J6342
118.737.1213
(%)
16545.115.9
14.114.7413
Real estateCertifiedImplementation phaseOperational
Hotel and tourismCertifiedImplementation phaseOperational
Social serviceCertifiedImplementation phaseOperational
2065
9414
27
1,244.13&2
457.82085
102*
—--
7,024~ 652~
4,6581,465
~
1,560~.
—
177.1555
983142.0
555
^^fiftrurttroGertifiedImplementation phaseOperational
TradeCertifiedImplementation phaseOperational
TransportCertifiedImplementation phaseOperational
MiningCertifiedun|ii*niMji«Tmii peaseOperational
TotalCertified (a)
15
—3
4211
23
5
42
1.0
1,069
425.4 ~— _635
180.485 —5.0
2343— — M.
703
1845 67512&2 64.144.4
7,377.2 5,114.0
4,460
—2278
3,1914959
1,878
726.0
42330899
60,435
95.4
—27.9
565173584.7
124.8
96.8
4363416.24485
122.1
Implement, pbaae (b)Operation! (c)
(Wa; percent)(Gfe percent)
11466
11.462
961.133013.74.6
785.9267.41&2S2
9,1576,41617.Q1O6
IQSJQ52*
1515433
Source: Investment Office of Ethiopia.
y Thousands of birr per employee.
- 92 -
12.0S*62
88.9795805
151515
11.1205195
45.844.7
.~
67.969.7
•~
21.719.4
~.
32.1303
M.
ffri niiHikinfofbirr.'^Fiteigothfriwigp gp&cifTfyj^
©International Monetary Fund. Not for Redistribution
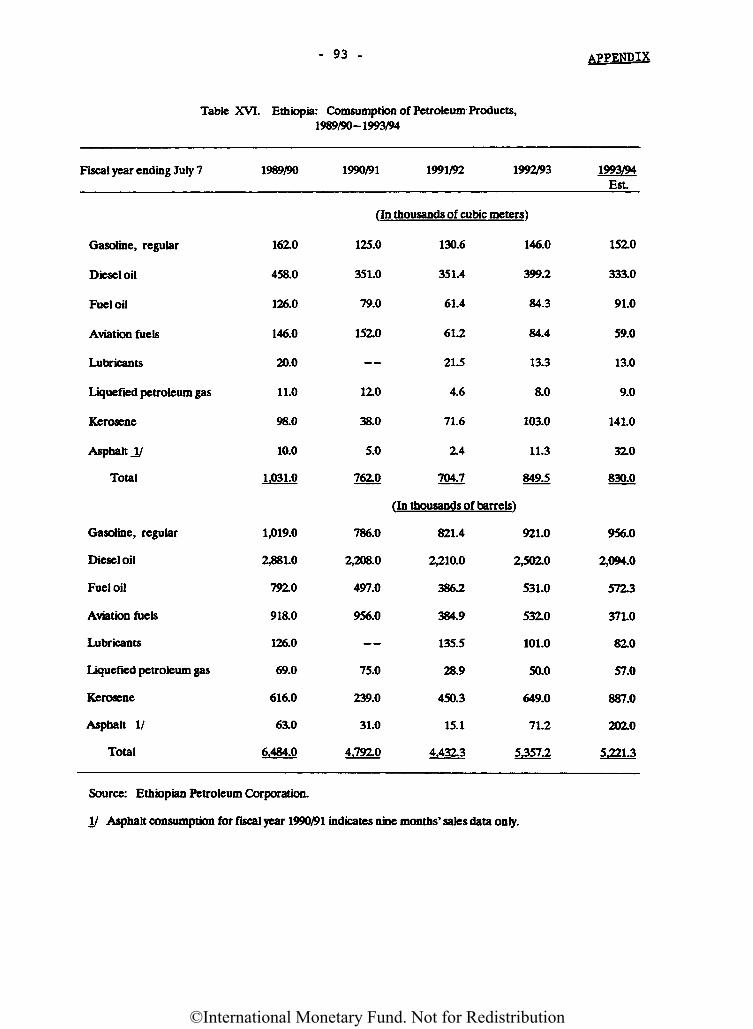
- 93 - APPENDIX
Table XVI. Ethiopia: Consumption of Petroleum Products,1989/90-1993/94
Fiscal year ending July 7 1989/90 1990/91 1991/92 1992/93 1993/94Est
(In thousands of cubic meters)
Gasoline, regular
Diesel oil
Fuel oil
Aviation fuels
Lubricants
Liquefied petroleum gas
Kerosene
Asphalt J/
Total
162.0
458.0
126.0
146.0
20.0
11.0
98.0
10.0
1,031.0
125.0
351.0
79.0
152.0
1ZO
38.0
5.0
76X0
130.6
351.4
61.4
61.2
21.5
4.6
71.6
2.4
704.7
146.0
399.2
84.3
84.4
13.3
8.0
103.0
11.3
849.5
15X0
333.0
91.0
59.0
13.0
9.0
141.0
3X0
830.0
(In thousands of barrels)
Gasoline, regular
Diesel oil
Fuel oil
Aviation fuels
Lubricants
Liquefied petroleum gas
Kerosene
Asphalt I/
Total
1,019.0
2,881.0
792.0
918.0
126.0
69.0
616.0
63.0
6,484.0
786.0
2,208.0
497.0
956.0
75.0
239.0
31.0
4,792.0
821.4
2,210.0
386.2
384.9
135.5
28.9
450.3
15.1
4,432.3
921.0
2,502.0
531.0
532.0
101.0
50.0
649.0
71.2
5,357.2
956.0
2,094.0
57X3
371.0
82.0
57.0
887.0
202.0
5.221.3
Source: Ethiopian Petroleum Corporation.
II Asphalt consumption for fiscal year 1990/91 indicates nine months' sales data only.
©International Monetary Fund. Not for Redistribution
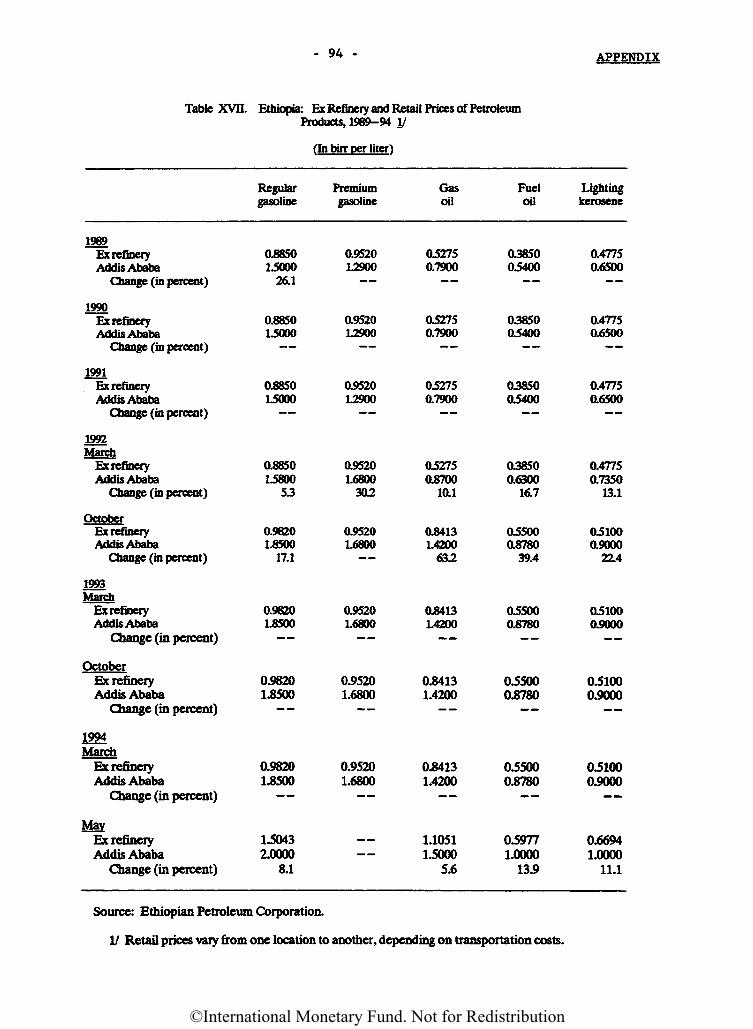
. 94 - APPENDIX
Table XVn. Ethiopia: Ex Refinery and Retail Prices of PetroleumProducts, 1989-94 I/
(In birr per liter 1
1969Ex refineryAddis Ababa
Change (in percent)
1990Ex refineryAddis Ababa
Change (in percent)
1991Ex refineryAddis Ababa
Change (in percent)
1992'K4>a*v*&iMarcn
Ex refineryAddis Ababa
Change (in percent)
OctoberEx refineryAddis Ababa
Change (in percent)
1993March
Ex refineryAddis Ababa
Change (in percent)
OctoberEx refineryAddis Ababa
Change (in percent)
1994fbTowvUmoTCD
Ex refineryAddis Ababa
Change (in percent)
MayEx refineryAddis Ababa
Change (in percent)
Regulargasoline
0.885015000
26.1
0.885015000
0.885015000
0.885015800
53
0.98201.8500
17.1
0.98201.8500
0.98201.8500
0.98201.8500
150432.0000
8.1
Premiumgasoline
0.952012900
0.9520L2900
0.952012900
0.95201.6800
302
0.95201.6800
0.95201.6800
0.95201.6800
0.95201.6800
Gasoil
052750.7900
052750.7900
052750.7900
052750.8700
10.1
0.84131.4200
632
0.84131.4200
0.84131.4200
0.84131.4200
1.10511.5000
5.6
Fueloil
0385005400
0385005400
0385005400
038500.6300
16.7
055000.8780
39.4
055000.8780
055000.8780
055000.8780
059771.0000
13.9
Lightingkerosene
0.47750.6500
0.47750.6500
0.47750.6500
0.47750.7350
13.1
051000.9000
22.4
051000.9000
051000.9000
051000.9000
0.66941.0000
11.1
Source: Ethiopian Petroleum Corporation.
I/ Retail prices vary from one location to another, depending on transportation costs.
©International Monetary Fund. Not for Redistribution
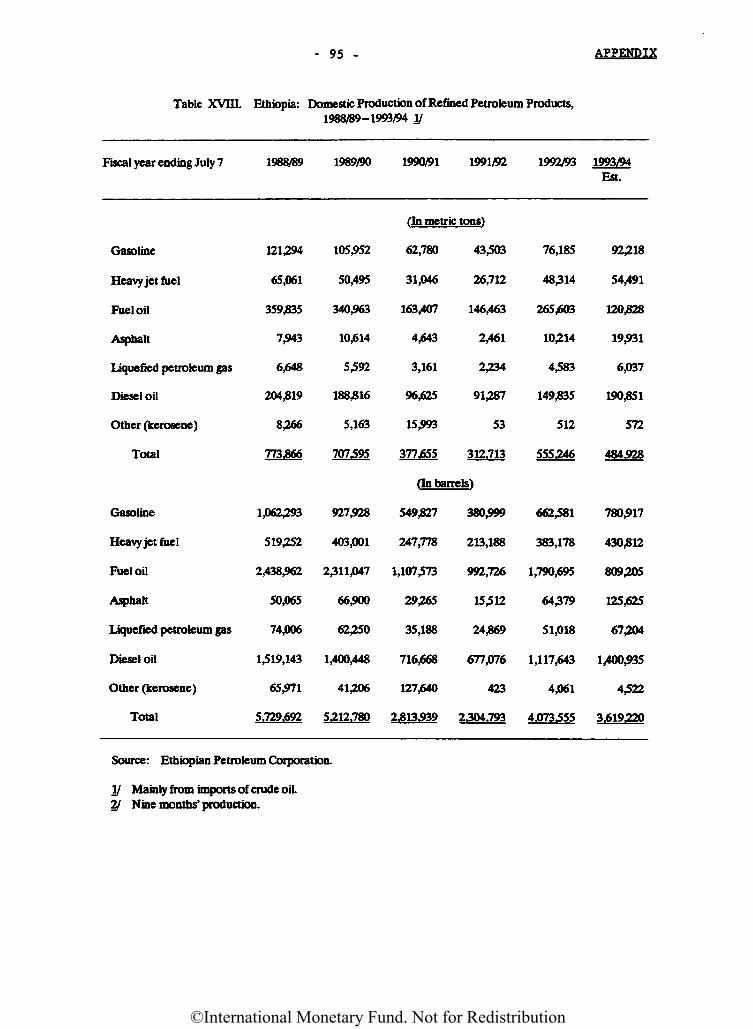
- 95 - APPENDIX
Table XVIII. Ethiopia: Domestic Production of Refined Petroleum Products,1988/89-1993/94 I/
Fiscal year ending July 7 1988/89 1989/90 1990/91 1991/92 1992/93 1993/94Est.
(In metric tons)
Gasoline
Heavy jet fuel
Fuel oil
Asphalt
Liquefied petroleum gas
Diesel oil
Other (kerosene)
Total
121,294
65,061
359335
7,943
6,648
204,819
8,266
773,866
105,952
50,495
340,963
10,614
5,592
188,816
5,163
707,595
62,780
31,046
163,407
4,643
3,161
96,625
15,993
377,655
43,503
26,712
146,463
2,461
2^34
91287
53
312,713
76,185
48314
265,603
10214
4,583
149335
512
555246
92218
54,491
120328
19,931
6,037
190351
572
484,928
fin barrels)
Gasoline
Heavy jet fuel
Fuel oil
Asphalt
Liquefied petroleum gas
Diesel oil
Other (kerosene)
Total
1,062,293
519,252
2,438,962
50,065
74,006
1,519,143
65,971
5,729,692
927,928
403,001
2^11,047
66,900
62^50
1,400,448
41,206
5212,780
549^27
247,778
1,107,573
29^65
35,188
716,668
127,640
2*13.939
380,999
213,188
992,726
15,512
24^69
677,076
423
2304.793
662,581
383,178
1,790,695
64379
51,018
1,117,643
4,061
4,073555
780,917
430312
809205
125,625
67204
1,400,935
4,522
3,619220
Source: Ethiopian Petroleum Corporation.
I/ Mainly from imports of crude oil.2/ Nine months' production.
©International Monetary Fund. Not for Redistribution
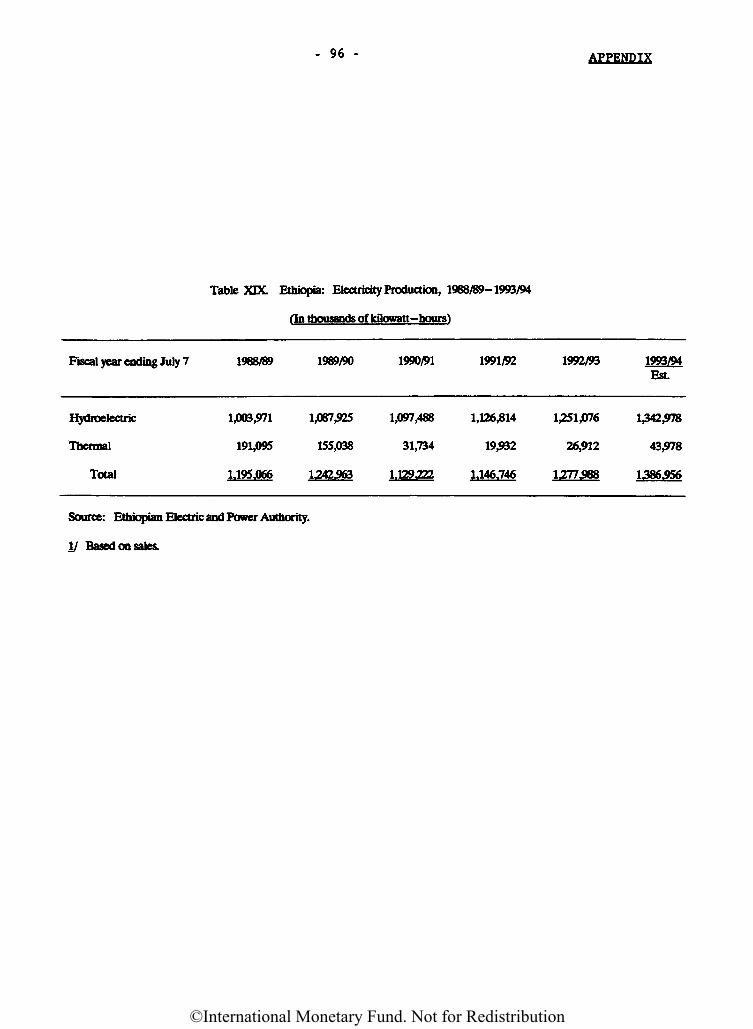
- 96 - APPENDIX
Table XDC Ethiopia: Electricity Production, 1968/89-1993/94
(In thousands of kilowatt-hours)
Fiscal year ending July 7
Hydroelectric
Thermal
Total
1968/89
1,003,971
191,095
1,195,066
1989/90 1990/91
1,087,925 1,097,488
155,038 31,734
1242563 1,129222
1991/92
1,126,814
19,932
1,146,746
1992/93
1,251,076
26,912
1277568
1993/94Est.
1,342,978
43,978
1386556
Source: Ethiopian Electric and Power Authority.
I/ Based on sales.
©International Monetary Fund. Not for Redistribution
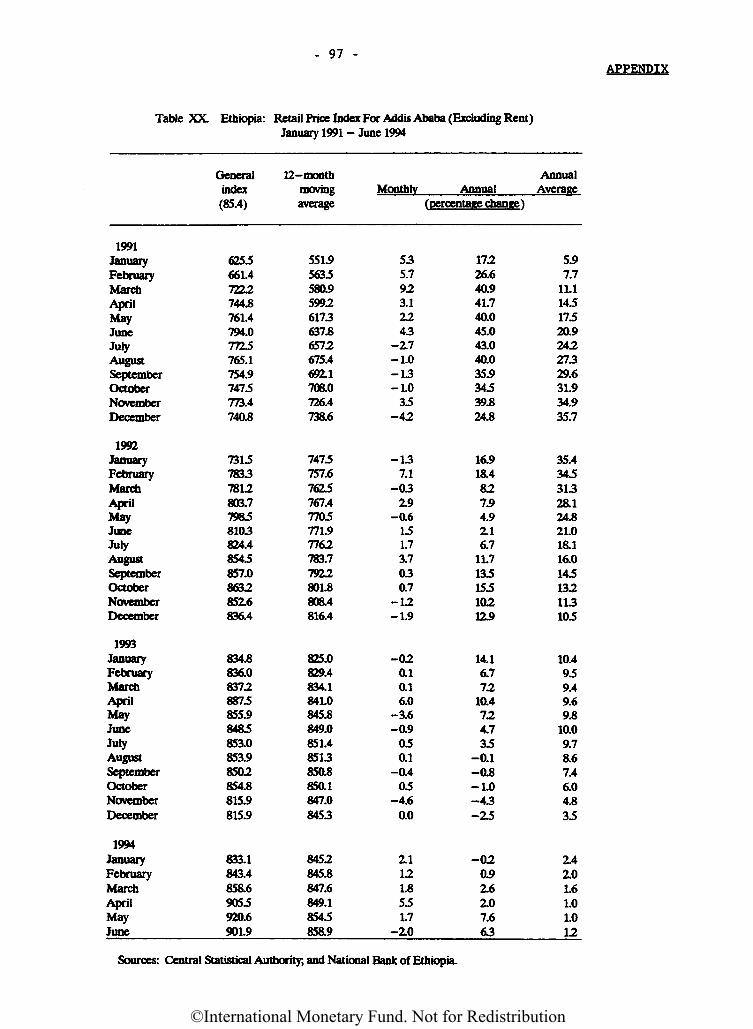
- 97 -APPENDIX
Table XX. Ethiopia: Retail Price Index For Addis Ababa (Excluding Rent)January 1991 - June 1994
1991JanuaryFebruaryMarchAprilMayJuneJulyAugustSeptemberOctoberNovemberDecember
1992JanuaryFebruaryMarchAprilMayJuneJulyAugustSeptemberOctoberNovemberDecember
1993JanuaryFebruaryMarchAprilMayJuneJulyAugustSeptemberOctoberNovemberDecember
1994JanuaryFebruaryMarchAprilMayJune
Generalindex(85.4)
625.5661.47223744.8761.4794.01715765.1754.9747.5773.4740.8
731578337812803.779858103824.48545857.08632852.6836.4
834.8836.083728875855.98485853.0853.98502854.8815.9815.9
833.1843.4858.69055920.6901.9
12- monthmovingaverage
551.95635580.959926173637.86572675.46911708.0726.4738.6
7475757.67625767.47705771.97762783.77922801.8808.4816.4
825.0829.4834.1841.0845.8849.0851.48513850.8850.1847.08453
8452845.8847.6849.18545858.9
Monthly AnnualAnnual
Average(percentage change)
535.7923.12243
-17-1.0-13-1.0
35-42
-137.1
-032.9
-0.6151.73.7030.7
-12-1.9
-020.10.16.0
-3.6-0.9
050.1
-0.405
-4.60.0
2.1121.8551.7
-10
17226.640.941.740.045.043.040.035.934539.824.8
16.918.4827.94.9116.7
11.7135155102119
14.16.772
10.4724.735
-0.1-0.8-1.0-43-25
-020.916107.663
5.97.7
11.114517520.924227329.631.934.935.7
35.434531328.124.821.018.116.0145132113105
10.4959.49.69.8
10.09.78.67.46.04.835
14101.61.01.012
Sources: Central Statistical Authority; and National Bank of Ethiopia.
©International Monetary Fund. Not for Redistribution
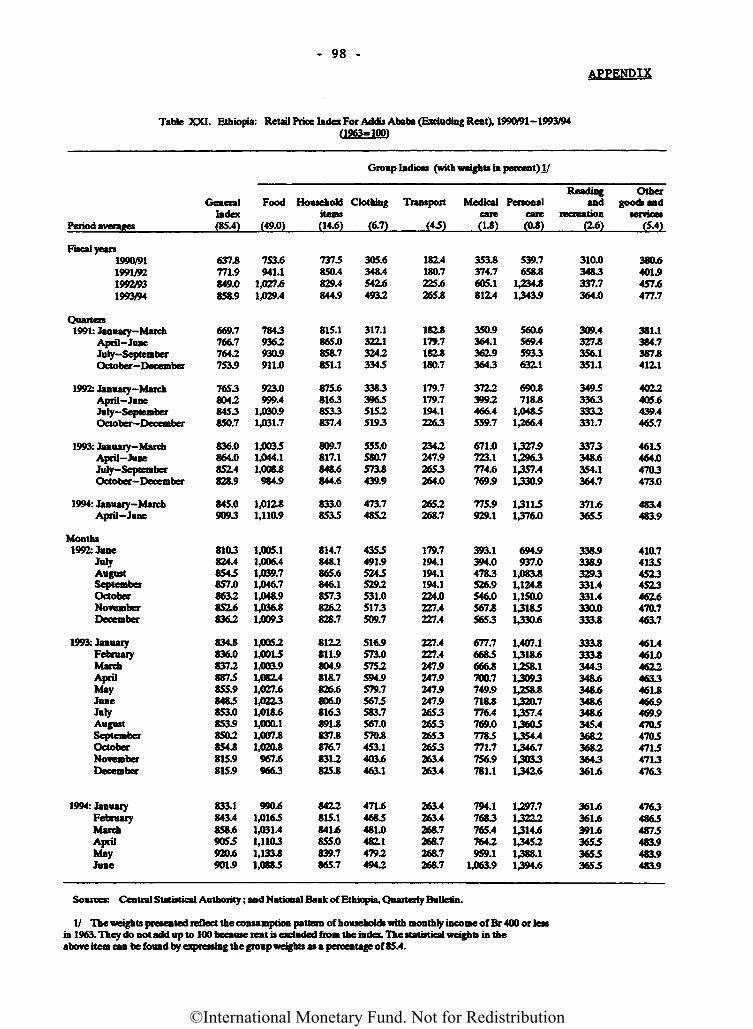
- 98 -APPENDIX
Table XXI. Ethiopia: Retail Price Index For Addis Ababa (Excluding Rent), 1990/91 -1993/94(1963=100)
Group Indices (with weights in percent) I/
PmrlfiA &UMWI..IU*enoa averages
Fiscal yean1990/911991/921992/931993/94
Quarters1991: January-March
April-JuneJuly-SeptemberOctober— December
1992: January-MarchApril-JuneJuly-SeptemberOctober— December
1993: January-MarchApril-JuneJuly-SeptemberOctober-December
1994: January-MarchApril-June
Months1992: June
JulyAugustSeptemberOctoberNovemberDecember
1993: JanuaryFebruaryMarchAprilMayJuneJuryAugustSeptemberOctoberNovemberDecember
1994: JanuaryFebruaryMarchAprilMayJune
GeneralIndex(85.4)
637.8771.9849.0858.9
669.7766.7764.2753.9
7653804.28453850.7
836.0864.0852.4828.9
845.09093
8103824.48545857.0863.2852.6836.2
834.8836.0837.28875855.98485853.0853.9850.2854.8815.9815.9
833.1843.4858.69055920.6901.9
Food Household Clothing Transportitem*
(49.0) (14.6) (6.7) (45)
753.6941.1
1,027.61,029.4
7843936.2930.9911.0
923.0999.4
1,030.91,031.7
1,00351,044.11,008.8
984.9
1,012.81,110.9
1,005.11,006.41,039.71,046.71,048.91,036.81,0093
1,005.21,00151,003.91,082.41,027.61,02231,018.61,000.11,007.81,020.8
967.69663
990.61,01651,031.41,11031,133.81,0885
7375850.4829.4844.9
815.1865.0858.7851.1
875.681638533837.4
809.7817.1848.6844.6
833.08535
814.7848.1865.6846.18573826.2828.7
8122811.9804.9818.7826.6806.08163891.8837.8876.78312825.8
8422815.1841.6855.0839.7865.7
305.6348.4542.64932
317.1322.132423345
3383396551525193
555.0580.7573.8439.9
473.74852
4355491.952455292531.05173509.7
516.9573.05752594.9579.75675583.7567.0570.8453.1403.6463.1
471.64685481.0482.147924942
182.4180.7225.6265.8
182.8179.7182.8180.7
179.7179.7194.12263
2342247.92653264.0
2652268.7
179.7194.1194.1194.1224.0227.4227.4
227.4227.4247.9247.9247.9247.92653265326532653263.4263.4
263.4263.4268.7268.7268.7268.7
Medicalcare(1.8)
353.8374.7605.1812.4
350.9364.1362.93643
37223992466.4559.7
671.0723.1774.6769.9
775.9929.1
393.1394.04783526.9546.0567.85653
677.76685666.8700.7749.9718.8776.4769.07785771.7756.9781.1
794.17683765.47642959.1
1,063.9
Reading OtherPersonal and goods and
care recreation services(0.8) (2.6) (5.4)
539.7658.8
1,234.81343.9
560.6569.45933632.1
690.8718.8
1,04851,266.4
1327.91,29631357.41330.9
131151376.0
694.9937.0
1,083.81,124.81,150.0131851330.6
1,407.11318.61,258.1130931,258.81320.71357.4136051354.41346.7130331342.6
1,297.7132221314.6134521388.11394.6
310.03483337.7364.0
309.4327.8356.1351.1
349533633332331.7
3373348.6354.1364.7
371.63655
338.9338.93293331.4331.4330.0333.8
333.8333.83443348.6348.6348.6348.6345.4368236823643361.6
361.6361.6391.6365536553655
380.6401.9457.6477.7
381.1384.7387.8412.1
4022405.6439.4465.7
4615464.04703473.0
483.4483.9
410.7413545234523462.6470.7463.7
461.4461.046224633461.8466.9469.947054705471547134763
476348654875483.9483.9483.9
Sources: Central Statistical Authority; and National Bank of Ethiopia, Quarterly Bulletin.
I/ The weights presented reflect the consumption pattern of households with monthly income of Br 400 or lessin 1963. They do not add up to 100 because rent is excluded from the index. The statistical weights in theabove item can be found by expressing the group weights as a percentage of 85.4.
©International Monetary Fund. Not for Redistribution
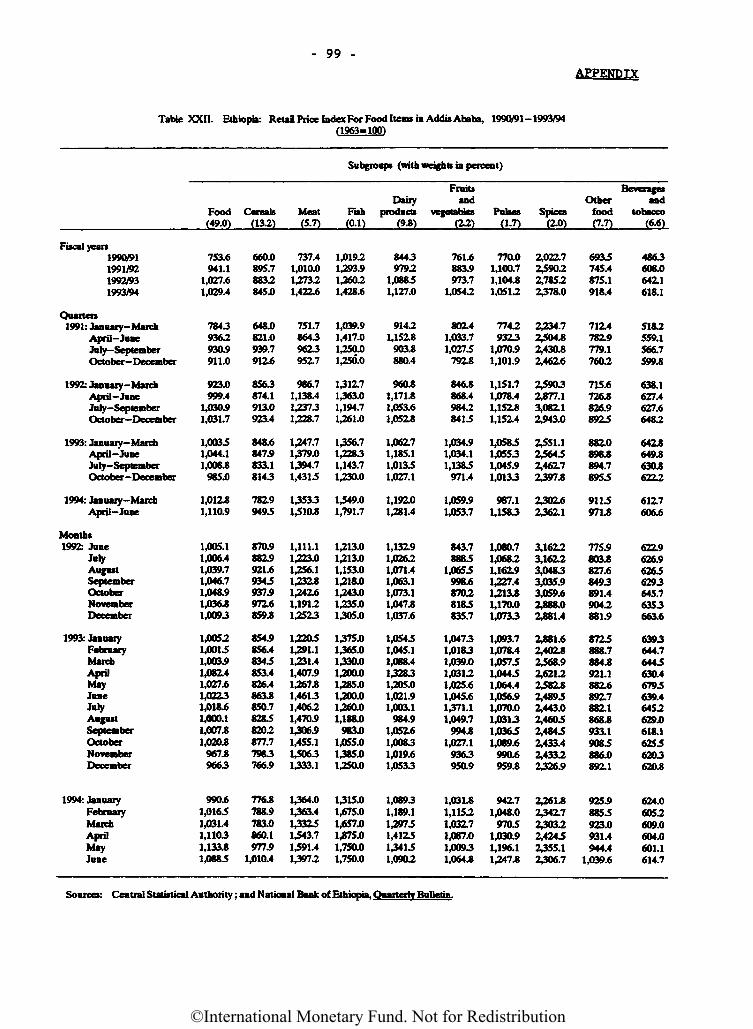
- 99 -APPENDIX
Table XXII. Ethiopia: Retail Price Index For Food Items in Addis Ababa, 1990/91-1993/94(1963«100)
Subgroups (with weights in percent)
Fiscal years1990/911991/921992/931993/94
Quarters1991: January-March
April-JuneJuly-SeptemberOctober-December
1992: January-MarchApril-JuneJuly-SeptemberOctober-- December
1993: January-MarchApril-JuneJuly-SeptemberOctober— December
1994: January-MarchApril-June
Months1992: June
JulyAugustSeptemberOctoberNovemberDecember
1993: JanuaryFebruaryMarchAprilMayJuneJulyAugustSeptemberOctoberNovemberDecember
1994: JanuaryFebruaryMarchAprilMayJune
Food(49.0)
753.6941.1
1,027.61,029.4
7843936.2930.9911.0
923.0999.4
1,030.91,031.7
1,00351,044.11,008.8
985.0
1,01241,110.9
1,005.11,006.41,039.71,046.71,048.91,03641,0093
1,005.21,00151,003.91,082.41,027.61,02231,018.61,000.11,00741,0204
96749663
990.61,01651,031.41,11031,13341,0885
Cereals(13.2)
660.0895.78832845.0
648.0821.0939.7912.6
8563874.1913.0923.4
848.6847.9833.18143
782.99495
870.9882.9921.69345937.9972.68594
854.9856.48345853.4826.48634850.782858202877.77983766.9
7764788.9783.0860.1977.9
1,010.4
Meat(5.7)
737.41,010.01,273.21,422.6
751.786439623952.7
986.71,138.41,23731,228.7
1,247.71,379.01,394.71,4315
135331,5104
1,111.11,223.01,256.11,23241,242.61,19121,2523
1,22051,291.11,231.41,407.91,26741,46131,40621,470.91306.91,455.1150631333.1
1364.01363.4133251343.71391.41397.2
Fish(0.1)
1,01921,293.91,26021,428.6
1,039.91,417.01,250.01,250.0
1312.71363.01,194.71,261.0
1356.71,22831,143.71,230.0
1349.01,791.7
1,213.01,213.01,153.01,218.01,243.01,235.01305.0
1375.01365.01330.01,200.01,285.01,200.01,260.01,188.0
983.01,055.01385.01250.0
1315.01,675.01,657.01375.01,750.01,750.0
Dairyproducts
(94)
84439792
1,08851,127.0
91421,15Z8
903.8880.4
960.81,171.81,053.61,0524
1,062.71,185.11,01351,027.1
1,192.01,281.4
1,132.91,02621,071.41,063.11,073.11,04741,037.6
1,05451,045.11,088.4132831,205.01,021.91,003.1
984.91,052.61,00831,019.61,0533
1,08931,189.112̂ 751,4125134151,0902
Fruitsand
vegetables(22)
761.6883.9973.7
1,054.2
802.41,033.71,0275
7924
8464868.496428415
1,034.91,034.11,1385
971.4
1,059.91,053.7
843.78885
1,0655998.687028185835.7
1,04731,01831,039.01,03121,025.61,045.61371.11,049.7
99441,027.1
9363950.9
1,031.81,11521,032.71,087.01,00931,0644
Pulses(1.7)
770.01,100.71,104.81,0512
77429323
1,070.91,101.9
1,151.71,078.41,152.81,152.4
1,05851,05531,045.91,0133
987.11,1583
1,080.71,06821,162.91,227.41,21341,170.01,0733
1,093.71,078.41,05751,04451,064.41,056.91,070.01,03131,03651,089.6
990.6959.8
942.71,048.0
97051,030.91,196.11,247.8
Spices(2.0)
2,022.72390.22,78522378.0
2^34.72304.82,430.82,462.6
239032,877.13,082.12,943.0
2351.1236452,462.723974
2302.62362.1
3,16223,16223,04833,035.93,059.62,888.02,881.4
2̂ 81.62,402.82368.92,621.22382.82,48952,443.02,46052,48452,433.42,43322326.9
2̂ 6142342.7230322,42452355.12306.7
ueveragesOther and
food tobacco(7-7) (6.6)
6935745.4875.1918.4
712.4782.9779.17602
715.6726.8826.98925
882.0898.8894.78955
91159714
775.98034827.68493891.49042881.9
8725888.78844921.1882.6892.7882.1868.8933.19085886.0892.1
925.98855923.0931.4944.4
1,039.6
4863606.0642.1618.1
5182559.1566.7599.8
638.1627.4627.66482
642.864946304(ft^i
612.7606.6
622.9626.962656293645.76353663.6
6393644.76445630.46795639.46452629.0618.1625562036204
624.06052609.0604.0601.1614.7
Sources: Central Statistical Authority; and National Bank of Ethiopia, Quarterly Bulletin.
©International Monetary Fund. Not for Redistribution
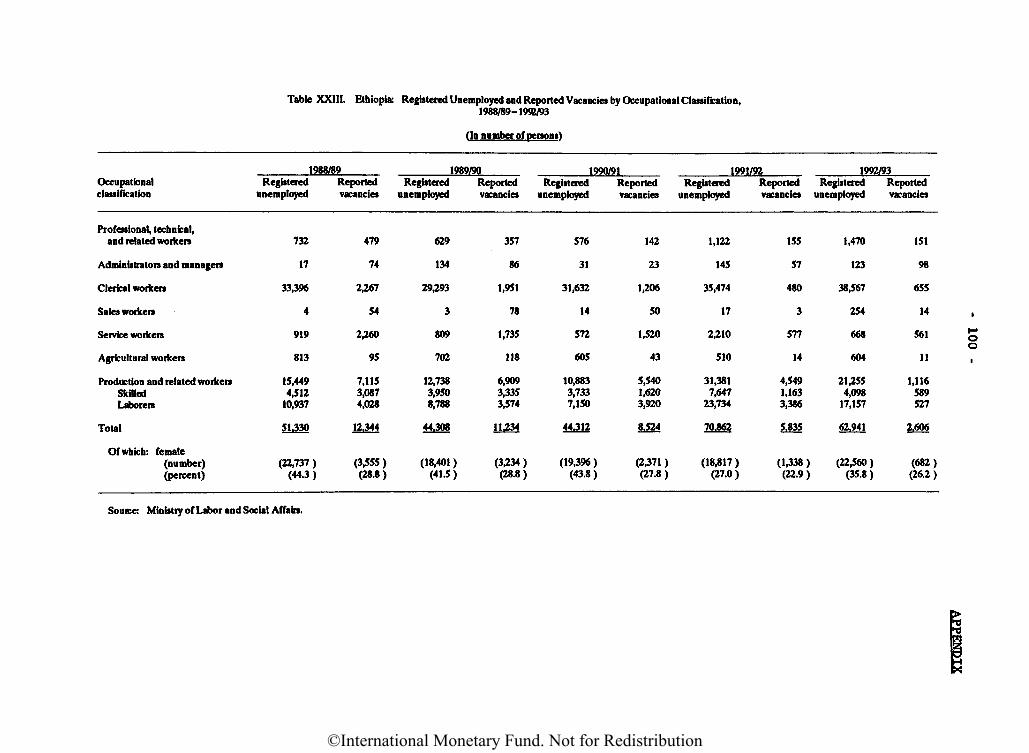
Table XXIII. Ethiopia: Registered Unemployed and Reported Vacancies by Occupational Classification,1988/89-1992/93
(In number of persons)
1988/89Occupationalclassification
Professional, technical,and related workers
Administrators and managers
Clerical workers
Sales workers
Service workers
Agricultural workers
Production and related workersSkilledLaborers
Total
Of which: female(number)(percent)
Registeredunemployed
732
17
33,396
4
919
813
15,4494,512
10,937
51.330
(22,737)(44.3)
1989/90Reported Registeredvacancies unemployed
479
74
2,267
54
2,260
95
7,1153,0874,028
12.344
(3,555)(28.8)
629
134
29,293
3
809
702
12,7383,9508,788
44.308
(18,401 )(41.5)
1990/91Reported Registeredvacancies unemployed
357
86
1,951
78
1,735
118
6,9093,3353,574
1U34
(3,234)(28.8)
576
31
31,632
14
572
605
10,8833,7337,150
44.312
(19,396)(43.8)
1991/92Reported Registeredvacancies unemployed
142
23
1,206
50
1,520
43
5,5401,6203,920
8.524
(2,371 )(27.8)
1,122
145
35,474
17
2,210
510
31,3817,647
23,734
70.862
(18,817 )(27.0)
1992/93Reported Registered Reportedvacancies unemployed vacancies
155
57
480
3
577
14
4,5491,1633,386
5.835
(1,338)(22.9 )
1,470
123
38,567
254
668
604
21,2554,098
17,157
62.941
(22,560)(35.8)
151
98
655
14
561
11
1,116589527
2.606
(682)(26.2)
Source: Ministry of Labor and Social Affairs.
©International Monetary Fund. Not for Redistribution
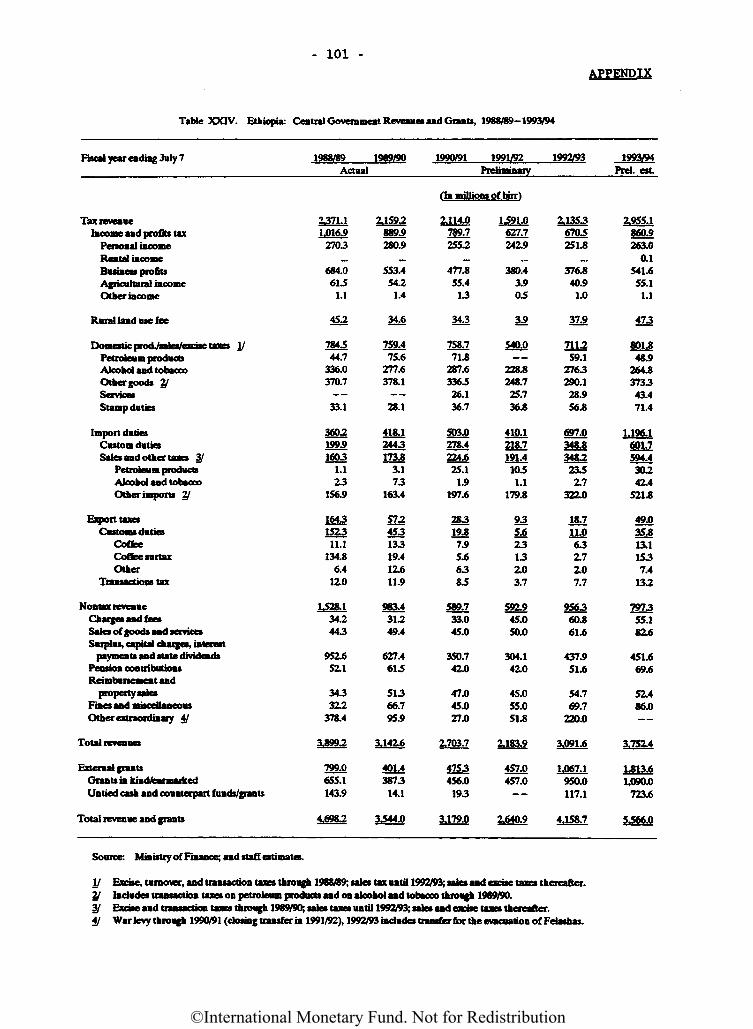
- 101 -
Table XXIV. Ethiopia: Central Government Revenues and Giants, 1968/89-1993/94
APPENDIX
Fiscal year ending July 7 1968/89 1969/90 1990/91 1991/92 1992/93Actual Preliminary
1993/94Prel. est.
Tax revenueIncome and profits tax
Personal incomeRental incomeBusiness profitsAgricultural incomeOther income
Rural land use fee
Domestic prod ./sales/excise taxes I/Petroleum productsAlcohol and tobaccoOther goods 2/ServicesStamp duties
Import dutiesCustom dutiesSales and other taxes 3/
Petroleum productsAlcohol and tobaccoOther imports 2}
Export taxesCustoms duties
CoffeeCoffee surtaxOther
Transactions tax
Nontax revenueCharges and feesSates of goods and servicesSnmlnft canitid rhanMt* mte»*rt
payments and state dividendsPension contributionsReimbursement and
property satesFines and miscellaneousOther extraordinary 4/
Total revenues
2371.11.016.92703
684.0613
1.1
2.159.2889.9280.9
553.454.2
1.4
(In millions of birr)
2.114.0 1391.0789.7 627.7255.2 242.9
477.855.413
45.2 34.6 343
784344.7
336.0370.7
33.1
3602199.91603
1.123
156.9
1643
759.475.6
277.6378.1
28.1
418.1JAA 1***-$173*
3.173
163.4
SL245313319.412.611.9
m*31̂49.4
627.461.5
51366.795.9
3.142.6
401.4387314.1
11.1134.8
6.412.0
1328.1342443
952.652.1
343322
378.4
External giantsGrants in kincUearmarkedUntied cash and counterpart funds/grants
Total revenue and grants
799.0655.1143.9
4.6982
758.771.8
287.6336326.136.7
503.0278.4224.625.1
1.9197.6
28315L87.95.66383
589.733.045.0
350.742.0
47.045.027.0
2.703.7
£753456.0193
380.43.903
540.0
228.8248.725.736.8
410.1218.7191.41031.1
179.8
93£62313ZO3.7
45.050.0
304.142.0
45.055.051.8
2.183.9
457.0457.0
2.13536703251.8
376.840.91.0
37,9
711259.1
2763290.128.956.8
697.0348.834822332.7
322.0
18/7!LQ632.72.07.7
956360.861.6
437.951.6
54.769.7
220.0
1.067.1950.0117.1
3.179.0 2.640.9 4.158.7
2.955.1860.9263.0
0.1541.655.1
1.1
473
801.848.9
264.8373343.471.4
1.196.1601.7594.430242.4
521.8
49435*13.11537.4
132
797355.182.6
451.669.6
52.486.0
3.75Z4
1.613.61,090.0
723.6
5366.0
Source: Ministry of Finance; and staff estimates.
I/ Excise, turnover, and transaction taxes through 1968/89; sates tax until 1992/93; sates and excise taxes thereafter.2/ Includes transaction taxes on petroleum products and on alcohol and tobacco thiough 1969/90.3/ Excise and transaction taxes through 1989/90; sates taxes untU 1992/93; sates and excise taxes thereafter.4/ War tevy through 1990/91 (closing transfer in 1991/92), 1992/93 includes transfer for the evacuation of Felashas.
3344.0
3.899.2 3.091.6
592.9
i2
152.3
©International Monetary Fund. Not for Redistribution
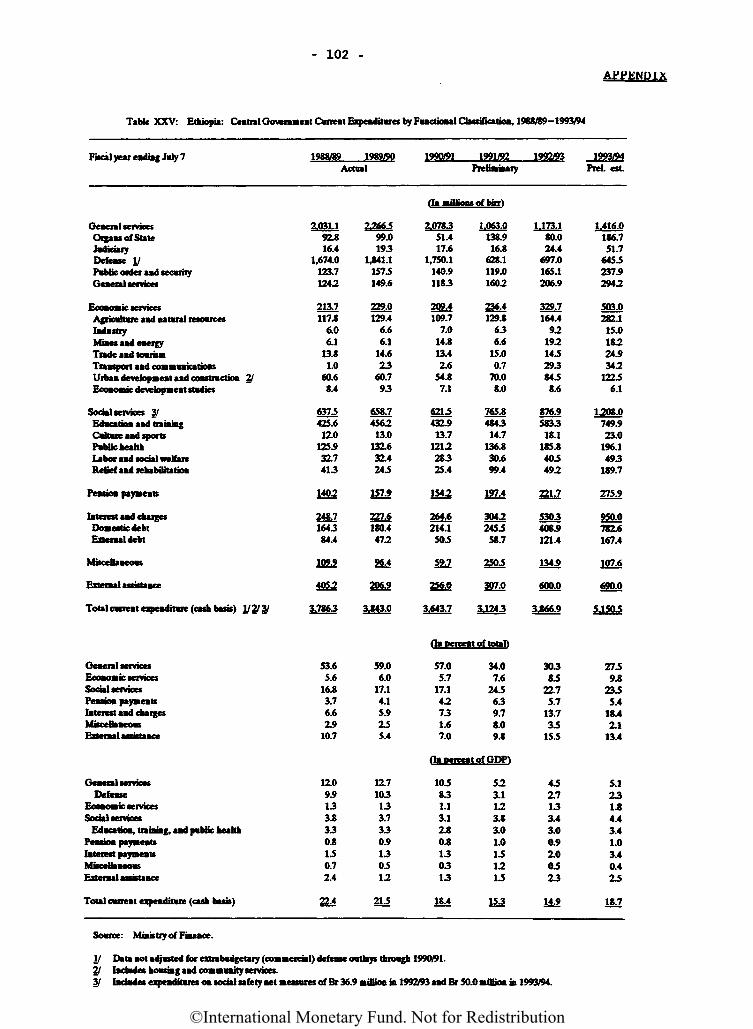
- 102 -APPENDIX
Table XXV: Ethiopia: Central Government Curremt Expenditures by Functional Classification, 1988/89-1993/94
Fiscal year ending July 7 1983/89 1989/90 1990/91Actual
1991/92Preliminary
1992/93 1993/94Prel. est.
On millions of birr)
General servicesOrgans of StateJudiciaryDefense I/Pvblic order and secuityGeneral servkes
Economic servicesAgriculture and natural resourcesIndustryMines and energyTrade and tourismTransport and communicationsUrban development and construction 2/Economic development studies
Social services 3/Education and trainingCulture and sportsPublic healthLabor and social welfareRelief and rehabilitation
Pension payments
Interest and chargesDomestic debtExternal debt
Miscellaneous
External assistance
Total current expenditure (cash basis) 1/2/3/
2.031.192.816.4
1,674.0123.71242
213J117.8
6.06.1
13.81.0
60.68.4
637.5425.612.0
125.932.7413
1402
248.7164384.4
109.9
4052
3.7863
2266599.0193
1,841.11573149.6
229.0129.4
6.66.1
14.623
60.793
658.7456213.0
132.632.4243
157.9
227.6180.4472
96A
206.9
3.843.0
2.078351.417.6
1,750.1140.91183
209U109.7
7.014.813.42.6
54.87.1
6213432.913.7
121228325.4
1542
264.6214.1503
59/7
256.0
3.643.7
1.063.0138.916.8
628.1119.01602
236,4129.8
636.6
15.00.7
70.08.0
765.8484314.7
136.830.699.4
197.4
3042245358.7
2503
307.0
3.1243
1.173.180.024.4
697.0165.1206.9
329.7164.4
921921432938438.6
876.9583318.1
185.8403492
mi5303408.9121.4
134.9
600.0
3.866.9
1.416.0186.751.7
6453237.92942
503.0282.115.018224.9342
12236.1
1208.0749.923.0
196.1493
189.7
275.9
950.0782.6167.4
107.6
690.0
5.1503
On percent of total)
General servicesEconomic servicesSocial servicesPension paymentsInterest tad chargesMfrcvlmuvoMExternal assistance
53.65.6
16.83.76.62.9
10.7
59.06.0
17.14.15.9235.4
57.05.7
17.142731.67.0
34.07.6
24.5639.78.09.8
30383
22.75.7
13.733
153
2739.8
2335.4
18.42.1
13.4
On percent of GDP)
General servicesDefense
Economic servicesSocial services
Education, training, and public healthPension paymentsInterest payment*Mwwllaiww*External assistance
Total orient expenditure (cash basis)
1X09.9133.8330.81.50.72.4
VA
12.7103133.7330.9130.512
21.5
103831.13.12.80.8130313
18.4
523.1123.83.01.0131213
153
432.7133.43.00.92.00323
14*
5.1231.84.43.41.03.40.423
18.7
Source: Ministry of Finance.
I/ Data not adjusted for extrabndgetary (commercial) defense outlays through 1990/91.2f Includes housing and community services.I/ Includes expenditures on social safety net measures of Br 36.9 million in 1992/93 and Br 50.0 million in 1993/94.
©International Monetary Fund. Not for Redistribution
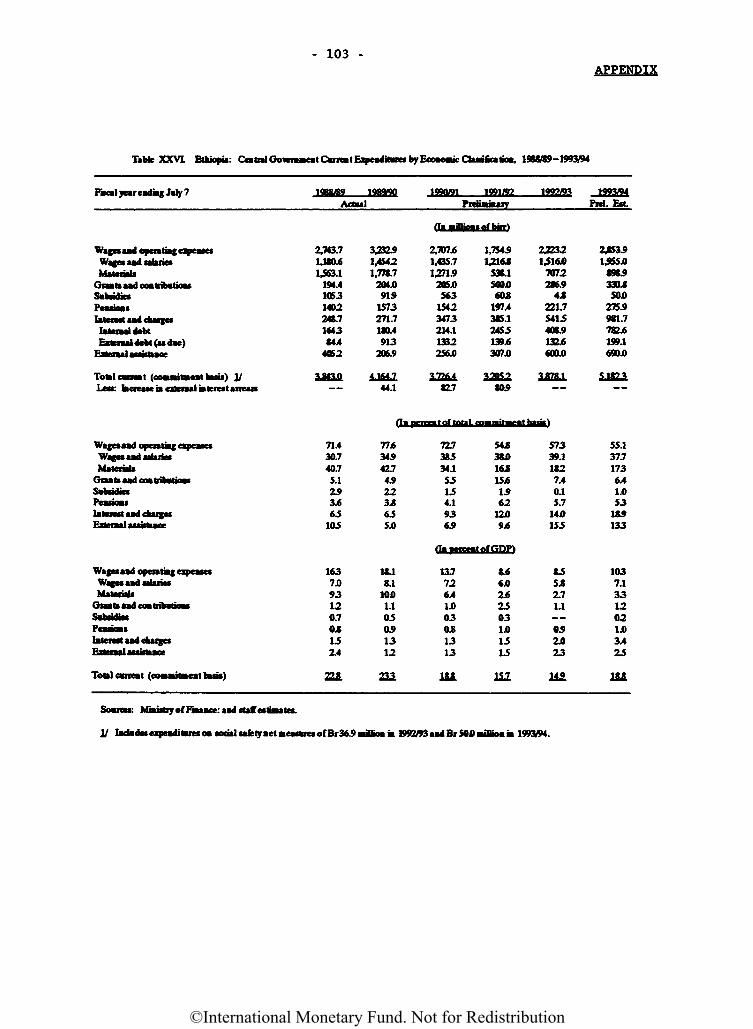
- 103 -APPENDIX
Table XXVL Etkiopia: O.tralGo^™^itC«r««tExpc«4it«jesbyEco^>«kCbj«6aitoo^ 1969/89-1993/94
Fiscal year eadiag Jury 7 1990/91 1991/92 1992/93Actual
1993/94Prel. Bit
Wagesaad opentiagexpeasesWages aad salariesMaterials
Gnats aad ooatnbutioasSubsidiesPcasioaslaterast aad caaigeslateraal debtExteiaaldebt(asdae)
2,713.7M80.6U63.1
194.410531402248.71643844
405.2
3232.91,45421,778.7
204.0915
1S73271.71804913
206.9
Toteloumt (coataut»eat basis) I/Lett: atcreaseiaezieiBalialerestancan 44.1
2,707.61,435.71,271.9
205.0563
15423473214.11332256.0
3.726482.7
1,754.91,21*8
538.1500.060*
197.4385.12453139.6307.0
3J20S3805
£22321,5160
7072286.9
4^221.75415408.913EL6600.0
2£53.914»5.0
898̂330̂50JO
275.9981.7782.6199.1690JO
5.183:3
Wagesaad opentaigexpeasesWages aad sabriesMaterials
Gnats aad coatributiouSubsidiesPeaskmtlatevastaadcaaifesEHeraal assktiaoe
7U30.740.75.1253.665
105
77J634542.74.9223J665.0
72.738334.155154.19365
54338JO16315J61.962
1249j6
57339.11827.40.15.7
14D155
fla nercgatof GPP\
55.137.71736.4
53185133
Wagesamd opentiag eipeaseiWages aad salariesMaterials
Gnats aad coatritmtioasSvhsidiesPeastoaslateiest aad caaigesEnenalassvtaace
Total cwreat (coaiautaieat basis)
1637J)93120.704152.4
222.
18.18.1
1001.105051312
2U
13.7726.4ID03031313
lft&
846.02*2503ID1515
HI
85532.71.1—052423
112.
1037.1331202ID3.425
182.
Soaraes: Miaistry of Fiaaace: aad staff estiautes.
I/ Iadadesezpeaditaiesc«socklsafetyaetaieas«iesofBr365BU^ 1993/94.
1QRft/RQ 1989̂ 90
ffii •nTlLrtmofbirr)
(In per^fflt off ffttaL commitment bask)
3.843.0 4.164.7 3.E78.1
Preliminaryy
©International Monetary Fund. Not for Redistribution
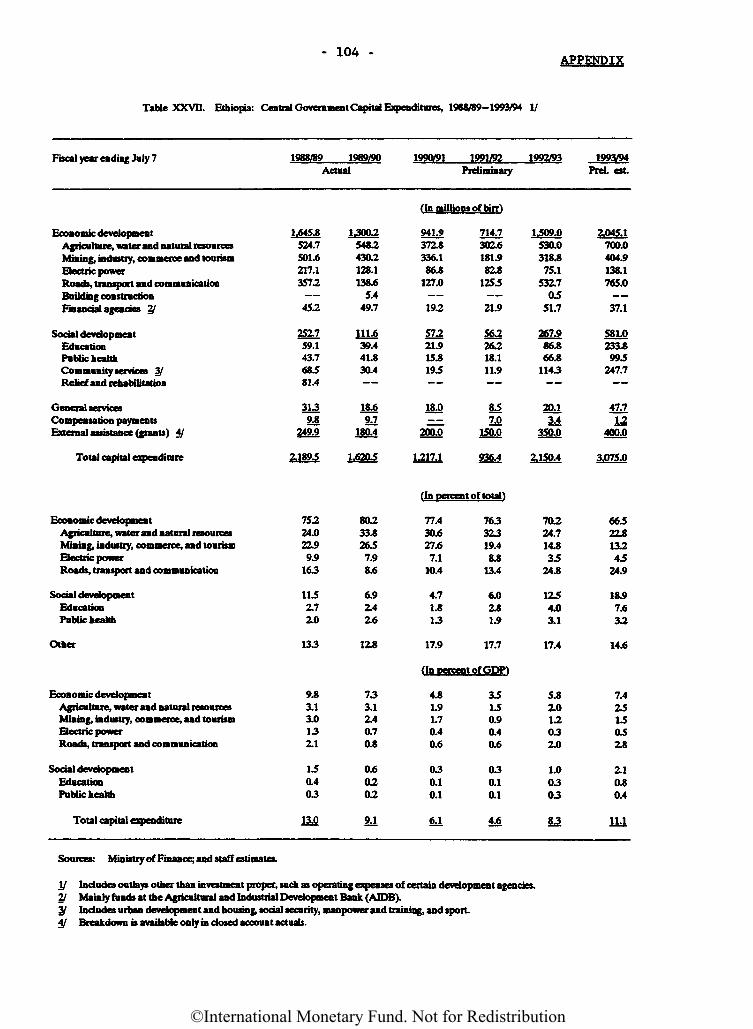
- 104 -APPENDIX
Table XXVII. Ethiopia: Central Government Capital Expenditures, 1988/89-1993/94 I/
Fiscal year ending July 7 1988/89 1989/90 1990/91Actual
1991/92Preliminary
1992/93 1993/94Prel. est.
fin millions of birrt
Economic developmentAgriculture, water and natural resourcesMining, industry, commerce and tourismElectric powerRoads, transport and communicationBuilding constructionFinancial agencies 2/
EducationPublic healthCommunity services 3/Relief and rehabilitation
General servicesCompensation paymentsExternal assistance (grants) 4/
Total capital expenditure
1.645.8524.7501.6217.1357.2
452
252.759.143.768581.4
3132£
249.9
2.189.5
13002548.2430.2128.1138.6
5.449.7
111.639.441.830.4
18.692
180.4
1.6205
941.9372.8336.186.8
127.0
19.2
57.221.915.8195
18.0
—200.0
1.217.1
714.7302.6181.982.8
1255
21.9
56226218.111.9__
85Z£
150.0
936.4
1509.0530.0318.875.1
532.705
51.7
267.986.866.8
1143
2013.4
350.0
2.150.4
2.045.1700.0404.9138.1765.0
37.1
581.0233.8995
247.7___
47/7L2
400.0
3.075.0
On percent of totaH
Economic developmentAgriculture, water and natural resourcesMining, industry, commerce, and tourismElectric powerRoads, transport and communication
Social developmentEducationPublic health
Other
75.224.022.99.9
163
1152.72.0
133
80.233.82657.98.6
6.92.42.6
12.8
77.430.627.67.1
10.4
4.71.813
17.9
76332319.48.8
13.4
6.02.81.9
17.7
70.224.714.835
24.8
1254.03.1
17.4
66522*13.245
24.9
18.97.633
14.6
(In percent of GDP)
Economic developmentAgriculture, water and natural resourcesMining, industry, commerce, and tourismElectric powerRoads, transport and communication
Social developmentEducationPublic health
Total capital expenditure
Sources: Ministry of Finance; and staff estimates.
9.83.13.0132.1
150.403
13,0
733.12.40.70.8
0.60.202
2d
4.81.91.70.40.6
030.10.1
6JL
35150.90.40.6
030.10.1
4£
5.82.012032.0
1.00303
83
7.42515052.8
2.10.80.4
1M
I/ Includes outlays other than investment proper, such as operating expenses of certain development agencies.2/ Mainly funds at the Agricultural and Industrial Development Bank (AIDE).3/ Includes urban development and housing, social security, manpower and training, and sport.4/ Breakdown is available only in closed account actuals.
Social developament
©International Monetary Fund. Not for Redistribution
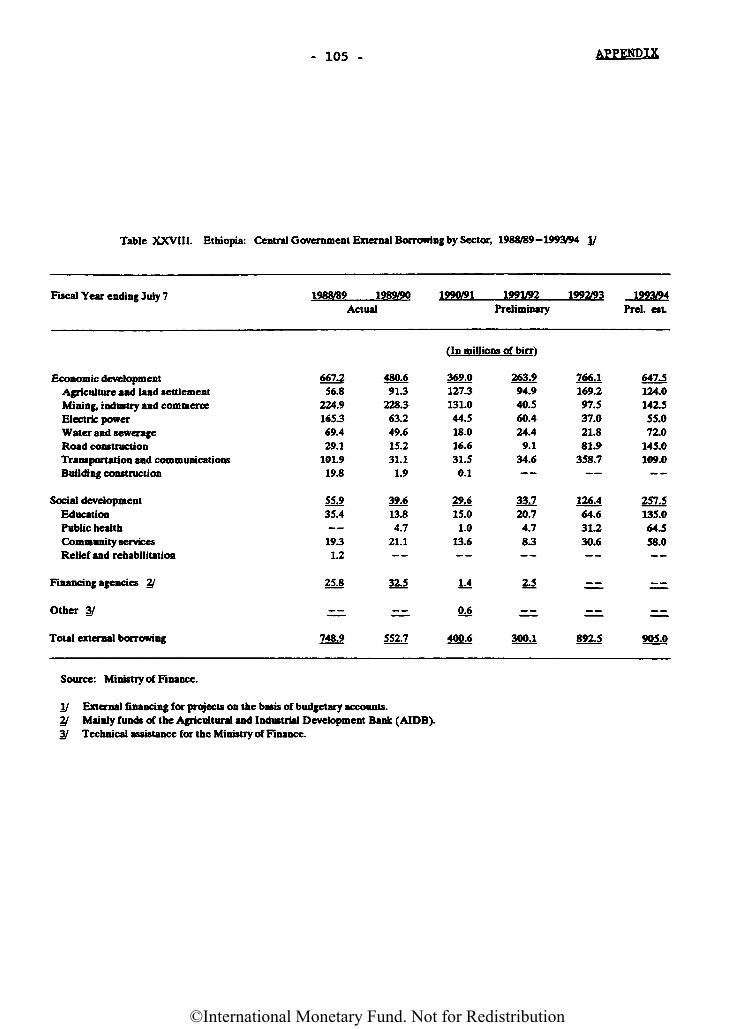
- 105 - APPENDIX
Table XXVIII. Ethiopia: Central Government External Borrowing by Sector, 1988/89-1993/94 I/
Fiscal Year ending July 7 1988/89 1989/90 1990/91 1991/92 1992/93Actual Preliminary
1993/94Prel. est
Bconomic developmentAgriculture and land settlementMining, industry and commerceElectric powerWater and sewerageRoad constructionTransportation and communicationsBuilding construction
Social developmentEducationPublic healthCommunity servicesRelief and rehabilitation
Financing agencies 2/
Other 3/
Total external borrowing
667.256.8
224.9165369.429.1
101.919.8
55.935.4
19.31.2
25J
748.9
480.691.3
228.363.249.615.231.11.9
39.613.84.7
21.1
fin millions of birrt
369.0127.3131.044.518.016.631.50.1
29.615.01.0
13.6
94.940.560.424.49.1
34.6
20.74.783
766.1169.297.537.021.881.9
358.7
126.464.631.230.6
647.5124.0142.555.072.0
145.0109.0
135.064.558.0
552.7
IA 2.5
0.6 —
400.6 300.1 905.0
Source: Ministry of Finance.
I/ External financing for projects on the basis of budgetary accounts.2f Mainly funds of the Agricultural and Industrial Development Bank (AIDB).3/ Technical assistance for the Ministry of Finance.
892.S
3^5
33,7 257.5
263.9
©International Monetary Fund. Not for Redistribution
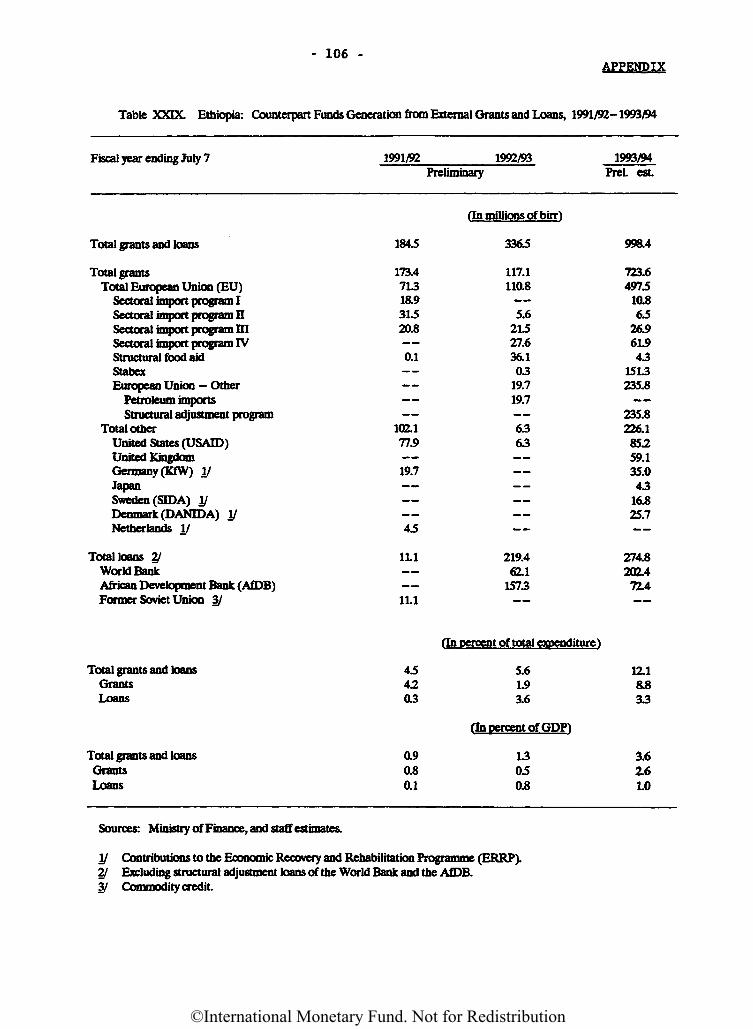
- 106 -APPENDIX
Table XXDC Ethiopia: Counterpart Funds Generation from External Grants and Loans, 1991/92-1993/94
Fiscal year ending July 7 1991/92 1992/93Preliminary
1993/94Prel. est
Total grants and loans
Total grantsTotal European Union (EU)
Sectoral import program Isectoral import program nSectoral import program mSectoral import program IVStructural food aidStabexEuropean Union - Other
Petroleum importsStructural adjustment program
Total otherUnited States (USAID)United KingdomGermany (KfW) l/JapanSweden (SIDA) I/Denmark (DANTOA) I/Netherlands I/
Total loans 2/World BankAfrican Development Bank (AfDB)Former Soviet Union 3/
1845
173.471318.931520.8
0.1
102.177.9
19.7
(In millions of birr)
3365
117.1110.8
5.621527.636.103
19.719.7
6363
11.1
11.1
219.462.1
1573
996.4
723.64975
10.865
26.961.943
1513235.8
235.8226.185.259.135.043
16.825.7
274.8202.472.4
Total grants and loansGrantsLoans
fin percent of total expenditure)
45 5.642 1.903 3.6
On percent of GDP)
12.1as33
Total grants and loansGrantsLoans
0.90.80.1
13050.8
3.62.61.0
Sources: Ministry of Finance, and staff estimates.
I/ Contributions to the Economic Recovery and Rehabilitation Programme (ERRP).2/ Excluding structural adjustment loans of the World Bank and the AfDB.3/ Commodity credit.
45
©International Monetary Fund. Not for Redistribution
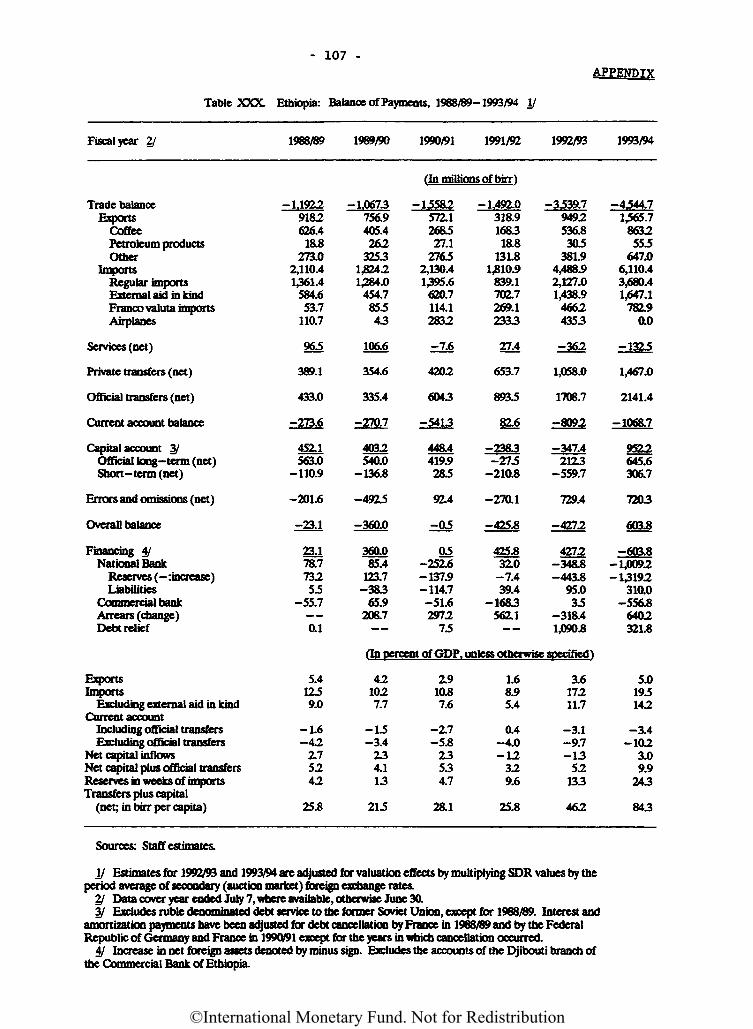
- 107 -
Table XXX. Ethiopia: Balance of Payments, 1988/89-1993/94 I/
APPENDIX
Fiscal year 2/ 1988/89 1989/90 1990/91 1991/92 1992/93 1993/94
(In millions of birr)
Trade balanceExports
CoffeePetroleum productsOther
ImportsRegular importsExternal aid in kindFranco valuta importsAirplanes
Services (net)
Private transfers (net)
Official transfers (net)
Current account balance
Capital account 3/Official long-term (net)Short-term (net)
Errors and omissions (net)
Overall balance
Financing 4/National Bank
Reserves (-:increase)Liabilities
Commercial bankArrears (change)Debt relief
-U9229182626.418.8
273.02,110.41361.4
584.653.7
110.7
965
389.1
433.0
-273.6
45X1563.0
-110.9
-201.6
-23.1
23.178.773255
-55.7
—0.1
-1,0673756.9405.4262
32531,82421,284.0
454.785.543
106.6
354.6
335.4
-270.7
4032540.0
-136.8
-4915
-360.0
360.085.4
123.7-383
65.9208.7
-15582572.1268.527.1
27632,130.41395.6
620.7114.12832
-7.6
4202
6043
-5413
448.4419.9283
92.4
^05
03-252.6-137.9-114.7-51.62972
73
-1,492.0318.9168318.8
131.81,810.9
839.1702.7269.12333
27.4
653.7
8933
82.6
-2383-273
-210.8
-270.1
-425.8
425.832.0-7.439.4
-1683562.1
-3339.79492536.8303
38L94,488.92,127.01,438.9
46624353
-362
1,058.0
1708.7
-8092
-347.42123
-559.7
729.4
-4272
4272-348.8-443.8
95.033
-318.41,090.8
-4344.71,565.78632553
647.06,110.43,680.41,647.1
782.90.0
-13251,467.0
2141.4
-1068.7
9522645.6306.7
7203
603.8
-603.8-1,0092-13192
310.0-556.8
6402321.8
fin percent of GDP, unless otherwise specified')
ExportsImports
Excluding external aid in kindCurrent account
Including official transfersExcluding official transfers
Net capital inflowsNet capital plus official transfersReserves in weeks of importsTransfers plus capital
(net; in birr per capita)
5.41239.0
-1.6-42
2.75242
25.8
421027.7
-1.5-3.4
234.113
21.5
2.910.87.6
-2.7-5.8
23534.7
28.1
1.68.95.4
0.4-4.0-12
329.6
25.8
3.617211.7
-3.1-9.7-13
52133
462
5.0193142
-3.4-102
3.09.9
243
843
Sources: Staff estimates.
I/ Estimates for 1992/93 and 1993/94 are adjusted for valuation effects by multiplying SDR values by theperiod average of secondary (auction market) foreign exchange rates.
2/ Data cover year ended July 7, where available, otherwise June 30.3/ Excludes ruble denominated debt service to the former Soviet Union, except for 1968/89. Interestand
amortization payments have been adjusted for debt cancellation by France in 1968/89 and by the FederalRepublic of Germany and France in 1990/91 except for the years in which cancellation occurred.
4/ Increase in net foreign assets denoted by minus sign. Excludes the accounts of the Djibouti branch ofthe Commercial Bank of Ethiopia.
©International Monetary Fund. Not for Redistribution
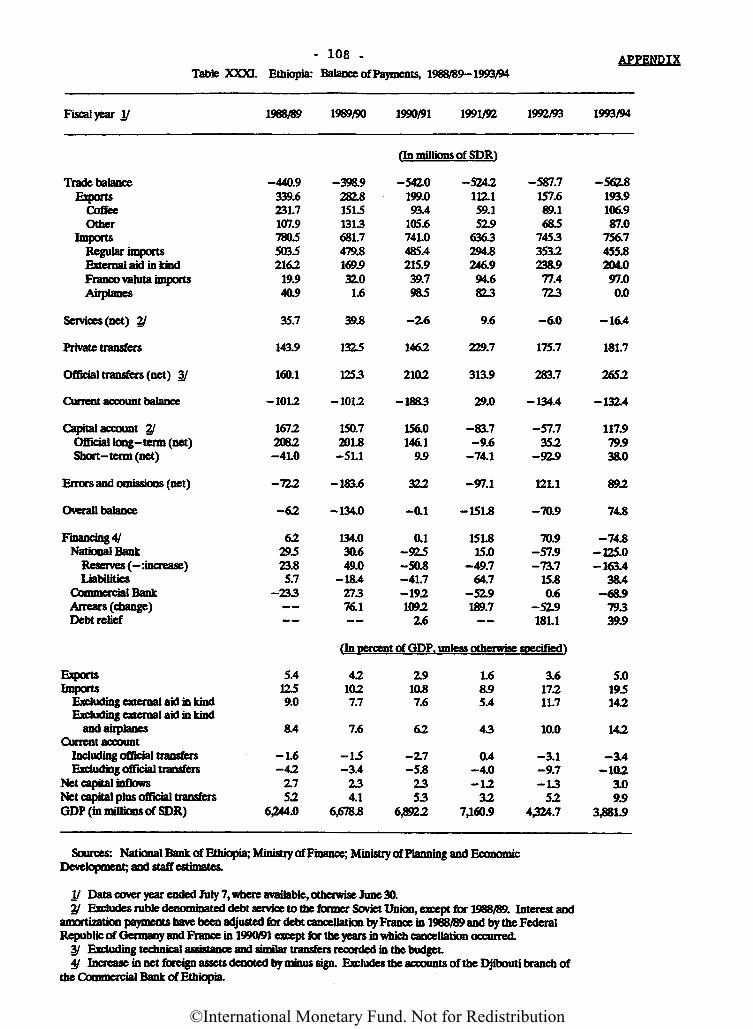
- 108 -
Table XXXI. Ethiopia: Balance of Payments, 1988/89-1993/94APPENDIX
Fiscal year I/ 1968/89 1989/90 1990/91 1991/92 1992/93 1993/94
(In millions of SDR)
Trade balanceExports
CoffeeOther
ImportsRegular importsExternal aid in kindFranco valuta importsAirplanes
Services (net) 2/
Private transfers
Official transfers (net) 3/
Current account balance
Capital account 2/Official long-term (net)Short-term (net)
Errors and omissions (net)
Overall balance
Financing 4/National Bank
Reserves (-nncrease)Liabilities
Commercial BankArrears (change)Debt relief
-440.9339.6231.7107.9780.5503.52162
19.940.9
35.7
143.9
160.1
-1012
16722082-41.0
-722
-62
6229.523.85.7
-233
::
-398.9282.8151.51313681.7479.8169.932.01.6
39.8
1315
1253
-1012
150.7201.8-51.1
-183.6
-134.0
134.030.649.0
-ia427376.1
-5410199.093.4
105.6741.0485.4215.939.79R5
-2.6
1462
2102
-1883
156.0146.1
9.9
322
-0.1
0.1-915-50.8-41.7-1921092
16
-5242111159.1519
6363294.8246.994.6823
9.6
229.7
313.9
29.0
-83.7-9.6
-74.1
-97.1
-151.8
151.815.0
-49.764.7
-519189.7
-587.7157.689.16&5
74533532238.977.4723
-6.0
175.7
283.7
-134.4
-57.7352
-919
12L1
-70.9
70.9-57.9-73.7
15.80.6
-519181.1
-5618193.9106.987.0
756.7455.8204.097.00.0
-16.4
181.7
2652
-1314
117.979.938.0
892
74.8
-74.8-125.0-163.4
38.4-68.9
79339.9
(In percent of GDP, unless otherwise specified)
ExportsImports
Excluding external aid in kindExcluding external aid in kind
and airplanesCurrent account
Including official transfersExcluding official transfers
Net capital inflowsNet capital plus official transfersGDP (in millions of SDR)
5.41159.0
&4
-1.6-42
2.752
6,244.0
421027.7
7.6
-L5-3.4234.1
6,678.8
1910.87.6
62
-17-5.8
2353
6,8922
1.6&95.4
43
0.4-4.0-12
327,160.9
3.617211.7
10.0
-3.1-9.7-13
524324.7
5.0195142
142
-3.4-102
3.09.9
3,881.9
Sources: National Bank of Ethiopia; Ministry of Finance; Ministry of Planning and EconomicDevelopment: and staff estimates.
I/ Data cover year ended July 7, where available, otherwise June 30.2/ Excludes ruble denominated debt service to the former Soviet Union, except for 1968/89. Interest and
amortization payments have been adjusted few debt cancellation by France in 1968/89 and by the FederalRepublic of Germany and France in 1990/91 except for the years in which cancellation occurred.
3/ Excluding technical assistance and similar transfers recorded in the budget4/ Increase in net foreign assets denoted by minus sign. Excludes the accounts of the Djibouti branch of
the Commercial Bank of Ethiopia
©International Monetary Fund. Not for Redistribution
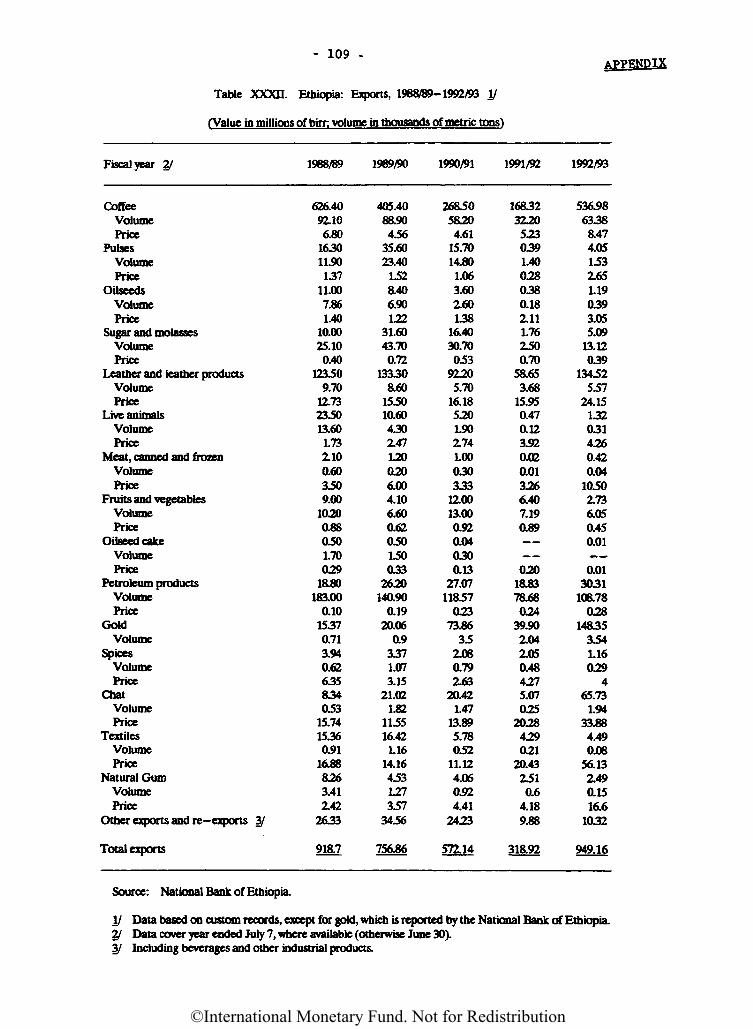
- 109 •
Table XXXH. Ethiopia: Exports, 1988/89-1992/93 I/
(Value in millions of birr volume in thousands of metric tons^
APPENDIX
Fiscal year 2f
CoffeeVolumePrice
PulsesVolumePrice
OilseedsVolumePrice
Sugar and molassesVolumePrice
Leather and leather productsVolumePrice
Live animalsVolumePrice
Meat, canned and frozenVolumePrice
Fruits and vegetablesVolumePrice
Oilseed cakeVolumePrice
Petroleum productsVolumePrice
GoldVolume
SpicesVolumePrice
ChatVolumePrice
TextilesVolumePrice
Natural GumVolumePrice
Other exports and re-exports 3/
Total exports
1988/89
626.4092.106.80
163011.90137
11.007.861.40
10.0025.100.40
123.509.70
12.73235013.601.732.100.603509.00
10200.880501.70029
18.80183.00
0.1015370.713.940.62635834053
15.7415360.91
16.888263.41142
2633
918.7
1989/90
405.4088.904.56
35.6023.401528.406.90122
31.6043.700.72
133308.60
155010.604302.471200206.004.106.600.62050150033
2620140.90
0.1920.06
0.93371.073.15
21.021.82
115516.421.16
14.16453127357
3456
756.86
1990/91
2685058204.61
15.7014.801.063.602.60138
16.4030.70053
92205.70
16.185201.902.741.00030333
12.0013.000.920.040300.13
27.0711857
02373.86
352.080.792.63
20.421.47
13.895.78052
11.124.060.924.41
2423
572.14
1991/92
1683232205230391.400280380.182.111.762500.70
58.653.68
15.950.470.123.920.020.013266.407.190.89
02018.8378.68024
39.902.042.050.484275.07025
2028429021
20.432510.6
4.189.88
318.92
1992/93
536.9863388.474.05153Z651.190393.055.09
13.12039
13452557
24.151320314260.420.04
10502.736.050.450.01
0.013031
106.78028
148353541.16029
465.73
1.9433.884.490.08
56.132.490.1516.6
1032
949.16
Source: National Bank of Ethiopia.
I/ Data based on custom records, except for gold, which is reported by the National Bank of Ethiopia.2/ Data cover year ended July 7, where available (otherwise June 30).3/ Including beverages and other industrial products.
©International Monetary Fund. Not for Redistribution
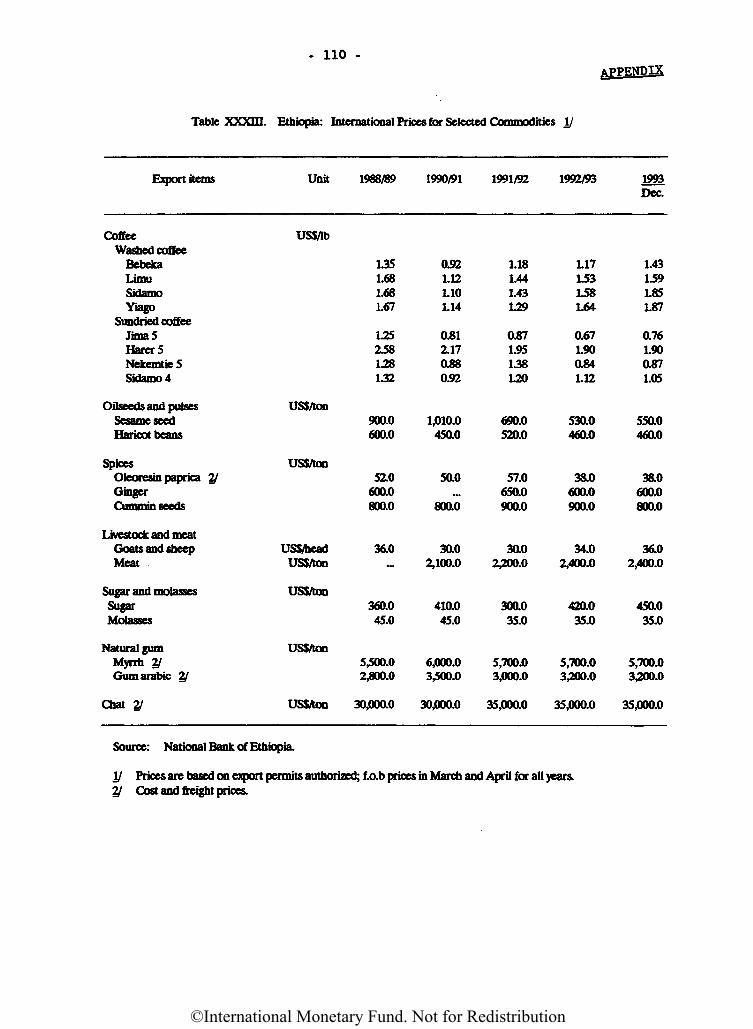
APPENDIX
Table XXXm. Ethiopia: International Prices for Selected Commodities I/
Export items Unit 1968/89 1990/91 1991/92 1992/93 1993Dec.
CoffeeWashed coffee
BebekaT.imu
SidamoYiago
Sundried coffeeJimaSRarer 5NekemtieSSidamo 4
Oilseeds and pulsesSesame seedHaricot beans
SpicesOteoresin paprica 2/GingerCummin seeds
Livestock and meatGoats and sheepMeat
Sugar and molassesSugarMolasses
Natural gumMyrrh 2/Gum arabic 2/
Chat 2/
US$/lb
1351.681.681.67
1.25258128132
USSAon900.0600.0
US$/ton510
600.0800.0
US$/head 36.0US$/ton
USSAon360.045.0
USSAon5,500.02,800.0
USSAon 30,000.0
0.921.121.101.14
0.812.170.880.92
1,010.0450.0
50.0...
800.0
30.02,100.0
410.045.0
6,000.03,500.0
30,000.0
1.181.441.43129
0.871.95138120
690.0520.0
57.0650.0900.0
30.02,200.0
300.035.0
5,700.03,000.0
35,000.0
1.171531581.64
0.671.900.841.12
530.0460.0
38.0600.0900.0
34.02,400.0
420.035.0
5,700.03,200.0
35,000.0
1.431591.851.87
0.761.900.871.05
550.0460.0
38.0600.0800.0
36.02,400.0
450.035.0
5,700.03,200.0
35,000.0
- 110 -
Source: National Bank of Ethiopia.
I/ Prices are based on export permits authorized; f.o.b prices in March and April for all years.2/ Cost and freight prices.
©International Monetary Fund. Not for Redistribution
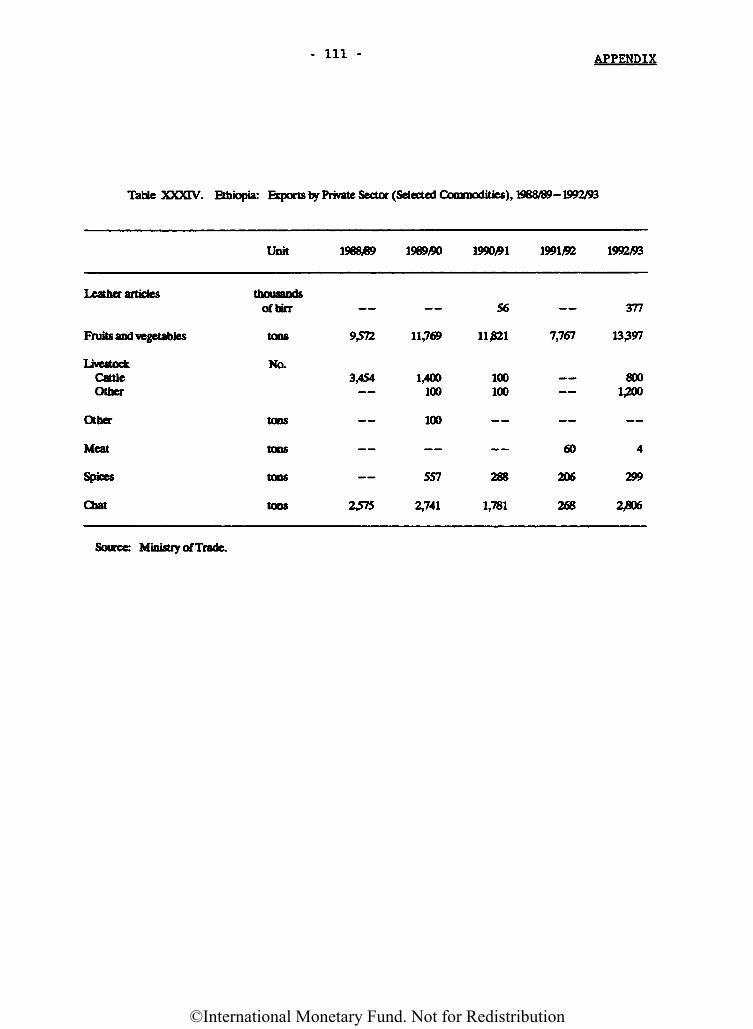
- Ill - APPENDIX
Table XXXIV. Ethiopia: Exports by Private Sector (Selected Commodities), 1988/89-1992/93
Leather articles
Fruits and vegetables
LivestockCattleOther
Other
Meat
Spices
Chat
Unit
thousandsof bin-
tons
No.
tons
tons
tons
tons
1968)89
9,572
3,454
2 )̂75
1989/90
11,769
1,400100
100
557
2,741
1990/91
56
11£21
100100
288
1,781
1991/92
7,767
60
206
268
1992/93
377
13397
8001,200
4
299
2*806
Source: Ministry of Trade.
©International Monetary Fund. Not for Redistribution
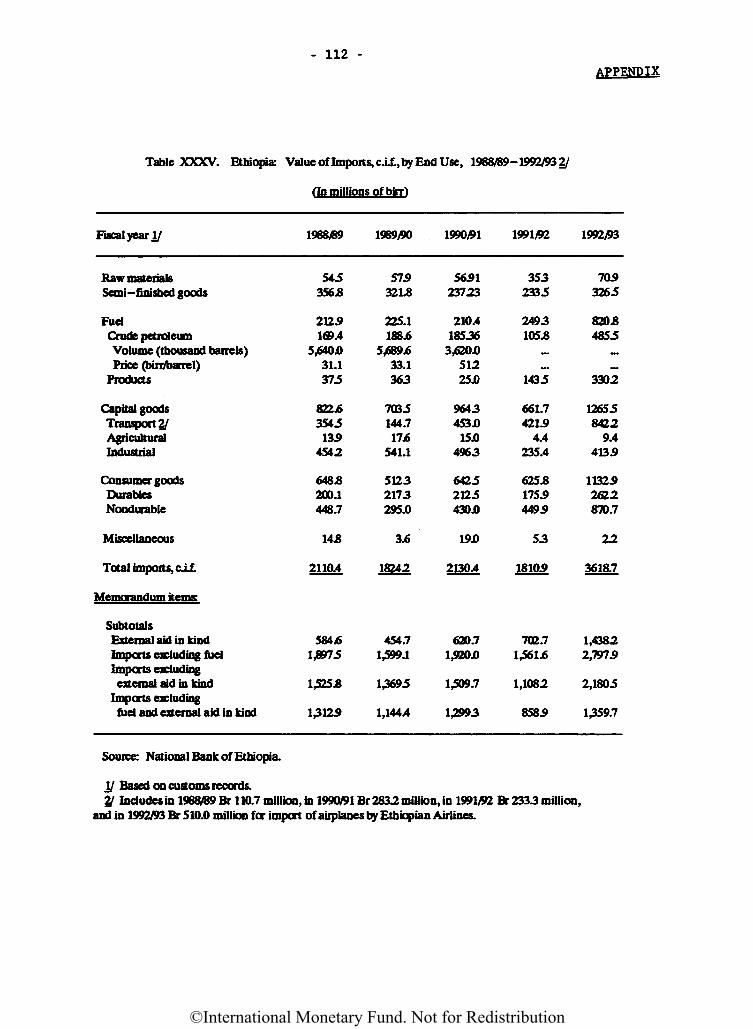
- 112 -APPENDIX
Table XXXV. Ethiopia: Value of Imports, c.Lf., by End Use, 1988/89-1992/93 2/
On millions of birr)
Fiscal year I/
Raw materialsSemi— finished goods
FuelCrude petroleumVolume (thousand barrels)Price (birr/barrel)
Products
Capital goodsTransport 2/AgriculturalIndustrial
Consumer goodsDurablesNondurable
Miscellaneous
Total imports, col
Memorandum items:
SubtotalsExternal aid in kindImports excluding fuelImports excludingexternal aid in kind
Imports excludingfuel and external aid in kind
1968/69
545356*
21251694
5,640031.1375
822.6354513.9
4542
648*200.1448.7
14J8
2110.4
584*1,8975
1,525*
1,3125
1989/90
575321.8
225.1188.6
5,689.633.1363
7035144.717*
541.1
51232173295.0
3.6
18Z42
454.71,599.1
13695
1,1444
1990/91
565123723
210.418536
3,620451225JO
9643453 JO154
4953
64252125430 JO
19D
2130.4
620.71,920D
1,509.7
1,2993
1991/92
3532335
2493105*
~....
1435
661.7421.9
4.4235.4
625.8175.94495
53
18105
702.71,561.6
1,1082
8585
1992)93
7053265
820*4855_
~.3302
126558422
9.44135
11325262287D.7
22
3618.7
1,43822,7975
2,1805
1359.7
Source: National Bank of Ethiopia.
I/ Based on customs records.2/ Includes in 1988/89 Br 110.7 million, in 1990/91 Br 2832 million, in 1991/92 Br 2333 million,
and in 1992/93 Br 510.0 million for import of airplanes by Ethiopian Airlines.
©International Monetary Fund. Not for Redistribution
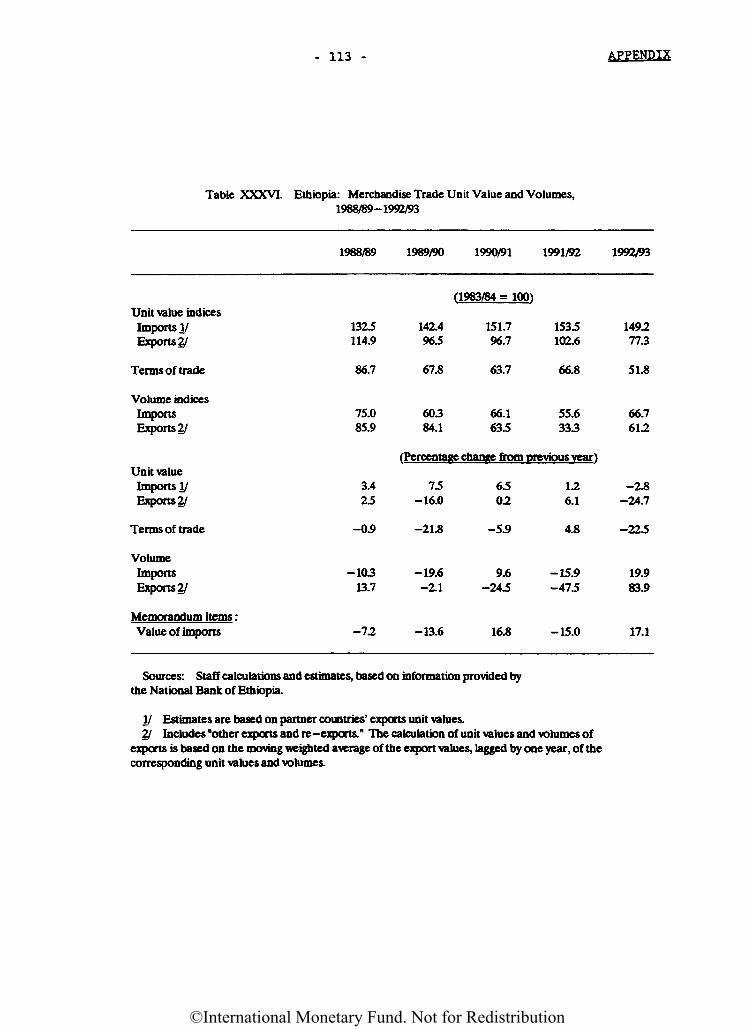
- 113 - APPENDIX
Table XXXVI. Ethiopia: Merchandise Trade Unit Value and Volumes,1988/89-1992/93
Unit value indicesImports!/Exports?/
Terms of trade
Volume indicesImportsExports 2/
Unit valueImports VExports 2/
Terms of trade
VolumeImportsExports 2/
Memorandum items :Value of imports
1988/89
132.5114.9
86.7
75.085.9
3.425
-0.9
-10313.7
-72
1989/90
142.496.5
67.8
1990/91
(1983/84 = 1(X»
151.796.7
63.7
1991/92
153.5102.6
66.8
603 66.1 55.684.1 63.5 333
(Percentage chance from previous yearl
7.5-16.0
-21.8
-19.6-2.1
-13.6
6502
-5.9
9.6-24.5
16.8
126.1
4.8
-15.9-475
-15.0
1992/93
1492773
51.8
66.7612
-2.8-24.7
-225
19.983.9
17.1
Sources: Staff calculations and estimates, based on information provided bythe National Bank of Ethiopia.
II Estimates are based on partner countries' exports unit values.2/ Includes "other exports and re-exports." The calculation of unit values and volumes of
exports is based on the moving weighted average of the export values, lagged by one year, of thecorresponding unit values and volumes.
©International Monetary Fund. Not for Redistribution
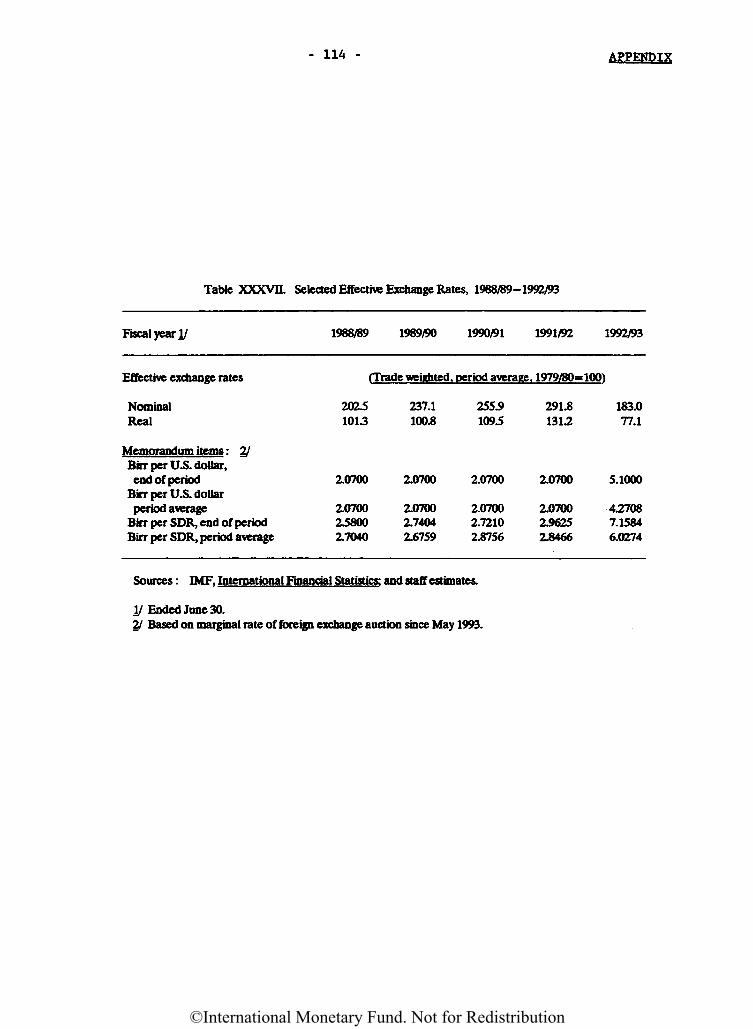
- 114 - APPENDIX
Table XXXVII. Selected Effective Exchange Rates, 1988/89-1992/93
Fiscal year I/ 1988/89 1989/90 1990/91 1991/92 1992/93
Effective exchange rates
NominalReal
Memorandum items i 2/Birr per U.S. dollar,end of period
Birr per U.S. dollarperiod average
Birr per SDR, end of periodBirr per SDR, period average
(Trade weighted, period average, 1979/80=100)
202.51013
2.0700
2.07002J8002.7040
237.1100.8
2,0700
2.07002.74042.6759
255.9109.5
2.0700
2.07002.72102.8756
291.81312
2.0700
2.07002.96252.8466
183.077.1
5.1000
427087.15846.0274
I/ Ended June 30.2/ Based on marginal rate of foreign exchange auction since May 199.
Sources : IMF, International Finncail Statistics: and staff estimates.
©International Monetary Fund. Not for Redistribution
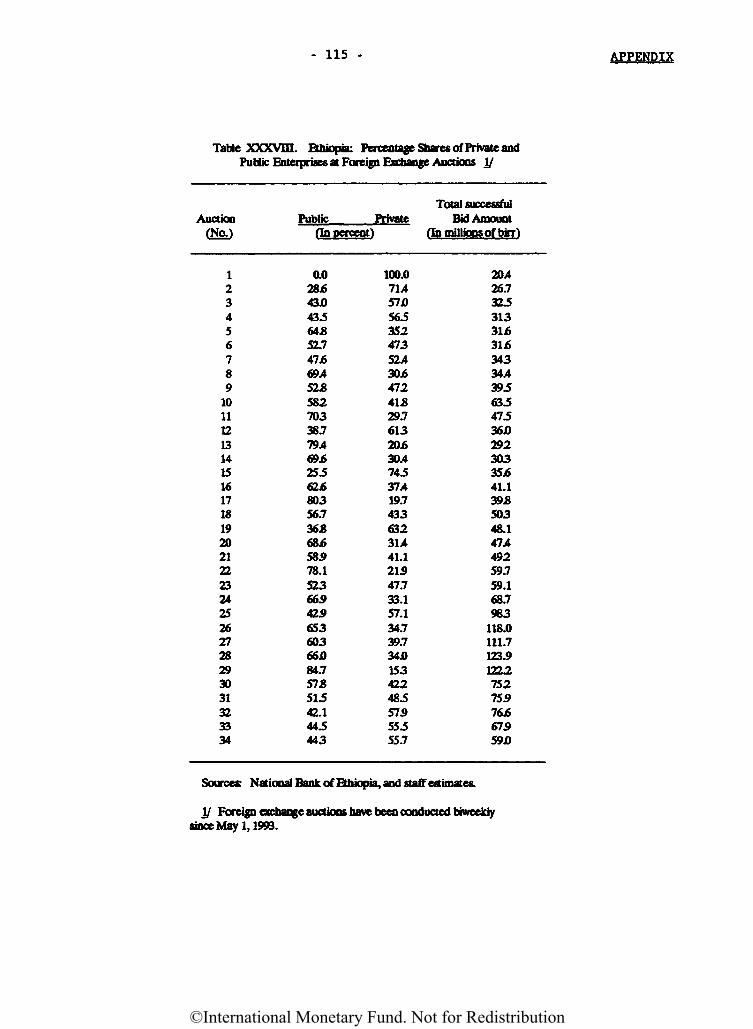
APPENDIX
Table XXXVffl. Ethiopia: Percentage Shares of Private andPuttie Enterprises at Foreign Exchange Auctions I/
Auction(No.)
123456789
10111213141516171819202122232425262728293031323334
Sources;
I/ Forei
Public(In percent)
ao28*43JO43.564J852.747j669452JB58270338.779469j625562 j680356.736*68j658578.152366542565360366JO84.757JBSIS42.1445443
Private
100.071457JD56535247352430j647241J829.761320j630474537419.743363231441.121547.733.157.134.739.734JO15342248557555555.7
Total successfulBid Amount
On millions of birr)
20426.732531331j631j634334439563547536JO29230335*41.139J850348.147449259.759.168.7983
118.0111.7123.9122.275275576*67559JO
National Bank of Ethiopia, and staff estimates.
en exchamte auctions have been cooducted biweeklysince May 1,1993.
- 115 -
©International Monetary Fund. Not for Redistribution
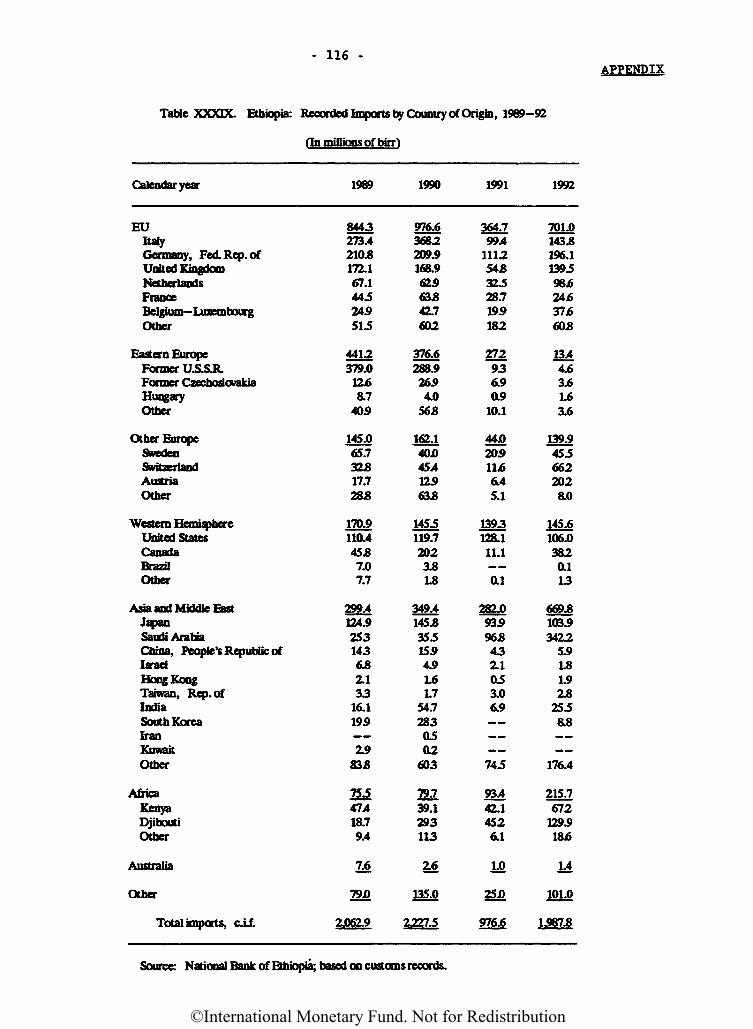
- 116 -
Table XXXIX. Ethiopia: Recorded Imports by Country of Origin, 1989-92
(In millions of birr)
Calendar year
EUItalyGermany, Fed. Rep. ofUnited KingdomNetherlandsFranceBelgium-LuxembourgOther
Eastern EuropeFormer U.S.&R.Former CzechoslovakiaHungaryOther
Other EuropeSwedenSwitzerlandAustriaOther
^western HemisphereUnited StatesCanadaBrazilOther
Asia and Middle EastJapanSaudi ArabiaChina, People's Republic ofIsraelHong KongTaiwan, Rep. ofIndiaSouth KoreaIranKuwaitOther
AfricaKenyaDjiboutiOther
Australia
Other
Total imports, c.Lf.
1969
8443273.4210.8172.167.144524.9515
441.2379.012*8.7
40.9
145.065.732JB17.728JB
170.9110.445JB7.07.7
299.4124.9253143&82.133
16.1199
2.9S3JS
75547418.79.4
M
79JD
2.062.9
1990
976.6368.2209.9168.9€2963J842.7602
376.6288.926.940
56JB
162.140JO45412963J8
1455119.72023.8L8
349.4145.83551594.91.61.7
54.72830502
603
79.739.1293113
Z6
135.0
2227.5
1991
364.7994
111254 JB32528.7194182
2Z2936.90.9
10.1
44 JD20J91L66.45.1
1393128.111.1
0.1
282.093596JB432.1053.06.9
745
93442.14526.1
LO
^0
976.6
1992
701.0143.8196.1139598*24637*60J8
1344.63.61.63.6
139.9455662202ao
145.6106.03820.113
669.8103.93422
5.91.81.92.8
255as
176.4
215.7672
129.918j6
M
101.0
1587̂
Source: National Bank of Ethiopia; based on customs records.
APPENDIX
©International Monetary Fund. Not for Redistribution
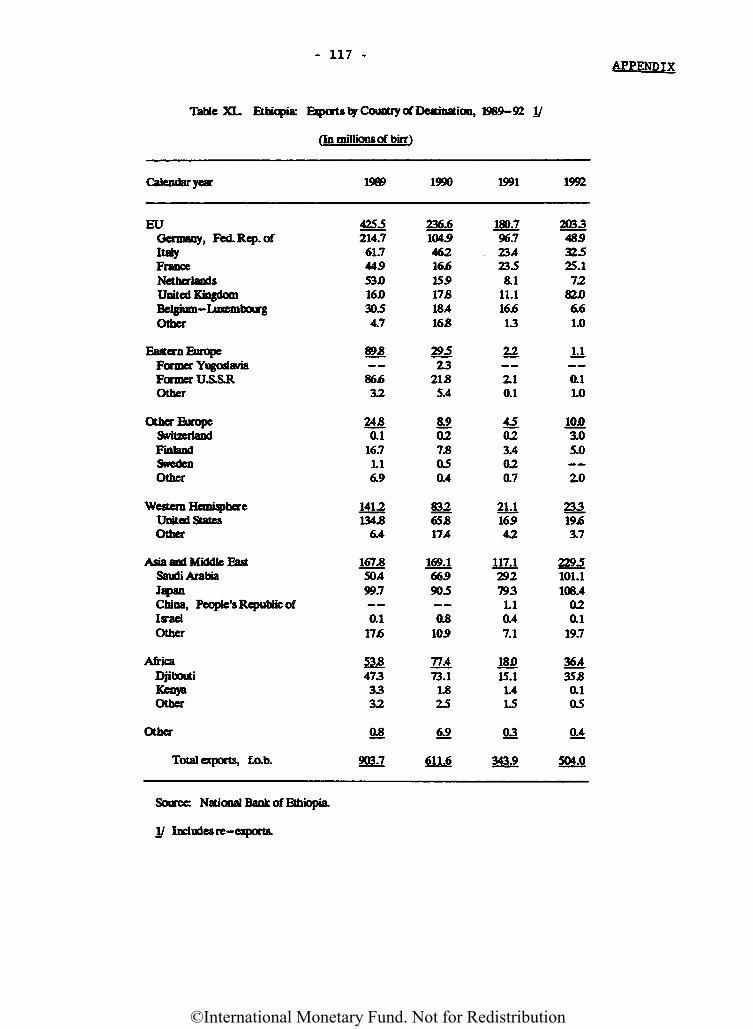
- 117 -
Table XL Ethiopia: Exports by Country of Destination, 1989-92 I/
(In millions of birr)
Calendar year
EUGermany, Fed. Rep. ofItalyFranceNetherlandsUnited KingdomBelgium-LuxembourgOther
Eastern EuropeFormer YugoslaviaFormer ILS.SJROther
Other EuropeSwitzerlandFinlandSwedenOther
Western HemisphereUnited StatesOther
Asia and Middle EastSaudi ArabiaJapanChina, People's Republic ofIsraelOther
AfricaDjiboutiKenyaOther
Other
Total exports, f.o.b.
1969
4253214.761.744953JO16JO3054.7
89 J8
—86*32
24J80.1
16.71.16.9
1412134.8
6.4
167.850499.7
0.117*
53&4733332
08
903.7
1990
236.6104.946216*15S17J818416JS
29523
21JB5.4
&9O27.805a4
83265JB174
169.1669905
0810.9
77473.1L*25
£2
611.6
1991
180.796.72342358.1
11.116*13
22
—2.10.1
M023.4020.7
21.116542
im2927931.10.47.1
18D15.11.415
03
343.9
1992
203348932525.172
82 JO6.61.0
M—ai1.0
IQJO3.05.0
2.0
23319*3.7
2295101.1108.4
020.1
19.7
36435 £ai05
04
504.0
Source: National Bank of Ethiopia.
\l Includes re-exports.
APPENDIX
©International Monetary Fund. Not for Redistribution
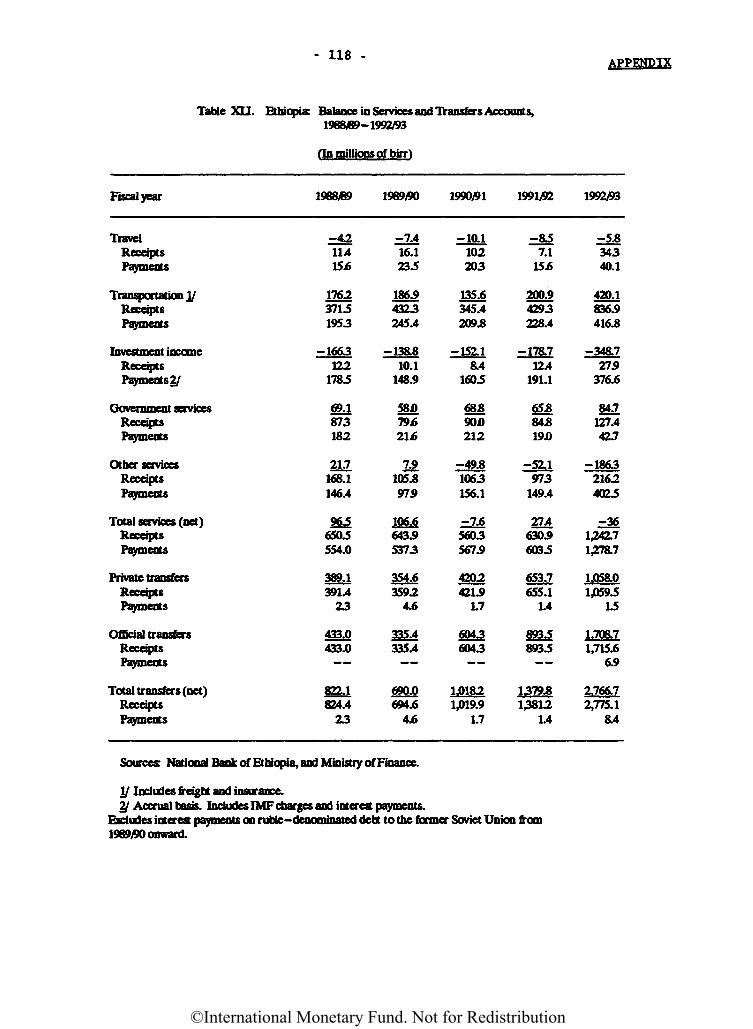
APPENDIX
Table XII. Ethiopia: Balance in Services and Transfers Accounts,1968/89-1992/93
(In millions of birr)
Fiscal year 1968/99 1989/90 1990/91 1991/92 1992/93
TravelReceiptsPayments
Transportation I/ReceiptsPayments
Investment incomeReceiptsPayments 2/
-42114156
116237151953
-1663122
1785
-7.416.1235
186.94323245.4
-138.810.1
148.9
-10.1102203
135.6345.4209.8
R41605
-857.1
15j6
200.94293228.4
-178.7124
191.1
-5.834340.1
420.1836.9416.8
-348.7275
376.6
Government servicesReceiptsPayments
Other servicesReceiptsPayments
Total services (net)ReceiptsPayments
Private transfersReceiptsPayments
Official transfersReceiptsPayments
Total transfers (net)ReceiptsPayments
69,1873182
21J168.1146.4
9656505554.0
mi391.4
23
433.0433.0
824.423
58 JO79j621*
24105.8979
106.6643.95373
354,6359.2
4.6
33^4335.4
690.0694.6
4.6
68JB90JD212
^49*1063156.1
-7.65603567.9
420.2421.9
L7
60436043
1.01821,019.9
1.7
65 J&84J819JO
=&±973
149.4
274630.96035
653.7655.1
1.4
89358935
13801.4
841127.442.1
-186321624025
-361,242.71,278.7
LOS8.01,059.5
15
1,706.71,715.6
6.9
2,766.72,775.1
a4
Sources: National Bank of Ethiopia, and Ministry of Finance.
y Includes freight and insurance.2J Accrual basis. Includes IMF charges and interest payments.
Excludes interest payments on ruble-denominated debt to the former Soviet Union from1989/90 onward.
- 118 -
– 152.
1.379.8822.1
©International Monetary Fund. Not for Redistribution
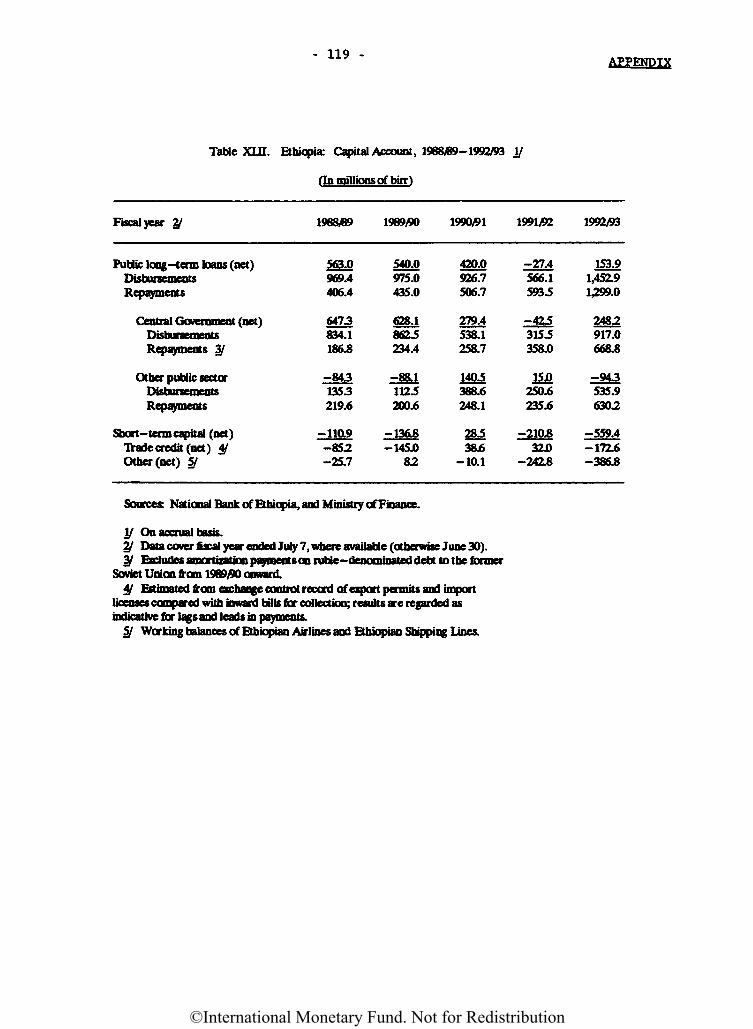
- 119 -APPENDIX
Table XIH. Ethiopia: Capital Account, 1968/99-1992/93 I/
(In millions of birr)
Fiscal year 2/ 1968/99 1989/90 1990y91 199102 1992/93
Public long-term loans (net)DisbursementsRepayments
Central Government (net)DisbursementsRepayments 3/
Other public sectorDisbursementsRepayments
Short- term capital (net)Trade credit (net) 4/Other (net) 5/
563.0969.4406.4
6473834.1186.8
^^431353219.6
-110.9-852-25.7
540.0975.0435.0
628.18625234.4
Z&A1125200.6
-136.8-145.0
82
420.0926.7506.7
279.4538.1258.7
1405388.6248.1
28538j6
-10.1
^2M566.15935
z^53155358.0
m250.6235.6
-210.832 JO
-242.8
153.91,452.91,299.0
2482917.0668.8
-943535.96302
-559.4-172.6-386.8
Sources: National Bank of Ethiopia, and Ministry of Finance.
y On accrual basis.2/ Data cover fiscal year ended July 7, where available (otherwise June 30).3f Excludes amortization payments on ruble-denominated debt to the former
Soviet Union from 1989£0 onward.4/ Estimated from qcbaqgc cootrol record of export permits and import
licenses compared with inward bills for collection; results are regarded asindicative for lags and leads in payments.
5/ Working balances of Ethiopian Airlines and Ethiopian Shipping Lines.
©International Monetary Fund. Not for Redistribution
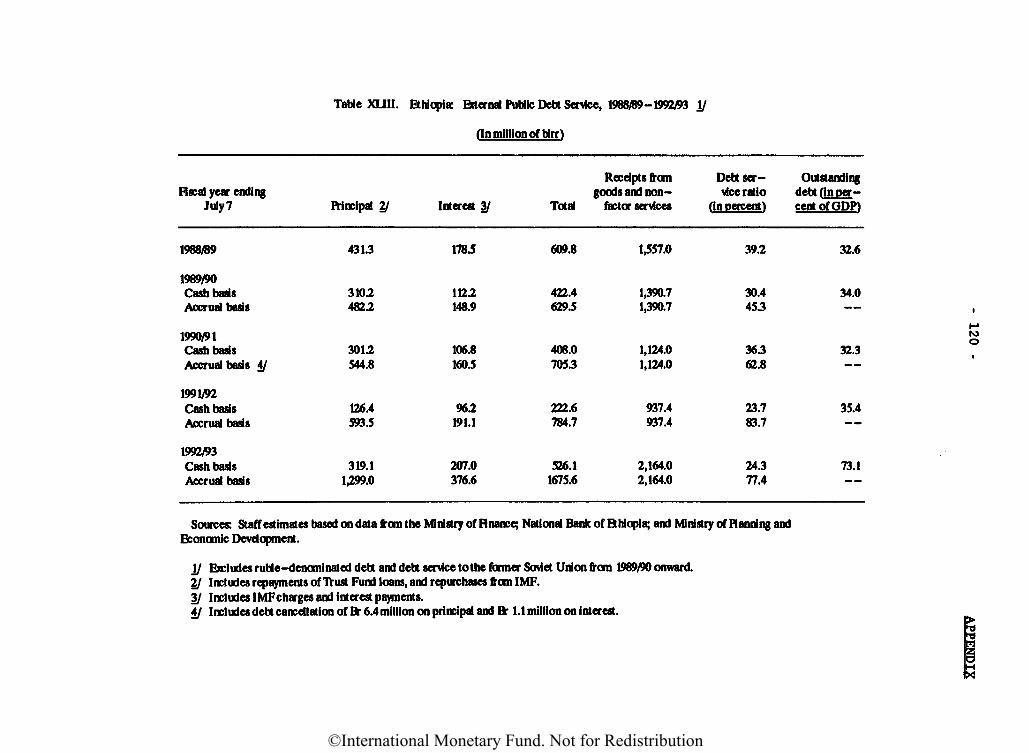
Table XUII. Ethiopia: External Public Debt Service, 1968/69-1992/93 I/
Hn million of birr)
Fiscal year endingJuly?
1988/89
1969/90Cash basisAccrual basis
1990/91Cash basisAccrual basis 4/
1991/92Cash basisAccrual basis
1992/93Cash basisAccrual basis
Principal 2/
431.3
31024822
301.2544.8
126.4593.5
319.1U99.0
Interest 3/
178.5
1122148.9
105.8160.5
962191.1
207.0376.6
Receipts fromgoods and non-
Total factor services
609.8
422.4629.5
408.0705.3
2Z2.6784.7
526.11675.6
1,557.0
1,390.71,390.7
1,124.01,124.0
937.4937.4
2,164.02,164.0
Debt ser- Outstandingvice ratio debt (in per-
fin percent) cent of GDP)
392
30.445.3
36.362.8
23.783.7
24.377.4
32.6
34.0
32.3
35.4
73.1
Sources: Staff estimates based on data from the Ministry of Finance; National Bank of Ethiopia; and Ministry of Planning andEconomic Development.
I/ Excludes ruble-denominated debt and debt service tothe former Soviet Union from 1969/90 onward.2/ Includes repayments of lYust Fund loans, and repurchases from IMF.3/ Includes IMFcharges and interest payments.4/ Includes debt cancellation of fit 6.4 million on principal and Br 1.1 million on interest.
©International Monetary Fund. Not for Redistribution
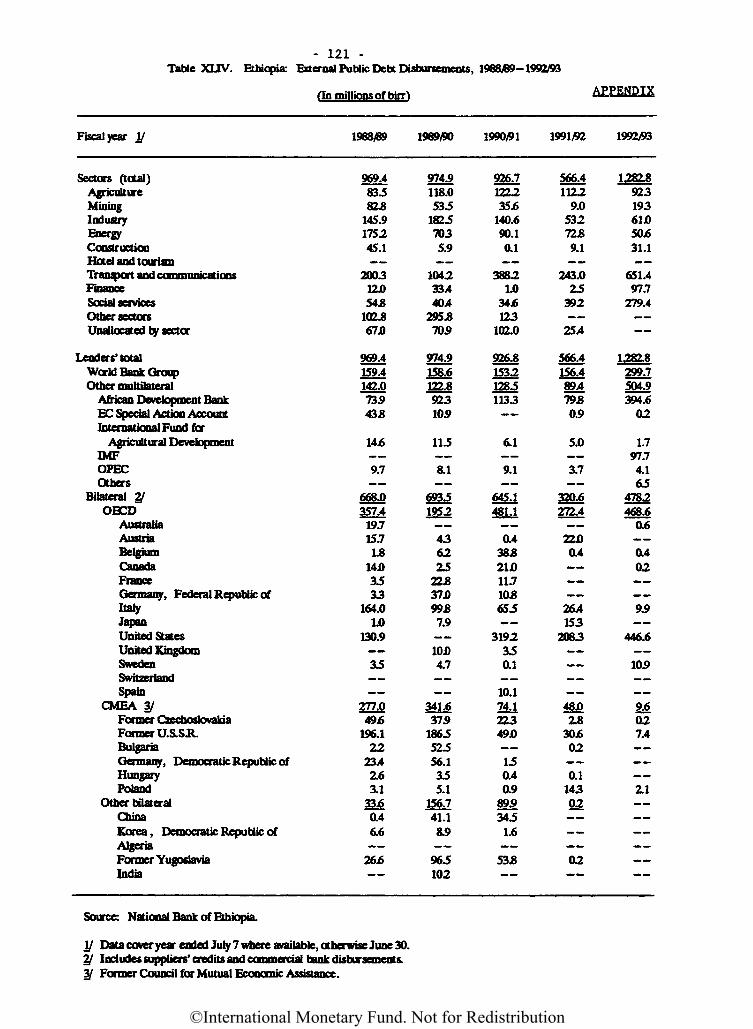
- 121 -Table XLTV. Ethiopia: External Public Debt Disbursements, 1968)69-1992/93
(In millions of birr) APPENDIX
Fiscal year I/
Sectors (total)AgricultureMiningIndustryEnergyConstructionHotel and tourismTr&nsfwt Aivjl cnf?VTYimkr4ttiOfl$FinanceSocial servicesOther sectorsUnallocated by sector
Lenders' totalWorld Bank GroupOther multilateral
African Development BankEC Special Action AccountTntcmfltkififll Fmyl for
Agricultural DevelopmentIMFOPECOthers
Bilateral 2/OBCD
AustraliaAustriaBelgiumCanadaFranceGermany, Federal Republic ofItalyJapanUnited StalesUnited KingdomSwedenSwitzerlandSpain
CMEA 3/Former CzechoslovakiaFormer U.S.SH.BulgariaGermany, Democratic Republic ofHungaryPoland
Other bilateralChinaKorea, Democratic Republic ofAlgeriaFormer YugoslaviaIndia
1968/39
969.483.582*
145.9175.245.1
2TO3^Am.j12JO54*
102.867 JO
969.4159.4142.073943J&
146
9.7
668.0357.419.715.7L8
14JO3533
164.01.0
130.9
35
277.0495
196.122
2342.63.1
33*0.46.6
266__
1989/90
974.9118.0535
18257035.9
ini9J\P»wfc
334404
295.8705
974.9158.6122.892310.9
115
8.1
69351952
436225
22JB37JO99JB7.9
10JO4.7
341*375
186552556.1355.1
156J41.1S.9
965102
1990/91
926.7122235*
140.690.10.1
MCOJOO«dfc
1.034*123
102.0
926.8153212851133
•» •••
6.1
9.1
645.148U
0.438JB21JD11.710JB655
3192350.1
10.1m22349JO
150.40.9
8953451.6
53J8
1991̂ 2
566.41122
9.053272J89.1
2430<^flJ.W
25392
254
5664156489479JB0.9
5.0
3.7
320.6272.4
22JO0.4
264153
2083
48 JOZ8
30*02
0.114302
02__
1992/93
1282.892319361JO50*31.1
^C1 AUU).l.*+
97.7279.4
1282.8299.7504.9394.6
02
1.797.74.165
4782468.6
0.6
0.402
9.9
446.6
105
9*027.4
2.1
Source: National Bank of Ethiopia.
I/ Data coveryear ended July 7 where available, otherwise June 30.2/ Includes suppliers' credits and coounercial bank disbursemeots.3/ Former Council to Mutual Economic Assistance.
©International Monetary Fund. Not for Redistribution
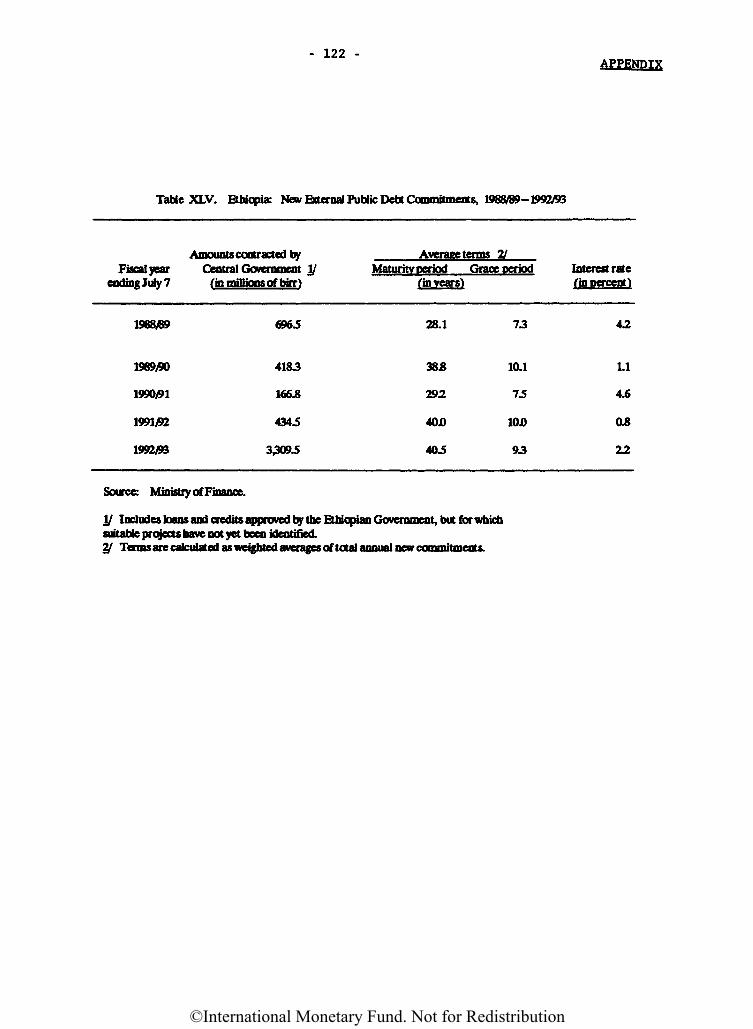
- 122 -APPENDIX
Table XLV. Ethiopia: New External Public Debt Commitments, 1988/89-1992/93
Fiscal yearcoding July 7
1988/89
196900
199001
199102
199203
AfiKwnts contracted twCentral Government I/
6965
4183
166.8
4345
3,309.5
Average terms 21Maturity oeriod Grace period
fin years)
28.1
38J8
292
40JD
405
73
10.1
75
10JO
93
Interest ratefinDcrcenn
42
LI
4.6
O8
22
Source: Ministry of Finance.
I/ Includes loans and credits approved by the Ethiopian Government, but for whichsuitable projects have not yet been identified.2/ Terms are calculated as weighted averages erf total annual new commitments.
(in millions of birr)
©International Monetary Fund. Not for Redistribution
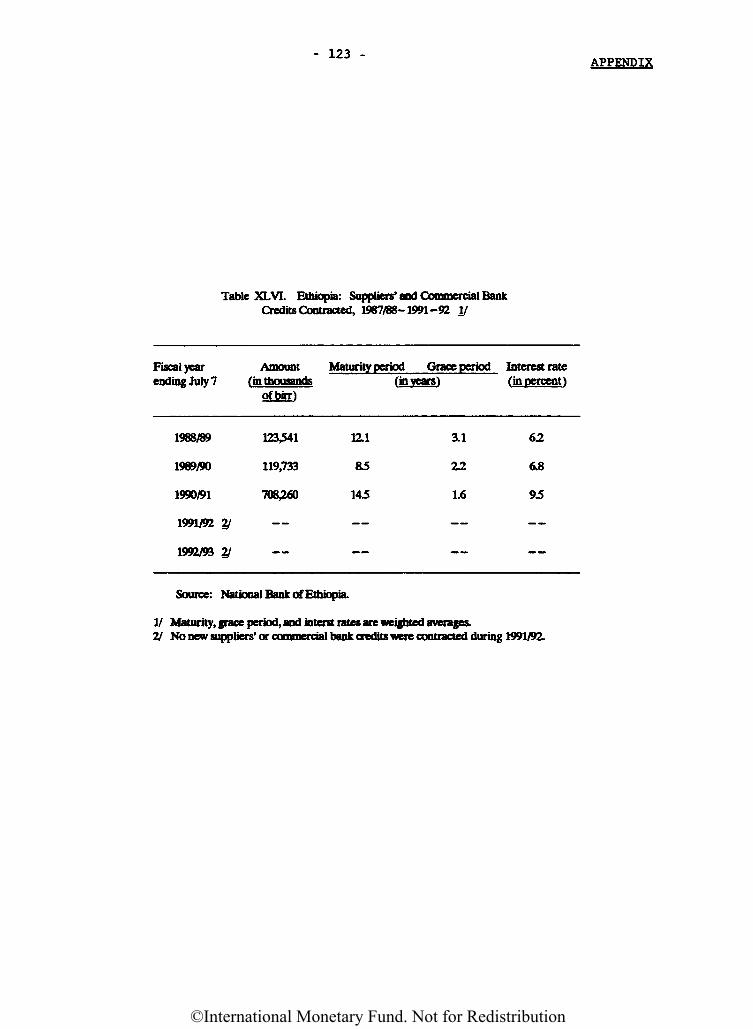
- 123 -APPENDIX
Table XLVI. Ethiopia: Suppliers' and Commercial BankCredits Contracted, 1987/88-1991-92 I/
Fiscal yearending July 7
1968/89
1989/90
1990/91
1991/92 2f
1992/93 y
Amount(in thousands
of birr)
123,541
119,733
708^60
Maturity period Grace period(invearsl
1Z1 3.1
83 22
145 1.6
Interest rate(in percent)
62
6.8
93
Source: National Bank of Ethiopia.
I/ Maturity, grace period, and interst rates are weighted averages.21 No new suppliers* or commercial bank credits were contracted during 1991/92.
©International Monetary Fund. Not for Redistribution
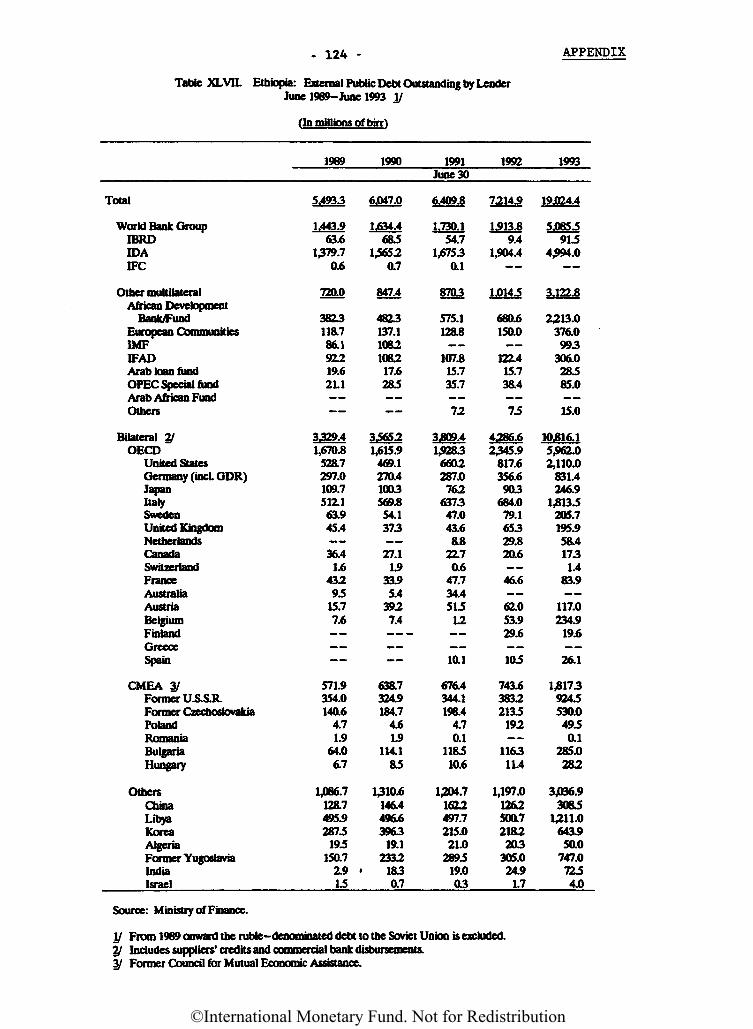
- 124 - APPENDIX
Table XLVII. Ethiopia: External Public Debt Outstanding by LenderJune 1989-June 1993 I/
(In millions of birr)
1969 1990 1991 1992 1993June 30
Total
World Bank GroupIBRDIDAEFC
Other multilateralAfrican Development
Bank/FundEuropean CommunitiesIMFIFADArab loan fundOPEC Special fundArab African FundOthers
Bilateral 2/OECD
United StatesGermany (incL GDR)JapanItalySwedenUnited KingdomNetherlands
5.4933 6.047.0
1.443.963.6
1379.70.6
1,634.4685
1,565.20.7
CanadaSwitzerlandFranceAustraliaAustriaBelgiumFinlandGreeceSpain
CMEA 3/Former U.S.S.R.Former CzechoslovakiaPolandRomaniaBulgariaHungary
720.0
3823118.786.191219.621.1
3329.41,670.8
528.7297.0109.7512.163.945.4
36.41.6
43295
15.77.6
571.9354.0140.6
4.71.9
64.06.7
847.4
4823137.11082106217.6285
356521,615.9
469.1270.41003569.854.1373
27.11.9
33.95.4
3927.4
638.7324.9184.7
4.6L9
114.185
1.730.154.7
1,67530.1
8703
575.1128.8
107.815.735.7
72
3J809.41,92836602287.0762
637347.043.6as
22.70.6
47.734.451512
10.1
676.4344.1196.4
4.70.1
118510.6
1,913.89.4
1,904.4
680.6150.0
122.415.738.4
75
2345.9817.6356.6903
684.079.165329.820.6
46.6
62.053.929.6
105
743.638322135192
116311.4
91.54,994.0
3.122.8
2,213.0376.0993
306.028585.0
15.0
10*16.15,962.02,110.0
831.4246.9
1,8135205.7195.958.41731.4
83.9
117.0234.9
19.6
26.1
9245530.04950.1
285.0282
OthersChinaLibyaKoreaAlgeriaFormer YugoslaviaIndiaIsrael
1,086.7128.7495.92875195
150.72.915
1310.6146.4496.63963
19.123321830.7
1,204.71622497.7215.021.0
289519.003
1,197.0126250QV72182203
305.024.91.7
3,036.93065
1,211.0643450.0
747.07254.0
Source: Ministry of Finance.
I/ From 1989 onward the ruble-denominated debt to the Soviet Union is excluded.2/ Includes suppliers' credits and commercial bank disbursements.3/ Former Council for Mutual Economic Assistance.
6,409.8 7314.9 19,024.4
4286.6
1,8173
5.085
1.014
©International Monetary Fund. Not for Redistribution
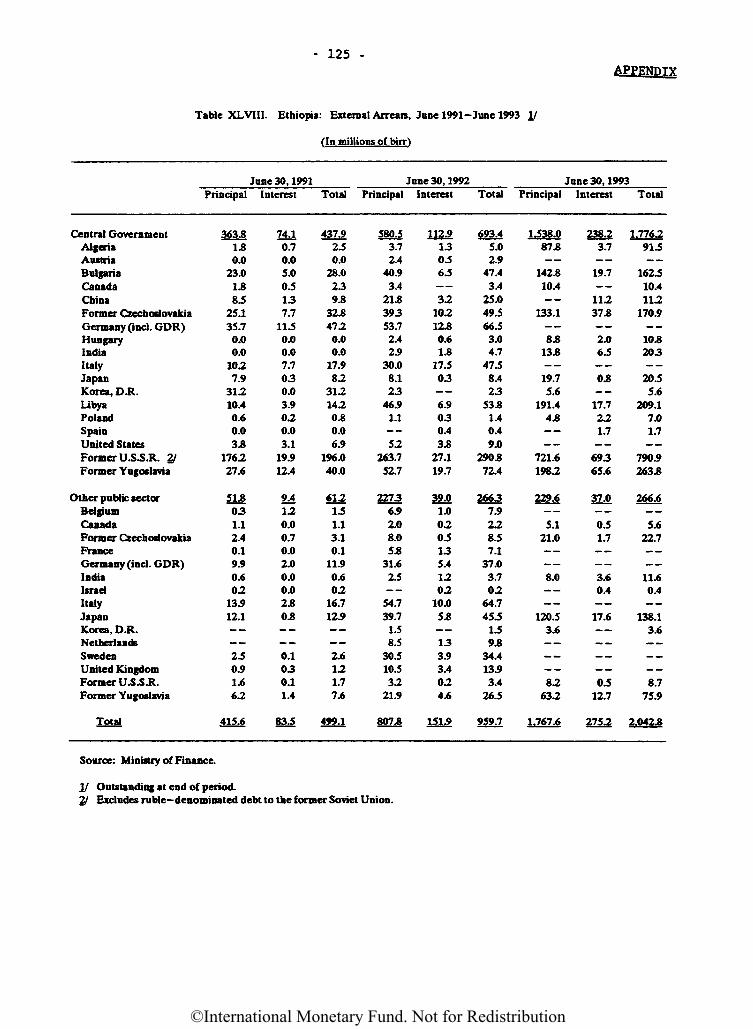
- 125 -APPENDIX
Table XLVI1I. Ethiopia: External Arrears, June 1991-June 1993 I/
(In millions of bin}
June 30, 1991Principal
Central GovernmentAlgeriaAustriaBulgariaCanadaChinaFormer CzechoslovakiaGermany (incl. GDR)HungaryIndiaItalyJapanKorea, D.R.LibyaPolandSpainUnited StatesFormer U.S.S.R. 2/Former Yugoslavia
Other public sectorBelgiumCanadaFormer CzechoslovakiaFranceGermany (incl. GDR)IndiaIsraelItalyJapanKorea, D.R.NetherlandsSwedenUnited KingdomFormer U.S.S.R.Former Yugoslavia
Total
363.81.80.0
23.01.88.5
25.135.70.00.0
10.27.9
31.210.40.60.03.8
176.227.6
5L8031.12.40.19.90.60.2
13.912.1
2.50.91.662
415.6
Interest
m0.70.05.00.5137.7
11.50.00.07.7030.03.90.20.03.1
19.912.4
9.4120.00.70.02.00.00.02.80.8
0.1030.11.4
83,5
Total
437.92.50.0
28.0239.8
32.847.20.00.0
17.98.2
31.214.20.80.06.9
196.040.0
6121.51.13,10.1
11.90.602
16.712.9
2.6121.77.6
499.1
June 30,1992Principal
580.53.72.4
40.93.4
21.839353.72.42.9
30.08.123
46.91.1
52263.7
52.7
22736.92.08.05.8
31.62.5
54.739.71.58.5
30.510.532
21.9
807.8
Interest
112.9130.56.5
3210212.80.61.8
17.503
—6.9030.43.8
27.119.7
39.01.0020.5135.41202
10.05.8
133.93.40.24.6
151.9
Total
693.45.02.9
47.43.4
25.049.566.53.04.7
47.58.423
53.81.40.49.0
290.872.4
26637.9228.57.1
37.03.70.2
64.745.51.59.8
34.413.93.4
26.5
959.7
June 30, 1993Principal
1.538.087.8
142.810.4
133.1
—8.813.8
19.75.6
191.44.8
721.6198.2
229.6
5.121.0
8.0
120.53.6
8.263.2
1.767.6
Interest
238.23.7
19.7
11.237.8
2.06.5__
0.8
—17.7221.7
69365.6
3LO
0.51.7
3.60.4
17.6
0.512.7
275.2
Total
1.776.291.5
162.510.4112
170.9
10.8203
20.55.6
209.17.01.7
790.9263.8
266.6
5.622.7
11.60.4
138.13.6
8.775.9
2.042.8
Source: Ministry of Finance.
If Outstanding at end of period.2/ Excludes ruble—denominated debt to the former Soviet Union.
©International Monetary Fund. Not for Redistribution
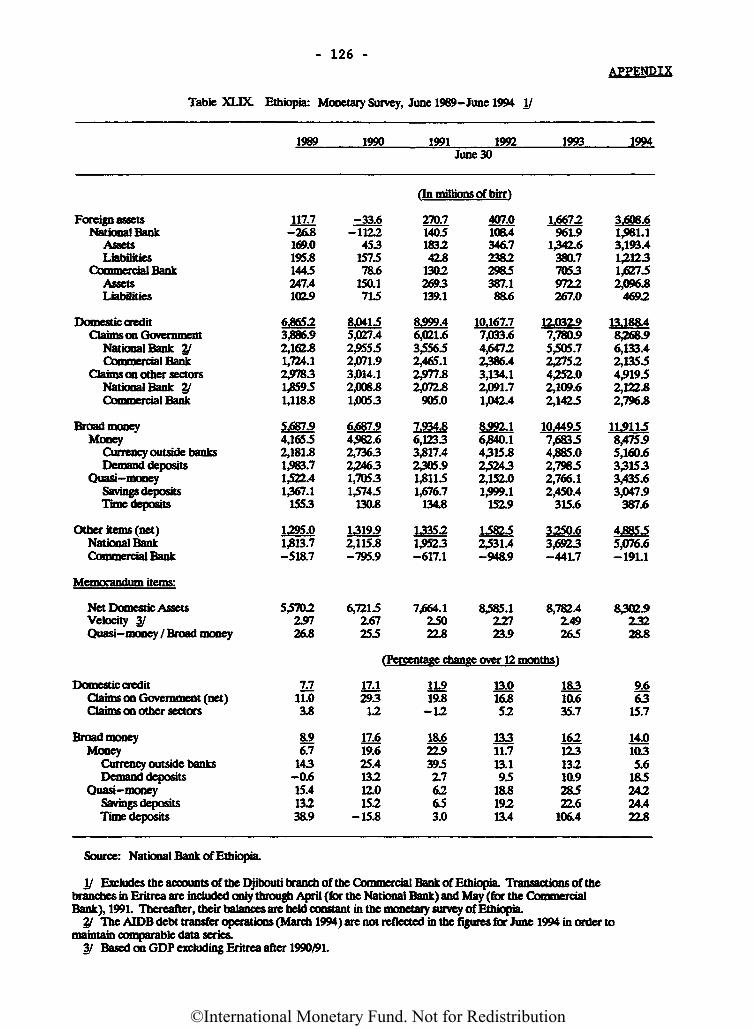
- 126 -APPENDIX
Table XLDt Ethiopia: Monetary Survey, June 1989- June 1994 I/
Foreign assetsNational Bank
AssetsLiabilities
Commercial BankAssetsLiabilities
Domestic creditClaims on Government
National Bank 2/Commercial Bank
Claims on other sectorsNational Bank 2/Commercial Bank
Broad moneyMoney
Currency outside banksDemand deposits
Quasi-moneySavings depositsTime deposits
Other items (net)National BankCommercial Bank
Memorandum items:
Net Domestic AssetsVelocity 3/Quasi-money / Broad money
1969
117.7-26.8169.0195.81445247.41019
6,865.23,886.92,162.81,724.12^7831,859.51,118.8
5,687.94,16552,181.81,983.71,522.41,367.1
1553
1295.01313.7-518.7
5,570.22.9726.8
1990
^^6-1122
453157578.6
150.1715
8,04155,027.42,95552,071.93,014.12,008.81,0053
6,687.94,982.62,73632,24631,70531,5745
130.8
1319.92,115.8-795.9
6,7215Z67255
1991 1992June 30
(In millions of birr)
270.7 407.01405 108.41832 346.742.8 2382
1302 29852693 387.1139.1 88.6
8599.4 10,167.76,021.6 7,033.63,5565 4,64722,465.1 2^86.42,977.8 3,134.12,072.8 2,091.7
905.0 1,042.4
7534.8 8,992.16,1233 6^40.13317.4 4315.82305.9 2^24313115 2,152.01,676.7 1,999.1
134.8 152.9
13352 15S251,9523 2̂ 31.4-617.1 -948.9
7,664.1 8,585.1250 22722.8 23.9
1993
1,6672961.9
1342.6380.770539722267.0
12,032.97,780.95,505.72^7524,252.02,109.62,1425
10,44957,68354385.02,79852,766.12,450.4
315.6
3250.63,6923-441.7
8,782.42.49265
1994
3,608.61,981.13,193.41,21231,62752,096.8
4692
13,188.48,268.96,133.42,13554,91952,122.82,796.8
11,91158,475.95,160.6331533,435.63,047.9
387.6
4,88555,076.6-191.1
8302.923228.8
(Percentage change over 12 months)
Domestic creditClaims on Government (net)Claims on other sectors
Broad moneyMoney
Currency outside banksDemand deposits
Quasi-moneySavings depositsTime deposits
7.711.03.8
8.96.7
143-0.615.413238.9
m29312
1Z619.625.413212.0152
-15.8
115 13.019.8 168-12 52
18.6 13322.9 11.7395 13.12.1 9562 ias65 1923.0 13.4
18310.635.7
16212313210.928522.6
106.4
9.663
15.7
14.01035.6
18524224.422.8
Source: National Bank of Ethiopia.
I/ Excludes the accounts of the Djibouti branch of the Commercial Bank of Ethiopia. Transactions of thebrandies in Eritrea are included only through April (for the National Bank) and May (for the CommercialBank), 1991. Thereafter, their balances are held constant in the monetary survey of Ethiopia.
2/ The AIDE debt transfer operations (March 1994) are not reflected in the figures for June 1994 in order tomaintain comparable data series.
31 Based on GDP excluding Eritrea after 1990/91.
©International Monetary Fund. Not for Redistribution
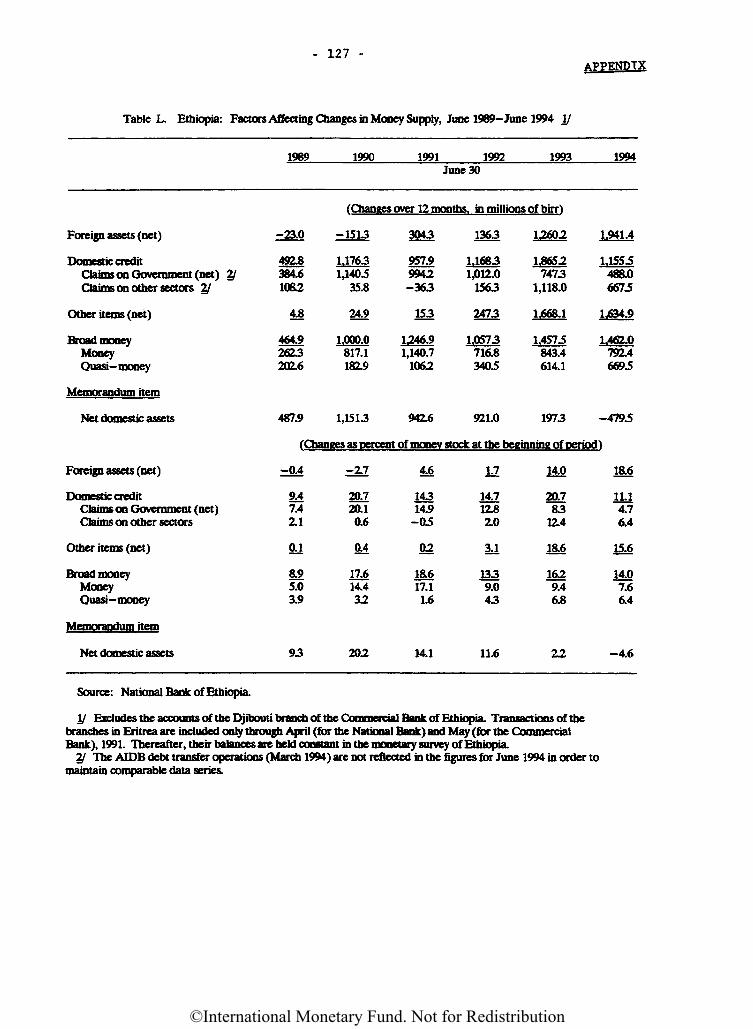
- 127 -APPENDIX
Table L. Ethiopia: Factors Affecting Changes in Money Supply, June 1989- June 1994 \l
1969 1990 1991 1992June 30
1993 1994
(Changes over 12 months in millions of birr)
Foreign assets (net)
Domestic creditClaims on Government (net) 2/Claims on other sectors 2/
Other items (net)
Broad moneyMoneyQuasi-money
Memorandum item
Net domestic assets
Foreign assets (net)
Domestic creditClaims on Government (net)Claims on other sectors
Other items (net)
Broad moneyMoneyQuasi-money
Memorandum item
Net domestic assets
-23.0
4918384.61082
4.8
464.9?fi?3202.6
-1513 3043 1363
1,1763 957.9 1,16831,140.5 9942 1,012.0
35.8 -363 1563
24.9 153 2473
1,000.0 1246.9 1,0573817.1 1,140.7 716.8182.9 1062 3405
12602
1,86527473
1,118.0
1,668.1
1,4575843.4614.1
487.9 1,1513 942.6 921.0 1973
(Changes as percent of money stock at the beginning of oerio
-0.4
9.47.42.1
&1
8.95.03.9
93
-Z7 4.6 1.7
20.7 143 14.720.1 14.9 12.80.6 -05 2.0
O4 02 3,1
17.6 18.6 13314.4 17.1 9.032 1.6 43
202 14.1 11.6
14.0
20.783
12.4
18.6
1629.46.8
22
1,941.4
1,1555488.06675
1,634.9
1,462.0792.46695
-4795
d)
18.6
11.14.76.4
15=6
14£7.66.4
-4.6
Source: National Bank of Ethiopia.
V Excludes the accounts of the Djibouti branch of the Commercial Bank of Ethiopia. Transactions of thebranches in Eritrea are included only through April (for the National Bank) and May (for the CommercialBank), 1991. Thereafter, their balances are held constant in the monetary survey of Ethiopia.
2/ The AIDE debt transfer operations (March 1994) are not reflected in the figures for June 1994 in order tomaintain comparable data series.
©International Monetary Fund. Not for Redistribution
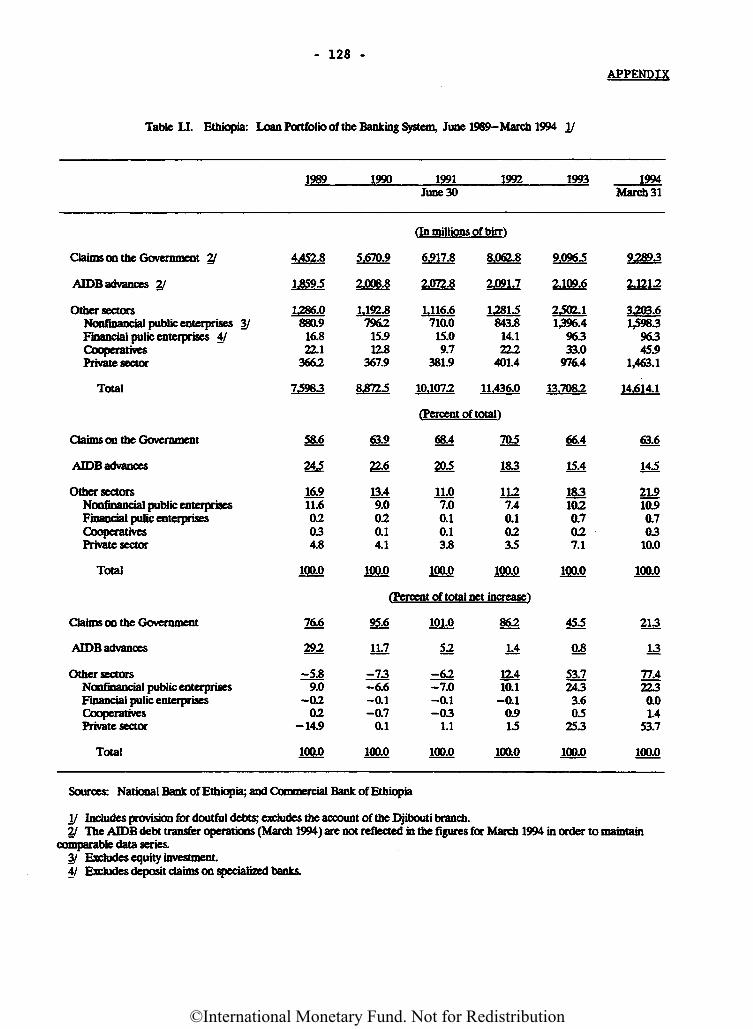
- 128 -
Table U. Ethiopia: Loan Portfolio of the Banking System, June 1989-March 1994 I/
APPENDIX
1969 1990 1991June 30
1992 1993 1994March 31
(In millions of birr)
Claims on the Government 2/
AIDB advances 2/
Other sectorsNonfinancial public enterprises 3/Financial pulic enterprises 4/CooperativesPrivate sector
Total
4,452.8
1,8593
1286.0880.9
16.822.1
3662
73963
5,670.9
2,006.8
1492.87962
15.912.8
367.9
8,8723
6,917.8
2,072.8
1,116.6710.0
15.09.7
381.9
10.1072
8,062.8
2,091.7
12813843.8
14.1222
401.4
11,436.0
9,0963
2.109.6
2302.11,396.4
96333.0
976.4
13,7082
92893
2,1212
3203.61,5983
96345.9
1,463.1
14,614.1
(Percent of totaH
Claims on the Government
AIDB advances
Other sectorsNonfinancial public enterprisesFinancial pulic enterprisesCooperativesPrivate sector
Total
5&6
243
1&911.602034.8
100.0
619
22,6
m9.0020.14.1
100.0
684
203
1LO7.00.10.13.8
100.0
705
183
1127.4Ol0233
100.0
66A
ISA
1831020.7027.1
100.0
63.6
143
21.910.90.703
10.0
100.0
(Percent of total net increase)
Claims on the Government
AIDB advances
Other sectorsNonfinancial public enterprisesFinancial pulic enterprisesCooperativesPrivate sector
Total
76.6
292
-5.8~9X)-02
02-14.9
100.0
95.6
11.7
-73-6.6-0.1-0.7
Ol
100.0
101.0
52
-62-7.0-01-03
1.1
100.0
862
M
12.4101-01
0.913
100.0
453
08
53.72433.603
253
100.0
213
13
77.42230.01.4
53.7
100.0
Sources: National Bank of Ethiopia; and Commercial Bank of Ethiopia
\l Includes provision for doutful debts; excludes the account of the Djibouti branch.2/ The AIDB debt transfer operations (March 1994) are not refleaed in the figures for March 1994 in order to maintain
comparable data series.3/ Excludes equity investment.4/ Excludes deposit claims on specialized banks.
©International Monetary Fund. Not for Redistribution
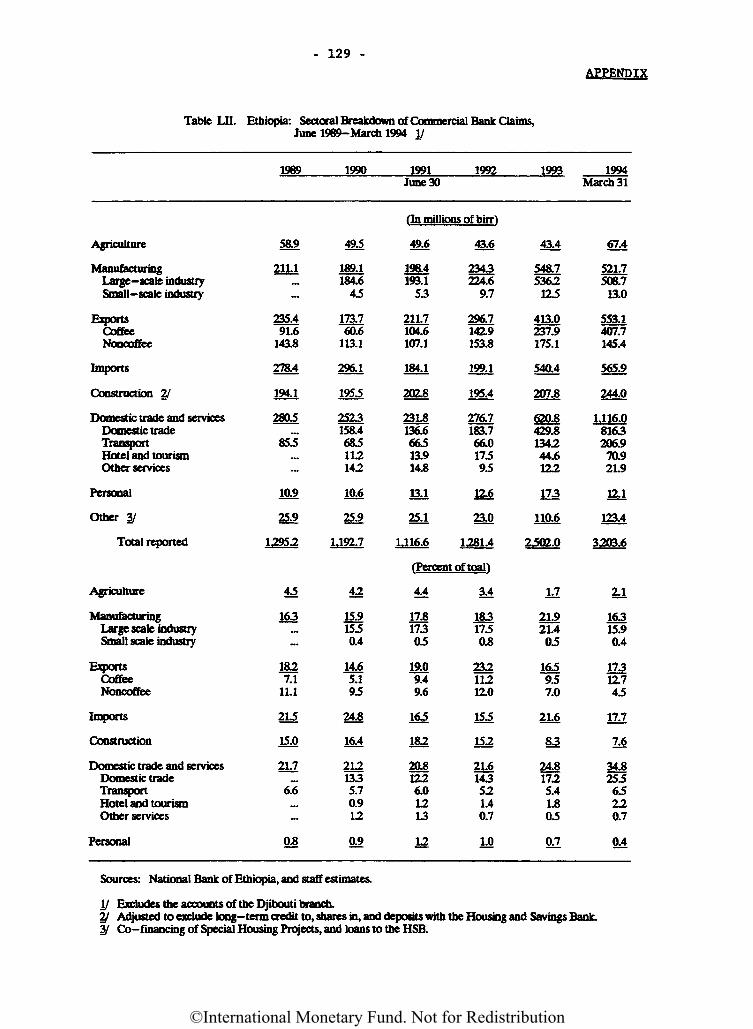
- 129 -
APPENDIX
Table LII. Ethiopia: Sectoral Breakdown of Commercial Bank Claims,June 1989-March 1994 I/
1989 1990 1991June 30
1992 1993 1994March 31
(In millions of birr}
Agriculture
ManufacturingLarge-scale industrySmall— scale industry
ExportsCoffeeNoocoffee
Imports
Construction 2/
Domestic trade and servicesDomestic tradeTransportHotel and tourismOther services
Personal
Other 3/
Total reported
58.9
211.1
235.491.6
143.8
278.4
194.1
280.5
853
10.9
25.9
49.5
189.1184.6
4.5
173.760.6
113.1
296.1
195,5
2523158.4683112142
10.6
25.9
1.295.2 1,192.7
49.6
198.4193.1
53
211.7104.6107.1
184.1
202.8
231.8136.666313.914.8
13.1
25.1
U16.6
43.6
2343224.6
9.7
296.7142.9153.8
199.1
195.4
276.7183.766.017393
1Z6
ao1281.4
43.4
548.75362123
413.0237.9175.1
540.4
207.8
620.8429.8134244.6122
173
110.6
2302.0
67.4
521.7508.7
13.0
553.1407.7145.4
565.9
244.0
1,116.08163206.970.921.9
12.1
123.4
3203.6
(Percent of toaH
Agriculture
ManufacturingLarge scale industrySmall scale industry
ExportsCoffeeNoncoffee
Imports
Construction
Domestic trade and servicesDomestic tradeTransportHotel and tourismOther services
Personal
«
163
1827.1
11.1
21.5
15.0
217
6.6
O8
i2
15.91530.4
14.65.195
24.8
16.4
2121335.70.912
09
4.4
17,817303
19.09.49.6
163
182
20.81226.01213
12
3.4
m1730.8
23211212.0
153
152
21.6143521.40.7
10
12
21.921.403
163937.0
21.6
83
24.81725.41.803
O7
M
16315.90.4
17312.743
17.7
TA34.825363220.7
O4
Sources: National Bank of Ethiopia, and staff estimates.
I/ Excludes the accounts of the Djibouti branch.2/ Adjusted to exclude long-term credit to, shares in, and deposits with the Housing and Savings Bank.3/ Co-financing of Special Housing Projects, and loans to the HSB.
©International Monetary Fund. Not for Redistribution
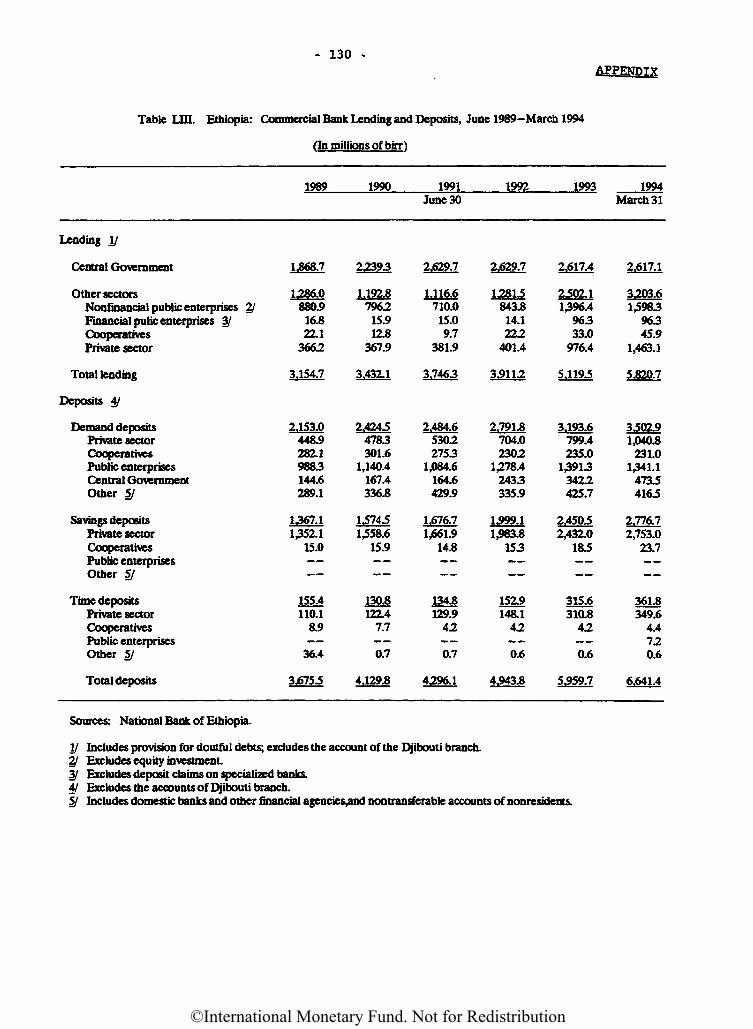
- 130 -
Table LJH. Ethiopia: Commercial Bank Lending and Deposits, June 1989-March 1994
(In millions of birr)
APPENDIX
1989 1990 1991 1992 1993 1994June 30 March 31
Lending I/
Central Government
Other sectorsNonfroantial public enterprises 2/Financial pulic enterprises 3/CooperativesPrivate sector
1286.0880.9
16.822.1
3662
1.192.8796215.91Z8
367.9
2.629.7 2,629.7
1.116.6710.015.09.7
381.9
843.814.1222
401.4
2,617.4
2302.11396.4
96333.0
976.4
Sources: National Bank of Ethiopia.
I/ Includes provision for doutful debts; excludes the account of the Djibouti branch.2/ Excludes equity investment3/ Excludes deposit claims on specialized banks.4/ Excludes the accounts of Djibouti branch.5/ Includes domestic banks and other financial agencies^nd nontransferable accounts of nonresidents.
2,617.1
3203.61,5983
96345.9
1,463.1
Total lending
Deposits 4/
Demand depositsPrivate sectorCooperativesPublic enterprisesCentral GovernmentOther 5/
Savings depositsPrivate sectorCooperativesPublic enterprisesOther 51
Time depositsPrivate sectorCooperativesPublic enterprisesOther 5/
Total deposits
3.154.7
2.153.0448.9282.19683144.6289.1
1367.11̂ 52.1
15.0
155,4110.1
8.9
36.4
3.6753
3.432.1
2.42434783301.6
1,140.4167.4336.8
137431,558.6
15.9
130.8122.4
7.7
0.7
4.129.8
3,7463
2.484.653022753
1,084.6164.6429.9
1,676.71,661.9
14.8
134.8129.9
42
0.7
4296.1
3,9112
2.791.8704.02302
1,278.42433335.9
1,999.11,983.8
153
152.9148.1
42
0.6
4,943.8
5,1193
3,193.6799.4235.0
139133422425.7
2,45032,432.0
183
315.6310.8
42
0.6
5,959.7
5,820.7
3302.91,040.8
231.01341.1
47334163
2,776.72,753.0
23.7
361.8349.6
4.4720.6
6.641.4
1,868.7 22393
12813
©International Monetary Fund. Not for Redistribution
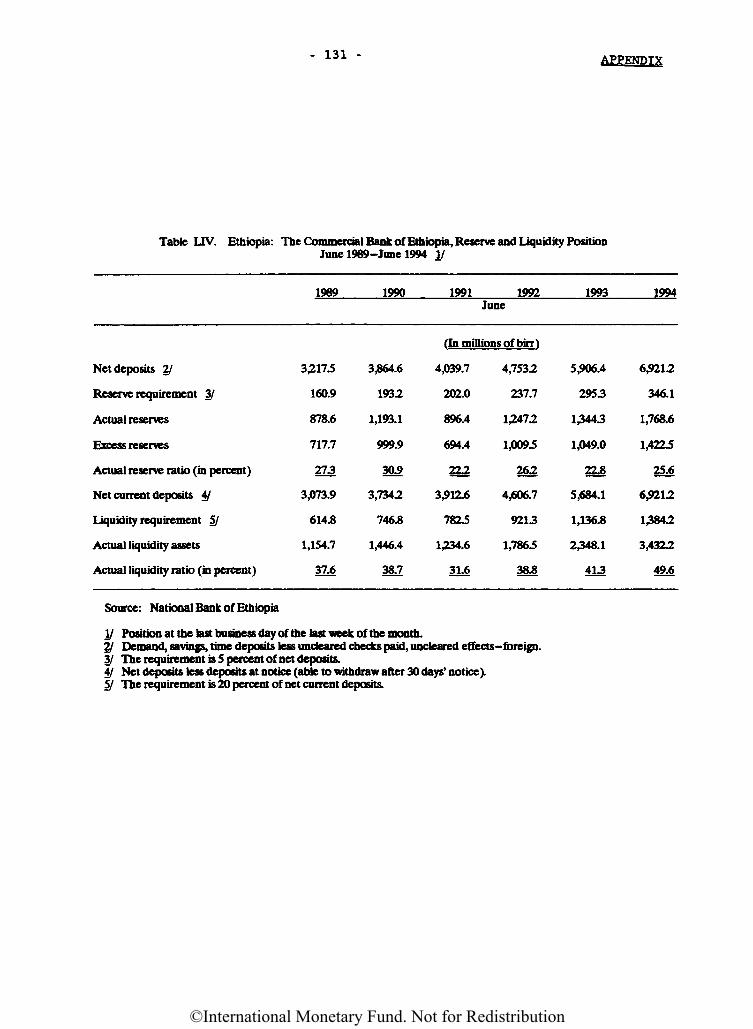
- 131 - APPENDIX
Table UV. Ethiopia: The Commercial Bank of Ethiopia, Reserve and Liquidity PositionJune 1989-June 1994 I/
1969 1990 1991 1992June
1993 1994
(In millions of birr)
Net deposits 21
Reserve requirement 3/
Actual reserves
Excess reserves
Actual reserve ratio (in percent)
Net current deposits 4/
Liquidity requirement 5/
Actual liquidity assets
Actual liquidity ratio (in percent)
3,217.5
160.9
878.6
717.7
273
3,073.9
614.8
1,154.7
37.6
3,864.6
1932
1,193.1
999.9
30.9
3,7342
746.8
1,446.4
38.7
4,039.7
202.0
896.4
694.4
222
3,912.6
782J
1,234.6
31.6
4,7532
237.7
1,2472
1,009.5
262
4,606.7
9213
1,7865
38.8
5,906.4
2953
13443
1,049.0
22.8
5,684.1
1,136.8
2348.1
413
6,9212
346.1
1,768.6
1,4225
25.6
6,9212
13842
3,4322
49.6
Source: National Bank of Ethiopia
I/ Position at the last business day of the last week of the month.2/ Demand, savings, time deposits less uncleared checks paid, uncleared effects-foreign.3/ The requirement is 5 percent of net deposits.4/ Net deposits less deposits at notice (able to withdraw after 30 days' notice).5/ The requirement is 20 percent of net current deposits.
©International Monetary Fund. Not for Redistribution
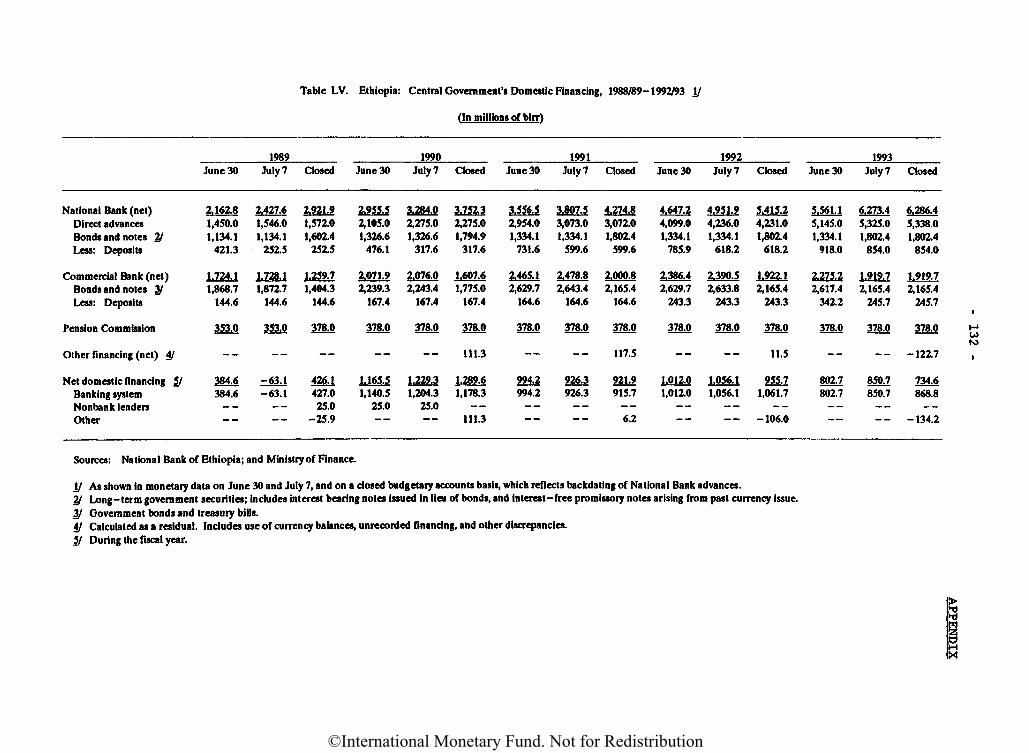
Table LV. Ethiopia: Central Government's Domestic Financing, 1988/89-1992/93 I/
(In millions of birrt
National Bank (net)Direct advancesBonds and notes 2/Less: Deposits
Commercial Bank (net)Bonds and notes 3/Less: Deposits
Pension Commission
Other financing (net) 4/
Net domestic financing 5/Banking systemNonbank lendersOther
June 30
2.162.81,450.01,134.1
421.3
1.724.11,868.7
144.6
353.0
384.6384.6
1989July 7
2.427.61,546.01,134.1
252.5
1.728.11,872.7
144.6
353.0
ZJS3J-63.1
Closed
2.921.91,572.01,602.4
252.5
1.259.71,404.3
144.6
378.0
426.1427.025.0
-25.9
June 30
2.955.52,105.01,326.6
476.1
2.071.92,239.3
167.4
378.0
1.165.51,140.5
25.0
1990July 7
3.284.02,275.01,326.6
317.6
2.076.02,243.4
167.4
378.0
1.229.31,204.3
25.0
Closed
3.752.32,275.01,794.9
317.6
1.607.61,775.0
167.4
378.0
111.3
1.289.61,178.3
--111.3
June 30
3.556.52,954.01,334.1
731.6
2.465.12,629.7
164.6
378.0
994.2994.2--""
1991July 7
3.807.53,073.01,334.1
599.6
2.478.82,643.4
164.6
378.0
926.3926.3
Closed
4.274.83,072.01,802.4
599.6
2.000.82,165.4
164.6
378.0
117.5
921.9915.7
6.2
June 30
4.647.24,099.01,334.1
785.9
2.386.42,629.7
243.3
378.0
1.012.01,012.0
--""
1992July 7
4.951.94,236.01,334.1
618.2
2.390.52,633.8
243.3
378.0
1.056.11,056.1
Closed
5.415.24,231.01,802.4
618.2
1.922.12,165.4
243.3
378.0
11.5
955.71,061.7
-106.0
June 30
5.561.15,145.01,334.1
918.0
2.275.22,617.4
342.2
378.0
802.7802.7--
1993July 7
6.273.45,325.01,802.4
854.0
1.919.72,165.4
245.7
378.0
850.7850.7-_
Closed
6.286.45,338.01,802.4
854.0
1.919.72,165.4
245.7
378.0
-122.7
73i6868.8--
-134.2
Sources: National Bank of Ethiopia; and Ministry of Finance.
I/ As shown in monetary data on June 30 and July 7, and on a closed budgetary accounts basis, which reflects backdating of National Bank advances.2/ Long-term government securities; includes interest bearing notes issued in lieu of bonds, and interest-free promissory notes arising from past currency issue.3/ Government bonds and treasury bills.4/ Calculated as a residual. Includes use of currency balances, unrecorded financing, and other discrepancies.5/ During the fiscal year.
©International Monetary Fund. Not for Redistribution
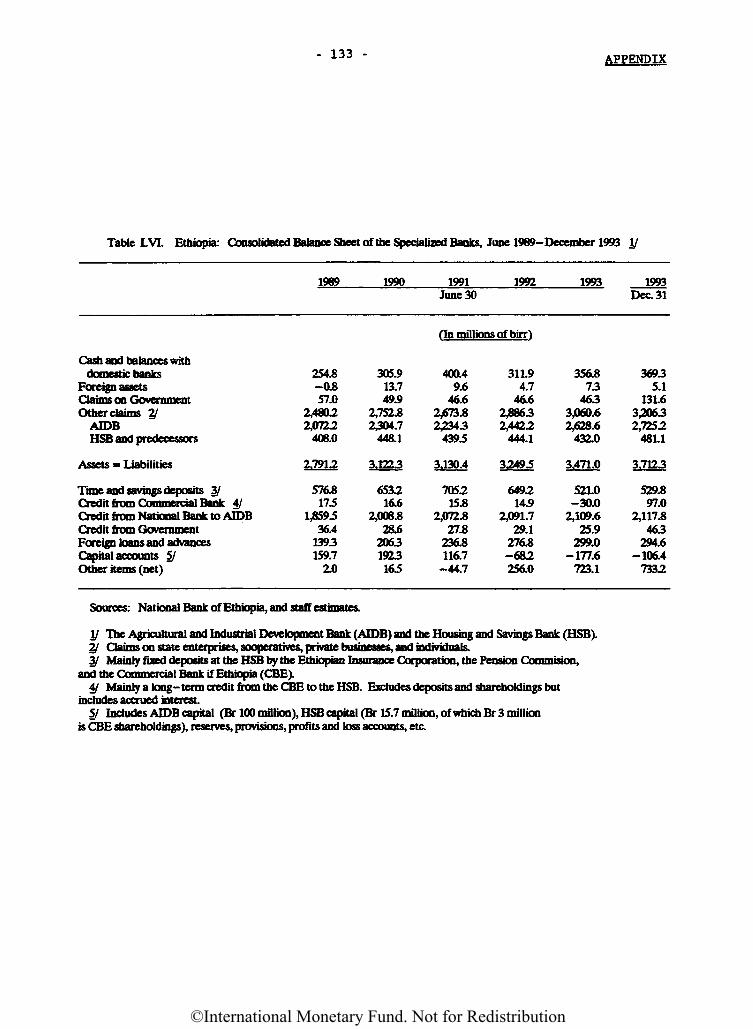
- 133 - APPENDIX
Table LVL Ethiopia: Consolidated Balance Sheet of the Specialized Banks, June 1969-December 1993 I/
1969 1990 1991 1992 1993 1993June 30 Dec. 31
(In millions of birr)
Cash and balances withdomestic banks 254.8 305.9
Foreign assets -0.8 13.7Claims on Government 57.0 49.9Other claims 2/ 2,4802 2,752.8
AIDB 2,0722 2304.7HSB and predecessors 406.0 448.1
Assets = Liabilities
Time and savings deposits 3/ 576.8 6532Credit from Commercial Bank 4/ 175 16.6Credit from National Bank to AIDB 1,859.5 2,008.8Credit from Government 36.4 28.6Foreign loans and advances 1393 2063Capital accounts 5/ 159.7 1923Other items (net) 2.0 165
400.49.6
46.62,673.82^343
4395
311.94.7
46.62,88632,4422
444.1
3,130.4 32495
705215.8
2,072.827.8
236.8116.7-44.7
649214.9
2,091.729.1
276.8-682256.0
356.873
4633,060.62,628.6
432.0
3,471.0
521.0-30.0
2,109.625.9
299.0-177.6
723.1
36935.1
131.63,20632,7252
461.1
3,7123
529.897.0
2,117.8463
294.6-106.4
7332
Sources: National Bank of Ethiopia, and staff estimates.
I/yyHie Agricultural and Industrial Development Bank (AIDB) and the Housing and Savings Bank (HSB).Claims on state enterprises, sooperatives, private businesses, and individuals.Mainly fixed deposits at the HSB by the Ethiopian Insurance Corporation, the Pension Commision,
and the Commercial Bank if Ethiopia (CBE).4/ Mainly a long-term credit from the CBE to the HSB. Excludes deposits and shareholdings but
includes accrued interest5/ Includes AIDB capital (Br 100 million), HSB capital (Br 15.7 million, of which Br 3 million
is CBE shareholdings), reserves, provisions, profits and loss accounts, etc.
2.7912 3J23
©International Monetary Fund. Not for Redistribution
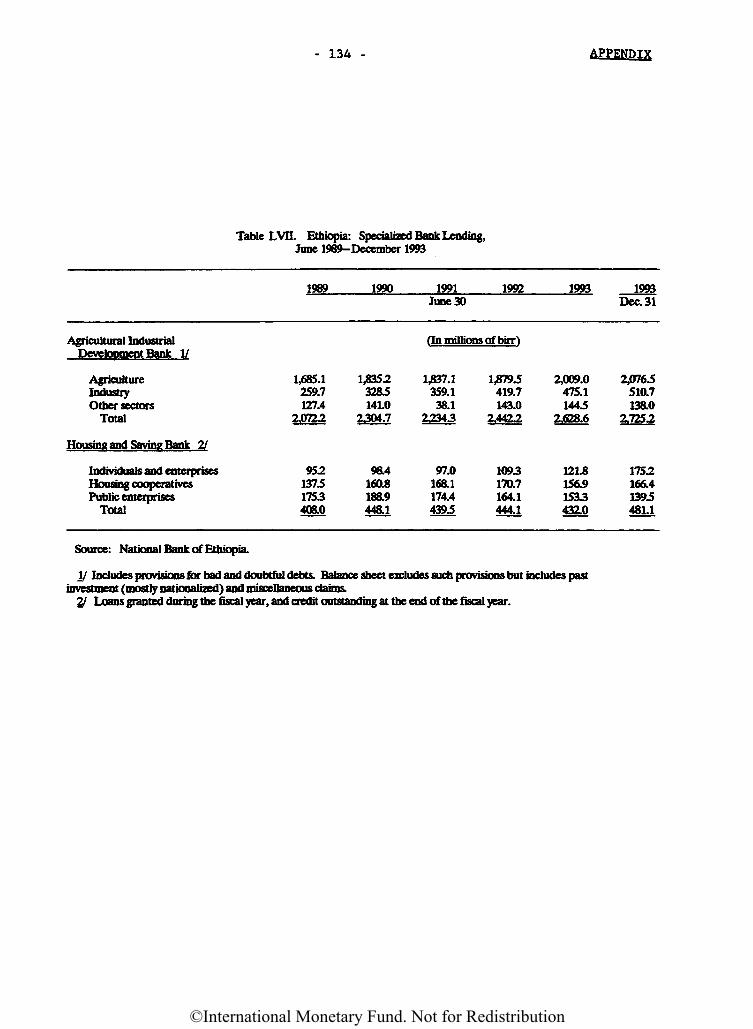
APPENDIX
Table LVn. Ethiopia: Specialized Bank Lending,June 1989-December 1993
1969 1990 1991 1992 1993 1993June 30 Dec. 31
Agricultural IndustrialDevelopment Bank 11
AgricultureIndustryOther sectors
Total
Housing and Savine Bank 21
Individuals and enterprisesHousing cooperativesPublic enterprises
Total
fin millions of birr)
1,685.1259.7127.4
2,072.2
95213731753408.0
1,835.23285141.0
2304.7
98.4160.8188.944ai
1337.1359.138.1
Z2343
97.0168.1174.44395
1,8795419.7143.0
2,4422
1093170.7164.1444.1
2,009.0475.11445
2,628.6
121.8156.91533432.0
2,0765510.7138.0
2.725.2
1752166.41395481.1
- 134 -
Source: National Bank of Ethiopia.
V Includes provisions for bad and doubtful debts. Balance sheet excludes such provisions but includes pastinvestment (mostly nationalized) and miscellaneous claims.
2/ Loans granted during the fiscal year, and credit outstanding at the end of the fiscal year.
©International Monetary Fund. Not for Redistribution
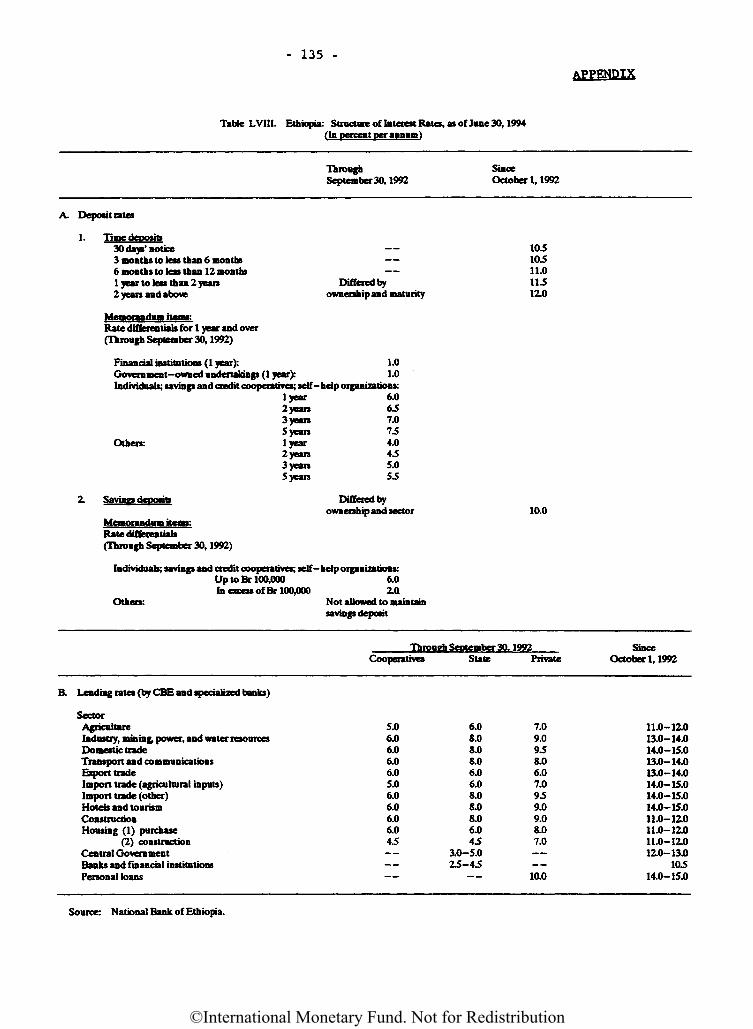
- 135 -APPENDIX
Table LVIH. Ethiopia: Structure of Interest Rates, as of Jane 30,1994(In percent per annum)
ThroughSeptember 30,1992
SinceOctober 1,1992
A. Deposit rates
Differed byownership and maturity
Time deposits30 days' notice3 months to less than 6 months6 months to toss than 12 months1 year to less than 2 yean2 years and above
Memorandum items:Rate differentials for 1 year and over(Through September 30,1992)
Financial institutions (1 year): 1.0Government-owned undertakings (1 year): 1.0Individuals; savings and credit cooperatives; self-help organizations:
lyear 6.02 yean 6.53 years 7.05 yean 75
Others: 1 year 4.02years 433 yean 5.05 years 55
Savfafs deposits
Memorandum items:Rate differentials(Through September 30,1992)
Differed byownership and sector
Individuals; savings and credit cooperatives; self-help organizations:Up to Br 100,000 6.0In excess of Br 100,000 2.0
Others: Not allowed to maintainsavings deposit
10510511.011512.0
10.0
Through September 30.1992Cooperatives State Private
SinceOctober 1,1992
B. Lending rates (by CBE and specialized banks)
SectorAgricultureIndustry, mining, power, and water resourcesDomestic tradeTransport and communicationsExport tradeImport trade (agricultural inputs)Import trade (other)Hotels and tourismConstructionHousing (1) purchase
(2) constructionCentral GovernmentBanks and financial institutionsPersonal loans
5.06.06.06.06.05.06.06.06.06.045
——— •—
6.08.08.08.06.06.08.08.08.06.045
3.0-5.025-45
7.09.0958.06.07.0959.09.08.07.0
——10.0
11.0-12.013.0-14.014.0-15.013.0-14.013.0-14.014.0-15.014.0-15.014.0-15.011.0-12.011.0-12.011.0-12.012.0-13.0
10514.0-15.0
Source: National Bank of Ethiopia.
1.
2.
©International Monetary Fund. Not for Redistribution
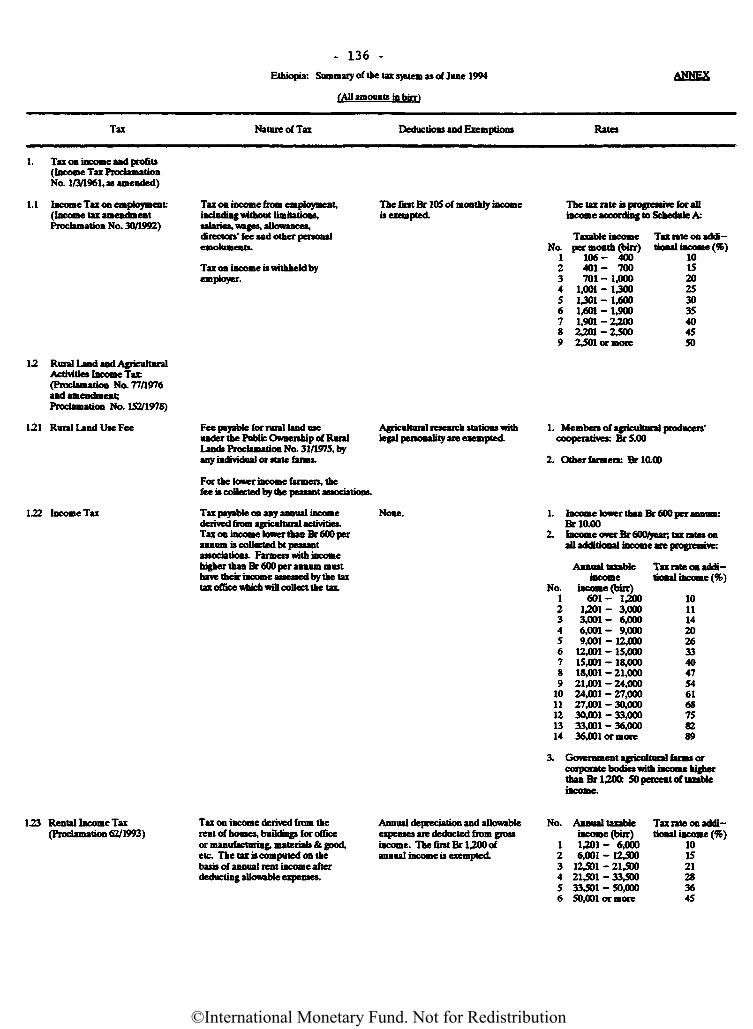
- 136 -Ethiopia: Summary of the tax system as of June 1994
(All amounts in birr}
ANNEX
Tax Nature of Tax Deductions and Exemptions Rates
1. Tax on income and profits(Income Tax ProclamationNo. 1/3/1961, as amended)
1.1 Income Tax on employment(Income tax amendmentProclamation No. 30/1992)
Tax on income from employment,including without limitations,salaries, wages, allowances,directors' fee and other personalemoluments.
Tax on income is withheld byemployer.
The first Br 105 of monthly incomeis exempted.
12 Rural Land and AgriculturalActivities Income Tax:(Proclamation No. 77/1976and amendment;Proclamation No. 152/1978)
121 Rural Land Use Fee Fee payable for rural land useunder the Pubic Ownership of RuralLands Proclamation No. 31/1975, byany individual or state farms.
Agricultural research stations withlegal personality are exempted.
122 Income Tax
The tax rate is progressive for allincome according to Schedule A:
Taxable income Tax rate on addi-No. per month (birr) tional income (%)
1 106- 400 102 401-700 153 701 - 1,000 204 1,001 - 1300 255 1301 - 1,600 306 1,601 - 1,900 357 1,901 - 2300 408 2201 - 2400 459 2,501 or more 50
1. Members of agricultural producers'cooperatives: Br5.00
2. Other farmers: Br 10.00
1. Income lower than Br 600 per annum:Br 10.00
2. Income over Br600^tart tax rates onall additional income are progressive:
No.123456789
1011121314
Annual taxableincome
income (birr)601- 1,200
UOl- 3,0003,001- 6,0006,001- 9,0009,001 - 12,000
12,001 - 15,00015,001 - 18,00018,001 - 21,00021,001 - 24,00024,001 - 27,00027,001 - 30,00030,001 - 33,00033,001 - 36,00036,001 or more
Tax rate on addi-tional income (%)
1011142026334047546168758289
3. Government agricultural farms orcorporate bodies with income higherthan Br 1,20ft 50 percent of taxableincome.
123 Rental Income Tax(Proclamation 62/1993)
Tax on income derived from therent of houses, buildings for officeor manufacturing, materials & good,etc. The tax is computed on thebasis of annual rent income afterdeducting allowable expenses.
Annual depreciation and allowableexpenses are deducted from grossincome. The first Br 1,200 ofannual income is exempted.
No. Annual taxableincome (bur)
1 1,201- 6,0002 6,001 - 124003 12^01-21,5004 21,501-33,5005 33,501-50,0006 50,001 or more
Tax rate on addi-tional income (%)
101521283645
For the lower income fanners, thefee is collected by the peasant associations.
Tax payable on any annual incomederived from agricultural activities.Tax on income lower than Br 600 perannum is collected bt peasantassociations. Fanners with incomehigher than Br 600 per annum musthave their income assessed by the taxtax office which will collect the tax.
None.
©International Monetary Fund. Not for Redistribution
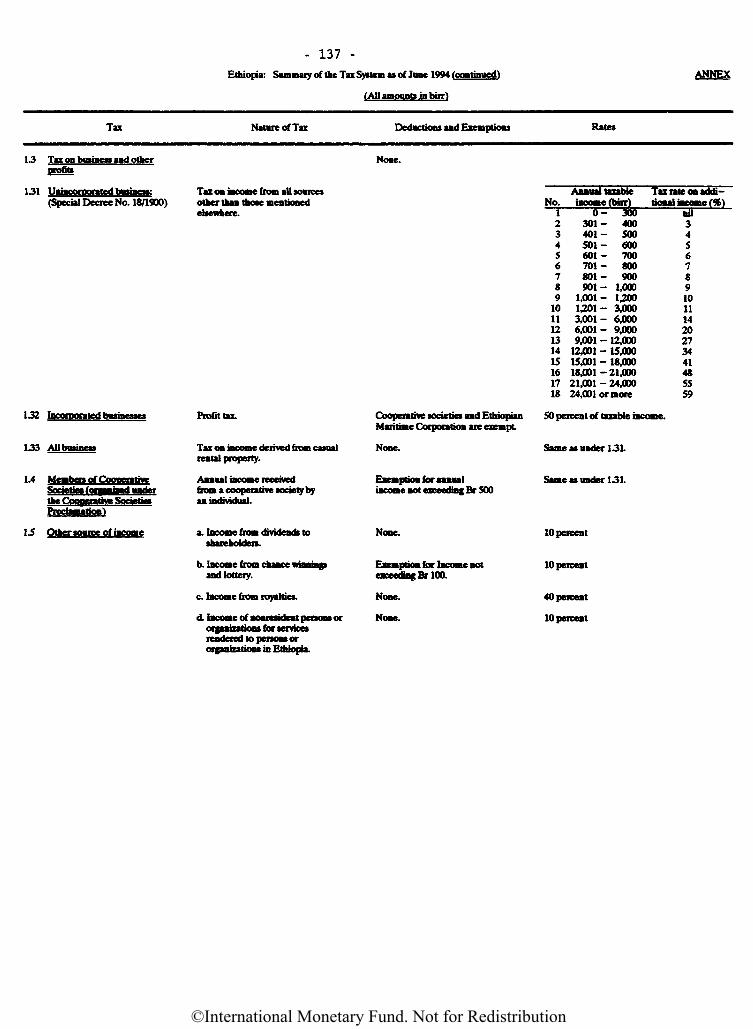
- 137 -Ethiopia: Summary of the Tai System at of June 1994 (continued)
(All amounts in bur)
ANNEX
Tax Nature of Tax Deductions and Exemptions
13 Tax on business and other None.profits
131 Unincorporated business: Tax on income from all sources(Special Decree No. 18/1900) other than those mentioned No.
J!.«J-UJ|I..ML» 1CDCwuCTC. 1
23456789
101112131415161718
Rates
Annual taxableincome (birr)
0- 300301- 400401- 500501- 600601- 700701- 800801- 900901- 1,000
1,001- 1,2001,201- 3,0003,001- 6,0006,001- 9,0009,001 - 12,000
12,001 - 15,00015,001 - 18,00018,001 - 21,00021,001 - 24,00024,001 or more
Tax rate on addi-tional income (%)
nil345678910111420273441485559
Profit tax.
Tax on income derived bom casualrental property.
Annual income receivedfrom a cooperative society byan individual.
a. Income from dividends toshareholder*.
b. Income from chance winningsand lottery.
c. Income from royalties.
d. Income of nonresident ptrumf ororganizations for servicesrendered to persons ororganizations in Ethiopia.
Cooperative societies and EthiopianMaritime Corporation are exempt
None.
Exemption for annualincome not exceeding Br 500
None.
Exemption for Income notexceeding Br 100.
None.
None.
50 percent of taxable income.
Same as under 131.
Same as under 131.
10 percent
10 percent
40 percent
* 10 percent
132 Incorporated businesses
133 All business
1.4 Members of Cooperative
the Cooperative SocietiesProclamation)
Societies (oreasaaiged under
1.5 other source of income
©International Monetary Fund. Not for Redistribution
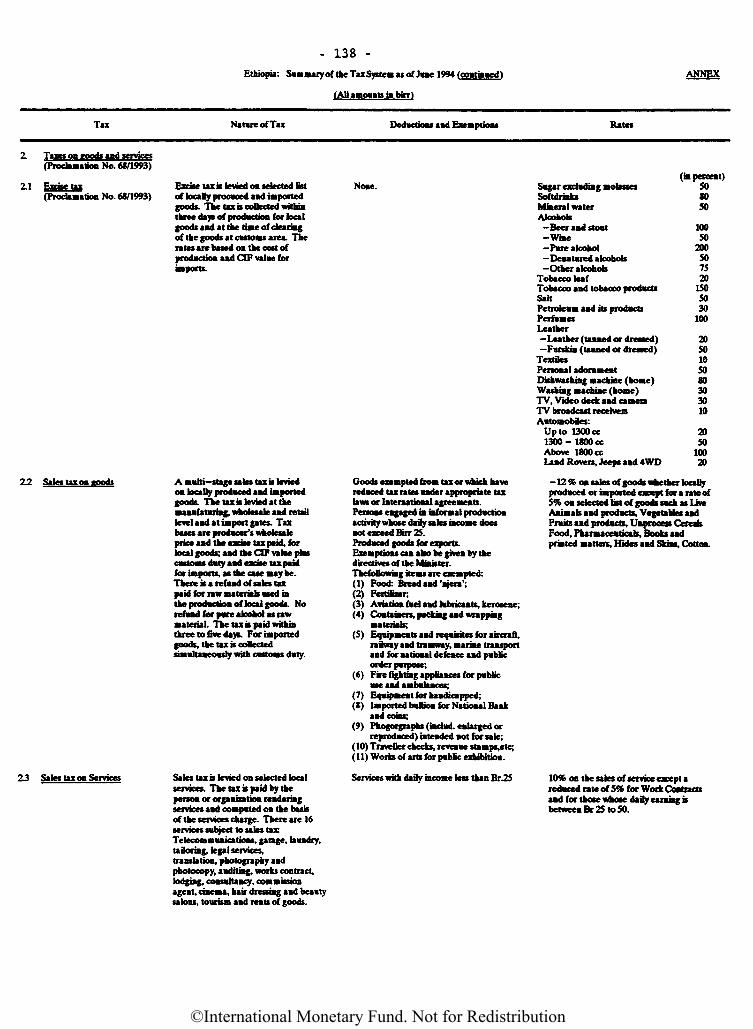
- 138 -Ethiopia: Summary of the Tax System as of June 1994 (continued)
(All amounts in birrl
ANNEX
Tax Nature of Tax Deductions and Exemptions Rates
Excise taxis levied OB selected listof locally procuced and importedgoods. The tax is collected withinthree days of production for focalgoods and at the time of clearingof the goods it customs area. Therates are based on the cost ofprediction and GIF value forimports.
None.
2.2 Sales tax on goods A multi-stage safes taxis leviedon locally produced and importedgoods. The tax is levied at themaaufataring, wholesale and retaillevel and at import gates. Taxbases are producer's wholesaleprice and the excise tax paid, forlocal goods; and the dF value pluscustoms duty and excise tax paidfor imports, as the case maybe.There is a refund of sales taxpaid for raw materials used inthe production of local goods. Norefund for pwe alcohol as rawmaterial. The tax is paid withinthree to five days. For importedgoods, the tax is collectedsimultaneously with customs duty.
23 Safes tax on Services Safes tax is levied on selected localservices. The tax is paid by theperson or organization renderingservices and computed on the basisof the services charge. There are 16services subject to safes taxTelecommunications, garage, laundry,tailoring, legal services,translation, photography andphotocopy, auditing, works contract,lodging, consultancy, commissionagent, cinema, hair dressing and beautysalons, tourism and rents of goods.
Goods exempted from tax or which havereduced tax rates under appropriate taxlaws or International agreements.Persons engaged in informal productionactivity whose daily sales income doesact exceed Birr 25.Produced goods for exports.Exemptions can also be given by thedirectives of the Minister.Thefollowing items are exempted:(1) Food: Bread and 'njera*;(2) Fertilizer,(3) Aviation fuel and[lubricants, kerosene;(4) Containers, packing and wrapping
materials;(5) Equipments and requisites for aircraft,
railway and tramway, marine transportand for national defence and publicorder purpose;
(6) Fire fighting appliances for publicuse and ambulances;
(7) Equipment for handicapped;(S) Imported bullion for National Bank
and coins;(9) Phogorgnphs (includ. enlarged or
reproduced) intended not for safe;(10) Traveller checks, revenue stamps,etq(11) Works of arts for public exhibition.
Services with daily income less than Br.25
(in percent)Sugar excluding molasses 50Softdrinks 80Mineral water SOAlcohols-Beer and stovt 100-Wine SO-Pure alcohol 200-Denatured alcohols SO-Other alcohols 75
Tobacco leaf 20Tobacco and tobacco products ISOSalt SOPetroleum and its products 30Perfumes 100Leather-Leather (tanned or dressed) 20-Furskin (tanned or dressed) SO
Textiles 10Personal adornment SODishwashing machine (home) 80Washing machine (home) 30TV, Video deck and camera 30TV broadcast receivers 10Automobiles:
Upto 1300 cc 201300-1800 cc 50Above 1800 cc 100Land Rovers, Jeeps and 4WD 20
-12% on safes of goods whether locallyproduced or imported except for a rate of5% on selected list of goods such as LiveAnimals and products, Vegetables andFruits and products, Unprocess CerealsFood, Pharmaceuticals, Books andprinted matters, Hides and Skins, Cotton.
10% on the safes of service except areduced rate off 5% for Work Contractsand for those whose dairy earning isbetween Br25 to 50.
2. Taxes on goods lad services(Proclamation No. 68/1993)
11 Excise tai(Proclamation No. 68/1993)
©International Monetary Fund. Not for Redistribution
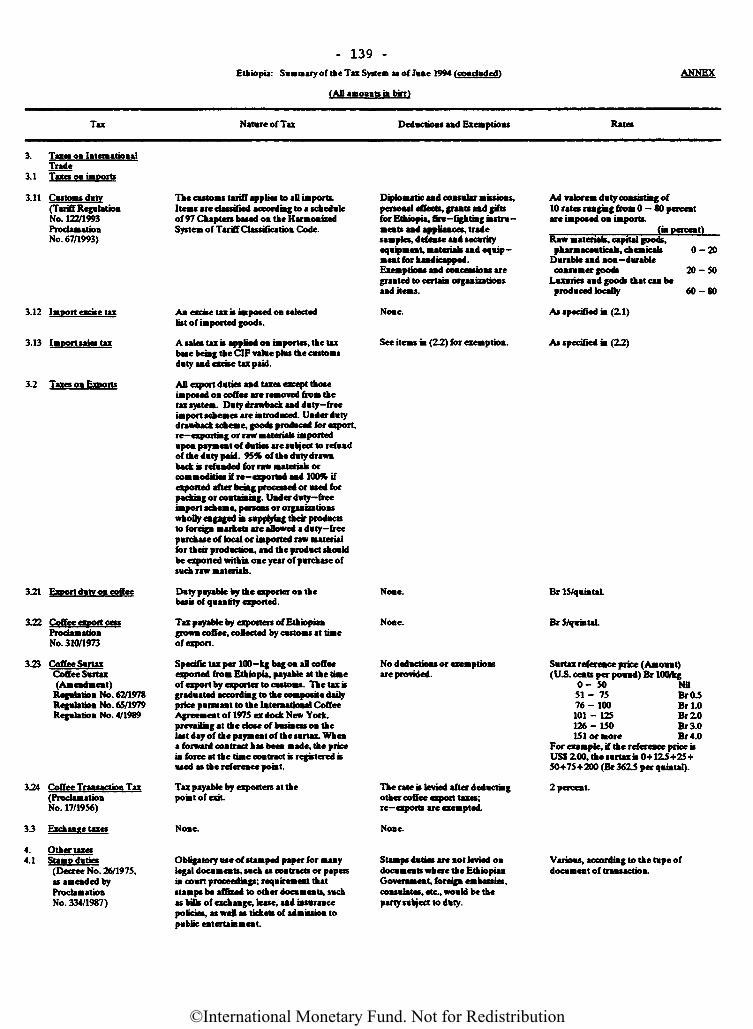
- 139 -Ethiopia: Sum nary of the Tax System as of June 1994 (concluded)
(All amounts in birr)
ANNEX
Tax Nature of Tax Deductions aid Exemptions Rates
3.12 Import excise tax
3.13 Import sates tax
3.2 Taxes on Fyyports
The customs tariff applies to all imports.Items are classified according to a scheduleof 97 Chapters based on the HarmonizedSystem of Tariff Classification Code.
3*21 Purport duty on coffee
3-22 Coffee export cessProclamationNo. 310/1973
3-23 Coffee SurtaxCoffee Surtax(Amendment)
Regulation No. 62/1978Regulation No. 65/1979Regulation No. 4/1989
3.24 Coffee Transaction Tax(ProclamationNo. 17/1956)
3.3 Exchange taxes
4. Other taxes*•! Stamp duties
(Decree No. 26/1975,as amended byProclamationNo. 334/1987)
An excise tax u imposed on selectedlist of imported goods.
A sates tax is applied on importes, the taxbase being the CIF vane plus the customsduty and excise tax paid.
All export duties and taxes except thoseimposed on coffee are removed from thetax system. Duty drawback and duty-freeimport schemes are introduced. Under dutydrawback scheme, goods produced for export,re—exporting or raw materials importedupon payment of duties are subject to refundof the duty paid. 95% of the duty drawnback is refunded for raw materials orcommodities if re-exported and 100% ifexported after being processed or used forpacking or containing. Under duty-freeimport scheme, persons or organizationswholly engaged in supplying their productsto foreign markets are allowed a duty-freepurchase of local or imported raw materialfor their production, and the product shouldbe exported within one year of purchase ofsuch raw materials.
Duty payable by the exporter on thebasis of quantity exported.
Tax payable by exporters of Ethiopiangrown coffee, collected by customs at timeof export.
Specific tax per 100-kg bag on all coffeeexported from Ethiopia, payable at the timeof export by exporter to customs. The taxisgraduated according to the composite dairyprice pursuant to the International CoffeeAgreement of 1975 ex dock New York,prevailing at the dose of business on thelast day of the payment of the surtax. Whena forward contract has been made, the pricein force at the time contract is registered kused as the reference point.
Tax payable by exporters at thepoint of exit.
None.
Obligatory use of stamped paper for manylegal documents, such as contracts or papecsin court proceedings; requirement thatstamps be affixed to other documents, suchas bills of exchange, lease, and insurancepolicies, as well as tickets of admission topublic entertainment.
Diplomatic and consular missions,personal effects, grants and giftsfor Ethiopia, fire-fighting instru -menu and appliances, tradesamples, defense and securityequipment, materials and equip-ment for handicapped.Exemptions and concessions aregranted to certain organizationsand items.
None.
See hems in (22) for exemption. As specified in (2.2)
None.
None.
No deductions or exemptionsare provided.
The rate is levied after deductingother coffee export taxes;re-exports are exempted.
None.
Stamps duties are not levied ondocuments where the EthiopianGovernment, foreign embassies,consulates, etc., would be theparty subject to duty.
Br 15/quintaL
BrS/quintaL
Surtax reference price (Amount)(U.S. cents per pound) Br 100/kg
0-50 Nil51 - 75 BrO.576-100 BM.O101-125 BrZO126-150 BrS.O151 or more Br 4.0
For example, if the reference price isUS$ ZOO, the surtaxk 0+123+25+50+75+200 (Br 3623 per quintal).
2 percent.
Various, according to the tupe ofdocument of transaction.
3. Taxes oa latetBatioaalTrade
3.1 Ta«e» OB imports
3-11 Customs duty(Tariff RegulationNo. 122/1993ProclamationNo. 67/1993)
Ad valorem dity coasistiBg of10 rates raagmg from 0-80 percemtare iaiposed OB imports.
(in percent)Raw materials, capital goods,pharmaceutical*, ckeaicak 0-20
DuraMe aad BOB-durablecoDS«mer goods 20-50
Lmxmhet aad goods that can beproduced locally 60-80
A* specified i» (2.1)
©International Monetary Fund. Not for Redistribution
This page intentionally left blank
©International Monetary Fund. Not for Redistribution
Annual Report on Exchange Arrangements and Exchange Restrictions.1993International Financial StatisticsSM/91/122, June 14, 1991 (Ethiopia- Recent Economic Developments)SM/93/102, May 13, 1993 (Ethiopia-Recent Economic Developments)
Ethiopian doctfn>ents
National Bank of Ethiopia, Quarterly BulletinMinistry of Planning & Economic Development, Economic Reforf* f^n^ar^**•Impact Analysis
Technical Committee for Macroeconomic Development, Report on Macro-economic Development in Ethiopia
Bibliography
Fund dnrtinjgtr^f g
©International Monetary Fund. Not for Redistribution