Embed Size (px)
Citation preview
© 2017 International Monetary Fund
IMF Country Report No. 17/104
BRAZIL FISCAL TRANSPARENCY EVALUATION
This Fiscal Transparency Evaluation report on Brazil was prepared by a staff team of
the International Monetary Fund. It is based on the information available at the time it
was completed in June 2016.
Copies of this report are available to the public from
International Monetary Fund Publication Services
PO Box 92780 Washington, D.C. 20090
Telephone: (202) 623-7430 Fax: (202) 623-7201
E-mail: [email protected] Web: http://www.imf.org
Price: $18.00 per printed copy
International Monetary Fund
Washington, D.C.
May 2017
©International Monetary Fund. Not for Redistribution
F I S C A L A F F A I R S D E P A R T M E N T
Brazil
Fiscal Transparency Evaluation
Benedict Clements, Paulo Medas, Miguel Alves, Fabian Bornhorst, Fabien Gonguet,
Timothy Irwin, Ernesto Jeger, Xavier Rame, and Jose Luiz Rossi
January 2017
©International Monetary Fund. Not for Redistribution
BRAZIL: FISCAL TRANSPARENCY EVALUATION
2 INTERNATIONAL MONETARY FUND
CONTENTS
GLOSSARY _________________________________________________________________________________________ 4
PREFACE ___________________________________________________________________________________________ 5
EXECUTIVE SUMMARY ____________________________________________________________________________ 6
I. FISCAL REPORTING ____________________________________________________________________________ 11
1.1. Coverage of Fiscal Reports ____________________________________________________________________ 13
1.2. Frequency and Timeliness of Fiscal Reporting _________________________________________________ 24
1.3. Quality of Fiscal Reports _______________________________________________________________________ 25
1.4. Integrity of Fiscal Reports ______________________________________________________________________ 27
1.5. Conclusions and Recommendations ___________________________________________________________ 30
II. FISCAL FORECASTING AND BUDGETING ____________________________________________________ 33
2.1. Comprehensiveness ___________________________________________________________________________ 33
2.2. Orderliness ____________________________________________________________________________________ 40
2.3. Policy Orientation _____________________________________________________________________________ 42
2.4. Credibility______________________________________________________________________________________ 44
2.5. Conclusions and Recommendations ___________________________________________________________ 46
III. FISCAL RISKS _________________________________________________________________________________ 50
3.1. Disclosure and Analysis ________________________________________________________________________ 51
3.2. Risk Management _____________________________________________________________________________ 54
3.3. Fiscal Coordination ____________________________________________________________________________ 61
3.4. Conclusions and Recommendations ___________________________________________________________ 66
ANNEXES
1. Fiscal Transparency Action Plan _________________________________________________________________ 70
2. Transactions Between the Treasury and Central Bank ___________________________________________ 75
3. Differences Across States in Complying with the Fiscal Responsibility Law ______________________ 80
4. Technical Note on Table 0.2 _____________________________________________________________________ 83
BOXES
1. Relations Between the Treasury and Public Banks: Unreported Liabilities ________________________ 22
2. Transparency and Fiscal Risks: The Case of Petrobras and Eletrobras ____________________________ 38
FIGURES
1.1. Coverage of Public Sector Institutions in Fiscal Reports _______________________________________ 15
1.2. Public Sector Gross Liabilities in Selected Countries ___________________________________________ 16
1.3. Public Sector Balance Sheet Coverage in Fiscal Reports, 2014 _________________________________ 18
1.4. Public Sector Net Worth in Selected Countries ________________________________________________ 19
©International Monetary Fund. Not for Redistribution
BRAZIL: FISCAL TRANSPARENCY EVALUATION
INTERNATIONAL MONETARY FUND 3
1.5. Revenue Loss from Tax Expenditures __________________________________________________________ 24
1.6. Revenue Loss from Tax Expenditures, Regional Comparison ___________________________________ 24
1.7. Deviation Between Below- and Above-the-Line Central Government Primary Balances,
1997-2015 _____________________________________________________________________________________ 26
1.8. Stock-Flow Adjustment, 2007-2015 ____________________________________________________________ 27
2.1. Real GDP Growth: Deviation Between One-Year-Ahead Forecast and Outturn, 2001-2015 ____ 36
2.2. Selected Indicators of Public Investment ______________________________________________________ 39
2.3. Successive Official Forecasts of Real GDP Growth _____________________________________________ 46
3.1. Example of Sensitivity and Debt-Sustainability Analysis _______________________________________ 52
3.2. Debt and Financial Assets of General Government, January 2007 to March 2016 ______________ 55
3.3. Brazil: Leverage of 20 Largest Banks by Liabilities, March 2016 ________________________________ 59
3.4. Debt-to-Revenue Ratio by State, 2015_________________________________________________________ 63
3.5. Liabilities of 20 Largest Public Corporations Outside the Fiscal Accounts, March 2016 ________ 65
TABLES
0.1. Summary Assessment Against the Fiscal Transparency Code ___________________________________ 9
0.2. Public Sector Financial Overview, 2014 ________________________________________________________ 10
1.1. List of Fiscal Reports ___________________________________________________________________________ 13
1.2. Public Sector Institutions and Finances, 2014 __________________________________________________ 14
1.3. Cash to Accrual Adjustments __________________________________________________________________ 20
1.4. Timetable of PCPR Submission and Audit _____________________________________________________ 25
1.5. TCU’s Preliminary Opinions on the Accounts of the Government of the Republic _____________ 29
1.6. Discrepancies Between Outturn Figures _______________________________________________________ 30
1.7. Summary Assessment of Fiscal Reporting _____________________________________________________ 32
2.1. Documents and Data on Fiscal Forecasting and Budget _______________________________________ 34
2.2. Scope of the Macroeconomic Forecasts Contained in Recent Budget Documents _____________ 35
2.3. Timetable for Budget Preparation and Approval _______________________________________________ 40
2.4. Dates of Budget Submission, Approval, and Publication, 2014-2016 __________________________ 41
2.5. Summary Assessment of Fiscal Forecasting and Budgeting ____________________________________ 49
3.1. Selected Government Reports Relevant to Fiscal Risks ________________________________________ 50
3.2. Long-Term Sustainability of Pension Spending ________________________________________________ 53
3.3. Liabilities of Financial Institutions, March 31, 2016_____________________________________________ 58
3.4. Summary Evaluation: Fiscal Risks ______________________________________________________________ 69
©International Monetary Fund. Not for Redistribution
BRAZIL: FISCAL TRANSPARENCY EVAULATION
4 INTERNATIONAL MONETARY FUND
GLOSSARY
BCB Central Bank of Brazil
BGU Financial statements of the Federal Government
BNDES National Bank for Economic and Social Development
BSPN Financial statements of the General Government
CG Central Government
DEST Department for Coordination and Governance of State Enterprises
GFSM Government Finance Statistics Manual
GG General Government
FAD Fiscal Affairs Department
FTC Fiscal Transparency Code
FRL Fiscal Responsibility Law
IBGE Brazilian Institute of Geography and Statistics
IPSAS International Public Sector Accounting Standards
LDO Budget Guidelines Law
LOA Annual Budget Law
MTEF Medium-Term Expenditure Framework
PAC Program for the Acceleration of Growth
PCPR Accounts of the President
PLDO Draft Budget Guidelines Law
PLOA Draft Annual Budget Law
PPA Multiyear Plan
RFB Federal Tax Administration
RGPS Social Security Fund for private sector workers
RPPS Social Security Fund for public sector employees
RTN Results of the National Treasury
SNA System of National Accounts
SDDS Special Data Dissemination Standards
SOF Federal Budget Secretariat
STN National Treasury Secretariat
TCU Federal Court of Accounts
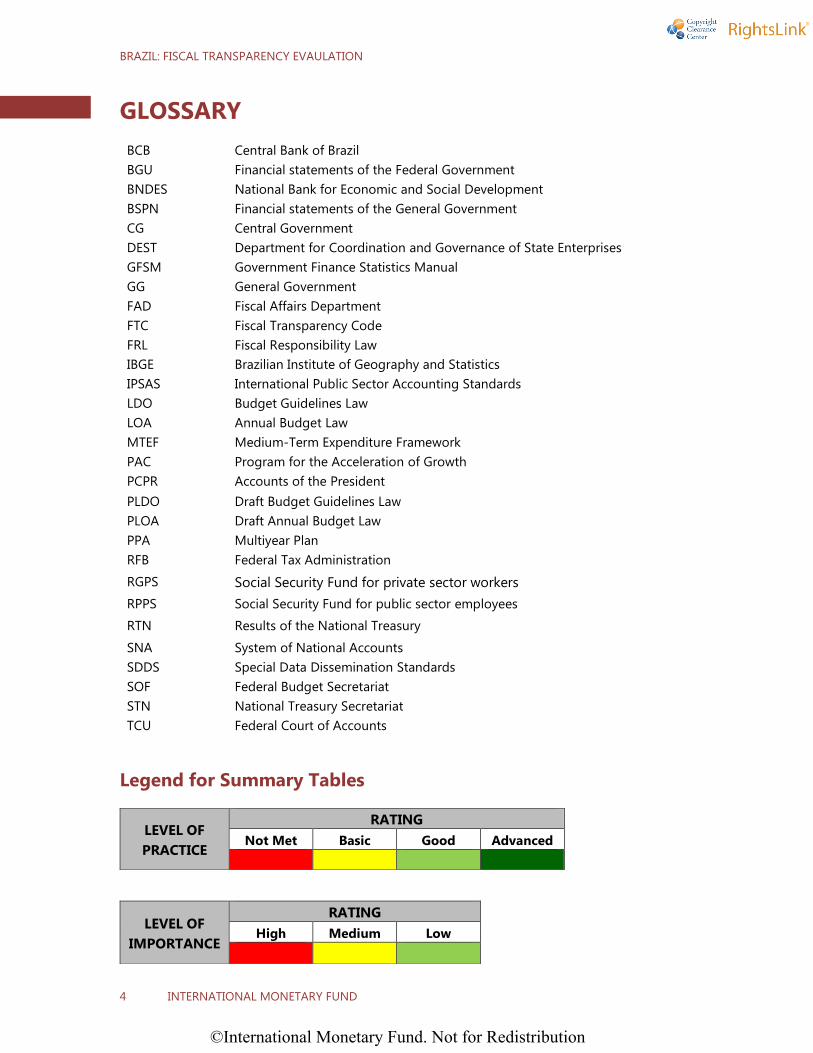
Legend for Summary Tables
LEVEL OF
PRACTICE
RATING
Not Met Basic Good Advanced
LEVEL OF
IMPORTANCE
RATING
High Medium Low
©International Monetary Fund. Not for Redistribution
BRAZIL: FISCAL TRANSPARENCY EVALUATION
INTERNATIONAL MONETARY FUND 5
PREFACE
In response to a request from the Brazilian Ministry of Finance (MoF), a mission from the Fiscal
Affairs Department (FAD) of the International Monetary Fund (IMF) visited Brasilia during the
period June 1-14, 2016 to conduct a Fiscal Transparency Evaluation (FTE).
The mission was led by Benedict Clements and included Paulo Medas, Miguel Alves, Fabien
Gonguet, Xavier Rame (all FAD staff); Fabian Bornhorst (IMF Resident Representative), Timothy
Irwin (FAD expert), Ernesto Jeger, and Jose Luiz Rossi (both IDB). The objective of the mission was
to evaluate Brazil’s fiscal reporting, fiscal forecasting and budgeting, and fiscal risk analysis
management practices against the standards set by the 2014 version of the IMF’s Fiscal
Transparency Code (FTC). This evaluation is based on information available at the time it was
completed in January 2017. The mission also prepared an action plan to further improve fiscal
transparency.
At the Ministry of Finance, the mission met with Mr. Henrique Meirelles (Minister of Finance),
Ms. Ana Paula Vescovi (incoming Treasury Secretary), Messrs. Otavio Ladeira (outgoing Secretary
of the National Treasury), Carlos Hamilton Araujo (Secretary of Economic Policy), Mansueto
Almeida (Secretary of Economic Affairs), and Marcelo Caetano (incoming Secretary of Social
Security), and their staff, including Ms. Fabiana Rodopoulos, and Messrs. William Baghdassarian,
Leonardo Nascimento, Felipe Bardella, Renato Dias, and Daniel Borges, and Ms. Karla Rocha. At
the Central Bank of Brazil, the mission met with Messrs. Luiz Queiroz, Lucio Capelletto, Wagner
Guerra, Bruno Saraiva, João Pereira, and Andre Miguel.
It also met at the Ministry of Planning and Budget with Mr. Fernando Soares (Director of DEST)
and his staff, including Ms. Elvira Schulz and Mr. Pedro Machado. The mission also met with staff
of the Ministry of Mining and Energy, including Messrs. João Patusco and Andre Regra (National
Agency of Petroleum, ANP), Ms. Natalia Souza (Undersecretary of Public Investment Monitoring
at Casa Civil), and Messrs. Leonardo Albernaz (Secretary of Government Macro Analysis) and
Tiago Dutra (Secretary of External Control of the Ministry of Finance) at the Federal Court of
Accounts (TCU). The mission appreciates the feedback provided by staff from the Ministry of
Planning and Budget, Central Bank, and Ministry of Finance on their presentations.
The mission expresses its gratitude for the excellent cooperation it received from all government
officials and for the candid discussions. Particular thanks are due to Mmes. Fabiana Rodopoulos,
Karla Rocha, and Mr. Felipe Bardella for the excellent cooperation before and during the mission.
Ms. Flavia Barbosa, local economist in the IMF office in Brasilia, provided valuable support for the
mission and preparation of the report.
©International Monetary Fund. Not for Redistribution
BRAZIL: FISCAL TRANSPARENCY EVAULATION
6 INTERNATIONAL MONETARY FUND
EXECUTIVE SUMMARY
This report assesses fiscal transparency practices in Brazil in relation to the requirements of
the IMF Fiscal Transparency Code (FTC). It also contains recommendations for further
consolidating and expanding fiscal transparency.
Despite the development of fiscal responsibility legislation, several weaknesses in fiscal
transparency have had adverse effects on the quality of fiscal policy—many of which are
being addressed. Brazil has made significant progress over recent decades in providing regular
information on the budget and its implementation at all levels of government, partly driven by
the 2000 Fiscal Responsibility Law (FRL). These include advances in implementing international
standards to improve the quality of data. At the same time, fiscal transparency has been
undermined by weaknesses in the fiscal framework and by practices that are inconsistent with
the principles of the FRL (including unreported liabilities, the “pedaladas”). These include:
incomplete information on policies and their costs or risks; accounting changes, and lack of
clarity on fiscal reporting standards, that undermine the effectiveness of the fiscal rules (at all
levels of government); lack of transparency in the relationship between the central government
and public banks and between the central government and subnational governments; and
corruption involving some of the largest public enterprises. Since 2015, important efforts have
been underway to address some of these weaknesses.
Brazil’s practices meet many of the principles of the Fiscal Transparency Code (Table 0.1)
at good or advanced levels. Fiscal statistics encompass the general government sector and
recognize most of its assets and liabilities. Fiscal reports are published in a frequent and timely
manner and annual financial statements are audited by the Federal Court of Accounts (TCU). The
transparency of fiscal forecasting and budgeting benefits in some areas from good or advanced
practices. The institutional scope of budget documentation is comprehensive and the key
sequences of the budget process are timely. Extensive budgetary information is made available
to the general public through websites and online databases. Fiscal risk disclosure and
management are anchored in the FRL, which mandates the publication of a statement of fiscal
risks. While still an area of relative weakness, the monitoring and management of fiscal risks have
improved recently.
This evaluation highlights a number of areas in which Brazil’s fiscal transparency practices
could be further improved:
Some of the key elements of fiscal policy and fiscal risks are not well communicated to the
broader public. While Brazil provides a wealth of fiscal information, it does not systematically
provide summary documents that describe developments across the entire public sector, the
main risks that could impact public finances, and how they relate to the government’s policy
priorities. For example, information on the role of Brazil’s public banks in implementing
public policies (including quasi-fiscal activities) is not widely disseminated.
©International Monetary Fund. Not for Redistribution
BRAZIL: FISCAL TRANSPARENCY EVALUATION
INTERNATIONAL MONETARY FUND 7
Brazil’s fiscal reports lack information on key parts of the public sector. For example, the
reports do not include Petrobras and Eletrobras. These institutions have played a key role in
implementing government policy and represent large fiscal risks.
Information on medium-term fiscal policy goals and challenges is lacking. Budget documents
do not provide a clear picture of the objectives of fiscal policy over the medium term,
including for key fiscal aggregates like public debt. This in part reflects the absence of a
medium-term budgetary framework. There is also limited information on medium-to long-
term fiscal challenges, such as the implications of rising pension liabilities for debt
sustainability.
The government’s budget and compliance with fiscal rules are not scrutinized by an
independent fiscal council. For example, there is no ex-ante independent assessment of
whether fiscal projections are realistic or the budget is in line with fiscal rules.
This report proposes recommendations aimed at enhancing information for decision
making and ensuring that Brazil keeps pace with best practices on fiscal transparency. The
most important ones are:
Produce comprehensive fiscal statistics on the public sector. This means incorporating
Petrobras and Eletrobras into the data on non-financial public enterprises and more
comprehensive information on the entire public sector. It will be also important to disclose
the quasi-fiscal costs of all public corporations. A more comprehensive view of the public
sector (Table 0.2) would improve the assessment of the fiscal sector’s financial position and
fiscal risks.
Further disclose the relationships between the public banks and other parts of the public sector.
This will help better understand the fiscal costs and fiscal risks involved, as public banks have
significant exposure to public enterprises and subnational governments.
Improve transparency on transactions between the BCB and the Treasury. Include separate
reporting of transactions and the balance sheets of the BCB and the central government,
which are two separate units of the public sector. Present more clearly discussion of policy
objectives and fiscal costs.
Formalize decision making ahead of the budget and provide more clarity on policy intentions
by publishing a medium-term fiscal policy statement. This could be complemented with
improvements to the legal framework by introducing a modern organic budget law.
Create an independent fiscal council to evaluate the realism of budget forecasts, assess fiscal
policy, and monitor compliance with fiscal rules and reporting standards for all levels of
government.1
Strengthen disclosure and management of fiscal risks. Create a working group to monitor
fiscal risks to help improve disclosure and assess whether risks are being monitored and
1 The Federal Senate, in November 2016, created the Instituição Fiscal Independente (Independent Fiscal
Institution) which will have some of the functions envisaged for a fiscal council but only for the federal
government.
©International Monetary Fund. Not for Redistribution
BRAZIL: FISCAL TRANSPARENCY EVAULATION
8 INTERNATIONAL MONETARY FUND
managed adequately throughout the public sector. Strengthen the fiscal risk statement by
clearly explaining the key risks and their potential impact on the public purse. The analysis of
risks should be expanded (e.g., to include public enterprises, subnational governments, and
the financial sector).
Disclose key medium-to long-term fiscal challenges, especially rising pension and health costs.
For example, the negative net financial worth (-131 percent of GDP, Table 0.2) is much lower
than many other countries, reflecting the large public pensions liabilities (88 percent of
GDP).2 Liabilities of the private sector employees’ pensions (208 percent of GDP) also pose a
major challenge for sustainability of the public accounts. Publishing a report on long-term
fiscal sustainability would help build consensus for indispensable reforms (e.g., pensions).
The actions required to implement these reforms, and other complementary
recommendations to strengthen fiscal transparency, are identified in the “Fiscal
Transparency Action Plan” included as Annex 1.
2 Brazil’s net financial worth is lower than emerging market economies such as Peru (–34 percent of GDP), the Philippines (–22
percent), and Russia (–18 percent) but is higher than that of some European countries such as Ireland (–157 percent of GDP)
and Portugal (–232 percent of GDP). The latter two also have high pension liabilities (73 and 134 percent of GDP, respectively).
©International Monetary Fund. Not for Redistribution
BRAZIL: FISCAL TRANSPARENCY EVALUATION
INTERNATIONAL MONETARY FUND 9
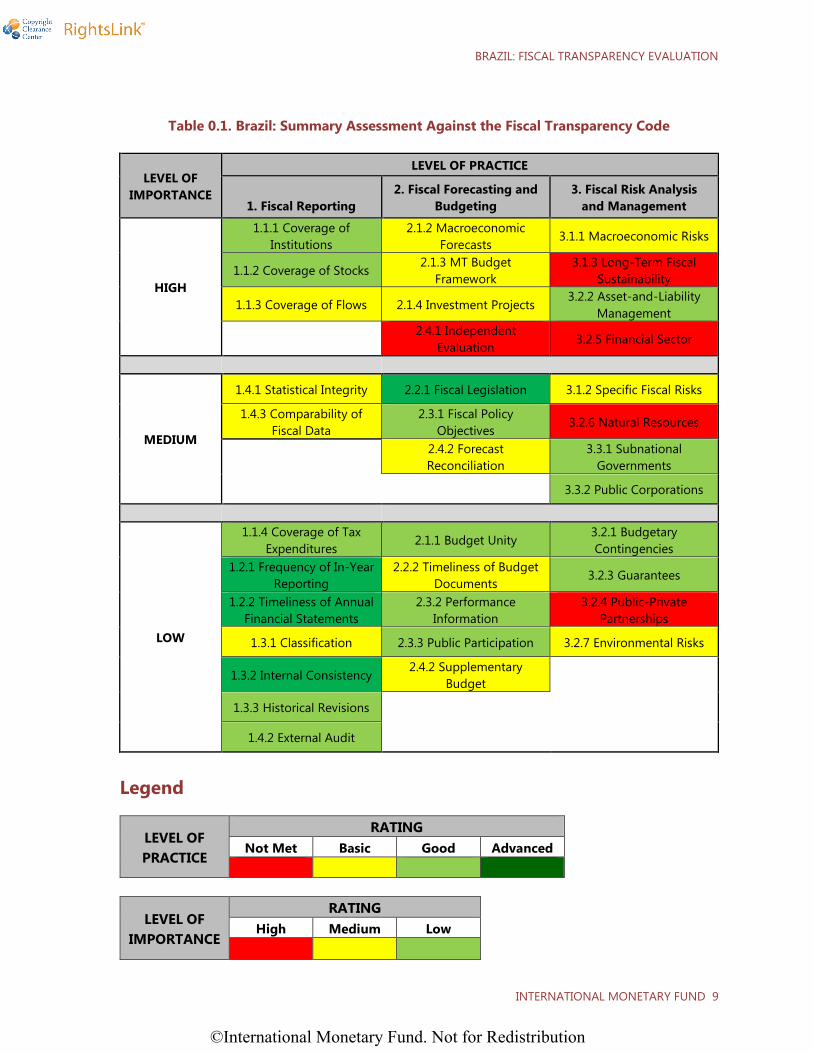
Table 0.1. Brazil: Summary Assessment Against the Fiscal Transparency Code
LEVEL OF
IMPORTANCE
LEVEL OF PRACTICE
1. Fiscal Reporting
2. Fiscal Forecasting and
Budgeting
3. Fiscal Risk Analysis
and Management
HIGH
1.1.1 Coverage of
Institutions
2.1.2 Macroeconomic
Forecasts 3.1.1 Macroeconomic Risks
1.1.2 Coverage of Stocks 2.1.3 MT Budget
Framework
3.1.3 Long-Term Fiscal
Sustainability
1.1.3 Coverage of Flows 2.1.4 Investment Projects 3.2.2 Asset-and-Liability
Management
2.4.1 Independent
Evaluation 3.2.5 Financial Sector
MEDIUM
1.4.1 Statistical Integrity 2.2.1 Fiscal Legislation 3.1.2 Specific Fiscal Risks
1.4.3 Comparability of
Fiscal Data
2.3.1 Fiscal Policy
Objectives 3.2.6 Natural Resources
2.4.2 Forecast
Reconciliation
3.3.1 Subnational
Governments
3.3.2 Public Corporations
LOW
1.1.4 Coverage of Tax
Expenditures 2.1.1 Budget Unity
3.2.1 Budgetary
Contingencies
1.2.1 Frequency of In-Year
Reporting
2.2.2 Timeliness of Budget
Documents 3.2.3 Guarantees
1.2.2 Timeliness of Annual
Financial Statements
2.3.2 Performance
Information
3.2.4 Public-Private
Partnerships
1.3.1 Classification 2.3.3 Public Participation 3.2.7 Environmental Risks
1.3.2 Internal Consistency 2.4.2 Supplementary
Budget
1.3.3 Historical Revisions
1.4.2 External Audit
Legend
LEVEL OF
PRACTICE
RATING
Not Met Basic Good Advanced
LEVEL OF
IMPORTANCE
RATING
High Medium Low
©International Monetary Fund. Not for Redistribution
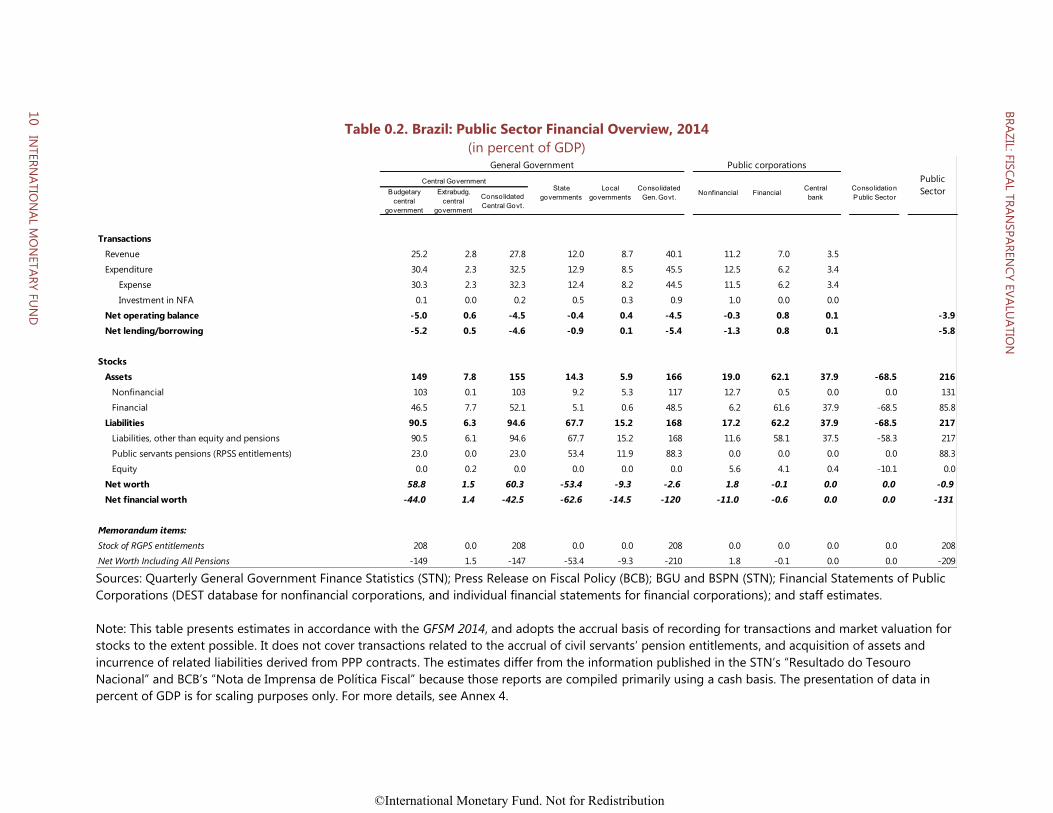
Table 0.2. Brazil: Public Sector Financial Overview, 2014
(in percent of GDP)
Sources: Quarterly General Government Finance Statistics (STN); Press Release on Fiscal Policy (BCB); BGU and BSPN (STN); Financial Statements of Public
Corporations (DEST database for nonfinancial corporations, and individual financial statements for financial corporations); and staff estimates.
Note: This table presents estimates in accordance with the GFSM 2014, and adopts the accrual basis of recording for transactions and market valuation for
stocks to the extent possible. It does not cover transactions related to the accrual of civil servants’ pension entitlements, and acquisition of assets and
incurrence of related liabilities derived from PPP contracts. The estimates differ from the information published in the STN’s “Resultado do Tesouro
Nacional” and BCB’s “Nota de Imprensa de Política Fiscal” because those reports are compiled primarily using a cash basis. The presentation of data in
percent of GDP is for scaling purposes only. For more details, see Annex 4.
General Government Public corporations
Central Government
Budgetary
central
government
Extrabudg.
central
government
Consolidated
Central Govt.
Transactions
Revenue 25.2 2.8 27.8 12.0 8.7 40.1 11.2 7.0 3.5
Expenditure 30.4 2.3 32.5 12.9 8.5 45.5 12.5 6.2 3.4
Expense 30.3 2.3 32.3 12.4 8.2 44.5 11.5 6.2 3.4
Investment in NFA 0.1 0.0 0.2 0.5 0.3 0.9 1.0 0.0 0.0
Net operating balance -5.0 0.6 -4.5 -0.4 0.4 -4.5 -0.3 0.8 0.1 -3.9
Net lending/borrowing -5.2 0.5 -4.6 -0.9 0.1 -5.4 -1.3 0.8 0.1 -5.8
Stocks
Assets 149 7.8 155 14.3 5.9 166 19.0 62.1 37.9 -68.5 216
Nonfinancial 103 0.1 103 9.2 5.3 117 12.7 0.5 0.0 0.0 131
Financial 46.5 7.7 52.1 5.1 0.6 48.5 6.2 61.6 37.9 -68.5 85.8
Liabilities 90.5 6.3 94.6 67.7 15.2 168 17.2 62.2 37.9 -68.5 217
Liabilities, other than equity and pensions 90.5 6.1 94.6 67.7 15.2 168 11.6 58.1 37.5 -58.3 217
Public servants pensions (RPSS entitlements) 23.0 0.0 23.0 53.4 11.9 88.3 0.0 0.0 0.0 0.0 88.3
Equity 0.0 0.2 0.0 0.0 0.0 0.0 5.6 4.1 0.4 -10.1 0.0
Net worth 58.8 1.5 60.3 -53.4 -9.3 -2.6 1.8 -0.1 0.0 0.0 -0.9
Net financial worth -44.0 1.4 -42.5 -62.6 -14.5 -120 -11.0 -0.6 0.0 0.0 -131
Memorandum items:
Stock of RGPS entitlements 208 0.0 208 0.0 0.0 208 0.0 0.0 0.0 0.0 208
Net Worth Including All Pensions -149 1.5 -147 -53.4 -9.3 -210 1.8 -0.1 0.0 0.0 -209
FinancialCentral
bank
Consolidation
Public Sector
State
governments
Local
governments
Consolidated
Gen. Govt.Nonfinancial
Public
Sector
10
10
INTER
NA
TIO
NA
L MO
NETA
RY
FU
ND
BR
AZ
IL: F
ISC
AL T
RA
NSP
AR
EN
CY E
VA
LUA
TIO
N
©International Monetary Fund. Not for Redistribution