Embed Size (px)
Citation preview

TITLE PAGE
The Effect of Advertisement and Sales Promotion on Sales Revenue of
Telecommunication Industry-“Nepal Doorsanchar Company Limited
(Nepal Telecom)
A Thesis
Submitted to
Central Department of Management Faculty
Tribhuvan University
By
Bishnu Maya Sharma
TU Reg. No: 72049-88
Campus Roll No.: 199/064
Exam Roll No (MBS 2nd year).: 220321
In the Partial Fulfillment of the Requirements for the Degree of Masters in Business
Studies (MBS)
Patan Multiple Campus
February, 2021

ii
RECOMMENDATION
This is to certify that the thesis
Submitted by:
Bishnu Maya Sharma
Entitled
The Effect of Advertisement and Sales Promotion on Sales Revenue of
Telecommunication Industry-“Nepal Doorsanchar Company Limited
(Nepal Telecom)
Has been prepared as approved by this campus in the prescribed format of the faculty
of management. This thesis is forwarded for examination.
……………………… …………………….. ……………………..
Sapna Baidhya Sapna Baidhya Som Raj Khanal
Thesis Supervisor Co-ordinator, MBS Program Asst. Campus Chief

iii
VIVA-VOCE SHEET
We have conducted the VIVA – VOCE SHEET examination of the thesis
Submitted by:
Bishnu Maya Sharma
Entitled
The Effect of Advertisement and Sales Promotion on Sales Revenue of
Telecommunication Industry-“Nepal Doorsanchar Company Limited
(Nepal Telecom)
And found the thesis to be original work of the student and written according to the
prescribed format. We recommended the thesis to be accepted as partial fulfillment of
the requirement for the degree of
Master of Business Studies (M.B.S)
VIVA – VOCE Committee
Head, Research Department: …………………………..
Member (Thesis Supervisor): ………………………….
Member (External Expert): ……………………………

iv
DECLARATION
I hereby declare that this MBS thesis entitled “The Effect of Advertisement and Sales
Promotion on Sales Revenue of Telecommunication Industry - Nepal Doorsanchar
Company Limited (Nepal Telecom)”submitted to the Central Department of
Management, Tribhuwan University is entirely my original work prepared under the
guidance and supervision of Ms. Sapna Baidhya. I have made due acknowledgements
to all ideas and information borrowed from different sources in course of preparing
this thesis.
.................................. Bishnu Maya Sharma Patan Multiple Campus Campus Roll No. :199/064 TU Regd., No. 72049-88 Second Year Exam Roll No. 220321
v
ACKNOWLEDGEMENTS
The thesis entitled “The Effect of Advertising and Sales Promotion on Sales Revenue of
Telecommunication Company of Nepal Government - Nepal Doorsanchar Company Limited
(Nepal Telecom)”has been prepared in the form of partial fulfillment of the requirement of
MBS to be submitted to Faculty of Management, Tribhuwan University.
Firstly I would like to express my sincere appreciation to Patan Multiple Campus, Faculty of
Management and T.U. for providing me an opportunity to write in this topic. I am grateful to
several individual who have contributed directly and indirectly to accomplish this research. I
would like to express my deep and sincere gratitude to my research supervisor, Ms. Sapna
Vaidya, for her generous encouragement throughout my entire study work. Her dynamism,
vision, sincerity and motivation have deeply inspired me. It was a great privilege and honor to
work and study under her guidance. I am extremely grateful for thankful for her friendship,
empathy, and great sense of humor.
I would like to express my heartiest thanks to my parents for their love, prayers, caring and
sacrifices for educating and preparing me for all their life long. I am very much thankful to my
husband Krishna Prasad Pantha and my son Aashutosh Pantha for their continuing support to
complete this research work. My Special thanks goes to my daughter Ms. Bijana Pantha for
her immense help thorough out to complete the research work and son in law Mr. Sanjeev
Khanal for keen interest shown to complete this thesis successfully. I also acknowledge to the
respondent of the questionnaire, staffs of Nepal Telecom for their kind co-ordination in my
thesis work.
Finally, my thanks go to all the people who have supported me directly and indirectly to
complete the research work.
Bishnu Maya Sharma

vi
TABLE OF CONTENTS
TITLE PAGE .................................................................................................................... i
RECOMMENDATION .................................................................................................... ii
VIVA-VOCE SHEET ......................................................................................................iii
DECLARATION ............................................................................................................. iv
ACKNOWLEDGEMENTS .............................................................................................. v
LIST OF TABLES ......................................................................................................... viii
LIST OF FIGURES ........................................................................................................ ix
ABBREVIATIONS ........................................................................................................... x
CHAPTER I .................................................................................................................. 1
INTRODUCTION .......................................................................................................... 1
1.1 Background of the Study ....................................................................................... 1
1.1.1 Brief Introduction of Nepal Doorsanchar Company Limited (NDCL) .............. 2
1.2 Statement of Problem ............................................................................................ 3
1.3 Objectives of Study ............................................................................................... 4
1.4 Significance of the Study ...................................................................................... 5
1.5 Limitations of the Study ........................................................................................ 5
1.6 Organization of the Study ..................................................................................... 6
CHAPTER II ................................................................................................................. 7
LITERATURE REVIEW ............................................................................................... 7
2.1 Conceptual Review ............................................................................................. 7
2.1.1 Elements of the promotion mix (Activities) ................................................. 8
2.1.2 Personal selling ........................................................................................... 15
2.1.3 Sales Promotion .......................................................................................... 16
2.1.4 Publicity and public relations ....................................................................... 21
2.2 Sales Volume....................................................................................................... 23
2.2.1 Measures of sale volume .............................................................................. 23
2.2.2 Factors that affect sales volume.................................................................... 24
2.3 Relationship between promotion and sale volume .............................................. 25
2.4 Relationship between Sales, Sales promotion and Advertisement ..................... 26
2.5 Review of Related Studies .................................................................................. 27
2.6 Research Gap ....................................................................................................... 32
CHAPTER - III ........................................................................................................... 33

vii
RESEARCH METHODOLOGY .................................................................................. 33
3.1 Research Design .................................................................................................. 33
3.2 Sources of Data ................................................................................................... 33
3.3 Data Collection Procedure .................................................................................. 33
3.4 Population and Sample ........................................................................................ 34
3.5 Period Covered .................................................................................................... 34
3.6 Tools for Analysis ............................................................................................... 34
3.6.1 Marketing Tools ........................................................................................... 34
3.6.2 Statistical Tools ............................................................................................ 34
CHAPTER IV.............................................................................................................. 36
DATA PRESENTATION AND ANALYSIS .............................................................. 36
4.1 Primary Data Analysis ........................................................................................ 36
4.1.1 Analysis of the Responses of Employees of NT .......................................... 36
4.1.2 Analysis of the Responses of Consumers of ................................................ 47
4.2 Secondary Data Analysis .................................................................................... 66
4.2.1 Selling and Advertising Expenses to Sales of NT ........................................ 66
4.2.2 Trend of Sales Revenue, Net Profit and Sales Promotion and Advertising Expenses of NT ..................................................................................................... 68
4.2.3 Sales Revenue ............................................................................................... 69
4.2.4 Net Income ................................................................................................... 70
4.2.5 Advertisement Expenditure .......................................................................... 70
4.2.2 Correlations Analysis ................................................................................... 71
4.3 Major Findings of the Study ............................................................................... 72
CHAPTER V ............................................................................................................... 76
SUMMARY, CONCLUSION AND RECOMMENDATIONS ................................... 76
5.1 Summary ............................................................................................................. 76
5.2 Conclusion ........................................................................................................... 77
5.3 Recommendations ............................................................................................... 78
REFERENCE .............................................................................................................. 80

viii
LIST OF TABLES
Table No. Title of the Table
4.1 Effect of Advertising and Sales Promotion on Sales ................................. 36
4.2 Crucial Element in Advertising ................................................................. 37
4.3 Strength of the company to its Rivals ........................................................ 39
4.4 Method to Enhance the Sales Promotion and Advertising ........................ 40
4.5 Responses on CAN Festival ....................................................................... 42
4.6 Major Competitor of NT ............................................................................ 43
4.7 Best Method for allocating Budget to Advertising and Sales Promotion .. 45
4.8 Emphasis of the Sales Promotion and Advertising .................................... 46
4.9 Preference of NT to Other .......................................................................... 48
4.10 Preference of NT's SIM to Others' ............................................................. 49
4.11 Sales Promotion Related to Mobile Services ............................................. 50
4.12 Preference of NT’s Internet to Others' ....................................................... 52
4.13 Sales Promotion Related to Internet Services ............................................ 53
4.14 Sales Promotion Related to Landline Services .......................................... 54
4.15 Perceptions on Bonus on Recharge Card during festivals ......................... 56
4.16 Experience after Sales Promotion in ADSL .............................................. 57
4.17 Source of Information Conveyed through Advertisement ......................... 58
4.18 Prompt Enhancement in the Services ........................................................ 59
4.19 Quality of Advertisement ........................................................................... 60
4.20 Criteria for Choosing Media ...................................................................... 61
4.21 Factors to be considered before Choosing Media Types ........................... 63
4.22 Decision on Media Timing ........................................................................ 64
4.23 Impact of Celebrity Advertising ................................................................ 65
4.24 Sales Revenue, Net Profit and Sales Promotion & Advertising Expenses
of Nepal Telecom ..................................................................................... 67
4.25 Pearson Correlations Coefficient of Variables (n=16) ............................... 71

ix
LIST OF FIGURES
Figure No. Title of the Figure
4.1 Effect of Advertising and Sales Promotion on Sales ................................... 37
4.2 Crucial Elements in Advertising ................................................................... 38
4.3 Strength of the Company to its Rivals .......................................................... 40
4.4 Method to Enhance the Sales Promotion and Advertising ........................... 41
4.5 Responses on CAN Festival .......................................................................... 43
4.6 Major Competitor of NT ............................................................................... 44
4.7 Method used for Allocating Budget to Advertising and Sales promotion
and satisfaction......................................................................................... 46
4.8 Enhancing capability to capture market through Sales Promotion and
Advertising ............................................................................................... 47
4.9 Preference of NT to Other ............................................................................. 48
4.10 Preference of NT's SIM to Others' ................................................................ 50
4.11 Sales Promotion Related to Mobile Services ................................................ 51
4.12 Preference of NT's Internet to Others' ........................................................... 53
4.13 Sales Promotion Related to Internet Services ............................................... 54
4.14 Sales Promotion Related to Landline Services ............................................. 55
4.15 Perceptions on Bonus on Recharge Card during festivals ............................ 56
4.16 Experience after Sales Promotion in ADSL ................................................. 58
4.17 Source of Information Conveyed through Advertisement ............................ 59
4.18 Prompt Enhancement in the Services ........................................................... 60
4.19 Quality of Advertisement .............................................................................. 61
4.20 Criteria for Choosing Media ......................................................................... 62
4.21 Factors to be considered before Choosing Media Types .............................. 63
4.22 Decisions on Media Timing .......................................................................... 64
4.23 Impact of Celebrity Advertising ................................................................... 66
4.24 Trend of Sales Revenue, Net Profit and Sales Promotion and Advertising
Expenses of NT ........................................................................................ 69
4.25 Trend of Sales Revenue ................................................................................ 69
4.26 Trend of Net Income ..................................................................................... 70
4.27 Trend of Advertisement Expenditure ............................................................ 71

x
ABBREVIATIONS
% Percentage
ADSL Asymmetric digital subscriber line (ADSL)
AMA American Marketing Associations
ASA Advertising Standard Authority’s
B.S Bikram Sambat
CAN Computer Association of Nepal
FTTH Fibre to the Home
FY Fiscal Year
GPRS General Packet Radio Service
GSM Global System for Mobile communications
GT Ghana Telecom
MPS Market price per share
N Number of observation
NDCL Nepal Doorsanchar Company Limited
No. Number
NT Nepal Telecom
NTC Nepal Telecommunication Corporations
PIN Personal Identification number
POP Point of Purchase
PSTN Public Switched Telephone Network
SIM Subscriber Identification Module
TU Tribhuwan University
TV Television
UTL United Telecom Limited

1
CHAPTER I
INTRODUCTION
1.1 Background of the Study
Globally, business environments always witness change in various forms with
competition being a pivotal element in the change forces. From the 1850s, the focus on
production business orientation changed to sales orientation in the early 1990s because
of increasing competition and from that time, companies persuaded customers to
purchase their products. By the 1950s, companies recognized that pushing products
which they design for customers was not effective enough. Instead they develop
products according to their customers’ needs. Hence a new business orientation was
built with the focus on the markets demands called marketing orientation. The advent
of globalization has helped the telecommunication industry to gain more popularity
while its service patronage is growing rapidly among citizens. This has prompted
telecommunications marketers to develop new strategies aimed at increasing their
customer’s size. Mobile phones are a more promising and high growth area of
telecommunication, with more than 1.7 billion global subscribers and about 80% of
the world’s population covered by mobile networks. Mobile phones are becoming so
popular that people are leaving landlines to rely completely on mobile phones
primarily because of mobility, safety, price and privacy.
Furthermore, one of its benefits is international Roaming service capability, which
gives consumers the ability to use the same mobile number to carry with them abroad
with active service and can contact their family members from abroad foreign land and
also provides the facility to call many countries anytime anywhere. At present
Customers gain advanced technological knowledge. The usage of mobile phone has
now extended from voice communication to the internet; on the other hand, phones
serve as personal organizers, with built-in cameras, camcorders, games, music
playback radio, push-to-talk, infrared and Bluetooth connectivity, and ability to watch
video and TV services. Although it could be indicated that mobile phone devices can
now provide users with many facilities to ensure customer enjoyment, satisfaction and
loyalty.

2
The objectives of service companies that offer communication services are to develop
services to satisfy the customer. In due time, satisfied customers will be those that will
be loyal and help the company to sustain business. It should be observed that retention
of existing customers is much cheaper than acquiring a new customer; therefore,
companies including communications companies are putting much more emphasis on
promotions as a marketing management tool to manage customer relationships and to
increase customer satisfaction and loyalty.
At present due to environmental dynamism and competitiveness, the struggle for
survival and success in the business has become more difficult and challenging. The
growth trend and nature of the service industry with the competitive environment
brought several and special problems for service marketing. Since service encounters
are complex and multiple factors affect interactions, organizations have to adopt a
holistic marketing approach to deal with those problems. In line with the above
identified peculiar problems with the service industry, this study seeks to assess the
effectiveness of promotion, especially advertising and sales promotion, to enhance the
sales performance of the telecommunication Industry, mainly Nepal Doorsanchar
Company Limited.
1.1.1 Brief Introduction of Nepal Doorsanchar Company Limited (NDCL)
History of Telecommunication in Nepal dates back to 1913 when the first telephone
line was introduced in Kathmandu with an open-wire trunk between Kathmandu and
Raxaul (Indian border town) in 1914. Evolving from such primitive practice to the
present day telecom scenario, Nepal has become a progressive and competitive
Telecom market.
The company's history dates back to when the first telecom service started in 1973 B.S
and Mohan Akashwani established in 2005 B.S. Then the Telecommunication
Department established as a Nation Five year plan was converted into a
Telecommunication Development board for the modernization and expansion. Later
they changed the same as a Nepal Telecommunication Corporation (NTC) in 2032
B.S. Lastly; the corporation was changed to a company called Nepal Doorsanchar
Company Ltd. (NDCL) or Nepal Telecom (NT), under the Company Act 2063 and
Communication Act 2053 in the 01 Baisakh 2061 B.S. However, the company is
known to the general public by the brand name Nepal Telecom "NT'' as its registered

3
trademark. However the company is known to the general public by the Brand name
Nepal Telecom (NT) as a registered trademark. Converting Nepal Telecommunication
Corporations (NTC) from government owned Monopoly Company to private owned,
business oriented, customer focused company in a competitive environment, invites
all the shareholders in the sacred work of nation building.
The government owns a 91.5% stake in the company while others are with the public
and its employees. Although the Government has decided to sell some stake (~30%) of
the company to a Telecom giant as a strategic partner, significant results or
development has not yet achieved till date.
NT has always put its endeavors in providing its valued customers a quality service
since its inception. To achieve this goal, technologies best meeting the interest of its
customers have always been selected. The nationwide reach of the organization, from
urban areas to the economically nonviable most remote locations, is the result of all
these efforts that makes this organization different from others.
Definitely NT's widespread reach will assist in the socio-economic development of the
urban as well as rural areas, as telecommunications is one of the most important
infrastructures required for development. Accordingly, in the era of globalization, it is
felt that milestones and achievements of the past are not adequate enough to catch up
with the global trend in the development of telecommunication sector and the growth
of telecommunication services in the country will be guided by technology, declining
equipment prices, market growth due to increase in standard of life and finally by
healthy competition.
1.2 Statement of Problem
Many firms today operate and compete on a global scale, and various forces are at
work to increase the competitiveness of other nations in high-tech sectors such as
telecommunications. Although almost all telecommunications markets are now global,
the degree of openness and true competitiveness varies. Competition is a critical factor
in marketing management which includes all possible actual and potential rival
offerings and substitutes that a buyer might consider. In the telecommunication
industry of Nepal, competition is intense and several factors are forcing major
changes. Mergers and consolidation have already completely altered the industry’s
landscape and cross-border ownership of telecom businesses is making this a

4
globalized industry. Deregulation and privatization will have a continual effect
worldwide. Internet and wireless technologies are continuing to advance rapidly
quickly changing customer preferences, disrupting traditional communication methods
and forcing prices downward. The telecommunication industry encompasses many
technology-related business sectors including: local and long distance telephone
services, wireless communications, Internet, Fiber-optics, Satellite, Cable TV systems,
etc. Cable companies are now aggressively offering internet service.
Telecommunications service providers are now selling internet protocol services,
competing directly against cable for consumers’ entertainment rupees and making the
relationship between the telecom and cable sectors more and more complex. Ingenuity,
innovation, insight and a reasonable approach to spending and investment can help to
move the industry ahead. To drive these, telecommunications service providers will
need to employ cost-effective business intelligence (BI) solutions and design the
appropriate promotion techniques; mainly sales promotion and advertising, to achieve
their organizational objectives. NT for one has witnessed significant rise in
competition in recent years due largely to the deregulation policy of the government
and the advent of mobile telecommunication companies. Though NT has persistently
used its promotional weapons for pushing its products and services and to accept the
competition forwarded by its rivals, the effectiveness of such promotional tools is
needed to be meticulously evaluated. Thus, for the study following research questions
has been chosen:
a. Do the employees of NT really think that the advertising and sales
promotion campaigns of companies have optimally worked out?
b. How far has been the advertisement and sales promotion successful in
influencing the feelings of customers?
c. What proportion of sales has been represented by advertising and sales
promotion?
1.3 Objectives of Study
The main objective of the study is to measure the effectiveness of advertising and sales
promotion in drawing the attention of customers towards NT. To achieve this
objective, the other specific objective has been set out:

5
a. To evaluate the effect of advertisement and sales promotion with the
employees of NT.
b. To measure the impact of advertisement and sales promotion on the customers.
c. To determine percentage of sales budget allocated for advertisement and sales
promotion by NT.
1.4 Significance of the Study
The subject matter of this study is related to measuring the effectiveness of advertising
and sales promotion to increase the sales volume of products and services of NT. Thus
the findings and conclusions drawn in the recommendations provided in this study
will, definitely, be much beneficial to the decision makers of NT. Further, the study
will be equally important to the rivals of the examined companies to determine the
practices adopted by NT for the proximity to the customers. Not only the rival
companies and the NT itself can be benefited from the study, but also the Nepal
Communication Authority, monitoring and regulating body for Telecommunications
Services, can also take the suggestions provided by this study for creating the policies
that can serve the customers much efficiently. Finally, the study would be a landmark
for novice researchers as well.
1.5 Limitations of the Study
The study has following major limitations:
a. The primary data is mainly based on the opinions of the different parties and
thus the interpretations and conclusions derived on the study totally rely on the
mood and intellectuality of these people.
b. The study only evaluates the two elements of the promotion; sales promotion
and advertising, and thus leaves no enlightenment of the contribution of the
other promotional elements in promoting the goods and services of NT.
c. Thus, the conclusions and recommendations presented may be not applicable
to the whole industry.
d. The secondary data evaluates the twelve years performances only.

6
1.6 Organization of the Study
The whole study has been broadly classified in five major chapters:
First chapter forms the basis for the study. In other words, this chapter clarifies on the
reason behind conducting this study, and the objectives to be met out. It consists of the
background of the study, brief introduction of the chosen organization, statement of
problem, objectives of the study, significance of the study and the limitation of the
study. The second chapter presents the concept related to the subject matter. Under this
chapter, the concepts of sales promotion and advertising have been mainly reviewed.
Besides these, the revival of journals and the articles, and thesis related to the subject
matter has been presented. And at last, the research gap has been traced out. Chapter
third can be considered as the arsenal for the research. In other words, this chapter
states what sorts of research tools are going to be employed. Also this chapter clarifies
the research design, population and samples and sources of data. Under chapter fourth,
it is considered as the main chapter of study, as the objectives set out in the first
chapter are attained on this fourth chapter. Under this chapter the data obtained by the
researcher through various sources are tabulated and interpreted. Finally at the end of
this chapter, major findings have been drawn. The study ends in this chapter. The
whole study is summarized and conclusion is drawn from the interpretation and the
recommendation is provided for the enhancement of the performance in the
organization.

7
CHAPTER II
LITERATURE REVIEW
2.1 Conceptual Review
Zallocco and Kincaid (2008) explained that promotion is the deliberate attempt on the
part of the individual business or other institution to communicate the appropriate
information in a manner persuasive enough to include the kind of acceptable response
desired. Thus, promotion is communication by the firm to other various audiences
with a view of forming them and influencing their attitude and behaviors
towards the firm's product. When any company uses different advertising and
communication channels in a coordinated way to run an effective marketing
campaign, it is called to be a promotion mix. According to (Kotler & William, 2014),
the mix consists of five major elements which are advertising, personal selling, sales
promotion, publicity and public relation.
In general, the relative importance of advertising, personal selling, sales
promotion, public relation and publicity in specific marketing programmers will vary
with the nature of the product, the buying behavior of customers, the competitor
practices in industry and the manner in which marketing managers choose to apply
resources. Each type of promotional activity will attain maximum effectiveness, if
only coordinated with others (Kotler, 2004).
Kotler and Armstrong (2010) explained that all functions in the satisfaction systems
are equally important, if any one system is missing, the system breaks down. The
same can be said about the ingredients in the promotional mix, those activities
that go together to make the bundle of utility and promotion is an important element
of the mix. According to Donnelly promotion makes the largest part of the marketing
expenses. Most organizations regard promotion expenses as secret and therefore
information about such expenditure are difficult to determine. Berkowitz (1982)
estimated that promotion quota to be 25% of the total marketing costs of the firm.
A successful promotion is one where a company sells a Jot of products to the
customers, and a promotion for an established brand can be used to attract and retain
new users to the brand. Promotion has become popular because it accounts for more
than 65% of typical marketing budgets. However, promotion alone cannot increase

8
sales volume, some facilities such as provision of credit and others contribute
to the increase of sales volume on pot of promotional activities.
Promotion Mix
A promotion mix is a set of different marketing approaches that marketers develop to
optimize promotional efforts and reach a broader audience. The marketer’s task is to
find the right promotion mix for a particular brand. These coordinated campaigns are
part of an effective integrated marketing communications plan. The five main methods
of promotion within the mix are advertising, publicity, sales promotion, personal
selling, and public relations. The most important factor in determining the optimal mix
is identifying the target market. This can be determined through extensive market
research. Once a company knows its target market, it can then research its use of
various media outlets in order to come up with the best combination of
marketing materials to reach the defined target. For example, if the target market is
stay-at-home moms, an organization might find that television advertisements
during certain daytime television shows are most effective for reaching them. If
the target market is a young professional, the marketer might find that using billboards
in a downtown commercial district and morning drive time radio advertisements are
effective for getting the message to this target market.
The size of the promotional budget will greatly influence the chosen mix as well.
Television advertising can be very costly and, therefore, may not be a feasible option
for a company with a smaller marketing budget, at least not during prime viewing
hours on major networks. Often the amount of money a firm spends on promotional
activities will be affected by the product life cycle, general economic conditions, and
the competition. The promotional mix may involve a company coordinating its
loyalty program with advertising campaigns and a promotional deal. For example, an
airline may send out a mailer to its frequent fliers advertising 5,000 free bonus miles
for booking a ticket in the next month. In this instance, the airline is coordinating a
direct mailing with loyalty program membership and a promotional campaign.
2.1.1 Elements of the promotion mix (Activities)
Kotler and William, (2014), elaborates the mix consists of five major elements which
are advertising, personal selling, sales promotion, publicity and public relation.

9
Advertising
The advertising is any paid form of non-personal presentation and promotion of
goods and services by the identified sponsor in the exchange of a fee. Through
advertising, the marketer tries to build a pull strategy; wherein the customer is
instigated to try the product at least once. The complete information along with the
attractive graphics of the product or service can be shown to the customers that grab
their attention and influences the purchase decision.
Generally, companies advertise through different forms of media such as television,
radio, newspapers, magazines, and billboards. A company uses advertising to inform,
persuade, or remind its target market of its products or services. Comparative
products, for example, McDonald's and Burger King used to run comparative
advertising, comparing their cooking methods for hamburgers. The "Pepsi
Challenge" campaign was another form of comparative advertising in which
consumers were asked to take blind taste tests to see if they could tell the difference
between the products. Reminder advertising is used once a product has matured in the
marketplace- that is, once a product has been around for a while. Credit card
companies use a lot of reminder advertising, such as American Express "Don’t leave
home without it" or Visa "It’s everywhere you want to be" campaigns. Coca-Cola
uses reminder ads to show how refreshing the beverage can be on a hot day, and
Budweiser wants to remain the consumer to “Make it a Bud night.” Some ads use
nostalgia to remind us of how much as children we enjoyed a product such as Oreo
cookies. Institutional advertising promotes the company, organization, government
agency, or a concept or philosophy, but not a specific product. For example, ads for
BASF, one of the world’s largest manufacturers of chemicals and chemical-related
products, states, "We don't make a lot of the products you buy. We make a lot of the
products you buy better." Industry advertising promotes a whole industry and not just
one company or product. The most popular example of this is the “Goat milk?”Ad
campaigns sponsored by the California Milk Processing Board.
Theories of advertising
Broadly, advertising is categorized into two; corporate and comparative advertising.
Comparative advertising is a marketing strategy in which a company's product or
service is presented as superior when compared to a competitor's. A comparative
advertising campaign may involve printing a side-by-side comparison of the features

10
of a company's products next to those of its competitor. However, Corporate
Advertising is defined as going beyond relations and product or brand advertising
and creating a lasting and favorable impression of a company and establishing
corporate dignity. Gambetta (1982) discussed three major areas where corporate
advertising is used and they are:
a. Issue advertising: Companies conduct this and in response to what they consider
to be threatening legislative or social activity.
b. Financial relation advertising: this can stimulate the interest of potential buyers.
c. Image building: This is due to establish an identity or get some erroneous view
about the firms. Large corporations use it to simplify and clarify public image.
Comparative advertising on the other hand is the way advertising of the
company's product in relation to its competitors. (Buchanan & Goldman, 1985)
said that comparative advertising is hard, bitter, attention to rubbing a way of
saying "we are better than the competitors". However, this advertising can lead
a firm to a legal suit, where rivals can sue it claiming it distorted the facts or
even invented them.
Roles and functions of advertising
Kotler (2004), describes the role of advertising in the marketing world is growing and
it is simplifying informing, persuading and reminding consumers about product
attributes. While, according to William & Ferrell, advertising is to communicate with
individuals, groups or organizations to directly or indirectly facilitate exchange
by informing and persuading one or more of the audiences to accept an
organization product. Advertising is used to effectively create a unique salient product
identity by adding emotional value to it, thus discriminating it from competition.
Kotler, (2004) grouped advertising into several categories and he identified six
functions of advertising namely;
● Awareness
● Comprehensive building
● Head generations
● Legitimizations
● Reassurance

11
All these are aimed at accelerating the process of communications to create demand
by building up repeat sales and improving the market share. Hence it would be guided
by the marketing concepts; advertising will have the central role of satisfying the
customers.
Objectives of Advertising
The long term objectives of advertising are broad and general, and concern the
contribution advertising should make to the achievement of overall company
objectives. Most companies regard advertising's main objective as that of providing
support to personal selling and other forms of promotion. But advertising is a highly
versatile communications tool and may therefore be used for achieving various short
and long term objectives. However, the major objective of advertising is "to increase
sales" and should be backed by a reference point of say by 5%. It should contain a
benchmark giving the current condition of the firm together with major sponsor's
goals. However, the advertising objectives are stated in terms of either sales or
communication.
Some of the basic objectives of advertising are:
● Preparing Ground for New Product
● Creation of Demand
● Facing the Competition
● Creating or Enhancing Goodwill
● Informing the Changes to the Customers
● Neutralizing Competitor's Advertising
● Barring New Entrants
Advantages of advertising
1. Advertising and Manufacturers
● Increased Sales
● Steady Demand
● Quick Turnover and Smaller Inventories
● Lower Costs v. Creation of Goodwill
● Controls Product Prices
● Greater Dealer Interest

12
2. Advertising and Consumers
● A Guiding Force in Making Purchase Decisions
● Improvement in Quality
● Elimination of Unnecessary Intermediaries
● Education of consumers
● Better quality goods at cheaper prices
● Consumers’ surplus
Drawbacks of advertising
a) Partial disclosure; that is stating what a product can do but not what it cannot do.
b) Visual distortions; making the product look larger than it really is.
c) Misleading comparisons; this involves making misleading comparisons like
genuine antique reproduction.
Advertising Mediums
Marketers must be able to divide their budgets among the various advertising
mediums in order to stretch them the farthest to reach the most customers.
Television
Television advertising is the leading medium for reaching audiences. Although a very
expensive form of advertising, television ads reach the largest percentage of the
population at once and can be very appealing due to their visual nature as well as their
sound.
TV ads can be classified into national, local, and cable advertisements. The type of
net work chosen will depend on which audience the marketer is trying to reach. The
time an advertisement is shown is also an important decision that companies must
make in order to reach the target audience. Budgetary constraints will also be a factor
in choosing time slots for advertisements.
Print Advertisements
Advertising in newspapers and magazines is another way of reaching customers with
a company's message. Print ads are effective because of their visual quality and can be
run in many different types of publications. Marketers selling products or services to
consumers may choose national newspapers such as the Kantipur. Businesses trying
to sell products or services to other businesses will often advertise in trade

13
publications of the industries they are trying to reach. Companies may also target
specialized publications; for example, a new computer product may be advertised in
PC World or another specialty technology publication. Print ads have a longer life
than electronic media ads and are good for telling a story about the value of a product
or Service.
Radio
Radio is an effective medium for reaching target consumers. The average radio
listener tunes in for three hours a day, and often on a regular basis. When using
radio advertisements in your marketing mix, it is necessary to make sure that the
company and product or service is clearly identified. As with television, it is also
necessary to find the right station for advertising to the target consumer. If your
service is a bar for college students, you may choose to advertise in the evenings on a
college station or an alternative rock station; if your target audience is senior citizens,
you may advertise on news stations or a talk show.
Internet
The Internet has become an important electronic medium, and its interactive quality is
unique. It permits immediacy of purchase and a high level of convenience. It can be
personalized and individualized. The Internet and the World Wide Web are becoming
essential tools in an integrated marketing plan and effective tools in sustaining
customer loyalty and satisfaction.
Direct Mail
Mailing advertisements or promotions directly to people's homes is another
commonly used method of reaching consumers. Direct mail campaigns can be
expensive, due to printing and postage costs, but these campaigns can be effective if
the mailings reach the right consumers. Often companies will purchase lists of
consumers or collect data themselves to build a mailing list. The people on these lists
will then be sent targeted mailings.
Telemarketing
The utilization of telemarketing has been greatly affected in the United States by the
recent implementation of the national "Do Not Call" registry, where millions of
Americans signed up to have their telephone numbers removed from telemarketer
lists. Internationally, however, regulation regarding telemarketing varies, and it may

14
still be a very effective method of reaching consumers. The downside of
telemarketing is that most people do not like the invasiveness of being called at home,
though unfortunately many mass marketers find the risk of offending non receptive
households is offset by the effective results and benefits from these marketing
methods.
Outdoor and "Out of Home"
The majority of outdoor advertising dollars is spent on billboards. Billboards are a
popular way of reaching commuters and consumers in a single geographic location.
Other forms of outdoor advertising (known as "out of home") include sports stadium
ads, bus shelter posters, or signage on buses and taxis.
Advertising Trends
A very popular way of getting a message across is using celebrity endorsements.
Advertising companies are willing to pay top dollar in order to hire celebrities to
represent their brands. For instance, the mega star, "Rajesh Hamal” playing ad for
"Jagadamba Steel Rod” can be taken as a good example of celebrity advertisement. Of
course, using a celebrity spokesperson can be a risk.
While choosing a celebrity to endorse products, it is important to find an appropriate
match with the product or service. The relationship should be believable. It is also
important that the celebrities endorsing the product be credible; they should either
have expertise in the field or be trustworthy characters.
Sponsorships
Sponsorship is a medium that is a well-used form of promotion and advertising that
allows the company to buy into a sporting event or activity. The amount of investment
in a sponsorship can range from an athletic company supporting a sports team by
providing them with brand-name uniforms in order to promote the brand to a
company sponsoring a football game such as the Nepal Investment Friends Club.
Infomercials
Another trend in advertising is the infomercial. It is an extended television
advertisement and usually runs at off-peak hours or on lower-budget television or
cable networks. Infomercials are usually at least a half hour long. Some of the most
popular items that are sold through infomercials are fitness videos, skin care products,

15
and kitchenware. Often they will feature celebrity endorsements and offer products
that cannot be purchased in stores. Their low-budget appearance and late-night
showing often characterize infomercials.
2.1.2 Personal selling
Personal selling is also known as face-to-face selling in which one person who is the
salesman tries to convince the customer in buying a product. It is a promotional
method by which the salesperson uses his or her skills and abilities in an attempt to
make a sale. Basically, it is informing customers and persuading them to purchase
products through personal communication in an exchange situation. When compared
to advertising, personal selling has three distinctive qualities.
a) Personal confrontation: As it involves a direct relationship between two or
more people. Each party is able to observe each other’s needs and
characteristics at close range and make immediate adjustments.
b) Cultivation: Personal selling permits all kinds of relationships to deep
personal friendship. Effective sales representatives will normally keep their
customers" interest at least if they wish to cultivate long term relationships.
c) Response: Kotler, (2004) observe that personal selling makes the buyer feel
under obligation to buy, having listened to sales talk.
The buyer has a greater need to attend and respond, even if the response is a polite
"NO" thank you.
When to Use Personal Selling
In general, if a product has a high unit value and requires a demonstration of its
benefits, it is well suited for personal sales. For example, an encyclopedia is a high-
priced item and most people do not feel they need one. After a demonstration,
however, most people agree it would be a useful item to have. Therefore,
encyclopedias are well suited to a promotion mix that emphasizes personal selling.
Highly technical products, such as computers and copiers, are also primarily sold
through personal sales methods. Products that involve a trade-in, like automobiles, are
usually handled through personal selling to help facilitate the trade-in process. Finally,
a company that cannot afford a mass-advertising campaign might consider personal
selling as an alternative to advertising. Since sales force compensation is largely based

16
on actual sales, personal selling may require less money up front than other parts of
the promotion mix.
Advantages of personal selling
a) It is a two-way communication. So the selling agent can get instant
feedback from the prospective buyer. If it is not according to plan he
can even adjust his approach accordingly.
b) Since it is an interactive form of selling, it helps build trust with the
customer. When you are selling high-value products like cars, it is
important that the customer trusts not only the product but the seller
also. This is possible in personal selling.
c) It also is a more persuasive form of marketing. Since the customer is
face to face with the salesperson it is not easy to dismiss them. The
customer at least makes an effort to listen.
d) Finally, direct selling helps reach the audience that we cannot reach in
any other form. There are sometimes customers that cannot be reached
by any other method.
Drawbacks of personal selling
a) It is a relatively expensive method of selling. High capital costs are
required.
b) Also, it is an extremely labor intensive method. A large sales force is
required to carry out personal selling successfully.
c) The training of the salesperson is also very time consuming and costly.
d) And the method can only reach a limited number of people. Unlike TV
or Radio ads it does not cover a huge demographic.
2.1.3 Sales Promotion
Sales promotion is a short-term marketing strategy designed to achieve a specific
purpose. Sales promotion differs from advertising in that its intent is to create a sense
of urgency to encourage immediate action as opposed to building sales or a brand over
a long period of time. Sales promotion may take the form of a temporary price
reduction or a campaign to introduce an item.

17
Sales promotion consists of many activities used to sell products. They are activities
that give consumers a short-term incentive to make a purchase. Sales promotions are
also activities that change the price and value relationship of a product as perceived by
the target audience with the possible effect of generating immediate sales. It is
possible that a sales promotion can also alter the long term value of the brand by
making what might be a premium product more affordable. Sales promotions are
generally time-bound programs that require participation on the part of the consumer
through either immediate purchase or some other action. The fundamental goals of
sales promotion are tactical, strategic, and ultimate. The tactical goals are to combat a
competitor's increase in market share, to combat other competitors' promotional
efforts, and to move brands that are either declining, overstocked, damaged, or not
selling fast enough. The strategic goals are to motivate consumers to switch from
arrival brand, to increase product consumption, to reinforce the
marketing communications efforts for the brand, and to motivate brand loyalty.
Brussel (1991), sale promotion consists of those marketing activities other than
advertising publicity and personal selling that stimulate customer purchasing,
but for (William & Ferrell, 1987), sales promotion is an activity that act as a direct
inducement, offering added value or incentive for a product to resellers, salesperson
or customers. Frequently marketers use sale promotion to improve the effectiveness
of other promotion mix ingredients, especially advertisement and personal
selling. Sales promotion method falls into one of two groups depending on the
intended audiences consumers. Sale promotion methods are directed towards
customers.
Measuring of sales promotion
Asael, (1987), says that a company can use four methods to measure sales
promotion effectiveness, these are:
a. Sale data should be examined before, during and after promotion
b. Consumer panel data would reveal the kind of people who responded to the
promotion and what they did after the promotion.
c. Consumer surveys can be conducted to learn how many recall the promotion,
what they thought of it, how many took advantage of it.

18
d. Experiments that vary such attribute as incentives values, duration and
distribution media.
Advantages of sales promotion
a. It stimulates in the consumers an attitude towards the product.
b. It creates a better incentive in the consumers to make a purchase. It is a
demand creator.
c. It gives direct inducement to the consumers to take immediate action.
d. It is flexible. It can be used at any stage of a new product introduction.
e. Sales promotion leads to low unit-cost, due to large-scale production and
large-scale selling.
f. It is an effective supporter of sales. It helps the salesman and makes his effort
more productive.
g. The promotional tools are the most effective to be used in increasing the sales
volume.
Limitations of sales promotion
a. Short-term sales peak caused by sales promotions may be followed by a trough
as the consumers go on using the stocks, over-purchased during the offer
period
b. Customers expect promotions all the time
c. Moderately high probability of return of unsold stock from retailers and
distributors at the end of promotion
d. Ineffective promotion may cause the extra stock to stay too long on the
shelves, so that they could be in poor condition at the time of purchase, leading
to consumer dissatisfaction
e. Bring about a competitive response leading to more promotional activity
f. Wholesalers and retailers do not always deliver their promises when given
incentives such as extra discounts
g. Difficulty in exciting consumers with clichéd promotional offers
Sales Promotion Channels
When a brand wants to increase the sales of its products, it uses Sales promotion. The
brand can increase the sales by attracting new customers to their products or by

19
retaining the old customers by various means. The company can also motivate the
dealers and distributors of their channel to perform better for their brand, and to get
their stock moving. Thus, there are different channels for sales promotions,
which include consumer promotions and trade promotions.
Consumer Promotions
Any sales promotion activity that you do keeping the end consumer in mind is known
as consumer sales promotions. Consumer promotions are geared toward getting
consumers to try a company’s products. Some examples of consumer promotion
activities include coupons, rebates, sampling, sweepstakes, point-of-purchase
displays, and special packs.
● Coupons
Quite commonly used to motivate people to purchase when they think the price is
high or it can be an incentive to buy your product above the competitors. Whether
we're cutting them from newspapers and magazines or getting them in the mail,
coupons are a very popular form of sales promotion. They are very effective,
especially in economic downturns, for luring people into restaurants or causing them
to make repeat purchases of products. E-coupons are another popular form of sales
promotion; they are extremely effective for luring in customers and are redeemed by
57 percent of the people who click on them. The most popular uses of e-coupons are
for sales of groceries, books, and health and music products. The disadvantage of
coupons is that they do not encourage brand loyalty; most consumers who use
coupons regularly are willing to switch brands if there is a better discount available.
● Rebates
Rebates are partial refunds that are offered by the manufacturers. Often manufacturers
will use mail-in rebates as incentives for purchasing. The consumer must purchase the
product at full price and then fill out paperwork and mail in the receipt in order to
receive some money back. Rebate programs allow marketers to promote a company's
product at a reduced post rebate price, offering substantial savings to its customers,
but also requiring that a set of conditions be met to qualify.
● Sampling

20
In order to attract customers companies will often send or hand out samples of
products to the customers who may or may not have purchased the company’s
product . Beverage companies may target college students and hand out soft drinks
on campuses, or a food company may set up a stand in a grocery store so that
consumers can sample their new chips. You may even receive a trial bottle of
shampoo in the mail. These are all examples of sampling, and the intention of these
promotions is to introduce a new product or service to a consumer in order to generate
brand loyalty. Sampling can be a costly method of attracting customers, and it often
results in wasted distribution; however, it can be a very effective method for getting
consumers to switch brands.
● Sweepstakes and Contests
There are different forms of contests which can be run to gather more customer
information or to motivate the customer to try the product or to create awareness
about the new retail place. Sweepstakes and contests are another strategy of sales
promotion. Data will be collected from consumers, and they will be entered to win a
prize. Companies can use the information that they collect from entrants in order to
develop a mailing list for future promotional campaigns. Organizations must be sure
to print all the guidelines for their sweepstakes or contests in order to avoid legal
entanglements. Some of the guidelines companies should follow in order to put
on a successful sweepstakes promotion include the following: clarify who is
eligible; indicate states where the promotion is not valid; declare the termination
date of the promotion; and clarify random drawing procedures. Companies should
also detail the prizes, disclose the odds of winning, declare a deadline for entry, and
reserve the right to use winners' names and photographs for publicity.
● Point-of-Purchase Displays
Point-of-purchase (POP) promotional materials are displays that are set up in stores in
order to prominently display products. At a grocery store a POP is usually placed in
the front of the store, at the end of an aisle, in the aisle, or on the shelf. POP displays
are very successful due to the fact that many people make last-minute purchasing
Decisions.

21
● Bundling
In order to promote a new product or to encourage consumers to try a
complementary product, sometimes companies bundle products together such as a
free small conditioner bundled with a shampoo purchase, or a free disposable
razor with a shaving cream purchase. A company may also offer a bonus pack or a
special pack with 20 percent more in order to encourage a customer to purchase a
product.
● Giveaways
Another strategy used by companies is that of special promotional items to be given
away. These may be hats or T-shirts advertising the company or brand. For example,
many times credit card companies will offer T-shirts if you sign up for a new credit
card , or a beer company may be giving away pint glasses to customers who purchase
that brand of beer on certain nights. Alcoholic beverage companies often hire young
men and women who will go to concerts, bars, and clubs and promote their products
by giving away promotional items.
Trade Promotions
If the promotional activities are focused on Dealers, distributors or agents, then it is
known as trade promotions. There is a lot of competition in any field. And in channel
sales, to get the products moving and to motivate the dealer to perform better, trade
discounts are given. A snack food manufacturer, for example, may offer a discounted
price to a retailer who buys a large quantity of a product. These types of promotions
are most successful when they offer financial incentives and serve to effectively
reduce the cost or the product. Another form of trade promotion is paying for shelf
space. On the shelf of the grocery store, product placement is very important. Items
placed at eye level on higher shelves have proven to sell much better than products
placed on lower shelves. Knowing this, manufacturers often pay a "slotting fee" in
order to have their products prominently displayed on the desired shelf or in a
preferred position within a retail store.
2.1.4 Publicity and public relations
Public relations (PR) help improve and promote an organization’s image and products
by putting a positive spin on news stories. Public relations materials include press
releases, publicity, product placement, and sponsorships.

22
Publicity and public relations are also presented as elements of a promotion mix by
the researcher Kotler, & Louise (2006) stated that marketers lend to use public
relations as an offer thought, yet a well thoroughly y public relations programmer
coordinated with promotion elements can be extremely effective. The appeal of
public relations may be based on three distinctions.
a) High credibility: New stories and features seem more authentic and
credible to readers than advertising do.
b) Off-guard: Public relations can reach those prospects that can avoid sales
persons and adverts.
c) Dramatization: Public relations, like advertising has a potential for
advertising a company's product.
Developing the appropriate promotional mix is one of the most daunting tasks
confronting marketers. For instance, Kotler and Armstrong (2006), say that one
of the hardest Marketing decisions facing a company is how much to spend on
promotion. The following question provides some general guidelines for allocating
promotional effort and expenditure among personal selling ,advertising, sale
promotion and public relations advanced by Boone and Kurt’s (1993).
a) What is the value of your product?
b) What is your target market?
c) Should you spend your promotional budget on personal selling?
d) What time frame of your work is involved?
The answers to the above questions are provided by use of appropriate strategies. For
instance the push and pull strategy so as to increase the sales, Kotler, (2004).
Pull Vs Push strategy
A pull strategy involves marketing activities like primary advertising and consumer
promotion directed to the users to induce them to request the product from
intermediaries. On the other hand, a push strategy involves firms' activities like
primary sales force and trade promotions directed at channels intermediaries to
induce them carry the product and promote it to the end users.
The nature of promotional activities
Even in situations where there are products which may sell themselves, such as
those that may be in short supply, a small budget promotion is still necessary. It is

23
necessary to inform the customers of the market situation on how best to make use
of the united products, because later on when the shortages are over, the goodwill is
necessary for the firm's survival. This is what has even compelled larger companies
in Uganda like British American Tobacco to appreciate the reality of having active
promotion campaigns in search of customers.
When it comes to high involvement products, where the consumers go through the
intensive search for information and evaluation of alternatives, promotion carries
heavy importance. By high involvement we mean those products where the buyer may
have to think hard and sometimes consult others before he/she decides to buy or not
to buy, Shift man and Kamuk (2011), such products like cars, computers and
other electronic equipment are regarded as greater value products. In this therefore,
Engel, Schewe & Smith, (1991), argue that promotion is the most effective way to sell
the people in the market. Kotler, (2014) summarizes up the importance of promotion
by saying that "the marketer's main question should not be whether or not to promote
but whom and how often to promote".
2.2 Sales Volume
Sales volume is the number of units sold within a reporting period. Basically, it is the
sum of a number of factors including gross sales returns and delayed billing. Sales
volume is the core interest of every organization that is based on Sale and profit.
When the volume goes up everything is manageable (margin, profit, numerical
distribution). But when the volume goes down it is difficult to manage the business
parameters. The sales do not go up or down without a force behind it. The company
is managing and directing its sale volume through the portfolio and channel.
2.2.1 Measures of sale volume
An enhanced sales volume can be expected in business when effective control
mechanism are in place for service firms because such firms will be able to minimize
the cost of implementing and coordinating promotional activities and making
necessary changes more effectively in the business, Kirca, (2010).
However, in review of practice in the Telecom industry, Haines, (2010) points out that
companies are not carefully considering metrics that are best for establishing a
foundation for sales success of the firm. Managers and executives, in this industry at
least, need to ensure that sales activities and results are captured and measured to

24
align with company objectives and strategy. This may well be the case in a number of
industries, where doing a good job with sales volume measurement is the exception
rather than the rule. There is a significant body of sales research that measures sale
volume in term of behaviors. This literature suggests that certain selling behaviors are
effective and others are not for example, White, (2012) operationalizes effectiveness
as the reward satisfaction outcomes that result from customer interactions with firm's
sales. Some of more recent research trends have explored the adoption and use of
technology in mediating sales volume efficiency. Morgan, Blackwell and Ainiard,
(2008) found that post sale business services are a critical element in building a firm’s
brand name and equity. Since information, knowledge, strategies, tactics and
organizational processes used in promotion are externally oriented; a final component
is that selling also be externally oriented and sales volume be evaluated base on their
contribution to the external perspective. In support of this notion, Haines (2015),
found external measures (customer oriented) to be positively related to salesperson
job satisfaction, while internal dimensions such as skills were not. One set of overall
sales volume measures was provided in 1997, and includes market share, relative
price, relative quality, customer preference, relative new product sales and response
time to customer problems. Many of these measures can be used directly to assess Sal
e volume. Zallocco, Perrault and Kincard, (2018), they felt that a critical measure of
sales volume is the quality of personal relationships salespersons develop with buyers,
although they clearly noted challenges in this particular area.
2.2.2 Factors that affect sales volume
Organization job descriptions and specifications would be different depending on the
orientation. Furthermore, customer-orientated selling requires better training, more
sophisticated salespeople with the capacities of being flexible, being customer
problem solvers, and having the financial and analytic tools to be truly externally
focused. Brat, (2015) says, flexibility in decision making and implementing would
positively affect the sales volume of the firm. But Jensen argued that decision making
is major factor that affects firm's sales because all activities rotate around decision that
management implements. The sales person's perceived interpersonal skills have a
positive influence on volume. Johlke, (2016) in his study found that manager's and
salespeople understand the overall purpose of sales volume outcomes are
inconsistent. A summary of respondents overall attitudes towards sales volume

25
shows that sales managers are more conserved with the ability to measure sales
volume precisely than Sales persons The sale volume is an integrative
component of an organization promotional activities volume measures should
be consistent with organizational mission objective, encouraging salesperson
behaviors that support desired outcomes.
Management control and training are important potential contributors to a
salespersons long-term performance. By designing and implementing appropriate
training programs, sales managers may increase the performance of their sales
force thus increasing on the sales volume, He goes ahead to say that however if
management control and training is power sales force performance is also poor which
affect sales volume.
2.3 Relationship between promotion and sale volume
Theoretically there should be a direct relationship between promotion and sale
volume. Some studies have shown that this is not always true, Engle et al, (1991). A
firm may increase on promotional activities in anticipation of an increase in sales
volume, market share and profits but customers may not want to buy for one reason or
another say perception of the product, place and price hence promotional activities
themselves are not good enough and successful. Weigand, (2010) and Kotler, (2014).
The cause could be that promotional activities form an important part of the
marketing mix, though the other elements of the mix also communicate. The
product communicate something to the customers for it to be bought, customers must
see it as the right one to satisfy their needs and wants.
Promotion does not have magic of selling a product that a customer may perceive to
be wrong due to wrong pricing. The same goes for place, if a firm promotes a product
very aggressively without making it accessible to the customers, it will be a wasted
efforts and money.
Therefore for promotion to have a direct relationship with sales volume the entire
marketing mix must be seen by the customers as the right one McCarthy and Jerome
E. (2019). Thus Kotler, (2014) emphasized a strong relationship between promotional
activities and sales volume. He observed that for there to be perfect performance of
the product, then a combination of two or more promotional activities have to be
performed and their performance should be done putting into consideration the

26
marketing mix element so as to aid the consumer make a decision to buy or not to
buy the product.
2.4 Relationship between Sales, Sales promotion and Advertisement
With companies investing millions of naira or dollars in marketing communication
including advertising, it is but natural to examine its impact on the bottom line of the
firm. With markets becoming powerful, practitioners and researchers have turned their
attention towards examining the impact of communication activities like advertising
on firm valuations. Moreover, interest is rising in quantifying the impact of marketing
activities on firm’s profitability and value providing the framework for linkages
between marketing, finance and strategy. This study focuses on studying these
relationships by seeking to measure the impact of advertisement spending by a firm
on the firm’s sales and profitability. In today’s competitive era one is constantly
bombarded with advertisements. Empirical studies show that advertisements have an
influence on the purchase behavior of consumers. Consumers purchase decision is
also influenced by the “value” they feel they would derive from purchasing that
particular product or service. Consumers expect a return on investment (price Vis a
Vis value). In other words, consumers expect value for each kobo they spend. At the
other end of the spectrum the marketers expect a return on the investment they make
on advertising. This is natural given the fact that promotion activities do cost the firms
a lot. The return may be in the form of increased profitability and an increase in firm’s
turnover. Every year companies invest millions of naira or dollars in marketing
communication. A bulk of this obviously goes into advertising expenditure. Naturally,
marketers expect a return on investment (ROI) on this. Their expectation stems from
the likely impact, marketing investments have on the market performance and thus the
profitability of the firm. Raymond (1995) argues that the effectiveness of advertising
conveys different meanings to different meanings to different groups. To a manager, it
would obviously mean the impact the advertising strategy has on the firm’s
profitability. With marketing communication used for creating awareness and building
a long lasting relationship, many studies have focused on copy and media effects and
awareness building about the product. A metrics have been developed to assess and
measure consumer awareness and loyalty. Besides many studies use the AIDA or its
adaptations that has been around from the early 20th century. Few research studies
concentrate on measuring the sales and profit effects Gottingen (2013), Montreal

27
(2014); Nail et al (2010). A cursory glance at this suggests that these effects have been
studied on the US consumers and markets. It therefore is imperative to study the
impact of spending on advertisements on the sales and profitability of the firm.
2.5 Review of Related Studies
A well planned and organized advertising scheme has the potential of increasing
awareness of a business products or brands in the environment in which the business
operates, ceteris paribus, Agbeja, O.Johnson and Daramola, (2019). Kotler (2014)
sees advertising as one of the four major tools companies use to direct persuasive
communications to target buyers and public noting that “it consists of non-
personal forms of communication conducted through paid media under clear
sponsorship”.
Omotayo, (2018), in her article, "Sales Promotion and Consumer Loyalty: A Study of
Nigerian Telecommunication Industry", investigates the relationship and effect of
promotion and customer loyalty. This was confirmed that there are positive
relations between sales promotion and customer loyalty. The study concluded that as
Sales promotion expenditure increases so does the customer loyalty. The results of the
study enable to make a number of conclusions. Most respondents are reluctant to
provide personal information as such their evaluation of sales promotion is negative.
Age and income are discovered to have separate impact on consumers' evaluation of
sales promotion. Consumers of different age categories are influenced by sales
promotions while different levels of income are equally affected. A major reason for
the heavy influence of sales promotion on loyalty can be explained with the dwindling
consumer income of an average Nigerian. The Nigerian economy has been going
through series of economic reforms including Structural Adjustment Programmer
Part or the cumulative effect of these reforms is the devaluation of currency
with it attendance effect on inflation and consumer purchasing power. The
implication of this to Telecom companies is the development of sales promotion
programmers to regularly attract and retain customers. In practical terms consumers
switch from one network to another or in most case make use of two or more SIM
(telecom contract) so as to switch between networks during promotion and take
advantage of reduced or discount tariffs. However, the high tendency to switch or
being loyal does not account for quality of service during promotion.

28
Okyere, Agyapong, and Nyarku, 2019), in their article, " The Effect of Marketing
Communications on the Sales Performance of Ghana Telecom (Vodafone, Ghana)",
have stated that GT Vodafone failed to institute the necessary structures to
periodically measure, evaluate and review their marketing communications activities.
They appear to be simply unaware of the relative effectiveness of each of elements
and how best to integrate them together across the firm to help make better decisions.
This is probably the most complicated challenge for GT Vodafone. For instance, how
much relative effect does each campaign have on sales volume as compared to the
effect on the other elements of marketing communications? It is obvious that of all the
decisions marketing managers make, those concerning promotional allocations are
considered to be the most difficult and troublesome to measure. Several reasons
account for this complexity. These reasons include: obstacles in identifying an
appropriate measure, or metric of effectiveness, challenge with getting people
throughout the organization to agree that a particular measure is the most appropriate,
difficulties encountered with gathering and assessing data impede the effective
evaluation of marketing communications activities, and difficulties involved in
determining the exact effect that each specific marketing communication element has
on the measure selected to indicate effectiveness.
Apparently, GT (Vodafone) has no laid down policies culminating into factors strictly
adhered to in the selection of marketing communications tools and its supporting
budgets. Their choices are based on previous practices backed by the prevailing
market conditions together with management discretion. It is evident too that the roles
and responsibilities of the marketing communications, corporate communications and
marketing overlap posing challenges to issues such as who does what and where does
the role end. This could cause conflicts among the managers, giving rise to territorial
divisions and culminating into power struggle that could tickle down to their
subordinates. Besides, getting all managers in separate units to agree on a budget can
become a big challenge to management. In addition, GT (Vodafone) has no
significant commitment to Research and Development (RandD) as far as
its communications campaigns are concerned. From the interactions, there was no
indication that the selections of GT's (Vodafone) marketing communications tools
were based on any scientific considerations and procedures.

29
Obasan and Soyabo (2018), in their article, "Assessing the Effectiveness of
Promotion as a Marketing Management Tool in the Swedish Telecommunication
Industry", have revealed that promotion has a significant effect on marketing
management in telecommunication industry and sales promotions are not only
effective in attaining short term sales as they are also more cost-effective compared to
other integrated marketing communications tools such as advertising. Moreover, the
study also supported that by offering the right promotional tools, it can help
organization carefully plan their promotional strategies by giving preference to the
more effective tools. It is vital because a specific marketing strategies decision assists
the company to minimize cost and maximize their profit. Hence, this study revealed
that promotion is a good marketing tool for survival, sustenance and expansion of
business in the Swedish Telecommunication Industry.
It is a veritable which must be reviewed regularly in order to meets customer’s needs
and satisfaction. It must focus explicitly on the firm long run competitive advantage
by serving as a link between a firm, clients, competitors and other stakeholders. To
this end, telecommunication Industry in Sweden should appreciate and exploit the
opportunities offered by promotion and learn how to modify promotional techniques
to meet the needs to diverse target market like Sweden. Also, they should recruit
professional s into the industry because a good promotion requires a professional
touch and design to stand as a marketing tool for organizational survival and growth.
Sunuwar (2007), in his study, "Vegetable Marketing in Bhaktapur ", has the main
objective to measure the impact of marketing in the sales growth of vegetables. The
other objective of the study was to find out the distribution strategy adopted, and to
measure the facilities of business persons and effort of the government to upgrade the
marketing. The study has found that the production was lower than the demand of
vegetable. Hence, there was no equilibrium between demand and supply. In addition,
the price of vegetables used to vary from one place to another. Farmers were facing
many problems for producing and selling of the product. Likewise, attention of
government officer was no sufficient to meet the expectation of the farmers.
Eventually, the distribution channel was very poor and the strategy implied was not so
effective to meet the consumers demand as well as the instability in price was making
consumer worry.

30
Tandukar, (2018), in his thesis, "The role of Advertising in Brand Choice and Product
Positioning ", has the main objective to analyze the effectiveness of advertising
on brand of consumer product. The other specific objectives was to evaluate the
role of adverting in product positioning from the consumers perspective, and to find
out do consumers give more importance to advertisement rather than any other
promotional tools while making selection decision or not.
The study is based mainly on primary data filed by respondents of Kathmandu valley.
The major findings of the study are: Nepal Television is the most popular media
within Kathmandu valley and Radio Nepal holds the second position along with
among the youth generation FM broadcasting is also being popular. Most of the
respondents are in favor of entertaining types of television advertisement. Most of the
marketers are using electronic media to advertise their product such as radio, TV are
supposed to be the effective media while considering the present situation of Nepalese
market. Advertising is the main sources of information about particular brand as well
as mostly y sensitive subject in the country in course of promotion.
Mainali, (2019), in her thesis, "A study on Brand Loyalty on Nondurable Product",
has the main objective to measure the loyalty on brand in non durable product. The
other specific objectives were to know the consumer behavior on Non durable
product, and to make the guideline for making marketing strategies.
The study has found that the Nepalese consumers give high importance to Brand in
the consumer non-durable goods. The weighted mean of the various important points
given (i.e. from 01 to 05) by the respondent is 3.94. Moreover, most of the consumers
are found buying the products selected for this study by brand rather than by
inspection or influences. The percentage of consumers who buy by brand is 70% in
Col d Drink, 74% in instant noodles, 52 % in Hair Oil and 60% in Shampoo. In each
product selected for the study, at least 64% of the consumer is found to have
knowledge of maximum alternative brands available in the market. This shows the
high brand awareness in Nepalese Urban consumers. Finally, majority of the Nepalese
urban consumers are found brand loyal.
Nakarmi (2015), in his study, “Advertising as a tool of Marketing”, has the main
objective of identifying the existing position of advertising practices in Nepal. The

31
other objectives of this study is to find out the existing pattern and blends of
advertising and the constrains prevailing advertising practices in Nepal. His study was
confined to the descriptive analysis of the then situation of advertising business. It was
natural to undertake such research on advertising field at that time as the
adverting was still on infant stage of development. Thus, his study did not touch the
creative aspect of advertising.
The major findings of the study state that the advertising is the main method of
promotion practiced in the country. Advertising in the company is handled by persons
at the senior level, when there is a separate advertising department in the company.
Regarding to the services rendered by the advertising agencies, none can offer full
services properly. A few agencies concentrating on producing interesting
advertisement from the advertisers and other specialists service such as block makers,
printers, artists' etc. publication media, radio and cinema are the most used media for
commercial advertising. But there are few alternatives. The Gorkhapatra is the only
medium with any significant circulation. The advertising programs are not well
coordinated with the other elements of marketing and promotional strategy. The
effects of advertising are generally not evaluated.
Deuja, (2018), in his study, “A Study on Brand Preference of Instant Noodles in
Nepal", has the main objective to analyze the consumers' brand preference on Instant
Noodles. The specific objectives of the study are to examine the consumers' brand
preference and brand switching on the basis demographic variables, to evaluate the
driving force and significance of consumers' brand preference on instant noodles, and
to the tools used by the consumers for identifying the brand of instant noodles The
stud y found that in Noodles brand, the consumers below the age of below the age of
30 years have shown hard core brand preference, while the consumers above the 30
years have depicted brand switching preference. Similarly, female consumers shown
strong brand preference than male, and male consumers shown shifting brand
preference. Likewise, the brand preference of the consumers has shown positive
relationship with the income level, which means the consumers having greater income
favor the usage of single brand. However, the education level of the consumers shown
positive relationship with brand shifts, and the bachelors' degree holding consumers
have shown most strong brand preference.

32
2.6 Research Gap
All of the above reviewed theses are indeed great stuffs for conducting the study.
These theses have played a rudimentary role, and thus are highly valuable and
important to a novice researcher. However, all these theses are concentrated either on
showing the impact of advertisement, or the impact of marketing as a whole. None of
the theses have put effort to determine the joint effect of advertising and sales
promotion, two major elements of promotion mix, on the consumers buying pattern.
Further, none of the reviewed theses have been conducted taking NT, the lea ding
telecommunication organization, as a sample. Thus, the present study will try to fulfill
all these aforementioned gaps, and applies all sorts of marketing tools for achieving
the objectives specified in previous section.

33
CHAPTER - III
RESEARCH METHODOLOGY
Research methodology sets the sketch of the study. It defines what activity is to be
done, how it would be done, and what data will be followed. A researcher can get data
from both primary and secondary sources. The secondary sources are the ones that
have been already available or published, for instance the annual reports, brochures,
magazines, journals and others. However, the primary sources demand the collection
of the data by the researcher himself. A questionnaire can be a good source of primary
data. The researcher has collected data from both the secondary sources and the
primary sources.
3.1 Research Design
The research design is the outline of a plan to test the hypothesis and should include
all the procedures that follow. The study aims to portray on the effectiveness of the
advertising and sales promotion on the consumers of NT. The research is based on
recent empirical and historical data. It deals with the examining the advertising and
sales promotion of communication services in Nepal on the basis of available
information. As the study aims to draw inferences from the observed evidences,
it can be categorically said that the study follows deductive reasoning method in
lieu of inductive reasoning. Thus in this study descriptive and casual comparative
research design has been used.
3.2 Sources of Data
The study is based on secondary data as well as primary data. Secondary data have
been collected by using the annual reports of NT, brochures and websites of
concerned sampled organization and so on. Further, primary data have been collected
through two different sets of questionnaire one for the employees and one for the
consumers.
3.3 Data Collection Procedure
The data are collected from secondary sources as well as primary sources. To collect
secondary data, the researcher visited Whitehouse Library, Library of NT, and official
websites of NT. For the collection of the primary data, the questionnaire approach
was adopted. The questionnaire was carried out with different employees and

34
consumers of NT. For the study, two set of questionnaires have been prepared. The
first set of questionnaires contains 9 questions to the employees of NT in the overall
sector of advertisement and sales. The second set of questionnaires contains 16
questions to the consumers.
3.4 Population and Sample
After the enforcement of Telecommunication Act, numerous communication service
providers exist in Nepal. However, the analysis of all these service providers on the
basis of advertising and sales promotion is somewhat impossible. Thus for the study,
only one company, NT, the leading communication organization, has been selected,
from where 130 responses were collected; 62 from the consumers and 68 from the
employees respectively.
3.5 Period Covered
The necessary data and information have been collected from various
sources covering a period of sixteen years.
3.6 Tools for Analysis
Basically, MS- Excel has been used to calculate the statistical data’s. To be particular,
marketing and statistical tools are the main tools to be used in the analysis of the data,
which are enumerated separately.
3.6.1 Marketing Tools
The major marketing tools that have been utilized to meet the objectives of the
study are;
A) Questionnaire
B) Sales and Advertising Promotion Expenses to Sales Revenue of NT.
3.6.2 Statistical Tools
In this study, the following statistical tools have been extensively used;
A) Arithmetic Mean
Arithmetic mean is the number which is obtained by adding the various numbers of all
the items as a series and dividing the total by the number of items.
Formula,

35
Arithmetic Mean = ΣX N Where,
X =Arithmetic Mean,
N =Number of observation
B) Standard Deviation
C) Kurtosis
D) Skewness
E) Range
Statistical Data is calculated using Excel 2007.

36
CHAPTER IV
DATA PRESENTATION AND ANALYSIS
4.1 Primary Data Analysis
This section of the study has been further divided in two sub-sections. The first sub-
section analyzes the responses of employees of NT in relation to the sales promotion
and advertisement and the second sub-section analyzes the responses of consumers of
NT.
4.1.1 Analysis of the Responses of Employees of NT
Under this section, the responses achieved from the 5 high level employees, 54 middle
level employees and 9 low level employees of NT through the conduction of
questionnaire that is related to sales promotion and advertising campaign of NT has
been analyzed.
4.1.1.1 Effect of Advertising and Sales Promotion on Sales
Generally, it is accepted that the promotional campaign, especially the advertising and
sales promotion, has a significant impact on increasing the sales of the company. To
test whether such accepted axioms apply in NT, the employees are asked on this
matter.
Table 4.1
Effect of Advertising and Sales Promotion on Sales
Details Total
% Respondent (No.)
Weak 7.4 5
Moderate 41.2 28
Strong 51.5 35
Total 100% 68
(Source: Google Form Survey)
The Table 4.1 reveals that the majority of the employees of NT believe that the
advertising and sales promotion effort of NT has a strong effect on enhancing the sales
of the company. Out of 68, 35 (which is 51.5%) employees believe that advertisement
has a strong and direct impact on the sales of the company services. However, 41.2%

37
of them believe that advertising has a moderate impact on sales and rest 7.4% believe;
there is almost no impact on the sales.
Figure 4.1 Effect of Advertising and Sales Promotion on Sales
4.1.1.2 Crucial Element in Advertising
Not the same element of advertising is crucial for each company; rather it varies on the
nature of the company. To examine what sort of element is much crucial while making
advertisement of the NT, the employees are asked on this matter.
Table 4.2
Crucial Element in Advertising
Details Respondents
No. %
Slogan 36 52.9
Trademark 51 75
Color 22 32.4
Total 109
(Source: Google Form Survey)
Observing the respondents obtained from the employees, it can be said that the
company should put much emphasis on the trademark of the company while making
advertisements, as the majority of the employees have sought that the trademark is a
much crucial element of advertising. Currently, the Namaste sign in the middle of the
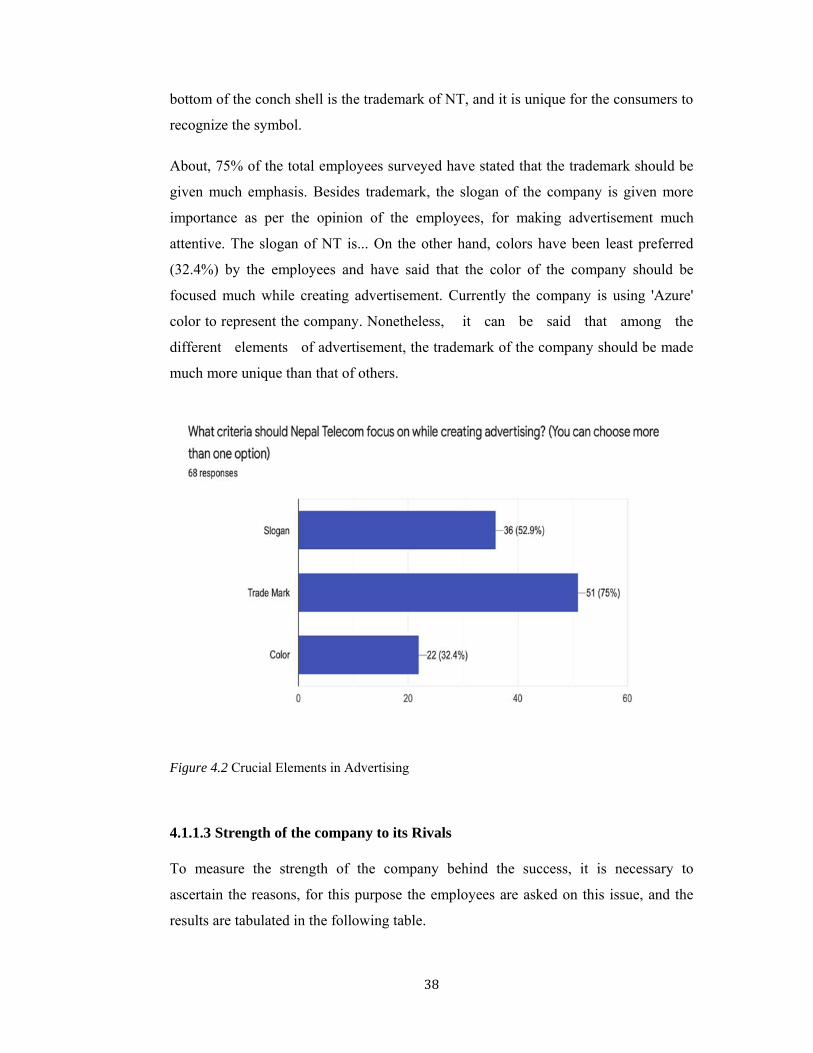
38
bottom of the conch shell is the trademark of NT, and it is unique for the consumers to
recognize the symbol.
About, 75% of the total employees surveyed have stated that the trademark should be
given much emphasis. Besides trademark, the slogan of the company is given more
importance as per the opinion of the employees, for making advertisement much
attentive. The slogan of NT is... On the other hand, colors have been least preferred
(32.4%) by the employees and have said that the color of the company should be
focused much while creating advertisement. Currently the company is using 'Azure'
color to represent the company. Nonetheless, it can be said that among the
different elements of advertisement, the trademark of the company should be made
much more unique than that of others.
Figure 4.2 Crucial Elements in Advertising
4.1.1.3 Strength of the company to its Rivals
To measure the strength of the company behind the success, it is necessary to
ascertain the reasons, for this purpose the employees are asked on this issue, and the
results are tabulated in the following table.

39
Table 4.3
Strength of the company to its Rivals
Details Respondents
No. %
Promotional Mixes 3 4.4
Good Management 6 8.8
Consumers’ Confidence 27 39.7
All of the above 32 47.1
Total 68 100
(Source: Google Form Survey)
No doubt, the NT has been achieving extreme profit in each year, and has captured the
market of the company the most. In other words, NT is the most leading
communicative organization in the industry. When asked about the main reason
behind the success of the company in comparison with its rivals, the high level
employees have pointed out the combination of promotional mixes, good
management of the company and consumers' confidence on the organization. About,
47% of the employees have admitted this combination to be the main reason behind
the success. Additionally, 39.7% of the employees have stated that the consumers’
confidence is another major cause behind the success of the company. In contrast, only
8.8% and 4.4% of total employees have opined that the good management and
promotional mixes in the company is also the main reason behind the achieved result,
respectively. Nonetheless, on the basis of the majority it can be deducted that the
perfect combination of promotional mixes, management and consumers’ confidence is
the major reason behind the success of the organization in comparison with its rivals.

40
Figure 4.3 Strength of the Company to its Rivals
4.1.1.4 Method to Enhance the Sales Promotion and Advertising
The sales promotion and advertisement made at once does not last forever, instead the
company should adopt new methods to make its sales promotion and advertising
tackle the new threats of the market and reap the opportunity. To know what sort of
methods can enhance the sales promotion and advertising of NT, the respondents are
asked.
Table 4.4
Method to Enhance the Sales Promotion and Advertising
Details Respondents
No. %
Celebrity endorsement 1 1.5
Opening Outlets 3 4.4
Good Commission for Recharge Seller and Agents 7 10.3
Offering Beneficial value to Customers 57 83.8
Total 68 100
(Source: Google Form Survey)
According to the majority of the employees of NT, it can be said that by offering
beneficial value to the customers, who can either be in the form of bonus at recharge
card, free SMS and other, the sales promotion and the advertising of the company
could be enhanced. Supporting the same, 83.8% of the employees preferred offering

41
worthy value to the consumers. As per these employees, the consumers are the
ultimate target of the company, and hence the advertising and sales promotion of the
company should be directly directed to these people.
On the other side, 10.3% of the total employees have said that the company should
extremely make use of the recharge seller and other agents by paying the good
commission to enhance the advertising and sales promotion of the company. However,
only 4.4% of the total surveyed employees have said that the sales promotion of the
company could be improvised by opening outlets at different corners of the city, just
as Ncell does by opening outlets even at pedestrian paths or through the support of
dealers. Further only 1.5% of the employees are forced on celebrity endorsement.
Thus, it can be said that the company can focus on offering worthy benefits to the
consumers of NT to enhance the advertising and promotion of the company.
Figure 4.4 Method to Enhance the Sales Promotion and Advertising
4.1.1.5 Responses on CAN Festival
Recently, NT participated in the CAN Info Festival. To know whether such sales
promotion activity has been able to draw the attention of the visitors, and if yes,
then to what extent the visitors have shown their enthusiasm in buying the
services, the employees are asked on this matter.

42
Table 4.5
Responses on CAN Festival
Details Respondents
No. %
High 17 25
Medium 46 67.6
Low 5 7.4
Total 68 100
(Source: Google Form Survey)
The majority of the employees of the NT have experienced medium or satisfactory
responses from the visitors in CAN festival toward the company. As per these
employees, the sales of the services, Mobile Services, Internet Services, Landline
Services and other, have surprisingly increased after and during the festival
period. About 67.6% of the total employees experienced positive or satisfactory
feedback due to the CAN festival. Further, it was seen that 25% of the employees
received very positive and high responses from the visitor at the CAN festival.
However, the other 7.4% of the total surveyed employees have said that the
curiosity and the excitement shown by the visitors of CAN on NT stall is not so
high, rather it was low in comparison to what their expectation level at CAN festival.
Nonetheless, excluding some exceptions, it can be inferred that such sales promotion
campaigns enhance the sales volume of the company.
Thus the company needs to do such campaigns frequently to make aware to
the consumers about the improvisation of the existing services and the
introduction of new services.

43
Figure 4.5 Responses on CAN Festival
4.1.1.6 Major Competitor of NT
After the enforcement of Telecommunication Act (2002), various telecommunication
service providers have emerged in the nation. To know which service provider is
presenting tough competition to NT, the respondents are asked.
Table 4.6
Major Competitor of NT
Details High Level Employee Middle Level Employee Total
No. % No. % No. %
Ncell 5 100 54 100 8 98.5
UTL - - - - - -
Other
Service
Provider
- - - - 1 1.5
Total 5 100 54 100 10 100
(Source: Google Form Survey)
From the analysis of the responses obtained from the majority of each group of the
employees categorized for the survey, it can be categorically inferred that Ncell is the
major competitor of the NT. The 100% of the high level employees, 100% of the total
middle level employees and in total 98.5% of the total surveyed employees

44
have pointed that Ncell is the major rival of the company, and such company is
adopting all sorts of promoting tools to capture the large section of the market.
Nevertheless, NT has its own large market, and as per these employees NT would
be the leading Telecommunication business, as it is now, in the forthcoming periods
as well, since NT has its own different strength which is impossible to debilitate
by the rival company. The employees of NT have not considered UTL as the
negligible rival, as none of the employees have experienced tough competition from
this organization. Nonetheless, the potentiality of this company to capture the market
should never be minimized as per the opinions of the employees. Similarly, only
1.5% of the total employees, have stated the other service providers such as world
link, broad link, Subisu etc. are competing toughly in internet services to NT.
Considering the opinions of the respondents quantitatively, it can be said that Ncell,
indeed, is the major rival of NT.
Figure 4.6 Major Competitor of NT
4. 1.l.7 Best Method for Allocating Budget to Advertising and Sales Promotion
In the present context, it has been ascertained through the personal interviews that the
company is following a judgment approach for allocating budget to advertising and
sales promotion. To determine whether such an approach is appropriate, if not what
could be the best approach, the employees are asked on this matter.
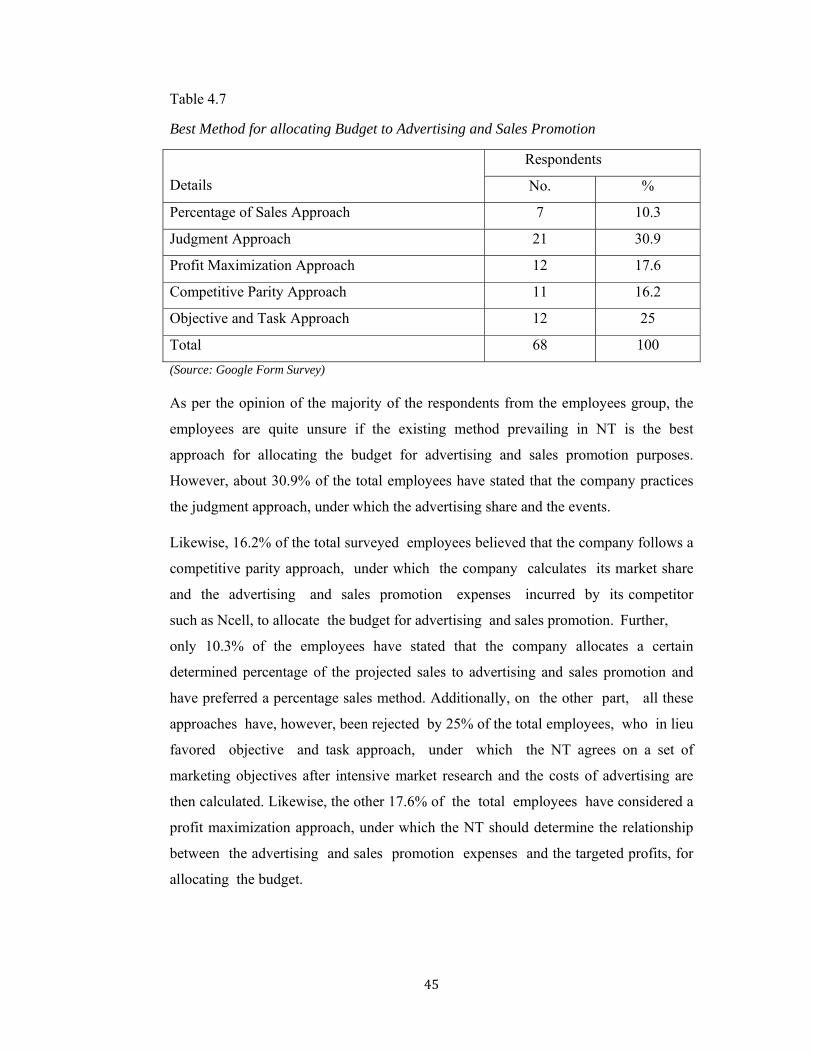
45
Table 4.7
Best Method for allocating Budget to Advertising and Sales Promotion
Details
Respondents
No. %
Percentage of Sales Approach 7 10.3
Judgment Approach 21 30.9
Profit Maximization Approach 12 17.6
Competitive Parity Approach 11 16.2
Objective and Task Approach 12 25
Total 68 100
(Source: Google Form Survey)
As per the opinion of the majority of the respondents from the employees group, the
employees are quite unsure if the existing method prevailing in NT is the best
approach for allocating the budget for advertising and sales promotion purposes.
However, about 30.9% of the total employees have stated that the company practices
the judgment approach, under which the advertising share and the events.
Likewise, 16.2% of the total surveyed employees believed that the company follows a
competitive parity approach, under which the company calculates its market share
and the advertising and sales promotion expenses incurred by its competitor
such as Ncell, to allocate the budget for advertising and sales promotion. Further,
only 10.3% of the employees have stated that the company allocates a certain
determined percentage of the projected sales to advertising and sales promotion and
have preferred a percentage sales method. Additionally, on the other part, all these
approaches have, however, been rejected by 25% of the total employees, who in lieu
favored objective and task approach, under which the NT agrees on a set of
marketing objectives after intensive market research and the costs of advertising are
then calculated. Likewise, the other 17.6% of the total employees have considered a
profit maximization approach, under which the NT should determine the relationship
between the advertising and sales promotion expenses and the targeted profits, for
allocating the budget.

46
Figure 4.7 Method used for Allocating Budget to Advertising and Sales promotion and satisfaction
4.1.1.8 Emphasis of the Sales Promotion and Advertising
Not all the services of the NT require strong sales promotion and advertisement,
Since it has earned strong belief of the consumers in some of the services. So to
examine which services the sale promotion and advertisement should give more
emphasis, the employees are asked on this matter.
Table 4.8
Emphasis of the Sales Promotion and Advertising
Details Respondents
No. %
PSTN Services 9 13.2
Mobile Services 38 55.9
Internet Services 57 83.8
(Source: Google Form Survey)
The table reveals that, as per the opinion of the employees, the sales promotion and
advertising of NT should give less emphasis on the PSTN services provided by the
company. Only13.2% of the total employees has stated this view. In other words, the
consumers of the country has already extensively preferred NT to other companies,
while installing the telephone services, and thus the promotional mix should less
focus on these services. However, 55.9% of the total employees have stated that the
studied promotional mixes should focus mainly on the Mobile service of the

47
company. As per them, the company should focus on the recent technological
improvement, if it has made, in mobile services while making sales promotion and
advertising strategy, since many consumers have grievances on the network of the
mobile services of NT. Although ADSL of NT has covered a wide market, the
employees have stated that the promotional tools of the company should emphasize
the most on the internet packages that have been provided. About 83.8% of the total
employees have stated this view. Eventually, it can be concluded, on the basis of the
majority, that NT should be more focused on the recent enhancement in the internet
services while making the sales promotion and advertising strategy.
Figure 4.8 Enhancing capability to capture market through Sales Promotion and Advertising
4.1.2 Analysis of the Responses of Consumers of
Under this section, the responses are received from 62 customers of NT through
questionnaires using Google forms that are related to sales promotion and advertising
campaigns of NT have been analyzed.
4.1.2.1 Preference of NT to Other
At present, three companies including NT are providing communication services to the
consumers of the country. To examine why the NT consumers have preferred NT to
NCell and UTL, the respondents are asked on this issue.

48
Table 4.9
Preference of NT to Other
Details Respondents
No. %
Effective Sales Promotion 11 17.7
Effective Advertising 10 16.1
Quality 19 30.6
Credibility 22 35.5
Total 62 100
(Source: Google Form Survey)
The Table 4.9 emblazons that a large section of the surveyed PSTN/Mobile/Other
users and Internet users of NT have been highly positively influenced by the
credibility of NT for their predilection toward it.
About 35.5% of the surveyed consumers have stated that the credibility of NT is the
main determinant for their preference for NT to Ncell and its other competitors.
However, 30.6% of the consumers have said that the quality of NT services has
influenced their preference. Similarly, 17.7% of total consumers have said that the
effective sales promotion of NT has enticed them to be the consumer of it.
Unfortunately, only 16.1% of total consumers have avowed that the effective
advertising of NT is the main factor for their preference.
This signifies that NT needs to enhance and make its advertisement more
effective without any procrastination to retain the existing consumers and other
potential consumers.
Figure 4.9 Preference of NT to Other

49
4.1.2.2 Preference of NT's SIM to Others'
Not only NT is providing the mobile services, but also the companies like Ncell are
also providing the same services. So to examine the reason behind the preference of
surveyed SIM users of NT to other companies, the question has been raised.
Table 4.10
Preference of NT's SIM to Others'
Details Respondents(SIM Card Users)
No. %
Good Network 22 35.5
Most Call Receiver Has NT’s SIM card 31 50
Persuading Promotion by NT 6 9.7
Reference group’s suggestion 3 4.8
Total 62 100
(Source: Google Form Survey)
As per the surveyed SIM Users of NT, it has been found that the most of the SIM
Users of this company have preferred NT' SIM to Others' SIM, especially Ncell and
UTL, due to the call receivers, as these receivers are using NT's SIM. Among the
surveyed users of NT, 50% of this group, which is 31 out of 62, has stated this reason
behind their preference. Next to this group, the other factor, representing 35.5% of the
surveyed users, has stated that they have given preference to NT, due to the good
network available by the company. Besides these, just 9.7% of the surveyed SIM users
have stated that their first choice is NT only due to persuading promotions by NT
through effective sales promotion and advertising. The suggestion of a reference
group; family, friends or others, has lost work out to some extent behind the
preference. The role of these reference groups seems very small, as only 4.8% of the
users have stated this fact. However, on the basis of the majority of the respondents, it
can be said that the promotional activities of NT is not the most crucial element in
causing the consumers to use NT's SIM, rather it is because of the call receivers that
are using NT's SIM. Nonetheless, the role of sales promotion and advertising of NT
would not be minimized.

50
Figure 4.10 Preference of NT's SIM to Others'
4.1.2.3 Sales Promotion Related to Mobile Services
To promote the mobile services, the NT has been using the sales promotion weapon at
a regular time interval. Thus, under this section, the study tries to detect the most
influencing sales promotional tool used by the company to promote mobile services.
Table 4.11
Sales Promotion Related to Mobile Services
Details Respondent (SIM Card User)
No. %
Bonus Call 19 30.6
Free SMS 6 9.7
Outlet Promotion 7 11.3
Easy Paying Mode 30 48.4
Total 62 100
(Source: Google Form Survey)

51
Figure 4.11 Sales Promotion Related to Mobile Services
Most of the surveyed SIM Users of NT have high affection for the company, due to
the easy paying mode provided by NT to its consumers on a regular basis. This sort of
sales promotion to enhance the mobile services has really worked out, as most of the
SIM users, 48.4% of the respondent group, has stated that this type of promotion has
caused them to use the product much frequently, by recharging their account as a
result of availability of the recharge cards.
Beside this sale promotion, the Bonus Call provided by the company has also
enticed the consumers. About 30.6% of the total SIM users have stated that they
use the call service more during this sort of sales promotional offer. However, free
SMS and outlet promotion made by NT as a part of sales promotion is considered to
be a less effective sales promotion technique as only 9.7% and 11.4% of total
consumers responded to these to be effective.
Thus, among the various types of sales promotional tools of NT, the offering of easy
paying mode and Bonus Call offered occasionally can be considered as a very
effective tool.
4.1.2.4 Preference of NT's Internet to Others'
The internet services providers are numerous in the country. Despite this reality, the
majority of the internet users subscribing to the internet services of NT are
tremendous. To know their affection toward the NT for internet services, the internet
users are asked on this issue.

52
Table 4.12
Preference of NT’s Internet to Others'
Details Respondents (SIM Card Users)
No. %
High Speed 13 24.5
Cheaper Kbps 28 52.8
Reference Group’s suggestions 8 15.1
Persuading Marketing by NT 4 7.6
Total 53 100
(Source: Google Form Survey)
Among the 53 surveyed internet users of the sampled company, the majority of the
internet users gave more predilections to the cheaper Kbps in the entire unlimited
package, the volume based package, dial up mode, leased connectivity, mobile
internet, and others. Exactly, 52.8% of the total internet users, 28out of 53, have
revealed this reason behind the preference of NT's internet to that of other service
Providers.
In addition, 24.5% of the surveyed internet users, 13 out of 53, have said that the high
speed as promised by the NT in its promotional campaign can be one of the effective
causes for the users' preference. Further, 15.1% of the surveyed internet users, 8 out of
53, have said that the suggestion of the reference groups have caused them to prefer
the internet of NT to that of other service providers. Thus, the role of the reference
group in affecting the preference of the consumers cannot be absolutely ignored as
well. However, the other 7.6% of the internet users, 4 out of 53, have said that the
encouraging marketing promotion in the form of sales promotion and advertising has
led them to prefer NT's internet to other service providers', such as Ncell's,
Worldlink's, Broadlink's etc., internet.
Summing up the received responses, it can be said that the cheaper kbps of NT is the
most crucial element behind the preference of the internet users. However, the high
speed internet can also be considered as one of the most important elements affecting
the users' preference.

53
Figure 4.12 Preference of NT's Internet to Others'
4.1.2.5 Sales Promotion Related to Internet Services
NT not only practices sales promotion tools for mobile services, but also for internet
services. To examine what sort of sales promotion related to internet services is much
effective, the respondents are asked on this matter.
Table 4.13
Sales Promotion Related to Internet Services
Details Internet Users
No. %
Increased Kbps at the same price 18 29
Low Tariff Rate on Unlimited Packages 34 54.8
Free Maintenance Service at NT’s premise 10 16.1
Total 62 100
(Source: Google Form Survey)
Analyzing the responses obtained from the opinion survey, the study has found that
the sales promotion in the form of low tariff rate on unlimited packages is the most
effective sales promotion of the company. Among the surveyed internet users, the
54.8% of them have been positively much influenced by this promotional tool and
further revealed that this sales promotion tool is one of the main reasons behind
connecting the internet of NT besides having lots of alternatives. Besides, increased
kbps at same price is considered as another effective sales promotion of the company;
for instance the NT has increased its internet speed from 128 kbps to 192 kbps at same
price of Rs. 800, including VAT as well, for the unlimited monthly package. Among

54
the surveyed internet users, 29 % of them have considered it as a major sales
promotion tool. However, the other 16.1% of the un eyed internet users have stated
that the provision of free maintenance of the general problem on router setting and
other software problems through the repair and maintenance department of the
nearest NT branch is the best sales promotion tool of the company. Considering the
majority of the responses, it can, however, categorically conclude that low tariff rate
on unlimited packages is the best sales promotion tactic adopted by NT on internet
services.
Figure 4.13 Sales Promotion Related to Internet Services
4.1.2.6 Sales Promotion Related to Landline Services
Under this section, the study finds out the best sales promotion exercised by the
company relating to the PSTN services by asking the question to the Landline users.
Table 4.14
Sales Promotion Related to Landline Services
Details Respondents (PSTN Users)
No. %
Low call Rate 31 50
No Tariff for STD Services 14 22.6
Bonus Payment on Deposit 4 6.5
Free Maintenance 6 9.7
Easy Complaining process 7 11.3
Total 62 100
(Source: Google Form Survey)

55
Among the 62 Landline Users, the majority of the respondents, 50%, have said that the
landline users have stated that the low call rate, such as the offer of 225 local free calls
out of minimum PSTN monthly charge (Rs. 200) at the 12th anniversary of NT, could
be proved as the most effective promotional tools. Further, the removal of tariff rate on
STD services has been proved to be a much effective sales promotion campaign of
NT.
However, the other 22.6% of this group shared different opinion; as per this group, the
low call rate, such as the offer of 225 local free calls out of minimum PSTN monthly
charge (Rs. 200) at the 12th anniversary of NT, could be proved as the most effective
promotional tools. On the other side, the other 11.3% of the users have stated that the
easy complaining process of NT about the Landline problems by dialing 198 either
through the Mobile using the SIM of Nepal Telecom or from the other Landline Line
phone of the same company, is the much effective sales promotion tool of NT.
Similarly, 9.7% of the landline users have said that the free maintenance service of NT
on landline by sending its employees either to the users' home or other else is the most
effective sales promotion tool of the company. And only 6.5% of the users have
considered bonus payment on deposit to be an effective promotional tool.
Figure 4.14 Sales Promotion Related to Landline Services
4.1.2.7 Perceptions on Bonus on Recharge Card during festivals
The consumers of prepaid mobile users of NT have generally noticed that the NT
provides bonuses during festivals and even on New Year. To know how the consumers
have perceived such proffer is substantial for the NT.

56
Table 4.15
Perceptions on Bonus on Recharge Card during festivals
Details Total Users
No. %
Motivation for multiple purchase 16 25.8
Promotional Strategy 22 35.5
Consumer Retention Strategy 12 19.4
Do not Know 12 19.4
Total 62 100
((Source: Google Form Survey)
The table depicts that 35.5% of the surveyed consumers have perceived bonus as a
mere promotional strategy rather than any other purpose. In contrast, 25.8% of the
surveyed consumers have analyzed the bonus on the recharge card for prepaid Mobile
as true motivation for making multiple usages.
Further, 19.4% of the respondents have perceived it as the consumer retaining strategy
of NT. And the other 19.4% of the respondents have shown no idea on this issue.
Paraphrasing the surveyed data it can be assumed that the bonus on recharge cards has
been used by NT for the purpose of mainly promotional strategy and not for the
consumer's benefit is what the consumers perceive.
Figure 4.15 Perceptions on Bonus on Recharge Card during festivals
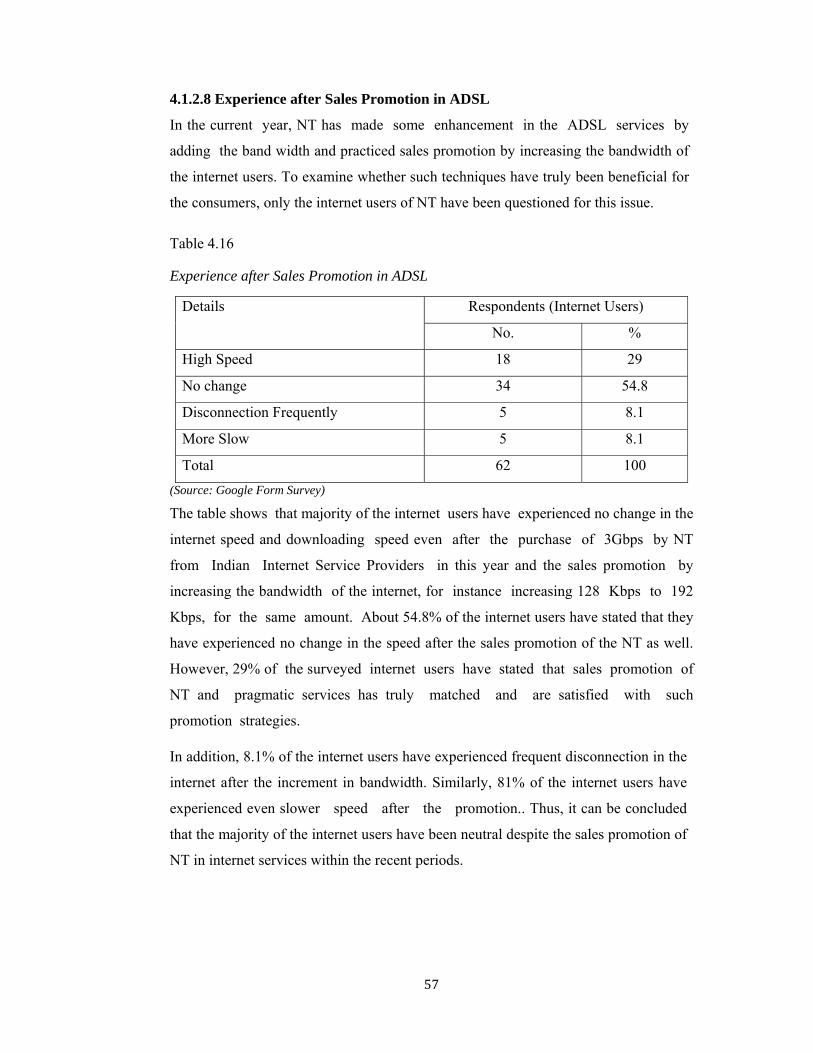
57
4.1.2.8 Experience after Sales Promotion in ADSL
In the current year, NT has made some enhancement in the ADSL services by
adding the band width and practiced sales promotion by increasing the bandwidth of
the internet users. To examine whether such techniques have truly been beneficial for
the consumers, only the internet users of NT have been questioned for this issue.
Table 4.16
Experience after Sales Promotion in ADSL
Details Respondents (Internet Users)
No. %
High Speed 18 29
No change 34 54.8
Disconnection Frequently 5 8.1
More Slow 5 8.1
Total 62 100
(Source: Google Form Survey)
The table shows that majority of the internet users have experienced no change in the
internet speed and downloading speed even after the purchase of 3Gbps by NT
from Indian Internet Service Providers in this year and the sales promotion by
increasing the bandwidth of the internet, for instance increasing 128 Kbps to 192
Kbps, for the same amount. About 54.8% of the internet users have stated that they
have experienced no change in the speed after the sales promotion of the NT as well.
However, 29% of the surveyed internet users have stated that sales promotion of
NT and pragmatic services has truly matched and are satisfied with such
promotion strategies.
In addition, 8.1% of the internet users have experienced frequent disconnection in the
internet after the increment in bandwidth. Similarly, 81% of the internet users have
experienced even slower speed after the promotion.. Thus, it can be concluded
that the majority of the internet users have been neutral despite the sales promotion of
NT in internet services within the recent periods.
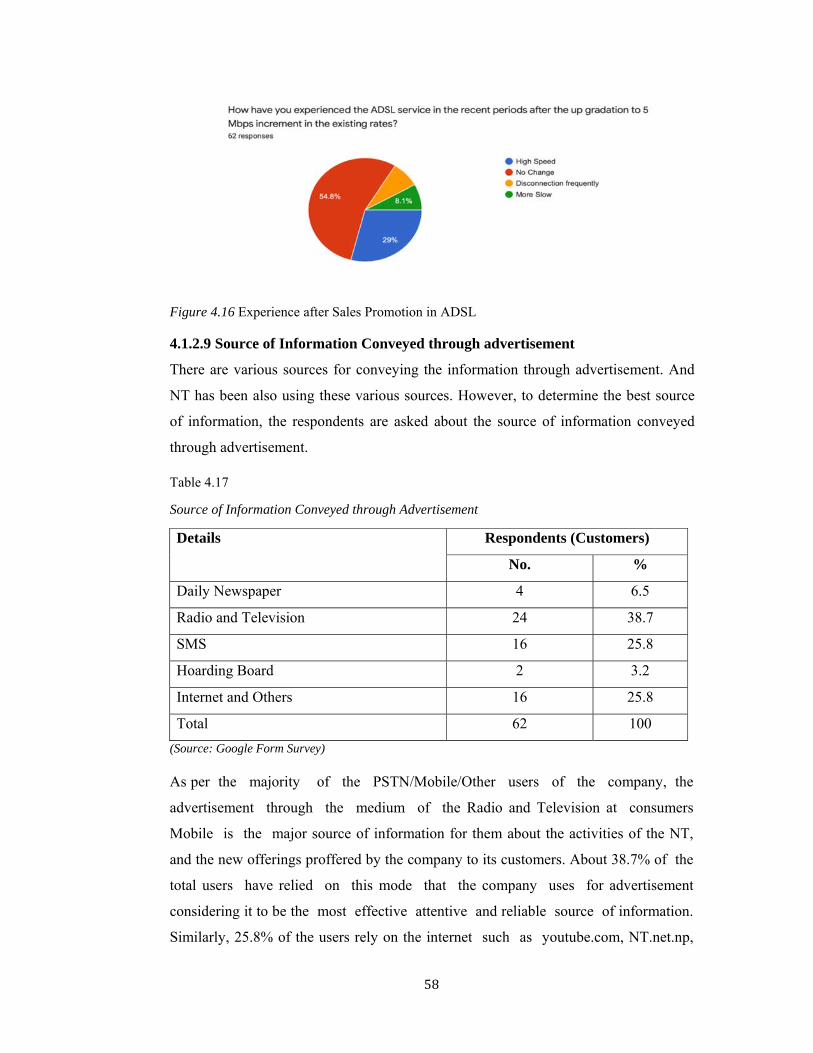
58
Figure 4.16 Experience after Sales Promotion in ADSL
4.1.2.9 Source of Information Conveyed through advertisement
There are various sources for conveying the information through advertisement. And
NT has been also using these various sources. However, to determine the best source
of information, the respondents are asked about the source of information conveyed
through advertisement.
Table 4.17
Source of Information Conveyed through Advertisement
Details Respondents (Customers)
No. %
Daily Newspaper 4 6.5
Radio and Television 24 38.7
SMS 16 25.8
Hoarding Board 2 3.2
Internet and Others 16 25.8
Total 62 100
(Source: Google Form Survey)
As per the majority of the PSTN/Mobile/Other users of the company, the
advertisement through the medium of the Radio and Television at consumers
Mobile is the major source of information for them about the activities of the NT,
and the new offerings proffered by the company to its customers. About 38.7% of the
total users have relied on this mode that the company uses for advertisement
considering it to be the most effective attentive and reliable source of information.
Similarly, 25.8% of the users rely on the internet such as youtube.com, NT.net.np,

59
facebook.com, and other sources, such as reference groups, as the major source
for getting information about the message conveyed by the NT through advertisement.
Likewise, 25.8% of the users rely on SMS for the information receiving purpose.
Further, for only 6.5% of the internet users, the daily newspapers have remained the
major sources of information for them. Remaining 3.2% of the surveyed users have
said that the hoarding board used by the NT to advertise its product and services is
the most effective source of information. However, considering the overall
majority, it can be concluded that the message sent by the company via radio and
television about its recent activities is the most fast and reliable mode for
advertisement.
Figure 4.17 Source of Information Conveyed through Advertisement
4.1.2.10 Prompt Enhancement in the Services
At the end of the questionnaire, the consumers are asked that, besides sales promotion
and advertising agency, on which services do they expect prompt enhancement for
gaining credibility. The obtained suggestions are presented in the table.
Table 4.18
Prompt Enhancement in the Services
Details Respondents (Customers)
No. %
PSTN Services 2 3.2
Mobile Services 32 51.6
ADSL/Internet 28 45.2
Total 62 100
(Source: Google Form Survey)

60
The table reveals that most of the consumers of the NT have expected prompt
enhancement in the network of mobile services. About 51.6% of the total surveyed
consumers have suggested this option.
Next to it, it can be assumed that the ADSL/Internet services of the NT have some
problems, such as slow connectivity, disconnection, low downloading rate etc. As a
result, 45.2% of the total surveyed consumers have pointed out this opinion. And only
4.2% of the total surveyed consumers have stated that the PSTN problems
such as interconnection disturbances should be promptly solved by the NT.
Figure 4.18 Prompt Enhancement in the Services
4.1.2.11 Quality of Advertising
The advertising should be such that it will impact on the consumers' mind in buying
the product. Thus, the advertiser should analyze each quality while building the
advertisement. To explore which quality is most crucial in making the advertisement,
the respondents are asked on this issue.
Table 4.19
Quality of Advertisement
Details No. %
Memorable 44 16.1
Meaningful 10 71
Likeability 8 12.9
Total 62 100
(Source: Google Form Survey)

61
The table depicts that the majority of the respondents have stated that the advertising
should be meaningful than memorable or likeable. 71% of the total respondents have
opined that the advertising should be meaningful, whereas 16.1% have affirmed that
the advertising should be easily memorable so that it stays at the time of purchase by
the consumers and only 12.9% of the respondents have stated the advertisement should
be likeable.
Considering the overall majority, and the majority of each category, it can be assumed
that the advertiser should concentrate most in making meaningful advertising to
affectionate the consumers toward the services of NT.
Figure 4.19 Quality of Advertisement
4.1.2.12 Criteria for Choosing Media
Before choosing the appropriate media for the advertising efficiently, the marketing
department of the NT needs to consider some of the criteria of the proposed media
types. To analyze on which criteria, the emphasis should be placed, the
respondents are asked on this matter.
Table 4.20
Criteria for Choosing Media
Details Respondents
No. %
Reach 19 30.6
Frequency 18 29
Impact 25 40.3
Media Timing 7 11.3
Total 62 100
(Source: Google Form Survey)

62
As per the suggestion of the majority of the respondents (40.3%), the marketing
department of NT should give more emphasis on the impact of the Media that has to
be chosen. For instance, how much impact do the media make while making
promotional campaigns? Further, 30.6% of the respondents suggest that NT should
give emphasis on the reach of the media to be chosen, that is, in case of Television,
NTV, Kantipur etc. are free channels and broadcasted throughout the nation,
while Avenues and others are payable channels and do not reach all the
population. Likewise, other 29% of the total employees have focused that the
Marketing Department of NT should focus on the frequency of the advertisement; no.
Of times a person is exposed to Ad that would be broadcasted. Finally, 11.3% of the
total respondents opined that the Media Timing, in case of Television and Radio,
should be considered most by NT. As per the opinions of the majority, it can be
inferred that impact and coverage of the media should be given more preference by the
NT for making the promotional strategy more efficient.
Figure 4.20 Criteria for Choosing Media
4.1.2.13 Factors to be considered Before Choosing Media Types
The company should be cautious enough while making decisions for the selection of
media types. The company should have a clear view on the targeted consumers,
messages to be conveyed and of course the cost associated with each media type.

63
Table 4.21
Factors to be considered before Choosing Media Types
Details Respondents (Customers)
No. %
Media Habits of Target Customer 28 45.2
Nature of Product 20 32.3
Type of the Message 8 12.9
Cost 6 9.7
Total 62 100
(Source: Google Form Survey)
The table depicts that 45.2% of the respondents have stated that NT should make
thorough investigation of the media habits of the targeted consumers before choosing
the types of media for promotion.
Similarly, 32.3% of the total respondents have stated that the nature of the services
should be considered for choosing the right media for promotional efficiency.
Also, 12.9% the total respondents have stated that the types of the messages that are
going to be conveyed should be given more preponderance while choosing the media.
And of course, 9.7% of the total respondents have stated that the cost should be
considered while choosing the media types.
Among the various discussed factors, it can be concluded, on the basis of the
Majority, that NT should focus mainly on the media habits of targeted consumers
before choosing the media types.
Figure 4.21 Factors to be considered before Choosing Media Types

64
4.1.2.14 Decision on Media Timing
Each company has each strategy for the timing of the advertisement. Some companies
follow seasonal, while some follow constant advertisement. Whatever, the
advertisement should be memorable and alluring to the consumers.
Table 4.22
Decision on Media Timing Details Respondents (Customers)
No. %
Follow Seasonal Pattern 23 37.1
Same Coverage all the year 22 35.5
Do not know 17 27.4
Total 62 100
(Source: Google Form Survey)
The table shows that 37.1 % total respondents have stated that following the seasonal
pattern advertising is sufficient for the promotion of NT services. In contrast, 35.5%
of the total respondents have stated that NT should have the same coverage all year for
promotion of the services.
However, 27.4% of the total respondents have stated that they have no idea on this
issue. Considering the overall majority, it can be stated that NT should follow the
recent strategy that is promoting the services throughout the year, for capturing the
market.
Figure 4.22 Decisions on Media Timing

65
4 .1.2.15 Impact of Celebrity Advertising
Although the audience is getting smarter and smarter and the modern day consumer
is getting immune to the exaggerated claims made in a majority of advertisements,
there exist a section of advertisers that still bank upon celebrities and their
popularity for advertising their products.
Table 4.23
Impact of Celebrity Advertising
Details Respondents (Customers)
No. %
Yes 34 54.8
No 15 24.2
Do not Know 13 21
Total 62 100
(Source: Google Form Survey)
The trend of celebrities endorsing brands has been steadily increasing over the past
years. Marketers acknowledge the power of celebrities in influencing consumer
purchasing decisions. Celebrity endorsement can bestow special attributes upon a
product that it may have lacked otherwise. However, if a celebrity can aggrandize the
merits of a brand, he or she can also exacerbate the image of a brand.
Today in Nepal, the popular brand ambassadors are Maha Jodi, Rajesh Hamal, Aachal
Sharma and others. Celebrity endorsements have several benefits, like building
credibility and getting attention of the public, which can translate into higher sales.
Most of the big companies have developed a new strategy to enroll celebrities and
make them brand ambassadors of their products to increase the product sale. When
asked to the respondents, the majority of them have stated that the endorsement of
celebrities in advertising could have a great impact on the promotion of the NT
services.
About 54.8% of the total respondents have the perceptions that the impact of
celebrity advertising can enhance the promotion of NT services. However, 24.2% of
the total respondents have stated that celebrity advertising can't enhance the

66
promotion. Finally, 21% of the total respondents have stated that they can 't state
precisely what impact will be in promotion, if NT uses celebrity advertising.
Figure 4.23 Impact of Celebrity Advertising
4.2 Secondary Data Analysis
Under this section, the data that are related to sales and the promotional mixes, mainly
sales promotion and advertisement, extracted from the reports of NT have been
analyzed.
4.2.1 Selling and Advertising Expenses to Sales of NT
Under this part of the study, the selling and advertising expenses incurred by Nepal
Telecom has been analyzed in order to stimulate the sales growth. Further the
proportion of selling and advertising expenses to sales of Nepal Telecom has
also been analyzed to ascertain the representation of observed promotional
expenses on total sales.

67
Table 4.24
Sales Revenue, Net Profit and Sales Promotion & Advertising Expenses of Nepal Telecom Year Net Sales Revenue Net Profit After Tax Total Sales Promotion &
Advertising Expenses2060/61 2,448,110,871.00 1,042,815,662.00 3,447,773.00
2061/62 9,194,297,192.00 3,542,461,326.00 13,728,601.00
2062/63 11,058,914,824.00 4,936,647,252.00 23,583,227.00
2063/64 14,751,623,805.00 5,652,688,491.00 29,463,508.00
2064/65 17,889,310,266.00 7,942,901,598.00 39,429,636.00
2065/66 22,147,582,000.00 10,178,025,000.00 41,127,348.00
2066/67 27,221,068,000.00 10,775,154,000.00 69,916,799.00
2067/68 29,849,161,000.00 12,120,299,000.00 83,848,754.00
2068/69 37,283,776,008.00 11,658,851,018.00 105,288,688.00
2069/70 38,858,260,979.00 11,299,175,997.00 100,718,272.00
2070/71 39,671,121,000.00 11,568,495,691.00 124,500,913.00
2071/72 42,638,371,000.00 14,556,338,378.00 122,840,805.00
2072/73 44,227,356,864.00 18,234,359,433.00 122,826,765.00
2073/74 44,588,989,122.00 20,575,855,348.00 163,171,219.00
2074/75 45,269,484,957.00 17,483,801,827.00 167,177,443.00
2075/76 43,839,038,016.00 9,757,575,839.00 169,149,456.00
Mean 27,202,028,562.75 10,707,840,366.25 86,263,700.44
Standard Deviation 15669443761 5361531995 56461346.81
Kurtosis -1.533202556 -0.3076540679 -1.350613801
Skewness -0.2698375405 0.07200239054 0.05904572822
Range 42,821,374,086.00 19,533,039,686.00 165,701,683.00
Minimum 2,448,110,871.00 1,042,815,662.00 3,447,773.00
Maximum 45,269,484,957.00 20,575,855,348.00 169,149,456.00
(Source: Annual Report of NT and Data are analyzed using excel-2007)
The descriptive statistical analysis describes the variable used in the study. It describes
the mean, standard deviation, Kurtosis, Skewness of data, data range (minimum and
maximum) of the variable. The table no. 4.24 shows that the mean value of sales
revenue for the given respective years is 27,202,028562.75 whereas the mean value of

68
the net profit after tax is 10,707,840,366.25 and for total sales promotion and
advertising are 86,263,700.44.
Further from the above given table, it can be analyzed that the net sales revenue has
been increasing for the past 12 years and decreases during the year 75/76, which is
similar to net profit after tax. However, for the past two years it can be analyzed that
the total sales and advertising expenditure has increased with a huge amount.
Standard deviation measures total risk and from the above table, standard deviation of
Net Sales Revenue, Net Profit after tax and total Sales Promotion and advertising
expenses is 15669443761, 5361531995 and 56461346.81 respectively.
The skewness for a normal distribution is zero, and any symmetric data should have
skewness near zero. Negative values for the skewness indicate data that are skewed
left and positive values for the skewness indicate data that are skewed right. In the
above given table, Net Sales revenue is skewed left with the value -0.2698375405
which indicates the left tail is long relative to the right tail, as the shape of distribution
in a graph. However, Net Profit after Tax and total Sales and Advertising expenses are
right skewed, meaning the right tail is long relative to the left tail, with the value
0.07200239054 and 0.05904572822 respectively.
Kurtosis is a measure of the combined sizes of the two tails. If a distribution has
negative kurtosis, there is a flatter peak and thinner tails compared to a normal
distribution. Here, Net Sales Revenue, Net Profit after Tax and total Sales and
Advertisement expenses, all of the three have a negative kurtosis the value being -
1.533202556, -0.3.76540679 and -1.350613801 respectively. This simply means that
more data values are located near the mean and less data values are located on the
tails.
4.2.2 Trend of Sales Revenue, Net Profit and Sales Promotion and Advertising
Expenses of NT
In the given figure X-axis shows the year and Y-axis shows Net Sales Revenue, Net
Profit after Tax and Total Sales and Advertisement expenses for the given period. The
figure shows that the sales revenue of NT had been increasing rapidly for past 12 years
however has slightly declined in the last year i.e. year 2075/76. However, Net Profit
after tax has comparatively risen in the year 2075/76 in comparison to 2074/75 year,

69
but when analyzed the data, it can be visibly noticed that Net profit had also been
increasing rapidly for the past 11 years. Further, it can be analyzed that Total Sales and
Advertisement expenditure is on a continuous verge of increasing even during the last
two years i.e. 2074/75 and 2075/76 irrespective of the net profit and sales revenue
trend.
Figure 4.24 Trend of Sales Revenue, Net Profit and Sales Promotion and Advertising Expenses of NT
4.2.3 Sales Revenue
The given figure shows that sales revenue of NT is increasing at increasing rate until
year 2071/72, onwards that year the sales revenue is increasing at a decreasing rate.
However, in the year 2075/76, the sales revenue has declined. Further, in the given set
of data, sales revenue is maximum in the year 2074/75 being 45,269,484,957.00.
Figure 4.25 Trend of Sales Revenue

70
4.2.4 Net Income
Net income or Net Profit after Tax of NT has an increasing trend. It has been
increasing at an increasing rate until year 2073/74, when it reaches maximum and then
slightly declines in the year 2074/75. However, it again increased in the last year, i.e.
2075/76. The figure shows that the net income of the company either increases or
decreases sharply and seems to be fluctuating more in the recent years.
Figure 4.26 Trend of Net Income
4.2.5 Advertisement Expenditure
The figure presented below shows the cost of expenditure made by the company in
sales promotion and advertisement. It can be analyzed that the company’s’ expenses is
increasing up to 2069/70 and then slightly declines in the following year and stays
constant until 2072/2073. After which, there’s a rapid rise in the expenses in the year
2073/74 and gradually increases for the last two years.
On comparison between three taken variables we see that there is not uniformity in the
sale revenue, net income and advertisement cost.

71
Figure 4.27 Trend of Advertisement Expenditure
4.2.2 Correlations Analysis
Table 4.25
Pearson Correlations Coefficient of Variables (n=16)
Variables Sales Revenue Net Profit Sales Promotion and
Advertising Expenses
Sales Revenue 1 - -
Net Profit 0.8084312215 1 -
Sales Promotion and
Advertising Expenses
0.7964779496 0.8416748748 1
Source: Annual Report of NT and data analyzed using excel 2007 version
Table 4.26 shows the Correlation Analysis of Sales Revenue, Net Profit and Sales
Promotion & Advertisement Expenses. The above given analysis shows that there’s a
positive correlation between Net Profit and Sales Revenue. This means the two
variables have a direct impact on each other. Further, Sales promotion and Advertising
expenses also have positive correlation with Net Profit and Sales Revenue. Looking
into detail, Sales and Advertising expenses has more impact on net profit as the value
results in 0.8416748748 than with sales revenue being 0.7964779496.

72
4.3 Major Findings of the Study
From the analysis of the data obtained through various sources, the following major
finding has been drawn;
A) Findings from Primary Data Analysis
a) Employees' Survey
• 51.5% of the employees have stated that the advertising and sales promotion have a
strong effect in order to increase sales.
• 75% of the employees have thought that the trademark is the most crucial element
of advertising than the slogan and the color do.
• 47.1% of the employees have stated that the combination of promotional mixes,
good governance of the company and the consumers’ confidence toward the
company is the strength of NT. .
• The majority of the employees, 83.8%, have said that the sales promotion and
advertising of NT could be much enhanced by offering beneficial values to
customers rather than by just opening an outlet or celebrity endorsement in
advertisement.
• 67.6% of the employees have experienced that the visitors at CAN festival
showed moderate enthusiasm toward the products and services of NT kept at a
stall.
• Among various service providers, the Ncell is the major competitor of NT, as per
the opinion of the 98.5% of the employees.
• The 35.3% of the employees are not satisfied with the applied judgment
approach for allocating budget to advertising and sales promotion. Only 20.6%
have voiced a judgment approach, and the rest are unsure about the method used.
• 55.9% of the employees have said that the company should focus much on
uplifting the sales of mobile services while practicing sales promotion and
advertising.

73
b) Consumers’ Survey
● As per the opinions of the majority of the customers, 35.5%, the consumers
prefer NT to other service providers due to its credibility among the
consumers.
● 50% of the SIM users of NT have said that they prefer the SIM of NT to other
Service Providers, mainly because the call receivers of these users are using NT’s
SIM, and thus it would be less costly for them to make calls.
● Among the various sales promotions practiced by NT, the majority, 48.4% of the
SIM cards users have experienced easy paying mode as the most effective
promotional tool.
● 52.8% of the internet users of NT have said that due to the cheaper kbps of this
company, these internet users prefer the internet services of NT to Others.
Further, 48% of the internet users have stated that the low tariff rate on unlimited
packages is the most effective sales promotion they have experienced.
● The 50% of the landline users have said that the low call rates of NT is the most
effective sales promotion on landline services.
● 35.5% of the customers of NT perceived the bonus offer in the recharge card of
NT during the festival occasion as promotional strategy.
● After the enhancement in the ADSL services; part of sales promotional
activities, the majority of the internet users, 54.8%, have experienced no change
in the speed of services.
● The 38.7% of the surveyed customers have said that the most important source of
information through advertisement of NT to the customers is via radio and
television.
● 51.6% of the surveyed customers have stated that ·the company needs to take
prompt action for ameliorating the Mobile Network, as the reputation of the
company is defaming due to the poor network.
● Majority of the surveyed customers, 71%, believe that the advertisers need to pay
attention to make meaningful advertisements to make it more attractive.
● 40.3% of the customers believe that NT should focus on making an impact while
choosing the media for advertisement.
● NT should consider media habits of the targeted customers before choosing Media

74
Type as per the 45.2% of the surveyed customers.
● 37.1% of the surveyed customers believe that following the seasonal pattern of
advertising the services would be more appropriate for NT to capture the higher
attention of customers.
● Finally, 54.8% of the customers surveyed have responded that NT should adopt
celebrity advertising for making the advertisement more efficient.
B) Findings from Secondary Data Analysis
● Net sales revenue of NT is increasing at increasing rate until year 2071/72,
onwards that year the sales revenue is increasing at a decreasing rate. Likewise, it
has been increasing at an increasing rate until year 2073/74, when it reaches
maximum and then slightly declines in the year 2074/75, followed by increase in
the next year. However, the total sales promotion and advertisement has more
rapid fluctuation with a rapid rise or decline than that of the other two.
● Mean Calculated for Net Sales Revenue, Net Income and Total sales promotion
and advertising is 27,202,028,562.75, 10,707,840,366.25 and 86,263,700.44
● Standard deviation measures total risk and the standard deviation of Net Sales
Revenue, Net Profit after tax and total Sales Promotion and advertising expenses is
15669443761, 5361531995 and 56461346.81 respectively.
● Net Sales revenue is skewed left with the value -0.2698375405 which indicates the
left tail is long relative to the right tail, as the shape of distribution in a graph.
However, Net Profit after Tax and total Sales and Advertising expenses are right
skewed with the value 0.07200239054 and 0.05904572822 respectively.
● Net Sales Revenue, Net Profit after Tax and total Sales and Advertisement
expenses, all of the three have a negative kurtosis the value being -1.533202556, -
0.3.76540679 and -1.350613801 respectively. This simply means that more data
values are located near the mean and less data values are located on the tails.
● Net Profit and Sales Revenue have a direct impact on each other being positively
correlated with the value 0.8084312215. Further, Sales promotion and Advertising
expenses also have positive correlation with Net Profit and Sales Revenue.
Looking into detail, Sales and Advertising expenses have more impact on net

75
profit as the value results in 0.8416748748 than with sales revenue being
0.7964779496.
As a promotional strategy, advertising serve as a major tool in creating product
awareness in the mind of a potential consumer to take eventual purchase decision.
Advertising through all mediums influence audiences, but television is one of the
strongest medium of advertising and due to its mass reach, it can influence not only
individual’s attitude, behavior, life style , exposure and in the long run, even the culture
of the country (Latif & Abideen, 2015).

76
CHAPTER V
SUMMARY, CONCLUSION AND RECOMMENDATIONS
5.1 Summary
The development of a nation, strengthening of the national economy, is almost
impossible without the utilization of telecommunication services. From economic
perspectives, beadles and capital and labor, the need of telecommunication is equally
important. Can someone imagine the avoidance of mobile/landline services and
instead favor the usage of postal services? However, the study does not intend to
undermine the significance of the postal services. Obviously not! This would
be just like a retrospective movement toward the Stone Age. Not only the
telecommunication services are just facilitating the landline and mobile services
as the mode of information transferring, but also the other services like the
internet is also equally important. In fact, it is the fastest mode ever to transfer the
message to a large population through just on clicks. For this, the social internet
sites like facebook.com, linkedin.com, twitter.com etc. can be the best
illustrations. Thus, it can be said that nobody can remain incommunicado, and the
essence of telecommunication services preliminary crux for development.
Although the evolution of telecommunication services in Nepal dates back to the
Rana Regime, the actual revolutionary effect of telecommunication services can be
seen after the enactment of Telecommunication Act (2002). After the effect of this
act the former Nepal Telecommunication Corporation has been transformed to NT
with the participation of the public. Also, the other Telecommunication Service
providers like Spice Nepal; NCell, UTL, and others have been established.
Nevertheless, the weight of NT has not been significantly blurred among the public.
As a result, NT is one of the leading Service Providers of Nepal and encompasses a
larger population of the country. However, the company is still producing products
and services through various promotional mixes. The sales promotion aids to get the
effect soon and for a short period, however, the advertisement is considered to have
long term effect. The NT is using both tools for promoting its products, and thus the
measurement of the effect of such tools for increasing the sales volume of the
company is important. Considering this necessity, the present study has been done

77
meaning the effect of sales promotion and advertising in promoting products and
services of NT as the subject matter.
5.2 Conclusion
It can be concluded that the NT needs to do additional exercise to get much positive
influencing impact of the advertising and sales promotion on increasing sales
volume. Further it can be said that while creating advertisements, the marketing
department should focus much on the Trademark, despite the trademark is unique
it should be much more memorable, than the slogan and color of the company.
The promotional mixes, the better management of the company, and the consumers’
confidence are the three strongest pillars of the company, and thus these pillars
should be supportive of each. From the analysis, it can also be concluded that by
celebrity endorsement besides using opening outlet, paying good commission to
mediators, and offering beneficial value to customers, the advertising and sales
promotion could be improvised. The company has considered Ncell as the major
competitor and the competition given by such companies could be weakened
by practicing the sales promotion like promoting the services at CAN festival
and others. Further, it can be said that the judgment approach for allocating the
budget to sales promotion and advertising is just not the best approach for NT
as many of the respondents are not even sure of the method to be used. Although the
sales promotion and advertising should go to all the services, 'the importance of this
promotional mix should be much on mobile Services.
In additional to the meaningful and likeability quality of the advertisement, the
memorable quality of this promotional element is rather highly important. From
the survey it can be further concluded that the company should focus much on
impact ability of the media than on the frequency, reach and timing of the media.
Also, the company should consider much on the media habits of the targeted
customers before choosing the types of media for promotion. It can be inferred that
the same coverage throughout the year is much better promotional timing impact of
celebrity advertising on drawing the attention of the large population toward the
promoted services is great.
Further, it is not only the effectiveness of sales promotion and advertising that the
majority of the consumers prefer NT to others, but the credibility of the company.

78
Further there all receivers' usage of SIM cards is one that affects the decision of the
callers to choose the company. The greater population of the company could be
much influenced by the bonus call, and then the seasonal pattern by other
promotional practices like free SMS, outlet promotion etc. The decision of the
internet users to prefer a company to others is much affected by the speed rather than
by the cost, suggestions and the marketing. And this fact has been strengthened by a
large proportion of the internet users considering that low tariff rate on unlimited
packages rather than increased kbps at the same price enticed the customers more.
Further, the low call rate is the better sales promotional activities of NT than the
other activities like free maintenance, removal of the Tariff on the STD services etc.
The impact of sales promotion and advertising to make the consumers loyal is not so
strong in NT, rather it is moderate. It can be further inferred that the infrequent
bonus payment by the company on the recharge of the mobile services is just not
more than the promotional strategy. However, the consumer has shown no reaction
on the sales promotion of ADSL activities, as the majority has experienced any
change in the speed of the internet. Also, it can be said that the promotional elements
like advertisements displayed on Television and Radio, as a part of sales promotion
practice, has been the prominent source of information regarding the activities of the
company’. Further, with the aid of sales promotion and advertisement, NT has been
able to increase the sales growth in each fiscal year. However, the representation of
sales promotion and advertisement on total sales of NT Nepal has been very low.
Similarly, in each year the cost of advertisement has increased, while the cost of
sales promotion of NT Nepal has decreased in most of the years. Nevertheless, it
cannot be denied that the success behind NT has been facilitated by the advertising
and sales promotion strategy it has adopted.
5.3 Recommendations
On the basis of major findings and conclusions drawn, the following
recommendations have been provided for the enhancement of the promotional mix
of NT;
● NT should use sales promotion for the immediate achievement in sales
acceleration, while the company should use advertisement for the long
term capture of the market.

79
● NT should use the effective tool for the ease identification of brands.
Since not all consumers are literate, the organization should consider these
consumers while making an effective advertisement. For this, color of the
brand, symbol and logo and cartoon and animation can be an easy tool for
brand recognition.
● Though the company has practiced a judgment method for allocation
budget for advertisement, yet the employees aren't sure if it is the most
effective method for allocation of budget. Thus, NT should, as per the
implications of the majority of respondents, apply the methods whichever
is best in various market situations and make it transparent showing the
pros and cons of the method applied.
● Both the modes of advertising, digital advertising and physical
advertising, are equally effective in their scope to convince the consumers
about the products. Thus, NT should have good harmony between these
two modes for achieving the optimum promotional mix.
● The sales promotion tool of NT should use market penetration, which
embraces a quest of more people to buy, encouraging brand switching of
product and trail product, for seizing the communicative market.
● Although the sales promotion of NT is consumer oriented, the company
should persistently practice consumer-oriented sales promotion in future
as well. NT should examine and modify, if necessary, the management
processes for establishing strategic promotional objectives and for seeing
that specific promotion plans have both objectives and plans to ensure that
the strategic objectives are met.
● NT should more effectively integrate sales and marketing operations,
utilizing both organizational structures to facilitate integration and
operating procedures to enforce/encourage the kind of consultation that
would lead to better integration.

80
REFERENCE
Baker, Wayne E. 2015. "Market Networks and Corporate Behavior" American Journal
of Sociology. 96: 589-625.
Berkowitz, S.D. 2008. "Markets and market-areas: Some preliminary formulations"
pp. 261-303 in Wellman and Berkowitz (eds.) Social structures: A network approach.
Cambridge: Cambridge University Press Edition.
Green, Paul E. & Toll, S. Dona is (2011). Research for Marketing Decision, 4th Ed.,
New Delhi: Prentice-Hall oldie (Pvt.) Ltd.
Kandel, L. (2019). Knowledge Acquisition in Nepalese Telecom Industry. NCC
Journal, 4(1), 121-129. https://doi.org/10.3126/nccj.v4i1.24745
Koirala, K.D. (2068), Marketing Decisions, Kathmandu: M.K. Publishers &
Distributors.
Kothari, C.R. (2000). Research Methodology: Methods and Techniques, 2nd Ed.,
Wiley Eastern Limited.
Kotler P. (2014), Marketing Management. Delhi: Pearson Education.
Kotler & William, 2014. Marketing Management , pp. 299-307
Kotler, P. & Armstrong, G. (2013) Principle of Marketing. 15th Edition, Prentice Hall.
Loudon, D.L., & Della Britta, A.J. (2015), Consumer Behavior. Singapore: Mc
Graw-Hill.
Neslin, Scott (2002), Sales Promotion, Marketing Science Institute (MSI), First
Obasan & Soyabo (2012), Assessing the Effectiveness of Promotion as a
Marketing Management Tool, A Study of Swedish Telecommunication
Industry"
Okyere, Agyapong, & Nyarku, (2011), The Effect of Marketing Communications on
the Sales Performance, Ghana Telecom (Vodafone, Ghana), Article on A
Study of Ghana Telecommunication Industry

81
Omotayo, (2018), Sales Promotion and Consumer Loyalty: Article on A Study of
Nigerian Telecommunication Industry.
Pant, P. R. (2015), Social Science Research and Thesis Writing. Kathmandu, Buddha
Academic Enterprises Pvt. Ltd.
Pant, Y. (2013). A Study on Brand Loyalty, an Unpublished Master Degree
Dissertation Submitted to Central Department of Management, T.U., and
Kirtipur
Sales and Advertisement Relationship for selected company’s operation in India: A
Panel Data Analysis (2009).
Sharma P.K., & Chaudhary, A.K. Statistical Methods for MBS and MPA, Kathmandu;
Khanal Publication Pvt. Ltd. 2058 B.S.
Sunuwar (2007), Vegetable Marketing in Bhaktapur, an Unpublished Master Degree
Dissertation Submitted to Central Department of Management, T.U.
Totten, J.C. & Block, M.P. (2014), Analyzing Sales Promotion Text & Cases: How to
Profit from the New Power of Promotion Marketing, 2nd ed., USA: The
Dartnell
Zallocco, Perreult & Kincaid (2018), Promotion, Persuasive Communication in
Annual Reports of Nepal Telecom: Various Years
https://en.wikipedia.org/
https://www.ntc.net.np
http://www.iiste.org
https://journals.sagepub.com/
https://www.researchgate.net/publication/313104075Fundamental_Analysis_of_Nepal
_Telecom_Ltd