Embed Size (px)
Citation preview
HAL Id: tel-01968067https://tel.archives-ouvertes.fr/tel-01968067
Submitted on 2 Jan 2019
HAL is a multi-disciplinary open accessarchive for the deposit and dissemination of sci-entific research documents, whether they are pub-lished or not. The documents may come fromteaching and research institutions in France orabroad, or from public or private research centers.
L’archive ouverte pluridisciplinaire HAL, estdestinée au dépôt et à la diffusion de documentsscientifiques de niveau recherche, publiés ou non,émanant des établissements d’enseignement et derecherche français ou étrangers, des laboratoirespublics ou privés.
Electrostatic MEMS vibrational energy harvester withlarge bandwidth for biomedical applications
Bogdan Vysotskyi
To cite this version:Bogdan Vysotskyi. Electrostatic MEMS vibrational energy harvester with large bandwidth for biomed-ical applications. Micro and nanotechnologies/Microelectronics. Université Paris Saclay (COmUE),2018. English. �NNT : 2018SACLS278�. �tel-01968067�
Récupérateur d'énergie vibratoire MEMS électrostatique à large
bande pour applications biomédicales
Thèse de doctorat de l'Université Paris-Saclay préparée à l'Université Paris-Sud
École doctorale n°575 electrical, optical, bio: physics and engineering (EOBE)
Spécialité de doctorat: Electronique et Optoélectronique, Nano- et Microtechnologies
Thèse présentée et soutenue à Orsay, 24/09/2018, par
Bogdan VYSOTSKYI Composition du Jury : M. Adrien Badel Professeur, Université de Savoie (– SYMME) Président
M. Jean-Claude Golinval Professeur, Université de Liège (– LTAS) Rapporteur
M. Philippe Basset Enseignant-Chercheur HDR, ESIEE Rapporteur
M. Dimitri Galayko Maître de conférences, UPMC (– LIP6) Examinateur
M. Jérôme Juillard Professeur, CentraleSupélec (– GEEPS) Examinateur
M. Fabien Parrain Maître de conférences, Université Paris-Sud (– C2N) Directeur de thèse
M. Denis Aubry Professeur, CentraleSupélec (– MSSMat) Co-Directeur de thèse
M. Elie Lefeuvre Professeur, Université Paris-Sud (– C2N) Invité
M. Philippe Gaucher Professeur, CentraleSupélec Invité
NN
T :
20
18
SA
CLS
278

Université Paris-Saclay Espace Technologique / Immeuble Discovery Route de l’Orme aux Merisiers RD 128 / 91190 Saint-Aubin, France
Université Paris-Saclay Espace Technologique / Immeuble Discovery Route de l’Orme aux Merisiers RD 128 / 91190 Saint-Aubin, France
Titre : Récupérateur d'énergie vibratoire MEMS électrostatique à large bande pour applications biomédicales
Mots clés : Microsystèmes, Récupération d'énergie, Battement de cœur, Microtechnologies, Ressorts non-linéaires
Résumé : Ce travail de recherche porte sur le
développement et la mise au point d'un récupérateur
d'énergie vibratoire MEMS à transduction capacitive dédié
aux applications biomédicales et plus particulièrement aux
stimulateurs cardiaques sans sonde autonomes. Cette
application impose une miniaturisation poussée (volume
inférieur à 1 cm3), une puissance de sortie dans la gamme
allant de 1 à 10 µW et une compatibilité vis-à-vis des
systèmes d'Imagerie à Résonance Magnétique (IRM). Ces
contraintes ainsi que l'effet de la gravité ont été pris en
compte sur tout le flot de conception afin d'obtenir un
dispositif innovant en technologie MEMS silicium capable
de fournir une puissance de sortie suffisante quelle que soit
son orientation une fois implanté. Afin de convertir
efficacement les battements cardiaques ayant un spectre
étendu (de 1 à 50 Hz) pour une amplitude d'accélération
faible (inférieure à 1 g), le système emploie des bras de
suspension ayant une raideur non-linéaire ce qui permet
d'étendre notablement la bande passante effective du
système. Cette non-linéarité est ici induite de manière
originale en faisant en sorte que la forme initiale des bras de
suspension soit une combinaison linéaire des modes de
déformée propre d'une poutre doublement encastrée.
Un soin particulier a été apporté afin de modéliser ceci dans
le but de prédire la réponse mécanique du système quels que
soient les stimuli imposés. Afin de réaliser les différents
dispositifs de test, une technologie MEMS de type SOG
(Silicon-On-Glass) a été développée. Cette technologie
permet d'obtenir des structures en silicium monocristallin
avec un fort rapport d'aspect tout en limitant le budget
thermique et se montre donc compatible avec une éventuelle
industrialisation. Ceci a été prouvé via la réalisation de
multiples véhicules de test qui se sont montrés totalement
fonctionnels. Ainsi la pertinence des modèles théoriques
permettant de prédire le comportement non-linéaire des
ressorts employés a été prouvée de manière expérimentale.
De même, les récupérateurs d'énergie réalisés ont été testés
en régime harmonique mais également via des stimuli
cardiaques et ont montré une large bande passante avec une
puissance de sortie équivalente à celle donnée dans l'état de
l'art et ce, quelle que soit leur orientation par rapport à la
gravité.
Title : Electrostatic MEMS vibrational energy harvester with large bandwidth for biomedical applications
Keywords : MEMS, Energy Harvesting, Heartbeat, Microtechnologies, Nonlinear springs
Abstract : Present work addresses question of MEMS
capacitive vibrational energy harvesting for biomedical
applications, and notably for powering an autonomous
leadless pacemaker system. Such an application imposes
several critical requirements upon the energy harvesting
system, notably the sufficient miniaturization (<1cm3),
power output in range of 1-10 µW, compatibility with
Magnetic Resonant Imaging (MRI). This work addresses a
problematics of MEMS energy harvester design,
simulation, fabrication and characterisation fulfilling such
a requirements. Moreover, a gravity effect is studied and
taken into account in the conception of the device to ensure
the power output at various orientations of the harvester.
To attain a heartbeat frequencies (1-50 Hz) and
acceleration amplitudes (<1g), the use of nonlinear springs
is proposed. A nonlinear stiffness is implemented in
original way of introducing a natural bending mode shapes
in the initial beam form. A mechanical description of
bending mode coupling along with its impact on a reaction
force of the suspension springs is presented.
An innovative clean room technology based on silicon-on-
glass (SOG) wafers is developed for the fabrication of the
innovative energy harvesters with high width-to-depth
aspect ratio. A straightforward and rapid low-temperature
process with the possibility of future industrialization is
validated by multiple experimental realisations of
miniaturized MEMS energy harvesters. Fabricated
microsystems are tested mechanically and electrically.
Proposed theoretical model of the curved beam is validated
with reactive force measurements of the MEMS springs.
Energy harvesting experiments are performed for both
harmonic and heartbeat mechanical excitations, which
demonstrate the large bandwidth in low frequencies
domain and a sufficiently large state-of-the-art power
output for envisaged application under different
orientations with respect to the gravity.

Université Paris-Saclay Espace Technologique / Immeuble Discovery Route de l’Orme aux Merisiers RD 128 / 91190 Saint-Aubin, France

In a living memory of my grandparents
My work consists of two parts: of the one which is here, and of everything I have not written.
And precisely this second part is the important one.
Ludwig Wittgenstein
i
Acknowledgements
First of all, it should be said that the list of the people that played a remarkable role and had an
impact upon the outcome of this work is in no way can be called complete. I wanted to make a
list of acknowledged people as concise as possible, while nevertheless mentioning everyone
that had to be mentioned as they assisted in production of this text, directly or indirectly. Thus,
I would like to apologise in advance if someone is forgotten to be properly acknowledged as he
or she should be!
The scientific discussions during the years of this thesis were shared between four people that
are also supervised present doctoral project. I wish to express my deep gratitude to Pr. Elie
Lefeuvre, who invited me into the Microsystems department for the internship at 2015, for his
continuous guidance, practical lessons, support and aid on an enormous variety of questions,
and for giving me an understanding of how to manage a research project. I want to thank Pr.
Denis Aubry for his precise and important teachings, availability for the discussion, broad-
mindedness, devotion to research, and deep attention given into this project. I am thankful to
Dr. Fabien Parrain for his useful advice in every aspect of this work, availability, his inspiring
nature, unceasing encouragement and help. I want also to thank Pr. Philippe Gaucher for the
assistance in this project and the valuable comments and discussions during all thesis years.
The reviewers of this work, Pr. Jean-Claude Golinval and Dr. Philippe Basset, had kindly
accepted and taken their time to review present text during phenomenally scorching August of
2018, for which I want to express my gratitude. I want to acknowledge the members of the
thesis committee that agreed to participate on the PhD defence: Pr. Adrien Badel, Dr. Dimitri
Galayko and Pr. Jérôme Juillard.
The role of the researchers from C2N, Orsay, Microsystem department is of the great
importance, as they shaped the environment favouring the fruitful creative work. I want to thank
Alain Bosseboeuf for his availability, numerous consultations, and readiness to help, Marion
Woytasik for valuable assistance in development of fabrication process, Emile Martincic for a
plenty of aid with simulations and electronics, Philippe Coste for his guidance with use of the
optical systems, Mehdi Ammar for the valuable discussions. I am also grateful to Johan Moulin,
Filippo Fabbri, Seonho Seok and Ming Zhang. I want equally give thanks to the colleagues of
IUT de Cachan where I had a pleasure to give classes: Nicolas Liebaux, Marie Gueunier-Farret
and Jean-Marc Steindecker.
I equally want to thank all of my colleagues and friends from the lab for making a such fantastic
adventure out of the time spent in the lab: Alexis Brenes for a plenty of fruitful work done
together, his involvement, friendship and dynamism, Baptiste Rousset for his love of life and
diligence, Olivier Levebvre for his openness and good will, Gwenaël Becan for his
cheerfulness, joy and inspiration, Vladyslav Vakarin for amusing conversations, Adrien Piot
for his encouragement and cordiality, Sylvain Lemettre for his passion towards good literature
and cinema, Hadrien Philippe for his friendship and outstanding expertise, Sylvie Bilent for her

ii
natural optimism, radiating happiness and complete knowledge of subtle art of Parisian life,
Lucas Blanc for his witty remarks and engaging conversations, Etienne Laborie for his
admirable art, Clément Bessouet for his inspiring discipline and effort, Maïté Do Vale for her
benevolence and remarkable decency, Sarah Risquez for introducing to the basics of energy
harvesting and passion for her work, Jie Wei for her assistance with interface circuits, Thi Hong
Nhung for her attention and care about the group, Giulia Rizzo for offering the insight into Italy,
Lucas Bonnin for a numerous discussions on culture, Zhichao Shi for his advice in simulations,
Ming Wu, Jingbo Xu and Qiongdi Zhang for a plenty of good moments spent sharing the office.
My deep gratitude is expressed towards Xavier Le Roux for his valuable lessons in
microfabrication, his expertise, and his assistance given to this work, which altogether played
a significant role in project unfolding. I give thanks to Jean-René Coudevylle for his advice and
valuable discussions, David Bouville for his cooperation, training and consultations, Etienne
Herth for his aid with etching procedures and good humour, and Nathalie Isac for her assistance
with wire bonding. I equally want to thank Cédric Villebasse, Marie-Paule Plante, Fabien
Bayle, Samson Edmond, François Maillard, Antoine Martin, Frédéric Hamouda, Benoît Bellier
and Abdel Aassime for their partaking in all ongoing clean room projects.
I want to thank my old friends Alexander K. (L.) and Dimitri Z. for all fun moments and
conversation we had, as far as it helped me a lot during the thesis years. I would also like to
thank my friends from undergraduate years – Dmytro, Vadim, Eugene, Bogdan, Oleg,
Mykhailo, Andriy, Anton. Despite the time and distance between us, you role is hard to
overestimate, for which I am grateful.
There are Ukrainian friends from the years spent in École Polytechnique to whom I want to
deeply thank for all unforgettable moments we shared in the years of the present work: Andrii
and Iryna, Yurij, Kostiantyn.
I want equally to thank to my friend Dr. Olga Petrova for her encouragement and support during
the most challenging final parts of this work.
Special thanks goes to my aunt Julia Lev, her spouse Pascal Fert, and my cousin Yuliy Lev for
their kindness, involvement, open-mindedness, and bringing to me the feeling of home in
France. The time spent with you in Paris was delightful and filled with joy.
And, of course, the appearance of this work will not be possible without the continuous and
crucial support from my closest family: my father Volodymyr, who is my example of
purposefulness, my mother Galyna, who makes the world around her a better place to be, and
my perseverant little sister Zinaida, who will go far. I want to express my deepest gratitude for
their attention, kindness, presence and effort, which put me on the way leading to appearance
of this thesis and made everything possible.
Grenoble, 29 September 2018
Dr. Bogdan Vysotskyi
iii
Résumé
Le cœur humain est un organe musculaire constitué de quatre chambres (les ventricules) qui
agit comme une pompe et permet, via ses battements, la circulation du sang au sein de tout le
corps afin d'irriguer les tissus. Le rythme cardiaque peut varier en fonction des conditions dans
lesquelles se trouve l'individu (sécrétion hormonale, agitation nerveuse, efforts …) mais peut
également être altéré par diverses pathologies dites cardiovasculaires. Celles-ci, telles les
arythmies ou les cardiomyopathies, dérèglent le rythme cardiaque induisant alors des troubles
allant des palpitations à la mort subite.
Pour parer à ces problèmes de dérèglement du rythme cardiaque, le recours à un stimulateur
cardiaque (pacemaker) peut s'avérer nécessaire. La majorité des dispositifs sont implantés à
proximité du cœur et les impulsions électriques, permettant la contraction du myocarde, sont
acheminés via des sondes intraveineuses dont les extrémités sont fixées à l'intérieure de la cavité
cardiaque. Les progrès récents en miniaturisation permettent maintenant d'intégrer tous les
composants nécessaires dans une capsule dont la petite taille permet son implantation au sein
même de la cavité cardiaque : ceci permet donc de s'affranchir de l'emploi de sondes qui sont
source de divers problèmes (infections, risques de rupture, perforations …) tout en fournissant
un meilleur confort pour le patient. De plus, la procédure d'implantation est simplifiée ce qui
limite les couts opératoires.
Bien de très séduisant, l'emploi de stimulateur sans sondes soulève néanmoins de nombreux
défis. Le plus délicat est relatif au fait que la procédure de remplacement d'un implant sans
sonde est très délicat et risqué. Ceci impose que ce type de dispositif doit être autonome d'un
point de vue énergétique sans avoir recours aux piles traditionnelles à durée de vie limitée. La
transmission d'énergie sans fil (par voie inductive, optique, ultrasonore …) est rendue difficile
par les conditions environnementales et est contraignante pour le patient. Une solution qui lui
est préférable est d'embarquer au sein de la capsule un système de récupération d'énergie qui
convertit une partie de l'énergie présente dans l'environnement du cœur en énergie électrique
permettant d'alimenter le dispositif le rendant ainsi totalement autonome.
Dans ce contexte, la source d'énergie la plus intéressante est incontestablement le gisement
vibratoire induit par les battements cardiaques. Différents modes de transduction du domaine
mécaniques vers le domaine électrique sont possibles et ont été largement décrits dans la
littérature existante. La transduction piézoélectrique est certainement le mode qui a été le plus
étudié mais les dispositifs sont relativement volumineux et sont donc difficiles à intégrer au
sein de la capsule du stimulateur. De plus la fiabilité à long termes de ces systèmes est encore
problématique. Un autre mode de transduction très employé dans le domaine de la récupération
d'énergie est la transduction électromagnétique qui permet d'obtenir des densités de puissance
élevée. Malheureusement, ce mode n'est pas compatible avec les systèmes d'Imagerie à
Résonance Magnétique (IRM) du fait de la présence d'élément paramagnétiques. Dans le cadre
iv
de ce travail de thèse, la transduction électrostatique (exploitation d'une structure capacitive
variable) est celle qui est employée : elle se révèle la plus fiable, la plus robuste dans le temps
et présente de très grandes perspectives de miniaturisation.
____________________
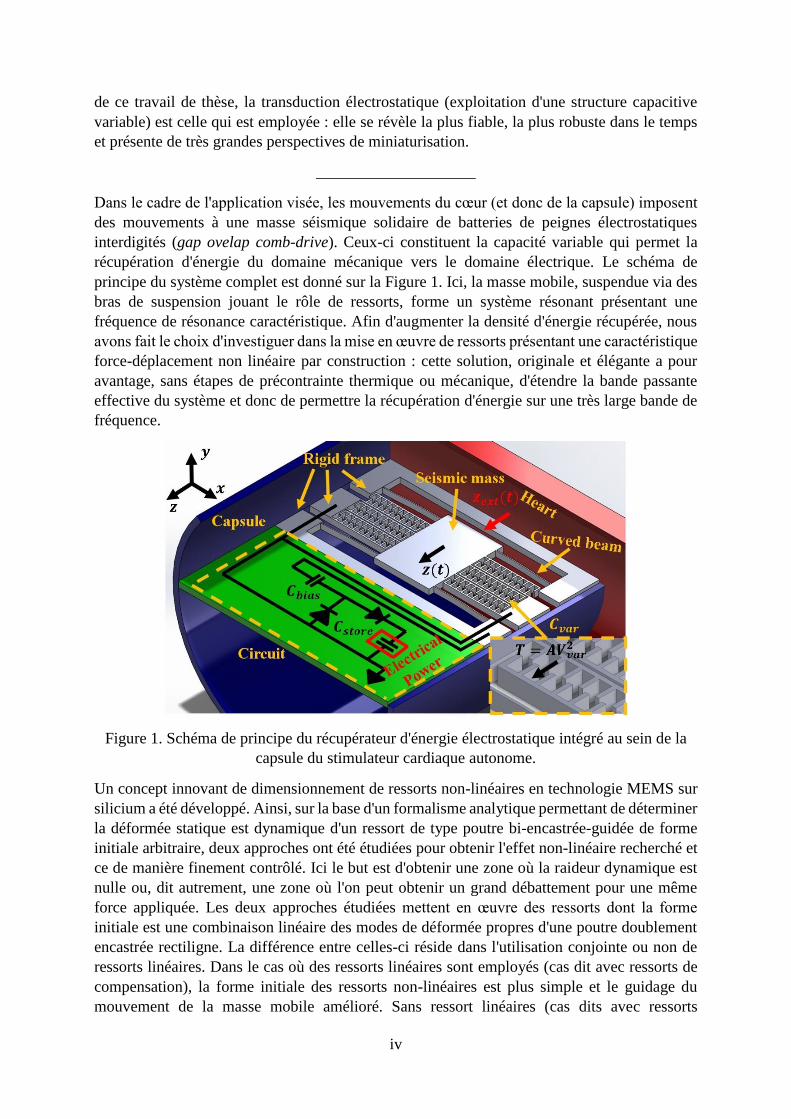
Dans le cadre de l'application visée, les mouvements du cœur (et donc de la capsule) imposent
des mouvements à une masse séismique solidaire de batteries de peignes électrostatiques
interdigités (gap ovelap comb-drive). Ceux-ci constituent la capacité variable qui permet la
récupération d'énergie du domaine mécanique vers le domaine électrique. Le schéma de
principe du système complet est donné sur la Figure 1. Ici, la masse mobile, suspendue via des
bras de suspension jouant le rôle de ressorts, forme un système résonant présentant une
fréquence de résonance caractéristique. Afin d'augmenter la densité d'énergie récupérée, nous
avons fait le choix d'investiguer dans la mise en œuvre de ressorts présentant une caractéristique
force-déplacement non linéaire par construction : cette solution, originale et élégante a pour
avantage, sans étapes de précontrainte thermique ou mécanique, d'étendre la bande passante
effective du système et donc de permettre la récupération d'énergie sur une très large bande de
fréquence.
Figure 1. Schéma de principe du récupérateur d'énergie électrostatique intégré au sein de la
capsule du stimulateur cardiaque autonome.
Un concept innovant de dimensionnement de ressorts non-linéaires en technologie MEMS sur
silicium a été développé. Ainsi, sur la base d'un formalisme analytique permettant de déterminer
la déformée statique est dynamique d'un ressort de type poutre bi-encastrée-guidée de forme
initiale arbitraire, deux approches ont été étudiées pour obtenir l'effet non-linéaire recherché et
ce de manière finement contrôlé. Ici le but est d'obtenir une zone où la raideur dynamique est
nulle ou, dit autrement, une zone où l'on peut obtenir un grand débattement pour une même
force appliquée. Les deux approches étudiées mettent en œuvre des ressorts dont la forme
initiale est une combinaison linéaire des modes de déformée propres d'une poutre doublement
encastrée rectiligne. La différence entre celles-ci réside dans l'utilisation conjointe ou non de
ressorts linéaires. Dans le cas où des ressorts linéaires sont employés (cas dit avec ressorts de
compensation), la forme initiale des ressorts non-linéaires est plus simple et le guidage du
mouvement de la masse mobile amélioré. Sans ressort linéaires (cas dits avec ressorts
v
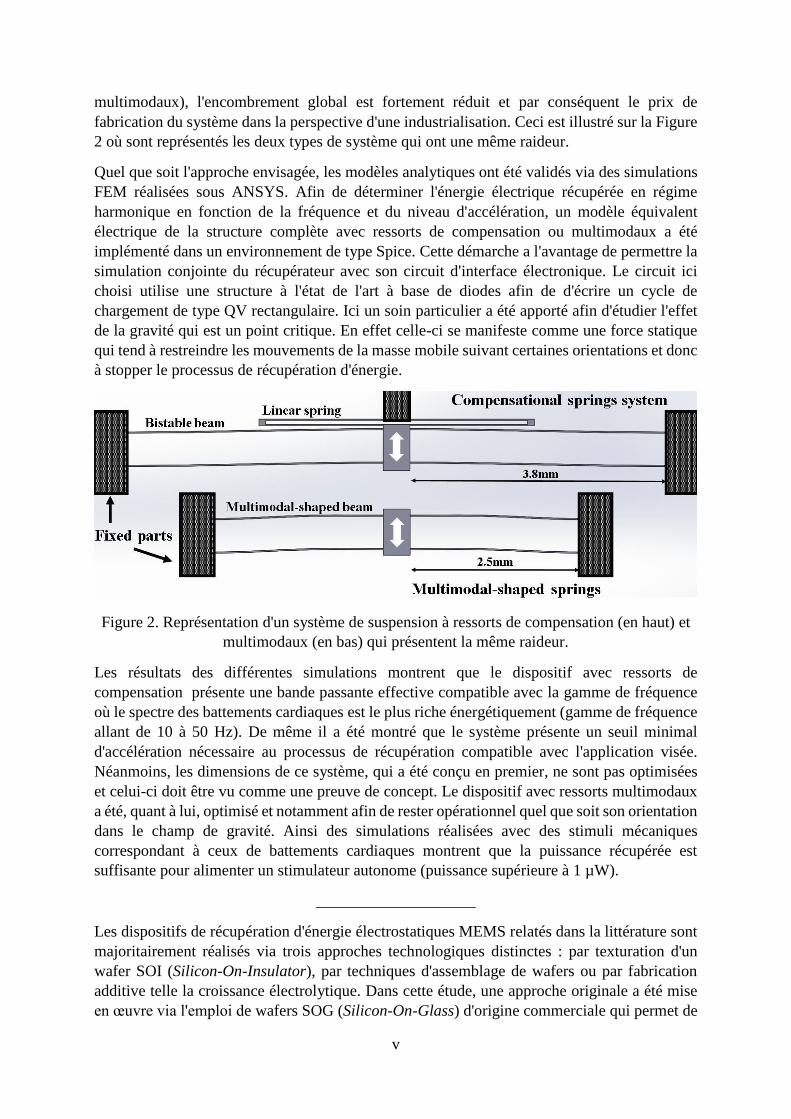
multimodaux), l'encombrement global est fortement réduit et par conséquent le prix de
fabrication du système dans la perspective d'une industrialisation. Ceci est illustré sur la Figure
2 où sont représentés les deux types de système qui ont une même raideur.
Quel que soit l'approche envisagée, les modèles analytiques ont été validés via des simulations
FEM réalisées sous ANSYS. Afin de déterminer l'énergie électrique récupérée en régime
harmonique en fonction de la fréquence et du niveau d'accélération, un modèle équivalent
électrique de la structure complète avec ressorts de compensation ou multimodaux a été
implémenté dans un environnement de type Spice. Cette démarche a l'avantage de permettre la
simulation conjointe du récupérateur avec son circuit d'interface électronique. Le circuit ici
choisi utilise une structure à l'état de l'art à base de diodes afin de d'écrire un cycle de
chargement de type QV rectangulaire. Ici un soin particulier a été apporté afin d'étudier l'effet
de la gravité qui est un point critique. En effet celle-ci se manifeste comme une force statique
qui tend à restreindre les mouvements de la masse mobile suivant certaines orientations et donc
à stopper le processus de récupération d'énergie.
Figure 2. Représentation d'un système de suspension à ressorts de compensation (en haut) et
multimodaux (en bas) qui présentent la même raideur.
Les résultats des différentes simulations montrent que le dispositif avec ressorts de
compensation présente une bande passante effective compatible avec la gamme de fréquence
où le spectre des battements cardiaques est le plus riche énergétiquement (gamme de fréquence
allant de 10 à 50 Hz). De même il a été montré que le système présente un seuil minimal
d'accélération nécessaire au processus de récupération compatible avec l'application visée.
Néanmoins, les dimensions de ce système, qui a été conçu en premier, ne sont pas optimisées
et celui-ci doit être vu comme une preuve de concept. Le dispositif avec ressorts multimodaux
a été, quant à lui, optimisé et notamment afin de rester opérationnel quel que soit son orientation
dans le champ de gravité. Ainsi des simulations réalisées avec des stimuli mécaniques
correspondant à ceux de battements cardiaques montrent que la puissance récupérée est
suffisante pour alimenter un stimulateur autonome (puissance supérieure à 1 µW).
____________________
Les dispositifs de récupération d'énergie électrostatiques MEMS relatés dans la littérature sont
majoritairement réalisés via trois approches technologiques distinctes : par texturation d'un
wafer SOI (Silicon-On-Insulator), par techniques d'assemblage de wafers ou par fabrication
additive telle la croissance électrolytique. Dans cette étude, une approche originale a été mise
en œuvre via l'emploi de wafers SOG (Silicon-On-Glass) d'origine commerciale qui permet de

vi
cumuler les avantages des différentes technologies sus nommées. Tous les développements
technologiques ont été menés à la Centrale de Technologie Universitaire (CTU) MINERVE
localisée au Centre de Nanosciences et Nanotechnologies (C2N) d'Orsay.
Le procédé d'élaboration se base principalement sur l'obtention de la structure mécanique par
gravure anisotrope de la couche supérieure en silicium monocristallin d'un wafer SOG par
DRIE (Deep Reactive Ion Etching). Les différentes étapes du procédé sont :
Enrésinement de la face supérieure du wafer SOG suivie d'une gravure DRIE. Ceci
permet de définir la structure mécanique du récupérateur.
Réalisation des électrodes en or au travers un wafer de silicium préalablement usiné par
gravure DRIE (étape de shadow masking). Ce masque en silicium n'est pas à usage
unique et peut être réemployé de nombreuses fois.
Collage temporaire d'un wafer de silicium servant de protection. Découpe des
échantillons à la scie diamantée (dicing)
Libération des structures suspendues par attaque HF/HCl en phase liquide
Collage d'une masse de tungstène sur la structure mobile afin d'augmenter sa masse
Collage des échantillons sur circuit imprimé. Prise des contacts électrique par
microsoudure (wire bonding)
La durée totale du procédé d'élaboration est estimée à 18 heures 40 minutes ce qui est
relativement faible dans ce domaine technologique. Les récupérateurs réalisés (avec ressort de
compensation et avec ressorts multimodaux) sont montrées sur la Figure 3.
Figure 3. Images des récupérateurs d'énergie réalisés (avec ressort multimodaux à gauche,
avec ressorts de compensation à gauche).
Ici, contrairement à un procédé de réalisation MEMS classique basé sur l'emploi wafer SOI
(Silicon-On-Insulator), l'utilisation d'un substrat SOG nous permet d'avoir une plus grande
liberté dans le choix de l'épaisseur de la couche de silicium. D'autre part, l'absence de support
conducteur nous permet de minimiser les capacités parasites qui limitent les performances des
récupérateurs d'énergie envisagés. En effet, rappelons qu'en comparaison à un wafer SOI, le
support en silicium est ici remplacé par un en borosilicate.
A part certaines structures de test, la totalité des dispositifs ont été réalisés sur la base de wafers
SOG ayant une épaisseur de silicium de 200 µm. Une astuce de conception nous a permis de
maximiser l'écart entre les motifs de silicium et donc de minimiser les risques de pollution/casse
durant le procédé de fabrication : les peignes électrostatiques sont réalisés non-engagés et
s'imbriquent l'un dans l'autre lors des mouvements de la masse mobile en fonctionnement.

vii
Ainsi, compte tenu des dimensions des différents dispositifs, le rapport d'aspect des gravures
DRIE est égal au maximum à seulement 10. En gardant à l'esprit ceci, l'angle des flancs est
réduit à une valeur de seulement 1,2 à 1,5° alors que l'effet du scalloping est réduit à un rayon
de 300 nm. Malgré ces bons résultats, ces défauts cumulés à la sous-gravure sous le masque ou
encore le phénomène de notching, modifient notablement la raideur effective des ressorts
fabriqués. Tout ceci a été pris en compte lors des différentes phases de conception afin d'obtenir
dans le cas des derniers dispositifs réalisés les caractéristiques voulues.
____________________
Avant de caractériser les récupérateurs d'énergie réalisés dans le cadre de ce travail de thèse en
"conditions réelles" via un pot vibrant, différents essais statiques ont été menés à bien. Afin de
vérifier la loi de comportement des ressorts non-linéaires conçus, un micromanipulateur
robotisé et instrumenté d'une cellule de force (FemtoTools FTMTA02) a été employé. Les tests
ont montré un parfait accord avec les modèles mis au point une fois les défauts introduits par le
procédé de fabrication pris en compte (réduction de la largeur effective des ressorts par la sous-
gravure et l'inclinaison des flancs). Le même instrument, utilisé conjointement avec un
impédancemètre (HIOKI IM3570), nous a également permis de déterminer la variation de
capacité en fonction du mouvement de la masse mobile. Ici la capacité minimale est augmentée
du fait des capacités parasites dues aux connexions (passage typique de 1 à 10 pF) et la capacité
maximale fortement diminuée du fait de l'augmentation du gap électrostatique sous l'effet de la
sous-gravure (passage de 144 à 74 pF et de 277 à 109 pF respectivement pour le récupérateur à
ressorts de compensation et à ressorts multimodaux). Ces variations de capacité vont réduire
l'efficacité énergétique des dispositifs sans pour autant compromettre leur fonctionnement.
L'effet statique de la gravité a été aussi étudié. Ainsi, le mouvement statique la masse mobile
sous l'effet de la masse de tungstène rapportée à sa surface a été mesurée par interférométrie
monochromatique à balayage de phase. Dans le pire cas (récupérateurs placée à l'horizontal), le
mouvement hors-plan de la masse mobile est limité à 1 µm ce qui négligeable compte tenu de
l'épaisseur totale de la structure qui est de 200 µm.
La caractérisation des récupérateurs d'énergie en fonctionnement a été rendue possible par
l'intermédiaire d'un pot vibrant qui permet de leur imposer des stimuli en accélération aussi bien
harmoniques que relatifs à des battements cardiaques. Ces essais ont été réalisés pour
différentes orientations par rapport à la gravité et pour différents circuit d'interfaçage. Pour ceci,
les récupérateurs d'énergie sont fixés au pot vibrant par l'intermédiaire d'un circuit-imprimé lui-
même solidaire d'une platine en aluminium comme montré sur la Figure 4.
viii
Figure 4. Récupérateurs d'énergie fixés sur le pot vibrant durant les essais.
Le récupérateur d'énergie avec ressorts de compensation qui, rappelons-le, n'a pas été optimisé,
a démontré une bande passante étendue sur un large domaine (de 10 à 100 Hz) et ce quelle que
soit son orientation par rapport à la gravité. L'accélération minimale permettant son mouvement
et donc la récupération d'énergie a été réduite à seulement 3 m/s². Le maximum de puissance
récupérée, qui est de 4,7 µW, a été mesuré pour une accélération harmonique de 10 m/s² à 50 Hz
lorsque le dispositif est placé horizontalement.
Le récupérateur d'énergie avec ressorts multimodaux, qui peut être vu comme une version
amélioré du précédent, a été plus finement caractérisé avec un circuit d'interface plus évolué.
En régime harmonique, bien qu'il présente la même bande passante effective (de 10 à 100 Hz),
l'amplitude d'accélération minimale est plus faible. Pour ce type d'excitation, un maximum de
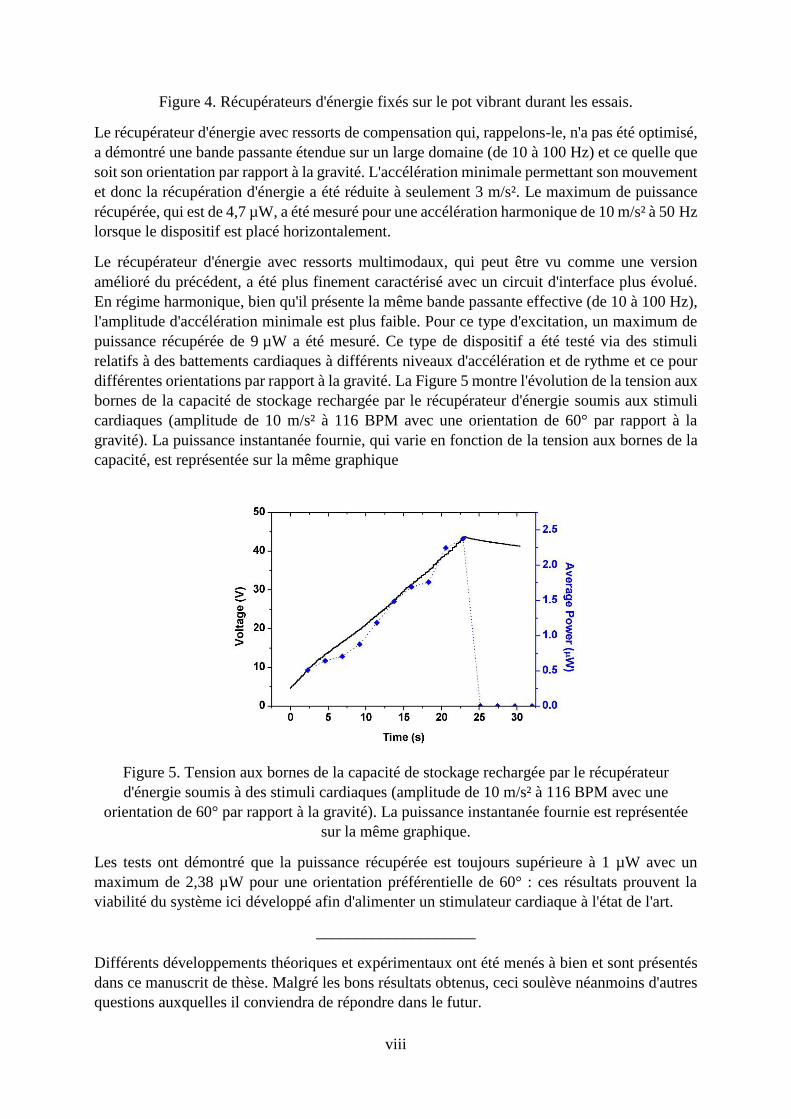
puissance récupérée de 9 µW a été mesuré. Ce type de dispositif a été testé via des stimuli
relatifs à des battements cardiaques à différents niveaux d'accélération et de rythme et ce pour
différentes orientations par rapport à la gravité. La Figure 5 montre l'évolution de la tension aux
bornes de la capacité de stockage rechargée par le récupérateur d'énergie soumis aux stimuli
cardiaques (amplitude de 10 m/s² à 116 BPM avec une orientation de 60° par rapport à la
gravité). La puissance instantanée fournie, qui varie en fonction de la tension aux bornes de la
capacité, est représentée sur la même graphique
Figure 5. Tension aux bornes de la capacité de stockage rechargée par le récupérateur
d'énergie soumis à des stimuli cardiaques (amplitude de 10 m/s² à 116 BPM avec une
orientation de 60° par rapport à la gravité). La puissance instantanée fournie est représentée
sur la même graphique.
Les tests ont démontré que la puissance récupérée est toujours supérieure à 1 µW avec un
maximum de 2,38 µW pour une orientation préférentielle de 60° : ces résultats prouvent la
viabilité du système ici développé afin d'alimenter un stimulateur cardiaque à l'état de l'art.
____________________
Différents développements théoriques et expérimentaux ont été menés à bien et sont présentés
dans ce manuscrit de thèse. Malgré les bons résultats obtenus, ceci soulève néanmoins d'autres
questions auxquelles il conviendra de répondre dans le futur.
ix
La première est relative à l'adaptation des récupérateurs d'énergie non-linéaires développés aux
dimensions de la capsule du stimulateur cardiaque. Ainsi, bien que la densité de puissance
fournie par les dispositifs présentés (du moins pour celui utilisant des ressorts multimodaux)
correspond aux spécifications, les dimensions de ceux-ci doivent être adaptés afin de pouvoir
embarquer un voir plusieurs récupérateurs d'énergie au sein de la capsule et ce avec le circuit
d'interface et le condensateur de stockage. Gardons à l'esprit que les dimensions typiques de la
capsule correspondent à celles d'un cylindre de 30 mm de long pour seulement 5 mm de
diamètre. Ceci met en exergue qu'une miniaturisation encore plus poussée du dispositif visé et
un point crucial.
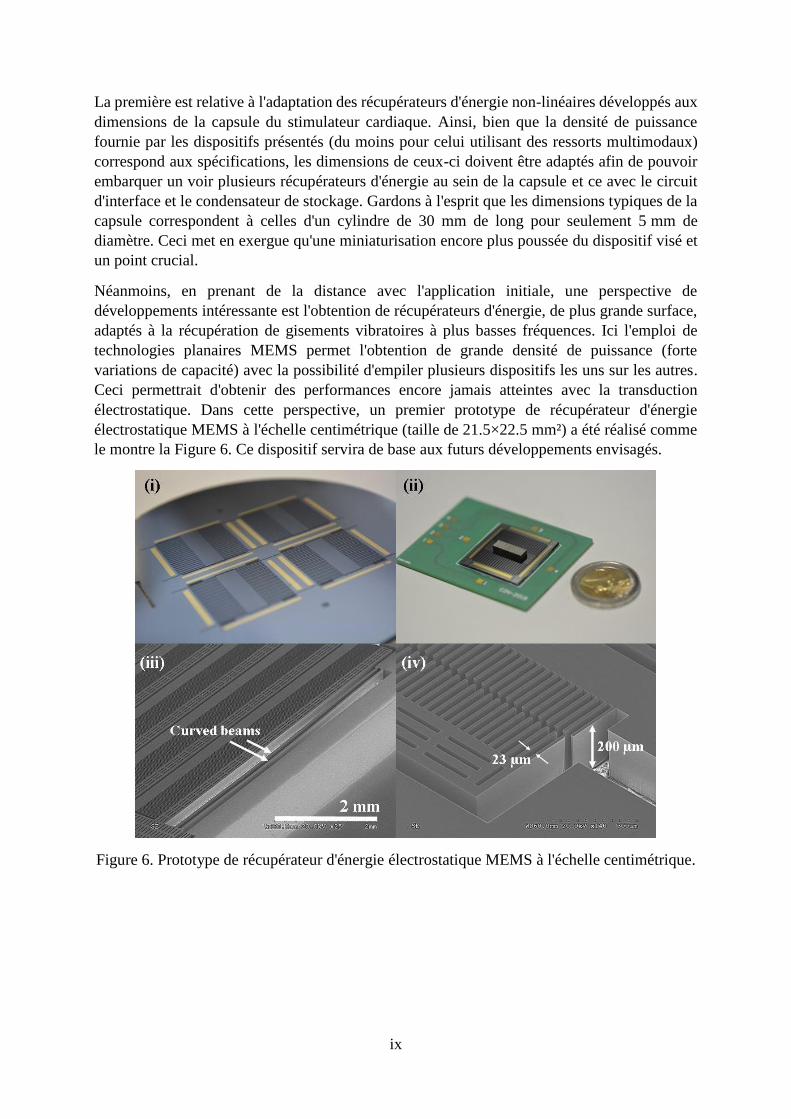
Néanmoins, en prenant de la distance avec l'application initiale, une perspective de
développements intéressante est l'obtention de récupérateurs d'énergie, de plus grande surface,
adaptés à la récupération de gisements vibratoires à plus basses fréquences. Ici l'emploi de
technologies planaires MEMS permet l'obtention de grande densité de puissance (forte
variations de capacité) avec la possibilité d'empiler plusieurs dispositifs les uns sur les autres.
Ceci permettrait d'obtenir des performances encore jamais atteintes avec la transduction
électrostatique. Dans cette perspective, un premier prototype de récupérateur d'énergie
électrostatique MEMS à l'échelle centimétrique (taille de 21.5×22.5 mm²) a été réalisé comme
le montre la Figure 6. Ce dispositif servira de base aux futurs développements envisagés.
Figure 6. Prototype de récupérateur d'énergie électrostatique MEMS à l'échelle centimétrique.
1
Abstract
The growing need for having a miniaturized but efficient energy source for a various
applications has stimulated the development of the large variety of energy harvesting devices
based on different physical, chemical or biological principles. Present work addresses question
of MEMS electrostatic vibrational energy harvesting for biomedical applications, and notably
for powering an autonomous leadless pacemaker system. Such an application imposes several
critical requirements upon the energy harvesting system, notably the sufficient miniaturization
(<1cm3), power output in range of 1 - 10µW, compatibility with Magnetic Resonant Imaging
(MRI) and long lifetime (more than twenty years). The solution proposed in this work is the
use of a structural nonlinearity to attain large bandwidth in low frequencies domain (10 – 100
Hz), along with the acceleration amplitude of external excitation that is lower than 1g. The
question of the device inclination with respect to the gravity orientation is also the critical one
in the context of envisaged application.
A several ways of introducing the structural nonlinearities in MEMS device are proposed in
this work. A nonlinear stiffness is implemented in original way of introducing a natural bending
mode shapes in the initial beam form. A mechanical description of bending mode coupling
along with its impact on a reaction force of the suspension springs is presented. An alternative
way of combining a bistable curved beam with a linear spring (referred as a compensational
spring in this work) to adjust a structural nonlinearity is studied as well, and equivalence of
these two approaches is demonstrated. Two designs of the MEMS energy harvesters are
proposed, using two different ways to engineer the structural nonlinearity. The performance of
the harvesters is evaluated by the dynamical simulations in LTSpice IV software with the
equivalent circuit approach under the various mechanical excitations. The crucial role of
gravity offset on the device performance is examined, and it is demonstrated that the nonlinear
energy harvester can produce a power output with a various orientations with respect to the
gravity field.
An innovative clean room technology based on silicon-on-glass (SOG) wafers is developed for
the fabrication of the innovative energy harvesters. A straightforward and rapid low-
temperature process with the possibility of future industrialization is presented and validated
by multiple experimental implementations. The important advantage of the proposed process
is the absence of an intermediate wafer bonding step, that is seen as a significant technological
challenge and in this way is hardly acceptable for the industry. The aspect ratio of fabricated
microsystems is shown to surpass the value of 20, which is close to the technological limit
imposed by the used deep reactive ion etching machine.

2
Fabricated microsystems are tested both mechanically and electrically. Proposed theoretical
model of the curved beam is validated with reactive force measurements of the MEMS springs
of different configurations. A static out-of-plane displacement due to the gravity is evaluated
and found to be negligible compared to the device thickness. Energy harvesting experiments
are performed for both harmonic and heartbeat mechanical excitations, which demonstrate the
large bandwidth in low frequencies domain and a sufficiently large power output for envisaged
application under different orientations with respect to the gravity.
Finally, the obtained results are summarized, discussed and placed in the context of the recent
state-of-the-art. The future perspectives deriving from the obtained results are analysed, and
several prospect devices are proposed: the one adapted for a leadless pacemaker packaging and
the one of a scale larger than a typical electrostatic energy harvester.

3

4
Table of contents
Acknowledgements ................................................................................................................... i
Résumé. ................................................................................................................................... iii
Chapter I. ................................................................................................................................ 10
I.1 Introduction ...................................................................................................................... 12
I.2 Microsystems .................................................................................................................... 12
I.2.1 General overview of applications ................................................................................ 13
I.2.2 MEMS market .............................................................................................................. 13
I.3 Human heart ..................................................................................................................... 15
I.3.1 Cardiac cycle and Blood circulation ............................................................................ 15
I.3.2 Electrical activity ......................................................................................................... 17
I.3.3 Mechanical heartbeat excitation .................................................................................. 18
I.3.4 Cardiac arrhythmias ..................................................................................................... 19
I.3.5 Pacemaker .................................................................................................................... 20
I.3.5.1 Leadless pacemaker............................................................................................... 21
I.4 Brief theoretical overview of a linear vibration energy harvester ............................... 22
I.4.1 Linear mechanical resonator ........................................................................................ 23
I.4.2 Transducer part ............................................................................................................ 25
I.5 Interface circuits overview .............................................................................................. 27
I.5.1 Triangular charge-voltage conversion ......................................................................... 27
I.5.2 Rectangular charge-voltage conversion ....................................................................... 28
I.5.2.1 Charge pump ......................................................................................................... 28
I.5.2.2 Bennet’s doubler-based circuits ............................................................................ 29
I.5.3 Conclusion on interface circuits................................................................................... 31
I.6 Energy harvesting for biomedical applications ............................................................. 32
I.6.1 Vibrational energy harvesting ...................................................................................... 32
I.6.1.1 Piezoelectric transduction ..................................................................................... 33
I.6.1.2 Electromagnetic transduction ................................................................................ 34
I.6.1.3 Electrostatic transduction ...................................................................................... 35
I.6.2 Other energy sources for powering biomedical devices .............................................. 36
I.6.2.1 Blood pressure harvesting ..................................................................................... 36
I.6.2.2 RF wireless recharging .......................................................................................... 37
I.6.2.3 Biofuel cells........................................................................................................... 38
5
I.6.3 Conclusion on energy harvesting for biomedical applications .................................... 38
I.7 Methods to improve performance of the energy harvester .......................................... 39
I.7.1 Frequency up-conversion ............................................................................................. 39
I.7.2 Mechanical nonlinearities ............................................................................................ 42
I.7.2.1 Use of spring softening and hardening .................................................................. 43
I.7.2.2 Bistability .............................................................................................................. 44
I.7.2.3 Use of shock, stoppers and secondary springs ...................................................... 47
I.7.2.4 Other types of nonlinearities ................................................................................. 48
I.7.3 Multimodal and multi-resonant systems ...................................................................... 49
I.7.4 Gravity offset ............................................................................................................... 49
I.7.5 Summary on the performance improvement approaches ............................................. 51
I.8 Conclusions ....................................................................................................................... 51
I.9 References ......................................................................................................................... 52
Chapter II. .............................................................................................................................. 62
II.1 Introduction ..................................................................................................................... 64
II.2 From a heart to electrical power: an overview of energy harvesting system ............ 64
II.2.1 Curved Beam .............................................................................................................. 65
II.2.1.1 Curved Beam model ............................................................................................ 65
II.2.1.2 Normal force evaluation ...................................................................................... 67
II.2.1.3 Euler equation ...................................................................................................... 67
II.2.2 Seismic mass dynamics .............................................................................................. 68
II.2.3 Electrical domain equations........................................................................................ 68
II.3 Curved beam theory ....................................................................................................... 69
II.3.1 Dynamical equation of the curved beam .................................................................... 70
II.3.2 Mode shapes projection .............................................................................................. 71
II.3.3 Bistable sine-shaped beam.......................................................................................... 74
II.3.4 Multimodal-shaped beam ........................................................................................... 75
II.3.5 Use of linear compensational springs ......................................................................... 78
II.3.6 Gravity effect .............................................................................................................. 80
II.3.7 Analogy of compensational springs system and multimodal-shaped spring system.. 81
II.3.8 Conclusion on curved beam model ............................................................................ 83
II.4 Design of the Nonlinear Energy Harvesters ................................................................. 83
II.4.1 Application constraints ............................................................................................... 83
II.4.2 Variable capacitance ................................................................................................... 84
II.4.3 Seismic mass............................................................................................................... 86
6
II.4.4 Nonlinear VEH using Compensational Springs ......................................................... 87
II.4.5 Nonlinear VEH using Multimodal-shaped Springs .................................................... 88
II.4.6 Static displacement in gravity field ............................................................................ 90
II.4.7 Stress evaluation ......................................................................................................... 91
II.4.8 Conclusion on design.................................................................................................. 93
II.5 Simulating the Energy Harvesters ................................................................................ 93
II.5.1 An equivalent circuit approach ................................................................................... 93
II.5.2 Model of nonlinear energy harvester .......................................................................... 94
II.5.3 Simulations of energy harvester using the compensational springs ........................... 95
II.5.4 Simulations of energy harvester using the multimodal-shaped springs ..................... 98
II.5.4.1 Choice of an optimal biasing voltage ................................................................... 98
II.5.4.2 Bandwidth study ................................................................................................ 100
II.5.4.3 Heartbeat signal ................................................................................................. 101
II.5.5 Conclusion on the simulations .................................................................................. 105
II.6 Conclusion ..................................................................................................................... 105
II.7 References ...................................................................................................................... 106
Chapter III. ........................................................................................................................... 108
III.1 Introduction ................................................................................................................. 110
III.2 Overview of existing electrostatic MEMS energy harvester fabrication techniques
................................................................................................................................................ 110
III.2.2 Fabrication using Silicon-on-Insulator (SOI) .......................................................... 110
III.2.3 Use of Wafer Bonding Technique ........................................................................... 112
III.2.4 Metallic devices....................................................................................................... 113
III.2.5 Fabrication techniques summary ............................................................................. 114
III.3 Fabrication process and its main challenges............................................................. 115
III.3.1 Material limitations ................................................................................................. 115
III.3.2 Choice of the wafer type ......................................................................................... 116
III.3.3 Fabrication process of the energy harvester ............................................................ 117
III.3.4 Geometry of fabricated energy harvesters .............................................................. 118
III.4 Development of the fabrication process .................................................................... 120
III.4.1 UV lithography ........................................................................................................ 120
III.4.1.1 Principle of UV lithography ............................................................................. 120
III.4.1.2 Preparation of the surface ................................................................................. 121
III.4.1.3 Spin-coating of the photoresist ......................................................................... 121
III.4.1.4 Bake .................................................................................................................. 122
7
III.4.1.5 Exposure ........................................................................................................... 122
III.4.1.6 Development ..................................................................................................... 123
III.4.2 Deep Reactive Ion Etching ...................................................................................... 123
III.4.2.1 Principle of Bosch process ............................................................................... 123
III.4.2.2 Experimental set-up .......................................................................................... 124
III.4.2.3 Etching procedure ............................................................................................. 126
III.4.2.4 DRIE realisations .............................................................................................. 126
III.4.2.5 Etching defects ................................................................................................. 127
III.4.3 Stripping of the photoresist ..................................................................................... 129
III.4.4 Shadow mask fabrication ........................................................................................ 130
III.4.5 Metal electrodes deposition ..................................................................................... 131
III.4.5.1 Principle of electron beam evaporation ............................................................ 131
III.4.5.2 Experimental set-up .......................................................................................... 132
III.4.5.3 Sample preparation ........................................................................................... 133
III.4.5.4 Deposition parameters ...................................................................................... 134
III.4.6 Dicing ...................................................................................................................... 134
III.4.7 Glass Wet Etch ........................................................................................................ 134
III.4.8 Final assembly ......................................................................................................... 136
III.5 Fabrication of the variety of multimodal-shaped springs ....................................... 137
III.5.1 Technological process ............................................................................................. 137
III.5.2 Geometry of fabricated prototypes .......................................................................... 138
III.5.3 Fabricated system .................................................................................................... 138
III.6 Conclusions .................................................................................................................. 139
III.7 References .................................................................................................................... 140
Chapter IV. ........................................................................................................................... 144
IV.1 Introduction ................................................................................................................. 145
IV.2 Mechanical properties measurements ....................................................................... 145
IV.2.1 Spring force measurements ..................................................................................... 145
IV.2.1.1 Experimental set-up .......................................................................................... 146
IV.2.1.2 The variety of multimodal-shaped springs ....................................................... 146
IV.2.1.3 Energy harvester using compensational springs .............................................. 148
IV.2.1.4 Energy harvester using multimodal-shaped springs ......................................... 150
IV.2.2 Out-of-plane static deformation measurements ...................................................... 151
IV.2.2.1 Experimental set-up .......................................................................................... 151
IV.2.2.2 Static out-of-plane deformation evaluation ...................................................... 152
8
IV.2.3 Conclusions on mechanical measurements ............................................................. 154
IV.3 Summary of the energy harvesters characteristics .................................................. 154
IV.3.1 Device using compensational springs ..................................................................... 155
IV.3.2 Device using multimodal-shaped springs ............................................................... 155
IV.4 Energy harvesting measurements .............................................................................. 156
IV.4.1 Device using compensational springs ..................................................................... 156
IV.4.1.1 Experimental set-up .......................................................................................... 156
IV.4.1.3 Study of power output ...................................................................................... 158
IV.4.1.4 Bandwidth measurements................................................................................. 160
IV.4.2 Device using multimodal-shaped springs ............................................................... 164
IV.4.2.1 Experimental set-up .......................................................................................... 164
IV.4.2.2 Study of the power output under harmonic excitation ..................................... 165
IV.4.2.3 Bandwidth measurements................................................................................. 165
IV.4.2.4 Fractioning interface circuits: heartbeat signal study ....................................... 168
IV.4.2.5 Study of heartbeat rate, acceleration amplitude and inclination ...................... 172
IV.4.3 Conclusions on the energy harvesting experiments ................................................ 175
IV.5 Conclusions .................................................................................................................. 176
IV.6 References .................................................................................................................... 177
Chapter V. .............................................................................................................................. 179
V.I Conclusions .................................................................................................................... 180
V.2 Future work and perspectives ...................................................................................... 182
V.2.1 Energy harvester integration in the leadless pacemaker .......................................... 182
V.2.2.1 Nonlinear eVEH design adaptation ................................................................... 183
V.2.2.2 Encapsulated system .......................................................................................... 184
V.2.2 Mesoscale nonlinear eVEH ...................................................................................... 187
V.3 References ...................................................................................................................... 188
List of Publications .............................................................................................................. 190
List of Communications ...................................................................................................... 191

9
10
Chapter I. Context and State of the Art
Table of contents I.1 Introduction ...................................................................................................................... 12
I.2 Microsystems .................................................................................................................... 12
I.2.1 General overview of applications ................................................................................ 13
I.2.2 MEMS market .............................................................................................................. 13
I.3 Human heart ..................................................................................................................... 15
I.3.1 Cardiac cycle and Blood circulation ............................................................................ 15
I.3.2 Electrical activity ......................................................................................................... 17
I.3.3 Mechanical heartbeat excitation .................................................................................. 18
I.3.4 Cardiac arrhythmias ..................................................................................................... 19
I.3.5 Pacemaker .................................................................................................................... 20
I.3.5.1 Leadless pacemaker............................................................................................... 21
I.4 Brief theoretical overview of a linear vibration energy harvester ............................... 22
I.4.1 Linear mechanical resonator ........................................................................................ 23
I.4.2 Transducer part ............................................................................................................ 25
I.5 Interface circuits overview .............................................................................................. 27
I.5.1 Triangular charge-voltage conversion ......................................................................... 27
I.5.2 Rectangular charge-voltage conversion ....................................................................... 28
I.5.2.1 Charge pump ......................................................................................................... 28
I.5.2.2 Bennet’s doubler-based circuits ............................................................................ 29
I.5.3 Conclusion on interface circuits................................................................................... 31
I.6 Energy harvesting for biomedical applications ............................................................. 32
I.6.1 Vibrational energy harvesting ...................................................................................... 32
I.6.1.1 Piezoelectric transduction ..................................................................................... 33
I.6.1.2 Electromagnetic transduction ................................................................................ 34
I.6.1.3 Electrostatic transduction ...................................................................................... 35
I.6.2 Other energy sources for powering biomedical devices .............................................. 36
I.6.2.1 Blood pressure harvesting ..................................................................................... 36
I.6.2.2 RF wireless recharging .......................................................................................... 37
I.6.2.3 Biofuel cells........................................................................................................... 38
I.6.3 Conclusion on energy harvesting for biomedical applications .................................... 38

11
I.7 Methods to improve performance of the energy harvester .......................................... 39
I.7.1 Frequency up-conversion ............................................................................................. 39
I.7.2 Mechanical nonlinearities ............................................................................................ 42
I.7.2.1 Use of spring softening and hardening .................................................................. 43
I.7.2.2 Bistability .............................................................................................................. 44
I.7.2.3 Use of shock, stoppers and secondary springs ...................................................... 47
I.7.2.4 Other types of nonlinearities ................................................................................. 48
I.7.3 Multimodal and multi-resonant systems ...................................................................... 49
I.7.4 Gravity offset ............................................................................................................... 49
I.7.5 Summary on the performance improvement approaches ............................................. 51
I.8 Conclusions ....................................................................................................................... 51
I.9 References ......................................................................................................................... 52

12
I.1 Introduction
The aim of the chapter is to present the context of electrostatic energy harvesting for biomedical
applications in all of its complexity. The main targeted application for the device presented in
this work is an autonomous pacemaker, which outlines all the interdisciplinary discussion
presented here. Due to the tremendous amount of information available in every aspect of the
studied subject, a focus will be set on the most crucial points of the topic, whereas the rest will
be left out of scope of this work.
A brief overview of the human heart structure and physiology is given and the typical
abnormalities of its functioning that can be treated with a pacemaker are discussed, explaining
the necessity of the studied device. A pacemaker structure is explained, along with the
advantages of the use of a leadless pacemaker and with the importance of an autonomous
system. A brief theoretical introduction to the energy harvesting devices is given, along with a
short review of the interface circuits used for extracting the electrical power output from the
mechanical movement. State-of-the-art devices for biomedical energy harvesting, both
vibrational and non-vibrational, are presented; the typical methods to improve the performance
of the energy harvester are discussed to underline the context for the devices presented in the
next chapters.
I.2 Microsystems
Micro Electro Mechanical Systems (MEMS) is a general term for a miniaturized mechano-
electrical devices with structural elements varying in size from 1 up to 100 µm realized by the
way of processes inherited from the semiconductor industry. At the scale of things given on
the Figure I.1, MEMS are located between sub-micron objects such as cells and mesoscale
devices that can be fabricated using classical mechanical machining.
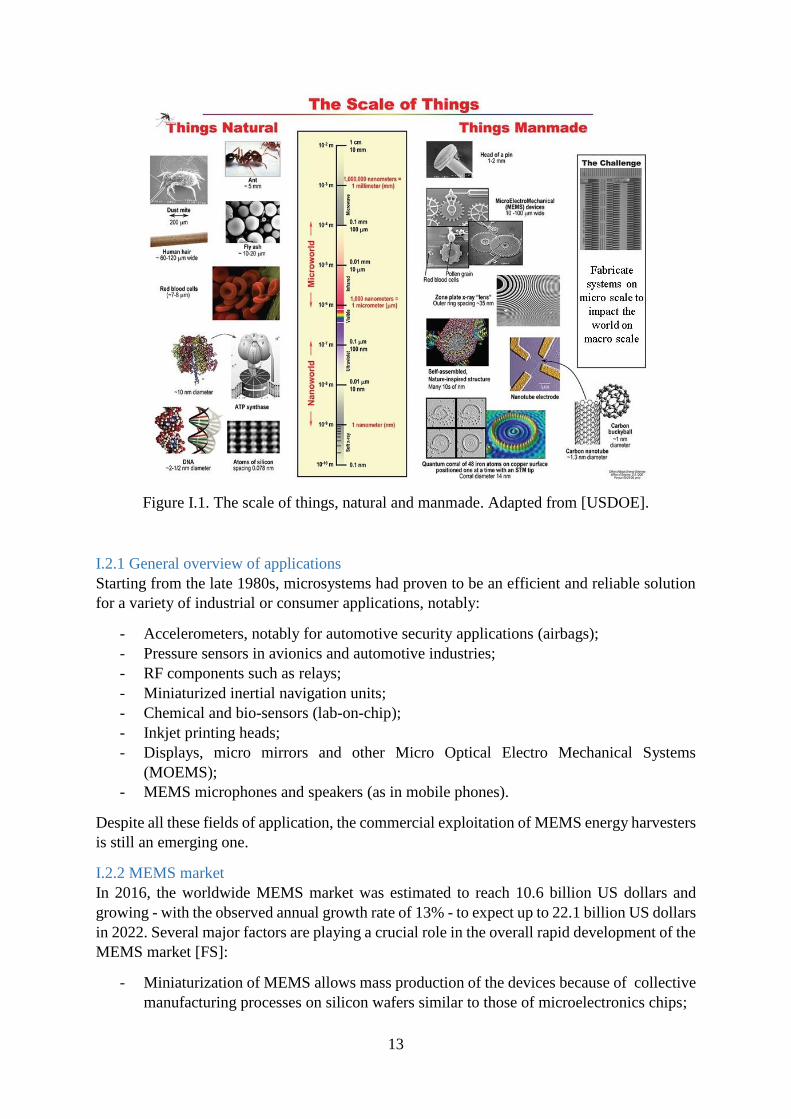
13
Figure I.1. The scale of things, natural and manmade. Adapted from [USDOE].
I.2.1 General overview of applications
Starting from the late 1980s, microsystems had proven to be an efficient and reliable solution
for a variety of industrial or consumer applications, notably:
- Accelerometers, notably for automotive security applications (airbags);
- Pressure sensors in avionics and automotive industries;
- RF components such as relays;
- Miniaturized inertial navigation units;
- Chemical and bio-sensors (lab-on-chip);
- Inkjet printing heads;
- Displays, micro mirrors and other Micro Optical Electro Mechanical Systems
(MOEMS);
- MEMS microphones and speakers (as in mobile phones).
Despite all these fields of application, the commercial exploitation of MEMS energy harvesters
is still an emerging one.
I.2.2 MEMS market
In 2016, the worldwide MEMS market was estimated to reach 10.6 billion US dollars and
growing - with the observed annual growth rate of 13% - to expect up to 22.1 billion US dollars
in 2022. Several major factors are playing a crucial role in the overall rapid development of the
MEMS market [FS]:
- Miniaturization of MEMS allows mass production of the devices because of collective
manufacturing processes on silicon wafers similar to those of microelectronics chips;
14
- The Internet of Things (IoT) is developing in many fields: agriculture, smart houses
and cities, well-being, security, automotive, etc.;
- The demand for health and physical activities monitoring is growing;
- The need of MEMS for structural health monitoring in large mechanical structures like
buildings or airplanes for maintenance purposes and so to improve security;
- Biocompatibility and sometimes biodegradability that sometimes is only possible with
MEMS.
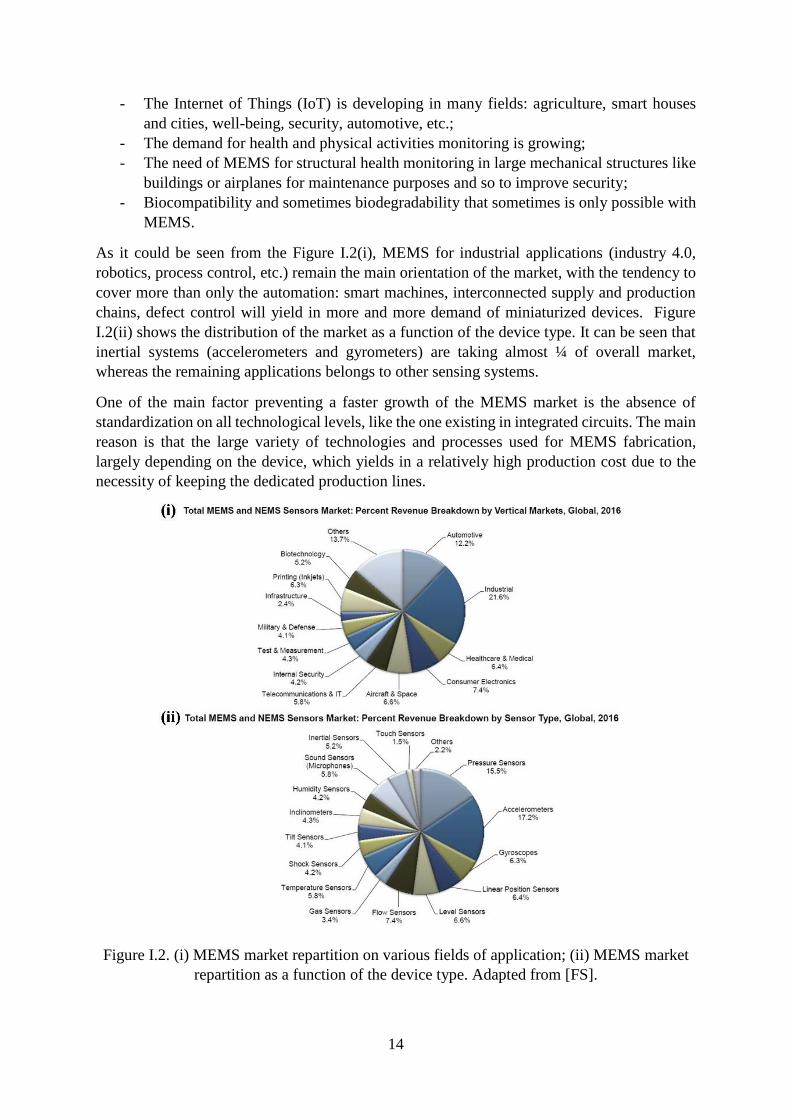
As it could be seen from the Figure I.2(i), MEMS for industrial applications (industry 4.0,
robotics, process control, etc.) remain the main orientation of the market, with the tendency to
cover more than only the automation: smart machines, interconnected supply and production
chains, defect control will yield in more and more demand of miniaturized devices. Figure
I.2(ii) shows the distribution of the market as a function of the device type. It can be seen that
inertial systems (accelerometers and gyrometers) are taking almost ¼ of overall market,
whereas the remaining applications belongs to other sensing systems.
One of the main factor preventing a faster growth of the MEMS market is the absence of
standardization on all technological levels, like the one existing in integrated circuits. The main
reason is that the large variety of technologies and processes used for MEMS fabrication,
largely depending on the device, which yields in a relatively high production cost due to the
necessity of keeping the dedicated production lines.
Figure I.2. (i) MEMS market repartition on various fields of application; (ii) MEMS market
repartition as a function of the device type. Adapted from [FS].
15
I.3 Human heart
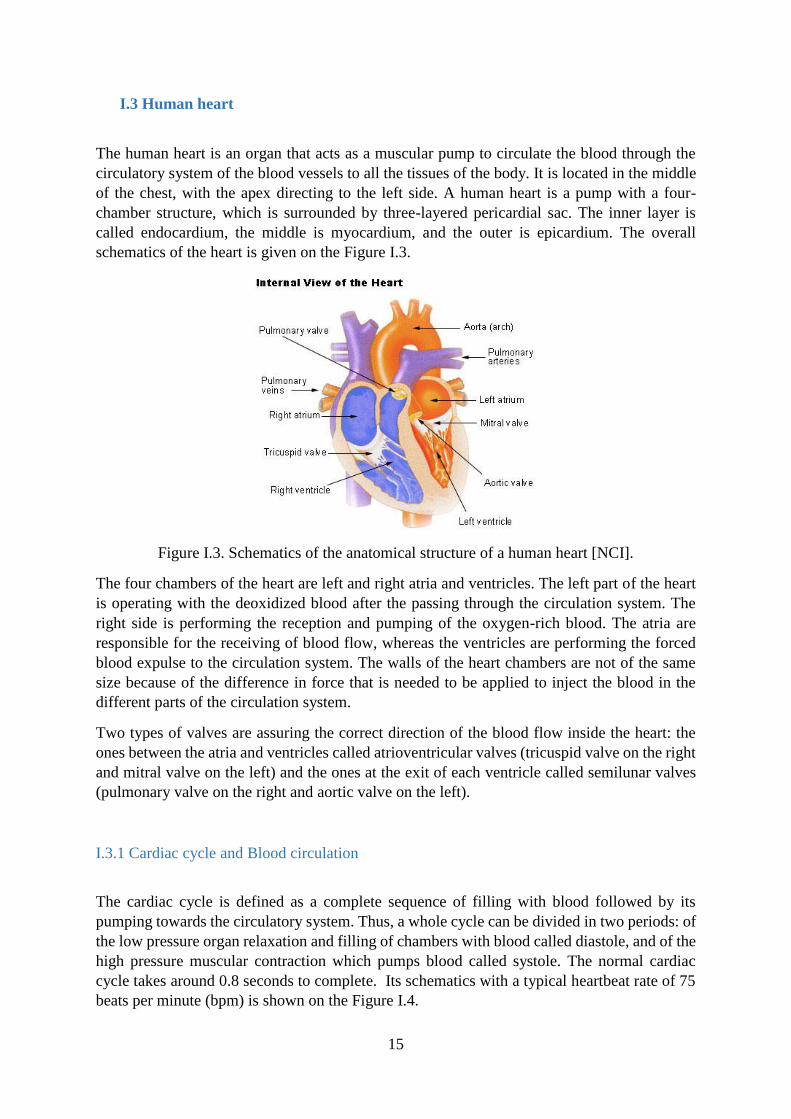
The human heart is an organ that acts as a muscular pump to circulate the blood through the
circulatory system of the blood vessels to all the tissues of the body. It is located in the middle
of the chest, with the apex directing to the left side. A human heart is a pump with a four-
chamber structure, which is surrounded by three-layered pericardial sac. The inner layer is
called endocardium, the middle is myocardium, and the outer is epicardium. The overall
schematics of the heart is given on the Figure I.3.
Figure I.3. Schematics of the anatomical structure of a human heart [NCI].
The four chambers of the heart are left and right atria and ventricles. The left part of the heart
is operating with the deoxidized blood after the passing through the circulation system. The
right side is performing the reception and pumping of the oxygen-rich blood. The atria are
responsible for the receiving of blood flow, whereas the ventricles are performing the forced
blood expulse to the circulation system. The walls of the heart chambers are not of the same
size because of the difference in force that is needed to be applied to inject the blood in the
different parts of the circulation system.
Two types of valves are assuring the correct direction of the blood flow inside the heart: the
ones between the atria and ventricles called atrioventricular valves (tricuspid valve on the right
and mitral valve on the left) and the ones at the exit of each ventricle called semilunar valves
(pulmonary valve on the right and aortic valve on the left).
I.3.1 Cardiac cycle and Blood circulation
The cardiac cycle is defined as a complete sequence of filling with blood followed by its
pumping towards the circulatory system. Thus, a whole cycle can be divided in two periods: of
the low pressure organ relaxation and filling of chambers with blood called diastole, and of the
high pressure muscular contraction which pumps blood called systole. The normal cardiac
cycle takes around 0.8 seconds to complete. Its schematics with a typical heartbeat rate of 75
beats per minute (bpm) is shown on the Figure I.4.

16
At the very beginning of the diastole period of cardiac cycle (1 at Figure I.4), that is called
isovolumic relaxation, both types of the valves are closed, and the blood flow stops for a short
moment. Next, the ventricular filling begins: atrioventricular valves are opening, both atria and
ventricles are expanding resulting in the blood flow inside the heart. After, the second part (2
at Figure I.4) of the cardiac cycle starts: the ventricles remain expanded, whereas the atrial
contraction injects blood under pressure in the both ventricles. The last part (3 at Figure I.4) of
the cardiac cycle begins with an isovolumic contraction when all of valves are closing for a
brief moment and the ventricles begin the contraction. The cardiac cycle ends with ventricular
injection when the semilunar valves are opening as a result of the ventricles contraction and
blood is pumped away from the heart to the body.
Figure I.4. The cardiac cycle at 75 bpm [Campbell, 1999].
The average stroke volume of a human heart is 75mL. It means, that a normally functioning
heart pumps around 5.6L of blood each minute, which corresponds to the average amount of
blood in a human body. During a physical activity, the amount of blood pumped per minute
can increase significantly up to five times.
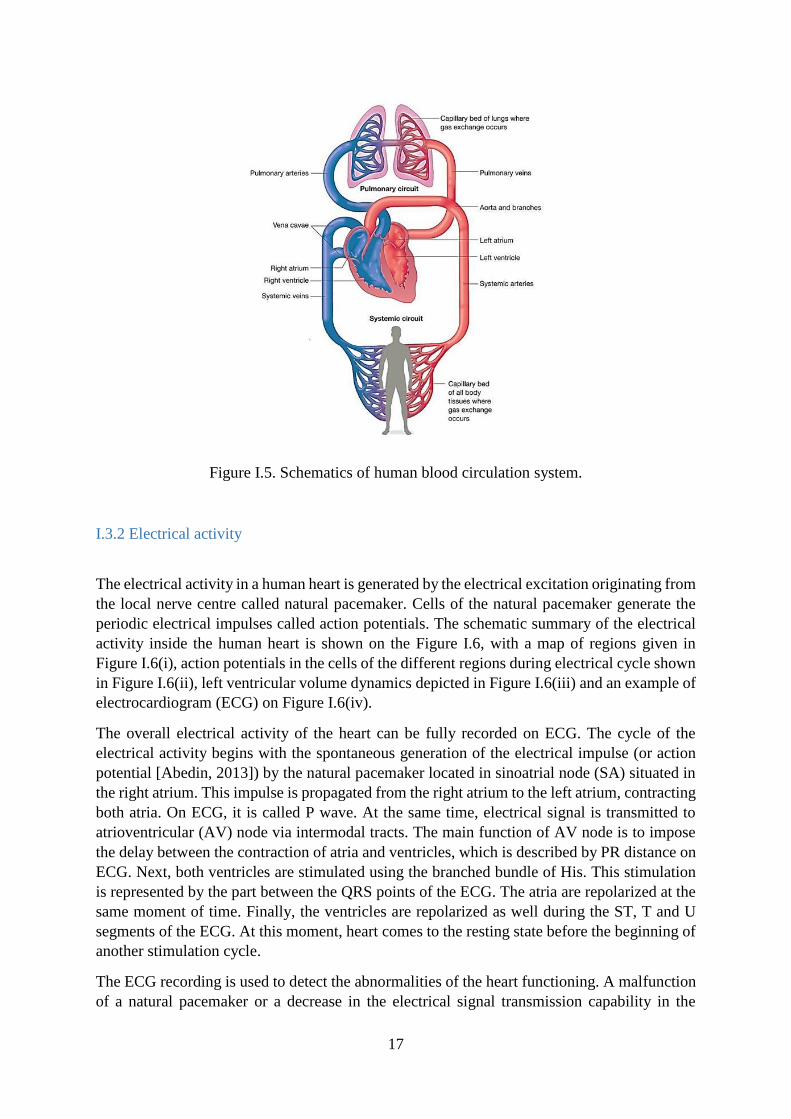
The blood circulation system is a critical part of a human body that brings the nutrients and
oxygen to the cells and helps to remove the products of metabolism. The schematics of a full
circulation system is given on the Figure I.5. Right ventricle supplies the blood that is poor in
oxygen to the lungs via pulmonary arteries, where the blood is enriched with the oxygen. Next,
pulmonary veins deliver the oxygen rich blood back to the left atrium of the heart, and it is
send to the rest of human body through the left ventricle by the systemic arteries and capillaries.
Once the oxygen is delivered to the tissues, the blood is delivered back to the right atrium
[Pappano, 2013].
The cardiac cycle is controlled by the electrical activity of the heart that is discussed in the next
sub-section.
17
Figure I.5. Schematics of human blood circulation system.
I.3.2 Electrical activity
The electrical activity in a human heart is generated by the electrical excitation originating from
the local nerve centre called natural pacemaker. Cells of the natural pacemaker generate the
periodic electrical impulses called action potentials. The schematic summary of the electrical
activity inside the human heart is shown on the Figure I.6, with a map of regions given in
Figure I.6(i), action potentials in the cells of the different regions during electrical cycle shown
in Figure I.6(ii), left ventricular volume dynamics depicted in Figure I.6(iii) and an example of
electrocardiogram (ECG) on Figure I.6(iv).
The overall electrical activity of the heart can be fully recorded on ECG. The cycle of the
electrical activity begins with the spontaneous generation of the electrical impulse (or action
potential [Abedin, 2013]) by the natural pacemaker located in sinoatrial node (SA) situated in
the right atrium. This impulse is propagated from the right atrium to the left atrium, contracting
both atria. On ECG, it is called P wave. At the same time, electrical signal is transmitted to
atrioventricular (AV) node via intermodal tracts. The main function of AV node is to impose
the delay between the contraction of atria and ventricles, which is described by PR distance on
ECG. Next, both ventricles are stimulated using the branched bundle of His. This stimulation
is represented by the part between the QRS points of the ECG. The atria are repolarized at the
same moment of time. Finally, the ventricles are repolarized as well during the ST, T and U
segments of the ECG. At this moment, heart comes to the resting state before the beginning of
another stimulation cycle.
The ECG recording is used to detect the abnormalities of the heart functioning. A malfunction
of a natural pacemaker or a decrease in the electrical signal transmission capability in the
18
human heart is often a reason for a cardiac arrhythmia, which are discussed in one of the
following sub-sections.
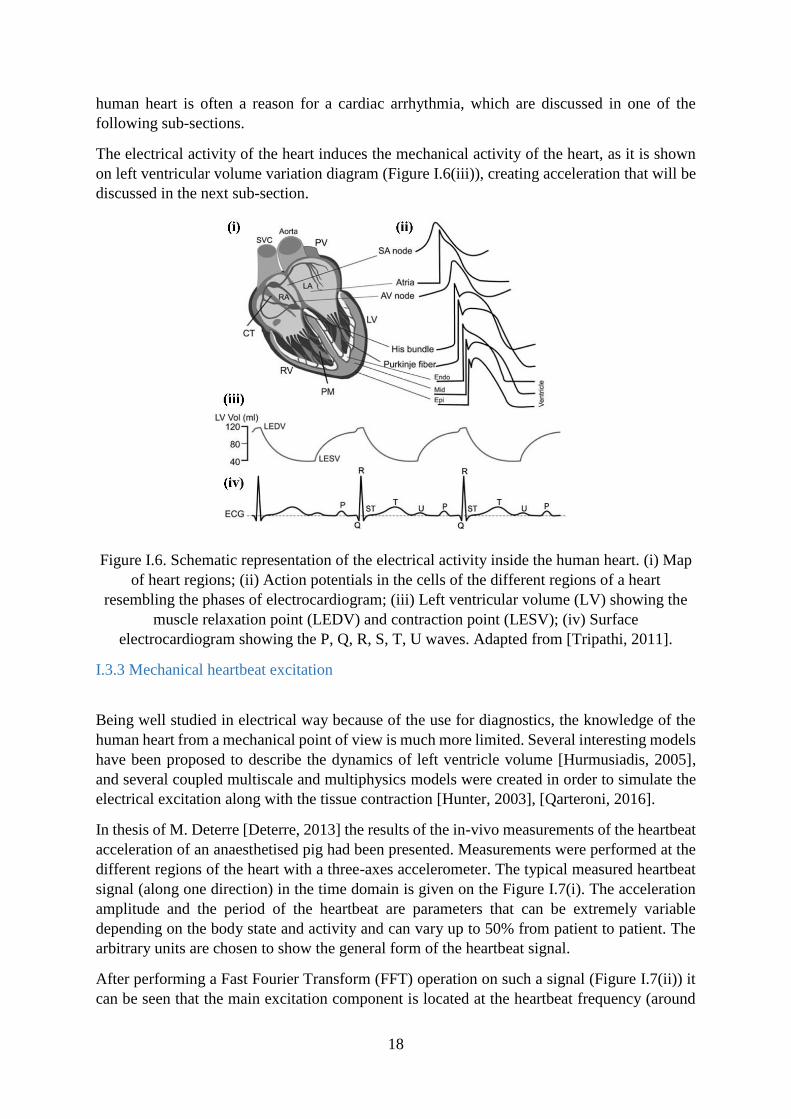
The electrical activity of the heart induces the mechanical activity of the heart, as it is shown
on left ventricular volume variation diagram (Figure I.6(iii)), creating acceleration that will be
discussed in the next sub-section.
Figure I.6. Schematic representation of the electrical activity inside the human heart. (i) Map
of heart regions; (ii) Action potentials in the cells of the different regions of a heart
resembling the phases of electrocardiogram; (iii) Left ventricular volume (LV) showing the
muscle relaxation point (LEDV) and contraction point (LESV); (iv) Surface
electrocardiogram showing the P, Q, R, S, T, U waves. Adapted from [Tripathi, 2011].
I.3.3 Mechanical heartbeat excitation
Being well studied in electrical way because of the use for diagnostics, the knowledge of the
human heart from a mechanical point of view is much more limited. Several interesting models
have been proposed to describe the dynamics of left ventricle volume [Hurmusiadis, 2005],
and several coupled multiscale and multiphysics models were created in order to simulate the
electrical excitation along with the tissue contraction [Hunter, 2003], [Qarteroni, 2016].
In thesis of M. Deterre [Deterre, 2013] the results of the in-vivo measurements of the heartbeat
acceleration of an anaesthetised pig had been presented. Measurements were performed at the
different regions of the heart with a three-axes accelerometer. The typical measured heartbeat
signal (along one direction) in the time domain is given on the Figure I.7(i). The acceleration
amplitude and the period of the heartbeat are parameters that can be extremely variable
depending on the body state and activity and can vary up to 50% from patient to patient. The
arbitrary units are chosen to show the general form of the heartbeat signal.
After performing a Fast Fourier Transform (FFT) operation on such a signal (Figure I.7(ii)) it
can be seen that the main excitation component is located at the heartbeat frequency (around
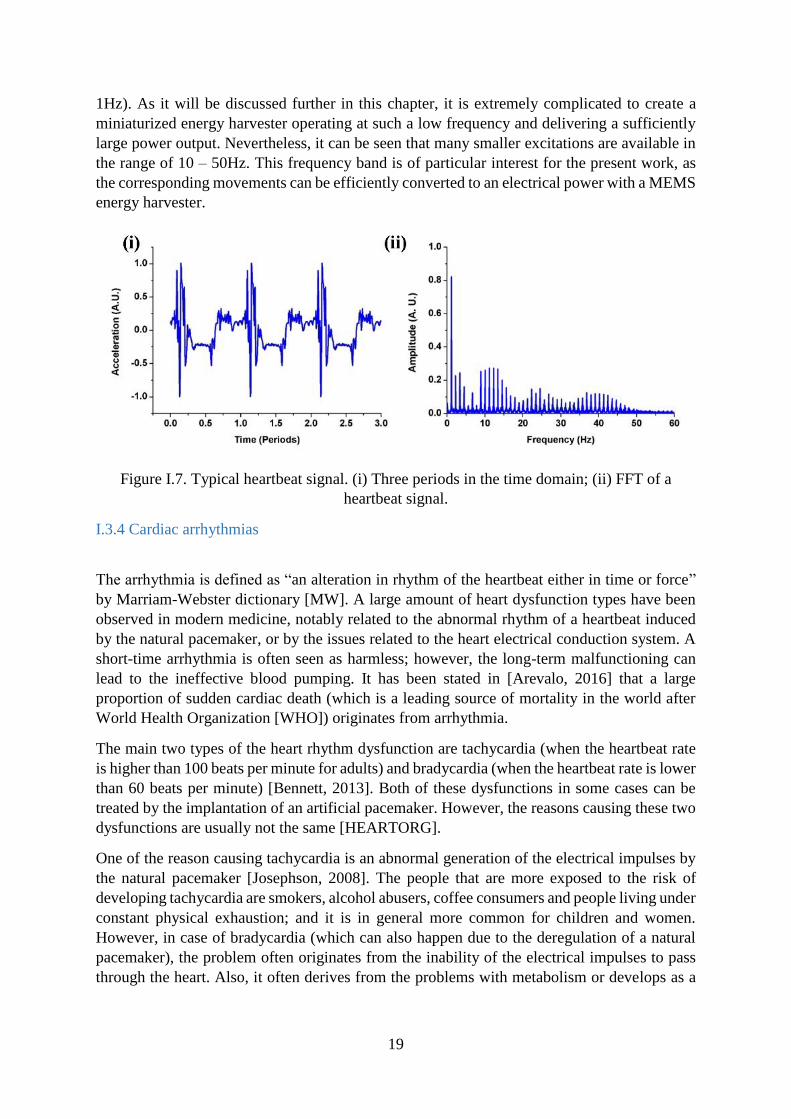
19
1Hz). As it will be discussed further in this chapter, it is extremely complicated to create a
miniaturized energy harvester operating at such a low frequency and delivering a sufficiently
large power output. Nevertheless, it can be seen that many smaller excitations are available in
the range of 10 – 50Hz. This frequency band is of particular interest for the present work, as
the corresponding movements can be efficiently converted to an electrical power with a MEMS
energy harvester.
Figure I.7. Typical heartbeat signal. (i) Three periods in the time domain; (ii) FFT of a
heartbeat signal.
I.3.4 Cardiac arrhythmias
The arrhythmia is defined as “an alteration in rhythm of the heartbeat either in time or force”
by Marriam-Webster dictionary [MW]. A large amount of heart dysfunction types have been
observed in modern medicine, notably related to the abnormal rhythm of a heartbeat induced
by the natural pacemaker, or by the issues related to the heart electrical conduction system. A
short-time arrhythmia is often seen as harmless; however, the long-term malfunctioning can
lead to the ineffective blood pumping. It has been stated in [Arevalo, 2016] that a large
proportion of sudden cardiac death (which is a leading source of mortality in the world after
World Health Organization [WHO]) originates from arrhythmia.
The main two types of the heart rhythm dysfunction are tachycardia (when the heartbeat rate
is higher than 100 beats per minute for adults) and bradycardia (when the heartbeat rate is lower
than 60 beats per minute) [Bennett, 2013]. Both of these dysfunctions in some cases can be
treated by the implantation of an artificial pacemaker. However, the reasons causing these two
dysfunctions are usually not the same [HEARTORG].
One of the reason causing tachycardia is an abnormal generation of the electrical impulses by
the natural pacemaker [Josephson, 2008]. The people that are more exposed to the risk of
developing tachycardia are smokers, alcohol abusers, coffee consumers and people living under
constant physical exhaustion; and it is in general more common for children and women.
However, in case of bradycardia (which can also happen due to the deregulation of a natural
pacemaker), the problem often originates from the inability of the electrical impulses to pass
through the heart. Also, it often derives from the problems with metabolism or develops as a
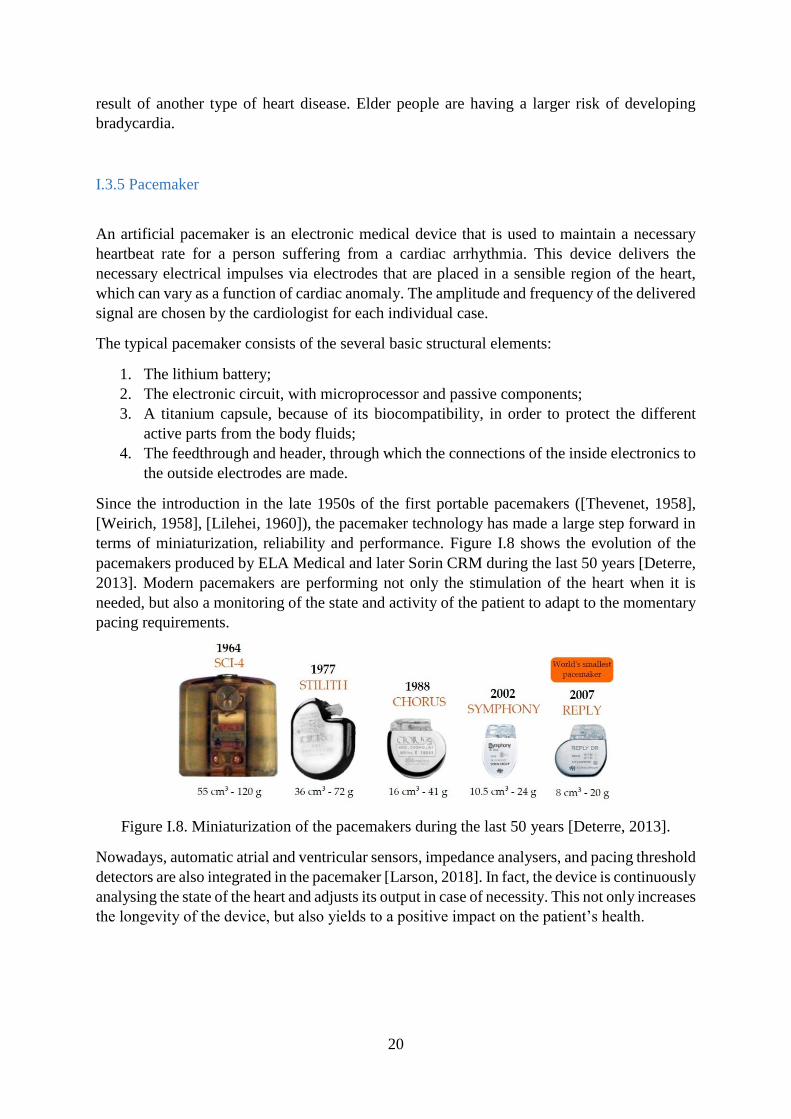
20
result of another type of heart disease. Elder people are having a larger risk of developing
bradycardia.
I.3.5 Pacemaker
An artificial pacemaker is an electronic medical device that is used to maintain a necessary
heartbeat rate for a person suffering from a cardiac arrhythmia. This device delivers the
necessary electrical impulses via electrodes that are placed in a sensible region of the heart,
which can vary as a function of cardiac anomaly. The amplitude and frequency of the delivered
signal are chosen by the cardiologist for each individual case.
The typical pacemaker consists of the several basic structural elements:
1. The lithium battery;
2. The electronic circuit, with microprocessor and passive components;
3. A titanium capsule, because of its biocompatibility, in order to protect the different
active parts from the body fluids;
4. The feedthrough and header, through which the connections of the inside electronics to
the outside electrodes are made.
Since the introduction in the late 1950s of the first portable pacemakers ([Thevenet, 1958],
[Weirich, 1958], [Lilehei, 1960]), the pacemaker technology has made a large step forward in
terms of miniaturization, reliability and performance. Figure I.8 shows the evolution of the
pacemakers produced by ELA Medical and later Sorin CRM during the last 50 years [Deterre,
2013]. Modern pacemakers are performing not only the stimulation of the heart when it is
needed, but also a monitoring of the state and activity of the patient to adapt to the momentary
pacing requirements.
Figure I.8. Miniaturization of the pacemakers during the last 50 years [Deterre, 2013].
Nowadays, automatic atrial and ventricular sensors, impedance analysers, and pacing threshold
detectors are also integrated in the pacemaker [Larson, 2018]. In fact, the device is continuously
analysing the state of the heart and adjusts its output in case of necessity. This not only increases
the longevity of the device, but also yields to a positive impact on the patient’s health.
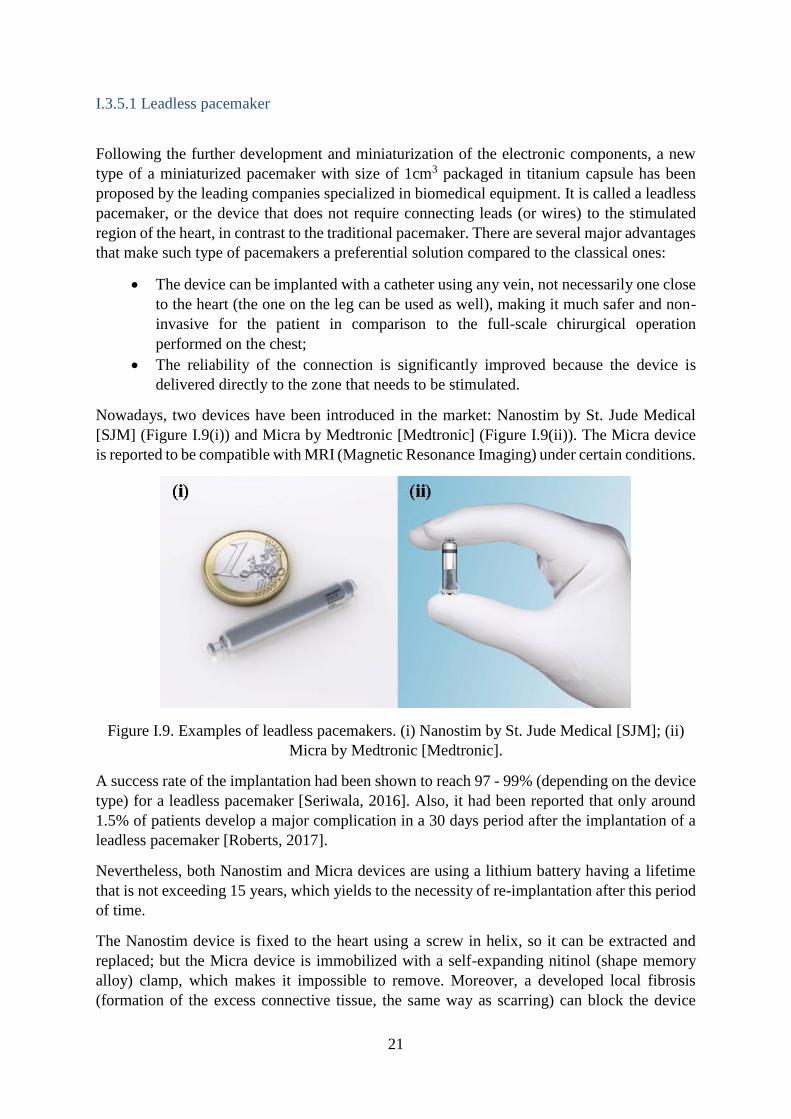
21
I.3.5.1 Leadless pacemaker
Following the further development and miniaturization of the electronic components, a new
type of a miniaturized pacemaker with size of 1cm3 packaged in titanium capsule has been
proposed by the leading companies specialized in biomedical equipment. It is called a leadless
pacemaker, or the device that does not require connecting leads (or wires) to the stimulated
region of the heart, in contrast to the traditional pacemaker. There are several major advantages
that make such type of pacemakers a preferential solution compared to the classical ones:
The device can be implanted with a catheter using any vein, not necessarily one close
to the heart (the one on the leg can be used as well), making it much safer and non-
invasive for the patient in comparison to the full-scale chirurgical operation
performed on the chest;
The reliability of the connection is significantly improved because the device is
delivered directly to the zone that needs to be stimulated.
Nowadays, two devices have been introduced in the market: Nanostim by St. Jude Medical
[SJM] (Figure I.9(i)) and Micra by Medtronic [Medtronic] (Figure I.9(ii)). The Micra device
is reported to be compatible with MRI (Magnetic Resonance Imaging) under certain conditions.
Figure I.9. Examples of leadless pacemakers. (i) Nanostim by St. Jude Medical [SJM]; (ii)
Micra by Medtronic [Medtronic].
A success rate of the implantation had been shown to reach 97 - 99% (depending on the device
type) for a leadless pacemaker [Seriwala, 2016]. Also, it had been reported that only around
1.5% of patients develop a major complication in a 30 days period after the implantation of a
leadless pacemaker [Roberts, 2017].
Nevertheless, both Nanostim and Micra devices are using a lithium battery having a lifetime
that is not exceeding 15 years, which yields to the necessity of re-implantation after this period
of time.
The Nanostim device is fixed to the heart using a screw in helix, so it can be extracted and
replaced; but the Micra device is immobilized with a self-expanding nitinol (shape memory
alloy) clamp, which makes it impossible to remove. Moreover, a developed local fibrosis
(formation of the excess connective tissue, the same way as scarring) can block the device
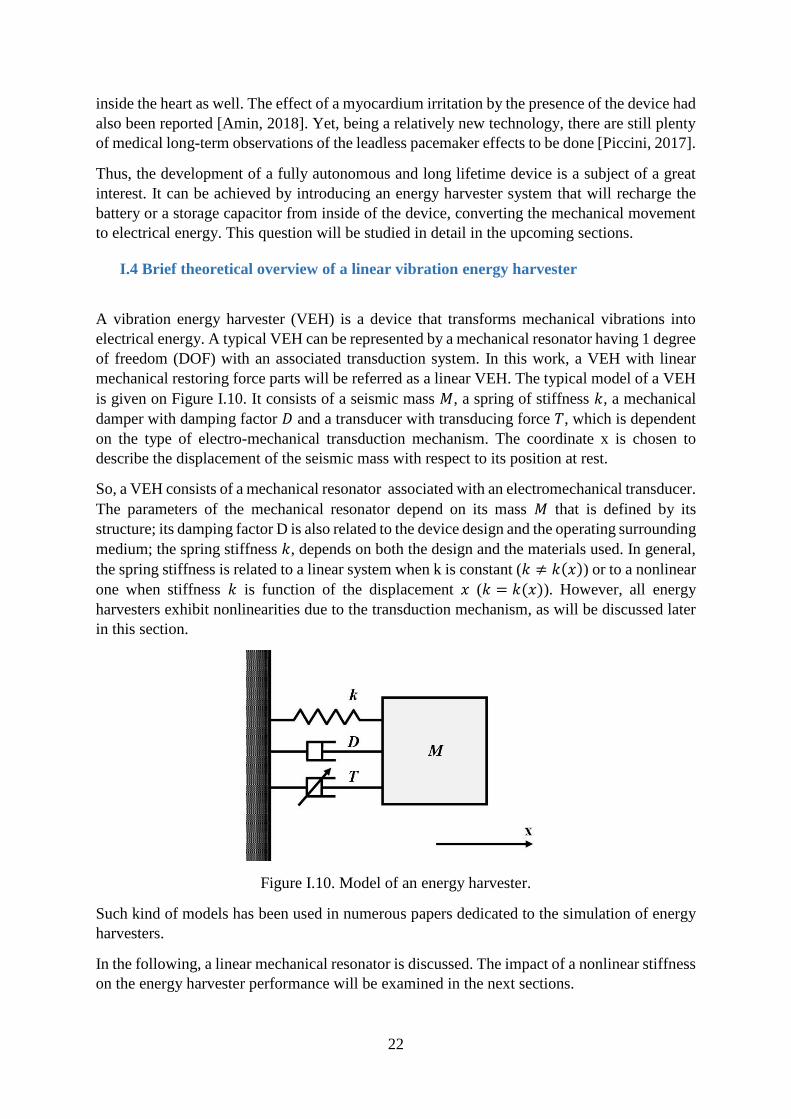
22
inside the heart as well. The effect of a myocardium irritation by the presence of the device had
also been reported [Amin, 2018]. Yet, being a relatively new technology, there are still plenty
of medical long-term observations of the leadless pacemaker effects to be done [Piccini, 2017].
Thus, the development of a fully autonomous and long lifetime device is a subject of a great
interest. It can be achieved by introducing an energy harvester system that will recharge the
battery or a storage capacitor from inside of the device, converting the mechanical movement
to electrical energy. This question will be studied in detail in the upcoming sections.
I.4 Brief theoretical overview of a linear vibration energy harvester
A vibration energy harvester (VEH) is a device that transforms mechanical vibrations into
electrical energy. A typical VEH can be represented by a mechanical resonator having 1 degree
of freedom (DOF) with an associated transduction system. In this work, a VEH with linear
mechanical restoring force parts will be referred as a linear VEH. The typical model of a VEH
is given on Figure I.10. It consists of a seismic mass 𝑀, a spring of stiffness 𝑘, a mechanical
damper with damping factor 𝐷 and a transducer with transducing force 𝑇, which is dependent
on the type of electro-mechanical transduction mechanism. The coordinate x is chosen to
describe the displacement of the seismic mass with respect to its position at rest.
So, a VEH consists of a mechanical resonator associated with an electromechanical transducer.
The parameters of the mechanical resonator depend on its mass 𝑀 that is defined by its
structure; its damping factor D is also related to the device design and the operating surrounding
medium; the spring stiffness 𝑘, depends on both the design and the materials used. In general,
the spring stiffness is related to a linear system when k is constant (𝑘 ≠ 𝑘(𝑥)) or to a nonlinear
one when stiffness 𝑘 is function of the displacement 𝑥 (𝑘 = 𝑘(𝑥)). However, all energy
harvesters exhibit nonlinearities due to the transduction mechanism, as will be discussed later
in this section.
Figure I.10. Model of an energy harvester.
Such kind of models has been used in numerous papers dedicated to the simulation of energy
harvesters.
In the following, a linear mechanical resonator is discussed. The impact of a nonlinear stiffness
on the energy harvester performance will be examined in the next sections.

23
I.4.1 Linear mechanical resonator
A mechanical resonator with springs with constant stiffness is now considered. In the absence
of nonconservative forces (𝐷 = 0), the equation describing the dynamics of the system is
written:
𝑀𝑑2𝑥
𝑑𝑡2+ 𝑘𝑥 = 0.
(I.1)
The natural frequency 𝑓𝐿 of the resonator is defined as a frequency of free and non-damped
oscillations. The natural frequency 𝑓𝐿 of the linear resonant system is expressed as:
𝑓𝐿 =1
2𝜋√𝑘
𝑀.
(I.2)
As it was discussed in the previous section, a human heart produces excitations in the range of
1 – 50Hz. To design a device with resonant frequency of 50Hz (Equation I.2), if a linear
resonator is used, a very low stiffness 𝑘 = 10N/m and a very high mass 𝑀 = 0.1g resonator has
to be developed while keeping a small size of an overall system, which is an engineering
challenge of a great difficulty in silicon MEMS domain.
In the presence of the dissipations (𝐷 ≠ 0), the dynamics of the resonator becomes damped.
Thus, the dynamical equation becomes:
𝑀𝑑2𝑥
𝑑𝑡2+ 𝐷
𝑑𝑥
𝑑𝑡+ 𝑘𝑥 = 0.
(I.3)
Or, normalising the equation (I.3), it can be rewritten as:
𝑑2𝑥
𝑑𝑡2+ 2𝜁𝜔0
𝑑𝑥
𝑑𝑡+ 𝜔0
2𝑥 = 0,
(I.4)
with the resonator damping ratio 𝜁 =𝐷
2√𝑘𝑀 and 𝜔0 = 2𝜋𝑓𝐿 = √
𝑘
𝑀 denoting the undamped
natural angular frequency of the resonator.
In the case of underdamped systems (𝜁 < 1), a notion of quality factor 𝑄 can be introduced as:
𝑄 =1
2𝜁=𝑓𝐿𝛥𝑓𝐿
=𝜔0𝛥𝜔0
,
(I.5)
with 𝛥𝑓𝐿 and 𝛥𝜔0 being a frequency and angular frequency resonance width at half maximum,
respectively. The higher the quality factor 𝑄 is, the less energy is mechanically dissipated in
the system. In the context of the energy harvesting, increasing the mechanical quality factor is
a subject of great interest. In microsystems, quality factors of more than 106 had been reported
[Zotov, 2015], [Senkal, 2015] in vacuum. At atmospheric pressure they are commonly close to
100 due to the viscous air damping and squeeze-film damping.
The dynamical equation for damped and not forced oscillations becomes:
𝑑2𝑥
𝑑𝑡2+𝜔0𝑄
𝑑𝑥
𝑑𝑡+ 𝜔0
2𝑥 = 0.
(I.6)
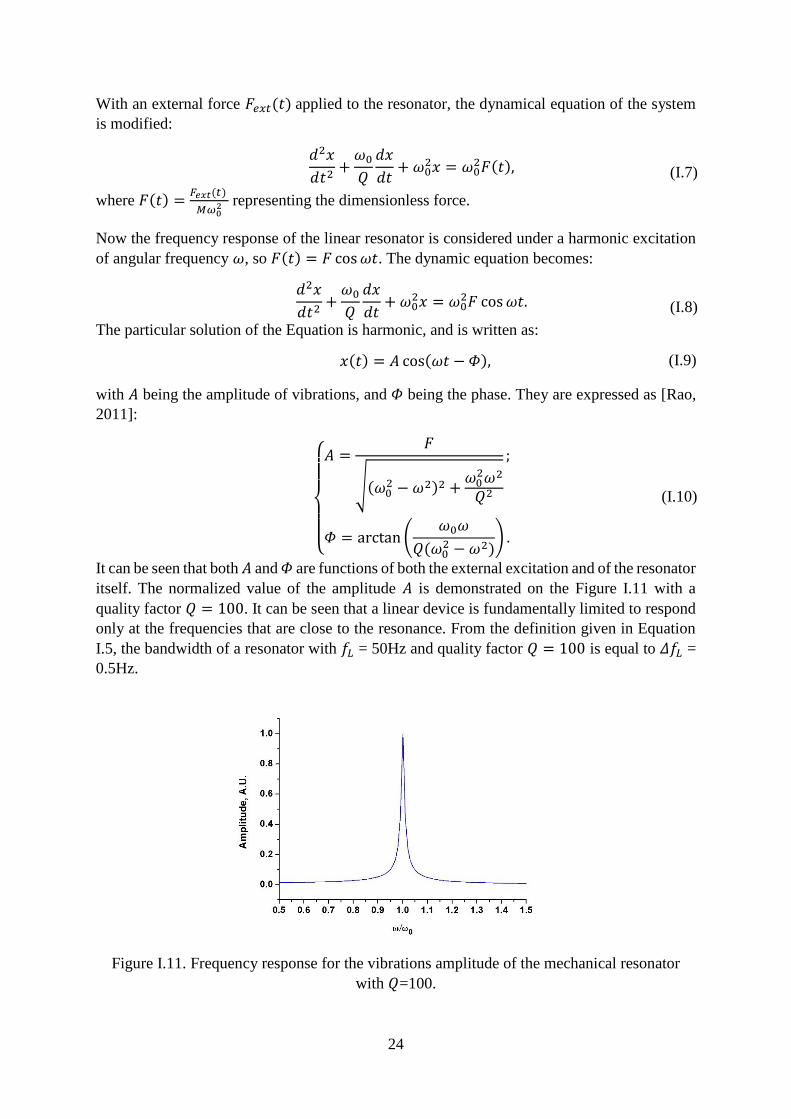
24
With an external force 𝐹𝑒𝑥𝑡(𝑡) applied to the resonator, the dynamical equation of the system
is modified:
𝑑2𝑥
𝑑𝑡2+𝜔0𝑄
𝑑𝑥
𝑑𝑡+ 𝜔0
2𝑥 = 𝜔02𝐹(𝑡),
(I.7)
where 𝐹(𝑡) =𝐹𝑒𝑥𝑡(𝑡)
𝑀𝜔02 representing the dimensionless force.
Now the frequency response of the linear resonator is considered under a harmonic excitation
of angular frequency 𝜔, so 𝐹(𝑡) = 𝐹 cos𝜔𝑡. The dynamic equation becomes:
𝑑2𝑥
𝑑𝑡2+𝜔0𝑄
𝑑𝑥
𝑑𝑡+ 𝜔0
2𝑥 = 𝜔02𝐹 cos𝜔𝑡.
(I.8)
The particular solution of the Equation is harmonic, and is written as:
𝑥(𝑡) = 𝐴 cos(𝜔𝑡 − 𝛷), (I.9)
with 𝐴 being the amplitude of vibrations, and 𝛷 being the phase. They are expressed as [Rao,
2011]:
{
𝐴 =
𝐹
√(𝜔02 − 𝜔2)2 +
𝜔02𝜔2
𝑄2
;
𝛷 = arctan (𝜔0𝜔
𝑄(𝜔02 − 𝜔2)
) .
(I.10)
It can be seen that both 𝐴 and 𝛷 are functions of both the external excitation and of the resonator
itself. The normalized value of the amplitude 𝐴 is demonstrated on the Figure I.11 with a
quality factor 𝑄 = 100. It can be seen that a linear device is fundamentally limited to respond
only at the frequencies that are close to the resonance. From the definition given in Equation
I.5, the bandwidth of a resonator with 𝑓𝐿 = 50Hz and quality factor 𝑄 = 100 is equal to 𝛥𝑓𝐿 =
0.5Hz.
Figure I.11. Frequency response for the vibrations amplitude of the mechanical resonator
with 𝑄=100.
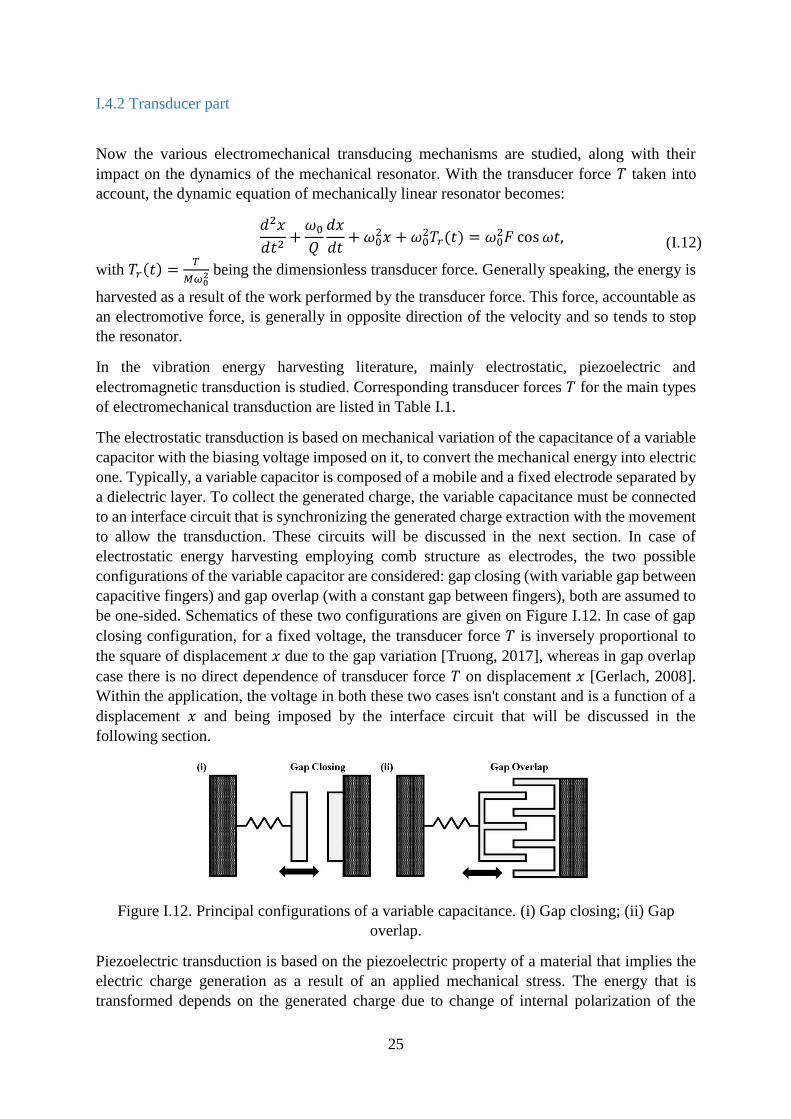
25
I.4.2 Transducer part
Now the various electromechanical transducing mechanisms are studied, along with their
impact on the dynamics of the mechanical resonator. With the transducer force 𝑇 taken into
account, the dynamic equation of mechanically linear resonator becomes:
𝑑2𝑥
𝑑𝑡2+𝜔0𝑄
𝑑𝑥
𝑑𝑡+ 𝜔0
2𝑥 + 𝜔02𝑇𝑟(𝑡) = 𝜔0
2𝐹 cos𝜔𝑡,
(I.12)
with 𝑇𝑟(𝑡) =𝑇
𝑀𝜔02 being the dimensionless transducer force. Generally speaking, the energy is
harvested as a result of the work performed by the transducer force. This force, accountable as
an electromotive force, is generally in opposite direction of the velocity and so tends to stop
the resonator.
In the vibration energy harvesting literature, mainly electrostatic, piezoelectric and
electromagnetic transduction is studied. Corresponding transducer forces 𝑇 for the main types
of electromechanical transduction are listed in Table I.1.
The electrostatic transduction is based on mechanical variation of the capacitance of a variable
capacitor with the biasing voltage imposed on it, to convert the mechanical energy into electric
one. Typically, a variable capacitor is composed of a mobile and a fixed electrode separated by
a dielectric layer. To collect the generated charge, the variable capacitance must be connected
to an interface circuit that is synchronizing the generated charge extraction with the movement
to allow the transduction. These circuits will be discussed in the next section. In case of
electrostatic energy harvesting employing comb structure as electrodes, the two possible
configurations of the variable capacitor are considered: gap closing (with variable gap between
capacitive fingers) and gap overlap (with a constant gap between fingers), both are assumed to
be one-sided. Schematics of these two configurations are given on Figure I.12. In case of gap
closing configuration, for a fixed voltage, the transducer force 𝑇 is inversely proportional to
the square of displacement 𝑥 due to the gap variation [Truong, 2017], whereas in gap overlap
case there is no direct dependence of transducer force 𝑇 on displacement 𝑥 [Gerlach, 2008].
Within the application, the voltage in both these two cases isn't constant and is a function of a
displacement 𝑥 and being imposed by the interface circuit that will be discussed in the
following section.
Figure I.12. Principal configurations of a variable capacitance. (i) Gap closing; (ii) Gap
overlap.
Piezoelectric transduction is based on the piezoelectric property of a material that implies the
electric charge generation as a result of an applied mechanical stress. The energy that is
transformed depends on the generated charge due to change of internal polarization of the
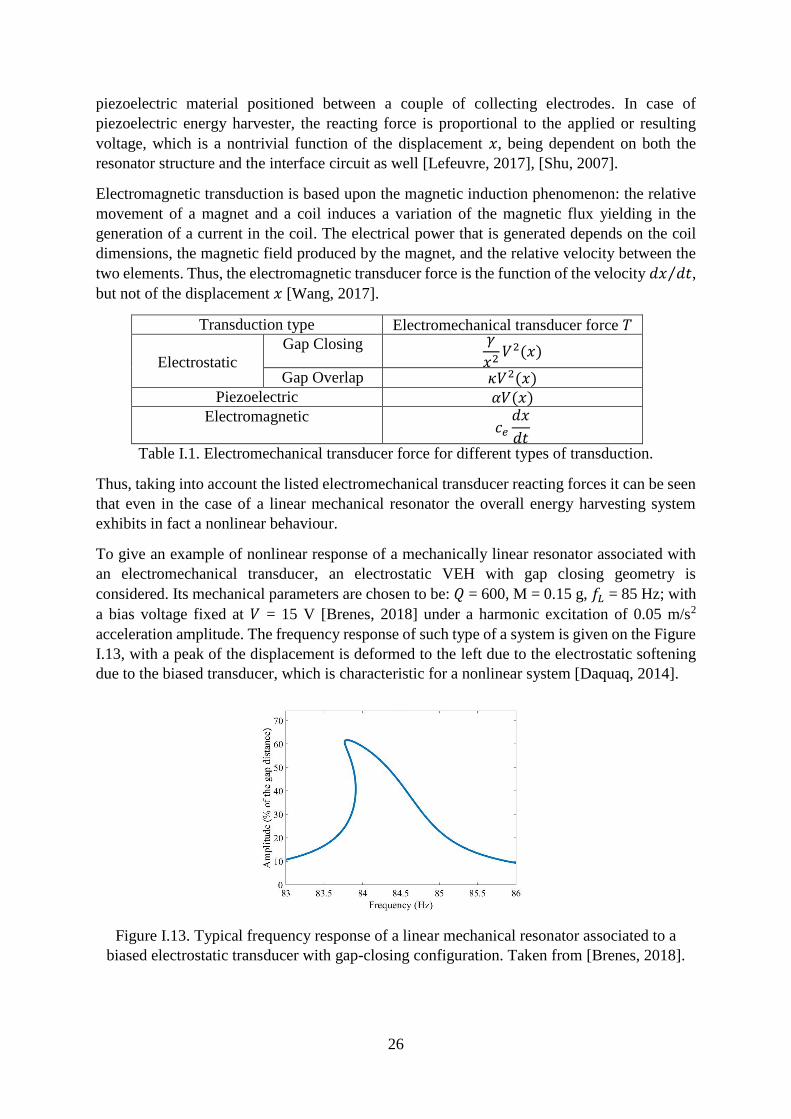
26
piezoelectric material positioned between a couple of collecting electrodes. In case of
piezoelectric energy harvester, the reacting force is proportional to the applied or resulting
voltage, which is a nontrivial function of the displacement 𝑥, being dependent on both the
resonator structure and the interface circuit as well [Lefeuvre, 2017], [Shu, 2007].
Electromagnetic transduction is based upon the magnetic induction phenomenon: the relative
movement of a magnet and a coil induces a variation of the magnetic flux yielding in the
generation of a current in the coil. The electrical power that is generated depends on the coil
dimensions, the magnetic field produced by the magnet, and the relative velocity between the
two elements. Thus, the electromagnetic transducer force is the function of the velocity 𝑑𝑥 𝑑𝑡⁄ ,
but not of the displacement 𝑥 [Wang, 2017].
Transduction type Electromechanical transducer force 𝑇
Electrostatic
Gap Closing 𝛾
𝑥2𝑉2(𝑥)
Gap Overlap 𝜅𝑉2(𝑥) Piezoelectric 𝛼𝑉(𝑥)
Electromagnetic 𝑐𝑒𝑑𝑥
𝑑𝑡
Table I.1. Electromechanical transducer force for different types of transduction.
Thus, taking into account the listed electromechanical transducer reacting forces it can be seen
that even in the case of a linear mechanical resonator the overall energy harvesting system
exhibits in fact a nonlinear behaviour.
To give an example of nonlinear response of a mechanically linear resonator associated with
an electromechanical transducer, an electrostatic VEH with gap closing geometry is
considered. Its mechanical parameters are chosen to be: 𝑄 = 600, M = 0.15 g, 𝑓𝐿 = 85 Hz; with
a bias voltage fixed at 𝑉 = 15 V [Brenes, 2018] under a harmonic excitation of 0.05 m/s2
acceleration amplitude. The frequency response of such type of a system is given on the Figure
I.13, with a peak of the displacement is deformed to the left due to the electrostatic softening
due to the biased transducer, which is characteristic for a nonlinear system [Daquaq, 2014].
Figure I.13. Typical frequency response of a linear mechanical resonator associated to a
biased electrostatic transducer with gap-closing configuration. Taken from [Brenes, 2018].
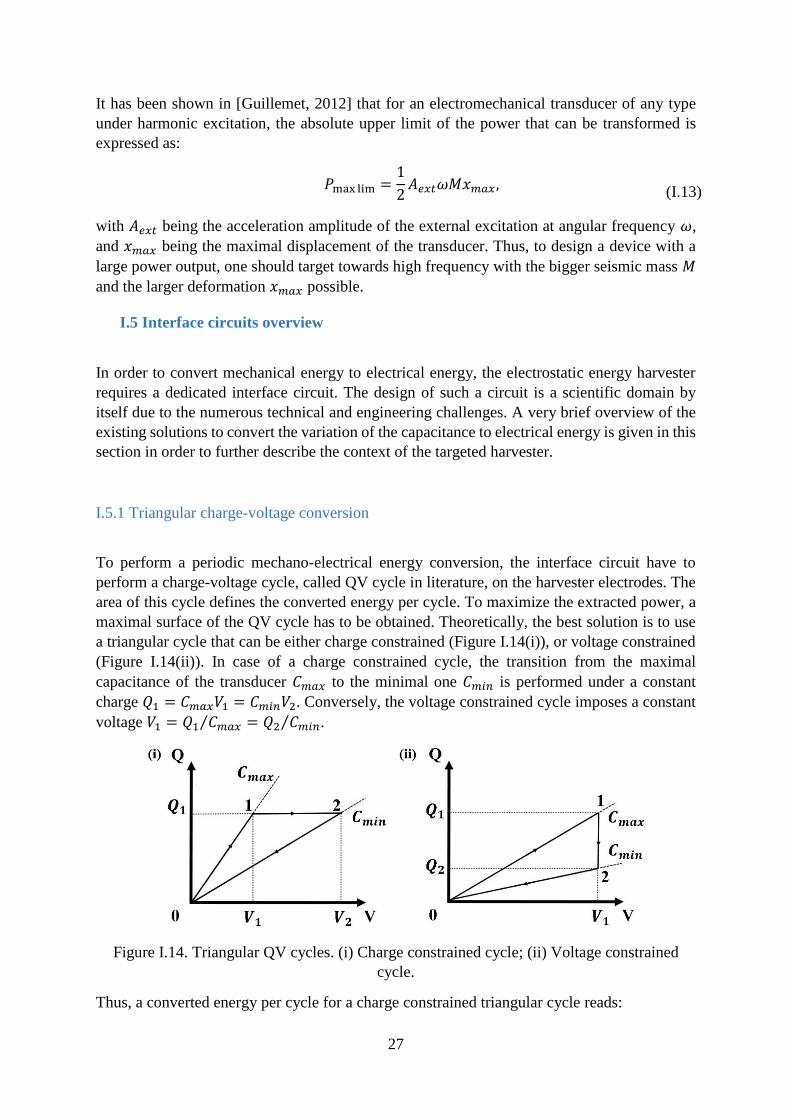
27
It has been shown in [Guillemet, 2012] that for an electromechanical transducer of any type
under harmonic excitation, the absolute upper limit of the power that can be transformed is
expressed as:
𝑃max lim =1
2𝐴𝑒𝑥𝑡𝜔𝑀𝑥𝑚𝑎𝑥 ,
(I.13)
with 𝐴𝑒𝑥𝑡 being the acceleration amplitude of the external excitation at angular frequency 𝜔,
and 𝑥𝑚𝑎𝑥 being the maximal displacement of the transducer. Thus, to design a device with a
large power output, one should target towards high frequency with the bigger seismic mass 𝑀
and the larger deformation 𝑥𝑚𝑎𝑥 possible.
I.5 Interface circuits overview
In order to convert mechanical energy to electrical energy, the electrostatic energy harvester
requires a dedicated interface circuit. The design of such a circuit is a scientific domain by
itself due to the numerous technical and engineering challenges. A very brief overview of the
existing solutions to convert the variation of the capacitance to electrical energy is given in this
section in order to further describe the context of the targeted harvester.
I.5.1 Triangular charge-voltage conversion
To perform a periodic mechano-electrical energy conversion, the interface circuit have to
perform a charge-voltage cycle, called QV cycle in literature, on the harvester electrodes. The
area of this cycle defines the converted energy per cycle. To maximize the extracted power, a
maximal surface of the QV cycle has to be obtained. Theoretically, the best solution is to use
a triangular cycle that can be either charge constrained (Figure I.14(i)), or voltage constrained
(Figure I.14(ii)). In case of a charge constrained cycle, the transition from the maximal
capacitance of the transducer 𝐶𝑚𝑎𝑥 to the minimal one 𝐶𝑚𝑖𝑛 is performed under a constant
charge 𝑄1 = 𝐶𝑚𝑎𝑥𝑉1 = 𝐶𝑚𝑖𝑛𝑉2. Conversely, the voltage constrained cycle imposes a constant
voltage 𝑉1 = 𝑄1 𝐶𝑚𝑎𝑥⁄ = 𝑄2 𝐶𝑚𝑖𝑛⁄ .
Figure I.14. Triangular QV cycles. (i) Charge constrained cycle; (ii) Voltage constrained
cycle.
Thus, a converted energy per cycle for a charge constrained triangular cycle reads:
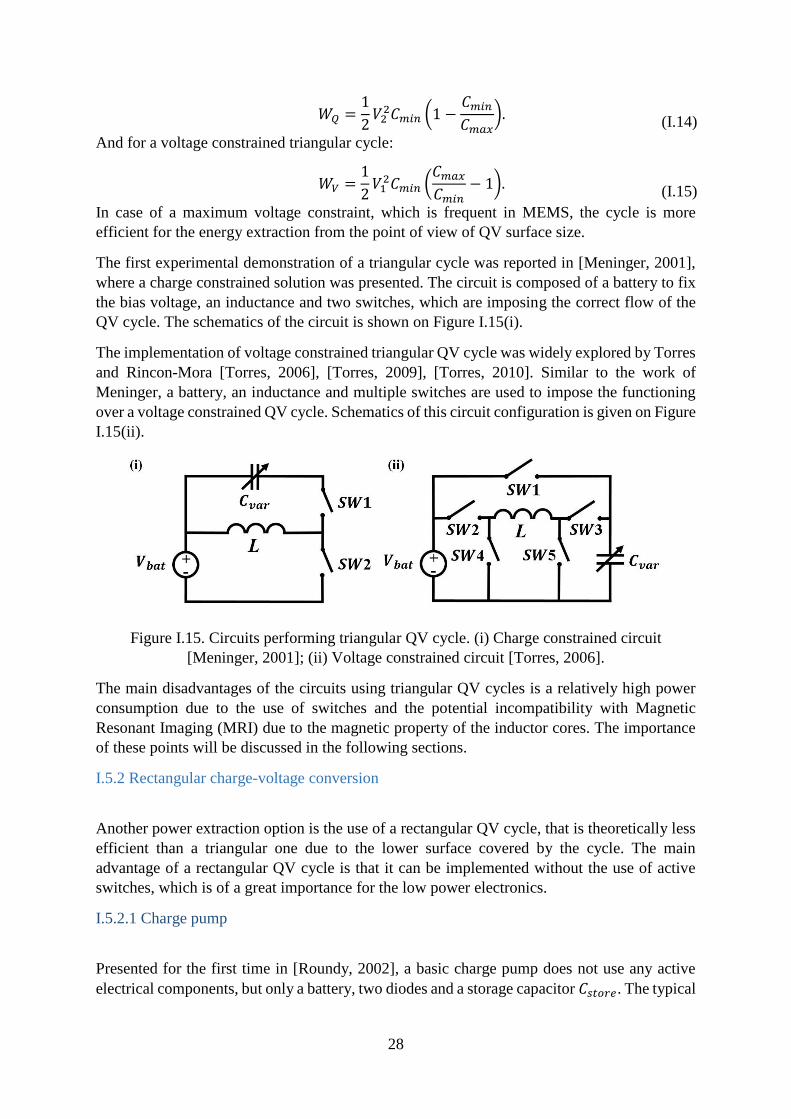
28
𝑊𝑄 =1
2𝑉22𝐶𝑚𝑖𝑛 (1 −
𝐶𝑚𝑖𝑛𝐶𝑚𝑎𝑥
).
(I.14)
And for a voltage constrained triangular cycle:
𝑊𝑉 =1
2𝑉12𝐶𝑚𝑖𝑛 (
𝐶𝑚𝑎𝑥𝐶𝑚𝑖𝑛
− 1).
(I.15)
In case of a maximum voltage constraint, which is frequent in MEMS, the cycle is more
efficient for the energy extraction from the point of view of QV surface size.
The first experimental demonstration of a triangular cycle was reported in [Meninger, 2001],
where a charge constrained solution was presented. The circuit is composed of a battery to fix
the bias voltage, an inductance and two switches, which are imposing the correct flow of the
QV cycle. The schematics of the circuit is shown on Figure I.15(i).
The implementation of voltage constrained triangular QV cycle was widely explored by Torres
and Rincon-Mora [Torres, 2006], [Torres, 2009], [Torres, 2010]. Similar to the work of
Meninger, a battery, an inductance and multiple switches are used to impose the functioning
over a voltage constrained QV cycle. Schematics of this circuit configuration is given on Figure
I.15(ii).
Figure I.15. Circuits performing triangular QV cycle. (i) Charge constrained circuit
[Meninger, 2001]; (ii) Voltage constrained circuit [Torres, 2006].
The main disadvantages of the circuits using triangular QV cycles is a relatively high power
consumption due to the use of switches and the potential incompatibility with Magnetic
Resonant Imaging (MRI) due to the magnetic property of the inductor cores. The importance
of these points will be discussed in the following sections.
I.5.2 Rectangular charge-voltage conversion
Another power extraction option is the use of a rectangular QV cycle, that is theoretically less
efficient than a triangular one due to the lower surface covered by the cycle. The main
advantage of a rectangular QV cycle is that it can be implemented without the use of active
switches, which is of a great importance for the low power electronics.
I.5.2.1 Charge pump
Presented for the first time in [Roundy, 2002], a basic charge pump does not use any active
electrical components, but only a battery, two diodes and a storage capacitor 𝐶𝑠𝑡𝑜𝑟𝑒. The typical
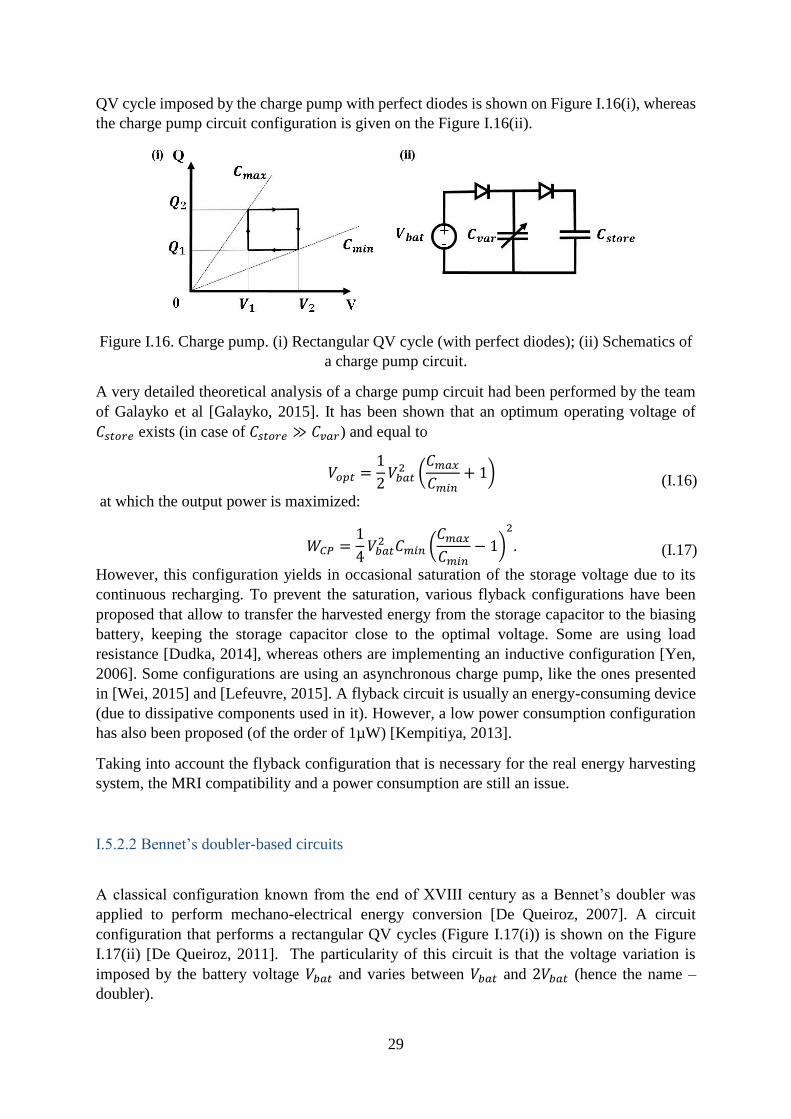
29
QV cycle imposed by the charge pump with perfect diodes is shown on Figure I.16(i), whereas
the charge pump circuit configuration is given on the Figure I.16(ii).
Figure I.16. Charge pump. (i) Rectangular QV cycle (with perfect diodes); (ii) Schematics of
a charge pump circuit.
A very detailed theoretical analysis of a charge pump circuit had been performed by the team
of Galayko et al [Galayko, 2015]. It has been shown that an optimum operating voltage of
𝐶𝑠𝑡𝑜𝑟𝑒 exists (in case of 𝐶𝑠𝑡𝑜𝑟𝑒 ≫ 𝐶𝑣𝑎𝑟) and equal to
𝑉𝑜𝑝𝑡 =1
2𝑉𝑏𝑎𝑡2 (
𝐶𝑚𝑎𝑥𝐶𝑚𝑖𝑛
+ 1)
(I.16)
at which the output power is maximized:
𝑊𝐶𝑃 =1
4𝑉𝑏𝑎𝑡2 𝐶𝑚𝑖𝑛 (
𝐶𝑚𝑎𝑥𝐶𝑚𝑖𝑛
− 1)2
.
(I.17)
However, this configuration yields in occasional saturation of the storage voltage due to its
continuous recharging. To prevent the saturation, various flyback configurations have been
proposed that allow to transfer the harvested energy from the storage capacitor to the biasing
battery, keeping the storage capacitor close to the optimal voltage. Some are using load
resistance [Dudka, 2014], whereas others are implementing an inductive configuration [Yen,
2006]. Some configurations are using an asynchronous charge pump, like the ones presented
in [Wei, 2015] and [Lefeuvre, 2015]. A flyback circuit is usually an energy-consuming device
(due to dissipative components used in it). However, a low power consumption configuration
has also been proposed (of the order of 1µW) [Kempitiya, 2013].
Taking into account the flyback configuration that is necessary for the real energy harvesting
system, the MRI compatibility and a power consumption are still an issue.
I.5.2.2 Bennet’s doubler-based circuits
A classical configuration known from the end of XVIII century as a Bennet’s doubler was
applied to perform mechano-electrical energy conversion [De Queiroz, 2007]. A circuit
configuration that performs a rectangular QV cycles (Figure I.17(i)) is shown on the Figure
I.17(ii) [De Queiroz, 2011]. The particularity of this circuit is that the voltage variation is
imposed by the battery voltage 𝑉𝑏𝑎𝑡 and varies between 𝑉𝑏𝑎𝑡 and 2𝑉𝑏𝑎𝑡 (hence the name –
doubler).
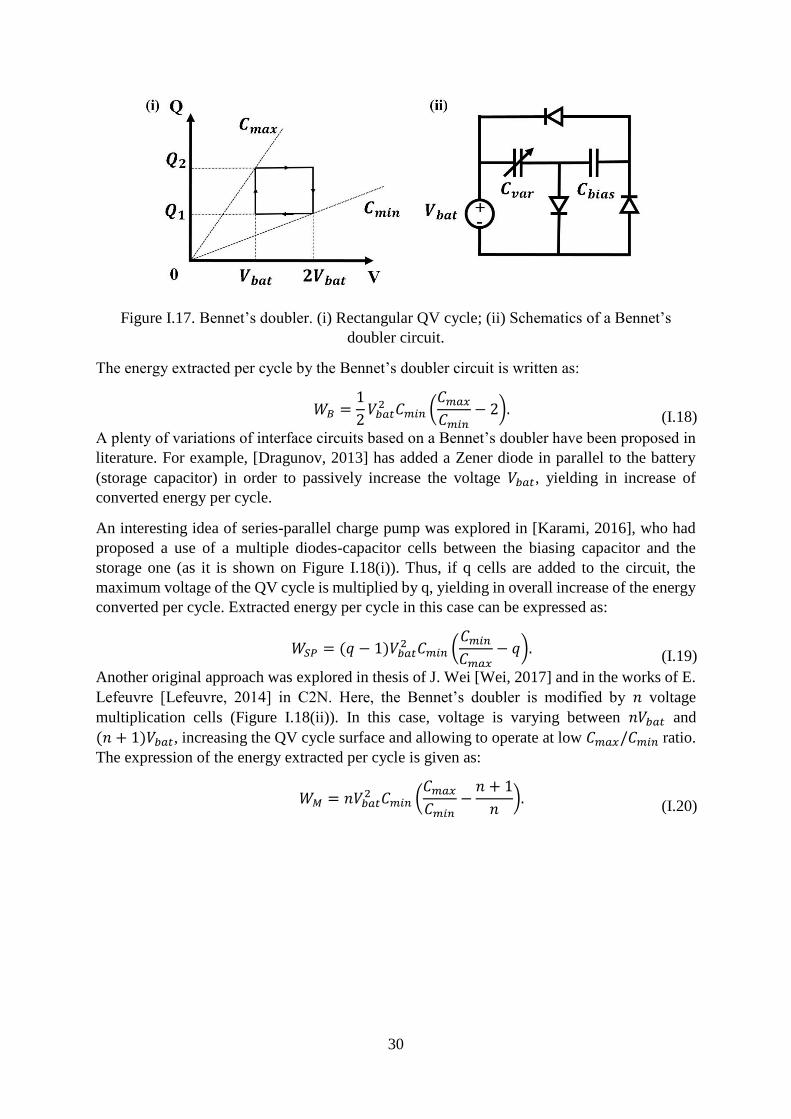
30
Figure I.17. Bennet’s doubler. (i) Rectangular QV cycle; (ii) Schematics of a Bennet’s
doubler circuit.
The energy extracted per cycle by the Bennet’s doubler circuit is written as:
𝑊𝐵 =1
2𝑉𝑏𝑎𝑡2 𝐶𝑚𝑖𝑛 (
𝐶𝑚𝑎𝑥𝐶𝑚𝑖𝑛
− 2).
(I.18)
A plenty of variations of interface circuits based on a Bennet’s doubler have been proposed in
literature. For example, [Dragunov, 2013] has added a Zener diode in parallel to the battery
(storage capacitor) in order to passively increase the voltage 𝑉𝑏𝑎𝑡, yielding in increase of
converted energy per cycle.
An interesting idea of series-parallel charge pump was explored in [Karami, 2016], who had
proposed a use of a multiple diodes-capacitor cells between the biasing capacitor and the
storage one (as it is shown on Figure I.18(i)). Thus, if q cells are added to the circuit, the
maximum voltage of the QV cycle is multiplied by q, yielding in overall increase of the energy
converted per cycle. Extracted energy per cycle in this case can be expressed as:
𝑊𝑆𝑃 = (𝑞 − 1)𝑉𝑏𝑎𝑡2 𝐶𝑚𝑖𝑛 (
𝐶𝑚𝑖𝑛𝐶𝑚𝑎𝑥
− 𝑞).
(I.19)
Another original approach was explored in thesis of J. Wei [Wei, 2017] and in the works of E.
Lefeuvre [Lefeuvre, 2014] in C2N. Here, the Bennet’s doubler is modified by 𝑛 voltage
multiplication cells (Figure I.18(ii)). In this case, voltage is varying between 𝑛𝑉𝑏𝑎𝑡 and
(𝑛 + 1)𝑉𝑏𝑎𝑡, increasing the QV cycle surface and allowing to operate at low 𝐶𝑚𝑎𝑥/𝐶𝑚𝑖𝑛 ratio.
The expression of the energy extracted per cycle is given as:
𝑊𝑀 = 𝑛𝑉𝑏𝑎𝑡2 𝐶𝑚𝑖𝑛 (
𝐶𝑚𝑎𝑥𝐶𝑚𝑖𝑛
−𝑛 + 1
𝑛).
(I.20)

31
Figure I.18. Modifications of Bennet’s doubler circuit with associated QV diagrams. (i)
Series-parallel charge pump with q cells [Karami, 2016]; (ii) Voltage multiplier configuration
with n cells [Lefeuvre, 2014].
In addition to being relatively simple, the main advantage of circuits based on Bennet’s doubler
configuration is the absence of active components yielding in low power losses and the
compatibility with MRI. This advantage makes such types of circuits a preferential choice for
envisaged biomedical applications.
I.5.3 Conclusion on interface circuits
Among the large number of interface circuits presented in the literature, only few of them can
be applied for the energy harvesting in biomedical context due to the two main requirements:
low power consumption and MRI compatibility (no use of magnetic components). The main
types of interface circuits for electrostatic energy harvesters and their parameters are
summarized in the Table I.2. The ratio of 𝐶𝑚𝑎𝑥/𝐶𝑚𝑖𝑛 is mentioned, being the important
parameters defined for the MEMS device design.
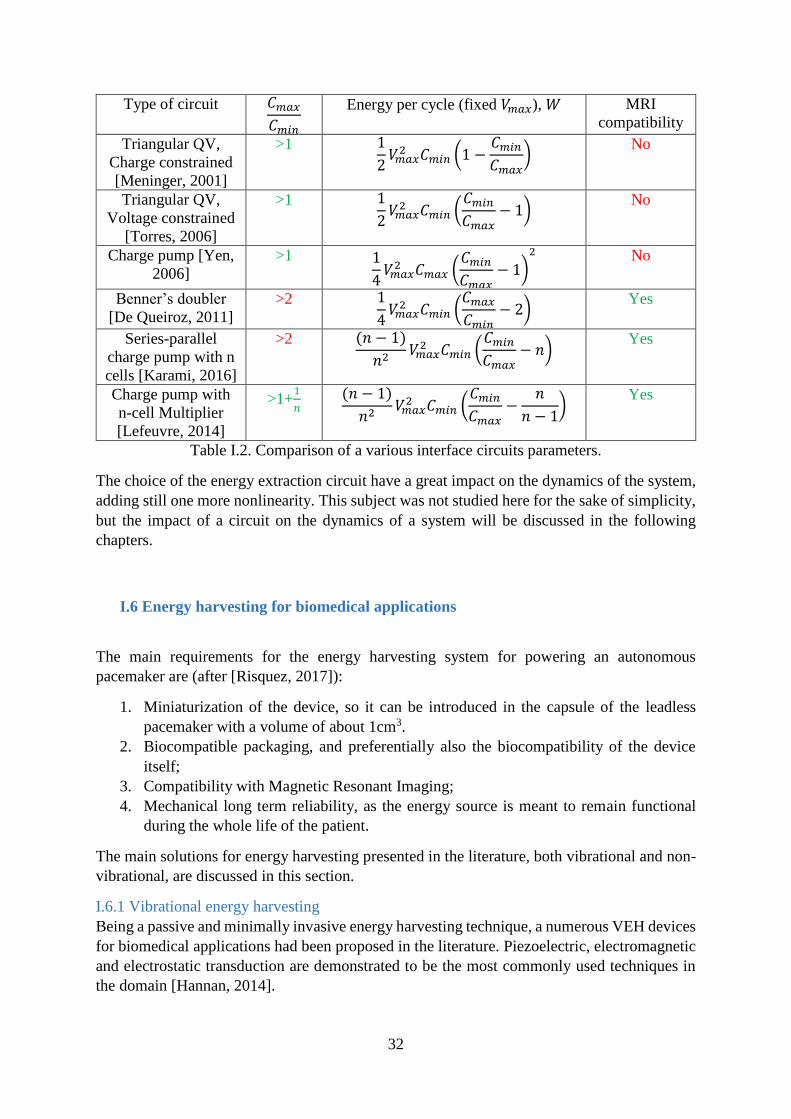
32
Type of circuit 𝐶𝑚𝑎𝑥𝐶𝑚𝑖𝑛
Energy per cycle (fixed 𝑉𝑚𝑎𝑥), 𝑊 MRI
compatibility
Triangular QV,
Charge constrained
[Meninger, 2001]
>1 1
2𝑉𝑚𝑎𝑥2 𝐶𝑚𝑖𝑛 (1 −
𝐶𝑚𝑖𝑛𝐶𝑚𝑎𝑥
) No
Triangular QV,
Voltage constrained
[Torres, 2006]
>1 1
2𝑉𝑚𝑎𝑥2 𝐶𝑚𝑖𝑛 (
𝐶𝑚𝑖𝑛𝐶𝑚𝑎𝑥
− 1) No
Charge pump [Yen,
2006]
>1 1
4𝑉𝑚𝑎𝑥2 𝐶𝑚𝑎𝑥 (
𝐶𝑚𝑖𝑛𝐶𝑚𝑎𝑥
− 1)2
No
Benner’s doubler
[De Queiroz, 2011]
>2 1
4𝑉𝑚𝑎𝑥2 𝐶𝑚𝑖𝑛 (
𝐶𝑚𝑎𝑥𝐶𝑚𝑖𝑛
− 2) Yes
Series-parallel
charge pump with n
cells [Karami, 2016]
>2 (𝑛 − 1)
𝑛2𝑉𝑚𝑎𝑥2 𝐶𝑚𝑖𝑛 (
𝐶𝑚𝑖𝑛𝐶𝑚𝑎𝑥
− 𝑛) Yes
Charge pump with
n-cell Multiplier
[Lefeuvre, 2014]
>1+1
𝑛 (𝑛 − 1)
𝑛2𝑉𝑚𝑎𝑥2 𝐶𝑚𝑖𝑛 (
𝐶𝑚𝑖𝑛𝐶𝑚𝑎𝑥
−𝑛
𝑛 − 1)
Yes
Table I.2. Comparison of a various interface circuits parameters.
The choice of the energy extraction circuit have a great impact on the dynamics of the system,
adding still one more nonlinearity. This subject was not studied here for the sake of simplicity,
but the impact of a circuit on the dynamics of a system will be discussed in the following
chapters.
I.6 Energy harvesting for biomedical applications
The main requirements for the energy harvesting system for powering an autonomous
pacemaker are (after [Risquez, 2017]):
1. Miniaturization of the device, so it can be introduced in the capsule of the leadless
pacemaker with a volume of about 1cm3.
2. Biocompatible packaging, and preferentially also the biocompatibility of the device
itself;
3. Compatibility with Magnetic Resonant Imaging;
4. Mechanical long term reliability, as the energy source is meant to remain functional
during the whole life of the patient.
The main solutions for energy harvesting presented in the literature, both vibrational and non-
vibrational, are discussed in this section.
I.6.1 Vibrational energy harvesting
Being a passive and minimally invasive energy harvesting technique, a numerous VEH devices
for biomedical applications had been proposed in the literature. Piezoelectric, electromagnetic
and electrostatic transduction are demonstrated to be the most commonly used techniques in
the domain [Hannan, 2014].
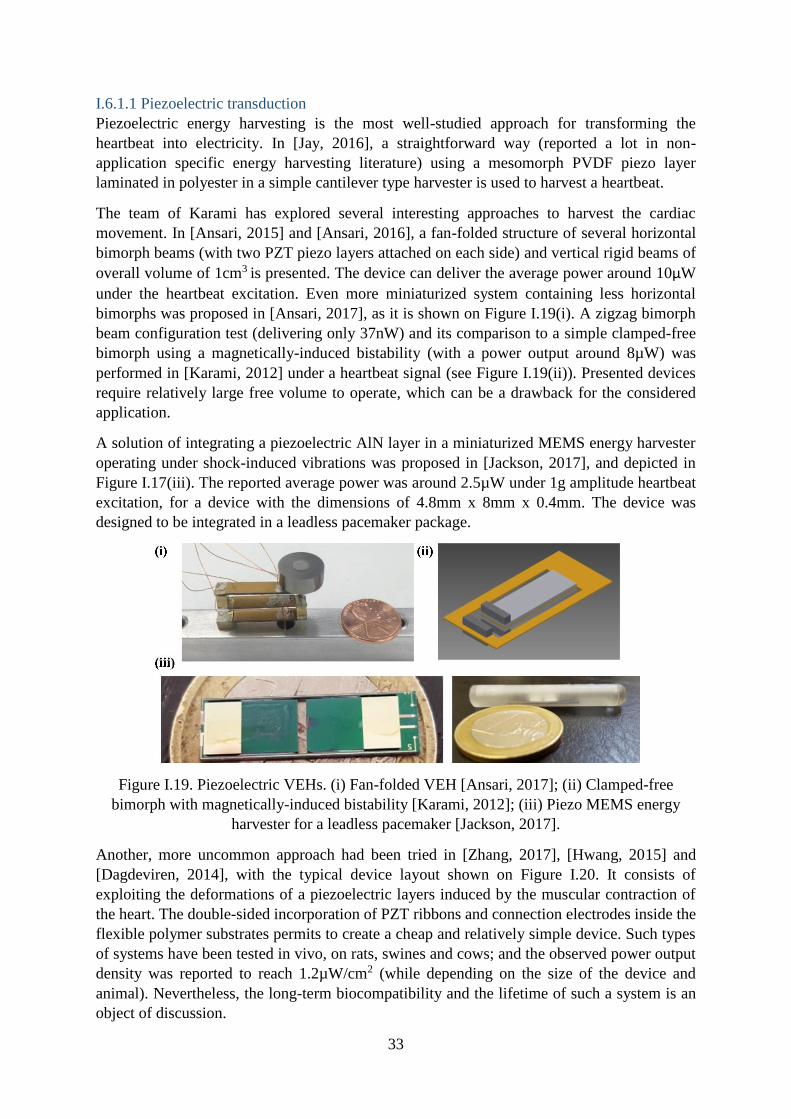
33
I.6.1.1 Piezoelectric transduction
Piezoelectric energy harvesting is the most well-studied approach for transforming the
heartbeat into electricity. In [Jay, 2016], a straightforward way (reported a lot in non-
application specific energy harvesting literature) using a mesomorph PVDF piezo layer
laminated in polyester in a simple cantilever type harvester is used to harvest a heartbeat.
The team of Karami has explored several interesting approaches to harvest the cardiac
movement. In [Ansari, 2015] and [Ansari, 2016], a fan-folded structure of several horizontal
bimorph beams (with two PZT piezo layers attached on each side) and vertical rigid beams of
overall volume of 1cm3 is presented. The device can deliver the average power around 10µW
under the heartbeat excitation. Even more miniaturized system containing less horizontal
bimorphs was proposed in [Ansari, 2017], as it is shown on Figure I.19(i). A zigzag bimorph
beam configuration test (delivering only 37nW) and its comparison to a simple clamped-free
bimorph using a magnetically-induced bistability (with a power output around 8µW) was
performed in [Karami, 2012] under a heartbeat signal (see Figure I.19(ii)). Presented devices
require relatively large free volume to operate, which can be a drawback for the considered
application.
A solution of integrating a piezoelectric AlN layer in a miniaturized MEMS energy harvester
operating under shock-induced vibrations was proposed in [Jackson, 2017], and depicted in
Figure I.17(iii). The reported average power was around 2.5µW under 1g amplitude heartbeat
excitation, for a device with the dimensions of 4.8mm x 8mm x 0.4mm. The device was
designed to be integrated in a leadless pacemaker package.
Figure I.19. Piezoelectric VEHs. (i) Fan-folded VEH [Ansari, 2017]; (ii) Clamped-free
bimorph with magnetically-induced bistability [Karami, 2012]; (iii) Piezo MEMS energy
harvester for a leadless pacemaker [Jackson, 2017].
Another, more uncommon approach had been tried in [Zhang, 2017], [Hwang, 2015] and
[Dagdeviren, 2014], with the typical device layout shown on Figure I.20. It consists of
exploiting the deformations of a piezoelectric layers induced by the muscular contraction of
the heart. The double-sided incorporation of PZT ribbons and connection electrodes inside the
flexible polymer substrates permits to create a cheap and relatively simple device. Such types
of systems have been tested in vivo, on rats, swines and cows; and the observed power output
density was reported to reach 1.2µW/cm2 (while depending on the size of the device and
animal). Nevertheless, the long-term biocompatibility and the lifetime of such a system is an
object of discussion.
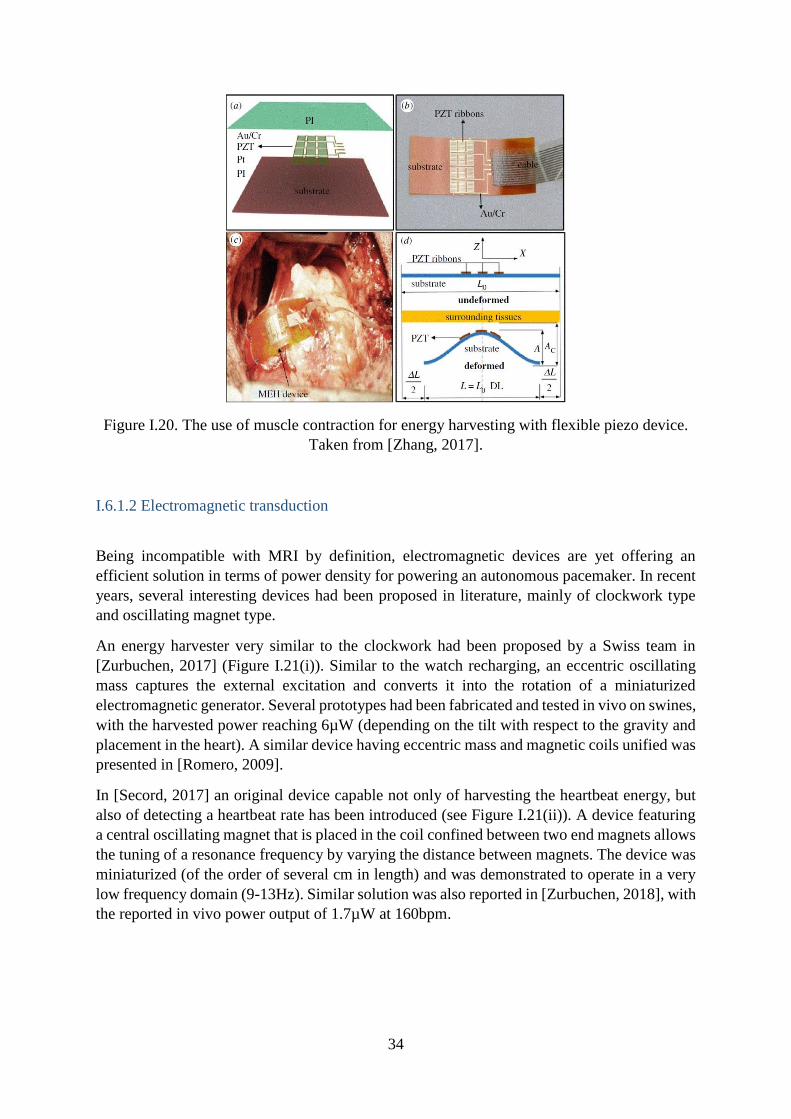
34
Figure I.20. The use of muscle contraction for energy harvesting with flexible piezo device.
Taken from [Zhang, 2017].
I.6.1.2 Electromagnetic transduction
Being incompatible with MRI by definition, electromagnetic devices are yet offering an
efficient solution in terms of power density for powering an autonomous pacemaker. In recent
years, several interesting devices had been proposed in literature, mainly of clockwork type
and oscillating magnet type.
An energy harvester very similar to the clockwork had been proposed by a Swiss team in
[Zurbuchen, 2017] (Figure I.21(i)). Similar to the watch recharging, an eccentric oscillating
mass captures the external excitation and converts it into the rotation of a miniaturized
electromagnetic generator. Several prototypes had been fabricated and tested in vivo on swines,
with the harvested power reaching 6µW (depending on the tilt with respect to the gravity and
placement in the heart). A similar device having eccentric mass and magnetic coils unified was
presented in [Romero, 2009].
In [Secord, 2017] an original device capable not only of harvesting the heartbeat energy, but
also of detecting a heartbeat rate has been introduced (see Figure I.21(ii)). A device featuring
a central oscillating magnet that is placed in the coil confined between two end magnets allows
the tuning of a resonance frequency by varying the distance between magnets. The device was
miniaturized (of the order of several cm in length) and was demonstrated to operate in a very
low frequency domain (9-13Hz). Similar solution was also reported in [Zurbuchen, 2018], with
the reported in vivo power output of 1.7µW at 160bpm.
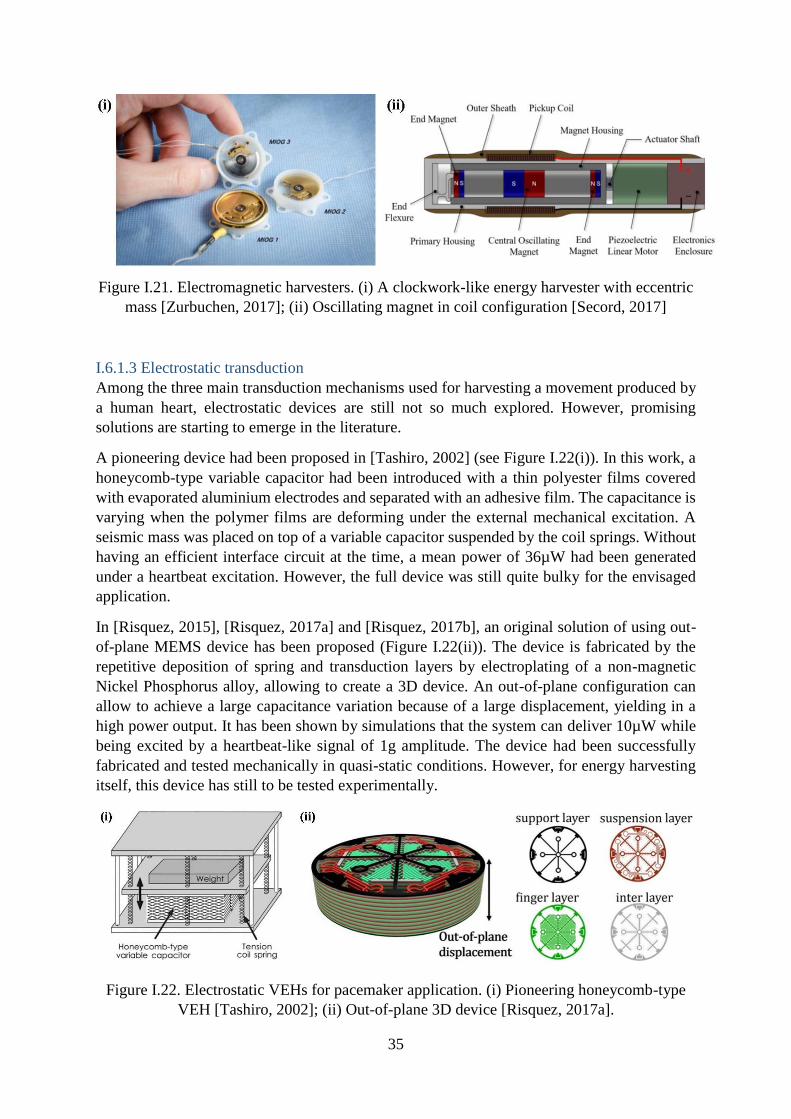
35
Figure I.21. Electromagnetic harvesters. (i) A clockwork-like energy harvester with eccentric
mass [Zurbuchen, 2017]; (ii) Oscillating magnet in coil configuration [Secord, 2017]
I.6.1.3 Electrostatic transduction
Among the three main transduction mechanisms used for harvesting a movement produced by
a human heart, electrostatic devices are still not so much explored. However, promising
solutions are starting to emerge in the literature.
A pioneering device had been proposed in [Tashiro, 2002] (see Figure I.22(i)). In this work, a
honeycomb-type variable capacitor had been introduced with a thin polyester films covered
with evaporated aluminium electrodes and separated with an adhesive film. The capacitance is
varying when the polymer films are deforming under the external mechanical excitation. A
seismic mass was placed on top of a variable capacitor suspended by the coil springs. Without
having an efficient interface circuit at the time, a mean power of 36µW had been generated
under a heartbeat excitation. However, the full device was still quite bulky for the envisaged
application.
In [Risquez, 2015], [Risquez, 2017a] and [Risquez, 2017b], an original solution of using out-
of-plane MEMS device has been proposed (Figure I.22(ii)). The device is fabricated by the
repetitive deposition of spring and transduction layers by electroplating of a non-magnetic
Nickel Phosphorus alloy, allowing to create a 3D device. An out-of-plane configuration can
allow to achieve a large capacitance variation because of a large displacement, yielding in a
high power output. It has been shown by simulations that the system can deliver 10µW while
being excited by a heartbeat-like signal of 1g amplitude. The device had been successfully
fabricated and tested mechanically in quasi-static conditions. However, for energy harvesting
itself, this device has still to be tested experimentally.
Figure I.22. Electrostatic VEHs for pacemaker application. (i) Pioneering honeycomb-type
VEH [Tashiro, 2002]; (ii) Out-of-plane 3D device [Risquez, 2017a].
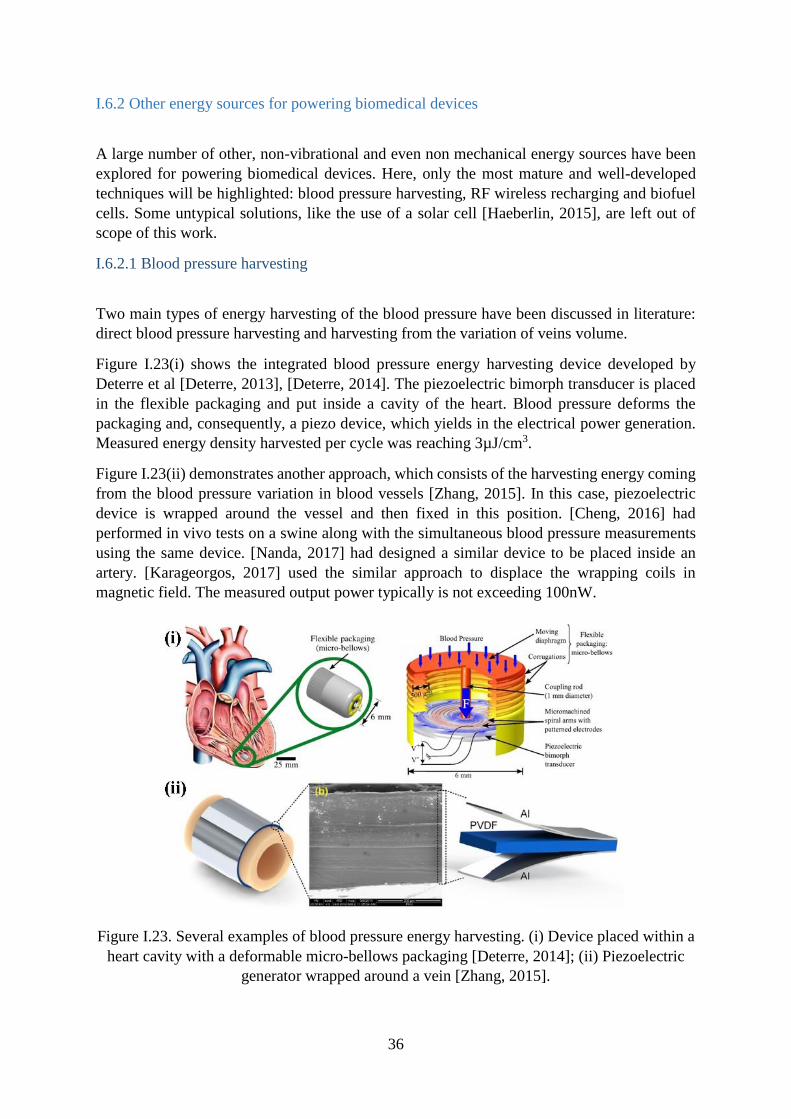
36
I.6.2 Other energy sources for powering biomedical devices
A large number of other, non-vibrational and even non mechanical energy sources have been
explored for powering biomedical devices. Here, only the most mature and well-developed
techniques will be highlighted: blood pressure harvesting, RF wireless recharging and biofuel
cells. Some untypical solutions, like the use of a solar cell [Haeberlin, 2015], are left out of
scope of this work.
I.6.2.1 Blood pressure harvesting
Two main types of energy harvesting of the blood pressure have been discussed in literature:
direct blood pressure harvesting and harvesting from the variation of veins volume.
Figure I.23(i) shows the integrated blood pressure energy harvesting device developed by
Deterre et al [Deterre, 2013], [Deterre, 2014]. The piezoelectric bimorph transducer is placed
in the flexible packaging and put inside a cavity of the heart. Blood pressure deforms the
packaging and, consequently, a piezo device, which yields in the electrical power generation.
Measured energy density harvested per cycle was reaching 3µJ/cm3.
Figure I.23(ii) demonstrates another approach, which consists of the harvesting energy coming
from the blood pressure variation in blood vessels [Zhang, 2015]. In this case, piezoelectric
device is wrapped around the vessel and then fixed in this position. [Cheng, 2016] had
performed in vivo tests on a swine along with the simultaneous blood pressure measurements
using the same device. [Nanda, 2017] had designed a similar device to be placed inside an
artery. [Karageorgos, 2017] used the similar approach to displace the wrapping coils in
magnetic field. The measured output power typically is not exceeding 100nW.
Figure I.23. Several examples of blood pressure energy harvesting. (i) Device placed within a
heart cavity with a deformable micro-bellows packaging [Deterre, 2014]; (ii) Piezoelectric
generator wrapped around a vein [Zhang, 2015].
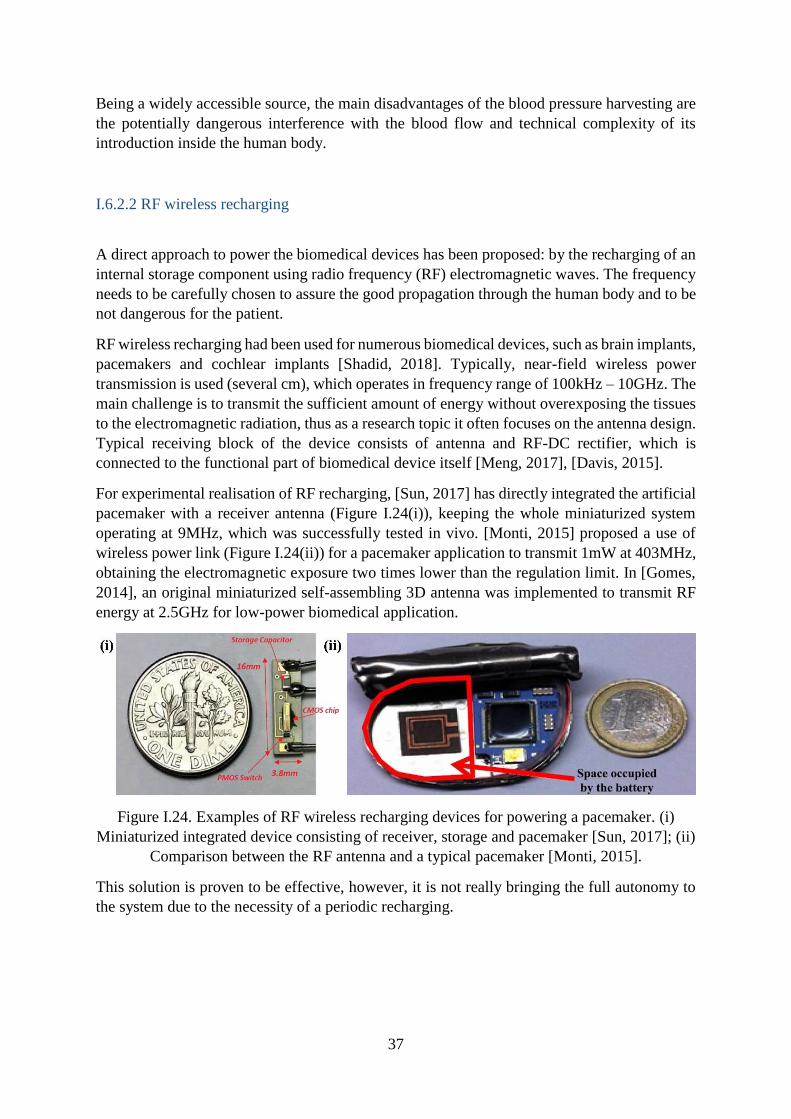
37
Being a widely accessible source, the main disadvantages of the blood pressure harvesting are
the potentially dangerous interference with the blood flow and technical complexity of its
introduction inside the human body.
I.6.2.2 RF wireless recharging
A direct approach to power the biomedical devices has been proposed: by the recharging of an
internal storage component using radio frequency (RF) electromagnetic waves. The frequency
needs to be carefully chosen to assure the good propagation through the human body and to be
not dangerous for the patient.
RF wireless recharging had been used for numerous biomedical devices, such as brain implants,
pacemakers and cochlear implants [Shadid, 2018]. Typically, near-field wireless power
transmission is used (several cm), which operates in frequency range of 100kHz – 10GHz. The
main challenge is to transmit the sufficient amount of energy without overexposing the tissues
to the electromagnetic radiation, thus as a research topic it often focuses on the antenna design.
Typical receiving block of the device consists of antenna and RF-DC rectifier, which is
connected to the functional part of biomedical device itself [Meng, 2017], [Davis, 2015].
For experimental realisation of RF recharging, [Sun, 2017] has directly integrated the artificial
pacemaker with a receiver antenna (Figure I.24(i)), keeping the whole miniaturized system
operating at 9MHz, which was successfully tested in vivo. [Monti, 2015] proposed a use of
wireless power link (Figure I.24(ii)) for a pacemaker application to transmit 1mW at 403MHz,
obtaining the electromagnetic exposure two times lower than the regulation limit. In [Gomes,
2014], an original miniaturized self-assembling 3D antenna was implemented to transmit RF
energy at 2.5GHz for low-power biomedical application.
Figure I.24. Examples of RF wireless recharging devices for powering a pacemaker. (i)
Miniaturized integrated device consisting of receiver, storage and pacemaker [Sun, 2017]; (ii)
Comparison between the RF antenna and a typical pacemaker [Monti, 2015].
This solution is proven to be effective, however, it is not really bringing the full autonomy to
the system due to the necessity of a periodic recharging.
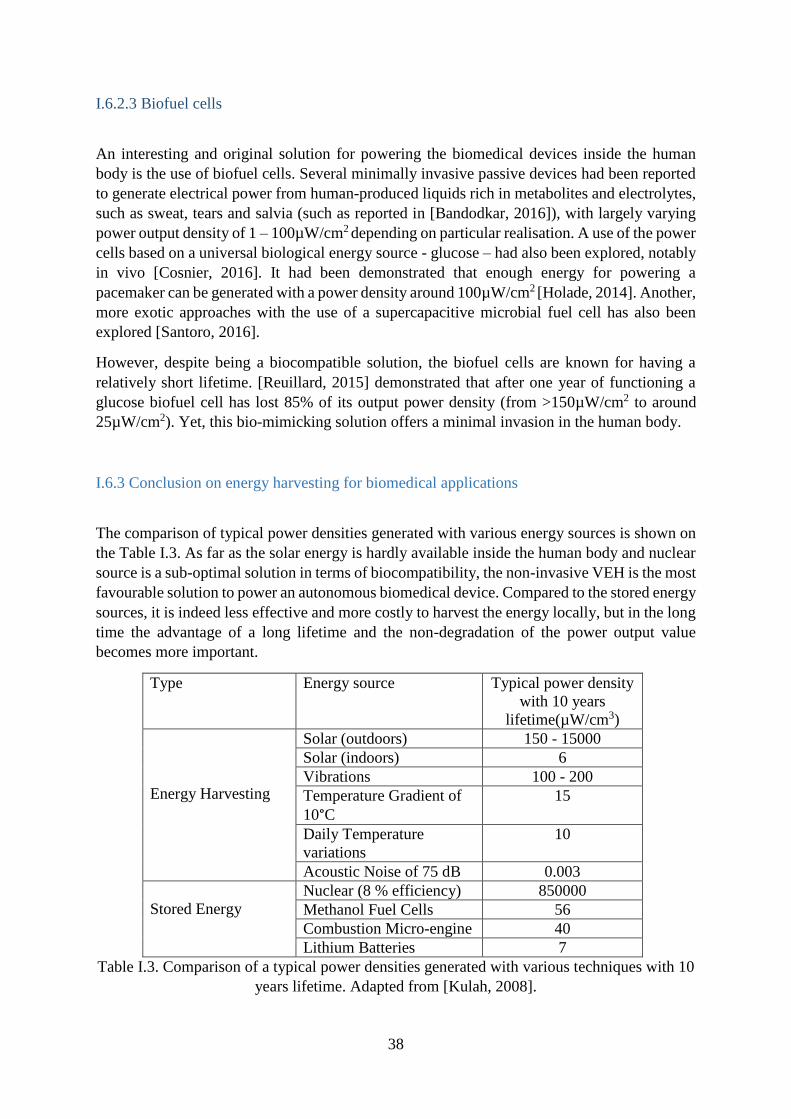
38
I.6.2.3 Biofuel cells
An interesting and original solution for powering the biomedical devices inside the human
body is the use of biofuel cells. Several minimally invasive passive devices had been reported
to generate electrical power from human-produced liquids rich in metabolites and electrolytes,
such as sweat, tears and salvia (such as reported in [Bandodkar, 2016]), with largely varying
power output density of 1 – 100µW/cm2 depending on particular realisation. A use of the power
cells based on a universal biological energy source - glucose – had also been explored, notably
in vivo [Cosnier, 2016]. It had been demonstrated that enough energy for powering a
pacemaker can be generated with a power density around 100µW/cm2 [Holade, 2014]. Another,
more exotic approaches with the use of a supercapacitive microbial fuel cell has also been
explored [Santoro, 2016].
However, despite being a biocompatible solution, the biofuel cells are known for having a
relatively short lifetime. [Reuillard, 2015] demonstrated that after one year of functioning a
glucose biofuel cell has lost 85% of its output power density (from >150µW/cm2 to around
25µW/cm2). Yet, this bio-mimicking solution offers a minimal invasion in the human body.
I.6.3 Conclusion on energy harvesting for biomedical applications
The comparison of typical power densities generated with various energy sources is shown on
the Table I.3. As far as the solar energy is hardly available inside the human body and nuclear
source is a sub-optimal solution in terms of biocompatibility, the non-invasive VEH is the most
favourable solution to power an autonomous biomedical device. Compared to the stored energy
sources, it is indeed less effective and more costly to harvest the energy locally, but in the long
time the advantage of a long lifetime and the non-degradation of the power output value
becomes more important.
Type Energy source Typical power density
with 10 years
lifetime(µW/cm3)
Energy Harvesting
Solar (outdoors) 150 - 15000
Solar (indoors) 6
Vibrations 100 - 200
Temperature Gradient of
10°C
15
Daily Temperature
variations
10
Acoustic Noise of 75 dB 0.003
Stored Energy
Nuclear (8 % efficiency) 850000
Methanol Fuel Cells 56
Combustion Micro-engine 40
Lithium Batteries 7
Table I.3. Comparison of a typical power densities generated with various techniques with 10
years lifetime. Adapted from [Kulah, 2008].
39
I.7 Methods to improve performance of the energy harvester
As it has been discussed previously, the simple energy harvester with a linear mechanical part
cannot be seen as an optimal solution for autonomous pacemaker application due to its
fundamental limitation of functioning around its resonant frequency.
In this section, a variety of approaches that are used in energy harvesting to improve the
performance of the system will be discussed. Among them, the focus will be set mainly on the
methods to improve the bandwidth of the mechanical harvesting system and to lower the
acceleration that is necessary to generate electrical power. In some cases, the search will not
be limited to the energy harvesting literature but will extend in the overall microsystem domain.
I.7.1 Frequency up-conversion
The frequency up-conversion approach consists of harvesting the external excitation at low
frequency that is mechanically converted to a higher frequency and then transduced. The
technique was firstly introduced in [Kulah, 2008], which used a large magnetic system as a
seismic mass and numerous miniaturized parylene cantilevers with coils. As it has been shown
in [Guillemet, 2012], the absolute upper limit of the power that can be converted by the
transducer is proportional to the frequency of the device operation. Thus, the frequency up-
conversion strategy is an interesting approach to obtain a relatively high power output of the
energy harvester with low frequency vibrations input. The energy transmission from the low-
frequency resonator to the high-frequency resonator can be done with mechanical contact (by
shock) or without mechanical contact (by electromagnetic field), or by the combination of two.
Several examples of the energy harvesting systems that are using the frequency up-conversion
approach are shown on the Figure I.25.

40
Figure I.25. Several examples of energy harvesters using frequency up-conversion technique.
(i) Piezoelectric energy harvester operated by noncontact mechanical frequency up-
conversion [Jang, 2015]; (ii) Electromagnetic Energy Harvester Using Mechanical Frequency
Up-Conversion Method [Zorlu, 2011]; (iii) Bistable magnetic device for low-frequency
vibrations scavenging [Galchev, 2009].
In [Jang, 2015], an interesting approach to frequency up-conversion has been proposed: the
driving beam with seismic mass having a smaller piezoelectric beam with smaller mass
attached to it is being excited by a low-frequency vibration (Figure I.25(i)). While the driving
beam reaches the critical amplitude, it stops abruptly by hitting stoppers, which yields in the
excitation by shock of the small piezoelectric resonator, followed by the electrical power
generation. The shape of the driving beam had been optimized to maximize the efficiency of
energy transmission to the high frequency resonator.
Another original way to transfer the energy from low-frequency to high-frequency resonator
had been proposed in [Zorlu, 2011], that is shown on Figure I.25(ii). The diaphragm with the
magnet is serving as a low-frequency resonator harvesting the external excitation and capturing
the beam clamped on the one side with the coil placed upon it. The relative movement of the
coil at the high frequency with respect to the magnet produces the electrical output of the energy
harvester.
The team of T. Galchev [Galchev, 2009], [Galchev, 2010], [Galchev, 2011], [Galchev, 2012]
has widely explored a more voluminous solution for autonomous structure health monitoring
system using the double-sided electromagnetic energy harvesting system (see Figure I.25(iii)).
An inertial tungsten mass is placed in the centre of the device on copper suspension springs.
Two smaller mechanical resonators of higher frequency with power generation magnets are
accommodated inside the coil that are placed on the limit of displacement of the seismic mass.
The option of using the piezo beams instead the magnet-coil pair had also been explored. A
low frequency excitation causes the movement of the central seismic mass, which induces the
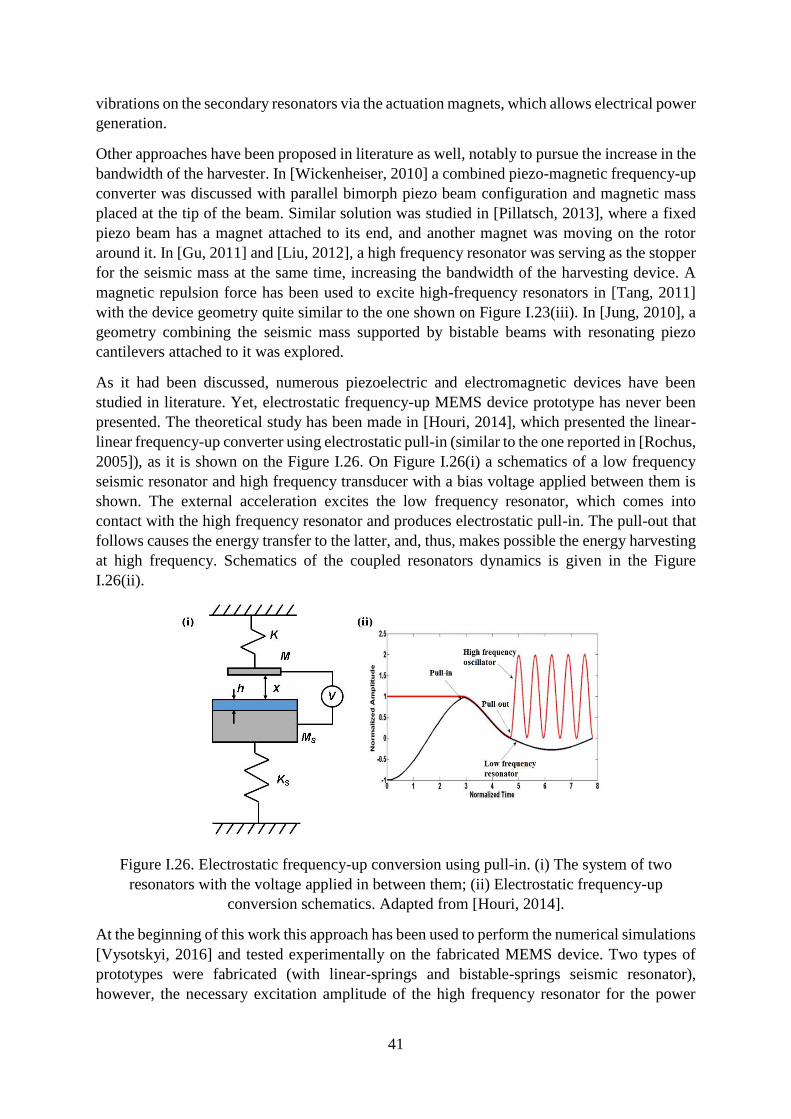
41
vibrations on the secondary resonators via the actuation magnets, which allows electrical power
generation.
Other approaches have been proposed in literature as well, notably to pursue the increase in the
bandwidth of the harvester. In [Wickenheiser, 2010] a combined piezo-magnetic frequency-up
converter was discussed with parallel bimorph piezo beam configuration and magnetic mass
placed at the tip of the beam. Similar solution was studied in [Pillatsch, 2013], where a fixed
piezo beam has a magnet attached to its end, and another magnet was moving on the rotor
around it. In [Gu, 2011] and [Liu, 2012], a high frequency resonator was serving as the stopper
for the seismic mass at the same time, increasing the bandwidth of the harvesting device. A
magnetic repulsion force has been used to excite high-frequency resonators in [Tang, 2011]
with the device geometry quite similar to the one shown on Figure I.23(iii). In [Jung, 2010], a
geometry combining the seismic mass supported by bistable beams with resonating piezo
cantilevers attached to it was explored.
As it had been discussed, numerous piezoelectric and electromagnetic devices have been
studied in literature. Yet, electrostatic frequency-up MEMS device prototype has never been
presented. The theoretical study has been made in [Houri, 2014], which presented the linear-
linear frequency-up converter using electrostatic pull-in (similar to the one reported in [Rochus,
2005]), as it is shown on the Figure I.26. On Figure I.26(i) a schematics of a low frequency
seismic resonator and high frequency transducer with a bias voltage applied between them is
shown. The external acceleration excites the low frequency resonator, which comes into
contact with the high frequency resonator and produces electrostatic pull-in. The pull-out that
follows causes the energy transfer to the latter, and, thus, makes possible the energy harvesting
at high frequency. Schematics of the coupled resonators dynamics is given in the Figure
I.26(ii).
Figure I.26. Electrostatic frequency-up conversion using pull-in. (i) The system of two
resonators with the voltage applied in between them; (ii) Electrostatic frequency-up
conversion schematics. Adapted from [Houri, 2014].
At the beginning of this work this approach has been used to perform the numerical simulations
[Vysotskyi, 2016] and tested experimentally on the fabricated MEMS device. Two types of
prototypes were fabricated (with linear-springs and bistable-springs seismic resonator),
however, the necessary excitation amplitude of the high frequency resonator for the power

42
generation has not been experimentally observed. Picture of one of the devices is given on
Figure I.27. This approach may remain a topic for future works.
Figure I.27. Photo of fabricated frequency-up energy harvester prototype. (i) Overall view;
(ii) Zoom on MEMS device.
The main issue associated with the frequency-up approach is the energy loss between the
seismic mass and the transducing high frequency resonator, which decreases the overall power
output of the energy harvesting system compared to the single-resonator device. Another
important drawback is that the necessity of having multiple resonators in the system makes it
challenging to miniaturize the device, notably to be compatible with biomedical applications.
I.7.2 Mechanical nonlinearities
To achieve a high bandwidth of the system, the most straightforward approach is the use of
mechanical nonlinearities. Here we will define a mechanical nonlinearity as a presence of a
non-constant stiffness 𝑘(𝑥) in the system. It is an efficient approach that is relatively simple to
implement by integrating particular nonlinear springs in energy harvesting system.
Various ways of introducing the structural nonlinearity in the mechanical system have been
explored in the literature. Traditional geometry optimization techniques developed in
mechanics offer a structural optimization approach (that defines topology, size and shape of
the spring as in [Jutte, 2008]) and pseudo-rigid body model which replaces conventional joints
by flexures [Howell, 2001]. These methods have numerous drawbacks when applied to the
developments of MEMS springs, mainly related to the overall complexity of the obtained
structures and the difficulty of their fabrication and assembling. Typically, in case of MEMS,
more straightforward ways to design the structural nonlinearities for springs are used, such as
the empirical method in development of particular stiffness [Nguyen, 2010], adding stoppers
or secondary springs; or more exotic approaches like pre-loading or thermal stiffness tuning.
In this sub-section, most typical types of nonlinearities found in literature and their impact on
energy harvester performance will be briefly overviewed. These nonlinearities are: spring
softening and hardening, bistability, and a shock-induced one.
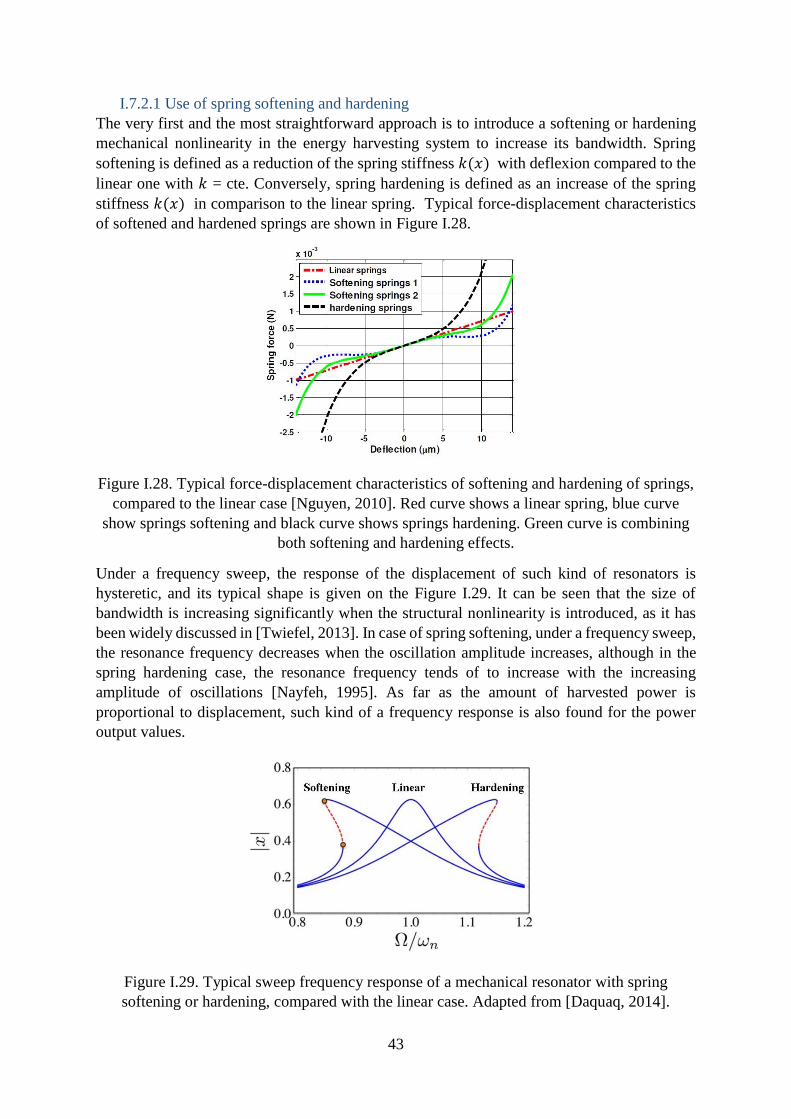
43
I.7.2.1 Use of spring softening and hardening
The very first and the most straightforward approach is to introduce a softening or hardening
mechanical nonlinearity in the energy harvesting system to increase its bandwidth. Spring
softening is defined as a reduction of the spring stiffness 𝑘(𝑥) with deflexion compared to the
linear one with 𝑘 = cte. Conversely, spring hardening is defined as an increase of the spring
stiffness 𝑘(𝑥) in comparison to the linear spring. Typical force-displacement characteristics
of softened and hardened springs are shown in Figure I.28.
Figure I.28. Typical force-displacement characteristics of softening and hardening of springs,
compared to the linear case [Nguyen, 2010]. Red curve shows a linear spring, blue curve
show springs softening and black curve shows springs hardening. Green curve is combining
both softening and hardening effects.
Under a frequency sweep, the response of the displacement of such kind of resonators is
hysteretic, and its typical shape is given on the Figure I.29. It can be seen that the size of
bandwidth is increasing significantly when the structural nonlinearity is introduced, as it has
been widely discussed in [Twiefel, 2013]. In case of spring softening, under a frequency sweep,
the resonance frequency decreases when the oscillation amplitude increases, although in the
spring hardening case, the resonance frequency tends of to increase with the increasing
amplitude of oscillations [Nayfeh, 1995]. As far as the amount of harvested power is
proportional to displacement, such kind of a frequency response is also found for the power
output values.
Figure I.29. Typical sweep frequency response of a mechanical resonator with spring
softening or hardening, compared with the linear case. Adapted from [Daquaq, 2014].
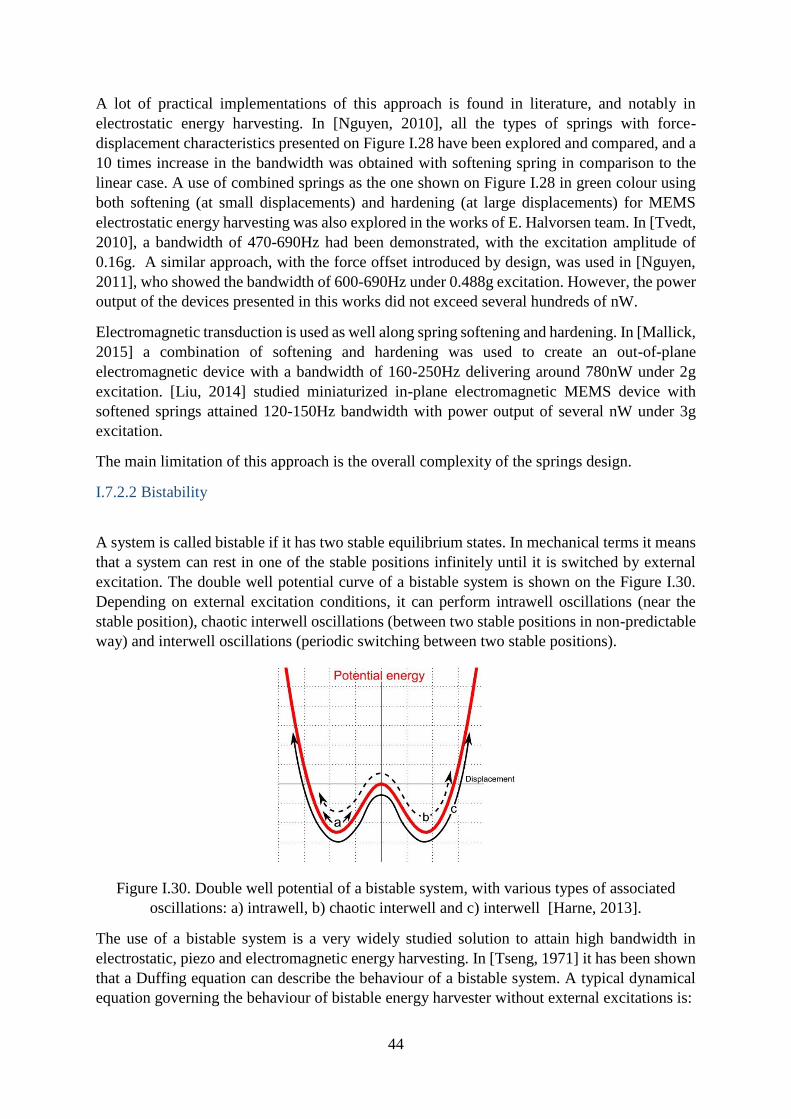
44
A lot of practical implementations of this approach is found in literature, and notably in
electrostatic energy harvesting. In [Nguyen, 2010], all the types of springs with force-
displacement characteristics presented on Figure I.28 have been explored and compared, and a
10 times increase in the bandwidth was obtained with softening spring in comparison to the
linear case. A use of combined springs as the one shown on Figure I.28 in green colour using
both softening (at small displacements) and hardening (at large displacements) for MEMS
electrostatic energy harvesting was also explored in the works of E. Halvorsen team. In [Tvedt,
2010], a bandwidth of 470-690Hz had been demonstrated, with the excitation amplitude of
0.16g. A similar approach, with the force offset introduced by design, was used in [Nguyen,
2011], who showed the bandwidth of 600-690Hz under 0.488g excitation. However, the power
output of the devices presented in this works did not exceed several hundreds of nW.
Electromagnetic transduction is used as well along spring softening and hardening. In [Mallick,
2015] a combination of softening and hardening was used to create an out-of-plane
electromagnetic device with a bandwidth of 160-250Hz delivering around 780nW under 2g
excitation. [Liu, 2014] studied miniaturized in-plane electromagnetic MEMS device with
softened springs attained 120-150Hz bandwidth with power output of several nW under 3g
excitation.
The main limitation of this approach is the overall complexity of the springs design.
I.7.2.2 Bistability
A system is called bistable if it has two stable equilibrium states. In mechanical terms it means
that a system can rest in one of the stable positions infinitely until it is switched by external
excitation. The double well potential curve of a bistable system is shown on the Figure I.30.
Depending on external excitation conditions, it can perform intrawell oscillations (near the
stable position), chaotic interwell oscillations (between two stable positions in non-predictable
way) and interwell oscillations (periodic switching between two stable positions).
Figure I.30. Double well potential of a bistable system, with various types of associated
oscillations: a) intrawell, b) chaotic interwell and c) interwell [Harne, 2013].
The use of a bistable system is a very widely studied solution to attain high bandwidth in
electrostatic, piezo and electromagnetic energy harvesting. In [Tseng, 1971] it has been shown
that a Duffing equation can describe the behaviour of a bistable system. A typical dynamical
equation governing the behaviour of bistable energy harvester without external excitations is:
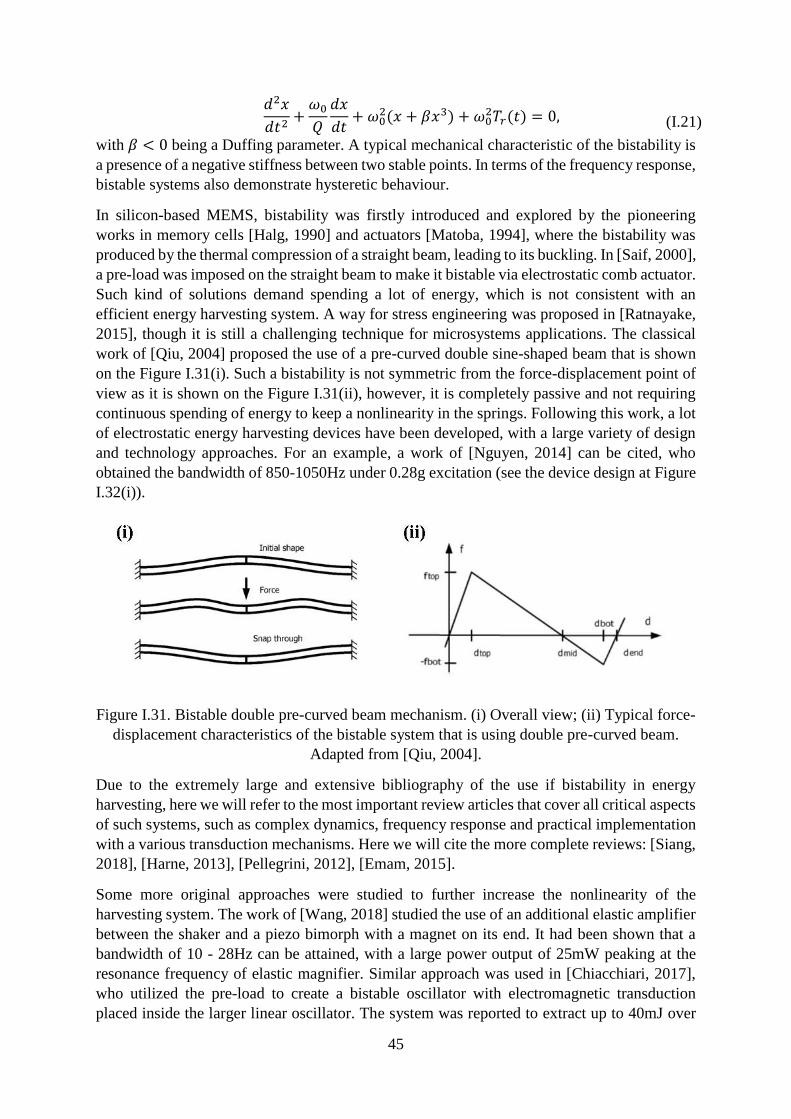
45
𝑑2𝑥
𝑑𝑡2+𝜔0𝑄
𝑑𝑥
𝑑𝑡+ 𝜔0
2(𝑥 + 𝛽𝑥3) + 𝜔02𝑇𝑟(𝑡) = 0,
(I.21)
with 𝛽 < 0 being a Duffing parameter. A typical mechanical characteristic of the bistability is
a presence of a negative stiffness between two stable points. In terms of the frequency response,
bistable systems also demonstrate hysteretic behaviour.
In silicon-based MEMS, bistability was firstly introduced and explored by the pioneering
works in memory cells [Halg, 1990] and actuators [Matoba, 1994], where the bistability was
produced by the thermal compression of a straight beam, leading to its buckling. In [Saif, 2000],
a pre-load was imposed on the straight beam to make it bistable via electrostatic comb actuator.
Such kind of solutions demand spending a lot of energy, which is not consistent with an
efficient energy harvesting system. A way for stress engineering was proposed in [Ratnayake,
2015], though it is still a challenging technique for microsystems applications. The classical
work of [Qiu, 2004] proposed the use of a pre-curved double sine-shaped beam that is shown
on the Figure I.31(i). Such a bistability is not symmetric from the force-displacement point of
view as it is shown on the Figure I.31(ii), however, it is completely passive and not requiring
continuous spending of energy to keep a nonlinearity in the springs. Following this work, a lot
of electrostatic energy harvesting devices have been developed, with a large variety of design
and technology approaches. For an example, a work of [Nguyen, 2014] can be cited, who
obtained the bandwidth of 850-1050Hz under 0.28g excitation (see the device design at Figure
I.32(i)).
Figure I.31. Bistable double pre-curved beam mechanism. (i) Overall view; (ii) Typical force-
displacement characteristics of the bistable system that is using double pre-curved beam.
Adapted from [Qiu, 2004].
Due to the extremely large and extensive bibliography of the use if bistability in energy
harvesting, here we will refer to the most important review articles that cover all critical aspects
of such systems, such as complex dynamics, frequency response and practical implementation
with a various transduction mechanisms. Here we will cite the more complete reviews: [Siang,
2018], [Harne, 2013], [Pellegrini, 2012], [Emam, 2015].
Some more original approaches were studied to further increase the nonlinearity of the
harvesting system. The work of [Wang, 2018] studied the use of an additional elastic amplifier
between the shaker and a piezo bimorph with a magnet on its end. It had been shown that a
bandwidth of 10 - 28Hz can be attained, with a large power output of 25mW peaking at the
resonance frequency of elastic magnifier. Similar approach was used in [Chiacchiari, 2017],
who utilized the pre-load to create a bistable oscillator with electromagnetic transduction
placed inside the larger linear oscillator. The system was reported to extract up to 40mJ over
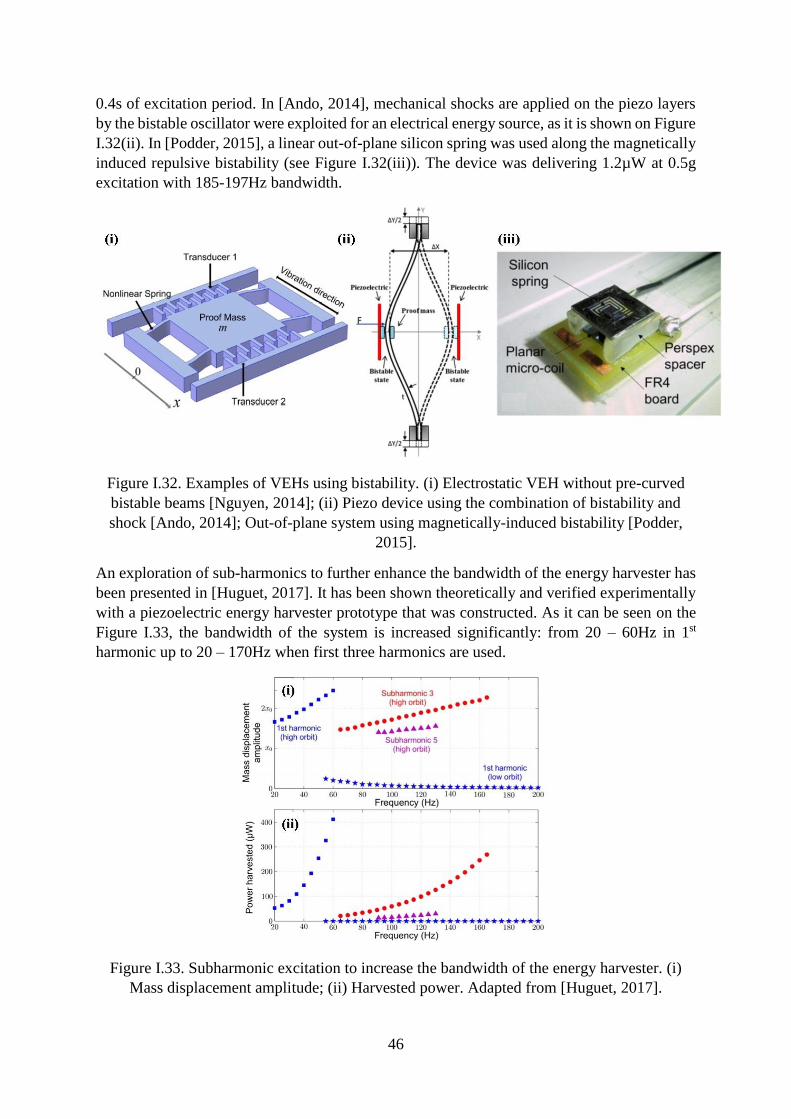
46
0.4s of excitation period. In [Ando, 2014], mechanical shocks are applied on the piezo layers
by the bistable oscillator were exploited for an electrical energy source, as it is shown on Figure
I.32(ii). In [Podder, 2015], a linear out-of-plane silicon spring was used along the magnetically
induced repulsive bistability (see Figure I.32(iii)). The device was delivering 1.2µW at 0.5g
excitation with 185-197Hz bandwidth.
Figure I.32. Examples of VEHs using bistability. (i) Electrostatic VEH without pre-curved
bistable beams [Nguyen, 2014]; (ii) Piezo device using the combination of bistability and
shock [Ando, 2014]; Out-of-plane system using magnetically-induced bistability [Podder,
2015].
An exploration of sub-harmonics to further enhance the bandwidth of the energy harvester has
been presented in [Huguet, 2017]. It has been shown theoretically and verified experimentally
with a piezoelectric energy harvester prototype that was constructed. As it can be seen on the
Figure I.33, the bandwidth of the system is increased significantly: from 20 – 60Hz in 1st
harmonic up to 20 – 170Hz when first three harmonics are used.
Figure I.33. Subharmonic excitation to increase the bandwidth of the energy harvester. (i)
Mass displacement amplitude; (ii) Harvested power. Adapted from [Huguet, 2017].
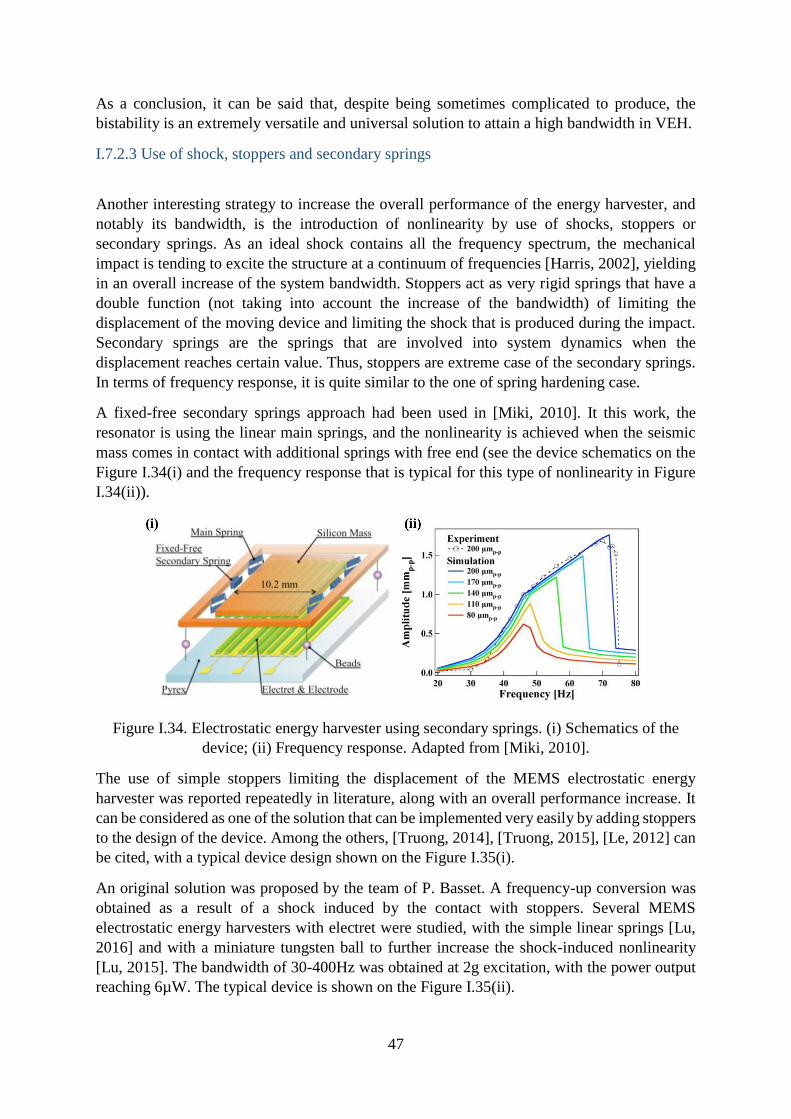
47
As a conclusion, it can be said that, despite being sometimes complicated to produce, the
bistability is an extremely versatile and universal solution to attain a high bandwidth in VEH.
I.7.2.3 Use of shock, stoppers and secondary springs
Another interesting strategy to increase the overall performance of the energy harvester, and
notably its bandwidth, is the introduction of nonlinearity by use of shocks, stoppers or
secondary springs. As an ideal shock contains all the frequency spectrum, the mechanical
impact is tending to excite the structure at a continuum of frequencies [Harris, 2002], yielding
in an overall increase of the system bandwidth. Stoppers act as very rigid springs that have a
double function (not taking into account the increase of the bandwidth) of limiting the
displacement of the moving device and limiting the shock that is produced during the impact.
Secondary springs are the springs that are involved into system dynamics when the
displacement reaches certain value. Thus, stoppers are extreme case of the secondary springs.
In terms of frequency response, it is quite similar to the one of spring hardening case.
A fixed-free secondary springs approach had been used in [Miki, 2010]. It this work, the
resonator is using the linear main springs, and the nonlinearity is achieved when the seismic
mass comes in contact with additional springs with free end (see the device schematics on the
Figure I.34(i) and the frequency response that is typical for this type of nonlinearity in Figure
I.34(ii)).
Figure I.34. Electrostatic energy harvester using secondary springs. (i) Schematics of the
device; (ii) Frequency response. Adapted from [Miki, 2010].
The use of simple stoppers limiting the displacement of the MEMS electrostatic energy
harvester was reported repeatedly in literature, along with an overall performance increase. It
can be considered as one of the solution that can be implemented very easily by adding stoppers
to the design of the device. Among the others, [Truong, 2014], [Truong, 2015], [Le, 2012] can
be cited, with a typical device design shown on the Figure I.35(i).
An original solution was proposed by the team of P. Basset. A frequency-up conversion was
obtained as a result of a shock induced by the contact with stoppers. Several MEMS
electrostatic energy harvesters with electret were studied, with the simple linear springs [Lu,
2016] and with a miniature tungsten ball to further increase the shock-induced nonlinearity
[Lu, 2015]. The bandwidth of 30-400Hz was obtained at 2g excitation, with the power output
reaching 6µW. The typical device is shown on the Figure I.35(ii).

48
An out-of-plane, 2DOF electret-based device was reported in [Tao, 2018], with a structural
nonlinearity induced by the impacts with the stop-ends limiting the displacement (see Figure
I.35(iii)). The combination of two resonant peaks with the effect of impact produced the large
bandwidth of 550-750Hz. The maximum power output of 15µW was achieved. Similar
mechanical design was used in [Wang, 2017b], who used the piezoelectric transduction.
Figure I.35. MEMS electrostatic energy harvesters using shock. (i) Electrostatic VEH without
electret [Le, 2012]; (ii) Electrostatic VEH with frequency-up effect induced by shock [Lu,
2016]; Out-of-plane 2DOF electret-based VEH [Tao, 2018].
Unusual way of using several nonlinearities was proposed in [Podder, 2016], who combined
magnetically induced bistability with an impact originating from a stopper. The device is a
plastic 3D printed cantilever holding a magnet, copper coil and a positioned stopper. The
bandwidth of 20-40Hz was demonstrated at 1.5g excitation with the power output reaching
18.6µW. The advantages of both nonlinearities are exploited: the low frequency of operation
originating from bistability and the expansion of the bandwidth due to the mechanically
induced shock.
The main disadvantage of such an approach is the increasing risk of the device failure in terms
of long time reliability due to the periodic exertion of shock on structural elements.
I.7.2.4 Other types of nonlinearities
Other, still more unusual methods to produce a mechanical nonlinearity can also be used in
energy harvesting systems. A thermally-induced nonlinearity in MEMS device was studied in
[Ziegler, 2015]. In [Leland, 2006] an external pre-load of the piezoelectric bimorph had been
used to generate the mechanical nonlinearity in order to increase the bandwidth of the energy
harvester. While being an interesting solution for a macro-scale device, this approach becomes
more challenging in micro-scale. In MEMS domain, the use of mechanical pre-load by the
electrostatic actuation that can be found in literature has been developed for other types of
applications. In [Boom, 2017], the geometric anti-spring is used along with the smart pre-
loading mechanism that requires to be loaded only once.
Being interesting in terms of exploration, the previously presented approaches to generate
nonlinearities cannot be considered as efficient solutions for the energy harvester due to two
main reasons: the overall difficulty of realisation, large size of the device producing the
required nonlinearity or the necessity to spend energy to maintain the required nonlinearity, in
contrast to the passive systems presented in previous sub-sections.
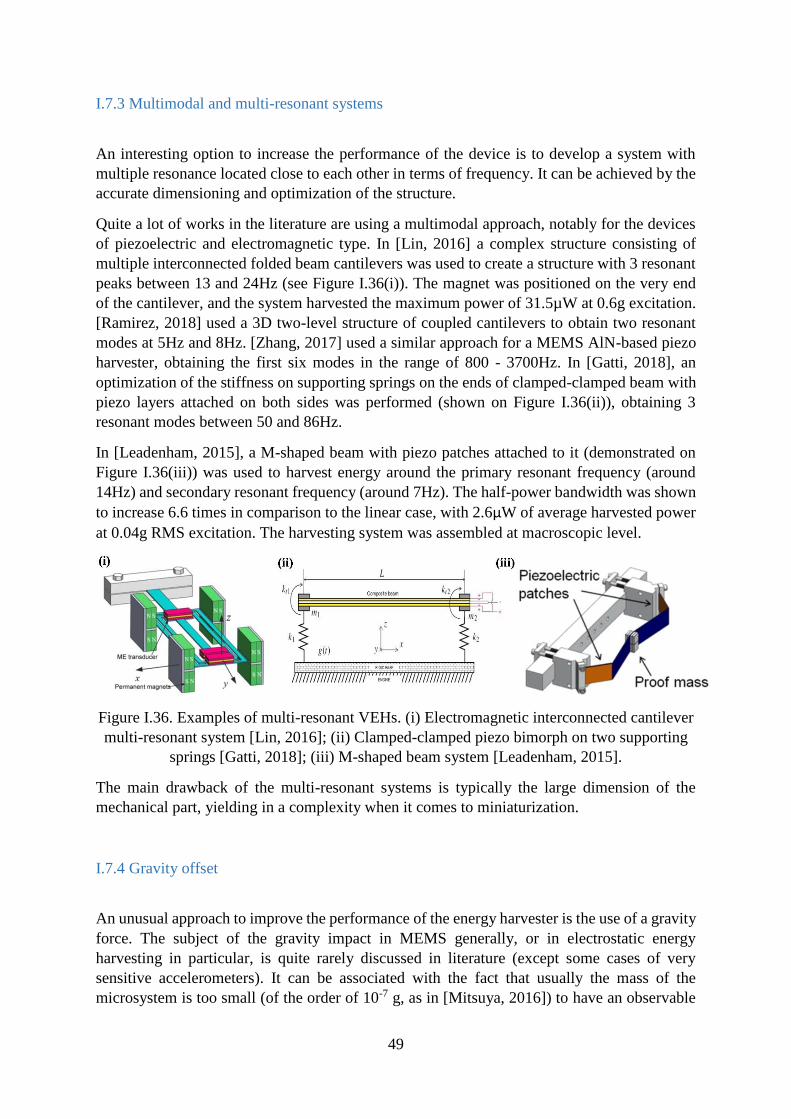
49
I.7.3 Multimodal and multi-resonant systems
An interesting option to increase the performance of the device is to develop a system with
multiple resonance located close to each other in terms of frequency. It can be achieved by the
accurate dimensioning and optimization of the structure.
Quite a lot of works in the literature are using a multimodal approach, notably for the devices
of piezoelectric and electromagnetic type. In [Lin, 2016] a complex structure consisting of
multiple interconnected folded beam cantilevers was used to create a structure with 3 resonant
peaks between 13 and 24Hz (see Figure I.36(i)). The magnet was positioned on the very end
of the cantilever, and the system harvested the maximum power of 31.5µW at 0.6g excitation.
[Ramirez, 2018] used a 3D two-level structure of coupled cantilevers to obtain two resonant
modes at 5Hz and 8Hz. [Zhang, 2017] used a similar approach for a MEMS AlN-based piezo
harvester, obtaining the first six modes in the range of 800 - 3700Hz. In [Gatti, 2018], an
optimization of the stiffness on supporting springs on the ends of clamped-clamped beam with
piezo layers attached on both sides was performed (shown on Figure I.36(ii)), obtaining 3
resonant modes between 50 and 86Hz.
In [Leadenham, 2015], a M-shaped beam with piezo patches attached to it (demonstrated on
Figure I.36(iii)) was used to harvest energy around the primary resonant frequency (around
14Hz) and secondary resonant frequency (around 7Hz). The half-power bandwidth was shown
to increase 6.6 times in comparison to the linear case, with 2.6µW of average harvested power
at 0.04g RMS excitation. The harvesting system was assembled at macroscopic level.
Figure I.36. Examples of multi-resonant VEHs. (i) Electromagnetic interconnected cantilever
multi-resonant system [Lin, 2016]; (ii) Clamped-clamped piezo bimorph on two supporting
springs [Gatti, 2018]; (iii) M-shaped beam system [Leadenham, 2015].
The main drawback of the multi-resonant systems is typically the large dimension of the
mechanical part, yielding in a complexity when it comes to miniaturization.
I.7.4 Gravity offset
An unusual approach to improve the performance of the energy harvester is the use of a gravity
force. The subject of the gravity impact in MEMS generally, or in electrostatic energy
harvesting in particular, is quite rarely discussed in literature (except some cases of very
sensitive accelerometers). It can be associated with the fact that usually the mass of the
microsystem is too small (of the order of 10-7 g, as in [Mitsuya, 2016]) to have an observable
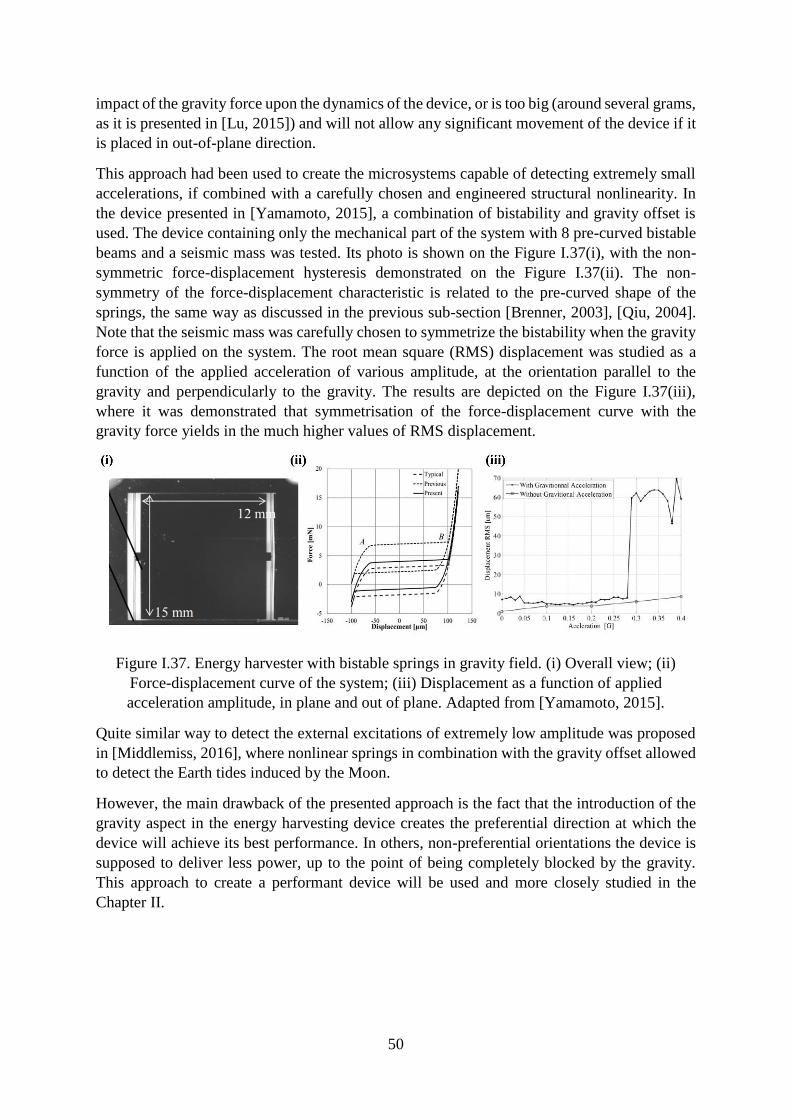
50
impact of the gravity force upon the dynamics of the device, or is too big (around several grams,
as it is presented in [Lu, 2015]) and will not allow any significant movement of the device if it
is placed in out-of-plane direction.
This approach had been used to create the microsystems capable of detecting extremely small
accelerations, if combined with a carefully chosen and engineered structural nonlinearity. In
the device presented in [Yamamoto, 2015], a combination of bistability and gravity offset is
used. The device containing only the mechanical part of the system with 8 pre-curved bistable
beams and a seismic mass was tested. Its photo is shown on the Figure I.37(i), with the non-
symmetric force-displacement hysteresis demonstrated on the Figure I.37(ii). The non-
symmetry of the force-displacement characteristic is related to the pre-curved shape of the
springs, the same way as discussed in the previous sub-section [Brenner, 2003], [Qiu, 2004].
Note that the seismic mass was carefully chosen to symmetrize the bistability when the gravity
force is applied on the system. The root mean square (RMS) displacement was studied as a
function of the applied acceleration of various amplitude, at the orientation parallel to the
gravity and perpendicularly to the gravity. The results are depicted on the Figure I.37(iii),
where it was demonstrated that symmetrisation of the force-displacement curve with the
gravity force yields in the much higher values of RMS displacement.
Figure I.37. Energy harvester with bistable springs in gravity field. (i) Overall view; (ii)
Force-displacement curve of the system; (iii) Displacement as a function of applied
acceleration amplitude, in plane and out of plane. Adapted from [Yamamoto, 2015].
Quite similar way to detect the external excitations of extremely low amplitude was proposed
in [Middlemiss, 2016], where nonlinear springs in combination with the gravity offset allowed
to detect the Earth tides induced by the Moon.
However, the main drawback of the presented approach is the fact that the introduction of the
gravity aspect in the energy harvesting device creates the preferential direction at which the
device will achieve its best performance. In others, non-preferential orientations the device is
supposed to deliver less power, up to the point of being completely blocked by the gravity.
This approach to create a performant device will be used and more closely studied in the
Chapter II.
51
I.7.5 Summary on the performance improvement approaches
As it was demonstrated in this section, the presence of nonlinearity can help to increase the
bandwidth of the energy harvester and to lower the amplitude of mechanical excitation that is
needed for efficient energy conversion. To summarize the techniques that are used to improve
the performance of the VEH, it can be stated that:
1. The better pronounced the nonlinearity is, the bigger impact it has on the performance
of the VEH (notably, on the bandwidth);
2. Apart of initially creating a structural nonlinearity, the choice of passive and
biocompatible techniques is quite limited;
3. Several techniques can be used at once to attain even further increase in the device
performance;
4. Not all of the techniques that are applicable at macro scale can be used in micro scale.
As it will be shown in Chapter II, several studied techniques will be used at once to develop a
performant device presented in this work.
I.8 Conclusions
In this chapter, the context and the state of the art for biomedical energy harvesting is presented
in its full interdisciplinary complexity. A brief introduction of MEMS applications and world
market is given; the structure, activity and some malfunctions of a human heart are described
in the context of the use of pacemaker. Classical and an innovative leadless pacemaker devices
are presented, as well as a brief theoretical introduction to the energy harvester dynamics.
Energy extractions circuits are briefly reviewed in the context of low-power electronics
applications, and a general overlook of existing solutions for powering an autonomous
pacemaker or other type of implantable device is given. Finally, most usual techniques to
improve the performance of a vibrational energy harvester are listed, with typical examples of
realizations found in literature.
The envisaged autonomous pacemaker application imposes a lot of constraints for energy
harvesting system. Various harvesting devices of different energy sources and transduction
types have been found in the literature, but the electrostatic vibration energy harvesting is seen
to be the most reliable, non-aging and efficient source for conversion due to its wide
availability, which is moreover suitable for miniaturization. Piezoelectric systems, being rather
well-studied, are known to be rather voluminous and difficult to fit inside the can of the leadless
pacemaker, being a subject of mechanical aging as well. Electromagnetic devices, being both
efficient and miniaturizable, are non-compatible with MRI, which is important point for
envisaged application.
For the interface circuit, among the numerous existing solutions a choice will be made for the
ones that are MRI compatible and do not include any active components for the reason of low
power consumption.
52
A mechanical nonlinearity needs to be introduced in a passive way to improve the performance
of the device. As it will be seen in the following chapters, the use of nonlinear springs is a
reliable, efficient and elegant solution to obtain a device operating at the heartbeat frequencies.
I.9 References
Abedin Z (2013) Essential cardiac electrophysiology: the self-assessment approach (Wiley-
Blackwell, Chichester, West Sussex).
Amin AK, Billakanty SR, Chopra N, Fu EY, Nichols AJ, Kleman JM, Kidwell GA (2018)
Premature ventricular contraction–induced polymorphic ventricular tachycardia after
leadless pacemaker implantation: A unique adverse effect of leadless pacing.
HeartRhythm Case Reports.
Amin Karami M, Inman DJ (2012) Powering pacemakers from heartbeat vibrations using
linear and nonlinear energy harvesters. Applied Physics Letters 100(4):042901.
Andò B, Baglio S, Bulsara AR, Marletta V (2014) A bistable buckled beam based approach
for vibrational energy harvesting. Sensors and Actuators A: Physical 211:153–161.
Anon American Heart Association - Building healthier lives, free of cardiovascular diseases
and stroke. Retrieved (April 16, 2018), http://www.heart.org/HEARTORG/.
Anon Comprehensive Cancer Information. National Cancer Institute. Retrieved (April 10,
2018), https://www.cancer.gov/.
Anon Dictionary by Merriam-Webster: America’s most-trusted online dictionary. Retrieved
(April 16, 2018), https://www.merriam-webster.com/.
Anon Scale of Things Chart | U.S. DOE Office of Science (SC). Retrieved (March 8, 2018),
https://science.energy.gov/bes/community-resources/scale-of-things-chart/.
Anon St. Jude Medical. Retrieved (April 23, 2018), https://www.stjudemedical.fr/.
Anon WHO | Cardiovascular diseases (CVDs). WHO. Retrieved (April 16, 2018),
http://www.who.int/cardiovascular_diseases/en/.
Ansari MH, Karami MA (2015) Piezoelectric energy harvesting from heartbeat vibrations for
leadless pacemakers. Journal of Physics: Conference Series 660:012121.
Ansari MH, Karami MA (2016) Modeling and experimental verification of a fan-folded
vibration energy harvester for leadless pacemakers. Journal of Applied Physics
119(9):094506.
Ansari MH, Karami MA (2017) Experimental investigation of fan-folded piezoelectric
energy harvesters for powering pacemakers. Smart Materials and Structures
26(6):065001.
Arevalo HJ, Vadakkumpadan F, Guallar E, Jebb A, Malamas P, Wu KC, Trayanova NA
(2016) Arrhythmia risk stratification of patients after myocardial infarction using
personalized heart models. Nature Communications 7:11437.
Bandodkar AJ, Wang J (2016) Wearable Biofuel Cells: A Review. Electroanalysis
28(6):1188–1200.
Bennett DH (2013) Bennett’s cardiac arrhythmias: practical notes on interpretation and
treatment 8th ed. (Wiley-Blackwell, Chichester, West Sussex).
Boom BA, Bertolini A, Hennes E, Brookhuis RA, Wiegerink RJ, van den Brand JFJ, Beker
MG, Oner A, van Wees D (2017) Nano-G accelerometer using geometric anti-springs.
(IEEE), 33–36.
Brenes A, Vysotskyi B, Lefeuvre E, Juillard J (2018) Nondestructive gap dimension
estimation of electrostatic MEMS resonators from electrical measurements.
Mechanical Systems and Signal Processing 112:10–21.
Brenner MP, Lang JH, Li J, Qiu J, Slocum AH (2003) Optimal design of a bistable switch.
Proceedings of the National Academy of Sciences 100(17):9663–9667.
53
Campbell NA, Reece JB, Mitchell LG (1999) Biology 5th ed. (Benjamin Cummings, Menlo
Park, Calif).
Cheng X, Xue X, Ma Y, Han M, Zhang W, Xu Z, Zhang Hao, Zhang Haixia (2016)
Implantable and self-powered blood pressure monitoring based on a piezoelectric
thinfilm: Simulated, in vitro and in vivo studies. Nano Energy 22:453–460.
Chiacchiari S, Romeo F, McFarland DM, Bergman LA, Vakakis AF (2017) Vibration energy
harvesting from impulsive excitations via a bistable nonlinear attachment.
International Journal of Non-Linear Mechanics 94:84–97.
Cosnier S, J. Gross A, Le Goff A, Holzinger M (2016) Recent advances on enzymatic
glucose/oxygen and hydrogen/oxygen biofuel cells: Achievements and limitations.
Journal of Power Sources 325:252–263.
Dagdeviren C, Yang BD, Su Y, Tran PL, Joe P, Anderson E, Xia J, et al. (2014) Conformal
piezoelectric energy harvesting and storage from motions of the heart, lung, and
diaphragm. Proceedings of the National Academy of Sciences 111(5):1927–1932.
Daqaq MF, Masana R, Erturk A, Dane Quinn D (2014) On the Role of Nonlinearities in
Vibratory Energy Harvesting: A Critical Review and Discussion. Appl. Mech. Rev
66(4):040801-040801–23.
Davis J, Sankman J, Ma D (2015) An input-powered 1.1-μA Iq 13.56 MHz RF energy
harvesting system for biomedical implantable devices. (IEEE), 1–4.
Deterre M (2013) Toward an energy harvester for leadless pacemakers. phdthesis.
(Université Paris Sud - Paris XI).
Deterre M, Lefeuvre E, Zhu Y, Woytasik M, Bosseboeuf A, Boutaud B, Dal Molin R (2013)
Micromachined piezoelectric spirals and ultra-compliant packaging for blood pressure
energy harvesters powering medical implants. (IEEE), 249–252.
Deterre M, Lefeuvre E, Zhu Y, Woytasik M, Boutaud B, Molin RD (2014) Micro Blood
Pressure Energy Harvester for Intracardiac Pacemaker. Journal of
Microelectromechanical Systems 23(3):651–660.
Dragunov V, Dorzhiev V (2013) Electrostatic vibration energy harvester with increased
charging current. Journal of Physics: Conference Series 476:012115.
Dudka A, Galayko D, Blokhina E, Basset P (2014) Smart integrated conditioning electronics
for electrostatic vibration energy harvesters. (IEEE), 2600–2603.
Emam SA, Inman DJ (2015) A Review on Bistable Composite Laminates for Morphing and
Energy Harvesting. Applied Mechanics Reviews 67(6):060803.
Frost & Sullivan (2017) Global Market for MEMS and NEMS Sensors, Forecast to 2022
MEMS & NEMS Sensors are Enabling Smart Devices and IoT Applications Across
Vertical Markets
Galayko D, Dudka A, Karami A, O’Riordan E, Blokhina E, Feely O, Basset P (2015)
Capacitive Energy Conversion With Circuits Implementing a Rectangular Charge-
Voltage Cycle—Part 1: Analysis of the Electrical Domain. IEEE Transactions on
Circuits and Systems I: Regular Papers 62(11):2652–2663.
Galchev T, Aktakka EE, Kim H, Najafi K (2010) A piezoelectric frequency-increased power
generator for scavenging low-frequency ambient vibration. (IEEE), 1203–1206.
Galchev T, Aktakka EE, Najafi K (2012) A Piezoelectric Parametric Frequency Increased
Generator for Harvesting Low-Frequency Vibrations. Journal of
Microelectromechanical Systems 21(6):1311–1320.
Galchev T, Kim H, Najafi⁎ K (2009) A Parametric Frequency Increased Power Generator
for Scavenging Low Frequency Ambient Vibrations. Procedia Chemistry 1(1):1439–
1442.
Galchev T, Kim H, Najafi K (2011) Micro Power Generator for Harvesting Low-Frequency
and Nonperiodic Vibrations. Journal of Microelectromechanical Systems.
54
Gatti C, Ramirez J, Febbo M, Machado S (2018) Multimodal piezoelectric device for energy
harvesting from engine vibration. Journal of Mechanics of Materials and Structures
13(1):17–34.
Gerlach G, Dötzel W (2008) Introduction to microsystem technology: a guide for students (J.
Wiley & Sons, Chichester, England ; Hoboken, NJ).
Gomes S, Fernandes J, Anacleto P, Mendes PM, Gultepe E, Gracias D (2014) Ultra-small
energy harvesting microsystem for biomedical applications. (IEEE), 660–663.
Gu L, Livermore C (2011) Impact-driven, frequency up-converting coupled vibration energy
harvesting device for low frequency operation. Smart Materials and Structures
20(4):045004.
Guillemet R, Basset P, Galayko D, Bourouina T (2012) Design optimization of an out-of-
plane gap-closing electrostatic Vibration Energy Harvester (VEH) with a limitation on
the output voltage. Analog Integrated Circuits and Signal Processing 71(1):39–47.
Haeberlin A, Zurbuchen A, Walpen S, Schaerer J, Niederhauser T, Huber C, Tanner H, et al.
(2015) The first batteryless, solar-powered cardiac pacemaker. Heart Rhythm
12(6):1317–1323.
Halg B (1990) On a nonvolatile memory cell based on micro-electro-mechanics. (IEEE),
172–176.
Hannan MA, Mutashar S, Samad SA, Hussain A (2014) Energy harvesting for the
implantable biomedical devices: issues and challenges. BioMedical Engineering
OnLine 13(1):79.
Harne RL, Wang KW (2013) A review of the recent research on vibration energy harvesting
via bistable systems. Smart Materials and Structures 22(2):023001.
Harris CM, Piersol AG eds. (2002) Harris’ shock and vibration handbook 5th ed. (McGraw-
Hill, New York).
Holade Y, MacVittie K, Conlon T, Guz N, Servat K, Napporn TW, Kokoh KB, Katz E
(2014) Pacemaker Activated by an Abiotic Biofuel Cell Operated in Human Serum
Solution. Electroanalysis 26(11):2445–2457.
Houri S, Aubry D, Gaucher P, Lefeuvre E (2014) An Electrostatic MEMS Frequency Up-
converter for Efficient Energy Harvesting. Procedia Engineering 87:1222–1225.
Howell LL (2001) Compliant mechanisms (Wiley, New York).
Huguet T, Badel A, Lallart M (2017) Exploiting bistable oscillator subharmonics for
magnified broadband vibration energy harvesting. Applied Physics Letters
111(17):173905.
Hunter PJ, Pullan AJ, Smaill BH (2003) Modeling Total Heart Function. Annual Review of
Biomedical Engineering 5(1):147–177.
Hurmusiadis V, Briscoe C (2005) A Functional Heart Model for Medical Education. Frangi
AF, Radeva PI, Santos A, Hernandez M, eds. Functional Imaging and Modeling of
the Heart. (Springer Berlin Heidelberg, Berlin, Heidelberg), 85–91.
Hwang GT, Byun M, Jeong CK, Lee KJ (2015) Flexible Piezoelectric Thin-Film Energy
Harvesters and Nanosensors for Biomedical Applications. Advanced Healthcare
Materials 4(5):646–658.
Jackson N, Olszewski OZ, O’Murchu C, Mathewson A (2017) Shock-induced aluminum
nitride based MEMS energy harvester to power a leadless pacemaker. Sensors and
Actuators A: Physical 264:212–218.
Jang M, Song S, Park YH, Yun KS (2015) Piezoelectric energy harvester operated by
noncontact mechanical frequency up-conversion using shell cantilever structure.
Japanese Journal of Applied Physics 54(6S1):06FP08.
Jay S, Caballero M, Quinn W, Barrett J, Hill M (2016) Characterization of piezoelectric
device for implanted pacemaker energy harvesting. Journal of Physics: Conference
55
Series 757:012038.
Josephson ME (2008) Clinical cardiac electrophysiology: techniques and interpretations 4.
ed. (Wolters Kluwer Health/Lippincott Williams & Wilkins, Philadelphia).
Jung SM, Yun KS (2010) Energy-harvesting device with mechanical frequency-up
conversion mechanism for increased power efficiency and wideband operation.
Applied Physics Letters 96(11):111906.
Jutte CV, Kota S (2008) Design of Nonlinear Springs for Prescribed Load-Displacement
Functions. Journal of Mechanical Design 130(8):081403.
Karageorgos G, Manopoulos C, Tsangaris S, Nikita KS (2017) Energy harvesting and
cardiovascular monitoring through arterial wall pulsation. (IEEE), 2491–2494.
Karami A, Galayko D, Basset P (2017) Series-Parallel Charge Pump Conditioning Circuits
for Electrostatic Kinetic Energy Harvesting. IEEE Transactions on Circuits and
Systems I: Regular Papers 64(1):227–240.
Kempitiya A, Borca-Tasciuc DA, Hella MM (2013) Low-Power ASIC for Microwatt
Electrostatic Energy Harvesters. IEEE Transactions on Industrial Electronics
60(12):5639–5647.
Kulah H, Najafi K (2008) Energy Scavenging From Low-Frequency Vibrations by Using
Frequency Up-Conversion for Wireless Sensor Applications. IEEE Sensors Journal
8(3):261–268.
Larson LW, Poole JE (2018) Surgical implantation of cardiac rhythm devices (Elsevier,
Philadelphia).
Le CP, Halvorsen E (2012) MEMS electrostatic energy harvesters with end-stop effects.
Journal of Micromechanics and Microengineering 22(7):074013.
Leadenham S, Erturk A (2015) Nonlinear M-shaped broadband piezoelectric energy
harvester for very low base accelerations: primary and secondary resonances. Smart
Materials and Structures 24(5):055021.
Lefeuvre E, Badel A, Brenes A, Seok S, Yoo CS (2017) Power and frequency bandwidth
improvement of piezoelectric energy harvesting devices using phase-shifted
synchronous electric charge extraction interface circuit. Journal of Intelligent
Material Systems and Structures 28(20):2988–2995.
Lefeuvre E, Risquez S, Wei J, Woytasik M, Parrain F (2014) Self-Biased Inductor-less
Interface Circuit for Electret-Free Electrostatic Energy Harvesters. Journal of
Physics: Conference Series 557:012052.
Lefeuvre E, Wei J, Mathias H, Costa F (2015) Single-switch inductorless power management
circuit for electrostatic vibration energy harvesters. (IEEE), 1–4.
Leland ES, Wright PK (2006) Resonance tuning of piezoelectric vibration energy scavenging
generators using compressive axial preload. Smart Materials and Structures
15(5):1413–1420.
Lillehei CW (1960) TRANSISTOR PACEMAKER FOR TREATMENT OF COMPLETE
ATRIOVENTRICULAR DISSOCIATION. Journal of the American Medical
Association 172(18):2006.
Lin Z, Yang J, Zhao J, Zhao N, Liu J, Wen Y, Li P (2016) Enhanced Broadband Vibration
Energy Harvesting Using a Multimodal Nonlinear Magnetoelectric Converter.
Journal of Electronic Materials 45(7):3554–3561.
Liu H, Lee C, Kobayashi T, Tay CJ, Quan C (2012) Piezoelectric MEMS-based wideband
energy harvesting systems using a frequency-up-conversion cantilever stopper.
Sensors and Actuators A: Physical 186:242–248.
Liu H, Qian Y, Wang N, Lee C (2014) An In-Plane Approximated Nonlinear MEMS
Electromagnetic Energy Harvester. Journal of Microelectromechanical Systems
23(3):740–749.

56
Lu Y, Cottone F, Boisseau S, Marty F, Galayko D, Basset P (2015) A nonlinear MEMS
electrostatic kinetic energy harvester for human-powered biomedical devices. Applied
Physics Letters 107(25):253902.
Lu Y, O’Riordan E, Cottone F, Boisseau S, Galayko D, Blokhina E, Marty F, Basset P (2016)
A batch-fabricated electret-biased wideband MEMS vibration energy harvester with
frequency-up conversion behavior powering a UHF wireless sensor node. Journal of
Micromechanics and Microengineering 26(12):124004.
Mallick D, Amann A, Roy S (2015) A nonlinear stretching based electromagnetic energy
harvester on FR4 for wideband operation. Smart Materials and Structures
24(1):015013.
Matoba H, Ishikawa T, Kim CJ, Muller RS (1994) A bistable snapping microactuator.
(IEEE), 45–50.
Medtronic Medical Technology, Services, and Solutions Global Leader | Medtronic.
Retrieved (April 23, 2018), /us-en/index.html.
Meng M, Kiani M (2017) A Hybrid Inductive-Ultrasonic Link for Wireless Power
Transmission to Millimeter-Sized Biomedical Implants. IEEE Transactions on
Circuits and Systems II: Express Briefs 64(10):1137–1141.
Meninger S, Mur-Miranda JO, Amirtharajah R, Chandrakasan A, Lang JH (2001) Vibration-
to-electric energy conversion. IEEE Transactions on Very Large Scale Integration
(VLSI) Systems 9(1):64–76.
Middlemiss RP, Samarelli A, Paul DJ, Hough J, Rowan S, Hammond GD (2016)
Measurement of the Earth tides with a MEMS gravimeter. Nature 531(7596):614–
617.
Miki D, Honzumi M, Suzuki Y, Kasagi N (2010) Large-amplitude MEMS electret generator
with nonlinear spring. (IEEE), 176–179.
Mitsuya H, Ashizawa H, Ishibashi K, Homma H, Ataka M, Hashiguchi G, Fujita H,
Toshiyoshi H (2016) A Frequency-Independent Vibrational Energy Harvester using
Symmetrically Charged Comb-Drive Electrodes with Heavily Doped Ion Electrets.
Journal of Physics: Conference Series 773:012014.
Monti G, Arcuti P, Tarricone L (2015) Resonant Inductive Link for Remote Powering of
Pacemakers. IEEE Transactions on Microwave Theory and Techniques 63(11):3814–
3822.
Nanda A, Karami MA (2017) Energy harvesting from arterial blood pressure for powering
embedded micro sensors in human brain. Journal of Applied Physics 121(12):124506.
Nayfeh AH, Mook DT (1995) Nonlinear oscillations Wiley classics library ed. (Wiley, New
York).
Nguyen CH, Nguyen DS, Halvorsen E (2014) Experimental Validation of Damping Model
for a MEMS Bistable Electrostatic Energy Harvester. Journal of Physics: Conference
Series 557:012114.
Nguyen DS, Halvorsen E (2010) ANALYSIS OF VIBRATION ENERGY HARVESTERS
UTILIZING A VARIETY OF NONLINEAR SPRINGS. (Leuven, Belgium).
Nguyen DS, Halvorsen E, Jensen GU, Vogl A (2010) Fabrication and characterization of a
wideband MEMS energy harvester utilizing nonlinear springs. Journal of
Micromechanics and Microengineering 20(12):125009.
Nguyen SD, Halvorsen E (2011) Nonlinear Springs for Bandwidth-Tolerant Vibration
Energy Harvesting. Journal of Microelectromechanical Systems 20(6):1225–1227.
Pappano AJ, Wier WG, Levy MN (2013) Cardiovascular physiology 10th ed.
(Elsevier/Mosby, Philadelphia, PA).
Pellegrini SP, Tolou N, Schenk M, Herder JL (2013) Bistable vibration energy harvesters: A
review. Journal of Intelligent Material Systems and Structures 24(11):1303–1312.
57
Piccini JP, Stromberg K, Jackson KP, Laager V, Duray GZ, El-Chami M, Ellis CR, et al.
(2017) Long-term outcomes in leadless Micra transcatheter pacemakers with elevated
thresholds at implantation: Results from the Micra Transcatheter Pacing System
Global Clinical Trial. Heart Rhythm 14(5):685–691.
Pillatsch P, Yeatman EM, Holmes AS (2014) A piezoelectric frequency up-converting energy
harvester with rotating proof mass for human body applications. Sensors and
Actuators A: Physical 206:178–185.
Podder P, Amann A, Roy S (2016) Combined Effect of Bistability and Mechanical Impact on
the Performance of a Nonlinear Electromagnetic Vibration Energy Harvester.
IEEE/ASME Transactions on Mechatronics 21(2):727–739.
Podder P, Constantinou P, Mallick D, Roy S (2015) Silicon MEMS bistable electromagnetic
vibration energy harvester using double-layer micro-coils. Journal of Physics:
Conference Series 660:012124.
Qiu J, Lang JH, Slocum AH (2004) A Curved-Beam Bistable Mechanism. Journal of
Microelectromechanical Systems 13(2):137–146.
Quarteroni A, Lassila T, Rossi S, Ruiz-Baier R (2017) Integrated Heart—Coupling multiscale
and multiphysics models for the simulation of the cardiac function. Computer
Methods in Applied Mechanics and Engineering 314:345–407.
Queiroz ACM de (2007) Doublers of electricity. Physics Education 42(2):156–162.
de Queiroz ACM, Domingues M (2011) The Doubler of Electricity Used as Battery Charger.
IEEE Transactions on Circuits and Systems II: Express Briefs 58(12):797–801.
Ramírez JM, Gatti CD, Machado SP, Febbo M (2018) A multi-modal energy harvesting
device for low-frequency vibrations. Extreme Mechanics Letters.
Rao SS (2011) Mechanical vibrations 5th ed. (Prentice Hall, Upper Saddle River, N.J).
Ratnayake D, Martin MD, Gowrishetty UR, Porter DA, Berfield TA, McNamara SP, Walsh
KM (2015) Engineering stress in thin films for the field of bistable MEMS. Journal of
Micromechanics and Microengineering 25(12):125025.
Reuillard B, Abreu C, Lalaoui N, Le Goff A, Holzinger M, Ondel O, Buret F, Cosnier S
(2015) One-year stability for a glucose/oxygen biofuel cell combined with pH
reactivation of the laccase/carbon nanotube biocathode. Bioelectrochemistry 106:73–
76.
Risquez S (2017) Microsystème électrostatique tridimensionnel de récupération d’énergie
pour alimenter un stimulateur cardiaque sans sonde (Paris Saclay).
Risquez S, Woytasik M, Cai H, Philippe H, Bayle F, Lefeuvre E, Moulin J (2017)
Micromolding of Ni-P with Reduced Ferromagnetic Properties for 3D MEMS.
Journal of The Electrochemical Society 164(5):B3096–B3100.
Risquez S, Woytasik M, Wei J, Parrain F, Lefeuvre E (2015) Design of a 3D multilayer out-
of-plane overlap electrostatic energy harvesting MEMS for medical implant
applications. (IEEE), 1–5.
Roberts PR, Clementy N, Al Samadi F, Garweg C, Martinez-Sande JL, Iacopino S, Johansen
JB, et al. (2017) A leadless pacemaker in the real-world setting: The Micra
Transcatheter Pacing System Post-Approval Registry. Heart Rhythm 14(9):1375–
1379.
Rochus V, Rixen DJ, Golinval JC (2005) Electrostatic coupling of MEMS structures:
transient simulations and dynamic pull-in. Nonlinear Analysis: Theory, Methods &
Applications 63(5–7):e1619–e1633.
Romero E, Warrington RO, Neuman MR (2009) Body motion for powering biomedical
devices. (IEEE), 2752–2755.
Roundy S, Wright PK, Pister KSJ (2002) Micro-Electrostatic Vibration-to-Electricity
Converters. (ASME), 487–496.
58
Saif MTA (2000) On a tunable bistable MEMS-theory and experiment. Journal of
Microelectromechanical Systems 9(2):157–170.
Santoro C, Soavi F, Serov A, Arbizzani C, Atanassov P (2016) Self-powered supercapacitive
microbial fuel cell: The ultimate way of boosting and harvesting power. Biosensors
and Bioelectronics 78:229–235.
Secord TW, Johnson AJ (2017) A tunable-resonance faraday device for dual cardiac sensing
and energy harvesting. (IEEE), 257–262.
Senkal D, Ahamed MJ, Ardakani MHA, Askari S, Shkel AM (2015) Demonstration of 1
Million $Q$ -Factor on Microglassblown Wineglass Resonators With Out-of-Plane
Electrostatic Transduction. Journal of Microelectromechanical Systems 24(1):29–37.
Seriwala HM, Khan MS, Munir MB, Riaz I bin, Riaz H, Saba S, Voigt AH (2016) Leadless
pacemakers: A new era in cardiac pacing. Journal of Cardiology 67(1):1–5.
Shadid R, Noghanian S (2018) A Literature Survey on Wireless Power Transfer for
Biomedical Devices. International Journal of Antennas and Propagation 2018:1–11.
Shu YC, Lien IC, Wu WJ (2007) An improved analysis of the SSHI interface in piezoelectric
energy harvesting. Smart Materials and Structures 16(6):2253–2264.
Siang J, Lim MH, Salman Leong M (2018) Review of vibration-based energy harvesting
technology: Mechanism and architectural approach. International Journal of Energy
Research 42(5):1866–1893.
Sun Y, Greet B, Burkland D, John M, Razavi M, Babakhani A (2017) Wirelessly powered
implantable pacemaker with on-chip antenna. (IEEE), 1242–1244.
Tang QC, Yang YL, Li X (2011) Bi-stable frequency up-conversion piezoelectric energy
harvester driven by non-contact magnetic repulsion. Smart Materials and Structures
20(12):125011.
Tao K, Tang L, Wu J, Lye SW, Chang H, Miao J (2018) Investigation of Multimodal
Electret-Based MEMS Energy Harvester With Impact-Induced Nonlinearity. Journal
of Microelectromechanical Systems 27(2):276–288.
Tashiro R, Kabei N, Katayama K, Tsuboi E, Tsuchiya K (2002) Development of an
electrostatic generator for a cardiac pacemaker that harnesses the ventricular wall
motion. Journal of Artificial Organs 5(4):239–245.
Thevenet A, Hodges PC, Lillehei CW (1958) The Use of a Myocardial Electrode Inserted
Percutaneously for Control of Complete Atrioventricular Block by an Artificial
Pacemaker. Diseases of the Chest 34(6):621–631.
Torres EO, Rincon-Mora GA (2006) Electrostatic Energy Harvester and Li-Ion Charger
Circuit for Micro-Scale Applications. (IEEE), 65–69.
Torres EO, Rincon-Mora GA (2009) Electrostatic Energy-Harvesting and Battery-Charging
CMOS System Prototype. IEEE Transactions on Circuits and Systems I: Regular
Papers 56(9):1938–1948.
Torres EO, Rincon-Mora GA (2010) A 0.7-$\mu$m BiCMOS Electrostatic Energy-
Harvesting System IC. IEEE Journal of Solid-State Circuits 45(2):483–496.
Tripathi ON (2011) Cardiac Ion Channels and Heart Rate and Rhythm. Tripathi Onkar N.,
Ravens U, Sanguinetti MC, eds. Heart Rate and Rhythm. (Springer Berlin Heidelberg,
Berlin, Heidelberg), 3–31.
Truong BD, Le CP, Halvorsen E (2014) Electric control of power extracting end-stop for
MEMS vibration energy harvesting. Journal of Physics: Conference Series
557:012012.
Truong BD, Le CP, Halvorsen E (2015) Experimentally verified model of electrostatic
energy harvester with internal impacts. (IEEE), 1125–1128.
Truong BD, Le CP, Halvorsen E (2017) Parameter identification from frequency response of
MEMS energy harvesters. Fonseca L, Prunnila M, Peiner E, eds. 102460U.
59
Tseng WY, Dugundji J (1971) Nonlinear Vibrations of a Buckled Beam Under Harmonic
Excitation. Journal of Applied Mechanics 38(2):467.
Turner R, White P, Benton F (1976a) The management of hypertension with special
reference to debrisoquine and beta blockade. Practitioner 216(1294):431.
Turner R, White P, Benton F (1976b) The management of hypertension with special
reference to debrisoquine and beta blockade. Practitioner 216(1294):431.
Tvedt LGW, Nguyen DS, Halvorsen E (2010) Nonlinear Behavior of an Electrostatic Energy
Harvester Under Wide- and Narrowband Excitation. Journal of
Microelectromechanical Systems 19(2):305–316.
Twiefel J, Westermann H (2013) Survey on broadband techniques for vibration energy
harvesting. Journal of Intelligent Material Systems and Structures 24(11):1291–1302.
Vysotskyi B, Parrain F, Lefeuvre E, Leroux X, Aubry D, Gaucher P (2016) Design and
Simulation of Bistable Microsystem with Frequency-up conversion effect for
Electrostatic Energy Harvesting. Journal of Physics: Conference Series 757:012007.
Wang G, Liao WH, Yang B, Wang X, Xu W, Li X (2018) Dynamic and energetic
characteristics of a bistable piezoelectric vibration energy harvester with an elastic
magnifier. Mechanical Systems and Signal Processing 105:427–446.
Wang W, Cao J, Zhang N, Lin J, Liao WH (2017) Magnetic-spring based energy harvesting
from human motions: Design, modeling and experiments. Energy Conversion and
Management 132:189–197.
Wang X, Chen C, Wang N, San H, Yu Y, Halvorsen E, Chen X (2017) A frequency and
bandwidth tunable piezoelectric vibration energy harvester using multiple nonlinear
techniques. Applied Energy 190:368–375.
Wei J (2017) Circuits de récupération d’énergie très basse puissance pour transducteurs à
capacité variable (Paris Saclay).
Wei J, Lefeuvre E, Mathias H, Costa F (2015) Interface Circuit for Vibration Energy
Harvesting with Adjustable Bias Voltage. Journal of Physics: Conference Series
660:012016.
Weirich WL, Paneth M, Gott VL, Lillehei CW (1958) Control of Complete Heart Block by
Use of an Artificial Pacemaker and a Myocardial Electrode: From Submarins to
Satellites. Circulation Research 6(4):410–415.
Wickenheiser AM, Garcia E (2010) Broadband vibration-based energy harvesting
improvement through frequency up-conversion by magnetic excitation. Smart
Materials and Structures 19(6):065020.
Yamamoto K, Fujita T, Badel A, Formosa F, Kanda K, Maenaka K (2015) Vibration Energy
Harvester with Bi-stable Curved Beam Spring Offset by Gravitational Acceleration.
Journal of Physics: Conference Series 660:012127.
Yen BC, Lang JH (2006) A variable-capacitance vibration-to-electric energy harvester. IEEE
Transactions on Circuits and Systems I: Regular Papers 53(2):288–295.
Zhang Hao, Zhang XS, Cheng X, Liu Y, Han M, Xue X, Wang S, et al. (2015) A flexible and
implantable piezoelectric generator harvesting energy from the pulsation of ascending
aorta: in vitro and in vivo studies. Nano Energy 12:296–304.
Zhang Q, Cao X, Zhang W (2017) Multimodal design of a novel MEMS structure for
piezoelectric energy harvester. (IEEE), 820–823.
Zhang Y, Lu B, Lü C, Feng X (2017) Theory of energy harvesting from heartbeat including
the effects of pleural cavity and respiration. Proceedings of the Royal Society A:
Mathematical, Physical and Engineering Science 473(2207):20170615.
Ziegler KK, Lake RA, Coutu RA (2015) Spring Constant Characterization of a Thermally
Tunable MEMS Regressive Spring. Prorok BC, Starman L, Hay J, Shaw, III G, eds.
MEMS and Nanotechnology, Volume 8. (Springer International Publishing, Cham), 7–
60
15.
Zorlu Ö, Topal ET, Kulah H (2011) A Vibration-Based Electromagnetic Energy Harvester
Using Mechanical Frequency Up-Conversion Method. IEEE Sensors Journal
11(2):481–488.
Zotov SA, Simon BR, Trusov AA, Shkel AM (2015) High Quality Factor Resonant MEMS
Accelerometer With Continuous Thermal Compensation. IEEE Sensors Journal
15(9):5045–5052.
Zurbuchen A, Haeberlin A, Bereuter L, Pfenniger A, Bosshard S, Kernen M, Philipp
Heinisch P, Fuhrer J, Vogel R (2018) Endocardial Energy Harvesting by
Electromagnetic Induction. IEEE Transactions on Biomedical Engineering
65(2):424–430.
Zurbuchen A, Haeberlin A, Pfenniger A, Bereuter L, Schaerer J, Jutzi F, Huber C, Fuhrer J,
Vogel R (2017) Towards Batteryless Cardiac Implantable Electronic Devices—The
Swiss Way. IEEE Transactions on Biomedical Circuits and Systems 11(1):78–86.

61

62
Chapter II.
Design and Simulations
Table of contents II.1 Introduction ..................................................................................................................... 64
II.2 From a heart to electrical power: an overview of energy harvesting system ............ 64
II.2.1 Curved Beam .............................................................................................................. 65
II.2.1.1 Curved Beam model ............................................................................................ 65
II.2.1.2 Normal force evaluation ...................................................................................... 67
II.2.1.3 Euler equation ...................................................................................................... 67
II.2.2 Seismic mass dynamics .............................................................................................. 68
II.2.3 Electrical domain equations........................................................................................ 68
II.3 Curved beam theory ....................................................................................................... 69
II.3.1 Dynamical equation of the curved beam .................................................................... 70
II.3.2 Mode shapes projection .............................................................................................. 71
II.3.3 Bistable sine-shaped beam.......................................................................................... 74
II.3.4 Multimodal-shaped beam ........................................................................................... 75
II.3.5 Use of linear compensational springs ......................................................................... 78
II.3.6 Gravity effect .............................................................................................................. 80
II.3.7 Analogy of compensational springs system and multimodal-shaped spring system.. 81
II.3.8 Conclusion on curved beam model ............................................................................ 83
II.4 Design of the Nonlinear Energy Harvesters ................................................................. 83
II.4.1 Application constraints ............................................................................................... 83
II.4.2 Variable capacitance ................................................................................................... 84
II.4.3 Seismic mass............................................................................................................... 86
II.4.4 Nonlinear VEH using Compensational Springs ......................................................... 87
II.4.5 Nonlinear VEH using Multimodal-shaped Springs .................................................... 88
II.4.6 Static displacement in gravity field ............................................................................ 90
II.4.7 Stress evaluation ......................................................................................................... 91
II.4.8 Conclusion on design.................................................................................................. 93
II.5 Simulating the Energy Harvesters ................................................................................ 93
II.5.1 An equivalent circuit approach ................................................................................... 93
II.5.2 Model of nonlinear energy harvester .......................................................................... 94
II.5.3 Simulations of energy harvester using the compensational springs ........................... 95

63
II.5.4 Simulations of energy harvester using the multimodal-shaped springs ..................... 98
II.5.4.1 Choice of an optimal biasing voltage ................................................................... 98
II.5.4.2 Bandwidth study ................................................................................................ 100
II.5.4.3 Heartbeat signal ................................................................................................. 101
II.5.5 Conclusion on the simulations .................................................................................. 105
II.6 Conclusion ..................................................................................................................... 105
II.7 References ...................................................................................................................... 106
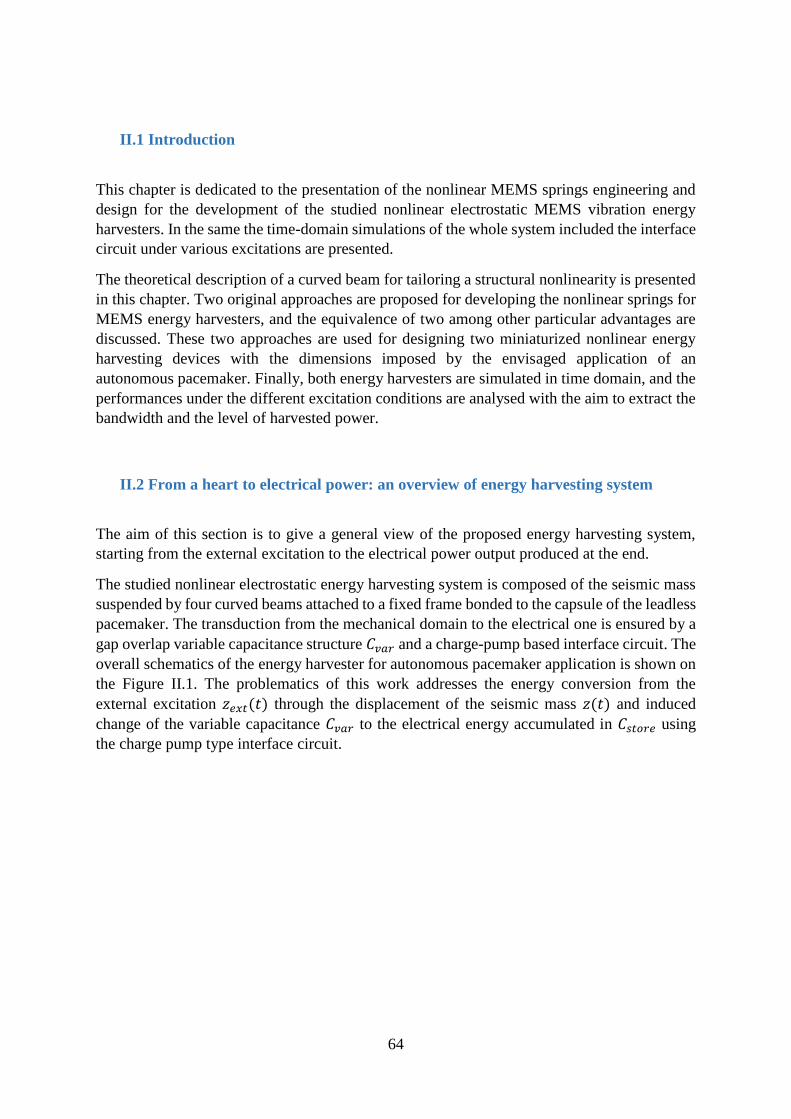
64
II.1 Introduction
This chapter is dedicated to the presentation of the nonlinear MEMS springs engineering and
design for the development of the studied nonlinear electrostatic MEMS vibration energy
harvesters. In the same the time-domain simulations of the whole system included the interface
circuit under various excitations are presented.
The theoretical description of a curved beam for tailoring a structural nonlinearity is presented
in this chapter. Two original approaches are proposed for developing the nonlinear springs for
MEMS energy harvesters, and the equivalence of two among other particular advantages are
discussed. These two approaches are used for designing two miniaturized nonlinear energy
harvesting devices with the dimensions imposed by the envisaged application of an
autonomous pacemaker. Finally, both energy harvesters are simulated in time domain, and the
performances under the different excitation conditions are analysed with the aim to extract the
bandwidth and the level of harvested power.
II.2 From a heart to electrical power: an overview of energy harvesting system
The aim of this section is to give a general view of the proposed energy harvesting system,
starting from the external excitation to the electrical power output produced at the end.
The studied nonlinear electrostatic energy harvesting system is composed of the seismic mass
suspended by four curved beams attached to a fixed frame bonded to the capsule of the leadless
pacemaker. The transduction from the mechanical domain to the electrical one is ensured by a
gap overlap variable capacitance structure 𝐶𝑣𝑎𝑟 and a charge-pump based interface circuit. The
overall schematics of the energy harvester for autonomous pacemaker application is shown on
the Figure II.1. The problematics of this work addresses the energy conversion from the
external excitation 𝑧𝑒𝑥𝑡(𝑡) through the displacement of the seismic mass 𝑧(𝑡) and induced
change of the variable capacitance 𝐶𝑣𝑎𝑟 to the electrical energy accumulated in 𝐶𝑠𝑡𝑜𝑟𝑒 using
the charge pump type interface circuit.
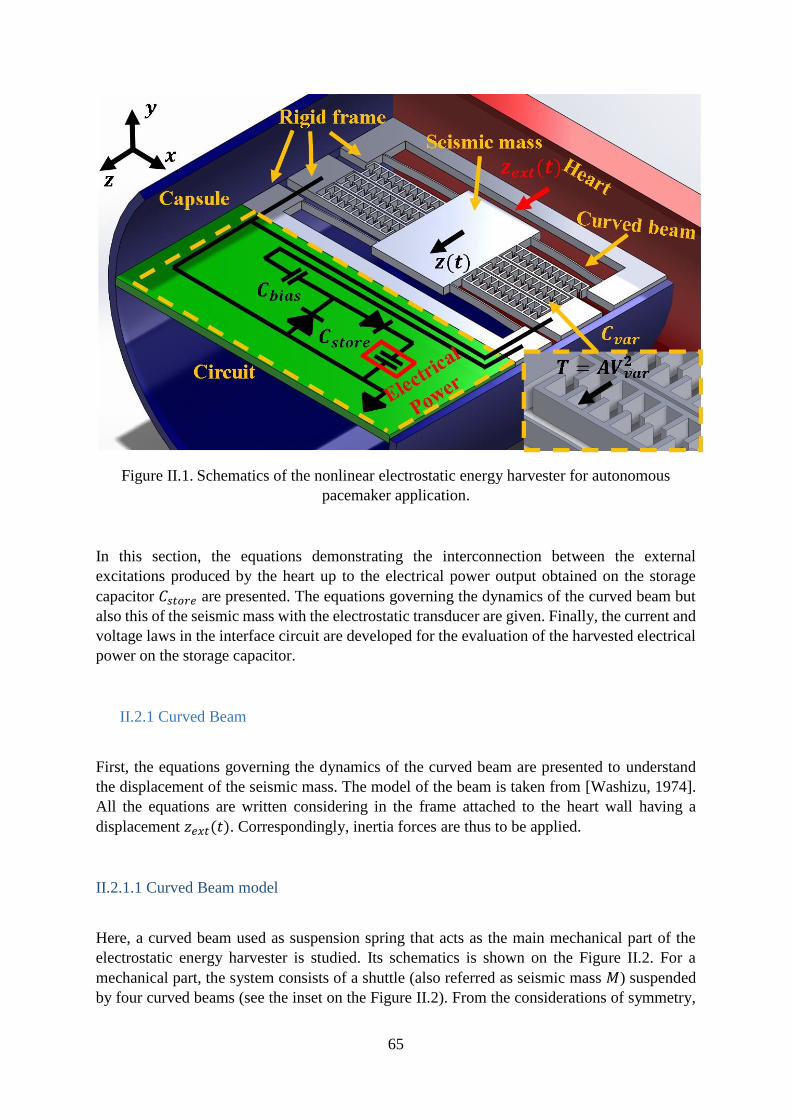
65
Figure II.1. Schematics of the nonlinear electrostatic energy harvester for autonomous
pacemaker application.
In this section, the equations demonstrating the interconnection between the external
excitations produced by the heart up to the electrical power output obtained on the storage
capacitor 𝐶𝑠𝑡𝑜𝑟𝑒 are presented. The equations governing the dynamics of the curved beam but
also this of the seismic mass with the electrostatic transducer are given. Finally, the current and
voltage laws in the interface circuit are developed for the evaluation of the harvested electrical
power on the storage capacitor.
II.2.1 Curved Beam
First, the equations governing the dynamics of the curved beam are presented to understand
the displacement of the seismic mass. The model of the beam is taken from [Washizu, 1974].
All the equations are written considering in the frame attached to the heart wall having a
displacement 𝑧𝑒𝑥𝑡(𝑡). Correspondingly, inertia forces are thus to be applied.
II.2.1.1 Curved Beam model
Here, a curved beam used as suspension spring that acts as the main mechanical part of the
electrostatic energy harvester is studied. Its schematics is shown on the Figure II.2. For a
mechanical part, the system consists of a shuttle (also referred as seismic mass 𝑀) suspended
by four curved beams (see the inset on the Figure II.2). From the considerations of symmetry,
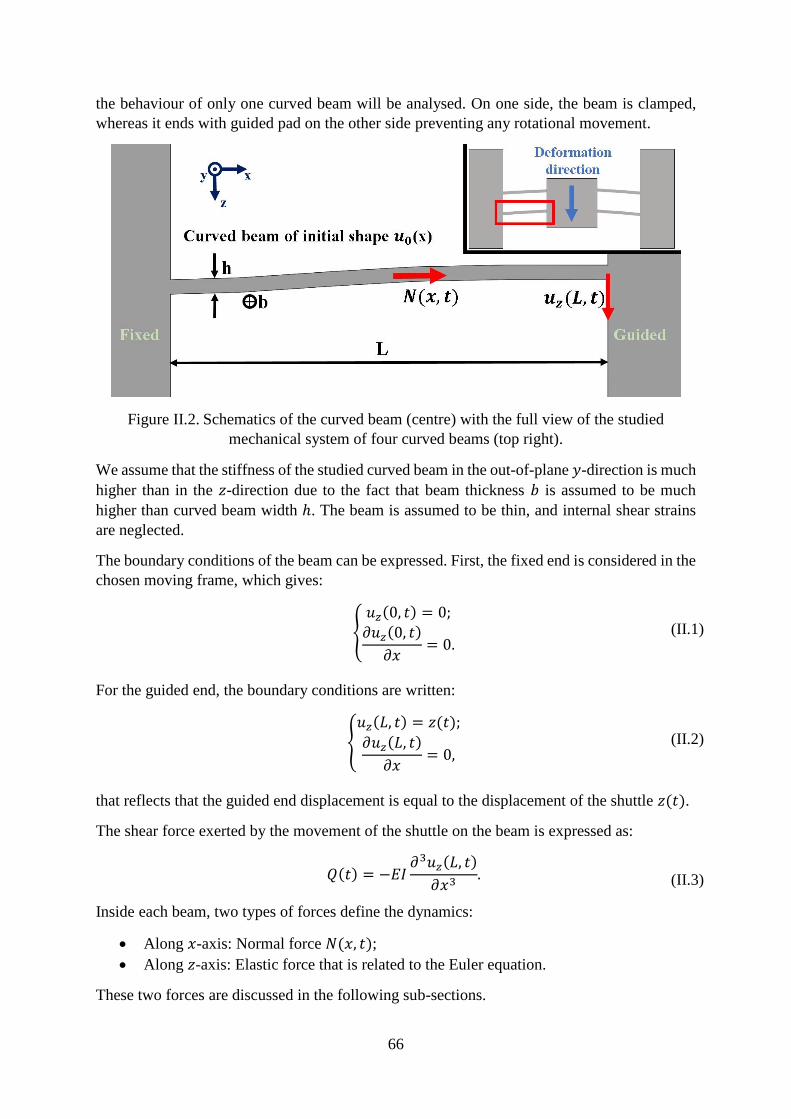
66
the behaviour of only one curved beam will be analysed. On one side, the beam is clamped,
whereas it ends with guided pad on the other side preventing any rotational movement.
Figure II.2. Schematics of the curved beam (centre) with the full view of the studied
mechanical system of four curved beams (top right).
We assume that the stiffness of the studied curved beam in the out-of-plane 𝑦-direction is much
higher than in the 𝑧-direction due to the fact that beam thickness 𝑏 is assumed to be much
higher than curved beam width ℎ. The beam is assumed to be thin, and internal shear strains
are neglected.
The boundary conditions of the beam can be expressed. First, the fixed end is considered in the
chosen moving frame, which gives:
{
𝑢𝑧(0, 𝑡) = 0;
𝜕𝑢𝑧(0, 𝑡)
𝜕𝑥= 0.
(II.1)
For the guided end, the boundary conditions are written:
{
𝑢𝑧(𝐿, 𝑡) = 𝑧(𝑡);
𝜕𝑢𝑧(𝐿, 𝑡)
𝜕𝑥= 0,
(II.2)
that reflects that the guided end displacement is equal to the displacement of the shuttle 𝑧(𝑡).
The shear force exerted by the movement of the shuttle on the beam is expressed as:
𝑄(𝑡) = −𝐸𝐼𝜕3𝑢𝑧(𝐿, 𝑡)
𝜕𝑥3.
(II.3)
Inside each beam, two types of forces define the dynamics:
Along 𝑥-axis: Normal force 𝑁(𝑥, 𝑡);
Along 𝑧-axis: Elastic force that is related to the Euler equation.
These two forces are discussed in the following sub-sections.
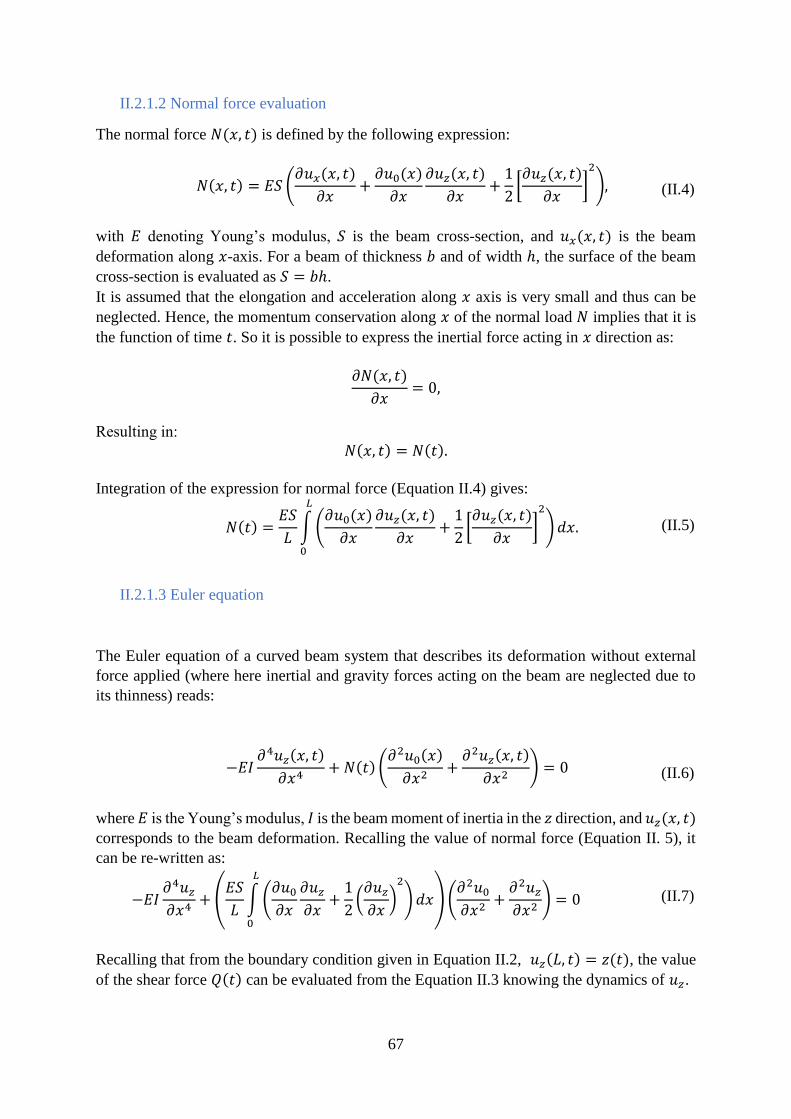
67
II.2.1.2 Normal force evaluation
The normal force 𝑁(𝑥, 𝑡) is defined by the following expression:
𝑁(𝑥, 𝑡) = 𝐸𝑆 (𝜕𝑢𝑥(𝑥, 𝑡)
𝜕𝑥+𝜕𝑢0(𝑥)
𝜕𝑥
𝜕𝑢𝑧(𝑥, 𝑡)
𝜕𝑥+1
2[𝜕𝑢𝑧(𝑥, 𝑡)
𝜕𝑥]2
),
(II.4)
with 𝐸 denoting Young’s modulus, 𝑆 is the beam cross-section, and 𝑢𝑥(𝑥, 𝑡) is the beam
deformation along 𝑥-axis. For a beam of thickness 𝑏 and of width ℎ, the surface of the beam
cross-section is evaluated as 𝑆 = 𝑏ℎ.
It is assumed that the elongation and acceleration along 𝑥 axis is very small and thus can be
neglected. Hence, the momentum conservation along 𝑥 of the normal load 𝑁 implies that it is
the function of time 𝑡. So it is possible to express the inertial force acting in 𝑥 direction as:
𝜕𝑁(𝑥, 𝑡)
𝜕𝑥= 0,
Resulting in:
𝑁(𝑥, 𝑡) = 𝑁(𝑡).
Integration of the expression for normal force (Equation II.4) gives:
𝑁(𝑡) =𝐸𝑆
𝐿∫(
𝜕𝑢0(𝑥)
𝜕𝑥
𝜕𝑢𝑧(𝑥, 𝑡)
𝜕𝑥+1
2[𝜕𝑢𝑧(𝑥, 𝑡)
𝜕𝑥]2
)
𝐿
0
𝑑𝑥.
(II.5)
II.2.1.3 Euler equation
The Euler equation of a curved beam system that describes its deformation without external
force applied (where here inertial and gravity forces acting on the beam are neglected due to
its thinness) reads:
−𝐸𝐼𝜕4𝑢𝑧(𝑥, 𝑡)
𝜕𝑥4+ 𝑁(𝑡) (
𝜕2𝑢0(𝑥)
𝜕𝑥2+𝜕2𝑢𝑧(𝑥, 𝑡)
𝜕𝑥2) = 0
(II.6)
where 𝐸 is the Young’s modulus, 𝐼 is the beam moment of inertia in the 𝑧 direction, and 𝑢𝑧(𝑥, 𝑡) corresponds to the beam deformation. Recalling the value of normal force (Equation II. 5), it
can be re-written as:
−𝐸𝐼𝜕4𝑢𝑧𝜕𝑥4
+ (𝐸𝑆
𝐿∫(
𝜕𝑢0𝜕𝑥
𝜕𝑢𝑧𝜕𝑥
+1
2(𝜕𝑢𝑧𝜕𝑥)2
)
𝐿
0
𝑑𝑥)(𝜕2𝑢0𝜕𝑥2
+𝜕2𝑢𝑧𝜕𝑥2
) = 0
(II.7)
Recalling that from the boundary condition given in Equation II.2, 𝑢𝑧(𝐿, 𝑡) = 𝑧(𝑡), the value
of the shear force 𝑄(𝑡) can be evaluated from the Equation II.3 knowing the dynamics of 𝑢𝑧.
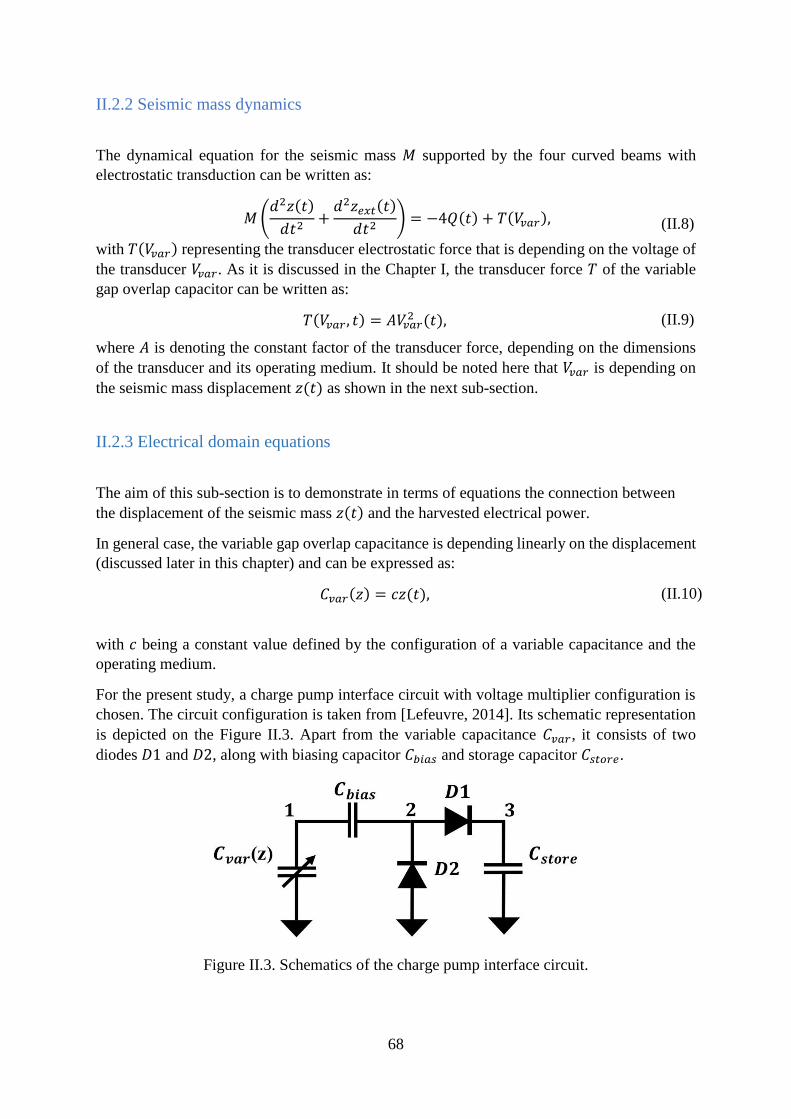
68
II.2.2 Seismic mass dynamics
The dynamical equation for the seismic mass 𝑀 supported by the four curved beams with
electrostatic transduction can be written as:
𝑀(𝑑2𝑧(𝑡)
𝑑𝑡2+𝑑2𝑧𝑒𝑥𝑡(𝑡)
𝑑𝑡2) = −4𝑄(𝑡) + 𝑇(𝑉𝑣𝑎𝑟),
(II.8)
with 𝑇(𝑉𝑣𝑎𝑟) representing the transducer electrostatic force that is depending on the voltage of
the transducer 𝑉𝑣𝑎𝑟. As it is discussed in the Chapter I, the transducer force 𝑇 of the variable
gap overlap capacitor can be written as:
𝑇(𝑉𝑣𝑎𝑟 , 𝑡) = 𝐴𝑉𝑣𝑎𝑟2 (𝑡), (II.9)
where 𝐴 is denoting the constant factor of the transducer force, depending on the dimensions
of the transducer and its operating medium. It should be noted here that 𝑉𝑣𝑎𝑟 is depending on
the seismic mass displacement 𝑧(𝑡) as shown in the next sub-section.
II.2.3 Electrical domain equations
The aim of this sub-section is to demonstrate in terms of equations the connection between
the displacement of the seismic mass 𝑧(𝑡) and the harvested electrical power.
In general case, the variable gap overlap capacitance is depending linearly on the displacement
(discussed later in this chapter) and can be expressed as:
𝐶𝑣𝑎𝑟(𝑧) = 𝑐𝑧(𝑡), (II.10)
with 𝑐 being a constant value defined by the configuration of a variable capacitance and the
operating medium.
For the present study, a charge pump interface circuit with voltage multiplier configuration is
chosen. The circuit configuration is taken from [Lefeuvre, 2014]. Its schematic representation
is depicted on the Figure II.3. Apart from the variable capacitance 𝐶𝑣𝑎𝑟, it consists of two
diodes 𝐷1 and 𝐷2, along with biasing capacitor 𝐶𝑏𝑖𝑎𝑠 and storage capacitor 𝐶𝑠𝑡𝑜𝑟𝑒.
Figure II.3. Schematics of the charge pump interface circuit.
69
To describe the diode behaviour, a Schottky model can be used that gives the relation between
the diode current 𝐼𝑑 and the applied voltage V:
𝐼𝑑 = 𝐼𝑠 (𝑒𝑉𝑛𝑉𝑇 − 1),
(II.11)
where 𝐼𝑠 is a saturation current of the diode, 𝑛 is the diode ideality factor and 𝑉𝑇 is a thermal
voltage.
The current induced by the variable capacitance on the point 2 can be written as the difference
of the currents passing through the two diodes coupling 𝑧(𝑡) and 𝑉𝑣𝑎𝑟(𝑡):
𝑑
𝑑𝑡(𝐶𝑣𝑎𝑟(𝑡)𝑉𝑣𝑎𝑟(𝑡)) =
= 𝑐𝑑
𝑑𝑡(𝑧(𝑡)𝑉𝑣𝑎𝑟(𝑡)) = 𝐼𝑑2[𝑉𝑣𝑎𝑟(𝑡) − 𝑉𝑏𝑖𝑎𝑠 − 𝑉𝑠𝑡𝑜𝑟𝑒] − 𝐼𝑑1[𝑉𝑏𝑖𝑎𝑠 − 𝑉𝑣𝑎𝑟(𝑡)],
(II.12)
with 𝐼𝑑1 and 𝐼𝑑2 denoting currents passing through diodes D1 and D2, respectively. The current
that is passing through the storage capacitor is equal to the current passing through the diode
D1:
𝑑
𝑑𝑡(𝑄𝑠𝑡𝑜𝑟𝑒(𝑡)) = 𝐼𝑑1[𝑉𝑣𝑎𝑟(𝑡) − 𝑉𝑏𝑖𝑎𝑠 − 𝑉𝑠𝑡𝑜𝑟𝑒],
(II.13)
with 𝑄𝑠𝑡𝑜𝑟𝑒(𝑡) denoting the charge of 𝐶𝑠𝑡𝑜𝑟𝑒.
It is considered that the storage capacitor is initially pre-charged to the value of:
𝑉𝑣𝑎𝑟(0) = 𝑉𝑏𝑖𝑎𝑠 + 𝑉𝑠𝑡𝑜𝑟𝑒.
In this way, the harvested power on the storage capacitance 𝐶𝑠𝑡𝑜𝑟𝑒 can be expressed:
𝑃ℎ𝑎𝑟𝑣𝑒𝑠𝑡𝑒𝑑 = 𝑉𝑠𝑡𝑜𝑟𝑒𝑑
𝑑𝑡(𝑄𝑠𝑡𝑜𝑟𝑒(𝑡)) = 𝑉𝑠𝑡𝑜𝑟𝑒𝐼𝑑1[𝑉𝑣𝑎𝑟(𝑡) − 𝑉𝑏𝑖𝑎𝑠 − 𝑉𝑠𝑡𝑜𝑟𝑒].
(II.14)
The input parameter of the system is 𝑧𝑒𝑥𝑡(𝑡) depending of the external movement of the heart
wall and the output is 𝑃ℎ𝑎𝑟𝑣𝑒𝑠𝑡𝑒𝑑 with intermediary unknowns 𝑧(𝑡) and 𝑉𝑣𝑎𝑟(𝑡):
𝑃ℎ𝑎𝑟𝑣𝑒𝑠𝑡𝑒𝑑 = 𝑃ℎ𝑎𝑟𝑣𝑒𝑠𝑡𝑒𝑑(𝑧𝑒𝑥𝑡(𝑡)).
II.3 Curved beam theory
In this section, a theoretical study of a curved beam bending is presented to describe the
nonlinear springs used for MEMS energy harvesters developed in this work. A way to study
the beam of arbitrary shape using the natural bending modes superposition is introduced. A
dynamical equation defining the coupling between the natural bending modes via normal force
of the curved beam is expressed, and its mechanical characteristics are studied with a quasi-
static approach. Unlike the approach using the progressive beam width variation along its
length [Li, 2017], the more elegant way of controlling the initial pre-curvature of the beam to
engineer the nonlinearity is proposed. Based upon the developed model of the curved beam,
70
two ways to engineer the structural nonlinearity are introduced: by introducing the higher mode
shapes in the initial pre-curved sine-shaped beam and by adding a linear spring to the bistable
beam. These two techniques are demonstrated to be equivalent in terms of the produced types
of nonlinearity, but the mode shapes combination approach will allow to further miniaturize
the footprint of the springs used for the energy harvester.
II.3.1 Dynamical equation of the curved beam
To find the shear force 𝑄(𝐿) of the curved beam (see Equation II.3), a beam deformation
𝑢𝑧(𝑥, 𝑡) needs to be evaluated first. To do that, an Euler equation is used:
−𝐸𝐼𝜕4𝑢𝑧𝜕𝑥4
+ (𝐸𝑆
𝐿∫(
𝜕𝑢0𝜕𝑥
𝜕𝑢𝑧𝜕𝑥
+1
2(𝜕𝑢𝑧𝜕𝑥)2
)𝑑𝑥
𝐿
0
)(𝜕2𝑢0𝜕𝑥2
+𝜕2𝑢𝑧𝜕𝑥2
) = 0.
(II.15)
Now the Galerkin technique is applied for the Euler equation (Equation II.15), with the
displacement test function 𝑤(𝑥), assumed to be continuous and differentiable. So the last
equation is projected on the test function 𝑤(𝑥) as below:
−𝐸𝐼 ∫𝜕4𝑢𝑧𝜕𝑥4
𝑤𝑑𝑥
𝐿
0
+ (𝐸𝑆
𝐿∫(
𝜕𝑢0𝜕𝑥
𝜕𝑢𝑧𝜕𝑥
+1
2(𝜕𝑢𝑧𝜕𝑥)2
)𝑑𝑥
𝐿
0
)∫(𝜕2𝑢0𝜕𝑥2
+𝜕2𝑢𝑧𝜕𝑥2
)
𝐿
0
𝑤𝑑𝑥 = 0
(II.16)
The first term is integrated by parts:
−𝐸𝐼∫𝜕4𝑢𝑧𝜕𝑥4
𝑤𝑑𝑥
𝐿
0
= 𝐸𝐼 (∫𝜕3𝑢𝑧𝜕𝑥3
𝜕𝑤
𝜕𝑥𝑑𝑥
𝐿
0
− [𝜕3𝑢𝑧𝜕𝑥3
𝑤]𝑜
𝐿
)
= 𝐸𝐼 (−∫𝜕2𝑢𝑧𝜕𝑥2
𝜕2𝑤
𝜕𝑥2𝑑𝑥 + [
𝜕2𝑢𝑧𝜕𝑥2
𝜕𝑤
𝜕𝑥]0
𝐿𝐿
0
− [𝜕3𝑢𝑧𝜕𝑥3
𝑤]𝑜
𝐿
)
(II.17)
Recalling the boundary conditions (Equations II.1 and II.2) along with the expression of the
shear force 𝑄 (Equation II.3), it can be written that:
[𝜕2𝑢𝑧𝜕𝑥2
𝜕𝑤
𝜕𝑥]0
𝐿
= 0
−𝐸𝐼 [𝜕3𝑢𝑧𝜕𝑥3
𝑤]𝑜
𝐿
= 𝑄(𝐿, 𝑡)𝑤(𝐿).
On the other side, the integration by parts of the second term multiplier with the test function
𝑤(𝑡) gives:
71
∫(𝜕2𝑢0𝜕𝑥2
+𝜕2𝑢𝑧𝜕𝑥2
)
𝐿
0
𝑤𝑑𝑥 = −∫(𝜕𝑢0𝜕𝑥
+𝜕𝑢𝑧𝜕𝑥)𝜕𝑤
𝜕𝑥𝑑𝑥
𝐿
0
+ [(𝜕𝑢0𝜕𝑥
+𝜕𝑢𝑧𝜕𝑥)𝑤]
0
𝐿
(II.18)
and taking into account the boundary conditions (Equations II.1 and II.2):
[(𝜕𝑢0𝜕𝑥
+𝜕𝑢𝑧𝜕𝑥)𝑤]
0
𝐿
= 0.
Thus regrouping the Euler equation (Equation II.16) with the results of the integration
(Equations II.17 And II.18), the expression for the shear force can be obtained:
𝑄(𝐿)𝑤(𝐿) =
= 𝐸𝐼∫𝜕2𝑢𝑧𝜕𝑥2
𝜕2𝑤
𝜕𝑥2𝑑𝑥
𝐿
0
+𝐸𝑆
𝐿(∫(
𝜕𝑢0𝜕𝑥
𝜕𝑢𝑧𝜕𝑥
+1
2(𝜕𝑢𝑧𝜕𝑥
)2
)𝑑𝑥
𝐿
0
)∫(𝜕𝑢0𝜕𝑥
+𝜕𝑢𝑧𝜕𝑥)𝜕𝑤
𝜕𝑥𝑑𝑥.
𝐿
0
(II.19)
II.3.2 Mode shapes projection
To describe an arbitrary deformation of the curved beam, a linear combination of the
orthogonal vibration mode shapes is used. In this case, an arbitrary curved beam deformation
denoted as 𝑢𝑧(𝑥, 𝑡) is written as a sum of bending modes with time dependent coefficient
multipliers 𝑎𝑖(𝑡):
𝑢𝑧(𝑥, 𝑡) =∑𝑎𝑖(𝑡)𝑓𝑖(𝑥)
𝑁𝑚
𝑖=1
.
(II.20)
The arbitrary initial shape of the beam itself is expressed as a sum of 𝑁𝑚 bending modes:
𝑢0(𝑥) =∑𝑎0𝑖𝑓𝑖(𝑥)
𝑁𝑚
𝑖=1
.
(II.21)
According to Galerkin approach, the displacement test function 𝑤(𝑥) is chosen as a trial
displacement 𝑓𝑖(𝑥):
𝑤(𝑥) = 𝑓𝑛(𝑥), 𝑛 = 1, … ,𝑁𝑚.
To describe the bending shape of a pre-curved beam a linear combination of natural orthogonal
bending modes needs to be introduced [Anderson, 1995]. The general form of the chosen
orthogonal mode shapes is written (similar to the ones reported in [Pustan, 2018]):
𝑓𝑛(𝑥) =1
2(1 − cos
𝑛𝜋𝑥
𝐿),
(II.22)
with 𝐿 denoting the beam length.
72
Similar to the boundary conditions imposed to the beam deformation 𝑢𝑧, chosen bending
modes have to satisfy clamped-guided boundary conditions:
𝑓𝑛(0) = 0,𝑑𝑓𝑛(0)
𝑑𝑥= 𝑑𝑓𝑛(𝐿)
𝑑𝑥= 0.
(II.23)
The orthogonality of the chosen basis is proven to give:
∫𝑑𝑓𝑛(𝑥)
𝑑𝑥
𝑑𝑓𝑚(𝑥)
𝑑𝑥𝑑𝑥 =
𝐿
0
{
0, 𝑛 ≠ 𝑚;
𝜋2𝑛2
8𝐿, 𝑛 = 𝑚;
∫𝑑2𝑓𝑛(𝑥)
𝑑𝑥2𝑑2𝑓𝑚(𝑥)
𝑑𝑥2𝑑𝑥 =
𝐿
0
{
0, 𝑛 ≠ 𝑚;
𝜋4𝑛4
8𝐿3, 𝑛 = 𝑚.
(II.24)
In this work it is assumed that only three modes are being excited with the observable
amplitude, with 𝑛 = 1, 2, 4 for vibrational mode shapes 𝑓𝑛(𝑥) (see Equation II.22). In this way,
the present study targets towards the exploration of the impact of the three mode shapes with
𝑛 = 1, 2, 4. Nevertheless, it can be easily extended for higher mode shapes if necessary.
Consequently only the first natural bending mode shape describes the movement of the guided
seismic mass shuttle with sufficient accuracy, because 𝑓1(𝐿) = 1 and thus 𝑢𝑧(𝐿, 𝑡) = 𝑧(𝑡), although 𝑓2𝑛(𝐿) = 0 for 𝑛 > 0. Thus, 𝑎1(𝑡) = 𝑧(𝑡) as well, and in this way, 𝑎1 can be denoted
as the value of the displacement of the suspended shuttle in parallel to the 𝑧-axis.
The modes that are even (n = 2, 4, 6…) represent the beam deformation not directly related to
the movement of the shuttle itself. In other words, they describe the beam deformation along
its length, but not the displacement of the shuttle.
Inserting the expressions for 𝑢𝑧 (Equation II.20), 𝑢0 (Equation II.21) and basis orthogonality
conditions (Equation II.24) in the expression for the shear force 𝑄 (Equation II.19), an
expression for the mode shape amplitudes 𝑎i is obtained:
𝑄𝑓𝑛(𝐿) = 𝑎𝑛𝐸𝐼 ∫𝑑2𝑓𝑛𝑑𝑥2
𝑑2𝑓𝑛𝑑𝑥2
𝑑𝑥
𝐿
0
+𝐸𝑆
𝐿(∫(𝑎0𝑘𝑎𝑘
𝑑𝑓𝑘𝑑𝑥
𝑑𝑓𝑘𝑑𝑥
+1
2(𝑎𝑘
𝑑𝑓𝑘𝑑𝑥)2
)𝑑𝑥
𝐿
0
) (𝑎0𝑛
+ 𝑎𝑛)∫𝑑𝑓𝑛𝑑𝑥
𝑑𝑓𝑛𝑑𝑥
𝑑𝑥.
𝐿
0
(II.25)
In this equation and further in this chapter the doubled index will denote the sum (Einstein
notation).
From the Equation II.25, a projection on each studied mode (n = 1, 2, 4) is written:
73
{
𝑄 =
𝜋4𝐸𝐼
8𝐿3𝑎1 +
𝐸𝑆
𝐿(𝜋2
8𝐿)(𝑎01𝑎1 + 4𝑎02𝑎2 + 16𝑎04𝑎4 +
1
2(𝑎1
2 + 4𝑎22 + 16𝑎4
2))(𝜋2
8𝐿) ;
+𝐸𝑆
𝐿(𝜋2
8𝐿)(𝑎01𝑎1 + 4𝑎02𝑎2 + 16𝑎04𝑎4 +
1
2(𝑎1
2 + 4𝑎22 + 16𝑎4
2))(𝜋2
8𝐿) (𝑎01 + 𝑎1);
16𝜋4𝐸𝐼
8𝐿3𝑎2 +
𝐸𝑆
𝐿(𝜋2
8𝐿)(𝑎01𝑎1 + 4𝑎02𝑎2 + 16𝑎04𝑎4 +
1
2(𝑎1
2 + 4𝑎22 + 16𝑎4
2)) (4𝜋2
8𝐿) ;
+𝐸𝑆
𝐿(𝜋2
8𝐿)(𝑎01𝑎1 + 4𝑎02𝑎2 + 16𝑎04𝑎4 +
1
2(𝑎1
2 + 4𝑎22 + 16𝑎4
2)) (4𝜋2
8𝐿) (𝑎02 + 𝑎2) = 0;
256𝜋4𝐸𝐼
8𝐿3𝑎4 +
𝐸𝑆
𝐿(𝜋2
8𝐿)(𝑎01𝑎1 + 4𝑎02𝑎2 + 16𝑎04𝑎4 +
1
2(𝑎1
2 + 4𝑎22 + 16𝑎4
2)) (16𝜋2
8𝐿) .
+𝐸𝑆
𝐿(𝜋2
8𝐿)(𝑎01𝑎1 + 4𝑎02𝑎2 + 16𝑎04𝑎4 +
1
2(𝑎1
2 + 4𝑎22 + 16𝑎4
2))(16𝜋2
8𝐿) (𝑎04 + 𝑎4) = 0.
(II.26)
Equation II.26 shows the existence of the cross-coupling between modes originating from the
normal force. However, only the first mode (𝑛 = 1) can be excited by the applied shear force,
whereas uneven modes (𝑛 = 2, 4) are excited only by the coupling effect.
For the initial conditions of the mode shape amplitudes 𝑎𝑖(𝑡) the undeformed state is chosen:
{
𝑎1(0) =
𝑑𝑎1(0)
𝑑𝑡= 0;
𝑎2(0) =𝑑𝑎2(0)
𝑑𝑡= 0;
𝑎4(0) =𝑑𝑎4(0)
𝑑𝑡= 0.
(II.27)
From the second and third equations in Equation II.26, it can be demonstrated that the higher
mode shapes (𝑎2, 𝑎4) are the function of the first mode shape 𝑎1:
{𝑎2 = 𝑎2(𝑎1);
𝑎4 = 𝑎4(𝑎1).
(II.28)
The dependencies of the higher mode shapes on the the first mode shape 𝑎1 for different values
of 𝑎0𝑖 are demonstrated later in this section.
In this way, the relation between 𝑄 and 𝑎1 (that is equivalent to the seismic mass
displacement𝑧(𝑡)) can be established:
𝑄 =𝜋4𝐸𝐼
8𝐿3𝑎1 +
𝐸𝑆
𝐿(𝜋2
8𝐿)(𝑎01𝑎1 + 4𝑎02𝑎2(𝑎1) + 16𝑎04𝑎4(𝑎1)
+1
2(𝑎1
2 + 4𝑎22(𝑎1) + 16𝑎4
2(𝑎1)))(𝜋2
8𝐿) (𝑎01 + 𝑎1).
(II.29)
From the expression connecting shear force 𝑄 and shuttle displacement 𝑎1 (Equation II.29),
the quasi static force-displacement function could be extracted by imposing the seismic mass
shuttle displacement. In other words, by varying the value of first mode amplitude 𝑎1 (that is
equivalent to the displacement of the seismic mass) in a quasi-static way a reaction force of the
curved beam 𝑄(𝑎1) can be evaluated.

74
However, it is important to remember that presented calculation is made for a single curved
beam. In this way, the reaction force 𝐹𝐵 produced by the whole system suspended on four
curved beam reads, keeping in mind that 𝑎1 = 𝑧(𝑡):
𝐹𝐵(𝑎1) = 4𝑄(𝑧(𝑡)). (II.30)
In this way, the dynamics of the seismic mass is evaluated in the same way as presented in
Equation II.8:
𝑀(𝑑2𝑧(𝑡)
𝑑𝑡2+𝑑2𝑧𝑒𝑥𝑡(𝑡)
𝑑𝑡2) = 𝐹𝐵(𝑎1) + 𝑇(𝑉𝑣𝑎𝑟).
(II.31)
II.3.3 Bistable sine-shaped beam
First, to check the validity of the proposed approach, a reaction force of the double curved
beam bistable mechanism presented in [Qiu, 2004] is calculated. In this case, the initial shape
𝑢0 is expressed as:
𝑢0(𝑥) = 𝑎01𝑓1(𝑥).
(II.32)
As example, a MEMS bistable system with the beam with length 𝐿 = 2.5mm, width ℎ = 20µm
and thickness 𝑏 = 85µm is be considered. Material is assumed to be silicon, with Young’s
modulus 𝐸 = 1.69 x 10¹¹Pa. First mode amplitude is chosen as 𝑎01 = 50µm.
The comparison of the calculated force-displacement curve for bistable system using the mode
combination method developed in this work with respect to the theory presented in [Qiu, 2004]
is given on the Figure II.4. For the comparison, the deformation is evaluated with three mode
shapes (𝑖 = 1, 2, 4; blue line) and four mode shapes (𝑖 = 1, 2, 3, 4; green line). The two models
are found to give close numerical results when compared to the classical work of [Qiu, 2004],
and with FEM, but four mode shape approach is naturally found to give a result that is a little
closer to the one of Qiu. However, even three modes model describes pretty well the effect of
structural bistability and can be used for further explorations.
Figure II.4. Calculated force-displacement characteristics of a double curved-beam bistable
system. Black line: theory presented in [Qiu, 2004]; blue line: 3 mode shapes combination
method; green line: 4 mode shapes combination method.
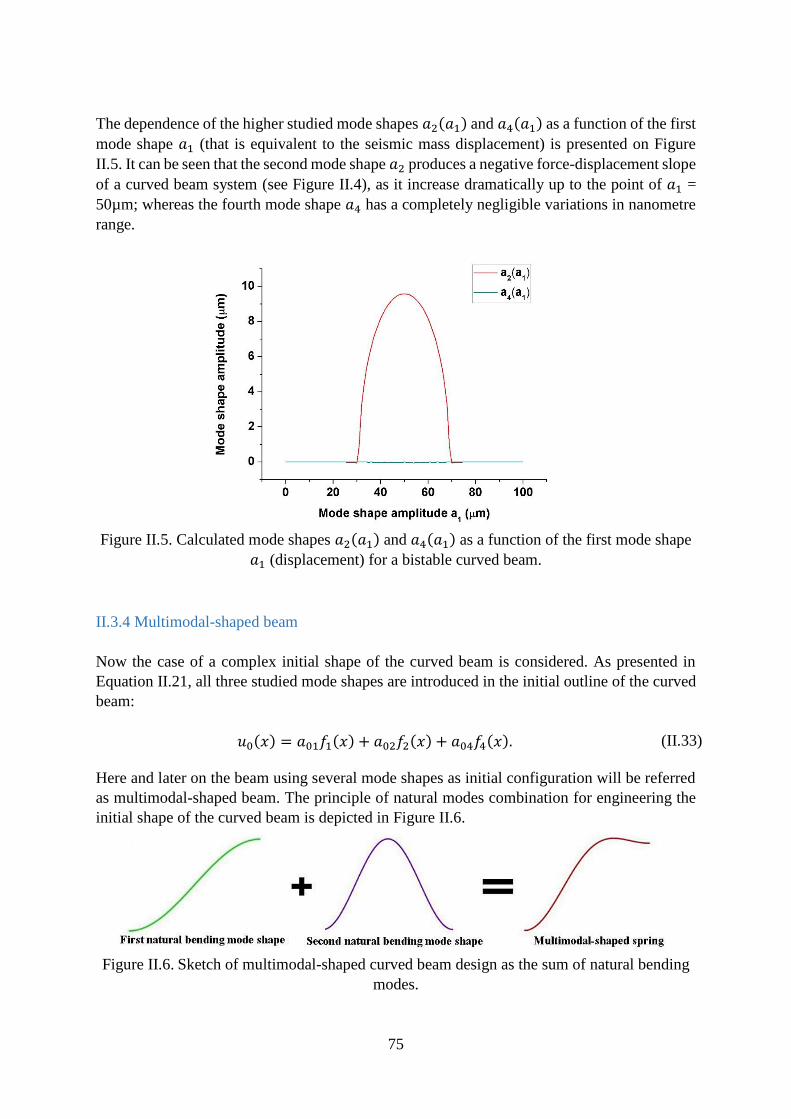
75
The dependence of the higher studied mode shapes 𝑎2(𝑎1) and 𝑎4(𝑎1) as a function of the first
mode shape 𝑎1 (that is equivalent to the seismic mass displacement) is presented on Figure
II.5. It can be seen that the second mode shape 𝑎2 produces a negative force-displacement slope
of a curved beam system (see Figure II.4), as it increase dramatically up to the point of 𝑎1 =
50µm; whereas the fourth mode shape 𝑎4 has a completely negligible variations in nanometre
range.
Figure II.5. Calculated mode shapes 𝑎2(𝑎1) and 𝑎4(𝑎1) as a function of the first mode shape
𝑎1 (displacement) for a bistable curved beam.
II.3.4 Multimodal-shaped beam
Now the case of a complex initial shape of the curved beam is considered. As presented in
Equation II.21, all three studied mode shapes are introduced in the initial outline of the curved
beam:
𝑢0(𝑥) = 𝑎01𝑓1(𝑥) + 𝑎02𝑓2(𝑥) + 𝑎04𝑓4(𝑥).
(II.33)
Here and later on the beam using several mode shapes as initial configuration will be referred
as multimodal-shaped beam. The principle of natural modes combination for engineering the
initial shape of the curved beam is depicted in Figure II.6.
Figure II.6. Sketch of multimodal-shaped curved beam design as the sum of natural bending
modes.
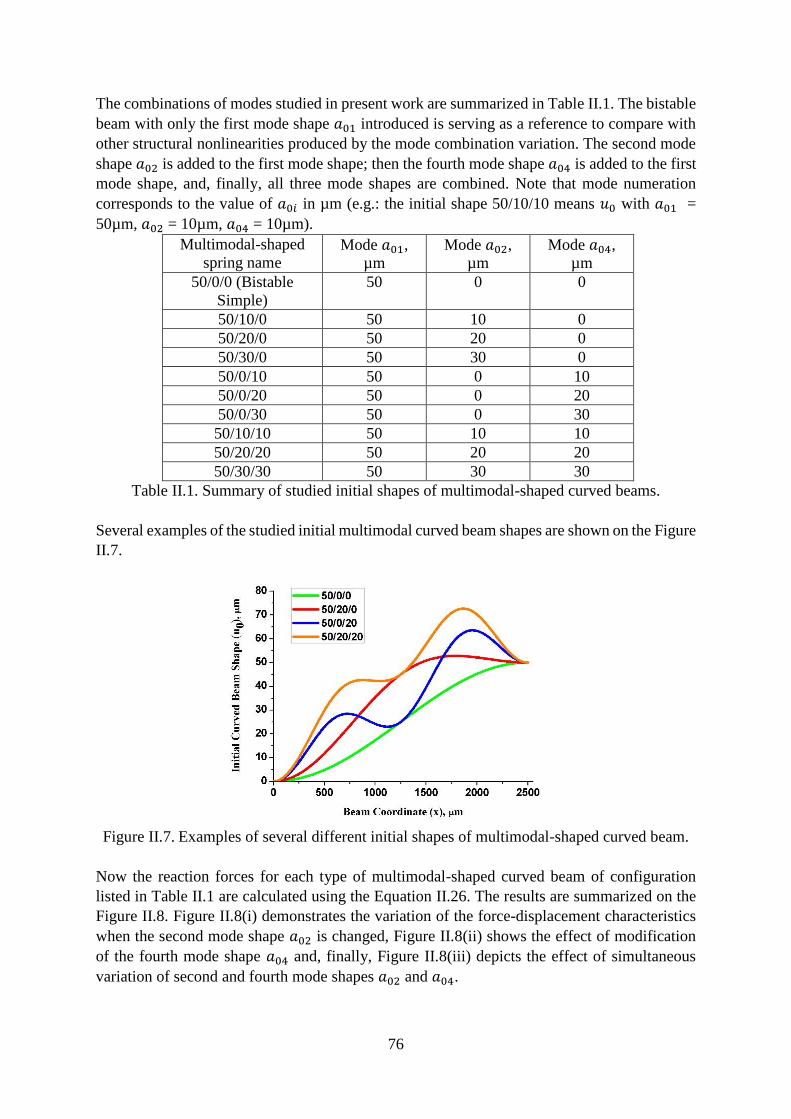
76
The combinations of modes studied in present work are summarized in Table II.1. The bistable
beam with only the first mode shape 𝑎01 introduced is serving as a reference to compare with
other structural nonlinearities produced by the mode combination variation. The second mode
shape 𝑎02 is added to the first mode shape; then the fourth mode shape 𝑎04 is added to the first
mode shape, and, finally, all three mode shapes are combined. Note that mode numeration
corresponds to the value of 𝑎0𝑖 in µm (e.g.: the initial shape 50/10/10 means 𝑢0 with 𝑎01 =
50µm, 𝑎02 = 10µm, 𝑎04 = 10µm).
Multimodal-shaped
spring name Mode 𝑎01,
µm
Mode 𝑎02,
µm
Mode 𝑎04,
µm
50/0/0 (Bistable
Simple)
50 0 0
50/10/0 50 10 0
50/20/0 50 20 0
50/30/0 50 30 0
50/0/10 50 0 10
50/0/20 50 0 20
50/0/30 50 0 30
50/10/10 50 10 10
50/20/20 50 20 20
50/30/30 50 30 30
Table II.1. Summary of studied initial shapes of multimodal-shaped curved beams.
Several examples of the studied initial multimodal curved beam shapes are shown on the Figure
II.7.
Figure II.7. Examples of several different initial shapes of multimodal-shaped curved beam.
Now the reaction forces for each type of multimodal-shaped curved beam of configuration
listed in Table II.1 are calculated using the Equation II.26. The results are summarized on the
Figure II.8. Figure II.8(i) demonstrates the variation of the force-displacement characteristics
when the second mode shape 𝑎02 is changed, Figure II.8(ii) shows the effect of modification
of the fourth mode shape 𝑎04 and, finally, Figure II.8(iii) depicts the effect of simultaneous
variation of second and fourth mode shapes 𝑎02 and 𝑎04.
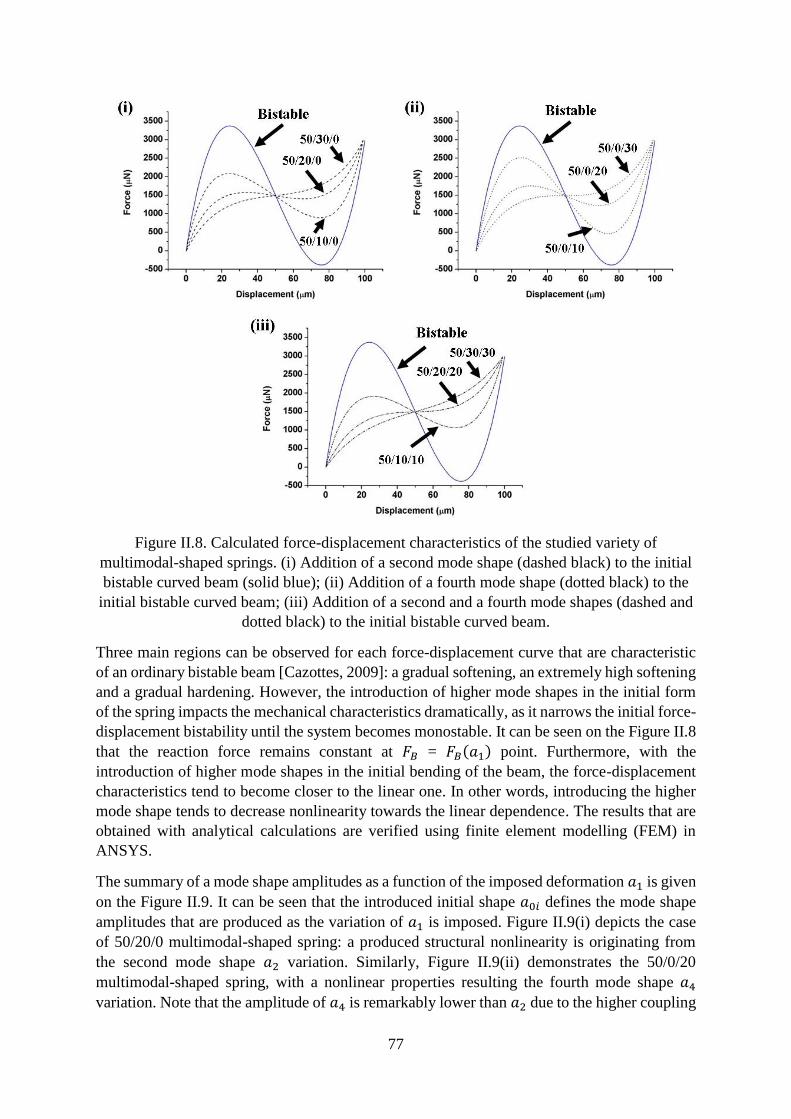
77
Figure II.8. Calculated force-displacement characteristics of the studied variety of
multimodal-shaped springs. (i) Addition of a second mode shape (dashed black) to the initial
bistable curved beam (solid blue); (ii) Addition of a fourth mode shape (dotted black) to the
initial bistable curved beam; (iii) Addition of a second and a fourth mode shapes (dashed and
dotted black) to the initial bistable curved beam.
Three main regions can be observed for each force-displacement curve that are characteristic
of an ordinary bistable beam [Cazottes, 2009]: a gradual softening, an extremely high softening
and a gradual hardening. However, the introduction of higher mode shapes in the initial form
of the spring impacts the mechanical characteristics dramatically, as it narrows the initial force-
displacement bistability until the system becomes monostable. It can be seen on the Figure II.8
that the reaction force remains constant at 𝐹𝐵 = 𝐹𝐵(𝑎1) point. Furthermore, with the
introduction of higher mode shapes in the initial bending of the beam, the force-displacement
characteristics tend to become closer to the linear one. In other words, introducing the higher
mode shape tends to decrease nonlinearity towards the linear dependence. The results that are
obtained with analytical calculations are verified using finite element modelling (FEM) in
ANSYS.
The summary of a mode shape amplitudes as a function of the imposed deformation 𝑎1 is given
on the Figure II.9. It can be seen that the introduced initial shape 𝑎0𝑖 defines the mode shape
amplitudes that are produced as the variation of 𝑎1 is imposed. Figure II.9(i) depicts the case
of 50/20/0 multimodal-shaped spring: a produced structural nonlinearity is originating from
the second mode shape 𝑎2 variation. Similarly, Figure II.9(ii) demonstrates the 50/0/20
multimodal-shaped spring, with a nonlinear properties resulting the fourth mode shape 𝑎4
variation. Note that the amplitude of 𝑎4 is remarkably lower than 𝑎2 due to the higher coupling
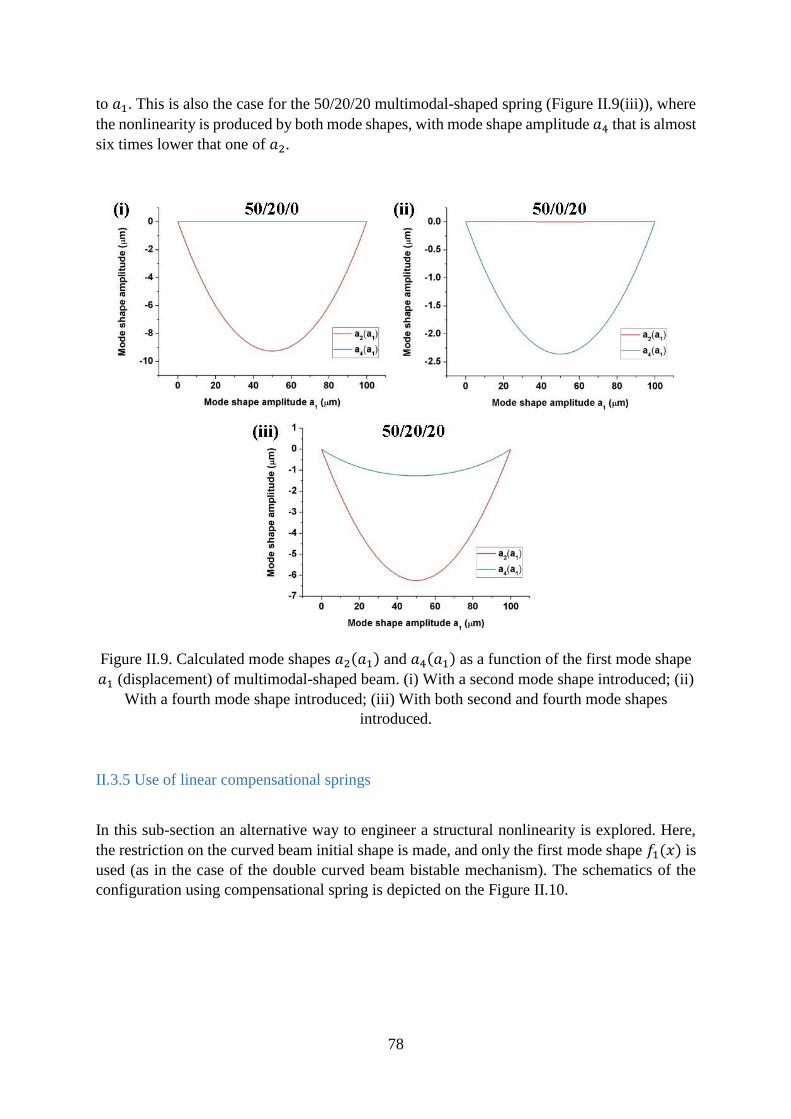
78
to 𝑎1. This is also the case for the 50/20/20 multimodal-shaped spring (Figure II.9(iii)), where
the nonlinearity is produced by both mode shapes, with mode shape amplitude 𝑎4 that is almost
six times lower that one of 𝑎2.
Figure II.9. Calculated mode shapes 𝑎2(𝑎1) and 𝑎4(𝑎1) as a function of the first mode shape
𝑎1 (displacement) of multimodal-shaped beam. (i) With a second mode shape introduced; (ii)
With a fourth mode shape introduced; (iii) With both second and fourth mode shapes
introduced.
II.3.5 Use of linear compensational springs
In this sub-section an alternative way to engineer a structural nonlinearity is explored. Here,
the restriction on the curved beam initial shape is made, and only the first mode shape 𝑓1(𝑥) is
used (as in the case of the double curved beam bistable mechanism). The schematics of the
configuration using compensational spring is depicted on the Figure II.10.
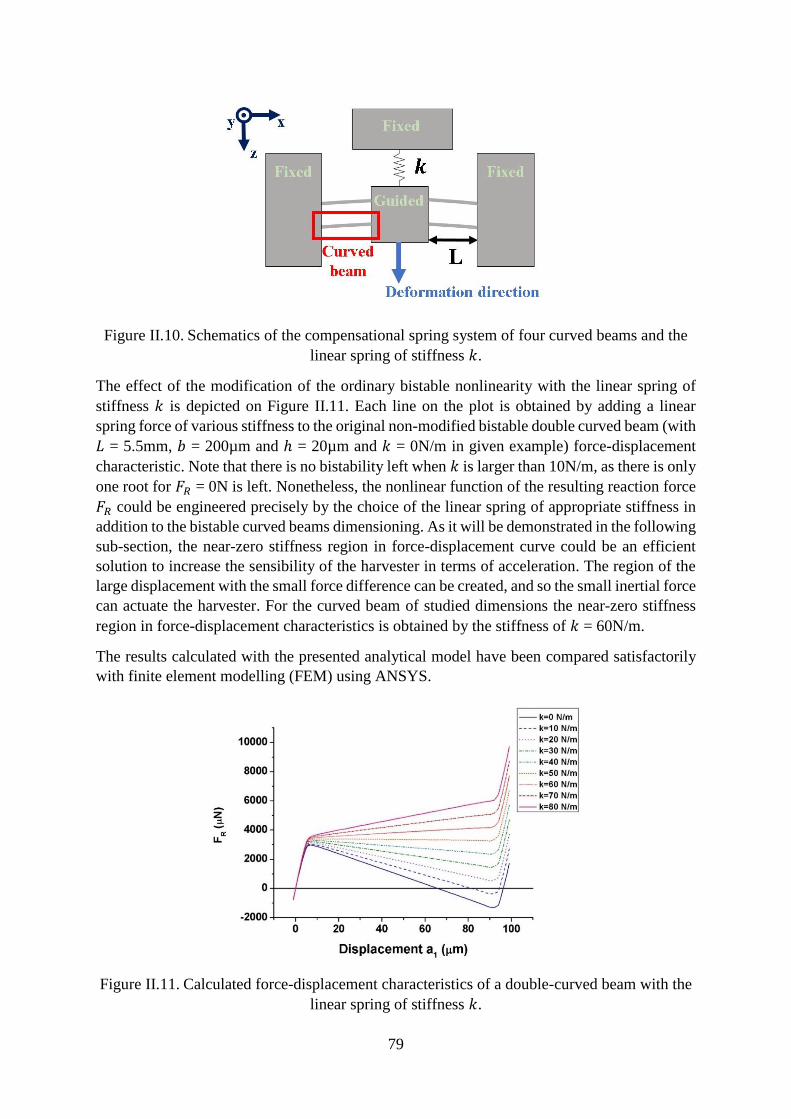
79
Figure II.10. Schematics of the compensational spring system of four curved beams and the
linear spring of stiffness 𝑘.
The effect of the modification of the ordinary bistable nonlinearity with the linear spring of
stiffness 𝑘 is depicted on Figure II.11. Each line on the plot is obtained by adding a linear
spring force of various stiffness to the original non-modified bistable double curved beam (with
𝐿 = 5.5mm, 𝑏 = 200µm and ℎ = 20µm and 𝑘 = 0N/m in given example) force-displacement
characteristic. Note that there is no bistability left when 𝑘 is larger than 10N/m, as there is only
one root for 𝐹𝑅 = 0N is left. Nonetheless, the nonlinear function of the resulting reaction force
𝐹𝑅 could be engineered precisely by the choice of the linear spring of appropriate stiffness in
addition to the bistable curved beams dimensioning. As it will be demonstrated in the following
sub-section, the near-zero stiffness region in force-displacement curve could be an efficient
solution to increase the sensibility of the harvester in terms of acceleration. The region of the
large displacement with the small force difference can be created, and so the small inertial force
can actuate the harvester. For the curved beam of studied dimensions the near-zero stiffness
region in force-displacement characteristics is obtained by the stiffness of 𝑘 = 60N/m.
The results calculated with the presented analytical model have been compared satisfactorily
with finite element modelling (FEM) using ANSYS.
Figure II.11. Calculated force-displacement characteristics of a double-curved beam with the
linear spring of stiffness 𝑘.
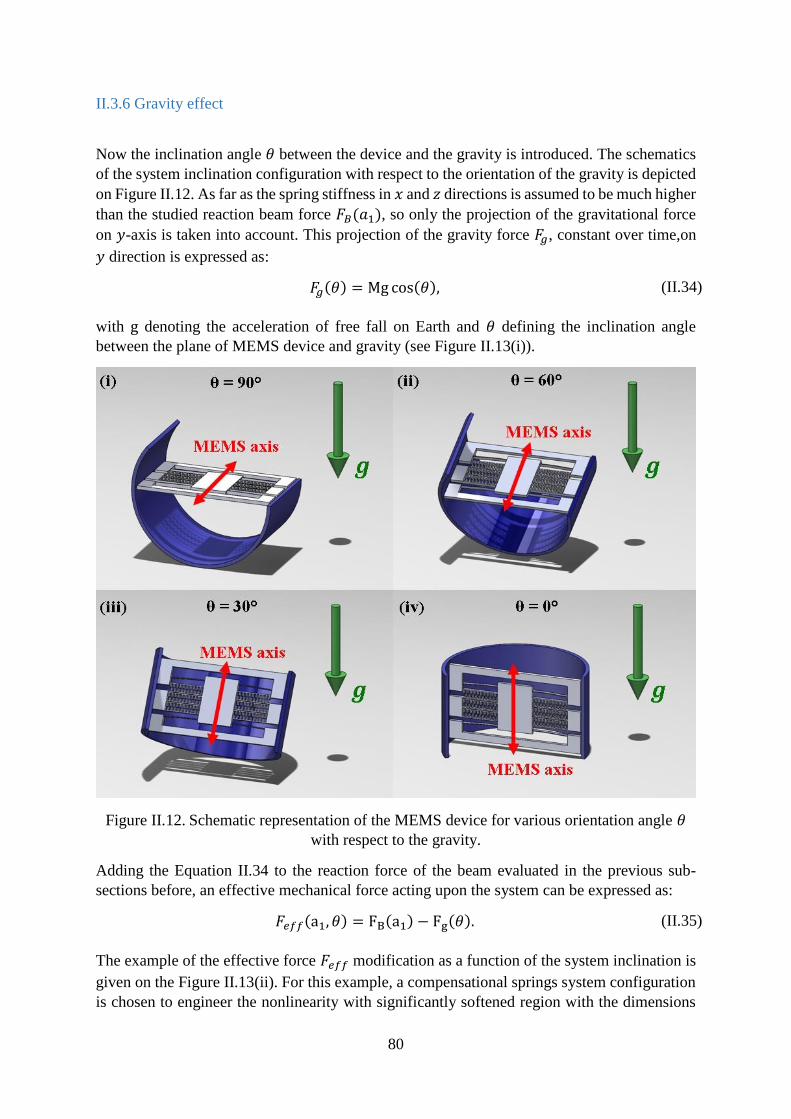
80
II.3.6 Gravity effect
Now the inclination angle 𝜃 between the device and the gravity is introduced. The schematics
of the system inclination configuration with respect to the orientation of the gravity is depicted
on Figure II.12. As far as the spring stiffness in 𝑥 and 𝑧 directions is assumed to be much higher
than the studied reaction beam force 𝐹𝐵(𝑎1), so only the projection of the gravitational force
on 𝑦-axis is taken into account. This projection of the gravity force 𝐹𝑔, constant over time,on
𝑦 direction is expressed as:
𝐹𝑔(𝜃) = Mg cos(𝜃),
(II.34)
with g denoting the acceleration of free fall on Earth and 𝜃 defining the inclination angle
between the plane of MEMS device and gravity (see Figure II.13(i)).
Figure II.12. Schematic representation of the MEMS device for various orientation angle 𝜃
with respect to the gravity.
Adding the Equation II.34 to the reaction force of the beam evaluated in the previous sub-
sections before, an effective mechanical force acting upon the system can be expressed as:
𝐹𝑒𝑓𝑓(a1, 𝜃) = FB(a1) − Fg(𝜃).
(II.35)
The example of the effective force 𝐹𝑒𝑓𝑓 modification as a function of the system inclination is
given on the Figure II.13(ii). For this example, a compensational springs system configuration
is chosen to engineer the nonlinearity with significantly softened region with the dimensions
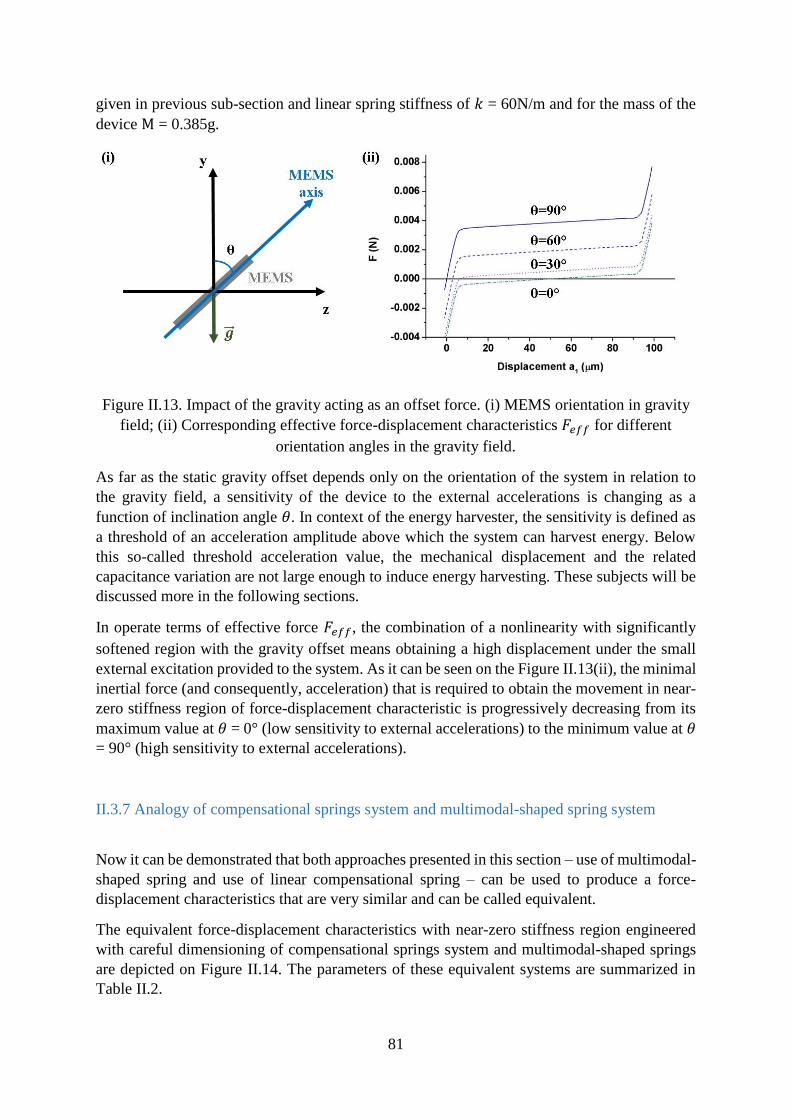
81
given in previous sub-section and linear spring stiffness of 𝑘 = 60N/m and for the mass of the
device M = 0.385g.
Figure II.13. Impact of the gravity acting as an offset force. (i) MEMS orientation in gravity
field; (ii) Corresponding effective force-displacement characteristics 𝐹𝑒𝑓𝑓 for different
orientation angles in the gravity field.
As far as the static gravity offset depends only on the orientation of the system in relation to
the gravity field, a sensitivity of the device to the external accelerations is changing as a
function of inclination angle 𝜃. In context of the energy harvester, the sensitivity is defined as
a threshold of an acceleration amplitude above which the system can harvest energy. Below
this so-called threshold acceleration value, the mechanical displacement and the related
capacitance variation are not large enough to induce energy harvesting. These subjects will be
discussed more in the following sections.
In operate terms of effective force 𝐹𝑒𝑓𝑓, the combination of a nonlinearity with significantly
softened region with the gravity offset means obtaining a high displacement under the small
external excitation provided to the system. As it can be seen on the Figure II.13(ii), the minimal
inertial force (and consequently, acceleration) that is required to obtain the movement in near-
zero stiffness region of force-displacement characteristic is progressively decreasing from its
maximum value at 𝜃 = 0° (low sensitivity to external accelerations) to the minimum value at 𝜃
= 90° (high sensitivity to external accelerations).
II.3.7 Analogy of compensational springs system and multimodal-shaped spring system
Now it can be demonstrated that both approaches presented in this section – use of multimodal-
shaped spring and use of linear compensational spring – can be used to produce a force-
displacement characteristics that are very similar and can be called equivalent.
The equivalent force-displacement characteristics with near-zero stiffness region engineered
with careful dimensioning of compensational springs system and multimodal-shaped springs
are depicted on Figure II.14. The parameters of these equivalent systems are summarized in
Table II.2.
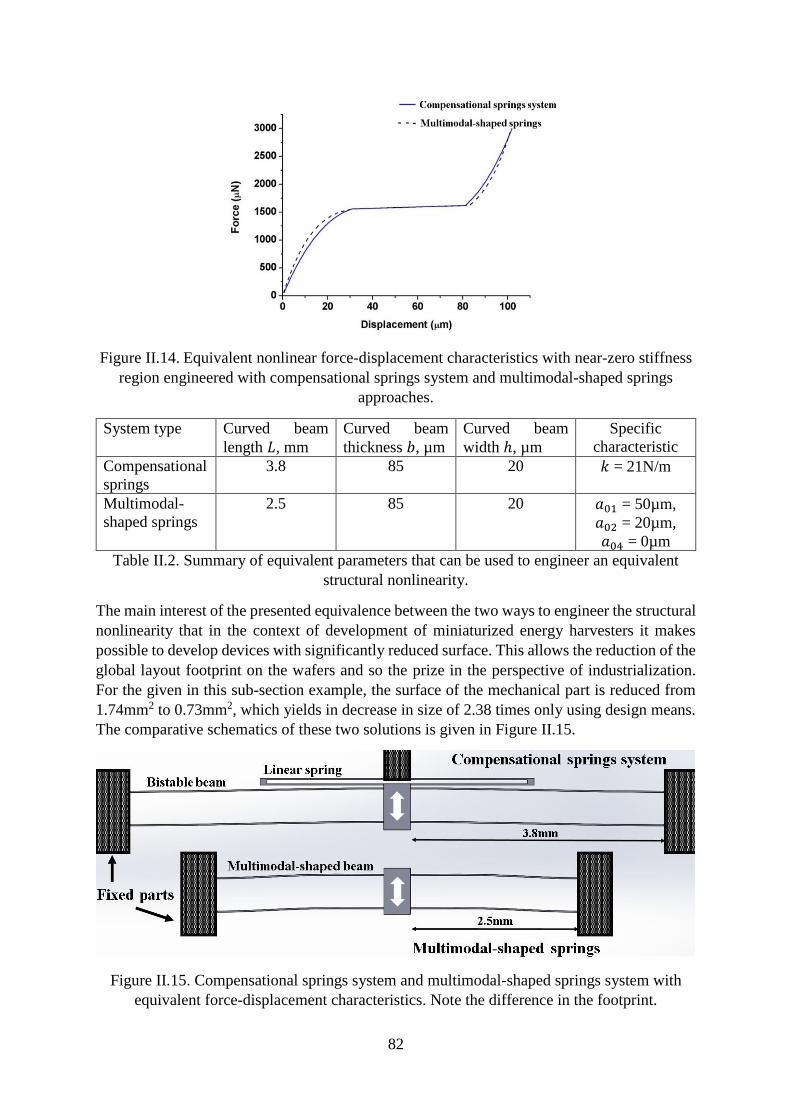
82
Figure II.14. Equivalent nonlinear force-displacement characteristics with near-zero stiffness
region engineered with compensational springs system and multimodal-shaped springs
approaches.
System type Curved beam
length 𝐿, mm
Curved beam
thickness 𝑏, µm
Curved beam
width ℎ, µm
Specific
characteristic
Compensational
springs
3.8 85 20 𝑘 = 21N/m
Multimodal-
shaped springs
2.5 85 20 𝑎01 = 50µm,
𝑎02 = 20µm,
𝑎04 = 0µm
Table II.2. Summary of equivalent parameters that can be used to engineer an equivalent
structural nonlinearity.
The main interest of the presented equivalence between the two ways to engineer the structural
nonlinearity that in the context of development of miniaturized energy harvesters it makes
possible to develop devices with significantly reduced surface. This allows the reduction of the
global layout footprint on the wafers and so the prize in the perspective of industrialization.
For the given in this sub-section example, the surface of the mechanical part is reduced from
1.74mm2 to 0.73mm2, which yields in decrease in size of 2.38 times only using design means.
The comparative schematics of these two solutions is given in Figure II.15.
Figure II.15. Compensational springs system and multimodal-shaped springs system with
equivalent force-displacement characteristics. Note the difference in the footprint.
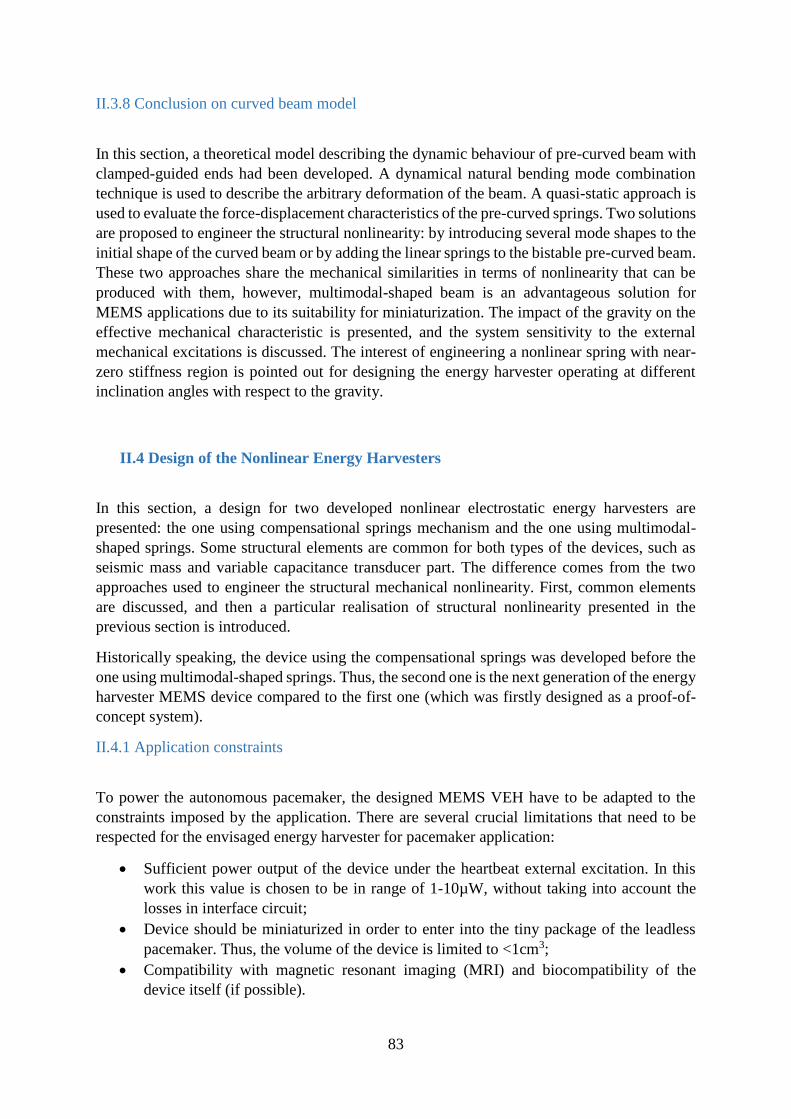
83
II.3.8 Conclusion on curved beam model
In this section, a theoretical model describing the dynamic behaviour of pre-curved beam with
clamped-guided ends had been developed. A dynamical natural bending mode combination
technique is used to describe the arbitrary deformation of the beam. A quasi-static approach is
used to evaluate the force-displacement characteristics of the pre-curved springs. Two solutions
are proposed to engineer the structural nonlinearity: by introducing several mode shapes to the
initial shape of the curved beam or by adding the linear springs to the bistable pre-curved beam.
These two approaches share the mechanical similarities in terms of nonlinearity that can be
produced with them, however, multimodal-shaped beam is an advantageous solution for
MEMS applications due to its suitability for miniaturization. The impact of the gravity on the
effective mechanical characteristic is presented, and the system sensitivity to the external
mechanical excitations is discussed. The interest of engineering a nonlinear spring with near-
zero stiffness region is pointed out for designing the energy harvester operating at different
inclination angles with respect to the gravity.
II.4 Design of the Nonlinear Energy Harvesters
In this section, a design for two developed nonlinear electrostatic energy harvesters are
presented: the one using compensational springs mechanism and the one using multimodal-
shaped springs. Some structural elements are common for both types of the devices, such as
seismic mass and variable capacitance transducer part. The difference comes from the two
approaches used to engineer the structural mechanical nonlinearity. First, common elements
are discussed, and then a particular realisation of structural nonlinearity presented in the
previous section is introduced.
Historically speaking, the device using the compensational springs was developed before the
one using multimodal-shaped springs. Thus, the second one is the next generation of the energy
harvester MEMS device compared to the first one (which was firstly designed as a proof-of-
concept system).
II.4.1 Application constraints
To power the autonomous pacemaker, the designed MEMS VEH have to be adapted to the
constraints imposed by the application. There are several crucial limitations that need to be
respected for the envisaged energy harvester for pacemaker application:
Sufficient power output of the device under the heartbeat external excitation. In this
work this value is chosen to be in range of 1-10µW, without taking into account the
losses in interface circuit;
Device should be miniaturized in order to enter into the tiny package of the leadless
pacemaker. Thus, the volume of the device is limited to <1cm3;
Compatibility with magnetic resonant imaging (MRI) and biocompatibility of the
device itself (if possible).
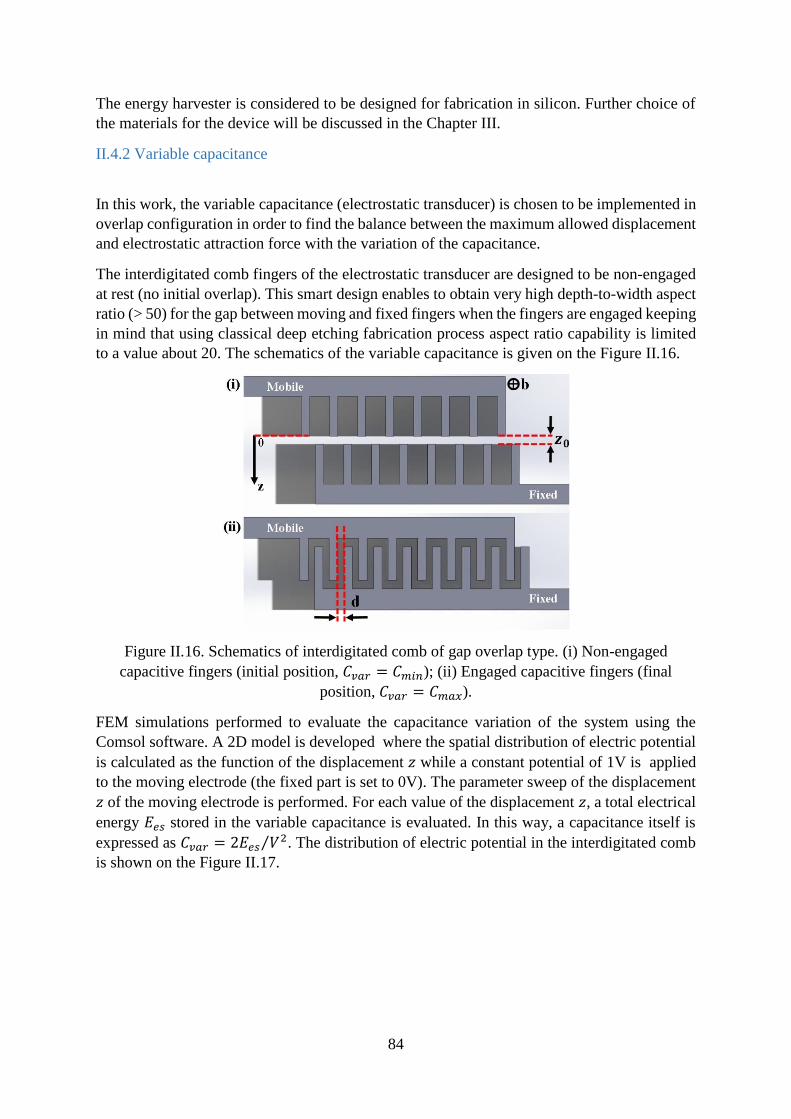
84
The energy harvester is considered to be designed for fabrication in silicon. Further choice of
the materials for the device will be discussed in the Chapter III.
II.4.2 Variable capacitance
In this work, the variable capacitance (electrostatic transducer) is chosen to be implemented in
overlap configuration in order to find the balance between the maximum allowed displacement
and electrostatic attraction force with the variation of the capacitance.
The interdigitated comb fingers of the electrostatic transducer are designed to be non-engaged
at rest (no initial overlap). This smart design enables to obtain very high depth-to-width aspect
ratio (> 50) for the gap between moving and fixed fingers when the fingers are engaged keeping
in mind that using classical deep etching fabrication process aspect ratio capability is limited
to a value about 20. The schematics of the variable capacitance is given on the Figure II.16.
Figure II.16. Schematics of interdigitated comb of gap overlap type. (i) Non-engaged
capacitive fingers (initial position, 𝐶𝑣𝑎𝑟 = 𝐶𝑚𝑖𝑛); (ii) Engaged capacitive fingers (final
position, 𝐶𝑣𝑎𝑟 = 𝐶𝑚𝑎𝑥).
FEM simulations performed to evaluate the capacitance variation of the system using the
Comsol software. A 2D model is developed where the spatial distribution of electric potential
is calculated as the function of the displacement 𝑧 while a constant potential of 1V is applied
to the moving electrode (the fixed part is set to 0V). The parameter sweep of the displacement
𝑧 of the moving electrode is performed. For each value of the displacement 𝑧, a total electrical
energy 𝐸𝑒𝑠 stored in the variable capacitance is evaluated. In this way, a capacitance itself is
expressed as 𝐶𝑣𝑎𝑟 = 2𝐸𝑒𝑠 𝑉2⁄ . The distribution of electric potential in the interdigitated comb
is shown on the Figure II.17.

85
Figure II.17. Distribution of electric potential in interdigitated comb. (i) Non-engaged fingers
(initial position, 𝐶𝑣𝑎𝑟 = 𝐶𝑚𝑖𝑛); (ii) Engaged fingers (final position, 𝐶𝑣𝑎𝑟 = 𝐶𝑚𝑎𝑥).
For the simulations that are presented in the next section it is useful to find the approximate
analytical expression to describe the capacitance variation. The capacitance of the gap overlap
variable capacitor 𝐶𝑣𝑎𝑟 can be expressed as a function of the displacement 𝑧, for 𝑧 > 𝑧0:
𝐶𝑣𝑎𝑟(𝑧) =𝜀0𝜀𝑆𝑐𝑑
= 2𝑁𝜀0𝜀𝑏(𝑧 − 𝑧0)
𝑑,
(II.36)
with 𝜀0 = 8.85x10⁻¹²F/m denoting the vacuum permittivity, 𝜀 = 1 representing the relative
permittivity in air, 𝑆𝑐 being the surface of the overlapping finger pair area, 𝑑 standing for
interfinger distance and 𝑁 is the number of comb finger pairs.
In the real case, however, a parasitic capacitance 𝐶𝑝 has to be taken into account as well. In
this case, variable capacitance 𝐶𝑣𝑎𝑟(𝑧) becomes:
{𝐶𝑣𝑎𝑟(𝑧 ≥ 𝑧0) = 𝐶𝑝 + 2𝑁
𝜀0𝜀𝑏(𝑧 − 𝑧0)
𝑑;
𝐶𝑣𝑎𝑟(𝑧 ≤ 𝑧0) = 𝐶𝑝.
(II.37)
In Figure II.18 a comparison between FEM and analytical model is shown for capacitance
variation as a function of the displacement of the mobile electrode, with 𝑁 = 2000, 𝑏 = 200µm,
𝑑 = 5µm and 𝐶𝑝 = 28pF. It can be seen that the proposed model overestimates the capacitance
when the displacement is lower than initial finger separation (20µm in this case), but once the
overlap between fingers is achieved, the model corresponds rather well to the result obtained
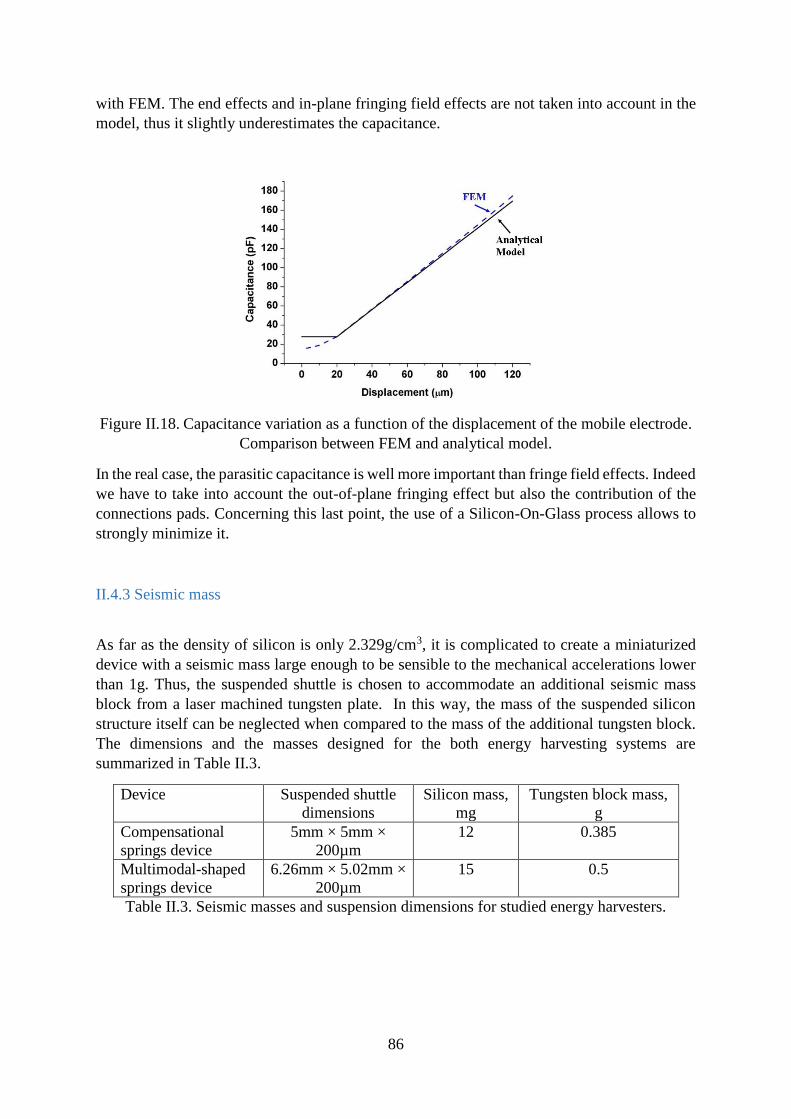
86
with FEM. The end effects and in-plane fringing field effects are not taken into account in the
model, thus it slightly underestimates the capacitance.
Figure II.18. Capacitance variation as a function of the displacement of the mobile electrode.
Comparison between FEM and analytical model.
In the real case, the parasitic capacitance is well more important than fringe field effects. Indeed
we have to take into account the out-of-plane fringing effect but also the contribution of the
connections pads. Concerning this last point, the use of a Silicon-On-Glass process allows to
strongly minimize it.
II.4.3 Seismic mass
As far as the density of silicon is only 2.329g/cm3, it is complicated to create a miniaturized
device with a seismic mass large enough to be sensible to the mechanical accelerations lower
than 1g. Thus, the suspended shuttle is chosen to accommodate an additional seismic mass
block from a laser machined tungsten plate. In this way, the mass of the suspended silicon
structure itself can be neglected when compared to the mass of the additional tungsten block.
The dimensions and the masses designed for the both energy harvesting systems are
summarized in Table II.3.
Device Suspended shuttle
dimensions
Silicon mass,
mg
Tungsten block mass,
g
Compensational
springs device
5mm × 5mm ×
200µm
12 0.385
Multimodal-shaped
springs device
6.26mm × 5.02mm ×
200µm
15 0.5
Table II.3. Seismic masses and suspension dimensions for studied energy harvesters.
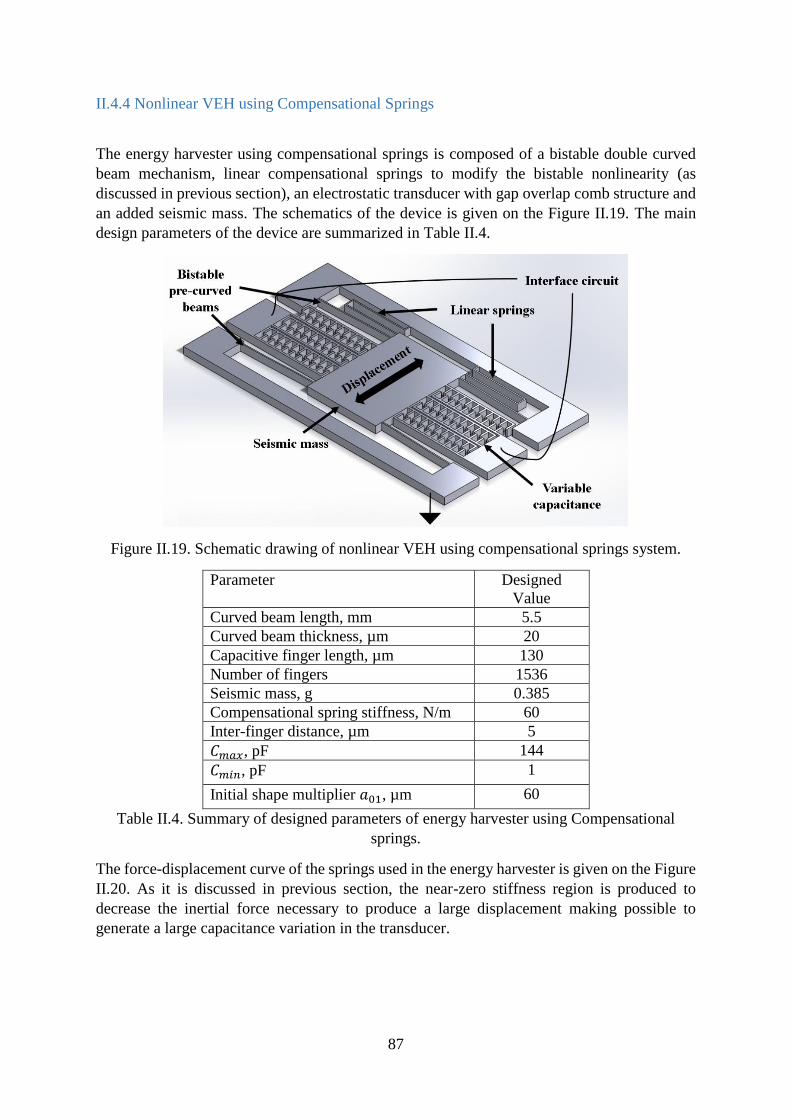
87
II.4.4 Nonlinear VEH using Compensational Springs
The energy harvester using compensational springs is composed of a bistable double curved
beam mechanism, linear compensational springs to modify the bistable nonlinearity (as
discussed in previous section), an electrostatic transducer with gap overlap comb structure and
an added seismic mass. The schematics of the device is given on the Figure II.19. The main
design parameters of the device are summarized in Table II.4.
Figure II.19. Schematic drawing of nonlinear VEH using compensational springs system.
Parameter Designed
Value
Curved beam length, mm 5.5
Curved beam thickness, µm 20
Capacitive finger length, µm 130
Number of fingers 1536
Seismic mass, g 0.385
Compensational spring stiffness, N/m 60
Inter-finger distance, µm 5
𝐶𝑚𝑎𝑥, pF 144
𝐶𝑚𝑖𝑛, pF 1
Initial shape multiplier 𝑎01, µm 60
Table II.4. Summary of designed parameters of energy harvester using Compensational
springs.
The force-displacement curve of the springs used in the energy harvester is given on the Figure
II.20. As it is discussed in previous section, the near-zero stiffness region is produced to
decrease the inertial force necessary to produce a large displacement making possible to
generate a large capacitance variation in the transducer.
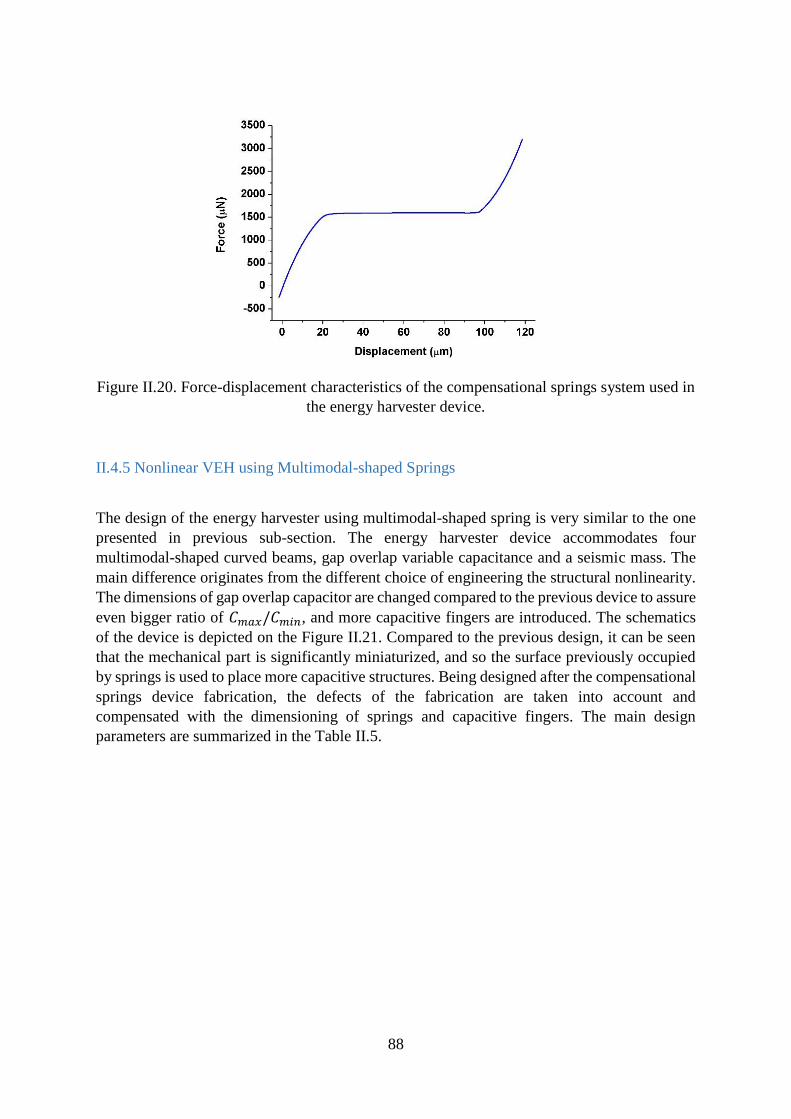
88
Figure II.20. Force-displacement characteristics of the compensational springs system used in
the energy harvester device.
II.4.5 Nonlinear VEH using Multimodal-shaped Springs
The design of the energy harvester using multimodal-shaped spring is very similar to the one
presented in previous sub-section. The energy harvester device accommodates four
multimodal-shaped curved beams, gap overlap variable capacitance and a seismic mass. The
main difference originates from the different choice of engineering the structural nonlinearity.
The dimensions of gap overlap capacitor are changed compared to the previous device to assure
even bigger ratio of 𝐶𝑚𝑎𝑥/𝐶𝑚𝑖𝑛, and more capacitive fingers are introduced. The schematics
of the device is depicted on the Figure II.21. Compared to the previous design, it can be seen
that the mechanical part is significantly miniaturized, and so the surface previously occupied
by springs is used to place more capacitive structures. Being designed after the compensational
springs device fabrication, the defects of the fabrication are taken into account and
compensated with the dimensioning of springs and capacitive fingers. The main design
parameters are summarized in the Table II.5.

89
Figure II.21. Schematic drawing of nonlinear VEH using multimodal-shaped springs.
Parameter Designed
Value
Curved beam length, mm 2.5
Curved beam thickness, µm 26
Capacitive finger length, µm 150
Number of fingers 2232
Seismic mass, g 0.5
Inter-finger distance, µm 4
𝐶𝑚𝑎𝑥, pF 277
𝐶𝑚𝑖𝑛, pF 1
Initial shape multiplier 𝑎01, µm 90
Initial shape multiplier 𝑎02, µm 50
Table II.5. Summary of designed parameters of energy harvester using multimodal-shaped
springs.
The characteristic of force-displacement used in present energy harvester is shown on the
Figure II.22. The region of near-zero stiffness is implemented as discussed before, with higher
associated reaction force 𝐹𝐵, which will yield in higher operating voltages, and, thus, higher
values of the energy harvested. The effects of this choice will be explored in the next section.
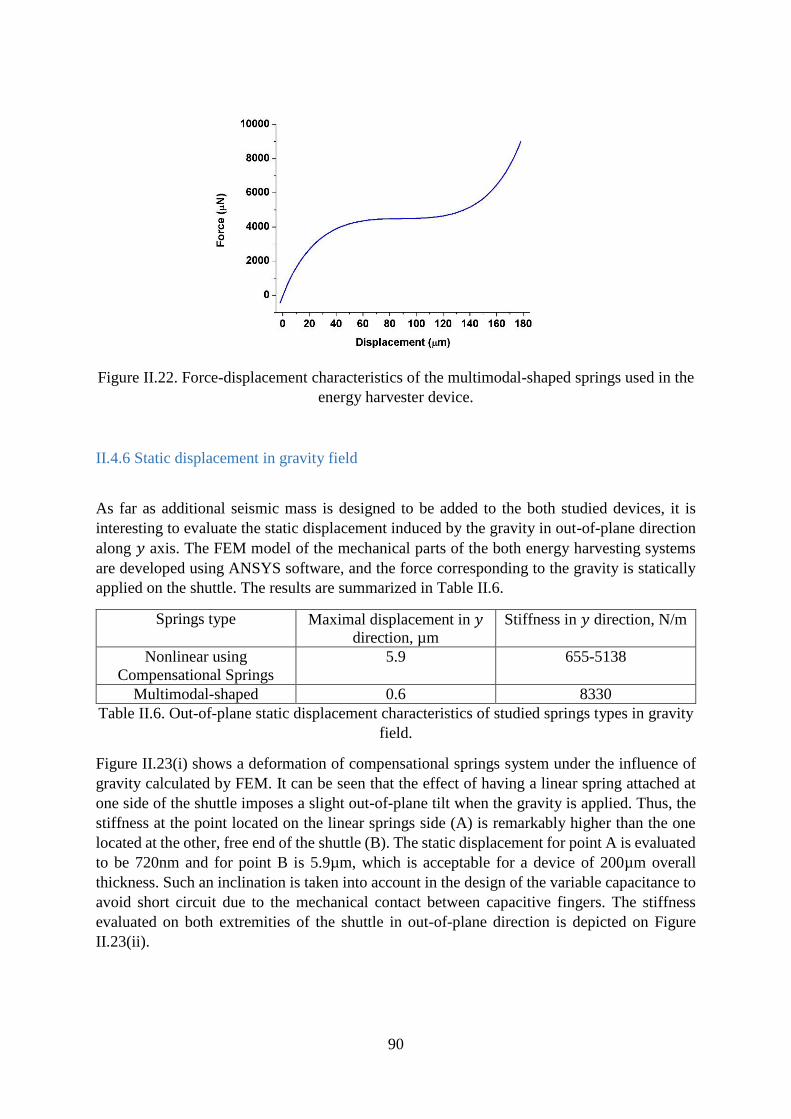
90
Figure II.22. Force-displacement characteristics of the multimodal-shaped springs used in the
energy harvester device.
II.4.6 Static displacement in gravity field
As far as additional seismic mass is designed to be added to the both studied devices, it is
interesting to evaluate the static displacement induced by the gravity in out-of-plane direction
along 𝑦 axis. The FEM model of the mechanical parts of the both energy harvesting systems
are developed using ANSYS software, and the force corresponding to the gravity is statically
applied on the shuttle. The results are summarized in Table II.6.
Springs type Maximal displacement in 𝑦
direction, µm
Stiffness in 𝑦 direction, N/m
Nonlinear using
Compensational Springs
5.9 655-5138
Multimodal-shaped 0.6 8330
Table II.6. Out-of-plane static displacement characteristics of studied springs types in gravity
field.
Figure II.23(i) shows a deformation of compensational springs system under the influence of
gravity calculated by FEM. It can be seen that the effect of having a linear spring attached at
one side of the shuttle imposes a slight out-of-plane tilt when the gravity is applied. Thus, the
stiffness at the point located on the linear springs side (A) is remarkably higher than the one
located at the other, free end of the shuttle (B). The static displacement for point A is evaluated
to be 720nm and for point B is 5.9µm, which is acceptable for a device of 200µm overall
thickness. Such an inclination is taken into account in the design of the variable capacitance to
avoid short circuit due to the mechanical contact between capacitive fingers. The stiffness
evaluated on both extremities of the shuttle in out-of-plane direction is depicted on Figure
II.23(ii).
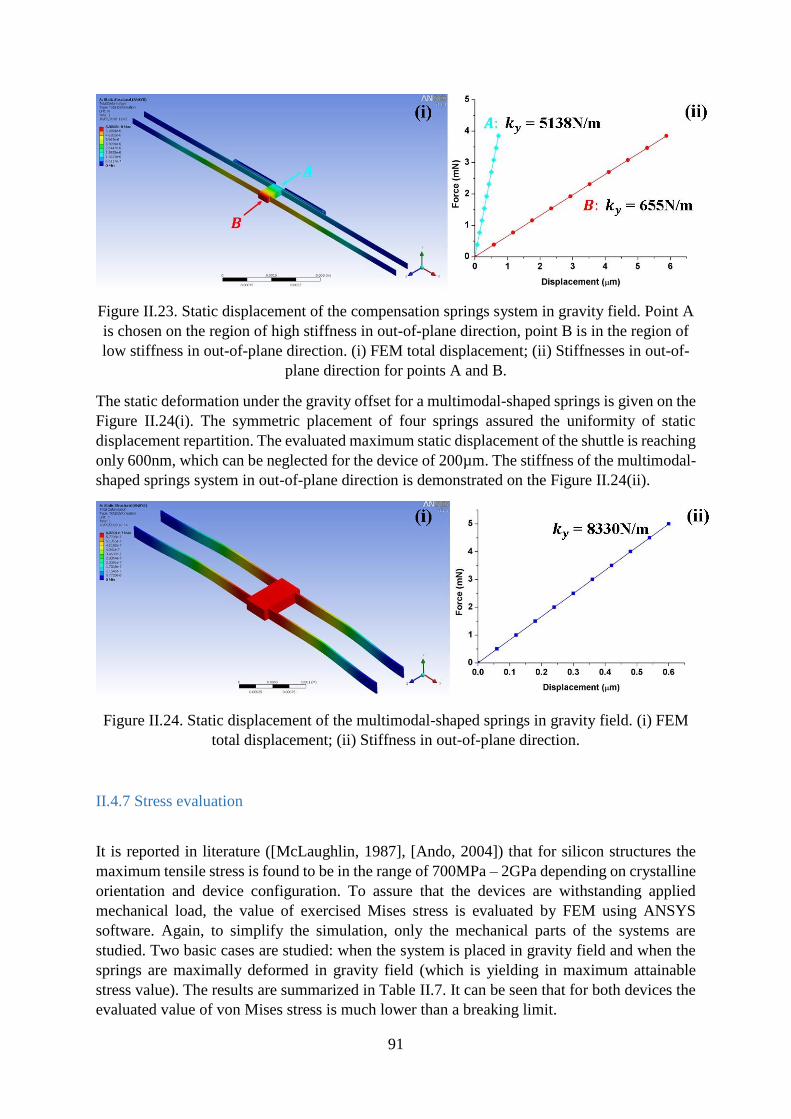
91
Figure II.23. Static displacement of the compensation springs system in gravity field. Point A
is chosen on the region of high stiffness in out-of-plane direction, point B is in the region of
low stiffness in out-of-plane direction. (i) FEM total displacement; (ii) Stiffnesses in out-of-
plane direction for points A and B.
The static deformation under the gravity offset for a multimodal-shaped springs is given on the
Figure II.24(i). The symmetric placement of four springs assured the uniformity of static
displacement repartition. The evaluated maximum static displacement of the shuttle is reaching
only 600nm, which can be neglected for the device of 200µm. The stiffness of the multimodal-
shaped springs system in out-of-plane direction is demonstrated on the Figure II.24(ii).
Figure II.24. Static displacement of the multimodal-shaped springs in gravity field. (i) FEM
total displacement; (ii) Stiffness in out-of-plane direction.
II.4.7 Stress evaluation
It is reported in literature ([McLaughlin, 1987], [Ando, 2004]) that for silicon structures the
maximum tensile stress is found to be in the range of 700MPa – 2GPa depending on crystalline
orientation and device configuration. To assure that the devices are withstanding applied
mechanical load, the value of exercised Mises stress is evaluated by FEM using ANSYS
software. Again, to simplify the simulation, only the mechanical parts of the systems are
studied. Two basic cases are studied: when the system is placed in gravity field and when the
springs are maximally deformed in gravity field (which is yielding in maximum attainable
stress value). The results are summarized in Table II.7. It can be seen that for both devices the
evaluated value of von Mises stress is much lower than a breaking limit.
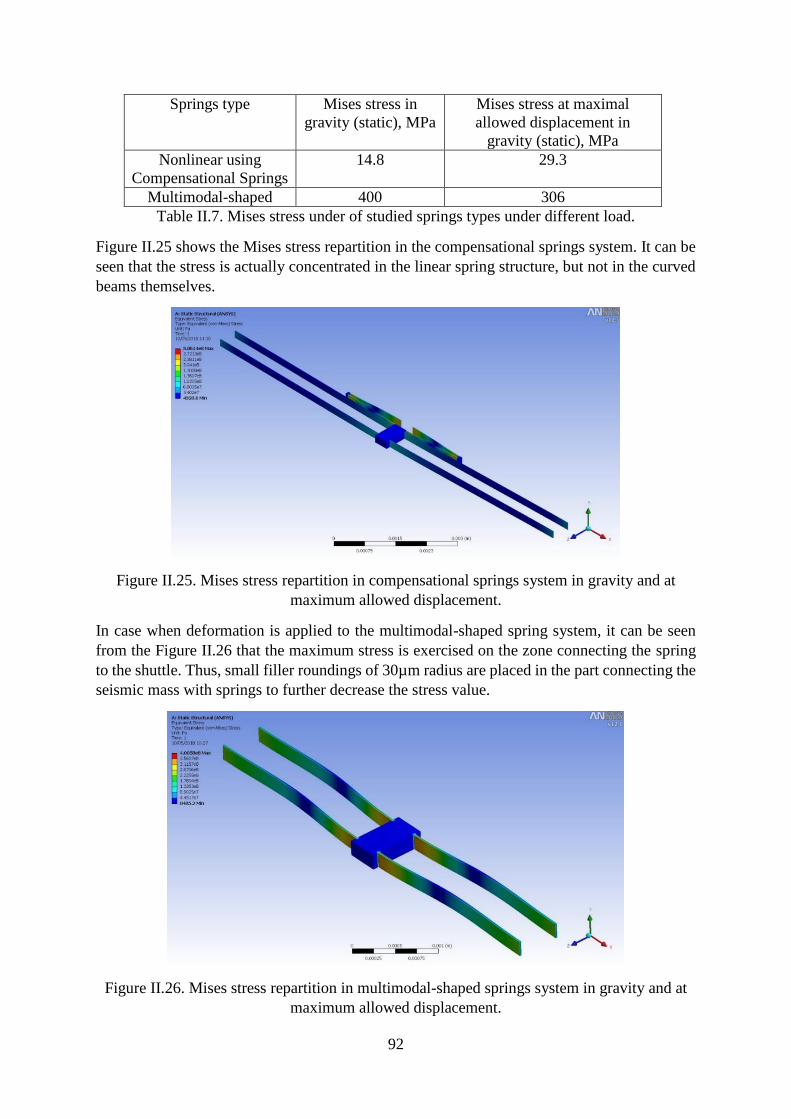
92
Springs type Mises stress in
gravity (static), MPa
Mises stress at maximal
allowed displacement in
gravity (static), MPa
Nonlinear using
Compensational Springs
14.8 29.3
Multimodal-shaped 400 306
Table II.7. Mises stress under of studied springs types under different load.
Figure II.25 shows the Mises stress repartition in the compensational springs system. It can be
seen that the stress is actually concentrated in the linear spring structure, but not in the curved
beams themselves.
Figure II.25. Mises stress repartition in compensational springs system in gravity and at
maximum allowed displacement.
In case when deformation is applied to the multimodal-shaped spring system, it can be seen
from the Figure II.26 that the maximum stress is exercised on the zone connecting the spring
to the shuttle. Thus, small filler roundings of 30µm radius are placed in the part connecting the
seismic mass with springs to further decrease the stress value.
Figure II.26. Mises stress repartition in multimodal-shaped springs system in gravity and at
maximum allowed displacement.
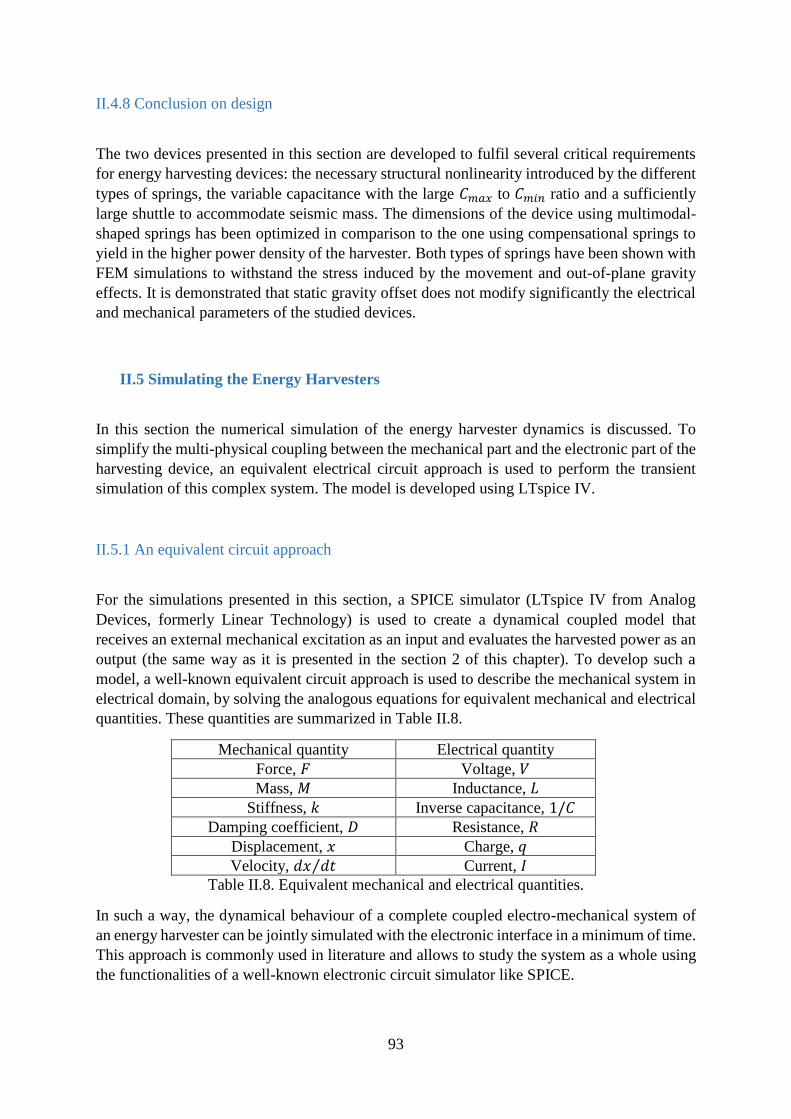
93
II.4.8 Conclusion on design
The two devices presented in this section are developed to fulfil several critical requirements
for energy harvesting devices: the necessary structural nonlinearity introduced by the different
types of springs, the variable capacitance with the large 𝐶𝑚𝑎𝑥 to 𝐶𝑚𝑖𝑛 ratio and a sufficiently
large shuttle to accommodate seismic mass. The dimensions of the device using multimodal-
shaped springs has been optimized in comparison to the one using compensational springs to
yield in the higher power density of the harvester. Both types of springs have been shown with
FEM simulations to withstand the stress induced by the movement and out-of-plane gravity
effects. It is demonstrated that static gravity offset does not modify significantly the electrical
and mechanical parameters of the studied devices.
II.5 Simulating the Energy Harvesters
In this section the numerical simulation of the energy harvester dynamics is discussed. To
simplify the multi-physical coupling between the mechanical part and the electronic part of the
harvesting device, an equivalent electrical circuit approach is used to perform the transient
simulation of this complex system. The model is developed using LTspice IV.
II.5.1 An equivalent circuit approach
For the simulations presented in this section, a SPICE simulator (LTspice IV from Analog
Devices, formerly Linear Technology) is used to create a dynamical coupled model that
receives an external mechanical excitation as an input and evaluates the harvested power as an
output (the same way as it is presented in the section 2 of this chapter). To develop such a
model, a well-known equivalent circuit approach is used to describe the mechanical system in
electrical domain, by solving the analogous equations for equivalent mechanical and electrical
quantities. These quantities are summarized in Table II.8.
Mechanical quantity Electrical quantity
Force, 𝐹 Voltage, 𝑉
Mass, 𝑀 Inductance, 𝐿
Stiffness, 𝑘 Inverse capacitance, 1/𝐶
Damping coefficient, 𝐷 Resistance, 𝑅
Displacement, 𝑥 Charge, 𝑞
Velocity, 𝑑𝑥 𝑑𝑡⁄ Current, 𝐼 Table II.8. Equivalent mechanical and electrical quantities.
In such a way, the dynamical behaviour of a complete coupled electro-mechanical system of
an energy harvester can be jointly simulated with the electronic interface in a minimum of time.
This approach is commonly used in literature and allows to study the system as a whole using
the functionalities of a well-known electronic circuit simulator like SPICE.
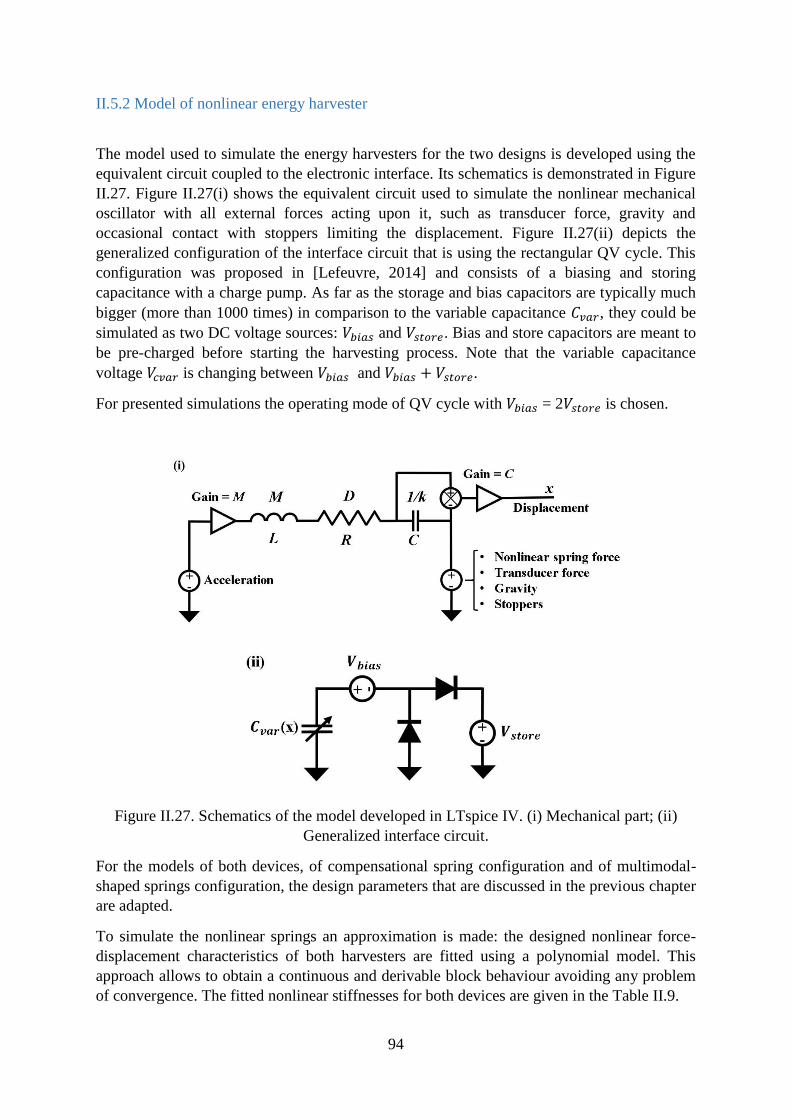
94
II.5.2 Model of nonlinear energy harvester
The model used to simulate the energy harvesters for the two designs is developed using the
equivalent circuit coupled to the electronic interface. Its schematics is demonstrated in Figure
II.27. Figure II.27(i) shows the equivalent circuit used to simulate the nonlinear mechanical
oscillator with all external forces acting upon it, such as transducer force, gravity and
occasional contact with stoppers limiting the displacement. Figure II.27(ii) depicts the
generalized configuration of the interface circuit that is using the rectangular QV cycle. This
configuration was proposed in [Lefeuvre, 2014] and consists of a biasing and storing
capacitance with a charge pump. As far as the storage and bias capacitors are typically much
bigger (more than 1000 times) in comparison to the variable capacitance 𝐶𝑣𝑎𝑟, they could be
simulated as two DC voltage sources: 𝑉𝑏𝑖𝑎𝑠 and 𝑉𝑠𝑡𝑜𝑟𝑒. Bias and store capacitors are meant to
be pre-charged before starting the harvesting process. Note that the variable capacitance
voltage 𝑉𝑐𝑣𝑎𝑟 is changing between 𝑉𝑏𝑖𝑎𝑠 and 𝑉𝑏𝑖𝑎𝑠 + 𝑉𝑠𝑡𝑜𝑟𝑒.
For presented simulations the operating mode of QV cycle with 𝑉𝑏𝑖𝑎𝑠 = 2𝑉𝑠𝑡𝑜𝑟𝑒 is chosen.
Figure II.27. Schematics of the model developed in LTspice IV. (i) Mechanical part; (ii)
Generalized interface circuit.
For the models of both devices, of compensational spring configuration and of multimodal-
shaped springs configuration, the design parameters that are discussed in the previous chapter
are adapted.
To simulate the nonlinear springs an approximation is made: the designed nonlinear force-
displacement characteristics of both harvesters are fitted using a polynomial model. This
approach allows to obtain a continuous and derivable block behaviour avoiding any problem
of convergence. The fitted nonlinear stiffnesses for both devices are given in the Table II.9.
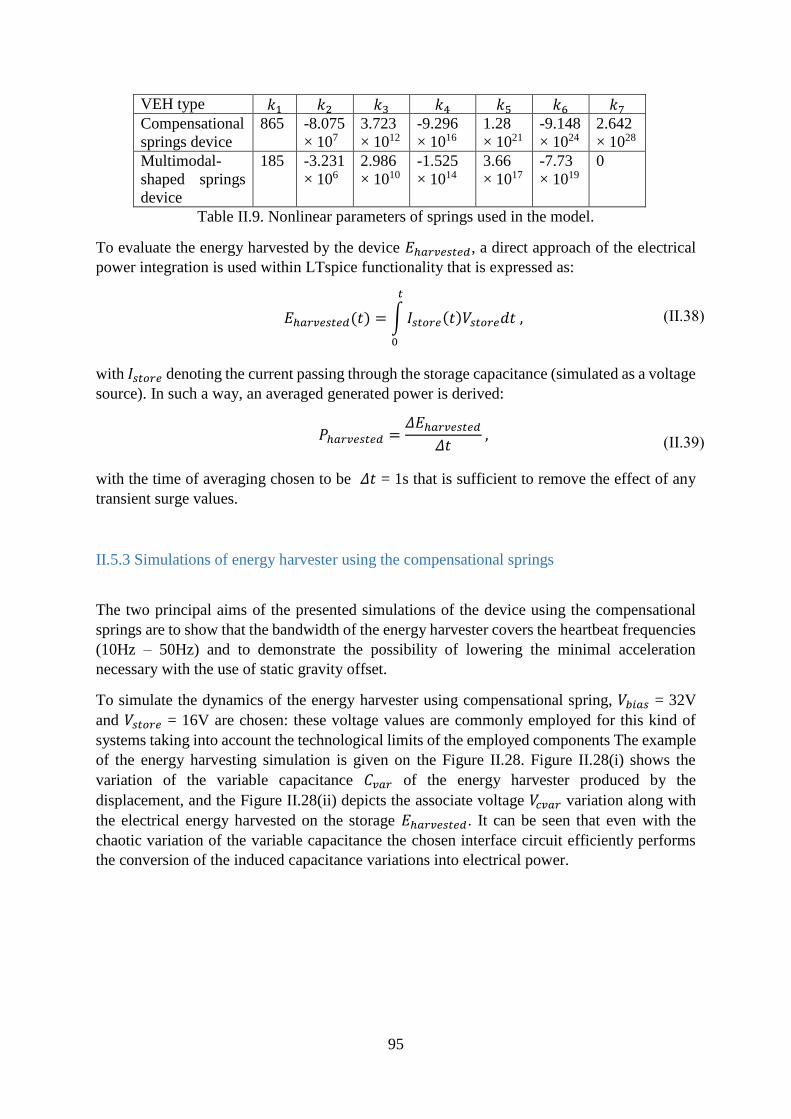
95
VEH type 𝑘1 𝑘2 𝑘3 𝑘4 𝑘5 𝑘6 𝑘7
Compensational
springs device
865 -8.075
× 107
3.723
× 1012
-9.296
× 1016
1.28
× 1021
-9.148
× 1024
2.642
× 1028
Multimodal-
shaped springs
device
185 -3.231
× 106
2.986
× 1010
-1.525
× 1014
3.66
× 1017
-7.73
× 1019
0
Table II.9. Nonlinear parameters of springs used in the model.
To evaluate the energy harvested by the device 𝐸ℎ𝑎𝑟𝑣𝑒𝑠𝑡𝑒𝑑, a direct approach of the electrical
power integration is used within LTspice functionality that is expressed as:
𝐸ℎ𝑎𝑟𝑣𝑒𝑠𝑡𝑒𝑑(𝑡) = ∫ 𝐼𝑠𝑡𝑜𝑟𝑒(𝑡)𝑉𝑠𝑡𝑜𝑟𝑒𝑑𝑡
𝑡
0
,
(II.38)
with 𝐼𝑠𝑡𝑜𝑟𝑒 denoting the current passing through the storage capacitance (simulated as a voltage
source). In such a way, an averaged generated power is derived:
𝑃ℎ𝑎𝑟𝑣𝑒𝑠𝑡𝑒𝑑 =𝛥𝐸ℎ𝑎𝑟𝑣𝑒𝑠𝑡𝑒𝑑
𝛥𝑡 ,
(II.39)
with the time of averaging chosen to be 𝛥𝑡 = 1s that is sufficient to remove the effect of any
transient surge values.
II.5.3 Simulations of energy harvester using the compensational springs
The two principal aims of the presented simulations of the device using the compensational
springs are to show that the bandwidth of the energy harvester covers the heartbeat frequencies
(10Hz – 50Hz) and to demonstrate the possibility of lowering the minimal acceleration
necessary with the use of static gravity offset.
To simulate the dynamics of the energy harvester using compensational spring, 𝑉𝑏𝑖𝑎𝑠 = 32V
and 𝑉𝑠𝑡𝑜𝑟𝑒 = 16V are chosen: these voltage values are commonly employed for this kind of
systems taking into account the technological limits of the employed components The example
of the energy harvesting simulation is given on the Figure II.28. Figure II.28(i) shows the
variation of the variable capacitance 𝐶𝑣𝑎𝑟 of the energy harvester produced by the
displacement, and the Figure II.28(ii) depicts the associate voltage 𝑉𝑐𝑣𝑎𝑟 variation along with
the electrical energy harvested on the storage 𝐸ℎ𝑎𝑟𝑣𝑒𝑠𝑡𝑒𝑑. It can be seen that even with the
chaotic variation of the variable capacitance the chosen interface circuit efficiently performs
the conversion of the induced capacitance variations into electrical power.
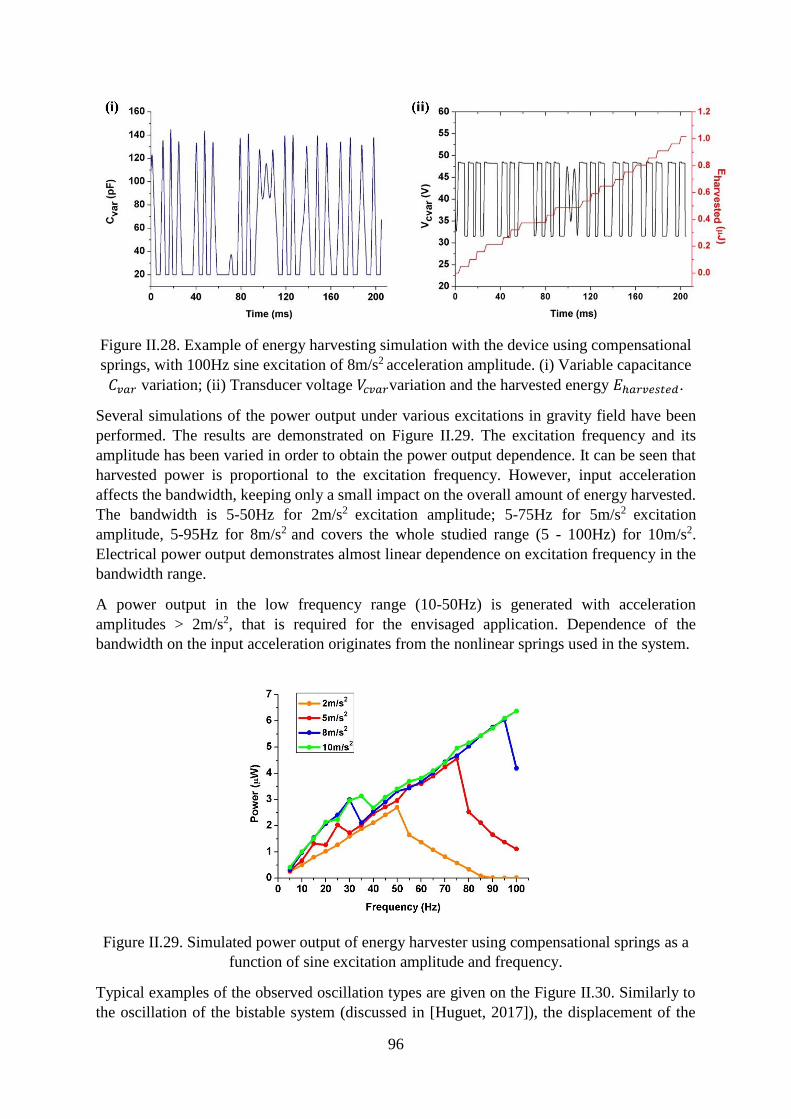
96
Figure II.28. Example of energy harvesting simulation with the device using compensational
springs, with 100Hz sine excitation of 8m/s2 acceleration amplitude. (i) Variable capacitance
𝐶𝑣𝑎𝑟 variation; (ii) Transducer voltage 𝑉𝑐𝑣𝑎𝑟variation and the harvested energy 𝐸ℎ𝑎𝑟𝑣𝑒𝑠𝑡𝑒𝑑.
Several simulations of the power output under various excitations in gravity field have been
performed. The results are demonstrated on Figure II.29. The excitation frequency and its
amplitude has been varied in order to obtain the power output dependence. It can be seen that
harvested power is proportional to the excitation frequency. However, input acceleration
affects the bandwidth, keeping only a small impact on the overall amount of energy harvested.
The bandwidth is 5-50Hz for 2m/s2 excitation amplitude; 5-75Hz for 5m/s2 excitation
amplitude, 5-95Hz for 8m/s2 and covers the whole studied range (5 - 100Hz) for 10m/s2.
Electrical power output demonstrates almost linear dependence on excitation frequency in the
bandwidth range.
A power output in the low frequency range (10-50Hz) is generated with acceleration
amplitudes > 2m/s2, that is required for the envisaged application. Dependence of the
bandwidth on the input acceleration originates from the nonlinear springs used in the system.
Figure II.29. Simulated power output of energy harvester using compensational springs as a
function of sine excitation amplitude and frequency.
Typical examples of the observed oscillation types are given on the Figure II.30. Similarly to
the oscillation of the bistable system (discussed in [Huguet, 2017]), the displacement of the

97
seismic mass of the device using compensational springs system can be produced in a variety
of ways. When the energy harvester is excited in the region of linear dependence far from the
cut-off frequency of the system, the response is chaotic, which yields in the interchanging
oscillations near the limits of displacement and a full displacement. Such chaotic behaviour is
depicted on Figure II.30(i), with external excitation of 50Hz and 8m/s2 acceleration amplitude.
Next, when the system is approaching its cut-off frequency, the displacement becomes more
and more regular up to the point of the external excitation following, which is demonstrated on
Figure II.30(ii) for the excitation of 100Hz at 10m/s2. Finally, after passing the cut-off
frequency, the chaotic response is reproduced up to the point of the response attenuation, which
yields in the near-stable position oscillations. This response is shown on the Figure II.30(iii),
for the excitation of 90Hz and 2m/s2 acceleration amplitude.
Figure II.30. Simulated displacement of the energy harvester using compensational springs.
(i) Chaotic behaviour; (ii) Movement following the external excitations; (iii) Near-stable
point oscillations.
The power output simulation as a function of 𝜃 under different amplitude of acceleration at
25Hz is presented on the Figure II.31. It could be seen that at small amplitude of acceleration
(2m/s2), a preferential orientation of the device with respect to the gravity clearly exists – the
one that is aligned with the gravity direction (𝜃 = 0°). It can be explained by the careful choice
of the force-displacement nonlinear characteristic of the device (Figure II.20), which assures
the movement of the seismic mass between two extreme positions even when the low inertial
force applied. However, increase of external acceleration amplitude spreads widely the
inclinations range at which the energy can be harvested, covering all inclination angles between
0° and 90° at 10m/s2. Such effect could be easily explained by the fact that increase in inertial
force that comes with the increase of acceleration amplitude brings enough excitation to
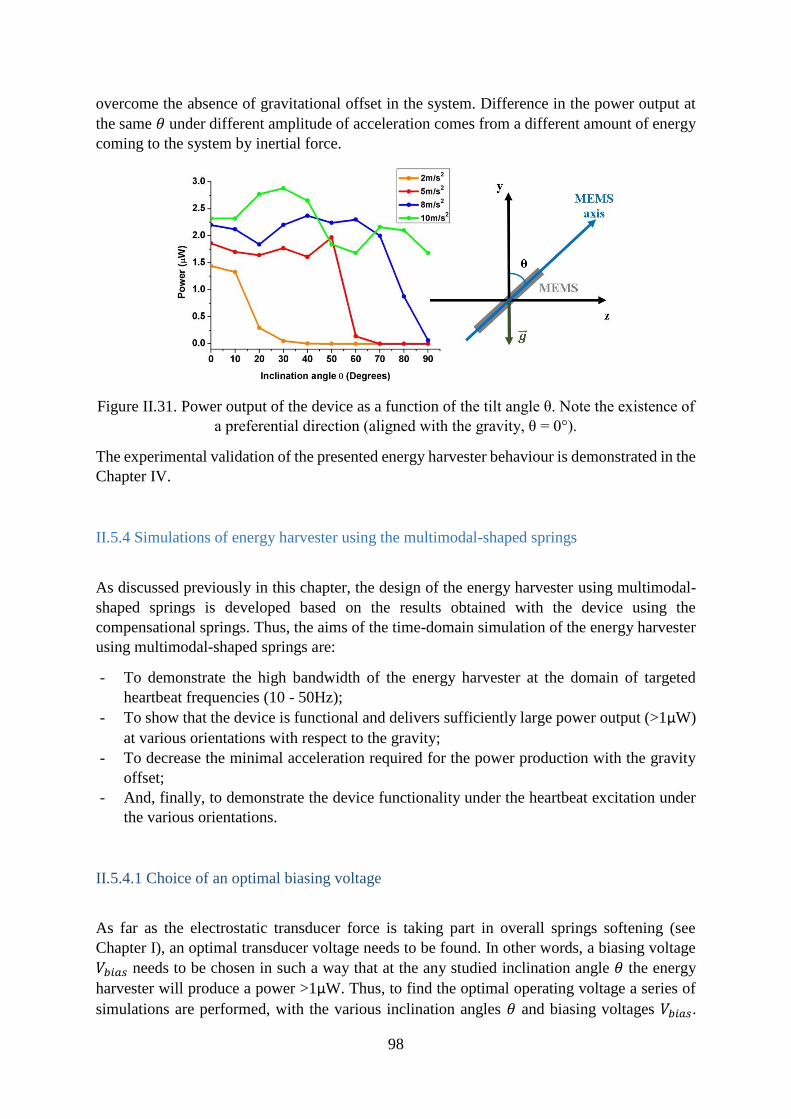
98
overcome the absence of gravitational offset in the system. Difference in the power output at
the same 𝜃 under different amplitude of acceleration comes from a different amount of energy
coming to the system by inertial force.
Figure II.31. Power output of the device as a function of the tilt angle θ. Note the existence of
a preferential direction (aligned with the gravity, θ = 0°).
The experimental validation of the presented energy harvester behaviour is demonstrated in the
Chapter IV.
II.5.4 Simulations of energy harvester using the multimodal-shaped springs
As discussed previously in this chapter, the design of the energy harvester using multimodal-
shaped springs is developed based on the results obtained with the device using the
compensational springs. Thus, the aims of the time-domain simulation of the energy harvester
using multimodal-shaped springs are:
- To demonstrate the high bandwidth of the energy harvester at the domain of targeted
heartbeat frequencies (10 - 50Hz);
- To show that the device is functional and delivers sufficiently large power output (>1µW)
at various orientations with respect to the gravity;
- To decrease the minimal acceleration required for the power production with the gravity
offset;
- And, finally, to demonstrate the device functionality under the heartbeat excitation under
the various orientations.
II.5.4.1 Choice of an optimal biasing voltage
As far as the electrostatic transducer force is taking part in overall springs softening (see
Chapter I), an optimal transducer voltage needs to be found. In other words, a biasing voltage
𝑉𝑏𝑖𝑎𝑠 needs to be chosen in such a way that at the any studied inclination angle 𝜃 the energy
harvester will produce a power >1µW. Thus, to find the optimal operating voltage a series of
simulations are performed, with the various inclination angles 𝜃 and biasing voltages 𝑉𝑏𝑖𝑎𝑠.

99
The results for the sine excitation of 20Hz and the acceleration amplitude of 8m/s2 are
demonstrated on the Figure II.32. It can be seen that in the range of 20V < 𝑉𝑏𝑖𝑎𝑠 < 45V, the
device is functional at all studied values of 𝜃. However, in terms of power output values as a
function of the inclination angle 𝜃, the good choice is to set 𝑉𝑏𝑖𝑎𝑠 = 40V because it guaranties
the power output superior to 5µW in all studied orientations to the gravity.
Figure II.32. Power output of the device using multimodal-shaped springs as a function of the
tilt angle 𝜃 and bias voltage 𝑉𝑏𝑖𝑎𝑠. External excitation is sine with 20Hz frequency and 8m/s2
acceleration amplitude. Note that for 20V < 𝑉𝑏𝑖𝑎𝑠 < 45V the power is extracted at all studied
inclination angles.
Another interesting study is performed to find out the impact of the external acceleration
amplitude and inclination angle 𝜃 on the power output of the energy harvester. The results
obtained are presented on the Figure II.33, for the sine excitation of 20Hz. As expected, the
overall harvested power is increasing with the increasing external acceleration amplitude.
However, the inclination of the system with angle 𝜃 produces a significant impact on the device
performance: it can be seen that with the increase of the inclination angle the power output
increases dramatically with the acceleration amplitude. With 0° < 𝜃 < 30°, the minimal
acceleration amplitude necessary for generating the power values >1µW is around 6m/s2,
whereas in range of 30° < 𝜃 < 90° this value decreases down to 3m/s2. In this way, the existence
of the preferential orientation is observed, where the device is delivering the largest amount of
power under the minimized external excitation. From the presented simulations results, it can
be concluded that for the studied harmonic excitation of 20Hz the preferential orientation
corresponds to 𝜃 = 45°, that is identified as the one having the highest power output along
studied range of acceleration amplitudes.
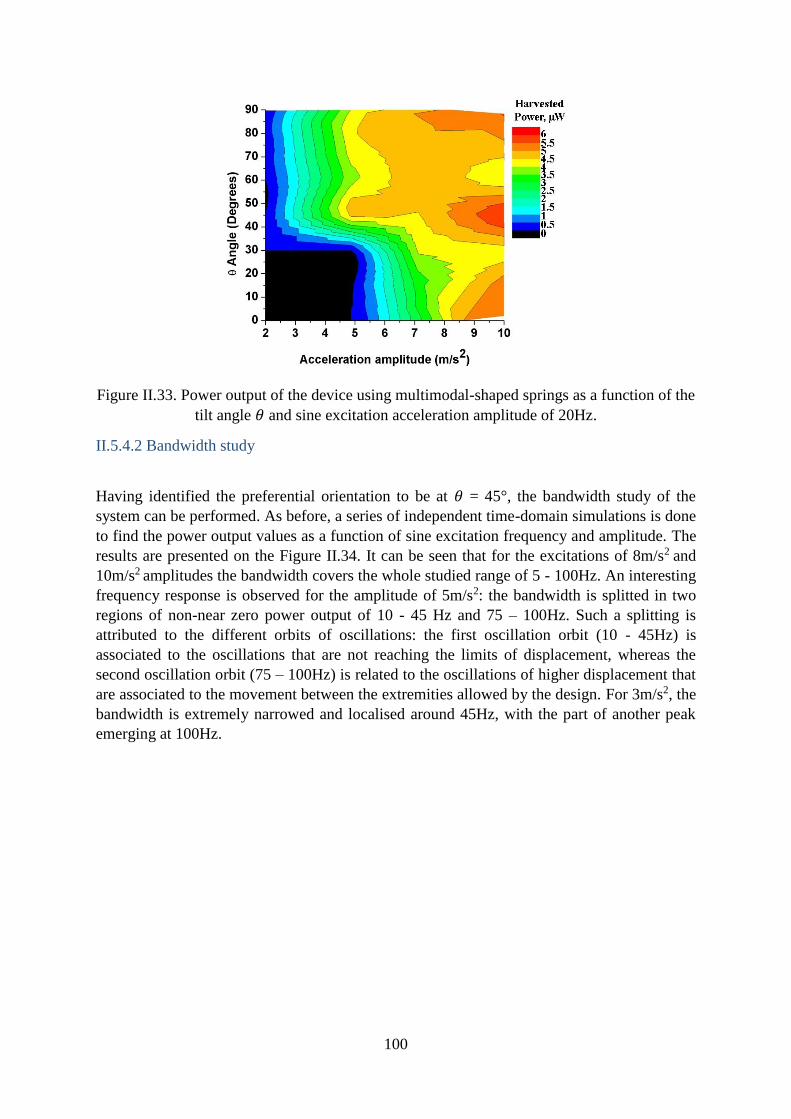
100
Figure II.33. Power output of the device using multimodal-shaped springs as a function of the
tilt angle 𝜃 and sine excitation acceleration amplitude of 20Hz.
II.5.4.2 Bandwidth study
Having identified the preferential orientation to be at 𝜃 = 45°, the bandwidth study of the
system can be performed. As before, a series of independent time-domain simulations is done
to find the power output values as a function of sine excitation frequency and amplitude. The
results are presented on the Figure II.34. It can be seen that for the excitations of 8m/s2 and
10m/s2 amplitudes the bandwidth covers the whole studied range of 5 - 100Hz. An interesting
frequency response is observed for the amplitude of 5m/s2: the bandwidth is splitted in two
regions of non-near zero power output of 10 - 45 Hz and 75 – 100Hz. Such a splitting is
attributed to the different orbits of oscillations: the first oscillation orbit (10 - 45Hz) is
associated to the oscillations that are not reaching the limits of displacement, whereas the
second oscillation orbit (75 – 100Hz) is related to the oscillations of higher displacement that
are associated to the movement between the extremities allowed by the design. For 3m/s2, the
bandwidth is extremely narrowed and localised around 45Hz, with the part of another peak
emerging at 100Hz.
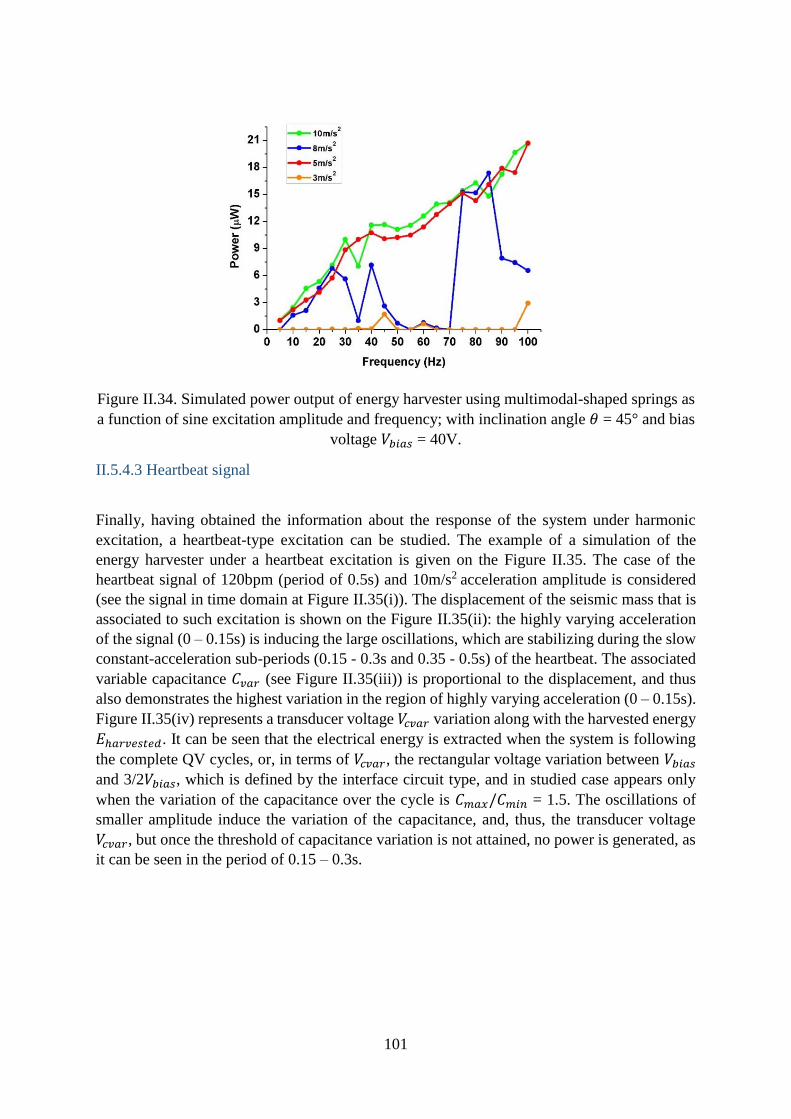
101
Figure II.34. Simulated power output of energy harvester using multimodal-shaped springs as
a function of sine excitation amplitude and frequency; with inclination angle 𝜃 = 45° and bias
voltage 𝑉𝑏𝑖𝑎𝑠 = 40V.
II.5.4.3 Heartbeat signal
Finally, having obtained the information about the response of the system under harmonic
excitation, a heartbeat-type excitation can be studied. The example of a simulation of the
energy harvester under a heartbeat excitation is given on the Figure II.35. The case of the
heartbeat signal of 120bpm (period of 0.5s) and 10m/s2 acceleration amplitude is considered
(see the signal in time domain at Figure II.35(i)). The displacement of the seismic mass that is
associated to such excitation is shown on the Figure II.35(ii): the highly varying acceleration
of the signal (0 – 0.15s) is inducing the large oscillations, which are stabilizing during the slow
constant-acceleration sub-periods (0.15 - 0.3s and 0.35 - 0.5s) of the heartbeat. The associated
variable capacitance 𝐶𝑣𝑎𝑟 (see Figure II.35(iii)) is proportional to the displacement, and thus
also demonstrates the highest variation in the region of highly varying acceleration (0 – 0.15s).
Figure II.35(iv) represents a transducer voltage 𝑉𝑐𝑣𝑎𝑟 variation along with the harvested energy
𝐸ℎ𝑎𝑟𝑣𝑒𝑠𝑡𝑒𝑑. It can be seen that the electrical energy is extracted when the system is following
the complete QV cycles, or, in terms of 𝑉𝑐𝑣𝑎𝑟, the rectangular voltage variation between 𝑉𝑏𝑖𝑎𝑠
and 3/2𝑉𝑏𝑖𝑎𝑠, which is defined by the interface circuit type, and in studied case appears only
when the variation of the capacitance over the cycle is 𝐶𝑚𝑎𝑥/𝐶𝑚𝑖𝑛 = 1.5. The oscillations of
smaller amplitude induce the variation of the capacitance, and, thus, the transducer voltage
𝑉𝑐𝑣𝑎𝑟, but once the threshold of capacitance variation is not attained, no power is generated, as
it can be seen in the period of 0.15 – 0.3s.

102
Figure II.35. Example of heartbeat energy harvesting simulation with the device using
multimodal-shaped springs, 120bpm excitation of 10m/s2 acceleration amplitude. (i)
Heartbeat acceleration in time domain; (ii) Displacement of the seismic mass; (iii) Variable
capacitance 𝐶𝑣𝑎𝑟; (iv) Transducer voltage 𝑉𝑐𝑣𝑎𝑟variation and the harvested energy 𝐸ℎ𝑎𝑟𝑣𝑒𝑠𝑡𝑒𝑑.
The complete study of the impact of the heartbeat rate (in range of 65 – 120bpm, which is
typical for a human heart as it was discussed in Chapter I) and acceleration amplitude (in range
of 4 – 10m/s2) of heartbeat signal is performed, as a function of the inclination angle introduced
between the device and gravity. The results are summarized in Figure II.36. Figure II.36(i)
shows the case when the device is aligned with gravity (θ = 0°), with no power generated with
the acceleration amplitude <7m/s2 (shown in the black colour) and the tendency to increase the
power output up to 990nW at 10m/s2 acceleration amplitude, with a little dependence on
heartbeat rate. The similar response is found for θ = 15° (Figure II.36(ii)), with the maximum
power output reaching 1.21µW and more pronounced proportionality on heartbeat rate. The
response is changing significantly in terms of power output values for θ = 30° orientation
(Figure II.36(iii)), reaching 1.65µW at 120bpm, 10m/s2 acceleration amplitude, with the
decreased minimal acceleration necessary for power generation (5.5m/s2). For the inclination
angle of θ = 45° (Figure II.36(iv)), the minimal acceleration necessary is decreased down to
4.5m/s2, which is completely excluded in the studied range for the high heartbeat rates. The
power output in this condition is reaching 1.77µW at 120bpm, 10m/s2 acceleration amplitude,
with an overall power plateau of >1.4µW found for the excitations higher than 95bpm and
8m/s2. The inclination θ = 60° (Figure II.36(v)) yields in even better performance: the region
with the power output >1µW is located in between 75bpm and 5m/s2, with the peak of power
reaching 1.98µW at 120bpm, 10m/s2 acceleration amplitude. However, the inclination θ = 75°
(Figure II.36(vi)) can be called preferential orientation due to the power output >1µW that is
103
independent on heartbeat rate with acceleration amplitude superior to 6m/s2 and the maximum
power output attaining the value of 2.17µW. With the device orientation is perpendicular to the
gravity (θ = 90°), the performance is decreasing compared to the previous case: the maximum
power is reaching 2.02µW at 120bpm, 10m/s2 acceleration amplitude with the power output
region of >1µW shrinking to the amplitudes higher than 9m/s2 at all studied heartbeat rates.
Considering obtained simulations results, a several important observations can be pointed out:
- The existence of the preferential direction where the device is attaining the highest
performance in terms of the power output while minimizing necessary external excitation.
Preferential direction depends on the device design (nonlinear springs, transducer
dimensions and seismic mass) and operating voltage (interface circuit), along on the
external excitation parameters. For the heartbeat excitation it is found to be θ = 75°.
- The power output is increasing with the increasing acceleration amplitude and heartbeat
rate due to the increase of the input mechanical power.
- In all studied orientations of the device with respect to the gravity (0° < 𝜃 < 90°) the power
output is generated. However, the power values attained that are >1µW are observed for
the orientations range of 15° < 𝜃 < 90°. In the context of application, it can be interpreted
in a way that the power will be harvested even if the device is not placed in its preferential
direction.
- The transducer voltage 𝑉𝑐𝑣𝑎𝑟 is a significant factor of the device performance as a function
of inclination. The use of interface circuit that will be able to adapt the biasing voltage
𝑉𝑏𝑖𝑎𝑠 as a function of external excitation parameters and orientation (or, in electrical terms,
as a function of detected variable capacitance 𝐶𝑣𝑎𝑟 variation amplitude). This subject is
left out of scope of this work, and rests a subject of the future research.

104
Figure II.36. Simulated surfaces showing the harvested power under the heartbeat excitations
of various rate and acceleration amplitude. (i) MEMS harvester is perpendicular to the
gravity: θ = 0°; (ii) θ = 15°; (iii) θ = 30°; (iv) θ=45°; (v) θ=60°; (vi) θ=75°; (vii) MEMS
harvester is parallel to the gravity: θ=90°.
105
II.5.5 Conclusion on the simulations
The presented section describes the model used to simulate the studied nonlinear energy
harvesters along with the results of time-domain simulations. Devices using compensational
springs and multimodal-shaped springs are simulated under the various excitation conditions
and orientation with respect to the gravity.
The simulation for two devices has been performed keeping the original objectives for each
system in mind. For the energy harvesting system using compensational springs, a high
bandwidth covering the heartbeat frequency range (10 - 50Hz) is obtained with the power
output sufficiently large for the envisaged applications (>1µW); and possibility to decrease the
minimal acceleration necessary for the power generation. The multimodal-shaped energy
harvesting system, inheriting and developing the ideas adapted in the first proof-of-concept
device design, is addressing the issues of generating the power output at various orientations
and under the heartbeat-type excitations. It is shown that the power of more than 1µW can be
theoretically extracted with the presented device under the heartbeat excitation with various
orientations to the gravity.
The results obtained with simulations show that the studied systems can definitely fill several
important specifications related to power output values at various orientations required for the
envisaged application. Obtained results will be used as a prerequisite for the experimental
studies presented in the Chapter IV.
II.6 Conclusion
In this chapter, two innovative concepts of nonlinear MEMS spring engineering are presented.
The analytical model that describes the bending of a beam of arbitrary shape is presented and
two methods to engineer a structural nonlinearity are described: the one using compensational
springs system and the one using multimodal-shaped springs. These two concepts are used to
design two MEMS energy harvesting systems, denoted as the one using compensational springs
and the one using multimodal-shaped springs, keeping in mind the fabrication techniques that
will be discussed in Chapter III. Both designed energy harvesting systems are simulated in
electrical domain using equivalent circuit approach, with chosen state-of-the-art interface
circuit. The results obtained for the device with compensational springs demonstrate that the
bandwidth of heartbeat frequencies is attained, along with the decrease of the threshold of the
minimal acceleration amplitude necessary for the power generation; while this system is
viewed more as a proof-of-concept. The device using multimodal-shaped springs addresses a
more general question of device operation under the various orientations with respect to the
gravity, along with the study of power extraction from a heartbeat-type signal. It is shown that
the heartbeat excitation can be used to generate the sufficient power output for autonomous
pacemaker application.
Following the discussion of the fabrication in Chapter III, the experimental observations of the
performances obtained with simulations will be given in Chapter IV.
106
II.7 References
Anderson, T. J. (Memphis State Univ., TN); Kreider, W. (Virginia Polytechnic Inst. and State
Univ., Blacksburg); Nayfeh, A. H. (Virginia Polytechnic Inst. and State Univ.,
Blacksburg) (1995) Investigation of natural frequencies and mode shapes of buckled
beams. AIAA Journal 33(6):1121–1126.
Ando T, Xueping Li, Nakao S, Kasai T, Shikida M, Sato K (2004) Effect of crystal
orientation on fracture strength and fracture toughness of single crystal silicon.
(IEEE), 177–180.
Cazottes P, Fernandes A, Pouget J, Hafez M (2009) Bistable Buckled Beam: Modeling of
Actuating Force and Experimental Validations. Journal of Mechanical Design
131(10):101001.
Huguet T, Badel A, Lallart M (2017) Exploiting bistable oscillator subharmonics for
magnified broadband vibration energy harvesting. Applied Physics Letters
111(17):173905.
Kerschen G, Golinval JC, Worden K (2001) THEORETICAL AND EXPERIMENTAL
IDENTIFICATION OF A NON-LINEAR BEAM. Journal of Sound and Vibration
244(4):597–613.
Lefeuvre E, Risquez S, Wei J, Woytasik M, Parrain F (2014) Self-Biased Inductor-less
Interface Circuit for Electret-Free Electrostatic Energy Harvesters. Journal of
Physics: Conference Series 557:012052.
Li LL, Polunin PM, Dou S, Shoshani O, Scott Strachan B, Jensen JS, Shaw SW, Turner KL
(2017) Tailoring the nonlinear response of MEMS resonators using shape
optimization. Applied Physics Letters 110(8):081902.
McLaughlin JC, Willoughby AFW (1987) Fracture of silicon wafers. Journal of Crystal
Growth 85(1–2):83–90.
Pustan M, Birleanu C, Dudescu C, Golinval JC (2018) Dynamic behavior of smart
microelectromechanical systems in industrial applications. Smart Sensors and MEMs.
(Elsevier), 377–394.
Qiu J, Lang JH, Slocum AH (2004) A Curved-Beam Bistable Mechanism. Journal of
Microelectromechanical Systems 13(2):137–146.
Washizu K (1974) Variational methods in elasticity and plasticity 2d ed. (Pergamon Press,
Oxford, New York).

107
108
Chapter III. Fabrication
Table of Contents III.1 Introduction ................................................................................................................. 110
III.2 Overview of existing electrostatic MEMS energy harvester fabrication techniques
................................................................................................................................................ 110
III.2.2 Fabrication using Silicon-on-Insulator (SOI) .......................................................... 110
III.2.3 Use of Wafer Bonding Technique ........................................................................... 112
III.2.4 Metallic devices....................................................................................................... 113
III.2.5 Fabrication techniques summary ............................................................................. 114
III.3 Fabrication process and its main challenges............................................................. 115
III.3.1 Material limitations ................................................................................................. 115
III.3.2 Choice of the wafer type ......................................................................................... 116
III.3.3 Fabrication process of the energy harvester ............................................................ 117
III.3.4 Geometry of fabricated energy harvesters .............................................................. 118
III.4 Development of the fabrication process .................................................................... 120
III.4.1 UV lithography ........................................................................................................ 120
III.4.1.1 Principle of UV lithography ............................................................................. 120
III.4.1.2 Preparation of the surface ................................................................................. 121
III.4.1.3 Spin-coating of the photoresist ......................................................................... 121
III.4.1.4 Bake .................................................................................................................. 122
III.4.1.5 Exposure ........................................................................................................... 122
III.4.1.6 Development ..................................................................................................... 123
III.4.2 Deep Reactive Ion Etching ...................................................................................... 123
III.4.2.1 Principle of Bosch process ............................................................................... 123
III.4.2.2 Experimental set-up .......................................................................................... 124
III.4.2.3 Etching procedure ............................................................................................. 126
III.4.2.4 DRIE realisations .............................................................................................. 126
III.4.2.5 Etching defects ................................................................................................. 127
III.4.3 Stripping of the photoresist ..................................................................................... 129
III.4.4 Shadow mask fabrication ........................................................................................ 130
III.4.5 Metal electrodes deposition ..................................................................................... 131
III.4.5.1 Principle of electron beam evaporation ............................................................ 131
III.4.5.2 Experimental set-up .......................................................................................... 132
109
III.4.5.3 Sample preparation ........................................................................................... 133
III.4.5.4 Deposition parameters ...................................................................................... 134
III.4.6 Dicing ...................................................................................................................... 134
III.4.7 Glass Wet Etch ........................................................................................................ 134
III.4.8 Final assembly ......................................................................................................... 136
III.5 Fabrication of the variety of multimodal-shaped springs ....................................... 137
III.5.1 Technological process ............................................................................................. 137
III.5.2 Geometry of fabricated prototypes .......................................................................... 138
III.5.3 Fabricated system .................................................................................................... 138
III.6 Conclusions .................................................................................................................. 139
III.7 References .................................................................................................................... 140
110
III.1 Introduction
The fabrication process discussed in this chapter aims towards the development of a simple,
fast and reliable process that can allow fabrication of the state-of-the-art electrostatic energy
harvester.
As reported in the literature, for electrostatic harvester fabrication, three basic approaches are
commonly used: structuring of a single silicon-on-insulator (SOI) wafer, fabrication technique
based on assembly of several structured wafers by bonding, and additive fabrication using
metal. In the present work, an original approach for fabrication is proposed which refers to the
use of commercially available silicon-on-glass wafer as a substrate in order to bring together
the advantages of various techniques.
In this chapter, a state-of-the art of electrostatic energy harvester fabrication techniques is
presented, along with the development of the proposed silicon-on-glass based process. The
choice of the fabrication technology is discussed, along with its experimental step-by-step
realisation. The technology is developed within the clean room of Centrale de Technologie
Universitaire (CTU) MINERVE located in Centre of Nanosciences and Nanotechnologies
(C2N), Orsay.
III.2 Overview of existing electrostatic MEMS energy harvester fabrication
techniques
During the last twenty years a variety of energy harvesting MEMS devices have been proposed
in the literature. Since the introduction of silicon as a mechanical material in the beginning of
1980-s [Petersen, 1982], it has been established as the material with the mature technology
level most suitable for micromachining.
In general, the fabrication techniques are often very similar for electrostatic harvesters with or
without using the electret, due to the resemblance of the mechanical part. The vast majority of
such harvesters are designed for in-plane operation, however 3D (out-of-plane) electrostatic
systems are also found in the literature.
Similarities can also be found with some types of piezoelectric and electromagnetic harvesters
realised on silicon substrate due to the resembling process of mobile part fabrication.
III.2.2 Fabrication using Silicon-on-Insulator (SOI)
The most straightforward fabrication technology for MEMS is the one based on SOI wafers.
The use of SOI has been a solution for fabrication of the microsystems with moving parts since
the beginning of 1990-s [Stemme, 1991].
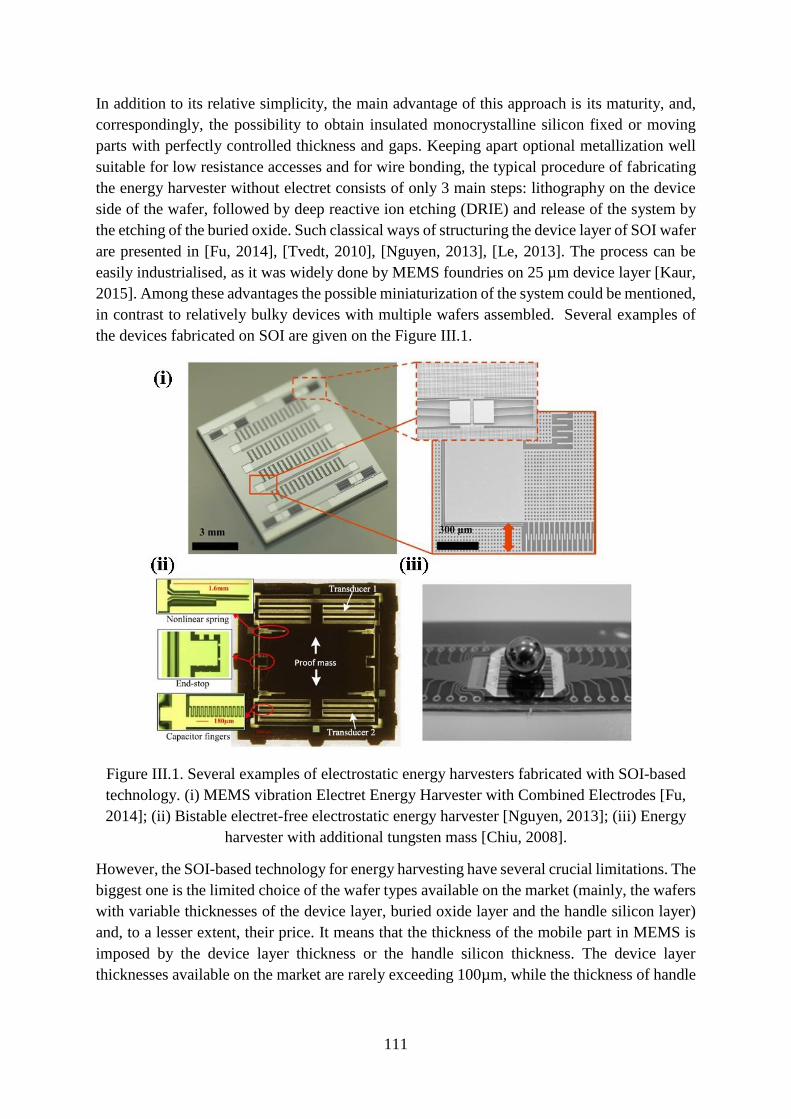
111
In addition to its relative simplicity, the main advantage of this approach is its maturity, and,
correspondingly, the possibility to obtain insulated monocrystalline silicon fixed or moving
parts with perfectly controlled thickness and gaps. Keeping apart optional metallization well
suitable for low resistance accesses and for wire bonding, the typical procedure of fabricating
the energy harvester without electret consists of only 3 main steps: lithography on the device
side of the wafer, followed by deep reactive ion etching (DRIE) and release of the system by
the etching of the buried oxide. Such classical ways of structuring the device layer of SOI wafer
are presented in [Fu, 2014], [Tvedt, 2010], [Nguyen, 2013], [Le, 2013]. The process can be
easily industrialised, as it was widely done by MEMS foundries on 25 µm device layer [Kaur,
2015]. Among these advantages the possible miniaturization of the system could be mentioned,
in contrast to relatively bulky devices with multiple wafers assembled. Several examples of
the devices fabricated on SOI are given on the Figure III.1.
Figure III.1. Several examples of electrostatic energy harvesters fabricated with SOI-based
technology. (i) MEMS vibration Electret Energy Harvester with Combined Electrodes [Fu,
2014]; (ii) Bistable electret-free electrostatic energy harvester [Nguyen, 2013]; (iii) Energy
harvester with additional tungsten mass [Chiu, 2008].
However, the SOI-based technology for energy harvesting have several crucial limitations. The
biggest one is the limited choice of the wafer types available on the market (mainly, the wafers
with variable thicknesses of the device layer, buried oxide layer and the handle silicon layer)
and, to a lesser extent, their price. It means that the thickness of the mobile part in MEMS is
imposed by the device layer thickness or the handle silicon thickness. The device layer
thicknesses available on the market are rarely exceeding 100µm, while the thickness of handle
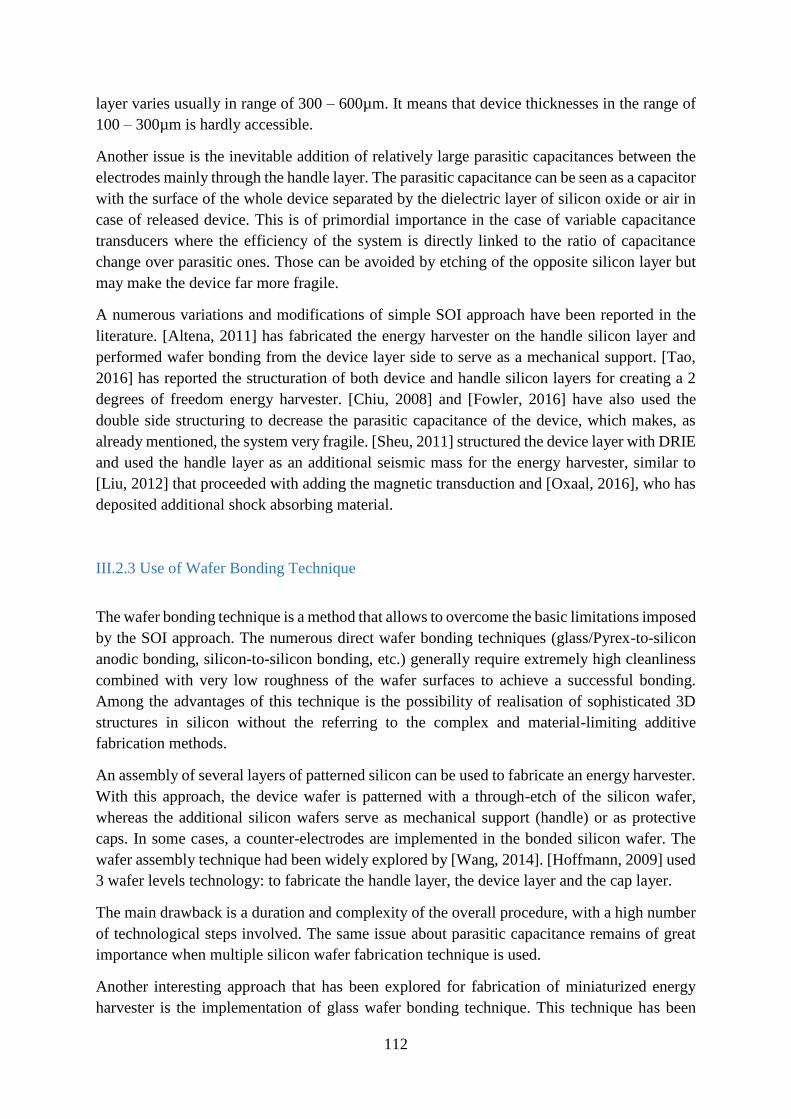
112
layer varies usually in range of 300 – 600µm. It means that device thicknesses in the range of
100 – 300µm is hardly accessible.
Another issue is the inevitable addition of relatively large parasitic capacitances between the
electrodes mainly through the handle layer. The parasitic capacitance can be seen as a capacitor
with the surface of the whole device separated by the dielectric layer of silicon oxide or air in
case of released device. This is of primordial importance in the case of variable capacitance
transducers where the efficiency of the system is directly linked to the ratio of capacitance
change over parasitic ones. Those can be avoided by etching of the opposite silicon layer but
may make the device far more fragile.
A numerous variations and modifications of simple SOI approach have been reported in the
literature. [Altena, 2011] has fabricated the energy harvester on the handle silicon layer and
performed wafer bonding from the device layer side to serve as a mechanical support. [Tao,
2016] has reported the structuration of both device and handle silicon layers for creating a 2
degrees of freedom energy harvester. [Chiu, 2008] and [Fowler, 2016] have also used the
double side structuring to decrease the parasitic capacitance of the device, which makes, as
already mentioned, the system very fragile. [Sheu, 2011] structured the device layer with DRIE
and used the handle layer as an additional seismic mass for the energy harvester, similar to
[Liu, 2012] that proceeded with adding the magnetic transduction and [Oxaal, 2016], who has
deposited additional shock absorbing material.
III.2.3 Use of Wafer Bonding Technique
The wafer bonding technique is a method that allows to overcome the basic limitations imposed
by the SOI approach. The numerous direct wafer bonding techniques (glass/Pyrex-to-silicon
anodic bonding, silicon-to-silicon bonding, etc.) generally require extremely high cleanliness
combined with very low roughness of the wafer surfaces to achieve a successful bonding.
Among the advantages of this technique is the possibility of realisation of sophisticated 3D
structures in silicon without the referring to the complex and material-limiting additive
fabrication methods.
An assembly of several layers of patterned silicon can be used to fabricate an energy harvester.
With this approach, the device wafer is patterned with a through-etch of the silicon wafer,
whereas the additional silicon wafers serve as mechanical support (handle) or as protective
caps. In some cases, a counter-electrodes are implemented in the bonded silicon wafer. The
wafer assembly technique had been widely explored by [Wang, 2014]. [Hoffmann, 2009] used
3 wafer levels technology: to fabricate the handle layer, the device layer and the cap layer.
The main drawback is a duration and complexity of the overall procedure, with a high number
of technological steps involved. The same issue about parasitic capacitance remains of great
importance when multiple silicon wafer fabrication technique is used.
Another interesting approach that has been explored for fabrication of miniaturized energy
harvester is the implementation of glass wafer bonding technique. This technique has been
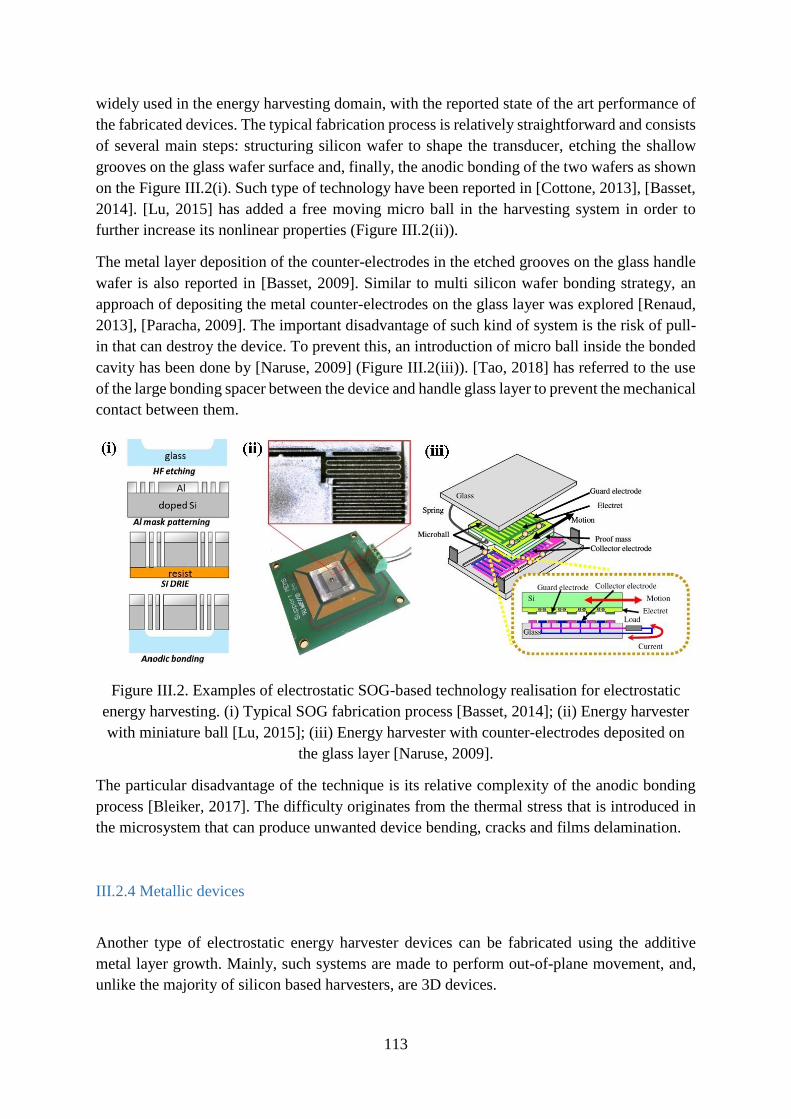
113
widely used in the energy harvesting domain, with the reported state of the art performance of
the fabricated devices. The typical fabrication process is relatively straightforward and consists
of several main steps: structuring silicon wafer to shape the transducer, etching the shallow
grooves on the glass wafer surface and, finally, the anodic bonding of the two wafers as shown
on the Figure III.2(i). Such type of technology have been reported in [Cottone, 2013], [Basset,
2014]. [Lu, 2015] has added a free moving micro ball in the harvesting system in order to
further increase its nonlinear properties (Figure III.2(ii)).
The metal layer deposition of the counter-electrodes in the etched grooves on the glass handle
wafer is also reported in [Basset, 2009]. Similar to multi silicon wafer bonding strategy, an
approach of depositing the metal counter-electrodes on the glass layer was explored [Renaud,
2013], [Paracha, 2009]. The important disadvantage of such kind of system is the risk of pull-
in that can destroy the device. To prevent this, an introduction of micro ball inside the bonded
cavity has been done by [Naruse, 2009] (Figure III.2(iii)). [Tao, 2018] has referred to the use
of the large bonding spacer between the device and handle glass layer to prevent the mechanical
contact between them.
Figure III.2. Examples of electrostatic SOG-based technology realisation for electrostatic
energy harvesting. (i) Typical SOG fabrication process [Basset, 2014]; (ii) Energy harvester
with miniature ball [Lu, 2015]; (iii) Energy harvester with counter-electrodes deposited on
the glass layer [Naruse, 2009].
The particular disadvantage of the technique is its relative complexity of the anodic bonding
process [Bleiker, 2017]. The difficulty originates from the thermal stress that is introduced in
the microsystem that can produce unwanted device bending, cracks and films delamination.
III.2.4 Metallic devices
Another type of electrostatic energy harvester devices can be fabricated using the additive
metal layer growth. Mainly, such systems are made to perform out-of-plane movement, and,
unlike the majority of silicon based harvesters, are 3D devices.
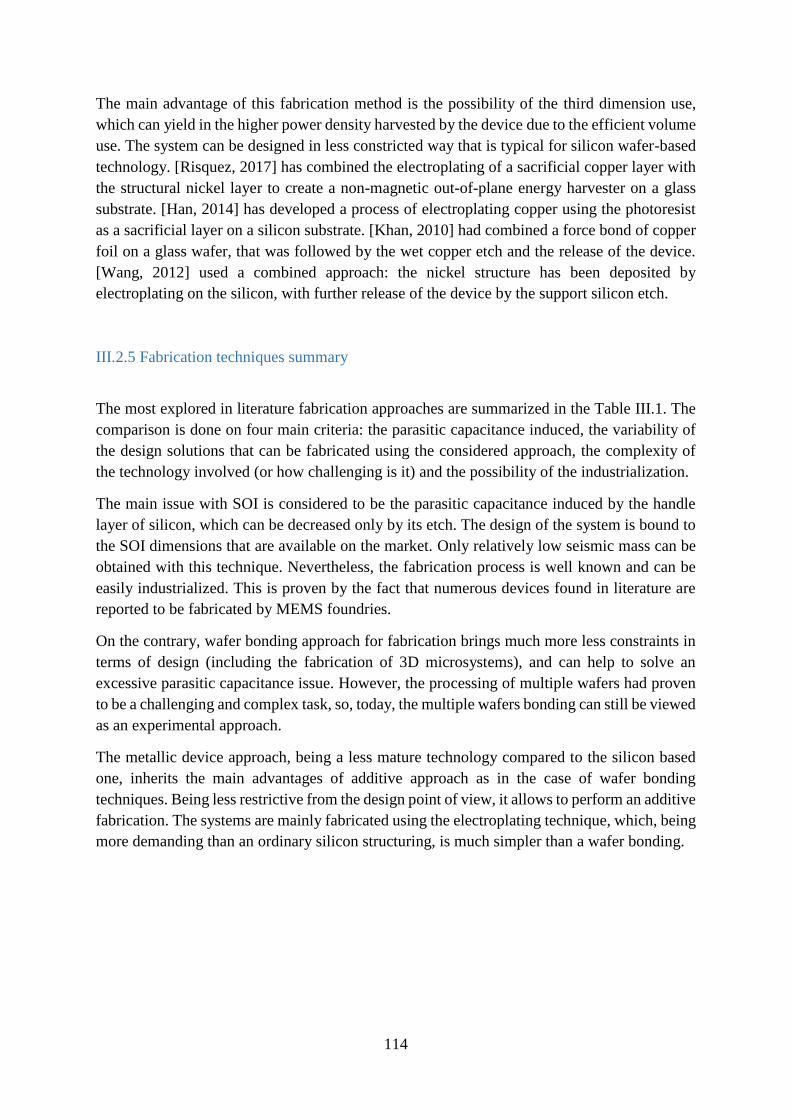
114
The main advantage of this fabrication method is the possibility of the third dimension use,
which can yield in the higher power density harvested by the device due to the efficient volume
use. The system can be designed in less constricted way that is typical for silicon wafer-based
technology. [Risquez, 2017] has combined the electroplating of a sacrificial copper layer with
the structural nickel layer to create a non-magnetic out-of-plane energy harvester on a glass
substrate. [Han, 2014] has developed a process of electroplating copper using the photoresist
as a sacrificial layer on a silicon substrate. [Khan, 2010] had combined a force bond of copper
foil on a glass wafer, that was followed by the wet copper etch and the release of the device.
[Wang, 2012] used a combined approach: the nickel structure has been deposited by
electroplating on the silicon, with further release of the device by the support silicon etch.
III.2.5 Fabrication techniques summary
The most explored in literature fabrication approaches are summarized in the Table III.1. The
comparison is done on four main criteria: the parasitic capacitance induced, the variability of
the design solutions that can be fabricated using the considered approach, the complexity of
the technology involved (or how challenging is it) and the possibility of the industrialization.
The main issue with SOI is considered to be the parasitic capacitance induced by the handle
layer of silicon, which can be decreased only by its etch. The design of the system is bound to
the SOI dimensions that are available on the market. Only relatively low seismic mass can be
obtained with this technique. Nevertheless, the fabrication process is well known and can be
easily industrialized. This is proven by the fact that numerous devices found in literature are
reported to be fabricated by MEMS foundries.
On the contrary, wafer bonding approach for fabrication brings much more less constraints in
terms of design (including the fabrication of 3D microsystems), and can help to solve an
excessive parasitic capacitance issue. However, the processing of multiple wafers had proven
to be a challenging and complex task, so, today, the multiple wafers bonding can still be viewed
as an experimental approach.
The metallic device approach, being a less mature technology compared to the silicon based
one, inherits the main advantages of additive approach as in the case of wafer bonding
techniques. Being less restrictive from the design point of view, it allows to perform an additive
fabrication. The systems are mainly fabricated using the electroplating technique, which, being
more demanding than an ordinary silicon structuring, is much simpler than a wafer bonding.
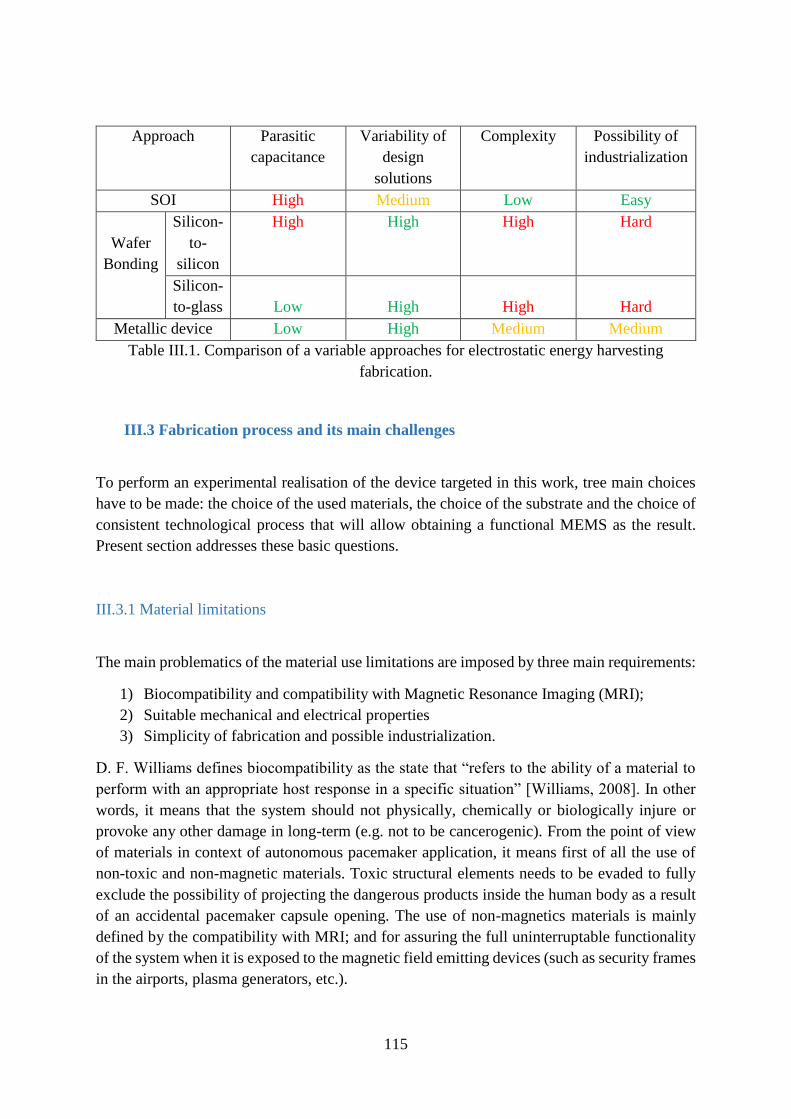
115
Approach Parasitic
capacitance
Variability of
design
solutions
Complexity Possibility of
industrialization
SOI High Medium Low Easy
Wafer
Bonding
Silicon-
to-
silicon
High High High Hard
Silicon-
to-glass
Low
High
High
Hard
Metallic device Low High Medium Medium
Table III.1. Comparison of a variable approaches for electrostatic energy harvesting
fabrication.
III.3 Fabrication process and its main challenges
To perform an experimental realisation of the device targeted in this work, tree main choices
have to be made: the choice of the used materials, the choice of the substrate and the choice of
consistent technological process that will allow obtaining a functional MEMS as the result.
Present section addresses these basic questions.
III.3.1 Material limitations
The main problematics of the material use limitations are imposed by three main requirements:
1) Biocompatibility and compatibility with Magnetic Resonance Imaging (MRI);
2) Suitable mechanical and electrical properties
3) Simplicity of fabrication and possible industrialization.
D. F. Williams defines biocompatibility as the state that “refers to the ability of a material to
perform with an appropriate host response in a specific situation” [Williams, 2008]. In other
words, it means that the system should not physically, chemically or biologically injure or
provoke any other damage in long-term (e.g. not to be cancerogenic). From the point of view
of materials in context of autonomous pacemaker application, it means first of all the use of
non-toxic and non-magnetic materials. Toxic structural elements needs to be evaded to fully
exclude the possibility of projecting the dangerous products inside the human body as a result
of an accidental pacemaker capsule opening. The use of non-magnetics materials is mainly
defined by the compatibility with MRI; and for assuring the full uninterruptable functionality
of the system when it is exposed to the magnetic field emitting devices (such as security frames
in the airports, plasma generators, etc.).
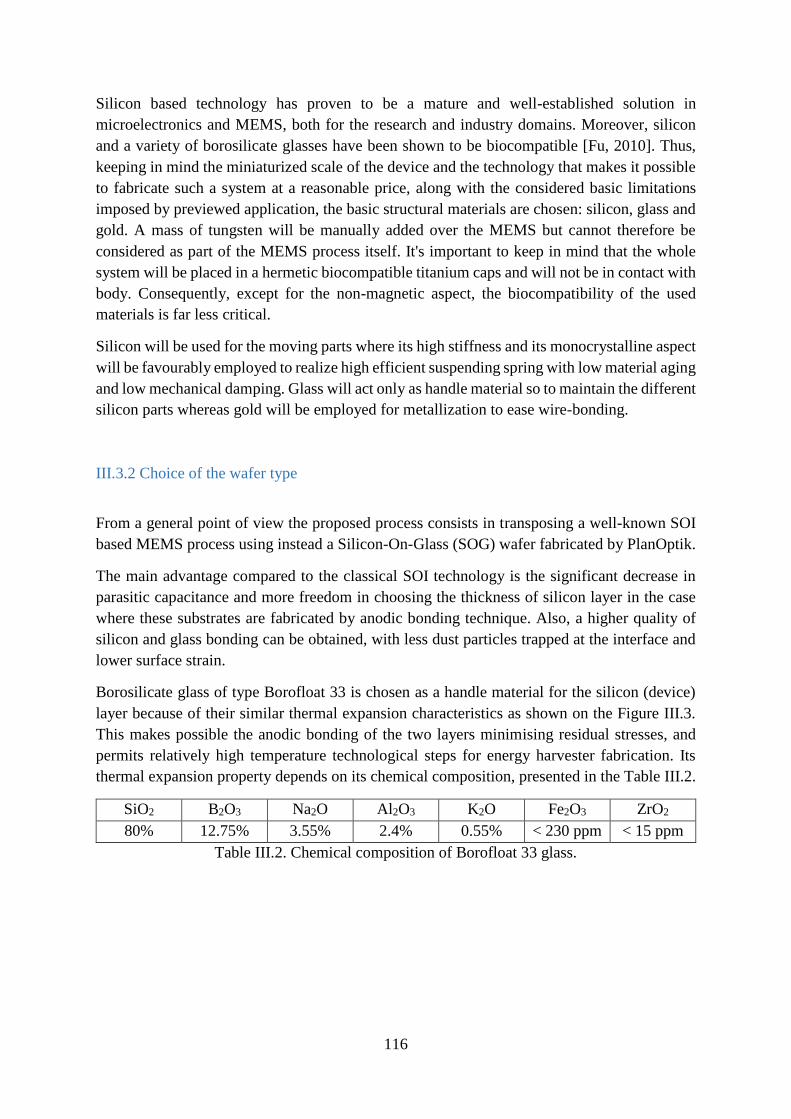
116
Silicon based technology has proven to be a mature and well-established solution in
microelectronics and MEMS, both for the research and industry domains. Moreover, silicon
and a variety of borosilicate glasses have been shown to be biocompatible [Fu, 2010]. Thus,
keeping in mind the miniaturized scale of the device and the technology that makes it possible
to fabricate such a system at a reasonable price, along with the considered basic limitations
imposed by previewed application, the basic structural materials are chosen: silicon, glass and
gold. A mass of tungsten will be manually added over the MEMS but cannot therefore be
considered as part of the MEMS process itself. It's important to keep in mind that the whole
system will be placed in a hermetic biocompatible titanium caps and will not be in contact with
body. Consequently, except for the non-magnetic aspect, the biocompatibility of the used
materials is far less critical.
Silicon will be used for the moving parts where its high stiffness and its monocrystalline aspect
will be favourably employed to realize high efficient suspending spring with low material aging
and low mechanical damping. Glass will act only as handle material so to maintain the different
silicon parts whereas gold will be employed for metallization to ease wire-bonding.
III.3.2 Choice of the wafer type
From a general point of view the proposed process consists in transposing a well-known SOI
based MEMS process using instead a Silicon-On-Glass (SOG) wafer fabricated by PlanOptik.
The main advantage compared to the classical SOI technology is the significant decrease in
parasitic capacitance and more freedom in choosing the thickness of silicon layer in the case
where these substrates are fabricated by anodic bonding technique. Also, a higher quality of
silicon and glass bonding can be obtained, with less dust particles trapped at the interface and
lower surface strain.
Borosilicate glass of type Borofloat 33 is chosen as a handle material for the silicon (device)
layer because of their similar thermal expansion characteristics as shown on the Figure III.3.
This makes possible the anodic bonding of the two layers minimising residual stresses, and
permits relatively high temperature technological steps for energy harvester fabrication. Its
thermal expansion property depends on its chemical composition, presented in the Table III.2.
SiO2 B2O3 Na2O Al2O3 K2O Fe2O3 ZrO2
80% 12.75% 3.55% 2.4% 0.55% < 230 ppm < 15 ppm
Table III.2. Chemical composition of Borofloat 33 glass.
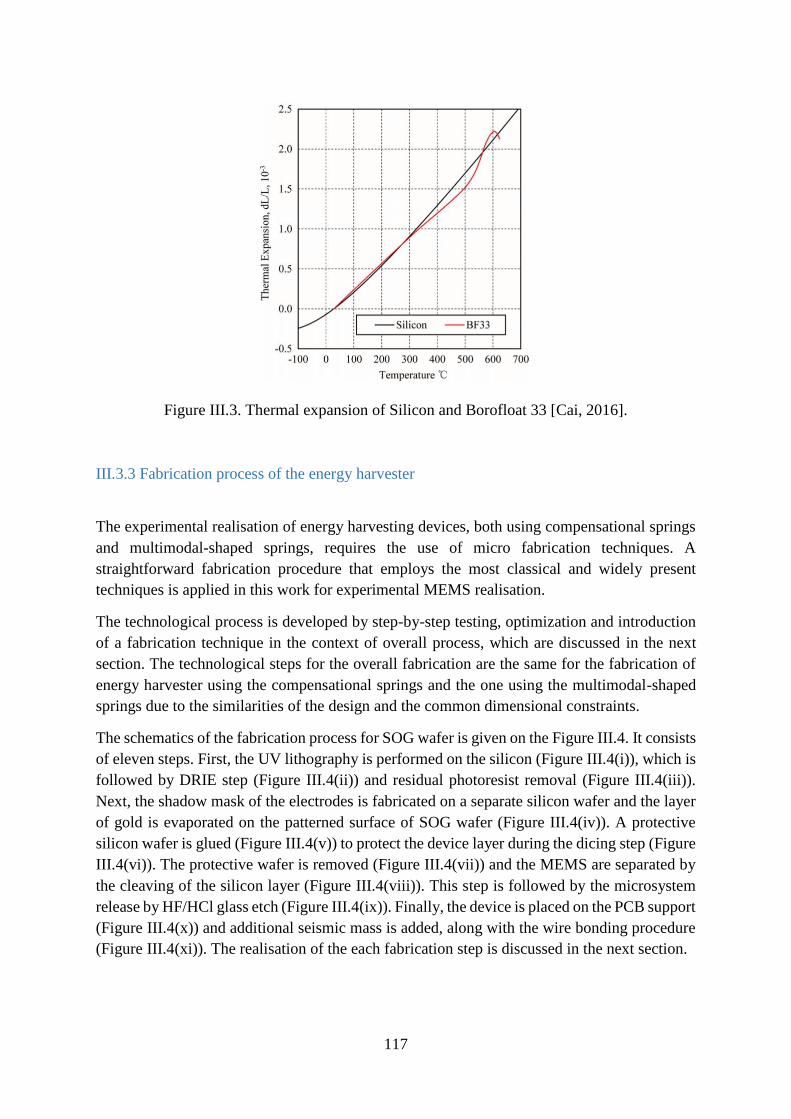
117
Figure III.3. Thermal expansion of Silicon and Borofloat 33 [Cai, 2016].
III.3.3 Fabrication process of the energy harvester
The experimental realisation of energy harvesting devices, both using compensational springs
and multimodal-shaped springs, requires the use of micro fabrication techniques. A
straightforward fabrication procedure that employs the most classical and widely present
techniques is applied in this work for experimental MEMS realisation.
The technological process is developed by step-by-step testing, optimization and introduction
of a fabrication technique in the context of overall process, which are discussed in the next
section. The technological steps for the overall fabrication are the same for the fabrication of
energy harvester using the compensational springs and the one using the multimodal-shaped
springs due to the similarities of the design and the common dimensional constraints.
The schematics of the fabrication process for SOG wafer is given on the Figure III.4. It consists
of eleven steps. First, the UV lithography is performed on the silicon (Figure III.4(i)), which is
followed by DRIE step (Figure III.4(ii)) and residual photoresist removal (Figure III.4(iii)).
Next, the shadow mask of the electrodes is fabricated on a separate silicon wafer and the layer
of gold is evaporated on the patterned surface of SOG wafer (Figure III.4(iv)). A protective
silicon wafer is glued (Figure III.4(v)) to protect the device layer during the dicing step (Figure
III.4(vi)). The protective wafer is removed (Figure III.4(vii)) and the MEMS are separated by
the cleaving of the silicon layer (Figure III.4(viii)). This step is followed by the microsystem
release by HF/HCl glass etch (Figure III.4(ix)). Finally, the device is placed on the PCB support
(Figure III.4(x)) and additional seismic mass is added, along with the wire bonding procedure
(Figure III.4(xi)). The realisation of the each fabrication step is discussed in the next section.
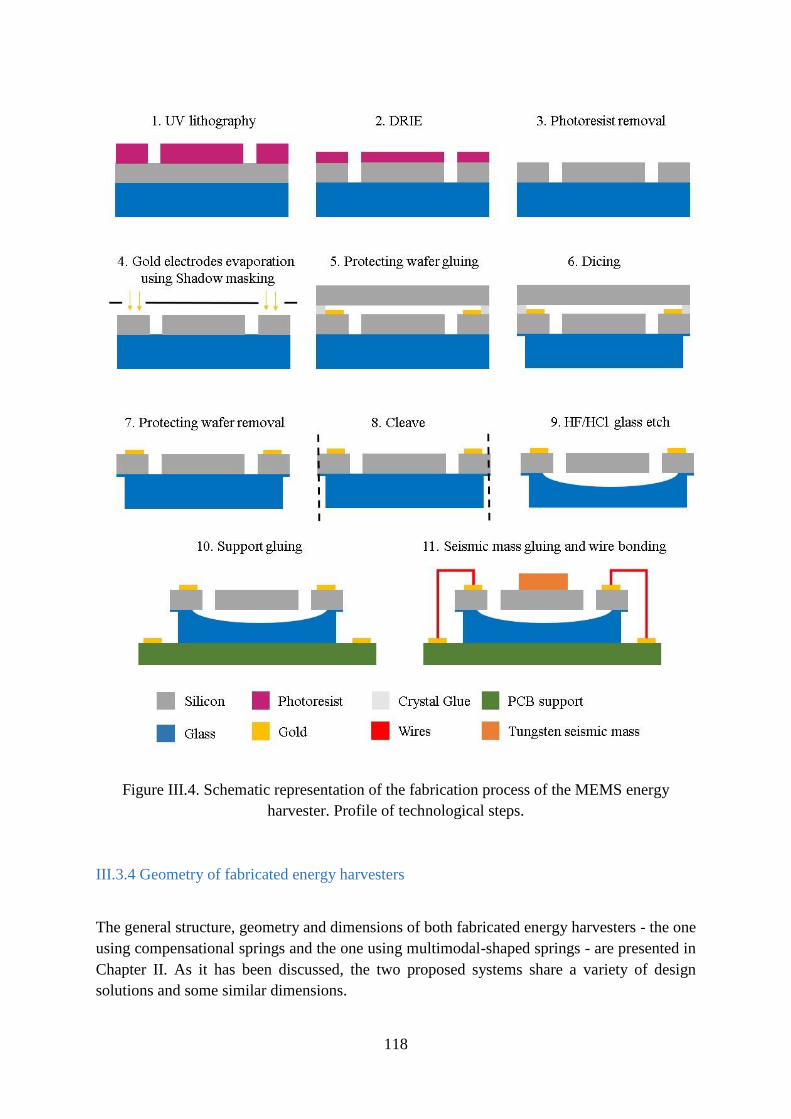
118
Figure III.4. Schematic representation of the fabrication process of the MEMS energy
harvester. Profile of technological steps.
III.3.4 Geometry of fabricated energy harvesters
The general structure, geometry and dimensions of both fabricated energy harvesters - the one
using compensational springs and the one using multimodal-shaped springs - are presented in
Chapter II. As it has been discussed, the two proposed systems share a variety of design
solutions and some similar dimensions.

119
The image of the photomask that is used to structure the silicon layer for energy harvester using
compensational springs is shown on the Figure III.5(i), with black colour being the chrome
layer and white representing the transparent part. So, with respect to the resin polarity, the
silicon underneath the transparent part will be etched. The alignment marks are used to set the
mask in parallel with the flat cut of the wafer. The device mask permits the simultaneous
fabrication of 20 devices. Zoom on one of the energy harvester devices is given in the Figure
III.5(ii). Access holes of 20x20µm² are done in the seismic mass to ease the etchant ingress
and so the release step. Stoppers of 1.6mm length and 60µm thickness are included in order to
restrict the maximum allowed displacement. The linear springs are designed in a horse-shoe
shape with the curvature radius of 100µm in order to provide the linear behaviour of the device
within its displacement range. Due to the large length of the curved beams used in this design,
openings in the mask occupy relatively large surface area. The total footprint of one device is
81.25mm2, whereas the silicon area covers only 51.43mm2, which gives a fill rate of almost
63%.
Figure III.5. (i) Image of device layer of photolithographic mask used for fabrication of
energy harvester with compensational springs; (ii) Zoom on one of the devices. Black colour
corresponds to the chrome, white is transparent.
The image of the photomask that is used to fabricate the energy harvester using multimodal-
shaped springs is shown in the Figure III.6(i). The mask have a symmetrical pattern, and
consists of twenty devices, which footprint shown at the Figure III.6(ii). Compared to the
design using the linear compensational springs, the device with multimodal-shaped springs is
denser in terms of the surface of silicon, due to the more compact springs used. The total
footprint of one device is 82.88mm2, whereas the silicon area covers only 57.2mm2, which
gives a fill rate of almost 69%. Other structural elements, such as access holes and stoppers,
have the same dimensions as the ones used in devices with the compensational springs.

120
Figure III.6. (i) Image of device layer of photolithographic mask used for fabrication of
energy harvester with multimodal-shaped springs; (ii) Zoom on one of the devices. Black
colour corresponds to the chrome, white is transparent.
III.4 Development of the fabrication process
This section presents the detailed technical description of the process that is proposed in the
previous section. A step-by-step fabrication procedure is presented and discussed. All
fabrication steps used in this work are performed with the ISO 4 clean room facilities of C2N,
Orsay.
III.4.1 UV lithography
III.4.1.1 Principle of UV lithography
The photolithography technique is one of the oldest known microtechnologies, and one of the
most basic instruments used by a large number of microfabrication processes. It allows to
pattern surfaces and layers of the wafer in a precise and well-controlled way. Figure III.7 shows
the principle of the UV lithography: first, the photoresist is spin-coated on the wafer surface,
which is followed by the exposure to the UV light through the transparent area of the employed
chrome mask. In this way the pattern of the mask is transferred to the photoresist layer, yielding
in openings in exposed regions for positive photoresist and in openings in non-exposed regions
for the negative photoresist after the development with a specific basic solution. The maximum
attainable precision of the pattern is limited by two main factors: the diffraction limit of the
exposing light source and the proximity between mask and the photoresist layer. In the case of
the used 248nm wavelength mask aligner, the minimum feature size usually do not exceed the
size of 1µm. The proximity can vary between the full mechanical contact between photoresist
and mask (which often produce the wear of the mask after the long-term use, and sometimes
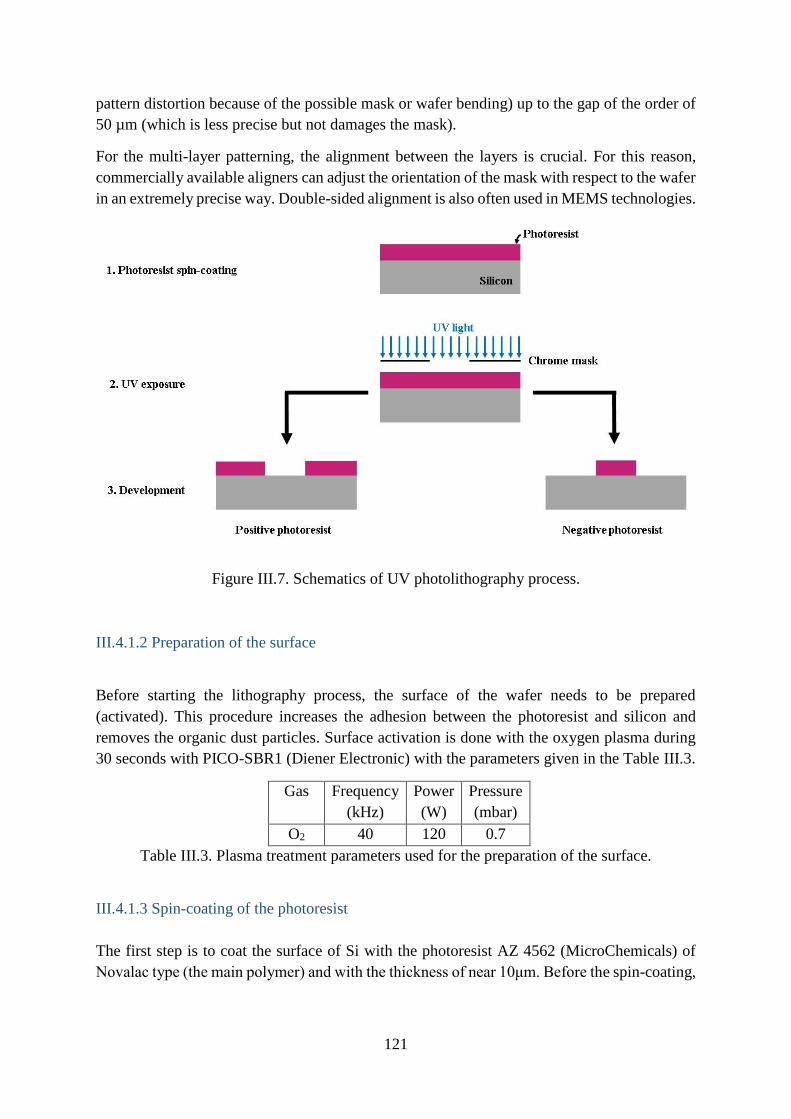
121
pattern distortion because of the possible mask or wafer bending) up to the gap of the order of
50 µm (which is less precise but not damages the mask).
For the multi-layer patterning, the alignment between the layers is crucial. For this reason,
commercially available aligners can adjust the orientation of the mask with respect to the wafer
in an extremely precise way. Double-sided alignment is also often used in MEMS technologies.
Figure III.7. Schematics of UV photolithography process.
III.4.1.2 Preparation of the surface
Before starting the lithography process, the surface of the wafer needs to be prepared
(activated). This procedure increases the adhesion between the photoresist and silicon and
removes the organic dust particles. Surface activation is done with the oxygen plasma during
30 seconds with PICO-SBR1 (Diener Electronic) with the parameters given in the Table III.3.
Gas Frequency
(kHz)
Power
(W)
Pressure
(mbar)
O2 40 120 0.7
Table III.3. Plasma treatment parameters used for the preparation of the surface.
III.4.1.3 Spin-coating of the photoresist
The first step is to coat the surface of Si with the photoresist AZ 4562 (MicroChemicals) of
Novalac type (the main polymer) and with the thickness of near 10μm. Before the spin-coating,
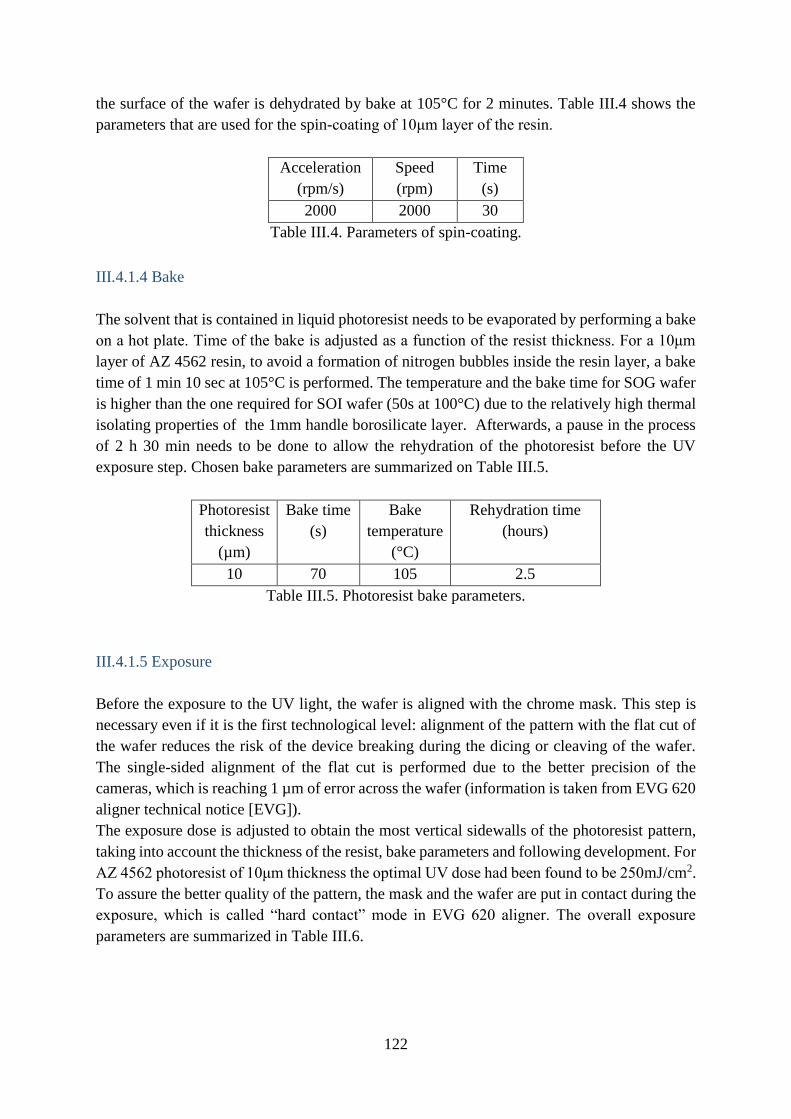
122
the surface of the wafer is dehydrated by bake at 105°C for 2 minutes. Table III.4 shows the
parameters that are used for the spin-coating of 10μm layer of the resin.
Acceleration
(rpm/s)
Speed
(rpm)
Time
(s)
2000 2000 30
Table III.4. Parameters of spin-coating.
III.4.1.4 Bake
The solvent that is contained in liquid photoresist needs to be evaporated by performing a bake
on a hot plate. Time of the bake is adjusted as a function of the resist thickness. For a 10μm
layer of AZ 4562 resin, to avoid a formation of nitrogen bubbles inside the resin layer, a bake
time of 1 min 10 sec at 105°C is performed. The temperature and the bake time for SOG wafer
is higher than the one required for SOI wafer (50s at 100°C) due to the relatively high thermal
isolating properties of the 1mm handle borosilicate layer. Afterwards, a pause in the process
of 2 h 30 min needs to be done to allow the rehydration of the photoresist before the UV
exposure step. Chosen bake parameters are summarized on Table III.5.
Photoresist
thickness
(µm)
Bake time
(s)
Bake
temperature
(°C)
Rehydration time
(hours)
10 70 105 2.5
Table III.5. Photoresist bake parameters.
III.4.1.5 Exposure
Before the exposure to the UV light, the wafer is aligned with the chrome mask. This step is
necessary even if it is the first technological level: alignment of the pattern with the flat cut of
the wafer reduces the risk of the device breaking during the dicing or cleaving of the wafer.
The single-sided alignment of the flat cut is performed due to the better precision of the
cameras, which is reaching 1 µm of error across the wafer (information is taken from EVG 620
aligner technical notice [EVG]).
The exposure dose is adjusted to obtain the most vertical sidewalls of the photoresist pattern,
taking into account the thickness of the resist, bake parameters and following development. For
AZ 4562 photoresist of 10μm thickness the optimal UV dose had been found to be 250mJ/cm2.
To assure the better quality of the pattern, the mask and the wafer are put in contact during the
exposure, which is called “hard contact” mode in EVG 620 aligner. The overall exposure
parameters are summarized in Table III.6.

123
Aligner UV
wavelength
(nm)
Dose
(mJ/cm2)
Type of contact
EVG 620 365 250 Hard contact
Table III.6. AZ 4562 exposure parameters.
III.4.1.6 Development
The development step is necessary to reveal the pattern exposed to UV on the photoresist. In
fact, for the positive resist (like the one that is used in this work - AZ 4562), the basic solution
is used to etch out the zone that had faced the exposure. The developing solution of AZ400K
by MicroChemicals diluted in water with 1:4 volume ratio is used. The development time for
the exposure dose of 250mJ/cm2 is found to be 1 min 15 sec. The sample is agitated carefully
during the process to increase the dissolution of exposed resist. The development process is
stopped by washing the sample in water and drying under nitrogen flow. The quality of the
obtained photoresist pattern is checked by optical inspection.
III.4.2 Deep Reactive Ion Etching
Etching is one of the essential techniques used for MEMS fabrication. In case of silicon, there
are plenty of options to etch it: using the wet etch with KOH, EDP, and TMAH solutions, using
XeF2 gas or by the means of dry plasma etch with RIE or DRIE technique. For the developed
process, a DRIE technique is chosen due to, its selectivity and its anisotropy with the high
attainable aspect ratio.
III.4.2.1 Principle of Bosch process
The Bosch process is now considered as a standard and well-proven anisotropic silicon etching
process with high selectivity rate, and which had been shown to achieve aspect ratio up to 100
[Parasuraman, 2014]. It had been developed by F. Laermer and A. Schilp from Robert Bosch
GmbH in 1993 [Laermer, 1996]. The process combines the advantages of ion and plasma
etching or in other words the advantages of both physical and chemical etch. Anisotropy of the
etching originates from the directed bombardment of the surface by accelerated ions. The high
selectivity attributes to the plasma chemical etch, and is achieved by the choice of the etching
gas in plasma. Compared to the reactive ion etching process (RIE), the surface passivation step
is added to increase the selectivity and anisotropy of the overall process. Thus the name – Deep
Reactive Ion Etching (DRIE).
General schematics of the Bosch etching process principle is shown on the Figure III.8(i).
Initially, in Bosch process, the vacuum chamber is filled with the gas mixture of SF6 and Ar.
The plasma is created, which releases F radicals that perform chemical etching of the silicon:

124
Si + 4 F → SiF4
Additionally, Ar+ ions are accelerated in the electric field applied inside the vacuum chamber
towards the substrate, hitting it and etching physically the surface.
Next, the passivation step proceeds. CHF3 gas is introduced in the vacuum chamber, that forms
Teflon CF2 monomer in plasma that polymerizes on all surfaces, both sidewalls and the bottom,
to form a thin Teflon layer of (-CF2-)n. This layer prevents the further chemical etching of the
silicon. Finally, the etching cycle repeats: accelerated Ar+ ions remove the Teflon polymer
layer on the bottom of the opening and chemical etching with F radicals proceeds. Example of
the pillar fabricated with DRIE technique is shown on the Figure III.8(ii). This alternation of
the etch-passivation steps assures the continuation of the etching in the vertical direction.
However, the scalloping is known to appear curing the each alternating cycle, which is
demonstrated on Figure III.8(iii). The overall angle of the sidewalls usually varies in the range
of 90 ± 2° following the operational conditions.
Figure III.8. (i) The principle of the Bosch process: etching step is followed by polymer
passivation step; (ii) SEM image of the thin pillar etched by DRIE and (iii) magnified SEM
image showing the scalloping of the sidewall.
III.4.2.2 Experimental set-up
For the experimental realization of the DRIE step, an ICP SPTS DRIE Rapier Omega LPX
equipment is used, which permits the implementation of the classical Bosch process. The
picture of the machine is shown on the Figure III.9. The ICP SPTS setup allows both through
etch of relatively thick silicon wafers (up to 1mm) and the small scale surface patterning (of
the order of 1µm).
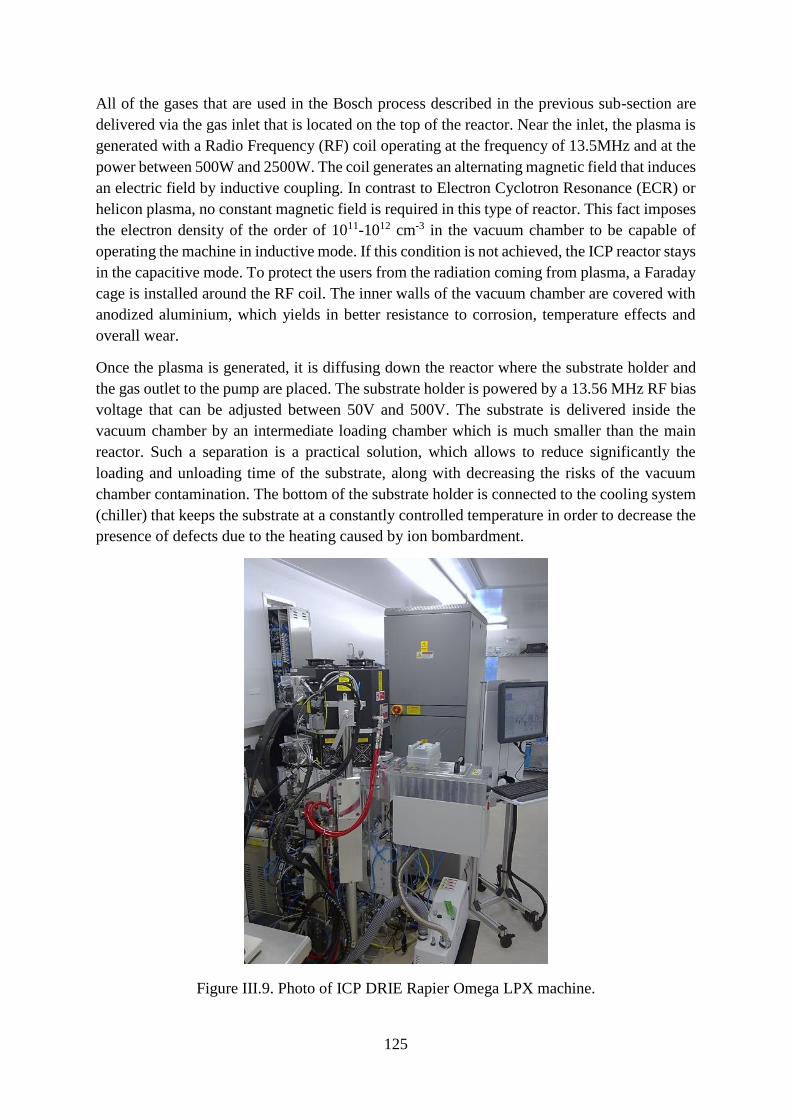
125
All of the gases that are used in the Bosch process described in the previous sub-section are
delivered via the gas inlet that is located on the top of the reactor. Near the inlet, the plasma is
generated with a Radio Frequency (RF) coil operating at the frequency of 13.5MHz and at the
power between 500W and 2500W. The coil generates an alternating magnetic field that induces
an electric field by inductive coupling. In contrast to Electron Cyclotron Resonance (ECR) or
helicon plasma, no constant magnetic field is required in this type of reactor. This fact imposes
the electron density of the order of 1011-1012 cm-3 in the vacuum chamber to be capable of
operating the machine in inductive mode. If this condition is not achieved, the ICP reactor stays
in the capacitive mode. To protect the users from the radiation coming from plasma, a Faraday
cage is installed around the RF coil. The inner walls of the vacuum chamber are covered with
anodized aluminium, which yields in better resistance to corrosion, temperature effects and
overall wear.
Once the plasma is generated, it is diffusing down the reactor where the substrate holder and
the gas outlet to the pump are placed. The substrate holder is powered by a 13.56 MHz RF bias
voltage that can be adjusted between 50V and 500V. The substrate is delivered inside the
vacuum chamber by an intermediate loading chamber which is much smaller than the main
reactor. Such a separation is a practical solution, which allows to reduce significantly the
loading and unloading time of the substrate, along with decreasing the risks of the vacuum
chamber contamination. The bottom of the substrate holder is connected to the cooling system
(chiller) that keeps the substrate at a constantly controlled temperature in order to decrease the
presence of defects due to the heating caused by ion bombardment.
Figure III.9. Photo of ICP DRIE Rapier Omega LPX machine.
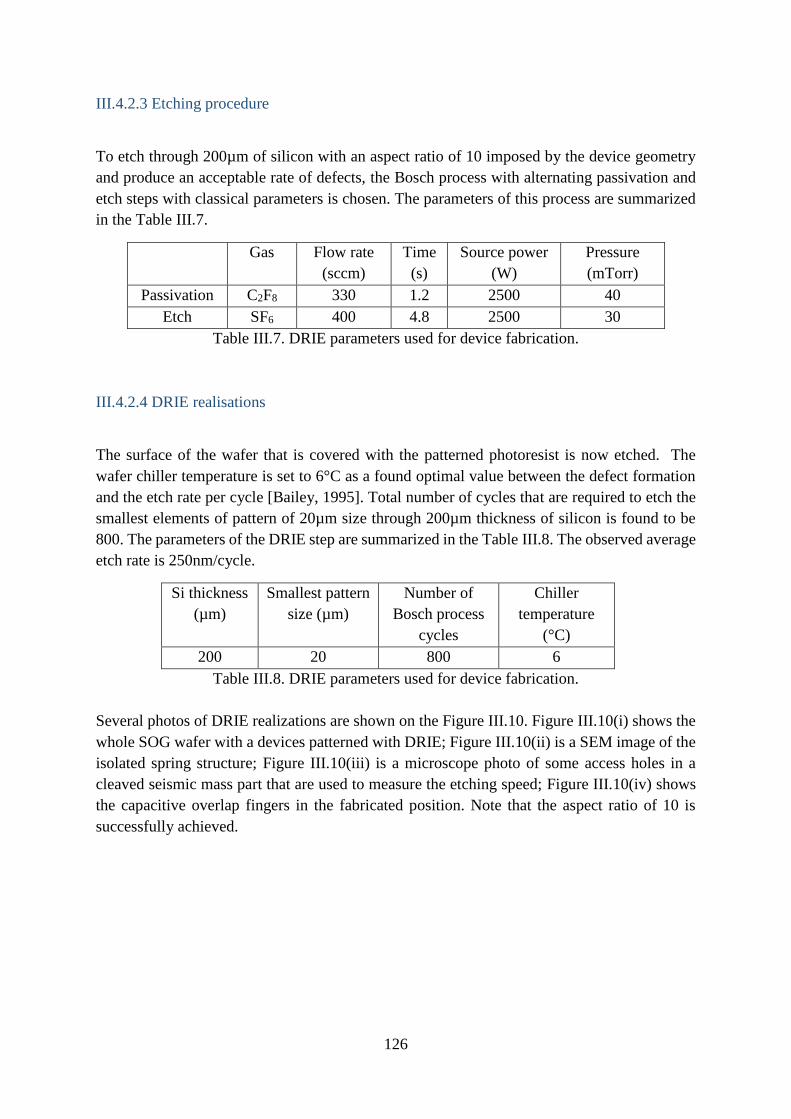
126
III.4.2.3 Etching procedure
To etch through 200µm of silicon with an aspect ratio of 10 imposed by the device geometry
and produce an acceptable rate of defects, the Bosch process with alternating passivation and
etch steps with classical parameters is chosen. The parameters of this process are summarized
in the Table III.7.
Gas Flow rate
(sccm)
Time
(s)
Source power
(W)
Pressure
(mTorr)
Passivation C2F8 330 1.2 2500 40
Etch SF6 400 4.8 2500 30
Table III.7. DRIE parameters used for device fabrication.
III.4.2.4 DRIE realisations
The surface of the wafer that is covered with the patterned photoresist is now etched. The
wafer chiller temperature is set to 6°C as a found optimal value between the defect formation
and the etch rate per cycle [Bailey, 1995]. Total number of cycles that are required to etch the
smallest elements of pattern of 20µm size through 200µm thickness of silicon is found to be
800. The parameters of the DRIE step are summarized in the Table III.8. The observed average
etch rate is 250nm/cycle.
Si thickness
(µm)
Smallest pattern
size (µm)
Number of
Bosch process
cycles
Chiller
temperature
(°C)
200 20 800 6
Table III.8. DRIE parameters used for device fabrication.
Several photos of DRIE realizations are shown on the Figure III.10. Figure III.10(i) shows the
whole SOG wafer with a devices patterned with DRIE; Figure III.10(ii) is a SEM image of the
isolated spring structure; Figure III.10(iii) is a microscope photo of some access holes in a
cleaved seismic mass part that are used to measure the etching speed; Figure III.10(iv) shows
the capacitive overlap fingers in the fabricated position. Note that the aspect ratio of 10 is
successfully achieved.
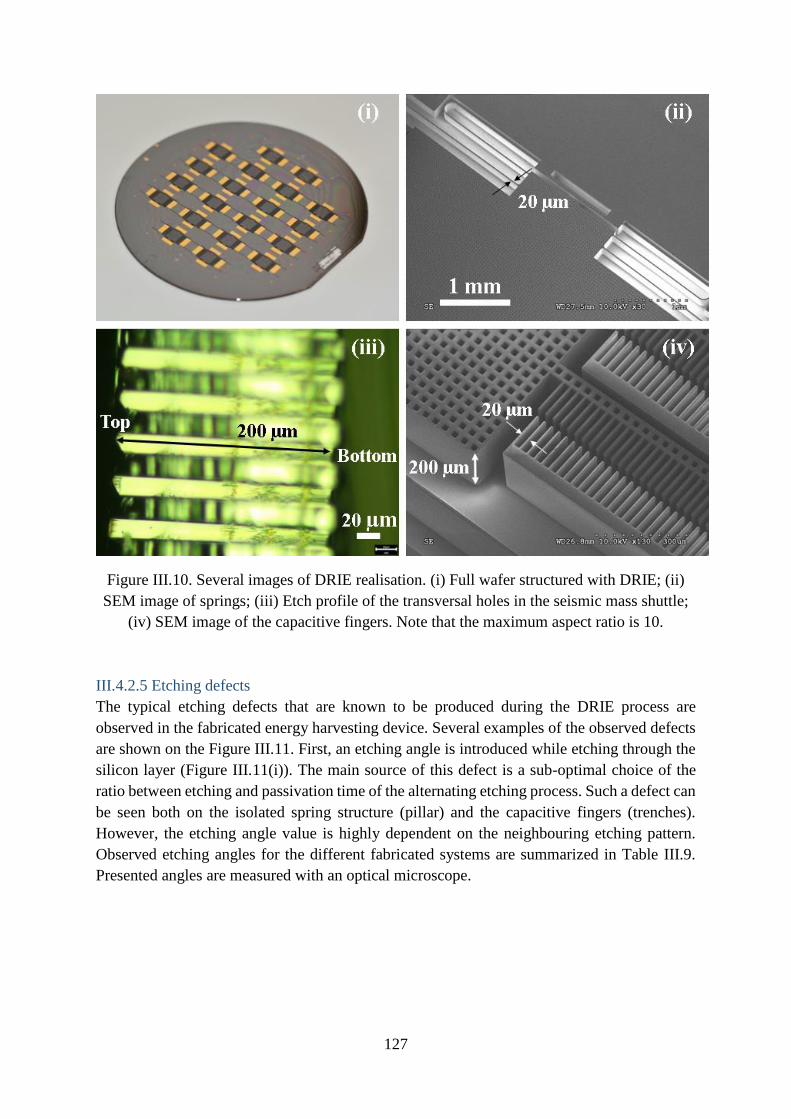
127
Figure III.10. Several images of DRIE realisation. (i) Full wafer structured with DRIE; (ii)
SEM image of springs; (iii) Etch profile of the transversal holes in the seismic mass shuttle;
(iv) SEM image of the capacitive fingers. Note that the maximum aspect ratio is 10.
III.4.2.5 Etching defects
The typical etching defects that are known to be produced during the DRIE process are
observed in the fabricated energy harvesting device. Several examples of the observed defects
are shown on the Figure III.11. First, an etching angle is introduced while etching through the
silicon layer (Figure III.11(i)). The main source of this defect is a sub-optimal choice of the
ratio between etching and passivation time of the alternating etching process. Such a defect can
be seen both on the isolated spring structure (pillar) and the capacitive fingers (trenches).
However, the etching angle value is highly dependent on the neighbouring etching pattern.
Observed etching angles for the different fabricated systems are summarized in Table III.9.
Presented angles are measured with an optical microscope.
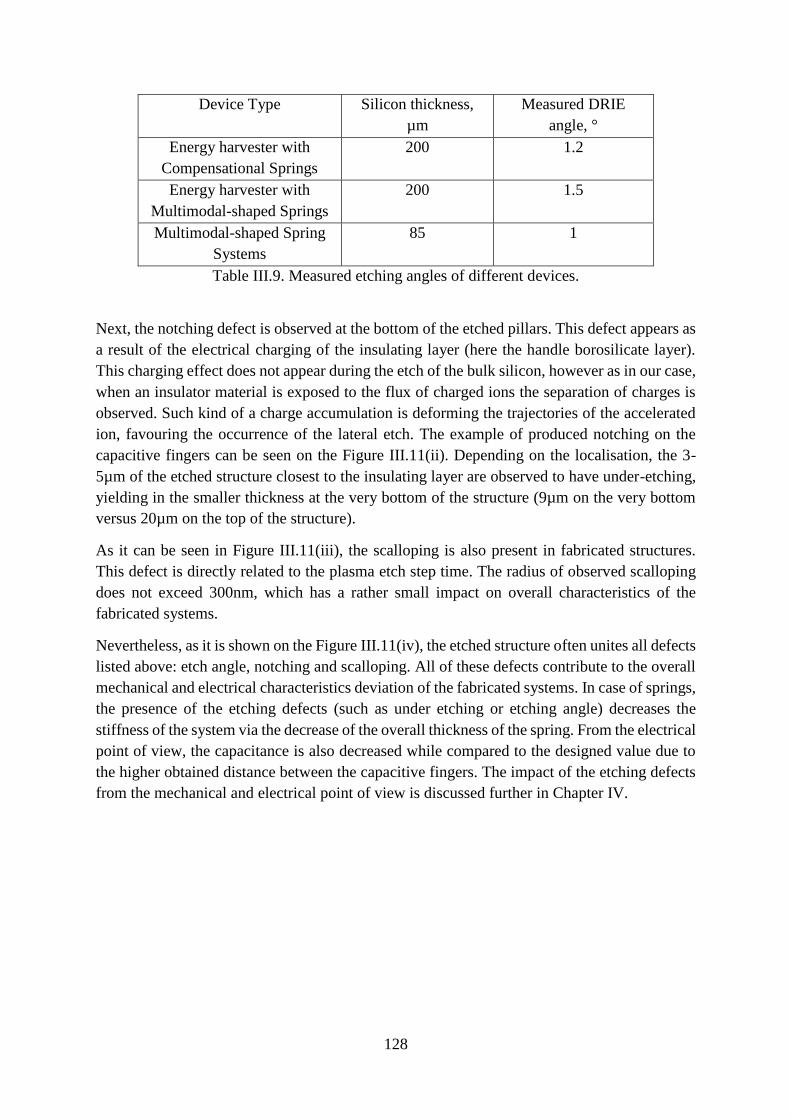
128
Device Type Silicon thickness,
µm
Measured DRIE
angle, °
Energy harvester with
Compensational Springs
200 1.2
Energy harvester with
Multimodal-shaped Springs
200 1.5
Multimodal-shaped Spring
Systems
85 1
Table III.9. Measured etching angles of different devices.
Next, the notching defect is observed at the bottom of the etched pillars. This defect appears as
a result of the electrical charging of the insulating layer (here the handle borosilicate layer).
This charging effect does not appear during the etch of the bulk silicon, however as in our case,
when an insulator material is exposed to the flux of charged ions the separation of charges is
observed. Such kind of a charge accumulation is deforming the trajectories of the accelerated
ion, favouring the occurrence of the lateral etch. The example of produced notching on the
capacitive fingers can be seen on the Figure III.11(ii). Depending on the localisation, the 3-
5µm of the etched structure closest to the insulating layer are observed to have under-etching,
yielding in the smaller thickness at the very bottom of the structure (9µm on the very bottom
versus 20µm on the top of the structure).
As it can be seen in Figure III.11(iii), the scalloping is also present in fabricated structures.
This defect is directly related to the plasma etch step time. The radius of observed scalloping
does not exceed 300nm, which has a rather small impact on overall characteristics of the
fabricated systems.
Nevertheless, as it is shown on the Figure III.11(iv), the etched structure often unites all defects
listed above: etch angle, notching and scalloping. All of these defects contribute to the overall
mechanical and electrical characteristics deviation of the fabricated systems. In case of springs,
the presence of the etching defects (such as under etching or etching angle) decreases the
stiffness of the system via the decrease of the overall thickness of the spring. From the electrical
point of view, the capacitance is also decreased while compared to the designed value due to
the higher obtained distance between the capacitive fingers. The impact of the etching defects
from the mechanical and electrical point of view is discussed further in Chapter IV.
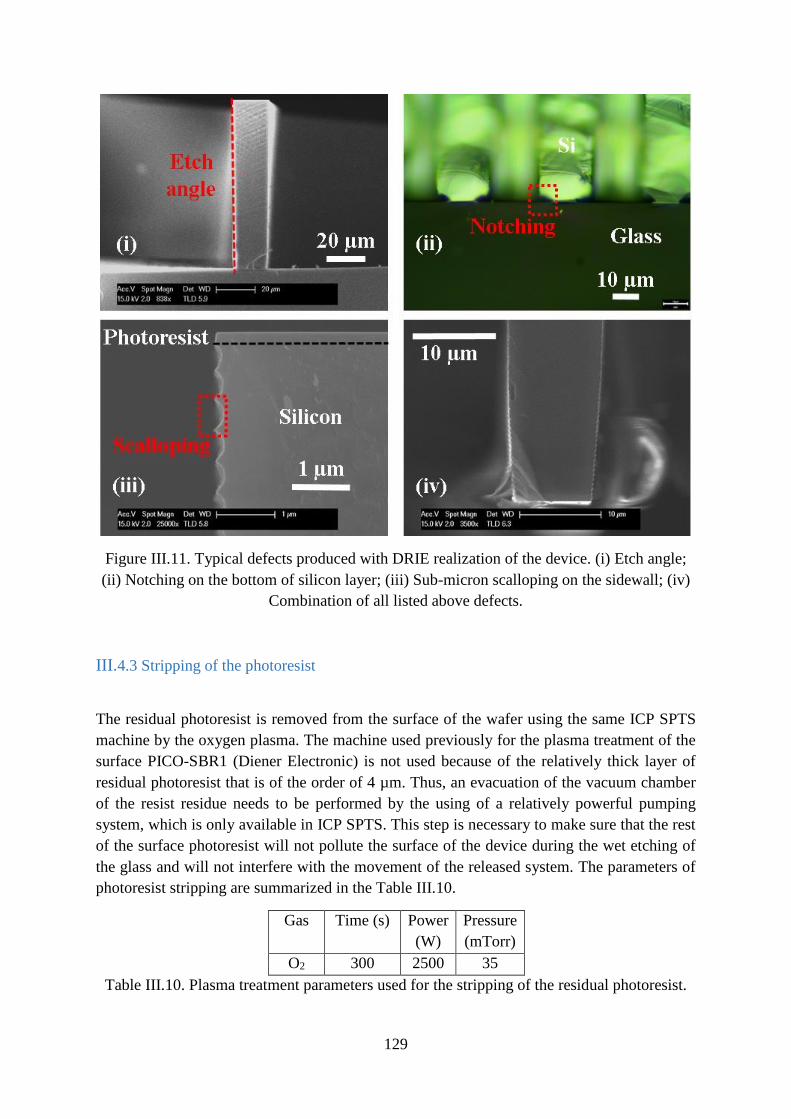
129
Figure III.11. Typical defects produced with DRIE realization of the device. (i) Etch angle;
(ii) Notching on the bottom of silicon layer; (iii) Sub-micron scalloping on the sidewall; (iv)
Combination of all listed above defects.
III.4.3 Stripping of the photoresist
The residual photoresist is removed from the surface of the wafer using the same ICP SPTS
machine by the oxygen plasma. The machine used previously for the plasma treatment of the
surface PICO-SBR1 (Diener Electronic) is not used because of the relatively thick layer of
residual photoresist that is of the order of 4 µm. Thus, an evacuation of the vacuum chamber
of the resist residue needs to be performed by the using of a relatively powerful pumping
system, which is only available in ICP SPTS. This step is necessary to make sure that the rest
of the surface photoresist will not pollute the surface of the device during the wet etching of
the glass and will not interfere with the movement of the released system. The parameters of
photoresist stripping are summarized in the Table III.10.
Gas Time (s) Power
(W)
Pressure
(mTorr)
O2 300 2500 35
Table III.10. Plasma treatment parameters used for the stripping of the residual photoresist.
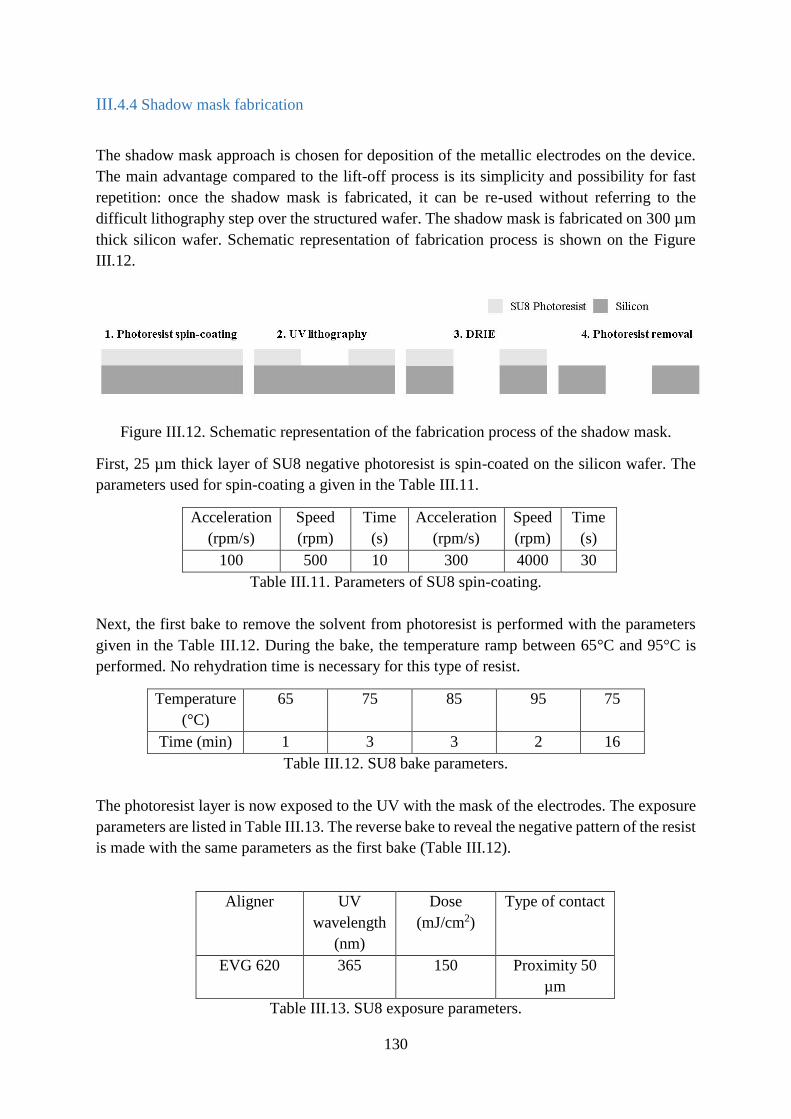
130
III.4.4 Shadow mask fabrication
The shadow mask approach is chosen for deposition of the metallic electrodes on the device.
The main advantage compared to the lift-off process is its simplicity and possibility for fast
repetition: once the shadow mask is fabricated, it can be re-used without referring to the
difficult lithography step over the structured wafer. The shadow mask is fabricated on 300 µm
thick silicon wafer. Schematic representation of fabrication process is shown on the Figure
III.12.
Figure III.12. Schematic representation of the fabrication process of the shadow mask.
First, 25 µm thick layer of SU8 negative photoresist is spin-coated on the silicon wafer. The
parameters used for spin-coating a given in the Table III.11.
Acceleration
(rpm/s)
Speed
(rpm)
Time
(s)
Acceleration
(rpm/s)
Speed
(rpm)
Time
(s)
100 500 10 300 4000 30
Table III.11. Parameters of SU8 spin-coating.
Next, the first bake to remove the solvent from photoresist is performed with the parameters
given in the Table III.12. During the bake, the temperature ramp between 65°C and 95°C is
performed. No rehydration time is necessary for this type of resist.
Temperature
(°C)
65 75 85 95 75
Time (min) 1 3 3 2 16
Table III.12. SU8 bake parameters.
The photoresist layer is now exposed to the UV with the mask of the electrodes. The exposure
parameters are listed in Table III.13. The reverse bake to reveal the negative pattern of the resist
is made with the same parameters as the first bake (Table III.12).
Aligner UV
wavelength
(nm)
Dose
(mJ/cm2)
Type of contact
EVG 620 365 150 Proximity 50
µm
Table III.13. SU8 exposure parameters.
131
The openings in shadow mask are made using the DRIE. The same etching recipe as for the
MEMS device fabrication is used for patterning the shadow mask. The parameters for DRIE
are summarized in the Table III.14. Finally, the rest of the photoresist is stripped using the
liquid HF.
Si thickness
(µm)
Number of
Bosch process
cycles
Chiller
temperature
(°C)
300 700 6
Table III.14. DRIE parameters used for shadow mask fabrication.
The main disadvantage of the use of shadow mask is the precision of the electrodes deposition.
However, taking into account the size of the electrodes and pads that are designed in the system,
this relatively low precision is still acceptable for the fabrication process.
III.4.5 Metal electrodes deposition
A large variety of physical and chemical techniques can be used to deposit a metal layer. To
perform a deposition of the electrodes for the studied MEMS the electron beam evaporation
technique is chosen as the one that is considered to be classical for the microsystems.
III.4.5.1 Principle of electron beam evaporation
The principle of electron beam evaporation is relatively easy and straightforward. First, free
electrons are created via electron emission from a tungsten filament that is heated by a high
applied current. Next, the electrons are accelerated by the electric field that is created inside
the vacuum chamber towards the crucible that contains the metal that is chosen to be deposited.
The magnetic field is also applied inside the chamber to focus the freed electrons on the
crucible.
Upon the collision of the accelerated electrons with the metal, the targeted material is heated
up to the temperature when sublimation or evaporation is possible. Thus, targeted metal is
deposited on the substrate positioned in front of the crucible. Schematics of the process is
shown on the Figure III.13.
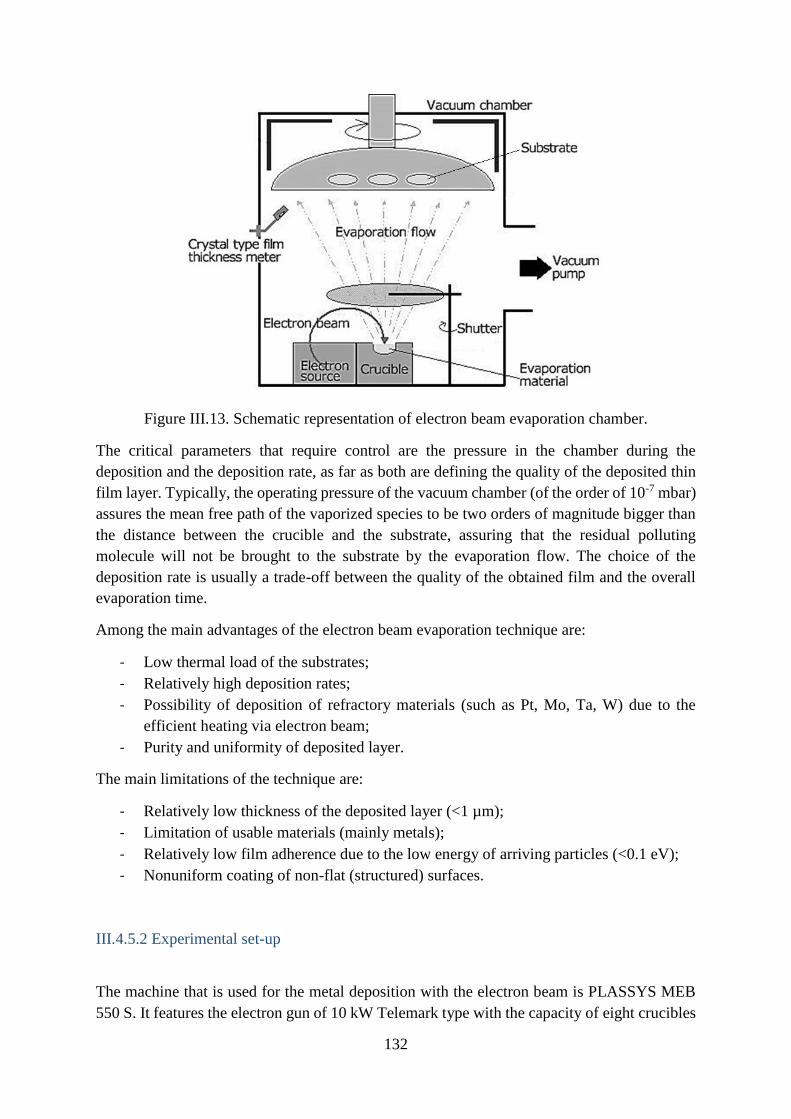
132
Figure III.13. Schematic representation of electron beam evaporation chamber.
The critical parameters that require control are the pressure in the chamber during the
deposition and the deposition rate, as far as both are defining the quality of the deposited thin
film layer. Typically, the operating pressure of the vacuum chamber (of the order of 10-7 mbar)
assures the mean free path of the vaporized species to be two orders of magnitude bigger than
the distance between the crucible and the substrate, assuring that the residual polluting
molecule will not be brought to the substrate by the evaporation flow. The choice of the
deposition rate is usually a trade-off between the quality of the obtained film and the overall
evaporation time.
Among the main advantages of the electron beam evaporation technique are:
- Low thermal load of the substrates;
- Relatively high deposition rates;
- Possibility of deposition of refractory materials (such as Pt, Mo, Ta, W) due to the
efficient heating via electron beam;
- Purity and uniformity of deposited layer.
The main limitations of the technique are:
- Relatively low thickness of the deposited layer (<1 µm);
- Limitation of usable materials (mainly metals);
- Relatively low film adherence due to the low energy of arriving particles (<0.1 eV);
- Nonuniform coating of non-flat (structured) surfaces.
III.4.5.2 Experimental set-up
The machine that is used for the metal deposition with the electron beam is PLASSYS MEB
550 S. It features the electron gun of 10 kW Telemark type with the capacity of eight crucibles
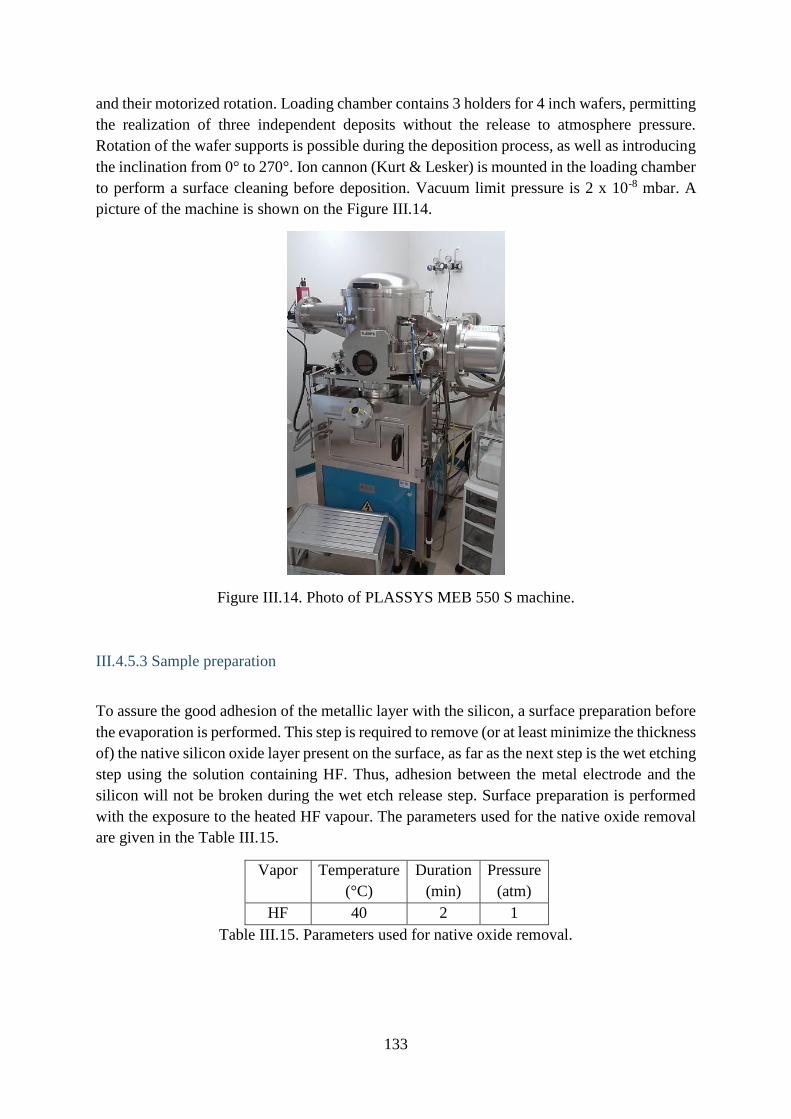
133
and their motorized rotation. Loading chamber contains 3 holders for 4 inch wafers, permitting
the realization of three independent deposits without the release to atmosphere pressure.
Rotation of the wafer supports is possible during the deposition process, as well as introducing
the inclination from 0° to 270°. Ion cannon (Kurt & Lesker) is mounted in the loading chamber
to perform a surface cleaning before deposition. Vacuum limit pressure is 2 x 10⁻⁸ mbar. A
picture of the machine is shown on the Figure III.14.
Figure III.14. Photo of PLASSYS MEB 550 S machine.
III.4.5.3 Sample preparation
To assure the good adhesion of the metallic layer with the silicon, a surface preparation before
the evaporation is performed. This step is required to remove (or at least minimize the thickness
of) the native silicon oxide layer present on the surface, as far as the next step is the wet etching
step using the solution containing HF. Thus, adhesion between the metal electrode and the
silicon will not be broken during the wet etch release step. Surface preparation is performed
with the exposure to the heated HF vapour. The parameters used for the native oxide removal
are given in the Table III.15.
Vapor Temperature
(°C)
Duration
(min)
Pressure
(atm)
HF 40 2 1
Table III.15. Parameters used for native oxide removal.
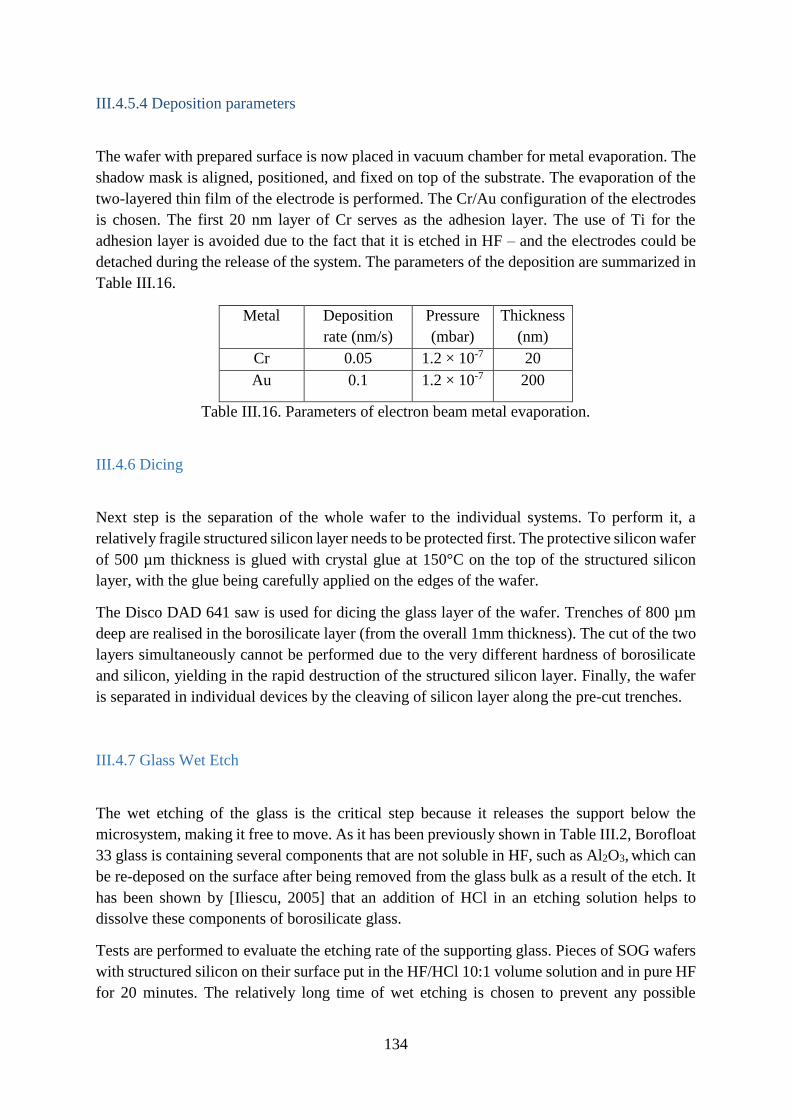
134
III.4.5.4 Deposition parameters
The wafer with prepared surface is now placed in vacuum chamber for metal evaporation. The
shadow mask is aligned, positioned, and fixed on top of the substrate. The evaporation of the
two-layered thin film of the electrode is performed. The Cr/Au configuration of the electrodes
is chosen. The first 20 nm layer of Cr serves as the adhesion layer. The use of Ti for the
adhesion layer is avoided due to the fact that it is etched in HF – and the electrodes could be
detached during the release of the system. The parameters of the deposition are summarized in
Table III.16.
Metal Deposition
rate (nm/s)
Pressure
(mbar)
Thickness
(nm)
Cr 0.05 1.2 × 10⁻⁷ 20
Au 0.1 1.2 × 10⁻⁷ 200
Table III.16. Parameters of electron beam metal evaporation.
III.4.6 Dicing
Next step is the separation of the whole wafer to the individual systems. To perform it, a
relatively fragile structured silicon layer needs to be protected first. The protective silicon wafer
of 500 µm thickness is glued with crystal glue at 150°C on the top of the structured silicon
layer, with the glue being carefully applied on the edges of the wafer.
The Disco DAD 641 saw is used for dicing the glass layer of the wafer. Trenches of 800 µm
deep are realised in the borosilicate layer (from the overall 1mm thickness). The cut of the two
layers simultaneously cannot be performed due to the very different hardness of borosilicate
and silicon, yielding in the rapid destruction of the structured silicon layer. Finally, the wafer
is separated in individual devices by the cleaving of silicon layer along the pre-cut trenches.
III.4.7 Glass Wet Etch
The wet etching of the glass is the critical step because it releases the support below the
microsystem, making it free to move. As it has been previously shown in Table III.2, Borofloat
33 glass is containing several components that are not soluble in HF, such as Al2O3, which can
be re-deposed on the surface after being removed from the glass bulk as a result of the etch. It
has been shown by [Iliescu, 2005] that an addition of HCl in an etching solution helps to
dissolve these components of borosilicate glass.
Tests are performed to evaluate the etching rate of the supporting glass. Pieces of SOG wafers
with structured silicon on their surface put in the HF/HCl 10:1 volume solution and in pure HF
for 20 minutes. The relatively long time of wet etching is chosen to prevent any possible
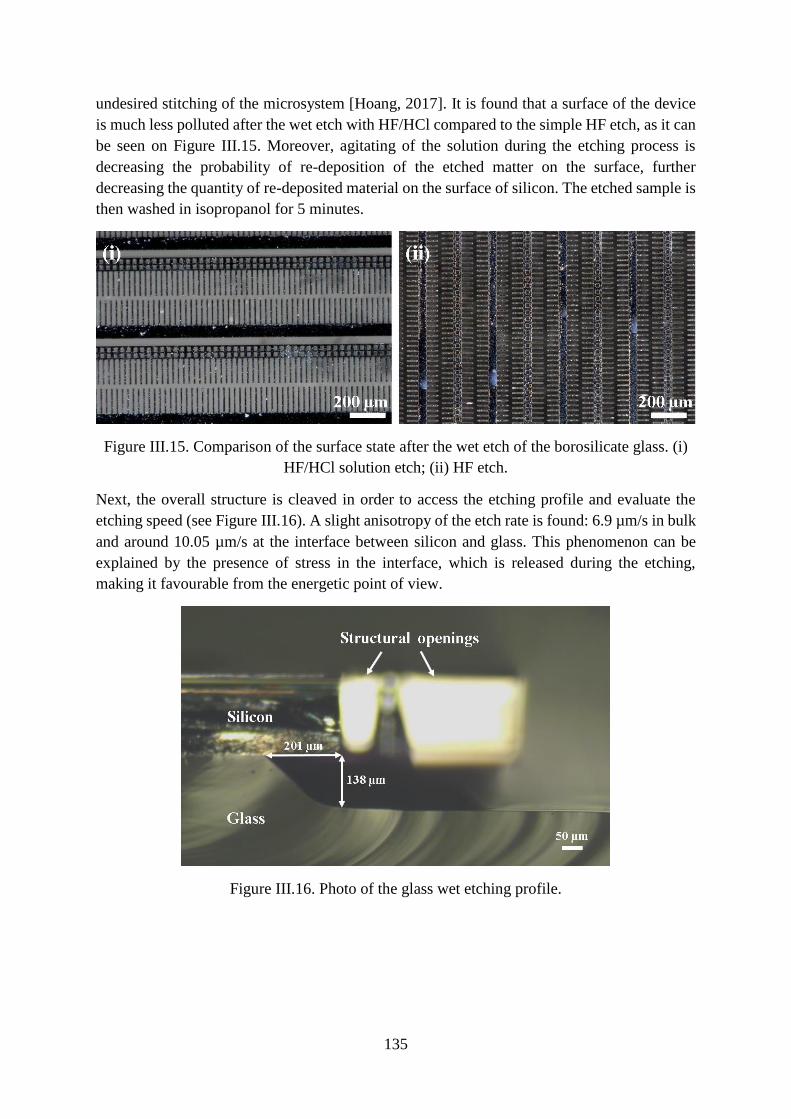
135
undesired stitching of the microsystem [Hoang, 2017]. It is found that a surface of the device
is much less polluted after the wet etch with HF/HCl compared to the simple HF etch, as it can
be seen on Figure III.15. Moreover, agitating of the solution during the etching process is
decreasing the probability of re-deposition of the etched matter on the surface, further
decreasing the quantity of re-deposited material on the surface of silicon. The etched sample is
then washed in isopropanol for 5 minutes.
Figure III.15. Comparison of the surface state after the wet etch of the borosilicate glass. (i)
HF/HCl solution etch; (ii) HF etch.
Next, the overall structure is cleaved in order to access the etching profile and evaluate the
etching speed (see Figure III.16). A slight anisotropy of the etch rate is found: 6.9 µm/s in bulk
and around 10.05 µm/s at the interface between silicon and glass. This phenomenon can be
explained by the presence of stress in the interface, which is released during the etching,
making it favourable from the energetic point of view.
Figure III.16. Photo of the glass wet etching profile.
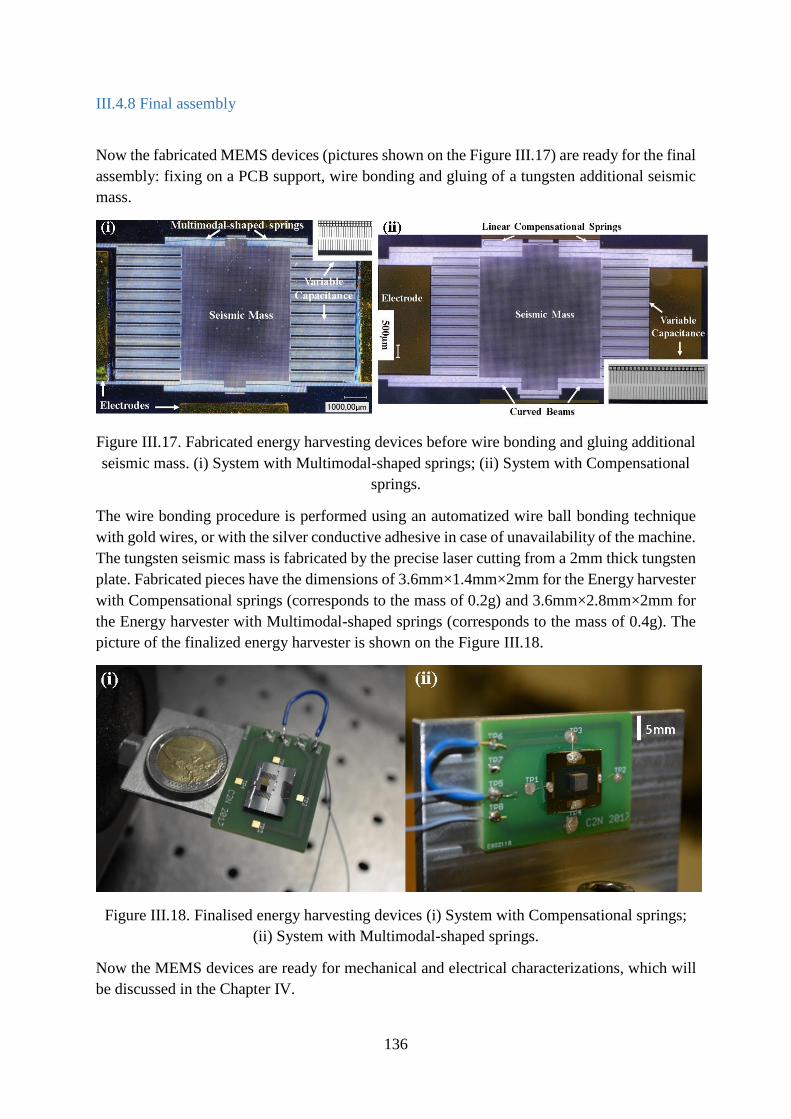
136
III.4.8 Final assembly
Now the fabricated MEMS devices (pictures shown on the Figure III.17) are ready for the final
assembly: fixing on a PCB support, wire bonding and gluing of a tungsten additional seismic
mass.
Figure III.17. Fabricated energy harvesting devices before wire bonding and gluing additional
seismic mass. (i) System with Multimodal-shaped springs; (ii) System with Compensational
springs.
The wire bonding procedure is performed using an automatized wire ball bonding technique
with gold wires, or with the silver conductive adhesive in case of unavailability of the machine.
The tungsten seismic mass is fabricated by the precise laser cutting from a 2mm thick tungsten
plate. Fabricated pieces have the dimensions of 3.6mm×1.4mm×2mm for the Energy harvester
with Compensational springs (corresponds to the mass of 0.2g) and 3.6mm×2.8mm×2mm for
the Energy harvester with Multimodal-shaped springs (corresponds to the mass of 0.4g). The
picture of the finalized energy harvester is shown on the Figure III.18.
Figure III.18. Finalised energy harvesting devices (i) System with Compensational springs;
(ii) System with Multimodal-shaped springs.
Now the MEMS devices are ready for mechanical and electrical characterizations, which will
be discussed in the Chapter IV.
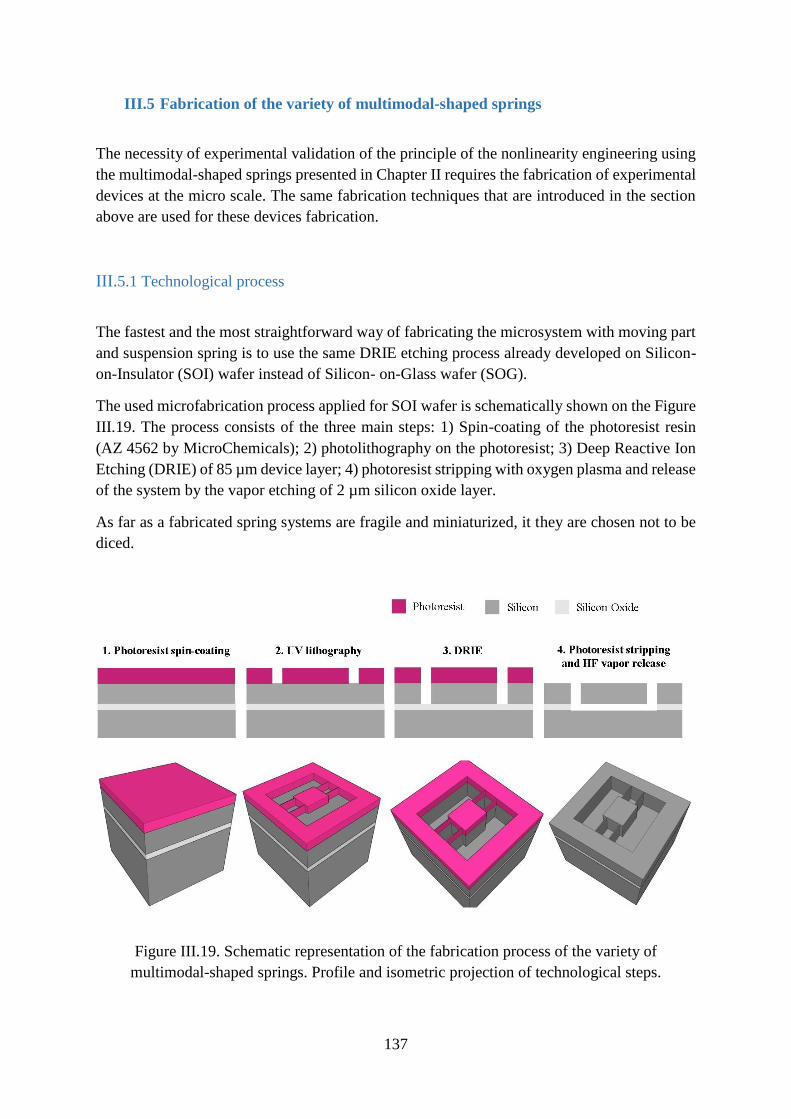
137
III.5 Fabrication of the variety of multimodal-shaped springs
The necessity of experimental validation of the principle of the nonlinearity engineering using
the multimodal-shaped springs presented in Chapter II requires the fabrication of experimental
devices at the micro scale. The same fabrication techniques that are introduced in the section
above are used for these devices fabrication.
III.5.1 Technological process
The fastest and the most straightforward way of fabricating the microsystem with moving part
and suspension spring is to use the same DRIE etching process already developed on Silicon-
on-Insulator (SOI) wafer instead of Silicon- on-Glass wafer (SOG).
The used microfabrication process applied for SOI wafer is schematically shown on the Figure
III.19. The process consists of the three main steps: 1) Spin-coating of the photoresist resin
(AZ 4562 by MicroChemicals); 2) photolithography on the photoresist; 3) Deep Reactive Ion
Etching (DRIE) of 85 µm device layer; 4) photoresist stripping with oxygen plasma and release
of the system by the vapor etching of 2 µm silicon oxide layer.
As far as a fabricated spring systems are fragile and miniaturized, it they are chosen not to be
diced.
Figure III.19. Schematic representation of the fabrication process of the variety of
multimodal-shaped springs. Profile and isometric projection of technological steps.
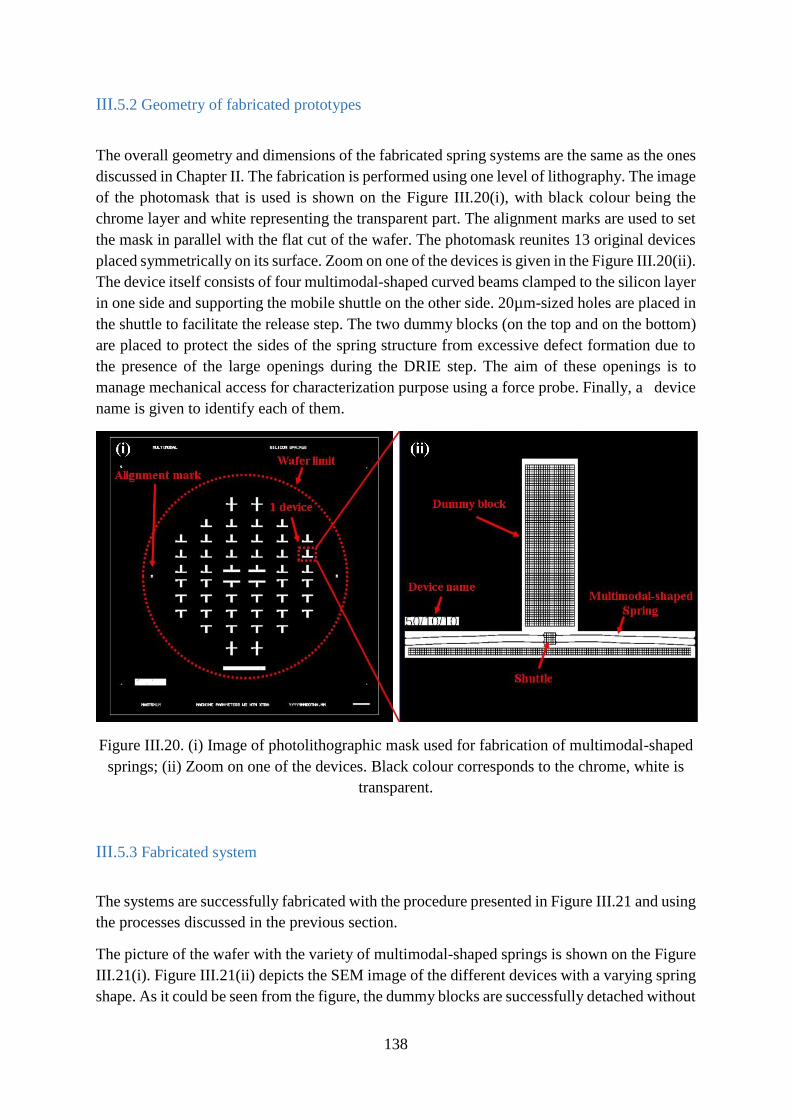
138
III.5.2 Geometry of fabricated prototypes
The overall geometry and dimensions of the fabricated spring systems are the same as the ones
discussed in Chapter II. The fabrication is performed using one level of lithography. The image
of the photomask that is used is shown on the Figure III.20(i), with black colour being the
chrome layer and white representing the transparent part. The alignment marks are used to set
the mask in parallel with the flat cut of the wafer. The photomask reunites 13 original devices
placed symmetrically on its surface. Zoom on one of the devices is given in the Figure III.20(ii).
The device itself consists of four multimodal-shaped curved beams clamped to the silicon layer
in one side and supporting the mobile shuttle on the other side. 20µm-sized holes are placed in
the shuttle to facilitate the release step. The two dummy blocks (on the top and on the bottom)
are placed to protect the sides of the spring structure from excessive defect formation due to
the presence of the large openings during the DRIE step. The aim of these openings is to
manage mechanical access for characterization purpose using a force probe. Finally, a device
name is given to identify each of them.
Figure III.20. (i) Image of photolithographic mask used for fabrication of multimodal-shaped
springs; (ii) Zoom on one of the devices. Black colour corresponds to the chrome, white is
transparent.
III.5.3 Fabricated system
The systems are successfully fabricated with the procedure presented in Figure III.21 and using
the processes discussed in the previous section.
The picture of the wafer with the variety of multimodal-shaped springs is shown on the Figure
III.21(i). Figure III.21(ii) depicts the SEM image of the different devices with a varying spring
shape. As it could be seen from the figure, the dummy blocks are successfully detached without
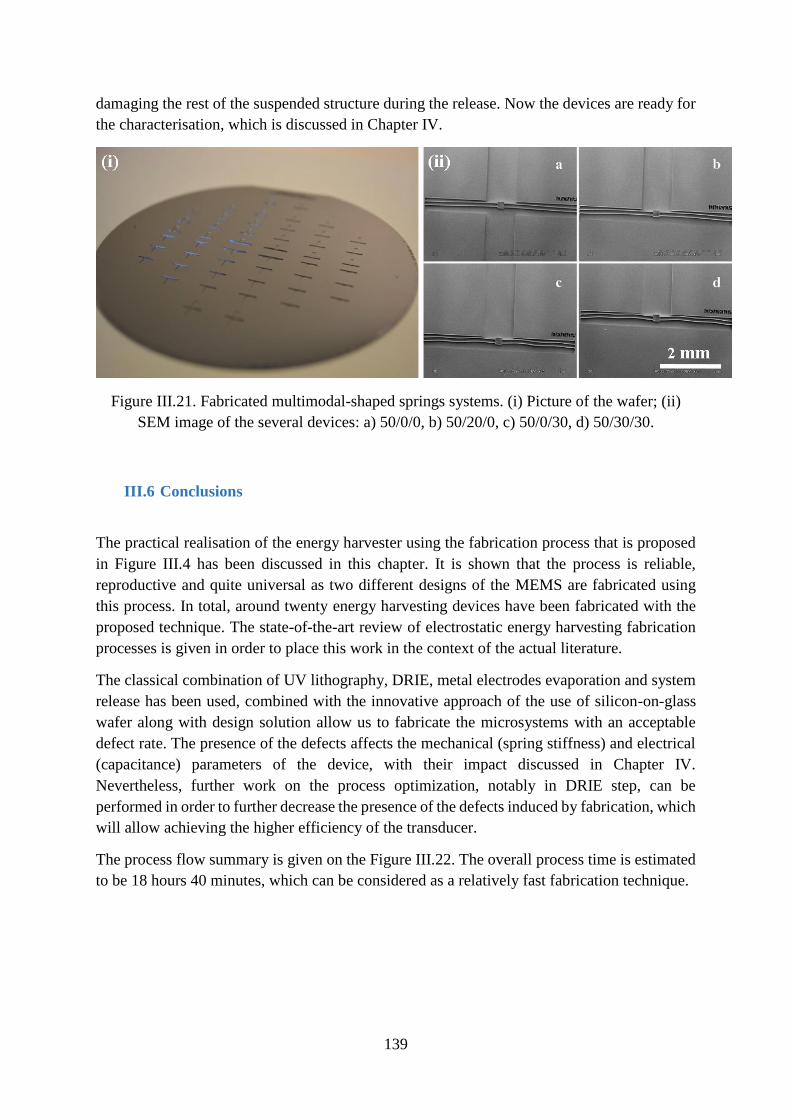
139
damaging the rest of the suspended structure during the release. Now the devices are ready for
the characterisation, which is discussed in Chapter IV.
Figure III.21. Fabricated multimodal-shaped springs systems. (i) Picture of the wafer; (ii)
SEM image of the several devices: a) 50/0/0, b) 50/20/0, c) 50/0/30, d) 50/30/30.
III.6 Conclusions
The practical realisation of the energy harvester using the fabrication process that is proposed
in Figure III.4 has been discussed in this chapter. It is shown that the process is reliable,
reproductive and quite universal as two different designs of the MEMS are fabricated using
this process. In total, around twenty energy harvesting devices have been fabricated with the
proposed technique. The state-of-the-art review of electrostatic energy harvesting fabrication
processes is given in order to place this work in the context of the actual literature.
The classical combination of UV lithography, DRIE, metal electrodes evaporation and system
release has been used, combined with the innovative approach of the use of silicon-on-glass
wafer along with design solution allow us to fabricate the microsystems with an acceptable
defect rate. The presence of the defects affects the mechanical (spring stiffness) and electrical
(capacitance) parameters of the device, with their impact discussed in Chapter IV.
Nevertheless, further work on the process optimization, notably in DRIE step, can be
performed in order to further decrease the presence of the defects induced by fabrication, which
will allow achieving the higher efficiency of the transducer.
The process flow summary is given on the Figure III.22. The overall process time is estimated
to be 18 hours 40 minutes, which can be considered as a relatively fast fabrication technique.
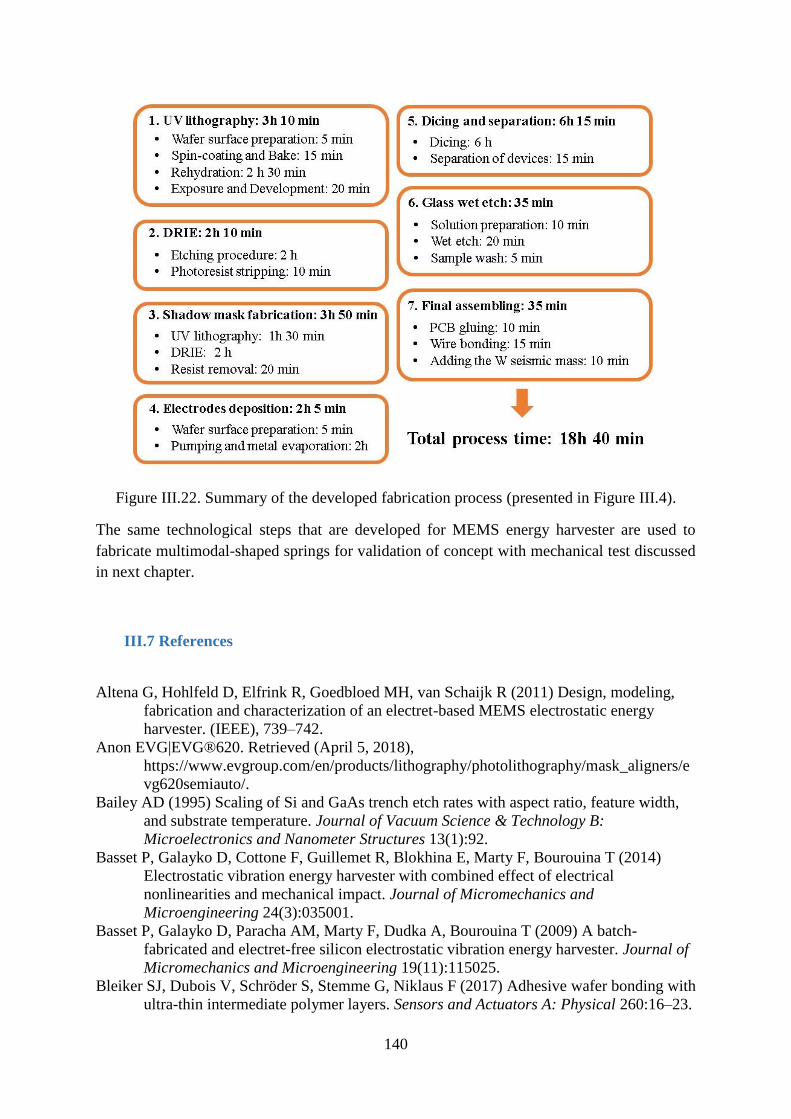
140
Figure III.22. Summary of the developed fabrication process (presented in Figure III.4).
The same technological steps that are developed for MEMS energy harvester are used to
fabricate multimodal-shaped springs for validation of concept with mechanical test discussed
in next chapter.
III.7 References
Altena G, Hohlfeld D, Elfrink R, Goedbloed MH, van Schaijk R (2011) Design, modeling,
fabrication and characterization of an electret-based MEMS electrostatic energy
harvester. (IEEE), 739–742.
Anon EVG|EVG®620. Retrieved (April 5, 2018),
https://www.evgroup.com/en/products/lithography/photolithography/mask_aligners/e
vg620semiauto/.
Bailey AD (1995) Scaling of Si and GaAs trench etch rates with aspect ratio, feature width,
and substrate temperature. Journal of Vacuum Science & Technology B:
Microelectronics and Nanometer Structures 13(1):92.
Basset P, Galayko D, Cottone F, Guillemet R, Blokhina E, Marty F, Bourouina T (2014)
Electrostatic vibration energy harvester with combined effect of electrical
nonlinearities and mechanical impact. Journal of Micromechanics and
Microengineering 24(3):035001.
Basset P, Galayko D, Paracha AM, Marty F, Dudka A, Bourouina T (2009) A batch-
fabricated and electret-free silicon electrostatic vibration energy harvester. Journal of
Micromechanics and Microengineering 19(11):115025.
Bleiker SJ, Dubois V, Schröder S, Stemme G, Niklaus F (2017) Adhesive wafer bonding with
ultra-thin intermediate polymer layers. Sensors and Actuators A: Physical 260:16–23.
141
Cai Y, Yang L, Zhang H, Wang Y (2016) Laser cutting silicon-glass double layer wafer with
laser induced thermal-crack propagation. Optics and Lasers in Engineering 82:173–
185.
Chiu Y, Tseng VFG (2008) A capacitive vibration-to-electricity energy converter with
integrated mechanical switches. Journal of Micromechanics and Microengineering
18(10):104004.
Cottone F, Basset P, Guillemet R, Galayko D, Marty F, Bourouina T (2013) Non-linear
MEMS electrostatic kinetic energy harvester with a tunable multistable potential for
stochastic vibrations. (IEEE), 1336–1339.
Fowler AG, Moheimani SOR (2016) A 4-DOF MEMS Energy Harvester Using Ultrasonic
Excitation. IEEE Sensors Journal 16(21):7774–7783.
Fu Q, Rahaman MN, Fu H, Liu X (2010) Silicate, borosilicate, and borate bioactive glass
scaffolds with controllable degradation rate for bone tissue engineering applications.
I. Preparation and in vitro degradation. Journal of Biomedical Materials Research
Part A 95A(1):164–171.
Fu Q, Suzuki Y (2014) MEMS vibration electret energy harvester with combined electrodes.
(IEEE), 409–412.
Han M, Yuan Q, Sun X, Zhang H (2014) Design and Fabrication of Integrated Magnetic
MEMS Energy Harvester for Low Frequency Applications. Journal of
Microelectromechanical Systems 23(1):204–212.
Hoang TV, Wu L, Paquay S, Golinval JC, Arnst M, Noels L (2017) A Stochastic Multi-Scale
Model for Predicting MEMS Stiction Failure. Starman LV, Hay J, Karanjgaokar N,
eds. Micro and Nanomechanics, Volume 5. (Springer International Publishing, Cham),
1–8.
Hoffmann D, Folkmer B, Manoli Y (2009) Fabrication, characterization and modelling of
electrostatic micro-generators. Journal of Micromechanics and Microengineering
19(9):094001.
Iliescu C, Chen B, Miao J (2008) On the wet etching of Pyrex glass. Sensors and Actuators
A: Physical 143(1):154–161.
Iliescu C, Jing J, Tay FEH, Miao J, Sun T (2005) Characterization of masking layers for deep
wet etching of glass in an improved HF/HCl solution. Surface and Coatings
Technology 198(1–3):314–318.
Jeong B, Kim MO, Lee JI, Eun Y, Choi J, Kim J (2017) Development of MEMS Multi-Mode
Electrostatic Energy Harvester Based on the SOI Process. Micromachines 8(2):51.
Kaur S, Halvorsen E, Sorasen O, Yeatman EM (2015) Characterization and Modeling of
Nonlinearities in In-Plane Gap Closing Electrostatic Energy Harvester. Journal of
Microelectromechanical Systems 24(6):2071–2082.
Khan F, Sassani F, Stoeber B (2010) Copper foil-type vibration-based electromagnetic
energy harvester. Journal of Micromechanics and Microengineering 20(12):125006.
Laermer F, Schilp A (1996) Method of anisotropically etching silicon.
Le CP, Halvorsen E, Søråsen O, Yeatman EM (2013) Wideband excitation of an electrostatic
vibration energy harvester with power-extracting end-stops. Smart Materials and
Structures 22(7):075020.
Liu H, Soon BW, Wang N, Tay CJ, Quan C, Lee C (2012) Feasibility study of a 3D
vibration-driven electromagnetic MEMS energy harvester with multiple vibration
modes. Journal of Micromechanics and Microengineering 22(12):125020.
Lu Y, Cottone F, Boisseau S, Marty F, Galayko D, Basset P (2015) A nonlinear MEMS
electrostatic kinetic energy harvester for human-powered biomedical devices. Applied
Physics Letters 107(25):253902.
Naruse Y, Matsubara N, Mabuchi K, Izumi M, Suzuki S (2009) Electrostatic micro power

142
generation from low-frequency vibration such as human motion. Journal of
Micromechanics and Microengineering 19(9):094002.
Nguyen SD, Halvorsen E, Paprotny I (2013) Bistable springs for wideband
microelectromechanical energy harvesters. Applied Physics Letters 102(2):023904.
Oxaal J, Hella M, Borca-Tasciuc DA (2016) Electrostatic MEMS vibration energy harvester
for HVAC applications with impact-based frequency up-conversion. Journal of
Micromechanics and Microengineering 26(12):124012.
Paracha AM, Basset P, Galayko D, Marty F, Bourouina T (2009) A Silicon MEMS DC/DC
Converter for Autonomous Vibration-to-Electrical-Energy Scavenger. IEEE Electron
Device Letters 30(5):481–483.
Parasuraman J, Summanwar A, Marty F, Basset P, Angelescu DE, Bourouina T (2014) Deep
reactive ion etching of sub-micrometer trenches with ultra high aspect ratio.
Microelectronic Engineering 113:35–39.
Petersen KE (1982) Silicon as a mechanical material. Proceedings of the IEEE 70(5):420–
457.
Renaud M, Altena G, Goedbloed M, Nooijer C d., Matova S, Naito Y, Yamakawa T,
Takeuchi H, Onishi K, van Schaijk R (2013) A high performance electrostatic MEMS
vibration energy harvester with corrugated inorganic SiO2-Si3N4 electret. (IEEE),
693–696.
Risquez S, Woytasik M, Cai H, Philippe H, Bayle F, Lefeuvre E, Moulin J (2017)
Micromolding of Ni-P with Reduced Ferromagnetic Properties for 3D MEMS.
Journal of The Electrochemical Society 164(5):B3096–B3100.
Sheu GJ, Yang SM, Lee T (2011) Development of a low frequency electrostatic comb-drive
energy harvester compatible to SoC design by CMOS process. Sensors and Actuators
A: Physical 167(1):70–76.
Stemme G (1991) Resonant silicon sensors. Journal of Micromechanics and
Microengineering 1(2):113–125.
Tao K, Tang L, Wu J, Lye SW, Chang H, Miao J (2018) Investigation of Multimodal
Electret-Based MEMS Energy Harvester With Impact-Induced Nonlinearity. Journal
of Microelectromechanical Systems 27(2):276–288.
Tao K, Wu J, Tang L, Xia X, Lye SW, Miao J, Hu X (2016) A novel two-degree-of-freedom
MEMS electromagnetic vibration energy harvester. Journal of Micromechanics and
Microengineering 26(3):035020.
Tvedt LGW, Nguyen DS, Halvorsen E (2010) Nonlinear Behavior of an Electrostatic Energy
Harvester Under Wide- and Narrowband Excitation. Journal of
Microelectromechanical Systems 19(2):305–316.
Wang F, Hansen O (2014) Electrostatic energy harvesting device with out-of-the-plane gap
closing scheme. Sensors and Actuators A: Physical 211:131–137.
Wang P, Liu H, Dai X, Yang Z, Wang Z, Zhao X (2012) Design, simulation, fabrication and
characterization of a micro electromagnetic vibration energy harvester with
sandwiched structure and air channel. Microelectronics Journal 43(2):154–159.
Williams DF (2008) On the mechanisms of biocompatibility. Biomaterials 29(20):2941–
2953.

143
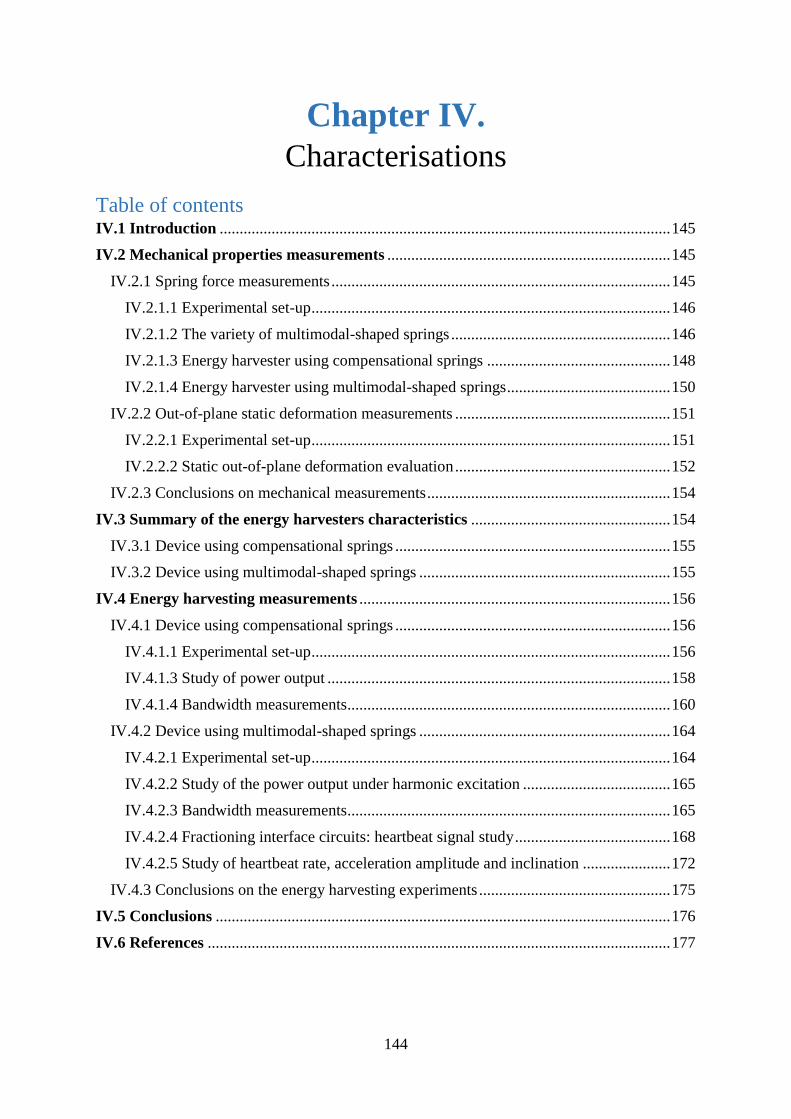
144
Chapter IV.
Characterisations
Table of contents IV.1 Introduction ................................................................................................................. 145
IV.2 Mechanical properties measurements ....................................................................... 145
IV.2.1 Spring force measurements ..................................................................................... 145
IV.2.1.1 Experimental set-up .......................................................................................... 146
IV.2.1.2 The variety of multimodal-shaped springs ....................................................... 146
IV.2.1.3 Energy harvester using compensational springs .............................................. 148
IV.2.1.4 Energy harvester using multimodal-shaped springs ......................................... 150
IV.2.2 Out-of-plane static deformation measurements ...................................................... 151
IV.2.2.1 Experimental set-up .......................................................................................... 151
IV.2.2.2 Static out-of-plane deformation evaluation ...................................................... 152
IV.2.3 Conclusions on mechanical measurements ............................................................. 154
IV.3 Summary of the energy harvesters characteristics .................................................. 154
IV.3.1 Device using compensational springs ..................................................................... 155
IV.3.2 Device using multimodal-shaped springs ............................................................... 155
IV.4 Energy harvesting measurements .............................................................................. 156
IV.4.1 Device using compensational springs ..................................................................... 156
IV.4.1.1 Experimental set-up .......................................................................................... 156
IV.4.1.3 Study of power output ...................................................................................... 158
IV.4.1.4 Bandwidth measurements................................................................................. 160
IV.4.2 Device using multimodal-shaped springs ............................................................... 164
IV.4.2.1 Experimental set-up .......................................................................................... 164
IV.4.2.2 Study of the power output under harmonic excitation ..................................... 165
IV.4.2.3 Bandwidth measurements................................................................................. 165
IV.4.2.4 Fractioning interface circuits: heartbeat signal study ....................................... 168
IV.4.2.5 Study of heartbeat rate, acceleration amplitude and inclination ...................... 172
IV.4.3 Conclusions on the energy harvesting experiments ................................................ 175
IV.5 Conclusions .................................................................................................................. 176
IV.6 References .................................................................................................................... 177
145
IV.1 Introduction
The aim of this chapter is to experimentally verify the mechanical and electrical properties of
the fabricated systems and to demonstrate their energy harvesting performance under various
excitations. First, the mechanical characterisation of the fabricated MEMS devices is
performed in order to evaluate the critical parameters of the energy harvester: the force-
displacement nonlinear characteristics of the spring and the out-of-plane deflection caused by
the static gravity force. The dimensions of the structural elements of the energy harvesters are
measured optically. The experimental capacitance values of the fabricated transducers are also
evaluated. Various energy harvesting experiments are performed for both types of MEMS
devices, with different types of external mechanical excitations and orientations with respect
to the gravity. The study of the energy harvesting under heartbeat excitation is done for the
system using multimodal-shaped springs, along with the choice of the optimal interface circuit
configuration and overall bandwidth evaluation.
IV.2 Mechanical properties measurements
This section is dedicated to the mechanical measurements performed on the fabricated MEMS
systems. Before performing the electrical measurements, it needs to be verified that desired
designed mechanical properties of the studied systems are actually obtained after the
fabrication process. The most important characteristics in the context of this work are
undoubtedly the force-displacement function of the springs and the static displacement in out-
of-plane direction due to the gravity. The experiments allowing such measurements are
presented in this section, along with the obtained results for the studied systems.
IV.2.1 Spring force measurements
The structural nonlinearities discussed before in Chapter II, being a crucial point of the energy
harvester devices, need to be experimentally verified. Several techniques are well-known to
provide the information on the force-displacement characteristics of springs, which can be
separated as direct (measurement of the reaction force) and indirect (measurement of the
dynamical response and nonlinear parameters identification, that is widely discussed in
[Kerschen, 2001], [Kerschen, 2006], [Kerschen, 2009]). In the present work, a reliable,
straightforward and relatively simple technique of measuring the reaction force using a force
probe is chosen to characterise the fabricated microsystems. This sub-section gives an overlook
on the used micromechanical testing instrument and the results of the measurements performed
for both nonlinear energy harvesting devices, as well as for the variety of multimodal-shaped
springs test structures.
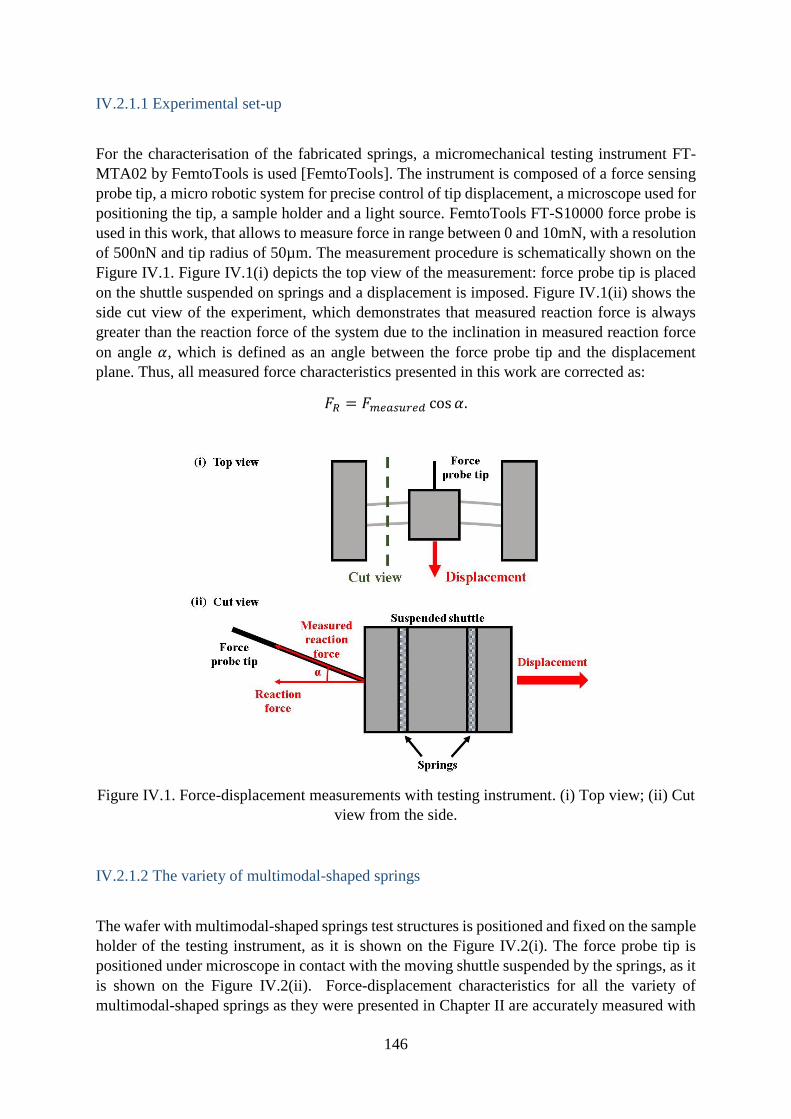
146
IV.2.1.1 Experimental set-up
For the characterisation of the fabricated springs, a micromechanical testing instrument FT-
MTA02 by FemtoTools is used [FemtoTools]. The instrument is composed of a force sensing
probe tip, a micro robotic system for precise control of tip displacement, a microscope used for
positioning the tip, a sample holder and a light source. FemtoTools FT-S10000 force probe is
used in this work, that allows to measure force in range between 0 and 10mN, with a resolution
of 500nN and tip radius of 50µm. The measurement procedure is schematically shown on the
Figure IV.1. Figure IV.1(i) depicts the top view of the measurement: force probe tip is placed
on the shuttle suspended on springs and a displacement is imposed. Figure IV.1(ii) shows the
side cut view of the experiment, which demonstrates that measured reaction force is always
greater than the reaction force of the system due to the inclination in measured reaction force
on angle 𝛼, which is defined as an angle between the force probe tip and the displacement
plane. Thus, all measured force characteristics presented in this work are corrected as:
𝐹𝑅 = 𝐹𝑚𝑒𝑎𝑠𝑢𝑟𝑒𝑑 cos 𝛼.
Figure IV.1. Force-displacement measurements with testing instrument. (i) Top view; (ii) Cut
view from the side.
IV.2.1.2 The variety of multimodal-shaped springs
The wafer with multimodal-shaped springs test structures is positioned and fixed on the sample
holder of the testing instrument, as it is shown on the Figure IV.2(i). The force probe tip is
positioned under microscope in contact with the moving shuttle suspended by the springs, as it
is shown on the Figure IV.2(ii). Force-displacement characteristics for all the variety of
multimodal-shaped springs as they were presented in Chapter II are accurately measured with

147
the displacement step size of 1μm by imposing the displacement on the shuttle, as it is depicted
on the Figure IV.2(iii).
Figure IV.2. Force-displacement characterisation of the multimodal-shaped springs. (i) Photo
of the measurement process; (ii) Example of the measurement conducted with a force probe:
probe is coming in contact with the suspended pad; (iii) Force probe is moving the suspended
pad, measuring the reaction force.
The results of the reaction force measurements are shown the Figure IV.3. The types of
produced nonlinearities well correspond to the results obtained with the numerical model
discussed in Chapter II. The main difference between the characteristics predicted by the model
and experimental results is the absolute values of reaction forces, which could be easily
explained by the limitations of the fabrication techniques, and notably the defects induced by
DRIE which is discussed in Chapter III. The presence of notching, in addition to the fact that
side walls of the springs are not perfectly vertical (which gives trapezoid shape of the spring
cross-section), contribute to the decrease of the effective thickness of the curved beam. Thus,
measured force-displacement curves are fitted by introducing the notion of effective width.
Effective width is the width of the equivalent spring of a rectangular cross-section that has the
same force-displacement characteristic as the fabricated spring of a trapezoid cross-section. It
has been evaluated that effective width of fabricated springs is equal to 16.0 ± 0.2μm, which is
consistent with SEM cross-section measurements. The experimental curves on Figure IV.3 are
fitted taking into account the effective width of fabricated curved beam and the uncertainty in
initial shape amplitude coefficients 𝑎0𝑖induced by the non-ideality of the fabrication process
and the photolithography mask itself, which is estimated not to exceed 2.5μm. Measured force-
displacement characteristics have not only the same shape as predicted by calculations, but also
the points of the intersection of the curves are quite similar to the ones evaluated numerically.
They are centred on the point of 𝑎01 = 50μm and are intersecting at 2𝑎01 = 100μm.

148
Figure IV.3. Measured force-displacement characteristics of the studied variety of
multimodal-shaped springs. (i) With second mode shape (dashed) added; (ii) With third mode
shape (dotted) added; (iii) With second and third mode shapes (dashed and dotted) added.
IV.2.1.3 Energy harvester using compensational springs
To measure the mechanical reaction force of the device using compensational springs, the
fabricated device preliminary glued on a PCB is positioned and fixed on the sample holder of
the testing instrument, as it is shown on the Figure IV.4(i). The tip of the force probe is placed
in contact with the edge of the added tungsten block, and then, as previously, the displacement
is imposed. The measured force-displacement curve with 1μm step size of the device (shown
in black dots) along with the fitted one (shown in blue solid) are given on the Figure IV.4(ii).
The measurement is performed without a bias applied between the electrodes.
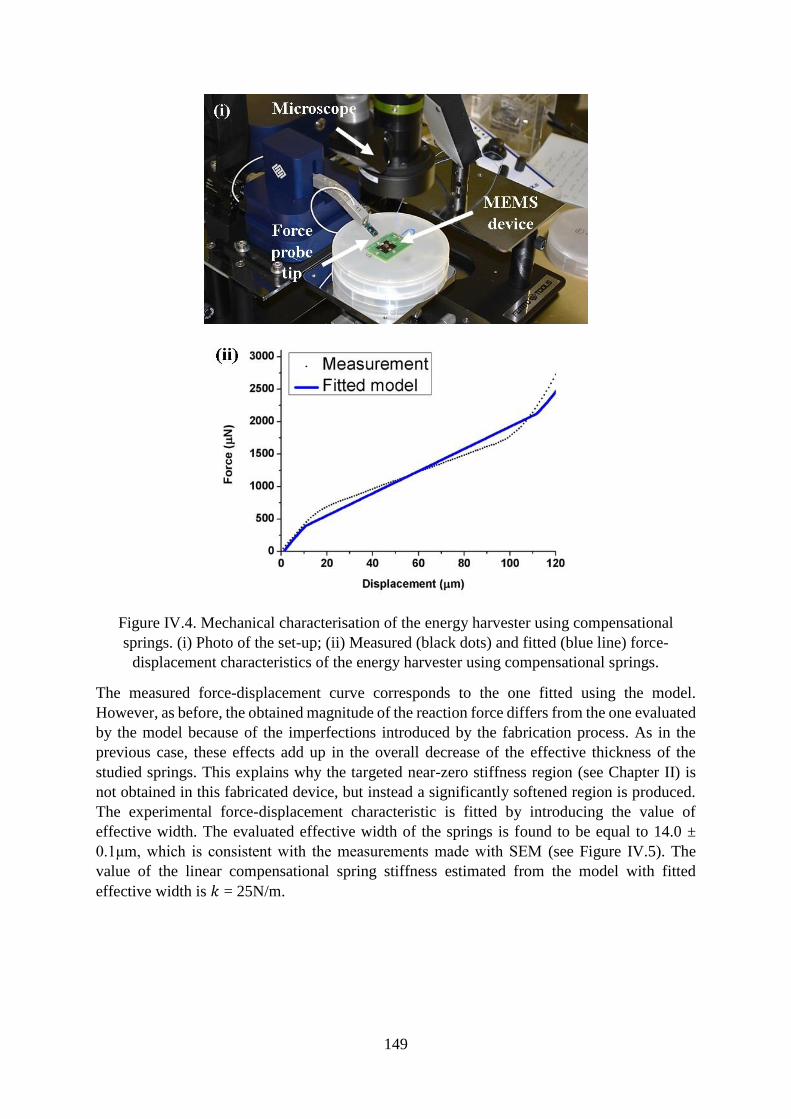
149
Figure IV.4. Mechanical characterisation of the energy harvester using compensational
springs. (i) Photo of the set-up; (ii) Measured (black dots) and fitted (blue line) force-
displacement characteristics of the energy harvester using compensational springs.
The measured force-displacement curve corresponds to the one fitted using the model.
However, as before, the obtained magnitude of the reaction force differs from the one evaluated
by the model because of the imperfections introduced by the fabrication process. As in the
previous case, these effects add up in the overall decrease of the effective thickness of the
studied springs. This explains why the targeted near-zero stiffness region (see Chapter II) is
not obtained in this fabricated device, but instead a significantly softened region is produced.
The experimental force-displacement characteristic is fitted by introducing the value of
effective width. The evaluated effective width of the springs is found to be equal to 14.0 ±
0.1μm, which is consistent with the measurements made with SEM (see Figure IV.5). The
value of the linear compensational spring stiffness estimated from the model with fitted
effective width is 𝑘 = 25N/m.
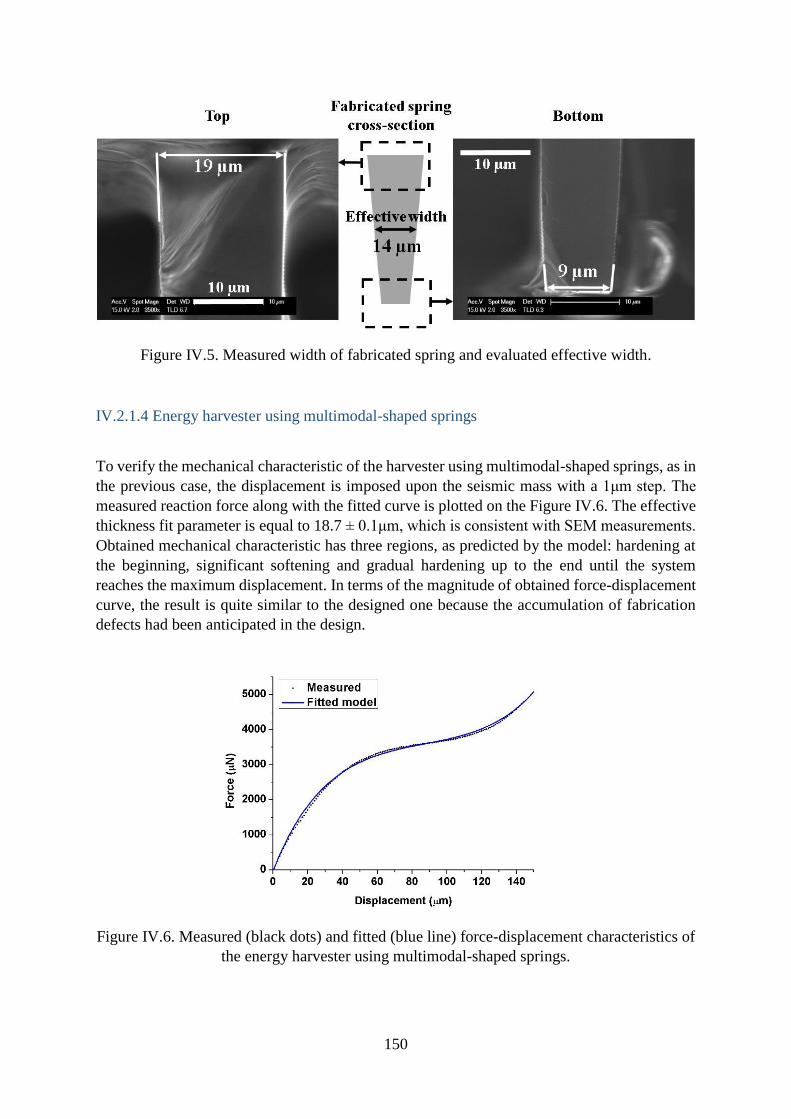
150
Figure IV.5. Measured width of fabricated spring and evaluated effective width.
IV.2.1.4 Energy harvester using multimodal-shaped springs
To verify the mechanical characteristic of the harvester using multimodal-shaped springs, as in
the previous case, the displacement is imposed upon the seismic mass with a 1μm step. The
measured reaction force along with the fitted curve is plotted on the Figure IV.6. The effective
thickness fit parameter is equal to 18.7 ± 0.1μm, which is consistent with SEM measurements.
Obtained mechanical characteristic has three regions, as predicted by the model: hardening at
the beginning, significant softening and gradual hardening up to the end until the system
reaches the maximum displacement. In terms of the magnitude of obtained force-displacement
curve, the result is quite similar to the designed one because the accumulation of fabrication
defects had been anticipated in the design.
Figure IV.6. Measured (black dots) and fitted (blue line) force-displacement characteristics of
the energy harvester using multimodal-shaped springs.

151
IV.2.2 Out-of-plane static deformation measurements
To assure that the out-of-plane deformation induced by the adding of the relatively heavy
tungsten block during the fabrication process does not affect critically the device
characteristics, it is interesting to observe the static deformation imposed by seismic mass.
Several techniques used for measuring the profile of the device can be found in literature,
mainly optical and mechanical. A full-field phase shifting profilometry technique is chosen as
relatively easy, straightforward and non-destructive method of observation.
IV.2.2.1 Experimental set-up
The set-up used to evaluate the out-of-plane deformation of the springs is a modified version
of a Michelson interferometer (Twyman-Green type) schematically shown on the Figure
IV.7(i). As a light sources, it is using two quasi-monochrome red and green light emitting
diodes (LEDs). For both sources, the emitted light is collimated and then deflected by a mirror
M1. Next, the light beam is divided into two beams by a beam splitter BS1. The first beam is
reflected from the surface of the studied device (S) through the window of the vacuum chamber
(denoted as H), whereas the second one is passing through a compensating blade identical to
the window H. The second beam is then reflected by a reference mirror M2 (with adjustable
inclination and position). The M2 mirror is controlled by a piezoelectric actuator in order to
perform phase shifting interferometry by interferogram phase shift demodulation. The two
beams, the one reflected by the sample and the reference one, are finally recombined by the
beam splitter BS2 and the produced interference is captured using a CCD camera. The photo
of the overall system is shown on the Figure IV.7(ii).
For the deformation measurements performed in this work, just the green LED is used.
Figure IV.7. Optical profilometer for the full-field measurement of the deformation of
microsystems. (i) Schematics of the set-up [Allain, 2012]; (ii) Photo of the system.
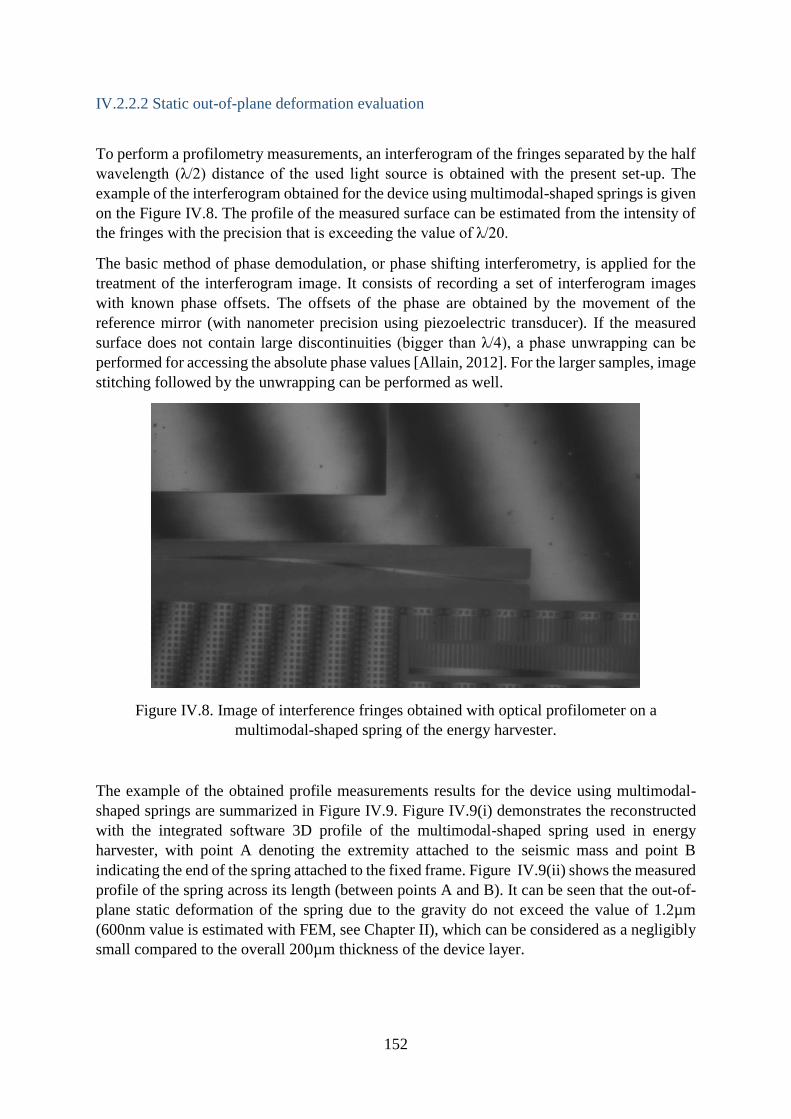
152
IV.2.2.2 Static out-of-plane deformation evaluation
To perform a profilometry measurements, an interferogram of the fringes separated by the half
wavelength (λ/2) distance of the used light source is obtained with the present set-up. The
example of the interferogram obtained for the device using multimodal-shaped springs is given
on the Figure IV.8. The profile of the measured surface can be estimated from the intensity of
the fringes with the precision that is exceeding the value of λ/20.
The basic method of phase demodulation, or phase shifting interferometry, is applied for the
treatment of the interferogram image. It consists of recording a set of interferogram images
with known phase offsets. The offsets of the phase are obtained by the movement of the
reference mirror (with nanometer precision using piezoelectric transducer). If the measured
surface does not contain large discontinuities (bigger than λ/4), a phase unwrapping can be
performed for accessing the absolute phase values [Allain, 2012]. For the larger samples, image
stitching followed by the unwrapping can be performed as well.
Figure IV.8. Image of interference fringes obtained with optical profilometer on a
multimodal-shaped spring of the energy harvester.
The example of the obtained profile measurements results for the device using multimodal-
shaped springs are summarized in Figure IV.9. Figure IV.9(i) demonstrates the reconstructed
with the integrated software 3D profile of the multimodal-shaped spring used in energy
harvester, with point A denoting the extremity attached to the seismic mass and point B
indicating the end of the spring attached to the fixed frame. Figure IV.9(ii) shows the measured
profile of the spring across its length (between points A and B). It can be seen that the out-of-
plane static deformation of the spring due to the gravity do not exceed the value of 1.2µm
(600nm value is estimated with FEM, see Chapter II), which can be considered as a negligibly
small compared to the overall 200µm thickness of the device layer.
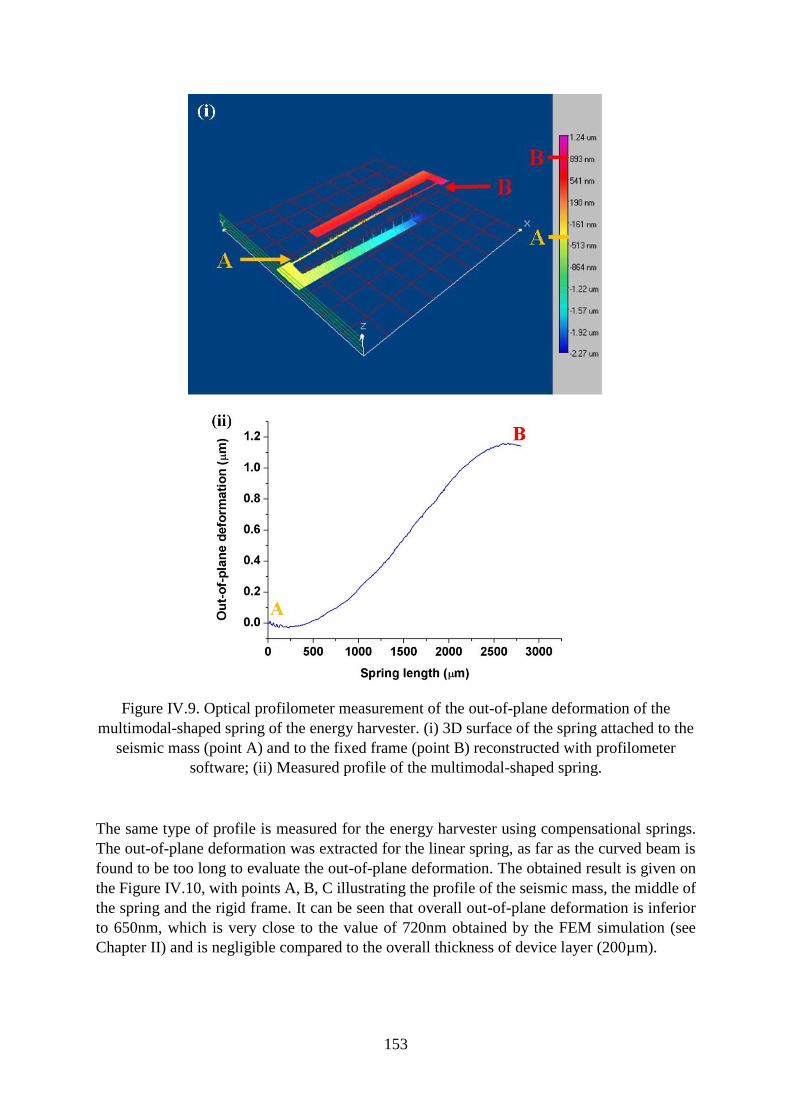
153
Figure IV.9. Optical profilometer measurement of the out-of-plane deformation of the
multimodal-shaped spring of the energy harvester. (i) 3D surface of the spring attached to the
seismic mass (point A) and to the fixed frame (point B) reconstructed with profilometer
software; (ii) Measured profile of the multimodal-shaped spring.
The same type of profile is measured for the energy harvester using compensational springs.
The out-of-plane deformation was extracted for the linear spring, as far as the curved beam is
found to be too long to evaluate the out-of-plane deformation. The obtained result is given on
the Figure IV.10, with points A, B, C illustrating the profile of the seismic mass, the middle of
the spring and the rigid frame. It can be seen that overall out-of-plane deformation is inferior
to 650nm, which is very close to the value of 720nm obtained by the FEM simulation (see
Chapter II) and is negligible compared to the overall thickness of device layer (200µm).

154
Figure IV.10. Measured profile of the compensational spring of the energy harvester. Points
A, B, C indicating seismic mass position, mid-spring and rigid frame, respectively.
IV.2.3 Conclusions on mechanical measurements
In this section, several measurements of the mechanical properties of the presented MEMS
devices are discussed. The microsystems are characterised with a force sensing probe in order
to extract the force-displacement curves of fabricated springs of various types. The fit using
the model presented in Chapter II is performed, and obtained experimental results are found to
be well described by the mentioned model. The optical profilometer measurements are done
for both energy harvesting MEMS devices to find the static out-of-plane offset induced by the
gravity. Obtained results of the optical profiles correspond pretty well to the values found with
FEM study, so the out-of-plane static deformation is proven to be well negligible compared to
the overall thickness of MEMS.
IV.3 Summary of the energy harvesters characteristics
The aim of this section is to present the basic characteristics of the fabricated energy harvesters.
As it is seen from the previous section, the fabrication process (mainly DRIE) introduces
defects that are typically impacting the dimensions of the structural elements of a MEMS. Here,
the dimensions of all the parts of the energy harvesters are measured and listed, with
comparison to the designed values, along with the maximum and minimal values of variable
capacitance 𝐶𝑣𝑎𝑟.
The structural dimensions are measured using an optical microscope. For the evaluation of the
capacitance values, a HIOKI IM3570 impedance analyser is used.
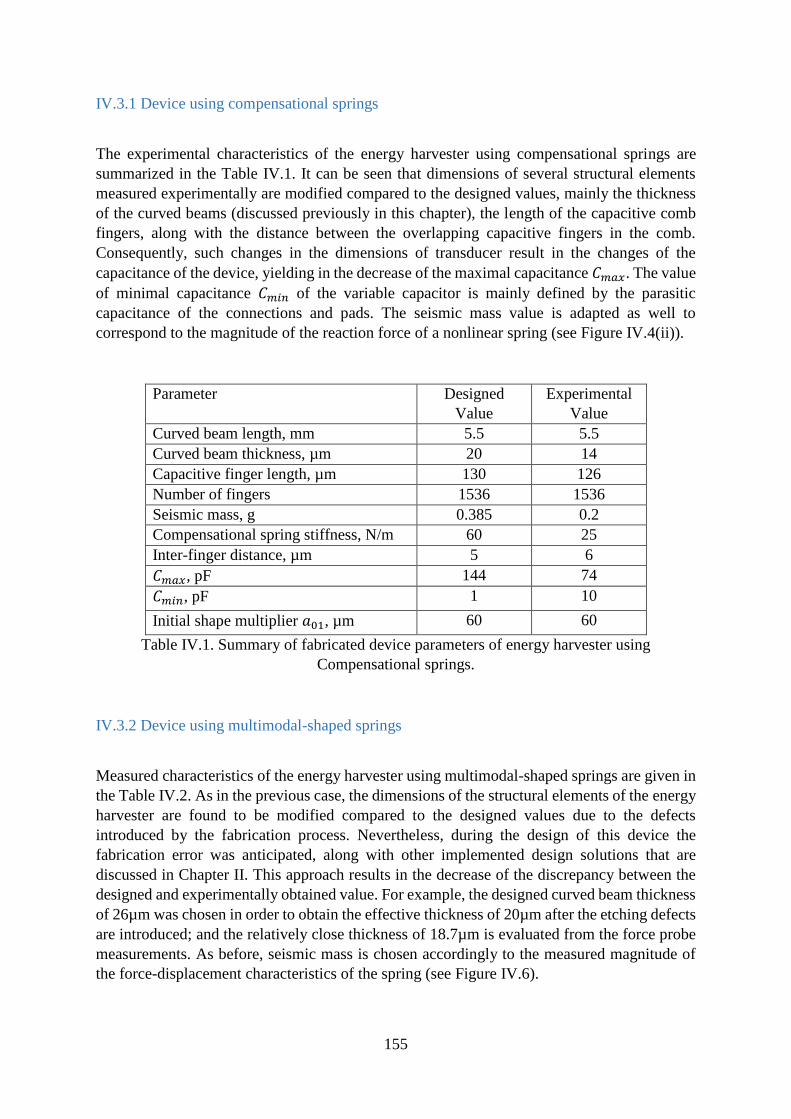
155
IV.3.1 Device using compensational springs
The experimental characteristics of the energy harvester using compensational springs are
summarized in the Table IV.1. It can be seen that dimensions of several structural elements
measured experimentally are modified compared to the designed values, mainly the thickness
of the curved beams (discussed previously in this chapter), the length of the capacitive comb
fingers, along with the distance between the overlapping capacitive fingers in the comb.
Consequently, such changes in the dimensions of transducer result in the changes of the
capacitance of the device, yielding in the decrease of the maximal capacitance 𝐶𝑚𝑎𝑥. The value
of minimal capacitance 𝐶𝑚𝑖𝑛 of the variable capacitor is mainly defined by the parasitic
capacitance of the connections and pads. The seismic mass value is adapted as well to
correspond to the magnitude of the reaction force of a nonlinear spring (see Figure IV.4(ii)).
Parameter Designed
Value
Experimental
Value
Curved beam length, mm 5.5 5.5
Curved beam thickness, µm 20 14
Capacitive finger length, µm 130 126
Number of fingers 1536 1536
Seismic mass, g 0.385 0.2
Compensational spring stiffness, N/m 60 25
Inter-finger distance, µm 5 6
𝐶𝑚𝑎𝑥, pF 144 74
𝐶𝑚𝑖𝑛, pF 1 10
Initial shape multiplier 𝑎01, µm 60 60
Table IV.1. Summary of fabricated device parameters of energy harvester using
Compensational springs.
IV.3.2 Device using multimodal-shaped springs
Measured characteristics of the energy harvester using multimodal-shaped springs are given in
the Table IV.2. As in the previous case, the dimensions of the structural elements of the energy
harvester are found to be modified compared to the designed values due to the defects
introduced by the fabrication process. Nevertheless, during the design of this device the
fabrication error was anticipated, along with other implemented design solutions that are
discussed in Chapter II. This approach results in the decrease of the discrepancy between the
designed and experimentally obtained value. For example, the designed curved beam thickness
of 26µm was chosen in order to obtain the effective thickness of 20µm after the etching defects
are introduced; and the relatively close thickness of 18.7µm is evaluated from the force probe
measurements. As before, seismic mass is chosen accordingly to the measured magnitude of
the force-displacement characteristics of the spring (see Figure IV.6).
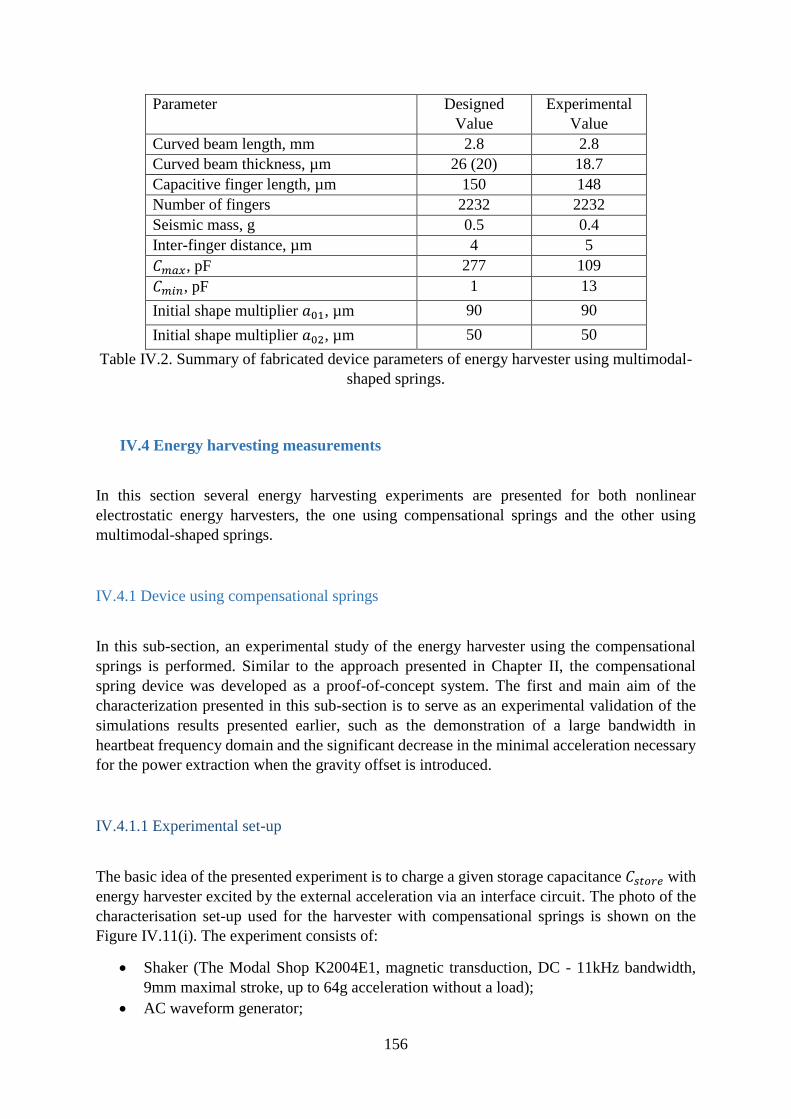
156
Parameter Designed
Value
Experimental
Value
Curved beam length, mm 2.8 2.8
Curved beam thickness, µm 26 (20) 18.7
Capacitive finger length, µm 150 148
Number of fingers 2232 2232
Seismic mass, g 0.5 0.4
Inter-finger distance, µm 4 5
𝐶𝑚𝑎𝑥, pF 277 109
𝐶𝑚𝑖𝑛, pF 1 13
Initial shape multiplier 𝑎01, µm 90 90
Initial shape multiplier 𝑎02, µm 50 50
Table IV.2. Summary of fabricated device parameters of energy harvester using multimodal-
shaped springs.
IV.4 Energy harvesting measurements
In this section several energy harvesting experiments are presented for both nonlinear
electrostatic energy harvesters, the one using compensational springs and the other using
multimodal-shaped springs.
IV.4.1 Device using compensational springs
In this sub-section, an experimental study of the energy harvester using the compensational
springs is performed. Similar to the approach presented in Chapter II, the compensational
spring device was developed as a proof-of-concept system. The first and main aim of the
characterization presented in this sub-section is to serve as an experimental validation of the
simulations results presented earlier, such as the demonstration of a large bandwidth in
heartbeat frequency domain and the significant decrease in the minimal acceleration necessary
for the power extraction when the gravity offset is introduced.
IV.4.1.1 Experimental set-up
The basic idea of the presented experiment is to charge a given storage capacitance 𝐶𝑠𝑡𝑜𝑟𝑒 with
energy harvester excited by the external acceleration via an interface circuit. The photo of the
characterisation set-up used for the harvester with compensational springs is shown on the
Figure IV.11(i). The experiment consists of:
Shaker (The Modal Shop K2004E1, magnetic transduction, DC - 11kHz bandwidth,
9mm maximal stroke, up to 64g acceleration without a load);
AC waveform generator;
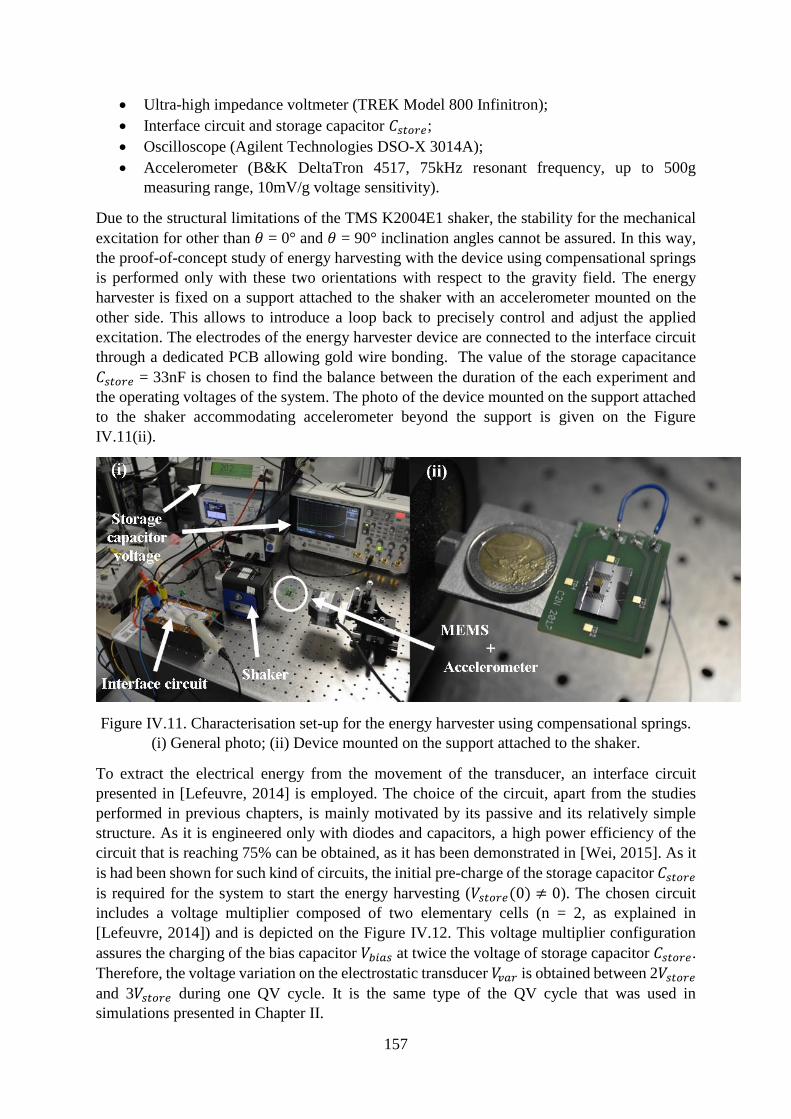
157
Ultra-high impedance voltmeter (TREK Model 800 Infinitron);
Interface circuit and storage capacitor 𝐶𝑠𝑡𝑜𝑟𝑒;
Oscilloscope (Agilent Technologies DSO-X 3014A);
Accelerometer (B&K DeltaTron 4517, 75kHz resonant frequency, up to 500g
measuring range, 10mV/g voltage sensitivity).
Due to the structural limitations of the TMS K2004E1 shaker, the stability for the mechanical
excitation for other than 𝜃 = 0° and 𝜃 = 90° inclination angles cannot be assured. In this way,
the proof-of-concept study of energy harvesting with the device using compensational springs
is performed only with these two orientations with respect to the gravity field. The energy
harvester is fixed on a support attached to the shaker with an accelerometer mounted on the
other side. This allows to introduce a loop back to precisely control and adjust the applied
excitation. The electrodes of the energy harvester device are connected to the interface circuit
through a dedicated PCB allowing gold wire bonding. The value of the storage capacitance
𝐶𝑠𝑡𝑜𝑟𝑒 = 33nF is chosen to find the balance between the duration of the each experiment and
the operating voltages of the system. The photo of the device mounted on the support attached
to the shaker accommodating accelerometer beyond the support is given on the Figure
IV.11(ii).
Figure IV.11. Characterisation set-up for the energy harvester using compensational springs.
(i) General photo; (ii) Device mounted on the support attached to the shaker.
To extract the electrical energy from the movement of the transducer, an interface circuit
presented in [Lefeuvre, 2014] is employed. The choice of the circuit, apart from the studies
performed in previous chapters, is mainly motivated by its passive and its relatively simple
structure. As it is engineered only with diodes and capacitors, a high power efficiency of the
circuit that is reaching 75% can be obtained, as it has been demonstrated in [Wei, 2015]. As it
is had been shown for such kind of circuits, the initial pre-charge of the storage capacitor 𝐶𝑠𝑡𝑜𝑟𝑒
is required for the system to start the energy harvesting (𝑉𝑠𝑡𝑜𝑟𝑒(0) ≠ 0). The chosen circuit
includes a voltage multiplier composed of two elementary cells (n = 2, as explained in
[Lefeuvre, 2014]) and is depicted on the Figure IV.12. This voltage multiplier configuration
assures the charging of the bias capacitor 𝑉𝑏𝑖𝑎𝑠 at twice the voltage of storage capacitor 𝐶𝑠𝑡𝑜𝑟𝑒.
Therefore, the voltage variation on the electrostatic transducer 𝑉𝑣𝑎𝑟 is obtained between 2𝑉𝑠𝑡𝑜𝑟𝑒
and 3𝑉𝑠𝑡𝑜𝑟𝑒 during one QV cycle. It is the same type of the QV cycle that was used in
simulations presented in Chapter II.
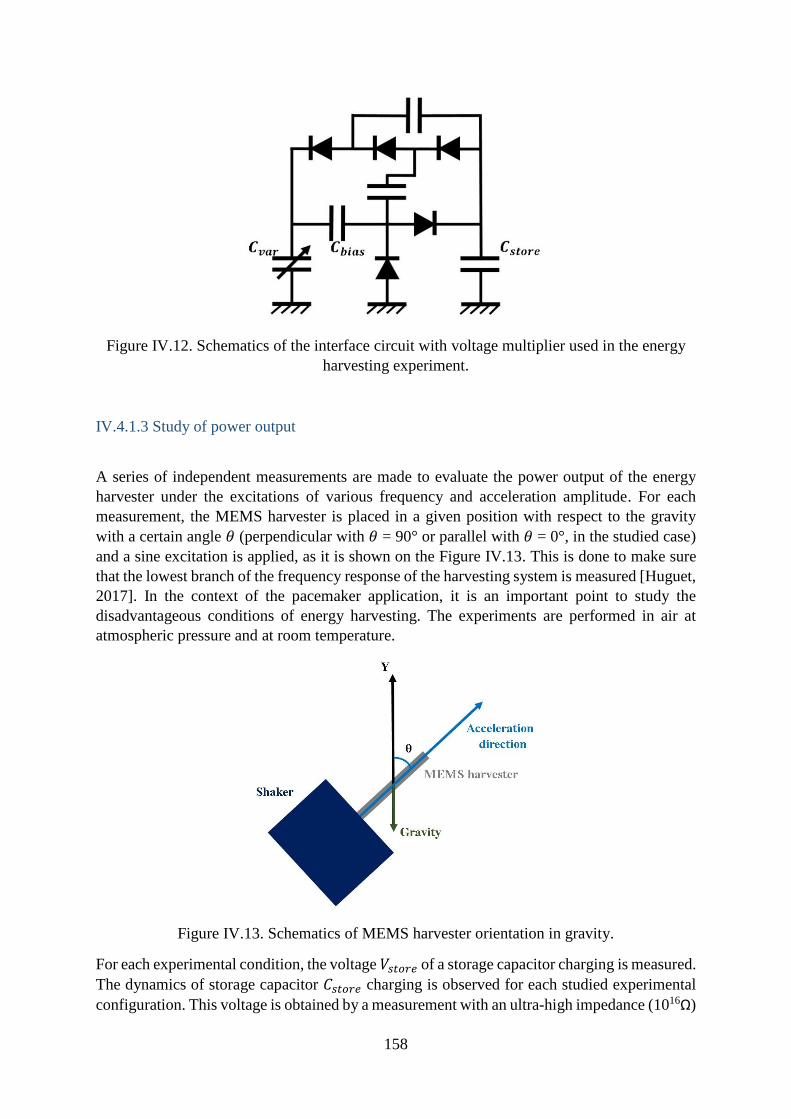
158
Figure IV.12. Schematics of the interface circuit with voltage multiplier used in the energy
harvesting experiment.
IV.4.1.3 Study of power output
A series of independent measurements are made to evaluate the power output of the energy
harvester under the excitations of various frequency and acceleration amplitude. For each
measurement, the MEMS harvester is placed in a given position with respect to the gravity
with a certain angle 𝜃 (perpendicular with 𝜃 = 90° or parallel with 𝜃 = 0°, in the studied case)
and a sine excitation is applied, as it is shown on the Figure IV.13. This is done to make sure
that the lowest branch of the frequency response of the harvesting system is measured [Huguet,
2017]. In the context of the pacemaker application, it is an important point to study the
disadvantageous conditions of energy harvesting. The experiments are performed in air at
atmospheric pressure and at room temperature.
Figure IV.13. Schematics of MEMS harvester orientation in gravity.
For each experimental condition, the voltage 𝑉𝑠𝑡𝑜𝑟𝑒 of a storage capacitor charging is measured.
The dynamics of storage capacitor 𝐶𝑠𝑡𝑜𝑟𝑒 charging is observed for each studied experimental
configuration. This voltage is obtained by a measurement with an ultra-high impedance (1016Ω)
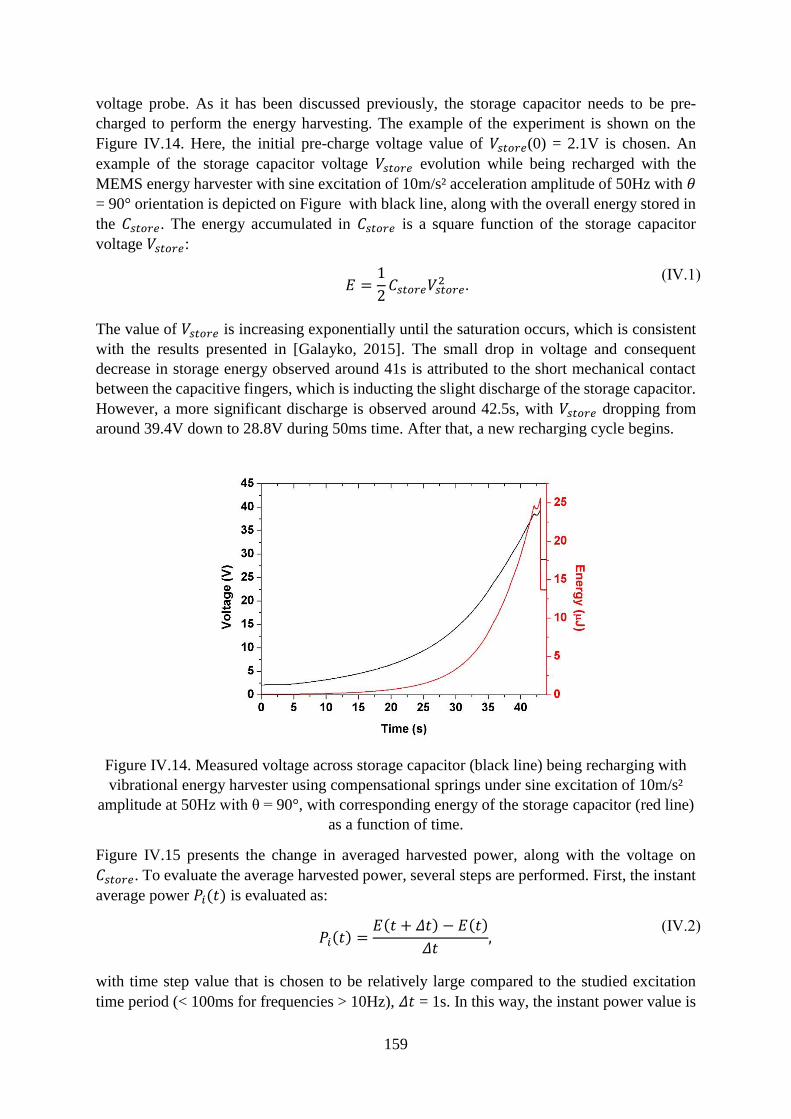
159
voltage probe. As it has been discussed previously, the storage capacitor needs to be pre-
charged to perform the energy harvesting. The example of the experiment is shown on the
Figure IV.14. Here, the initial pre-charge voltage value of 𝑉𝑠𝑡𝑜𝑟𝑒(0) = 2.1V is chosen. An
example of the storage capacitor voltage 𝑉𝑠𝑡𝑜𝑟𝑒 evolution while being recharged with the
MEMS energy harvester with sine excitation of 10m/s² acceleration amplitude of 50Hz with 𝜃
= 90° orientation is depicted on Figure with black line, along with the overall energy stored in
the 𝐶𝑠𝑡𝑜𝑟𝑒. The energy accumulated in 𝐶𝑠𝑡𝑜𝑟𝑒 is a square function of the storage capacitor
voltage 𝑉𝑠𝑡𝑜𝑟𝑒:
𝐸 =1
2𝐶𝑠𝑡𝑜𝑟𝑒𝑉𝑠𝑡𝑜𝑟𝑒
2 .
(IV.1)
The value of 𝑉𝑠𝑡𝑜𝑟𝑒 is increasing exponentially until the saturation occurs, which is consistent
with the results presented in [Galayko, 2015]. The small drop in voltage and consequent
decrease in storage energy observed around 41s is attributed to the short mechanical contact
between the capacitive fingers, which is inducting the slight discharge of the storage capacitor.
However, a more significant discharge is observed around 42.5s, with 𝑉𝑠𝑡𝑜𝑟𝑒 dropping from
around 39.4V down to 28.8V during 50ms time. After that, a new recharging cycle begins.
Figure IV.14. Measured voltage across storage capacitor (black line) being recharging with
vibrational energy harvester using compensational springs under sine excitation of 10m/s²
amplitude at 50Hz with θ = 90°, with corresponding energy of the storage capacitor (red line)
as a function of time.
Figure IV.15 presents the change in averaged harvested power, along with the voltage on
𝐶𝑠𝑡𝑜𝑟𝑒. To evaluate the average harvested power, several steps are performed. First, the instant
average power 𝑃𝑖(𝑡) is evaluated as:
𝑃𝑖(𝑡) =𝐸(𝑡 + 𝛥𝑡) − 𝐸(𝑡)
𝛥𝑡,
(IV.2)
with time step value that is chosen to be relatively large compared to the studied excitation
time period (< 100ms for frequencies > 10Hz), 𝛥𝑡 = 1s. In this way, the instant power value is
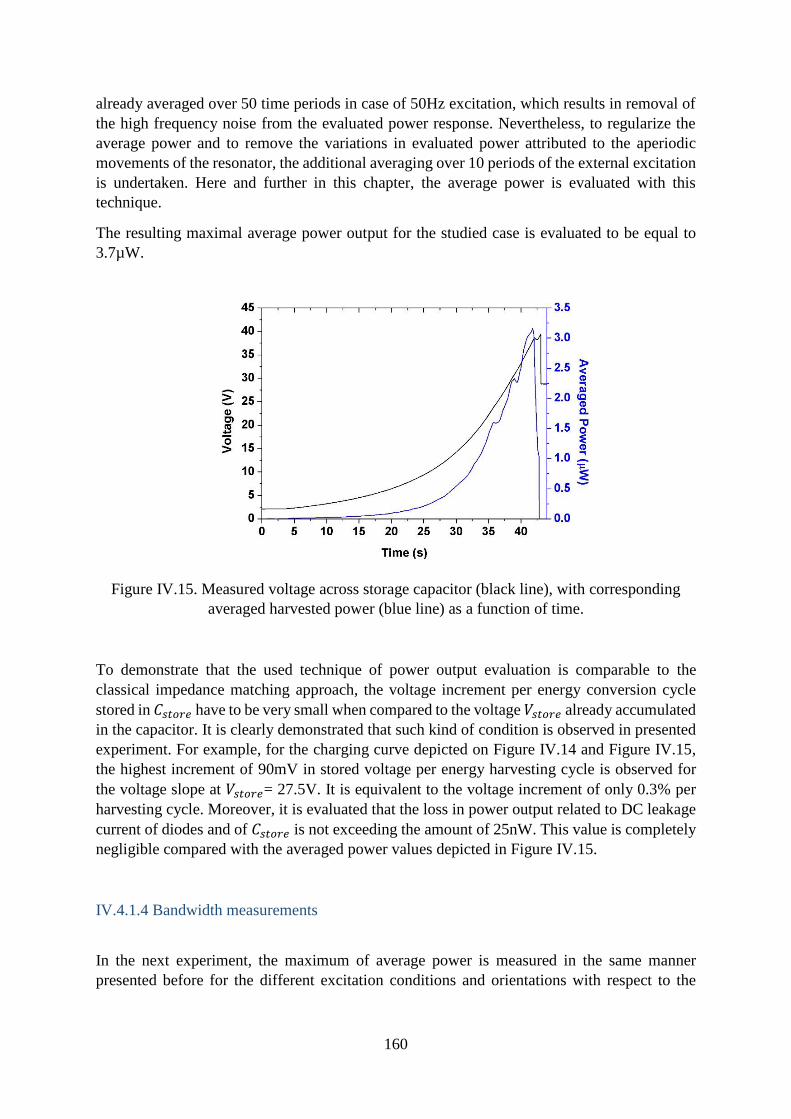
160
already averaged over 50 time periods in case of 50Hz excitation, which results in removal of
the high frequency noise from the evaluated power response. Nevertheless, to regularize the
average power and to remove the variations in evaluated power attributed to the aperiodic
movements of the resonator, the additional averaging over 10 periods of the external excitation
is undertaken. Here and further in this chapter, the average power is evaluated with this
technique.
The resulting maximal average power output for the studied case is evaluated to be equal to
3.7µW.
Figure IV.15. Measured voltage across storage capacitor (black line), with corresponding
averaged harvested power (blue line) as a function of time.
To demonstrate that the used technique of power output evaluation is comparable to the
classical impedance matching approach, the voltage increment per energy conversion cycle
stored in 𝐶𝑠𝑡𝑜𝑟𝑒 have to be very small when compared to the voltage 𝑉𝑠𝑡𝑜𝑟𝑒 already accumulated
in the capacitor. It is clearly demonstrated that such kind of condition is observed in presented
experiment. For example, for the charging curve depicted on Figure IV.14 and Figure IV.15,
the highest increment of 90mV in stored voltage per energy harvesting cycle is observed for
the voltage slope at 𝑉𝑠𝑡𝑜𝑟𝑒= 27.5V. It is equivalent to the voltage increment of only 0.3% per
harvesting cycle. Moreover, it is evaluated that the loss in power output related to DC leakage
current of diodes and of 𝐶𝑠𝑡𝑜𝑟𝑒 is not exceeding the amount of 25nW. This value is completely
negligible compared with the averaged power values depicted in Figure IV.15.
IV.4.1.4 Bandwidth measurements
In the next experiment, the maximum of average power is measured in the same manner
presented before for the different excitation conditions and orientations with respect to the

161
gravity. As previously, the maximum of the average power is accessed from the series of
independent measurements of 𝐶𝑠𝑡𝑜𝑟𝑒 recharging with the MEMS energy harvester under test.
First, the measurements are performed for the device orientation perpendicular to the gravity,
𝜃 = 90°. The series of point-by-point experiments of the voltage capacitor 𝐶𝑠𝑡𝑜𝑟𝑒 charging
under the different acceleration amplitudes (varying between 3m/s2 and 13m/s2) and
frequencies (in range of 10 – 100Hz) of sine excitation is done. Obtained results are plotted on
the Figure IV.16(i). A significant modification of the obtained bandwidth is observed: no power
is extracted at all frequencies for a 3m/s2 acceleration amplitude (red solid line); at 7m/s2
(yellow dashed line) the frequency range of 20 – 100Hz is covered with nearly-linear
dependence between the harvested power and the frequency, with observed harvested power
>1μW at frequencies >30Hz; at 10m/s2 acceleration amplitude (green dotted line) the averaged
harvested power increases even more up to the value of 4.7μW, until it drops significantly at
the frequency of 90Hz; at 13m/s2 amplitude (blue dash-dotted line) only relatively small
frequency range of 10-50Hz provides power output with the maximum of 920nW at 20Hz
frequency.
Next, the same type of experiment is performed for the system orientation aligned with the
gravity, 𝜃 = 0°. The results are demonstrated on the Figure IV.16(ii). The frequency response
in terms of average harvested power is changed dramatically while compared with in-plane
case: at 3m/s2 acceleration amplitude (red solid line) a peak that is reaching the value of 1.47μW
is observed; 7m/s2 acceleration amplitude (yellow dashed line) produces almost linear increase
in average harvested power up to 800nW at 50Hz, followed by the drop; at 10m/s2 excitation
(green dotted line) a plateau in frequency range of 10 – 60Hz is produced, which reaches
780nW at 30Hz; and 13m/s2 excitation produces a broad response in 10 – 60Hz frequency range
with drop at 300Hz attributed to the short-circuit.
Note that the natural resonant frequency of the device for small displacements is evaluated as
66.6Hz for 𝜃 = 90° and 77.9Hz for 𝜃 = 0°.
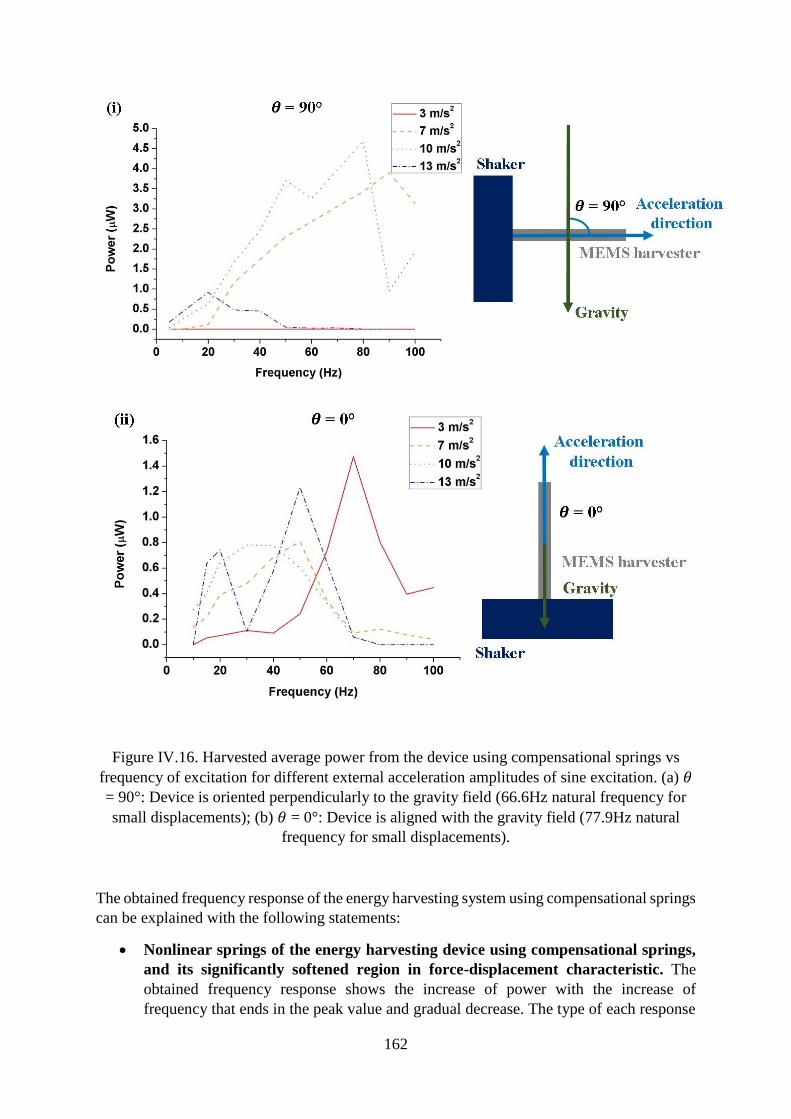
162
Figure IV.16. Harvested average power from the device using compensational springs vs
frequency of excitation for different external acceleration amplitudes of sine excitation. (a) 𝜃
= 90°: Device is oriented perpendicularly to the gravity field (66.6Hz natural frequency for
small displacements); (b) 𝜃 = 0°: Device is aligned with the gravity field (77.9Hz natural
frequency for small displacements).
The obtained frequency response of the energy harvesting system using compensational springs
can be explained with the following statements:
Nonlinear springs of the energy harvesting device using compensational springs,
and its significantly softened region in force-displacement characteristic. The
obtained frequency response shows the increase of power with the increase of
frequency that ends in the peak value and gradual decrease. The type of each response
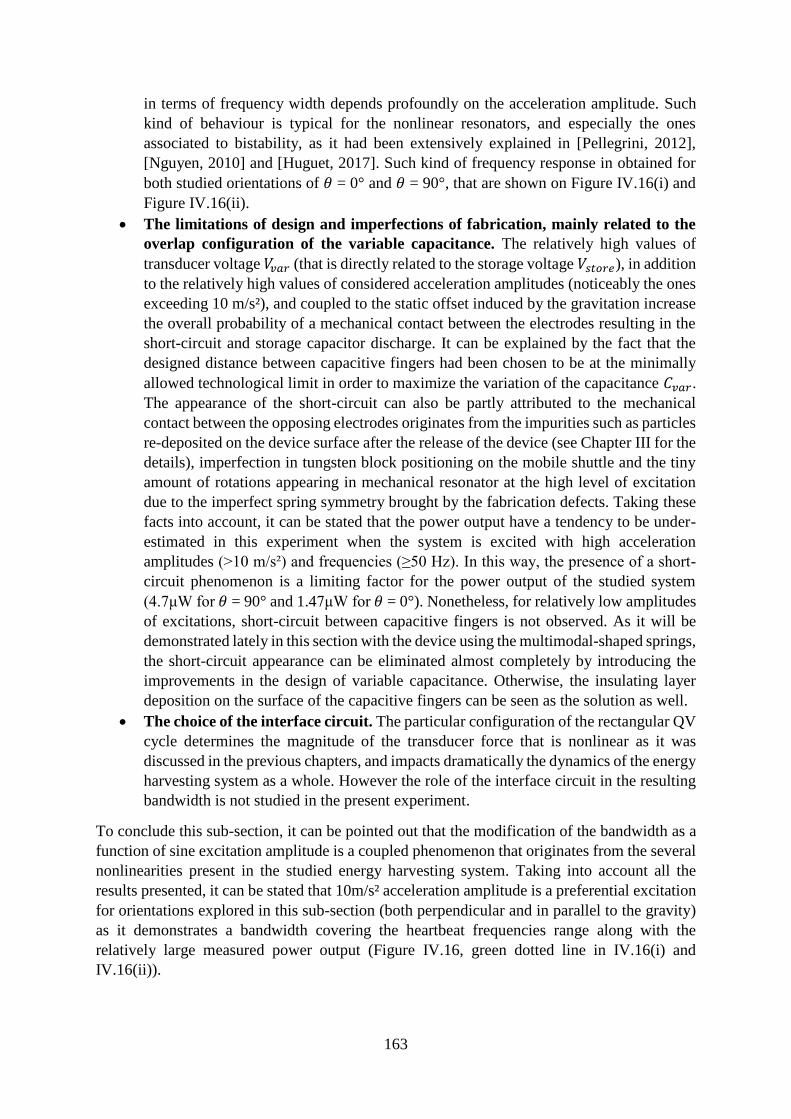
163
in terms of frequency width depends profoundly on the acceleration amplitude. Such
kind of behaviour is typical for the nonlinear resonators, and especially the ones
associated to bistability, as it had been extensively explained in [Pellegrini, 2012],
[Nguyen, 2010] and [Huguet, 2017]. Such kind of frequency response in obtained for
both studied orientations of 𝜃 = 0° and 𝜃 = 90°, that are shown on Figure IV.16(i) and
Figure IV.16(ii).
The limitations of design and imperfections of fabrication, mainly related to the
overlap configuration of the variable capacitance. The relatively high values of
transducer voltage 𝑉𝑣𝑎𝑟 (that is directly related to the storage voltage 𝑉𝑠𝑡𝑜𝑟𝑒), in addition
to the relatively high values of considered acceleration amplitudes (noticeably the ones
exceeding 10 m/s²), and coupled to the static offset induced by the gravitation increase
the overall probability of a mechanical contact between the electrodes resulting in the
short-circuit and storage capacitor discharge. It can be explained by the fact that the
designed distance between capacitive fingers had been chosen to be at the minimally
allowed technological limit in order to maximize the variation of the capacitance 𝐶𝑣𝑎𝑟.
The appearance of the short-circuit can also be partly attributed to the mechanical
contact between the opposing electrodes originates from the impurities such as particles
re-deposited on the device surface after the release of the device (see Chapter III for the
details), imperfection in tungsten block positioning on the mobile shuttle and the tiny
amount of rotations appearing in mechanical resonator at the high level of excitation
due to the imperfect spring symmetry brought by the fabrication defects. Taking these
facts into account, it can be stated that the power output have a tendency to be under-
estimated in this experiment when the system is excited with high acceleration
amplitudes (>10 m/s²) and frequencies (≥50 Hz). In this way, the presence of a short-
circuit phenomenon is a limiting factor for the power output of the studied system
(4.7μW for 𝜃 = 90° and 1.47μW for 𝜃 = 0°). Nonetheless, for relatively low amplitudes
of excitations, short-circuit between capacitive fingers is not observed. As it will be
demonstrated lately in this section with the device using the multimodal-shaped springs,
the short-circuit appearance can be eliminated almost completely by introducing the
improvements in the design of variable capacitance. Otherwise, the insulating layer
deposition on the surface of the capacitive fingers can be seen as the solution as well.
The choice of the interface circuit. The particular configuration of the rectangular QV
cycle determines the magnitude of the transducer force that is nonlinear as it was
discussed in the previous chapters, and impacts dramatically the dynamics of the energy
harvesting system as a whole. However the role of the interface circuit in the resulting
bandwidth is not studied in the present experiment.
To conclude this sub-section, it can be pointed out that the modification of the bandwidth as a
function of sine excitation amplitude is a coupled phenomenon that originates from the several
nonlinearities present in the studied energy harvesting system. Taking into account all the
results presented, it can be stated that 10m/s² acceleration amplitude is a preferential excitation
for orientations explored in this sub-section (both perpendicular and in parallel to the gravity)
as it demonstrates a bandwidth covering the heartbeat frequencies range along with the
relatively large measured power output (Figure IV.16, green dotted line in IV.16(i) and
IV.16(ii)).

164
IV.4.2 Device using multimodal-shaped springs
In this sub-section the results of the energy harvesting experiment for the device using
multimodal-shaped springs are presented. A slight modification of experimental set-up is
performed to allow the study of a heartbeat-type mechanical excitation. The experiment of a
bandwidth evaluation under the harmonic excitation similar to the one presented in the previous
sub-section is performed. Next, an impact of the innovative type of interface circuits -
fractioning circuits - is studied under the heartbeat excitation. Finally, a complete study of the
role of the heartbeat acceleration amplitude, heartbeat rate and the orientation with respect to
the gravity is performed in order to evaluate the performance of the energy harvester in the
context of autonomous pacemaker application.
IV.4.2.1 Experimental set-up
The experimental set-up that is used to characterise the device with multimodal-shaped springs
share a lot of similarities with the one presented in the previous sub-section for the device using
compensational springs. However, an important modification to the energy harvesting set-up
is made and the shaker is replaced with the more advance model (B&K Type 4809, magnetic
transduction, 10 – 20kHz bandwidth, 8mm maximal stroke, up to 100g acceleration), along
with an associated power amplifier (B&K Type 2718) and an arbitrary waveform generator
(KEYSIGHT 33600A). This shaker model allows to introduce the arbitrary inclination of the
MEMS device with respect to the gravity orientation. The use of an arbitrary waveform
generator, as already mentioned, is required here to reproduce a heartbeat-type signal. The
photo of the set-up is presented on the Figure IV.17.
Figure IV.17. Photo of characterisation set-up for the energy harvester using multimodal-
shaped springs.
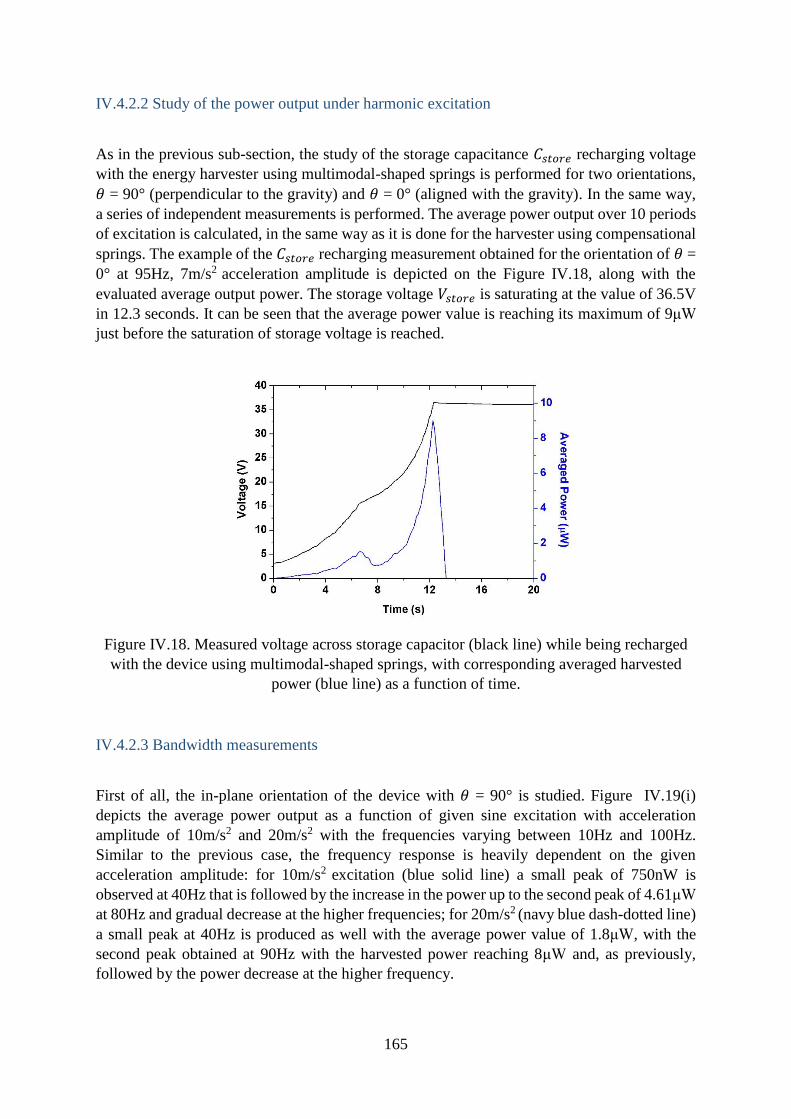
165
IV.4.2.2 Study of the power output under harmonic excitation
As in the previous sub-section, the study of the storage capacitance 𝐶𝑠𝑡𝑜𝑟𝑒 recharging voltage
with the energy harvester using multimodal-shaped springs is performed for two orientations,
𝜃 = 90° (perpendicular to the gravity) and 𝜃 = 0° (aligned with the gravity). In the same way,
a series of independent measurements is performed. The average power output over 10 periods
of excitation is calculated, in the same way as it is done for the harvester using compensational
springs. The example of the 𝐶𝑠𝑡𝑜𝑟𝑒 recharging measurement obtained for the orientation of 𝜃 =
0° at 95Hz, 7m/s2 acceleration amplitude is depicted on the Figure IV.18, along with the
evaluated average output power. The storage voltage 𝑉𝑠𝑡𝑜𝑟𝑒 is saturating at the value of 36.5V
in 12.3 seconds. It can be seen that the average power value is reaching its maximum of 9μW
just before the saturation of storage voltage is reached.
Figure IV.18. Measured voltage across storage capacitor (black line) while being recharged
with the device using multimodal-shaped springs, with corresponding averaged harvested
power (blue line) as a function of time.
IV.4.2.3 Bandwidth measurements
First of all, the in-plane orientation of the device with 𝜃 = 90° is studied. Figure IV.19(i)
depicts the average power output as a function of given sine excitation with acceleration
amplitude of 10m/s2 and 20m/s2 with the frequencies varying between 10Hz and 100Hz.
Similar to the previous case, the frequency response is heavily dependent on the given
acceleration amplitude: for 10m/s2 excitation (blue solid line) a small peak of 750nW is
observed at 40Hz that is followed by the increase in the power up to the second peak of 4.61μW
at 80Hz and gradual decrease at the higher frequencies; for 20m/s2 (navy blue dash-dotted line)
a small peak at 40Hz is produced as well with the average power value of 1.8μW, with the
second peak obtained at 90Hz with the harvested power reaching 8μW and, as previously,
followed by the power decrease at the higher frequency.
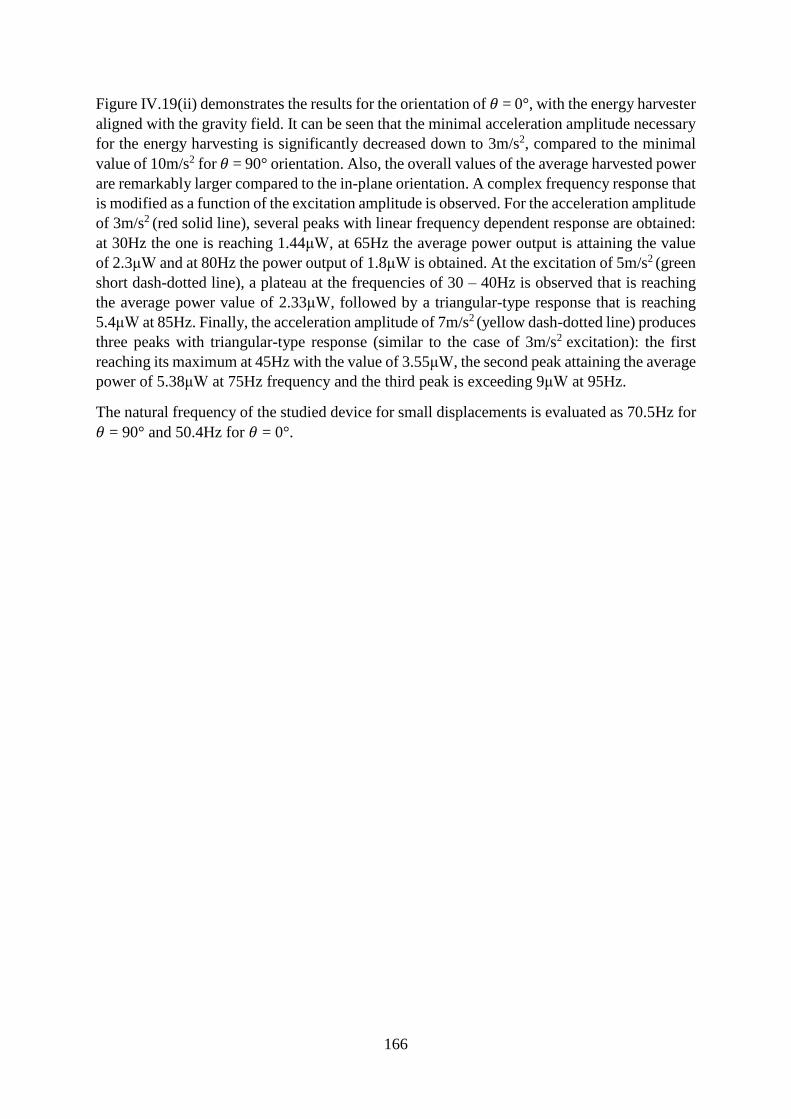
166
Figure IV.19(ii) demonstrates the results for the orientation of 𝜃 = 0°, with the energy harvester
aligned with the gravity field. It can be seen that the minimal acceleration amplitude necessary
for the energy harvesting is significantly decreased down to 3m/s2, compared to the minimal
value of 10m/s2 for 𝜃 = 90° orientation. Also, the overall values of the average harvested power
are remarkably larger compared to the in-plane orientation. A complex frequency response that
is modified as a function of the excitation amplitude is observed. For the acceleration amplitude
of 3m/s2 (red solid line), several peaks with linear frequency dependent response are obtained:
at 30Hz the one is reaching 1.44μW, at 65Hz the average power output is attaining the value
of 2.3μW and at 80Hz the power output of 1.8μW is obtained. At the excitation of 5m/s2 (green
short dash-dotted line), a plateau at the frequencies of 30 – 40Hz is observed that is reaching
the average power value of 2.33μW, followed by a triangular-type response that is reaching
5.4μW at 85Hz. Finally, the acceleration amplitude of 7m/s2 (yellow dash-dotted line) produces
three peaks with triangular-type response (similar to the case of 3m/s2 excitation): the first
reaching its maximum at 45Hz with the value of 3.55μW, the second peak attaining the average
power of 5.38μW at 75Hz frequency and the third peak is exceeding 9μW at 95Hz.
The natural frequency of the studied device for small displacements is evaluated as 70.5Hz for
𝜃 = 90° and 50.4Hz for 𝜃 = 0°.
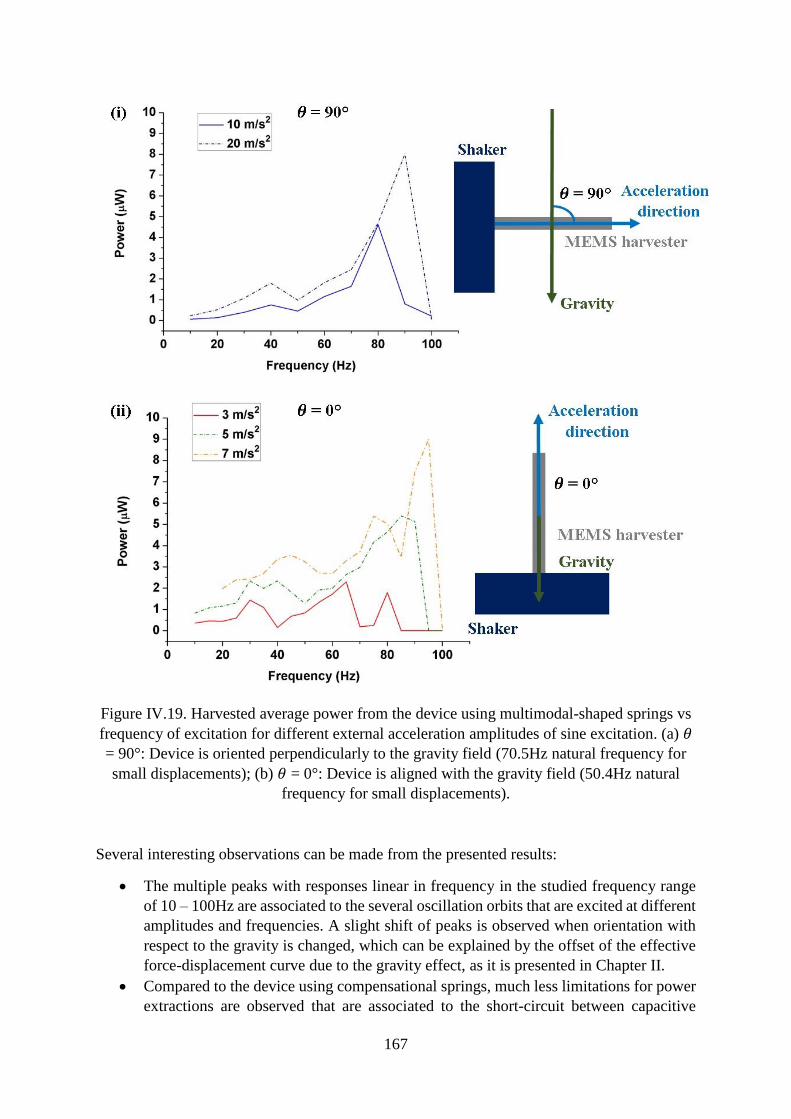
167
Figure IV.19. Harvested average power from the device using multimodal-shaped springs vs
frequency of excitation for different external acceleration amplitudes of sine excitation. (a) 𝜃
= 90°: Device is oriented perpendicularly to the gravity field (70.5Hz natural frequency for
small displacements); (b) 𝜃 = 0°: Device is aligned with the gravity field (50.4Hz natural
frequency for small displacements).
Several interesting observations can be made from the presented results:
The multiple peaks with responses linear in frequency in the studied frequency range
of 10 – 100Hz are associated to the several oscillation orbits that are excited at different
amplitudes and frequencies. A slight shift of peaks is observed when orientation with
respect to the gravity is changed, which can be explained by the offset of the effective
force-displacement curve due to the gravity effect, as it is presented in Chapter II.
Compared to the device using compensational springs, much less limitations for power
extractions are observed that are associated to the short-circuit between capacitive

168
fingers. This result is explained by the fact that the multimodal-shaped springs designed
for this system tend to produce less undesired in-plane rotations, decreasing the
probability of mechanical contact between electrodes. This claim can be supported by
the fact that less power drops in the bandwidth are observed, compared to the case of
compensational springs device.
The device can produce a power output >1µW with parallel to the gravity orientation
(𝜃 = 0°) in all studied frequency range (10 – 100Hz) under the excitations of amplitude
lower than 10m/s2.
IV.4.2.4 Fractioning interface circuits: heartbeat signal study
Fractioning interface circuits are the innovative interface circuits for electrostatic electret-free
energy harvesting that were patented by E. Lefeuvre in 2017 [Lefeuvre, 2017]. The general
configuration schematics of these circuits is shown on the Figure IV.20. It consists of
alternating patterns of diodes and capacitances. The structural elements that are placed between
he variable capacitance 𝐶𝑣𝑎𝑟 and storage capacitor 𝐶𝑠𝑡𝑜𝑟𝑒 are denoted as P blocks (highlighted
in green on Figure IV.20), whereas the ones that are positioned in between storage capacitor
𝐶𝑠𝑡𝑜𝑟𝑒 and the ground are denoted as Q blocks (highlighted in blue on Figure IV.20). As it can
be seen from the schematics, the circuit is completely passive (which yield in relatively low
energy losses) and compatible with Magnetic Resonance Imaging (MRI), which is important
in the context of the envisaged application. Indeed, this kind of circuit doesn't embed any
magnetic cores generally used to obtain high inductance or high coupling coils.
Figure IV.20. Schematics of fractioning interface circuit.
The remarkable characteristic of such kind of the circuits is the possibility to adjust the voltage
parameters of QV cycle (𝑉𝑚𝑖𝑛 and 𝑉𝑚𝑎𝑥) as a fractions of a storage voltage 𝑉𝑠𝑡𝑜𝑟𝑒 by controlling
the quantity of used structural elements, denoted as P and Q. The minimal (𝑉𝑚𝑖𝑛) and maximal
voltage (𝑉𝑚𝑎𝑥) of QV cycle can be expressed as:
{
𝑉𝑚𝑖𝑛 =
𝑃 + 𝑄 − 1
𝑄𝑉𝑠𝑡𝑜𝑟𝑒;
𝑉𝑚𝑎𝑥 =𝑃 + 𝑄
𝑄𝑉𝑠𝑡𝑜𝑟𝑒;
𝑉𝑚𝑎𝑥 − 𝑉𝑚𝑖𝑛 =1
𝑄𝑉𝑠𝑡𝑜𝑟𝑒 ,
(IV.1)
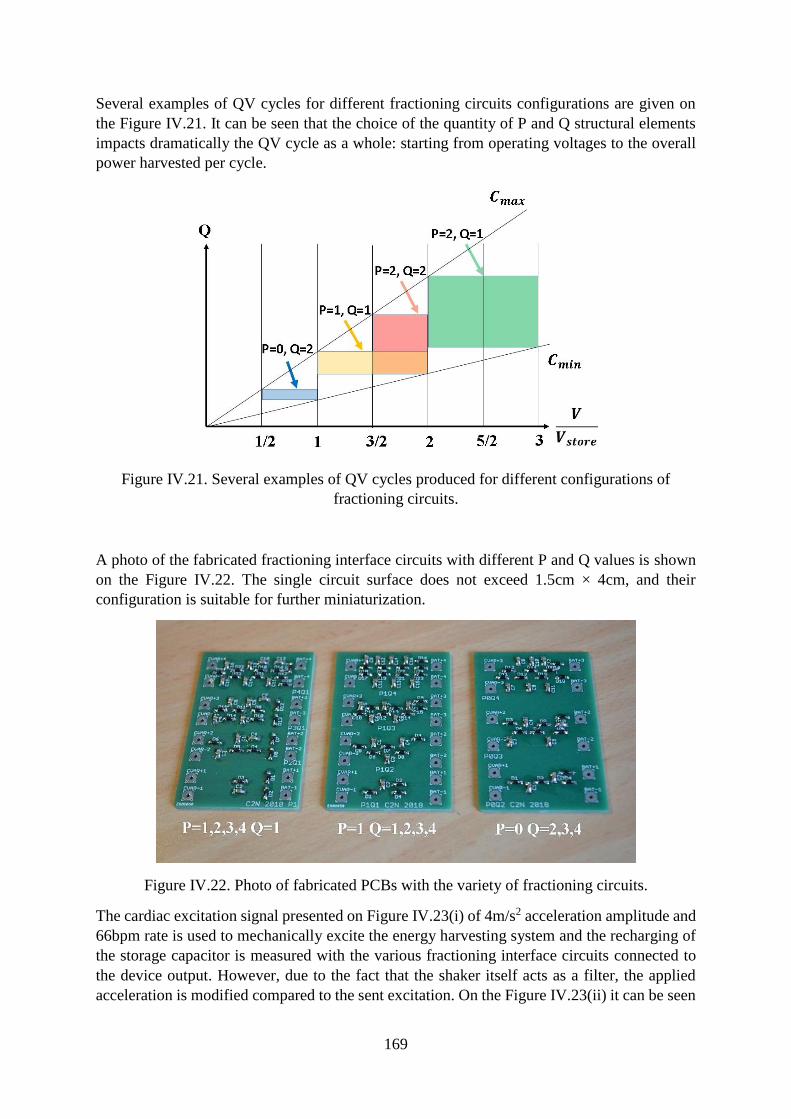
169
Several examples of QV cycles for different fractioning circuits configurations are given on
the Figure IV.21. It can be seen that the choice of the quantity of P and Q structural elements
impacts dramatically the QV cycle as a whole: starting from operating voltages to the overall
power harvested per cycle.
Figure IV.21. Several examples of QV cycles produced for different configurations of
fractioning circuits.
A photo of the fabricated fractioning interface circuits with different P and Q values is shown
on the Figure IV.22. The single circuit surface does not exceed 1.5cm × 4cm, and their
configuration is suitable for further miniaturization.
Figure IV.22. Photo of fabricated PCBs with the variety of fractioning circuits.
The cardiac excitation signal presented on Figure IV.23(i) of 4m/s2 acceleration amplitude and
66bpm rate is used to mechanically excite the energy harvesting system and the recharging of
the storage capacitor is measured with the various fractioning interface circuits connected to
the device output. However, due to the fact that the shaker itself acts as a filter, the applied
acceleration is modified compared to the sent excitation. On the Figure IV.23(ii) it can be seen
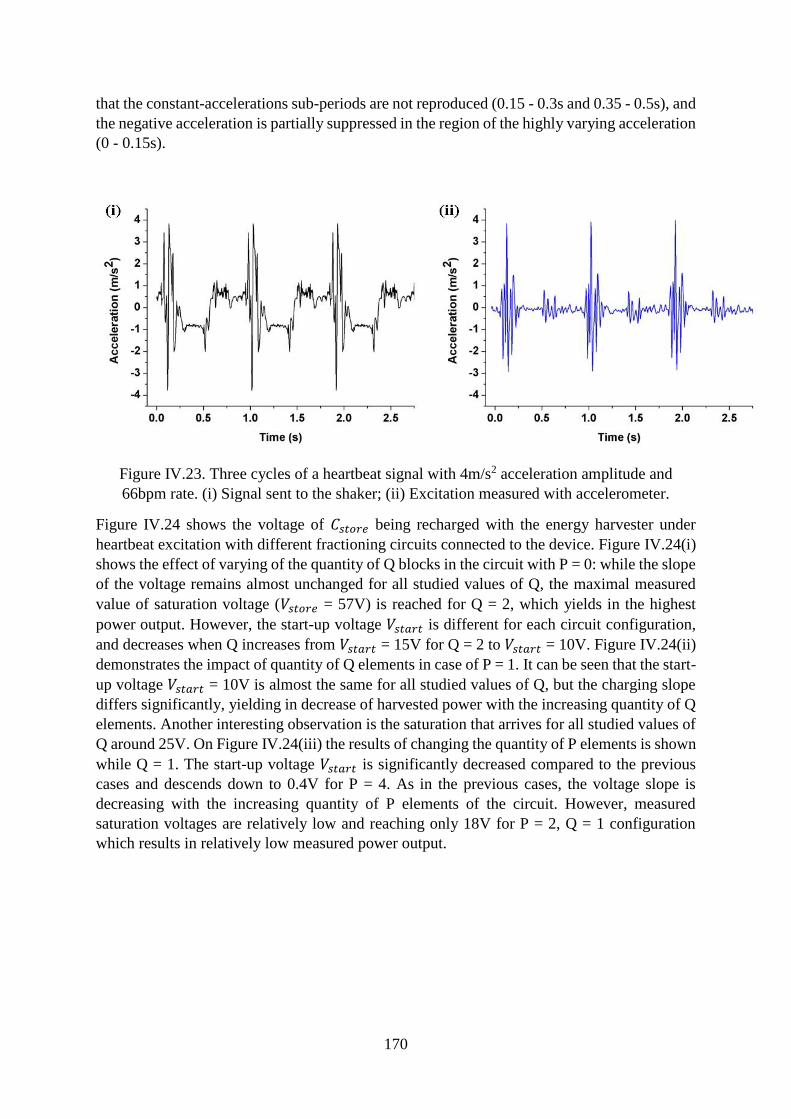
170
that the constant-accelerations sub-periods are not reproduced (0.15 - 0.3s and 0.35 - 0.5s), and
the negative acceleration is partially suppressed in the region of the highly varying acceleration
(0 - 0.15s).
Figure IV.23. Three cycles of a heartbeat signal with 4m/s2 acceleration amplitude and
66bpm rate. (i) Signal sent to the shaker; (ii) Excitation measured with accelerometer.
Figure IV.24 shows the voltage of 𝐶𝑠𝑡𝑜𝑟𝑒 being recharged with the energy harvester under
heartbeat excitation with different fractioning circuits connected to the device. Figure IV.24(i)
shows the effect of varying of the quantity of Q blocks in the circuit with P = 0: while the slope
of the voltage remains almost unchanged for all studied values of Q, the maximal measured
value of saturation voltage (𝑉𝑠𝑡𝑜𝑟𝑒 = 57V) is reached for Q = 2, which yields in the highest
power output. However, the start-up voltage 𝑉𝑠𝑡𝑎𝑟𝑡 is different for each circuit configuration,
and decreases when Q increases from 𝑉𝑠𝑡𝑎𝑟𝑡 = 15V for Q = 2 to 𝑉𝑠𝑡𝑎𝑟𝑡 = 10V. Figure IV.24(ii)
demonstrates the impact of quantity of Q elements in case of P = 1. It can be seen that the start-
up voltage 𝑉𝑠𝑡𝑎𝑟𝑡 = 10V is almost the same for all studied values of Q, but the charging slope
differs significantly, yielding in decrease of harvested power with the increasing quantity of Q
elements. Another interesting observation is the saturation that arrives for all studied values of
Q around 25V. On Figure IV.24(iii) the results of changing the quantity of P elements is shown
while Q = 1. The start-up voltage 𝑉𝑠𝑡𝑎𝑟𝑡 is significantly decreased compared to the previous
cases and descends down to 0.4V for P = 4. As in the previous cases, the voltage slope is
decreasing with the increasing quantity of P elements of the circuit. However, measured
saturation voltages are relatively low and reaching only 18V for P = 2, Q = 1 configuration
which results in relatively low measured power output.
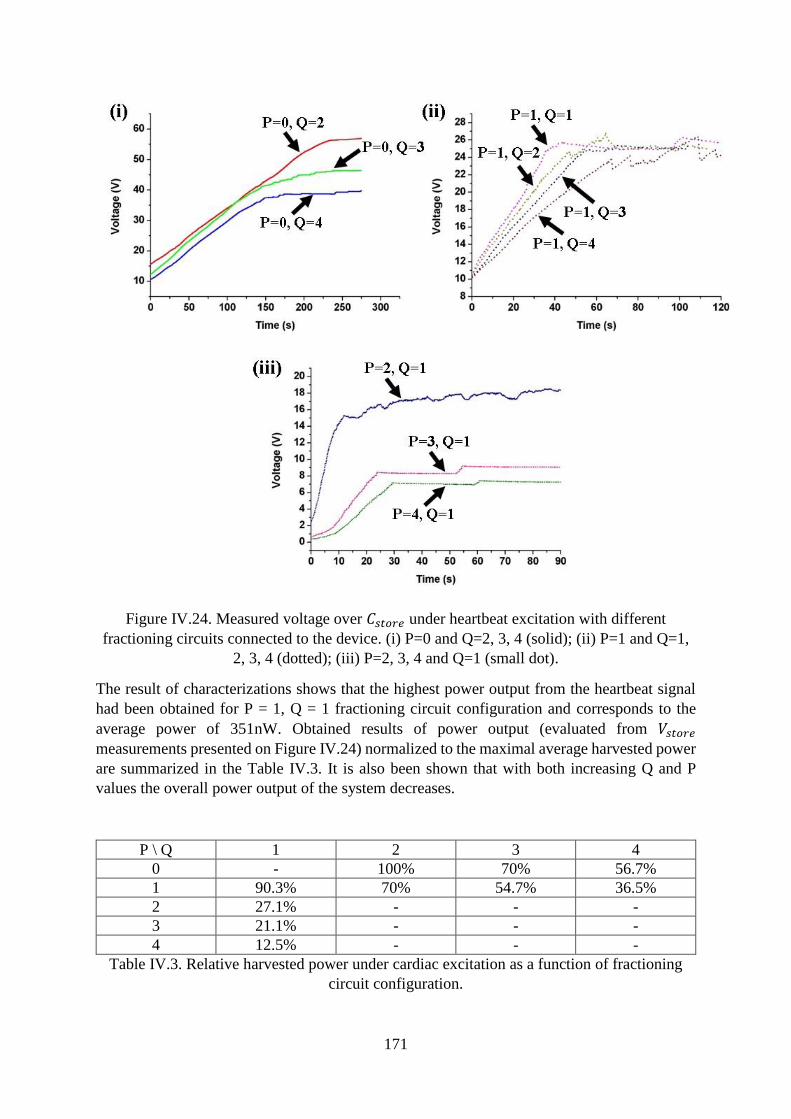
171
Figure IV.24. Measured voltage over 𝐶𝑠𝑡𝑜𝑟𝑒 under heartbeat excitation with different
fractioning circuits connected to the device. (i) P=0 and Q=2, 3, 4 (solid); (ii) P=1 and Q=1,
2, 3, 4 (dotted); (iii) P=2, 3, 4 and Q=1 (small dot).
The result of characterizations shows that the highest power output from the heartbeat signal
had been obtained for P = 1, Q = 1 fractioning circuit configuration and corresponds to the
average power of 351nW. Obtained results of power output (evaluated from 𝑉𝑠𝑡𝑜𝑟𝑒
measurements presented on Figure IV.24) normalized to the maximal average harvested power
are summarized in the Table IV.3. It is also been shown that with both increasing Q and P
values the overall power output of the system decreases.
P \ Q 1 2 3 4
0 - 100% 70% 56.7%
1 90.3% 70% 54.7% 36.5%
2 27.1% - - -
3 21.1% - - -
4 12.5% - - -
Table IV.3. Relative harvested power under cardiac excitation as a function of fractioning
circuit configuration.
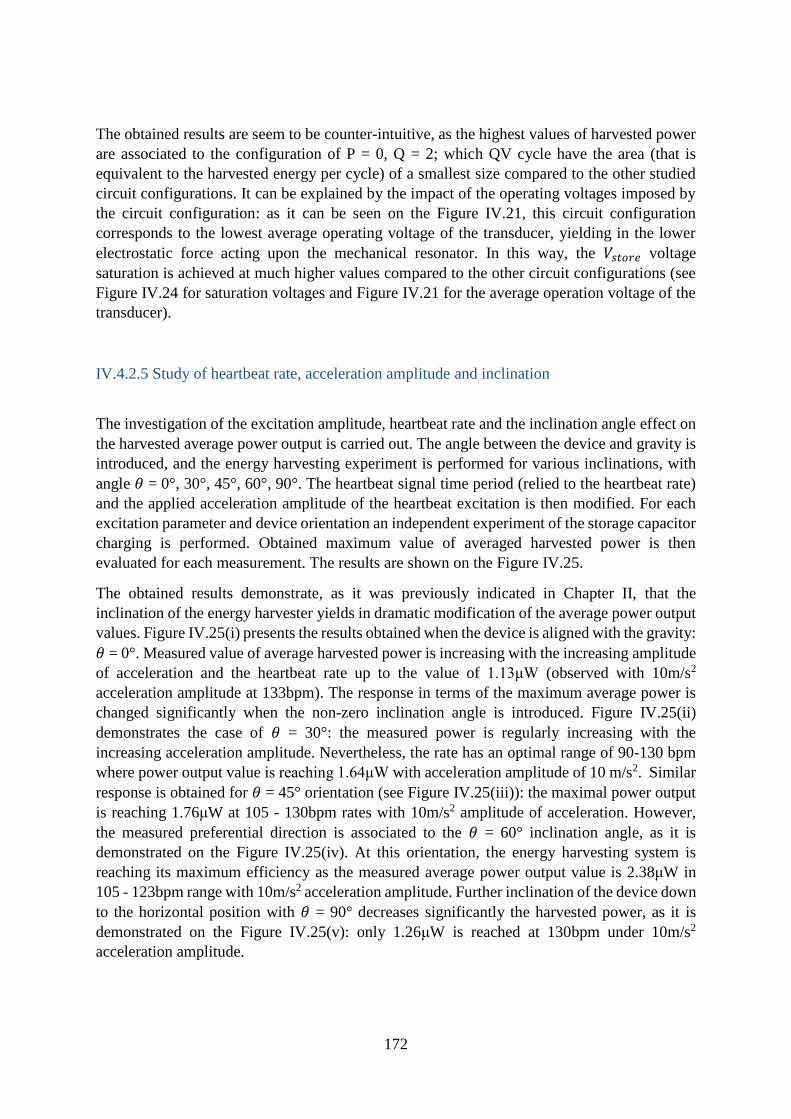
172
The obtained results are seem to be counter-intuitive, as the highest values of harvested power
are associated to the configuration of P = 0, Q = 2; which QV cycle have the area (that is
equivalent to the harvested energy per cycle) of a smallest size compared to the other studied
circuit configurations. It can be explained by the impact of the operating voltages imposed by
the circuit configuration: as it can be seen on the Figure IV.21, this circuit configuration
corresponds to the lowest average operating voltage of the transducer, yielding in the lower
electrostatic force acting upon the mechanical resonator. In this way, the 𝑉𝑠𝑡𝑜𝑟𝑒 voltage
saturation is achieved at much higher values compared to the other circuit configurations (see
Figure IV.24 for saturation voltages and Figure IV.21 for the average operation voltage of the
transducer).
IV.4.2.5 Study of heartbeat rate, acceleration amplitude and inclination
The investigation of the excitation amplitude, heartbeat rate and the inclination angle effect on
the harvested average power output is carried out. The angle between the device and gravity is
introduced, and the energy harvesting experiment is performed for various inclinations, with
angle 𝜃 = 0°, 30°, 45°, 60°, 90°. The heartbeat signal time period (relied to the heartbeat rate)
and the applied acceleration amplitude of the heartbeat excitation is then modified. For each
excitation parameter and device orientation an independent experiment of the storage capacitor
charging is performed. Obtained maximum value of averaged harvested power is then
evaluated for each measurement. The results are shown on the Figure IV.25.
The obtained results demonstrate, as it was previously indicated in Chapter II, that the
inclination of the energy harvester yields in dramatic modification of the average power output
values. Figure IV.25(i) presents the results obtained when the device is aligned with the gravity:
𝜃 = 0°. Measured value of average harvested power is increasing with the increasing amplitude
of acceleration and the heartbeat rate up to the value of 1.13μW (observed with 10m/s2
acceleration amplitude at 133bpm). The response in terms of the maximum average power is
changed significantly when the non-zero inclination angle is introduced. Figure IV.25(ii)
demonstrates the case of 𝜃 = 30°: the measured power is regularly increasing with the
increasing acceleration amplitude. Nevertheless, the rate has an optimal range of 90-130 bpm
where power output value is reaching 1.64μW with acceleration amplitude of 10 m/s2. Similar
response is obtained for 𝜃 = 45° orientation (see Figure IV.25(iii)): the maximal power output
is reaching 1.76μW at 105 - 130bpm rates with 10m/s2 amplitude of acceleration. However,
the measured preferential direction is associated to the 𝜃 = 60° inclination angle, as it is
demonstrated on the Figure IV.25(iv). At this orientation, the energy harvesting system is
reaching its maximum efficiency as the measured average power output value is 2.38μW in
105 - 123bpm range with 10m/s2 acceleration amplitude. Further inclination of the device down
to the horizontal position with 𝜃 = 90° decreases significantly the harvested power, as it is
demonstrated on the Figure IV.25(v): only 1.26μW is reached at 130bpm under 10m/s2
acceleration amplitude.
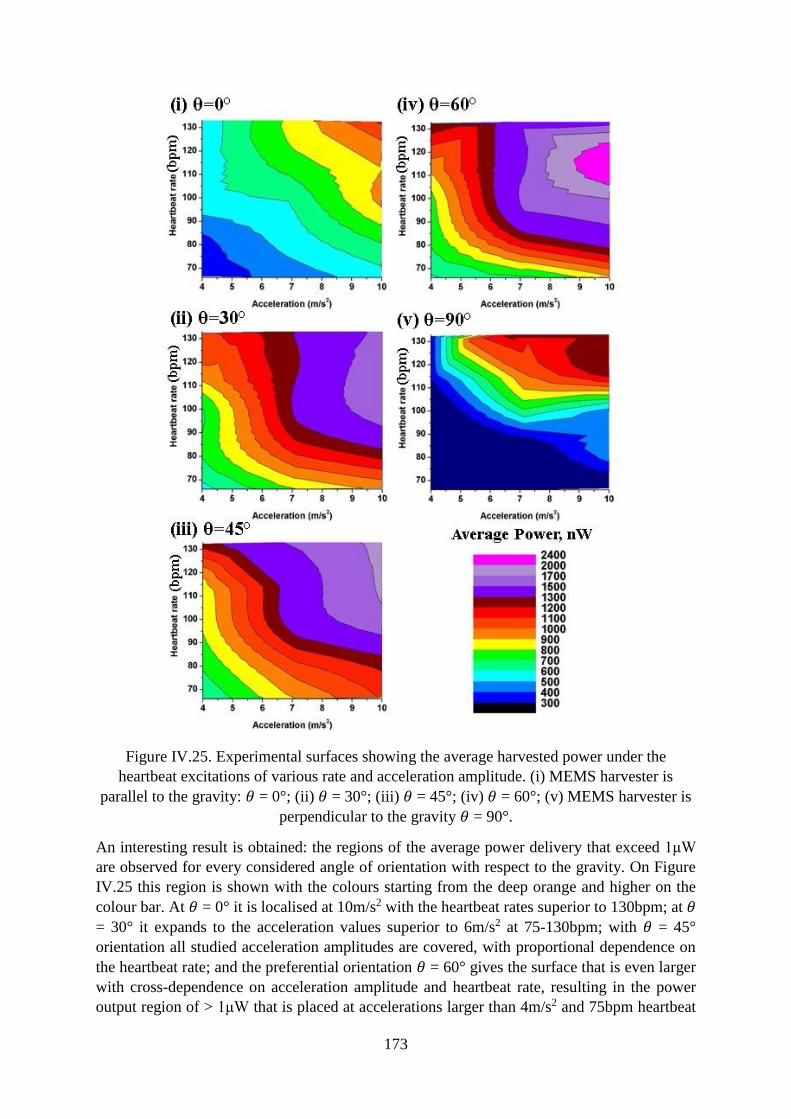
173
Figure IV.25. Experimental surfaces showing the average harvested power under the
heartbeat excitations of various rate and acceleration amplitude. (i) MEMS harvester is
parallel to the gravity: 𝜃 = 0°; (ii) 𝜃 = 30°; (iii) 𝜃 = 45°; (iv) 𝜃 = 60°; (v) MEMS harvester is
perpendicular to the gravity 𝜃 = 90°.
An interesting result is obtained: the regions of the average power delivery that exceed 1μW
are observed for every considered angle of orientation with respect to the gravity. On Figure
IV.25 this region is shown with the colours starting from the deep orange and higher on the
colour bar. At 𝜃 = 0° it is localised at 10m/s2 with the heartbeat rates superior to 130bpm; at 𝜃
= 30° it expands to the acceleration values superior to 6m/s2 at 75-130bpm; with 𝜃 = 45°
orientation all studied acceleration amplitudes are covered, with proportional dependence on
the heartbeat rate; and the preferential orientation 𝜃 = 60° gives the surface that is even larger
with cross-dependence on acceleration amplitude and heartbeat rate, resulting in the power
output region of > 1μW that is placed at accelerations larger than 4m/s2 and 75bpm heartbeat
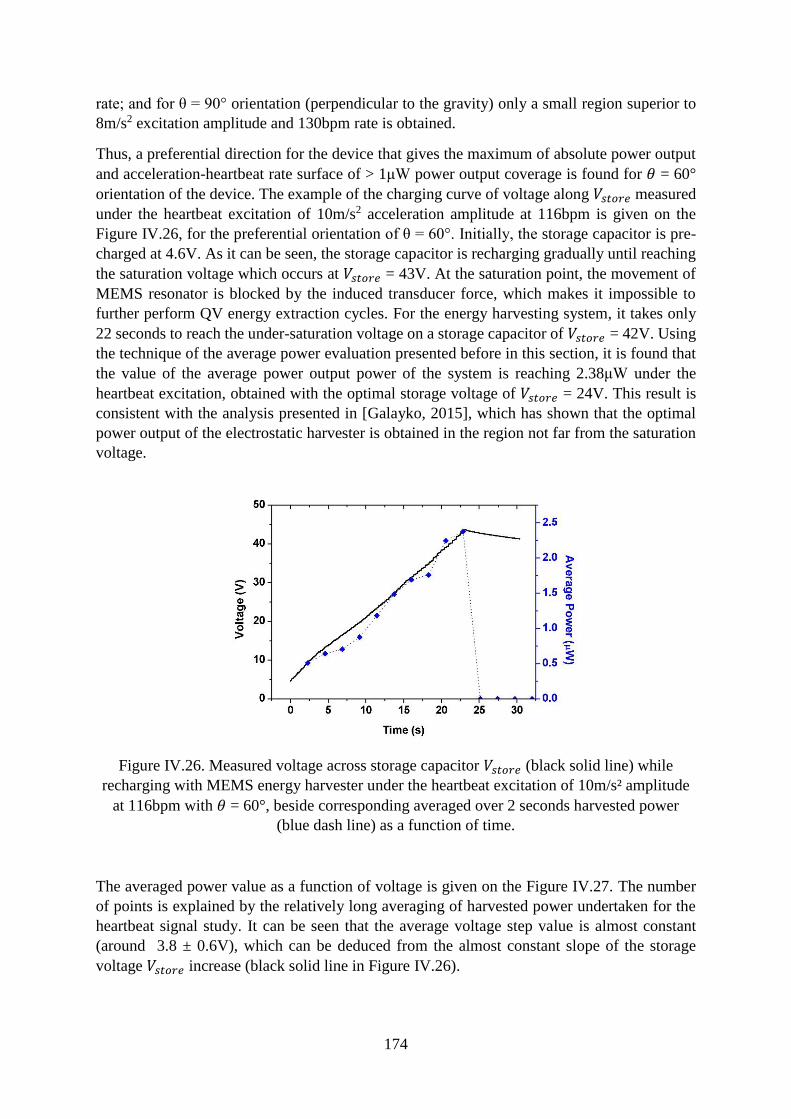
174
rate; and for θ = 90° orientation (perpendicular to the gravity) only a small region superior to
8m/s2 excitation amplitude and 130bpm rate is obtained.
Thus, a preferential direction for the device that gives the maximum of absolute power output
and acceleration-heartbeat rate surface of > 1μW power output coverage is found for 𝜃 = 60°
orientation of the device. The example of the charging curve of voltage along 𝑉𝑠𝑡𝑜𝑟𝑒 measured
under the heartbeat excitation of 10m/s2 acceleration amplitude at 116bpm is given on the
Figure IV.26, for the preferential orientation of θ = 60°. Initially, the storage capacitor is pre-
charged at 4.6V. As it can be seen, the storage capacitor is recharging gradually until reaching
the saturation voltage which occurs at 𝑉𝑠𝑡𝑜𝑟𝑒 = 43V. At the saturation point, the movement of
MEMS resonator is blocked by the induced transducer force, which makes it impossible to
further perform QV energy extraction cycles. For the energy harvesting system, it takes only
22 seconds to reach the under-saturation voltage on a storage capacitor of 𝑉𝑠𝑡𝑜𝑟𝑒 = 42V. Using
the technique of the average power evaluation presented before in this section, it is found that
the value of the average power output power of the system is reaching 2.38μW under the
heartbeat excitation, obtained with the optimal storage voltage of 𝑉𝑠𝑡𝑜𝑟𝑒 = 24V. This result is
consistent with the analysis presented in [Galayko, 2015], which has shown that the optimal
power output of the electrostatic harvester is obtained in the region not far from the saturation
voltage.
Figure IV.26. Measured voltage across storage capacitor 𝑉𝑠𝑡𝑜𝑟𝑒 (black solid line) while
recharging with MEMS energy harvester under the heartbeat excitation of 10m/s² amplitude
at 116bpm with 𝜃 = 60°, beside corresponding averaged over 2 seconds harvested power
(blue dash line) as a function of time.
The averaged power value as a function of voltage is given on the Figure IV.27. The number
of points is explained by the relatively long averaging of harvested power undertaken for the
heartbeat signal study. It can be seen that the average voltage step value is almost constant
(around 3.8 ± 0.6V), which can be deduced from the almost constant slope of the storage
voltage 𝑉𝑠𝑡𝑜𝑟𝑒 increase (black solid line in Figure IV.26).
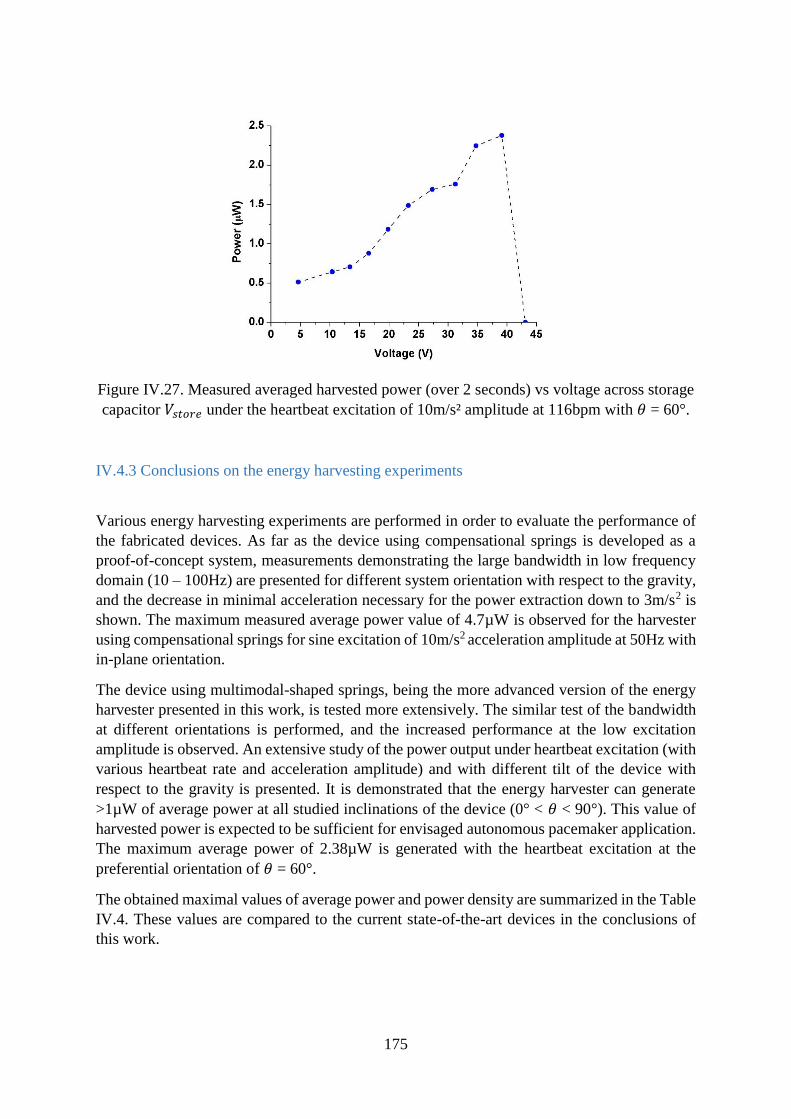
175
Figure IV.27. Measured averaged harvested power (over 2 seconds) vs voltage across storage
capacitor 𝑉𝑠𝑡𝑜𝑟𝑒 under the heartbeat excitation of 10m/s² amplitude at 116bpm with 𝜃 = 60°.
IV.4.3 Conclusions on the energy harvesting experiments
Various energy harvesting experiments are performed in order to evaluate the performance of
the fabricated devices. As far as the device using compensational springs is developed as a
proof-of-concept system, measurements demonstrating the large bandwidth in low frequency
domain (10 – 100Hz) are presented for different system orientation with respect to the gravity,
and the decrease in minimal acceleration necessary for the power extraction down to 3m/s2 is
shown. The maximum measured average power value of 4.7µW is observed for the harvester
using compensational springs for sine excitation of 10m/s2 acceleration amplitude at 50Hz with
in-plane orientation.
The device using multimodal-shaped springs, being the more advanced version of the energy
harvester presented in this work, is tested more extensively. The similar test of the bandwidth
at different orientations is performed, and the increased performance at the low excitation
amplitude is observed. An extensive study of the power output under heartbeat excitation (with
various heartbeat rate and acceleration amplitude) and with different tilt of the device with
respect to the gravity is presented. It is demonstrated that the energy harvester can generate
>1µW of average power at all studied inclinations of the device (0° < 𝜃 < 90°). This value of
harvested power is expected to be sufficient for envisaged autonomous pacemaker application.
The maximum average power of 2.38µW is generated with the heartbeat excitation at the
preferential orientation of 𝜃 = 60°.
The obtained maximal values of average power and power density are summarized in the Table
IV.4. These values are compared to the current state-of-the-art devices in the conclusions of
this work.
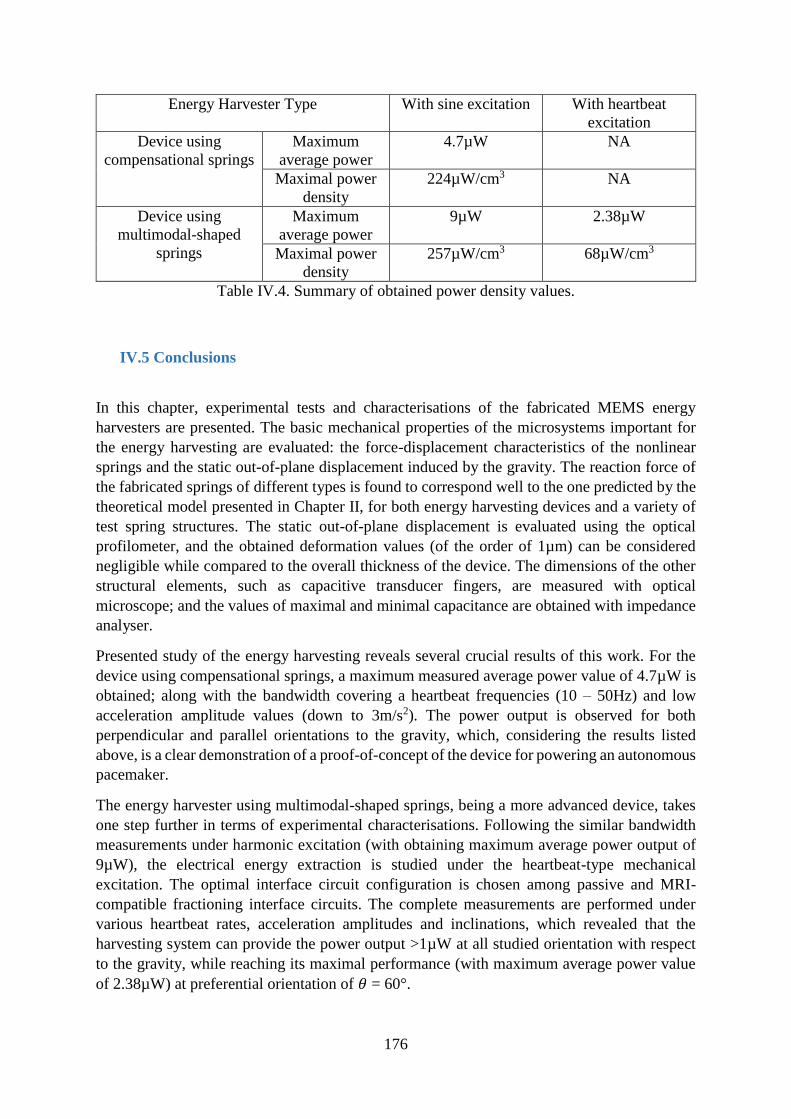
176
Energy Harvester Type With sine excitation With heartbeat
excitation
Device using
compensational springs
Maximum
average power
4.7µW NA
Maximal power
density
224µW/cm3 NA
Device using
multimodal-shaped
springs
Maximum
average power
9µW 2.38µW
Maximal power
density
257µW/cm3 68µW/cm3
Table IV.4. Summary of obtained power density values.
IV.5 Conclusions
In this chapter, experimental tests and characterisations of the fabricated MEMS energy
harvesters are presented. The basic mechanical properties of the microsystems important for
the energy harvesting are evaluated: the force-displacement characteristics of the nonlinear
springs and the static out-of-plane displacement induced by the gravity. The reaction force of
the fabricated springs of different types is found to correspond well to the one predicted by the
theoretical model presented in Chapter II, for both energy harvesting devices and a variety of
test spring structures. The static out-of-plane displacement is evaluated using the optical
profilometer, and the obtained deformation values (of the order of 1µm) can be considered
negligible while compared to the overall thickness of the device. The dimensions of the other
structural elements, such as capacitive transducer fingers, are measured with optical
microscope; and the values of maximal and minimal capacitance are obtained with impedance
analyser.
Presented study of the energy harvesting reveals several crucial results of this work. For the
device using compensational springs, a maximum measured average power value of 4.7µW is
obtained; along with the bandwidth covering a heartbeat frequencies (10 – 50Hz) and low
acceleration amplitude values (down to 3m/s2). The power output is observed for both
perpendicular and parallel orientations to the gravity, which, considering the results listed
above, is a clear demonstration of a proof-of-concept of the device for powering an autonomous
pacemaker.
The energy harvester using multimodal-shaped springs, being a more advanced device, takes
one step further in terms of experimental characterisations. Following the similar bandwidth
measurements under harmonic excitation (with obtaining maximum average power output of
9µW), the electrical energy extraction is studied under the heartbeat-type mechanical
excitation. The optimal interface circuit configuration is chosen among passive and MRI-
compatible fractioning interface circuits. The complete measurements are performed under
various heartbeat rates, acceleration amplitudes and inclinations, which revealed that the
harvesting system can provide the power output >1µW at all studied orientation with respect
to the gravity, while reaching its maximal performance (with maximum average power value
of 2.38µW) at preferential orientation of 𝜃 = 60°.
177
The results presented in this chapter can be summarized in these two statements:
A structural nonlinearity in MEMS can be created in a well-controlled manner with the
introduction of the higher mode shapes to the initial silhouette of the curved beams;
Designed structural nonlinearity allows to harvest energy from the small accelerations
at very low frequencies, including the heartbeat excitation, and to achieve a
performance necessary for a device powering an autonomous pacemaker.
These results, along with the considerations presented in Chapter II and Chapter III, are used
to introduce the next generation of MEMS energy harvester adapted for a leadless pacemaker
capsule that is presented in the following chapter.
IV.6 References
Allain P (2012) Etude des propriétés électro-thermo-mécaniques de nanofils en silicium pour
leur intégration dans les microsystèmes. phdthesis. (Université Paris Sud - Paris XI).
Anon FemtoTools. Retrieved (July 1, 2018), http://www.femtotools.com/.
Galayko D, Dudka A, Karami A, O’Riordan E, Blokhina E, Feely O, Basset P (2015)
Capacitive Energy Conversion With Circuits Implementing a Rectangular Charge-
Voltage Cycle—Part 1: Analysis of the Electrical Domain. IEEE Transactions on
Circuits and Systems I: Regular Papers 62(11):2652–2663.
Huguet T, Badel A, Lallart M (2017) Exploiting bistable oscillator subharmonics for
magnified broadband vibration energy harvesting. Applied Physics Letters
111(17):173905.
Jie Wei, Risquez S, Mathias H, Lefeuvre E, Costa F (2015) Simple and efficient interface
circuit for vibration electrostatic energy harvesters. (IEEE), 1–4.
Kerschen G, Golinval JC, Worden K (2001) THEORETICAL AND EXPERIMENTAL
IDENTIFICATION OF A NON-LINEAR BEAM. Journal of Sound and Vibration
244(4):597–613.
Kerschen G, Peeters M, Golinval JC, Vakakis AF (2009) Nonlinear normal modes, Part I: A
useful framework for the structural dynamicist. Mechanical Systems and Signal
Processing 23(1):170–194.
Kerschen G, Worden K, Vakakis AF, Golinval JC (2006) Past, present and future of
nonlinear system identification in structural dynamics. Mechanical Systems and
Signal Processing 20(3):505–592.
Lefeuvre E (2017) Autonomous electronic device with supply by electrostatic transduction
produced by a variable capacitor.
Lefeuvre E, Risquez S, Wei J, Woytasik M, Parrain F (2014) Self-Biased Inductor-less
Interface Circuit for Electret-Free Electrostatic Energy Harvesters. Journal of
Physics: Conference Series 557:012052.
Nguyen DS, Halvorsen E, Jensen GU, Vogl A (2010) Fabrication and characterization of a
wideband MEMS energy harvester utilizing nonlinear springs. Journal of
Micromechanics and Microengineering 20(12):125009.
Pellegrini SP, Tolou N, Schenk M, Herder JL (2013) Bistable vibration energy harvesters: A
review. Journal of Intelligent Material Systems and Structures 24(11):1303–1312.

178
179
Chapter V.
Conclusions and Future perspectives
Table of contents V.I Conclusions .................................................................................................................... 180
V.2 Future work and perspectives ...................................................................................... 182
V.2.1 Energy harvester integration in the leadless pacemaker .......................................... 182
V.2.2.1 Nonlinear eVEH design adaptation ................................................................... 183
V.2.2.2 Encapsulated system .......................................................................................... 184
V.2.2 Mesoscale nonlinear eVEH ...................................................................................... 187
V.3 References ...................................................................................................................... 188
180
V.I Conclusions
This thesis presents an extensive study of the energy harvester development for a biomedical
applications. The full cycle of the MEMS device development is covered in this work: from
the theoretical model to the design and simulations, fabrication and extensive experimental
testing. Two generations of MEMS are proposed and studied in this work, one being a proof-
of-concept device (energy harvester using compensational springs) and the other one being a
more advanced system (energy harvester using multimodal-shaped springs) adapted for a
harvesting of the heartbeat mechanical excitation. An overall context of the work is studied,
and the advantage of using an energy harvester to power a leadless pacemaker is discussed,
along with the ways to improve the performance of the device. In this way, a requirements for
the developed device are established: a structural nonlinearity to achieve a high bandwidth at
low frequencies (or access to a heartbeat) and small accelerations (lower than 1g), along with
Magnetic Resonance Imaging (MRI) compatibility and sufficient miniaturization (<1cm3).
An arbitrary shaped curved beam theory is introduced and discussed in this work. An
innovative approach of engineering the structural nonlinearity in MEMS springs is presented:
by the including the natural bending mode shapes in the initial contour of the beam. Such kind
of spring is denoted as multimodal-shaped spring. Another approach of tailoring the structural
nonlinearity by combining the sine-shaped beam with linear spring (called compensational
spring in this work) is explored as well. These two methods are shown to be equivalent in terms
of the produced nonlinear reaction force, but the multimodal-shaped spring is demonstrated to
be better suitable for miniaturization of a microsystem. Two designs of MEMS energy
harvesters are presented, with two different approaches used to engineer the nonlinear springs.
A numerical model is developed to perform a transient simulations of the energy harvesting.
The numerical simulations revealed several important conceptual results: the device using
compensational springs is demonstrated to have a bandwidth covering the low frequency range
(10 – 100Hz) and can deliver electrical power output at the excitations inferior to 1g. The
threshold of a minimal necessary excitation is shown to vary as a function of inclination angle
between the device and the gravity. A more elaborate study is completed for the device using
multimodal-shaped springs: as a complete study of operating transducer voltage, tilt and
excitation acceleration dependence on power output is carried out. As the large bandwidth and
low necessary acceleration amplitude is confirmed, a heartbeat signal is shown to provide the
average power superior to 1µW at different orientations with respect to the gravity.
An innovative, reliable and reproductive fabrication process of the MEMS energy harvester
based on the developed silicon-on-glass technology is introduced, for wafers with 200µm
silicon layer and 1mm glass layer. The process is developed with a possible industrialization
being kept in mind, and for the sake of simplifying the process the wafer bonding step is
avoided. A classic and well-known clean room fabrication techniques are used in the presented
process, such as UV lithography, deep reactive ion etching (DRIE), metal evaporation, and wet
etch release, which can be seen as an advantage in terms of process adjustment and possible
transfer. Several types of defects are observed to be produced as a results of the fabrication
process (mainly by the DRIE step), modifying mechanical and electrical properties of MEMS.
Nevertheless, the defect accumulation rate is found to be acceptable for the presented study, as
far as the desired mechanical and electrical characteristics are produced. Further work on the
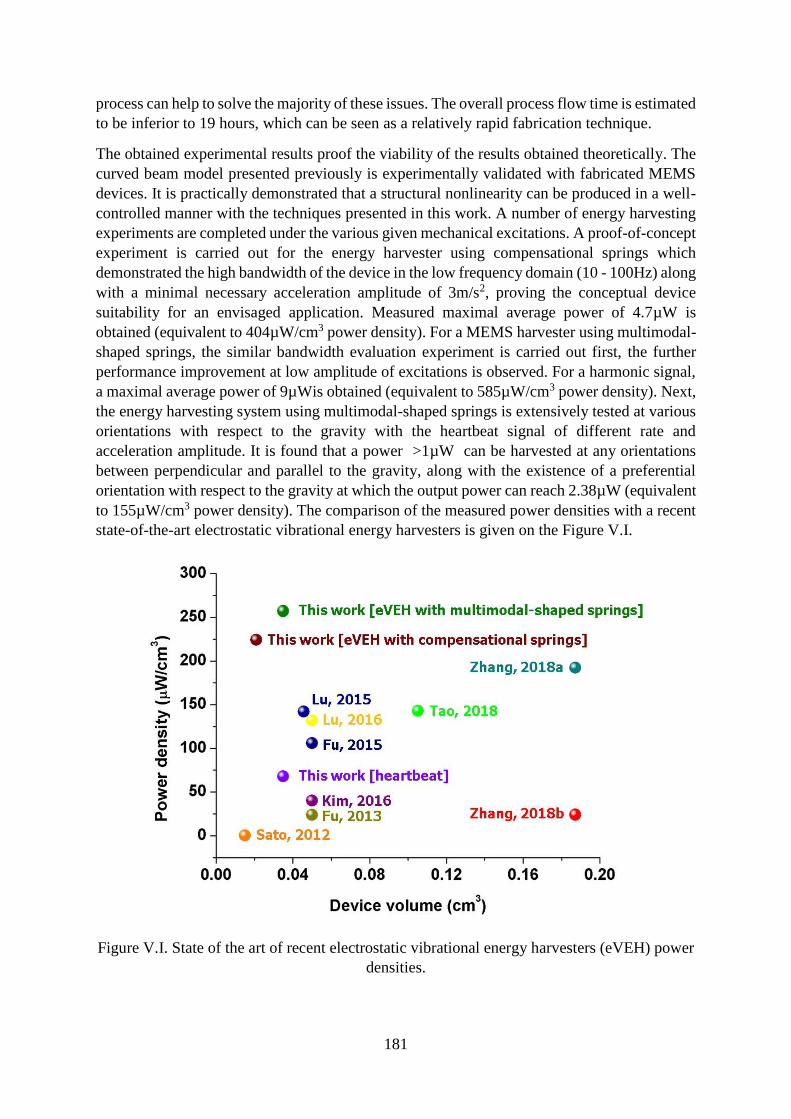
181
process can help to solve the majority of these issues. The overall process flow time is estimated
to be inferior to 19 hours, which can be seen as a relatively rapid fabrication technique.
The obtained experimental results proof the viability of the results obtained theoretically. The
curved beam model presented previously is experimentally validated with fabricated MEMS
devices. It is practically demonstrated that a structural nonlinearity can be produced in a well-
controlled manner with the techniques presented in this work. A number of energy harvesting
experiments are completed under the various given mechanical excitations. A proof-of-concept
experiment is carried out for the energy harvester using compensational springs which
demonstrated the high bandwidth of the device in the low frequency domain (10 - 100Hz) along
with a minimal necessary acceleration amplitude of 3m/s2, proving the conceptual device
suitability for an envisaged application. Measured maximal average power of 4.7µW is
obtained (equivalent to 404µW/cm3 power density). For a MEMS harvester using multimodal-
shaped springs, the similar bandwidth evaluation experiment is carried out first, the further
performance improvement at low amplitude of excitations is observed. For a harmonic signal,
a maximal average power of 9µWis obtained (equivalent to 585µW/cm3 power density). Next,
the energy harvesting system using multimodal-shaped springs is extensively tested at various
orientations with respect to the gravity with the heartbeat signal of different rate and
acceleration amplitude. It is found that a power >1µW can be harvested at any orientations
between perpendicular and parallel to the gravity, along with the existence of a preferential
orientation with respect to the gravity at which the output power can reach 2.38µW (equivalent
to 155µW/cm3 power density). The comparison of the measured power densities with a recent
state-of-the-art electrostatic vibrational energy harvesters is given on the Figure V.I.
Figure V.I. State of the art of recent electrostatic vibrational energy harvesters (eVEH) power
densities.
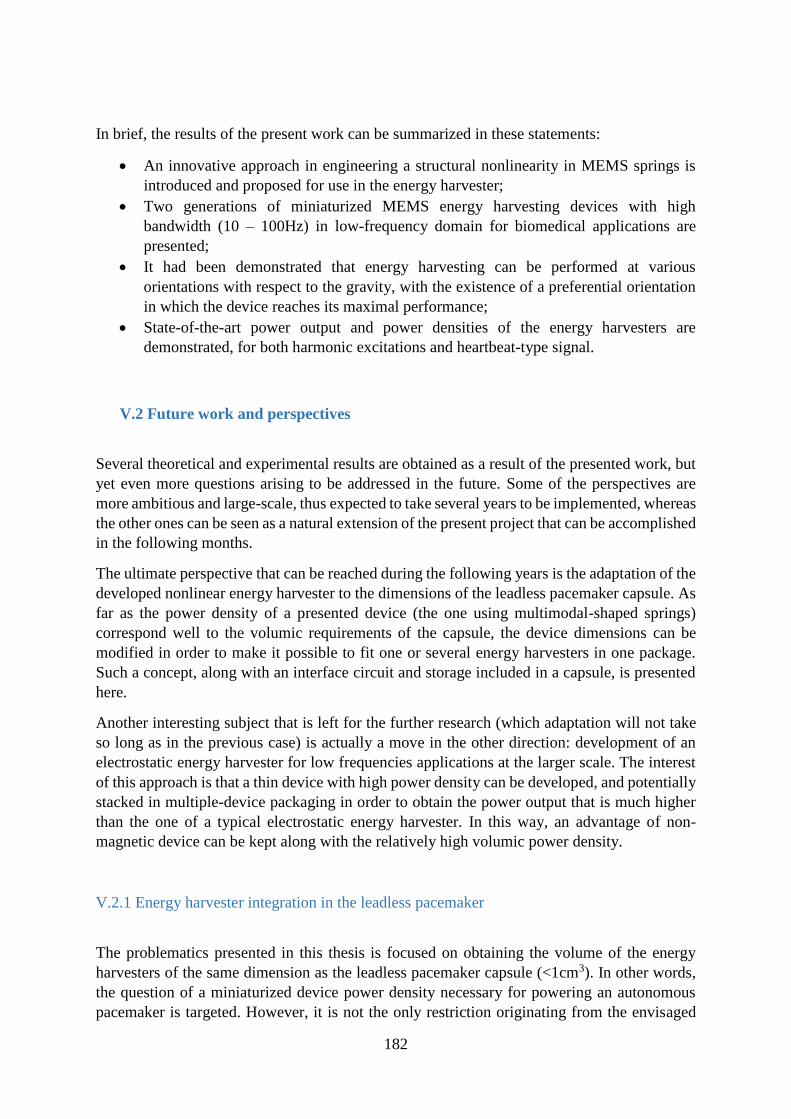
182
In brief, the results of the present work can be summarized in these statements:
An innovative approach in engineering a structural nonlinearity in MEMS springs is
introduced and proposed for use in the energy harvester;
Two generations of miniaturized MEMS energy harvesting devices with high
bandwidth (10 – 100Hz) in low-frequency domain for biomedical applications are
presented;
It had been demonstrated that energy harvesting can be performed at various
orientations with respect to the gravity, with the existence of a preferential orientation
in which the device reaches its maximal performance;
State-of-the-art power output and power densities of the energy harvesters are
demonstrated, for both harmonic excitations and heartbeat-type signal.
V.2 Future work and perspectives
Several theoretical and experimental results are obtained as a result of the presented work, but
yet even more questions arising to be addressed in the future. Some of the perspectives are
more ambitious and large-scale, thus expected to take several years to be implemented, whereas
the other ones can be seen as a natural extension of the present project that can be accomplished
in the following months.
The ultimate perspective that can be reached during the following years is the adaptation of the
developed nonlinear energy harvester to the dimensions of the leadless pacemaker capsule. As
far as the power density of a presented device (the one using multimodal-shaped springs)
correspond well to the volumic requirements of the capsule, the device dimensions can be
modified in order to make it possible to fit one or several energy harvesters in one package.
Such a concept, along with an interface circuit and storage included in a capsule, is presented
here.
Another interesting subject that is left for the further research (which adaptation will not take
so long as in the previous case) is actually a move in the other direction: development of an
electrostatic energy harvester for low frequencies applications at the larger scale. The interest
of this approach is that a thin device with high power density can be developed, and potentially
stacked in multiple-device packaging in order to obtain the power output that is much higher
than the one of a typical electrostatic energy harvester. In this way, an advantage of non-
magnetic device can be kept along with the relatively high volumic power density.
V.2.1 Energy harvester integration in the leadless pacemaker
The problematics presented in this thesis is focused on obtaining the volume of the energy
harvesters of the same dimension as the leadless pacemaker capsule (<1cm3). In other words,
the question of a miniaturized device power density necessary for powering an autonomous
pacemaker is targeted. However, it is not the only restriction originating from the envisaged
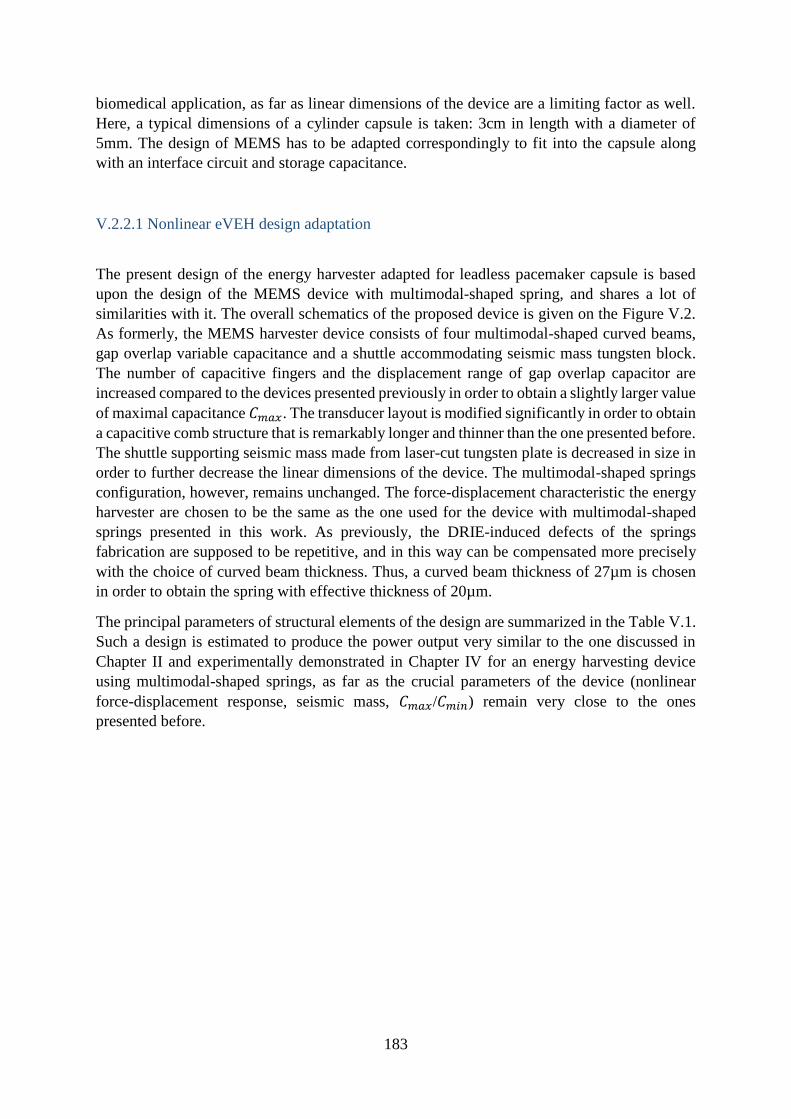
183
biomedical application, as far as linear dimensions of the device are a limiting factor as well.
Here, a typical dimensions of a cylinder capsule is taken: 3cm in length with a diameter of
5mm. The design of MEMS has to be adapted correspondingly to fit into the capsule along
with an interface circuit and storage capacitance.
V.2.2.1 Nonlinear eVEH design adaptation
The present design of the energy harvester adapted for leadless pacemaker capsule is based
upon the design of the MEMS device with multimodal-shaped spring, and shares a lot of
similarities with it. The overall schematics of the proposed device is given on the Figure V.2.
As formerly, the MEMS harvester device consists of four multimodal-shaped curved beams,
gap overlap variable capacitance and a shuttle accommodating seismic mass tungsten block.
The number of capacitive fingers and the displacement range of gap overlap capacitor are
increased compared to the devices presented previously in order to obtain a slightly larger value
of maximal capacitance 𝐶𝑚𝑎𝑥. The transducer layout is modified significantly in order to obtain
a capacitive comb structure that is remarkably longer and thinner than the one presented before.
The shuttle supporting seismic mass made from laser-cut tungsten plate is decreased in size in
order to further decrease the linear dimensions of the device. The multimodal-shaped springs
configuration, however, remains unchanged. The force-displacement characteristic the energy
harvester are chosen to be the same as the one used for the device with multimodal-shaped
springs presented in this work. As previously, the DRIE-induced defects of the springs
fabrication are supposed to be repetitive, and in this way can be compensated more precisely
with the choice of curved beam thickness. Thus, a curved beam thickness of 27µm is chosen
in order to obtain the spring with effective thickness of 20µm.
The principal parameters of structural elements of the design are summarized in the Table V.1.
Such a design is estimated to produce the power output very similar to the one discussed in
Chapter II and experimentally demonstrated in Chapter IV for an energy harvesting device
using multimodal-shaped springs, as far as the crucial parameters of the device (nonlinear
force-displacement response, seismic mass, 𝐶𝑚𝑎𝑥/𝐶𝑚𝑖𝑛) remain very close to the ones
presented before.
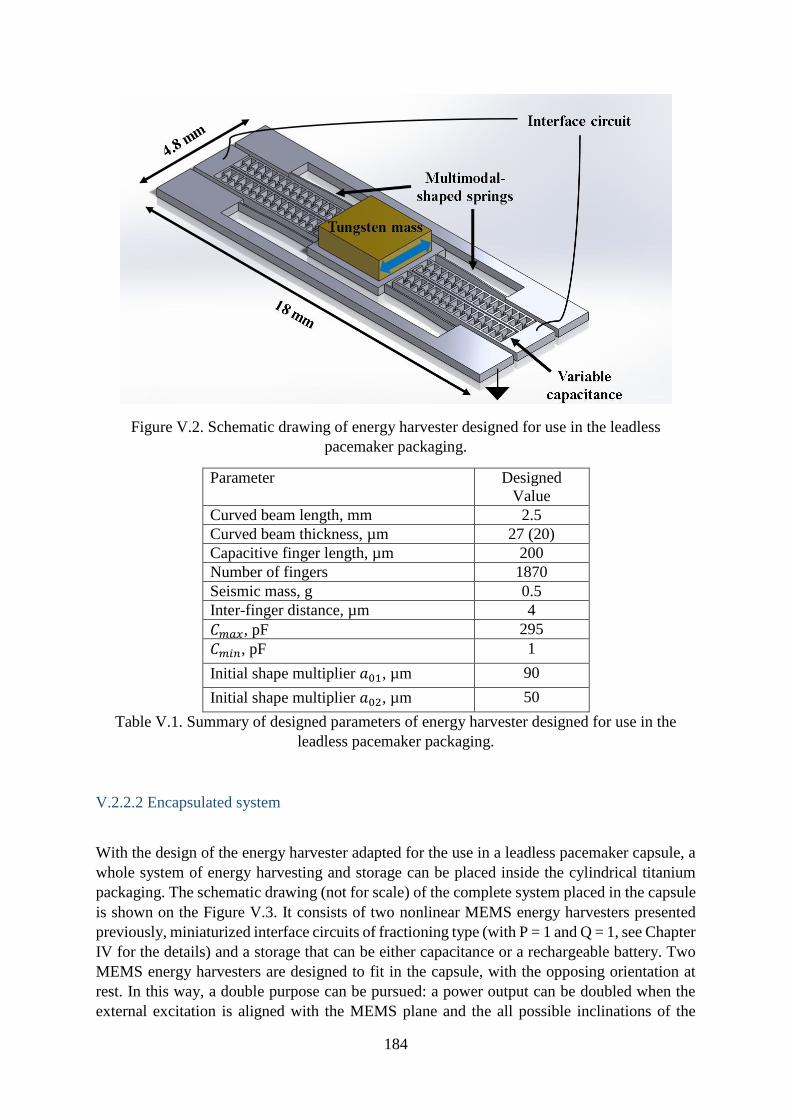
184
Figure V.2. Schematic drawing of energy harvester designed for use in the leadless
pacemaker packaging.
Parameter Designed
Value
Curved beam length, mm 2.5
Curved beam thickness, µm 27 (20)
Capacitive finger length, µm 200
Number of fingers 1870
Seismic mass, g 0.5
Inter-finger distance, µm 4
𝐶𝑚𝑎𝑥, pF 295
𝐶𝑚𝑖𝑛, pF 1
Initial shape multiplier 𝑎01, µm 90
Initial shape multiplier 𝑎02, µm 50
Table V.1. Summary of designed parameters of energy harvester designed for use in the
leadless pacemaker packaging.
V.2.2.2 Encapsulated system
With the design of the energy harvester adapted for the use in a leadless pacemaker capsule, a
whole system of energy harvesting and storage can be placed inside the cylindrical titanium
packaging. The schematic drawing (not for scale) of the complete system placed in the capsule
is shown on the Figure V.3. It consists of two nonlinear MEMS energy harvesters presented
previously, miniaturized interface circuits of fractioning type (with P = 1 and Q = 1, see Chapter
IV for the details) and a storage that can be either capacitance or a rechargeable battery. Two
MEMS energy harvesters are designed to fit in the capsule, with the opposing orientation at
rest. In this way, a double purpose can be pursued: a power output can be doubled when the
external excitation is aligned with the MEMS plane and the all possible inclinations of the

185
device with respect to the gravity can be covered (0° < 𝜃 < 180°, upright and upside down
orientation of the MEMS plane with respect to the gravity; compared to the upright 0° < 𝜃 <
90°).
Figure V.3. Drawing of a complete energy harvesting system placed in leadless pacemaker
capsule, which consists of two nonlinear MEMS energy harvesters, interface circuit and
storage.
The different views of the complete system schematics are given on the Figure V.4 (not for
scale). Figure V.4(i) shown the front view of the capsule: the thickness of the supporting glass
layer of a SOG wafer needs to be decreased to 0.5mm (compared to 1mm used previously in
this work) and a tungsten mass dimensions needs to be chosen accordingly in order to not
surpass 1.5mm in height in order to fit in the diameter imposed by the capsule restrictions.
Figure V.4(ii) depicts the top view of the system, where it can be seen that 60% of the volume
is used for the MEMS energy harvester and the rest 40% is dedicated for the electronics. The
opposing orientations of MEMS energy harvesters can also be seen on the top view. Figure
V.4(iii) presents the side view of the system, and it is clear that some volume dedicated for the
electronics rests unused, which can potentially exploited in the future work.
186
Figure V.4. Different perspectives of a complete energy harvesting system placed in leadless
pacemaker capsule. (i) Front view; (ii) Top view; (iii) Side view.

187
V.2.2 Mesoscale nonlinear eVEH
Another interesting development originating from the present work is an increase in the scale
of the energy harvester, in contrary to the adaptation to the leadless pacemaker package. The
larger size of the device, the larger power output it can produce.
The main technical challenge for a microsystem with large area is a choice of an optimal
fabrication process that will allow to produce a necessary mechanical characteristics of the
device along with required electrical parameters. The problematics of avoiding the defects over
a large surface covered by the microsystem can be seen as a challenge as well.
A first prototype of mesoscale MEMS nonlinear electrostatic energy harvester is fabricated,
with the surface dimensions of 21.5mm × 22.5mm. Its pictures are shown on the Figure V.5.
Figure V.5(i) shows a full wafer view of a fabricated batch of 4 devices and Figure V.5(ii)
demonstrates a scale of an energy harvester with attached tungsten mass and fixed on PCB
support. The SEM picture of a nonlinear curved beams with gap-overlap transducer is shown
on the Figure V.5(iii), and zoom on capacitive fingers is given on Figure V.5(iv).
Figure V.5. Mesoscale nonlinear energy harvester. (i) Photo of the full wafer; (ii) Single
device placed on PCB support with added seismic mass; (iii) SEM image of springs; (iv)
SEM image of the capacitive fingers.
Both mechanical and electrical characterisations, along with the energy harvesting experiments
under various excitations, are the subject of the future work.
188
V.3 References
Fu Q, Suzuki Y (2013) Large-dynamic-range MEMS Electret Energy Harvester with
Combined Gap-closing/Overlapping-area-change Electrodes. Journal of Physics:
Conference Series 476:012112.
Fu Q, Suzuki Y (2015) IN-plane gap-closing mems vibration electret energy harvester on
thick box layer. (IEEE), 1925–1928.
Honma H, Mitsuya H, Hashiguchi G, Fujita H, Toshiyoshi H (2018) Improvement of energy
conversion effectiveness and maximum output power of electrostatic induction-type
MEMS energy harvesters by using symmetric comb-electrode structures. Journal of
Micromechanics and Microengineering 28(6):064005.
Kim S, Suzuki Y (2016) MEMS comb-drive electret energy harvester charged after
packaging. (IEEE), 1–3.
Lu Y, Cottone F, Boisseau S, Marty F, Galayko D, Basset P (2015) A nonlinear MEMS
electrostatic kinetic energy harvester for human-powered biomedical devices. Applied
Physics Letters 107(25):253902.
Lu Y, O’Riordan E, Cottone F, Boisseau S, Galayko D, Blokhina E, Marty F, Basset P (2016)
A batch-fabricated electret-biased wideband MEMS vibration energy harvester with
frequency-up conversion behavior powering a UHF wireless sensor node. Journal of
Micromechanics and Microengineering 26(12):124004.
Sato N, Ono K, Shimamura T, Kuwabara K, Ugajin M, Sato Y (2012) Analysis of Electret-
Based MEMS Vibrational Energy Harvester With Slit-and-Slider Structure. Journal
of Microelectromechanical Systems 21(5):1218–1228.
Suzuki Y (2011) Recent progress in MEMS electret generator for energy harvesting. IEEJ
Transactions on Electrical and Electronic Engineering 6(2):101–111.
Tao K, Tang L, Wu J, Lye SW, Chang H, Miao J (2018) Investigation of Multimodal
Electret-Based MEMS Energy Harvester With Impact-Induced Nonlinearity. Journal
of Microelectromechanical Systems 27(2):276–288.
Zhang Y, Quo X, Wang F (2018) Perforated electrode for performance optimization of
electrostatic energy harvester. (IEEE), 612–615.
Zhang Y, Wang T, Luo A, Hu Y, Li X, Wang F (2018) Micro electrostatic energy harvester
with both broad bandwidth and high normalized power density. Applied Energy
212:362–371.

189
190
List of Publications
Journal papers:
[1] B. Vysotskyi, F. Parrain, D. Aubry, P. Gaucher, X. Le Roux, and E. Lefeuvre, “Engineering
the Structural Nonlinearity Using Multimodal-Shaped Springs in MEMS,” Journal of
Microelectromechanical Systems, vol. 27, no. 1, pp. 40–46, Feb. 2018.
[2] B. Vysotskyi, D. Aubry, P. Gaucher, X. Le Roux, F. Parrain, and E. Lefeuvre, “Nonlinear
Electrostatic Energy Harvester using Compensational Springs in Gravity Field,” Journal
of Micromechanics and Microengineering, Apr. 2018.
[3] A. Brenes, B. Vysotskyi, E. Lefeuvre and J. Juillard, “Nondestructive gap dimension
estimation of electrostatic MEMS resonators from electrical measurements,” Mechanical
Systems and Signal Processing, vol. 112, pp. 10–21, 2018.
Conference papers:
[1] B. Vysotskyi, D. Aubry, P. Gaucher, X. Le Roux, F. Parrain, and E. Lefeuvre, “Electrostatic
vibration energy harvester using Multimodal-shaped springs for pacemaker application,”
Symposium on Design, Test, Integration & Packaging of MEMS and MOEMS (DTIP),
2018
[2] B. Vysotskyi, D. Aubry, P. Gaucher, E. Lefeuvre, X. Le Roux, and F. Parrain,
“Miniaturization of Compensational Spring System using the Highly Nonlinear Curved
beams in MEMS,” Journal of Physics: Conference Series, vol. 922, p. 012012, Nov. 2017.
[3] B. Vysotskyi, F. Parrain, D. Aubry, P. Gaucher, and E. Lefeuvre, “Innovative Energy
Harvester Design Using Bistable Mechanism With Compensational Springs In Gravity
Field,” Journal of Physics: Conference Series, vol. 773, p. 012064, Nov. 2016.
[4] B. Vysotskyi, F. Parrain, E. Lefeuvre, X. Leroux, D. Aubry, and P. Gaucher, “Design and
Simulation of Bistable Microsystem with Frequency-up conversion effect for Electrostatic
Energy Harvesting,” Journal of Physics: Conference Series, vol. 757, p. 012007, Oct.
2016.

191
List of Communications International conferences:
13th Nano and Microsystems (NAMIS) workshop, Wroclaw, Poland, 2015, Oral
presentation
E-MRS 2016 Spring meeting, European Materials Research Society, May 2 – 6, Lille,
France, Oral presentation
Nano and Microsystems (NAMIS) Marathon workshop, 2016, December 17 – 20,
Hsinchu, Taiwan, Oral presentation
PowerMEMS 2016, The 16th International Conference on Micro and Nanotechnology
for Power Generation and Energy Conversion Applications, December 6 – 9, Paris,
France, Poster
MME 2016, 27th Micromechanics and Microsystems Europe workshop, August 28 –
30, Cork, Ireland, Poster
MME 2017, 28th Micromechanics and Microsystems Europe workshop, August 23 –
25, Uppsala, Sweden, Poster
PowerMEMS 2017, The 17th International Conference on Micro and Nanotechnology
for Power Generation and Energy Conversion Applications, November 14 – 17,
Kanazawa, Japan, Oral presentation
DTIP 2018, 20th edition of the Symposium on Design, Test, Integration & Packaging
of MEMS and MOEMS, May 22 – 25, Rome, Italy, Oral presentation
French national conferences:
JNRSE 2016, Journées Nationales sur la Récupération et le Stockage d'Energie, May 9
– 10, Bordeaux, France, Oral presentation
JNRDM 2016, Journées nationales du réseau doctoral en micro-nanoélectronique, May
11 – 13, Toulouse, France, Oral presentation
WTE 2016, Vers la transition énergétique, October 4 – 5, Palaiseau, France, Poster
JNRSE 2017, Journées Nationales sur la Récupération et le Stockage d'Energie, May 9
– 10, Lyon, France, Poster
JNRSE 2018, Journées Nationales sur la Récupération et le Stockage d'Energie, May
14 – 15, Besançon, France, Oral presentation
Awards:
JNRSE 2016 Best presentation award
JNRDM 2016 Best presentation award
WTE 2016 Best poster award
JNRSE 2018 Best presentation award


