Embed Size (px)
Citation preview

This content has been downloaded from IOPscience. Please scroll down to see the full text.
Download details:
IP Address: 193.1.100.108
This content was downloaded on 27/03/2014 at 16:14
Please note that terms and conditions apply.
Electrostatic vibration energy harvester with combined effect of electrical nonlinearities and
mechanical impact
View the table of contents for this issue, or go to the journal homepage for more
2014 J. Micromech. Microeng. 24 035001
(http://iopscience.iop.org/0960-1317/24/3/035001)
Home Search Collections Journals About Contact us My IOPscience
Journal of Micromechanics and Microengineering
J. Micromech. Microeng. 24 (2014) 035001 (14pp) doi:10.1088/0960-1317/24/3/035001
Electrostatic vibration energy harvesterwith combined effect of electricalnonlinearities and mechanical impact
P Basset1,4, D Galayko2, F Cottone1, R Guillemet1, E Blokhina3, F Marty1
and T Bourouina1
1 Universite Paris-Est, ESYCOM, ESIEE Paris, France2 Sorbonne Universites, UPMC Univ. Paris 06, UMR 7606, LIP6, Paris, France3 School of Electrical, Electronic and Communications Engineering, University College Dublin, Ireland
E-mail: [email protected]
Received 23 July 2013, revised 20 December 2013Accepted for publication 20 December 2013Published 4 February 2014
AbstractThis paper presents an advanced study including the design, characterization and theoreticalanalysis of a capacitive vibration energy harvester. Although based on a resonantelectromechanical device, it is intended for operation in a wide frequency band due to thecombination of stop-end effects and a strong biasing electrical field. The electrostatictransducer has an interdigited comb geometry with in-plane motion, and is obtained through asimple batch process using two masks. A continuous conditioning circuit is used for thecharacterization of the transducer. A nonlinear model of the coupled system‘transduce-conditioning circuit’ is presented and analyzed employing two differentsemi-analytical techniques together with precise numerical modelling. Experimental resultsare in good agreement with results obtained from numerical modelling. With the 1 g amplitudeof harmonic external acceleration at atmospheric pressure, the system transducer-conditioningcircuit has a half-power bandwidth of more than 30% and converts more than 2 μW of thepower of input mechanical vibrations over the range of 140 and 160 Hz. The harvester has alsobeen characterized under stochastic noise-like input vibrations.
Keywords: vibration energy harvesting, electrostatic transduction, MEMS, mechanicalimpedance, VEH, e-VEH, eVEH
(Some figures may appear in colour only in the online journal)
1. Introduction
Vibration energy harvesters (VEHs) catch mechanical energytrough a spring–mass system and then convert the largestpossible fraction of this energy into electrical power.To this end, electromagnetic, piezoelectric or electrostatictransduction can be used, and sometimes a combination ofthese. VEHs with electrostatic transduction (e-VEHs) displayinteresting features that can make a difference with theother transduction mechanisms. They are particularly suitablefor fabrication using silicon-based microelectromechanical
4 Author to whom any correspondence should be addressed.
systems (MEMS) technologies through a full batch fabricationprocess [1–3]. Moreover, bulk crystalline silicon displaysrepeatable elastic properties even under strong deformations[4]. It can be used for the fabrication of nonlinear springs forwideband VEHs. The main drawback of e-VEHs is that unlikeelectromagnetic and piezoelectric VEHs they need to be pre-charged in order to initiate the conversion process. Therefore,in order to obtain a totally battery-free system, an electret or apiezoelectric layer needs to be added [5, 6].
One of the main issues when designing a VEH is totake into account a possible variability of the power spectraldensity in time and frequency. However, many VEHs arebased on linear spring–mass systems and are optimized to
0960-1317/14/035001+14$33.00 1 © 2014 IOP Publishing Ltd Printed in the UK
J. Micromech. Microeng. 24 (2014) 035001 P Basset et al
work at specific frequencies. In such structures, power ismaximized only near the resonance frequency while vastmajority of applications require a wideband conversion ofvibration energy. The self-tuning of the operation frequencyhas been proposed in [7–9]. These solutions are quite efficientbut require additional power for an active conditioning circuit(CC). Oscillator arrays with different resonance frequenciescan also be used to obtain an overall response covering a largerfrequency interval. However, this will drastically decreasethe power density of a harvester [10–12]. Energy harvestingemploying multi-mass oscillators has also been investigatedin [13]. There is another approach that allows one toextend the frequency bandwidth of MEMS-based resonators;it consists in adding nonlinearities into their structure.Nonlinearities can be of different origins: mechanical springsoftening/hardening at large oscillation amplitudes [3, 15–18],multistable potential fields [14, 19–23], electrostaticnonlinearities [24] or nonlinearities due to impact [25]. Allthese techniques are particularly efficient for harvesting energyfrom stochastic vibrations.
In 2006 we presented the first MEMS e-VEH based onthe in-plane overlap-plate geometry [1, 26]. This previousdesign, in which silicon has been partially etched betweenthe electrodes to reduce the parasitic capacitance, is nowcommonly used for e-VEH employing an electret layer.This paper presents a new silicon-based e-VEH whosevariable capacitor is made of in-plane gap-closing (IPGC)interdigited combs. The IPGC architecture was initiallyproposed by Roundy [27], but we present here the firstdevice able to harvest a significant amount of power inrealistic conditions, i.e. moderate vibration frequency, levelof acceleration and bias voltage. In addition, due to thecombination of nonlinearities induced by mechanical stoppersand by the high electromechanical coupling arising from anapplied bias voltage required for electrostatic transduction,energy harvesting from wideband vibration is obtained. Alarge half-power bandwidth of 30% has been measured, with aroughly constant converted power of about 2 μW cm−2 below200 Hz, all this for moderate bias voltage of 30 V andacceleration of 1 g.
The paper is organized as follows. Section 2 presentsthe results of the characterization of the capacitivetransducer. Section 3 discusses the analysis of thecoupled system ‘transducer-CC/mechanical resonator’, andsection 4 presents the measurements of the electricalpower converted by the system from the mechanicaldomain.
2. Description of the MEMS variable capacitor
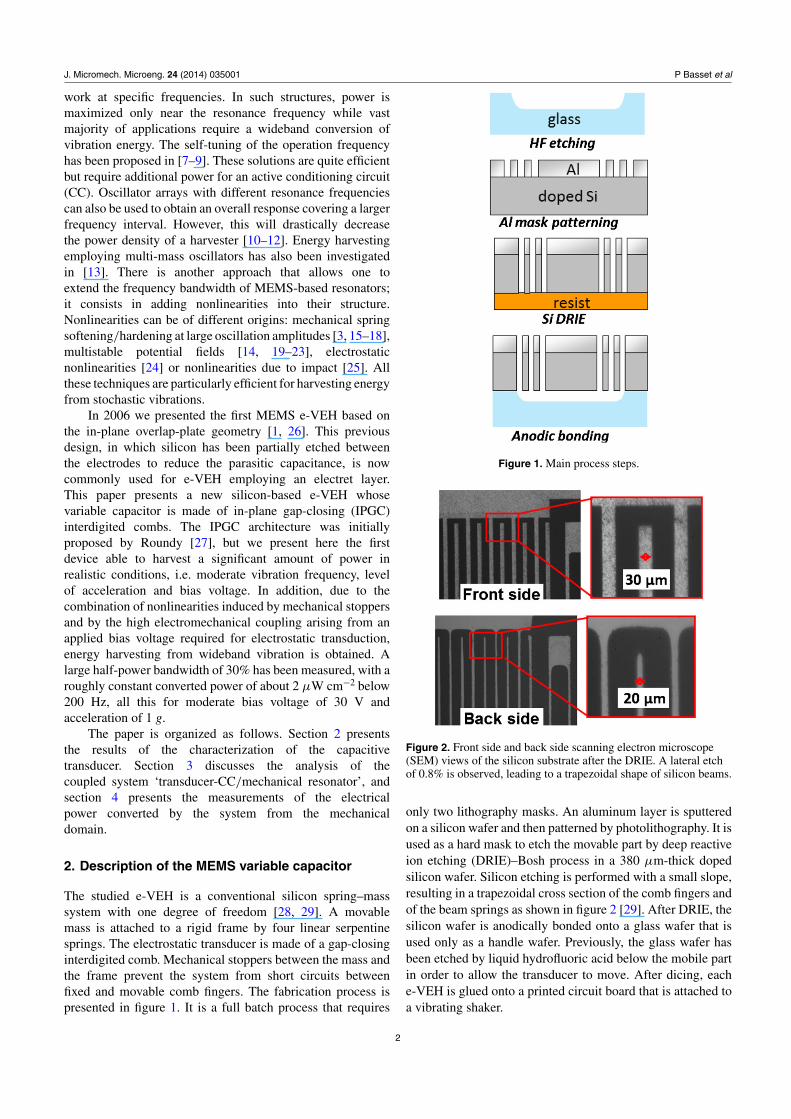
The studied e-VEH is a conventional silicon spring–masssystem with one degree of freedom [28, 29]. A movablemass is attached to a rigid frame by four linear serpentinesprings. The electrostatic transducer is made of a gap-closinginterdigited comb. Mechanical stoppers between the mass andthe frame prevent the system from short circuits betweenfixed and movable comb fingers. The fabrication process ispresented in figure 1. It is a full batch process that requires
Figure 1. Main process steps.
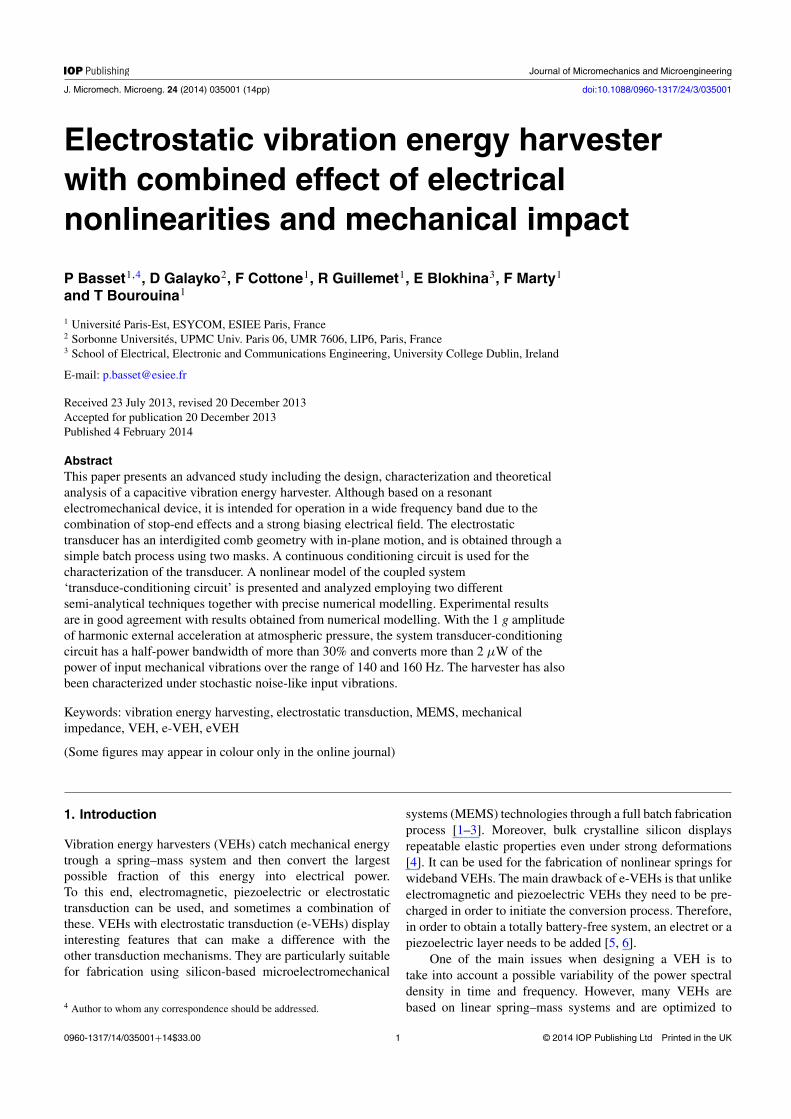
Figure 2. Front side and back side scanning electron microscope(SEM) views of the silicon substrate after the DRIE. A lateral etchof 0.8% is observed, leading to a trapezoidal shape of silicon beams.
only two lithography masks. An aluminum layer is sputteredon a silicon wafer and then patterned by photolithography. It isused as a hard mask to etch the movable part by deep reactiveion etching (DRIE)–Bosh process in a 380 μm-thick dopedsilicon wafer. Silicon etching is performed with a small slope,resulting in a trapezoidal cross section of the comb fingers andof the beam springs as shown in figure 2 [29]. After DRIE, thesilicon wafer is anodically bonded onto a glass wafer that isused only as a handle wafer. Previously, the glass wafer hasbeen etched by liquid hydrofluoric acid below the mobile partin order to allow the transducer to move. After dicing, eache-VEH is glued onto a printed circuit board that is attached toa vibrating shaker.
2
J. Micromech. Microeng. 24 (2014) 035001 P Basset et al
(a)
(b)
Figure 3. Pictures of the transducer. (a) 3D view fromcoventoreware, (b) photos with a SEM close-up view.
Table 1. Parameters of the tested e-VEH.
Parameters Value/Unit
Proof mass (m) 66 mgElastic spring stiffness (km) 68 N m−1
Mechanical resonance ( f 0) 162 HzActive area (mass + springs) 1.1 mm2
Initial gap between fingers (d0) 43.5 μmStopper location (Xlim) 36 μmLoad resistance (RL) 5.4 M�Device thickness (hf) 380 μmFingers length (lf) 1.97 mmFingers width (wf) 30 μmFingers number (Nf) 142Aspect ratio of sidewalls (α) 0.013
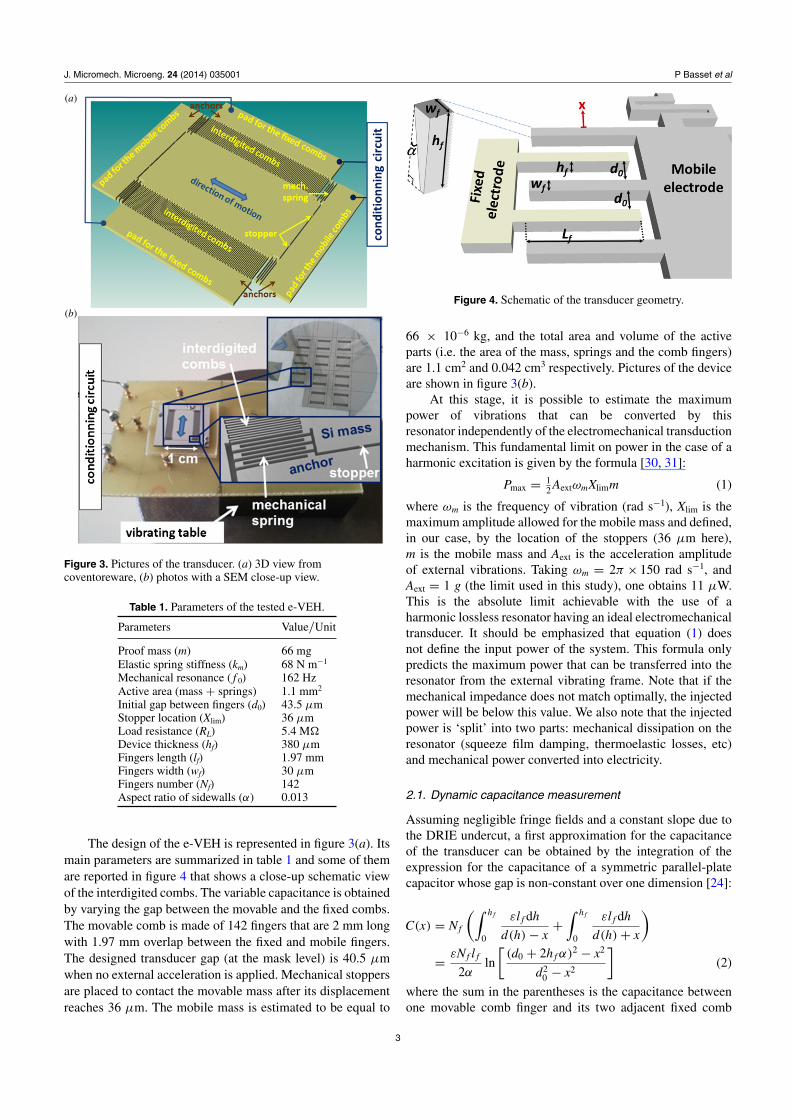
The design of the e-VEH is represented in figure 3(a). Itsmain parameters are summarized in table 1 and some of themare reported in figure 4 that shows a close-up schematic viewof the interdigited combs. The variable capacitance is obtainedby varying the gap between the movable and the fixed combs.The movable comb is made of 142 fingers that are 2 mm longwith 1.97 mm overlap between the fixed and mobile fingers.The designed transducer gap (at the mask level) is 40.5 μmwhen no external acceleration is applied. Mechanical stoppersare placed to contact the movable mass after its displacementreaches 36 μm. The mobile mass is estimated to be equal to
Figure 4. Schematic of the transducer geometry.
66 × 10−6 kg, and the total area and volume of the activeparts (i.e. the area of the mass, springs and the comb fingers)are 1.1 cm2 and 0.042 cm3 respectively. Pictures of the deviceare shown in figure 3(b).
At this stage, it is possible to estimate the maximumpower of vibrations that can be converted by thisresonator independently of the electromechanical transductionmechanism. This fundamental limit on power in the case of aharmonic excitation is given by the formula [30, 31]:
Pmax = 12 AextωmXlimm (1)
where ωm is the frequency of vibration (rad s−1), Xlim is themaximum amplitude allowed for the mobile mass and defined,in our case, by the location of the stoppers (36 μm here),m is the mobile mass and Aext is the acceleration amplitudeof external vibrations. Taking ωm = 2π × 150 rad s−1, andAext = 1 g (the limit used in this study), one obtains 11 μW.This is the absolute limit achievable with the use of aharmonic lossless resonator having an ideal electromechanicaltransducer. It should be emphasized that equation (1) doesnot define the input power of the system. This formula onlypredicts the maximum power that can be transferred into theresonator from the external vibrating frame. Note that if themechanical impedance does not match optimally, the injectedpower will be below this value. We also note that the injectedpower is ‘split’ into two parts: mechanical dissipation on theresonator (squeeze film damping, thermoelastic losses, etc)and mechanical power converted into electricity.
2.1. Dynamic capacitance measurement
Assuming negligible fringe fields and a constant slope due tothe DRIE undercut, a first approximation for the capacitanceof the transducer can be obtained by the integration of theexpression for the capacitance of a symmetric parallel-platecapacitor whose gap is non-constant over one dimension [24]:
C(x) = Nf
(∫ h f
0
εl f dh
d(h) − x+
∫ h f
0
εl f dh
d(h) + x
)
= εNf l f
2αln
[(d0 + 2h f α)2 − x2
d20 − x2
](2)
where the sum in the parentheses is the capacitance betweenone movable comb finger and its two adjacent fixed comb
3
J. Micromech. Microeng. 24 (2014) 035001 P Basset et al
fingers, Nf is the total number of movable fingers, ε is thedielectric permittivity of air, hf is the height of the siliconsubstrate, lf is the length of the overlapping part of thecomb fingers, d0 is the gap between the fixed and movablefingers measured in the non-deformed device at the top of thecomb, α is the ratio of the silicon undercut by DRIE. x isthe instantaneous displacement of the mobile electrode (withregard to the non-deformed device shape). d(h) = d0+2hα
is the gap between the movable finger and fixed fingers foran non-deformed structure: because of the undercut, it is afunction of the coordinate h defined in the direction orthogonalto the substrate plane. With a minimum gap on top of 4.5 μmcorresponding to the stopper location, the theoretical nominalmaximum and minimum values of Cvar are 121 pF and 41 pF.If the electrode edges were parallel with the nominal gap d0,the maximum and minimum capacitances would be 221 pFand 46 pF respectively.
The goal of the experiment is to measure the evolutionof the transducer capacitance over time when the deviceis subjected to external vibrations. The extreme values ofthe transducer capacitance Cmax and Cmin are of particularinterest for electromechanical energy conversion [1]. In theconsidered device, the capacitance is minimal for the non-deformed device (given that there is no misalignment of theinterdigited comb fingers). The measurement is carried out bydynamical detection of the phase shift in a series RCvar circuitto which a 200 kHz/1 V peak-to-peak ac signal is applied. Thecapacitance is calculated as [1]:
Cvar = 1
tan(θ )Rω, (3)
where ω is the angular frequency of the source signal, θ is thephase shift between the voltage across the capacitor and thevoltage generated by the source. R and ω must be chosen tomaximize the accuracy of the Cvar measurement, i.e. with aphase shift around π/4. The relative error of Cvar is given by[1]:
�Cvar
Cvar m= −2
Tsω
sin[2a tan
(1
ωRCvar m
)] (4)
where Ts is the sampling period of the oscilloscope and Cvar_m isthe mean value of Cvar. According to the setup parameters (Ts =10 ns, R = 5.6 k�), the mean value of the relative error of Cvar is7%.
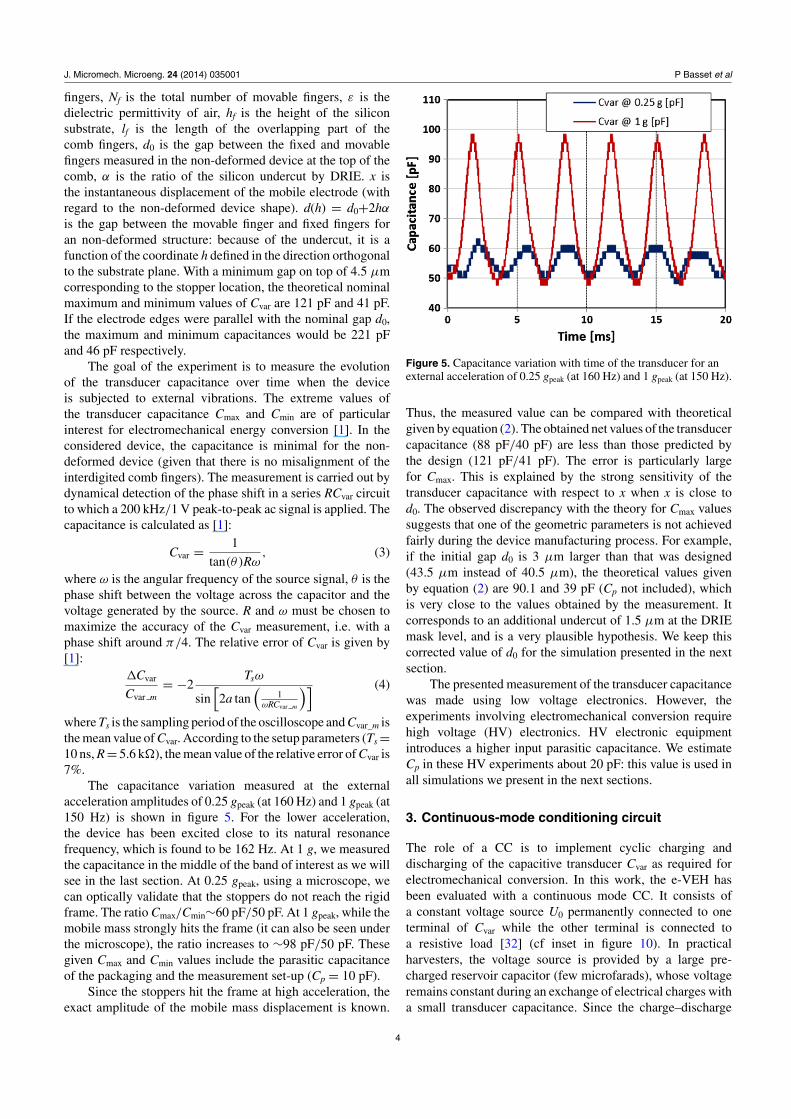
The capacitance variation measured at the externalacceleration amplitudes of 0.25 gpeak (at 160 Hz) and 1 gpeak (at150 Hz) is shown in figure 5. For the lower acceleration,the device has been excited close to its natural resonancefrequency, which is found to be 162 Hz. At 1 g, we measuredthe capacitance in the middle of the band of interest as we willsee in the last section. At 0.25 gpeak, using a microscope, wecan optically validate that the stoppers do not reach the rigidframe. The ratio Cmax/Cmin∼60 pF/50 pF. At 1 gpeak, while themobile mass strongly hits the frame (it can also be seen underthe microscope), the ratio increases to ∼98 pF/50 pF. Thesegiven Cmax and Cmin values include the parasitic capacitanceof the packaging and the measurement set-up (Cp = 10 pF).
Since the stoppers hit the frame at high acceleration, theexact amplitude of the mobile mass displacement is known.
Figure 5. Capacitance variation with time of the transducer for anexternal acceleration of 0.25 gpeak (at 160 Hz) and 1 gpeak (at 150 Hz).
Thus, the measured value can be compared with theoreticalgiven by equation (2). The obtained net values of the transducercapacitance (88 pF/40 pF) are less than those predicted bythe design (121 pF/41 pF). The error is particularly largefor Cmax. This is explained by the strong sensitivity of thetransducer capacitance with respect to x when x is close tod0. The observed discrepancy with the theory for Cmax valuessuggests that one of the geometric parameters is not achievedfairly during the device manufacturing process. For example,if the initial gap d0 is 3 μm larger than that was designed(43.5 μm instead of 40.5 μm), the theoretical values givenby equation (2) are 90.1 and 39 pF (Cp not included), whichis very close to the values obtained by the measurement. Itcorresponds to an additional undercut of 1.5 μm at the DRIEmask level, and is a very plausible hypothesis. We keep thiscorrected value of d0 for the simulation presented in the nextsection.
The presented measurement of the transducer capacitancewas made using low voltage electronics. However, theexperiments involving electromechanical conversion requirehigh voltage (HV) electronics. HV electronic equipmentintroduces a higher input parasitic capacitance. We estimateCp in these HV experiments about 20 pF: this value is used inall simulations we present in the next sections.
3. Continuous-mode conditioning circuit
The role of a CC is to implement cyclic charging anddischarging of the capacitive transducer Cvar as required forelectromechanical conversion. In this work, the e-VEH hasbeen evaluated with a continuous mode CC. It consists ofa constant voltage source U0 permanently connected to oneterminal of Cvar while the other terminal is connected toa resistive load [32] (cf inset in figure 10). In practicalharvesters, the voltage source is provided by a large pre-charged reservoir capacitor (few microfarads), whose voltageremains constant during an exchange of electrical charges witha small transducer capacitance. Since the charge–discharge
4
J. Micromech. Microeng. 24 (2014) 035001 P Basset et al
process is cyclic and the overall charge is conserved in thecircuit, on average, no energy is consumed from the reservoir.For practical reasons, our experiments were done with avoltage source: this substitution has no impact on the systembehavior. Due to the dc biasing of the RloadCvar circuit, thevariation of the transducer capacitance induces an ac chargeflowing through the load that dissipates the energy convertedfrom the mechanical domain. Depending on an application,the resistor may be replaced by an electronic circuit thatwill transform the harvested electrical energy into a formappropriate for a load supply (e.g., as in [32–34]).
3.1. Behavior of the conditioning circuit
Below we give a discussion that provides an understanding ofthe operation of this CC depending on the value of the loadresistance.
3.1.1. Rload = 0. This is an extreme case that correspondsto an electrostatic transducer biased by a constant voltage.Such a system has been thoroughly studied in the literature.The transducer is equivalent to a nonlinear spring whose force-displacement characteristic is given by the following equation:
Ft = 1
2U2
0∂Cvar(x)
∂x. (5)
This force is added to the mechanical spring force. For agap-closing transducer, Ft increases with the displacement xfaster than linearly. Ft is attractive and acts in opposition tothe restoring mechanical spring force. Consequently, Ft leadsto an effective softening of the resonator spring and thereforeto a negative shift in the resonance frequency. The softeningeffect depends on the vibration amplitude and is stronger if thevibration amplitude increases.
When the capacitance changes from Cmin to Cmax, there isan average current flowing though the transducer at each halfof the oscillation cycle. It is equal to:
Iav max = 2U0(Cmax − Cmin)
Te(6)
where Te is the period of the transducer capacitance variation(note that it can be different from the period of externalvibrations). Iav_max is the upper limit of the average transducercurrent which can only be reached when Rload = 0. However,the average converted power is zero for Rload = 0 since thereis no voltage variation across the capacitor.
3.1.2. Rload is small such that Iav max Rload � U0. In the casewhen Rload is such that Iav_maxRload � U0, the voltage dropacross the resistor is negligible compared to U0. The voltageacross the transducer terminals can be considered equal toU0. The power dissipated by the resistor is proportional tothe resistance value. From the mechanical point of view, thecontext is exactly as in the previous case. However, since thereis a real power dissipated by the resistor, the converted power isnon-zero, although small. This electromechanical conversionhas a small impact on the mechanical dynamics of the system.
3.1.3. Rload is large such that Iav max Rload is of the same orderof magnitude as U0. This is the case of interest for energyharvesters: a non-negligible amount of mechanical energy isconverted into the electrical domain and is dissipated throughRload. As we shall see in the next section, the equation thatdescribes the system cannot be solved analytically for thiscase. The real part of the transducer mechanical impedanceincreases, and so does the converted power. In this case, thepresence of the resistor cannot be neglected in the analysis ofthe mechanical behavior of the system.
3.1.4. Rload increased toward very large values. This isanother extreme case. The current through the resistordecreases, and the charge flow between Cvar and U0 is impeded.If Rload is extremely large, there is no current, the convertedpower is zero and the transducer operates in constant chargemode. In this case, the only influence of the CC on thetransducer is a frequency shift in the mechanical resonancedue to a phenomenon known as nonlinear electrostatic spring.The electrostatic force is now given by:
Ft (x) = 1
2
Q20
C2var(x)
∂Cvar(x)
∂x. (7)
Here Q0 is the bias charge of the capacitor. In this context, Ft
is defined from the transient process described by the modelpresented in the next section.
We note that the electrostatic force given by equations (5)and (7) depends on the geometry of a transducer. For example,for a gap-closing transducer with parallel walls, equation (5)gives a non-zero function while equation (7) gives zero.Since the studied device has a transducer with a geometryresembling an ideal gap-closing transducer, we expect similar,although not exactly equivalent, behavior. This is confirmedby numerical simulations presented in the next section.
3.2. Modeling of the system
Similarly to all CCs for e-VEHs [33–35], the continuousmode CC shown in figure 10 is nonlinear. The correspondingordinary differential equation (ODE) cannot be solved inclosed form and can only be studied using an ODEsolver (Matlab, Scilab, VHDL-AMS, VerlogA or other).The mathematical model we used for this study is suitablefor VHDL-AMS/Eldo based simulation [36]. The systemdynamics are described in a three-dimensional state spacewhere the state variables are the instantaneous transducercharge q, the displacement x and the velocity v. The differentialequations are derived from the mesh law describing thevoltages in a single mesh of the CC and from the Newtonlaw written for the resonator, when no impact occurs betweenthe mobile mass and the stoppers:⎧⎪⎨
⎪⎩q =
(U0 − q
Cvar(x)
) /Rload
v = Aext(t) − km x − μ
mv + 1m Ft (x, v)
x = v
(8)
Cvar(x) given by equation (2), Aext(t) is the time evolution ofthe acceleration of external vibrations, m, k and μ are theresonator lumped mass, stiffness and damping respectively. Ft
5
J. Micromech. Microeng. 24 (2014) 035001 P Basset et al
is the force generated by the transducer on the mobile mass,which can, in general, depend on the displacement, the velocityand the transducer charge. The damping factor μ is related tothe intrinsic quality factor of the resonator connected to a zero-biased transducer:
μ =√
km
Q(9)
where Q is the quality factor of the resonator. It should benoted that our structure is tested under atmospheric pressure,and the main origin of the damping is squeeze film damping ofthe air layer between the transducer electrodes. In this model,damping is supposed to be linear, but in reality it depends onthe amplitude of vibrations: the higher is the amplitude, thestronger is the damping since the smallest is the gap betweenthe electrodes at the maximum displacement. In the analysispresented in this section, we will give the value of an ‘effective’quality factor for each simulation of model equation (8) byfitting the model with the measurements. We have estimatedthat Q ≈ 8.5 for small vibration amplitudes. For high vibrationamplitudes, the squeeze film damping is strong and the systemis nonlinear: hence, the quality factor notion is not applicableto the system. However, we estimate the effective quality factorof an ‘equivalent’ linear resonator to be Q ≈ 4.5: it providesa correct prediction of the resonator vibration amplitude forstrong input acceleration, as it will be shown in figure 14.
In the absence of contact with the stoppers, the transducerforce Ft depends only on x and on the transducer charge q:
Ft (x) = 1
2
q2
C2var(x)
∂Cvar(x)
∂x. (10)
However, because of electrostatic instability, it is difficultto use this model ‘as is’: during the transient process, anamplitude overshoot may induce the pull-in phenomenonforcing the simulation to crash. Hence, the stopper effectshould be modeled at least to limit the displacement of themobile mass and, ideally, to model the dynamics of theimpact process correctly. In our stimulations, we have usedthe following model for the rebound force applied by eachstopper to the movable mass:
Fstop(x, v)
={−kstop(d0 − dstop − x)sign(x) − μstopV, abs(x) > d0 − dstop
0 otherwise (11)
where dstop is the minimal gap allowed between the transducerelectrodes by the stoppers, μstop and kstop are the dampingand stiffness of the stoppers. The dstop value is defined by thestructure design and is known a priori. Several studies haveaddressed the estimation of μstop and kstop, and the fitting ofapproximated analytical models appears to be the mainstreamtechnique [25]. We used 1 Ns m−1 for μstop and 104 N m−1 forkstop.
3.3. Prediction of the optimal load and the harvested power
The power dissipated by a resistive load can be calculated as:
PRload = 1
t2 − t1
∫ t2
t1
U2load
Rloaddt (12)
where Uload is the voltage on Rload related to the chargeq in equation (8) as Uload = qRload. It is not possible tocalculate the integral in equation (8) in closed form. However,this expression can directly be used for an experimentalmeasurement of the converted power. The output voltageUload is, in general case, alternating and non-harmonic. Twotechniques that we discuss below can provide an insight intothe link between the system parameters and the convertedpower: mechanical impedance approach and charge–voltagediagrams.
3.3.1. The mechanical impedance approach. The analysisbased on the mechanical impedance describes the dynamicbehavior of a mobile mass in the mechanical domainby analyzing the mechanical contribution of a transducercoupled with a CC accounting for nonlinear features ofthese components [37]. The mechanical impedance of anelectromechanical transducer associated with a given CC canbe defined in the context of energy conversion systems. If themobile terminal of the transducer displays sinusoidal motionwith the amplitude X, and the transducer generates a periodicelectrostatic force with the same frequency but not obviouslysinusoidal (the transducer is nonlinear in general case), themechanical impedance of the transducer t is given by [37]:
ψt = − Fωt
V= − Fω
t
jωmX(13)
where Fωt is the complex amplitude of the first harmonic
of the transducer force at a frequency ωm of the mobileterminal displacement and the dotted X and V are the complexamplitudes of the displacement and the velocity of the mobileterminal respectively. It is very important to remember that,since the system is nonlinear, t depends on the amplitude X.When the transducer is associated with a mechanical system (aresonator), the actual complex amplitude of the mobile massvibration is given by the second Newtonian law expressed bythe following nonlinear algebraic equation [37]:
Fext = − [ψt (X ) + ψr] jωmX (14)
where Fext is the complex amplitude of the inertial force appliedto the mobile mass because of external vibrations [38] and r
is the mechanical impedance of the resonator.If the amplitude of the resonator vibrations is known,
the converted power is immediately calculated through thetransducer mechanical impedance [37]:
Pconverted = 12 (ωmX )2 Re (ψt ) (15)
where ωm is the angular frequency of mechanical vibrations, t is the transducer impedance and X is the amplitude ofthe mobile mass displacement. Note that equations (12) and(15), which allow one to calculate the converted power inthe electrical and mechanical domains respectively, provideidentical value of converted power.
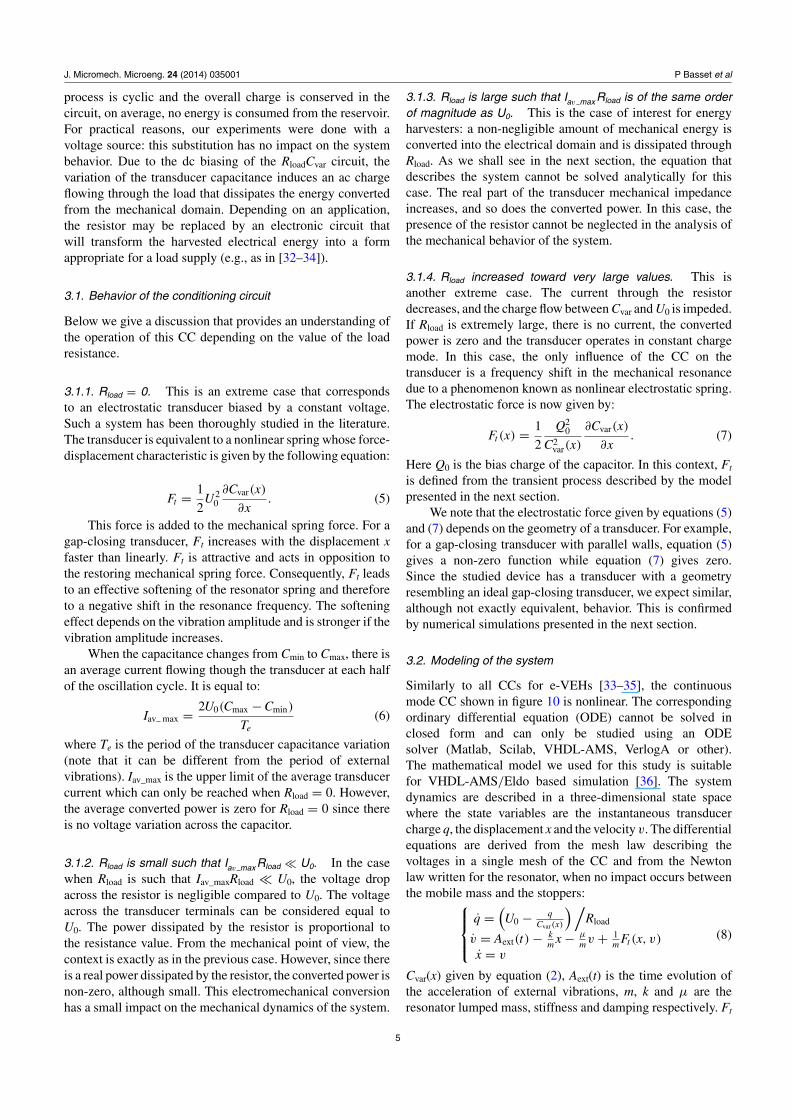
Figure 6 shows the charts of transducer mechanicalimpedance calculated for three values of the bias voltage U0 forthe maximum amplitude allowed by the stoppers (36 μm)when the resistance of the load changes from 100 k� to500 M�. Several conclusions can be made based on theanalysis of the mechanical impedance:
6
J. Micromech. Microeng. 24 (2014) 035001 P Basset et al
Figure 6. Mechanical impedance chart of the transducer-conditioning circuit block versus load resistance. X = 36 μm,R = 100 k�, . . . ,500 M�.
• The value of the impedance is linearly scaled as the squareof U0.
• As is expected, the imaginary part of the impedanceresponsible for the electrostatic spring softeningphenomenon is positive. It is large for low values of theload resistance and decreases at high values of the loadresistance.
• As the load resistance increases from low values to verylarge values, the real part of the mechanical impedanceincreases, reaches a peak value and then decreases. Thereis an evident correspondence with the four typical casesof Rload considered previously in this section (cf alsoequation (15) giving the converted power).
• Since the impedance is calculated for a fixed amplitude ofthe mobile terminal, the converted power is proportionalto the real part of the transducer impedance, according toequation (15). For U0 = 30 V, it corresponds to 3.2 μW.
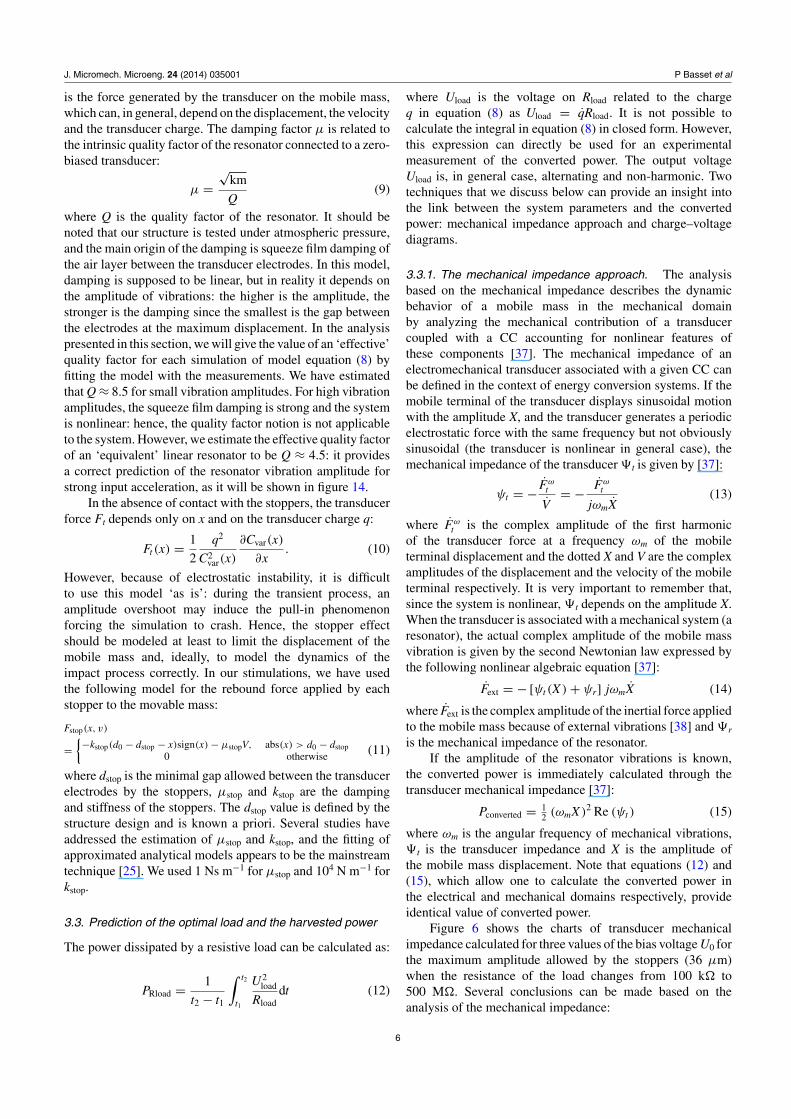
Figure 7 shows the real part of the transducer mechanicalimpedance versus the load resistance. As can be seen from thefigure, the optimal Rload maximizing the converted power isthe same for all voltages U0 and is equal to 6 M�.
It is important to point out that the figures showing theconverted power that we present and discuss in this sectionare valid under assumption that the amplitude of the mobileelectrode of the transducer is fixed and is known. Obviously,the power calculated using this approach could increaseunlimitedly if the voltage U0 increases. This contradicts to therealistic behavior of the system since the system, ‘transducer-CC’ is analyzed separately from the dynamics of the resonatorin the mechanical domain. Such a ‘separate’ approach givesan insight only into the properties of the electromechanicalconversion process. The actual displacement of the mobilemass and the actual converted power can only be found fromequation (14) taking into account all components of the system.
3.3.2. The charge–voltage diagram approach. Charge–voltage diagrams (QU) provide a good intuitive insight into the
Figure 7. Real part of impedance of the transducer-conditioningcircuit block versus load resistance. X = 36 μm, fm = 150 Hz, R =100 k�, . . . ,50 M�. The resistance value corresponding to themaximal power is 6 M�—the same for the three plots.
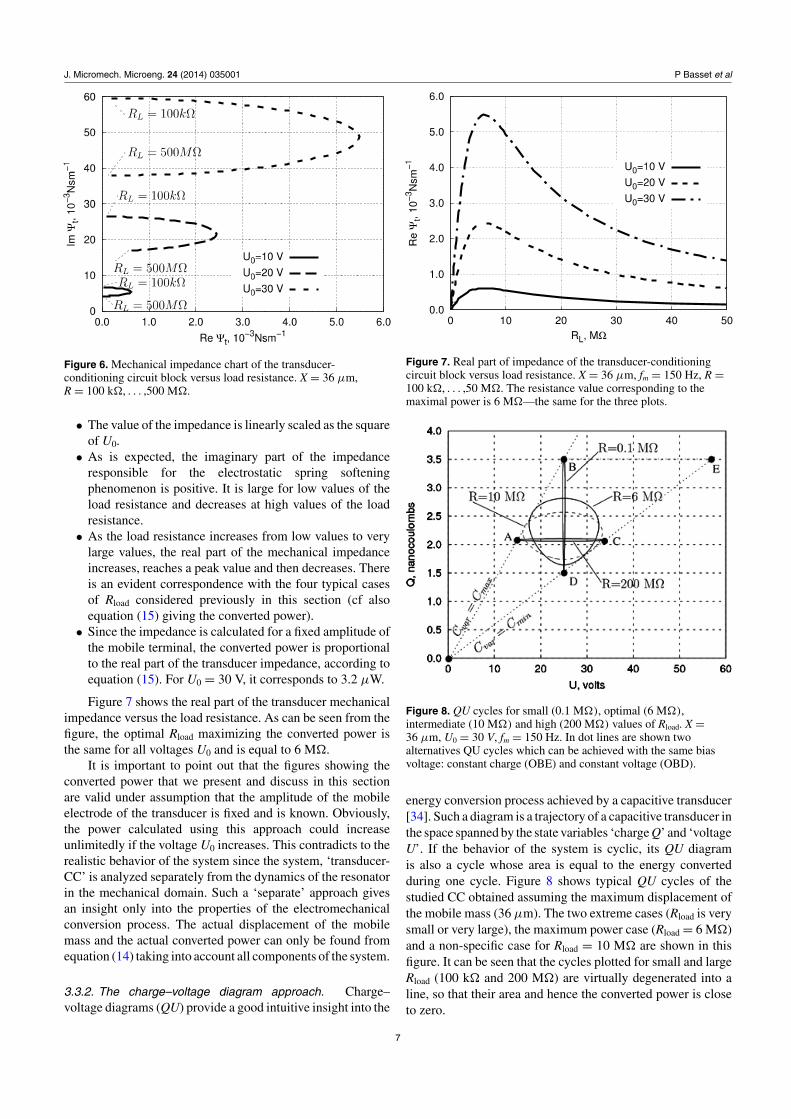
Figure 8. QU cycles for small (0.1 M�), optimal (6 M�),intermediate (10 M�) and high (200 M�) values of Rload. X =36 μm, U0 = 30 V, fm = 150 Hz. In dot lines are shown twoalternatives QU cycles which can be achieved with the same biasvoltage: constant charge (OBE) and constant voltage (OBD).
energy conversion process achieved by a capacitive transducer[34]. Such a diagram is a trajectory of a capacitive transducer inthe space spanned by the state variables ‘charge Q’ and ‘voltageU’. If the behavior of the system is cyclic, its QU diagramis also a cycle whose area is equal to the energy convertedduring one cycle. Figure 8 shows typical QU cycles of thestudied CC obtained assuming the maximum displacement ofthe mobile mass (36 μm). The two extreme cases (Rload is verysmall or very large), the maximum power case (Rload = 6 M�)and a non-specific case for Rload = 10 M� are shown in thisfigure. It can be seen that the cycles plotted for small and largeRload (100 k� and 200 M�) are virtually degenerated into aline, so that their area and hence the converted power is closeto zero.
7
J. Micromech. Microeng. 24 (2014) 035001 P Basset et al
At this point, it is interesting to compare the operation ofthis CC with a CC implementing a triangular constant-chargeQU cycle (e.g., as in [34]). During the constant-charge cycle,the transducer is pre-charged to U0 when its capacitance ismaximal. Such a QU cycle is also shown in the figure 8 bydashed lines forming the triangle OBE. It can easily be seenthat the constant-charge triangular QU cycle is much largerthan the QU cycle of the studied CC plotted for the optimalRload value. The power converted during the constant-chargeQU cycle is given by the formula [34]:
PconstQ = 1
2U2
0 Cmax
(Cmax
Cmin− 1
)fe. (16)
At the amplitude X = 36 μm, Cmax = 110 pF, Cmin = 59 pFincluding a 20 pF parasitic capacitance, fe is the frequencyof the capacitance variation and is twice the frequency of themechanical vibrations fm (fm = 150 Hz for this simulation).At U0 = 30 V, equation (16) gives 12.8 μW. The comparisonis less disadvantageous for the studied circuit if the latter iscompared to the constant-voltage triangular QU cycle alsogiven in figure 8 as the triangle OBD. In this case, the poweris calculated using the formula [34]:
PconstU = 12U2
0 (Cmax − Cmin) fe. (17)
This formula predicts 6.9 μW of power.For our circuit, the converted power calculated using the
real part of the impedance equation (15) at U0 = 30 V andRload = 6 M� (see figure 7) yields only 3.2 μW. As a result,while the continuous mode CC is very simple to implement, itstheoretical performance is weaker comparing to other circuitsensuring best power conversion scenarios. We note that thepower values calculated in this section are obtained withoutaccounting for the power available in the mechanical domain,since the mobile mass vibration amplitude was assumed of agiven amplitude. Hence these values can be greater than onegiven by equation (1), as it is the case for the constant-chargeCC.
3.4. Influence of nonlinear forces: resonator softening andhardening behavior
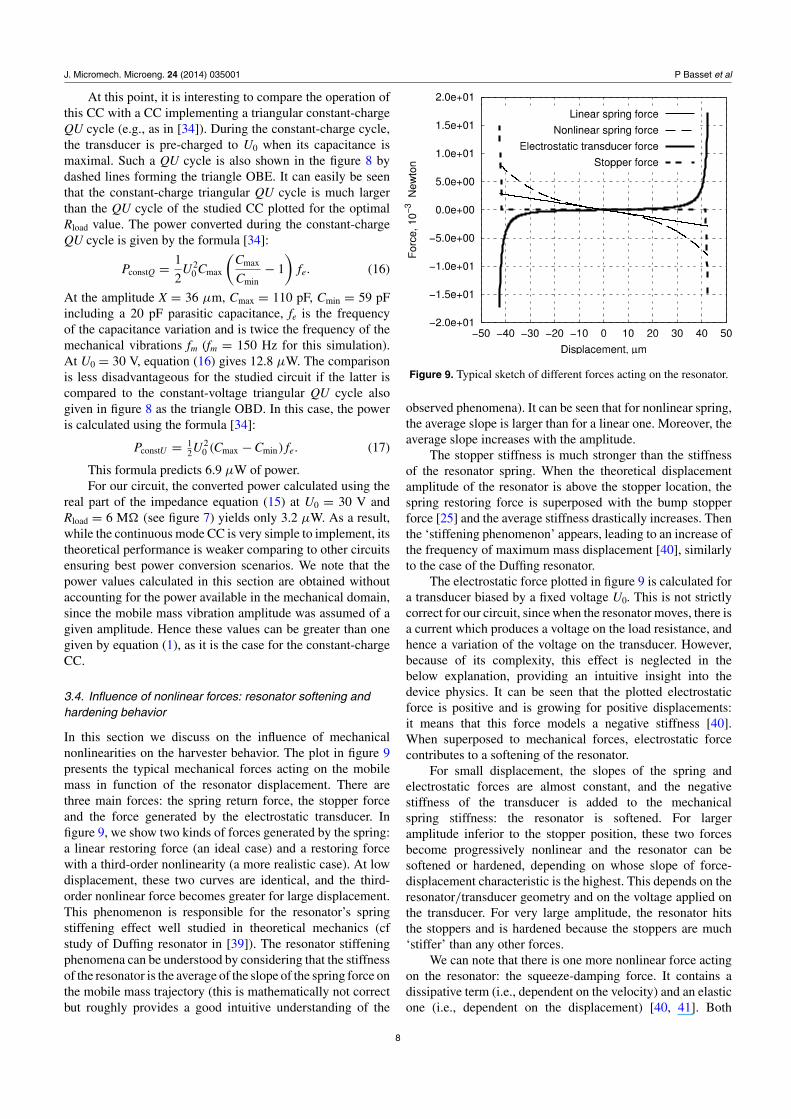
In this section we discuss on the influence of mechanicalnonlinearities on the harvester behavior. The plot in figure 9presents the typical mechanical forces acting on the mobilemass in function of the resonator displacement. There arethree main forces: the spring return force, the stopper forceand the force generated by the electrostatic transducer. Infigure 9, we show two kinds of forces generated by the spring:a linear restoring force (an ideal case) and a restoring forcewith a third-order nonlinearity (a more realistic case). At lowdisplacement, these two curves are identical, and the third-order nonlinear force becomes greater for large displacement.This phenomenon is responsible for the resonator’s springstiffening effect well studied in theoretical mechanics (cfstudy of Duffing resonator in [39]). The resonator stiffeningphenomena can be understood by considering that the stiffnessof the resonator is the average of the slope of the spring force onthe mobile mass trajectory (this is mathematically not correctbut roughly provides a good intuitive understanding of the
Figure 9. Typical sketch of different forces acting on the resonator.
observed phenomena). It can be seen that for nonlinear spring,the average slope is larger than for a linear one. Moreover, theaverage slope increases with the amplitude.
The stopper stiffness is much stronger than the stiffnessof the resonator spring. When the theoretical displacementamplitude of the resonator is above the stopper location, thespring restoring force is superposed with the bump stopperforce [25] and the average stiffness drastically increases. Thenthe ‘stiffening phenomenon’ appears, leading to an increase ofthe frequency of maximum mass displacement [40], similarlyto the case of the Duffing resonator.
The electrostatic force plotted in figure 9 is calculated fora transducer biased by a fixed voltage U0. This is not strictlycorrect for our circuit, since when the resonator moves, there isa current which produces a voltage on the load resistance, andhence a variation of the voltage on the transducer. However,because of its complexity, this effect is neglected in thebelow explanation, providing an intuitive insight into thedevice physics. It can be seen that the plotted electrostaticforce is positive and is growing for positive displacements:it means that this force models a negative stiffness [40].When superposed to mechanical forces, electrostatic forcecontributes to a softening of the resonator.
For small displacement, the slopes of the spring andelectrostatic forces are almost constant, and the negativestiffness of the transducer is added to the mechanicalspring stiffness: the resonator is softened. For largeramplitude inferior to the stopper position, these two forcesbecome progressively nonlinear and the resonator can besoftened or hardened, depending on whose slope of force-displacement characteristic is the highest. This depends on theresonator/transducer geometry and on the voltage applied onthe transducer. For very large amplitude, the resonator hitsthe stoppers and is hardened because the stoppers are much‘stiffer’ than any other forces.
We can note that there is one more nonlinear force actingon the resonator: the squeeze-damping force. It contains adissipative term (i.e., dependent on the velocity) and an elasticone (i.e., dependent on the displacement) [40, 41]. Both
8
J. Micromech. Microeng. 24 (2014) 035001 P Basset et al
terms are amplitude-dependent, and they increase nonlinearlywhen the resonator mobile mass comes close to the stoppers,so contributing to the spring stiffening effect. The elasticterm has not been taken into account in this study, as thenonlinear amplitude dependency of the dissipating term.Instead, as mentioned previously, an effective constant qualityfactor (obtained by fitting the experimental curves) has beenintroduced in the model.
The main consequence of the softening and hardening ofthe resonator is a variation of the ‘average’ resonator stiffness,and hence of the actual resonance frequency. Since, as it isexplained above, the stiffening/softening phenomena dependson the mobile masse amplitude and bias voltage, the resonatorcan respond by high amplitude vibrations at frequencies whichare different from its natural resonance frequency. Moreover,since the resonator amplitude has an influence on the resonatorresonance frequency, the whole frequency response can bevery strongly impacted by the nonlinearities. As it was shownin other works, typical effects of spring stiffening due tostoppers and to high order spring nonlinearity is an increase ofthe resonator bandwidth [25, 42]. As shown by the experimentsdescribed in the next sections, this is also true for the designedresonator.
4. Measurement of converted power
The first set of measurements has been performed atatmospheric pressure and at two levels of the external harmonicacceleration amplitude Aext, 0.25 gpeak and 1 gpeak respectively.It was observed that at Aext = 0.25 g the mobile mass does notreach the limits defined by the stoppers: we call this regime‘non-contact mode’. At Aext = 1 gpeak, the mobile mass hits therigid frame. The impact of the mobile mass and the stoppers hasbeen both observed under a microscope and confirmed by themeasurements. The second set of measurements presents thebehavior of the system under input stochastic noise vibrations.The main goal of the experiments is to provide the relationbetween the converted power and the parameters of theexperiment: the frequency, the initial voltage U0, the loadresistance and the input vibration amplitude. The output poweris calculated using equation (12), and the voltage is directlymeasured across the load resistor employing a high inputimpedance voltage amplifier. Since the goal of a capacitivetransducer in the context of energy harvesting is to convertmaximum power, all power measurements are carried out atthe frequency corresponding to the maximal power, unlessotherwise mentioned.
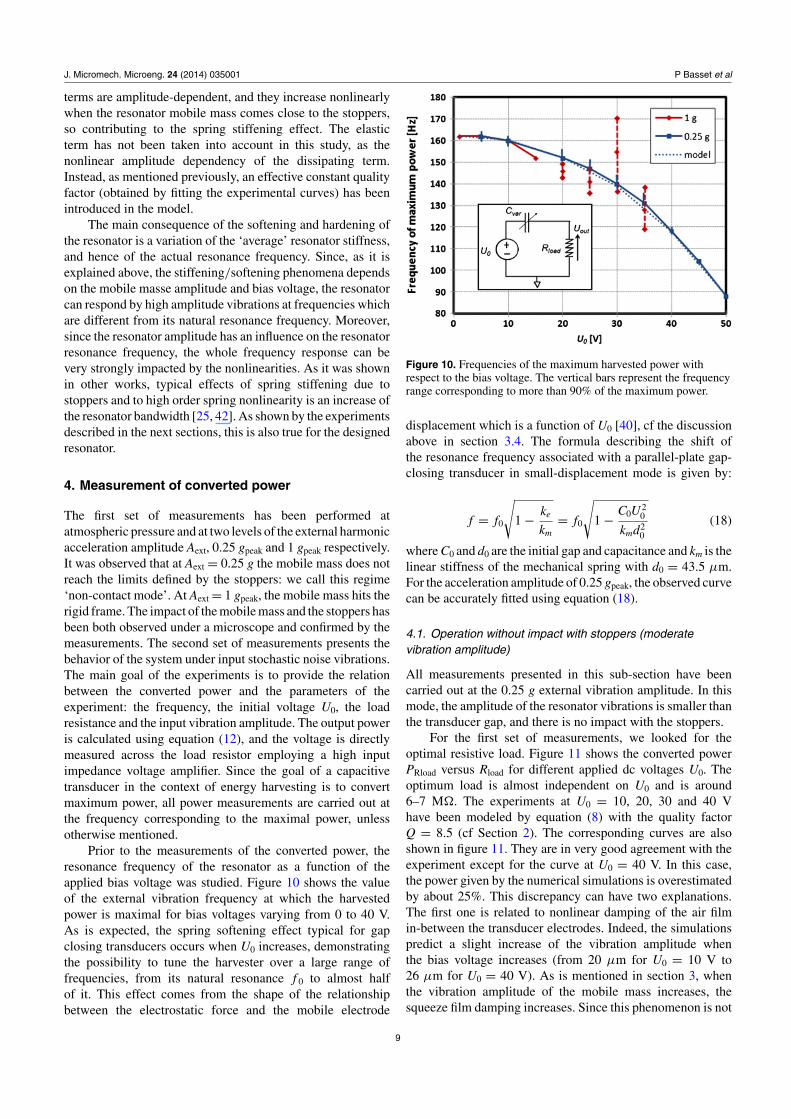
Prior to the measurements of the converted power, theresonance frequency of the resonator as a function of theapplied bias voltage was studied. Figure 10 shows the valueof the external vibration frequency at which the harvestedpower is maximal for bias voltages varying from 0 to 40 V.As is expected, the spring softening effect typical for gapclosing transducers occurs when U0 increases, demonstratingthe possibility to tune the harvester over a large range offrequencies, from its natural resonance f 0 to almost halfof it. This effect comes from the shape of the relationshipbetween the electrostatic force and the mobile electrode
Figure 10. Frequencies of the maximum harvested power withrespect to the bias voltage. The vertical bars represent the frequencyrange corresponding to more than 90% of the maximum power.
displacement which is a function of U0 [40], cf the discussionabove in section 3.4. The formula describing the shift ofthe resonance frequency associated with a parallel-plate gap-closing transducer in small-displacement mode is given by:
f = f0
√1 − ke
km= f0
√1 − C0U2
0
kmd20
(18)
where C0 and d0 are the initial gap and capacitance and km is thelinear stiffness of the mechanical spring with d0 = 43.5 μm.For the acceleration amplitude of 0.25 gpeak, the observed curvecan be accurately fitted using equation (18).
4.1. Operation without impact with stoppers (moderatevibration amplitude)
All measurements presented in this sub-section have beencarried out at the 0.25 g external vibration amplitude. In thismode, the amplitude of the resonator vibrations is smaller thanthe transducer gap, and there is no impact with the stoppers.
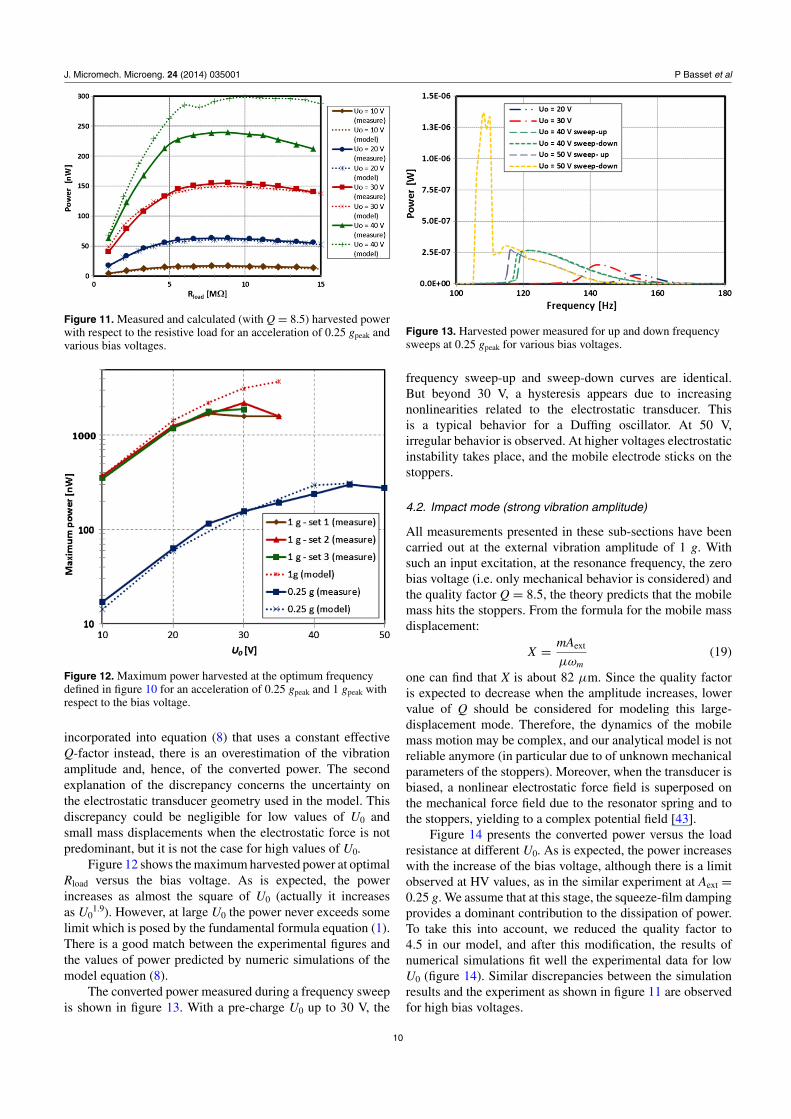
For the first set of measurements, we looked for theoptimal resistive load. Figure 11 shows the converted powerPRload versus Rload for different applied dc voltages U0. Theoptimum load is almost independent on U0 and is around6–7 M�. The experiments at U0 = 10, 20, 30 and 40 Vhave been modeled by equation (8) with the quality factorQ = 8.5 (cf Section 2). The corresponding curves are alsoshown in figure 11. They are in very good agreement with theexperiment except for the curve at U0 = 40 V. In this case,the power given by the numerical simulations is overestimatedby about 25%. This discrepancy can have two explanations.The first one is related to nonlinear damping of the air filmin-between the transducer electrodes. Indeed, the simulationspredict a slight increase of the vibration amplitude whenthe bias voltage increases (from 20 μm for U0 = 10 V to26 μm for U0 = 40 V). As is mentioned in section 3, whenthe vibration amplitude of the mobile mass increases, thesqueeze film damping increases. Since this phenomenon is not
9
J. Micromech. Microeng. 24 (2014) 035001 P Basset et al
Figure 11. Measured and calculated (with Q = 8.5) harvested powerwith respect to the resistive load for an acceleration of 0.25 gpeak andvarious bias voltages.
Figure 12. Maximum power harvested at the optimum frequencydefined in figure 10 for an acceleration of 0.25 gpeak and 1 gpeak withrespect to the bias voltage.
incorporated into equation (8) that uses a constant effectiveQ-factor instead, there is an overestimation of the vibrationamplitude and, hence, of the converted power. The secondexplanation of the discrepancy concerns the uncertainty onthe electrostatic transducer geometry used in the model. Thisdiscrepancy could be negligible for low values of U0 andsmall mass displacements when the electrostatic force is notpredominant, but it is not the case for high values of U0.
Figure 12 shows the maximum harvested power at optimalRload versus the bias voltage. As is expected, the powerincreases as almost the square of U0 (actually it increasesas U0
1.9). However, at large U0 the power never exceeds somelimit which is posed by the fundamental formula equation (1).There is a good match between the experimental figures andthe values of power predicted by numeric simulations of themodel equation (8).
The converted power measured during a frequency sweepis shown in figure 13. With a pre-charge U0 up to 30 V, the
Figure 13. Harvested power measured for up and down frequencysweeps at 0.25 gpeak for various bias voltages.
frequency sweep-up and sweep-down curves are identical.But beyond 30 V, a hysteresis appears due to increasingnonlinearities related to the electrostatic transducer. Thisis a typical behavior for a Duffing oscillator. At 50 V,irregular behavior is observed. At higher voltages electrostaticinstability takes place, and the mobile electrode sticks on thestoppers.
4.2. Impact mode (strong vibration amplitude)
All measurements presented in these sub-sections have beencarried out at the external vibration amplitude of 1 g. Withsuch an input excitation, at the resonance frequency, the zerobias voltage (i.e. only mechanical behavior is considered) andthe quality factor Q = 8.5, the theory predicts that the mobilemass hits the stoppers. From the formula for the mobile massdisplacement:
X = mAext
μωm(19)
one can find that X is about 82 μm. Since the quality factoris expected to decrease when the amplitude increases, lowervalue of Q should be considered for modeling this large-displacement mode. Therefore, the dynamics of the mobilemass motion may be complex, and our analytical model is notreliable anymore (in particular due to of unknown mechanicalparameters of the stoppers). Moreover, when the transducer isbiased, a nonlinear electrostatic force field is superposed onthe mechanical force field due to the resonator spring and tothe stoppers, yielding to a complex potential field [43].
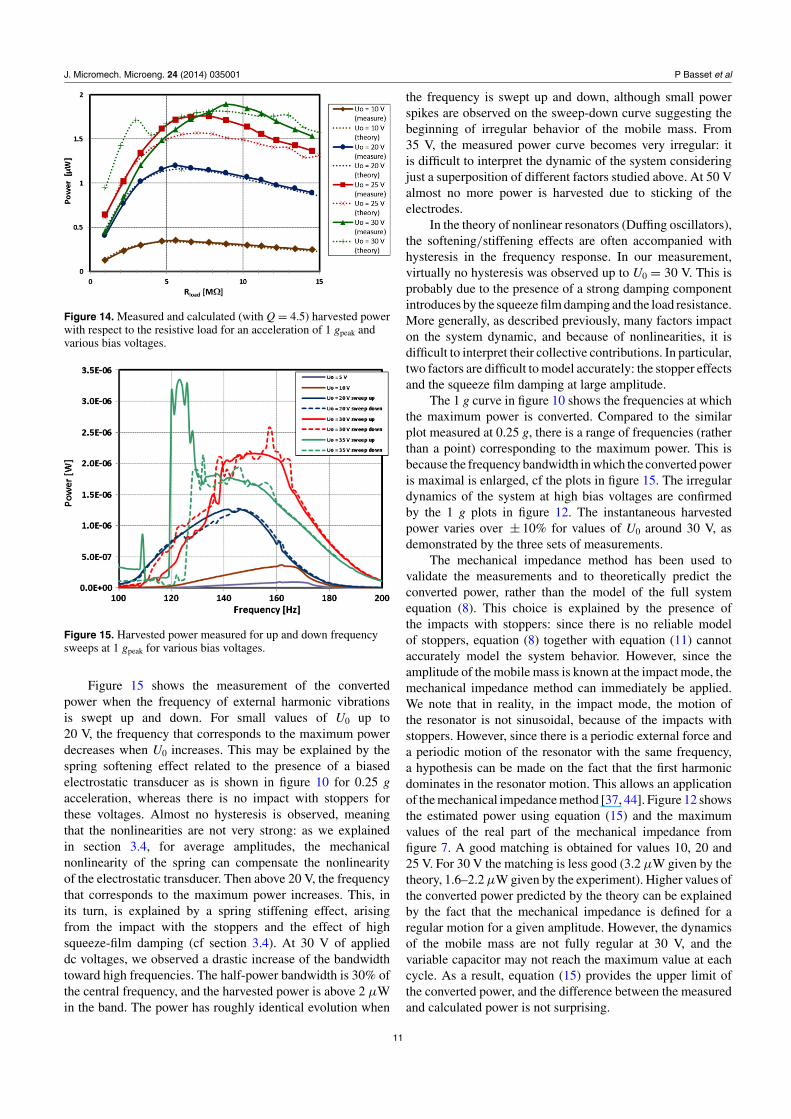
Figure 14 presents the converted power versus the loadresistance at different U0. As is expected, the power increaseswith the increase of the bias voltage, although there is a limitobserved at HV values, as in the similar experiment at Aext =0.25 g. We assume that at this stage, the squeeze-film dampingprovides a dominant contribution to the dissipation of power.To take this into account, we reduced the quality factor to4.5 in our model, and after this modification, the results ofnumerical simulations fit well the experimental data for lowU0 (figure 14). Similar discrepancies between the simulationresults and the experiment as shown in figure 11 are observedfor high bias voltages.
10
J. Micromech. Microeng. 24 (2014) 035001 P Basset et al
Figure 14. Measured and calculated (with Q = 4.5) harvested powerwith respect to the resistive load for an acceleration of 1 gpeak andvarious bias voltages.
Figure 15. Harvested power measured for up and down frequencysweeps at 1 gpeak for various bias voltages.
Figure 15 shows the measurement of the convertedpower when the frequency of external harmonic vibrationsis swept up and down. For small values of U0 up to20 V, the frequency that corresponds to the maximum powerdecreases when U0 increases. This may be explained by thespring softening effect related to the presence of a biasedelectrostatic transducer as is shown in figure 10 for 0.25 gacceleration, whereas there is no impact with stoppers forthese voltages. Almost no hysteresis is observed, meaningthat the nonlinearities are not very strong: as we explainedin section 3.4, for average amplitudes, the mechanicalnonlinearity of the spring can compensate the nonlinearityof the electrostatic transducer. Then above 20 V, the frequencythat corresponds to the maximum power increases. This, inits turn, is explained by a spring stiffening effect, arisingfrom the impact with the stoppers and the effect of highsqueeze-film damping (cf section 3.4). At 30 V of applieddc voltages, we observed a drastic increase of the bandwidthtoward high frequencies. The half-power bandwidth is 30% ofthe central frequency, and the harvested power is above 2 μWin the band. The power has roughly identical evolution when
the frequency is swept up and down, although small powerspikes are observed on the sweep-down curve suggesting thebeginning of irregular behavior of the mobile mass. From35 V, the measured power curve becomes very irregular: itis difficult to interpret the dynamic of the system consideringjust a superposition of different factors studied above. At 50 Valmost no more power is harvested due to sticking of theelectrodes.
In the theory of nonlinear resonators (Duffing oscillators),the softening/stiffening effects are often accompanied withhysteresis in the frequency response. In our measurement,virtually no hysteresis was observed up to U0 = 30 V. This isprobably due to the presence of a strong damping componentintroduces by the squeeze film damping and the load resistance.More generally, as described previously, many factors impacton the system dynamic, and because of nonlinearities, it isdifficult to interpret their collective contributions. In particular,two factors are difficult to model accurately: the stopper effectsand the squeeze film damping at large amplitude.
The 1 g curve in figure 10 shows the frequencies at whichthe maximum power is converted. Compared to the similarplot measured at 0.25 g, there is a range of frequencies (ratherthan a point) corresponding to the maximum power. This isbecause the frequency bandwidth in which the converted poweris maximal is enlarged, cf the plots in figure 15. The irregulardynamics of the system at high bias voltages are confirmedby the 1 g plots in figure 12. The instantaneous harvestedpower varies over ± 10% for values of U0 around 30 V, asdemonstrated by the three sets of measurements.
The mechanical impedance method has been used tovalidate the measurements and to theoretically predict theconverted power, rather than the model of the full systemequation (8). This choice is explained by the presence ofthe impacts with stoppers: since there is no reliable modelof stoppers, equation (8) together with equation (11) cannotaccurately model the system behavior. However, since theamplitude of the mobile mass is known at the impact mode, themechanical impedance method can immediately be applied.We note that in reality, in the impact mode, the motion ofthe resonator is not sinusoidal, because of the impacts withstoppers. However, since there is a periodic external force anda periodic motion of the resonator with the same frequency,a hypothesis can be made on the fact that the first harmonicdominates in the resonator motion. This allows an applicationof the mechanical impedance method [37, 44]. Figure 12 showsthe estimated power using equation (15) and the maximumvalues of the real part of the mechanical impedance fromfigure 7. A good matching is obtained for values 10, 20 and25 V. For 30 V the matching is less good (3.2 μW given by thetheory, 1.6–2.2 μW given by the experiment). Higher values ofthe converted power predicted by the theory can be explainedby the fact that the mechanical impedance is defined for aregular motion for a given amplitude. However, the dynamicsof the mobile mass are not fully regular at 30 V, and thevariable capacitor may not reach the maximum value at eachcycle. As a result, equation (15) provides the upper limit ofthe converted power, and the difference between the measuredand calculated power is not surprising.
11
J. Micromech. Microeng. 24 (2014) 035001 P Basset et al
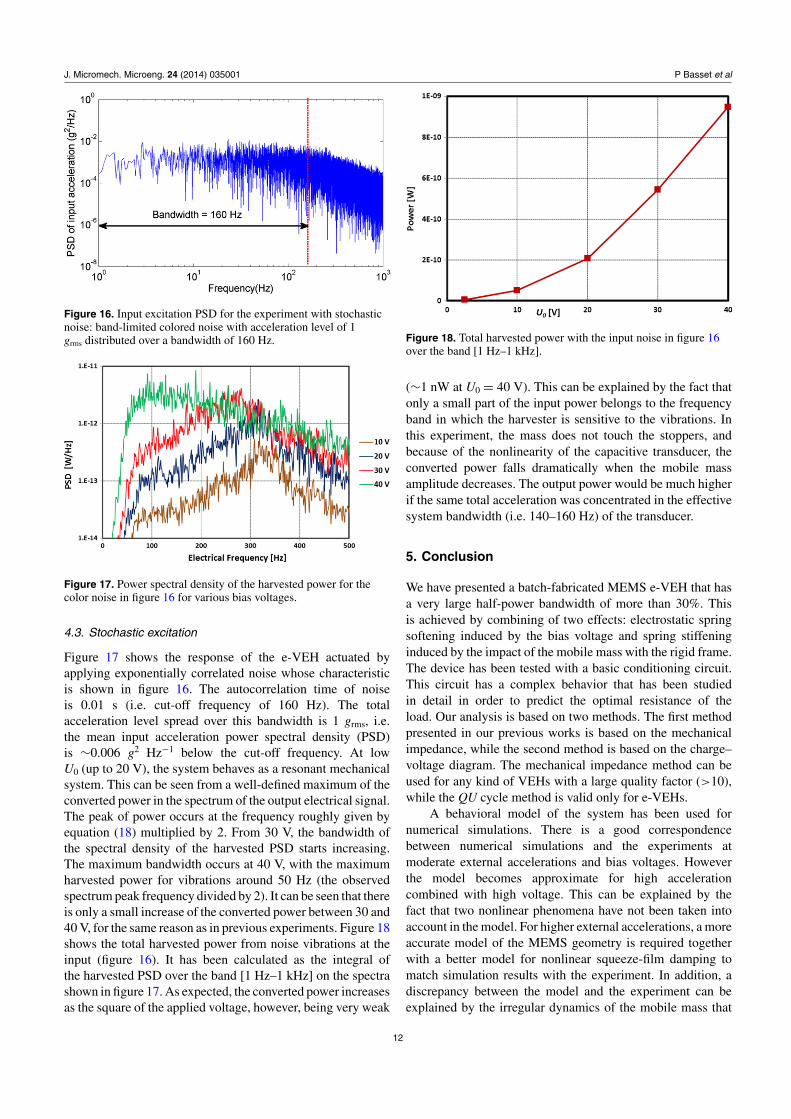
Figure 16. Input excitation PSD for the experiment with stochasticnoise: band-limited colored noise with acceleration level of 1grms distributed over a bandwidth of 160 Hz.
Figure 17. Power spectral density of the harvested power for thecolor noise in figure 16 for various bias voltages.
4.3. Stochastic excitation
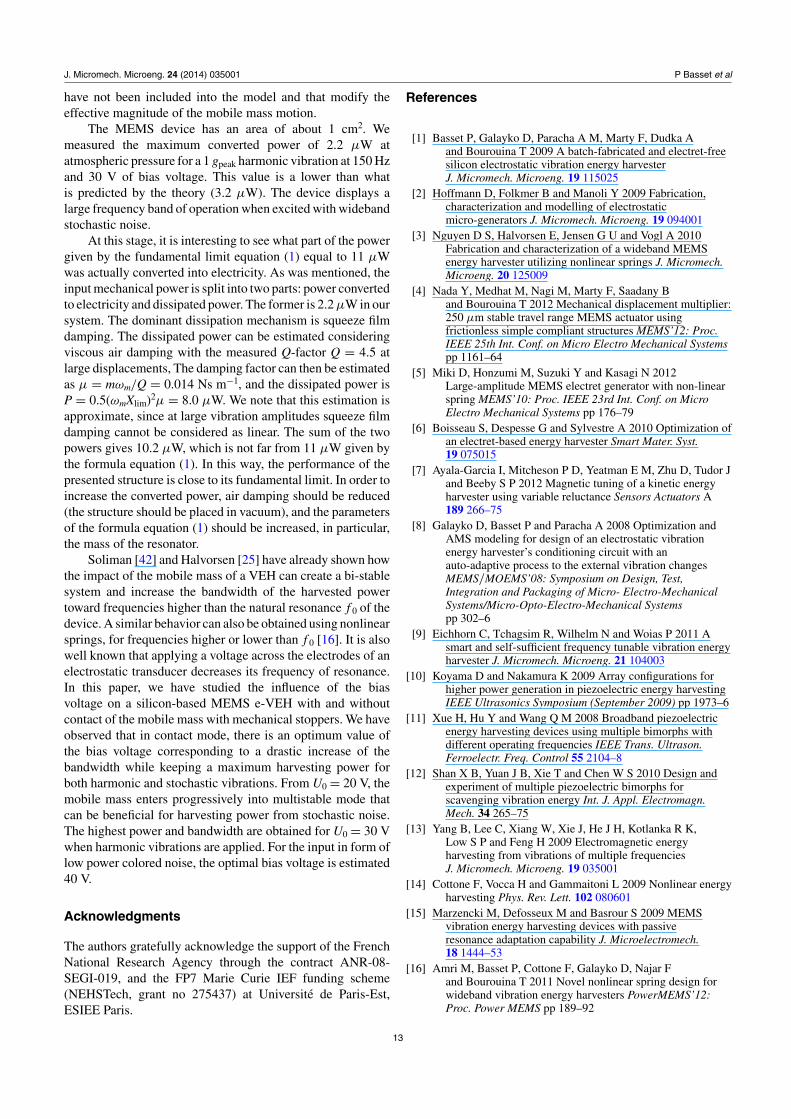
Figure 17 shows the response of the e-VEH actuated byapplying exponentially correlated noise whose characteristicis shown in figure 16. The autocorrelation time of noiseis 0.01 s (i.e. cut-off frequency of 160 Hz). The totalacceleration level spread over this bandwidth is 1 grms, i.e.the mean input acceleration power spectral density (PSD)is ∼0.006 g2 Hz−1 below the cut-off frequency. At lowU0 (up to 20 V), the system behaves as a resonant mechanicalsystem. This can be seen from a well-defined maximum of theconverted power in the spectrum of the output electrical signal.The peak of power occurs at the frequency roughly given byequation (18) multiplied by 2. From 30 V, the bandwidth ofthe spectral density of the harvested PSD starts increasing.The maximum bandwidth occurs at 40 V, with the maximumharvested power for vibrations around 50 Hz (the observedspectrum peak frequency divided by 2). It can be seen that thereis only a small increase of the converted power between 30 and40 V, for the same reason as in previous experiments. Figure 18shows the total harvested power from noise vibrations at theinput (figure 16). It has been calculated as the integral ofthe harvested PSD over the band [1 Hz–1 kHz] on the spectrashown in figure 17. As expected, the converted power increasesas the square of the applied voltage, however, being very weak
Figure 18. Total harvested power with the input noise in figure 16over the band [1 Hz–1 kHz].
(∼1 nW at U0 = 40 V). This can be explained by the fact thatonly a small part of the input power belongs to the frequencyband in which the harvester is sensitive to the vibrations. Inthis experiment, the mass does not touch the stoppers, andbecause of the nonlinearity of the capacitive transducer, theconverted power falls dramatically when the mobile massamplitude decreases. The output power would be much higherif the same total acceleration was concentrated in the effectivesystem bandwidth (i.e. 140–160 Hz) of the transducer.
5. Conclusion
We have presented a batch-fabricated MEMS e-VEH that hasa very large half-power bandwidth of more than 30%. Thisis achieved by combining of two effects: electrostatic springsoftening induced by the bias voltage and spring stiffeninginduced by the impact of the mobile mass with the rigid frame.The device has been tested with a basic conditioning circuit.This circuit has a complex behavior that has been studiedin detail in order to predict the optimal resistance of theload. Our analysis is based on two methods. The first methodpresented in our previous works is based on the mechanicalimpedance, while the second method is based on the charge–voltage diagram. The mechanical impedance method can beused for any kind of VEHs with a large quality factor (>10),while the QU cycle method is valid only for e-VEHs.
A behavioral model of the system has been used fornumerical simulations. There is a good correspondencebetween numerical simulations and the experiments atmoderate external accelerations and bias voltages. Howeverthe model becomes approximate for high accelerationcombined with high voltage. This can be explained by thefact that two nonlinear phenomena have not been taken intoaccount in the model. For higher external accelerations, a moreaccurate model of the MEMS geometry is required togetherwith a better model for nonlinear squeeze-film damping tomatch simulation results with the experiment. In addition, adiscrepancy between the model and the experiment can beexplained by the irregular dynamics of the mobile mass that
12
J. Micromech. Microeng. 24 (2014) 035001 P Basset et al
have not been included into the model and that modify theeffective magnitude of the mobile mass motion.
The MEMS device has an area of about 1 cm2. Wemeasured the maximum converted power of 2.2 μW atatmospheric pressure for a 1 gpeak harmonic vibration at 150 Hzand 30 V of bias voltage. This value is a lower than whatis predicted by the theory (3.2 μW). The device displays alarge frequency band of operation when excited with widebandstochastic noise.
At this stage, it is interesting to see what part of the powergiven by the fundamental limit equation (1) equal to 11 μWwas actually converted into electricity. As was mentioned, theinput mechanical power is split into two parts: power convertedto electricity and dissipated power. The former is 2.2 μW in oursystem. The dominant dissipation mechanism is squeeze filmdamping. The dissipated power can be estimated consideringviscous air damping with the measured Q-factor Q = 4.5 atlarge displacements, The damping factor can then be estimatedas μ = mωm/Q = 0.014 Ns m−1, and the dissipated power isP = 0.5(ωmXlim)2μ = 8.0 μW. We note that this estimation isapproximate, since at large vibration amplitudes squeeze filmdamping cannot be considered as linear. The sum of the twopowers gives 10.2 μW, which is not far from 11 μW given bythe formula equation (1). In this way, the performance of thepresented structure is close to its fundamental limit. In order toincrease the converted power, air damping should be reduced(the structure should be placed in vacuum), and the parametersof the formula equation (1) should be increased, in particular,the mass of the resonator.
Soliman [42] and Halvorsen [25] have already shown howthe impact of the mobile mass of a VEH can create a bi-stablesystem and increase the bandwidth of the harvested powertoward frequencies higher than the natural resonance f 0 of thedevice. A similar behavior can also be obtained using nonlinearsprings, for frequencies higher or lower than f 0 [16]. It is alsowell known that applying a voltage across the electrodes of anelectrostatic transducer decreases its frequency of resonance.In this paper, we have studied the influence of the biasvoltage on a silicon-based MEMS e-VEH with and withoutcontact of the mobile mass with mechanical stoppers. We haveobserved that in contact mode, there is an optimum value ofthe bias voltage corresponding to a drastic increase of thebandwidth while keeping a maximum harvesting power forboth harmonic and stochastic vibrations. From U0 = 20 V, themobile mass enters progressively into multistable mode thatcan be beneficial for harvesting power from stochastic noise.The highest power and bandwidth are obtained for U0 = 30 Vwhen harmonic vibrations are applied. For the input in form oflow power colored noise, the optimal bias voltage is estimated40 V.
Acknowledgments
The authors gratefully acknowledge the support of the FrenchNational Research Agency through the contract ANR-08-SEGI-019, and the FP7 Marie Curie IEF funding scheme(NEHSTech, grant no 275437) at Universite de Paris-Est,ESIEE Paris.
References
[1] Basset P, Galayko D, Paracha A M, Marty F, Dudka Aand Bourouina T 2009 A batch-fabricated and electret-freesilicon electrostatic vibration energy harvesterJ. Micromech. Microeng. 19 115025
[2] Hoffmann D, Folkmer B and Manoli Y 2009 Fabrication,characterization and modelling of electrostaticmicro-generators J. Micromech. Microeng. 19 094001
[3] Nguyen D S, Halvorsen E, Jensen G U and Vogl A 2010Fabrication and characterization of a wideband MEMSenergy harvester utilizing nonlinear springs J. Micromech.Microeng. 20 125009
[4] Nada Y, Medhat M, Nagi M, Marty F, Saadany Band Bourouina T 2012 Mechanical displacement multiplier:250 μm stable travel range MEMS actuator usingfrictionless simple compliant structures MEMS’12: Proc.IEEE 25th Int. Conf. on Micro Electro Mechanical Systemspp 1161–64
[5] Miki D, Honzumi M, Suzuki Y and Kasagi N 2012Large-amplitude MEMS electret generator with non-linearspring MEMS’10: Proc. IEEE 23rd Int. Conf. on MicroElectro Mechanical Systems pp 176–79
[6] Boisseau S, Despesse G and Sylvestre A 2010 Optimization ofan electret-based energy harvester Smart Mater. Syst.19 075015
[7] Ayala-Garcia I, Mitcheson P D, Yeatman E M, Zhu D, Tudor Jand Beeby S P 2012 Magnetic tuning of a kinetic energyharvester using variable reluctance Sensors Actuators A189 266–75
[8] Galayko D, Basset P and Paracha A 2008 Optimization andAMS modeling for design of an electrostatic vibrationenergy harvester’s conditioning circuit with anauto-adaptive process to the external vibration changesMEMS/MOEMS’08: Symposium on Design, Test,Integration and Packaging of Micro- Electro-MechanicalSystems/Micro-Opto-Electro-Mechanical Systemspp 302–6
[9] Eichhorn C, Tchagsim R, Wilhelm N and Woias P 2011 Asmart and self-sufficient frequency tunable vibration energyharvester J. Micromech. Microeng. 21 104003
[10] Koyama D and Nakamura K 2009 Array configurations forhigher power generation in piezoelectric energy harvestingIEEE Ultrasonics Symposium (September 2009) pp 1973–6
[11] Xue H, Hu Y and Wang Q M 2008 Broadband piezoelectricenergy harvesting devices using multiple bimorphs withdifferent operating frequencies IEEE Trans. Ultrason.Ferroelectr. Freq. Control 55 2104–8
[12] Shan X B, Yuan J B, Xie T and Chen W S 2010 Design andexperiment of multiple piezoelectric bimorphs forscavenging vibration energy Int. J. Appl. Electromagn.Mech. 34 265–75
[13] Yang B, Lee C, Xiang W, Xie J, He J H, Kotlanka R K,Low S P and Feng H 2009 Electromagnetic energyharvesting from vibrations of multiple frequenciesJ. Micromech. Microeng. 19 035001
[14] Cottone F, Vocca H and Gammaitoni L 2009 Nonlinear energyharvesting Phys. Rev. Lett. 102 080601
[15] Marzencki M, Defosseux M and Basrour S 2009 MEMSvibration energy harvesting devices with passiveresonance adaptation capability J. Microelectromech.18 1444–53
[16] Amri M, Basset P, Cottone F, Galayko D, Najar Fand Bourouina T 2011 Novel nonlinear spring design forwideband vibration energy harvesters PowerMEMS’12:Proc. Power MEMS pp 189–92
13
J. Micromech. Microeng. 24 (2014) 035001 P Basset et al
[17] Miki D, Honzumi M, Suzuki Y and Kasagi N 2010 Largeamplitude MEMS electret generator with nonlinear springMEMS’10: IEEE 23rd Int. Conf. on Micro ElectroMechanical Systems pp 176–9
[18] Burrow S and Clare L 2007 A resonant generator withnon-linear compliance for energy harvesting in highvibrational environments IEMDC’07: IEEE Int. ElectricMachines and Drives Conference pp 715–20
[19] Erturk A and Inman D J 2010 Broadband piezoelectric powergeneration on high-energy orbits of the bistable Duffingoscillator with electromechanical coupling J. Sound Vib.330 2339–53
[20] Stanton S C, McGehee C C and Mann B P 2010 Nonlineardynamics for broadband energy harvesting: Investigation ofa bistable piezoelectric inertial generator Physica D239 640–53
[21] Cottone F, Gammaitoni L, Vocca H, Ferrari M and Ferrari V2012 Piezoelectric buckled beams for random vibrationenergy harvesting Smart Mater. Struct. 21 035021
[22] Cottone F, Basset P, Vocca H and Gammaitoni L 2012Electromagnetic buckled beam oscillator for enhancedvibration energy harvesting IEEE Conf. on GreenComputing and Comms. (November 2012) pp 624–27
[23] Liu W Q, Badel A, Formosa F, Wu Y P and Agbossou A 2013Novel piezoelectric bistable oscillator architecture forwideband vibration energy harvesting Smart Mater. Struct.22 035013
[24] Cottone F, Basset P, Guillemet R, Galayko D, Marty Fand Bourouina T 2013 Non-linear MEMS electrostatickinetic energy harvester with a tunable multistable potentialfor stochastic vibrations Transducers’13: Proc. 17th Int.Conf. on Solid-State Sensors, Actuators and Microsystems(Barcelona, Spain) pp 1336–9
[25] Phu Le C and Halvorsen E 2012 MEMS electrostatic energyharvesters with end-stop effects J. Micromech. Microeng.22 074013
[26] Paracha A M, Basset P, Lim P C L, Marty F and Bourouina T2006 A bulk silicon-based electrostaticvibration-to-electricity energy converter usingin-plane-overlap-plate (IPOP) mechanism PowerMEMS’06:Proc. 6th Int. Workshop on Micro and Nanotechnology forPower Generation and Energy Conversion Applications(Berkeley, CA) pp 169–72
[27] Roundy S J 2003 Energy scavenging for wireless sensor nodesPhD Thesis University of California-Berkeley
[28] Guillemet R, Basset P, Galayko D, Marty F and Bourouina T2012 Efficient in-plane gap-closing MEMS electrostaticvibration energy harvester PowerMEMS’12: Proc. 12th Int.Workshop on Micro and Nanotechnology for PowerGeneration and Energy Conversion Applications (Atlanta,GA)
[29] Guillemet R et al 2013 Wideband MEMS electrostaticvibration energy harvesters based on gap-closing
interdigited combs with a trapezoidal section IEEE 26th Int.Conf. on MEMS (Taipei, 2013)
[30] Mitcheson P D, Green T C, Yeatman E M and Holmes A S2004 Architectures for vibration-driven micropowergenerators J. Microelectromech. Syst. 13 429–40
[31] Blokhina E, Galayko D, Harte P, Basset P and Feely O 2012Limit on converted power in resonant electrostatic vibrationenergy harvesters Appl. Phys. Lett. 101 173904
[32] Mitcheson P D, Sterken T, He C, Kiziroglou M, Yeatman E Mand Puers R 2008 Electrostatic microgenerators Meas.Control 41 114
[33] Dudka A, Galayko D and Basset P 2013 IC design of anadaptive electrostatic vibration energy harvester: focus onclock generator DTIP: Proc. 15th Symp. on Design, Test,Integration and Packaging Conference, (Barcelona, Spain)
[34] Meninger S, Mur-Miranda J O, Amirtharajah R,Chandrakasan A P and Lang J H 2001 Vibration-to-electricenergy conversion IEEE Trans. Very Large Scale Integr.(VLSI) Syst. 9 64–76
[35] Yen B C and Lang J H 2006 A variable capacitance vibrationto electric energy harvester IEEE Trans. Circuits Syst.53 288–95
[36] Galayko D, Basset P and Paracha A 2008 Optimization andAMS modeling for design of an electrostatic vibrationenergy harverster’s conditioning circuit with anauto-adaptative process to the external vibration changesDTIP’08: Proc. 10th Symp. on Design, Test, Integration andPackaging Conference (Nice, France)
[37] Galayko D and Basset P 2011 A general analytical tool for thedesign of vibration energy harvesters (VEHs) based on themechanical impedance concept IEEE Trans. Circuits Syst..58 299–311
[38] Landau L D and Lifshitz E M 1976 Mechanics Course ofTheoretical Physics 3rd edn vol 1 (Amsterdam: Elsevier)
[39] Nayfeh A H and Mook D T 1995 Nonlinear Oscillations (NewYork: Wiley)
[40] Senturia S 2001 Microsystem Design (Dordrecht: Kluwer)[41] Steeneken P G, Rijks T G, Van Beek J T M, Ulenaers M J E,
De Coster J and Puers R 2005 Dynamics and squeeze filmgas damping of a capacitive RF MEMS switchJ. Micromech. Microeng. 15 176
[42] Soliman M, Abdel-Rahman E M, El-Saadany E Fand Mansour R R 2008 A wideband vibration-based energyharvester J. Micromech. Microeng. 18 115021
[43] Cottone F, Basset P, Guillemet R, Galayko D, Marty Fand Bourouina T 2013 Non-linear MEMS electrostatickinetic energy harvester with a tunable multistable potentialfor stochastic vibrations Transducers’13: Proc. 17th Int.Conf. on Solid-State Sensors, Actuators and Microsystems(Barcelona, Spain)
[44] Blokhina E, Galayko D, Basset P and Feely O 2013Steady-state oscillations in electrostatic vibration energyharvesters IEEE Trans. Circuits Syst. 60 875–84
14