Embed Size (px)
Citation preview
REVIEW OF SCIENTIFIC INSTRUMENTS 77, 085104 �2006�
Piezoelectric trace vapor calibratorR. Michael Verkouteren and Greg GillenSurface and Microanalysis Science Division, National Institute of Standards and Technology,Gaithersburg, Maryland 20899
David W. TaylorMicroFab Technologies, Inc., 1104 Summit Avenue, Suite 110, Plano, Texas 75074
�Received 19 April 2006; accepted 29 June 2006; published online 14 August 2006�
The design and performance of a vapor generator for calibration and testing of trace chemicalsensors are described. The device utilizes piezoelectric ink-jet nozzles to dispense and vaporizeprecisely known amounts of analyte solutions as monodisperse droplets onto a hot ceramic surface,where the generated vapors are mixed with air before exiting the device. Injected droplets aremonitored by microscope with strobed illumination, and the reproducibility of droplet volumes isoptimized by adjustment of piezoelectric wave form parameters. Complete vaporization of thedroplets occurs only across a 10 °C window within the transition boiling regime of the solvent, andthe minimum and maximum rates of trace analyte that may be injected and evaporated aredetermined by thermodynamic principles and empirical observations of droplet formation andstability. By varying solution concentrations, droplet injection rates, air flow, and the number ofactive nozzles, the system is designed to deliver—on demand—continuous vapor concentrationsacross more than six orders of magnitude �nominally 290 fg/ l to 1.05 �g/ l�. Vapor pulsescontaining femtogram to microgram quantities of analyte may also be generated. Calibrated rangesof three explosive vapors at ng/l levels were generated by the device and directly measured by ionmobility spectrometry �IMS�. These data demonstrate expected linear trends within the limitedworking range of the IMS detector and also exhibit subtle nonlinear behavior from the IMS
measurement process. © 2006 American Institute of Physics. �DOI: 10.1063/1.2236109�I. INTRODUCTION
The National Academies have assessed current technolo-gies used to detect trace explosives for aviation security andthe military and have called for improvements in sensitivity,selectivity, and comprehensiveness.1,2 Next-generation detec-tion technologies are now being developed to detect the va-pors of concealed contraband �e.g., explosives, narcotics, orchemical warfare agents� that may exist only at parts-per-trillion levels �pL/L� in nearby air or in downwind airplumes. A technical barrier to this development has been thelack of a reliable and certifiable means to generate calibratedreference samples containing part-per-trillion quantities ofcontraband. Reference materials and methods are needed toestablish tangible benchmarks for detector development, toenable intercomparison of detection technologies, and to al-low quantitative verification of detector performance in thefield. Verification mechanisms are also required to supportthe acceptance of emerging technologies by the agencies re-sponsible for public safety and homeland security. The lackof standards has led to the development of other means togenerate known concentrations of explosive vapors,3,4 whichhave offered temporary recourse and are valuable as inde-pendent methods and low-cost field-portable devices.
Piezoelectric nozzles afford precise control over the mi-crodeposition of substances, as observed in ink-jet printingand the microfabrication of microelectromechanical systems�MEMS� devices. Piezoelectric nozzles have even been used
to produce aromas but have not been used, to our knowledge,0034-6748/2006/77�8�/085104/6/$23.00 77, 08510
Downloaded 27 Nov 2006 to 129.6.126.23. Redistribution subject to
for the generation of calibrated gas mixtures. The focus ofthis study was to develop and measure the performance of atrace vapor generator that used piezoelectric nozzles to pro-vide air mixtures containing known ultratrace concentrationsof explosive compounds.
II. EXPERIMENT AND METHODS
A. Design of the device
Design and performance specifications of the devicewere developed by the National Institute of Standards andTechnology �NIST�, and the device was built by MicroFabTechnologies, Inc.5 Principles of microdispensing technologyand a brief description of the system-as-delivered have beenpublished elsewhere.6 At NIST, the system was customizedto help characterize and enhance performance and placed ina chemical fume hood to vent the generated vapors.
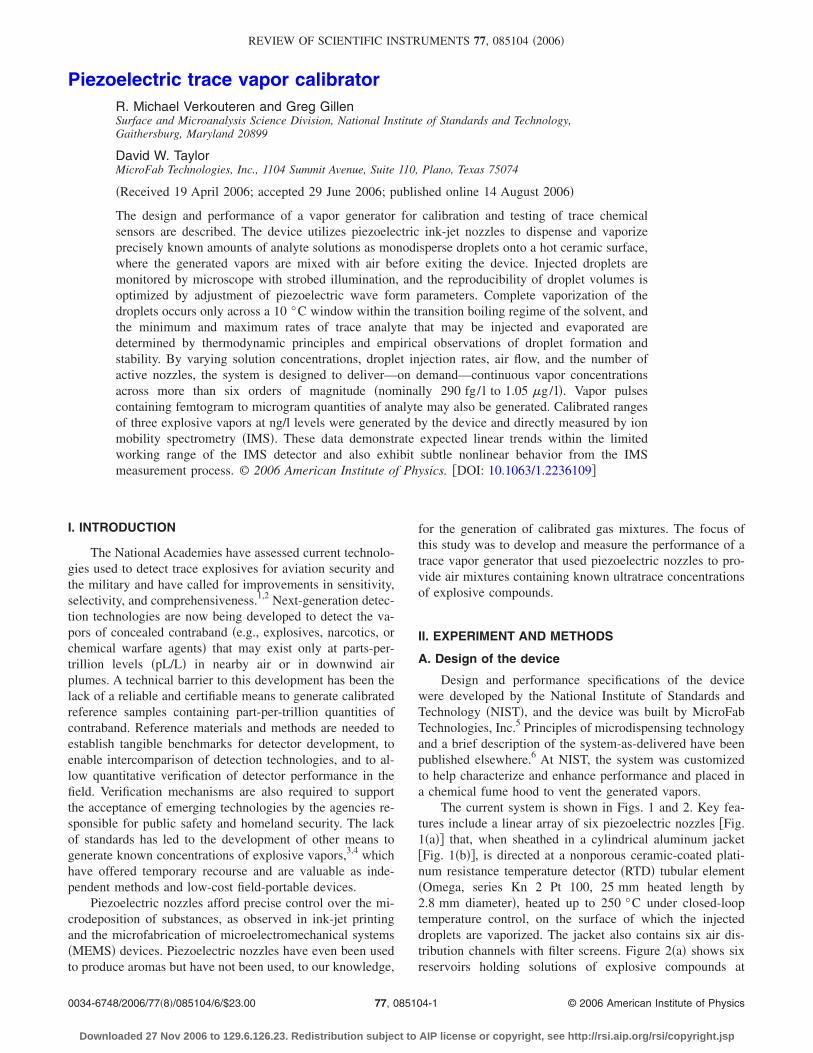
The current system is shown in Figs. 1 and 2. Key fea-tures include a linear array of six piezoelectric nozzles �Fig.1�a�� that, when sheathed in a cylindrical aluminum jacket�Fig. 1�b��, is directed at a nonporous ceramic-coated plati-num resistance temperature detector �RTD� tubular element�Omega, series Kn 2 Pt 100, 25 mm heated length by2.8 mm diameter�, heated up to 250 °C under closed-looptemperature control, on the surface of which the injecteddroplets are vaporized. The jacket also contains six air dis-tribution channels with filter screens. Figure 2�a� shows six
reservoirs holding solutions of explosive compounds at© 2006 American Institute of Physics4-1
AIP license or copyright, see http://rsi.aip.org/rsi/copyright.jsp
085104-2 Verkouteren, Gillen, and Taylor Rev. Sci. Instrum. 77, 085104 �2006�
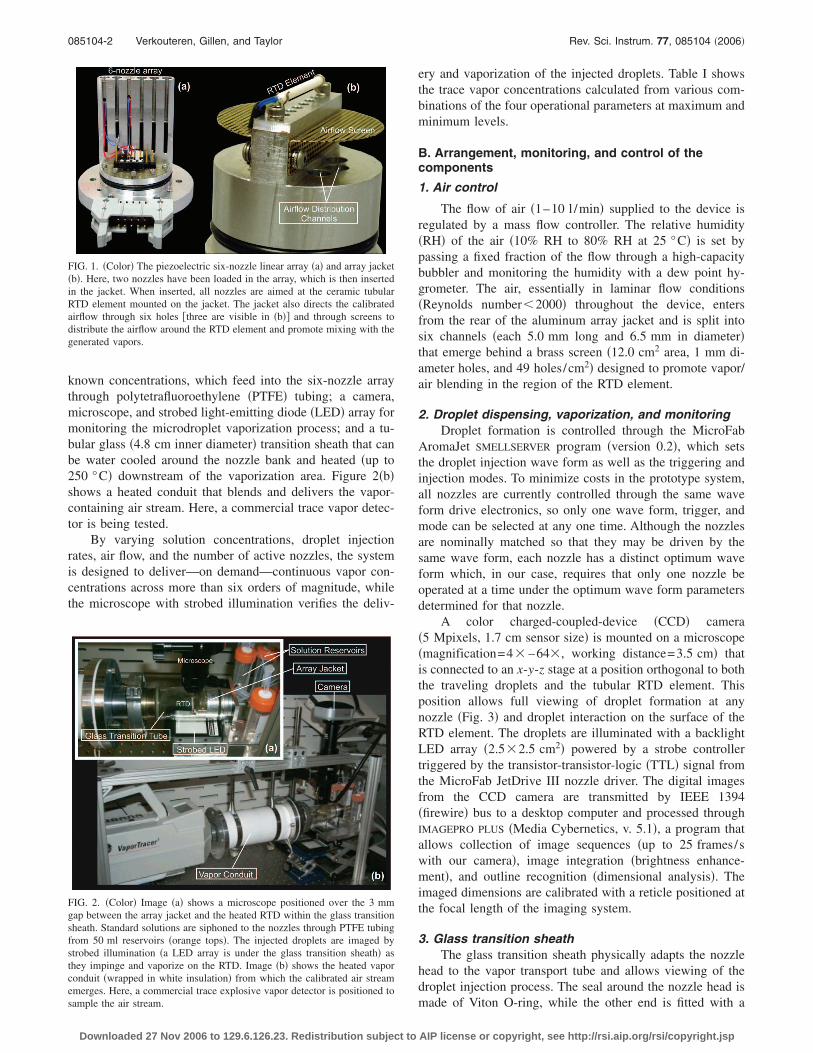
known concentrations, which feed into the six-nozzle arraythrough polytetrafluoroethylene �PTFE� tubing; a camera,microscope, and strobed light-emitting diode �LED� array formonitoring the microdroplet vaporization process; and a tu-bular glass �4.8 cm inner diameter� transition sheath that canbe water cooled around the nozzle bank and heated �up to250 °C� downstream of the vaporization area. Figure 2�b�shows a heated conduit that blends and delivers the vapor-containing air stream. Here, a commercial trace vapor detec-tor is being tested.
By varying solution concentrations, droplet injectionrates, air flow, and the number of active nozzles, the systemis designed to deliver—on demand—continuous vapor con-centrations across more than six orders of magnitude, whilethe microscope with strobed illumination verifies the deliv-
FIG. 1. �Color� The piezoelectric six-nozzle linear array �a� and array jacket�b�. Here, two nozzles have been loaded in the array, which is then insertedin the jacket. When inserted, all nozzles are aimed at the ceramic tubularRTD element mounted on the jacket. The jacket also directs the calibratedairflow through six holes �three are visible in �b�� and through screens todistribute the airflow around the RTD element and promote mixing with thegenerated vapors.
FIG. 2. �Color� Image �a� shows a microscope positioned over the 3 mmgap between the array jacket and the heated RTD within the glass transitionsheath. Standard solutions are siphoned to the nozzles through PTFE tubingfrom 50 ml reservoirs �orange tops�. The injected droplets are imaged bystrobed illumination �a LED array is under the glass transition sheath� asthey impinge and vaporize on the RTD. Image �b� shows the heated vaporconduit �wrapped in white insulation� from which the calibrated air streamemerges. Here, a commercial trace explosive vapor detector is positioned to
sample the air stream.Downloaded 27 Nov 2006 to 129.6.126.23. Redistribution subject to
ery and vaporization of the injected droplets. Table I showsthe trace vapor concentrations calculated from various com-binations of the four operational parameters at maximum andminimum levels.
B. Arrangement, monitoring, and control of thecomponents
1. Air control
The flow of air �1–10 l /min� supplied to the device isregulated by a mass flow controller. The relative humidity�RH� of the air �10% RH to 80% RH at 25 °C� is set bypassing a fixed fraction of the flow through a high-capacitybubbler and monitoring the humidity with a dew point hy-grometer. The air, essentially in laminar flow conditions�Reynolds number�2000� throughout the device, entersfrom the rear of the aluminum array jacket and is split intosix channels �each 5.0 mm long and 6.5 mm in diameter�that emerge behind a brass screen �12.0 cm2 area, 1 mm di-ameter holes, and 49 holes/cm2� designed to promote vapor/air blending in the region of the RTD element.
2. Droplet dispensing, vaporization, and monitoringDroplet formation is controlled through the MicroFab
AromaJet SMELLSERVER program �version 0.2�, which setsthe droplet injection wave form as well as the triggering andinjection modes. To minimize costs in the prototype system,all nozzles are currently controlled through the same waveform drive electronics, so only one wave form, trigger, andmode can be selected at any one time. Although the nozzlesare nominally matched so that they may be driven by thesame wave form, each nozzle has a distinct optimum waveform which, in our case, requires that only one nozzle beoperated at a time under the optimum wave form parametersdetermined for that nozzle.
A color charged-coupled-device �CCD� camera�5 Mpixels, 1.7 cm sensor size� is mounted on a microscope�magnification=4� –64�, working distance=3.5 cm� thatis connected to an x-y-z stage at a position orthogonal to boththe traveling droplets and the tubular RTD element. Thisposition allows full viewing of droplet formation at anynozzle �Fig. 3� and droplet interaction on the surface of theRTD element. The droplets are illuminated with a backlightLED array �2.5�2.5 cm2� powered by a strobe controllertriggered by the transistor-transistor-logic �TTL� signal fromthe MicroFab JetDrive III nozzle driver. The digital imagesfrom the CCD camera are transmitted by IEEE 1394�firewire� bus to a desktop computer and processed throughIMAGEPRO PLUS �Media Cybernetics, v. 5.1�, a program thatallows collection of image sequences �up to 25 frames/swith our camera�, image integration �brightness enhance-ment�, and outline recognition �dimensional analysis�. Theimaged dimensions are calibrated with a reticle positioned atthe focal length of the imaging system.
3. Glass transition sheathThe glass transition sheath physically adapts the nozzle
head to the vapor transport tube and allows viewing of thedroplet injection process. The seal around the nozzle head is
made of Viton O-ring, while the other end is fitted with aAIP license or copyright, see http://rsi.aip.org/rsi/copyright.jsp
085104-3 Piezoelectric trace vapor calibrator Rev. Sci. Instrum. 77, 085104 �2006�
63 mm i.d. International Standards Organization �ISO�flange. The ISO ends of the sheath can be heated to 250 °Cwith heating tape. To protect the nozzle head from heat, thefront end of the sheath may be cooled with an external cop-per coil connected to a water-based cooling unit.
4. Vapor conduitThe vapor conduit is designed to test the transport kinet-
ics of explosive vapors through tubing of known composi-tion, dimensions, and temperature and to assist with blendingof the vapors and calibrated airflow. The tube �304 stainlesssteel� is 300 cm long with an inner diameter of 2.5 cm. It iswrapped in successive layers of heating tape, fiberglass insu-lation, and PTFE sheeting. The tube surface temperature canexceed 250 °C, which is monitored by thermocouplesmounted at several locations.
TABLE I. Calculated trace vapor output at extreme
Operational conditions
Solutionconcentration
�mg/l�
Numberof
activenozzles
Injectionrate�Hz�
Airflow�l/m�
10 6 3000 110 1 3000 110 6 50 110 1 50 110 6 3000 1010 1 3000 1010 6 50 1010 1 50 10
0.010 6 3000 10.010 1 3000 10.010 6 50 10.010 1 50 10.010 6 3000 100.010 1 3000 100.010 6 50 100.010 1 50 10
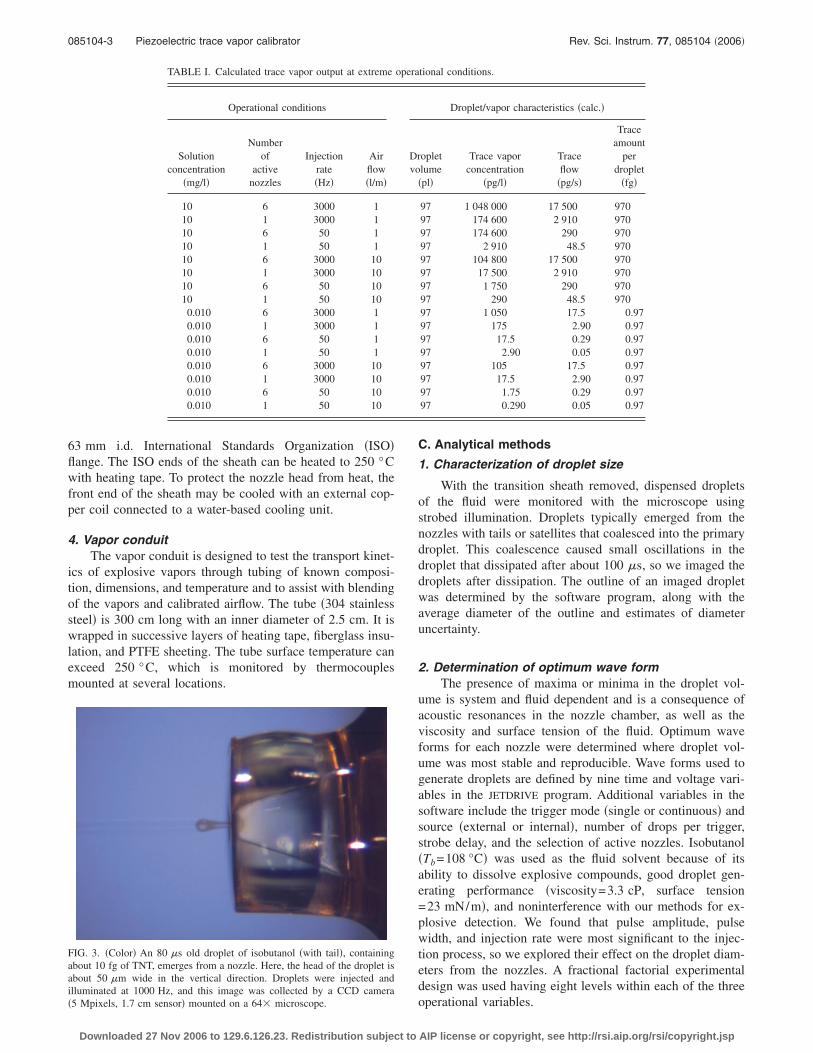
FIG. 3. �Color� An 80 �s old droplet of isobutanol �with tail�, containingabout 10 fg of TNT, emerges from a nozzle. Here, the head of the droplet isabout 50 �m wide in the vertical direction. Droplets were injected andilluminated at 1000 Hz, and this image was collected by a CCD camera
�5 Mpixels, 1.7 cm sensor� mounted on a 64� microscope.Downloaded 27 Nov 2006 to 129.6.126.23. Redistribution subject to
C. Analytical methods
1. Characterization of droplet size
With the transition sheath removed, dispensed dropletsof the fluid were monitored with the microscope usingstrobed illumination. Droplets typically emerged from thenozzles with tails or satellites that coalesced into the primarydroplet. This coalescence caused small oscillations in thedroplet that dissipated after about 100 �s, so we imaged thedroplets after dissipation. The outline of an imaged dropletwas determined by the software program, along with theaverage diameter of the outline and estimates of diameteruncertainty.
2. Determination of optimum wave formThe presence of maxima or minima in the droplet vol-
ume is system and fluid dependent and is a consequence ofacoustic resonances in the nozzle chamber, as well as theviscosity and surface tension of the fluid. Optimum waveforms for each nozzle were determined where droplet vol-ume was most stable and reproducible. Wave forms used togenerate droplets are defined by nine time and voltage vari-ables in the JETDRIVE program. Additional variables in thesoftware include the trigger mode �single or continuous� andsource �external or internal�, number of drops per trigger,strobe delay, and the selection of active nozzles. Isobutanol�Tb=108 °C� was used as the fluid solvent because of itsability to dissolve explosive compounds, good droplet gen-erating performance �viscosity=3.3 cP, surface tension=23 mN/m�, and noninterference with our methods for ex-plosive detection. We found that pulse amplitude, pulsewidth, and injection rate were most significant to the injec-tion process, so we explored their effect on the droplet diam-eters from the nozzles. A fractional factorial experimentaldesign was used having eight levels within each of the threeoperational variables.
tional conditions.
Droplet/vapor characteristics �calc.�
opletlume�pl�
Trace vaporconcentration
�pg/l�
Traceflow
�pg/s�
Traceamount
perdroplet
�fg�
97 1 048 000 17 500 97097 174 600 2 910 97097 174 600 290 97097 2 910 48.5 97097 104 800 17 500 97097 17 500 2 910 97097 1 750 290 97097 290 48.5 97097 1 050 17.5 0.9797 175 2.90 0.9797 17.5 0.29 0.9797 2.90 0.05 0.9797 105 17.5 0.9797 17.5 2.90 0.9797 1.75 0.29 0.9797 0.290 0.05 0.97
opera
Drvo
AIP license or copyright, see http://rsi.aip.org/rsi/copyright.jsp
085104-4 Verkouteren, Gillen, and Taylor Rev. Sci. Instrum. 77, 085104 �2006�
3. Optimization of droplet vaporizationThe effectiveness of the system depends on complete
evaporation of the two-component fluid �analyte and solvent�after droplet injection and complete blending of the vaporswith the calibrated air stream. We chose to monitor and con-trol droplet evaporation on a RTD element rather than simplyspraying droplets into the air stream. The latter would requirelonger residence time in the air stream to assure completeevaporation and would be susceptible to losses of droplets onsurfaces as well as result in formation of aerosols rather thanvapors.
The interactions of droplets with hot surfaces have beenintensively studied due to significance with spray coating,fuel injection, spray cooling, and fire suppression. Thesestudies provided guidance to system design and expectationsregarding droplet impact models, boiling regimes, andLeidenfrost phenomena,7–9 although our unique applicationlent some uncertainty to the expected performance. Interac-tions of the droplets with the surface of the RTD elementwere therefore observed and documented with the cameraand microscope across RTD temperatures ranging from roomtemperature to 220 °C.
4. Testing with a trace explosive detectorThe vapor transfer tube was attached to the glass-to-
stainless steel transition sheath and both were heated to200 °C. In turn, three different explosives �RDX, PETN, andTNT �Ref. 10�� as isobutanol solutions �10.0 mg/ l� were dis-pensed at rates from 200 to 3000 Hz into 10 l /m of air, gen-erating trace explosive concentrations of about1.2–18.9 ng/ l. The generated vapors were sampled by a Va-por Tracer 2 �VT2, GE Security� trace explosive detectoroperating in single gas sampling mode. In this mode, theinstrument can sample and preconcentrate the vapors forvarious time intervals before ion mobility spectrometry�IMS� analysis, which involves an atmospheric pressure ionsource, an ion-molecule reactor, an ion-drift spectrometer,and a detector.11 The front end of the VT2 may also be fittedwith a thermal desorber that allows sampling of particles andresidues, and before use this instrument was calibrated forIMS drift time in this configuration using reference materialson swipes. Important to note, however, is that the associatedcalibration of peak response amplitude would not be equiva-lent between vapor sampling and particle sampling since theinlet mechanisms are different.
III. RESULTS AND DISCUSSION
A. Droplet size and optimum wave forms
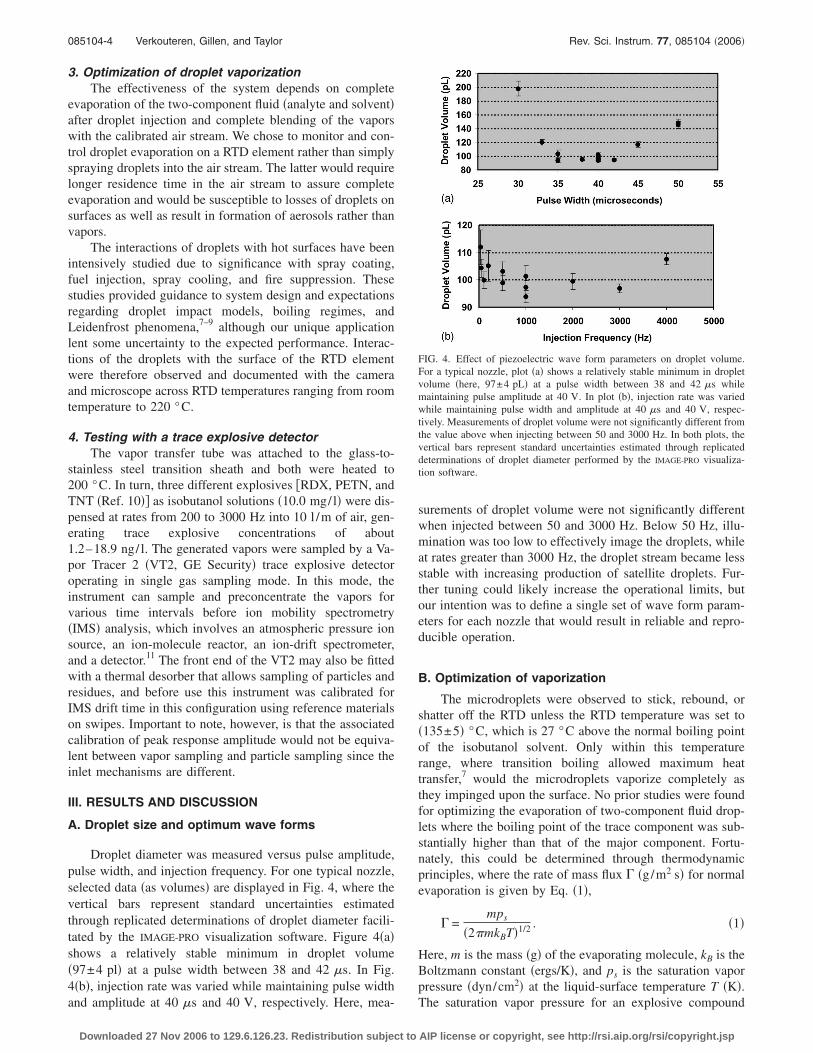
Droplet diameter was measured versus pulse amplitude,pulse width, and injection frequency. For one typical nozzle,selected data �as volumes� are displayed in Fig. 4, where thevertical bars represent standard uncertainties estimatedthrough replicated determinations of droplet diameter facili-tated by the IMAGE-PRO visualization software. Figure 4�a�shows a relatively stable minimum in droplet volume�97±4 pl� at a pulse width between 38 and 42 �s. In Fig.4�b�, injection rate was varied while maintaining pulse width
and amplitude at 40 �s and 40 V, respectively. Here, mea-Downloaded 27 Nov 2006 to 129.6.126.23. Redistribution subject to
surements of droplet volume were not significantly differentwhen injected between 50 and 3000 Hz. Below 50 Hz, illu-mination was too low to effectively image the droplets, whileat rates greater than 3000 Hz, the droplet stream became lessstable with increasing production of satellite droplets. Fur-ther tuning could likely increase the operational limits, butour intention was to define a single set of wave form param-eters for each nozzle that would result in reliable and repro-ducible operation.
B. Optimization of vaporization
The microdroplets were observed to stick, rebound, orshatter off the RTD unless the RTD temperature was set to�135±5� °C, which is 27 °C above the normal boiling pointof the isobutanol solvent. Only within this temperaturerange, where transition boiling allowed maximum heattransfer,7 would the microdroplets vaporize completely asthey impinged upon the surface. No prior studies were foundfor optimizing the evaporation of two-component fluid drop-lets where the boiling point of the trace component was sub-stantially higher than that of the major component. Fortu-nately, this could be determined through thermodynamicprinciples, where the rate of mass flux � �g/m2 s� for normalevaporation is given by Eq. �1�,
� =mps
�2�mkBT�1/2 . �1�
Here, m is the mass �g� of the evaporating molecule, kB is theBoltzmann constant �ergs/K�, and ps is the saturation vaporpressure �dyn/cm2� at the liquid-surface temperature T �K�.
FIG. 4. Effect of piezoelectric wave form parameters on droplet volume.For a typical nozzle, plot �a� shows a relatively stable minimum in dropletvolume �here, 97±4 pL� at a pulse width between 38 and 42 �s whilemaintaining pulse amplitude at 40 V. In plot �b�, injection rate was variedwhile maintaining pulse width and amplitude at 40 �s and 40 V, respec-tively. Measurements of droplet volume were not significantly different fromthe value above when injecting between 50 and 3000 Hz. In both plots, thevertical bars represent standard uncertainties estimated through replicateddeterminations of droplet diameter performed by the IMAGE-PRO visualiza-tion software.
The saturation vapor pressure for an explosive compound
AIP license or copyright, see http://rsi.aip.org/rsi/copyright.jsp
085104-5 Piezoelectric trace vapor calibrator Rev. Sci. Instrum. 77, 085104 �2006�
represents the limiting droplet injection condition, and thisquantity may be calculated through a reduced form of theClausius-Clapeyron equation �Eq. �2��, with coefficients �and � �Table II� adapted from Dionne et al. �1986�,12
log ps =�
T+ � . �2�
The value of � �maximum analyte evaporation rate� over adroplet impingement area defines the upper limit of the al-lowed analyte injection rate � �g/s� per nozzle, which iscalculated through Eq. �3�,
� = CvI . �3�
Here, C is the analyte concentration in the solvent �g/l�, v isthe volume of a droplet �l�, and I is the droplet injection rate�Hz�. For each explosive compound, values of � at 130 °Cover a droplet impingement area �2700 �m2� and maximumvalues of � allowed per nozzle are listed in Table II. Using10 mg/ l solutions, RDX must be limited to injection ratesequal to or less than 1000 Hz �corresponding to 1.0 ng/s,40% of saturation level�. PETN and TNT have �130 °C valuesof 42 and 550 ng/s, respectively, which are comfortablyabove the operating limits �4.2 ng/s� of any nozzle in oursystem.
C. Testing with a trace explosive detector
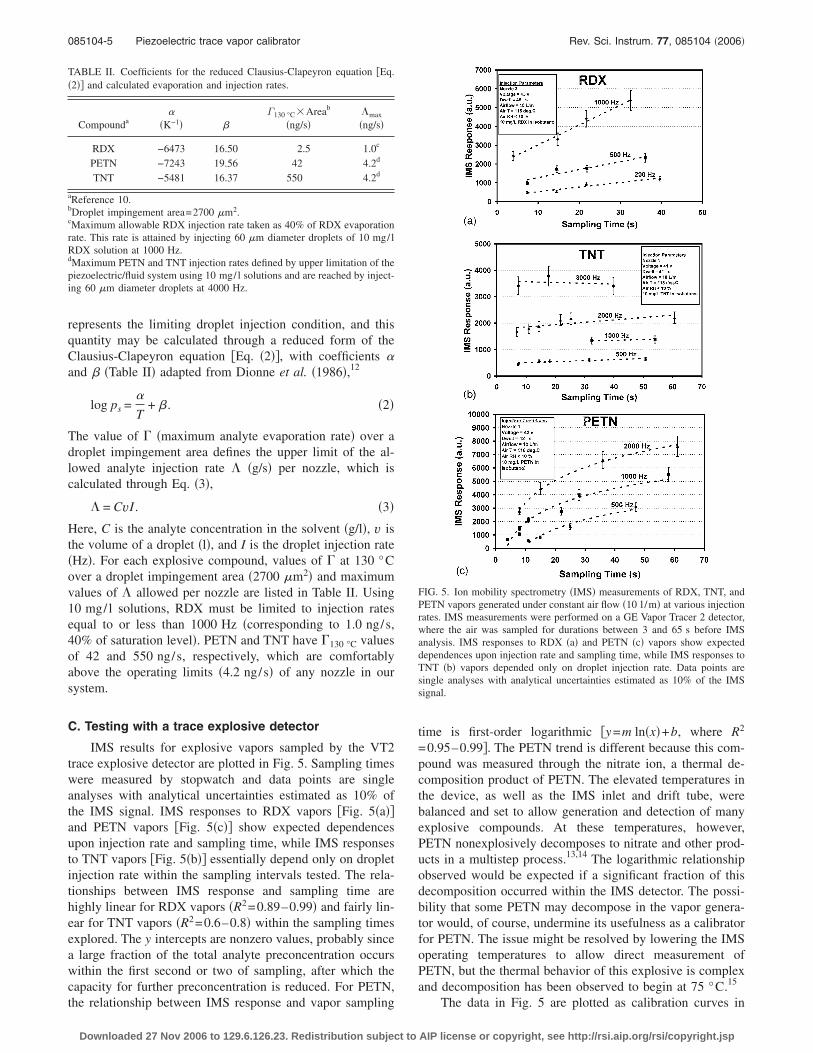
IMS results for explosive vapors sampled by the VT2trace explosive detector are plotted in Fig. 5. Sampling timeswere measured by stopwatch and data points are singleanalyses with analytical uncertainties estimated as 10% ofthe IMS signal. IMS responses to RDX vapors �Fig. 5�a��and PETN vapors �Fig. 5�c�� show expected dependencesupon injection rate and sampling time, while IMS responsesto TNT vapors �Fig. 5�b�� essentially depend only on dropletinjection rate within the sampling intervals tested. The rela-tionships between IMS response and sampling time arehighly linear for RDX vapors �R2=0.89–0.99� and fairly lin-ear for TNT vapors �R2=0.6–0.8� within the sampling timesexplored. The y intercepts are nonzero values, probably sincea large fraction of the total analyte preconcentration occurswithin the first second or two of sampling, after which thecapacity for further preconcentration is reduced. For PETN,
TABLE II. Coefficients for the reduced Clausius-Clapeyron equation �Eq.�2�� and calculated evaporation and injection rates.
Compounda�
�K−1� �G130 °C�Areab
�ng/s��max
�ng/s�
RDX −6473 16.50 2.5 1.0c
PETN −7243 19.56 42 4.2d
TNT −5481 16.37 550 4.2d
aReference 10.bDroplet impingement area=2700 �m2.cMaximum allowable RDX injection rate taken as 40% of RDX evaporationrate. This rate is attained by injecting 60 �m diameter droplets of 10 mg/ lRDX solution at 1000 Hz.dMaximum PETN and TNT injection rates defined by upper limitation of thepiezoelectric/fluid system using 10 mg/ l solutions and are reached by inject-ing 60 �m diameter droplets at 4000 Hz.
the relationship between IMS response and vapor sampling
Downloaded 27 Nov 2006 to 129.6.126.23. Redistribution subject to
time is first-order logarithmic �y=m ln�x�+b, where R2
=0.95–0.99�. The PETN trend is different because this com-pound was measured through the nitrate ion, a thermal de-composition product of PETN. The elevated temperatures inthe device, as well as the IMS inlet and drift tube, werebalanced and set to allow generation and detection of manyexplosive compounds. At these temperatures, however,PETN nonexplosively decomposes to nitrate and other prod-ucts in a multistep process.13,14 The logarithmic relationshipobserved would be expected if a significant fraction of thisdecomposition occurred within the IMS detector. The possi-bility that some PETN may decompose in the vapor genera-tor would, of course, undermine its usefulness as a calibratorfor PETN. The issue might be resolved by lowering the IMSoperating temperatures to allow direct measurement ofPETN, but the thermal behavior of this explosive is complexand decomposition has been observed to begin at 75 °C.15
FIG. 5. Ion mobility spectrometry �IMS� measurements of RDX, TNT, andPETN vapors generated under constant air flow �10 l /m� at various injectionrates. IMS measurements were performed on a GE Vapor Tracer 2 detector,where the air was sampled for durations between 3 and 65 s before IMSanalysis. IMS responses to RDX �a� and PETN �c� vapors show expecteddependences upon injection rate and sampling time, while IMS responses toTNT �b� vapors depended only on droplet injection rate. Data points aresingle analyses with analytical uncertainties estimated as 10% of the IMSsignal.
The data in Fig. 5 are plotted as calibration curves in
AIP license or copyright, see http://rsi.aip.org/rsi/copyright.jsp
085104-6 Verkouteren, Gillen, and Taylor Rev. Sci. Instrum. 77, 085104 �2006�
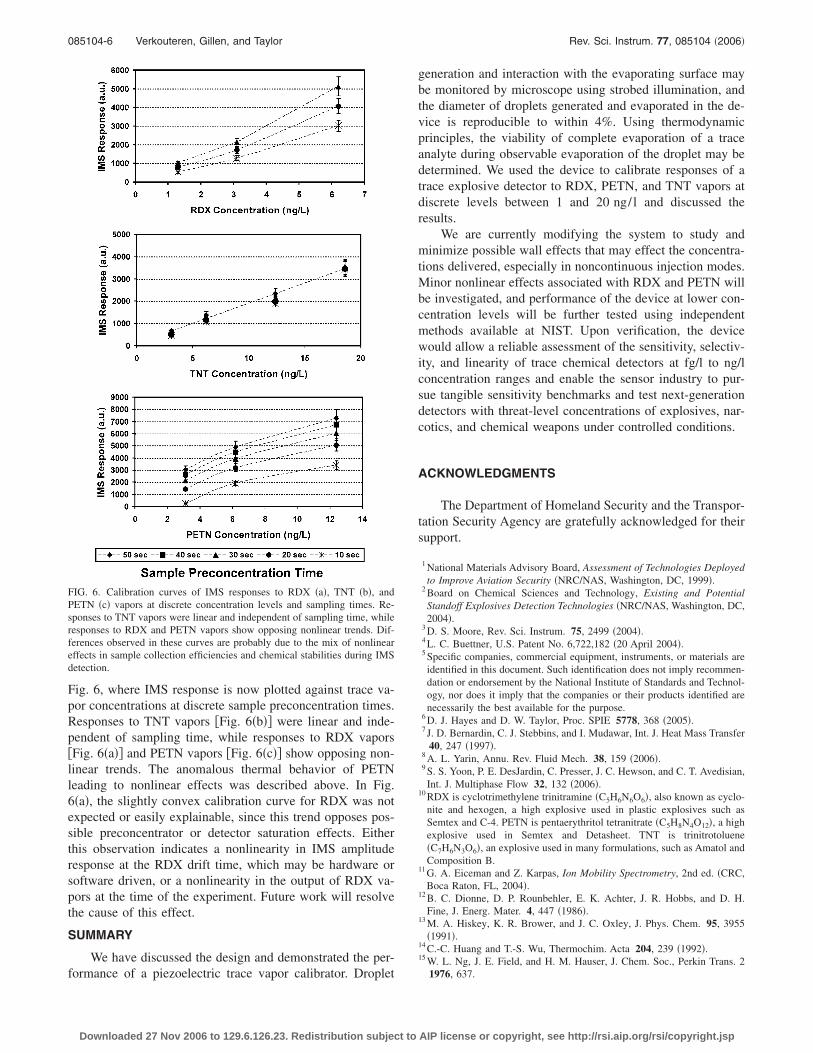
Fig. 6, where IMS response is now plotted against trace va-por concentrations at discrete sample preconcentration times.Responses to TNT vapors �Fig. 6�b�� were linear and inde-pendent of sampling time, while responses to RDX vapors�Fig. 6�a�� and PETN vapors �Fig. 6�c�� show opposing non-linear trends. The anomalous thermal behavior of PETNleading to nonlinear effects was described above. In Fig.6�a�, the slightly convex calibration curve for RDX was notexpected or easily explainable, since this trend opposes pos-sible preconcentrator or detector saturation effects. Eitherthis observation indicates a nonlinearity in IMS amplituderesponse at the RDX drift time, which may be hardware orsoftware driven, or a nonlinearity in the output of RDX va-pors at the time of the experiment. Future work will resolvethe cause of this effect.
SUMMARY
We have discussed the design and demonstrated the per-
FIG. 6. Calibration curves of IMS responses to RDX �a�, TNT �b�, andPETN �c� vapors at discrete concentration levels and sampling times. Re-sponses to TNT vapors were linear and independent of sampling time, whileresponses to RDX and PETN vapors show opposing nonlinear trends. Dif-ferences observed in these curves are probably due to the mix of nonlineareffects in sample collection efficiencies and chemical stabilities during IMSdetection.
formance of a piezoelectric trace vapor calibrator. Droplet
Downloaded 27 Nov 2006 to 129.6.126.23. Redistribution subject to
generation and interaction with the evaporating surface maybe monitored by microscope using strobed illumination, andthe diameter of droplets generated and evaporated in the de-vice is reproducible to within 4%. Using thermodynamicprinciples, the viability of complete evaporation of a traceanalyte during observable evaporation of the droplet may bedetermined. We used the device to calibrate responses of atrace explosive detector to RDX, PETN, and TNT vapors atdiscrete levels between 1 and 20 ng/ l and discussed theresults.
We are currently modifying the system to study andminimize possible wall effects that may effect the concentra-tions delivered, especially in noncontinuous injection modes.Minor nonlinear effects associated with RDX and PETN willbe investigated, and performance of the device at lower con-centration levels will be further tested using independentmethods available at NIST. Upon verification, the devicewould allow a reliable assessment of the sensitivity, selectiv-ity, and linearity of trace chemical detectors at fg/l to ng/lconcentration ranges and enable the sensor industry to pur-sue tangible sensitivity benchmarks and test next-generationdetectors with threat-level concentrations of explosives, nar-cotics, and chemical weapons under controlled conditions.
ACKNOWLEDGMENTS
The Department of Homeland Security and the Transpor-tation Security Agency are gratefully acknowledged for theirsupport.
1 National Materials Advisory Board, Assessment of Technologies Deployedto Improve Aviation Security �NRC/NAS, Washington, DC, 1999�.
2 Board on Chemical Sciences and Technology, Existing and PotentialStandoff Explosives Detection Technologies �NRC/NAS, Washington, DC,2004�.
3 D. S. Moore, Rev. Sci. Instrum. 75, 2499 �2004�.4 L. C. Buettner, U.S. Patent No. 6,722,182 �20 April 2004�.5 Specific companies, commercial equipment, instruments, or materials areidentified in this document. Such identification does not imply recommen-dation or endorsement by the National Institute of Standards and Technol-ogy, nor does it imply that the companies or their products identified arenecessarily the best available for the purpose.
6 D. J. Hayes and D. W. Taylor, Proc. SPIE 5778, 368 �2005�.7 J. D. Bernardin, C. J. Stebbins, and I. Mudawar, Int. J. Heat Mass Transfer
40, 247 �1997�.8 A. L. Yarin, Annu. Rev. Fluid Mech. 38, 159 �2006�.9 S. S. Yoon, P. E. DesJardin, C. Presser, J. C. Hewson, and C. T. Avedisian,Int. J. Multiphase Flow 32, 132 �2006�.
10 RDX is cyclotrimethylene trinitramine �C5H6N6O6�, also known as cyclo-nite and hexogen, a high explosive used in plastic explosives such asSemtex and C-4. PETN is pentaerythritol tetranitrate �C5H8N4O12�, a highexplosive used in Semtex and Detasheet. TNT is trinitrotoluene�C7H6N3O6�, an explosive used in many formulations, such as Amatol andComposition B.
11 G. A. Eiceman and Z. Karpas, Ion Mobility Spectrometry, 2nd ed. �CRC,Boca Raton, FL, 2004�.
12 B. C. Dionne, D. P. Rounbehler, E. K. Achter, J. R. Hobbs, and D. H.Fine, J. Energ. Mater. 4, 447 �1986�.
13 M. A. Hiskey, K. R. Brower, and J. C. Oxley, J. Phys. Chem. 95, 3955�1991�.
14 C.-C. Huang and T.-S. Wu, Thermochim. Acta 204, 239 �1992�.15 W. L. Ng, J. E. Field, and H. M. Hauser, J. Chem. Soc., Perkin Trans. 2
1976, 637.
AIP license or copyright, see http://rsi.aip.org/rsi/copyright.jsp
![Understanding the solvatochromism of 10-hydroxybenzo[h]quinoline. An appraisal of a polarity calibrator](https://img.dokumen.tips/doc/110x75/63174061b6c3e3926d0dca55/understanding-the-solvatochromism-of-10-hydroxybenzohquinoline-an-appraisal-of.jpg)


