Embed Size (px)
Citation preview
Classification of HIV-1 Sequences Using Profile HiddenMarkov ModelsSanjiv K. Dwivedi1,2, Supratim Sengupta1,3*
1 School of Computational and Integrative Sciences, Jawaharlal Nehru University, New Delhi, India, 2 School of Sciences, Indian Institute of Technology, Indore, Indore,
India, 3Department of Physical Sciences, Indian Institute of Science Education and Research, Kolkata, Mohanpur, West Bengal, India
Abstract
Accurate classification of HIV-1 subtypes is essential for studying the dynamic spatial distribution pattern of HIV-1 subtypesand also for developing effective methods of treatment that can be targeted to attack specific subtypes. We proposea classification method based on profile Hidden Markov Model that can accurately identify an unknown strain. We showthat a standard method that relies on the construction of a positive training set only, to capture unique features associatedwith a particular subtype, can accurately classify sequences belonging to all subtypes except B and D. We point out thedrawbacks of the standard method; namely, an arbitrary choice of threshold to distinguish between true positives and truenegatives, and the inability to discriminate between closely related subtypes. We then propose an improved classificationmethod based on construction of a positive as well as a negative training set to improve discriminating ability betweenclosely related subtypes like B and D. Finally, we show how the improved method can be used to accurately determine thesubtype composition of Common Recombinant Forms of the virus that are made up of two or more subtypes. Our methodprovides a simple and highly accurate alternative to other classification methods and will be useful in accurately annotatingnewly sequenced HIV-1 strains.
Citation: Dwivedi SK, Sengupta S (2012) Classification of HIV-1 Sequences Using Profile Hidden Markov Models. PLoS ONE 7(5): e36566. doi:10.1371/journal.pone.0036566
Editor: Art F. Y. Poon, British Columbia Centre for Excellence in HIV/AIDS, Canada
Received September 29, 2011; Accepted April 10, 2012; Published May 18, 2012
Copyright: � 2012 Dwivedi, Sengupta. This is an open-access article distributed under the terms of the Creative Commons Attribution License, which permitsunrestricted use, distribution, and reproduction in any medium, provided the original author and source are credited.
Funding: No current external funding sources for this study.
Competing Interests: The authors have declared that no competing interests exist.
* E-mail: [email protected]
Introduction
HIV affects millions of people worldwide and poses significant
public health challenges especially in developing countries which
lack the resources to effectively combat the AIDS pandemic. A
major characteristic of HIV virus is its ability to rapidly mutate
into different forms thereby eluding the ability of drugs to
effectively attack and destroy it. While a complete cure for HIV/
AIDS still eludes researchers, more recently a cocktail of drugs has
proved quite effective in considerably enhancing the life-span of
patients [1] infected by the virus. However, the drug cocktails have
to be designed to target a specific strain of virus and it is therefore
essential to know the strain which infects the patient in order to
prescribe an effective course of treatment.
HIV-1 strains have been classified into three distinct groups – M
(major), O (outlier) and N (non-M, non-O) based on their genetic
variability. Most HIV-1 viruses fall in group M which has been
further sub-divided [2,3] into distinct subtypes –
A,B,C,D,F,G,H,J,K based on phylogenetic clustering of se-
quences. Some subtypes like A (and F) have been further sub-
divided into sub-subtypes A1, A2 (and F1, F2) also based on
phylogenetic clustering of sequences within the subtype.
Analysis of the geographical spread of different HIV strains [4]
indicates that subtype C is found predominantly in China, India,
Nepal and South Africa; while subtype B is most commonly found
in patients residing in the Americas, Australia, Japan, Thailand
and Western Europe. Subtypes A and D are common in Africa
while subtype F has been found predominantly in Central Africa,
South America and Eastern Europe. However, the ease of trans-
continental mobility implies that patients infected by a strain not
typically found in a particular region can often appear in that
region [5,6]. This has important implications for treatment since
many retroviral drug cocktails are specifically tailored for
a particular strain. It is therefore essential to develop an efficient
method for subtype determination of an HIV-1 strain. Developing
effective treatments against HIV-1 is further complicated by the
presence of Circulating Recombinant Forms (CRFs) which
frequently arise as a result of recombination [7] of two or more
HIV-1 subtypes. This poses the additional challenge of effectively
determining the subtype composition of a CRF.
Most of the methods developed so far to determine the subtype
of unknown HIV-1 sequences are based on obtaining pairwise-
distances between sequences or on phylogenetic analysis [8–14]. In
these methods subtype determination was based on the clustering
of the unknown sequence in the phylogenetic tree with sequences
of a known subtype. Early work on classification [8] made use of
the genetic variation of the env region of HIV-1 sequences to
construct the phylogenetic tree. Subtypes A to F could be
successfully classified using this method. The gag region of HIV-
1 was also used [9] for phylogenetic tree construction and
improved classification. Phylogenetic analysis based on both env
and gag regions [10–12] were subsequently used to reveal the
presence of subtypes G to J. However, phylogenetic studies based
on these regions alone were unable to distinguish between distinct
clusters within subtypes A and F which were later found from
phylogenetic tree construction based on whole-genome analysis
PLoS ONE | www.plosone.org 1 May 2012 | Volume 7 | Issue 5 | e36566
[13]. Further investigations [14] also revealed earlier errors in
classification [11] by pointing out that subtype I was found to be
a CRF made up of subtypes A and G. It has become clear that
phylogenetic analysis based on complete genomes is much more
reliable than those based on short segments of the HIV-1 genome.
However, complete genomes are often not available and there is
need for a method which accurately determines the subtype of
strains for which only a segment of the genome has been
sequenced.
More recently several new methods [15–20] have been
developed to improve the accuracy of HIV-1 subtype classifica-
tion. Gale et al. [16] and Myers et al. [17] developed a classification
tool (STAR) that used subtype specific profiles created by Position
Specific Scoring Matrices (PSSMs) from multiple sequence
alignments of HIV-1 sequence data. These subtype profiles were
then used to score an unknown sequence to determine its subtype
with high accuracy. Hraber et al. [18] developed a method that
combines information from pairwise distances and phylogenetic
methods. They used the branching index (BI) to determine how
closely a test sequence clusters with sequences belonging to a given
subtype. Pandit et al. [19] used Chaos Game Representation to
find subtype specific patterns which allow for accurate classifica-
tion.
Hidden Markov Models (HMMs) have been successfully used
[21–23] for identifying conserved patterns in protein [24] and
nucleotide [25] sequences. Profile HMMs (pHMMs) are con-
structed from multiple sequence alignments (MSA) of a set of
homologous sequences and can capture the unique characteristics
of the set. Hence they can be used to determine whether an
unknown sequence can be considered to be homologous to the set
of sequences that were used to build the MSA. Recently, pHMMs
have also been shown [25] to be extremely useful for fast and
accurate classification of a type of regulatory RNA called
riboswitches. Variations of pHMMs have also been used to detect
breakpoints in recombinant HIV-1 strains by several research
groups [26–30].
Recently a method based on pHMM called the jumping profile
Hidden Markov Model (jpHMM) has been developed [26–27] to
accurately determine the subtype composition as well as determine
the location of breakpoints in CRFs. jpHMM is a generalization of
the jumping alignment method [31] and is based on aligning
a query sequence to the multiple sequence alignment of entire
subtypes and not just to a single reference sequence belonging to
a subtype as in the case of an the jumping alignment algorithm.
Jumps between subtypes are allowed with a low probability (which
is tuned) albeit with certain restrictions. Using this method, Schultz
et al. [26–27] have been able to predict the subtype composition of
CRFs as well determine the location of the breakpoints with higher
accuracy compared to the popular recombination detection tool
SimPlot [28]. Very recently, Truszkowski and Brown [29] have
developed a new algorithm to improve the accuracy of breakpoint
predictions by the jpHMM method. Westesson and Holmes [30]
combined phylogenetic analysis and HMMs to detect breakpoints
accurately by detecting changes in phylogenetic tree topology
across multiple sequence alignments. All these papers focus on the
accuracy of breakpoint detection in recombinant HIV-1 strains.
Our main objective in this paper is to present an efficient and
highly accurate pHMM-based method to classify HIV-1 se-
quences. Although our method cannot detect recombination
breakpoints, it nevertheless provides a simple and unified scheme
for detecting the subtype composition of CRFs with high accuracy.
Results
We have used profile Hidden Markov Models to classify
sequences belonging to the M group of HIV-1 to appropriate
subtypes. We find that the standard method of classification
(described in the ‘‘Methods’’ section) based on construction of
a positive training set containing six sequences known to belong to
a particular subtype, is adequate for classifying the strains of HIV-
1 that belong to subtypes A,C,F and G with 100% sensitivity and
specificity. However, the close similarity between sequences that
belong to subtypes B and D results in reduction of the accuracy of
classification using the standard method. We then demonstrate the
use of an improved method based on construction of a positive and
a negative training set for accurately discriminating between
sequences belonging to the B and D subtypes. We find that these
sequences can be classified with 100% accuracy using the
improved method. Finally, we demonstrate how our pHMM-
based method of classification can be used to identify the
composition of CRF’s that contain segments belonging to multiple
subtypes of HIV-1.
Classification using the Standard MethodA pHMM is constructed for each HIV-1 subtype using a positive
training set only. It is then used to determine the bit-scores of all
sequences belonging to the test set. For a given threshold, which is
arbitrarily fixed for a given subtype, based on the distribution of
scores for all the sequences in the test-set; the model can predict
whether the query sequence can be considered to be a member of
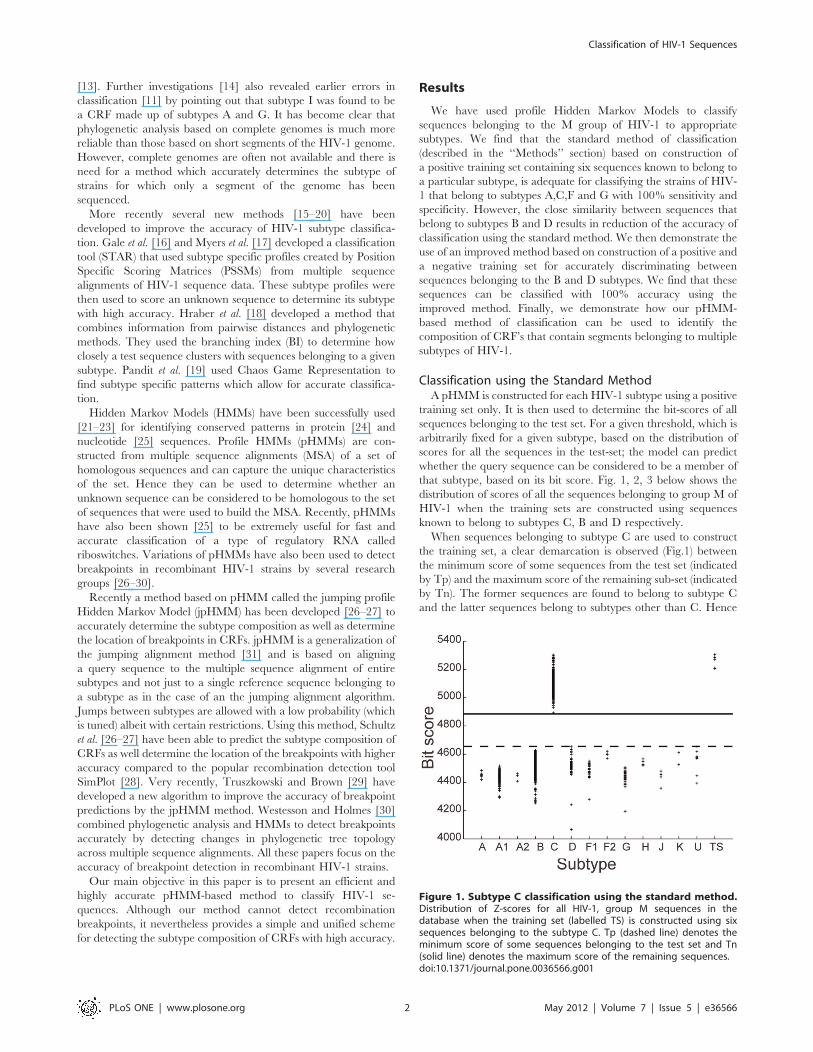
that subtype, based on its bit score. Fig. 1, 2, 3 below shows the
distribution of scores of all the sequences belonging to group M of
HIV-1 when the training sets are constructed using sequences
known to belong to subtypes C, B and D respectively.
When sequences belonging to subtype C are used to construct
the training set, a clear demarcation is observed (Fig.1) between
the minimum score of some sequences from the test set (indicated
by Tp) and the maximum score of the remaining sub-set (indicated
by Tn). The former sequences are found to belong to subtype C
and the latter sequences belong to subtypes other than C. Hence
Figure 1. Subtype C classification using the standard method.Distribution of Z-scores for all HIV-1, group M sequences in thedatabase when the training set (labelled TS) is constructed using sixsequences belonging to the subtype C. Tp (dashed line) denotes theminimum score of some sequences belonging to the test set and Tn(solid line) denotes the maximum score of the remaining sequences.doi:10.1371/journal.pone.0036566.g001
Classification of HIV-1 Sequences
PLoS ONE | www.plosone.org 2 May 2012 | Volume 7 | Issue 5 | e36566
specifying a threshold between Tp and Tn allows for classification
of sequences belonging to the C subtype with 100% accuracy.
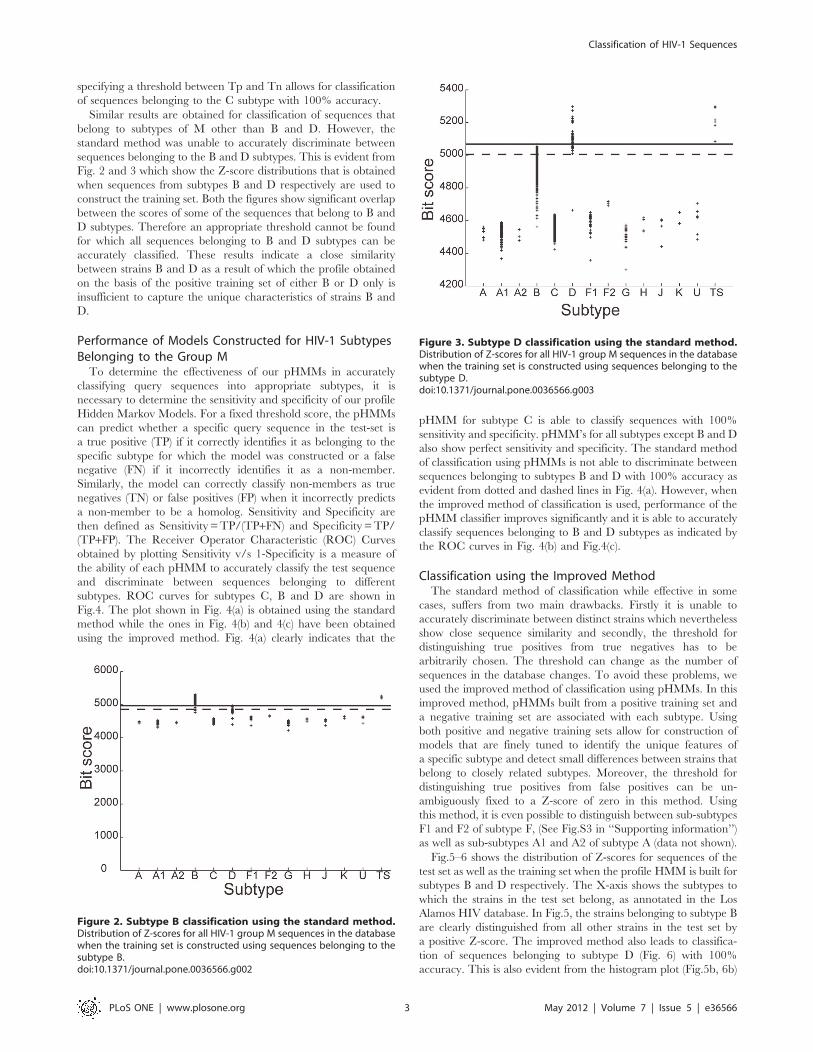
Similar results are obtained for classification of sequences that
belong to subtypes of M other than B and D. However, the
standard method was unable to accurately discriminate between
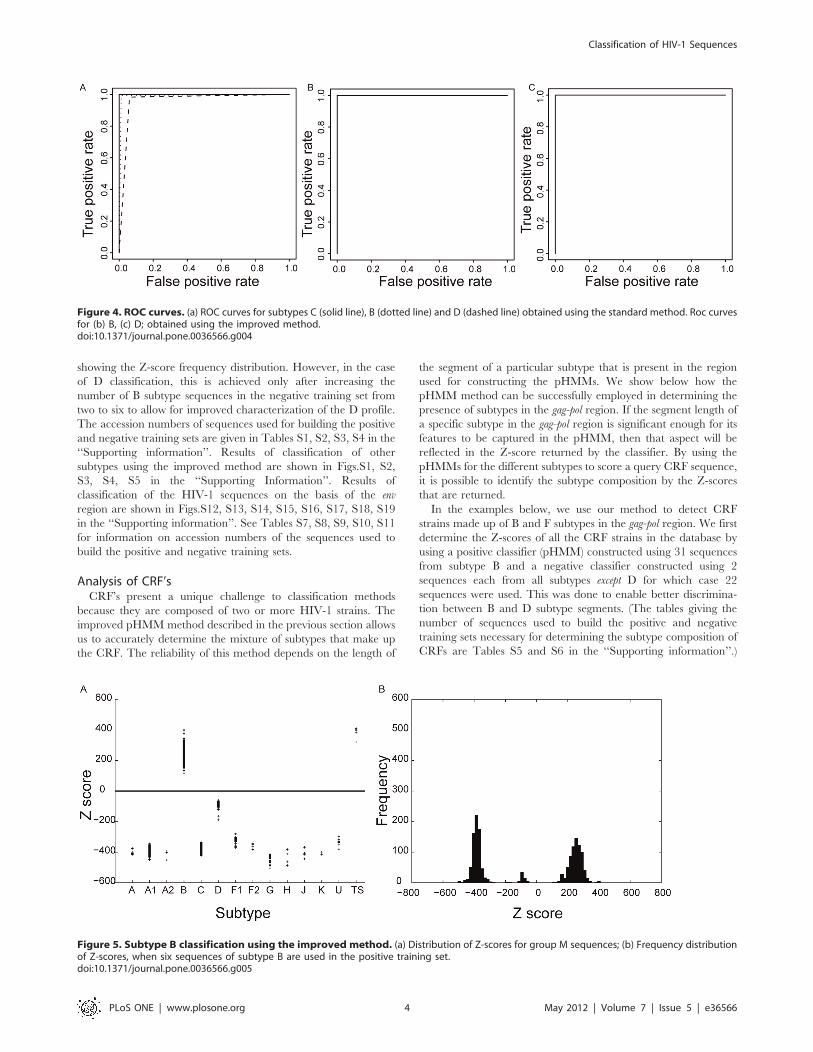
sequences belonging to the B and D subtypes. This is evident from
Fig. 2 and 3 which show the Z-score distributions that is obtained
when sequences from subtypes B and D respectively are used to
construct the training set. Both the figures show significant overlap
between the scores of some of the sequences that belong to B and
D subtypes. Therefore an appropriate threshold cannot be found
for which all sequences belonging to B and D subtypes can be
accurately classified. These results indicate a close similarity
between strains B and D as a result of which the profile obtained
on the basis of the positive training set of either B or D only is
insufficient to capture the unique characteristics of strains B and
D.
Performance of Models Constructed for HIV-1 SubtypesBelonging to the Group MTo determine the effectiveness of our pHMMs in accurately
classifying query sequences into appropriate subtypes, it is
necessary to determine the sensitivity and specificity of our profile
Hidden Markov Models. For a fixed threshold score, the pHMMs
can predict whether a specific query sequence in the test-set is
a true positive (TP) if it correctly identifies it as belonging to the
specific subtype for which the model was constructed or a false
negative (FN) if it incorrectly identifies it as a non-member.
Similarly, the model can correctly classify non-members as true
negatives (TN) or false positives (FP) when it incorrectly predicts
a non-member to be a homolog. Sensitivity and Specificity are
then defined as Sensitivity =TP/(TP+FN) and Specificity =TP/
(TP+FP). The Receiver Operator Characteristic (ROC) Curves
obtained by plotting Sensitivity v/s 1-Specificity is a measure of
the ability of each pHMM to accurately classify the test sequence
and discriminate between sequences belonging to different
subtypes. ROC curves for subtypes C, B and D are shown in
Fig.4. The plot shown in Fig. 4(a) is obtained using the standard
method while the ones in Fig. 4(b) and 4(c) have been obtained
using the improved method. Fig. 4(a) clearly indicates that the
pHMM for subtype C is able to classify sequences with 100%
sensitivity and specificity. pHMM’s for all subtypes except B and D
also show perfect sensitivity and specificity. The standard method
of classification using pHMMs is not able to discriminate between
sequences belonging to subtypes B and D with 100% accuracy as
evident from dotted and dashed lines in Fig. 4(a). However, when
the improved method of classification is used, performance of the
pHMM classifier improves significantly and it is able to accurately
classify sequences belonging to B and D subtypes as indicated by
the ROC curves in Fig. 4(b) and Fig.4(c).
Classification using the Improved MethodThe standard method of classification while effective in some
cases, suffers from two main drawbacks. Firstly it is unable to
accurately discriminate between distinct strains which nevertheless
show close sequence similarity and secondly, the threshold for
distinguishing true positives from true negatives has to be
arbitrarily chosen. The threshold can change as the number of
sequences in the database changes. To avoid these problems, we
used the improved method of classification using pHMMs. In this
improved method, pHMMs built from a positive training set and
a negative training set are associated with each subtype. Using
both positive and negative training sets allow for construction of
models that are finely tuned to identify the unique features of
a specific subtype and detect small differences between strains that
belong to closely related subtypes. Moreover, the threshold for
distinguishing true positives from false positives can be un-
ambiguously fixed to a Z-score of zero in this method. Using
this method, it is even possible to distinguish between sub-subtypes
F1 and F2 of subtype F, (See Fig.S3 in ‘‘Supporting information’’)
as well as sub-subtypes A1 and A2 of subtype A (data not shown).
Fig.5–6 shows the distribution of Z-scores for sequences of the
test set as well as the training set when the profile HMM is built for
subtypes B and D respectively. The X-axis shows the subtypes to
which the strains in the test set belong, as annotated in the Los
Alamos HIV database. In Fig.5, the strains belonging to subtype B
are clearly distinguished from all other strains in the test set by
a positive Z-score. The improved method also leads to classifica-
tion of sequences belonging to subtype D (Fig. 6) with 100%
accuracy. This is also evident from the histogram plot (Fig.5b, 6b)
Figure 2. Subtype B classification using the standard method.Distribution of Z-scores for all HIV-1 group M sequences in the databasewhen the training set is constructed using sequences belonging to thesubtype B.doi:10.1371/journal.pone.0036566.g002
Figure 3. Subtype D classification using the standard method.Distribution of Z-scores for all HIV-1 group M sequences in the databasewhen the training set is constructed using sequences belonging to thesubtype D.doi:10.1371/journal.pone.0036566.g003
Classification of HIV-1 Sequences
PLoS ONE | www.plosone.org 3 May 2012 | Volume 7 | Issue 5 | e36566
showing the Z-score frequency distribution. However, in the case
of D classification, this is achieved only after increasing the
number of B subtype sequences in the negative training set from
two to six to allow for improved characterization of the D profile.
The accession numbers of sequences used for building the positive
and negative training sets are given in Tables S1, S2, S3, S4 in the
‘‘Supporting information’’. Results of classification of other
subtypes using the improved method are shown in Figs.S1, S2,
S3, S4, S5 in the ‘‘Supporting Information’’. Results of
classification of the HIV-1 sequences on the basis of the env
region are shown in Figs.S12, S13, S14, S15, S16, S17, S18, S19
in the ‘‘Supporting information’’. See Tables S7, S8, S9, S10, S11
for information on accession numbers of the sequences used to
build the positive and negative training sets.
Analysis of CRF’sCRF’s present a unique challenge to classification methods
because they are composed of two or more HIV-1 strains. The
improved pHMM method described in the previous section allows
us to accurately determine the mixture of subtypes that make up
the CRF. The reliability of this method depends on the length of
the segment of a particular subtype that is present in the region
used for constructing the pHMMs. We show below how the
pHMM method can be successfully employed in determining the
presence of subtypes in the gag-pol region. If the segment length of
a specific subtype in the gag-pol region is significant enough for its
features to be captured in the pHMM, then that aspect will be
reflected in the Z-score returned by the classifier. By using the
pHMMs for the different subtypes to score a query CRF sequence,
it is possible to identify the subtype composition by the Z-scores
that are returned.
In the examples below, we use our method to detect CRF
strains made up of B and F subtypes in the gag-pol region. We first
determine the Z-scores of all the CRF strains in the database by
using a positive classifier (pHMM) constructed using 31 sequences
from subtype B and a negative classifier constructed using 2
sequences each from all subtypes except D for which case 22
sequences were used. This was done to enable better discrimina-
tion between B and D subtype segments. (The tables giving the
number of sequences used to build the positive and negative
training sets necessary for determining the subtype composition of
CRFs are Tables S5 and S6 in the ‘‘Supporting information’’.)
Figure 4. ROC curves. (a) ROC curves for subtypes C (solid line), B (dotted line) and D (dashed line) obtained using the standard method. Roc curvesfor (b) B, (c) D; obtained using the improved method.doi:10.1371/journal.pone.0036566.g004
Figure 5. Subtype B classification using the improved method. (a) Distribution of Z-scores for group M sequences; (b) Frequency distributionof Z-scores, when six sequences of subtype B are used in the positive training set.doi:10.1371/journal.pone.0036566.g005
Classification of HIV-1 Sequences
PLoS ONE | www.plosone.org 4 May 2012 | Volume 7 | Issue 5 | e36566
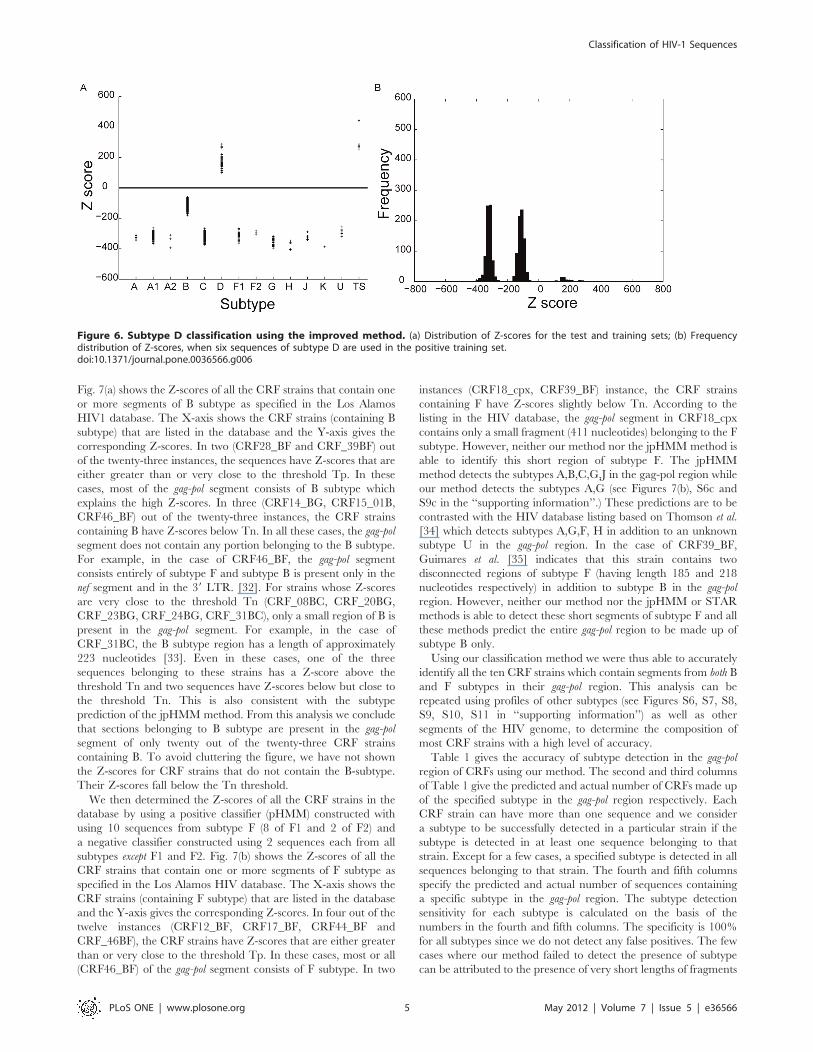
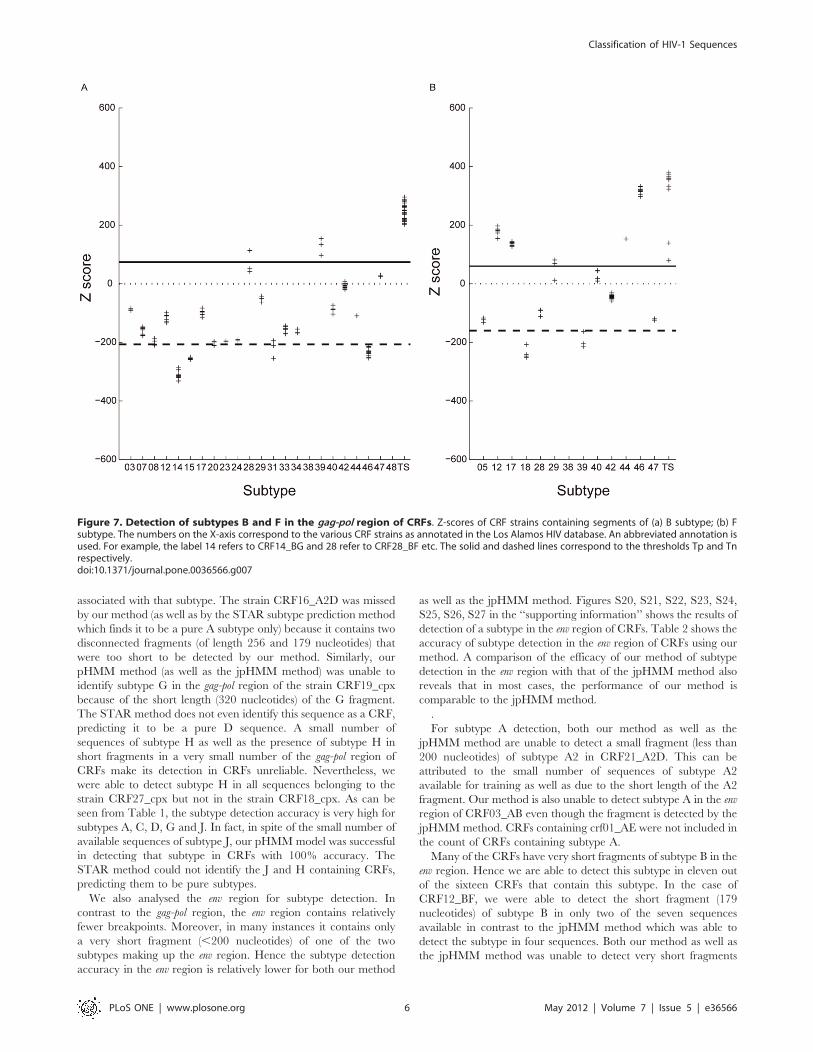
Fig. 7(a) shows the Z-scores of all the CRF strains that contain one
or more segments of B subtype as specified in the Los Alamos
HIV1 database. The X-axis shows the CRF strains (containing B
subtype) that are listed in the database and the Y-axis gives the
corresponding Z-scores. In two (CRF28_BF and CRF_39BF) out
of the twenty-three instances, the sequences have Z-scores that are
either greater than or very close to the threshold Tp. In these
cases, most of the gag-pol segment consists of B subtype which
explains the high Z-scores. In three (CRF14_BG, CRF15_01B,
CRF46_BF) out of the twenty-three instances, the CRF strains
containing B have Z-scores below Tn. In all these cases, the gag-pol
segment does not contain any portion belonging to the B subtype.
For example, in the case of CRF46_BF, the gag-pol segment
consists entirely of subtype F and subtype B is present only in the
nef segment and in the 39 LTR. [32]. For strains whose Z-scores
are very close to the threshold Tn (CRF_08BC, CRF_20BG,
CRF_23BG, CRF_24BG, CRF_31BC), only a small region of B is
present in the gag-pol segment. For example, in the case of
CRF_31BC, the B subtype region has a length of approximately
223 nucleotides [33]. Even in these cases, one of the three
sequences belonging to these strains has a Z-score above the
threshold Tn and two sequences have Z-scores below but close to
the threshold Tn. This is also consistent with the subtype
prediction of the jpHMM method. From this analysis we conclude
that sections belonging to B subtype are present in the gag-pol
segment of only twenty out of the twenty-three CRF strains
containing B. To avoid cluttering the figure, we have not shown
the Z-scores for CRF strains that do not contain the B-subtype.
Their Z-scores fall below the Tn threshold.
We then determined the Z-scores of all the CRF strains in the
database by using a positive classifier (pHMM) constructed with
using 10 sequences from subtype F (8 of F1 and 2 of F2) and
a negative classifier constructed using 2 sequences each from all
subtypes except F1 and F2. Fig. 7(b) shows the Z-scores of all the
CRF strains that contain one or more segments of F subtype as
specified in the Los Alamos HIV database. The X-axis shows the
CRF strains (containing F subtype) that are listed in the database
and the Y-axis gives the corresponding Z-scores. In four out of the
twelve instances (CRF12_BF, CRF17_BF, CRF44_BF and
CRF_46BF), the CRF strains have Z-scores that are either greater
than or very close to the threshold Tp. In these cases, most or all
(CRF46_BF) of the gag-pol segment consists of F subtype. In two
instances (CRF18_cpx, CRF39_BF) instance, the CRF strains
containing F have Z-scores slightly below Tn. According to the
listing in the HIV database, the gag-pol segment in CRF18_cpx
contains only a small fragment (411 nucleotides) belonging to the F
subtype. However, neither our method nor the jpHMM method is
able to identify this short region of subtype F. The jpHMM
method detects the subtypes A,B,C,G,J in the gag-pol region while
our method detects the subtypes A,G (see Figures 7(b), S6c and
S9c in the ‘‘supporting information’’.) These predictions are to be
contrasted with the HIV database listing based on Thomson et al.
[34] which detects subtypes A,G,F, H in addition to an unknown
subtype U in the gag-pol region. In the case of CRF39_BF,
Guimares et al. [35] indicates that this strain contains two
disconnected regions of subtype F (having length 185 and 218
nucleotides respectively) in addition to subtype B in the gag-pol
region. However, neither our method nor the jpHMM or STAR
methods is able to detect these short segments of subtype F and all
these methods predict the entire gag-pol region to be made up of
subtype B only.
Using our classification method we were thus able to accurately
identify all the ten CRF strains which contain segments from both B
and F subtypes in their gag-pol region. This analysis can be
repeated using profiles of other subtypes (see Figures S6, S7, S8,
S9, S10, S11 in ‘‘supporting information’’) as well as other
segments of the HIV genome, to determine the composition of
most CRF strains with a high level of accuracy.
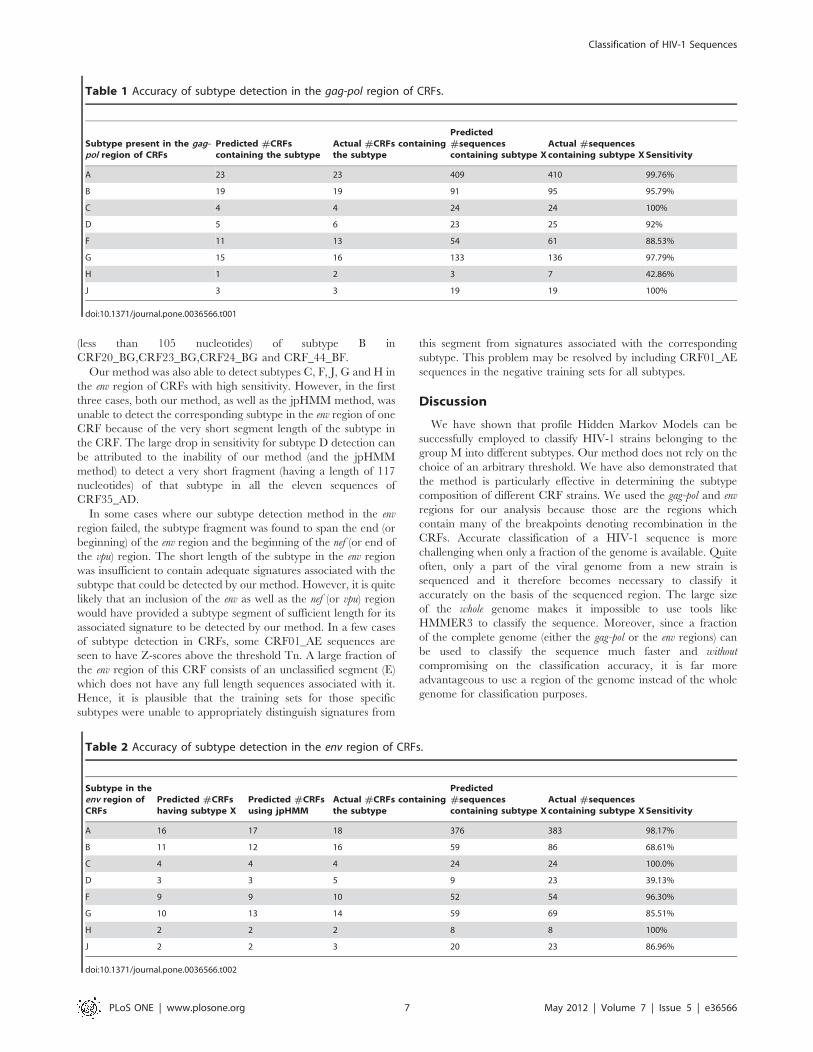
Table 1 gives the accuracy of subtype detection in the gag-pol
region of CRFs using our method. The second and third columns
of Table 1 give the predicted and actual number of CRFs made up
of the specified subtype in the gag-pol region respectively. Each
CRF strain can have more than one sequence and we consider
a subtype to be successfully detected in a particular strain if the
subtype is detected in at least one sequence belonging to that
strain. Except for a few cases, a specified subtype is detected in all
sequences belonging to that strain. The fourth and fifth columns
specify the predicted and actual number of sequences containing
a specific subtype in the gag-pol region. The subtype detection
sensitivity for each subtype is calculated on the basis of the
numbers in the fourth and fifth columns. The specificity is 100%
for all subtypes since we do not detect any false positives. The few
cases where our method failed to detect the presence of subtype
can be attributed to the presence of very short lengths of fragments
Figure 6. Subtype D classification using the improved method. (a) Distribution of Z-scores for the test and training sets; (b) Frequencydistribution of Z-scores, when six sequences of subtype D are used in the positive training set.doi:10.1371/journal.pone.0036566.g006
Classification of HIV-1 Sequences
PLoS ONE | www.plosone.org 5 May 2012 | Volume 7 | Issue 5 | e36566
associated with that subtype. The strain CRF16_A2D was missed
by our method (as well as by the STAR subtype prediction method
which finds it to be a pure A subtype only) because it contains two
disconnected fragments (of length 256 and 179 nucleotides) that
were too short to be detected by our method. Similarly, our
pHMM method (as well as the jpHMM method) was unable to
identify subtype G in the gag-pol region of the strain CRF19_cpx
because of the short length (320 nucleotides) of the G fragment.
The STAR method does not even identify this sequence as a CRF,
predicting it to be a pure D sequence. A small number of
sequences of subtype H as well as the presence of subtype H in
short fragments in a very small number of the gag-pol region of
CRFs make its detection in CRFs unreliable. Nevertheless, we
were able to detect subtype H in all sequences belonging to the
strain CRF27_cpx but not in the strain CRF18_cpx. As can be
seen from Table 1, the subtype detection accuracy is very high for
subtypes A, C, D, G and J. In fact, in spite of the small number of
available sequences of subtype J, our pHMM model was successful
in detecting that subtype in CRFs with 100% accuracy. The
STAR method could not identify the J and H containing CRFs,
predicting them to be pure subtypes.
We also analysed the env region for subtype detection. In
contrast to the gag-pol region, the env region contains relatively
fewer breakpoints. Moreover, in many instances it contains only
a very short fragment (,200 nucleotides) of one of the two
subtypes making up the env region. Hence the subtype detection
accuracy in the env region is relatively lower for both our method
as well as the jpHMM method. Figures S20, S21, S22, S23, S24,
S25, S26, S27 in the ‘‘supporting information’’ shows the results of
detection of a subtype in the env region of CRFs. Table 2 shows the
accuracy of subtype detection in the env region of CRFs using our
method. A comparison of the efficacy of our method of subtype
detection in the env region with that of the jpHMM method also
reveals that in most cases, the performance of our method is
comparable to the jpHMM method.
.
For subtype A detection, both our method as well as the
jpHMM method are unable to detect a small fragment (less than
200 nucleotides) of subtype A2 in CRF21_A2D. This can be
attributed to the small number of sequences of subtype A2
available for training as well as due to the short length of the A2
fragment. Our method is also unable to detect subtype A in the env
region of CRF03_AB even though the fragment is detected by the
jpHMMmethod. CRFs containing crf01_AE were not included in
the count of CRFs containing subtype A.
Many of the CRFs have very short fragments of subtype B in the
env region. Hence we are able to detect this subtype in eleven out
of the sixteen CRFs that contain this subtype. In the case of
CRF12_BF, we were able to detect the short fragment (179
nucleotides) of subtype B in only two of the seven sequences
available in contrast to the jpHMM method which was able to
detect the subtype in four sequences. Both our method as well as
the jpHMM method was unable to detect very short fragments
Figure 7. Detection of subtypes B and F in the gag-pol region of CRFs. Z-scores of CRF strains containing segments of (a) B subtype; (b) Fsubtype. The numbers on the X-axis correspond to the various CRF strains as annotated in the Los Alamos HIV database. An abbreviated annotation isused. For example, the label 14 refers to CRF14_BG and 28 refer to CRF28_BF etc. The solid and dashed lines correspond to the thresholds Tp and Tnrespectively.doi:10.1371/journal.pone.0036566.g007
Classification of HIV-1 Sequences
PLoS ONE | www.plosone.org 6 May 2012 | Volume 7 | Issue 5 | e36566
(less than 105 nucleotides) of subtype B in
CRF20_BG,CRF23_BG,CRF24_BG and CRF_44_BF.
Our method was also able to detect subtypes C, F, J, G and H in
the env region of CRFs with high sensitivity. However, in the first
three cases, both our method, as well as the jpHMM method, was
unable to detect the corresponding subtype in the env region of one
CRF because of the very short segment length of the subtype in
the CRF. The large drop in sensitivity for subtype D detection can
be attributed to the inability of our method (and the jpHMM
method) to detect a very short fragment (having a length of 117
nucleotides) of that subtype in all the eleven sequences of
CRF35_AD.
In some cases where our subtype detection method in the env
region failed, the subtype fragment was found to span the end (or
beginning) of the env region and the beginning of the nef (or end of
the vpu) region. The short length of the subtype in the env region
was insufficient to contain adequate signatures associated with the
subtype that could be detected by our method. However, it is quite
likely that an inclusion of the env as well as the nef (or vpu) region
would have provided a subtype segment of sufficient length for its
associated signature to be detected by our method. In a few cases
of subtype detection in CRFs, some CRF01_AE sequences are
seen to have Z-scores above the threshold Tn. A large fraction of
the env region of this CRF consists of an unclassified segment (E)
which does not have any full length sequences associated with it.
Hence, it is plausible that the training sets for those specific
subtypes were unable to appropriately distinguish signatures from
this segment from signatures associated with the corresponding
subtype. This problem may be resolved by including CRF01_AE
sequences in the negative training sets for all subtypes.
Discussion
We have shown that profile Hidden Markov Models can be
successfully employed to classify HIV-1 strains belonging to the
group M into different subtypes. Our method does not rely on the
choice of an arbitrary threshold. We have also demonstrated that
the method is particularly effective in determining the subtype
composition of different CRF strains. We used the gag-pol and env
regions for our analysis because those are the regions which
contain many of the breakpoints denoting recombination in the
CRFs. Accurate classification of a HIV-1 sequence is more
challenging when only a fraction of the genome is available. Quite
often, only a part of the viral genome from a new strain is
sequenced and it therefore becomes necessary to classify it
accurately on the basis of the sequenced region. The large size
of the whole genome makes it impossible to use tools like
HMMER3 to classify the sequence. Moreover, since a fraction
of the complete genome (either the gag-pol or the env regions) can
be used to classify the sequence much faster and without
compromising on the classification accuracy, it is far more
advantageous to use a region of the genome instead of the whole
genome for classification purposes.
Table 1 Accuracy of subtype detection in the gag-pol region of CRFs.
Subtype present in the gag-pol region of CRFs
Predicted #CRFscontaining the subtype
Actual #CRFs containingthe subtype
Predicted#sequencescontaining subtype X
Actual #sequencescontaining subtype XSensitivity
A 23 23 409 410 99.76%
B 19 19 91 95 95.79%
C 4 4 24 24 100%
D 5 6 23 25 92%
F 11 13 54 61 88.53%
G 15 16 133 136 97.79%
H 1 2 3 7 42.86%
J 3 3 19 19 100%
doi:10.1371/journal.pone.0036566.t001
Table 2 Accuracy of subtype detection in the env region of CRFs.
Subtype in theenv region ofCRFs
Predicted #CRFshaving subtype X
Predicted #CRFsusing jpHMM
Actual #CRFs containingthe subtype
Predicted#sequencescontaining subtype X
Actual #sequencescontaining subtype XSensitivity
A 16 17 18 376 383 98.17%
B 11 12 16 59 86 68.61%
C 4 4 4 24 24 100.0%
D 3 3 5 9 23 39.13%
F 9 9 10 52 54 96.30%
G 10 13 14 59 69 85.51%
H 2 2 2 8 8 100%
J 2 2 3 20 23 86.96%
doi:10.1371/journal.pone.0036566.t002
Classification of HIV-1 Sequences
PLoS ONE | www.plosone.org 7 May 2012 | Volume 7 | Issue 5 | e36566
Another advantage of this method is that it can be used for
subtype classification even if a small number of sequences are
available for a particular subtype. The positive profile HMM can
be effectively constructed from as few as six sequences as long as
the sequences contain sufficient diversity for the positive (and
negative) profiles to capture the unique features associated with the
subtype. Even in the case of subtypes H and J which contain very
few sequences, we find that a pHMM built (using the gag-pol
region) with 3 out of the 4 sequences of H (or 2 out of the 4
sequences of J) can accurately classify the remaining sequences as
is evident from Figure S5 in ‘‘supporting information’’. Similarly,
for the env region, a profile made with 3 out of 4 sequences of H (or
J) can classify the remaining sequence accurately as is seen in
Figures S18, S19 in the ‘‘supporting information’’.
The sequences labelled as ‘‘unclassified’’ in the database were
not found to be associated with any subtype in the sense that their
Z-scores were always negative. However, some unclassified
sequences show strong similarity with certain subtypes as manifest
through their Z-scores which were very close to zero. For instance,
the unclassified strain AY046058 has a Z-score which is very close
to the zero threshold when the positive profile is constructed for
subtype A. This suggests that this strain share similarities with the
A-subtype and may explain why it clusters with the A-subtype in
phylogenetic studies (Pandit et al., 2010). Another unclassified
sequence (accession number FJ388921) share similarities with
sequences belonging to the F subtype, as evident from their Z-
scores (see Fig.S3 in ‘‘supporting information’’). This is also
consistent with results from previous analysis where these
sequences have been found to cluster with subtype K and form
the sister group of subtype F.
The performance of our pHMM based classification method is
also better than the subtype analyser method based on construc-
tion of PSSMs [16,17]. Their method, which is used to assign
sequence subtypes to the PR and RT sequences belonging to the
Pol region, depends on the choice of a scoring threshold as well as
a choice of positive and negative discriminant thresholds. Even for
optimal choice of such thresholds, the accuracy of classification of
pure subtypes was 98.6%. However, this method was far less
accurate (60%) in identifying CRFs. The STAR-rec method which
allowed for improved accuracy in identification of CRFs had an
accuracy of about 93–95% for sub-typing of both pure subtypes
and CRFs, but the accuracy of their CRF subtype detection
method was obtained on the basis of only 20 CRF sequences. The
STAR program is also restricted to detect subtypes in only the Pol
region of CRFs. Moreover, the program cannot correctly de-
termine the subtype composition for many of the CRF strains
currently available in the HIV database, and predicts them to
belong to pure subtypes. In comparison, our improved pHMM
based method can classify pure sequences with 100% accuracy
based on the sign of the Z-score of the query sequence, since the Z-
score threshold is always fixed at zero. Moreover, our method can
be adopted without modification to accurately identify the subtype
composition of most CRFs with the accuracy of subtype detection
in CRFs being above 95% for most subtypes. Determination of the
subtype composition of CRFs may fail only in those rare
circumstances when the subtype present has a very short segment
in the region being analysed or if that region is constituted entirely
of one subtype only and the other subtype(s) are present in
a different region of the CRF. The problem can be easily resolved
by constructing pHMMs from other regions of the genome and
repeating the analysis. By combining the results of such analysis, it
is straightforward to infer the subtype composition of the CRF
accurately.
Although the jpHMM method [26,27] is primarily geared for
identifying breakpoints in CRFs, it can also be used for detecting
subtypes. An extensive comparison of the accuracy of that
classification method with ours is not possible since those papers
do not provide sufficient data on subtype classification for all real
HIV-1 strains. While being based on pHMM, our method of
classification differs from the jpHMM method of Schultz et al. In
our case, 100% classification accuracy is achieved by introducing
a negative training set in addition to the positive training set used
in the standard pHMM method. As far as subtype detection in
CRFs is concerned, our pHMM method performs as well as the
jpHMM method. Moreover, in our method, once the positive and
negative profiles are created, it is easy to generate the Z-score (on
the basis of which the query sequence is classified) for an entire
database of test sequences simultaneously. This makes it possible
to classify batches of query sequences rather than do so one query
sequenceat a time.
The pHMM based-method described in this paper provides
a unified and efficient method of determining the subtypes of
unknown HIV-1 sequences as well as CRFs. We believe it will
prove useful to HIV researchers for understanding the distribution
pattern of different types of HIV and for developing more effective
and targeted therapies against the disease.
Materials and Methods
All available HIV-1 genome sequences including CRF
sequences were downloaded from the Los Alamos HIV database.
For each subtype, six sequences were selected at random to build
the training set. Multiple sequence alignments (MSA) of the gag-pol
segment of these nucleotide sequences were created using the
MUSCLE 3.7 package [36]. A pHMM was then generated for
each of the MSA using the hmmbuild program from the HMMER3
package [37]. The log-odd or bit score for each of the 1511
genome sequences in the database (six of which were used for the
training set and the rest made up the test set, for each subtype) was
generated by the hmmsearch program in HMMER3. For pure (i.e.
non-CRF) sequences, we developed a classification method based
on the bit score. In this method, all sequences have a positive bit
score and the membership of a sequence in the corresponding
subtype was dependent on its bit score and a threshold score which
distinguished the true positives from the true negatives. If the bit-
score was found to be greater than the threshold score, the
corresponding query sequence was predicted to belong to the
subtype for which the pHMM was constructed. This threshold was
chosen arbitrarily to lie between the scores of the high-scoring and
low-scoring clusters of query sequences. Overlap between these
two clusters signifies imperfect classification. Even though this
threshold varied for classification of different subtypes, we were
able to unambiguously assign a threshold score for all subtypes
(except B and D) which allowed for accurate discrimination
between true positives and true negatives.
The standard method of classification described above was
unable to discriminate between sequences belonging to subtypes B
and D with 100% accuracy. We therefore used an improved
method for subtype classification that made use of a positive as
well as a negative profile HMM. Creation of these two different
profiles allowed us to capture the unique signatures associated with
a specific subtype and therefore more effectively distinguish
subtypes such as B and D which show a higher level of sequence
similarity than is observed between any other subtypes. For
subtypes other than B and D, a positive training set was
constructed for a specific subtype using six randomly chosen
sequences (avoiding redundancy) known to belong to that subtype.
Classification of HIV-1 Sequences
PLoS ONE | www.plosone.org 8 May 2012 | Volume 7 | Issue 5 | e36566
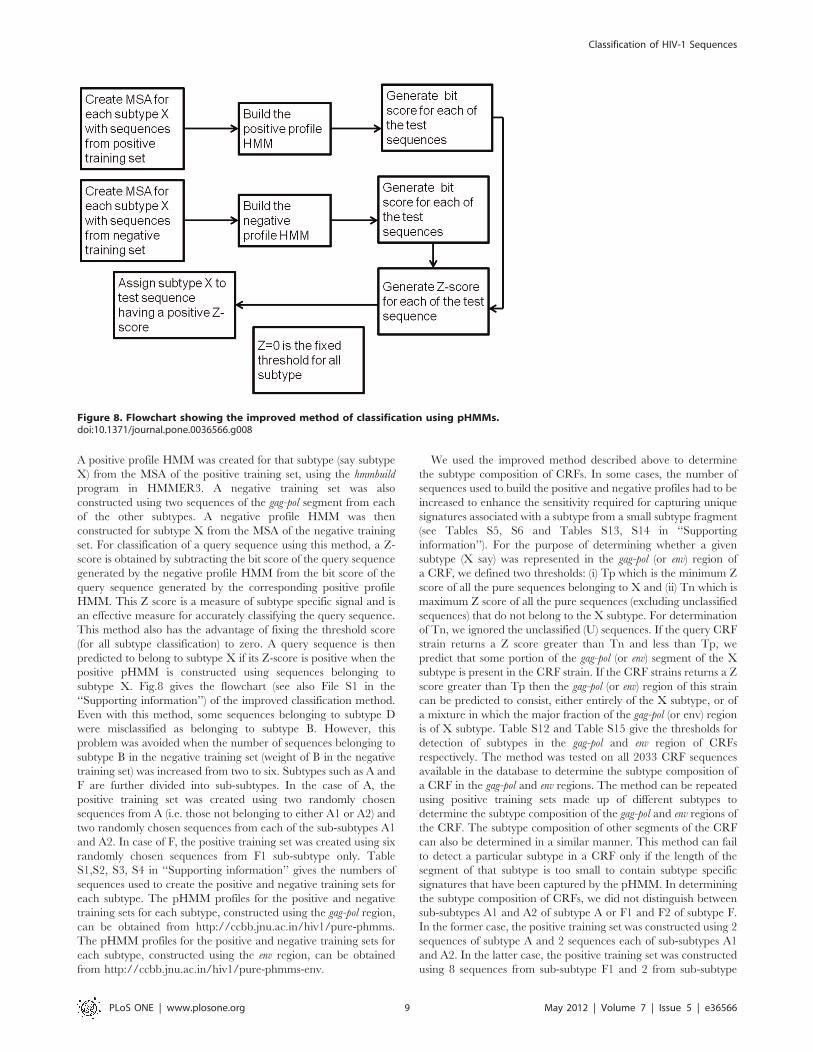
A positive profile HMM was created for that subtype (say subtype
X) from the MSA of the positive training set, using the hmmbuild
program in HMMER3. A negative training set was also
constructed using two sequences of the gag-pol segment from each
of the other subtypes. A negative profile HMM was then
constructed for subtype X from the MSA of the negative training
set. For classification of a query sequence using this method, a Z-
score is obtained by subtracting the bit score of the query sequence
generated by the negative profile HMM from the bit score of the
query sequence generated by the corresponding positive profile
HMM. This Z score is a measure of subtype specific signal and is
an effective measure for accurately classifying the query sequence.
This method also has the advantage of fixing the threshold score
(for all subtype classification) to zero. A query sequence is then
predicted to belong to subtype X if its Z-score is positive when the
positive pHMM is constructed using sequences belonging to
subtype X. Fig.8 gives the flowchart (see also File S1 in the
‘‘Supporting information’’) of the improved classification method.
Even with this method, some sequences belonging to subtype D
were misclassified as belonging to subtype B. However, this
problem was avoided when the number of sequences belonging to
subtype B in the negative training set (weight of B in the negative
training set) was increased from two to six. Subtypes such as A and
F are further divided into sub-subtypes. In the case of A, the
positive training set was created using two randomly chosen
sequences from A (i.e. those not belonging to either A1 or A2) and
two randomly chosen sequences from each of the sub-subtypes A1
and A2. In case of F, the positive training set was created using six
randomly chosen sequences from F1 sub-subtype only. Table
S1,S2, S3, S4 in ‘‘Supporting information’’ gives the numbers of
sequences used to create the positive and negative training sets for
each subtype. The pHMM profiles for the positive and negative
training sets for each subtype, constructed using the gag-pol region,
can be obtained from http://ccbb.jnu.ac.in/hiv1/pure-phmms.
The pHMM profiles for the positive and negative training sets for
each subtype, constructed using the env region, can be obtained
from http://ccbb.jnu.ac.in/hiv1/pure-phmms-env.
We used the improved method described above to determine
the subtype composition of CRFs. In some cases, the number of
sequences used to build the positive and negative profiles had to be
increased to enhance the sensitivity required for capturing unique
signatures associated with a subtype from a small subtype fragment
(see Tables S5, S6 and Tables S13, S14 in ‘‘Supporting
information’’). For the purpose of determining whether a given
subtype (X say) was represented in the gag-pol (or env) region of
a CRF, we defined two thresholds: (i) Tp which is the minimum Z
score of all the pure sequences belonging to X and (ii) Tn which is
maximum Z score of all the pure sequences (excluding unclassified
sequences) that do not belong to the X subtype. For determination
of Tn, we ignored the unclassified (U) sequences. If the query CRF
strain returns a Z score greater than Tn and less than Tp, we
predict that some portion of the gag-pol (or env) segment of the X
subtype is present in the CRF strain. If the CRF strains returns a Z
score greater than Tp then the gag-pol (or env) region of this strain
can be predicted to consist, either entirely of the X subtype, or of
a mixture in which the major fraction of the gag-pol (or env) region
is of X subtype. Table S12 and Table S15 give the thresholds for
detection of subtypes in the gag-pol and env region of CRFs
respectively. The method was tested on all 2033 CRF sequences
available in the database to determine the subtype composition of
a CRF in the gag-pol and env regions. The method can be repeated
using positive training sets made up of different subtypes to
determine the subtype composition of the gag-pol and env regions of
the CRF. The subtype composition of other segments of the CRF
can also be determined in a similar manner. This method can fail
to detect a particular subtype in a CRF only if the length of the
segment of that subtype is too small to contain subtype specific
signatures that have been captured by the pHMM. In determining
the subtype composition of CRFs, we did not distinguish between
sub-subtypes A1 and A2 of subtype A or F1 and F2 of subtype F.
In the former case, the positive training set was constructed using 2
sequences of subtype A and 2 sequences each of sub-subtypes A1
and A2. In the latter case, the positive training set was constructed
using 8 sequences from sub-subtype F1 and 2 from sub-subtype
Figure 8. Flowchart showing the improved method of classification using pHMMs.doi:10.1371/journal.pone.0036566.g008
Classification of HIV-1 Sequences
PLoS ONE | www.plosone.org 9 May 2012 | Volume 7 | Issue 5 | e36566
F2. The pHMM profiles for the positive and negative training sets,
constructed using the gag-pol and env regions, and used for
identifying the subtype composition of CRFs, can be obtained
from http://ccbb.jnu.ac.in/hiv1/crf-phmms and http://ccbb.jnu.
ac.in/hiv1/env-crf-phmms respectively.
Supporting Information
Figure S1 Subtype A classification using the improvedmethod. (a) Distribution of Z-scores of group M sequences. (b)
Frequency distribution of Z-scores when six sequences from
subtype A are used to build the positive training set.
(PDF)
Figure S2 Subtype C classification using the improvedmethod. (a) Distribution of Z-scores of group M sequences. (b)
Frequency distribution of Z-scores when six sequences from
subtype C are used to build the positive training set.
(PDF)
Figure S3 Sub-subtype F1 classification using the im-proved method. (a) Distribution of Z-scores of group M
sequences. (b) Frequency distribution of Z-scores when six
sequences from subtype F1 are used to build the positive training
set. The four sequences of subtype F2 have a Z-score close to zero
indicating their close similarity to sequences of subtype F1.
(PDF)
Figure S4 Subtype G classification using the improvedmethod. (a) Distribution of Z-scores of group M sequences. (b)
Frequency distribution of Z-scores when six sequences from
subtype G are used to build the positive training set.
(PDF)
Figure S5 Classification of subtypes (a) H (b) J using theimproved method. Three out of four sequences are used to
construct the positive profile HMM for H and two out of four
sequences are used to construct the positive profile HMM for J. In
both cases, the remaining sequences are correctly classified.
(PDF)
Figure S6 Detection of subtype A in the gag-pol region ofCRF’s. The figures show the distribution of Z-scores of (a) pure
sequences and (b)-(e): all CRF strains when the positive training set
is constructed using two sequences each belonging to A,A1 and
A2. Abbreviations are used to label CRF strains in the X-axis. For
example, the label 02 refers to CRF02_AG and 18 refer to
CRF18_cpx etc. The solid and dashed lines correspond to the
thresholds Tp and Tn respectively.
(PDF)
Figure S7 Detection of subtype C in the gag-pol regionof CRF’s. The figures show the distribution of Z-scores of (a) pure
sequences and (b)-(e) all CRF strains when the positive training set
is constructed using sixteen sequences belonging to C. The solid
and dashed lines correspond to the thresholds Tp and Tn
respectively.
(PDF)
Figure S8 Detection of subtype D in the gag-pol regionof CRF’s. The figures show the distribution of Z-scores of (a) pure
sequences and (b)-(e) all CRF strains when the positive training set
is constructed using fourteen sequences belonging to D. The solid
and dashed lines correspond to the thresholds Tp and Tn
respectively. Subtype D is not detected only in CRF16_A2D since
very small fragments of D are present in the gag-pol region. There
are no data points corresponding to CRF41_CD since sequences
belonging to that strain are not yet publicly available.
(PDF)
Figure S9 Detection of subtype G in the gag-pol regionof CRF’s. The figures show the distribution of Z-scores of (a) pure
sequences and (b)-(e) all CRF strains when the positive training set
is constructed using six sequences belonging to G. The solid and
dashed lines correspond to the thresholds Tp and Tn respectively.
(PDF)
Figure S10 Detection of subtype H in the gag-pol regionof CRF’s. The figures show the distribution of Z-scores of (a) pure
sequences and (b)-(e) all CRF strains when the positive training set
is constructed using four sequences belonging to H. The solid and
dashed lines correspond to the thresholds Tp and Tn respectively.
(PDF)
Figure S11 Detection of subtype J in the gag-pol regionof CRF’s. The figures show the distribution of Z-scores of (a) pure
sequences and (b)-(e) all CRF strains when the positive training set
is constructed using three sequences belonging to J. The solid and
dashed lines correspond to the thresholds Tp and Tn respectively.
(PDF)
Figure S12 Subtype A classification using the improvedmethod when the env region is used to construct thepositive and negative pHMMs. Distribution of Z-scores for
group M sequences.
(TIF)
Figure S13 Subtype B classification using the improvedmethod when the env region is used to construct thepositive and negative pHMMs. Distribution of Z-scores for
group M sequences.
(TIF)
Figure S14 Subtype C classification using the improvedmethod when the env region is used to construct thepositive and negative pHMMs. Distribution of Z-scores for
group M sequences.
(TIF)
Figure S15 Subtype D classification using the improvedmethod when the env region is used to construct thepositive and negative pHMMs. Distribution of Z-scores for
group M sequences.
(TIF)
Figure S16 Subtype F1 classification using the improvedmethod when the env region is used to construct thepositive and negative pHMMs. Distribution of Z-scores for
group M sequences.
(TIF)
Figure S17 Subtype G classification using the improvedmethod when the env region is used to construct thepositive and negative pHMMs. Distribution of Z-scores for
group M sequences.
(TIF)
Figure S18 Subtype H classification using the improvedmethod when the env region is used to construct thepositive and negative pHMMs. Distribution of Z-scores for
group M sequences.
(TIF)
Figure S19 Subtype J classification using the improvedmethod when the env region is used to construct thepositive and negative pHMMs. Distribution of Z-scores for
group M sequences.
(TIF)
Classification of HIV-1 Sequences
PLoS ONE | www.plosone.org 10 May 2012 | Volume 7 | Issue 5 | e36566
Figure S20 Detection of subtype A in the env region ofCRF’s. The figures show the distribution of Z-scores of (a) pure
sequences and (b)-(e): all CRF strains when the positive training set
is constructed using a total of twelve sequences belonging to A,A1
and A2. The solid and dashed lines correspond to the thresholds
Tp and Tn respectively.
(PDF)
Figure S21 Detection of subtype B in the env region ofCRF’s. The figures show the distribution of Z-scores of (a) pure
sequences and (b)-(e): all CRF strains when the positive training set
is constructed using thirty sequences each belonging to B. The
solid and dashed lines correspond to the thresholds Tp and Tn
respectively.
(PDF)
Figure S22 Detection of subtype C in the env region ofCRF’s. The figures show the distribution of Z-scores of (a) pure
sequences and (b)-(e) all CRF strains when the positive training set
is constructed using ten sequences belonging to C. The solid and
dashed lines correspond to the thresholds Tp and Tn respectively.
(PDF)
Figure S23 Detection of subtype D in the env region ofCRF’s. The figures show the distribution of Z-scores of (a) pure
sequences and (b)-(e) all CRF strains when the positive training set
is constructed using twenty sequences belonging to D. The solid
and dashed lines correspond to the thresholds Tp and Tn
respectively.
(PDF)
Figure S24 Detection of subtype F in the env region ofCRF’s. The figures show the distribution of Z-scores of (a) pure
sequences and (b)-(e) all CRF strains when the positive training set
is constructed using twelve sequences belonging to F. The solid
and dashed lines correspond to the thresholds Tp and Tn
respectively.
(PDF)
Figure S25 Detection of subtype G in the env region ofCRF’s. The figures show the distribution of Z-scores of (a) pure
sequences and (b)-(e) all CRF strains when the positive training set
is constructed using twelve sequences belonging to G. The solid
and dashed lines correspond to the thresholds Tp and Tn
respectively.
(PDF)
Figure S26 Detection of subtype H in the env region ofCRF’s. The figures show the distribution of Z-scores of (a) pure
sequences and (b)-(e) all CRF strains when the positive training set
is constructed using four sequences belonging to H. The solid and
dashed lines correspond to the thresholds Tp and Tn respectively.
(PDF)
Figure S27 Detection of subtype J in the env region ofCRF’s. The figures show the distribution of Z-scores of (a) pure
sequences and (b)-(e) all CRF strains when the positive training set
is constructed using four sequences belonging to J. The solid and
dashed lines correspond to the thresholds Tp and Tn respectively.
(PDF)
Table S1 Accession numbers of sequences making upthe positive training set for all sub-types except H & Jwhen the gag-pol region is used for classification.
(PDF)
Table S2 Accession numbers of sequences making upthe positive training set for sub-type H and J when thegag-pol region is used for classification. Since there are
only 4 sequences of the gag-pol region for H and 3 for J, 3 of the 4
sequences of H and 2 of the 3 sequences of J were used to build the
respective pHMMs which were then successful in classifying the
remaining sequences.
(PDF)
Table S3 Accession numbers of sequences making upthe negative training set for all sub-types except D whenthe gag-pol region is used for classification.(PDF)
Table S4 Accession numbers of sequences making upthe negative training set for sub-type D when the gag-polregion is used for classification.(PDF)
Table S5 Number of sequences making up the positivetraining set used for determining whether a given sub-type (X) is present in the gag-pol region of a CRF.(PDF)
Table S6 Number of sequences of each sub-type makingup the negative training set used for determiningwhether a given sub-type (X) is present in the gag-polregion of a CRF.(PDF)
Table S7 Accession numbers of sequences making upthe positive training set for all sub-types, except H and J,when the env region is used for classification.(PDF)
Table S8 Accession numbers of sequences making upthe negative training set for all sub-types, except H andJ, when the env region is used for classification.(PDF)
Table S9 Accession numbers of sequences making upthe positive training set for sub-type H and J when theenv region is used for classification. Since there are only 4
sequences of the env region for both H and J, three were used to
build the pHMM which was then successful in classifying the
remaining sequence. Note that a choice of any 3 of the 4 env
sequences can be used to build a pHMM which can successfully
classify the remaining one.
(PDF)
Table S10 Accession numbers of sequences making upthe negative training set for sub-type H when the envregion is used for classification.(PDF)
Table S11 Accession numbers of sequences making upthe negative training set for sub-type J when the envregion is used for classification.(PDF)
Table S12 Thresholds for detection of sub-types in thegag-pol region of CRF strains.(PDF)
Table S13 Number of sequences making up the positivetraining set used for determining whether a given sub-type (X) is present in the env region of a CRF.(PDF)
Table S14 Number of sequences of each sub-typemaking up the negative training set used for determin-ing whether a given sub-type (X) is present in the envregion of a CRF.(PDF)
Classification of HIV-1 Sequences
PLoS ONE | www.plosone.org 11 May 2012 | Volume 7 | Issue 5 | e36566
Table S15 Thresholds for detection of sub-types in theenv region of CRF strains.
(PDF)
File S1 Instructions for classifying a query sequence (Q)using our pHMM method.
(PDF)
Acknowledgments
We thank Somdatta Sinha and Payal Singh for useful discussions.
Author Contributions
Conceived and designed the experiments: SS SKD. Performed the
experiments: SKD. Analyzed the data: SKD SS. Contributed reagents/
materials/analysis tools: SKD SS. Wrote the paper: SS.
References
1. Palella FJ Jr., Delaney KM, Moorman AC, Loveless MO, Fuhrer J, et al. (1998)
Declining morbidity and mortality among patients with advanced humanimmunodeficiency virus infection. New England Journal of Medicine 338:
853–860.2. Robertson D, Anderson J, Bradac J, Carr J, Foley B, et al. (2000) HIV-1
nomenclature proposal. Science 288: 55.
3. Takebe Y, Uenishi R, Li X (2008) Global molecular epidemiology of HIV:understanding the genesis of AIDS pandemic. Advances in Pharmacology 56:
1–25.4. Goudsmit J (1997) Viral sex: The nature of AIDS. Oxford University Press,
USA. p.5. Parry JV, Murphy G, Barlow KL, Lewis K, Rogers PA, et al. (2001) National
surveillance of HIV-1 subtypes for England and Wales: design, methods, and
initial findings. JAIDS Journal of Acquired Immune Deficiency Syndromes 26:381.
6. Paraskevis D, Magiorkinis E, Magiorkinis G, Sypsa V, Paparizos V, et al. (2007)Increasing prevalence of HIV-1 subtype A in Greece: estimating epidemic
history and origin. Journal of Infectious Diseases 196: 1167.
7. Robertson DL, Hahn BH, Sharp PM (1995) Recombination in AIDS viruses.Journal of Molecular Evolution 40: 249–259.
8. Myers G, MacInnes K, Korber B (1992) The emergence of simian/humanimmunodeficiency viruses. AIDS Research and Human Retroviruses 8:
373–386.
9. Louwagie J, McCutchan FE, Peeters M, Brennan TP, Sanders-Buell E, et al.(1993) Phylogenetic analysis of gag genes from 70 international HIV-1 isolates
provides evidence for multiple genotypes. Aids 7: 769.10. Janssens W, Heyndrickx L, Fransen K, Motte J, Peeters M, et al. (1994) Genetic
and phylogenetic analysis of env subtypes G and H in Central Africa. AIDSResearch and Human Retroviruses 10: 877–879.
11. Kostrikis LG, Bagdades E, Cao Y, Zhang L, Dimitriou D, et al. (1995) Genetic
analysis of human immunodeficiency virus type 1 strains from patients inCyprus: identification of a new subtype designated subtype I. Journal of Virology
69: 6122.12. Leitner T, Alaeus A, Marquina S, Lilja E, Lidman K, et al. (1995) Yet another
subtype of HIV type 1? AIDS Research and Human Retroviruses 11: 995–997.
13. Triques K, Bourgeois A, Vidal N, Mpoudi-Ngole E, Mulanga-Kabeya C, et al.(2000) Near-full-length genome sequencing of divergent African HIV type 1
subtype F viruses leads to the identification of a new HIV type 1 subtypedesignated K. AIDS Research and Human Retroviruses 16: 139–151.
14. Gao F, Robertson DL, Carruthers CD, Li Y, Bailes E, et al. (1998) An isolate ofhuman immunodeficiency virus type 1 originally classified as subtype I
represents a complex mosaic comprising three different group M subtypes (A,
G, and I). Journal of Virology 72: 10234.15. Rozanov M, Plikat U, Chappey C, Kochergin A, Tatusova T (2004) A web-
based genotyping resource for viral sequences. Nucleic Acids Research 32:W654.
16. Gale CV, Myers R, Tedder RS, Williams IG, Kellam P (2004) Development of
a novel human immunodeficiency virus type 1 subtyping tool, Subtype Analyzer(STAR): analysis of subtype distribution in London. AIDS Research and Human
Retroviruses 20: 457–464.17. Myers R, Gale C, Harrison A, Takeuchi Y, Kellam P (2005) A statistical model
for HIV-1 sequence classification using the subtype analyser (STAR).Bioinformatics 21: 3535.
18. Hraber P, Kuiken C, Waugh M, Geer S, Bruno WJ, et al. (2008) Classification
of hepatitis C virus and human immunodeficiency virus-1 sequences with the
branching index. Journal of General Virology 89: 2098.
19. Pandit A, Sinha S (2010) Using genomic signatures for HIV-1 sub-typing. BMC
Bioinformatics 11: S26.
20. Bulla I, Schultz AK, Schreiber F, Zhang M, Leitner T, et al. (2010) HIV
classification using the coalescent theory. Bioinformatics 26: 1409.
21. Krogh A, Brown M, Mian IS, Sjolander K, Haussler D (1994) Hidden Markov
models in computational biology. Applications to protein modeling. Journal of
Molecular Biology 235: 1501–1531.
22. Durbin R, Eddy SR, Krogh A, Mitchison G (1998) Biological sequence analysis:
Probabilistic models of proteins and nucleic acids. Cambridge University Press.
23. Eddy SR (1998) Profile hidden Markov models. Bioinformatics 14: 755.
24. Karplus K, Barrett C, Hughey R (1998) Hidden Markov models for detecting
remote protein homologies. Bioinformatics 14: 846.
25. Singh P, Bandyopadhyay P, Bhattacharya S, Krishnamachari A, Sengupta S
(2009) Riboswitch detection using profile hidden Markov models. BMC
Bioinformatics 10: 325.
26. Schultz AK, Zhang M, Leitner T, Kuiken C, Korber B, et al. (2006) A jumping
profile Hidden Markov Model and applications to recombination sites in HIV
and HCV genomes. BMC Bioinformatics 7: 265.
27. Schultz AK, Zhang M, Bulla I, Leitner T, Korber B, et al. (2009) jpHMM:
Improving the reliability of recombination prediction in HIV-1. Nucleic Acids
Research W647–W651: 37.
28. Lole KS, Bollinger RC, Paranjape RS, Gadkari D, Kulkarni SS, et al. (1999)
Full-length human immunodeficiency virus type 1 genomes from subtype C-
infected seroconverters in India, with evidence of intersubtype recombination. J.
Virol. 73(1): 152–160.
29. Truszkowski J, Brown DG (2011) More accurate recombination prediction in
HIV-1 using a robust decoding algorithm for HMMs. BMC Bioinformatics 12:
168.
30. Westesson O, Homes I (2011) Accurate Detection of Recombinant Breakpoints
in Whole-Genome Alignments. PLoS Computational Biology 5(3): e1000318.
31. Spang R, Rehmsmeier M, Stoye J (2002) A novel approach to remote homology
detection: Jumping alignments. Journal of Computational Biology. 9: 747–760.
32. Sanabani SS, Pastena E, Neto WK, Martinez VP, Sabino EC (2010)
Characterization and frequency of a newly identified HIV-1 BF1 intersubtype
circulating recombinant form in Sao Paulo, Brazil. Virol J 7: 74.
33. Santos AF, Sousa TM, Soares EAJM, Sanabani S, Martinez A, et al. (2006)
Characterization of a new circulating recombinant form comprising HIV-1
subtypes C and B in southern Brazil. Aids 20: 2011.
34. Thomson MM, Casado G, Posada D, Sierra M, Najera R (2005) Identification
of a novel HIV-1 complex circulating recombinant form (CRF18_cpx) of
Central African origin in Cuba. Aids 19(11): 1155–1163.
35. Guimaraes ML, Eyer-Silva WA, Couto-Fernandez JC, Morgado MG (2008)
Identification of two new CRF_BF in Rio de Janeiro State, Brazil. Aids 22(3):
433–435.
36. Edgar RC (2004) MUSCLE: multiple sequence alignment with high accuracy
and high throughput. Nucleic Acids Research 32: 1792.
37. Finn RD, Clements J, Eddy SR (2011) HMMER web server: interactive
sequence similarity searching. Nucleic Acids Research 39: W29–W37.
Classification of HIV-1 Sequences
PLoS ONE | www.plosone.org 12 May 2012 | Volume 7 | Issue 5 | e36566