Edexcel GCSE Geography A
Practical support to help you deliver this Edexcel
specification
Edexcel GCSE Geography A Geographical Themes and Challenges offers a thematic approach to studying geography, and the content is split into
physical and human geography. As with all GCSEs, the guided learning hours are 120 hours over two years. This document provides a topic guide for
teaching Component 1, Topic 2, which can be adapted by centres to fit their own contexts and teaching styles. It is meant as an example approach only
and is not intended to be prescriptive. The topic guides indicate resources that you can use to support your teaching. This document can be edited and updated over time to develop a resource bank. These are only suggestions
and you are encouraged to use a wide range of resources to suit the needs of your own students.
The advised teaching time for Topic 2: Weather hazards and climate change is
roughly 15 guided learning hours. This requires some blending together of the detailed content. In the guidance below, suggestions are made about
contextualisation or stretch challenges that may be suitable for more able students, as well as expected lesson outcomes for those less able. Please note that these are suggestions only and not specific syllabus requirements.
The two- and three-year course planners suggest appropriate times to introduce this
material. For example, in centres studying over three years, you might want to cover this topic in the autumn term of year nine for a three-year course or year ten for the two-year course. At this time of year there are likely to be some significant weather
events, including tropical cyclones, which could be tracked, mapped and studied. It may be a good idea to teach Topic 2 before Topic 3 so that some knowledge on
climate can be reinforced again when studying tropical rainforest distribution and characteristics.
Each key idea is broken down into subsections (a, b, c) and roughly one hour should
be spent on each of these, except for some of the key ideas on tropical cyclones and drought where more than one key idea can be covered in one lesson. There is a quick overview of the breadth of the key idea followed by a more detailed
explanation of the key concepts and processes, examples of teaching strategies, guidance on integrating geographical skills, and a summary of the key terminology
required. The structure is suggestive, not prescriptive.
Synoptic linkages and case study nesting No in-depth case studies are required for this topic – just two located examples for
each of tropical cyclones and drought. It is possible that these located examples can nest within the case study chosen for Topic 4 a major UK city (e.g.
drought could be studied in London), Topic 4 a major city in a developing or emerging country and Topic 5 a developing or emerging country (e.g. tropical cyclones such as Haiyan in the Philippines), or in a developed country (e.g.
Hurricane Sandy in the USA).

2 © Pearson Education Ltd 2016. Copying permitted for purchasing institution only. This material is not copyright free.
Topic Guide for Component 1,
Topic 2: Weather hazards and climate change
Introduction
Quick overview By the end of covering this topic, students should have an understanding of how and why the global climate has changed, what the evidence for this change is and how climate change has potentially influenced the severity of the two hydro-meteorological hazards of tropical cyclones and drought. As well as looking at the other causes of these two extreme weather events, students also need to develop an understanding of how the impacts of and responses to tropical cyclones and drought vary due to a country’s level of economic development. There also needs to be an awareness of the global atmospheric circulation and ocean currents, and how these operate as systems to transfer heat and energy around the planet. It is also important that the role of climate change in the UK is studied. In particular, how the UK’s climate has changed over the past 1,000 years and the way in which the UK’s geographical location influences its climate.
It is important for students to note that that the term ‘climate change’ does not automatically mean a warming of the climate (global warming). There have certainly been extended cooling periods in our climatic history in the form of ice ages and so called mini ice ages. For example, Europe experienced a cooling period from around 1400 to 1850, when many Alpine glaciers advanced rather than retreated. It is also important to give a balanced view on climate change. Of course, there is no doubt that our climate is changing as modern meteorological technology and research clearly shows that the planet has warmed since the late 19th century.
However, exposing students to facts and figures about climate change will give them factual knowledge to support their arguments and claims about the evidence for global warming and how it may be creating more extreme weather, such as tropical cyclones and drought. Various timescales of climate change need to be covered. Long-term changes going back over several hundred thousand years, medium-term over the last few thousand years and short-term changes, which are more recent, from around 1850 onwards. Evidence for changes over these timescales need to be studied in some depth.
Also, students need to remember that the greenhouse effect is a naturally occurring phenomenon, and so the focus of Key idea 2.3a is ‘enhanced’ greenhouse effect as a result of human activity. Students should know what the greenhouse effect is and have an understanding of how it works.

© Pearson Education Ltd 2016. Copying permitted for purchasing institution only. This material is not copyright free. 3
Key ideas 2.1 – 2.3 Teaching approach over six hours
Lesson 1 (1hr) 2.1a The features of global atmospheric circulation.
Lesson 2 (1hr) 2.1b How circulation cells and ocean currents transfer and
redistribute heat energy across the Earth.
Lesson 3 (1hr)
2.2a How climate has changed in the past over different
timescales: glacial and interglacial periods during the Quaternary
period.
Lesson 4 (1hr)
2.2b Causes (Milankovitch cycles, solar variation, volcanism) and
evidence (ice cores, pollen records, tree rings, historical sources)
for natural change.
Lesson 5 (1hr)
2.3a How human activities (industry, transport, energy, farming)
produce greenhouse gases (carbon dioxide, methane) that cause
the enhanced greenhouse effect.
Lesson 6 (1hr)
2.3b Negative effects that climate change is having on the
environment and people (changing patterns of crop yield, rising
sea levels and retreating glaciers).
Lesson 1: The features of global atmospheric circulation.
Overview
Students should be able to establish the difference between weather and climate.
They should have a brief overview of the key aspects of weather. They should have a good understanding of the different climates, possibly by plotting on a world map the different climatic zones (based on the Köppen system): equatorial, arid,
Mediterranean, snow, polar and temperate. An in-depth understanding of the Tricellular model of atmospheric circulation is required. Students should draw this,
and they need an understanding of the three cells, the direction of air movement, the latitudes involved and how this influences climate.
Key concepts and processes The Earth is a sphere, which means
that the sun’s energy hits the Equator more directly than the polar regions. This causes large-
scale atmospheric circulation, creating the ever changing areas of
high and low pressure. Winds are a part of the global atmospheric circulation cells, and move from
high to low pressure. The Earth heats up more at the Equator than
at the poles; as it heats up, the air at the Equator expands and rises,
and as it cools it moves outwards
towards around 30 north and Figure 1 (Source: Edexcel GCSE (9-1) Geography A student book, Pearson)

4 © Pearson Education Ltd 2016. Copying permitted for purchasing institution only. This material is not copyright free.
south of the Equator, where it sinks, creating high pressure (Hadley cell). The cooler air eventually reaches the ground surface and moves as surface winds back to the
Equator or towards the poles. Around 60 north and south of the Equator the warmer surface winds meet colder air from the poles. The warmer air is less dense than the
cold air and so it rises, creating low pressure (Ferrel cell). At the poles the cool air sinks, creating high pressure. The smallest and weakest cells are the polar cells,
extending from 60 north and south of the Equator. Here the air is very dry and
stable.
Guidance on teaching A good starting point to this topic is to make sure that students have an
understanding of the global system. Teaching this through diagrams or animations (see resources) can help students to visualise what is happening. There will also be unfamiliar terminology here that students need to learn. A useful starting point is the
BBC Bitesize video clip on Global weather circulation.
Lesson 2: How circulation cells and ocean currents transfer and redistribute heat energy across the Earth.
Overview
Students should have an overview of how surface winds, changes in sea temperature
and saltiness (salinity) create ocean currents. For example, the Gulf Stream is one of the strongest currents in the world. This helps to ‘even out’ temperature extremes between the poles and the Equator.
Key concepts and processes Surface water in the North Atlantic is cooled by winds from the Arctic. Cold, dense,
salty water sinks and travels towards the Equator deep in the ocean as part of the thermohaline circulation. In turn, the Gulf Stream moves warm water from the Gulf
of Mexico north-eastwards at the surface to replace it. This brings warmth to North-west Europe, making the climate milder than any other place at the same latitude. Students need to understand that it is these interactions between the sun’s energy
and the atmosphere and oceans that moves heat around the Earth and produces different climates in different parts of the world, giving us variations in our day to
day weather.
Guidance on teaching Students don’t necessarily need to memorise a map of ocean currents but they need to learn the main patterns of ocean currents and how they move energy from the
equator towards the poles. They should have an understanding of what causes ocean currents and how they can affect climate.
Example strategies for teaching ocean currents include:
‘Back-to-back’ (or drawing by memory) exercises to help students describe the
circulation pattern. Use global satellite imagery of clouds or rainfall to make links to key features of
the global circulation diagram (e.g. Figure 8 in the SAMS pack for Specification A, p.32).
Suggest mnemonics such as the 3Cs (Cools, Condenses, Condensation) and the
3Ds (Density, Descends, Deep), as well as the ‘Air blows from high to low’ rhyme, to help students grasp the terminology and key processes.

© Pearson Education Ltd 2016. Copying permitted for purchasing institution only. This material is not copyright free. 5
A simple labelling exercise or multiple choice quiz would be helpful as a recap, perhaps prompted by Figure 8 in the SAMS pack for Specification A (p.32).
Lesson 3: How climate has changed in the past over different
timescales: glacial and interglacial periods during the Quaternary period.
Overview
Students should be aware that throughout the Quaternary period there have been
major natural changes in the Earth’s climate. Climate cycles have moved through colder glacial periods and warmer interglacial periods. The ice ages have occurred at roughly 100,000-year intervals, and evidence from past glacial periods shows that
temperatures were about five degrees colder than in interglacial periods. An understanding of the timescales involved is important, as well as when the last ice
age was and how long it lasted.
Lesson 4: Causes (Milankovitch cycles, solar variation, volcanism) and
evidence (ice cores, pollen records, tree rings, historical sources) for natural change.
Overview
The fourth lesson would explore the natural causes (with a focus on Milankovitch cycles, solar variation and volcanism) and the evidence for climate change (with a
focus on ice cores, pollen records, tree rings and historical sources).
Key concepts and processes Causes The natural causes of climate change should be examined at different timescales, together with consequent climatological events:
Geological-scale external forcing mechanisms, such as the three types of Milankovitch cycle (eccentricity, tilt and precession), are responsible for defining
the scope of the Quaternary period. Within the Quaternary, the Pleistocene and more recently the Holocene periods,
major volcanic eruptions caused global cooling (such as in 1816 – the ‘year
without a summer’). Also, 11-year cycle variations in solar output that led to specific events such as the Maunder Minimum and Little Ice Age periods.
Evidence Apart from knowing what has caused the climate to change naturally, students need
to know in some depth and detail what the evidence is for this change: Extracting ice cores is a way of establishing what the climate used to be like over
a long period of time. Sediment cores from the ground can be extracted from peat bogs and lake beds.
These cores can contain pollen preserved in the sediment, and when viewed
under a microscope it can be possible to detect which plant/vegetation it came from. Once this has been identified it is possible to work out what climatic
conditions were required for the plant to grow. The study of tree rings (dendrochronology) can also show what the climate used
to be like. A new tree ring is formed each year, and if the rings are thick this
indicates good growing conditions such as a warm and wet climate. If the rings are close together, this indicates a cooler period as there is less growth.
6 © Pearson Education Ltd 2016. Copying permitted for purchasing institution only. This material is not copyright free.
Various historical records also show evidence of what the climate used to be like. For example, there are records of agricultural reports showing what past harvest
yields were like, detailed weather conditions collected by organisations such as the Met Office going back as far as 1861, photographic records showing how
glaciers have retreated and going back even further there are paintings depicting frost fairs on a frozen River Thames as well as written accounts.
Guidance on teaching Playing i-Spy in pairs might help to develop descriptive literacy, particularly if
played in two rounds and using descriptive literacy cards, looking first at the historical scale, and then at the geological scale. This helps students appreciate
the scale of natural climate change, that human existence can seem insignificant in comparison to geological history, and finally the degree of abnormality in CO2
concentrations since the industrial revolution. SERC provides a useful step-by-step guide to using satellite images to
understand the Earth’s atmosphere. The Guardian’s Satellite Eye on Earth also
provides a weekly collection of recent satellite photos, as well as useful analysis for each image.
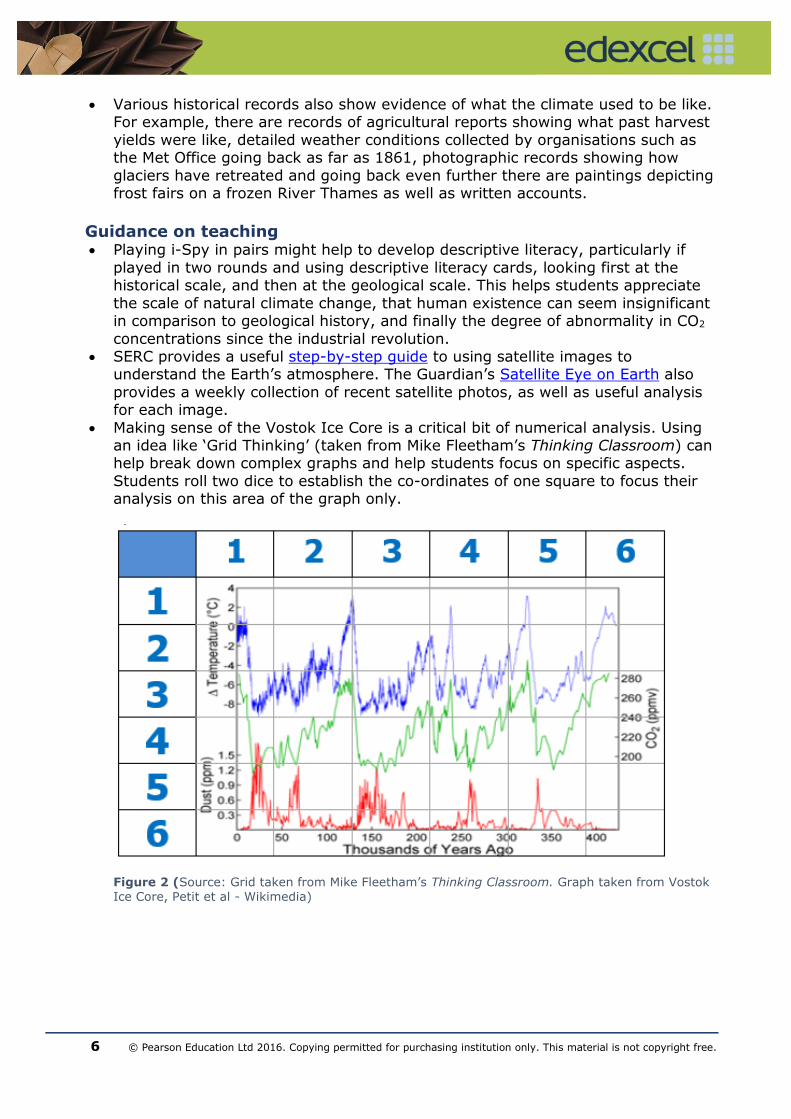
Making sense of the Vostok Ice Core is a critical bit of numerical analysis. Using an idea like ‘Grid Thinking’ (taken from Mike Fleetham’s Thinking Classroom) can help break down complex graphs and help students focus on specific aspects.
Students roll two dice to establish the co-ordinates of one square to focus their analysis on this area of the graph only.
Figure 2 (Source: Grid taken from Mike Fleetham’s Thinking Classroom. Graph taken from Vostok Ice Core, Petit et al - Wikimedia)

© Pearson Education Ltd 2016. Copying permitted for purchasing institution only. This material is not copyright free. 7
Lesson 5: How human activities (industry, transport, energy, farming) produce greenhouse gases (carbon dioxide, methane) that
cause the enhanced greenhouse effect.
Overview The fifth lesson would tackle the anthropogenic causes of climate change. Students
will need to understand the human activities and greenhouses gases that have led to the enhanced greenhouse effect, perhaps by examining evidence to assess its
validity. • More able students might like to consider the context of an emerging country
such as China, and the contribution it might be making to climate change.
• Less able students could focus on a visualisation game to memorise the key aspects of the enhanced greenhouse effect, including sources of pollution.
Key concepts and processes Students need to be made aware of rising concern over the enhanced greenhouse
effect. They also need to know the difference between incoming short-wave radiation and outgoing long-wave radiation, as well as the role of different greenhouse gases. There are several opportunities here to develop students’ quantitative skills. For
example, students could explore IPCC (Intergovernmental Panel on Climate Change) ‘forcings charts’, or the infamous ‘Hockey stick’ graphs.
Guidance on teaching There are numerous ways to go about evaluating the evidence for and against
anthropogenic climate change. A scaffolding technique such as VIPA analysis can be used to consider the Value, Impact, Purpose and Anything else that can be
said about a range of numerical sources (for example, the data produced in the 5th
IPCC Report, 2014. The IPCC summary of observed changes might also be useful).
Lesson 6: Negative effects that climate change is having on the environment and people (changing patterns of crop yield, rising sea
levels and retreating glaciers).
Overview
In the sixth lesson, students should have a detailed understanding of how and why human activity has influenced climate change due to the increase in greenhouse
gases. Once this has been established they should have a good understanding of the impacts. These impacts could be given some locational context, although the
specification does not demand this.
Key concepts and processes Negative impacts include:
Lower crop yields – have become more common than positive impacts (some positive trends are evident at higher latitudes). Climate change has negatively affected wheat and maize yields for many regions and globally since 1960. The effects on rice and soybean yields have been smaller in major production regions and globally. The majority of this impact has been on food production, and food prices for the consumer. The IPCC states that there is a large negative sensitivity of crop yields to extreme daytime temperatures of around 30.

8 © Pearson Education Ltd 2016. Copying permitted for purchasing institution only. This material is not copyright free.
Rising sea levels – global mean sea level is measured using tidal gauge records and, since 1993, satellite data. The IPCC states that between 1901 and 2010 it has risen 19cm, at an average rate of 1.7mm per year. The rate increased to 3.2mm per year between 1993 and 2010. Global mean sea level will continue to rise through the 21st century at an ever increasing rate, due to increased ocean warming and expansion (thermal expansion – which contributes far more than melting ice) and melting of glaciers and ice sheets.
Retreating glaciers – most glaciers around the world have retreated since 1850. Mountain glaciers are a vital source of water for many people. As the smaller glaciers in the Andes disappear, this could threaten the water supplies of up to 50 million people, and the possible disappearance of larger glaciers in the Himalayas could affect millions of people living in China and India. In addition, glaciers are of great importance for the tourist industry.
Key vocabulary for Key ideas 2.1 – 2.3
Global atmospheric and oceanic circulation
Natural climate change Anthropogenic climate
change
Heat budget
Latitude Insolation
Convection Condensation Equator
High/low pressure Frontal rain
Air circulation Desert Trade winds
Hadley cell Ferrel cell
Polar cell Mid-latitudes Air density
Thermohaline circulation
Geological scale
Forcings External
Milankovitch Cycles Precession Eccentricity
Tilt Quaternary
Pleistocene Holocene Sunspot cycle
Maunder Minimum Little Ice Age
Vostok Ice Core Roman Warm Period
Enhanced greenhouse
effect Short-wave
Long-wave Eustatic Thermal expansion
Intergovernmental Panel on Climate Change
(IPCC) Albedo Positive feedback
Projections Representation
Concentration Pathways (RCPs)
Further reading
Key idea 2.1
http://www.metoffice.gov.uk/climate-guide/climate http://www.metoffice.gov.uk/climate-guide/climate/zones
http://www.metoffice.gov.uk/media/pdf/4/d/Weather_and_climate_guide.pdf Key idea 2.2
http://www.metoffice.gov.uk/climate-guide/climate/regional http://www.metoffice.gov.uk/climate-guide/climate/what-affects-climate
http://unfccc.int/meetings/copenhagen_dec_2009/session/6262.php Key idea 2.3

© Pearson Education Ltd 2016. Copying permitted for purchasing institution only. This material is not copyright free. 9
http://www.metoffice.gov.uk/climate-guide/science/science-behind-climate-change/hadley
http://www.metoffice.gov.uk/climate-guide/science/uk/expert-advice/IPCC
Key idea 2.4
Teaching approach over three hours
Lesson 1 (1hr) 2.4a Climate of the UK today and changes over the last 1,000
years.
Lesson 2 (1hr) 2.4b Spatial variations in temperature, prevailing wind and
rainfall within the UK.
Lesson 3 (1hr) 2.4c: The significance of the UK’s geographic location in relation
to its climate.
Lesson 1: Climate of the UK today and changes over the last 1,000
years.
Overview
An understanding of what the UK’s climate has been like over the past 1,000 years is required. This can be linked back to some of the evidence in Key idea 2.2 –
interglacial periods, Little Ice Age. Students must have an understanding of today’s climate characteristics. There is an opportunity here to integrate Skill 1 here. Students can interpret and draw climate graphs for different areas of the UK and
make comparisons.
Guidance on teaching Use a series of maps showing long-term climatic averages across the UK, including maximum and minimum temperatures, sunshine hours, days of rain, total
precipitation, number of days with snow, etc. Students work in groups and focus on different months or climatic variables. The Met Office website also has information
about weather extremes, regional climates within the UK and explanations of variation.
Exam-style questions could be used to develop some skills. Using one of the graphs from the Met Office website, describe how the climate of the UK has changed:
http://www.metoffice.gov.uk/public/weather/climate. Integrated skill 1 – use and interpretation of line graphs/bar charts showing climate
change. Students should have plenty of practice at using graphs such as these to describe and interpret the changes. They should be able to identify trends and
patterns as well as glacial and interglacial periods.

10 © Pearson Education Ltd 2016. Copying permitted for purchasing institution only. This material is not copyright free.
Lesson 2: Spatial variations in temperature, prevailing wind and
rainfall within the UK.
Overview
This lesson should focus on how temperature, prevailing wind and rainfall vary within the UK.
Guidance on teaching A useful link from the Met Office website: http://www.metoffice.gov.uk/climate/uk/summaries.
Use some of the maps on the website to prompt discussion about variations in UK weather. Using maps to show the variations in rainfall, wind and temperature can
help with the teaching and understanding of this key idea. For example: Using data to plot and then annotate a climate graph for a UK location, draw
maps comparing and contrasting temperature, wind and rainfall in the UK.
Draw a sketch map of the British Isles and divide it into four climate areas. Annotate the map with key information about the climate. Include maximum
temperature, minimum temperature, range of temperatures and total precipitation.
Use diagrams to help students understand the concept of relief rainfall and
rain shadows.
Lesson 3: The significance of the UK’s geographic location in relation to its climate.
Overview
In this lesson students need to understand why the UK’s weather and climate are changeable. They should learn the different air masses affecting the UK, and how the
country’s geographical position in the North-west Atlantic influences its weather and climate.
Key concepts and processes Students should understand the factors affecting the UK’s climate, including latitude,
air masses, distance from the sea and ocean currents, which could be linked back to Key idea 2.1a. This is a useful map showing the air masses that affect the UK, from www.metoffice.gov.uk.
Guidance on teaching Students could: Produce a simple map of air masses and
their characteristics.
Consider the impact on the UK climate of latitudinal shifts in air masses (i.e. less
frequent polar air). There are various BBC Class Clips or YouTube clips illustrating how
air masses develop and move. Describe how the air masses affect the type
of weather we get in the UK.
Refer back to Lesson 2. Discuss how ocean currents play a part in the UK’s weather.
Figure 3 (Source: www.metoffice.gov.uk)
© Pearson Education Ltd 2016. Copying permitted for purchasing institution only. This material is not copyright free. 11
Also consider the effects of latitude, position in the North Atlantic and prevailing winds.
More able students may examine the UK Climate Impacts Programme website for projections: http://ukclimateprojections.metoffice.gov.uk/.
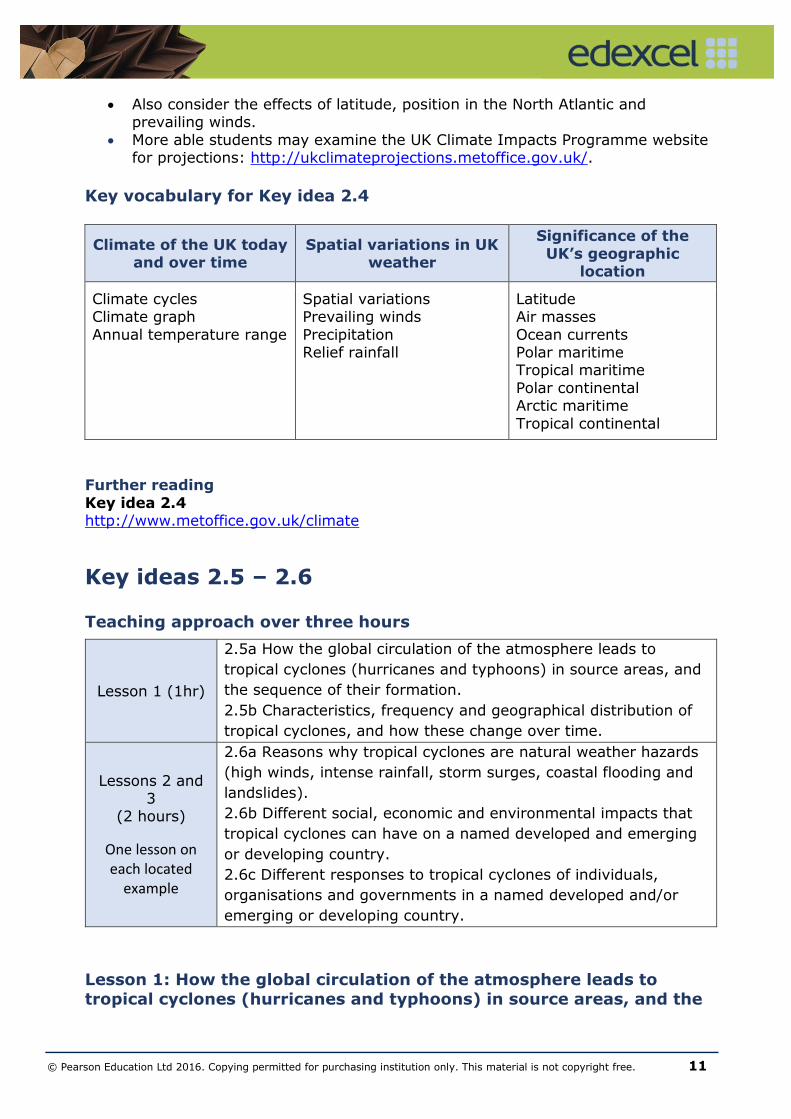
Key vocabulary for Key idea 2.4
Climate of the UK today and over time
Spatial variations in UK weather
Significance of the
UK’s geographic location
Climate cycles Climate graph
Annual temperature range
Spatial variations Prevailing winds
Precipitation Relief rainfall
Latitude Air masses
Ocean currents Polar maritime Tropical maritime
Polar continental Arctic maritime
Tropical continental
Further reading
Key idea 2.4 http://www.metoffice.gov.uk/climate
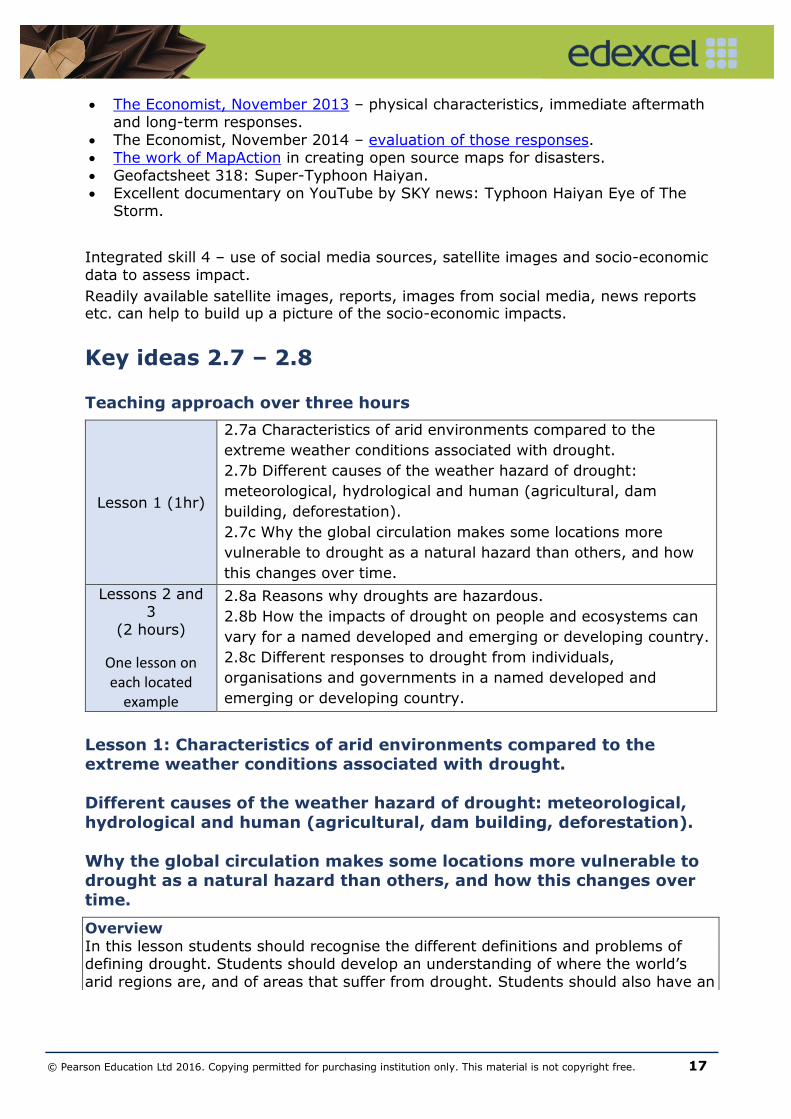
Key ideas 2.5 – 2.6 Teaching approach over three hours
Lesson 1 (1hr)
2.5a How the global circulation of the atmosphere leads to
tropical cyclones (hurricanes and typhoons) in source areas, and
the sequence of their formation.
2.5b Characteristics, frequency and geographical distribution of
tropical cyclones, and how these change over time.
Lessons 2 and 3
(2 hours)
One lesson on each located
example
2.6a Reasons why tropical cyclones are natural weather hazards
(high winds, intense rainfall, storm surges, coastal flooding and
landslides).
2.6b Different social, economic and environmental impacts that
tropical cyclones can have on a named developed and emerging
or developing country.
2.6c Different responses to tropical cyclones of individuals,
organisations and governments in a named developed and/or
emerging or developing country.
Lesson 1: How the global circulation of the atmosphere leads to
tropical cyclones (hurricanes and typhoons) in source areas, and the

12 © Pearson Education Ltd 2016. Copying permitted for purchasing institution only. This material is not copyright free.
sequence of their formation. Characteristics, frequency and
geographical distribution of tropical cyclones, and how these change over time.
Overview
It is worth planning to cover Key ideas 2.5 a and b in one lesson so that students
understand the causes of tropical cyclone formation, particularly in the context of ideas studied earlier about global atmospheric circulation. Studying the location and frequency of hurricanes in the Atlantic Ocean (particularly the few recent exceptions
in the Southern Hemisphere) will help students explore how tropical cyclone tracks change over time.
A global perspective on tropical cyclone patterns is useful so that students know how locations and tracks differ for hurricanes and typhoons, as well as the impact that
global warming may have on the severity and frequency of tropical cyclones. • More able students might like to explore causes of climate variability and
changes over time, as well as the Coriolis force, in more detail. • Less able students must be clear about the major factors causing tropical
cyclone formation and which aspects could be affected by global warming.
Key concepts and processes Students should have an understanding of the characteristics of hurricanes and
typhoons from the idea that they are intense low-pressure systems, largely
restricted to ocean areas 30 north and south of the Equator but not on the Equator. They bring heavy rain, strong winds and storm surges to coastal regions. Winds blow
anticlockwise in the Northern Hemisphere; hurricanes can be over 100km in diameter with an eye up to 60km in diameter. Mature hurricanes are almost
circularly symmetrical and can be over 15km in height.
Students need an understanding of how tropical storms (hurricanes and typhoons) form, including the controlling factors (ocean temperature, depth, humidity, wind
Figure 4 (Source: www.physicalgeography.net)

© Pearson Education Ltd 2016. Copying permitted for purchasing institution only. This material is not copyright free. 13
direction, low-pressure systems, the effects of the Coriolis force, etc.), the sequence of their formation and when (in which season) they form.
Guidance on teaching An opportunity to integrate the use of GIS to track tropical storm formation has
been highlighted in the specification. Separate GIS lesson plans and worksheets will be made available on the Edexcel website. Integrated skill 2 – use of GIS to track the movement of tropical cyclones.
Coriolis force: there are various videos to illustrate this principle. One particularly
good one is from NOVA PBS and another is used in the BBC's Orbit: Earth's
Extraordinary Journey programme. A diamond ranking exercise would help assess students’ understanding of the
different factors: latitude, evaporation, pressure differences, Coriolis force,
precipitation, wind, eye wall, sea surface temperature, subtropical ridge. The reasons they give will help you judge their understanding of the links between
the key processes. Based on an understanding of tropical cyclone formation and structure, students
could be challenged to use data from two tropical cyclones and decide whether
Atlantic hurricanes are more or less intense than Pacific typhoons.
Lesson 2: Reasons why tropical cyclones are natural weather hazards (high winds, intense rainfall, storm surges, coastal flooding and
landslides).
Different social, economic and environmental impacts that tropical cyclones can have on a named developed and emerging or developing
country.
Different responses to tropical cyclones of individuals, organisations
and governments in a named developed and/or emerging or developing country.
Overview
Probably the best way to tackle the impacts and responses to tropical cyclones is via the two located examples. A lesson should be spent on each example; one from a
developed country and one from an emerging or developing country. The two located examples can then be compared and contrasted to identify why the impacts and
responses may be different. Many different case studies are relevant and can be used to teach this key idea.
Teachers may wish to choose examples that they know well and for which they have numerous relevant materials and resources; for example, Hurricane Katrina, Cyclone
Nargis, Myanmar etc. However, it would be nice to see some more up to date/newer located examples to tackle this key idea. For example, Superstorm Sandy, USA 22–31 October 2012 (developed), Typhoon Haiyan, Philippines November 2013
(emerging) or Typhoon Soudelor, Taiwan, Japan and China August 2015 (emerging and developed).

14 © Pearson Education Ltd 2016. Copying permitted for purchasing institution only. This material is not copyright free.
In this lesson students should focus on a tropical cyclone hitting a developed city, e.g. Hurricane Sandy's impact on New York in 2012. This located example is good for
helping to appreciate the importance of successful management strategies, including hurricane prediction, as well as the potential economic impacts of strong hurricanes
hitting major cities in the developed world (e.g. New York as a global financial hub).
Key concepts and processes Satellite tracking and predictions of Saffir-Simpson magnitude of individual events are critical parts of planning, particularly when attempting to predict the impacts of
coastal flooding. Even in the developing world, tropical cyclone forecasting often depends on developed countries. Evacuation measures and preparation are
supported by computer-driven models of human behaviour, in contrast to developing or emerging countries where those responsible for governance are often victims themselves. There is a growing use of crowd-source mapping and co-ordinated
global humanitarian responses to developing or emerging country hazard events.
Guidance on teaching Storm surge data and Saffir-Simpson magnitude data for Atlantic and Pacific
Ocean storms provided by NOAA (e.g. 2015 hurricane season shown here).
Students should be able to make sense of the different scales and methods of
measuring the physical characteristics of tropical storms. Hashtag searches are useful for investigating the impact of tropical storm events
(e.g. #Sandy). For centres studying the course over three years, there is an
opportunity to spend one lesson on this to examine different attitudes towards the hazard event, perhaps between different affected groups: individuals,
organisations, NGOs, TNCs and governments. Contrasting imagery could be used to catalogue the impacts of events in a
developed versus a developing or emerging country.
Category Winds Effects
One 74-95 mph
No real damage to building structures. Damage primarly to unanchored mobile
homes, shrubbery, and trees. Also, some coastal road flooding and minor pier
damage
Two 96-110 mph
Some roofing material, door, and window damage to buildings. Considerable
damage to vegetation, mobile homes, and piers. Coastal and low-lying escape
routes flood 2-4 hours before arrival of center. Small craft in unprotected
anchorages break moorings.
Three 111-130 mph
Some structural damage to small residences and utility buildings with a minor
amount of curtainwall failures. Mobile homes are destroyed. Flooding near the
coast destroys smaller structures with larger structures damaged by floating
debris.
Four 131-155 mph
More extensive curtainwall failures with some complete roof strucutre failure on
small residences. Major erosion of beach. Major damage to lower floors of
structures near the shore. Terrain continuously lower than 10 feet ASL may be
flooded requiring mass.
Five >155 mph
Complete roof failure on many residences and industrial buildings. Some
complete building failures with small utility buildings blown over or away. Major
damage to lower floors of all structures located less than 15 feet and within 500
yards of the shore.

© Pearson Education Ltd 2016. Copying permitted for purchasing institution only. This material is not copyright free. 15
Figure 5 (Source: NOAA)
Hurricane Sandy, which struck New York City in October 2012, is a good located example to illustrate the impacts of a tropical storm in the developed world. It
highlights how countries respond to challenges created by a globalised world. For this case study, students should familiarise themselves with the following details:
hurricane characteristics (wind, pressure, rainfall, category) prediction of the storm, for example, the role played by European forecasting
(ECMWF, based in Reading, UK) in accurately predicting the track
preparations, including the role of computer modelling, which forecast potential damage to the subway
the impact on the physical environment, for example, how the storm surge affected the city
the economic damage in the short term and longer term
immediate responses to the hazard and long-term future planning.
Additional information can be found here: http://disasterphilanthropy.org/disasters/hurricane-sandy/. There is also an excellent BBC documentary on YouTube: Sandy – Anatomy of a
Superstorm 2012. First 15 minutes on the causes, middle section on effects and last 15 minutes on responses..
Integrated skill 3 – use of weather and storm surge data to calculate Saffir-Simpson
magnitude.
Based on written accounts, newspaper reports and official reports, students can calculate the magnitude of tropical cyclones.

16 © Pearson Education Ltd 2016. Copying permitted for purchasing institution only. This material is not copyright free.
Lesson 3: Reasons why tropical cyclones are natural weather hazards
(high winds, intense rainfall, storm surges, coastal flooding and landslides).
Different social, economic and environmental impacts that tropical
cyclones can have on a named developed and emerging or developing country.
Different responses to tropical cyclones of individuals, organisations and governments in a named developed and/or emerging or
developing country.
Overview
In this lesson students also need to study a tropical cyclone hitting a developing or
emerging country, e.g. Typhoon Haiyan's impact on South-east Asia in 2013. This located example can help students appreciate the physical and social vulnerability of these countries, as well as why management is difficult in a different socio-economic
context. The two located tropical cyclone examples provide an opportunity for students to explicitly contrast management approaches in different socio-economic
contexts, with scope to explore physical hazards and vulnerability in a location of their choice. • More able students might like to consider how a combination of hazards and
vulnerability creates hazard hotspots in particular parts of the world. This is particularly the case when combined with work on development dynamics.
• Less able students should be aware that a hazard created by tropical cyclones has far more devastating consequences in a developing or emerging context.
Key concepts and processes For this case study, students should familiarise themselves with the following details:
the typhoon’s characteristics (wind, pressure, rainfall, category) prediction of the storm, particularly the role played by other countries, in
contrast to the somewhat less effective prediction by the Filipino government impact on the physical environment, i.e. the storm surge and how this affected
the city, particularly Tacloban City
the huge social damage (loss of life) and long-term economic impacts lack of preparations made, leading to socio-political problems encountered during
initial aid responses, as well as the humanitarian crisis the role of open source mapping and environmental planning for hazard
management in the future.
Guidance on teaching There is a wealth of information published about hazard events. Below are some excellent sources of detail on Typhoon Haiyan, but similar sources could be used for
the previous located example. Summaries of the event from the Geographical Association and the Royal
Geographical Society. National Geographic explains the physical characteristics.
© Pearson Education Ltd 2016. Copying permitted for purchasing institution only. This material is not copyright free. 17
The Economist, November 2013 – physical characteristics, immediate aftermath and long-term responses.
The Economist, November 2014 – evaluation of those responses. The work of MapAction in creating open source maps for disasters.
Geofactsheet 318: Super-Typhoon Haiyan. Excellent documentary on YouTube by SKY news: Typhoon Haiyan Eye of The
Storm.
Integrated skill 4 – use of social media sources, satellite images and socio-economic data to assess impact.
Readily available satellite images, reports, images from social media, news reports etc. can help to build up a picture of the socio-economic impacts.
Key ideas 2.7 – 2.8 Teaching approach over three hours
Lesson 1 (1hr)
2.7a Characteristics of arid environments compared to the
extreme weather conditions associated with drought.
2.7b Different causes of the weather hazard of drought:
meteorological, hydrological and human (agricultural, dam
building, deforestation).
2.7c Why the global circulation makes some locations more
vulnerable to drought as a natural hazard than others, and how
this changes over time.
Lessons 2 and 3
(2 hours)
One lesson on each located
example
2.8a Reasons why droughts are hazardous.
2.8b How the impacts of drought on people and ecosystems can
vary for a named developed and emerging or developing country.
2.8c Different responses to drought from individuals,
organisations and governments in a named developed and
emerging or developing country.
Lesson 1: Characteristics of arid environments compared to the extreme weather conditions associated with drought.
Different causes of the weather hazard of drought: meteorological,
hydrological and human (agricultural, dam building, deforestation).
Why the global circulation makes some locations more vulnerable to drought as a natural hazard than others, and how this changes over
time.
Overview
In this lesson students should recognise the different definitions and problems of defining drought. Students should develop an understanding of where the world’s
arid regions are, and of areas that suffer from drought. Students should also have an

18 © Pearson Education Ltd 2016. Copying permitted for purchasing institution only. This material is not copyright free.
understanding of the different types of vegetation found in arid environments, and why the soil is not very fertile.
Students need an understanding of why some areas are more vulnerable than
others; they can link this back to their earlier understanding of the Tricellular model. This is good practice in linking different key ideas, and produces a degree of synopticity within the topic.
Key concepts and processes Definitions
The definition of drought varies from country to country. However, essentially drought is an acute water shortage associated with long periods of serious or
severe rainfall deficiency. Drought exists when there is far less water in a particular area over a period
of time compared to what is normal for that same period of the year. Characteristics of arid environments
Low levels of annual rainfall Pastoral farming
Very little vegetation Short growing season
Causes of drought
Meteorological drought – this is due to the shortfall of precipitation and
depends on how long the dry period lasts. This can vary from place to place. The causes of meteorological drought can include both human and physical
factors, such as the natural variation in atmospheric conditions, El Nino events, changing land use e.g. deforestation and climate change.
Hydrological drought – evidence to suggest that an area is suffering from
hydrological drought comes from decreasing river and reservoir levels, possibly due to dam building. It could also be a result of agriculture, such as
poor farming practices and the over-abstraction of water for irrigation.
Why are some locations more vulnerable than others?
At around 30 north and south of the eEquator the air in the Hadley cells descends. This dry air creates a zone of high pressure. Winds blow outwards
from the high-pressure areas and so no moisture is brought in by the wind leaving areas that receive low levels of precipitation, such as the Sahara
Desert. Other locations are also vulnerable to drought due to their location in relation
to colder ocean currents, whether they are in the middle of continents and
away from the oceans or whether they are close to large mountain ranges and suffer as a result of the rain shadow effect.
Guidance on teaching Integrated skill 5 – use and interpretation of graphs showing medium-term rainfall trends. Graphs such as those from the Met Office showing the rainfall patterns of the UK
drought of 2010–2012 can be used for students to interpret: http://www.metoffice.gov.uk/climate/uk/interesting/2012-drought.

© Pearson Education Ltd 2016. Copying permitted for purchasing institution only. This material is not copyright free. 19
Lesson 2: Reasons why droughts are hazardous.
How the impacts of drought on people and ecosystems can vary for a
named developed and emerging or developing country.
Different responses to drought from individuals, organisations and
governments in a named developed and emerging or developing country.
Overview
Probably the best way to tackle the impacts and responses to drought is via the
located case study examples. Two case studies are required: one from a developed country and one from either an emerging or developing country. The two located examples can then be compared and contrasted to identify why the impacts and
responses may be different. One lesson should be spent on each located example.
It is possible that these located examples can nest within the case study chosen for Topic 4 a major UK city, Topic 4 a major city in a developing or emerging country and Topic 5 developing or emerging country. For example, the UK suffered drought
and water shortages in 1975–1976, 1995, 1996 and 2004, and more recently in 2010–2012. This caused many problems for the south-east and London in particular.
(This London case study could nest into your teaching of Topic 4, a major UK city.)
Key concepts and processes London case study could nest into your teaching of Topic 4 a major UK city
Between September 2010 and March 2012 many parts of England experienced the driest 18 months in over 100 years.
The effect of two dry winters led to low groundwater levels across the majority of England, apart from the north-west, with many sites recording their lowest
levels on record. Reservoir stocks were also low across much of south and central England, with
a number at their lowest recorded levels for the time of year, with potentially
significant effects on households and businesses. This resulted in seven water companies in south and east England imposing temporary use bans on 20
million people in April 2012. The drought ended abruptly in summer 2012 with the wettest April to
September on record, resulting in widespread flooding. The environment and
farming sector, which had initially been affected by the dry weather, was then further affected by the heavy rain and flooding.
Impacts on people included: reduced public water supply, more reliance on the Thames Water (Beckton) desalination plant, building subsidence due to shrinkage of the clay on which a significant part of London is located (increase
in insurance premiums), impacts on power and electricity generation and problems with rail track geometry and road subsidence.
Impacts on ecosystems included: problems for aquatic ecosystems, fish pooling in lower reaches of estuaries, wetland ecosystems drying out and wildfires on heathland and moorland.
20 © Pearson Education Ltd 2016. Copying permitted for purchasing institution only. This material is not copyright free.
Guidance on teaching
Integrated skill 6 – use and interpretation of socio-economic data.
Facts and statistics from reports on tropical cyclones and droughts can be interpreted to build up a picture of the events and draw comparisons between countries.
Lesson 3: Reasons why droughts are hazardous.
How the impacts of drought on people and ecosystems can vary for a named developed and emerging or developing country.
Different responses to drought from individuals, organisations and governments in a named developed and emerging or developing
country.
Overview
This lesson focuses on drought in an emerging or developing country. This case study could nest into your teaching of Topic 5: Study of development in an emerging country. For example, drought in China could be studied. However, there is no
necessity to do this, and other suitable examples could be used based on materials and resources that are available. A more recent drought could be used such as the
South Africa drought of 2015 (emerging country).
Key concepts and processes Drought in China (this case study could nest into your teaching of Topic 5: Study of development in an emerging country)
Between September 2009 and March 2010, south-west China suffered one of its worst droughts for over a century.
Scientists in China say that the crisis was one of the strongest examples so far of how climate change and poor environmental practice can combine to create a disaster.
The drought affected 51 million Chinese and left more than 16 million people and 11 million livestock short of drinking water.
Around 4.3 million hectares of farmland were affected and there was no harvest from 940,000 hectares of agricultural land according to China’s State
Commission Disaster Relief. The drought resulted in a loss of 54.4 million US dollars to the economy.
Guidance on teaching These located examples lend themselves well to group work, research and
presentations. Fact sheets, newspaper articles and research reports could be produced by students.

© Pearson Education Ltd 2016. Copying permitted for purchasing institution only. This material is not copyright free. 21
Key vocabulary for Key ideas 2.5 – 2.8
Tropical cyclones Drought
Coriolis force Low-pressure system Tropics
Equator Track
Frequency Distribution Eye wall
Diameter Magnitude
Storm surge Track
Social, economic and environmental impacts.
Aridity Drought vulnerability
Meteorological drought Hydrological drought
Global circulation Natural hazard Over-abstraction
Vulnerability El Nino
Further reading
Key idea 2.5
http://www.metoffice.gov.uk/climate-guide/climate/what-affects-climate/extreme-weather
http://www.nhc.noaa.gov/ Key idea 2.6
http://www.weather.gov/okx/HurricaneSandy http://www.bbc.co.uk/news/world-24901032
Key idea 2.7 http://drought.unl.edu/DroughtBasics/WhatisDrought.aspx
Key idea 2.8
http://www.nature.com/news/2010/100511/pdf/465142a.pdf http://www.water.org.uk/consumers/tubs
Recommended