Embed Size (px)
Citation preview

0270.6474/85/0509-2443$02.00/O The Journal of Neuroscience Copyright 0 Socrety for Neuroscrence Vol 5. No. 9, op. 2443-2452 Printed In U.S A September 1985
The Postnatal Development of the Association Projection from Visual Cortical Area 17 to Area 18 in the Cat’
DAVID J. PRICE2 AND COLIN BLAKEMORE
University Laboratory of Physiology, Parks Road, Oxford OX1 3PT, United Kingdom
Abstract
The postnatal development of the association projection from area 17 to area 18 was studied in normal and binocularly deprived kittens between 1 and 28 days of age, using retro- grade transport of horseradish peroxidase conjugated with wheat germ agglutinin. The positions of injection sites in the visual cortex, defined in relation to the borders of visual areas 17, 18, and 19 located in Nissl- and cytochrome oxi- dase-stained sections, were confirmed by observing the pat- terns of labeling of cells in the lateral geniculate nucleus.
The association projection is present and is arranged at least roughly topographically from birth onward; at all ages it arises from cells in both the superficial layers (II, Ill, and the upper part of IV) and the deep layers (V and VI). In older kittens (20 days or more), however, the origin of the pathway is principally from the upper layers, as in adult cats, whereas in younger animals the projection arises roughly equally from cells in superficial and deep laminae. Initially, the association neurons in area 17 are distributed uniformly along each lamina. Periodic clustering of labeled cells in the upper layers can just be discerned at 10 days, and this patchiness has reached its adult clarity by 20 days, at which stage the projection from the lower layers is greatly diminished. Binoc- ular deprivation until the age of 28 days did not prevent these developmental changes in the projection. Various controls established that the patterns of labeling seen in this study were not due to direct spread of tracer into area 17, to uptake of tracers by fibers-of-passage, or to transcellular transport via the thalamus.
Recent work has established that many neurons in the mammalian nervous system form connections early in development that are later eliminated with or without loss of the cells of origin of these “exu- berant” projections (see Cowan et al., 1984). Such regressive events probably play a major role in the maturation of the mammalian central nervous system; they have been demonstrated, for instance, during the postnatal segregation of geniculate terminals to form ocular dominance columns in the visual cortex, and during the maturation of interhemispheric and corticospinal projections. Moreover, it has also been shown that visual experience can influence the elimination of neuronal processes during the development of ocular dominance
Received November 20, 1984; Revised February 1, 198.5;
Accepted February 5, 1985
’ We thank Karen Wenk-Salamone for her technical assistance and the
Medrcal Research Council for support. D. P. is a Medical Research Council Training Fellow and the experiments were funded from Medical Research Council Programme Grants G979/49 and G7900491 to C. B.
’ To whom correspondence should be addressed.
columns (LeVay et al., 1980; Swindale et al., 1981) and callosal connections (Lund et al., 1978; Innocenti and Frost, 1980; Rhoades and Dellacroce, 1980; Cusick and Lund, 1982). It is important to know whether such events occur generally throughout the nervous system in both long and short neural pathways and the extent to which activity plays a role in the loss of aberrant projections. The corticocortical association connections from area 17 to area 18 of the cat constitute a relatively short pathway the development of which has previously not been described.
In the adult cat, both the origin and the termination of the association projection from visual cortical area 17 to area 18 have been studied in a variety of ways: many workers have examined the patterns of degeneration in area 18 resulting from lesions in area 17 (Hubel and Wiesel, 1965; Garey et al., 1968; Wilson, 1968; Kawa- mura, 1973) and Montero (1981) using anterogradely transported, radioactively labeled proline, has found that regions in the two areas with similar receptive field positions are connected. Gilbert and Kelly (1975) injected horseradish peroxidase (HRP) into area 18 and reported that the retrogradely labeled cells in area 17 lie in distinct clusters in cortical layers II and Ill. More recently, Albus and Meyer (1981) have shown that some cells in the lower cortical layers of area 17 also project to area 18.
Despite the strength and distinctive arrangement of this associa- tion projection in the adult cat, its function is unclear, since the physiological properties of most neurons in area 18 are largely unaffected by abolition of the input from area 17 (Donaldson and Nash, 1975; Dreher and Cottee, 1975; Sherk, 1978). It is conceivable that the projection plays a special role in the development of the visual cortex. In this report we describe the initial exuberance and postnatal maturation of this association pathway and consider the extent to which its development depends on visual stimulation. A preliminary report of some of this work has been published previously (Price, 1984).
Materials and Methods Animals. Successful experiments were performed on 18 domestic tabby
kittens at various ages (stated throughout as ages at the time of injection), bred in an isolated colony. Two of them were binocularly deprived (BD) by suturing the conjunctivae and eyelids under ketamine anesthesia before the time of natural eye opening, using the procedure described by Blakemore and Van Sluyters (1975).
injection of tracers. For injection into the cortex each animal was anesthe- tized with halothane and placed in a special purpose stereotaxic holder (Eldridge et al., 1981). The major gyral patterns were visible through the thin skull in the younger kittens. In 14 cases a small craniotomy was made over the lateral gyrus on one side of the brain, a few mrllrmeters anterior to the coronal plane passing through the rudimentary external auditory meatuses (APO), over the presumed positton of area 18 (Otsuka and Hassler, 1962). In the other 4 kittens a craniotomy was made at the same rostrocaudal location but as close as possible to the sagittal suture so that a single injection could involve both areas 17 and 18. In each animal the dura was incised and a single injection of a tracer was made.
Area 18 was injected with HRP conjugated with wheat germ agglutinin (WGA-HRP) in nine normal kittens on postnatal days 1, 2, 4 (three animals),
2443

2444 Price and Blakemore Vol. 5, No. 9, Sept. 1985
TABLE I Summary of the ages and survival times of kittens in which a tracer was
injected /nto both areas 17 and 18. area 18 a/one, or white matter
Each kitten IS given a number ranging from Kl to K18 (K8 and K9 were BD animals), and its age in postnatal days is indicated in parentheses after this number.
Procedure
Injection of HRP Into areas 17 & 18
8 hr
Survival Time
24 hr
Kl(4); K2(4)
lnlectlon of WGA-HRP K3(1); K4(14)
Into areas 17 & 18
Injection of WGA-HRP into area 18
K5(1); K6(4); K7(10); Kl O(2); Kl l(4); K12(4); K8(28); K9(28) K13(5); K14(10);
K15(20)
InjectIon of WGA-HRP K16(10) into white matter
Control for WGA-HRP: inJectIon of vehicle
alone
K17(2); K18(2)
5, 10 (two animals), and 20, and In the two BD kittens on day 28. In order to see whether damaged and/or intact fibers can take up WGA-HRP in young kittens, tracer was deliberately injected into the white matter underlying the visual cortex through a cranlotomy over area 18 in a 1 O-day animal. Injections Involving both areas 17 and 18 were made with unconjugated HRP in two kittens (both day 4) and with WGA-HRP in two klttens (days 1 and 14), in order to compare the pattern of labeling produced in the lateral geniculate nucleus (LGN) with that seen after smaller in]ections restricted to area 18. Table I summarizes these procedures.
HRP and WGA-HRP were injected iontophoretrcally (~-PA positive pulses, 2.5 Hz for 2 hr) from a glass micropipette with a tip diameter of about 50 pm, filled with a 10% solution of HRP or WGA-HRP dissolved In a 0.05 M solution of Tris (hydroxymethyl)-methylamine at pH 7.8. Where area 18 was to be injected, the tip of the pipette was lowered into the cortex to a depth of 500 wrn in the younger kittens and 700 pm in older animals. For deliberate injection into the white matter the trp was lowered to a depth of several millimeters. Injections involving both areas 17 and 18 were achieved by lowering the tip of the pipette through a craniotomy close to the sagittal suture to a depth of 1000 grn so that it lay in the region of the area 17/l 8 border. Survival times before perfusion are shown in Table I. For control purposes 0.05 M Tris without tracer was Injected iontophoretlcally Into area 18 in two klttens (both aged 2 days).
Hfstologrcal preparation. The animals were anesthetized with pentobarbi- tone sodium before perfusion Kittens were perfused first with a bolus of saline, followed by a solution of 1% paraformaldehyde and 1.25% glutaral- dehyde, and the fixative was flushed out with phosphate buffer containing 10% sucrose (Mesulam, 1982). The whole brains were photographed and their dimensions were measured immediately after removal from the skull, and they were left to equilibrate in phosphate buffer containing 10% sucrose. Fifty-micrometer-thick coronal sections of cortex and coronal or parasagittal sectlons of the region of the thalamus containing the LGN were cut on a freezing microtome and mounted on gelatinized slides.
A series (1 in 3) of sections of cortex and LGN from all of the animals was incubated using the method of Mesulam (1982) with tetramethylbenzidlne (TMB) as the chromogen. Sections that had been treated with TMB were counterstained with neutral red and were differentiated only very briefly in alcohol. At regular intervals throughout every brain, unreacted sections were stained with cresyl violet.
Another series of cortical sections was taken from each brain for the hlstochemtcal demonstration of cytochrome oxidase activity (Wong-Riley, 1979), which reveals the area 17/18 and 18/19 borders, even in young klttens (Price, 1985). The cytochrome oxidase method also helps the identi- fication of cortical laminae in area 17, even In very young, immature kittens, because layers IV and VI are more heavily stained than layers I, II, Ill, and V (Wang-Riley, 1979; Price, 1985). Where sections contained HRP or WGA-HRP injection sites, the tracer reacted during processing for cyto- chrome oxldase to give a brown product, which obscured the pattern of cytochrome oxidase staining (Price and Zumbroich, 1985). In these cases we examined cytochrome oxidase-stained sections not only from immediately outside the area of the injection site, rostrally and caudally, but also from the
contralateral hemisphere exactly opposite the point of injection, to gain a good indication of the positions of the boundaries of area 18.
Analysis. Sections of cortex and LGN were examined using bright- and dark-field microscopy, and drawings were made using a camera luclda. In order to measure the sizes of labeled and intermingled unlabeled LGN cells, a graticule marked with a square was used to demarcate a series of 100 x 100 pm areas within the region of labeled cells; within each of these squares the outline of every cell in which the nucleus and nucleolus could clearly be seen was drawn at higher power. A sample of several hundred labeled and nearby unlabeled LGN cells was obtained for most animals. Cross-sectional areas of cells were calculated from the drawings using a graphics tablet linked to a computer.
Results
The aim of this study was to use retrogradely transported tracers to examine the postnatal development of the association projections from area 17 to area 18. Because of the absence of visual responses
in the cortex of very young kittens it was impossible to use physio- logical criteria to identify area 18, which consists of only a very narrow strip of cortex in young animals. Therefore, it was especially important to define the visual areas as accurately as possible by histological criteria, to examine carefully the spread of tracers at the injection site, and to estimate the effective area of uptake.
Cortical injection sites
The sizes of the diffusely stained injection sites observed in sections of visual cortex seemed to depend on the type of tracer used and, in young animals injected with WGA-HRP, on the survival time before perfusion (Fig. 1). In general, unconjugated HRP ap- peared to diffuse over a wider area (several millimeters) from the point of injection than did WGA-HRP. In kittens aged 10 days or less, injection sites of WGA-HRP appeared consistently larger in animals that had survived for only 8 hr before perfusion (2 to 3 mm in diameter) than in those that were sacrificed after 24 hr (1 to 2 mm in diameter), although in older kittens injection sites were similar in size after both short and long survival times. The probable rapid expansion and subsequent gradual contraction of deposits of un- conjugated HRP over the 24 hr after an injection has been described in adult cats (Vanegas et al., 1978), but in the present study we found evidence for shrinkage of injection sites of WGA-HRP only in very young kittens. It appeared that in such animals considerable expansion and then contra&ion of the WGA-HRP deposit occurred after injection, although by 24 hr after injection the sites were similar in size in kittens of all ages.
Actual uptake of tracer may occur from a region smaller than that which is diffusely stained around the injection site (Mesulam, 1982). In particular, the effective site was probably considerably smaller than the region visibly stained 8 hr after injection in animals younger than IO days; in such kittens a bundle of labeled axons, running toward the thalamus, could be seen leaving only the central l-mm- diameter dense core of the 2- to 3-mm diameter injection site (Fig. Ic). An impression of the extent of the effective uptake site, as well as its topographic position within the cortical area injected, was obtained by studying the distribution of labeled cells in the LGN. In addition, the position of each injection site relative to the area 17/18 and 18/l 9 borders was estimated by using cytoarchitectonic criteria (Garey, 1971; Anker and Cragg, 1974) and by examining the pattern of cytochrome oxidase activity in surrounding cortex (Price, 1985). The area 17/18 boundary can be distinguished in cytochrome oxidase-stained sections since the lightly stained band correspond- ing to layer V is about 25% thicker in area 18 than in area 17, whereas at the area 18/19 border the dense staining of layer IV in area 18 comes to an abrupt end (Price, 1985). The appearances of areas 17, 18, and 19 in Nissl- and cytochrome oxidase-stained sections were similar in BD and normal kittens.
Labeling of LGN cells with HRP or WGA-HRP
Injection of HRP or WGA-HRP into either areas 17 and 18 or area 18 alone led to retrograde labeling of cells in the LGN in all normal

The Journal of Neuroscience Development of Visual Cortical Association Projection 2445
Figure 7. Inlectlon sttes. a, A 4-day-old kltten perfused 24 hr after an InjectIon with uncoqugated HRP that involved areas 17 and 18; b, a 2-day-old kitten that was injected with WGA-HRP tn area 18 and survived for 24 hr before perfusion; c, a IO-day-old kitten that was injected with WGA-HRP In area 18 and survived for 8 hr before perfusion. The largest Injection sites, like that shown in a, were seen in animals Injected with UnCOnJugated HRP. In animals InJeCted
with WGA-HRP, a large area of diffuse staining around the iqectm site was observed 8 hr after qection in animals aged 10 days or less (c). whereas small, dense sites were seen after 8 hr in older kittens and In all animals perfused after 24 hr (b). A study of the distribution of cells labeled in the LGN Indicated that the effective uptake site In c was actually very slmllar In dimension to the heavy staining vlslble in b. Note the labeled axons (thick arrows) leaving only the central core of the injection sate In c; labeled axons are also seen in b originating from almost the entire qectlon site and in a arising, for reasons which are not clear, at intervals throughout the in]ection site. These sections are not counterstained. for clarity, and the areal borders (arrows) were defined in neighboring Nissl-stained and cytochrome oxidase-stalned sections. Scale bar = 1 mm.
animals with the exception of the oldest kitten that was sacrificed
only 8 hr after injection (K4). There was also no labeling of geniculate cells in the two 28-day-old BD kittens, which were perfused after 8 hr, despite the fact that neurons in area 18 in BD animals do receive an input from the LGN (Singer and Tretter, 1976). It is probable that in older kittens, perhaps because of the greater length of the geniculocortical pathway, 8 hr survival time is insufficient to allow WGA-HRP to accumulate within the LGN.
In order to assess whether the effective area of uptake of HRP or WGA-HRP was restricted to area 18 or had strayed across the area 17/l 8 or 18/l 9 border, we examined the distribution and dimensions of labeled cells within the LGN, wherever retrograde transport as far as the nucleus had occurred (Fig. 2). Since all injections were made anteriorly in the visual cortex the area of labeling in the LGN was found either anteriorly, in older kittens, or ventrally in younger animals in which the LGN was still oriented ventrodorsally (Kalil, 1978). Labeled cells were seen in all LGN laminae, A, Al, and C, at all
ages following injection of either area 17 or both areas 17 and 18. We assumed that area 18 alone was involved in the injection when a subpopulation of relatively large cells was selectively labeled in the LGN in a centrally placed position in the coronal plane (Henderson, 1982). In the adult cat, cells at the medial boundary of the LGN represent the vertical meridian and project to the vicinity of the area 17/18 border, whereas neurons along the lateral edge of the LGN represent peripheral visual field and project to the region of the area 18/19 border (Sanderson, 1971); this topographic pattern is also present in newborn kittens (Henderson, 1982).
Figure 2a shows a histogram of the sizes of cells labeled with WGA-HRP within a sample pooled from laminae A and Al of the LGN followlng an area 18 injection; this is compared with the results of an injection that involved both areas 17 and 18 (Fig. 2b). The mean size of labeled cells was considerably larger than that of the total sample of cells following area 18 injections. After injections of WGA-HRP into both areas 17 and 18 the mean size of labeled cells was almost the same as that of the total sample.

Price and Blakemore Vol. 5, No. 9, Sept. 1985 2446
a b
lateral 2
1s
cross-sectional area (pm2)
cross-sectional area(pm2)
Figure 2. Drawings (top) show the positions of cells in the LGN retrogradely labeled after a cortical injection; histograms (bottom) show the cross- sectional areas of these labeled cells (solid blocks) and of intermingled unlabeled cells (open blocks) within a sample from the center of the region of labeling in laminae A and Al of the LGN In a i-day kitten injected in area 18 (a) and a l-day kitten where the injection involved both areas 17 and 18 (b). Mean sizes (in square micrometers) are shown for labeled cells (solid arrowheads) and the total sample (open arrowheads). In anrmals In which area 18 alone was injected, a subpopulation of relatively large cells in the center of the LGN In the coronal plane was selectively labeled; injections of both areas 17 and 18 labeled many cells, extending right up to the medial edge of the LGN, and their mean size was stmilar to that of the total sample. In all cases cells of the medial interlaminar nucleus (M/N) were labeled.
Labeling in area 17 following injection of WGA-HRP into area 18
Topography of the association projection. In all animals in which WGA-HRP had been injected into area 18 alone, including the two BD kittens, retrogradely labeled cells were seen in area 17. In the youngest kittens, aged 1 and 2 days, many labeled cells in area 17 contained only a few small particles of reaction product, but, since such subtle labeling was entirely absent in the sham-injected control animals (K17 and K18), we were quite convinced that these cells were genuinely retrogradely labeled. innocenti et al. (1977) have described similar fine labeling in cortical neurons of young kittens after injection of the opposite hemisphere.
a 18 b b 18
Figure 3. Camera lucida drawings of coronal sections of the visual cortex of two kittens, one aged 2 days (a), the other aged 4 days (b). In a the densely stained injection sate (black area) lay in area 18 close to the area 17/18 border, and the area of labeled cells in area 17 (stippled area) was correspondrngly close to this boundary. In b the injection lay more lateral within area 18 and the labeled ceils were found at the lip of the splenial sulcus (arrowheads indicate areal boundaries). These topographic arrange- ments of the associatronal connections, stmrlar to the pattern seen in adults, were observed at all ages. Scale bar = 1 mm.
Retrograde labeling in area 17 lay in a region directly medial to the injection site in all animals in which area 18 had been injected, including the two BD animals. Labeled cells were not seen in much more rostra1 or caudal parts of area 17. Where an injection had been made close to the 18/19 border the area of label lay within cortex deep in the sagittal fissure close to the medial border of area 17. Where the injection site in area 18 lay close to the 17/l 8 border the area of uptake within area 17 was also close to this border (Fig. 3). In animals in which the injection site occupied a large proportion of the width of area 18, extending from the 17/l 8 to the 18/l 9 border, the region of uptake in area 17 was correspondingly large, whereas small injections produced restricted regions of labeling. Thus, a basic topographic arrangement of these connections, like that in the adult cat (Montero, 1981) is apparently present from birth.
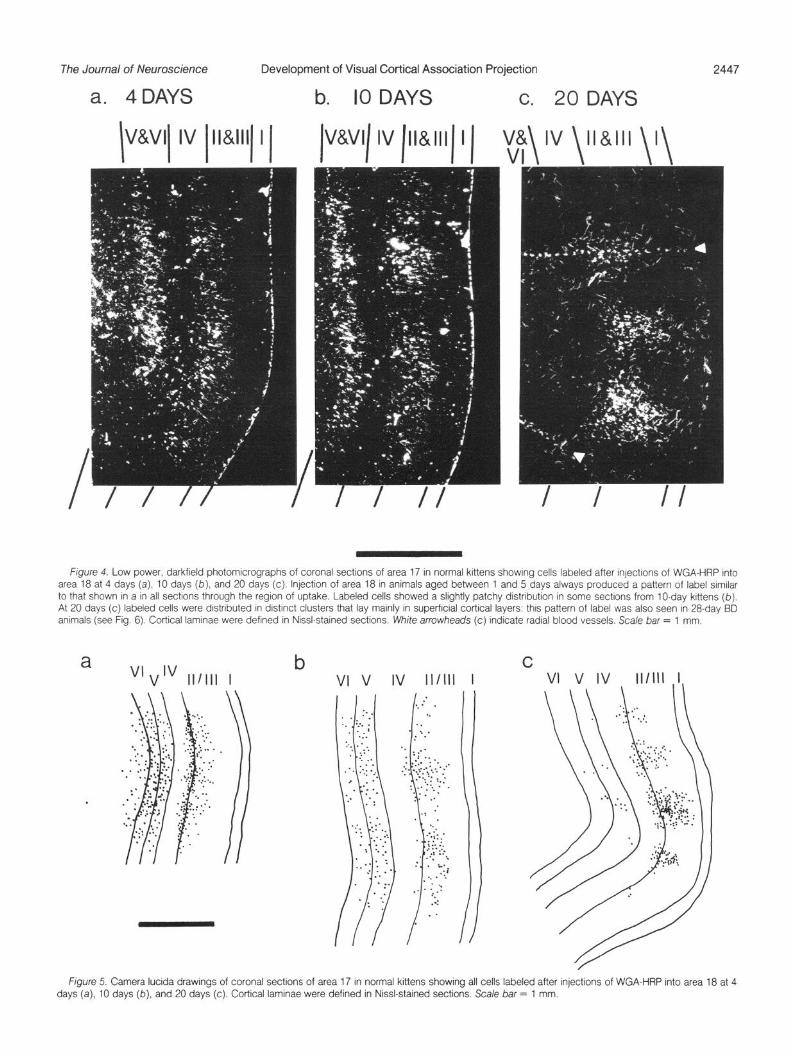
Emergence of patchiness. By comparison with the clear gross topography of the projection which is well developed even in neo- natal kittens, there is a striking progressive change in the precise local arrangement within the cortex of the cells of origin of the associational pathway during postnatal development (Figs. 4 and 5). In kittens of all ages, including the two BD animals, labeled association cells in area 17 were distributed densely throughout much of the superficial layers (II, Ill, and the upper half of layer IV) and deep layers (V and VI); very few cells were labeled in the most superficial part of layer II and the deep portion of layer IV, and no clearly labeled cells were seen in layer I. However, on postnatal days 1, 2, 4, and 5 the density of labeled cells along each layer was uniform and decreased only toward the edges of the area of uptake, with no obvious periodic variation in density across the cortex (Figs. 4a and 5a). In these very young kittens a number of labeled cells lay in white matter underlying the region of uptake in area 17 (Figs. 4a and 5a), but such cells were not present in kittens aged 10 days or more.
By 10 days of age, in some sections the labeled cells showed a tendency to be patchy in their distribution, with regions of higher density of neurons extending through superficial and deep layers (Figs. 4b and 5b). In a 20.day normal animal and two 28-day BD kittens, labeled cells were clearly grouped in a series of clusters in area 17 (Figs. 4c, 5c, and 6). Thus, the characteristic patchy distribution of the cells of origin of the association pathway from area 17 to area 18 emerges from a uniform pattern during the second postnatal week, after the time of normal eye opening, but this change does not seem to require patterned visual stimulation.
We wondered whether the non-patchy distribution of labeled cells in area 17 in the younger kittens might be due to the injection sites
The Journal of Neuroscience Development of Visual Cortical Association Projection 2447
b. IO DAYS c. 20 DAYS
Ffgure 4 Low power, darkfreld photomrcrographs of coronal sectrons of area 17 In normal krttens showing cells labeled after qectrons of WGA-HRP Into area 18 at 4 days (a), IO days (b), and 20 days (c). Injection of area 18 in animals aged between 1 and 5 days always produced a pattern of label srmrlar to that shown In a in all sectrons through the region of uptake Labeled cells showed a slightly patchy drstnbutron in some sectrons from lo-day krttens (b). At 20 days (c) labeled cells were distributed In drstrnct clusters that lay marnly in superficral cortrcal layers this pattern of label was also seen In 28-day BD animals (see Fig 6) Cortcal lamrnae were defined In Nasl-stained sections W/Me arrowheads (c) rndrcate radial blood vessels. Scale bar = 1 mm.
a “‘v’” 111111 I
b C VI v IV ll/lll I VI v IV , 111111 ,I
:- . . ._ . . . :-. .
, -.: . . .
:.. . . :.
, I- -. . . ..-
. . . . . . . . ‘* , . *
-. .+
:- *, * :
. .
~~~
‘... : . . . . .* . .
:.f.
\ :. 1.
. . . . : : i. .-,
. . - ,.
. .
’ . : * .
. . : .
. .
. .
. . ‘..
*. . .
: : . ; . . . :‘.
:.&-, . . . . f :
.
. I
*-.. . . . : .*. 5..
: . ..‘. .
. .* . . . . .
. : *
*.
. a a.
.* . .
. ;..yj*
‘3’ :‘..
. . . . *.
: . L.*
**. . . :.’
. . . ; : :
. : :
. .
Rgure 5. Camera luctda drawings of coronal sections of area 17 in normal kittens showrng all cells labeled after Infections of WGA-HRP into area 18 at 4 days (a), 10 days (b), and 20 days (c). Cortical lamrnae were defined in Nrssl-stained sections Scale bar = 1 mm.

2448 Price and Blakemore Vol. 5, No. 9, Sept. 1985
Figure 6. Surface views of area 17 In a 20-day normal krtten (a) and a 28-day BD antmal (b) showrng patches of labeled ceils resulting from injectron of area 18 wrth WGA- HRP. The depth of shading, as shown In the key, indicates the densrty of ceils, aver- aged throughout the en&e cortical depth, projected onto the cortrcal surface. The in- set is a darkfield photomrcrograph of a cor- onal section through area 17 of the BD animal showrng a dense cluster of labeled cells and, to the right, a nearby smaller patch (whrte arrowhead indicates a blood vessel). The cortical area covered by la- beled cells and their overall density were lower in both BD anrmals than In the older normal animal (see Table II also), although whether this is genuinely an abnormality caused by deprivation IS unclear. Scale bars =lmm.
TABLE II Densities of cells labeled with WGA-HRP in various layers of area 7 7 at different age.9
Layers
Kitten Age
In Days
survival
Time
(W II &
III Upper
IV
All superficial
(Il. ill, & upper IV)
Deep (V & VI)
All layers (II, Ill,
upper IV. v. &
VI)
Density Ratio
(ww IV/II & Ill)
Density Ratio (all
superficial/
deep)
K5 1 8 140 260 170 210 190 1.9 0.8 KlO 2 24 30 70 40 130 80 2.3 0.3 Kli 4 24 30 230 80 110 90 7.7 0.7
K6 4 8 400 650 460 210 360 1.6 2.2 K14 10 24 160 140 150 110 130 0.9 1.4 K7 10 8 240 240 240 190 220 1.0 1.3
K15 20 24 180 210 200 30 120 1.2 7.0
K8(BD) 28 8 50 40 50 10 30 0.8 5.0 KS(BD) 28 8 70 50 70 20 50 0.7 3.5
a Density of cells was measured as number per square mrllrmeter In 50-pm-thick coronal sections.
being effectively larger than in older animals. Obviously, if area 18 were to increase substantially in mediolateral width, an injection of a particular absolute size would occupy a larger proportion of area 18 in a very young animal. This is unlikely to account for our findings since patchiness of labeled cells was seen in all animals older than 10 days, in which the injection sites had dense staining varying in diameter from 50% to 60% of the width of area 18; equally, no obvious clumping was seen in any of the younger animals in which the injection sites were similar in relative size, occupying 40% to 75% of the width of area 18.
In order to assess the shapes and dimensions of the patches of association cells that developed in area 17, we reconstructed the clusters on a surface view of the cortex from drawings of serial sections in three older animals (the 20-day normal and both 28-day
BD animals). To allow for the curvature of the cortex, a line was drawn on the tracing of each coronal section, parallel to the cortical surface midway through the depth of the cortex, and this line was marked off into 100~pm bins by radial lines drawn at right angles to it, extending from the surface to the white matter. The number of labeled cells within each bin was counted and values from a series of sections were assembled to generate two-dimensional reconstruc- tions of cell density projected on to the cortical surface. Two such reconstructions are shown in Figure 6 for a 20-day normal and a 28 day BD kitten. The regions of high cell density appear to be roughly radially symmetrical and not to form elongated slabs, at least after such small injections in area 18. The average distance between the centers of the patches was 560 pm in the 20-day normal animal and 630 and 720 pm in the two 28-day BD kittens.

The Journal of Neuroscience Development of Visual Cortical Association Projection 2449
in upper layer IV. (The dense cytochrome oxrdase activity of layer IV made It easy to define its borders, even in very young anrmals where lamrnation is less clear in Nissl-starned material; Price, 1985).
There was considerable variability between animals of similar age in the density of labeled cells within a particular lamina or group of laminae, possibly largely due to slight differences in the form and size of the injection site and to different survrval times. This variability made it difficult to discern overall trends in the density of labeled cells with age. (The possibility that substantially different degrees of shrinkage occurred during histological processing was dismissed since a comparison of the dimensions of sections with photographs of unprocessed brains revealed that shrinkage was always by about 5% of the original size.) The only consistent change that could be detected was an unequivocal decrease during development in the density of cells labeled in the deep layers. In the normal kitten aged 20 days and in the two BD animals aged 28 days the density of labeled cells in layers V and VI was much lower (10 to 30 cells/mm*) than in animals aged 1 to IO days (110 to 210 cells/mm2), whereas there was no consistent difference in the overall density of labeled cells in the superfrcral layers between these two groups of anrmals (see Table II). Even wrthrn individual clumps of labeled cells in the lower layers in older kittens the highest density recorded (70 cells/ mm2) was still much lower than the average values obtained in kittens aged between 1 and 10 days. This selective decrease of density of labeled cells in the deep layers could not be accounted for by differential growth. All of our observations were made on the non-curved portion of area 17, In the medial bank of the lateral gyrus, where areal expansron should stretch all layers equally.
F/gure 7. Tracrng of a coronal section of the lateral gyrus showrng an Measurement of the thickness of the cortex showed a small amount
Injectton of WGA-HRP Into whrte matter underlyrng vrsual cortex In a 1 O-day of postnatal growth over the first 3 weeks of life, much of which
kltten. The black area represents the dense center of the injection site, and occurred during the first 10 days, but this increase in thickness was tracer spread diffusely over the area Indicated by cross-hatch/rig, which certainly no greater in lower than in upper layers. Thus, it seems included deep cortical layers of areas 17, 18, and 19. Labeled cells (shown very likely that an initial strong projection to area 18 from the deep as individual dots) mainly lay very superfrclally In layer II, as seen tn the layers of area 17 is largely lost during the second and third weeks photomicrograph (inset) of a regron of area 17 viewed In darkfreld. This pattern IS quite unlike that obtained followrng area 18 gray matter injections
of postnatal life, as the adult pattern emerges.
(see Rgs. 4 and 5). No clearly labeled cells were visible in the deep layers For each animal we calculated the ratio of the overall density of
but detection of sparsely labeled cells would have been drffrcult because of labeled cells In the upper layers to that of the deep layers (Table II).
diffuse staining wrth WGA-HRP (see Inset micrograph) In kittens aged 1 to 10 days this ratio ranged from 0.3 to 2.2, whereas in a 20-day normal kitten and the two 28-day BD animals
Reduction of the projection from the deep layers. Concomitantly the ratio ranged from 3.5 to 7.0. The increased ratio in the older with the emergence of patches of association cells in area 17, during kittens was due to the markedly reduced density of labeled cells in the second week postnatally, a change occurred in the relative deep layers. The ratro of the density of labeled cells In upper layer density of projections from different cortical layers, the borders of IV to that in layers II and III (Table II) ranged from 0.7 to 1.2 in kittens which were defined in Nissl- and cytochrome oxidase-stained sec- aged 10 days or more, whereas In animals aged 4 days or less it tions. varied between 1.6 and 7.7, indicating that in the first few days after
Table II shows the densities of labeled cells within cortical laminae birth the projection to area 18 from the superficral layers of area 17 calculated for each of a number of animals. The values were arises more strongly from cells In upper layer IV, but in older animals obtained from a series of IO sections from each animal by studying it originates from cells drstrrbuted with similar density throughout the an area of several square millimeters in each coronal section (the depth of the superficial layers. exact size depended upon the overall dimensions of the area of uptake) in the center of the region of uptake, excluding the periphery Possible sources of spurious labeling
of the labeled area where the density of labeled cells was obviously Transneuronal transport via the LGN. Cells In the lower cortical diminishing. The center alone was considered since labeling here laminae in cats and kittens project to the LGN (Gilbert and Kelly, presumably derives from the middle of the injection site, where we 1975; Tsumoto and Suda, 1982) and it occurred to us that tracer were confident that all cortical layers in area 18 were reasonably injected into area 18 might conceivably have been transported evenly covered by the deposit of tracer. The average density of transneuronally via the LGN to label corticogeniculate cells in the labeled cells per square millimeter on these coronal sections (50 pm thick) was estimated for superficial and deep layers; in older animals,
deep lamrnae of area 17. We considered it extremely unlikely that an 8-hr survival would allow sufficient time for passage of WGA-HRP
where labeled cells were distributed in patches, average densities by such a route, especially since, as mentioned earlier, only in kittens across the cortex were estimated by counting cells between two radial lines drawn through the depth of the cortex halfway between
aged IO days or less was 8 hr adequate to produce labeling of any cells in the LGN itself. However, the laminar patterns of label in area
the centers of two clusters medially and through the center of a cluster laterally (values of densities in small 0.04-mm2 areas within
17 were similar in animals of comparable age, whether survival was 8 or 24 hr, indicating that transneuronal transort via the LGN is most
patches were also estimated and are discussed below). Since unlikely to explain the high density of labeled cells in lower cortical qualitative examination of the superficial layers suggested that in lamrnae seen in very young kittens (Table II). very young kittens (between 1 and 4 days) the density of labeled Direct uptake from diffused tracer in area 17. In the three kittens cells was higher in upper layer IV than in layers II and Ill, values of injected with WGA-HRP on days 1, 4, and 10, which survived for densities in laminae II and Ill were measured separately from those only 8 hr before perfusion (K5, K6, and K7), tracer was distributed

2450 Price and Blakemore Vol. 5, No. 9, Sept. 1985
diffusely over a large area around the injection site (Fig. lc), and the region of labeled cells in area 17 was sometimes seen to merge into this pale halo of diffuse WGA-HRP, raising the possibility that in very young animals the absence of patchiness in the upper layers and the presence of dense labeling in the lower layers of area 17 might be due to direct uptake of WGA-HRP by non-association cells in area 17 itself. However, even in these cases the central core of the injection site was clearly confined to area 18 and, more important, retrograde label in the LGN was restricted to a subpopulation of very large cells lying in the center of the mediolateral extent of the nucleus, indicating that the effective uptake site did not extend across the 17/l 8 or 18/l 9 borders. At 24 hr after injection there was always a clear gap of cortex, free of both diffuse staining and labeled cell bodies, between the visible injection site (which probably cor- responded closely in size to the effective uptake site) in area 18 and the labeled region of area 17 (Fig. 3); such a gap would not be expected if a retracting injection site was simply leaving labeled cells in its wake.
Uptake of WGA-HRP by fibers-of-passage. In all animals in which area 18 was injected with WGA-HRP, the diffuse halo stained the white matter, to a depth of 200 to 300 pm below the cortex in those kittens that survived for 24 hr and older animals that survived for 8 hr, but to a greater depth in kittens aged 10 days or less that survived for only 8 hr before perfusion (Fig. 1). In animals studied 24 hr after injection, tracer had presumably diffused into the white matter to a depth greater than 2 to 300 Frn during the evolution of the injection site, at least in the youngest kittens. Direct uptake from axons in the undamaged white matter underlying an injection site was considered unlikely, especially in view of the work of Brodal et al. (1983) showing no uptake of WGA-HRP by intact fibers-of- passage. However, to be sure, we performed a control experiment.
In animal K16, which was 10 days old, white matter underlying areas 17 and 18 was deliberately injected with WGA-HRP. Despite the frank damage of axons, no label was found in the LGN after 8 hr whereas labeling had been found 8 hr after an area 18 gray matter injection in another lo-day-old animal (K7). After this white matter injection, labeled cells were seen in the upper layers of areas 17, 18, and 19, but they were distributed in a pattern very different from that seen in area 17 when gray matter of area 18 was injected (Fig. 7). There was a dense strip of labeled cells in the superficial portion of layer II immediately beneath layer I, a sparse distribution of labeled cells throughout the rest of layers II and Ill, and hardly any labeled cells in upper layer IV; there was no obvious anterograde labeling of layer I. WGA-HRP spread upward from the injection site in white matter to obscure the lower layers of areas 17, 18, and 19 (deep to the middle of layer IV), but no obvious anterograde labeling was seen in the upper portion of layer IV. The absence of retrograde label in the LGN and anterograde label of thalamic afferents to layers I and IV (Henderson, 1982; Kato et al., 1983, 1984) suggests that geniculocortical axons do not take up WGA-HRP significantly even after a direct small injection into white matter. We are not sure why cells in upper layer II were selectively labeled, although it is conceiv- able that this was due to uptake of WGA-HRP that had spread into layers V and VI of areas 17, 18, and 19 by layer II cells with terminals in the deep layers (Gilbert and Wiesel, 1981). What is clear is that uptake of diffused WGA-HRP by axons in the white matter is most unlikely to account for the excessive labeling in lower layers or the absence of patchiness in the upper layers of area 17 after area 18 injections in young kittens.
Discussion
The association projection from area 17 to area 18 is present in kittens and is arranged at least roughly topographically from birth onwards. The pathway originates from both superficial cortical layers (II, Ill, and upper IV) and deep layers (V and VI) at all ages; however, initially there is a strong projection from both superficial and deep laminae, but in kittens older than about 2 weeks, as in adults (Gilbert and Kelly, 1975) the pathway arises mainly from the upper layers.
Because of the variability in the absolute density of labeled cells at different ages (probably caused by technical differences between injections) it was impossible to be sure whether there was any overall change in the number of cells projecting to area 18 from the superficial layers during development. However, it seems almost certain that there is a substantial decrease in the density of the projection from deep laminae during the third postnatal week (Table II). The clustering in the distribution of the cells of origin of the projection, so characteristic of the adult, begins to appear only at 10 days, and it is not until 20 days that clearly defined patches of cells projecting to area 18 are present in the upper layers.
The interpretation of these results is based on a number of control experiments and observations. First, the validity of our findings obviously depends on the injections having been effectively confined to area 18. We determined the position of each injection in relation to the borders of area 18, which were identified directly both by conventional cytoarchitectonic criteria (Garey, 1971; Anker and Cragg, 1974) and by studying the laminar patterns of cytochrome oxidase activity (Price, 1985). The distribution and dimensions of retrogradely labeled cells in the LGN were invaluable indicators of the region of effective uptake, and here our results suggest that the shrunken injection spots seen 24 hr after injection are probably not much larger than the true area of uptake. The results of direct injection of WGA-HRP into white matter indicated that our main observations are unlikely to have been seriously contaminated by uptake of WGA-HRP by axons other than those of the association projection. Finally, examination of labeling in area 17 after a survival time so short that the label had hardly, if at all, reached the thalamus eliminated the possibility that the early excessive labeling in deep cortical layers might be due to transneuronal transport (Coulter et al., 1980) via the corticogeniculate system.
During the first few days of postnatal life an association projection arises densely from cells in upper layer IV of area 17, whereas at 10 days or more, cells of origin of the pathway are distributed with similar density throughout layers II, Ill, and upper IV. Although the variability in the absolute densities of labeled cells in the upper cortical layers in kittens of similar ages (Table II) makes it difficult to decide whether the projection actually decreases from layer IV or increases from layers II and Ill, it seems possible that the change of distribution in the superficial layers might be caused by migration of association cells from upper layer IV to more superficial positions as part of the embryonic pattern of movement of cells to form the layers of the cortex (Rakic, 1974). In Nissl- and cytochrome oxidase-stained sections of the visual cortex of very young kittens a dense band of small, closely packed cells is seen in layer II, representing the remnant of the cortical plate (Anker and Cragg, 1974; Price, 1985) and it seems likely that there is still some cell migration within the cortex, particularly within superficial layers, during the first few weeks postnatally (Luskin and Shatz, 1984).
It is even conceivable that the disappearance of the large popu- lations of cells projecting to area 18 from the infragranular layers of area 17 in young kittens is due to their migration to an ultimate resting place in the superficial layers. However, this is most unlikely since the deep portion of layer IV was always relatively free of labeled cells: there was no indication, at any age, of neurons passing from infragranular to supragranular layers.
Elimination and formation of axonal projections, neuronal death, and cell migration might all contribute to the developmental changes observed here. However, the evidence available (Table II) strongly suggests that the total number of association cells decreases during postnatal development. Our principal finding of a loss of the projec- tion from deep layers and the development of a patchy upper layer projection could be explained by loss of connections from a projec- tion that is well developed, indeed exuberant, at birth. The highest density of ceils projecting to area 18 in any animal was found in the upper layers in a 4-day kitten (460 cells/mm*); even within the densest patch of labeled cells in the upper layers of area 17 in a 20. day animal (380 cells/mm*), the association cells did not appear as

The Journal of Neuroscience Development of Visual Cortical Association Projection 2451
closely packed. The most parsimonious interpretation of our results is that, within regions of the upper layers that are destined to become
typrcal mature clumps of association cells, there is little or no postnatal change in the density of cells projecting to area 18, whereas for cells In the inter-clump regions and in the whole of the deep layers there is massive elimination of the association projection.
Very recent results suggest that both axon withdrawal and neuronal death are involved in this process (Price and Blakemore, 1985). The loss of projections during the development of corticocortlcal path-
ways may be a widespread event since an early exuberant projection into the corpus callosum from the visual cortex of newborn cats is greatly drmlnished as the cortex matures (Innocenti et al., 1977); this elimination of inappropriate interhemispheric connections is accom- pllshed largely through withdrawal of axons (Innocenti, 1981; O’Leary
et al., 1981; Ivy and Killackey, 1982). In this study we have shown that the onset of the patterned visual
stimulation that occurs when the eyelids separate at about 10 days
IS not necessary for the formation of the clusters of cells of origin of the associational pathway from area 17 to area 18, nor for the relative reduction of the projection from cells in the lower layers. However,
the two BD animals that we examined both had a comparatively low overall density of labeling (compare Fig. 6, a and b) which might have been due to chance differences in the injections or to genuine differences in the degree of uptake between normal and deprived animals. Further work is needed to see whether there are subtle but real differences In the association projection in deprived animals and
whether much longer periods of deprivation might have a more profound effect. At this stage, however, we can be confident that the major maturational changes in this association pathway, even
though they take place after the time of natural eye opening, do not depend on patterned visual stimulation. This conclusion contrasts somewhat with the evidence that the elimination of Inappropriate
interhemispheric projections from cells in the body of area 17 IS influenced by the visual experience of the animal (Lund et al., 1978; Innocenti and Frost, 1980; Rhoades and Dellcroce, 1980; Cusick
and Lund, 1982). The typical patches of cells found in the upper layers in area 17
of older animals may be spatially related to ocular dominance or
orlentatlon columns. The separation between the centers of neigh- boring clusters of association cells (about 600 pm; see Fig. 6) IS roughy twice the distance between the centers of adjacent right-eye and left-eye ocular dominance stripes of geniculate termination in layer IV of area 17 In kittens at a few weeks of age (LeVay et al.,
1978), although they do not appear to form elongated bands, as do the ocular dominance stripes. It would be interesting to compare the segregation of right-eye and left-eye terminals In layer IV with the
degree and distribution of clumping in cells of origin of the associa- tlon proJectIon, to discover whether these two perrodic patterns mature in parallel and form some regular relationship with each other, as they appear to do In the monkey (Livlngstone and Hubel, 1984).
References Albus, K., and G. Meyer (1981) Spiny stellates as cells of origin of association
flbres from area 17 to area 18 rn the cat’s neocortex. Braln Res. 270: 335 341
Anker, R. L., and B. C. Cragg (1974) Development of the extnnslc connect tlons of the visual cortex in the cat. J Comp. Neural. 1.54: 29-42.
Blakemore, C., and R. C. Van Sluyters (1975) Innate and environmental factors In the development of the kltten’s visual cortex J. Physiol. (Lond.) 248: 663-716.
Brodal, P., E Dletrichs. J. G. Bjaalle, T Nordby, and F. Walberg (1983) Is lectin~coupled horseradtsh peroxldase taken up and transported by un- damaged as well as by damaged fibers In the central nervous system. Brain Res 278: 1-9.
Coulter, J. D., M. C. Sulltvan, and M. A. Ruda (1980) Lectins as markers of neuronal connectivity. Sot. Neuroscl. Abstr. 6: 339.
Cowan, W. M., J. W. Fawcett. D. D. M O’Leary, and B. B. Stanfield (1984) Regressive events In neurogenesis. Science 225: 1258-l 265.
Cuslck, C. G., and R. D. Lund (1982) Modlflcatlon of visual callosal pro]ections In rats. J. Comp. Neurol 272. 385-398.
Donaldson, I. M. L., and J. R. G. Nash (1975) The effect of a chronic lesion in cortical area 17 on the vtsual responses of units in area 18 of the cat. J. Physiol. (Lond.) 245: 325-332.
Dreher. B., and L. J. Cottee (1975) Visual receptive-field properties of cells in area 18 of cat’s cerebral cortex before and after acute lesions in area 17. J. Neurophyslol. 38: 735-750.
Eldndge, J L., 2. Henderson, and V. C. Wilkins (1981) A stereotaxic method for neonatal kitten brain. J. Physiol. (Lond.) 320: 12P.
Garey, L. J. (1971) A light and electron microscopic study of the visual cortex of the cat and monkey. Proc. R. Sot. Lond. (Biol.) 779: 21-40.
Garey, L. J., E. G Jones, and T. P. S. Powell (1968) Interrelationships of striate and extrastriate cortex with the primary relay sites of the visual pathway. J. Neurol. Neurosurg. Psychiatry 37: 135-157.
Gilbert, C. D , and J. P. Kelly (1975) The projection of cells in different layers
of the cat’s visual cortex J. Comp. Neural. 763: 81-106. Gilbert, C. D., and T. N. Wlesel (1981) Laminar specialization and lntracortical
connections In cat primary visual cortex. In Organfzation of the Cerebra/ Cortex, F. 0. Schmitt, F. G. Worden. G Adelman, and S. G. Dennis, eds., pp. 163-191, MIT Press, Cambridge, MA.
Henderson, Z. (1982) An anatomical lnvestigatlon of projections from lateral genlculate nucleus to visual cortical areas 17 and 18 in newborn kitten. Exp Brain Res. 46. 177-l 85.
Hubel, D. H., and T. N. Wiesel (1965) Receptive fields and functional architecture in two non~stnate visual areas (18 and 19) of the cat. J. Neurophyslol. 28: 229-289.
Innocenti, G. M. (1981) Growth and reshaping of axons In the establishment of visual callosal connections. Science 272: 824-827
Innocenti, G. M., and D 0. Frost (1980) The postnatal development of visual callosal connections In the absence of visual experience or of the eyes. Exp. Brain Res. 39: 365-375.
Innocenti. G. M., L. Flare, and R. Caminit (1977) Exuberant proJectIon Into the corpus callosum form the visual cortex of newborn cats. Neuroscl. Lett. 4: 237-242.
Ivy, G. O., and H. P. Klllackey (1982) Ontogenetlc changes In the prelections of neocortical neurons. J. Neuroscl 2: 735-743.
Kalil. R. (1978) Development of the dorsal lateral genlculate nucleus In the cat. J. Comp. Neurol. 782. 265-292.
Kato, N., S. Kawaguchi, T Yamamoto, A. Samelima, and H Miyata (1983) Postnatal development of the geniculocortical projectIon in the cat: Elec- trophyslological and morphological studies. Exp. Braln Res. 57: 65-72.
Kato, N., S. Kawaguchl, and H. Mlyata (1984) Genlculocortlcal prolectlon to layer I of area 17 In klttens: Orthograde and retrograde HRP studies. J. Comp. Neurol. 225. 441-447
Kawamura, K. (1973) Corticocortical flbre connectlons of the cat cerebrum. III. The occlpltal regton. Brain Res. 57: 41-60.
LeVay, S., M. P Stryker. and C. J. Shatz (1978) Ocular dominance columns and their development in layer IV of the cat’s visual cortex: A quantitative study J. Comp. Neurol. 7 79: 223-244.
LeVay, S., T. N. Wiesel, and D. H Hubel (1980) The development of ocular dominance columns in normal and visually deprived monkeys. J. Comp Neurol. 797: l-51.
Livingstone, M. S., and D. H. Hubel (1984) Anatomy and physiology of a
color system in the primate visual cortex. J. Neuroscl 4: 309-356. Lund, R. D., D. E. Mitchell. and G. H. Henry (1978) Squint-induced modifl-
cation of callosal connections in cats. Brain Res. 744: 169-172. Luskln, M. B., and C. J. Shatz (1984) Spatio-temporal relations between the
cells of layers 4 and 6 and their geniculocortical afferent input during development. Sot. Neuroscl. Abstr. 70: 1079
Mesulam, M. -M. (1982) Pnnclples of horseradish peroxldase neurohlsto~ chemistry and their appllcatlons for tracing neural pathways-Axonal transport, enzyme hlstochemlstry and light microscopic analysis. In Tracfng Neural Connections wfth Horseradish feroxidase. M. -M. Mesulam, ed., pp. l-151, John Wiley & Sons, Inc., New York.
Montero, V. M. (1981) Topography of the cortico-cortical connections from the striate cortex in the cat. Brain Behav. Evol. 78: 194-218
O’Leary, D. D. M., B. B StanfIeld, and W. M. Cowan (1981) Evidence that the early postnatal restriction of the cells of ongin of the callosal projectron
IS due to the elimlnat!on of axonal collaterals rather than to the death of neurons Dev. Braln Res. 7: 607-617.
Otsuka, R., and R. Hassler (1962) Uber Aufbau und Gllederung des corticalen Sehsphare bei der Katze. Arch. Psychiatr Nervenkr. 203: 212-234.
Price. D. J. (1984) The postnatal development of the assocrabon projectIon from visual cortical area 17 to area 18 in the cat. J. Physlol (Lond ) 346: 31P.
Price, D. J. (1985) Patterns of cytochrome oxidase actlvlty In areas 17, 18

2452 Price and Blakemore Vol. 5, No. 9, Sept. 1985
and 19 of the visual cortex of cats and kittens. Exp. Brain Res. 58: 125 133.
Prrce, D. J. and C. Blakemore (1985) Regressive events In the postnatal development of association projections in the vrsual cortex. Nature, in press.
Prrce, D. J., and T. Zumbroich (1985) Horseradish peroxidase cross-reacts during cytochrome oxidase histochemistry. Exp. Brain Res. 58: 206-207.
Rakrc, P. (1974) Neurons In rhesus monkey visual cortex: Systematic rela- tionship between time of origin and eventual deposition. Science 183: 425-427.
Rhoades, R. W., and D. D. Dellacroce (1980) Neonatal enucleation induces an asymmetric pattern of vrsual callosal connections in hamsters. Brain Res. 202: 189-195.
Sanderson, K. J. (1971) The projection of the visual field to the lateral genrculate and medral interlamrnar nuclei In the cat. J. Comp. Neural. 743: 101-118.
Sherk, H. (1978) Area 18 cell responses in cat during reversible inactivation of area 17. J Neurophysiol. 47: 204-215.
Singer, W., and F. Tretter (1976) Receptive-field properties and neuronal connectrvity rn striate and parastnate cortex of contour-deprived cats. J. Neurophysrol. 39: 613-630.
Swrndale, N. V., F. VitaCDurand, and C. Blakemore (1981) Recovery from monocular deprivation in the monkey. Ill. Reversal of anatomical effects in the visual cortex. Proc. R. Sot. Lond. (Biol.) 273: 435-450.
Tsumoto, T., and K. Suda (1982) Postnatal development of the cortrcofugal projection from striate cortex to lateral geniculate nucleus in kittens. Dev. Brain Res. 4: 323-332.
Vanegas, H., H. Hollander, and D. Hansjurgen (1978) Early stages of uptake and transport of horseradish peroxrdase by cortrcal structures, and its use for the study of local neurons and their processes. J. Comp. Neurol. 7 77: 193-212.
Wilson, M. E. (1968) Conrco-cortical connexions of the cat vrsual areas. J. Anat. 102: 375-386.
Wang-Riley, M. (1979) Changes in the visual system of monocularly sutured or enucleated cats demonstrable with cytochrome oxidase hrstochemistry. Brain Res. 777: 1 l-28.