Embed Size (px)
Citation preview

The Changing Economy and Demography of Saskatchewan and its Impact on Crime and Policing
Phase IV Report: Survey on the Perceptions and Expectations of Economic and Demographic Change and of Community Safety
in Saskatchewan
Prepared by:
Stuart Wilson, Department of Economics, University of Regina
December 2017
CCJSCollaborative Centre for
Justice and Safety

Research Collaboration Project between the Royal Canadian Mounted Police “F” Division and the University of Regina’s Collaborative Centre for Justice and Safety
December 2017
The Changing Economy and Demography of Saskatchewan and its Impact on Crime and PolicingPhase IV Report: Survey on the Perceptions and Expectations of Economic and Demographic Change and of Community Safety in Saskatchewan
Stuart Wilson
Department of Economics, University of Regina
i
Author Profile
Dr Stuart Wilson is an Associate Professor at the University of Regina. He earned his PhD in Economics from Queen’s University at Kingston, and conducts research on the links between demographic change, public policy, public safety, savings and investment, and economic growth. Among his works are articles in the Review of Economic Dynamics, Empirical Economics, the Australian Economic History Review, the Journal of Community Safety and Well-Being, and a chapter in the McGill-Queen’s University Press book, Canadian Immigration Policy for the 21st Century. He teaches courses in macroeconomics, econometrics, and population economics at the University of Regina.
Acknowledgements
The author gratefully acknowledges financial and administrative support from the Research Collaboration Project between the Royal Canadian Mounted Police “F” Division, and the University of Regina’s Collaborative Centre for Justice and Safety . The author thanks members of the RCMP “F” Division, Steve Palmer of the Collaborative Centre for Justice and Safety (CCJS), Steve McLennan and members of the Saskatchewan Chamber of Commerce (SCC) and of regional chambers, and civic leaders who kindly distributed survey information and encouraged individuals to complete the survey, as well as survey respondents who took the time to assist in this project. The inferences and opinions presented in this report remain solely those of the author and do not reflect those of the RCMP, the CCJS, or of the SCC.
Release Note
The survey was conducted during the spring of 2015 and the results of the survey were presented during the fall of 2015 to members of the RCMP and to community and business leaders who assisted in the distribution of the survey. This report was then delayed until data on the actual recent economic and crime environment became available, and also until after the Phase III report was completed. Although the survey results point to a time over two years ago, they are still instructive and provide meaningful information on perceptions of the economy and of crime during the twenty years prior to the survey.

ii
Executive Summary
This report is the fourth report of a larger research project focusing on the changing economy and demography of Saskatchewan and its impact on crime and policing. The first report presented an overview of economic, demographic, policing, and crime trends over the last two decades in Saskatchewan and its ten major cities, with the additional context of developments in the other Prairie provinces, and in Canada as a whole. The second report provided a review of the literature on the theoretical and empirical determinants of criminal behaviour and crime. The third report examined crime patterns in Saskatchewan, Alberta and Manitoba, and investigated their determinants, with a particular focus on demographic, economic, and policing influences.
This fourth report presents the results of a survey on perceptions of economic growth and opportunity, gang activity, alcohol abuse, illicit drug use, crime, youth activities, and community safety and policing in the largest cities of Saskatchewan.
The survey was conducted between March and July of 2015. There were 252 survey respondents:
• 90 from Regina • 53 from Swift Current • 24 from Yorkton • 23 from Lloydminster
• 93 were business leaders • 70 were employees • 35 were city officials • 22 were first responders
Perceptions of growth
• 83% perceived economic growth in the last decade as fast or very fast • 51% expected future growth to be the same as in the last decade
o 24% expected growth to be better o 24% expected growth to be slower
• Natural resources, construction, business investment, grain prices, and energy prices were seen as important economic drivers
• 76% thought that bringing in workers from outside the city was important for economic growth

iii
Perceptions of community health
• 52% agreed that families of workers integrated well, while 35% agreed that single workers integrated well into their communities
• 87% of respondents believed that illicit drug use was a problem in their city over the last decade o 59% believed these problems worsened over the last decade
• 82% believed that alcohol abuse was a problem in their cities o 32% agreed that problems had worsened over the past decade
• 48% of respondents perceived that adult gangs were a problem in their city over the last decade o 37% believed these problems worsened from the last decade
• 48% of respondents agreed that violent crime was a problem in their city over the last decade o 30% disagreed o 50% believed the prevalence of violent crime had not changed much since the previous
decade • 75% of respondents agreed that property crime was a problem in their city over the last decade
o 45% believed the prevalence of property crime had increased since the previous decade o 40% believed there had been no change since the previous decade
Youth opportunities and activities
• 75% believed youth employment opportunities had increased in the last decade • 61% believed that the availability of youth after-school activities had improved in the last decade • 56% believed that youth gangs were a problem in their city
o 41% believed that youth gang problems had increased in the last decade • 70% agreed that youth crime was a problem in their city
o 46% believed problems with youth crime increased in the last decade o 40% believed the extent of these problems was similar to those in the previous decade
Community safety
• 53% indicated there were some community safety programs in their city o 14% indicated there were many o 13% believed there were none o 17% didn’t know
• 30% believed there were more and/or more effective community safety programs than in the previous decade.
o 49% answered these were similar when compared to the previous decade • 74% believed the police force has a strong presence in their city
o 44% believed that the police size and presence had increased since the previous decade o 4% believed that the size and presence of the police force in their city had declined

iv
Regional differences
When compared to respondents from Swift Current and the central cities (Yorkton, Lloydminster, North Battleford, Prince Albert, and Saskatoon), respondents from Regina were more likely to report fast growth over the last decade, and be less optimistic regarding future economic performance.
Respondents from Regina and the central cities were more likely than those from Swift Current to perceive problematic levels of crime, consistent with the crime rate differences across these cities.
Swift Current has experienced growth in the rate of police-reported drug offenses in the city, along with many other cities in Saskatchewan, and this is reflected in the survey responses as the majority reported that illicit drug use was a problem in their city.
Opportunities
Community perceptions of economic growth and growth in policing appear consistent with actual growth, however, the perception that crime has remained similar or has become worse over the years is not consistent with the data that indicates that crime and victimization rates had been declining in Saskatchewan. Community leaders and police have an opportunity to improve public awareness of the decline in crime since 2003, and of their crime prevention initiatives.
Communities notice the importance of migrants to economic growth, while recent empirical evidence has tied increased migration movements to crime increases. Survey respondents believe that migrant families integrate well, but that single migrant workers are relatively less successfully integrated into their communities. Communities have the opportunity to improve the integration of migrants as well as improve crime prevention and community awareness when there are increased population movements in their communities.
Limitations
The results of this survey are to be taken with caution, as survey respondents were not representative of the Saskatchewan population, of the populations of the ten largest cities of the province, nor of the target survey groups of business leaders, city officials and first responders.
Recent developments
Since the survey was completed, Saskatchewan has faced two years of low energy prices, economic contraction, elevated rates of unemployment, government austerity measures, and rising crime rates. Forecasts point to a return to economic growth and reduced unemployment, and it is hoped that crime rates will return to their previous downward trajectory and that the recent rise in crime rates is only temporary.

v
Table of Contents
Author Profile .............................................................................................................................................................. i
Acknowledgements ..................................................................................................................................................... i
Release Note ................................................................................................................................................................ i
Executive Summary.................................................................................................................................................... ii
List of Figures ........................................................................................................................................................... vi
1 Introduction .............................................................................................................................................................1
2 Economic Context ...................................................................................................................................................3
2.1 Economic Conditions in 2015 ..........................................................................................................................3
2.2 A Changing Economic Outlook .......................................................................................................................4
3 Saskatchewan Surveys .............................................................................................................................................6
3.1 Saskatchewan Chamber of Commerce Member Surveys .................................................................................6
3.2 Saskatchewan Perceptions Study, 2012 ............................................................................................................7
3.3 Survey on the Perceptions of Crime in RCMP Jurisdictions, 2013 ..................................................................9
3.4 Statistics Canada’s General Social Survey Results ..........................................................................................9
3.5 Regina Police Service Surveys .........................................................................................................................9
3.5 Saskatoon Police Service Surveys ................................................................................................................. 10
3.7 Summary ....................................................................................................................................................... 11
4 Expert Perceptions and Expectations: Community Survey .................................................................................. 12
4.1 Survey Design ............................................................................................................................................... 12
4.2 Aggregate Results .......................................................................................................................................... 14
4.2.1 The Economy .......................................................................................................................................... 14
4.2.2 Community Support ............................................................................................................................... 15
4.2.3 Undesirable Activities ............................................................................................................................ 15
4.2.4 Youth Opportunities and Activities ........................................................................................................ 16
4.2.5 Safety and Policing ................................................................................................................................. 16
4.2.6 Aggregate Overview ............................................................................................................................... 16
4.2.7 Limitations .............................................................................................................................................. 17
4.3 Regional Results ............................................................................................................................................ 17
4.3.1 The Economy .......................................................................................................................................... 18
4.3.2 Community Support ............................................................................................................................... 19
vi
4.3.3 Undesirable Activities ............................................................................................................................ 19
4.3.4 Youth Opportunities and Activities ........................................................................................................ 20
4.3.5 Safety and Policing ................................................................................................................................. 21
4.3.6 Regional Differences .............................................................................................................................. 21
4.4 Result Highlights ........................................................................................................................................... 21
5 Update: Recent Saskatchewan Developments ...................................................................................................... 23
6 Conclusion ............................................................................................................................................................ 27
Bibliography ............................................................................................................................................................ 29
Appendix 1: Survey Questionnaire ......................................................................................................................... 33
Appendix 2: Survey Results - Tables and Figures .................................................................................................. 55
List of Figures
Figure 1: Distribution of Survey Respondents by City ........................................................................................... 13 Figure 2: Distribution of Survey Respondents by Occupation ................................................................................ 14 Figure 3: Bank of Canada Commodity Price Indices, Monthly, January 2003 - November 2017 .......................... 23 Figure 4: Saskatchewan GDP and GDP Growth Rates, 2003-2016 ........................................................................ 24 Figure 5: Saskatchewan Crime Rates, 2003-2016 (incidents per 100,000 residents) .............................................. 25 Figure 6: Number of Police Officers and Police Officer Rates, Saskatchewan, 2003-2016 ................................... 26

1
1 Introduction
This report is the fourth report of the research project titled, The Changing Economy and Demography of Saskatchewan and its Impact on Crime and Policing, as part of the Research Collaboration Project between the Royal Canadian Mounted Police “F” Division and the University of Regina’s Collaborative Centre for Justice and Safety. This research project aims to examine the socio-economic determinants of crime, identify how economic and demographic changes in Saskatchewan and its cities have influenced changes in crime rates, and to speculate how crime rates might evolve with the evolution of the Saskatchewan economy.
The first report provided an overview of the economic and demographic changes that have occurred over the last two decades in Saskatchewan as a whole and in its ten major cities, and the coinciding changes in policing and crime rates (Wilson & Sagynbekov, 2014). After two decades of slow economic and population growth, the Saskatchewan economy shifted into a higher gear in 2006 in response to higher commodity prices. Saskatchewan experienced an export boom, increased resource exploration and development, a construction boom, and increased immigration and inter-provincial in-migration. The province benefitted with higher median incomes and reduced poverty rates. Crime rates have fallen since 2003, and yet are still among the highest in the country. Saskatchewan has also been dealing with a rise in drug-related offenses since 2009. Three cities in the province with above average crime rates share the characteristics of low median incomes, high rates of poverty, and high proportions of Aboriginal peoples with the associated characteristics of youthfulness, low educational attainment, low household income, high rates of unemployment, and high rates of poverty. Two cities in the province with above-average rates of violent crime and drug-related offenses share the characteristics of fast population growth and high median incomes. These facts were presented in the first report.
The second report provided a review of the literature concerning the influences on criminal behaviour, with a particular focus on economic, demographic, policing, and justice system factors (Wilson, Sagynbekov, Pardy, & Penner, 2015). This second report provided the theoretical and empirical background necessary to carry out subsequent work for this research project. The third report was designed to empirically examine the socio-economic influences on violent and property crime patterns in Saskatchewan and the Canadian West from 1967 to 2013 (Wilson, 2017). The empirical results suggested that declining property crime rates coincided with rising real household incomes per capita, increasing real per capita alcohol sales, declining unemployment rates, a declining share of youth in the population, and decreasing migration rates. Rising migration rates and their upward pressure on crime rates partially counteracted the downward pressure on crime rates resulting from improvements in the economy. The empirical results also suggested that economic and demographic change had only small effects on rates of violent crime. Of particular interest was the result that changes in police-reporting methods caused one-period jumps in crime rates in 1998 and 2003, of between fourteen and twenty-seven percent. These reporting changes interrupted the steady decline in crime rates which has occurred since the early 1990s.

2
This fourth report presents survey results on perceptions of economic and demographic change, and on crime and policing in Saskatchewan. The survey was conducted during the spring of 2015, and attracted responses from business and community leaders, first responders, and members of the general public. The survey was conducted following a major drop in the price of oil and energy sector downsizing, in a period of economic uncertainty, and during a period of increasing crime and fear of crime and personal safety.
Survey respondents perceived that significant improvements had occurred in the economy over the previous decade, that there were some community safety programs in their communities, and that the police force had a strong presence in their cities. However, respondents believed that crime had remained steady or had become worse over the previous decade. This perception is not consistent with the decline since 2003 in the official police-reported crime rates nor with the decline in victimization rates estimated from the General Social Survey.
Following the survey, the Saskatchewan economy experienced a continuation of low oil prices, a contraction in production, a rise in unemployment, austerity provincial budgets, and rising levels of crime. The current forecast is for a return to growth and slightly lower rates of unemployment, but not to rates experienced during the economic boom of the last decade. It is hoped that the recent rise in crime rates proves to be temporary, with crime rates returning to the long-run trend decline experienced since the early 1990s.
In section 2 of this report, the economic context leading up to the spring of 2015 and the release of the survey is described. Section 3 provides the results of recent surveys on the Saskatchewan economy, on public perceptions of crime, personal safety, and on the police forces. Section 4 describes and presents the results of the survey of community and business leaders, and of first responders and residents of the ten major cities in the province, on perceptions of economic growth, crime and community safety over the past decade. Section 5 provides an update on the economy and on crime rates since 2015, and Section 6 concludes the report.

3
2 Economic Context
Over the period from 2004 to 2014, the province of Saskatchewan experienced booming economic conditions, a dramatic change from conditions experienced from the mid-1990s to mid-2000s. A rise in commodity prices in the mid-2000s led to greater demand for Saskatchewan’s resources, an export boom, and a migration boom in the province. Growth of the Saskatchewan economy paused as a result of the 2008 world financial crisis and of the fall in resource prices including those of oil and potash. But prices recovered, resource exploration and development continued, and growth in the Saskatchewan economy resumed. Saskatchewan weathered the 2009 worldwide recession relatively well. However, resource prices once again tumbled in 2014, and resource regions and the Saskatchewan economy were seriously affected.
2.1 Economic Conditions in 2015 Oil prices dropped from US$97.86 for Western Texas Intermediate in August of 2014, to US$45.63 in August of 2015 (Macrotrends, 2015). CBC News reported in March of 2015 that half of the oil drilling rigs in the province were shut down, hotel vacancies were up sharply, oil patch servicing companies lost much of their business and laid off workers, and trucking companies had let drivers go, sold off trucks and closed (CBC News, 2015). Baytex Energy Corp announced it would stop drilling in the Lloydminster area for the remainder of the year (Canadian Press, 2015). However, Husky planned to move forward with oil projects in the Lloydminster area, including its Rush Lake heavy oil thermal project in Saskatchewan, even with low oil prices (Morgan, 2015). The pace of construction activity slowed significantly in Weyburn, as building permits worth CAN$8 million had been issued in 2015 up to August, while the corresponding year-to-date value of building permits to August 2014 were valued at CAN$21 million (Weyburn Review, 2015). Vacancy rates for rental apartments rose in three major oil producing cities of the province: the vacancy rate in Estevan was 5.5% in April of 2014, compared to 20% in April of 2015; in Weyburn, the vacancy rate rose from 3.8% to 8.0% from April 2014 to April 2015; in Lloydminster, the vacancy rate increased from 1.8% to 11.6% from April 2014 to April 2015 (Canadian Mortgage and Housing Corporation, 2015).
Statistics Canada’s Labour Force Survey indicated that employment in the province of Saskatchewan dropped by 13,800 (2.3%) from June to July of 2015, and the unemployment rate increased by 1.2 percentage points to 5.4%. Employment in Saskatchewan declined by 2,100 workers from July of 2014 to July of 2015, and the unemployment rate increased from 3.6% in July of 2014 to 5.4% in July of 2015. For Canada as a whole, employment decreased by 0.4%, and the unemployment rate increased by 0.6 percentage points to 7.1% from June to July of 2015; employment in Canada increased by 0.9% from July of 2014 to July of 2015, while the unemployment rate decreased from 7.3% to 7.1% (Statistics Canada, 2015).

4
For Saskatchewan as a whole, there were 4,800 less workers in agriculture, 2,800 less workers in forestry, fishing, mining and oil and gas, 4,300 less workers in construction, 2,300 less workers in manufacturing, 3,800 less workers in educational services, and 2,800 less workers in public administration, in July of 2015 when compared to July of 2014. Employment gains over the 12-month period were most noticeable in health care and social assistance (6,100 more workers), accommodation and food services (2,100), information, culture and recreation (2,600), and other services (3,400). The population of Saskatchewan was estimated to have grown by only 1,762 during the first quarter of 2015, when compared to growth of 4,885 during the first quarter of 2014. Total net migration deceased from 3,674 during the first quarter of 2014, to 500 during the first quarter of 2015: fewer workers were migrating to Saskatchewan due to changes in the economic climate of the province. Retail sales for 2015 up to and including the month of May decreased by 3.4% in Saskatchewan. New motor vehicle sales fell by 5.6% in units, and by 27.3% in dollar value, over the same period. Overall, housing statistics for the province indicate a slight drop in dwelling starts, from 8,290 during the first half of 2014, to 8,257 during the first half of 2015, and a 10% increase in completed units. However, there were dramatic changes in some of the major cities of the province. Estevan experienced an 88% reduction in housing starts and a 56% reduction in completions. Lloydminster housing starts dropped by 88% and completions dropped by 34%. Swift Current starts fell by 80% while completions were reduced by 15%. Starts fell in both metro Regina (15%) and Saskatoon (34%), and completions in Regina also fell, by 29%, while completions increased in Saskatoon by 9% (Saskatchewan Bureau of Statistics, 2015).
Economic growth in Saskatchewan slowed considerably from 2014 to 2015. It was unclear how resource industries, and the economy more generally, would weather the recent storm; would growth resume as it did after 2009? What was the outlook for the province? What are the implications of the slowdown on crime? In order to get a decent view of the economy and expectations at the time of the survey to be described and analyzed in this report, it is not only important to look at the 2015 view of prospects for the province, but also look at the evolution of the economic outlook over the year, given the uncertainty in oil prices and other economic conditions, and the unexpected decline in oil prices.
2.2 A Changing Economic Outlook In the early stages of 2014, the economic outlook was optimistic. The US economy was growing, and the value of the Canadian dollar had fallen slightly, making Canadian exports more attractive for our largest trade partner. Credit conditions were accommodative so that businesses could easily attract investment funding. There was still some excess capacity in the Canadian economy, and businesses were focusing more on short-term investment plans, rather than long-term expansions (Bank of Canada, 2014). Oil prices remained high, but volatile. Prices for Western Texas Intermediate had fluctuated between US$85 and 110 per barrel, and Western Canadian Select prices had ranged from US$55 to 95 per barrel since 2011. The Bank of Canada was projecting oil prices to remain high. In April of 2014, the Bank of Canada pointed to risks that US shale oil production might continue to grow, and that OPEC might decide to increase production. High oil prices and technological innovation led to the development of large US shale oil resources over the previous five years, and OPEC had been
5
accommodating those production increases (Bank of Canada, April 2014).The outlook for the province of Saskatchewan at the time was rosy. Employment growth in 2013 was 3.4% and the unemployment rate was 3.8%, the best rates of all Canadian provinces. Oil and potash production were rising, investment was strong, and the agricultural sector was expected to have another good year, with the preceding year as one of record crops. Private sector forecasters ranked Saskatchewan second behind only Alberta for growth in 2014 (Government of Saskatchewan, 2014).
In July of 2014, oil prices started to fall. At the time, the slight decline was seen as part of a normal fluctuation pattern, but soon thereafter, was viewed as a result of the increased supply of oil in the US and in Libya, and of weakened world demand for oil. The global economy was not growing as had been previously expected, although the US economy and its currency were strengthening. Forecasts of US shale oil production had consistently been revised upwards, and oil producers appeared to be competing on price for world markets. By October, prices for oil were US$20 cheaper than three months prior (Bank of Canada, October 2014).
Production growth and price competition continued into the new year, as prices dropped a further 40%, averaging US$55 for WTI, and US$40 for WCS by January 2015. At that time, estimates suggested that about one-third of oil production was uneconomical at US$60. The drop in oil prices was seen to be good for the US and world economies heavily reliant on oil for production. The addition of a weakening Canadian currency versus the US was expected to help the non-energy producing provinces through increased demand for exports (Bank of Canada, January 2015).
The outlook for Saskatchewan changed dramatically over the year. The 2014-15 Budget forecast real GDP growth of 2.2% for 2014. The Saskatchewan Government revised that figure to 1.4% with the release of the 2015-16 Budget during the spring of 2015. The Government expected a nominal reduction in GDP of 0.6%, due to falling prices of oil, wheat, canola and potash. Employment growth had slowed to 1.0% in 2014. Even with a decline in nominal GDP, real GDP and employment were expected to grow in the coming years (Government of Saskatchewan, 2015). For 2015, the Conference Board of Canada projected a drop in Saskatchewan employment of 1,416 jobs, a rise in the unemployment rate to 4.6%, a contraction in the construction industry by 3.5%, and a reduction in housing starts by 16%. On the positive side, the potash, metal mining, agricultural, and manufacturing sectors were expected to provide strength to the Saskatchewan economy. Twenty-six nuclear reactors were under construction worldwide, the Saskatchewan Government signed a deal with India for uranium, and Cameco’s Cigar Lake Mine had expanded. Several potash mines and a major pipeline project were in or near development, and the Regina Bypass project was expected to start that year (Conference Board of Canada, 2015).
Overall, the Saskatchewan economy had experienced a slowdown, and expectations were not overly pessimistic, nor were they optimistic for a quick recovery. This is the general context of the current survey that was conducted over the spring and summer of 2015 to determine the outlook on the economy and comparisons to past decades, and to determine perceptions on crime and policing.

6
3 Saskatchewan Surveys
The primary purpose of the current phase of this research project is to gauge opinions of business leaders, city officials, and first responders on changes their cities have experienced economically, demographically, and in terms of crime and community safety. Other surveys had been conducted on the economic, demographic, crime, and community safety conditions and environment in the province. Several of these will now be reviewed, in particular, those conducted by Statistics Canada through the General Social Survey, by the Saskatchewan Chamber of Commerce, by the University of Saskatchewan’s Social Sciences Research Laboratories and its Centre for Forensic Behavioural Science and Justice Studies, by Insightrix Research, and by members of the University of Regina’s Department of Justice Studies.
3.1 Saskatchewan Chamber of Commerce Member Surveys The Saskatchewan Chamber of Commerce (SCC) conducts an economic outlook survey of its members almost each year. The SCC asks questions about realized growth in sales, market base and employment, expectations of sales, wage levels, investment plans in the coming year, the state and health of the overall economy, and about perceptions on the governments’ roles in promoting competitive and attractive business environments.
Results from the 2008 Economic Outlook Survey, based on results of 2007 operations and expectations for 2008, indicated that the Saskatchewan business community (or at least the survey respondents) had experienced an exceptional year in 2007 (Saskatchewan Chamber of Commerce, 2008). Of survey respondents, 78% indicated growth in revenue, 53% experienced an expansion of their market base, and 72% hired more staff. For 2008, 75% of respondents planned to increase the level of their investment, and 75% expected an increase in sales. The 2009 Economic Outlook Survey followed the disastrous financial events of the fall of 2008, but indicated that Saskatchewan business respondents did experience growth and expansion in 2008, with 78% indicating growth in sales in 2008. However, the outlook for 2009 was slightly less rosy than in previous years, with 61% of respondents expecting growth in revenues in 2009, and only 39% planned to increase investment (Saskatchewan Chamber of Commerce, 2009).
The 2010 SCC Economic Outlook Survey questionnaire was released in December of 2009, after a tumultuous year on financial markets, and in the midst of a worldwide recession. The Saskatchewan economy wasn’t as severely hurt as the Alberta and Canadian economies overall, and of the survey respondents, just over half (53%) stated that their businesses grew in 2009, and 60% expected more growth in 2010. Only 39% of respondents increased the level of their investment in 2009, with slightly less, 31%, expecting to increase their investment in 2010 (Saskatchewan Chamber of Commerce, 2010). The Saskatchewan economy had performed well, posting growth numbers second only to Alberta among Canadian provinces.

7
The SCC did not release another survey until the end of 2013. At that time, business performance was strong, and expectations of future growth remained optimistic. Of those responding to the survey, 63% felt the Saskatchewan economy as a whole was performing better in 2013, 61% experienced growth in revenues during 2013, and 67% expected revenues to increase in 2014. Investment planning was slightly subdued in 2013, compared to 2008, with only 39% of respondents declaring they increased their investment in 2013, with 35% expecting to increase investment in 2014. In 2013, 49% of respondents increased their staffing, and 44% expected to increase their number of full-time employees in 2014. There were signs of labour shortages, however, with 44% of respondents claiming jobs remaining unfilled in 2013 (Saskatchewan Chamber of Commerce, 2013).
The 2015 Economic Outlook survey was released in January of 2015, following the dramatic drop in oil prices. The optimism of the Saskatchewan business community was reduced. Only 42% of survey respondents believed the economy was better off in the previous year, while that rate was 63% for 2013. Correspondingly, 53% of survey respondents experienced growth in revenues in 2014, whereas 61% of 2014 survey respondents experienced growth in 2013. The proportion of survey respondents expecting a better economy (and an increase in business revenues) in the coming year fell in recent successive surveys, from 55% to 25% (and from 67% to 49%). However, businesses still expected tight labour conditions, with 44% of respondents indicating that jobs remained vacant, 42% expecting to hire more full-time staff, and 78% expecting wages to continue increasing at an average rate of 4% (Saskatchewan Chamber of Commerce, 2015).
3.2 Saskatchewan Perceptions Study, 2012 In 2012, University of Saskatchewan researchers affiliated with the Social Sciences Research Laboratories (SSRL), conducted phone interviews with 1,750 randomly-selected Saskatchewan residents representative of the provincial adult population. The phone survey covered a series of topics and solicited respondent perceptions on issues including the economy, resource development, Aboriginal issues, immigration, ethnic and cultural diversity, and mental and physical health. The results were released in a series of reports in 2012, with the title, “Taking the Pulse of Saskatchewan” (TTP).
Of the many results, there are several which are of particular interest to this study, which are highlighted here. Natural resources are important to Saskatchewan and its residents, as 94% of respondents agreed that the development of the province’s natural resources was critical to the economy and prosperity (McDowell, Down, Keatings, Bruneau, et al., 2012). On the state of the economy, 87% were optimistic about employment opportunities for youth in the province, and this level of optimism was a huge improvement since 2001 when only 52% of respondents to that year’s survey indicated optimism about youth employment in Saskatchewan (Keatings, Jones, Gilchrist, Huq, & Walker, 2012).
In 2011, 16% of the Saskatchewan population was Aboriginal. Saskatchewan’s Aboriginal population is relatively young, with 54% of its population younger than 25 years of age in 2011. The Aboriginal population has faced considerable socio-economic disadvantage, however improvements have been

8
made over the years, in educational attainment as an example (Wilson & Sagynbekov, 2014). TPP Survey respondents realized the importance of this demographic group, as 57% agreed that Aboriginal people make important contributions to the current Saskatchewan economy, 74% agreed that this population will make important contributions in the future, and 72% of respondents agreed that public investment in education for the Aboriginal population pays off in the long run (Keatings, Innes, Laliberte, & Howe, 2012).
The recent surge in natural resource development and economic growth in the province has led to labour shortages. While Saskatchewan has received many interprovincial migrants to meet labour shortages, attracting international migrants has become increasingly important. By 2006, 5.3% of Saskatchewan residents were foreign-born, and less than 60% of immigrants to Saskatchewan settled permanently in the province (Elliot, 2006). As of the 2011 Census, 7.4% of Saskatchewan residents were immigrants (Wilson & Sagynbekov, 2014). Of the 2012 Survey respondents, 87% agreed that new immigrants were important contributors to Saskatchewan, and 86% agreed that more work was needed to recognize foreign credentials and work experience of immigrants. Of foreign-born survey respondents, 87% agreed that Saskatchewan was “a welcoming place to new immigrants” (Keatings, Down, Garcea, Zong, et al., 2012).
One of the TPP reports focused on perceptions of crime and safety. From 2003 to 2012, rates of violent criminal code violations and rates of property crime violations fell, each by approximately 30%. However, these rates were almost double the national average (Wilson & Sagynbekov, 2014). The TPP survey asked respondents about crime in their neighborhoods, and 34% believed that crime had increased over the previous three years, while 47% believed crime remained the same, but only 15% thought that crime had decreased. Similarly, 38% of respondents believed that youth crime had increased over the previous three years, 45% thought it remained the same, and 12% felt that youth crime had decreased. While a slight majority of respondents believed that crime had not increased, an overwhelming majority of respondents, 92%, felt safe in their neighborhoods. The level of satisfaction with policing was also high, with 83% satisfied, while 15% expressed dissatisfaction at policing performance. The level of satisfaction, however, varied largely based on region, with the highest level of satisfaction among residents of the Regina Census Metropolitan Area (CMA), at 90%, while 84% of residents of the Saskatoon CMA and of residents of the smaller cities of Saskatchewan expressed satisfaction in policing, and 81% of residents in the rural south and only 50% of residents in the rural north, were satisfied with policing. The Aboriginal population had different perceptions on crime, safety, and policing: 48% of Aboriginal respondents believed that crime had increased over the previous three years, compared to 34% of all survey respondents; 67% of Aboriginal respondents felt that youth crime had increased, compared to 38% of all survey respondents; 81% of Aboriginal respondents felt safe in their communities, compared with 92% of all respondents; and 61% of Aboriginal respondents were satisfied with policing over the previous year, compared to 83% of all respondents (McDowell, Jones, Keatings, Brooks, et al., 2012).
9
3.3 Survey on the Perceptions of Crime in RCMP Jurisdictions, 2013 In November of 2013, a telephone survey with 715 respondents from Saskatchewan jurisdictions policed by the RCMP was conducted to assess resident perceptions of crime, safety and victimization (Jewell, 2015). A large proportion of respondents, at 43.3%, believed that crime had increased over the preceding three years, while only 8.3% believed that crime had declined. Survey respondents were slightly more likely to report increasing crime over the past few years than those of the TTP study noted above. Of survey respondents, 94% felt safe in their communities, 91% were satisfied with their level of safety, and 79% were satisfied with policing in their communities; these results were slightly lower than those obtained with the TTP study.
The study identified the female, the Aboriginal, the northern, and the on-reserve populations as more likely than other populations to experience fear and have high perceptions of crime and low perceptions of safety in their communities. Respondents reported a higher level of victimization than what would be inferred from official police-reported crime rates; of survey respondents, 26.3% had experienced a crime in the past year, and only 33.7% of those who were victim to a crime reported all crimes they experienced to police. Overall, study respondents seemed to perceive that crime had either stayed the same or increased over the past three years, rather than perceiving a decline in crime consistent with crime statistics, but perceptions of personal safety were high.
3.4 Statistics Canada’s General Social Survey Results Results from the 2004, 2009, and 2014 General Social Survey (GSS) indicated that a very high proportion of residents of Saskatchewan and of Canada as a whole, were either somewhat satisfied or very satisfied with their personal safety from crime. The proportion of Saskatchewan respondents satisfied with their safety was 94% in both 2004 and 2009. In comparison, the proportions for Canada as a whole also remained stable, and were 94% in 2004 and 93% in 2009 (Brennan, 2011). More recent GSS results indicated that total household victimization rates in Canada fell by 42% from approximately 250 incidents per 1,000 population aged 15 years or older in 2004, to approximately 145 in 2014; for Saskatchewan, the total household victimization rate was halved, from approximately 405 incidents per 1,000 population in 2004, to approximately 180 in 2014 (Perreault, 2015). These drops in victimization rates are consistent with the declines in crime rates across Canada and Saskatchewan since 2003.
3.5 Regina Police Service Surveys Jones & Ruddell (2012) began a series of biennial community surveys on perceptions of the Regina Police Service in 2011, building upon annual surveys conducted by Sigma Analytics from 2004 to 2009 (Sigma Analytics, 2009). They conducted telephone surveys of 504 Regina residents during the second half of 2011, and of 450 Regina residents during the second half of 2013 (Jones & Ruddell, 2012, 2014). Those surveys revealed that Regina residents perceived an increase in the degree of visibility of police officers in their neighborhoods between the mid-2000s and 2013, that Regina residents stated a higher

10
level of satisfaction with the Regina Police Service (RPS) between the mid-2000s and 2013, and that Regina residents felt a higher level of service quality, and of trust and confidence in the RPS in 2013 when compared to 2011. Jones & Ruddell (2014: 43) concluded their report by stating that, “positive perceptions [of the RPS] have been trending upward since the civic surveys conducted in 2005.” This increase in positive perceptions of the RPS has occurred while public contact with the RPS increased, especially from 2007, when 34% of Sigma Analytics survey respondents reported having contact with the RPS, to 2013, when 47% of survey respondents reported having contact with the police.
Keeping in mind the perception of higher service quality and satisfaction, respondents also reported a higher level of average safety in 2013 (3.57 on a 5-point scale) when compared to 2011 (3.51 average rating) and to the latter half of the 2000s (ratings ranging from 3.2 to 3.3). In addition, a lower proportion of 2013 survey respondents reported they do not walk alone in their neighborhoods after dark (9.3%), and that fear of crime prevents them from engaging in some activities (17.6%), when compared to 2011 respondents (26.4%, and 21.6% respectively). Overall, however, there was little change in respondents’ perception regarding the change in the level of crime over the year prior to the 2011 and 2013 surveys, and it is not possible to characterize the public perception of changes in neighborhood crime over the previous decade since corresponding questions were not administered as part of earlier surveys.
The 2015 biennial survey was released in January of 2016 and the results suggested that the average level of satisfaction and average level of trust and confidence in the RPS continued to increase from 2013 to 2015. However, the perception of crime and fear of crime worsened: a higher proportion of respondents in 2015 agreed or strongly agreed that the possibility of crime prevents them from engaging in some activities (22.1%) when compared to the proportion of respondents in 2013 (17.6%), and there was a slightly lower rating for safety in 2013, at 3.46 on a 5-point scale, than the 3.57 rating in 2013 (Jones & Ruddell, 2016). This perception is consistent with the rise in crime from 2014 to 2015 following the drop in oil prices and disruption in the Saskatchewan energy sector.
3.6 Saskatoon Police Service Surveys The Saskatoon Police Service commissioned Insightrix Research Ltd. to conduct and report on a community satisfaction and policing priority survey in 2008 (Insightrix Research Ltd., 2009). The 2008 survey sample consisted of 400 Saskatoon residents, with an additional 396 residents sampled from specific groups (those with Aboriginal ancestry, members of visible minorities, and residents with recent police contact), and the results were compared with similar surveys conducted in 2002 and 2005. The results indicated a high level of satisfaction among Saskatoon residents in the Saskatoon Police Service (SPS), with 89%, 85%, and 91% of 2002, 2005, and 2008 respondents respectively indicating they were very or somewhat satisfied. The lowest level of SPS satisfaction occurred in the same year when the highest proportion of respondents believed that crime had increased over the previous five years, at 35% in 2005, compared to 29% in 2002 and 27% in 2008.

11
Over the three survey cycles in 2002, 2005, and 2008, growing proportions of respondents perceived that organized crime (from 24% to 36% to 46%), violent youth crime (56% to 71% to 73%), and illegal gang activities (32% to 72% to 78%) were “big problems.” Although the perceived severity of juvenile prostitution declined over those years, 58% of respondents believed juvenile prostitution was a big problem in 2008 (down from 81% in 2002). The availability of illegal drugs also remained a severe issue in the minds of respondents in the 2000s, with 86% believing drugs to be a big problem in 2005, higher than the proportions of 68% in 2002 and 76% in 2008.
A subsequent survey in 2011 indicated that 74% of respondents viewed their neighborhoods as reasonably or very safe, lower than the rates of 77% and 76% in 2002 and 2005, but similar to the rate of 73.5% in 2008 (Saskatoon Police Service, 2012). The 2015 survey results indicated that more Saskatoon residents (42%) felt less safe over the previous three years than in 2013, when 30% of respondents felt less safe. Residents reported more loitering, panhandling, drunkenness and drug dealing than in prior years, and the stabbing in February of 2015 outside the downtown Galaxy Theatre shocked and shook residents’ sense of safety (Saskatoon StarPhoenix, 2015).
3.7 Summary Overall, the various survey results suggest that residents of Saskatchewan felt that crime had been increasing or remained steady during the economic expansion, when crime rates and victimization rates had been decreasing, and that residents were more recently feeling the effects of a slowdown in the Saskatchewan economy, perceived an increase in crime, and felt less safe. Business leaders were well aware of the effects of the economic slowdown in Saskatchewan, but were neither overly pessimistic nor overly optimistic about the future with relatively uncertain expectations about the persistence of the economic downturn. It is in this context that the survey of business and community leaders on changes in the economy, community and policing was released.

12
4 Expert Perceptions and Expectations: Community Survey
The Saskatchewan economy has experienced dramatic changes over the past decade: changes in natural resource prices and in the value of resource exports, a flurry of resource exploration and development, growth in investment and construction activity, a surge in labour demand and labour shortages, inter-provincial and international immigration, and rising incomes. During the past ten years, Saskatchewan has faced two significant and abrupt declines in Western Texas Intermediate (WTI) oil prices, from US$133.93 in June of 2008, to US$39.16 in February of 2009, and most recently from US$97.86 in August of 2014, to US$45.63 in August of 2015 (Macrotrends, 2015). The Saskatchewan economy recovered from the former event with the recovery in oil prices. The lasting effect of the latter event is not yet known. This section presents the results of a survey of business leaders, city officials, and first responders from the ten largest cities of Saskatchewan, conducted during the spring of 2015. The survey collected perceptions of past economic, demographic, crime and policing conditions, as well as expectations for the future.
4.1 Survey Design A survey was developed with the intent to solicit expert opinion on the state of the Saskatchewan economy and its cities, and crime and policing, over the last ten years of relatively booming conditions, over the previous ten-year period of slow growth, and in the coming five years. The survey consisted of 52 questions, mostly multiple choice in nature, which would take approximately 15 minutes to complete online. The survey questionnaire is included in Appendix 1: Survey Questionnaire.
Members of the business community, civic leaders and community representatives, and police officers and first responders were viewed as the target audience for the survey. The leaders of the Saskatchewan Chamber of Commerce, and of the chapters in each of the ten major cities of Saskatchewan, were contacted for assistance in distributing the survey. These leaders kindly agreed to either email out or to post in their monthly newsletters an introductory message and link to the survey website. Members of the RCMP “F” Division Operations Strategy Branch contacted leaders of the RCMP detachments in the cities of Lloydminster, North Battleford, Swift Current, and Yorkton; members of the Collaborative Centre for Justice and Safety contacted police chiefs in the remaining six major cities. All those contacted were provided with the introduction and link to the survey and a request to distribute the information amongst their police officers. Civic leaders, including elected representatives, key administrative personnel, and fire chiefs were contacted by email using their public email addresses as indicated on their websites. The survey was designed to maintain anonymity and voluntary participation. The survey was managed electronically using Qualtrics, an online software and storage company based in Ireland.
The survey was opened for participation on March 2, 2015 and was closed on July 7, 2015. The final response was received on June 5, 2015. By the close of the survey, 252 responses had been recorded.

13
Figure 1 identifies the respondents by city, and Figure 2 identifies the respondents by community role. By no means can the survey results be seen as representative for the Saskatchewan population in general, or for the population in each of the individual cities. The responses also cannot be viewed as representative for members of each of the community groups by role. The number of responses from civic leaders of the ten cities ranged from a low of 1 to 6. The number of responses from business leaders ranged from 0 to a high of 38, with two cities for which no responses from business leaders were received. The number of responses from first responders ranged from 0 to a high of 7, with no responses from first responders of five cities. Survey partners noted that it was difficult to solicit responses during the survey period as there was a general sense of survey overload in many regions of Saskatchewan, and due to the voluntary and electronic nature of the survey. The Saskatchewan Chamber of Commerce sends out its annual economic outlook survey to its members and generally receives just over a hundred completed responses, a response rate around 10%. Although the responses are not representative, they may be informative. As such, the overall results are now reviewed.
Figure 1: Distribution of Survey Respondents by City
9
90
12
12
24
53
15
5
9
23
Saskatoon
Regina
Prince Albert
Moose Jaw
Yorkton
Swift Current
North Battleford
Estevan
Weyburn
Lloydminster
Number of Responses

14
Figure 2: Distribution of Survey Respondents by Occupation
4.2 Aggregate Results Survey questions focused on perceptions of: economic growth and sources of labour; community support for single workers and workers with families; gang-related activities, alcohol and illicit drug use, and violent and property crime; youth employment, after-school activities, youth gangs and crime; and community safety programs and policing. This sub-section provides an overview of the aggregate results, for the whole sample of survey respondents. The following sub-section (4.3) presents comparative regional results of the sample.1
4.2.1 The Economy Survey respondents were asked to evaluate the rate of economic growth in their cities over the last ten years, and 83% of respondents rated that growth as fast or very fast, and only 7% rated growth as slow. In comparison to this recent pace of growth, 64% of respondents rated economic growth in their city during the period from 1996 to 2005 as worse or much worse, and 16% as the same. Expectations about growth in the future were relatively neutral, with 51% of respondents believing that economic growth in their city will be the same as the most recent period, with a split of 24% expecting growth to be better, and 24% expecting growth to be worse.
The main drivers of the economy were identified by respondents as natural resources, general construction, and agriculture. Consistent with these views, 89% of respondents rated business investment and construction activity as important to the local economy, 77% rated grain prices as important, 76% rated energy prices as important, and 47% rated potash prices as important. Some survey respondents indicated that their perceptions of future growth did depend on how quickly oil prices would recover.
1 Readers may choose to jump to Appendix 2: Survey Results - Tables and Figures for the tabular and graphical presentation of the data.
35
20
93
70
9
22
3
City government official or representative
Representative of a community group
Business owner/leader
Employee/worker
Other (resident)
First responder (incl police, fire, ambulance responders)
No Answer
Number of Responses

15
Businesses have experienced labour shortages during the recent period of growth. A large majority of respondents, at 76%, indicated that bringing in workers from outside of their city has been very important to economic growth. And there has been a strong reliance on attracting foreign workers to meet labour demand: 56% of respondents rated that the extent workers have come from foreign countries was “a lot.”
4.2.2 Community Support The cities of Saskatchewan have welcomed workers and families from various parts of the province, country, and world. Having programs to support and integrate these new arrivals into their new cities is important not only to attract, but also to retain them. Respondents were asked if there are any support programs to integrate new arrivals into the community, and 60% of respondents indicated there were some, 18% indicated there were a lot, and 12% believed there was little support for new arrivals. Based on the survey responses, it appears that families of workers integrate better than single workers into the communities, and support for families had improved more than support systems for single workers: 52% of respondents agreed or strongly agreed that families of workers integrate well into the community, whereas 35% of respondents agreed or strongly agreed that single workers integrated well (a slight majority neither agreed nor disagreed or chose not to answer, to both of these questions); 41% of respondents agreed or strongly agreed that support for families of workers had recently improved, while only 16% of respondents felt that support for single workers had improved.
4.2.3 Undesirable Activities Respondents were asked for their perceptions on the undesirable activities of gangs, and alcohol and illicit drug use. Of survey respondents, 48% agreed or strongly agreed that adult gangs were a problem in the community, while 25% neither agreed nor disagreed, and 24% disagreed or strongly disagreed. When asked how respondents would compare the current problems with adult gangs in the community compared with those before 2006, 37% believed there were more problems currently, while 57% believed the problems were similar. Respondents perceived alcohol abuse as problematic in their cities: 82% of respondents believed that alcohol abuse was a problem in their cities, and 32% believed that there were more problems with alcohol abuse currently compared to those before 2006, although the majority, 58%, believed problems were at the same level as those before 2006. Views on illicit drug abuse were more unfavourable: 87% of respondents agreed or strongly agreed that there were problems with illicit drug abuse in their cities, and the majority, 59%, believed that those problems got worse over the years since 2006.
In response to the statement that violent crime is a problem in the city, 48% either agreed or strongly agreed, while 30% either disagreed or strongly disagreed; 33% of respondents believed that the prevalence of violent crime increased since before 2006 while 50% believed the prevalence of violent crime had not changed. 75% of respondents agreed or strongly agreed that property crime was a problem in their city, 45% believed the prevalence of property crime had increased since before 2006, and 40% believed there had been no change in the prevalence of property crime.

16
4.2.4 Youth Opportunities and Activities On the subject of youth employment, 75% of survey respondents either agreed or strongly agreed to the statement that youth employment opportunities had improved over the last ten years. Youth activities outside employment and school are also important. Of survey respondents, 80% either agreed or strongly agreed with the statement that there were accessible evening and weekend sports activities for youth, 63% agreed or strongly agreed that there were accessible evening and weekend non-sport activities for youth, and 61% agreed or strongly agreed that the availability of youth activities had improved over the previous ten years.
Perceptions of survey respondents were just slightly more unfavorable regarding youth gangs versus adult gangs: 56% agreed or strongly agreed that youth gangs were a problem in the community (compared to 48% for adult gangs); and 41% of respondents believed that problems with youth gangs had increased since before 2006 (compared to 37% for adult gangs). In addition, 70% of respondents agreed or strongly agreed that youth crime was a problem in their cities, and 46% believed that the prevalence of youth crime had increased since before 2006, while 40% believed there had been no change in youth crime.
4.2.5 Safety and Policing Of survey respondents, 53% indicated there were some community safety programs or activities in the city, and 14% indicated there were a lot of such programs or activities, while 13% indicated there were few or none, and 17% did not know. The follow-up question asked respondents to compare the number and effectiveness of community safety programs in the community compared to those before 2006, and of the 213 respondents, 49% answered these were similar (“the same”), and 30% suggested there were more and/or more effective community safety programs currently when compared to those before 2006.
Three-quarters of the respondents agreed or strongly agreed that the police force had a noticeable presence in their city, while only 11% disagreed or strongly disagreed, and 44% believed that the police force had more or much more size and presence currently than they did before 2006, while 49% believed the size and presence was the same.
4.2.6 Aggregate Overview For the most part, survey respondents indicated that growth in the cities of Saskatchewan was faster in the recent decade (during the recent “Saskaboom”), than in the previous decade. This fast growth has been driven by developments in the natural resources sector, and in investment and construction activity. However, given the most recent drop in oil prices, and the accompanying slowdown in economic activity, perceptions on future growth were neutral, with most respondents expecting growth to remain steady (“the same”) in the coming years.
Respondents indicated that bringing in labour from outside their cities, and even internationally, was important to the economic growth of their cities. However, respondents also noted that while families seemed to integrate well enough and find support in their cities, single workers did not tend to integrate as well, and that there was little growth in support programming for single workers.

17
Survey respondents indicated there were problems with gangs, alcohol abuse, illicit drug use, and both violent and property crime in their cities. In addition, there was a very strong belief that illicit drug use had increased over the past decade. While there was a majority who believed that there were many youth employment opportunities and accessible after-school programs in their cities, and that the availability of these activities had increased over the past decade, there was also the perception that youth crime was problematic and had intensified over the last decade.
The majority of survey respondents believed that there were at least some community safety programs and that the police force had a noticeable presence in their cities. Police forces and community safety programs either maintained or improved their presence over the past decade. Community perceptions of economic growth and growth in policing appear consistent with actual growth, however, the perception that crime had remained similar or had become worse over the years is not consistent with the data that indicates crime rates had been declining in Saskatchewan.
4.2.7 Limitations As noted earlier, survey responses are not representative of the Saskatchewan population, of the population in each individual city, nor of the different occupational groups. The survey was delivered on a voluntary basis and respondents remained anonymous. Any inferences should be made with caution as a result due to the differences across city environments, and due to any inconsistencies between questions or statements and the answers available to respondents.
4.3 Regional Results As shown in Figure 1, the majority of responses came from Regina (90) and Swift Current (53). There were not enough responses from any of the other cities to consider independently. Responses from residents of Yorkton, Saskatoon, Prince Albert, North Battleford, and Lloydminster were grouped together, to construct a subset of 83 survey respondents for the central cities of Saskatchewan. A grouping of southern cities was not chosen since those responses would primarily reflect responses from residents of Regina and Swift Current, with only 26 responses combined for Moose Jaw, Weyburn and Estevan. The responses for Regina and Swift Current were therefore treated independently.
It is important to acknowledge the characteristics of the three different regions. Regina is the major business centre for the south of Saskatchewan, the second largest populated city in the province, and is more economically diverse when compared to cities of smaller size (like Swift Current). The responses from the central cities were predominantly from the medium-sized and smaller cities of Lloydminster, Yorkton and North Battleford. Although these cities are small, collectively they could be considered diverse. The largest city of Saskatchewan, Saskatoon, was significantly under-represented in the survey. In addition, the central cities tend to have some combination of higher rates of poverty, lower median incomes, and younger populations, as well as the highest rates of violent and property crime amongst the ten largest cities in the province as shown in Wilson & Sagynbekov (2014).

18
With these important differing characteristics in mind, the responses for all respondents are now compared to those for Regina, Swift Current, and for the five central cities. The responses are tabulated and shown in Appendix 2, Tables 1 through 38. While interpreting the percentages, it is important to note that one response for the entire survey group of 252 responders corresponds to 0.40 percentage points, while one response for the Regina group corresponds to 1.11 percentage points, one response for the Swift Current group equates to 1.89 percentage points, and one response for the Central group equates to 1.20 percentage points.
4.3.1 The Economy Respondents from Regina were more bullish on the growth performance of their city, with 93% feeling that growth was fast or very fast, compared to 83% for all respondents, 70% for Swift Current respondents, and 81% for respondents in the central cities, as indicated in Appendix 2 Table 1 and its accompanying figure. Results presented in Table 2 indicate that respondents believed their local economies did better in the recent ten years than the ten years prior to 2006, with little difference between Regina, Swift Current, and the central cities. Optimism regarding future prospects was stronger in Swift Current (36% of respondents indicated they expect better performance in the coming 5 years), and in the central cities (31%), than in Regina (13%), as indicated in Table 3.
The natural resources sector was cited as the primary driver of growth by 49% of central city respondents, by 59% of Swift Current respondents, and by 62% of Regina respondents, as shown in Table 4. The results in Tables 4 and 5 indicate that Agriculture is an important sector of the Swift Current economy, as 21% of respondents from that city indicate this sector as a primary driver of growth, while 42% of respondents indicated this sector as a secondary driver of growth. The results from Tables 4 and 5 also show that the construction sector is important to the economies of Saskatchewan cities. This is consistent with the results in Table 6 which indicate that 91% of respondents in Regina and 89% in the central cities, and 85% of respondents in Swift Current, rated business investment and construction as important to the local economy. Energy prices are important drivers of the economy of all Saskatchewan’s major cities, as indicated in Table 7. Grain prices were also important for the major city economies, and especially so for Swift Current, as shown in Table 8, where 90% of respondents from that city believed that grain prices were important drivers of economic opportunity. Table 9 shows that 91% of Swift Current respondents, and 60% of respondents from the central cities, did not believe that potash prices were important to their city economies, while 73% of Regina respondents thought potash prices were important to the Regina economy.
Of all survey respondents, 76% indicated that economic growth was dependent on bringing in workers from outside their cities. Similarly, 81% of Regina respondents, 77% of Swift Current respondents, and a slightly lower percentage of respondents from the central cities, at 69%, thought that bringing in workers from outside the city was very important to economic growth, as shown in Table 10. Saskatchewan cities were reliant on foreign workers, as 96% and 94% of respondents in Regina and Swift Current respectively, and 85% of respondents in the central cities, thought that foreign workers were arriving in their cities to some or to a large extent, as indicated in Table 11.

19
4.3.2 Community Support There is clear acknowledgement of available support services for new arrivals in Saskatchewan cities, as 78% of all survey respondents indicated there were some or many programs in existence. A slight difference in awareness of, and/or the availability of support programs for new arrivals is noted in the responses shown in Table 12, as 89% of Swift Current respondents indicated there were some or a lot of support programs to integrate new arrivals into their city, compared to 72% of respondents from the central cities, and 81% of Regina respondents. There were also minor differences in the perception of how well families and single workers integrate into and are supported by Saskatchewan cities, as shown in Tables 13 to 16. Of all respondents, 52% agreed that families of workers integrate well into their communities (57% for Swift Current, 50% for central cities, and 46% for Regina), and 41% of respondents agreed that family support services have recently improved (49% for Swift Current, 37% for central cities and for Regina), while only 35% agreed that single workers integrated well (29% for central cities, 30% for Swift Current, and 42% for Regina), and only 16% of respondents agreed that support for single workers has recently improved (19% for Swift Current, 15% for the central cities, and 12% for Regina).
4.3.3 Undesirable Activities Adult gangs appear to pose problems in Regina and the central cities, with 68% and 65% of the respondents from those cities respectively indicating such. Swift Current, however, does not appear to have difficulties with adult gangs, as only 6% of respondents from Swift Current would agree that adult gangs pose a problem in their community (see Table 17). A slight majority (53%) of respondents from the central cities believed problems with adult gangs have increased since before 2006, as did a large minority (43%) of respondents from Regina. Only 8% of respondents from Swift Current thought that problems with adult gangs increased since 2005, which is expected given that most Swift Current respondents didn’t agree that adult gangs were problematic (see Table 18).
Tables 19 through 22 indicate that most respondents believed that alcohol abuse and illicit drug use were problems in their cities. On a regional basis, 95% of respondents from the central cities, 83% of respondents from Regina, and 57% of respondents from Swift Current believed that alcohol abuse was a problem. For the most part, perceptions of alcohol abuse haven’t changed dramatically over the years, as only 32% of all survey respondents, 30% of respondents from Regina, and only 13% of respondents from Swift Current thought that alcohol abuse problems had increased since before 2006. Relatively more respondents from the central cities, at 45%, thought that problems had increased. In Swift Current, 81% of respondents agreed that illicit drug use was a problem, higher than the rate for the perception of alcohol abuse as problematic in the city, while perceptions of illicit drug use were relatively similar to those of alcohol abuse from survey respondents in other regions. However, unlike the case for alcohol abuse, a slight majority of respondents in Regina (56%), and in Swift Current (53%), and two-thirds of respondents from the central cities believed that illicit drug problems had increased since before 2006.
Violent crime was perceived to be a problem by most respondents in Regina (59%) and in the central cities (68%), while only 8% of respondents from Swift Current thought violent crime was a problem. While almost half (48%) of respondents from the central cities thought that the prevalence of violent

20
crime had increased in their cities since before 2006, 35% of respondents from Regina, and only 9% of respondents from Swift Current thought that violent crime had increased over the past decade. A higher proportion of respondents thought that property crime was a problem, and had increased over the past decade: 88% of respondents from the central cities, 81% of respondents from Regina, and 43% of respondents from Swift Current thought that property crime was a problem in their cities; 55% of respondents from the central cities, 37% of respondents from Regina, and 38% of respondents from Swift Current, thought that the prevalence of property crime had increased over the past decade. These results are shown in Tables 23 through 26.
4.3.4 Youth Opportunities and Activities The experience of improved economic conditions and prosperity over the past decade was reflected in perceptions of improvements in employment opportunities. When presented with the statement “youth employment opportunities have improved over the last ten years,” 75% of all survey respondents, 82% of respondents from Regina, 74% of respondents from the central cities, and 68% of respondents from Swift Current either agreed or strongly agreed (see Table 27). There was a general sense that there were accessible evening and weekend sport and non-sport activities for youth, and that the availability of youth activities had improved over the last decade (see Tables 28 through 30). There are minor differences in the regional responses, with a slightly higher proportion of respondents from Swift Current agreeing there were accessible after-school sports activities (87% of Swift Current respondents agreed, compared to 77% of respondents from Regina and 80% from the central cities; see Table 28), that there were accessible after-school non-sports activities (75% of Swift Current respondents agreed compared to 57% from the central cities, and 63% from Regina; see Table 29), and that the availability of youth activities had increased over the past ten years (77% of Swift Current respondents agreed, compared to 59% of respondents from the central cities, and 55% of respondents from Regina; see Table 30).
Table 31 indicates that Swift Current respondents strongly differed from those of Regina and the central cities in their perception of youth gangs in their city. While only 6% of respondents from Swift Current agreed there were problems with youth gangs, 79% of respondents from Regina agreed there were youth gang problems in Regina, and 72% of respondents from the central cities agreed there were youth gang problems in their cities. Consistent with these results, only 19% of Swift Current respondents believed that youth gang problems had increased over the last decade, while 48% of Regina respondents, and 52% of respondents from the central cities, believed that problems with youth gangs had increased over the past ten years; these results are presented in Table 32.
Responses regarding perceptions of youth crime are shown in Tables 33 and 34. While only 42% of Swift Current respondents agreed that youth crime was a problem in the city, 79% of Regina respondents, and 82% of respondents from the central cities agreed that youth crime was a problem in their cities. Similarly, only 28% of respondents from Swift Current believed that youth crime in their city had increased over the past decade, compared to 47% of Regina respondents, and 58% of respondents from the central cities.

21
4.3.5 Safety and Policing Respondents were generally aware of community safety programs in their cities. The majority of respondents believed that there were some or many community safety programs in their cities – 66% of all survey respondents, 67% of respondents from Regina, 71% of respondents from the central cities, and 57% of respondents from Swift Current (see Table 35). For the most part, responses on changes in the number and effectiveness of community safety programs varied little across regions; the proportion of respondents indicating that these remained the same or increased was 77% of all survey respondents, 77% of respondents from Swift Current, 72% from the central cities, and 80% of Regina respondents, as shown in Table 36. There was a higher proportion of respondents from the central cities that indicated an increase in the amount and effectiveness of community programs in the central cities, at 36%, compared to one-quarter of respondents from Regina and Swift Current.
Survey respondents were presented with the statement, “the police force has a noticeable presence in the city,” and slightly less than three-quarters of the respondents across the selected regions either agreed or strongly agreed (see Table 37). Regional differences did exist, with 21% of those in the central cities strongly agreeing with the statement, but only 4% of Swift Current respondents. Very few respondents believed that the size and presence of the police force had decreased over the past decade (4% of all respondents, 7% of respondents from the central cities, 2% of Swift Current respondents, and 1% of Regina respondents; see Table 38). The majority of respondents in the central cities, at 54%, a fewer 46% of respondents from Regina, and 21% of Swift Current respondents believed that the size and presence of the police force had increased since before 2006.
4.3.6 Regional Differences There are a few key differences in the survey responses across the three regions worthy of being summarized here. Respondents from Regina were the most likely to report fast growth over the past decade, while also having less optimism about future growth prospects when compared to respondents from Swift Current and the central cities. Swift Current respondents were more likely than other respondents to cite agriculture and grain prices as important drivers of their city’s economy.
Consistent with the higher crime rates in Regina and the central cities, respondents from these regions were more likely to perceive problematic levels of crime, and more problems with both adult and youth gangs, than respondents from Swift Current. Swift Current has experienced growth in the rate of police-reported drug offenses in the city, along with many other cities in Saskatchewan, and this is reflected in the survey responses as the majority reported that illicit drug use was a problem in their city.
4.4 Result Highlights Survey respondents noted the strong growth experienced in Saskatchewan over the previous decade, but expectations about the future were neutral and were influenced by the recent economic shock of falling oil prices. This neutrality or uncertainty is consistent with the survey results from Saskatchewan Chamber of Commerce members around the same time. The 2012 Taking The Pulse survey indicated

22
that respondents perceived migrants as important contributors to the Saskatchewan economy. Respondents of this 2015 survey also indicated that migrants were important sources of growth and that migrant families integrated well into their communities, but that single migrant workers weren’t perceived as integrating as successfully. These results should be cautiously taken in context with the results from the Phase III report which indicated that increasing migration movements were associated with increases in rates of property crime, and that migrants are potential targets and/or perpetrators of crime (Wilson, 2017). Leaders have an opportunity to strengthen their communities by improving how they reach out to new migrants and help them better integrate and become more aware of crime prevention actions and initiatives.
Illicit drug use and alcohol abuse remain as strong challenges for communities and the police. Respondents of this survey also indicated that they perceived that property and violent crime was either increasing or remaining at the same level over the past decade when compared to the previous decade. These perceptions are consistent with other surveys, but are contrary to the data which suggests declining crime and victimization rates over the past decade, and this may be an indication of greater media coverage and community awareness of crime incidents. The police force and community leaders have an opportunity to change these perceptions and point to the success in bringing down rates of crime since 2003.

23
5 Update: Recent Saskatchewan Developments
In the time since the survey was conducted in 2015, resource prices have remained low, the Saskatchewan economy has contracted, unemployment rates have risen, the Saskatchewan Government has tightened the provincial budget, and crime rates have increased. Figure 3 shows the monthly commodity price indices compiled by the Bank of Canada. These price indices include those of the energy, metals and minerals, and agricultural sectors, as well as the total commodity price index, which also includes prices from the forestry and fishing sectors. The figure indicates that prices in the energy sector recovered after the collapse over the second half of 2008, but once again dropped precipitously at the end of 2014 and continued to decline into the beginning of 2016.
With the drop in oil and energy prices, the Saskatchewan economy contracted. Nominal gross domestic product (GDP) declined by 5.4% in 2015 and by another 4.0% in 2016. Nominal GDP and GDP growth rates for Saskatchewan are illustrated in Figure 4. Due to the decline in energy prices, real gross domestic product declined by only one percent in 2015, and by another one-half percent in 2016. Housing starts declined by 36% in 2015 and by 10% again in 2016. The Saskatchewan labour force was adversely impacted by these events, and the unemployment rate rose from 3.8% in 2014 to 5.0% in 2015, and again to 6.3% in 2016 (TD Economics, 2017).
Figure 3: Bank of Canada Commodity Price Indices, Monthly, January 2003 - November 2017
Source: Bank of Canada, https://www.bankofcanada.ca/rates/price-indexes/bcpi/, accessed on December 28, 2017.
-
500.00
1,000.00
1,500.00
2,000.00
2,500.00
3,000.00
01-0
1-20
03
01-0
1-20
04
01-0
1-20
05
01-0
1-20
06
01-0
1-20
07
01-0
1-20
08
01-0
1-20
09
01-0
1-20
10
01-0
1-20
11
01-0
1-20
12
01-0
1-20
13
01-0
1-20
14
01-0
1-20
15
01-0
1-20
16
01-0
1-20
17
Monthly Bank of Canada commodityprice index - Energy
Monthly Bank of Canada commodityprice index - Metals and Minerals
Monthly Bank of Canada commodityprice index - Total
Monthly Bank of Canada commodityprice index - Agriculture
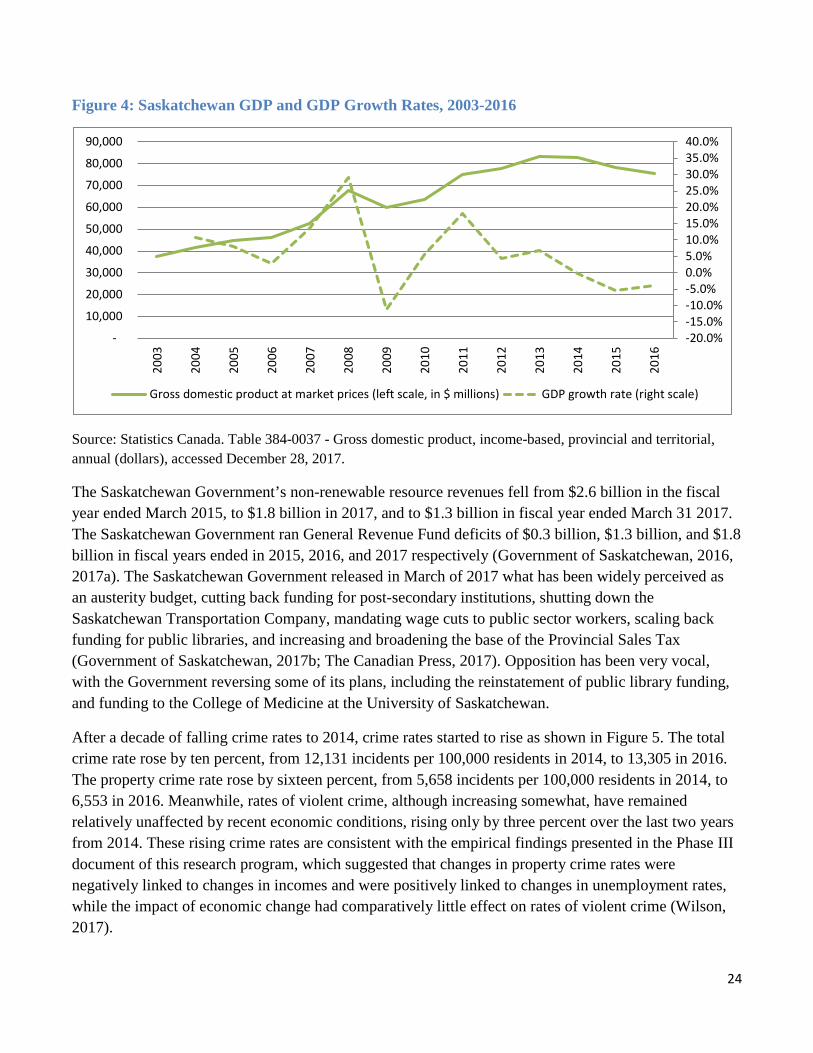
24
Figure 4: Saskatchewan GDP and GDP Growth Rates, 2003-2016
Source: Statistics Canada. Table 384-0037 - Gross domestic product, income-based, provincial and territorial, annual (dollars), accessed December 28, 2017.
The Saskatchewan Government’s non-renewable resource revenues fell from $2.6 billion in the fiscal year ended March 2015, to $1.8 billion in 2017, and to $1.3 billion in fiscal year ended March 31 2017. The Saskatchewan Government ran General Revenue Fund deficits of $0.3 billion, $1.3 billion, and $1.8 billion in fiscal years ended in 2015, 2016, and 2017 respectively (Government of Saskatchewan, 2016, 2017a). The Saskatchewan Government released in March of 2017 what has been widely perceived as an austerity budget, cutting back funding for post-secondary institutions, shutting down the Saskatchewan Transportation Company, mandating wage cuts to public sector workers, scaling back funding for public libraries, and increasing and broadening the base of the Provincial Sales Tax (Government of Saskatchewan, 2017b; The Canadian Press, 2017). Opposition has been very vocal, with the Government reversing some of its plans, including the reinstatement of public library funding, and funding to the College of Medicine at the University of Saskatchewan.
After a decade of falling crime rates to 2014, crime rates started to rise as shown in Figure 5. The total crime rate rose by ten percent, from 12,131 incidents per 100,000 residents in 2014, to 13,305 in 2016. The property crime rate rose by sixteen percent, from 5,658 incidents per 100,000 residents in 2014, to 6,553 in 2016. Meanwhile, rates of violent crime, although increasing somewhat, have remained relatively unaffected by recent economic conditions, rising only by three percent over the last two years from 2014. These rising crime rates are consistent with the empirical findings presented in the Phase III document of this research program, which suggested that changes in property crime rates were negatively linked to changes in incomes and were positively linked to changes in unemployment rates, while the impact of economic change had comparatively little effect on rates of violent crime (Wilson, 2017).
-20.0%-15.0%-10.0%-5.0%0.0%5.0%10.0%15.0%20.0%25.0%30.0%35.0%40.0%
-
10,000
20,000
30,000
40,000
50,000
60,000
70,000
80,000
90,00020
03
2004
2005
2006
2007
2008
2009
2010
2011
2012
2013
2014
2015
2016
Gross domestic product at market prices (left scale, in $ millions) GDP growth rate (right scale)

25
Figure 5: Saskatchewan Crime Rates, 2003-2016 (incidents per 100,000 residents)
Source: Statistics Canada. Table 252-0051 - Incident-based crime statistics, by detailed violations, annual, accessed December 28, 2017.
The decade of declining crime rates up to 2014 occurred during a time of economic and population expansion, and growth in government revenues and spending. The number of police officers grew quickly from 2,046 in 2007 to a peak of 2,306 in 2011 as shown in Figure 6. However, the number of police officers has remained relatively steady ever since while the population has continued to grow, which has resulted in a decline in the number of police officers per 100,000 residents. The police officer rate has now declined to rates experienced in the early 2000s. With recent poor economic conditions and austerity budgeting, it is unclear to what extent police forces will be stretched to deal with rising crime rates and what pressures will be placed on the authorities to increase police officer strength. Pressure may increase given the findings by Jones & Ruddell (2016) that the perception of crime and fear of crime among Regina residents worsened from 2013 to 2015. An increase in the perception of crime and fear of personal safety was also experienced in Saskatoon in 2015. In addition, a recent report on the 2014 General Social Survey indicated that the level of satisfaction with personal security from crime fell with less than 90% of Saskatchewan respondents indicating that were satisfied or very satisfied (Perreault, 2017); this proportion is down from 94% in 2009 and 2004 (Brennan, 2011).
-
2,000
4,000
6,000
8,000
10,000
12,000
14,000
16,000
18,000
20,00020
03
2004
2005
2006
2007
2008
2009
2010
2011
2012
2013
2014
2015
2016
Total Crime Rate Total Property Crime Rate Total Violent Crime Rate

26
Figure 6: Number of Police Officers and Police Officer Rates, Saskatchewan, 2003-2016
Source: Statistics Canada. Table 254-0005 - Police officers by rank and gender (excluding personnel from the RCMP Training Academy), Canada, provinces and territories, annual, as of June 15 (2003-2005), or as of May 15 (2006-2016), and Table 051-0001 - Estimates of population, by age group and sex for July 1, Canada, provinces and territories, annual, accessed December 28, 2017.
The Saskatchewan economy is expected to recover in 2018, with the energy sector projected to be a major contributing factor, as rig count is expected to increase by 50%. However, construction activity and household spending are forecast to remain slow, and provincial government austerity measures are expected to continue in the immediate future. Annual nominal GDP growth is projected at between four and five percent in the next two years, with real GDP remaining steady at two percent per year. The unemployment rate is expected to drop somewhat, from 6.2% to 5.7% in 2018 (TD Economics, 2017). If the Saskatchewan economy continues to show improvement, it is hoped and expected that the recent uptick in crime rates will prove to have been temporary, that crime rates will return to their previous trend decline, that Saskatchewan residents will feel improvements in their personal security and safety, and that their confidence in police will remain exceptionally high.
160.00
180.00
200.00
220.00
240.00
1,600
1,800
2,000
2,200
2,40020
03
2004
2005
2006
2007
2008
2009
2010
2011
2012
2013
2014
2015
2016
Total number of police officers (left scale) Police officer rate (right scale, per 100,000 residents)

27
6 Conclusion
This report is the fourth preliminary report of a larger research project focusing on the changing economy and demography of Saskatchewan and its impact on crime and policing. The first report provided an overview of economic, demographic, and policing and crime trends over the last two decades in Saskatchewan and its ten major cities. The second report presented a review of the literature on the theoretical and empirical determinants of criminal behaviour and crime. The third report provided an empirical investigation on the economic and demographic determinants of crime in Saskatchewan and among the western provinces over the last five decades. The results of that investigation suggested that property crime rates declined with strong economic conditions and with declining youth population shares, but were pressured upwards with increasing migration movements. The results, however, indicated that the changing economic and demographic conditions experienced over the last five decades had relatively little impact on violent crime rates. In addition, the results showed that there were two major points at which crime rates jumped, in 1998 and 2003, and were caused by changes in reporting methods.
This fourth report presented the results of a 2015 survey of community and business leaders on perceptions of changes in the economy, community, and crime and safety over the last two decades. Survey respondents indicated that economic growth had been quite strong over the previous decade and a slight majority expected similarly strong growth in the future. Respondents indicated that migrants were important for growth, and that migrant families integrated well into their communities, but less so for single migrant workers. As increasing migration movements have been empirically tied to increases in property crime, communities have a heightened incentive to better integrate new migrants and to improve awareness of crime prevention methods and initiatives when people move into and out of communities.
Respondents believed that the police force had a strong presence in their communities, and that there were as many or more community safety, youth employment, and youth activities available in their communities than in the previous decade. However, the majority of respondents believed that illicit drug use, alcohol abuse, and youth gangs, were problems in their communities. Strong majorities (at or just above 70%) also indicated that property crime and youth crime were problems in their communities, with almost half (45-46%) perceiving that property and youth crime increased over the past decade, and slightly less than half (40%) believing that the extent of property and youth crime over the past decade was similar to that of the previous decade. In general, these results and perceptions are comparable to those reported by other recent surveys on perceptions of the economy, crime and safety. Community leaders have an opportunity to better educate the public on the decline in crime since 2003 and on crime prevention initiatives. The results also hint at the changes occurring over 2014-15, as a result of the drop in oil prices, the downturn in the economy, and the rise in crime rates.
The Saskatchewan economy has contracted and crime rates have increased over the two years following the survey. Forecasts suggest that the Saskatchewan economy will begin to grow again in the coming

28
years, and it is hoped that crime rates will return to a trend decline, and that the recent rise in crime rates is only temporary.
29
Bibliography
Bank of Canada. (2014). Business Outlook Survey, Vol 11.2. Ottawa ON: Bank of Canada.
Bank of Canada. (April 2014, April). Monetary Policy Report. Ottawa ON: Bank of Canada.
Bank of Canada. (January 2015). Monetary Policy Report. Ottawa ON: Bank of canada.
Bank of Canada. (October 2014). Monetary Policy Report. Ottawa ON: Bank of Canada.
Brennan, S. (2011, December 1). Canadians' perceptions of personal safety and crime, 2009. Juristat, Statistics Canada, Catalogue no. 85-002-X.
Canadian Mortgage and Housing Corporation. (2015). CMHC 2015 Rental Market Report, Saskatchewan Highlights Spring 2015. Retrieved from https://www03.cmhc-schl.gc.ca/catalog/productDetail.cfm?lang=en&cat=110&itm=3&fr=1441230250053 or through http://www.cmhc-schl.gc.ca/en/hoficlincl/homain/stda/
Canadian Press. (2015, August 22). Baytex Energy drops dividend, cuts spending. Retrieved from http://www.thestarphoenix.com/business/baytex+energy+drops+dividend+cuts+spending/11309639/story.html
CBC News. (2015, March 5). Business in Estevan, Sask., reeling from oil price collapse. Retrieved from http://www.cbc.ca/news/canada/saskatchewan/businesses-in-estevan-sask-reeling-from-oil-price-collapse-1.2982962
Conference Board of Canada. (2015). Provincial Outlook Spring 2015: Saskatchewan. Ottawa ON: Conference Board of Canada.
Elliot, D. (2006). International Immigration. In Encyclopedia of Saskatchewan. Regina, SK: Canadian Plains Research Center.
Government of Saskatchewan. (2014). Saskatchewan Provincial Budget 14-15. Regina SK: Government of Saskatchewan.
Government of Saskatchewan. (2015). Saskatchewan Provincial Budget 15-16. Regina SK: Government of Saskatchewan.
Government of Saskatchewan. (2016). Public Accounts, 2015-16. Regina, SK: Government of Saskatchewan.
Government of Saskatchewan. (2017a). Public Accounts, 2016-17. Regina, SK: Government of Saskatchewan.
Government of Saskatchewan. (2017b). Saskatchewan Provincial Budget, 2017-18. Regina, SK: Government of Saskatchewan.

30
Insightrix Research Ltd. (2009, May 4). 2008 Community Satisfaction & Policing Priority Survey. Retrieved from http://www.thestarphoenix.com/pdf/2008CommSatisfSurvey_Final_Report3.pdf
Jewell, L. (2015). Perceptions of Crime, Feelings of Safety, and Experiences of Victimization in Saskatchewan Jurisdictions Policed by the Royal Canadian Mounted Police. Saskatoon: Centre for Forensic Behavioural Science and Justice Studies, University of Saskatchewan.
Jones, ,. N., & Ruddell, R. (2012). Community Perceptions of the Regina Police Service, 2011. Regina, SK: University of Regina.
Jones, N., & Ruddell, R. (2014). Commmunity Perceptions of the Regina Police Service, 2013. Regina, SK: University of Regina.
Jones, N., & Ruddell, R. (2016). Community Perceptions of the Regina Police Service, 2015. Regina, SK: Collaborative Centre for Justice and Safety.
Keatings, T., Down, C., Garcea, J., Zong, L., Huq, M., Grant, P., & Wotherspoon, T. (2012). Taking the Pulse of Saskatchewan 2012: Immigration and Diversity in Saskatchewan. Saskatoon, SK: Social Sciences Research Laboratories, University of Saskatchewan.
Keatings, T., Innes, R., Laliberte, R., & Howe, E. (2012). Taking the Pulse of Saskatchewan 2012: Aboriginal Issues in Saskatchewan. Saskatoon, SK: Social Sciences Research Laboratories: University of Saskatchewan.
Keatings, T., Jones, K., Gilchrist, D., Huq, M., & Walker, R. (2012). Taking the Pulse of Saskatchewan 2012: Saskatchewan's Economy. Saskatoon, SK: Social Sciences Research Laboratories, University of Saskatchewan.
Macrotrends. (2015, September 01). Crude Oil Price History Chart. Retrieved from http://www.macrotrends.net/1369/crude-oil-price-history-chart
McDowell, M., Down, C., Keatings, T., Bruneau, J., Deonandan, K., Noble, B., . . . Westman, C. (2012). Taking the Pulse of Saskatchewan 2012: Sustainable Resource Development. Saskatoon, SK: Social Sciences Research Laboratories, University of Saskatchewan.
McDowell, M., Jones, K., Keatings, T., Brooks, C., Cheng, H., Olver, M., & Wormith, S. (2012). Taking the Pulse of Saskatchewan 2012: Crime and Safety in Saskatchewan. Saskatoon, SK: Social Sciences Research Laboratories, University of Saskatchewan.
Morgan, G. (2015, September 1). New oilsands production may widen Western Canada Select discounts, analysts say. Retrieved from http://www.nationalpost.com/oilsands+production+widen+western+canada+select+discounts+analysts/11333049/story.html
Perreault, S. (2015, November 23). Criminal victimization in Canada, 2014. Juristat, Statistics Canada, Catalogue no. 85-002-X.

31
Perreault, S. (2017, December 12). Canadians' perceptions of personal safety and crime, 2014. Juristat, Statistics Canada, Catalogue no. 85-002-X.
Saskatchewan Bureau of Statistics. (2015, August). Monthly Statistical Review, Vol. 41, No. 8. Retrieved from http://www.stats.gov.sk.ca/stats/August15.pdf
Saskatchewan Chamber of Commerce. (2008). 2008 Economic Outlook Survey Results - Summary. Regina SK: Saskatchewan Chamber of Commerce.
Saskatchewan Chamber of Commerce. (2009). 2009 Economic Outlook Survey Results - Summary. Regina SK: Saskatchewan Chamber of Commerce.
Saskatchewan Chamber of Commerce. (2010). 2010 Economic Outlook Survey Results - Summary. Regina SK: Saskatchewan Chamber of Commerce.
Saskatchewan Chamber of Commerce. (2013). Economic Outlook 2014, Survey Results. Regina SK: Saskatchewan Chamber of Commerce.
Saskatchewan Chamber of Commerce. (2015). Economic Outlook 2015, Survey Results. Regina SK: Saskatchewan Chamber of Commerce.
Saskatchewan Chamber of Commerce. (2016). Economic Outlook 2016 - Survey Results. Regina SK: Saskatchewan Chamber of Commerce.
Saskatoon Police Service. (2012, April 18). Community Satisfaction Survey on Policing Shows Positive Results. Retrieved from https://saskatoonpolice.ca/news/2012280
Saskatoon StarPhoenix. (2015, September 5). People feeling less safe downtown, survey finds. Retrieved from http://thestarphoenix.com/news/local-news/people-feeling-less-safe-downtown-survey-finds
Sigma Analytics. (2009). City of Regina 2009 summer survey. Retrieved from https://www.regina.ca/opencms/export/sites/regina.ca/residents/city-administration/.media/pdf/2009-summer-survey.pdf
Statistics Canada. (2015, September 1). Table 282-0087 - Labour force survey estimates (LFS), CANSIM database.
TD Economics. (2017, December 14). Provincial Economic Forecast. Retrieved from https://economics.td.com/provincial-economic-forecast
The Canadian Press. (2017, March 22). Saskatchewan budget: Winners and losers. Retrieved from http://thestarphoenix.com/news/local-news/saskatchewan-budget-winners-losers-school-boards-stay-pst-goes-up
Weyburn Review. (2015, August 26). Construction activity is at reduced level from last year. Retrieved from http://www.weyburnreview.com/news/local-news/construction-activity-is-at-reduced-level-from-last-year-1.2039881

32
Wilson, S. (2017). Saskatchewan Crime Patterns and Determinants, Phase III Report, The Changing Economy and Demography of Saskatchewan and its Impact on Crime and Policing. Regina, SK: Collaborative Centre for Justice and Safety (forthcoming).
Wilson, S., & Sagynbekov, K. (2014). Overview of Demographic, Economic, Crime and Policing Trends in Saskatchewan. Phase I Report, The Changing Economy and Demography of Saskatchewan and its Impact on Crime and Policing. Regina, SK: Collaborative Centre for Justice and Safety, University of Regina.
Wilson, S., Sagynbekov, K., Pardy, T., & Penner, J. (2015). Influences on Criminal Behaviour - Theory and Evidence, Phase II Report, The Changing Economy and Demography of Saskatchewan and its Impact on Crime and Policing. Regina SK: Collaborative Centre for Justice and Safety, University of Regina.

33
Appendix 1: Survey Questionnaire (21 additional pages)

Qualtrics Survey Software https://eu.qualtrics.com/ControlPanel/Ajax.php?action=GetSurveyPrintP...
1 of 21 03/09/2015 1:55 PM

Qualtrics Survey Software https://eu.qualtrics.com/ControlPanel/Ajax.php?action=GetSurveyPrintP...
2 of 21 03/09/2015 1:55 PM

Qualtrics Survey Software https://eu.qualtrics.com/ControlPanel/Ajax.php?action=GetSurveyPrintP...
3 of 21 03/09/2015 1:55 PM

Qualtrics Survey Software https://eu.qualtrics.com/ControlPanel/Ajax.php?action=GetSurveyPrintP...
4 of 21 03/09/2015 1:55 PM

Qualtrics Survey Software https://eu.qualtrics.com/ControlPanel/Ajax.php?action=GetSurveyPrintP...
5 of 21 03/09/2015 1:55 PM

Qualtrics Survey Software https://eu.qualtrics.com/ControlPanel/Ajax.php?action=GetSurveyPrintP...
6 of 21 03/09/2015 1:55 PM

Qualtrics Survey Software https://eu.qualtrics.com/ControlPanel/Ajax.php?action=GetSurveyPrintP...
7 of 21 03/09/2015 1:55 PM
Qualtrics Survey Software https://eu.qualtrics.com/ControlPanel/Ajax.php?action=GetSurveyPrintP...
8 of 21 03/09/2015 1:55 PM

Qualtrics Survey Software https://eu.qualtrics.com/ControlPanel/Ajax.php?action=GetSurveyPrintP...
9 of 21 03/09/2015 1:55 PM

Qualtrics Survey Software https://eu.qualtrics.com/ControlPanel/Ajax.php?action=GetSurveyPrintP...
10 of 21 03/09/2015 1:55 PM

Qualtrics Survey Software https://eu.qualtrics.com/ControlPanel/Ajax.php?action=GetSurveyPrintP...
11 of 21 03/09/2015 1:55 PM

Qualtrics Survey Software https://eu.qualtrics.com/ControlPanel/Ajax.php?action=GetSurveyPrintP...
12 of 21 03/09/2015 1:55 PM

Qualtrics Survey Software https://eu.qualtrics.com/ControlPanel/Ajax.php?action=GetSurveyPrintP...
13 of 21 03/09/2015 1:55 PM

Qualtrics Survey Software https://eu.qualtrics.com/ControlPanel/Ajax.php?action=GetSurveyPrintP...
14 of 21 03/09/2015 1:55 PM

Qualtrics Survey Software https://eu.qualtrics.com/ControlPanel/Ajax.php?action=GetSurveyPrintP...
15 of 21 03/09/2015 1:55 PM

Qualtrics Survey Software https://eu.qualtrics.com/ControlPanel/Ajax.php?action=GetSurveyPrintP...
16 of 21 03/09/2015 1:55 PM

Qualtrics Survey Software https://eu.qualtrics.com/ControlPanel/Ajax.php?action=GetSurveyPrintP...
17 of 21 03/09/2015 1:55 PM

Qualtrics Survey Software https://eu.qualtrics.com/ControlPanel/Ajax.php?action=GetSurveyPrintP...
18 of 21 03/09/2015 1:55 PM

Qualtrics Survey Software https://eu.qualtrics.com/ControlPanel/Ajax.php?action=GetSurveyPrintP...
19 of 21 03/09/2015 1:55 PM

Qualtrics Survey Software https://eu.qualtrics.com/ControlPanel/Ajax.php?action=GetSurveyPrintP...
20 of 21 03/09/2015 1:55 PM

Qualtrics Survey Software https://eu.qualtrics.com/ControlPanel/Ajax.php?action=GetSurveyPrintP...
21 of 21 03/09/2015 1:55 PM
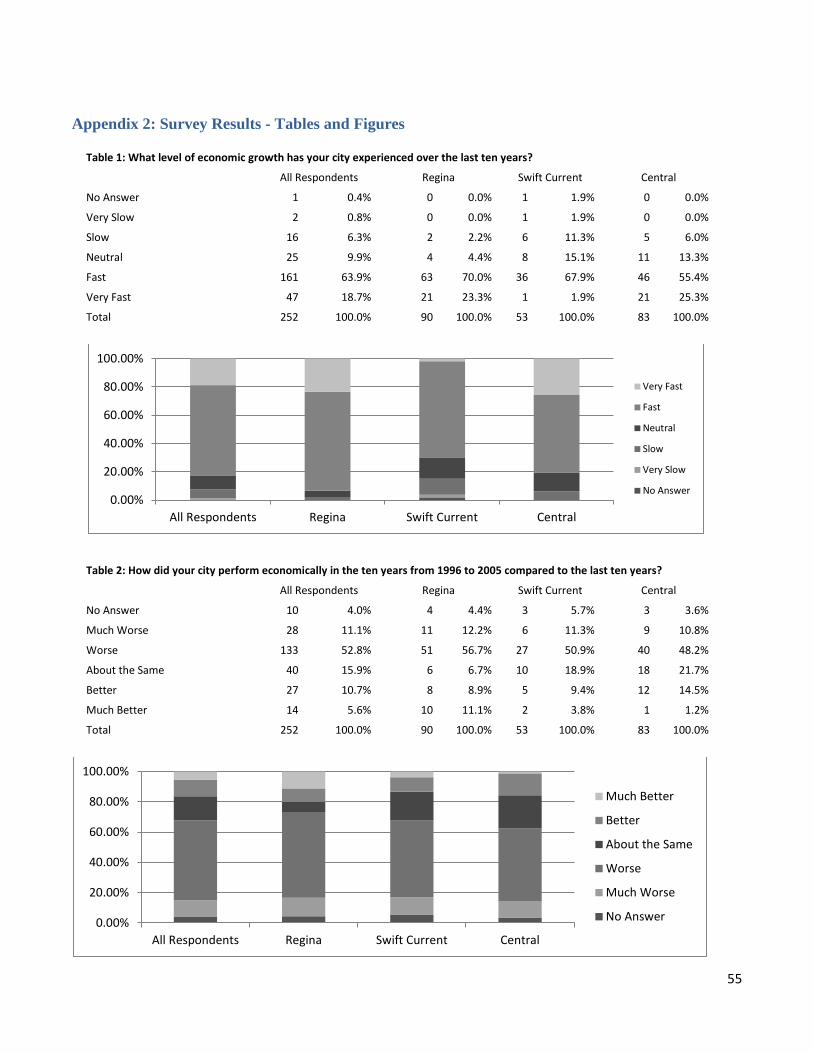
55
Appendix 2: Survey Results - Tables and Figures Table 1: What level of economic growth has your city experienced over the last ten years?
All Respondents Regina Swift Current Central
No Answer 1 0.4% 0 0.0% 1 1.9% 0 0.0%
Very Slow 2 0.8% 0 0.0% 1 1.9% 0 0.0%
Slow 16 6.3% 2 2.2% 6 11.3% 5 6.0%
Neutral 25 9.9% 4 4.4% 8 15.1% 11 13.3%
Fast 161 63.9% 63 70.0% 36 67.9% 46 55.4%
Very Fast 47 18.7% 21 23.3% 1 1.9% 21 25.3%
Total 252 100.0% 90 100.0% 53 100.0% 83 100.0%
Table 2: How did your city perform economically in the ten years from 1996 to 2005 compared to the last ten years?
All Respondents Regina Swift Current Central
No Answer 10 4.0% 4 4.4% 3 5.7% 3 3.6%
Much Worse 28 11.1% 11 12.2% 6 11.3% 9 10.8%
Worse 133 52.8% 51 56.7% 27 50.9% 40 48.2%
About the Same 40 15.9% 6 6.7% 10 18.9% 18 21.7%
Better 27 10.7% 8 8.9% 5 9.4% 12 14.5%
Much Better 14 5.6% 10 11.1% 2 3.8% 1 1.2%
Total 252 100.0% 90 100.0% 53 100.0% 83 100.0%
0.00%
20.00%
40.00%
60.00%
80.00%
100.00%
All Respondents Regina Swift Current Central
Very Fast
Fast
Neutral
Slow
Very Slow
No Answer
0.00%
20.00%
40.00%
60.00%
80.00%
100.00%
All Respondents Regina Swift Current Central
Much Better
Better
About the Same
Worse
Much Worse
No Answer

56
Table 3: How do you expect your city to perform economically in the coming five years compared to the last ten years?
All Respondents Regina Swift Current Central
No Answer 2 0.8% 0 0.0% 0 0.0% 1 1.2%
Much Worse 4 1.6% 1 1.1% 0 0.0% 1 1.2%
Worse 57 22.6% 28 31.1% 7 13.2% 13 15.7%
About the Same 128 50.8% 49 54.4% 27 50.9% 42 50.6%
Better 52 20.6% 11 12.2% 14 26.4% 23 27.7%
Much Better 9 3.6% 1 1.1% 5 9.4% 3 3.6%
Total 252 100.0% 90 100.0% 53 100.0% 83 100.0%
Table 4: Which sector of the economy appears to have been the primary driver of growth?
All Respondents Regina Swift Current Central
Natural Resources 144 57.1% 56 62.2% 31 58.5% 41 49.4%
Agriculture 26 10.3% 2 2.2% 11 20.8% 10 12.0%
General Construction 49 19.4% 24 26.7% 7 13.2% 13 15.7%
Manufacturing 4 1.6% 1 1.1% 0 0.0% 3 3.6%
Health 1 0.4% 0 0.0% 1 1.9% 0 0.0%
Education 1 0.4% 0 0.0% 1 1.9% 0 0.0%
Government services 3 1.2% 1 1.1% 1 1.9% 1 1.2%
Sales and services 15 6.0% 1 1.1% 1 1.9% 11 13.3%
Other/No Answer 9 3.6% 5 5.6% 0 0.0% 4 4.8%
Total 252 100.0% 90 100.0% 53 100.0% 83 100.0%
0.00%
20.00%
40.00%
60.00%
80.00%
100.00%
All Respondents Regina Swift Current Central
Much Better
Better
About the Same
Worse
Much Worse
No Answer
0.00%
20.00%
40.00%
60.00%
80.00%
100.00%
All Respondents Regina Swift Current Central
Other
Sales and services
Government services
Education
Health
Manufacturing
General Construction
Agriculture
Natural Resources

57
Table 5: Which sector of the economy appears to be the secondary driver of growth?
All Respondents Regina Swift Current Central
Natural Resources 45 17.9% 18 20.0% 12 22.6% 13 15.7%
Agriculture 63 25.0% 17 18.9% 22 41.5% 16 19.3%
General Construction 89 35.3% 35 38.9% 13 24.5% 31 37.3%
Manufacturing 18 7.1% 5 5.6% 5 9.4% 7 8.4%
Health 1 0.4% 1 1.1% 0 0.0% 0 0.0%
Education 2 0.8% 0 0.0% 1 1.9% 1 1.2%
Government services 11 4.4% 4 4.4% 0 0.0% 6 7.2%
Sales and services 13 5.2% 6 6.7% 0 0.0% 5 6.0%
Other/No Answer 10 4.0% 4 4.4% 0 0.0% 4 4.8%
Total 252 100.0% 90 100.0% 53 100.0% 83 100.0%
Table 6: To what extent are business investment and construction activity important drivers of economic opportunity in your city?
All Respondents Regina Swift Current Central
No Answer 0 0.0% 0 0.0% 0 0.0% 0 0.0%
Not at all Important 0 0.0% 0 0.0% 0 0.0% 0 0.0%
Very Unimportant 16 6.3% 4 4.4% 5 9.4% 6 7.2% Neither Important nor Unimportant 12 4.8% 4 4.4% 3 5.7% 3 3.6%
Very Important 172 68.3% 60 66.7% 38 71.7% 55 66.3%
Extremely Important 52 20.6% 22 24.4% 7 13.2% 19 22.9%
Total 252 100.0% 90 100.0% 53 100.0% 83 100.0%
0.00%
20.00%
40.00%
60.00%
80.00%
100.00%
All Respondents Regina Swift Current Central
Other
Sales and services
Government services
Education
Health
Manufacturing
General Construction
Agriculture
Natural Resources
0.00%
20.00%
40.00%
60.00%
80.00%
100.00%
All Respondents Regina Swift Current Central
Extremely Important
Very Important
Neither Important nor Unimportant
Very Unimportant
Not at all Important
No Answer

58
Table 7: To what extent are energy (e.g. oil and gas) prices important drivers of economic opportunity in your city?
All Respondents Regina Swift Current Central
No Answer 0 0.0% 0 0.0% 0 0.0% 0 0.0%
Not at all Important 0 0.0% 0 0.0% 0 0.0% 0 0.0%
Very Unimportant 11 4.4% 1 1.1% 5 9.4% 4 4.8% Neither Important nor Unimportant 49 19.4% 14 15.6% 5 9.4% 23 27.7%
Very Important 145 57.5% 65 72.2% 32 60.4% 38 45.8%
Extremely Important 47 18.7% 10 11.1% 11 20.8% 18 21.7%
Total 252 100.0% 90 100.0% 53 100.0% 83 100.0%
Table 8: To what extent are grain prices important drivers of economic opportunity in your city?
All Respondents Regina Swift Current Central
No Answer 2 0.8% 1 1.1% 0 0.0% 1 1.2%
Not at all Important 1 0.4% 1 1.1% 0 0.0% 0 0.0%
Very Unimportant 12 4.8% 2 2.2% 3 5.7% 6 7.2% Neither Important nor Unimportant 43 17.1% 29 32.2% 2 3.8% 9 10.8%
Very Important 145 57.5% 51 56.7% 25 47.2% 53 63.9%
Extremely Important 49 19.4% 6 6.7% 23 43.4% 14 16.9%
Total 252 100.0% 90 100.0% 53 100.0% 83 100.0%
0.00%
20.00%
40.00%
60.00%
80.00%
100.00%
All Respondents Regina Swift Current Central
Extremely Important
Very Important
Neither Important nor Unimportant
Very Unimportant
Not at all Important
No Answer
0.00%
20.00%
40.00%
60.00%
80.00%
100.00%
All Respondents Regina Swift Current Central
Extremely Important
Very Important
Neither Important nor Unimportant
Very Unimportant
Not at all Important
No Answer

59
Table 9: To what extent are potash prices important drivers of economic opportunity in your city?
All Respondents Regina Swift Current Central
No Answer 5 2.0% 1 1.1% 3 5.7% 1 1.2%
Not at all Important 21 8.3% 0 0.0% 11 20.8% 8 9.6%
Very Unimportant 29 11.5% 2 2.2% 14 26.4% 13 15.7% Neither Important nor Unimportant 80 31.7% 21 23.3% 20 37.7% 28 33.7%
Very Important 102 40.5% 60 66.7% 5 9.4% 27 32.5%
Extremely Important 15 6.0% 6 6.7% 0 0.0% 6 7.2%
Total 252 100.0% 90 100.0% 53 100.0% 83 100.0%
Table 10: To what extent is economic growth in your city dependent on bringing in workers from outside of the city?
All Respondents Regina Swift Current Central
No Answer 7 2.8% 3 3.3% 0 0.0% 3 3.6%
Not at all Important 3 1.2% 0 0.0% 0 0.0% 2 2.4%
Very Unimportant 14 5.6% 3 3.3% 4 7.5% 7 8.4% Neither Important nor Unimportant 37 14.7% 11 12.2% 8 15.1% 14 16.9%
Very Important 165 65.5% 63 70.0% 37 69.8% 49 59.0%
Extremely Important 26 10.3% 10 11.1% 4 7.5% 8 9.6%
Total 252 100.0% 90 100.0% 53 100.0% 83 100.0%
0.00%
20.00%
40.00%
60.00%
80.00%
100.00%
All Respondents Regina Swift Current Central
Extremely Important
Very Important
Neither Important nor Unimportant
Very Unimportant
Not at all Important
No Answer
0.00%
20.00%
40.00%
60.00%
80.00%
100.00%
All Respondents Regina Swift Current Central
Extremely Important
Very Important
Neither Important nor Unimportant
Very Unimportant
Not at all Important
No Answer

60
Table 11: To what extent have workers come from other countries?
All Respondents Regina Swift Current Central
No Answer 3 1.2% 2 2.2% 0 0.0% 1 1.2%
None 2 0.8% 0 0.0% 0 0.0% 1 1.2%
Little 11 4.4% 1 1.1% 2 3.8% 8 9.6%
Some 92 36.5% 34 37.8% 17 32.1% 28 33.7%
A Lot 140 55.6% 52 57.8% 33 62.3% 43 51.8%
Unknown 4 1.6% 1 1.1% 1 1.9% 2 2.4%
Total 252 100.0% 90 100.0% 53 100.0% 83 100.0%
Table 12: Are there any support programs to integrate new arrivals into the community?
All Respondents Regina Swift Current Central
No Answer 7 2.8% 1 1.1% 1 1.9% 4 4.8%
None 1 0.4% 0 0.0% 0 0.0% 1 1.2%
Little 30 11.9% 10 11.1% 4 7.5% 9 10.8%
Some 152 60.3% 60 66.7% 30 56.6% 46 55.4%
A Lot 45 17.9% 13 14.4% 17 32.1% 14 16.9%
Unknown 17 6.7% 6 6.7% 1 1.9% 9 10.8%
Total 252 100.0% 90 100.0% 53 100.0% 83 100.0%
0.00%
20.00%
40.00%
60.00%
80.00%
100.00%
All Respondents Regina Swift Current Central
Unknown
A Lot
Some
Little
None
No Answer
0.00%
20.00%
40.00%
60.00%
80.00%
100.00%
All Respondents Regina Swift Current Central
Unknown
A Lot
Some
Little
None
No Answer

61
Table 13: Would you agree or disagree with the following statement: Families of workers integrate well into the community.
All Respondents Regina Swift Current Central
No Answer 8 3.2% 3 3.3% 1 1.9% 3 3.6%
Strongly Disagree 4 1.6% 2 2.2% 0 0.0% 2 2.4%
Disagree 23 9.1% 11 12.2% 5 9.4% 5 6.0%
Neither Agree nor Disagree 86 34.1% 33 36.7% 17 32.1% 32 38.6%
Agree 125 49.6% 40 44.4% 29 54.7% 38 45.8%
Strongly Agree 6 2.4% 1 1.1% 1 1.9% 3 3.6%
Total 252 100.0% 90 100.0% 53 100.0% 83 100.0%
Table 14: Would you agree or disagree with the following statement: Community support for families of workers has recently improved.
All Respondents Regina Swift Current Central
No Answer 6 2.4% 2 2.2% 1 1.9% 3 3.6%
Strongly Disagree 2 0.8% 2 2.2% 0 0.0% 0 0.0%
Disagree 18 7.1% 8 8.9% 2 3.8% 5 6.0%
Neither Agree nor Disagree 122 48.4% 45 50.0% 24 45.3% 44 53.0%
Agree 99 39.3% 33 36.7% 24 45.3% 29 34.9%
Strongly Agree 5 2.0% 0 0.0% 2 3.8% 2 2.4%
Total 252 100.0% 90 100.0% 53 100.0% 83 100.0%
0.00%
20.00%
40.00%
60.00%
80.00%
100.00%
All Respondents Regina Swift Current Central
Strongly Agree
Agree
Neither Agree nor Disagree
Disagree
Strongly Disagree
No Answer
0.00%
20.00%
40.00%
60.00%
80.00%
100.00%
All Respondents Regina Swift Current Central
Strongly Agree
Agree
Neither Agree nor Disagree
Disagree
Strongly Disagree
No Answer

62
Table 15: Would you agree or disagree with the following statement: Single workers integrate well into the community.
All Respondents Regina Swift Current Central
No Answer 7 2.8% 2 2.2% 0 0.0% 4 4.8%
Strongly Disagree 3 1.2% 1 1.1% 0 0.0% 1 1.2%
Disagree 35 13.9% 12 13.3% 7 13.2% 13 15.7%
Neither Agree nor Disagree 120 47.6% 37 41.1% 30 56.6% 41 49.4%
Agree 83 32.9% 37 41.1% 15 28.3% 23 27.7%
Strongly Agree 4 1.6% 1 1.1% 1 1.9% 1 1.2%
Total 252 100.0% 90 100.0% 53 100.0% 83 100.0%
Table 16: Would you agree or disagree with the following statement: Community support for single workers has recently improved.
All Respondents Regina Swift Current Central
No Answer 7 2.8% 2 2.2% 1 1.9% 3 3.6%
Strongly Disagree 1 0.4% 0 0.0% 0 0.0% 1 1.2%
Disagree 41 16.3% 14 15.6% 6 11.3% 14 16.9%
Neither Agree nor Disagree 164 65.1% 63 70.0% 36 67.9% 53 63.9%
Agree 39 15.5% 11 12.2% 10 18.9% 12 14.5%
Strongly Agree 0 0.0% 0 0.0% 0 0.0% 0 0.0%
Total 252 100.0% 90 100.0% 53 100.0% 83 100.0%
0.00%
20.00%
40.00%
60.00%
80.00%
100.00%
All Respondents Regina Swift Current Central
Strongly Agree
Agree
Neither Agree nor Disagree
Disagree
Strongly Disagree
No Answer
0.00%
20.00%
40.00%
60.00%
80.00%
100.00%
All Respondents Regina Swift Current Central
Strongly Agree
Agree
Neither Agree nor Disagree
Disagree
Strongly Disagree
No Answer

63
Table 17: Would you agree or disagree with the following statement: There are problems with adult gangs in the community.
All Respondents Regina Swift Current Central
No Answer 7 2.8% 2 2.2% 2 3.8% 3 3.6%
Strongly Disagree 20 7.9% 0 0.0% 18 34.0% 0 0.0%
Disagree 41 16.3% 3 3.3% 19 35.8% 8 9.6%
Neither Agree nor Disagree 62 24.6% 24 26.7% 11 20.8% 18 21.7%
Agree 91 36.1% 46 51.1% 3 5.7% 39 47.0%
Strongly Agree 31 12.3% 15 16.7% 0 0.0% 15 18.1%
Total 252 100.0% 90 100.0% 53 100.0% 83 100.0%
Table 18: How would you compare current problems with adult gangs in the community compared to those before 2006?
All Respondents Regina Swift Current Central
No Answer 22 8.7% 5 5.6% 7 13.2% 9 10.8%
Much Less 4 1.6% 2 2.2% 1 1.9% 0 0.0%
Less 4 1.6% 0 0.0% 1 1.9% 2 2.4%
The Same 130 51.6% 44 48.9% 40 75.5% 28 33.7%
More 68 27.0% 27 30.0% 3 5.7% 33 39.8%
Much More 24 9.5% 12 13.3% 1 1.9% 11 13.3%
Total 252 100.0% 90 100.0% 53 100.0% 83 100.0%
0.00%
20.00%
40.00%
60.00%
80.00%
100.00%
All Respondents Regina Swift Current Central
Strongly Agree
Agree
Neither Agree nor Disagree
Disagree
Strongly Disagree
No Answer
0.00%
20.00%
40.00%
60.00%
80.00%
100.00%
All Respondents Regina Swift Current Central
Much More
More
The Same
Less
Much Less
No Answer

64
Table 19: Would you agree or disagree with the following statement: There are problems with alcohol abuse in the community.
All Respondents Regina Swift Current Central
No Answer 4 1.6% 3 3.3% 1 1.9% 0 0.0%
Strongly Disagree 0 0.0% 0 0.0% 0 0.0% 0 0.0%
Disagree 10 4.0% 2 2.2% 6 11.3% 1 1.2%
Neither Agree nor Disagree 31 12.3% 10 11.1% 16 30.2% 3 3.6%
Agree 124 49.2% 49 54.4% 23 43.4% 39 47.0%
Strongly Agree 83 32.9% 26 28.9% 7 13.2% 40 48.2%
Total 252 100.0% 90 100.0% 53 100.0% 83 100.0%
Table 20: How would you compare current problems with alcohol abuse in the community compared to those before 2006?
All Respondents Regina Swift Current Central
No Answer 19 7.5% 8 8.9% 4 7.5% 7 8.4%
Much Less 0 0.0% 0 0.0% 0 0.0% 0 0.0%
Less 6 2.4% 3 3.3% 1 1.9% 1 1.2%
The Same 146 57.9% 52 57.8% 41 77.4% 38 45.8%
More 58 23.0% 18 20.0% 6 11.3% 26 31.3%
Much More 23 9.1% 9 10.0% 1 1.9% 11 13.3%
Total 252 100.0% 90 100.0% 53 100.0% 83 100.0%
0.00%
20.00%
40.00%
60.00%
80.00%
100.00%
All Respondents Regina Swift Current Central
Strongly Agree
Agree
Neither Agree nor Disagree
Disagree
Strongly Disagree
No Answer
0.00%
20.00%
40.00%
60.00%
80.00%
100.00%
All Respondents Regina Swift Current Central
Much More
More
The Same
Less
Much Less
No Answer

65
Table 21: Would you agree or disagree with the following statement: There are problems with illicit drug use in the community.
All Respondents Regina Swift Current Central
No Answer 7 2.8% 3 3.3% 2 3.8% 2 2.4%
Strongly Disagree 1 0.4% 0 0.0% 1 1.9% 0 0.0%
Disagree 5 2.0% 1 1.1% 3 5.7% 1 1.2%
Neither Agree nor Disagree 19 7.5% 10 11.1% 4 7.5% 2 2.4%
Agree 129 51.2% 52 57.8% 26 49.1% 40 48.2%
Strongly Agree 91 36.1% 24 26.7% 17 32.1% 38 45.8%
Total 252 100.0% 90 100.0% 53 100.0% 83 100.0%
Table 22: How would you compare current problems with illicit drug abuse in the community compared to those before 2006?
All Respondents Regina Swift Current Central
No Answer 19 7.5% 7 7.8% 3 5.7% 9 10.8%
Much Less 0 0.0% 0 0.0% 0 0.0% 0 0.0%
Less 4 1.6% 1 1.1% 1 1.9% 1 1.2%
The Same 81 32.1% 32 35.6% 21 39.6% 18 21.7%
More 96 38.1% 35 38.9% 17 32.1% 33 39.8%
Much More 52 20.6% 15 16.7% 11 20.8% 22 26.5%
Total 252 100.0% 90 100.0% 53 100.0% 83 100.0%
0.00%
20.00%
40.00%
60.00%
80.00%
100.00%
All Respondents Regina Swift Current Central
Strongly Agree
Agree
Neither Agree nor Disagree
Disagree
Strongly Disagree
No Answer
0.00%
20.00%
40.00%
60.00%
80.00%
100.00%
All Respondents Regina Swift Current Central
Much More
More
The Same
Less
Much Less
No Answer

66
Table 23: Would you agree or disagree with the following statement: Violent crime is a problem in the city.
All Respondents Regina Swift Current Central
No Answer 3 1.2% 1 1.1% 3 5.7% 0 0.0%
Strongly Disagree 17 6.7% 2 2.2% 9 17.0% 6 7.2%
Disagree 59 23.4% 14 15.6% 30 56.6% 6 7.2%
Neither Agree nor Disagree 52 20.6% 20 22.2% 7 13.2% 15 18.1%
Agree 93 36.9% 40 44.4% 3 5.7% 42 50.6%
Strongly Agree 28 11.1% 13 14.4% 1 1.9% 14 16.9%
Total 252 100.0% 90 100.0% 53 100.0% 83 100.0%
Table 24: How would you compare the prevalence of violent crime in the community compared to that before 2006?
All Respondents Regina Swift Current Central
No Answer 21 8.3% 7 7.8% 4 7.5% 10 12.0%
Much Less 1 0.4% 0 0.0% 0 0.0% 1 1.2%
Less 21 8.3% 13 14.4% 3 5.7% 4 4.8%
The Same 126 50.0% 39 43.3% 41 77.4% 28 33.7%
More 63 25.0% 23 25.6% 5 9.4% 29 34.9%
Much More 20 7.9% 8 8.9% 0 0.0% 11 13.3%
Total 252 100.0% 90 100.0% 53 100.0% 83 100.0%
0.00%
20.00%
40.00%
60.00%
80.00%
100.00%
All Respondents Regina Swift Current Central
Strongly Agree
Agree
Neither Agree nor Disagree
Disagree
Strongly Disagree
No Answer
0.00%
20.00%
40.00%
60.00%
80.00%
100.00%
All Respondents Regina Swift Current Central
Much More
More
The Same
Less
Much Less
No Answer

67
Table 25: Would you agree or disagree with the following statement: Property crime is a problem in the city.
All Respondents Regina Swift Current Central
No Answer 4 1.6% 3 3.3% 1 1.9% 0 0.0%
Strongly Disagree 3 1.2% 0 0.0% 2 3.8% 1 1.2%
Disagree 21 8.3% 3 3.3% 11 20.8% 5 6.0%
Neither Agree nor Disagree 34 13.5% 11 12.2% 16 30.2% 4 4.8%
Agree 123 48.8% 53 58.9% 17 32.1% 38 45.8%
Strongly Agree 67 26.6% 20 22.2% 6 11.3% 35 42.2%
Total 252 100.0% 90 100.0% 53 100.0% 83 100.0%
Table 26: How would you compare the prevalence of property crime in the community compared to that before 2006?
All Respondents Regina Swift Current Central
No Answer 18 7.1% 8 8.9% 3 5.7% 7 8.4%
Much Less 0 0.0% 0 0.0% 0 0.0% 0 0.0%
Less 21 8.3% 14 15.6% 0 0.0% 5 6.0%
The Same 100 39.7% 35 38.9% 30 56.6% 25 30.1%
More 81 32.1% 25 27.8% 18 34.0% 29 34.9%
Much More 32 12.7% 8 8.9% 2 3.8% 17 20.5%
Total 252 100.0% 90 100.0% 53 100.0% 83 100.0%
0.00%
20.00%
40.00%
60.00%
80.00%
100.00%
All Respondents Regina Swift Current Central
Strongly Agree
Agree
Neither Agree nor Disagree
Disagree
Strongly Disagree
No Answer
0.00%
20.00%
40.00%
60.00%
80.00%
100.00%
All Respondents Regina Swift Current Central
Much More
More
The Same
Less
Much Less
No Answer

68
Table 27: Would you agree or disagree with the following statement: Youth employment opportunities overall have improved over the last ten years.
All Respondents Regina Swift Current Central
No Answer 6 2.4% 1 1.1% 2 3.8% 3 3.6%
Strongly Disagree 4 1.6% 1 1.1% 0 0.0% 2 2.4%
Disagree 16 6.3% 8 8.9% 3 5.7% 5 6.0%
Neither Agree nor Disagree 36 14.3% 6 6.7% 12 22.6% 12 14.5%
Agree 139 55.2% 53 58.9% 28 52.8% 45 54.2%
Strongly Agree 51 20.2% 21 23.3% 8 15.1% 16 19.3%
Total 252 100.0% 90 100.0% 53 100.0% 83 100.0%
Table 28: Would you agree or disagree with the following statement: There are accessible evening and weekend sports activities for youth.
All Respondents Regina Swift Current Central
No Answer 8 3.2% 3 3.3% 2 3.8% 3 3.6%
Strongly Disagree 5 2.0% 2 2.2% 0 0.0% 3 3.6%
Disagree 16 6.3% 3 3.3% 2 3.8% 8 9.6%
Neither Agree nor Disagree 21 8.3% 13 14.4% 3 5.7% 3 3.6%
Agree 153 60.7% 51 56.7% 37 69.8% 49 59.0%
Strongly Agree 49 19.4% 18 20.0% 9 17.0% 17 20.5%
Total 252 100.0% 90 100.0% 53 100.0% 83 100.0%
0.00%
20.00%
40.00%
60.00%
80.00%
100.00%
All Respondents Regina Swift Current Central
Strongly Agree
Agree
Neither Agree nor Disagree
Disagree
Strongly Disagree
No Answer
0.00%
20.00%
40.00%
60.00%
80.00%
100.00%
All Respondents Regina Swift Current Central
Strongly Agree
Agree
Neither Agree nor Disagree
Disagree
Strongly Disagree
No Answer

69
Table 29: Would you agree or disagree with the following statement: There are accessible evening and weekend non-sports activities for youth.
All Respondents Regina Swift Current Central
No Answer 8 3.2% 3 3.3% 4 7.5% 1 1.2%
Strongly Disagree 7 2.8% 3 3.3% 0 0.0% 4 4.8%
Disagree 33 13.1% 7 7.8% 3 5.7% 18 21.7%
Neither Agree nor Disagree 45 17.9% 20 22.2% 6 11.3% 13 15.7%
Agree 133 52.8% 47 52.2% 35 66.0% 38 45.8%
Strongly Agree 26 10.3% 10 11.1% 5 9.4% 9 10.8%
Total 252 100.0% 90 100.0% 53 100.0% 83 100.0%
Table 30: Would you agree or disagree with the following statement: The availability of youth activities has improved over the last ten years.
All Respondents Regina Swift Current Central
No Answer 10 4.0% 3 3.3% 2 3.8% 5 6.0%
Strongly Disagree 5 2.0% 2 2.2% 0 0.0% 3 3.6%
Disagree 23 9.1% 6 6.7% 1 1.9% 14 16.9%
Neither Agree nor Disagree 61 24.2% 30 33.3% 9 17.0% 12 14.5%
Agree 125 49.6% 42 46.7% 32 60.4% 38 45.8%
Strongly Agree 28 11.1% 7 7.8% 9 17.0% 11 13.3%
Total 252 100.0% 90 100.0% 53 100.0% 83 100.0%
0.00%
20.00%
40.00%
60.00%
80.00%
100.00%
All Respondents Regina Swift Current Central
Strongly Agree
Agree
Neither Agree nor Disagree
Disagree
Strongly Disagree
No Answer
0.00%
20.00%
40.00%
60.00%
80.00%
100.00%
All Respondents Regina Swift Current Central
Strongly Agree
Agree
Neither Agree nor Disagree
Disagree
Strongly Disagree
No Answer
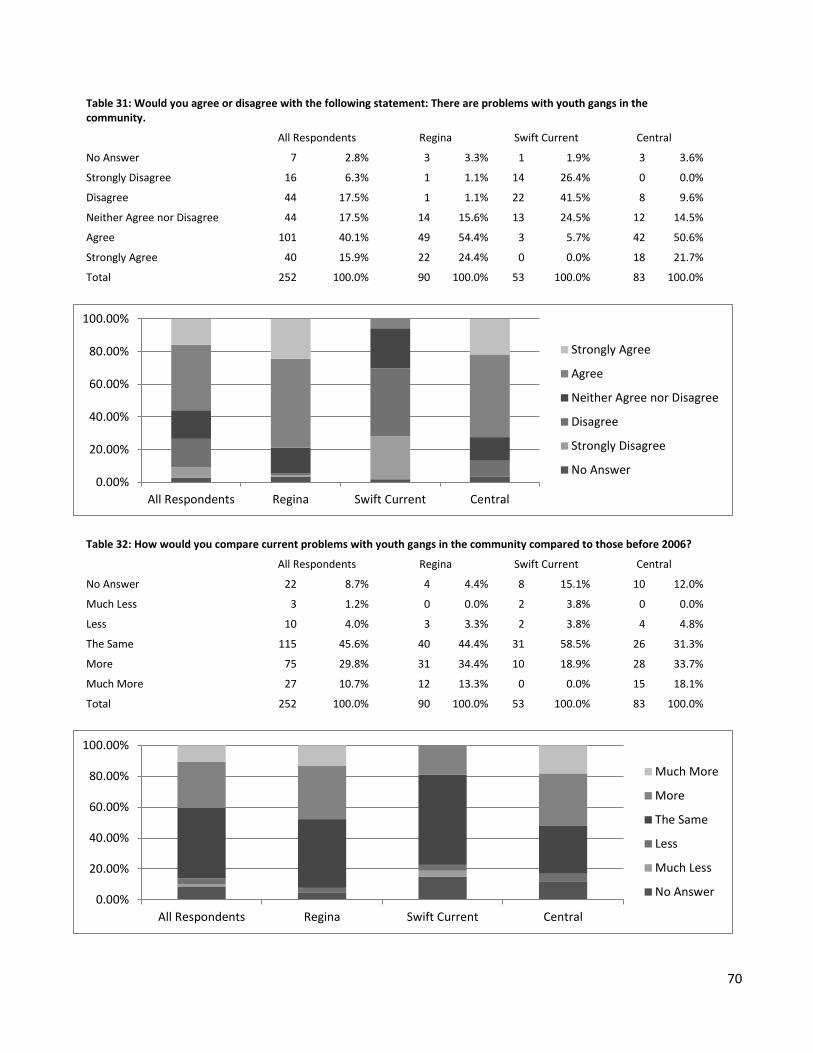
70
Table 31: Would you agree or disagree with the following statement: There are problems with youth gangs in the community.
All Respondents Regina Swift Current Central
No Answer 7 2.8% 3 3.3% 1 1.9% 3 3.6%
Strongly Disagree 16 6.3% 1 1.1% 14 26.4% 0 0.0%
Disagree 44 17.5% 1 1.1% 22 41.5% 8 9.6%
Neither Agree nor Disagree 44 17.5% 14 15.6% 13 24.5% 12 14.5%
Agree 101 40.1% 49 54.4% 3 5.7% 42 50.6%
Strongly Agree 40 15.9% 22 24.4% 0 0.0% 18 21.7%
Total 252 100.0% 90 100.0% 53 100.0% 83 100.0%
Table 32: How would you compare current problems with youth gangs in the community compared to those before 2006?
All Respondents Regina Swift Current Central
No Answer 22 8.7% 4 4.4% 8 15.1% 10 12.0%
Much Less 3 1.2% 0 0.0% 2 3.8% 0 0.0%
Less 10 4.0% 3 3.3% 2 3.8% 4 4.8%
The Same 115 45.6% 40 44.4% 31 58.5% 26 31.3%
More 75 29.8% 31 34.4% 10 18.9% 28 33.7%
Much More 27 10.7% 12 13.3% 0 0.0% 15 18.1%
Total 252 100.0% 90 100.0% 53 100.0% 83 100.0%
0.00%
20.00%
40.00%
60.00%
80.00%
100.00%
All Respondents Regina Swift Current Central
Strongly Agree
Agree
Neither Agree nor Disagree
Disagree
Strongly Disagree
No Answer
0.00%
20.00%
40.00%
60.00%
80.00%
100.00%
All Respondents Regina Swift Current Central
Much More
More
The Same
Less
Much Less
No Answer

71
Table 33: Would you agree or disagree with the following statement: Youth crime is a problem in the city.
All Respondents Regina Swift Current Central
No Answer 5 2.0% 3 3.3% 2 3.8% 0 0.0%
Strongly Disagree 6 2.4% 1 1.1% 3 5.7% 2 2.4%
Disagree 20 7.9% 4 4.4% 12 22.6% 3 3.6%
Neither Agree nor Disagree 44 17.5% 11 12.2% 14 26.4% 10 12.0%
Agree 132 52.4% 53 58.9% 19 35.8% 46 55.4%
Strongly Agree 45 17.9% 18 20.0% 3 5.7% 22 26.5%
Total 252 100.0% 90 100.0% 53 100.0% 83 100.0%
Table 34: How would you compare the prevalence of youth crime in the community compared to that before 2006?
All Respondents Regina Swift Current Central
No Answer 21 8.3% 8 8.9% 4 7.5% 8 9.6%
Much Less 1 0.4% 1 1.1% 0 0.0% 0 0.0%
Less 14 5.6% 8 8.9% 2 3.8% 3 3.6%
The Same 100 39.7% 31 34.4% 32 60.4% 24 28.9%
More 90 35.7% 33 36.7% 14 26.4% 33 39.8%
Much More 26 10.3% 9 10.0% 1 1.9% 15 18.1%
Total 252 100.0% 90 100.0% 53 100.0% 83 100.0%
0.00%
20.00%
40.00%
60.00%
80.00%
100.00%
All Respondents Regina Swift Current Central
Strongly Agree
Agree
Neither Agree nor Disagree
Disagree
Strongly Disagree
No Answer
0.00%
20.00%
40.00%
60.00%
80.00%
100.00%
All Respondents Regina Swift Current Central
Much More
More
The Same
Less
Much Less
No Answer

72
Table 35: Are there any community safety programs or activities in the city?
All Respondents Regina Swift Current Central
No Answer 9 3.6% 3 3.3% 2 3.8% 4 4.8%
None 4 1.6% 0 0.0% 1 1.9% 2 2.4%
Little 29 11.5% 12 13.3% 9 17.0% 4 4.8%
Some 133 52.8% 51 56.7% 26 49.1% 43 51.8%
A Lot 34 13.5% 9 10.0% 4 7.5% 16 19.3%
Unknown 43 17.1% 15 16.7% 11 20.8% 14 16.9%
Total 252 100.0% 90 100.0% 53 100.0% 83 100.0%
Table 36: How would you compare the amount and effectiveness of community safety programs in the community compared to those before 2006?
All Respondents Regina Swift Current Central
No Answer 39 15.5% 13 14.4% 10 18.9% 13 15.7%
Much Less 1 0.4% 0 0.0% 1 1.9% 0 0.0%
Less 13 5.2% 5 5.6% 1 1.9% 6 7.2%
The Same 123 48.8% 50 55.6% 28 52.8% 34 41.0%
More 71 28.2% 22 24.4% 13 24.5% 26 31.3%
Much More 5 2.0% 0 0.0% 0 0.0% 4 4.8%
Total 252 100.0% 90 100.0% 53 100.0% 83 100.0%
0.00%
20.00%
40.00%
60.00%
80.00%
100.00%
All Respondents Regina Swift Current Central
Unknown
A Lot
Some
Little
None
No Answer
0.00%
20.00%
40.00%
60.00%
80.00%
100.00%
All Respondents Regina Swift Current Central
Much More
More
The Same
Less
Much Less
No Answer

73
Table 37: Would you agree or disagree with the following statement: The police force has a noticeable presence in the city.
All Respondents Regina Swift Current Central
No Answer 5 2.0% 3 3.3% 0 0.0% 2 2.4%
Strongly Disagree 3 1.2% 0 0.0% 1 1.9% 1 1.2%
Disagree 24 9.5% 6 6.7% 7 13.2% 10 12.0%
Neither Agree nor Disagree 33 13.1% 15 16.7% 8 15.1% 9 10.8%
Agree 149 59.1% 56 62.2% 35 66.0% 44 53.0%
Strongly Agree 38 15.1% 10 11.1% 2 3.8% 17 20.5%
Total 252 100.0% 90 100.0% 53 100.0% 83 100.0%
Table 38: How would you compare the size and presence of the police force in the community compared to that before 2006?
All Respondents Regina Swift Current Central
No Answer 18 7.1% 7 7.8% 5 9.4% 6 7.2%
Much Less 2 0.8% 0 0.0% 0 0.0% 1 1.2%
Less 8 3.2% 1 1.1% 1 1.9% 5 6.0%
The Same 114 45.2% 41 45.6% 36 67.9% 26 31.3%
More 97 38.5% 38 42.2% 11 20.8% 39 47.0%
Much More 13 5.2% 3 3.3% 0 0.0% 6 7.2%
Total 252 100.0% 90 100.0% 53 100.0% 83 100.0%
0.00%
20.00%
40.00%
60.00%
80.00%
100.00%
All Respondents Regina Swift Current Central
Strongly Agree
Agree
Neither Agree nor Disagree
Disagree
Strongly Disagree
No Answer
0.00%
20.00%
40.00%
60.00%
80.00%
100.00%
All Respondents Regina Swift Current Central
Much More
More
The Same
Less
Much Less
No Answer