Embed Size (px)
Citation preview

II. SITE DEMOGRAPHY AND DESCRIPTION
Number: 2002-127Date Released: September 6, 2002
BULACAN:POPULATION REACHED TWO MILLIONTH MARK
(Results from the 2000 Census of Population and Housing, NSO)
Population to double in 14 years
The province of Bulacan registered a total population of 2,234,088 persons in the year 2000, up from 1,784,441 persons in 1995. This figure gave the province an average annual growth rate of 4.93 percent, an increase of 1.69 percentage points from the 1990 to 1995 period. The number of households was registered at 463,886, an increase of 104,273 households over the 1995 figure. This gave an average household size of 4.8 persons, a slight decrease from the 1995 and national average of five persons. If the current growth rate continues, the population of Bulacan was expected to double in 14 years.
Bulacan ranked first in Central Luzon Region in terms of population size
Bulacan ranked first in terms of population size among the six provinces (Bataan, Bulacan, Nueva Ecija, Pampanga, Tarlac, Zambales) and two highly urbanized cities (Angeles City and Olongapo City) in Central Luzon, contributing 27.82 percent to the 8 million population of the region. At the national level, the province shared 2.87 percent to the total population of 76.5 million as recorded in the 2000 Census of Population and Housing.
San Jose Del Monte, the biggest municipality in terms of population size
Of the 24 municipalities comprising Bulacan, San Jose Del Monte, was the biggest in terms of population size. This registered a population of 315,807 persons or 14.1 percent of the total provincial population. It was followed by Malolos, the provincial capital (7.85 percent), Meycauayan (7.30 percent), Santa Maria (6.46 percent) and San Miguel (5.54 percent). Doña Remedios Trinidad had the smallest population with 0.61 percent of the total provincial population.
Bulacan had a median age of 23 years
Bulacan had a median age of 23 years. This meant that in 2000, half of the population were below 23 years old. In 1995, the median age was 22 years.
Sex ratio was recorded at 99.96
Females outnumbered their male counterparts with a sex ratio of 99.96 females for every 100 males.
There were 1,315,820 persons or 58.90 percent of the total population belonging to the voting population. The proportion of males (49.32 percent) in the voting age was lower than that of the females (50.68 percent).
2

More than half of females were in childbearing ages
Out of 1,117,258 females, 594,028 or 53.17 percent belonged to childbearing or reproductive group (15 to 49 years). The highest percentage of which, were those at age group 15 to 19 years (18.53 percent).
Dependency ratio down to 64
The percentage of the total population belonging to age group 0 to 14 years was 35.3 percent. The oldest group (65 years and over) accounted for 3.6 percent, while 61.2 percent were in 15 to 64 years age group (economically active population).The overall dependency ratio in 2000 was 64. This meant that for every 100 persons aged 15 to 64 years, there were about 64 dependents (58 persons aged 0 to 14 years - young dependents; and six persons aged 65 years and over - old dependents). In 1995, the dependency ratio was recorded at 65.
Females dominated higher levels of education
About 40.46 percent of the household population aged five years and over in Bulacan had attended or completed elementary education; 30.93 percent, high school; 10.77 percent, college undergraduates; 5.07 percent, academic degree holders and only 0.20 percent with post baccalaureate courses. On the other hand, the proportion of children 5 to 6 years old who had completed pre-school and were likely to become Grade I students in the next school year was 2.52 percent (49,015 pupils).
3

There were more males than females who had attended or finished high school and post secondary education. On the other hand, those who were college undergraduates, had college degree and with post baccalaureate courses were predominantly females.
Nine out of ten were Tagalog
Majority (90.4 percent) of the household population in Bulacan classified themselves as Tagalog. Others were Bisaya/Binisaya (2.22 percent), and Bicol/Bikol (1.95 percent). Other ethnic groups included Ilocano and Cebuano with 1.08 percent and 0.75 percent, respectively.
Married persons outnumbered single persons
Of the total population 10 years old and over in Bulacan, a higher proportion of married persons (48.33 percent) was reported as compared to single persons (41.30 percent). The remaining 10.37 percent were either widowed, divorced/separated, with other arrangements or with unknown marital status.
About 21 percent of the housing units had floor area of 20 to 29 square meters
Twenty one percent of the occupied housing units had floor area of 20 to 29 square meters (20.6 percent). About 20 percent had floor area of 10 to 19 square meters and 30 to 49 square meters. Only 5.4 percent of the occupied housing units had floor area of 120 and over square meters.
Majority of the households used strong materials for their houses
Majority of the households in Bulacan used galvanized iron/aluminum (84.9 percent) and a small percentage still used cogon/nipa/anahaw (2.2 percent) as roof of their houses. As to the construction material of the outer walls, more than half of the occupied housing units had walls made of concrete/brick/stone (57.4 percent), and 24 percent, half concrete/brick/stone and half wood.
Of the total occupied housing units, 55.5 percent had roof made of galvanized iron/aluminum and concrete/brick/stone for walls.
BULACAN
Bulacan is the land of Tagalog Poets, whose prosperous towns and rich agricultural lands have nurtured a most vibrant and colorful people. The province of Nueva Ecija bound it on the north, on the east by the provinces of Aurora and Quezon, on the west by the province of Pampanga and on the south by the province of Rizal, Metro Manila and Manila Bay. Bulacan got its name from the Tagalog word "bulak" meaning cotton, which was its former principal product. The climate in Bulacan is similar to the rest of Central Luzon. There were two pronounced seasons with a dry period from November to April and a wet period the rest of the year.
The province is also known for world-class jewelry. Tourist attractions include Barasoain Church, where the revolutionary congress drafted the first Philippine Constitution; the Shrine of Marcelo H. Del Pilar and the monument of Francisco Balagtas. Bulacan is also known for the unique rites and fiestas held around the different towns, like the Carabao Festival in Pulilan and the fiesta of Obando, marked by fertility rite consisting of street dancing by childless couples who hope to be blessed with offspring, and the Crus ng Wawa River festival where a huge decorated pagoda is paraded in the Bocaue River.
Source: Website of League of Provinces of the Philippines (www.leagueofprovinces.org.ph)
(Sgd.) CARMELITA N. ERICTAAdministrator
4

Table1. Total Population Distribution of Top 5 Municipalities by Sex: Bulacan, 2000
Municipalities Total Population Percent Male Female
Bulacan 2,234,088 100.00 1,116,830 1,117,258
San Jose Del Monte 315,807 14.14 158,241 157,566
Malolos (Capital) 175,291 7.85 86,600 88,691
Meycauyan 163,037 7.30 81,450 81,587
Sta. Maria 144,282 6.46 72,209 72,073
San Miguel 123,824 5.54 62,739 61,085
Other Municipalities 1,311,847 58.72 655,591 656,256
Source: NSO, 2000 Census of Population and Housing
Table 2. Total Population by Age Group, Sex and Sex Ratio: Bulacan, 2000
Age Group Total Population Male Female Sex Ratio
Bulacan 2,234,088 1,116,830 1,117,258 99.96
Under 1 57,616 29,397 28,219 104.17
1 to 4 227,154 116,120 111,034 104.58
5 to 9 268,396 137,614 130,782 105.22
10 to 14 235,055 119,300 115,755 103.06
15 to 19 219,439 109,352 110,087 99.33
20 to 24 214,941 106,119 108,822 97.52
25 to 29 190,372 94,478 95,894 98.52
30 to 34 182,392 91,156 91,236 99.91
35 to 39 153,757 78,248 75,509 103.63
40 to 44 127,653 64,785 62,868 103.05
45 to 49 100,493 50,881 49,612 102.56
50 to 54 81,379 40,612 40,767 99.62
55 to 59 52,338 25,684 26,654 96.36
60 to 64 43,593 20,297 23,296 87.13
65 to 69 30,911 13,735 17,176 79.97
70 to 74 21,480 9,127 12,353 73.88
75 to 79 13,712 5,349 8,363 63.96
80 & Over 13,407 4,576 8,831 51.82
Source: NSO, 2000 Census of Population and Housing
Table 3. Household Population 5 Years Old and Over by Highest Educational Attainment and Sex: Bulacan, 2000
Highest Educational AttainmentHousehold Population5 Years Old & Over
Male Female
Bulacan 1,946,048 969,058 976,990
5

No Grade Completed 62,371 32,273 30,098
Pre-School 49,015 25,241 23,774
Elementary 787,280 390,401 396,879
High School 601,969 305,701 296,268
Post Secondary 91,637 46,858 44,779
College Undergraduate 209,540 104,033 105,507
Academic Degree Holder 98,732 42,290 56,442
Post Baccalaureate 3,925 1,568 2,357
Not Stated 41,579 20,693 20,886
Source: NSO, 2000 Census of Population and Housing
Table 4. Total Population 10 Years Old and Over by Age Group and Marital Status: Bulacan, 2000
Age GroupTotal Population10 Years Old & Over
Single Married WidowedDivorced/Separated
Others Unknown
Bulacan 1,680,922 694,218 812,359 67,385 21,392 72,643 12,925
Below 20 454,494 425,600 14,224 461 605 6,890 6,714
20 – 24 214,941 133,044 63,464 446 1,659 14,170 2,158
25 – 29 190,372 60,258 112,501 816 2,549 13,068 1,180
30 – 34 182,392 30,089 135,588 1,586 3,209 11,129 791
35 – 39 153,757 15,547 123,448 2,359 3,194 8,742 467
40 – 44 127,653 9,021 104,788 3,698 3,097 6,732 317
45 – 49 100,493 5,968 82,175 5,032 2,483 4,580 255
50 – 54 81,379 4,587 64,571 7,005 1,889 3,116 211
55 – 59 52,338 2,527 40,052 6,941 1,036 1,635 147
60 – 64 43,593 2,303 30,467 8,767 750 1,135 171
65 – 69 30,911 1,782 19,346 8,541 451 656 135
70 – 74 21,480 1,493 11,524 7,694 246 385 138
75 – 79 13,712 964 6,079 6,242 130 211 86
80 & Over 13,407 1,035 4,132 7,797 94 194 155
Source: NSO, 2000 Census of Population and Housing
Table 5. Household Population by Ethnicity and Sex: Bulacan, 2000
Ethnicity Both Sexes Male Female
Bulacan 2,230,778 1,114,552 1,116,226
Tagalog 2,015,822 1,008,323 1,007,499
Bisaya/Binisaya 49,431 24,145 25,286
Bikol/Bicol 43,605 22,268 21,337
Ilocano 24,159 11,987 12,172
Cebuano 16,786 8,139 8,647
Others 69,717 34,030 35,687
Other Foreign Ethnicity 511 355 156
6

Not Reported 10,747 5,305 5,442
Source: NSO, 2000 Census of Population and Housing
7

Table 6. Total Occupied Housing Units by Construction Materials of the Outer Walls and Roof: Bulacan, 2000
CONSTRUCTIONMATERIALS OF THEOUTER WALLS
CONSTRUCTION MATERIALS OF THE ROOF
TotalOccupiedHousingUnits
GalvanizedIron/Aluminum
Tile/Concrete/Clay Tile
HalfGalvanized,Iron/HalfConcrete
WoodCogon/Nipa/Anahaw
Makeshift/Salvaged/ImprovisedMaterials
Asbestos/Others
NotReported
Bulacan 456,208 387,512 4,622 36,925 8,618 10,170 3,301 462 4,598
Concrete/Brick/ Stone
261,869 253,035 3,381 3,941 575 461 369 107 -
Wood 51,757 41,140 231 2,314 6,143 1,654 225 50 -
Half Concrete/ Brick/Stone and Half Wood
109,584 76,733 824 29,264 1,380 1,128 192 63 -
Galvanized iron/ Aluminum
3,069 2,341 35 572 62 30 18 11 -
Bamboo/Sawali/ Cogon/Nipa
16,279 8,641 - 440 315 6,593 200 85 5
Asbestos 185 104 8 15 6 - - 52 -
Glass 83 68 9 3 - - - 3 -
Makeshift/ Salvaged/ Improvised Materials
5,401 2,761 - 93 46 207 2,248 46 -
Others/ Not reported
7,493 2,355 58 262 62 90 39 35 4,592
No Walls 488 334 76 21 29 7 10 10 1
Source: NSO, 2000 Census of Population and Housing
2

TECHNICAL NOTES
Average Household Size – average number of people who live in the household
Growth Rate – the rate at which the population is increasing (or decreasing) in a given year due to natural increase and net migration, expressed as a percentage of the base population
Median Age – the age at which exactly half of the population is young and half is old
Sex Ratio – the ratio of males to females in a given population expressed as the number of males per 100 females
Age-Dependency Ratio – the ratio of persons in the "dependent" ages (under 15 years and over 64 years) to those in the "economically productive" ages (15 to 64 years old) in the population
Household – a social unit consisting of a person or a group of persons who sleep in the same housing unit and have common arrangements in the preparation and consumption of food
The 2000 Census of Population and Housing (Census 2000) was undertaken by the National Statistics Office (NSO) in May 2000, as mandated by Commonwealth Act No. 591, Batas Pambansa Blg. 72 and Executive Order No. 121. It was the 11th census of population and 5th census of housing undertaken in this country since the first census in 1903. It was designed to take an inventory of the total population and housing units all over the Philippines and to collect information about their characteristics. Census day for the Census 2000 was May 1, 2000 (12:01 a.m.). Enumeration started on May 1, 2000 and lasted for about 30 days.
--- o0o ---Page last revised: September 6, 2002
2

Number: 2003-12Date Released: January 14, 2003
NATIONAL CAPITAL REGION:CLOSE TO 10 MILLION PERSONS
(Results from the 2000 Census of Population and Housing, NSO)
Population growth rate slowed down to 1.06 percent
The National Capital Region, which covers the 12 cities and five municipalities, recorded a total population of 9,932,560 persons in the 2000 Census of Population and Housing (Census 2000). This was up by 478,520 persons as compared to 9,454,040 persons recorded in the 1995 Census of Population (POPCEN). For the period 1995 to 2000, the annual population growth rate for the National Capital Region was 1.06 percent, lower than that of the 1990 to 1995 period (3.30 percent). If the current annual population growth rate of the metropolitan area continues, the population is expected to double in 65 years.
The number of households increased to 2,132,989 as compared to 1,985,299 households in 1995. The average household size recorded in Census 2000 was 4.63 persons, slightly lower than the 1995 figure of 4.74 persons and the national average of five persons.
National Capital Region, the second biggest region in the Philippines in terms of population
The National Capital Region ranked second, next to Southern Tagalog (Region IV), in terms of population size among the 16 regions in the Philippines, contributing 12.98 percent to the 76.5 million population of the country as recorded in the 2000 Census of Population and Housing.
3

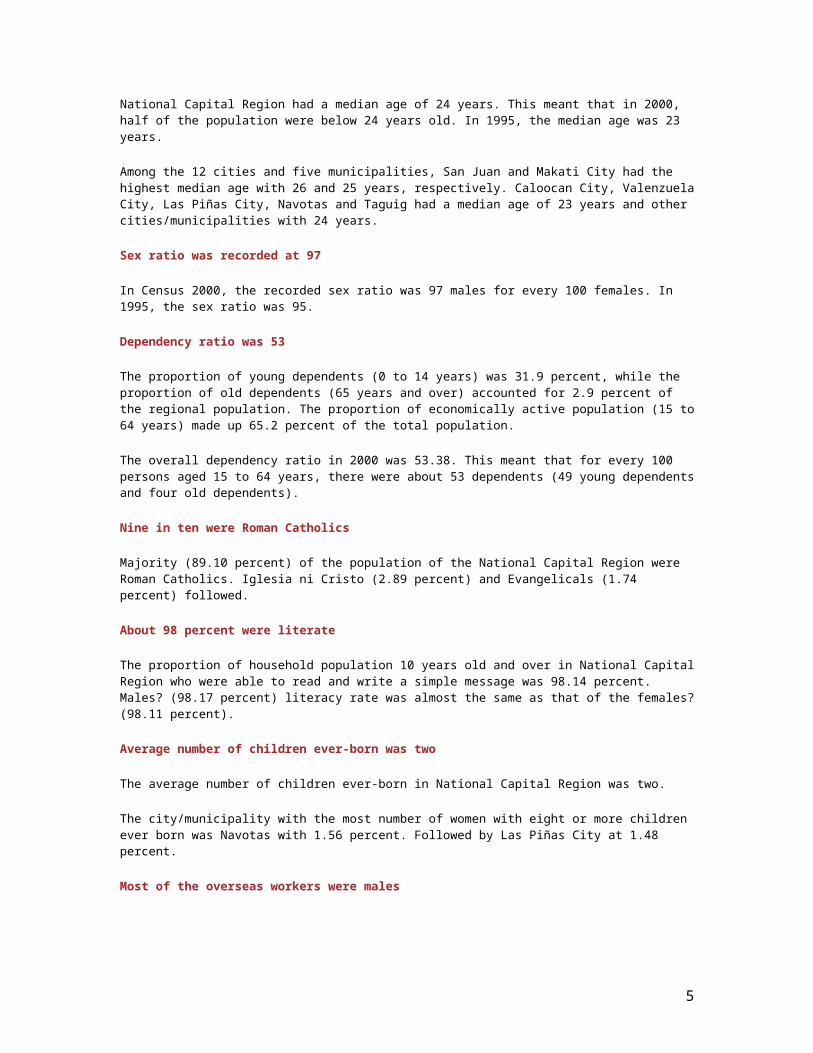
Median age was 24 years
National Capital Region had a median age of 24 years. This meant that in 2000, half of the population were below 24 years old. In 1995, the median age was 23 years.
Among the 12 cities and five municipalities, San Juan and Makati City had the highest median age with 26 and 25 years, respectively. Caloocan City, Valenzuela City, Las Piñas City, Navotas and Taguig had a median age of 23 years and other cities/municipalities with 24 years.
Sex ratio was recorded at 97
In Census 2000, the recorded sex ratio was 97 males for every 100 females. In 1995, the sex ratio was 95.
Dependency ratio was 53
The proportion of young dependents (0 to 14 years) was 31.9 percent, while the proportion of old dependents (65 years and over) accounted for 2.9 percent of the regional population. The proportion of economically active population (15 to 64 years) made up 65.2 percent of the total population.
The overall dependency ratio in 2000 was 53.38. This meant that for every 100 persons aged 15 to 64 years, there were about 53 dependents (49 young dependents and four old dependents).
Nine in ten were Roman Catholics
Majority (89.10 percent) of the population of the National Capital Region were Roman Catholics. Iglesia ni Cristo (2.89 percent) and Evangelicals (1.74 percent) followed.
About 98 percent were literate
The proportion of household population 10 years old and over in National Capital Region who were able to read and write a simple message was 98.14 percent. Males? (98.17 percent) literacy rate was almost the same as that of the females? (98.11 percent).
4

Average number of children ever-born was two
The average number of children ever-born in National Capital Region was two.
The city/municipality with the most number of women with eight or more children ever born was Navotas with 1.56 percent. Followed by Las Piñas City at 1.48 percent.
Most of the overseas workers were males
In 2000, there were 165,575 overseas workers as compared to 182,335 overseas workers in 1995 POPCEN. More than half (56.52 percent) of these overseas workers were males.
The population of overseas workers in 2000, had a median age of 34 years. This meant that half of the overseas workers were below 34 years old. Female?s overseas workers had a median age of 29 years, younger than their male?s counterparts (37 years).
Electricity, main source of lighting
Majority (92.67 percent) of the households used electricity for lighting, only 1.51 percent used kerosene or gaas and 1.74 percent, liquefied petroleum gas (LPG).
The proportion of households using electricity as the main source of lighting was highest in Pateros (95.61 percent). In Novotas, 3.12 percent of the households still used kerosene or gaas.
One in two households depended on own use, faucet community water system for potable water
The main sources of water supply for drinking and/or cooking were own use, faucet, community water system (50.78 percent); shared, faucet community water system (24.29 percent); and shared, tubed/piped deep well (9.69 percent).
Majority of the households used liquefied petroleum gas for cooking
Majority of the households used liquefied petroleum gas (71.81 percent) as fuel for cooking; 17.69 percent used kerosene and 5.44 percent used electricity for cooking.
Households exclusively used water sealed, sewer/septic tank
The proportion of households with water sealed, sewer/septic tank, used exclusively was 67.84 percent. About 16 percent had water sealed sewer/septic tank shared with other households and 1.09 percent used closed pit. Households that did not have any toilet facility accounted for one percent.
Picked up by garbage truck was the usual manner of garbage disposal
Proper disposal of garbage leads to a good environment and good health. About 90 percent of the households in National Capital Region had their garbage picked up by garbage truck; 5.27 percent, through burning; and 3.06 percent, dumping in individual pit.
The proportion of households that had their garbage picked up by garbage truck was highest in San Juan and Marikina City at 98.76 percent and 98.63 percent, respectively. The lowest proportions were in Taguig (79.84 percent) and Caloocan City (78.43 percent). On the other hand, the proportion of households that had their garbage burned was highest in Caloocan City at 14.25 percent.
5

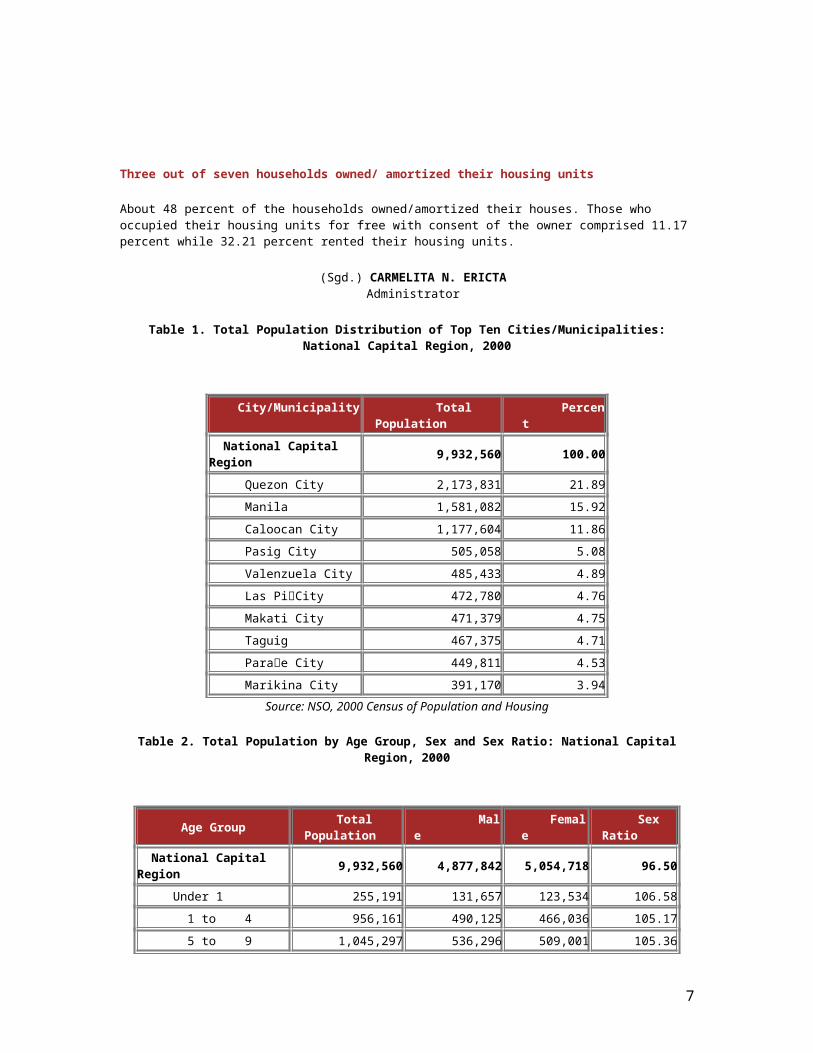
Three out of seven households owned/ amortized their housing units
About 48 percent of the households owned/amortized their houses. Those who occupied their housing units for free with consent of the owner comprised 11.17 percent while 32.21 percent rented their housing units.
(Sgd.) CARMELITA N. ERICTAAdministrator
Table 1. Total Population Distribution of Top Ten Cities/Municipalities:National Capital Region, 2000
City/Municipality Total Population Percent
National Capital Region 9,932,560 100.00
Quezon City 2,173,831 21.89
Manila 1,581,082 15.92
Caloocan City 1,177,604 11.86
Pasig City 505,058 5.08
Valenzuela City 485,433 4.89
Las PiCity 472,780 4.76
Makati City 471,379 4.75
Taguig 467,375 4.71
Parae City 449,811 4.53
Marikina City 391,170 3.94
Source: NSO, 2000 Census of Population and Housing
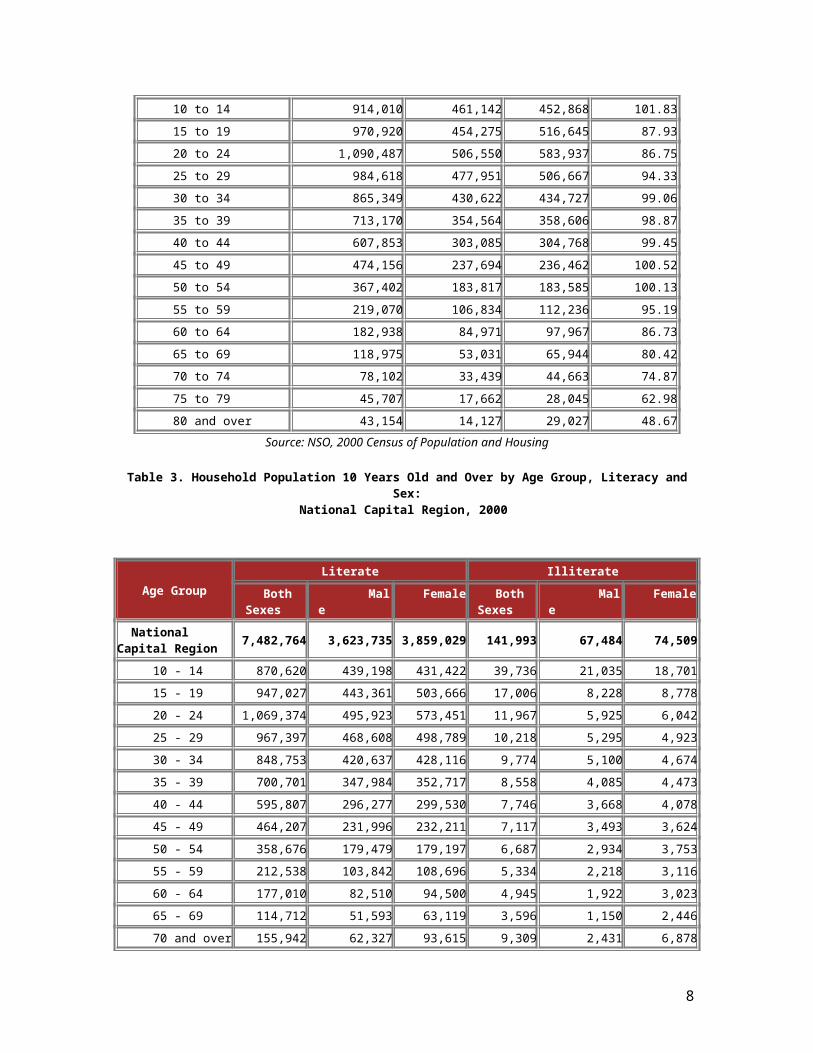
Table 2. Total Population by Age Group, Sex and Sex Ratio: National Capital Region, 2000
Age Group Total Population Male Female Sex Ratio
National Capital Region 9,932,560 4,877,842 5,054,718 96.50
Under 1 255,191 131,657 123,534 106.58
1 to 4 956,161 490,125 466,036 105.17
5 to 9 1,045,297 536,296 509,001 105.36
10 to 14 914,010 461,142 452,868 101.83
15 to 19 970,920 454,275 516,645 87.93
20 to 24 1,090,487 506,550 583,937 86.75
25 to 29 984,618 477,951 506,667 94.33
30 to 34 865,349 430,622 434,727 99.06
35 to 39 713,170 354,564 358,606 98.87
40 to 44 607,853 303,085 304,768 99.45
45 to 49 474,156 237,694 236,462 100.52
50 to 54 367,402 183,817 183,585 100.13
55 to 59 219,070 106,834 112,236 95.19
60 to 64 182,938 84,971 97,967 86.73
65 to 69 118,975 53,031 65,944 80.42
6
70 to 74 78,102 33,439 44,663 74.87
75 to 79 45,707 17,662 28,045 62.98
80 and over 43,154 14,127 29,027 48.67
Source: NSO, 2000 Census of Population and Housing
Table 3. Household Population 10 Years Old and Over by Age Group, Literacy and Sex:National Capital Region, 2000
Age Group
Literate Illiterate
Both Sexes
Male Female Both
Sexes Male Female
National Capital Region
7,482,764 3,623,735 3,859,029 141,993 67,484 74,509
10 - 14 870,620 439,198 431,422 39,736 21,035 18,701
15 - 19 947,027 443,361 503,666 17,006 8,228 8,778
20 - 24 1,069,374 495,923 573,451 11,967 5,925 6,042
25 - 29 967,397 468,608 498,789 10,218 5,295 4,923
30 - 34 848,753 420,637 428,116 9,774 5,100 4,674
35 - 39 700,701 347,984 352,717 8,558 4,085 4,473
40 - 44 595,807 296,277 299,530 7,746 3,668 4,078
45 - 49 464,207 231,996 232,211 7,117 3,493 3,624
50 - 54 358,676 179,479 179,197 6,687 2,934 3,753
55 - 59 212,538 103,842 108,696 5,334 2,218 3,116
60 - 64 177,010 82,510 94,500 4,945 1,922 3,023
65 - 69 114,712 51,593 63,119 3,596 1,150 2,446
70 and over 155,942 62,327 93,615 9,309 2,431 6,878
Source: NSO, 2000 Census of Population and Housing
Table 4. Disabled Persons by Type of Disability and Sex:National Capital Region, 2000
Type of Disability Both Sexes Male Female
National Capital Region 109,236 52,554 56,682
Low vision 46,910 19,954 26,956
Mental illness 13,584 6,778 6,806
Partial blindness 7,248 3,432 3,816
Mental retardation 6,459 3,633 2,826
Loss of one or both arms 6,037 3,159 2,878
Quadriplegic 4,943 2,785 2,158
Others 24,055 12,813 11,242
Source: NSO, 2000 Census of Population and Housing
Table 5. Average Number of Children Ever-Born to Ever-Married Women 15 to 49 Years Old by Age of Women and City/Municipality: National Capital Region, 2000
7

City/Municipality
AverageNumber
of Children
Age Group
15 ? 19
20 ? 24
25 ? 29
30 ? 34
35 ? 39
40 ? 44
45 ? 49
Ever-Married Women 15-49 Years Old
1,741,587 53,903 229,289 328,568 343,714 305,370 268,936 211,807
National Capital Region
2.10 0.51 1.04 1.55 2.12 2.57 2.81 2.86
Manila 2.05 0.53 1.04 1.53 2.11 2.46 2.74 2.80
Mandaluyong City 2.10 0.51 1.05 1.60 2.10 2.54 2.78 2.81
Marikina CIty 2.19 0.55 1.06 1.55 2.15 2.58 2.97 2.99
Pasig City 2.14 0.50 1.08 1.55 2.09 2.57 2.90 2.93
Quezon City 2.08 0.55 1.08 1.54 2.10 2.55 2.75 2.81
San Juan 1.93 0.31 0.96 1.26 1.64 2.45 2.61 2.88
Caloocan City 2.19 0.48 1.03 1.63 2.24 2.72 2.98 2.97
Malabon 2.13 0.43 0.97 1.67 2.30 2.49 2.96 2.83
Navotas 2.18 0.52 1.14 1.83 2.41 2.77 2.61 2.93
Valenzuela City 2.03 0.66 0.96 1.52 2.12 2.58 2.71 2.82
Las Piñas City 2.18 0.47 1.01 1.62 2.20 2.68 2.86 2.96
Makati City 1.93 0.43 0.90 1.37 1.85 2.29 2.65 2.73
Muntinlupa City 2.10 0.42 1.02 1.53 2.06 2.63 2.77 2.83
Parañaque City 2.04 0.45 1.00 1.56 2.01 2.60 2.63 2.75
Pasay City 1.98 0.61 1.05 1.41 1.95 2.45 2.74 2.91
Pateros 2.39 0.64 1.26 1.72 2.43 2.72 3.02 3.32
Taguig 2.19 0.49 1.08 1.56 2.24 2.81 3.10 2.96
Source: NSO, 2000 Census of Population and Housing
Table 6. Ever-Married Women 15-49 Years Old by Age Group and City/Municipality: National Capital Region, 2000
City/Municipality
Ever-MarriedWomen
15-49 Years Old
Age Group
15 ? 19 20 ?
24 25 ?
29 30 ?
34 35 ?
39 40 ?
44 45 ?
49
National Capital Region
1,741,587 53,903 229,289 328,568 343,714 305,370 268,936 211,807
Manila 265,362 9,762 36,475 48,114 50,328 45,237 41,559 33,887
Mandaluyong City 47,271 1,260 6,078 9,149 9,365 8,529 7,155 5,735
Marikina City 66,382 1,745 7,729 12,565 13,068 11,779 10,700 8,796
Pasig City 90,608 2,376 11,201 17,344 18,569 15,806 13,603 11,709
Quezon City 381,332 10,501 49,448 72,636 77,022 67,421 58,522 45,782
San Juan 18,820 663 2,016 3,319 3,582 3,731 3,116 2,393
Caloocan City 210,621 6,985 28,064 38,713 41,880 37,787 32,580 24,612
Malabon 60,027 2,410 8,232 10,722 11,425 10,520 9,344 7,374
8
Navotas 42,383 1,902 6,208 7,967 8,181 7,161 6,078 4,886
Valenzuela City 87,994 2,849 12,999 17,286 17,081 15,085 12,704 9,990
Las Piñas City 80,508 2,482 10,224 14,604 16,004 13,959 12,812 10,423
Makati City 84,995 2,254 10,326 16,008 16,648 15,490 13,831 10,438
Muntinlupa City 66,140 1,833 8,298 12,572 12,703 11,603 10,754 8,377
Parañaque City 80,055 2,362 10,272 15,104 15,814 13,814 12,852 9,837
Pasay City 62,447 2,088 8,294 13,106 12,146 10,472 9,133 7,208
Pateros 9,785 182 1,231 1,726 2,073 1,768 1,488 1,317
Taguig 86,857 2,249 12,194 17,633 17,825 15,208 12,705 9,043
Source: NSO, 2000 Census of Population and Housing
Table 7. Overseas Workers 10 Years Old and Over by Age Group and Sex:National Capital Region, 2000
Age Group Both Sexes Male Female
National Capital Region 165,575 93,577 71,998
Below 20 25,395 8,909 16,486
20 ? 24 18,422 6,945 11,477
25 ? 29 21,194 11,599 9,595
30 ? 34 23,396 14,073 9,323
35 ? 39 20,703 13,796 6,907
40 ? 44 20,546 14,305 6,241
45 years old and over 35,919 23,950 11,969
Source: NSO, 2000 Census of Population and Housing
Table 8. Language/Dialects Generally Spoken in the Households:National Capital Region, 2000
Language/Dialect Total Population Percent
National Capital Region 2,132,989 100.00
Tagalog 2,012,285 94.34
Ilocano 15,657 0.73
Bisaya/Binisaya 13,234 0.62
Bicol/Bikol 11,689 0.55
Other local languages/dialects 71,293 3.34
Other foreign languages/dialects 8,831 0.41
Source: NSO, 2000 Census of Population and Housing
Table 9. Household Population by Top Five Religious Affiliation and Sex:National Capital Region, 2000
Religious Affiliation Both Sexes Male Female
9
National Capital Region 9,880,102 4,848,560 5,031,542
Roman Catholic 8,803,072 4,323,010 4,480,062
Iglesia ni Cristo 285,587 141,868 143,719
Evangelicals 171,892 81,714 90,178
Islam 58,859 29,652 29,207
Other Protestant 48,827 23,354 25,473
Others 348,636 166,855 181,781
None 8,280 4,078 4,202
Unknown 154,949 78,029 76,920
Source: NSO, 2000 Census of Population and Housing
Table 10. Households by Type of Fuel Used for Lighting and City/Municipality:National Capital Region, 2000
City/MunicipalityTotal
Households
Type of Fuel Used for Lighting
Electricity Kerosene LPG Oil Others
National Capital Region
2,132,989 1,976,739 32,304 37,051 920 85,975
Manila 333,547 304,881 5,856 4,780 80 17,950
Mandaluyong CIty 59,682 55,537 632 752 20 2,741
Marikina City 80,160 75,680 590 778 33 3,079
Pasig City 107,835 100,742 1,312 1,263 33 4,485
Quezon City 480,624 446,269 6,621 9,844 251 17,639
San Juan 24,605 22,826 147 236 - 1,396
Caloocan City 249,567 231,513 4,204 3,669 109 10,072
Malabon 74,137 68,238 1,739 1,845 11 2,304
Navotas 49,450 45,888 1,545 474 11 1,532
Valenzuela City 106,382 99,998 1,060 1,142 21 4,161
Las Piñas City 97,962 90,290 1,283 2,511 31 3,847
Makati City 103,981 97,325 1,190 1,914 44 3,508
Muntinlupa City 78,016 71,357 1,286 2,291 83 2,999
Parañaque City 94,109 86,953 1,865 1,997 41 3,253
Pasay City 78,180 72,278 1,217 1,620 33 3,032
Pateros 12,029 11,501 128 49 - 351
Taguig 102,723 95,463 1,629 1,886 119 3,626
Source: NSO, 2000 Census of Population and Housing
Table 11. Households by Usual Manner of Garbage Disposal and City/Municipality:National Capital Region, 2000
City/Municipality TotalHouse-holds
Usual Manner of Garbage Disposal
Picked-Upby
Garbage
Dumpingin
Individual
Burning Compost-ing
Burying Feedingto
Animals
Others
10

Truck Pit
National Capital Region
2,132,989 1,910,139 65,181 112,380 8,646 11,677 7,839 7,127
Manila 333,547 318,444 5,008 1,568 612 732 1,112 6,071
Mandaluyong City 59,682 57,940 1,176 278 94 29 82 83
Marikina City 80,160 79,064 627 191 20 184 74 -
Pasig City 107,835 102,707 1,116 2,950 200 449 334 79
Quezon City 480,624 443,491 13,015 16,544 2,722 1,832 1,120 1,900
San Juan 24,605 24,301 99 36 24 11 88 46
Caloocan City 249,567 195,740 10,703 35,560 1,038 2,665 1,434 2,427
Malabon 74,137 65,956 4,923 2,308 263 193 253 241
Navotas 49,450 42,759 2,698 1,039 591 513 130 1,720
Valenzuela City 106,382 85,217 5,582 12,815 477 1,190 408 693
Las Piñas City 97,962 88,488 3,353 4,447 222 562 667 223
Makati City 103,981 96,620 2,520 3,533 500 354 297 157
Muntinlupa City 78,016 64,592 4,044 7,674 547 770 175 214
Parañaque City 94,109 79,837 4,404 7,916 303 545 260 844
Pasay City 78,180 72,052 2,480 917 183 642 372 1,534
Pateros 12,029 10,919 282 741 51 12 12 12
Taguig 102,723 82,012 3,151 13,863 799 994 1,021 883
Source: NSO, 2000 Census of Population and Housing
Table 12. Households by Main Source of Water Supply for Drinking and/or Cooking and City/Municipality:
National Capital Region, 2000
City/Municipality Total
House-holds
Main Source of Water Supply for Drinking and/or Cooking
Own Use,Faucet,Commu-
nity Water System
Shared,Faucet,
Commu-nity
Water System
OwnUse,
Tubed/Piped DeepWell
Shared,Tubed/PipedDeepWell
Tubed/Piped
ShallowWell
Dug Well
Spring,Lake,River,Rain, etc.
PeddlerBottledWater
Others
National Capital Region
2,132,989 1,083,072 518,091 84,776 206,709 13,057 13,049 3,629 135,205 27,603 47,798
Manila 333,547 210,142 91,326 3,899 5,521 712 438 707 9,394 1,823 9,585
Mandaluyong 59,682 31,809 19,682 2,274 3,452 64 164 22 622 631 962
Marikina City 80,160 49,884 17,161 1,775 4,182 362 72 20 3,777 677 2,250
Pasig City 107,835 62,407 25,219 2,624 2,256 1,157 211 - 10,565 1,043 2,353
Quezon City 480,624 264,477 114,730 17,173 55,806 3,012 4,838 453 6,284 3,414 10,437
San Juan 24,605 18,151 5,697 68 41 - 24 36 142 107 339
Caloocan City 249,567 111,247 58,618 12,136 34,646 2,640 2,512 429 19,514 2,241 5,584
Malabon 74,137 42,109 26,975 1,276 1,594 99 12 45 187 554 1,286
Navotas 49,450 22,381 19,489 488 1,451 55 550 12 3,860 106 1,058
Valenzuela City 106,382 43,684 20,504 3,737 11,976 978 608 211 20,290 923 3,471
11

Las Piñas City 97,962 36,650 12,985 9,384 16,805 1,144 819 211 13,654 3,960 2,350
Makati City 103,981 65,148 26,742 1,562 4,267 135 79 55 2,802 1,999 1,192
Muntinlupa City 78,016 21,719 14,309 11,787 21,228 702 471 178 4,293 1,984 1,345
Parañaque City 94,109 33,226 14,322 5,483 10,271 704 724 634 21,398 5,364 1,983
Pasay City 78,180 44,487 26,728 1,330 1,898 75 188 464 1,025 689 1,296
Pateros 12,029 7,049 3,497 90 458 - 13 - 298 522 102
Taguig 102,723 18,502 20,107 9,690 30,857 1,218 1,326 152 17,100 1,566 2,205
Source: NSO, 2000 Census of Population and Housing
TECHNICAL NOTES
Average Household Size ? average number of people who live in the household
Growth Rate ? the rate at which the population is increasing (or decreasing) in a given year due to natural increase and net migration, expressed as a percentage of the base population
Median Age ? the age at which exactly half of the population is young and half is old
Sex Ratio ? the ratio of males to females in a given population expressed as the number of males per 100 females
Age-Dependency Ratio ? the ratio of persons in the "dependent" ages (under 15 years and over 64 years) to those in the "economically productive" ages (15 to 64 years old) in the population
Household ? a social unit consisting of a person or a group of persons who sleep in the same housing unit and have common arrangements in the preparation and consumption of food
Literacy Rate ? the proportion of literates to the total population in a given group
The 2000 Census of Population and Housing (Census 2000) was undertaken by the National Statistics Office (NSO) in May 2000, as mandated by Commonwealth Act No. 591, Batas Pambansa Blg. 72 and Executive Order No. 121. It was the 11th census of population and 5th census of housing undertaken in this country since the first census in 1903. It was designed to take an inventory of the total population and housing units all over the Philippines and to collect information about their characteristics. Census day for the Census 2000 was May 1, 2000 (12:01 a.m.). Enumeration started on May 1, 2000 and lasted for about 30 days.
--- o0o ---Page last revised: May 17, 2004
12