Embed Size (px)
Citation preview
ERA-Net Smart Grids Plus | From local trials towards a European Knowledge Community This project has received funding in the framework of the joint programming initiative ERA-Net Smart Grids Plus, with support from the European Union’s Horizon 2020 research and innovation programme.
Smart Grids Business Models and Market Integration
Version 1.0
Deliverable Work Package 2
Partners:
Bergische Universität Wuppertal, Germany
INESC TEC, Portugal
SINTEF Energi AS, Norway
Skagerak Nett AS, Norway
Smarter Grid Solutions, United Kingdom
27 June 2017
Deliverable No. 2 | Smart Grids Business Models and Market Integration 2
INTERNAL REFERENCE
• Deliverable No.: D2
• Deliverable Name: Smart Grids Business Models and Market Integration
• Lead Partner: SINTEF Energy Research
• Work Package No.: 2
• Task No. & Name: Task 2.1 – 2.5
• Document (File): SmartGuide WP2 - SG Business Models and Market Integration
• Issue (Save) Date: 2017-06-27
DOCUMENT SENSITIVITY
☒ Not Sensitive Contains only factual or background information; contains no new or additional analysis, recommendations or policy-relevant statements
☐ Moderately Sensitive Contains some analysis or interpretation of results; contains no recommendations or policy-relevant statements
☐ Sensitive Contains analysis or interpretation of results with policy-relevance and/or recommendations or policy-relevant statements
☐ Highly Sensitive Confidential
Contains significant analysis or interpretation of results with major policy-relevance or implications, contains extensive recommendations or policy-relevant statements, and/or contain policy-prescriptive statements. This sensitivity requires SB decision.
Deliverable No. 2 | Smart Grids Business Models and Market Integration 3
DOCUMENT STATUS
Date Person(s) Organisation
Author(s) 2017-05-24 Kevin Cibis Bergische Universität Wuppertal
Julian Wruk Bergische Universität Wuppertal
Nuno Fonseca INESC TEC
Fabian Heyman INESC TEC
André Madureira INESC TEC
Filipe Soares INESC TEC
Bruna Tavares INESC TEC
Lovinda Ødegården SINTEF Energi
Hanne Sæle SINTEF Energi
Henrik Landsverk Skagerak Nett
Laura Kane Smarter Grid Solutions
Robert MacDonald Smarter Grid Solutions
Verification by 2017-06-02 Graham Ault Smarter Grid Solutions
Approval by 2017-06-16 Markus Zdrallek Bergische Universität Wuppertal
Deliverable No. 2 | Smart Grids Business Models and Market Integration 4
CONTENTS
ABBREVIATIONS ................................................................................................ 8
1. INTRODUCTION ........................................................................................ 13
1.1 Introduction and main challenges of SmartGuide ..................................... 13
1.1.1 Historic conditions and process of change ........................................................13
1.1.2 Overview of SmartGuide project .....................................................................13
1.2 Objectives and goals of Work Package 2 .................................................. 14
2. COUNTRY SPECIFIC LEGAL AND REGULATORY CIRCUMSTANCES OF DER PROMOTION ......................................................................................... 15
2.1 Portugal .................................................................................................... 15
2.1.1 National directives ........................................................................................15
2.1.2 Integration into existing grids ........................................................................17
2.1.3 Support schemes ..........................................................................................18
2.1.4 Future foresight/future plans ..........................................................................20
2.2 Norway ..................................................................................................... 21
2.2.1 National directives ........................................................................................21
2.2.2 Integration into existing grids ........................................................................22
2.2.3 Support schemes ..........................................................................................23
2.2.4 Future foresight/future plans ..........................................................................24
2.3 United Kingdom ........................................................................................ 24
2.3.1 National directives ........................................................................................24
2.3.2 Integration into existing grids ........................................................................27
2.3.3 DER support schemes ...................................................................................29
2.3.4 Future foresight/future plans ..........................................................................30
2.4 Germany ................................................................................................... 30
2.4.1 National directives ........................................................................................30
2.4.2 Integration into existing grids ........................................................................32
2.4.3 Support schemes ..........................................................................................33
2.4.4 Future foresight/future plans ..........................................................................34
2.5 Comparison of country specific circumstances of DER promotion ............. 36
3. DRIVERS FOR SMART GRID AND APPROACHES FOR DEPLOYMENT OF SMART GRID – FROM A DSO POINT OF VIEW .............................................. 39
3.1 Portugal .................................................................................................... 39
3.1.1 Regulatory Framework (for the DSO) ..............................................................39
3.1.2 Regulatory Framework relevant for different Smart Grid Technology ...................42
3.2 Norway ..................................................................................................... 44
Deliverable No. 2 | Smart Grids Business Models and Market Integration 5
3.2.1 Regulatory Framework (for the DSO) ..............................................................44
3.2.2 Regulatory Framework relevant for different Smart Grid Technology ...................45
3.3 United Kingdom ........................................................................................ 47
3.3.1 Regulatory Framework (for the DSO) ..............................................................47
3.3.2 Regulatory Framework relevant for different Smart Grid Technology ...................48
3.4 Germany ................................................................................................... 51
3.4.1 Regulatory Framework (for the DSO) ..............................................................51
3.4.2 Regulatory Framework relevant for different Smart Grid Technology ...................52
3.5 Comparison of drivers for smart grid ........................................................ 57
4. ECONOMICAL INCENTIVES – SMART MARKET AND SMART GRID .............. 61
4.1 General introduction/definition ................................................................ 61
4.2 Description of smart market applications ................................................. 61
4.2.1 Smart market applications – in an energy market .............................................62
4.2.2 Smart market applications – in a balancing market ...........................................65
4.3 Country specific circumstances ................................................................. 69
4.3.1 Portugal ......................................................................................................69
4.3.2 Norway .......................................................................................................74
4.3.3 United Kingdom ............................................................................................78
4.3.4 Germany .....................................................................................................87
4.4 Summary tables ........................................................................................ 93
5. REVIEW OF DEVELOPMENTS OF GRID CODES FOR SMART GRID TECHNOLOGIES ................................................................................................ 98
5.1 Short overview of Network Codes ............................................................. 98
5.2 Portugal .................................................................................................. 100
5.3 Norway ................................................................................................... 104
5.4 United Kingdom ...................................................................................... 105
5.5 Germany ................................................................................................. 107
6. CONCLUSIONS ........................................................................................ 112
7. REFERENCES ........................................................................................... 114
Deliverable No. 2 | Smart Grids Business Models and Market Integration 6
FIGURES
Figure 2.1: Installed power in renewables of all technologies in Portugal 2010-2030 [10] ..........................................................................................................................18
Figure 2.2: Accumulated capacity of solar PV power in Norway (Source: Multiconsult) [20] ....................................................................................................................23
Figure 2.3: Projection of future UK CO2 emissions under the four scenarios studied in the National Grid Future Energy Scenarios ....................................................................25
Figure 2.4: Diagram of how CfD will operate ............................................................26
Figure 2.5: Increase in number of installed smart meters in the UK [40] .....................27
Figure 2.6: Cumulative contracted capacity connected to Transmission level under the Connect and Manage scheme in the UK [41] ............................................................28
Figure 2.7: Projected installed capacity of distribution generation, based on Slow Progress Scenario [30] ..........................................................................................28
Figure 2.8: Example of a distribution heatmap from SP Energy Networks ....................29
Figure 2.9: Components of both fixed feed-in tariffs and the market-premium system. Based on [52] ......................................................................................................31
Figure 2.10: Expansion of installed capacity of RES power plants in Germany [57] .......33
Figure 2.11: Share of RES in the gross electricity consumption 1999-2016 [57] ...........33
Figure 2.12: Architecture of the German energy transition [55] ..................................35
Figure 3.1: HV MV and LV Distribution network tariff price structure [70] ....................41
Figure 3.2: Time periods in the German regulatory system, based on [98] ..................51
Figure 3.3: The effect of the incentive regulation [99] ...............................................52
Figure 4.1: Illustration of the different market and control phases ..............................61
Figure 4.2: Price setting in the day-ahead market [118] ............................................62
Figure 4.3: Intra-day market designs in the EU [119] ...............................................63
Figure 4.4: Diagram demonstrating the timescales for reserve services [128] ..............66
Figure 4.5: Share of clients and consumption by the retail energy sales companies in Portugal [137] .....................................................................................................70
Figure 4.6: Alternative Bid curves - demand and supply ............................................75
Figure 4.7: Monopoly actors and market participants involved in smart market applications [91] ..................................................................................................78
Figure 4.8: Overview of the settlement and balancing process in the UK .....................79
Figure 4.9: Breakdown of TNUoS charging in GB ......................................................83
Figure 4.10: Example of Time of Use charges ...........................................................84
Figure 4.11: Diagram to illustrate the interaction between GB Energy Market Stakeholders ........................................................................................................86
Figure 4.12: A diagram from National Grid detailing the commercial interdependencies between stakeholders [153] ..................................................................................86
Figure 5.1: Requested prior information (PIP) steps [169] ....................................... 100
Figure 5.2: Requested prior information (PIP) steps [169] ....................................... 101
Figure 5.3: Development of German Network Codes, based on [183] ........................ 108

Deliverable No. 2 | Smart Grids Business Models and Market Integration 7
TABLES
Table 2.1: Differences between each law of small scale generation in Portugal .............19
Table 2.2: Costs of Smart Meters [39] ....................................................................27
Table 2.3: Comparing the circumstances of DER promotion in the different countries ....36
Table 3.1: Number of publicly accessible slow and fast chargers for EVs in Norway. (Note that the numbers denote the number of charging points, not charging stations.) [87] ...46
Table 3.2: Summary of RIIO-ED1 assessment categories [92] ...................................48
Table 3.3: Summary of incentives which can be linked to Smart Grid Technologies .......50
Table 3.4: Regulations regarding the implementation of Smart Meter in German distribution network. Based on [102] ......................................................................53
Table 3.5: Comparing drivers for smart grid technologies in the different countries .......57
Table 4.1: Business opportunities of each agent of the electric mobility .......................74
Table 4.2: Stakeholders in the UK market................................................................81
Table 4.3: German Balancing System, based on [156]. .............................................88
Table 4.4: Prices for SR/TR, based on [156]. ...........................................................88
Table 4.5: Summary table for potential smart market applications for the future ..........93
Table 4.6 Summary table for potential smart grid applications for the future ................97
Table 5.1: Values for the inductive and capacitive reactive energy of the PRE ............ 103
Table 5.2: Layers to the invoicing of inductive reactive energy ................................. 104
Table 5.3: Core standards and series .................................................................... 106
Table 5.4: Further standards regarding grid connection in Germany .......................... 111
Deliverable No. 2 | Smart Grids Business Models and Market Integration 8
ABBREVIATIONS
AbLaV Verordnung über Vereinbarungen zu abschaltbaren Lasten
AC Alternating current
ACER Agency for the Cooperation of Energy Regulators
ANM Active Network Management
APREN Portuguese association of renewable energy
AregV Anreizregulierungsverordnung
BDEW the German Association of Energy and Water Industries
BETTA British Electricity Trading Transmission Arrangements
BM Balancing market
BM Balancing Mechanism
BNetzA Bundesnetzagentur
BSC Balancing and Settlement Code
BSCCo Balancing and Settlement Code Company
BSUoS Balancing Service Use of System Charges
CACM Capacity Allocation and Congestion Management
CAE Electricity Acquisition Contracts
CAF Cost Apportionment Factors
CAPEX Case of investment costs. Capital expenditures.
CCL Climate Change Levy
CCS Combined charging system
CENS Costs of Energy Not Supplied
CfD Contracts for Difference
CHP Combined Heat and Power plants
CI Customer Interruptions
CIEG Costs arising essentially from legal decisions
CIM Common Information Model
CMEC Maintenance of Contractual Equilibrium
CML Customer Minutes Lost
COP21 Kyoto Protocol
DA Day ahead market
DCC Data and Communications Company
DCC Demand Connection Code
DCLF ICRP DC Load Flow Investment Cost Related Pricing
DER Distributed Energy Resources
DFIG Doubly fed induction generator technology
DG Distributed Generation
DGEG Direcção Geral de Geologia e Energia (Director General for Energy)
Deliverable No. 2 | Smart Grids Business Models and Market Integration 9
DIN Deutsches Institut für Normung
DL Decree-Law
DNA Decentralised network automation
DNO Distribution Network Operator
DR Demand Response
DSO Distribution System Operator
DSR Demand Side Response
EDA Electricidade dos Açores
EDP Energias de Portugal
EEA European Economic Area
EEF Energy Efficiency Fund
EEG Renewable Energies Act
EEM Empresa de Electricidade da Madeira
EEX European Energy Exchange
EHV Extra High Voltage
ENE 2020 The National Energy Strategy 2020
EnEG Energieeinsparungsgesetz
ENTSO-E European Network of Transmission System Operators for Electricity
EnWG Energiewirtschaftsgesetz
EPC European Price Coupling
ERO Early Rollout Obligation
ERSE National regulatory authority for energy services
EU European Union
EV Electric Vehicle
EZA Erzeugungsanlagen am Mittelspannungsnetz
FAI Innovation Support Fund
FES Future Energy Scenarios
FiT Feed-in Tariff
FPN Final Physical Notification
G2V Grid-to-vehicle
GasNEV Gasnetzentgeltverordnung
GAV Gross Asset Value
GDP Gross Domestic Product
GHG Greenhouse Gases
HV High voltage
HVDC high-voltage direct current
ICE The Incentive on Connections Engagement
ICT Information and Communication Technology
ID Intraday market
Deliverable No. 2 | Smart Grids Business Models and Market Integration 10
IEC International Electrotechnical Commission
IHD In-Home Displays
IIS Interruptions Incentive Scheme
KfW Kreditanstalt für Wiederaufbau, engl. Reconstruction Credit Institute
LEC Levy Exemption Certificates
LLFC Line Loss Factor Classes
LSV Ladesäulenverordnung
LV Low voltage
MessZV Messzugangsverordnung
mFRR manual Frequency Restoration Reserves
MIBEL Iberian Electricity Market
MITS Main Interconnected Transmission System
MV Medium voltage
NEEAP National Energy Efficiency Action Plan
NEK Norsk Elektroteknisk Komite
NETA New Electricity Trading Arrangements
NETS National Electricity Transmission System
NHH Non Half-Hourly
NIA National Innovation Allowance
NIC National Innovation Competition
NREAP National Renewable Energy Action Plan
NVE The Norwegian Water Resources and Energy Directorate
OFGEM Office of Gas and Electricity Markets
OLTC On Load Tap Changer
OPEX Unit operating costs/Operating expenses
PCR Primary Control Reserve
PIP Prior Information
PLC Power Line Communication
PNAEE National Action Plan for Energy Efficiency
PNAER 2020 Plano Nacional de Ação para as Energias Renováveis
PPEC Consumption Efficiency Promotion Plan
PRE Special regime producers
PRO Ordinary regime producers
PV Photovoltaic
RAV Regulatory Asset Value
REGO Renewable Energy Guarantees of Origin
RES Renewable Energy Sources
RESP Rede Eléctrica de Serviço Público
RfG Requirements for Generators
Deliverable No. 2 | Smart Grids Business Models and Market Integration 11
RIIO Revenue = Incentives + Innovation + Outputs
ROC Renewable Obligation Certificates
RPC Reactive Power Controller
RPI Retail Price Index
RQS Quality of Service Code
RRC Commercial Relations Code
RRD Code of distribution grid
RT Tariff Code
SEC Smart Energy Code
SEN National Electricity System
SGT Smart Grid Technology
SME Small and Medium Enterprises
SPT Scottish Power Transmission
SRG Special regime generation
SSF Site Specific Charges
StromNEV Stromnetzentgeltverordnung
StromNZV Stromnetzzugangsverordnung
StromStG Stromsteuergesetz
SVAC Static Var Compensator
TAB Technische Anschlussbedingungen
TC Transmission Running Costs
TNUoS Transmission Network Use of System
TOTEX Total Expenditure
ToU Time of use tariffs
TSO Transmission System Operator
UPAC Self-Consumption Units
UPP Small Production Units
V2G Vehicle-to-grid
VDE Association of Electrical, Electronic and Information Technologies
VPP Virtual Power Plant
WTG Wind Turbine Generators
Deliverable No. 2 | Smart Grids Business Models and Market Integration 12
Disclaimer
The content and views expressed in this material are those of the authors and do not necessarily reflect the views or opinion of the ERA-Net SG+ initiative. Any reference given does not necessarily imply the endorsement by ERA-Net SG+.
About ERA-Net Smart Grids Plus
ERA-Net Smart Grids Plus is an initiative of 21 European countries and regions. The vision for Smart Grids in Europe is to create an electric power system that integrates renewable energies and enables flexible consumer and production technologies. This can help to shape an electricity grid with a high security of supply, coupled with low greenhouse gas emissions, at an affordable price. Our aim is to support the development of the technologies, market designs and customer adoptions that are necessary to reach this goal. The initiative is providing a hub for the collaboration of European member-states. It supports the coordination of funding partners, enabling joint funding of RDD projects. Beyond that ERA-Net SG+ builds up a knowledge community, involving key demo projects and experts from all over Europe, to organise the learning between projects and programs from the local level up to the European level.
www.eranet-smartgridsplus.eu
The work of INESCT TEC is financed by FCT – Fundação para a Ciência e a Tecnologia (Portuguese Foundation for Science and Technology) within project SmartGP/0002/2015, under the framework of the ERA-Net Smart Grids Plus initiative.
The work of SINTEF Energi and Skagerak is mainly funded by the Norwegian Research Council, under the framework of the ERA-NET Smart Grids Plus initiative.
Deliverable No. 2 | Smart Grids Business Models and Market Integration 13
1. Introduction
In WP2, SG Business Models and Market Integration, the analysis of country specific regulatory and legal circumstances of the use of smart grid technologies and smart market applications are performed. Additionally, country specific legal and regulatory circumstances of promotion of renewable energy sources are analysed in the European-wide context. Furthermore developments of Grid Codes focusing specifically on the integration and full value realization of smart grid technologies are reviewed.
This report presents the work that has been produced within the scope of the second work package of the SmartGuide project.
WP1 (SG Solutions and Technologies) and WP2 ran with a partial overlap so that they could influence each other in the development of a solid structure for the project that would then be input to the following work packages.
1.1 Introduction and main challenges of SmartGuide
1.1.1 Historic conditions and process of change
Future electrical distribution systems will come across many modifications mostly due to new paradigms both at conceptual and technical levels. During the last decades, the planning and operation procedures of power distribution grids have been changing, one of the main reasons being the high penetration of Distributed Energy Resources (DER), in particular Distributed Generation (DG) units based on Renewable Energy Sources (RES). The intention of developed countries, mainly in Europe, to decrease fossil fuels dependency and the policies imposing the reduction of Greenhouse Gases (GHG) emissions have contributed to the development of this paradigm. In fact, environmental concerns are behind the increase of renewable-based DG, as well as the promotion of electric mobility and integration of storage units in the distribution network. However, distribution grids, which have been designed to supply customers through unidirectional power flows coming from the transmission network, may not be able to handle technical issues brought by the inclusion of these DER.
The integration of RES in existing energy distribution systems all over Europe is being promoted following the climate and energy 20/20/20 targets of the European Union (EU). Due to the variability of these RES, in particular wind turbines and photovoltaic (PV) systems, the uncertainty associated to the balancing of generation and demand escalates. Smart Grid (SG) technologies are important to ensure cost-effective expansion of distribution systems. Naturally, the SG use cases may vary from country to country depending on specific regulatory and legal parameters as well as historical and geographical conditions, which have led to different grid topologies and operation principles. It must be accepted that there is no ‘one size fits all’ approach when it comes to smart grid implementation – each country or organisation has to first identify what they really want from their smart grid solution and develop an appropriate strategy and execution plan accordingly.
1.1.2 Overview of SmartGuide project
SmartGuide is a research project with five project partners from four associated partner countries: Norway, Portugal, the United Kingdom and Germany. The main objective of the project SmartGuide is the development of improved and generalised planning and operating guidelines for European smart distribution systems, considering RES and the demand-side that arise from smart market applications (e.g. demand response, ancillary services such as frequency control). The associated Distribution System Operators (DSOs) will provide network data in order to analyse SG technologies used in current distribution
Deliverable No. 2 | Smart Grids Business Models and Market Integration 14
networks and provide expertise of operational network planning. On this basis, country specific planning and operation principles will be derived. In a further step, these principles will be abstracted to form a European planning guideline for using smart grid technologies in distribution networks. The guideline is supposed to assist DSOs noncommittally when assessing the deployment of smart grid technologies in their network. During the project, all partners will develop different software frameworks to identify increased requirements for network reinforcement and possible SG solutions in order to upgrade existing distribution networks in a cost-efficient manner.
Within WP1 of the project, a state-of-art of the current Smart Grid (SG) solutions and technologies in each country of the participating partners was developed. It also summarized the main SG solutions and technologies explored by the literature in the last years.
1.2 Objectives and goals of Work Package 2
The overall purpose of WP2 is to describe the state-of-the-art related to smart grids business models and market integration.
The report describes country specific regulatory and legal circumstances of the use of smart grid technologies and smart market applications, country specific legal and regulatory circumstances of promotion of renewable energy sources (in an European-wide context) and the developments of Grid Codes focusing specifically on the integration and full value realization of smart grid technologies will be reviewed.
This document is divided into five main sections. The first chapter is this introduction. The second chapter describes country specific legal and regulatory circumstances of DER promotion, focusing on national directives, integration into existing grids (the success of the directives), support schemes for private customers or companies to invest in DER and foresights/future plans, including RES promotion mechanism. The third chapter describes the drivers for smart grid and approaches for deployment of smart grid from a DSO point of view. The smart grid technologies to be reviewed in this chapter are smart meters, demand side response (DSR)/management, electric vehicle charging, network automation, active voltage management, energy storage and distributed generation. For each country the existing legal and regulatory elements of relevance and their implications for rollout of smart grid technology and legal/regulatory improvements to incentivise smart grid technology should be described. The fourth chapter describes economical incentives in smart market and smart grid, where "smart market" concerns contents geared to the behaviour of market players and "smart grid" is related to electricity network issues and the monopoly activity performed by the DSO. The fifth chapter describes the Grid Codes and the status of implementation in the different countries (Portugal, Norway, UK and Germany).
Deliverable No. 2 | Smart Grids Business Models and Market Integration 15
2. Country specific legal and regulatory circumstances of DER promotion
In this chapter national regulation related to DER1 promotion are described, focusing on renewable energy resources. For the countries Portugal, Norway, UK and Germany, the following topics are included:
• National directives: Existing regulation to support DER integration. • Integration into existing grids: Review of success of regulation to date
including total installed capacity in the country due to the regulation. • Support schemes/incentive schemes: Incentive mechanisms that
supports private customers or companies to invest in DER • Foresight/future plans, incl. future RES promotion mechanisms.
2.1 Portugal
2.1.1 National directives
Energy policies in Portugal are very reliant on strategy set at European level and more specifically to the commitments made under such plan within the Kyoto Protocol (COP21). Several measures have been adopted in recent years in order to stimulate energy efficiency and reduce carbon emissions by promoting “green” investments and growth of renewable energy production. Among them are The National Energy Strategy 2020 (“ENE 2020”) [1], the Energy Efficiency Fund (EEF) [2] which encourage measures of the National Action Plan for Energy Efficiency (“PNAEE”), the Portuguese Carbon Fund and the restructuring of Green Taxation which altered a set of environmental tax rules in the energy sector [3].
According to PNAER 2020 (Plano Nacional de Ação para as Energias Renováveis) established through Council of Ministers Resolution 20/2013 of 10th April 2013 [4] the incentives to renewable energy investments until 2020 are:
• Encouraging the installation of solar thermal systems in the residential sector;
• Promoting the installation in buildings of more efficient energy systems;
• Streamlining the licensing procedures of renewable electricity plants;
• Conceding incentives to be applied to power plants dedicated to forest biomass;
• Endorsing the use of endogenous resources and excess for the production of biofuels.
Regarding the small scale generation (micro-generation and mini-generation) there are two main decree-laws that regulate this type of production of renewable electricity. All producers have grid access under both regimes. Decree-Law 363/2007, of 2nd November (revised by the Decree-Law 118-A/2010 of 8th October and by the Decree-Law 25/2013 of 8th March) regulates the production by RES up to 5.75 kW.
1 DER = Distribution Energy Resources. DER includes Distributed Generation (DG) and energy storage.
Deliverable No. 2 | Smart Grids Business Models and Market Integration 16
The micro-generation law is characterized in two regimes [5]:
• The general regime is applicable to any type of micro-generation up to a limit of 5.75 kW (25 A single-phase);
• The special regime is applicable to renewable electricity production up to a limit of 3.68 kW (16 A single-phase).
In 2014 there were 25,000 installations in the special regime and 900 in the general regime with a total capacity of 93 MW and 4.0 MW, respectively [5].
Decree-Law 34/2011 of 8th March (revised by the Decree-Law 25/2013 of 19th February) regulates the production from 5.75 kW to 250 kW. The mini-generation law is also characterized in two regimes [5]:
• The general regime is applicable to any type of renewable energy generation technology up to 250 kW;
• The special regime is applicable to any type of renewable energy generation technology up to 3.68 kW (16 A single-phase).
In 2014 there were 1,200 installations in the special regime with a total capacity of 52 MW [5]. In September of the same year, the government ratified a decree law that aims at merging the micro-generation and mini-generation framework (Decree-Law 153/2014 of 20th October). This new regime for Small Production Units (UPP in Portuguese) and Self-Consumption Units (UPAC in Portuguese) replaces the remuneration regime previously applicable to micro and mini generation units, which continues to be applicable only to installations registered until January 2015, date on which Decree-Law 153/2014 has come into force through Ordinance 14/2015.
In Portugal, the generation of electricity from RES is mainly promoted through a Feed-in Tariff (FiT). Currently, the FiT regime continues to apply only to existing installations. A new regime for Small Production Units (UPP) and Self-Consumption Units (UPAC) has been introduced by Decree-Law 153/2014 as mentioned above, replacing the remuneration regime previously applicable to micro and mini generation units, which continues to be applicable only to installations registered until January 2015, date on which DL 153/2014 has come into force through Ordinance 14/2015 (same as above).
This new decree-law waives licensing for the activity of electricity production when its goal is self-consumption or when production is carried out by small plants. Micro production rules are meant to encourage domestic production for in-house consumption but the exceeding power may still be fed in to the Public Service Electricity Network (Rede Eléctrica de Serviço Público – RESP, in Portuguese). It is also possible to sell all the production to the RESP through a bidding system. In these cases, micro producers will take advantage of a specific tariff that varies depending on the type of energy source and the amount of power already fed in by micro producers [6].
In recent years, due to the economic crisis that the country went through, the adoption of cross-cutting measures of public expenses had been set which also affected the energy sector, including the costs associated with the remuneration of producers for instance. Lately, the period of intense subsidies to investment in renewable energy sector is over. Moreover, the current system of incentives to power guarantee (for thermal and hydroelectric power projects) is considerably distant from the preceding subsidy regime. On the other hand, important steps were taken in order the creation of a dynamic renewable market. It was introduced the possibility of produce energy from RES under the ordinary regime which means the chance to participate in a regime with a remuneration by RES (through organized markets or bilateral contracts).
Also, the tax incentives and a recent ministerial order of February 2015 established the access circumstances and financing policy for projects in the area of sustainability and efficiency. These comprise promoting the generation and distribution of energy from RES,

Deliverable No. 2 | Smart Grids Business Models and Market Integration 17
supporting energy efficiency and use of renewables in companies, homes and public infrastructures and promoting the use of sustainable mobility [3].
2.1.2 Integration into existing grids
Owners of UPACs may enter into a power purchase agreement with the last resort supplier in order to sell their surplus of electricity if they use RES and have an installed capacity of up to 1 MW, and if their electrical usage installation is connected to the public energy grid. If the UPACs have an installed capacity of more than 1.5 kW and are connected to the public energy grid, the owners are subject to pay fixed monthly compensation intended to recover part of the costs arising from measures related to energy policy, sustainability and general economic interests. The connection capacity that may be attributed each year to UPPs cannot exceed 20 MW, in accordance with the programme established annually by the Director General for Energy and Geology (DGEG). Furthermore, UPP owners may enter into power purchase agreements with the last recourse supplier to sell the electricity that they generate [7].
Portugal’s greenhouse gas emission levels developed in line with the goals defined under Kyoto Protocol. Although an increase of greenhouse gas emissions of 27% was allowed, actual emission levels lie on smaller values (around 19% in 2012). Decree-Law 141/2010 of 31st December 2010 settled as a mandatory target that, by 2020, the minimum of 31% of Portugal’s primary energy consumption should come from RES, which is higher than EU-27 average. According to Eurostat data [8], between 2008 and 2012, the renewables share in gross final energy consumption increased from 22.8% to 24.6% and the country is showing good progress towards its 2020 RES obligation. In 2012 61% of electricity in Portugal was already coming from RES. Besides, Portugal decreased its external energy dependency from 89% in 2005 to 71% in 2014. Between 2011 and 2014, a total of 2,757 MW from RES were licensed, thus achieving 11.6 GW of installed capacity [6].
Wind energy takes the leading role among national RES installed capacities. As of December 2013 there were approximately 224 wind farms and 2,540 wind turbine generators (WTG) installed in Portugal, a 42% increase from the 192 wind farms installed in 2008. As of March 2015 the number of wind farms has risen to 245 and the number of WTG almost reached the 2,500 mark (being at 2,496).
Recent studies have rated wave energy in Portugal as an energy resource with a medium-high potential. With an average annual flow of 30 MW per kilometre of water front with a depth of 50 meters, the Portuguese coast has the potential to generate approximately 10 TWh/year of electricity (about 20% of Portuguese consumption).
In 2013, biomass with combined heat and power (CHP) represented 367 MW of the installed power, while biomass without CHP represented 105 MW. As regards Municipal solid waste, it generates about 88 MW of power.
Today, biomass is one of the main export products in Portugal: in 2013 the country exported 824,000 tons of biomass worth € 111,000,000.00. Italy, the United Kingdom and Belgium are the main importers.
Reaching an annual average of 2,200 to 3,000 hours of sun in the mainland, and between 1,700 and 2,200, respectively, in the Azores and Madeira islands, Portugal has a strong potential for solar energy. According APREN (Associação de Energias Renováveis) [9], in 2015, the installed power in Portugal was 429 MW. This represented a 733.3% increase considering the mere 58.5 MW installed in 2008.
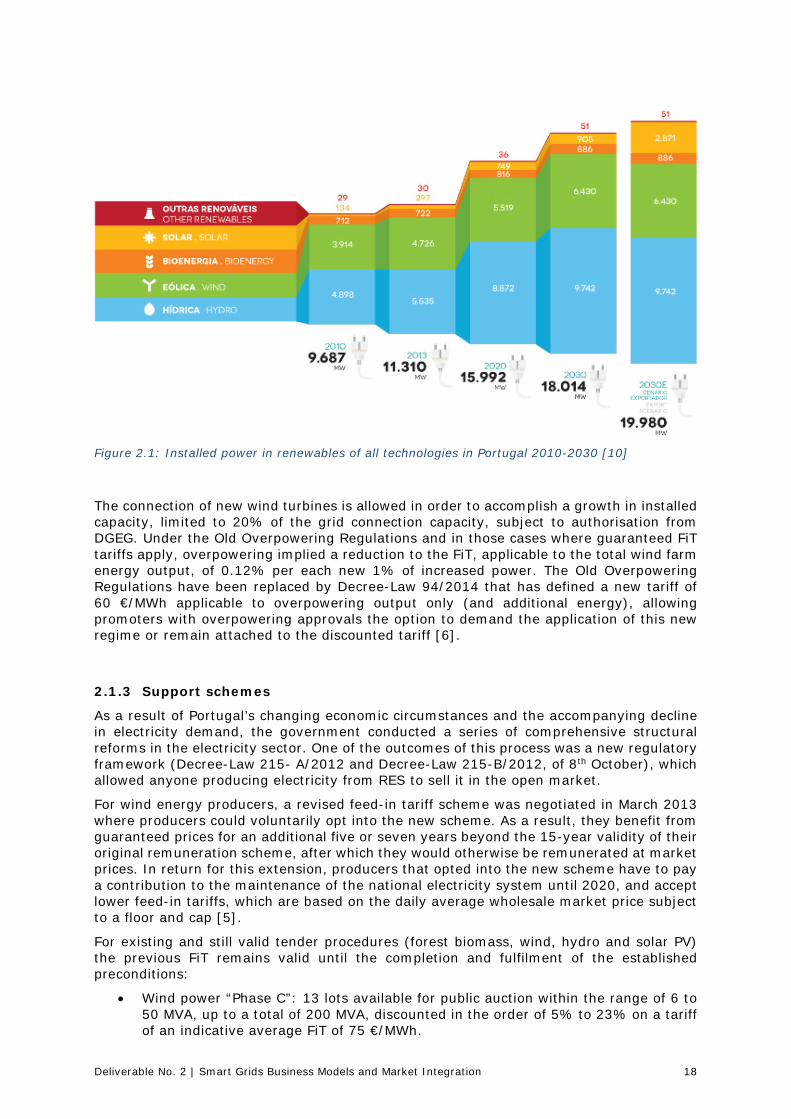
The installed power in renewables increased on all of the technologies and it is predictable that it duplicates between 2010 and 2030, replacing the generation from coal and natural gas and responding to the foreseen consumption grow for Portugal according to APREN (Associação de Energias Renováveis).
Deliverable No. 2 | Smart Grids Business Models and Market Integration 18
Figure 2.1: Installed power in renewables of all technologies in Portugal 2010-2030 [10]
The connection of new wind turbines is allowed in order to accomplish a growth in installed capacity, limited to 20% of the grid connection capacity, subject to authorisation from DGEG. Under the Old Overpowering Regulations and in those cases where guaranteed FiT tariffs apply, overpowering implied a reduction to the FiT, applicable to the total wind farm energy output, of 0.12% per each new 1% of increased power. The Old Overpowering Regulations have been replaced by Decree-Law 94/2014 that has defined a new tariff of 60 €/MWh applicable to overpowering output only (and additional energy), allowing promoters with overpowering approvals the option to demand the application of this new regime or remain attached to the discounted tariff [6].
2.1.3 Support schemes
As a result of Portugal’s changing economic circumstances and the accompanying decline in electricity demand, the government conducted a series of comprehensive structural reforms in the electricity sector. One of the outcomes of this process was a new regulatory framework (Decree-Law 215- A/2012 and Decree-Law 215-B/2012, of 8th October), which allowed anyone producing electricity from RES to sell it in the open market.
For wind energy producers, a revised feed-in tariff scheme was negotiated in March 2013 where producers could voluntarily opt into the new scheme. As a result, they benefit from guaranteed prices for an additional five or seven years beyond the 15-year validity of their original remuneration scheme, after which they would otherwise be remunerated at market prices. In return for this extension, producers that opted into the new scheme have to pay a contribution to the maintenance of the national electricity system until 2020, and accept lower feed-in tariffs, which are based on the daily average wholesale market price subject to a floor and cap [5].
For existing and still valid tender procedures (forest biomass, wind, hydro and solar PV) the previous FiT remains valid until the completion and fulfilment of the established preconditions:
• Wind power “Phase C”: 13 lots available for public auction within the range of 6 to 50 MVA, up to a total of 200 MVA, discounted in the order of 5% to 23% on a tariff of an indicative average FiT of 75 €/MWh.

Deliverable No. 2 | Smart Grids Business Models and Market Integration 19
• Hydroelectric plants of up to 10 MW each to a total of 150 MVA: indicative average FiT of 91-95 € per MWh for a period of 25 years (Decree-Law 126/2010 of 23rd November).
• Solar photovoltaics (PV or CPV) of 2.0 MVA each, to a total of 150 MVA: an indicative average of 257 €/MWh for a period of 20 years and for the first 34 GWh per installed MW (Decree-Law 132-A/2010, of 21st December).
• Forest biomass: an indicative average of 119 €/MWh for a period of 25 years (Decree-Law 5/2011, of 10th January revised by the Decree-Law 179/2012 of 3rd August, and by Decree-Law 166/2015 of 21st August) [5].
Table 2.1 shows the difference between the reference I and other support schemes applied for each law of small scale generation.
Table 2.1: Differences between each law of small scale generation in Portugal
Micro-generation
-Reference FiT applied to each technology with different percentage: 100% for solar, 80% for wind, 40% for hydro, 70% for biomass CHP and 40% for non-renewable CHP.
-Valid for 15 years divided in two periods (e.g. reference FiT for PV: 66/145 €/MWh in 2014).
Mini-generation
- Reference FiT applied to each technology with different percentage: 100% for solar, 80% for wind, 50% for hydro, 60% for biomass and 60% for biogas.
- Reduced each year and, once defined, is valid for 15 years (e.g. 105.7 €/MWh for PV in 2014).
Small generation
- Reference FiT applied to each technology with different percentage: 100% for solar, 90% for biomass and biogas, 70% for wind and 60% for hydro.
- Is valid for 15 years for new producers and has a value of 95 €/MWh.
- If there is 2 m2 of solar thermal panels in the consumer’s installation 5 €/MWh are added or 10 €/MWh if there is an Electric Vehicle (EV) charging power outlet connected to the mobility grid in the consumer facility.
Self-consumption
- Does not benefit from a FiT.
- Has the possibility of injecting the surplus into the grid, which if paid by the last-resort supplier at 90% of the average monthly market price or trade the electricity surplus by green certificates.
- Has a mechanism to compensate the electric system through the general and economic interest costs.
The construction and operation of forest biomass power plants was promoted by the Decree-Law 5/2011, of 10th January 2011, which stipulated a favourable feed-in tariff calculus for power plants that start operating until 31st December 2016 [6].
There are other support schemes towards to integrate more DER in the grid and to improve energy efficiency. The Government has assumed a commitment to Green Growth allowing access to a fund (about 1,000 M€) in connection for energy efficiency and the efficient management of water and waste projects.
Deliverable No. 2 | Smart Grids Business Models and Market Integration 20
Through a resolution of the municipal council, municipalities may agree a discount up to 15% of the property tax applied to buildings with high energy efficiency [6]:
• Buildings with energy class equal or higher than A, in accordance with Decree-Law 118/2013, of 20th August 2013;
• Building where the execution of construction works, reconstruction, modification, extension and maintenance, improve their energy class in at least two classes;
• A reduction of up to 50% of property tax may be applied to properties that are solely affected to the production of energy from RES.
2.1.4 Future foresight/future plans
It is foreseen that Portuguese legal rules that approach investments in the sector will be revised and readjusted. In the future, the viability of these investments should arise from commercial plans and regulated tariffs. Yet, the scientific and technological developments such as energy from the waves or PV should continue to be incentivized. A recovery of investments is expected befitting from European Union’s commitment to reinforce the interconnections in southwest Europe, from the increasing number of incentives directed towards the growth of the share of RES in production mix, from the promotion of energy efficiency measures and from the development of smart grids and smart meters in accordance with the priorities agreed in both the Europe 2020 Strategy and Partnership Agreement for Portugal 2014-2020 [3].
Due of the stable relationships with commercial partners in transmission and distribution of energy and because historically there have been no retroactive changes to legislation, it is not expected that investments in wind farms be affected by any future regulatory modifications. Extended regulated tariffs after 2020 and the market facilitator offtake obligation prolongs these favourable conditions [6].
However, Portugal possesses a significant electricity tariff debt, which could adversely affect the availability of financial incentives for smart grid and innovation programs.
Electricity tariff deficits occur in case the regulated components in the retail price for electricity are set below the cost by the energy companies (in this case EDP Distribuição).
The deficit accounted for 4.4 billion € in 2013 which corresponded to roughly 2.6% of the national GDP. The creation of the tariff deficit was partly explained by the rocketing amount of renewable subsidies made available due to the increase in installed RES capacity subject to FiT. The capacity addition lead to an increase of RES support from 528 million € to 752 million € between 2009 and 2011 [11].
This led to the inclusion of restrictive measures to reduce tariff into the economic programme for Portugal by the European Commission, curbing RES support and revising remuneration schemes (e.g. for co-generation) [11]. In return, this partly caused a 1.2% rise of network charges for low normal voltage tariffs, to be borne by all residential customers [12].
Driven by objectives of the broader “Commitment to Green Growth”, Portugal is seeking to achieve ambitious goals such as:
• Reaching 31% renewable energy in gross end-consumer power consumption by 2020 and 40% in 2030;
• Increasing self-consumption to 300 MW by 2020, lowering prices and allowing for the sale of excess production to the national grid;
• Decreasing the price of renewable energy by 30-40%;
• Reducing the Public Administration’s energy consumption by 30% in 2020 and 35% in 2030;

Deliverable No. 2 | Smart Grids Business Models and Market Integration 21
• Establishing energy interconnection, with the goals of 12% by 2020 and 25% by 2030;
• Reducing the energy consumption of buildings by 25% in 2020 and 30% in 2030;
• Encouraging export of renewable energy to other EU countries.
The IEA [5] indicates several recommendations for energy policies that Portugal’s government should take in the next years. The main recommendations are:
• Prepare an annual energy policy statement, a monitoring tool which examines implementation of energy policy;
• Develop energy plans and scenarios to 2030 and beyond consulting stakeholders to improve to understand new energy realities;
• Pursue the development of interconnections with neighbouring countries, facilitating RES integration and security of supply;
• Start the phased and cost-effective introduction of smart meters across SME and commercial sectors;
• Incorporate the additional cost of RES energy in end-user electricity prices in a transparent manner and monitor the electricity tariff deficit closely.
2.2 Norway
2.2.1 National directives
Much of the legal framework in Norway is based on decisions in EU due to the agreement of the European Economic Area (EEA). The relevant regulations for supporting integration of DER in Norway are typically motivated by environmental/climate mitigation causes, mainly aimed towards renewable energy sources.
The Green Certificate market
After Directive 2009/28/EC, Norway's goal of reaching a renewable share of 67.5% of total energy production in 2020, motivated the establishment of a joint green certificate market with Sweden. Renewable power producers receive one certificate per MWh, and the electricity suppliers have a statutory obligation to buy an amount of green certificates corresponding to a given share of the supplier's total sales volume. The joint market allows Norwegian suppliers to purchase certificates from Swedish producers, and vice versa. The common goal is to increase the renewable energy production by 28.4 TWh from 2012 to 2020 [13]. Norway will finance 13.2 TWh and Sweden will finance 15.3 TWh of the certificates each, independent of the division of production between the countries. The green certificate market started up in 1st January 2012 [14]. There is no requirement regarding size of the generation unit, as long as it uses renewable energy sources [13].
The plusskunde scheme (small prosumers)
The Norwegian regulator, NVE2, defines the term "plusskunde" (translated to "plus-customer") as a grid-connected prosumer whose net export of power is below 100 kW at all times. Such a prosumer can sign a plusskunde agreement with their DSO, and the customer is then getting a reduced network tariff for the net energy fed into the grid (compared to the network tariff other generation units have to pay) [15]. Net exported kWh the plusskunde will only be billed per kWh according to a marginal loss rate which depends on the impact that the plusskunde's exported power has on local grid losses. This marginal loss rate is mostly negative, meaning that the plusskunde earns money per net
2 NVE = The Norwegian Water Resources and Energy Directorate
Deliverable No. 2 | Smart Grids Business Models and Market Integration 22
kWh exported, in addition to revenues from selling the electricity. The prosumers with a plusskunde agreement do not pay taxes for their self-consumed electricity, even though this is not established by law at present. This exemption is practiced for all prosumers with solar panels [16].
A plusskunde may be approved for certificates for their surplus electricity production or the total production, without losing the plusskunde benefits. For green certificates to be granted for the total production, installation of an extra metering device, metering the total production, is required. In Norway, the green certificate scheme is rarely economically attractive for small prosumers. To be approved for green certificates, there is a fee of minimum 15,000 NOK for the smallest generation units [17].
Building regulations
Building regulations are encouraging buildings with low (net) energy consumption, which can be achieved by e.g. heat pumps, district heating, non-fossil boilers or solar collectors. Since July 2010, energy performance certification of buildings has been mandatory, as to increase the interest in energy effective solutions. The directive regarding technical requirements for constructions (Byggteknisk forskrift, TEK10) was revised in January 2016, including reduced requirements for buildings with their own renewable electricity generation (e.g. solar panels). The precondition is that the electricity production is at 20 kWh/m2 of total heated useable floor area [13].
2.2.2 Integration into existing grids
The number of granted green certificates has been low in Norway compared to Sweden. This is partially because most of the renewable power plants in Norway are small (≤ 10 MWp) hydropower plants with a small cumulative installed capacity. At January 2017, 565 small power plants have been approved by NVE to receive green certificates for their electricity. All of these are small hydropower plants, with a total capacity of 1.3 GWp. 92% of the power plants were granted certificates for the total production, while the rest only for parts of the production. In addition, many of the applications for constructing power plants have been rejected due to causes such as negative influence on biodiversity, fish populations, protected watercourses and outdoor activities. Only three PV installations have been granted green certificates in Norway, all of which are larger units (the smallest one is rated 70 kWp) [18].
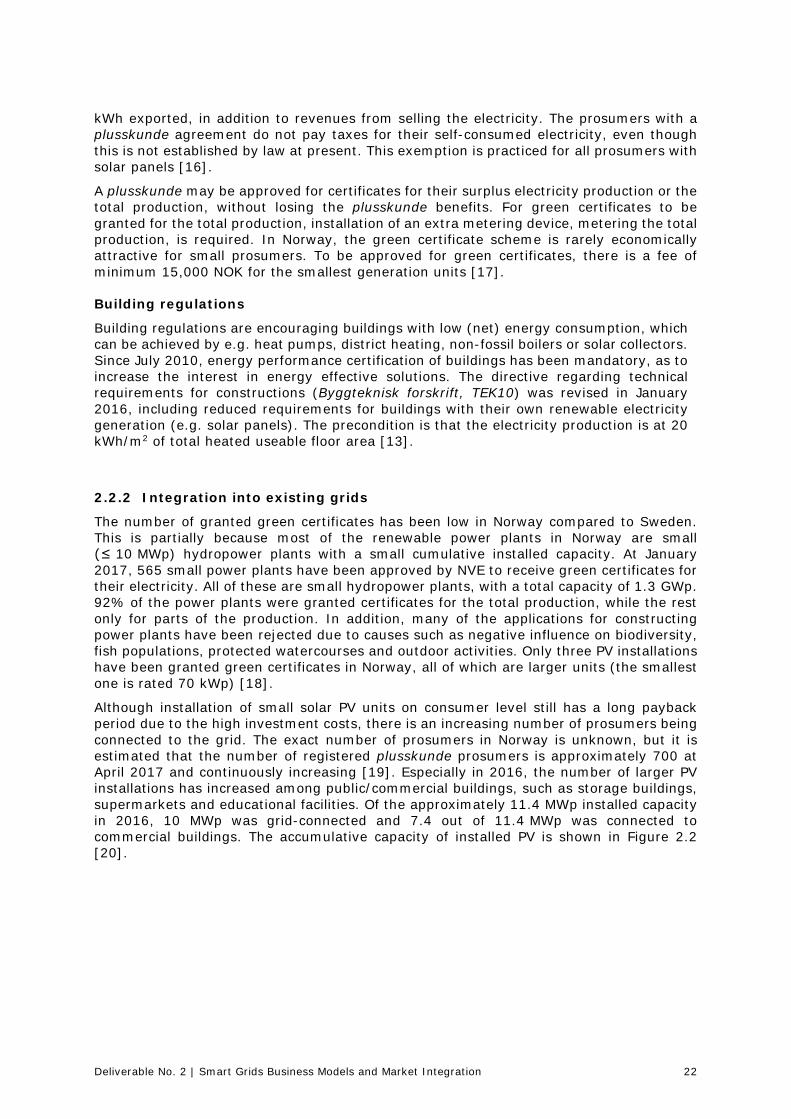
Although installation of small solar PV units on consumer level still has a long payback period due to the high investment costs, there is an increasing number of prosumers being connected to the grid. The exact number of prosumers in Norway is unknown, but it is estimated that the number of registered plusskunde prosumers is approximately 700 at April 2017 and continuously increasing [19]. Especially in 2016, the number of larger PV installations has increased among public/commercial buildings, such as storage buildings, supermarkets and educational facilities. Of the approximately 11.4 MWp installed capacity in 2016, 10 MWp was grid-connected and 7.4 out of 11.4 MWp was connected to commercial buildings. The accumulative capacity of installed PV is shown in Figure 2.2 [20].
Deliverable No. 2 | Smart Grids Business Models and Market Integration 23
Figure 2.2: Accumulated capacity of solar PV power in Norway [20]
Regarding PV power, Norway is still far behind its neighbours Sweden and Denmark. This is likely due to the fact that the electricity price and taxes are higher in Sweden and in Denmark, i.e. prosumers may save more money from reductions in electricity purchases. In addition, the economic support schemes are more profitable than in Norway, and there may be a greater environmental awareness [20].
As mentioned, the tax exemption for self-consumed electricity from solar PV is non-statutory today, and the Norwegian Tax Administration have not stated how long this exemption will be practiced. In addition to this, there is also uncertainty around the green certificate tax for PV production. This has caused end users with large rooftop areas, such as business actors and housing cooperatives, to be reluctant to install PV panels. If these taxes are suddenly charged after all, the profitability and payback period will be significantly worsened [21].
2.2.3 Support schemes
Enova's national support schemes
An important part of the regulatory framework for driving forward environmentally friendly consumption and generation of energy is the public enterprise Enova, owned by the Ministry of Petroleum and Energy. Enova's main actions towards DER promotion consist of advisory programmes and support schemes for renewable energy, working closely with public and private enterprises. The financing of Enova comes from allocated funds within the national Energy Fund, which again is financed by a small tax per consumed kWh at electricity customers [22].
For households, Enova offers refund schemes for measures such as installing a heat pump, thermal control system, wind generator, solar thermal or solar photovoltaic (PV) system. A criterion for receiving support for a residential generation unit is that the system is grid-connected and that customers sign a plusskunde agreement with their DSO. There are separate support schemes for business actors, which also includes local (renewable) energy production. For private end users, the most common is to install rooftop PV generators. After the installation, the prosumer can receive 35% of the total costs as a refund. The upper limit is 10 000 NOK per installation, plus 1250 NOK per installed power up to 15 kW, corresponding to a maximum amount of 28,750 NOK (= €3200) [23].
Local support schemes
In addition to the national support scheme by Enova, there are a few local support schemes that support micro-generation. The largest one is that of the municipality of Oslo, offering up to 40% of the costs as refunds. For businesses and residential consumers within the municipality of Oslo, there is a local support schemes that includes investments in local energy production from wind and solar PV. Similarly to the Enova support scheme, the generation unit must be connected to the grid through a plusskunde agreement. Other
Deliverable No. 2 | Smart Grids Business Models and Market Integration 24
examples of local support schemes are those of the municipality of Hvaler and the county of Vestfold, with smaller investment support [24].
In April 2016 the Norwegian Environment Agency was given the responsibility of administrating a new support scheme for municipalities, named Klimasats. The municipalities may apply for economic support for all actions that either reduce emissions of greenhouse gases or that contribute to the transition towards a low-emission society. The projects may be in cooperation with local businesses, organizations or private persons, but the municipality must have an active role [25].
2.2.4 Future foresight/future plans
The Norwegian regulator has expressed that a transition from energy-based to capacity-based tariffs is wanted. This may cause self-consumption for prosumers to be less profitable, as today they are mainly saving money per kWh not extracted from the grid. As the new tariffs will be reflecting only the marginal losses, the energy-based part of the electricity bill will be smaller. As most prosumers with PV panels are producing power outside their peak consumption, the power-based part of the bill may be as large as for an end user without local generation. The Norwegian Regulator, NVE, has indicated different tariff models through a hearing, but have not yet presented any final suggestions [26], [27].
2.3 United Kingdom
2.3.1 National directives
The UK Government has a number of road maps and incentives in place to encourage the development of a low carbon energy system across the UK.
UK Government targets, outlined in the UK Government Low Carbon Transition Plan [28], state that 30% of electricity will be generated from renewable energy sources by 2020. The devolved Scottish Government has also set its own ambitious targets, aiming for 100% of electrical demand to be met from renewable energy by 2020 [29].
The UK undertakes a process of agreeing ‘Carbon Budgets’. This implements a restriction on the total amount of greenhouse gases that the UK will emit over a 5-year period. The most recent budget was set in July 2016 for the period 2028 – 2032. If emissions rise in one sector, they must be reduced in another to ensure the budget of 1,725 million tonnes of CO2 equivalent is not exceeded. This will result in a reduction in carbon emissions of 57% by 2030 compared to 1990 levels; this is a tougher restriction than that imposed by the EU which requires a 40% cut by 2030 on 1990 levels.
National Grid, the UK transmission system operator, publishes a study of ‘Future Energy Scenarios’ (FES) [30] each year. The 2016 document includes discussion on the impact of FES on UK Emissions. Some projections are included below in Figure 2.3. There are 4 scenarios studied, each with varying levels of low carbon solutions deployed:
• Gone Green: A wealthy world where environmental sustainability is top priority;
• Consumer Power: A wealthy, market-driven world;
• Slow Progression: A world focused on long-term environmental strategy;
• No Progression: A world focused on low-cost solutions.
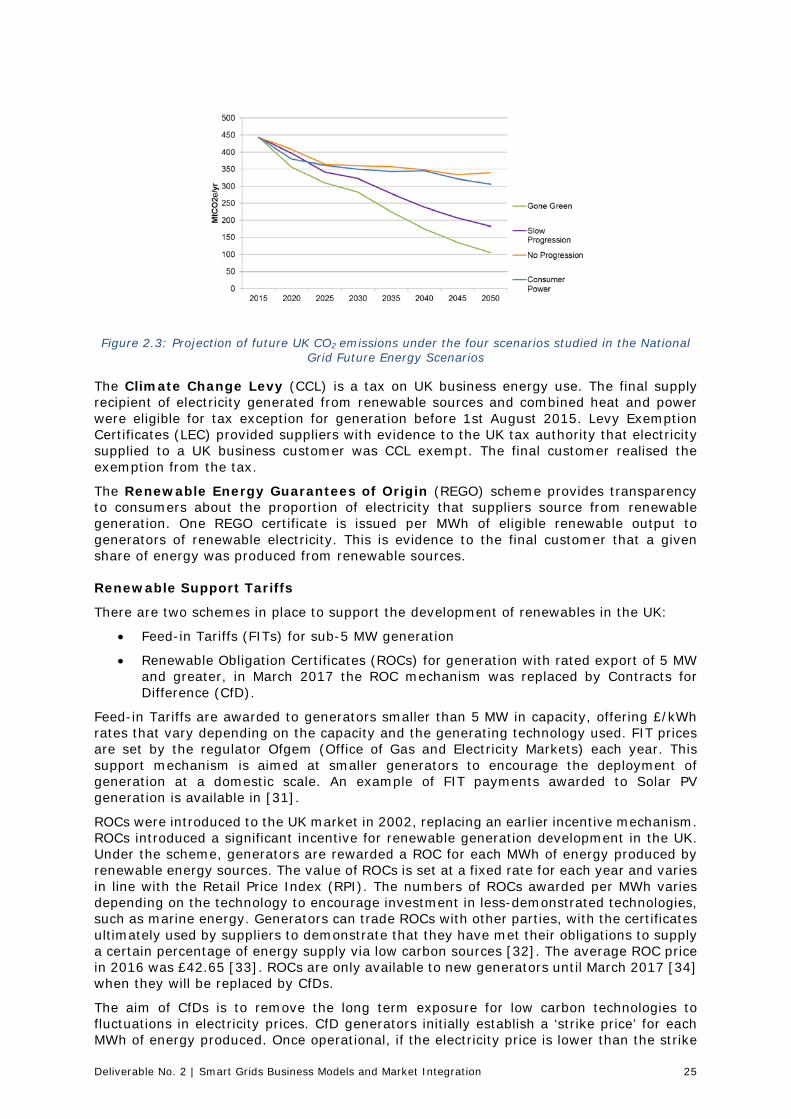
Deliverable No. 2 | Smart Grids Business Models and Market Integration 25
Figure 2.3: Projection of future UK CO2 emissions under the four scenarios studied in the National
Grid Future Energy Scenarios
The Climate Change Levy (CCL) is a tax on UK business energy use. The final supply recipient of electricity generated from renewable sources and combined heat and power were eligible for tax exception for generation before 1st August 2015. Levy Exemption Certificates (LEC) provided suppliers with evidence to the UK tax authority that electricity supplied to a UK business customer was CCL exempt. The final customer realised the exemption from the tax.
The Renewable Energy Guarantees of Origin (REGO) scheme provides transparency to consumers about the proportion of electricity that suppliers source from renewable generation. One REGO certificate is issued per MWh of eligible renewable output to generators of renewable electricity. This is evidence to the final customer that a given share of energy was produced from renewable sources.
Renewable Support Tariffs
There are two schemes in place to support the development of renewables in the UK:
• Feed-in Tariffs (FITs) for sub-5 MW generation
• Renewable Obligation Certificates (ROCs) for generation with rated export of 5 MW and greater, in March 2017 the ROC mechanism was replaced by Contracts for Difference (CfD).
Feed-in Tariffs are awarded to generators smaller than 5 MW in capacity, offering £/kWh rates that vary depending on the capacity and the generating technology used. FIT prices are set by the regulator Ofgem (Office of Gas and Electricity Markets) each year. This support mechanism is aimed at smaller generators to encourage the deployment of generation at a domestic scale. An example of FIT payments awarded to Solar PV generation is available in [31].
ROCs were introduced to the UK market in 2002, replacing an earlier incentive mechanism. ROCs introduced a significant incentive for renewable generation development in the UK. Under the scheme, generators are rewarded a ROC for each MWh of energy produced by renewable energy sources. The value of ROCs is set at a fixed rate for each year and varies in line with the Retail Price Index (RPI). The numbers of ROCs awarded per MWh varies depending on the technology to encourage investment in less-demonstrated technologies, such as marine energy. Generators can trade ROCs with other parties, with the certificates ultimately used by suppliers to demonstrate that they have met their obligations to supply a certain percentage of energy supply via low carbon sources [32]. The average ROC price in 2016 was £42.65 [33]. ROCs are only available to new generators until March 2017 [34] when they will be replaced by CfDs.
The aim of CfDs is to remove the long term exposure for low carbon technologies to fluctuations in electricity prices. CfD generators initially establish a ‘strike price’ for each MWh of energy produced. Once operational, if the electricity price is lower than the strike
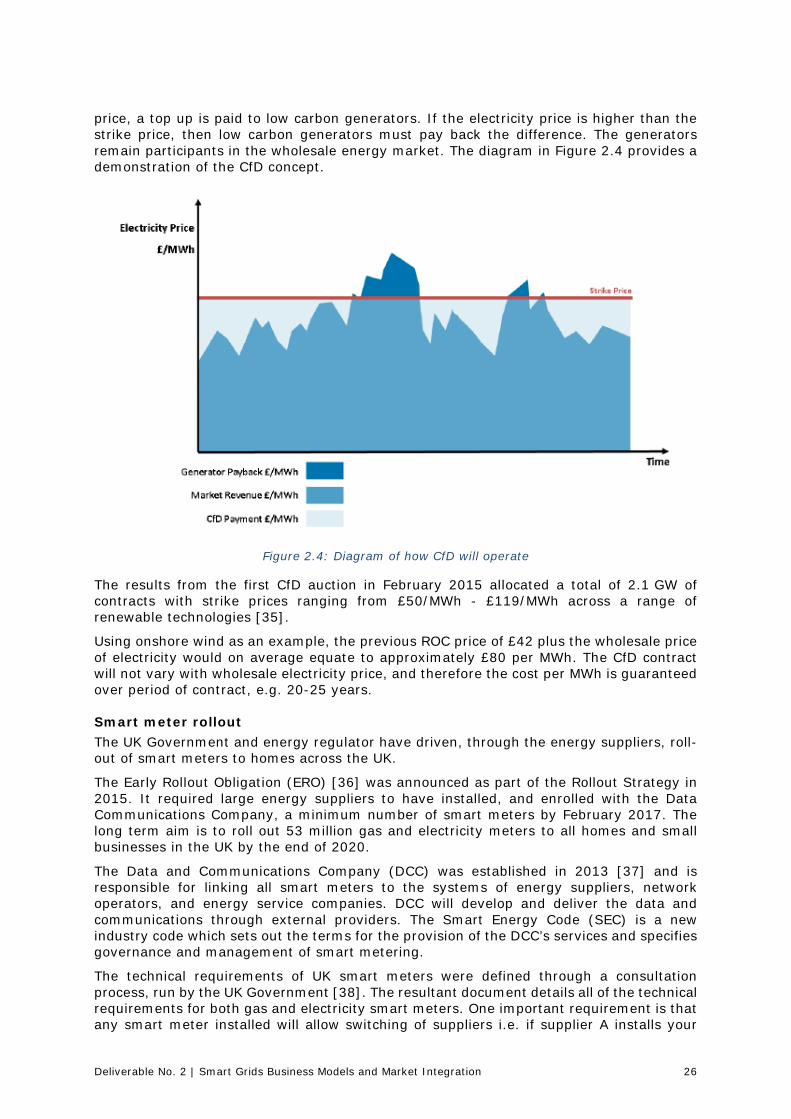
Deliverable No. 2 | Smart Grids Business Models and Market Integration 26
price, a top up is paid to low carbon generators. If the electricity price is higher than the strike price, then low carbon generators must pay back the difference. The generators remain participants in the wholesale energy market. The diagram in Figure 2.4 provides a demonstration of the CfD concept.
Figure 2.4: Diagram of how CfD will operate
The results from the first CfD auction in February 2015 allocated a total of 2.1 GW of contracts with strike prices ranging from £50/MWh - £119/MWh across a range of renewable technologies [35].
Using onshore wind as an example, the previous ROC price of £42 plus the wholesale price of electricity would on average equate to approximately £80 per MWh. The CfD contract will not vary with wholesale electricity price, and therefore the cost per MWh is guaranteed over period of contract, e.g. 20-25 years.
Smart meter rollout The UK Government and energy regulator have driven, through the energy suppliers, roll-out of smart meters to homes across the UK.
The Early Rollout Obligation (ERO) [36] was announced as part of the Rollout Strategy in 2015. It required large energy suppliers to have installed, and enrolled with the Data Communications Company, a minimum number of smart meters by February 2017. The long term aim is to roll out 53 million gas and electricity meters to all homes and small businesses in the UK by the end of 2020.
The Data and Communications Company (DCC) was established in 2013 [37] and is responsible for linking all smart meters to the systems of energy suppliers, network operators, and energy service companies. DCC will develop and deliver the data and communications through external providers. The Smart Energy Code (SEC) is a new industry code which sets out the terms for the provision of the DCC’s services and specifies governance and management of smart metering.
The technical requirements of UK smart meters were defined through a consultation process, run by the UK Government [38]. The resultant document details all of the technical requirements for both gas and electricity smart meters. One important requirement is that any smart meter installed will allow switching of suppliers i.e. if supplier A installs your

Deliverable No. 2 | Smart Grids Business Models and Market Integration 27
smart meter, you will be able to move to Supplier B without having to install a new smart meter or seek any permissions for using the smart meter with another supplier.
The cost of the Smart Meter rollout is itemised in Table 2.2. The costs to suppliers will be refunded though consumer energy bills. The recent cost–benefit analysis performed by the UK Government [39] proposed there is £5 billion of net benefits to consumers, and £8.25 billion of net benefits to suppliers, achieved by rolling out smart meters.
Table 2.2: Costs of Smart Meters [39]
Item Cost (£ bn) Meters, their installation and operation, and the In-Home Displays (IHDs)
5.44
DCC related costs, including communications hubs provision
3.13
Energy suppliers’ and other industries’ IT system costs
1
Industry governance, organisational and administration costs, energy, pavement reading inefficiency and other costs
1.42
Total 10.99
The most recent progress report from the government on smart meter installations [40] states that a total of 540,100 smart meters were installed by large energy suppliers in the first quarter of 2016. The growth in the number of smart meters installed is presented in Figure 2.5 below.
Figure 2.5: Increase in number of installed smart meters in the UK [40]
2.3.2 Integration into existing grids
The introduction of renewable incentives in 20023 led to a sharp growth in the installed capacity of renewable generation at transmission and distribution level. More details on these incentive schemes are provided in Section 2.3.1.
On the transmission system, the ‘Connect and Manage’ scheme was introduced in 2011 to ensure renewable generation was provided accelerated connection dates ahead of
3 Renewable Obligation was introduced in 2002, with Feed-in Tariffs following in 2010
Deliverable No. 2 | Smart Grids Business Models and Market Integration 28
necessary reinforcement; the export from this generation was managed within the capacity limits of the existing system with compensation for export curtailment paid to generators by the System Operator.
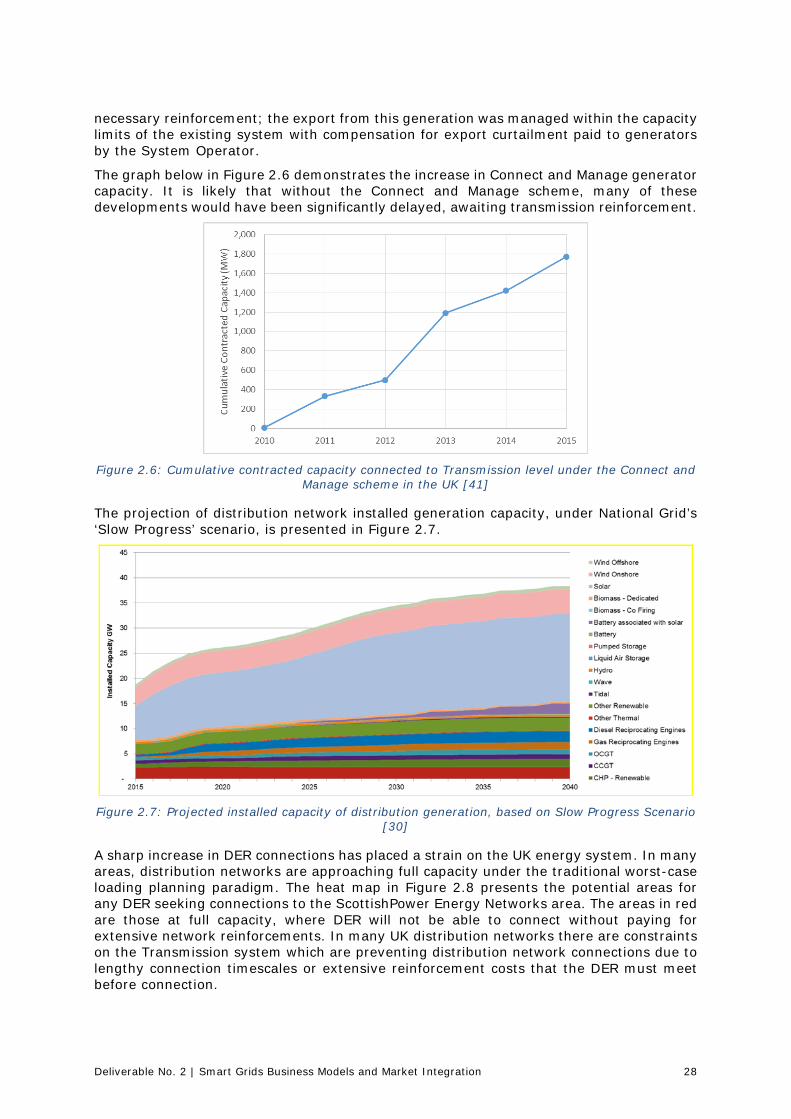
The graph below in Figure 2.6 demonstrates the increase in Connect and Manage generator capacity. It is likely that without the Connect and Manage scheme, many of these developments would have been significantly delayed, awaiting transmission reinforcement.
Figure 2.6: Cumulative contracted capacity connected to Transmission level under the Connect and
Manage scheme in the UK [41]
The projection of distribution network installed generation capacity, under National Grid’s ‘Slow Progress’ scenario, is presented in Figure 2.7.
Figure 2.7: Projected installed capacity of distribution generation, based on Slow Progress Scenario
[30]
A sharp increase in DER connections has placed a strain on the UK energy system. In many areas, distribution networks are approaching full capacity under the traditional worst-case loading planning paradigm. The heat map in Figure 2.8 presents the potential areas for any DER seeking connections to the ScottishPower Energy Networks area. The areas in red are those at full capacity, where DER will not be able to connect without paying for extensive network reinforcements. In many UK distribution networks there are constraints on the Transmission system which are preventing distribution network connections due to lengthy connection timescales or extensive reinforcement costs that the DER must meet before connection.

Deliverable No. 2 | Smart Grids Business Models and Market Integration 29
Figure 2.8: Example of a distribution heatmap from SP Energy Networks
To address these constraint issues, DSOs are having to develop alternative connection options for DG developers.
In addition to capacity constraints, the increase in DER has created a number of wider system issues that have been documented in National Grid’s System Operability Framework [42] document:
• Lack of visibility and coordination at transmission level; • Low frequency demand disconnection and fault ride through capabilities; • System frequency issues due to the increase of inverter connected technologies and
reduction in spinning machines.
Electric Vehicles (EV) are a significant part of the progress towards reducing the carbon emissions from transport. EV technology has developed significantly in recent years and is discussed in greater detail in the WP1 Report [43].
Recent figures suggest that the Government is falling behind EV rollout targets. While there has been an increase in the number of EVs owned in the UK, the increase has not been as great as initially predicted.
A statistical release in September 2016 [44] notes that in the first quarter of 2016, there was a 31% increase in the number of EVs registered for the first time in the UK, 1% of the total number of new vehicle registrations. This same document captures public attitudes towards electric vehicles in the UK. Attitudes are changing slowly but there has not been a massive swing towards electric vehicles despite the incentives in place.
The majority of motorway service stations now have some fast charging points, and many cities and towns across the UK have dedicated parking bays for electric vehicles [45].
2.3.3 DER support schemes
There are a number of funding support schemes available to renewable energy developers in the UK [46]. Such schemes cover different sizes of investment, from large multi-MW wind farms to community groups looking to install small-scale DER schemes.
The Green Investment Bank [47] is an investment bank created by the UK Government, the sole shareholder, to provide initial capital to invest in the UK Green Economy. The Green Investment Bank has invested in every part of the UK and across all target sectors, including energy efficiency, waste and bioenergy, offshore wind and onshore renewables. Project expenditure ranges from £1 billion down to £2 million, with additional funds set up specifically to target smaller-scale green investments.
As an example of a smaller funding body, ‘Local Energy Scotland’ [48] provides support and funding opportunities to local communities and rural businesses. Funding support includes a start-up grant, pre-planning loan, infrastructure and innovation fund, and post-

Deliverable No. 2 | Smart Grids Business Models and Market Integration 30
consent loans. There a number of similar bodies to this across the UK. These bodies are separated by country as this type of power has been devolved to individual nation governments.
In addition to funding for developers, there is support available for individuals to purchase electric vehicles, and for installation of EV charging infrastructure. As long as the vehicle meets certain conditions [49] the government grant will contribute 35% of the cost of the car, up to a maximum of either £2,500 or £4,500 depending on the model or 20% of the cost of a van, up to a maximum of £8,000. Since the launch of the grants, there have been 80,239 eligible cars registered [50].
2.3.4 Future foresight/future plans
The change in subsidies and support schemes in the UK, coupled with changes in government personnel and policy decisions, has resulted in a reduction in confidence in the UK renewable energy industry. Connection applications for new developments at distribution level have reduced significantly according to DSOs.
Regardless of this, there are still significant planned infrastructure reinforcements that are required to accommodate the large volume of contracted, but not built, generation that is due to connect in the coming years.
The government has made some attempts to understand what is required of them to ensure a low carbon energy future is realised. A 2015 consultation launched by the Parliamentary Committee on Energy and Climate Change [51] asked for industry stakeholders to provide feedback on the current electricity system and how changes could be made to improve upon flexibility of the system, whole system coordination, improve the connection process for developers and maintain value for money for customers. Stakeholders were invited to give oral evidence at several meetings during the first half of 2016. Three reports were published in the second half of 2016 summarising all that was learned and highlighting changes required to obtain future goals.
In 2016 the regulator, Ofgem, and the department for Business, Energy and Industrial Strategy (BEIS) 4 published a number consultation documents on system flexibility and quicker and more efficient connections to the network.
The shift towards whole system coordination, and the interaction of distribution with transmission is the focus of the UK energy industry at the moment, and in particular, the creation of a Distribution System Operator and development of the overall System Operator role which has the potential to introduce more control and ancillary services to distribution-connected generation. Democratisation of the energy market can increase competition and lead to lower costs for users of the system.
2.4 Germany
2.4.1 National directives
In the early 2000, the German Federal Government started to develop a legislative proposal to increase the share of RES in the German energy mix in the following years. The main driver for the initiative was climate and environmental protection and the reduction of energy supply costs, considering long term external effects caused by conventional energy resources [52]. There are different kinds of national directives used in Germany to promote RES and improve their economic efficiency.
4 Formerly Department of Energy and Climate Change (DECC)

Deliverable No. 2 | Smart Grids Business Models and Market Integration 31
Fixed feed-in tariffs
The first national directive specified in the German Renewable Energies Act (Erneuerbare-Energien-Gesetz, EEG) are fixed feed-in tariffs. They were introduced in the first amendment Act in 2010 for the EEG 2009 to promote the installation of RES and are designed in line with the currently installed RES capacity. The tariffs are fixed for 20 years starting with the commissioning of the RES system. The costs are redirected to the German electricity consumers (apportionment), who have to pay a levy which increases their electricity tariff. The costs are therefore covered by the electricity consumers and are not paid by federal organisations [53].
Feed-In Premium
In 2012, an additional component was added and is since then available as an alternative to the fixed feed-in tariff. The feed-in premium system was introduced to allow better feed-in forecast and therefore a safer network operation. This system is a first step from a promotional system for RES towards making them independent on the free market. This includes a management bonus, which is awarded if power plant owners participate in the direct marketing of electricity. This means, instead of selling the electricity to the network operator (who then sells it on the wholesale market) the electricity is sold by the RES plant operator (or an agent) through the stock exchange, the e.g. the European Stock Exchange (EEX). When RES operators sell the electricity at a price lower than the feed-in tariff they are paid the so-called market premium to compensate for the difference.
In the latest version of the EEG (2017) a tendering process was introduced taking into account development corridors of RES. The feed-in premium is now set through a tendering process which adds a market or competitive component to the former fixed premium system. In the past, the premium was not connected to market behaviour and the current electricity prices. This was changed effective from 2017 and possible interested RES plant owners need to participate in the tendering process to be able to get promotion payments from the funding system. The power plant operators have to bid for the market premium and the operators, who offer the smallest premium will get the promotion contract. This is supposed to reduce the amount the financial support for the future promotion of RES and to give an incentive to operate RES power pants completely without any future promotion measures.
Additionally, the market bonus paid through the EEG apportionment depends on the current electricity exchange price. If the exchange price rises, the paid market bonus will
Fixed Feed-In Tariffs Market-Premium System
• Before 2017:Variation based on current exchange price
• After 2017: Variation based on current exchange price and tendering processFeed-In
Tariff
Electricity exchange
price
Market Premium
Management-Bonus
Figure 2.9: Components of both fixed feed-in tariffs and the market-premium system. Based on [52]
Deliverable No. 2 | Smart Grids Business Models and Market Integration 32
be reduced to allow the same paid tariff for the whole funding period [54]. Therefore, the remuneration for the operators will be constant and independent from fluctuation on the energy market. This leads to better calculability for future investments.
After network congestions occurred more frequently and the EEG apportionment increased, which led to constantly rising electricity tariffs, the EEG was changed and development corridors were introduced. They limit the additional funding for the integration of RES to a predefined capacity per year [55]. The funding is granted according to the aforementioned tendering process.
Guaranteed network integration
Network operators have to connect RES generators to their networks if there is not an-other network economically or technically more suitable. They are required to do so with priority and without delay. The connection point in the network has to be suitable regarding the voltage level and has to be in closest distance (beeline) to the generator.
Building regulations
Additional building regulations aim at increasing energy efficiency and promoting locally installed and used RES solutions in private households. At the moment, the most economical heating solutions are based on renewable energies, but other options, such as better house insulation are also available and not fully exploited. Therefore, reaching the energy efficiency targets can be achieved mainly by using heat pumps, PV-systems or reducing energy losses. It is determined by law in the Energy Saving Act (Energieinsparungsgesetz, EnEG) and associated ordinances [56].
The different directives which aim at promoting the integration of RES into the German power supply system led to an increased share of RES and growing numbers of installed capacity of RES in Germany. The results of the past years will be displayed in the following section.
2.4.2 Integration into existing grids
After introducing the EEG (from 2000) and the start of the promotion of RES, the installed capacity increased significantly over the 16 years to 2016. Starting with a total of 9,600 MW of installed RES power plants in 1999 the promotion led to an increase of nearly 1,100% until 2016. Figure 2.10 displays the development in this specific time period. The impact of the RES funding was significant particularly for PV [57].
Although installations of small PV units in consumer households have high payback periods and are mainly attractive for owners of real estates, they were installed successfully all over Germany in recent years.
Specifically, the increase of wind power in the last years has pushed the development further into the direction the German government and the EU set their goals for future RES development. Already built offshore wind farms will be connected to the network in the near future and increase the installed capacity even more [55].

Deliverable No. 2 | Smart Grids Business Models and Market Integration 33
Figure 2.10: Expansion of installed capacity of RES power plants in Germany [57]
Figure 2.11 displays the share of RES of the gross electricity consumption in Germany [57].
Figure 2.11: Share of RES in the gross electricity consumption 1999-2016 [57]
The target set in the EEG is a share of 35% of electrical energy in 2020. The projection is that it will be reached and the next step is set for 2030, with a share of 50% of RES.
Due to Germany’s phase out of the remaining nuclear power plants, the conventional coal and lignite power plants are required to keep producing energy. Their high CO2-emmissions are threatening the EU 20-20-20 target of reducing the CO2-emmissions by 20% compared to 1990. However, at the moment they are still irreplaceable to cover the German power demand [58].
2.4.3 Support schemes
There are various support schemes that companies and private customers can use to support the investment into DER.
The government-owned development bank KfW (Kreditanstalt für Wiederaufbau, engl. Reconstruction Credit Institute) offers inexpensive loans meant to finance projects concerning the installation of facilities, such as PV power plants, combined heat and power plants (CHP), storages, Power-to-X, control and regulating systems. The loans are subject
9.600 11.74514.572 18.239
21.197 24.397 27.866 31.57634.818 37.762
46.517
55.72566.198
76.391 82.47089.830
97.326104.024
0
20.000
40.000
60.000
80.000
100.000
120.000
1999 2000 2001 2002 2003 2004 2005 2006 2007 2008 2009 2010 2011 2012 2013 2014 2015 2016
Inst
alle
d Cap
acity
[M
W]
Installed Capacity of RES in Germany
Hydro Power Wind On-Shore Wind Off-Shore Photovoltaics Other Total
0,0
5,0
10,0
15,0
20,0
25,0
30,0
35,0
40,0
Sha
re o
f RES
of
gros
s el
ectr
icity
co
nsum
ptio
n
Share of RES of gross electricity consumption Goal 2020
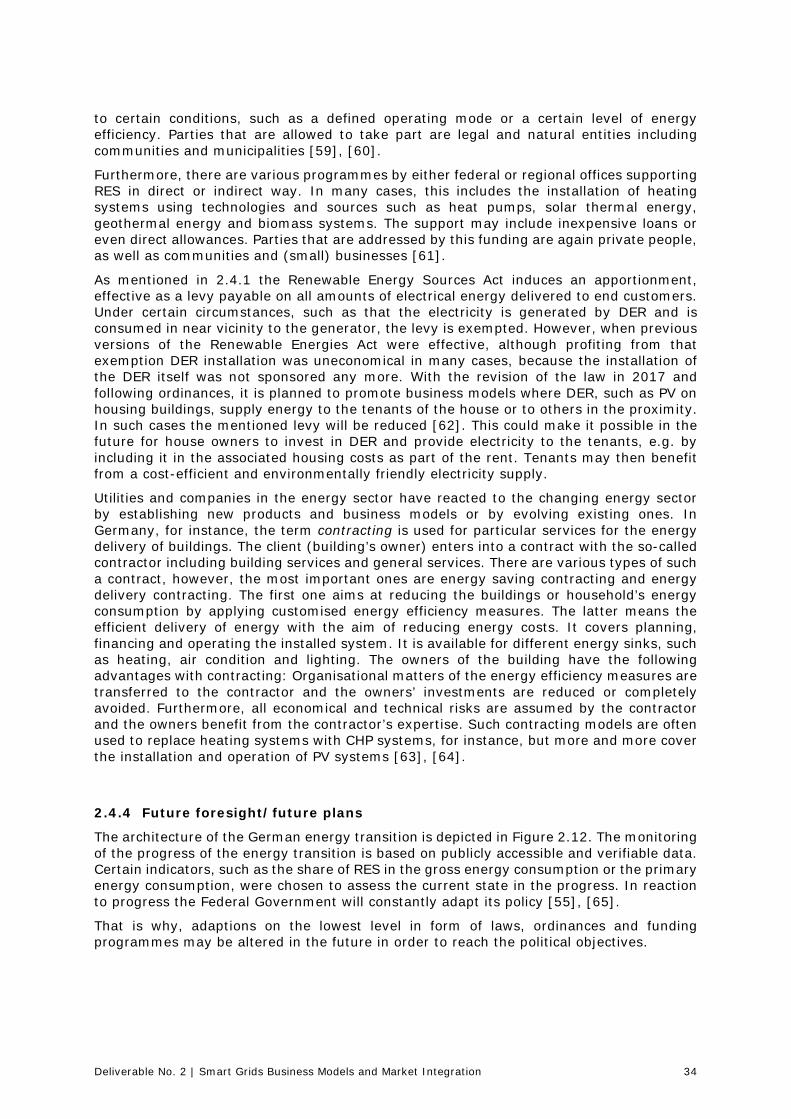
Deliverable No. 2 | Smart Grids Business Models and Market Integration 34
to certain conditions, such as a defined operating mode or a certain level of energy efficiency. Parties that are allowed to take part are legal and natural entities including communities and municipalities [59], [60].
Furthermore, there are various programmes by either federal or regional offices supporting RES in direct or indirect way. In many cases, this includes the installation of heating systems using technologies and sources such as heat pumps, solar thermal energy, geothermal energy and biomass systems. The support may include inexpensive loans or even direct allowances. Parties that are addressed by this funding are again private people, as well as communities and (small) businesses [61].
As mentioned in 2.4.1 the Renewable Energy Sources Act induces an apportionment, effective as a levy payable on all amounts of electrical energy delivered to end customers. Under certain circumstances, such as that the electricity is generated by DER and is consumed in near vicinity to the generator, the levy is exempted. However, when previous versions of the Renewable Energies Act were effective, although profiting from that exemption DER installation was uneconomical in many cases, because the installation of the DER itself was not sponsored any more. With the revision of the law in 2017 and following ordinances, it is planned to promote business models where DER, such as PV on housing buildings, supply energy to the tenants of the house or to others in the proximity. In such cases the mentioned levy will be reduced [62]. This could make it possible in the future for house owners to invest in DER and provide electricity to the tenants, e.g. by including it in the associated housing costs as part of the rent. Tenants may then benefit from a cost-efficient and environmentally friendly electricity supply.
Utilities and companies in the energy sector have reacted to the changing energy sector by establishing new products and business models or by evolving existing ones. In Germany, for instance, the term contracting is used for particular services for the energy delivery of buildings. The client (building’s owner) enters into a contract with the so-called contractor including building services and general services. There are various types of such a contract, however, the most important ones are energy saving contracting and energy delivery contracting. The first one aims at reducing the buildings or household’s energy consumption by applying customised energy efficiency measures. The latter means the efficient delivery of energy with the aim of reducing energy costs. It covers planning, financing and operating the installed system. It is available for different energy sinks, such as heating, air condition and lighting. The owners of the building have the following advantages with contracting: Organisational matters of the energy efficiency measures are transferred to the contractor and the owners’ investments are reduced or completely avoided. Furthermore, all economical and technical risks are assumed by the contractor and the owners benefit from the contractor’s expertise. Such contracting models are often used to replace heating systems with CHP systems, for instance, but more and more cover the installation and operation of PV systems [63], [64].
2.4.4 Future foresight/future plans
The architecture of the German energy transition is depicted in Figure 2.12. The monitoring of the progress of the energy transition is based on publicly accessible and verifiable data. Certain indicators, such as the share of RES in the gross energy consumption or the primary energy consumption, were chosen to assess the current state in the progress. In reaction to progress the Federal Government will constantly adapt its policy [55], [65].
That is why, adaptions on the lowest level in form of laws, ordinances and funding programmes may be altered in the future in order to reach the political objectives.
Deliverable No. 2 | Smart Grids Business Models and Market Integration 35
Figure 2.12: Architecture of the German energy transition [55]
As indicated in the preceding section, there is a phrase in the Renewable Energy Source Act 2017 allowing the German government to pass an ordinance that reduces the renewables energies levy for amounts of electricity that were generated on a housing buildings and consumed by the tenants. However, the Federal Ministry of Economic Affairs and Energy has recently published a paper describing a different approach. According to the report the Ministry prefers a direct monetary subsidy (comparable to the incentive for RES as stated in the Renewables Energies Act) instead of reducing the levy for such a DER systems. As advantages, it is mentioned that such a mechanism can be designed more accurately and reducing the levy may incur an EU regulation infringement concerning illegal aid. Furthermore, it is said to be easier to include third parties, such as contractors, in such direct incentive programme [66].
In 2018-2020 the German regulator is going to issue a call for tenders for innovative feed-in technologies totalling 50 MW per year. An ordinance will be passed in May 2018 ensuring that technologies that are particularly beneficial for that network will be funded. The funding is not limited to individual RES but tenders can be made for the combination of different RES. According to the success of the tenders, the Federal Government will decide whether to extend the programme [54].
Climate goals (-40 % green house gas emissions until 2020), nuclear energy phase-out (until 2022), competetiveness
Politcal objectives
Core objectives“strategy level“
Steering target“strategy level“
“Measures level“
Optimisation
Guiding criteria:Cost-efficiency,
System integration
Measures(laws, ordinances, funding programmes etc.)
Energy consumption accounted for
by traffic
Energy consumption accounted for
by the heat sector
Reduction ofelectricity
consumptionRES in trafficHeat from RES
Electricityconsumption
from RES
Increase of the energy productivity
-10 %-20 %-10 %14 %≥ 35 %
With objectives for 2020Energy concept 2010
Increase of the share of RES in the total energyconsumption
Reduction of the primary energy consumption andimprovement of energy efficiency
18 % -20 %
2,1 %
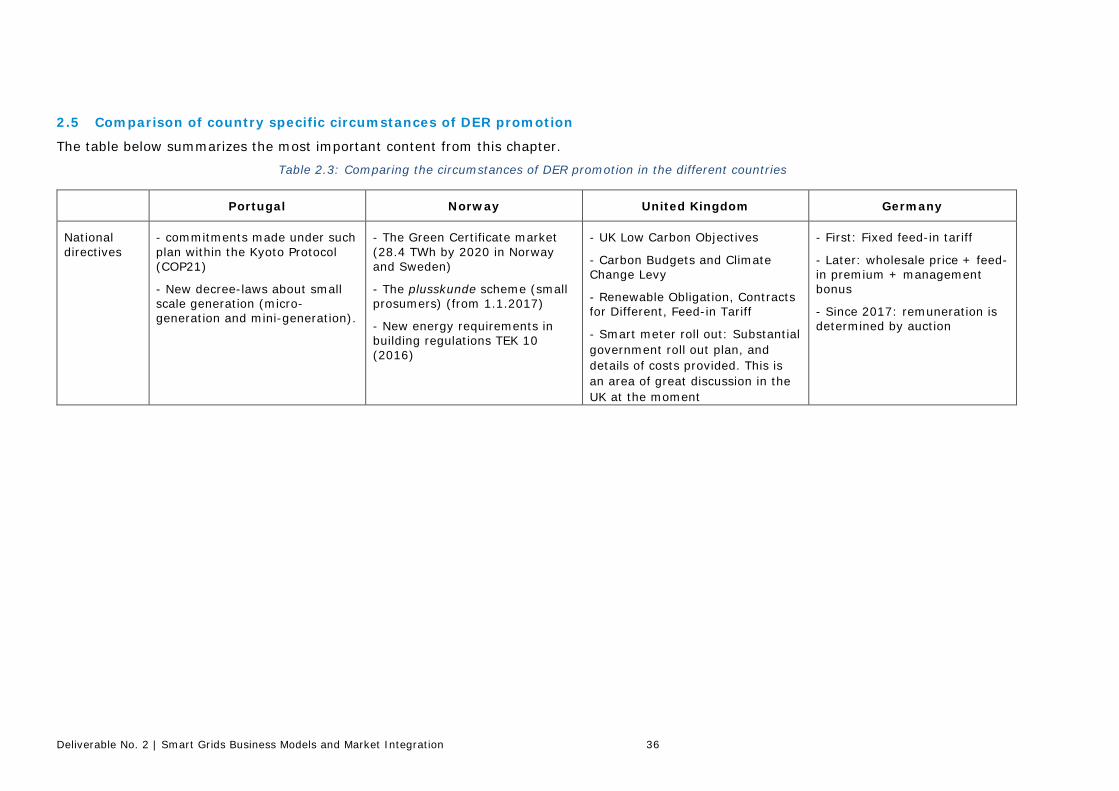
Deliverable No. 2 | Smart Grids Business Models and Market Integration 36
2.5 Comparison of country specific circumstances of DER promotion
The table below summarizes the most important content from this chapter.
Table 2.3: Comparing the circumstances of DER promotion in the different countries
Portugal Norway United Kingdom Germany
National directives
- commitments made under such plan within the Kyoto Protocol (COP21)
- New decree-laws about small scale generation (micro-generation and mini-generation).
- The Green Certificate market (28.4 TWh by 2020 in Norway and Sweden)
- The plusskunde scheme (small prosumers) (from 1.1.2017)
- New energy requirements in building regulations TEK 10 (2016)
- UK Low Carbon Objectives
- Carbon Budgets and Climate Change Levy
- Renewable Obligation, Contracts for Different, Feed-in Tariff
- Smart meter roll out: Substantial government roll out plan, and details of costs provided. This is an area of great discussion in the UK at the moment
- First: Fixed feed-in tariff
- Later: wholesale price + feed-in premium + management bonus
- Since 2017: remuneration is determined by auction

Deliverable No. 2 | Smart Grids Business Models and Market Integration 37
Portugal Norway United Kingdom Germany
Integration into existing grids
- If UPACs connected to the grid have an installed capacity higher than 1.5 kW, the owners are subject to pay fixed monthly compensation intended to recover part of the costs.
- by 2020, the minimum of 31% of Portugal’s primary energy consumption should come from RES, which is higher than EU-27 average.
- Between 2011 and 2014, a total of 2.757 MW from RES were licensed, thus achieving 11.6 GW of installed capacity.
- in 2015, the installed solar power in Portugal was 429 MW (+755% than 2008).
- The installed power in renewables increased on all of the technologies and it is predictable that it duplicates between 2010 and 2030.
- 565 small hydropower plants approved to receive green certificate (1.3 GWp) (January 2017)
- Approx. 700 prosumers per April 2017.
- 11.4 MWp installed capacity in 2016, whereas 10 MWp was grid-connected. 26.7 MWp installed capacity of solar PV in total.
- Connect and Manage approach at transmission
- Projection of installed capacity based on future energy scenarios from National Grid (SO)
- DNO Heatmaps – present current issues with the level of DG connecting to the network today
- EV: There is growth in EV but not as fast as predicted. DNOs are considering the impact, and have trialled to model some of the impacts in innovation projects.
- Connection priority and feed-in guarantee for RES by law
- from 1999 until 2016 the promotion led to an increase of nearly 1,100%
- PV has highest growth out of all RES installations
- in 2016: 31% RES of gross energy consumption
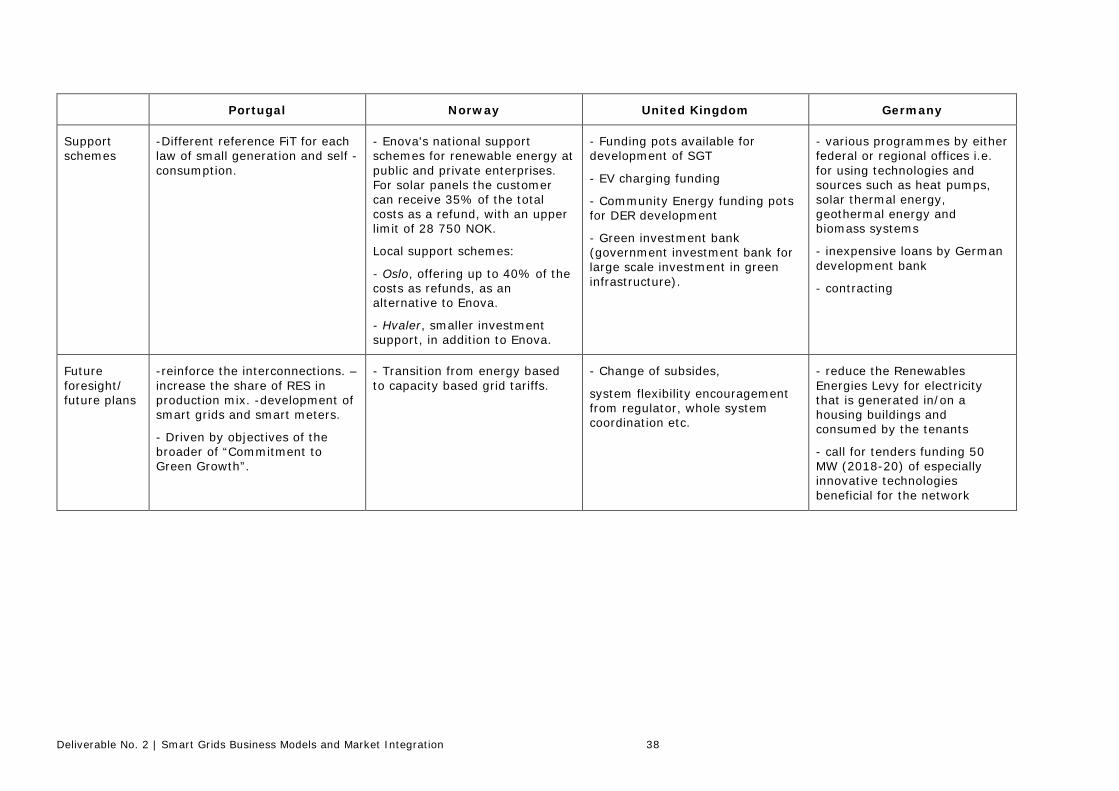
Deliverable No. 2 | Smart Grids Business Models and Market Integration 38
Portugal Norway United Kingdom Germany
Support schemes
-Different reference FiT for each law of small generation and self -consumption.
- Enova's national support schemes for renewable energy at public and private enterprises. For solar panels the customer can receive 35% of the total costs as a refund, with an upper limit of 28 750 NOK.
Local support schemes:
- Oslo, offering up to 40% of the costs as refunds, as an alternative to Enova.
- Hvaler, smaller investment support, in addition to Enova.
- Funding pots available for development of SGT
- EV charging funding
- Community Energy funding pots for DER development
- Green investment bank (government investment bank for large scale investment in green infrastructure).
- various programmes by either federal or regional offices i.e. for using technologies and sources such as heat pumps, solar thermal energy, geothermal energy and biomass systems
- inexpensive loans by German development bank
- contracting
Future foresight/ future plans
-reinforce the interconnections. –increase the share of RES in production mix. -development of smart grids and smart meters.
- Driven by objectives of the broader of “Commitment to Green Growth”.
- Transition from energy based to capacity based grid tariffs.
- Change of subsides,
system flexibility encouragement from regulator, whole system coordination etc.
- reduce the Renewables Energies Levy for electricity that is generated in/on a housing buildings and consumed by the tenants
- call for tenders funding 50 MW (2018-20) of especially innovative technologies beneficial for the network
Deliverable No. 2 | Smart Grids Business Models and Market Integration 39
3. Drivers for smart grid and approaches for deployment of smart grid – from a DSO point of view
This chapter contains a description of drivers for smart grid (regulations/requirements/ incentives) for deployment of smart grid technology installed in the grid, from the point of view of the DSO. Including both smart meters installed at the customer site and smart grid technology installed in the distribution grid.
3.1 Portugal
3.1.1 Regulatory Framework (for the DSO)
In Portugal, the national distribution system is divided into the mainland (operated by EDP Distribuição) and the autonomous regions of the Azores (operated by EDA) and Madeira (operated by EEM). Their activity is regulated by a national regulatory authority for energy services – ERSE, which defines the network tariffs, monitoring and assuring the levels of quality of service required by DGEG (Direcção Geral de Energia e Geologia).
In the following, information is provided emphasizing on EDP Distribuição, which owns about 99% of the distribution network on Portugal mainland and connects over 6 million clients to its distribution network [5].
Connections and smart meters roll-out
With the revision of the Commercial Relations Code (RRC) in 2012, the applicant for a connection became responsible for the construction of the sections for exclusive use, with the obligation of the distribution system operator (DSO) to present a budget being eliminated. However, in geographic areas where there are no service providers, the DSO must handle the construction of the connection. The DSO continues to be obliged to send ERSE the data related to their activity in this area.
However, for monitoring purposes, the distribution system operator is required to provide ERSE with annual information regarding connections to electricity networks, which includes, among other aspects, the average execution time of connections made by the network operators. In 2015, the average execution time in the distribution network for the LV and MV levels was approximately 17 days, for a total of 6,946 connections. We should also add that the Quality of Service Code (RQS) for the electricity sector establishes the obligation for the DSOs to monitor the response times to requests for low-voltage connection services, namely the proportion of requests in which the corresponding information was provided to the applicant within 15 business days after the request was made [67].
Regarding the smart meters roll-out, the regulation in Portugal is following the state of development of this technology which is only tested in demonstration sites. Nevertheless, the guide of measurement, reading and availability of electric energy data (“Guia de Medição” in Portuguese) [68] was approved, for the first time, in 2007, through the dispatch of ERSE no. 4591-A/2007, of 13th March, revised in 2012 in the directive no. 2/2012 of 6th January and then changed by the directive no. 22/2013 of 22nd November.
In August 2015, through a new directive, no. 14/2015, the Portuguese regulator (ERSE) carried out a significant changes regarding:
• Small production and self-consumption;
• Access, security, processing, availability and data conservation;
• Multi-tariff measurement equipment;

Deliverable No. 2 | Smart Grids Business Models and Market Integration 40
• Installation of low voltage clients with smart meters.
These changes resulted from direct consultations between the regulator and the several operators of LV distribution networks which discussed the harmonisation between the guide of measurement and the electric mobility regulation.
According to the changes specified in the guide, at installations with Very High Voltage (VHV), High Voltage (HV), Medium Voltage (MV) and Special Low Voltage (SpLV) multi-tariff meters should be installed with capacity to memorize programmed data for a long period of time and integrate communication capabilities, thus developing a superior remote reading measurement system.
Price level, transparency level and market opening and competition
The distribution system operator is obliged to conduct a meter reading every 3 months (Under the terms of Article 105 of the Commercial Relations Code, "when suppliers have 5,000 or more customers, it is assumed that their retail activities cover all types of electricity supply."), and should provide a toll-free telephone assistance service to all its customers so they can submit their own readings. (Under the terms of Article 35 of the Quality of Service Code for the electricity sector, available at [69]) The readings provided by the customer and by the DSO have the same legal value for billing purposes [67].
Technical quality of service – incentive to improve continuity of supply
In Mainland Portugal, both the Tariff Code (RT) and the Quality of Service Code (RQS) include provisions to regulate continuity of supply as well as establishing obligations related to the quality of the voltage wave and of commercial service.
The RT establishes an incentive to improve the continuity of supply with repercussions on the allowed revenue for the medium voltage (MV) and high voltage (HV) distribution system operators in Mainland Portugal. This incentive is aimed, on the one hand, at promoting the global continuity of electricity supply ("component 1" of the incentive), and, on the other, at encouraging the improvement of the level of the continuity of service among worst served customers ("component 2" of the incentive). "Component 2" was introduced in the 2014 regulatory revisions, and applied for the first time to the network’s performance in 2015.
Also, the RQS for the electricity sector establishes the obligation for the DSOs to monitor the response times to requests for low-voltage connection services [67].
Regulation methodologies for determining allowed revenue
The recent regulatory period started in 2015 and it refers to the 2015-2017 regulatory period. For Mainland in Portugal, a price cap methodology applied to unit operating costs (OPEX) and costs accepted on an annual basis in the case of investment costs (including net-assets and amortisations) (CAPEX), taking into account the investment plans proposed by the companies. Other incentives also apply:
(i) incentive for investment in smart networks;
(ii) incentive to improve quality of service and
(iii) incentive to reduce losses.
The allowed revenue for transmission and distribution system operators in what regards the overall management of the system, the purchase and sale of electricity from and to the commercial agent and the purchase and sale of the access to the transmission network includes costs arising essentially from legal decisions, the so-called CIEGs. The most significant CIEGs, either in terms of value or their impact on the functioning of the market, are related to generation. Market liberalisation has led to the need to anticipate the termination of the long-term Electricity Acquisition Contracts (CAE). Two of these contracts remained in force, and the energy generated by those two plants is now managed by a trading company. The revenue of this company depends on incentives defined by ERSE. In general, these incentives result in a direct relation between the supply revenues and the
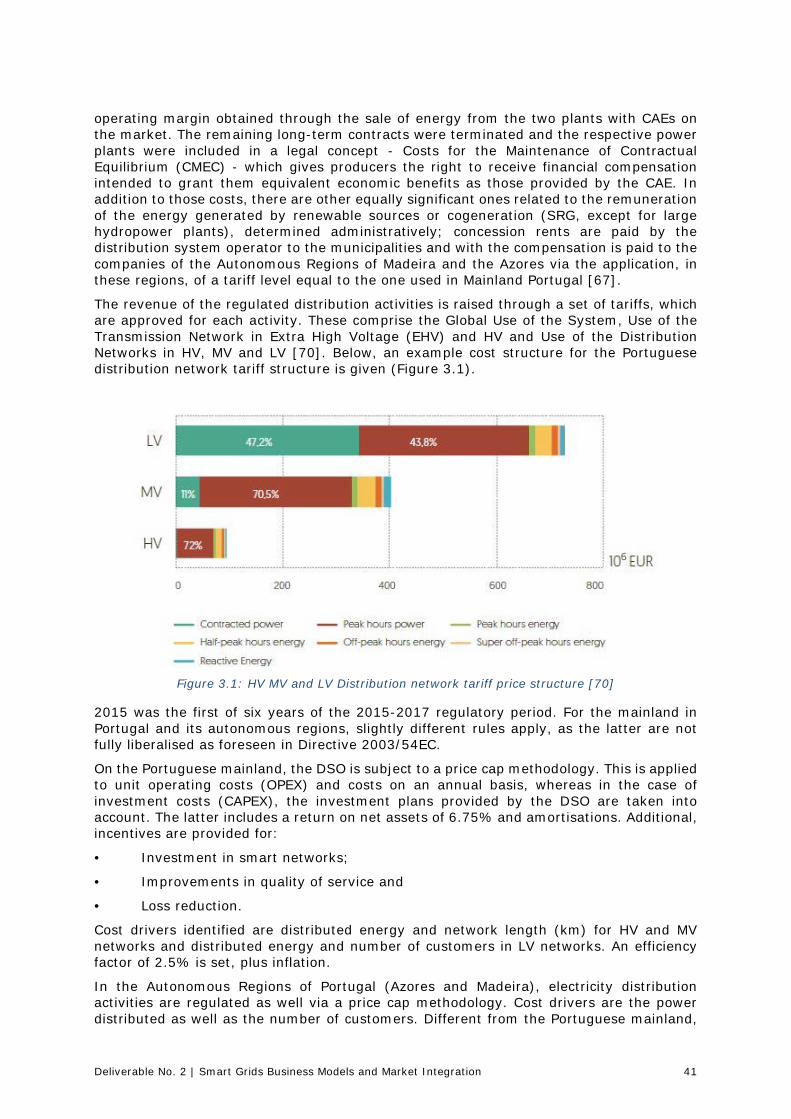
Deliverable No. 2 | Smart Grids Business Models and Market Integration 41
operating margin obtained through the sale of energy from the two plants with CAEs on the market. The remaining long-term contracts were terminated and the respective power plants were included in a legal concept - Costs for the Maintenance of Contractual Equilibrium (CMEC) - which gives producers the right to receive financial compensation intended to grant them equivalent economic benefits as those provided by the CAE. In addition to those costs, there are other equally significant ones related to the remuneration of the energy generated by renewable sources or cogeneration (SRG, except for large hydropower plants), determined administratively; concession rents are paid by the distribution system operator to the municipalities and with the compensation is paid to the companies of the Autonomous Regions of Madeira and the Azores via the application, in these regions, of a tariff level equal to the one used in Mainland Portugal [67].
The revenue of the regulated distribution activities is raised through a set of tariffs, which are approved for each activity. These comprise the Global Use of the System, Use of the Transmission Network in Extra High Voltage (EHV) and HV and Use of the Distribution Networks in HV, MV and LV [70]. Below, an example cost structure for the Portuguese distribution network tariff structure is given (Figure 3.1).
Figure 3.1: HV MV and LV Distribution network tariff price structure [70]
2015 was the first of six years of the 2015-2017 regulatory period. For the mainland in Portugal and its autonomous regions, slightly different rules apply, as the latter are not fully liberalised as foreseen in Directive 2003/54EC.
On the Portuguese mainland, the DSO is subject to a price cap methodology. This is applied to unit operating costs (OPEX) and costs on an annual basis, whereas in the case of investment costs (CAPEX), the investment plans provided by the DSO are taken into account. The latter includes a return on net assets of 6.75% and amortisations. Additional, incentives are provided for:
• Investment in smart networks;
• Improvements in quality of service and
• Loss reduction.
Cost drivers identified are distributed energy and network length (km) for HV and MV networks and distributed energy and number of customers in LV networks. An efficiency factor of 2.5% is set, plus inflation.
In the Autonomous Regions of Portugal (Azores and Madeira), electricity distribution activities are regulated as well via a price cap methodology. Cost drivers are the power distributed as well as the number of customers. Different from the Portuguese mainland,
Deliverable No. 2 | Smart Grids Business Models and Market Integration 42
an efficiency target factor of 2% is applied for distribution activities on Azores and 4% for the Autonomous Region of Madeira [71].
3.1.2 Regulatory Framework relevant for different Smart Grid Technology
Smart Meters
In Portugal, the shift to a smarter distribution grid is managed by EDP Distribuição, the main Portuguese DSO, through the InovGrid project [72] for the progress and implemen-tation of smart grid concepts and related technology. An important element of InovGrid has been the roll-out of a smart grid infrastructure in the Portuguese municipality of Évora in 2011. The infrastructure spans the entire municipality, reaching around 32,000 electricity customers. The deployment in Évora has demonstrated many of the benefits of smart grids. EDP Distribuição is currently installing second-generation smart meters to 100,000 customers throughout the country, with the objective of developing the supply chain and improving the integration with existing business processes. Currently, there is a pending government/regulator decision. The roll-out of smart meters will enable gathering detailed data on the energy use of small consumers. Portugal has undertaken a number of studies in these fields and has conducted a comprehensive field trial of the technology. The information obtained from this work should be applied to support the roll-out of advanced metering technologies to SMEs and commercial enterprises with a view to supporting their efforts to manage energy demand [5]. Under the conclusions of these studies and European standards the installation of between 370,000 and 900,000 meters from 2014 to 2020 is foreseen. But the final date to large scale establishment is not yet defined. Moreover, according to European standards, it is expected that roll-out be at least 80% established by 2020 and full coverage by 2022.
Demand Side Response/Management
Consumer demand response can provide regulation services, such as balancing, and may come at low cost. An enhanced demand response scheme is needed in Portugal alongside a transition from capacity payments to services-based payments [5].
Portugal, while open to the idea of Demand Response in principle, is a closed market, largely due to a lack of regulatory structures defining roles and responsibilities, access rights, measurement, prequalification and all other technical modalities required for creating a clear path for consumer participation.
Even though the aggregation of Distributed Generation (DG) is enabled, the aggregation of consumer load has not yet been defined. The regulator is conscious that with the structures in the place, Demand Response would be defined, but they plan to handle these concerns once they have an impulse from market participants, which until the date have not requested this mechanism to the market.
In spite of consumers have had access to a dynamic price of 3-4 price bands per day since 1997, most of them have decided to continue with a flat tariff scheme.
Demand Response is not active in Portugal, however, the largest consumers have a requirement to shed load during a system security event. Due to a large volume of capacity and the capped electricity prices, which slow market development, retailers do not seem to be interested in including consumers within their portfolio and be present in the market. DG can be aggregated and sold but there is no specific enabling regulation for the aggregation of demand although it is not expressly forbidden. There are a small number of large consumers (such as steel mills), which act as their own retailer and participate in the wholesale market [73].
From the point of view of energy efficiency, the regulator has established a mechanism aimed at promoting efficiency in electricity consumption and the adoption of more efficient equipment, by which eligible promoters submit candidate measures to that effect – Consumption Efficiency Promotion Plan (PPEC) [74]. With this mechanism, eligible

Deliverable No. 2 | Smart Grids Business Models and Market Integration 43
promoters submit measures to improve electricity efficiency, which are selected through technical and economical evaluation criteria.
The Energy Efficiency Fund (EEF) [2] is a financial tool produced by Decree-Law 50/2010 of 20th May aiming to fund programmes and measures identified in the National Energy Efficiency Action Plan NEEAP, to encourage energy efficiency on the part of citizens and businesses, to support energy efficiency projects and to promote behavioural change.
Other funding mechanism is the Innovation Support Fund (FAI), which offers financial incentives to pilot projects related to energy performance contracts in privately owned buildings [5].
Furthermore, Portugal also established a specific objective for the public sector of reducing energy consumption by 30%. The ENE 2020, approved by Cabinet Resolution No. 29/2010 of 15th April, later defined a goal of reducing final energy consumption by 20% by 2020. In NEEAP 2016, Portugal established a general target to reduce primary energy consumption by 25% by 2020 along with a specific target reduction of 30% for public administration [5].
Electric Vehicle Charging
Electric mobility is one of the priorities of the government policy contributing to achieve the goals to which Portugal has committed in COP21 [75].
In order to increase the use of renewable electricity in the road transport sector, the government recently approved (Commitment to Green Growth) several fiscal incentives for EVs, including a subsidy for the purchase of an EV when scrapping an old conventional vehicle.
The Resolution of minister’s council no. 49/2016 established that the society Mobi.E, S.A. [76] is the managing entity of mobility network for the next years. The Mobi.E programme promotes the acquisition of EVs and makes the most of existing investments in terms of developing an intelligent and integrated management platform. Solutions in this sector include upgrading existing charging infrastructure and adapting it to public and private covered parking sites [5].
There is recent approved regulation towards increasing the integration of EVs into the grid being the main of these:
• Ordinance 220/2016 [77] (Minimum rated power of installations of EV charging and technical rules) Minimum rated power per EV connection point- 3,680 kVA Multifamily houses- number of connection points affected with simultaneity
factor • Directive nº 2014/94/EU [78] (Fast charging (AC) and normal charging (DC)
available for compatible equipment for each case). • Ordinance 221/2016 [79] (technical and security rules in the installation of EV
charging)
Network Automation
In Portugal, there is not any special type of network automation regulation. The foreseen roll-out of smart meters may bring some new legislation regarding several linked issues, among them the network automation.
Active Voltage Management
Typically, in the Portuguese distribution network, voltage control is achieved using capacitor banks and transformers with OLTC (On Load Tap Changer) mechanism. Such a control is suboptimal leading to considerable active losses and injection of reactive energy in the transmission network. Plus, the injected reactive energy in the transmission grid is also invoiced. A coordinated management of the several DER connected at the MV and LV
Deliverable No. 2 | Smart Grids Business Models and Market Integration 44
levels may help obtaining a smooth and efficient operation of the distribution system as a whole and could be especially important in active voltage management.
Energy storage
In Portugal the regulator is incorporating storage from pumped hydro plants in the balancing market replacing, for now, the possible impact of demand reduction [73].
Significant investments have been made in pumped storage to provide system flexibility in low-demand, high-wind scenarios. Interconnection with Europe offers potentially more cost-effective options to manage system constraints and opens a wider market for Portugal’s renewable potential.
The first NREAP (National Renewable Energy Action Plan) [80] established a national 2020 target of 31% of renewable energy in gross final energy consumption. Portugal aims to achieve a share of 60% of renewable energy. For the purposes of the NREAP, however, the share in the electricity sector will correspond to 55.3%, taking into account pumped production in gross final energy consumption as per the methodology defined by the directive (NREAP 2010).
Distributed Generation
In Portugal, renewable energy sources were labelled as special regime generation (SRG). Special regime electricity generation comprises co-generation, generation from renewable and non-renewable endogenous resources, distributed generation and generation without the injection of power into the network. Furthermore, the special regime includes generation of electricity through renewable and non-renewable endogenous resources that are not subject to any other legal regime [70].
Thus, the special regime concept includes all renewable energy sources for generating electricity, including all hydropower generation. As in most other European countries, where RES are supported under FiT schemes, generation from renewable energy sources benefit from priority network access and prioritised dispatch [81].
However, under exceptional circumstances in the system operation (e.g. congestion or supply/demand imbalance), the managing body of the system can enforce curtailment in order to not exceed a specific power value for the respective SRG installation. In addition to that, he might limit the nominal power of each SRG facility that can be connected at each point of the network, depending on the availability of the network itself to accom-modate these connections.
It is noteworthy that in Portugal, the special regime can experience guaranteed remune-ration without being financially accountable for local imbalances (system balancing costs) necessary to dispatch these generation technologies to the market. These costs are uniquely covered by the last resort supplier and are eventually included in the network access tariff paid by all network users [70].
3.2 Norway
3.2.1 Regulatory Framework (for the DSO)
The regulator NVE uses a combination of direct regulations, economic regulations and compliance monitoring towards the Norwegian DSOs. The direct regulations include standards, roles and procedures, while the compliance monitoring (inspections and thematic supervision) is performed to ensure that the DSOs are following the regulations. The economic regulations are in the form of revenue caps, where the DSOs' maximum allowed revenues for the upcoming year are decided by NVE each November, based on numbers from the previous year. An important incentive for proper asset management and investment decisions, is the Costs of Energy Not Supplied (CENS) scheme. The DSOs' revenue caps are adjusted according to the expected CENS versus the actual CENS for
Deliverable No. 2 | Smart Grids Business Models and Market Integration 45
the previous year, such that DSOs with improved security of supply are awarded with increased revenue caps, and punished with reduced revenue caps in the opposite case [82].
In 2012, the Norwegian Energy Act introduced a general obligation for all grid owners to provide grid connection for new producers and consumers. All socioeconomically beneficial projects have the right to be connected to the grid. If there is lacking or no capacity in the existing grid, all the affected grid companies must perform the necessary investments to connect the production unit. There are no benefits for power production from RES regarding grid connection since all producers are treated equally by the Norwegian legislation [13].
3.2.2 Regulatory Framework relevant for different Smart Grid Technology
The Norwegian regulations have not set any direct requirements for smart grid technology. Through strict requirements regarding quality of supply and efficient grid operation, the investment in smart grid technologies is indirectly incentivized for the DSOs.
Smart Meters
The Norwegian Regulator has decided that the DSOs must install smart meters in all metering points by January 1st 2019. The only requirements from the regulator regarding smart meters, are functional requirements. These requirements are described in [43]. As of January 1st 2019, several paragraphs will be added to the directive addressing smart meters. The upcoming requirements for metering data are that the data must be stored at the metering point until they are transmitted to the DSO after the end of the operating day. The metering data must be available for the end user and the electricity/balance suppliers before 9 AM the next day. Suppliers of other energy services must be granted access to the end user's metering data, given the authorization of the end user [83]. All smart meters are required to have four-quadrant metering, making it easier to become a plusskunde prosumer.
Demand Side Response/Management
The smart meters to be rolled out contain a switch that makes it possible to disconnect or limit the power output of the customer. This functionality is not planned to be used for Demand Side Response, but rather for people moving out or for those that do not pay their bill. The AMI will also transfer information about electricity prices and tariffs to the customers, which may increase the awareness of energy consumption, stimulate energy saving and load-shifting to avoid peak-load hours. The customer can connect a display/ app (or similar) to the meter to get this information in real time.
DSOs are able to offer a reduced tariff for customers with interruptible loads. The DSO may disconnect interruptible loads at the customer at any time, momentarily or after a few hours' notice. The reduced tariff is voluntary to offer today, whereas it was mandatory to offer before July 2012. The reduced tariff must be offered on a general basis, but the DSO may freely decide the discount and they may differentiate the tariff between different customers. The DSOs are able to offer a reduced tariff for end users with low demands for security of supply. It has to be offered at a general basis, but the DSO may freely decide the discounted tariff [84], [85].
Electric Vehicle Charging
The Norwegian EV policy is the main reason that Norway has the world's highest number of EVs per capita, offering several advantages for EV owners (read more in [43]). By the middle of December 2016, the number of battery EVs on Norwegian roads reached 100,000, accounting for approximately 3% of the total number of cars. The Norwegian Parliament has set a goal of achieving that all sold vehicles in 2025 are emission free. The Norwegian EV Association states that the number of EVs needs to be 400,000 to reach the
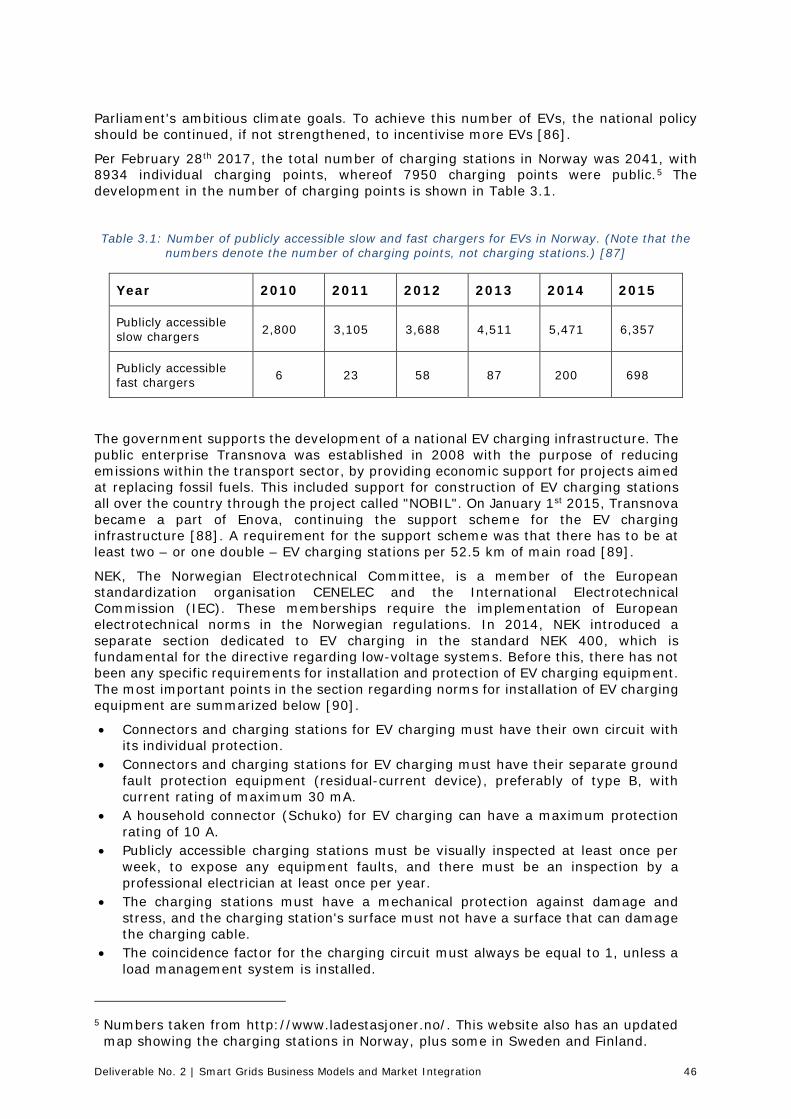
Deliverable No. 2 | Smart Grids Business Models and Market Integration 46
Parliament's ambitious climate goals. To achieve this number of EVs, the national policy should be continued, if not strengthened, to incentivise more EVs [86].
Per February 28th 2017, the total number of charging stations in Norway was 2041, with 8934 individual charging points, whereof 7950 charging points were public.5 The development in the number of charging points is shown in Table 3.1.
Table 3.1: Number of publicly accessible slow and fast chargers for EVs in Norway. (Note that the numbers denote the number of charging points, not charging stations.) [87]
Year 2010 2011 2012 2013 2014 2015
Publicly accessible slow chargers 2,800 3,105 3,688 4,511 5,471 6,357
Publicly accessible fast chargers 6 23 58 87 200 698
The government supports the development of a national EV charging infrastructure. The public enterprise Transnova was established in 2008 with the purpose of reducing emissions within the transport sector, by providing economic support for projects aimed at replacing fossil fuels. This included support for construction of EV charging stations all over the country through the project called "NOBIL". On January 1st 2015, Transnova became a part of Enova, continuing the support scheme for the EV charging infrastructure [88]. A requirement for the support scheme was that there has to be at least two – or one double – EV charging stations per 52.5 km of main road [89].
NEK, The Norwegian Electrotechnical Committee, is a member of the European standardization organisation CENELEC and the International Electrotechnical Commission (IEC). These memberships require the implementation of European electrotechnical norms in the Norwegian regulations. In 2014, NEK introduced a separate section dedicated to EV charging in the standard NEK 400, which is fundamental for the directive regarding low-voltage systems. Before this, there has not been any specific requirements for installation and protection of EV charging equipment. The most important points in the section regarding norms for installation of EV charging equipment are summarized below [90].
• Connectors and charging stations for EV charging must have their own circuit with its individual protection.
• Connectors and charging stations for EV charging must have their separate ground fault protection equipment (residual-current device), preferably of type B, with current rating of maximum 30 mA.
• A household connector (Schuko) for EV charging can have a maximum protection rating of 10 A.
• Publicly accessible charging stations must be visually inspected at least once per week, to expose any equipment faults, and there must be an inspection by a professional electrician at least once per year.
• The charging stations must have a mechanical protection against damage and stress, and the charging station's surface must not have a surface that can damage the charging cable.
• The coincidence factor for the charging circuit must always be equal to 1, unless a load management system is installed.
5 Numbers taken from http://www.ladestasjoner.no/. This website also has an updated
map showing the charging stations in Norway, plus some in Sweden and Finland.
Deliverable No. 2 | Smart Grids Business Models and Market Integration 47
Network Automation
In Norway there is no specific regulation related to network automation. When planning full-scale rollout of smart meters, several DSOs also plan to installed remote terminal units in MV/LV substation. Network Automation combined with smart meters, will give more information to the DSOs about the status in the grid, which will further give potential for more efficient management and planning of the grid.
Active Voltage Management
Norway has a strict regulation for voltage management, which the DSOs have to follow. The regulation does not specify how the requirement in the regulation should be fulfilled.
Energy storage
Since Norway's power production is dominated by hydropower, which is quick and easy to regulate, there is no overall crucial need for new large-scale energy storage. Any need for energy storage solutions would therefore be in areas where the transmission capacity is limited. The most used storage solution in Norway is reservoir water storage, practiced by holding back water during periods with low power prices. There are also a few pumped-storage hydropower plants. Regarding battery storage, there are almost no batteries installed, either at grid or consumer level.
Most of the Norwegian households have an electric water heaters installed, typically 2 kW, with storage capacity of 200 litres. This also includes storage that can be disconnected for a few hours without reduced comfort for the customer. This potential has been demonstrated in several pilot projects [91], but has not been implemented.
Distributed generation
It is mandatory for the DSOs to connect all customers and producers to the grid, if they want to. The DSOs cannot deny anyone to be connected to the grid. Everyone that plans to build new or increase generation capacity should clarify this with the DSO if the capacity in the existing grid is sufficient to handle this extra generation. If the existing grid capacity is not sufficient, the DSO can require that the company/person that wants to build this extra generation capacity also should pay their share of the investment costs in the grid upgrade. If not, the duty for connecting the installation will be withdrawn. It is not allowed (today) to make agreement for reduced generation as a permanent alternative to grid investments.
The regulation relevant for a household wants to invest in a PV-panel and become a prosumer, is described in chapter 2.2.1.
3.3 United Kingdom
3.3.1 Regulatory Framework (for the DSO)
Distribution companies in the UK are regulated to ensure they do not overcharge consumers for electricity and that they are incentivised to innovate and improve the efficiency and quality of service provided. The regulation framework used in the UK is referred to as the RIIO model:
(Revenue = Incentives + Innovation + Outputs)
The purpose of this framework was to encourage network companies to:
• Put stakeholders at the heart of their decision-making process;
• Invest efficiently to ensure continued safe and reliable services;
• Innovate to reduce network costs for current and future consumers;
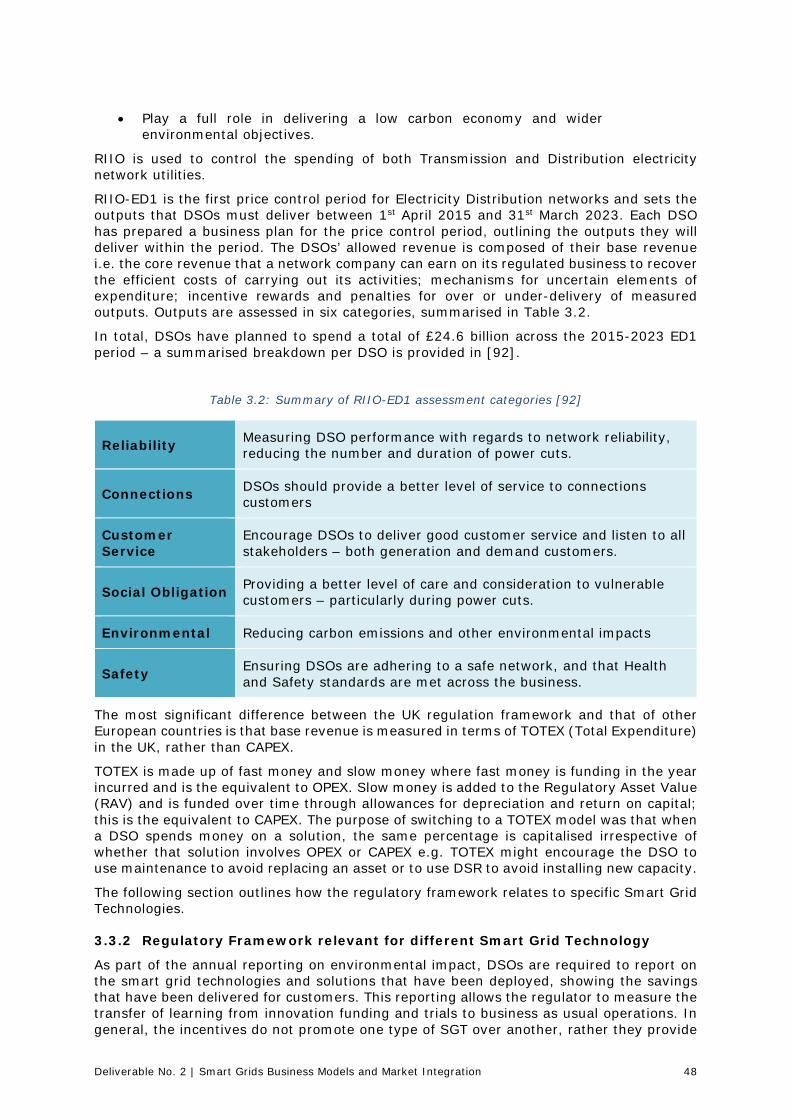
Deliverable No. 2 | Smart Grids Business Models and Market Integration 48
• Play a full role in delivering a low carbon economy and wider environmental objectives.
RIIO is used to control the spending of both Transmission and Distribution electricity network utilities.
RIIO-ED1 is the first price control period for Electricity Distribution networks and sets the outputs that DSOs must deliver between 1st April 2015 and 31st March 2023. Each DSO has prepared a business plan for the price control period, outlining the outputs they will deliver within the period. The DSOs’ allowed revenue is composed of their base revenue i.e. the core revenue that a network company can earn on its regulated business to recover the efficient costs of carrying out its activities; mechanisms for uncertain elements of expenditure; incentive rewards and penalties for over or under-delivery of measured outputs. Outputs are assessed in six categories, summarised in Table 3.2.
In total, DSOs have planned to spend a total of £24.6 billion across the 2015-2023 ED1 period – a summarised breakdown per DSO is provided in [92].
Table 3.2: Summary of RIIO-ED1 assessment categories [92]
Reliability Measuring DSO performance with regards to network reliability, reducing the number and duration of power cuts.
Connections DSOs should provide a better level of service to connections customers
Customer Service
Encourage DSOs to deliver good customer service and listen to all stakeholders – both generation and demand customers.
Social Obligation Providing a better level of care and consideration to vulnerable customers – particularly during power cuts.
Environmental Reducing carbon emissions and other environmental impacts
Safety Ensuring DSOs are adhering to a safe network, and that Health and Safety standards are met across the business.
The most significant difference between the UK regulation framework and that of other European countries is that base revenue is measured in terms of TOTEX (Total Expenditure) in the UK, rather than CAPEX.
TOTEX is made up of fast money and slow money where fast money is funding in the year incurred and is the equivalent to OPEX. Slow money is added to the Regulatory Asset Value (RAV) and is funded over time through allowances for depreciation and return on capital; this is the equivalent to CAPEX. The purpose of switching to a TOTEX model was that when a DSO spends money on a solution, the same percentage is capitalised irrespective of whether that solution involves OPEX or CAPEX e.g. TOTEX might encourage the DSO to use maintenance to avoid replacing an asset or to use DSR to avoid installing new capacity.
The following section outlines how the regulatory framework relates to specific Smart Grid Technologies.
3.3.2 Regulatory Framework relevant for different Smart Grid Technology
As part of the annual reporting on environmental impact, DSOs are required to report on the smart grid technologies and solutions that have been deployed, showing the savings that have been delivered for customers. This reporting allows the regulator to measure the transfer of learning from innovation funding and trials to business as usual operations. In general, the incentives do not promote one type of SGT over another, rather they provide
Deliverable No. 2 | Smart Grids Business Models and Market Integration 49
a framework to encourage DSOs to invest in a smarter, more cost-effective and flexible way of operating networks.
Full details of the incentives discussed here are available in a guide from the regulator [93].
The customer service output category ensures customer satisfaction across three areas: connections, interruptions, and general enquiries. Developers of distributed generation (DG) requesting connections to the network have a high level of interaction with the DSO and are considered a key stakeholder in measuring performance in this area. There is a maximum reward penalty of +/-0.5% of DSO annual base revenue for connections customer satisfaction. This incentivises DSO to provide support to DG customers, such as heat maps and enhanced network capacity information.
There are a number of connections incentives that ensures DSOs consider the needs of customers connecting low carbon technologies and distributed generation: the time to connect incentive and the Incentive on Connections Engagement (ICE). The ‘time to connect’ incentive is for minor connections (single point, low voltage connections) customers and sets a target number of days to provide a quote and deliver a connection.
The Incentive on Connections Engagement (ICE) applies to large connections customers. Each DSO must publish a ‘Looking Forward’ plan for each regulatory year detailing a high level engagement strategy, a work plan of activities and key performance outputs. At the end of the year, the DSO publishes a ‘Looking Back’ report which outlines how they have performed against the plan set at the start of the year. This is a penalty-only incentive.
Due to limited capacity in parts of the GB network, it is now very difficult to provide a connection offer with a reasonable connection cost and timeframe for the DG developer. This requires DSOs to offer alternative routes to connection such as Active Network Management (ANM), timed connections, or export limiting solutions. DSOs set objectives for issue of such alternative routes to connection within their ICE plans.
In 2016 there has been a number of consultations and discussions regarding the facilitation of quicker and more efficient connections for distribution connected customers [94]. ANM is noted as one of the key ways in which to enable a better connection experience for the customer, and the regulator has noted that it expects DSOs to offer various types of managed connection.
The efficiency incentive drives DSOs to look for lower cost solutions and manage the cost of output delivery e.g. schemes to work with customers to manage electricity usage and to offset the need for reinforcement. This could be as simple as local household energy efficiency education to something more complex such as a DSR program which could be funded through Network Innovation Allowances.
In the area of Smart Meters, the UK Government is leading the UK wide roll-out. Energy Supply Companies have the responsibility to install smart meters at domestic energy users’ homes, as these are the stakeholders who have the most interaction with the domestic energy users. DSOs are required to realise the benefits provided by smart meters i.e. better interruption and usage data, to operate the networks more efficiently.
The regulator has provided an allowance for DSOs to reclaim fixed costs of accessing smart meters up to end of 2019, but beyond this point DSOs must fund the access costs of smart meters through benefits realised. There is also a need to address privacy concerns. Before the data can be used to benefit the DSO, the companies require individual household permission to use the data or they must demonstrate arrangements which will anonymise the data.
The Interruptions Incentive Scheme (IIS) incentivises DSOs to ensure security of supply is met on their networks, minimising Customer Interruptions (CIs) and Customer Minutes Lost (CMLs). This IIS encourages enhanced Network automation schemes, such as automatic switching in response to fault conditions. Utilisation of the increased volumes of information made available to the DSO following smart meter roll-out is identified as a means to improve visibility of CIs and CMLs.
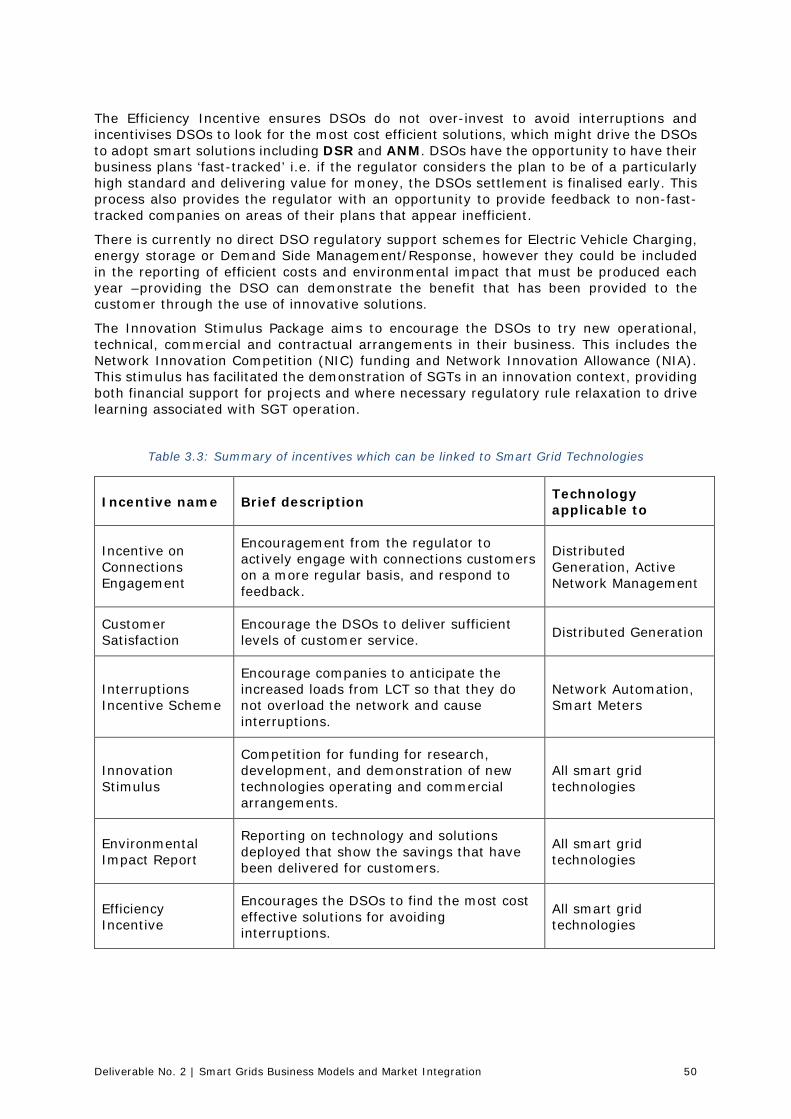
Deliverable No. 2 | Smart Grids Business Models and Market Integration 50
The Efficiency Incentive ensures DSOs do not over-invest to avoid interruptions and incentivises DSOs to look for the most cost efficient solutions, which might drive the DSOs to adopt smart solutions including DSR and ANM. DSOs have the opportunity to have their business plans ‘fast-tracked’ i.e. if the regulator considers the plan to be of a particularly high standard and delivering value for money, the DSOs settlement is finalised early. This process also provides the regulator with an opportunity to provide feedback to non-fast-tracked companies on areas of their plans that appear inefficient.
There is currently no direct DSO regulatory support schemes for Electric Vehicle Charging, energy storage or Demand Side Management/Response, however they could be included in the reporting of efficient costs and environmental impact that must be produced each year –providing the DSO can demonstrate the benefit that has been provided to the customer through the use of innovative solutions.
The Innovation Stimulus Package aims to encourage the DSOs to try new operational, technical, commercial and contractual arrangements in their business. This includes the Network Innovation Competition (NIC) funding and Network Innovation Allowance (NIA). This stimulus has facilitated the demonstration of SGTs in an innovation context, providing both financial support for projects and where necessary regulatory rule relaxation to drive learning associated with SGT operation.
Table 3.3: Summary of incentives which can be linked to Smart Grid Technologies
Incentive name Brief description Technology applicable to
Incentive on Connections Engagement
Encouragement from the regulator to actively engage with connections customers on a more regular basis, and respond to feedback.
Distributed Generation, Active Network Management
Customer Satisfaction
Encourage the DSOs to deliver sufficient levels of customer service. Distributed Generation
Interruptions Incentive Scheme
Encourage companies to anticipate the increased loads from LCT so that they do not overload the network and cause interruptions.
Network Automation, Smart Meters
Innovation Stimulus
Competition for funding for research, development, and demonstration of new technologies operating and commercial arrangements.
All smart grid technologies
Environmental Impact Report
Reporting on technology and solutions deployed that show the savings that have been delivered for customers.
All smart grid technologies
Efficiency Incentive
Encourages the DSOs to find the most cost effective solutions for avoiding interruptions.
All smart grid technologies
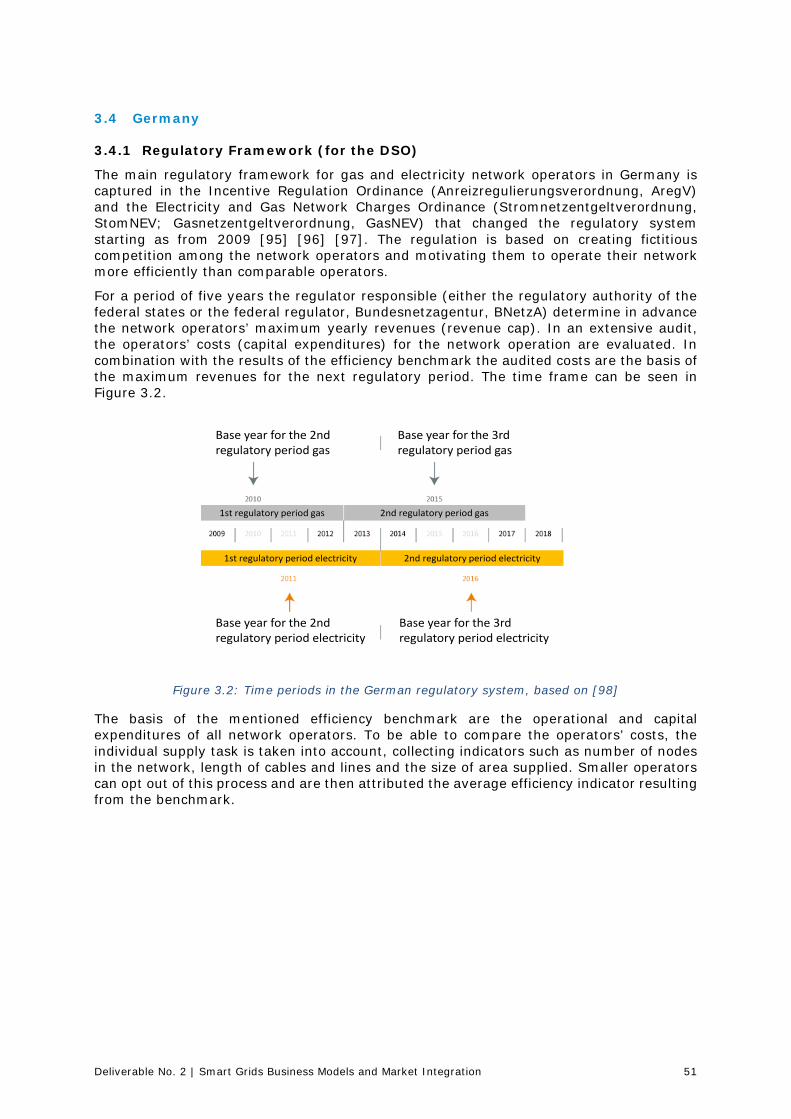
Deliverable No. 2 | Smart Grids Business Models and Market Integration 51
3.4 Germany
3.4.1 Regulatory Framework (for the DSO)
The main regulatory framework for gas and electricity network operators in Germany is captured in the Incentive Regulation Ordinance (Anreizregulierungsverordnung, AregV) and the Electricity and Gas Network Charges Ordinance (Stromnetzentgeltverordnung, StomNEV; Gasnetzentgeltverordnung, GasNEV) that changed the regulatory system starting as from 2009 [95] [96] [97]. The regulation is based on creating fictitious competition among the network operators and motivating them to operate their network more efficiently than comparable operators.
For a period of five years the regulator responsible (either the regulatory authority of the federal states or the federal regulator, Bundesnetzagentur, BNetzA) determine in advance the network operators’ maximum yearly revenues (revenue cap). In an extensive audit, the operators’ costs (capital expenditures) for the network operation are evaluated. In combination with the results of the efficiency benchmark the audited costs are the basis of the maximum revenues for the next regulatory period. The time frame can be seen in Figure 3.2.
Figure 3.2: Time periods in the German regulatory system, based on [98]
The basis of the mentioned efficiency benchmark are the operational and capital expenditures of all network operators. To be able to compare the operators’ costs, the individual supply task is taken into account, collecting indicators such as number of nodes in the network, length of cables and lines and the size of area supplied. Smaller operators can opt out of this process and are then attributed the average efficiency indicator resulting from the benchmark.
Base year for the 2ndregulatory period gas
Base year for the 3rdregulatory period gas
1st regulatory period gas 2nd regulatory period gas
1st regulatory period electricity 2nd regulatory period electricity
Base year for the 2ndregulatory period electricity
Base year for the 3rdregulatory period electricity
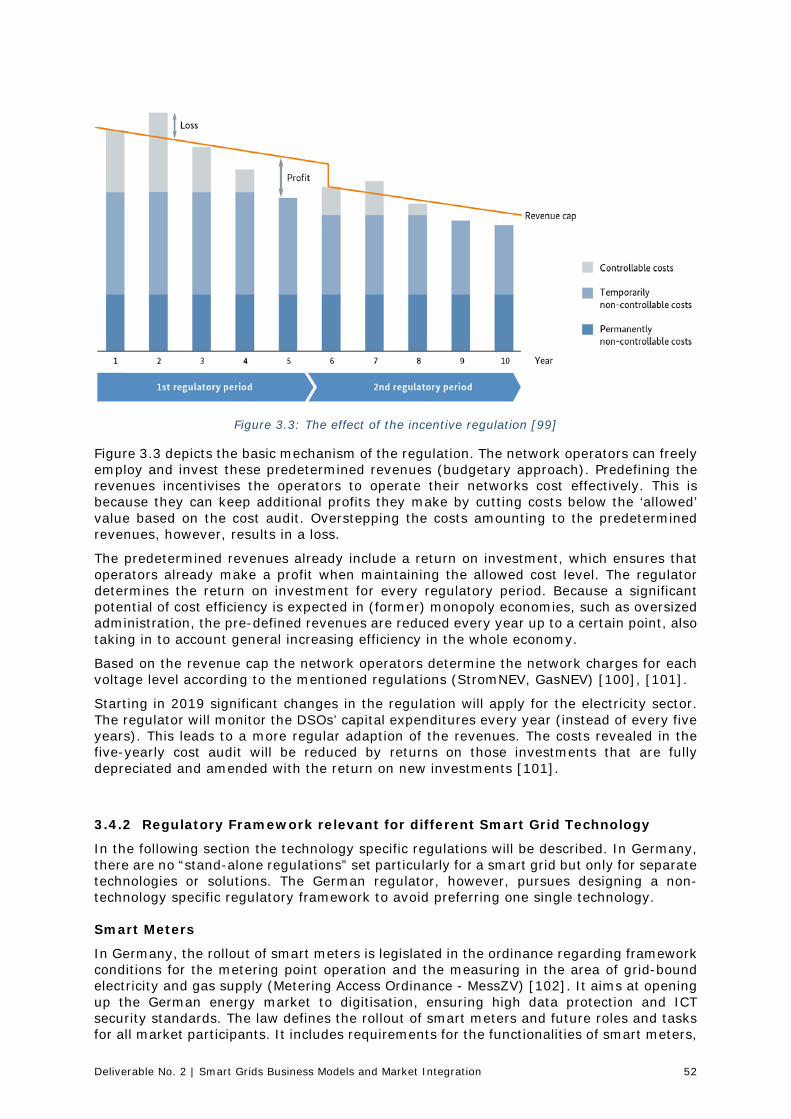
Deliverable No. 2 | Smart Grids Business Models and Market Integration 52
Figure 3.3: The effect of the incentive regulation [99]
Figure 3.3 depicts the basic mechanism of the regulation. The network operators can freely employ and invest these predetermined revenues (budgetary approach). Predefining the revenues incentivises the operators to operate their networks cost effectively. This is because they can keep additional profits they make by cutting costs below the ‘allowed’ value based on the cost audit. Overstepping the costs amounting to the predetermined revenues, however, results in a loss.
The predetermined revenues already include a return on investment, which ensures that operators already make a profit when maintaining the allowed cost level. The regulator determines the return on investment for every regulatory period. Because a significant potential of cost efficiency is expected in (former) monopoly economies, such as oversized administration, the pre-defined revenues are reduced every year up to a certain point, also taking in to account general increasing efficiency in the whole economy.
Based on the revenue cap the network operators determine the network charges for each voltage level according to the mentioned regulations (StromNEV, GasNEV) [100], [101].
Starting in 2019 significant changes in the regulation will apply for the electricity sector. The regulator will monitor the DSOs’ capital expenditures every year (instead of every five years). This leads to a more regular adaption of the revenues. The costs revealed in the five-yearly cost audit will be reduced by returns on those investments that are fully depreciated and amended with the return on new investments [101].
3.4.2 Regulatory Framework relevant for different Smart Grid Technology
In the following section the technology specific regulations will be described. In Germany, there are no “stand-alone regulations” set particularly for a smart grid but only for separate technologies or solutions. The German regulator, however, pursues designing a non-technology specific regulatory framework to avoid preferring one single technology.
Smart Meters
In Germany, the rollout of smart meters is legislated in the ordinance regarding framework conditions for the metering point operation and the measuring in the area of grid-bound electricity and gas supply (Metering Access Ordinance - MessZV) [102]. It aims at opening up the German energy market to digitisation, ensuring high data protection and ICT security standards. The law defines the rollout of smart meters and future roles and tasks for all market participants. It includes requirements for the functionalities of smart meters,
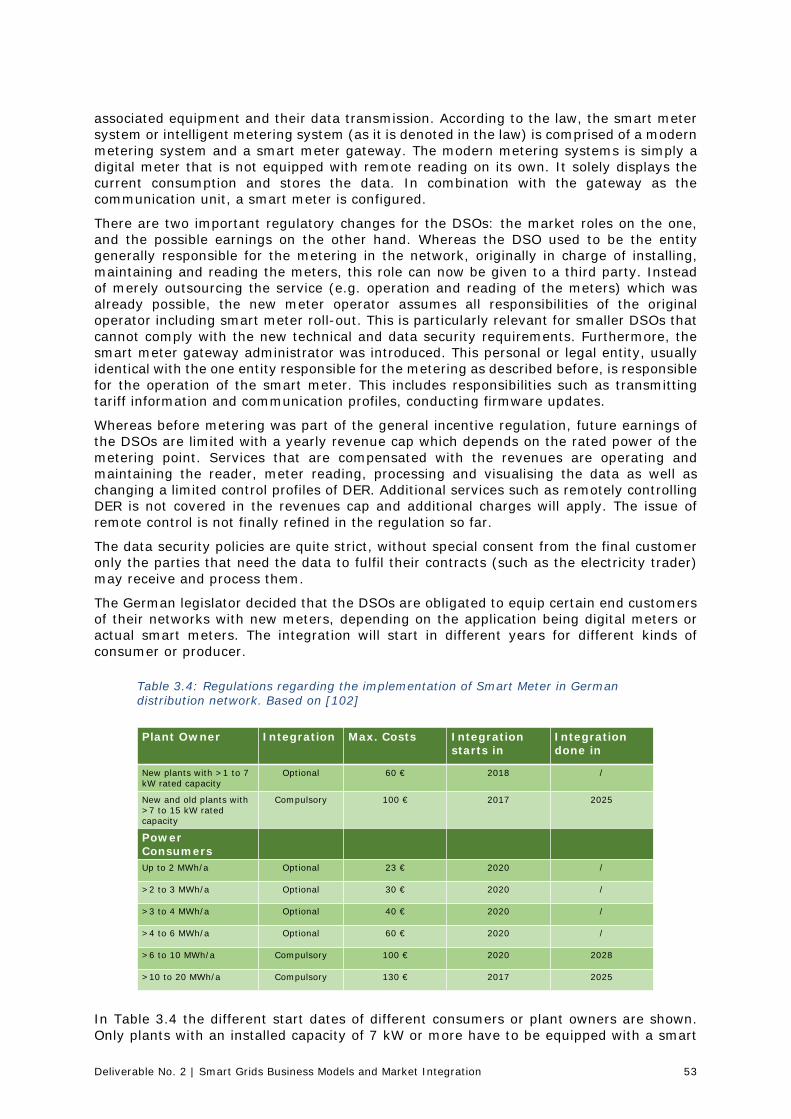
Deliverable No. 2 | Smart Grids Business Models and Market Integration 53
associated equipment and their data transmission. According to the law, the smart meter system or intelligent metering system (as it is denoted in the law) is comprised of a modern metering system and a smart meter gateway. The modern metering systems is simply a digital meter that is not equipped with remote reading on its own. It solely displays the current consumption and stores the data. In combination with the gateway as the communication unit, a smart meter is configured.
There are two important regulatory changes for the DSOs: the market roles on the one, and the possible earnings on the other hand. Whereas the DSO used to be the entity generally responsible for the metering in the network, originally in charge of installing, maintaining and reading the meters, this role can now be given to a third party. Instead of merely outsourcing the service (e.g. operation and reading of the meters) which was already possible, the new meter operator assumes all responsibilities of the original operator including smart meter roll-out. This is particularly relevant for smaller DSOs that cannot comply with the new technical and data security requirements. Furthermore, the smart meter gateway administrator was introduced. This personal or legal entity, usually identical with the one entity responsible for the metering as described before, is responsible for the operation of the smart meter. This includes responsibilities such as transmitting tariff information and communication profiles, conducting firmware updates.
Whereas before metering was part of the general incentive regulation, future earnings of the DSOs are limited with a yearly revenue cap which depends on the rated power of the metering point. Services that are compensated with the revenues are operating and maintaining the reader, meter reading, processing and visualising the data as well as changing a limited control profiles of DER. Additional services such as remotely controlling DER is not covered in the revenues cap and additional charges will apply. The issue of remote control is not finally refined in the regulation so far.
The data security policies are quite strict, without special consent from the final customer only the parties that need the data to fulfil their contracts (such as the electricity trader) may receive and process them.
The German legislator decided that the DSOs are obligated to equip certain end customers of their networks with new meters, depending on the application being digital meters or actual smart meters. The integration will start in different years for different kinds of consumer or producer.
In Table 3.4 the different start dates of different consumers or plant owners are shown. Only plants with an installed capacity of 7 kW or more have to be equipped with a smart
Plant Owner Integration Max. Costs Integration starts in
Integrationdone in
New plants with >1 to 7 kW rated capacity
Optional 60 € 2018 /
New and old plants with >7 to 15 kW rated capacity
Compulsory 100 € 2017 2025
Power ConsumersUp to 2 MWh/a Optional 23 € 2020 /
>2 to 3 MWh/a Optional 30 € 2020 /
>3 to 4 MWh/a Optional 40 € 2020 /
>4 to 6 MWh/a Optional 60 € 2020 /
>6 to 10 MWh/a Compulsory 100 € 2020 2028
>10 to 20 MWh/a Compulsory 130 € 2017 2025
Table 3.4: Regulations regarding the implementation of Smart Meter in German distribution network. Based on [102]

Deliverable No. 2 | Smart Grids Business Models and Market Integration 54
meter. The rollout is scheduled to start in 2017 and should be finished by 2025. For power consumers the integration has already started namely in private households with an energy demand of 10 MWh/a or more that have to be equipped until 2025. Despite this effort, by 2032 only approximately 13 % of all meter meters will be capable of remote reading as the remaining ones will just have the basic functions described. Furthermore, the smart meters will mainly replace those metering points already having a recorded power measurement every 15 minutes [103]. The remaining meters will only be digital meters that still have to be read once a year [104], [105].
Demand Side Response/Management
In the German regulation regime, there are several legislations which affect the possibility of Demand Side Management. In fact, not only specific regulations on Demand Response and Demand Side Management are part of the discussion. The market for balancing power as well as the electricity spot market are often included.
The most important regulation is the Ordinance on Agreements Concerning Interruptible Loads (Verordnung über Vereinbarungen zu abschaltbaren Lasten, AbLaV) [106]. It sets a basis for a voluntary provision of flexible loads, which is fixed in a bilateral contracts. The consumers, which are usually industrial loads, are reimbursed for participating and the costs are spread over all customers. Each month the TSOs have a joint competitive bidding in order to find the most favourable provider of the flexibility of 3 GW. The loads which are allowed to participate in the demand side management are defined in §1 and §2 AbLaV. The regulator mentions furnaces or electrolysis systems as typical examples, but still other options exist. The loads may only be connected to networks that are two transformer levels below high voltage, which lets systems in the medium voltage level qualify. Loads connected to a distribution network can only be contracted by the TSOs in cooperation with the responsible DSOs.
These regulations focus on disconnecting loads from the network. The potential and possible application of connecting additional loads for instance in times of surplus electricity fed into the network requires deeper analyses according to the official opinion of the before mentioned ordinance.
The second law which legislates the usage of Demand Side Management in Germany is the Law on Energy Management (Energiewirtschaftsgesetz, EnWG) [107]. §§ 13 and 22 EnWG are the most important parts, which define the system responsibility of TSOs in Germany. They have network related or market related measures at hand in order to guarantee security and reliability of their networks. Market related measures refer to balancing power as well as disconnecting contracted loads. The regulations on balancing power can be found in the ordinance for the electricity network access (Stromnetzzunganzsvorordnung, StromNZV) [108].
The Ordinance on Electricity Network Charges (Verordnung über die Entgelte für den Zugang zu Elektrizitätsversorgungsnetzen, StromNEV) aims in §19 at increasing the possibility of flexibility usage in the German power supply system [96]. Consumers with a high and so-called atypical use of the network pay less network tariffs. It refers to those customers that have a severely smaller load at the time of the general maximum load of the network or those that at least consume a total of 10 GWh at 7000 hours per year. This gives the incentive to large loads to draw electricity from the network in times when the general maximum load is lower.
For consumers connected to the low voltage network § 14 EnWG is relevant. It states that DSOs are required to offer them a reduced network charge if they operate loads that are controllable and (remotely) interruptible from the network by the DSO. The load may be disconnected by the DSO or another third party ordered by the DSO. Typical applications for such a tariff are electrical storage heating and heat pumps [109], [110].
Electric Vehicle Charging
There are several incentives and regulations in Germany regarding electric vehicles. But most of them are not regulating the charging process, which is the important part from
Deliverable No. 2 | Smart Grids Business Models and Market Integration 55
the DSOs perspective. The target of reaching 500,000 electric vehicles (EV) in Germany by 2020 will probably not be achieved [111]. This is the reason why the German government initiated an incentive to support EV with a premium system. For EVs a premium of 4,000 € is paid and for hybrid cars the premium is 3,000 €. Furthermore, EVs profit from reduced motor-vehicle taxation for 10 years. Concerning the charging infrastructure, the government is also aiming at sponsoring the installation of charging points and quick chargers with at least 300 million € during the coming years [194].
Currently there is a regulation called Ladesäulenverordnung (LSV) (charging station ordinance), which defines technical requirements for a safe and stable operation of charging stations. The framework was introduced on 9th March 2016 and is valid since 17th March 2016. Firstly, it defines the plug, which has fulfil certain requirements. For charging using AC an IEC 62196 Typ 2 plug has to be used and for using DC a combined charging system (CCS) plug is mandatory. This is valid only for newly built charging stations [112]. Besides at special charging station, EVs or hybrid cars can be charged at standard household power outlets but existing standards and grid codes need to be considered.
The reduced network charges for interruptible loads in the low voltage networks mentioned in the previous section is also explicitly meant for EV. In general, the regulatory framework for EVs with its potential in controlled charging to support network stability and security is not clearly defined [113].
Network Automation
There exist no particular regulations for decentralised network automation (DNA) in Germany. Due to DNA not being commonly used in German electricity networks, the regulator and industry bodies have not set norms and frameworks on how install or operate DNAs. The general rules, regulations and standards for operating electricity networks apply.
Active Voltage Management
For Active Voltage Management the standard technical rules and regulations as for conventional operation of the electricity network apply. Further details especially on the underlying grid codes will be given in chapter 5.
Active Voltage Management for RES plants is legislated in the Renewable Energies Act §9. Different types of RES plant have to be equipped with controllable power inverters or have to be self-limiting. RES including PV and CHP plant operators with an installed power of 100 kW and higher are required to equip their systems with remote meter reading and remote control. This includes the capability of reducing the feed-in during network congestion. PV plants in the range of 30-100 kW rated power must only comply with either of the mentioned regulations for RES. Below 30 kW, PV plant operators have the additional choice to constantly limit the feed-in to 70% of the rated power.
With the objective to secure power supply, WTG must also participate in curtailment and need to be equipped with the same metering and control mechanisms as large PV plants. Those have to be able to be turned from the wind. This ensures the power reduction and is part of a complex system to avoid voltage increases and equipment overload. The German curtailment for RES is defined in the Renewable Energies Act (EEG) in para-graphs §6, §11 and §12. Additionally it is mentioned in §13 of Law on Energy Management (EnWG). All those solutions are not automated and must be monitored and performed by the DSO’s control centres.
As the German regulation of network operators is CAPEX-based, DSOs get a return on reinforcing their networks, also when choosing innovative smart grid technologies. Those operational costs that are regarded unavoidable by the regulator, such as remuneration for curtailment with regard to § 9 of the Renewable Energy Sources Act, are included in the revenue cap. However, no return on operational costs is granted. This means that in terms of revenue, network operators are refunded operational costs through the network charges. However, as investing in the network earns them a revenue, smart grid
Deliverable No. 2 | Smart Grids Business Models and Market Integration 56
technologies and applications – especially those tending to cause OPEX rather than CAPEX – lack an incentive compared to conventional network reinforcement.
Energy storage
In the German legislation there has not been coined a legal definition for storage systems so far. Form the network’s point of view they are regarded as loads and generators at the same time. This is why certain regulations for both criteria apply, such as network charges and electricity tax on the one hand, and the RES levy funding the financial support for RES in the other. Furthermore, storage can be used by market players who trade electricity, for instance to optimise their portfolio. Whereas network operators may use storage solely to assist to balance electricity supply and demand in their networks.
In the latest version of the Renewable Energies Act (EEG 2017) the obligation for storage for paying the renewable energies levy was changed. Whereas small storage operated with RES below the power of 10 kW have been exempted from the tax, this now also applies for larger systems. In the past, the levy was added to both the amount of energy that the storage was charged with and it actually discharged. Storage units are regarded as generators. From 2017, the RES levy only applies to the amount of energy that the storage releases, not to the energy used for charging anymore. Furthermore, internal losses are completely exempted from the levy. If the storage is operated in a mixed operational mode, for optimising the self-consumption as well as supporting network stability, a measuring system needs to be installed [114].
The Federal Government financially supports decentralised energy storages that support network reliability installed in the time period 2016-2018. If fact, the German development bank KfW assumes up to 25% of the redemption of a loan taken to invest in storage used in combination with PV systems. This indirectly lowers the investments costs [115].
Distributed generation
In §8 of the German EEG the connection of RES into existing networks is regulated. German DSOs are obligated to connect all RES to the network prioritising them before other power plants. They have to be connected to a suitable voltage level. For RES plants with a capacity with less than 30 kW and placed on a property with an existing network access point, the plant must be connected to the network using the existing connection. For other RES plants a suitable access point will be defined by the DSO analysing costs for needed investments [52].
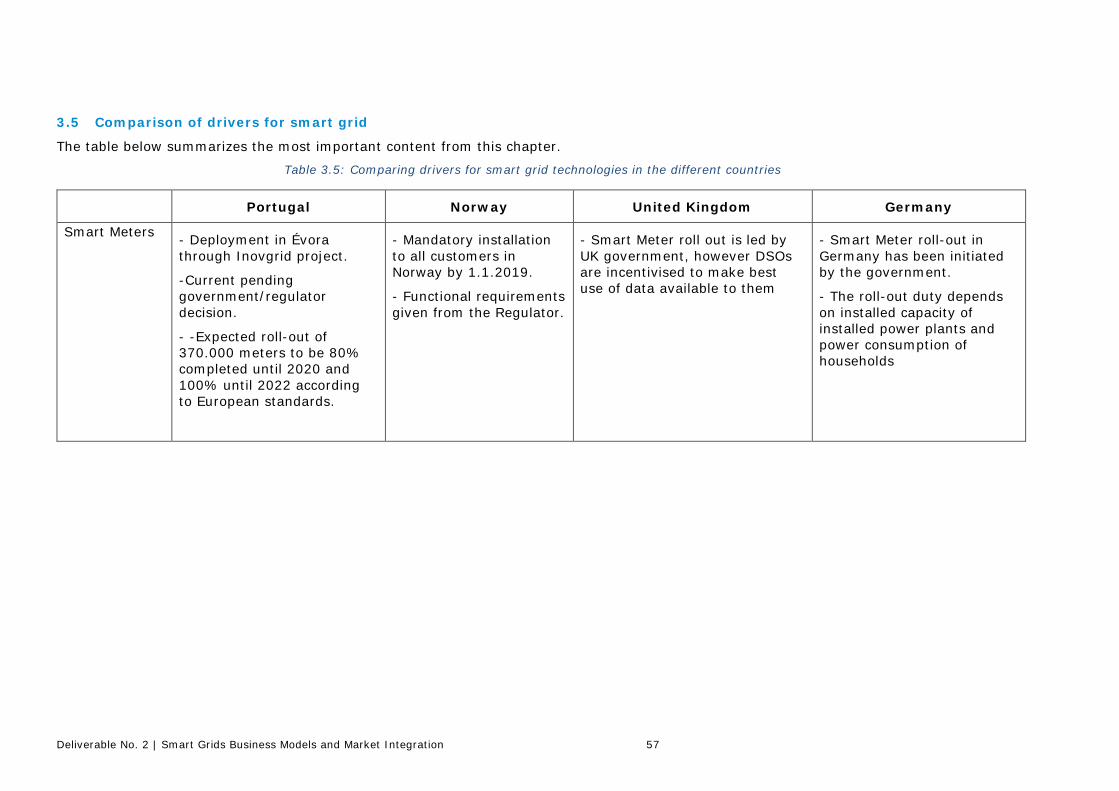
Deliverable No. 2 | Smart Grids Business Models and Market Integration 57
3.5 Comparison of drivers for smart grid
The table below summarizes the most important content from this chapter.
Table 3.5: Comparing drivers for smart grid technologies in the different countries
Portugal Norway United Kingdom Germany
Smart Meters - Deployment in Évora through Inovgrid project.
-Current pending government/regulator decision.
- -Expected roll-out of 370.000 meters to be 80% completed until 2020 and 100% until 2022 according to European standards.
- Mandatory installation to all customers in Norway by 1.1.2019.
- Functional requirements given from the Regulator.
- Smart Meter roll out is led by UK government, however DSOs are incentivised to make best use of data available to them
- Smart Meter roll-out in Germany has been initiated by the government.
- The roll-out duty depends on installed capacity of installed power plants and power consumption of households

Deliverable No. 2 | Smart Grids Business Models and Market Integration 58
Portugal Norway United Kingdom Germany
Demand Side Response/ Management
-Lack of regulation because the aggregation of consumer load has not yet been defined.
- Large consumers (such as steel mills), act as their own retailer and participate in the wholesale market.
- From the point of view of energy efficiency, the regulator has established a mechanism (PPEC).
- Smart meters equipped with a switch than can disconnect or limit the power output at customers. Planned to be used when people move out of their house.
- Reduced tariffs can be offered to customers with interruptible loads.
- No incentives that directly influence EV Charging, Energy Storage, or DSR but there is reporting that can include them in general.
- Larger consumers with flexible loads already play significant role in established system balancing and ancillary services markets at Transmission level.
- The German regulation (AblaV ordinance) defines possibilities of curtailing loads specifically in the HV networks.
- In §§13 and 22 of EnWG the responsibility of TSO for DSM is defined
- For consumers connected to LV networks the DSOs have to provide reduced network charges for controllable installations, such as heat pumps.
Electric Vehicle Charging
- Several fiscal incentives for EVs, including a subsidy for the purchase of an EV when scrapping an old conventional vehicle.
- Recent approved regulation towards to increasing integration of EVs into the grid.
- The government supports the development of a national EV charging infrastructure.
- In 2014, NEK introduced a separate section dedicated to EV charging in the standard NEK 400.
No incentives that directly influence EV Charging, Energy Storage, or DSR but there is reporting that can include them in general.
- The government promotes the development of new EV charging infrastructures.
- An ordinance exists defining standards for charging infrastructure.
- Premium paid for newly bought EV and hybrid cars
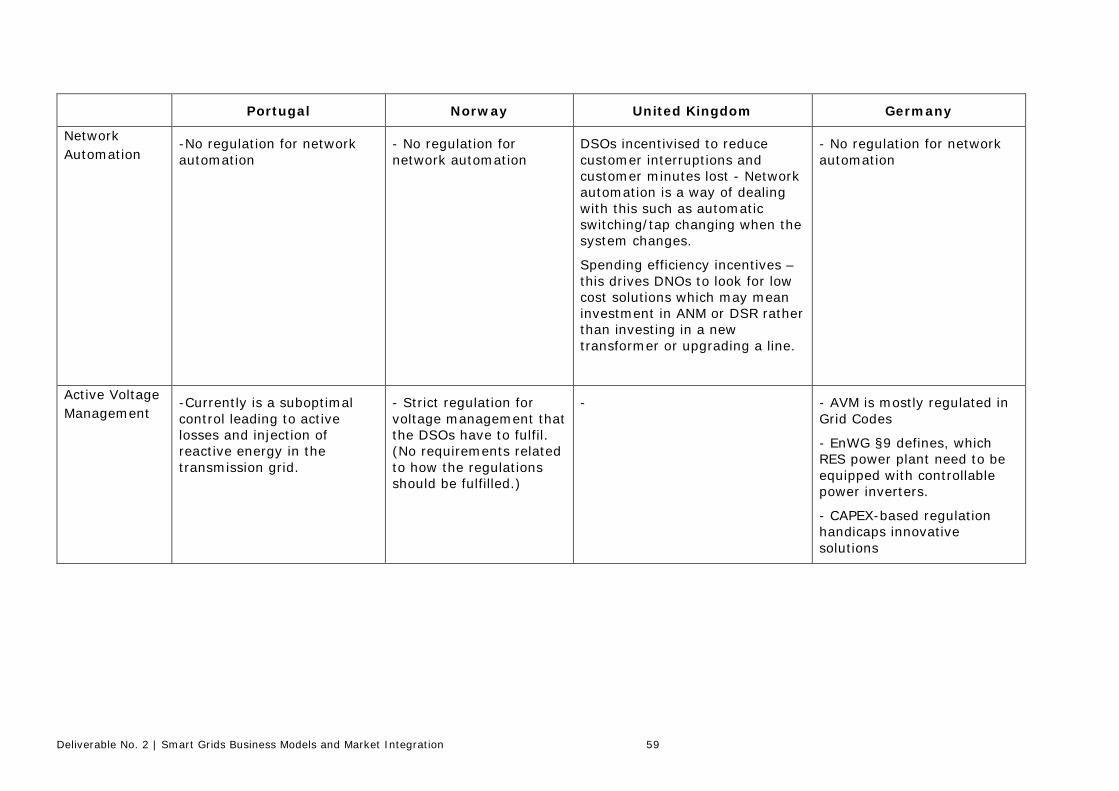
Deliverable No. 2 | Smart Grids Business Models and Market Integration 59
Portugal Norway United Kingdom Germany
Network Automation
-No regulation for network automation
- No regulation for network automation
DSOs incentivised to reduce customer interruptions and customer minutes lost - Network automation is a way of dealing with this such as automatic switching/tap changing when the system changes.
Spending efficiency incentives – this drives DNOs to look for low cost solutions which may mean investment in ANM or DSR rather than investing in a new transformer or upgrading a line.
- No regulation for network automation
Active Voltage Management
-Currently is a suboptimal control leading to active losses and injection of reactive energy in the transmission grid.
- Strict regulation for voltage management that the DSOs have to fulfil. (No requirements related to how the regulations should be fulfilled.)
- - AVM is mostly regulated in Grid Codes
- EnWG §9 defines, which RES power plant need to be equipped with controllable power inverters.
- CAPEX-based regulation handicaps innovative solutions
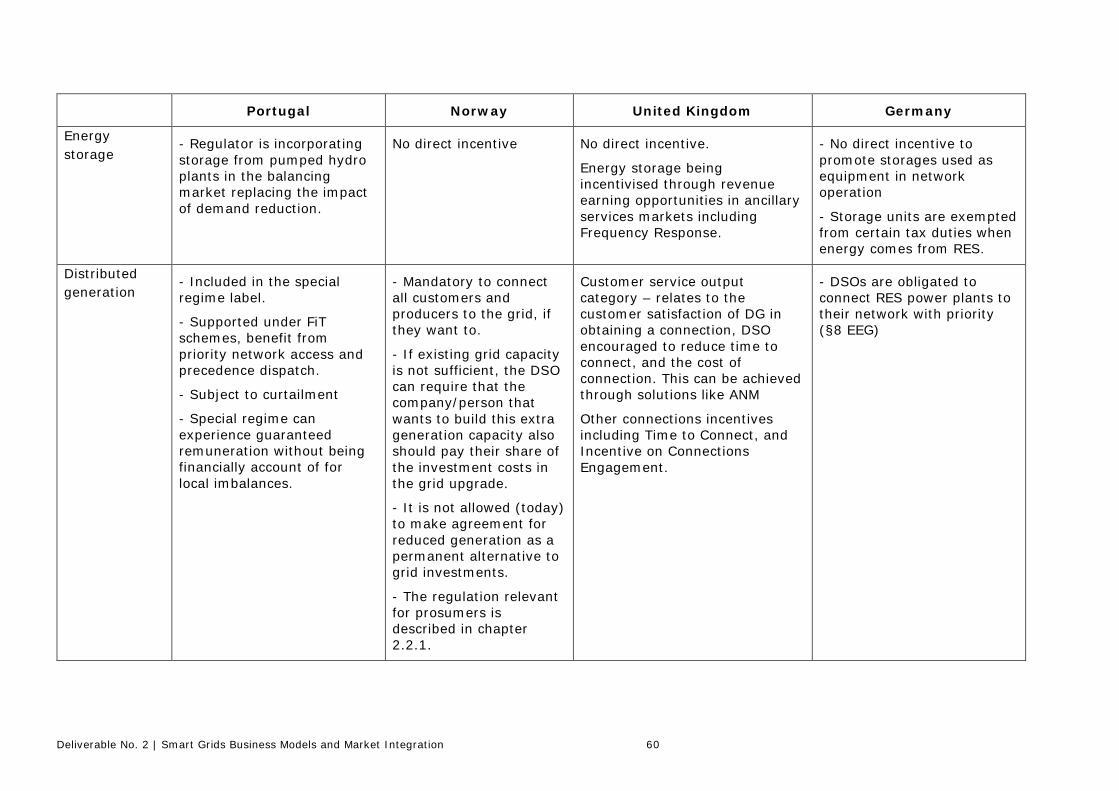
Deliverable No. 2 | Smart Grids Business Models and Market Integration 60
Portugal Norway United Kingdom Germany
Energy storage
- Regulator is incorporating storage from pumped hydro plants in the balancing market replacing the impact of demand reduction.
No direct incentive No direct incentive.
Energy storage being incentivised through revenue earning opportunities in ancillary services markets including Frequency Response.
- No direct incentive to promote storages used as equipment in network operation
- Storage units are exempted from certain tax duties when energy comes from RES.
Distributed generation
- Included in the special regime label.
- Supported under FiT schemes, benefit from priority network access and precedence dispatch.
- Subject to curtailment
- Special regime can experience guaranteed remuneration without being financially account of for local imbalances.
- Mandatory to connect all customers and producers to the grid, if they want to.
- If existing grid capacity is not sufficient, the DSO can require that the company/person that wants to build this extra generation capacity also should pay their share of the investment costs in the grid upgrade.
- It is not allowed (today) to make agreement for reduced generation as a permanent alternative to grid investments.
- The regulation relevant for prosumers is described in chapter 2.2.1.
Customer service output category – relates to the customer satisfaction of DG in obtaining a connection, DSO encouraged to reduce time to connect, and the cost of connection. This can be achieved through solutions like ANM
Other connections incentives including Time to Connect, and Incentive on Connections Engagement.
- DSOs are obligated to connect RES power plants to their network with priority (§8 EEG)
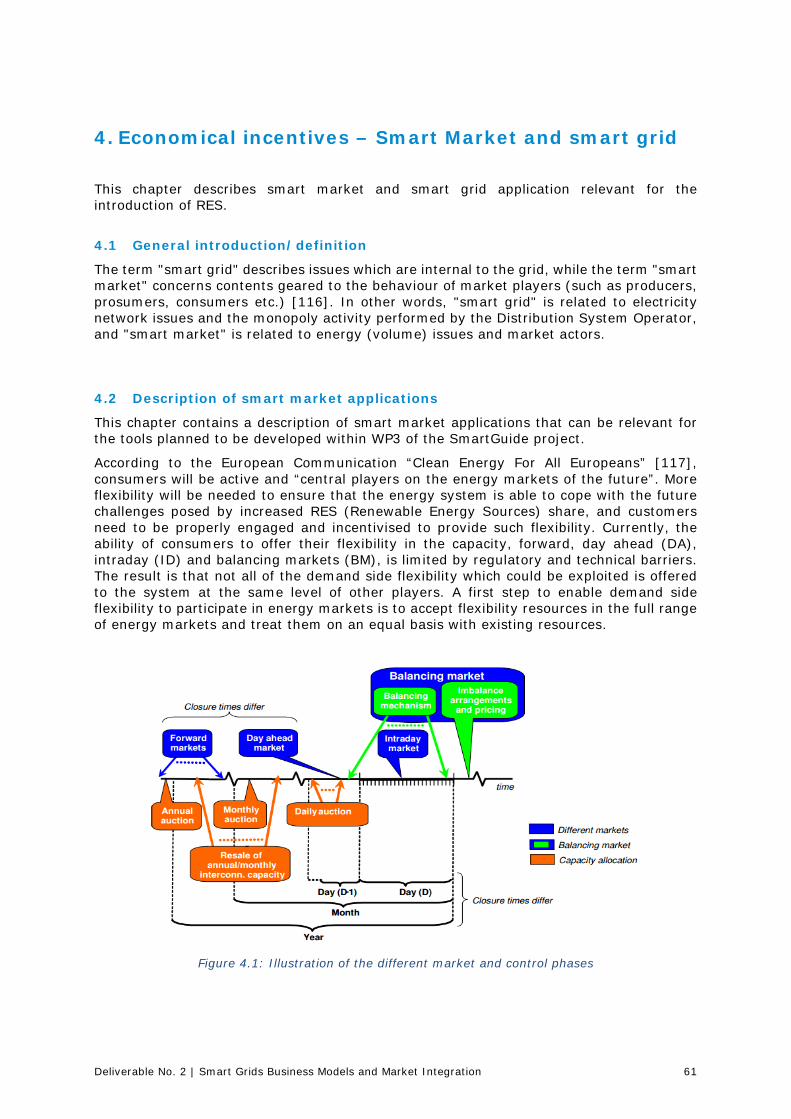
Deliverable No. 2 | Smart Grids Business Models and Market Integration 61
4. Economical incentives – Smart Market and smart grid
This chapter describes smart market and smart grid application relevant for the introduction of RES.
4.1 General introduction/definition
The term "smart grid" describes issues which are internal to the grid, while the term "smart market" concerns contents geared to the behaviour of market players (such as producers, prosumers, consumers etc.) [116]. In other words, "smart grid" is related to electricity network issues and the monopoly activity performed by the Distribution System Operator, and "smart market" is related to energy (volume) issues and market actors.
4.2 Description of smart market applications
This chapter contains a description of smart market applications that can be relevant for the tools planned to be developed within WP3 of the SmartGuide project.
According to the European Communication “Clean Energy For All Europeans” [117], consumers will be active and “central players on the energy markets of the future”. More flexibility will be needed to ensure that the energy system is able to cope with the future challenges posed by increased RES (Renewable Energy Sources) share, and customers need to be properly engaged and incentivised to provide such flexibility. Currently, the ability of consumers to offer their flexibility in the capacity, forward, day ahead (DA), intraday (ID) and balancing markets (BM), is limited by regulatory and technical barriers. The result is that not all of the demand side flexibility which could be exploited is offered to the system at the same level of other players. A first step to enable demand side flexibility to participate in energy markets is to accept flexibility resources in the full range of energy markets and treat them on an equal basis with existing resources.
Figure 4.1: Illustration of the different market and control phases
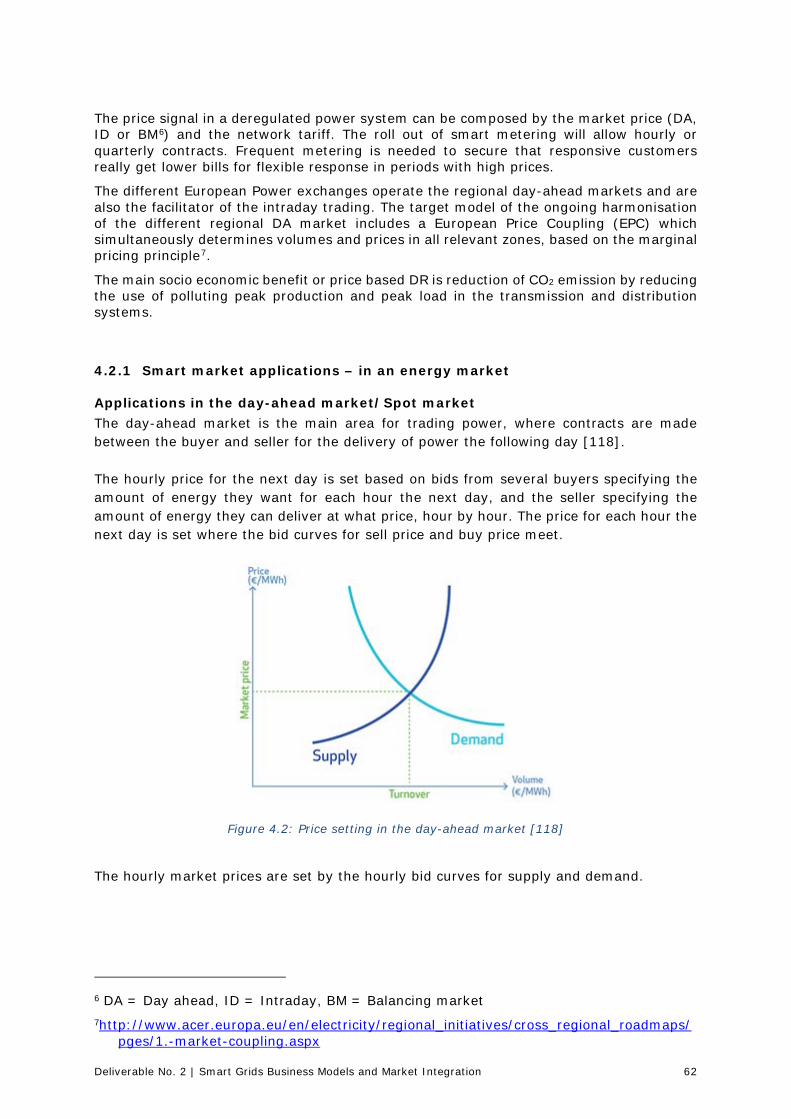
Deliverable No. 2 | Smart Grids Business Models and Market Integration 62
The price signal in a deregulated power system can be composed by the market price (DA, ID or BM6) and the network tariff. The roll out of smart metering will allow hourly or quarterly contracts. Frequent metering is needed to secure that responsive customers really get lower bills for flexible response in periods with high prices.
The different European Power exchanges operate the regional day-ahead markets and are also the facilitator of the intraday trading. The target model of the ongoing harmonisation of the different regional DA market includes a European Price Coupling (EPC) which simultaneously determines volumes and prices in all relevant zones, based on the marginal pricing principle7.
The main socio economic benefit or price based DR is reduction of CO2 emission by reducing the use of polluting peak production and peak load in the transmission and distribution systems.
4.2.1 Smart market applications – in an energy market
Applications in the day-ahead market/Spot market The day-ahead market is the main area for trading power, where contracts are made between the buyer and seller for the delivery of power the following day [118]. The hourly price for the next day is set based on bids from several buyers specifying the amount of energy they want for each hour the next day, and the seller specifying the amount of energy they can deliver at what price, hour by hour. The price for each hour the next day is set where the bid curves for sell price and buy price meet.
Figure 4.2: Price setting in the day-ahead market [118]
The hourly market prices are set by the hourly bid curves for supply and demand.
6 DA = Day ahead, ID = Intraday, BM = Balancing market 7http://www.acer.europa.eu/en/electricity/regional_initiatives/cross_regional_roadmaps/
pges/1.-market-coupling.aspx
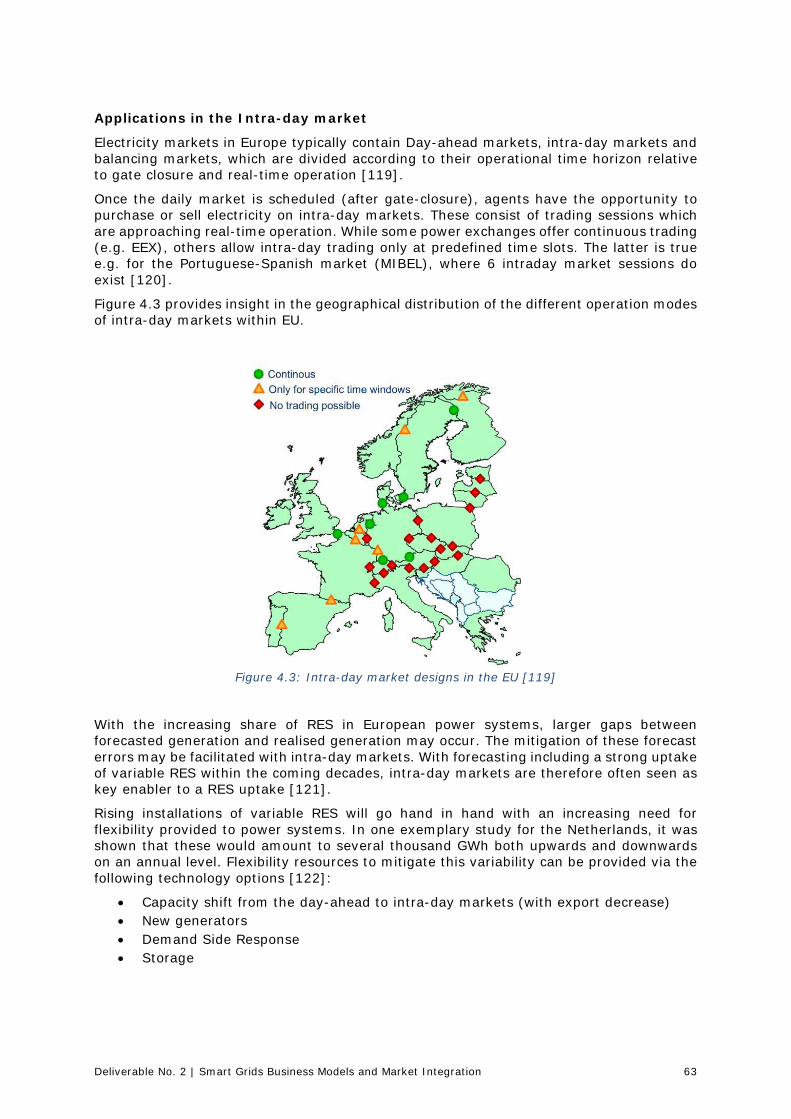
Deliverable No. 2 | Smart Grids Business Models and Market Integration 63
Applications in the Intra-day market
Electricity markets in Europe typically contain Day-ahead markets, intra-day markets and balancing markets, which are divided according to their operational time horizon relative to gate closure and real-time operation [119].
Once the daily market is scheduled (after gate-closure), agents have the opportunity to purchase or sell electricity on intra-day markets. These consist of trading sessions which are approaching real-time operation. While some power exchanges offer continuous trading (e.g. EEX), others allow intra-day trading only at predefined time slots. The latter is true e.g. for the Portuguese-Spanish market (MIBEL), where 6 intraday market sessions do exist [120].
Figure 4.3 provides insight in the geographical distribution of the different operation modes of intra-day markets within EU.
Figure 4.3: Intra-day market designs in the EU [119]
With the increasing share of RES in European power systems, larger gaps between forecasted generation and realised generation may occur. The mitigation of these forecast errors may be facilitated with intra-day markets. With forecasting including a strong uptake of variable RES within the coming decades, intra-day markets are therefore often seen as key enabler to a RES uptake [121].
Rising installations of variable RES will go hand in hand with an increasing need for flexibility provided to power systems. In one exemplary study for the Netherlands, it was shown that these would amount to several thousand GWh both upwards and downwards on an annual level. Flexibility resources to mitigate this variability can be provided via the following technology options [122]:
• Capacity shift from the day-ahead to intra-day markets (with export decrease) • New generators • Demand Side Response • Storage
Deliverable No. 2 | Smart Grids Business Models and Market Integration 64
Ranking preference for smart markets:
1. Capacity shift from the day-ahead to intra-day markets (need regulatory adjustments)
2. Storage (relatively most mature solution)
3. Demand Side Response (recent technology)
4. New generators (fossil based, not preferred)
Flexibility may also be used to overcome punctual line / transformer overloads or voltage violations. Currently, extreme load or RES scenarios can lead to excessive investments. In the future, assuming proper flexibility utilisation, it is expected that these investments can be postponed or even avoided.
Using flexibility as an alternative for network reinforcement implies a further energy market application: Among the intra-day market, the DSO must assure the integrity of the system, free of congestion or voltage violations. If the foreseen scenarios do not ensure security of operation, the flexibility bids proposed by the market aggregator must be used.
The market aggregator plays an important role in this application, since he would be responsible for setting the flexibility margins and coordinating the demand response of the several end users.
Local flexibility market
Local flexibility markets provide the ability for distribution networks to perform local system balancing in a way similar to that already undertaken by transmission system operators.
This can include trading between demand and generation connected within the same network area, demand side response, services via storage technology, and the creation of an ancillary services market for distribution services such as constraint management. In terms of flexible demand in particular, it may be the case that the starting point is to engage with larger demand customers e.g. I&C customers, but expand to residential.
There have been various examples across Europe of local flexibility, focusing on Demand Side Response however there has yet to be a wide scale uptake of Demand Response programs at Distribution level out with a project trial.
In terms of volume of Energy, local flexibility markets would operate at the lower end of the scale when compared with similar types of balancing at transmission, from 1 – 50MW capacity.
Time Resolution – in the first instance, is likely to be day ahead balancing, with a focus on peak demand periods e.g. in the UK there is a demand peak between 4pm and 7pm. The intricacy of real-time system balancing will develop as the DSO capabilities expand.
Technology required for this sort of deployment is some form of Network Management for the more complex end of the scale i.e. any real-time management of supply and demand. At a more basic level, measuring, communications, and metering devices to record power delivered during period in question for settlement purposes.
There is potential for DER to maximise revenue particularly in areas of the network that are subject to constraints, or to participate in any new market services that are created by the DSO as part of exploring the local flexibility market. Examples of existing solutions include peer-to-peer trading platforms, Constraint Management Zones, constraint management, and demand response.
Deliverable No. 2 | Smart Grids Business Models and Market Integration 65
Sector coupling concepts/ Cross carrier energy synergies The term sector coupling is very present in the German discussion on how to frame the energy transition towards a decarbonised electricity production. It describes the approach to jointly optimise electrical power, thermal power and mobility networks and sectors together and is often seen crucial for the success [123]. Certain systems enable the interconnection between those systems and the underlying networks, such as Power-to-Heat, Power-to-Gas and heat pumps for combining electricity and thermal power and electromobility for combining the electricity and mobility sector by energy exchange. Those technologies offer flexibility to the electrical power system by offering a certain level of demand control. The interaction between the mentioned sectors is only enabled by installing smart grid technologies in the networks. In order to implement such combined approaches, incentives, markets and business models have to be implemented in to order to make them economically feasible for investors. [123] This can be performed by, for instance, exempting plant operators from particular monetary obligations set by the regulation. On the other hand, markets, such as balancing market on the local level, need to be designed for such novel concepts in order to be economically feasible.
4.2.2 Smart market applications – in a balancing market
Applications contributing to primary reserves
The Primary Control Reserve (PCR) markets collect bids for upward and downward flexibility which will be activated to restore frequency deviations in the internationally interconnected system. In other words, grid imbalances would be mitigated with PCR through a response of all connected generators or applications to force system balance restoration [124].
Possible applications available for PCR participation of DER in smart market environments have already been analysed. Results show potential business cases such as:
• Vehicle-to-grid and grid-to-vehicle charging [124]: o Price setting: On primary reserve markets; in some countries obligatory
participation of generators does exist (PT) o Actors: EV charging point managers, aggregators, DSOs (if still bundled, e.g.
in isolated systems) o Volume of energy: depending on battery size and EV fleet significant (e.g.
MWh to GWh scale) o Time resolution: maximum a few hours depending on EV user willingness to
provide PCR o Potential to include DER in the market applications: very high potential.
• Wind farms equipped with doubly fed induction generator technology (DFIG) [125]:
o Price setting: On primary reserve markets; in some countries obligatory participation of generators does exist (PT)
o Actors: Wind farm operators, energy trading companies o Volume of energy: depending on wind farm size (e.g. MWh scale) o Time resolution: minutes, highly depending on wind speed characteristics o Potential to include DER in the market applications: very high potential (in
fact it is based on DER technologies)
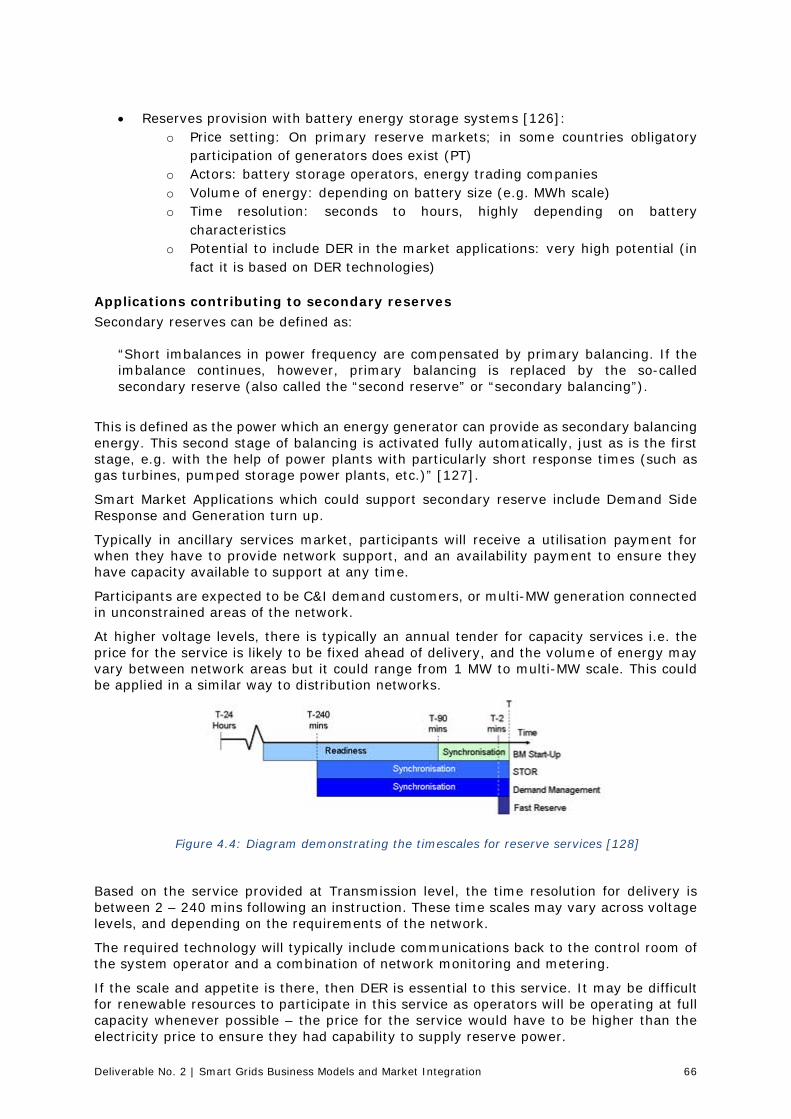
Deliverable No. 2 | Smart Grids Business Models and Market Integration 66
• Reserves provision with battery energy storage systems [126]: o Price setting: On primary reserve markets; in some countries obligatory
participation of generators does exist (PT) o Actors: battery storage operators, energy trading companies o Volume of energy: depending on battery size (e.g. MWh scale) o Time resolution: seconds to hours, highly depending on battery
characteristics o Potential to include DER in the market applications: very high potential (in
fact it is based on DER technologies)
Applications contributing to secondary reserves Secondary reserves can be defined as:
“Short imbalances in power frequency are compensated by primary balancing. If the imbalance continues, however, primary balancing is replaced by the so-called secondary reserve (also called the “second reserve” or “secondary balancing”).
This is defined as the power which an energy generator can provide as secondary balancing energy. This second stage of balancing is activated fully automatically, just as is the first stage, e.g. with the help of power plants with particularly short response times (such as gas turbines, pumped storage power plants, etc.)” [127].
Smart Market Applications which could support secondary reserve include Demand Side Response and Generation turn up.
Typically in ancillary services market, participants will receive a utilisation payment for when they have to provide network support, and an availability payment to ensure they have capacity available to support at any time.
Participants are expected to be C&I demand customers, or multi-MW generation connected in unconstrained areas of the network.
At higher voltage levels, there is typically an annual tender for capacity services i.e. the price for the service is likely to be fixed ahead of delivery, and the volume of energy may vary between network areas but it could range from 1 MW to multi-MW scale. This could be applied in a similar way to distribution networks.
Figure 4.4: Diagram demonstrating the timescales for reserve services [128]
Based on the service provided at Transmission level, the time resolution for delivery is between 2 – 240 mins following an instruction. These time scales may vary across voltage levels, and depending on the requirements of the network.
The required technology will typically include communications back to the control room of the system operator and a combination of network monitoring and metering.
If the scale and appetite is there, then DER is essential to this service. It may be difficult for renewable resources to participate in this service as operators will be operating at full capacity whenever possible – the price for the service would have to be higher than the electricity price to ensure they had capability to supply reserve power.
Deliverable No. 2 | Smart Grids Business Models and Market Integration 67
Applications contributing to tertiary reserves
Tertiary reserves can be used for several purposes. Both for frequency regulation by reducing imbalances (due to differences in generation, consumption and exchange) and releasing primary and secondary reserves to be ready for the next event, and to handle regional bottlenecks to secure power exchange between different system areas [129].
Tertiary reserves are manual reserves than can be activated within 15 minutes. In the Nordic countries it is required that the volume for tertiary reserve should be equal to the size of the largest generation unit in each part of the system.
Specifications for the service:
• Name of product: mFRR (manual Frequency Restoration Reserves), • Price setting: hourly prices, based on activated bids. • Actors: Producers and large consumers • Bidding: Volume per hour or per 15 minutes for up or down
regulation. • Volume of energy: (volume for a period of 15 minutes). Ordinary size:
At least 10 MW • Time resolution: Response within 15 minutes • Needed technology: Manual or automatic load control and/or change
in production of electricity
(Local) Capacity market
In most markets short-run profits increase as supply tightens or demand expands, which sends a signal to invest into new capacities. Current electricity markets, however, often lack a robust demand side. That motivates the need for some kind of capacity market. This is because most loads neither see nor pay the real-time price due to lack of real-time meter or demand control systems. [130] This is naturally the case in a system where a significant share of the market such as RES in many cases, are fully funded by promotion measures and do not see market prices at all, or, like in Germany enjoy a feed-in guarantee. Missing demand control measures and certain promotional designs for RES makes loads unwilling to reduce demand to set the price during times of supply scarcity. Price peaks are too infrequent to incentivise investments in new capacity, which calls for some kind of capacity market design. This is where generators can earn additional revenue apart from the energy and reserve markets [130].
Another perspective to argue for a capacity market is from looking at system reliability. In the scientific discussion on how to approach the fluctuating feed in of RES it is brought forward that now only the amount of energy is regarded crucial, however, also particular qualities of the capacity, such as flexibility, is needed. This means that in future very flexible resources may be needed that step in when feed-in from RES is unavailable [131].
A capacity market in that regard is often seen as a complimentary system to the energy-only market, where only amounts of energy are traded. In general it describes a market in which resources are traded that can be activated during a possible bottleneck in the network. It is necessary to maintain the equilibrium between demand and supply. There are various designs of capacity markets either already in place in certain countries or part of theoretical consideration. A strategic reserve describes a system where the regulator or TSOs contracts certain resources (usually conventional power plants) after a tendering process. Those resources are only activated in emergency situations in which the energy-only market would collapse and in its consequence the network threatens to black out. Such a reserve could additionally be offered in the market (usually stock exchange) when – despite of peak prices – demand significantly exceeds the supply. Such a measure is available in a transition phase towards a full-scale capacity market. Where there a local energy market in place, naturally such a design of a limited capacity market can also be applied to distribution networks or energy cells.
Deliverable No. 2 | Smart Grids Business Models and Market Integration 68
A full-scale capacity market, such as in place at the east coast of the USA, exists beside the regular energy-only market. In a central auction power plant operators offer their capacity. If the bid is successful, the power of the plant needs to be available during the designated time slot. Such a system offers (additional) revenues as a return on their investment in building the power plant. So-called focused capacity markets may only include certain types of power plants, differentiated in the time frame they may offer reliability of supply. In such a system, only plants that are highly flexible and low in CO2 emissions, such gas-driven ones, might be allowed bid on long-term products (e.g. up to 15 years), whereas power plants with few historical full load hours might only bid for short-term products (e.g. up to four years) [131].
Such concepts may also be designed in a decentralised manner, meaning that the demand for guarantied capacity originates from particular market participants. Currently discussed market designs often focus on large generators providing guarantied capacity. However, apart from conventional power plants, also Demand Side Management is a possibility to supply guaranteed capacity on a capacity market [132]. Hence, the definition of barriers for market actors is vital. Otherwise many of the decentralised or local potentials, such as demand response, for proving guarantied capacity may be neglected. In order to avoid this, a market segmentation is possible. In a separate market for decentralised capacities flexible, decentralised and atypical potentials for providing or releasing guarantied capacity can be assessed and traded [133]. To provide local flexibility in the distribution networks that can be marketed as guarantied capacity, it will be necessary to deploy and operate smart grid technologies that help assess and alter the network state.
Reactive power services (Seen from the DSOs' point of view)
In an alternating current (AC) grid with resistive and inductive/capacitive loads both active and reactive power will be present. It is a target to keep the reactive power at a certain level compared to the real power (power factor, cos ϕ) to reduce losses in the grid and provide voltage control. The level of reactive power can be adjusted from the consumption and/or generation side. Traditionally DSOs have used capacitors, inductors and/or transformer to adjust the level of reactive power.
In a smart grid network additional automation and/or other sources for compensating reactive power can be utilised, like:
• Distributed generation, solar, wind, thermal • Energy storage • Smart appliances • Reactive Power Controller (RPC) • Static Var Compensator (SVAC) • Other consumers/generators
To utilise this possibility these other consumers or generator must be integrated in the grid at the right place with the needed functionality to control, measure and analyse.
Real time data is needed from the different smart measurement technologies like smart meters and smart appliances. The amount of data is substantial and infrastructure to support this is needed both at measurement point, transfer, receiving end and analysis to be able to make the optimum decision at the right time [134].
Deliverable No. 2 | Smart Grids Business Models and Market Integration 69
4.3 Country specific circumstances
4.3.1 Portugal
Overview
Since 1998, the Portuguese and Spanish Administrations began to share a common path in building the Iberian Electricity Market (MIBEL) [135].
In accordance with the legislation in force, the following types of agents carry out activities at SEN (National Electricity System) [136]:
• Ordinary regime producers: Have conventional stations (hydro and/or thermal, oil, coal and natural gas) that can sell the electricity produced through bilateral contracts with clients or with electricity traders or through participation in organized markets. They can also supply ancillary services, signing contracts with the system operator or participating in markets specially organised for this purpose.
• Special regime producers: Produce electricity under specific legislation which aims to encourage the production of electricity through renewable resources or production comprising both heat and electricity. They have the right to sell the electricity they produce to the last resort supplier.
• Transmission Network Operator, REN: Concessionary entity under a public regime from the National Transmission Grid.
• Distribution Network Operators, EDP Distribuição: is the main Portuguese DSO accounting for 97% of the market with more than 6 million customers. Concessionary entity under a public regime from the National Distribution Network or LV networks.
• Last Resort Supplier: Subject to the obligations of a universal service. The exercise of the activity of the last resort supplier is subject to the attribution of license.
• Retailer: Can contract the electricity needed to supply their clients signing bilateral contracts or through participation in other markets.
• Regulator, ERSE: Entity responsible for regulating the electricity and natural gas sectors.
Besides, the Portuguese legislation, namely Decree-Law 39/2010, already defined the main lines of EV orientation for entities with capacity to perform aggregation activities. It is expected that the definition of such an entity may unblock the lack of electricity market developments in order to better follow the new smart solutions in the near future.
The transmission and distribution of electric energy in Portugal are natural monopolies, in the form of regulated concessions. The LV distribution networks are operated within the scope of concession contracts established between the municipalities and retailers. According to data of February of 2017 from EDP Distribuição, Portugal has 27 retailers of electric energy in the liberalised market. EDP group, which before had the monopoly in the regulated market, created a new company (EDP Comercial) in order to compete in the liberalised market. Now they are the owner of more than 84% of residential electricity contracts. Galp, with 5.57%, trails in the market share followed by Endesa, Iberdrola and Goldenergy. The rest of the retailers have less than 1 % of clients share each. Regarding the amount of consumption, the share is divided mainly by the same companies although in this case, for instance, the leader EDP Comercial supply 45.03 % of the company.

Deliverable No. 2 | Smart Grids Business Models and Market Integration 70
Figure 4.5: Share of clients and consumption by the retail energy sales companies in Portugal
[137]
Since 2006 the Portuguese electricity sector has been fully liberalised. Under the financial assistance programme, the Portuguese Government gave new push to the ongoing process to remove end-user price regulation. The first phase-out deadlines applied to non-household consumers (1 January 2011). Following this, regulated end-user tariffs (including households) were abolished as of 1 January 2013.
Smart market applications – in energy market:
Buying and selling agents may trade on market regardless of whether they are in Spain or in Portugal. Their purchase and sale bids are accepted according to their economic merit order, until the interconnection between Spain and Portugal is fully occupied. If at a certain time of the day the capacity of the interconnection is such that it permits the flow of the electricity traded by the agents, the price of electricity for that hour will be the same for Spain and Portugal. If, on the other hand, the interconnection is fully occupied at that time, a price-setting algorithm is run separately so that there is a price difference between the two countries.
After the daily market, agents may once again buy and sell electricity in the intraday market, that is, at different trading sessions some hours earlier than real time. There are six trading sessions based on auctions such as those described for the daily market, where the volume of energy and each hourly price are determined by the point where supply and demand meet. The first session covers 28 hours (the last four in D-1 and 24 on day D) while the sixth session covers the last nine hours of day D.
The various stakeholders in the electricity sector are involved in the process for the approval of the tariffs and the Tariff Code. The Portuguese tariff system is additive and it contains a number of elementary tariffs and, based on their addition, composite tariffs are obtained. Among the elementary tariffs, there are the energy tariff, the tariff for the use of transmission network, the tariff for the use of high HV and MV distribution networks, the tariff for the global use of system and the retail commercial tariff.
Additionally, the regulatory review submitted on 26 June 2014 by the Portuguese regulator, ERSE, introduced rules for dynamic tariffs (pilot studies). As a matter of fact, the 59th public consultation [138] is in course since beginning of March of 2017 exploring the pilot projects for improvement of tariff structure and introduction of dynamic tariffs.

Deliverable No. 2 | Smart Grids Business Models and Market Integration 71
In Portugal, time of use tariffs (ToU) have been in place for a long time and a significant percentage of consumers use them. A ToU tariff option split into two time periods makes up 27.3% of Normal Low Voltage (NLV) consumers (those with less than 20.7 KVA total consumption, i.e. mainly residential) on the Portuguese mainland, 3.2% in Azores and 11.6% in Madeira. Another ToU tariff with three time periods represents 31.2% of NLV consumers in the Azores. NLV consumers with less than 20.7 kVA consumption make up 35% of total Portuguese demand [139]. For Normal Low Voltage consumers between 20.7 kVA and 41.4 kVA (i.e. commercial/small industrial), a tariff option with three time periods is in place and is mandatory (no flat tariff option exists). This group of consumers (20.7KVA-41.4KVA) represents 8% of total Portuguese demand. For Special Low Voltage (SLV) consumers (above 41.4 kVA) four time period ToU tariff option is in place. Again this is mandatory and this group of consumers makes up 7% of total demand. For higher voltage levels a four time period ToU tariff is in place as a minimum requisite. Due to the large penetration of renewables in Portugal, ERSE wants to go further in encouraging more dynamic tariffs/pricing. The revision of the Tariff Code of July 2011 establishes that, with the objective of introducing dynamic tariff options, the TSO and DSO of Portugal’s mainland and islands (Azores and Madeira) have to regularly send the regulator studies on the viability and the definition of the necessary variables of these tariffs.
Following the results of these studies, pilot projects will determine if the introduction of dynamic pricing will have a net positive benefit, both on the mainland and on the islands where regulated prices are permitted. The experience acquired from these pilot studies may enable an application of dynamic pricing on a much larger scale. The flexibility introduced by CPP options allows that demand, motivated by strong price signals applied in critical times for networks or generation, follows offers variations [139].
Smart market applications – in balancing market:
Ancillary services in Portugal are comprised of:
• Mandatory services, which are not paid and include voltage regulation, frequency regulation and maintenance of stability.
• Additional services, such as synchronous and static compensation, regulation reserve, secondary regulation, quick interruptibility, black start and remote start, which are subject to payment. Currently, only secondary regulation and regulation reserve are remunerated under the competitive market. Remaining services may be subject to bilateral trading.
Within ancillary services, especially important are services association with frequency-power regulation: primary regulation, secondary regulation and regulation reserve.
Primary regulation, associated with the immobility of generator sets, is an unpaid ancillary service that is mandatory for all generators in operation. Changes in power resulting from their actions should be conducted in 15 seconds for disruptions that cause frequency deviations of less than 100 mHz and linearly between 15 and 30 seconds for frequency deviations of between 100 and 200 mHz.
Secondary regulation, associated with service of remote regulation of generator sets, is an ancillary service that is remunerated according to market mechanisms, where the value of the service is composed of two parts: the secondary regulation, valued according the top marginal price of the secondary regulation, which goes up or down every hour; and the secondary regulation energy, valued according to the price of the last offer to sell for mobilised regulation reserve energy each hour [140].
The regulation reserve is an additional service paid by market mechanisms comprising two parts: minimum reserve of tertiary regulation and additional reserve. The minimum reserve of tertiary regulation is established by the System Operator for each scheduling period and is based on the maximum loss of production caused directly by one single failure of an element of the electrical system, thus causing planned consumption to increase 2%. The purpose of the additional regulation reserve is to guarantee that consumption is covered
Deliverable No. 2 | Smart Grids Business Models and Market Integration 72
and that the system continues functioning in events where hourly consumption planned by the System Operator exceeds the hourly consumption resulting from production markets by more than 2%, and when the expected loss of generation due to successive failures and/or delays in the connection or load increase of thermal groups is greater than the established tertiary regulation reserve.
For the purpose of providing the service, tertiary reserve is defined as the maximum variation of power in the generation schedule that can be realised in a production unit and/or balancing system in a maximum time of 15 minutes and that can be maintained for at least two consecutive hours.
A balancing system is a group of producing and pumping units that belong to the same agent and are inter-related in an area of the network where production deviations accumulate.
Between 6:00 pm and 9:00 pm, market agents submit upward or downward regulation reserve offers for all enabled balancing systems and for each schedule period for the following day. Agents may change offers for the following reasons: participation in several intraday market sessions, random outages, allocation of secondary regulation, lack of or excess water in dams of the same basin or extreme hydrological situations in balancing systems with hydroelectric power plants.
In real time, the System Operator uses the curves of the regulation reserve offers submitted by agents to mobilise or demobilise production/consumption, and market agents are paid the price of the last mobilised offer to increase or decrease.
Excess costs stemming from the use of the regulation reserve are divided among market agents that deviated from the respective contracted schedule [140].
Storage types and applications:
Various technologies to store electricity exist, providing storage opportunities ranging from very-short-term (seconds) to long-term (months) horizons. These technologies can be classified according to their applicability to certain power system services, considering their:
• Power capacity (MW) • Discharge duration (h) • Response time.
Focusing on the application to the distribution grids, storages could be valuable assets to provide the following services:
• Avoid grid congestion and defer investments for grid updates • Reduce frequency and duration of interruptions (UPS) • Voltage control.
Considering small scale storage, technologies such as redox flow batteries, conventional batteries, high-temperature batteries and hydrogen storage (power-to-gas) demonstrated to have the appropriate technical characteristics to fit the above mentioned service requirements.
Regulatory barriers hindering large-scale storage employment:
In Portugal, some regulatory barriers were identified which hinder the ample introduction of small scale batteries and their participation in electricity markets:
o Non-negative prices: Under the current design, the Iberian electric market (MIBEL) does not foresee negative prices. It could be argued that negative prices would facilitate storage operation as they incentivize flexible consumption.
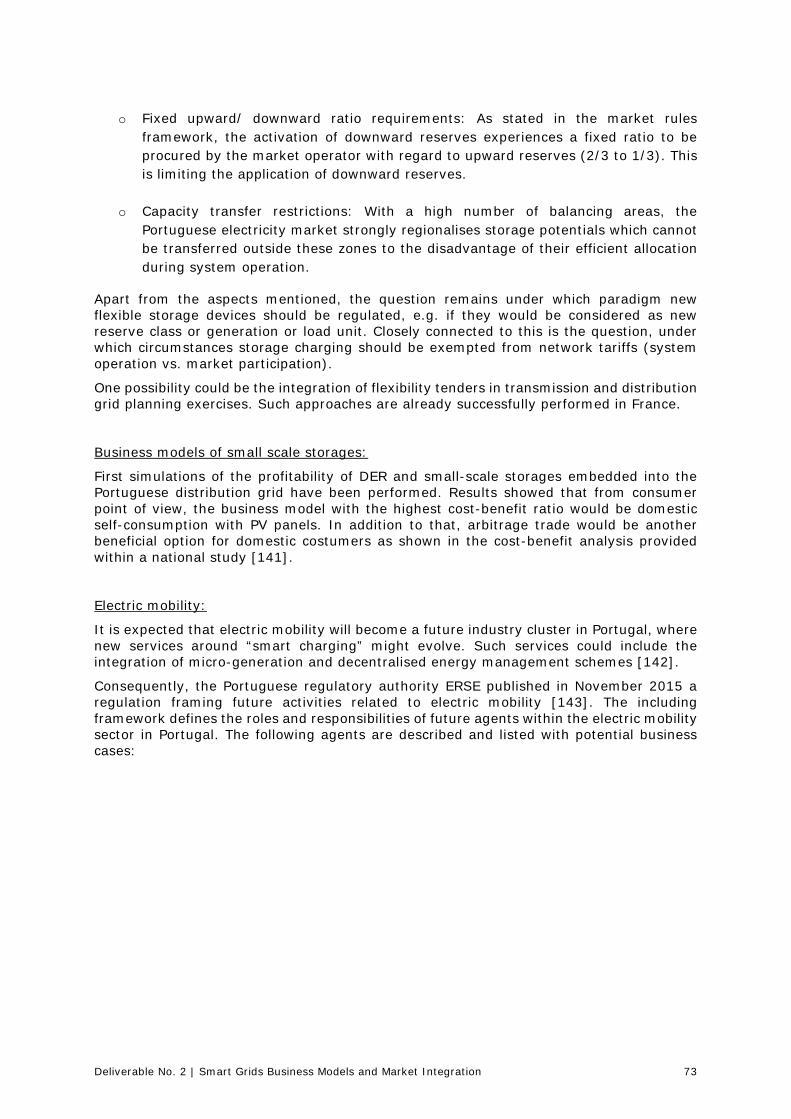
Deliverable No. 2 | Smart Grids Business Models and Market Integration 73
o Fixed upward/ downward ratio requirements: As stated in the market rules framework, the activation of downward reserves experiences a fixed ratio to be procured by the market operator with regard to upward reserves (2/3 to 1/3). This is limiting the application of downward reserves.
o Capacity transfer restrictions: With a high number of balancing areas, the Portuguese electricity market strongly regionalises storage potentials which cannot be transferred outside these zones to the disadvantage of their efficient allocation during system operation.
Apart from the aspects mentioned, the question remains under which paradigm new flexible storage devices should be regulated, e.g. if they would be considered as new reserve class or generation or load unit. Closely connected to this is the question, under which circumstances storage charging should be exempted from network tariffs (system operation vs. market participation).
One possibility could be the integration of flexibility tenders in transmission and distribution grid planning exercises. Such approaches are already successfully performed in France.
Business models of small scale storages:
First simulations of the profitability of DER and small-scale storages embedded into the Portuguese distribution grid have been performed. Results showed that from consumer point of view, the business model with the highest cost-benefit ratio would be domestic self-consumption with PV panels. In addition to that, arbitrage trade would be another beneficial option for domestic costumers as shown in the cost-benefit analysis provided within a national study [141].
Electric mobility:
It is expected that electric mobility will become a future industry cluster in Portugal, where new services around “smart charging” might evolve. Such services could include the integration of micro-generation and decentralised energy management schemes [142].
Consequently, the Portuguese regulatory authority ERSE published in November 2015 a regulation framing future activities related to electric mobility [143]. The including framework defines the roles and responsibilities of future agents within the electric mobility sector in Portugal. The following agents are described and listed with potential business cases:
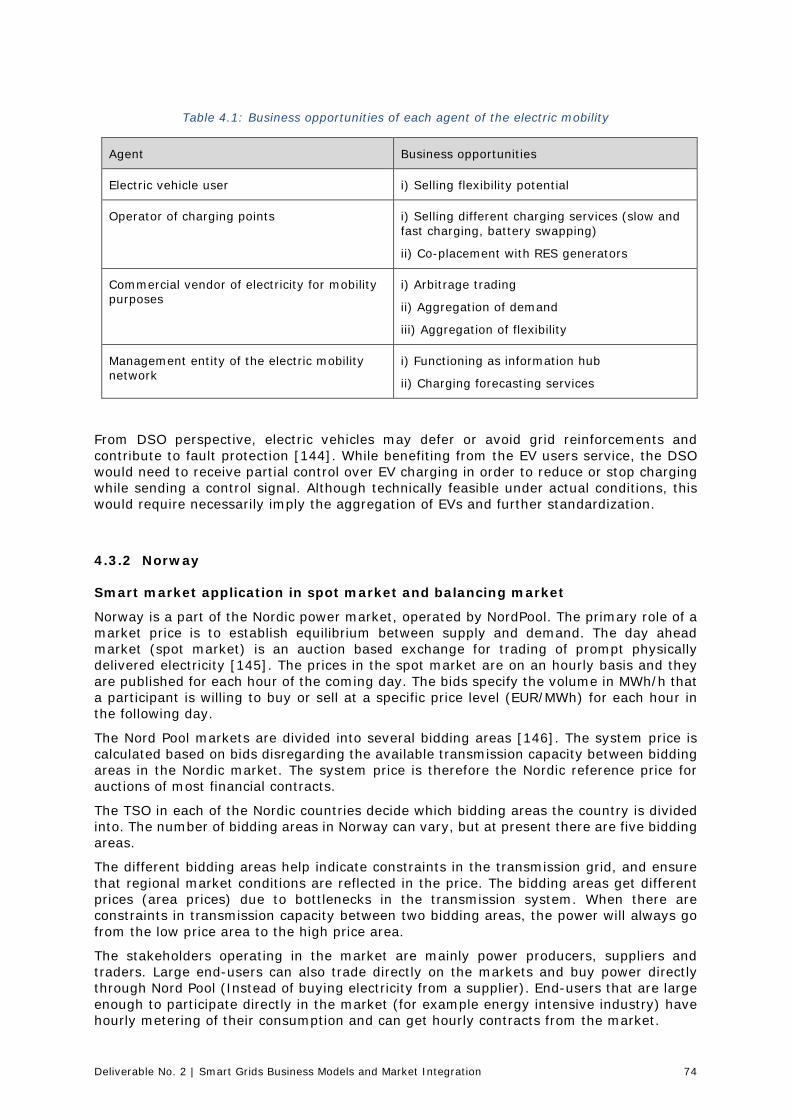
Deliverable No. 2 | Smart Grids Business Models and Market Integration 74
Table 4.1: Business opportunities of each agent of the electric mobility
Agent Business opportunities
Electric vehicle user i) Selling flexibility potential
Operator of charging points i) Selling different charging services (slow and fast charging, battery swapping)
ii) Co-placement with RES generators
Commercial vendor of electricity for mobility purposes
i) Arbitrage trading
ii) Aggregation of demand
iii) Aggregation of flexibility
Management entity of the electric mobility network
i) Functioning as information hub
ii) Charging forecasting services
From DSO perspective, electric vehicles may defer or avoid grid reinforcements and contribute to fault protection [144]. While benefiting from the EV users service, the DSO would need to receive partial control over EV charging in order to reduce or stop charging while sending a control signal. Although technically feasible under actual conditions, this would require necessarily imply the aggregation of EVs and further standardization.
4.3.2 Norway
Smart market application in spot market and balancing market
Norway is a part of the Nordic power market, operated by NordPool. The primary role of a market price is to establish equilibrium between supply and demand. The day ahead market (spot market) is an auction based exchange for trading of prompt physically delivered electricity [145]. The prices in the spot market are on an hourly basis and they are published for each hour of the coming day. The bids specify the volume in MWh/h that a participant is willing to buy or sell at a specific price level (EUR/MWh) for each hour in the following day.
The Nord Pool markets are divided into several bidding areas [146]. The system price is calculated based on bids disregarding the available transmission capacity between bidding areas in the Nordic market. The system price is therefore the Nordic reference price for auctions of most financial contracts.
The TSO in each of the Nordic countries decide which bidding areas the country is divided into. The number of bidding areas in Norway can vary, but at present there are five bidding areas.
The different bidding areas help indicate constraints in the transmission grid, and ensure that regional market conditions are reflected in the price. The bidding areas get different prices (area prices) due to bottlenecks in the transmission system. When there are constraints in transmission capacity between two bidding areas, the power will always go from the low price area to the high price area.
The stakeholders operating in the market are mainly power producers, suppliers and traders. Large end-users can also trade directly on the markets and buy power directly through Nord Pool (Instead of buying electricity from a supplier). End-users that are large enough to participate directly in the market (for example energy intensive industry) have hourly metering of their consumption and can get hourly contracts from the market.
Deliverable No. 2 | Smart Grids Business Models and Market Integration 75
Smaller end-users buy electricity from a supplier. Small customers with hourly metering of their consumption can get a market based energy contract (with hourly prices) from a supplier. Customers without hourly metering usually have monthly self-reading of their metering, and can therefore get a market based energy contract with monthly average values.
The main smart market applications in the spot markets can for example be related to hourly spot price contract with flexible customers and demand response included in the bids.
Load shifting from high to low priced periods is the most common demand response actions. This means that the demand side flexibility (elasticity) will affect the hourly calculation of the DA prices, as show in the figure below: Low volume changes (V0-V1) will result in significant price changes (P0-P1). Note that the market price effect only appears if the price flexibility is correctly bid into the market.
Figure 4.6: Alternative Bid curves - demand and supply
Smart market application in balancing market
In the power system there must always be a balance between the supply and consumption (then the frequency in the Nordic power system is 50.00 Hz) [147]. In the balancing market the participants bid a price to alter production or consumption, and this is used when any imbalances arise in the power system.
The Norwegian TSO (Statnett) is responsible for operating the balancing market in Norway. Statnett has the role as authority responsible for settlements in the Regulated Power Market.
The system is continuously exposed to factors that may disturb this balance, such as weather-related fluctuations in consumption, short-term changes in major industrial consumption, breakdowns in production facilities or power line outages or other grid component breakdowns. To be able to handle such unforeseen events, it is essential that there are sufficient reserves in the power system.
Deliverable No. 2 | Smart Grids Business Models and Market Integration 76
There are three main types of reserves:
• Momentary imbalances are initially regulated by primary regulation. Activated automatically due to changes in the grid frequency.
• If the imbalance continues for several minutes, secondary regulation will take over (freeing up primary regulation resources for regulation of new imbalances). Activated automatically due to changes in the grid frequency.
• If further regulation is necessary, tertiary regulation (regulating power) will be activated (will make secondary regulating resources available). Activated manually by Statnett’s National Control Centre.
Primary, secondary and tertiary reserves are acquired through market solutions. Statnett is also operating an option market for reserves, securing that there are sufficient volume of regulating resources available in the Norwegian part of the Nordic balancing market. This option market is a capacity market where the companies giving bids get paid to guarantee that they will bid into the balancing market (tertiary reserves). The need for increased regulating reserves has mainly been during winter (October – April). The Regulation options can be on seasonally or weekly basis. Both producers and large customers can give bids to the option market.
The bids to the Balancing market and the Balancing option market can contain both consumption and production. The minimum volume of a bid is 10 MW. Both large customers with flexible demand and aggregated volume of several flexible loads can give bids to the Balancing market and the Balancing option market.
Stakeholders operating in the market today and their roles.
The following stakeholders are operating in the Norwegian market today (referring to Figure 4.6):
Distribution System Operator (DSO) is responsible for the operation of the distribution grid. The costs for operating the grid is covered via the grid tariff. The development of the grid tariff is strictly governed by monopoly regulation (Revenue cap regulation is used in Norway). DR can reduce bottleneck problems in the distribution system, and the DSO can benefit from reduced system losses by load reduction in the peak hours. Customer satisfaction can be increased, and new "smart" services for customers and/or for suppliers can be commercialized in the future.
Market operator (NordPool) is the organiser of the DA and the ID market [91].
Power Retailer buys and sells from the power market (spot, financial market) and sell it further to the customers. The customers are free to change supplier, which stimulates to a more efficient competition. Development of new and attractive contracts for electricity with incentives for load reduction when the prices are high can therefore be a competition advantage for the suppliers. There is also a potential for reduction of the volume risk in high price periods.
Transmission System Operator (TSO) is, among other tasks, responsible for facilitating a well-functioning power market. Increased demand side participation is an important part of the market development and also a source for power system operation improvements. The TSO is responsible for operating the balancing market.
Technology manufacturers and vendors: A great volume of smart meters is expected to be installed in a few years horizon. Development of new commercial products e.g. for price dependent load control might additionally have a large international market potential.
Possibilities for customers/demand response/RES to participate in the market
The flexible customers will offer demand response in bids to the balancing market and balancing option market and thereby improve their energy economy e.g. by shifting "low prioritised" consumption from high priced to low priced periods.
Deliverable No. 2 | Smart Grids Business Models and Market Integration 77
Aggregator models: Aggregators are already well established in several countries. E.g. in Germany and Great Britain, where around 30 and 60 companies respectively are prequalified for the ancillary service market.
In other countries, such companies are currently in the start-up phase. Some aggregators have been in the market for a while with products related to direct control of appliances for balancing and congestion management purposes.
A main challenge for the aggregator model is that the potential benefit clearly has been limited so far. In the Scandinavian countries where hourly metering and operative central "El hubs"8 will be available within a few years, new innovative products and initiatives might increase the potential benefit significantly.
Smart grid application (economical)
According to the monopoly regulation in Norway the grid tariff for customers connected to the distribution grid, without hourly metering reading, consists of two parts: a fixed charge [E/year] and an energy charge [€/kWh] [148]. The fixed charge shall as a minimum, cover the costs associated with customer management and support. The energy charge is usage-dependent and shall at least cover the marginal network losses. A seasonally differentiated energy charge must be offered to all customers with consumption higher than 8.000 kWh/year.
The grid tariffs for customers with hourly metering introduce a third part, a capacity charge (€/kW). The capacity charge shall be based on the customers’ power consumption in certain time periods, and shall be designed so that the customers pay the highest price (€/kW) for the first kWs [148].
Smart meter should be installed to all customers by 1.1.2019. The grid tariff is not decided, but the Norwegian regulator has initiated a process for redefining the regulation on the grid tariff structure, from a focus on energy based to capacity based grid tariffs. The settlement should be performed based on hourly meter data from the customers.
Customers with interruptible loads can be offered a reduced tariff (See chapter 3.2.2).
Interfaces between stakeholders (monopoly/market)
The interfaces between the different monopoly stakeholders and market participants are presented in Figure 4.7. The stakeholders are the same as described earlier.
8 http://elhub.no/en/pages

Deliverable No. 2 | Smart Grids Business Models and Market Integration 78
Figure 4.7: Monopoly actors and market participants involved in smart market applications [91]
Potential Business cases for smart market and economical smart grid applications
With smart meters rolled out to all customers within 1.1.2019, both the DSOs and the power retailer get information about the customers' actual consumption. This can be used for developing new application.
With the smart meter, it is also possible for the customer to get information about their actual consumption. This can be combined with an energy contract based on the hourly market prices (Elspot). This give the customers incentives for demand response and shifting of loads from peak hours. This flexibility can also be used by the retailer in their bids to the spot market.
Based on today's regulation the benefit for a prosumer when feeding electricity into the grid is limited, and it is also expensive investing in the PV-panel. New companies are offering new business model where they hire the roof and are responsible for installation and management of the PV panel. The same companies are operating as a power retailer, both selling electricity to the customer and buying the excess electricity from the prosumer to a price up to 1 NOK/kWh (0.125 €/kWh).
A new tariff regime in Norway is under discussion, and dependent on the conclusion, this can give further incentives for smart grid applications and demand response.
4.3.3 United Kingdom
Smart market application in spot market and balancing market
Currently the Spot and Balancing markets in the UK are only operating at Transmission level. There is some large scale embedded generation on the distribution network that participates in the balancing mechanism but there is no opportunity for smaller distributed generation to participate directly in the market, nor is there a local market system at distribution level.
In 2001, the UK established the New Electricity Trading Arrangements (NETA) in a move from a pool to a bilateral market for England and Wales. In 2005, NETA changed to become the British Electricity Trading Transmission Arrangements (BETTA). BETTA includes Scotland, England and Wales.

Deliverable No. 2 | Smart Grids Business Models and Market Integration 79
There are three transmission system operators who are responsible for the physical GB National Grid: Scottish Hydro Electrics Transmission Ltd (SHETL) and Scottish Power Transmission (SPT) in Scotland, and National Grid Transmission Operator in England and Wales. These bodies are responsible for maintaining the transmission assets in each of their own regions. In addition to maintaining the English and Welsh transmission system, National Grid is responsible for managing the balance of supply and demand for the whole of the Main Interconnected Transmission System (MITS) i.e. for the whole of GB.
There are 14 licensed distribution network areas. Each distribution network has its own network owner and operator, commonly referred to as the DNO9. They are in charge of maintaining the network assets as well as managing the network and ensuring the system stays within limits and continues to provide electricity to customers.
Ofgem is the industry regulator, and is responsible for ensuring that the gas and electricity markets continue to offer value for money to energy customers. It is also responsible for monitoring the investments of gas and electricity network owners in order to ensure security of supply for current and future users of the system. Ofgem regulates transmission and distribution Network owners and operators, as well as energy suppliers.
The electricity market in Great Britain allows customers to choose the supplier of their choice, and for suppliers to buy electricity to meet customer demands from generators of their choice. This market is dominated by the Big Six suppliers – Npower, British Gas, EDF Energy, E. ON UK, Scottish Power and SSE. There are many smaller energy suppliers on the UK market and customers are free to change suppliers as and when they please.
Organisations without a physical demand for electricity or any means of generating electricity (Non Physical Traders) such as banks are also entitled to trade electricity on the GB electricity market.
Elexon is the Balancing and Settlement Code Company (BSCCo) established under the provisions of the Balancing and Settlement Code (BSC). It is in charge of calculating how much each generator and supplier owes the system after gate closure. The BSC contains the rules and governance arrangements for electricity balancing and settlement in GB, and Elexon is responsible for ensuring its proper implementation.
Figure 4.8 provides an overview of the market operation within the GB electricity market. Each of the stages are explained in more detail below.
Figure 4.8: Overview of the settlement and balancing process in the UK
The grid is a dynamic system, and therefore it is difficult to calculate the exact level of generation and demand acting during any half hour period. So the Balancing Mechanism (BM) allows the system operator to increase and reduce generation as required.
9 DNO = Distribution Network Operator

Deliverable No. 2 | Smart Grids Business Models and Market Integration 80
Years in advance of the gate closure (i.e. the spot time one hour before the spot time at the start of that settlement period), long-term contracts are struck between energy suppliers and generators. These contracts guarantee levels of generation at a fixed price and are typically used for generators who provide the base load. Power exchanges are used to ‘add shape’ to the supply profile and more closely match the demand profile. These are carried out closer to gate closure. As the gate closure approaches, finer system balancing takes place.
In the hour following gate closure, bids and offers from generators participating in the BM (BM units) are accepted. BM units must submit an expected level of generation/demand, which is known as a Physical Notification, during the settlement period. After gate closure this becomes Final Physical Notification (FPN). BM Units also submit bid-offer data which indicates the ability of the unit to move away from FPN after gate closure in return for payment.
In the minutes and seconds before the operating point, the system operator can call on additional balancing services known as ancillary services [24]. This includes support for reactive power, frequency response, back start capability and reserve. These services are contracted in advance. Some ancillary services, such as frequency response, must be provided as part of a participant’s grid connection agreements. For many of these services, generators receive an availability payment in addition to a utilisation payment. Due to the short response time required for services such as frequency response, generators must be available to increase or decrease output at short notice.
Following the end of the settlement period, metered volumes are collected from generators and suppliers and compared to contracted volumes. Imbalances must be paid for by each and every imbalanced party. If units generate more than contracted for, they must sell additional electricity to the system. This is known as the ‘System Sell Price’. If the unit uses more electricity than contracted for then they must buy from the system at the ‘System Buy Price’. These prices are calculated by summing up daily charges and adding VAT. Other charges and payments, such as constraint payments, are also calculated during settlement.
All units connected to the transmission system must be fitted with ‘Half Hourly’ (HH) metering system which feed directly into settlement calculations. However, units connected to the distribution system such as houses are not fitted with HH meters as standard. Using profiling, an annualised value of demand, is calculated and used in settlement calculations. As more accurate data is gathered, the calculations are repeated on four occasions spaced across fourteen months, providing a more accurate picture of settlement each time. All imbalances are settled centrally and managed by Elexon.
In order to participate in the balancing mechanism, there are a number of requirements that participants must adhere to. The first is the installation of the appropriate metering and communications devices to allow National Grid Control to provide balancing signals to the participants when balancing services require to be called upon. The metering devices also help with the settlement process, and in identifying exactly what energy was delivered during the balancing action.
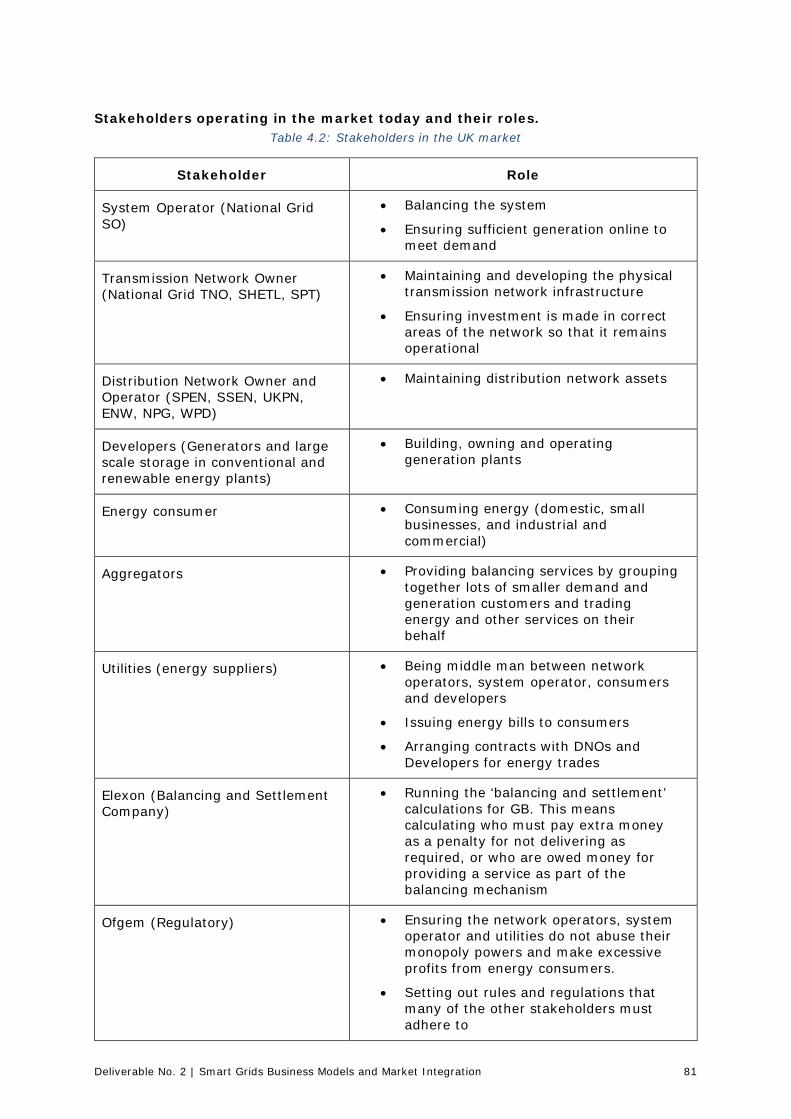
Deliverable No. 2 | Smart Grids Business Models and Market Integration 81
Stakeholders operating in the market today and their roles. Table 4.2: Stakeholders in the UK market
Stakeholder Role
System Operator (National Grid SO)
• Balancing the system
• Ensuring sufficient generation online to meet demand
Transmission Network Owner (National Grid TNO, SHETL, SPT)
• Maintaining and developing the physical transmission network infrastructure
• Ensuring investment is made in correct areas of the network so that it remains operational
Distribution Network Owner and Operator (SPEN, SSEN, UKPN, ENW, NPG, WPD)
• Maintaining distribution network assets
Developers (Generators and large scale storage in conventional and renewable energy plants)
• Building, owning and operating generation plants
Energy consumer • Consuming energy (domestic, small businesses, and industrial and commercial)
Aggregators • Providing balancing services by grouping together lots of smaller demand and generation customers and trading energy and other services on their behalf
Utilities (energy suppliers) • Being middle man between network operators, system operator, consumers and developers
• Issuing energy bills to consumers
• Arranging contracts with DNOs and Developers for energy trades
Elexon (Balancing and Settlement Company)
• Running the ‘balancing and settlement’ calculations for GB. This means calculating who must pay extra money as a penalty for not delivering as required, or who are owed money for providing a service as part of the balancing mechanism
Ofgem (Regulatory) • Ensuring the network operators, system operator and utilities do not abuse their monopoly powers and make excessive profits from energy consumers.
• Setting out rules and regulations that many of the other stakeholders must adhere to
Deliverable No. 2 | Smart Grids Business Models and Market Integration 82
Possibilities for customers/demand response/RES to participate in the market
There is a current push to create markets at distribution by the UK Regulator – but this will take time and change to current regulations before this happens. At the moment, it is more likely to provide an extension to existing markets than to create new markets.
National Grid Power Responsive program is looking to encourage more large scale demand response. Again, while this is currently focused at Transmission level, there is an industry-wide agreement that the potential for demand response at distribution level is something that should be encouraged and explored in more detail.
Smart grid application (economical)
Grid tariffs are split in to charges for connection, and charges for use of the system. Different charges apply depending on the voltage level the customer is connected to, and whether they are a demand or generation customer.
Transmission Connection and Use of System Charges
Connection charges cover the costs of installing and maintaining each user’s connection assets. At transmission level these charges are made up of capital and non-capital components. Capital components cover the cost of construction, engineering works, interest accumulated during construction, return element and liquidated damages premium where relevant.
The non-capital components include Site Specific Charges (SSF) and Transmission Running Costs (TC) which are calculated as a percentage of the Gross Asset Value (GAV). For the period 2010/11, the percentage value of SSF was 0.52% and TC was equal to 1.45% of capital costs for GB. Connection charges are paid on a monthly basis, and are one-twelfth of the annual charge.
Transmission Network Use of System (TNUoS) charges cover the cost of installing and maintaining the National Electricity Transmission System (NETS). The application of TNUoS revenue is split between generation and demand, 27% to 73% respectively.
The current TNUoS tariff is made up of two separate parts. The first is a locational varying element derived from the DC Load Flow Investment Cost Related Pricing (DCLF ICRP) transport model. DC Load Flow enables a load flow calculation to be performed on a network with a large number of buses. This reflects the costs of capital investment, operation and maintenance of the transmission system. This ’zonal’ price is based on the average nodal price in the area at peak time. The cost to the generator is based on maximum power generated or consumed over a year, and the charges are based on the long-run costs of electricity transmission infrastructure and notional reinforcements. The charges do not distinguish between different types of generation. The second part of the TNUoS tariff is a non-locational element related to the delivery of outstanding revenue recovery. The components which come together to make up the TNUoS charge are shown in Figure 4.9. Other charges included in TNUoS are one-off works charges, rental costs, and metering costs.
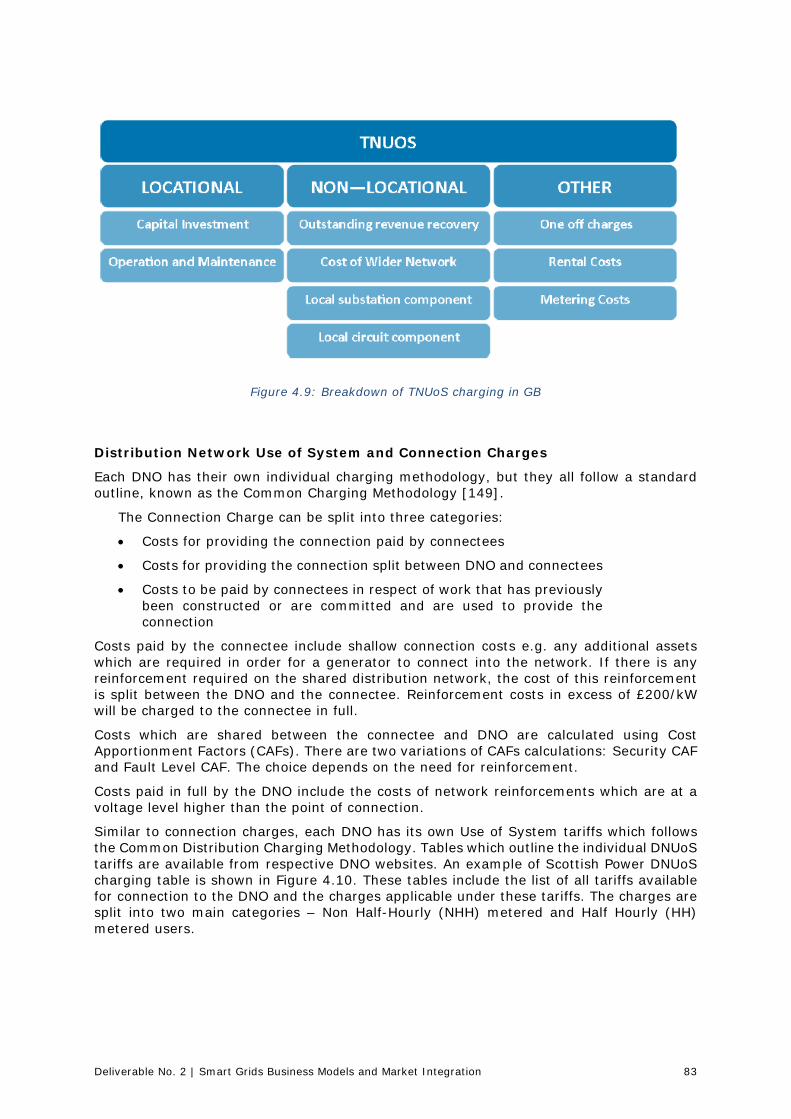
Deliverable No. 2 | Smart Grids Business Models and Market Integration 83
Figure 4.9: Breakdown of TNUoS charging in GB
Distribution Network Use of System and Connection Charges
Each DNO has their own individual charging methodology, but they all follow a standard outline, known as the Common Charging Methodology [149].
The Connection Charge can be split into three categories:
• Costs for providing the connection paid by connectees
• Costs for providing the connection split between DNO and connectees
• Costs to be paid by connectees in respect of work that has previously been constructed or are committed and are used to provide the connection
Costs paid by the connectee include shallow connection costs e.g. any additional assets which are required in order for a generator to connect into the network. If there is any reinforcement required on the shared distribution network, the cost of this reinforcement is split between the DNO and the connectee. Reinforcement costs in excess of £200/kW will be charged to the connectee in full.
Costs which are shared between the connectee and DNO are calculated using Cost Apportionment Factors (CAFs). There are two variations of CAFs calculations: Security CAF and Fault Level CAF. The choice depends on the need for reinforcement.
Costs paid in full by the DNO include the costs of network reinforcements which are at a voltage level higher than the point of connection.
Similar to connection charges, each DNO has its own Use of System tariffs which follows the Common Distribution Charging Methodology. Tables which outline the individual DNUoS tariffs are available from respective DNO websites. An example of Scottish Power DNUoS charging table is shown in Figure 4.10. These tables include the list of all tariffs available for connection to the DNO and the charges applicable under these tariffs. The charges are split into two main categories – Non Half-Hourly (NHH) metered and Half Hourly (HH) metered users.
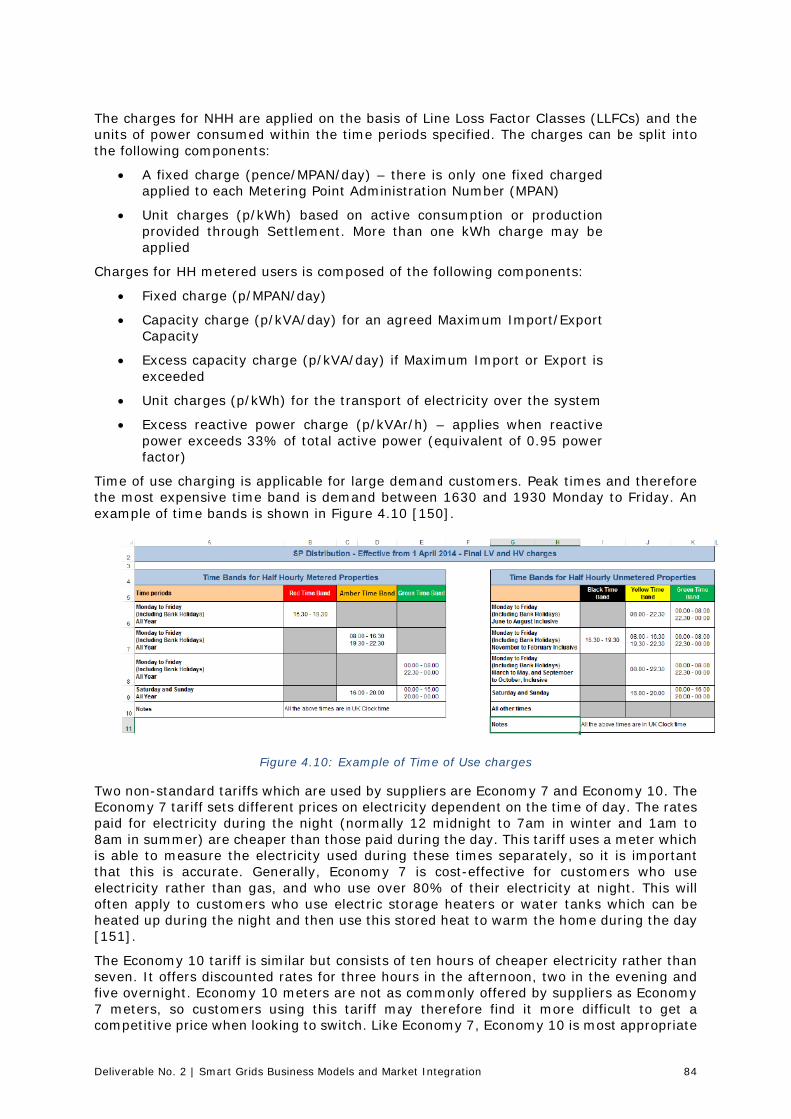
Deliverable No. 2 | Smart Grids Business Models and Market Integration 84
The charges for NHH are applied on the basis of Line Loss Factor Classes (LLFCs) and the units of power consumed within the time periods specified. The charges can be split into the following components:
• A fixed charge (pence/MPAN/day) – there is only one fixed charged applied to each Metering Point Administration Number (MPAN)
• Unit charges (p/kWh) based on active consumption or production provided through Settlement. More than one kWh charge may be applied
Charges for HH metered users is composed of the following components:
• Fixed charge (p/MPAN/day)
• Capacity charge (p/kVA/day) for an agreed Maximum Import/Export Capacity
• Excess capacity charge (p/kVA/day) if Maximum Import or Export is exceeded
• Unit charges (p/kWh) for the transport of electricity over the system
• Excess reactive power charge (p/kVAr/h) – applies when reactive power exceeds 33% of total active power (equivalent of 0.95 power factor)
Time of use charging is applicable for large demand customers. Peak times and therefore the most expensive time band is demand between 1630 and 1930 Monday to Friday. An example of time bands is shown in Figure 4.10 [150].
Figure 4.10: Example of Time of Use charges
Two non-standard tariffs which are used by suppliers are Economy 7 and Economy 10. The Economy 7 tariff sets different prices on electricity dependent on the time of day. The rates paid for electricity during the night (normally 12 midnight to 7am in winter and 1am to 8am in summer) are cheaper than those paid during the day. This tariff uses a meter which is able to measure the electricity used during these times separately, so it is important that this is accurate. Generally, Economy 7 is cost-effective for customers who use electricity rather than gas, and who use over 80% of their electricity at night. This will often apply to customers who use electric storage heaters or water tanks which can be heated up during the night and then use this stored heat to warm the home during the day [151].
The Economy 10 tariff is similar but consists of ten hours of cheaper electricity rather than seven. It offers discounted rates for three hours in the afternoon, two in the evening and five overnight. Economy 10 meters are not as commonly offered by suppliers as Economy 7 meters, so customers using this tariff may therefore find it more difficult to get a competitive price when looking to switch. Like Economy 7, Economy 10 is most appropriate
Deliverable No. 2 | Smart Grids Business Models and Market Integration 85
for customers with storage heaters, but it allows more flexibility to heat them up during the day and evening [152].
Balancing Service Use of System Charges (BSUoS)
The principle of BSUoS charging is to allow the National Grid to recover the costs incurred in balancing the transmission system i.e. ensuring safe and secure supply to end users. National Grid is incentivised by Ofgem to accrue these balancing services in a cost effective manner. In recent years the cost of balancing the system has increased sharply. This can be explained by the increase in renewable generation and the work being carried out to upgrade the transmission infrastructure. The constraints caused by upgrade work will lead to an increase in balancing services required.
BSUoS charges include the following costs:
• The total costs of the balancing mechanism (BM)
• Total balancing services contract costs
• Payments/receipts from National Grid incentive schemes
• Internal costs of operating the system
• Costs associated with contracting and developing balancing services The Daily BSUoS charge for each party is the sum of BM Unit Metered Volume for all BM Units owned summed over all the settlement periods on a particular settlement day. Transmission losses are taken into account. The Total BSUoS Charge applicable for each settlement period is composed of two parts: an External and Internal Charge.
The External Charge is calculated by taking the cash flow and variable costs for each settlement period and is allocated on a per MWh basis for each settlement period in a day. The External Charge also considers the external incentive payment which is calculated as the difference between the new total incentive payment and the incentive payment that has been made to date for previous days.
The Internal Charge for each settlement period is calculated by taking the incentives and non-incentivised system operator internal costs for each settlement day, allocated on a MWh basis across each settlement period. Similarly to the external charge, an internal incentive payment is included in this calculation. There is further inclusion of a daily cost of Manifest errors and Special Provisions which account for any compensation which National Grid must pay to balancing service participants.
Interfaces between stakeholders (monopoly/market)
The diagram below sets out the trade of money and energy between different stakeholders in the electricity market in the UK.
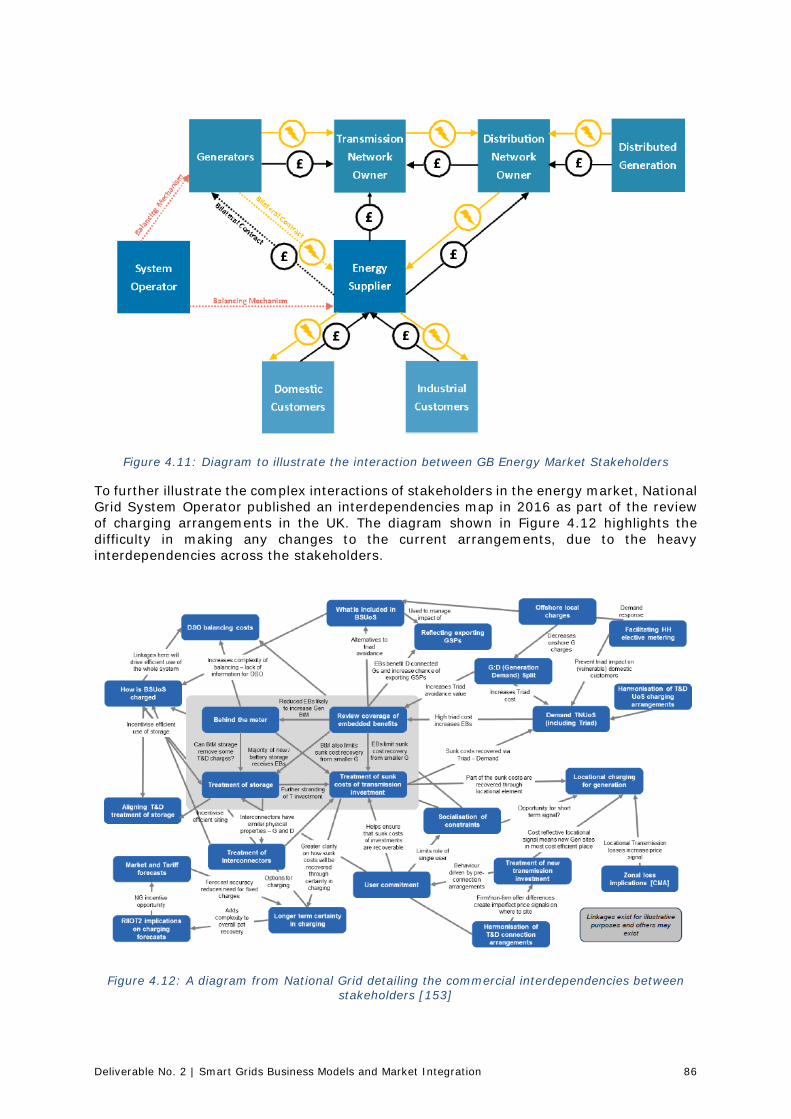
Deliverable No. 2 | Smart Grids Business Models and Market Integration 86
Figure 4.11: Diagram to illustrate the interaction between GB Energy Market Stakeholders
To further illustrate the complex interactions of stakeholders in the energy market, National Grid System Operator published an interdependencies map in 2016 as part of the review of charging arrangements in the UK. The diagram shown in Figure 4.12 highlights the difficulty in making any changes to the current arrangements, due to the heavy interdependencies across the stakeholders.
Figure 4.12: A diagram from National Grid detailing the commercial interdependencies between stakeholders [153]
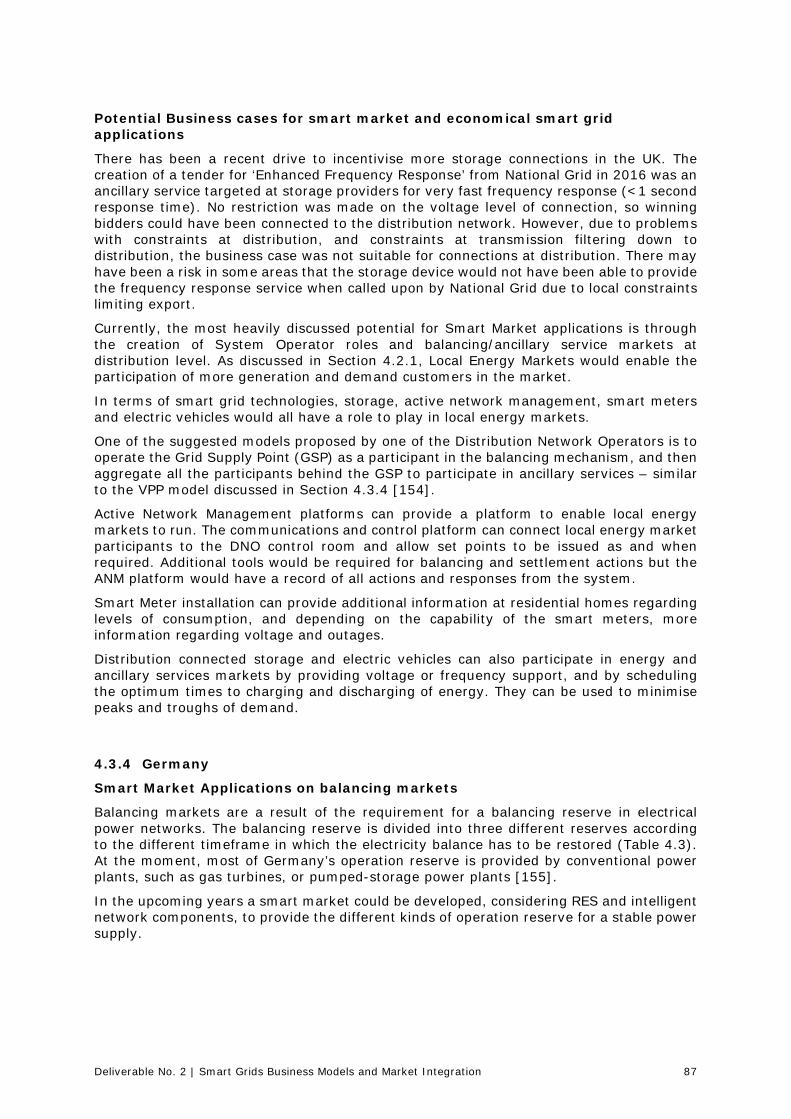
Deliverable No. 2 | Smart Grids Business Models and Market Integration 87
Potential Business cases for smart market and economical smart grid applications
There has been a recent drive to incentivise more storage connections in the UK. The creation of a tender for ‘Enhanced Frequency Response’ from National Grid in 2016 was an ancillary service targeted at storage providers for very fast frequency response (<1 second response time). No restriction was made on the voltage level of connection, so winning bidders could have been connected to the distribution network. However, due to problems with constraints at distribution, and constraints at transmission filtering down to distribution, the business case was not suitable for connections at distribution. There may have been a risk in some areas that the storage device would not have been able to provide the frequency response service when called upon by National Grid due to local constraints limiting export.
Currently, the most heavily discussed potential for Smart Market applications is through the creation of System Operator roles and balancing/ancillary service markets at distribution level. As discussed in Section 4.2.1, Local Energy Markets would enable the participation of more generation and demand customers in the market.
In terms of smart grid technologies, storage, active network management, smart meters and electric vehicles would all have a role to play in local energy markets.
One of the suggested models proposed by one of the Distribution Network Operators is to operate the Grid Supply Point (GSP) as a participant in the balancing mechanism, and then aggregate all the participants behind the GSP to participate in ancillary services – similar to the VPP model discussed in Section 4.3.4 [154].
Active Network Management platforms can provide a platform to enable local energy markets to run. The communications and control platform can connect local energy market participants to the DNO control room and allow set points to be issued as and when required. Additional tools would be required for balancing and settlement actions but the ANM platform would have a record of all actions and responses from the system.
Smart Meter installation can provide additional information at residential homes regarding levels of consumption, and depending on the capability of the smart meters, more information regarding voltage and outages.
Distribution connected storage and electric vehicles can also participate in energy and ancillary services markets by providing voltage or frequency support, and by scheduling the optimum times to charging and discharging of energy. They can be used to minimise peaks and troughs of demand.
4.3.4 Germany
Smart Market Applications on balancing markets
Balancing markets are a result of the requirement for a balancing reserve in electrical power networks. The balancing reserve is divided into three different reserves according to the different timeframe in which the electricity balance has to be restored (Table 4.3). At the moment, most of Germany’s operation reserve is provided by conventional power plants, such as gas turbines, or pumped-storage power plants [155].
In the upcoming years a smart market could be developed, considering RES and intelligent network components, to provide the different kinds of operation reserve for a stable power supply.
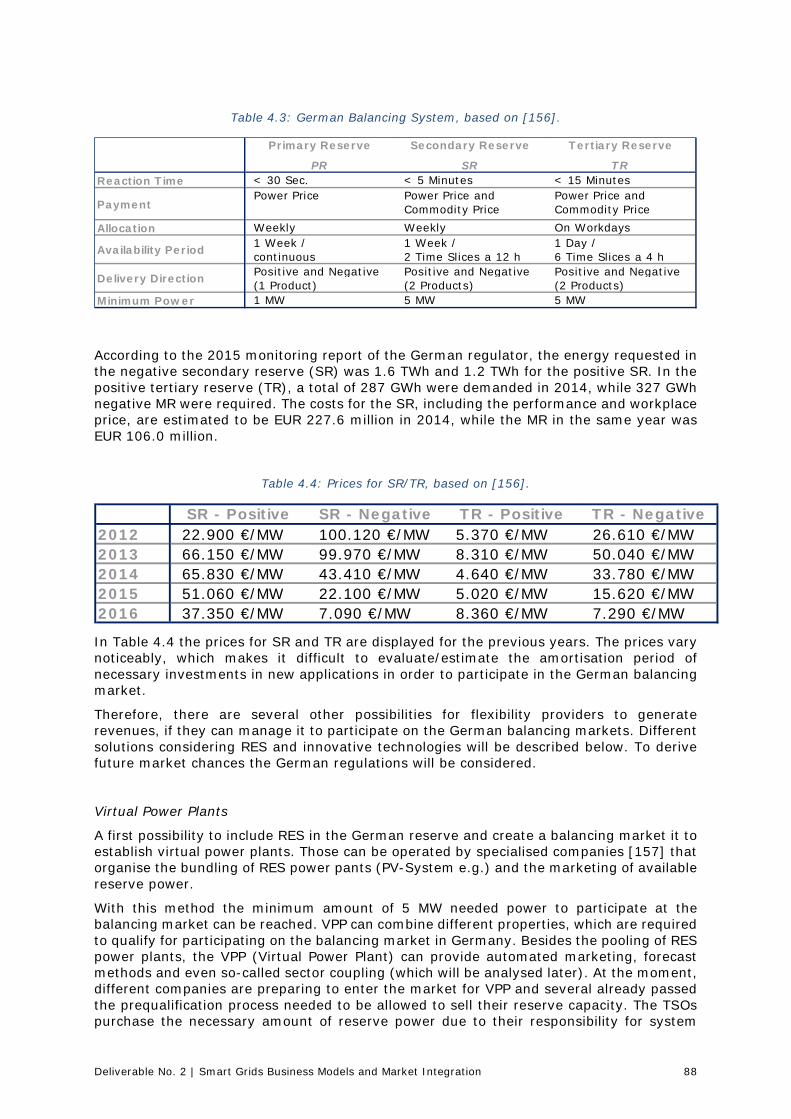
Deliverable No. 2 | Smart Grids Business Models and Market Integration 88
Table 4.3: German Balancing System, based on [156].
According to the 2015 monitoring report of the German regulator, the energy requested in the negative secondary reserve (SR) was 1.6 TWh and 1.2 TWh for the positive SR. In the positive tertiary reserve (TR), a total of 287 GWh were demanded in 2014, while 327 GWh negative MR were required. The costs for the SR, including the performance and workplace price, are estimated to be EUR 227.6 million in 2014, while the MR in the same year was EUR 106.0 million.
Table 4.4: Prices for SR/TR, based on [156].
In Table 4.4 the prices for SR and TR are displayed for the previous years. The prices vary noticeably, which makes it difficult to evaluate/estimate the amortisation period of necessary investments in new applications in order to participate in the German balancing market.
Therefore, there are several other possibilities for flexibility providers to generate revenues, if they can manage it to participate on the German balancing markets. Different solutions considering RES and innovative technologies will be described below. To derive future market chances the German regulations will be considered.
Virtual Power Plants
A first possibility to include RES in the German reserve and create a balancing market it to establish virtual power plants. Those can be operated by specialised companies [157] that organise the bundling of RES power pants (PV-System e.g.) and the marketing of available reserve power.
With this method the minimum amount of 5 MW needed power to participate at the balancing market can be reached. VPP can combine different properties, which are required to qualify for participating on the balancing market in Germany. Besides the pooling of RES power plants, the VPP (Virtual Power Plant) can provide automated marketing, forecast methods and even so-called sector coupling (which will be analysed later). At the moment, different companies are preparing to enter the market for VPP and several already passed the prequalification process needed to be allowed to sell their reserve capacity. The TSOs purchase the necessary amount of reserve power due to their responsibility for system
Primary Reserve Secondary Reserve Tertiary Reserve
PR SR TRReaction Time < 30 Sec. < 5 Minutes < 15 Minutes
PaymentPower Price Power Price and
Commodity PricePower Price and Commodity Price
Allocation Weekly Weekly On Workdays1 Week / 1 Week / 1 Day / continuous 2 Time Slices a 12 h 6 Time Slices a 4 hPositive and Negative Positive and Negative Positive and Negative(1 Product) (2 Products) (2 Products)
Minimum Power 1 MW 5 MW 5 MW
Availability Period
Delivery Direction
SR - Positive SR - Negative TR - Positive TR - Negative2012 22.900 €/MW 100.120 €/MW 5.370 €/MW 26.610 €/MW2013 66.150 €/MW 99.970 €/MW 8.310 €/MW 50.040 €/MW2014 65.830 €/MW 43.410 €/MW 4.640 €/MW 33.780 €/MW2015 51.060 €/MW 22.100 €/MW 5.020 €/MW 15.620 €/MW2016 37.350 €/MW 7.090 €/MW 8.360 €/MW 7.290 €/MW

Deliverable No. 2 | Smart Grids Business Models and Market Integration 89
stability. They provide the necessary system services and are responsible for the prequalification process.
At the moment regulatory circumstances and the fact that responsibilities for balancing reserves still lie with the TSOs, the participation of RES in the balancing market is still small compared to the conventional power plants, which provide most of the reserve power. But private companies started to enter the market and to create a balance market with RES from MV and LV levels participating in it.
The integration of VPP into existing networks and additionally use them to prevent equipment overload or voltage increases, relies heavily on ICT technologies. For example a working DNA has to be implemented to measure the network’s state and control the RES and loads accordingly. To allow a safe operation of VPP the monitoring of the current network situation is necessary. Smart Meters can be used to provide such needed information, such as voltage rises or frequency status, to analyse if measurements or usage of VPPs is possible.
In the upcoming years different application areas of VPP are considered in Germany. For example, another case of application of VPP is the development of energy autarchic city districts. Many different projects analyse, whether VPP can provide enough power and system services to allow a self-sufficient city district [158].
Storage
Storage can be used to store surplus power produced by RES and afterwards used as a supplier of different kinds of operation reserve. At the moment, again aggregation of small household storages has to be used to be able to get access to balancing markets. Other solution with so called district storages are discussed. These storage units, with a capacity which is high enough to reach the 5 MW criterion, can be prequalified for the balancing reserve without the requirement of a pooling solution [159].
At the moment the participation of storage in German balancing markets is in an early phase and possible solutions must pass the prequalification process by the TSOs, where the responsibility for system stability and operation reserve currently is placed.
Compared to VPP pooled storage solutions are mostly available in pilot projects and not sold as a standard solution. At the moment the participation of pooled storages in a balancing market is not a common situation. But they are able to provide negative and positive reserve and therefore are more flexible then VPP. Due to that the sales opportunities are better than those from VPP. In the new version of the EEG the feed-in from storage has been exempted from duty of participating twice (formerly they had to pay for charging and feed-in) at the EEG apportionment, which makes a storage solution much more economic. Until now the prices for storages are too high to be able to compete with other providers of control reserve.
Electric Vehicles
EV can be used in two distinctly different ways to support the electricity network or generate additional revenue. But so far all available solutions have not made out of conceptual or prototype phase.
The first application is the usage of EV as a flexible load. It is often referred to as grid-to-vehicle (G2V). To allow a network supporting operation the installation of an ICT system is necessary. Additionally the car owners have to allow access to their cars or station by the DSO. Afterwards systems for load shifting can be implemented and used by the DSO. A market can be created, when G2V get access to balancing markets and the possibility to participate in the provision of control reserve.
In a further application the EVs’ batteries are used as storage feeding into the grid (vehicle-to-grid (V2G)). Therefore it is technically possible to use electric vehicles as storages for balancing reserves, if the electricity grid is equipped with intelligent infrastructure and the

Deliverable No. 2 | Smart Grids Business Models and Market Integration 90
car manufacturers allows access to their loading architecture. This includes pooling of EVs with the same systematic which has been described before.
One of the main challenges with the acceptance of EVs is the problematic life cycle of batteries used in the cars. With increasing loading cycles the capacity of the battery will reduce and the possible distance the car owner can use is reducing as well. It is not defined which stakeholder is responsible for the cost of an early battery exchange or a compensation for car owners providing his car as flexible load. Therefore, the technology penetration is low in Germany and possible usage of EVs in a balancing market is unsure [160].
Sector coupling concepts Sector coupling concepts are often mentioned as a solution in the discussion on how to provide sufficient flexibility and storage capacity in a power network characterised by fluctuating RES feed-in. It is argued that in a system dominated by PV and wind energy the heat and mobility sector is capable of providing additional electrical loads in times when supply from RES exceeds direct electricity consumption. There are many technologies that can be mentioned with reference to this topic: from geothermal energy to electrical engines. There is neither an overall regulatory framework for sector coupling in Germany, neither particular markets they can participate on; the variety of technologies entails that the regulatory and economic circumstances of all those technologies combined comprise the regulatory and economic view of the topic sector coupling. The Power-to-Gas technology is a very prominent aspect in the German discussion. That is why its regulatory framework will be described in more detail in the following.
Unlike technologies like Power-to-Heat, for instance, that – from the power network’s point of view – function as a flexible load only, Power-to-Gas plants can be implemented as a storage system. Such plants use electricity to produce hydrogen and in a second stage methane, which can both be fed into gas network, but can also be directly combined with a gas-fired power plant that feeds electrical power back into the network when needed. This makes it possible to produce methane from surplus energy in the systems which can then be used to produce electrical energy again in times of shortage of RES feed-in. The downside is a low degree of efficiency of the whole process of approximately 36 %. The efficiency of the sole production of hydrogen accounts to 51 %. Hydrogen can also be fed into the German gas networks or storages but strong limits to the amount apply [161].
According to § 3 No. 10c EnWG and the Ordinance on the Gas Network Access Part 6 (Gasnetzzugangsverordnung, GasNZV) plants feeding in hydrogen and methane that is produced using electrolysis and methanation using electricity and carbon dioxide mainly come from RES, are treated as biogas. This gives them the certain privileges also conventional biogas producers using biomass have. This includes, for instance, the DSO connecting such power plants with priority, priority feed-in and no feed-in charge (that is applicable to all gas injections). [161] Furthermore, the plant operators are exempted from paying network charges for 20 years for those amounts of electrical energy they draw from the network for the purpose of storage (EnWG § 118 (6)). They are also exempted from, refunded or remunerated for the electricity tax charged on the electricity drawn from the network for performing the electrolysis. (§ 9a (1) Nr. 1 StromStG). From the economic point of view, Power-to-Heat plants can participate in the balancing market to finance the investment. The technology itself is already available on the market, however, it is mainly used in demo projects at the current stage. This is due to little commercial experience and the high investments and operational costs.
(Local) Capacity market In Germany, the introduction of a capacity market is regularly claimed necessary by stakeholders in the energy sector, especially by conventional power plant operators. In fact, the legislator has introduced some measures over the last years.
Deliverable No. 2 | Smart Grids Business Models and Market Integration 91
In 2016 an overall change of the energy legislation was passed in Germany, which affected various laws and ordinance. Also the new capacity mechanism were introduced or the existing ones changes. This concerns different strategic reserves: the so-called network reserve, capacity reserve and security backup.
The network reserve, already in effect since 2013 in a different ordinance, was specified in 2016. The reserve is built during the winter months on TSO level as backup capacity that exceeds the scope of normal redispatch measures. Its objective is to maintain the security and reliability of the electrical power system, particularly during congestion and voltage level stability problems or for reconstruction purposes after blackout. The reserve is currently only comprised of power plants that are currently not operation but classified crucial for system reliability or those pending decommissioning. The operators are remunerated the costs for keeping that standby status which are financed with the general network charges [57], [162]. For the winter 2016/2017 the German regulator determined 5.4 GW of necessary reserve capacity, and 1.9 GW for 2018/2019 [163].
The capacity reserve describes backup capacity that can be used by the TSOs when supply and demand do not match on the energy-only markets. In terms of timing, it is not activated before market close of the intraday market and the balancing market. The capacity is contracted after a tendering process and many not make offers on the on the energy markets. In 2018/2019 2 GW are planned to be contracted. The reserve is also designed for plants. Costs are again refunded. When plants leave the reserve they are obligated to be decommissioned.
The security backup as the third measure is only meant for aged lignite power plants that are mothballed and will only be activated after exploiting the other capacity mechanism. After staying in the reserve for four years they are decommissioned. This measure is focused on lignite plants because they emit the largest amount of carbon dioxide compared to other technologies in Germany.
As presented, the current capacity mechanism in Germany are focused on conventional power plants, mainly those close to or already having reached their financial payback time. The Federal Ministry of Economics and Energy argues that only opening them to such capacities that are not active on the regular energy market prevents distorting competition and pricing. The ministry depreciates a full-scale capacity market [164]. This is why smart grid applications and novel concepts can currently not be active on the German capacity market. The discussion on capacity mechanism in Germany is mainly driven by the estimation that the energy only market will not provide high and stable enough prices to encourage investments in conventional generation that will be needed in the future. That is why the instruction of the measure focuses on providing incentives for such conventional power plants that when decommissioned threaten system stability. Although, it is often mentioned that, for instance, highly flexibles gas turbine power plants are a perfect match to compensate for the disadvantages of RES, flexible generation general is somewhat not represented in the capacity measures. In consequence, novel concepts based on smart grid technologies proving flexibility for the network, cannot participate in the capacity market measures. Furthermore, locally limited capacity measures as such do not play a role in the discussion.
Variable Tariff According to § 40 (5) EnWG suppliers, if technically and economically feasible, have to offer their clients a tariff that incentivises energy saving as well as control of consumption. Whereas large clients equipped with an interval meter usually have variable tariffs to a certain degree, this does not generally apply to small customers, such as households and small business. In contrast to the proven approach of using standard profiles to realise the purchase of their electricity usage and forecast network utilisation, DSOs may only do so anymore if there is no interchange of interval metering data available [96, 96]. This, however, only applies, if such clients are equipped with smart meters and the supporting infrastructure is installed. DSOs are currently only starting to do that, as the technology is pending certification by German authorities.

Deliverable No. 2 | Smart Grids Business Models and Market Integration 92
What has been on the market for many years are high and low tariffs, but only for electrical storage heating (night tariff and day tariff). The requirement is a switchable meter with two counting units. Switching between the tariffs is done by the network operator using external ripple control with Power Line Communication (PLC). However, the tariffs are not flexible per se, meaning that the price during peak time and low time are fixed beforehand. External price signals such as from the stock exchange EEX are not included.
For interruptible loads that can be controlled by the DSO, a special a reduced network charge has to be offered [52]. Electricity suppliers pass on that discount to the final customers, resulting in a cheaper overall electricity tariff. Customers need a special meter which can temporarily interrupt the connection to the network. DSOs decide on the daily times of disconnection according to the projected network’s state. The same time frame per day is usually fixed for a year. Such network charge discounts also apply for EV [52].
In the Ordinance on the Operation of Metering Points it is legislated that the future meters need to be capable to distinguish between variable tariffs. The specifications of the smart meter gateway as part of a smart meter system include different variable tariffs to be implemented. There are supposed to be tariffs that are in line with either the time, load and energy consumption [165].
It is expected that only with the installation of a smart meter systems variable tariffs will be introduced on a large scale.
Variable energy pricing can be an external stimulus for DSM. In Germany, for households a load shifting potential of 19 GW was identified. The responsible task force within the Association for Electrical, Electronic & Information Technologies recommends to deploy smart equipment in the networks in order to integrate flexible loads. Furthermore, smart meter systems as well as variable tariffs are regarded an essential requirement to exploit potentials for DSM in households [166].
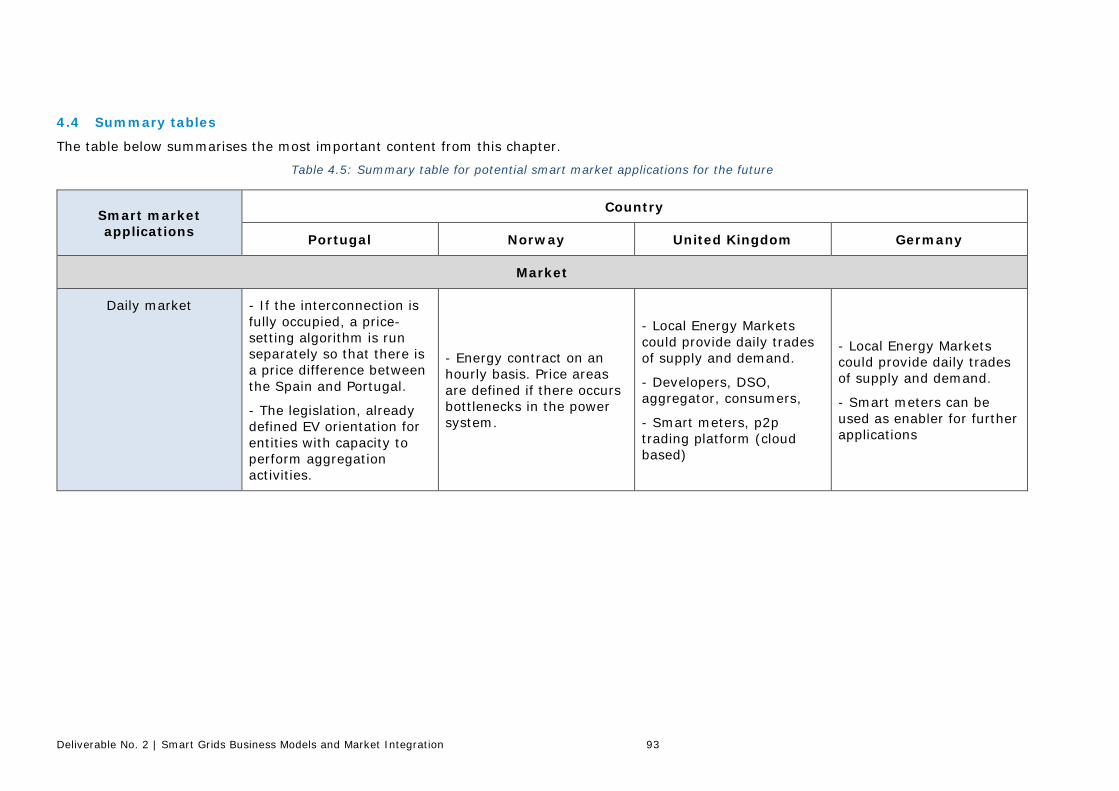
Deliverable No. 2 | Smart Grids Business Models and Market Integration 93
4.4 Summary tables
The table below summarises the most important content from this chapter.
Table 4.5: Summary table for potential smart market applications for the future
Smart market applications
Country
Portugal Norway United Kingdom Germany
Market
Daily market - If the interconnection is fully occupied, a price-setting algorithm is run separately so that there is a price difference between the Spain and Portugal.
- The legislation, already defined EV orientation for entities with capacity to perform aggregation activities.
- Energy contract on an hourly basis. Price areas are defined if there occurs bottlenecks in the power system.
- Local Energy Markets could provide daily trades of supply and demand.
- Developers, DSO, aggregator, consumers,
- Smart meters, p2p trading platform (cloud based)
- Local Energy Markets could provide daily trades of supply and demand.
- Smart meters can be used as enabler for further applications
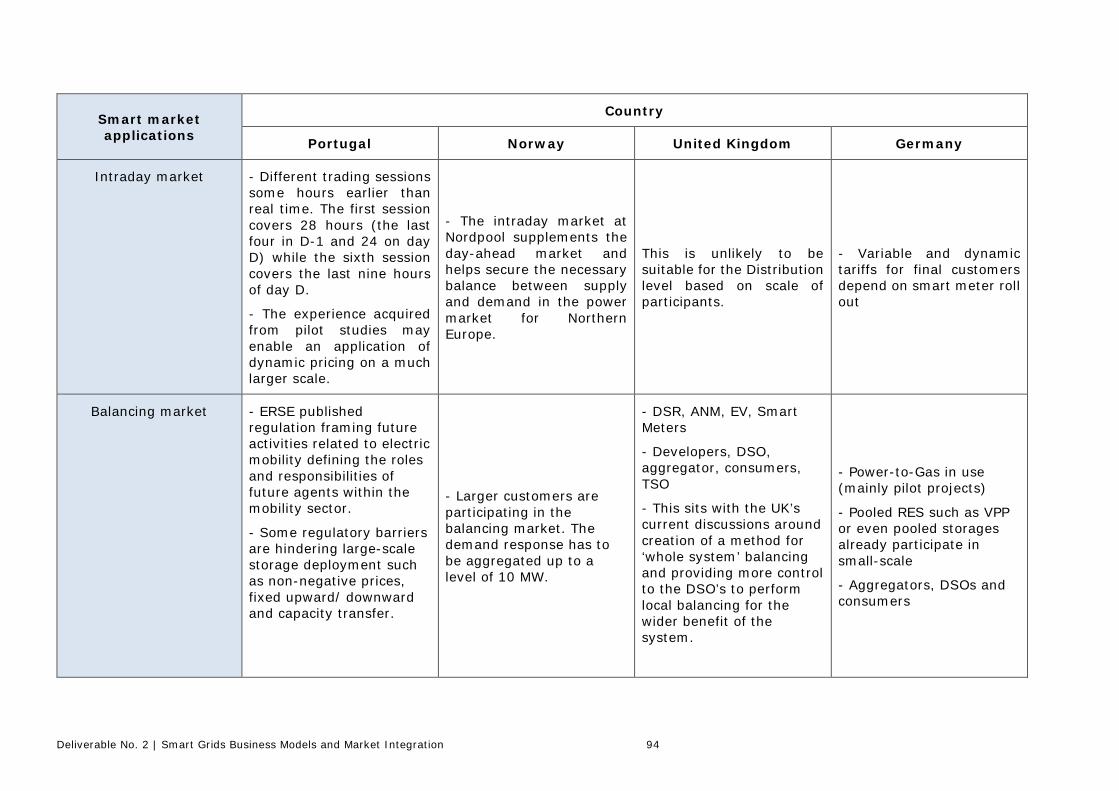
Deliverable No. 2 | Smart Grids Business Models and Market Integration 94
Smart market applications
Country
Portugal Norway United Kingdom Germany
Intraday market - Different trading sessions some hours earlier than real time. The first session covers 28 hours (the last four in D-1 and 24 on day D) while the sixth session covers the last nine hours of day D.
- The experience acquired from pilot studies may enable an application of dynamic pricing on a much larger scale.
- The intraday market at Nordpool supplements the day-ahead market and helps secure the necessary balance between supply and demand in the power market for Northern Europe.
This is unlikely to be suitable for the Distribution level based on scale of participants.
- Variable and dynamic tariffs for final customers depend on smart meter roll out
Balancing market - ERSE published regulation framing future activities related to electric mobility defining the roles and responsibilities of future agents within the mobility sector.
- Some regulatory barriers are hindering large-scale storage deployment such as non-negative prices, fixed upward/ downward and capacity transfer.
- Larger customers are participating in the balancing market. The demand response has to be aggregated up to a level of 10 MW.
- DSR, ANM, EV, Smart Meters
- Developers, DSO, aggregator, consumers, TSO
- This sits with the UK’s current discussions around creation of a method for ‘whole system’ balancing and providing more control to the DSO’s to perform local balancing for the wider benefit of the system.
- Power-to-Gas in use (mainly pilot projects)
- Pooled RES such as VPP or even pooled storages already participate in small-scale
- Aggregators, DSOs and consumers
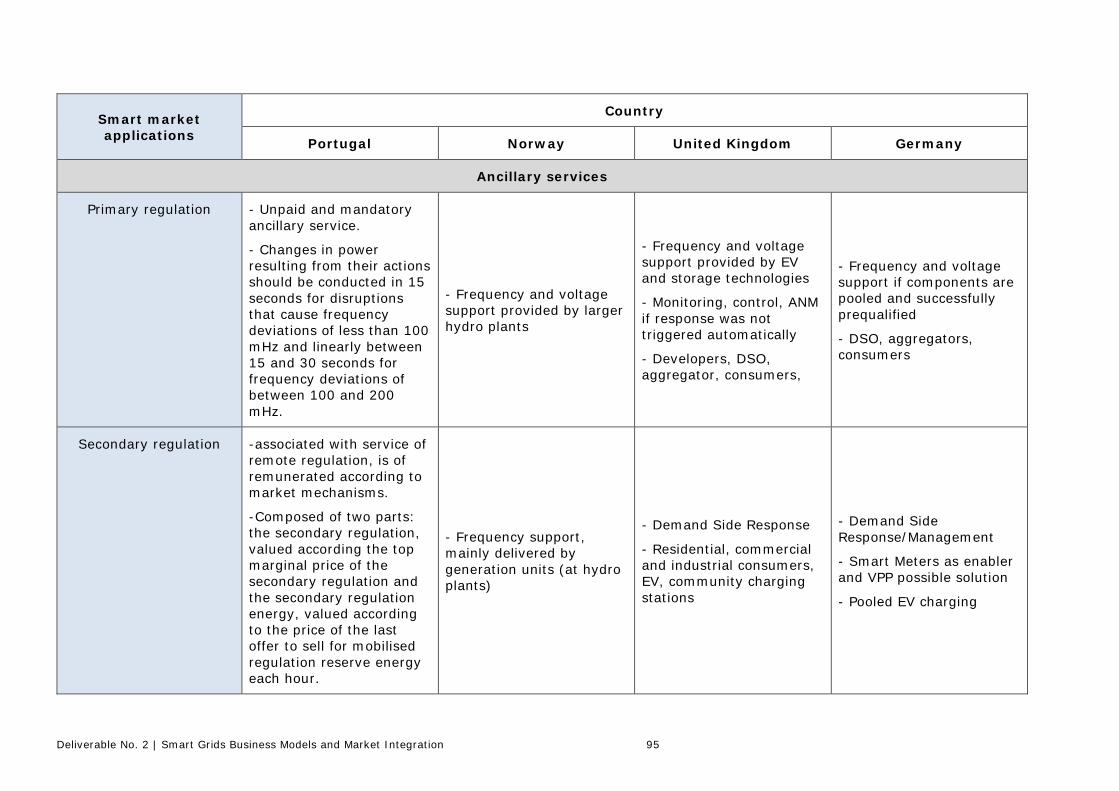
Deliverable No. 2 | Smart Grids Business Models and Market Integration 95
Smart market applications
Country
Portugal Norway United Kingdom Germany
Ancillary services
Primary regulation - Unpaid and mandatory ancillary service.
- Changes in power resulting from their actions should be conducted in 15 seconds for disruptions that cause frequency deviations of less than 100 mHz and linearly between 15 and 30 seconds for frequency deviations of between 100 and 200 mHz.
- Frequency and voltage support provided by larger hydro plants
- Frequency and voltage support provided by EV and storage technologies
- Monitoring, control, ANM if response was not triggered automatically
- Developers, DSO, aggregator, consumers,
- Frequency and voltage support if components are pooled and successfully prequalified
- DSO, aggregators, consumers
Secondary regulation -associated with service of remote regulation, is of remunerated according to market mechanisms.
-Composed of two parts: the secondary regulation, valued according the top marginal price of the secondary regulation and the secondary regulation energy, valued according to the price of the last offer to sell for mobilised regulation reserve energy each hour.
- Frequency support, mainly delivered by generation units (at hydro plants)
- Demand Side Response
- Residential, commercial and industrial consumers, EV, community charging stations
- Demand Side Response/Management
- Smart Meters as enabler and VPP possible solution
- Pooled EV charging
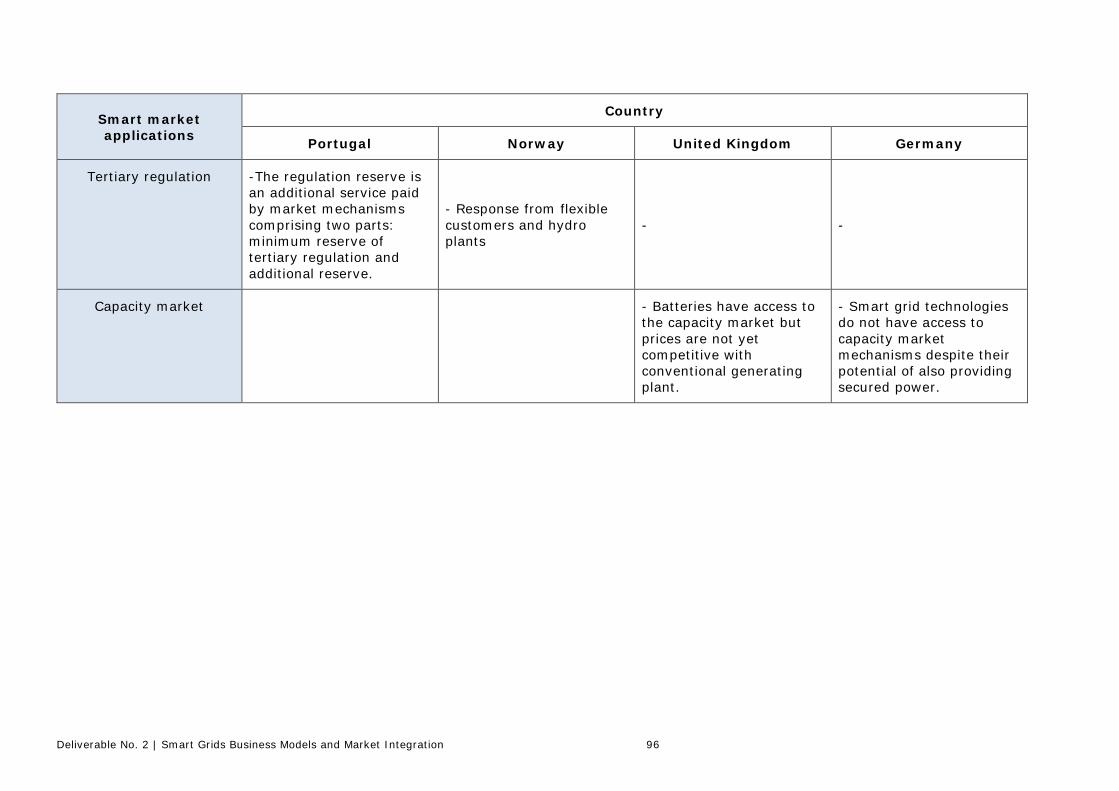
Deliverable No. 2 | Smart Grids Business Models and Market Integration 96
Smart market applications
Country
Portugal Norway United Kingdom Germany
Tertiary regulation -The regulation reserve is an additional service paid by market mechanisms comprising two parts: minimum reserve of tertiary regulation and additional reserve.
- Response from flexible customers and hydro plants
- -
Capacity market
- Batteries have access to the capacity market but prices are not yet competitive with conventional generating plant.
- Smart grid technologies do not have access to capacity market mechanisms despite their potential of also providing secured power.
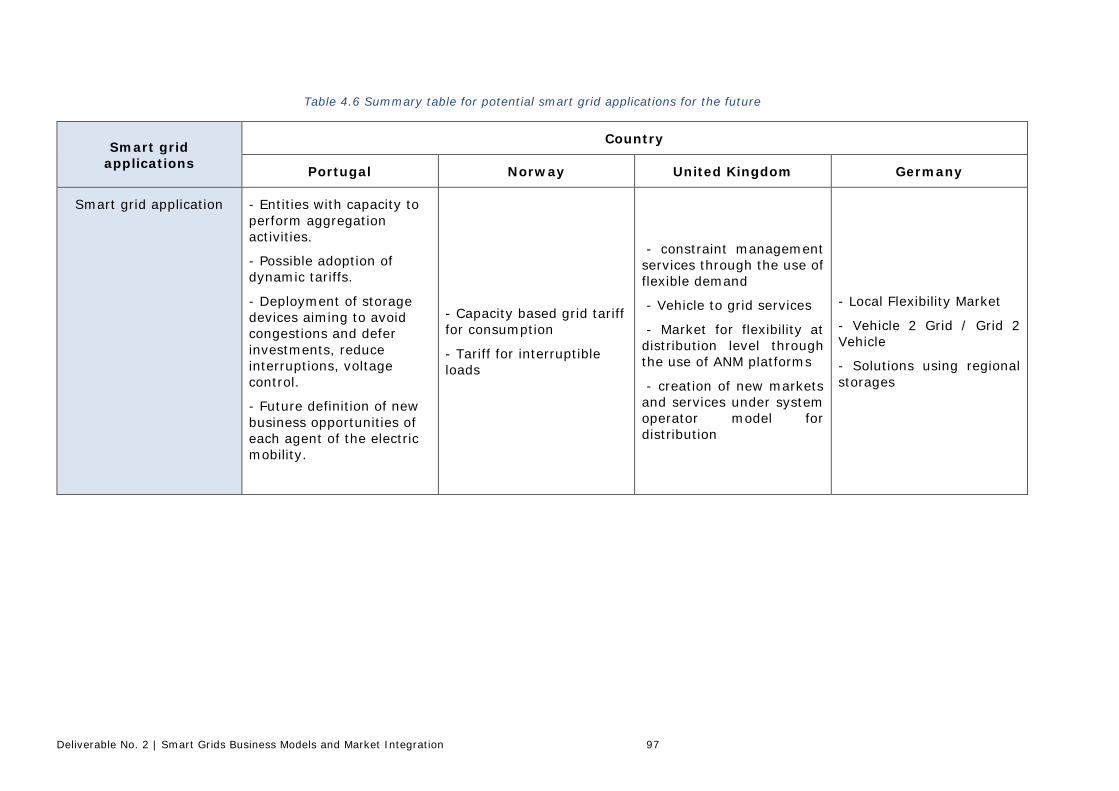
Deliverable No. 2 | Smart Grids Business Models and Market Integration 97
Table 4.6 Summary table for potential smart grid applications for the future
Smart grid applications
Country
Portugal Norway United Kingdom Germany
Smart grid application - Entities with capacity to perform aggregation activities.
- Possible adoption of dynamic tariffs.
- Deployment of storage devices aiming to avoid congestions and defer investments, reduce interruptions, voltage control.
- Future definition of new business opportunities of each agent of the electric mobility.
- Capacity based grid tariff for consumption
- Tariff for interruptible loads
- constraint management services through the use of flexible demand
- Vehicle to grid services
- Market for flexibility at distribution level through the use of ANM platforms
- creation of new markets and services under system operator model for distribution
- Local Flexibility Market
- Vehicle 2 Grid / Grid 2 Vehicle
- Solutions using regional storages
Deliverable No. 2 | Smart Grids Business Models and Market Integration 98
5. Review of developments of Grid Codes for smart grid technologies
This chapter contains description of network codes/grid codes relevant for smart grid technologies in the distribution grid, and the status of implementation in each country.
5.1 Short overview of Network Codes Network codes and related guidelines are a set of rules drafted by ENTSO-E (European Network of Transmission System Operators for Electricity), with guidance from ACER (Agency for the Cooperation of Energy Regulators). The codes facilitate the harmonisation, integration and efficiency of the European electricity market. Network codes apply to one or more parts of the energy sector. At present there are eight different network codes. The descriptions below are selected from the different network codes.
Electricity Balancing A guideline on electricity balancing including the establishment of common principles for the procurement and the settlement of frequency containment reserves, frequency restoration reserves and replacement reserves and a common methodology for the activation of frequency restoration reserves and replacement reserves10. Emergency and Restoration, requirements on: a) the management by TSOs of the emergency, blackout and restoration states; b) the coordination of system operation across the Union in the emergency, blackout and
restoration states; c) the simulations and tests to guarantee a reliable, efficient and fast restoration of the
interconnected transmission systems to the normal state from the emergency or blackout states;
d) the tools and facilities needed to guarantee a reliable, efficient and fast restoration of the interconnected11
System Operations, guidelines on: a) requirements and principles concerning operational security; b) rules and responsibilities for the coordination and data exchange between TSOs,
between TSOs and DSOs, and between TSOs or DSOs and SGUs, in operational planning and in close to real-time operation;
c) rules for training and certification of system operator employees; d) requirements on outage coordination; e) requirements for scheduling between the TSOs’ control areas; and
10https://www.entsoe.eu/Documents/Network%20codes%20documents/NC%20EB/Informal_Servic
e_Level_EBGL_16-03-2017_Final.pdf 11 http://ec.europa.eu/energy/sites/ener/files/documents/nc_er_ener_vs_12_ecbc_on_24_25-10-
2016.pdf
Deliverable No. 2 | Smart Grids Business Models and Market Integration 99
f) rules aiming at the establishment of a Union framework for load-frequency control and reserve12
Capacity Allocation and Congestion Management (CACM) Guidelines on cross-zonal capacity allocation and congestion management in the day-ahead and intraday markets, including the requirements for the establishment of common methodologies for determining the volumes of capacity simultaneously available between bidding zones, criteria to assess efficiency and a review process for defining bidding zones13. Requirements for Generators (RfG) Requirements for grid connection of power-generating facilities, namely synchronous power-generating modules, power park modules and offshore power park modules, to the interconnected system. It, therefore, helps to ensure fair conditions of competition in the internal electricity market, to ensure system security and the integration of renewable electricity sources, and to facilitate Union-wide trade in electricity14.
Demand Connection (DCC), the requirements for grid connection of: a) transmission-connected demand facilities; g) transmission-connected distribution facilities; h) distribution systems, including closed distribution systems; i) demand units, used by a demand facility or a closed distribution system to provide
demand response services to relevant system operators and relevant TSOs15.
HVDC The requirements for grid connections of high-voltage direct current (HVDC) systems and DC-connected power park modules. It, therefore, helps to ensure fair conditions of competition in the internal electricity market, to ensure system security and the integration of renewable electricity sources, and to facilitate Union-wide trade in electricity16. Forward Capacity Allocation Detailed rules on cross-zonal capacity allocation in the forward markets, on the establishment of a common methodology to determine long-term cross-zonal capacity, on the establishment of a single allocation platform at European level offering long-term transmission rights, and on the possibility to return long-term transmission rights for subsequent forward capacity allocation or transfer long-term transmission rights between market participants17.
12
https://ec.europa.eu/energy/sites/ener/files/documents/SystemOperationGuideline%20final%28provisional%2904052016.pdf
13 http://eur-lex.europa.eu/legal-content/EN/TXT/HTML/?uri=CELEX:32015R1222&from=EN 14 http://eur-lex.europa.eu/legal-content/EN/TXT/HTML/?uri=CELEX:32016R0631&from=EN 15 http://eur-lex.europa.eu/legal-content/EN/TXT/HTML/?uri=CELEX:32016R1388&from=EN 16 http://eur-lex.europa.eu/legal-content/EN/TXT/HTML/?uri=CELEX:32016R1447&from=EN 17 http://eur-lex.europa.eu/legal-content/EN/TXT/HTML/?uri=CELEX:32016R1719&from=EN
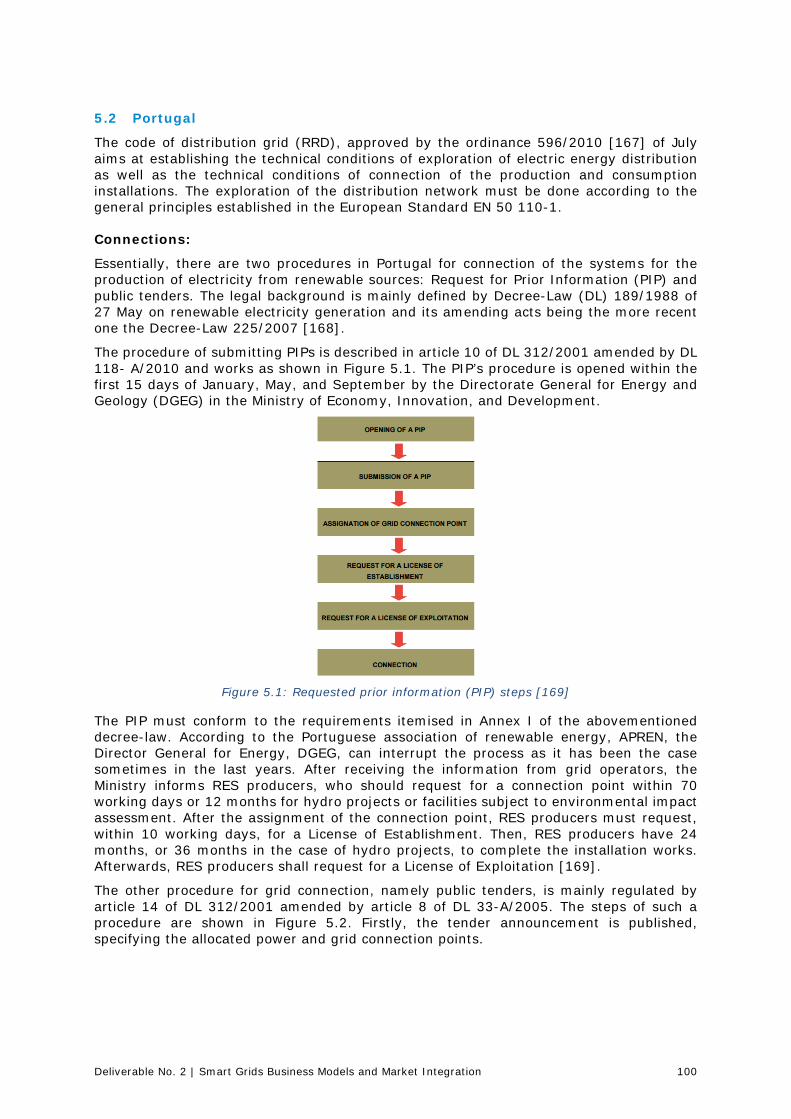
Deliverable No. 2 | Smart Grids Business Models and Market Integration 100
5.2 Portugal
The code of distribution grid (RRD), approved by the ordinance 596/2010 [167] of July aims at establishing the technical conditions of exploration of electric energy distribution as well as the technical conditions of connection of the production and consumption installations. The exploration of the distribution network must be done according to the general principles established in the European Standard EN 50 110-1.
Connections:
Essentially, there are two procedures in Portugal for connection of the systems for the production of electricity from renewable sources: Request for Prior Information (PIP) and public tenders. The legal background is mainly defined by Decree-Law (DL) 189/1988 of 27 May on renewable electricity generation and its amending acts being the more recent one the Decree-Law 225/2007 [168].
The procedure of submitting PIPs is described in article 10 of DL 312/2001 amended by DL 118- A/2010 and works as shown in Figure 5.1. The PIP’s procedure is opened within the first 15 days of January, May, and September by the Directorate General for Energy and Geology (DGEG) in the Ministry of Economy, Innovation, and Development.
Figure 5.1: Requested prior information (PIP) steps [169]
The PIP must conform to the requirements itemised in Annex I of the abovementioned decree-law. According to the Portuguese association of renewable energy, APREN, the Director General for Energy, DGEG, can interrupt the process as it has been the case sometimes in the last years. After receiving the information from grid operators, the Ministry informs RES producers, who should request for a connection point within 70 working days or 12 months for hydro projects or facilities subject to environmental impact assessment. After the assignment of the connection point, RES producers must request, within 10 working days, for a License of Establishment. Then, RES producers have 24 months, or 36 months in the case of hydro projects, to complete the installation works. Afterwards, RES producers shall request for a License of Exploitation [169].
The other procedure for grid connection, namely public tenders, is mainly regulated by article 14 of DL 312/2001 amended by article 8 of DL 33-A/2005. The steps of such a procedure are shown in Figure 5.2. Firstly, the tender announcement is published, specifying the allocated power and grid connection points.
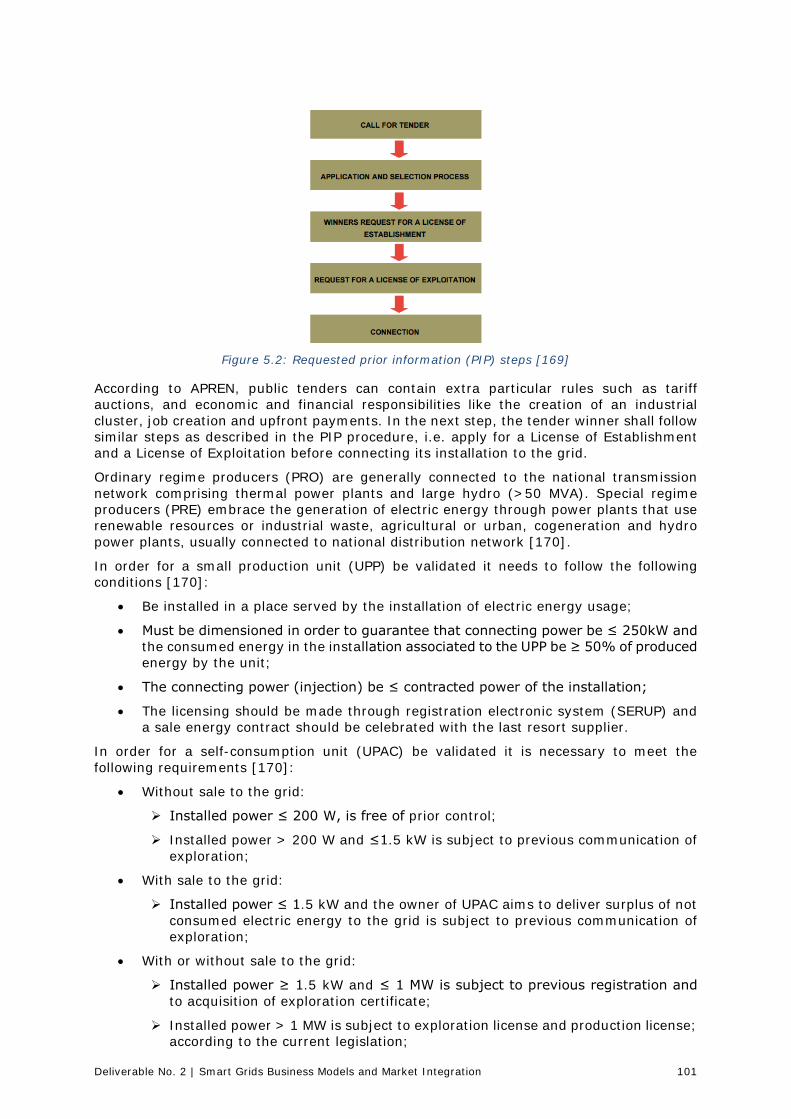
Deliverable No. 2 | Smart Grids Business Models and Market Integration 101
Figure 5.2: Requested prior information (PIP) steps [169]
According to APREN, public tenders can contain extra particular rules such as tariff auctions, and economic and financial responsibilities like the creation of an industrial cluster, job creation and upfront payments. In the next step, the tender winner shall follow similar steps as described in the PIP procedure, i.e. apply for a License of Establishment and a License of Exploitation before connecting its installation to the grid.
Ordinary regime producers (PRO) are generally connected to the national transmission network comprising thermal power plants and large hydro (>50 MVA). Special regime producers (PRE) embrace the generation of electric energy through power plants that use renewable resources or industrial waste, agricultural or urban, cogeneration and hydro power plants, usually connected to national distribution network [170].
In order for a small production unit (UPP) be validated it needs to follow the following conditions [170]:
• Be installed in a place served by the installation of electric energy usage;
• Must be dimensioned in order to guarantee that connecting power be ≤ 250kW and the consumed energy in the installation associated to the UPP be ≥ 50% of produced energy by the unit;
• The connecting power (injection) be ≤ contracted power of the installation;
• The licensing should be made through registration electronic system (SERUP) and a sale energy contract should be celebrated with the last resort supplier.
In order for a self-consumption unit (UPAC) be validated it is necessary to meet the following requirements [170]:
• Without sale to the grid:
Installed power ≤ 200 W, is free of prior control;
Installed power > 200 W and ≤1.5 kW is subject to previous communication of exploration;
• With sale to the grid:
Installed power ≤ 1.5 kW and the owner of UPAC aims to deliver surplus of not consumed electric energy to the grid is subject to previous communication of exploration;
• With or without sale to the grid:
Installed power ≥ 1.5 kW and ≤ 1 MW is subject to previous registration and to acquisition of exploration certificate;
Installed power > 1 MW is subject to exploration license and production license; according to the current legislation;
Deliverable No. 2 | Smart Grids Business Models and Market Integration 102
• The connection power (injection) of UPAC must be ≤ 100% of contracted power in the installation usage;
• The installed power of UPAC cannot be superior to twice of connection power;
• The licensing of UPAC must be done through the registration electronic system (SERUP);
• UPACs with installed power superior to 1.5 kW and if the installation is connected to RESP, are subject to the payment of the fix monthly compensation, in the first 10 years after the acquirement of exploration certificate.
As a rule, connection to the grid shall be granted according to the principle of non-discrimination. Besides priority shall be given to electricity produced from renewable energy sources, except for hydro plants with an installed capacity exceeding 30 MW (Art. 33 W of DL 172/2006 amended by DL 215-B/2012). The obligation to purchase all electricity produced under the Special Regime in the period it benefits from the FiT (art. 55 of DL 172/2006 amended by DL 215-B/2012) creates favourable conditions for the deployment of RES technologies. Regarding the distribution of costs, the plant operator whose plant is to be connected to the grid shall install an additional connection to the grid which is considered part of the entire grid. However, the plant operator shall bear the full costs. If an operator of a renewable energy plant aims to install a connection to the grid and there is no capacity available, the plant operator shall wait for the grid to be upgraded or contribute in the costs of the grid reinforcement. The operators of renewable-energy UPPs and UPACs connected to the grid shall bear the costs of connection to and eventual reinforcement of the grid (art. 8 DL 153/2014) [171].
Grid operation
The framework regulating the operation of the grid provides favourable conditions for the deployment of RES installations because of the existing purchase obligation for electricity from renewable sources. Grid operators are obliged to purchase and transmit all electricity from renewable sources offered by RES producers and an autonomous entity, known as Last Resort Vendor, shall buy this electricity from the producers [169]. The legal framework for the grid operation is mainly defined by the Decree-Law (DL) 189/1988 of 27 May on renewable electricity generation with amending acts.
Grid operators are obliged to dispatch all electricity from renewable sources offered by the RES plant operator (art. 4 of DL 312/2001 amended by DL 118-A/2010 and art. 5 of DL 312/2001). Actually, RES producers are contractually entitled against the Last Resort Vendor, an autonomous entity, which shall buy the electricity produced in the Special Regime (art. 20 of DL 29/2006). According to the Portuguese NREAP, “the electricity produced from renewable energy sources has precedence over electricity that is produced from other, non-renewable sources and it is compulsory for the former to enter the transmission or distribution network”. Due to this purchase obligation, in addition to the lack of enough interconnections between Spain and France that limit electricity exports, sometimes it is necessary to suspend power imports from Spain, or to sell the RESE energy surplus in the Iberian Market at zero bids. Wind energy producers under the Special Regime Production are not required to regulate the frequency as it is the case for energy producers under the Ordinary Regime Production. Nevertheless, RES-E producers shall be able to withstand voltage dips and are required to comply with the standards set by the grid operator.
Curtailment measures to ensure grid stability are regulated by decrees (DL 29/2006 and DL 172/2006), network regulations (ERSE, 2011; RPA, 2011), and by a protocol of operation signed between the RES producer and the grid operator (EEVM, 2011). Curtailment measures are necessary if the capacity of the distribution or transmission grids is not sufficient to dispatch RES.
The distribution network, as a primary network, has a reduced availability. If a problem happens in the line, consumers are left without energy. Additionally, in the case just one connection line is in place, the RES installations cannot operate until the problem is solved.
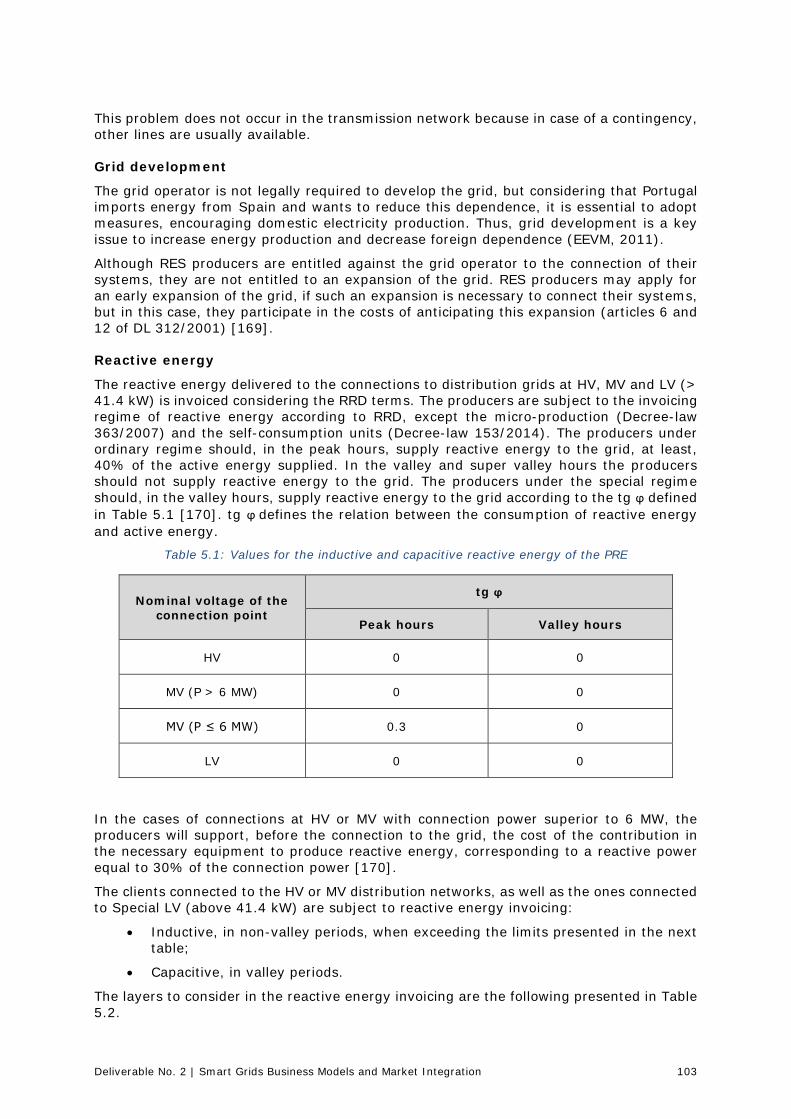
Deliverable No. 2 | Smart Grids Business Models and Market Integration 103
This problem does not occur in the transmission network because in case of a contingency, other lines are usually available.
Grid development
The grid operator is not legally required to develop the grid, but considering that Portugal imports energy from Spain and wants to reduce this dependence, it is essential to adopt measures, encouraging domestic electricity production. Thus, grid development is a key issue to increase energy production and decrease foreign dependence (EEVM, 2011).
Although RES producers are entitled against the grid operator to the connection of their systems, they are not entitled to an expansion of the grid. RES producers may apply for an early expansion of the grid, if such an expansion is necessary to connect their systems, but in this case, they participate in the costs of anticipating this expansion (articles 6 and 12 of DL 312/2001) [169].
Reactive energy
The reactive energy delivered to the connections to distribution grids at HV, MV and LV (> 41.4 kW) is invoiced considering the RRD terms. The producers are subject to the invoicing regime of reactive energy according to RRD, except the micro-production (Decree-law 363/2007) and the self-consumption units (Decree-law 153/2014). The producers under ordinary regime should, in the peak hours, supply reactive energy to the grid, at least, 40% of the active energy supplied. In the valley and super valley hours the producers should not supply reactive energy to the grid. The producers under the special regime should, in the valley hours, supply reactive energy to the grid according to the tg ϕ defined in Table 5.1 [170]. tg ϕ defines the relation between the consumption of reactive energy and active energy.
Table 5.1: Values for the inductive and capacitive reactive energy of the PRE
Nominal voltage of the connection point
tg ϕ
Peak hours Valley hours
HV 0 0
MV (P > 6 MW) 0 0
MV (P ≤ 6 MW) 0.3 0
LV 0 0
In the cases of connections at HV or MV with connection power superior to 6 MW, the producers will support, before the connection to the grid, the cost of the contribution in the necessary equipment to produce reactive energy, corresponding to a reactive power equal to 30% of the connection power [170].
The clients connected to the HV or MV distribution networks, as well as the ones connected to Special LV (above 41.4 kW) are subject to reactive energy invoicing:
• Inductive, in non-valley periods, when exceeding the limits presented in the next table;
• Capacitive, in valley periods.
The layers to consider in the reactive energy invoicing are the following presented in Table 5.2.
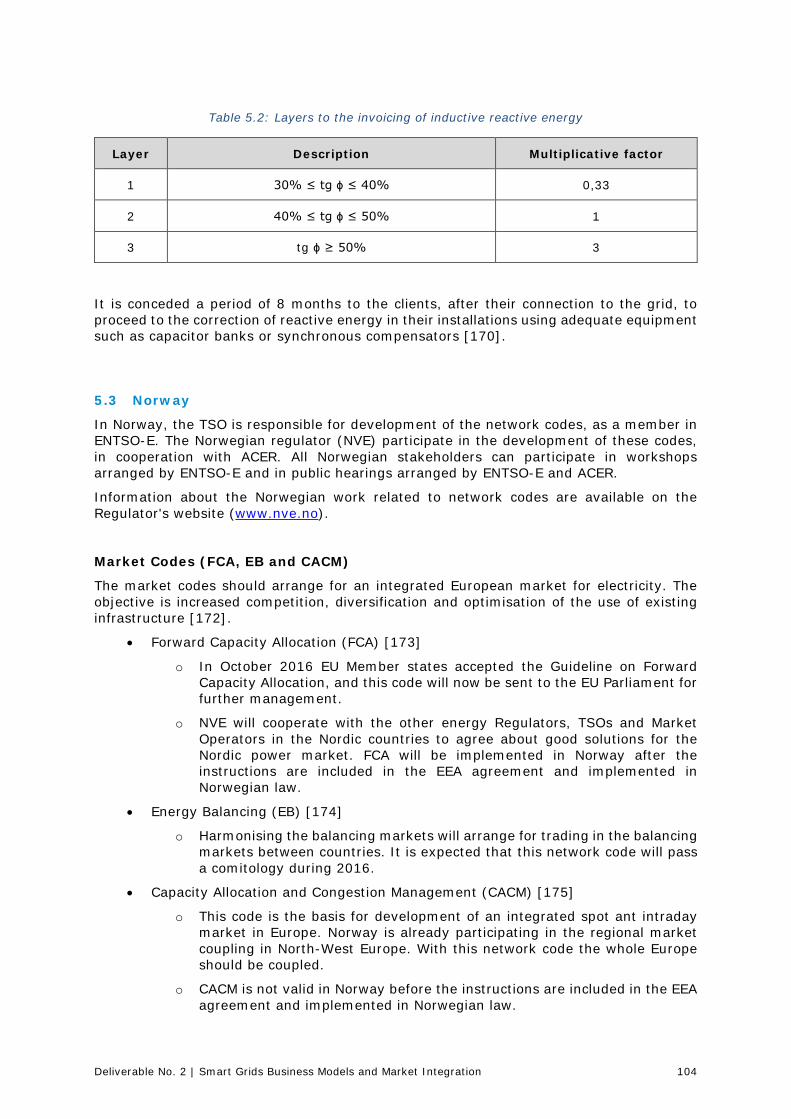
Deliverable No. 2 | Smart Grids Business Models and Market Integration 104
Table 5.2: Layers to the invoicing of inductive reactive energy
Layer Description Multiplicative factor
1 30% ≤ tg ϕ ≤ 40% 0,33
2 40% ≤ tg ϕ ≤ 50% 1
3 tg ϕ ≥ 50% 3
It is conceded a period of 8 months to the clients, after their connection to the grid, to proceed to the correction of reactive energy in their installations using adequate equipment such as capacitor banks or synchronous compensators [170].
5.3 Norway
In Norway, the TSO is responsible for development of the network codes, as a member in ENTSO-E. The Norwegian regulator (NVE) participate in the development of these codes, in cooperation with ACER. All Norwegian stakeholders can participate in workshops arranged by ENTSO-E and in public hearings arranged by ENTSO-E and ACER.
Information about the Norwegian work related to network codes are available on the Regulator's website (www.nve.no).
Market Codes (FCA, EB and CACM)
The market codes should arrange for an integrated European market for electricity. The objective is increased competition, diversification and optimisation of the use of existing infrastructure [172].
• Forward Capacity Allocation (FCA) [173]
o In October 2016 EU Member states accepted the Guideline on Forward Capacity Allocation, and this code will now be sent to the EU Parliament for further management.
o NVE will cooperate with the other energy Regulators, TSOs and Market Operators in the Nordic countries to agree about good solutions for the Nordic power market. FCA will be implemented in Norway after the instructions are included in the EEA agreement and implemented in Norwegian law.
• Energy Balancing (EB) [174]
o Harmonising the balancing markets will arrange for trading in the balancing markets between countries. It is expected that this network code will pass a comitology during 2016.
• Capacity Allocation and Congestion Management (CACM) [175]
o This code is the basis for development of an integrated spot ant intraday market in Europe. Norway is already participating in the regional market coupling in North-West Europe. With this network code the whole Europe should be coupled.
o CACM is not valid in Norway before the instructions are included in the EEA agreement and implemented in Norwegian law.
Deliverable No. 2 | Smart Grids Business Models and Market Integration 105
Network Codes for Grid operation (OS, OPS and LFC)
The network codes for grid operation specify requirements related to the cooperation between the TSOs. These network codes includes information exchange and instruments to maintain operation security, coordinated outages and frequency regulation. These network codes are collected in guideline for system operation [172].
Comitology of the System Operation Guideline was expected in 2016 [176].
Network Codes for Grid Connection (RfG, DCC, HVDC)18
The connection codes specify functional requirements for generators (RfG), demand connections (DCC) and HVDC connections, including DC connected power park modules (HVDC). The connection codes, once ratified, will be part of Norwegian regulations.
NVE has requested Statnett to review the technical requirements in the connection codes, in close collaboration with national stakeholders. There are established three separate stakeholder groups, each working with one of the three connection codes. The groups are led by Statnett and the Regulator (NVE) participates as observer. The national industry associations within the energy sector have selected the participants among their stakeholders, based on technical expertise. The composition of each stakeholder group represents a cross section of the industry, to ensure that all relevant technical issues are addressed [177].
5.4 United Kingdom
In the UK, the Energy Networks Association is responsible for managing grid codes and standards. They act as the voice of the DNOs and provide representation for the UK on various groups: IEC, CENELEC, BSI and BSI/IET Committees, in addition to attending meetings of CIGRE working groups and providing members with regular reports.
All UK grid codes are developed in line with European Grid Code standards in order to ensure they adhere to those of the interconnected system.
In 2014, the Smart Grid Coordination Group [178] issued four reports for comment:
1. Smart Grid Information Security
2. Methodologies to facilitate Smart Grid System Interoperability through standardisation, system design and testing
3. Set of Standards
4. Overview of Methodologies
On March 1st 2011, The European Commission issued a Mandate for Smart Grids standards to the European Standardization Organizations. Through this mandate, the EC requested CEN, CENELEC, and ETSI to develop or update a set of consistent standards within a common European framework of communication and electrical architectures and associated processes, that will enable or facilitate the implementation in Europe of the different high level Smart Grid services and functionalities as defined by the Smart Grid Task Force that will be flexible enough to accommodate future developments. Building, Industry, Appliances and Home automation are out of the scope of this mandate; however, their interfaces with the Smart Grid and related services have to be treated under this mandate.
The document lists the following standards as ‚core‘ to any future Smart Grid.
18 https://www.nve.no/energy-market-and-regulation/rules-and-regulations-in-europe/network-
codes/grid-connection-codes-rfg-dcc-hvdc/
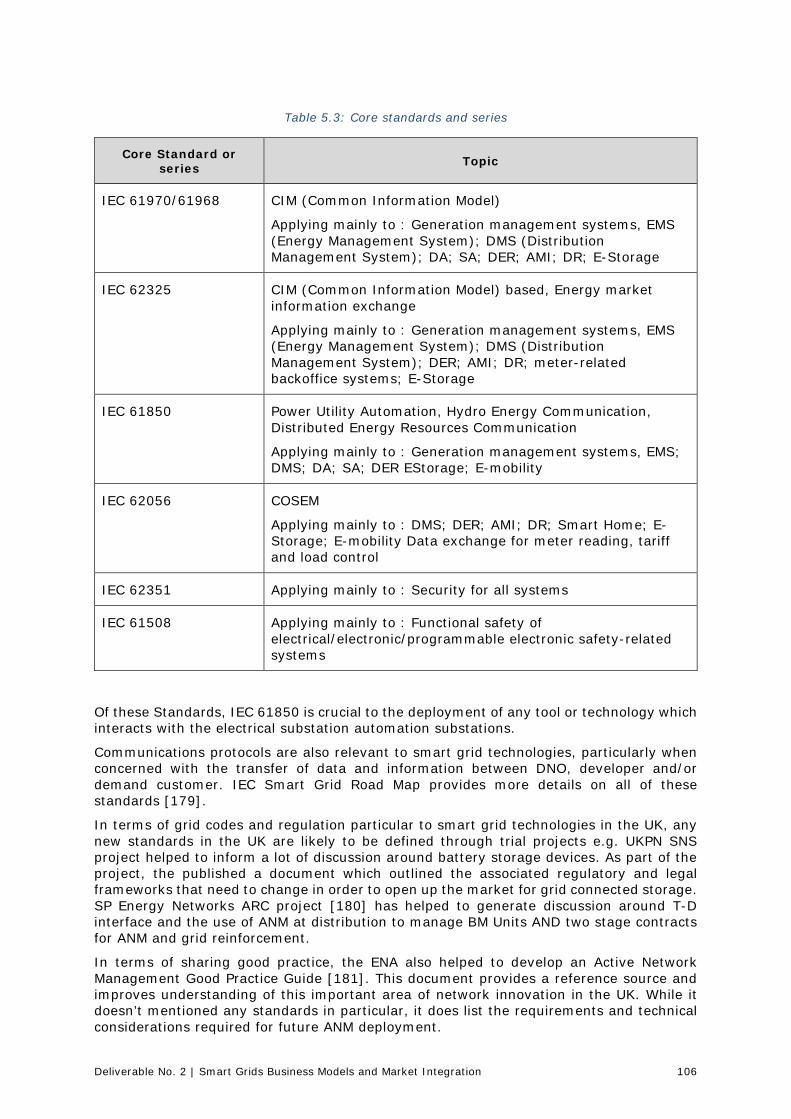
Deliverable No. 2 | Smart Grids Business Models and Market Integration 106
Table 5.3: Core standards and series
Core Standard or series Topic
IEC 61970/61968 CIM (Common Information Model)
Applying mainly to : Generation management systems, EMS (Energy Management System); DMS (Distribution Management System); DA; SA; DER; AMI; DR; E-Storage
IEC 62325 CIM (Common Information Model) based, Energy market information exchange
Applying mainly to : Generation management systems, EMS (Energy Management System); DMS (Distribution Management System); DER; AMI; DR; meter-related backoffice systems; E-Storage
IEC 61850 Power Utility Automation, Hydro Energy Communication, Distributed Energy Resources Communication
Applying mainly to : Generation management systems, EMS; DMS; DA; SA; DER EStorage; E-mobility
IEC 62056 COSEM
Applying mainly to : DMS; DER; AMI; DR; Smart Home; E-Storage; E-mobility Data exchange for meter reading, tariff and load control
IEC 62351 Applying mainly to : Security for all systems
IEC 61508 Applying mainly to : Functional safety of electrical/electronic/programmable electronic safety-related systems
Of these Standards, IEC 61850 is crucial to the deployment of any tool or technology which interacts with the electrical substation automation substations.
Communications protocols are also relevant to smart grid technologies, particularly when concerned with the transfer of data and information between DNO, developer and/or demand customer. IEC Smart Grid Road Map provides more details on all of these standards [179].
In terms of grid codes and regulation particular to smart grid technologies in the UK, any new standards in the UK are likely to be defined through trial projects e.g. UKPN SNS project helped to inform a lot of discussion around battery storage devices. As part of the project, the published a document which outlined the associated regulatory and legal frameworks that need to change in order to open up the market for grid connected storage. SP Energy Networks ARC project [180] has helped to generate discussion around T-D interface and the use of ANM at distribution to manage BM Units AND two stage contracts for ANM and grid reinforcement.
In terms of sharing good practice, the ENA also helped to develop an Active Network Management Good Practice Guide [181]. This document provides a reference source and improves understanding of this important area of network innovation in the UK. While it doesn’t mentioned any standards in particular, it does list the requirements and technical considerations required for future ANM deployment.

Deliverable No. 2 | Smart Grids Business Models and Market Integration 107
DCode
The Distribution Code of Licenced Distribution Operators of Great Britain sets the codes which all UK DNO’s must adhere to. They are also in charge of reviewing existing codes and standards and providing the updates to the standards as and when required though stakeholder panels and working groups.
Security of Supply
One the current projects that the DCode group is undertaking is a review of the security of supply standards.
In the UK, P2/6 is the standard which determines the security of supply standards for distribution connected customers. The standards set out the maximum length of time the customer can experience a loss of power as a result of a network fault or issue before the DNO will be penalised.
This review [182] reflects the ongoing development of planning approaches that UK DNOs are adopting based on the growth of Smart Grid technologies and the requirement to improve the flexibility of the system.
The first phase of the code review has been completed. The report produced by Workstream 8 of the review group found the following:
• In many parts of the network, network redundancy is significantly greater than the value of lost load, therefore in some cases more flexible approaches should be considered
• DER can provide supply reliability through better management of the resources
• DNOs should be allowed to make efficient use of Operational Measures and other smart technologies like demand side management, automation and active management.
• Distribution losses should be accounted for in planning
• Planning the network for high impact, low probability events can cause unnecessary investment in the network.
• Mitigate the risks of customer interruption during relatively long-lasting asset replacement works by reducing the exposure of customers to the risk of prolonged outages during these periods
Work has now commenced on the 2nd phase of work which will include mapping next steps and future work for the review panel.
5.5 Germany
The Law on Energy Management (Energiewirtschaftsgesetz, EnWG) provides that electricity network operators define certain technical conditions for connecting, designing and operating generating units, storages, distribution systems, customer installations, lines and direct connections [107].
The Association of Electrical, Electronic and Information Technologies (VDE) as well as interest groups such as the German Association of Energy and Water Industries (BDEW) compile and constantly update technical rules and agreements for network operators and manufacturers which DSOs are usually bound by when planning and operating their networks as they are regarded as so-called best available techniques. The list in Figure 5.3 shows the network codes. There are currently various codes which were developed by various organisations. Within the VDE the Forum for Network
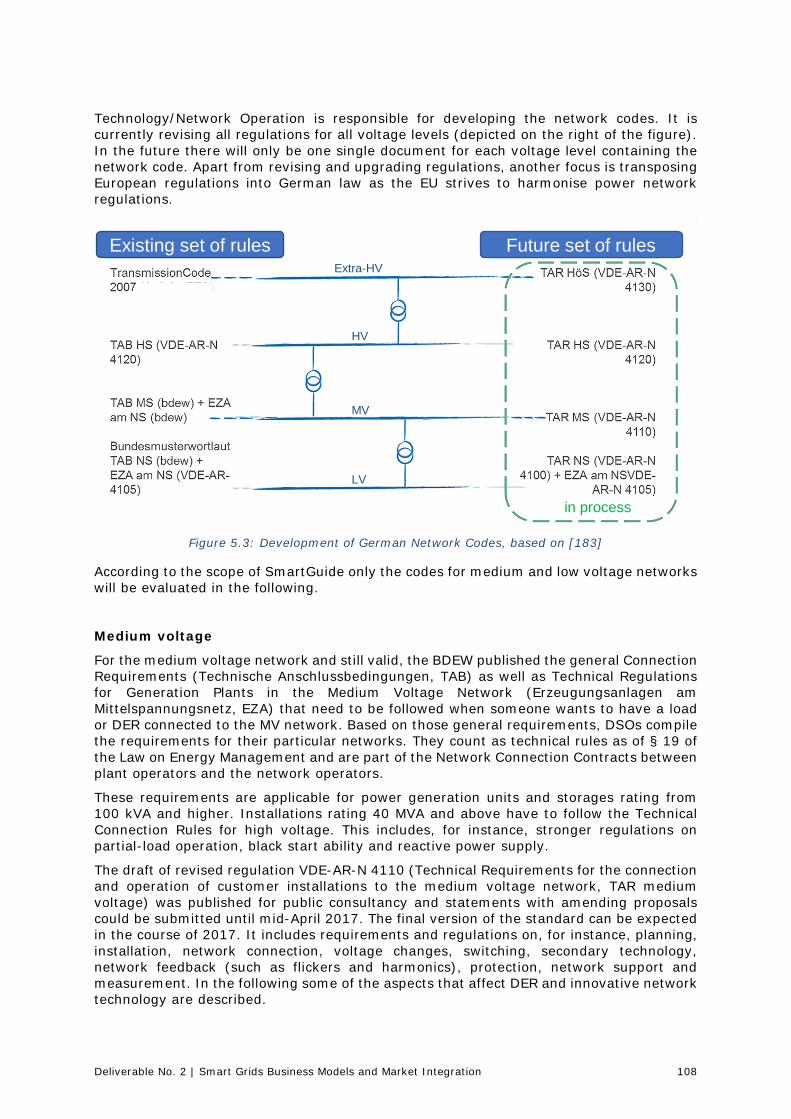
Deliverable No. 2 | Smart Grids Business Models and Market Integration 108
Technology/Network Operation is responsible for developing the network codes. It is currently revising all regulations for all voltage levels (depicted on the right of the figure). In the future there will only be one single document for each voltage level containing the network code. Apart from revising and upgrading regulations, another focus is transposing European regulations into German law as the EU strives to harmonise power network regulations.
Figure 5.3: Development of German Network Codes, based on [183]
According to the scope of SmartGuide only the codes for medium and low voltage networks will be evaluated in the following.
Medium voltage
For the medium voltage network and still valid, the BDEW published the general Connection Requirements (Technische Anschlussbedingungen, TAB) as well as Technical Regulations for Generation Plants in the Medium Voltage Network (Erzeugungsanlagen am Mittelspannungsnetz, EZA) that need to be followed when someone wants to have a load or DER connected to the MV network. Based on those general requirements, DSOs compile the requirements for their particular networks. They count as technical rules as of § 19 of the Law on Energy Management and are part of the Network Connection Contracts between plant operators and the network operators.
These requirements are applicable for power generation units and storages rating from 100 kVA and higher. Installations rating 40 MVA and above have to follow the Technical Connection Rules for high voltage. This includes, for instance, stronger regulations on partial-load operation, black start ability and reactive power supply.
The draft of revised regulation VDE-AR-N 4110 (Technical Requirements for the connection and operation of customer installations to the medium voltage network, TAR medium voltage) was published for public consultancy and statements with amending proposals could be submitted until mid-April 2017. The final version of the standard can be expected in the course of 2017. It includes requirements and regulations on, for instance, planning, installation, network connection, voltage changes, switching, secondary technology, network feedback (such as flickers and harmonics), protection, network support and measurement. In the following some of the aspects that affect DER and innovative network technology are described.
Existing set of rules Future set of rules
in process
LV
MV
HV
Extra-HV
Deliverable No. 2 | Smart Grids Business Models and Market Integration 109
The VDE standard summarises the main aspects that have to be considered when connecting to and operating customer installations in the medium voltage network. It serves as a planning guideline and decision-making to support equally planners and DSOs.
According to the draft of the standard, the requirements for storages are sharpened. They may, for instance, participate in a demand side management system e.g. by remote control. But such an operational mode requires separate arrangements between DSO and customers though.
During undisturbed operation, voltage changes caused by generating units and storages may not exceed 2 % of the nominal voltage level at any connection point compared to the voltage level without generating units.
Voltage changes caused by the cut-out of all generators and loads in one protective (e.g. one MV line section), as such including storages, is limited to a maximum of 5 % of the rated power. Furthermore, the frequency of voltage changes and the compulsory time gap between them is also limited. If the limits are exceeded, special arrangements need to me made with the DSO. Short-term flickers of a single customer installations need to be limited to 0.75 perceptive value, all customer installations together may not exceed 0.8.
Furthermore, changes in voltage caused by switching on and off a significant number of storages simultaneously is limited by a specified maximum load change gradient.
All innovative systems, including storages, have to comply with the general rules for feed-in systems. (10.4.2) Furthermore, it is particularly mentioned for storages to note:
• coordinating the protection concepts with the DSOs
• special requirements when the customer additionally using the emergency power generators to feed-in electricity
• providing the following capabilities by feed-in units which may not be influenced by customers’ automatic control
o frequency-dependent active power management
o requirements for dynamic network support
• requirements for the active power management by the DSO (power curtailment)
• static voltage management
• certification proving certain electrical qualities
Voltage regulation needs to be supported by storages that feed-in. They have to stay connected to the network for at least 60 seconds when the network’s voltage is equal or below 90 % and above 85 % of the nominal voltage at the connecting point.
To support the network generators and storages have to be capable of providing reactive power. In the voltage of 95 % to 105 % of the rated power a cos φ between 0.95 under excited and 0.95 overexcited is to be provided without reducing active power feed-in. Furthermore, a certain characteristic curve for cos φ in relation to the current voltage of the network is mandatory and will be requested by the DSO when necessary. There are also further requirements on reactive power provision in partial load operation.
Generators and loads, which includes storages and interruptible loads, are expected to support the network in bottleneck situations, outside the tolerated frequency corridor of ± 200 mHz of the nominal frequency of 50 Hz. In case of over-frequency, generators need to reduce the feed-in with a gradient of 40 % of the current feed-in power per Hertz. When the network’s frequency exceeds 51.5 Hz, storages, but also generators and loads, may be disconnected for self-protection. Below 49.4 Hz systems that feed-in are to increase the power with a gradient of their nominal power per Hertz up to their limit.
Deliverable No. 2 | Smart Grids Business Models and Market Integration 110
The protection of storages has to be designed like at sole feed-in systems. However, for storages there is a simplification to reduce expensive control lines in customer networks. This is the case for the location of the voltage rise protection (U>> and U>) and voltage drop protection (U<), which may be installed at the connection point of the generating unit within the customer network instead of in the transmission station.
Low voltage
The standards on connecting customer installations to the low voltage network (VDE-AR-N 4100 and 4105) are also being revised and some changes for DER are planned according to publications of the committees. Decentralised generators shall be obliged to stay connected to the network during short voltage dips (e.g. due to a short circuit). Furthermore, generators are supposed to support the voltage at the connection point, e.g. by providing reactive power.
As for the medium voltage standard, also the standard generators connected to the low-voltage distribution network – technical requirements for the connection to and parallel operation with low voltage distribution networks (VDE-AR-N 4105) is valid for planning, installing, operating and altering generating units and operated in parallel model to the network. It includes requirements and regulations on planning, installation, network connection, voltage changes, network feedback (such as flickers and harmonics), protection and measurement. The following exemplary aspects have effect on smart grid technologies connected to the network.
Generating units, which may in future explicitly include large-sale storages, need to be connected to the LV network where deemed feasible by the DSO.
During undisturbed operation, voltage changes caused by generating units may not exceed 3 % of the nominal voltage at any connection point compared to the voltage level without generating units. Storages are not explicitly included here like in the medium voltage standard.
Voltage changes at the connection point caused by switching generating units may not exceed 3 % of the nominal voltage level. It a change of 3 % occurs, a next one may not within the following 10 minutes.
Long-term flickers may not exceed the level of 0.5; there are not requirements concerning short-time flickers.
Furthermore, the occurrence of harmonics is limited. Details can be found in DIN EN 61000-3-2 and DEN EN 61000-3-12.
Voltage dips incurred by line-commutated converters are limited to 5 % of the voltage variation in relation to the peak value of the rated voltage.
In the corridor of 47.5 to 51.5 Hz automatically disconnecting generating unit from the network is not permitted.
The DSO may demand shutting down the unit or execute it himself when the following conditions apply: (5.7.3.1, S 26)
• potential threat for the system;
• bottleneck or threat of congestion in the DSO’s network;
• threat of the forming of an island network;
• system threatened by frequency rise;
• maintenance and/or construction work;
• operation of replacement plants;
• re-synchronisation of subnetworks;
• when executing generation or network security management.
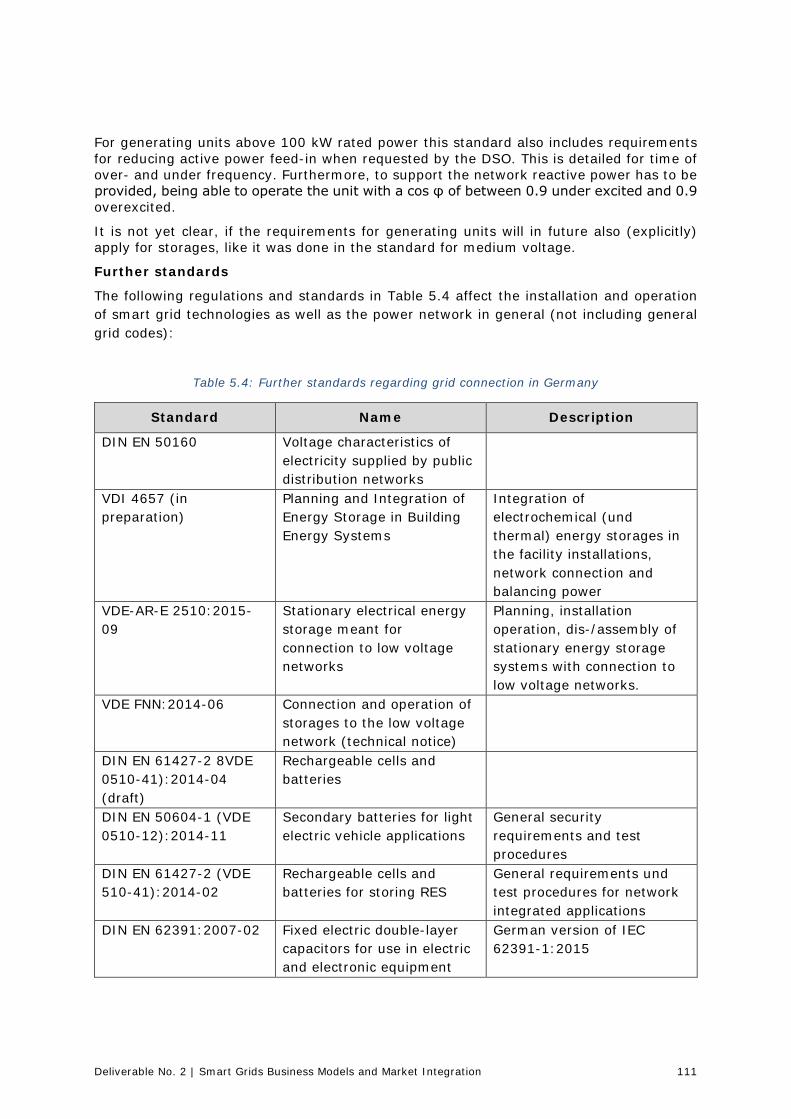
Deliverable No. 2 | Smart Grids Business Models and Market Integration 111
For generating units above 100 kW rated power this standard also includes requirements for reducing active power feed-in when requested by the DSO. This is detailed for time of over- and under frequency. Furthermore, to support the network reactive power has to be provided, being able to operate the unit with a cos φ of between 0.9 under excited and 0.9 overexcited.
It is not yet clear, if the requirements for generating units will in future also (explicitly) apply for storages, like it was done in the standard for medium voltage.
Further standards
The following regulations and standards in Table 5.4 affect the installation and operation of smart grid technologies as well as the power network in general (not including general grid codes):
Table 5.4: Further standards regarding grid connection in Germany
Standard Name Description
DIN EN 50160 Voltage characteristics of electricity supplied by public distribution networks
VDI 4657 (in preparation)
Planning and Integration of Energy Storage in Building Energy Systems
Integration of electrochemical (und thermal) energy storages in the facility installations, network connection and balancing power
VDE-AR-E 2510:2015-09
Stationary electrical energy storage meant for connection to low voltage networks
Planning, installation operation, dis-/assembly of stationary energy storage systems with connection to low voltage networks.
VDE FNN:2014-06 Connection and operation of storages to the low voltage network (technical notice)
DIN EN 61427-2 8VDE 0510-41):2014-04 (draft)
Rechargeable cells and batteries
DIN EN 50604-1 (VDE 0510-12):2014-11
Secondary batteries for light electric vehicle applications
General security requirements and test procedures
DIN EN 61427-2 (VDE 510-41):2014-02
Rechargeable cells and batteries for storing RES
General requirements und test procedures for network integrated applications
DIN EN 62391:2007-02 Fixed electric double-layer capacitors for use in electric and electronic equipment
German version of IEC 62391-1:2015
Deliverable No. 2 | Smart Grids Business Models and Market Integration 112
6. Conclusions
This document presented, in compact form, the study of WP2 in the SmartGuide project. This deliverable gathered all available data regarding the state-of-art of the current SG Business Models and Market Integration in each country of the participating partners.
The current deliverable shows the differences and similarities between legal and regulatory circumstances of DER promotion, drivers for SG and approaches for deployment of SG (from a DSO point of view), economical incentives (smart market and smart grid) and the status of the development of grid codes for smart grid technologies.
The different countries have different incentives for stimulating energy efficiency, reduced carbon emissions and increased volume of electricity produced by Renewable Energy Sources (RES). For the national directives in Portugal, energy policies are reliant on strategy set at European level and to the commitments made within the Kyoto Protocol, and new decree-laws about small scale generation are introduced to regulate distributed generation (DG). Moreover, a recent decree-law introduced self-consumption to LV customers, which will have an impact on the distribution system yet to be evaluated. In Norway, a green certificate market was established in cooperation with Sweden, stimulating to 28.4 TWh from Renewable energy sources by 2020, and new scheme for prosumer was introduced in January 2017 to enable an increase in the volume of distributed generation on customer level. New energy requirement in building regulations will also give further incentives for distributed generation on customer level. In UK, the government has roadmaps and incentives to encourage the development of a low carbon energy system, including a carbon budget. For customers that want to buy electricity from RES, the renewable energy guarantees of origin scheme will give customers information about that and for customers/utilities that want to invest in distributed generation based on RES, feed-in tariff is an incentive stimulating for this.
For all the different countries, the installed power in renewables increases, and also the potential for flexibility including electrical vehicles. Potential for electricity produced by RES is dependent on available local resources, and the potential for demand response depends on available flexible resources. The overview in this report shows that the development is (of course) dependent on local resources. In Portugal installed solar power was 429 MW in 2015, which is an increase of 755% from 2008. The plan is that a minimum 31% of the primary energy should come from RES, by 2020. In Norway the total installed capacity of solar PV was 26.7 MWp, of which 11.4 MWp was installed in 2016. In Germany 31% of the energy consumption was covered by RES.
Different support schemes are described for different countries – some are giving support via a Feed-in-tariff, and other are giving support via support scheme/funding pots or inexpensive loans.
Different drivers for smart grid and approaches for deployment of smart grid – from a DSO's point of view, are evaluated in chapter 3.
Smart Meters are an enabling technology for both DG and DR/flexibility, giving updated information about actual consumption and generation in the distribution grid. In Portugal it is expected that the roll-out of 370.000 meters will be 80% completed until 2020 and 100% until 2022 according to European standards. In Norway, there is a mandatory roll-out of smart meters by 1.1.2019 (in total 2.9 mill. meters). In UK the energy supplier is responsible for the roll-out, and the aim is to toll out 53 million gas and electricity meters to all homes and small business by the end of 2020. In Germany, smart meter roll-out is initiated by the government, and the roll-out duty depends on installed capacity of installed power plants and power consumption of households.
For Demand Response/Demand Side Management on household level there is a lack of regulation in all the countries. For Electric Vehicle Charging the different countries have fiscal incentives related to purchase of the cars, and infrastructure for charging station are developed. This will make it easier for customers to buy an electrical vehicle instead of a
Deliverable No. 2 | Smart Grids Business Models and Market Integration 113
conventional car, contributing to reduced emission from the traffic. There are no direct incentives related to the charging time of electrical vehicles, but new tariffs can be a solution for this.
For Network Automation and Active Voltage Management there is limited regulation. For these topics, the regulations are mainly related to requirements for an efficient operation of the grid, included in today’s regulation for the DSOs.
Energy storage is a new technology to be included in the distribution grid, especially energy storage in the case of batteries. This new technology is included in several pilot projects, to get experiences related to how this technology can be used in operation of the distribution grid. The regulations related to how batteries should be used, need to be clarified.
When utilities build new Distributed generation the DSOs are obliged to connect this to the distribution grid. This is valid for all the countries presented in this report. With such requirements the development of DG will increase when utilities see the benefit for this, and the regulations enable the produced electricity to be delivered to the grid.
Economic incentives are described in chapter 4. The focus is on smart market and smart grid, where the term "smart grid" describes issues which are internal to the grid, while the term "smart market" concerns contents geared to the behaviour of market players (such as producers, prosumers, consumers etc.). In other words, "smart grid" is related to electricity network issues and the monopoly activity performed by the Distribution System Operator, and "smart market" is related to energy (volume) issues and market actors.
Both smart market and smart grid applications are described in chapter 4. Elaborating in which services distributed generation from RES and flexibility can be used, as a basis for further work within the project (especially WP3). The different applications are described for the different countries (Portugal, Norway, UK and Germany) for both for the market (daily market and intraday market) and for balancing services (balancing market, primary/secondary/tertiary regulation), capacity market).
Network codes and related guidelines (described in chapter 5) are a set of rules drafted by ENTSO-E (European Network of Transmission System Operators for Electricity), with guidance from ACER (Agency for the Cooperation of Energy Regulators). The codes facilitate the harmonisation, integration and efficiency of the European electricity market. Network codes apply to one or more parts of the energy sector. At present there are eight different network codes that will be implemented in the European countries.
This deliverable gives an overview of SG Business models and market integration in several countries, namely Portugal, Norway, UK and Germany. Through the analysis of the subjects addressed in this report, it is possible to conclude that European distribution systems are facing new challenges with the increased amount of RES and subsequent development of SG business models and the market integration of RES. In spite of the different states of integration by the SG business models and market integration in each country, there is a global common transition to a smarter and more interoperable distribution power system throughout Europe. The contents of this deliverable will serve as the basis for the future work to be developed in the remaining SmartGuide work packages.
Deliverable No. 2 | Smart Grids Business Models and Market Integration 114
7. References
[1] D. d. República, “Resolution of Minister's Council nº 29/2010,” 15 April 2010. [Online]. Available: https://dre.pt/application/dir/pdf1sdip/2010/04/07300/0128901296.pdf. [Accessed 14 March 2017].
[2] D. d. República, “Decree-law nº 50/2010 - Fundo para eficiência energética,” 20 Maio 2010. [Online]. Available: https://dre.pt/application/conteudo/614844. [Accessed 14 March 2017].
[3] C. A. Gomes, B. G. Lucas, D. Almeida, J. V. Oliveira, J. C. Guerra and N. Carmona, “Energy Law in Portugal - five questions on the "state of the art",” March 2016. [Online]. Available: http://www.vda.pt/xms/files/Publicacoes/2016/Artigo_VC_-_ICJP_-_Energy_Law_in_Portugal_-_Five_questionso_n_the_state_of_the_art_-2016-.pdf. [Accessed 14 March 2017].
[4] D. d. República, “Resolution of Minister's Council nº 20/2013,” 10 April 2013. [Online]. Available: https://dre.pt/application/conteudo/260463. [Accessed 14 March 2017].
[5] I. E. Agency, “Energy Policies of IEA Countries - Portugal 2016 review,” 2016. [Online]. Available: https://www.iea.org/publications/freepublications/publication/Energy_Policies_of_IEA_Countries_Portugal_2016_Review.pdf. [Accessed 14 March 2017].
[6] M. V. &. Associados, “Portuguese Renewable Energy Sources: Overview,” September 2015. [Online]. Available: http://www.macedovitorino.com/xms/files/20150908-Portuguese_Renewable_Energy_Sources_-Overview-.pdf. [Accessed 14 March 2017].
[7] N. Fonseca, A. Madureira, F. Soares, R. Ferreira, J. Wruk, K. Cibis, H. Sæle, L. Ødegården, R. Macdonald, R. Methven and R. Taljaaard, “WORK PACKAGE 1 - SMART GRID SOLUTIONS AND TECHNOLOGIES,” March 2017. [Online]. Available: http://www.smartguide.uni-wuppertal.de/en/publications.html. [Accessed March 2017].
[8] E. Comission, “Eurostat data,” [Online]. Available: http://ec.europa.eu/eurostat/data/database. [Accessed 14 March 2017].
[9] APREN - Associação de Energias Renováveis, [Online]. Available: http://www.apren.pt/en/. [Accessed 22 March 2017].
[10] APREN - Associação de Energias Renováveis, “Economic impact of electricity from renewables sector in Portugal,” [Online]. Available: http://www.apren.pt/pt/dados-tecnicos-3/dados-nacionais-2/resumo-do-estudo-impacto-macroeconomico-do-setor-da-eletricidade-de-origem-renovavel-em-portugal-2/evolucao-do-sector-da-eletricidade-renovavel-em-portugal-2/evolucao-da-potencia-instalada-em-renov. [Accessed 22 March 2017].
Deliverable No. 2 | Smart Grids Business Models and Market Integration 115
[11] F. K. E. M. J. P. Asa Johannesson Linden, “Electricity Tariff Deficit: Temporary or Permanent Problem in the EU?,” European Comission, Brussels, October 2014.
[12] E. Distribuição, “ERSE ANNOUNCES PROPOSAL FOR TARIFFS IN 2017,” October 2016. [Online]. Available: http://www.edp.pt/en/Investidores/informacaoprivilegiada/2016/Info%20Privilegiada%2016/Tariffs%20Proposal%202017.pdf. [Accessed 28th March 2017].
[13] The Ministry of Petroleum and Energy, “Norway's National Renewable Energy Action Plan under Directive 2009/28/EC,” 2013.
[14] Regjeringen.no, “Green certificate market (Elsertifikatordningen - In Norwegian),” https://www.regjeringen.no/no/tema/energi/fornybar-energi/elsertifikater1/id517462/, 2014.
[15] NVE, “Plusskunder,” 2016. [Online]. Available: https://www.nve.no/elmarkedstilsynet-marked-og-monopol/nettjenester/nettleie/tariffer-for-produksjon/plusskunder/. [Accessed 24 February 2017].
[16] NVE, “Endringer i kontrollforskriften (rapport 2016–47),” NVE, 2016.
[17] Ø. Lie, “Ennå har ingen solkraftverk i Norge fått elsertifikater,” Teknisk Ukeblad (news magazine), 2014. [Online]. Available: https://www.tu.no/artikler/enna-har-ingen-solkraftverk-i-norge-fatt-elsertifikater/225458. [Accessed 10 January 2017].
[18] NVE, “NVE's overview of green certificate applications,” [Online]. Available: https://www.nve.no/energiforsyning-og-konsesjon/elsertifikater/elsertifikater-behandlede-anlegg/ . [Accessed 24 February 2017].
[19] K. Rønningsbakk, “PV-energy from Norwegian household is multiplied by four in one year (Solenergi fra norske hjem er firedoblet på ett år - In Norwegian),” http://kraftnytt.no/2017/04/24/solenergi-fra-norske-hjem-er-firedoblet-pa-ett-ar/, April 2017.
[20] R. Ramsdal, “Det er flere tak å ta av, vi har så vidt bare skrapt litt i overflaten,” Teknisk Ukeblad (news magazine), 2014. [Online]. Available: https://www.tu.no/artikler/norsk-solkraftutbygging-naer-firedoblet-i-2016-vi-har-savidt-skrapt-i-overflaten/377031. [Accessed 27 February 2017].
[21] Ø. Lie, “Frykter sovende, norsk solskatt skal gjøre norske solcelle-anlegg ulønnsomme,” Teknisk Ukeblad (news magazine), 2016. [Online]. Available: http://www.tu.no/artikler/frykter-sovende-solcelleskatt-skal-gjore-norske-solcelle-anlegg-ulonnsomme/365552. [Accessed 24 February 2017].
[22] Enova, “About Enova,” [Online]. Available: https://www.enova.no/about-enova. [Accessed 28 February 2017].
[23] H. Kirkeby, K. Sand and H. Sæle, “TR A7517 - Rammevilkår for plusskunder,” SINTEF Energy Research, Trondheim, 2015.
[24] J. Nilsen, “Fyller potten på nytt: Oslo kommune gir 2 nye millioner til solcelle-støtte,” Teknisk Ukeblad (news magazine), 2016. [Online]. Available:
Deliverable No. 2 | Smart Grids Business Models and Market Integration 116
https://www.tu.no/artikler/fyller-potten-pa-nytt-oslo-kommune-gir-2-nye-millioner-til-solcelle-stotte/349192. [Accessed 24 February 2017].
[25] Miljøkommune, “Klimasats - støtte til klimasatsing i kommunene 2017,” 21 December 2016. [Online]. Available: http://www.miljokommune.no/Temaoversikt/Klima/Klimasats---stotte-til-klimasatsing-i-kommunene. [Accessed 28 February 2017].
[26] T. M. Andresen and A. M. Velaug, “Høring om tariffer for uttak i distibusjonsnettet,” NVE, 2015.
[27] THEMA Consulting Group, “Sammenligning av ulike effekttariffer,” 2016.
[28] UK Government, “The UK Low Carbon Transition Plan,” 20 July 2009. [Online]. Available: https://www.gov.uk/government/uploads/system/uploads/attachment_data/file/228752/9780108508394.pdf.
[29] Scottish Government, “A Low Carbon Economic Strategy for Scotland,” November 2010. [Online]. Available: http://www.gov.scot/resource/doc/331364/0107855.pdf. [Accessed December 2016].
[30] National Grid, “Future Energy Scenarios,” 06 07 2016. [Online]. Available: http://fes.nationalgrid.com/fes-document/. [Accessed 07 12 2016].
[31] Ofgem, “Feed-in Tariff (FIT): Generation & Export Payment Rate Table 01 October- 31 December 2016,” 07 10 2016. [Online]. Available: https://www.ofgem.gov.uk/publications-and-updates/feed-tariff-fit-generation-export-payment-rate-table-01-october-31-december-2016. [Accessed 08 12 2016].
[32] HM Gov, “2010-2015 Goverment Policy on Low Carbon Technologies,” 08 05 2015. [Online]. Available: https://www.gov.uk/government/publications/2010-to-2015-government-policy-low-carbon-technologies/2010-to-2015-government-policy-low-carbon-technologies#appendix-5-the-renewables-obligation-ro. [Accessed 08 12 2016].
[33] e-ROC, “e-ROC Track Record,” 25 11 2016. [Online]. Available: http://www.epowerauctions.co.uk/erocrecord.htm. [Accessed 08 12 2016].
[34] Ofgem, “Renewables Obliation: Guidance for Generators,” 01 06 2014. [Online]. Available: https://www.ofgem.gov.uk/ofgem-publications/87997/renewablesobligation-guidanceforgenerators1june2014.pdf. [Accessed 08 12 2016].
[35] HM Government, “Contracts for Difference Allocation: Round One Outcome,” 1 02 2015. [Online]. Available: https://www.gov.uk/government/publications/contracts-for-difference-cfd-allocation-round-one-outcome. [Accessed 08 12 2016].
[36] HM Government, “The smart metering Early Rollout Obligatoin (ERO),” 14 12 2016. [Online]. Available: https://www.gov.uk/government/publications/the-smart-metering-early-rollout-obligation-ero.
Deliverable No. 2 | Smart Grids Business Models and Market Integration 117
[37] HM Government, “Award of Smart Meters DCC Licence,” 23 09 2013. [Online]. Available: https://www.gov.uk/government/news/award-of-smart-meters-dcc-licence. [Accessed 14 12 2016].
[38] UK Government, “Smart Metering equipment technical specifications: second version,” 28 11 2014. [Online]. Available: https://www.gov.uk/government/consultations/smart-metering-equipment-technical-specifications-second-version. [Accessed 14 12 2016].
[39] Department for Business, Energy & Industrial Strategy, “Smart Meter Roll-out Cost-Benefit Analysis,” 10 11 2016. [Online]. Available: https://www.gov.uk/government/uploads/system/uploads/attachment_data/file/567167/OFFSEN_2016_smart_meters_cost-benefit-update_Part_I_FINAL_VERSION.PDF. [Accessed 14 12 2016].
[40] HM Government, “Smart Meters: Quarterly Report to end March 2016, Great Britain,” 30 06 2016. [Online]. Available: https://www.gov.uk/government/uploads/system/uploads/attachment_data/file/533060/2016_Q1_Smart_Meters_Report.pdf. [Accessed 15 12 2016].
[41] National Grid, “Connect and Manage: Interim Outturn Report Quarter 2: July 2015 - 30 September 2015,” 05 11 2015. [Online]. Available: http://www2.nationalgrid.com/WorkArea/DownloadAsset.aspx?id=43723. [Accessed 07 12 2016].
[42] National Grid, “System Operability Framework,” 1 11 2016. [Online]. Available: http://www2.nationalgrid.com/UK/Industry-information/Future-of-Energy/System-Operability-Framework/. [Accessed 08 03 2017].
[43] N. Fonseca, A. Madureira, F. Soares, R. Ferreira, K. C. Julian Wruk, H. Sæle, L. Ødegården, R. Macdonald, R. Methven and R. Taljaaard, “SG Solutions and Technologies. SmartGuide Deliverable D1,” Era-Net Smart Grids Plus. SmartGuide-project, http://www.smartguide.uni-wuppertal.de/fileadmin/Abteilung/smartguide/SmartGuide_WP1_-_SG_Solutions_and_Technologies.pdf, 2017.
[44] HM Government, “Public attitudes towards electric vehicles: 2016 (Revised),” 8 9 2016. [Online]. Available: https://www.gov.uk/government/uploads/system/uploads/attachment_data/file/551446/electric-vehicles-survey-2016.pdf. [Accessed 15 12 2016].
[45] Next Green Car Ltd, “Zap Map,” [Online]. Available: https://www.zap-map.com/live/. [Accessed 06 01 2017].
[46] energyshare, “Funding and Grants Information,” [Online]. Available: http://groups.energyshare.com/make-energy/funding-and-grants-information/. [Accessed 18 01 2017].
[47] Green Investment Bank, “Green Investment Bank,” 2017. [Online]. Available: http://www.greeninvestmentbank.com/. [Accessed 16 01 2017].
[48] Local Energy Scotland, “Local Energy Scotland,” [Online]. Available: http://www.localenergyscotland.org/. [Accessed 16 01 2017].
Deliverable No. 2 | Smart Grids Business Models and Market Integration 118
[49] HM Government, “Plug-in car and van grants,” [Online]. Available: https://www.gov.uk/plug-in-car-van-grants/what-youll-get. [Accessed 15 12 2016].
[50] SMMT, “November 2016 - Ev registrations,” 5 12 2016. [Online]. Available: https://www.smmt.co.uk/2016/12/november-2016-ev-registrations/. [Accessed 15 12 2016].
[51] Commons Select Committee, “Energy and Climate Change Committee,” 1 10 2016. [Online]. Available: http://www.parliament.uk/business/committees/committees-a-z/commons-select/energy-and-climate-change-committee/. [Accessed 08 12 2016].
[52] Bundesministerium der Justiz und für Verbraucherschutz, Gesetz für den Ausbau erneuerbarer Energien (Erneuerbare-Energien-Gesetz-EEG 2017), 2016.
[53] IHK München und Oberbayern, “Finanzierung der Erneuerbaren Energien in EU-Strommärkten,” 2016. [Online]. Available: https://www.ihk-muenchen.de/Energie/Finanzierung-der-Erneuerbaren-Energien-in-EU-Stromm%C3%A4rkten.pdf.
[54] Erneuerbare-Energien-Gesetz vom 21. Juli 2014 (BGBl. I S. 1066), 2016.
[55] Bundesministerium für Wirtschaft und Energie, “Fünfter Monitoring-Bericht zur Energiewende Berichtsjahr 2015,” 2016.
[56] Bundesministerium der Justiz und für Verbraucherschutz, Gesetz zur Einsparung von Energie in Gebäuden (EnEG), 2005.
[57] Bundesministerium für Wirtschaft und Energie, “Zeitreihen zur Entwicklung der erneuerbaren Energien in Deutschland,” 2017.
[58] V. Quaschning, “Umweltauswirkungen von Kohlekraftwerken in Deutschland,” [Online]. Available: https://www.volker-quaschning.de/datserv/Kohle-in-D/index.php. [Accessed 25 04 2017].
[59] KfW, „Erneuerbare Energien - Standard,“ 2017. [Online]. Available: https://www.kfw.de/inlandsfoerderung/Unternehmen/Energie-Umwelt/F%C3%B6rderprodukte/Erneuerbare-Energien-Standard-(270)/. [Zugriff am 2017].
[60] KfW, “Merkblatt Erneuerbare Energien,” Frankfurt.
[61] Bundesministerium für Wirtschaft und Energie, “Informationsportal Erneuerbare Energien,” 2017. [Online]. Available: http://www.erneuerbare-energien.de/EE/Navigation/DE/Foerderung/foerderung.html.
[62] BET, “Auswirkungen des geplanten Messstellenbetriebsgesetzes auf das Energiedatenmanagement für betriebliche Anwendungen und Abrechnungszwecke des Verteilnetzbetreibers,” Aachen, 2016.
[63] Deutsche Energie-Agentur (dena), “Kompetenzzentrum Contracting für Gebäude,” 2017. [Online]. Available: http://www.kompetenzzentrum-contracting.de/contracting-modelle/.
Deliverable No. 2 | Smart Grids Business Models and Market Integration 119
[64] Berliner Energieagentur, “Grünes Energiespar-Contracting, Kurzleitfaden zur Integration von erneuerbaren Energien,” Berlin, 2016.
[65] Bundesministerium für Wirtschaft und Energie, “Impulspapier - Strom 2013,” 2016.
[66] Bundesministerium für Wirtschaft und Energie, “Eckpunktepapier Mieterstrom”.
[67] ERSE - Entidade Reguladora dos Serviços Energéticos, “Annual report on the electricity and natural gas markets in 2015 - Portugal,” July 2016. [Online]. Available: http://www.erse.pt/pt/uniaoeuropeia/Documents/Relat%C3%B3rio%20CE%202015_EN.pdf. [Accessed 23 March 2017].
[68] E. -. E. R. d. S. Energéticos, “Directive nº 2/2016 - Guia de Medição, Leitura e Disponibilizaçãode Dados de energia elétrica em Portugal continental,” 2016. [Online]. Available: http://www.edpdistribuicao.pt/pt/produtores/Legislao/Diretiva_2_2016_GMLDD_2016_Vers%C3%A3o%20Internet.pdf. [Accessed 14 March 2017].
[69] ERSE - Entidade Reguladora dos Serviços Energéticos, “Quality of service regulations,” [Online]. Available: http://www.erse.pt/pt/electricidade/regulamentos/qualidadedeservico/Documents/DR_Regulamento%20455-2013-RQS.pdf. [Accessed 23 March 2017].
[70] ERSE, “A REGULAÇÃO DA ENERGIA EM PORTUGAL,” ERSE, Lisbon, 2016c.
[71] ERSE, “ANNUAL REPORT ON THE ELECTRICITY AND NATURAL GAS MARKETS IN 2015 PORTUGAL,” Lisbon, 2016b.
[72] EDP Distribuição, “Inovgrid project,” [Online]. Available: http://www.inovgrid.pt/.
[73] European Comission , “JRC Science for Policy Report - Demand Response status in EU Member States,” 2016. [Online]. Available: https://iet.jrc.ec.europa.eu/energyefficiency/sites/energyefficiency/files/publications/demand_response_status_in_eu28_member_states-online.pdf. [Accessed 14 March 2017].
[74] Governo de Portugal - Ministério da Economia, “Plano de Promoção da Eficiência no Consumo de Energia Elétrica,” November 2016. [Online]. Available: http://www.erse.pt/pt/planodepromocaodaeficiencianoconsumoppec/ppec17-18/Documents/Relat%C3%B3rio%20ERSE-DGEG%20de%20avalia%C3%A7%C3%A3o%20do%20PPEC%202017-2018.pdf. [Accessed 14 March 2017].
[75] United Nations Environment Programme (UNEP) & Climate Action, “The Sustainable Innovation Forum,” COP21, [Online]. Available: http://www.cop21paris.org. [Accessed 14 March 2017].
[76] Diário da República, “Resolution of Minister's Council nº 49/2016,” 2016. [Online]. Available: https://dre.pt/application/conteudo/75239711. [Accessed 14 March 2017].
Deliverable No. 2 | Smart Grids Business Models and Market Integration 120
[77] Diário da República, “Ordinance 220/2016,” 10 August 2016. [Online]. Available: https://dre.pt/application/conteudo/75126728. [Accessed 14 March 2017].
[78] EUR-Lex - Access to European Union Law, “Directive nº 2014/94/EU,” 22 October 2014. [Online]. Available: http://eur-lex.europa.eu/legal-content/PT/TXT/?uri=celex%3A32014L0094. [Accessed 14 March 2017].
[79] Diário da República, “Ordinance nº221/2016,” 10 August 2016. [Online]. Available: https://dre.pt/application/conteudo/75126729. [Accessed 14 March 2017].
[80] European Comission - Joint Research Centre, “National Renewable Energy Action Plans (NREAPs),” [Online]. Available: http://iet.jrc.ec.europa.eu/remea/national-renewable-energy-action-plans-nreaps. [Accessed 14 March 2017].
[81] CEER, “Status Review of Renewable and Energy Efficiency Support Schemes in Europe in 2012 and 2013,” CEER, Bruxelles, 2015.
[82] NVE, “Revenue regulation,” updated 10 October 2016. [Online]. Available: https://www.nve.no/energy-market-and-regulation/revenue-regulation/. [Accessed 7 March 2017].
[83] NVE, “Forskriftsbestemmelser om AMS, jf. kapittel 4 i forskrift 11. Mars 1999 nr. 301,” [Online]. Available: https://www.nve.no/elmarkedstilsynet-marked-og-monopol/sluttbrukermarkedet/smarte-strommalere-ams/.
[84] THEMA Consulting Group, “Rules and regulation for demand response and micro-production,” 2015.
[85] THEMA Consulting Group, “Teoretisk tilnærming til en markedsløsning for lokal fleksibilitet,” NVE, 2015.
[86] S. Frydenlund, “Norway now has 100,000 electric cars,” The Norwegian EV Association, 2016. [Online]. Available: http://elbil.no/norway-now-has-100000-electric-cars/. [Accessed 28 February 2017].
[87] International Energy Agency, “Global EV Outlook 2016,” 2016.
[88] Store Norske Leksikon, “Transnova,” 2015. [Online]. Available: https://snl.no/Transnova. [Accessed 28 February 2017].
[89] Enova, “Utlysningstekst - Støtte til ladeinfrastruktur,” 2015. [Online]. Available: https://www.enova.no/finansiering/naring/programtekster/utlysningstekst---stotte-til-ladeinfrastruktur-/245/2209/.
[90] Ladeguiden, “Elektriske forskrifter - NEK400,” [Online]. Available: http://ladeguiden.enmira.no/elektriske-forskrifter-nek400/. [Accessed 13 December 2016].
[91] O. S. G. Hanne Sæle, “Demand Response From Household Customers: Experiences From a Pilot Study in Norway,” IEEE Transactions on Smart Grid, vol. 2, no. 1, pp. 102-109, MARCH 2011.
Deliverable No. 2 | Smart Grids Business Models and Market Integration 121
[92] Ofgem, “Infographic: How Ofgem's network price control proposals (RIIO-ED1) will affect you,” 28 11 2014. [Online]. Available: https://www.ofgem.gov.uk/publications-and-updates/infographic-how-ofgems-network-price-control-proposals-riio-ed1-will-affect-you. [Accessed 25 01 2017].
[93] Ofgem, “Guide to RIIO ED1,” 18 01 2017. [Online]. Available: https://www.ofgem.gov.uk/system/files/docs/2017/01/guide_to_riioed1.pdf. [Accessed 25 01 2017].
[94] Ofgem, “Quicker and more efficient connections – an update on industry progress,” 02 2016. [Online]. Available: https://www.ofgem.gov.uk/publications-and-updates/quicker-and-more-efficient-connections-update-industry-progress. [Accessed 06 01 2017].
[95] Verordnung über die Anreizregulierung der Energieversorgungsnetze (Anreizregulierungsverordnung ARegV), 2016.
[96] Bundesministeriums der Justiz und für Verbraucherschutz, Verordnung über die Entgelte für den Zugang zu Elektrizitätsversorgungsnetzen (Stromnetzentgeltverordnung - StromNEV), 2016.
[97] Verordnung über die Entgelte für den Zugang zu Gasversorgungsnetzen (Gasnetzentgeltverordnung - GasNEV), 2017.
[98] Bundesnetzagentur, “Ermittlung der Netzkosten,” 21 March 2017. [Online]. Available: https://www.bundesnetzagentur.de/DE/Sachgebiete/ElektrizitaetundGas/Unternehmen_Institutionen/Netzentgelte/Anreizregulierung/WesentlicheElemente/Netzkosten/Netzkostenermittlung_node.html. [Accessed 22 03 2017].
[99] Bundesnetzagentur, “The mechanism,” 2015. [Online]. Available: https://www.bundesnetzagentur.de/EN/Areas/Energy/Companies/GeneralInformationOnEnergyRegulation/IncentiveRegulation/Mechanism/IncebtReg_Mechanism-node.html.
[100] Bundesnetzagentur, “The introduction of incentive regulation,” 2015. [Online]. Available: https://www.bundesnetzagentur.de/EN/Areas/Energy/Companies/GeneralInformationOnEnergyRegulation/IncentiveRegulation/Introduction/IncentiveReg_Introduction-node.html.
[101] Bundesnetzagentur, “Wesentliche Elemente der Anreizregulierung,” 2017. [Online]. Available: https://www.bundesnetzagentur.de/DE/Sachgebiete/ElektrizitaetundGas/Unternehmen_Institutionen/Netzentgelte/Anreizregulierung/WesentlicheElemente/elemente_anreizreg-node.html.
[102] Bundesministeriums der Justiz und für Verbraucherschutz, Gesetz über den Messtellenbetrieb und die Datenkommunikation in intelligenten Energienetzen, 2016.
[103] BET, “Kurzgutachten - Auswirkungen des geplanten Messstellenbetriebsgesetzes auf das Energiedatenmanagement für betriebliche Anwendungen und Abrechnungszwecke des Verteilnetzbetreibers,” Aachen, 2016.

Deliverable No. 2 | Smart Grids Business Models and Market Integration 122
[104] Verbraucherzentrale, “Erste Strom-Kunden müssen den Einbau von Smart-Meter-Geräten zahlen,” [Online]. Available: https://www.verbraucherzentrale.de/smart-meter.
[105] Bundnesministerium für Wirtschaft und Energie, Gesetz zur Digitalisierung der Energiewende, Bonn, 2016.
[106] Verordnung über Vereinbarungen zu abschaltbaren Lasten (Verordnung zu abschaltbaren Lasten - AbLaV), 2016.
[107] Gesetz über die Elektrizitäts- und Gasversorgung (Energiewirtschaftsgesetz - EnWG), 2017.
[108] Verordnung über den Zugang zu Elektrizitätsversorgungsnetzen (Stromnetzzugangsverordnung - StromNZV), 2016.
[109] J. Kühling and C. Klein, “Übersicht gesetzlicher Rahmenbedingungen für Demand Side Management,” 2016.
[110] H. Seidl, C. Schenuit and M. Tecihmann, “Roadmap Demand Side Management. Industrielles Lastmanagement für ein zukunftsfähiges Energiesystem,” DENA, 2016.
[111] J. Kölch, “Förderung von Elektromobilität in Deutschland im Vergleich zu anderen Ländern,” München, 2015.
[112] Bundesministerium der Justiz und für Verbraucherschutz;, LSV - Verordnung über technische Mindestanforderungen an den sicheren und interoperablen Aufbau und Betrieb von öffentlich zugänglichen Ladepunkten für Elektromobile, 2016.
[113] B. Dr. Harendt and C. A. Mayer, “Rechtliche Rahmenbedingungen für Ladeinfrastruktur im Neubau und Bestand”.
[114] B. f. W. u. Energie, Förderbekanntmachung PV-Batteriespeicher, 2016.
[115] Bundesministerium für Wirtschaft und Energie, Bekanntmachung zur Förderung von stationären und dezentralen Batteriespeichersystemen zur Nutzung in Verbindung mit Photovoltaikanlagen vom 17. Februar 2016, 2016.
[116] Bundesnetzagentur, “"Smart Grid" and "Smart Market". Summary of the BNetzA Position Paper,” Bonn, December 2011.
[117] E. Commission, “COM/2016/0860 final "Clean Energy For All Europeans",” http://eur-lex.europa.eu/resource.html?uri=cellar:fa6ea15b-b7b0-11e6-9e3c-01aa75ed71a1.0001.02/DOC_1&format=PDF, 2016.
[118] N. Spot, “Day-ahead market,” [Online]. Available: http://www.nordpoolspot.com/How-does-it-work/Day-ahead-market-Elspot-/. [Accessed 18 04 2017].
[119] K. N. F. Borggrefe, “Balancing and Intraday Market Design: Options for Wind Integration,” Climate Policy Initiative, Berlin, 2011.
Deliverable No. 2 | Smart Grids Business Models and Market Integration 123
[120] OMIE, “Intraday market,” [Online]. Available: http://www.omel.es/en/home/markets-and-products/electricity-market/our-electricity-markets/intraday-market. [Accessed 17 April 2017].
[121] N. Pool, “Intraday market,” [Online]. Available: http://www.nordpoolspot.com/How-does-it-work/Intraday-market/. [Accessed 17 April 2017].
[122] ECN, “Quantifying flexibility markets,” Petten, 2014.
[123] K. Rohrig, C. Hoffmann and N. Gerhardt, “Wirtschaftliche und technische Aspekte der Dekarbonisierung des Wärmesektors,” FVEE, 2015.
[124] G. L. W. v. S. T.W. Hoogvliet, “Provision of regulating- and reserve power by electric vehicle owners in,” Applied Energy, 2017.
[125] D. Raoofsheibani, E. Abbasi and K. Pfeiffer, “Provision of primary control reserve by DFIG-based wind farms in compliance with ENTSO-E frequency grid codes,” Innovative Smart Grid Technologies Conference Europe (ISGT-Europe), 2014 .
[126] CIGRÉ, “Primary control reserves provision with battery energy storage systems in the,” Zürich, 2016.
[127] Energy2Market, “Secondary reserve,” ENergy2Market, [Online]. Available: http://www.energy2market.com/glossary-secondary-reserve.html. [Accessed 19 05 2017].
[128] NationalGrid, “What are Reserve Services,” NationalGrid, [Online]. Available: http://www2.nationalgrid.com/uk/services/balancing-services/reserve-services/. [Accessed 19 05 2017].
[129] Statnett, “Tertiary reserves,” [Online]. Available: http://www.statnett.no/Kraftsystemet/Markedsinformasjon/RKOM1/. [Accessed 18 04 2017].
[130] P. Cramton and S. Stoft, “A Capacity Market that Makes Sense,” The Electricity Journal, p. 15, 2005.
[131] Agora Energiewende, “Kapazitätsmarkt oder strategische Reserve: Was ist der nächste Schritt?,” Berlin, 2013.
[132] E. Augsten-Alves, “Kapazitätsmarkt braucht moderne Kraftwerke,” VDE-Nachrichten, 07 11 2014.
[133] C. Aichele and O. Doleski, Smart Market, Wiesbaden: Springer Fachmedien Wiesbaden, 2014.
[134] J. Momoh, “Smart Grid: Fundamentals of Design and Analysis,” John Wiley & Sons, Inc., 2012.
[135] MIBEL, “Iberian Electricity Market,” [Online]. Available: http://www.mibel.com/index.php?lang=en. [Accessed 20 March 2017].
Deliverable No. 2 | Smart Grids Business Models and Market Integration 124
[136] ERSE, “Entidade Reguladora dos Serviços Energéticos - Electricity - Stakeholders,” [Online]. Available: http://www.erse.pt/eng/electricity/Stakeholders/Paginas/default.aspx. [Accessed 20 March 2017].
[137] EDP Distribuição, “Share of electric energy retailers,” [Online]. Available: https://www.edpdistribuicao.pt/pt/mudancaComercializador/comoMudarComercializador/EDP%20Documents/quotas_mercado.pdf. [Accessed 20 March 2017].
[138] ERSE - Entidade Reguladora dos Serviços Energéticos, “59 th Public Consultation - Pilot projects for improvement of tariff structure and introduction to dynamic tariffs (in Portuguese),” 6 March 2017. [Online]. Available: http://www.erse.pt/pt/consultaspublicas/consultas/Paginas/59.aspx. [Accessed 23 March 2017].
[139] Council of European Energy Regulators, “CEER Advice on ensuring market and regulatory arrangements help deliver demand side flexibility,” 26 June 2014. [Online]. Available: http://www.ceer.eu/portal/page/portal/EER_HOME/EER_PUBLICATIONS/CEER_PAPERS/Electricity/Tab3/C14-SDE-40-03_CEER%20Advice%20on%20Demand-Side%20Flexibility_26-June-2014.pdf. [Accessed April 2017].
[140] ERSE, “Entidade Reguladora dos Serviços Energéticos - Electricity - MIBEL,” [Online]. Available: http://www.erse.pt/eng/electricity/MIBEL/Paginas/default.aspx.
[141] J. P. Lopes, T. Saraiva, M. Matos and e. al, “Tecnologias de Armazenamento de Energia e seu potencial para os sistemas elétricos - EDP Produção,” March, 2015.
[142] S. P. a. E. Portuguese Ministry for Environment, “Electric Mobility - Moving from black fuel to green power,” Lisbon, 2014.
[143] ERSE, “REGULAMENTO DA MOBILIDADE ELÉTRICA,” Lisbon, November 2015.
[144] S. S. Z. W. S. Hall, “The Innovation Interface - Business model innovation for electric vehicle futures,” Leeds, 2016.
[145] NordPool, “Price formation,” Nord Pool Spot, [Online]. Available: http://www.nordpoolspot.com/How-does-it-work/Day-ahead-market-Elspot-/Price-formation/. [Accessed 19 05 2017].
[146] N. Spot, “Bidding areas,” Nord Pool Spot, [Online]. Available: http://www.nordpoolspot.com/How-does-it-work/Bidding-areas/. [Accessed 19 05 2017].
[147] Statnett, “Statnett,” [Online]. Available: www.statnett.no. [Accessed 19 05 2017].
[148] Ø. H. Hanne Sæle and D. E. Nordgård, “EVALUATION OF ALTERNATIVE NETWORK TARIFFS – FOR RESIDENTIAL CUSTOMERS WITH HOURLY METERING OF ELECTRICITY CONSUMPTION,” in CIRED Workshop - Helsinki 14-15 June 2016, Paper 0470, 2016.
Deliverable No. 2 | Smart Grids Business Models and Market Integration 125
[149] “Ofgem; Charging Arrangements,” 2017. [Online]. Available: https://www.ofgem.gov.uk/electricity/distribution-networks/charging-arrangements. [Accessed 02 05 2017].
[150] “SP Energy Networks Use of System Charging statement,” 01 12 2016. [Online]. Available: https://www.scottishpower.com/userfiles/document_library/SPD_LC14_Statement_2018.pdf. [Accessed 02 05 2017].
[151] “Centre for Sustainable Energy,” 2013. [Online]. Available: https://www.cse.org.uk/advice/advice-and-support/economy-7. [Accessed 02 05 2017].
[152] “UK Power Economy 10 electricity heating tariff,” 2017. [Online]. Available: https://www.ukpower.co.uk/home_energy/economy_10. [Accessed 02 05 2017].
[153] “National Grid,” 23 09 2016. [Online]. Available: http://www2.nationalgrid.com/WorkArea/DownloadAsset.aspx?id=8589937129. [Accessed 30 04 2017].
[154] “SPEN DSO Vision,” 21 10 2016. [Online]. Available: https://www.spenergynetworks.co.uk/userfiles/file/SPEN%20DSO%20Vision%20210116.pdf. [Accessed 30 04 2017].
[155] Bundesnetzagentur, “Monitoring report 2015,” Bonn, 2016.
[156] BalancePower GmbH, “Erlöse für Ihren Beitrag für die Netzstabilität,” [Online]. Available: http://balancepower.de/regelleistung/articles/regelleistung.html. [Accessed 02 05 2017].
[157] Next Kraftwerke, “Virtuelles Kraftwerk,” [Online]. Available: https://www.next-kraftwerke.de/virtuelles-kraftwerk. [Accessed 16 05 2017].
[158] O. Doleski, Herausforderungen Utility 4.0, Springer Vieweg, 2017.
[159] R. Hollinger, “Regelleistung mit Heimspeichern sinnvoll,” pv magazine, 19 06 2016. [Online]. Available: https://www.pv-magazine.de/2016/06/19/regelleistung-mit-heimspeichern-sinnvoll/. [Accessed 03 05 2017].
[160] M. Richter and L. Steiner, “Begleitforschungs-Studie Elektromobilität: Potentialermittlung der Rückspeisefähigkeit von Elektrofahrzeugen und der sich daraus ergebenden Vorteile”.
[161] Bundesnetzagentur, “Position paper on the application of the regulations on the feed-in of biogas to the injection of hydrogen and synthetic methane into gas grids,” Bonn, 2014.
[162] NEXT Kraftwerke, “Was sind Netzreserve, Kapazitätsreserve & Sicherheitsbereitschaft?,” [Online]. Available: https://www.next-kraftwerke.de/wissen/strommarkt/netzreserve-kapazitatsreserve-sicherheitsbereitschaft. [Accessed 02 05 2017].
Deliverable No. 2 | Smart Grids Business Models and Market Integration 126
[163] Bundesnetzagentur, “Netzreserve,” 02 05 2017. [Online]. Available: https://www.bundesnetzagentur.de/DE/Sachgebiete/ElektrizitaetundGas/Unternehmen_Institutionen/Versorgungssicherheit/Netzreserve/netzreserve-node.html. [Accessed 08 05 2017].
[164] Bundesministerium für Wirtschaft und Energie, “Ein Strommarkt für die Energiwende, Ergebnispapier des Bundesministeriums für Wirtschaft und Energie (Weißbuch),” Berlin, 2015.
[165] Bundesamt für Sicherheit in der Informationstechnik, Technische Richtlinie BSI TR-03109, 2015.
[166] ETG-Fask Force Demand Side Management, “VDE-Studie Ein notwendiger Baustein der Energiewende: Demand Side Integration,” VDE, Fankfurt a. M. , 2012.
[167] Ministério da Economia, da Inovação e do Desenvolvimento, “Diário da República Eletrónico - Ordinance 596/2010,” 2010. [Online]. Available: https://dre.pt/web/guest/pesquisa/-/search/334076/details/normal?q=596%2F2010. [Accessed April 2017].
[168] Ministério da Economia e da Inovação, “Diário da República Eletrónico - DL 225/2007,” May 2007. [Online]. Available: https://dre.pt/web/guest/pesquisa/-/search/638769/details/normal?q=225%2F2007. [Accessed April 2017].
[169] eclareon, “Portugal - RES Integration National Study_NREAP,” December 2011. [Online]. Available: http://www.eclareon.com/sites/default/files/portugal_-_res_integration_national_study_nreap.pdf. [Accessed April 2017].
[170] EDP Distribuição, “Manual de ligações à rede elétrica de serviço público,” October 2015. [Online]. Available: http://www.edpdistribuicao.pt/pt/profissionais/EDP%20Documents/EDP%20Distribui%C3%A7%C3%A3o_Manual_Liga%C3%A7%C3%B5es_2015.pdf. [Accessed April 2017].
[171] European Comission, “RES legal - LEGAL SOURCES ON RENEWABLE ENERGY,” [Online]. Available: http://www.res-legal.eu/search-by-country/portugal/single/s/res-e/t/gridaccess/aid/grid-development-2/lastp/179/. [Accessed April 2017].
[172] NVE, “Network Codes (Nettkoder - In Norwegian),” NVE, [Online]. Available: https://www.nve.no/elmarkedstilsynet-marked-og-monopol/europeisk-regelverksutvikling/nettkoder/. [Accessed 18 05 2017].
[173] NVE, “Network codes in the market: Forward Capacity Allocation (FCA (In Norwegian),” NVE, [Online]. Available: https://www.nve.no/elmarkedstilsynet-marked-og-monopol/europeisk-regelverksutvikling/nettkoder/nettkoden-om-terminmarkedet-forward-capacity-allocation-fca/. [Accessed 18 05 2017].
[174] NVE, “Network code for the balancing market: ELectricity Balancing (EB) (In Norwegian),” NVE, [Online]. Available: https://www.nve.no/elmarkedstilsynet-marked-og-monopol/europeisk-regelverksutvikling/nettkoder/nettkoden-om-balansemarkeder-electricity-balancing-eb/. [Accessed 18 05 2017].
Deliverable No. 2 | Smart Grids Business Models and Market Integration 127
[175] NVE, “Kapasitetsfastsettelse og flaksehalshåndtering (CACM) (In Norwegian),” NVE, [Online]. Available: https://www.nve.no/elmarkedstilsynet-marked-og-monopol/europeisk-regelverksutvikling/nettkoder/kapasitetsfastsettelse-og-flaskehalshandtering-cacm/. [Accessed 18 05 2017].
[176] NVE, “Network Code: System Operation Guideline (Driftskosdene: System Operation Guideline - In Norwegian),” NVE, [Online]. Available: https://www.nve.no/elmarkedstilsynet-marked-og-monopol/europeisk-regelverksutvikling/nettkoder/driftskodene-system-operation-guideline/. [Accessed 18 05 2017].
[177] NVE, “Connection codes: RfG, DCC, HVDC (Tilknytningskodene: RfG, DCC, HVDC - In Norwegian),” NVE, [Online]. Available: https://www.nve.no/elmarkedstilsynet-marked-og-monopol/europeisk-regelverksutvikling/nettkoder/tilknytningskodene-rfg-dcc-hvdc/. [Accessed 18 05 2017].
[178] Energy Networks Association, “International, European and British Standards,” 07 10 2014. [Online]. Available: http://www.energynetworks.org/electricity/engineering/standards/standards.html. [Accessed 03 05 2017].
[179] International Electrotechnical Commission, “Smart Grid,” [Online]. Available: http://www.iec.ch/smartgrid/. [Accessed 03 05 2017].
[180] ScottishPower Energy Networks, “ARC: Accelerating Renewable Connections,” [Online]. Available: https://www.spenergynetworks.co.uk/pages/arc_accelerating_renewable_connections.aspx. [Accessed 03 05 2017].
[181] Energy Networks Association, “ANM Good Practice Guide,” 15 07 2015. [Online]. Available: http://www.energynetworks.org/news/press-releases/2015/july/new-active-network-management-guide-will-help-deliver-a-more-efficient-energy-system.html. [Accessed 03 05 2017].
[182] DCode, “P2 Working Group,” [Online]. Available: http://www.dcode.org.uk/dcrp-er-p2-working-group.html.
[183] VDE, VDE-AR-N 4110 Technical requirements for the connection and operation of customer installations to the medium voltage network (TAR medium voltage) - Entwurf, Berlin: VDE Verlag GmbH, 2017.


![Smart Grids[1]](https://img.dokumen.tips/doc/110x75/541009b77bef0a0e0a8b45d7/smart-grids1.jpg)