Embed Size (px)
Citation preview

Investor PresentationManaging Director & CEO | Dr Paul DalgleishChief Financial Officer | Mr Andrew Phipps25 August 2016
RCR Tomlinson LtdStrategy Update and FY16 ResultsRCR Tomlinson LtdFull Year Results
Investor Presentation Managing Director & CEO | Dr Paul DalgleishChief Financial Officer | Mr Andrew Phipps25 August 2016
For
per
sona
l use
onl
y
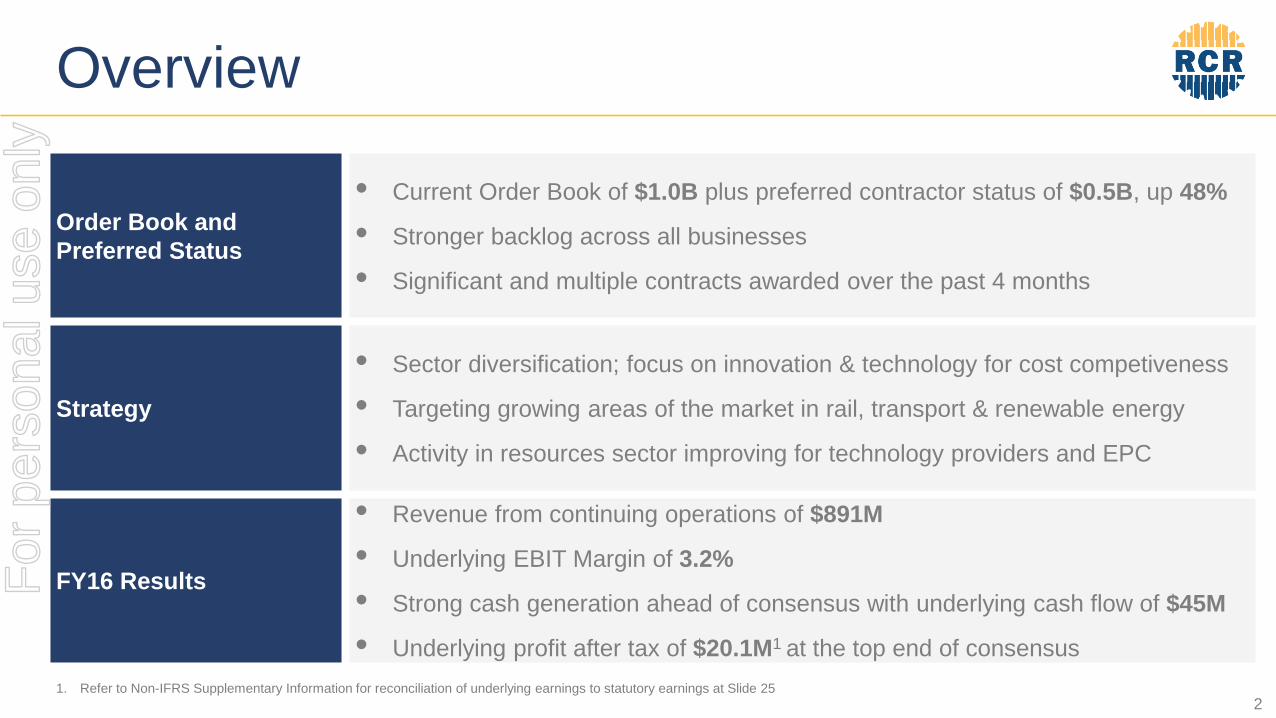
Overview
Order Book andPreferred Status
• Current Order Book of $1.0B plus preferred contractor status of $0.5B, up 48%
• Stronger backlog across all businesses
• Significant and multiple contracts awarded over the past 4 months
Strategy
• Sector diversification; focus on innovation & technology for cost competiveness
• Targeting growing areas of the market in rail, transport & renewable energy
• Activity in resources sector improving for technology providers and EPC
FY16 Results
• Revenue from continuing operations of $891M
• Underlying EBIT Margin of 3.2%
• Strong cash generation ahead of consensus with underlying cash flow of $45M
• Underlying profit after tax of $20.1M1 at the top end of consensus1. Refer to Non-IFRS Supplementary Information for reconciliation of underlying earnings to statutory earnings at Slide 25
2
For
per
sona
l use
onl
y

Our Strategy
3
For
per
sona
l use
onl
y

Our Strategy
To continue to diversify our business, through an engineering led approach, using innovation and technology to provide cost competitive solutions for our clients
Deliver long-term shareholder returns
5 Year TSR 22%
Our Strategy
7 Year TSR 239%
4
For
per
sona
l use
onl
y

Strategic Objectives
• Focus on rail, transport, renewable energy through technology• Mining and Minerals EPC and technology led opportunities• Grow Energy and Water business in the Asia Pacific region
• Target large complex EPC turnkey projects.• Expand products and services across sectors, includingapproach to innovative technologies.
• Build on Asia Pacific footprint using our existing presence in Malaysia as a hub.
• Use technology as an entry to the Asia Pacific markets.
• Long-term maintenance contracts with low risk, recurringrevenue streams.
• Large turnkey EPC projects with whole of life approach.
• Sustainable service delivery for our clients and our people.• High quality work force maximising productivity.
• Continue growth through new and existing organic revenuestreams as well as strategic mergers and acquisitions.
Growing Market Sectors
Integration of Engineering Capabilities - End to End Service Provision
Geographical Diversification
Target Larger Opportunities Over Multiple Years
Safety Performance
Enhance Shareholder Value
Strategic Focus Execution Total Shareholder Returns - 5 Years
RCR will strive to exceed market expectations in deliveringshareholder returns
5
For
per
sona
l use
onl
y

Strong Pipeline $11.0B
Targeting Growth SectorsRail and Transport• Major pipeline of rail and tunnel projects across Australia and NZ• Partnering with Rhomberg Rail• Focus on EPC through technology, innovation and partneringRenewables• Renewable generation is forecast to be the fastest growing energy sector• Developed an advanced system delivery approach for large solar projects• ECI with Origin for solar farm for over 100MWWater• Secured long-term service arrangements with water authorities• Targeting opportunities in Australia, NZ and SE AsiaCommodities• Innovative Technology approach to EPC (Silvergrass and Dugald River)• Agreement with Kiruna ‘Helix wagon and car dumper’ technology for transport
of minerals
6
For
per
sona
l use
onl
y

Positioned for GrowthChart 1: New Contract Wins Chart 2: Order Book and Preferred Chart 3: Preferred Status
$500M $550M
Infrastructure Energy Resources
TfNSW - Multiple Rail Projects NSW Power Maintenance Rio Tinto - Silvergrass Mine
Vic Govt Housing Rio Tinto - Cape Lambert MMG - Dugald River Project
Visionstream Newcrest - Cadia Operations
Sydney Water - Picton Upgrade BHP - Multiple ProjectsSecured $500M innew contract wins in thepast 4 months
FY14 FY15 FY16
$1.0B
$0.8B
$1.5B
Charts 1 & 3 - By Business
InfrastructureEnergyResources
Charts 1 & 3 – By Sector
Oil & GasRail & TransportWaterProperty Services
RenewablesEnergyMinerals
Chart 2
Order BookWater Business AcquisitionPreferred Contractor Status
LEGEND:
7
For
per
sona
l use
onl
y

Expanding Capabilities Through Innovation
RCR will expand our capabilities through innovation and technology
3D Printed Airbus Fuel Connector(© Bionic Production GmBH)
RCR’s Award winningMobile In-Pit Crushing & Conveying Unit (IP2C)
As a leading diversified engineering company, RCR is focused on innovative solutions and smarter delivery to reduce costs for our customers
Leveraging New Technologies• Designed and developed a modularised processing plant system for
construction projects• Innovative technology in EPC for mining and minerals• Developed advanced systems delivery for large solar projects• 3D printing capabilities for existing and emerging new markets• Finalising technology partnerships for various robotic platforms• Exclusive agreement with Kiruna for ‘Helix wagon and car dumper’
8
For
per
sona
l use
onl
y

Kiruna WagonHelix Dumper Wagon & Unloading SolutionRCR & Kiruna Wagon:• Agreement for exclusive licencing with Kiruna Wagon AB
• Complete rail car unloading solution
• Continuous rolling discharge of bulk commodities
• Wagon body is rotated 148°; chassis remains on the rails
• RCR to manufacture & distribute throughout Asia Pacific
• Enquiries received for over 500 wagons
Helix Wagon Solution - Benefits:• High-capacity continuous discharge up to over 30,000tpa
• Unloading rates 3-4 times faster than existing methods
• No additional power supply (4MW for existing methods)
• Reduced stresses and strains on the wagon (longer life)
• Reduce capital & maintenance cost
• Improved safety & reductions in dust & noise
Innovative technologyrevolutionising rail transport and unloading for bulk commodities
To see more visit:https://www.youtube.com/kirunawagon
9
For
per
sona
l use
onl
y

FY16 Financial Results
10
For
per
sona
l use
onl
y
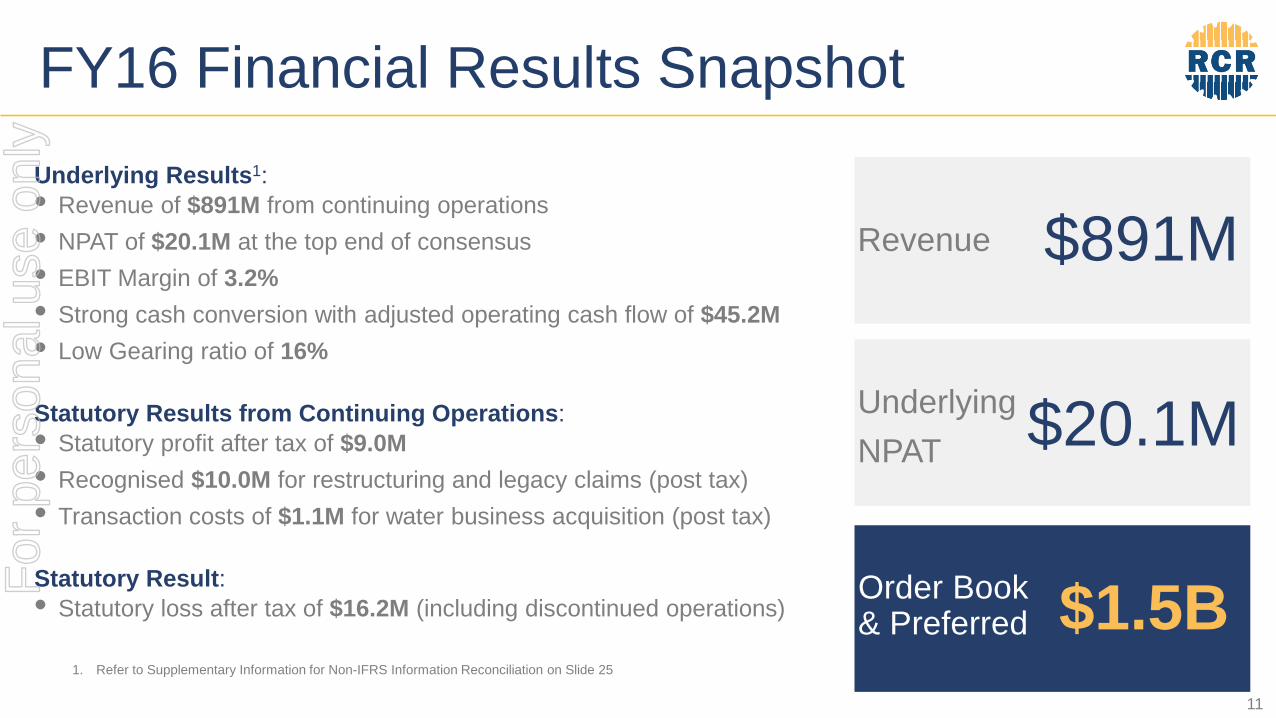
Underlying Results1:• Revenue of $891M from continuing operations• NPAT of $20.1M at the top end of consensus• EBIT Margin of 3.2%• Strong cash conversion with adjusted operating cash flow of $45.2M• Low Gearing ratio of 16%
Statutory Results from Continuing Operations:• Statutory profit after tax of $9.0M• Recognised $10.0M for restructuring and legacy claims (post tax)• Transaction costs of $1.1M for water business acquisition (post tax)
Statutory Result:• Statutory loss after tax of $16.2M (including discontinued operations)
Revenue $891M
UnderlyingNPAT $20.1M
Order Book & Preferred $1.5B
FY16 Financial Results Snapshot
1. Refer to Supplementary Information for Non-IFRS Information Reconciliation on Slide 25
11
For
per
sona
l use
onl
y

Key Metrics• Adjusted operating cash flow $45.2M• 92% conversion of EBITDA• Focus on cash and working capital• Interest paid $4.1M• Tax paid $0.9M• Restructure costs $11.1M• Legacy legal and claims costs $1.9M• WA Water Business acquisition costs:
• Acquisition working capital $3.2M• Transaction costs $1.2M
Operating Cash Flow from Continuing Operations ($M)
FY16 Operating Cash Flow
13.2
45.2
49.2
4.1 0.9
11.1 1.93.2 1.2
9.6
Ope
ratin
g C
ash
Flow
from
Con
tinui
ngO
pera
tions In
tere
st
Tax
Res
truct
ure
Cos
ts
Lega
cy L
egal
and
Cla
imC
osts
Acqu
isiti
on W
orki
ngC
apita
l
Tran
sact
ion
Cos
ts
Oth
er W
orki
ng C
apita
lM
ovem
ents
Adju
sted
Ope
ratin
gC
ash
Flow
EBIT
DA^
^ Refer to Supplementary Information for Non-IFRS Information Reconciliationon Slide 25
12
For
per
sona
l use
onl
y

Key Metrics• Gearing ratio 16% with Net Debt of $55.6M:
• Water business acquisition $15M• Discontinued operations $22M• Dividends paid $13M• Capex $13M
• Cash and available facilities $216M• Capacity to support future growth and acquisitions• Total CBA Facility $236M - term Nov 2017:
• $41M senior debt• $30M cash advance• $70M working capital• $95M guarantee facility
• Additional project financing available via:• $150M insurance bonding facilities
Funding FacilitiesFunding Summary
*Gearing Ratio = Net Debt/(Net Debt + Equity)
FacilityFY16
$MFY15
$MSenior Debt and Working Capital Facility 236.3 231.3
Insurance Bonding Facilities 150.0 150.0
Total Facilities 386.3 381.3Less: Senior Debt Utilised 41.3 61.3
Less: Cash Advance 30.0 0.0
Less: Non-Cash Facilities Utilised 114.3 81.0
Available Facilities 200.7 239.0Plus: Cash 15.6 49.2
Total Cash/Funding Facilities Available 216.3 288.2
Key Financial Ratios Net Debt $55.6M $12.2M
Gearing Ratio* 16.2% 3.7%
Facility Utilisation 48.0% 37.3%
Available Cash $85.6M $124.2M
Debt Facility Expiry Nov 2017 Nov 2017
13
For
per
sona
l use
onl
y

FY16 Review of Operations
14
For
per
sona
l use
onl
y
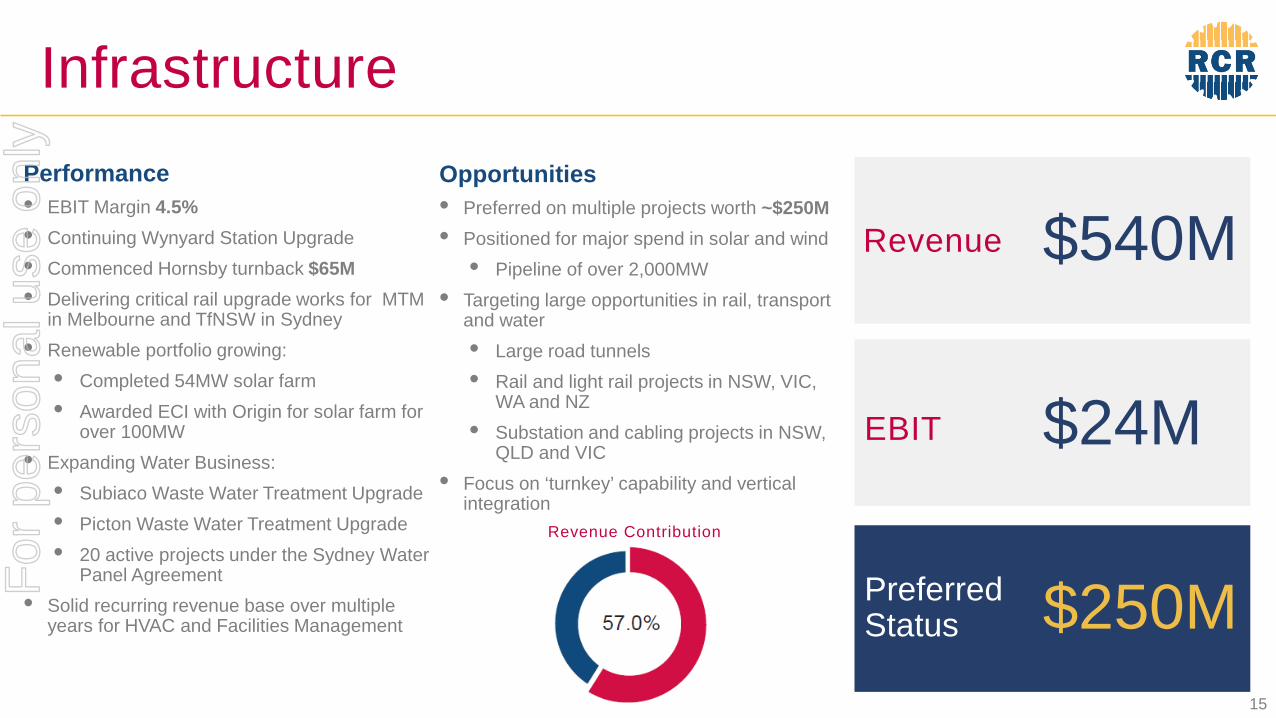
Performance• EBIT Margin 4.5%• Continuing Wynyard Station Upgrade• Commenced Hornsby turnback $65M• Delivering critical rail upgrade works for MTM
in Melbourne and TfNSW in Sydney• Renewable portfolio growing:
• Completed 54MW solar farm• Awarded ECI with Origin for solar farm for
over 100MW • Expanding Water Business:
• Subiaco Waste Water Treatment Upgrade• Picton Waste Water Treatment Upgrade• 20 active projects under the Sydney Water
Panel Agreement• Solid recurring revenue base over multiple
years for HVAC and Facilities Management
Opportunities• Preferred on multiple projects worth ~$250M• Positioned for major spend in solar and wind
• Pipeline of over 2,000MW• Targeting large opportunities in rail, transport
and water• Large road tunnels• Rail and light rail projects in NSW, VIC,
WA and NZ• Substation and cabling projects in NSW,
QLD and VIC• Focus on ‘turnkey’ capability and vertical
integration
Revenue $540M
EBIT $24M
Preferred Status $250M
Infrastructure
Revenue Contribution
15
For
per
sona
l use
onl
y

Opportunities• Preferred on multiple projects worth ~$200M• Preferred tenderer on large 100MW open cycle
power plant
• Multiple opportunities in NZ dairy sector
• Tendering further turnkey power projects in Asia Pacific
• PNG, Indonesia and Thailand
• ECI for Adani - MOU extended to March 2018
Revenue $160M
EBIT $2M
Preferred Status $200M
Energy
Revenue Contribution
Performance• Revenue $160M • Completion of major shutdown and
maintenance work:• AGL’s Liddell and Torrens Power Stations• Eraring, Gladstone, Bayswater and
Condamine• Design and construction of a 53MW natural
gas fired boiler for Fonterra• Design and construction of a new 20MW coal
fired boiler for Synlait Milk• Awarded Rio Tinto’s 80MW Cape Lambert
Power Station:• Includes project management,
construction, commissioning and performance testing
16
For
per
sona
l use
onl
y
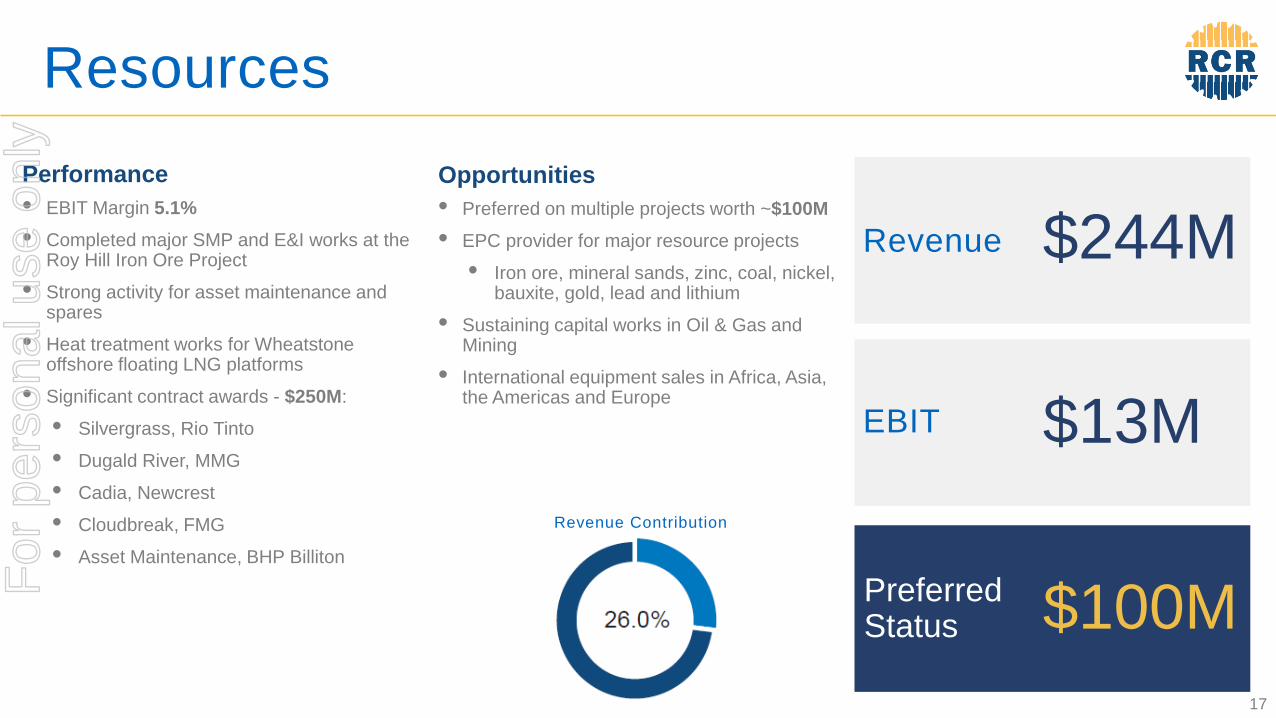
Performance• EBIT Margin 5.1%• Completed major SMP and E&I works at the
Roy Hill Iron Ore Project
• Strong activity for asset maintenance and spares
• Heat treatment works for Wheatstone offshore floating LNG platforms
• Significant contract awards - $250M:
• Silvergrass, Rio Tinto
• Dugald River, MMG
• Cadia, Newcrest
• Cloudbreak, FMG
• Asset Maintenance, BHP Billiton
Opportunities• Preferred on multiple projects worth ~$100M• EPC provider for major resource projects
• Iron ore, mineral sands, zinc, coal, nickel, bauxite, gold, lead and lithium
• Sustaining capital works in Oil & Gas and Mining
• International equipment sales in Africa, Asia, the Americas and Europe
Revenue $244M
EBIT $13M
Preferred Status $100M
Resources
Revenue Contribution
17
For
per
sona
l use
onl
y

Outlook
18
For
per
sona
l use
onl
y
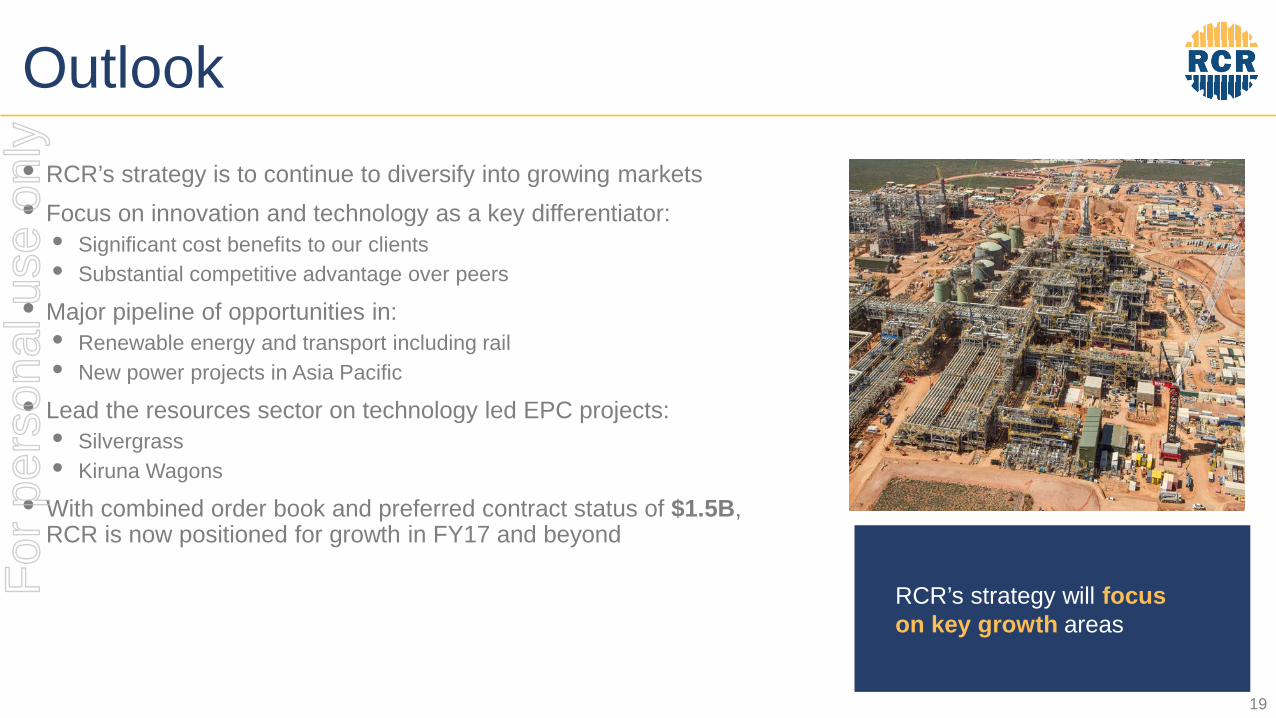
• RCR’s strategy is to continue to diversify into growing markets• Focus on innovation and technology as a key differentiator:
• Significant cost benefits to our clients• Substantial competitive advantage over peers
• Major pipeline of opportunities in:• Renewable energy and transport including rail• New power projects in Asia Pacific
• Lead the resources sector on technology led EPC projects:• Silvergrass• Kiruna Wagons
• With combined order book and preferred contract status of $1.5B,RCR is now positioned for growth in FY17 and beyond
Outlook
RCR’s strategy will focuson key growth areas
19
For
per
sona
l use
onl
y

Corporate Overview
20
For
per
sona
l use
onl
y
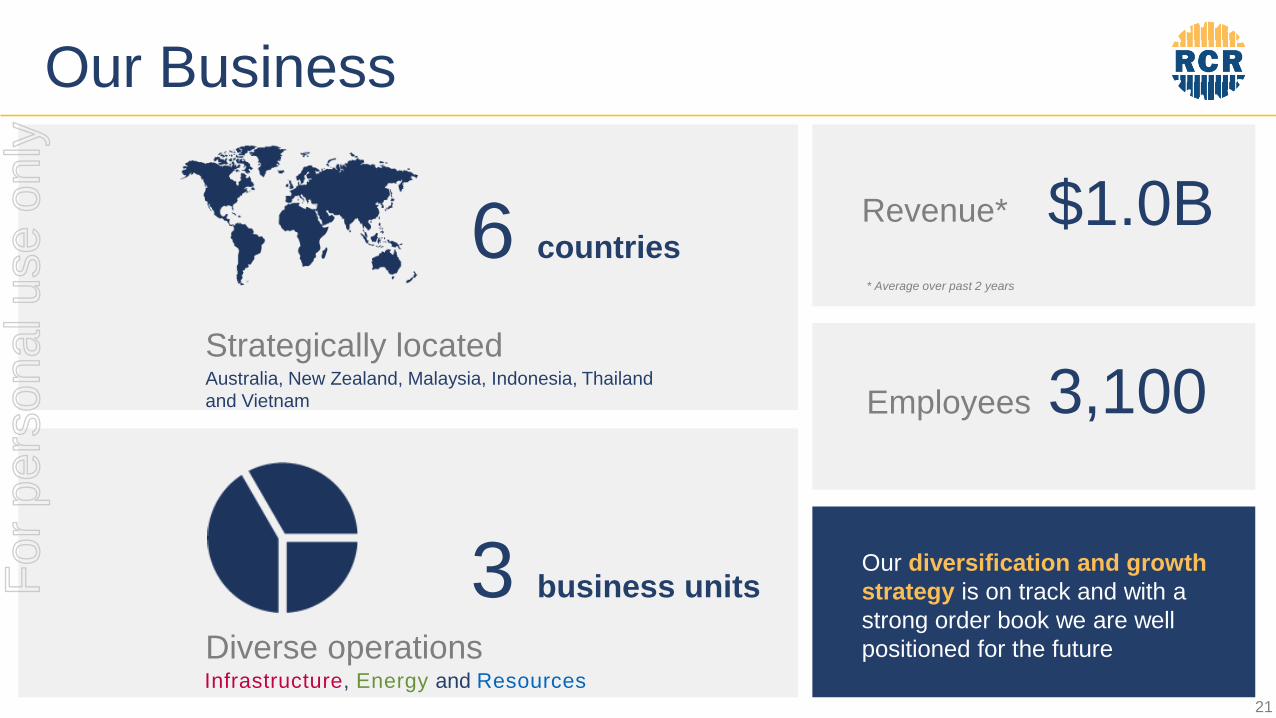
Our Business
Our diversification and growth strategy is on track and with a strong order book we are well positioned for the future
$1.0B
3,100
Revenue*
Employees
6 countries
3 business units
Diverse operations
Strategically locatedAustralia, New Zealand, Malaysia, Indonesia, Thailand and Vietnam
Infrastructure, Energy and Resources
* Average over past 2 years
21
For
per
sona
l use
onl
y
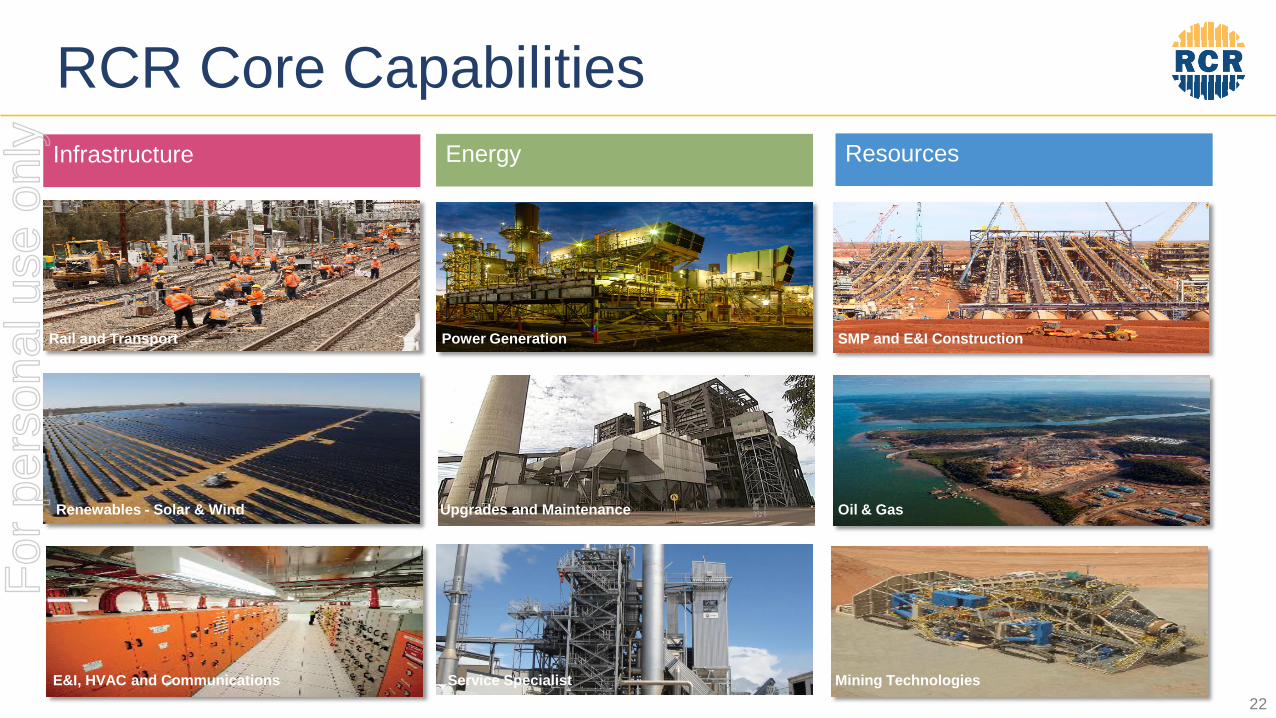
RCR Core Capabilities
Rail and Transport Power Generation SMP and E&I Construction
Renewables - Solar & Wind Upgrades and Maintenance Oil & Gas
E&I, HVAC and Communications Service Specialist Mining Technologies
Infrastructure Energy Resources
22
For
per
sona
l use
onl
y
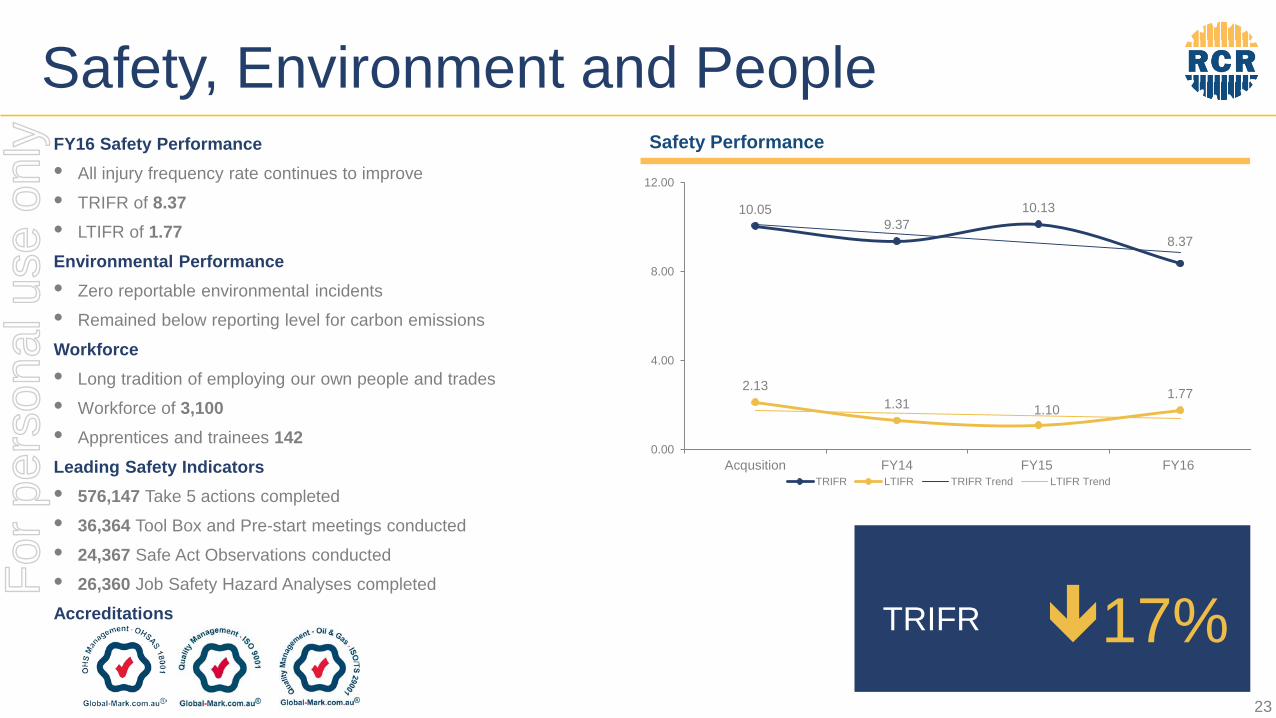
TRIFR 17%
Safety, Environment and PeopleFY16 Safety Performance• All injury frequency rate continues to improve• TRIFR of 8.37• LTIFR of 1.77Environmental Performance• Zero reportable environmental incidents • Remained below reporting level for carbon emissions
Workforce• Long tradition of employing our own people and trades • Workforce of 3,100• Apprentices and trainees 142Leading Safety Indicators• 576,147 Take 5 actions completed• 36,364 Tool Box and Pre-start meetings conducted• 24,367 Safe Act Observations conducted• 26,360 Job Safety Hazard Analyses completedAccreditations
Safety Performance
10.059.37
10.13
8.37
2.131.31 1.10
1.77
0.00
4.00
8.00
12.00
Acqusition FY14 FY15 FY16TRIFR LTIFR TRIFR Trend LTIFR Trend
23
For
per
sona
l use
onl
y

Non-IFRS Supplementary Information
24
For
per
sona
l use
onl
y

Non-IFRS ReconciliationsReconciliation of Statutory Earnings from Continuing Operations to Underlying Earnings
Underlying Operating Result
Restructuring Costs
Legacy Legal & Claim Costs
Transaction Costs
Capital Management
Initiatives
Statutory Result from Continuing
OperationsFY161,2 $’000 $’000 $’000 $’000 $’000 $’000Revenue 890.5 - - - - 890.5EBITDA 49.2 (9.7) (4.6) (1.2) - 33.7
Depreciation and Amortisation (21.1) - - - - (21.1)
EBIT 28.1 (9.7) (4.6) (1.2) - 12.6Net Interest (4.0) - - - - (4.0)Tax (4.0) 2.9 1.4 0.1 - 0.4Net Profit/(Loss) after Tax 20.1 (6.8) (3.2) (1.1) - 9.0
FY152,3 $’000 $’000 $’000 $’000 $’000 $’000Revenue 1,033.6 - - - - 1,033.6EBITDA 89.1 (6.6) (1.7) - 2.6 83.4
Depreciation and Amortisation (19.7) - - - - (19.7)
EBIT 69.4 (6.6) (1.7) - 2.6 63.7Net Interest (4.2) - - - - (4.2)Tax (13.8) 2.0 0.5 - (0.8) (12.1)Net Profit/(Loss) after Tax 51.4 (4.6) (1.2) - 1.8 47.4
1. FY16 Underlying profit from ordinary activities (“Underlying Operating Result”) is after tax and excludes the costs for discontinued operations of $25.2M2. Statutory Loss of $16.2 million (FY15 NPAT: $39.1 million). This includes discontinued operations and non-recurring items3. FY15 Underlying Operating Result after tax excludes the cost for discontinued operations of $8.3M (being those discontinued in March 2016 and results for those businesses disclosed on a
comparative basis) 25
For
per
sona
l use
onl
y
DisclaimerThis presentation and any oral presentation accompanying it has been prepared by RCR Tomlinson Ltd ABN 81 008 898 486 (“RCR” or “the Company”).
Summary of information: This presentation contains general and background information about RCR’s activities current as at the date of the presentation and should not beconsidered to be comprehensive or to comprise all the information that an investor should consider when making an investment decision. The information is provided in summaryform, has not been independently verified, and should not be considered to be comprehensive or complete. RCR is not responsible for providing updated information and assumes noresponsibility to do so.
Forward looking information: This presentation contains forecasts and other forward looking information. Such forward looking information is not a guarantee of future performanceand is subject to risks, uncertainties and assumptions which could cause actual results, timings or events to differ materially from the expectations described in such forward lookinginformation. This forward looking information does not constitute any representation as to future performance and should not be relied upon as financial advice of any nature. Anyforward looking information contained in this presentation is qualified by this cautionary statement. Before making an investment decision, investors should consider the risks andstrategic objects of RCR as set out in its 2016 Annual Report.
Disclaimer: To the maximum extent permitted by applicable laws, RCR and its related bodies corporate, and each of their respective directors, agents, officers, employees andadvisers, expressly disclaim all liabilities (however caused, including negligence) in respect of, make no representations regarding, and take no responsibility for, any part of thispresentation and make no representation, or warranty as to the currency, accuracy, reliability or completeness of any information, statements, opinions, conclusions or representationscontained in this presentation. In particular, this presentation does not constitute, and shall not be relied upon as, a promise, representation, warranty or guarantee as to the past,present or the future performance of RCR.
Not financial product advice: This presentation is not a financial product, investment advice or a recommendation to acquire RCR securities, and has been prepared without takinginto account the objectives, financial situation or needs of individuals. Before making an investment decision, investors should consider the appropriateness of the information havingregard to their own objectives, financial situation and needs, and seek legal, taxation and financial advice appropriate to their jurisdiction and circumstances. RCR is not licensed toprovide financial product advice in respect of its securities or any other financial products. RCR assumes that the recipient is capable of making its own independent assessment,without reliance on this presentation, of all publicly available information and any potential investment and will conduct its own investigation.
This presentation should not be considered as an offer or invitation to subscribe for or purchase any securities in the Company or as an inducement to make an offer or invitation withrespect to those securities. No agreement to subscribe for securities in the Company will be entered into on the basis of this presentation.
Risks and Non-IFRS Information: RCR’s performance is subject to a range of risks that can impact performance (including those summarised in the 2016 Annual Report) andfactors outside of the control of RCR (for example, the timing for commencement of projects or awards of tenders). Risks related to both Order Book and Preferred Contractor Statusare subject to, amongst other things, timing, cancellation or delays and therefore are not sufficiently certain. Investors or potential investors are therefore cautioned on placing unduereliance on any forward looking information.
RCR’s financial reporting complies with Australian Accounting Standards and International Financial Reporting Standards (“IFRS”). Underlying EBITDA, underlying EBIT andunderlying NPAT, both adjusted for discontinued operations, restructuring, legacy claims and capital management initiatives and transaction costs, is unaudited but is derived from theaudited annual financial report. RCR believe the non-IFRS earnings reflect a more meaningful measure of the company’s underlying performance. The information reported in thisannouncement contains non-IFRS financial indicators to assist in understanding the Company’s performance. A reconciliation to IFRS financial information is set out in theSupplementary Information.
26
For
per
sona
l use
onl
y