Embed Size (px)
DESCRIPTION
Overcapacity in the steel industry
Citation preview
Philip Tomlinson Metals and minerals economics consultant www.philiptomlinson.co.uk
Steel Industry Responses to
Overcapacity
OECD Steel Committee
June 5, 2014
By Philip Tomlinson
Philip Tomlinson Metals and minerals economics consultant www.philiptomlinson.co.uk
0
200
400
600
800
1000
1200
1400
1600
1800
1951 1956 1961 1966 1971 1976 1981 1986 1991 1996 2001 2006 2011
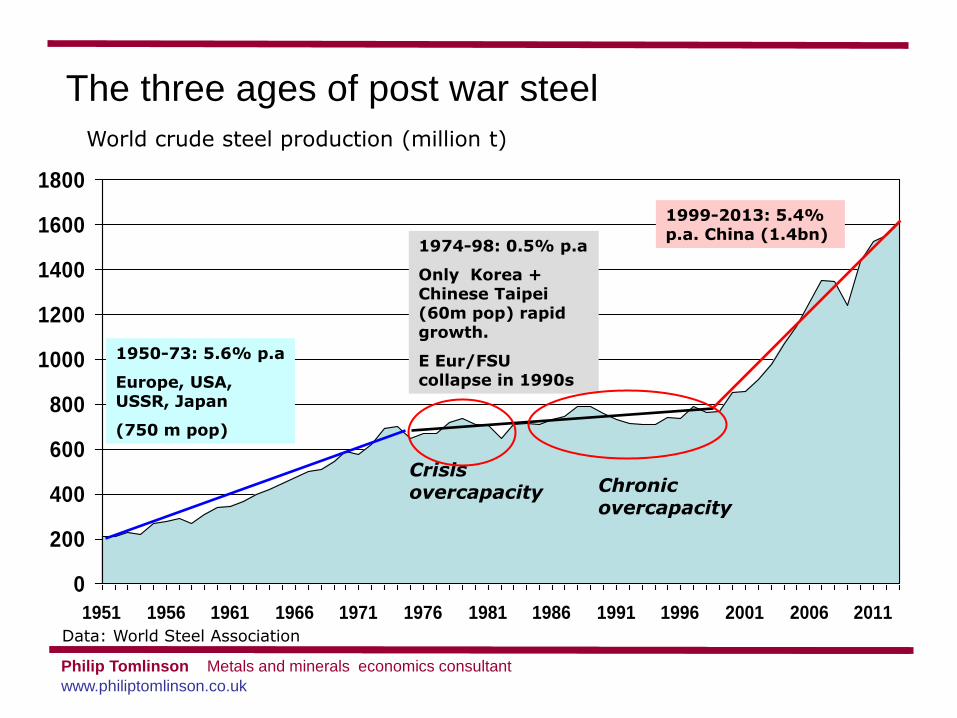
World crude steel production (million t)
Data: World Steel Association
The three ages of post war steel
1950-73: 5.6% p.a
Europe, USA, USSR, Japan
(750 m pop)
1974-98: 0.5% p.a
Only Korea + Chinese Taipei (60m pop) rapid growth.
E Eur/FSU collapse in 1990s
1999-2013: 5.4% p.a. China (1.4bn)
Crisis overcapacity
Chronic overcapacity
Philip Tomlinson Metals and minerals economics consultant www.philiptomlinson.co.uk
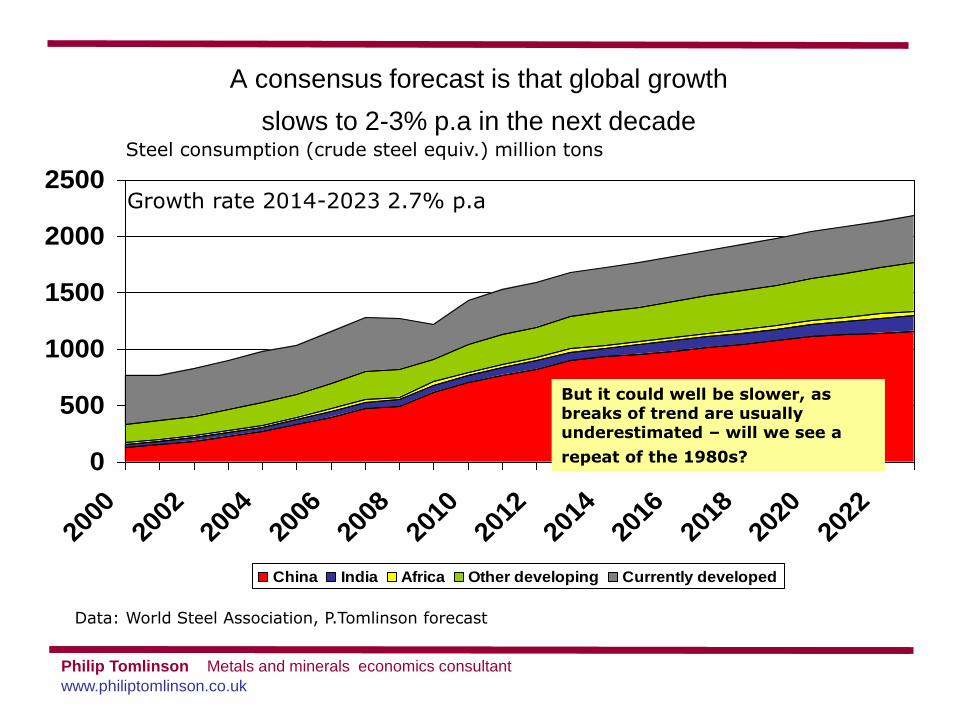
A consensus forecast is that global growth
slows to 2-3% p.a in the next decade
0
500
1000
1500
2000
2500
2000
2002
2004
2006
2008
2010
2012
2014
2016
2018
2020
2022
China India Africa Other developing Currently developed
Growth rate 2014-2023 2.7% p.a
Steel consumption (crude steel equiv.) million tons
Data: World Steel Association, P.Tomlinson forecast
But it could well be slower, as breaks of trend are usually underestimated – will we see a
repeat of the 1980s?
Philip Tomlinson Metals and minerals economics consultant www.philiptomlinson.co.uk
-2
0
2
4
6
1965-74 1975-84 1985-94
GDP
Steel Prod
4
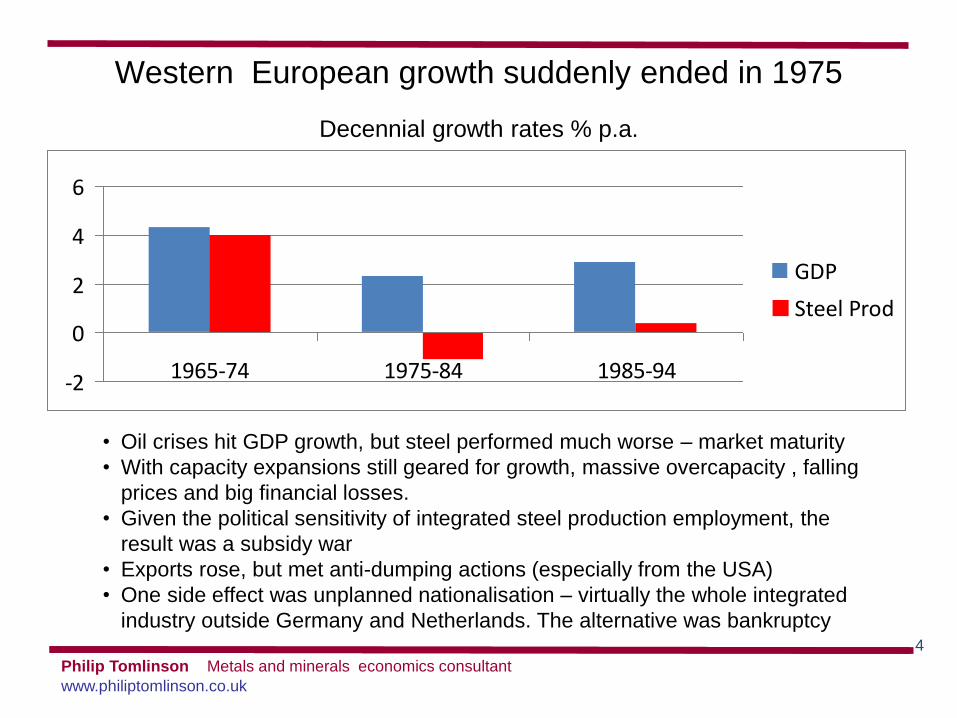
Western European growth suddenly ended in 1975
Decennial growth rates % p.a.
• Oil crises hit GDP growth, but steel performed much worse – market maturity
• With capacity expansions still geared for growth, massive overcapacity , falling
prices and big financial losses.
• Given the political sensitivity of integrated steel production employment, the
result was a subsidy war
• Exports rose, but met anti-dumping actions (especially from the USA)
• One side effect was unplanned nationalisation – virtually the whole integrated
industry outside Germany and Netherlands. The alternative was bankruptcy
Philip Tomlinson Metals and minerals economics consultant www.philiptomlinson.co.uk
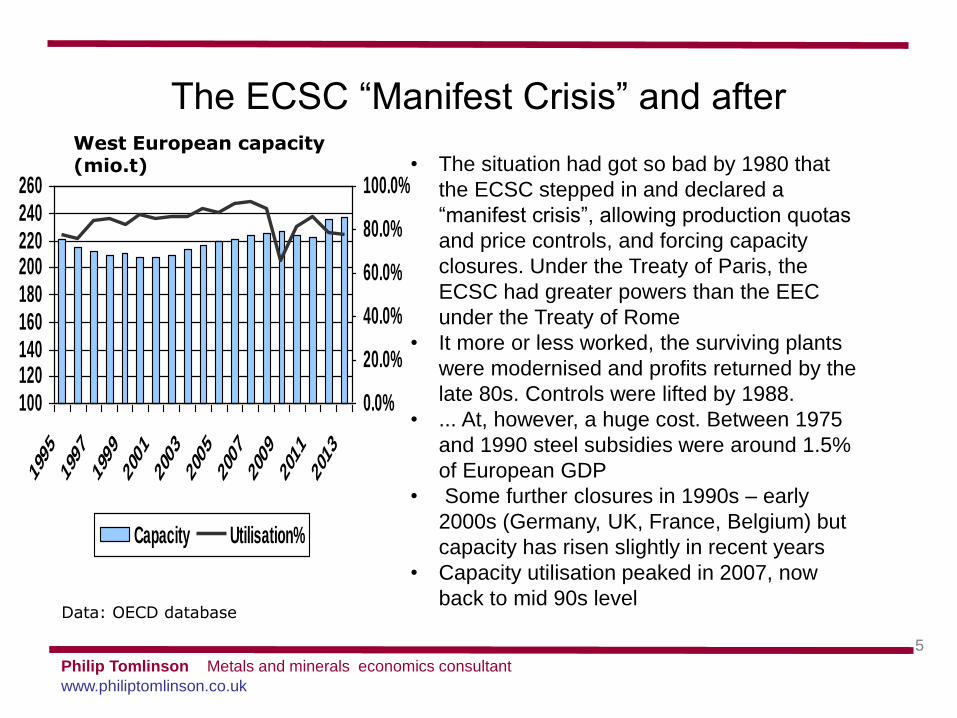
The ECSC “Manifest Crisis” and after
5
• The situation had got so bad by 1980 that
the ECSC stepped in and declared a
“manifest crisis”, allowing production quotas
and price controls, and forcing capacity
closures. Under the Treaty of Paris, the
ECSC had greater powers than the EEC
under the Treaty of Rome
• It more or less worked, the surviving plants
were modernised and profits returned by the
late 80s. Controls were lifted by 1988.
• ... At, however, a huge cost. Between 1975
and 1990 steel subsidies were around 1.5%
of European GDP
• Some further closures in 1990s – early
2000s (Germany, UK, France, Belgium) but
capacity has risen slightly in recent years
• Capacity utilisation peaked in 2007, now
back to mid 90s level
100120140160180200220240260
1995
1997
1999
2001
2003
2005
2007
2009
2011
2013
0.0%
20.0%
40.0%
60.0%
80.0%
100.0%
Capacity Utilisation%
West European capacity (mio.t)
Data: OECD database
Philip Tomlinson Metals and minerals economics consultant www.philiptomlinson.co.uk
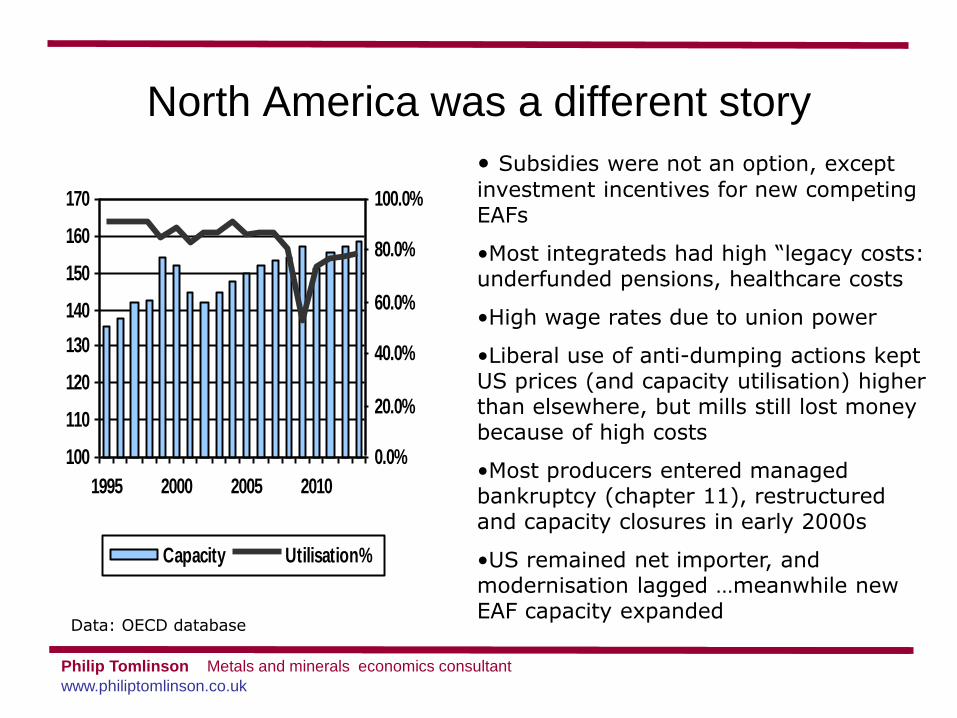
North America was a different story
100
110
120
130
140
150
160
170
1995 2000 2005 2010
0.0%
20.0%
40.0%
60.0%
80.0%
100.0%
Capacity Utilisation%
• Subsidies were not an option, except
investment incentives for new competing EAFs
•Most integrateds had high “legacy costs: underfunded pensions, healthcare costs
•High wage rates due to union power
•Liberal use of anti-dumping actions kept US prices (and capacity utilisation) higher than elsewhere, but mills still lost money because of high costs
•Most producers entered managed bankruptcy (chapter 11), restructured and capacity closures in early 2000s
•US remained net importer, and modernisation lagged …meanwhile new EAF capacity expanded
Data: OECD database
Philip Tomlinson Metals and minerals economics consultant www.philiptomlinson.co.uk
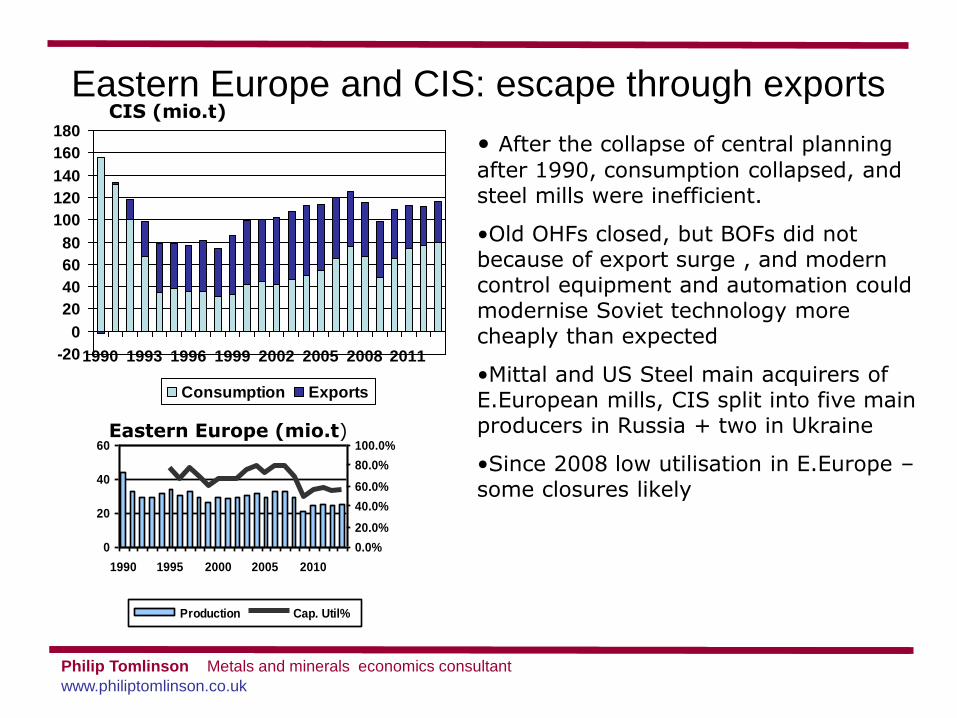
Eastern Europe and CIS: escape through exports
0
20
40
60
1990 1995 2000 2005 2010
0.0%
20.0%
40.0%
60.0%
80.0%
100.0%
Production Cap. Util%
• After the collapse of central planning
after 1990, consumption collapsed, and steel mills were inefficient.
•Old OHFs closed, but BOFs did not because of export surge , and modern control equipment and automation could modernise Soviet technology more cheaply than expected
•Mittal and US Steel main acquirers of E.European mills, CIS split into five main producers in Russia + two in Ukraine
•Since 2008 low utilisation in E.Europe – some closures likely
Eastern Europe (mio.t)
-20
0
20
40
60
80
100
120
140
160
180
1990 1993 1996 1999 2002 2005 2008 2011
Consumption Exports
CIS (mio.t)
Philip Tomlinson Metals and minerals economics consultant www.philiptomlinson.co.uk
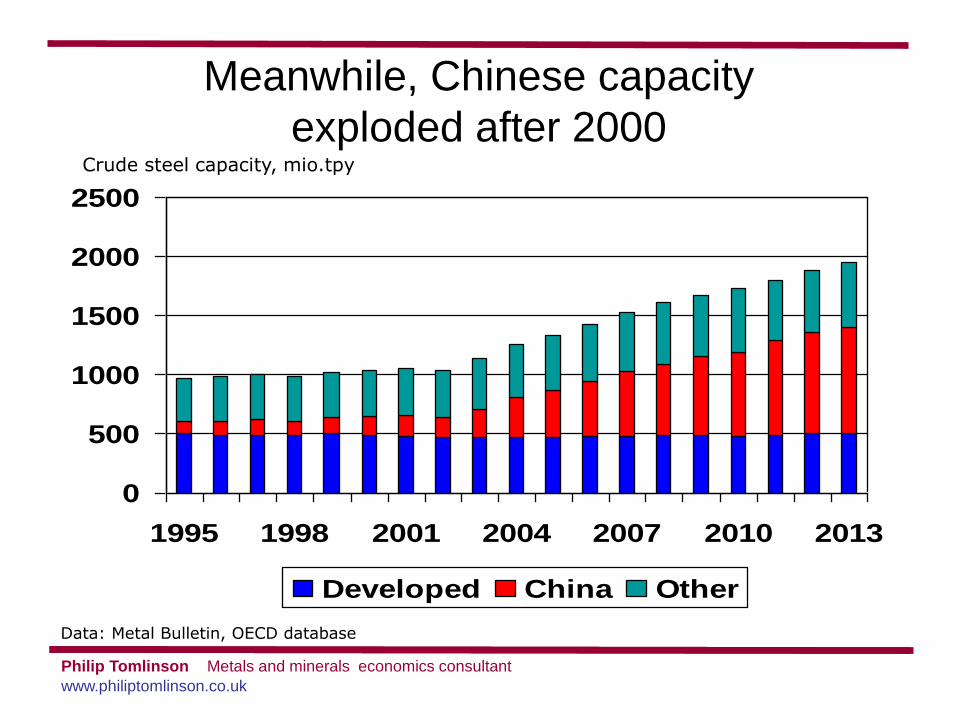
Meanwhile, Chinese capacity
exploded after 2000
0
500
1000
1500
2000
2500
1995 1998 2001 2004 2007 2010 2013
Developed China Other
Data: Metal Bulletin, OECD database
Crude steel capacity, mio.tpy
Philip Tomlinson Metals and minerals economics consultant www.philiptomlinson.co.uk
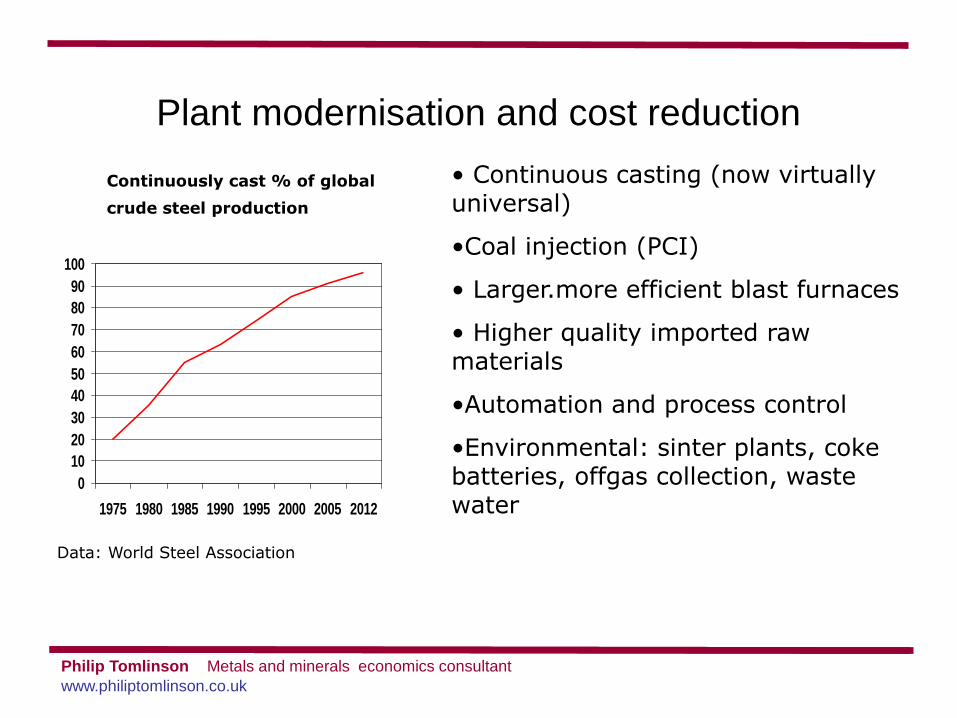
Plant modernisation and cost reduction
0
10
20
30
40
50
60
70
80
90
100
1975 1980 1985 1990 1995 2000 2005 2012
Continuously cast % of global
crude steel production
• Continuous casting (now virtually universal)
•Coal injection (PCI)
• Larger.more efficient blast furnaces
• Higher quality imported raw materials
•Automation and process control
•Environmental: sinter plants, coke batteries, offgas collection, waste water
Data: World Steel Association
Philip Tomlinson Metals and minerals economics consultant www.philiptomlinson.co.uk
The rise of the EAF- but not in China
0 200 400 600 800 1000
Europe
CIS
N America
Japan
China
Others
EAF BOF Other
0%
10%
20%
30%
40%
50%
60%
70%
1988 1991 1994 1997 2000 2003 2006 2009 2012
Europe N America
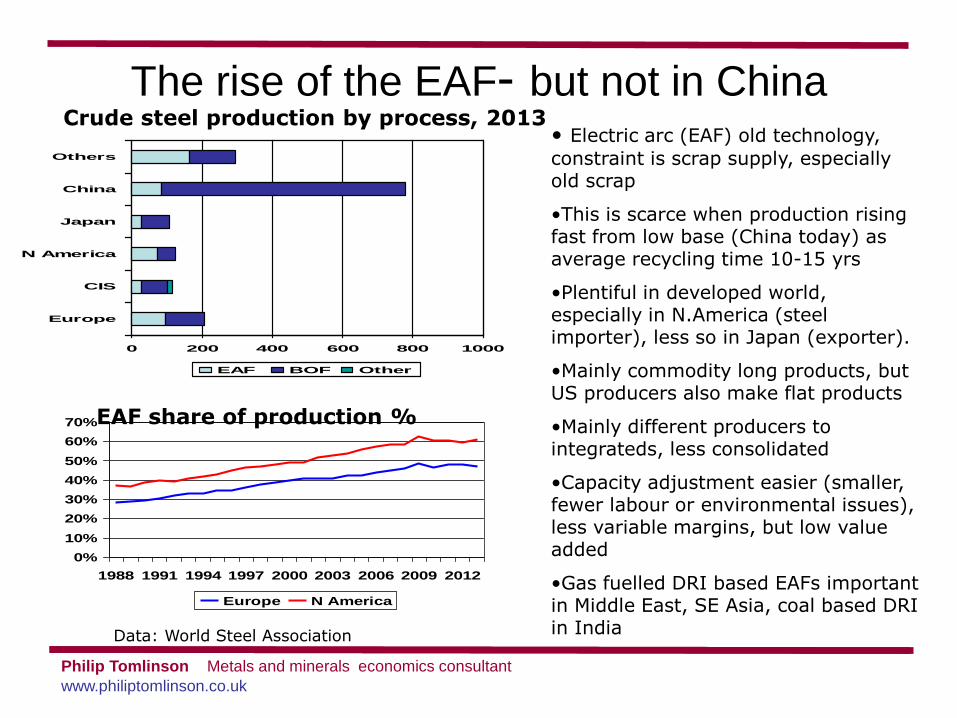
Crude steel production by process, 2013
EAF share of production %
• Electric arc (EAF) old technology,
constraint is scrap supply, especially old scrap
•This is scarce when production rising fast from low base (China today) as average recycling time 10-15 yrs
•Plentiful in developed world, especially in N.America (steel importer), less so in Japan (exporter).
•Mainly commodity long products, but US producers also make flat products
•Mainly different producers to integrateds, less consolidated
•Capacity adjustment easier (smaller, fewer labour or environmental issues), less variable margins, but low value added
•Gas fuelled DRI based EAFs important in Middle East, SE Asia, coal based DRI in India Data: World Steel Association
Philip Tomlinson Metals and minerals economics consultant www.philiptomlinson.co.uk
Privatisation
11
1988
1992
1995
1995
1995
1997
2003
2003
1994
2001
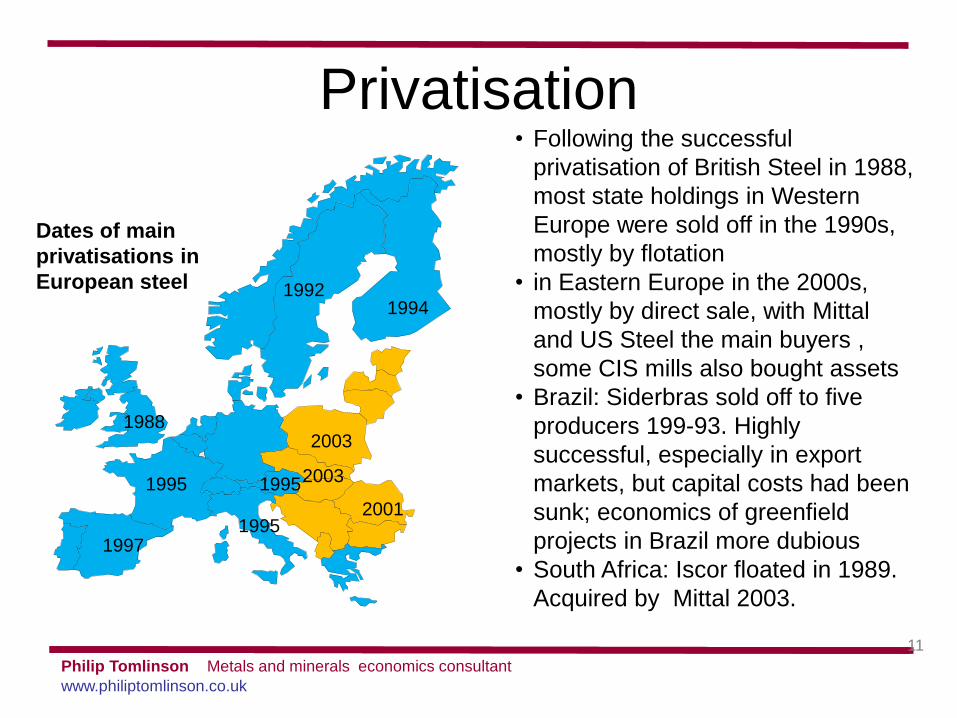
Dates of main
privatisations in
European steel
• Following the successful
privatisation of British Steel in 1988,
most state holdings in Western
Europe were sold off in the 1990s,
mostly by flotation
• in Eastern Europe in the 2000s,
mostly by direct sale, with Mittal
and US Steel the main buyers ,
some CIS mills also bought assets
• Brazil: Siderbras sold off to five
producers 199-93. Highly
successful, especially in export
markets, but capital costs had been
sunk; economics of greenfield
projects in Brazil more dubious
• South Africa: Iscor floated in 1989.
Acquired by Mittal 2003.
Philip Tomlinson Metals and minerals economics consultant www.philiptomlinson.co.uk
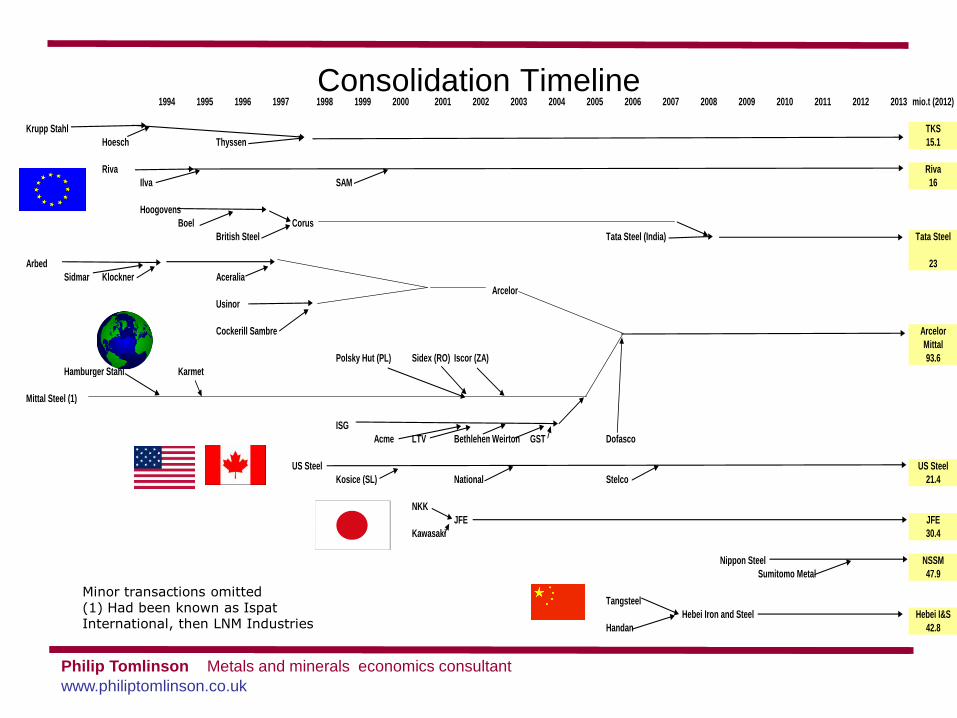
Consolidation Timeline 1994 1995 1996 1997 1998 1999 2000 2001 2002 2003 2004 2005 2006 2007 2008 2009 2010 2011 2012 2013 mio.t (2012)
Krupp Stahl TKS
Hoesch Thyssen 15.1
Riva Riva
Ilva SAM 16
Hoogovens
Boel Corus
British Steel Tata Steel (India) Tata Steel
Arbed 23
Sidmar Klockner Aceralia
Arcelor
Usinor
Cockerill Sambre Arcelor
Mittal
Polsky Hut (PL) Sidex (RO) Iscor (ZA) 93.6
Hamburger Stahl Karmet
Mittal Steel (1)
ISG
Acme LTV BethlehemWeirton GST Dofasco
US Steel US Steel
Kosice (SL) National Stelco 21.4
NKK
JFE JFE
Kawasaki 30.4
Nippon Steel NSSM
Sumitomo Metal 47.9
Tangsteel
Hebei Iron and Steel Hebei I&S
Handan 42.8
Minor transactions omitted (1) Had been known as Ispat International, then LNM Industries
Philip Tomlinson Metals and minerals economics consultant www.philiptomlinson.co.uk
Ansteel *
JFE
Wuhan Group*
POSCO
Baosteel Group*
Hebei *
Arcelor Mittal
0 20 40 60 80 100
Nippon Steel & Sumitomo Metal Corporation (1)
Shagang Group*
Shougang Group *
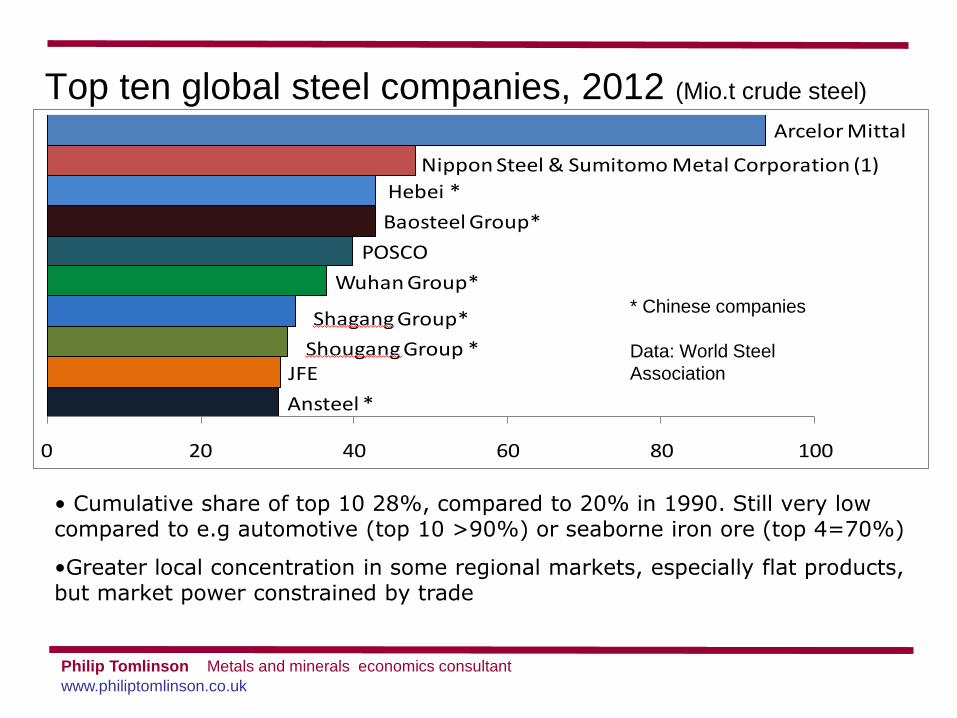
Top ten global steel companies, 2012 (Mio.t crude steel)
Data: World Steel Association
* Chinese companies
Data: World Steel
Association
• Cumulative share of top 10 28%, compared to 20% in 1990. Still very low compared to e.g automotive (top 10 >90%) or seaborne iron ore (top 4=70%)
•Greater local concentration in some regional markets, especially flat products, but market power constrained by trade
Philip Tomlinson Metals and minerals economics consultant www.philiptomlinson.co.uk
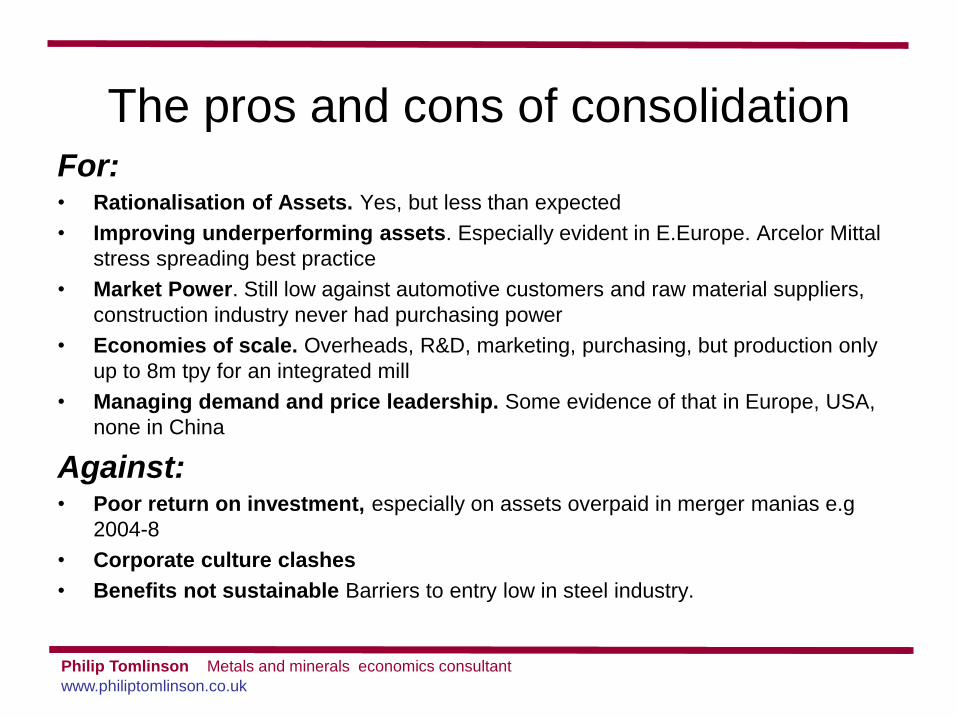
The pros and cons of consolidation For: • Rationalisation of Assets. Yes, but less than expected
• Improving underperforming assets. Especially evident in E.Europe. Arcelor Mittal
stress spreading best practice
• Market Power. Still low against automotive customers and raw material suppliers,
construction industry never had purchasing power
• Economies of scale. Overheads, R&D, marketing, purchasing, but production only
up to 8m tpy for an integrated mill
• Managing demand and price leadership. Some evidence of that in Europe, USA,
none in China
Against: • Poor return on investment, especially on assets overpaid in merger manias e.g
2004-8
• Corporate culture clashes
• Benefits not sustainable Barriers to entry low in steel industry.
Philip Tomlinson Metals and minerals economics consultant www.philiptomlinson.co.uk
-2.0%0.0%2.0%4.0%6.0%8.0%
10.0%12.0%14.0%
Arcelo
r*
Corus
TKS
Rautaru
ukki
Salzg
itter
SSAB
voest
alpin
e
1997-2006 1997-2011
n/a
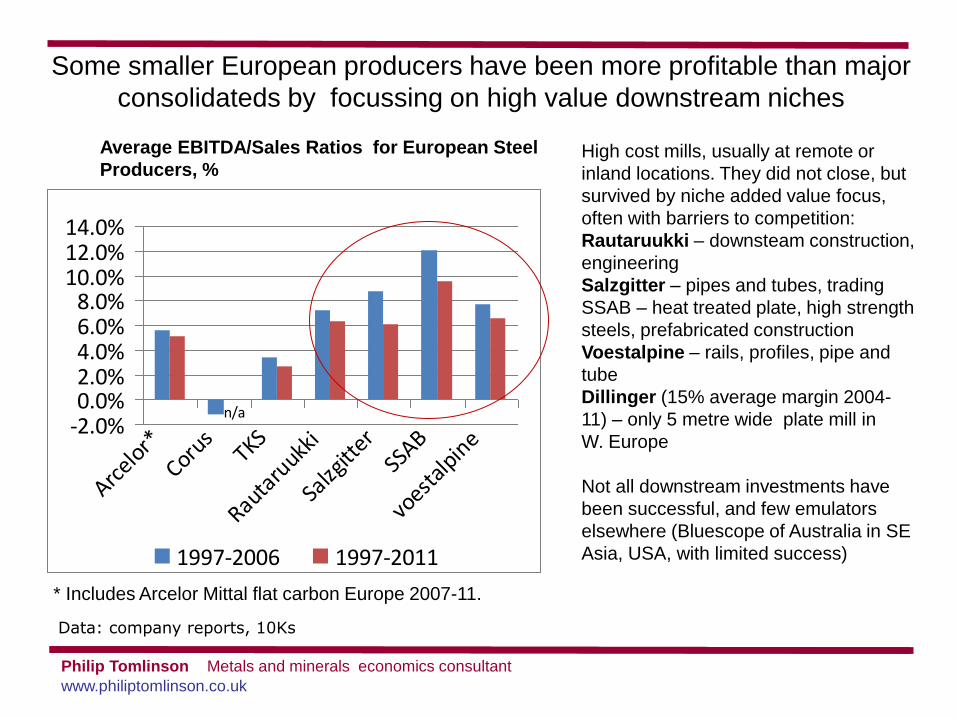
Some smaller European producers have been more profitable than major
consolidateds by focussing on high value downstream niches
Data: company reports
and websites
* Includes Arcelor Mittal flat carbon Europe 2007-11.
Average EBITDA/Sales Ratios for European Steel
Producers, % High cost mills, usually at remote or
inland locations. They did not close, but
survived by niche added value focus,
often with barriers to competition:
Rautaruukki – downsteam construction,
engineering
Salzgitter – pipes and tubes, trading
SSAB – heat treated plate, high strength
steels, prefabricated construction
Voestalpine – rails, profiles, pipe and
tube
Dillinger (15% average margin 2004-
11) – only 5 metre wide plate mill in
W. Europe
Not all downstream investments have
been successful, and few emulators
elsewhere (Bluescope of Australia in SE
Asia, USA, with limited success)
Data: company reports, 10Ks
Philip Tomlinson Metals and minerals economics consultant www.philiptomlinson.co.uk
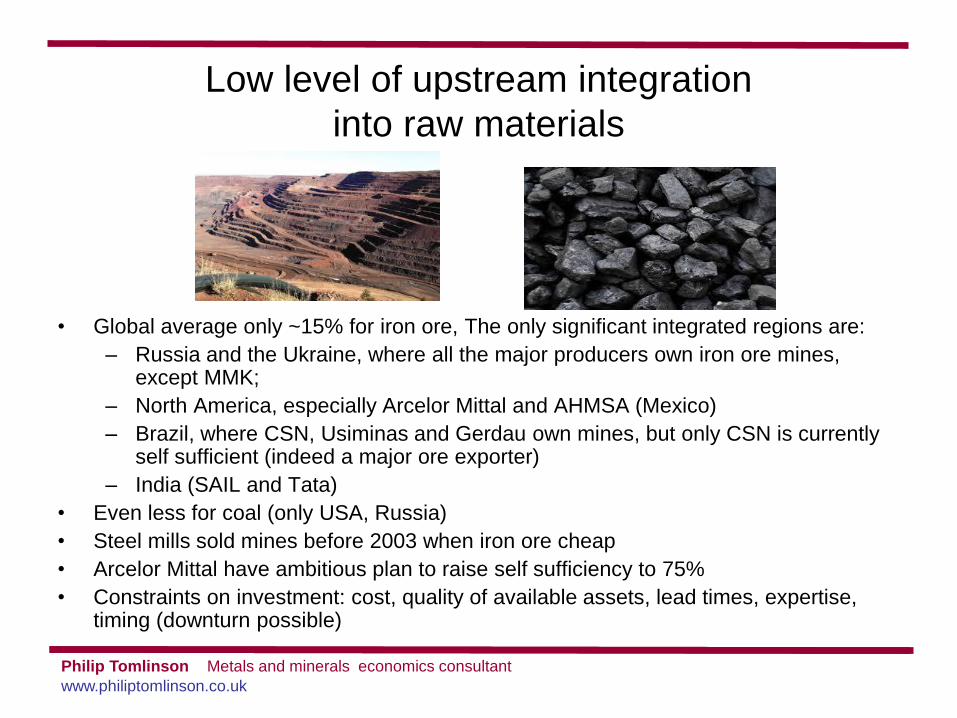
Low level of upstream integration
into raw materials
• Global average only ~15% for iron ore, The only significant integrated regions are:
– Russia and the Ukraine, where all the major producers own iron ore mines, except MMK;
– North America, especially Arcelor Mittal and AHMSA (Mexico)
– Brazil, where CSN, Usiminas and Gerdau own mines, but only CSN is currently self sufficient (indeed a major ore exporter)
– India (SAIL and Tata)
• Even less for coal (only USA, Russia)
• Steel mills sold mines before 2003 when iron ore cheap
• Arcelor Mittal have ambitious plan to raise self sufficiency to 75%
• Constraints on investment: cost, quality of available assets, lead times, expertise, timing (downturn possible)
Philip Tomlinson Metals and minerals economics consultant www.philiptomlinson.co.uk
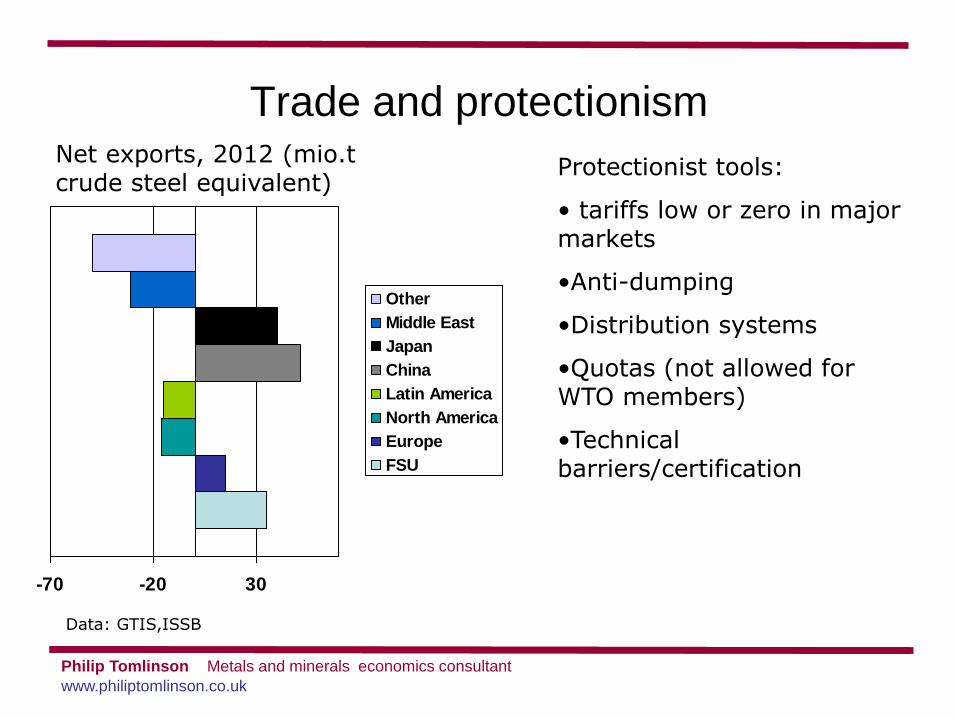
Trade and protectionism
-70 -20 30
Other
Middle East
Japan
China
Latin America
North America
Europe
FSU
Net exports, 2012 (mio.t crude steel equivalent)
Data: GTIS,ISSB
Protectionist tools:
• tariffs low or zero in major markets
•Anti-dumping
•Distribution systems
•Quotas (not allowed for WTO members)
•Technical barriers/certification
Philip Tomlinson Metals and minerals economics consultant www.philiptomlinson.co.uk
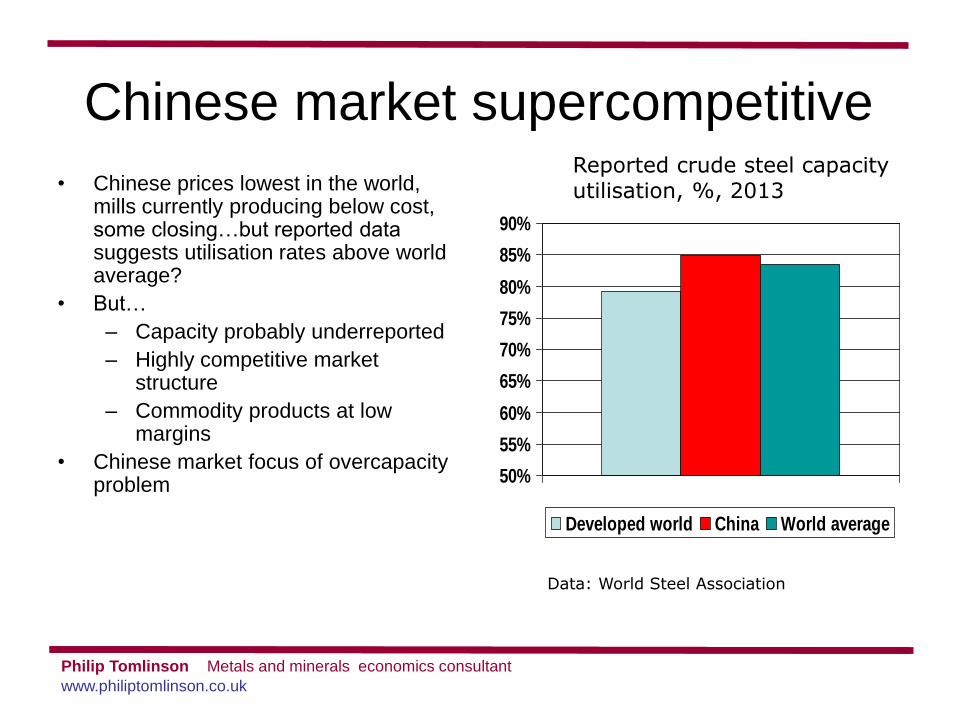
Chinese market supercompetitive
• Chinese prices lowest in the world, mills currently producing below cost, some closing…but reported data suggests utilisation rates above world average?
• But…
– Capacity probably underreported
– Highly competitive market structure
– Commodity products at low margins
• Chinese market focus of overcapacity problem
50%
55%
60%
65%
70%
75%
80%
85%
90%
Developed world China World average
Reported crude steel capacity utilisation, %, 2013
Data: World Steel Association
Philip Tomlinson Metals and minerals economics consultant www.philiptomlinson.co.uk
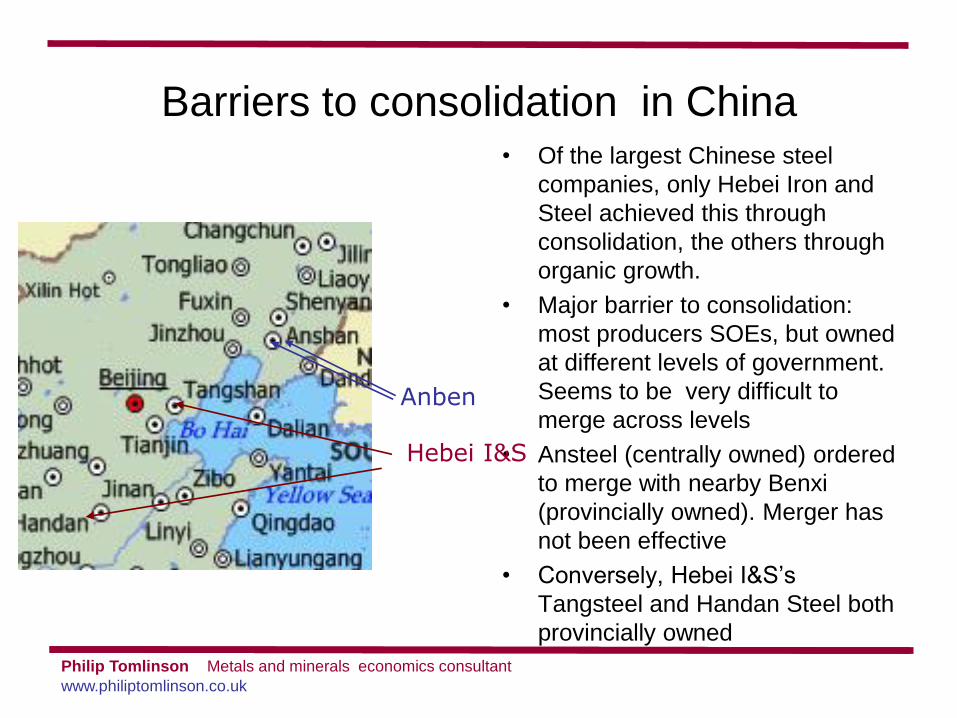
Barriers to consolidation in China • Of the largest Chinese steel
companies, only Hebei Iron and
Steel achieved this through
consolidation, the others through
organic growth.
• Major barrier to consolidation:
most producers SOEs, but owned
at different levels of government.
Seems to be very difficult to
merge across levels
• Ansteel (centrally owned) ordered
to merge with nearby Benxi
(provincially owned). Merger has
not been effective
• Conversely, Hebei I&S’s
Tangsteel and Handan Steel both
provincially owned
Anben
Hebei I&S

Philip Tomlinson Metals and minerals economics consultant www.philiptomlinson.co.uk
Europe after 1975 v China Today
Similarities
• The largest competitive market in the world, private and state producers, imported raw materials .
• In theory central power (EEC Commission or Chinese central government) has strong powers, in practice local powers important
• Because of importance of integrated mill employment, local subsidies as growth declined
• Market forces alone would lead to closures being focussed on weaker regions, politically unacceptable
Differences
• EEC industry invested in new cost reducing technologies (e.g concast), most Chinese industry new and modern – but environmental enforcement is lax
• No significant EAF sector
Philip Tomlinson Metals and minerals economics consultant www.philiptomlinson.co.uk
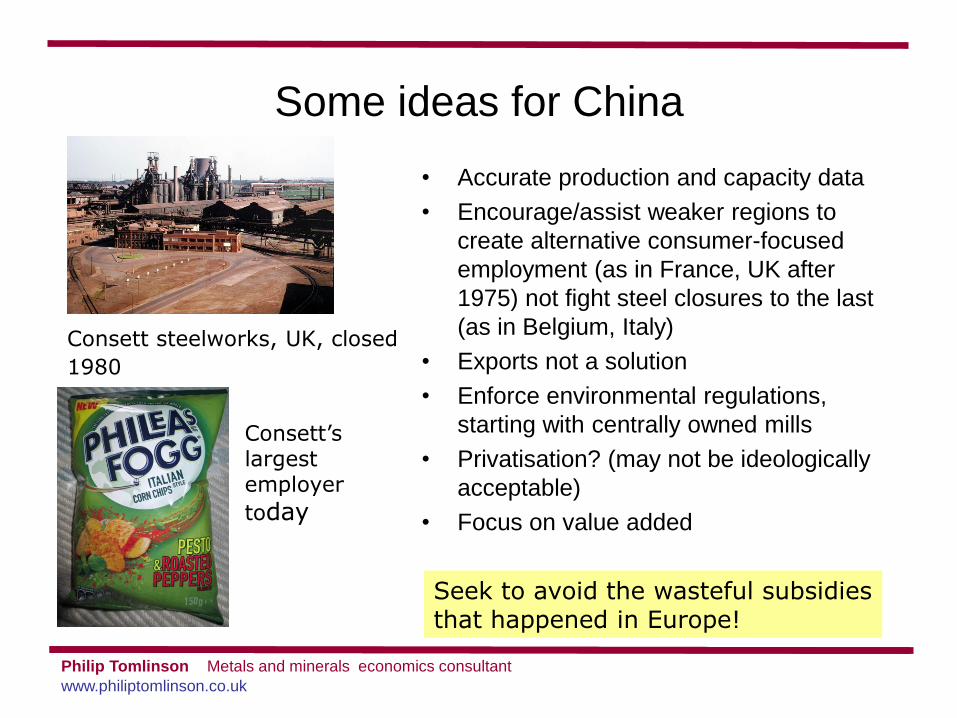
Some ideas for China
• Accurate production and capacity data
• Encourage/assist weaker regions to
create alternative consumer-focused
employment (as in France, UK after
1975) not fight steel closures to the last
(as in Belgium, Italy)
• Exports not a solution
• Enforce environmental regulations,
starting with centrally owned mills
• Privatisation? (may not be ideologically
acceptable)
• Focus on value added
Consett steelworks, UK, closed
1980
Consett’s largest employer
today
Seek to avoid the wasteful subsidies that happened in Europe!